UNITED STATES
SECURITIES AND EXCHANGE COMMISSION
FORM N-CSR
CERTIFIED SHAREHOLDER REPORT OF REGISTERED MANAGEMENT INVESTMENT COMPANIES
Investment Company Act file number811-04367
Columbia Funds Series Trust I
(Exact name of registrant as specified in charter)
290 Congress Street
Boston, MA 02210
(Address of principal executive offices) (Zip code)
Daniel J. Beckman
c/o Columbia Management Investment Advisers, LLC
290 Congress Street
Boston, MA 02210
Ryan C. Larrenaga, Esq.
c/o Columbia Management Investment Advisers, LLC
290 Congress Street
Boston, MA 02210
(Name and address of agent for service)
Registrant's telephone number, including area code: (800) 345-6611
Date of fiscal year end: April 30
Date of reporting period: April 30, 2022
Form N-CSR is to be used by management investment companies to file reports with the Commission not later than 10 days after the transmission to stockholders of any report that is required to be transmitted to stockholders under Rule 30e-1 under the Investment Company Act of 1940 (17 CFR 270.30e-1). The Commission may use the information provided on Form N-CSR in its regulatory, disclosure review, inspection, and policymaking roles.
A registrant is required to disclose the information specified by Form N-CSR, and the Commission will make this information public. A registrant is not required to respond to the collection of information contained in Form N-CSR unless the Form displays a currently valid Office of Management and Budget ("OMB") control number. Please direct comments concerning the accuracy of the information collection burden estimate and any suggestions for reducing the burden to Secretary, Securities and Exchange Commission, 100 F Street, NE, Washington, DC 20549. The OMB has reviewed this collection of information under the clearance requirements of 44 U.S.C. § 3507.
Item 1. Reports to Stockholders.

April 30, 2022

| 3 | |
| 5 | |
| 7 | |
| 8 | |
| 24 | |
| 26 | |
| 28 | |
| 30 | |
| 34 | |
| 51 | |
| 52 | |
| 52 | |
| 58 |
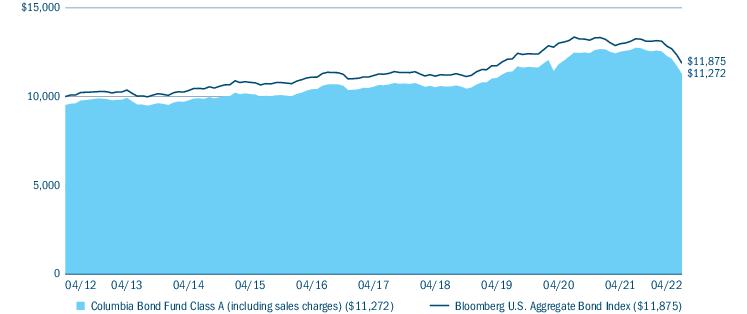
(Unaudited)
| Average annual total returns (%) (for the period ended April 30, 2022) | |||||
| Inception | 1 Year | 5 Years | 10 Years | ||
| Class A | Excluding sales charges | 03/31/08 | -10.02 | 1.32 | 1.70 |
| Including sales charges | -14.29 | 0.35 | 1.20 | ||
| Advisor Class* | 11/08/12 | -9.81 | 1.57 | 1.95 | |
| Class C | Excluding sales charges | 03/31/08 | -10.71 | 0.56 | 0.97 |
| Including sales charges | -11.60 | 0.56 | 0.97 | ||
| Institutional Class | 01/09/86 | -9.80 | 1.57 | 1.95 | |
| Institutional 2 Class* | 11/08/12 | -9.74 | 1.68 | 2.04 | |
| Institutional 3 Class | 07/15/09 | -9.70 | 1.73 | 2.11 | |
| Class R | 11/16/11 | -10.28 | 1.06 | 1.44 | |
| Class V | Excluding sales charges | 03/07/11 | -9.93 | 1.41 | 1.80 |
| Including sales charges | -14.20 | 0.43 | 1.30 | ||
| Bloomberg U.S. Aggregate Bond Index | -8.51 | 1.20 | 1.73 | ||
| * | The returns shown for periods prior to the share class inception date (including returns for the Life of the Fund, if shown, which are since Fund inception) include the returns of the Fund’s oldest share class. These returns are adjusted to reflect any higher class-related operating expenses of the newer share classes, as applicable. Please visit columbiathreadneedleus.com/investor/investment-products/mutual-funds/appended-performance for more information. |
| Columbia Bond Fund | Annual Report 2022 | 3 |
(Unaudited)
| Portfolio breakdown (%) (at April 30, 2022) | |
| Asset-Backed Securities — Non-Agency | 15.0 |
| Commercial Mortgage-Backed Securities - Agency | 0.5 |
| Commercial Mortgage-Backed Securities - Non-Agency | 15.7 |
| Common Stocks | 0.0(a) |
| Corporate Bonds & Notes | 15.8 |
| Money Market Funds | 3.9 |
| Options Purchased Calls | 0.0(a) |
| Options Purchased Puts | 0.7 |
| Residential Mortgage-Backed Securities - Agency | 19.6 |
| Residential Mortgage-Backed Securities - Non-Agency | 28.6 |
| U.S. Treasury Obligations | 0.2 |
| Total | 100.0 |
| (a) | Rounds to zero. |
| Quality breakdown (%) (at April 30, 2022) | |
| AAA rating | 18.8 |
| AA rating | 13.9 |
| A rating | 21.2 |
| BBB rating | 22.1 |
| BB rating | 0.0(a) |
| Not rated | 24.0 |
| Total | 100.0 |
| (a) | Rounds to zero. |
| 4 | Columbia Bond Fund | Annual Report 2022 |
(Unaudited)
| • | In broad terms, the Fund’s approach to balancing risk exposures across credit-oriented sectors and between credit risk and interest rate risk was less effective than we have seen historically as interest rates moved sharply higher and credit sentiment weakened in early 2022. |
| • | The Fund’s underperformance relative to the benchmark was largely the result of positioning with respect to interest rates. Specifically, the Fund had an above-benchmark stance with respect to duration and corresponding interest rate sensitivity as Treasury yields spiked in the first quarter of 2022. In addition, the Fund was overweight the front end of the curve which was most impacted by rising yields. |
| • | From an asset allocation perspective, the Fund’s underweight to Treasuries weighed on relative performance as investor risk aversion increased entering 2022. |
| • | Security selection within investment-grade corporates detracted as a tilt toward longer maturities had a negative impact as credit spreads widened in early 2022. |
| Columbia Bond Fund | Annual Report 2022 | 5 |
(Unaudited)
| • | Overall sector allocation had a positive impact on performance relative to the benchmark. Most notably, the Fund’s exposure to non-agency mortgage-backed securities benefited return as the segment continued to be supported by a strong housing market and resilient consumer demand. |
| • | While security selection had an essentially neutral impact on performance overall, selection was positive within asset-backed securities where a focus on high quality collateralized loan obligations proved beneficial. |
| 6 | Columbia Bond Fund | Annual Report 2022 |
(Unaudited)
| November 1, 2021 — April 30, 2022 | |||||||
| Account value at the beginning of the period ($) | Account value at the end of the period ($) | Expenses paid during the period ($) | Fund’s annualized expense ratio (%) | ||||
| Actual | Hypothetical | Actual | Hypothetical | Actual | Hypothetical | Actual | |
| Class A | 1,000.00 | 1,000.00 | 898.20 | 1,021.09 | 3.64 | 3.88 | 0.77 |
| Advisor Class | 1,000.00 | 1,000.00 | 899.20 | 1,022.34 | 2.46 | 2.62 | 0.52 |
| Class C | 1,000.00 | 1,000.00 | 894.70 | 1,017.35 | 7.18 | 7.64 | 1.52 |
| Institutional Class | 1,000.00 | 1,000.00 | 899.30 | 1,022.34 | 2.46 | 2.62 | 0.52 |
| Institutional 2 Class | 1,000.00 | 1,000.00 | 899.60 | 1,022.69 | 2.13 | 2.27 | 0.45 |
| Institutional 3 Class | 1,000.00 | 1,000.00 | 899.80 | 1,022.94 | 1.89 | 2.02 | 0.40 |
| Class R | 1,000.00 | 1,000.00 | 896.80 | 1,019.85 | 4.82 | 5.14 | 1.02 |
| Class V | 1,000.00 | 1,000.00 | 898.70 | 1,021.59 | 3.17 | 3.38 | 0.67 |
| Columbia Bond Fund | Annual Report 2022 | 7 |
April 30, 2022
| Asset-Backed Securities — Non-Agency 18.1% | ||||
| Issuer | Coupon Rate | Principal Amount ($) | Value ($) | |
| ACM Auto Trust(a) | ||||
| Subordinated Series 2022-1A Class C | ||||
| 04/20/2029 | 5.480% | 3,750,000 | 3,752,649 | |
| American Credit Acceptance Receivables Trust(a) | ||||
| Subordinated Series 2022-2 Class C | ||||
| 06/13/2028 | 4.410% | 5,000,000 | 5,014,871 | |
| Ares LVIII CLO Ltd.(a),(b) | ||||
| Series 2020-58A Class DR | ||||
| 3-month Term SOFR + 3.200% Floor 3.200% 01/15/2035 | 4.046% | 3,000,000 | 2,974,233 | |
| Avant Loans Funding Trust(a) | ||||
| Subordinated Series 2021-REV1 Class B | ||||
| 07/15/2030 | 1.640% | 3,950,000 | 3,774,759 | |
| Bain Capital Credit CLO Ltd.(a),(b) | ||||
| Series 2018-1A Class B | ||||
| 3-month USD LIBOR + 1.400% 04/23/2031 | 2.584% | 2,000,000 | 1,955,150 | |
| Series 2020-5A Class A1 | ||||
| 3-month USD LIBOR + 1.220% Floor 1.220% 01/20/2032 | 2.283% | 10,000,000 | 9,940,260 | |
| Series 2020-5A Class C | ||||
| 3-month USD LIBOR + 2.350% Floor 2.350% 01/20/2032 | 3.413% | 4,480,000 | 4,365,469 | |
| Carlyle Group LP(a),(b) | ||||
| Series 2017-5A Class A2 | ||||
| 3-month USD LIBOR + 1.400% 01/20/2030 | 2.463% | 2,000,000 | 1,953,126 | |
| Carlyle US CLO Ltd.(a),(b) | ||||
| Series 2020-2A Class CR | ||||
| 3-month USD LIBOR + 3.200% Floor 3.200% 01/25/2035 | 3.458% | 1,850,000 | 1,817,978 | |
| Cent CLO Ltd.(a),(b) | ||||
| Series 2018-C17A Class A2R | ||||
| 3-month USD LIBOR + 1.600% Floor 1.600% 04/30/2031 | 1.899% | 1,800,000 | 1,776,478 | |
| Consumer Loan Underlying Bond CLUB Credit Trust(a) | ||||
| Subordinated Series 2020-P1 Class B | ||||
| 03/15/2028 | 2.920% | 64,733 | 64,748 | |
| Consumer Underlying Bond Securitization(a) | ||||
| Series 2018-1 Class A | ||||
| 02/17/2026 | 4.790% | 175,466 | 175,535 | |
| Asset-Backed Securities — Non-Agency (continued) | ||||
| Issuer | Coupon Rate | Principal Amount ($) | Value ($) | |
| Dryden 83 CLO Ltd.(a),(b) | ||||
| Series 2020-83A Class C | ||||
| 3-month USD LIBOR + 2.150% Floor 2.150% 01/18/2032 | 3.194% | 5,000,000 | 4,965,410 | |
| Dryden 86 CLO Ltd.(a),(b) | ||||
| Series 2020-86A Class BR | ||||
| 3-month USD LIBOR + 1.700% Floor 1.700% 07/17/2034 | 2.744% | 1,250,000 | 1,228,597 | |
| Dryden CLO Ltd.(a),(b) | ||||
| Series 2018-57A Class B | ||||
| 3-month USD LIBOR + 1.350% Floor 1.350% 05/15/2031 | 1.856% | 1,250,000 | 1,230,027 | |
| GLS Auto Receivables Issuer Trust(a) | ||||
| Subordinated Series 2020-3A Class C | ||||
| 05/15/2025 | 1.920% | 3,000,000 | 2,985,393 | |
| LendingPoint Asset Securitization Trust(a) | ||||
| Series 2021-1 Class A | ||||
| 04/15/2027 | 1.750% | 514,750 | 514,709 | |
| Series 2021-A Class A | ||||
| 12/15/2028 | 1.000% | 4,201,453 | 4,176,600 | |
| Series 2021-B Class A | ||||
| 02/15/2029 | 1.110% | 3,248,232 | 3,192,432 | |
| LendingPoint Pass-Through Trust(a) | ||||
| Series 2022-ST1 Class A | ||||
| 03/15/2028 | 2.500% | 3,711,564 | 3,611,754 | |
| LL ABS Trust(a) | ||||
| Series 2021-1A Class A | ||||
| 05/15/2029 | 1.070% | 1,464,357 | 1,399,063 | |
| Lucali CLO Ltd.(a),(b) | ||||
| Series 2020-1A Class C | ||||
| 3-month USD LIBOR + 2.200% Floor 2.200% 01/15/2033 | 2.441% | 6,500,000 | 6,444,522 | |
| Series 2020-1A Class D | ||||
| 3-month USD LIBOR + 3.600% Floor 3.600% 01/15/2033 | 3.841% | 1,500,000 | 1,471,125 | |
| Madison Park Funding XXIV Ltd.(a),(b) | ||||
| Series 2016-24A Class BR | ||||
| 3-month USD LIBOR + 1.750% 10/20/2029 | 2.813% | 5,000,000 | 4,998,230 | |
| Madison Park Funding XXVII Ltd.(a),(b) | ||||
| Series 2018-27A Class A2 | ||||
| 3-month USD LIBOR + 1.350% 04/20/2030 | 2.413% | 3,700,000 | 3,644,896 | |
| 8 | Columbia Bond Fund | Annual Report 2022 |
April 30, 2022
| Asset-Backed Securities — Non-Agency (continued) | ||||
| Issuer | Coupon Rate | Principal Amount ($) | Value ($) | |
| Marlette Funding Trust(a) | ||||
| Series 2021-1A Class B | ||||
| 06/16/2031 | 1.000% | 1,800,000 | 1,764,861 | |
| Subordinated Series 2019-4A Class B | ||||
| 12/17/2029 | 2.950% | 2,882,922 | 2,882,620 | |
| Octagon Investment Partners 35 Ltd.(a),(b) | ||||
| Series 2018-1A Class A2 | ||||
| 3-month USD LIBOR + 1.400% Floor 1.400% 01/20/2031 | 2.463% | 1,820,000 | 1,794,802 | |
| Octagon Investment Partners XXII Ltd.(a),(b) | ||||
| Series 2014-1A Class BRR | ||||
| 3-month USD LIBOR + 1.450% Floor 1.450% 01/22/2030 | 2.586% | 4,000,000 | 3,964,080 | |
| Octane Receivables Trust(a) | ||||
| Series 2019-1A Class A | ||||
| 09/20/2023 | 3.160% | 3,258 | 3,260 | |
| OneMain Financial Issuance Trust(a) | ||||
| Series 2018-1A Class A | ||||
| 03/14/2029 | 3.300% | 156,618 | 156,719 | |
| Oportun Issuance Trust(a) | ||||
| Series 2021-B Class A | ||||
| 05/08/2031 | 1.470% | 6,800,000 | 6,574,803 | |
| OZLM XXI(a),(b) | ||||
| Series 2017-21A Class A1 | ||||
| 3-month USD LIBOR + 1.150% 01/20/2031 | 2.213% | 7,500,000 | 7,462,492 | |
| Pagaya AI Debt Selection Trust(a) | ||||
| Series 2019-3 Class A | ||||
| 11/16/2026 | 3.821% | 282,240 | 282,512 | |
| Series 2020-3 Class B | ||||
| 05/17/2027 | 3.220% | 3,000,000 | 2,991,467 | |
| Series 2021-1 Class A | ||||
| 11/15/2027 | 1.180% | 7,469,023 | 7,344,572 | |
| Series 2021-3 Class A | ||||
| 05/15/2029 | 1.150% | 6,191,146 | 6,064,314 | |
| Series 2021-5 Class A | ||||
| 08/15/2029 | 1.530% | 4,352,860 | 4,241,919 | |
| Pagaya AI Debt Trust(a) | ||||
| Subordinated Series 2022-1 Class B | ||||
| 10/15/2029 | 3.344% | 2,200,000 | 2,073,806 | |
| Research-Driven Pagaya Motor Asset Trust IV(a) | ||||
| Series 2021-2A Class A | ||||
| 03/25/2030 | 2.650% | 2,507,684 | 2,395,892 | |
| RR 1 LLC(a),(b) | ||||
| Series 2017-1A Class A2B | ||||
| 3-month USD LIBOR + 1.600% Floor 1.600% 07/15/2035 | 2.644% | 10,000,000 | 9,849,490 | |
| Asset-Backed Securities — Non-Agency (continued) | ||||
| Issuer | Coupon Rate | Principal Amount ($) | Value ($) | |
| RR 3 Ltd.(a),(b) | ||||
| Series 2014-14A Class A1R2 | ||||
| 3-month USD LIBOR + 1.090% Floor 1.090% 01/15/2030 | 2.134% | 4,500,000 | 4,480,546 | |
| Theorem Funding Trust(a) | ||||
| Series 2021-1A Class A | ||||
| 12/15/2027 | 1.210% | 3,770,463 | 3,708,183 | |
| Series 2022-1A Class A | ||||
| 02/15/2028 | 1.850% | 1,807,709 | 1,784,040 | |
| Upstart Pass-Through Trust(a),(c) | ||||
| Series 2020-ST4 Class A | ||||
| 11/20/2026 | 3.250% | 1,194,672 | 1,196,352 | |
| Series 2021-ST10 Class A | ||||
| 01/20/2030 | 2.250% | 5,464,797 | 5,347,659 | |
| Upstart Pass-Through Trust(a) | ||||
| Series 2021-ST1 Class A | ||||
| 02/20/2027 | 2.750% | 1,251,540 | 1,223,043 | |
| Series 2021-ST6 Class A | ||||
| 08/20/2027 | 1.850% | 4,303,349 | 4,133,283 | |
| Series 2021-ST9 Class A | ||||
| 11/20/2029 | 1.700% | 2,584,570 | 2,471,915 | |
| Upstart Securitization Trust(a) | ||||
| Series 2021-1 Class B | ||||
| 03/20/2031 | 1.890% | 4,250,000 | 4,131,467 | |
| Series 2021-3 Class A | ||||
| 07/20/2031 | 0.830% | 6,263,164 | 6,139,726 | |
| Series 2021-4 Class A | ||||
| 09/20/2031 | 0.840% | 4,225,011 | 4,094,633 | |
| Subordinated Series 2020-3 Class B | ||||
| 11/20/2030 | 3.014% | 4,000,000 | 3,916,827 | |
| Subordinated Series 2021-5 Class B | ||||
| 11/20/2031 | 2.490% | 5,000,000 | 4,602,271 | |
| Total Asset-Backed Securities — Non-Agency (Cost $187,965,281) | 184,505,568 | |||
| Commercial Mortgage-Backed Securities - Agency 0.6% | ||||
| Federal Home Loan Mortgage Corp. Multifamily Structured Pass-Through Certificates(d) | ||||
| Series 2017-K070 Class A2 | ||||
| 11/25/2027 | 3.303% | 1,000,000 | 1,003,168 | |
| Federal National Mortgage Association(d) | ||||
| Series 2017-M15 Class ATS2 | ||||
| 11/25/2027 | 3.209% | 4,491,079 | 4,434,652 | |
| Government National Mortgage Association(d),(e) | ||||
| Series 2019-147 Class IO | ||||
| 06/16/2061 | 0.419% | 5,918,583 | 265,190 | |
| Total Commercial Mortgage-Backed Securities - Agency (Cost $6,114,860) | 5,703,010 | |||
| Columbia Bond Fund | Annual Report 2022 | 9 |
April 30, 2022
| Commercial Mortgage-Backed Securities - Non-Agency 18.8% | ||||
| Issuer | Coupon Rate | Principal Amount ($) | Value ($) | |
| American Homes 4 Rent Trust(a) | ||||
| Series 2014-SFR2 Class A | ||||
| 10/17/2036 | 3.786% | 2,366,930 | 2,349,637 | |
| Series 2014-SFR3 Class A | ||||
| 12/17/2036 | 3.678% | 2,942,798 | 2,900,492 | |
| BAMLL Commercial Mortgage Securities Trust(a),(d) | ||||
| Series 2013-WBRK Class A | ||||
| 03/10/2037 | 3.652% | 1,350,000 | 1,315,828 | |
| BAMLL Commercial Mortgage Securities Trust(a),(b) | ||||
| Series 2018-DSNY Class A | ||||
| 1-month USD LIBOR + 0.850% Floor 0.850% 09/15/2034 | 1.405% | 4,500,000 | 4,409,744 | |
| Series 2019-RLJ Class D | ||||
| 1-month USD LIBOR + 1.950% Floor 1.950% 04/15/2036 | 2.504% | 1,300,000 | 1,251,681 | |
| Subordinated Series 2018-DSNY Class B | ||||
| 1-month USD LIBOR + 1.150% Floor 1.150% 09/15/2034 | 1.705% | 9,325,000 | 9,044,498 | |
| Subordinated Series 2018-DSNY Class D | ||||
| 1-month USD LIBOR + 1.700% Floor 1.700% 09/15/2034 | 2.255% | 1,000,000 | 957,393 | |
| BBCMS Trust(a),(b) | ||||
| Series 2018-BXH Class A | ||||
| 1-month USD LIBOR + 1.000% Floor 1.000% 10/15/2037 | 1.554% | 2,503,753 | 2,453,589 | |
| Subordinated Series 2018-BXH Class D | ||||
| 1-month USD LIBOR + 2.000% Floor 2.000% 10/15/2037 | 2.554% | 2,000,000 | 1,928,321 | |
| BFLD Trust(a),(b) | ||||
| Series 2019-DPLO Class A | ||||
| 1-month USD LIBOR + 1.090% Floor 1.091% 10/15/2034 | 1.644% | 3,000,000 | 2,966,472 | |
| BHMS Mortgage Trust(a),(b) | ||||
| Series 2018-ATLS Class A | ||||
| 1-month USD LIBOR + 1.250% Floor 1.250% 07/15/2035 | 1.805% | 3,000,000 | 2,947,849 | |
| Braemar Hotels & Resorts Trust(a),(b) | ||||
| Series 2018-PRME Class A | ||||
| 1-month USD LIBOR + 0.820% Floor 0.820% 06/15/2035 | 1.375% | 8,000,000 | 7,845,660 | |
| Commercial Mortgage-Backed Securities - Non-Agency (continued) | ||||
| Issuer | Coupon Rate | Principal Amount ($) | Value ($) | |
| BX Commercial Mortgage Trust(a) | ||||
| Series 2020-VIV4 Class A | ||||
| 03/09/2044 | 2.843% | 7,500,000 | 6,724,878 | |
| BX Trust(a),(b) | ||||
| Series 2018-GW Class A | ||||
| 1-month USD LIBOR + 0.800% Floor 0.800% 05/15/2035 | 1.354% | 5,950,000 | 5,837,837 | |
| Series 2019-ATL Class C | ||||
| 1-month USD LIBOR + 1.587% Floor 1.587%, Cap 1.587% 10/15/2036 | 2.141% | 823,000 | 798,471 | |
| Subordinated Series 2019-ATL Class D | ||||
| 1-month USD LIBOR + 1.887% Floor 1.887% 10/15/2036 | 2.441% | 747,000 | 721,025 | |
| BX Trust(a) | ||||
| Series 2019-OC11 Class A | ||||
| 12/09/2041 | 3.202% | 3,400,000 | 3,162,662 | |
| CHT Mortgage Trust(a),(b) | ||||
| Series 2017-CSMO Class B | ||||
| 1-month USD LIBOR + 1.400% Floor 1.200% 11/15/2036 | 1.954% | 8,450,000 | 8,406,101 | |
| Series 2017-CSMO Class C | ||||
| 1-month USD LIBOR + 1.500% Floor 1.350% 11/15/2036 | 2.054% | 1,600,000 | 1,592,215 | |
| Series 2017-CSMO Class D | ||||
| 1-month USD LIBOR + 2.250% Floor 2.100% 11/15/2036 | 2.804% | 2,000,000 | 1,988,492 | |
| Citigroup Commercial Mortgage Trust(a),(d) | ||||
| Subordinated Series 2020-420K Class D | ||||
| 11/10/2042 | 3.422% | 2,250,000 | 1,842,718 | |
| CLNY Trust(a),(b) | ||||
| Series 2019-IKPR Class A | ||||
| 1-month USD LIBOR + 1.129% Floor 1.129% 11/15/2038 | 1.683% | 1,000,000 | 980,102 | |
| COMM Mortgage Trust(a),(d) | ||||
| Series 2020-CBM Class D | ||||
| 02/10/2037 | 3.754% | 1,750,000 | 1,649,450 | |
| Corevest American Finance Trust(a) | ||||
| Series 2020-4 Class A | ||||
| 12/15/2052 | 1.174% | 17,718,312 | 16,158,387 | |
| Credit Suisse Mortgage Capital Certificates OA LLC(a) | ||||
| Series 2014-USA Class A2 | ||||
| 09/15/2037 | 3.953% | 6,220,000 | 6,018,046 | |
| 10 | Columbia Bond Fund | Annual Report 2022 |
April 30, 2022
| Commercial Mortgage-Backed Securities - Non-Agency (continued) | ||||
| Issuer | Coupon Rate | Principal Amount ($) | Value ($) | |
| Extended Stay America Trust(a),(b) | ||||
| Series 2021-ESH Class C | ||||
| 1-month USD LIBOR + 1.700% Floor 1.700% 07/15/2038 | 2.097% | 10,659,397 | 10,505,013 | |
| Hilton USA Trust(a),(d) | ||||
| Subordinated Series 2016-HHV Class C | ||||
| 11/05/2038 | 4.333% | 1,700,000 | 1,641,867 | |
| Hilton USA Trust(a) | ||||
| Subordinated Series 2016-SFP Class D | ||||
| 11/05/2035 | 4.927% | 1,646,000 | 1,618,217 | |
| Independence Plaza Trust(a) | ||||
| Series 2018-INDP Class B | ||||
| 07/10/2035 | 3.911% | 4,000,000 | 3,890,439 | |
| Invitation Homes Trust(a),(b) | ||||
| Series 2018-SFR2 Class A | ||||
| 1-month USD LIBOR + 0.900% Floor 0.900% 06/17/2037 | 1.091% | 582,144 | 581,608 | |
| Series 2018-SFR2 Class C | ||||
| 1-month USD LIBOR + 1.280% Floor 1.280% 06/17/2037 | 1.471% | 370,767 | 368,972 | |
| Subordinated Series 2018-SFR4 Class C | ||||
| 1-month USD LIBOR + 1.400% Floor 1.400% 01/17/2038 | 1.954% | 1,999,908 | 1,991,096 | |
| JPMorgan Chase Commercial Mortgage Securities Trust(a),(d) | ||||
| Subordinated Series 2021-2NU Class C | ||||
| 01/05/2040 | 2.146% | 1,750,000 | 1,494,862 | |
| Morgan Stanley Capital I Trust(a),(d) | ||||
| Series 2019-MEAD Class D | ||||
| 11/10/2036 | 3.283% | 1,200,000 | 1,107,297 | |
| New Residential Mortgage Loan Trust(a) | ||||
| Series 2022-SFR1 Class A | ||||
| 02/17/2039 | 2.400% | 6,200,000 | 5,775,983 | |
| One New York Plaza Trust(a),(b) | ||||
| Subordinated Series 2020-1NYP Class B | ||||
| 1-month USD LIBOR + 1.500% Floor 1.500% 01/15/2036 | 2.054% | 15,000,000 | 14,769,781 | |
| Subordinated Series 2020-1NYP Class C | ||||
| 1-month USD LIBOR + 2.200% Floor 2.200% 01/15/2036 | 2.754% | 5,000,000 | 4,935,058 | |
| Progress Residential Trust(a) | ||||
| Series 2020-SFR1 Class E | ||||
| 04/17/2037 | 3.032% | 1,800,000 | 1,689,296 | |
| Series 2020-SFR3 Class B | ||||
| 10/17/2027 | 1.495% | 4,000,000 | 3,605,328 | |
| Commercial Mortgage-Backed Securities - Non-Agency (continued) | ||||
| Issuer | Coupon Rate | Principal Amount ($) | Value ($) | |
| Series 2020-SFR3 Class C | ||||
| 10/17/2027 | 1.695% | 6,250,000 | 5,652,767 | |
| Series 2022-SFR1 Class A | ||||
| 02/17/2041 | 2.709% | 3,000,000 | 2,749,940 | |
| Progress Residential Trust(a),(c),(f) | ||||
| Subordinated Series 2022-SFR4 Class B | ||||
| 05/17/2041 | 4.788% | 6,000,000 | 5,960,625 | |
| SFO Commercial Mortgage Trust(a),(b) | ||||
| Series 2021-555 Class A | ||||
| 1-month USD LIBOR + 1.150% Floor 1.150% 05/15/2038 | 1.704% | 8,000,000 | 7,830,497 | |
| Tricon American Homes(a) | ||||
| Series 2020-SFR1 Class C | ||||
| 07/17/2038 | 2.249% | 7,000,000 | 6,356,314 | |
| UBS Commercial Mortgage Trust(a),(b) | ||||
| Series 2018-NYCH Class A | ||||
| 1-month USD LIBOR + 0.850% Floor 0.851% 02/15/2032 | 1.404% | 1,737,226 | 1,720,781 | |
| Series 2018-NYCH Class B | ||||
| 1-month USD LIBOR + 1.250% Floor 1.250% 02/15/2032 | 1.804% | 900,000 | 891,039 | |
| Wells Fargo Commercial Mortgage Trust(a),(b) | ||||
| Series 2017-SMP Class A | ||||
| 1-month USD LIBOR + 0.875% Floor 0.875% 12/15/2034 | 1.429% | 4,720,000 | 4,662,196 | |
| Series 2020-SDAL Class D | ||||
| 1-month USD LIBOR + 2.090% Floor 2.090%, Cap 4.500% 02/15/2037 | 2.644% | 5,600,000 | 5,380,048 | |
| Subordinated Series 2017-SMP Class C | ||||
| 1-month USD LIBOR + 1.325% Floor 1.200% 12/15/2034 | 1.879% | 800,000 | 787,448 | |
| Total Commercial Mortgage-Backed Securities - Non-Agency (Cost $199,500,930) | 192,218,020 | |||
| Common Stocks 0.0% | ||
| Issuer | Shares | Value ($) |
| Consumer Staples 0.0% | ||
| Beverages 0.0% | ||
| Crimson Wine Group Ltd.(g) | 3 | 24 |
| Total Consumer Staples | 24 | |
| Columbia Bond Fund | Annual Report 2022 | 11 |
April 30, 2022
| Common Stocks (continued) | ||
| Issuer | Shares | Value ($) |
| Financials 0.0% | ||
| Capital Markets 0.0% | ||
| Jefferies Financial Group, Inc. | 39 | 1,199 |
| Total Financials | 1,199 | |
| Total Common Stocks (Cost $—) | 1,223 | |
| Corporate Bonds & Notes 19.0% | ||||
| Issuer | Coupon Rate | Principal Amount ($) | Value ($) | |
| Aerospace & Defense 0.7% | ||||
| Boeing Co. (The) | ||||
| 08/01/2059 | 3.950% | 1,690,000 | 1,257,944 | |
| 05/01/2060 | 5.930% | 3,050,000 | 3,030,456 | |
| Lockheed Martin Corp.(f) | ||||
| 06/15/2053 | 4.150% | 274,000 | 265,912 | |
| 06/15/2062 | 4.300% | 955,000 | 932,860 | |
| Northrop Grumman Corp. | ||||
| 01/15/2028 | 3.250% | 1,720,000 | 1,652,882 | |
| Total | 7,140,054 | |||
| Banking 6.1% | ||||
| Bank of America Corp.(h) | ||||
| 07/23/2031 | 1.898% | 7,130,000 | 5,819,869 | |
| 10/24/2031 | 1.922% | 2,300,000 | 1,870,182 | |
| 10/20/2032 | 2.572% | 2,220,000 | 1,875,403 | |
| 02/04/2033 | 2.972% | 5,600,000 | 4,883,291 | |
| Citigroup, Inc.(h) | ||||
| 06/03/2031 | 2.572% | 864,000 | 742,311 | |
| 01/25/2033 | 3.057% | 5,541,000 | 4,845,692 | |
| Goldman Sachs Group, Inc. (The)(h) | ||||
| 07/21/2032 | 2.383% | 3,506,000 | 2,904,103 | |
| 02/24/2033 | 3.102% | 5,160,000 | 4,510,581 | |
| HSBC Holdings PLC(h) | ||||
| 05/24/2032 | 2.804% | 2,260,000 | 1,898,689 | |
| 11/22/2032 | 2.871% | 4,402,000 | 3,673,367 | |
| JPMorgan Chase & Co.(h) | ||||
| 10/15/2030 | 2.739% | 1,812,000 | 1,608,424 | |
| 04/22/2032 | 2.580% | 8,049,000 | 6,926,921 | |
| 11/08/2032 | 2.545% | 6,592,000 | 5,593,679 | |
| Morgan Stanley(h) | ||||
| 07/21/2032 | 2.239% | 2,124,000 | 1,758,548 | |
| 10/20/2032 | 2.511% | 2,858,000 | 2,406,981 | |
| Subordinated | ||||
| 04/20/2037 | 5.297% | 1,720,000 | 1,724,343 | |
| Corporate Bonds & Notes (continued) | ||||
| Issuer | Coupon Rate | Principal Amount ($) | Value ($) | |
| Wells Fargo & Co.(h) | ||||
| 10/30/2030 | 2.879% | 593,000 | 532,160 | |
| 02/11/2031 | 2.572% | 7,892,000 | 6,921,161 | |
| 03/02/2033 | 3.350% | 1,385,000 | 1,258,853 | |
| Total | 61,754,558 | |||
| Cable and Satellite 0.7% | ||||
| Charter Communications Operating LLC/Capital | ||||
| 05/01/2047 | 5.375% | 610,000 | 544,714 | |
| 12/01/2061 | 4.400% | 1,230,000 | 918,969 | |
| 06/30/2062 | 3.950% | 3,642,000 | 2,515,165 | |
| 04/01/2063 | 5.500% | 3,365,000 | 2,935,282 | |
| Total | 6,914,130 | |||
| Diversified Manufacturing 0.9% | ||||
| Carrier Global Corp. | ||||
| 04/05/2050 | 3.577% | 4,718,000 | 3,780,633 | |
| GE Capital International Funding Co. Unlimited Co. | ||||
| 11/15/2035 | 4.418% | 2,735,000 | 2,672,959 | |
| General Electric Co.(b) | ||||
| Junior Subordinated | ||||
| 3-month USD LIBOR + 3.330% 12/31/2049 | 4.156% | 2,395,000 | 2,269,940 | |
| Total | 8,723,532 | |||
| Electric 2.0% | ||||
| AEP Texas, Inc. | ||||
| 01/15/2050 | 3.450% | 2,980,000 | 2,362,329 | |
| DTE Energy Co. | ||||
| 10/01/2026 | 2.850% | 4,075,000 | 3,889,346 | |
| Duke Energy Corp. | ||||
| 09/01/2046 | 3.750% | 3,035,000 | 2,511,895 | |
| Emera US Finance LP | ||||
| 06/15/2046 | 4.750% | 2,910,000 | 2,728,533 | |
| Exelon Corp.(a) | ||||
| 03/15/2052 | 4.100% | 410,000 | 365,342 | |
| Georgia Power Co. | ||||
| 03/15/2042 | 4.300% | 2,450,000 | 2,234,194 | |
| Pacific Gas and Electric Co. | ||||
| 07/01/2050 | 4.950% | 3,660,000 | 3,055,190 | |
| Southern Co. (The) | ||||
| 07/01/2046 | 4.400% | 1,059,000 | 966,542 | |
| Xcel Energy, Inc. | ||||
| 06/01/2030 | 3.400% | 2,425,000 | 2,269,326 | |
| Total | 20,382,697 | |||
| Food and Beverage 1.4% | ||||
| Anheuser-Busch Companies LLC/InBev Worldwide, Inc. | ||||
| 02/01/2046 | 4.900% | 6,417,000 | 6,328,492 | |
| 12 | Columbia Bond Fund | Annual Report 2022 |
April 30, 2022
| Corporate Bonds & Notes (continued) | ||||
| Issuer | Coupon Rate | Principal Amount ($) | Value ($) | |
| Bacardi Ltd.(a) | ||||
| 05/15/2048 | 5.300% | 3,445,000 | 3,450,678 | |
| Kraft Heinz Foods Co. | ||||
| 06/01/2046 | 4.375% | 5,644,000 | 4,946,255 | |
| Total | 14,725,425 | |||
| Health Care 1.1% | ||||
| Becton Dickinson and Co.(b) | ||||
| 3-month USD LIBOR + 1.030% 06/06/2022 | 1.613% | 533,000 | 533,147 | |
| Becton Dickinson and Co. | ||||
| 06/06/2027 | 3.700% | 2,345,000 | 2,307,913 | |
| 02/11/2031 | 1.957% | 505,000 | 416,236 | |
| Cigna Corp. | ||||
| 03/15/2051 | 3.400% | 2,470,000 | 1,935,300 | |
| CVS Health Corp. | ||||
| 03/25/2048 | 5.050% | 2,730,000 | 2,743,729 | |
| HCA, Inc.(a) | ||||
| 03/15/2052 | 4.625% | 4,309,000 | 3,769,686 | |
| Total | 11,706,011 | |||
| Integrated Energy 0.1% | ||||
| Cenovus Energy, Inc. | ||||
| 02/15/2052 | 3.750% | 840,000 | 672,911 | |
| Life Insurance 0.3% | ||||
| Guardian Life Insurance Co. of America (The)(a) | ||||
| Subordinated | ||||
| 06/19/2064 | 4.875% | 1,000,000 | 1,014,099 | |
| Massachusetts Mutual Life Insurance Co.(a) | ||||
| Subordinated | ||||
| 12/01/2061 | 3.200% | 1,190,000 | 869,770 | |
| 10/15/2070 | 3.729% | 357,000 | 278,633 | |
| Peachtree Corners Funding Trust(a) | ||||
| 02/15/2025 | 3.976% | 335,000 | 335,298 | |
| Teachers Insurance & Annuity Association of America(a) | ||||
| Subordinated | ||||
| 09/15/2044 | 4.900% | 475,000 | 485,459 | |
| Total | 2,983,259 | |||
| Media and Entertainment 0.5% | ||||
| Magallanes, Inc.(a) | ||||
| 03/15/2062 | 5.391% | 6,042,000 | 5,379,589 | |
| Midstream 0.9% | ||||
| Enterprise Products Operating LLC | ||||
| 01/31/2060 | 3.950% | 1,275,000 | 1,034,155 | |
| Kinder Morgan Energy Partners LP | ||||
| 03/01/2043 | 5.000% | 54,000 | 50,312 | |
| Corporate Bonds & Notes (continued) | ||||
| Issuer | Coupon Rate | Principal Amount ($) | Value ($) | |
| Kinder Morgan, Inc. | ||||
| 02/15/2046 | 5.050% | 2,651,000 | 2,511,805 | |
| Plains All American Pipeline LP/Finance Corp. | ||||
| 06/15/2044 | 4.700% | 4,576,000 | 3,815,792 | |
| Western Gas Partners LP | ||||
| 08/15/2048 | 5.500% | 550,000 | 483,396 | |
| Williams Companies, Inc. (The) | ||||
| 09/15/2045 | 5.100% | 821,000 | 799,244 | |
| 10/15/2051 | 3.500% | 917,000 | 704,929 | |
| Total | 9,399,633 | |||
| Natural Gas 0.5% | ||||
| NiSource, Inc. | ||||
| 09/01/2029 | 2.950% | 1,000,000 | 902,018 | |
| 05/01/2030 | 3.600% | 1,535,000 | 1,431,843 | |
| 02/15/2043 | 5.250% | 455,000 | 450,064 | |
| 05/15/2047 | 4.375% | 2,380,000 | 2,145,333 | |
| Total | 4,929,258 | |||
| Pharmaceuticals 0.8% | ||||
| AbbVie, Inc. | ||||
| 06/15/2044 | 4.850% | 2,780,000 | 2,765,963 | |
| Amgen, Inc. | ||||
| 02/22/2062 | 4.400% | 4,037,000 | 3,609,548 | |
| Bristol-Myers Squibb Co. | ||||
| 03/15/2062 | 3.900% | 2,000,000 | 1,753,852 | |
| Total | 8,129,363 | |||
| Property & Casualty 0.4% | ||||
| Berkshire Hathaway Finance Corp. | ||||
| 03/15/2052 | 3.850% | 5,107,000 | 4,547,634 | |
| Retailers 0.4% | ||||
| Lowe’s Companies, Inc. | ||||
| 10/15/2050 | 3.000% | 2,360,000 | 1,729,547 | |
| 04/01/2062 | 4.450% | 2,217,000 | 1,980,207 | |
| Total | 3,709,754 | |||
| Technology 0.7% | ||||
| Broadcom, Inc.(a) | ||||
| 04/15/2034 | 3.469% | 2,096,000 | 1,778,421 | |
| 11/15/2036 | 3.187% | 876,000 | 693,421 | |
| NXP BV/Funding LLC/USA, Inc.(a) | ||||
| 05/01/2030 | 3.400% | 200,000 | 182,176 | |
| 02/15/2042 | 3.125% | 1,128,000 | 864,957 | |
| Oracle Corp. | ||||
| 04/01/2050 | 3.600% | 3,945,000 | 2,832,338 | |
| 03/25/2061 | 4.100% | 1,305,000 | 967,048 | |
| Total | 7,318,361 | |||
| Columbia Bond Fund | Annual Report 2022 | 13 |
April 30, 2022
| Corporate Bonds & Notes (continued) | ||||
| Issuer | Coupon Rate | Principal Amount ($) | Value ($) | |
| Wireless 0.6% | ||||
| American Tower Corp. | ||||
| 08/15/2029 | 3.800% | 2,461,000 | 2,303,721 | |
| 06/15/2030 | 2.100% | 685,000 | 561,771 | |
| T-Mobile USA, Inc.(a) | ||||
| 10/15/2052 | 3.400% | 2,731,000 | 2,068,322 | |
| 11/15/2060 | 3.600% | 1,025,000 | 765,269 | |
| Total | 5,699,083 | |||
| Wirelines 0.9% | ||||
| AT&T, Inc. | ||||
| 09/15/2055 | 3.550% | 3,193,000 | 2,472,958 | |
| 12/01/2057 | 3.800% | 5,189,000 | 4,164,450 | |
| Verizon Communications, Inc. | ||||
| 03/22/2061 | 3.700% | 3,702,000 | 2,963,114 | |
| Total | 9,600,522 | |||
| Total Corporate Bonds & Notes (Cost $227,788,578) | 193,715,774 | |||
| Residential Mortgage-Backed Securities - Agency 23.6% | ||||
| Federal Home Loan Mortgage Corp.(i) | ||||
| 06/01/2043 | 4.000% | 1,357,609 | 1,380,848 | |
| Federal Home Loan Mortgage Corp.(b),(e) | ||||
| CMO Series 4903 Class SA | ||||
| -1.0 x 1-month USD LIBOR + 6.050% Cap 6.050% 08/25/2049 | 5.382% | 2,365,041 | 359,452 | |
| Federal Home Loan Mortgage Corp.(e) | ||||
| CMO Series 5162 Class IA | ||||
| 11/25/2051 | 3.000% | 8,931,621 | 1,503,783 | |
| Federal National Mortgage Association | ||||
| 08/01/2029- 09/01/2045 | 3.000% | 2,087,653 | 2,069,869 | |
| 05/01/2043- 10/01/2045 | 3.500% | 2,801,559 | 2,768,665 | |
| 02/01/2048 | 4.000% | 764,435 | 769,444 | |
| Federal National Mortgage Association(i) | ||||
| 07/01/2038 | 6.000% | 655,333 | 724,712 | |
| 01/01/2040 | 5.500% | 769,689 | 821,969 | |
| 08/01/2040 | 4.500% | 1,213,852 | 1,249,461 | |
| 10/01/2042 | 3.000% | 1,674,408 | 1,616,285 | |
| 07/01/2045- 02/01/2046 | 3.500% | 2,064,592 | 2,037,868 | |
| 11/01/2045 | 4.000% | 646,258 | 648,177 | |
| Residential Mortgage-Backed Securities - Agency (continued) | ||||
| Issuer | Coupon Rate | Principal Amount ($) | Value ($) | |
| Federal National Mortgage Association(b),(e) | ||||
| CMO Series 2016-53 Class KS | ||||
| -1.0 x 1-month USD LIBOR + 6.000% Cap 6.000% 08/25/2046 | 5.332% | 787,998 | 126,823 | |
| CMO Series 2016-57 Class SA | ||||
| -1.0 x 1-month USD LIBOR + 6.000% Cap 6.000% 08/25/2046 | 5.332% | 2,054,783 | 323,243 | |
| CMO Series 2016-93 Class SL | ||||
| -1.0 x 1-month USD LIBOR + 6.650% Cap 6.650% 12/25/2046 | 5.982% | 3,104,983 | 358,491 | |
| CMO Series 2017-109 Class SA | ||||
| -1.0 x 1-month USD LIBOR + 6.150% Cap 6.150% 01/25/2048 | 5.482% | 1,009,831 | 164,866 | |
| CMO Series 2017-20 Class SA | ||||
| -1.0 x 1-month USD LIBOR + 6.100% Cap 6.100% 04/25/2047 | 5.432% | 845,567 | 140,224 | |
| CMO Series 2017-54 Class SN | ||||
| -1.0 x 1-month USD LIBOR + 6.150% Cap 6.150% 07/25/2047 | 5.482% | 1,627,056 | 310,239 | |
| CMO Series 2018-66 Class SM | ||||
| -1.0 x 1-month USD LIBOR + 6.200% Cap 6.200% 09/25/2048 | 5.532% | 1,147,428 | 209,137 | |
| CMO Series 2018-74 Class SA | ||||
| -1.0 x 1-month USD LIBOR + 6.150% Cap 6.150% 10/25/2048 | 5.482% | 1,473,612 | 225,231 | |
| CMO Series 2019-33 Class SB | ||||
| -1.0 x 1-month USD LIBOR + 6.050% Cap 6.050% 07/25/2049 | 5.382% | 3,564,174 | 524,161 | |
| CMO Series 2019-60 Class SH | ||||
| -1.0 x 1-month USD LIBOR + 6.050% Cap 6.050% 10/25/2049 | 5.382% | 1,325,250 | 216,610 | |
| 14 | Columbia Bond Fund | Annual Report 2022 |
April 30, 2022
| Residential Mortgage-Backed Securities - Agency (continued) | ||||
| Issuer | Coupon Rate | Principal Amount ($) | Value ($) | |
| CMO Series 2019-67 Class SE | ||||
| -1.0 x 1-month USD LIBOR + 6.050% Cap 6.050% 11/25/2049 | 5.382% | 2,064,506 | 412,266 | |
| Federal National Mortgage Association(e) | ||||
| CMO Series 2021-3 Class TI | ||||
| 02/25/2051 | 2.500% | 23,483,934 | 4,083,462 | |
| Freddie Mac REMICS(e) | ||||
| CMO Series 5152 Class XI | ||||
| 11/25/2050 | 2.500% | 16,001,216 | 2,270,776 | |
| Government National Mortgage Association(b) | ||||
| 1-year CMT + 1.500% Floor 1.500%, Cap 11.500% 07/20/2022 | 1.625% | 207 | 207 | |
| 1-year CMT + 1.500% Cap 10.000% 04/20/2028 | 1.875% | 1,373 | 1,392 | |
| Government National Mortgage Association(i) | ||||
| 04/20/2048 | 4.500% | 899,612 | 930,287 | |
| Government National Mortgage Association(b),(e) | ||||
| CMO Series 2017-112 Class SJ | ||||
| -1.0 x 1-month USD LIBOR + 5.660% Cap 5.660% 07/20/2047 | 5.066% | 3,056,390 | 355,838 | |
| CMO Series 2017-130 Class HS | ||||
| -1.0 x 1-month USD LIBOR + 6.200% Cap 6.200% 08/20/2047 | 5.606% | 976,334 | 144,137 | |
| CMO Series 2017-149 Class BS | ||||
| -1.0 x 1-month USD LIBOR + 6.200% Cap 6.200% 10/20/2047 | 5.606% | 1,280,120 | 180,665 | |
| CMO Series 2017-163 Class SA | ||||
| -1.0 x 1-month USD LIBOR + 6.200% Cap 6.200% 11/20/2047 | 5.606% | 560,523 | 77,166 | |
| CMO Series 2017-37 Class SB | ||||
| -1.0 x 1-month USD LIBOR + 6.150% Cap 6.150% 03/20/2047 | 5.556% | 780,178 | 104,705 | |
| CMO Series 2018-103 Class SA | ||||
| -1.0 x 1-month USD LIBOR + 6.200% Cap 6.200% 08/20/2048 | 5.606% | 752,646 | 89,182 | |
| Residential Mortgage-Backed Securities - Agency (continued) | ||||
| Issuer | Coupon Rate | Principal Amount ($) | Value ($) | |
| CMO Series 2018-112 Class LS | ||||
| -1.0 x 1-month USD LIBOR + 6.200% Cap 6.200% 08/20/2048 | 5.606% | 925,629 | 117,738 | |
| CMO Series 2018-125 Class SK | ||||
| -1.0 x 1-month USD LIBOR + 6.250% Cap 6.250% 09/20/2048 | 5.656% | 1,194,436 | 153,768 | |
| CMO Series 2018-134 Class KS | ||||
| -1.0 x 1-month USD LIBOR + 6.200% Cap 6.200% 10/20/2048 | 5.606% | 963,762 | 124,918 | |
| CMO Series 2018-148 Class SB | ||||
| -1.0 x 1-month USD LIBOR + 6.200% Cap 6.200% 01/20/2048 | 5.606% | 1,806,474 | 247,971 | |
| CMO Series 2018-151 Class SA | ||||
| -1.0 x 1-month USD LIBOR + 6.150% Cap 6.150% 11/20/2048 | 5.556% | 1,557,399 | 196,511 | |
| CMO Series 2018-89 Class MS | ||||
| -1.0 x 1-month USD LIBOR + 6.200% Cap 6.200% 06/20/2048 | 5.606% | 1,002,573 | 131,580 | |
| CMO Series 2018-91 Class DS | ||||
| -1.0 x 1-month USD LIBOR + 6.200% Cap 6.200% 07/20/2048 | 5.606% | 1,088,368 | 137,236 | |
| CMO Series 2019-20 Class JS | ||||
| -1.0 x 1-month USD LIBOR + 6.000% Cap 6.000% 02/20/2049 | 5.406% | 1,487,816 | 189,025 | |
| CMO Series 2019-5 Class SH | ||||
| -1.0 x 1-month USD LIBOR + 6.150% Cap 6.150% 01/20/2049 | 5.556% | 1,084,882 | 144,657 | |
| CMO Series 2019-56 Class SG | ||||
| -1.0 x 1-month USD LIBOR + 6.150% Cap 6.150% 05/20/2049 | 5.556% | 1,125,926 | 137,644 | |
| Columbia Bond Fund | Annual Report 2022 | 15 |
April 30, 2022
| Residential Mortgage-Backed Securities - Agency (continued) | ||||
| Issuer | Coupon Rate | Principal Amount ($) | Value ($) | |
| CMO Series 2019-59 Class KS | ||||
| -1.0 x 1-month USD LIBOR + 6.050% Cap 6.050% 05/20/2049 | 5.456% | 1,152,425 | 127,147 | |
| CMO Series 2019-85 Class SC | ||||
| -1.0 x 1-month USD LIBOR + 6.150% Cap 6.150% 07/20/2049 | 5.556% | 1,104,327 | 163,696 | |
| CMO Series 2019-90 Class SD | ||||
| -1.0 x 1-month USD LIBOR + 6.150% 07/20/2049 | 5.556% | 2,551,761 | 350,703 | |
| CMO Series 2019-92 Class SD | ||||
| -1.0 x 1-month USD LIBOR + 6.100% Cap 6.100% 07/20/2049 | 5.506% | 6,313,471 | 797,050 | |
| CMO Series 2020-188 Class SA | ||||
| 1-month USD LIBOR + 6.300% Cap 6.300% 12/20/2050 | 5.706% | 13,294,747 | 2,419,641 | |
| CMO Series 2020-21 Class VS | ||||
| -1.0 x 1-month USD LIBOR + 6.050% Cap 6.050% 02/20/2050 | 5.456% | 840,102 | 114,147 | |
| CMO Series 2020-62 Class SG | ||||
| -1.0 x 1-month USD LIBOR + 6.150% Cap 6.150% 05/20/2050 | 5.556% | 1,516,129 | 194,417 | |
| Government National Mortgage Association(e) | ||||
| CMO Series 2020-164 Class CI | ||||
| 11/20/2050 | 3.000% | 8,440,354 | 1,263,603 | |
| CMO Series 2020-175 Class KI | ||||
| 11/20/2050 | 2.500% | 22,715,649 | 3,373,681 | |
| CMO Series 2020-191 Class UG | ||||
| 12/20/2050 | 3.500% | 8,638,099 | 1,386,006 | |
| CMO Series 2021-119 Class QI | ||||
| 07/20/2051 | 3.000% | 8,931,562 | 1,233,278 | |
| CMO Series 2021-139 Class IC | ||||
| 08/20/2051 | 3.000% | 21,659,321 | 3,413,095 | |
| CMO Series 2021-16 Class KI | ||||
| 01/20/2051 | 2.500% | 10,582,317 | 1,594,076 | |
| CMO Series 2021-9 Class MI | ||||
| 01/20/2051 | 2.500% | 10,363,474 | 1,396,844 | |
| Government National Mortgage Association TBA(f) | ||||
| 05/19/2052 | 4.000% | 18,000,000 | 18,045,352 | |
| Residential Mortgage-Backed Securities - Agency (continued) | ||||
| Issuer | Coupon Rate | Principal Amount ($) | Value ($) | |
| Uniform Mortgage-Backed Security TBA(f) | ||||
| 05/17/2037 | 2.000% | 10,000,000 | 9,373,633 | |
| 05/17/2037 | 2.500% | 4,100,000 | 3,925,269 | |
| 05/17/2037- 05/12/2052 | 3.000% | 61,478,000 | 58,119,690 | |
| 05/17/2037- 05/12/2052 | 3.500% | 39,000,000 | 37,986,249 | |
| 05/12/2052 | 4.000% | 67,000,000 | 66,689,863 | |
| Total Residential Mortgage-Backed Securities - Agency (Cost $244,604,251) | 240,748,129 | |||
| Residential Mortgage-Backed Securities - Non-Agency 34.4% | ||||
| 510 Asset Backed Trust(a),(d) | ||||
| CMO Series 2021-NPL2 Class A1 | ||||
| 06/25/2061 | 2.116% | 4,014,354 | 3,818,162 | |
| American Mortgage Trust(c),(d),(j) | ||||
| CMO Series 2093-3 Class 3A | ||||
| 07/27/2023 | 8.188% | 54 | 33 | |
| Angel Oak Mortgage Trust(a),(d) | ||||
| CMO Series 2020-1 Class M1 | ||||
| 12/25/2059 | 3.161% | 3,000,000 | 2,914,482 | |
| CMO Series 2020-3 Class A1 | ||||
| 04/25/2065 | 1.691% | 2,941,338 | 2,880,996 | |
| CMO Series 2021-5 Class A2 | ||||
| 07/25/2066 | 1.208% | 5,436,261 | 5,024,998 | |
| Angel Oak Mortgage Trust I LLC(a),(d) | ||||
| CMO Series 2018-3 Class M1 | ||||
| 09/25/2048 | 4.421% | 960,000 | 953,804 | |
| Arroyo Mortgage Trust(a),(d) | ||||
| CMO Series 2019-2 Class A3 | ||||
| 04/25/2049 | 3.800% | 238,929 | 231,795 | |
| Bayview Opportunity Master Fund IVb Trust(a) | ||||
| CMO Series 2017-SPL3 Class A | ||||
| 11/28/2053 | 4.000% | 1,215,643 | 1,193,252 | |
| Bellemeade Re Ltd.(a),(b) | ||||
| CMO Series 2018-1A Class M2 | ||||
| 1-month USD LIBOR + 2.900% 04/25/2028 | 3.568% | 4,098,717 | 4,084,702 | |
| CMO Series 2019-2A Class M1C | ||||
| 1-month USD LIBOR + 2.000% Floor 2.000% 04/25/2029 | 2.668% | 4,250,000 | 4,236,535 | |
| CMO Series 2019-3A Class M1B | ||||
| 1-month USD LIBOR + 1.600% Floor 1.600% 07/25/2029 | 2.268% | 1,700,280 | 1,698,774 | |
| CMO Series 2019-3A Class M1C | ||||
| 1-month USD LIBOR + 1.950% Floor 1.950% 07/25/2029 | 2.407% | 3,500,000 | 3,480,075 | |
| 16 | Columbia Bond Fund | Annual Report 2022 |
April 30, 2022
| Residential Mortgage-Backed Securities - Non-Agency (continued) | ||||
| Issuer | Coupon Rate | Principal Amount ($) | Value ($) | |
| CMO Series 2021-2A Class M1A | ||||
| 30-day Average SOFR + 1.200% Floor 1.200% 06/25/2031 | 1.489% | 3,838,074 | 3,801,930 | |
| CMO Series 2021-2A Class M1B | ||||
| 30-day Average SOFR + 1.500% Floor 1.500% 06/25/2031 | 1.789% | 2,000,000 | 1,949,122 | |
| CMO Series 2022-1 Class M1A | ||||
| 30-day Average SOFR + 1.750% Floor 1.750% 01/26/2032 | 1.856% | 4,900,000 | 4,878,540 | |
| BRAVO Residential Funding Trust(a),(d) | ||||
| CMO Series 2019-NQM2 Class A1 | ||||
| 11/25/2059 | 2.748% | 156,419 | 153,421 | |
| CMO Series 2019-NQM2 Class A3 | ||||
| 11/25/2059 | 3.108% | 67,037 | 65,423 | |
| CMO Series 2019-NQM2 Class M1 | ||||
| 11/25/2059 | 3.451% | 300,000 | 283,593 | |
| CMO Series 2020-NQM1 Class M1 | ||||
| 05/25/2060 | 3.181% | 2,500,000 | 2,464,146 | |
| CMO Series 2020-RPL2 Class A1 | ||||
| 05/25/2059 | 2.000% | 2,184,150 | 2,047,321 | |
| Bunker Hill Loan Depositary Trust(a),(d) | ||||
| CMO Series 2019-3 Class A2 | ||||
| 11/25/2059 | 2.981% | 1,281,682 | 1,262,556 | |
| CMO Series 2019-3 Class A3 | ||||
| 11/25/2059 | 3.135% | 1,867,593 | 1,841,337 | |
| CMO Series 2020-1 Class A1 | ||||
| 02/25/2055 | 1.724% | 4,375,863 | 4,254,025 | |
| BVRT Financing Trust(a),(b),(c) | ||||
| CMO Series 2021-3F Class M1 | ||||
| 30-day Average SOFR + 1.750% Floor 1.750% 07/12/2033 | 1.976% | 5,087,549 | 5,087,549 | |
| CMO Series 2021-3F Class M2 | ||||
| 30-day Average SOFR + 2.900% Floor 2.900% 07/12/2033 | 3.126% | 6,000,000 | 6,000,000 | |
| BVRT Financing Trust(a),(b),(c),(j) | ||||
| CMO Series 2021-CRT1 Class M2 | ||||
| 1-month USD LIBOR + 2.250% Floor 2.250% 01/10/2033 | 2.345% | 380,085 | 375,465 | |
| CHNGE Mortgage Trust(a),(d) | ||||
| CMO Series 2022-1 Class A1 | ||||
| 01/25/2067 | 3.007% | 5,621,130 | 5,455,874 | |
| CMO Series 2022-2 Class A1 | ||||
| 03/25/2067 | 3.757% | 4,588,436 | 4,489,289 | |
| Residential Mortgage-Backed Securities - Non-Agency (continued) | ||||
| Issuer | Coupon Rate | Principal Amount ($) | Value ($) | |
| CIM Trust(a),(b) | ||||
| CMO Series 2018-R6 Class A1 | ||||
| 1-month USD LIBOR + 1.076% Floor 1.076% 09/25/2058 | 1.876% | 832,541 | 813,475 | |
| COLT Mortgage Loan Trust(a),(d) | ||||
| CMO Series 2020-2 Class A2 | ||||
| 03/25/2065 | 3.094% | 350,000 | 347,546 | |
| CMO Series 2021-3 Class A1 | ||||
| 09/27/2066 | 0.956% | 3,203,374 | 2,911,136 | |
| CMO Series 2021-5 Class A2 | ||||
| 11/26/2066 | 2.606% | 4,270,000 | 3,670,755 | |
| Connecticut Avenue Securities Trust(a),(b) | ||||
| CMO Series 2022-R01 Class 1M2 | ||||
| 30-day Average SOFR + 1.900% 12/25/2041 | 2.189% | 2,650,000 | 2,556,621 | |
| CMO Series 2022-R04 Class 1M2 | ||||
| 30-day Average SOFR + 3.100% 03/25/2042 | 3.389% | 4,000,000 | 4,019,959 | |
| Credit Suisse Mortgage Capital Certificates(a),(d) | ||||
| CMO Series 2020-SPT1 Class A1 | ||||
| 04/25/2065 | 1.616% | 614,441 | 608,989 | |
| Credit Suisse Mortgage Trust(a),(d) | ||||
| CMO Series 2021-RPL2 Class A1A | ||||
| 01/25/2060 | 1.115% | 3,729,572 | 3,388,717 | |
| CSMC Trust(a),(d) | ||||
| CMO Series 2020-RPL2 Class A12 | ||||
| 02/25/2060 | 3.410% | 979,453 | 940,254 | |
| CMO Series 2020-RPL6 Class A1 | ||||
| 03/25/2059 | 2.688% | 10,112,363 | 9,855,055 | |
| Subordinated CMO Series 2020-RPL3 Class A1 | ||||
| 03/25/2060 | 2.691% | 2,971,327 | 2,898,299 | |
| Deephaven Residential Mortgage Trust(a),(d) | ||||
| CMO Series 2021-1 Class A2 | ||||
| 05/25/2065 | 0.973% | 856,620 | 830,450 | |
| Eagle Re Ltd.(a),(b) | ||||
| CMO Series 2018-1 Class M1 | ||||
| 1-month USD LIBOR + 1.700% Floor 1.700% 11/25/2028 | 2.157% | 275,303 | 274,775 | |
| CMO Series 2021-1 Class M1A | ||||
| 30-day Average SOFR + 1.700% Floor 1.700% 10/25/2033 | 1.989% | 4,492,414 | 4,490,820 | |
| Subordinated CMO Series 2020-1 Class M1B | ||||
| 1-month USD LIBOR + 1.450% 01/25/2030 | 1.907% | 3,100,000 | 3,067,139 | |
| Ellington Financial Mortgage Trust(a),(d) | ||||
| CMO Series 2020-1 Class A3 | ||||
| 05/25/2065 | 3.999% | 550,000 | 534,257 | |
| Columbia Bond Fund | Annual Report 2022 | 17 |
April 30, 2022
| Residential Mortgage-Backed Securities - Non-Agency (continued) | ||||
| Issuer | Coupon Rate | Principal Amount ($) | Value ($) | |
| Federal Home Loan Mortgage Corp. Structured Agency Credit Risk Debt Notes(b) | ||||
| CMO Series 2014-DN3 Class M3 | ||||
| 1-month USD LIBOR + 4.000% 08/25/2024 | 4.668% | 1,324,607 | 1,337,995 | |
| Freddie Mac STACR REMIC Trust(a),(b) | ||||
| CMO Series 2020-DNA4 Class M2 | ||||
| 1-month USD LIBOR + 3.750% Floor 3.750% 08/25/2050 | 4.418% | 130,104 | 130,568 | |
| CMO Series 2021-DNA3 Class M1 | ||||
| 30-day Average SOFR + 0.750% 10/25/2033 | 1.039% | 5,630,590 | 5,584,052 | |
| CMO Series 2022-DNA1 Class M1B | ||||
| 30-day Average SOFR + 1.850% 01/25/2042 | 2.139% | 3,000,000 | 2,858,107 | |
| Freddie Mac Structured Agency Credit Risk Debt Notes(b) | ||||
| CMO Series 2014-DN4 Class M3 | ||||
| 1-month USD LIBOR + 4.550% 10/25/2024 | 5.218% | 1,653,932 | 1,681,025 | |
| Freddie Mac Structured Agency Credit Risk Debt Notes(a),(d) | ||||
| CMO Series 2022-DNA2 Class M1B | ||||
| 02/25/2042 | 2.689% | 3,800,000 | 3,731,996 | |
| FWD Securitization Trust(a),(d) | ||||
| CMO Series 2020-INV1 Class M1 | ||||
| 01/25/2050 | 2.850% | 3,500,000 | 3,376,232 | |
| GCAT LLC(a),(d) | ||||
| CMO Series 2021-CM1 Class A1 | ||||
| 04/25/2065 | 1.469% | 3,586,989 | 3,494,100 | |
| GCAT Trust(a),(d) | ||||
| CMO Series 2021-CM2 Class A1 | ||||
| 08/25/2066 | 2.352% | 4,089,669 | 3,955,152 | |
| CMO Series 2022-NQM2 Class A3 | ||||
| 02/25/2067 | 4.210% | 5,300,000 | 5,161,611 | |
| GS Mortgage-Backed Securities Corp. Trust(a),(d) | ||||
| CMO Series 2021-NQM1 Class A1 | ||||
| 07/25/2061 | 1.017% | 3,137,337 | 2,946,342 | |
| Home Re Ltd.(a),(b) | ||||
| Subordinated CMO Series 2022-1 Class M1A | ||||
| 30-day Average SOFR + 2.850% 10/25/2034 | 3.125% | 2,700,000 | 2,699,976 | |
| Imperial Fund Mortgage Trust(a),(d) | ||||
| CMO Series 2021-NQM4 Class A2 | ||||
| 01/25/2057 | 2.296% | 1,950,648 | 1,724,304 | |
| Legacy Mortgage Asset Trust(a),(d) | ||||
| CMO Series 2021-GS2 Class A1 | ||||
| 04/25/2061 | 1.750% | 2,340,580 | 2,217,315 | |
| CMO Series 2021-SL2 Class A | ||||
| 10/25/2068 | 1.875% | 3,483,144 | 3,350,036 | |
| Residential Mortgage-Backed Securities - Non-Agency (continued) | ||||
| Issuer | Coupon Rate | Principal Amount ($) | Value ($) | |
| Loan Revolving Advance Investment Trust(a),(b),(c),(j) | ||||
| CMO Series 2021-2 Class A1X | ||||
| 1-month USD LIBOR + 2.750% Floor 2.750% 06/30/2023 | 3.301% | 4,000,000 | 4,000,000 | |
| Mello Warehouse Securitization Trust(a),(b) | ||||
| CMO Series 2020-2 Class B | ||||
| 1-month USD LIBOR + 1.100% Floor 1.100% 11/25/2053 | 1.557% | 10,800,000 | 10,750,725 | |
| CMO Series 2020-2 Class C | ||||
| 1-month USD LIBOR + 1.300% Floor 1.300% 11/25/2053 | 1.757% | 4,200,000 | 4,187,096 | |
| MFA Trust(a),(d) | ||||
| CMO Series 2020-NQM2 Class M1 | ||||
| 04/25/2065 | 3.034% | 3,500,000 | 3,362,296 | |
| CMO Series 2020-NQM3 Class A1 | ||||
| 01/26/2065 | 1.014% | 7,229,424 | 6,964,472 | |
| CMO Series 2020-NQM3 Class A2 | ||||
| 01/26/2065 | 1.324% | 2,891,770 | 2,766,263 | |
| CMO Series 2020-NQM3 Class A3 | ||||
| 01/26/2065 | 1.632% | 2,168,827 | 2,079,501 | |
| CMO Series 2021-INV2 Class A3 | ||||
| 11/25/2056 | 2.264% | 2,740,659 | 2,525,193 | |
| MFRA Trust(a),(d) | ||||
| CMO Series 2021-INV1 Class A2 | ||||
| 01/25/2056 | 1.057% | 508,257 | 484,550 | |
| CMO Series 2021-INV1 Class A3 | ||||
| 01/25/2056 | 1.262% | 792,373 | 753,907 | |
| New Residential Mortgage Loan Trust(a),(d) | ||||
| CMO Series 2018-1A Class A1A | ||||
| 12/25/2057 | 4.000% | 7,819,930 | 7,672,265 | |
| NRZ Excess Spread-Collateralized Notes(a) | ||||
| Series 2020-PLS1 Class A | ||||
| 12/25/2025 | 3.844% | 4,432,945 | 4,278,049 | |
| Oaktown Re II Ltd.(a),(b) | ||||
| CMO Series 2018-1A Class M1 | ||||
| 1-month USD LIBOR + 1.550% 07/25/2028 | 2.218% | 413,106 | 411,933 | |
| Oaktown Re III Ltd.(a),(b) | ||||
| CMO Series 2019-1A Class M1A | ||||
| 1-month USD LIBOR + 1.400% Floor 1.400% 07/25/2029 | 2.068% | 25,204 | 25,088 | |
| CMO Series 2019-1A Class M1B | ||||
| 1-month USD LIBOR + 1.950% Floor 1.950% 07/25/2029 | 2.618% | 1,500,000 | 1,498,246 | |
| 18 | Columbia Bond Fund | Annual Report 2022 |
April 30, 2022
| Residential Mortgage-Backed Securities - Non-Agency (continued) | ||||
| Issuer | Coupon Rate | Principal Amount ($) | Value ($) | |
| Oaktown Re VI Ltd.(a),(b) | ||||
| CMO Series 2021-1A Class M1A | ||||
| 30-day Average SOFR + 1.650% Floor 1.650% 10/25/2033 | 1.939% | 5,036,875 | 5,029,928 | |
| PMT Credit Risk Transfer Trust(a),(b) | ||||
| Series 2019-2R Class A | ||||
| 1-month USD LIBOR + 2.750% Floor 2.750% 05/27/2023 | 3.448% | 497,015 | 473,765 | |
| PNMAC GMSR Issuer Trust(a),(b) | ||||
| CMO Series 2018-FT1 Class A | ||||
| 1-month USD LIBOR + 2.350% 04/25/2023 | 3.018% | 2,500,000 | 2,469,979 | |
| CMO Series 2018-GT1 Class A | ||||
| 1-month USD LIBOR + 2.850% Floor 2.850% 02/25/2023 | 3.518% | 10,700,000 | 10,657,877 | |
| CMO Series 2018-GT2 Class A | ||||
| 1-month USD LIBOR + 2.650% 08/25/2025 | 3.318% | 3,950,000 | 3,913,254 | |
| Preston Ridge Partners Mortgage Trust(a),(d) | ||||
| CMO Series 2020-6 Class A1 | ||||
| 11/25/2025 | 2.363% | 9,430,696 | 9,137,017 | |
| CMO Series 2021-1 Class A1 | ||||
| 01/25/2026 | 2.115% | 6,594,327 | 6,315,379 | |
| CMO Series 2021-2 Class A1 | ||||
| 03/25/2026 | 2.115% | 2,736,451 | 2,628,251 | |
| CMO Series 2021-3 Class A1 | ||||
| 04/25/2026 | 1.867% | 2,439,962 | 2,311,873 | |
| CMO Series 2021-8 Class A1 | ||||
| 09/25/2026 | 1.743% | 1,729,351 | 1,639,406 | |
| Pretium Mortgage Credit Partners(a),(d) | ||||
| CMO Series 2022-NPL1 Class A1 | ||||
| 01/25/2052 | 2.981% | 4,722,298 | 4,536,957 | |
| PRKCM Trust(a),(d) | ||||
| CMO Series 2021-AFC1 Class A3 | ||||
| 08/25/2056 | 2.069% | 6,084,898 | 5,417,003 | |
| PRPM LLC(a),(d) | ||||
| CMO Series 2021-RPL1 Class A1 | ||||
| 07/25/2051 | 1.319% | 4,746,700 | 4,479,577 | |
| Radnor Re Ltd.(a),(b) | ||||
| CMO Series 2019-2 Class M1B | ||||
| 1-month USD LIBOR + 1.750% Floor 1.750% 06/25/2029 | 2.418% | 772,425 | 765,693 | |
| CMO Series 2020-1 Class M1A | ||||
| 1-month USD LIBOR + 0.950% Floor 0.950% 02/25/2030 | 1.407% | 3,250,000 | 3,191,578 | |
| Residential Mortgage-Backed Securities - Non-Agency (continued) | ||||
| Issuer | Coupon Rate | Principal Amount ($) | Value ($) | |
| Residential Mortgage Loan Trust(a),(d) | ||||
| CMO Series 2019-3 Class A3 | ||||
| 09/25/2059 | 3.044% | 56,288 | 55,282 | |
| Stanwich Mortgage Loan Co. LLC(a),(d) | ||||
| CMO Series 2021-NPB1 Class A1 | ||||
| 10/16/2026 | 2.735% | 3,082,353 | 2,976,357 | |
| Starwood Mortgage Residential Trust(a),(d) | ||||
| CMO Series 2019-INV1 Class A3 | ||||
| 09/27/2049 | 2.916% | 3,305,327 | 3,266,257 | |
| CMO Series 2020-2 Class A3 | ||||
| 04/25/2060 | 3.000% | 8,250,000 | 8,183,223 | |
| CMO Series 2020-3 Class A3 | ||||
| 04/25/2065 | 2.591% | 5,000,000 | 4,623,449 | |
| CMO Series 2020-3 Class M1 | ||||
| 04/25/2065 | 3.544% | 2,800,000 | 2,728,807 | |
| CMO Series 2020-INV1 Class A2 | ||||
| 11/25/2055 | 1.439% | 5,226,901 | 5,050,162 | |
| CMO Series 2020-INV1 Class A3 | ||||
| 11/25/2055 | 1.593% | 1,978,425 | 1,909,780 | |
| CMO Series 2021-3 Class A1 | ||||
| 06/25/2056 | 1.127% | 1,070,275 | 1,002,684 | |
| Stonnington Mortgage Trust(a),(c),(d),(j) | ||||
| CMO Series 2020-1 Class A | ||||
| 07/28/2024 | 3.500% | 3,159,626 | 3,159,626 | |
| Toorak Mortgage Corp., Ltd.(d) | ||||
| CMO Series 2019-2 Class A1 | ||||
| 09/25/2022 | 3.721% | 782,490 | 782,065 | |
| Towd Point Mortgage Trust(a),(d) | ||||
| CMO Series 2016-2 Class A1 | ||||
| 08/25/2055 | 3.000% | 25,141 | 25,124 | |
| CMO Series 2019-4 Class M1B | ||||
| 10/25/2059 | 3.000% | 10,000,000 | 8,922,381 | |
| Triangle Re Ltd.(a),(b) | ||||
| CMO Series 2021-2 Class M1A | ||||
| 1-month USD LIBOR + 2.050% Floor 2.050% 10/25/2033 | 2.718% | 6,000,000 | 6,001,093 | |
| TRK Trust(a),(d) | ||||
| CMO Series 2021-INV2 Class A1 | ||||
| 11/25/2056 | 1.966% | 6,684,329 | 6,331,403 | |
| Vendee Mortgage Trust(d),(e) | ||||
| CMO Series 1998-1 Class 2IO | ||||
| 03/15/2028 | 0.000% | 591,372 | 1 | |
| CMO Series 1998-3 Class IO | ||||
| 03/15/2029 | 0.000% | 721,724 | 1 | |
| Verus Securitization Trust(a),(d) | ||||
| CMO Series 2019-INV3 Class A3 | ||||
| 11/25/2059 | 3.100% | 490,446 | 483,132 | |
| Columbia Bond Fund | Annual Report 2022 | 19 |
April 30, 2022
| Residential Mortgage-Backed Securities - Non-Agency (continued) | ||||
| Issuer | Coupon Rate | Principal Amount ($) | Value ($) | |
| CMO Series 2020-1 Class A3 | ||||
| 01/25/2060 | 2.724% | 1,185,339 | 1,162,249 | |
| CMO Series 2020-4 Class A3 | ||||
| 05/25/2065 | 2.321% | 2,060,996 | 2,005,757 | |
| CMO Series 2021-4 Class A2 | ||||
| 07/25/2066 | 1.247% | 4,764,416 | 4,263,028 | |
| Verus Securitization Trust(a) | ||||
| CMO Series 2020-INV1 Class A2 | ||||
| 03/25/2060 | 3.035% | 4,000,000 | 3,913,278 | |
| CMO Series 2020-INV1 Class A3 | ||||
| 03/25/2060 | 3.889% | 2,800,000 | 2,727,484 | |
| Visio Trust(a) | ||||
| CMO Series 2020-1R Class A3 | ||||
| 11/25/2055 | 1.873% | 2,079,144 | 2,014,712 | |
| CMO Series 2021-1R Class A1 | ||||
| 05/25/2056 | 1.280% | 3,237,979 | 3,053,107 | |
| ZH Trust(a) | ||||
| CMO Series 2021-1 Class A | ||||
| 02/18/2027 | 2.253% | 1,360,864 | 1,331,330 | |
| Total Residential Mortgage-Backed Securities - Non-Agency (Cost $363,704,810) | 351,083,150 | |||
| U.S. Treasury Obligations 0.2% | ||||
| U.S. Treasury | ||||
| 08/15/2048 | 3.000% | 530,000 | 521,056 | |
| U.S. Treasury Obligations (continued) | ||||
| Issuer | Coupon Rate | Principal Amount ($) | Value ($) | |
| U.S. Treasury(k) | ||||
| STRIPS | ||||
| 02/15/2040 | 0.000% | 3,461,000 | 1,971,824 | |
| Total U.S. Treasury Obligations (Cost $2,835,198) | 2,492,880 | |||
| Options Purchased Calls 0.0% | ||||
| Value ($) | ||||
| (Cost $127,500) | 48 | |||
| Options Purchased Puts 0.8% | ||||
| (Cost $1,689,480) | 8,195,530 | |||
| Money Market Funds 4.7% | ||
| Shares | Value ($) | |
| Columbia Short-Term Cash Fund, 0.462%(l),(m) | 48,472,874 | 48,458,332 |
| Total Money Market Funds (Cost $48,453,144) | 48,458,332 | |
| Total Investments in Securities (Cost: $1,282,784,032) | 1,227,121,664 | |
| Other Assets & Liabilities, Net | (205,982,974) | |
| Net Assets | 1,021,138,690 | |
| Long futures contracts | ||||||
| Description | Number of contracts | Expiration date | Trading currency | Notional amount | Value/Unrealized appreciation ($) | Value/Unrealized depreciation ($) |
| U.S. Treasury 10-Year Note | 3,134 | 06/2022 | USD | 373,435,688 | — | (17,732,395) |
| U.S. Ultra Treasury Bond | 280 | 06/2022 | USD | 44,922,500 | — | (5,377,158) |
| Total | — | (23,109,553) | ||||
| Short futures contracts | ||||||
| Description | Number of contracts | Expiration date | Trading currency | Notional amount | Value/Unrealized appreciation ($) | Value/Unrealized depreciation ($) |
| U.S. Treasury 5-Year Note | (1,120) | 06/2022 | USD | (126,192,500) | 2,365,519 | — |
| Call option contracts purchased | ||||||||
| Description | Counterparty | Trading currency | Notional amount | Number of contracts | Exercise price/Rate | Expiration date | Cost ($) | Value ($) |
| 10-Year OTC interest rate swap with Citi to receive exercise rate and pay 3-Month USD LIBOR BBA | Citi | USD | 12,500,000 | 12,500,000 | 1.00 | 07/08/2022 | 127,500 | 48 |
| 20 | Columbia Bond Fund | Annual Report 2022 |
April 30, 2022
| Put option contracts purchased | ||||||||
| Description | Counterparty | Trading currency | Notional amount | Number of contracts | Exercise price/Rate | Expiration date | Cost ($) | Value ($) |
| 10-Year OTC interest rate swap with Morgan Stanley to receive 3-Month USD LIBOR BBA and pay exercise rate | Morgan Stanley | USD | 72,200,000 | 72,200,000 | 1.75 | 11/09/2022 | 1,689,480 | 8,195,530 |
| Put option contracts written | ||||||||
| Description | Counterparty | Trading currency | Notional amount | Number of contracts | Exercise price/Rate | Expiration date | Premium received ($) | Value ($) |
| 2-Year OTC interest rate swap with Citi to receive exercise rate and pay 3-Month USD LIBOR BBA | Citi | USD | (48,000,000) | (48,000,000) | 1.10 | 05/03/2022 | (204,000) | (1,802,678) |
| 2-Year OTC interest rate swap with Citi to receive exercise rate and pay 3-Month USD LIBOR BBA | Citi | USD | (48,700,000) | (48,700,000) | 1.25 | 05/23/2022 | (180,190) | (1,757,700) |
| 2-Year OTC interest rate swap with Morgan Stanley to receive exercise rate and pay 3-Month USD LIBOR BBA | Morgan Stanley | USD | (48,700,000) | (48,700,000) | 1.25 | 05/23/2022 | (192,365) | (1,757,700) |
| 5-Year OTC interest rate swap with Morgan Stanley to receive exercise rate and pay 3-Month USD LIBOR BBA | Morgan Stanley | USD | (69,100,000) | (69,100,000) | 1.85 | 07/07/2022 | (587,350) | (3,972,538) |
| Total | (1,163,905) | (9,290,616) | ||||||
| (a) | Represents privately placed and other securities and instruments exempt from Securities and Exchange Commission registration (collectively, private placements), such as Section 4(a)(2) and Rule 144A eligible securities, which are often sold only to qualified institutional buyers. At April 30, 2022, the total value of these securities amounted to $746,306,738, which represents 73.09% of total net assets. |
| (b) | Variable rate security. The interest rate shown was the current rate as of April 30, 2022. |
| (c) | Valuation based on significant unobservable inputs. |
| (d) | Variable or floating rate security, the interest rate of which adjusts periodically based on changes in current interest rates and prepayments on the underlying pool of assets. The interest rate shown was the current rate as of April 30, 2022. |
| (e) | Represents interest only securities which have the right to receive the monthly interest payments on an underlying pool of mortgage loans. |
| (f) | Represents a security purchased on a when-issued basis. |
| (g) | Non-income producing investment. |
| (h) | Represents a variable rate security with a step coupon where the rate adjusts according to a schedule for a series of periods, typically lower for an initial period and then increasing to a higher coupon rate thereafter. The interest rate shown was the current rate as of April 30, 2022. |
| (i) | This security or a portion of this security has been pledged as collateral in connection with derivative contracts. |
| (j) | Represents fair value as determined in good faith under procedures approved by the Board of Trustees. At April 30, 2022, the total value of these securities amounted to $7,535,124, which represents 0.74% of total net assets. |
| (k) | Zero coupon bond. |
| (l) | The rate shown is the seven-day current annualized yield at April 30, 2022. |
| (m) | As defined in the Investment Company Act of 1940, as amended, an affiliated company is one in which the Fund owns 5% or more of the company’s outstanding voting securities, or a company which is under common ownership or control with the Fund. The value of the holdings and transactions in these affiliated companies during the year ended April 30, 2022 are as follows: |
| Affiliated issuers | Beginning of period($) | Purchases($) | Sales($) | Net change in unrealized appreciation (depreciation)($) | End of period($) | Realized gain (loss)($) | Dividends($) | End of period shares |
| Columbia Short-Term Cash Fund, 0.462% | ||||||||
| 54,158,560 | 529,071,322 | (534,774,699) | 3,149 | 48,458,332 | (9,210) | 61,471 | 48,472,874 | |
| CMO | Collateralized Mortgage Obligation |
| CMT | Constant Maturity Treasury |
| LIBOR | London Interbank Offered Rate |
| Columbia Bond Fund | Annual Report 2022 | 21 |
April 30, 2022
| SOFR | Secured Overnight Financing Rate |
| STRIPS | Separate Trading of Registered Interest and Principal Securities |
| TBA | To Be Announced |
| USD | US Dollar |
| ■ | Level 1 — Valuations based on quoted prices for investments in active markets that the Fund has the ability to access at the measurement date. Valuation adjustments are not applied to Level 1 investments. |
| ■ | Level 2 — Valuations based on other significant observable inputs (including quoted prices for similar securities, interest rates, prepayment speeds, credit risks, etc.). |
| ■ | Level 3 — Valuations based on significant unobservable inputs (including the Fund’s own assumptions and judgment in determining the fair value of investments). |
| Level 1 ($) | Level 2 ($) | Level 3 ($) | Total ($) | |
| Investments in Securities | ||||
| Asset-Backed Securities — Non-Agency | — | 177,961,557 | 6,544,011 | 184,505,568 |
| Commercial Mortgage-Backed Securities - Agency | — | 5,703,010 | — | 5,703,010 |
| Commercial Mortgage-Backed Securities - Non-Agency | — | 186,257,395 | 5,960,625 | 192,218,020 |
| Common Stocks | ||||
| Consumer Staples | — | 24 | — | 24 |
| Financials | 1,199 | — | — | 1,199 |
| Total Common Stocks | 1,199 | 24 | — | 1,223 |
| Corporate Bonds & Notes | — | 193,715,774 | — | 193,715,774 |
| Residential Mortgage-Backed Securities - Agency | — | 240,748,129 | — | 240,748,129 |
| Residential Mortgage-Backed Securities - Non-Agency | — | 332,460,477 | 18,622,673 | 351,083,150 |
| U.S. Treasury Obligations | 521,056 | 1,971,824 | — | 2,492,880 |
| 22 | Columbia Bond Fund | Annual Report 2022 |
April 30, 2022
| Level 1 ($) | Level 2 ($) | Level 3 ($) | Total ($) | |
| Options Purchased Calls | — | 48 | — | 48 |
| Options Purchased Puts | — | 8,195,530 | — | 8,195,530 |
| Money Market Funds | 48,458,332 | — | — | 48,458,332 |
| Total Investments in Securities | 48,980,587 | 1,147,013,768 | 31,127,309 | 1,227,121,664 |
| Investments in Derivatives | ||||
| Asset | ||||
| Futures Contracts | 2,365,519 | — | — | 2,365,519 |
| Liability | ||||
| Futures Contracts | (23,109,553) | — | — | (23,109,553) |
| Options Contracts Written | — | (9,290,616) | — | (9,290,616) |
| Total | 28,236,553 | 1,137,723,152 | 31,127,309 | 1,197,087,014 |
| Balance as of 04/30/2021 ($) | Increase (decrease) in accrued discounts/ premiums ($) | Realized gain (loss) ($) | Change in unrealized appreciation (depreciation)(a) ($) | Purchases ($) | Sales ($) | Transfers into Level 3 ($) | Transfers out of Level 3 ($) | Balance as of 04/30/2022 ($) | |
| Asset-Backed Securities — Non-Agency | 2,137,798 | — | — | (115,458) | 6,000,000 | (1,478,329) | — | — | 6,544,011 |
| Commercial Mortgage-Backed Securities — Non-Agency | — | — | — | (38,683) | 5,999,308 | — | — | — | 5,960,625 |
| Residential Mortgage-Backed Securities — Non-Agency | 58,913,795 | 13 | 22,500 | (65,218) | 20,650,000 | (52,398,461) | — | (8,499,956) | 18,622,673 |
| Total | 61,051,593 | 13 | 22,500 | (219,359) | 32,649,308 | (53,876,790) | — | (8,499,956) | 31,127,309 |
| Columbia Bond Fund | Annual Report 2022 | 23 |
April 30, 2022
| Assets | |
| Investments in securities, at value | |
| Unaffiliated issuers (cost $1,232,513,908) | $1,170,467,754 |
| Affiliated issuers (cost $48,453,144) | 48,458,332 |
| Options purchased (cost $1,816,980) | 8,195,578 |
| Cash | 7,042 |
| Cash collateral held at broker for: | |
| Options contracts written | 3,452,000 |
| TBA | 1,594,000 |
| Receivable for: | |
| Investments sold | 562,291 |
| Investments sold on a delayed delivery basis | 50,071,281 |
| Capital shares sold | 1,691,355 |
| Dividends | 18,897 |
| Interest | 3,521,354 |
| Foreign tax reclaims | 11,080 |
| Variation margin for futures contracts | 192,500 |
| Expense reimbursement due from Investment Manager | 3,557 |
| Prepaid expenses | 9,115 |
| Trustees’ deferred compensation plan | 233,964 |
| Total assets | 1,288,490,100 |
| Liabilities | |
| Option contracts written, at value (premiums received $1,163,905) | 9,290,616 |
| Payable for: | |
| Investments purchased | 570,661 |
| Investments purchased on a delayed delivery basis | 253,963,683 |
| Capital shares purchased | 664,796 |
| Distributions to shareholders | 1,615,927 |
| Variation margin for futures contracts | 864,094 |
| Management services fees | 13,959 |
| Distribution and/or service fees | 725 |
| Transfer agent fees | 19,395 |
| Compensation of board members | 75,766 |
| Other expenses | 37,824 |
| Trustees’ deferred compensation plan | 233,964 |
| Total liabilities | 267,351,410 |
| Net assets applicable to outstanding capital stock | $1,021,138,690 |
| Represented by | |
| Paid in capital | 1,147,932,083 |
| Total distributable earnings (loss) | (126,793,393) |
| Total - representing net assets applicable to outstanding capital stock | $1,021,138,690 |
| 24 | Columbia Bond Fund | Annual Report 2022 |
April 30, 2022
| Class A | |
| Net assets | $81,291,464 |
| Shares outstanding | 2,590,103 |
| Net asset value per share | $31.39 |
| Maximum sales charge | 4.75% |
| Maximum offering price per share (calculated by dividing the net asset value per share by 1.0 minus the maximum sales charge for Class A shares) | $32.96 |
| Advisor Class | |
| Net assets | $3,475,478 |
| Shares outstanding | 110,889 |
| Net asset value per share | $31.34 |
| Class C | |
| Net assets | $4,924,973 |
| Shares outstanding | 157,150 |
| Net asset value per share | $31.34 |
| Institutional Class | |
| Net assets | $76,310,725 |
| Shares outstanding | 2,431,699 |
| Net asset value per share | $31.38 |
| Institutional 2 Class | |
| Net assets | $12,074,538 |
| Shares outstanding | 385,815 |
| Net asset value per share | $31.30 |
| Institutional 3 Class | |
| Net assets | $836,473,583 |
| Shares outstanding | 26,596,804 |
| Net asset value per share | $31.45 |
| Class R | |
| Net assets | $342,337 |
| Shares outstanding | 10,909 |
| Net asset value per share | $31.38 |
| Class V | |
| Net assets | $6,245,592 |
| Shares outstanding | 199,369 |
| Net asset value per share | $31.33 |
| Maximum sales charge | 4.75% |
| Maximum offering price per share (calculated by dividing the net asset value per share by 1.0 minus the maximum sales charge for Class V shares) | $32.89 |
| Columbia Bond Fund | Annual Report 2022 | 25 |
Year Ended April 30, 2022
| Net investment income | |
| Income: | |
| Dividends — unaffiliated issuers | $39 |
| Dividends — affiliated issuers | 61,471 |
| Interest | 25,280,648 |
| Total income | 25,342,158 |
| Expenses: | |
| Management services fees | 5,680,830 |
| Distribution and/or service fees | |
| Class A | 240,062 |
| Class C | 66,494 |
| Class R | 4,188 |
| Class V | 10,713 |
| Transfer agent fees | |
| Class A | 117,512 |
| Advisor Class | 3,799 |
| Class C | 8,123 |
| Institutional Class | 102,275 |
| Institutional 2 Class | 7,817 |
| Institutional 3 Class | 49,444 |
| Class R | 1,019 |
| Class V | 8,741 |
| Compensation of board members | 32,847 |
| Custodian fees | 31,586 |
| Printing and postage fees | 30,840 |
| Registration fees | 133,704 |
| Audit fees | 39,500 |
| Legal fees | 22,233 |
| Interest on collateral | 8,094 |
| Compensation of chief compliance officer | 376 |
| Other | 26,048 |
| Total expenses | 6,626,245 |
| Fees waived or expenses reimbursed by Investment Manager and its affiliates | (1,452,619) |
| Fees waived by transfer agent | |
| Institutional 2 Class | (588) |
| Institutional 3 Class | (32,050) |
| Expense reduction | (700) |
| Total net expenses | 5,140,288 |
| Net investment income | 20,201,870 |
| 26 | Columbia Bond Fund | Annual Report 2022 |
Year Ended April 30, 2022
| Realized and unrealized gain (loss) — net | |
| Net realized gain (loss) on: | |
| Investments — unaffiliated issuers | $(10,909,959) |
| Investments — affiliated issuers | (9,210) |
| Foreign currency translations | (279) |
| Futures contracts | (30,837,521) |
| Options purchased | 6,184,085 |
| Options contracts written | 713,460 |
| Swap contracts | (658,929) |
| Net realized loss | (35,518,353) |
| Net change in unrealized appreciation (depreciation) on: | |
| Investments — unaffiliated issuers | (75,132,172) |
| Investments — affiliated issuers | 3,149 |
| Futures contracts | (13,479,761) |
| Options purchased | (448,024) |
| Options contracts written | (8,221,773) |
| Swap contracts | 13,478 |
| Net change in unrealized appreciation (depreciation) | (97,265,103) |
| Net realized and unrealized loss | (132,783,456) |
| Net decrease in net assets resulting from operations | $(112,581,586) |
| Columbia Bond Fund | Annual Report 2022 | 27 |
| Year Ended April 30, 2022 | Year Ended April 30, 2021 | |
| Operations | ||
| Net investment income | $20,201,870 | $17,427,582 |
| Net realized gain (loss) | (35,518,353) | 4,193,195 |
| Net change in unrealized appreciation (depreciation) | (97,265,103) | 7,949,566 |
| Net increase (decrease) in net assets resulting from operations | (112,581,586) | 29,570,343 |
| Distributions to shareholders | ||
| Net investment income and net realized gains | ||
| Class A | (1,343,503) | (4,095,337) |
| Advisor Class | (51,463) | (95,400) |
| Class C | (42,853) | (341,919) |
| Institutional Class | (1,380,038) | (3,622,047) |
| Institutional 2 Class | (239,345) | (413,556) |
| Institutional 3 Class | (16,563,854) | (26,231,751) |
| Class R | (9,374) | (49,383) |
| Class V | (107,146) | (350,296) |
| Total distributions to shareholders | (19,737,576) | (35,199,689) |
| Increase in net assets from capital stock activity | 19,410,835 | 704,393,822 |
| Total increase (decrease) in net assets | (112,908,327) | 698,764,476 |
| Net assets at beginning of year | 1,134,047,017 | 435,282,541 |
| Net assets at end of year | $1,021,138,690 | $1,134,047,017 |
| 28 | Columbia Bond Fund | Annual Report 2022 |
| Year Ended | Year Ended | |||
| April 30, 2022 | April 30, 2021 | |||
| Shares | Dollars ($) | Shares(a) | Dollars ($) | |
| Capital stock activity | ||||
| Class A | ||||
| Subscriptions | 514,592 | 18,041,620 | 1,052,886 | 37,794,128 |
| Distributions reinvested | 33,550 | 1,162,376 | 97,887 | 3,515,038 |
| Redemptions | (775,565) | (26,774,023) | (494,210) | (17,570,141) |
| Net increase (decrease) | (227,423) | (7,570,027) | 656,563 | 23,739,025 |
| Advisor Class | ||||
| Subscriptions | 99,979 | 3,516,270 | 87,868 | 3,333,177 |
| Distributions reinvested | 1,494 | 51,300 | 2,644 | 94,921 |
| Redemptions | (50,685) | (1,764,363) | (78,522) | (2,998,903) |
| Net increase | 50,788 | 1,803,207 | 11,990 | 429,195 |
| Class C | ||||
| Subscriptions | 40,771 | 1,428,310 | 115,398 | 4,142,956 |
| Distributions reinvested | 1,149 | 39,800 | 9,177 | 329,004 |
| Redemptions | (102,150) | (3,537,125) | (151,780) | (5,440,805) |
| Net decrease | (60,230) | (2,069,015) | (27,205) | (968,845) |
| Institutional Class | ||||
| Subscriptions | 874,794 | 30,582,605 | 998,279 | 35,937,092 |
| Distributions reinvested | 35,702 | 1,234,732 | 89,987 | 3,231,666 |
| Redemptions | (755,624) | (26,037,919) | (779,462) | (27,865,249) |
| Net increase | 154,872 | 5,779,418 | 308,804 | 11,303,509 |
| Institutional 2 Class | ||||
| Subscriptions | 255,038 | 8,966,455 | 140,010 | 5,049,877 |
| Distributions reinvested | 6,934 | 239,285 | 11,552 | 413,556 |
| Redemptions | (161,269) | (5,513,463) | (40,049) | (1,433,710) |
| Net increase | 100,703 | 3,692,277 | 111,513 | 4,029,723 |
| Institutional 3 Class | ||||
| Subscriptions | 3,064,643 | 107,828,340 | 19,970,295 | 719,666,240 |
| Distributions reinvested | 295,435 | 10,247,690 | 320,691 | 11,517,196 |
| Redemptions | (2,860,357) | (98,964,763) | (1,796,093) | (64,570,215) |
| Net increase | 499,721 | 19,111,267 | 18,494,893 | 666,613,221 |
| Class R | ||||
| Subscriptions | 4,102 | 144,331 | 1,413 | 50,793 |
| Distributions reinvested | 260 | 9,131 | 1,373 | 49,298 |
| Redemptions | (25,317) | (889,864) | (6,040) | (219,028) |
| Net decrease | (20,955) | (736,402) | (3,254) | (118,937) |
| Class V | ||||
| Subscriptions | 585 | 20,248 | 4,820 | 169,851 |
| Distributions reinvested | 2,229 | 77,103 | 7,219 | 258,820 |
| Redemptions | (19,809) | (697,241) | (29,619) | (1,061,740) |
| Net decrease | (16,995) | (599,890) | (17,580) | (633,069) |
| Total net increase | 480,481 | 19,410,835 | 19,535,724 | 704,393,822 |
| (a) | Share activity has been adjusted on a retroactive basis to reflect a 4 to 1 reverse stock split completed after the close of business on September 11, 2020. |
| Columbia Bond Fund | Annual Report 2022 | 29 |
| Net asset value, beginning of period | Net investment income | Net realized and unrealized gain (loss) | Total from investment operations | Distributions from net investment income | Distributions from net realized gains | Total distributions to shareholders | |
| Class A(c) | |||||||
| Year Ended 4/30/2022 | $35.38 | 0.50 | (4.00) | (3.50) | (0.49) | — | (0.49) |
| Year Ended 4/30/2021 | $34.88 | 0.69 | 1.39 | 2.08 | (0.72) | (0.86) | (1.58) |
| Year Ended 4/30/2020 | $33.84 | 0.88 | 1.48 | 2.36 | (0.88) | (0.44) | (1.32) |
| Year Ended 4/30/2019 | $33.13 | 0.92 | 0.67 | 1.59 | (0.88) | — | (0.88) |
| Year Ended 4/30/2018 | $33.87 | 0.64 | (0.74) | (0.10) | (0.60) | (0.04) | (0.64) |
| Advisor Class(c) | |||||||
| Year Ended 4/30/2022 | $35.33 | 0.58 | (4.00) | (3.42) | (0.57) | — | (0.57) |
| Year Ended 4/30/2021 | $34.83 | 0.79 | 1.38 | 2.17 | (0.81) | (0.86) | (1.67) |
| Year Ended 4/30/2020 | $33.80 | 0.96 | 1.47 | 2.43 | (0.96) | (0.44) | (1.40) |
| Year Ended 4/30/2019 | $33.09 | 1.00 | 0.71 | 1.71 | (1.00) | — | (1.00) |
| Year Ended 4/30/2018 | $33.85 | 0.72 | (0.72) | 0.00(f) | (0.72) | (0.04) | (0.76) |
| Class C(c) | |||||||
| Year Ended 4/30/2022 | $35.33 | 0.24 | (4.01) | (3.77) | (0.22) | — | (0.22) |
| Year Ended 4/30/2021 | $34.83 | 0.43 | 1.38 | 1.81 | (0.45) | (0.86) | (1.31) |
| Year Ended 4/30/2020 | $33.79 | 0.60 | 1.52 | 2.12 | (0.64) | (0.44) | (1.08) |
| Year Ended 4/30/2019 | $33.08 | 0.64 | 0.71 | 1.35 | (0.64) | — | (0.64) |
| Year Ended 4/30/2018 | $33.84 | 0.36 | (0.72) | (0.36) | (0.36) | (0.04) | (0.40) |
| Institutional Class(c) | |||||||
| Year Ended 4/30/2022 | $35.37 | 0.59 | (4.01) | (3.42) | (0.57) | — | (0.57) |
| Year Ended 4/30/2021 | $34.88 | 0.78 | 1.38 | 2.16 | (0.81) | (0.86) | (1.67) |
| Year Ended 4/30/2020 | $33.83 | 0.96 | 1.49 | 2.45 | (0.96) | (0.44) | (1.40) |
| Year Ended 4/30/2019 | $33.13 | 1.00 | 0.70 | 1.70 | (1.00) | — | (1.00) |
| Year Ended 4/30/2018 | $33.87 | 0.60 | (0.58) | 0.02 | (0.72) | (0.04) | (0.76) |
| Institutional 2 Class(c) | |||||||
| Year Ended 4/30/2022 | $35.28 | 0.61 | (3.99) | (3.38) | (0.60) | — | (0.60) |
| Year Ended 4/30/2021 | $34.78 | 0.80 | 1.39 | 2.19 | (0.83) | (0.86) | (1.69) |
| Year Ended 4/30/2020 | $33.74 | 1.00 | 1.48 | 2.48 | (1.00) | (0.44) | (1.44) |
| Year Ended 4/30/2019 | $33.02 | 1.04 | 0.68 | 1.72 | (1.00) | — | (1.00) |
| Year Ended 4/30/2018 | $33.78 | 0.76 | (0.76) | 0.00(f) | (0.72) | (0.04) | (0.76) |
| Institutional 3 Class(c) | |||||||
| Year Ended 4/30/2022 | $35.45 | 0.63 | (4.01) | (3.38) | (0.62) | — | (0.62) |
| Year Ended 4/30/2021 | $34.95 | 0.79 | 1.42 | 2.21 | (0.85) | (0.86) | (1.71) |
| Year Ended 4/30/2020 | $33.90 | 1.00 | 1.53 | 2.53 | (1.04) | (0.44) | (1.48) |
| Year Ended 4/30/2019 | $33.19 | 1.04 | 0.71 | 1.75 | (1.04) | — | (1.04) |
| Year Ended 4/30/2018 | $33.93 | 0.84 | (0.78) | 0.06 | (0.76) | (0.04) | (0.80) |
| 30 | Columbia Bond Fund | Annual Report 2022 |
| Net asset value, end of period | Total return | Total gross expense ratio to average net assets(a) | Total net expense ratio to average net assets(a),(b) | Net investment income ratio to average net assets | Portfolio turnover | Net assets, end of period (000’s) | |
| Class A(c) | |||||||
| Year Ended 4/30/2022 | $31.39 | (10.02%) | 0.90%(d) | 0.77%(d),(e) | 1.44% | 224% | $81,291 |
| Year Ended 4/30/2021 | $35.38 | 5.96% | 0.91%(d) | 0.77%(d),(e) | 1.92% | 227% | $99,681 |
| Year Ended 4/30/2020 | $34.88 | 7.05% | 0.97% | 0.80%(e) | 2.50% | 229% | $75,375 |
| Year Ended 4/30/2019 | $33.84 | 4.98% | 1.01% | 0.83%(e) | 2.73% | 236% | $49,696 |
| Year Ended 4/30/2018 | $33.13 | (0.33%) | 1.00% | 0.86%(e) | 1.84% | 257% | $50,845 |
| Advisor Class(c) | |||||||
| Year Ended 4/30/2022 | $31.34 | (9.81%) | 0.65%(d) | 0.52%(d),(e) | 1.70% | 224% | $3,475 |
| Year Ended 4/30/2021 | $35.33 | 6.20% | 0.66%(d) | 0.52%(d),(e) | 2.19% | 227% | $2,123 |
| Year Ended 4/30/2020 | $34.83 | 7.32% | 0.71% | 0.55%(e) | 2.74% | 229% | $1,676 |
| Year Ended 4/30/2019 | $33.80 | 5.24% | 0.76% | 0.58%(e) | 3.03% | 236% | $738 |
| Year Ended 4/30/2018 | $33.09 | (0.08%) | 0.75% | 0.61%(e) | 2.09% | 257% | $497 |
| Class C(c) | |||||||
| Year Ended 4/30/2022 | $31.34 | (10.71%) | 1.65%(d) | 1.52%(d),(e) | 0.69% | 224% | $4,925 |
| Year Ended 4/30/2021 | $35.33 | 5.15% | 1.66%(d) | 1.52%(d),(e) | 1.19% | 227% | $7,680 |
| Year Ended 4/30/2020 | $34.83 | 6.26% | 1.72% | 1.55%(e) | 1.74% | 229% | $8,519 |
| Year Ended 4/30/2019 | $33.79 | 4.20% | 1.76% | 1.59%(e) | 1.96% | 236% | $4,058 |
| Year Ended 4/30/2018 | $33.08 | (1.08%) | 1.75% | 1.61%(e) | 1.04% | 257% | $6,001 |
| Institutional Class(c) | |||||||
| Year Ended 4/30/2022 | $31.38 | (9.80%) | 0.65%(d) | 0.52%(d),(e) | 1.69% | 224% | $76,311 |
| Year Ended 4/30/2021 | $35.37 | 6.19% | 0.66%(d) | 0.52%(d),(e) | 2.18% | 227% | $80,542 |
| Year Ended 4/30/2020 | $34.88 | 7.32% | 0.72% | 0.55%(e) | 2.76% | 229% | $68,640 |
| Year Ended 4/30/2019 | $33.83 | 5.24% | 0.76% | 0.58%(e) | 2.97% | 236% | $51,185 |
| Year Ended 4/30/2018 | $33.13 | (0.08%) | 0.74% | 0.61%(e) | 1.74% | 257% | $56,556 |
| Institutional 2 Class(c) | |||||||
| Year Ended 4/30/2022 | $31.30 | (9.74%) | 0.58%(d) | 0.45%(d) | 1.76% | 224% | $12,075 |
| Year Ended 4/30/2021 | $35.28 | 6.24% | 0.60%(d) | 0.45%(d) | 2.23% | 227% | $10,058 |
| Year Ended 4/30/2020 | $34.78 | 7.55% | 0.62% | 0.46% | 2.83% | 229% | $6,038 |
| Year Ended 4/30/2019 | $33.74 | 5.24% | 0.64% | 0.47% | 3.20% | 236% | $3,687 |
| Year Ended 4/30/2018 | $33.02 | 0.13% | 0.64% | 0.51% | 2.20% | 257% | $864 |
| Institutional 3 Class(c) | |||||||
| Year Ended 4/30/2022 | $31.45 | (9.70%) | 0.53%(d) | 0.40%(d) | 1.81% | 224% | $836,474 |
| Year Ended 4/30/2021 | $35.45 | 6.31% | 0.55%(d) | 0.40%(d) | 2.22% | 227% | $925,195 |
| Year Ended 4/30/2020 | $34.95 | 7.47% | 0.57% | 0.40% | 2.91% | 229% | $265,665 |
| Year Ended 4/30/2019 | $33.90 | 5.41% | 0.58% | 0.42% | 3.14% | 236% | $257,417 |
| Year Ended 4/30/2018 | $33.19 | 0.19% | 0.59% | 0.46% | 2.46% | 257% | $284,876 |
| Columbia Bond Fund | Annual Report 2022 | 31 |
| Net asset value, beginning of period | Net investment income | Net realized and unrealized gain (loss) | Total from investment operations | Distributions from net investment income | Distributions from net realized gains | Total distributions to shareholders | |
| Class R(c) | |||||||
| Year Ended 4/30/2022 | $35.38 | 0.41 | (4.01) | (3.60) | (0.40) | — | (0.40) |
| Year Ended 4/30/2021 | $34.88 | 0.61 | 1.38 | 1.99 | (0.63) | (0.86) | (1.49) |
| Year Ended 4/30/2020 | $33.83 | 0.80 | 1.49 | 2.29 | (0.80) | (0.44) | (1.24) |
| Year Ended 4/30/2019 | $33.12 | 0.84 | 0.67 | 1.51 | (0.80) | — | (0.80) |
| Year Ended 4/30/2018 | $33.88 | 0.52 | (0.72) | (0.20) | (0.52) | (0.04) | (0.56) |
| Class V(c) | |||||||
| Year Ended 4/30/2022 | $35.31 | 0.53 | (3.99) | (3.46) | (0.52) | — | (0.52) |
| Year Ended 4/30/2021 | $34.82 | 0.73 | 1.37 | 2.10 | (0.75) | (0.86) | (1.61) |
| Year Ended 4/30/2020 | $33.78 | 0.92 | 1.48 | 2.40 | (0.92) | (0.44) | (1.36) |
| Year Ended 4/30/2019 | $33.07 | 0.92 | 0.71 | 1.63 | (0.92) | — | (0.92) |
| Year Ended 4/30/2018 | $33.82 | 0.64 | (0.71) | (0.07) | (0.64) | (0.04) | (0.68) |
| Notes to Financial Highlights | |
| (a) | In addition to the fees and expenses that the Fund bears directly, the Fund indirectly bears a pro rata share of the fees and expenses of any other funds in which it invests. Such indirect expenses are not included in the Fund’s reported expense ratios. |
| (b) | Total net expenses include the impact of certain fee waivers/expense reimbursements made by the Investment Manager and certain of its affiliates, if applicable. |
| (c) | Per share amounts have been adjusted on a retroactive basis to reflect a 4 to 1 reverse stock split completed after the close of business on September 11, 2020. |
| (d) | Ratios include interest on collateral expense which is less than 0.01%. |
| (e) | The benefits derived from expense reductions had an impact of less than 0.01%. |
| (f) | Rounds to zero. |
| 32 | Columbia Bond Fund | Annual Report 2022 |
| Net asset value, end of period | Total return | Total gross expense ratio to average net assets(a) | Total net expense ratio to average net assets(a),(b) | Net investment income ratio to average net assets | Portfolio turnover | Net assets, end of period (000’s) | |
| Class R(c) | |||||||
| Year Ended 4/30/2022 | $31.38 | (10.28%) | 1.14%(d) | 1.02%(d),(e) | 1.18% | 224% | $342 |
| Year Ended 4/30/2021 | $35.38 | 5.70% | 1.16%(d) | 1.02%(d),(e) | 1.69% | 227% | $1,127 |
| Year Ended 4/30/2020 | $34.88 | 6.79% | 1.22% | 1.05%(e) | 2.26% | 229% | $1,225 |
| Year Ended 4/30/2019 | $33.83 | 4.71% | 1.26% | 1.08%(e) | 2.51% | 236% | $680 |
| Year Ended 4/30/2018 | $33.12 | (0.58%) | 1.25% | 1.11%(e) | 1.54% | 257% | $550 |
| Class V(c) | |||||||
| Year Ended 4/30/2022 | $31.33 | (9.93%) | 0.80%(d) | 0.67%(d),(e) | 1.54% | 224% | $6,246 |
| Year Ended 4/30/2021 | $35.31 | 6.10% | 0.81%(d) | 0.67%(d),(e) | 2.04% | 227% | $7,640 |
| Year Ended 4/30/2020 | $34.82 | 7.17% | 0.87% | 0.70%(e) | 2.62% | 229% | $8,145 |
| Year Ended 4/30/2019 | $33.78 | 4.96% | 0.91% | 0.73%(e) | 2.83% | 236% | $8,242 |
| Year Ended 4/30/2018 | $33.07 | (0.23%) | 0.90% | 0.76%(e) | 1.92% | 257% | $8,934 |
| Columbia Bond Fund | Annual Report 2022 | 33 |
April 30, 2022
| 34 | Columbia Bond Fund | Annual Report 2022 |
April 30, 2022
| Columbia Bond Fund | Annual Report 2022 | 35 |
April 30, 2022
| 36 | Columbia Bond Fund | Annual Report 2022 |
April 30, 2022
| Columbia Bond Fund | Annual Report 2022 | 37 |
April 30, 2022
| 38 | Columbia Bond Fund | Annual Report 2022 |
April 30, 2022
| Asset derivatives | ||
| Risk exposure category | Statement of assets and liabilities location | Fair value ($) |
| Interest rate risk | Component of total distributable earnings (loss) — unrealized appreciation on futures contracts | 2,365,519* |
| Interest rate risk | Investments, at value — Options purchased | 8,195,578 |
| Total | 10,561,097 |
| Liability derivatives | ||
| Risk exposure category | Statement of assets and liabilities location | Fair value ($) |
| Interest rate risk | Component of total distributable earnings (loss) — unrealized depreciation on futures contracts | 23,109,553* |
| Interest rate risk | Options contracts written, at value | 9,290,616 |
| Total | 32,400,169 |
| * | Includes cumulative appreciation (depreciation) as reported in the tables following the Portfolio of Investments. Only the current day’s variation margin is reported in receivables or payables in the Statement of Assets and Liabilities. |
| Amount of realized gain (loss) on derivatives recognized in income | |||||
| Risk exposure category | Futures contracts ($) | Options contracts written ($) | Options contracts purchased ($) | Swap contracts ($) | Total ($) |
| Interest rate risk | (30,837,521) | 713,460 | 6,184,085 | (658,929) | (24,598,905) |
| Change in unrealized appreciation (depreciation) on derivatives recognized in income | |||||
| Risk exposure category | Futures contracts ($) | Options contracts written ($) | Options contracts purchased ($) | Swap contracts ($) | Total ($) |
| Interest rate risk | (13,479,761) | (8,221,773) | (448,024) | 13,478 | (22,136,080) |
| Columbia Bond Fund | Annual Report 2022 | 39 |
April 30, 2022
| Derivative instrument | Average notional amounts ($) |
| Futures contracts — long | 593,146,975* |
| Futures contracts — short | 12,408,866** |
| Derivative instrument | Average value ($)* |
| Options contracts — purchased | 6,121,493 |
| Options contracts — written | (3,312,735) |
| Derivative instrument | Average unrealized appreciation ($)** | Average unrealized depreciation ($)** |
| Interest rate swap contracts | 76 | (80,584) |
| * | Based on the ending quarterly outstanding amounts for the year ended April 30, 2022. |
| ** | Based on the ending daily outstanding amounts for the year ended April 30, 2022. |
| 40 | Columbia Bond Fund | Annual Report 2022 |
April 30, 2022
| Citi ($) | Morgan Stanley ($) | Total ($) | |
| Assets | |||
| Options purchased calls | 48 | - | 48 |
| Options purchased puts | - | 8,195,530 | 8,195,530 |
| Total assets | 48 | 8,195,530 | 8,195,578 |
| Liabilities | |||
| Options contracts written | 3,560,378 | 5,730,238 | 9,290,616 |
| Total financial and derivative net assets | (3,560,330) | 2,465,292 | (1,095,038) |
| Total collateral received (pledged) (a) | (3,452,000) | 2,440,682 | (1,011,318) |
| Net amount (b) | (108,330) | 24,610 | (83,720) |
| (a) | In some instances, the actual collateral received and/or pledged may be more than the amount shown due to overcollateralization. |
| (b) | Represents the net amount due from/(to) counterparties in the event of default. |
| Columbia Bond Fund | Annual Report 2022 | 41 |
April 30, 2022
| 42 | Columbia Bond Fund | Annual Report 2022 |
April 30, 2022
| Columbia Bond Fund | Annual Report 2022 | 43 |
April 30, 2022
| Effective rate (%) | |
| Class A | 0.12 |
| Advisor Class | 0.12 |
| Class C | 0.12 |
| Institutional Class | 0.12 |
| Institutional 2 Class | 0.05 |
| Institutional 3 Class | 0.00 |
| Class R | 0.12 |
| Class V | 0.12 |
| Front End (%) | CDSC (%) | Amount ($) | |
| Class A | 4.75 | 0.50 - 1.00(a) | 121,362 |
| Class C | — | 1.00(b) | 1,721 |
| Class V | 4.75 | 0.50 - 1.00(a) | 41 |
| 44 | Columbia Bond Fund | Annual Report 2022 |
April 30, 2022
| (a) | This charge is imposed on certain investments of between $1 million and $50 million redeemed within 18 months after purchase, as follows: 1.00% if redeemed within 12 months after purchase, and 0.50% if redeemed more than 12, but less than 18, months after purchase, with certain limited exceptions. |
| (b) | This charge applies to redemptions within 12 months after purchase, with certain limited exceptions. |
| September 1, 2021 through August 31, 2022 | Prior to September 1, 2021 | |
| Class A | 0.77% | 0.78% |
| Advisor Class | 0.52 | 0.53 |
| Class C | 1.52 | 1.53 |
| Institutional Class | 0.52 | 0.53 |
| Institutional 2 Class | 0.45 | 0.45 |
| Institutional 3 Class | 0.40 | 0.40 |
| Class R | 1.02 | 1.03 |
| Class V | 0.67 | 0.68 |
| Columbia Bond Fund | Annual Report 2022 | 45 |
April 30, 2022
| Excess of distributions over net investment income ($) | Accumulated net realized (loss) ($) | Paid in capital ($) |
| 139,796 | (139,796) | — |
| Year Ended April 30, 2022 | Year Ended April 30, 2021 | ||||
| Ordinary income ($) | Long-term capital gains ($) | Total ($) | Ordinary income ($) | Long-term capital gains ($) | Total ($) |
| 19,737,576 | — | 19,737,576 | 28,415,979 | 6,783,710 | 35,199,689 |
| Undistributed ordinary income ($) | Undistributed long-term capital gains ($) | Capital loss carryforwards ($) | Net unrealized (depreciation) ($) |
| 1,810,845 | — | (64,857,044) | (61,822,640) |
| Federal tax cost ($) | Gross unrealized appreciation ($) | Gross unrealized (depreciation) ($) | Net unrealized (depreciation) ($) |
| 1,258,909,654 | 7,766,154 | (69,588,794) | (61,822,640) |
| No expiration short-term ($) | No expiration long-term ($) | Total ($) | Utilized ($) |
| (33,282,749) | (31,574,295) | (64,857,044) | — |
| 46 | Columbia Bond Fund | Annual Report 2022 |
April 30, 2022
| Columbia Bond Fund | Annual Report 2022 | 47 |
April 30, 2022
| 48 | Columbia Bond Fund | Annual Report 2022 |
April 30, 2022
| Columbia Bond Fund | Annual Report 2022 | 49 |
April 30, 2022
| 50 | Columbia Bond Fund | Annual Report 2022 |
| Columbia Bond Fund | Annual Report 2022 | 51 |
| Section 163(j) Interest Dividends | |
| 100.00% |
| Name, address, year of birth | Position held with the Columbia Funds and length of service | Principal occupation(s) during past five years and other relevant professional experience | Number of Funds in the Columbia Funds Complex* overseen | Other directorships held by Trustee during the past five years |
| George S. Batejan c/o Columbia Management Investment Advisers, LLC 290 Congress Street Boston, MA 02210 1953 | Trustee since 2017 | Executive Vice President, Global Head of Technology and Operations, Janus Capital Group, Inc., 2010-2016 | 176 | Former Chairman of the Board, NICSA (National Investment Company Services Association) (Executive Committee, Nominating Committee and Governance Committee), 2014-2016; former Director, Intech Investment Management, 2011-2016; former Board Member, Metro Denver Chamber of Commerce, 2015-2016; former Advisory Board Member, University of Colorado Business School, 2015-2018 |
| 52 | Columbia Bond Fund | Annual Report 2022 |
(Unaudited)
Independent trustees (continued)
| Name, address, year of birth | Position held with the Columbia Funds and length of service | Principal occupation(s) during past five years and other relevant professional experience | Number of Funds in the Columbia Funds Complex* overseen | Other directorships held by Trustee during the past five years |
| Kathleen Blatz c/o Columbia Management Investment Advisers, LLC 290 Congress Street Boston, MA 02210 1954 | Trustee since 2006 | Attorney, specializing in arbitration and mediation; Chief Justice, Minnesota Supreme Court, 1998-2006; Associate Justice, Minnesota Supreme Court, 1996-1998; Fourth Judicial District Court Judge, Hennepin County, 1994-1996; Attorney in private practice and public service, 1984-1993; State Representative, Minnesota House of Representatives, 1979-1993, which included service on the Tax and Financial Institutions and Insurance Committees; Member and Interim Chair, Minnesota Sports Facilities Authority, January 2017-July 2017; Interim President and Chief Executive Officer, Blue Cross and Blue Shield of Minnesota (health care insurance), February-July 2018, April-October 2021 | 176 | Former Trustee, Blue Cross and Blue Shield of Minnesota, 2009-2021 (Chair of the Business Development Committee, 2014-2017; Chair of the Governance Committee, 2017-2019); former Member and Chair of the Board, Minnesota Sports Facilities Authority, January 2017-July 2017; former Director, Robina Foundation, 2009-2020 (Chair, 2014-2020); Director, Schulze Family Foundation, since 2021 |
| Pamela G. Carlton c/o Columbia Management Investment Advisers, LLC 290 Congress Street Boston, MA 02210 1954 | Trustee since 2007 | President, Springboard — Partners in Cross Cultural Leadership (consulting company) since 2003; Managing Director of US Equity Research, JP Morgan Chase, 1999-2003; Director of US Equity Research, Chase Asset Management, 1996-1999; Co-Director Latin America Research, 1993-1996, COO Global Research, 1992-1996, Co-Director of US Research, 1991-1992, Investment Banker, 1982-1991, Morgan Stanley; Attorney, Cleary Gottlieb Steen & Hamilton LLP, 1980-1982 | 176 | Trustee, New York Presbyterian Hospital Board (Executive Committee and Chair of People Committee) since 1996; Director, DR Bank (Audit Committee) since 2017; Director, Evercore Inc. (Audit Committee) since 2019; Director, Apollo Commercial Real Estate Finance, Inc. since 2021; the Governing Council of the Independent Directors Council (IDC), since 2021 |
| Janet Langford Carrig c/o Columbia Management Investment Advisers, LLC 290 Congress Street Boston, MA 02210 1957 | Trustee since 1996 | Senior Vice President, General Counsel and Corporate Secretary, ConocoPhillips (independent energy company), September 2007-October 2018 | 174 | Director, EQT Corporation (natural gas producer) since 2019; Director, Whiting Petroleum Corporation (independent oil and gas company) since 2020 |
| J. Kevin Connaughton c/o Columbia Management Investment Advisers, LLC 290 Congress Street Boston, MA 02210 1964 | Trustee since 2020 | Member, FINRA National Adjudicatory Council since January 2020; Adjunct Professor of Finance, Bentley University since January 2018; Consultant to Independent Trustees of CFVIT and CFST I from March 2016 to June 2020 with respect to CFVIT and to December 2020 with respect to CFST I; Managing Director and General Manager of Mutual Fund Products, Columbia Management Investment Advisers, LLC, May 2010-February 2015; President, Columbia Funds, 2008-2015; and senior officer of Columbia Funds and affiliated funds, 2003-2015 | 174 | Former Director, The Autism Project, March 2015-December 2021; former Member of the Investment Committee, St. Michael’s College, November 2015-February 2020; former Trustee, St. Michael’s College, June 2017-September 2019; former Trustee, New Century Portfolios, January 2015-December 2017 |
| Columbia Bond Fund | Annual Report 2022 | 53 |
(Unaudited)
Independent trustees (continued)
| Name, address, year of birth | Position held with the Columbia Funds and length of service | Principal occupation(s) during past five years and other relevant professional experience | Number of Funds in the Columbia Funds Complex* overseen | Other directorships held by Trustee during the past five years |
| Olive M. Darragh c/o Columbia Management Investment Advisers, LLC 290 Congress Street Boston, MA 02210 1962 | Trustee since 2020 | Managing Director of Darragh Inc. (strategy and talent management consulting firm) since 2010; Founder and CEO, Zolio, Inc. (investment management talent identification platform) since 2004; Consultant to Independent Trustees of CFVIT and CFST I from June 2019 to June 2020 with respect to CFVIT and to December 2020 with respect to CFST I; Partner, Tudor Investments, 2004-2010; Senior Partner, McKinsey & Company (consulting), 1990-2004; Touche Ross CPA, 1985-1988 | 174 | Former Director, University of Edinburgh Business School (Member of US Board); former Director, Boston Public Library Foundation |
| Patricia M. Flynn c/o Columbia Management Investment Advisers, LLC 290 Congress Street Boston, MA 02210 1950 | Trustee since 2004 | Trustee Professor of Economics and Management, Bentley University since 1976 (also teaches and conducts research on corporate governance); Dean, McCallum Graduate School of Business, Bentley University, 1992-2002 | 176 | Trustee, MA Taxpayers Foundation since 1997; Board of Governors, Innovation Institute, MA Technology Collaborative, 2010-2020; former Board of Directors, The MA Business Roundtable, 2003-2019 |
| Brian J. Gallagher c/o Columbia Management Investment Advisers, LLC 290 Congress Street Boston, MA 02210 1954 | Trustee since 2017 | Retired; Partner with Deloitte & Touche LLP and its predecessors, 1977-2016 | 176 | Trustee, Catholic Schools Foundation since 2004 |
| Douglas A. Hacker c/o Columbia Management Investment Advisers, LLC 290 Congress Street Boston, MA 02210 1955 | Co-Chair since 2021; Chair of CFST I and CFVIT since 2014; Trustee of CFST I and CFVIT since 1996 and CFST, CFST II, CFVST II, CET I and CET II since 2021 | Independent business executive since May 2006; Executive Vice President – Strategy of United Airlines, December 2002 - May 2006; President of UAL Loyalty Services (airline marketing company), September 2001-December 2002; Executive Vice President and Chief Financial Officer of United Airlines, July 1999-September 2001 | 176 | Director, Spartan Nash Company (food distributor); Director, Aircastle Limited (Chair of Audit Committee) (aircraft leasing); former Director, Nash Finch Company (food distributor), 2005-2013; former Director, SeaCube Container Leasing Ltd. (container leasing), 2010-2013; and former Director, Travelport Worldwide Limited (travel information technology), 2014-2019 |
| Nancy T. Lukitsh c/o Columbia Management Investment Advisers, LLC 290 Congress Street Boston, MA 02210 1956 | Trustee since 2011 | Senior Vice President, Partner and Director of Marketing, Wellington Management Company, LLP (investment adviser), 1997-2010; Chair, Wellington Management Portfolios (commingled non-U.S. investment pools), 2007 -2010; Director, Wellington Trust Company, NA and other Wellington affiliates, 1997-2010 | 174 | None |
| 54 | Columbia Bond Fund | Annual Report 2022 |
(Unaudited)
Independent trustees (continued)
| Name, address, year of birth | Position held with the Columbia Funds and length of service | Principal occupation(s) during past five years and other relevant professional experience | Number of Funds in the Columbia Funds Complex* overseen | Other directorships held by Trustee during the past five years |
| David M. Moffett c/o Columbia Management Investment Advisers, LLC 290 Congress Street Boston, MA 02210 1952 | Trustee since 2011 | Retired; Consultant to Bridgewater and Associates | 174 | Director, CSX Corporation (transportation suppliers); Director, Genworth Financial, Inc. (financial and insurance products and services); Director, PayPal Holdings Inc. (payment and data processing services); Trustee, University of Oklahoma Foundation; former Director, eBay Inc. (online trading community), 2007-2015; and former Director, CIT Bank, CIT Group Inc. (commercial and consumer finance), 2010-2016 |
| Catherine James Paglia c/o Columbia Management Investment Advisers, LLC 290 Congress Street Boston, MA 02210 1952 | Co-Chair since 2021; Chair of CFST, CFST II, CFVST II, CET I and CET II since 2020; Trustee of CFST, CFST II and CFVST II since 2004 and CFST I and CFVIT since 2021 | Director, Enterprise Asset Management, Inc. (private real estate and asset management company) since September 1998; Managing Director and Partner, Interlaken Capital, Inc., 1989-1997; Vice President, 1982-1985, Principal, 1985-1987, Managing Director, 1987-1989, Morgan Stanley; Vice President, Investment Banking, 1980-1982, Associate, Investment Banking, 1976-1980, Dean Witter Reynolds, Inc. | 176 | Director, Valmont Industries, Inc. (irrigation systems manufacturer) since 2012; Trustee, Carleton College (on the Investment Committee); Trustee, Carnegie Endowment for International Peace (on the Investment Committee) |
| Minor M. Shaw c/o Columbia Management Investment Advisers, LLC 290 Congress Street Boston, MA 02210 1947 | Trustee since 2003 | President, Micco LLC (private investments) since 2011; President, Micco Corp. (family investment business), 1998-2011 | 176 | Director, Blue Cross Blue Shield of South Carolina (Chair of Compensation Committee) since April 2008; Trustee, Hollingsworth Funds (on the Investment Committee) since 2016 (previously Board Chair from 2016-2019); Former Advisory Board member, Duke Energy Corp., 2016-2020; Chair of the Duke Endowment; Chair of Greenville – Spartanburg Airport Commission; former Trustee, BofA Funds Series Trust (11 funds), 2003-2011; former Director, Piedmont Natural Gas, 2004-2016; former Director, National Association of Corporate Directors, Carolinas Chapter, 2013-2018; Chair, Daniel-Mickel Foundation since 1998 |
| Columbia Bond Fund | Annual Report 2022 | 55 |
(Unaudited)
Independent trustees (continued)
| Name, address, year of birth | Position held with the Columbia Funds and length of service | Principal occupation(s) during past five years and other relevant professional experience | Number of Funds in the Columbia Funds Complex* overseen | Other directorships held by Trustee during the past five years |
| Natalie A. Trunow c/o Columbia Management Investment Advisers, LLC 290 Congress Street Boston, MA 02210 1967 | Trustee since 2020 | Chief Executive Officer, Millennial Portfolio Solutions LLC (asset management and consulting services), January 2016-January 2021; Non-executive Member of the Investment Committee and Valuation Committee, Sarona Asset Management Inc. (private equity firm) since September 2019; Advisor, Horizon Investments (asset management and consulting services), August 2018-January 2021; Advisor, Paradigm Asset Management, November 2016-December 2021; Consultant to Independent Trustees of CFVIT and CFST I from September 2016 to June 2020 with respect to CFVIT and to December 2020 with respect to CFST I; Director of Investments/Consultant, Casey Family Programs, April 2016-November 2016; Senior Vice President and Chief Investment Officer, Calvert Investments, August 2008-January 2016; Section Head and Portfolio Manager, General Motors Asset Management, June 1997-August 2008 | 174 | Former Director, Investment Committee, Health Services for Children with Special Needs, Inc., 2012-2019; Director, Chair of Audit Committee, Consumer Credit Counseling Services (formerly Guidewell Financial Solutions), since 2019; Independent Director, Investment Committee and Valuation Committee, Sarona Asset Management, since 2019 |
| Sandra L. Yeager c/o Columbia Management Investment Advisers, LLC 290 Congress Street Boston, MA 02210 1964 | Trustee since 2017 | Retired; President and founder, Hanoverian Capital, LLC (SEC registered investment advisor firm), 2008-2016; Managing Director, DuPont Capital, 2006-2008; Managing Director, Morgan Stanley Investment Management, 2004-2006; Senior Vice President, Alliance Bernstein, 1990-2004 | 176 | Former Director, NAPE Education Foundation, October 2016-October 2020 |
| * | The term “Columbia Funds Complex” as used herein includes Columbia Seligman Premium Technology Growth Fund, Tri-Continental Corporation and each series of Columbia Fund Series Trust (CFST), Columbia Funds Series Trust I (CFST I), Columbia Funds Series Trust II (CFST II), Columbia ETF Trust I (CET I), Columbia ETF Trust II (CET II), Columbia Funds Variable Insurance Trust (CFVIT) and Columbia Funds Variable Series Trust II (CFVST II). Messrs. Batejan, Beckman, Gallagher and Hacker and Mses. Blatz, Carlton, Flynn, Paglia, Shaw and Yeager serve as Directors of Columbia Seligman Premium Technology Growth Fund and Tri-Continental Corporation. |
| Name, address, year of birth | Position held with the Columbia Funds and length of service | Principal occupation(s) during the past five years and other relevant professional experience | Number of Funds in the Columbia Funds Complex overseen | Other directorships held by Trustee during the past five years |
| Daniel J. Beckman c/o Columbia Management Investment Advisers, LLC 290 Congress Street Boston, MA 02210 1962 | Trustee since November 2021 and President since June 2021 | Vice President – Head of North America Product, Columbia Management Investment Advisers, LLC since April 2015; President and Principal Executive Officer of the Columbia Funds since June 2021; officer of Columbia Funds and affiliated funds, 2020-2021 | 176 | Director, Ameriprise Trust Company, since October 2016; Director, Columbia Management Investment Distributors, Inc. since November 2018; Board of Governors, Columbia Wanger Asset Management, LLC since January 2022 |
| * | Interested person (as defined under the 1940 Act) by reason of being an officer, director, security holder and/or employee of the Investment Manager or Ameriprise Financial. |
| 56 | Columbia Bond Fund | Annual Report 2022 |
(Unaudited)
The Board has appointed officers who are responsible for day-to-day business decisions based on policies it has established. The officers serve at the pleasure of the Board. The following table provides basic information about the Officers of the Fund as of the printing of this report, including principal occupations during the past five years, although their specific titles may have varied over the period. In addition to Mr. Beckman, who is President and Principal Executive Officer, the Fund’s other officers are:
| Name, address and year of birth | Position and year first appointed to position for any Fund in the Columbia Funds Complex or a predecessor thereof | Principal occupation(s) during past five years |
| Michael G. Clarke 290 Congress Street Boston, MA 02210 1969 | Chief Financial Officer and Principal Financial Officer (2009) and Senior Vice President (2019) | Senior Vice President and Head of Global Operations & Investor Services, Columbia Management Investment Advisers, LLC, since March 2022 (previously Vice President, Head of North American Operations, and Co-Head of Global Operations, June 2019 to February 2022 and Vice President – Accounting and Tax, May 2010 - May 2019); senior officer of Columbia Funds and affiliated funds since 2002. |
| Joseph Beranek 5890 Ameriprise Financial Center Minneapolis, MN 55474 1965 | Treasurer and Chief Accounting Officer (Principal Accounting Officer) (2019) and Principal Financial Officer (2020), CFST, CFST I, CFST II, CFVIT and CFVST II; Assistant Treasurer, CET I and CET II | Vice President – Mutual Fund Accounting and Financial Reporting, Columbia Management Investment Advisers, LLC, since December 2018 and March 2017, respectively (previously Vice President – Pricing and Corporate Actions, May 2010 - March 2017). |
| Marybeth Pilat 290 Congress Street Boston, MA 02210 1968 | Treasurer and Chief Accounting Officer (Principal Accounting Officer) and Principal Financial Officer (2020) for CET I and CET II; Assistant Treasurer, CFST, CFST I, CFST II, CFVIT and CFVST II | Vice President – Product Pricing and Administration, Columbia Management Investment Advisers, LLC, since May 2017; Director - Fund Administration, Calvert Investments, August 2015 – March 2017; Vice President - Fund Administration, Legg Mason, May 2015 - July 2015; Vice President - Fund Administration, Columbia Management Investment Advisers, LLC, May 2010 - April 2015. |
| William F. Truscott 290 Congress Street Boston, MA 02210 1960 | Senior Vice President (2001) | Formerly, Trustee/Director of Columbia Funds Complex or legacy funds, November 2001-January 1, 2021; Chief Executive Officer, Global Asset Management, Ameriprise Financial, Inc. since September 2012; Chairman of the Board and President, Columbia Management Investment Advisers, LLC since July 2004 and February 2012, respectively; Chairman of the Board and Chief Executive Officer, Columbia Management Investment Distributors, Inc. since November 2008 and February 2012, respectively; Chairman of the Board and Director, Threadneedle Asset Management Holdings, Sàrl since March 2013 and December 2008, respectively; senior executive of various entities affiliated with Columbia Threadneedle. |
| Christopher O. Petersen 5228 Ameriprise Financial Center Minneapolis, MN 55474 1970 | Senior Vice President and Assistant Secretary (2021) | Formerly, Trustee/Director of funds within the Columbia Funds Complex, July 1, 2020 - November 22, 2021; Senior Vice President and Assistant General Counsel, Ameriprise Financial, Inc. since September 2021 (previously Vice President and Lead Chief Counsel, January 2015 - September 2021); President and Principal Executive Officer of the Columbia Funds, 2015 - 2021; officer of Columbia Funds and affiliated funds since 2007. |
| Thomas P. McGuire 290 Congress Street Boston, MA 02210 1972 | Senior Vice President and Chief Compliance Officer (2012) | Vice President – Asset Management Compliance, Ameriprise Financial, Inc., since May 2010; Chief Compliance Officer, Columbia Acorn/Wanger Funds since December 2015; Chief Compliance Officer, Ameriprise Certificate Company, September 2010 – September 2020. |
| Ryan C. Larrenaga 290 Congress Street Boston, MA 02210 1970 | Senior Vice President (2017), Chief Legal Officer (2017), and Secretary (2015) | Vice President and Chief Counsel, Ameriprise Financial, Inc. since August 2018 (previously Vice President and Group Counsel, August 2011 - August 2018); Chief Legal Officer, Columbia Acorn/Wanger Funds, since September 2020; officer of Columbia Funds and affiliated funds since 2005. |
| Columbia Bond Fund | Annual Report 2022 | 57 |
(Unaudited)
Fund officers (continued)
| Name, address and year of birth | Position and year first appointed to position for any Fund in the Columbia Funds Complex or a predecessor thereof | Principal occupation(s) during past five years |
| Michael E. DeFao 290 Congress Street Boston, MA 02210 1968 | Vice President (2011) and Assistant Secretary (2010) | Vice President and Chief Counsel, Ameriprise Financial, Inc. since May 2010; Vice President, Chief Legal Officer and Assistant Secretary, Columbia Management Investment Advisers, LLC since October 2021 (previously Vice President and Assistant Secretary, May 2010 – September 2021). |
| Lyn Kephart-Strong 5228 Ameriprise Financial Center Minneapolis, MN 55474 1960 | Vice President (2015) | President, Columbia Management Investment Services Corp. since October 2014; Vice President & Resolution Officer, Ameriprise Trust Company since August 2009. |
| • | the Fund had sufficient liquidity to both meet redemptions and operate effectively on behalf of shareholders; |
| • | there were no material changes to the Program during the period; |
| • | the implementation of the Program was effective to manage the Fund’s liquidity risk; and |
| • | the Program operated adequately during the period. |
| 58 | Columbia Bond Fund | Annual Report 2022 |
columbiathreadneedleus.com/investor/. The Fund is distributed by Columbia Management Investment Distributors, Inc., member FINRA, and managed by Columbia Management Investment Advisers, LLC.

April 30, 2022

| 3 | |
| 5 | |
| 7 | |
| 8 | |
| 14 | |
| 16 | |
| 17 | |
| 20 | |
| 24 | |
| 34 | |
| 35 | |
| 35 | |
| 41 |
(Unaudited)
| Average annual total returns (%) (for the period ended April 30, 2022) | |||||
| Inception | 1 Year | 5 Years | 10 Years | ||
| Class A | Excluding sales charges | 07/25/86 | -5.94 | 7.28 | 9.79 |
| Including sales charges | -11.35 | 6.02 | 9.14 | ||
| Advisor Class* | 11/08/12 | -5.71 | 7.55 | 10.06 | |
| Class C | Excluding sales charges | 01/15/96 | -6.66 | 6.47 | 8.97 |
| Including sales charges | -7.42 | 6.47 | 8.97 | ||
| Institutional Class | 07/31/95 | -5.70 | 7.55 | 10.07 | |
| Institutional 2 Class* | 11/08/12 | -5.60 | 7.68 | 10.20 | |
| Institutional 3 Class | 07/15/09 | -5.55 | 7.73 | 10.27 | |
| Class R | 09/27/10 | -6.17 | 7.01 | 9.52 | |
| Russell 2000 Value Index | -6.59 | 6.75 | 9.81 | ||
| * | The returns shown for periods prior to the share class inception date (including returns for the Life of the Fund, if shown, which are since Fund inception) include the returns of the Fund’s oldest share class. These returns are adjusted to reflect any higher class-related operating expenses of the newer share classes, as applicable. Please visit columbiathreadneedleus.com/investor/investment-products/mutual-funds/appended-performance for more information. |
| Columbia Small Cap Value Fund I | Annual Report 2022 | 3 |
(Unaudited)
| Portfolio breakdown (%) (at April 30, 2022) | |
| Common Stocks | 99.6 |
| Money Market Funds | 0.4 |
| Total | 100.0 |
| Equity sector breakdown (%) (at April 30, 2022) | |
| Communication Services | 2.5 |
| Consumer Discretionary | 10.6 |
| Consumer Staples | 3.8 |
| Energy | 8.1 |
| Financials | 26.0 |
| Health Care | 7.3 |
| Industrials | 16.9 |
| Information Technology | 9.1 |
| Materials | 8.6 |
| Real Estate | 6.1 |
| Utilities | 1.0 |
| Total | 100.0 |
| 4 | Columbia Small Cap Value Fund I | Annual Report 2022 |
(Unaudited)
| • | The Fund’s outperformance of its benchmark was driven primarily by relatively strong stock selection, particularly within the industrials, health care, financials and materials sectors. |
| • | Sector allocations, particularly an underweight to the poor performing health care sector and an overweight versus the benchmark to the stronger performing (though still negative for the period) materials sector. |
| • | Top individual contributors during the period included Range Resources Corp., iRhythm Technologies, Inc., American National Group, Inc., Chesapeake Energy Corp. and Andersons, Inc. |
| ○ | Within the financials sector, insurance provider American National Group, a long-term holding in the Fund, announced an acquisition offer from Brookfield Asset Management. |
| ○ | Within health care, medical device company iRhythm technologies, Inc., which makes wearable heart monitors, was added to the portfolio in the third quarter of 2021. Shares of iRhythm Technologies increased with the appointment of a new company President and CEO, as well as better-than-expected quarterly results. The Fund’s position was sold on strength. |
| ○ | Within energy, U.S. natural gas producers Range Resources and Chesapeake Energy were strong performers for the Fund. Both companies benefited from the strong rally in commodity prices and a pivot to U.S. produced gas exports in order to decrease dependence on Russian-produced gas. |
| ○ | Agricultural company Andersons reported strong results during the period, surpassing consensus expectations. |
| • | Stock selection within and allocations to the information technology, energy, real estate and consumer discretionary sectors detracted from Fund performance versus the benchmark. |
| • | Fund holdings that detracted most from performance versus the benchmark during the period included Cognyte Software Ltd., Inogen, Inc. and eHealth, Inc. |
| Columbia Small Cap Value Fund I | Annual Report 2022 | 5 |
(Unaudited)
| ○ | Cognyte Software, a leader in investigative analytics software, saw its share price drop considerably during the period. Shares were challenged as the company lowered and then suspended forward guidance as a result of continued pandemic related headwinds and continued supply chain challenges along with uncertainty owing to the war in Ukraine. |
| ○ | Within health care, medical technology company Inogen, Inc. disappointed as rising expenses pressured the company’s margins during the period. |
| ○ | Health insurance marketplace eHealth disappointed as the company missed earnings expectations during the period and its stock declined. The Fund’s position was sold. |
| • | Not owning oil and gas producers Ovintiv and Antero Resources Corporation weighed on the Fund’s results versus the benchmark. Both were larger names in the benchmark that benefitted from the rise in energy prices during the period. |
| 6 | Columbia Small Cap Value Fund I | Annual Report 2022 |
(Unaudited)
| November 1, 2021 — April 30, 2022 | |||||||
| Account value at the beginning of the period ($) | Account value at the end of the period ($) | Expenses paid during the period ($) | Fund’s annualized expense ratio (%) | ||||
| Actual | Hypothetical | Actual | Hypothetical | Actual | Hypothetical | Actual | |
| Class A | 1,000.00 | 1,000.00 | 917.80 | 1,018.65 | 6.02 | 6.34 | 1.26 |
| Advisor Class | 1,000.00 | 1,000.00 | 919.00 | 1,019.90 | 4.83 | 5.09 | 1.01 |
| Class C | 1,000.00 | 1,000.00 | 914.30 | 1,014.91 | 9.59 | 10.10 | 2.01 |
| Institutional Class | 1,000.00 | 1,000.00 | 918.90 | 1,019.90 | 4.83 | 5.09 | 1.01 |
| Institutional 2 Class | 1,000.00 | 1,000.00 | 919.50 | 1,020.39 | 4.35 | 4.58 | 0.91 |
| Institutional 3 Class | 1,000.00 | 1,000.00 | 919.70 | 1,020.64 | 4.12 | 4.33 | 0.86 |
| Class R | 1,000.00 | 1,000.00 | 916.70 | 1,017.40 | 7.22 | 7.59 | 1.51 |
| Columbia Small Cap Value Fund I | Annual Report 2022 | 7 |
April 30, 2022
| Common Stocks 99.4% | ||
| Issuer | Shares | Value ($) |
| Communication Services 2.5% | ||
| Diversified Telecommunication Services 0.4% | ||
| Liberty Latin America Ltd., Class C(a) | 551,203 | 5,093,116 |
| Entertainment 0.5% | ||
| Gaia, Inc.(a) | 392,060 | 1,936,777 |
| Playstudios, Inc.(a) | 666,538 | 3,859,255 |
| Total | 5,796,032 | |
| Interactive Media & Services 0.4% | ||
| Cargurus, Inc.(a) | 66,320 | 2,167,338 |
| Trivago NV, ADR(a) | 1,149,194 | 2,424,799 |
| Total | 4,592,137 | |
| Media 0.5% | ||
| Criteo SA, ADR(a) | 210,130 | 5,207,021 |
| Wireless Telecommunication Services 0.7% | ||
| Telephone and Data Systems, Inc. | 426,770 | 7,818,426 |
| Total Communication Services | 28,506,732 | |
| Consumer Discretionary 10.6% | ||
| Auto Components 1.4% | ||
| Gentherm, Inc.(a) | 82,388 | 5,554,599 |
| Modine Manufacturing Co.(a) | 504,329 | 3,984,199 |
| Visteon Corp.(a) | 63,760 | 6,676,309 |
| Total | 16,215,107 | |
| Distributors 0.2% | ||
| Educational Development Corp. | 338,836 | 2,219,376 |
| Diversified Consumer Services 0.9% | ||
| American Public Education, Inc.(a) | 138,902 | 2,700,255 |
| Stride, Inc.(a) | 178,720 | 7,023,696 |
| Total | 9,723,951 | |
| Household Durables 3.5% | ||
| Cavco Industries, Inc.(a) | 21,407 | 5,057,404 |
| Century Communities, Inc. | 85,220 | 4,492,798 |
| Ethan Allen Interiors, Inc. | 164,483 | 3,904,827 |
| Legacy Housing Corp.(a) | 182,777 | 3,202,253 |
| Lifetime Brands, Inc. | 164,001 | 2,069,693 |
| Lovesac Co. (The)(a) | 67,973 | 2,979,936 |
| Meritage Homes Corp.(a) | 85,637 | 7,069,334 |
| Common Stocks (continued) | ||
| Issuer | Shares | Value ($) |
| Tri Pointe Homes, Inc.(a) | 380,923 | 7,873,678 |
| Universal Electronics, Inc.(a) | 113,107 | 3,336,657 |
| Total | 39,986,580 | |
| Internet & Direct Marketing Retail 0.7% | ||
| 1-800-Flowers.com, Inc., Class A(a) | 205,424 | 2,095,325 |
| Overstock.com, Inc.(a) | 87,370 | 2,932,137 |
| Redbubble Ltd.(a) | 3,187,100 | 2,503,230 |
| Total | 7,530,692 | |
| Leisure Products 0.5% | ||
| Malibu Boats, Inc., Class A(a) | 102,082 | 5,133,704 |
| Multiline Retail 0.3% | ||
| Big Lots, Inc. | 121,722 | 3,761,210 |
| Specialty Retail 0.7% | ||
| Urban Outfitters, Inc.(a) | 352,500 | 8,389,500 |
| Textiles, Apparel & Luxury Goods 2.4% | ||
| Canada Goose Holdings, Inc.(a) | 243,030 | 5,290,763 |
| Culp, Inc. | 329,360 | 2,127,666 |
| Fossil Group, Inc.(a) | 454,010 | 4,485,619 |
| Movado Group, Inc. | 134,202 | 4,827,246 |
| Skechers U.S.A., Inc., Class A(a) | 86,328 | 3,306,362 |
| Steven Madden Ltd. | 193,050 | 7,926,633 |
| Total | 27,964,289 | |
| Total Consumer Discretionary | 120,924,409 | |
| Consumer Staples 3.7% | ||
| Beverages 1.0% | ||
| Boston Beer Co., Inc. (The), Class A(a) | 12,380 | 4,642,500 |
| MGP Ingredients, Inc. | 76,743 | 7,008,938 |
| Total | 11,651,438 | |
| Food & Staples Retailing 0.7% | ||
| Andersons, Inc. (The) | 162,695 | 8,172,170 |
| Food Products 1.7% | ||
| Dole PLC | 478,900 | 5,703,699 |
| Fresh Del Monte Produce, Inc. | 259,694 | 6,765,029 |
| TreeHouse Foods, Inc.(a) | 235,030 | 7,403,445 |
| Total | 19,872,173 | |
| 8 | Columbia Small Cap Value Fund I | Annual Report 2022 |
April 30, 2022
| Common Stocks (continued) | ||
| Issuer | Shares | Value ($) |
| Personal Products 0.3% | ||
| Honest Co., Inc. (The)(a) | 830,449 | 3,288,578 |
| Total Consumer Staples | 42,984,359 | |
| Energy 8.0% | ||
| Energy Equipment & Services 3.4% | ||
| ChampionX Corp. | 578,550 | 12,207,405 |
| Expro Group Holdings NV(a) | 319,582 | 4,883,213 |
| Natural Gas Services Group, Inc.(a) | 349,993 | 4,297,914 |
| Newpark Resources, Inc.(a) | 1,346,104 | 4,697,903 |
| Pason Systems, Inc. | 362,253 | 4,570,989 |
| Profire Energy, Inc.(a) | 1,131,153 | 1,527,056 |
| TechnipFMC PLC(a) | 927,155 | 6,415,913 |
| Total | 38,600,393 | |
| Oil, Gas & Consumable Fuels 4.6% | ||
| Chesapeake Energy Corp. | 185,192 | 15,189,448 |
| CVR Energy, Inc. | 264,580 | 6,633,021 |
| Equitrans Midstream Corp. | 1,042,670 | 8,195,386 |
| Range Resources Corp.(a) | 355,080 | 10,631,095 |
| Talos Energy, Inc.(a) | 368,920 | 6,703,277 |
| W&T Offshore, Inc.(a) | 1,236,440 | 5,885,454 |
| Total | 53,237,681 | |
| Total Energy | 91,838,074 | |
| Financials 25.8% | ||
| Banks 15.8% | ||
| Ameris Bancorp | 230,634 | 9,617,438 |
| BancFirst Corp. | 61,551 | 5,031,794 |
| Bank of Marin Bancorp | 117,445 | 3,671,331 |
| BankUnited, Inc. | 274,776 | 10,315,091 |
| Banner Corp. | 140,101 | 7,523,424 |
| Brookline Bancorp, Inc. | 448,030 | 6,478,514 |
| Capital Bancorp, Inc. | 174,735 | 3,933,285 |
| Capital City Bank Group, Inc. | 151,702 | 3,885,088 |
| Central Pacific Financial Corp. | 169,581 | 4,100,469 |
| Central Valley Community Bancorp | 140,695 | 2,716,820 |
| Community Trust Bancorp, Inc. | 123,936 | 4,933,892 |
| First BanCorp | 743,106 | 10,113,673 |
| First BanCorp | 143,518 | 5,376,184 |
| First Community Corp. | 182,586 | 3,618,855 |
| Common Stocks (continued) | ||
| Issuer | Shares | Value ($) |
| First Financial Corp. | 160,320 | 6,832,838 |
| First of Long Island Corp. (The) | 179,904 | 3,018,789 |
| Heritage Financial Corp. | 233,584 | 5,657,404 |
| Hilltop Holdings, Inc. | 292,850 | 7,464,747 |
| HomeStreet, Inc. | 109,807 | 4,457,066 |
| National Bank Holdings Corp., Class A | 157,740 | 5,759,087 |
| Northrim BanCorp, Inc. | 134,076 | 5,372,425 |
| OFG Bancorp | 268,351 | 7,132,770 |
| Plumas Bancorp | 90,091 | 3,171,203 |
| Popular, Inc. | 150,317 | 11,723,223 |
| Professional Holding Corp., Class A(a) | 167,450 | 3,747,531 |
| Riverview Bancorp, Inc. | 356,879 | 2,512,428 |
| Shore Bancshares, Inc. | 205,633 | 4,139,392 |
| Sierra Bancorp | 137,527 | 2,991,212 |
| Southern First Bancshares, Inc.(a) | 106,515 | 4,867,736 |
| Towne Bank | 280,624 | 7,736,804 |
| UMB Financial Corp. | 142,766 | 12,874,638 |
| Total | 180,775,151 | |
| Capital Markets 0.5% | ||
| StoneX Group, Inc.(a) | 94,459 | 6,402,431 |
| Consumer Finance 1.1% | ||
| Ezcorp, Inc., Class A(a) | 1,039,560 | 7,276,920 |
| PROG Holdings, Inc.(a) | 187,867 | 4,972,839 |
| Total | 12,249,759 | |
| Insurance 4.1% | ||
| American Equity Investment Life Holding Co. | 281,442 | 10,615,992 |
| Employers Holdings, Inc. | 149,554 | 5,883,454 |
| Global Indemnity Group LLC | 186,603 | 4,840,482 |
| Horace Mann Educators Corp. | 113,681 | 4,530,188 |
| Mercury General Corp. | 165,120 | 8,327,002 |
| National Western Life Group, Inc., Class A | 30,744 | 6,110,678 |
| ProAssurance Corp. | 266,234 | 6,541,369 |
| Total | 46,849,165 | |
| Thrifts & Mortgage Finance 4.3% | ||
| MGIC Investment Corp. | 829,405 | 10,832,029 |
| NMI Holdings, Inc., Class A(a) | 361,117 | 6,637,331 |
| Provident Financial Holdings, Inc. | 181,140 | 2,751,517 |
| Radian Group, Inc. | 640,810 | 13,706,926 |
| Columbia Small Cap Value Fund I | Annual Report 2022 | 9 |
April 30, 2022
| Common Stocks (continued) | ||
| Issuer | Shares | Value ($) |
| Territorial Bancorp, Inc. | 146,730 | 3,332,238 |
| Washington Federal, Inc. | 278,600 | 8,477,798 |
| Western New England Bancorp, Inc. | 478,594 | 4,111,122 |
| Total | 49,848,961 | |
| Total Financials | 296,125,467 | |
| Health Care 7.3% | ||
| Biotechnology 3.0% | ||
| ACADIA Pharmaceuticals, Inc.(a) | 251,322 | 4,634,378 |
| Atara Biotherapeutics, Inc.(a) | 349,933 | 2,225,574 |
| Coherus Biosciences, Inc.(a) | 238,907 | 2,159,719 |
| Insmed, Inc.(a) | 306,490 | 6,733,585 |
| Iovance Biotherapeutics, Inc.(a) | 304,806 | 4,617,811 |
| Novavax, Inc.(a) | 116,580 | 5,254,260 |
| Sage Therapeutics, Inc.(a) | 141,730 | 4,467,330 |
| Spero Therapeutics, Inc.(a) | 382,877 | 1,860,782 |
| uniQure NV(a) | 175,840 | 2,627,050 |
| Total | 34,580,489 | |
| Health Care Equipment & Supplies 0.4% | ||
| Inogen, Inc.(a) | 186,641 | 4,718,285 |
| Health Care Providers & Services 1.1% | ||
| Encompass Health Corp. | 186,300 | 12,823,029 |
| Health Care Technology 0.4% | ||
| Sharecare, Inc.(a) | 1,638,027 | 4,488,194 |
| Pharmaceuticals 2.4% | ||
| ANI Pharmaceuticals, Inc.(a) | 108,534 | 3,202,838 |
| Athira Pharma, Inc.(a) | 255,880 | 2,633,005 |
| Perrigo Co. PLC | 247,190 | 8,478,617 |
| Satsuma Pharmaceuticals, Inc.(a) | 407,708 | 1,585,984 |
| Supernus Pharmaceuticals, Inc.(a) | 243,405 | 6,791,000 |
| Taro Pharmaceutical Industries Ltd.(a) | 101,473 | 3,982,815 |
| Total | 26,674,259 | |
| Total Health Care | 83,284,256 | |
| Common Stocks (continued) | ||
| Issuer | Shares | Value ($) |
| Industrials 16.8% | ||
| Aerospace & Defense 2.7% | ||
| Aerojet Rocketdyne Holdings, Inc.(a) | 160,716 | 6,425,426 |
| Curtiss-Wright Corp. | 67,100 | 9,589,261 |
| Maxar Technologies, Inc. | 284,080 | 9,150,217 |
| Moog, Inc., Class A | 80,220 | 6,407,171 |
| Total | 31,572,075 | |
| Building Products 1.8% | ||
| Caesarstone Ltd. | 317,614 | 3,122,146 |
| Resideo Technologies, Inc.(a) | 359,060 | 8,075,259 |
| UFP Industries, Inc. | 125,375 | 9,700,264 |
| Total | 20,897,669 | |
| Commercial Services & Supplies 1.0% | ||
| Healthcare Services Group, Inc. | 313,339 | 5,354,964 |
| HNI Corp. | 181,880 | 6,482,203 |
| Total | 11,837,167 | |
| Construction & Engineering 0.6% | ||
| MDU Resources Group, Inc. | 248,940 | 6,412,694 |
| Electrical Equipment 2.2% | ||
| Array Technologies, Inc.(a) | 449,222 | 2,933,420 |
| AZZ, Inc. | 120,040 | 5,478,626 |
| Encore Wire Corp. | 82,251 | 9,278,735 |
| Shoals Technologies Group, Inc., Class A(a) | 373,573 | 3,728,258 |
| Thermon(a) | 252,150 | 3,782,250 |
| Total | 25,201,289 | |
| Machinery 3.4% | ||
| Gorman-Rupp Co. | 118,378 | 3,771,523 |
| Greenbrier Companies, Inc. (The) | 145,120 | 6,198,075 |
| Hurco Companies, Inc. | 119,775 | 3,398,017 |
| John Bean Technologies Corp. | 48,940 | 5,769,537 |
| LB Foster Co., Class A(a) | 177,926 | 2,526,549 |
| Manitex International, Inc.(a) | 515,582 | 3,980,293 |
| Mueller Industries, Inc. | 162,570 | 8,803,166 |
| Standex International Corp. | 46,234 | 4,347,845 |
| Total | 38,795,005 | |
| 10 | Columbia Small Cap Value Fund I | Annual Report 2022 |
April 30, 2022
| Common Stocks (continued) | ||
| Issuer | Shares | Value ($) |
| Marine 1.1% | ||
| Costamare, Inc. | 435,810 | 5,844,212 |
| Kirby Corp.(a) | 111,240 | 7,252,848 |
| Total | 13,097,060 | |
| Professional Services 1.1% | ||
| Korn/Ferry International | 147,177 | 9,042,555 |
| Red Violet, Inc.(a) | 124,960 | 3,258,956 |
| Total | 12,301,511 | |
| Road & Rail 1.9% | ||
| Avis Budget Group, Inc.(a) | 26,983 | 7,222,540 |
| Marten Transport Ltd. | 370,725 | 6,443,200 |
| Schneider National, Inc., Class B | 329,718 | 7,791,236 |
| Total | 21,456,976 | |
| Trading Companies & Distributors 1.0% | ||
| H&E Equipment Services, Inc. | 123,778 | 4,391,643 |
| Textainer Group Holdings Ltd. | 202,412 | 6,788,899 |
| Total | 11,180,542 | |
| Total Industrials | 192,751,988 | |
| Information Technology 9.1% | ||
| Communications Equipment 1.8% | ||
| Applied Optoelectronics, Inc.(a) | 587,770 | 1,510,569 |
| Casa Systems, Inc.(a) | 620,346 | 3,039,695 |
| Digi International, Inc.(a) | 204,250 | 3,864,410 |
| NETGEAR, Inc.(a) | 149,090 | 3,235,253 |
| Netscout Systems, Inc.(a) | 278,184 | 8,568,067 |
| Total | 20,217,994 | |
| Electronic Equipment, Instruments & Components 3.2% | ||
| Airgain, Inc.(a) | 239,651 | 2,029,844 |
| Bel Fuse, Inc., Class B | 227,870 | 3,716,560 |
| ePlus, Inc.(a) | 143,500 | 8,104,880 |
| FARO Technologies, Inc.(a) | 66,380 | 2,276,170 |
| OSI Systems, Inc.(a) | 80,130 | 6,338,283 |
| Powerfleet, Inc.(a) | 783,494 | 2,068,424 |
| Vishay Intertechnology, Inc. | 517,470 | 9,640,466 |
| Vishay Precision Group, Inc.(a) | 97,709 | 3,049,498 |
| Total | 37,224,125 | |
| Common Stocks (continued) | ||
| Issuer | Shares | Value ($) |
| IT Services 2.5% | ||
| Cass Information Systems, Inc. | 110,822 | 4,289,920 |
| IBEX Holdings Ltd.(a) | 307,636 | 4,765,282 |
| International Money Express, Inc.(a) | 222,188 | 4,414,875 |
| Kyndryl Holdings, Inc.(a) | 492,999 | 5,861,758 |
| Payoneer Global, Inc.(a) | 829,848 | 3,468,765 |
| Shift4 Payments, Inc., Class A(a) | 105,087 | 5,512,864 |
| Total | 28,313,464 | |
| Semiconductors & Semiconductor Equipment 0.7% | ||
| Cohu, Inc.(a) | 179,422 | 4,765,448 |
| CyberOptics Corp.(a) | 83,440 | 3,538,691 |
| Total | 8,304,139 | |
| Software 0.9% | ||
| BTRS Holdings, Inc.(a) | 645,240 | 4,336,013 |
| Cognyte Software Ltd.(a) | 478,034 | 3,241,070 |
| Upland Software, Inc.(a) | 172,085 | 2,567,508 |
| Total | 10,144,591 | |
| Total Information Technology | 104,204,313 | |
| Materials 8.5% | ||
| Chemicals 1.1% | ||
| Livent Corp.(a) | 211,063 | 4,508,306 |
| Tronox Holdings PLC, Class A | 448,618 | 7,716,229 |
| Total | 12,224,535 | |
| Construction Materials 0.9% | ||
| Eagle Materials, Inc. | 87,967 | 10,848,090 |
| Containers & Packaging 0.5% | ||
| Greif, Inc., Class A | 98,839 | 5,997,551 |
| Metals & Mining 4.5% | ||
| Ampco-Pittsburgh Corp.(a) | 536,544 | 3,010,012 |
| Capstone Copper Corp.(a) | 1,209,741 | 5,508,882 |
| Centerra Gold, Inc. | 823,260 | 7,619,633 |
| Commercial Metals Co. | 359,500 | 14,739,500 |
| ERO Copper Corp.(a) | 420,796 | 6,049,976 |
| Ferroglobe PLC(a) | 474,247 | 3,058,893 |
| Olympic Steel, Inc. | 125,037 | 4,292,520 |
| Torex Gold Resources, Inc.(a) | 426,461 | 4,773,681 |
| Universal Stainless & Alloy Products, Inc.(a) | 258,187 | 2,246,227 |
| Total | 51,299,324 | |
| Columbia Small Cap Value Fund I | Annual Report 2022 | 11 |
April 30, 2022
| Common Stocks (continued) | ||
| Issuer | Shares | Value ($) |
| Paper & Forest Products 1.5% | ||
| Clearwater Paper Corp.(a) | 106,470 | 3,525,222 |
| Glatfelter Corp. | 239,367 | 2,633,037 |
| Louisiana-Pacific Corp. | 175,300 | 11,310,356 |
| Total | 17,468,615 | |
| Total Materials | 97,838,115 | |
| Real Estate 6.1% | ||
| Equity Real Estate Investment Trusts (REITS) 5.7% | ||
| Highwoods Properties, Inc. | 214,290 | 8,751,604 |
| Hudson Pacific Properties, Inc. | 362,330 | 8,435,042 |
| Macerich Co. (The) | 444,670 | 5,580,609 |
| Pebblebrook Hotel Trust | 421,601 | 10,295,496 |
| PotlatchDeltic Corp. | 210,453 | 11,656,992 |
| RLJ Lodging Trust | 731,171 | 10,251,017 |
| Sunstone Hotel Investors, Inc.(a) | 824,122 | 10,095,495 |
| Total | 65,066,255 | |
| Real Estate Management & Development 0.4% | ||
| Forestar Group, Inc.(a) | 267,085 | 4,356,156 |
| Total Real Estate | 69,422,411 | |
| Common Stocks (continued) | ||
| Issuer | Shares | Value ($) |
| Utilities 1.0% | ||
| Gas Utilities 1.0% | ||
| National Fuel Gas Co. | 117,800 | 8,261,314 |
| RGC Resources, Inc. | 152,689 | 3,175,931 |
| Total | 11,437,245 | |
| Total Utilities | 11,437,245 | |
| Total Common Stocks (Cost $921,909,888) | 1,139,317,369 | |
| Money Market Funds 0.4% | ||
| Shares | Value ($) | |
| Columbia Short-Term Cash Fund, 0.462%(b),(c) | 4,497,655 | 4,496,306 |
| Total Money Market Funds (Cost $4,496,303) | 4,496,306 | |
| Total Investments in Securities (Cost: $926,406,191) | 1,143,813,675 | |
| Other Assets & Liabilities, Net | 2,346,771 | |
| Net Assets | 1,146,160,446 | |
| (a) | Non-income producing investment. |
| (b) | The rate shown is the seven-day current annualized yield at April 30, 2022. |
| (c) | As defined in the Investment Company Act of 1940, as amended, an affiliated company is one in which the Fund owns 5% or more of the company’s outstanding voting securities, or a company which is under common ownership or control with the Fund. The value of the holdings and transactions in these affiliated companies during the year ended April 30, 2022 are as follows: |
| Affiliated issuers | Beginning of period($) | Purchases($) | Sales($) | Net change in unrealized appreciation (depreciation)($) | End of period($) | Realized gain (loss)($) | Dividends($) | End of period shares |
| Columbia Short-Term Cash Fund, 0.462% | ||||||||
| 12,379,847 | 383,359,921 | (391,243,465) | 3 | 4,496,306 | (63) | 7,817 | 4,497,655 | |
| ADR | American Depositary Receipt |
| 12 | Columbia Small Cap Value Fund I | Annual Report 2022 |
April 30, 2022
Fair value inputs are summarized in the three broad levels listed below:
| ■ | Level 1 — Valuations based on quoted prices for investments in active markets that the Fund has the ability to access at the measurement date. Valuation adjustments are not applied to Level 1 investments. |
| ■ | Level 2 — Valuations based on other significant observable inputs (including quoted prices for similar securities, interest rates, prepayment speeds, credit risks, etc.). |
| ■ | Level 3 — Valuations based on significant unobservable inputs (including the Fund’s own assumptions and judgment in determining the fair value of investments). |
| Level 1 ($) | Level 2 ($) | Level 3 ($) | Total ($) | |
| Investments in Securities | ||||
| Common Stocks | ||||
| Communication Services | 28,506,732 | — | — | 28,506,732 |
| Consumer Discretionary | 118,421,179 | 2,503,230 | — | 120,924,409 |
| Consumer Staples | 42,984,359 | — | — | 42,984,359 |
| Energy | 91,838,074 | — | — | 91,838,074 |
| Financials | 296,125,467 | — | — | 296,125,467 |
| Health Care | 83,284,256 | — | — | 83,284,256 |
| Industrials | 192,751,988 | — | — | 192,751,988 |
| Information Technology | 104,204,313 | — | — | 104,204,313 |
| Materials | 97,838,115 | — | — | 97,838,115 |
| Real Estate | 69,422,411 | — | — | 69,422,411 |
| Utilities | 11,437,245 | — | — | 11,437,245 |
| Total Common Stocks | 1,136,814,139 | 2,503,230 | — | 1,139,317,369 |
| Money Market Funds | 4,496,306 | — | — | 4,496,306 |
| Total Investments in Securities | 1,141,310,445 | 2,503,230 | — | 1,143,813,675 |
| Columbia Small Cap Value Fund I | Annual Report 2022 | 13 |
April 30, 2022
| Assets | |
| Investments in securities, at value | |
| Unaffiliated issuers (cost $921,909,888) | $1,139,317,369 |
| Affiliated issuers (cost $4,496,303) | 4,496,306 |
| Receivable for: | |
| Investments sold | 4,124,545 |
| Capital shares sold | 1,646,561 |
| Dividends | 448,574 |
| Prepaid expenses | 7,614 |
| Trustees’ deferred compensation plan | 389,485 |
| Total assets | 1,150,430,454 |
| Liabilities | |
| Due to custodian | 486 |
| Payable for: | |
| Investments purchased | 2,490,010 |
| Capital shares purchased | 1,137,018 |
| Management services fees | 26,198 |
| Distribution and/or service fees | 1,994 |
| Transfer agent fees | 154,690 |
| Compensation of board members | 14,593 |
| Other expenses | 55,534 |
| Trustees’ deferred compensation plan | 389,485 |
| Total liabilities | 4,270,008 |
| Net assets applicable to outstanding capital stock | $1,146,160,446 |
| Represented by | |
| Paid in capital | 895,252,771 |
| Total distributable earnings (loss) | 250,907,675 |
| Total - representing net assets applicable to outstanding capital stock | $1,146,160,446 |
| 14 | Columbia Small Cap Value Fund I | Annual Report 2022 |
April 30, 2022
| Class A | |
| Net assets | $250,665,470 |
| Shares outstanding | 6,126,655 |
| Net asset value per share | $40.91 |
| Maximum sales charge | 5.75% |
| Maximum offering price per share (calculated by dividing the net asset value per share by 1.0 minus the maximum sales charge for Class A shares) | $43.41 |
| Advisor Class | |
| Net assets | $58,695,976 |
| Shares outstanding | 1,207,635 |
| Net asset value per share | $48.60 |
| Class C | |
| Net assets | $7,269,365 |
| Shares outstanding | 306,699 |
| Net asset value per share | $23.70 |
| Institutional Class | |
| Net assets | $537,446,834 |
| Shares outstanding | 11,466,092 |
| Net asset value per share | $46.87 |
| Institutional 2 Class | |
| Net assets | $105,228,899 |
| Shares outstanding | 2,161,778 |
| Net asset value per share | $48.68 |
| Institutional 3 Class | |
| Net assets | $184,850,490 |
| Shares outstanding | 3,913,856 |
| Net asset value per share | $47.23 |
| Class R | |
| Net assets | $2,003,412 |
| Shares outstanding | 49,273 |
| Net asset value per share | $40.66 |
| Columbia Small Cap Value Fund I | Annual Report 2022 | 15 |
Year Ended April 30, 2022
| Net investment income | |
| Income: | |
| Dividends — unaffiliated issuers | $14,962,547 |
| Dividends — affiliated issuers | 7,817 |
| Foreign taxes withheld | (128,004) |
| Total income | 14,842,360 |
| Expenses: | |
| Management services fees | 9,303,647 |
| Distribution and/or service fees | |
| Class A | 698,947 |
| Class C | 87,269 |
| Class R | 12,488 |
| Transfer agent fees | |
| Class A | 430,867 |
| Advisor Class | 99,022 |
| Class C | 13,453 |
| Institutional Class | 743,626 |
| Institutional 2 Class | 64,227 |
| Institutional 3 Class | 11,560 |
| Class R | 3,859 |
| Compensation of board members | 27,621 |
| Custodian fees | 30,934 |
| Printing and postage fees | 109,604 |
| Registration fees | 164,245 |
| Audit fees | 35,000 |
| Legal fees | 23,042 |
| Interest on interfund lending | 1,179 |
| Compensation of chief compliance officer | 378 |
| Other | 49,374 |
| Total expenses | 11,910,342 |
| Expense reduction | (2,544) |
| Total net expenses | 11,907,798 |
| Net investment income | 2,934,562 |
| Realized and unrealized gain (loss) — net | |
| Net realized gain (loss) on: | |
| Investments — unaffiliated issuers | 140,454,620 |
| Investments — affiliated issuers | (63) |
| Foreign currency translations | 8,644 |
| Net realized gain | 140,463,201 |
| Net change in unrealized appreciation (depreciation) on: | |
| Investments — unaffiliated issuers | (212,547,030) |
| Investments — affiliated issuers | 3 |
| Net change in unrealized appreciation (depreciation) | (212,547,027) |
| Net realized and unrealized loss | (72,083,826) |
| Net decrease in net assets resulting from operations | $(69,149,264) |
| 16 | Columbia Small Cap Value Fund I | Annual Report 2022 |
| Year Ended April 30, 2022 | Year Ended April 30, 2021 | |
| Operations | ||
| Net investment income | $2,934,562 | $5,365,721 |
| Net realized gain | 140,463,201 | 63,577,580 |
| Net change in unrealized appreciation (depreciation) | (212,547,027) | 399,238,662 |
| Net increase (decrease) in net assets resulting from operations | (69,149,264) | 468,181,963 |
| Distributions to shareholders | ||
| Net investment income and net realized gains | ||
| Class A | (34,661,347) | (1,160,307) |
| Advisor Class | (6,688,259) | (177,582) |
| Class C | (1,744,634) | (5,544) |
| Institutional Class | (51,903,589) | (1,812,485) |
| Institutional 2 Class | (12,568,941) | (577,275) |
| Institutional 3 Class | (20,943,537) | (1,074,845) |
| Class R | (329,937) | (7,085) |
| Total distributions to shareholders | (128,840,244) | (4,815,123) |
| Increase in net assets from capital stock activity | 257,119,317 | 192,029,700 |
| Total increase in net assets | 59,129,809 | 655,396,540 |
| Net assets at beginning of year | 1,087,030,637 | 431,634,097 |
| Net assets at end of year | $1,146,160,446 | $1,087,030,637 |
| Columbia Small Cap Value Fund I | Annual Report 2022 | 17 |
| Year Ended | Year Ended | |||
| April 30, 2022 | April 30, 2021 | |||
| Shares | Dollars ($) | Shares | Dollars ($) | |
| Capital stock activity | ||||
| Class A | ||||
| Subscriptions | 628,215 | 29,444,739 | 792,138 | 30,745,196 |
| Fund reorganization | — | — | 749,058 | 20,756,334 |
| Distributions reinvested | 693,929 | 31,789,734 | 29,979 | 1,066,400 |
| Redemptions | (1,004,933) | (46,390,939) | (1,411,683) | (51,005,190) |
| Net increase | 317,211 | 14,843,534 | 159,492 | 1,562,740 |
| Advisor Class | ||||
| Subscriptions | 1,155,300 | 63,891,992 | 652,486 | 33,613,095 |
| Fund reorganization | — | — | 23,850 | 769,407 |
| Distributions reinvested | 108,730 | 5,887,738 | 3,386 | 139,315 |
| Redemptions | (1,006,847) | (56,195,509) | (338,346) | (14,828,695) |
| Net increase | 257,183 | 13,584,221 | 341,376 | 19,693,122 |
| Class C | ||||
| Subscriptions | 90,981 | 2,646,075 | 124,991 | 3,463,386 |
| Fund reorganization | — | — | 97,768 | 1,714,870 |
| Distributions reinvested | 62,233 | 1,683,680 | 288 | 5,178 |
| Redemptions | (119,948) | (3,311,185) | (135,914) | (3,249,186) |
| Net increase | 33,266 | 1,018,570 | 87,133 | 1,934,248 |
| Institutional Class | ||||
| Subscriptions | 5,939,467 | 306,524,158 | 5,760,693 | 230,900,160 |
| Fund reorganization | — | — | 1,392,865 | 43,499,400 |
| Distributions reinvested | 779,290 | 40,687,924 | 30,595 | 1,282,323 |
| Redemptions | (3,163,933) | (165,504,371) | (2,774,077) | (123,743,095) |
| Net increase | 3,554,824 | 181,707,711 | 4,410,076 | 151,938,788 |
| Institutional 2 Class | ||||
| Subscriptions | 645,557 | 35,674,714 | 813,796 | 37,795,832 |
| Fund reorganization | — | — | 14,915 | 481,614 |
| Distributions reinvested | 231,712 | 12,568,941 | 14,044 | 577,275 |
| Redemptions | (735,537) | (39,935,484) | (507,180) | (22,924,661) |
| Net increase | 141,732 | 8,308,171 | 335,575 | 15,930,060 |
| Institutional 3 Class | ||||
| Subscriptions | 1,330,426 | 70,352,538 | 804,192 | 37,736,473 |
| Fund reorganization | — | — | 6,037 | 189,748 |
| Distributions reinvested | 299,125 | 15,740,695 | 23,589 | 937,683 |
| Redemptions | (903,984) | (48,368,264) | (818,757) | (37,742,017) |
| Net increase | 725,567 | 37,724,969 | 15,061 | 1,121,887 |
| Class R | ||||
| Subscriptions | 18,879 | 895,719 | 19,947 | 726,715 |
| Distributions reinvested | 7,230 | 329,493 | 201 | 7,065 |
| Redemptions | (28,200) | (1,293,071) | (24,292) | (884,925) |
| Net decrease | (2,091) | (67,859) | (4,144) | (151,145) |
| Total net increase | 5,027,692 | 257,119,317 | 5,344,569 | 192,029,700 |
| 18 | Columbia Small Cap Value Fund I | Annual Report 2022 |
| Net asset value, beginning of period | Net investment income (loss) | Net realized and unrealized gain (loss) | Total from investment operations | Distributions from net investment income | Distributions from net realized gains | Total distributions to shareholders | |
| Class A | |||||||
| Year Ended 4/30/2022 | $49.30 | 0.02 | (2.46) | (2.44) | (0.07) | (5.88) | (5.95) |
| Year Ended 4/30/2021 | $26.90 | 0.19 | 22.41 | 22.60 | (0.17) | (0.03) | (0.20) |
| Year Ended 4/30/2020 | $36.62 | 0.18 | (8.59) | (8.41) | (0.17) | (1.14) | (1.31) |
| Year Ended 4/30/2019 | $40.70 | 0.08 | (1.08) | (1.00) | (0.13) | (2.95) | (3.08) |
| Year Ended 4/30/2018 | $41.62 | (0.03) | 3.95 | 3.92 | (0.01) | (4.83) | (4.84) |
| Advisor Class | |||||||
| Year Ended 4/30/2022 | $57.47 | 0.15 | (2.94) | (2.79) | (0.20) | (5.88) | (6.08) |
| Year Ended 4/30/2021 | $31.32 | 0.37 | 26.06 | 26.43 | (0.25) | (0.03) | (0.28) |
| Year Ended 4/30/2020 | $42.37 | 0.30 | (9.98) | (9.68) | (0.23) | (1.14) | (1.37) |
| Year Ended 4/30/2019 | $46.56 | 0.21 | (1.25) | (1.04) | (0.20) | (2.95) | (3.15) |
| Year Ended 4/30/2018 | $46.89 | 0.10 | 4.48 | 4.58 | (0.08) | (4.83) | (4.91) |
| Class C | |||||||
| Year Ended 4/30/2022 | $31.15 | (0.20) | (1.37) | (1.57) | — | (5.88) | (5.88) |
| Year Ended 4/30/2021 | $17.06 | (0.04) | 14.16 | 14.12 | — | (0.03) | (0.03) |
| Year Ended 4/30/2020 | $23.72 | (0.04) | (5.48) | (5.52) | — | (1.14) | (1.14) |
| Year Ended 4/30/2019 | $27.55 | (0.16) | (0.72) | (0.88) | — | (2.95) | (2.95) |
| Year Ended 4/30/2018 | $29.86 | (0.24) | 2.76 | 2.52 | — | (4.83) | (4.83) |
| Institutional Class | |||||||
| Year Ended 4/30/2022 | $55.63 | 0.15 | (2.82) | (2.67) | (0.21) | (5.88) | (6.09) |
| Year Ended 4/30/2021 | $30.33 | 0.33 | 25.25 | 25.58 | (0.25) | (0.03) | (0.28) |
| Year Ended 4/30/2020 | $41.07 | 0.30 | (9.67) | (9.37) | (0.23) | (1.14) | (1.37) |
| Year Ended 4/30/2019 | $45.24 | 0.20 | (1.22) | (1.02) | (0.20) | (2.95) | (3.15) |
| Year Ended 4/30/2018 | $45.70 | 0.08 | 4.37 | 4.45 | (0.08) | (4.83) | (4.91) |
| Institutional 2 Class | |||||||
| Year Ended 4/30/2022 | $57.55 | 0.21 | (2.94) | (2.73) | (0.26) | (5.88) | (6.14) |
| Year Ended 4/30/2021 | $31.36 | 0.40 | 26.11 | 26.51 | (0.29) | (0.03) | (0.32) |
| Year Ended 4/30/2020 | $42.40 | 0.36 | (10.00) | (9.64) | (0.26) | (1.14) | (1.40) |
| Year Ended 4/30/2019 | $46.57 | 0.27 | (1.25) | (0.98) | (0.24) | (2.95) | (3.19) |
| Year Ended 4/30/2018 | $46.88 | 0.17 | 4.46 | 4.63 | (0.11) | (4.83) | (4.94) |
| 20 | Columbia Small Cap Value Fund I | Annual Report 2022 |
| Net asset value, end of period | Total return | Total gross expense ratio to average net assets(a) | Total net expense ratio to average net assets(a),(b) | Net investment income (loss) ratio to average net assets | Portfolio turnover | Net assets, end of period (000’s) | |
| Class A | |||||||
| Year Ended 4/30/2022 | $40.91 | (5.94%) | 1.26%(c) | 1.26%(c),(d) | 0.04% | 58% | $250,665 |
| Year Ended 4/30/2021 | $49.30 | 84.29% | 1.33%(c) | 1.31%(c),(d) | 0.53% | 43% | $286,411 |
| Year Ended 4/30/2020 | $26.90 | (23.69%) | 1.37%(c),(e) | 1.32%(c),(d),(e) | 0.55% | 60% | $152,006 |
| Year Ended 4/30/2019 | $36.62 | (2.38%) | 1.36%(c),(e) | 1.32%(c),(d),(e) | 0.21% | 62% | $234,765 |
| Year Ended 4/30/2018 | $40.70 | 10.03% | 1.35%(e) | 1.33%(d),(e) | (0.07%) | 51% | $248,266 |
| Advisor Class | |||||||
| Year Ended 4/30/2022 | $48.60 | (5.71%) | 1.01%(c) | 1.01%(c),(d) | 0.28% | 58% | $58,696 |
| Year Ended 4/30/2021 | $57.47 | 84.74% | 1.08%(c) | 1.06%(c),(d) | 0.87% | 43% | $54,621 |
| Year Ended 4/30/2020 | $31.32 | (23.49%) | 1.12%(c),(e) | 1.07%(c),(d),(e) | 0.79% | 60% | $19,077 |
| Year Ended 4/30/2019 | $42.37 | (2.14%) | 1.12%(c),(e) | 1.07%(c),(d),(e) | 0.48% | 62% | $29,064 |
| Year Ended 4/30/2018 | $46.56 | 10.34% | 1.10%(e) | 1.08%(d),(e) | 0.20% | 51% | $11,734 |
| Class C | |||||||
| Year Ended 4/30/2022 | $23.70 | (6.66%) | 2.01%(c) | 2.01%(c),(d) | (0.71%) | 58% | $7,269 |
| Year Ended 4/30/2021 | $31.15 | 82.90% | 2.08%(c) | 2.05%(c),(d) | (0.19%) | 43% | $8,516 |
| Year Ended 4/30/2020 | $17.06 | (24.24%) | 2.12%(c),(e) | 2.07%(c),(d),(e) | (0.20%) | 60% | $3,178 |
| Year Ended 4/30/2019 | $23.72 | (3.15%) | 2.10%(c),(e) | 2.07%(c),(d),(e) | (0.59%) | 62% | $7,969 |
| Year Ended 4/30/2018 | $27.55 | 9.24% | 2.10%(e) | 2.08%(d),(e) | (0.83%) | 51% | $22,792 |
| Institutional Class | |||||||
| Year Ended 4/30/2022 | $46.87 | (5.70%) | 1.01%(c) | 1.01%(c),(d) | 0.30% | 58% | $537,447 |
| Year Ended 4/30/2021 | $55.63 | 84.72% | 1.07%(c) | 1.05%(c),(d) | 0.77% | 43% | $440,126 |
| Year Ended 4/30/2020 | $30.33 | (23.48%) | 1.12%(c),(e) | 1.07%(c),(d),(e) | 0.79% | 60% | $106,186 |
| Year Ended 4/30/2019 | $41.07 | (2.16%) | 1.11%(c),(e) | 1.07%(c),(d),(e) | 0.47% | 62% | $192,878 |
| Year Ended 4/30/2018 | $45.24 | 10.32% | 1.10%(e) | 1.08%(d),(e) | 0.17% | 51% | $209,822 |
| Institutional 2 Class | |||||||
| Year Ended 4/30/2022 | $48.68 | (5.60%) | 0.91%(c) | 0.91%(c) | 0.39% | 58% | $105,229 |
| Year Ended 4/30/2021 | $57.55 | 84.97% | 0.95%(c) | 0.93%(c) | 0.93% | 43% | $116,249 |
| Year Ended 4/30/2020 | $31.36 | (23.39%) | 0.98%(c),(e) | 0.94%(c),(e) | 0.96% | 60% | $52,825 |
| Year Ended 4/30/2019 | $42.40 | (2.01%) | 0.97%(c),(e) | 0.94%(c),(e) | 0.61% | 62% | $39,831 |
| Year Ended 4/30/2018 | $46.57 | 10.45% | 0.97%(e) | 0.96%(e) | 0.35% | 51% | $15,739 |
| Columbia Small Cap Value Fund I | Annual Report 2022 | 21 |
| Net asset value, beginning of period | Net investment income (loss) | Net realized and unrealized gain (loss) | Total from investment operations | Distributions from net investment income | Distributions from net realized gains | Total distributions to shareholders | |
| Institutional 3 Class | |||||||
| Year Ended 4/30/2022 | $56.01 | 0.23 | (2.84) | (2.61) | (0.29) | (5.88) | (6.17) |
| Year Ended 4/30/2021 | $30.53 | 0.39 | 25.43 | 25.82 | (0.31) | (0.03) | (0.34) |
| Year Ended 4/30/2020 | $41.30 | 0.37 | (9.72) | (9.35) | (0.28) | (1.14) | (1.42) |
| Year Ended 4/30/2019 | $45.45 | 0.28 | (1.22) | (0.94) | (0.26) | (2.95) | (3.21) |
| Year Ended 4/30/2018 | $45.86 | 0.17 | 4.37 | 4.54 | (0.12) | (4.83) | (4.95) |
| Class R | |||||||
| Year Ended 4/30/2022 | $49.08 | (0.09) | (2.45) | (2.54) | — | (5.88) | (5.88) |
| Year Ended 4/30/2021 | $26.79 | 0.11 | 22.30 | 22.41 | (0.09) | (0.03) | (0.12) |
| Year Ended 4/30/2020 | $36.50 | 0.10 | (8.56) | (8.46) | (0.11) | (1.14) | (1.25) |
| Year Ended 4/30/2019 | $40.61 | (0.01) | (1.09) | (1.10) | (0.06) | (2.95) | (3.01) |
| Year Ended 4/30/2018 | $41.63 | (0.13) | 3.94 | 3.81 | — | (4.83) | (4.83) |
| Notes to Financial Highlights | |
| (a) | In addition to the fees and expenses that the Fund bears directly, the Fund indirectly bears a pro rata share of the fees and expenses of any other funds in which it invests. Such indirect expenses are not included in the Fund’s reported expense ratios. |
| (b) | Total net expenses include the impact of certain fee waivers/expense reimbursements made by the Investment Manager and certain of its affiliates, if applicable. |
| (c) | Ratios include interfund lending expense which is less than 0.01%. |
| (d) | The benefits derived from expense reductions had an impact of less than 0.01%. |
| (e) | Ratios include line of credit interest expense which is less than 0.01%. |
| 22 | Columbia Small Cap Value Fund I | Annual Report 2022 |
| Net asset value, end of period | Total return | Total gross expense ratio to average net assets(a) | Total net expense ratio to average net assets(a),(b) | Net investment income (loss) ratio to average net assets | Portfolio turnover | Net assets, end of period (000’s) | |
| Institutional 3 Class | |||||||
| Year Ended 4/30/2022 | $47.23 | (5.55%) | 0.86%(c) | 0.86%(c) | 0.44% | 58% | $184,850 |
| Year Ended 4/30/2021 | $56.01 | 85.03% | 0.90%(c) | 0.88%(c) | 0.96% | 43% | $178,586 |
| Year Ended 4/30/2020 | $30.53 | (23.34%) | 0.93%(c),(e) | 0.89%(c),(e) | 1.01% | 60% | $96,875 |
| Year Ended 4/30/2019 | $41.30 | (1.97%) | 0.92%(c),(e) | 0.89%(c),(e) | 0.64% | 62% | $108,132 |
| Year Ended 4/30/2018 | $45.45 | 10.50% | 0.93%(e) | 0.91%(e) | 0.37% | 51% | $115,296 |
| Class R | |||||||
| Year Ended 4/30/2022 | $40.66 | (6.17%) | 1.51%(c) | 1.51%(c),(d) | (0.20%) | 58% | $2,003 |
| Year Ended 4/30/2021 | $49.08 | 83.85% | 1.58%(c) | 1.56%(c),(d) | 0.30% | 43% | $2,521 |
| Year Ended 4/30/2020 | $26.79 | (23.87%) | 1.62%(c),(e) | 1.57%(c),(d),(e) | 0.31% | 60% | $1,487 |
| Year Ended 4/30/2019 | $36.50 | (2.67%) | 1.60%(c),(e) | 1.57%(c),(d),(e) | (0.03%) | 62% | $2,048 |
| Year Ended 4/30/2018 | $40.61 | 9.77% | 1.60%(e) | 1.58%(d),(e) | (0.31%) | 51% | $3,790 |
| Columbia Small Cap Value Fund I | Annual Report 2022 | 23 |
April 30, 2022
| 24 | Columbia Small Cap Value Fund I | Annual Report 2022 |
April 30, 2022
| Columbia Small Cap Value Fund I | Annual Report 2022 | 25 |
April 30, 2022
| 26 | Columbia Small Cap Value Fund I | Annual Report 2022 |
April 30, 2022
| Purchases ($) | Sales ($) | Net realized gain (loss) ($) |
| 6,560,341 | — | — |
| Effective rate (%) | |
| Class A | 0.15 |
| Advisor Class | 0.15 |
| Class C | 0.15 |
| Institutional Class | 0.15 |
| Institutional 2 Class | 0.06 |
| Institutional 3 Class | 0.01 |
| Class R | 0.15 |
| Columbia Small Cap Value Fund I | Annual Report 2022 | 27 |
April 30, 2022
| Front End (%) | CDSC (%) | Amount ($) | |
| Class A | 5.75 | 0.50 - 1.00(a) | 175,013 |
| Class C | — | 1.00(b) | 1,504 |
| (a) | This charge is imposed on certain investments of between $1 million and $50 million redeemed within 18 months after purchase, as follows: 1.00% if redeemed within 12 months after purchase, and 0.50% if redeemed more than 12, but less than 18, months after purchase, with certain limited exceptions. |
| (b) | This charge applies to redemptions within 12 months after purchase, with certain limited exceptions. |
| September 1, 2021 through August 31, 2022 | Prior to September 1, 2021 | |
| Class A | 1.27% | 1.31% |
| Advisor Class | 1.02 | 1.06 |
| Class C | 2.02 | 2.06 |
| Institutional Class | 1.02 | 1.06 |
| Institutional 2 Class | 0.93 | 0.93 |
| Institutional 3 Class | 0.88 | 0.88 |
| Class R | 1.52 | 1.56 |
| 28 | Columbia Small Cap Value Fund I | Annual Report 2022 |
April 30, 2022
| Excess of distributions over net investment income ($) | Accumulated net realized gain ($) | Paid in capital ($) |
| (183,137) | (9,591,482) | 9,774,619 |
| Year Ended April 30, 2022 | Year Ended April 30, 2021 | ||||
| Ordinary income ($) | Long-term capital gains ($) | Total ($) | Ordinary income ($) | Long-term capital gains ($) | Total ($) |
| 28,353,615 | 100,486,629 | 128,840,244 | 4,371,513 | 443,610 | 4,815,123 |
| Undistributed ordinary income ($) | Undistributed long-term capital gains ($) | Capital loss carryforwards ($) | Net unrealized appreciation ($) |
| — | 53,765,313 | (7,021,227) | 213,185,773 |
| Federal tax cost ($) | Gross unrealized appreciation ($) | Gross unrealized (depreciation) ($) | Net unrealized appreciation ($) |
| 930,627,902 | 282,092,657 | (68,906,884) | 213,185,773 |
| Columbia Small Cap Value Fund I | Annual Report 2022 | 29 |
April 30, 2022
| No expiration short-term ($) | No expiration long-term ($) | Total ($) | Utilized ($) |
| (7,021,227) | — | (7,021,227) | 599,961 |
| Late year ordinary losses ($) | Post-October capital losses ($) |
| — | 8,619,206 |
| Borrower or lender | Average loan balance ($) | Weighted average interest rate (%) | Number of days with outstanding loans |
| Borrower | 3,261,905 | 0.65 | 21 |
| 30 | Columbia Small Cap Value Fund I | Annual Report 2022 |
April 30, 2022
| Shares | |
| Class A | 749,058 |
| Advisor Class | 23,850 |
| Class C | 97,768 |
| Institutional Class | 1,392,865(a) |
| Institutional 2 Class | 14,915 |
| Institutional 3 Class | 6,037 |
| (a) | 1,101,599 shares of Institutional Class were issued in exchange of Class V shares of the Acquired Fund. |
| Columbia Small Cap Value Fund I | Annual Report 2022 | 31 |
April 30, 2022
| ($) | |
| Net investment income | 5,436,000 |
| Net realized gain | 63,659,000 |
| Net change in unrealized appreciation/(depreciation) | 403,525,000 |
| Net increase in net assets from operations | 472,620,000 |
| 32 | Columbia Small Cap Value Fund I | Annual Report 2022 |
April 30, 2022
| Columbia Small Cap Value Fund I | Annual Report 2022 | 33 |
| 34 | Columbia Small Cap Value Fund I | Annual Report 2022 |
| Qualified dividend income | Dividends received deduction | Section 199A dividends | Capital gain dividend |
| 70.96% | 60.78% | 1.61% | $137,188,545 |
| Name, address, year of birth | Position held with the Columbia Funds and length of service | Principal occupation(s) during past five years and other relevant professional experience | Number of Funds in the Columbia Funds Complex* overseen | Other directorships held by Trustee during the past five years |
| George S. Batejan c/o Columbia Management Investment Advisers, LLC 290 Congress Street Boston, MA 02210 1953 | Trustee since 2017 | Executive Vice President, Global Head of Technology and Operations, Janus Capital Group, Inc., 2010-2016 | 176 | Former Chairman of the Board, NICSA (National Investment Company Services Association) (Executive Committee, Nominating Committee and Governance Committee), 2014-2016; former Director, Intech Investment Management, 2011-2016; former Board Member, Metro Denver Chamber of Commerce, 2015-2016; former Advisory Board Member, University of Colorado Business School, 2015-2018 |
| Columbia Small Cap Value Fund I | Annual Report 2022 | 35 |
(Unaudited)
Independent trustees (continued)
| Name, address, year of birth | Position held with the Columbia Funds and length of service | Principal occupation(s) during past five years and other relevant professional experience | Number of Funds in the Columbia Funds Complex* overseen | Other directorships held by Trustee during the past five years |
| Kathleen Blatz c/o Columbia Management Investment Advisers, LLC 290 Congress Street Boston, MA 02210 1954 | Trustee since 2006 | Attorney, specializing in arbitration and mediation; Chief Justice, Minnesota Supreme Court, 1998-2006; Associate Justice, Minnesota Supreme Court, 1996-1998; Fourth Judicial District Court Judge, Hennepin County, 1994-1996; Attorney in private practice and public service, 1984-1993; State Representative, Minnesota House of Representatives, 1979-1993, which included service on the Tax and Financial Institutions and Insurance Committees; Member and Interim Chair, Minnesota Sports Facilities Authority, January 2017-July 2017; Interim President and Chief Executive Officer, Blue Cross and Blue Shield of Minnesota (health care insurance), February-July 2018, April-October 2021 | 176 | Former Trustee, Blue Cross and Blue Shield of Minnesota, 2009-2021 (Chair of the Business Development Committee, 2014-2017; Chair of the Governance Committee, 2017-2019); former Member and Chair of the Board, Minnesota Sports Facilities Authority, January 2017-July 2017; former Director, Robina Foundation, 2009-2020 (Chair, 2014-2020); Director, Schulze Family Foundation, since 2021 |
| Pamela G. Carlton c/o Columbia Management Investment Advisers, LLC 290 Congress Street Boston, MA 02210 1954 | Trustee since 2007 | President, Springboard — Partners in Cross Cultural Leadership (consulting company) since 2003; Managing Director of US Equity Research, JP Morgan Chase, 1999-2003; Director of US Equity Research, Chase Asset Management, 1996-1999; Co-Director Latin America Research, 1993-1996, COO Global Research, 1992-1996, Co-Director of US Research, 1991-1992, Investment Banker, 1982-1991, Morgan Stanley; Attorney, Cleary Gottlieb Steen & Hamilton LLP, 1980-1982 | 176 | Trustee, New York Presbyterian Hospital Board (Executive Committee and Chair of People Committee) since 1996; Director, DR Bank (Audit Committee) since 2017; Director, Evercore Inc. (Audit Committee) since 2019; Director, Apollo Commercial Real Estate Finance, Inc. since 2021; the Governing Council of the Independent Directors Council (IDC), since 2021 |
| Janet Langford Carrig c/o Columbia Management Investment Advisers, LLC 290 Congress Street Boston, MA 02210 1957 | Trustee since 1996 | Senior Vice President, General Counsel and Corporate Secretary, ConocoPhillips (independent energy company), September 2007-October 2018 | 174 | Director, EQT Corporation (natural gas producer) since 2019; Director, Whiting Petroleum Corporation (independent oil and gas company) since 2020 |
| J. Kevin Connaughton c/o Columbia Management Investment Advisers, LLC 290 Congress Street Boston, MA 02210 1964 | Trustee since 2020 | Member, FINRA National Adjudicatory Council since January 2020; Adjunct Professor of Finance, Bentley University since January 2018; Consultant to Independent Trustees of CFVIT and CFST I from March 2016 to June 2020 with respect to CFVIT and to December 2020 with respect to CFST I; Managing Director and General Manager of Mutual Fund Products, Columbia Management Investment Advisers, LLC, May 2010-February 2015; President, Columbia Funds, 2008-2015; and senior officer of Columbia Funds and affiliated funds, 2003-2015 | 174 | Former Director, The Autism Project, March 2015-December 2021; former Member of the Investment Committee, St. Michael’s College, November 2015-February 2020; former Trustee, St. Michael’s College, June 2017-September 2019; former Trustee, New Century Portfolios, January 2015-December 2017 |
| 36 | Columbia Small Cap Value Fund I | Annual Report 2022 |
(Unaudited)
Independent trustees (continued)
| Name, address, year of birth | Position held with the Columbia Funds and length of service | Principal occupation(s) during past five years and other relevant professional experience | Number of Funds in the Columbia Funds Complex* overseen | Other directorships held by Trustee during the past five years |
| Olive M. Darragh c/o Columbia Management Investment Advisers, LLC 290 Congress Street Boston, MA 02210 1962 | Trustee since 2020 | Managing Director of Darragh Inc. (strategy and talent management consulting firm) since 2010; Founder and CEO, Zolio, Inc. (investment management talent identification platform) since 2004; Consultant to Independent Trustees of CFVIT and CFST I from June 2019 to June 2020 with respect to CFVIT and to December 2020 with respect to CFST I; Partner, Tudor Investments, 2004-2010; Senior Partner, McKinsey & Company (consulting), 1990-2004; Touche Ross CPA, 1985-1988 | 174 | Former Director, University of Edinburgh Business School (Member of US Board); former Director, Boston Public Library Foundation |
| Patricia M. Flynn c/o Columbia Management Investment Advisers, LLC 290 Congress Street Boston, MA 02210 1950 | Trustee since 2004 | Trustee Professor of Economics and Management, Bentley University since 1976 (also teaches and conducts research on corporate governance); Dean, McCallum Graduate School of Business, Bentley University, 1992-2002 | 176 | Trustee, MA Taxpayers Foundation since 1997; Board of Governors, Innovation Institute, MA Technology Collaborative, 2010-2020; former Board of Directors, The MA Business Roundtable, 2003-2019 |
| Brian J. Gallagher c/o Columbia Management Investment Advisers, LLC 290 Congress Street Boston, MA 02210 1954 | Trustee since 2017 | Retired; Partner with Deloitte & Touche LLP and its predecessors, 1977-2016 | 176 | Trustee, Catholic Schools Foundation since 2004 |
| Douglas A. Hacker c/o Columbia Management Investment Advisers, LLC 290 Congress Street Boston, MA 02210 1955 | Co-Chair since 2021; Chair of CFST I and CFVIT since 2014; Trustee of CFST I and CFVIT since 1996 and CFST, CFST II, CFVST II, CET I and CET II since 2021 | Independent business executive since May 2006; Executive Vice President – Strategy of United Airlines, December 2002 - May 2006; President of UAL Loyalty Services (airline marketing company), September 2001-December 2002; Executive Vice President and Chief Financial Officer of United Airlines, July 1999-September 2001 | 176 | Director, Spartan Nash Company (food distributor); Director, Aircastle Limited (Chair of Audit Committee) (aircraft leasing); former Director, Nash Finch Company (food distributor), 2005-2013; former Director, SeaCube Container Leasing Ltd. (container leasing), 2010-2013; and former Director, Travelport Worldwide Limited (travel information technology), 2014-2019 |
| Nancy T. Lukitsh c/o Columbia Management Investment Advisers, LLC 290 Congress Street Boston, MA 02210 1956 | Trustee since 2011 | Senior Vice President, Partner and Director of Marketing, Wellington Management Company, LLP (investment adviser), 1997-2010; Chair, Wellington Management Portfolios (commingled non-U.S. investment pools), 2007 -2010; Director, Wellington Trust Company, NA and other Wellington affiliates, 1997-2010 | 174 | None |
| Columbia Small Cap Value Fund I | Annual Report 2022 | 37 |
(Unaudited)
Independent trustees (continued)
| Name, address, year of birth | Position held with the Columbia Funds and length of service | Principal occupation(s) during past five years and other relevant professional experience | Number of Funds in the Columbia Funds Complex* overseen | Other directorships held by Trustee during the past five years |
| David M. Moffett c/o Columbia Management Investment Advisers, LLC 290 Congress Street Boston, MA 02210 1952 | Trustee since 2011 | Retired; Consultant to Bridgewater and Associates | 174 | Director, CSX Corporation (transportation suppliers); Director, Genworth Financial, Inc. (financial and insurance products and services); Director, PayPal Holdings Inc. (payment and data processing services); Trustee, University of Oklahoma Foundation; former Director, eBay Inc. (online trading community), 2007-2015; and former Director, CIT Bank, CIT Group Inc. (commercial and consumer finance), 2010-2016 |
| Catherine James Paglia c/o Columbia Management Investment Advisers, LLC 290 Congress Street Boston, MA 02210 1952 | Co-Chair since 2021; Chair of CFST, CFST II, CFVST II, CET I and CET II since 2020; Trustee of CFST, CFST II and CFVST II since 2004 and CFST I and CFVIT since 2021 | Director, Enterprise Asset Management, Inc. (private real estate and asset management company) since September 1998; Managing Director and Partner, Interlaken Capital, Inc., 1989-1997; Vice President, 1982-1985, Principal, 1985-1987, Managing Director, 1987-1989, Morgan Stanley; Vice President, Investment Banking, 1980-1982, Associate, Investment Banking, 1976-1980, Dean Witter Reynolds, Inc. | 176 | Director, Valmont Industries, Inc. (irrigation systems manufacturer) since 2012; Trustee, Carleton College (on the Investment Committee); Trustee, Carnegie Endowment for International Peace (on the Investment Committee) |
| Minor M. Shaw c/o Columbia Management Investment Advisers, LLC 290 Congress Street Boston, MA 02210 1947 | Trustee since 2003 | President, Micco LLC (private investments) since 2011; President, Micco Corp. (family investment business), 1998-2011 | 176 | Director, Blue Cross Blue Shield of South Carolina (Chair of Compensation Committee) since April 2008; Trustee, Hollingsworth Funds (on the Investment Committee) since 2016 (previously Board Chair from 2016-2019); Former Advisory Board member, Duke Energy Corp., 2016-2020; Chair of the Duke Endowment; Chair of Greenville – Spartanburg Airport Commission; former Trustee, BofA Funds Series Trust (11 funds), 2003-2011; former Director, Piedmont Natural Gas, 2004-2016; former Director, National Association of Corporate Directors, Carolinas Chapter, 2013-2018; Chair, Daniel-Mickel Foundation since 1998 |
| 38 | Columbia Small Cap Value Fund I | Annual Report 2022 |
(Unaudited)
Independent trustees (continued)
| Name, address, year of birth | Position held with the Columbia Funds and length of service | Principal occupation(s) during past five years and other relevant professional experience | Number of Funds in the Columbia Funds Complex* overseen | Other directorships held by Trustee during the past five years |
| Natalie A. Trunow c/o Columbia Management Investment Advisers, LLC 290 Congress Street Boston, MA 02210 1967 | Trustee since 2020 | Chief Executive Officer, Millennial Portfolio Solutions LLC (asset management and consulting services), January 2016-January 2021; Non-executive Member of the Investment Committee and Valuation Committee, Sarona Asset Management Inc. (private equity firm) since September 2019; Advisor, Horizon Investments (asset management and consulting services), August 2018-January 2021; Advisor, Paradigm Asset Management, November 2016-December 2021; Consultant to Independent Trustees of CFVIT and CFST I from September 2016 to June 2020 with respect to CFVIT and to December 2020 with respect to CFST I; Director of Investments/Consultant, Casey Family Programs, April 2016-November 2016; Senior Vice President and Chief Investment Officer, Calvert Investments, August 2008-January 2016; Section Head and Portfolio Manager, General Motors Asset Management, June 1997-August 2008 | 174 | Former Director, Investment Committee, Health Services for Children with Special Needs, Inc., 2012-2019; Director, Chair of Audit Committee, Consumer Credit Counseling Services (formerly Guidewell Financial Solutions), since 2019; Independent Director, Investment Committee and Valuation Committee, Sarona Asset Management, since 2019 |
| Sandra L. Yeager c/o Columbia Management Investment Advisers, LLC 290 Congress Street Boston, MA 02210 1964 | Trustee since 2017 | Retired; President and founder, Hanoverian Capital, LLC (SEC registered investment advisor firm), 2008-2016; Managing Director, DuPont Capital, 2006-2008; Managing Director, Morgan Stanley Investment Management, 2004-2006; Senior Vice President, Alliance Bernstein, 1990-2004 | 176 | Former Director, NAPE Education Foundation, October 2016-October 2020 |
| * | The term “Columbia Funds Complex” as used herein includes Columbia Seligman Premium Technology Growth Fund, Tri-Continental Corporation and each series of Columbia Fund Series Trust (CFST), Columbia Funds Series Trust I (CFST I), Columbia Funds Series Trust II (CFST II), Columbia ETF Trust I (CET I), Columbia ETF Trust II (CET II), Columbia Funds Variable Insurance Trust (CFVIT) and Columbia Funds Variable Series Trust II (CFVST II). Messrs. Batejan, Beckman, Gallagher and Hacker and Mses. Blatz, Carlton, Flynn, Paglia, Shaw and Yeager serve as Directors of Columbia Seligman Premium Technology Growth Fund and Tri-Continental Corporation. |
| Name, address, year of birth | Position held with the Columbia Funds and length of service | Principal occupation(s) during the past five years and other relevant professional experience | Number of Funds in the Columbia Funds Complex overseen | Other directorships held by Trustee during the past five years |
| Daniel J. Beckman c/o Columbia Management Investment Advisers, LLC 290 Congress Street Boston, MA 02210 1962 | Trustee since November 2021 and President since June 2021 | Vice President – Head of North America Product, Columbia Management Investment Advisers, LLC since April 2015; President and Principal Executive Officer of the Columbia Funds since June 2021; officer of Columbia Funds and affiliated funds, 2020-2021 | 176 | Director, Ameriprise Trust Company, since October 2016; Director, Columbia Management Investment Distributors, Inc. since November 2018; Board of Governors, Columbia Wanger Asset Management, LLC since January 2022 |
| * | Interested person (as defined under the 1940 Act) by reason of being an officer, director, security holder and/or employee of the Investment Manager or Ameriprise Financial. |
| Columbia Small Cap Value Fund I | Annual Report 2022 | 39 |
(Unaudited)
The Board has appointed officers who are responsible for day-to-day business decisions based on policies it has established. The officers serve at the pleasure of the Board. The following table provides basic information about the Officers of the Fund as of the printing of this report, including principal occupations during the past five years, although their specific titles may have varied over the period. In addition to Mr. Beckman, who is President and Principal Executive Officer, the Fund’s other officers are:
| Name, address and year of birth | Position and year first appointed to position for any Fund in the Columbia Funds Complex or a predecessor thereof | Principal occupation(s) during past five years |
| Michael G. Clarke 290 Congress Street Boston, MA 02210 1969 | Chief Financial Officer and Principal Financial Officer (2009) and Senior Vice President (2019) | Senior Vice President and Head of Global Operations & Investor Services, Columbia Management Investment Advisers, LLC, since March 2022 (previously Vice President, Head of North American Operations, and Co-Head of Global Operations, June 2019 to February 2022 and Vice President – Accounting and Tax, May 2010 - May 2019); senior officer of Columbia Funds and affiliated funds since 2002. |
| Joseph Beranek 5890 Ameriprise Financial Center Minneapolis, MN 55474 1965 | Treasurer and Chief Accounting Officer (Principal Accounting Officer) (2019) and Principal Financial Officer (2020), CFST, CFST I, CFST II, CFVIT and CFVST II; Assistant Treasurer, CET I and CET II | Vice President – Mutual Fund Accounting and Financial Reporting, Columbia Management Investment Advisers, LLC, since December 2018 and March 2017, respectively (previously Vice President – Pricing and Corporate Actions, May 2010 - March 2017). |
| Marybeth Pilat 290 Congress Street Boston, MA 02210 1968 | Treasurer and Chief Accounting Officer (Principal Accounting Officer) and Principal Financial Officer (2020) for CET I and CET II; Assistant Treasurer, CFST, CFST I, CFST II, CFVIT and CFVST II | Vice President – Product Pricing and Administration, Columbia Management Investment Advisers, LLC, since May 2017; Director - Fund Administration, Calvert Investments, August 2015 – March 2017; Vice President - Fund Administration, Legg Mason, May 2015 - July 2015; Vice President - Fund Administration, Columbia Management Investment Advisers, LLC, May 2010 - April 2015. |
| William F. Truscott 290 Congress Street Boston, MA 02210 1960 | Senior Vice President (2001) | Formerly, Trustee/Director of Columbia Funds Complex or legacy funds, November 2001-January 1, 2021; Chief Executive Officer, Global Asset Management, Ameriprise Financial, Inc. since September 2012; Chairman of the Board and President, Columbia Management Investment Advisers, LLC since July 2004 and February 2012, respectively; Chairman of the Board and Chief Executive Officer, Columbia Management Investment Distributors, Inc. since November 2008 and February 2012, respectively; Chairman of the Board and Director, Threadneedle Asset Management Holdings, Sàrl since March 2013 and December 2008, respectively; senior executive of various entities affiliated with Columbia Threadneedle. |
| Christopher O. Petersen 5228 Ameriprise Financial Center Minneapolis, MN 55474 1970 | Senior Vice President and Assistant Secretary (2021) | Formerly, Trustee/Director of funds within the Columbia Funds Complex, July 1, 2020 - November 22, 2021; Senior Vice President and Assistant General Counsel, Ameriprise Financial, Inc. since September 2021 (previously Vice President and Lead Chief Counsel, January 2015 - September 2021); President and Principal Executive Officer of the Columbia Funds, 2015 - 2021; officer of Columbia Funds and affiliated funds since 2007. |
| Thomas P. McGuire 290 Congress Street Boston, MA 02210 1972 | Senior Vice President and Chief Compliance Officer (2012) | Vice President – Asset Management Compliance, Ameriprise Financial, Inc., since May 2010; Chief Compliance Officer, Columbia Acorn/Wanger Funds since December 2015; Chief Compliance Officer, Ameriprise Certificate Company, September 2010 – September 2020. |
| Ryan C. Larrenaga 290 Congress Street Boston, MA 02210 1970 | Senior Vice President (2017), Chief Legal Officer (2017), and Secretary (2015) | Vice President and Chief Counsel, Ameriprise Financial, Inc. since August 2018 (previously Vice President and Group Counsel, August 2011 - August 2018); Chief Legal Officer, Columbia Acorn/Wanger Funds, since September 2020; officer of Columbia Funds and affiliated funds since 2005. |
| 40 | Columbia Small Cap Value Fund I | Annual Report 2022 |
(Unaudited)
Fund officers (continued)
| Name, address and year of birth | Position and year first appointed to position for any Fund in the Columbia Funds Complex or a predecessor thereof | Principal occupation(s) during past five years |
| Michael E. DeFao 290 Congress Street Boston, MA 02210 1968 | Vice President (2011) and Assistant Secretary (2010) | Vice President and Chief Counsel, Ameriprise Financial, Inc. since May 2010; Vice President, Chief Legal Officer and Assistant Secretary, Columbia Management Investment Advisers, LLC since October 2021 (previously Vice President and Assistant Secretary, May 2010 – September 2021). |
| Lyn Kephart-Strong 5228 Ameriprise Financial Center Minneapolis, MN 55474 1960 | Vice President (2015) | President, Columbia Management Investment Services Corp. since October 2014; Vice President & Resolution Officer, Ameriprise Trust Company since August 2009. |
| • | the Fund had sufficient liquidity to both meet redemptions and operate effectively on behalf of shareholders; |
| • | there were no material changes to the Program during the period; |
| • | the implementation of the Program was effective to manage the Fund’s liquidity risk; and |
| • | the Program operated adequately during the period. |
| Columbia Small Cap Value Fund I | Annual Report 2022 | 41 |
columbiathreadneedleus.com/investor/. The Fund is distributed by Columbia Management Investment Distributors, Inc., member FINRA, and managed by Columbia Management Investment Advisers, LLC.

April 30, 2022

| 3 | |
| 5 | |
| 6 | |
| 7 | |
| 11 | |
| 12 | |
| 13 | |
| 16 | |
| 20 | |
| 28 | |
| 29 | |
| 29 | |
| 35 |
(Unaudited)
| Average annual total returns (%) (for the period ended April 30, 2022) | |||||
| Inception | 1 Year | 5 Years | 10 Years | ||
| Class A | 11/25/02 | -7.54 | 0.65 | 0.84 | |
| Class C | Excluding sales charges | 11/25/02 | -8.14 | -0.03 | 0.17 |
| Including sales charges | -9.06 | -0.03 | 0.17 | ||
| Institutional Class | 06/04/91 | -7.48 | 0.80 | 1.02 | |
| Institutional 2 Class* | 11/08/12 | -7.42 | 0.80 | 1.02 | |
| Institutional 3 Class* | 03/01/17 | -7.44 | 0.79 | 1.01 | |
| FTSE USBIG Treasury Index | -7.15 | 1.00 | 1.22 | ||
| * | The returns shown for periods prior to the share class inception date (including returns for the Life of the Fund, if shown, which are since Fund inception) include the returns of the Fund’s oldest share class. These returns are adjusted to reflect any higher class-related operating expenses of the newer share classes, as applicable. Please visit columbiathreadneedleus.com/investor/investment-products/mutual-funds/appended-performance for more information. |
| Columbia U.S. Treasury Index Fund | Annual Report 2022 | 3 |
(Unaudited)
| Portfolio breakdown (%) (at April 30, 2022) | |
| Money Market Funds | 0.9 |
| U.S. Treasury Obligations | 99.1 |
| Total | 100.0 |
| Quality breakdown (%) (at April 30, 2022) | |
| AAA rating | 100.0 |
| Total | 100.0 |
| 4 | Columbia U.S. Treasury Index Fund | Annual Report 2022 |
(Unaudited)
| • | The Fund attempts to match the return of its benchmark, the unmanaged FTSE USBIG Treasury Index. |
| • | Shorter term U.S. Treasuries, though in negative territory, returning -4.19%, outperformed the benchmark during the period. |
| • | Treasury returns were negatively impacted by the move toward higher rates during the period. |
| • | Total returns for intermediate maturity Treasuries were down 9% and longer term Treasuries were down 19.4%. |
| • | A flattening of the yield curve is typical as the Fed embarks on an interest rate hiking cycle. However, the current environment is different from more recent hiking cycles as the Fed is behind the curve in its inflation mandate. As a result, the market is adjusting to the fact that short term interest rates could rise higher than what is generally perceived as “neutral” and reach a more “restrictive” level. |
| Columbia U.S. Treasury Index Fund | Annual Report 2022 | 5 |
(Unaudited)
| November 1, 2021 — April 30, 2022 | |||||||
| Account value at the beginning of the period ($) | Account value at the end of the period ($) | Expenses paid during the period ($) | Fund’s annualized expense ratio (%) | ||||
| Actual | Hypothetical | Actual | Hypothetical | Actual | Hypothetical | Actual | |
| Class A | 1,000.00 | 1,000.00 | 916.80 | 1,023.34 | 1.53 | 1.61 | 0.32 |
| Class C | 1,000.00 | 1,000.00 | 913.80 | 1,020.09 | 4.63 | 4.89 | 0.97 |
| Institutional Class | 1,000.00 | 1,000.00 | 916.70 | 1,024.08 | 0.81 | 0.86 | 0.17 |
| Institutional 2 Class | 1,000.00 | 1,000.00 | 917.30 | 1,024.08 | 0.81 | 0.86 | 0.17 |
| Institutional 3 Class | 1,000.00 | 1,000.00 | 917.10 | 1,024.08 | 0.81 | 0.86 | 0.17 |
| 6 | Columbia U.S. Treasury Index Fund | Annual Report 2022 |
April 30, 2022
| U.S. Treasury Obligations 98.9% | ||||
| Issuer | Coupon Rate | Principal Amount ($) | Value ($) | |
| U.S. Treasury | ||||
| 04/30/2023 | 0.125% | 3,599,000 | 3,527,301 | |
| 04/30/2023 | 2.750% | 3,348,000 | 3,366,963 | |
| 05/15/2023 | 0.125% | 7,654,000 | 7,493,146 | |
| 05/15/2023 | 1.750% | 4,971,000 | 4,948,864 | |
| 05/31/2023 | 1.625% | 3,369,000 | 3,347,286 | |
| 05/31/2023 | 2.750% | 3,539,000 | 3,558,492 | |
| 06/15/2023 | 0.250% | 6,948,000 | 6,795,470 | |
| 06/30/2023 | 1.375% | 6,823,000 | 6,751,305 | |
| 06/30/2023 | 2.625% | 6,836,000 | 6,861,635 | |
| 07/15/2023 | 0.125% | 6,693,000 | 6,515,740 | |
| 07/31/2023 | 1.250% | 4,168,000 | 4,109,876 | |
| 07/31/2023 | 2.750% | 4,617,000 | 4,636,839 | |
| 08/15/2023 | 0.125% | 9,193,000 | 8,925,110 | |
| 08/15/2023 | 2.500% | 1,864,000 | 1,866,184 | |
| 08/31/2023 | 1.375% | 5,465,000 | 5,387,935 | |
| 08/31/2023 | 2.750% | 1,832,000 | 1,838,798 | |
| 09/15/2023 | 0.125% | 7,282,000 | 7,053,015 | |
| 09/30/2023 | 1.375% | 4,418,000 | 4,350,004 | |
| 09/30/2023 | 2.875% | 4,914,000 | 4,939,338 | |
| 10/15/2023 | 0.125% | 5,403,000 | 5,219,171 | |
| 10/31/2023 | 1.625% | 4,343,000 | 4,285,489 | |
| 10/31/2023 | 2.875% | 3,399,000 | 3,414,667 | |
| 11/15/2023 | 0.250% | 7,045,000 | 6,800,351 | |
| 11/15/2023 | 2.750% | 7,448,000 | 7,468,947 | |
| 11/30/2023 | 2.125% | 3,030,000 | 3,009,050 | |
| 11/30/2023 | 2.875% | 4,657,000 | 4,677,192 | |
| 12/15/2023 | 0.125% | 6,963,000 | 6,690,464 | |
| 12/31/2023 | 2.250% | 3,622,000 | 3,599,504 | |
| 12/31/2023 | 2.625% | 5,549,000 | 5,550,517 | |
| 01/15/2024 | 0.125% | 6,544,000 | 6,270,481 | |
| 01/31/2024 | 2.250% | 2,818,000 | 2,798,076 | |
| 01/31/2024 | 2.500% | 5,542,000 | 5,525,980 | |
| 02/15/2024 | 0.125% | 14,764,000 | 14,111,731 | |
| 02/15/2024 | 2.750% | 6,184,000 | 6,191,972 | |
| 02/29/2024 | 2.125% | 4,896,000 | 4,847,996 | |
| 02/29/2024 | 2.375% | 7,373,000 | 7,333,543 | |
| 03/15/2024 | 0.250% | 17,558,000 | 16,780,236 | |
| 03/31/2024 | 2.125% | 6,657,000 | 6,585,229 | |
| 04/15/2024 | 0.375% | 25,423,000 | 24,294,854 | |
| 04/30/2024 | 2.000% | 3,166,000 | 3,121,849 | |
| 04/30/2024 | 2.250% | 9,466,000 | 9,380,584 | |
| 05/15/2024 | 0.250% | 11,075,000 | 10,530,768 | |
| 05/15/2024 | 2.500% | 5,498,000 | 5,471,799 | |
| 05/31/2024 | 2.000% | 6,944,000 | 6,839,298 | |
| 06/15/2024 | 0.250% | 10,900,000 | 10,336,266 | |
| 06/30/2024 | 1.750% | 2,038,000 | 1,993,896 | |
| 06/30/2024 | 2.000% | 2,523,000 | 2,482,593 | |
| 07/15/2024 | 0.375% | 534,000 | 506,633 | |
| 07/31/2024 | 1.750% | 5,053,000 | 4,939,308 | |
| 07/31/2024 | 2.125% | 7,678,000 | 7,566,429 | |
| 08/15/2024 | 0.375% | 5,951,000 | 5,631,134 | |
| 08/15/2024 | 2.375% | 6,973,000 | 6,901,091 | |
| 08/31/2024 | 1.250% | 6,494,000 | 6,264,681 | |
| 08/31/2024 | 1.875% | 7,241,000 | 7,085,432 | |
| U.S. Treasury Obligations (continued) | ||||
| Issuer | Coupon Rate | Principal Amount ($) | Value ($) | |
| 09/15/2024 | 0.375% | 5,457,000 | 5,149,617 | |
| 09/30/2024 | 1.500% | 4,452,000 | 4,313,918 | |
| 10/15/2024 | 0.625% | 2,158,000 | 2,045,042 | |
| 10/31/2024 | 1.500% | 4,952,000 | 4,791,060 | |
| 10/31/2024 | 2.250% | 3,416,000 | 3,365,828 | |
| 11/15/2024 | 0.750% | 4,291,000 | 4,069,410 | |
| 11/15/2024 | 2.250% | 2,075,000 | 2,043,389 | |
| 11/30/2024 | 1.500% | 2,174,000 | 2,100,628 | |
| 11/30/2024 | 2.125% | 346,000 | 339,594 | |
| 12/15/2024 | 1.000% | 6,928,000 | 6,604,332 | |
| 12/31/2024 | 1.750% | 1,636,000 | 1,588,837 | |
| 12/31/2024 | 2.250% | 1,789,000 | 1,760,348 | |
| 01/15/2025 | 1.125% | 2,542,000 | 2,426,220 | |
| 01/31/2025 | 1.375% | 6,343,000 | 6,090,767 | |
| 01/31/2025 | 2.500% | 2,209,000 | 2,187,083 | |
| 02/15/2025 | 2.000% | 9,508,000 | 9,283,671 | |
| 02/28/2025 | 1.125% | 3,322,000 | 3,164,465 | |
| 02/28/2025 | 2.750% | 5,138,000 | 5,118,331 | |
| 03/31/2025 | 0.500% | 3,215,000 | 3,001,755 | |
| 03/31/2025 | 2.625% | 3,771,000 | 3,742,718 | |
| 04/30/2025 | 0.375% | 4,205,000 | 3,902,437 | |
| 04/30/2025 | 2.875% | 5,744,000 | 5,740,410 | |
| 05/15/2025 | 2.125% | 5,903,000 | 5,768,338 | |
| 05/31/2025 | 0.250% | 12,272,000 | 11,314,209 | |
| 05/31/2025 | 2.875% | 8,714,000 | 8,704,469 | |
| 06/30/2025 | 0.250% | 6,823,000 | 6,276,094 | |
| 06/30/2025 | 2.750% | 3,280,000 | 3,263,856 | |
| 07/31/2025 | 0.250% | 9,257,000 | 8,491,128 | |
| 07/31/2025 | 2.875% | 2,468,000 | 2,464,529 | |
| 08/15/2025 | 2.000% | 10,216,000 | 9,918,299 | |
| 08/31/2025 | 0.250% | 8,883,000 | 8,130,721 | |
| 08/31/2025 | 2.750% | 4,848,000 | 4,819,594 | |
| 09/30/2025 | 0.250% | 8,282,000 | 7,563,148 | |
| 09/30/2025 | 3.000% | 3,564,000 | 3,571,796 | |
| 10/31/2025 | 0.250% | 7,432,000 | 6,771,829 | |
| 10/31/2025 | 3.000% | 3,111,000 | 3,118,291 | |
| 11/15/2025 | 2.250% | 6,847,000 | 6,688,128 | |
| 11/30/2025 | 0.375% | 13,209,000 | 12,060,436 | |
| 11/30/2025 | 2.875% | 3,722,000 | 3,712,986 | |
| 12/31/2025 | 0.375% | 7,714,000 | 7,029,382 | |
| 01/31/2026 | 0.375% | 9,051,000 | 8,226,510 | |
| 01/31/2026 | 2.625% | 4,569,000 | 4,516,885 | |
| 02/15/2026 | 1.625% | 5,126,000 | 4,882,115 | |
| 02/15/2026 | 6.000% | 2,388,000 | 2,646,016 | |
| 02/28/2026 | 2.500% | 4,259,000 | 4,189,791 | |
| 03/31/2026 | 0.750% | 17,639,000 | 16,205,831 | |
| 03/31/2026 | 2.250% | 6,048,000 | 5,891,130 | |
| 04/30/2026 | 0.750% | 7,190,000 | 6,595,140 | |
| 04/30/2026 | 2.375% | 6,787,000 | 6,641,186 | |
| 05/15/2026 | 1.625% | 5,906,000 | 5,607,470 | |
| 05/31/2026 | 2.125% | 4,135,000 | 4,003,197 | |
| 06/30/2026 | 0.875% | 1,645,000 | 1,510,958 | |
| 06/30/2026 | 1.875% | 3,287,000 | 3,149,870 | |
| 07/31/2026 | 0.625% | 8,552,000 | 7,756,931 | |
| 07/31/2026 | 1.875% | 3,061,000 | 2,931,147 | |
| Columbia U.S. Treasury Index Fund | Annual Report 2022 | 7 |
April 30, 2022
| U.S. Treasury Obligations (continued) | ||||
| Issuer | Coupon Rate | Principal Amount ($) | Value ($) | |
| 08/15/2026 | 1.500% | 8,703,000 | 8,189,659 | |
| 08/31/2026 | 0.750% | 4,634,000 | 4,219,474 | |
| 08/31/2026 | 1.375% | 4,003,000 | 3,746,558 | |
| 09/30/2026 | 0.875% | 8,656,000 | 7,912,125 | |
| 09/30/2026 | 1.625% | 1,997,000 | 1,886,697 | |
| 10/31/2026 | 1.625% | 2,647,000 | 2,498,520 | |
| 11/15/2026 | 2.000% | 7,318,000 | 7,015,561 | |
| 11/30/2026 | 1.625% | 3,260,000 | 3,074,842 | |
| 12/31/2026 | 1.250% | 7,284,000 | 6,745,098 | |
| 12/31/2026 | 1.750% | 2,844,000 | 2,695,579 | |
| 01/31/2027 | 1.500% | 5,609,000 | 5,250,112 | |
| 02/15/2027 | 2.250% | 5,499,000 | 5,325,008 | |
| 02/28/2027 | 1.125% | 2,631,000 | 2,416,204 | |
| 02/28/2027 | 1.875% | 3,566,000 | 3,396,058 | |
| 03/31/2027 | 0.625% | 2,295,000 | 2,052,591 | |
| 04/30/2027 | 0.500% | 3,196,000 | 2,833,953 | |
| 05/15/2027 | 2.375% | 8,873,000 | 8,633,845 | |
| 05/31/2027 | 0.500% | 5,916,000 | 5,232,425 | |
| 06/30/2027 | 0.500% | 7,037,000 | 6,211,252 | |
| 07/31/2027 | 0.375% | 9,213,000 | 8,066,413 | |
| 08/15/2027 | 2.250% | 7,510,000 | 7,245,977 | |
| 08/31/2027 | 0.500% | 10,005,000 | 8,795,020 | |
| 09/30/2027 | 0.375% | 9,622,000 | 8,383,919 | |
| 10/31/2027 | 0.500% | 13,366,000 | 11,702,560 | |
| 11/15/2027 | 2.250% | 8,740,000 | 8,421,127 | |
| 11/30/2027 | 0.625% | 11,420,000 | 10,050,492 | |
| 12/31/2027 | 0.625% | 5,653,000 | 4,965,807 | |
| 01/31/2028 | 0.750% | 10,056,000 | 8,878,348 | |
| 02/15/2028 | 2.750% | 8,150,000 | 8,054,492 | |
| 02/29/2028 | 1.125% | 9,165,000 | 8,268,548 | |
| 03/31/2028 | 1.250% | 9,588,000 | 8,695,117 | |
| 04/30/2028 | 1.250% | 9,978,000 | 9,036,326 | |
| 05/15/2028 | 2.875% | 7,901,000 | 7,855,322 | |
| 06/30/2028 | 1.250% | 4,719,000 | 4,261,110 | |
| 07/31/2028 | 1.000% | 8,077,000 | 7,170,231 | |
| 08/15/2028 | 2.875% | 7,563,000 | 7,516,913 | |
| 08/31/2028 | 1.125% | 7,179,000 | 6,415,110 | |
| 09/30/2028 | 1.250% | 5,488,000 | 4,935,770 | |
| 10/31/2028 | 1.375% | 6,477,000 | 5,866,745 | |
| 11/15/2028 | 3.125% | 7,800,000 | 7,870,687 | |
| 11/15/2028 | 5.250% | 2,293,000 | 2,601,122 | |
| 11/30/2028 | 1.500% | 4,376,000 | 3,991,733 | |
| 12/31/2028 | 1.375% | 6,195,000 | 5,604,539 | |
| 02/15/2029 | 2.625% | 9,624,000 | 9,427,009 | |
| 02/15/2029 | 5.250% | 2,562,000 | 2,919,879 | |
| 02/28/2029 | 1.875% | 3,717,000 | 3,471,330 | |
| 05/15/2029 | 2.375% | 8,965,000 | 8,638,618 | |
| 08/15/2029 | 1.625% | 6,694,000 | 6,126,056 | |
| 11/15/2029 | 1.750% | 5,207,000 | 4,799,390 | |
| 02/15/2030 | 1.500% | 7,924,000 | 7,147,696 | |
| 05/15/2030 | 0.625% | 15,387,000 | 12,869,783 | |
| 05/15/2030 | 6.250% | 1,377,000 | 1,704,253 | |
| 08/15/2030 | 0.625% | 18,410,000 | 15,323,448 | |
| 11/15/2030 | 0.875% | 18,751,000 | 15,888,543 | |
| 02/15/2031 | 1.125% | 15,542,000 | 13,412,260 | |
| 02/15/2031 | 5.375% | 1,250,000 | 1,487,305 | |
| 05/15/2031 | 1.625% | 15,247,000 | 13,705,624 | |
| U.S. Treasury Obligations (continued) | ||||
| Issuer | Coupon Rate | Principal Amount ($) | Value ($) | |
| 08/15/2031 | 1.250% | 16,190,000 | 14,024,587 | |
| 11/15/2031 | 1.375% | 14,468,000 | 12,634,633 | |
| 02/15/2032 | 1.875% | 4,945,000 | 4,515,403 | |
| 02/15/2036 | 4.500% | 729,000 | 868,991 | |
| 05/15/2038 | 4.500% | 1,496,000 | 1,789,123 | |
| 02/15/2039 | 3.500% | 1,695,000 | 1,802,262 | |
| 05/15/2039 | 4.250% | 1,608,000 | 1,871,813 | |
| 08/15/2039 | 4.500% | 2,316,000 | 2,776,667 | |
| 11/15/2039 | 4.375% | 2,197,000 | 2,590,400 | |
| 02/15/2040 | 4.625% | 3,245,000 | 3,949,266 | |
| 05/15/2040 | 1.125% | 6,983,000 | 5,028,851 | |
| 05/15/2040 | 4.375% | 3,156,000 | 3,724,573 | |
| 08/15/2040 | 1.125% | 9,785,000 | 7,011,564 | |
| 08/15/2040 | 3.875% | 3,436,000 | 3,799,464 | |
| 11/15/2040 | 1.375% | 10,418,000 | 7,793,966 | |
| 11/15/2040 | 4.250% | 3,217,000 | 3,722,170 | |
| 02/15/2041 | 1.875% | 12,464,000 | 10,173,740 | |
| 02/15/2041 | 4.750% | 1,371,000 | 1,690,400 | |
| 05/15/2041 | 2.250% | 6,846,000 | 5,929,278 | |
| 05/15/2041 | 4.375% | 852,000 | 1,001,499 | |
| 08/15/2041 | 1.750% | 4,890,000 | 3,873,797 | |
| 08/15/2041 | 3.750% | 2,049,000 | 2,221,564 | |
| 11/15/2041 | 2.000% | 9,307,000 | 7,702,997 | |
| 02/15/2042 | 3.125% | 568,000 | 563,829 | |
| 08/15/2042 | 2.750% | 2,255,000 | 2,100,673 | |
| 11/15/2042 | 2.750% | 2,735,000 | 2,543,977 | |
| 02/15/2043 | 3.125% | 2,664,000 | 2,629,868 | |
| 05/15/2043 | 2.875% | 3,873,000 | 3,669,668 | |
| 08/15/2043 | 3.625% | 2,765,000 | 2,946,021 | |
| 11/15/2043 | 3.750% | 2,919,000 | 3,167,571 | |
| 02/15/2044 | 3.625% | 1,326,000 | 1,413,226 | |
| 05/15/2044 | 3.375% | 2,463,000 | 2,527,654 | |
| 08/15/2044 | 3.125% | 3,841,000 | 3,786,386 | |
| 11/15/2044 | 3.000% | 3,163,000 | 3,053,778 | |
| 02/15/2045 | 2.500% | 3,574,000 | 3,161,873 | |
| 05/15/2045 | 3.000% | 740,000 | 715,256 | |
| 08/15/2045 | 2.875% | 1,992,000 | 1,885,864 | |
| 11/15/2045 | 3.000% | 1,425,000 | 1,380,914 | |
| 02/15/2046 | 2.500% | 3,435,000 | 3,043,732 | |
| 05/15/2046 | 2.500% | 3,888,000 | 3,443,918 | |
| 08/15/2046 | 2.250% | 4,173,000 | 3,520,317 | |
| 11/15/2046 | 2.875% | 1,212,000 | 1,153,294 | |
| 02/15/2047 | 3.000% | 3,885,000 | 3,781,805 | |
| 05/15/2047 | 3.000% | 2,960,000 | 2,886,000 | |
| 08/15/2047 | 2.750% | 4,243,000 | 3,962,564 | |
| 11/15/2047 | 2.750% | 4,527,000 | 4,229,916 | |
| 02/15/2048 | 3.000% | 5,040,000 | 4,951,013 | |
| 05/15/2048 | 3.125% | 5,412,000 | 5,452,590 | |
| 08/15/2048 | 3.000% | 6,224,000 | 6,118,970 | |
| 11/15/2048 | 3.375% | 6,544,000 | 6,918,235 | |
| 02/15/2049 | 3.000% | 7,441,000 | 7,375,891 | |
| 05/15/2049 | 2.875% | 7,655,000 | 7,418,173 | |
| 08/15/2049 | 2.250% | 6,500,000 | 5,554,453 | |
| 11/15/2049 | 2.375% | 7,158,000 | 6,292,329 | |
| 02/15/2050 | 2.000% | 7,545,000 | 6,087,872 | |
| 05/15/2050 | 1.250% | 9,776,000 | 6,514,787 | |
| 08/15/2050 | 1.375% | 10,576,000 | 7,275,957 | |
| 8 | Columbia U.S. Treasury Index Fund | Annual Report 2022 |
April 30, 2022
| U.S. Treasury Obligations (continued) | ||||
| Issuer | Coupon Rate | Principal Amount ($) | Value ($) | |
| 11/15/2050 | 1.625% | 11,078,000 | 8,140,599 | |
| 02/15/2051 | 1.875% | 11,678,000 | 9,150,808 | |
| 05/15/2051 | 2.375% | 9,868,000 | 8,686,924 | |
| 08/15/2051 | 2.000% | 6,962,000 | 5,621,815 | |
| 11/15/2051 | 1.875% | 5,861,000 | 4,595,390 | |
| 02/15/2052 | 2.250% | 1,218,000 | 1,045,767 | |
| Total U.S. Treasury Obligations (Cost $1,381,184,063) | 1,278,208,650 | |||
| Money Market Funds 0.9% | ||
| Shares | Value ($) | |
| Columbia Short-Term Cash Fund, 0.462%(a),(b) | 12,207,617 | 12,203,954 |
| Total Money Market Funds (Cost $12,202,685) | 12,203,954 | |
| Total Investments in Securities (Cost: $1,393,386,748) | 1,290,412,604 | |
| Other Assets & Liabilities, Net | 2,422,852 | |
| Net Assets | 1,292,835,456 | |
| (a) | The rate shown is the seven-day current annualized yield at April 30, 2022. |
| (b) | As defined in the Investment Company Act of 1940, as amended, an affiliated company is one in which the Fund owns 5% or more of the company’s outstanding voting securities, or a company which is under common ownership or control with the Fund. The value of the holdings and transactions in these affiliated companies during the year ended April 30, 2022 are as follows: |
| Affiliated issuers | Beginning of period($) | Purchases($) | Sales($) | Net change in unrealized appreciation (depreciation)($) | End of period($) | Realized gain (loss)($) | Dividends($) | End of period shares |
| Columbia Short-Term Cash Fund, 0.462% | ||||||||
| 5,961,437 | 137,837,543 | (131,596,100) | 1,074 | 12,203,954 | (2,139) | 12,562 | 12,207,617 | |
| ■ | Level 1 — Valuations based on quoted prices for investments in active markets that the Fund has the ability to access at the measurement date. Valuation adjustments are not applied to Level 1 investments. |
| ■ | Level 2 — Valuations based on other significant observable inputs (including quoted prices for similar securities, interest rates, prepayment speeds, credit risks, etc.). |
| ■ | Level 3 — Valuations based on significant unobservable inputs (including the Fund’s own assumptions and judgment in determining the fair value of investments). |
| Columbia U.S. Treasury Index Fund | Annual Report 2022 | 9 |
April 30, 2022
The following table is a summary of the inputs used to value the Fund’s investments at April 30, 2022:
| Level 1 ($) | Level 2 ($) | Level 3 ($) | Total ($) | |
| Investments in Securities | ||||
| U.S. Treasury Obligations | 1,278,208,650 | — | — | 1,278,208,650 |
| Money Market Funds | 12,203,954 | — | — | 12,203,954 |
| Total Investments in Securities | 1,290,412,604 | — | — | 1,290,412,604 |
| 10 | Columbia U.S. Treasury Index Fund | Annual Report 2022 |
April 30, 2022
| Assets | |
| Investments in securities, at value | |
| Unaffiliated issuers (cost $1,381,184,063) | $1,278,208,650 |
| Affiliated issuers (cost $12,202,685) | 12,203,954 |
| Receivable for: | |
| Investments sold | 4,935,090 |
| Capital shares sold | 2,063,551 |
| Dividends | 5,023 |
| Interest | 6,862,015 |
| Expense reimbursement due from Investment Manager | 8,231 |
| Trustees’ deferred compensation plan | 138,780 |
| Total assets | 1,304,425,294 |
| Liabilities | |
| Payable for: | |
| Investments purchased | 9,681,054 |
| Capital shares purchased | 267,856 |
| Distributions to shareholders | 1,470,760 |
| Management services fees | 14,241 |
| Distribution and/or service fees | 202 |
| Compensation of board members | 16,945 |
| Trustees’ deferred compensation plan | 138,780 |
| Total liabilities | 11,589,838 |
| Net assets applicable to outstanding capital stock | $1,292,835,456 |
| Represented by | |
| Paid in capital | 1,401,076,211 |
| Total distributable earnings (loss) | (108,240,755) |
| Total - representing net assets applicable to outstanding capital stock | $1,292,835,456 |
| Class A | |
| Net assets | $35,498,765 |
| Shares outstanding | 3,375,352 |
| Net asset value per share | $10.52 |
| Class C | |
| Net assets | $2,540,002 |
| Shares outstanding | 241,517 |
| Net asset value per share | $10.52 |
| Institutional Class | |
| Net assets | $444,883,392 |
| Shares outstanding | 42,283,607 |
| Net asset value per share | $10.52 |
| Institutional 2 Class | |
| Net assets | $43,738,350 |
| Shares outstanding | 4,165,800 |
| Net asset value per share | $10.50 |
| Institutional 3 Class | |
| Net assets | $766,174,947 |
| Shares outstanding | 72,413,699 |
| Net asset value per share | $10.58 |
| Columbia U.S. Treasury Index Fund | Annual Report 2022 | 11 |
Year Ended April 30, 2022
| Net investment income | |
| Income: | |
| Dividends — affiliated issuers | $12,562 |
| Interest | 20,229,013 |
| Total income | 20,241,575 |
| Expenses: | |
| Management services fees | 5,973,899 |
| Distribution and/or service fees | |
| Class A | 76,649 |
| Class C | 39,593 |
| Compensation of board members | 31,664 |
| Total expenses | 6,121,805 |
| Fees waived or expenses reimbursed by Investment Manager and its affiliates | (3,466,656) |
| Fees waived by distributor | |
| Class A | (15,011) |
| Class C | (3,835) |
| Expense reduction | (560) |
| Total net expenses | 2,635,743 |
| Net investment income | 17,605,832 |
| Realized and unrealized gain (loss) — net | |
| Net realized gain (loss) on: | |
| Investments — unaffiliated issuers | (968,748) |
| Investments — affiliated issuers | (2,139) |
| Net realized loss | (970,887) |
| Net change in unrealized appreciation (depreciation) on: | |
| Investments — unaffiliated issuers | (124,255,496) |
| Investments — affiliated issuers | 1,074 |
| Net change in unrealized appreciation (depreciation) | (124,254,422) |
| Net realized and unrealized loss | (125,225,309) |
| Net decrease in net assets resulting from operations | $(107,619,477) |
| 12 | Columbia U.S. Treasury Index Fund | Annual Report 2022 |
| Year Ended April 30, 2022 | Year Ended April 30, 2021 | |
| Operations | ||
| Net investment income | $17,605,832 | $15,765,172 |
| Net realized gain (loss) | (970,887) | 4,878,183 |
| Net change in unrealized appreciation (depreciation) | (124,254,422) | (77,711,771) |
| Net decrease in net assets resulting from operations | (107,619,477) | (57,068,416) |
| Distributions to shareholders | ||
| Net investment income and net realized gains | ||
| Class A | (508,052) | (1,007,331) |
| Class C | (25,091) | (102,605) |
| Institutional Class | (7,204,929) | (10,927,800) |
| Institutional 2 Class | (725,831) | (1,056,029) |
| Institutional 3 Class | (12,283,759) | (9,468,987) |
| Total distributions to shareholders | (20,747,662) | (22,562,752) |
| Increase in net assets from capital stock activity | 182,947,241 | 210,255,941 |
| Total increase in net assets | 54,580,102 | 130,624,773 |
| Net assets at beginning of year | 1,238,255,354 | 1,107,630,581 |
| Net assets at end of year | $1,292,835,456 | $1,238,255,354 |
| Columbia U.S. Treasury Index Fund | Annual Report 2022 | 13 |
| Year Ended | Year Ended | |||
| April 30, 2022 | April 30, 2021 | |||
| Shares | Dollars ($) | Shares | Dollars ($) | |
| Capital stock activity | ||||
| Class A | ||||
| Subscriptions | 823,155 | 9,394,626 | 2,503,519 | 30,279,238 |
| Distributions reinvested | 25,050 | 286,578 | 52,006 | 623,745 |
| Redemptions | (1,667,328) | (19,113,195) | (2,581,410) | (30,736,169) |
| Net increase (decrease) | (819,123) | (9,431,991) | (25,885) | 166,814 |
| Class C | ||||
| Subscriptions | 20,460 | 237,356 | 463,270 | 5,632,251 |
| Distributions reinvested | 2,179 | 25,022 | 8,523 | 102,314 |
| Redemptions | (360,822) | (4,116,126) | (454,200) | (5,406,784) |
| Net increase (decrease) | (338,183) | (3,853,748) | 17,593 | 327,781 |
| Institutional Class | ||||
| Subscriptions | 7,139,052 | 81,835,936 | 13,476,919 | 162,645,987 |
| Distributions reinvested | 611,158 | 6,987,861 | 877,042 | 10,532,133 |
| Redemptions | (12,069,469) | (137,444,941) | (15,064,561) | (180,968,131) |
| Net decrease | (4,319,259) | (48,621,144) | (710,600) | (7,790,011) |
| Institutional 2 Class | ||||
| Subscriptions | 1,498,220 | 17,118,267 | 3,633,451 | 43,793,657 |
| Distributions reinvested | 13,042 | 149,480 | 24,726 | 296,679 |
| Redemptions | (1,968,952) | (22,484,879) | (3,212,716) | (38,649,751) |
| Net increase (decrease) | (457,690) | (5,217,132) | 445,461 | 5,440,585 |
| Institutional 3 Class | ||||
| Subscriptions | 30,992,063 | 359,650,385 | 31,328,526 | 377,853,939 |
| Distributions reinvested | 1,066,894 | 12,261,812 | 785,573 | 9,460,633 |
| Redemptions | (10,775,546) | (121,840,941) | (14,582,431) | (175,203,800) |
| Net increase | 21,283,411 | 250,071,256 | 17,531,668 | 212,110,772 |
| Total net increase | 15,349,156 | 182,947,241 | 17,258,237 | 210,255,941 |
| 14 | Columbia U.S. Treasury Index Fund | Annual Report 2022 |
| Net asset value, beginning of period | Net investment income | Net realized and unrealized gain (loss) | Total from investment operations | Distributions from net investment income | Distributions from net realized gains | Total distributions to shareholders | |
| Class A | |||||||
| Year Ended 4/30/2022 | $11.52 | 0.12 | (0.98) | (0.86) | (0.12) | (0.02) | (0.14) |
| Year Ended 4/30/2021 | $12.30 | 0.14 | (0.71) | (0.57) | (0.14) | (0.07) | (0.21) |
| Year Ended 4/30/2020 | $11.00 | 0.21 | 1.30 | 1.51 | (0.21) | — | (0.21) |
| Year Ended 4/30/2019 | $10.75 | 0.21 | 0.25 | 0.46 | (0.21) | — | (0.21) |
| Year Ended 4/30/2018 | $11.06 | 0.16 | (0.31) | (0.15) | (0.16) | — | (0.16) |
| Class C | |||||||
| Year Ended 4/30/2022 | $11.52 | 0.04 | (0.97) | (0.93) | (0.05) | (0.02) | (0.07) |
| Year Ended 4/30/2021 | $12.29 | 0.06 | (0.70) | (0.64) | (0.06) | (0.07) | (0.13) |
| Year Ended 4/30/2020 | $11.00 | 0.13 | 1.29 | 1.42 | (0.13) | — | (0.13) |
| Year Ended 4/30/2019 | $10.75 | 0.13 | 0.25 | 0.38 | (0.13) | — | (0.13) |
| Year Ended 4/30/2018 | $11.06 | 0.09 | (0.31) | (0.22) | (0.09) | — | (0.09) |
| Institutional Class | |||||||
| Year Ended 4/30/2022 | $11.53 | 0.14 | (0.99) | (0.85) | (0.14) | (0.02) | (0.16) |
| Year Ended 4/30/2021 | $12.30 | 0.16 | (0.70) | (0.54) | (0.16) | (0.07) | (0.23) |
| Year Ended 4/30/2020 | $11.01 | 0.23 | 1.29 | 1.52 | (0.23) | — | (0.23) |
| Year Ended 4/30/2019 | $10.75 | 0.22 | 0.27 | 0.49 | (0.23) | — | (0.23) |
| Year Ended 4/30/2018 | $11.06 | 0.18 | (0.31) | (0.13) | (0.18) | — | (0.18) |
| Institutional 2 Class | |||||||
| Year Ended 4/30/2022 | $11.50 | 0.13 | (0.97) | (0.84) | (0.14) | (0.02) | (0.16) |
| Year Ended 4/30/2021 | $12.27 | 0.16 | (0.70) | (0.54) | (0.16) | (0.07) | (0.23) |
| Year Ended 4/30/2020 | $10.98 | 0.23 | 1.29 | 1.52 | (0.23) | — | (0.23) |
| Year Ended 4/30/2019 | $10.73 | 0.23 | 0.25 | 0.48 | (0.23) | — | (0.23) |
| Year Ended 4/30/2018 | $11.04 | 0.18 | (0.31) | (0.13) | (0.18) | — | (0.18) |
| 16 | Columbia U.S. Treasury Index Fund | Annual Report 2022 |
| Net asset value, end of period | Total return | Total gross expense ratio to average net assets(a) | Total net expense ratio to average net assets(a),(b) | Net investment income ratio to average net assets | Portfolio turnover | Net assets, end of period (000’s) | |
| Class A | |||||||
| Year Ended 4/30/2022 | $10.52 | (7.54%) | 0.59% | 0.32%(c) | 1.03% | 31% | $35,499 |
| Year Ended 4/30/2021 | $11.52 | (4.66%) | 0.65% | 0.32%(c),(d) | 1.20% | 40% | $48,338 |
| Year Ended 4/30/2020 | $12.30 | 13.88% | 0.65% | 0.33%(c),(d) | 1.83% | 54% | $51,890 |
| Year Ended 4/30/2019 | $11.00 | 4.32% | 0.65% | 0.35%(c),(d) | 1.93% | 50% | $35,707 |
| Year Ended 4/30/2018 | $10.75 | (1.35%) | 0.65% | 0.35%(c),(d) | 1.49% | 27% | $45,074 |
| Class C | |||||||
| Year Ended 4/30/2022 | $10.52 | (8.14%) | 1.29% | 0.97%(c) | 0.37% | 31% | $2,540 |
| Year Ended 4/30/2021 | $11.52 | (5.22%) | 1.40% | 0.99%(c),(d) | 0.53% | 40% | $6,680 |
| Year Ended 4/30/2020 | $12.29 | 13.00% | 1.41% | 1.03%(c),(d) | 1.12% | 54% | $6,910 |
| Year Ended 4/30/2019 | $11.00 | 3.59% | 1.40% | 1.05%(c),(d) | 1.23% | 50% | $2,801 |
| Year Ended 4/30/2018 | $10.75 | (2.03%) | 1.41% | 1.05%(c),(d) | 0.78% | 27% | $4,143 |
| Institutional Class | |||||||
| Year Ended 4/30/2022 | $10.52 | (7.48%) | 0.40% | 0.17%(c) | 1.18% | 31% | $444,883 |
| Year Ended 4/30/2021 | $11.53 | (4.44%) | 0.40% | 0.17%(c) | 1.35% | 40% | $537,273 |
| Year Ended 4/30/2020 | $12.30 | 13.95% | 0.40% | 0.18%(c) | 1.98% | 54% | $581,931 |
| Year Ended 4/30/2019 | $11.01 | 4.57% | 0.40% | 0.20%(c) | 2.08% | 50% | $323,226 |
| Year Ended 4/30/2018 | $10.75 | (1.20%) | 0.40% | 0.20%(c) | 1.64% | 27% | $392,889 |
| Institutional 2 Class | |||||||
| Year Ended 4/30/2022 | $10.50 | (7.42%) | 0.40% | 0.17% | 1.18% | 31% | $43,738 |
| Year Ended 4/30/2021 | $11.50 | (4.45%) | 0.40% | 0.17% | 1.35% | 40% | $53,191 |
| Year Ended 4/30/2020 | $12.27 | 13.98% | 0.40% | 0.18% | 1.98% | 54% | $51,284 |
| Year Ended 4/30/2019 | $10.98 | 4.48% | 0.40% | 0.20% | 2.10% | 50% | $35,855 |
| Year Ended 4/30/2018 | $10.73 | (1.20%) | 0.40% | 0.20% | 1.65% | 27% | $30,710 |
| Columbia U.S. Treasury Index Fund | Annual Report 2022 | 17 |
| Net asset value, beginning of period | Net investment income | Net realized and unrealized gain (loss) | Total from investment operations | Distributions from net investment income | Distributions from net realized gains | Total distributions to shareholders | |
| Institutional 3 Class | |||||||
| Year Ended 4/30/2022 | $11.59 | 0.14 | (0.99) | (0.85) | (0.14) | (0.02) | (0.16) |
| Year Ended 4/30/2021 | $12.37 | 0.16 | (0.71) | (0.55) | (0.16) | (0.07) | (0.23) |
| Year Ended 4/30/2020 | $11.07 | 0.23 | 1.30 | 1.53 | (0.23) | — | (0.23) |
| Year Ended 4/30/2019 | $10.81 | 0.23 | 0.26 | 0.49 | (0.23) | — | (0.23) |
| Year Ended 4/30/2018 | $11.13 | 0.18 | (0.32) | (0.14) | (0.18) | — | (0.18) |
| Notes to Financial Highlights | |
| (a) | In addition to the fees and expenses that the Fund bears directly, the Fund indirectly bears a pro rata share of the fees and expenses of any other funds in which it invests. Such indirect expenses are not included in the Fund’s reported expense ratios. |
| (b) | Total net expenses include the impact of certain fee waivers/expense reimbursements made by the Investment Manager and certain of its affiliates, if applicable. |
| (c) | The benefits derived from expense reductions had an impact of less than 0.01%. |
| (d) | Ratios include the impact of voluntary waivers paid by the Investment Manager. For the periods indicated below, if the Investment Manager had not paid these voluntary waivers, the Fund’s net expense ratio would increase by: |
| 4/30/2021 | 4/30/2020 | 4/30/2019 | 4/30/2018 | |
| Class A | 0.03% | 0.10% | 0.10% | 0.10% |
| Class C | 0.05% | 0.15% | 0.15% | 0.15% |
| 18 | Columbia U.S. Treasury Index Fund | Annual Report 2022 |
| Net asset value, end of period | Total return | Total gross expense ratio to average net assets(a) | Total net expense ratio to average net assets(a),(b) | Net investment income ratio to average net assets | Portfolio turnover | Net assets, end of period (000’s) | |
| Institutional 3 Class | |||||||
| Year Ended 4/30/2022 | $10.58 | (7.44%) | 0.40% | 0.17% | 1.19% | 31% | $766,175 |
| Year Ended 4/30/2021 | $11.59 | (4.49%) | 0.40% | 0.17% | 1.33% | 40% | $592,772 |
| Year Ended 4/30/2020 | $12.37 | 13.97% | 0.40% | 0.18% | 2.00% | 54% | $415,616 |
| Year Ended 4/30/2019 | $11.07 | 4.56% | 0.40% | 0.20% | 2.10% | 50% | $445,200 |
| Year Ended 4/30/2018 | $10.81 | (1.27%) | 0.40% | 0.20% | 1.66% | 27% | $401,768 |
| Columbia U.S. Treasury Index Fund | Annual Report 2022 | 19 |
April 30, 2022
| 20 | Columbia U.S. Treasury Index Fund | Annual Report 2022 |
April 30, 2022
| Columbia U.S. Treasury Index Fund | Annual Report 2022 | 21 |
April 30, 2022
| 22 | Columbia U.S. Treasury Index Fund | Annual Report 2022 |
April 30, 2022
| Front End (%) | CDSC (%) | Amount ($) | |
| Class C | — | 1.00(a) | 2,377 |
| (a) | This charge applies to redemptions within 12 months after purchase, with certain limited exceptions. |
| September 1, 2021 through August 31, 2022 | Prior to September 1, 2021 | |
| Class A | 0.32% | 0.42% |
| Class C | 0.97 | 1.17 |
| Institutional Class | 0.17 | 0.17 |
| Institutional 2 Class | 0.17 | 0.17 |
| Institutional 3 Class | 0.17 | 0.17 |
| Columbia U.S. Treasury Index Fund | Annual Report 2022 | 23 |
April 30, 2022
| Excess of distributions over net investment income ($) | Accumulated net realized (loss) ($) | Paid in capital ($) |
| (200,287) | 200,287 | — |
| Year Ended April 30, 2022 | Year Ended April 30, 2021 | ||||
| Ordinary income ($) | Long-term capital gains ($) | Total ($) | Ordinary income ($) | Long-term capital gains ($) | Total ($) |
| 17,854,919 | 2,892,743 | 20,747,662 | 19,038,808 | 3,523,944 | 22,562,752 |
| Undistributed ordinary income ($) | Undistributed long-term capital gains ($) | Capital loss carryforwards ($) | Net unrealized (depreciation) ($) |
| 1,211,183 | — | — | (104,421,973) |
| Federal tax cost ($) | Gross unrealized appreciation ($) | Gross unrealized (depreciation) ($) | Net unrealized (depreciation) ($) |
| 1,394,834,577 | 697,834 | (105,119,807) | (104,421,973) |
| 24 | Columbia U.S. Treasury Index Fund | Annual Report 2022 |
April 30, 2022
| Late year ordinary losses ($) | Post-October capital losses ($) |
| — | 3,404,597 |
| Columbia U.S. Treasury Index Fund | Annual Report 2022 | 25 |
April 30, 2022
| 26 | Columbia U.S. Treasury Index Fund | Annual Report 2022 |
April 30, 2022
| Columbia U.S. Treasury Index Fund | Annual Report 2022 | 27 |
| 28 | Columbia U.S. Treasury Index Fund | Annual Report 2022 |
| Capital gain dividend | Section 163(j) Interest Dividends |
| $382,751 | 100.00% |
| Name, address, year of birth | Position held with the Columbia Funds and length of service | Principal occupation(s) during past five years and other relevant professional experience | Number of Funds in the Columbia Funds Complex* overseen | Other directorships held by Trustee during the past five years |
| George S. Batejan c/o Columbia Management Investment Advisers, LLC 290 Congress Street Boston, MA 02210 1953 | Trustee since 2017 | Executive Vice President, Global Head of Technology and Operations, Janus Capital Group, Inc., 2010-2016 | 176 | Former Chairman of the Board, NICSA (National Investment Company Services Association) (Executive Committee, Nominating Committee and Governance Committee), 2014-2016; former Director, Intech Investment Management, 2011-2016; former Board Member, Metro Denver Chamber of Commerce, 2015-2016; former Advisory Board Member, University of Colorado Business School, 2015-2018 |
| Columbia U.S. Treasury Index Fund | Annual Report 2022 | 29 |
(Unaudited)
Independent trustees (continued)
| Name, address, year of birth | Position held with the Columbia Funds and length of service | Principal occupation(s) during past five years and other relevant professional experience | Number of Funds in the Columbia Funds Complex* overseen | Other directorships held by Trustee during the past five years |
| Kathleen Blatz c/o Columbia Management Investment Advisers, LLC 290 Congress Street Boston, MA 02210 1954 | Trustee since 2006 | Attorney, specializing in arbitration and mediation; Chief Justice, Minnesota Supreme Court, 1998-2006; Associate Justice, Minnesota Supreme Court, 1996-1998; Fourth Judicial District Court Judge, Hennepin County, 1994-1996; Attorney in private practice and public service, 1984-1993; State Representative, Minnesota House of Representatives, 1979-1993, which included service on the Tax and Financial Institutions and Insurance Committees; Member and Interim Chair, Minnesota Sports Facilities Authority, January 2017-July 2017; Interim President and Chief Executive Officer, Blue Cross and Blue Shield of Minnesota (health care insurance), February-July 2018, April-October 2021 | 176 | Former Trustee, Blue Cross and Blue Shield of Minnesota, 2009-2021 (Chair of the Business Development Committee, 2014-2017; Chair of the Governance Committee, 2017-2019); former Member and Chair of the Board, Minnesota Sports Facilities Authority, January 2017-July 2017; former Director, Robina Foundation, 2009-2020 (Chair, 2014-2020); Director, Schulze Family Foundation, since 2021 |
| Pamela G. Carlton c/o Columbia Management Investment Advisers, LLC 290 Congress Street Boston, MA 02210 1954 | Trustee since 2007 | President, Springboard — Partners in Cross Cultural Leadership (consulting company) since 2003; Managing Director of US Equity Research, JP Morgan Chase, 1999-2003; Director of US Equity Research, Chase Asset Management, 1996-1999; Co-Director Latin America Research, 1993-1996, COO Global Research, 1992-1996, Co-Director of US Research, 1991-1992, Investment Banker, 1982-1991, Morgan Stanley; Attorney, Cleary Gottlieb Steen & Hamilton LLP, 1980-1982 | 176 | Trustee, New York Presbyterian Hospital Board (Executive Committee and Chair of People Committee) since 1996; Director, DR Bank (Audit Committee) since 2017; Director, Evercore Inc. (Audit Committee) since 2019; Director, Apollo Commercial Real Estate Finance, Inc. since 2021; the Governing Council of the Independent Directors Council (IDC), since 2021 |
| Janet Langford Carrig c/o Columbia Management Investment Advisers, LLC 290 Congress Street Boston, MA 02210 1957 | Trustee since 1996 | Senior Vice President, General Counsel and Corporate Secretary, ConocoPhillips (independent energy company), September 2007-October 2018 | 174 | Director, EQT Corporation (natural gas producer) since 2019; Director, Whiting Petroleum Corporation (independent oil and gas company) since 2020 |
| J. Kevin Connaughton c/o Columbia Management Investment Advisers, LLC 290 Congress Street Boston, MA 02210 1964 | Trustee since 2020 | Member, FINRA National Adjudicatory Council since January 2020; Adjunct Professor of Finance, Bentley University since January 2018; Consultant to Independent Trustees of CFVIT and CFST I from March 2016 to June 2020 with respect to CFVIT and to December 2020 with respect to CFST I; Managing Director and General Manager of Mutual Fund Products, Columbia Management Investment Advisers, LLC, May 2010-February 2015; President, Columbia Funds, 2008-2015; and senior officer of Columbia Funds and affiliated funds, 2003-2015 | 174 | Former Director, The Autism Project, March 2015-December 2021; former Member of the Investment Committee, St. Michael’s College, November 2015-February 2020; former Trustee, St. Michael’s College, June 2017-September 2019; former Trustee, New Century Portfolios, January 2015-December 2017 |
| 30 | Columbia U.S. Treasury Index Fund | Annual Report 2022 |
(Unaudited)
Independent trustees (continued)
| Name, address, year of birth | Position held with the Columbia Funds and length of service | Principal occupation(s) during past five years and other relevant professional experience | Number of Funds in the Columbia Funds Complex* overseen | Other directorships held by Trustee during the past five years |
| Olive M. Darragh c/o Columbia Management Investment Advisers, LLC 290 Congress Street Boston, MA 02210 1962 | Trustee since 2020 | Managing Director of Darragh Inc. (strategy and talent management consulting firm) since 2010; Founder and CEO, Zolio, Inc. (investment management talent identification platform) since 2004; Consultant to Independent Trustees of CFVIT and CFST I from June 2019 to June 2020 with respect to CFVIT and to December 2020 with respect to CFST I; Partner, Tudor Investments, 2004-2010; Senior Partner, McKinsey & Company (consulting), 1990-2004; Touche Ross CPA, 1985-1988 | 174 | Former Director, University of Edinburgh Business School (Member of US Board); former Director, Boston Public Library Foundation |
| Patricia M. Flynn c/o Columbia Management Investment Advisers, LLC 290 Congress Street Boston, MA 02210 1950 | Trustee since 2004 | Trustee Professor of Economics and Management, Bentley University since 1976 (also teaches and conducts research on corporate governance); Dean, McCallum Graduate School of Business, Bentley University, 1992-2002 | 176 | Trustee, MA Taxpayers Foundation since 1997; Board of Governors, Innovation Institute, MA Technology Collaborative, 2010-2020; former Board of Directors, The MA Business Roundtable, 2003-2019 |
| Brian J. Gallagher c/o Columbia Management Investment Advisers, LLC 290 Congress Street Boston, MA 02210 1954 | Trustee since 2017 | Retired; Partner with Deloitte & Touche LLP and its predecessors, 1977-2016 | 176 | Trustee, Catholic Schools Foundation since 2004 |
| Douglas A. Hacker c/o Columbia Management Investment Advisers, LLC 290 Congress Street Boston, MA 02210 1955 | Co-Chair since 2021; Chair of CFST I and CFVIT since 2014; Trustee of CFST I and CFVIT since 1996 and CFST, CFST II, CFVST II, CET I and CET II since 2021 | Independent business executive since May 2006; Executive Vice President – Strategy of United Airlines, December 2002 - May 2006; President of UAL Loyalty Services (airline marketing company), September 2001-December 2002; Executive Vice President and Chief Financial Officer of United Airlines, July 1999-September 2001 | 176 | Director, Spartan Nash Company (food distributor); Director, Aircastle Limited (Chair of Audit Committee) (aircraft leasing); former Director, Nash Finch Company (food distributor), 2005-2013; former Director, SeaCube Container Leasing Ltd. (container leasing), 2010-2013; and former Director, Travelport Worldwide Limited (travel information technology), 2014-2019 |
| Nancy T. Lukitsh c/o Columbia Management Investment Advisers, LLC 290 Congress Street Boston, MA 02210 1956 | Trustee since 2011 | Senior Vice President, Partner and Director of Marketing, Wellington Management Company, LLP (investment adviser), 1997-2010; Chair, Wellington Management Portfolios (commingled non-U.S. investment pools), 2007 -2010; Director, Wellington Trust Company, NA and other Wellington affiliates, 1997-2010 | 174 | None |
| Columbia U.S. Treasury Index Fund | Annual Report 2022 | 31 |
(Unaudited)
Independent trustees (continued)
| Name, address, year of birth | Position held with the Columbia Funds and length of service | Principal occupation(s) during past five years and other relevant professional experience | Number of Funds in the Columbia Funds Complex* overseen | Other directorships held by Trustee during the past five years |
| David M. Moffett c/o Columbia Management Investment Advisers, LLC 290 Congress Street Boston, MA 02210 1952 | Trustee since 2011 | Retired; Consultant to Bridgewater and Associates | 174 | Director, CSX Corporation (transportation suppliers); Director, Genworth Financial, Inc. (financial and insurance products and services); Director, PayPal Holdings Inc. (payment and data processing services); Trustee, University of Oklahoma Foundation; former Director, eBay Inc. (online trading community), 2007-2015; and former Director, CIT Bank, CIT Group Inc. (commercial and consumer finance), 2010-2016 |
| Catherine James Paglia c/o Columbia Management Investment Advisers, LLC 290 Congress Street Boston, MA 02210 1952 | Co-Chair since 2021; Chair of CFST, CFST II, CFVST II, CET I and CET II since 2020; Trustee of CFST, CFST II and CFVST II since 2004 and CFST I and CFVIT since 2021 | Director, Enterprise Asset Management, Inc. (private real estate and asset management company) since September 1998; Managing Director and Partner, Interlaken Capital, Inc., 1989-1997; Vice President, 1982-1985, Principal, 1985-1987, Managing Director, 1987-1989, Morgan Stanley; Vice President, Investment Banking, 1980-1982, Associate, Investment Banking, 1976-1980, Dean Witter Reynolds, Inc. | 176 | Director, Valmont Industries, Inc. (irrigation systems manufacturer) since 2012; Trustee, Carleton College (on the Investment Committee); Trustee, Carnegie Endowment for International Peace (on the Investment Committee) |
| Minor M. Shaw c/o Columbia Management Investment Advisers, LLC 290 Congress Street Boston, MA 02210 1947 | Trustee since 2003 | President, Micco LLC (private investments) since 2011; President, Micco Corp. (family investment business), 1998-2011 | 176 | Director, Blue Cross Blue Shield of South Carolina (Chair of Compensation Committee) since April 2008; Trustee, Hollingsworth Funds (on the Investment Committee) since 2016 (previously Board Chair from 2016-2019); Former Advisory Board member, Duke Energy Corp., 2016-2020; Chair of the Duke Endowment; Chair of Greenville – Spartanburg Airport Commission; former Trustee, BofA Funds Series Trust (11 funds), 2003-2011; former Director, Piedmont Natural Gas, 2004-2016; former Director, National Association of Corporate Directors, Carolinas Chapter, 2013-2018; Chair, Daniel-Mickel Foundation since 1998 |
| 32 | Columbia U.S. Treasury Index Fund | Annual Report 2022 |
(Unaudited)
Independent trustees (continued)
| Name, address, year of birth | Position held with the Columbia Funds and length of service | Principal occupation(s) during past five years and other relevant professional experience | Number of Funds in the Columbia Funds Complex* overseen | Other directorships held by Trustee during the past five years |
| Natalie A. Trunow c/o Columbia Management Investment Advisers, LLC 290 Congress Street Boston, MA 02210 1967 | Trustee since 2020 | Chief Executive Officer, Millennial Portfolio Solutions LLC (asset management and consulting services), January 2016-January 2021; Non-executive Member of the Investment Committee and Valuation Committee, Sarona Asset Management Inc. (private equity firm) since September 2019; Advisor, Horizon Investments (asset management and consulting services), August 2018-January 2021; Advisor, Paradigm Asset Management, November 2016-December 2021; Consultant to Independent Trustees of CFVIT and CFST I from September 2016 to June 2020 with respect to CFVIT and to December 2020 with respect to CFST I; Director of Investments/Consultant, Casey Family Programs, April 2016-November 2016; Senior Vice President and Chief Investment Officer, Calvert Investments, August 2008-January 2016; Section Head and Portfolio Manager, General Motors Asset Management, June 1997-August 2008 | 174 | Former Director, Investment Committee, Health Services for Children with Special Needs, Inc., 2012-2019; Director, Chair of Audit Committee, Consumer Credit Counseling Services (formerly Guidewell Financial Solutions), since 2019; Independent Director, Investment Committee and Valuation Committee, Sarona Asset Management, since 2019 |
| Sandra L. Yeager c/o Columbia Management Investment Advisers, LLC 290 Congress Street Boston, MA 02210 1964 | Trustee since 2017 | Retired; President and founder, Hanoverian Capital, LLC (SEC registered investment advisor firm), 2008-2016; Managing Director, DuPont Capital, 2006-2008; Managing Director, Morgan Stanley Investment Management, 2004-2006; Senior Vice President, Alliance Bernstein, 1990-2004 | 176 | Former Director, NAPE Education Foundation, October 2016-October 2020 |
| * | The term “Columbia Funds Complex” as used herein includes Columbia Seligman Premium Technology Growth Fund, Tri-Continental Corporation and each series of Columbia Fund Series Trust (CFST), Columbia Funds Series Trust I (CFST I), Columbia Funds Series Trust II (CFST II), Columbia ETF Trust I (CET I), Columbia ETF Trust II (CET II), Columbia Funds Variable Insurance Trust (CFVIT) and Columbia Funds Variable Series Trust II (CFVST II). Messrs. Batejan, Beckman, Gallagher and Hacker and Mses. Blatz, Carlton, Flynn, Paglia, Shaw and Yeager serve as Directors of Columbia Seligman Premium Technology Growth Fund and Tri-Continental Corporation. |
| Name, address, year of birth | Position held with the Columbia Funds and length of service | Principal occupation(s) during the past five years and other relevant professional experience | Number of Funds in the Columbia Funds Complex overseen | Other directorships held by Trustee during the past five years |
| Daniel J. Beckman c/o Columbia Management Investment Advisers, LLC 290 Congress Street Boston, MA 02210 1962 | Trustee since November 2021 and President since June 2021 | Vice President – Head of North America Product, Columbia Management Investment Advisers, LLC since April 2015; President and Principal Executive Officer of the Columbia Funds since June 2021; officer of Columbia Funds and affiliated funds, 2020-2021 | 176 | Director, Ameriprise Trust Company, since October 2016; Director, Columbia Management Investment Distributors, Inc. since November 2018; Board of Governors, Columbia Wanger Asset Management, LLC since January 2022 |
| * | Interested person (as defined under the 1940 Act) by reason of being an officer, director, security holder and/or employee of the Investment Manager or Ameriprise Financial. |
| Columbia U.S. Treasury Index Fund | Annual Report 2022 | 33 |
(Unaudited)
The Board has appointed officers who are responsible for day-to-day business decisions based on policies it has established. The officers serve at the pleasure of the Board. The following table provides basic information about the Officers of the Fund as of the printing of this report, including principal occupations during the past five years, although their specific titles may have varied over the period. In addition to Mr. Beckman, who is President and Principal Executive Officer, the Fund’s other officers are:
| Name, address and year of birth | Position and year first appointed to position for any Fund in the Columbia Funds Complex or a predecessor thereof | Principal occupation(s) during past five years |
| Michael G. Clarke 290 Congress Street Boston, MA 02210 1969 | Chief Financial Officer and Principal Financial Officer (2009) and Senior Vice President (2019) | Senior Vice President and Head of Global Operations & Investor Services, Columbia Management Investment Advisers, LLC, since March 2022 (previously Vice President, Head of North American Operations, and Co-Head of Global Operations, June 2019 to February 2022 and Vice President – Accounting and Tax, May 2010 - May 2019); senior officer of Columbia Funds and affiliated funds since 2002. |
| Joseph Beranek 5890 Ameriprise Financial Center Minneapolis, MN 55474 1965 | Treasurer and Chief Accounting Officer (Principal Accounting Officer) (2019) and Principal Financial Officer (2020), CFST, CFST I, CFST II, CFVIT and CFVST II; Assistant Treasurer, CET I and CET II | Vice President – Mutual Fund Accounting and Financial Reporting, Columbia Management Investment Advisers, LLC, since December 2018 and March 2017, respectively (previously Vice President – Pricing and Corporate Actions, May 2010 - March 2017). |
| Marybeth Pilat 290 Congress Street Boston, MA 02210 1968 | Treasurer and Chief Accounting Officer (Principal Accounting Officer) and Principal Financial Officer (2020) for CET I and CET II; Assistant Treasurer, CFST, CFST I, CFST II, CFVIT and CFVST II | Vice President – Product Pricing and Administration, Columbia Management Investment Advisers, LLC, since May 2017; Director - Fund Administration, Calvert Investments, August 2015 – March 2017; Vice President - Fund Administration, Legg Mason, May 2015 - July 2015; Vice President - Fund Administration, Columbia Management Investment Advisers, LLC, May 2010 - April 2015. |
| William F. Truscott 290 Congress Street Boston, MA 02210 1960 | Senior Vice President (2001) | Formerly, Trustee/Director of Columbia Funds Complex or legacy funds, November 2001-January 1, 2021; Chief Executive Officer, Global Asset Management, Ameriprise Financial, Inc. since September 2012; Chairman of the Board and President, Columbia Management Investment Advisers, LLC since July 2004 and February 2012, respectively; Chairman of the Board and Chief Executive Officer, Columbia Management Investment Distributors, Inc. since November 2008 and February 2012, respectively; Chairman of the Board and Director, Threadneedle Asset Management Holdings, Sàrl since March 2013 and December 2008, respectively; senior executive of various entities affiliated with Columbia Threadneedle. |
| Christopher O. Petersen 5228 Ameriprise Financial Center Minneapolis, MN 55474 1970 | Senior Vice President and Assistant Secretary (2021) | Formerly, Trustee/Director of funds within the Columbia Funds Complex, July 1, 2020 - November 22, 2021; Senior Vice President and Assistant General Counsel, Ameriprise Financial, Inc. since September 2021 (previously Vice President and Lead Chief Counsel, January 2015 - September 2021); President and Principal Executive Officer of the Columbia Funds, 2015 - 2021; officer of Columbia Funds and affiliated funds since 2007. |
| Thomas P. McGuire 290 Congress Street Boston, MA 02210 1972 | Senior Vice President and Chief Compliance Officer (2012) | Vice President – Asset Management Compliance, Ameriprise Financial, Inc., since May 2010; Chief Compliance Officer, Columbia Acorn/Wanger Funds since December 2015; Chief Compliance Officer, Ameriprise Certificate Company, September 2010 – September 2020. |
| Ryan C. Larrenaga 290 Congress Street Boston, MA 02210 1970 | Senior Vice President (2017), Chief Legal Officer (2017), and Secretary (2015) | Vice President and Chief Counsel, Ameriprise Financial, Inc. since August 2018 (previously Vice President and Group Counsel, August 2011 - August 2018); Chief Legal Officer, Columbia Acorn/Wanger Funds, since September 2020; officer of Columbia Funds and affiliated funds since 2005. |
| 34 | Columbia U.S. Treasury Index Fund | Annual Report 2022 |
(Unaudited)
Fund officers (continued)
| Name, address and year of birth | Position and year first appointed to position for any Fund in the Columbia Funds Complex or a predecessor thereof | Principal occupation(s) during past five years |
| Michael E. DeFao 290 Congress Street Boston, MA 02210 1968 | Vice President (2011) and Assistant Secretary (2010) | Vice President and Chief Counsel, Ameriprise Financial, Inc. since May 2010; Vice President, Chief Legal Officer and Assistant Secretary, Columbia Management Investment Advisers, LLC since October 2021 (previously Vice President and Assistant Secretary, May 2010 – September 2021). |
| Lyn Kephart-Strong 5228 Ameriprise Financial Center Minneapolis, MN 55474 1960 | Vice President (2015) | President, Columbia Management Investment Services Corp. since October 2014; Vice President & Resolution Officer, Ameriprise Trust Company since August 2009. |
| • | the Fund had sufficient liquidity to both meet redemptions and operate effectively on behalf of shareholders; |
| • | there were no material changes to the Program during the period; |
| • | the implementation of the Program was effective to manage the Fund’s liquidity risk; and |
| • | the Program operated adequately during the period. |
| Columbia U.S. Treasury Index Fund | Annual Report 2022 | 35 |
columbiathreadneedleus.com/investor/. The Fund is distributed by Columbia Management Investment Distributors, Inc., member FINRA, and managed by Columbia Management Investment Advisers, LLC.

April 30, 2022

| 3 | |
| 5 | |
| 7 | |
| 8 | |
| 24 | |
| 26 | |
| 27 | |
| 30 | |
| 34 | |
| 48 | |
| 49 | |
| 49 | |
| 55 |
(Unaudited)
| Average annual total returns (%) (for the period ended April 30, 2022) | |||||
| Inception | 1 Year | 5 Years | 10 Years | ||
| Class A | Excluding sales charges | 07/31/00 | -10.79 | 1.92 | 2.76 |
| Including sales charges | -15.05 | 0.94 | 2.27 | ||
| Advisor Class* | 11/08/12 | -10.58 | 2.17 | 3.03 | |
| Class C | Excluding sales charges | 07/15/02 | -11.28 | 1.33 | 2.16 |
| Including sales charges | -12.14 | 1.33 | 2.16 | ||
| Institutional Class | 03/05/86 | -10.57 | 2.17 | 3.02 | |
| Institutional 2 Class* | 11/08/12 | -10.49 | 2.29 | 3.14 | |
| Institutional 3 Class* | 11/08/12 | -10.43 | 2.33 | 3.19 | |
| Blended Benchmark | -9.62 | 2.22 | 3.28 | ||
| Bloomberg U.S. Corporate Bond Index | -10.43 | 1.97 | 2.93 | ||
| * | The returns shown for periods prior to the share class inception date (including returns for the Life of the Fund, if shown, which are since Fund inception) include the returns of the Fund’s oldest share class. These returns are adjusted to reflect any higher class-related operating expenses of the newer share classes, as applicable. Please visit columbiathreadneedleus.com/investor/investment-products/mutual-funds/appended-performance for more information. |
| Columbia Corporate Income Fund | Annual Report 2022 | 3 |
(Unaudited)
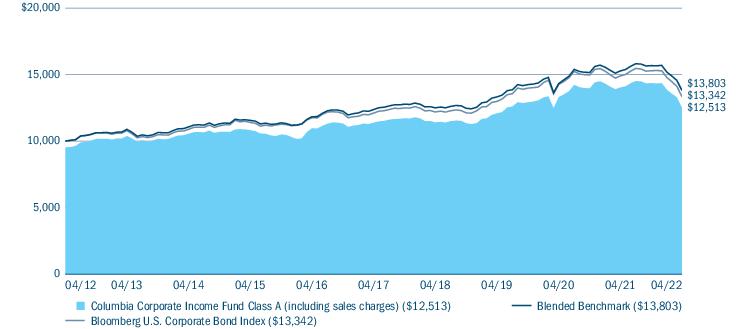
| Portfolio breakdown (%) (at April 30, 2022) | |
| Common Stocks | 0.0(a) |
| Convertible Bonds | 0.0(a) |
| Corporate Bonds & Notes | 90.6 |
| Foreign Government Obligations | 0.0(a) |
| Money Market Funds | 6.9 |
| Senior Loans | 0.2 |
| U.S. Treasury Obligations | 2.3 |
| Total | 100.0 |
| (a) | Rounds to zero. |
| Quality breakdown (%) (at April 30, 2022) | |
| AAA rating | 3.5 |
| AA rating | 5.1 |
| A rating | 24.8 |
| BBB rating | 46.8 |
| BB rating | 11.3 |
| B rating | 6.6 |
| CCC rating | 1.7 |
| Not rated | 0.2 |
| Total | 100.0 |
| 4 | Columbia Corporate Income Fund | Annual Report 2022 |
(Unaudited)
| • | The Fund’s consistent overweight to credit versus the benchmark weighed on relative return. This was primarily driven by exposure to below-investment-grade, high-yield corporates. |
| • | Security selection within high yield detracted as well. The team marginally reduced the portfolio’s credit risk profile in the latter part of the period while awaiting a possible re-entry point after first quarter earnings are reported. |
| • | Overall security selection detracted from the Fund’s relative performance over the period. Within investment-grade corporates, notable individual detractors included positions held in a cable company and a communication services company. Marginally offsetting these detractors were positions in a media company and a food & beverage company. |
| • | Sector and sub-industry exposures within investment-grade corporates also constrained relative performance. Most notably, an overweight to banking and an underweight to independent energy detracted. The negative impact of these allocations was modestly offset by overweights to finance companies and midstream energy. |
| Columbia Corporate Income Fund | Annual Report 2022 | 5 |
(Unaudited)
| • | Positive contributions to performance relative to the benchmark were led by the Fund’s stance with respect to overall portfolio duration and corresponding sensitivity to changes in interest rates. Specifically, the Fund was slightly underweight duration as Treasury yields moved sharply higher in the first quarter of 2022. |
| • | Duration and yield curve positioning are generally not a meaningful source of relative performance for the Fund as the management team seeks to maintain portfolio duration within a fairly narrow band around that of the benchmark. |
| 6 | Columbia Corporate Income Fund | Annual Report 2022 |
(Unaudited)
| November 1, 2021 — April 30, 2022 | |||||||
| Account value at the beginning of the period ($) | Account value at the end of the period ($) | Expenses paid during the period ($) | Fund’s annualized expense ratio (%) | ||||
| Actual | Hypothetical | Actual | Hypothetical | Actual | Hypothetical | Actual | |
| Class A | 1,000.00 | 1,000.00 | 871.60 | 1,020.59 | 4.06 | 4.38 | 0.87 |
| Advisor Class | 1,000.00 | 1,000.00 | 873.40 | 1,021.84 | 2.90 | 3.13 | 0.62 |
| Class C | 1,000.00 | 1,000.00 | 869.20 | 1,017.85 | 6.62 | 7.14 | 1.42 |
| Institutional Class | 1,000.00 | 1,000.00 | 872.70 | 1,021.84 | 2.89 | 3.13 | 0.62 |
| Institutional 2 Class | 1,000.00 | 1,000.00 | 873.80 | 1,022.34 | 2.43 | 2.62 | 0.52 |
| Institutional 3 Class | 1,000.00 | 1,000.00 | 874.20 | 1,022.59 | 2.20 | 2.37 | 0.47 |
| Columbia Corporate Income Fund | Annual Report 2022 | 7 |
April 30, 2022
| Common Stocks 0.0% | ||
| Issuer | Shares | Value ($) |
| Financials 0.0% | ||
| Insurance 0.0% | ||
| Mr. Cooper Group, Inc.(a) | 1,782 | 80,137 |
| Total Financials | 80,137 | |
| Total Common Stocks (Cost $1,077,470) | 80,137 | |
| Convertible Bonds 0.0% | ||||
| Issuer | Coupon Rate | Principal Amount ($) | Value ($) | |
| Cable and Satellite 0.0% | ||||
| DISH Network Corp. | ||||
| Subordinated | ||||
| 08/15/2026 | 3.375% | 471,000 | 403,882 | |
| Total Convertible Bonds (Cost $445,855) | 403,882 | |||
| Corporate Bonds & Notes 89.8% | ||||
| Aerospace & Defense 4.2% | ||||
| BAE Systems PLC(b) | ||||
| 02/15/2031 | 1.900% | 29,890,000 | 24,502,531 | |
| Boeing Co. (The) | ||||
| 03/01/2029 | 3.200% | 5,263,000 | 4,719,014 | |
| 05/01/2034 | 3.600% | 1,109,000 | 942,509 | |
| 08/01/2059 | 3.950% | 15,225,000 | 11,332,659 | |
| Bombardier, Inc.(b) | ||||
| 12/01/2024 | 7.500% | 269,000 | 268,548 | |
| 04/15/2027 | 7.875% | 360,000 | 335,451 | |
| Howmet Aerospace, Inc. | ||||
| 01/15/2029 | 3.000% | 9,685,000 | 8,461,904 | |
| Lockheed Martin Corp.(c) | ||||
| 06/15/2053 | 4.150% | 832,000 | 807,439 | |
| 06/15/2062 | 4.300% | 2,898,000 | 2,830,816 | |
| Moog, Inc.(b) | ||||
| 12/15/2027 | 4.250% | 139,000 | 130,536 | |
| Raytheon Technologies Corp. | ||||
| 03/15/2032 | 2.375% | 4,340,000 | 3,717,025 | |
| Spirit AeroSystems, Inc.(b) | ||||
| 04/15/2025 | 7.500% | 2,000,000 | 2,031,216 | |
| TransDigm, Inc.(b) | ||||
| 03/15/2026 | 6.250% | 4,391,000 | 4,396,614 | |
| Corporate Bonds & Notes (continued) | ||||
| Issuer | Coupon Rate | Principal Amount ($) | Value ($) | |
| TransDigm, Inc. | ||||
| 06/15/2026 | 6.375% | 622,000 | 614,643 | |
| 11/15/2027 | 5.500% | 710,000 | 651,156 | |
| 05/01/2029 | 4.875% | 664,000 | 581,514 | |
| Total | 66,323,575 | |||
| Airlines 0.3% | ||||
| Air Canada(b) | ||||
| 08/15/2026 | 3.875% | 520,000 | 480,791 | |
| American Airlines, Inc.(b) | ||||
| 07/15/2025 | 11.750% | 400,000 | 460,934 | |
| American Airlines, Inc./AAdvantage Loyalty IP Ltd.(b) | ||||
| 04/20/2026 | 5.500% | 1,322,207 | 1,310,450 | |
| 04/20/2029 | 5.750% | 179,155 | 172,848 | |
| Delta Air Lines, Inc. | ||||
| 01/15/2026 | 7.375% | 491,000 | 523,027 | |
| 04/19/2028 | 4.375% | 135,000 | 126,373 | |
| Hawaiian Brand Intellectual Property Ltd./Miles Loyalty Ltd.(b) | ||||
| 01/20/2026 | 5.750% | 482,739 | 471,158 | |
| United Airlines, Inc.(b) | ||||
| 04/15/2026 | 4.375% | 219,000 | 211,028 | |
| 04/15/2029 | 4.625% | 245,000 | 225,102 | |
| United Airlines, Inc. Pass-Through Trust | ||||
| 10/15/2027 | 5.875% | 1,397,289 | 1,415,114 | |
| Total | 5,396,825 | |||
| Automotive 1.2% | ||||
| American Axle & Manufacturing, Inc. | ||||
| 03/15/2026 | 6.250% | 197,000 | 190,190 | |
| 07/01/2028 | 6.875% | 1,450,000 | 1,365,093 | |
| Clarios Global LP(b) | ||||
| 05/15/2025 | 6.750% | 80,000 | 82,005 | |
| Ford Motor Co. | ||||
| 02/12/2032 | 3.250% | 2,908,000 | 2,361,229 | |
| 12/08/2046 | 5.291% | 2,000,000 | 1,719,338 | |
| Ford Motor Credit Co. LLC | ||||
| 09/08/2024 | 3.664% | 1,168,000 | 1,133,629 | |
| 06/16/2025 | 5.125% | 256,000 | 255,071 | |
| 08/04/2025 | 4.134% | 1,500,000 | 1,452,415 | |
| 11/13/2025 | 3.375% | 1,251,000 | 1,179,518 | |
| 08/17/2027 | 4.125% | 554,000 | 513,731 | |
| 02/10/2029 | 2.900% | 1,642,000 | 1,377,160 | |
| 11/13/2030 | 4.000% | 214,000 | 185,474 | |
| General Motors Co. | ||||
| 04/01/2048 | 5.400% | 2,835,000 | 2,655,806 | |
| Goodyear Tire & Rubber Co. (The) | ||||
| 07/15/2029 | 5.000% | 223,000 | 197,588 | |
| 8 | Columbia Corporate Income Fund | Annual Report 2022 |
April 30, 2022
| Corporate Bonds & Notes (continued) | ||||
| Issuer | Coupon Rate | Principal Amount ($) | Value ($) | |
| IAA Spinco, Inc.(b) | ||||
| 06/15/2027 | 5.500% | 910,000 | 890,297 | |
| Jaguar Land Rover Automotive PLC(b) | ||||
| 01/15/2028 | 5.875% | 540,000 | 464,983 | |
| 07/15/2029 | 5.500% | 312,000 | 260,501 | |
| KAR Auction Services, Inc.(b) | ||||
| 06/01/2025 | 5.125% | 579,000 | 586,882 | |
| Panther BF Aggregator 2 LP/Finance Co., Inc.(b) | ||||
| 05/15/2026 | 6.250% | 60,000 | 60,851 | |
| 05/15/2027 | 8.500% | 503,000 | 503,786 | |
| Real Hero Merger Sub 2, Inc.(b) | ||||
| 02/01/2029 | 6.250% | 180,000 | 146,141 | |
| Tenneco, Inc.(b) | ||||
| 01/15/2029 | 7.875% | 557,000 | 562,528 | |
| 04/15/2029 | 5.125% | 1,240,000 | 1,207,872 | |
| Total | 19,352,088 | |||
| Banking 18.9% | ||||
| Bank of America Corp.(d) | ||||
| 10/22/2030 | 2.884% | 9,530,000 | 8,505,834 | |
| 07/23/2031 | 1.898% | 19,015,000 | 15,521,011 | |
| 10/24/2031 | 1.922% | 34,690,000 | 28,207,215 | |
| 02/04/2033 | 2.972% | 16,550,000 | 14,431,869 | |
| Subordinated | ||||
| 09/21/2036 | 2.482% | 7,200,000 | 5,786,358 | |
| Bank of Nova Scotia (The) | ||||
| 04/11/2025 | 3.450% | 7,991,000 | 7,900,330 | |
| Citigroup, Inc.(d) | ||||
| 06/03/2031 | 2.572% | 12,483,000 | 10,724,852 | |
| 01/25/2033 | 3.057% | 19,390,000 | 16,956,862 | |
| Goldman Sachs Group, Inc. (The)(d) | ||||
| 07/21/2032 | 2.383% | 14,875,000 | 12,321,317 | |
| 02/24/2033 | 3.102% | 27,062,000 | 23,656,073 | |
| HSBC Holdings PLC(d) | ||||
| 05/24/2032 | 2.804% | 14,401,000 | 12,098,680 | |
| 11/22/2032 | 2.871% | 19,440,000 | 16,222,231 | |
| JPMorgan Chase & Co.(d) | ||||
| 10/15/2030 | 2.739% | 18,187,000 | 16,143,712 | |
| 11/19/2031 | 1.764% | 3,635,000 | 2,933,525 | |
| 04/22/2032 | 2.580% | 22,216,000 | 19,118,955 | |
| 11/08/2032 | 2.545% | 20,138,000 | 17,088,215 | |
| Morgan Stanley(d) | ||||
| 07/21/2032 | 2.239% | 13,464,000 | 11,147,403 | |
| 10/20/2032 | 2.511% | 11,424,000 | 9,621,188 | |
| Subordinated | ||||
| 04/20/2037 | 5.297% | 8,580,000 | 8,601,662 | |
| Washington Mutual Bank(e),(f),(g) | ||||
| Subordinated | ||||
| 01/15/2015 | 0.000% | 6,350,000 | 9,525 | |
| Corporate Bonds & Notes (continued) | ||||
| Issuer | Coupon Rate | Principal Amount ($) | Value ($) | |
| Wells Fargo & Co.(d) | ||||
| 10/30/2030 | 2.879% | 13,846,000 | 12,425,451 | |
| 02/11/2031 | 2.572% | 37,514,000 | 32,899,195 | |
| Total | 302,321,463 | |||
| Brokerage/Asset Managers/Exchanges 0.1% | ||||
| Hightower Holding LLC(b) | ||||
| 04/15/2029 | 6.750% | 455,000 | 422,892 | |
| NFP Corp.(b) | ||||
| 08/15/2028 | 4.875% | 492,000 | 449,223 | |
| 08/15/2028 | 6.875% | 1,340,000 | 1,185,704 | |
| Total | 2,057,819 | |||
| Building Materials 0.2% | ||||
| American Builders & Contractors Supply Co., Inc.(b) | ||||
| 01/15/2028 | 4.000% | 455,000 | 422,899 | |
| Beacon Roofing Supply, Inc.(b) | ||||
| 11/15/2026 | 4.500% | 550,000 | 536,349 | |
| 05/15/2029 | 4.125% | 291,000 | 255,956 | |
| Interface, Inc.(b) | ||||
| 12/01/2028 | 5.500% | 210,000 | 190,185 | |
| James Hardie International Finance DAC(b) | ||||
| 01/15/2028 | 5.000% | 572,000 | 551,341 | |
| SRS Distribution, Inc.(b) | ||||
| 07/01/2028 | 4.625% | 551,000 | 504,577 | |
| 07/01/2029 | 6.125% | 439,000 | 387,222 | |
| 12/01/2029 | 6.000% | 488,000 | 427,000 | |
| White Cap Buyer LLC(b) | ||||
| 10/15/2028 | 6.875% | 567,000 | 522,536 | |
| Total | 3,798,065 | |||
| Cable and Satellite 3.4% | ||||
| CCO Holdings LLC/Capital Corp.(b) | ||||
| 05/01/2027 | 5.125% | 324,000 | 315,685 | |
| 03/01/2030 | 4.750% | 1,263,000 | 1,127,580 | |
| 02/01/2031 | 4.250% | 1,353,000 | 1,142,012 | |
| 02/01/2032 | 4.750% | 531,000 | 459,769 | |
| CCO Holdings LLC/Capital Corp. | ||||
| 05/01/2032 | 4.500% | 381,000 | 321,029 | |
| Charter Communications Operating LLC/Capital | ||||
| 05/01/2047 | 5.375% | 17,235,000 | 15,390,403 | |
| 12/01/2061 | 4.400% | 1,706,000 | 1,274,603 | |
| 06/30/2062 | 3.950% | 4,058,000 | 2,802,454 | |
| 04/01/2063 | 5.500% | 14,480,000 | 12,630,872 | |
| Comcast Corp.(b) | ||||
| 11/01/2056 | 2.937% | 4,912,000 | 3,527,973 | |
| CSC Holdings LLC(b) | ||||
| 01/15/2030 | 5.750% | 664,000 | 551,029 | |
| 12/01/2030 | 4.125% | 1,316,000 | 1,088,608 | |
| 02/15/2031 | 3.375% | 504,000 | 393,396 | |
| Columbia Corporate Income Fund | Annual Report 2022 | 9 |
April 30, 2022
| Corporate Bonds & Notes (continued) | ||||
| Issuer | Coupon Rate | Principal Amount ($) | Value ($) | |
| DIRECTV Holdings LLC/Financing Co., Inc.(b) | ||||
| 08/15/2027 | 5.875% | 748,000 | 705,337 | |
| DISH DBS Corp. | ||||
| 07/01/2026 | 7.750% | 958,000 | 914,660 | |
| 06/01/2029 | 5.125% | 833,000 | 650,493 | |
| DISH DBS Corp.(b) | ||||
| 12/01/2028 | 5.750% | 1,026,000 | 920,286 | |
| NBCUniversal Media LLC | ||||
| 01/15/2043 | 4.450% | 1,810,000 | 1,738,297 | |
| Radiate Holdco LLC/Finance, Inc.(b) | ||||
| 09/15/2026 | 4.500% | 202,000 | 186,392 | |
| 09/15/2028 | 6.500% | 1,027,000 | 897,996 | |
| Sirius XM Radio, Inc.(b) | ||||
| 09/01/2026 | 3.125% | 1,933,000 | 1,780,776 | |
| 07/15/2028 | 4.000% | 1,000,000 | 904,231 | |
| 07/01/2030 | 4.125% | 461,000 | 405,241 | |
| Videotron Ltd.(b) | ||||
| 06/15/2029 | 3.625% | 255,000 | 222,334 | |
| Virgin Media Finance PLC(b) | ||||
| 07/15/2030 | 5.000% | 1,806,000 | 1,581,995 | |
| Virgin Media Secured Finance PLC(b) | ||||
| 05/15/2029 | 5.500% | 168,000 | 156,471 | |
| VZ Secured Financing BV(b) | ||||
| 01/15/2032 | 5.000% | 990,000 | 864,750 | |
| Ziggo Bond Co. BV(b) | ||||
| 02/28/2030 | 5.125% | 509,000 | 442,923 | |
| Ziggo Bond Finance BV(b) | ||||
| 01/15/2027 | 6.000% | 501,000 | 492,105 | |
| Ziggo BV(b) | ||||
| 01/15/2030 | 4.875% | 1,000,000 | 886,836 | |
| Total | 54,776,536 | |||
| Chemicals 0.5% | ||||
| Ashland LLC(b) | ||||
| 09/01/2031 | 3.375% | 1,000,000 | 865,426 | |
| Axalta Coating Systems LLC(b) | ||||
| 02/15/2029 | 3.375% | 650,000 | 563,814 | |
| Axalta Coating Systems LLC/Dutch Holding B BV(b) | ||||
| 06/15/2027 | 4.750% | 265,000 | 251,874 | |
| Element Solutions, Inc.(b) | ||||
| 09/01/2028 | 3.875% | 533,000 | 476,725 | |
| HB Fuller Co. | ||||
| 10/15/2028 | 4.250% | 818,000 | 735,382 | |
| Herens Holdco Sarl(b) | ||||
| 05/15/2028 | 4.750% | 369,000 | 328,581 | |
| Illuminate Buyer LLC/Holdings IV, Inc.(b) | ||||
| 07/01/2028 | 9.000% | 355,000 | 341,803 | |
| Corporate Bonds & Notes (continued) | ||||
| Issuer | Coupon Rate | Principal Amount ($) | Value ($) | |
| Innophos Holdings, Inc.(b) | ||||
| 02/15/2028 | 9.375% | 401,000 | 423,036 | |
| Iris Holdings, Inc.(b),(h) | ||||
| 02/15/2026 | 8.750% | 245,000 | 234,854 | |
| Minerals Technologies, Inc.(b) | ||||
| 07/01/2028 | 5.000% | 189,000 | 176,069 | |
| Olympus Water US Holding Corp.(b) | ||||
| 10/01/2028 | 4.250% | 432,000 | 383,555 | |
| 10/01/2029 | 6.250% | 190,000 | 158,885 | |
| SPCM SA(b) | ||||
| 03/15/2027 | 3.125% | 46,000 | 40,647 | |
| Unifrax Escrow Issuer Corp.(b) | ||||
| 09/30/2028 | 5.250% | 219,000 | 193,135 | |
| 09/30/2029 | 7.500% | 123,000 | 100,752 | |
| WR Grace Holdings LLC(b) | ||||
| 06/15/2027 | 4.875% | 1,848,000 | 1,737,169 | |
| 08/15/2029 | 5.625% | 675,000 | 579,736 | |
| Total | 7,591,443 | |||
| Construction Machinery 1.1% | ||||
| H&E Equipment Services, Inc.(b) | ||||
| 12/15/2028 | 3.875% | 895,000 | 779,346 | |
| John Deere Capital Corp. | ||||
| 01/10/2025 | 1.250% | 3,691,000 | 3,507,970 | |
| 03/07/2025 | 2.125% | 1,419,000 | 1,378,250 | |
| PECF USS Intermediate Holding III Corp.(b) | ||||
| 11/15/2029 | 8.000% | 64,000 | 59,772 | |
| Ritchie Bros Holdings, Inc.(b) | ||||
| 12/15/2031 | 4.750% | 634,000 | 633,786 | |
| United Rentals North America, Inc. | ||||
| 05/15/2027 | 5.500% | 97,000 | 99,171 | |
| 11/15/2027 | 3.875% | 10,420,000 | 9,979,381 | |
| 02/15/2031 | 3.875% | 181,000 | 160,210 | |
| 01/15/2032 | 3.750% | 211,000 | 183,773 | |
| Total | 16,781,659 | |||
| Consumer Cyclical Services 0.2% | ||||
| APX Group, Inc.(b) | ||||
| 07/15/2029 | 5.750% | 68,000 | 55,782 | |
| Arches Buyer, Inc.(b) | ||||
| 12/01/2028 | 6.125% | 500,000 | 435,027 | |
| Match Group, Inc.(b) | ||||
| 06/01/2028 | 4.625% | 174,000 | 162,430 | |
| Staples, Inc.(b) | ||||
| 04/15/2026 | 7.500% | 673,000 | 642,562 | |
| 04/15/2027 | 10.750% | 56,000 | 49,553 | |
| 10 | Columbia Corporate Income Fund | Annual Report 2022 |
April 30, 2022
| Corporate Bonds & Notes (continued) | ||||
| Issuer | Coupon Rate | Principal Amount ($) | Value ($) | |
| Uber Technologies, Inc.(b) | ||||
| 05/15/2025 | 7.500% | 778,000 | 803,127 | |
| 01/15/2028 | 6.250% | 257,000 | 254,405 | |
| 08/15/2029 | 4.500% | 1,635,000 | 1,408,346 | |
| Total | 3,811,232 | |||
| Consumer Products 0.3% | ||||
| CD&R Smokey Buyer, Inc.(b) | ||||
| 07/15/2025 | 6.750% | 657,000 | 668,841 | |
| Energizer Holdings, Inc.(b) | ||||
| 06/15/2028 | 4.750% | 1,500,000 | 1,315,970 | |
| Mattel, Inc.(b) | ||||
| 04/01/2026 | 3.375% | 171,000 | 166,313 | |
| 04/01/2029 | 3.750% | 532,000 | 506,746 | |
| Mattel, Inc. | ||||
| 11/01/2041 | 5.450% | 54,000 | 54,217 | |
| Newell Brands, Inc. | ||||
| 06/01/2025 | 4.875% | 92,000 | 93,061 | |
| Prestige Brands, Inc.(b) | ||||
| 01/15/2028 | 5.125% | 509,000 | 487,604 | |
| 04/01/2031 | 3.750% | 237,000 | 201,146 | |
| Spectrum Brands, Inc. | ||||
| 07/15/2025 | 5.750% | 209,000 | 211,592 | |
| Tempur Sealy International, Inc.(b) | ||||
| 10/15/2031 | 3.875% | 303,000 | 251,553 | |
| Total | 3,957,043 | |||
| Diversified Manufacturing 2.2% | ||||
| BWX Technologies, Inc.(b) | ||||
| 06/30/2028 | 4.125% | 231,000 | 215,259 | |
| Carrier Global Corp. | ||||
| 02/15/2030 | 2.722% | 15,488,000 | 13,686,309 | |
| 04/05/2040 | 3.377% | 6,890,000 | 5,683,134 | |
| Gates Global LLC/Co.(b) | ||||
| 01/15/2026 | 6.250% | 807,000 | 791,422 | |
| GE Capital International Funding Co. Unlimited Co. | ||||
| 11/15/2035 | 4.418% | 9,177,000 | 8,968,830 | |
| General Electric Co.(i) | ||||
| Junior Subordinated | ||||
| 3-month USD LIBOR + 3.330% 12/31/2049 | 4.156% | 3,210,000 | 3,042,382 | |
| Madison IAQ LLC(b) | ||||
| 06/30/2028 | 4.125% | 600,000 | 526,632 | |
| 06/30/2029 | 5.875% | 538,000 | 438,595 | |
| Resideo Funding, Inc.(b) | ||||
| 09/01/2029 | 4.000% | 422,000 | 377,329 | |
| Vertical US Newco, Inc.(b) | ||||
| 07/15/2027 | 5.250% | 526,000 | 493,365 | |
| Corporate Bonds & Notes (continued) | ||||
| Issuer | Coupon Rate | Principal Amount ($) | Value ($) | |
| Welbilt, Inc. | ||||
| 02/15/2024 | 9.500% | 103,000 | 103,460 | |
| WESCO Distribution, Inc.(b) | ||||
| 06/15/2025 | 7.125% | 302,000 | 313,548 | |
| 06/15/2028 | 7.250% | 558,000 | 579,885 | |
| Total | 35,220,150 | |||
| Electric 9.9% | ||||
| AEP Texas, Inc. | ||||
| 01/15/2050 | 3.450% | 12,440,000 | 9,861,537 | |
| AES Corp. (The) | ||||
| 01/15/2031 | 2.450% | 6,605,000 | 5,474,858 | |
| American Transmission Systems, Inc.(b) | ||||
| 01/15/2032 | 2.650% | 2,737,000 | 2,377,364 | |
| Calpine Corp.(b) | ||||
| 02/15/2028 | 4.500% | 357,000 | 331,125 | |
| 03/15/2028 | 5.125% | 292,000 | 265,254 | |
| CenterPoint Energy, Inc. | ||||
| 09/01/2024 | 2.500% | 3,517,000 | 3,428,373 | |
| Clearway Energy Operating LLC(b) | ||||
| 03/15/2028 | 4.750% | 2,560,000 | 2,435,328 | |
| 02/15/2031 | 3.750% | 1,052,000 | 904,613 | |
| 01/15/2032 | 3.750% | 215,000 | 183,124 | |
| CMS Energy Corp. | ||||
| 03/01/2024 | 3.875% | 2,124,000 | 2,137,372 | |
| 11/15/2025 | 3.600% | 8,564,000 | 8,481,814 | |
| Dominion Energy, Inc. | ||||
| 08/15/2031 | 2.250% | 5,500,000 | 4,631,547 | |
| DTE Energy Co. | ||||
| 06/15/2029 | 3.400% | 7,403,000 | 6,925,851 | |
| Duke Energy Corp. | ||||
| 06/15/2031 | 2.550% | 11,660,000 | 9,943,021 | |
| Emera US Finance LP | ||||
| 06/15/2046 | 4.750% | 4,303,000 | 4,034,665 | |
| Eversource Energy | ||||
| 10/01/2024 | 2.900% | 5,000,000 | 4,919,230 | |
| 08/15/2030 | 1.650% | 24,816,000 | 19,948,987 | |
| Exelon Corp.(b) | ||||
| 03/15/2032 | 3.350% | 10,315,000 | 9,375,638 | |
| Georgia Power Co. | ||||
| 07/30/2023 | 2.100% | 13,854,000 | 13,730,915 | |
| 03/15/2042 | 4.300% | 12,855,000 | 11,722,678 | |
| Jersey Central Power & Light Co.(b) | ||||
| 03/01/2032 | 2.750% | 1,783,000 | 1,561,367 | |
| Leeward Renewable Energy Operations LLC(b) | ||||
| 07/01/2029 | 4.250% | 130,000 | 117,711 | |
| NextEra Energy Operating Partners LP(b) | ||||
| 09/15/2027 | 4.500% | 425,000 | 402,371 | |
| Columbia Corporate Income Fund | Annual Report 2022 | 11 |
April 30, 2022
| Corporate Bonds & Notes (continued) | ||||
| Issuer | Coupon Rate | Principal Amount ($) | Value ($) | |
| NRG Energy, Inc. | ||||
| 01/15/2028 | 5.750% | 7,000 | 6,835 | |
| NRG Energy, Inc.(b) | ||||
| 06/15/2029 | 5.250% | 2,298,000 | 2,174,292 | |
| 02/15/2031 | 3.625% | 600,000 | 500,832 | |
| 02/15/2032 | 3.875% | 549,000 | 458,536 | |
| Pacific Gas and Electric Co. | ||||
| 07/01/2050 | 4.950% | 11,670,000 | 9,741,547 | |
| PG&E Corp. | ||||
| 07/01/2030 | 5.250% | 398,000 | 362,559 | |
| Southern California Edison Co. | ||||
| 10/01/2043 | 4.650% | 295,000 | 280,443 | |
| 04/01/2047 | 4.000% | 1,665,000 | 1,423,211 | |
| Vistra Operations Co. LLC(b) | ||||
| 09/01/2026 | 5.500% | 159,000 | 158,493 | |
| 02/15/2027 | 5.625% | 408,000 | 402,438 | |
| 07/31/2027 | 5.000% | 252,000 | 241,823 | |
| 05/01/2029 | 4.375% | 310,000 | 282,152 | |
| WEC Energy Group, Inc. | ||||
| 10/15/2027 | 1.375% | 7,695,000 | 6,720,666 | |
| Xcel Energy, Inc. | ||||
| 11/15/2031 | 2.350% | 5,588,000 | 4,722,791 | |
| 12/01/2049 | 3.500% | 10,115,000 | 8,292,379 | |
| Total | 158,963,740 | |||
| Environmental 1.0% | ||||
| GFL Environmental, Inc.(b) | ||||
| 06/01/2025 | 4.250% | 95,000 | 92,227 | |
| 08/01/2025 | 3.750% | 7,660,000 | 7,324,449 | |
| 12/15/2026 | 5.125% | 364,000 | 357,875 | |
| 08/01/2028 | 4.000% | 320,000 | 282,025 | |
| 06/15/2029 | 4.750% | 509,000 | 461,972 | |
| 08/15/2029 | 4.375% | 158,000 | 139,997 | |
| Stericycle, Inc.(b) | ||||
| 01/15/2029 | 3.875% | 500,000 | 441,290 | |
| Waste Connections, Inc. | ||||
| 01/15/2032 | 2.200% | 7,000,000 | 5,893,523 | |
| Waste Pro USA, Inc.(b) | ||||
| 02/15/2026 | 5.500% | 1,022,000 | 908,489 | |
| Total | 15,901,847 | |||
| Finance Companies 0.2% | ||||
| Navient Corp. | ||||
| 01/25/2023 | 5.500% | 508,000 | 510,543 | |
| 10/25/2024 | 5.875% | 111,000 | 110,523 | |
| 06/15/2026 | 6.750% | 475,000 | 467,492 | |
| 03/15/2028 | 4.875% | 224,000 | 196,697 | |
| Provident Funding Associates LP/Finance Corp.(b) | ||||
| 06/15/2025 | 6.375% | 383,000 | 375,853 | |
| Corporate Bonds & Notes (continued) | ||||
| Issuer | Coupon Rate | Principal Amount ($) | Value ($) | |
| Quicken Loans LLC/Co-Issuer, Inc.(b) | ||||
| 03/01/2029 | 3.625% | 321,000 | 274,644 | |
| Rocket Mortgage LLC/Co-Issuer, Inc.(b) | ||||
| 10/15/2033 | 4.000% | 1,312,000 | 1,053,318 | |
| Springleaf Finance Corp. | ||||
| 03/15/2024 | 6.125% | 585,000 | 587,194 | |
| 06/01/2025 | 8.875% | 102,000 | 107,032 | |
| Total | 3,683,296 | |||
| Food and Beverage 4.2% | ||||
| Anheuser-Busch Companies LLC/InBev Worldwide, Inc. | ||||
| 02/01/2046 | 4.900% | 21,316,000 | 21,021,993 | |
| Bacardi Ltd.(b) | ||||
| 05/15/2038 | 5.150% | 3,790,000 | 3,805,323 | |
| 05/15/2048 | 5.300% | 8,920,000 | 8,934,703 | |
| FAGE International SA/USA Dairy Industry, Inc.(b) | ||||
| 08/15/2026 | 5.625% | 556,000 | 523,111 | |
| JBS USA LUX SA/Food Co./Finance, Inc.(b) | ||||
| 12/01/2031 | 3.750% | 248,000 | 218,333 | |
| Kraft Heinz Foods Co. | ||||
| 06/01/2046 | 4.375% | 16,296,000 | 14,281,390 | |
| Lamb Weston Holdings, Inc.(b) | ||||
| 01/31/2030 | 4.125% | 463,000 | 412,962 | |
| 01/31/2032 | 4.375% | 463,000 | 415,683 | |
| Mondelez International, Inc. | ||||
| 05/04/2025 | 1.500% | 11,610,000 | 10,961,773 | |
| Pilgrim’s Pride Corp.(b) | ||||
| 09/30/2027 | 5.875% | 261,000 | 262,821 | |
| 04/15/2031 | 4.250% | 2,025,000 | 1,840,434 | |
| 03/01/2032 | 3.500% | 1,246,000 | 1,056,096 | |
| Post Holdings, Inc.(b) | ||||
| 03/01/2027 | 5.750% | 910,000 | 900,172 | |
| 04/15/2030 | 4.625% | 736,000 | 629,450 | |
| 09/15/2031 | 4.500% | 523,000 | 436,181 | |
| Primo Water Holdings, Inc.(b) | ||||
| 04/30/2029 | 4.375% | 309,000 | 269,064 | |
| Simmons Foods, Inc./Prepared Foods, Inc./Pet Food, Inc./Feed(b) | ||||
| 03/01/2029 | 4.625% | 418,000 | 377,042 | |
| Triton Water Holdings, Inc.(b) | ||||
| 04/01/2029 | 6.250% | 510,000 | 422,718 | |
| US Foods, Inc.(b) | ||||
| 02/15/2029 | 4.750% | 523,000 | 482,820 | |
| 06/01/2030 | 4.625% | 354,000 | 317,986 | |
| Total | 67,570,055 | |||
| Gaming 0.6% | ||||
| Boyd Gaming Corp.(b) | ||||
| 06/01/2025 | 8.625% | 46,000 | 48,012 | |
| 06/15/2031 | 4.750% | 503,000 | 455,682 | |
| 12 | Columbia Corporate Income Fund | Annual Report 2022 |
April 30, 2022
| Corporate Bonds & Notes (continued) | ||||
| Issuer | Coupon Rate | Principal Amount ($) | Value ($) | |
| Boyd Gaming Corp. | ||||
| 12/01/2027 | 4.750% | 205,000 | 194,027 | |
| Caesars Entertainment, Inc.(b) | ||||
| 10/15/2029 | 4.625% | 1,058,000 | 913,442 | |
| Colt Merger Sub, Inc.(b) | ||||
| 07/01/2025 | 5.750% | 607,000 | 619,578 | |
| 07/01/2025 | 6.250% | 682,000 | 689,697 | |
| 07/01/2027 | 8.125% | 56,000 | 58,516 | |
| International Game Technology PLC(b) | ||||
| 04/15/2026 | 4.125% | 2,003,000 | 1,882,332 | |
| MGM Resorts International | ||||
| 05/01/2025 | 6.750% | 1,375,000 | 1,408,797 | |
| Midwest Gaming Borrower LLC(b) | ||||
| 05/01/2029 | 4.875% | 414,000 | 365,655 | |
| Penn National Gaming, Inc.(b) | ||||
| 07/01/2029 | 4.125% | 242,000 | 205,158 | |
| Scientific Games Holdings LP/US FinCo, Inc.(b) | ||||
| 03/01/2030 | 6.625% | 719,000 | 683,050 | |
| Scientific Games International, Inc.(b) | ||||
| 07/01/2025 | 8.625% | 104,000 | 109,200 | |
| 11/15/2029 | 7.250% | 579,000 | 607,694 | |
| VICI Properties LP/Note Co., Inc.(b) | ||||
| 06/15/2025 | 4.625% | 166,000 | 162,990 | |
| 12/01/2026 | 4.250% | 176,000 | 167,204 | |
| 02/01/2027 | 5.750% | 154,000 | 154,005 | |
| 02/15/2029 | 3.875% | 103,000 | 93,650 | |
| Wynn Las Vegas LLC/Capital Corp.(b) | ||||
| 03/01/2025 | 5.500% | 92,000 | 89,010 | |
| Wynn Resorts Finance LLC/Capital Corp.(b) | ||||
| 04/15/2025 | 7.750% | 94,000 | 96,914 | |
| 10/01/2029 | 5.125% | 126,000 | 110,407 | |
| Total | 9,115,020 | |||
| Health Care 4.1% | ||||
| Acadia Healthcare Co., Inc.(b) | ||||
| 07/01/2028 | 5.500% | 1,258,000 | 1,224,921 | |
| 04/15/2029 | 5.000% | 109,000 | 103,348 | |
| AdaptHealth LLC(b) | ||||
| 08/01/2029 | 4.625% | 1,135,000 | 966,982 | |
| 03/01/2030 | 5.125% | 749,000 | 644,473 | |
| Avantor Funding, Inc.(b) | ||||
| 07/15/2028 | 4.625% | 914,000 | 872,513 | |
| 11/01/2029 | 3.875% | 941,000 | 845,749 | |
| Becton Dickinson and Co. | ||||
| 06/06/2024 | 3.363% | 5,698,000 | 5,676,792 | |
| 02/11/2031 | 1.957% | 6,540,000 | 5,390,464 | |
| Catalent Pharma Solutions, Inc.(b) | ||||
| 04/01/2030 | 3.500% | 288,000 | 251,072 | |
| Corporate Bonds & Notes (continued) | ||||
| Issuer | Coupon Rate | Principal Amount ($) | Value ($) | |
| Charles River Laboratories International, Inc.(b) | ||||
| 03/15/2029 | 3.750% | 148,000 | 134,374 | |
| 03/15/2031 | 4.000% | 194,000 | 173,373 | |
| CHS/Community Health Systems, Inc.(b) | ||||
| 03/15/2026 | 8.000% | 394,000 | 407,616 | |
| 04/15/2029 | 6.875% | 459,000 | 402,723 | |
| 05/15/2030 | 5.250% | 988,000 | 866,776 | |
| Cigna Corp. | ||||
| 03/15/2031 | 2.375% | 16,445,000 | 14,077,168 | |
| CVS Health Corp. | ||||
| 03/25/2048 | 5.050% | 13,675,000 | 13,743,773 | |
| Encompass Health Corp. | ||||
| 02/01/2028 | 4.500% | 1,000,000 | 920,719 | |
| HCA, Inc. | ||||
| 02/01/2029 | 5.875% | 863,000 | 899,150 | |
| 09/01/2030 | 3.500% | 730,000 | 654,405 | |
| HCA, Inc.(b) | ||||
| 03/15/2052 | 4.625% | 13,301,000 | 11,636,247 | |
| Indigo Merger Sub, Inc.(b) | ||||
| 07/15/2026 | 2.875% | 200,000 | 185,197 | |
| Mozart Debt Merger Sub, Inc.(b) | ||||
| 04/01/2029 | 3.875% | 100,000 | 87,431 | |
| 10/01/2029 | 5.250% | 215,000 | 187,026 | |
| Ortho-Clinical Diagnostics, Inc./SA(b) | ||||
| 06/01/2025 | 7.375% | 105,000 | 107,567 | |
| Owens & Minor, Inc.(b) | ||||
| 04/01/2030 | 6.625% | 459,000 | 449,280 | |
| Radiology Partners, Inc.(b) | ||||
| 02/01/2028 | 9.250% | 151,000 | 143,718 | |
| RP Escrow Issuer LLC(b) | ||||
| 12/15/2025 | 5.250% | 420,000 | 394,681 | |
| Select Medical Corp.(b) | ||||
| 08/15/2026 | 6.250% | 1,121,000 | 1,112,593 | |
| Tenet Healthcare Corp.(b) | ||||
| 01/01/2026 | 4.875% | 405,000 | 394,828 | |
| 02/01/2027 | 6.250% | 394,000 | 391,138 | |
| 11/01/2027 | 5.125% | 1,793,000 | 1,748,998 | |
| 10/01/2028 | 6.125% | 721,000 | 691,730 | |
| 01/15/2030 | 4.375% | 465,000 | 423,146 | |
| Total | 66,209,971 | |||
| Healthcare Insurance 1.0% | ||||
| Aetna, Inc. | ||||
| 08/15/2047 | 3.875% | 2,502,000 | 2,158,687 | |
| Anthem, Inc. | ||||
| 05/15/2052 | 4.550% | 3,075,000 | 2,997,552 | |
| Columbia Corporate Income Fund | Annual Report 2022 | 13 |
April 30, 2022
| Corporate Bonds & Notes (continued) | ||||
| Issuer | Coupon Rate | Principal Amount ($) | Value ($) | |
| Centene Corp. | ||||
| 02/15/2030 | 3.375% | 7,594,000 | 6,785,087 | |
| 10/15/2030 | 3.000% | 2,046,000 | 1,774,905 | |
| 03/01/2031 | 2.500% | 612,000 | 508,579 | |
| 08/01/2031 | 2.625% | 1,280,000 | 1,067,609 | |
| Total | 15,292,419 | |||
| Home Construction 0.1% | ||||
| Meritage Homes Corp. | ||||
| 06/01/2025 | 6.000% | 330,000 | 336,295 | |
| Meritage Homes Corp.(b) | ||||
| 04/15/2029 | 3.875% | 423,000 | 379,426 | |
| Shea Homes LP/Funding Corp.(b) | ||||
| 02/15/2028 | 4.750% | 171,000 | 152,427 | |
| 04/01/2029 | 4.750% | 65,000 | 56,652 | |
| Taylor Morrison Communities, Inc.(b) | ||||
| 01/15/2028 | 5.750% | 193,000 | 189,464 | |
| 08/01/2030 | 5.125% | 355,000 | 324,825 | |
| Total | 1,439,089 | |||
| Independent Energy 1.1% | ||||
| Apache Corp. | ||||
| 09/01/2040 | 5.100% | 184,000 | 166,527 | |
| 02/01/2042 | 5.250% | 748,000 | 690,052 | |
| 04/15/2043 | 4.750% | 403,000 | 347,285 | |
| Callon Petroleum Co. | ||||
| 07/01/2026 | 6.375% | 922,000 | 895,937 | |
| Callon Petroleum Co.(b) | ||||
| 08/01/2028 | 8.000% | 191,000 | 197,263 | |
| Canadian Natural Resources Ltd. | ||||
| 06/01/2027 | 3.850% | 4,885,000 | 4,777,294 | |
| CNX Resources Corp.(b) | ||||
| 03/14/2027 | 7.250% | 610,000 | 623,245 | |
| 01/15/2029 | 6.000% | 519,000 | 512,671 | |
| Comstock Resources, Inc.(b) | ||||
| 03/01/2029 | 6.750% | 235,000 | 237,499 | |
| 01/15/2030 | 5.875% | 174,000 | 167,607 | |
| CrownRock LP/Finance, Inc.(b) | ||||
| 10/15/2025 | 5.625% | 219,000 | 218,989 | |
| 05/01/2029 | 5.000% | 153,000 | 149,787 | |
| Endeavor Energy Resources LP/Finance, Inc.(b) | ||||
| 01/30/2028 | 5.750% | 158,000 | 158,406 | |
| Hilcorp Energy I LP/Finance Co.(b) | ||||
| 02/01/2029 | 5.750% | 281,000 | 275,554 | |
| 04/15/2030 | 6.000% | 226,000 | 222,901 | |
| 02/01/2031 | 6.000% | 300,000 | 289,662 | |
| 04/15/2032 | 6.250% | 353,000 | 344,344 | |
| Matador Resources Co. | ||||
| 09/15/2026 | 5.875% | 520,000 | 510,238 | |
| Corporate Bonds & Notes (continued) | ||||
| Issuer | Coupon Rate | Principal Amount ($) | Value ($) | |
| Occidental Petroleum Corp. | ||||
| 07/15/2025 | 8.000% | 786,000 | 850,845 | |
| 09/01/2030 | 6.625% | 593,000 | 642,865 | |
| 01/01/2031 | 6.125% | 1,173,000 | 1,234,642 | |
| 09/15/2036 | 6.450% | 208,000 | 225,549 | |
| 08/15/2039 | 4.300% | 1,250,000 | 1,065,472 | |
| 03/15/2046 | 6.600% | 1,048,000 | 1,144,505 | |
| 04/15/2046 | 4.400% | 358,000 | 308,076 | |
| 03/15/2048 | 4.200% | 240,000 | 199,003 | |
| 08/15/2049 | 4.400% | 235,000 | 198,678 | |
| Southwestern Energy Co. | ||||
| 02/01/2029 | 5.375% | 227,000 | 224,307 | |
| 02/01/2032 | 4.750% | 1,134,000 | 1,072,832 | |
| Total | 17,952,035 | |||
| Integrated Energy 0.5% | ||||
| BP Capital Markets America, Inc. | ||||
| 06/17/2041 | 3.060% | 2,659,000 | 2,163,050 | |
| 02/08/2061 | 3.379% | 697,000 | 540,822 | |
| Cenovus Energy, Inc. | ||||
| 02/15/2052 | 3.750% | 5,913,000 | 4,736,814 | |
| Total | 7,440,686 | |||
| Leisure 0.6% | ||||
| Carnival Corp.(b) | ||||
| 03/01/2026 | 7.625% | 803,000 | 785,880 | |
| 03/01/2027 | 5.750% | 1,309,000 | 1,191,578 | |
| 08/01/2028 | 4.000% | 740,000 | 666,254 | |
| 05/01/2029 | 6.000% | 572,000 | 513,445 | |
| Cedar Fair LP/Canada’s Wonderland Co./Magnum Management Corp./Millennium Operations LLC(b) | ||||
| 05/01/2025 | 5.500% | 300,000 | 301,572 | |
| Cedar Fair LP/Canada’s Wonderland Co./Magnum Management Corp./Millennium Operations LLC | ||||
| 10/01/2028 | 6.500% | 472,000 | 475,300 | |
| Cinemark USA, Inc.(b) | ||||
| 05/01/2025 | 8.750% | 121,000 | 125,637 | |
| 03/15/2026 | 5.875% | 481,000 | 452,079 | |
| 07/15/2028 | 5.250% | 225,000 | 199,108 | |
| Live Nation Entertainment, Inc.(b) | ||||
| 05/15/2027 | 6.500% | 258,000 | 265,835 | |
| 10/15/2027 | 4.750% | 398,000 | 374,127 | |
| NCL Corp., Ltd.(b) | ||||
| 03/15/2026 | 5.875% | 210,000 | 193,041 | |
| 02/15/2029 | 7.750% | 112,000 | 108,665 | |
| NCL Finance Ltd.(b) | ||||
| 03/15/2028 | 6.125% | 117,000 | 105,300 | |
| Royal Caribbean Cruises Ltd. | ||||
| 11/15/2022 | 5.250% | 1,000,000 | 1,002,748 | |
| 03/15/2028 | 3.700% | 292,000 | 245,351 | |
| 14 | Columbia Corporate Income Fund | Annual Report 2022 |
April 30, 2022
| Corporate Bonds & Notes (continued) | ||||
| Issuer | Coupon Rate | Principal Amount ($) | Value ($) | |
| Royal Caribbean Cruises Ltd.(b) | ||||
| 06/15/2023 | 9.125% | 143,000 | 147,734 | |
| 07/01/2026 | 4.250% | 292,000 | 264,331 | |
| 08/31/2026 | 5.500% | 426,000 | 397,030 | |
| 07/15/2027 | 5.375% | 226,000 | 207,676 | |
| 04/01/2028 | 5.500% | 388,000 | 353,899 | |
| Six Flags Entertainment Corp.(b) | ||||
| 07/31/2024 | 4.875% | 471,000 | 469,269 | |
| Total | 8,845,859 | |||
| Life Insurance 7.9% | ||||
| AIG Global Funding(b) | ||||
| 09/22/2025 | 0.900% | 6,680,000 | 6,054,199 | |
| CoreBridge Financial, Inc.(b) | ||||
| 04/05/2027 | 3.650% | 3,085,000 | 2,993,371 | |
| Five Corners Funding Trust(b) | ||||
| 11/15/2023 | 4.419% | 23,065,000 | 23,360,813 | |
| Guardian Life Global Funding(b) | ||||
| 12/10/2025 | 0.875% | 13,510,000 | 12,283,708 | |
| Guardian Life Insurance Co. of America (The)(b) | ||||
| Subordinated | ||||
| 06/19/2064 | 4.875% | 980,000 | 993,817 | |
| Massachusetts Mutual Life Insurance Co.(b) | ||||
| Subordinated | ||||
| 12/01/2061 | 3.200% | 4,070,000 | 2,974,760 | |
| New York Life Global Funding(b) | ||||
| 01/15/2026 | 0.850% | 9,189,000 | 8,310,680 | |
| New York Life Insurance Co.(b) | ||||
| Subordinated | ||||
| 05/15/2050 | 3.750% | 2,780,000 | 2,435,125 | |
| Northwestern Mutual Global Funding(b) | ||||
| 01/14/2026 | 0.800% | 8,667,000 | 7,861,357 | |
| Northwestern Mutual Life Insurance Co. (The)(b) | ||||
| Subordinated | ||||
| 09/30/2059 | 3.625% | 8,678,000 | 7,079,959 | |
| Pacific Life Global Funding II(b) | ||||
| 04/14/2026 | 1.375% | 17,139,000 | 15,546,184 | |
| Peachtree Corners Funding Trust(b) | ||||
| 02/15/2025 | 3.976% | 16,462,000 | 16,476,613 | |
| Principal Life Global Funding II(b) | ||||
| 11/21/2024 | 2.250% | 7,165,000 | 6,914,117 | |
| Teachers Insurance & Annuity Association of America(b) | ||||
| Subordinated | ||||
| 09/15/2044 | 4.900% | 4,715,000 | 4,818,822 | |
| 05/15/2050 | 3.300% | 8,368,000 | 6,754,569 | |
| Voya Financial, Inc. | ||||
| 06/15/2046 | 4.800% | 825,000 | 834,305 | |
| Total | 125,692,399 | |||
| Corporate Bonds & Notes (continued) | ||||
| Issuer | Coupon Rate | Principal Amount ($) | Value ($) | |
| Lodging 0.2% | ||||
| Hilton Domestic Operating Co., Inc.(b) | ||||
| 05/01/2025 | 5.375% | 310,000 | 314,777 | |
| Marriott Ownership Resorts, Inc.(b) | ||||
| 06/15/2029 | 4.500% | 128,000 | 114,084 | |
| Travel + Leisure Co.(d) | ||||
| 04/01/2027 | 6.000% | 2,000,000 | 1,999,662 | |
| Total | 2,428,523 | |||
| Media and Entertainment 3.3% | ||||
| Cengage Learning, Inc.(b) | ||||
| 06/15/2024 | 9.500% | 524,000 | 513,783 | |
| Clear Channel International BV(b) | ||||
| 08/01/2025 | 6.625% | 274,000 | 276,772 | |
| Clear Channel Outdoor Holdings, Inc.(b) | ||||
| 04/15/2028 | 7.750% | 1,353,000 | 1,279,512 | |
| 06/01/2029 | 7.500% | 433,000 | 408,408 | |
| iHeartCommunications, Inc. | ||||
| 05/01/2026 | 6.375% | 261,962 | 262,546 | |
| 05/01/2027 | 8.375% | 884,518 | 875,558 | |
| iHeartCommunications, Inc.(b) | ||||
| 08/15/2027 | 5.250% | 102,000 | 95,693 | |
| 01/15/2028 | 4.750% | 749,000 | 680,211 | |
| Lamar Media Corp. | ||||
| 02/15/2028 | 3.750% | 404,000 | 372,470 | |
| Magallanes, Inc.(b) | ||||
| 03/15/2062 | 5.391% | 18,626,000 | 16,583,950 | |
| Netflix, Inc. | ||||
| 11/15/2028 | 5.875% | 995,000 | 1,024,314 | |
| 05/15/2029 | 6.375% | 388,000 | 412,104 | |
| Netflix, Inc.(b) | ||||
| 11/15/2029 | 5.375% | 22,747,000 | 22,773,744 | |
| 06/15/2030 | 4.875% | 725,000 | 709,121 | |
| Outfront Media Capital LLC/Corp.(b) | ||||
| 01/15/2029 | 4.250% | 216,000 | 192,157 | |
| 03/15/2030 | 4.625% | 367,000 | 327,615 | |
| Playtika Holding Corp.(b) | ||||
| 03/15/2029 | 4.250% | 283,000 | 254,887 | |
| Roblox Corp.(b) | ||||
| 05/01/2030 | 3.875% | 453,000 | 389,010 | |
| Scripps Escrow II, Inc.(b) | ||||
| 01/15/2029 | 3.875% | 1,500,000 | 1,332,817 | |
| Scripps Escrow, Inc.(b) | ||||
| 07/15/2027 | 5.875% | 564,000 | 539,370 | |
| Univision Communications, Inc.(b) | ||||
| 05/01/2029 | 4.500% | 248,000 | 222,635 | |
| Columbia Corporate Income Fund | Annual Report 2022 | 15 |
April 30, 2022
| Corporate Bonds & Notes (continued) | ||||
| Issuer | Coupon Rate | Principal Amount ($) | Value ($) | |
| Walt Disney Co. (The) | ||||
| 09/15/2044 | 4.750% | 3,480,000 | 3,508,579 | |
| Total | 53,035,256 | |||
| Metals and Mining 0.3% | ||||
| Allegheny Technologies, Inc. | ||||
| 10/01/2029 | 4.875% | 122,000 | 111,162 | |
| 10/01/2031 | 5.125% | 590,000 | 532,495 | |
| Constellium NV(b) | ||||
| 02/15/2026 | 5.875% | 376,000 | 372,398 | |
| Constellium SE(b) | ||||
| 06/15/2028 | 5.625% | 893,000 | 855,658 | |
| 04/15/2029 | 3.750% | 491,000 | 423,728 | |
| Hudbay Minerals, Inc.(b) | ||||
| 04/01/2026 | 4.500% | 344,000 | 317,375 | |
| 04/01/2029 | 6.125% | 403,000 | 381,986 | |
| Kaiser Aluminum Corp.(b) | ||||
| 03/01/2028 | 4.625% | 91,000 | 82,876 | |
| 06/01/2031 | 4.500% | 836,000 | 719,466 | |
| Novelis Corp.(b) | ||||
| 11/15/2026 | 3.250% | 305,000 | 278,539 | |
| 01/30/2030 | 4.750% | 836,000 | 768,361 | |
| 08/15/2031 | 3.875% | 367,000 | 313,916 | |
| Total | 5,157,960 | |||
| Midstream 2.9% | ||||
| Cheniere Energy Partners LP | ||||
| 03/01/2031 | 4.000% | 283,000 | 256,245 | |
| Cheniere Energy Partners LP(b) | ||||
| 01/31/2032 | 3.250% | 992,000 | 847,612 | |
| Cheniere Energy, Inc. | ||||
| 10/15/2028 | 4.625% | 567,000 | 551,036 | |
| CNX Midstream Partners LP(b) | ||||
| 04/15/2030 | 4.750% | 485,000 | 444,059 | |
| DCP Midstream Operating LP | ||||
| 05/15/2029 | 5.125% | 341,000 | 335,592 | |
| 04/01/2044 | 5.600% | 230,000 | 219,957 | |
| DT Midstream, Inc.(b) | ||||
| 06/15/2029 | 4.125% | 318,000 | 288,746 | |
| 06/15/2031 | 4.375% | 637,000 | 571,687 | |
| Enterprise Products Operating LLC | ||||
| 01/31/2060 | 3.950% | 6,085,000 | 4,935,555 | |
| EQM Midstream Partners LP | ||||
| 08/01/2024 | 4.000% | 1,500,000 | 1,451,814 | |
| EQM Midstream Partners LP(b) | ||||
| 07/01/2025 | 6.000% | 212,000 | 210,598 | |
| 07/01/2027 | 6.500% | 307,000 | 309,719 | |
| 01/15/2029 | 4.500% | 333,000 | 299,672 | |
| 01/15/2031 | 4.750% | 1,171,000 | 1,046,674 | |
| Corporate Bonds & Notes (continued) | ||||
| Issuer | Coupon Rate | Principal Amount ($) | Value ($) | |
| Hess Midstream Operations LP(b) | ||||
| 02/15/2030 | 4.250% | 143,000 | 130,916 | |
| Holly Energy Partners LP/Finance Corp.(b) | ||||
| 04/15/2027 | 6.375% | 274,000 | 280,114 | |
| ITT Holdings LLC(b) | ||||
| 08/01/2029 | 6.500% | 210,000 | 185,856 | |
| Kinder Morgan Energy Partners LP | ||||
| 03/01/2043 | 5.000% | 5,946,000 | 5,539,916 | |
| Kinder Morgan, Inc. | ||||
| 02/15/2046 | 5.050% | 6,324,000 | 5,991,948 | |
| MPLX LP | ||||
| 04/15/2048 | 4.700% | 1,199,000 | 1,063,210 | |
| 03/14/2052 | 4.950% | 3,022,000 | 2,765,137 | |
| NuStar Logistics LP | ||||
| 10/01/2025 | 5.750% | 182,000 | 180,562 | |
| 06/01/2026 | 6.000% | 132,000 | 131,414 | |
| 04/28/2027 | 5.625% | 247,000 | 237,153 | |
| Plains All American Pipeline LP/Finance Corp. | ||||
| 06/15/2044 | 4.700% | 6,975,000 | 5,816,248 | |
| Sunoco LP/Finance Corp. | ||||
| 04/15/2027 | 6.000% | 316,000 | 318,555 | |
| Targa Resources Partners LP/Finance Corp. | ||||
| 01/15/2028 | 5.000% | 357,000 | 351,303 | |
| 03/01/2030 | 5.500% | 869,000 | 861,386 | |
| TransMontaigne Partners LP/TLP Finance Corp. | ||||
| 02/15/2026 | 6.125% | 402,000 | 391,849 | |
| Venture Global Calcasieu Pass LLC(b) | ||||
| 08/15/2029 | 3.875% | 699,000 | 638,276 | |
| 08/15/2031 | 4.125% | 1,016,000 | 926,841 | |
| 11/01/2033 | 3.875% | 562,000 | 489,455 | |
| Western Gas Partners LP | ||||
| 08/15/2048 | 5.500% | 2,776,000 | 2,439,831 | |
| Williams Companies, Inc. (The) | ||||
| 09/15/2045 | 5.100% | 2,955,000 | 2,876,693 | |
| 10/15/2051 | 3.500% | 3,512,000 | 2,699,794 | |
| Total | 46,085,423 | |||
| Natural Gas 1.5% | ||||
| NiSource, Inc. | ||||
| 09/01/2029 | 2.950% | 13,755,000 | 12,407,255 | |
| 02/15/2043 | 5.250% | 7,015,000 | 6,938,902 | |
| 05/15/2047 | 4.375% | 4,414,000 | 3,978,782 | |
| Total | 23,324,939 | |||
| Oil Field Services 0.0% | ||||
| Apergy Corp. | ||||
| 05/01/2026 | 6.375% | 71,000 | 71,625 | |
| Nabors Industries Ltd.(b) | ||||
| 01/15/2026 | 7.250% | 220,000 | 215,289 | |
| 16 | Columbia Corporate Income Fund | Annual Report 2022 |
April 30, 2022
| Corporate Bonds & Notes (continued) | ||||
| Issuer | Coupon Rate | Principal Amount ($) | Value ($) | |
| Transocean Guardian Ltd.(b) | ||||
| 01/15/2024 | 5.875% | 76,406 | 73,013 | |
| Transocean Sentry Ltd.(b) | ||||
| 05/15/2023 | 5.375% | 397,417 | 386,694 | |
| Total | 746,621 | |||
| Other Industry 0.0% | ||||
| Dycom Industries, Inc.(b) | ||||
| 04/15/2029 | 4.500% | 286,000 | 260,753 | |
| Hillenbrand, Inc. | ||||
| 03/01/2031 | 3.750% | 215,000 | 189,767 | |
| Total | 450,520 | |||
| Other REIT 0.3% | ||||
| Blackstone Mortgage Trust, Inc.(b) | ||||
| 01/15/2027 | 3.750% | 621,000 | 567,882 | |
| Ladder Capital Finance Holdings LLLP/Corp.(b) | ||||
| 10/01/2025 | 5.250% | 558,000 | 548,410 | |
| 02/01/2027 | 4.250% | 390,000 | 359,708 | |
| 06/15/2029 | 4.750% | 1,036,000 | 931,614 | |
| Park Intermediate Holdings LLC/Domestic Property/Finance Co-Issuer(b) | ||||
| 10/01/2028 | 5.875% | 384,000 | 372,508 | |
| Park Intermediate Holdings LLC/PK Domestic Property LLC/Finance Co-Issuer(b) | ||||
| 05/15/2029 | 4.875% | 317,000 | 290,625 | |
| RHP Hotel Properties LP/Finance Corp.(b) | ||||
| 02/15/2029 | 4.500% | 216,000 | 195,635 | |
| RLJ Lodging Trust LP(b) | ||||
| 07/01/2026 | 3.750% | 222,000 | 206,592 | |
| 09/15/2029 | 4.000% | 275,000 | 245,432 | |
| Service Properties Trust | ||||
| 03/15/2024 | 4.650% | 209,000 | 198,478 | |
| 10/01/2024 | 4.350% | 98,000 | 90,686 | |
| 12/15/2027 | 5.500% | 129,000 | 117,387 | |
| Total | 4,124,957 | |||
| Packaging 0.3% | ||||
| Ardagh Metal Packaging Finance USA LLC/PLC(b) | ||||
| 09/01/2029 | 4.000% | 769,000 | 658,830 | |
| Ardagh Packaging Finance PLC/Holdings USA, Inc.(b) | ||||
| 08/15/2026 | 4.125% | 594,000 | 550,992 | |
| 08/15/2027 | 5.250% | 420,000 | 360,818 | |
| 08/15/2027 | 5.250% | 366,000 | 313,705 | |
| Berry Global, Inc. | ||||
| 01/15/2026 | 1.570% | 2,125,000 | 1,933,832 | |
| Canpack SA/US LLC(b) | ||||
| 11/15/2029 | 3.875% | 829,000 | 711,653 | |
| LABL, Inc.(b) | ||||
| 11/01/2028 | 5.875% | 70,000 | 64,083 | |
| Corporate Bonds & Notes (continued) | ||||
| Issuer | Coupon Rate | Principal Amount ($) | Value ($) | |
| Trivium Packaging Finance BV(b) | ||||
| 08/15/2026 | 5.500% | 178,000 | 172,038 | |
| 08/15/2027 | 8.500% | 399,000 | 393,886 | |
| Total | 5,159,837 | |||
| Pharmaceuticals 3.0% | ||||
| AbbVie, Inc. | ||||
| 05/14/2035 | 4.500% | 3,064,000 | 3,029,895 | |
| 11/06/2042 | 4.400% | 6,305,000 | 5,976,734 | |
| 11/21/2049 | 4.250% | 3,972,000 | 3,641,332 | |
| Amgen, Inc. | ||||
| 02/22/2062 | 4.400% | 13,290,000 | 11,882,809 | |
| AstraZeneca Finance LLC | ||||
| 05/28/2026 | 1.200% | 9,485,000 | 8,620,607 | |
| Bausch Health Companies, Inc.(b) | ||||
| 04/15/2025 | 6.125% | 358,000 | 358,947 | |
| 04/01/2026 | 9.250% | 269,000 | 266,820 | |
| 02/01/2027 | 6.125% | 486,000 | 467,275 | |
| 06/01/2028 | 4.875% | 152,000 | 134,887 | |
| 02/15/2031 | 5.250% | 649,000 | 450,963 | |
| Bristol-Myers Squibb Co. | ||||
| 03/15/2062 | 3.900% | 6,888,000 | 6,040,267 | |
| Endo Dac/Finance LLC/Finco, Inc.(b) | ||||
| 06/30/2028 | 6.000% | 260,000 | 114,668 | |
| Endo Luxembourg Finance Co I Sarl/US, Inc.(b) | ||||
| 04/01/2029 | 6.125% | 356,000 | 309,770 | |
| Gilead Sciences, Inc. | ||||
| 10/01/2040 | 2.600% | 6,890,000 | 5,162,784 | |
| Grifols Escrow Issuer SA(b) | ||||
| 10/15/2028 | 4.750% | 352,000 | 322,014 | |
| Organon Finance 1 LLC(b) | ||||
| 04/30/2028 | 4.125% | 918,000 | 852,743 | |
| 04/30/2031 | 5.125% | 763,000 | 690,082 | |
| Par Pharmaceutical, Inc.(b) | ||||
| 04/01/2027 | 7.500% | 267,000 | 243,782 | |
| Total | 48,566,379 | |||
| Property & Casualty 1.2% | ||||
| Alliant Holdings Intermediate LLC/Co-Issuer(b) | ||||
| 10/15/2027 | 4.250% | 32,000 | 29,524 | |
| 10/15/2027 | 6.750% | 834,000 | 789,388 | |
| 11/01/2029 | 5.875% | 332,000 | 308,799 | |
| AssuredPartners, Inc.(b) | ||||
| 01/15/2029 | 5.625% | 608,000 | 535,141 | |
| Berkshire Hathaway Finance Corp. | ||||
| 03/15/2052 | 3.850% | 18,810,000 | 16,749,754 | |
| BroadStreet Partners, Inc.(b) | ||||
| 04/15/2029 | 5.875% | 716,000 | 621,973 | |
| Columbia Corporate Income Fund | Annual Report 2022 | 17 |
April 30, 2022
| Corporate Bonds & Notes (continued) | ||||
| Issuer | Coupon Rate | Principal Amount ($) | Value ($) | |
| GTCR AP Finance, Inc.(b) | ||||
| 05/15/2027 | 8.000% | 39,000 | 38,871 | |
| HUB International Ltd.(b) | ||||
| 12/01/2029 | 5.625% | 622,000 | 569,782 | |
| Ryan Specialty Group LLC(b) | ||||
| 02/01/2030 | 4.375% | 165,000 | 150,695 | |
| Total | 19,793,927 | |||
| Railroads 0.3% | ||||
| Canadian Pacific Railway Co. | ||||
| 12/02/2051 | 3.100% | 1,611,000 | 1,237,283 | |
| CSX Corp. | ||||
| 11/01/2046 | 3.800% | 4,193,000 | 3,706,258 | |
| Total | 4,943,541 | |||
| Restaurants 0.2% | ||||
| 1011778 BC ULC/New Red Finance, Inc.(b) | ||||
| 01/15/2028 | 3.875% | 578,000 | 531,760 | |
| 10/15/2030 | 4.000% | 294,000 | 251,483 | |
| Fertitta Entertainment LLC/Finance Co., Inc.(b) | ||||
| 01/15/2030 | 6.750% | 605,000 | 527,489 | |
| IRB Holding Corp.(b) | ||||
| 06/15/2025 | 7.000% | 874,000 | 894,402 | |
| Papa John’s International, Inc.(b) | ||||
| 09/15/2029 | 3.875% | 145,000 | 128,007 | |
| Yum! Brands, Inc. | ||||
| 04/01/2032 | 5.375% | 558,000 | 533,607 | |
| Total | 2,866,748 | |||
| Retailers 1.0% | ||||
| Asbury Automotive Group, Inc.(b) | ||||
| 11/15/2029 | 4.625% | 142,000 | 127,931 | |
| 02/15/2032 | 5.000% | 143,000 | 127,494 | |
| Group 1 Automotive, Inc.(b) | ||||
| 08/15/2028 | 4.000% | 100,000 | 89,953 | |
| L Brands, Inc.(b) | ||||
| 07/01/2025 | 9.375% | 37,000 | 41,636 | |
| 10/01/2030 | 6.625% | 498,000 | 495,926 | |
| L Brands, Inc. | ||||
| 06/15/2029 | 7.500% | 113,000 | 116,727 | |
| 11/01/2035 | 6.875% | 227,000 | 221,786 | |
| Subordinated | ||||
| 03/01/2033 | 6.950% | 1,350,000 | 1,283,844 | |
| LCM Investments Holdings II LLC(b) | ||||
| 05/01/2029 | 4.875% | 273,000 | 239,417 | |
| Lowe’s Companies, Inc. | ||||
| 10/15/2050 | 3.000% | 1,250,000 | 916,074 | |
| 04/01/2062 | 4.450% | 12,455,000 | 11,124,711 | |
| Corporate Bonds & Notes (continued) | ||||
| Issuer | Coupon Rate | Principal Amount ($) | Value ($) | |
| PetSmart, Inc./Finance Corp.(b) | ||||
| 02/15/2028 | 4.750% | 423,000 | 393,451 | |
| 02/15/2029 | 7.750% | 603,000 | 599,986 | |
| Total | 15,778,936 | |||
| Supermarkets 0.1% | ||||
| Albertsons Companies LLC/Safeway, Inc./New Albertsons LP/Albertsons LLC(b) | ||||
| 03/15/2026 | 7.500% | 147,000 | 154,686 | |
| 02/15/2028 | 5.875% | 378,000 | 367,397 | |
| 03/15/2029 | 3.500% | 486,000 | 409,108 | |
| Albertsons Companies, Inc./Safeway, Inc./New Albertsons LP/Albertsons LLC(b) | ||||
| 03/15/2026 | 3.250% | 223,000 | 203,875 | |
| 01/15/2027 | 4.625% | 339,000 | 317,533 | |
| 02/15/2030 | 4.875% | 124,000 | 112,310 | |
| Total | 1,564,909 | |||
| Technology 5.1% | ||||
| Apple, Inc. | ||||
| 02/09/2045 | 3.450% | 8,040,000 | 7,176,892 | |
| Black Knight InfoServ LLC(b) | ||||
| 09/01/2028 | 3.625% | 185,000 | 171,750 | |
| Boxer Parent Co., Inc.(b) | ||||
| 10/02/2025 | 7.125% | 82,000 | 83,638 | |
| Broadcom, Inc.(b) | ||||
| 11/15/2036 | 3.187% | 9,706,000 | 7,683,040 | |
| Clarivate Science Holdings Corp.(b) | ||||
| 07/01/2028 | 3.875% | 258,000 | 229,739 | |
| 07/01/2029 | 4.875% | 695,000 | 613,972 | |
| Condor Merger Sub, Inc.(b) | ||||
| 02/15/2030 | 7.375% | 940,000 | 840,970 | |
| Dun & Bradstreet Corp. (The)(b) | ||||
| 12/15/2029 | 5.000% | 197,000 | 183,102 | |
| Fidelity National Information Services, Inc. | ||||
| 03/01/2024 | 0.600% | 1,932,000 | 1,832,668 | |
| Gartner, Inc.(b) | ||||
| 07/01/2028 | 4.500% | 2,178,000 | 2,089,534 | |
| 06/15/2029 | 3.625% | 195,000 | 176,060 | |
| HealthEquity, Inc.(b) | ||||
| 10/01/2029 | 4.500% | 626,000 | 571,962 | |
| Helios Software Holdings, Inc.(b) | ||||
| 05/01/2028 | 4.625% | 476,000 | 421,124 | |
| International Business Machines Corp. | ||||
| 05/15/2040 | 2.850% | 1,796,000 | 1,426,122 | |
| 05/15/2050 | 2.950% | 2,028,000 | 1,544,618 | |
| ION Trading Technologies Sarl(b) | ||||
| 05/15/2028 | 5.750% | 421,000 | 395,603 | |
| Iron Mountain, Inc.(b) | ||||
| 07/15/2030 | 5.250% | 827,000 | 759,082 | |
| 18 | Columbia Corporate Income Fund | Annual Report 2022 |
April 30, 2022
| Corporate Bonds & Notes (continued) | ||||
| Issuer | Coupon Rate | Principal Amount ($) | Value ($) | |
| Logan Merger Sub, Inc.(b) | ||||
| 09/01/2027 | 5.500% | 1,248,000 | 1,100,490 | |
| Microchip Technology, Inc. | ||||
| 02/15/2024 | 0.972% | 8,629,000 | 8,224,871 | |
| Minerva Merger Sub, Inc.(b) | ||||
| 02/15/2030 | 6.500% | 1,042,000 | 958,595 | |
| MSCI, Inc.(b) | ||||
| 11/01/2031 | 3.625% | 7,585,000 | 6,668,585 | |
| NCR Corp.(b) | ||||
| 09/01/2027 | 5.750% | 274,000 | 264,687 | |
| 10/01/2028 | 5.000% | 290,000 | 276,576 | |
| 04/15/2029 | 5.125% | 603,000 | 570,547 | |
| 09/01/2029 | 6.125% | 215,000 | 205,920 | |
| 10/01/2030 | 5.250% | 194,000 | 182,236 | |
| Nielsen Finance LLC/Co.(b) | ||||
| 10/01/2028 | 5.625% | 224,000 | 216,967 | |
| 07/15/2029 | 4.500% | 254,000 | 239,893 | |
| 10/01/2030 | 5.875% | 95,000 | 91,273 | |
| 07/15/2031 | 4.750% | 317,000 | 299,480 | |
| NXP BV/Funding LLC/USA, Inc.(b) | ||||
| 05/01/2030 | 3.400% | 1,375,000 | 1,252,461 | |
| 05/11/2031 | 2.500% | 15,995,000 | 13,352,564 | |
| Oracle Corp. | ||||
| 03/25/2041 | 3.650% | 6,388,000 | 4,939,935 | |
| 11/15/2047 | 4.000% | 1,000,000 | 772,666 | |
| 04/01/2050 | 3.600% | 9,000,000 | 6,461,608 | |
| Plantronics, Inc.(b) | ||||
| 03/01/2029 | 4.750% | 963,000 | 978,396 | |
| Shift4 Payments LLC/Finance Sub, Inc.(b) | ||||
| 11/01/2026 | 4.625% | 912,000 | 873,524 | |
| Square, Inc.(b) | ||||
| 06/01/2026 | 2.750% | 103,000 | 94,065 | |
| 06/01/2031 | 3.500% | 217,000 | 181,671 | |
| Switch Ltd.(b) | ||||
| 09/15/2028 | 3.750% | 45,000 | 42,203 | |
| 06/15/2029 | 4.125% | 289,000 | 276,636 | |
| Tempo Acquisition LLC/Finance Corp.(b) | ||||
| 06/01/2025 | 5.750% | 175,000 | 176,145 | |
| VeriSign, Inc. | ||||
| 06/15/2031 | 2.700% | 6,364,000 | 5,462,611 | |
| Verscend Escrow Corp.(b) | ||||
| 08/15/2026 | 9.750% | 505,000 | 520,150 | |
| ZoomInfo Technologies LLC/Finance Corp.(b) | ||||
| 02/01/2029 | 3.875% | 1,098,000 | 971,626 | |
| Total | 81,856,257 | |||
| Tobacco 0.2% | ||||
| BAT Capital Corp. | ||||
| 08/15/2047 | 4.540% | 4,180,000 | 3,310,934 | |
| Corporate Bonds & Notes (continued) | ||||
| Issuer | Coupon Rate | Principal Amount ($) | Value ($) | |
| Transportation Services 0.2% | ||||
| FedEx Corp. | ||||
| 11/15/2045 | 4.750% | 2,550,000 | 2,425,356 | |
| Wireless 1.9% | ||||
| Altice France Holding SA(b) | ||||
| 05/15/2027 | 10.500% | 329,000 | 333,017 | |
| 02/15/2028 | 6.000% | 343,000 | 283,324 | |
| Altice France SA(b) | ||||
| 02/01/2027 | 8.125% | 372,000 | 374,679 | |
| 01/15/2028 | 5.500% | 1,647,000 | 1,457,872 | |
| 07/15/2029 | 5.125% | 1,059,000 | 895,823 | |
| 10/15/2029 | 5.500% | 120,000 | 103,302 | |
| American Tower Corp. | ||||
| 08/15/2029 | 3.800% | 4,746,000 | 4,442,691 | |
| 06/15/2030 | 2.100% | 2,850,000 | 2,337,295 | |
| Crown Castle International Corp. | ||||
| 04/01/2031 | 2.100% | 6,110,000 | 4,951,437 | |
| Rogers Communications, Inc. | ||||
| 11/15/2049 | 3.700% | 2,530,000 | 2,011,301 | |
| SBA Communications Corp. | ||||
| 02/15/2027 | 3.875% | 277,000 | 262,810 | |
| 02/01/2029 | 3.125% | 110,000 | 94,311 | |
| Sprint Capital Corp. | ||||
| 03/15/2032 | 8.750% | 125,000 | 158,873 | |
| Sprint Corp. | ||||
| 06/15/2024 | 7.125% | 316,000 | 332,428 | |
| 03/01/2026 | 7.625% | 552,000 | 600,927 | |
| T-Mobile USA, Inc. | ||||
| 02/15/2026 | 2.250% | 1,147,000 | 1,054,396 | |
| 04/15/2026 | 2.625% | 1,000,000 | 932,699 | |
| 02/15/2029 | 2.625% | 602,000 | 520,825 | |
| 02/15/2031 | 2.875% | 334,000 | 284,239 | |
| 04/15/2031 | 3.500% | 671,000 | 597,904 | |
| T-Mobile USA, Inc.(b) | ||||
| 04/15/2031 | 3.500% | 303,000 | 268,573 | |
| 10/15/2052 | 3.400% | 1,646,000 | 1,246,597 | |
| 11/15/2060 | 3.600% | 6,945,000 | 5,185,167 | |
| Vmed O2 UK Financing I PLC(b) | ||||
| 01/31/2031 | 4.250% | 1,059,000 | 895,527 | |
| 07/15/2031 | 4.750% | 849,000 | 732,489 | |
| Total | 30,358,506 | |||
| Wirelines 4.0% | ||||
| AT&T, Inc. | ||||
| 05/15/2035 | 4.500% | 2,000,000 | 1,969,081 | |
| 09/15/2055 | 3.550% | 9,209,000 | 7,132,311 | |
| 12/01/2057 | 3.800% | 17,141,000 | 13,756,568 | |
| Cablevision Lightpath LLC(b) | ||||
| 09/15/2027 | 3.875% | 373,000 | 328,533 | |
| Columbia Corporate Income Fund | Annual Report 2022 | 19 |
April 30, 2022
| Corporate Bonds & Notes (continued) | ||||
| Issuer | Coupon Rate | Principal Amount ($) | Value ($) | |
| CenturyLink, Inc. | ||||
| 12/01/2023 | 6.750% | 355,000 | 360,986 | |
| 04/01/2025 | 5.625% | 155,000 | 151,071 | |
| CenturyLink, Inc.(b) | ||||
| 02/15/2027 | 4.000% | 205,000 | 182,332 | |
| Front Range BidCo, Inc.(b) | ||||
| 03/01/2027 | 4.000% | 984,000 | 859,071 | |
| 03/01/2028 | 6.125% | 413,000 | 346,340 | |
| Iliad Holding SAS(b) | ||||
| 10/15/2026 | 6.500% | 690,000 | 664,450 | |
| 10/15/2028 | 7.000% | 1,037,000 | 989,029 | |
| Northwest Fiber LLC/Finance Sub, Inc.(b) | ||||
| 02/15/2028 | 6.000% | 222,000 | 185,431 | |
| Telefonica Emisiones SAU | ||||
| 03/06/2048 | 4.895% | 5,905,000 | 5,383,363 | |
| Verizon Communications, Inc. | ||||
| 03/21/2031 | 2.550% | 35,860,000 | 31,125,242 | |
| Total | 63,433,808 | |||
| Total Corporate Bonds & Notes (Cost $1,631,248,870) | 1,434,907,651 | |||
| Foreign Government Obligations(j) 0.0% | ||||
| Canada 0.0% | ||||
| NOVA Chemicals Corp.(b) | ||||
| 06/01/2027 | 5.250% | 251,000 | 240,185 | |
| 05/15/2029 | 4.250% | 313,000 | 271,522 | |
| Total | 511,707 | |||
| Total Foreign Government Obligations (Cost $560,240) | 511,707 | |||
| Senior Loans 0.2% | ||||
| Borrower | Coupon Rate | Principal Amount ($) | Value ($) | |
| Chemicals 0.0% | ||||
| WR Grace & Co.(i),(k) | ||||
| Term Loan | ||||
| 1-month USD LIBOR + 3.750% Floor 0.500% 09/22/2028 | 4.813% | 387,030 | 383,256 | |
| Consumer Cyclical Services 0.0% | ||||
| 8th Avenue Food & Provisions, Inc.(i),(k) | ||||
| 1st Lien Term Loan | ||||
| 1-month USD LIBOR + 3.750% 10/01/2025 | 4.514% | 334,785 | 287,915 | |
| Senior Loans (continued) | ||||
| Borrower | Coupon Rate | Principal Amount ($) | Value ($) | |
| 2nd Lien Term Loan | ||||
| 1-month USD LIBOR + 7.750% 10/01/2026 | 8.514% | 78,084 | 70,130 | |
| Total | 358,045 | |||
| Consumer Products 0.1% | ||||
| SWF Holdings I Corp.(i),(k) | ||||
| 1st Lien Term Loan | ||||
| 1-month USD LIBOR + 4.000% Floor 0.750% 10/06/2028 | 4.750% | 740,000 | 684,041 | |
| Media and Entertainment 0.0% | ||||
| Cengage Learning, Inc.(i),(k) | ||||
| Tranche B 1st Lien Term Loan | ||||
| 1-month USD LIBOR + 4.750% Floor 1.000% 07/14/2026 | 5.750% | 463,985 | 455,866 | |
| Technology 0.1% | ||||
| Ascend Learning LLC(i),(k) | ||||
| 1st Lien Term Loan | ||||
| 1-month USD LIBOR + 3.500% Floor 0.500% 12/11/2028 | 4.264% | 411,968 | 406,595 | |
| 2nd Lien Term Loan | ||||
| 1-month USD LIBOR + 5.750% Floor 0.500% 12/10/2029 | 6.514% | 246,000 | 242,618 | |
| DCert Buyer, Inc.(i),(k) | ||||
| 2nd Lien Term Loan | ||||
| 1-month USD LIBOR + 7.000% 02/19/2029 | 7.764% | 357,000 | 352,687 | |
| Epicore Software Corp.(i),(k) | ||||
| 2nd Lien Term Loan | ||||
| 1-month USD LIBOR + 7.750% Floor 1.000% 07/31/2028 | 8.750% | 101,000 | 102,831 | |
| UKG, Inc.(i),(k) | ||||
| 1st Lien Term Loan | ||||
| 1-month USD LIBOR + 3.250% Floor 0.500% 05/04/2026 | 4.212% | 247,010 | 244,231 | |
| 2nd Lien Term Loan | ||||
| 1-month USD LIBOR + 5.250% Floor 0.500% 05/03/2027 | 6.212% | 478,000 | 473,101 | |
| Total | 1,822,063 | |||
| Total Senior Loans (Cost $3,823,227) | 3,703,271 | |||
| 20 | Columbia Corporate Income Fund | Annual Report 2022 |
April 30, 2022
| U.S. Treasury Obligations 2.3% | ||||
| Issuer | Coupon Rate | Principal Amount ($) | Value ($) | |
| U.S. Treasury | ||||
| 04/30/2022 | 0.125% | 5,640,000 | 5,639,967 | |
| 06/30/2025 | 0.250% | 3,450,000 | 3,173,461 | |
| 11/30/2025 | 0.375% | 3,600,000 | 3,286,969 | |
| 12/31/2025 | 0.375% | 11,000,000 | 10,023,750 | |
| 06/30/2027 | 0.500% | 8,300,000 | 7,326,047 | |
| 12/31/2027 | 0.625% | 4,000,000 | 3,513,750 | |
| 11/15/2051 | 1.875% | 3,810,000 | 2,987,278 | |
| Total U.S. Treasury Obligations (Cost $39,544,034) | 35,951,222 | |||
| Money Market Funds 6.8% | ||
| Shares | Value ($) | |
| Columbia Short-Term Cash Fund, 0.462%(l),(m) | 108,921,543 | 108,888,867 |
| Total Money Market Funds (Cost $108,882,497) | 108,888,867 | |
| Total Investments in Securities (Cost: $1,785,582,193) | 1,584,446,737 | |
| Other Assets & Liabilities, Net | 13,772,620 | |
| Net Assets | 1,598,219,357 | |
| Long futures contracts | ||||||
| Description | Number of contracts | Expiration date | Trading currency | Notional amount | Value/Unrealized appreciation ($) | Value/Unrealized depreciation ($) |
| U.S. Long Bond | 543 | 06/2022 | USD | 76,393,313 | — | (7,193,678) |
| U.S. Treasury 2-Year Note | 550 | 06/2022 | USD | 115,946,875 | — | (1,817,330) |
| U.S. Treasury 5-Year Note | 1,885 | 06/2022 | USD | 212,386,484 | — | (7,779,775) |
| Total | — | (16,790,783) | ||||
| Short futures contracts | ||||||
| Description | Number of contracts | Expiration date | Trading currency | Notional amount | Value/Unrealized appreciation ($) | Value/Unrealized depreciation ($) |
| U.S. Treasury 10-Year Note | (1,095) | 06/2022 | USD | (130,476,094) | 4,191,303 | — |
| U.S. Treasury Ultra 10-Year Note | (1,082) | 06/2022 | USD | (139,578,000) | 11,510,884 | — |
| U.S. Ultra Treasury Bond | (357) | 06/2022 | USD | (57,276,188) | 6,799,115 | — |
| Total | 22,501,302 | — | ||||
| (a) | Non-income producing investment. |
| (b) | Represents privately placed and other securities and instruments exempt from Securities and Exchange Commission registration (collectively, private placements), such as Section 4(a)(2) and Rule 144A eligible securities, which are often sold only to qualified institutional buyers. At April 30, 2022, the total value of these securities amounted to $447,378,269, which represents 27.99% of total net assets. |
| (c) | Represents a security purchased on a when-issued basis. |
| (d) | Represents a variable rate security with a step coupon where the rate adjusts according to a schedule for a series of periods, typically lower for an initial period and then increasing to a higher coupon rate thereafter. The interest rate shown was the current rate as of April 30, 2022. |
| (e) | Represents fair value as determined in good faith under procedures approved by the Board of Trustees. At April 30, 2022, the total value of these securities amounted to $9,525, which represents less than 0.01% of total net assets. |
| (f) | Represents securities that have defaulted on payment of interest. The Fund has stopped accruing interest on these securities. At April 30, 2022, the total value of these securities amounted to $9,525, which represents less than 0.01% of total net assets. |
| (g) | Valuation based on significant unobservable inputs. |
| (h) | Payment-in-kind security. Interest can be paid by issuing additional par of the security or in cash. |
| (i) | Variable rate security. The interest rate shown was the current rate as of April 30, 2022. |
| (j) | Principal and interest may not be guaranteed by a governmental entity. |
| Columbia Corporate Income Fund | Annual Report 2022 | 21 |
April 30, 2022
| (k) | The stated interest rate represents the weighted average interest rate at April 30, 2022 of contracts within the senior loan facility. Interest rates on contracts are primarily determined either weekly, monthly or quarterly by reference to the indicated base lending rate and spread and the reset period. These base lending rates are primarily the LIBOR and other short-term rates. Base lending rates may be subject to a floor or minimum rate. The interest rate for senior loans purchased on a when-issued or delayed delivery basis will be determined upon settlement, therefore no interest rate is disclosed. Senior loans often require prepayments from excess cash flows or permit the borrowers to repay at their election. The degree to which borrowers repay cannot be predicted with accuracy. As a result, remaining maturities of senior loans may be less than the stated maturities. Generally, the Fund is contractually obligated to receive approval from the agent bank and/or borrower prior to the disposition of a senior loan. |
| (l) | The rate shown is the seven-day current annualized yield at April 30, 2022. |
| (m) | As defined in the Investment Company Act of 1940, as amended, an affiliated company is one in which the Fund owns 5% or more of the company’s outstanding voting securities, or a company which is under common ownership or control with the Fund. The value of the holdings and transactions in these affiliated companies during the year ended April 30, 2022 are as follows: |
| Affiliated issuers | Beginning of period($) | Purchases($) | Sales($) | Net change in unrealized appreciation (depreciation)($) | End of period($) | Realized gain (loss)($) | Dividends($) | End of period shares |
| Columbia Short-Term Cash Fund, 0.462% | ||||||||
| 10,464,850 | 795,024,029 | (696,606,206) | 6,194 | 108,888,867 | (21,549) | 103,590 | 108,921,543 | |
| LIBOR | London Interbank Offered Rate |
| USD | US Dollar |
| ■ | Level 1 — Valuations based on quoted prices for investments in active markets that the Fund has the ability to access at the measurement date. Valuation adjustments are not applied to Level 1 investments. |
| ■ | Level 2 — Valuations based on other significant observable inputs (including quoted prices for similar securities, interest rates, prepayment speeds, credit risks, etc.). |
| ■ | Level 3 — Valuations based on significant unobservable inputs (including the Fund’s own assumptions and judgment in determining the fair value of investments). |
| 22 | Columbia Corporate Income Fund | Annual Report 2022 |
April 30, 2022
additional valuation matters, which may include the need to review back-testing results, review time-sensitive information or approve related valuation actions. The Committee reports to the Board, with members of the Committee meeting with the Board at each of its regularly scheduled meetings to discuss valuation matters and actions during the period, similar to those described earlier.
| Level 1 ($) | Level 2 ($) | Level 3 ($) | Total ($) | |
| Investments in Securities | ||||
| Common Stocks | ||||
| Financials | 80,137 | — | — | 80,137 |
| Total Common Stocks | 80,137 | — | — | 80,137 |
| Convertible Bonds | — | 403,882 | — | 403,882 |
| Corporate Bonds & Notes | — | 1,434,898,126 | 9,525 | 1,434,907,651 |
| Foreign Government Obligations | — | 511,707 | — | 511,707 |
| Senior Loans | — | 3,703,271 | — | 3,703,271 |
| U.S. Treasury Obligations | 35,951,222 | — | — | 35,951,222 |
| Money Market Funds | 108,888,867 | — | — | 108,888,867 |
| Total Investments in Securities | 144,920,226 | 1,439,516,986 | 9,525 | 1,584,446,737 |
| Investments in Derivatives | ||||
| Asset | ||||
| Futures Contracts | 22,501,302 | — | — | 22,501,302 |
| Liability | ||||
| Futures Contracts | (16,790,783) | — | — | (16,790,783) |
| Total | 150,630,745 | 1,439,516,986 | 9,525 | 1,590,157,256 |
| Columbia Corporate Income Fund | Annual Report 2022 | 23 |
April 30, 2022
| Assets | |
| Investments in securities, at value | |
| Unaffiliated issuers (cost $1,676,699,696) | $1,475,557,870 |
| Affiliated issuers (cost $108,882,497) | 108,888,867 |
| Cash | 14,433 |
| Margin deposits on: | |
| Futures contracts | 4,450,051 |
| Receivable for: | |
| Investments sold | 2,750,090 |
| Investments sold on a delayed delivery basis | 748,022 |
| Capital shares sold | 3,678,982 |
| Dividends | 41,053 |
| Interest | 14,549,890 |
| Foreign tax reclaims | 54,732 |
| Variation margin for futures contracts | 832,805 |
| Prepaid expenses | 11,274 |
| Trustees’ deferred compensation plan | 199,284 |
| Other assets | 1 |
| Total assets | 1,611,777,354 |
| Liabilities | |
| Payable for: | |
| Investments purchased | 2,784,913 |
| Investments purchased on a delayed delivery basis | 4,443,575 |
| Capital shares purchased | 1,241,217 |
| Distributions to shareholders | 3,920,950 |
| Variation margin for futures contracts | 719,875 |
| Management services fees | 21,623 |
| Distribution and/or service fees | 803 |
| Transfer agent fees | 162,384 |
| Compensation of board members | 17,552 |
| Other expenses | 45,821 |
| Trustees’ deferred compensation plan | 199,284 |
| Total liabilities | 13,557,997 |
| Net assets applicable to outstanding capital stock | $1,598,219,357 |
| Represented by | |
| Paid in capital | 1,814,763,868 |
| Total distributable earnings (loss) | (216,544,511) |
| Total - representing net assets applicable to outstanding capital stock | $1,598,219,357 |
| 24 | Columbia Corporate Income Fund | Annual Report 2022 |
April 30, 2022
| Class A | |
| Net assets | $107,905,054 |
| Shares outstanding | 11,701,092 |
| Net asset value per share | $9.22 |
| Maximum sales charge | 4.75% |
| Maximum offering price per share (calculated by dividing the net asset value per share by 1.0 minus the maximum sales charge for Class A shares) | $9.68 |
| Advisor Class | |
| Net assets | $190,943,491 |
| Shares outstanding | 20,739,766 |
| Net asset value per share | $9.21 |
| Class C | |
| Net assets | $2,608,621 |
| Shares outstanding | 282,969 |
| Net asset value per share | $9.22 |
| Institutional Class | |
| Net assets | $380,743,106 |
| Shares outstanding | 41,292,798 |
| Net asset value per share | $9.22 |
| Institutional 2 Class | |
| Net assets | $51,118,616 |
| Shares outstanding | 5,552,313 |
| Net asset value per share | $9.21 |
| Institutional 3 Class | |
| Net assets | $864,900,469 |
| Shares outstanding | 93,843,975 |
| Net asset value per share | $9.22 |
| Columbia Corporate Income Fund | Annual Report 2022 | 25 |
Year Ended April 30, 2022
| Net investment income | |
| Income: | |
| Dividends — affiliated issuers | $103,590 |
| Interest | 46,114,051 |
| Total income | 46,217,641 |
| Expenses: | |
| Management services fees | 7,895,106 |
| Distribution and/or service fees | |
| Class A | 246,785 |
| Class C | 32,379 |
| Transfer agent fees | |
| Class A | 157,614 |
| Advisor Class | 116,328 |
| Class C | 5,809 |
| Institutional Class | 669,990 |
| Institutional 2 Class | 27,897 |
| Institutional 3 Class | 51,067 |
| Compensation of board members | 33,140 |
| Custodian fees | 15,645 |
| Printing and postage fees | 30,997 |
| Registration fees | 110,282 |
| Audit fees | 29,500 |
| Legal fees | 26,875 |
| Compensation of chief compliance officer | 507 |
| Other | 27,636 |
| Total expenses | 9,477,557 |
| Fees waived or expenses reimbursed by Investment Manager and its affiliates | (710,495) |
| Fees waived by distributor | |
| Class C | (2,837) |
| Fees waived by transfer agent | |
| Institutional 2 Class | (1,553) |
| Institutional 3 Class | (33,206) |
| Expense reduction | (794) |
| Total net expenses | 8,728,672 |
| Net investment income | 37,488,969 |
| Realized and unrealized gain (loss) — net | |
| Net realized gain (loss) on: | |
| Investments — unaffiliated issuers | (8,380,438) |
| Investments — affiliated issuers | (21,549) |
| Foreign currency translations | (18) |
| Futures contracts | 6,228,703 |
| Net realized loss | (2,173,302) |
| Net change in unrealized appreciation (depreciation) on: | |
| Investments — unaffiliated issuers | (229,979,524) |
| Investments — affiliated issuers | 6,194 |
| Futures contracts | 3,877,463 |
| Net change in unrealized appreciation (depreciation) | (226,095,867) |
| Net realized and unrealized loss | (228,269,169) |
| Net decrease in net assets resulting from operations | $(190,780,200) |
| 26 | Columbia Corporate Income Fund | Annual Report 2022 |
| Year Ended April 30, 2022 | Year Ended April 30, 2021 | |
| Operations | ||
| Net investment income | $37,488,969 | $30,385,975 |
| Net realized gain (loss) | (2,173,302) | 52,823,472 |
| Net change in unrealized appreciation (depreciation) | (226,095,867) | (23,119,699) |
| Net increase (decrease) in net assets resulting from operations | (190,780,200) | 60,089,748 |
| Distributions to shareholders | ||
| Net investment income and net realized gains | ||
| Class A | (3,854,952) | (5,331,630) |
| Advisor Class | (2,031,592) | (1,101,540) |
| Class C | (130,378) | (368,028) |
| Institutional Class | (18,611,079) | (31,133,094) |
| Institutional 2 Class | (2,203,410) | (545,291) |
| Institutional 3 Class | (43,577,361) | (42,137,931) |
| Total distributions to shareholders | (70,408,772) | (80,617,514) |
| Increase in net assets from capital stock activity | 399,692,269 | 460,373,330 |
| Total increase in net assets | 138,503,297 | 439,845,564 |
| Net assets at beginning of year | 1,459,716,060 | 1,019,870,496 |
| Net assets at end of year | $1,598,219,357 | $1,459,716,060 |
| Columbia Corporate Income Fund | Annual Report 2022 | 27 |
| Year Ended | Year Ended | |||
| April 30, 2022 | April 30, 2021 | |||
| Shares | Dollars ($) | Shares | Dollars ($) | |
| Capital stock activity | ||||
| Class A | ||||
| Subscriptions | 638,607 | 6,769,881 | 2,697,195 | 30,058,077 |
| Fund reorganization | 5,714,967 | 59,304,731 | — | — |
| Distributions reinvested | 343,238 | 3,605,192 | 442,851 | 4,930,570 |
| Redemptions | (3,212,631) | (32,315,030) | (1,261,240) | (14,061,169) |
| Net increase | 3,484,181 | 37,364,774 | 1,878,806 | 20,927,478 |
| Advisor Class | ||||
| Subscriptions | 877,829 | 8,954,563 | 410,874 | 4,590,830 |
| Fund reorganization | 24,537,894 | 254,220,549 | — | — |
| Distributions reinvested | 145,363 | 1,444,471 | 85,525 | 953,153 |
| Redemptions | (5,808,925) | (57,624,830) | (1,175,449) | (13,101,669) |
| Net increase (decrease) | 19,752,161 | 206,994,753 | (679,050) | (7,557,686) |
| Class C | ||||
| Subscriptions | 53,093 | 553,091 | 233,445 | 2,613,615 |
| Distributions reinvested | 11,849 | 125,621 | 31,893 | 355,172 |
| Redemptions | (195,053) | (2,044,510) | (371,965) | (4,115,281) |
| Net decrease | (130,111) | (1,365,798) | (106,627) | (1,146,494) |
| Institutional Class | ||||
| Subscriptions | 8,951,136 | 94,457,557 | 21,574,553 | 239,072,587 |
| Distributions reinvested | 1,360,579 | 14,368,616 | 2,133,747 | 23,768,542 |
| Redemptions | (9,054,166) | (95,583,271) | (17,252,995) | (191,452,395) |
| Net increase | 1,257,549 | 13,242,902 | 6,455,305 | 71,388,734 |
| Institutional 2 Class | ||||
| Subscriptions | 2,215,006 | 22,835,824 | 4,076,722 | 43,998,512 |
| Distributions reinvested | 208,806 | 2,202,458 | 49,219 | 545,225 |
| Redemptions | (1,448,999) | (15,704,938) | (125,903) | (1,385,958) |
| Net increase | 974,813 | 9,333,344 | 4,000,038 | 43,157,779 |
| Institutional 3 Class | ||||
| Subscriptions | 17,930,828 | 191,386,445 | 36,922,199 | 409,476,388 |
| Distributions reinvested | 3,706,220 | 39,133,542 | 3,039,549 | 33,789,874 |
| Redemptions | (9,092,452) | (96,397,693) | (9,856,703) | (109,662,743) |
| Net increase | 12,544,596 | 134,122,294 | 30,105,045 | 333,603,519 |
| Total net increase | 37,883,189 | 399,692,269 | 41,653,517 | 460,373,330 |
| 28 | Columbia Corporate Income Fund | Annual Report 2022 |
| Net asset value, beginning of period | Net investment income | Net realized and unrealized gain (loss) | Total from investment operations | Distributions from net investment income | Distributions from net realized gains | Total distributions to shareholders | |
| Class A | |||||||
| Year Ended 4/30/2022 | $10.77 | 0.21 | (1.32) | (1.11) | (0.22) | (0.22) | (0.44) |
| Year Ended 4/30/2021 | $10.87 | 0.23 | 0.38 | 0.61 | (0.24) | (0.47) | (0.71) |
| Year Ended 4/30/2020 | $10.15 | 0.29 | 0.72 | 1.01 | (0.29) | — | (0.29) |
| Year Ended 4/30/2019 | $9.88 | 0.30 | 0.27 | 0.57 | (0.30) | — | (0.30) |
| Year Ended 4/30/2018 | $10.11 | 0.26 | (0.23) | 0.03 | (0.26) | — | (0.26) |
| Advisor Class | |||||||
| Year Ended 4/30/2022 | $10.76 | 0.25 | (1.34) | (1.09) | (0.24) | (0.22) | (0.46) |
| Year Ended 4/30/2021 | $10.85 | 0.27 | 0.37 | 0.64 | (0.26) | (0.47) | (0.73) |
| Year Ended 4/30/2020 | $10.14 | 0.32 | 0.71 | 1.03 | (0.32) | — | (0.32) |
| Year Ended 4/30/2019 | $9.87 | 0.33 | 0.27 | 0.60 | (0.33) | — | (0.33) |
| Year Ended 4/30/2018 | $10.10 | 0.28 | (0.23) | 0.05 | (0.28) | — | (0.28) |
| Class C | |||||||
| Year Ended 4/30/2022 | $10.77 | 0.15 | (1.32) | (1.17) | (0.16) | (0.22) | (0.38) |
| Year Ended 4/30/2021 | $10.86 | 0.17 | 0.38 | 0.55 | (0.17) | (0.47) | (0.64) |
| Year Ended 4/30/2020 | $10.15 | 0.23 | 0.71 | 0.94 | (0.23) | — | (0.23) |
| Year Ended 4/30/2019 | $9.88 | 0.24 | 0.27 | 0.51 | (0.24) | — | (0.24) |
| Year Ended 4/30/2018 | $10.11 | 0.20 | (0.23) | (0.03) | (0.20) | — | (0.20) |
| Institutional Class | |||||||
| Year Ended 4/30/2022 | $10.77 | 0.24 | (1.33) | (1.09) | (0.24) | (0.22) | (0.46) |
| Year Ended 4/30/2021 | $10.87 | 0.26 | 0.37 | 0.63 | (0.26) | (0.47) | (0.73) |
| Year Ended 4/30/2020 | $10.15 | 0.32 | 0.72 | 1.04 | (0.32) | — | (0.32) |
| Year Ended 4/30/2019 | $9.88 | 0.33 | 0.27 | 0.60 | (0.33) | — | (0.33) |
| Year Ended 4/30/2018 | $10.11 | 0.28 | (0.23) | 0.05 | (0.28) | — | (0.28) |
| Institutional 2 Class | |||||||
| Year Ended 4/30/2022 | $10.76 | 0.25 | (1.32) | (1.07) | (0.26) | (0.22) | (0.48) |
| Year Ended 4/30/2021 | $10.85 | 0.27 | 0.38 | 0.65 | (0.27) | (0.47) | (0.74) |
| Year Ended 4/30/2020 | $10.14 | 0.33 | 0.71 | 1.04 | (0.33) | — | (0.33) |
| Year Ended 4/30/2019 | $9.87 | 0.35 | 0.26 | 0.61 | (0.34) | — | (0.34) |
| Year Ended 4/30/2018 | $10.09 | 0.29 | (0.22) | 0.07 | (0.29) | — | (0.29) |
| 30 | Columbia Corporate Income Fund | Annual Report 2022 |
| Net asset value, end of period | Total return | Total gross expense ratio to average net assets(a) | Total net expense ratio to average net assets(a),(b) | Net investment income ratio to average net assets | Portfolio turnover | Net assets, end of period (000’s) | |
| Class A | |||||||
| Year Ended 4/30/2022 | $9.22 | (10.79%) | 0.92% | 0.87%(c) | 2.03% | 80% | $107,905 |
| Year Ended 4/30/2021 | $10.77 | 5.47% | 0.93% | 0.88%(c) | 2.10% | 74% | $88,537 |
| Year Ended 4/30/2020 | $10.87 | 10.10% | 0.95% | 0.91%(c) | 2.77% | 91% | $68,880 |
| Year Ended 4/30/2019 | $10.15 | 5.93% | 0.93% | 0.91%(c) | 3.07% | 65% | $60,085 |
| Year Ended 4/30/2018 | $9.88 | 0.22% | 0.95% | 0.92%(c) | 2.52% | 78% | $63,283 |
| Advisor Class | |||||||
| Year Ended 4/30/2022 | $9.21 | (10.58%) | 0.67% | 0.62%(c) | 2.54% | 80% | $190,943 |
| Year Ended 4/30/2021 | $10.76 | 5.83% | 0.68% | 0.63%(c) | 2.38% | 74% | $10,624 |
| Year Ended 4/30/2020 | $10.85 | 10.28% | 0.70% | 0.66%(c) | 3.02% | 91% | $18,086 |
| Year Ended 4/30/2019 | $10.14 | 6.20% | 0.68% | 0.66%(c) | 3.32% | 65% | $8,289 |
| Year Ended 4/30/2018 | $9.87 | 0.46% | 0.70% | 0.67%(c) | 2.75% | 78% | $9,009 |
| Class C | |||||||
| Year Ended 4/30/2022 | $9.22 | (11.28%) | 1.54% | 1.42%(c) | 1.41% | 80% | $2,609 |
| Year Ended 4/30/2021 | $10.77 | 4.96% | 1.68% | 1.45%(c) | 1.53% | 74% | $4,450 |
| Year Ended 4/30/2020 | $10.86 | 9.35% | 1.70% | 1.51%(c) | 2.17% | 91% | $5,646 |
| Year Ended 4/30/2019 | $10.15 | 5.29% | 1.68% | 1.51%(c) | 2.45% | 65% | $5,045 |
| Year Ended 4/30/2018 | $9.88 | (0.38%) | 1.70% | 1.52%(c) | 1.92% | 78% | $7,856 |
| Institutional Class | |||||||
| Year Ended 4/30/2022 | $9.22 | (10.57%) | 0.67% | 0.62%(c) | 2.24% | 80% | $380,743 |
| Year Ended 4/30/2021 | $10.77 | 5.73% | 0.68% | 0.63%(c) | 2.36% | 74% | $431,331 |
| Year Ended 4/30/2020 | $10.87 | 10.37% | 0.70% | 0.66%(c) | 3.02% | 91% | $364,875 |
| Year Ended 4/30/2019 | $10.15 | 6.19% | 0.68% | 0.66%(c) | 3.31% | 65% | $579,312 |
| Year Ended 4/30/2018 | $9.88 | 0.47% | 0.69% | 0.66%(c) | 2.78% | 78% | $760,048 |
| Institutional 2 Class | |||||||
| Year Ended 4/30/2022 | $9.21 | (10.49%) | 0.56% | 0.52% | 2.34% | 80% | $51,119 |
| Year Ended 4/30/2021 | $10.76 | 5.94% | 0.58% | 0.53% | 2.45% | 74% | $49,251 |
| Year Ended 4/30/2020 | $10.85 | 10.39% | 0.58% | 0.56% | 3.13% | 91% | $6,267 |
| Year Ended 4/30/2019 | $10.14 | 6.29% | 0.59% | 0.58% | 3.52% | 65% | $8,052 |
| Year Ended 4/30/2018 | $9.87 | 0.67% | 0.59% | 0.57% | 2.86% | 78% | $1,782 |
| Columbia Corporate Income Fund | Annual Report 2022 | 31 |
| Net asset value, beginning of period | Net investment income | Net realized and unrealized gain (loss) | Total from investment operations | Distributions from net investment income | Distributions from net realized gains | Total distributions to shareholders | |
| Institutional 3 Class | |||||||
| Year Ended 4/30/2022 | $10.77 | 0.25 | (1.32) | (1.07) | (0.26) | (0.22) | (0.48) |
| Year Ended 4/30/2021 | $10.86 | 0.28 | 0.38 | 0.66 | (0.28) | (0.47) | (0.75) |
| Year Ended 4/30/2020 | $10.15 | 0.33 | 0.72 | 1.05 | (0.34) | — | (0.34) |
| Year Ended 4/30/2019 | $9.88 | 0.34 | 0.27 | 0.61 | (0.34) | — | (0.34) |
| Year Ended 4/30/2018 | $10.11 | 0.30 | (0.23) | 0.07 | (0.30) | — | (0.30) |
| Notes to Financial Highlights | |
| (a) | In addition to the fees and expenses that the Fund bears directly, the Fund indirectly bears a pro rata share of the fees and expenses of any other funds in which it invests. Such indirect expenses are not included in the Fund’s reported expense ratios. |
| (b) | Total net expenses include the impact of certain fee waivers/expense reimbursements made by the Investment Manager and certain of its affiliates, if applicable. |
| (c) | The benefits derived from expense reductions had an impact of less than 0.01%. |
| 32 | Columbia Corporate Income Fund | Annual Report 2022 |
| Net asset value, end of period | Total return | Total gross expense ratio to average net assets(a) | Total net expense ratio to average net assets(a),(b) | Net investment income ratio to average net assets | Portfolio turnover | Net assets, end of period (000’s) | |
| Institutional 3 Class | |||||||
| Year Ended 4/30/2022 | $9.22 | (10.43%) | 0.51% | 0.47% | 2.39% | 80% | $864,900 |
| Year Ended 4/30/2021 | $10.77 | 5.99% | 0.52% | 0.47% | 2.49% | 74% | $875,524 |
| Year Ended 4/30/2020 | $10.86 | 10.44% | 0.53% | 0.50% | 3.17% | 91% | $556,117 |
| Year Ended 4/30/2019 | $10.15 | 6.34% | 0.53% | 0.52% | 3.44% | 65% | $442,521 |
| Year Ended 4/30/2018 | $9.88 | 0.62% | 0.53% | 0.51% | 2.93% | 78% | $622,383 |
| Columbia Corporate Income Fund | Annual Report 2022 | 33 |
April 30, 2022
| 34 | Columbia Corporate Income Fund | Annual Report 2022 |
April 30, 2022
| Columbia Corporate Income Fund | Annual Report 2022 | 35 |
April 30, 2022
| 36 | Columbia Corporate Income Fund | Annual Report 2022 |
April 30, 2022
| Asset derivatives | ||
| Risk exposure category | Statement of assets and liabilities location | Fair value ($) |
| Interest rate risk | Component of total distributable earnings (loss) — unrealized appreciation on futures contracts | 22,501,302* |
| Liability derivatives | ||
| Risk exposure category | Statement of assets and liabilities location | Fair value ($) |
| Interest rate risk | Component of total distributable earnings (loss) — unrealized depreciation on futures contracts | 16,790,783* |
| * | Includes cumulative appreciation (depreciation) as reported in the tables following the Portfolio of Investments. Only the current day’s variation margin is reported in receivables or payables in the Statement of Assets and Liabilities. |
| Amount of realized gain (loss) on derivatives recognized in income | |
| Risk exposure category | Futures contracts ($) |
| Interest rate risk | 6,228,703 |
| Change in unrealized appreciation (depreciation) on derivatives recognized in income | |
| Risk exposure category | Futures contracts ($) |
| Interest rate risk | 3,877,463 |
| Derivative instrument | Average notional amounts ($)* |
| Futures contracts — long | 331,736,022 |
| Futures contracts — short | 267,574,727 |
| * | Based on the ending quarterly outstanding amounts for the year ended April 30, 2022. |
| Columbia Corporate Income Fund | Annual Report 2022 | 37 |
April 30, 2022
| 38 | Columbia Corporate Income Fund | Annual Report 2022 |
April 30, 2022
| Columbia Corporate Income Fund | Annual Report 2022 | 39 |
April 30, 2022
| Effective rate (%) | |
| Class A | 0.16 |
| Advisor Class | 0.17 |
| Class C | 0.16 |
| Institutional Class | 0.16 |
| Institutional 2 Class | 0.05 |
| Institutional 3 Class | 0.00 |
| 40 | Columbia Corporate Income Fund | Annual Report 2022 |
April 30, 2022
| Front End (%) | CDSC (%) | Amount ($) | |
| Class A | 4.75 | 0.50 - 1.00(a) | 52,103 |
| Class C | — | 1.00(b) | 1,493 |
| (a) | This charge is imposed on certain investments of between $1 million and $50 million redeemed within 18 months after purchase, as follows: 1.00% if redeemed within 12 months after purchase, and 0.50% if redeemed more than 12, but less than 18, months after purchase, with certain limited exceptions. |
| (b) | This charge applies to redemptions within 12 months after purchase, with certain limited exceptions. |
| September 1, 2021 through August 31, 2024 | Prior to September 1, 2021 | |
| Class A | 0.87% | 0.90% |
| Advisor Class | 0.62 | 0.65 |
| Class C | 1.42 | 1.65 |
| Institutional Class | 0.62 | 0.65 |
| Institutional 2 Class | 0.52 | 0.52 |
| Institutional 3 Class | 0.47 | 0.47 |
| Columbia Corporate Income Fund | Annual Report 2022 | 41 |
April 30, 2022
| Excess of distributions over net investment income ($) | Accumulated net realized (loss) ($) | Paid in capital ($) |
| 618,813 | (631,373) | 12,560 |
| Year Ended April 30, 2022 | Year Ended April 30, 2021 | ||||
| Ordinary income ($) | Long-term capital gains ($) | Total ($) | Ordinary income ($) | Long-term capital gains ($) | Total ($) |
| 47,640,113 | 22,768,659 | 70,408,772 | 45,213,911 | 35,403,603 | 80,617,514 |
| Undistributed ordinary income ($) | Undistributed long-term capital gains ($) | Capital loss carryforwards ($) | Net unrealized (depreciation) ($) |
| 3,982,679 | — | — | (199,656,418) |
| 42 | Columbia Corporate Income Fund | Annual Report 2022 |
April 30, 2022
| Federal tax cost ($) | Gross unrealized appreciation ($) | Gross unrealized (depreciation) ($) | Net unrealized (depreciation) ($) |
| 1,789,813,674 | 2,783,346 | (202,439,764) | (199,656,418) |
| Late year ordinary losses ($) | Post-October capital losses ($) |
| — | 16,734,117 |
| Columbia Corporate Income Fund | Annual Report 2022 | 43 |
April 30, 2022
| Shares | |
| Class A | 5,714,967 |
| Advisor Class | 24,537,894 |
| 44 | Columbia Corporate Income Fund | Annual Report 2022 |
April 30, 2022
| ($) | |
| Net investment income | 45,018,000 |
| Net realized gain | 9,130,000 |
| Net change in unrealized appreciation/(depreciation) | (240,761,000) |
| Net decrease in net assets from operations | (186,613,000) |
| Columbia Corporate Income Fund | Annual Report 2022 | 45 |
April 30, 2022
| 46 | Columbia Corporate Income Fund | Annual Report 2022 |
April 30, 2022
| Columbia Corporate Income Fund | Annual Report 2022 | 47 |
| 48 | Columbia Corporate Income Fund | Annual Report 2022 |
| Capital gain dividend | Section 163(j) Interest Dividends |
| $17,649,722 | 81.59% |
| Name, address, year of birth | Position held with the Columbia Funds and length of service | Principal occupation(s) during past five years and other relevant professional experience | Number of Funds in the Columbia Funds Complex* overseen | Other directorships held by Trustee during the past five years |
| George S. Batejan c/o Columbia Management Investment Advisers, LLC 290 Congress Street Boston, MA 02210 1953 | Trustee since 2017 | Executive Vice President, Global Head of Technology and Operations, Janus Capital Group, Inc., 2010-2016 | 176 | Former Chairman of the Board, NICSA (National Investment Company Services Association) (Executive Committee, Nominating Committee and Governance Committee), 2014-2016; former Director, Intech Investment Management, 2011-2016; former Board Member, Metro Denver Chamber of Commerce, 2015-2016; former Advisory Board Member, University of Colorado Business School, 2015-2018 |
| Columbia Corporate Income Fund | Annual Report 2022 | 49 |
(Unaudited)
Independent trustees (continued)
| Name, address, year of birth | Position held with the Columbia Funds and length of service | Principal occupation(s) during past five years and other relevant professional experience | Number of Funds in the Columbia Funds Complex* overseen | Other directorships held by Trustee during the past five years |
| Kathleen Blatz c/o Columbia Management Investment Advisers, LLC 290 Congress Street Boston, MA 02210 1954 | Trustee since 2006 | Attorney, specializing in arbitration and mediation; Chief Justice, Minnesota Supreme Court, 1998-2006; Associate Justice, Minnesota Supreme Court, 1996-1998; Fourth Judicial District Court Judge, Hennepin County, 1994-1996; Attorney in private practice and public service, 1984-1993; State Representative, Minnesota House of Representatives, 1979-1993, which included service on the Tax and Financial Institutions and Insurance Committees; Member and Interim Chair, Minnesota Sports Facilities Authority, January 2017-July 2017; Interim President and Chief Executive Officer, Blue Cross and Blue Shield of Minnesota (health care insurance), February-July 2018, April-October 2021 | 176 | Former Trustee, Blue Cross and Blue Shield of Minnesota, 2009-2021 (Chair of the Business Development Committee, 2014-2017; Chair of the Governance Committee, 2017-2019); former Member and Chair of the Board, Minnesota Sports Facilities Authority, January 2017-July 2017; former Director, Robina Foundation, 2009-2020 (Chair, 2014-2020); Director, Schulze Family Foundation, since 2021 |
| Pamela G. Carlton c/o Columbia Management Investment Advisers, LLC 290 Congress Street Boston, MA 02210 1954 | Trustee since 2007 | President, Springboard — Partners in Cross Cultural Leadership (consulting company) since 2003; Managing Director of US Equity Research, JP Morgan Chase, 1999-2003; Director of US Equity Research, Chase Asset Management, 1996-1999; Co-Director Latin America Research, 1993-1996, COO Global Research, 1992-1996, Co-Director of US Research, 1991-1992, Investment Banker, 1982-1991, Morgan Stanley; Attorney, Cleary Gottlieb Steen & Hamilton LLP, 1980-1982 | 176 | Trustee, New York Presbyterian Hospital Board (Executive Committee and Chair of People Committee) since 1996; Director, DR Bank (Audit Committee) since 2017; Director, Evercore Inc. (Audit Committee) since 2019; Director, Apollo Commercial Real Estate Finance, Inc. since 2021; the Governing Council of the Independent Directors Council (IDC), since 2021 |
| Janet Langford Carrig c/o Columbia Management Investment Advisers, LLC 290 Congress Street Boston, MA 02210 1957 | Trustee since 1996 | Senior Vice President, General Counsel and Corporate Secretary, ConocoPhillips (independent energy company), September 2007-October 2018 | 174 | Director, EQT Corporation (natural gas producer) since 2019; Director, Whiting Petroleum Corporation (independent oil and gas company) since 2020 |
| J. Kevin Connaughton c/o Columbia Management Investment Advisers, LLC 290 Congress Street Boston, MA 02210 1964 | Trustee since 2020 | Member, FINRA National Adjudicatory Council since January 2020; Adjunct Professor of Finance, Bentley University since January 2018; Consultant to Independent Trustees of CFVIT and CFST I from March 2016 to June 2020 with respect to CFVIT and to December 2020 with respect to CFST I; Managing Director and General Manager of Mutual Fund Products, Columbia Management Investment Advisers, LLC, May 2010-February 2015; President, Columbia Funds, 2008-2015; and senior officer of Columbia Funds and affiliated funds, 2003-2015 | 174 | Former Director, The Autism Project, March 2015-December 2021; former Member of the Investment Committee, St. Michael’s College, November 2015-February 2020; former Trustee, St. Michael’s College, June 2017-September 2019; former Trustee, New Century Portfolios, January 2015-December 2017 |
| 50 | Columbia Corporate Income Fund | Annual Report 2022 |
(Unaudited)
Independent trustees (continued)
| Name, address, year of birth | Position held with the Columbia Funds and length of service | Principal occupation(s) during past five years and other relevant professional experience | Number of Funds in the Columbia Funds Complex* overseen | Other directorships held by Trustee during the past five years |
| Olive M. Darragh c/o Columbia Management Investment Advisers, LLC 290 Congress Street Boston, MA 02210 1962 | Trustee since 2020 | Managing Director of Darragh Inc. (strategy and talent management consulting firm) since 2010; Founder and CEO, Zolio, Inc. (investment management talent identification platform) since 2004; Consultant to Independent Trustees of CFVIT and CFST I from June 2019 to June 2020 with respect to CFVIT and to December 2020 with respect to CFST I; Partner, Tudor Investments, 2004-2010; Senior Partner, McKinsey & Company (consulting), 1990-2004; Touche Ross CPA, 1985-1988 | 174 | Former Director, University of Edinburgh Business School (Member of US Board); former Director, Boston Public Library Foundation |
| Patricia M. Flynn c/o Columbia Management Investment Advisers, LLC 290 Congress Street Boston, MA 02210 1950 | Trustee since 2004 | Trustee Professor of Economics and Management, Bentley University since 1976 (also teaches and conducts research on corporate governance); Dean, McCallum Graduate School of Business, Bentley University, 1992-2002 | 176 | Trustee, MA Taxpayers Foundation since 1997; Board of Governors, Innovation Institute, MA Technology Collaborative, 2010-2020; former Board of Directors, The MA Business Roundtable, 2003-2019 |
| Brian J. Gallagher c/o Columbia Management Investment Advisers, LLC 290 Congress Street Boston, MA 02210 1954 | Trustee since 2017 | Retired; Partner with Deloitte & Touche LLP and its predecessors, 1977-2016 | 176 | Trustee, Catholic Schools Foundation since 2004 |
| Douglas A. Hacker c/o Columbia Management Investment Advisers, LLC 290 Congress Street Boston, MA 02210 1955 | Co-Chair since 2021; Chair of CFST I and CFVIT since 2014; Trustee of CFST I and CFVIT since 1996 and CFST, CFST II, CFVST II, CET I and CET II since 2021 | Independent business executive since May 2006; Executive Vice President – Strategy of United Airlines, December 2002 - May 2006; President of UAL Loyalty Services (airline marketing company), September 2001-December 2002; Executive Vice President and Chief Financial Officer of United Airlines, July 1999-September 2001 | 176 | Director, Spartan Nash Company (food distributor); Director, Aircastle Limited (Chair of Audit Committee) (aircraft leasing); former Director, Nash Finch Company (food distributor), 2005-2013; former Director, SeaCube Container Leasing Ltd. (container leasing), 2010-2013; and former Director, Travelport Worldwide Limited (travel information technology), 2014-2019 |
| Nancy T. Lukitsh c/o Columbia Management Investment Advisers, LLC 290 Congress Street Boston, MA 02210 1956 | Trustee since 2011 | Senior Vice President, Partner and Director of Marketing, Wellington Management Company, LLP (investment adviser), 1997-2010; Chair, Wellington Management Portfolios (commingled non-U.S. investment pools), 2007 -2010; Director, Wellington Trust Company, NA and other Wellington affiliates, 1997-2010 | 174 | None |
| Columbia Corporate Income Fund | Annual Report 2022 | 51 |
(Unaudited)
Independent trustees (continued)
| Name, address, year of birth | Position held with the Columbia Funds and length of service | Principal occupation(s) during past five years and other relevant professional experience | Number of Funds in the Columbia Funds Complex* overseen | Other directorships held by Trustee during the past five years |
| David M. Moffett c/o Columbia Management Investment Advisers, LLC 290 Congress Street Boston, MA 02210 1952 | Trustee since 2011 | Retired; Consultant to Bridgewater and Associates | 174 | Director, CSX Corporation (transportation suppliers); Director, Genworth Financial, Inc. (financial and insurance products and services); Director, PayPal Holdings Inc. (payment and data processing services); Trustee, University of Oklahoma Foundation; former Director, eBay Inc. (online trading community), 2007-2015; and former Director, CIT Bank, CIT Group Inc. (commercial and consumer finance), 2010-2016 |
| Catherine James Paglia c/o Columbia Management Investment Advisers, LLC 290 Congress Street Boston, MA 02210 1952 | Co-Chair since 2021; Chair of CFST, CFST II, CFVST II, CET I and CET II since 2020; Trustee of CFST, CFST II and CFVST II since 2004 and CFST I and CFVIT since 2021 | Director, Enterprise Asset Management, Inc. (private real estate and asset management company) since September 1998; Managing Director and Partner, Interlaken Capital, Inc., 1989-1997; Vice President, 1982-1985, Principal, 1985-1987, Managing Director, 1987-1989, Morgan Stanley; Vice President, Investment Banking, 1980-1982, Associate, Investment Banking, 1976-1980, Dean Witter Reynolds, Inc. | 176 | Director, Valmont Industries, Inc. (irrigation systems manufacturer) since 2012; Trustee, Carleton College (on the Investment Committee); Trustee, Carnegie Endowment for International Peace (on the Investment Committee) |
| Minor M. Shaw c/o Columbia Management Investment Advisers, LLC 290 Congress Street Boston, MA 02210 1947 | Trustee since 2003 | President, Micco LLC (private investments) since 2011; President, Micco Corp. (family investment business), 1998-2011 | 176 | Director, Blue Cross Blue Shield of South Carolina (Chair of Compensation Committee) since April 2008; Trustee, Hollingsworth Funds (on the Investment Committee) since 2016 (previously Board Chair from 2016-2019); Former Advisory Board member, Duke Energy Corp., 2016-2020; Chair of the Duke Endowment; Chair of Greenville – Spartanburg Airport Commission; former Trustee, BofA Funds Series Trust (11 funds), 2003-2011; former Director, Piedmont Natural Gas, 2004-2016; former Director, National Association of Corporate Directors, Carolinas Chapter, 2013-2018; Chair, Daniel-Mickel Foundation since 1998 |
| 52 | Columbia Corporate Income Fund | Annual Report 2022 |
(Unaudited)
Independent trustees (continued)
| Name, address, year of birth | Position held with the Columbia Funds and length of service | Principal occupation(s) during past five years and other relevant professional experience | Number of Funds in the Columbia Funds Complex* overseen | Other directorships held by Trustee during the past five years |
| Natalie A. Trunow c/o Columbia Management Investment Advisers, LLC 290 Congress Street Boston, MA 02210 1967 | Trustee since 2020 | Chief Executive Officer, Millennial Portfolio Solutions LLC (asset management and consulting services), January 2016-January 2021; Non-executive Member of the Investment Committee and Valuation Committee, Sarona Asset Management Inc. (private equity firm) since September 2019; Advisor, Horizon Investments (asset management and consulting services), August 2018-January 2021; Advisor, Paradigm Asset Management, November 2016-December 2021; Consultant to Independent Trustees of CFVIT and CFST I from September 2016 to June 2020 with respect to CFVIT and to December 2020 with respect to CFST I; Director of Investments/Consultant, Casey Family Programs, April 2016-November 2016; Senior Vice President and Chief Investment Officer, Calvert Investments, August 2008-January 2016; Section Head and Portfolio Manager, General Motors Asset Management, June 1997-August 2008 | 174 | Former Director, Investment Committee, Health Services for Children with Special Needs, Inc., 2012-2019; Director, Chair of Audit Committee, Consumer Credit Counseling Services (formerly Guidewell Financial Solutions), since 2019; Independent Director, Investment Committee and Valuation Committee, Sarona Asset Management, since 2019 |
| Sandra L. Yeager c/o Columbia Management Investment Advisers, LLC 290 Congress Street Boston, MA 02210 1964 | Trustee since 2017 | Retired; President and founder, Hanoverian Capital, LLC (SEC registered investment advisor firm), 2008-2016; Managing Director, DuPont Capital, 2006-2008; Managing Director, Morgan Stanley Investment Management, 2004-2006; Senior Vice President, Alliance Bernstein, 1990-2004 | 176 | Former Director, NAPE Education Foundation, October 2016-October 2020 |
| * | The term “Columbia Funds Complex” as used herein includes Columbia Seligman Premium Technology Growth Fund, Tri-Continental Corporation and each series of Columbia Fund Series Trust (CFST), Columbia Funds Series Trust I (CFST I), Columbia Funds Series Trust II (CFST II), Columbia ETF Trust I (CET I), Columbia ETF Trust II (CET II), Columbia Funds Variable Insurance Trust (CFVIT) and Columbia Funds Variable Series Trust II (CFVST II). Messrs. Batejan, Beckman, Gallagher and Hacker and Mses. Blatz, Carlton, Flynn, Paglia, Shaw and Yeager serve as Directors of Columbia Seligman Premium Technology Growth Fund and Tri-Continental Corporation. |
| Name, address, year of birth | Position held with the Columbia Funds and length of service | Principal occupation(s) during the past five years and other relevant professional experience | Number of Funds in the Columbia Funds Complex overseen | Other directorships held by Trustee during the past five years |
| Daniel J. Beckman c/o Columbia Management Investment Advisers, LLC 290 Congress Street Boston, MA 02210 1962 | Trustee since November 2021 and President since June 2021 | Vice President – Head of North America Product, Columbia Management Investment Advisers, LLC since April 2015; President and Principal Executive Officer of the Columbia Funds since June 2021; officer of Columbia Funds and affiliated funds, 2020-2021 | 176 | Director, Ameriprise Trust Company, since October 2016; Director, Columbia Management Investment Distributors, Inc. since November 2018; Board of Governors, Columbia Wanger Asset Management, LLC since January 2022 |
| * | Interested person (as defined under the 1940 Act) by reason of being an officer, director, security holder and/or employee of the Investment Manager or Ameriprise Financial. |
| Columbia Corporate Income Fund | Annual Report 2022 | 53 |
(Unaudited)
The Board has appointed officers who are responsible for day-to-day business decisions based on policies it has established. The officers serve at the pleasure of the Board. The following table provides basic information about the Officers of the Fund as of the printing of this report, including principal occupations during the past five years, although their specific titles may have varied over the period. In addition to Mr. Beckman, who is President and Principal Executive Officer, the Fund’s other officers are:
| Name, address and year of birth | Position and year first appointed to position for any Fund in the Columbia Funds Complex or a predecessor thereof | Principal occupation(s) during past five years |
| Michael G. Clarke 290 Congress Street Boston, MA 02210 1969 | Chief Financial Officer and Principal Financial Officer (2009) and Senior Vice President (2019) | Senior Vice President and Head of Global Operations & Investor Services, Columbia Management Investment Advisers, LLC, since March 2022 (previously Vice President, Head of North American Operations, and Co-Head of Global Operations, June 2019 to February 2022 and Vice President – Accounting and Tax, May 2010 - May 2019); senior officer of Columbia Funds and affiliated funds since 2002. |
| Joseph Beranek 5890 Ameriprise Financial Center Minneapolis, MN 55474 1965 | Treasurer and Chief Accounting Officer (Principal Accounting Officer) (2019) and Principal Financial Officer (2020), CFST, CFST I, CFST II, CFVIT and CFVST II; Assistant Treasurer, CET I and CET II | Vice President – Mutual Fund Accounting and Financial Reporting, Columbia Management Investment Advisers, LLC, since December 2018 and March 2017, respectively (previously Vice President – Pricing and Corporate Actions, May 2010 - March 2017). |
| Marybeth Pilat 290 Congress Street Boston, MA 02210 1968 | Treasurer and Chief Accounting Officer (Principal Accounting Officer) and Principal Financial Officer (2020) for CET I and CET II; Assistant Treasurer, CFST, CFST I, CFST II, CFVIT and CFVST II | Vice President – Product Pricing and Administration, Columbia Management Investment Advisers, LLC, since May 2017; Director - Fund Administration, Calvert Investments, August 2015 – March 2017; Vice President - Fund Administration, Legg Mason, May 2015 - July 2015; Vice President - Fund Administration, Columbia Management Investment Advisers, LLC, May 2010 - April 2015. |
| William F. Truscott 290 Congress Street Boston, MA 02210 1960 | Senior Vice President (2001) | Formerly, Trustee/Director of Columbia Funds Complex or legacy funds, November 2001-January 1, 2021; Chief Executive Officer, Global Asset Management, Ameriprise Financial, Inc. since September 2012; Chairman of the Board and President, Columbia Management Investment Advisers, LLC since July 2004 and February 2012, respectively; Chairman of the Board and Chief Executive Officer, Columbia Management Investment Distributors, Inc. since November 2008 and February 2012, respectively; Chairman of the Board and Director, Threadneedle Asset Management Holdings, Sàrl since March 2013 and December 2008, respectively; senior executive of various entities affiliated with Columbia Threadneedle. |
| Christopher O. Petersen 5228 Ameriprise Financial Center Minneapolis, MN 55474 1970 | Senior Vice President and Assistant Secretary (2021) | Formerly, Trustee/Director of funds within the Columbia Funds Complex, July 1, 2020 - November 22, 2021; Senior Vice President and Assistant General Counsel, Ameriprise Financial, Inc. since September 2021 (previously Vice President and Lead Chief Counsel, January 2015 - September 2021); President and Principal Executive Officer of the Columbia Funds, 2015 - 2021; officer of Columbia Funds and affiliated funds since 2007. |
| Thomas P. McGuire 290 Congress Street Boston, MA 02210 1972 | Senior Vice President and Chief Compliance Officer (2012) | Vice President – Asset Management Compliance, Ameriprise Financial, Inc., since May 2010; Chief Compliance Officer, Columbia Acorn/Wanger Funds since December 2015; Chief Compliance Officer, Ameriprise Certificate Company, September 2010 – September 2020. |
| Ryan C. Larrenaga 290 Congress Street Boston, MA 02210 1970 | Senior Vice President (2017), Chief Legal Officer (2017), and Secretary (2015) | Vice President and Chief Counsel, Ameriprise Financial, Inc. since August 2018 (previously Vice President and Group Counsel, August 2011 - August 2018); Chief Legal Officer, Columbia Acorn/Wanger Funds, since September 2020; officer of Columbia Funds and affiliated funds since 2005. |
| 54 | Columbia Corporate Income Fund | Annual Report 2022 |
(Unaudited)
Fund officers (continued)
| Name, address and year of birth | Position and year first appointed to position for any Fund in the Columbia Funds Complex or a predecessor thereof | Principal occupation(s) during past five years |
| Michael E. DeFao 290 Congress Street Boston, MA 02210 1968 | Vice President (2011) and Assistant Secretary (2010) | Vice President and Chief Counsel, Ameriprise Financial, Inc. since May 2010; Vice President, Chief Legal Officer and Assistant Secretary, Columbia Management Investment Advisers, LLC since October 2021 (previously Vice President and Assistant Secretary, May 2010 – September 2021). |
| Lyn Kephart-Strong 5228 Ameriprise Financial Center Minneapolis, MN 55474 1960 | Vice President (2015) | President, Columbia Management Investment Services Corp. since October 2014; Vice President & Resolution Officer, Ameriprise Trust Company since August 2009. |
| • | the Fund had sufficient liquidity to both meet redemptions and operate effectively on behalf of shareholders; |
| • | there were no material changes to the Program during the period; |
| • | the implementation of the Program was effective to manage the Fund’s liquidity risk; and |
| • | the Program operated adequately during the period. |
| Columbia Corporate Income Fund | Annual Report 2022 | 55 |
columbiathreadneedleus.com/investor/. The Fund is distributed by Columbia Management Investment Distributors, Inc., member FINRA, and managed by Columbia Management Investment Advisers, LLC.

April 30, 2022

| 3 | |
| 6 | |
| 8 | |
| 9 | |
| 42 | |
| 44 | |
| 46 | |
| 48 | |
| 52 | |
| 72 | |
| 73 | |
| 73 | |
| 79 |
(Unaudited)
| Average annual total returns (%) (for the period ended April 30, 2022) | |||||
| Inception | 1 Year | 5 Years | 10 Years | ||
| Class A | Excluding sales charges | 07/31/00 | -10.72 | 2.03 | 2.35 |
| Including sales charges | -13.41 | 1.41 | 2.04 | ||
| Advisor Class* | 11/08/12 | -10.49 | 2.31 | 2.60 | |
| Class C | Excluding sales charges | 02/01/02 | -11.42 | 1.27 | 1.62 |
| Including sales charges | -12.29 | 1.27 | 1.62 | ||
| Institutional Class | 12/05/78 | -10.49 | 2.30 | 2.61 | |
| Institutional 2 Class* | 11/08/12 | -10.43 | 2.36 | 2.67 | |
| Institutional 3 Class* | 11/08/12 | -10.41 | 2.42 | 2.72 | |
| Class R | 01/23/06 | -10.94 | 1.79 | 2.10 | |
| Bloomberg U.S. Aggregate Bond Index | -8.51 | 1.20 | 1.73 | ||
| * | The returns shown for periods prior to the share class inception date (including returns for the Life of the Fund, if shown, which are since Fund inception) include the returns of the Fund’s oldest share class. These returns are adjusted to reflect any higher class-related operating expenses of the newer share classes, as applicable. Please visit columbiathreadneedleus.com/investor/investment-products/mutual-funds/appended-performance for more information. |
| Columbia Total Return Bond Fund | Annual Report 2022 | 3 |
(Unaudited)
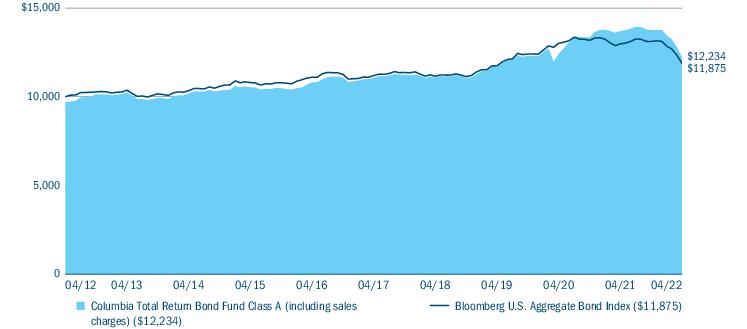
| Portfolio breakdown (%) (at April 30, 2022) | |
| Asset-Backed Securities — Non-Agency | 9.5 |
| Commercial Mortgage-Backed Securities - Agency | 0.2 |
| Commercial Mortgage-Backed Securities - Non-Agency | 5.6 |
| Common Stocks | 0.0(a) |
| Convertible Bonds | 0.0(a) |
| Corporate Bonds & Notes | 30.3 |
| Foreign Government Obligations | 2.2 |
| Money Market Funds | 3.4 |
| Options Purchased Calls | 0.1 |
| Options Purchased Puts | 0.6 |
| Residential Mortgage-Backed Securities - Agency | 16.7 |
| Residential Mortgage-Backed Securities - Non-Agency | 28.1 |
| Senior Loans | 0.1 |
| U.S. Treasury Obligations | 3.2 |
| Total | 100.0 |
| (a) | Rounds to zero. |
| Quality breakdown (%) (at April 30, 2022) | |
| AAA rating | 12.0 |
| AA rating | 3.4 |
| A rating | 11.2 |
| BBB rating | 24.3 |
| BB rating | 16.6 |
| B rating | 7.3 |
| CCC rating | 1.3 |
| C rating | 0.1 |
| Not rated | 23.8 |
| Total | 100.0 |
| 4 | Columbia Total Return Bond Fund | Annual Report 2022 |
(Unaudited)
| Market exposure through derivatives investments (% of notional exposure) (at April 30, 2022)(a) | |||
| Long | Short | Net | |
| Fixed Income Derivative Contracts | 268.6 | (168.0) | 100.6 |
| Foreign Currency Derivative Contracts | — | (0.6) | (0.6) |
| Total Notional Market Value of Derivative Contracts | 268.6 | (168.6) | 100.0 |
| Columbia Total Return Bond Fund | Annual Report 2022 | 5 |
(Unaudited)
| • | In broad terms, the Fund’s approach to balancing risk exposures across credit-oriented sectors and between credit risk and interest rate risk was less effective than we have seen historically as interest rates moved sharply higher and credit sentiment weakened in early 2022. |
| • | The Fund’s underperformance relative to the benchmark was largely the result of positioning with respect to interest rates. Specifically, the Fund had an above-benchmark stance with respect to duration and corresponding interest rate sensitivity as Treasury yields spiked in the first quarter of 2022. In addition, the Fund was overweight the front end of the curve which was most impacted by rising yields. |
| • | From an asset allocation perspective, the Fund’s underweight to Treasuries weighed on relative performance as investor risk aversion increased entering 2022. |
| • | Security selection within investment-grade corporates detracted as a tilt toward longer maturities had a negative impact as credit spreads widened in early 2022. |
| • | Overall sector allocation had a positive impact on performance relative to the benchmark. Most notably, the Fund’s exposure to non-agency mortgage-backed securities benefited return as the segment continued to be supported by a strong housing market and resilient consumer demand. |
| 6 | Columbia Total Return Bond Fund | Annual Report 2022 |
(Unaudited)
| • | Within commercial mortgage-backed securities, a focus on single-asset, single-borrower issues with underlying collateral such as hotels and malls proved beneficial as investors were attracted to the economic reopening theme. |
| • | Within asset-backed securities, performance was supported by a focus on high quality collateralized loan obligations. |
| • | Exposure to below-investment grade, high-yield corporates proved additive, most notably issues in the BB quality range (the highest below-investment grade rating category). |
| Columbia Total Return Bond Fund | Annual Report 2022 | 7 |
(Unaudited)
| November 1, 2021 — April 30, 2022 | |||||||
| Account value at the beginning of the period ($) | Account value at the end of the period ($) | Expenses paid during the period ($) | Fund’s annualized expense ratio (%) | ||||
| Actual | Hypothetical | Actual | Hypothetical | Actual | Hypothetical | Actual | |
| Class A | 1,000.00 | 1,000.00 | 889.30 | 1,021.24 | 3.49 | 3.73 | 0.74 |
| Advisor Class | 1,000.00 | 1,000.00 | 890.50 | 1,022.49 | 2.31 | 2.47 | 0.49 |
| Class C | 1,000.00 | 1,000.00 | 886.00 | 1,017.50 | 7.01 | 7.49 | 1.49 |
| Institutional Class | 1,000.00 | 1,000.00 | 890.50 | 1,022.49 | 2.31 | 2.47 | 0.49 |
| Institutional 2 Class | 1,000.00 | 1,000.00 | 891.10 | 1,022.84 | 1.98 | 2.12 | 0.42 |
| Institutional 3 Class | 1,000.00 | 1,000.00 | 891.00 | 1,023.09 | 1.74 | 1.87 | 0.37 |
| Class R | 1,000.00 | 1,000.00 | 888.50 | 1,020.00 | 4.66 | 4.99 | 0.99 |
| 8 | Columbia Total Return Bond Fund | Annual Report 2022 |
April 30, 2022
| Asset-Backed Securities — Non-Agency 10.6% | ||||
| Issuer | Coupon Rate | Principal Amount ($) | Value ($) | |
| Ares LVIII CLO Ltd.(a),(b) | ||||
| Series 2020-58A Class DR | ||||
| 3-month Term SOFR + 3.200% Floor 3.200% 01/15/2035 | 4.046% | 5,000,000 | 4,957,055 | |
| Ares XLVI CLO Ltd.(a),(b) | ||||
| Series 2017-46A Class B1 | ||||
| 3-month USD LIBOR + 1.350% Floor 1.350% 01/15/2030 | 2.394% | 7,780,000 | 7,678,121 | |
| Atrium XIII(a),(b) | ||||
| Series 2013A Class B | ||||
| 3-month USD LIBOR + 1.500% Floor 1.500% 11/21/2030 | 2.684% | 2,250,000 | 2,225,914 | |
| Bain Capital Credit CLO Ltd.(a),(b) | ||||
| Series 2020-3A Class DR | ||||
| 3-month USD LIBOR + 3.250% Floor 3.250% 10/23/2034 | 4.434% | 8,250,000 | 8,132,074 | |
| Series 2020-4A Class D | ||||
| 3-month USD LIBOR + 4.250% Floor 4.250% 10/20/2033 | 5.313% | 3,750,000 | 3,689,468 | |
| Carlyle Global Market Strategies CLO Ltd.(a),(b) | ||||
| Series 2016-3A Class ERR | ||||
| 3-month USD LIBOR + 7.000% Floor 7.000% 07/20/2034 | 8.063% | 5,000,000 | 4,820,780 | |
| Carlyle Group LP(a),(b) | ||||
| Series 2017-5A Class A2 | ||||
| 3-month USD LIBOR + 1.400% 01/20/2030 | 2.463% | 3,810,000 | 3,720,705 | |
| Carlyle US CLO Ltd.(a),(b) | ||||
| Series 2019-3R Class CR | ||||
| 3-month USD LIBOR + 3.200% Floor 3.200% 10/20/2032 | 4.263% | 13,400,000 | 13,190,491 | |
| Series 2020-2A Class CR | ||||
| 3-month USD LIBOR + 3.200% Floor 3.200% 01/25/2035 | 3.458% | 15,150,000 | 14,887,769 | |
| Cent CLO Ltd.(a),(b) | ||||
| Series 2018-C17A Class A2R | ||||
| 3-month USD LIBOR + 1.600% Floor 1.600% 04/30/2031 | 1.899% | 9,300,000 | 9,178,468 | |
| Asset-Backed Securities — Non-Agency (continued) | ||||
| Issuer | Coupon Rate | Principal Amount ($) | Value ($) | |
| Dryden CLO Ltd.(a),(b) | ||||
| Series 2018-57A Class B | ||||
| 3-month USD LIBOR + 1.350% Floor 1.350% 05/15/2031 | 1.856% | 7,000,000 | 6,888,154 | |
| Series 2020-83A Class D | ||||
| 3-month USD LIBOR + 3.500% Floor 3.500% 01/18/2032 | 4.544% | 4,000,000 | 3,891,308 | |
| Exeter Automobile Receivables Trust(a) | ||||
| Subordinated Series 2021-2A Class E | ||||
| 07/17/2028 | 2.900% | 6,000,000 | 5,576,704 | |
| FREED ABS Trust(a) | ||||
| Series 2019-1 Class C | ||||
| 06/18/2026 | 5.390% | 3,083,923 | 3,087,475 | |
| Subordinated Series 2019-2 Class C | ||||
| 11/18/2026 | 4.860% | 2,737,334 | 2,748,437 | |
| Goldentree Loan Management US CLO 10 Ltd.(a),(b) | ||||
| Series 2021-10A Class D | ||||
| 3-month USD LIBOR + 3.050% Floor 3.050% 07/20/2034 | 4.113% | 12,750,000 | 12,526,671 | |
| Goldentree Loan Opportunities XI Ltd.(a),(b) | ||||
| Series 2015-11A Class BR2 | ||||
| 3-month USD LIBOR + 1.350% 01/18/2031 | 2.394% | 5,000,000 | 4,945,460 | |
| LendingClub Receivables Trust(a),(c),(d),(e) | ||||
| Series 2020-JPSL Class R | ||||
| 02/15/2025 | 0.000% | 50,000 | 1,246,000 | |
| LendingPoint Asset Securitization Trust(a) | ||||
| Series 2020-REV1 Class C | ||||
| 10/15/2028 | 7.699% | 10,125,000 | 10,075,280 | |
| Series 2021-1 Class A | ||||
| 04/15/2027 | 1.750% | 1,186,784 | 1,186,690 | |
| LendingPoint Asset Securitization Trust(a),(c),(e) | ||||
| Subordinated Series 2021-1 Class B | ||||
| 04/15/2027 | 2.853% | 5,050,000 | 4,999,500 | |
| LL ABS Trust(a) | ||||
| Series 2020-1A Class A | ||||
| 01/17/2028 | 2.330% | 238,056 | 238,096 | |
| LP LMS Asset Securitization Trust(a) | ||||
| Series 2021-2A Class A | ||||
| 01/15/2029 | 1.750% | 9,112,840 | 8,975,399 | |
| Lucali CLO Ltd.(a),(b) | ||||
| Series 2020-1A Class D | ||||
| 3-month USD LIBOR + 3.600% Floor 3.600% 01/15/2033 | 3.841% | 5,000,000 | 4,903,750 | |
| Columbia Total Return Bond Fund | Annual Report 2022 | 9 |
April 30, 2022
| Asset-Backed Securities — Non-Agency (continued) | ||||
| Issuer | Coupon Rate | Principal Amount ($) | Value ($) | |
| Madison Park Funding XLVII Ltd.(a),(b) | ||||
| Series 2020-47A Class D | ||||
| 3-month USD LIBOR + 4.100% Floor 4.000% 01/19/2034 | 4.124% | 6,800,000 | 6,672,752 | |
| Madison Park Funding XXVII Ltd.(a),(b) | ||||
| Series 2018-27A Class A2 | ||||
| 3-month USD LIBOR + 1.350% 04/20/2030 | 2.413% | 14,000,000 | 13,791,498 | |
| Marlette Funding Trust(a) | ||||
| Series 2020-2A Class D | ||||
| 09/16/2030 | 4.650% | 2,000,000 | 1,998,409 | |
| Series 2021-1A Class B | ||||
| 06/16/2031 | 1.000% | 3,950,000 | 3,872,890 | |
| Subordinated Series 2020-2A Class C | ||||
| 09/16/2030 | 2.830% | 3,550,000 | 3,540,832 | |
| Octagon 55 Ltd.(a),(b) | ||||
| Series 2021-1A Class D | ||||
| 3-month USD LIBOR + 3.100% Floor 3.100% 07/20/2034 | 4.163% | 8,750,000 | 8,532,064 | |
| Octagon Investment Partners 35 Ltd.(a),(b) | ||||
| Series 2018-1A Class A2 | ||||
| 3-month USD LIBOR + 1.400% Floor 1.400% 01/20/2031 | 2.463% | 9,350,000 | 9,220,549 | |
| Oportun Issuance Trust(a) | ||||
| Series 2021-B Class A | ||||
| 05/08/2031 | 1.470% | 15,100,000 | 14,599,930 | |
| Subordinated Series 2021-B Class B | ||||
| 05/08/2031 | 1.960% | 3,100,000 | 2,996,162 | |
| OZLM Funding IV Ltd.(a),(b) | ||||
| Series 2013-4A Class D2R | ||||
| 3-month USD LIBOR + 7.250% Floor 7.250% 10/22/2030 | 8.386% | 1,000,000 | 940,542 | |
| Pagaya AI Debt Selection Trust(a) | ||||
| Series 2019-3 Class A | ||||
| 11/16/2026 | 3.821% | 581,415 | 581,974 | |
| Series 2021-2 Class NOTE | ||||
| 01/25/2029 | 3.000% | 8,617,520 | 8,362,341 | |
| Series 2021-5 Class A | ||||
| 08/15/2029 | 1.530% | 12,188,008 | 11,877,372 | |
| Series 2021-HG1 Class A | ||||
| 01/16/2029 | 1.220% | 5,571,684 | 5,419,963 | |
| Subordinated Series 2020-3 Class C | ||||
| 05/17/2027 | 6.430% | 8,300,000 | 8,370,132 | |
| Subordinated Series 2021-3 Class B | ||||
| 05/15/2029 | 1.740% | 6,199,934 | 5,838,810 | |
| Asset-Backed Securities — Non-Agency (continued) | ||||
| Issuer | Coupon Rate | Principal Amount ($) | Value ($) | |
| Subordinated Series 2021-5 Class B | ||||
| 08/15/2029 | 2.630% | 9,250,000 | 8,639,661 | |
| Subordinated Series 2021-HG1 Class B | ||||
| 01/16/2029 | 1.820% | 1,289,111 | 1,253,913 | |
| Pagaya AI Debt Trust(a) | ||||
| Subordinated Series 2022-1 Class B | ||||
| 10/15/2029 | 3.344% | 5,000,000 | 4,713,195 | |
| Palmer Square Loan Funding Ltd.(a),(b) | ||||
| Series 2021-4A Class B | ||||
| 3-month USD LIBOR + 1.750% Floor 1.750% 10/15/2029 | 2.794% | 15,000,000 | 14,820,705 | |
| Prosper Marketplace Issuance Trust(a) | ||||
| Subordinated Series 2019-3A Class C | ||||
| 07/15/2025 | 4.940% | 3,044,868 | 3,044,645 | |
| Prosper Pass-Through Trust(a),(e) | ||||
| Series 2019-ST2 Class A | ||||
| 11/15/2025 | 3.750% | 1,181,031 | 1,192,842 | |
| Research-Driven Pagaya Motor Asset Trust IV(a) | ||||
| Series 2021-2A Class A | ||||
| 03/25/2030 | 2.650% | 6,847,908 | 6,542,628 | |
| RR 1 LLC(a),(b) | ||||
| Series 2017-1A Class D1B | ||||
| 3-month USD LIBOR + 6.350% Floor 6.350% 07/15/2035 | 7.394% | 5,000,000 | 4,790,885 | |
| Stewart Park CLO Ltd.(a),(b) | ||||
| Series 2017-1A Class BR | ||||
| 3-month USD LIBOR + 1.370% Floor 1.370% 01/15/2030 | 2.414% | 5,828,571 | 5,758,651 | |
| Theorem Funding Trust(a) | ||||
| Series 2020-1A Class B | ||||
| 10/15/2026 | 3.950% | 2,930,242 | 2,937,844 | |
| Upstart Pass-Through Trust(a) | ||||
| Series 2020-ST6 Class A | ||||
| 01/20/2027 | 3.000% | 2,985,273 | 2,908,189 | |
| Series 2021-ST4 Class A | ||||
| 07/20/2027 | 2.000% | 6,614,051 | 6,379,546 | |
| Series 2021-ST5 Class A | ||||
| 07/20/2027 | 2.000% | 6,321,819 | 6,075,489 | |
| Upstart Pass-Through Trust(a),(e) | ||||
| Series 2021-ST10 Class A | ||||
| 01/20/2030 | 2.250% | 7,923,955 | 7,754,106 | |
| Voya CLO Ltd.(a),(b) | ||||
| Series 2021-1A Class D | ||||
| 3-month USD LIBOR + 3.150% Floor 3.150% 07/15/2034 | 4.194% | 8,350,000 | 8,141,450 | |
| 10 | Columbia Total Return Bond Fund | Annual Report 2022 |
April 30, 2022
| Asset-Backed Securities — Non-Agency (continued) | ||||
| Issuer | Coupon Rate | Principal Amount ($) | Value ($) | |
| Series 2021-2A Class E | ||||
| 3-month USD LIBOR + 6.600% Floor 6.600% 10/20/2034 | 7.663% | 4,724,403 | 4,525,099 | |
| Total Asset-Backed Securities — Non-Agency (Cost $347,136,251) | 339,864,837 | |||
| Commercial Mortgage-Backed Securities - Agency 0.2% | ||||
| FRESB Mortgage Trust(f) | ||||
| Series 2018-SB45 Class A10F (FHLMC) | ||||
| 11/25/2027 | 3.160% | 4,288,934 | 4,168,969 | |
| Government National Mortgage Association(f),(g) | ||||
| Series 2019-147 Class IO | ||||
| 06/16/2061 | 0.419% | 60,109,089 | 2,693,266 | |
| Total Commercial Mortgage-Backed Securities - Agency (Cost $10,135,543) | 6,862,235 | |||
| Commercial Mortgage-Backed Securities - Non-Agency 6.3% | ||||
| American Homes 4 Rent Trust(a) | ||||
| Series 2014-SFR3 Class A | ||||
| 12/17/2036 | 3.678% | 1,380,785 | 1,360,935 | |
| BAMLL Commercial Mortgage Securities Trust(a),(f) | ||||
| Series 2013-WBRK Class A | ||||
| 03/10/2037 | 3.652% | 3,000,000 | 2,924,062 | |
| BAMLL Commercial Mortgage Securities Trust(a),(b) | ||||
| Series 2019-RLJ Class D | ||||
| 1-month USD LIBOR + 1.950% Floor 1.950% 04/15/2036 | 2.504% | 7,730,000 | 7,442,688 | |
| BBCMS Trust(a),(b) | ||||
| Subordinated Series 2018-BXH Class E | ||||
| 1-month USD LIBOR + 2.250% Floor 2.250% 10/15/2037 | 2.804% | 4,790,000 | 4,581,011 | |
| Subordinated Series 2018-BXH Class F | ||||
| 1-month USD LIBOR + 2.950% Floor 2.950% 10/15/2037 | 3.504% | 1,750,000 | 1,671,698 | |
| BFLD Trust(a),(b) | ||||
| Series 2019-DPLO Class F | ||||
| 1-month USD LIBOR + 2.540% Floor 2.540% 10/15/2034 | 3.094% | 1,800,000 | 1,735,946 | |
| Subordinated Series 2019-DPLO Class D | ||||
| 1-month USD LIBOR + 1.840% Floor 1.840% 10/15/2034 | 2.394% | 1,600,000 | 1,564,133 | |
| Commercial Mortgage-Backed Securities - Non-Agency (continued) | ||||
| Issuer | Coupon Rate | Principal Amount ($) | Value ($) | |
| Braemar Hotels & Resorts Trust(a),(b) | ||||
| Series 2018-PRME Class E | ||||
| 1-month USD LIBOR + 2.400% Floor 2.400% 06/15/2035 | 2.955% | 6,850,000 | 6,601,428 | |
| Subordinated Series 2018-PRME Class D | ||||
| 1-month USD LIBOR + 1.800% Floor 1.925% 06/15/2035 | 2.355% | 3,100,000 | 3,008,230 | |
| BX Trust(a),(b) | ||||
| Series 2018-GW Class G | ||||
| 1-month USD LIBOR + 2.920% Floor 2.920% 05/15/2035 | 3.474% | 2,160,000 | 2,075,131 | |
| Series 2019-ATL Class C | ||||
| 1-month USD LIBOR + 1.587% Floor 1.587%, Cap 1.587% 10/15/2036 | 2.141% | 4,361,000 | 4,231,022 | |
| Subordinated Series 2019-ATL Class D | ||||
| 1-month USD LIBOR + 1.887% Floor 1.887% 10/15/2036 | 2.441% | 3,801,000 | 3,668,832 | |
| BX Trust(a) | ||||
| Series 2019-OC11 Class E | ||||
| 12/09/2041 | 4.076% | 2,850,000 | 2,434,278 | |
| CHT Mortgage Trust(a),(b) | ||||
| Series 2017-CSMO Class B | ||||
| 1-month USD LIBOR + 1.400% Floor 1.200% 11/15/2036 | 1.954% | 3,000,000 | 2,984,415 | |
| Series 2017-CSMO Class C | ||||
| 1-month USD LIBOR + 1.500% Floor 1.350% 11/15/2036 | 2.054% | 3,000,000 | 2,985,403 | |
| Series 2017-CSMO Class D | ||||
| 1-month USD LIBOR + 2.250% Floor 2.100% 11/15/2036 | 2.804% | 2,000,000 | 1,988,492 | |
| Series 2017-CSMO Class E | ||||
| 1-month USD LIBOR + 3.000% Floor 3.000% 11/15/2036 | 3.554% | 11,500,000 | 11,398,049 | |
| CLNY Trust(a),(b) | ||||
| Series 2019-IKPR Class E | ||||
| 1-month USD LIBOR + 2.721% Floor 2.721% 11/15/2038 | 3.275% | 8,500,000 | 8,140,429 | |
| Cold Storage Trust(a),(b) | ||||
| Subordinated Series 2020-ICE5 Class F | ||||
| 1-month USD LIBOR + 3.492% Floor 3.333% 11/15/2037 | 4.047% | 7,618,177 | 7,535,260 | |
| Columbia Total Return Bond Fund | Annual Report 2022 | 11 |
April 30, 2022
| Commercial Mortgage-Backed Securities - Non-Agency (continued) | ||||
| Issuer | Coupon Rate | Principal Amount ($) | Value ($) | |
| COMM Mortgage Trust(a),(f) | ||||
| Series 2020-CBM Class E | ||||
| 02/10/2037 | 3.754% | 4,850,000 | 4,415,662 | |
| Subordinated Series 2013-CR12 Class D | ||||
| 10/10/2046 | 5.237% | 4,500,000 | 2,250,915 | |
| Subordinated Series 2020-CX Class D | ||||
| 11/10/2046 | 2.684% | 5,600,000 | 4,600,745 | |
| Cosmopolitan Hotel Mortgage Trust(a),(b) | ||||
| Subordinated Series 2017-CSMO Class F | ||||
| 1-month USD LIBOR + 3.741% Floor 3.741% 11/15/2036 | 4.295% | 6,392,000 | 6,279,848 | |
| Credit Suisse Mortgage Capital Certificates OA LLC(a) | ||||
| Subordinated Series 2014-USA Class D | ||||
| 09/15/2037 | 4.373% | 1,400,000 | 1,186,295 | |
| Subordinated Series 2014-USA Class E | ||||
| 09/15/2037 | 4.373% | 8,285,000 | 6,655,640 | |
| Subordinated Series 2014-USA Class F | ||||
| 09/15/2037 | 4.373% | 7,750,000 | 5,605,897 | |
| CSAIL Commercial Mortgage Trust(f) | ||||
| Subordinated Series 2015-C3 Class B | ||||
| 08/15/2048 | 4.119% | 3,325,000 | 3,148,526 | |
| Extended Stay America Trust(a),(b) | ||||
| Series 2021-ESH Class D | ||||
| 1-month USD LIBOR + 2.250% Floor 2.250% 07/15/2038 | 2.647% | 13,467,117 | 13,234,228 | |
| GS Mortgage Securities Trust | ||||
| Series 2017-GS7 Class A3 | ||||
| 08/10/2050 | 3.167% | 13,000,000 | 12,438,269 | |
| Hilton USA Trust(a),(f) | ||||
| Series 2016-HHV Class F | ||||
| 11/05/2038 | 4.333% | 2,500,000 | 2,217,473 | |
| Hilton USA Trust(a) | ||||
| Subordinated Series 2016-SFP Class E | ||||
| 11/05/2035 | 5.519% | 5,500,000 | 5,399,884 | |
| Morgan Stanley Capital I Trust(a),(f) | ||||
| Series 2019-MEAD Class E | ||||
| 11/10/2036 | 3.283% | 6,200,000 | 5,609,020 | |
| Progress Residential Trust(a) | ||||
| Series 2020-SFR1 Class E | ||||
| 04/17/2037 | 3.032% | 8,750,000 | 8,211,857 | |
| Subordinated Series 2019-SFR2 Class F | ||||
| 05/17/2036 | 4.837% | 1,400,000 | 1,354,852 | |
| Subordinated Series 2019-SFR3 Class F | ||||
| 09/17/2036 | 3.867% | 1,225,000 | 1,180,883 | |
| Subordinated Series 2019-SFR4 Class F | ||||
| 10/17/2036 | 3.684% | 765,000 | 737,485 | |
| Commercial Mortgage-Backed Securities - Non-Agency (continued) | ||||
| Issuer | Coupon Rate | Principal Amount ($) | Value ($) | |
| Subordinated Series 2020-SFR2 Class E | ||||
| 06/17/2037 | 5.115% | 2,800,000 | 2,772,475 | |
| SFO Commercial Mortgage Trust(a),(b) | ||||
| Series 2021-555 Class A | ||||
| 1-month USD LIBOR + 1.150% Floor 1.150% 05/15/2038 | 1.704% | 9,600,000 | 9,396,596 | |
| UBS Commercial Mortgage Trust(a),(b) | ||||
| Series 2018-NYCH Class B | ||||
| 1-month USD LIBOR + 1.250% Floor 1.250% 02/15/2032 | 1.804% | 4,800,000 | 4,752,207 | |
| Series 2018-NYCH Class E | ||||
| 1-month USD LIBOR + 2.900% Floor 3.200% 02/15/2032 | 3.454% | 5,737,000 | 5,582,445 | |
| Wells Fargo Commercial Mortgage Trust(a),(b) | ||||
| Series 2017-SMP Class A | ||||
| 1-month USD LIBOR + 0.875% Floor 0.875% 12/15/2034 | 1.429% | 4,555,000 | 4,499,216 | |
| WFRBS Commercial Mortgage Trust(a),(f) | ||||
| Subordinated Series 2013-C16 Class D | ||||
| 09/15/2046 | 5.001% | 9,094,000 | 8,626,662 | |
| Subordinated Series 2014-C25 Class D | ||||
| 11/15/2047 | 3.803% | 2,000,000 | 1,778,468 | |
| Total Commercial Mortgage-Backed Securities - Non-Agency (Cost $207,062,237) | 200,266,990 | |||
| Common Stocks 0.0% | ||
| Issuer | Shares | Value ($) |
| Financials 0.0% | ||
| Insurance 0.0% | ||
| Mr. Cooper Group, Inc.(h) | 4,518 | 203,174 |
| Total Financials | 203,174 | |
| Industrials 0.0% | ||
| Airlines 0.0% | ||
| United Airlines Holdings, Inc.(h) | 1,493 | 75,397 |
| Total Industrials | 75,397 | |
| Total Common Stocks (Cost $1,511,077) | 278,571 | |
| 12 | Columbia Total Return Bond Fund | Annual Report 2022 |
April 30, 2022
| Convertible Bonds 0.0% | ||||
| Issuer | Coupon Rate | Principal Amount ($) | Value ($) | |
| Cable and Satellite 0.0% | ||||
| DISH Network Corp. | ||||
| Subordinated | ||||
| 08/15/2026 | 3.375% | 850,000 | 728,875 | |
| Total Convertible Bonds (Cost $805,534) | 728,875 | |||
| Corporate Bonds & Notes 33.9% | ||||
| Aerospace & Defense 1.1% | ||||
| Boeing Co. (The) | ||||
| 05/01/2025 | 4.875% | 3,750,000 | 3,795,621 | |
| 08/01/2059 | 3.950% | 3,475,000 | 2,586,600 | |
| 05/01/2060 | 5.930% | 7,305,000 | 7,258,190 | |
| Bombardier, Inc.(a) | ||||
| 12/01/2024 | 7.500% | 471,000 | 470,209 | |
| 04/15/2027 | 7.875% | 563,000 | 524,608 | |
| Howmet Aerospace, Inc. | ||||
| 01/15/2029 | 3.000% | 3,800,000 | 3,320,107 | |
| Lockheed Martin Corp.(i) | ||||
| 06/15/2053 | 4.150% | 872,000 | 846,259 | |
| 06/15/2062 | 4.300% | 3,035,000 | 2,964,640 | |
| Northrop Grumman Corp. | ||||
| 01/15/2028 | 3.250% | 3,490,000 | 3,353,813 | |
| TransDigm, Inc.(a) | ||||
| 12/15/2025 | 8.000% | 394,000 | 410,214 | |
| 03/15/2026 | 6.250% | 5,697,000 | 5,704,283 | |
| TransDigm, Inc. | ||||
| 06/15/2026 | 6.375% | 993,000 | 981,255 | |
| 03/15/2027 | 7.500% | 73,000 | 73,545 | |
| 11/15/2027 | 5.500% | 1,505,000 | 1,380,267 | |
| 01/15/2029 | 4.625% | 75,000 | 64,805 | |
| 05/01/2029 | 4.875% | 543,000 | 475,545 | |
| Total | 34,209,961 | |||
| Airlines 0.1% | ||||
| Air Canada(a) | ||||
| 08/15/2026 | 3.875% | 647,000 | 598,215 | |
| American Airlines, Inc.(a) | ||||
| 07/15/2025 | 11.750% | 550,000 | 633,784 | |
| American Airlines, Inc./AAdvantage Loyalty IP Ltd.(a) | ||||
| 04/20/2026 | 5.500% | 1,886,643 | 1,869,867 | |
| 04/20/2029 | 5.750% | 256,571 | 247,538 | |
| Delta Air Lines, Inc. | ||||
| 04/19/2028 | 4.375% | 185,000 | 173,179 | |
| Hawaiian Brand Intellectual Property Ltd./Miles Loyalty Ltd.(a) | ||||
| 01/20/2026 | 5.750% | 657,100 | 641,335 | |
| Corporate Bonds & Notes (continued) | ||||
| Issuer | Coupon Rate | Principal Amount ($) | Value ($) | |
| United Airlines, Inc.(a) | ||||
| 04/15/2026 | 4.375% | 320,000 | 308,352 | |
| 04/15/2029 | 4.625% | 357,000 | 328,006 | |
| Total | 4,800,276 | |||
| Automotive 0.6% | ||||
| American Axle & Manufacturing, Inc. | ||||
| 03/15/2026 | 6.250% | 221,000 | 213,360 | |
| 04/01/2027 | 6.500% | 29,000 | 27,130 | |
| 07/01/2028 | 6.875% | 2,000,000 | 1,882,887 | |
| Clarios Global LP(a) | ||||
| 05/15/2025 | 6.750% | 118,000 | 120,958 | |
| Ford Motor Co. | ||||
| 02/12/2032 | 3.250% | 1,115,000 | 905,354 | |
| 01/15/2043 | 4.750% | 4,457,000 | 3,589,322 | |
| 12/08/2046 | 5.291% | 1,500,000 | 1,289,504 | |
| Ford Motor Credit Co. LLC | ||||
| 03/18/2024 | 5.584% | 1,014,000 | 1,024,635 | |
| 09/08/2024 | 3.664% | 934,000 | 906,515 | |
| 11/13/2025 | 3.375% | 1,019,000 | 960,774 | |
| 01/09/2027 | 4.271% | 630,000 | 596,013 | |
| 08/17/2027 | 4.125% | 540,000 | 500,749 | |
| 02/16/2028 | 2.900% | 329,000 | 282,184 | |
| 11/13/2030 | 4.000% | 2,000,000 | 1,733,399 | |
| Goodyear Tire & Rubber Co. (The) | ||||
| 07/15/2029 | 5.000% | 328,000 | 290,623 | |
| IAA Spinco, Inc.(a) | ||||
| 06/15/2027 | 5.500% | 740,000 | 723,978 | |
| Jaguar Land Rover Automotive PLC(a) | ||||
| 07/15/2029 | 5.500% | 486,000 | 405,780 | |
| KAR Auction Services, Inc.(a) | ||||
| 06/01/2025 | 5.125% | 2,164,000 | 2,193,460 | |
| Panther BF Aggregator 2 LP/Finance Co., Inc.(a) | ||||
| 05/15/2026 | 6.250% | 987,000 | 1,000,996 | |
| 05/15/2027 | 8.500% | 592,000 | 592,926 | |
| Tenneco, Inc.(a) | ||||
| 01/15/2029 | 7.875% | 618,000 | 624,134 | |
| Total | 19,864,681 | |||
| Banking 6.5% | ||||
| Bank of America Corp.(j) | ||||
| 07/23/2031 | 1.898% | 18,920,000 | 15,443,467 | |
| 10/20/2032 | 2.572% | 18,220,000 | 15,391,822 | |
| 02/04/2033 | 2.972% | 18,480,000 | 16,114,860 | |
| Citigroup, Inc.(j) | ||||
| 06/03/2031 | 2.572% | 3,633,000 | 3,121,316 | |
| 01/25/2033 | 3.057% | 17,722,000 | 15,498,170 | |
| Goldman Sachs Group, Inc. (The)(j) | ||||
| 07/21/2032 | 2.383% | 17,727,000 | 14,683,696 | |
| 02/24/2033 | 3.102% | 19,436,000 | 16,989,854 | |
| Columbia Total Return Bond Fund | Annual Report 2022 | 13 |
April 30, 2022
| Corporate Bonds & Notes (continued) | ||||
| Issuer | Coupon Rate | Principal Amount ($) | Value ($) | |
| HSBC Holdings PLC(j) | ||||
| 05/22/2030 | 3.973% | 4,000,000 | 3,785,055 | |
| 05/24/2032 | 2.804% | 5,399,000 | 4,535,850 | |
| 11/22/2032 | 2.871% | 12,954,000 | 10,809,814 | |
| JPMorgan Chase & Co.(j) | ||||
| 04/22/2027 | 1.578% | 9,500,000 | 8,591,021 | |
| 10/15/2030 | 2.739% | 4,175,000 | 3,705,944 | |
| 11/19/2031 | 1.764% | 2,500,000 | 2,017,555 | |
| 04/22/2032 | 2.580% | 21,216,000 | 18,258,361 | |
| 11/08/2032 | 2.545% | 15,753,000 | 13,367,298 | |
| Morgan Stanley(j) | ||||
| 12/10/2026 | 0.985% | 2,000,000 | 1,785,921 | |
| 07/22/2028 | 3.591% | 5,000,000 | 4,792,896 | |
| 07/21/2032 | 2.239% | 5,336,000 | 4,417,895 | |
| 10/20/2032 | 2.511% | 8,314,000 | 7,001,974 | |
| Subordinated | ||||
| 04/20/2037 | 5.297% | 4,705,000 | 4,716,879 | |
| Washington Mutual Bank(c),(e),(k) | ||||
| Subordinated | ||||
| 01/15/2015 | 0.000% | 27,379,000 | 41,069 | |
| Wells Fargo & Co.(j) | ||||
| 10/30/2030 | 2.879% | 1,254,000 | 1,125,344 | |
| 02/11/2031 | 2.572% | 25,691,000 | 22,530,608 | |
| Total | 208,726,669 | |||
| Brokerage/Asset Managers/Exchanges 0.1% | ||||
| Hightower Holding LLC(a) | ||||
| 04/15/2029 | 6.750% | 669,000 | 621,790 | |
| NFP Corp.(a) | ||||
| 08/15/2028 | 4.875% | 700,000 | 639,138 | |
| 08/15/2028 | 6.875% | 2,366,000 | 2,093,564 | |
| Total | 3,354,492 | |||
| Building Materials 0.1% | ||||
| American Builders & Contractors Supply Co., Inc.(a) | ||||
| 01/15/2028 | 4.000% | 445,000 | 413,605 | |
| Beacon Roofing Supply, Inc.(a) | ||||
| 11/15/2026 | 4.500% | 689,000 | 671,899 | |
| 05/15/2029 | 4.125% | 424,000 | 372,939 | |
| James Hardie International Finance DAC(a) | ||||
| 01/15/2028 | 5.000% | 250,000 | 240,971 | |
| SRS Distribution, Inc.(a) | ||||
| 07/01/2028 | 4.625% | 781,000 | 715,199 | |
| 07/01/2029 | 6.125% | 826,000 | 728,576 | |
| 12/01/2029 | 6.000% | 665,000 | 581,875 | |
| White Cap Buyer LLC(a) | ||||
| 10/15/2028 | 6.875% | 474,000 | 436,829 | |
| Total | 4,161,893 | |||
| Corporate Bonds & Notes (continued) | ||||
| Issuer | Coupon Rate | Principal Amount ($) | Value ($) | |
| Cable and Satellite 1.7% | ||||
| CCO Holdings LLC/Capital Corp.(a) | ||||
| 05/01/2027 | 5.125% | 396,000 | 385,837 | |
| 06/01/2029 | 5.375% | 233,000 | 221,134 | |
| 03/01/2030 | 4.750% | 862,000 | 769,575 | |
| 08/15/2030 | 4.500% | 1,694,000 | 1,480,237 | |
| 02/01/2031 | 4.250% | 288,000 | 243,089 | |
| 02/01/2032 | 4.750% | 920,000 | 796,587 | |
| CCO Holdings LLC/Capital Corp. | ||||
| 05/01/2032 | 4.500% | 3,639,000 | 3,066,204 | |
| Charter Communications Operating LLC/Capital | ||||
| 05/01/2047 | 5.375% | 1,980,000 | 1,768,088 | |
| 12/01/2061 | 4.400% | 3,104,000 | 2,319,090 | |
| 06/30/2062 | 3.950% | 5,246,000 | 3,622,887 | |
| 04/01/2063 | 5.500% | 12,640,000 | 11,025,844 | |
| CSC Holdings LLC | ||||
| 06/01/2024 | 5.250% | 871,000 | 849,912 | |
| CSC Holdings LLC(a) | ||||
| 02/01/2028 | 5.375% | 952,000 | 880,600 | |
| 01/15/2030 | 5.750% | 598,000 | 496,258 | |
| 12/01/2030 | 4.125% | 1,399,000 | 1,157,266 | |
| 12/01/2030 | 4.625% | 358,000 | 273,784 | |
| 02/15/2031 | 3.375% | 1,904,000 | 1,486,164 | |
| 11/15/2031 | 5.000% | 237,000 | 183,116 | |
| DIRECTV Holdings LLC/Financing Co., Inc.(a) | ||||
| 08/15/2027 | 5.875% | 990,000 | 933,534 | |
| DISH DBS Corp. | ||||
| 07/15/2022 | 5.875% | 739,000 | 741,118 | |
| 07/01/2026 | 7.750% | 1,187,000 | 1,133,301 | |
| 06/01/2029 | 5.125% | 1,993,000 | 1,556,342 | |
| DISH DBS Corp.(a) | ||||
| 12/01/2028 | 5.750% | 1,403,000 | 1,258,442 | |
| Radiate Holdco LLC/Finance, Inc.(a) | ||||
| 09/15/2026 | 4.500% | 536,000 | 494,585 | |
| 09/15/2028 | 6.500% | 2,041,000 | 1,784,625 | |
| Sirius XM Radio, Inc.(a) | ||||
| 09/01/2026 | 3.125% | 611,000 | 562,884 | |
| 08/01/2027 | 5.000% | 347,000 | 334,808 | |
| 07/15/2028 | 4.000% | 813,000 | 735,140 | |
| 07/01/2030 | 4.125% | 363,000 | 319,094 | |
| Videotron Ltd.(a) | ||||
| 06/15/2029 | 3.625% | 9,707,000 | 8,463,504 | |
| Virgin Media Finance PLC(a) | ||||
| 07/15/2030 | 5.000% | 805,000 | 705,153 | |
| Virgin Media Secured Finance PLC(a) | ||||
| 05/15/2029 | 5.500% | 469,000 | 436,814 | |
| VZ Secured Financing BV(a) | ||||
| 01/15/2032 | 5.000% | 1,732,000 | 1,512,877 | |
| Ziggo Bond Co. BV(a) | ||||
| 02/28/2030 | 5.125% | 555,000 | 482,952 | |
| 14 | Columbia Total Return Bond Fund | Annual Report 2022 |
April 30, 2022
| Corporate Bonds & Notes (continued) | ||||
| Issuer | Coupon Rate | Principal Amount ($) | Value ($) | |
| Ziggo Bond Finance BV(a) | ||||
| 01/15/2027 | 6.000% | 335,000 | 329,052 | |
| Ziggo BV(a) | ||||
| 01/15/2030 | 4.875% | 1,246,000 | 1,104,998 | |
| Total | 53,914,895 | |||
| Chemicals 0.3% | ||||
| Axalta Coating Systems LLC(a) | ||||
| 02/15/2029 | 3.375% | 328,000 | 284,509 | |
| Axalta Coating Systems LLC/Dutch Holding B BV(a) | ||||
| 06/15/2027 | 4.750% | 607,000 | 576,934 | |
| Braskem Netherlands Finance BV(a) | ||||
| 01/31/2030 | 4.500% | 1,500,000 | 1,355,064 | |
| Element Solutions, Inc.(a) | ||||
| 09/01/2028 | 3.875% | 618,000 | 552,751 | |
| HB Fuller Co. | ||||
| 10/15/2028 | 4.250% | 633,000 | 569,067 | |
| Herens Holdco Sarl(a) | ||||
| 05/15/2028 | 4.750% | 476,000 | 423,860 | |
| Illuminate Buyer LLC/Holdings IV, Inc.(a) | ||||
| 07/01/2028 | 9.000% | 829,000 | 798,182 | |
| INEOS Quattro Finance 2 Plc(a) | ||||
| 01/15/2026 | 3.375% | 739,000 | 672,577 | |
| Ingevity Corp.(a) | ||||
| 11/01/2028 | 3.875% | 494,000 | 445,909 | |
| Innophos Holdings, Inc.(a) | ||||
| 02/15/2028 | 9.375% | 454,000 | 478,948 | |
| Iris Holdings, Inc.(a),(l) | ||||
| 02/15/2026 | 8.750% | 279,000 | 267,446 | |
| Minerals Technologies, Inc.(a) | ||||
| 07/01/2028 | 5.000% | 140,000 | 130,422 | |
| Olympus Water US Holding Corp.(a) | ||||
| 10/01/2028 | 4.250% | 568,000 | 504,304 | |
| 10/01/2029 | 6.250% | 282,000 | 235,818 | |
| SPCM SA(a) | ||||
| 03/15/2027 | 3.125% | 282,000 | 249,181 | |
| Unifrax Escrow Issuer Corp.(a) | ||||
| 09/30/2028 | 5.250% | 284,000 | 250,459 | |
| 09/30/2029 | 7.500% | 160,000 | 131,060 | |
| WR Grace Holdings LLC(a) | ||||
| 06/15/2027 | 4.875% | 836,000 | 785,862 | |
| 08/15/2029 | 5.625% | 1,743,000 | 1,497,008 | |
| Total | 10,209,361 | |||
| Construction Machinery 0.1% | ||||
| H&E Equipment Services, Inc.(a) | ||||
| 12/15/2028 | 3.875% | 1,855,000 | 1,615,292 | |
| Corporate Bonds & Notes (continued) | ||||
| Issuer | Coupon Rate | Principal Amount ($) | Value ($) | |
| Herc Holdings, Inc.(a) | ||||
| 07/15/2027 | 5.500% | 129,000 | 126,381 | |
| PECF USS Intermediate Holding III Corp.(a) | ||||
| 11/15/2029 | 8.000% | 87,000 | 81,252 | |
| Ritchie Bros Holdings, Inc.(a) | ||||
| 12/15/2031 | 4.750% | 870,000 | 869,706 | |
| Ritchie Bros. Auctioneers, Inc.(a) | ||||
| 01/15/2025 | 5.375% | 183,000 | 183,600 | |
| United Rentals North America, Inc. | ||||
| 05/15/2027 | 5.500% | 361,000 | 369,080 | |
| 02/15/2031 | 3.875% | 194,000 | 171,717 | |
| 01/15/2032 | 3.750% | 302,000 | 263,030 | |
| Total | 3,680,058 | |||
| Consumer Cyclical Services 0.2% | ||||
| APX Group, Inc.(a) | ||||
| 07/15/2029 | 5.750% | 98,000 | 80,392 | |
| Arches Buyer, Inc.(a) | ||||
| 06/01/2028 | 4.250% | 155,000 | 138,673 | |
| 12/01/2028 | 6.125% | 668,000 | 581,196 | |
| ASGN, Inc.(a) | ||||
| 05/15/2028 | 4.625% | 398,000 | 369,769 | |
| Staples, Inc.(a) | ||||
| 04/15/2026 | 7.500% | 1,045,000 | 997,738 | |
| 04/15/2027 | 10.750% | 28,000 | 24,777 | |
| Uber Technologies, Inc.(a) | ||||
| 05/15/2025 | 7.500% | 688,000 | 710,220 | |
| 01/15/2028 | 6.250% | 200,000 | 197,980 | |
| 08/15/2029 | 4.500% | 3,037,000 | 2,615,992 | |
| Total | 5,716,737 | |||
| Consumer Products 0.3% | ||||
| CD&R Smokey Buyer, Inc.(a) | ||||
| 07/15/2025 | 6.750% | 912,000 | 928,437 | |
| Energizer Holdings, Inc.(a) | ||||
| 06/15/2028 | 4.750% | 2,500,000 | 2,193,284 | |
| 03/31/2029 | 4.375% | 382,000 | 317,950 | |
| Mattel, Inc.(a) | ||||
| 04/01/2026 | 3.375% | 247,000 | 240,230 | |
| 12/15/2027 | 5.875% | 446,000 | 456,066 | |
| 04/01/2029 | 3.750% | 765,000 | 728,686 | |
| Mattel, Inc. | ||||
| 10/01/2040 | 6.200% | 1,375,000 | 1,440,441 | |
| 11/01/2041 | 5.450% | 28,000 | 28,113 | |
| Newell Brands, Inc. | ||||
| 06/01/2025 | 4.875% | 371,000 | 375,277 | |
| 04/01/2046 | 6.000% | 3,600,000 | 3,353,612 | |
| Columbia Total Return Bond Fund | Annual Report 2022 | 15 |
April 30, 2022
| Corporate Bonds & Notes (continued) | ||||
| Issuer | Coupon Rate | Principal Amount ($) | Value ($) | |
| Prestige Brands, Inc.(a) | ||||
| 01/15/2028 | 5.125% | 214,000 | 205,004 | |
| 04/01/2031 | 3.750% | 255,000 | 216,423 | |
| Spectrum Brands, Inc. | ||||
| 07/15/2025 | 5.750% | 202,000 | 204,505 | |
| Spectrum Brands, Inc.(a) | ||||
| 03/15/2031 | 3.875% | 247,000 | 207,854 | |
| Tempur Sealy International, Inc.(a) | ||||
| 10/15/2031 | 3.875% | 472,000 | 391,858 | |
| Total | 11,287,740 | |||
| Diversified Manufacturing 0.9% | ||||
| Carrier Global Corp. | ||||
| 04/05/2050 | 3.577% | 15,017,000 | 12,033,440 | |
| Gates Global LLC/Co.(a) | ||||
| 01/15/2026 | 6.250% | 876,000 | 859,090 | |
| GE Capital International Funding Co. Unlimited Co. | ||||
| 11/15/2035 | 4.418% | 5,680,000 | 5,551,155 | |
| General Electric Co.(b) | ||||
| Junior Subordinated | ||||
| 3-month USD LIBOR + 3.330% 12/31/2049 | 4.156% | 7,810,000 | 7,402,183 | |
| Madison IAQ LLC(a) | ||||
| 06/30/2028 | 4.125% | 741,000 | 650,390 | |
| 06/30/2029 | 5.875% | 1,282,000 | 1,045,128 | |
| Resideo Funding, Inc.(a) | ||||
| 09/01/2029 | 4.000% | 573,000 | 512,345 | |
| Vertical US Newco, Inc.(a) | ||||
| 07/15/2027 | 5.250% | 340,000 | 318,906 | |
| WESCO Distribution, Inc.(a) | ||||
| 06/15/2025 | 7.125% | 1,621,000 | 1,682,983 | |
| 06/15/2028 | 7.250% | 346,000 | 359,570 | |
| Total | 30,415,190 | |||
| Electric 2.6% | ||||
| AEP Texas, Inc. | ||||
| 01/15/2050 | 3.450% | 4,500,000 | 3,567,276 | |
| Appalachian Power Co. | ||||
| 05/15/2044 | 4.400% | 4,045,000 | 3,722,918 | |
| Calpine Corp.(a) | ||||
| 02/15/2028 | 4.500% | 1,125,000 | 1,043,460 | |
| Clearway Energy Operating LLC(a) | ||||
| 03/15/2028 | 4.750% | 744,000 | 707,767 | |
| 02/15/2031 | 3.750% | 1,511,000 | 1,299,306 | |
| 01/15/2032 | 3.750% | 287,000 | 244,449 | |
| DTE Energy Co. | ||||
| 10/01/2026 | 2.850% | 6,056,000 | 5,780,093 | |
| Corporate Bonds & Notes (continued) | ||||
| Issuer | Coupon Rate | Principal Amount ($) | Value ($) | |
| Duke Energy Corp. | ||||
| 09/01/2046 | 3.750% | 8,515,000 | 7,047,376 | |
| Emera US Finance LP | ||||
| 06/15/2046 | 4.750% | 7,655,000 | 7,177,635 | |
| Eversource Energy | ||||
| 01/15/2028 | 3.300% | 3,472,000 | 3,310,746 | |
| Exelon Corp.(a) | ||||
| 03/15/2052 | 4.100% | 1,344,000 | 1,197,608 | |
| Georgia Power Co. | ||||
| 03/15/2042 | 4.300% | 4,320,000 | 3,939,476 | |
| Leeward Renewable Energy Operations LLC(a) | ||||
| 07/01/2029 | 4.250% | 200,000 | 181,093 | |
| NextEra Energy Operating Partners LP(a) | ||||
| 07/15/2024 | 4.250% | 988,000 | 980,693 | |
| 09/15/2027 | 4.500% | 240,000 | 227,221 | |
| NRG Energy, Inc. | ||||
| 01/15/2028 | 5.750% | 15,000 | 14,647 | |
| NRG Energy, Inc.(a) | ||||
| 02/15/2029 | 3.375% | 270,000 | 231,044 | |
| 06/15/2029 | 5.250% | 1,142,000 | 1,080,523 | |
| 02/15/2031 | 3.625% | 5,525,000 | 4,611,829 | |
| 02/15/2032 | 3.875% | 10,210,000 | 8,527,603 | |
| Pacific Gas and Electric Co. | ||||
| 07/01/2050 | 4.950% | 10,245,000 | 8,552,027 | |
| PacifiCorp | ||||
| 02/15/2050 | 4.150% | 2,080,000 | 1,916,527 | |
| Pattern Energy Operations LP/Inc.(a) | ||||
| 08/15/2028 | 4.500% | 132,000 | 124,740 | |
| PG&E Corp. | ||||
| 07/01/2028 | 5.000% | 80,000 | 73,654 | |
| Southern Co. (The) | ||||
| 07/01/2046 | 4.400% | 2,083,000 | 1,901,140 | |
| TerraForm Power Operating LLC(a) | ||||
| 01/15/2030 | 4.750% | 494,000 | 446,386 | |
| Vistra Operations Co. LLC(a) | ||||
| 09/01/2026 | 5.500% | 68,000 | 67,784 | |
| 02/15/2027 | 5.625% | 209,000 | 206,151 | |
| 07/31/2027 | 5.000% | 712,000 | 683,245 | |
| 05/01/2029 | 4.375% | 5,950,000 | 5,415,503 | |
| Xcel Energy, Inc. | ||||
| 12/01/2029 | 2.600% | 1,414,000 | 1,256,453 | |
| 06/01/2030 | 3.400% | 8,245,000 | 7,715,708 | |
| Total | 83,252,081 | |||
| 16 | Columbia Total Return Bond Fund | Annual Report 2022 |
April 30, 2022
| Corporate Bonds & Notes (continued) | ||||
| Issuer | Coupon Rate | Principal Amount ($) | Value ($) | |
| Environmental 0.1% | ||||
| GFL Environmental, Inc.(a) | ||||
| 06/01/2025 | 4.250% | 262,000 | 254,353 | |
| 08/01/2025 | 3.750% | 1,266,000 | 1,210,542 | |
| 12/15/2026 | 5.125% | 407,000 | 400,152 | |
| 08/01/2028 | 4.000% | 343,000 | 302,295 | |
| 09/01/2028 | 3.500% | 445,000 | 399,702 | |
| 06/15/2029 | 4.750% | 749,000 | 679,798 | |
| 08/15/2029 | 4.375% | 448,000 | 396,954 | |
| Waste Pro USA, Inc.(a) | ||||
| 02/15/2026 | 5.500% | 1,375,000 | 1,222,283 | |
| Total | 4,866,079 | |||
| Finance Companies 0.6% | ||||
| Navient Corp. | ||||
| 01/25/2023 | 5.500% | 225,000 | 226,126 | |
| 06/25/2025 | 6.750% | 117,000 | 117,586 | |
| 06/15/2026 | 6.750% | 860,000 | 846,407 | |
| 03/15/2028 | 4.875% | 256,000 | 224,797 | |
| Provident Funding Associates LP/Finance Corp.(a) | ||||
| 06/15/2025 | 6.375% | 618,000 | 606,468 | |
| Quicken Loans LLC/Co-Issuer, Inc.(a) | ||||
| 03/01/2029 | 3.625% | 2,049,000 | 1,753,098 | |
| 03/01/2031 | 3.875% | 4,282,000 | 3,614,500 | |
| Rocket Mortgage LLC/Co-Issuer, Inc.(a) | ||||
| 10/15/2033 | 4.000% | 12,693,000 | 10,190,372 | |
| Springleaf Finance Corp. | ||||
| 03/15/2024 | 6.125% | 502,000 | 503,883 | |
| 03/15/2025 | 6.875% | 181,000 | 182,761 | |
| 06/01/2025 | 8.875% | 57,000 | 59,812 | |
| Total | 18,325,810 | |||
| Food and Beverage 1.9% | ||||
| Anheuser-Busch Companies LLC/InBev Worldwide, Inc. | ||||
| 02/01/2046 | 4.900% | 13,543,000 | 13,356,204 | |
| Bacardi Ltd.(a) | ||||
| 05/15/2048 | 5.300% | 8,600,000 | 8,614,175 | |
| Becle SAB de CV(a) | ||||
| 10/14/2031 | 2.500% | 3,000,000 | 2,546,337 | |
| FAGE International SA/USA Dairy Industry, Inc.(a) | ||||
| 08/15/2026 | 5.625% | 1,199,000 | 1,128,077 | |
| Grupo Bimbo SAB de CV(a) | ||||
| 06/27/2024 | 3.875% | 971,000 | 976,588 | |
| JBS USA LUX SA/Food Co./Finance, Inc.(a) | ||||
| 01/15/2030 | 5.500% | 223,000 | 220,551 | |
| 12/01/2031 | 3.750% | 362,000 | 318,696 | |
| Kraft Heinz Foods Co. | ||||
| 06/01/2046 | 4.375% | 14,314,000 | 12,544,417 | |
| Corporate Bonds & Notes (continued) | ||||
| Issuer | Coupon Rate | Principal Amount ($) | Value ($) | |
| Kraft Heinz Foods Co. (The) | ||||
| 07/15/2045 | 5.200% | 3,400,000 | 3,318,065 | |
| Lamb Weston Holdings, Inc.(a) | ||||
| 01/31/2030 | 4.125% | 627,000 | 559,238 | |
| 01/31/2032 | 4.375% | 626,000 | 562,026 | |
| MHP SE(a) | ||||
| 05/10/2024 | 7.750% | 581,000 | 305,383 | |
| Pilgrim’s Pride Corp.(a) | ||||
| 09/30/2027 | 5.875% | 491,000 | 494,426 | |
| 04/15/2031 | 4.250% | 1,914,000 | 1,739,551 | |
| 03/01/2032 | 3.500% | 11,644,000 | 9,869,329 | |
| Post Holdings, Inc.(a) | ||||
| 03/01/2027 | 5.750% | 435,000 | 430,302 | |
| 01/15/2028 | 5.625% | 92,000 | 87,069 | |
| 04/15/2030 | 4.625% | 624,000 | 533,664 | |
| 09/15/2031 | 4.500% | 1,284,000 | 1,070,855 | |
| Primo Water Holdings, Inc.(a) | ||||
| 04/30/2029 | 4.375% | 450,000 | 391,841 | |
| Simmons Foods, Inc./Prepared Foods, Inc./Pet Food, Inc./Feed(a) | ||||
| 03/01/2029 | 4.625% | 517,000 | 466,342 | |
| Triton Water Holdings, Inc.(a) | ||||
| 04/01/2029 | 6.250% | 685,000 | 567,768 | |
| US Foods, Inc.(a) | ||||
| 04/15/2025 | 6.250% | 563,000 | 578,870 | |
| 02/15/2029 | 4.750% | 585,000 | 540,056 | |
| 06/01/2030 | 4.625% | 487,000 | 437,455 | |
| Total | 61,657,285 | |||
| Gaming 0.5% | ||||
| Boyd Gaming Corp.(a) | ||||
| 06/01/2025 | 8.625% | 23,000 | 24,006 | |
| 06/15/2031 | 4.750% | 739,000 | 669,481 | |
| Boyd Gaming Corp. | ||||
| 12/01/2027 | 4.750% | 332,000 | 314,229 | |
| Caesars Entertainment, Inc.(a) | ||||
| 10/15/2029 | 4.625% | 2,043,000 | 1,763,858 | |
| Colt Merger Sub, Inc.(a) | ||||
| 07/01/2025 | 5.750% | 428,000 | 436,869 | |
| 07/01/2025 | 6.250% | 1,442,000 | 1,458,275 | |
| 07/01/2027 | 8.125% | 646,000 | 675,023 | |
| International Game Technology PLC(a) | ||||
| 02/15/2025 | 6.500% | 568,000 | 577,725 | |
| 04/15/2026 | 4.125% | 524,000 | 492,432 | |
| MGM Resorts International | ||||
| 05/01/2025 | 6.750% | 2,000,000 | 2,049,159 | |
| Midwest Gaming Borrower LLC(a) | ||||
| 05/01/2029 | 4.875% | 607,000 | 536,117 | |
| Penn National Gaming, Inc.(a) | ||||
| 07/01/2029 | 4.125% | 373,000 | 316,215 | |
| Columbia Total Return Bond Fund | Annual Report 2022 | 17 |
April 30, 2022
| Corporate Bonds & Notes (continued) | ||||
| Issuer | Coupon Rate | Principal Amount ($) | Value ($) | |
| Scientific Games Holdings LP/US FinCo, Inc.(a) | ||||
| 03/01/2030 | 6.625% | 1,011,000 | 960,450 | |
| Scientific Games International, Inc.(a) | ||||
| 07/01/2025 | 8.625% | 182,000 | 191,100 | |
| 05/15/2028 | 7.000% | 88,000 | 90,128 | |
| 11/15/2029 | 7.250% | 603,000 | 632,883 | |
| VICI Properties LP/Note Co., Inc.(a) | ||||
| 02/15/2025 | 3.500% | 495,000 | 475,959 | |
| 06/15/2025 | 4.625% | 413,000 | 405,512 | |
| 09/01/2026 | 4.500% | 538,000 | 516,867 | |
| 12/01/2026 | 4.250% | 358,000 | 340,109 | |
| 02/01/2027 | 5.750% | 223,000 | 223,007 | |
| 02/15/2027 | 3.750% | 106,000 | 97,763 | |
| 02/15/2029 | 3.875% | 130,000 | 118,199 | |
| 12/01/2029 | 4.625% | 23,000 | 21,524 | |
| 08/15/2030 | 4.125% | 2,049,000 | 1,841,015 | |
| Wynn Las Vegas LLC/Capital Corp.(a) | ||||
| 03/01/2025 | 5.500% | 137,000 | 132,548 | |
| Wynn Resorts Finance LLC/Capital Corp.(a) | ||||
| 04/15/2025 | 7.750% | 260,000 | 268,061 | |
| 10/01/2029 | 5.125% | 165,000 | 144,581 | |
| Total | 15,773,095 | |||
| Health Care 1.6% | ||||
| 180 Medical, Inc.(a) | ||||
| 10/15/2029 | 3.875% | 200,000 | 179,286 | |
| Acadia Healthcare Co., Inc.(a) | ||||
| 07/01/2028 | 5.500% | 290,000 | 282,374 | |
| 04/15/2029 | 5.000% | 994,000 | 942,461 | |
| AdaptHealth LLC(a) | ||||
| 08/01/2029 | 4.625% | 205,000 | 174,653 | |
| 03/01/2030 | 5.125% | 1,020,000 | 877,653 | |
| Avantor Funding, Inc.(a) | ||||
| 07/15/2028 | 4.625% | 485,000 | 462,986 | |
| 11/01/2029 | 3.875% | 1,275,000 | 1,145,940 | |
| Becton Dickinson and Co.(b) | ||||
| 3-month USD LIBOR + 1.030% 06/06/2022 | 1.613% | 2,717,000 | 2,717,752 | |
| Becton Dickinson and Co. | ||||
| 02/11/2031 | 1.957% | 1,505,000 | 1,240,466 | |
| Catalent Pharma Solutions, Inc.(a) | ||||
| 02/15/2029 | 3.125% | 158,000 | 136,995 | |
| 04/01/2030 | 3.500% | 382,000 | 333,019 | |
| Change Healthcare Holdings LLC/Finance, Inc.(a) | ||||
| 03/01/2025 | 5.750% | 390,000 | 389,237 | |
| Charles River Laboratories International, Inc.(a) | ||||
| 05/01/2028 | 4.250% | 42,000 | 40,086 | |
| 03/15/2029 | 3.750% | 215,000 | 195,205 | |
| 03/15/2031 | 4.000% | 275,000 | 245,761 | |
| Corporate Bonds & Notes (continued) | ||||
| Issuer | Coupon Rate | Principal Amount ($) | Value ($) | |
| CHS/Community Health Systems, Inc.(a) | ||||
| 03/15/2026 | 8.000% | 392,000 | 405,547 | |
| 03/15/2027 | 5.625% | 129,000 | 123,063 | |
| 04/15/2029 | 6.875% | 627,000 | 550,125 | |
| 05/15/2030 | 5.250% | 1,710,000 | 1,500,189 | |
| Cigna Corp. | ||||
| 03/15/2051 | 3.400% | 9,360,000 | 7,333,767 | |
| CVS Health Corp. | ||||
| 03/25/2048 | 5.050% | 8,250,000 | 8,291,490 | |
| Encompass Health Corp. | ||||
| 02/01/2028 | 4.500% | 422,000 | 388,544 | |
| HCA, Inc. | ||||
| 02/01/2025 | 5.375% | 1,273,000 | 1,309,514 | |
| 09/01/2028 | 5.625% | 223,000 | 230,481 | |
| 02/01/2029 | 5.875% | 873,000 | 909,569 | |
| 09/01/2030 | 3.500% | 529,000 | 474,220 | |
| HCA, Inc.(a) | ||||
| 03/15/2052 | 4.625% | 12,675,000 | 11,088,598 | |
| Hologic, Inc.(a) | ||||
| 02/15/2029 | 3.250% | 170,000 | 151,593 | |
| Indigo Merger Sub, Inc.(a) | ||||
| 07/15/2026 | 2.875% | 281,000 | 260,201 | |
| IQVIA, Inc.(a) | ||||
| 10/15/2026 | 5.000% | 970,000 | 966,093 | |
| Mozart Debt Merger Sub, Inc.(a) | ||||
| 04/01/2029 | 3.875% | 135,000 | 118,031 | |
| 10/01/2029 | 5.250% | 287,000 | 249,658 | |
| Ortho-Clinical Diagnostics, Inc./SA(a) | ||||
| 06/01/2025 | 7.375% | 248,000 | 254,063 | |
| 02/01/2028 | 7.250% | 23,000 | 23,371 | |
| Owens & Minor, Inc.(a) | ||||
| 04/01/2030 | 6.625% | 619,000 | 605,892 | |
| Radiology Partners, Inc.(a) | ||||
| 02/01/2028 | 9.250% | 186,000 | 177,030 | |
| RP Escrow Issuer LLC(a) | ||||
| 12/15/2025 | 5.250% | 417,000 | 391,862 | |
| Select Medical Corp.(a) | ||||
| 08/15/2026 | 6.250% | 1,751,000 | 1,737,868 | |
| Syneos Health, Inc.(a) | ||||
| 01/15/2029 | 3.625% | 159,000 | 140,719 | |
| Tenet Healthcare Corp. | ||||
| 07/15/2024 | 4.625% | 507,000 | 505,788 | |
| Tenet Healthcare Corp.(a) | ||||
| 01/01/2026 | 4.875% | 220,000 | 214,475 | |
| 02/01/2027 | 6.250% | 578,000 | 573,801 | |
| 11/01/2027 | 5.125% | 774,000 | 755,005 | |
| 06/15/2028 | 4.625% | 69,000 | 65,176 | |
| 10/01/2028 | 6.125% | 900,000 | 863,463 | |
| 06/01/2029 | 4.250% | 84,000 | 76,055 | |
| 18 | Columbia Total Return Bond Fund | Annual Report 2022 |
April 30, 2022
| Corporate Bonds & Notes (continued) | ||||
| Issuer | Coupon Rate | Principal Amount ($) | Value ($) | |
| 01/15/2030 | 4.375% | 941,000 | 856,303 | |
| Total | 50,955,428 | |||
| Healthcare Insurance 0.2% | ||||
| Centene Corp. | ||||
| 12/15/2029 | 4.625% | 916,000 | 887,633 | |
| 10/15/2030 | 3.000% | 752,000 | 652,360 | |
| 08/01/2031 | 2.625% | 6,500,000 | 5,421,454 | |
| Total | 6,961,447 | |||
| Home Construction 0.3% | ||||
| Meritage Homes Corp. | ||||
| 06/01/2025 | 6.000% | 277,000 | 282,284 | |
| Meritage Homes Corp.(a) | ||||
| 04/15/2029 | 3.875% | 7,748,000 | 6,949,861 | |
| Shea Homes LP/Funding Corp.(a) | ||||
| 02/15/2028 | 4.750% | 70,000 | 62,397 | |
| Taylor Morrison Communities, Inc.(a) | ||||
| 01/15/2028 | 5.750% | 84,000 | 82,461 | |
| 08/01/2030 | 5.125% | 514,000 | 470,310 | |
| Taylor Morrison Communities, Inc./Holdings II(a) | ||||
| 04/15/2023 | 5.875% | 284,000 | 287,042 | |
| TRI Pointe Group, Inc./Homes | ||||
| 06/15/2024 | 5.875% | 143,000 | 144,989 | |
| Total | 8,279,344 | |||
| Independent Energy 2.0% | ||||
| Apache Corp. | ||||
| 01/15/2030 | 4.250% | 1,168,000 | 1,089,694 | |
| 09/01/2040 | 5.100% | 2,110,000 | 1,909,631 | |
| 02/01/2042 | 5.250% | 337,000 | 310,892 | |
| 04/15/2043 | 4.750% | 365,000 | 314,538 | |
| 01/15/2044 | 4.250% | 193,000 | 154,450 | |
| Callon Petroleum Co. | ||||
| 10/01/2024 | 6.125% | 71,000 | 70,116 | |
| 07/01/2026 | 6.375% | 920,000 | 893,994 | |
| Callon Petroleum Co.(a) | ||||
| 08/01/2028 | 8.000% | 215,000 | 222,050 | |
| CNX Resources Corp.(a) | ||||
| 03/14/2027 | 7.250% | 595,000 | 607,919 | |
| 01/15/2029 | 6.000% | 453,000 | 447,476 | |
| Comstock Resources, Inc.(a) | ||||
| 03/01/2029 | 6.750% | 284,000 | 287,021 | |
| 01/15/2030 | 5.875% | 286,000 | 275,492 | |
| CrownRock LP/Finance, Inc.(a) | ||||
| 10/15/2025 | 5.625% | 648,000 | 647,969 | |
| 05/01/2029 | 5.000% | 223,000 | 218,317 | |
| Corporate Bonds & Notes (continued) | ||||
| Issuer | Coupon Rate | Principal Amount ($) | Value ($) | |
| Endeavor Energy Resources LP/Finance, Inc.(a) | ||||
| 07/15/2025 | 6.625% | 202,000 | 207,595 | |
| 01/30/2028 | 5.750% | 213,000 | 213,548 | |
| Hilcorp Energy I LP/Finance Co.(a) | ||||
| 11/01/2028 | 6.250% | 22,000 | 21,925 | |
| 02/01/2029 | 5.750% | 264,000 | 258,884 | |
| 04/15/2030 | 6.000% | 300,000 | 295,886 | |
| 02/01/2031 | 6.000% | 282,000 | 272,282 | |
| 04/15/2032 | 6.250% | 467,000 | 455,548 | |
| Matador Resources Co. | ||||
| 09/15/2026 | 5.875% | 627,000 | 615,230 | |
| Occidental Petroleum Corp. | ||||
| 07/15/2025 | 8.000% | 213,000 | 230,573 | |
| 09/01/2030 | 6.625% | 896,000 | 971,344 | |
| 01/01/2031 | 6.125% | 3,429,000 | 3,609,195 | |
| 09/15/2036 | 6.450% | 9,723,000 | 10,543,351 | |
| 03/15/2040 | 6.200% | 672,000 | 695,223 | |
| 07/15/2044 | 4.500% | 1,959,000 | 1,683,164 | |
| 06/15/2045 | 4.625% | 12,134,000 | 10,434,573 | |
| 03/15/2046 | 6.600% | 12,797,000 | 13,975,412 | |
| 04/15/2046 | 4.400% | 8,025,000 | 6,905,892 | |
| 03/15/2048 | 4.200% | 1,807,000 | 1,498,327 | |
| 08/15/2049 | 4.400% | 2,059,000 | 1,740,760 | |
| Southwestern Energy Co. | ||||
| 02/01/2029 | 5.375% | 214,000 | 211,461 | |
| 02/01/2032 | 4.750% | 1,973,000 | 1,866,576 | |
| Total | 64,156,308 | |||
| Integrated Energy 0.1% | ||||
| Cenovus Energy, Inc. | ||||
| 02/15/2052 | 3.750% | 2,315,000 | 1,854,511 | |
| Lukoil International Finance BV(a) | ||||
| 04/24/2023 | 4.563% | 971,000 | 488,585 | |
| Total | 2,343,096 | |||
| Leisure 0.5% | ||||
| Carnival Corp.(a) | ||||
| 03/01/2026 | 7.625% | 1,281,000 | 1,253,689 | |
| 03/01/2027 | 5.750% | 2,393,000 | 2,178,340 | |
| 08/01/2028 | 4.000% | 926,000 | 833,718 | |
| 05/01/2029 | 6.000% | 775,000 | 695,664 | |
| Cedar Fair LP/Canada’s Wonderland Co./Magnum Management Corp./Millennium Operations LLC(a) | ||||
| 05/01/2025 | 5.500% | 968,000 | 973,071 | |
| Cedar Fair LP/Canada’s Wonderland Co./Magnum Management Corp./Millennium Operations LLC | ||||
| 10/01/2028 | 6.500% | 496,000 | 499,468 | |
| Cinemark USA, Inc.(a) | ||||
| 05/01/2025 | 8.750% | 138,000 | 143,288 | |
| 03/15/2026 | 5.875% | 695,000 | 653,212 | |
| 07/15/2028 | 5.250% | 1,044,000 | 923,860 | |
| Columbia Total Return Bond Fund | Annual Report 2022 | 19 |
April 30, 2022
| Corporate Bonds & Notes (continued) | ||||
| Issuer | Coupon Rate | Principal Amount ($) | Value ($) | |
| NCL Corp., Ltd.(a) | ||||
| 03/15/2026 | 5.875% | 322,000 | 295,996 | |
| 02/15/2029 | 7.750% | 154,000 | 149,414 | |
| NCL Finance Ltd.(a) | ||||
| 03/15/2028 | 6.125% | 168,000 | 151,200 | |
| Royal Caribbean Cruises Ltd. | ||||
| 11/15/2022 | 5.250% | 2,500,000 | 2,506,871 | |
| 03/15/2028 | 3.700% | 330,000 | 277,280 | |
| Royal Caribbean Cruises Ltd.(a) | ||||
| 06/15/2023 | 9.125% | 146,000 | 150,833 | |
| 07/01/2026 | 4.250% | 435,000 | 393,780 | |
| 08/31/2026 | 5.500% | 977,000 | 910,560 | |
| 07/15/2027 | 5.375% | 395,000 | 362,974 | |
| 04/01/2028 | 5.500% | 1,296,000 | 1,182,096 | |
| Six Flags Entertainment Corp.(a) | ||||
| 07/31/2024 | 4.875% | 491,000 | 489,196 | |
| Six Flags Theme Parks, Inc.(a) | ||||
| 07/01/2025 | 7.000% | 61,000 | 63,347 | |
| VOC Escrow Ltd.(a) | ||||
| 02/15/2028 | 5.000% | 34,000 | 30,699 | |
| Total | 15,118,556 | |||
| Life Insurance 0.2% | ||||
| Massachusetts Mutual Life Insurance Co.(a) | ||||
| Subordinated | ||||
| 12/01/2061 | 3.200% | 2,595,000 | 1,896,684 | |
| 10/15/2070 | 3.729% | 1,556,000 | 1,214,434 | |
| Peachtree Corners Funding Trust(a) | ||||
| 02/15/2025 | 3.976% | 2,100,000 | 2,101,864 | |
| Teachers Insurance & Annuity Association of America(a) | ||||
| Subordinated | ||||
| 09/15/2044 | 4.900% | 205,000 | 209,514 | |
| Total | 5,422,496 | |||
| Lodging 0.1% | ||||
| Hilton Domestic Operating Co., Inc.(a) | ||||
| 05/01/2025 | 5.375% | 61,000 | 61,940 | |
| 05/01/2028 | 5.750% | 67,000 | 67,875 | |
| 02/15/2032 | 3.625% | 253,000 | 214,554 | |
| Marriott Ownership Resorts, Inc.(a) | ||||
| 06/15/2029 | 4.500% | 188,000 | 167,561 | |
| Travel + Leisure Co. | ||||
| 04/01/2024 | 5.650% | 2,250,000 | 2,273,084 | |
| Wyndham Hotels & Resorts, Inc.(a) | ||||
| 08/15/2028 | 4.375% | 312,000 | 290,884 | |
| Total | 3,075,898 | |||
| Corporate Bonds & Notes (continued) | ||||
| Issuer | Coupon Rate | Principal Amount ($) | Value ($) | |
| Media and Entertainment 1.0% | ||||
| Cengage Learning, Inc.(a) | ||||
| 06/15/2024 | 9.500% | 815,000 | 799,109 | |
| Clear Channel International BV(a) | ||||
| 08/01/2025 | 6.625% | 289,000 | 291,924 | |
| Clear Channel Outdoor Holdings, Inc.(a) | ||||
| 04/15/2028 | 7.750% | 2,248,000 | 2,125,899 | |
| 06/01/2029 | 7.500% | 1,217,000 | 1,147,882 | |
| Clear Channel Worldwide Holdings, Inc.(a) | ||||
| 08/15/2027 | 5.125% | 672,000 | 631,960 | |
| iHeartCommunications, Inc. | ||||
| 05/01/2026 | 6.375% | 767,634 | 769,347 | |
| 05/01/2027 | 8.375% | 996,507 | 986,412 | |
| iHeartCommunications, Inc.(a) | ||||
| 01/15/2028 | 4.750% | 1,257,000 | 1,141,556 | |
| Magallanes, Inc.(a) | ||||
| 03/15/2062 | 5.391% | 19,657,000 | 17,501,916 | |
| Netflix, Inc. | ||||
| 04/15/2028 | 4.875% | 546,000 | 536,029 | |
| 11/15/2028 | 5.875% | 749,000 | 771,067 | |
| 05/15/2029 | 6.375% | 525,000 | 557,615 | |
| Netflix, Inc.(a) | ||||
| 11/15/2029 | 5.375% | 167,000 | 167,196 | |
| 06/15/2030 | 4.875% | 3,306,000 | 3,233,592 | |
| Outfront Media Capital LLC/Corp.(a) | ||||
| 08/15/2027 | 5.000% | 268,000 | 253,885 | |
| 01/15/2029 | 4.250% | 207,000 | 184,150 | |
| 03/15/2030 | 4.625% | 144,000 | 128,546 | |
| Playtika Holding Corp.(a) | ||||
| 03/15/2029 | 4.250% | 409,000 | 368,371 | |
| Roblox Corp.(a) | ||||
| 05/01/2030 | 3.875% | 614,000 | 527,268 | |
| Univision Communications, Inc.(a) | ||||
| 05/01/2029 | 4.500% | 361,000 | 324,078 | |
| Total | 32,447,802 | |||
| Metals and Mining 0.4% | ||||
| Allegheny Technologies, Inc. | ||||
| 10/01/2029 | 4.875% | 161,000 | 146,697 | |
| 10/01/2031 | 5.125% | 1,155,000 | 1,042,427 | |
| Commercial Metals Co. | ||||
| 02/15/2031 | 3.875% | 60,000 | 52,787 | |
| Constellium NV(a) | ||||
| 02/15/2026 | 5.875% | 614,000 | 608,119 | |
| Constellium SE(a) | ||||
| 06/15/2028 | 5.625% | 961,000 | 920,814 | |
| 04/15/2029 | 3.750% | 1,309,000 | 1,129,653 | |
| 20 | Columbia Total Return Bond Fund | Annual Report 2022 |
April 30, 2022
| Corporate Bonds & Notes (continued) | ||||
| Issuer | Coupon Rate | Principal Amount ($) | Value ($) | |
| Freeport-McMoRan, Inc. | ||||
| 03/15/2043 | 5.450% | 4,010,000 | 3,996,240 | |
| Hudbay Minerals, Inc.(a) | ||||
| 04/01/2029 | 6.125% | 655,000 | 620,846 | |
| Kaiser Aluminum Corp.(a) | ||||
| 03/01/2028 | 4.625% | 123,000 | 112,020 | |
| 06/01/2031 | 4.500% | 2,091,000 | 1,799,525 | |
| Novelis Corp.(a) | ||||
| 11/15/2026 | 3.250% | 381,000 | 347,945 | |
| 01/30/2030 | 4.750% | 824,000 | 757,331 | |
| 08/15/2031 | 3.875% | 459,000 | 392,609 | |
| Total | 11,927,013 | |||
| Midstream 2.3% | ||||
| Cheniere Energy Partners LP | ||||
| 10/01/2029 | 4.500% | 392,000 | 375,450 | |
| 03/01/2031 | 4.000% | 409,000 | 370,333 | |
| Cheniere Energy Partners LP(a) | ||||
| 01/31/2032 | 3.250% | 1,328,000 | 1,134,707 | |
| Cheniere Energy, Inc. | ||||
| 10/15/2028 | 4.625% | 593,000 | 576,304 | |
| CNX Midstream Partners LP(a) | ||||
| 04/15/2030 | 4.750% | 671,000 | 614,358 | |
| DCP Midstream Operating LP | ||||
| 03/15/2023 | 3.875% | 48,000 | 47,882 | |
| 05/15/2029 | 5.125% | 484,000 | 476,324 | |
| 04/01/2044 | 5.600% | 174,000 | 166,402 | |
| Delek Logistics Partners LP/Finance Corp. | ||||
| 05/15/2025 | 6.750% | 143,000 | 141,004 | |
| DT Midstream, Inc.(a) | ||||
| 06/15/2029 | 4.125% | 469,000 | 425,855 | |
| 06/15/2031 | 4.375% | 931,000 | 835,542 | |
| Enterprise Products Operating LLC | ||||
| 01/31/2060 | 3.950% | 4,300,000 | 3,487,738 | |
| EQM Midstream Partners LP(a) | ||||
| 07/01/2025 | 6.000% | 157,000 | 155,962 | |
| 07/01/2027 | 6.500% | 417,000 | 420,693 | |
| 01/15/2029 | 4.500% | 315,000 | 283,473 | |
| 01/15/2031 | 4.750% | 3,893,000 | 3,479,678 | |
| EQM Midstream Partners LP | ||||
| 07/15/2048 | 6.500% | 9,020,000 | 8,301,021 | |
| Galaxy Pipeline Assets Bidco Ltd.(a) | ||||
| 09/30/2040 | 3.250% | 3,995,000 | 3,308,027 | |
| Hess Midstream Operations LP(a) | ||||
| 02/15/2030 | 4.250% | 202,000 | 184,931 | |
| Holly Energy Partners LP/Finance Corp.(a) | ||||
| 04/15/2027 | 6.375% | 365,000 | 373,145 | |
| 02/01/2028 | 5.000% | 722,000 | 686,507 | |
| Corporate Bonds & Notes (continued) | ||||
| Issuer | Coupon Rate | Principal Amount ($) | Value ($) | |
| ITT Holdings LLC(a) | ||||
| 08/01/2029 | 6.500% | 324,000 | 286,749 | |
| Kinder Morgan Energy Partners LP | ||||
| 03/01/2043 | 5.000% | 340,000 | 316,780 | |
| Kinder Morgan, Inc. | ||||
| 02/15/2046 | 5.050% | 8,970,000 | 8,499,015 | |
| NuStar Logistics LP | ||||
| 10/01/2025 | 5.750% | 1,237,000 | 1,227,224 | |
| 06/01/2026 | 6.000% | 284,000 | 282,738 | |
| 04/28/2027 | 5.625% | 165,000 | 158,422 | |
| Plains All American Pipeline LP/Finance Corp. | ||||
| 06/15/2044 | 4.700% | 11,015,000 | 9,185,086 | |
| Rockpoint Gas Storage Canada Ltd.(a) | ||||
| 03/31/2023 | 7.000% | 184,000 | 182,204 | |
| Sunoco LP/Finance Corp. | ||||
| 04/15/2027 | 6.000% | 239,000 | 240,933 | |
| Targa Resources Partners LP/Finance Corp. | ||||
| 01/15/2028 | 5.000% | 577,000 | 567,792 | |
| 01/15/2029 | 6.875% | 43,000 | 45,284 | |
| 03/01/2030 | 5.500% | 1,091,000 | 1,081,441 | |
| TransMontaigne Partners LP/TLP Finance Corp. | ||||
| 02/15/2026 | 6.125% | 355,000 | 346,036 | |
| Venture Global Calcasieu Pass LLC(a) | ||||
| 08/15/2029 | 3.875% | 1,753,000 | 1,600,712 | |
| 08/15/2031 | 4.125% | 5,024,000 | 4,583,118 | |
| 11/01/2033 | 3.875% | 9,677,000 | 8,427,854 | |
| Western Gas Partners LP | ||||
| 03/01/2048 | 5.300% | 3,131,000 | 2,719,511 | |
| 08/15/2048 | 5.500% | 2,583,000 | 2,270,203 | |
| Williams Companies, Inc. (The) | ||||
| 09/15/2045 | 5.100% | 2,916,000 | 2,838,726 | |
| 10/15/2051 | 3.500% | 2,924,000 | 2,247,778 | |
| Total | 72,952,942 | |||
| Natural Gas 0.4% | ||||
| NiSource, Inc. | ||||
| 05/01/2030 | 3.600% | 3,435,000 | 3,204,157 | |
| 02/15/2043 | 5.250% | 535,000 | 529,196 | |
| 05/15/2047 | 4.375% | 8,669,000 | 7,814,241 | |
| Total | 11,547,594 | |||
| Oil Field Services 0.0% | ||||
| Apergy Corp. | ||||
| 05/01/2026 | 6.375% | 221,000 | 222,944 | |
| Archrock Partners LP/Finance Corp.(a) | ||||
| 04/01/2028 | 6.250% | 100,000 | 97,019 | |
| Nabors Industries Ltd.(a) | ||||
| 01/15/2026 | 7.250% | 164,000 | 160,488 | |
| Columbia Total Return Bond Fund | Annual Report 2022 | 21 |
April 30, 2022
| Corporate Bonds & Notes (continued) | ||||
| Issuer | Coupon Rate | Principal Amount ($) | Value ($) | |
| Transocean Guardian Ltd.(a) | ||||
| 01/15/2024 | 5.875% | 50,331 | 48,096 | |
| Transocean Pontus Ltd.(a) | ||||
| 08/01/2025 | 6.125% | 28,905 | 28,458 | |
| Transocean Sentry Ltd.(a) | ||||
| 05/15/2023 | 5.375% | 527,390 | 513,160 | |
| USA Compression Partners LP/Finance Corp. | ||||
| 04/01/2026 | 6.875% | 103,000 | 101,113 | |
| Total | 1,171,278 | |||
| Other Industry 0.0% | ||||
| Dycom Industries, Inc.(a) | ||||
| 04/15/2029 | 4.500% | 420,000 | 382,923 | |
| Hillenbrand, Inc. | ||||
| 03/01/2031 | 3.750% | 333,000 | 293,918 | |
| Total | 676,841 | |||
| Other REIT 0.2% | ||||
| Blackstone Mortgage Trust, Inc.(a) | ||||
| 01/15/2027 | 3.750% | 825,000 | 754,432 | |
| Ladder Capital Finance Holdings LLLP/Corp.(a) | ||||
| 10/01/2025 | 5.250% | 531,000 | 521,874 | |
| 02/01/2027 | 4.250% | 372,000 | 343,106 | |
| 06/15/2029 | 4.750% | 2,104,000 | 1,892,004 | |
| Park Intermediate Holdings LLC/Domestic Property/Finance Co-Issuer(a) | ||||
| 10/01/2028 | 5.875% | 380,000 | 368,628 | |
| Park Intermediate Holdings LLC/PK Domestic Property LLC/Finance Co-Issuer(a) | ||||
| 05/15/2029 | 4.875% | 462,000 | 423,561 | |
| RHP Hotel Properties LP/Finance Corp.(a) | ||||
| 02/15/2029 | 4.500% | 232,000 | 210,126 | |
| RLJ Lodging Trust LP(a) | ||||
| 07/01/2026 | 3.750% | 326,000 | 303,373 | |
| 09/15/2029 | 4.000% | 358,000 | 319,507 | |
| Service Properties Trust | ||||
| 03/15/2024 | 4.650% | 219,000 | 207,975 | |
| 10/01/2024 | 4.350% | 103,000 | 95,313 | |
| Total | 5,439,899 | |||
| Packaging 0.3% | ||||
| Ardagh Metal Packaging Finance USA LLC/PLC(a) | ||||
| 09/01/2029 | 4.000% | 1,806,000 | 1,547,265 | |
| Ardagh Packaging Finance PLC/Holdings USA, Inc.(a) | ||||
| 08/15/2026 | 4.125% | 1,492,000 | 1,383,973 | |
| 08/15/2027 | 5.250% | 383,000 | 329,031 | |
| 08/15/2027 | 5.250% | 303,000 | 259,707 | |
| Berry Global, Inc. | ||||
| 01/15/2026 | 1.570% | 4,500,000 | 4,095,173 | |
| Corporate Bonds & Notes (continued) | ||||
| Issuer | Coupon Rate | Principal Amount ($) | Value ($) | |
| Berry Global, Inc.(a) | ||||
| 02/15/2026 | 4.500% | 296,000 | 291,397 | |
| BWAY Holding Co.(a) | ||||
| 04/15/2024 | 5.500% | 296,000 | 289,032 | |
| CANPACK SA/Eastern PA Land Investment Holding LLC(a) | ||||
| 11/01/2025 | 3.125% | 219,000 | 202,494 | |
| Canpack SA/US LLC(a) | ||||
| 11/15/2029 | 3.875% | 1,122,000 | 963,178 | |
| Trivium Packaging Finance BV(a) | ||||
| 08/15/2026 | 5.500% | 1,187,000 | 1,147,242 | |
| 08/15/2027 | 8.500% | 555,000 | 547,887 | |
| Total | 11,056,379 | |||
| Pharmaceuticals 1.0% | ||||
| AbbVie, Inc. | ||||
| 06/15/2044 | 4.850% | 2,170,000 | 2,159,043 | |
| 11/21/2049 | 4.250% | 5,360,000 | 4,913,781 | |
| Amgen, Inc. | ||||
| 02/22/2062 | 4.400% | 18,426,000 | 16,474,991 | |
| Bausch Health Companies, Inc.(a) | ||||
| 04/15/2025 | 6.125% | 319,000 | 319,844 | |
| 11/01/2025 | 5.500% | 248,000 | 239,890 | |
| 04/01/2026 | 9.250% | 1,613,000 | 1,599,928 | |
| 02/01/2027 | 6.125% | 686,000 | 659,570 | |
| 08/15/2027 | 5.750% | 608,000 | 570,389 | |
| 06/01/2028 | 4.875% | 223,000 | 197,893 | |
| 02/15/2031 | 5.250% | 523,000 | 363,411 | |
| Endo Dac/Finance LLC/Finco, Inc.(a) | ||||
| 06/30/2028 | 6.000% | 326,000 | 143,776 | |
| Endo Luxembourg Finance Co I Sarl/US, Inc.(a) | ||||
| 04/01/2029 | 6.125% | 518,000 | 450,733 | |
| Grifols Escrow Issuer SA(a) | ||||
| 10/15/2028 | 4.750% | 501,000 | 458,321 | |
| Organon Finance 1 LLC(a) | ||||
| 04/30/2028 | 4.125% | 1,339,000 | 1,243,816 | |
| 04/30/2031 | 5.125% | 1,107,000 | 1,001,206 | |
| Par Pharmaceutical, Inc.(a) | ||||
| 04/01/2027 | 7.500% | 149,000 | 136,043 | |
| Total | 30,932,635 | |||
| Property & Casualty 0.7% | ||||
| Alliant Holdings Intermediate LLC/Co-Issuer(a) | ||||
| 10/15/2027 | 4.250% | 701,000 | 646,758 | |
| 10/15/2027 | 6.750% | 1,168,000 | 1,105,521 | |
| 11/01/2029 | 5.875% | 1,030,000 | 958,021 | |
| AssuredPartners, Inc.(a) | ||||
| 01/15/2029 | 5.625% | 769,000 | 676,848 | |
| Berkshire Hathaway Finance Corp. | ||||
| 03/15/2052 | 3.850% | 16,192,000 | 14,418,502 | |
| 22 | Columbia Total Return Bond Fund | Annual Report 2022 |
April 30, 2022
| Corporate Bonds & Notes (continued) | ||||
| Issuer | Coupon Rate | Principal Amount ($) | Value ($) | |
| BroadStreet Partners, Inc.(a) | ||||
| 04/15/2029 | 5.875% | 1,015,000 | 881,708 | |
| GTCR AP Finance, Inc.(a) | ||||
| 05/15/2027 | 8.000% | 277,000 | 276,087 | |
| HUB International Ltd.(a) | ||||
| 12/01/2029 | 5.625% | 856,000 | 784,137 | |
| MGIC Investment Corp. | ||||
| 08/15/2028 | 5.250% | 49,000 | 46,174 | |
| Radian Group, Inc. | ||||
| 03/15/2025 | 6.625% | 908,000 | 924,449 | |
| 03/15/2027 | 4.875% | 339,000 | 324,376 | |
| Ryan Specialty Group LLC(a) | ||||
| 02/01/2030 | 4.375% | 285,000 | 260,291 | |
| USI, Inc.(a) | ||||
| 05/01/2025 | 6.875% | 65,000 | 64,013 | |
| Total | 21,366,885 | |||
| Restaurants 0.2% | ||||
| 1011778 BC ULC/New Red Finance, Inc.(a) | ||||
| 04/15/2025 | 5.750% | 1,123,000 | 1,147,852 | |
| 01/15/2028 | 3.875% | 884,000 | 813,280 | |
| 10/15/2030 | 4.000% | 299,000 | 255,760 | |
| Fertitta Entertainment LLC/Finance Co., Inc.(a) | ||||
| 01/15/2030 | 6.750% | 945,000 | 823,929 | |
| IRB Holding Corp.(a) | ||||
| 06/15/2025 | 7.000% | 1,508,000 | 1,543,202 | |
| Papa John’s International, Inc.(a) | ||||
| 09/15/2029 | 3.875% | 189,000 | 166,851 | |
| Yum! Brands, Inc. | ||||
| 03/15/2031 | 3.625% | 223,000 | 191,750 | |
| 04/01/2032 | 5.375% | 754,000 | 721,038 | |
| Total | 5,663,662 | |||
| Retailers 0.5% | ||||
| Asbury Automotive Group, Inc.(a) | ||||
| 11/15/2029 | 4.625% | 195,000 | 175,680 | |
| 02/15/2032 | 5.000% | 195,000 | 173,856 | |
| Group 1 Automotive, Inc.(a) | ||||
| 08/15/2028 | 4.000% | 227,000 | 204,193 | |
| L Brands, Inc.(a) | ||||
| 07/01/2025 | 9.375% | 28,000 | 31,509 | |
| 10/01/2030 | 6.625% | 278,000 | 276,842 | |
| L Brands, Inc. | ||||
| 06/15/2029 | 7.500% | 63,000 | 65,078 | |
| 11/01/2035 | 6.875% | 200,000 | 195,406 | |
| Subordinated | ||||
| 03/01/2033 | 6.950% | 1,500,000 | 1,426,494 | |
| Corporate Bonds & Notes (continued) | ||||
| Issuer | Coupon Rate | Principal Amount ($) | Value ($) | |
| LCM Investments Holdings II LLC(a) | ||||
| 05/01/2029 | 4.875% | 377,000 | 330,623 | |
| Lowe’s Companies, Inc. | ||||
| 10/15/2050 | 3.000% | 11,375,000 | 8,336,269 | |
| 04/01/2062 | 4.450% | 4,219,000 | 3,768,379 | |
| Penske Automotive Group, Inc. | ||||
| 09/01/2025 | 3.500% | 36,000 | 34,912 | |
| PetSmart, Inc./Finance Corp.(a) | ||||
| 02/15/2028 | 4.750% | 603,000 | 560,877 | |
| 02/15/2029 | 7.750% | 945,000 | 940,276 | |
| Total | 16,520,394 | |||
| Supermarkets 0.1% | ||||
| Albertsons Companies LLC/Safeway, Inc./New Albertsons LP/Albertsons LLC(a) | ||||
| 03/15/2026 | 7.500% | 76,000 | 79,974 | |
| 02/15/2028 | 5.875% | 296,000 | 287,698 | |
| Albertsons Companies, Inc./Safeway, Inc./New Albertsons LP/Albertsons LLC(a) | ||||
| 03/15/2026 | 3.250% | 1,250,000 | 1,142,796 | |
| 01/15/2027 | 4.625% | 688,000 | 644,432 | |
| 02/15/2030 | 4.875% | 581,000 | 526,225 | |
| Total | 2,681,125 | |||
| Technology 2.0% | ||||
| Black Knight InfoServ LLC(a) | ||||
| 09/01/2028 | 3.625% | 269,000 | 249,734 | |
| Boxer Parent Co., Inc.(a) | ||||
| 10/02/2025 | 7.125% | 94,000 | 95,878 | |
| Broadcom, Inc.(a) | ||||
| 04/15/2034 | 3.469% | 10,850,000 | 9,206,046 | |
| 11/15/2036 | 3.187% | 4,079,000 | 3,228,840 | |
| Camelot Finance SA(a) | ||||
| 11/01/2026 | 4.500% | 189,000 | 178,570 | |
| CDK Global, Inc. | ||||
| 06/01/2027 | 4.875% | 91,000 | 91,682 | |
| CDK Global, Inc.(a) | ||||
| 05/15/2029 | 5.250% | 190,000 | 191,434 | |
| Clarivate Science Holdings Corp.(a) | ||||
| 07/01/2028 | 3.875% | 375,000 | 333,923 | |
| 07/01/2029 | 4.875% | 886,000 | 782,704 | |
| CommScope Technologies LLC(a) | ||||
| 06/15/2025 | 6.000% | 147,000 | 128,994 | |
| Condor Merger Sub, Inc.(a) | ||||
| 02/15/2030 | 7.375% | 1,058,000 | 946,539 | |
| Dun & Bradstreet Corp. (The)(a) | ||||
| 12/15/2029 | 5.000% | 271,000 | 251,881 | |
| Gartner, Inc.(a) | ||||
| 07/01/2028 | 4.500% | 204,000 | 195,714 | |
| 06/15/2029 | 3.625% | 4,944,000 | 4,463,810 | |
| 10/01/2030 | 3.750% | 11,958,000 | 10,697,458 | |
| Columbia Total Return Bond Fund | Annual Report 2022 | 23 |
April 30, 2022
| Corporate Bonds & Notes (continued) | ||||
| Issuer | Coupon Rate | Principal Amount ($) | Value ($) | |
| HealthEquity, Inc.(a) | ||||
| 10/01/2029 | 4.500% | 995,000 | 909,109 | |
| Helios Software Holdings, Inc.(a) | ||||
| 05/01/2028 | 4.625% | 693,000 | 613,106 | |
| ION Trading Technologies Sarl(a) | ||||
| 05/15/2028 | 5.750% | 614,000 | 576,960 | |
| Iron Mountain, Inc.(a) | ||||
| 07/15/2028 | 5.000% | 140,000 | 132,549 | |
| 09/15/2029 | 4.875% | 62,000 | 56,858 | |
| 07/15/2030 | 5.250% | 769,000 | 705,846 | |
| Logan Merger Sub, Inc.(a) | ||||
| 09/01/2027 | 5.500% | 1,724,000 | 1,520,229 | |
| Minerva Merger Sub, Inc.(a) | ||||
| 02/15/2030 | 6.500% | 1,473,000 | 1,355,096 | |
| NCR Corp.(a) | ||||
| 09/01/2027 | 5.750% | 91,000 | 87,907 | |
| 10/01/2028 | 5.000% | 512,000 | 488,300 | |
| 04/15/2029 | 5.125% | 883,000 | 835,478 | |
| 09/01/2029 | 6.125% | 274,000 | 262,428 | |
| 10/01/2030 | 5.250% | 203,000 | 190,690 | |
| Nielsen Finance LLC/Co.(a) | ||||
| 10/01/2028 | 5.625% | 204,000 | 197,595 | |
| 07/15/2029 | 4.500% | 373,000 | 352,284 | |
| 10/01/2030 | 5.875% | 404,000 | 388,149 | |
| 07/15/2031 | 4.750% | 466,000 | 440,245 | |
| NXP BV/Funding LLC/USA, Inc.(a) | ||||
| 05/01/2030 | 3.400% | 1,090,000 | 992,860 | |
| 02/15/2042 | 3.125% | 2,907,000 | 2,229,104 | |
| Oracle Corp. | ||||
| 04/01/2050 | 3.600% | 14,840,000 | 10,654,474 | |
| 03/25/2061 | 4.100% | 2,769,000 | 2,051,920 | |
| Plantronics, Inc.(a) | ||||
| 03/01/2029 | 4.750% | 1,400,000 | 1,422,382 | |
| PTC, Inc.(a) | ||||
| 02/15/2025 | 3.625% | 221,000 | 215,034 | |
| Sabre GLBL, Inc.(a) | ||||
| 04/15/2025 | 9.250% | 108,000 | 115,380 | |
| 09/01/2025 | 7.375% | 148,000 | 149,815 | |
| Shift4 Payments LLC/Finance Sub, Inc.(a) | ||||
| 11/01/2026 | 4.625% | 362,000 | 346,728 | |
| Square, Inc.(a) | ||||
| 06/01/2026 | 2.750% | 151,000 | 137,901 | |
| 06/01/2031 | 3.500% | 318,000 | 266,227 | |
| Switch Ltd.(a) | ||||
| 09/15/2028 | 3.750% | 186,000 | 174,438 | |
| 06/15/2029 | 4.125% | 438,000 | 419,261 | |
| Tempo Acquisition LLC/Finance Corp.(a) | ||||
| 06/01/2025 | 5.750% | 285,000 | 286,865 | |
| Corporate Bonds & Notes (continued) | ||||
| Issuer | Coupon Rate | Principal Amount ($) | Value ($) | |
| Tencent Holdings Ltd.(a) | ||||
| 06/03/2050 | 3.240% | 2,050,000 | 1,458,473 | |
| Verscend Escrow Corp.(a) | ||||
| 08/15/2026 | 9.750% | 739,000 | 761,170 | |
| ZoomInfo Technologies LLC/Finance Corp.(a) | ||||
| 02/01/2029 | 3.875% | 1,026,000 | 907,913 | |
| Total | 62,745,981 | |||
| Transportation Services 0.1% | ||||
| FedEx Corp. | ||||
| 04/01/2046 | 4.550% | 3,660,000 | 3,387,030 | |
| Wireless 1.0% | ||||
| Altice France Holding SA(a) | ||||
| 02/15/2028 | 6.000% | 831,000 | 686,421 | |
| Altice France SA(a) | ||||
| 02/01/2027 | 8.125% | 127,000 | 127,915 | |
| 01/15/2028 | 5.500% | 1,233,000 | 1,091,412 | |
| 07/15/2029 | 5.125% | 1,309,000 | 1,107,302 | |
| 10/15/2029 | 5.500% | 798,000 | 686,956 | |
| American Tower Corp. | ||||
| 08/15/2029 | 3.800% | 7,011,000 | 6,562,938 | |
| 06/15/2030 | 2.100% | 1,950,000 | 1,599,202 | |
| SBA Communications Corp. | ||||
| 02/15/2027 | 3.875% | 557,000 | 528,466 | |
| 02/01/2029 | 3.125% | 857,000 | 734,769 | |
| Sprint Capital Corp. | ||||
| 03/15/2032 | 8.750% | 310,000 | 394,006 | |
| Sprint Corp. | ||||
| 06/15/2024 | 7.125% | 994,000 | 1,045,676 | |
| 02/15/2025 | 7.625% | 741,000 | 789,005 | |
| 03/01/2026 | 7.625% | 485,000 | 527,989 | |
| T-Mobile USA, Inc. | ||||
| 02/01/2028 | 4.750% | 286,000 | 282,321 | |
| 02/15/2029 | 2.625% | 572,000 | 494,870 | |
| 02/15/2031 | 2.875% | 3,158,000 | 2,687,509 | |
| 04/15/2031 | 3.500% | 2,392,000 | 2,131,424 | |
| T-Mobile USA, Inc.(a) | ||||
| 04/15/2031 | 3.500% | 6,060,000 | 5,371,462 | |
| 10/15/2052 | 3.400% | 3,098,000 | 2,346,269 | |
| Vmed O2 UK Financing I PLC(a) | ||||
| 01/31/2031 | 4.250% | 1,813,000 | 1,533,136 | |
| 07/15/2031 | 4.750% | 1,155,000 | 996,495 | |
| Total | 31,725,543 | |||
| Wirelines 1.0% | ||||
| AT&T, Inc. | ||||
| 09/15/2055 | 3.550% | 7,097,000 | 5,496,581 | |
| 12/01/2057 | 3.800% | 15,097,000 | 12,116,148 | |
| 24 | Columbia Total Return Bond Fund | Annual Report 2022 |
April 30, 2022
| Corporate Bonds & Notes (continued) | ||||
| Issuer | Coupon Rate | Principal Amount ($) | Value ($) | |
| CenturyLink, Inc. | ||||
| 12/01/2023 | 6.750% | 1,148,000 | 1,167,359 | |
| 04/01/2025 | 5.625% | 527,000 | 513,641 | |
| CenturyLink, Inc.(a) | ||||
| 12/15/2026 | 5.125% | 329,000 | 298,113 | |
| 02/15/2027 | 4.000% | 338,000 | 300,625 | |
| Front Range BidCo, Inc.(a) | ||||
| 03/01/2027 | 4.000% | 698,000 | 609,382 | |
| 03/01/2028 | 6.125% | 516,000 | 432,715 | |
| Iliad Holding SAS(a) | ||||
| 10/15/2026 | 6.500% | 937,000 | 902,305 | |
| 10/15/2028 | 7.000% | 1,929,000 | 1,839,765 | |
| Verizon Communications, Inc. | ||||
| 03/22/2061 | 3.700% | 8,837,000 | 7,073,214 | |
| Total | 30,749,848 | |||
| Total Corporate Bonds & Notes (Cost $1,253,088,087) | 1,083,521,727 | |||
| Foreign Government Obligations(m) 2.4% | ||||
| Belarus 0.0% | ||||
| Republic of Belarus International Bond(a) | ||||
| 02/28/2023 | 6.875% | 660,000 | 110,007 | |
| Canada 0.0% | ||||
| NOVA Chemicals Corp.(a) | ||||
| 05/01/2025 | 5.000% | 75,000 | 74,250 | |
| 06/01/2027 | 5.250% | 445,000 | 425,827 | |
| 05/15/2029 | 4.250% | 441,000 | 382,559 | |
| Total | 882,636 | |||
| Colombia 0.5% | ||||
| Colombia Government International Bond | ||||
| 04/15/2031 | 3.125% | 3,793,000 | 2,965,624 | |
| 04/22/2032 | 3.250% | 2,860,000 | 2,203,719 | |
| 02/26/2044 | 5.625% | 775,000 | 628,458 | |
| 06/15/2045 | 5.000% | 3,000,000 | 2,246,044 | |
| 05/15/2049 | 5.200% | 4,442,000 | 3,353,273 | |
| Ecopetrol SA | ||||
| 04/29/2030 | 6.875% | 4,400,000 | 4,347,141 | |
| Total | 15,744,259 | |||
| Dominican Republic 0.0% | ||||
| Dominican Republic International Bond(a) | ||||
| 01/25/2027 | 5.950% | 785,000 | 788,136 | |
| Egypt 0.1% | ||||
| Egypt Government International Bond(a) | ||||
| 02/16/2031 | 5.875% | 4,255,000 | 3,119,664 | |
| 01/31/2047 | 8.500% | 1,015,000 | 739,324 | |
| Total | 3,858,988 | |||
| Foreign Government Obligations(m) (continued) | ||||
| Issuer | Coupon Rate | Principal Amount ($) | Value ($) | |
| India 0.1% | ||||
| Export-Import Bank of India(a) | ||||
| 01/15/2030 | 3.250% | 2,250,000 | 2,019,456 | |
| Indonesia 0.1% | ||||
| PT Indonesia Asahan Aluminium Persero(a) | ||||
| 05/15/2025 | 4.750% | 342,000 | 342,211 | |
| 05/15/2030 | 5.450% | 1,700,000 | 1,696,434 | |
| Total | 2,038,645 | |||
| Ivory Coast 0.1% | ||||
| Ivory Coast Government International Bond(a) | ||||
| 06/15/2033 | 6.125% | 2,801,000 | 2,568,851 | |
| Mexico 0.7% | ||||
| Petroleos Mexicanos | ||||
| 09/21/2047 | 6.750% | 14,016,000 | 10,157,730 | |
| 01/23/2050 | 7.690% | 6,500,000 | 5,093,719 | |
| 01/28/2060 | 6.950% | 11,185,000 | 8,101,654 | |
| Total | 23,353,103 | |||
| Paraguay 0.1% | ||||
| Paraguay Government International Bond(a) | ||||
| 08/11/2044 | 6.100% | 2,465,000 | 2,434,071 | |
| Qatar 0.2% | ||||
| Qatar Government International Bond(a) | ||||
| 03/14/2049 | 4.817% | 2,400,000 | 2,569,072 | |
| Qatar Petroleum(a) | ||||
| 07/12/2031 | 2.250% | 5,762,000 | 5,042,937 | |
| Total | 7,612,009 | |||
| Russian Federation 0.0% | ||||
| Gazprom OAO Via Gaz Capital SA(a) | ||||
| 02/06/2028 | 4.950% | 1,320,000 | 370,053 | |
| Saudi Arabia 0.1% | ||||
| Saudi Government International Bond(a) | ||||
| 04/17/2049 | 5.000% | 2,550,000 | 2,634,367 | |
| South Africa 0.2% | ||||
| Republic of South Africa Government International Bond | ||||
| 09/30/2029 | 4.850% | 2,300,000 | 2,113,450 | |
| 09/30/2049 | 5.750% | 3,152,000 | 2,490,670 | |
| Total | 4,604,120 | |||
| Ukraine 0.0% | ||||
| Ukraine Government International Bond(a) | ||||
| 09/25/2032 | 7.375% | 800,000 | 252,392 | |
| Columbia Total Return Bond Fund | Annual Report 2022 | 25 |
April 30, 2022
| Foreign Government Obligations(m) (continued) | ||||
| Issuer | Coupon Rate | Principal Amount ($) | Value ($) | |
| United Arab Emirates 0.2% | ||||
| DP World Ltd.(a) | ||||
| 09/25/2048 | 5.625% | 3,620,000 | 3,618,364 | |
| DP World PLC(a) | ||||
| 07/02/2037 | 6.850% | 3,540,000 | 4,015,923 | |
| Total | 7,634,287 | |||
| Total Foreign Government Obligations (Cost $93,684,785) | 76,905,380 | |||
| Residential Mortgage-Backed Securities - Agency 18.8% | ||||
| Federal Home Loan Mortgage Corp. | ||||
| 04/01/2026- 11/01/2041 | 4.000% | 1,625,030 | 1,646,370 | |
| 12/01/2040- 12/01/2046 | 3.500% | 14,521,186 | 14,325,269 | |
| 11/01/2042- 04/01/2045 | 3.000% | 13,535,468 | 13,053,199 | |
| 12/01/2051 | 2.500% | 24,759,440 | 22,656,918 | |
| Federal Home Loan Mortgage Corp.(n) | ||||
| 09/01/2049 | 3.000% | 5,304,424 | 5,025,293 | |
| Federal Home Loan Mortgage Corp.(b),(g) | ||||
| CMO Series 3922 Class SH | ||||
| -1.0 x 1-month USD LIBOR + 5.900% Cap 5.900% 09/15/2041 | 5.346% | 277,373 | 36,111 | |
| CMO Series 4097 Class ST | ||||
| -1.0 x 1-month USD LIBOR + 6.050% Cap 6.050% 08/15/2042 | 5.496% | 683,801 | 146,975 | |
| CMO Series 4620 Class AS | ||||
| -1.0 x 1-month USD LIBOR + 0.440% 11/15/2042 | 1.460% | 837,215 | 40,163 | |
| CMO Series 4903 Class SA | ||||
| -1.0 x 1-month USD LIBOR + 6.050% Cap 6.050% 08/25/2049 | 5.382% | 12,785,147 | 1,943,156 | |
| CMO Series 4979 Class KS | ||||
| -1.0 x 1-month USD LIBOR + 6.050% Cap 6.050% 06/25/2048 | 5.382% | 5,686,226 | 971,612 | |
| CMO STRIPS Series 2012-278 Class S1 | ||||
| -1.0 x 1-month USD LIBOR + 6.050% Cap 6.050% 09/15/2042 | 5.496% | 1,000,291 | 152,427 | |
| Residential Mortgage-Backed Securities - Agency (continued) | ||||
| Issuer | Coupon Rate | Principal Amount ($) | Value ($) | |
| CMO STRIPS Series 309 Class S4 | ||||
| -1.0 x 1-month USD LIBOR + 5.970% Cap 5.970% 08/15/2043 | 5.416% | 469,843 | 75,108 | |
| Federal Home Loan Mortgage Corp.(g) | ||||
| CMO Series 4176 Class BI | ||||
| 03/15/2043 | 3.500% | 869,089 | 124,377 | |
| Federal Home Loan Mortgage Corp. REMICS(g) | ||||
| CMO Series 5187 Class IK | ||||
| 01/25/2052 | 3.000% | 23,586,645 | 5,133,067 | |
| Federal National Mortgage Association | ||||
| 07/01/2022 | 5.000% | 863 | 878 | |
| 08/01/2034 | 5.500% | 44,164 | 47,146 | |
| 06/01/2039- 08/01/2041 | 4.500% | 370,396 | 385,777 | |
| 11/01/2040- 09/01/2048 | 4.000% | 2,286,858 | 2,299,972 | |
| 05/01/2042- 12/01/2047 | 3.500% | 4,051,222 | 3,994,297 | |
| 03/01/2043- 11/01/2049 | 3.000% | 29,864,104 | 28,661,078 | |
| 07/01/2050- 08/01/2050 | 2.000% | 12,339,574 | 10,948,110 | |
| CMO Series 2017-72 Class B | ||||
| 09/25/2047 | 3.000% | 5,828,355 | 5,573,101 | |
| Federal National Mortgage Association(b) | ||||
| 6-month USD LIBOR + 1.415% Floor 1.415%, Cap 11.040% 06/01/2032 | 1.665% | 2,623 | 2,621 | |
| 1-year CMT + 2.305% Floor 2.305%, Cap 10.430% 07/01/2037 | 2.305% | 50,019 | 50,181 | |
| Federal National Mortgage Association(n) | ||||
| 10/01/2040- 07/01/2041 | 4.500% | 1,926,719 | 2,007,619 | |
| 08/01/2043- 02/01/2048 | 4.000% | 11,345,690 | 11,502,176 | |
| 09/01/2049 | 3.000% | 5,089,324 | 4,822,980 | |
| Federal National Mortgage Association(b),(g) | ||||
| CMO Series 2013-101 Class CS | ||||
| -1.0 x 1-month USD LIBOR + 5.900% Cap 5.900% 10/25/2043 | 5.232% | 2,344,818 | 382,920 | |
| CMO Series 2014-93 Class ES | ||||
| -1.0 x 1-month USD LIBOR + 6.150% Cap 6.150% 01/25/2045 | 5.482% | 1,411,818 | 237,314 | |
| 26 | Columbia Total Return Bond Fund | Annual Report 2022 |
April 30, 2022
| Residential Mortgage-Backed Securities - Agency (continued) | ||||
| Issuer | Coupon Rate | Principal Amount ($) | Value ($) | |
| CMO Series 2016-31 Class VS | ||||
| -1.0 x 1-month USD LIBOR + 6.000% Cap 6.000% 06/25/2046 | 5.332% | 1,044,534 | 142,816 | |
| CMO Series 2016-53 Class KS | ||||
| -1.0 x 1-month USD LIBOR + 6.000% Cap 6.000% 08/25/2046 | 5.332% | 4,333,990 | 697,529 | |
| CMO Series 2016-57 Class SA | ||||
| -1.0 x 1-month USD LIBOR + 6.000% Cap 6.000% 08/25/2046 | 5.332% | 10,216,347 | 1,607,160 | |
| CMO Series 2017-109 Class SA | ||||
| -1.0 x 1-month USD LIBOR + 6.150% Cap 6.150% 01/25/2048 | 5.482% | 5,269,480 | 860,299 | |
| CMO Series 2017-20 Class SA | ||||
| -1.0 x 1-month USD LIBOR + 6.100% Cap 6.100% 04/25/2047 | 5.432% | 4,365,568 | 723,963 | |
| CMO Series 2017-54 Class NS | ||||
| -1.0 x 1-month USD LIBOR + 6.150% Cap 6.150% 07/25/2047 | 5.482% | 3,797,216 | 695,477 | |
| CMO Series 2017-54 Class SN | ||||
| -1.0 x 1-month USD LIBOR + 6.150% Cap 6.150% 07/25/2047 | 5.482% | 7,525,628 | 1,434,951 | |
| CMO Series 2018-66 Class SM | ||||
| -1.0 x 1-month USD LIBOR + 6.200% Cap 6.200% 09/25/2048 | 5.532% | 5,278,167 | 962,031 | |
| CMO Series 2018-67 MS Class MS | ||||
| -1.0 x 1-month USD LIBOR + 6.200% Cap 6.200% 09/25/2048 | 5.532% | 4,058,234 | 708,753 | |
| CMO Series 2018-74 Class SA | ||||
| -1.0 x 1-month USD LIBOR + 6.150% Cap 6.150% 10/25/2048 | 5.482% | 7,734,744 | 1,182,202 | |
| Residential Mortgage-Backed Securities - Agency (continued) | ||||
| Issuer | Coupon Rate | Principal Amount ($) | Value ($) | |
| CMO Series 2019-33 Class SB | ||||
| -1.0 x 1-month USD LIBOR + 6.050% Cap 6.050% 07/25/2049 | 5.382% | 18,711,913 | 2,751,843 | |
| CMO Series 2019-60 Class SH | ||||
| -1.0 x 1-month USD LIBOR + 6.050% Cap 6.050% 10/25/2049 | 5.382% | 11,512,111 | 1,881,637 | |
| CMO Series 2019-67 Class SE | ||||
| -1.0 x 1-month USD LIBOR + 6.050% Cap 6.050% 11/25/2049 | 5.382% | 9,806,404 | 1,958,263 | |
| Federal National Mortgage Association(g) | ||||
| CMO Series 2020-76 Class EI | ||||
| 11/25/2050 | 2.500% | 14,631,322 | 2,329,864 | |
| CMO Series 2021-3 Class TI | ||||
| 02/25/2051 | 2.500% | 49,316,262 | 8,575,269 | |
| Freddie Mac REMICS(g) | ||||
| CMO Series 5123 Class IG | ||||
| 08/25/2048 | 2.500% | 15,857,623 | 2,286,233 | |
| CMO Series 5152 Class XI | ||||
| 11/25/2050 | 2.500% | 42,930,092 | 6,092,325 | |
| Freddie Mac STACR REMIC Trust(a),(b) | ||||
| Subordinated CMO Series 2021-HQA2 Class B2 | ||||
| 30-day Average SOFR + 5.450% 12/25/2033 | 5.739% | 5,000,000 | 4,609,881 | |
| Government National Mortgage Association(b) | ||||
| 1-year CMT + 1.500% Floor 1.500%, Cap 11.500% 07/20/2025 | 1.625% | 4,322 | 4,374 | |
| Government National Mortgage Association | ||||
| 12/15/2038- 01/15/2039 | 6.000% | 37,024 | 40,320 | |
| 02/15/2039 | 5.500% | 16,552 | 17,735 | |
| 10/15/2040- 04/15/2041 | 4.000% | 491,096 | 509,995 | |
| Government National Mortgage Association(n) | ||||
| 04/20/2048 | 4.500% | 4,498,061 | 4,651,435 | |
| Government National Mortgage Association(g) | ||||
| CMO Series 2014-184 Class CI | ||||
| 11/16/2041 | 3.500% | 4,003,893 | 424,662 | |
| CMO Series 2020-127 Class AI | ||||
| 08/20/2050 | 3.000% | 28,931,186 | 4,709,670 | |
| CMO Series 2020-175 Class KI | ||||
| 11/20/2050 | 2.500% | 27,258,779 | 4,048,417 | |
| CMO Series 2020-191 Class UG | ||||
| 12/20/2050 | 3.500% | 19,003,818 | 3,049,214 | |
| Columbia Total Return Bond Fund | Annual Report 2022 | 27 |
April 30, 2022
| Residential Mortgage-Backed Securities - Agency (continued) | ||||
| Issuer | Coupon Rate | Principal Amount ($) | Value ($) | |
| CMO Series 2021-119 Class QI | ||||
| 07/20/2051 | 3.000% | 23,504,109 | 3,245,469 | |
| CMO Series 2021-16 Class KI | ||||
| 01/20/2051 | 2.500% | 23,925,238 | 3,603,997 | |
| CMO Series 2021-89 Class IO | ||||
| 05/20/2051 | 3.000% | 25,894,441 | 3,695,870 | |
| CMO Series 2021-9 Class MI | ||||
| 01/20/2051 | 2.500% | 21,590,571 | 2,910,092 | |
| CMO Series 2021-97 Class IQ | ||||
| 06/20/2051 | 2.500% | 15,724,969 | 2,187,658 | |
| Government National Mortgage Association(b),(g) | ||||
| CMO Series 2017-130 Class GS | ||||
| -1.0 x 1-month USD LIBOR + 6.200% Cap 6.200% 08/20/2047 | 5.606% | 10,001,265 | 1,940,530 | |
| CMO Series 2017-130 Class HS | ||||
| -1.0 x 1-month USD LIBOR + 6.200% Cap 6.200% 08/20/2047 | 5.606% | 5,114,128 | 755,005 | |
| CMO Series 2017-149 Class BS | ||||
| -1.0 x 1-month USD LIBOR + 6.200% Cap 6.200% 10/20/2047 | 5.606% | 6,827,309 | 963,546 | |
| CMO Series 2017-163 Class SA | ||||
| -1.0 x 1-month USD LIBOR + 6.200% Cap 6.200% 11/20/2047 | 5.606% | 2,864,892 | 394,406 | |
| CMO Series 2017-37 Class SB | ||||
| -1.0 x 1-month USD LIBOR + 6.150% Cap 6.150% 03/20/2047 | 5.556% | 4,149,554 | 556,896 | |
| CMO Series 2018-103 Class SA | ||||
| -1.0 x 1-month USD LIBOR + 6.200% Cap 6.200% 08/20/2048 | 5.606% | 3,926,847 | 465,295 | |
| CMO Series 2018-112 Class LS | ||||
| -1.0 x 1-month USD LIBOR + 6.200% Cap 6.200% 08/20/2048 | 5.606% | 4,809,112 | 611,709 | |
| CMO Series 2018-125 Class SK | ||||
| -1.0 x 1-month USD LIBOR + 6.250% Cap 6.250% 09/20/2048 | 5.656% | 6,211,067 | 799,594 | |
| Residential Mortgage-Backed Securities - Agency (continued) | ||||
| Issuer | Coupon Rate | Principal Amount ($) | Value ($) | |
| CMO Series 2018-134 Class KS | ||||
| -1.0 x 1-month USD LIBOR + 6.200% Cap 6.200% 10/20/2048 | 5.606% | 4,930,874 | 639,117 | |
| CMO Series 2018-139 Class SC | ||||
| -1.0 x 1-month USD LIBOR + 6.150% Cap 6.150% 10/20/2048 | 5.556% | 3,577,894 | 432,518 | |
| CMO Series 2018-148 Class SB | ||||
| -1.0 x 1-month USD LIBOR + 6.200% Cap 6.200% 01/20/2048 | 5.606% | 9,663,246 | 1,326,456 | |
| CMO Series 2018-151 Class SA | ||||
| -1.0 x 1-month USD LIBOR + 6.150% Cap 6.150% 11/20/2048 | 5.556% | 8,177,537 | 1,031,833 | |
| CMO Series 2018-89 Class MS | ||||
| -1.0 x 1-month USD LIBOR + 6.200% Cap 6.200% 06/20/2048 | 5.606% | 5,166,226 | 678,025 | |
| CMO Series 2018-89 Class SM | ||||
| -1.0 x 1-month USD LIBOR + 6.200% Cap 6.200% 06/20/2048 | 5.606% | 6,442,496 | 788,514 | |
| CMO Series 2018-91 Class DS | ||||
| -1.0 x 1-month USD LIBOR + 6.200% Cap 6.200% 07/20/2048 | 5.606% | 5,079,049 | 640,435 | |
| CMO Series 2019-20 Class JS | ||||
| -1.0 x 1-month USD LIBOR + 6.000% Cap 6.000% 02/20/2049 | 5.406% | 7,807,644 | 991,953 | |
| CMO Series 2019-5 Class SH | ||||
| -1.0 x 1-month USD LIBOR + 6.150% Cap 6.150% 01/20/2049 | 5.556% | 5,677,339 | 757,008 | |
| CMO Series 2019-56 Class SG | ||||
| -1.0 x 1-month USD LIBOR + 6.150% Cap 6.150% 05/20/2049 | 5.556% | 6,216,329 | 759,945 | |
| 28 | Columbia Total Return Bond Fund | Annual Report 2022 |
April 30, 2022
| Residential Mortgage-Backed Securities - Agency (continued) | ||||
| Issuer | Coupon Rate | Principal Amount ($) | Value ($) | |
| CMO Series 2019-59 Class KS | ||||
| -1.0 x 1-month USD LIBOR + 6.050% Cap 6.050% 05/20/2049 | 5.456% | 6,126,274 | 675,909 | |
| CMO Series 2019-85 Class SC | ||||
| -1.0 x 1-month USD LIBOR + 6.150% Cap 6.150% 07/20/2049 | 5.556% | 5,542,709 | 821,602 | |
| CMO Series 2019-90 Class SD | ||||
| -1.0 x 1-month USD LIBOR + 6.150% 07/20/2049 | 5.556% | 8,718,516 | 1,198,234 | |
| CMO Series 2020-21 Class VS | ||||
| -1.0 x 1-month USD LIBOR + 6.050% Cap 6.050% 02/20/2050 | 5.456% | 4,103,844 | 557,602 | |
| CMO Series 2020-62 Class SG | ||||
| -1.0 x 1-month USD LIBOR + 6.150% Cap 6.150% 05/20/2050 | 5.556% | 7,486,944 | 960,069 | |
| Government National Mortgage Association TBA(i) | ||||
| 05/19/2052 | 4.000% | 96,000,000 | 96,241,875 | |
| Uniform Mortgage-Backed Security TBA(i) | ||||
| 05/17/2037 | 2.000% | 18,000,000 | 16,872,539 | |
| 05/17/2037 | 2.500% | 27,000,000 | 25,849,330 | |
| 05/17/2037- 05/12/2052 | 3.000% | 116,500,000 | 111,145,962 | |
| 05/12/2052 | 3.500% | 45,750,000 | 44,420,391 | |
| 05/12/2052 | 4.000% | 77,000,000 | 76,643,574 | |
| Total Residential Mortgage-Backed Securities - Agency (Cost $614,291,920) | 598,765,491 | |||
| Residential Mortgage-Backed Securities - Non-Agency 31.5% | ||||
| 510 Asset Backed Trust(a),(f) | ||||
| CMO Series 2021-NPL2 Class A1 | ||||
| 06/25/2061 | 2.116% | 9,634,450 | 9,163,588 | |
| American Mortgage Trust(c),(e),(f) | ||||
| CMO Series 2093-3 Class 3A | ||||
| 07/27/2023 | 8.188% | 35 | 21 | |
| Angel Oak Mortgage Trust I LLC(a),(f) | ||||
| CMO Series 2018-3 Class M1 | ||||
| 09/25/2048 | 4.421% | 4,795,000 | 4,764,051 | |
| Bellemeade Re Ltd.(a),(b) | ||||
| CMO Series 2017-1 Class M2 | ||||
| 1-month USD LIBOR + 3.350% 10/25/2027 | 4.018% | 1,426,400 | 1,431,595 | |
| Residential Mortgage-Backed Securities - Non-Agency (continued) | ||||
| Issuer | Coupon Rate | Principal Amount ($) | Value ($) | |
| CMO Series 2019-1A Class M1B | ||||
| 1-month USD LIBOR + 1.750% Floor 1.750% 03/25/2029 | 2.418% | 3,123,370 | 3,114,870 | |
| CMO Series 2019-2A Class M1C | ||||
| 1-month USD LIBOR + 2.000% Floor 2.000% 04/25/2029 | 2.668% | 5,250,000 | 5,233,367 | |
| CMO Series 2019-2A Class M2 | ||||
| 1-month USD LIBOR + 3.100% Floor 3.100% 04/25/2029 | 3.768% | 10,964,000 | 10,761,455 | |
| CMO Series 2019-4A Class M1C | ||||
| 1-month USD LIBOR + 2.500% Floor 2.500% 10/25/2029 | 2.957% | 3,727,000 | 3,685,141 | |
| CMO Series 2020-3A Class M1B | ||||
| 1-month USD LIBOR + 2.850% Floor 2.850% 10/25/2030 | 3.518% | 2,622,096 | 2,625,326 | |
| CMO Series 2020-3A Class M1C | ||||
| 1-month USD LIBOR + 3.700% Floor 3.700% 10/25/2030 | 4.157% | 6,900,000 | 7,011,111 | |
| CMO Series 2020-4A Class M2B | ||||
| 1-month USD LIBOR + 3.600% Floor 3.600% 06/25/2030 | 4.268% | 6,121,510 | 6,159,590 | |
| CMO Series 2021-2A Class M1B | ||||
| 30-day Average SOFR + 1.500% Floor 1.500% 06/25/2031 | 1.789% | 8,000,000 | 7,796,486 | |
| Subordinated CMO Series 2018-3A Class B1 | ||||
| 1-month USD LIBOR + 3.900% Floor 3.900% 10/25/2028 | 4.357% | 6,000,000 | 5,885,324 | |
| BRAVO Residential Funding Trust(a),(f) | ||||
| CMO Series 2019-NQM2 Class A3 | ||||
| 11/25/2059 | 3.108% | 379,875 | 370,728 | |
| CMO Series 2019-NQM2 Class M1 | ||||
| 11/25/2059 | 3.451% | 1,700,000 | 1,607,025 | |
| BVRT Financing Trust(a),(b),(e) | ||||
| CMO Series 2020-CRT1 Class M3 | ||||
| 1-month USD LIBOR + 4.000% 07/10/2032 | 4.077% | 3,607,775 | 3,625,814 | |
| CMO Series 2021-3F Class M1 | ||||
| 30-day Average SOFR + 1.750% Floor 1.750% 07/12/2033 | 1.976% | 13,011,520 | 13,011,520 | |
| Columbia Total Return Bond Fund | Annual Report 2022 | 29 |
April 30, 2022
| Residential Mortgage-Backed Securities - Non-Agency (continued) | ||||
| Issuer | Coupon Rate | Principal Amount ($) | Value ($) | |
| CMO Series 2021-3F Class M2 | ||||
| 30-day Average SOFR + 2.900% Floor 2.900% 07/12/2033 | 3.126% | 15,300,000 | 15,300,000 | |
| CMO Series 2021-CRT3 Class B1 | ||||
| 30-day Average SOFR + 4.300% Floor 4.300% 01/10/2031 | 4.338% | 10,000,000 | 10,000,000 | |
| CMO Series 2021-CRT3 Class M3 | ||||
| 30-day Average SOFR + 3.150% Floor 3.150% 01/10/2031 | 3.188% | 2,182,634 | 2,182,634 | |
| BVRT Financing Trust(a),(b),(c),(e) | ||||
| CMO Series 2021-CRT1 Class M2 | ||||
| 1-month USD LIBOR + 2.250% Floor 2.250% 01/10/2033 | 2.345% | 2,413,540 | 2,384,201 | |
| CMO Series 2021-CRT1 Class M3 | ||||
| 1-month USD LIBOR + 2.750% Floor 3.000% 01/10/2033 | 3.000% | 20,000,000 | 19,800,000 | |
| CHL GMSR Issuer Trust(a),(b) | ||||
| CMO Series 2018-GT1 Class A | ||||
| 1-month USD LIBOR + 1.000% 05/25/2023 | 3.418% | 6,600,000 | 6,543,956 | |
| CIM Trust(a),(b) | ||||
| CMO Series 2018-R6 Class A1 | ||||
| 1-month USD LIBOR + 1.076% Floor 1.076% 09/25/2058 | 1.876% | 4,810,234 | 4,700,078 | |
| Citigroup Mortgage Loan Trust, Inc.(a) | ||||
| Subordinated CMO Series 2014-C Class B1 | ||||
| 02/25/2054 | 4.250% | 5,495,421 | 5,320,953 | |
| COLT Mortgage Loan Trust(a),(f) | ||||
| CMO Series 2021-3 Class A1 | ||||
| 09/27/2066 | 0.956% | 8,328,772 | 7,568,954 | |
| CMO Series 2021-5 Class A3 | ||||
| 11/26/2066 | 2.807% | 6,400,000 | 5,538,947 | |
| CMO Series 2021-6 Class A3 | ||||
| 12/25/2066 | 3.006% | 8,426,000 | 7,395,540 | |
| Connecticut Avenue Securities Trust(a),(b) | ||||
| CMO Series 2019-HRP1 Class M2 | ||||
| 1-month USD LIBOR + 2.150% 11/25/2039 | 2.818% | 6,664,631 | 6,554,491 | |
| CMO Series 2022-R01 Class 1M2 | ||||
| 30-day Average SOFR + 1.900% 12/25/2041 | 2.189% | 15,000,000 | 14,471,439 | |
| Subordinated CMO Series 2022-R01 Class 1B2 | ||||
| 30-day Average SOFR + 6.000% 12/25/2041 | 6.289% | 19,800,000 | 17,940,451 | |
| Residential Mortgage-Backed Securities - Non-Agency (continued) | ||||
| Issuer | Coupon Rate | Principal Amount ($) | Value ($) | |
| Subordinated CMO Series 2022-R02 Class 2B1 | ||||
| 30-day Average SOFR + 4.500% 01/25/2042 | 4.789% | 10,000,000 | 9,489,748 | |
| Credit Suisse Mortgage Trust(a),(f) | ||||
| CMO Series 2021-NQM1 Class A3 | ||||
| 05/25/2065 | 1.199% | 2,310,822 | 2,240,752 | |
| CSMC Trust(a),(f) | ||||
| CMO Series 2020-RPL2 Class A12 | ||||
| 02/25/2060 | 3.410% | 15,671,252 | 15,044,062 | |
| Deephaven Residential Mortgage Trust(a),(f) | ||||
| CMO Series 2020-2 Class M1 | ||||
| 05/25/2065 | 4.112% | 7,190,000 | 7,181,042 | |
| CMO Series 2021-4 Class A1 | ||||
| 11/25/2066 | 1.931% | 7,295,089 | 6,949,056 | |
| CMO Series 2021-4 Class A3 | ||||
| 11/25/2066 | 2.239% | 7,568,655 | 7,124,417 | |
| Eagle Re Ltd.(a),(b) | ||||
| CMO Series 2018-1 Class B1 | ||||
| 1-month USD LIBOR + 4.000% Floor 4.000% 11/25/2028 | 4.457% | 3,000,000 | 2,971,065 | |
| CMO Series 2018-1 Class M1 | ||||
| 1-month USD LIBOR + 1.700% Floor 1.700% 11/25/2028 | 2.157% | 1,376,515 | 1,373,875 | |
| Subordinated CMO Series 2020-1 Class M1B | ||||
| 1-month USD LIBOR + 1.450% 01/25/2030 | 1.907% | 15,300,000 | 15,137,817 | |
| Ellington Financial Mortgage Trust(a),(f) | ||||
| CMO Series 2019-2 Class M1 | ||||
| 11/25/2059 | 3.469% | 2,500,000 | 2,472,263 | |
| Federal Home Loan Mortgage Corp. STACR REMIC Trust(a),(b) | ||||
| CMO Series 2020-HQA4 Class M2 | ||||
| 1-month USD LIBOR + 3.150% 09/25/2050 | 3.818% | 1,044,581 | 1,046,901 | |
| Federal Home Loan Mortgage Corp. Structured Agency Credit Risk Trust(a),(b) | ||||
| CMO Series 2019-DNA1 Class M2 | ||||
| 1-month USD LIBOR + 2.650% 01/25/2049 | 3.318% | 3,807,204 | 3,840,867 | |
| FMC GMSR Issuer Trust(a),(f) | ||||
| CMO Series 2020-GT1 Class A | ||||
| 01/25/2026 | 4.450% | 10,500,000 | 9,984,646 | |
| Freddie Mac STACR REMIC Trust(a),(b) | ||||
| CMO Series 2020-DNA4 Class M2 | ||||
| 1-month USD LIBOR + 3.750% Floor 3.750% 08/25/2050 | 4.418% | 1,105,887 | 1,109,829 | |
| CMO Series 2021-DNA5 Class M2 | ||||
| 30-day Average SOFR + 1.650% 01/25/2034 | 1.939% | 4,600,000 | 4,560,315 | |
| 30 | Columbia Total Return Bond Fund | Annual Report 2022 |
April 30, 2022
| Residential Mortgage-Backed Securities - Non-Agency (continued) | ||||
| Issuer | Coupon Rate | Principal Amount ($) | Value ($) | |
| CMO Series 2021-HQA1 Class M2 | ||||
| 30-day Average SOFR + 2.250% 08/25/2033 | 2.539% | 8,500,000 | 8,340,376 | |
| CMO Series 2022-DNA1 Class M1B | ||||
| 30-day Average SOFR + 1.850% 01/25/2042 | 2.139% | 7,900,000 | 7,526,348 | |
| CMO Series 2022-HQA1 Class M2 | ||||
| 30-day Average SOFR + 5.250% 03/25/2042 | 5.539% | 9,150,000 | 9,332,253 | |
| Subordinated CMO Series 2020-HQA3 Class B1 | ||||
| 1-month USD LIBOR + 5.750% 07/25/2050 | 6.418% | 7,625,000 | 8,049,933 | |
| Subordinated CMO Series 2021-DNA5 Class B2 | ||||
| 30-day Average SOFR + 5.500% 01/25/2034 | 5.789% | 16,000,000 | 15,182,566 | |
| Freddie Mac STACR Trust(a),(b) | ||||
| Subordinated CMO Series 2019-DNA4 Class B1 | ||||
| 1-month USD LIBOR + 2.700% 10/25/2049 | 3.368% | 8,625,000 | 8,448,235 | |
| Subordinated CMO Series 2019-FTR2 Class M2 | ||||
| 1-month USD LIBOR + 2.150% 11/25/2048 | 2.818% | 7,000,000 | 6,847,714 | |
| Freddie Mac Structured Agency Credit Risk Debt Notes(a),(b) | ||||
| CMO Series 2020-HQA5 Class M2 | ||||
| 30-day Average SOFR + 2.600% 11/25/2050 | 2.889% | 12,455,475 | 12,483,367 | |
| Subordinated CMO Series 2020-HQA5 Class B1 | ||||
| 30-day Average SOFR + 4.000% 11/25/2050 | 4.289% | 8,500,000 | 8,401,813 | |
| Subordinated CMO Series 2022-DNA2 Class B1 | ||||
| 30-day Average SOFR + 4.750% 02/25/2042 | 5.039% | 10,500,000 | 9,828,929 | |
| Freddie Mac Structured Agency Credit Risk Debt Notes(a),(f) | ||||
| Subordinated CMO Series 2022-DNA2 Class B2 | ||||
| 02/25/2042 | 8.789% | 8,750,000 | 8,304,172 | |
| GCAT LLC(a),(f) | ||||
| CMO Series 2021-CM1 Class A1 | ||||
| 04/25/2065 | 1.469% | 10,549,967 | 10,276,763 | |
| GCAT Trust(a),(f) | ||||
| CMO Series 2021-NQM6 Class A2 | ||||
| 08/25/2066 | 2.710% | 4,100,000 | 3,762,720 | |
| CMO Series 2021-NQM6 Class A3 | ||||
| 08/25/2066 | 2.810% | 7,500,000 | 6,820,658 | |
| CMO Series 2021-NQM7 Class A3 | ||||
| 08/25/2066 | 2.891% | 10,000,000 | 9,284,538 | |
| Genworth Mortgage Insurance Corp.(a),(b) | ||||
| CMO Series 2021-3 Class M1B | ||||
| 30-day Average SOFR + 2.900% Floor 2.900% 02/25/2034 | 3.189% | 18,000,000 | 17,375,683 | |
| Residential Mortgage-Backed Securities - Non-Agency (continued) | ||||
| Issuer | Coupon Rate | Principal Amount ($) | Value ($) | |
| Glebe Funding Trust (The)(a),(e) | ||||
| CMO Series 2021-1 Class PT | ||||
| 10/27/2023 | 3.000% | 18,151,762 | 17,856,796 | |
| Home Re Ltd.(a),(b) | ||||
| CMO Series 2020-1 Class M1C | ||||
| 1-month USD LIBOR + 4.150% Floor 4.150% 10/25/2030 | 4.607% | 11,550,000 | 11,629,878 | |
| Subordinated CMO Series 2019-1 Class B1 | ||||
| 1-month USD LIBOR + 4.350% 05/25/2029 | 5.018% | 7,323,000 | 7,190,892 | |
| Homeward Opportunities Fund Trust(a),(f) | ||||
| CMO Series 2020-BPL1 Class A1 | ||||
| 08/25/2025 | 3.228% | 8,662,516 | 8,665,309 | |
| Imperial Fund Mortgage Trust(a),(f) | ||||
| CMO Series 2021-NQM4 Class A2 | ||||
| 01/25/2057 | 2.296% | 4,010,532 | 3,545,169 | |
| Legacy Mortgage Asset Trust(a),(f) | ||||
| CMO Series 2021-GS1 Class A1 | ||||
| 10/25/2066 | 1.892% | 6,162,544 | 5,907,937 | |
| CMO Series 2021-GS2 Class A1 | ||||
| 04/25/2061 | 1.750% | 5,106,719 | 4,837,778 | |
| CMO Series 2021-SL2 Class A | ||||
| 10/25/2068 | 1.875% | 10,209,216 | 9,819,070 | |
| Loan Revolving Advance Investment Trust(a),(b),(c),(e) | ||||
| CMO Series 2021-2 Class A1X | ||||
| 1-month USD LIBOR + 2.750% Floor 2.750% 06/30/2023 | 3.301% | 18,300,000 | 18,300,000 | |
| MFA Trust(a),(f) | ||||
| CMO Series 2020-NQM1 Class M1 | ||||
| 08/25/2049 | 3.071% | 2,800,000 | 2,551,266 | |
| CMO Series 2020-NQM2 Class M1 | ||||
| 04/25/2065 | 3.034% | 12,854,000 | 12,348,271 | |
| Mortgage Acquisition Trust I LLC(a),(e) | ||||
| CMO Series 2021-1 Class PT | ||||
| 11/29/2023 | 3.500% | 6,689,645 | 6,689,645 | |
| Mortgage Insurance-Linked Notes(a),(b) | ||||
| CMO Series 2020-1 Class M1C | ||||
| 1-month USD LIBOR + 1.750% Floor 1.750% 02/25/2030 | 1.937% | 2,387,788 | 2,305,771 | |
| New York Mortgage Trust(a),(f) | ||||
| CMO Series 2021-BPL1 Class A1 | ||||
| 05/25/2026 | 2.239% | 8,280,000 | 8,089,885 | |
| NRZ Excess Spread-Collateralized Notes(a) | ||||
| Series 2020-PLS1 Class A | ||||
| 12/25/2025 | 3.844% | 3,799,667 | 3,666,899 | |
| Columbia Total Return Bond Fund | Annual Report 2022 | 31 |
April 30, 2022
| Residential Mortgage-Backed Securities - Non-Agency (continued) | ||||
| Issuer | Coupon Rate | Principal Amount ($) | Value ($) | |
| Oaktown Re II Ltd.(a),(b) | ||||
| CMO Series 2018-1A Class M1 | ||||
| 1-month USD LIBOR + 1.550% 07/25/2028 | 2.218% | 1,032,766 | 1,029,832 | |
| Oaktown Re III Ltd.(a),(b) | ||||
| CMO Series 2019-1A Class M1A | ||||
| 1-month USD LIBOR + 1.400% Floor 1.400% 07/25/2029 | 2.068% | 116,746 | 116,208 | |
| CMO Series 2019-1A Class M1B | ||||
| 1-month USD LIBOR + 1.950% Floor 1.950% 07/25/2029 | 2.618% | 5,000,000 | 4,994,153 | |
| Oaktown Re V Ltd.(a),(b) | ||||
| CMO Series 2020-2A Class M1B | ||||
| 1-month USD LIBOR + 3.600% Floor 3.600% 10/25/2030 | 4.268% | 5,039,218 | 5,084,544 | |
| Oaktown Re VI Ltd.(a),(b) | ||||
| CMO Series 2021-1A Class M1B | ||||
| 30-day Average SOFR + 2.050% Floor 2.050% 10/25/2033 | 2.339% | 4,000,000 | 3,993,563 | |
| PMT Credit Risk Transfer Trust(a),(b) | ||||
| Series 2019-2R Class A | ||||
| 1-month USD LIBOR + 2.750% Floor 2.750% 05/27/2023 | 3.448% | 2,783,284 | 2,653,083 | |
| PNMAC GMSR Issuer Trust(a),(b) | ||||
| CMO Series 2018-GT1 Class A | ||||
| 1-month USD LIBOR + 2.850% Floor 2.850% 02/25/2023 | 3.518% | 26,000,000 | 25,897,646 | |
| CMO Series 2018-GT2 Class A | ||||
| 1-month USD LIBOR + 2.650% 08/25/2025 | 3.318% | 38,450,000 | 38,092,311 | |
| Point Securitization Trust(a),(f) | ||||
| CMO Series 2021-1 Class A1 | ||||
| 02/25/2052 | 3.228% | 12,122,771 | 12,090,089 | |
| Preston Ridge Partners Mortgage Trust(a),(f) | ||||
| CMO Series 2021-1 Class A1 | ||||
| 01/25/2026 | 2.115% | 14,012,944 | 13,420,181 | |
| CMO Series 2021-2 Class A1 | ||||
| 03/25/2026 | 2.115% | 5,928,977 | 5,694,543 | |
| CMO Series 2021-3 Class A1 | ||||
| 04/25/2026 | 1.867% | 16,266,412 | 15,412,488 | |
| CMO Series 2021-7 Class A1 | ||||
| 08/25/2026 | 1.867% | 7,388,581 | 6,964,268 | |
| CMO Series 2021-8 Class A1 | ||||
| 09/25/2026 | 1.743% | 5,929,203 | 5,620,821 | |
| Residential Mortgage-Backed Securities - Non-Agency (continued) | ||||
| Issuer | Coupon Rate | Principal Amount ($) | Value ($) | |
| Pretium Mortgage Credit Partners(a),(f) | ||||
| CMO Series 2022-NPL1 Class A1 | ||||
| 01/25/2052 | 2.981% | 23,611,488 | 22,684,784 | |
| Pretium Mortgage Credit Partners I LLC(a),(f) | ||||
| CMO Series 2021-NPL2 Class A1 | ||||
| 06/27/2060 | 1.992% | 9,767,260 | 9,287,982 | |
| Pretium Mortgage Credit Partners LLC(a),(f) | ||||
| CMO Series 2021-RN2 Class A1 | ||||
| 07/25/2051 | 1.744% | 6,874,881 | 6,587,733 | |
| PRPM LLC(a),(f) | ||||
| CMO Series 2021-RPL1 Class A1 | ||||
| 07/25/2051 | 1.319% | 5,142,258 | 4,852,875 | |
| Radnor Re Ltd.(a),(b) | ||||
| CMO Series 2020-1 Class M1B | ||||
| 1-month USD LIBOR + 1.450% Floor 1.450% 02/25/2030 | 1.907% | 12,340,000 | 12,188,734 | |
| Radnor RE Ltd.(a),(b) | ||||
| CMO Series 2021-1 Class M1A | ||||
| 30-day Average SOFR + 1.650% Floor 1.650% 12/27/2033 | 1.939% | 9,439,063 | 9,422,021 | |
| CMO Series 2021-1 Class M1C | ||||
| 30-day Average SOFR + 2.700% Floor 2.700% 12/27/2033 | 2.989% | 14,000,000 | 13,079,618 | |
| Residential Mortgage Loan Trust(a),(f) | ||||
| CMO Series 2019-3 Class A3 | ||||
| 09/25/2059 | 3.044% | 360,242 | 353,806 | |
| Saluda Grade Alternative Mortgage Trust(a) | ||||
| CMO Series 2020-FIG1 Class A1 | ||||
| 09/25/2050 | 3.568% | 6,268,368 | 6,238,963 | |
| SG Residential Mortgage Trust(a),(f) | ||||
| CMO Series 2019-3 Class M1 | ||||
| 09/25/2059 | 3.526% | 3,801,000 | 3,761,165 | |
| Stanwich Mortgage Loan Co. LLC(a),(f) | ||||
| CMO Series 2021-NPB1 Class A1 | ||||
| 10/16/2026 | 2.735% | 10,017,649 | 9,673,162 | |
| Starwood Mortgage Residential Trust(a),(f) | ||||
| CMO Series 2020-3 Class M1 | ||||
| 04/25/2065 | 3.544% | 6,500,000 | 6,334,730 | |
| CMO Series 2021-3 Class A1 | ||||
| 06/25/2056 | 1.127% | 2,675,688 | 2,506,711 | |
| CMO Series 2021-6 Class A3 | ||||
| 11/25/2066 | 2.933% | 13,954,000 | 12,442,119 | |
| Stonnington Mortgage Trust(a),(c),(e),(f) | ||||
| CMO Series 2020-1 Class A | ||||
| 07/28/2024 | 3.500% | 4,977,843 | 4,977,843 | |
| 32 | Columbia Total Return Bond Fund | Annual Report 2022 |
April 30, 2022
| Residential Mortgage-Backed Securities - Non-Agency (continued) | ||||
| Issuer | Coupon Rate | Principal Amount ($) | Value ($) | |
| Toorak Mortgage Corp., Ltd.(f) | ||||
| CMO Series 2019-2 Class A1 | ||||
| 09/25/2022 | 3.721% | 2,183,692 | 2,182,506 | |
| Toorak Mortgage Corp., Ltd.(a),(f) | ||||
| CMO Series 2021-1 Class A1 | ||||
| 06/25/2024 | 2.240% | 15,000,000 | 14,431,407 | |
| Triangle Re Ltd.(a),(b) | ||||
| CMO Series 2021-1 Class M1B | ||||
| 1-month USD LIBOR + 3.000% Floor 3.000% 08/25/2033 | 3.457% | 981,660 | 982,257 | |
| CMO Series 2021-1 Class M1C | ||||
| 1-month USD LIBOR + 3.400% Floor 3.400% 08/25/2033 | 3.857% | 7,250,000 | 7,261,675 | |
| CMO Series 2021-2 Class M1B | ||||
| 1-month USD LIBOR + 2.600% Floor 2.600% 10/25/2033 | 3.268% | 8,800,000 | 8,692,848 | |
| CMO Series 2021-2 Class M1C | ||||
| 1-month USD LIBOR + 4.500% Floor 4.500% 10/25/2033 | 5.168% | 4,800,000 | 4,946,192 | |
| VCAT Asset Securitization LLC(a),(f) | ||||
| CMO Series 2021-NPL6 Class A1 | ||||
| 09/25/2051 | 1.917% | 11,141,085 | 10,571,501 | |
| VCAT LLC(a),(f) | ||||
| CMO Series 2021-NPL5 Class A1 | ||||
| 08/25/2051 | 1.868% | 13,033,227 | 12,443,767 | |
| Vericrest Opportunity Loan Transferee CVI LLC(a),(f) | ||||
| CMO Series 2021-NP12 Class A1 | ||||
| 12/26/2051 | 2.734% | 26,293,450 | 24,899,542 | |
| Vericrest Opportunity Loan Transferee XCIX LLC(a),(f) | ||||
| CMO Series 2021-NPL8 Class A1 | ||||
| 04/25/2051 | 2.116% | 6,222,517 | 5,944,999 | |
| Vericrest Opportunity Loan Transferee XCVI LLC(a),(f) | ||||
| CMO Series 2021-NPL5 Class A1 | ||||
| 03/27/2051 | 2.116% | 8,242,236 | 7,981,165 | |
| Verus Securitization Trust(a),(f) | ||||
| CMO Series 2020-1 Class M1 | ||||
| 01/25/2060 | 3.021% | 13,245,000 | 12,675,378 | |
| CMO Series 2020-4 Class M1 | ||||
| 05/25/2065 | 3.291% | 4,000,000 | 3,822,858 | |
| CMO Series 2020-NPL1 Class A1 | ||||
| 08/25/2050 | 3.598% | 800,942 | 801,083 | |
| CMO Series 2021-5 Class A2 | ||||
| 09/25/2066 | 1.218% | 2,461,749 | 2,216,830 | |
| CMO Series 2021-5 Class A3 | ||||
| 09/25/2066 | 1.373% | 4,661,095 | 4,177,903 | |
| Residential Mortgage-Backed Securities - Non-Agency (continued) | ||||
| Issuer | Coupon Rate | Principal Amount ($) | Value ($) | |
| CMO Series 2021-5 Class M1 | ||||
| 09/25/2066 | 2.331% | 2,600,000 | 2,121,436 | |
| CMO Series 2021-7 Class A3 | ||||
| 10/25/2066 | 2.240% | 7,607,995 | 6,918,158 | |
| CMO Series 2021-R1 Class A1 | ||||
| 10/25/2063 | 0.820% | 2,926,511 | 2,809,901 | |
| Subordinated CMO Series 2021-8 Class B1 | ||||
| 11/25/2066 | 4.242% | 12,412,000 | 11,263,308 | |
| Visio Trust(a),(f) | ||||
| CMO Series 2019-2 Class A3 | ||||
| 11/25/2054 | 3.076% | 1,527,211 | 1,496,583 | |
| Visio Trust(a) | ||||
| CMO Series 2021-1R Class A1 | ||||
| 05/25/2056 | 1.280% | 9,713,935 | 9,159,322 | |
| CMO Series 2021-1R Class A2 | ||||
| 05/25/2056 | 1.484% | 3,076,164 | 2,901,060 | |
| ZH Trust(a) | ||||
| CMO Series 2021-1 Class A | ||||
| 02/18/2027 | 2.253% | 3,515,566 | 3,439,269 | |
| Total Residential Mortgage-Backed Securities - Non-Agency (Cost $1,032,673,189) | 1,005,742,869 | |||
| Senior Loans 0.2% | ||||
| Borrower | Coupon Rate | Principal Amount ($) | Value ($) | |
| Chemicals 0.0% | ||||
| WR Grace & Co.(b),(o) | ||||
| Term Loan | ||||
| 1-month USD LIBOR + 3.750% Floor 0.500% 09/22/2028 | 4.813% | 523,687 | 518,581 | |
| Consumer Cyclical Services 0.0% | ||||
| 8th Avenue Food & Provisions, Inc.(b),(o) | ||||
| 1st Lien Term Loan | ||||
| 1-month USD LIBOR + 3.750% 10/01/2025 | 4.514% | 383,789 | 330,059 | |
| 2nd Lien Term Loan | ||||
| 1-month USD LIBOR + 7.750% 10/01/2026 | 8.514% | 32,969 | 29,610 | |
| Total | 359,669 | |||
| Consumer Products 0.1% | ||||
| SWF Holdings I Corp.(b),(o) | ||||
| 1st Lien Term Loan | ||||
| 1-month USD LIBOR + 4.000% Floor 0.750% 10/06/2028 | 4.750% | 1,050,000 | 970,599 | |
| Columbia Total Return Bond Fund | Annual Report 2022 | 33 |
April 30, 2022
| Senior Loans (continued) | ||||
| Borrower | Coupon Rate | Principal Amount ($) | Value ($) | |
| Media and Entertainment 0.0% | ||||
| Cengage Learning, Inc.(b),(o) | ||||
| Tranche B 1st Lien Term Loan | ||||
| 1-month USD LIBOR + 4.750% Floor 1.000% 07/14/2026 | 5.750% | 716,355 | 703,819 | |
| Technology 0.1% | ||||
| Ascend Learning LLC(b),(o) | ||||
| 1st Lien Term Loan | ||||
| 1-month USD LIBOR + 3.500% Floor 0.500% 12/11/2028 | 4.264% | 566,580 | 559,192 | |
| 2nd Lien Term Loan | ||||
| 1-month USD LIBOR + 5.750% Floor 0.500% 12/10/2029 | 6.514% | 338,000 | 333,352 | |
| DCert Buyer, Inc.(b),(o) | ||||
| 2nd Lien Term Loan | ||||
| 1-month USD LIBOR + 7.000% 02/19/2029 | 7.764% | 404,000 | 399,120 | |
| Epicore Software Corp.(b),(o) | ||||
| 2nd Lien Term Loan | ||||
| 1-month USD LIBOR + 7.750% Floor 1.000% 07/31/2028 | 8.750% | 106,000 | 107,922 | |
| Project Alpha Intermediate Holding, Inc.(b),(o) | ||||
| Term Loan | ||||
| 1-month USD LIBOR + 4.000% 04/26/2024 | 4.770% | 96,491 | 96,225 | |
| UKG, Inc.(b),(o) | ||||
| 1st Lien Term Loan | ||||
| 1-month USD LIBOR + 3.250% Floor 0.500% 05/04/2026 | 4.212% | 339,972 | 336,147 | |
| 2nd Lien Term Loan | ||||
| 1-month USD LIBOR + 5.250% Floor 0.500% 05/03/2027 | 6.212% | 657,000 | 650,266 | |
| Total | 2,482,224 | |||
| Total Senior Loans (Cost $5,173,088) | 5,034,892 | |||
| U.S. Treasury Obligations 3.6% | ||||
| Issuer | Coupon Rate | Principal Amount ($) | Value ($) | |
| U.S. Treasury | ||||
| 04/30/2025 | 0.375% | 25,000,000 | 23,201,172 | |
| 06/30/2025 | 2.750% | 20,000,000 | 19,901,562 | |
| 08/15/2027 | 2.250% | 6,872,500 | 6,630,889 | |
| 05/15/2029 | 2.375% | 5,000,000 | 4,817,969 | |
| 05/15/2031 | 1.625% | 15,000,000 | 13,483,594 | |
| 05/15/2040 | 1.125% | 19,000,000 | 13,682,969 | |
| 08/15/2048 | 3.000% | 4,590,000 | 4,512,544 | |
| 05/15/2049 | 2.875% | 20,150,000 | 19,526,609 | |
| 08/15/2049 | 2.250% | 10,000,000 | 8,545,312 | |
| Total U.S. Treasury Obligations (Cost $128,704,127) | 114,302,620 | |||
| Options Purchased Calls 0.0% | ||||
| Value ($) | ||||
| (Cost $2,267,520) | 1,515,339 | |||
| Options Purchased Puts 0.7% | ||||
| (Cost $4,654,261) | 22,577,437 | |||
| Money Market Funds 3.8% | ||
| Shares | Value ($) | |
| Columbia Short-Term Cash Fund, 0.462%(p),(q) | 121,348,316 | 121,311,912 |
| Total Money Market Funds (Cost $121,298,696) | 121,311,912 | |
| Total Investments in Securities (Cost: $3,822,486,315) | 3,577,679,175 | |
| Other Assets & Liabilities, Net | (384,028,416) | |
| Net Assets | 3,193,650,759 | |
| 34 | Columbia Total Return Bond Fund | Annual Report 2022 |
April 30, 2022
| Forward foreign currency exchange contracts | |||||
| Currency to be sold | Currency to be purchased | Counterparty | Settlement date | Unrealized appreciation ($) | Unrealized depreciation ($) |
| 4,490,000 EUR | 4,853,802 USD | UBS | 05/27/2022 | 112,120 | — |
| Long futures contracts | ||||||
| Description | Number of contracts | Expiration date | Trading currency | Notional amount | Value/Unrealized appreciation ($) | Value/Unrealized depreciation ($) |
| Euro-BTP | 517 | 06/2022 | EUR | 67,385,780 | — | (8,926,374) |
| Long Gilt | 389 | 06/2022 | GBP | 46,073,160 | — | (1,961,726) |
| U.S. Treasury 10-Year Note | 6,581 | 06/2022 | USD | 784,167,281 | — | (3,995,506) |
| U.S. Treasury 2-Year Note | 301 | 06/2022 | USD | 63,454,563 | — | (1,119,961) |
| U.S. Ultra Treasury Bond | 1,122 | 06/2022 | USD | 180,010,875 | — | (23,554,709) |
| Total | — | (39,558,276) | ||||
| Short futures contracts | ||||||
| Description | Number of contracts | Expiration date | Trading currency | Notional amount | Value/Unrealized appreciation ($) | Value/Unrealized depreciation ($) |
| U.S. Treasury 5-Year Note | (8,945) | 06/2022 | USD | (1,007,849,922) | 20,468,130 | — |
| Call option contracts purchased | ||||||||
| Description | Counterparty | Trading currency | Notional amount | Number of contracts | Exercise price/Rate | Expiration date | Cost ($) | Value ($) |
| 10-Year OTC interest rate swap with Citi to receive exercise rate and pay 3-Month USD LIBOR BBA | Citi | USD | 30,000,000 | 30,000,000 | 1.00 | 07/08/2022 | 306,000 | 114 |
| 10-Year OTC interest rate swap with Citi to receive exercise rate and pay SOFR | Citi | USD | 81,730,000 | 81,730,000 | 2.25 | 04/27/2023 | 1,961,520 | 1,515,225 |
| Total | 2,267,520 | 1,515,339 | ||||||
| Put option contracts purchased | ||||||||
| Description | Counterparty | Trading currency | Notional amount | Number of contracts | Exercise price/Rate | Expiration date | Cost ($) | Value ($) |
| 10-Year OTC interest rate swap with Morgan Stanley to receive 3-Month USD LIBOR BBA and pay exercise rate | Morgan Stanley | USD | 198,900,000 | 198,900,000 | 1.75 | 11/09/2022 | 4,654,261 | 22,577,437 |
| Put option contracts written | ||||||||
| Description | Counterparty | Trading currency | Notional amount | Number of contracts | Exercise price/Rate | Expiration date | Premium received ($) | Value ($) |
| 10-Year OTC interest rate swap with Citi to receive exercise rate and pay SOFR | Citi | USD | (100,000,000) | (100,000,000) | 2.55 | 07/13/2022 | (1,600,000) | (2,871,680) |
| 2-Year OTC interest rate swap with Citi to receive exercise rate and pay 3-Month USD LIBOR BBA | Citi | USD | (133,000,000) | (133,000,000) | 1.10 | 05/03/2022 | (565,250) | (4,994,921) |
| 2-Year OTC interest rate swap with Citi to receive exercise rate and pay 3-Month USD LIBOR BBA | Citi | USD | (134,300,000) | (134,300,000) | 1.25 | 05/23/2022 | (496,910) | (4,847,209) |
| 2-Year OTC interest rate swap with Morgan Stanley to receive exercise rate and pay 3-Month USD LIBOR BBA | Morgan Stanley | USD | (134,300,000) | (134,300,000) | 1.25 | 05/23/2022 | (530,485) | (4,847,209) |
| Columbia Total Return Bond Fund | Annual Report 2022 | 35 |
April 30, 2022
| Put option contracts written (continued) | ||||||||
| Description | Counterparty | Trading currency | Notional amount | Number of contracts | Exercise price/Rate | Expiration date | Premium received ($) | Value ($) |
| 5-Year OTC interest rate swap with Citi to receive exercise rate and pay 3-Month USD LIBOR BBA | Citi | USD | (172,100,000) | (172,100,000) | 1.75 | 07/05/2022 | (1,333,775) | (10,650,873) |
| 5-Year OTC interest rate swap with Morgan Stanley to receive exercise rate and pay 3-Month USD LIBOR BBA | Morgan Stanley | USD | (239,000,000) | (239,000,000) | 1.85 | 07/07/2022 | (2,031,500) | (13,740,038) |
| Total | (6,557,920) | (41,951,930) | ||||||
| Credit default swap contracts - buy protection | ||||||||||||
| Reference entity | Counterparty | Maturity date | Pay fixed rate (%) | Payment frequency | Notional currency | Notional amount | Value ($) | Periodic payments receivable (payable) ($) | Upfront payments ($) | Upfront receipts ($) | Unrealized appreciation ($) | Unrealized depreciation ($) |
| Markit CMBX North America Index, Series 10 BBB- | JPMorgan | 11/17/2059 | 3.000 | Monthly | USD | 8,000,000 | 991,250 | (3,333) | 331,627 | — | 656,290 | — |
| Markit CMBX North America Index, Series 11 BBB- | JPMorgan | 11/18/2054 | 3.000 | Monthly | USD | 1,700,000 | 178,234 | (708) | 58,984 | — | 118,542 | — |
| Markit CMBX North America Index, Series 11 BBB- | Morgan Stanley | 11/17/2059 | 3.000 | Monthly | USD | 1,000,000 | 123,907 | (417) | 59,299 | — | 64,191 | — |
| Total | 1,293,391 | (4,458) | 449,910 | — | 839,023 | — | ||||||
| Cleared credit default swap contracts - buy protection | |||||||||||
| Reference entity | Counterparty | Maturity date | Pay fixed rate (%) | Payment frequency | Notional currency | Notional amount | Value ($) | Upfront payments ($) | Upfront receipts ($) | Unrealized appreciation ($) | Unrealized depreciation ($) |
| Markit CDX North America High Yield Index, Series 38 | Morgan Stanley | 06/20/2027 | 5.000 | Quarterly | USD | 247,962,000 | 7,661,259 | — | — | 7,661,259 | — |
| Credit default swap contracts - sell protection | |||||||||||||
| Reference entity | Counterparty | Maturity date | Receive fixed rate (%) | Payment frequency | Implied credit spread (%)* | Notional currency | Notional amount | Value ($) | Periodic payments receivable (payable) ($) | Upfront payments ($) | Upfront receipts ($) | Unrealized appreciation ($) | Unrealized depreciation ($) |
| Markit CMBX North America Index, Series 10 BBB- | Citi | 11/17/2059 | 3.000 | Monthly | 6.373 | USD | 4,000,000 | (495,625) | 1,667 | — | (888,599) | 394,641 | — |
| Markit CMBX North America Index, Series 10 BBB- | Citi | 11/17/2059 | 3.000 | Monthly | 6.373 | USD | 5,000,000 | (619,530) | 2,083 | — | (606,488) | — | (10,959) |
| Markit CMBX North America Index, Series 10 BBB- | Citi | 11/17/2059 | 3.000 | Monthly | 6.373 | USD | 7,000,000 | (867,344) | 2,917 | — | (853,202) | — | (11,225) |
| Markit CMBX North America Index, Series 13 BBB- | Citi | 12/16/2072 | 3.000 | Monthly | 5.312 | USD | 6,400,000 | (829,000) | 2,667 | — | (324,933) | — | (501,400) |
| Markit CMBX North America Index, Series 10 BBB- | Goldman Sachs International | 11/17/2059 | 3.000 | Monthly | 6.373 | USD | 7,500,000 | (929,297) | 3,125 | — | (860,623) | — | (65,549) |
| Markit CMBX North America Index, Series 12 BBB- | Goldman Sachs International | 08/17/2061 | 3.000 | Monthly | 5.403 | USD | 6,500,000 | (767,812) | 2,708 | — | (354,481) | — | (410,623) |
| 36 | Columbia Total Return Bond Fund | Annual Report 2022 |
April 30, 2022
| Credit default swap contracts - sell protection (continued) | |||||||||||||
| Reference entity | Counterparty | Maturity date | Receive fixed rate (%) | Payment frequency | Implied credit spread (%)* | Notional currency | Notional amount | Value ($) | Periodic payments receivable (payable) ($) | Upfront payments ($) | Upfront receipts ($) | Unrealized appreciation ($) | Unrealized depreciation ($) |
| Markit CMBX North America Index, Series 13 BBB- | Goldman Sachs International | 12/16/2072 | 3.000 | Monthly | 5.312 | USD | 3,800,000 | (492,219) | 1,583 | — | (312,080) | — | (178,556) |
| Markit CMBX North America Index, Series 13 BBB- | Goldman Sachs International | 12/16/2072 | 3.000 | Monthly | 5.312 | USD | 5,400,000 | (699,469) | 2,250 | — | (277,825) | — | (419,394) |
| Markit CMBX North America Index, Series 13 BBB- | Goldman Sachs International | 12/16/2072 | 3.000 | Monthly | 5.312 | USD | 7,400,000 | (958,531) | 3,083 | — | (398,668) | — | (556,780) |
| Markit CMBX North America Index, Series 10 BBB- | JPMorgan | 11/17/2059 | 3.000 | Monthly | 6.373 | USD | 5,000,000 | (619,530) | 2,083 | — | (1,099,980) | 482,533 | — |
| Markit CMBX North America Index, Series 10 BBB- | JPMorgan | 11/17/2059 | 3.000 | Monthly | 6.373 | USD | 5,000,000 | (619,531) | 2,083 | — | (852,082) | 234,634 | — |
| Markit CMBX North America Index, Series 10 BBB- | JPMorgan | 11/17/2059 | 3.000 | Monthly | 6.373 | USD | 6,000,000 | (743,437) | 2,500 | — | (952,805) | 211,868 | — |
| Markit CMBX North America Index, Series 10 BBB- | JPMorgan | 11/17/2059 | 3.000 | Monthly | 6.373 | USD | 5,000,000 | (619,530) | 2,083 | — | (820,503) | 203,056 | — |
| Markit CMBX North America Index, Series 11 BBB- | JPMorgan | 11/18/2054 | 3.000 | Monthly | 5.389 | USD | 3,000,000 | (314,532) | 1,250 | — | (446,247) | 132,965 | — |
| Markit CMBX North America Index, Series 13 BBB- | JPMorgan | 12/16/2072 | 3.000 | Monthly | 5.312 | USD | 4,900,000 | (634,704) | 2,042 | — | (305,692) | — | (326,970) |
| Markit CMBX North America Index, Series 13 BBB- | JPMorgan | 12/16/2072 | 3.000 | Monthly | 5.312 | USD | 5,400,000 | (699,468) | 2,250 | — | (308,174) | — | (389,044) |
| Markit CMBX North America Index, Series 13 BBB- | JPMorgan | 12/16/2072 | 3.000 | Monthly | 5.312 | USD | 6,400,000 | (829,000) | 2,667 | — | (322,958) | — | (503,375) |
| Markit CMBX North America Index, Series 10 BBB- | Morgan Stanley | 11/17/2059 | 3.000 | Monthly | 6.373 | USD | 7,000,000 | (867,344) | 2,917 | — | (1,535,544) | 671,117 | — |
| Markit CMBX North America Index, Series 10 BBB- | Morgan Stanley | 11/17/2059 | 3.000 | Monthly | 6.373 | USD | 5,000,000 | (619,531) | 2,083 | — | (995,516) | 378,068 | — |
| Markit CMBX North America Index, Series 10 BBB- | Morgan Stanley | 11/17/2059 | 3.000 | Monthly | 6.373 | USD | 7,000,000 | (867,344) | 2,917 | — | (1,148,705) | 284,278 | — |
| Markit CMBX North America Index, Series 10 BBB- | Morgan Stanley | 11/17/2059 | 3.000 | Monthly | 6.373 | USD | 3,000,000 | (371,719) | 1,250 | — | (579,649) | 209,180 | — |
| Markit CMBX North America Index, Series 11 BBB- | Morgan Stanley | 11/18/2054 | 3.000 | Monthly | 5.389 | USD | 8,800,000 | (922,626) | 3,667 | — | (539,813) | — | (379,146) |
| Markit CMBX North America Index, Series 12 BBB- | Morgan Stanley | 08/17/2061 | 3.000 | Monthly | 5.403 | USD | 7,500,000 | (885,937) | 3,125 | — | (356,695) | — | (526,117) |
| Columbia Total Return Bond Fund | Annual Report 2022 | 37 |
April 30, 2022
| Credit default swap contracts - sell protection (continued) | |||||||||||||
| Reference entity | Counterparty | Maturity date | Receive fixed rate (%) | Payment frequency | Implied credit spread (%)* | Notional currency | Notional amount | Value ($) | Periodic payments receivable (payable) ($) | Upfront payments ($) | Upfront receipts ($) | Unrealized appreciation ($) | Unrealized depreciation ($) |
| Markit CMBX North America Index, Series 13 BBB- | Morgan Stanley | 12/16/2072 | 3.000 | Monthly | 5.312 | USD | 23,000,000 | (2,979,217) | 9,583 | — | (1,304,330) | — | (1,665,304) |
| Markit CMBX North America Index, Series 14 BBB- | Morgan Stanley | 12/16/2072 | 3.000 | Monthly | 5.537 | USD | 6,250,000 | (829,101) | 2,604 | — | (570,153) | — | (256,344) |
| Total | (20,081,378) | 67,187 | — | (17,015,745) | 3,202,340 | (6,200,786) | |||||||
| * | Implied credit spreads, represented in absolute terms, utilized in determining the market value of credit default swap agreements on corporate or sovereign issues as of period end serve as an indicator of the current status of the payment/performance risk and represent the likelihood or risk of default for the credit derivative. The implied credit spread of a particular referenced entity reflects the cost of buying/selling protection and may include upfront payments required to be made to enter into the agreement. Wider credit spreads represent a deterioration of the referenced entity’s credit soundness and a greater likelihood or risk of default or other credit event occurring as defined under the terms of the agreement. |
| (a) | Represents privately placed and other securities and instruments exempt from Securities and Exchange Commission registration (collectively, private placements), such as Section 4(a)(2) and Rule 144A eligible securities, which are often sold only to qualified institutional buyers. At April 30, 2022, the total value of these securities amounted to $1,968,025,543, which represents 61.62% of total net assets. |
| (b) | Variable rate security. The interest rate shown was the current rate as of April 30, 2022. |
| (c) | Represents fair value as determined in good faith under procedures approved by the Board of Trustees. At April 30, 2022, the total value of these securities amounted to $51,748,634, which represents 1.62% of total net assets. |
| (d) | Security represents a pool of loans that generate cash payments generally over fixed periods of time. Such securities entitle the security holders to receive distributions (i.e. principal and interest, net of fees and expenses) that are tied to the payments made by the borrower on the underlying loans. Due to the structure of the security the cash payments received are not known until the time of payment. The interest rate shown is the stated coupon rate as of April 30, 2022 and is not reflective of the cash flow payments. |
| (e) | Valuation based on significant unobservable inputs. |
| (f) | Variable or floating rate security, the interest rate of which adjusts periodically based on changes in current interest rates and prepayments on the underlying pool of assets. The interest rate shown was the current rate as of April 30, 2022. |
| (g) | Represents interest only securities which have the right to receive the monthly interest payments on an underlying pool of mortgage loans. |
| (h) | Non-income producing investment. |
| (i) | Represents a security purchased on a when-issued basis. |
| (j) | Represents a variable rate security with a step coupon where the rate adjusts according to a schedule for a series of periods, typically lower for an initial period and then increasing to a higher coupon rate thereafter. The interest rate shown was the current rate as of April 30, 2022. |
| (k) | Represents securities that have defaulted on payment of interest. The Fund has stopped accruing interest on these securities. At April 30, 2022, the total value of these securities amounted to $41,069, which represents less than 0.01% of total net assets. |
| (l) | Payment-in-kind security. Interest can be paid by issuing additional par of the security or in cash. |
| (m) | Principal and interest may not be guaranteed by a governmental entity. |
| (n) | This security or a portion of this security has been pledged as collateral in connection with derivative contracts. |
| (o) | The stated interest rate represents the weighted average interest rate at April 30, 2022 of contracts within the senior loan facility. Interest rates on contracts are primarily determined either weekly, monthly or quarterly by reference to the indicated base lending rate and spread and the reset period. These base lending rates are primarily the LIBOR and other short-term rates. Base lending rates may be subject to a floor or minimum rate. The interest rate for senior loans purchased on a when-issued or delayed delivery basis will be determined upon settlement, therefore no interest rate is disclosed. Senior loans often require prepayments from excess cash flows or permit the borrowers to repay at their election. The degree to which borrowers repay cannot be predicted with accuracy. As a result, remaining maturities of senior loans may be less than the stated maturities. Generally, the Fund is contractually obligated to receive approval from the agent bank and/or borrower prior to the disposition of a senior loan. |
| (p) | The rate shown is the seven-day current annualized yield at April 30, 2022. |
| 38 | Columbia Total Return Bond Fund | Annual Report 2022 |
April 30, 2022
| (q) | As defined in the Investment Company Act of 1940, as amended, an affiliated company is one in which the Fund owns 5% or more of the company’s outstanding voting securities, or a company which is under common ownership or control with the Fund. The value of the holdings and transactions in these affiliated companies during the year ended April 30, 2022 are as follows: |
| Affiliated issuers | Beginning of period($) | Purchases($) | Sales($) | Net change in unrealized appreciation (depreciation)($) | End of period($) | Realized gain (loss)($) | Dividends($) | End of period shares |
| Columbia Short-Term Cash Fund, 0.462% | ||||||||
| 167,900,915 | 1,909,282,665 | (1,955,867,587) | (4,081) | 121,311,912 | (9,527) | 162,789 | 121,348,316 | |
| CMO | Collateralized Mortgage Obligation |
| CMT | Constant Maturity Treasury |
| FHLMC | Federal Home Loan Mortgage Corporation |
| LIBOR | London Interbank Offered Rate |
| SOFR | Secured Overnight Financing Rate |
| STRIPS | Separate Trading of Registered Interest and Principal Securities |
| TBA | To Be Announced |
| EUR | Euro |
| GBP | British Pound |
| USD | US Dollar |
| ■ | Level 1 — Valuations based on quoted prices for investments in active markets that the Fund has the ability to access at the measurement date. Valuation adjustments are not applied to Level 1 investments. |
| ■ | Level 2 — Valuations based on other significant observable inputs (including quoted prices for similar securities, interest rates, prepayment speeds, credit risks, etc.). |
| ■ | Level 3 — Valuations based on significant unobservable inputs (including the Fund’s own assumptions and judgment in determining the fair value of investments). |
| Columbia Total Return Bond Fund | Annual Report 2022 | 39 |
April 30, 2022
illiquid, restricted, or in default; and the effectiveness of third party pricing vendors, including periodic reviews of vendors. The Committee meets more frequently, as needed, to discuss additional valuation matters, which may include the need to review back-testing results, review time-sensitive information or approve related valuation actions. The Committee reports to the Board, with members of the Committee meeting with the Board at each of its regularly scheduled meetings to discuss valuation matters and actions during the period, similar to those described earlier.
| Level 1 ($) | Level 2 ($) | Level 3 ($) | Total ($) | |
| Investments in Securities | ||||
| Asset-Backed Securities — Non-Agency | — | 324,672,389 | 15,192,448 | 339,864,837 |
| Commercial Mortgage-Backed Securities - Agency | — | 6,862,235 | — | 6,862,235 |
| Commercial Mortgage-Backed Securities - Non-Agency | — | 200,266,990 | — | 200,266,990 |
| Common Stocks | ||||
| Financials | 203,174 | — | — | 203,174 |
| Industrials | 75,397 | — | — | 75,397 |
| Total Common Stocks | 278,571 | — | — | 278,571 |
| Convertible Bonds | — | 728,875 | — | 728,875 |
| Corporate Bonds & Notes | — | 1,083,480,658 | 41,069 | 1,083,521,727 |
| Foreign Government Obligations | — | 76,905,380 | — | 76,905,380 |
| Residential Mortgage-Backed Securities - Agency | — | 598,765,491 | — | 598,765,491 |
| Residential Mortgage-Backed Securities - Non-Agency | — | 891,614,395 | 114,128,474 | 1,005,742,869 |
| Senior Loans | — | 5,034,892 | — | 5,034,892 |
| U.S. Treasury Obligations | 114,302,620 | — | — | 114,302,620 |
| Options Purchased Calls | — | 1,515,339 | — | 1,515,339 |
| Options Purchased Puts | — | 22,577,437 | — | 22,577,437 |
| Money Market Funds | 121,311,912 | — | — | 121,311,912 |
| Total Investments in Securities | 235,893,103 | 3,212,424,081 | 129,361,991 | 3,577,679,175 |
| Investments in Derivatives | ||||
| Asset | ||||
| Forward Foreign Currency Exchange Contracts | — | 112,120 | — | 112,120 |
| Futures Contracts | 20,468,130 | — | — | 20,468,130 |
| Swap Contracts | — | 11,702,622 | — | 11,702,622 |
| Liability | ||||
| Futures Contracts | (39,558,276) | — | — | (39,558,276) |
| Options Contracts Written | — | (41,951,930) | — | (41,951,930) |
| Swap Contracts | — | (6,200,786) | — | (6,200,786) |
| Total | 216,802,957 | 3,176,086,107 | 129,361,991 | 3,522,251,055 |
| Balance as of 04/30/2021 ($) | Increase (decrease) in accrued discounts/ premiums ($) | Realized gain (loss) ($) | Change in unrealized appreciation (depreciation)(a) ($) | Purchases ($) | Sales ($) | Transfers into Level 3 ($) | Transfers out of Level 3 ($) | Balance as of 04/30/2022 ($) | |
| Asset-Backed Securities — Non-Agency | 9,110,923 | (1,689,489) | — | 1,138,047 | 13,749,910 | (7,116,943) | — | — | 15,192,448 |
| Corporate Bonds & Notes | 41,069 | — | — | — | — | — | — | — | 41,069 |
| Residential Mortgage-Backed Securities — Non-Agency | 113,532,969 | (37,422) | — | (410,600) | 62,050,000 | (62,756,603) | 26,750,000 | (24,999,870) | 114,128,474 |
| Total | 122,684,961 | (1,726,911) | — | 727,447 | 75,799,910 | (69,873,546) | 26,750,000 | (24,999,870) | 129,361,991 |
| 40 | Columbia Total Return Bond Fund | Annual Report 2022 |
April 30, 2022
The Fund’s assets assigned to the Level 3 category are valued utilizing the valuation technique deemed the most appropriate in the circumstances.
| Columbia Total Return Bond Fund | Annual Report 2022 | 41 |
April 30, 2022
| Assets | |
| Investments in securities, at value | |
| Unaffiliated issuers (cost $3,694,265,838) | $3,432,274,487 |
| Affiliated issuers (cost $121,298,696) | 121,311,912 |
| Options purchased (cost $6,921,781) | 24,092,776 |
| Cash | 1,067,190 |
| Cash collateral held at broker for: | |
| Swap contracts | 14,147,000 |
| TBA | 4,086,000 |
| Other(a) | 22,909,000 |
| Margin deposits on: | |
| Swap contracts | 14,556,992 |
| Unrealized appreciation on forward foreign currency exchange contracts | 112,120 |
| Unrealized appreciation on swap contracts | 4,041,363 |
| Upfront payments on swap contracts | 449,910 |
| Receivable for: | |
| Investments sold | 12,529,192 |
| Investments sold on a delayed delivery basis | 46,910,239 |
| Capital shares sold | 17,728,598 |
| Dividends | 44,447 |
| Interest | 18,211,549 |
| Foreign tax reclaims | 37,356 |
| Variation margin for futures contracts | 1,386,177 |
| Variation margin for swap contracts | 1,629,277 |
| Expense reimbursement due from Investment Manager | 11,892 |
| Prepaid expenses | 18,717 |
| Trustees’ deferred compensation plan | 377,069 |
| Total assets | 3,737,933,263 |
| Liabilities | |
| Option contracts written, at value (premiums received $6,557,920) | 41,951,930 |
| Unrealized depreciation on swap contracts | 6,200,786 |
| Upfront receipts on swap contracts | 17,015,745 |
| Payable for: | |
| Investments purchased | 2,888,038 |
| Investments purchased on a delayed delivery basis | 426,100,327 |
| Capital shares purchased | 38,878,123 |
| Distributions to shareholders | 7,517,363 |
| Variation margin for futures contracts | 2,769,527 |
| Management services fees | 42,186 |
| Distribution and/or service fees | 5,352 |
| Transfer agent fees | 397,775 |
| Compensation of board members | 26,801 |
| Other expenses | 111,482 |
| Trustees’ deferred compensation plan | 377,069 |
| Total liabilities | 544,282,504 |
| Net assets applicable to outstanding capital stock | $3,193,650,759 |
| Represented by | |
| Paid in capital | 3,628,521,490 |
| Total distributable earnings (loss) | (434,870,731) |
| Total - representing net assets applicable to outstanding capital stock | $3,193,650,759 |
| 42 | Columbia Total Return Bond Fund | Annual Report 2022 |
April 30, 2022
| Class A | |
| Net assets | $699,471,376 |
| Shares outstanding | 21,292,217 |
| Net asset value per share | $32.85 |
| Maximum sales charge | 3.00% |
| Maximum offering price per share (calculated by dividing the net asset value per share by 1.0 minus the maximum sales charge for Class A shares) | $33.87 |
| Advisor Class | |
| Net assets | $358,749,400 |
| Shares outstanding | 10,934,064 |
| Net asset value per share | $32.81 |
| Class C | |
| Net assets | $16,369,785 |
| Shares outstanding | 498,244 |
| Net asset value per share | $32.85 |
| Institutional Class | |
| Net assets | $1,497,858,453 |
| Shares outstanding | 45,568,918 |
| Net asset value per share | $32.87 |
| Institutional 2 Class | |
| Net assets | $209,091,191 |
| Shares outstanding | 6,373,474 |
| Net asset value per share | $32.81 |
| Institutional 3 Class | |
| Net assets | $405,758,860 |
| Shares outstanding | 12,342,698 |
| Net asset value per share | $32.87 |
| Class R | |
| Net assets | $6,351,694 |
| Shares outstanding | 193,265 |
| Net asset value per share | $32.87 |
| (a) | Includes collateral related to options purchased and options contracts written. |
| Columbia Total Return Bond Fund | Annual Report 2022 | 43 |
Year Ended April 30, 2022
| Net investment income | |
| Income: | |
| Dividends — affiliated issuers | $162,789 |
| Interest | 105,616,221 |
| Total income | 105,779,010 |
| Expenses: | |
| Management services fees | 15,626,595 |
| Distribution and/or service fees | |
| Class A | 1,989,544 |
| Class C | 199,653 |
| Class R | 31,492 |
| Transfer agent fees | |
| Class A | 938,409 |
| Advisor Class | 513,612 |
| Class C | 23,536 |
| Institutional Class | 1,613,465 |
| Institutional 2 Class | 127,012 |
| Institutional 3 Class | 25,456 |
| Class R | 7,431 |
| Compensation of board members | 51,593 |
| Custodian fees | 53,425 |
| Printing and postage fees | 168,998 |
| Registration fees | 226,818 |
| Audit fees | 49,690 |
| Legal fees | 43,890 |
| Interest on collateral | 48,971 |
| Compensation of chief compliance officer | 1,073 |
| Other | 40,481 |
| Total expenses | 21,781,144 |
| Fees waived or expenses reimbursed by Investment Manager and its affiliates | (4,125,761) |
| Fees waived by transfer agent | |
| Institutional 2 Class | (13,246) |
| Institutional 3 Class | (25,456) |
| Expense reduction | (1,300) |
| Total net expenses | 17,615,381 |
| Net investment income | 88,163,629 |
| 44 | Columbia Total Return Bond Fund | Annual Report 2022 |
Year Ended April 30, 2022
| Realized and unrealized gain (loss) — net | |
| Net realized gain (loss) on: | |
| Investments — unaffiliated issuers | $(31,365,460) |
| Investments — affiliated issuers | (9,527) |
| Foreign currency translations | (18,287) |
| Forward foreign currency exchange contracts | 468,371 |
| Futures contracts | (119,539,109) |
| Options purchased | 16,090,320 |
| Options contracts written | 1,793,910 |
| Swap contracts | (12,763,600) |
| Net realized loss | (145,343,382) |
| Net change in unrealized appreciation (depreciation) on: | |
| Investments — unaffiliated issuers | (311,001,744) |
| Investments — affiliated issuers | (4,081) |
| Foreign currency translations | (1,567) |
| Forward foreign currency exchange contracts | 165,952 |
| Futures contracts | (9,092,765) |
| Options purchased | 263,209 |
| Options contracts written | (35,641,450) |
| Swap contracts | 4,350,330 |
| Net change in unrealized appreciation (depreciation) | (350,962,116) |
| Net realized and unrealized loss | (496,305,498) |
| Net decrease in net assets resulting from operations | $(408,141,869) |
| Columbia Total Return Bond Fund | Annual Report 2022 | 45 |
| Year Ended April 30, 2022 | Year Ended April 30, 2021 | |
| Operations | ||
| Net investment income | $88,163,629 | $74,216,346 |
| Net realized gain (loss) | (145,343,382) | 66,395,171 |
| Net change in unrealized appreciation (depreciation) | (350,962,116) | 87,375,881 |
| Net increase (decrease) in net assets resulting from operations | (408,141,869) | 227,987,398 |
| Distributions to shareholders | ||
| Net investment income and net realized gains | ||
| Class A | (20,545,842) | (59,111,740) |
| Advisor Class | (10,992,351) | (9,899,845) |
| Class C | (365,555) | (1,663,273) |
| Institutional Class | (39,125,903) | (69,252,953) |
| Institutional 2 Class | (6,621,970) | (8,342,279) |
| Institutional 3 Class | (13,245,990) | (41,349,583) |
| Class R | (147,159) | (239,878) |
| Total distributions to shareholders | (91,044,770) | (189,859,551) |
| Increase in net assets from capital stock activity | 1,148,230,395 | 374,921,635 |
| Total increase in net assets | 649,043,756 | 413,049,482 |
| Net assets at beginning of year | 2,544,607,003 | 2,131,557,521 |
| Net assets at end of year | $3,193,650,759 | $2,544,607,003 |
| 46 | Columbia Total Return Bond Fund | Annual Report 2022 |
| Year Ended | Year Ended | |||
| April 30, 2022 | April 30, 2021 | |||
| Shares | Dollars ($) | Shares(a) | Dollars ($) | |
| Capital stock activity | ||||
| Class A | ||||
| Subscriptions | 3,044,452 | 113,585,218 | 3,392,143 | 131,241,097 |
| Fund reorganization | 1,160,251 | 43,249,882 | — | — |
| Distributions reinvested | 539,052 | 19,810,483 | 1,497,723 | 57,351,626 |
| Redemptions | (4,293,120) | (156,197,661) | (2,850,040) | (109,899,016) |
| Net increase | 450,635 | 20,447,922 | 2,039,826 | 78,693,707 |
| Advisor Class | ||||
| Subscriptions | 4,447,352 | 164,193,332 | 2,218,443 | 85,382,536 |
| Fund reorganization | 22,289,843 | 829,852,611 | — | — |
| Distributions reinvested | 294,563 | 10,666,605 | 258,509 | 9,883,128 |
| Redemptions | (20,328,558) | (718,469,434) | (775,459) | (29,812,236) |
| Net increase | 6,703,200 | 286,243,114 | 1,701,493 | 65,453,428 |
| Class C | ||||
| Subscriptions | 191,880 | 7,174,826 | 309,029 | 11,982,924 |
| Distributions reinvested | 9,468 | 348,440 | 41,869 | 1,601,588 |
| Redemptions | (245,685) | (9,028,183) | (368,227) | (14,177,432) |
| Net decrease | (44,337) | (1,504,917) | (17,329) | (592,920) |
| Institutional Class | ||||
| Subscriptions | 33,295,466 | 1,210,427,840 | 13,153,693 | 506,956,850 |
| Distributions reinvested | 915,801 | 33,518,142 | 1,704,417 | 65,293,510 |
| Redemptions | (16,764,044) | (602,857,360) | (5,951,290) | (229,194,998) |
| Net increase | 17,447,223 | 641,088,622 | 8,906,820 | 343,055,362 |
| Institutional 2 Class | ||||
| Subscriptions | 6,069,976 | 224,354,721 | 2,429,819 | 93,135,315 |
| Distributions reinvested | 180,719 | 6,615,919 | 217,562 | 8,317,392 |
| Redemptions | (4,012,675) | (143,682,213) | (795,737) | (30,592,116) |
| Net increase | 2,238,020 | 87,288,427 | 1,851,644 | 70,860,591 |
| Institutional 3 Class | ||||
| Subscriptions | 5,326,489 | 198,016,596 | 2,326,346 | 89,641,196 |
| Distributions reinvested | 187,435 | 6,885,479 | 602,295 | 23,118,888 |
| Redemptions | (2,548,127) | (92,789,213) | (7,755,176) | (297,530,308) |
| Net increase (decrease) | 2,965,797 | 112,112,862 | (4,826,535) | (184,770,224) |
| Class R | ||||
| Subscriptions | 109,119 | 4,081,279 | 82,698 | 3,167,249 |
| Distributions reinvested | 3,963 | 145,150 | 6,158 | 235,661 |
| Redemptions | (45,604) | (1,672,064) | (30,713) | (1,181,219) |
| Net increase | 67,478 | 2,554,365 | 58,143 | 2,221,691 |
| Total net increase | 29,828,016 | 1,148,230,395 | 9,714,062 | 374,921,635 |
| (a) | Share activity has been adjusted on a retroactive basis to reflect a 4 to 1 reverse stock split completed after the close of business on September 11, 2020. |
| Columbia Total Return Bond Fund | Annual Report 2022 | 47 |
| Net asset value, beginning of period | Net investment income | Net realized and unrealized gain (loss) | Total from investment operations | Distributions from net investment income | Distributions from net realized gains | Tax return of capital | Total distributions to shareholders | |
| Class A(c) | ||||||||
| Year Ended 4/30/2022 | $37.76 | 0.91 | (4.87) | (3.96) | (0.87) | (0.08) | — | (0.95) |
| Year Ended 4/30/2021 | $36.96 | 1.16 | 2.64 | 3.80 | (1.13) | (1.87) | — | (3.00) |
| Year Ended 4/30/2020 | $36.19 | 1.12 | 1.17 | 2.29 | (1.04) | (0.48) | — | (1.52) |
| Year Ended 4/30/2019 | $35.33 | 1.12 | 0.74 | 1.86 | (1.00) | — | — | (1.00) |
| Year Ended 4/30/2018 | $36.14 | 0.92 | (0.85) | 0.07 | (0.84) | — | (0.04) | (0.88) |
| Advisor Class(c) | ||||||||
| Year Ended 4/30/2022 | $37.71 | 0.98 | (4.84) | (3.86) | (0.96) | (0.08) | — | (1.04) |
| Year Ended 4/30/2021 | $36.91 | 1.26 | 2.64 | 3.90 | (1.23) | (1.87) | — | (3.10) |
| Year Ended 4/30/2020 | $36.16 | 1.20 | 1.15 | 2.35 | (1.12) | (0.48) | — | (1.60) |
| Year Ended 4/30/2019 | $35.29 | 1.24 | 0.75 | 1.99 | (1.12) | — | — | (1.12) |
| Year Ended 4/30/2018 | $36.09 | 1.00 | (0.84) | 0.16 | (0.92) | — | (0.04) | (0.96) |
| Class C(c) | ||||||||
| Year Ended 4/30/2022 | $37.77 | 0.64 | (4.89) | (4.25) | (0.59) | (0.08) | — | (0.67) |
| Year Ended 4/30/2021 | $36.96 | 0.87 | 2.65 | 3.52 | (0.84) | (1.87) | — | (2.71) |
| Year Ended 4/30/2020 | $36.19 | 0.84 | 1.17 | 2.01 | (0.76) | (0.48) | — | (1.24) |
| Year Ended 4/30/2019 | $35.33 | 0.84 | 0.78 | 1.62 | (0.76) | — | — | (0.76) |
| Year Ended 4/30/2018 | $36.15 | 0.64 | (0.86) | (0.22) | (0.56) | — | (0.04) | (0.60) |
| Institutional Class(c) | ||||||||
| Year Ended 4/30/2022 | $37.78 | 1.01 | (4.87) | (3.86) | (0.97) | (0.08) | — | (1.05) |
| Year Ended 4/30/2021 | $36.98 | 1.26 | 2.64 | 3.90 | (1.23) | (1.87) | — | (3.10) |
| Year Ended 4/30/2020 | $36.21 | 1.24 | 1.13 | 2.37 | (1.12) | (0.48) | — | (1.60) |
| Year Ended 4/30/2019 | $35.34 | 1.20 | 0.79 | 1.99 | (1.12) | — | — | (1.12) |
| Year Ended 4/30/2018 | $36.16 | 1.00 | (0.86) | 0.14 | (0.92) | — | (0.04) | (0.96) |
| Institutional 2 Class(c) | ||||||||
| Year Ended 4/30/2022 | $37.71 | 1.03 | (4.86) | (3.83) | (0.99) | (0.08) | — | (1.07) |
| Year Ended 4/30/2021 | $36.91 | 1.28 | 2.64 | 3.92 | (1.25) | (1.87) | — | (3.12) |
| Year Ended 4/30/2020 | $36.15 | 1.24 | 1.16 | 2.40 | (1.16) | (0.48) | — | (1.64) |
| Year Ended 4/30/2019 | $35.29 | 1.28 | 0.70 | 1.98 | (1.12) | — | — | (1.12) |
| Year Ended 4/30/2018 | $36.11 | 1.04 | (0.86) | 0.18 | (0.96) | — | (0.04) | (1.00) |
| 48 | Columbia Total Return Bond Fund | Annual Report 2022 |
| Net asset value, end of period | Total return | Total gross expense ratio to average net assets(a) | Total net expense ratio to average net assets(a),(b) | Net investment income ratio to average net assets | Portfolio turnover | Net assets, end of period (000’s) | |
| Class A(c) | |||||||
| Year Ended 4/30/2022 | $32.85 | (10.72%) | 0.87%(d) | 0.74%(d),(e) | 2.48% | 173% | $699,471 |
| Year Ended 4/30/2021 | $37.76 | 10.36% | 0.88%(d) | 0.74%(d),(e) | 3.00% | 295% | $786,976 |
| Year Ended 4/30/2020 | $36.96 | 6.34% | 0.90%(d) | 0.74%(d),(e) | 3.05% | 272% | $694,852 |
| Year Ended 4/30/2019 | $36.19 | 5.45% | 0.91%(d) | 0.86%(d),(e) | 3.19% | 262% | $681,416 |
| Year Ended 4/30/2018 | $35.33 | 0.08% | 0.91% | 0.86%(e) | 2.51% | 300% | $711,850 |
| Advisor Class(c) | |||||||
| Year Ended 4/30/2022 | $32.81 | (10.49%) | 0.62%(d) | 0.49%(d),(e) | 2.69% | 173% | $358,749 |
| Year Ended 4/30/2021 | $37.71 | 10.62% | 0.63%(d) | 0.49%(d),(e) | 3.27% | 295% | $159,565 |
| Year Ended 4/30/2020 | $36.91 | 6.61% | 0.65%(d) | 0.49%(d),(e) | 3.32% | 272% | $93,369 |
| Year Ended 4/30/2019 | $36.16 | 5.72% | 0.66%(d) | 0.61%(d),(e) | 3.53% | 262% | $15,272 |
| Year Ended 4/30/2018 | $35.29 | 0.44% | 0.66% | 0.61%(e) | 2.72% | 300% | $6,726 |
| Class C(c) | |||||||
| Year Ended 4/30/2022 | $32.85 | (11.42%) | 1.62%(d) | 1.49%(d),(e) | 1.73% | 173% | $16,370 |
| Year Ended 4/30/2021 | $37.77 | 9.57% | 1.63%(d) | 1.49%(d),(e) | 2.25% | 295% | $20,492 |
| Year Ended 4/30/2020 | $36.96 | 5.55% | 1.65%(d) | 1.50%(d),(e) | 2.30% | 272% | $20,696 |
| Year Ended 4/30/2019 | $36.19 | 4.66% | 1.66%(d) | 1.61%(d),(e) | 2.37% | 262% | $18,905 |
| Year Ended 4/30/2018 | $35.33 | (0.67%) | 1.66% | 1.61%(e) | 1.75% | 300% | $38,975 |
| Institutional Class(c) | |||||||
| Year Ended 4/30/2022 | $32.87 | (10.49%) | 0.62%(d) | 0.49%(d),(e) | 2.75% | 173% | $1,497,858 |
| Year Ended 4/30/2021 | $37.78 | 10.70% | 0.63%(d) | 0.49%(d),(e) | 3.26% | 295% | $1,062,540 |
| Year Ended 4/30/2020 | $36.98 | 6.61% | 0.65%(d) | 0.49%(d),(e) | 3.30% | 272% | $710,558 |
| Year Ended 4/30/2019 | $36.21 | 5.60% | 0.66%(d) | 0.61%(d),(e) | 3.42% | 262% | $949,377 |
| Year Ended 4/30/2018 | $35.34 | 0.44% | 0.66% | 0.61%(e) | 2.76% | 300% | $1,037,101 |
| Institutional 2 Class(c) | |||||||
| Year Ended 4/30/2022 | $32.81 | (10.43%) | 0.55%(d) | 0.42%(d) | 2.80% | 173% | $209,091 |
| Year Ended 4/30/2021 | $37.71 | 10.69% | 0.57%(d) | 0.43%(d) | 3.33% | 295% | $155,945 |
| Year Ended 4/30/2020 | $36.91 | 6.69% | 0.57%(d) | 0.42%(d) | 3.38% | 272% | $84,295 |
| Year Ended 4/30/2019 | $36.15 | 5.81% | 0.58%(d) | 0.53%(d) | 3.64% | 262% | $80,083 |
| Year Ended 4/30/2018 | $35.29 | 0.38% | 0.58% | 0.55% | 2.82% | 300% | $31,099 |
| Columbia Total Return Bond Fund | Annual Report 2022 | 49 |
| Net asset value, beginning of period | Net investment income | Net realized and unrealized gain (loss) | Total from investment operations | Distributions from net investment income | Distributions from net realized gains | Tax return of capital | Total distributions to shareholders | |
| Institutional 3 Class(c) | ||||||||
| Year Ended 4/30/2022 | $37.79 | 1.05 | (4.88) | (3.83) | (1.01) | (0.08) | — | (1.09) |
| Year Ended 4/30/2021 | $36.98 | 1.29 | 2.66 | 3.95 | (1.27) | (1.87) | — | (3.14) |
| Year Ended 4/30/2020 | $36.21 | 1.24 | 1.17 | 2.41 | (1.16) | (0.48) | — | (1.64) |
| Year Ended 4/30/2019 | $35.35 | 1.28 | 0.74 | 2.02 | (1.16) | — | — | (1.16) |
| Year Ended 4/30/2018 | $36.16 | 1.04 | (0.85) | 0.19 | (0.96) | — | (0.04) | (1.00) |
| Class R(c) | ||||||||
| Year Ended 4/30/2022 | $37.78 | 0.82 | (4.87) | (4.05) | (0.78) | (0.08) | — | (0.86) |
| Year Ended 4/30/2021 | $36.97 | 1.06 | 2.66 | 3.72 | (1.04) | (1.87) | — | (2.91) |
| Year Ended 4/30/2020 | $36.20 | 1.04 | 1.17 | 2.21 | (0.96) | (0.48) | — | (1.44) |
| Year Ended 4/30/2019 | $35.33 | 1.04 | 0.75 | 1.79 | (0.92) | — | — | (0.92) |
| Year Ended 4/30/2018 | $36.15 | 0.80 | (0.82) | (0.02) | (0.76) | — | (0.04) | (0.80) |
| Notes to Financial Highlights | |
| (a) | In addition to the fees and expenses that the Fund bears directly, the Fund indirectly bears a pro rata share of the fees and expenses of any other funds in which it invests. Such indirect expenses are not included in the Fund’s reported expense ratios. |
| (b) | Total net expenses include the impact of certain fee waivers/expense reimbursements made by the Investment Manager and certain of its affiliates, if applicable. |
| (c) | Per share amounts have been adjusted on a retroactive basis to reflect a 4 to 1 reverse stock split completed after the close of business on September 11, 2020. |
| (d) | Ratios include interest on collateral expense which is less than 0.01%. |
| (e) | The benefits derived from expense reductions had an impact of less than 0.01%. |
| 50 | Columbia Total Return Bond Fund | Annual Report 2022 |
| Net asset value, end of period | Total return | Total gross expense ratio to average net assets(a) | Total net expense ratio to average net assets(a),(b) | Net investment income ratio to average net assets | Portfolio turnover | Net assets, end of period (000’s) | |
| Institutional 3 Class(c) | |||||||
| Year Ended 4/30/2022 | $32.87 | (10.41%) | 0.50%(d) | 0.37%(d) | 2.85% | 173% | $405,759 |
| Year Ended 4/30/2021 | $37.79 | 10.73% | 0.52%(d) | 0.38%(d) | 3.32% | 295% | $354,336 |
| Year Ended 4/30/2020 | $36.98 | 6.86% | 0.53%(d) | 0.37%(d) | 3.42% | 272% | $525,287 |
| Year Ended 4/30/2019 | $36.21 | 5.73% | 0.53%(d) | 0.49%(d) | 3.56% | 262% | $258,172 |
| Year Ended 4/30/2018 | $35.35 | 0.55% | 0.52% | 0.50% | 2.85% | 300% | $272,332 |
| Class R(c) | |||||||
| Year Ended 4/30/2022 | $32.87 | (10.94%) | 1.12%(d) | 0.99%(d),(e) | 2.24% | 173% | $6,352 |
| Year Ended 4/30/2021 | $37.78 | 10.15% | 1.13%(d) | 0.99%(d),(e) | 2.76% | 295% | $4,752 |
| Year Ended 4/30/2020 | $36.97 | 6.08% | 1.15%(d) | 1.00%(d),(e) | 2.79% | 272% | $2,501 |
| Year Ended 4/30/2019 | $36.20 | 5.19% | 1.16%(d) | 1.11%(d),(e) | 2.97% | 262% | $2,380 |
| Year Ended 4/30/2018 | $35.33 | (0.17%) | 1.16% | 1.11%(e) | 2.24% | 300% | $1,637 |
| Columbia Total Return Bond Fund | Annual Report 2022 | 51 |
April 30, 2022
| 52 | Columbia Total Return Bond Fund | Annual Report 2022 |
April 30, 2022
| Columbia Total Return Bond Fund | Annual Report 2022 | 53 |
April 30, 2022
| 54 | Columbia Total Return Bond Fund | Annual Report 2022 |
April 30, 2022
| Columbia Total Return Bond Fund | Annual Report 2022 | 55 |
April 30, 2022
| 56 | Columbia Total Return Bond Fund | Annual Report 2022 |
April 30, 2022
| Columbia Total Return Bond Fund | Annual Report 2022 | 57 |
April 30, 2022
| Asset derivatives | ||
| Risk exposure category | Statement of assets and liabilities location | Fair value ($) |
| Credit risk | Component of total distributable earnings (loss) — unrealized appreciation on swap contracts | 11,702,622* |
| Credit risk | Upfront payments on swap contracts | 449,910 |
| Foreign exchange risk | Unrealized appreciation on forward foreign currency exchange contracts | 112,120 |
| Interest rate risk | Component of total distributable earnings (loss) — unrealized appreciation on futures contracts | 20,468,130* |
| Interest rate risk | Investments, at value — Options purchased | 24,092,776 |
| Total | 56,825,558 |
| Liability derivatives | ||
| Risk exposure category | Statement of assets and liabilities location | Fair value ($) |
| Credit risk | Component of total distributable earnings (loss) — unrealized depreciation on swap contracts | 6,200,786* |
| Credit risk | Upfront receipts on swap contracts | 17,015,745 |
| Interest rate risk | Component of total distributable earnings (loss) — unrealized depreciation on futures contracts | 39,558,276* |
| Interest rate risk | Options contracts written, at value | 41,951,930 |
| Total | 104,726,737 |
| * | Includes cumulative appreciation (depreciation) as reported in the tables following the Portfolio of Investments. Only the current day’s variation margin is reported in receivables or payables in the Statement of Assets and Liabilities. |
| 58 | Columbia Total Return Bond Fund | Annual Report 2022 |
April 30, 2022
| Amount of realized gain (loss) on derivatives recognized in income | ||||||
| Risk exposure category | Forward foreign currency exchange contracts ($) | Futures contracts ($) | Options contracts written ($) | Options contracts purchased ($) | Swap contracts ($) | Total ($) |
| Credit risk | — | — | — | — | (247,363) | (247,363) |
| Foreign exchange risk | 468,371 | — | — | — | — | 468,371 |
| Interest rate risk | — | (119,539,109) | 1,793,910 | 16,090,320 | (12,516,237) | (114,171,116) |
| Total | 468,371 | (119,539,109) | 1,793,910 | 16,090,320 | (12,763,600) | (113,950,108) |
| Change in unrealized appreciation (depreciation) on derivatives recognized in income | ||||||
| Risk exposure category | Forward foreign currency exchange contracts ($) | Futures contracts ($) | Options contracts written ($) | Options contracts purchased ($) | Swap contracts ($) | Total ($) |
| Credit risk | — | — | — | — | 1,672,068 | 1,672,068 |
| Foreign exchange risk | 165,952 | — | — | — | — | 165,952 |
| Interest rate risk | — | (9,092,765) | (35,641,450) | 263,209 | 2,678,262 | (41,792,744) |
| Total | 165,952 | (9,092,765) | (35,641,450) | 263,209 | 4,350,330 | (39,954,724) |
| Derivative instrument | Average notional amounts ($)* |
| Futures contracts — long | 1,472,936,955 |
| Futures contracts — short | 272,908,507 |
| Credit default swap contracts — buy protection | 180,037,000 |
| Credit default swap contracts — sell protection | 114,137,500 |
| Derivative instrument | Average value ($)* |
| Options contracts — purchased | 15,866,277 |
| Options contracts — written | (13,614,855) |
| Derivative instrument | Average unrealized appreciation ($)* | Average unrealized depreciation ($)* |
| Forward foreign currency exchange contracts | 41,228 | (11,170) |
| Interest rate swap contracts | — | (2,797,383) |
| * | Based on the ending quarterly outstanding amounts for the year ended April 30, 2022. |
| Columbia Total Return Bond Fund | Annual Report 2022 | 59 |
April 30, 2022
| 60 | Columbia Total Return Bond Fund | Annual Report 2022 |
April 30, 2022
| Citi ($)(a) | Citi ($)(a) | Goldman Sachs International ($) | JPMorgan ($) | Morgan Stanley ($)(a) | Morgan Stanley ($)(a) | UBS ($) | Total ($) | ||
| Assets | |||||||||
| Centrally cleared credit default swap contracts (b) | - | - | - | - | - | 1,629,277 | - | 1,629,277 | |
| Forward foreign currency exchange contracts | - | - | - | - | - | - | 112,120 | 112,120 | |
| Options purchased calls | 1,515,339 | - | - | - | - | - | - | 1,515,339 | |
| Options purchased puts | - | - | - | - | 22,577,437 | - | - | 22,577,437 | |
| OTC credit default swap contracts (c) | - | 394,641 | - | 2,430,499 | 1,666,133 | - | - | 4,491,273 | |
| Total assets | 1,515,339 | 394,641 | - | 2,430,499 | 24,243,570 | 1,629,277 | 112,120 | 30,325,446 | |
| Liabilities | |||||||||
| Options contracts written | 23,364,683 | - | - | - | 18,587,247 | - | - | 41,951,930 | |
| OTC credit default swap contracts (c) | - | 3,196,806 | 3,834,579 | 6,327,830 | 9,857,316 | - | - | 23,216,531 | |
| Total liabilities | 23,364,683 | 3,196,806 | 3,834,579 | 6,327,830 | 28,444,563 | - | - | 65,168,461 | |
| Total financial and derivative net assets | (21,849,344) | (2,802,165) | (3,834,579) | (3,897,331) | (4,200,993) | 1,629,277 | 112,120 | (34,843,015) | |
| Total collateral received (pledged) (d) | (21,849,344) | (2,794,000) | (3,590,000) | (3,680,000) | (4,083,000) | - | - | (35,996,344) | |
| Net amount (e) | - | (8,165) | (244,579) | (217,331) | (117,993) | 1,629,277 | 112,120 | 1,153,329 |
| (a) | Exposure can only be netted across transactions governed under the same master agreement with the same legal entity. |
| (b) | Centrally cleared swaps are included within payable/receivable for variation margin on the Statement of Assets and Liabilities. |
| (c) | Over-the-Counter (OTC) swap contracts are presented at market value plus periodic payments receivable (payable), which is comprised of unrealized appreciation, unrealized depreciation, upfront payments and upfront receipts. |
| (d) | In some instances, the actual collateral received and/or pledged may be more than the amount shown due to overcollateralization. |
| (e) | Represents the net amount due from/(to) counterparties in the event of default. |
| Columbia Total Return Bond Fund | Annual Report 2022 | 61 |
April 30, 2022
| 62 | Columbia Total Return Bond Fund | Annual Report 2022 |
April 30, 2022
| Columbia Total Return Bond Fund | Annual Report 2022 | 63 |
April 30, 2022
| Effective rate (%) | |
| Class A | 0.12 |
| Advisor Class | 0.13 |
| Class C | 0.12 |
| Institutional Class | 0.12 |
| Institutional 2 Class | 0.05 |
| Institutional 3 Class | 0.00 |
| Class R | 0.12 |
| 64 | Columbia Total Return Bond Fund | Annual Report 2022 |
April 30, 2022
| Front End (%) | CDSC (%) | Amount ($) | |
| Class A | 3.00 | 0.50 - 1.00(a) | 409,977 |
| Class C | — | 1.00(b) | 3,921 |
| (a) | This charge is imposed on certain investments of between $1 million and $50 million redeemed within 18 months after purchase, as follows: 1.00% if redeemed within 12 months after purchase, and 0.50% if redeemed more than 12, but less than 18, months after purchase, with certain limited exceptions. |
| (b) | This charge applies to redemptions within 12 months after purchase, with certain limited exceptions. |
| December 11, 2021 through August 31, 2024 | September 1, 2021 through December 10, 2021 | Prior to September 1, 2021 | |
| Class A | 0.74% | 0.74% | 0.75% |
| Advisor Class | 0.49 | 0.49 | 0.50 |
| Class C | 1.49 | 1.49 | 1.50 |
| Institutional Class | 0.49 | 0.49 | 0.50 |
| Institutional 2 Class | 0.42 | 0.43 | 0.43 |
| Institutional 3 Class | 0.37 | 0.38 | 0.38 |
| Class R | 0.99 | 0.99 | 1.00 |
| Columbia Total Return Bond Fund | Annual Report 2022 | 65 |
April 30, 2022
| Excess of distributions over net investment income ($) | Accumulated net realized (loss) ($) | Paid in capital ($) |
| 1,114,126 | (1,114,432) | 306 |
| Year Ended April 30, 2022 | Year Ended April 30, 2021 | ||||
| Ordinary income ($) | Long-term capital gains ($) | Total ($) | Ordinary income ($) | Long-term capital gains ($) | Total ($) |
| 84,107,203 | 6,937,567 | 91,044,770 | 154,497,770 | 35,361,781 | 189,859,551 |
| Undistributed ordinary income ($) | Undistributed long-term capital gains ($) | Capital loss carryforwards ($) | Net unrealized (depreciation) ($) |
| 13,838,527 | — | (175,720,066) | (265,069,179) |
| Federal tax cost ($) | Gross unrealized appreciation ($) | Gross unrealized (depreciation) ($) | Net unrealized (depreciation) ($) |
| 3,787,320,234 | 16,365,854 | (281,435,033) | (265,069,179) |
| No expiration short-term ($) | No expiration long-term ($) | Total ($) | Utilized ($) |
| (91,843,703) | (83,876,363) | (175,720,066) | — |
| 66 | Columbia Total Return Bond Fund | Annual Report 2022 |
April 30, 2022
| Columbia Total Return Bond Fund | Annual Report 2022 | 67 |
April 30, 2022
| Shares | |
| Class A | 1,160,251 |
| Advisor Class | 22,289,843 |
| ($) | |
| Net investment income | 104,475,000 |
| Net realized loss | (114,922,000) |
| Net change in unrealized appreciation/(depreciation) | (384,820,000) |
| Net decrease in net assets from operations | (395,267,000) |
| 68 | Columbia Total Return Bond Fund | Annual Report 2022 |
April 30, 2022
| Columbia Total Return Bond Fund | Annual Report 2022 | 69 |
April 30, 2022
| 70 | Columbia Total Return Bond Fund | Annual Report 2022 |
April 30, 2022
| Columbia Total Return Bond Fund | Annual Report 2022 | 71 |
| 72 | Columbia Total Return Bond Fund | Annual Report 2022 |
| Section 163(j) Interest Dividends | |
| 94.80% |
| Name, address, year of birth | Position held with the Columbia Funds and length of service | Principal occupation(s) during past five years and other relevant professional experience | Number of Funds in the Columbia Funds Complex* overseen | Other directorships held by Trustee during the past five years |
| George S. Batejan c/o Columbia Management Investment Advisers, LLC 290 Congress Street Boston, MA 02210 1953 | Trustee since 2017 | Executive Vice President, Global Head of Technology and Operations, Janus Capital Group, Inc., 2010-2016 | 176 | Former Chairman of the Board, NICSA (National Investment Company Services Association) (Executive Committee, Nominating Committee and Governance Committee), 2014-2016; former Director, Intech Investment Management, 2011-2016; former Board Member, Metro Denver Chamber of Commerce, 2015-2016; former Advisory Board Member, University of Colorado Business School, 2015-2018 |
| Columbia Total Return Bond Fund | Annual Report 2022 | 73 |
(Unaudited)
Independent trustees (continued)
| Name, address, year of birth | Position held with the Columbia Funds and length of service | Principal occupation(s) during past five years and other relevant professional experience | Number of Funds in the Columbia Funds Complex* overseen | Other directorships held by Trustee during the past five years |
| Kathleen Blatz c/o Columbia Management Investment Advisers, LLC 290 Congress Street Boston, MA 02210 1954 | Trustee since 2006 | Attorney, specializing in arbitration and mediation; Chief Justice, Minnesota Supreme Court, 1998-2006; Associate Justice, Minnesota Supreme Court, 1996-1998; Fourth Judicial District Court Judge, Hennepin County, 1994-1996; Attorney in private practice and public service, 1984-1993; State Representative, Minnesota House of Representatives, 1979-1993, which included service on the Tax and Financial Institutions and Insurance Committees; Member and Interim Chair, Minnesota Sports Facilities Authority, January 2017-July 2017; Interim President and Chief Executive Officer, Blue Cross and Blue Shield of Minnesota (health care insurance), February-July 2018, April-October 2021 | 176 | Former Trustee, Blue Cross and Blue Shield of Minnesota, 2009-2021 (Chair of the Business Development Committee, 2014-2017; Chair of the Governance Committee, 2017-2019); former Member and Chair of the Board, Minnesota Sports Facilities Authority, January 2017-July 2017; former Director, Robina Foundation, 2009-2020 (Chair, 2014-2020); Director, Schulze Family Foundation, since 2021 |
| Pamela G. Carlton c/o Columbia Management Investment Advisers, LLC 290 Congress Street Boston, MA 02210 1954 | Trustee since 2007 | President, Springboard — Partners in Cross Cultural Leadership (consulting company) since 2003; Managing Director of US Equity Research, JP Morgan Chase, 1999-2003; Director of US Equity Research, Chase Asset Management, 1996-1999; Co-Director Latin America Research, 1993-1996, COO Global Research, 1992-1996, Co-Director of US Research, 1991-1992, Investment Banker, 1982-1991, Morgan Stanley; Attorney, Cleary Gottlieb Steen & Hamilton LLP, 1980-1982 | 176 | Trustee, New York Presbyterian Hospital Board (Executive Committee and Chair of People Committee) since 1996; Director, DR Bank (Audit Committee) since 2017; Director, Evercore Inc. (Audit Committee) since 2019; Director, Apollo Commercial Real Estate Finance, Inc. since 2021; the Governing Council of the Independent Directors Council (IDC), since 2021 |
| Janet Langford Carrig c/o Columbia Management Investment Advisers, LLC 290 Congress Street Boston, MA 02210 1957 | Trustee since 1996 | Senior Vice President, General Counsel and Corporate Secretary, ConocoPhillips (independent energy company), September 2007-October 2018 | 174 | Director, EQT Corporation (natural gas producer) since 2019; Director, Whiting Petroleum Corporation (independent oil and gas company) since 2020 |
| J. Kevin Connaughton c/o Columbia Management Investment Advisers, LLC 290 Congress Street Boston, MA 02210 1964 | Trustee since 2020 | Member, FINRA National Adjudicatory Council since January 2020; Adjunct Professor of Finance, Bentley University since January 2018; Consultant to Independent Trustees of CFVIT and CFST I from March 2016 to June 2020 with respect to CFVIT and to December 2020 with respect to CFST I; Managing Director and General Manager of Mutual Fund Products, Columbia Management Investment Advisers, LLC, May 2010-February 2015; President, Columbia Funds, 2008-2015; and senior officer of Columbia Funds and affiliated funds, 2003-2015 | 174 | Former Director, The Autism Project, March 2015-December 2021; former Member of the Investment Committee, St. Michael’s College, November 2015-February 2020; former Trustee, St. Michael’s College, June 2017-September 2019; former Trustee, New Century Portfolios, January 2015-December 2017 |
| 74 | Columbia Total Return Bond Fund | Annual Report 2022 |
(Unaudited)
Independent trustees (continued)
| Name, address, year of birth | Position held with the Columbia Funds and length of service | Principal occupation(s) during past five years and other relevant professional experience | Number of Funds in the Columbia Funds Complex* overseen | Other directorships held by Trustee during the past five years |
| Olive M. Darragh c/o Columbia Management Investment Advisers, LLC 290 Congress Street Boston, MA 02210 1962 | Trustee since 2020 | Managing Director of Darragh Inc. (strategy and talent management consulting firm) since 2010; Founder and CEO, Zolio, Inc. (investment management talent identification platform) since 2004; Consultant to Independent Trustees of CFVIT and CFST I from June 2019 to June 2020 with respect to CFVIT and to December 2020 with respect to CFST I; Partner, Tudor Investments, 2004-2010; Senior Partner, McKinsey & Company (consulting), 1990-2004; Touche Ross CPA, 1985-1988 | 174 | Former Director, University of Edinburgh Business School (Member of US Board); former Director, Boston Public Library Foundation |
| Patricia M. Flynn c/o Columbia Management Investment Advisers, LLC 290 Congress Street Boston, MA 02210 1950 | Trustee since 2004 | Trustee Professor of Economics and Management, Bentley University since 1976 (also teaches and conducts research on corporate governance); Dean, McCallum Graduate School of Business, Bentley University, 1992-2002 | 176 | Trustee, MA Taxpayers Foundation since 1997; Board of Governors, Innovation Institute, MA Technology Collaborative, 2010-2020; former Board of Directors, The MA Business Roundtable, 2003-2019 |
| Brian J. Gallagher c/o Columbia Management Investment Advisers, LLC 290 Congress Street Boston, MA 02210 1954 | Trustee since 2017 | Retired; Partner with Deloitte & Touche LLP and its predecessors, 1977-2016 | 176 | Trustee, Catholic Schools Foundation since 2004 |
| Douglas A. Hacker c/o Columbia Management Investment Advisers, LLC 290 Congress Street Boston, MA 02210 1955 | Co-Chair since 2021; Chair of CFST I and CFVIT since 2014; Trustee of CFST I and CFVIT since 1996 and CFST, CFST II, CFVST II, CET I and CET II since 2021 | Independent business executive since May 2006; Executive Vice President – Strategy of United Airlines, December 2002 - May 2006; President of UAL Loyalty Services (airline marketing company), September 2001-December 2002; Executive Vice President and Chief Financial Officer of United Airlines, July 1999-September 2001 | 176 | Director, Spartan Nash Company (food distributor); Director, Aircastle Limited (Chair of Audit Committee) (aircraft leasing); former Director, Nash Finch Company (food distributor), 2005-2013; former Director, SeaCube Container Leasing Ltd. (container leasing), 2010-2013; and former Director, Travelport Worldwide Limited (travel information technology), 2014-2019 |
| Nancy T. Lukitsh c/o Columbia Management Investment Advisers, LLC 290 Congress Street Boston, MA 02210 1956 | Trustee since 2011 | Senior Vice President, Partner and Director of Marketing, Wellington Management Company, LLP (investment adviser), 1997-2010; Chair, Wellington Management Portfolios (commingled non-U.S. investment pools), 2007 -2010; Director, Wellington Trust Company, NA and other Wellington affiliates, 1997-2010 | 174 | None |
| Columbia Total Return Bond Fund | Annual Report 2022 | 75 |
(Unaudited)
Independent trustees (continued)
| Name, address, year of birth | Position held with the Columbia Funds and length of service | Principal occupation(s) during past five years and other relevant professional experience | Number of Funds in the Columbia Funds Complex* overseen | Other directorships held by Trustee during the past five years |
| David M. Moffett c/o Columbia Management Investment Advisers, LLC 290 Congress Street Boston, MA 02210 1952 | Trustee since 2011 | Retired; Consultant to Bridgewater and Associates | 174 | Director, CSX Corporation (transportation suppliers); Director, Genworth Financial, Inc. (financial and insurance products and services); Director, PayPal Holdings Inc. (payment and data processing services); Trustee, University of Oklahoma Foundation; former Director, eBay Inc. (online trading community), 2007-2015; and former Director, CIT Bank, CIT Group Inc. (commercial and consumer finance), 2010-2016 |
| Catherine James Paglia c/o Columbia Management Investment Advisers, LLC 290 Congress Street Boston, MA 02210 1952 | Co-Chair since 2021; Chair of CFST, CFST II, CFVST II, CET I and CET II since 2020; Trustee of CFST, CFST II and CFVST II since 2004 and CFST I and CFVIT since 2021 | Director, Enterprise Asset Management, Inc. (private real estate and asset management company) since September 1998; Managing Director and Partner, Interlaken Capital, Inc., 1989-1997; Vice President, 1982-1985, Principal, 1985-1987, Managing Director, 1987-1989, Morgan Stanley; Vice President, Investment Banking, 1980-1982, Associate, Investment Banking, 1976-1980, Dean Witter Reynolds, Inc. | 176 | Director, Valmont Industries, Inc. (irrigation systems manufacturer) since 2012; Trustee, Carleton College (on the Investment Committee); Trustee, Carnegie Endowment for International Peace (on the Investment Committee) |
| Minor M. Shaw c/o Columbia Management Investment Advisers, LLC 290 Congress Street Boston, MA 02210 1947 | Trustee since 2003 | President, Micco LLC (private investments) since 2011; President, Micco Corp. (family investment business), 1998-2011 | 176 | Director, Blue Cross Blue Shield of South Carolina (Chair of Compensation Committee) since April 2008; Trustee, Hollingsworth Funds (on the Investment Committee) since 2016 (previously Board Chair from 2016-2019); Former Advisory Board member, Duke Energy Corp., 2016-2020; Chair of the Duke Endowment; Chair of Greenville – Spartanburg Airport Commission; former Trustee, BofA Funds Series Trust (11 funds), 2003-2011; former Director, Piedmont Natural Gas, 2004-2016; former Director, National Association of Corporate Directors, Carolinas Chapter, 2013-2018; Chair, Daniel-Mickel Foundation since 1998 |
| 76 | Columbia Total Return Bond Fund | Annual Report 2022 |
(Unaudited)
Independent trustees (continued)
| Name, address, year of birth | Position held with the Columbia Funds and length of service | Principal occupation(s) during past five years and other relevant professional experience | Number of Funds in the Columbia Funds Complex* overseen | Other directorships held by Trustee during the past five years |
| Natalie A. Trunow c/o Columbia Management Investment Advisers, LLC 290 Congress Street Boston, MA 02210 1967 | Trustee since 2020 | Chief Executive Officer, Millennial Portfolio Solutions LLC (asset management and consulting services), January 2016-January 2021; Non-executive Member of the Investment Committee and Valuation Committee, Sarona Asset Management Inc. (private equity firm) since September 2019; Advisor, Horizon Investments (asset management and consulting services), August 2018-January 2021; Advisor, Paradigm Asset Management, November 2016-December 2021; Consultant to Independent Trustees of CFVIT and CFST I from September 2016 to June 2020 with respect to CFVIT and to December 2020 with respect to CFST I; Director of Investments/Consultant, Casey Family Programs, April 2016-November 2016; Senior Vice President and Chief Investment Officer, Calvert Investments, August 2008-January 2016; Section Head and Portfolio Manager, General Motors Asset Management, June 1997-August 2008 | 174 | Former Director, Investment Committee, Health Services for Children with Special Needs, Inc., 2012-2019; Director, Chair of Audit Committee, Consumer Credit Counseling Services (formerly Guidewell Financial Solutions), since 2019; Independent Director, Investment Committee and Valuation Committee, Sarona Asset Management, since 2019 |
| Sandra L. Yeager c/o Columbia Management Investment Advisers, LLC 290 Congress Street Boston, MA 02210 1964 | Trustee since 2017 | Retired; President and founder, Hanoverian Capital, LLC (SEC registered investment advisor firm), 2008-2016; Managing Director, DuPont Capital, 2006-2008; Managing Director, Morgan Stanley Investment Management, 2004-2006; Senior Vice President, Alliance Bernstein, 1990-2004 | 176 | Former Director, NAPE Education Foundation, October 2016-October 2020 |
| * | The term “Columbia Funds Complex” as used herein includes Columbia Seligman Premium Technology Growth Fund, Tri-Continental Corporation and each series of Columbia Fund Series Trust (CFST), Columbia Funds Series Trust I (CFST I), Columbia Funds Series Trust II (CFST II), Columbia ETF Trust I (CET I), Columbia ETF Trust II (CET II), Columbia Funds Variable Insurance Trust (CFVIT) and Columbia Funds Variable Series Trust II (CFVST II). Messrs. Batejan, Beckman, Gallagher and Hacker and Mses. Blatz, Carlton, Flynn, Paglia, Shaw and Yeager serve as Directors of Columbia Seligman Premium Technology Growth Fund and Tri-Continental Corporation. |
| Name, address, year of birth | Position held with the Columbia Funds and length of service | Principal occupation(s) during the past five years and other relevant professional experience | Number of Funds in the Columbia Funds Complex overseen | Other directorships held by Trustee during the past five years |
| Daniel J. Beckman c/o Columbia Management Investment Advisers, LLC 290 Congress Street Boston, MA 02210 1962 | Trustee since November 2021 and President since June 2021 | Vice President – Head of North America Product, Columbia Management Investment Advisers, LLC since April 2015; President and Principal Executive Officer of the Columbia Funds since June 2021; officer of Columbia Funds and affiliated funds, 2020-2021 | 176 | Director, Ameriprise Trust Company, since October 2016; Director, Columbia Management Investment Distributors, Inc. since November 2018; Board of Governors, Columbia Wanger Asset Management, LLC since January 2022 |
| * | Interested person (as defined under the 1940 Act) by reason of being an officer, director, security holder and/or employee of the Investment Manager or Ameriprise Financial. |
| Columbia Total Return Bond Fund | Annual Report 2022 | 77 |
(Unaudited)
The Board has appointed officers who are responsible for day-to-day business decisions based on policies it has established. The officers serve at the pleasure of the Board. The following table provides basic information about the Officers of the Fund as of the printing of this report, including principal occupations during the past five years, although their specific titles may have varied over the period. In addition to Mr. Beckman, who is President and Principal Executive Officer, the Fund’s other officers are:
| Name, address and year of birth | Position and year first appointed to position for any Fund in the Columbia Funds Complex or a predecessor thereof | Principal occupation(s) during past five years |
| Michael G. Clarke 290 Congress Street Boston, MA 02210 1969 | Chief Financial Officer and Principal Financial Officer (2009) and Senior Vice President (2019) | Senior Vice President and Head of Global Operations & Investor Services, Columbia Management Investment Advisers, LLC, since March 2022 (previously Vice President, Head of North American Operations, and Co-Head of Global Operations, June 2019 to February 2022 and Vice President – Accounting and Tax, May 2010 - May 2019); senior officer of Columbia Funds and affiliated funds since 2002. |
| Joseph Beranek 5890 Ameriprise Financial Center Minneapolis, MN 55474 1965 | Treasurer and Chief Accounting Officer (Principal Accounting Officer) (2019) and Principal Financial Officer (2020), CFST, CFST I, CFST II, CFVIT and CFVST II; Assistant Treasurer, CET I and CET II | Vice President – Mutual Fund Accounting and Financial Reporting, Columbia Management Investment Advisers, LLC, since December 2018 and March 2017, respectively (previously Vice President – Pricing and Corporate Actions, May 2010 - March 2017). |
| Marybeth Pilat 290 Congress Street Boston, MA 02210 1968 | Treasurer and Chief Accounting Officer (Principal Accounting Officer) and Principal Financial Officer (2020) for CET I and CET II; Assistant Treasurer, CFST, CFST I, CFST II, CFVIT and CFVST II | Vice President – Product Pricing and Administration, Columbia Management Investment Advisers, LLC, since May 2017; Director - Fund Administration, Calvert Investments, August 2015 – March 2017; Vice President - Fund Administration, Legg Mason, May 2015 - July 2015; Vice President - Fund Administration, Columbia Management Investment Advisers, LLC, May 2010 - April 2015. |
| William F. Truscott 290 Congress Street Boston, MA 02210 1960 | Senior Vice President (2001) | Formerly, Trustee/Director of Columbia Funds Complex or legacy funds, November 2001-January 1, 2021; Chief Executive Officer, Global Asset Management, Ameriprise Financial, Inc. since September 2012; Chairman of the Board and President, Columbia Management Investment Advisers, LLC since July 2004 and February 2012, respectively; Chairman of the Board and Chief Executive Officer, Columbia Management Investment Distributors, Inc. since November 2008 and February 2012, respectively; Chairman of the Board and Director, Threadneedle Asset Management Holdings, Sàrl since March 2013 and December 2008, respectively; senior executive of various entities affiliated with Columbia Threadneedle. |
| Christopher O. Petersen 5228 Ameriprise Financial Center Minneapolis, MN 55474 1970 | Senior Vice President and Assistant Secretary (2021) | Formerly, Trustee/Director of funds within the Columbia Funds Complex, July 1, 2020 - November 22, 2021; Senior Vice President and Assistant General Counsel, Ameriprise Financial, Inc. since September 2021 (previously Vice President and Lead Chief Counsel, January 2015 - September 2021); President and Principal Executive Officer of the Columbia Funds, 2015 - 2021; officer of Columbia Funds and affiliated funds since 2007. |
| Thomas P. McGuire 290 Congress Street Boston, MA 02210 1972 | Senior Vice President and Chief Compliance Officer (2012) | Vice President – Asset Management Compliance, Ameriprise Financial, Inc., since May 2010; Chief Compliance Officer, Columbia Acorn/Wanger Funds since December 2015; Chief Compliance Officer, Ameriprise Certificate Company, September 2010 – September 2020. |
| Ryan C. Larrenaga 290 Congress Street Boston, MA 02210 1970 | Senior Vice President (2017), Chief Legal Officer (2017), and Secretary (2015) | Vice President and Chief Counsel, Ameriprise Financial, Inc. since August 2018 (previously Vice President and Group Counsel, August 2011 - August 2018); Chief Legal Officer, Columbia Acorn/Wanger Funds, since September 2020; officer of Columbia Funds and affiliated funds since 2005. |
| 78 | Columbia Total Return Bond Fund | Annual Report 2022 |
(Unaudited)
Fund officers (continued)
| Name, address and year of birth | Position and year first appointed to position for any Fund in the Columbia Funds Complex or a predecessor thereof | Principal occupation(s) during past five years |
| Michael E. DeFao 290 Congress Street Boston, MA 02210 1968 | Vice President (2011) and Assistant Secretary (2010) | Vice President and Chief Counsel, Ameriprise Financial, Inc. since May 2010; Vice President, Chief Legal Officer and Assistant Secretary, Columbia Management Investment Advisers, LLC since October 2021 (previously Vice President and Assistant Secretary, May 2010 – September 2021). |
| Lyn Kephart-Strong 5228 Ameriprise Financial Center Minneapolis, MN 55474 1960 | Vice President (2015) | President, Columbia Management Investment Services Corp. since October 2014; Vice President & Resolution Officer, Ameriprise Trust Company since August 2009. |
| • | the Fund had sufficient liquidity to both meet redemptions and operate effectively on behalf of shareholders; |
| • | there were no material changes to the Program during the period; |
| • | the implementation of the Program was effective to manage the Fund’s liquidity risk; and |
| • | the Program operated adequately during the period. |
| Columbia Total Return Bond Fund | Annual Report 2022 | 79 |
columbiathreadneedleus.com/investor/. The Fund is distributed by Columbia Management Investment Distributors, Inc., member FINRA, and managed by Columbia Management Investment Advisers, LLC.

April 30, 2022

| 3 | |
| 6 | |
| 11 | |
| 12 | |
| 28 | |
| 29 | |
| 30 | |
| 31 | |
| 32 | |
| 46 | |
| 47 | |
| 47 | |
| 53 | |
| 54 |
(Unaudited)
| Average annual total returns (%) (for the period ended April 30, 2022) | |||||
| Inception | 1 Year | 5 Years | Life | ||
| Institutional Class* | 01/03/17 | 10.42 | 3.81 | 4.60 | |
| HFRX Equity Hedge Index | 3.91 | 4.15 | 4.63 | ||
| Wilshire Liquid Alternative Equity Hedge Index | 0.42 | 3.45 | 3.97 | ||
| MSCI World Index (Net) | -3.52 | 10.17 | 11.46 | ||
| * | The returns shown for periods prior to the share class inception date (including returns for the Life of the Fund, if shown, which are since Fund inception) include the returns of the Fund’s oldest share class. Returns shown for periods prior to the inception date of the Fund’s Institutional Class shares include the returns of the Fund’s Class A shares for the period from October 17, 2016 (the inception date of the Fund) through January 2, 2017. Class A shares were offered prior to the Fund’s Institutional Class shares but have since been merged into the Fund’s Institutional Class shares. These returns are adjusted to reflect any higher class-related operating expenses of the newer share classes, as applicable. Please visit columbiathreadneedleus.com/investor/investment-products/mutual-funds/appended-performance for more information. |
| Multi-Manager Directional Alternative Strategies Fund | Annual Report 2022 | 3 |
(Unaudited)
| Portfolio breakdown — long positions (%) (at April 30, 2022) | |
| Common Stocks | 118.6 |
| Exchange-Traded Equity Funds | 0.4 |
| Preferred Stocks | 0.0(a) |
| Warrants | 0.1 |
| Short-Term Investments Segregated in Connection with Open Derivatives Contracts(b) | 22.9 |
| Total | 142.0 |
| (a) | Rounds to zero. |
| (b) | Includes investments in Money Market Funds (amounting to $42.6 million) which have been segregated to cover obligations relating to the Fund’s investment in derivatives which provide exposure to multiple markets. For a description of the Fund’s investments in derivatives, see Investments in derivatives following the Portfolio of Investments and Note 2 to the Notes to Financial Statements. |
| Portfolio breakdown — short positions (%) (at April 30, 2022) | |
| Common Stocks | (40.8) |
| Exchange-Traded Equity Funds | (1.2) |
| Total | (42.0) |
| Equity sector breakdown — long positions (%) (at April 30, 2022) | |
| Communication Services | 5.2 |
| Consumer Discretionary | 13.8 |
| Consumer Staples | 7.6 |
| Energy | 8.3 |
| Financials | 8.7 |
| Health Care | 17.6 |
| Industrials | 12.8 |
| Information Technology | 14.3 |
| Materials | 6.7 |
| Real Estate | 3.0 |
| Utilities | 2.0 |
| Total | 100.0 |
| 4 | Multi-Manager Directional Alternative Strategies Fund | Annual Report 2022 |
(Unaudited)
| Equity sector breakdown — short positions (%) (at April 30, 2022) | |
| Communication Services | (4.2) |
| Consumer Discretionary | (12.7) |
| Consumer Staples | (14.0) |
| Energy | (2.4) |
| Financials | (14.5) |
| Health Care | (8.3) |
| Industrials | (19.5) |
| Information Technology | (13.0) |
| Materials | (7.6) |
| Real Estate | (2.8) |
| Utilities | (1.0) |
| Total | (100.0) |
| Market exposure through derivatives investments (% of notional exposure) (at April 30, 2022)(a) | |||
| Long | Short | Net | |
| Equity Derivative Contracts | 268.7 | (368.7) | (100.0) |
| Total Notional Market Value of Derivative Contracts | 268.7 | (368.7) | (100.0) |
| Multi-Manager Directional Alternative Strategies Fund | Annual Report 2022 | 5 |
(Unaudited)
| 6 | Multi-Manager Directional Alternative Strategies Fund | Annual Report 2022 |
(Unaudited)
| • | The Fund’s passive market exposure contributed to overall performance. |
| • | From an investment theme perspective, valuation, sentiment, quality, and momentum each contributed positively to performance. |
| • | The top contributing sectors were health care, consumer discretionary, and industrials. The strategy’s portfolio process is a market neutral model that does not think in benchmark-relative terms, along with a static passive exposure via futures. |
| • | The top three individual contributors to performance during our reporting period were WM Morrison Super Markets, Vroom, and Beyond Meat, Inc. |
| • | From a country perspective, stock selection within the United States and the United Kingdom were the largest contributors to performance during the period. |
| • | Tactical market exposure in our portion of the Fund detracted from overall performance. |
| • | The bottom performing sectors in our portion of the portfolio were real estate and utilities. |
| • | During our reporting period, the top three individual detractors from performance were Avis Budget Group, Toyota Motor Corporation, and AtoS SE. |
| • | In terms of country exposure, Germany, France and Switzerland were the largest detractors. |
| • | Long positions in energy stocks were the top contributors to performance in our portion of the Fund during the reporting period, as oil prices measured by WTI (West Texas Intermediate) Oil were up over 65% during the year. |
| • | Top contributors were oil producers including Cenovus Energy, Inc., Devon Energy Corp. and Canadian Natural Resources Ltd. |
| • | Long positions in the health care sector were also among the top contributors, with pharmaceutical holdings including Novo Nordisk A/S and AstraZeneca PLC delivering strong earnings reports, while managed care insurance holdings Centene Corp. and CVS Health Corp. also benefitted from better-than-expected earnings and guidance. |
| • | Short positions in the consumer discretionary sector fell sharply and positively contributed, as less profitable e-commerce holdings saw revenue growth slow, with names such as Chewy, Inc. and Carvana Co. down more than 50% and positively contributing. |
| Multi-Manager Directional Alternative Strategies Fund | Annual Report 2022 | 7 |
(Unaudited)
| • | Several statistically expensive health care shorts also fell in price, primarily within biotechnology and included names such as CureVac NV, Kodiak Sciences, Inc. and Allogene Therapeutics, Inc. (all down more than 70% during the period). |
| • | Lastly, several small- to mid-cap U.S. software shorts fell sharply and contributed positively to results, with the common theme consisting of very high valuations (typically greater than 20x sales) with slowing revenue growth and increasing competition. |
| • | Long positions within the consumer discretionary sector were the top detractors, as companies in the leisure and lodging sector fell in price as the Omicron variant further delayed a full earnings recovery. |
| • | Top leisure and lodging detractors included Flutter Entertainment PLC, Wynn Macau Ltd. and Las Vegas Sands Corp. |
| • | Long positions in housing-related stocks also declined amid the surge higher in mortgage rates, with top detractors including Tempur Sealy International, Inc., Mohawk Industries, Inc. and Whirlpool Corp. |
| • | Long positions in financials also detracted, as regional banks fell in price as the U.S. yield curve flattened during the latter portion of the period. Top individual detractors included Truist Financial Corp., Huntington Bancshares, Inc., KeyCorp and Capital One Financial Corp. |
| • | Short positions in Carvana Co., Canopy Growth Corp. and Exact Sciences Corp., were the largest positive contributors to performance in our portion of the Fund. These companies exhibited factor exposures which were penalized by the market environment and our short positions were rewarded. |
| • | An underweight exposure to the consumer discretionary sector was the greatest positive contributor from a sector weighting perspective. |
| • | Countries that made positive contributions were underweight positions to the Netherlands, Germany and Japan as all three underperformed the MSCI World Index (Net). |
| • | In addition, while an underweight position in the United States detracted slightly from performance, stock selection within the United States was particularly strong and added significant value overall. |
| • | Long positions in Yamada Holdings Co., Ltd., Moderna, Inc. and Adecco Group AG, were the largest detractors from performance. These companies exhibited factor exposures which were not rewarded by the market environment. |
| • | An underweight exposure to the strong-performing energy sector was the greatest detractor from a sector weighting perspective. |
| 8 | Multi-Manager Directional Alternative Strategies Fund | Annual Report 2022 |
(Unaudited)
| • | Countries that had negative contributions were the United Kingdom, Canada and Hong Kong. |
| ○ | An overweight position to Hong Kong negatively impacted performance as this country posted negative returns. In addition, stock selection within Hong Kong struggled within our portion of the Fund. |
| ○ | Underweight positions to the UK and Canada negatively detracted from returns as these countries posted positive gains and outperformed the index. However, strong stock selection within both the UK and Canada also positively impacted returns overall. |
| • | Our strategy’s short portfolio was a modest contributor during the period, as short positions in the information technology and industrials sectors contributed to performance in our portion of the Fund. |
| • | Long positions in the financials sector contributed during the period. Top individual contributors during the period included long positions in UnitedHealth Group, Inc. and Berkshire Hathaway, Inc. |
| • | The long portfolio was the primary detractor during the period. |
| • | Long positions in the information technology and industrials sectors were top detractors. |
| • | Top individual detractors included long positions in Tempur Sealy International, Inc. and Seagate Technology Holdings PLC. |
| Multi-Manager Directional Alternative Strategies Fund | Annual Report 2022 | 9 |
(Unaudited)
| 10 | Multi-Manager Directional Alternative Strategies Fund | Annual Report 2022 |
(Unaudited)
| November 1, 2021 — April 30, 2022 | |||||||
| Account value at the beginning of the period ($) | Account value at the end of the period ($) | Expenses paid during the period ($) | Fund’s annualized expense ratio (%) | ||||
| Actual | Hypothetical | Actual | Hypothetical | Actual | Hypothetical | Actual | |
| Institutional Class | 1,000.00 | 1,000.00 | 1,078.80 | 1,012.86 | 12.54 | 12.14 | 2.42 |
| Multi-Manager Directional Alternative Strategies Fund | Annual Report 2022 | 11 |
April 30, 2022
| Common Stocks 82.8% | ||
| Issuer | Shares | Value ($) |
| Communication Services 4.3% | ||
| Diversified Telecommunication Services 0.7% | ||
| Deutsche Telekom AG, Registered Shares | 31,117 | 573,211 |
| Liberty Global PLC, Class C(a),(b) | 15,285 | 362,255 |
| Lumen Technologies, Inc.(b) | 86,625 | 871,447 |
| Total | 1,806,913 | |
| Entertainment 0.3% | ||
| Activision Blizzard, Inc. | 6,710 | 507,276 |
| Live Nation Entertainment, Inc.(a) | 2,266 | 237,658 |
| Total | 744,934 | |
| Interactive Media & Services 1.8% | ||
| Alphabet, Inc., Class A(a),(b) | 1,361 | 3,106,061 |
| Alphabet, Inc., Class C(a),(b) | 490 | 1,126,672 |
| Meta Platforms, Inc., Class A(a) | 2,522 | 505,585 |
| Total | 4,738,318 | |
| Media 1.3% | ||
| Charter Communications, Inc., Class A(a) | 613 | 262,664 |
| Dentsu Group, Inc. | 12,300 | 443,312 |
| Gray Television, Inc. | 26,705 | 494,577 |
| Interpublic Group of Companies, Inc. (The)(b) | 15,256 | 497,651 |
| Nexstar Media Group, Inc., Class A | 8,536 | 1,352,273 |
| Omnicom Group, Inc. | 7,504 | 571,279 |
| Publicis Groupe SA | 396 | 23,775 |
| Total | 3,645,531 | |
| Wireless Telecommunication Services 0.2% | ||
| T-Mobile USA, Inc.(a) | 4,815 | 592,919 |
| Total Communication Services | 11,528,615 | |
| Consumer Discretionary 11.4% | ||
| Automobiles 2.1% | ||
| Ferrari NV | 1,826 | 382,985 |
| Harley-Davidson, Inc. | 18,968 | 691,384 |
| Tesla Motors, Inc.(a),(b) | 5,099 | 4,440,005 |
| Total | 5,514,374 | |
| Distributors 0.2% | ||
| LKQ Corp. | 11,022 | 547,022 |
| Common Stocks (continued) | ||
| Issuer | Shares | Value ($) |
| Diversified Consumer Services 0.2% | ||
| Stride, Inc.(a) | 14,684 | 577,081 |
| Hotels, Restaurants & Leisure 1.4% | ||
| Domino’s Pizza, Inc.(b) | 2,700 | 912,600 |
| Entain PLC(a) | 24,000 | 450,968 |
| Flutter Entertainment PLC(a) | 4,733 | 478,064 |
| International Game Technology PLC | 19,900 | 434,417 |
| Restaurant Brands International, Inc. | 8,118 | 463,457 |
| Travel + Leisure Co. | 9,975 | 553,413 |
| Wyndham Hotels & Resorts, Inc. | 4,010 | 352,720 |
| Wynn Macau Ltd.(a) | 232,800 | 142,992 |
| Yum! Brands, Inc.(b) | 450 | 52,654 |
| Total | 3,841,285 | |
| Household Durables 1.0% | ||
| Garmin Ltd. | 5,970 | 655,148 |
| Lennar Corp., Class A(b) | 1,059 | 81,003 |
| Mohawk Industries, Inc.(a) | 3,363 | 474,385 |
| PulteGroup, Inc.(b) | 10,564 | 441,153 |
| Sony Group Corp., ADR | 1,385 | 119,179 |
| Tempur Sealy International, Inc. | 18,184 | 492,968 |
| Whirlpool Corp.(b) | 2,027 | 367,941 |
| Total | 2,631,777 | |
| Internet & Direct Marketing Retail 0.4% | ||
| Amazon.com, Inc.(a),(b) | 147 | 365,388 |
| eBay, Inc.(b) | 10,806 | 561,047 |
| Total | 926,435 | |
| Leisure Products 0.4% | ||
| Callaway Golf Co.(a) | 17,621 | 386,605 |
| Hasbro, Inc. | 5,606 | 493,664 |
| Polaris, Inc. | 2,360 | 224,059 |
| Total | 1,104,328 | |
| Multiline Retail 3.3% | ||
| Dollar General Corp.(b) | 13,670 | 3,247,035 |
| Kohl’s Corp. | 1,965 | 113,734 |
| Target Corp.(b) | 23,338 | 5,336,234 |
| Total | 8,697,003 | |
| 12 | Multi-Manager Directional Alternative Strategies Fund | Annual Report 2022 |
April 30, 2022
| Common Stocks (continued) | ||
| Issuer | Shares | Value ($) |
| Specialty Retail 2.1% | ||
| AutoNation, Inc.(a) | 868 | 100,610 |
| AutoZone, Inc.(a),(b) | 784 | 1,533,089 |
| O’Reilly Automotive, Inc.(a),(b) | 4,122 | 2,500,199 |
| Ross Stores, Inc. | 6,460 | 644,514 |
| TJX Companies, Inc. (The) | 7,291 | 446,792 |
| Ulta Beauty, Inc.(a) | 1,049 | 416,243 |
| Total | 5,641,447 | |
| Textiles, Apparel & Luxury Goods 0.3% | ||
| Carter’s, Inc. | 3,207 | 270,157 |
| Pandora A/S | 5,184 | 455,189 |
| PVH Corp. | 1,909 | 138,937 |
| Total | 864,283 | |
| Total Consumer Discretionary | 30,345,035 | |
| Consumer Staples 6.3% | ||
| Beverages 1.1% | ||
| Carlsberg AS, Class B | 2,284 | 290,144 |
| Coca-Cola Bottling Co. Consolidated(b) | 409 | 180,574 |
| Coca-Cola Co. (The)(b) | 3,943 | 254,757 |
| Coca-Cola Europacific Partners PLC(b) | 30,711 | 1,534,014 |
| Keurig Dr. Pepper, Inc. | 16,613 | 621,326 |
| Molson Coors Beverage Co., Class B(b) | 2,261 | 122,411 |
| Total | 3,003,226 | |
| Food & Staples Retailing 1.7% | ||
| Alimentation Couche-Tard, Inc. | 6,900 | 307,174 |
| Carrefour SA | 13,292 | 281,891 |
| Costco Wholesale Corp.(b) | 441 | 234,488 |
| George Weston Ltd. | 3,100 | 385,663 |
| J. Sainsbury PLC | 69,488 | 202,749 |
| Jeronimo Martins SGPS SA | 24,000 | 499,599 |
| Koninklijke Ahold Delhaize NV | 1,020 | 30,086 |
| Kroger Co. (The)(b) | 17,128 | 924,227 |
| Loblaw Companies Ltd. | 1,500 | 137,209 |
| Tesco PLC | 55,695 | 189,214 |
| U.S. Foods Holding Corp.(a) | 14,104 | 530,592 |
| Walgreens Boots Alliance, Inc.(b) | 2,959 | 125,462 |
| Walmart, Inc. | 4,851 | 742,154 |
| Total | 4,590,508 | |
| Common Stocks (continued) | ||
| Issuer | Shares | Value ($) |
| Food Products 2.3% | ||
| Archer-Daniels-Midland Co.(b) | 10,446 | 935,544 |
| Bunge Ltd.(b) | 6,898 | 780,302 |
| Chocoladefabriken Lindt & Spruengli AG | 12 | 134,580 |
| ConAgra Foods, Inc.(b) | 1,579 | 55,154 |
| General Mills, Inc.(b) | 2,444 | 172,864 |
| Hershey Co. (The)(b) | 2,574 | 581,132 |
| JM Smucker Co. (The)(b) | 2,097 | 287,142 |
| Kellogg Co.(b) | 456 | 31,236 |
| Kraft Heinz Co. (The) | 16,966 | 723,261 |
| Tyson Foods, Inc., Class A(b) | 15,552 | 1,448,824 |
| WH Group Ltd. | 1,277,500 | 882,241 |
| Total | 6,032,280 | |
| Household Products 0.8% | ||
| Church & Dwight Co., Inc.(b) | 2,937 | 286,534 |
| Colgate-Palmolive Co.(b) | 3,019 | 232,614 |
| Kimberly-Clark Corp.(b) | 1,761 | 244,480 |
| Procter & Gamble Co. (The)(b) | 8,139 | 1,306,716 |
| Total | 2,070,344 | |
| Tobacco 0.4% | ||
| British American Tobacco PLC | 208 | 8,718 |
| British American Tobacco, ADR | 18,910 | 790,060 |
| Imperial Brands PLC | 17,358 | 361,316 |
| Philip Morris International, Inc.(b) | 203 | 20,300 |
| Total | 1,180,394 | |
| Total Consumer Staples | 16,876,752 | |
| Energy 6.8% | ||
| Energy Equipment & Services 0.6% | ||
| Halliburton Co. | 26,293 | 936,557 |
| Schlumberger NV | 20,614 | 804,152 |
| Total | 1,740,709 | |
| Oil, Gas & Consumable Fuels 6.2% | ||
| BP PLC | 30,312 | 146,340 |
| Canadian Natural Resources Ltd. | 4,300 | 266,137 |
| Canadian Natural Resources Ltd. | 9,499 | 587,703 |
| Cenovus Energy, Inc. | 63,016 | 1,165,010 |
| Centrus Energy Corp. Class A(a),(b) | 8,545 | 237,209 |
| ConocoPhillips Co.(b) | 8,148 | 778,297 |
| Multi-Manager Directional Alternative Strategies Fund | Annual Report 2022 | 13 |
April 30, 2022
| Common Stocks (continued) | ||
| Issuer | Shares | Value ($) |
| Devon Energy Corp.(b) | 20,637 | 1,200,454 |
| Diamondback Energy, Inc.(b) | 7,609 | 960,484 |
| Enerplus Corp. | 47,183 | 578,103 |
| ENI SpA | 14,823 | 207,208 |
| EOG Resources, Inc.(b) | 4,509 | 526,471 |
| Equinor ASA | 30,250 | 1,022,437 |
| Exxon Mobil Corp.(b) | 5,742 | 489,506 |
| Imperial Oil Ltd. | 15,100 | 760,260 |
| Inpex Corp. | 85,300 | 1,014,914 |
| Kosmos Energy Ltd.(a) | 43,260 | 292,438 |
| Marathon Petroleum Corp. | 10,436 | 910,645 |
| MEG Energy Corp.(a) | 45,148 | 678,283 |
| Occidental Petroleum Corp.(b) | 6,646 | 366,128 |
| Parex Resources, Inc. | 10,639 | 207,372 |
| PDC Energy, Inc. | 6,606 | 460,703 |
| Pioneer Natural Resources Co. | 2,993 | 695,783 |
| Range Resources Corp.(a) | 20,161 | 603,620 |
| Repsol SA | 34,419 | 513,459 |
| TotalEnergies SE, ADR | 5,377 | 261,914 |
| Tourmaline Oil Corp. | 17,900 | 921,857 |
| Valero Energy Corp. | 1,265 | 141,022 |
| Whiting Petroleum Corp. | 7,457 | 544,734 |
| Total | 16,538,491 | |
| Total Energy | 18,279,200 | |
| Financials 7.2% | ||
| Banks 3.3% | ||
| Banco Santander SA | 185,449 | 541,947 |
| Bank of America Corp.(b) | 21,730 | 775,326 |
| DBS Group Holdings Ltd. | 6,200 | 150,416 |
| East West Bancorp, Inc. | 10,411 | 742,304 |
| Fifth Third Bancorp | 19,998 | 750,525 |
| Hana Financial Group, Inc. | 5,416 | 201,078 |
| Huntington Bancshares, Inc. | 57,926 | 761,727 |
| ING Groep NV | 18,116 | 171,635 |
| JPMorgan Chase & Co.(b) | 6,009 | 717,234 |
| KeyCorp | 35,707 | 689,502 |
| NatWest Group PLC | 352,701 | 946,222 |
| Nordea Bank Abp | 35,020 | 349,152 |
| Regions Financial Corp. | 12,752 | 264,222 |
| Common Stocks (continued) | ||
| Issuer | Shares | Value ($) |
| Societe Generale SA | 759 | 18,242 |
| Truist Financial Corp. | 12,561 | 607,324 |
| United Overseas Bank Ltd. | 11,900 | 254,734 |
| Wells Fargo & Co.(b) | 21,623 | 943,412 |
| Total | 8,885,002 | |
| Capital Markets 0.8% | ||
| Charles Schwab Corp. (The) | 8,516 | 564,866 |
| Deutsche Bank AG, Registered Shares(a) | 6,972 | 69,716 |
| Franklin Resources, Inc.(b) | 12,246 | 301,129 |
| Goldman Sachs Group, Inc. (The) | 1,380 | 421,576 |
| S&P Global, Inc.(b) | 1,126 | 423,939 |
| UBS Group AG, Registered Shares | 17,439 | 293,673 |
| Total | 2,074,899 | |
| Consumer Finance 0.7% | ||
| Capital One Financial Corp. | 3,569 | 444,769 |
| Discover Financial Services | 4,745 | 533,622 |
| SLM Corp. | 29,401 | 491,879 |
| Synchrony Financial | 9,685 | 356,505 |
| Total | 1,826,775 | |
| Diversified Financial Services 1.1% | ||
| A-Mark Precious Metals, Inc.(b) | 6,921 | 545,375 |
| Berkshire Hathaway, Inc., Class B(a),(b) | 6,187 | 1,997,349 |
| Investor AB, Class A | 2,714 | 56,686 |
| Wendel SA | 2,242 | 223,380 |
| Total | 2,822,790 | |
| Insurance 1.3% | ||
| Aegon NV | 2,290 | 11,873 |
| Allstate Corp. (The) | 4,002 | 506,413 |
| American International Group, Inc. | 2,069 | 121,057 |
| Aon PLC, Class A | 1,454 | 418,737 |
| Chubb Ltd. | 980 | 202,321 |
| Direct Line Insurance Group PLC | 129,520 | 411,081 |
| Everest Re Group Ltd.(b) | 2,696 | 740,618 |
| RenaissanceRe Holdings Ltd. | 2,532 | 363,393 |
| Sampo OYJ, Class A | 7,313 | 355,101 |
| WR Berkley Corp. | 5,513 | 366,559 |
| Total | 3,497,153 | |
| Total Financials | 19,106,619 | |
| 14 | Multi-Manager Directional Alternative Strategies Fund | Annual Report 2022 |
April 30, 2022
| Common Stocks (continued) | ||
| Issuer | Shares | Value ($) |
| Health Care 14.6% | ||
| Biotechnology 2.1% | ||
| AbbVie, Inc.(b) | 17,112 | 2,513,411 |
| Amgen, Inc. | 3,057 | 712,862 |
| Catalyst Pharmaceuticals, Inc.(a),(b) | 47,151 | 359,291 |
| Gilead Sciences, Inc.(b) | 22,462 | 1,332,895 |
| iTeos Therapeutics, Inc.(a),(b) | 8,003 | 213,600 |
| Moderna, Inc.(a),(b) | 2,072 | 278,497 |
| Regeneron Pharmaceuticals, Inc.(a),(b) | 12 | 7,909 |
| Vir Biotechnology, Inc.(a),(b) | 9,388 | 191,046 |
| Total | 5,609,511 | |
| Health Care Equipment & Supplies 2.6% | ||
| Abbott Laboratories | 2,531 | 287,269 |
| Boston Scientific Corp.(a) | 7,130 | 300,244 |
| Envista Holdings Corp.(a) | 6,879 | 272,546 |
| Getinge AB, Series CPO | 3,384 | 97,892 |
| Medtronic PLC | 4,973 | 518,982 |
| Ortho Clinical Diagnostics Holdings PLC(a) | 2,286 | 40,256 |
| Stryker Corp. | 1,351 | 325,942 |
| Zimmer Biomet Holdings, Inc.(b) | 40,356 | 4,872,987 |
| Zynex, Inc.(b) | 39,456 | 251,335 |
| Total | 6,967,453 | |
| Health Care Providers & Services 4.9% | ||
| Amedisys, Inc.(a) | 838 | 106,971 |
| AmerisourceBergen Corp. | 451 | 68,232 |
| AMN Healthcare Services, Inc.(a),(b) | 4,142 | 404,880 |
| Anthem, Inc.(b) | 388 | 194,749 |
| Centene Corp.(a),(b) | 48,890 | 3,938,089 |
| Cigna Corp.(b) | 1,817 | 448,399 |
| Cross Country Healthcare, Inc.(a),(b) | 17,834 | 334,209 |
| CVS Health Corp.(b) | 9,722 | 934,576 |
| HCA Healthcare, Inc. | 3,468 | 744,059 |
| Humana, Inc. | 891 | 396,103 |
| Molina Healthcare, Inc.(a),(b) | 3,764 | 1,179,826 |
| R1 RCM, Inc.(a) | 6,200 | 139,624 |
| UnitedHealth Group, Inc.(b) | 8,221 | 4,180,790 |
| Universal Health Services, Inc., Class B | 468 | 57,344 |
| Total | 13,127,851 | |
| Common Stocks (continued) | ||
| Issuer | Shares | Value ($) |
| Life Sciences Tools & Services 1.0% | ||
| Avantor, Inc.(a) | 15,641 | 498,635 |
| ICON PLC(a) | 1,387 | 313,753 |
| IQVIA Holdings, Inc.(a) | 1,541 | 335,923 |
| Maravai LifeSciences Holdings, Inc., Class A(a),(b) | 5,462 | 167,847 |
| Sotera Health Co.(a) | 13,025 | 265,450 |
| Syneos Health, Inc.(a) | 960 | 70,166 |
| Thermo Fisher Scientific, Inc. | 1,820 | 1,006,314 |
| Total | 2,658,088 | |
| Pharmaceuticals 4.0% | ||
| Amphastar Pharmaceuticals, Inc.(a),(b) | 7,701 | 273,154 |
| AstraZeneca PLC | 2,936 | 391,783 |
| Bristol-Myers Squibb Co.(b) | 21,522 | 1,619,961 |
| Eli Lilly & Co.(b) | 621 | 181,413 |
| Hikma Pharmaceuticals PLC | 17,177 | 403,495 |
| Innoviva, Inc.(a),(b) | 20,168 | 344,066 |
| Johnson & Johnson(b) | 3,844 | 693,688 |
| Merck & Co., Inc.(b) | 10,228 | 907,121 |
| Novartis AG, ADR | 2,083 | 183,367 |
| Novartis AG, Registered Shares | 8,298 | 733,289 |
| Novo Nordisk A/S, Class B | 10,557 | 1,205,887 |
| Pfizer, Inc.(b) | 32,545 | 1,596,983 |
| Roche Holding AG | 483 | 194,043 |
| Sanofi | 3,957 | 418,235 |
| UCB SA | 2,356 | 267,813 |
| Viatris, Inc.(b) | 102,296 | 1,056,718 |
| Total | 10,471,016 | |
| Total Health Care | 38,833,919 | |
| Industrials 10.6% | ||
| Aerospace & Defense 0.8% | ||
| Boeing Co. (The)(a) | 1,117 | 166,254 |
| BWX Technologies, Inc. | 8,211 | 426,315 |
| Hexcel Corp. | 5,726 | 311,265 |
| Howmet Aerospace, Inc. | 10,290 | 351,095 |
| Lockheed Martin Corp.(b) | 412 | 178,034 |
| Maxar Technologies, Inc. | 2,272 | 73,181 |
| Multi-Manager Directional Alternative Strategies Fund | Annual Report 2022 | 15 |
April 30, 2022
| Common Stocks (continued) | ||
| Issuer | Shares | Value ($) |
| Northrop Grumman Corp.(b) | 949 | 416,991 |
| Textron, Inc. | 2,712 | 187,806 |
| Total | 2,110,941 | |
| Air Freight & Logistics 0.9% | ||
| CH Robinson Worldwide, Inc.(b) | 763 | 80,992 |
| Expeditors International of Washington, Inc.(b) | 15,978 | 1,582,941 |
| FedEx Corp. | 3,535 | 702,546 |
| Total | 2,366,479 | |
| Building Products 0.7% | ||
| Advanced Drainage Systems, Inc. | 6,354 | 651,031 |
| AGC, Inc. | 16,100 | 603,579 |
| Allegion PLC | 3,867 | 441,766 |
| Resideo Technologies, Inc.(a) | 13,675 | 307,551 |
| Total | 2,003,927 | |
| Commercial Services & Supplies 0.4% | ||
| Clean Harbors, Inc.(a) | 4,661 | 489,079 |
| Copart, Inc.(a) | 3,964 | 450,508 |
| Total | 939,587 | |
| Electrical Equipment 0.4% | ||
| ABB Ltd. | 5,835 | 175,062 |
| AMETEK, Inc. | 1,236 | 156,057 |
| Eaton Corp. PLC | 862 | 125,007 |
| nVent Electric PLC | 9,503 | 321,011 |
| Regal Rexnord Corp. | 1,440 | 183,226 |
| Sensata Technologies Holding(a) | 4,124 | 187,271 |
| Total | 1,147,634 | |
| Machinery 2.5% | ||
| AGCO Corp. | 2,980 | 379,652 |
| Allison Transmission Holdings, Inc. | 3,453 | 129,280 |
| Altra Industrial Motion Corp. | 2,483 | 96,837 |
| Caterpillar, Inc.(b) | 1,848 | 389,078 |
| Deere & Co. | 639 | 241,254 |
| Dover Corp. | 1,114 | 148,496 |
| Fortive Corp. | 5,518 | 317,285 |
| Middleby Corp. (The)(a) | 2,448 | 376,723 |
| Oshkosh Corp. | 1,810 | 167,316 |
| Otis Worldwide Corp. | 3,488 | 254,066 |
| PACCAR, Inc.(b) | 40,732 | 3,382,793 |
| Common Stocks (continued) | ||
| Issuer | Shares | Value ($) |
| Parker-Hannifin Corp. | 1,139 | 308,464 |
| Westinghouse Air Brake Technologies Corp. | 3,914 | 351,908 |
| Total | 6,543,152 | |
| Marine 0.2% | ||
| Nippon Yusen KK | 4,700 | 339,077 |
| ZIM Integrated Shipping Services Ltd.(b) | 5,329 | 296,452 |
| Total | 635,529 | |
| Professional Services 1.3% | ||
| ASGN, Inc.(a) | 3,548 | 402,521 |
| Leidos Holdings, Inc. | 3,738 | 386,920 |
| Persol Holdings Co., Ltd. | 1,900 | 37,695 |
| Robert Half International, Inc.(b) | 12,241 | 1,203,413 |
| Science Applications International Corp. | 7,592 | 631,882 |
| Teleperformance SA | 659 | 236,522 |
| TransUnion | 6,601 | 577,720 |
| Total | 3,476,673 | |
| Road & Rail 2.2% | ||
| Canadian National Railway Co. | 1,032 | 121,384 |
| Knight-Swift Transportation Holdings, Inc.(b) | 12,098 | 579,373 |
| Landstar System, Inc. | 2,539 | 393,291 |
| Norfolk Southern Corp. | 1,987 | 512,408 |
| Old Dominion Freight Line, Inc.(b) | 11,653 | 3,264,238 |
| Union Pacific Corp.(b) | 4,348 | 1,018,693 |
| Total | 5,889,387 | |
| Trading Companies & Distributors 1.2% | ||
| Marubeni Corp. | 102,200 | 1,115,577 |
| Mitsubishi Corp. | 5,100 | 171,235 |
| Mitsui & Co., Ltd. | 21,100 | 510,954 |
| Sumitomo Corp. | 60,800 | 962,077 |
| WESCO International, Inc.(a) | 3,696 | 455,569 |
| Total | 3,215,412 | |
| Total Industrials | 28,328,721 | |
| Information Technology 11.9% | ||
| Communications Equipment 0.3% | ||
| Cisco Systems, Inc.(b) | 16,515 | 808,905 |
| 16 | Multi-Manager Directional Alternative Strategies Fund | Annual Report 2022 |
April 30, 2022
| Common Stocks (continued) | ||
| Issuer | Shares | Value ($) |
| Electronic Equipment, Instruments & Components 0.9% | ||
| Arrow Electronics, Inc.(a),(b) | 11,138 | 1,312,725 |
| Flex Ltd.(a),(b) | 29,693 | 489,637 |
| Jabil, Inc. | 9,974 | 575,799 |
| Total | 2,378,161 | |
| IT Services 2.1% | ||
| Amdocs Ltd. | 5,782 | 460,768 |
| Capgemini SE | 2,936 | 597,708 |
| Cognizant Technology Solutions Corp., Class A | 9,346 | 756,091 |
| Concentrix Corp. | 3,785 | 596,062 |
| Fidelity National Information Services, Inc. | 5,302 | 525,693 |
| FleetCor Technologies, Inc.(a) | 3,492 | 871,324 |
| Gartner, Inc.(a),(b) | 1,423 | 413,453 |
| Global Payments, Inc. | 4,039 | 553,262 |
| VeriSign, Inc.(a),(b) | 2,481 | 443,330 |
| WEX, Inc.(a) | 2,473 | 411,111 |
| Total | 5,628,802 | |
| Semiconductors & Semiconductor Equipment 4.1% | ||
| Advanced Micro Devices, Inc.(a),(b) | 29,698 | 2,539,773 |
| Alpha & Omega Semiconductor Ltd.(a),(b) | 7,533 | 323,166 |
| Applied Materials, Inc. | 4,714 | 520,190 |
| Broadcom, Inc. | 786 | 435,751 |
| KLA Corp. | 1,167 | 372,576 |
| Lam Research Corp. | 1,002 | 466,692 |
| Microchip Technology, Inc. | 6,975 | 454,770 |
| Micron Technology, Inc. | 6,823 | 465,260 |
| NVIDIA Corp.(b) | 815 | 151,158 |
| NXP Semiconductors NV(b) | 23,689 | 4,048,450 |
| Qorvo, Inc.(a) | 4,335 | 493,236 |
| QUALCOMM, Inc. | 4,804 | 671,071 |
| Total | 10,942,093 | |
| Software 3.0% | ||
| Check Point Software Technologies Ltd.(a) | 4,547 | 574,241 |
| Dropbox, Inc., Class A(a),(b) | 21,820 | 474,585 |
| Fortinet, Inc.(a),(b) | 1,834 | 530,044 |
| Microsoft Corp.(b) | 15,203 | 4,219,137 |
| NortonLifeLock, Inc.(b) | 21,325 | 533,978 |
| Oracle Corp.(b) | 4,605 | 338,007 |
| Common Stocks (continued) | ||
| Issuer | Shares | Value ($) |
| Palo Alto Networks, Inc.(a),(b) | 1,100 | 617,408 |
| Sage Group PLC (The) | 5,601 | 51,398 |
| SS&C Technologies Holdings, Inc.(b) | 10,585 | 684,426 |
| Zoom Video Communications, Inc., Class A(a),(b) | 405 | 40,326 |
| Total | 8,063,550 | |
| Technology Hardware, Storage & Peripherals 1.5% | ||
| Apple, Inc.(b) | 8,649 | 1,363,515 |
| Avid Technology, Inc.(a),(b) | 9,381 | 297,472 |
| Hewlett Packard Enterprise Co.(b) | 42,756 | 658,870 |
| HP, Inc.(b) | 6,932 | 253,919 |
| NetApp, Inc. | 7,009 | 513,409 |
| Seagate Technology Holdings PLC(b) | 7,885 | 646,885 |
| Western Digital Corp.(a) | 1,614 | 85,655 |
| Total | 3,819,725 | |
| Total Information Technology | 31,641,236 | |
| Materials 5.6% | ||
| Chemicals 2.6% | ||
| Axalta Coating Systems Ltd.(a) | 21,678 | 549,971 |
| Cabot Corp. | 2,141 | 140,985 |
| CF Industries Holdings, Inc.(b) | 5,529 | 535,373 |
| Corteva, Inc. | 14,638 | 844,466 |
| DuPont de Nemours, Inc. | 12,167 | 802,170 |
| FMC Corp. | 2,328 | 308,553 |
| K+S AG(a) | 6,199 | 208,212 |
| Linde PLC | 983 | 306,657 |
| Mosaic Co. (The)(b) | 6,074 | 379,139 |
| Nutrien Ltd. | 12,000 | 1,179,216 |
| Olin Corp. | 7,678 | 440,717 |
| Scotts Miracle-Gro Co. (The), Class A | 1,524 | 158,389 |
| Solvay SA | 1,877 | 176,508 |
| Tronox Holdings PLC, Class A | 14,705 | 252,926 |
| Valvoline, Inc. | 17,098 | 516,873 |
| Yara International ASA | 1,512 | 76,883 |
| Total | 6,877,038 | |
| Containers & Packaging 0.3% | ||
| Avery Dennison Corp. | 1,562 | 282,097 |
| Crown Holdings, Inc. | 5,548 | 610,502 |
| Total | 892,599 | |
| Multi-Manager Directional Alternative Strategies Fund | Annual Report 2022 | 17 |
April 30, 2022
| Common Stocks (continued) | ||
| Issuer | Shares | Value ($) |
| Metals & Mining 2.6% | ||
| Alpha Metallurgical Resources, Inc.(a),(b) | 2,395 | 370,602 |
| BlueScope Steel Ltd. | 17,869 | 254,019 |
| Ferroglobe PLC(a) | 73,081 | 471,372 |
| Glencore PLC(a) | 215,043 | 1,325,023 |
| Norsk Hydro ASA | 19,349 | 162,484 |
| Nucor Corp.(b) | 5,972 | 924,346 |
| POSCO Holdings, Inc. | 2,322 | 530,175 |
| Rio Tinto Ltd. | 6,805 | 538,302 |
| Ryerson Holding Corp.(b) | 9,916 | 365,008 |
| South32 Ltd. | 337,096 | 1,122,643 |
| Steel Dynamics, Inc.(b) | 4,469 | 383,217 |
| Teck Resources Ltd., Class B | 1,400 | 55,231 |
| Warrior Met Coal, Inc.(b) | 8,843 | 301,281 |
| Total | 6,803,703 | |
| Paper & Forest Products 0.1% | ||
| West Fraser Timber Co., Ltd. | 3,187 | 280,111 |
| Total Materials | 14,853,451 | |
| Real Estate 2.4% | ||
| Equity Real Estate Investment Trusts (REITS) 2.2% | ||
| Americold Realty Trust | 18,790 | 495,680 |
| Essex Property Trust, Inc. | 1,050 | 345,733 |
| Extra Space Storage, Inc.(b) | 2,831 | 537,890 |
| Host Hotels & Resorts, Inc. | 19,949 | 405,962 |
| Iron Mountain, Inc.(b) | 7,557 | 406,038 |
| Klepierre | 6,206 | 148,545 |
| Lamar Advertising Co., Class A | 4,915 | 542,665 |
| Regency Centers Corp. | 3,918 | 269,676 |
| RioCan Real Estate Investment Trust | 22,100 | 412,875 |
| Segro PLC | 8,648 | 144,786 |
| Ventas, Inc. | 8,889 | 493,784 |
| Vicinity Centres | 547,031 | 713,774 |
| Welltower, Inc. | 11,472 | 1,041,772 |
| Total | 5,959,180 | |
| Common Stocks (continued) | ||
| Issuer | Shares | Value ($) |
| Real Estate Management & Development 0.2% | ||
| CBRE Group, Inc., Class A(a),(b) | 448 | 37,202 |
| City Developments Ltd. | 46,600 | 285,710 |
| New World Development Co., Ltd. | 59,000 | 225,663 |
| Total | 548,575 | |
| Total Real Estate | 6,507,755 | |
| Utilities 1.7% | ||
| Electric Utilities 0.8% | ||
| Electricite de France SA | 29,988 | 272,622 |
| Exelon Corp. | 26,986 | 1,262,405 |
| FirstEnergy Corp.(b) | 478 | 20,702 |
| Fortum OYJ | 37,934 | 630,686 |
| Total | 2,186,415 | |
| Independent Power and Renewable Electricity Producers 0.4% | ||
| Uniper SE | 25,931 | 666,547 |
| Vistra Corp.(b) | 16,079 | 402,297 |
| Total | 1,068,844 | |
| Multi-Utilities 0.5% | ||
| Engie SA | 72,421 | 854,602 |
| NiSource, Inc.(b) | 12,315 | 358,613 |
| Veolia Environnement SA | 613 | 17,885 |
| Total | 1,231,100 | |
| Total Utilities | 4,486,359 | |
| Total Common Stocks (Cost $203,255,611) | 220,787,662 | |
| Exchange-Traded Equity Funds 0.3% | ||
| Shares | Value ($) | |
| International Large Cap 0.3% | ||
| Invesco QQQ Trust Series 1 ETF | 2,402 | 752,426 |
| Total Exchange-Traded Equity Funds (Cost $770,629) | 752,426 | |
| 18 | Multi-Manager Directional Alternative Strategies Fund | Annual Report 2022 |
April 30, 2022
| Preferred Stocks 0.0% | |||
| Issuer | Shares | Value ($) | |
| Consumer Discretionary 0.0% | |||
| Automobiles 0.0% | |||
| BMW AG | 1,035 | 76,247 | |
| Total Consumer Discretionary | 76,247 | ||
| Total Preferred Stocks (Cost $78,651) | 76,247 | ||
| Warrants 0.0% | ||
| Issuer | Shares | Value ($) |
| Energy 0.0% | ||
| Oil, Gas & Consumable Fuels 0.0% | ||
| Vista Oil & Gas SAB de CV(a) | 692,543 | 128,962 |
| Total Energy | 128,962 | |
| Total Warrants (Cost $137,248) | 128,962 | |
| Money Market Funds 16.0% | ||
| Shares | Value ($) | |
| Columbia Short-Term Cash Fund, 0.462%(c),(d) | 42,575,028 | 42,562,256 |
| Total Money Market Funds (Cost $42,558,903) | 42,562,256 | |
| Total Investments (Cost $246,801,042) | 264,307,553 | |
| Investments in Securities Sold Short | ||
| Common Stocks (28.5)% | ||
| Issuer | Shares | Value ($) |
| Communication Services (1.2)% | ||
| Diversified Telecommunication Services (0.2)% | ||
| Cellnex Telecom SA | (7,871) | (366,869) |
| Proximus SADP | (7,223) | (126,246) |
| Telia Co. AB | (42,279) | (175,484) |
| Total | (668,599) | |
| Entertainment (0.4)% | ||
| CTS Eventim AG & Co. KGaA(a) | (4,183) | (287,105) |
| Lions Gate Entertainment Corp.(a) | (22,344) | (301,421) |
| Roblox Corp. Class A(a) | (3,482) | (106,723) |
| Roku, Inc.(a) | (2,868) | (266,437) |
| Total | (961,686) | |
| Common Stocks (continued) | ||
| Issuer | Shares | Value ($) |
| Interactive Media & Services (0.3)% | ||
| Angi, Inc.(a) | (49,343) | (217,603) |
| Genius Sports Ltd.(a) | (14,620) | (55,848) |
| Pinterest, Inc., Class A(a) | (10,316) | (211,684) |
| Vimeo, Inc.(a) | (35,913) | (365,954) |
| Total | (851,089) | |
| Media (0.3)% | ||
| Cable One, Inc. | (201) | (234,406) |
| Schibsted ASA | (5,404) | (104,573) |
| Schibsted ASA, Class A | (17,744) | (369,765) |
| Total | (708,744) | |
| Total Communication Services | (3,190,118) | |
| Consumer Discretionary (3.6)% | ||
| Auto Components (0.0)% | ||
| Luminar Technologies, Inc.(a) | (6,762) | (83,646) |
| Stoneridge, Inc.(a) | (3,367) | (66,364) |
| Total | (150,010) | |
| Automobiles (0.2)% | ||
| Rivian Automotive, Inc.(a) | (7,149) | (216,186) |
| Tata Motors Ltd.(a) | (12,156) | (342,921) |
| Total | (559,107) | |
| Hotels, Restaurants & Leisure (1.7)% | ||
| Bally’s Corp.(a) | (7,864) | (234,662) |
| Domino’s Pizza Group PLC | (34,729) | (151,797) |
| Huazhu Group Ltd., ADR | (9,408) | (284,498) |
| Hyatt Hotels Corp., Class A(a) | (3,922) | (372,433) |
| Las Vegas Sands Corp.(a) | (11,504) | (407,587) |
| Oriental Land Co., Ltd. | (4,100) | (620,208) |
| Papa John’s International, Inc. | (1,810) | (164,800) |
| PointsBet Holdings Ltd.(a) | (45,572) | (92,867) |
| Shake Shack, Inc., Class A(a) | (1,340) | (77,492) |
| Texas Roadhouse, Inc. | (1,999) | (164,578) |
| Whitbread PLC(a) | (13,260) | (462,865) |
| Wingstop, Inc. | (852) | (78,179) |
| Wynn Resorts Ltd.(a) | (20,064) | (1,414,111) |
| Yum China Holdings, Inc. | (3,642) | (152,235) |
| Total | (4,678,312) | |
| Multi-Manager Directional Alternative Strategies Fund | Annual Report 2022 | 19 |
April 30, 2022
| Common Stocks (continued) | ||
| Issuer | Shares | Value ($) |
| Household Durables (0.1)% | ||
| Fujitsu General Ltd. | (4,600) | (81,761) |
| iRobot Corp.(a) | (419) | (21,222) |
| Vuzix Corp.(a) | (19,081) | (98,649) |
| Total | (201,632) | |
| Internet & Direct Marketing Retail (0.6)% | ||
| Chewy, Inc., Class A(a) | (7,410) | (215,335) |
| Delivery Hero SE(a) | (6,873) | (241,606) |
| DoorDash, Inc., Class A(a) | (1,048) | (85,339) |
| Just Eat Takeaway.com NV(a) | (1,053) | (28,602) |
| Rakuten Group, Inc. | (34,600) | (243,234) |
| Revolve Group, Inc.(a) | (5,303) | (224,105) |
| Wayfair, Inc., Class A(a) | (5,813) | (447,252) |
| Total | (1,485,473) | |
| Leisure Products (0.1)% | ||
| Shimano, Inc. | (900) | (159,466) |
| Multiline Retail (0.0)% | ||
| Big Lots, Inc. | (2,841) | (87,787) |
| Specialty Retail (0.7)% | ||
| Carvana Co.(a) | (4,926) | (285,511) |
| Dick’s Sporting Goods, Inc. | (1,941) | (187,151) |
| Fast Retailing Co., Ltd. | (900) | (414,366) |
| Five Below, Inc.(a) | (1,473) | (231,408) |
| Floor & Decor Holdings, Inc., Class A(a) | (2,138) | (170,441) |
| National Vision Holdings, Inc.(a) | (3,076) | (115,811) |
| RH(a) | (414) | (139,154) |
| Warby Parker, Inc.(a) | (4,947) | (115,216) |
| Williams-Sonoma Inc | (1,486) | (193,893) |
| Total | (1,852,951) | |
| Textiles, Apparel & Luxury Goods (0.2)% | ||
| Moncler SpA | (3,372) | (175,660) |
| On Holding AG(a) | (5,090) | (127,097) |
| VF Corp. | (2,561) | (133,172) |
| Total | (435,929) | |
| Total Consumer Discretionary | (9,610,667) | |
| Common Stocks (continued) | ||
| Issuer | Shares | Value ($) |
| Consumer Staples (4.0)% | ||
| Beverages (0.2)% | ||
| Coca-Cola Bottlers Japan Holdings, Inc. | (27,900) | (312,771) |
| National Beverage Corp. | (5,810) | (256,105) |
| Total | (568,876) | |
| Food & Staples Retailing (0.3)% | ||
| Ocado Group PLC(a) | (58,786) | (672,315) |
| Rite Aid Corp.(a) | (6,623) | (42,189) |
| Sprouts Farmers Market, Inc.(a) | (3,148) | (93,810) |
| Total | (808,314) | |
| Food Products (1.0)% | ||
| B&G Foods, Inc. | (9,020) | (242,909) |
| Beyond Meat, Inc.(a) | (6,056) | (223,345) |
| Cal-Maine Foods, Inc. | (7,143) | (383,793) |
| Campbell Soup Co. | (5,563) | (262,685) |
| ConAgra Foods, Inc. | (12,283) | (429,045) |
| Freshpet, Inc.(a) | (3,361) | (313,749) |
| Hormel Foods Corp. | (5,130) | (268,761) |
| Kellogg Co. | (3,130) | (214,405) |
| Kikkoman Corp. | (4,100) | (230,425) |
| Tattooed Chef, Inc.(a) | (18,817) | (150,348) |
| Total | (2,719,465) | |
| Household Products (2.0)% | ||
| Kimberly-Clark Corp. | (38,276) | (5,313,857) |
| Tobacco (0.5)% | ||
| Altria Group, Inc. | (21,660) | (1,203,646) |
| Total Consumer Staples | (10,614,158) | |
| Energy (0.7)% | ||
| Oil, Gas & Consumable Fuels (0.7)% | ||
| Clean Energy Fuels Corp.(a) | (34,035) | (199,445) |
| Enbridge, Inc. | (8,200) | (357,834) |
| Gevo, Inc.(a) | (94,570) | (350,855) |
| Neste OYJ | (10,518) | (451,315) |
| Washington H. Soul Pattinson & Co., Ltd. | (21,902) | (426,785) |
| Total | (1,786,234) | |
| Total Energy | (1,786,234) | |
| 20 | Multi-Manager Directional Alternative Strategies Fund | Annual Report 2022 |
April 30, 2022
| Common Stocks (continued) | ||
| Issuer | Shares | Value ($) |
| Financials (4.1)% | ||
| Banks (2.0)% | ||
| Bank of Hawaii Corp. | (5,655) | (420,393) |
| Commerce Bancshares, Inc. | (6,939) | (474,419) |
| Commonwealth Bank of Australia | (7,221) | (524,848) |
| Community Bank System, Inc. | (7,186) | (462,778) |
| Cullen/Frost Bankers, Inc. | (3,478) | (460,105) |
| CVB Financial Corp. | (17,023) | (391,869) |
| First Financial Bankshares, Inc. | (11,321) | (452,614) |
| Glacier Bancorp, Inc. | (7,429) | (339,951) |
| Hang Seng Bank Ltd. | (27,600) | (488,671) |
| Independent Bank Corp. | (2,328) | (179,629) |
| Trustmark Corp. | (5,264) | (146,760) |
| United Bankshares, Inc. | (14,586) | (485,130) |
| Westamerica Bancorporation | (7,445) | (438,659) |
| Total | (5,265,826) | |
| Capital Markets (0.7)% | ||
| Ashmore Group PLC | (47,149) | (130,341) |
| B. Riley Financial, Inc. | (5,547) | (250,503) |
| Credit Suisse Group AG, Registered Shares | (61,156) | (415,085) |
| Deutsche Bank AG(a) | (40,341) | (403,383) |
| Hamilton Lane, Inc., Class A | (3,938) | (270,068) |
| Hargreaves Lansdown PLC | (9,370) | (107,271) |
| T Rowe Price Group, Inc. | (1,792) | (220,488) |
| WisdomTree Investments, Inc. | (23,688) | (138,101) |
| Total | (1,935,240) | |
| Consumer Finance (0.9)% | ||
| Credit Acceptance Corp.(a) | (920) | (471,500) |
| SoFi Technologies, Inc.(a) | (300,477) | (1,838,920) |
| Upstart Holdings, Inc.(a) | (912) | (68,418) |
| Total | (2,378,838) | |
| Insurance (0.5)% | ||
| eHealth, Inc.(a) | (1,028) | (8,276) |
| Goosehead Insurance, Inc. | (1,805) | (103,770) |
| Kinsale Capital Group, Inc. | (1,570) | (348,053) |
| Lemonade, Inc.(a) | (8,779) | (183,130) |
| RLI Corp. | (3,390) | (389,104) |
| Common Stocks (continued) | ||
| Issuer | Shares | Value ($) |
| Trupanion, Inc.(a) | (1,560) | (99,247) |
| Tryg A/S | (13,661) | (324,819) |
| Total | (1,456,399) | |
| Total Financials | (11,036,303) | |
| Health Care (2.4)% | ||
| Biotechnology (1.2)% | ||
| Allogene Therapeutics, Inc.(a) | (4,103) | (34,260) |
| Alnylam Pharmaceuticals, Inc.(a) | (3,428) | (457,398) |
| Apellis Pharmaceuticals, Inc.(a) | (2,849) | (124,017) |
| Argenx SE(a) | (1,917) | (552,304) |
| Ascendis Pharma A/S ADR(a) | (1,225) | (111,806) |
| CureVac NV(a) | (9,730) | (166,286) |
| Exact Sciences Corp.(a) | (11,582) | (637,589) |
| Global Blood Therapeutics, Inc.(a) | (4,615) | (141,680) |
| Idorsia Ltd.(a) | (6,769) | (115,536) |
| Inovio Pharmaceuticals, Inc.(a) | (6,727) | (18,365) |
| Myriad Genetics, Inc.(a) | (5,138) | (105,329) |
| Seagen, Inc.(a) | (4,225) | (553,517) |
| TG Therapeutics, Inc.(a) | (20,609) | (143,026) |
| Twist Bioscience Corp.(a) | (2,133) | (61,516) |
| Verve Therapeutics, Inc.(a) | (3,630) | (54,160) |
| Total | (3,276,789) | |
| Health Care Equipment & Supplies (0.2)% | ||
| Ambu A/S | (4,061) | (53,453) |
| Glaukos Corp.(a) | (2,010) | (95,053) |
| Novocure Ltd.(a) | (4,179) | (320,028) |
| Total | (468,534) | |
| Health Care Providers & Services (0.1)% | ||
| Alignment Healthcare, Inc.(a) | (5,753) | (55,286) |
| Fulgent Genetics, Inc.(a) | (1,124) | (61,685) |
| Guardant Health, Inc.(a) | (1,763) | (108,777) |
| Progyny, Inc.(a) | (3,424) | (131,653) |
| Total | (357,401) | |
| Multi-Manager Directional Alternative Strategies Fund | Annual Report 2022 | 21 |
April 30, 2022
| Common Stocks (continued) | ||
| Issuer | Shares | Value ($) |
| Health Care Technology (0.3)% | ||
| Definitive Healthcare Corp.(a) | (6,655) | (157,391) |
| GoodRx Holdings, Inc., Class A(a) | (8,666) | (117,424) |
| Phreesia, Inc.(a) | (14,171) | (324,233) |
| Teladoc Health, Inc.(a) | (1,673) | (56,480) |
| Total | (655,528) | |
| Life Sciences Tools & Services (0.2)% | ||
| 10X Genomics, Inc., Class A(a) | (8,245) | (393,781) |
| Brooks Automation, Inc. | (1,678) | (125,783) |
| Oxford Nanopore Technologies PLC(a) | (21,824) | (83,099) |
| Total | (602,663) | |
| Pharmaceuticals (0.4)% | ||
| Canopy Growth Corp.(a) | (79,800) | (460,295) |
| Cassava Sciences, Inc.(a) | (2,398) | (50,046) |
| Nippon Shinyaku Co., Ltd. | (2,000) | (135,268) |
| Phathom Pharmaceuticals, Inc.(a) | (12,441) | (160,987) |
| Royalty Pharma PLC, Class A | (3,373) | (143,622) |
| Taisho Pharmaceutical Holdings Co., Ltd. | (500) | (19,694) |
| Total | (969,912) | |
| Total Health Care | (6,330,827) | |
| Industrials (5.5)% | ||
| Aerospace & Defense (0.4)% | ||
| AeroVironment, Inc.(a) | (2,315) | (185,941) |
| Boeing Co. (The)(a) | (1,643) | (244,544) |
| CAE, Inc.(a) | (9,355) | (222,469) |
| Safran SA | (3,409) | (366,121) |
| Total | (1,019,075) | |
| Air Freight & Logistics (0.1)% | ||
| InPost SA(a) | (45,914) | (281,493) |
| Airlines (0.6)% | ||
| American Airlines Group, Inc.(a) | (26,362) | (494,815) |
| Frontier Group Holdings, Inc.(a) | (18,906) | (200,593) |
| Joby Aviation, Inc.(a) | (55,591) | (291,297) |
| United Continental Holdings, Inc.(a) | (10,539) | (532,219) |
| Wheels Up Experience, Inc.(a) | (60,643) | (184,961) |
| Total | (1,703,885) | |
| Common Stocks (continued) | ||
| Issuer | Shares | Value ($) |
| Building Products (0.7)% | ||
| Johnson Controls International PLC | (20,341) | (1,217,816) |
| Lennox International, Inc. | (745) | (158,827) |
| Tecnoglass, Inc. | (18,271) | (407,991) |
| Total | (1,784,634) | |
| Commercial Services & Supplies (0.1)% | ||
| Healthcare Services Group, Inc. | (5,360) | (91,603) |
| MSA Safety, Inc. | (2,354) | (284,104) |
| Total | (375,707) | |
| Construction & Engineering (0.1)% | ||
| MDU Resources Group, Inc. | (13,462) | (346,781) |
| Electrical Equipment (0.8)% | ||
| Ballard Power Systems, Inc.(a) | (54,000) | (448,511) |
| Blink Charging Co.(a) | (12,162) | (232,294) |
| FuelCell Energy, Inc.(a) | (29,714) | (121,233) |
| ITM Power PLC(a) | (68,730) | (283,155) |
| Nordex SE(a) | (18,145) | (261,871) |
| Plug Power, Inc.(a) | (19,499) | (409,869) |
| Sunrun, Inc.(a) | (14,404) | (287,792) |
| Vestas Wind Systems A/S | (2,310) | (58,907) |
| Total | (2,103,632) | |
| Industrial Conglomerates (1.1)% | ||
| 3M Co. | (18,941) | (2,731,671) |
| General Electric Co. | (2,565) | (191,221) |
| Total | (2,922,892) | |
| Machinery (0.6)% | ||
| Chart Industries, Inc.(a) | (2,631) | (444,165) |
| Enerpac Tool Group Corp. | (12,726) | (255,538) |
| McPhy Energy SA(a) | (9,435) | (172,352) |
| Proto Labs, Inc.(a) | (5,398) | (230,009) |
| Techtronic Industries Co., Ltd. | (17,500) | (233,592) |
| VAT Group AG | (800) | (247,449) |
| Total | (1,583,105) | |
| Professional Services (0.2)% | ||
| Dun & Bradstreet Holdings, Inc.(a) | (16,835) | (265,825) |
| ManpowerGroup, Inc. | (3,930) | (354,486) |
| Total | (620,311) | |
| 22 | Multi-Manager Directional Alternative Strategies Fund | Annual Report 2022 |
April 30, 2022
| Common Stocks (continued) | ||
| Issuer | Shares | Value ($) |
| Road & Rail (0.4)% | ||
| Grab Holdings Ltd. Class A(a) | (227,556) | (671,290) |
| Lyft, Inc.(a) | (8,279) | (269,895) |
| TuSimple Holdings, Inc.(a) | (16,885) | (175,098) |
| Uber Technologies, Inc.(a) | (115) | (3,620) |
| Total | (1,119,903) | |
| Trading Companies & Distributors (0.4)% | ||
| Custom Truck One Source, Inc.(a) | (40,171) | (263,923) |
| Triton International Ltd. | (10,664) | (651,464) |
| Total | (915,387) | |
| Total Industrials | (14,776,805) | |
| Information Technology (3.7)% | ||
| Electronic Equipment, Instruments & Components (0.4)% | ||
| 908 Devices, Inc.(a) | (12,374) | (219,639) |
| Itron, Inc.(a) | (3,516) | (167,994) |
| Novanta, Inc.(a) | (2,624) | (337,709) |
| PAR Technology Corp.(a) | (3,377) | (111,576) |
| Taiyo Yuden Co., Ltd. | (7,400) | (290,727) |
| Total | (1,127,645) | |
| IT Services (0.7)% | ||
| Affirm Holdings, Inc.(a) | (4,872) | (139,827) |
| Amadeus IT Holding SA, Class A(a) | (5,591) | (350,348) |
| Bechtle AG | (1,141) | (52,725) |
| BigCommerce Holdings, Inc., Series 1(a) | (14,354) | (256,506) |
| Megaport Ltd.(a) | (4,201) | (24,958) |
| Okta, Inc.(a) | (3,969) | (473,541) |
| Toast, Inc. Class A(a) | (7,191) | (133,968) |
| Twilio, Inc.(a) | (2,208) | (246,899) |
| Tyro Payments Ltd.(a) | (57,062) | (48,773) |
| Worldline SA(a) | (6,418) | (252,511) |
| Total | (1,980,056) | |
| Semiconductors & Semiconductor Equipment (0.5)% | ||
| Allegro MicroSystems, Inc.(a) | (12,376) | (300,861) |
| Melexis NV | (3,719) | (319,219) |
| SkyWater Technology, Inc.(a) | (4,629) | (28,329) |
| SunPower Corp.(a) | (16,580) | (273,736) |
| Wolfspeed, Inc.(a) | (3,286) | (301,359) |
| Total | (1,223,504) | |
| Common Stocks (continued) | ||
| Issuer | Shares | Value ($) |
| Software (1.6)% | ||
| Appfolio, Inc., Class A(a) | (2,811) | (291,951) |
| Appian Corp.(a) | (5,611) | (268,206) |
| AVEVA Group PLC | (5,576) | (149,861) |
| BlackBerry Ltd.(a) | (41,050) | (234,806) |
| Blackline, Inc.(a) | (4,081) | (273,631) |
| Ceridian HCM Holding, Inc.(a) | (5,043) | (283,064) |
| DocuSign, Inc.(a) | (2,338) | (189,378) |
| Duck Creek Technologies, Inc.(a) | (6,994) | (111,414) |
| Guidewire Software, Inc.(a) | (3,564) | (309,854) |
| Jamf Holding Corp.(a) | (9,136) | (281,389) |
| Lightspeed Commerce, Inc.(a) | (21,300) | (476,023) |
| Palantir Technologies, Inc., Class A(a) | (21,725) | (225,940) |
| Procore Technologies, Inc.(a) | (5,479) | (303,920) |
| Q2 Holdings, Inc.(a) | (4,812) | (248,925) |
| Unity Software, Inc.(a) | (4,175) | (277,262) |
| Wisetech Global Ltd. | (6,130) | (190,047) |
| Xero Ltd.(a) | (2,102) | (138,610) |
| Total | (4,254,281) | |
| Technology Hardware, Storage & Peripherals (0.5)% | ||
| Apple, Inc. | (8,036) | (1,266,875) |
| Total Information Technology | (9,852,361) | |
| Materials (2.2)% | ||
| Chemicals (0.6)% | ||
| Amyris, Inc.(a) | (57,864) | (198,473) |
| Aspen Aerogels, Inc.(a) | (8,234) | (177,854) |
| Eastman Chemical Co. | (1,864) | (191,377) |
| Ecolab, Inc. | (720) | (121,925) |
| EMS-Chemie Holding AG, Registered Shares | (199) | (177,533) |
| Mitsui Chemicals, Inc. | (5,200) | (118,809) |
| PureCycle Technologies, Inc.(a) | (16,732) | (130,510) |
| RPM International, Inc. | (1,619) | (134,215) |
| Umicore SA | (6,513) | (250,382) |
| Total | (1,501,078) | |
| Multi-Manager Directional Alternative Strategies Fund | Annual Report 2022 | 23 |
April 30, 2022
| Common Stocks (continued) | ||
| Issuer | Shares | Value ($) |
| Construction Materials (0.4)% | ||
| Cemex SAB de CV, ADR(a) | (61,583) | (270,965) |
| Holcim AG, Registered Shares(a) | (5,381) | (263,107) |
| Siam Cement PCL (The), NVDR | (18,000) | (193,463) |
| Sumitomo Osaka Cement Co., Ltd. | (5,100) | (142,609) |
| Summit Materials, Inc., Class A(a) | (8,471) | (235,494) |
| Total | (1,105,638) | |
| Containers & Packaging (0.2)% | ||
| Ball Corp. | (3,140) | (254,842) |
| Greif, Inc., Class A | (3,870) | (234,832) |
| Ranpak Holdings Corp.(a) | (9,146) | (137,922) |
| Total | (627,596) | |
| Metals & Mining (0.8)% | ||
| Allegheny Technologies, Inc.(a) | (15,408) | (418,789) |
| Antofagasta PLC | (11,236) | (215,101) |
| Compass Minerals International, Inc. | (6,693) | (395,757) |
| De Grey Mining Ltd.(a) | (252,274) | (212,255) |
| Greatland Gold PLC(a) | (984,608) | (164,365) |
| KGHM Polska Miedz SA | (6,333) | (204,861) |
| Southern Copper Corp. | (2,196) | (136,745) |
| Standard Lithium Ltd.(a) | (37,743) | (234,762) |
| Total | (1,982,635) | |
| Paper & Forest Products (0.2)% | ||
| Nippon Paper Industries Co., Ltd. | (42,900) | (340,748) |
| UPM-Kymmene Oyj | (7,214) | (249,549) |
| Total | (590,297) | |
| Total Materials | (5,807,244) | |
| Real Estate (0.8)% | ||
| Equity Real Estate Investment Trusts (REITS) (0.5)% | ||
| Alexandria Real Estate Equities, Inc. | (1,297) | (236,262) |
| Extra Space Storage, Inc. | (889) | (168,910) |
| Rexford Industrial Realty, Inc. | (4,520) | (352,741) |
| SL Green Realty Corp. | (4,015) | (277,918) |
| Unibail-Rodamco-Westfield(a) | (2,392) | (168,815) |
| Total | (1,204,646) | |
| Common Stocks (continued) | ||
| Issuer | Shares | Value ($) |
| Real Estate Management & Development (0.3)% | ||
| Howard Hughes Corp. (The)(a) | (3,051) | (305,985) |
| Redfin Corp.(a) | (21,494) | (239,658) |
| WeWork, Inc.(a) | (50,071) | (350,998) |
| Total | (896,641) | |
| Total Real Estate | (2,101,287) | |
| Utilities (0.3)% | ||
| Electric Utilities (0.1)% | ||
| Kyushu Electric Power Co., Inc. | (37,700) | (236,620) |
| Gas Utilities (0.1)% | ||
| Spire, Inc. | (3,103) | (225,743) |
| Independent Power and Renewable Electricity Producers (0.1)% | ||
| Neoen SA(a) | (8,292) | (331,313) |
| Total Utilities | (793,676) | |
| Total Common Stocks (Proceeds $91,556,819) | (75,899,680) | |
| Exchange-Traded Equity Funds (0.8)% | ||
| Shares | Value ($) | |
| U.S. Large Cap (0.8)% | ||
| SPDR S&P 500 ETF Trust | (5,552) | (2,287,424) |
| Total Exchange-Traded Equity Funds (Proceeds $2,283,762) | (2,287,424) | |
| Total Investments in Securities Sold Short (Proceeds $93,840,581) | (78,187,104) | |
| Total Investments in Securities, Net of Securities Sold Short | 186,120,449 | |
| Other Assets & Liabilities, Net | 80,579,975 | |
| Net Assets | 266,700,424 | |
| 24 | Multi-Manager Directional Alternative Strategies Fund | Annual Report 2022 |
April 30, 2022
| Total return swap contracts | ||||||||||||
| Fund receives | Fund pays | Payment frequency | Counterparty | Maturity date | Notional currency | Notional amount | Value ($) | Periodic payments receivable (payable) ($) | Upfront payments ($) | Upfront receipts ($) | Unrealized appreciation ($) | Unrealized depreciation ($) |
| SOFR minus 1.642%† | Total return on Sillajen, Inc. | Monthly | Macquarie | 09/19/2023 | USD | 32,148 | 23,776†† | (12) | — | — | 23,764 | — |
| SOFR minus 1.000% | Total return on Advantech Ltd. | Monthly | Macquarie | 09/19/2023 | USD | 278,767 | 5,293 | (57) | — | — | 5,236 | — |
| Total return on Samsung Electronics Co., Ltd. | SOFR plus 0.800% | Monthly | Macquarie | 09/19/2023 | USD | 226,582 | (4,669) | 791 | — | — | — | (3,878) |
| Total | 24,400 | 722 | — | — | 29,000 | (3,878) | ||||||
| † | Represents fair value as determined in good faith under procedures approved by the Board of Trustees. At April 30, 2022, the total value of these swap contracts amounted to $23,776, which represents 0.01% of total net assets. |
| †† | Valuation based on significant unobservable inputs. |
| Reference index and values for swap contracts as of period end | ||
| Reference index | Reference rate | |
| SOFR | Secured Overnight Financing Rate | 0.280% |
| (a) | Non-income producing investment. |
| (b) | This security or a portion of this security has been pledged as collateral in connection with investments sold short. |
| (c) | The rate shown is the seven-day current annualized yield at April 30, 2022. |
| (d) | As defined in the Investment Company Act of 1940, as amended, an affiliated company is one in which the Fund owns 5% or more of the company’s outstanding voting securities, or a company which is under common ownership or control with the Fund. The value of the holdings and transactions in these affiliated companies during the year ended April 30, 2022 are as follows: |
| Affiliated issuers | Beginning of period($) | Purchases($) | Sales($) | Net change in unrealized appreciation (depreciation)($) | End of period($) | Realized gain (loss)($) | Dividends($) | End of period shares |
| Columbia Short-Term Cash Fund, 0.462% | ||||||||
| 22,000,966 | 351,962,240 | (331,400,793) | (157) | 42,562,256 | (11,777) | 42,163 | 42,575,028 | |
| ADR | American Depositary Receipt |
| NVDR | Non-Voting Depositary Receipt |
| USD | US Dollar |
| Multi-Manager Directional Alternative Strategies Fund | Annual Report 2022 | 25 |
April 30, 2022
| ■ | Level 1 — Valuations based on quoted prices for investments in active markets that the Fund has the ability to access at the measurement date. Valuation adjustments are not applied to Level 1 investments. |
| ■ | Level 2 — Valuations based on other significant observable inputs (including quoted prices for similar securities, interest rates, prepayment speeds, credit risks, etc.). |
| ■ | Level 3 — Valuations based on significant unobservable inputs (including the Fund’s own assumptions and judgment in determining the fair value of investments). |
| Level 1 ($) | Level 2 ($) | Level 3 ($) | Total ($) | |
| Investments in Securities | ||||
| Common Stocks | ||||
| Communication Services | 10,488,317 | 1,040,298 | — | 11,528,615 |
| Consumer Discretionary | 28,817,822 | 1,527,213 | — | 30,345,035 |
| Consumer Staples | 13,996,214 | 2,880,538 | — | 16,876,752 |
| Energy | 15,374,842 | 2,904,358 | — | 18,279,200 |
| Financials | 15,345,356 | 3,761,263 | — | 19,106,619 |
| Health Care | 35,121,482 | 3,712,437 | — | 38,833,919 |
| Industrials | 24,176,943 | 4,151,778 | — | 28,328,721 |
| Information Technology | 30,992,130 | 649,106 | — | 31,641,236 |
| Materials | 10,459,202 | 4,394,249 | — | 14,853,451 |
| Real Estate | 4,989,277 | 1,518,478 | — | 6,507,755 |
| Utilities | 2,044,017 | 2,442,342 | — | 4,486,359 |
| Total Common Stocks | 191,805,602 | 28,982,060 | — | 220,787,662 |
| Exchange-Traded Equity Funds | 752,426 | — | — | 752,426 |
| Preferred Stocks | ||||
| Consumer Discretionary | — | 76,247 | — | 76,247 |
| Total Preferred Stocks | — | 76,247 | — | 76,247 |
| Warrants | ||||
| Energy | 128,962 | — | — | 128,962 |
| Total Warrants | 128,962 | — | — | 128,962 |
| Money Market Funds | 42,562,256 | — | — | 42,562,256 |
| Total Investments in Securities | 235,249,246 | 29,058,307 | — | 264,307,553 |
| Investments in Securities Sold Short |
| 26 | Multi-Manager Directional Alternative Strategies Fund | Annual Report 2022 |
April 30, 2022
| Level 1 ($) | Level 2 ($) | Level 3 ($) | Total ($) | |
| Common Stocks | ||||
| Communication Services | (1,760,076) | (1,430,042) | — | (3,190,118) |
| Consumer Discretionary | (6,938,235) | (2,672,432) | — | (9,610,667) |
| Consumer Staples | (9,398,647) | (1,215,511) | — | (10,614,158) |
| Energy | (908,134) | (878,100) | — | (1,786,234) |
| Financials | (8,641,885) | (2,394,418) | — | (11,036,303) |
| Health Care | (5,371,473) | (959,354) | — | (6,330,827) |
| Industrials | (12,871,865) | (1,904,940) | — | (14,776,805) |
| Information Technology | (8,034,582) | (1,817,779) | — | (9,852,361) |
| Materials | (3,274,462) | (2,532,782) | — | (5,807,244) |
| Real Estate | (1,932,472) | (168,815) | — | (2,101,287) |
| Utilities | (225,743) | (567,933) | — | (793,676) |
| Total Common Stocks | (59,357,574) | (16,542,106) | — | (75,899,680) |
| Exchange-Traded Equity Funds | (2,287,424) | — | — | (2,287,424) |
| Total Investments in Securities Sold Short | (61,644,998) | (16,542,106) | — | (78,187,104) |
| Total Investments in Securities, Net of Securities Sold Short | 173,604,248 | 12,516,201 | — | 186,120,449 |
| Investments in Derivatives | ||||
| Asset | ||||
| Swap Contracts | — | 5,236 | 23,764 | 29,000 |
| Liability | ||||
| Swap Contracts | — | (3,878) | — | (3,878) |
| Total | 173,604,248 | 12,517,559 | 23,764 | 186,145,571 |
| Multi-Manager Directional Alternative Strategies Fund | Annual Report 2022 | 27 |
April 30, 2022
| Assets | |
| Investments in securities, at value | |
| Unaffiliated issuers (cost $204,242,139) | $221,745,297 |
| Affiliated issuers (cost $42,558,903) | 42,562,256 |
| Cash | 212 |
| Cash collateral held at broker for: | |
| Swap contracts | 60,000 |
| Securities sold short | 83,026,347 |
| Unrealized appreciation on swap contracts | 29,000 |
| Receivable for: | |
| Investments sold | 10,578,243 |
| Capital shares sold | 839,658 |
| Dividends | 259,715 |
| Foreign tax reclaims | 268,900 |
| Expense reimbursement due from Investment Manager | 1,935 |
| Prepaid expenses | 2,535 |
| Trustees’ deferred compensation plan | 38,781 |
| Total assets | 359,412,879 |
| Liabilities | |
| Securities sold short, at value (proceeds $93,840,581) | 78,187,104 |
| Foreign currency (cost $11,203) | 11,204 |
| Unrealized depreciation on swap contracts | 3,878 |
| Payable for: | |
| Investments purchased | 13,953,188 |
| Capital shares purchased | 198,023 |
| Dividends and interest on securities sold short | 116,852 |
| Management services fees | 11,845 |
| Transfer agent fees | 34,271 |
| Compensation of board members | 9,566 |
| Other expenses | 147,743 |
| Trustees’ deferred compensation plan | 38,781 |
| Total liabilities | 92,712,455 |
| Net assets applicable to outstanding capital stock | $266,700,424 |
| Represented by | |
| Paid in capital | 219,621,195 |
| Total distributable earnings (loss) | 47,079,229 |
| Total - representing net assets applicable to outstanding capital stock | $266,700,424 |
| Institutional Class | |
| Net assets | $266,700,424 |
| Shares outstanding | 35,935,926 |
| Net asset value per share | $7.42 |
| 28 | Multi-Manager Directional Alternative Strategies Fund | Annual Report 2022 |
Year Ended April 30, 2022
| Net investment income | |
| Income: | |
| Dividends — unaffiliated issuers | $3,997,407 |
| Dividends — affiliated issuers | 42,163 |
| Foreign taxes withheld | (211,868) |
| Total income | 3,827,702 |
| Expenses: | |
| Management services fees | 4,300,211 |
| Transfer agent fees | |
| Institutional Class | 491,719 |
| Compensation of board members | 17,450 |
| Custodian fees | 392,555 |
| Printing and postage fees | 57,125 |
| Registration fees | 43,228 |
| Audit fees | 82,150 |
| Legal fees | 13,508 |
| Interest on collateral | 885 |
| Dividends and interest on securities sold short | 1,581,090 |
| Interest on interfund lending | 19 |
| Compensation of chief compliance officer | 87 |
| Other | 25,607 |
| Total expenses | 7,005,634 |
| Fees waived or expenses reimbursed by Investment Manager and its affiliates | (478,398) |
| Total net expenses | 6,527,236 |
| Net investment loss | (2,699,534) |
| Realized and unrealized gain (loss) — net | |
| Net realized gain (loss) on: | |
| Investments — unaffiliated issuers | 27,124,969 |
| Investments — affiliated issuers | (11,777) |
| Foreign currency translations | (991,725) |
| Forward foreign currency exchange contracts | (817,171) |
| Futures contracts | 4,217,580 |
| Securities sold short | 1,996,149 |
| Swap contracts | 11,585,694 |
| Net realized gain | 43,103,719 |
| Net change in unrealized appreciation (depreciation) on: | |
| Investments — unaffiliated issuers | (33,381,071) |
| Investments — affiliated issuers | (157) |
| Foreign currency translations | (955,340) |
| Forward foreign currency exchange contracts | 55,175 |
| Futures contracts | (1,814,575) |
| Securities sold short | 23,807,102 |
| Swap contracts | 1,029,908 |
| Net change in unrealized appreciation (depreciation) | (11,258,958) |
| Net realized and unrealized gain | 31,844,761 |
| Net increase in net assets resulting from operations | $29,145,227 |
| Multi-Manager Directional Alternative Strategies Fund | Annual Report 2022 | 29 |
| Year Ended April 30, 2022 | Year Ended April 30, 2021 | |
| Operations | ||
| Net investment loss | $(2,699,534) | $(3,194,998) |
| Net realized gain | 43,103,719 | 15,647,061 |
| Net change in unrealized appreciation (depreciation) | (11,258,958) | 34,887,283 |
| Net increase in net assets resulting from operations | 29,145,227 | 47,339,346 |
| Distributions to shareholders | ||
| Net investment income and net realized gains | ||
| Institutional Class | (19,622,766) | — |
| Total distributions to shareholders | (19,622,766) | — |
| Increase (decrease) in net assets from capital stock activity | (21,172,260) | 9,851,969 |
| Total increase (decrease) in net assets | (11,649,799) | 57,191,315 |
| Net assets at beginning of year | 278,350,223 | 221,158,908 |
| Net assets at end of year | $266,700,424 | $278,350,223 |
| Year Ended | Year Ended | |||
| April 30, 2022 | April 30, 2021 | |||
| Shares | Dollars ($) | Shares | Dollars ($) | |
| Capital stock activity | ||||
| Institutional Class | ||||
| Subscriptions | 7,824,223 | 58,217,586 | 8,789,623 | 55,388,433 |
| Distributions reinvested | 2,767,668 | 19,622,766 | — | — |
| Redemptions | (13,156,101) | (99,012,612) | (7,151,858) | (45,536,464) |
| Net increase (decrease) | (2,564,210) | (21,172,260) | 1,637,765 | 9,851,969 |
| Total net increase (decrease) | (2,564,210) | (21,172,260) | 1,637,765 | 9,851,969 |
| 30 | Multi-Manager Directional Alternative Strategies Fund | Annual Report 2022 |
| Institutional Class | Year Ended April 30, | ||||
| 2022 | 2021 | 2020 | 2019 | 2018 | |
| Per share data | |||||
| Net asset value, beginning of period | $7.23 | $6.00 | $6.78 | $10.82 | $10.60 |
| Income (loss) from investment operations: | |||||
| Net investment loss | (0.07) | (0.08) | (0.01) | (0.01) | (0.09) |
| Net realized and unrealized gain (loss) | 0.80 | 1.31 | (0.72) | (0.80) | 0.92 |
| Total from investment operations | 0.73 | 1.23 | (0.73) | (0.81) | 0.83 |
| Distributions to shareholders | |||||
| Distributions from net investment income | (0.08) | — | — | (0.06) | (0.18) |
| Distributions from net realized gains | (0.46) | — | (0.05) | (3.17) | (0.43) |
| Total distributions to shareholders | (0.54) | — | (0.05) | (3.23) | (0.61) |
| Net asset value, end of period | $7.42 | $7.23 | $6.00 | $6.78 | $10.82 |
| Total return | 10.42% | 20.50% | (10.81%) | (5.65%) | 7.67% |
| Ratios to average net assets | |||||
| Total gross expenses(a) | 2.61%(b),(c),(d) | 2.90%(b),(c),(d) | 2.31%(b),(c) | 2.16%(b),(c),(d) | 2.36%(b) |
| Total net expenses(a),(e) | 2.43%(b),(c),(d) | 2.71%(b),(c),(d) | 2.19%(b),(c) | 2.12%(b),(c),(d) | 2.36%(b) |
| Net investment loss | (1.00%) | (1.31%) | (0.14%) | (0.11%) | (0.83%) |
| Supplemental data | |||||
| Net assets, end of period (in thousands) | $266,700 | $278,350 | $221,159 | $251,976 | $290,666 |
| Portfolio turnover | 323% | 254% | 197% | 146%(f) | 158% |
| Notes to Financial Highlights | |
| (a) | In addition to the fees and expenses that the Fund bears directly, the Fund indirectly bears a pro rata share of the fees and expenses of any other funds in which it invests. Such indirect expenses are not included in the Fund’s reported expense ratios. |
| (b) | Ratios include dividends and interest on securities sold short. If dividends and interest on securities sold short had been excluded, expenses would have been lower by: |
| Class | 4/30/2022 | 4/30/2021 | 4/30/2020 | 4/30/2019 | 4/30/2018 |
| Institutional Class | 0.59% | 0.87% | 0.32% | 0.19% | 0.40% |
| (c) | Ratios include interest on collateral expense which is less than 0.01%. |
| (d) | Ratios include interfund lending expense which is less than 0.01%. |
| (e) | Total net expenses include the impact of certain fee waivers/expense reimbursements made by the Investment Manager and certain of its affiliates, if applicable. |
| (f) | The rate for the year ended April 30, 2019, as disclosed in the April 30, 2020 and 2019 financial statements was calculated and presented incorrectly and has been corrected. |
| Multi-Manager Directional Alternative Strategies Fund | Annual Report 2022 | 31 |
April 30, 2022
| 32 | Multi-Manager Directional Alternative Strategies Fund | Annual Report 2022 |
April 30, 2022
| Multi-Manager Directional Alternative Strategies Fund | Annual Report 2022 | 33 |
April 30, 2022
| 34 | Multi-Manager Directional Alternative Strategies Fund | Annual Report 2022 |
April 30, 2022
| Multi-Manager Directional Alternative Strategies Fund | Annual Report 2022 | 35 |
April 30, 2022
| Asset derivatives | ||
| Risk exposure category | Statement of assets and liabilities location | Fair value ($) |
| Equity risk | Component of total distributable earnings (loss) — unrealized appreciation on swap contracts | 29,000* |
| Liability derivatives | ||
| Risk exposure category | Statement of assets and liabilities location | Fair value ($) |
| Equity risk | Component of total distributable earnings (loss) — unrealized depreciation on swap contracts | 3,878* |
| * | Includes cumulative appreciation (depreciation) as reported in the tables following the Portfolio of Investments. Only the current day’s variation margin is reported in receivables or payables in the Statement of Assets and Liabilities. |
| 36 | Multi-Manager Directional Alternative Strategies Fund | Annual Report 2022 |
April 30, 2022
| Amount of realized gain (loss) on derivatives recognized in income | ||||
| Risk exposure category | Forward foreign currency exchange contracts ($) | Futures contracts ($) | Swap contracts ($) | Total ($) |
| Equity risk | — | 4,217,580 | 11,585,694 | 15,803,274 |
| Foreign exchange risk | (817,171) | — | — | (817,171) |
| Total | (817,171) | 4,217,580 | 11,585,694 | 14,986,103 |
| Change in unrealized appreciation (depreciation) on derivatives recognized in income | ||||
| Risk exposure category | Forward foreign currency exchange contracts ($) | Futures contracts ($) | Swap contracts ($) | Total ($) |
| Equity risk | — | (1,814,575) | 1,029,908 | (784,667) |
| Foreign exchange risk | 55,175 | — | — | 55,175 |
| Total | 55,175 | (1,814,575) | 1,029,908 | (729,492) |
| Derivative instrument | Average notional amounts ($) |
| Futures contracts — long | 22,891,759* |
| Futures contracts — short | 212,927** |
| Derivative instrument | Average unrealized appreciation ($)* | Average unrealized depreciation ($)* |
| Forward foreign currency exchange contracts | 81,237 | (213,320) |
| Total return swap contracts | 207,325 | (370,788) |
| * | Based on the ending quarterly outstanding amounts for the year ended April 30, 2022. |
| ** | Based on the ending daily outstanding amounts for the year ended April 30, 2022. |
| Multi-Manager Directional Alternative Strategies Fund | Annual Report 2022 | 37 |
April 30, 2022
| Citi ($) | JPMorgan ($) | Macquarie ($) | Morgan Stanley ($) | Total ($) | |
| Assets | |||||
| OTC total return swap contracts (a) | - | - | 29,000 | - | 29,000 |
| Liabilities | |||||
| OTC total return swap contracts (a) | - | - | 3,878 | - | 3,878 |
| Securities borrowed | 17,311,274 | 5,646,129 | - | 55,229,701 | 78,187,104 |
| Total liabilities | 17,311,274 | 5,646,129 | 3,878 | 55,229,701 | 78,190,982 |
| Total financial and derivative net assets | (17,311,274) | (5,646,129) | 25,122 | (55,229,701) | (78,161,982) |
| Total collateral received (pledged) (b) | (17,311,274) | (5,646,129) | - | (55,229,701) | (78,187,104) |
| Net amount (c) | - | - | 25,122 | - | 25,122 |
| (a) | Over-the-Counter (OTC) swap contracts are presented at market value plus periodic payments receivable (payable), which is comprised of unrealized appreciation, unrealized depreciation, upfront payments and upfront receipts. |
| (b) | In some instances, the actual collateral received and/or pledged may be more than the amount shown due to overcollateralization. |
| (c) | Represents the net amount due from/(to) counterparties in the event of default. |
| 38 | Multi-Manager Directional Alternative Strategies Fund | Annual Report 2022 |
April 30, 2022
| Multi-Manager Directional Alternative Strategies Fund | Annual Report 2022 | 39 |
April 30, 2022
| Effective rate (%) | |
| Institutional Class | 0.18 |
| 40 | Multi-Manager Directional Alternative Strategies Fund | Annual Report 2022 |
April 30, 2022
| Fee rate(s) contractual through August 31, 2022 | |
| Institutional Class | 1.84% |
| Undistributed net investment income ($) | Accumulated net realized gain ($) | Paid in capital ($) |
| 9,918,081 | (10,167,347) | 249,266 |
| Year Ended April 30, 2022 | Year Ended April 30, 2021 | ||||
| Ordinary income ($) | Long-term capital gains ($) | Total ($) | Ordinary income ($) | Long-term capital gains ($) | Total ($) |
| 2,950,230 | 16,672,536 | 19,622,766 | — | — | — |
| Multi-Manager Directional Alternative Strategies Fund | Annual Report 2022 | 41 |
April 30, 2022
| Undistributed ordinary income ($) | Undistributed long-term capital gains ($) | Capital loss carryforwards ($) | Net unrealized appreciation ($) |
| 15,484,169 | 11,863,827 | — | 20,711,324 |
| Federal tax cost ($) | Gross unrealized appreciation ($) | Gross unrealized (depreciation) ($) | Net unrealized appreciation ($) |
| 165,434,247 | 33,732,420 | (13,021,096) | 20,711,324 |
| Borrower or lender | Average loan balance ($) | Weighted average interest rate (%) | Number of days with outstanding loans |
| Borrower | 550,000 | 0.64 | 2 |
| 42 | Multi-Manager Directional Alternative Strategies Fund | Annual Report 2022 |
April 30, 2022
| Multi-Manager Directional Alternative Strategies Fund | Annual Report 2022 | 43 |
April 30, 2022
| 44 | Multi-Manager Directional Alternative Strategies Fund | Annual Report 2022 |
April 30, 2022
| Multi-Manager Directional Alternative Strategies Fund | Annual Report 2022 | 45 |
| 46 | Multi-Manager Directional Alternative Strategies Fund | Annual Report 2022 |
| Qualified dividend income | Dividends received deduction | Capital gain dividend |
| 18.52% | 10.01% | $23,416,948 |
| Name, address, year of birth | Position held with the Columbia Funds and length of service | Principal occupation(s) during past five years and other relevant professional experience | Number of Funds in the Columbia Funds Complex* overseen | Other directorships held by Trustee during the past five years |
| George S. Batejan c/o Columbia Management Investment Advisers, LLC 290 Congress Street Boston, MA 02210 1953 | Trustee since 2017 | Executive Vice President, Global Head of Technology and Operations, Janus Capital Group, Inc., 2010-2016 | 176 | Former Chairman of the Board, NICSA (National Investment Company Services Association) (Executive Committee, Nominating Committee and Governance Committee), 2014-2016; former Director, Intech Investment Management, 2011-2016; former Board Member, Metro Denver Chamber of Commerce, 2015-2016; former Advisory Board Member, University of Colorado Business School, 2015-2018 |
| Multi-Manager Directional Alternative Strategies Fund | Annual Report 2022 | 47 |
(Unaudited)
Independent trustees (continued)
| Name, address, year of birth | Position held with the Columbia Funds and length of service | Principal occupation(s) during past five years and other relevant professional experience | Number of Funds in the Columbia Funds Complex* overseen | Other directorships held by Trustee during the past five years |
| Kathleen Blatz c/o Columbia Management Investment Advisers, LLC 290 Congress Street Boston, MA 02210 1954 | Trustee since 2006 | Attorney, specializing in arbitration and mediation; Chief Justice, Minnesota Supreme Court, 1998-2006; Associate Justice, Minnesota Supreme Court, 1996-1998; Fourth Judicial District Court Judge, Hennepin County, 1994-1996; Attorney in private practice and public service, 1984-1993; State Representative, Minnesota House of Representatives, 1979-1993, which included service on the Tax and Financial Institutions and Insurance Committees; Member and Interim Chair, Minnesota Sports Facilities Authority, January 2017-July 2017; Interim President and Chief Executive Officer, Blue Cross and Blue Shield of Minnesota (health care insurance), February-July 2018, April-October 2021 | 176 | Former Trustee, Blue Cross and Blue Shield of Minnesota, 2009-2021 (Chair of the Business Development Committee, 2014-2017; Chair of the Governance Committee, 2017-2019); former Member and Chair of the Board, Minnesota Sports Facilities Authority, January 2017-July 2017; former Director, Robina Foundation, 2009-2020 (Chair, 2014-2020); Director, Schulze Family Foundation, since 2021 |
| Pamela G. Carlton c/o Columbia Management Investment Advisers, LLC 290 Congress Street Boston, MA 02210 1954 | Trustee since 2007 | President, Springboard — Partners in Cross Cultural Leadership (consulting company) since 2003; Managing Director of US Equity Research, JP Morgan Chase, 1999-2003; Director of US Equity Research, Chase Asset Management, 1996-1999; Co-Director Latin America Research, 1993-1996, COO Global Research, 1992-1996, Co-Director of US Research, 1991-1992, Investment Banker, 1982-1991, Morgan Stanley; Attorney, Cleary Gottlieb Steen & Hamilton LLP, 1980-1982 | 176 | Trustee, New York Presbyterian Hospital Board (Executive Committee and Chair of People Committee) since 1996; Director, DR Bank (Audit Committee) since 2017; Director, Evercore Inc. (Audit Committee) since 2019; Director, Apollo Commercial Real Estate Finance, Inc. since 2021; the Governing Council of the Independent Directors Council (IDC), since 2021 |
| Janet Langford Carrig c/o Columbia Management Investment Advisers, LLC 290 Congress Street Boston, MA 02210 1957 | Trustee since 1996 | Senior Vice President, General Counsel and Corporate Secretary, ConocoPhillips (independent energy company), September 2007-October 2018 | 174 | Director, EQT Corporation (natural gas producer) since 2019; Director, Whiting Petroleum Corporation (independent oil and gas company) since 2020 |
| J. Kevin Connaughton c/o Columbia Management Investment Advisers, LLC 290 Congress Street Boston, MA 02210 1964 | Trustee since 2020 | Member, FINRA National Adjudicatory Council since January 2020; Adjunct Professor of Finance, Bentley University since January 2018; Consultant to Independent Trustees of CFVIT and CFST I from March 2016 to June 2020 with respect to CFVIT and to December 2020 with respect to CFST I; Managing Director and General Manager of Mutual Fund Products, Columbia Management Investment Advisers, LLC, May 2010-February 2015; President, Columbia Funds, 2008-2015; and senior officer of Columbia Funds and affiliated funds, 2003-2015 | 174 | Former Director, The Autism Project, March 2015-December 2021; former Member of the Investment Committee, St. Michael’s College, November 2015-February 2020; former Trustee, St. Michael’s College, June 2017-September 2019; former Trustee, New Century Portfolios, January 2015-December 2017 |
| 48 | Multi-Manager Directional Alternative Strategies Fund | Annual Report 2022 |
(Unaudited)
Independent trustees (continued)
| Name, address, year of birth | Position held with the Columbia Funds and length of service | Principal occupation(s) during past five years and other relevant professional experience | Number of Funds in the Columbia Funds Complex* overseen | Other directorships held by Trustee during the past five years |
| Olive M. Darragh c/o Columbia Management Investment Advisers, LLC 290 Congress Street Boston, MA 02210 1962 | Trustee since 2020 | Managing Director of Darragh Inc. (strategy and talent management consulting firm) since 2010; Founder and CEO, Zolio, Inc. (investment management talent identification platform) since 2004; Consultant to Independent Trustees of CFVIT and CFST I from June 2019 to June 2020 with respect to CFVIT and to December 2020 with respect to CFST I; Partner, Tudor Investments, 2004-2010; Senior Partner, McKinsey & Company (consulting), 1990-2004; Touche Ross CPA, 1985-1988 | 174 | Former Director, University of Edinburgh Business School (Member of US Board); former Director, Boston Public Library Foundation |
| Patricia M. Flynn c/o Columbia Management Investment Advisers, LLC 290 Congress Street Boston, MA 02210 1950 | Trustee since 2004 | Trustee Professor of Economics and Management, Bentley University since 1976 (also teaches and conducts research on corporate governance); Dean, McCallum Graduate School of Business, Bentley University, 1992-2002 | 176 | Trustee, MA Taxpayers Foundation since 1997; Board of Governors, Innovation Institute, MA Technology Collaborative, 2010-2020; former Board of Directors, The MA Business Roundtable, 2003-2019 |
| Brian J. Gallagher c/o Columbia Management Investment Advisers, LLC 290 Congress Street Boston, MA 02210 1954 | Trustee since 2017 | Retired; Partner with Deloitte & Touche LLP and its predecessors, 1977-2016 | 176 | Trustee, Catholic Schools Foundation since 2004 |
| Douglas A. Hacker c/o Columbia Management Investment Advisers, LLC 290 Congress Street Boston, MA 02210 1955 | Co-Chair since 2021; Chair of CFST I and CFVIT since 2014; Trustee of CFST I and CFVIT since 1996 and CFST, CFST II, CFVST II, CET I and CET II since 2021 | Independent business executive since May 2006; Executive Vice President – Strategy of United Airlines, December 2002 - May 2006; President of UAL Loyalty Services (airline marketing company), September 2001-December 2002; Executive Vice President and Chief Financial Officer of United Airlines, July 1999-September 2001 | 176 | Director, Spartan Nash Company (food distributor); Director, Aircastle Limited (Chair of Audit Committee) (aircraft leasing); former Director, Nash Finch Company (food distributor), 2005-2013; former Director, SeaCube Container Leasing Ltd. (container leasing), 2010-2013; and former Director, Travelport Worldwide Limited (travel information technology), 2014-2019 |
| Nancy T. Lukitsh c/o Columbia Management Investment Advisers, LLC 290 Congress Street Boston, MA 02210 1956 | Trustee since 2011 | Senior Vice President, Partner and Director of Marketing, Wellington Management Company, LLP (investment adviser), 1997-2010; Chair, Wellington Management Portfolios (commingled non-U.S. investment pools), 2007 -2010; Director, Wellington Trust Company, NA and other Wellington affiliates, 1997-2010 | 174 | None |
| Multi-Manager Directional Alternative Strategies Fund | Annual Report 2022 | 49 |
(Unaudited)
Independent trustees (continued)
| Name, address, year of birth | Position held with the Columbia Funds and length of service | Principal occupation(s) during past five years and other relevant professional experience | Number of Funds in the Columbia Funds Complex* overseen | Other directorships held by Trustee during the past five years |
| David M. Moffett c/o Columbia Management Investment Advisers, LLC 290 Congress Street Boston, MA 02210 1952 | Trustee since 2011 | Retired; Consultant to Bridgewater and Associates | 174 | Director, CSX Corporation (transportation suppliers); Director, Genworth Financial, Inc. (financial and insurance products and services); Director, PayPal Holdings Inc. (payment and data processing services); Trustee, University of Oklahoma Foundation; former Director, eBay Inc. (online trading community), 2007-2015; and former Director, CIT Bank, CIT Group Inc. (commercial and consumer finance), 2010-2016 |
| Catherine James Paglia c/o Columbia Management Investment Advisers, LLC 290 Congress Street Boston, MA 02210 1952 | Co-Chair since 2021; Chair of CFST, CFST II, CFVST II, CET I and CET II since 2020; Trustee of CFST, CFST II and CFVST II since 2004 and CFST I and CFVIT since 2021 | Director, Enterprise Asset Management, Inc. (private real estate and asset management company) since September 1998; Managing Director and Partner, Interlaken Capital, Inc., 1989-1997; Vice President, 1982-1985, Principal, 1985-1987, Managing Director, 1987-1989, Morgan Stanley; Vice President, Investment Banking, 1980-1982, Associate, Investment Banking, 1976-1980, Dean Witter Reynolds, Inc. | 176 | Director, Valmont Industries, Inc. (irrigation systems manufacturer) since 2012; Trustee, Carleton College (on the Investment Committee); Trustee, Carnegie Endowment for International Peace (on the Investment Committee) |
| Minor M. Shaw c/o Columbia Management Investment Advisers, LLC 290 Congress Street Boston, MA 02210 1947 | Trustee since 2003 | President, Micco LLC (private investments) since 2011; President, Micco Corp. (family investment business), 1998-2011 | 176 | Director, Blue Cross Blue Shield of South Carolina (Chair of Compensation Committee) since April 2008; Trustee, Hollingsworth Funds (on the Investment Committee) since 2016 (previously Board Chair from 2016-2019); Former Advisory Board member, Duke Energy Corp., 2016-2020; Chair of the Duke Endowment; Chair of Greenville – Spartanburg Airport Commission; former Trustee, BofA Funds Series Trust (11 funds), 2003-2011; former Director, Piedmont Natural Gas, 2004-2016; former Director, National Association of Corporate Directors, Carolinas Chapter, 2013-2018; Chair, Daniel-Mickel Foundation since 1998 |
| 50 | Multi-Manager Directional Alternative Strategies Fund | Annual Report 2022 |
(Unaudited)
Independent trustees (continued)
| Name, address, year of birth | Position held with the Columbia Funds and length of service | Principal occupation(s) during past five years and other relevant professional experience | Number of Funds in the Columbia Funds Complex* overseen | Other directorships held by Trustee during the past five years |
| Natalie A. Trunow c/o Columbia Management Investment Advisers, LLC 290 Congress Street Boston, MA 02210 1967 | Trustee since 2020 | Chief Executive Officer, Millennial Portfolio Solutions LLC (asset management and consulting services), January 2016-January 2021; Non-executive Member of the Investment Committee and Valuation Committee, Sarona Asset Management Inc. (private equity firm) since September 2019; Advisor, Horizon Investments (asset management and consulting services), August 2018-January 2021; Advisor, Paradigm Asset Management, November 2016-December 2021; Consultant to Independent Trustees of CFVIT and CFST I from September 2016 to June 2020 with respect to CFVIT and to December 2020 with respect to CFST I; Director of Investments/Consultant, Casey Family Programs, April 2016-November 2016; Senior Vice President and Chief Investment Officer, Calvert Investments, August 2008-January 2016; Section Head and Portfolio Manager, General Motors Asset Management, June 1997-August 2008 | 174 | Former Director, Investment Committee, Health Services for Children with Special Needs, Inc., 2012-2019; Director, Chair of Audit Committee, Consumer Credit Counseling Services (formerly Guidewell Financial Solutions), since 2019; Independent Director, Investment Committee and Valuation Committee, Sarona Asset Management, since 2019 |
| Sandra L. Yeager c/o Columbia Management Investment Advisers, LLC 290 Congress Street Boston, MA 02210 1964 | Trustee since 2017 | Retired; President and founder, Hanoverian Capital, LLC (SEC registered investment advisor firm), 2008-2016; Managing Director, DuPont Capital, 2006-2008; Managing Director, Morgan Stanley Investment Management, 2004-2006; Senior Vice President, Alliance Bernstein, 1990-2004 | 176 | Former Director, NAPE Education Foundation, October 2016-October 2020 |
| * | The term “Columbia Funds Complex” as used herein includes Columbia Seligman Premium Technology Growth Fund, Tri-Continental Corporation and each series of Columbia Fund Series Trust (CFST), Columbia Funds Series Trust I (CFST I), Columbia Funds Series Trust II (CFST II), Columbia ETF Trust I (CET I), Columbia ETF Trust II (CET II), Columbia Funds Variable Insurance Trust (CFVIT) and Columbia Funds Variable Series Trust II (CFVST II). Messrs. Batejan, Beckman, Gallagher and Hacker and Mses. Blatz, Carlton, Flynn, Paglia, Shaw and Yeager serve as Directors of Columbia Seligman Premium Technology Growth Fund and Tri-Continental Corporation. |
| Name, address, year of birth | Position held with the Columbia Funds and length of service | Principal occupation(s) during the past five years and other relevant professional experience | Number of Funds in the Columbia Funds Complex overseen | Other directorships held by Trustee during the past five years |
| Daniel J. Beckman c/o Columbia Management Investment Advisers, LLC 290 Congress Street Boston, MA 02210 1962 | Trustee since November 2021 and President since June 2021 | Vice President – Head of North America Product, Columbia Management Investment Advisers, LLC since April 2015; President and Principal Executive Officer of the Columbia Funds since June 2021; officer of Columbia Funds and affiliated funds, 2020-2021 | 176 | Director, Ameriprise Trust Company, since October 2016; Director, Columbia Management Investment Distributors, Inc. since November 2018; Board of Governors, Columbia Wanger Asset Management, LLC since January 2022 |
| * | Interested person (as defined under the 1940 Act) by reason of being an officer, director, security holder and/or employee of the Investment Manager or Ameriprise Financial. |
| Multi-Manager Directional Alternative Strategies Fund | Annual Report 2022 | 51 |
(Unaudited)
The Board has appointed officers who are responsible for day-to-day business decisions based on policies it has established. The officers serve at the pleasure of the Board. The following table provides basic information about the Officers of the Fund as of the printing of this report, including principal occupations during the past five years, although their specific titles may have varied over the period. In addition to Mr. Beckman, who is President and Principal Executive Officer, the Fund’s other officers are:
| Name, address and year of birth | Position and year first appointed to position for any Fund in the Columbia Funds Complex or a predecessor thereof | Principal occupation(s) during past five years |
| Michael G. Clarke 290 Congress Street Boston, MA 02210 1969 | Chief Financial Officer and Principal Financial Officer (2009) and Senior Vice President (2019) | Senior Vice President and Head of Global Operations & Investor Services, Columbia Management Investment Advisers, LLC, since March 2022 (previously Vice President, Head of North American Operations, and Co-Head of Global Operations, June 2019 to February 2022 and Vice President – Accounting and Tax, May 2010 - May 2019); senior officer of Columbia Funds and affiliated funds since 2002. |
| Joseph Beranek 5890 Ameriprise Financial Center Minneapolis, MN 55474 1965 | Treasurer and Chief Accounting Officer (Principal Accounting Officer) (2019) and Principal Financial Officer (2020), CFST, CFST I, CFST II, CFVIT and CFVST II; Assistant Treasurer, CET I and CET II | Vice President – Mutual Fund Accounting and Financial Reporting, Columbia Management Investment Advisers, LLC, since December 2018 and March 2017, respectively (previously Vice President – Pricing and Corporate Actions, May 2010 - March 2017). |
| Marybeth Pilat 290 Congress Street Boston, MA 02210 1968 | Treasurer and Chief Accounting Officer (Principal Accounting Officer) and Principal Financial Officer (2020) for CET I and CET II; Assistant Treasurer, CFST, CFST I, CFST II, CFVIT and CFVST II | Vice President – Product Pricing and Administration, Columbia Management Investment Advisers, LLC, since May 2017; Director - Fund Administration, Calvert Investments, August 2015 – March 2017; Vice President - Fund Administration, Legg Mason, May 2015 - July 2015; Vice President - Fund Administration, Columbia Management Investment Advisers, LLC, May 2010 - April 2015. |
| William F. Truscott 290 Congress Street Boston, MA 02210 1960 | Senior Vice President (2001) | Formerly, Trustee/Director of Columbia Funds Complex or legacy funds, November 2001-January 1, 2021; Chief Executive Officer, Global Asset Management, Ameriprise Financial, Inc. since September 2012; Chairman of the Board and President, Columbia Management Investment Advisers, LLC since July 2004 and February 2012, respectively; Chairman of the Board and Chief Executive Officer, Columbia Management Investment Distributors, Inc. since November 2008 and February 2012, respectively; Chairman of the Board and Director, Threadneedle Asset Management Holdings, Sàrl since March 2013 and December 2008, respectively; senior executive of various entities affiliated with Columbia Threadneedle. |
| Christopher O. Petersen 5228 Ameriprise Financial Center Minneapolis, MN 55474 1970 | Senior Vice President and Assistant Secretary (2021) | Formerly, Trustee/Director of funds within the Columbia Funds Complex, July 1, 2020 - November 22, 2021; Senior Vice President and Assistant General Counsel, Ameriprise Financial, Inc. since September 2021 (previously Vice President and Lead Chief Counsel, January 2015 - September 2021); President and Principal Executive Officer of the Columbia Funds, 2015 - 2021; officer of Columbia Funds and affiliated funds since 2007. |
| Thomas P. McGuire 290 Congress Street Boston, MA 02210 1972 | Senior Vice President and Chief Compliance Officer (2012) | Vice President – Asset Management Compliance, Ameriprise Financial, Inc., since May 2010; Chief Compliance Officer, Columbia Acorn/Wanger Funds since December 2015; Chief Compliance Officer, Ameriprise Certificate Company, September 2010 – September 2020. |
| Ryan C. Larrenaga 290 Congress Street Boston, MA 02210 1970 | Senior Vice President (2017), Chief Legal Officer (2017), and Secretary (2015) | Vice President and Chief Counsel, Ameriprise Financial, Inc. since August 2018 (previously Vice President and Group Counsel, August 2011 - August 2018); Chief Legal Officer, Columbia Acorn/Wanger Funds, since September 2020; officer of Columbia Funds and affiliated funds since 2005. |
| 52 | Multi-Manager Directional Alternative Strategies Fund | Annual Report 2022 |
(Unaudited)
Fund officers (continued)
| Name, address and year of birth | Position and year first appointed to position for any Fund in the Columbia Funds Complex or a predecessor thereof | Principal occupation(s) during past five years |
| Michael E. DeFao 290 Congress Street Boston, MA 02210 1968 | Vice President (2011) and Assistant Secretary (2010) | Vice President and Chief Counsel, Ameriprise Financial, Inc. since May 2010; Vice President, Chief Legal Officer and Assistant Secretary, Columbia Management Investment Advisers, LLC since October 2021 (previously Vice President and Assistant Secretary, May 2010 – September 2021). |
| Lyn Kephart-Strong 5228 Ameriprise Financial Center Minneapolis, MN 55474 1960 | Vice President (2015) | President, Columbia Management Investment Services Corp. since October 2014; Vice President & Resolution Officer, Ameriprise Trust Company since August 2009. |
| • | the Fund had sufficient liquidity to both meet redemptions and operate effectively on behalf of shareholders; |
| • | there were no material changes to the Program during the period; |
| • | the implementation of the Program was effective to manage the Fund’s liquidity risk; and |
| • | the Program operated adequately during the period. |
| Multi-Manager Directional Alternative Strategies Fund | Annual Report 2022 | 53 |
| • | Terms of the Subadvisory Agreement; |
| • | Subadvisory fees payable by the Investment Manager under the Subadvisory Agreement; |
| • | Descriptions of various services proposed to be performed by JPMIM under the Subadvisory Agreement, including portfolio management and portfolio trading practices; |
| • | Information regarding the experience and resources of JPMIM, including information regarding senior management, portfolio managers and other personnel; |
| • | Information regarding the capabilities of JPMIM’s compliance program; and |
| • | The profitability to the Investment Manager and its affiliates from their relationships with the Fund. |
| 54 | Multi-Manager Directional Alternative Strategies Fund | Annual Report 2022 |
| Multi-Manager Directional Alternative Strategies Fund | Annual Report 2022 | 55 |
columbiathreadneedleus.com/investor/. The Fund is distributed by Columbia Management Investment Distributors, Inc., member FINRA, and managed by Columbia Management Investment Advisers, LLC.
Item 2. Code of Ethics.
(a)The registrant has adopted a code of ethics that applies to the registrant's principal executive officer, principal financial officer, principal accounting officer or controller, or persons performing similar functions, regardless of whether these individuals are employed by the registrant or a third party.
(b)During the period covered by this report, there were not any amendments to a provision of the code of ethics that applies to the registrant's principal executive officer, principal financial officer, principal accounting officer or controller, or persons performing similar functions, regardless of whether these individuals are employed by the registrant or a third party, and that relates to any element of the code of ethics definition enumerated in paragraph (b) of this Item.
(c)During the period covered by this report, there were no waivers, including any implicit waivers, from a provision of the code of ethics to the registrant's principal executive officer, principal financial officer, principal accounting officer or controller, or persons performing similar functions, regardless of whether these individuals are employed by the registrant or a third party that relates to one or more of the items set forth in paragraph (b) of this Item.
Item 3. Audit Committee Financial Expert.
The registrant's Board of Trustees has determined that David M. Moffett, Brian J. Gallagher, J. Kevin Connaughton, and Sandra L. Yeager, each of whom are members of the registrant's Board of Trustees and Audit Committee, each qualify as an audit committee financial expert. Mr. Moffett, Mr. Gallagher, Mr. Connaughton, and Ms. Yeager are each independent trustees, as defined in paragraph (a)(2) of this item's instructions.
Item 4. Principal Accountant Fees and Services.
Fee information below is disclosed for the six series of the registrant whose reports to stockholders are included in this annual filing. Fiscal Year 2021 also includes fees for one fund that liquidated during the period.
(a)Audit Fees. Aggregate Audit Fees billed by the principal accountant for professional services rendered during the fiscal years ended April 30, 2022 and April 30, 2021 are approximately as follows:
20222021
$227,000 $279,900
Audit Fees include amounts related to the audit of the registrant's annual financial statements or services that are normally provided by the accountant in connection with statutory and regulatory filings or engagements for those fiscal years.
(b)Audit-Related Fees. Aggregate Audit-Related Fees billed to the registrant by the principal accountant for professional services rendered during the fiscal years ended April 30, 2022 and April 30, 2021 are approximately as follows:
20222021
$5,500 $5,200
Audit-Related Fees include amounts for assurance and related services by the principal accountant that are reasonably related to the performance of the audit of the registrant's financial statements and are not reported in Audit Fees above.
During the fiscal years ended April 30, 2022 and April 30, 2021, there were no Audit- Related Fees billed by the registrant's principal accountant to the registrant's investment adviser (not including any sub-adviser whose role is primarily portfolio management and is subcontracted with or overseen by another investment adviser) and any entity controlling, controlled by, or under common control with the adviser that provides ongoing services to the registrant for an engagement that related directly to the operations and financial reporting of the registrant.
(c)Tax Fees. Aggregate Tax Fees billed by the principal accountant to the registrant for professional services rendered during the fiscal years ended April 30, 2022 and April 30,
2021 are approximately as follows:
2022 | 2021 |
$7,500 | $0 |
Tax Fees include amounts for the review of annual tax returns, the review of required shareholder distribution calculations and typically include amounts for professional services by the principal accountant for tax compliance, tax advice and tax planning.
During the fiscal years ended April 30, 2022 and April 30, 2021, there were no Tax Fees billed by the registrant's principal accountant to the registrant's investment adviser (not including any sub-adviser whose role is primarily portfolio management and is subcontracted with or overseen by another investment adviser) and any entity controlling, controlled by, or under common control with the adviser that provides ongoing services to the registrant for an engagement that related directly to the operations and financial reporting of the registrant.
(d)All Other Fees. Aggregate All Other Fees billed by the principal accountant to the registrant for professional services rendered during the fiscal years ended April 30, 2022 and April 30, 2021 are approximately as follows:
2022 | 2021 |
$0 | $0 |
All Other Fees, if any, include amounts for products and services provided by the principal accountant, other than the services reported in paragraphs (a) through (c) above.
Aggregate All Other Fees billed by the registrant's principal accountant to the registrant's investment adviser (not including any sub-adviser whose role is primarily portfolio management and is subcontracted with or overseen by another investment adviser) and any entity controlling, controlled by, or under common control with the adviser that provides ongoing services to the registrant for an engagement that related directly to the operations and financial reporting of the registrant during the fiscal years ended April 30,
2022 and April 30, 2021 are approximately as follows:
20222021
$520,000 $520,000
In fiscal years 2022 and 2021, All Other Fees primarily consists of fees billed for internal control examinations of the registrant's transfer agent and investment adviser.
(e)(1) Audit Committee Pre-Approval Policies and Procedures
The registrant's Audit Committee is required to pre-approve the engagement of the registrant's independent auditors to provide audit and non-audit services to the registrant and non-audit services to its investment adviser (excluding any sub-adviser whose role is primarily portfolio management and is sub-contracted or overseen by another investment adviser (the "Adviser") or any entity controlling, controlled by or under common control with the Adviser that provides ongoing services to the Fund (a "Control Affiliate") if the engagement relates directly to the operations and financial reporting of the registrant.
The Audit Committee has adopted a Policy for Engagement of Independent Auditors for Audit and Non-Audit Services (the "Policy"). The Policy sets forth the understanding of the Audit Committee regarding the engagement of the registrant's independent accountants to provide (i) audit and permissible audit-related, tax and other services to the registrant ("Fund Services"); (ii) non-audit services to the registrant's Adviser and any Control Affiliates, that relates directly to the operations and financial reporting of a Fund ("Fund-related Adviser Services"); and (iii) certain other audit and non-audit services to the registrant's Adviser and its Control Affiliates. A service will require specific pre-approval by the Audit Committee if it is to be provided by the Fund's independent auditor; provided, however, that pre-approval of non-audit services to the Fund, the Adviser or Control Affiliates may be waived if certain de minimis requirements set forth in the SEC's rules are met.
Under the Policy, the Audit Committee may delegate pre-approval authority to any pre- designated member or members who are independent board members. The member(s) to whom such authority is delegated must report, for informational purposes only, any pre- approval decisions to the Audit Committee at its next regular meeting. The Audit
Committee's responsibilities with respect to the pre-approval of services performed by the independent auditor may not be delegated to management.
On an annual basis, at a regularly scheduled Audit Committee meeting, the Fund's Treasurer or other Fund officer shall submit to the Audit Committee a schedule of the types of Fund Services and Fund-related Adviser Services that are subject to specific pre- approval. This schedule will provide a description of each type of service that is subject to specific pre-approval, along with total projected fees for each service. The pre- approval will generally cover a one-year period. The Audit Committee will review and approve the types of services and the projected fees for the next one-year period and may add to, or subtract from, the list of pre-approved services from time to time, based on subsequent determinations. This specific approval acknowledges that the Audit Committee is in agreement with the specific types of services that the independent auditor will be permitted to perform and the projected fees for each service.
The Fund's Treasurer or other Fund officer shall report to the Audit Committee at each of its regular meetings regarding all Fund Services or Fund-related Adviser Services provided since the last such report was rendered, including a description of the services, by category, with forecasted fees for the annual reporting period, proposed changes requiring specific pre-approval and a description of services provided by the independent auditor, by category, with actual fees during the current reporting period.
*****
(e)(2) None, or 0%, of the Audit-Related Fees, Tax Fees and All Other Fees paid by the Fund or affiliated entities relating directly to the operations and financial reporting of the Registrant disclosed above were approved by the audit committee pursuant to paragraphs (c)(7)(i)(C) of Rule 2-01 of Regulation S-X (which permits audit committee approval after the start of the engagement with respect to services other than audit, review or attest services, if certain conditions are satisfied).
(f)Not applicable.
(g)The aggregate non-audit fees billed by the registrant's accountant for services rendered to the registrant, and rendered to the registrant's investment adviser (not including any sub-adviser whose role is primarily portfolio management and is subcontracted with or overseen by another investment adviser), and any entity controlling, controlled by, or under common control with the adviser that provides ongoing services to the registrant for the fiscal years ended April 30, 2022 and April 30,
2021 are approximately as follows:
20222021
$533,000 $525,200
(h)The registrant's Audit Committee of the Board of Directors has considered whether the provision of non-audit services that were rendered to the registrant's adviser (not including any sub-adviser whose role is primarily portfolio management and is subcontracted with or overseen by another investment adviser), and any entity
controlling, controlled by, or under common control with the investment adviser that provides ongoing services to the registrant that were not pre-approved pursuant to paragraph (c)(7)(ii) of Rule 2-01 of Regulation S-X, is compatible with maintaining the principal accountant's independence.
Item 5. Audit Committee of Listed Registrants.
Not applicable.
Item 6. Investments
(a)The registrant's "Schedule I – Investments in securities of unaffiliated issuers" (as set forth in 17 CFR 210.12-12) is included in Item 1 of this Form N-CSR.
(b)Not applicable.
Item 7. Disclosure of Proxy Voting Policies and Procedures for Closed-End Management Investment Companies.
Not applicable.
Item 8. Portfolio Managers of Closed-End Management Investment Companies.
Not applicable.
Item 9. Purchases of Equity Securities by Closed-End Management Investment Company and Affiliated Purchasers.
Not applicable.
Item 10. Submission of Matters to a Vote of Security Holders.
There were no material changes to the procedures by which shareholders may recommend nominees to the registrant's board of directors.
Item 11. Controls and Procedures.
(a)The registrant's principal executive officer and principal financial officer, based on their evaluation of the registrant's disclosure controls and procedures as of a date within 90 days of the filing of this report, have concluded that such controls and procedures are adequately designed to ensure that information required to be disclosed by the registrant in Form N-CSR is accumulated and communicated to the registrant's management, including the principal executive officer and principal financial officer, or persons performing similar functions, as appropriate to allow timely decisions regarding required disclosure.
(b)There was no change in the registrant's internal control over financial reporting that occurred during the period covered by this report that has materially affected, or is reasonably likely to materially affect, the registrant's internal control over financial reporting.
Item 12. Disclosure of Securities Lending Activities for Closed-End Management Investment Companies
Not applicable.
Item 13. Exhibits.
SIGNATURES
Pursuant to the requirements of the Securities Exchange Act of 1934 and the Investment Company Act of 1940, the registrant has duly caused this report to be signed on its behalf by the undersigned, thereunto duly
authorized. |
|
| ||
(registrant) |
| Columbia Funds Series Trust I |
| |
By (Signature and Title) | /s/ Daniel J. Beckman |
| ||
|
|
| Daniel J. Beckman, President and Principal Executive Officer |
|
Date |
| June 23, 2022 |
| |
Pursuant to the requirements of the Securities Exchange Act of 1934 and the Investment Company Act of 1940, this report has been signed below by the following persons on behalf of the registrant and in the capacities and on the dates indicated.
By (Signature and Title) | /s/ Daniel J. Beckman | ||
|
| Daniel J. Beckman, President and Principal Executive Officer | |
Date |
| June 23, 2022 |
|
By (Signature and Title) | /s/ Michael G. Clarke | ||
|
| Michael G. Clarke, Chief Financial Officer, Principal Financial Officer | |
|
| and Senior Vice President | |
Date |
| June 23, 2022 |
|
By (Signature and Title) | /s/ Joseph Beranek | ||
|
| Joseph Beranek, Treasurer, Chief Accounting Officer and Principal | |
|
| Financial Officer | |
Date |
| June 23, 2022 |
|