UNITED STATES
SECURITIES AND EXCHANGE COMMISSION
Washington, D.C. 20549
FORM N-CSR
CERTIFIED SHAREHOLDER REPORT OF REGISTERED MANAGEMENT INVESTMENT COMPANIES
Investment Company Act file number 811-04367
Columbia Funds Series Trust I
(Exact name of registrant as specified in charter)
290 Congress Street
Boston, MA 02210
(Address of principal executive offices) (Zip code)
Daniel J. Beckman
c/o Columbia Management Investment Advisers, LLC
290 Congress Street
Boston, MA 02210
Ryan C. Larrenaga, Esq.
c/o Columbia Management Investment Advisers, LLC
290 Congress Street
Boston, MA 02210
(Name and address of agent for service)
Registrant's telephone number, including area code: (800) 345-6611
Date of fiscal year end: August 31
Date of reporting period: August 31, 2022
Form N-CSR is to be used by management investment companies to file reports with the Commission not later than 10 days after the transmission to stockholders of any report that is required to be transmitted to stockholders under Rule 30e-1 under the Investment Company Act of 1940 (17 CFR 270.30e-1). The Commission may use the information provided on Form N-CSR in its regulatory, disclosure review, inspection, and policymaking roles.
A registrant is required to disclose the information specified by Form N-CSR, and the Commission will make this information public. A registrant is not required to respond to the collection of information contained in Form N-CSR unless the Form displays a currently valid Office of Management and Budget ("OMB") control number. Please direct comments concerning the accuracy of the information collection burden estimate and any suggestions for reducing the burden to Secretary, Securities and Exchange Commission, 100 F Street, NE, Washington, DC 20549. The OMB has reviewed this collection of information under the clearance requirements of 44 U.S.C. § 3507.
Item 1. Reports to Stockholders.

August 31, 2022

| 3 | |
| 6 | |
| 14 | |
| 15 | |
| 61 | |
| 62 | |
| 63 | |
| 64 | |
| 65 | |
| 85 | |
| 86 | |
| 86 | |
| 92 | |
| 93 |
(Unaudited)
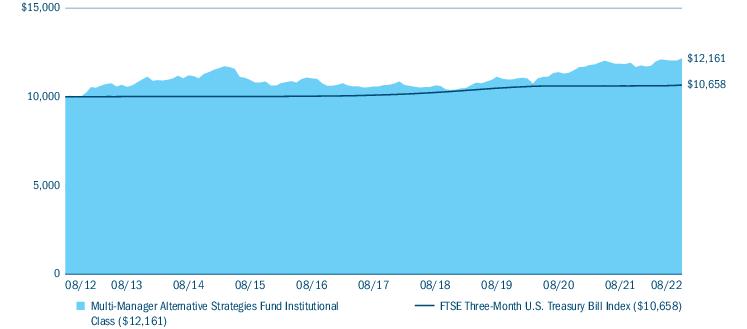
| Average annual total returns (%) (for the period ended August 31, 2022) | |||||
| Inception | 1 Year | 5 Years | 10 Years | ||
| Institutional Class* | 01/03/17 | 2.60 | 2.84 | 1.98 | |
| FTSE Three-Month U.S. Treasury Bill Index | 0.44 | 1.10 | 0.64 | ||
| * | The returns shown for periods prior to the share class inception date (including returns for the Life of the Fund, if shown, which are since Fund inception) include the returns of the Fund’s oldest share class. Returns shown for periods prior to the inception date of the Fund’s Institutional Class shares include the returns of the Fund’s Class A shares for the period from April 23, 2012 (the inception date of the Fund) through January 2, 2017. Class A shares were offered prior to the Fund’s Institutional Class shares but have since been merged into the Fund’s Institutional Class shares. These returns are adjusted to reflect any higher class-related operating expenses of the newer share classes, as applicable. Please visit columbiathreadneedleus.com/investor/investment-products/mutual-funds/appended-performance for more information. |
| Multi-Manager Alternative Strategies Fund | Annual Report 2022 | 3 |
(Unaudited)
| 4 | Multi-Manager Alternative Strategies Fund | Annual Report 2022 |
(Unaudited)
| Portfolio breakdown — long positions (%) (at August 31, 2022) | |
| Asset-Backed Securities — Non-Agency | 3.1 |
| Commercial Mortgage-Backed Securities - Agency | 0.4 |
| Commercial Mortgage-Backed Securities - Non-Agency | 2.6 |
| Common Stocks | 22.3 |
| Convertible Bonds | 0.6 |
| Convertible Preferred Stocks | 0.5 |
| Corporate Bonds & Notes | 16.4 |
| Foreign Government Obligations | 5.4 |
| Limited Partnerships | 0.1 |
| Municipal Bonds | 0.1 |
| Options Purchased Calls | 0.0(a) |
| Options Purchased Puts | 0.0(a) |
| Preferred Debt | 0.0(a) |
| Preferred Stocks | 0.1 |
| Residential Mortgage-Backed Securities - Agency | 4.3 |
| Residential Mortgage-Backed Securities - Non-Agency | 6.3 |
| Rights | 0.0(a) |
| Senior Loans | 1.5 |
| Treasury Bills | 1.0 |
| U.S. Government & Agency Obligations | 0.1 |
| U.S. Treasury Obligations | 1.3 |
| Money Market Funds(b) | 35.0 |
| Total | 101.1 |
| (a) | Rounds to zero. |
| (b) | Includes investments in Money Market Funds which have been segregated to cover obligations relating to the Fund’s investment in derivatives as part of its principal investment strategies. For a description of the Fund’s investments in derivatives, see Investments in derivatives following the Consolidated Portfolio of Investments and the derivative instruments discussion in Note 2 to the Notes to Consolidated Financial Statements. |
| Portfolio breakdown — short positions (%) (at August 31, 2022) | |
| Common Stocks | (1.0) |
| Exchange-Traded Equity Funds | (0.1) |
| Total | (1.1) |
| Market exposure through derivatives investments (% of notional exposure) (at August 31, 2022)(a) | |||
| Long | Short | Net | |
| Fixed Income Derivative Contracts | 8.5 | (78.0) | (69.5) |
| Commodities Derivative Contracts | 3.8 | (3.9) | (0.1) |
| Equity Derivative Contracts | 4.7 | (3.4) | 1.3 |
| Foreign Currency Derivative Contracts | 42.6 | (74.3) | (31.7) |
| Total Notional Market Value of Derivative Contracts | 59.6 | (159.6) | (100.0) |
| Multi-Manager Alternative Strategies Fund | Annual Report 2022 | 5 |
(Unaudited)
| 6 | Multi-Manager Alternative Strategies Fund | Annual Report 2022 |
(Unaudited)
| • | Positive returns in our portion of the Fund during the period primarily came from short positions in fixed income and long positions in energies. |
| • | Additional gains came from short positions in foreign currencies (long USD). |
| • | In fixed income, gains came from short positions in both U.S. and international markets. |
| • | Short-term rates also contributed positively. |
| • | In commodities, gains came primarily from long positions in energy markets, with additional gains from long positions in base metals and agricultural commodities. |
| • | Currency gains were driven by short positions in developed markets, especially the Japanese yen and the euro. |
| • | Within the different model types used in our strategy, we saw positive performance from all model types, with adaptive and basic multi-trend models outperforming the short-horizon models. |
| • | Top individual contributors to performance included the Japanese Yen, the Euro, and the U.S. 2-Year Treasury Note. |
| • | Long positions in equities detracted from performance. |
| ○ | In equities, losses came from long positions in the U.S. and international developed markets. |
| ○ | The largest losses came from the S&P 500 and NASDAQ 100. |
| • | Long positions in fixed income and currencies, as well as some commodity markets, also detracted. |
| ○ | While the strategy’s short positions in fixed income led to gains, long positions led to losses over the period, both in international and U.S. markets. |
| ○ | Similarly, short positions in certain currencies provided gains, but most currencies detracted over the period. |
| ○ | The largest losses came from the Canadian and Australian dollars. |
| ○ | Commodities were more mixed, with gains from long positions in energies outweighing losses from short positions in agricultural commodities, long positions in precious metals, and the strategy’s livestock exposures. |
| • | Top individual detractors from performance included the S&P 500 Index, the Canadian Dollar and the NASDAQ 100. |
| Multi-Manager Alternative Strategies Fund | Annual Report 2022 | 7 |
(Unaudited)
| • | The largest detractors in our portion of the Fund during our reporting period were the Swedish krona, Polish zloty, and Hungarian forint. |
| • | Overall, trend following in currencies drove losses over the period. Losses were concentrated in September and November, when news of central banks’ plans to withdraw stimulus and the Omicron coronavirus variant caused significant reversals and depreciation of emerging market and commodity-producer currencies. |
| • | Trend following in equities also detracted over the reporting period. Net short positioning in US markets hurt performance as these equities rallied on average. However, markets such as China and Hong Kong sold off, providing some partially offsetting gains. |
| • | The largest positive contributors during our reporting period were the short euro currency, long Eurodollar, and long heating oil positions. |
| • | At an asset class level, trend following in commodities contributed positively to performance. Performance benefited from net long positioning in the asset class over the period as commodities rallied on average over our reporting period. |
| • | Trend following in fixed income also generated positive returns over our reporting period as net short exposures across longer duration fixed income and short-term rate futures benefited performance as these assets declined on inflation data and news that central banks planned to begin withdrawing pandemic-era stimulus. |
| • | The key factors behind outperformance in our portion of the Fund versus the Bloomberg Multiverse Index were duration profile and currency positioning relative to the benchmark. |
| ○ | Our portion of the Fund had a significantly shorter duration (a measure of interest-rate sensitivity) than our benchmark across developed market economies where interest rates rose sharply higher over the period, which limited the negative impact of rising interest rates on performance. |
| ○ | In addition, broad-based U.S. dollar strength over the period helped relative performance given our underweight exposure to other major developed market currencies. From a foreign exchange (FX) and currency management perspective, underweight exposure to the euro, Japanese yen, and British pound were the largest contributors. |
| • | Security selection was a modest contributor, particularly positioning within our emerging market credit allocation. |
| 8 | Multi-Manager Alternative Strategies Fund | Annual Report 2022 |
(Unaudited)
| • | Relative to the Bloomberg Multiverse Index, our portion of the Fund benefited from an overweight position in bank loans and from a modest underweight to investment-grade corporate bonds. |
| • | From a local rate and country allocation perspective, the top contributors were relative underweights to local markets in Europe and the United Kingdom and overweight local positions in Indonesia, Malaysia, and Norway where higher energy prices helped and interest rates outperformed other developed market economies. |
| • | Sector and country allocation overall was a detractor from relative performance due largely to our underweight bias to developed market government bonds and overweight to corporate credit and spread sectors in general. |
| • | The largest detractors to relative performance were overweight sector allocations to high-yield corporate bonds, equities, convertible bonds, and emerging market credit combined with an underweight to U.S. Treasuries. |
| • | In addition, negative security selection within our developed market high-yield and investment-grade credit allocations weighed on relative performance. |
| • | Overweight currency exposure to the Canadian dollar, Norwegian krone, Mexican peso, and Malaysian ringgit which depreciated against the U.S. dollar over the period also weighed on performance. |
| • | From a local rate and country allocation perspective, top detractors were our overweight to the domestic U.S. market and underweight exposure to local markets in Japan and China where government-related holdings outperformed as monetary policy remained more accommodative and interest rates outperformed on a relative basis. |
| • | With rates higher over the period, the positive duration position in our portion of the Fund was the most significant drag on relative performance during the period. |
| • | While our portion of the Fund was defensively positioned across spread sectors, higher yield premiums across the fixed-income space weighed on performance. |
| • | Corporate credit allocations contributed early in the period, particularly the small position in high yield, which was a top performing fixed-income sector in Q3 2021, while issue selection among investment-grade credit also rewarded returns. However, as volatility picked up and yields widened in the first half of 2022, both investment-grade and high-yield corporate bonds trailed U.S. Treasuries on a duration-adjusted basis. |
| • | A small exposure to emerging markets debt proved to be a negative, as the asset class was under pressure from more aggressive central bank tightening, high inflation and slower global growth. |
| • | The emphasis on securitized products also weighed on returns. |
| ○ | Non-agency mortgage-backed securities (MBS), which have generally been a steady source of incremental return since the housing crisis, detracted during the period as broader market volatility and reduced trading in the space weighed on pricing in the first half of 2022. |
| Multi-Manager Alternative Strategies Fund | Annual Report 2022 | 9 |
(Unaudited)
| ○ | Agency MBS also underperformed during the period as the sector struggled from continued rate volatility, aggressive Fed policy, and concern of outright sales from the Fed’s balance sheet. |
| ○ | Finally, the small positions in asset-backed securities (ABS) and commercial mortgage-backed securities (CMBS) detracted on the margin as yield spreads in both sectors widened in sympathy with broader markets. |
| • | While nearly all elements of attribution in our portion of the Fund were negative for the period, defensive positioning (higher quality, higher in the capital structure focus) across spread sectors helped to mitigate losses during the period of significant volatility in the first half of 2022. |
| • | In accordance with our value-oriented process, our portion of the Fund had been selective in exposure across credit markets that were generally trading through historical average spread ranges through the first half of the period, with valuations generally not compelling enough to warrant a substantial underwriting of risk. |
| • | As economic conditions became increasingly strained throughout 2022, especially in 2Q 2022, we believe that a combination of wider yield spread levels, improving valuations and market dislocations provided an opportunity to add exposure at favorable levels. |
| • | Purchases were focused on longer tenor bonds from high quality issuers across a variety of sectors including banking, communications, consumer non-cyclicals, and insurance. While those additions were made amid yield spread widening and resulted in a headwind, they set the stage for better prospective returns when spreads remediate, with increased income and an enhanced yield profile helping to cushion performance in the meantime. |
| • | During the period, both of the sub-strategy sleeves in our portion of the Fund – merger arbitrage and credit opportunities – generated positive returns. The merger arbitrage sleeve comprised the bulk of our portion of the Fund for the period and was thus responsible for most of the performance. |
| • | The portfolio’s top performing sectors were health care, industrials, and real estate, each driven primarily by the successful completion of idiosyncratic merger arbitrage investments in deals within those sectors. |
| • | The top performing investment overall was our position in the acquisition of Xilinx Inc by Advanced Micro Devices Inc. In October 2020, Xilinx – a US-based semiconductor manufacturer – agreed to be acquired by local peer Advanced Micro Devices for $35.7 billion in stock. This transaction experienced ongoing volatility in the deal spread, in large part due to its lengthy timeline stemming from continued delays in receiving regulatory approval from China (a required condition to complete the deal, where antitrust reviews are a notoriously opaque process). The companies ultimately received approval from China in February 2022 and the merger subsequently closed successfully, leading to gains for our portion of the Fund. |
| • | Other top contributors included the pending acquisition of Change Healthcare Inc. by UnitedHealth Group Inc. and the merger of Coherent Inc and II-VI. |
| 10 | Multi-Manager Alternative Strategies Fund | Annual Report 2022 |
(Unaudited)
| ○ | The Change HealthCare/UnitedHealth deal encountered opposition from the Department of Justice (DOJ) based on competition concerns. While the deal spread has experienced intermittent volatility, as of this writing, investors have driven the spread tighter based on UnitedHealth’s commitment to the deal combined with general consensus holding that the companies are succeeding in disproving the DOJ’s arguments in court. |
| ○ | II-VI, which won a bidding war for Coherent in 2021, successfully closed the deal in July after an unexpectedly lengthy regulatory review. |
| • | On a sector basis, the worst performers in our portion of the Fund were communication services, financials, and information technology. |
| • | The top detractor was our position in the failed merger of Momentive Global Inc and Zendesk Inc. In October 2021, Zendesk, a U.S.-based developer of software for customer support and customer communications, agreed to acquire Momentive Global, a U.S.-based developer of software for conducting web-based surveys, for $4.1 billion in stock after an activist investor in Momentive pushed for a sale process. In January, however, yet another activist investor, this time at Zendesk, began to push Zendesk’s board of directors and management to reject the acquisition, believing the company should instead be put up for sale itself. The very next month, Zendesk management rejected an offer from a private equity consortium that would have valued the company at $17 billion, yet Zendesk shareholders appear to have agreed with the activist, as they overwhelmingly rejected the Momentive deal mere days later. Subsequent share price volatility has led to mark-to-market losses for our portion of the Fund. We are maintaining our Momentive exposure, however, as not only has its activist reemerged, but the proxy background of the Zendesk merger indicated there were at least two other interested parties who put forth bids for the company before Zendesk won the initial sale process. We believe there is more left to this story. |
| • | Other top detractors for the period included Elon Musk’s bid for Twitter Inc and the failed acquisition of Magnachip Semiconductor Corp by Wise Road Capital. |
| ○ | Musk’s commitment to acquiring Twitter seemingly wavered nearly as swiftly his public pursuit of the company began. While his attempt to back out of the deal has led to volatility in the share price, we believe the merger agreement and related litigation are favoring Twitter thus far. We believe the case will end in Twitter’s favor. |
| ○ | Magnachip is a South-Korea-based semiconductor designer and manufacturer that agreed to be acquired by Wise Road, a private equity firm with ties to China, in 2021. Despite both parties being based outside of U.S. borders with little to no domestic presence, the Committee on Foreign Investment in the United States (CFIUS) requested the parties undergo a formal review. CFIUS ultimately rejected the merger based on U.S. national security concerns, forcing the companies to terminate their agreement. |
| Multi-Manager Alternative Strategies Fund | Annual Report 2022 | 11 |
(Unaudited)
| • | The equities sector was the strongest detractor from performance in our portion of the Fund during our reporting period. |
| ○ | Coming into 2022, many equity markets were at or near all-time equity highs. The bear market that followed initially wrong-footed most equity positions. Further, strong risk-on reversals were littered through the year despite the overall risk-off environment. The twists and turns created difficulty for our strategy as our portion of the Fund was not able to hang on to either a pervasively long or short exposure to equities. |
| ○ | Non-U.S. equity markets were particularly challenging as the Nikkei 225 Index, TOPIX Index, and the DAX Index were among the most difficult markets. |
| ○ | While U.S. equity markets were also challenging, our strategy’s diversification by geography caused the equity sector losses to be slightly larger than they might have been with a purely U.S. focus. |
| • | While the foreign exchange sector was very valuable overall, several smaller non-G7 currency pairs saw sharp reversals from long-term trends and were challenging. |
| ○ | In contrast to some trend programs, our strategy seeks to diversify exposure usefully beyond the G7. |
| ○ | The Mexican Peso, Chinese Yuan Renminbi, Australian Dollar/Canadian Dollar cross, South African Rand, and Israeli Shekel all experienced challenges despite the program’s overall success in foreign exchange. |
| • | None of the above, however, indicate statistical abnormalities. Both the positive and negative attributions, along with the risk level of the portfolio throughout the year, are all well within operational norms. |
| • | The foreign exchange sector provided the largest positive attribution, followed closely by strong performance from the fixed income sector. |
| • | The commodities sector was also strongly positive, particularly in the first five months of the year, on the heels of strong increases in prices across commodity markets. Several individual markets stood out for our strategy: |
| ○ | The energy sub-sector within commodities was very strong. Four of the ten most positive contributors were found in the sector. |
| ○ | In foreign exchange trading, crosses against the Japanese Yen tended to find strong opportunity. The Yen against the U.S. Dollar was the top contributor to performance in the period. |
| ○ | With yields moving dramatically higher, triggered by inflationary concerns and global monetary policy moves, many markets in the sector provided strong opportunity. |
| • | With yields moving higher and the yield curve flattening, the 2-Year U.S. Treasury Note was particularly strong, as were several non-U.S. fixed-income markets including the Euro-OAT French Government Bond and the Long Gilt. |
| • | Our strategy seeks to target equal risk across all four market sectors. However, with heightened opportunity as a function of inflation and the war in Ukraine, many pieces of position-modifying logic were able to position the portfolio with slightly more risk in fixed income and commodities. This helped produce further strong returns. |
| • | While volatility overall was high, the timeframe posture of our strategy also proved advantageous as more medium-term strategies dominated trading in commodities and long-term trend strategies were more prevalent in the fixed-income sector. Both postures allowed the portfolio to position itself directionally in a favorable way. The timeframe utilized is part of the systematic process inherent in our strategy’s construction, which has proved useful in volatile years such as 2020 and 2022. |
| 12 | Multi-Manager Alternative Strategies Fund | Annual Report 2022 |
(Unaudited)
| Multi-Manager Alternative Strategies Fund | Annual Report 2022 | 13 |
(Unaudited)
| March 1, 2022 — August 31, 2022 | |||||||
| Account value at the beginning of the period ($) | Account value at the end of the period ($) | Expenses paid during the period ($) | Fund’s annualized expense ratio (%) | ||||
| Actual | Hypothetical | Actual | Hypothetical | Actual | Hypothetical | Actual | |
| Institutional Class | 1,000.00 | 1,000.00 | 1,036.00 | 1,018.70 | 6.62 | 6.56 | 1.29 |
| 14 | Multi-Manager Alternative Strategies Fund | Annual Report 2022 |
August 31, 2022
| Asset-Backed Securities — Non-Agency 3.1% | ||||
| Issuer | Coupon Rate | Principal Amount ($) | Value ($) | |
| AGL CLO Ltd.(a),(b) | ||||
| Series 2021-13A Class A1 | ||||
| 3-month USD LIBOR + 1.160% Floor 1.160% 10/20/2034 | 3.870% | 500,000 | 486,524 | |
| AIMCO CLO Ltd.(a),(b) | ||||
| Series 2020-11A Class AR | ||||
| 3-month USD LIBOR + 1.130% Floor 1.130% 10/17/2034 | 3.870% | 400,000 | 390,310 | |
| Aligned Data Centers Issuer LLC(a) | ||||
| Series 2021-1A Class A2 | ||||
| 08/15/2046 | 1.937% | 388,000 | 342,000 | |
| Allegro CLO XII Ltd.(a),(b) | ||||
| Series 2020-1A Class B | ||||
| 3-month USD LIBOR + 1.700% Floor 1.700% 01/21/2032 | 4.432% | 250,000 | 241,427 | |
| American Express Credit Account Master Trust | ||||
| Series 2022-2 Class A | ||||
| 05/17/2027 | 3.390% | 250,000 | 247,244 | |
| AMMC CLO 24 Ltd.(a),(b) | ||||
| Series 2021-24A Class B | ||||
| 3-month USD LIBOR + 1.750% Floor 1.750% 01/20/2035 | 4.460% | 350,000 | 334,698 | |
| AREIT Trust(a),(c) | ||||
| Subordinated Series 2019-CRE3 Class AS | ||||
| 09/14/2036 | 3.711% | 500,000 | 489,136 | |
| BlueMountain CLO XXX Ltd.(a),(b) | ||||
| Series 2020-30A Class AR | ||||
| 3-month USD LIBOR + 1.370% Floor 1.370% 04/15/2035 | 3.698% | 450,000 | 436,940 | |
| BlueMountain Fuji US CLO I Ltd.(a),(b) | ||||
| Series 2017-1A Class BR | ||||
| 3-month USD LIBOR + 1.500% Floor 1.500% 07/20/2029 | 4.210% | 375,000 | 358,527 | |
| Conseco Finance Corp.(c) | ||||
| Series 2096-9 Class M1 | ||||
| 08/15/2027 | 7.630% | 170,278 | 171,666 | |
| Conseco Finance Securitizations Corp.(b) | ||||
| Series 2001-4 Class M1 | ||||
| 1-month USD LIBOR + 1.750% Floor 1.750%, Cap 15.000% 09/01/2033 | 4.314% | 434,528 | 430,066 | |
| Asset-Backed Securities — Non-Agency (continued) | ||||
| Issuer | Coupon Rate | Principal Amount ($) | Value ($) | |
| DB Master Finance LLC(a) | ||||
| Series 2019-1A Class A2II | ||||
| 05/20/2049 | 4.021% | 97,000 | 90,814 | |
| Dryden CLO Ltd.(a),(b) | ||||
| Series 2020-85A Class AR | ||||
| 3-month USD LIBOR + 1.150% Floor 1.150% 10/15/2035 | 3.662% | 800,000 | 780,777 | |
| Dryden Senior Loan Fund(a),(b) | ||||
| Series 2013-30A Class AR | ||||
| 3-month USD LIBOR + 0.820% Floor 0.820% 11/15/2028 | 3.725% | 222,346 | 219,611 | |
| Eaton Vance CLO Ltd.(a),(b) | ||||
| Series 2013-1A Class A13R | ||||
| 3-month USD LIBOR + 1.250% Floor 1.250% 01/15/2034 | 3.762% | 625,000 | 612,051 | |
| ECMC Group Student Loan Trust(a),(b) | ||||
| Series 2016-1A Class A | ||||
| 1-month USD LIBOR + 1.350% 07/26/2066 | 3.794% | 641,756 | 633,865 | |
| Golub Capital Partners CLO 54M LP(a),(b) | ||||
| Series 2021-54A Class A | ||||
| 3-month USD LIBOR + 1.530% Floor 1.530% 08/05/2033 | 4.362% | 450,000 | 435,379 | |
| HPS Loan Management Ltd.(a),(b) | ||||
| Series 2010-A16 Class A1RR | ||||
| 3-month USD LIBOR + 1.140% Floor 1.140% 04/20/2034 | 3.850% | 450,000 | 437,509 | |
| Jack in the Box Funding LLC(a) | ||||
| Series 2019-1A Class A2II | ||||
| 08/25/2049 | 4.476% | 123,125 | 115,719 | |
| JG Wentworth XXII LLC(a) | ||||
| Series 2010-3A Class A | ||||
| 12/15/2048 | 3.820% | 310,132 | 304,877 | |
| LCM XXI LP(a),(b) | ||||
| Series 20 18-21A Class AR | ||||
| 3-month USD LIBOR + 0.880% 04/20/2028 | 3.590% | 141,666 | 140,475 | |
| MVW Owner Trust(a) | ||||
| Series 2018-1A Class A | ||||
| 01/21/2036 | 3.450% | 30,193 | 29,600 | |
| Multi-Manager Alternative Strategies Fund | Annual Report 2022 | 15 |
August 31, 2022
| Asset-Backed Securities — Non-Agency (continued) | ||||
| Issuer | Coupon Rate | Principal Amount ($) | Value ($) | |
| Navient Student Loan Trust(b) | ||||
| Series 2014-1 Class A3 | ||||
| 1-month USD LIBOR + 0.510% Floor 0.510% 06/25/2031 | 2.769% | 397,588 | 390,218 | |
| Nelnet Student Loan Trust(a),(b) | ||||
| Series 2012-1A Class A | ||||
| 1-month USD LIBOR + 0.800% Floor 0.800% 12/27/2039 | 3.244% | 265,968 | 261,561 | |
| OCP CLO Ltd.(a),(b) | ||||
| Series 2021-21A Class B | ||||
| 3-month USD LIBOR + 1.700% Floor 1.700% 07/20/2034 | 4.410% | 300,000 | 286,523 | |
| OHA Credit Funding Ltd.(a),(b) | ||||
| Series 2020-7A Class AR | ||||
| 3-month USD LIBOR + 1.300% Floor 1.300% 02/24/2037 | 3.853% | 475,000 | 466,829 | |
| Option One Mortgage Loan Trust(b) | ||||
| Series 2006-3 Class 1A1 | ||||
| 1-month USD LIBOR + 0.140% Floor 0.140% 02/25/2037 | 2.584% | 980,344 | 664,194 | |
| Park Avenue Institutional Advisers CLO Ltd.(a),(b) | ||||
| Series 2021-1A Class A2 | ||||
| 3-month USD LIBOR + 1.750% Floor 1.750% 01/20/2034 | 4.460% | 250,000 | 239,487 | |
| Ready Capital Mortgage Financing LLC(a),(b) | ||||
| Series 2020-FL4 Class AS | ||||
| 1-month USD LIBOR + 3.100% Floor 3.100% 02/25/2035 | 5.544% | 250,000 | 248,379 | |
| Sabey Data Center Issuer LLC(a) | ||||
| Series 2020-1 Class A2 | ||||
| 04/20/2045 | 3.812% | 470,000 | 450,442 | |
| Saxon Asset Securities Trust(b) | ||||
| Series 2007-2 Class A2D | ||||
| 1-month USD LIBOR + 0.300% Floor 0.300% 05/25/2047 | 2.744% | 605,729 | 453,644 | |
| SLM Student Loan Trust(b) | ||||
| Series 2008-2 Class B | ||||
| 3-month USD LIBOR + 1.200% Floor 1.200% 01/25/2083 | 3.983% | 740,000 | 582,558 | |
| Series 2008-4 Class A4 | ||||
| 3-month USD LIBOR + 1.650% Floor 1.650% 07/25/2023 | 4.433% | 297,616 | 296,217 | |
| Asset-Backed Securities — Non-Agency (continued) | ||||
| Issuer | Coupon Rate | Principal Amount ($) | Value ($) | |
| Series 2008-5 Class A4 | ||||
| 3-month USD LIBOR + 1.700% Floor 1.700% 07/25/2023 | 4.483% | 190,681 | 189,334 | |
| Series 2008-6 Class A4 | ||||
| 3-month USD LIBOR + 1.100% Floor 1.100% 07/25/2023 | 3.883% | 256,187 | 250,185 | |
| Series 2008-7 Class B | ||||
| 3-month USD LIBOR + 1.850% Floor 1.850% 07/26/2083 | 4.633% | 500,000 | 449,782 | |
| Series 2008-9 Class A | ||||
| 3-month USD LIBOR + 1.500% Floor 1.500% 04/25/2023 | 4.283% | 169,650 | 168,804 | |
| Series 2012-1 Class A3 | ||||
| 1-month USD LIBOR + 0.950% Floor 0.950% 09/25/2028 | 3.394% | 403,262 | 388,615 | |
| Subordinated Series 2004-10 Class B | ||||
| 3-month USD LIBOR + 0.370% Floor 0.370% 01/25/2040 | 3.153% | 310,079 | 284,591 | |
| Subordinated Series 2012-7 Class B | ||||
| 1-month USD LIBOR + 1.800% Floor 1.800% 09/25/2043 | 4.244% | 550,000 | 521,875 | |
| Taco Bell Funding LLC(a) | ||||
| Series 2016-1A Class A23 | ||||
| 05/25/2046 | 4.970% | 364,787 | 361,465 | |
| TAL Advantage VII LLC(a) | ||||
| Series 2020-1A Class A | ||||
| 09/20/2045 | 2.050% | 367,425 | 331,398 | |
| Textainer Marine Containers VII Ltd.(a) | ||||
| Series 2021-2A Class A | ||||
| 04/20/2046 | 2.230% | 692,333 | 611,327 | |
| Textainer Marine Containers VIII Ltd.(a) | ||||
| Series 2020-2A Class A | ||||
| 09/20/2045 | 2.100% | 253,320 | 226,075 | |
| Series 2020-3A Class A | ||||
| 09/20/2045 | 2.110% | 297,210 | 265,294 | |
| Tif Funding II LLC(a) | ||||
| Series 2020-1A Class A | ||||
| 08/20/2045 | 2.090% | 185,900 | 165,590 | |
| 16 | Multi-Manager Alternative Strategies Fund | Annual Report 2022 |
August 31, 2022
| Asset-Backed Securities — Non-Agency (continued) | ||||
| Issuer | Coupon Rate | Principal Amount ($) | Value ($) | |
| Vantage Data Centers LLC(a) | ||||
| Series 2020-1A Class A2 | ||||
| 09/15/2045 | 1.645% | 395,000 | 352,657 | |
| Total Asset-Backed Securities — Non-Agency (Cost $17,286,537) | 16,636,259 | |||
| Commercial Mortgage-Backed Securities - Agency 0.4% | ||||
| Federal Home Loan Mortgage Corp. Multifamily Pass-Through REMIC Trust(c),(d) | ||||
| Series 2019-P002 Class X | ||||
| 07/25/2033 | 1.138% | 705,000 | 62,051 | |
| Federal Home Loan Mortgage Corp. Multifamily Structured Pass-Through Certificates(c),(d) | ||||
| CMO Series K057 Class X1 | ||||
| 07/25/2026 | 1.305% | 3,738,847 | 135,915 | |
| Series 2018-K732 Class X3 | ||||
| 05/25/2046 | 2.244% | 1,350,000 | 76,944 | |
| Series K025 Class X3 | ||||
| 11/25/2040 | 1.804% | 2,400,000 | 24 | |
| Series K035 Class X3 | ||||
| 12/25/2041 | 1.849% | 3,000,000 | 48,557 | |
| Series K039 Class X3 (FHLMC) | ||||
| 08/25/2042 | 2.177% | 1,520,000 | 67,613 | |
| Series K043 Class X3 | ||||
| 02/25/2043 | 1.690% | 3,951,044 | 139,041 | |
| Series K051 Class X3 | ||||
| 10/25/2043 | 1.668% | 2,100,000 | 89,980 | |
| Series K060 Class X3 | ||||
| 12/25/2044 | 1.961% | 1,350,000 | 90,403 | |
| Series K0728 Class X3 | ||||
| 11/25/2045 | 2.017% | 1,975,000 | 80,817 | |
| Series KC07 Class X1 | ||||
| 09/25/2026 | 0.847% | 3,929,777 | 81,627 | |
| Series KL05 Class X1HG | ||||
| 12/25/2027 | 1.368% | 2,400,000 | 132,734 | |
| Series KLU3 Class X1 | ||||
| 01/25/2031 | 2.079% | 1,595,915 | 187,949 | |
| Series KS06 Class X | ||||
| 08/25/2026 | 1.177% | 2,656,407 | 75,987 | |
| Series Q004 Class XFL | ||||
| 05/25/2044 | 1.334% | 1,617,124 | 50,476 | |
| Federal National Mortgage Association(c),(d) | ||||
| Series 2016-M11B Class X2 | ||||
| 07/25/2039 | 2.960% | 707,602 | 17,342 | |
| Series 2016-M4 Class X2 | ||||
| 01/25/2039 | 2.704% | 354,462 | 6,212 | |
| Series 2019-M29 Class X4 | ||||
| 03/25/2029 | 0.700% | 4,300,000 | 143,583 | |
| Commercial Mortgage-Backed Securities - Agency (continued) | ||||
| Issuer | Coupon Rate | Principal Amount ($) | Value ($) | |
| Freddie Mac Multifamily Structured Pass-Through Certificates(c),(d) | ||||
| Series K096 Class X3 (FHLMC) | ||||
| 07/25/2029 | 2.112% | 3,390,000 | 369,062 | |
| FREMF Mortgage Trust(a),(b) | ||||
| Subordinated Series 2019-KF71 Class B | ||||
| 1-month USD LIBOR + 2.300% Floor 2.300% 10/25/2029 | 4.662% | 314,373 | 305,885 | |
| Government National Mortgage Association(c),(d) | ||||
| CMO Series 2014-103 Class IO | ||||
| 05/16/2055 | 0.195% | 1,078,711 | 9,834 | |
| Series 2012-4 Class IO | ||||
| 05/16/2052 | 0.000% | 2,083,717 | 21 | |
| Total Commercial Mortgage-Backed Securities - Agency (Cost $2,700,188) | 2,172,057 | |||
| Commercial Mortgage-Backed Securities - Non-Agency 2.6% | ||||
| 225 Liberty Street Trust(a),(c),(d) | ||||
| Series 2016-225L Class X | ||||
| 02/10/2036 | 1.030% | 5,000,000 | 127,857 | |
| AREIT Trust(a),(b) | ||||
| Subordinated Series 2020-CRE4 Class B | ||||
| 30-day Average SOFR + 4.264% Floor 4.150% 04/15/2037 | 6.247% | 365,000 | 354,656 | |
| BAMLL Commercial Mortgage Securities Trust(a),(c) | ||||
| Series 2018-PARK Class A | ||||
| 08/10/2038 | 4.227% | 95,000 | 90,549 | |
| BDS Ltd.(a),(b) | ||||
| Series 2020-FL6 Class D | ||||
| 30-day Average SOFR + 2.865% Floor 2.750% 09/15/2035 | 4.847% | 302,000 | 290,629 | |
| Series 2021-FL8 Class A | ||||
| 1-month USD LIBOR + 0.920% Floor 0.920% 01/18/2036 | 3.076% | 505,221 | 492,764 | |
| BFLD Trust(a),(b) | ||||
| Series 2020-EYP Class A | ||||
| 1-month USD LIBOR + 1.150% Floor 1.150% 10/15/2035 | 3.541% | 480,000 | 466,386 | |
| Series 2021-FPM Class A | ||||
| 1-month USD LIBOR + 1.600% Floor 1.600% 06/15/2038 | 3.991% | 288,000 | 278,915 | |
| BOCA Commercial Mortgage Trust(a),(b) | ||||
| Subordinated Series 2022-BOCA Class B | ||||
| 1-month Term SOFR + 2.319% Floor 2.319% 05/15/2039 | 4.627% | 100,000 | 97,645 | |
| Multi-Manager Alternative Strategies Fund | Annual Report 2022 | 17 |
August 31, 2022
| Commercial Mortgage-Backed Securities - Non-Agency (continued) | ||||
| Issuer | Coupon Rate | Principal Amount ($) | Value ($) | |
| BX Commercial Mortgage Trust(a),(b) | ||||
| Series 2019-XL Class A | ||||
| 1-month USD LIBOR + 0.920% Floor 0.921% 10/15/2036 | 3.311% | 430,593 | 425,487 | |
| Series 2021-CIP Class A | ||||
| 1-month USD LIBOR + 0.921% Floor 0.921% 12/15/2038 | 3.312% | 115,000 | 111,550 | |
| Series 2021-VOLT Class A | ||||
| 1-month USD LIBOR + 0.700% Floor 0.700% 09/15/2036 | 3.091% | 125,000 | 120,752 | |
| Subordinated Series 2021-VINO Class E | ||||
| 1-month USD LIBOR + 1.952% Floor 1.952% 05/15/2038 | 3.951% | 165,000 | 153,862 | |
| BX Trust(a) | ||||
| Series 2019-OC11 Class A | ||||
| 12/09/2041 | 3.202% | 225,000 | 199,217 | |
| BX Trust(a),(b) | ||||
| Subordinated Series 2021-LBA Class EJV | ||||
| 1-month USD LIBOR + 2.000% Floor 2.000% 02/15/2036 | 4.000% | 240,000 | 221,784 | |
| CAMB Commercial Mortgage Trust(a),(b) | ||||
| Series 2019-LIFE Class A | ||||
| 1-month USD LIBOR + 1.070% Floor 1.071% 12/15/2037 | 3.461% | 100,000 | 98,751 | |
| Citigroup Commercial Mortgage Trust(c),(d) | ||||
| Series 2016-P3 Class XA | ||||
| 04/15/2049 | 1.820% | 9,053,491 | 392,459 | |
| COMM Mortgage Trust(a),(c),(d) | ||||
| Series 2013-LC6 Class XB | ||||
| 01/10/2046 | 0.502% | 11,750,000 | 4,116 | |
| Series 2020-CBM Class XCP | ||||
| 02/10/2037 | 0.722% | 3,134,666 | 40,255 | |
| Series 2020-SBX Class X | ||||
| 01/10/2038 | 0.662% | 11,501,000 | 195,989 | |
| Commercial Mortgage Pass-Through Certificates(c),(d) | ||||
| Series 2012-CR3 Class XA | ||||
| 10/15/2045 | 1.888% | 514,298 | 5 | |
| Commercial Mortgage Trust(c),(d) | ||||
| Series 2012-CR4 Class XA | ||||
| 10/15/2045 | 1.745% | 1,838,456 | 9 | |
| Series 2013-LC6 Class XA | ||||
| 01/10/2046 | 1.375% | 976,437 | 281 | |
| Series 2014-UBS2 Class XA | ||||
| 03/10/2047 | 1.235% | 3,905,291 | 43,480 | |
| Commercial Mortgage-Backed Securities - Non-Agency (continued) | ||||
| Issuer | Coupon Rate | Principal Amount ($) | Value ($) | |
| CoreVest American Finance Trust(a),(c),(d) | ||||
| Series 2019-1 Class XA | ||||
| 03/15/2052 | 2.449% | 202,352 | 9,447 | |
| Series 2019-3 Class XA | ||||
| 10/15/2052 | 2.219% | 191,426 | 9,372 | |
| Series 2020-1 Class XA | ||||
| 03/15/2050 | 2.774% | 660,034 | 52,174 | |
| Series 2020-3 Class XA | ||||
| 08/15/2053 | 3.841% | 631,639 | 63,930 | |
| Series 2020-3 Class XB | ||||
| 08/15/2053 | 2.785% | 850,000 | 103,107 | |
| CoreVest American Finance Trust(a) | ||||
| Series 2020-1 Class A2 | ||||
| 03/15/2050 | 2.296% | 265,000 | 228,237 | |
| Credit Suisse Mortgage Capital Certificates(a),(b) | ||||
| Series 2019-ICE4 Class A | ||||
| 1-month USD LIBOR + 0.980% Floor 0.980% 05/15/2036 | 3.371% | 255,000 | 252,097 | |
| CSAIL Commercial Mortgage Trust(c),(d) | ||||
| Series 2015-C3 Class XA | ||||
| 08/15/2048 | 0.836% | 9,140,935 | 142,353 | |
| CSMC Trust(a),(c),(d) | ||||
| Series 2021-980M Class X | ||||
| 07/15/2031 | 1.109% | 6,982,000 | 239,903 | |
| CSMC Trust(a),(c) | ||||
| Subordinated Series 2021-B33 Class B | ||||
| 10/10/2043 | 3.766% | 423,000 | 354,852 | |
| Del Amo Fashion Center Trust(a),(c) | ||||
| Subordinated Series 2017-AMO Class C | ||||
| 06/05/2035 | 3.757% | 420,000 | 340,357 | |
| DROP Mortgage Trust(a),(b) | ||||
| Series 2021-FILE Class B | ||||
| 1-month USD LIBOR + 1.700% Floor 1.700% 04/15/2026 | 4.091% | 400,000 | 382,001 | |
| FirstKey Homes Trust(a) | ||||
| Series 2020-SFR2 Class A | ||||
| 10/19/2037 | 1.266% | 99,219 | 91,347 | |
| Fontainebleau Miami Beach Trust(a) | ||||
| Subordinated Series 2019-FBLU Class B | ||||
| 12/10/2036 | 3.447% | 435,810 | 413,708 | |
| Fontainebleau Miami Beach Trust(a),(c) | ||||
| Subordinated Series 2019-FBLU Class E | ||||
| 12/10/2036 | 3.963% | 310,000 | 288,128 | |
| Grace Trust(a) | ||||
| Subordinated Series 2020-GRCE Class B | ||||
| 12/10/2040 | 2.600% | 500,000 | 411,184 | |
| 18 | Multi-Manager Alternative Strategies Fund | Annual Report 2022 |
August 31, 2022
| Commercial Mortgage-Backed Securities - Non-Agency (continued) | ||||
| Issuer | Coupon Rate | Principal Amount ($) | Value ($) | |
| GS Mortgage Securities Trust(a),(c),(d) | ||||
| Series 2012-GC6 Class XB | ||||
| 01/10/2045 | 1.039% | 2,122,857 | 21 | |
| Series 2020-UPTN Class XA | ||||
| 02/10/2037 | 0.446% | 1,750,000 | 13,402 | |
| Home Partners of America Trust(a) | ||||
| Series 2019-1 Class B | ||||
| 09/17/2039 | 3.157% | 81,289 | 75,885 | |
| Hudson Yards Mortgage Trust(a),(c) | ||||
| Series 2019-55HY Class F | ||||
| 12/10/2041 | 3.041% | 85,000 | 64,100 | |
| INTOWN Mortgage Trust(a),(b) | ||||
| Subordinated Series 2022-STAY Class B | ||||
| 1-month Term SOFR + 3.286% Floor 3.286% 08/15/2037 | 5.536% | 150,000 | 148,498 | |
| JPMBB Commercial Mortgage Securities Trust(c),(d) | ||||
| Series 2014-C21 Class XA | ||||
| 08/15/2047 | 1.100% | 857,077 | 10,520 | |
| Series 2014-C23 Class XA | ||||
| 09/15/2047 | 0.748% | 2,560,965 | 23,731 | |
| Series 2014-C26 Class XA | ||||
| 01/15/2048 | 1.087% | 5,111,019 | 83,758 | |
| JPMorgan Chase Commercial Mortgage Securities Trust(c),(d) | ||||
| Series 2012-LC9 Class XA | ||||
| 12/15/2047 | 1.380% | 1,023,322 | 763 | |
| JPMorgan Chase Commercial Mortgage Securities Trust(a) | ||||
| Series 2019-OSB Class A | ||||
| 06/05/2039 | 3.397% | 375,000 | 341,648 | |
| JPMorgan Chase Commercial Mortgage Securities Trust(a),(b) | ||||
| Subordinated Series 2022-NLP Class H | ||||
| 1-month Term SOFR + 5.010% Floor 5.010% 04/15/2037 | 7.290% | 230,000 | 214,517 | |
| Life Mortgage Trust(a),(b) | ||||
| Series 2022-BMR2 Class A1 | ||||
| 1-month Term SOFR + 1.295% Floor 1.295% 05/15/2039 | 3.575% | 285,000 | 279,660 | |
| Series 2022-BMR2 Class B | ||||
| 1-month Term SOFR + 1.794% Floor 1.794% 05/15/2039 | 4.074% | 270,000 | 263,262 | |
| Series 2022-BMR2 Class D | ||||
| 1-month Term SOFR + 2.542% Floor 2.542% 05/15/2039 | 4.822% | 215,000 | 206,943 | |
| Morgan Stanley Bank of America Merrill Lynch Trust(c),(d) | ||||
| Series 2016-C31 Class XA | ||||
| 11/15/2049 | 1.417% | 2,174,819 | 86,790 | |
| Commercial Mortgage-Backed Securities - Non-Agency (continued) | ||||
| Issuer | Coupon Rate | Principal Amount ($) | Value ($) | |
| Morgan Stanley Capital I Trust(a),(c) | ||||
| Series 2018-MP Class A | ||||
| 07/11/2040 | 4.419% | 315,000 | 293,250 | |
| MSCG Trust(a),(b) | ||||
| Subordinated Series 2018-SELF Class E | ||||
| 1-month USD LIBOR + 2.150% Floor 2.150% 10/15/2037 | 4.541% | 375,000 | 359,063 | |
| MSDB Trust(a),(c) | ||||
| Series 2017-712F Class A | ||||
| 07/11/2039 | 3.427% | 285,000 | 258,676 | |
| Natixis Commercial Mortgage Securities Trust(a),(c),(d) | ||||
| Series 2020-2PAC Class XA | ||||
| 12/15/2038 | 1.387% | 2,665,000 | 65,201 | |
| Series 2020-2PAC Class XB | ||||
| 12/15/2038 | 0.948% | 2,665,000 | 49,352 | |
| Natixis Commercial Mortgage Securities Trust(a),(c) | ||||
| Subordinated Series 2018-ALXA Class E | ||||
| 01/15/2043 | 4.460% | 60,000 | 51,578 | |
| Progress Residential Trust(a) | ||||
| Subordinated Series 2021-SFR9 Class E1 | ||||
| 11/17/2040 | 2.811% | 910,000 | 739,551 | |
| SFAVE Commercial Mortgage Securities Trust(a),(c) | ||||
| Series 2015-5AVE Class A2A | ||||
| 01/05/2043 | 3.659% | 425,000 | 336,655 | |
| Series 2015-5AVE Class A2B | ||||
| 01/05/2043 | 4.144% | 35,000 | 27,654 | |
| Subordinated Series 2015-5AVE Class C | ||||
| 01/05/2043 | 4.534% | 345,000 | 238,384 | |
| SMRT Commercial Mortgage Trust(a),(b) | ||||
| Subordinated Series 2022-MINI Class E | ||||
| 1-month Term SOFR + 2.700% Floor 2.700% 01/15/2039 | 5.008% | 350,000 | 324,624 | |
| STWD FL1 Ltd.(a),(b) | ||||
| Series 2019 Class AS | ||||
| 1-month USD LIBOR + 1.515% Floor 1.400% 07/15/2038 | 3.811% | 398,000 | 393,304 | |
| Tricon American Homes Trust(a) | ||||
| Subordinated Series 2017-SFR2 Class E | ||||
| 01/17/2036 | 4.216% | 375,000 | 368,306 | |
| VMC Finance LLC(a),(b) | ||||
| Series 2021-FL4 Class B | ||||
| 1-month USD LIBOR + 1.800% Floor 1.800% 06/16/2036 | 4.177% | 299,000 | 284,146 | |
| Wells Fargo Commercial Mortgage Trust(a),(c) | ||||
| Subordinated Series 2019-JDWR Class D | ||||
| 09/15/2031 | 3.437% | 425,000 | 376,175 | |
| Multi-Manager Alternative Strategies Fund | Annual Report 2022 | 19 |
August 31, 2022
| Commercial Mortgage-Backed Securities - Non-Agency (continued) | ||||
| Issuer | Coupon Rate | Principal Amount ($) | Value ($) | |
| WF-RBS Commercial Mortgage Trust(a),(c),(d) | ||||
| Series 2012-C9 Class XA | ||||
| 11/15/2045 | 1.842% | 132,464 | 1 | |
| WF-RBS Commercial Mortgage Trust(c),(d) | ||||
| Series 2014-C24 Class XA | ||||
| 11/15/2047 | 0.988% | 2,380,692 | 33,898 | |
| Total Commercial Mortgage-Backed Securities - Non-Agency (Cost $14,740,841) | 13,602,911 | |||
| Common Stocks 22.3% | ||
| Issuer | Shares | Value ($) |
| Communication Services 2.2% | ||
| Entertainment 0.9% | ||
| Activision Blizzard, Inc. | 58,681 | 4,605,872 |
| Interactive Media & Services 0.5% | ||
| Twitter, Inc.(e) | 70,369 | 2,726,799 |
| Media 0.8% | ||
| Intelsat Jackson Holdings SA(e),(f),(g) | 362,000 | 0 |
| Intelsat Jackson Holdings SA(e),(f),(g) | 248,000 | 0 |
| Intelsat Jackson Series A, CVR(e),(f),(g) | 612 | — |
| Intelsat Jackson Series B, CVR(e),(f),(g) | 612 | — |
| Shaw Communications, Inc. | 16,870 | 432,620 |
| TEGNA, Inc.(h),(i) | 188,436 | 4,032,531 |
| Total | 4,465,151 | |
| Total Communication Services | 11,797,822 | |
| Consumer Discretionary 1.7% | ||
| Auto Components 0.4% | ||
| Tenneco, Inc.(e) | 105,417 | 1,988,165 |
| Automobiles 0.0% | ||
| General Motors Co. | 2,667 | 101,906 |
| Diversified Consumer Services 0.9% | ||
| Houghton Mifflin Harcourt Co.(e),(f),(g) | 180,721 | 3,795,141 |
| Terminix Global Holdings, Inc.(e) | 23,372 | 996,816 |
| Total | 4,791,957 | |
| Household Durables 0.4% | ||
| iRobot Corp.(e) | 37,537 | 2,210,178 |
| Total Consumer Discretionary | 9,092,206 | |
| Common Stocks (continued) | ||
| Issuer | Shares | Value ($) |
| Consumer Staples 0.2% | ||
| Food & Staples Retailing —% | ||
| Fresh Market Escrow(e),(f),(g) | 90,477 | 0 |
| Tobacco 0.2% | ||
| Swedish Match AB | 89,494 | 898,443 |
| Total Consumer Staples | 898,443 | |
| Financials 2.2% | ||
| Banks 0.6% | ||
| First Horizon Corp.(h),(i) | 145,516 | 3,291,572 |
| U.S. Bancorp | 2,925 | 133,409 |
| Total | 3,424,981 | |
| Capital Markets 0.3% | ||
| Brewin Dolphin Holdings PLC | 123,222 | 732,913 |
| Cowen, Inc., Class A | 16,099 | 619,006 |
| Total | 1,351,919 | |
| Diversified Financial Services 0.0% | ||
| Intelsat Emergence SA(e) | 5,853 | 168,762 |
| Insurance 1.3% | ||
| Alleghany Corp.(e) | 6,549 | 5,508,888 |
| Willis Towers Watson PLC | 7,602 | 1,572,322 |
| Total | 7,081,210 | |
| Total Financials | 12,026,872 | |
| Health Care 4.9% | ||
| Biotechnology 1.4% | ||
| Biohaven Pharmaceutical Holding Co., Ltd.(e),(h),(i) | 15,340 | 2,291,029 |
| ChemoCentryx, Inc.(e) | 37,044 | 1,888,503 |
| Global Blood Therapeutics, Inc.(e) | 40,090 | 2,722,111 |
| Swedish Orphan Biovitrum AB(e) | 35,768 | 789,823 |
| Total | 7,691,466 | |
| Health Care Providers & Services 1.6% | ||
| 1Life Healthcare, Inc.(e) | 144,759 | 2,491,302 |
| Covetrus, Inc.(e) | 69,597 | 1,452,489 |
| Hanger, Inc.(e) | 45,561 | 848,802 |
| LHC Group, Inc.(e) | 18,964 | 3,062,117 |
| Mediclinic International PLC | 143,824 | 835,750 |
| Total | 8,690,460 | |
| 20 | Multi-Manager Alternative Strategies Fund | Annual Report 2022 |
August 31, 2022
| Common Stocks (continued) | ||
| Issuer | Shares | Value ($) |
| Health Care Technology 1.6% | ||
| Change Healthcare, Inc.(e) | 271,156 | 6,662,303 |
| Inovalon Holdings, Inc., Class A(e),(f),(g) | 38,146 | 1,563,986 |
| Total | 8,226,289 | |
| Pharmaceuticals 0.3% | ||
| Aerie Pharmaceuticals, Inc.(e) | 97,242 | 1,468,354 |
| Total Health Care | 26,076,569 | |
| Industrials 2.6% | ||
| Aerospace & Defense 0.5% | ||
| Aerojet Rocketdyne Holdings, Inc.(e) | 45,886 | 1,976,310 |
| Boeing Co. (The)(e) | 1,186 | 190,056 |
| Meggitt PLC(e) | 42,276 | 391,816 |
| Total | 2,558,182 | |
| Air Freight & Logistics 0.4% | ||
| Atlas Air Worldwide Holdings, Inc.(e) | 22,598 | 2,257,992 |
| Airlines 0.0% | ||
| Delta Air Lines, Inc.(e) | 2,848 | 88,487 |
| Commercial Services & Supplies 0.1% | ||
| HomeServe PLC | 44,697 | 615,825 |
| Construction & Engineering 0.2% | ||
| Infrastructure and Energy Alternatives, Inc.(e) | 63,929 | 908,431 |
| Electrical Equipment 0.1% | ||
| Siemens Gamesa Renewable Energy SA(e) | 23,212 | 418,232 |
| Professional Services 1.1% | ||
| Intertrust NV(e) | 65,081 | 1,272,724 |
| Mantech International Corp., Class A | 11,344 | 1,088,003 |
| Nielsen Holdings PLC | 126,079 | 3,510,039 |
| Total | 5,870,766 | |
| Transportation Infrastructure 0.2% | ||
| Atlantia SpA | 42,531 | 973,895 |
| Total Industrials | 13,691,810 | |
| Information Technology 6.3% | ||
| Communications Equipment 0.5% | ||
| Sierra Wireless, Inc.(e) | 92,214 | 2,838,347 |
| Electronic Equipment, Instruments & Components 0.6% | ||
| Rogers Corp.(e) | 12,317 | 3,085,655 |
| Common Stocks (continued) | ||
| Issuer | Shares | Value ($) |
| IT Services 0.8% | ||
| Evo Payments, Inc., Class A(e) | 45,477 | 1,515,294 |
| Switch, Inc., Class A | 79,170 | 2,687,821 |
| Total | 4,203,115 | |
| Semiconductors & Semiconductor Equipment 0.4% | ||
| MagnaChip Semiconductor Corp.(e) | 40,326 | 471,814 |
| Silicon Motion Technology Corp., ADR | 19,818 | 1,528,166 |
| Total | 1,999,980 | |
| Software 4.0% | ||
| Anaplan, Inc.(e),(f),(g) | 60,584 | 3,862,230 |
| Avalara, Inc.(e) | 29,514 | 2,703,187 |
| Black Knight, Inc.(e) | 6,199 | 410,126 |
| Citrix Systems, Inc. | 35,205 | 3,618,018 |
| Micro Focus International PLC | 101,779 | 612,794 |
| Momentive Global, Inc.(e) | 143,016 | 1,013,983 |
| Ping Identity Holding Corp.(e) | 82,270 | 2,315,078 |
| VMware, Inc., Class A(h),(i) | 21,774 | 2,526,437 |
| Zendesk, Inc.(e) | 59,288 | 4,551,540 |
| Total | 21,613,393 | |
| Total Information Technology | 33,740,490 | |
| Materials 0.5% | ||
| Construction Materials 0.3% | ||
| Forterra, Inc.(e),(f),(g) | 55,377 | 1,388,911 |
| Paper & Forest Products 0.2% | ||
| Resolute Forest Products, Inc.(e) | 65,281 | 1,322,593 |
| Total Materials | 2,711,504 | |
| Real Estate 0.5% | ||
| Equity Real Estate Investment Trusts (REITS) 0.5% | ||
| Americold Realty Trust, Inc. | 2,907 | 85,524 |
| Duke Realty Corp. | 40,530 | 2,385,191 |
| Total | 2,470,715 | |
| Total Real Estate | 2,470,715 | |
| Utilities 1.2% | ||
| Electric Utilities 0.7% | ||
| Electricite de France SA | 80,031 | 956,869 |
| PNM Resources, Inc.(h),(i) | 58,595 | 2,779,161 |
| Total | 3,736,030 | |
| Multi-Manager Alternative Strategies Fund | Annual Report 2022 | 21 |
August 31, 2022
| Common Stocks (continued) | ||
| Issuer | Shares | Value ($) |
| Gas Utilities 0.5% | ||
| South Jersey Industries, Inc.(h),(i) | 79,903 | 2,704,716 |
| Total Utilities | 6,440,746 | |
| Total Common Stocks (Cost $122,037,996) | 118,947,177 | |
| Convertible Bonds 0.6% | ||||
| Issuer | Coupon Rate | Principal Amount ($) | Value ($) | |
| Airlines 0.2% | ||||
| Air Canada | ||||
| 07/01/2025 | 4.000% | 110,000 | 122,848 | |
| American Airlines Group, Inc. | ||||
| 07/01/2025 | 6.500% | 375,000 | 405,750 | |
| Southwest Airlines Co. | ||||
| 05/01/2025 | 1.250% | 205,000 | 256,148 | |
| Total | 784,746 | |||
| Banking 0.3% | ||||
| Banco Santander SA(j) | ||||
| 12/31/2049 | 4.750% | 200,000 | 159,476 | |
| Barclays PLC(j) | ||||
| 12/31/2049 | 4.375% | 200,000 | 150,288 | |
| Deutsche Bank AG(j) | ||||
| 12/31/2049 | 6.000% | 200,000 | 164,557 | |
| ING Groep NV(j) | ||||
| 12/31/2049 | 5.750% | 220,000 | 204,177 | |
| Intesa Sanpaolo SpA(a),(j) | ||||
| 12/31/2049 | 7.700% | 200,000 | 180,500 | |
| Lloyds Banking Group PLC(j) | ||||
| 12/31/2049 | 7.500% | 200,000 | 195,971 | |
| Societe Generale SA(a),(j) | ||||
| 12/31/2049 | 6.750% | 205,000 | 184,924 | |
| UBS Group AG(a),(j) | ||||
| 12/31/2049 | 4.375% | 200,000 | 151,321 | |
| Total | 1,391,214 | |||
| Cable and Satellite 0.1% | ||||
| Liberty Broadband Corp.(a) | ||||
| 09/30/2050 | 1.250% | 270,000 | 255,825 | |
| 09/30/2050 | 2.750% | 180,000 | 174,323 | |
| Liberty Media Corp.(a) | ||||
| 12/01/2050 | 0.500% | 105,000 | 121,629 | |
| Total | 551,777 | |||
| Convertible Bonds (continued) | ||||
| Issuer | Coupon Rate | Principal Amount ($) | Value ($) | |
| Consumer Cyclical Services 0.0% | ||||
| Uber Technologies, Inc.(k) | ||||
| 12/15/2025 | 0.000% | 225,000 | 192,843 | |
| Retailers 0.0% | ||||
| Burlington Stores, Inc. | ||||
| 04/15/2025 | 2.250% | 225,000 | 233,156 | |
| Total Convertible Bonds (Cost $3,580,512) | 3,153,736 | |||
| Convertible Preferred Stocks 0.5% | |||
| Issuer | Shares | Value ($) | |
| Communication Services 0.1% | |||
| Diversified Telecommunication Services 0.1% | |||
| 2020 Cash Mandatory Exchangeable Trust(a) | 5.250% | 320 | 381,306 |
| Media 0.0% | |||
| ViacomCBS, Inc. | 5.750% | 2,100 | 79,864 |
| Total Communication Services | 461,170 | ||
| Financials 0.0% | |||
| Capital Markets 0.0% | |||
| KKR & Co., Inc. | 6.000% | 1,200 | 74,688 |
| Total Financials | 74,688 | ||
| Health Care 0.1% | |||
| Health Care Equipment & Supplies 0.0% | |||
| Becton Dickinson and Co. | 6.000% | 2,200 | 111,100 |
| Life Sciences Tools & Services 0.1% | |||
| Danaher Corp. | 5.000% | 205 | 288,059 |
| Total Health Care | 399,159 | ||
| Information Technology 0.0% | |||
| IT Services 0.0% | |||
| Sabre Corp. | 6.500% | 500 | 47,450 |
| Total Information Technology | 47,450 | ||
| Utilities 0.3% | |||
| Electric Utilities 0.2% | |||
| American Electric Power Co., Inc. | 6.125% | 6,600 | 360,756 |
| NextEra Energy, Inc. | 5.279% | 14,000 | 726,740 |
| NextEra Energy, Inc. | 6.219% | 3,800 | 199,006 |
| Total | 1,286,502 | ||
| 22 | Multi-Manager Alternative Strategies Fund | Annual Report 2022 |
August 31, 2022
| Convertible Preferred Stocks (continued) | |||
| Issuer | Shares | Value ($) | |
| Independent Power and Renewable Electricity Producers 0.1% | |||
| AES Corp. (The) | 6.375% | 3,400 | 329,902 |
| Multi-Utilities 0.0% | |||
| Algonquin Power & Utilities Corp. | 7.750% | 5,650 | 251,007 |
| Total Utilities | 1,867,411 | ||
| Total Convertible Preferred Stocks (Cost $2,936,097) | 2,849,878 | ||
| Corporate Bonds & Notes(l) 16.3% | ||||
| Issuer | Coupon Rate | Principal Amount ($) | Value ($) | |
| Aerospace & Defense 0.2% | ||||
| Airbus SE(a) | ||||
| 06/09/2030 | 1.625% | EUR | 100,000 | 91,350 |
| Boeing Co. (The) | ||||
| 02/04/2024 | 1.433% | 300,000 | 287,651 | |
| 05/01/2027 | 5.040% | 300,000 | 299,095 | |
| 05/01/2030 | 5.150% | 550,000 | 541,160 | |
| TransDigm, Inc. | ||||
| 01/15/2029 | 4.625% | 125,000 | 105,845 | |
| Total | 1,325,101 | |||
| Airlines 0.5% | ||||
| American Airlines Pass-Through Trust | ||||
| Series 2016-2 Class AA | ||||
| 06/15/2028 | 3.200% | 185,500 | 165,594 | |
| American Airlines, Inc./AAdvantage Loyalty IP Ltd.(a) | ||||
| 04/20/2026 | 5.500% | 215,000 | 204,686 | |
| 04/20/2029 | 5.750% | 270,000 | 243,895 | |
| Delta Air Lines Pass-Through Trust | ||||
| 06/10/2028 | 2.500% | 98,314 | 84,664 | |
| Delta Air Lines, Inc. | ||||
| 10/28/2024 | 2.900% | 105,000 | 98,494 | |
| 01/15/2026 | 7.375% | 80,000 | 81,561 | |
| Delta Air Lines, Inc./SkyMiles IP Ltd.(a) | ||||
| 10/20/2025 | 4.500% | 100,000 | 97,992 | |
| 10/20/2028 | 4.750% | 734,000 | 702,341 | |
| JetBlue Pass-Through Trust | ||||
| Series 2020-1 Class A | ||||
| 11/15/2032 | 4.000% | 360,738 | 329,099 | |
| Singapore Airlines Ltd.(a) | ||||
| 01/19/2029 | 3.375% | 200,000 | 183,150 | |
| U.S. Airways Pass-Through Trust | ||||
| 04/22/2023 | 6.250% | 144,924 | 142,831 | |
| United Airlines, Inc. Pass-Through Trust | ||||
| 10/15/2027 | 5.875% | 85,954 | 85,332 | |
| Total | 2,419,639 | |||
| Corporate Bonds & Notes(l) (continued) | ||||
| Issuer | Coupon Rate | Principal Amount ($) | Value ($) | |
| Automotive 0.7% | ||||
| BMW Finance NV(a) | ||||
| 11/14/2024 | 1.000% | EUR | 75,000 | 73,580 |
| Ford Motor Co. | ||||
| 02/12/2032 | 3.250% | 135,000 | 105,453 | |
| Ford Motor Credit Co. LLC | ||||
| 06/14/2024 | 2.748% | GBP | 100,000 | 108,942 |
| 08/01/2026 | 4.542% | 200,000 | 186,989 | |
| 05/28/2027 | 4.950% | 200,000 | 187,886 | |
| 08/17/2027 | 4.125% | 200,000 | 180,287 | |
| 02/16/2028 | 2.900% | 200,000 | 166,995 | |
| 06/17/2031 | 3.625% | 275,000 | 222,592 | |
| General Motors Financial Co., Inc. | ||||
| 10/15/2024 | 1.200% | 265,000 | 247,731 | |
| 11/07/2024 | 3.500% | 105,000 | 102,876 | |
| Meritor, Inc.(a) | ||||
| 12/15/2028 | 4.500% | 544,000 | 558,321 | |
| Tenneco, Inc.(a) | ||||
| 04/15/2029 | 5.125% | 1,603,000 | 1,573,556 | |
| Total | 3,715,208 | |||
| Banking 2.7% | ||||
| American Express Co.(j) | ||||
| 12/31/2049 | 3.550% | 85,000 | 73,262 | |
| Banco Actinver SA/Grupo GICSA SAB de CV(a) | ||||
| 12/18/2032 | 9.500% | MXN | 3,000,000 | 94,980 |
| Bank of America Corp.(j) | ||||
| 10/01/2025 | 3.093% | 345,000 | 334,285 | |
| 01/20/2028 | 3.824% | 110,000 | 105,264 | |
| 06/14/2029 | 2.087% | 50,000 | 42,541 | |
| 04/22/2032 | 2.687% | 50,000 | 41,537 | |
| 10/20/2032 | 2.572% | 700,000 | 573,670 | |
| 12/31/2049 | 4.375% | 80,000 | 68,647 | |
| Capital One Financial Corp.(j) | ||||
| 11/02/2027 | 1.878% | 215,000 | 189,175 | |
| Citigroup, Inc.(j) | ||||
| 02/24/2028 | 3.070% | 80,000 | 74,069 | |
| 11/05/2030 | 2.976% | 100,000 | 87,090 | |
| 01/29/2031 | 2.666% | 80,000 | 67,863 | |
| 03/31/2031 | 4.412% | 355,000 | 337,764 | |
| 06/03/2031 | 2.572% | 95,000 | 79,419 | |
| 11/03/2032 | 2.520% | 220,000 | 177,316 | |
| 01/25/2033 | 3.057% | 415,000 | 351,594 | |
| Comerica, Inc.(j) | ||||
| 12/31/2049 | 5.625% | 95,000 | 96,599 | |
| Credit Suisse Group AG(a),(j) | ||||
| 02/02/2027 | 1.305% | 450,000 | 379,810 | |
| 05/14/2032 | 3.091% | 200,000 | 151,185 | |
| 08/12/2033 | 6.537% | 265,000 | 253,616 | |
| Multi-Manager Alternative Strategies Fund | Annual Report 2022 | 23 |
August 31, 2022
| Corporate Bonds & Notes(l) (continued) | ||||
| Issuer | Coupon Rate | Principal Amount ($) | Value ($) | |
| Credit Suisse Group Funding Guernsey Ltd. | ||||
| 03/26/2025 | 3.750% | 135,000 | 129,134 | |
| Goldman Sachs Group, Inc. (The)(a) | ||||
| 05/15/2024 | 1.375% | EUR | 186,000 | 185,569 |
| 03/27/2025 | 3.375% | EUR | 38,000 | 38,653 |
| 11/01/2028 | 2.000% | EUR | 147,000 | 134,464 |
| Goldman Sachs Group, Inc. (The)(j) | ||||
| 04/22/2032 | 2.615% | 970,000 | 799,004 | |
| 07/21/2032 | 2.383% | 230,000 | 185,617 | |
| 10/21/2032 | 2.650% | 500,000 | 411,028 | |
| HSBC Holdings PLC(j) | ||||
| 05/24/2025 | 0.976% | 225,000 | 209,930 | |
| 05/24/2027 | 1.589% | 125,000 | 108,913 | |
| 06/09/2028 | 4.755% | 25,000 | 24,084 | |
| 09/22/2028 | 2.013% | 365,000 | 307,760 | |
| 08/17/2029 | 2.206% | 215,000 | 178,025 | |
| 05/24/2032 | 2.804% | 170,000 | 135,066 | |
| 08/11/2033 | 5.402% | 200,000 | 190,129 | |
| Intesa Sanpaolo SpA(a),(j) | ||||
| Subordinated | ||||
| 06/01/2032 | 4.198% | 200,000 | 145,404 | |
| JPMorgan Chase & Co.(j) | ||||
| 11/19/2026 | 1.045% | 235,000 | 208,922 | |
| 04/22/2027 | 1.578% | 285,000 | 254,635 | |
| 02/24/2028 | 2.947% | 425,000 | 393,197 | |
| 10/15/2030 | 2.739% | 105,000 | 90,938 | |
| 04/22/2032 | 2.580% | 340,000 | 281,269 | |
| 11/08/2032 | 2.545% | 165,000 | 135,950 | |
| 12/31/2049 | 3.650% | 85,000 | 73,725 | |
| Lloyds Banking Group PLC(j) | ||||
| 07/09/2025 | 3.870% | 400,000 | 392,278 | |
| 08/11/2033 | 4.976% | 330,000 | 313,641 | |
| Macquarie Group Ltd.(a),(j) | ||||
| 06/23/2032 | 2.691% | 195,000 | 157,214 | |
| 01/14/2033 | 2.871% | 305,000 | 244,914 | |
| Morgan Stanley(j) | ||||
| 04/28/2032 | 1.928% | 85,000 | 67,149 | |
| 07/21/2032 | 2.239% | 400,000 | 322,586 | |
| 10/20/2032 | 2.511% | 205,000 | 168,102 | |
| Subordinated | ||||
| 09/16/2036 | 2.484% | 100,000 | 77,339 | |
| 04/20/2037 | 5.297% | 690,000 | 662,655 | |
| Nationwide Building Society(a),(j) | ||||
| 03/08/2024 | 3.766% | 660,000 | 656,831 | |
| 08/01/2024 | 4.363% | 100,000 | 99,296 | |
| Popular, Inc. | ||||
| 09/14/2023 | 6.125% | 370,000 | 374,773 | |
| Santander UK Group Holdings PLC(j) | ||||
| 11/15/2024 | 4.796% | 90,000 | 89,538 | |
| 03/15/2025 | 1.089% | 300,000 | 280,777 | |
| 06/14/2027 | 1.673% | 110,000 | 95,367 | |
| Corporate Bonds & Notes(l) (continued) | ||||
| Issuer | Coupon Rate | Principal Amount ($) | Value ($) | |
| Santander UK PLC(a) | ||||
| Subordinated | ||||
| 11/07/2023 | 5.000% | 115,000 | 114,920 | |
| Shinhan Financial Group Co., Ltd.(a),(j) | ||||
| 12/31/2049 | 2.875% | 200,000 | 177,641 | |
| U.S. Bancorp | ||||
| 06/07/2024 | 0.850% | EUR | 370,000 | 361,261 |
| US Bancorp(j) | ||||
| 12/31/2049 | 3.700% | 299,000 | 251,079 | |
| Wells Fargo & Co.(j) | ||||
| 06/02/2028 | 2.393% | 160,000 | 143,123 | |
| 02/11/2031 | 2.572% | 375,000 | 319,333 | |
| 03/02/2033 | 3.350% | 540,000 | 470,940 | |
| 07/25/2033 | 4.897% | 195,000 | 192,141 | |
| Total | 14,234,000 | |||
| Brokerage/Asset Managers/Exchanges 0.1% | ||||
| Charles Schwab Corp. (The) | ||||
| 12/01/2031 | 1.950% | 245,000 | 199,945 | |
| Intercontinental Exchange, Inc. | ||||
| 09/15/2032 | 1.850% | 175,000 | 138,079 | |
| 03/15/2033 | 4.600% | 60,000 | 59,409 | |
| Total | 397,433 | |||
| Building Materials 0.1% | ||||
| Advanced Drainage Systems, Inc.(a) | ||||
| 06/15/2030 | 6.375% | 70,000 | 69,306 | |
| Cemex SAB de CV(a) | ||||
| 07/11/2031 | 3.875% | 205,000 | 172,565 | |
| St. Marys Cement, Inc.(a) | ||||
| 01/28/2027 | 5.750% | 200,000 | 201,912 | |
| Total | 443,783 | |||
| Cable and Satellite 0.9% | ||||
| Cable One, Inc.(a) | ||||
| 11/15/2030 | 4.000% | 225,000 | 187,277 | |
| CCO Holdings LLC/Capital Corp.(a) | ||||
| 05/01/2027 | 5.125% | 305,000 | 289,706 | |
| 03/01/2030 | 4.750% | 295,000 | 253,485 | |
| 08/15/2030 | 4.500% | 265,000 | 223,031 | |
| 02/01/2031 | 4.250% | 35,000 | 28,581 | |
| 02/01/2032 | 4.750% | 175,000 | 144,936 | |
| 06/01/2033 | 4.500% | 115,000 | 90,962 | |
| Charter Communications Operating LLC/Capital | ||||
| 04/01/2031 | 2.800% | 50,000 | 40,513 | |
| 02/01/2032 | 2.300% | 20,000 | 15,200 | |
| 05/01/2047 | 5.375% | 65,000 | 55,397 | |
| 04/01/2048 | 5.750% | 320,000 | 283,218 | |
| 07/01/2049 | 5.125% | 355,000 | 289,142 | |
| 04/01/2053 | 5.250% | 280,000 | 234,594 | |
| 24 | Multi-Manager Alternative Strategies Fund | Annual Report 2022 |
August 31, 2022
| Corporate Bonds & Notes(l) (continued) | ||||
| Issuer | Coupon Rate | Principal Amount ($) | Value ($) | |
| CSC Holdings LLC(a) | ||||
| 02/01/2028 | 5.375% | 275,000 | 248,550 | |
| DIRECTV Holdings LLC/Financing Co., Inc.(a) | ||||
| 08/15/2027 | 5.875% | 150,000 | 137,265 | |
| Globo Comunicacao e Participacoes SA(a) | ||||
| 01/14/2032 | 5.500% | 200,000 | 164,068 | |
| Intelsat Jackson Holdings SA(a) | ||||
| 03/15/2030 | 6.500% | 248,000 | 225,351 | |
| LCPR Senior Secured Financing DAC(a) | ||||
| 07/15/2029 | 5.125% | 200,000 | 171,937 | |
| SES GLOBAL Americas Holdings GP(a) | ||||
| 03/25/2044 | 5.300% | 375,000 | 311,507 | |
| Sirius XM Radio, Inc.(a) | ||||
| 07/01/2030 | 4.125% | 255,000 | 216,213 | |
| 09/01/2031 | 3.875% | 107,000 | 86,531 | |
| Time Warner Cable LLC | ||||
| 09/01/2041 | 5.500% | 195,000 | 168,417 | |
| Virgin Media Finance PLC(a) | ||||
| 07/15/2030 | 5.000% | 200,000 | 158,290 | |
| Virgin Media Secured Finance PLC(a) | ||||
| 05/15/2029 | 5.500% | 225,000 | 201,484 | |
| 08/15/2030 | 4.500% | 200,000 | 166,359 | |
| VTR Finance NV(a) | ||||
| 07/15/2028 | 6.375% | 200,000 | 88,793 | |
| VZ Secured Financing BV(a) | ||||
| 01/15/2032 | 5.000% | 165,000 | 134,456 | |
| Total | 4,615,263 | |||
| Chemicals 0.1% | ||||
| Braskem Idesa SAPI(a) | ||||
| 02/20/2032 | 6.990% | 200,000 | 155,944 | |
| Braskem Netherlands Finance BV(a) | ||||
| 01/31/2030 | 4.500% | 200,000 | 176,812 | |
| EverArc Escrow Sarl(a) | ||||
| 10/30/2029 | 5.000% | 190,000 | 162,641 | |
| Unifrax Escrow Issuer Corp.(a) | ||||
| 09/30/2029 | 7.500% | 155,000 | 115,256 | |
| Westlake Corp. | ||||
| 08/15/2024 | 0.875% | 115,000 | 108,692 | |
| Total | 719,345 | |||
| Construction Machinery 0.1% | ||||
| OT Merger Corp.(a) | ||||
| 10/15/2029 | 7.875% | 240,000 | 171,787 | |
| Corporate Bonds & Notes(l) (continued) | ||||
| Issuer | Coupon Rate | Principal Amount ($) | Value ($) | |
| United Rentals North America, Inc. | ||||
| 01/15/2028 | 4.875% | 205,000 | 191,771 | |
| 07/15/2030 | 4.000% | 140,000 | 121,784 | |
| 02/15/2031 | 3.875% | 235,000 | 202,912 | |
| Total | 688,254 | |||
| Consumer Cyclical Services 0.1% | ||||
| Atento Luxco 1 SA(a) | ||||
| 02/10/2026 | 8.000% | 106,000 | 50,946 | |
| Match Group, Inc.(a) | ||||
| 08/01/2030 | 4.125% | 150,000 | 124,809 | |
| WASH Multifamily Acquisition, Inc.(a) | ||||
| 04/15/2026 | 5.750% | 145,000 | 139,852 | |
| Total | 315,607 | |||
| Consumer Products 0.2% | ||||
| Edgewell Personal Care Co.(a) | ||||
| 06/01/2028 | 5.500% | 150,000 | 138,976 | |
| Energizer Holdings, Inc.(a) | ||||
| 12/31/2027 | 6.500% | 150,000 | 140,500 | |
| Natura & Co. Luxembourg Holdings SARL(a) | ||||
| 04/19/2029 | 6.000% | 200,000 | 177,059 | |
| Natura Cosmeticos SA(a) | ||||
| 05/03/2028 | 4.125% | 200,000 | 166,074 | |
| Prestige Brands, Inc.(a) | ||||
| 04/01/2031 | 3.750% | 185,000 | 148,325 | |
| Spectrum Brands, Inc.(a) | ||||
| 07/15/2030 | 5.500% | 165,000 | 143,267 | |
| Valvoline, Inc.(a) | ||||
| 02/15/2030 | 4.250% | 155,000 | 151,281 | |
| Total | 1,065,482 | |||
| Diversified Manufacturing 0.1% | ||||
| GE Capital International Funding Co. Unlimited Co. | ||||
| 11/15/2035 | 4.418% | 167,000 | 157,481 | |
| General Electric Co. | ||||
| 03/15/2032 | 6.750% | 27,000 | 30,603 | |
| Johnson Controls International PLC/Tyco Fire & Security Finance SCA | ||||
| 09/15/2027 | 0.375% | EUR | 100,000 | 87,289 |
| Total | 275,373 | |||
| Electric 0.6% | ||||
| AES Corp. (The)(a) | ||||
| 07/15/2030 | 3.950% | 35,000 | 31,768 | |
| Alliant Energy Finance LLC(a) | ||||
| 03/01/2032 | 3.600% | 305,000 | 276,018 | |
| DPL, Inc. | ||||
| 07/01/2025 | 4.125% | 270,000 | 254,907 | |
| Multi-Manager Alternative Strategies Fund | Annual Report 2022 | 25 |
August 31, 2022
| Corporate Bonds & Notes(l) (continued) | ||||
| Issuer | Coupon Rate | Principal Amount ($) | Value ($) | |
| DTE Energy Co. | ||||
| 06/01/2025 | 1.050% | 80,000 | 73,310 | |
| Duke Energy Corp. | ||||
| 08/15/2032 | 4.500% | 75,000 | 72,291 | |
| Duke Energy Progress LLC | ||||
| 12/01/2044 | 4.150% | 225,000 | 199,894 | |
| E.ON SE(a) | ||||
| 09/29/2027 | 0.375% | EUR | 65,000 | 57,371 |
| FirstEnergy Corp.(j) | ||||
| 07/15/2027 | 4.400% | 190,000 | 182,118 | |
| FirstEnergy Corp. | ||||
| 11/15/2031 | 7.375% | 260,000 | 305,306 | |
| FirstEnergy Transmission LLC(a) | ||||
| 09/15/2028 | 2.866% | 229,000 | 203,259 | |
| Inversiones Latin America Power Ltda(a) | ||||
| 06/15/2033 | 5.125% | 195,890 | 108,688 | |
| ITC Holdings Corp. | ||||
| 11/15/2027 | 3.350% | 150,000 | 142,102 | |
| Jersey Central Power & Light Co.(a) | ||||
| 04/01/2024 | 4.700% | 330,000 | 328,087 | |
| NSTAR Electric Co. | ||||
| 05/15/2027 | 3.200% | 520,000 | 501,536 | |
| Southern Co. (The) | ||||
| 07/01/2026 | 3.250% | 184,000 | 175,935 | |
| WEC Energy Group, Inc. | ||||
| 03/15/2024 | 0.800% | 77,000 | 73,373 | |
| Total | 2,985,963 | |||
| Environmental 0.0% | ||||
| Waste Pro USA, Inc.(a) | ||||
| 02/15/2026 | 5.500% | 250,000 | 228,155 | |
| Finance Companies 0.2% | ||||
| AerCap Ireland Capital DAC/Global Aviation Trust | ||||
| 01/23/2028 | 3.875% | 75,000 | 68,154 | |
| 01/30/2032 | 3.300% | 344,000 | 276,684 | |
| Air Lease Corp. | ||||
| 03/01/2025 | 3.250% | 160,000 | 153,384 | |
| Avolon Holdings Funding Ltd.(a) | ||||
| 07/01/2024 | 3.950% | 45,000 | 43,039 | |
| 02/15/2025 | 2.875% | 195,000 | 179,304 | |
| 11/18/2027 | 2.528% | 199,000 | 162,943 | |
| Park Aerospace Holdings Ltd.(a) | ||||
| 03/15/2023 | 4.500% | 45,000 | 44,728 | |
| 02/15/2024 | 5.500% | 63,000 | 62,365 | |
| Total | 990,601 | |||
| Corporate Bonds & Notes(l) (continued) | ||||
| Issuer | Coupon Rate | Principal Amount ($) | Value ($) | |
| Food and Beverage 0.8% | ||||
| Anheuser-Busch Companies LLC/InBev Worldwide, Inc. | ||||
| 02/01/2046 | 4.900% | 200,000 | 189,908 | |
| Becle SAB de CV(a) | ||||
| 10/14/2031 | 2.500% | 205,000 | 167,480 | |
| Chobani LLC/Finance Corp., Inc.(a) | ||||
| 11/15/2028 | 4.625% | 150,000 | 131,626 | |
| Darling Ingredients, Inc.(a) | ||||
| 06/15/2030 | 6.000% | 170,000 | 170,165 | |
| JBS USA LUX SA/Food Co./Finance, Inc.(a) | ||||
| 12/01/2031 | 3.750% | 400,000 | 348,940 | |
| 01/15/2032 | 3.625% | 200,000 | 173,157 | |
| 04/01/2033 | 5.750% | 170,000 | 169,337 | |
| 12/01/2052 | 6.500% | 75,000 | 78,394 | |
| Kraft Heinz Foods Co. | ||||
| 06/01/2026 | 3.000% | 135,000 | 127,657 | |
| 05/15/2027 | 3.875% | 70,000 | 67,618 | |
| 03/01/2031 | 4.250% | 300,000 | 284,574 | |
| 07/15/2035 | 5.000% | 40,000 | 38,873 | |
| 01/26/2039 | 6.875% | 220,000 | 243,462 | |
| 10/01/2039 | 4.625% | 235,000 | 208,678 | |
| 06/01/2046 | 4.375% | 205,000 | 173,962 | |
| Kraft Heinz Foods Co.(a) | ||||
| 08/01/2039 | 7.125% | 35,000 | 39,112 | |
| MARB BondCo PLC(a) | ||||
| 01/29/2031 | 3.950% | 200,000 | 158,360 | |
| NBM US Holdings, Inc.(a) | ||||
| 05/14/2026 | 7.000% | 200,000 | 200,196 | |
| Pilgrim’s Pride Corp.(a) | ||||
| 09/30/2027 | 5.875% | 150,000 | 147,734 | |
| 04/15/2031 | 4.250% | 150,000 | 129,304 | |
| Post Holdings, Inc.(a) | ||||
| 01/15/2028 | 5.625% | 315,000 | 299,254 | |
| 12/15/2029 | 5.500% | 210,000 | 192,504 | |
| 09/15/2031 | 4.500% | 165,000 | 140,292 | |
| TreeHouse Foods, Inc. | ||||
| 09/01/2028 | 4.000% | 160,000 | 134,223 | |
| Total | 4,014,810 | |||
| Gaming 0.6% | ||||
| Caesars Entertainment, Inc.(a) | ||||
| 10/15/2029 | 4.625% | 90,000 | 72,421 | |
| Churchill Downs, Inc.(a) | ||||
| 01/15/2028 | 4.750% | 92,000 | 83,664 | |
| Colt Merger Sub, Inc.(a) | ||||
| 07/01/2027 | 8.125% | 130,000 | 127,928 | |
| 26 | Multi-Manager Alternative Strategies Fund | Annual Report 2022 |
August 31, 2022
| Corporate Bonds & Notes(l) (continued) | ||||
| Issuer | Coupon Rate | Principal Amount ($) | Value ($) | |
| GLP Capital LP/Financing II, Inc. | ||||
| 04/15/2026 | 5.375% | 395,000 | 388,984 | |
| 06/01/2028 | 5.750% | 80,000 | 79,331 | |
| 01/15/2029 | 5.300% | 130,000 | 125,963 | |
| MGM Resorts International | ||||
| 10/15/2028 | 4.750% | 20,000 | 17,588 | |
| Peninsula Pacific Entertainment LLC/Finance, Inc.(a) | ||||
| 11/15/2027 | 8.500% | 1,243,000 | 1,336,225 | |
| Penn National Gaming, Inc.(a) | ||||
| 07/01/2029 | 4.125% | 185,000 | 149,852 | |
| VICI Properties LP | ||||
| 05/15/2032 | 5.125% | 335,000 | 319,237 | |
| 05/15/2052 | 5.625% | 70,000 | 64,795 | |
| VICI Properties LP/Note Co., Inc.(a) | ||||
| 05/01/2024 | 5.625% | 75,000 | 75,108 | |
| 09/01/2026 | 4.500% | 30,000 | 28,254 | |
| 02/01/2027 | 5.750% | 55,000 | 54,137 | |
| 02/15/2027 | 3.750% | 10,000 | 9,067 | |
| 01/15/2028 | 4.500% | 45,000 | 41,833 | |
| 02/15/2029 | 3.875% | 35,000 | 31,159 | |
| 12/01/2029 | 4.625% | 185,000 | 170,871 | |
| 08/15/2030 | 4.125% | 190,000 | 166,940 | |
| Total | 3,343,357 | |||
| Health Care 1.2% | ||||
| 180 Medical, Inc.(a) | ||||
| 10/15/2029 | 3.875% | 160,000 | 140,074 | |
| Baylor Scott & White Holdings | ||||
| 11/15/2026 | 2.650% | 500,000 | 470,747 | |
| Becton Dickinson Euro Finance SARL | ||||
| 06/04/2026 | 1.208% | EUR | 255,000 | 240,108 |
| Cano Health LLC(a) | ||||
| 10/01/2028 | 6.250% | 90,000 | 81,182 | |
| CommonSpirit Health | ||||
| 10/01/2030 | 2.782% | 70,000 | 58,702 | |
| CVS Health Corp. | ||||
| 03/25/2048 | 5.050% | 305,000 | 293,570 | |
| Dentsply Sirona, Inc. | ||||
| 06/01/2030 | 3.250% | 165,000 | 135,960 | |
| DH Europe Finance II SARL | ||||
| 03/18/2028 | 0.450% | EUR | 335,000 | 294,549 |
| Embecta Corp.(a) | ||||
| 02/15/2030 | 5.000% | 270,000 | 236,929 | |
| Hackensack Meridian Health, Inc. | ||||
| 07/01/2057 | 4.500% | 300,000 | 292,052 | |
| Corporate Bonds & Notes(l) (continued) | ||||
| Issuer | Coupon Rate | Principal Amount ($) | Value ($) | |
| HCA, Inc. | ||||
| 02/01/2025 | 5.375% | 430,000 | 433,763 | |
| 09/15/2025 | 7.580% | 125,000 | 132,794 | |
| 12/01/2027 | 7.050% | 115,000 | 123,414 | |
| 09/01/2028 | 5.625% | 100,000 | 100,576 | |
| 06/15/2029 | 4.125% | 403,000 | 373,514 | |
| 09/01/2030 | 3.500% | 854,000 | 742,811 | |
| 06/15/2047 | 5.500% | 84,000 | 77,478 | |
| 06/15/2049 | 5.250% | 230,000 | 205,575 | |
| HCA, Inc.(a) | ||||
| 03/15/2052 | 4.625% | 335,000 | 277,233 | |
| ModivCare Escrow Issuer, Inc.(a) | ||||
| 10/01/2029 | 5.000% | 75,000 | 66,585 | |
| New York and Presbyterian Hospital (The) | ||||
| 08/01/2036 | 3.563% | 390,000 | 351,320 | |
| Option Care Health, Inc.(a) | ||||
| 10/31/2029 | 4.375% | 160,000 | 140,920 | |
| Prime Healthcare Services, Inc.(a) | ||||
| 11/01/2025 | 7.250% | 150,000 | 137,180 | |
| Providence Service Corp. (The)(a) | ||||
| 11/15/2025 | 5.875% | 58,000 | 54,964 | |
| Rede D’or Finance SARL(a) | ||||
| 01/22/2030 | 4.500% | 200,000 | 177,503 | |
| Stryker Corp. | ||||
| 12/01/2023 | 0.600% | 49,000 | 47,062 | |
| 06/15/2025 | 1.150% | 155,000 | 143,114 | |
| Tenet Healthcare Corp. | ||||
| 07/15/2024 | 4.625% | 22,000 | 21,555 | |
| Thermo Fisher Scientific, Inc. | ||||
| 09/12/2024 | 0.750% | EUR | 100,000 | 97,884 |
| 01/23/2026 | 1.400% | EUR | 125,000 | 120,875 |
| 03/01/2028 | 0.500% | EUR | 105,000 | 93,528 |
| Zimmer Biomet Holdings, Inc. | ||||
| 11/22/2024 | 1.450% | 155,000 | 145,645 | |
| Total | 6,309,166 | |||
| Healthcare Insurance 0.3% | ||||
| Centene Corp. | ||||
| 12/15/2027 | 4.250% | 115,000 | 109,175 | |
| 07/15/2028 | 2.450% | 447,000 | 377,318 | |
| 12/15/2029 | 4.625% | 55,000 | 51,814 | |
| 02/15/2030 | 3.375% | 385,000 | 330,235 | |
| 10/15/2030 | 3.000% | 390,000 | 325,725 | |
| 03/01/2031 | 2.500% | 195,000 | 155,738 | |
| Molina Healthcare, Inc.(a) | ||||
| 06/15/2028 | 4.375% | 200,000 | 184,436 | |
| 11/15/2030 | 3.875% | 225,000 | 194,725 | |
| UnitedHealth Group, Inc. | ||||
| 05/15/2024 | 0.550% | 95,000 | 90,228 | |
| Total | 1,819,394 | |||
| Multi-Manager Alternative Strategies Fund | Annual Report 2022 | 27 |
August 31, 2022
| Corporate Bonds & Notes(l) (continued) | ||||
| Issuer | Coupon Rate | Principal Amount ($) | Value ($) | |
| Healthcare REIT 0.0% | ||||
| Healthcare Realty Holdings LP | ||||
| 03/15/2030 | 2.400% | 30,000 | 24,015 | |
| Healthcare Trust of America Holdings LP | ||||
| 07/01/2027 | 3.750% | 50,000 | 47,866 | |
| 03/15/2031 | 2.000% | 175,000 | 136,261 | |
| Total | 208,142 | |||
| Home Construction 0.0% | ||||
| China Aoyuan Group, Ltd.(a),(m) | ||||
| 02/08/2024 | 0.000% | 200,000 | 13,281 | |
| Independent Energy 0.6% | ||||
| Aker BP ASA(a) | ||||
| 01/15/2030 | 3.750% | 210,000 | 189,269 | |
| Continental Resources, Inc.(a) | ||||
| 01/15/2031 | 5.750% | 321,000 | 306,817 | |
| 04/01/2032 | 2.875% | 318,000 | 247,925 | |
| Encana Corp. | ||||
| 08/15/2034 | 6.500% | 255,000 | 263,252 | |
| 02/01/2038 | 6.500% | 130,000 | 132,775 | |
| EQT Corp.(a) | ||||
| 05/15/2026 | 3.125% | 40,000 | 37,668 | |
| 05/15/2031 | 3.625% | 625,000 | 549,122 | |
| EQT Corp. | ||||
| 10/01/2027 | 3.900% | 69,000 | 65,388 | |
| Medco Oak Tree Pte Ltd.(a) | ||||
| 05/14/2026 | 7.375% | 440,000 | 413,896 | |
| Occidental Petroleum Corp. | ||||
| 04/15/2026 | 3.400% | 150,000 | 144,157 | |
| 08/15/2026 | 3.200% | 100,000 | 94,485 | |
| 09/01/2030 | 6.625% | 235,000 | 251,218 | |
| 01/01/2031 | 6.125% | 170,000 | 177,041 | |
| 05/01/2031 | 7.500% | 75,000 | 84,499 | |
| Occidental Petroleum Corp.(k) | ||||
| 10/10/2036 | 0.000% | 285,000 | 148,153 | |
| Petrorio Luxembourg Sarl(a) | ||||
| 06/09/2026 | 6.125% | 200,000 | 187,468 | |
| Southwestern Energy Co.(j) | ||||
| 01/23/2025 | 5.700% | 4,000 | 3,999 | |
| Total | 3,297,132 | |||
| Integrated Energy 0.2% | ||||
| Cenovus Energy, Inc. | ||||
| 02/07/2028 | 3.500% | CAD | 115,000 | 81,856 |
| 06/15/2037 | 5.250% | 175,000 | 167,876 | |
| 11/15/2039 | 6.750% | 403,000 | 438,893 | |
| 06/15/2047 | 5.400% | 175,000 | 170,371 | |
| Corporate Bonds & Notes(l) (continued) | ||||
| Issuer | Coupon Rate | Principal Amount ($) | Value ($) | |
| Shell International Finance BV | ||||
| 05/10/2046 | 4.000% | 117,000 | 103,232 | |
| Total | 962,228 | |||
| Leisure 0.2% | ||||
| Carnival Corp.(a) | ||||
| 03/01/2027 | 5.750% | 255,000 | 197,028 | |
| Cinemark USA, Inc.(a) | ||||
| 07/15/2028 | 5.250% | 160,000 | 129,637 | |
| Live Nation Entertainment, Inc.(a) | ||||
| 10/15/2027 | 4.750% | 70,000 | 64,151 | |
| Royal Caribbean Cruises Ltd.(a) | ||||
| 07/01/2026 | 4.250% | 205,000 | 158,825 | |
| 08/15/2027 | 11.625% | 63,000 | 62,008 | |
| 04/01/2028 | 5.500% | 270,000 | 203,897 | |
| Total | 815,546 | |||
| Life Insurance 0.1% | ||||
| Athene Global Funding(a) | ||||
| 03/08/2027 | 3.205% | 95,000 | 86,273 | |
| 08/19/2028 | 1.985% | 395,000 | 324,637 | |
| Total | 410,910 | |||
| Lodging 0.2% | ||||
| Hilton Domestic Operating Co., Inc. | ||||
| 01/15/2030 | 4.875% | 161,000 | 147,130 | |
| Hilton Domestic Operating Co., Inc.(a) | ||||
| 02/15/2032 | 3.625% | 105,000 | 84,817 | |
| Hyatt Hotels Corp.(j) | ||||
| 04/23/2030 | 6.000% | 256,000 | 260,819 | |
| Travel + Leisure Co.(a) | ||||
| 07/31/2026 | 6.625% | 150,000 | 145,454 | |
| 12/01/2029 | 4.500% | 190,000 | 154,468 | |
| Wyndham Hotels & Resorts, Inc.(a) | ||||
| 08/15/2028 | 4.375% | 135,000 | 120,709 | |
| Total | 913,397 | |||
| Media and Entertainment 0.4% | ||||
| Diamond Sports Group LLC/Finance Co.(a) | ||||
| 08/15/2026 | 5.375% | 293,000 | 55,705 | |
| Gray Escrow II, Inc.(a) | ||||
| 11/15/2031 | 5.375% | 150,000 | 126,821 | |
| Magallanes, Inc.(a) | ||||
| 03/15/2042 | 5.050% | 305,000 | 249,248 | |
| 03/15/2052 | 5.141% | 513,000 | 413,013 | |
| National CineMedia LLC(a) | ||||
| 04/15/2028 | 5.875% | 226,000 | 159,515 | |
| 28 | Multi-Manager Alternative Strategies Fund | Annual Report 2022 |
August 31, 2022
| Corporate Bonds & Notes(l) (continued) | ||||
| Issuer | Coupon Rate | Principal Amount ($) | Value ($) | |
| Netflix, Inc. | ||||
| 02/15/2025 | 5.875% | 285,000 | 291,510 | |
| 04/15/2028 | 4.875% | 110,000 | 106,755 | |
| Netflix, Inc.(a) | ||||
| 11/15/2029 | 5.375% | 230,000 | 226,250 | |
| News Corp.(a) | ||||
| 05/15/2029 | 3.875% | 370,000 | 325,327 | |
| Scripps Escrow II, Inc.(a) | ||||
| 01/15/2031 | 5.375% | 140,000 | 115,830 | |
| WMG Acquisition Corp(a) | ||||
| 02/15/2031 | 3.000% | 410,000 | 325,768 | |
| Total | 2,395,742 | |||
| Metals and Mining 0.2% | ||||
| Cleveland-Cliffs, Inc.(a) | ||||
| 03/01/2029 | 4.625% | 400,000 | 355,394 | |
| 03/01/2031 | 4.875% | 170,000 | 148,657 | |
| FMG Resources August 2006 Pty Ltd.(a) | ||||
| 04/01/2031 | 4.375% | 130,000 | 106,355 | |
| Freeport-McMoRan, Inc. | ||||
| 08/01/2030 | 4.625% | 260,000 | 240,360 | |
| 03/15/2043 | 5.450% | 450,000 | 404,029 | |
| Total | 1,254,795 | |||
| Midstream 0.7% | ||||
| Cheniere Energy Partners LP | ||||
| 10/01/2029 | 4.500% | 180,000 | 165,833 | |
| 03/01/2031 | 4.000% | 260,000 | 226,774 | |
| Enbridge, Inc. | ||||
| 11/15/2029 | 3.125% | 250,000 | 226,188 | |
| Energy Transfer LP(j) | ||||
| 12/31/2049 | 6.625% | 336,000 | 270,878 | |
| Energy Transfer Operating LP | ||||
| 06/01/2027 | 5.500% | 90,000 | 91,083 | |
| 06/15/2028 | 4.950% | 92,000 | 90,507 | |
| 05/15/2050 | 5.000% | 12,000 | 10,299 | |
| Energy Transfer Partners LP | ||||
| 03/15/2045 | 5.150% | 245,000 | 212,737 | |
| Enterprise Products Operating LLC | ||||
| 02/15/2045 | 5.100% | 60,000 | 57,351 | |
| Galaxy Pipeline Assets Bidco Ltd.(a) | ||||
| 03/31/2034 | 2.160% | 192,172 | 167,602 | |
| Global Partners LP/Finance Corp. | ||||
| 01/15/2029 | 6.875% | 150,000 | 137,724 | |
| Kinder Morgan, Inc. | ||||
| 12/01/2034 | 5.300% | 145,000 | 141,826 | |
| NGL Energy Operating LLC/Finance Corp.(a) | ||||
| 02/01/2026 | 7.500% | 125,000 | 113,158 | |
| Corporate Bonds & Notes(l) (continued) | ||||
| Issuer | Coupon Rate | Principal Amount ($) | Value ($) | |
| Rockies Express Pipeline LLC(a) | ||||
| 07/15/2029 | 4.950% | 100,000 | 90,159 | |
| 05/15/2030 | 4.800% | 100,000 | 84,957 | |
| 04/15/2040 | 6.875% | 100,000 | 83,205 | |
| Sunoco LP/Finance Corp. | ||||
| 05/15/2029 | 4.500% | 225,000 | 193,630 | |
| 04/30/2030 | 4.500% | 47,000 | 40,121 | |
| TransCanada PipeLines Ltd. | ||||
| 10/12/2024 | 1.000% | 154,000 | 143,614 | |
| 04/15/2030 | 4.100% | 320,000 | 304,084 | |
| Transcontinental Gas Pipe Line Co. LLC | ||||
| 05/15/2030 | 3.250% | 80,000 | 71,437 | |
| TransMontaigne Partners LP/TLP Finance Corp. | ||||
| 02/15/2026 | 6.125% | 139,000 | 119,348 | |
| Venture Global Calcasieu Pass LLC(a) | ||||
| 08/15/2029 | 3.875% | 225,000 | 197,547 | |
| Western Midstream Operating LP(j) | ||||
| 02/01/2030 | 4.300% | 225,000 | 202,404 | |
| Williams Companies, Inc. (The) | ||||
| 11/15/2030 | 3.500% | 130,000 | 117,054 | |
| Total | 3,559,520 | |||
| Natural Gas 0.0% | ||||
| Engie SA(a) | ||||
| 06/21/2027 | 0.375% | EUR | 100,000 | 89,293 |
| Office REIT 0.1% | ||||
| Hudson Pacific Properties LP | ||||
| 11/01/2027 | 3.950% | 160,000 | 149,977 | |
| SL Green Operating Partnership LP | ||||
| 10/15/2022 | 3.250% | 260,000 | 259,581 | |
| Total | 409,558 | |||
| Oil Field Services 0.1% | ||||
| Archrock Partners LP/Finance Corp.(a) | ||||
| 04/01/2028 | 6.250% | 153,000 | 139,637 | |
| Transocean Poseidon Ltd.(a) | ||||
| 02/01/2027 | 6.875% | 153,125 | 145,113 | |
| Transocean Proteus Ltd.(a) | ||||
| 12/01/2024 | 6.250% | 90,000 | 86,989 | |
| USA Compression Partners LP/Finance Corp. | ||||
| 04/01/2026 | 6.875% | 150,000 | 139,918 | |
| Total | 511,657 | |||
| Other Financial Institutions 0.1% | ||||
| Mexico Remittances Funding Fiduciary Estate Management Sarl(a) | ||||
| 01/15/2028 | 4.875% | 200,000 | 169,888 | |
| Simpar Finance Sarl(a) | ||||
| 02/12/2028 | 10.750% | BRL | 640,000 | 99,471 |
| Multi-Manager Alternative Strategies Fund | Annual Report 2022 | 29 |
August 31, 2022
| Corporate Bonds & Notes(l) (continued) | ||||
| Issuer | Coupon Rate | Principal Amount ($) | Value ($) | |
| Sunac China Holdings, Ltd.(a),(m) | ||||
| 01/10/2025 | 0.000% | 200,000 | 28,886 | |
| Swiss Insured Brazil Power Finance SARL(a) | ||||
| 07/16/2032 | 9.850% | BRL | 1,775,350 | 311,784 |
| Total | 610,029 | |||
| Other Industry 0.0% | ||||
| Adtalem Global Education, Inc.(a) | ||||
| 03/01/2028 | 5.500% | 84,000 | 79,279 | |
| AECOM | ||||
| 03/15/2027 | 5.125% | 190,000 | 185,517 | |
| Total | 264,796 | |||
| Other REIT 0.2% | ||||
| American Assets Trust LP | ||||
| 02/01/2031 | 3.375% | 155,000 | 129,725 | |
| American Campus Communities Operating Partnership LP | ||||
| 04/15/2023 | 3.750% | 500,000 | 501,084 | |
| Host Hotels & Resorts LP | ||||
| 12/15/2029 | 3.375% | 165,000 | 140,656 | |
| 09/15/2030 | 3.500% | 115,000 | 97,210 | |
| Lexington Realty Trust | ||||
| 09/15/2030 | 2.700% | 135,000 | 109,115 | |
| Starwood Property Trust, Inc.(a) | ||||
| 01/15/2027 | 4.375% | 80,000 | 71,271 | |
| Total | 1,049,061 | |||
| Packaging 0.4% | ||||
| Ardagh Metal Packaging Finance USA LLC/PLC(a) | ||||
| 09/01/2028 | 3.250% | 220,000 | 189,847 | |
| Ardagh Packaging Finance PLC/Holdings USA, Inc.(a) | ||||
| 08/15/2027 | 5.250% | 235,000 | 171,454 | |
| Ball Corp. | ||||
| 07/01/2025 | 5.250% | 265,000 | 264,252 | |
| 03/15/2026 | 4.875% | 250,000 | 242,092 | |
| 08/15/2030 | 2.875% | 255,000 | 207,040 | |
| Berry Global Escrow Corp.(a) | ||||
| 07/15/2026 | 4.875% | 51,000 | 49,789 | |
| 07/15/2027 | 5.625% | 125,000 | 121,997 | |
| Clydesdale Acquisition Holdings, Inc.(a) | ||||
| 04/15/2029 | 6.625% | 75,000 | 72,356 | |
| Sealed Air Corp.(a) | ||||
| 09/15/2025 | 5.500% | 357,000 | 356,085 | |
| 04/15/2029 | 5.000% | 100,000 | 95,112 | |
| Trivium Packaging Finance BV(a) | ||||
| 08/15/2026 | 5.500% | 180,000 | 172,756 | |
| Total | 1,942,780 | |||
| Corporate Bonds & Notes(l) (continued) | ||||
| Issuer | Coupon Rate | Principal Amount ($) | Value ($) | |
| Paper 0.0% | ||||
| Graphic Packaging International LLC(a) | ||||
| 07/15/2027 | 4.750% | 75,000 | 71,557 | |
| Graphic Packaging International, Inc. | ||||
| 11/15/2022 | 4.875% | 150,000 | 149,959 | |
| Total | 221,516 | |||
| Pharmaceuticals 0.3% | ||||
| AbbVie, Inc. | ||||
| 03/15/2035 | 4.550% | 110,000 | 105,505 | |
| 05/14/2035 | 4.500% | 200,000 | 190,352 | |
| 05/14/2046 | 4.450% | 73,000 | 66,205 | |
| Allergan Funding SCS | ||||
| 06/01/2024 | 1.250% | EUR | 100,000 | 96,760 |
| 11/15/2028 | 2.625% | EUR | 100,000 | 93,096 |
| Bayer US Finance II LLC(a) | ||||
| 12/15/2025 | 4.250% | 100,000 | 98,370 | |
| 12/15/2028 | 4.375% | 289,000 | 278,156 | |
| 06/25/2038 | 4.625% | 370,000 | 330,263 | |
| Grifols Escrow Issuer SA(a) | ||||
| 10/15/2028 | 4.750% | 245,000 | 207,692 | |
| Total | 1,466,399 | |||
| Property & Casualty 0.3% | ||||
| Acrisure LLC/Finance, Inc.(a) | ||||
| 02/15/2029 | 4.250% | 150,000 | 128,406 | |
| 08/01/2029 | 6.000% | 80,000 | 65,741 | |
| Alliant Holdings Intermediate LLC/Co-Issuer(a) | ||||
| 10/15/2027 | 6.750% | 155,000 | 141,208 | |
| Aon Corp. | ||||
| 05/15/2030 | 2.800% | 230,000 | 200,834 | |
| Berkshire Hathaway Finance Corp. | ||||
| 06/19/2039 | 2.375% | GBP | 125,000 | 111,466 |
| Berkshire Hathaway, Inc.(k) | ||||
| 03/12/2025 | 0.000% | EUR | 215,000 | 203,954 |
| Brown & Brown, Inc. | ||||
| 03/17/2052 | 4.950% | 115,000 | 102,394 | |
| Chubb INA Holdings, Inc. | ||||
| 12/15/2024 | 0.300% | EUR | 180,000 | 172,149 |
| Farmers Exchange Capital III(a),(j) | ||||
| Subordinated | ||||
| 10/15/2054 | 5.454% | 300,000 | 292,679 | |
| Nationwide Mutual Insurance Co.(a),(b) | ||||
| Subordinated | ||||
| 3-month USD LIBOR + 2.290% 12/15/2024 | 4.119% | 450,000 | 449,724 | |
| Total | 1,868,555 | |||
| 30 | Multi-Manager Alternative Strategies Fund | Annual Report 2022 |
August 31, 2022
| Corporate Bonds & Notes(l) (continued) | ||||
| Issuer | Coupon Rate | Principal Amount ($) | Value ($) | |
| Railroads 0.0% | ||||
| Canadian Pacific Railway Co. | ||||
| 12/02/2024 | 1.350% | 75,000 | 70,503 | |
| Union Pacific Corp. | ||||
| 02/14/2042 | 3.375% | 75,000 | 63,064 | |
| Total | 133,567 | |||
| Refining 0.1% | ||||
| FS Luxembourg Sarl(a) | ||||
| 12/15/2025 | 10.000% | 200,000 | 206,875 | |
| MC Brazil Downstream Trading SARL(a) | ||||
| 06/30/2031 | 7.250% | 220,000 | 183,910 | |
| Total | 390,785 | |||
| Restaurants 0.4% | ||||
| 1011778 BC ULC/New Red Finance, Inc.(a) | ||||
| 01/15/2028 | 3.875% | 200,000 | 177,887 | |
| 02/15/2029 | 3.500% | 245,000 | 210,701 | |
| 10/15/2030 | 4.000% | 570,000 | 462,543 | |
| Bloomin’ Brands, Inc./OSI Restaurant Partners LLC(a) | ||||
| 04/15/2029 | 5.125% | 160,000 | 139,652 | |
| Fertitta Entertainment LLC/Finance Co., Inc.(a) | ||||
| 01/15/2030 | 6.750% | 250,000 | 204,041 | |
| Yum! Brands, Inc.(a) | ||||
| 01/15/2030 | 4.750% | 360,000 | 328,167 | |
| Yum! Brands, Inc. | ||||
| 03/15/2031 | 3.625% | 475,000 | 399,848 | |
| 01/31/2032 | 4.625% | 195,000 | 172,290 | |
| Total | 2,095,129 | |||
| Retailers 0.1% | ||||
| Magic MergeCo, Inc.(a) | ||||
| 05/01/2029 | 7.875% | 315,000 | 209,291 | |
| MercadoLibre, Inc. | ||||
| 01/14/2026 | 2.375% | 200,000 | 178,974 | |
| Rent-A-Center, Inc.(a) | ||||
| 02/15/2029 | 6.375% | 200,000 | 168,876 | |
| Total | 557,141 | |||
| Supranational 0.2% | ||||
| Asian Development Bank | ||||
| 10/14/2026 | 3.000% | AUD | 135,000 | 88,842 |
| European Investment Bank(a),(b) | ||||
| SONIA + 0.350% 06/29/2023 | 2.040% | GBP | 115,000 | 133,856 |
| Inter-American Development Bank(a) | ||||
| 10/30/2025 | 2.750% | AUD | 120,000 | 79,382 |
| Corporate Bonds & Notes(l) (continued) | ||||
| Issuer | Coupon Rate | Principal Amount ($) | Value ($) | |
| Inter-American Development Bank | ||||
| 01/29/2026 | 2.700% | AUD | 138,000 | 90,613 |
| International Bank for Reconstruction & Development | ||||
| 01/16/2025 | 1.900% | CAD | 295,000 | 214,906 |
| 11/30/2026 | 2.875% | NZD | 170,000 | 97,861 |
| 01/19/2027 | 1.800% | CAD | 150,000 | 105,495 |
| International Finance Corp. | ||||
| 09/10/2025 | 0.375% | NZD | 270,000 | 146,396 |
| 02/24/2026 | 3.600% | AUD | 330,000 | 223,606 |
| Nordic Investment Bank | ||||
| 04/10/2024 | 1.875% | NOK | 980,000 | 95,844 |
| Total | 1,276,801 | |||
| Technology 0.6% | ||||
| Apple, Inc. | ||||
| 05/24/2025 | 0.875% | EUR | 175,000 | 170,786 |
| Broadcom, Inc. | ||||
| 11/15/2032 | 4.300% | 90,000 | 81,175 | |
| CDW LLC/Finance Corp. | ||||
| 04/01/2028 | 4.250% | 35,000 | 32,347 | |
| CommScope, Inc.(a) | ||||
| 09/01/2029 | 4.750% | 160,000 | 135,988 | |
| Dell International LLC/EMC Corp. | ||||
| 07/15/2046 | 8.350% | 115,000 | 139,855 | |
| Everi Holdings, Inc.(a) | ||||
| 07/15/2029 | 5.000% | 175,000 | 154,415 | |
| Fidelity National Information Services, Inc. | ||||
| 05/21/2027 | 1.500% | EUR | 205,000 | 189,498 |
| 12/03/2028 | 1.000% | EUR | 100,000 | 85,665 |
| Fiserv, Inc. | ||||
| 07/01/2027 | 1.125% | EUR | 100,000 | 91,008 |
| Gartner, Inc.(a) | ||||
| 10/01/2030 | 3.750% | 140,000 | 120,096 | |
| Global Payments, Inc. | ||||
| 11/15/2024 | 1.500% | 240,000 | 224,470 | |
| Iron Mountain Information Management Services, Inc.(a) | ||||
| 07/15/2032 | 5.000% | 240,000 | 200,194 | |
| MSCI, Inc.(a) | ||||
| 09/01/2030 | 3.625% | 330,000 | 282,106 | |
| 02/15/2031 | 3.875% | 160,000 | 137,917 | |
| 11/01/2031 | 3.625% | 265,000 | 222,115 | |
| 08/15/2033 | 3.250% | 90,000 | 71,505 | |
| Oracle Corp. | ||||
| 04/01/2027 | 2.800% | 100,000 | 91,612 | |
| 03/25/2031 | 2.875% | 60,000 | 49,745 | |
| 11/15/2037 | 3.800% | 55,000 | 42,859 | |
| 11/15/2047 | 4.000% | 280,000 | 203,207 | |
| S&P Global, Inc.(a) | ||||
| 08/01/2028 | 4.750% | 245,000 | 251,007 | |
| Multi-Manager Alternative Strategies Fund | Annual Report 2022 | 31 |
August 31, 2022
| Corporate Bonds & Notes(l) (continued) | ||||
| Issuer | Coupon Rate | Principal Amount ($) | Value ($) | |
| SK Hynix, Inc.(a) | ||||
| 01/19/2026 | 1.500% | 200,000 | 177,540 | |
| Tencent Holdings Ltd.(a) | ||||
| 04/22/2041 | 3.680% | 200,000 | 155,800 | |
| Total | 3,310,910 | |||
| Tobacco 0.1% | ||||
| BAT Capital Corp. | ||||
| 08/15/2047 | 4.540% | 100,000 | 73,069 | |
| 03/16/2052 | 5.650% | 140,000 | 119,474 | |
| Reynolds American, Inc. | ||||
| 08/15/2045 | 5.850% | 510,000 | 435,531 | |
| Total | 628,074 | |||
| Transportation Services 0.0% | ||||
| Hertz Corp (The)(a) | ||||
| 12/01/2029 | 5.000% | 255,000 | 205,181 | |
| Wireless 0.8% | ||||
| American Tower Corp. | ||||
| 05/22/2026 | 1.950% | EUR | 100,000 | 96,253 |
| 01/15/2028 | 0.500% | EUR | 100,000 | 84,807 |
| Cellnex Telecom SA | ||||
| 06/26/2029 | 1.875% | EUR | 100,000 | 81,129 |
| Crown Castle International Corp. | ||||
| 01/15/2031 | 2.250% | 65,000 | 52,666 | |
| Crown Castle, Inc. | ||||
| 07/15/2025 | 1.350% | 39,000 | 35,766 | |
| Kenbourne Invest SA(a) | ||||
| 01/22/2028 | 4.700% | 200,000 | 161,370 | |
| Millicom International Cellular SA(a) | ||||
| 04/27/2031 | 4.500% | 200,000 | 165,001 | |
| SBA Communications Corp. | ||||
| 02/15/2027 | 3.875% | 495,000 | 452,483 | |
| 02/01/2029 | 3.125% | 305,000 | 251,243 | |
| Sprint Corp. | ||||
| 09/15/2023 | 7.875% | 193,000 | 198,893 | |
| Sprint Spectrum Co. I/II/III LLC(a) | ||||
| 03/20/2025 | 4.738% | 556,875 | 558,760 | |
| 03/20/2028 | 5.152% | 125,000 | 126,395 | |
| T-Mobile US, Inc. | ||||
| 04/15/2026 | 2.625% | 304,000 | 281,951 | |
| 04/15/2027 | 3.750% | 20,000 | 19,184 | |
| 02/01/2028 | 4.750% | 153,000 | 149,532 | |
| 02/15/2029 | 2.625% | 90,000 | 77,252 | |
| 04/15/2029 | 3.375% | 105,000 | 94,508 | |
| 04/15/2030 | 3.875% | 283,000 | 261,592 | |
| 02/15/2031 | 2.875% | 125,000 | 105,684 | |
| 04/15/2031 | 3.500% | 175,000 | 154,166 | |
| 04/15/2040 | 4.375% | 175,000 | 154,463 | |
| Corporate Bonds & Notes(l) (continued) | ||||
| Issuer | Coupon Rate | Principal Amount ($) | Value ($) | |
| Vmed O2 UK Financing I PLC(a) | ||||
| 01/31/2031 | 3.250% | EUR | 160,000 | 135,163 |
| 01/31/2031 | 4.250% | 430,000 | 346,414 | |
| Vodafone Group PLC | ||||
| 05/30/2048 | 5.250% | 230,000 | 214,950 | |
| 06/19/2049 | 4.875% | 20,000 | 17,796 | |
| Total | 4,277,421 | |||
| Wirelines 0.4% | ||||
| AT&T, Inc. | ||||
| 03/25/2024 | 0.900% | 77,000 | 73,676 | |
| 12/01/2033 | 2.550% | 340,000 | 271,402 | |
| 05/15/2035 | 4.500% | 35,000 | 32,858 | |
| 03/01/2037 | 5.250% | 45,000 | 45,109 | |
| 05/15/2046 | 4.750% | 40,000 | 36,793 | |
| 12/01/2057 | 3.800% | 727,000 | 549,738 | |
| C&W Senior Financing DAC(a) | ||||
| 09/15/2027 | 6.875% | 200,000 | 177,436 | |
| Frontier Communications Corp.(a) | ||||
| 05/01/2028 | 5.000% | 200,000 | 175,354 | |
| Level 3 Financing, Inc.(a) | ||||
| 09/15/2027 | 4.625% | 275,000 | 242,768 | |
| 07/01/2028 | 4.250% | 165,000 | 137,266 | |
| 11/15/2029 | 3.875% | 50,000 | 42,624 | |
| Lumen Technologies, Inc.(a) | ||||
| 06/15/2029 | 5.375% | 235,000 | 183,382 | |
| Total Play Telecomunicaciones SA de CV(a) | ||||
| 11/12/2025 | 7.500% | 210,000 | 188,977 | |
| Verizon Communications, Inc. | ||||
| 03/22/2024 | 0.750% | 58,000 | 55,357 | |
| Total | 2,212,740 | |||
| Total Corporate Bonds & Notes (Cost $98,218,184) | 87,258,020 | |||
| Foreign Government Obligations(l),(n) 5.4% | ||||
| Australia 0.2% | ||||
| Australia Government Bond(a) | ||||
| 11/21/2024 | 0.250% | AUD | 460,000 | 295,489 |
| 09/21/2026 | 0.500% | AUD | 320,000 | 195,724 |
| New South Wales Treasury Corp.(a) | ||||
| 02/08/2024 | 1.000% | AUD | 325,000 | 214,970 |
| 03/20/2025 | 1.250% | AUD | 315,000 | 203,475 |
| Queensland Treasury Corp.(a) | ||||
| 07/21/2023 | 4.250% | AUD | 275,000 | 190,237 |
| Total | 1,099,895 | |||
| Austria 0.0% | ||||
| Republic of Austria Government Bond(a) | ||||
| 02/20/2029 | 0.500% | EUR | 160,000 | 147,324 |
| 32 | Multi-Manager Alternative Strategies Fund | Annual Report 2022 |
August 31, 2022
| Foreign Government Obligations(l),(n) (continued) | ||||
| Issuer | Coupon Rate | Principal Amount ($) | Value ($) | |
| Bahrain 0.0% | ||||
| CBB International Sukuk Co. 7 SPC(a) | ||||
| 10/05/2025 | 6.875% | 200,000 | 210,103 | |
| Brazil 0.0% | ||||
| Brazilian Government International Bond | ||||
| 06/12/2030 | 3.875% | 200,000 | 174,703 | |
| Canada 0.5% | ||||
| Canada Housing Trust No. 1(a) | ||||
| 12/15/2025 | 1.950% | CAD | 465,000 | 335,191 |
| 06/15/2026 | 1.250% | CAD | 610,000 | 425,616 |
| Canadian Government Bond | ||||
| 09/01/2024 | 1.500% | CAD | 205,000 | 149,831 |
| 12/01/2029 | 2.250% | CAD | 445,000 | 319,810 |
| CPPIB Capital, Inc.(a) | ||||
| 12/01/2031 | 2.250% | CAD | 155,000 | 103,220 |
| Province of Ontario | ||||
| 06/02/2028 | 2.900% | CAD | 245,000 | 178,439 |
| 12/02/2030 | 1.350% | CAD | 1,050,000 | 658,723 |
| 06/02/2045 | 3.450% | CAD | 215,000 | 148,170 |
| Province of Quebec | ||||
| 09/01/2023 | 3.000% | CAD | 325,000 | 245,400 |
| Province of Quebec(a) | ||||
| 12/15/2023 | 1.500% | GBP | 105,000 | 118,775 |
| 04/07/2025 | 0.200% | EUR | 205,000 | 195,923 |
| Total | 2,879,098 | |||
| Chile 0.0% | ||||
| Chile Government International Bond | ||||
| 02/06/2028 | 3.240% | 200,000 | 186,248 | |
| Colombia 0.3% | ||||
| Colombia Government International Bond | ||||
| 01/28/2026 | 4.500% | 400,000 | 378,328 | |
| 08/26/2026 | 7.500% | COP | 470,500,000 | 92,637 |
| 03/15/2029 | 4.500% | 200,000 | 175,262 | |
| 04/22/2032 | 3.250% | 215,000 | 158,591 | |
| Colombian TES | ||||
| 07/24/2024 | 10.000% | COP | 1,249,000,000 | 277,133 |
| 11/26/2025 | 6.250% | COP | 840,000,000 | 164,167 |
| Ecopetrol SA | ||||
| 06/26/2026 | 5.375% | 50,000 | 47,027 | |
| 04/29/2030 | 6.875% | 110,000 | 102,153 | |
| 11/02/2031 | 4.625% | 105,000 | 82,204 | |
| 05/28/2045 | 5.875% | 55,000 | 38,112 | |
| Total | 1,515,614 | |||
| Dominican Republic 0.1% | ||||
| Dominican Republic International Bond(a) | ||||
| 01/30/2030 | 4.500% | 350,000 | 294,257 | |
| Foreign Government Obligations(l),(n) (continued) | ||||
| Issuer | Coupon Rate | Principal Amount ($) | Value ($) | |
| Egypt 0.0% | ||||
| Egypt Government International Bond(a) | ||||
| 10/06/2025 | 5.250% | 200,000 | 170,992 | |
| Greece 0.1% | ||||
| Hellenic Republic Government Bond(a) | ||||
| 04/22/2027 | 2.000% | EUR | 236,000 | 224,512 |
| 06/18/2030 | 1.500% | EUR | 290,000 | 244,869 |
| 01/30/2042 | 4.200% | EUR | 150,000 | 151,894 |
| Total | 621,275 | |||
| Guatemala 0.0% | ||||
| Guatemala Government Bond(a) | ||||
| 10/07/2033 | 3.700% | 242,000 | 196,277 | |
| Hong Kong 0.0% | ||||
| Airport Authority(a) | ||||
| 01/12/2052 | 3.250% | 200,000 | 157,257 | |
| India 0.1% | ||||
| Export-Import Bank of India(a) | ||||
| 02/01/2028 | 3.875% | 200,000 | 190,167 | |
| India Government Bond | ||||
| 04/08/2026 | 7.270% | INR | 3,500,000 | 44,504 |
| 07/12/2031 | 6.100% | INR | 7,990,000 | 93,642 |
| Indian Railway Finance Corp., Ltd.(a) | ||||
| 02/13/2030 | 3.249% | 200,000 | 174,933 | |
| Total | 503,246 | |||
| Indonesia 0.7% | ||||
| Freeport Indonesia PT(a) | ||||
| 04/14/2027 | 4.763% | 200,000 | 194,362 | |
| Indonesia Government International Bond(a) | ||||
| 06/14/2023 | 2.625% | EUR | 225,000 | 227,527 |
| 07/18/2024 | 2.150% | EUR | 200,000 | 199,994 |
| Indonesia Government International Bond | ||||
| 10/15/2030 | 3.850% | 200,000 | 195,310 | |
| 03/12/2033 | 1.100% | EUR | 100,000 | 74,488 |
| 03/12/2051 | 3.050% | 200,000 | 151,967 | |
| Indonesia Treasury Bond | ||||
| 06/15/2025 | 6.500% | IDR | 5,915,000,000 | 401,795 |
| 09/15/2026 | 8.375% | IDR | 2,322,000,000 | 166,790 |
| 05/15/2027 | 7.000% | IDR | 2,047,000,000 | 139,808 |
| 05/15/2028 | 6.125% | IDR | 773,000,000 | 50,626 |
| 03/15/2029 | 9.000% | IDR | 1,012,000,000 | 75,374 |
| 05/15/2031 | 8.750% | IDR | 4,550,000,000 | 338,587 |
| 04/15/2032 | 6.375% | IDR | 6,547,000,000 | 418,423 |
| 05/15/2033 | 6.625% | IDR | 2,025,000,000 | 132,275 |
| 06/15/2035 | 7.500% | IDR | 1,095,000,000 | 76,013 |
| 05/15/2038 | 7.500% | IDR | 1,751,000,000 | 120,904 |
| Multi-Manager Alternative Strategies Fund | Annual Report 2022 | 33 |
August 31, 2022
| Foreign Government Obligations(l),(n) (continued) | ||||
| Issuer | Coupon Rate | Principal Amount ($) | Value ($) | |
| Perusahaan Penerbit SBSN Indonesia III(a) | ||||
| 03/29/2027 | 4.150% | 270,000 | 270,575 | |
| PT Indonesia Asahan Aluminium Persero(a) | ||||
| 05/15/2025 | 4.750% | 220,000 | 220,890 | |
| PT Pertamina Persero(a) | ||||
| 08/25/2030 | 3.100% | 200,000 | 179,098 | |
| PT Perusahaan Listrik Negara(a) | ||||
| 05/15/2027 | 4.125% | 280,000 | 271,068 | |
| Total | 3,905,874 | |||
| Ireland 0.0% | ||||
| Ireland Government Bond(a) | ||||
| 05/15/2029 | 1.100% | EUR | 130,000 | 124,566 |
| Israel 0.0% | ||||
| Israel Electric Corp., Ltd.(a) | ||||
| 02/22/2032 | 3.750% | 200,000 | 185,254 | |
| Italy 0.1% | ||||
| Italy Buoni Poliennali Del Tesoro(a) | ||||
| 07/01/2025 | 1.850% | EUR | 415,000 | 408,759 |
| Republic of Italy Government International Bond | ||||
| 02/17/2026 | 1.250% | 200,000 | 174,958 | |
| Total | 583,717 | |||
| Japan 0.2% | ||||
| Japan Government 5-Year Bond | ||||
| 06/20/2025 | 0.100% | JPY | 102,050,000 | 738,437 |
| Japan Government Five-Year Bond | ||||
| 03/20/2027 | 0.005% | JPY | 30,000,000 | 216,189 |
| Total | 954,626 | |||
| Kazakhstan 0.0% | ||||
| KazMunayGas National Co. JSC(a) | ||||
| 04/24/2030 | 5.375% | 215,000 | 200,536 | |
| Malaysia 0.3% | ||||
| Malaysia Government Bond | ||||
| 09/30/2024 | 4.059% | MYR | 975,000 | 220,960 |
| 03/14/2025 | 3.882% | MYR | 545,000 | 123,391 |
| 11/30/2026 | 3.900% | MYR | 405,000 | 91,349 |
| 11/16/2027 | 3.899% | MYR | 1,300,000 | 292,795 |
| 06/15/2028 | 3.733% | MYR | 375,000 | 83,272 |
| 04/15/2033 | 3.844% | MYR | 1,223,000 | 266,978 |
| 07/05/2034 | 3.828% | MYR | 400,000 | 86,338 |
| Petronas Capital Ltd.(a) | ||||
| 01/28/2032 | 2.480% | 200,000 | 174,005 | |
| Total | 1,339,088 | |||
| Foreign Government Obligations(l),(n) (continued) | ||||
| Issuer | Coupon Rate | Principal Amount ($) | Value ($) | |
| Mauritius 0.1% | ||||
| Greenko Solar Mauritius Ltd.(a) | ||||
| 01/29/2025 | 5.550% | 200,000 | 183,562 | |
| Greenko Wind Projects Mauritius Ltd.(a) | ||||
| 04/06/2025 | 5.500% | 205,000 | 184,680 | |
| Total | 368,242 | |||
| Mexico 0.4% | ||||
| Mexican Bonos | ||||
| 03/06/2025 | 5.000% | MXN | 6,540,000 | 292,212 |
| 03/05/2026 | 5.750% | MXN | 5,420,000 | 240,686 |
| 06/03/2027 | 7.500% | MXN | 10,590,000 | 493,368 |
| Mexico Government International Bond | ||||
| 05/24/2031 | 2.659% | 475,000 | 393,384 | |
| 05/29/2031 | 7.750% | MXN | 7,820,000 | 357,984 |
| Petroleos Mexicanos | ||||
| 09/21/2047 | 6.750% | 100,000 | 63,039 | |
| 02/12/2048 | 6.350% | 19,000 | 11,528 | |
| 01/23/2050 | 7.690% | 231,000 | 159,093 | |
| 01/28/2060 | 6.950% | 70,000 | 44,000 | |
| Total | 2,055,294 | |||
| Netherlands 0.1% | ||||
| Bank Nederlandse Gemeenten NV(a) | ||||
| 06/07/2024 | 0.250% | EUR | 85,000 | 82,975 |
| Greenko Dutch BV(a) | ||||
| 03/29/2026 | 3.850% | 194,000 | 164,686 | |
| Total | 247,661 | |||
| New Zealand 0.3% | ||||
| New Zealand Government Bond(a) | ||||
| 04/15/2023 | 5.500% | NZD | 75,000 | 46,369 |
| 04/15/2027 | 4.500% | NZD | 215,000 | 135,043 |
| New Zealand Government Bond | ||||
| 05/15/2024 | 0.500% | NZD | 975,000 | 564,137 |
| 05/15/2026 | 0.500% | NZD | 770,000 | 416,921 |
| New Zealand Local Government Funding Agency Bond(a) | ||||
| 04/15/2026 | 1.500% | NZD | 160,000 | 88,435 |
| New Zealand Local Government Funding Agency Bond | ||||
| 04/15/2027 | 4.500% | NZD | 285,000 | 175,059 |
| Total | 1,425,964 | |||
| Norway 0.3% | ||||
| Kommunalbanken AS | ||||
| 07/15/2024 | 5.250% | AUD | 184,000 | 129,038 |
| 07/16/2025 | 4.250% | AUD | 280,000 | 193,027 |
| 34 | Multi-Manager Alternative Strategies Fund | Annual Report 2022 |
August 31, 2022
| Foreign Government Obligations(l),(n) (continued) | ||||
| Issuer | Coupon Rate | Principal Amount ($) | Value ($) | |
| Nordea Eiendomskreditt AS(b) | ||||
| 3-month NIBOR + 0.300% 06/21/2023 | 1.720% | NOK | 2,000,000 | 201,570 |
| 3-month NIBOR + 0.340% 06/19/2024 | 1.780% | NOK | 2,000,000 | 201,801 |
| Norway Government Bond(a) | ||||
| 05/24/2023 | 2.000% | NOK | 2,531,000 | 252,912 |
| 03/13/2025 | 1.750% | NOK | 3,815,000 | 368,046 |
| 02/19/2026 | 1.500% | NOK | 1,805,000 | 169,964 |
| 02/17/2027 | 1.750% | NOK | 3,025,000 | 282,892 |
| Total | 1,799,250 | |||
| Oman 0.0% | ||||
| Oman Government International Bond(a) | ||||
| 01/17/2028 | 5.625% | 200,000 | 196,784 | |
| Panama 0.1% | ||||
| Panama Government International Bond | ||||
| 01/23/2030 | 3.160% | 200,000 | 175,958 | |
| 09/29/2032 | 2.252% | 200,000 | 155,437 | |
| Total | 331,395 | |||
| Paraguay 0.0% | ||||
| Paraguay Government International Bond(a) | ||||
| 03/27/2027 | 4.700% | 200,000 | 198,291 | |
| Peru 0.1% | ||||
| Peruvian Government International Bond | ||||
| 08/25/2027 | 4.125% | 100,000 | 98,133 | |
| 06/20/2030 | 2.844% | 165,000 | 143,350 | |
| Total | 241,483 | |||
| Philippines 0.1% | ||||
| Philippine Government International Bond | ||||
| 05/17/2027 | 0.875% | EUR | 305,000 | 276,221 |
| 05/05/2030 | 2.457% | 200,000 | 179,748 | |
| 01/14/2036 | 6.250% | PHP | 10,000,000 | 170,744 |
| Total | 626,713 | |||
| Portugal 0.1% | ||||
| Portugal Obrigacoes do Tesouro OT(a) | ||||
| 10/15/2027 | 0.700% | EUR | 90,000 | 85,029 |
| 10/18/2030 | 0.475% | EUR | 470,000 | 407,931 |
| Total | 492,960 | |||
| Qatar 0.2% | ||||
| Qatar Energy(a) | ||||
| 07/12/2031 | 2.250% | 200,000 | 174,387 | |
| Qatar Government International Bond(a) | ||||
| 03/14/2029 | 4.000% | 225,000 | 229,118 | |
| 04/16/2030 | 3.750% | 250,000 | 250,732 | |
| Foreign Government Obligations(l),(n) (continued) | ||||
| Issuer | Coupon Rate | Principal Amount ($) | Value ($) | |
| Qatar Petroleum(a) | ||||
| 07/12/2031 | 2.250% | 200,000 | 174,387 | |
| QNB Finance Ltd.(a) | ||||
| 03/28/2024 | 3.500% | 200,000 | 197,886 | |
| Total | 1,026,510 | |||
| Romania 0.0% | ||||
| Romanian Government International Bond(a) | ||||
| 02/14/2031 | 3.000% | 200,000 | 158,830 | |
| Saudi Arabia 0.0% | ||||
| Saudi Government International Bond(a) | ||||
| 03/04/2028 | 3.625% | 200,000 | 198,524 | |
| Singapore 0.1% | ||||
| Singapore Government Bond | ||||
| 06/01/2025 | 2.375% | SGD | 165,000 | 116,864 |
| 11/01/2026 | 1.250% | SGD | 515,000 | 345,613 |
| Total | 462,477 | |||
| South Africa 0.1% | ||||
| Republic of South Africa Government International Bond | ||||
| 09/30/2029 | 4.850% | 300,000 | 265,385 | |
| South Korea 0.2% | ||||
| Korea Treasury Bond | ||||
| 03/10/2027 | 2.375% | KRW | 952,660,000 | 679,129 |
| 06/10/2027 | 2.125% | KRW | 316,190,000 | 220,650 |
| Total | 899,779 | |||
| Spain 0.1% | ||||
| Spain Government Bond(a) | ||||
| 07/30/2024 | 0.250% | EUR | 330,000 | 323,962 |
| 07/30/2027 | 0.800% | EUR | 255,000 | 241,929 |
| Total | 565,891 | |||
| Sweden 0.1% | ||||
| Sweden Government International Bond(a) | ||||
| 04/24/2023 | 0.125% | EUR | 250,000 | 249,282 |
| Turkey 0.1% | ||||
| Turkey Government International Bond | ||||
| 03/23/2023 | 3.250% | 240,000 | 235,804 | |
| United Arab Emirates 0.1% | ||||
| Abu Dhabi Government International Bond(a) | ||||
| 04/16/2030 | 3.125% | 200,000 | 193,262 | |
| 03/02/2031 | 1.700% | 205,000 | 175,011 | |
| 04/16/2050 | 3.875% | 200,000 | 180,953 | |
| Multi-Manager Alternative Strategies Fund | Annual Report 2022 | 35 |
August 31, 2022
| Foreign Government Obligations(l),(n) (continued) | ||||
| Issuer | Coupon Rate | Principal Amount ($) | Value ($) | |
| DP World Crescent Ltd.(a) | ||||
| 09/26/2028 | 4.848% | 200,000 | 203,053 | |
| Total | 752,279 | |||
| United Kingdom 0.1% | ||||
| United Kingdom Gilt(a) | ||||
| 01/31/2024 | 0.125% | GBP | 290,000 | 323,181 |
| 01/31/2025 | 0.250% | GBP | 80,000 | 86,898 |
| Total | 410,079 | |||
| Uruguay 0.1% | ||||
| Uruguay Government International Bond | ||||
| 01/23/2031 | 4.375% | 325,000 | 331,929 | |
| Total Foreign Government Obligations (Cost $32,939,020) | 28,990,756 | |||
| Limited Partnerships 0.1% | ||
| Issuer | Shares | Value ($) |
| Energy 0.1% | ||
| Oil, Gas & Consumable Fuels 0.1% | ||
| Shell Midstream Partners LP | 20,328 | 321,386 |
| Total Energy | 321,386 | |
| Total Limited Partnerships (Cost $326,189) | 321,386 | |
| Municipal Bonds 0.1% | ||||
| Issue Description | Coupon Rate | Principal Amount ($) | Value ($) | |
| Airport 0.0% | ||||
| County of Miami-Dade Aviation | ||||
| Refunding Revenue Bonds | ||||
| Taxable | ||||
| Series 2020B | ||||
| 10/01/2035 | 2.857% | 85,000 | 69,378 | |
| Sales Tax 0.0% | ||||
| Santa Clara Valley Transportation Authority | ||||
| Revenue Bonds | ||||
| Series 2010 (BAM) | ||||
| 04/01/2032 | 5.876% | 250,000 | 269,742 | |
| Transportation 0.1% | ||||
| Metropolitan Transportation Authority | ||||
| Revenue Bonds | ||||
| Series 2010 (BAM) | ||||
| 11/15/2031 | 6.548% | 250,000 | 271,207 | |
| Total Municipal Bonds (Cost $678,187) | 610,327 | |||
| Preferred Debt 0.0% | ||||
| Issuer | Coupon Rate | Shares | Value ($) | |
| Banking 0.0% | ||||
| Wells Fargo & Co.(j) | ||||
| 12/31/2049 | 5.850% | 7,885 | 189,319 | |
| Total Preferred Debt (Cost $206,354) | 189,319 | |||
| Preferred Stocks 0.1% | |||
| Issuer | Shares | Value ($) | |
| Financials 0.1% | |||
| Banks 0.1% | |||
| U.S. Bancorp(j) | 3.532% | 265 | 197,322 |
| Valley National Bancorp(j) | 5.500% | 6,350 | 150,241 |
| Total | 347,563 | ||
| Capital Markets 0.0% | |||
| Stifel Financial Corp. | 4.500% | 7,350 | 131,859 |
| Total Financials | 479,422 | ||
| Total Preferred Stocks (Cost $596,195) | 479,422 | ||
| Residential Mortgage-Backed Securities - Agency 4.3% | ||||
| Issuer | Coupon Rate | Principal Amount ($) | Value ($) | |
| Federal Home Loan Mortgage Corp.(b) | ||||
| CMO Series 204919 Class FP | ||||
| 1-month USD LIBOR + 0.450% Floor 0.450%, Cap 6.500% 09/25/2049 | 2.894% | 152,083 | 151,493 | |
| Federal National Mortgage Association(b) | ||||
| CMO Series 2012-56 Class FK | ||||
| 1-month USD LIBOR + 0.450% Floor 0.450%, Cap 6.500% 06/25/2042 | 2.894% | 94,309 | 94,171 | |
| CMO Series 2013-5 Class GF | ||||
| 1-month USD LIBOR + 1.100% Floor 1.100%, Cap 5.000% 10/25/2042 | 3.544% | 245,648 | 243,839 | |
| CMO Series 2019-33 Class FN | ||||
| 1-month USD LIBOR + 0.400% Floor 0.400%, Cap 6.500% 07/25/2049 | 2.844% | 184,693 | 185,139 | |
| Government National Mortgage Association(d) | ||||
| CMO Series 2017-136 Class IO | ||||
| 09/20/2047 | 5.000% | 657,649 | 122,508 | |
| CMO Series 2018-63 Class IO | ||||
| 09/20/2047 | 4.000% | 852,371 | 137,535 | |
| 36 | Multi-Manager Alternative Strategies Fund | Annual Report 2022 |
August 31, 2022
| Residential Mortgage-Backed Securities - Agency (continued) | ||||
| Issuer | Coupon Rate | Principal Amount ($) | Value ($) | |
| Government National Mortgage Association(b) | ||||
| CMO Series 2019-86 Class FE | ||||
| 1-month USD LIBOR + 0.400% Floor 0.400%, Cap 6.500% 07/20/2049 | 2.768% | 196,324 | 194,950 | |
| Government National Mortgage Association(c) | ||||
| CMO Series 2020-133 Class FA | ||||
| 02/20/2049 | 2.539% | 142,549 | 139,215 | |
| Uniform Mortgage-Backed Security TBA(o) | ||||
| 09/14/2052 | 3.500% | 775,000 | 739,819 | |
| 09/14/2052 | 4.000% | 865,000 | 845,537 | |
| 09/14/2052- 10/13/2052 | 4.500% | 3,325,000 | 3,308,660 | |
| 10/13/2052 | 2.000% | 5,225,000 | 4,505,780 | |
| 10/13/2052 | 2.500% | 8,275,000 | 7,397,002 | |
| 10/13/2052 | 3.000% | 5,100,000 | 4,722,211 | |
| Total Residential Mortgage-Backed Securities - Agency (Cost $23,237,844) | 22,787,859 | |||
| Residential Mortgage-Backed Securities - Non-Agency 6.2% | ||||
| ABFC Trust(b) | ||||
| CMO Series 2007-WMC1 Class A1A | ||||
| 1-month USD LIBOR + 1.250% Floor 1.250% 06/25/2037 | 3.694% | 671,541 | 497,397 | |
| Adjustable Rate Mortgage Trust(b) | ||||
| CMO Series 2005-9 Class 5A3 | ||||
| 1-month USD LIBOR + 0.640% Floor 0.320%, Cap 11.000% 11/25/2035 | 3.084% | 130,656 | 129,750 | |
| Alternative Loan Trust(c) | ||||
| CMO Series 2005-43 Class 1A | ||||
| 10/25/2035 | 2.852% | 208,178 | 191,984 | |
| Alternative Loan Trust(b) | ||||
| CMO Series 2007-OH3 Class A1B | ||||
| 1-month USD LIBOR + 0.220% Floor 0.220%, Cap 10.000% 09/25/2047 | 2.884% | 470,790 | 412,800 | |
| American Home Mortgage Investment Trust(b) | ||||
| CMO Series 2005-1 Class 6A | ||||
| 6-month USD LIBOR + 2.000% Floor 2.000% 06/25/2045 | 5.377% | 118,135 | 117,897 | |
| Arroyo Mortgage Trust(a),(c) | ||||
| CMO Series 2019-1 Class A1 | ||||
| 01/25/2049 | 3.805% | 76,244 | 73,859 | |
| Banc of America Funding Trust(b) | ||||
| CMO Series 2005-B Class 3M1 | ||||
| 1-month USD LIBOR + 0.675% Floor 0.450%, Cap 11.000% 04/20/2035 | 3.043% | 214,895 | 212,541 | |
| Residential Mortgage-Backed Securities - Non-Agency (continued) | ||||
| Issuer | Coupon Rate | Principal Amount ($) | Value ($) | |
| Banc of America Funding Trust(a),(c) | ||||
| Subordinated CMO Series 2014-R6 Class 2A13 | ||||
| 07/26/2036 | 2.519% | 620,749 | 598,566 | |
| Bear Stearns Alt-A Trust(b) | ||||
| CMO Series 2004-6 Class M1 | ||||
| 1-month USD LIBOR + 0.825% Floor 0.825%, Cap 11.500% 07/25/2034 | 3.269% | 299,299 | 300,885 | |
| Bear Stearns Mortgage Funding Trust(b) | ||||
| CMO Series 2006-AR3 Class 1A1 | ||||
| 1-month USD LIBOR + 0.180% Floor 0.180%, Cap 10.500% 10/25/2036 | 2.624% | 304,012 | 259,346 | |
| CMO Series 2006-AR4 Class A1 | ||||
| 1-month USD LIBOR + 0.210% Floor 0.210%, Cap 10.500% 12/25/2036 | 2.654% | 409,544 | 383,046 | |
| CMO Series 2007-AR3 Class 21A1 | ||||
| 1-month USD LIBOR + 0.150% Floor 0.150%, Cap 10.500% 04/25/2037 | 2.594% | 322,375 | 285,757 | |
| Centex Home Equity Loan Trust(b) | ||||
| CMO Series 2005-A Class M1 | ||||
| 1-month USD LIBOR + 0.720% Floor 0.480% 01/25/2035 | 3.164% | 320,184 | 316,696 | |
| CMO Series 2005-D Class M4 | ||||
| 1-month USD LIBOR + 0.915% Floor 0.610% 10/25/2035 | 3.359% | 542,667 | 541,621 | |
| CIM Trust(a),(c) | ||||
| CMO Series 2021-R3 Class A1A | ||||
| 06/25/2057 | 1.951% | 496,843 | 452,084 | |
| Citigroup Mortgage Loan Trust, Inc.(c) | ||||
| CMO Series 2006-AR2 Class 1A1 | ||||
| 03/25/2036 | 2.966% | 251,934 | 203,062 | |
| Citigroup Mortgage Loan Trust, Inc.(b) | ||||
| CMO Series 2006-WFH3 Class M2 | ||||
| 1-month USD LIBOR + 0.450% Floor 0.450% 10/25/2036 | 2.894% | 356,533 | 354,049 | |
| COLT Mortgage Loan Trust(a),(c) | ||||
| CMO Series 2022-5 Class A1 | ||||
| 04/25/2067 | 4.550% | 94,316 | 92,632 | |
| Connecticut Avenue Securities Trust(a),(b) | ||||
| CMO Series 2022-R01 Class 1M1 | ||||
| 30-day Average SOFR + 1.000% 12/25/2041 | 3.183% | 55,030 | 54,357 | |
| CMO Series 2022-R03 Class 1M1 | ||||
| 30-day Average SOFR + 2.100% 03/25/2042 | 4.283% | 26,221 | 26,208 | |
| Multi-Manager Alternative Strategies Fund | Annual Report 2022 | 37 |
August 31, 2022
| Residential Mortgage-Backed Securities - Non-Agency (continued) | ||||
| Issuer | Coupon Rate | Principal Amount ($) | Value ($) | |
| CMO Series 2022-R04 Class 1M1 | ||||
| 30-day Average SOFR + 2.000% 03/25/2042 | 4.183% | 47,922 | 47,879 | |
| CMO Series 2022-R05 Class 2M2 | ||||
| 30-day Average SOFR + 3.000% 04/25/2042 | 5.183% | 255,000 | 248,941 | |
| CMO Series 2022-R06 Class 1M1 | ||||
| 30-day Average SOFR + 2.750% 05/25/2042 | 4.933% | 93,086 | 94,596 | |
| Subordinated CMO Series 2022-R01 Class 1B1 | ||||
| 30-day Average SOFR + 3.150% 12/25/2041 | 5.333% | 311,000 | 286,098 | |
| Countrywide Asset-Backed Certificates(b) | ||||
| CMO Series 2007-13 Class 2A1 | ||||
| 1-month USD LIBOR + 0.900% Floor 0.900% 10/25/2047 | 3.344% | 147,405 | 141,754 | |
| CMO Series 2007-13 Class 2A2 | ||||
| 1-month USD LIBOR + 0.800% Floor 0.800% 10/25/2047 | 3.244% | 293,023 | 281,465 | |
| Credit Suisse Mortgage Trust(a),(c) | ||||
| CMO Series 2019-NQM1 Class A1 | ||||
| 10/25/2059 | 2.656% | 22,319 | 21,460 | |
| CSMC Trust(a),(c) | ||||
| CMO Series 2021-RPL4 Class A1 | ||||
| 12/27/2060 | 1.796% | 602,793 | 564,043 | |
| CWABS Asset-Backed Certificates Trust(b) | ||||
| CMO Series 2004-10 Class MV4 | ||||
| 1-month USD LIBOR + 1.575% Floor 1.575% 12/25/2034 | 4.019% | 920,101 | 882,567 | |
| CMO Series 2005-14 Class M2 | ||||
| 1-month USD LIBOR + 0.705% Floor 0.470% 04/25/2036 | 3.149% | 77,762 | 77,627 | |
| CMO Series 2005-17 Class MV1 | ||||
| 1-month USD LIBOR + 0.460% Floor 0.460% 05/25/2036 | 3.134% | 307,338 | 305,324 | |
| First Franklin Mortgage Loan Trust(b) | ||||
| CMO Series 2006-FF4 Class A3 | ||||
| 1-month USD LIBOR + 0.280% Floor 0.560% 03/25/2036 | 2.724% | 168,401 | 166,525 | |
| First Horizon Mortgage Pass-Through Trust(c) | ||||
| CMO Series 2005-AR4 Class 2A1 | ||||
| 10/25/2035 | 3.286% | 156,897 | 150,721 | |
| Residential Mortgage-Backed Securities - Non-Agency (continued) | ||||
| Issuer | Coupon Rate | Principal Amount ($) | Value ($) | |
| First NLC Trust(b) | ||||
| CMO Series 2005-4 Class A4 | ||||
| 1-month USD LIBOR + 0.780% Floor 0.390%, Cap 14.000% 02/25/2036 | 3.224% | 311,355 | 304,373 | |
| Freddie Mac STACR REMIC Trust(a),(b) | ||||
| CMO Series 2022-DNA3 Class M1A | ||||
| 30-day Average SOFR + 2.000% 04/25/2042 | 3.514% | 176,987 | 177,888 | |
| CMO Series 2022-DNA4 Class M1A | ||||
| 30-day Average SOFR + 2.200% 05/25/2042 | 4.383% | 214,532 | 214,976 | |
| CMO Series 2022-DNA4 Class M1B | ||||
| 30-day Average SOFR + 3.350% 05/25/2042 | 5.533% | 285,000 | 284,891 | |
| CMO Series 2022-HQA1 Class M1B | ||||
| 30-day Average SOFR + 3.500% 03/25/2042 | 5.683% | 90,000 | 89,205 | |
| CMO Series 2022-HQA3 Class M1B | ||||
| 30-day Average SOFR + 3.550% 08/25/2042 | 5.358% | 130,000 | 128,818 | |
| GCAT Trust(a),(c) | ||||
| CMO Series 2022-NQM4 Class A1 | ||||
| 09/25/2067 | 5.269% | 100,000 | 99,905 | |
| GE-WMC Asset-Backed Pass-Through Certificates(b) | ||||
| CMO Series 2005-1 Class M1 | ||||
| 1-month USD LIBOR + 0.660% Floor 0.660% 10/25/2035 | 3.104% | 363,271 | 350,925 | |
| GMACM Mortgage Loan Trust(c) | ||||
| CMO Series 2006-AR1 Class 1A1 | ||||
| 04/19/2036 | 2.903% | 423,227 | 338,748 | |
| GSAMP Trust(b) | ||||
| CMO Series 2005-WMC3 Class A2C | ||||
| 1-month USD LIBOR + 0.660% Floor 0.330% 12/25/2035 | 3.104% | 810,000 | 780,757 | |
| CMO Series 2006-HE7 Class A2D | ||||
| 1-month USD LIBOR + 0.230% Floor 0.230% 10/25/2046 | 2.904% | 155,662 | 154,383 | |
| CMO Series 2007-FM2 Class A1 | ||||
| 1-month USD LIBOR + 0.140% Floor 0.140% 01/25/2037 | 2.584% | 804,791 | 505,433 | |
| HarborView Mortgage Loan Trust(b) | ||||
| CMO Series 2007-6 Class 1A1A | ||||
| 1-month USD LIBOR + 0.200% Floor 0.200%, Cap 10.500% 08/19/2037 | 2.566% | 505,634 | 440,630 | |
| 38 | Multi-Manager Alternative Strategies Fund | Annual Report 2022 |
August 31, 2022
| Residential Mortgage-Backed Securities - Non-Agency (continued) | ||||
| Issuer | Coupon Rate | Principal Amount ($) | Value ($) | |
| Home Equity Mortgage Loan Asset-Backed Trust(b) | ||||
| CMO Series 2005-D Class AII4 | ||||
| 1-month USD LIBOR + 0.700% Floor 0.350% 03/25/2036 | 3.144% | 122,939 | 122,000 | |
| HSI Asset Securitization Corp. Trust(b) | ||||
| CMO Series 2005-I1 Class 2A4 | ||||
| 1-month USD LIBOR + 0.780% Floor 0.780% 11/25/2035 | 3.224% | 601,776 | 577,401 | |
| CMO Series 2006-HE2 Class 1A | ||||
| 1-month USD LIBOR + 0.260% Floor 0.260% 12/25/2036 | 2.704% | 1,224,277 | 553,821 | |
| Impac CMB Trust(b) | ||||
| CMO Series 2004-8 Class 2A1 (FGIC) | ||||
| 1-month USD LIBOR + 0.700% Floor 0.700%, Cap 11.000% 10/25/2034 | 3.144% | 271,177 | 269,997 | |
| Impac Secured Assets Trust(b) | ||||
| CMO Series 2006-5 Class 1A1C | ||||
| 1-month USD LIBOR + 0.540% Floor 0.270%, Cap 11.500% 02/25/2037 | 2.984% | 586,555 | 520,817 | |
| IndyMac INDX Mortgage Loan Trust(b) | ||||
| CMO Series 2006-AR2 Class 1A1A | ||||
| 1-month USD LIBOR + 0.220% Floor 0.220% 04/25/2046 | 2.884% | 333,626 | 294,404 | |
| CMO Series 2006-AR2 Class 1A1B | ||||
| 1-month USD LIBOR + 0.210% Floor 0.210% 04/25/2046 | 2.864% | 671,144 | 591,092 | |
| JPMorgan Alternative Loan Trust(b) | ||||
| CMO Series 2006-A1 Class 1A1 | ||||
| 1-month USD LIBOR + 0.460% Floor 0.230%, Cap 11.500% 03/25/2036 | 2.904% | 531,428 | 503,761 | |
| CMO Series 2007-S1 Class A2 | ||||
| 1-month USD LIBOR + 0.680% Floor 0.340%, Cap 11.500% 04/25/2047 | 3.124% | 169,912 | 162,051 | |
| JPMorgan Mortgage Acquisition Trust(b) | ||||
| CMO Series 2006-FRE1 Class M1 | ||||
| 1-month USD LIBOR + 0.585% Floor 0.585% 05/25/2035 | 3.029% | 290,537 | 287,238 | |
| CMO Series 2007-HE1 Class AV4 | ||||
| 1-month USD LIBOR + 0.280% Floor 0.280% 03/25/2047 | 2.724% | 1,103,000 | 1,039,387 | |
| Residential Mortgage-Backed Securities - Non-Agency (continued) | ||||
| Issuer | Coupon Rate | Principal Amount ($) | Value ($) | |
| Legacy Mortgage Asset Trust(a),(c) | ||||
| CMO Series 2020-GS2 Class A1 | ||||
| 03/25/2060 | 2.750% | 694,736 | 693,536 | |
| Lehman Mortgage Trust | ||||
| CMO Series 2006-1 Class 1A5 | ||||
| 02/25/2036 | 5.500% | 536,943 | 318,299 | |
| Lehman XS Trust(b) | ||||
| CMO Series 2006-15 Class A4 | ||||
| 1-month USD LIBOR + 0.340% Floor 0.170% 10/25/2036 | 2.784% | 509,008 | 478,299 | |
| CMO Series 2006-2N Class 2A1 | ||||
| 1-year MTA + 1.010% Floor 1.010% 02/25/2036 | 3.124% | 481,715 | 432,088 | |
| CMO Series 2007-16N Class 2A2 | ||||
| 1-month USD LIBOR + 0.850% Floor 0.850% 09/25/2047 | 4.144% | 573,874 | 523,350 | |
| Long Beach Mortgage Loan Trust(b) | ||||
| CMO Series 2006-10 Class 2A3 | ||||
| 1-month USD LIBOR + 0.160% Floor 0.160% 11/25/2036 | 2.604% | 1,600,139 | 565,183 | |
| CMO Series 2006-4 Class 1A | ||||
| 1-month USD LIBOR + 0.300% Floor 0.300% 05/25/2036 | 2.744% | 1,036,772 | 620,440 | |
| MASTR Adjustable Rate Mortgages Trust(b) | ||||
| Subordinated CMO Series 2004-14 Class B1 | ||||
| 1-month USD LIBOR + 2.150% Floor 1.650% 01/25/2035 | 4.594% | 396,660 | 396,575 | |
| Mastr Asset Backed Securities Trust(b) | ||||
| CMO Series 2005-WF1 Class M6 | ||||
| 1-month USD LIBOR + 0.990% Floor 0.660% 06/25/2035 | 3.434% | 672,400 | 655,785 | |
| Morgan Stanley ABS Capital I, Inc. Trust(b) | ||||
| CMO Series 2005-WMC1 Class M3 | ||||
| 1-month USD LIBOR + 0.780% Floor 0.780% 01/25/2035 | 3.224% | 305,090 | 296,417 | |
| CMO Series 2007-HE2 Class A2B | ||||
| 1-month USD LIBOR + 0.090% Floor 0.090% 01/25/2037 | 2.534% | 1,260,448 | 649,692 | |
| CMO Series 2007-NC3 Class A2D | ||||
| 1-month USD LIBOR + 0.260% Floor 0.260% 05/25/2037 | 2.704% | 720,843 | 557,238 | |
| Multi-Manager Alternative Strategies Fund | Annual Report 2022 | 39 |
August 31, 2022
| Residential Mortgage-Backed Securities - Non-Agency (continued) | ||||
| Issuer | Coupon Rate | Principal Amount ($) | Value ($) | |
| Morgan Stanley Mortgage Loan Trust(b) | ||||
| CMO Series 2005-5AR Class 1M6 | ||||
| 1-month USD LIBOR + 1.125% Floor 1.125% 09/25/2035 | 3.694% | 500,000 | 509,981 | |
| Nomura Resecuritization Trust(a),(c) | ||||
| CMO Series 2014-3R Class 3A9 | ||||
| 11/26/2035 | 2.779% | 33,003 | 32,921 | |
| Option One Mortgage Loan Trust(b) | ||||
| CMO Series 2005-2 Class M1 | ||||
| 1-month USD LIBOR + 0.660% Floor 0.660% 05/25/2035 | 3.104% | 609,275 | 606,207 | |
| CMO Series 2007-5 Class 2A2 | ||||
| 1-month USD LIBOR + 0.170% Floor 0.170% 05/25/2037 | 2.614% | 899,048 | 517,226 | |
| Preston Ridge Partners Mortgage Trust(a),(c),(f),(g) | ||||
| CMO Series 2022-4 Class A2 | ||||
| 08/25/2027 | 5.000% | 615,000 | 556,698 | |
| Pretium Mortgage Credit Partners LLC(a),(c) | ||||
| CMO Series 2022-RN2 Class A2 | ||||
| 06/25/2052 | 6.500% | 720,000 | 666,420 | |
| RALI Series Trust(b) | ||||
| CMO Series 2006-QA6 Class A3 | ||||
| 1-month USD LIBOR + 0.380% Floor 0.190% 07/25/2036 | 2.824% | 342,788 | 329,681 | |
| CMO Series 2007-QH6 Class A1 | ||||
| 1-month USD LIBOR + 0.190% Floor 0.190% 07/25/2037 | 2.824% | 326,341 | 302,180 | |
| RALI Trust(b) | ||||
| CMO Series 2006-QO10 Class A1 | ||||
| 1-month USD LIBOR + 0.320% Floor 0.160% 01/25/2037 | 2.764% | 641,352 | 568,236 | |
| RAMP Trust(b) | ||||
| CMO Series 2006-RZ2 Class M1 | ||||
| 1-month USD LIBOR + 0.495% Floor 0.330%, Cap 14.000% 05/25/2036 | 2.939% | 576,969 | 563,689 | |
| RFMSI Trust | ||||
| CMO Series 2006-S10 Class 1A1 | ||||
| 10/25/2036 | 6.000% | 601,261 | 529,241 | |
| Soundview Home Loan Trust(b) | ||||
| CMO Series 2006-OPT5 Class 1A1 | ||||
| 1-month USD LIBOR + 0.140% Floor 0.140% 07/25/2036 | 2.724% | 346,023 | 331,548 | |
| Residential Mortgage-Backed Securities - Non-Agency (continued) | ||||
| Issuer | Coupon Rate | Principal Amount ($) | Value ($) | |
| Structured Adjustable Rate Mortgage Loan Trust(b) | ||||
| CMO Series 2005-19XS Class 2A1 | ||||
| 1-month USD LIBOR + 0.300% Floor 0.300% 10/25/2035 | 2.744% | 58,328 | 58,245 | |
| Series 2007-4 Class 1A2 | ||||
| 1-month USD LIBOR + 0.440% Floor 0.220% 05/25/2037 | 2.884% | 404,337 | 369,389 | |
| Structured Asset Investment Loan Trust(b) | ||||
| CMO Series 2004-6 Class A3 | ||||
| 1-month USD LIBOR + 0.800% Floor 0.800% 07/25/2034 | 3.244% | 401,666 | 387,759 | |
| Structured Asset Mortgage Investments II Trust(b) | ||||
| CMO Series 2006-AR8 Class A1A | ||||
| 1-month USD LIBOR + 0.400% Floor 0.200%, Cap 10.500% 10/25/2036 | 2.844% | 478,071 | 441,746 | |
| Structured Asset Securities Corp Mortgage Loan Trust(b) | ||||
| CMO Series 2005-2XS Class M1 | ||||
| 1-month USD LIBOR + 0.705% Floor 0.470%, Cap 11.000% 02/25/2035 | 3.149% | 756,186 | 750,432 | |
| Thornburg Mortgage Securities Trust(b) | ||||
| CMO Series 2004-3 Class A | ||||
| 1-month USD LIBOR + 0.740% Floor 0.370%, Cap 11.000% 09/25/2034 | 3.184% | 359,574 | 337,786 | |
| Towd Point Mortgage Trust(a),(b) | ||||
| CMO Series 2017-5 Class A1 | ||||
| 1-month USD LIBOR + 0.600% 02/25/2057 | 3.044% | 105,797 | 104,893 | |
| Verus Securitization Trust(a),(c) | ||||
| CMO Series 2022-4 Class A2 | ||||
| 04/25/2067 | 4.740% | 184,560 | 180,169 | |
| CMO Series 2022-INV1 Class A1 | ||||
| 08/25/2067 | 5.041% | 100,000 | 99,660 | |
| WaMu Asset-Backed Certificates Trust(b) | ||||
| CMO Series 2007-HE1 Class 2A4 | ||||
| 1-month USD LIBOR + 0.230% Floor 0.230% 01/25/2037 | 2.674% | 1,167,736 | 598,279 | |
| WaMu Mortgage Pass-Through Certificates Trust(b) | ||||
| CMO Series 2007-OA4 Class 1A | ||||
| 1-year MTA + 0.770% Floor 0.770% 05/25/2047 | 1.874% | 608,386 | 545,269 | |
| 40 | Multi-Manager Alternative Strategies Fund | Annual Report 2022 |
August 31, 2022
| Residential Mortgage-Backed Securities - Non-Agency (continued) | ||||
| Issuer | Coupon Rate | Principal Amount ($) | Value ($) | |
| Washington Mutual Mortgage Pass-Through Certificates WMALT Trust(b) | ||||
| CMO Series 2006-AR2 Class A1A | ||||
| 1-year MTA + 0.940% Floor 0.940% 04/25/2046 | 2.044% | 230,084 | 201,531 | |
| Total Residential Mortgage-Backed Securities - Non-Agency (Cost $34,769,976) | 33,342,526 | |||
| Rights 0.0% | ||
| Issuer | Shares | Value ($) |
| Health Care 0.0% | ||
| Pharmaceuticals 0.0% | ||
| Zogenix, Inc. CVR(e),(f),(g) | 29,926 | 21,310 |
| Total Health Care | 21,310 | |
| Total Rights (Cost $—) | 21,310 | |
| Senior Loans 1.5% | ||||
| Borrower | Coupon Rate | Principal Amount ($) | Value ($) | |
| Airlines 0.2% | ||||
| AAdvantage Loyalty IP Ltd./American Airlines, Inc.(b),(p),(q) | ||||
| Term Loan | ||||
| 1-month USD LIBOR + 4.750% Floor 0.750% 04/20/2028 | 7.460% | 385,000 | 378,424 | |
| Air Canada(b),(q) | ||||
| Term Loan | ||||
| 1-month USD LIBOR + 3.500% Floor 0.750% 08/11/2028 | 6.421% | 201,000 | 194,001 | |
| Mileage Plus Holdings LLC/Intellectual Property Assets Ltd.(b),(q) | ||||
| Term Loan | ||||
| 1-month USD LIBOR + 5.250% Floor 1.000% 06/21/2027 | 7.313% | 250,000 | 253,555 | |
| United AirLines, Inc.(b),(q) | ||||
| Tranche B Term Loan | ||||
| 3-month USD LIBOR + 3.750% Floor 0.750% 04/21/2028 | 6.533% | 360,233 | 349,628 | |
| Total | 1,175,608 | |||
| Building Materials 0.0% | ||||
| Hunter Douglas Holding BV(b),(q) | ||||
| Tranche B1 Term Loan | ||||
| 1-month Term SOFR + 3.500% Floor 0.500% 02/26/2029 | 6.340% | 134,000 | 116,781 | |
| Senior Loans (continued) | ||||
| Borrower | Coupon Rate | Principal Amount ($) | Value ($) | |
| Jeld-Wen, Inc.(b),(q) | ||||
| Term Loan | ||||
| 1-month USD LIBOR + 2.250% 07/28/2028 | 4.743% | 74,250 | 69,393 | |
| Total | 186,174 | |||
| Consumer Cyclical Services 0.0% | ||||
| APX Group, Inc.(b),(q) | ||||
| Term Loan | ||||
| 1-month USD LIBOR + 3.500% Floor 0.500% 07/10/2028 | 5.878% | 79,400 | 77,204 | |
| Consumer Products 0.0% | ||||
| Herman Miller, Inc.(b),(q) | ||||
| Tranche B Term Loan | ||||
| 1-month USD LIBOR + 2.000% 07/19/2028 | 1.000% | 92,613 | 89,603 | |
| Environmental 0.0% | ||||
| Clean Harbors, Inc.(b),(q) | ||||
| Term Loan | ||||
| 1-month USD LIBOR + 2.000% 10/08/2028 | 4.524% | 39,450 | 39,179 | |
| Finance Companies 0.0% | ||||
| Setanta Aircraft Leasing DAC(b),(q) | ||||
| Term Loan | ||||
| 1-month USD LIBOR + 2.000% 11/05/2028 | 4.250% | 75,000 | 73,594 | |
| Food and Beverage 0.1% | ||||
| Aramark Intermediate HoldCo Corp.(b),(q) | ||||
| Tranche B3 Term Loan | ||||
| 3-month USD LIBOR + 1.750% 03/11/2025 | 4.274% | 395,000 | 389,075 | |
| Gaming 0.0% | ||||
| Bally’s Corp.(b),(q) | ||||
| Tranche B Term Loan | ||||
| 1-month USD LIBOR + 3.250% Floor 0.500% 10/02/2028 | 5.623% | 114,425 | 108,875 | |
| Health Care 0.1% | ||||
| ICON PLC(b),(q) | ||||
| Term Loan | ||||
| 3-month USD LIBOR + 2.250% 07/03/2028 | 4.563% | 144,751 | 142,327 | |
| 3-month USD LIBOR + 2.250% 07/03/2028 | 4.563% | 35,017 | 34,430 | |
| Multi-Manager Alternative Strategies Fund | Annual Report 2022 | 41 |
August 31, 2022
| Senior Loans (continued) | ||||
| Borrower | Coupon Rate | Principal Amount ($) | Value ($) | |
| Medline Borrower LP(b),(q) | ||||
| Term Loan | ||||
| 1-month USD LIBOR + 3.250% Floor 0.500% 10/23/2028 | 5.774% | 284,288 | 270,733 | |
| Total | 447,490 | |||
| Leisure 0.1% | ||||
| Carnival Corp.(b),(q) | ||||
| Term Loan | ||||
| 1-month USD LIBOR + 3.000% Floor 0.750% 06/30/2025 | 3.750% | 277,010 | 263,334 | |
| Tranche B Term Loan | ||||
| 1-month USD LIBOR + 3.250% Floor 0.750% 10/18/2028 | 6.127% | 109,450 | 101,788 | |
| Total | 365,122 | |||
| Lodging 0.1% | ||||
| Hilton Grand Vacations Borrower LLC(b),(q) | ||||
| Term Loan | ||||
| 1-month USD LIBOR + 3.000% Floor 0.500% 08/02/2028 | 5.524% | 11,287 | 11,024 | |
| Hilton Worldwide Finance LLC(b),(q) | ||||
| Tranche B2 Term Loan | ||||
| 3-month USD LIBOR + 1.750% 06/22/2026 | 4.194% | 160,000 | 156,320 | |
| Marriott Ownership Reports, Inc.(b),(q) | ||||
| Term Loan | ||||
| 1-month USD LIBOR + 1.750% 08/29/2025 | 4.274% | 175,000 | 170,275 | |
| Total | 337,619 | |||
| Media and Entertainment 0.1% | ||||
| AP Core Holdings II LLC(b),(q) | ||||
| Tranche B1 1st Lien Term Loan | ||||
| 1-month USD LIBOR + 5.500% Floor 0.750% 09/01/2027 | 8.024% | 154,000 | 145,376 | |
| Tranche B2 1st Lien Term Loan | ||||
| 1-month USD LIBOR + 5.500% Floor 0.750% 09/01/2027 | 8.024% | 110,000 | 104,041 | |
| Senior Loans (continued) | ||||
| Borrower | Coupon Rate | Principal Amount ($) | Value ($) | |
| Univision Communications, Inc.(b),(q) | ||||
| 1st Lien Term Loan | ||||
| 1-month USD LIBOR + 3.250% Floor 0.750% 03/15/2026 | 5.774% | 153,300 | 149,523 | |
| 1-month Term SOFR + 4.250% Floor 0.500% 06/24/2029 | 6.254% | 20,000 | 19,600 | |
| WMG Acquisition Corp.(b),(q) | ||||
| Tranche G Term Loan | ||||
| 1-month USD LIBOR + 2.125% 01/20/2028 | 4.649% | 245,000 | 238,160 | |
| Total | 656,700 | |||
| Packaging 0.0% | ||||
| Berry Global, Inc.(b),(p),(q) | ||||
| Tranche Z Term Loan | ||||
| 1-month USD LIBOR + 1.750% 07/01/2026 | 4.178% | 235,000 | 229,456 | |
| Pharmaceuticals 0.2% | ||||
| Grifols Worldwide Operations Ltd.(b),(q) | ||||
| Tranche B Term Loan | ||||
| 1-month USD LIBOR + 2.000% 11/15/2027 | 4.524% | 240,000 | 231,734 | |
| Jazz Pharmaceuticals PLC(b),(q) | ||||
| Term Loan | ||||
| 1-month USD LIBOR + 3.500% Floor 0.500% 05/05/2028 | 6.024% | 197,050 | 193,038 | |
| Organon & Co.(b),(q) | ||||
| Term Loan | ||||
| 1-month USD LIBOR + 3.000% Floor 0.500% 06/02/2028 | 4.625% | 289,246 | 285,631 | |
| Padagis LLC(b),(g),(q) | ||||
| Tranche B Term Loan | ||||
| 1-month USD LIBOR + 4.750% Floor 0.500% 07/06/2028 | 7.043% | 151,530 | 138,649 | |
| Total | 849,052 | |||
| Property & Casualty 0.0% | ||||
| Asurion LLC(b),(q) | ||||
| Tranche B4 2nd Lien Term Loan | ||||
| 1-month USD LIBOR + 5.250% 01/20/2029 | 7.774% | 145,000 | 123,069 | |
| Tranche B9 Term Loan | ||||
| 1-month USD LIBOR + 3.250% 07/31/2027 | 5.774% | 108,897 | 99,459 | |
| Total | 222,528 | |||
| 42 | Multi-Manager Alternative Strategies Fund | Annual Report 2022 |
August 31, 2022
| Senior Loans (continued) | ||||
| Borrower | Coupon Rate | Principal Amount ($) | Value ($) | |
| Restaurants 0.2% | ||||
| 1011778 BC ULC(b),(q) | ||||
| Tranche B4 Term Loan | ||||
| 3-month USD LIBOR + 1.750% 11/19/2026 | 4.274% | 391,942 | 380,101 | |
| KFC Holding Co./Yum! Brands(b),(q) | ||||
| Tranche B Term Loan | ||||
| 1-month USD LIBOR + 1.750% 03/15/2028 | 4.127% | 435,212 | 431,730 | |
| Whatabrands LLC(b),(p),(q) | ||||
| Tranche B Term Loan | ||||
| 1-month USD LIBOR + 3.250% Floor 0.500% 08/03/2028 | 5.774% | 175,120 | 165,762 | |
| Total | 977,593 | |||
| Retailers 0.1% | ||||
| Burlington Coat Factory Warehouse Corp.(b),(q) | ||||
| Tranche B6 Term Loan | ||||
| 1-month USD LIBOR + 2.000% 06/24/2028 | 4.530% | 207,900 | 203,570 | |
| Restoration Hardware, Inc.(b),(q) | ||||
| Term Loan | ||||
| 1-month USD LIBOR + 2.500% Floor 0.500% 10/20/2028 | 5.024% | 218,449 | 200,755 | |
| Total | 404,325 | |||
| Technology 0.1% | ||||
| athenahealth Group, Inc.(b),(p),(q),(r) | ||||
| Delayed Draw Term Loan | ||||
| 1-month Term SOFR + 3.500% Floor 0.500% 02/15/2029 | 3.500% | 11,000 | 10,505 | |
| athenahealth Group, Inc.(b),(q) | ||||
| Term Loan | ||||
| 1-month Term SOFR + 3.500% Floor 0.500% 02/15/2029 | 5.800% | 65,000 | 62,075 | |
| Central Parent Inc.(b),(q) | ||||
| 1st Lien Term Loan B | ||||
| 1-month Term SOFR + 4.500% Floor 0.500% 07/06/2029 | 6.610% | 55,000 | 53,541 | |
| Quest Software US Holdings, Inc.(b),(q) | ||||
| 1st Lien Term Loan | ||||
| 1-month Term SOFR + 4.250% Floor 0.500% 02/01/2029 | 6.977% | 190,000 | 172,214 | |
| Total | 298,335 | |||
| Senior Loans (continued) | ||||
| Borrower | Coupon Rate | Principal Amount ($) | Value ($) | |
| Transportation Services 0.1% | ||||
| Avis Budget Car Rental LLC(b),(q) | ||||
| Tranche C Term Loan | ||||
| 1-month Term SOFR + 3.500% Floor 0.500% 03/16/2029 | 6.059% | 114,712 | 112,204 | |
| Brown Group Holdings LLC(b),(q) | ||||
| Term Loan | ||||
| 1-month USD LIBOR + 2.750% Floor 0.500% 06/07/2028 | 5.024% | 115,860 | 113,736 | |
| Hertz Corp. (The)(b),(q) | ||||
| Tranche B Term Loan | ||||
| 1-month USD LIBOR + 3.250% Floor 0.500% 06/30/2028 | 5.780% | 247,701 | 241,469 | |
| Tranche C Term Loan | ||||
| 1-month USD LIBOR + 3.250% Floor 0.500% 06/30/2028 | 5.780% | 47,080 | 45,895 | |
| Total | 513,304 | |||
| Wireless 0.1% | ||||
| SBA Senior Finance II LLC(b),(p),(q) | ||||
| Term Loan | ||||
| 3-month USD LIBOR + 1.750% 04/11/2025 | 4.280% | 336,289 | 328,114 | |
| Wirelines 0.0% | ||||
| Patagonia Holdco LLC(b),(q) | ||||
| Term Loan | ||||
| 1-month Term SOFR + 5.750% Floor 0.500% 08/01/2029 | 8.386% | 150,000 | 126,874 | |
| Total Senior Loans (Cost $8,136,029) | 7,895,824 | |||
| Treasury Bills 1.0% | ||||
| Issuer | Yield | Principal Amount ($) | Value ($) | |
| United States 1.0% | ||||
| U.S. Treasury Bills | ||||
| 01/19/2023 | 3.080% | 5,040,000 | 4,980,808 | |
| 07/13/2023 | 3.430% | 500,000 | 485,562 | |
| Total | 5,466,370 | |||
| Total Treasury Bills (Cost $5,471,222) | 5,466,370 | |||
| Multi-Manager Alternative Strategies Fund | Annual Report 2022 | 43 |
August 31, 2022
| U.S. Government & Agency Obligations 0.2% | ||||
| Issuer | Coupon Rate | Principal Amount ($) | Value ($) | |
| Federal Home Loan Banks | ||||
| 09/04/2024 | 1.610% | 400,000 | 383,650 | |
| 09/04/2024 | 1.610% | 400,000 | 383,569 | |
| Total U.S. Government & Agency Obligations (Cost $800,000) | 767,219 | |||
| U.S. Treasury Obligations 1.3% | ||||
| U.S. Treasury | ||||
| 03/31/2024 | 2.250% | 495,000 | 485,525 | |
| 11/30/2025 | 0.375% | 275,000 | 248,810 | |
| 02/28/2026 | 0.500% | 230,000 | 207,521 | |
| 04/30/2026 | 2.375% | 60,000 | 57,844 | |
| 11/15/2026 | 2.000% | 260,000 | 245,475 | |
| 01/31/2027 | 1.500% | 795,000 | 733,574 | |
| 05/31/2027 | 2.625% | 230,000 | 222,759 | |
| 03/31/2029 | 2.375% | 345,000 | 325,378 | |
| 02/15/2032 | 1.875% | 556,000 | 497,272 | |
| 05/15/2032 | 2.875% | 695,000 | 677,625 | |
| 02/15/2042 | 2.375% | 1,165,000 | 966,222 | |
| 02/15/2049 | 3.000% | 1,260,000 | 1,171,997 | |
| 02/15/2050 | 2.000% | 1,370,000 | 1,036,491 | |
| Total U.S. Treasury Obligations (Cost $7,452,907) | 6,876,493 | |||
| Options Purchased Calls 0.0% | ||||
| Value ($) | ||||
| (Cost $206,077) | 87,341 | |||
| Options Purchased Puts 0.0% | ||||
| (Cost $32,097) | 16,255 | |||
| Money Market Funds 34.9% | ||
| Shares | Value ($) | |
| Columbia Short-Term Cash Fund, 2.366%(s),(t) | 186,612,253 | 186,518,946 |
| Total Money Market Funds (Cost $186,528,169) | 186,518,946 | |
| Total Investments in Securities (Cost $562,880,621) | 538,991,391 | |
| Investments in Securities Sold Short | ||
| Common Stocks (1.0)% | ||
| Issuer | Shares | Value ($) |
| Consumer Discretionary (0.0)% | ||
| Auto Components (0.0)% | ||
| Tenneco, Inc.(e) | (12,521) | (236,146) |
| Total Consumer Discretionary | (236,146) | |
| Common Stocks (continued) | ||
| Issuer | Shares | Value ($) |
| Financials (0.0)% | ||
| Capital Markets (0.0)% | ||
| IntercontinentalExchange Group, Inc. | (879) | (88,647) |
| Total Financials | (88,647) | |
| Health Care (0.0)% | ||
| Biotechnology (0.0)% | ||
| Biohaven Pharmaceutical Holding Co.(e),(g) | (3,833) | (20,890) |
| Total Health Care | (20,890) | |
| Industrials (0.2)% | ||
| Commercial Services & Supplies (0.1)% | ||
| Rentokil Initial PLC | (124,094) | (749,462) |
| Construction & Engineering (0.1)% | ||
| MasTec, Inc.(e) | (3,088) | (248,584) |
| Total Industrials | (998,046) | |
| Information Technology (0.3)% | ||
| Semiconductors & Semiconductor Equipment (0.3)% | ||
| Broadcom, Inc. | (2,742) | (1,368,559) |
| MaxLinear, Inc.(e) | (7,689) | (276,266) |
| Total | (1,644,825) | |
| Total Information Technology | (1,644,825) | |
| Real Estate (0.5)% | ||
| Equity Real Estate Investment Trusts (REITS) (0.5)% | ||
| Prologis, Inc. | (19,252) | (2,397,067) |
| Total Real Estate | (2,397,067) | |
| Total Common Stocks (Proceeds $5,409,900) | (5,385,621) | |
| 44 | Multi-Manager Alternative Strategies Fund | Annual Report 2022 |
August 31, 2022
| Exchange-Traded Equity Funds (0.1)% | ||
| Issuer | Shares | Value ($) |
| Financials (0.1)% | ||
| Diversified Financial Services (0.1)% | ||
| iShares North American Tech-Software ETF | (864) | (243,026) |
| iShares Russell 2000 Growth ETF | (774) | (176,186) |
| Total | (419,212) | |
| Total Financials | (419,212) | |
| Total Exchange-Traded Equity Funds (Proceeds $406,844) | (419,212) | |
| Total Investments in Securities Sold Short (Proceeds $5,816,744) | (5,804,833) | |
| Total Investments in Securities, Net of Securities Sold Short | 533,186,558 | |
| Other Assets & Liabilities, Net | 1,182,322 | |
| Net Assets | 534,368,880 | |
| Forward foreign currency exchange contracts | |||||
| Currency to be sold | Currency to be purchased | Counterparty | Settlement date | Unrealized appreciation ($) | Unrealized depreciation ($) |
| 1,600,992 AUD | 1,117,591 USD | ANZ Securities | 09/21/2022 | 21,767 | — |
| 540,487 NZD | 343,095 USD | ANZ Securities | 09/21/2022 | 12,405 | — |
| 941,427 SGD | 676,856 USD | ANZ Securities | 09/21/2022 | 3,126 | — |
| 1,348,081 EUR | 1,415,686 USD | Barclays | 09/21/2022 | 59,190 | — |
| 65,173 EUR | 64,860 USD | Barclays | 09/21/2022 | — | (720) |
| 237,043 SGD | 170,046 USD | Barclays | 09/21/2022 | 407 | — |
| 505,647 USD | 803,749 NZD | Barclays | 09/21/2022 | — | (13,883) |
| 43,226,165 JPY | 319,528 USD | BMO Capital Markets Corp. | 09/21/2022 | 7,897 | — |
| 683,863 MXN | 33,698 USD | BMO Capital Markets Corp. | 09/21/2022 | — | (121) |
| 45,021 USD | 42,413 EUR | BMO Capital Markets Corp. | 09/21/2022 | — | (2,343) |
| 38,329 SGD | 27,717 USD | BNY Capital Markets | 09/21/2022 | 287 | — |
| 335,400 AUD | 371,182 NZD | CIBC | 09/21/2022 | — | (2,467) |
| 594,527 AUD | 424,519 USD | CIBC | 09/21/2022 | 17,586 | — |
| 282,089 CAD | 216,672 USD | CIBC | 09/21/2022 | 1,921 | — |
| 1,804,391 EUR | 1,918,832 USD | CIBC | 09/21/2022 | 103,178 | — |
| 335,403 NZD | 210,212 USD | CIBC | 09/21/2022 | 5,000 | — |
| 235,112 SGD | 169,129 USD | CIBC | 09/21/2022 | 871 | — |
| 287,429 USD | 414,952 AUD | CIBC | 09/21/2022 | — | (3,409) |
| 886,951 USD | 1,126,618 CAD | CIBC | 09/21/2022 | — | (29,268) |
| 1,068,741 USD | 1,015,958 EUR | CIBC | 09/21/2022 | — | (46,441) |
| 251,825 USD | 401,875 NZD | CIBC | 09/21/2022 | — | (5,943) |
| 20,438 USD | 28,709 SGD | CIBC | 09/21/2022 | 107 | — |
| 335,400 AUD | 371,019 NZD | Citi | 09/21/2022 | — | (2,566) |
| 993,057 AUD | 686,970 USD | Citi | 09/21/2022 | 7,257 | — |
| 427,212 AUD | 288,883 USD | Citi | 09/21/2022 | — | (3,529) |
| 405,902 CAD | 322,524 USD | Citi | 09/21/2022 | 13,515 | — |
| 1,793,187 EUR | 1,886,555 USD | Citi | 09/21/2022 | 82,174 | — |
| 215,326 GBP | 260,075 USD | Citi | 09/21/2022 | 9,838 | — |
| 28,961,255 JPY | 219,453 USD | Citi | 09/21/2022 | 10,663 | — |
| 441,122 NZD | 275,998 USD | Citi | 09/21/2022 | 6,103 | — |
| Multi-Manager Alternative Strategies Fund | Annual Report 2022 | 45 |
August 31, 2022
| Forward foreign currency exchange contracts (continued) | |||||
| Currency to be sold | Currency to be purchased | Counterparty | Settlement date | Unrealized appreciation ($) | Unrealized depreciation ($) |
| 1,095,113 SGD | 788,957 USD | Citi | 09/21/2022 | 5,242 | — |
| 469,155 USD | 677,267 AUD | Citi | 09/21/2022 | — | (5,589) |
| 697,500 USD | 902,952 CAD | Citi | 09/21/2022 | — | (10,091) |
| 969,726 USD | 915,809 EUR | Citi | 09/21/2022 | — | (48,201) |
| 672,872 USD | 570,164 GBP | Citi | 09/21/2022 | — | (10,267) |
| 512,384 USD | 812,430 NZD | Citi | 09/21/2022 | — | (15,308) |
| 873,874 USD | 1,223,753 SGD | Citi | 09/21/2022 | 1,902 | — |
| 376,163 USD | 525,078 SGD | Citi | 09/21/2022 | — | (392) |
| 900,700 AUD | 627,450 USD | Goldman Sachs | 09/15/2022 | 11,013 | — |
| 9,100 AUD | 6,130 USD | Goldman Sachs | 09/15/2022 | — | (98) |
| 683,200 CAD | 529,264 USD | Goldman Sachs | 09/15/2022 | 9,124 | — |
| 5,558,000 EUR | 5,818,944 USD | Goldman Sachs | 09/15/2022 | 228,519 | — |
| 3,793,800 GBP | 4,588,659 USD | Goldman Sachs | 09/15/2022 | 180,283 | — |
| 109,400 GBP | 127,121 USD | Goldman Sachs | 09/15/2022 | — | (1) |
| 22,888,400 SEK | 2,252,109 USD | Goldman Sachs | 09/15/2022 | 103,578 | — |
| 628,303 USD | 909,800 AUD | Goldman Sachs | 09/15/2022 | — | (5,639) |
| 1,974,802 USD | 1,898,800 EUR | Goldman Sachs | 09/15/2022 | — | (64,924) |
| 1,358,810 USD | 1,132,000 GBP | Goldman Sachs | 09/15/2022 | — | (43,432) |
| 473,462 USD | 4,867,800 SEK | Goldman Sachs | 09/15/2022 | — | (16,523) |
| 559,372 AUD | 394,884 USD | Goldman Sachs | 09/21/2022 | 12,013 | — |
| 283,581 CAD | 216,672 USD | Goldman Sachs | 09/21/2022 | 785 | — |
| 833,250 EUR | 850,235 USD | Goldman Sachs | 09/21/2022 | 11,783 | — |
| 58,483,721 JPY | 438,726 USD | Goldman Sachs | 09/21/2022 | 17,099 | — |
| 2,137,524 NOK | 218,317 EUR | Goldman Sachs | 09/21/2022 | 4,514 | — |
| 308,535 USD | 448,393 AUD | Goldman Sachs | 09/21/2022 | — | (1,625) |
| 1,198,303 USD | 1,132,768 EUR | Goldman Sachs | 09/21/2022 | — | (58,464) |
| 219,302 USD | 29,534,517 JPY | Goldman Sachs | 09/21/2022 | — | (6,379) |
| 211,872 AUD | 147,140 USD | HSBC | 09/21/2022 | 2,121 | — |
| 427,212 AUD | 288,929 USD | HSBC | 09/21/2022 | — | (3,483) |
| 1,440,254 CAD | 1,138,811 USD | HSBC | 09/21/2022 | 42,359 | — |
| 2,388,236 EUR | 2,520,316 USD | HSBC | 09/21/2022 | 117,172 | — |
| 627,070 SGD | 452,426 USD | HSBC | 09/21/2022 | 3,664 | — |
| 1,902,933 USD | 1,810,262 EUR | HSBC | 09/21/2022 | — | (81,372) |
| 466,336 USD | 394,752 GBP | HSBC | 09/21/2022 | — | (7,583) |
| 533,823 USD | 746,809 SGD | HSBC | 09/21/2022 | 629 | — |
| 6,433,532,000 KRW | 4,900,000 USD | JPMorgan | 09/01/2022 | 90,062 | — |
| 4,900,000 USD | 6,549,030,910 KRW | JPMorgan | 09/01/2022 | — | (3,711) |
| 969,009,400 INR | 12,200,000 USD | JPMorgan | 09/02/2022 | 4,783 | — |
| 12,200,000 USD | 964,731,383 INR | JPMorgan | 09/02/2022 | — | (58,623) |
| 91,288,153 CLP | 100,000 USD | JPMorgan | 09/06/2022 | — | (1,779) |
| 1,108,053,600 INR | 14,000,000 USD | JPMorgan | 09/06/2022 | 61,160 | — |
| 100,000 USD | 89,636,496 CLP | JPMorgan | 09/06/2022 | — | (63) |
| 13,700,000 USD | 1,092,538,598 INR | JPMorgan | 09/06/2022 | 43,668 | — |
| 300,000 USD | 23,775,855 INR | JPMorgan | 09/06/2022 | — | (910) |
| 56,956,724 TWD | 1,900,000 USD | JPMorgan | 09/08/2022 | 27,554 | — |
| 1,900,000 USD | 56,797,259 TWD | JPMorgan | 09/08/2022 | — | (32,796) |
| 93,256,297 CLP | 100,000 USD | JPMorgan | 09/12/2022 | — | (3,855) |
| 1,093,260,000 INR | 13,700,000 USD | JPMorgan | 09/12/2022 | — | (43,447) |
| 100,000 USD | 91,082,243 CLP | JPMorgan | 09/12/2022 | 1,434 | — |
| 13,700,000 USD | 1,094,729,998 INR | JPMorgan | 09/12/2022 | 61,926 | — |
| 9,000,000 AUD | 8,088,030 CAD | JPMorgan | 09/15/2022 | — | (1,926) |
| 1,200,000 AUD | 112,898,880 JPY | JPMorgan | 09/15/2022 | — | (7,753) |
| 4,000,000 AUD | 2,792,086 USD | JPMorgan | 09/15/2022 | 54,497 | — |
| 400,000 CAD | 42,249,076 JPY | JPMorgan | 09/15/2022 | — | (94) |
| 6,100,000 CAD | 4,717,849 USD | JPMorgan | 09/15/2022 | 73,744 | — |
| 2,625,000 CHF | 2,767,574 USD | JPMorgan | 09/15/2022 | 79,264 | — |
| 39,506,392 CNH | 5,800,000 USD | JPMorgan | 09/15/2022 | 80,007 | — |
| 4,750,000 EUR | 6,919,263 AUD | JPMorgan | 09/15/2022 | — | (42,186) |
| 46 | Multi-Manager Alternative Strategies Fund | Annual Report 2022 |
August 31, 2022
| Forward foreign currency exchange contracts (continued) | |||||
| Currency to be sold | Currency to be purchased | Counterparty | Settlement date | Unrealized appreciation ($) | Unrealized depreciation ($) |
| 5,250,000 EUR | 6,891,700 CAD | JPMorgan | 09/15/2022 | — | (33,779) |
| 4,875,000 EUR | 4,714,602 CHF | JPMorgan | 09/15/2022 | — | (75,132) |
| 4,000,000 EUR | 3,369,978 GBP | JPMorgan | 09/15/2022 | — | (107,439) |
| 4,000,000 EUR | 39,459,032 NOK | JPMorgan | 09/15/2022 | — | (51,782) |
| 3,750,000 EUR | 3,823,385 USD | JPMorgan | 09/15/2022 | 51,507 | — |
| 4,500,000 GBP | 7,817,922 AUD | JPMorgan | 09/15/2022 | 121,589 | — |
| 1,000,000 GBP | 1,148,595 CHF | JPMorgan | 09/15/2022 | 14,302 | — |
| 254,568 GBP | 300,000 EUR | JPMorgan | 09/15/2022 | 5,944 | — |
| 500,000 GBP | 80,554,355 JPY | JPMorgan | 09/15/2022 | — | (541) |
| 2,687,500 GBP | 3,255,787 USD | JPMorgan | 09/15/2022 | 132,926 | — |
| 122,913,789 HUF | 300,000 EUR | JPMorgan | 09/15/2022 | — | (5,653) |
| 491,835,180 HUF | 1,200,000 USD | JPMorgan | 09/15/2022 | — | (30,061) |
| 7,476,171 ILS | 2,300,000 USD | JPMorgan | 09/15/2022 | 54,259 | — |
| 431,974,772 JPY | 4,600,000 AUD | JPMorgan | 09/15/2022 | 35,515 | — |
| 439,367,120 JPY | 4,200,000 CAD | JPMorgan | 09/15/2022 | 31,601 | — |
| 390,119,620 JPY | 2,750,000 CHF | JPMorgan | 09/15/2022 | 5,211 | — |
| 356,627,674 JPY | 2,600,000 EUR | JPMorgan | 09/15/2022 | 45,390 | — |
| 120,920,610 JPY | 750,000 GBP | JPMorgan | 09/15/2022 | 169 | — |
| 285,183,204 JPY | 1,750,000 GBP | JPMorgan | 09/15/2022 | — | (21,475) |
| 16,956,120 JPY | 200,000 NZD | JPMorgan | 09/15/2022 | 186 | — |
| 305,940,240 JPY | 3,600,000 NZD | JPMorgan | 09/15/2022 | — | (1,907) |
| 412,500,000 JPY | 3,065,669 USD | JPMorgan | 09/15/2022 | 93,287 | — |
| 31,967,202 NOK | 3,300,000 USD | JPMorgan | 09/15/2022 | 82,499 | — |
| 14,363,501 NZD | 13,000,000 AUD | JPMorgan | 09/15/2022 | 108,982 | — |
| 4,500,000 NZD | 2,841,954 USD | JPMorgan | 09/15/2022 | 88,668 | — |
| 1,909,783 PLN | 400,000 EUR | JPMorgan | 09/15/2022 | — | (3,102) |
| 16,213,757 PLN | 3,400,000 USD | JPMorgan | 09/15/2022 | — | (42,081) |
| 55,333,090 SEK | 5,250,000 EUR | JPMorgan | 09/15/2022 | 86,517 | — |
| 40,661,824 SEK | 38,000,000 NOK | JPMorgan | 09/15/2022 | 7,781 | — |
| 547,500 SEK | 500,000 NOK | JPMorgan | 09/15/2022 | — | (1,069) |
| 35,156,391 SEK | 3,400,000 USD | JPMorgan | 09/15/2022 | 99,873 | — |
| 3,205,871 SEK | 300,000 USD | JPMorgan | 09/15/2022 | — | (935) |
| 13,372,199 SGD | 9,700,000 USD | JPMorgan | 09/15/2022 | 130,466 | — |
| 84,704,037 TRY | 4,400,000 USD | JPMorgan | 09/15/2022 | — | (208,525) |
| 56,779,055 TWD | 1,900,000 USD | JPMorgan | 09/15/2022 | 32,025 | — |
| 1,900,000 USD | 6,168,245 ILS | JPMorgan | 09/15/2022 | — | (47,143) |
| 3,154,273 USD | 63,500,000 MXN | JPMorgan | 09/15/2022 | — | (10,354) |
| 1,100,000 USD | 20,328,550 TRY | JPMorgan | 09/15/2022 | 6,023 | — |
| 400,000 USD | 7,195,981 TRY | JPMorgan | 09/15/2022 | — | (8,485) |
| 44,566,435 ZAR | 2,700,000 USD | JPMorgan | 09/15/2022 | 101,350 | — |
| 15,992,900 INR | 200,000 USD | JPMorgan | 09/19/2022 | — | (889) |
| 200,000 USD | 15,948,343 INR | JPMorgan | 09/19/2022 | 330 | — |
| 90,585,297 CLP | 100,000 USD | JPMorgan | 09/20/2022 | — | (728) |
| 67,920 AUD | 46,989 USD | JPMorgan | 09/21/2022 | 500 | — |
| 427,212 AUD | 288,525 USD | JPMorgan | 09/21/2022 | — | (3,887) |
| 426,454 CAD | 332,500 USD | JPMorgan | 09/21/2022 | 7,844 | — |
| 2,198,356 EUR | 2,294,588 USD | JPMorgan | 09/21/2022 | 82,510 | — |
| 1,084,607 GBP | 1,338,976 USD | JPMorgan | 09/21/2022 | 78,522 | — |
| 132,136,730 JPY | 997,600 USD | JPMorgan | 09/21/2022 | 44,986 | — |
| 1,362,010 MXN | 64,903 USD | JPMorgan | 09/21/2022 | — | (2,451) |
| 5,137,403 NOK | 523,962 EUR | JPMorgan | 09/21/2022 | 10,094 | — |
| 335,750 NOK | 345,934 SEK | JPMorgan | 09/21/2022 | — | (1,315) |
| 1,430,021 SGD | 1,029,239 USD | JPMorgan | 09/21/2022 | 5,848 | — |
| 316,467 USD | 456,057 AUD | JPMorgan | 09/21/2022 | — | (4,312) |
| 746,285 USD | 954,259 CAD | JPMorgan | 09/21/2022 | — | (19,816) |
| 853,886 USD | 822,742 EUR | JPMorgan | 09/21/2022 | — | (26,008) |
| 1,333,805 USD | 178,103,213 JPY | JPMorgan | 09/21/2022 | — | (49,804) |
| 799,798 USD | 1,122,582 SGD | JPMorgan | 09/21/2022 | 3,575 | — |
| Multi-Manager Alternative Strategies Fund | Annual Report 2022 | 47 |
August 31, 2022
| Forward foreign currency exchange contracts (continued) | |||||
| Currency to be sold | Currency to be purchased | Counterparty | Settlement date | Unrealized appreciation ($) | Unrealized depreciation ($) |
| 558,669 USD | 779,769 SGD | JPMorgan | 09/21/2022 | — | (630) |
| 1,079,966,250 INR | 13,500,000 USD | JPMorgan | 09/23/2022 | — | (59,494) |
| 13,500,000 USD | 1,080,758,739 INR | JPMorgan | 09/23/2022 | 69,444 | — |
| 32,060,914 INR | 400,000 USD | JPMorgan | 09/26/2022 | — | (2,404) |
| 6,547,761,661 KRW | 4,900,000 USD | JPMorgan | 09/26/2022 | 17,059 | — |
| 100,000 USD | 93,528,847 CLP | JPMorgan | 09/26/2022 | 3,883 | — |
| 400,000 USD | 32,042,225 INR | JPMorgan | 09/26/2022 | 2,169 | — |
| 1,081,318,680 INR | 13,500,000 USD | JPMorgan | 09/29/2022 | — | (67,280) |
| 13,500,000 USD | 1,078,896,954 INR | JPMorgan | 09/29/2022 | 36,894 | — |
| 32,054,496 INR | 400,000 USD | JPMorgan | 09/30/2022 | — | (2,142) |
| 45,576,657 TWD | 1,500,000 USD | JPMorgan | 09/30/2022 | — | (1,784) |
| 88,235,297 CLP | 100,000 USD | JPMorgan | 10/03/2022 | 2,128 | — |
| 1,079,380,215 INR | 13,500,000 USD | JPMorgan | 10/03/2022 | — | (37,155) |
| 100,000 USD | 89,238,703 CLP | JPMorgan | 10/03/2022 | — | (1,015) |
| 3,492,398 USD | 278,733,906 INR | JPMorgan | 10/03/2022 | 3,371 | — |
| 2,071,726 USD | 165,083,481 INR | JPMorgan | 10/03/2022 | — | (1,315) |
| 100,000 USD | 512,822 BRL | JPMorgan | 10/04/2022 | — | (2,221) |
| 335,400 AUD | 371,758 NZD | Morgan Stanley | 09/21/2022 | — | (2,114) |
| 212,192 AUD | 152,597 USD | Morgan Stanley | 09/21/2022 | 7,360 | — |
| 854,424 AUD | 577,527 USD | Morgan Stanley | 09/21/2022 | — | (7,297) |
| 1,480,933 CAD | 1,144,629 USD | Morgan Stanley | 09/21/2022 | 17,209 | — |
| 2,684,071 EUR | 2,805,689 USD | Morgan Stanley | 09/21/2022 | 104,864 | — |
| 144,622 EUR | 144,493 USD | Morgan Stanley | 09/21/2022 | — | (1,031) |
| 751,980 GBP | 900,339 USD | Morgan Stanley | 09/21/2022 | 26,441 | — |
| 100,480,689 JPY | 762,548 USD | Morgan Stanley | 09/21/2022 | 38,152 | — |
| 481,828 NZD | 310,391 USD | Morgan Stanley | 09/21/2022 | 15,590 | — |
| 343,438 SEK | 335,750 NOK | Morgan Stanley | 09/21/2022 | 1,549 | — |
| 661,082 SGD | 476,683 USD | Morgan Stanley | 09/21/2022 | 3,582 | — |
| 161,945 SGD | 115,812 USD | Morgan Stanley | 09/21/2022 | — | (83) |
| 1,182,655 USD | 1,720,487 AUD | Morgan Stanley | 09/21/2022 | — | (5,040) |
| 665,000 USD | 856,717 CAD | Morgan Stanley | 09/21/2022 | — | (12,789) |
| 2,637,476 USD | 2,527,416 EUR | Morgan Stanley | 09/21/2022 | — | (94,284) |
| 418,748 USD | 355,625 GBP | Morgan Stanley | 09/21/2022 | — | (5,466) |
| 343,125 USD | 45,179,124 JPY | Morgan Stanley | 09/21/2022 | — | (17,415) |
| 510,550 USD | 803,749 NZD | Morgan Stanley | 09/21/2022 | — | (18,787) |
| 169,620 USD | 237,381 SGD | Morgan Stanley | 09/21/2022 | 261 | — |
| 133,035 AUD | 92,042 USD | RBC Capital Markets | 09/21/2022 | 984 | — |
| 2,093,610 CAD | 1,633,580 USD | RBC Capital Markets | 09/21/2022 | 39,734 | — |
| 461,993 EUR | 488,200 USD | RBC Capital Markets | 09/21/2022 | 23,323 | — |
| 645,977 GBP | 780,440 USD | RBC Capital Markets | 09/21/2022 | 29,730 | — |
| 343,125 USD | 444,230 CAD | RBC Capital Markets | 09/21/2022 | — | (4,937) |
| 698,098 USD | 686,250 EUR | RBC Capital Markets | 09/21/2022 | — | (7,565) |
| 253,130 USD | 214,539 GBP | RBC Capital Markets | 09/21/2022 | — | (3,808) |
| 858,315 CAD | 665,000 USD | Standard Chartered | 09/21/2022 | 11,573 | — |
| 45,346,746 JPY | 348,250 USD | Standard Chartered | 09/21/2022 | 21,332 | — |
| 343,125 USD | 45,785,158 JPY | Standard Chartered | 09/21/2022 | — | (13,046) |
| 2,363,412 AUD | 1,688,327 USD | State Street | 09/21/2022 | 70,653 | — |
| 445,397 CAD | 348,750 USD | State Street | 09/21/2022 | 9,673 | — |
| 7,004,704 EUR | 7,443,514 USD | State Street | 09/21/2022 | 395,086 | — |
| 77,650,936 JPY | 587,694 USD | State Street | 09/21/2022 | 27,885 | — |
| 200,762 NZD | 129,203 USD | State Street | 09/21/2022 | 6,369 | — |
| 235,941 SGD | 170,046 USD | State Street | 09/21/2022 | 1,196 | — |
| 1,430,254 USD | 2,047,525 AUD | State Street | 09/21/2022 | — | (28,794) |
| 868,246 USD | 1,115,762 CAD | State Street | 09/21/2022 | — | (18,828) |
| 3,489,699 USD | 3,338,237 EUR | State Street | 09/21/2022 | — | (130,623) |
| 227,257 USD | 30,580,053 JPY | State Street | 09/21/2022 | — | (6,797) |
| 127,968 AUD | 88,519 USD | UBS | 09/21/2022 | 930 | — |
| 847,706 CAD | 650,017 USD | UBS | 09/21/2022 | 4,667 | — |
| 48 | Multi-Manager Alternative Strategies Fund | Annual Report 2022 |
August 31, 2022
| Forward foreign currency exchange contracts (continued) | |||||
| Currency to be sold | Currency to be purchased | Counterparty | Settlement date | Unrealized appreciation ($) | Unrealized depreciation ($) |
| 1,250,472 EUR | 1,299,277 USD | UBS | 09/21/2022 | 41,000 | — |
| 355,625 GBP | 421,753 USD | UBS | 09/21/2022 | 8,471 | — |
| 21,973,835 MXN | 1,098,609 USD | UBS | 09/21/2022 | 11,950 | — |
| 2,014,373 NZD | 1,293,746 USD | UBS | 09/21/2022 | 61,277 | — |
| 941,301 SGD | 676,856 USD | UBS | 09/21/2022 | 3,216 | — |
| 1,008,982 USD | 1,457,209 AUD | UBS | 09/21/2022 | — | (11,573) |
| 665,000 USD | 850,289 CAD | UBS | 09/21/2022 | — | (17,683) |
| 1,902,507 USD | 1,809,677 EUR | UBS | 09/21/2022 | — | (81,534) |
| 877,456 USD | 744,170 GBP | UBS | 09/21/2022 | — | (12,633) |
| 219,453 USD | 29,235,330 JPY | UBS | 09/21/2022 | — | (8,687) |
| 127,996 USD | 2,696,988 MXN | UBS | 09/21/2022 | 5,377 | — |
| 168,810 USD | 237,252 SGD | UBS | 09/21/2022 | 979 | — |
| 188,081 USD | 262,581 SGD | UBS | 09/21/2022 | — | (166) |
| Total | 4,388,831 | (2,132,297) | |||
| Long futures contracts | ||||||
| Description | Number of contracts | Expiration date | Trading currency | Notional amount | Value/Unrealized appreciation ($) | Value/Unrealized depreciation ($) |
| Amsterdam Index | 1 | 09/2022 | EUR | 136,014 | — | (9,914) |
| Brazilian Real | 1 | 09/2022 | USD | 19,065 | — | (547) |
| Brazilian Real | 12 | 09/2022 | USD | 228,780 | — | (5,909) |
| Brent Crude | 1 | 09/2022 | USD | 95,640 | — | (3,591) |
| Brent Crude | 3 | 09/2022 | USD | 286,920 | — | (11,683) |
| Brent Crude | 12 | 10/2022 | USD | 1,130,520 | — | (7,329) |
| Brent Crude | 6 | 10/2022 | USD | 565,260 | — | (20,985) |
| Brent Crude | 3 | 11/2022 | USD | 278,790 | — | (11,013) |
| CAC40 Index | 7 | 09/2022 | EUR | 428,680 | — | (32,342) |
| Cocoa | 1 | 03/2023 | USD | 23,960 | 48 | — |
| Cocoa | 1 | 05/2023 | GBP | 18,290 | 839 | — |
| Coffee | 4 | 12/2022 | USD | 352,875 | 4,544 | — |
| Coffee | 2 | 12/2022 | USD | 176,438 | — | (1,430) |
| Corn | 22 | 12/2022 | USD | 737,550 | 7,003 | — |
| Corn | 9 | 12/2022 | USD | 301,725 | — | (2,374) |
| Corn | 4 | 03/2023 | USD | 135,300 | — | (121) |
| Corn | 6 | 05/2023 | USD | 203,475 | 487 | — |
| Cotton | 3 | 12/2022 | USD | 169,815 | 273 | — |
| Cotton | 7 | 12/2022 | USD | 396,235 | — | (10,282) |
| Crude Oil E-mini | 2 | 09/2022 | USD | 89,550 | — | (4,253) |
| ECX Emissions EUA | 5 | 12/2022 | EUR | 400,150 | — | (23,886) |
| Euro STOXX 50 Index | 1 | 09/2022 | EUR | 35,050 | — | (1,188) |
| Euro-BTP | 2 | 09/2022 | EUR | 239,020 | — | (10,813) |
| FTSE 100 Index | 24 | 09/2022 | GBP | 1,749,000 | — | (43,351) |
| FTSE 100 Index | 27 | 09/2022 | GBP | 1,967,625 | — | (63,378) |
| FTSE/JSE Top 40 Index | 5 | 09/2022 | ZAR | 3,037,900 | — | (9,044) |
| Gas Oil | 8 | 10/2022 | USD | 860,200 | 42,092 | — |
| Gas Oil | 2 | 10/2022 | USD | 215,050 | 7,373 | — |
| Gas Oil | 3 | 11/2022 | USD | 312,450 | — | (2,553) |
| Gas Oil | 1 | 12/2022 | USD | 100,450 | — | (10,326) |
| Gas Oil | 2 | 01/2023 | USD | 197,000 | — | (8,452) |
| Gold | 1 | 04/2023 | JPY | 7,659,000 | 773 | — |
| Gold | 12 | 06/2023 | JPY | 91,812,000 | 3,661 | — |
| Lean Hogs | 6 | 10/2022 | USD | 219,660 | — | (21,229) |
| Live Cattle | 4 | 10/2022 | USD | 228,120 | — | (2,639) |
| Live Cattle | 9 | 10/2022 | USD | 513,270 | — | (9,636) |
| Live Cattle | 2 | 12/2022 | USD | 118,780 | — | (1,174) |
| Live Cattle | 1 | 02/2023 | USD | 61,330 | — | (692) |
| Mexican Peso | 2 | 09/2022 | USD | 49,460 | 1,342 | — |
| Multi-Manager Alternative Strategies Fund | Annual Report 2022 | 49 |
August 31, 2022
| Long futures contracts (continued) | ||||||
| Description | Number of contracts | Expiration date | Trading currency | Notional amount | Value/Unrealized appreciation ($) | Value/Unrealized depreciation ($) |
| Mexican Peso | 214 | 09/2022 | USD | 5,292,220 | — | (41,953) |
| Milling Wheat | 4 | 03/2023 | EUR | 64,950 | — | (142) |
| Natural Gas | 7 | 09/2022 | USD | 638,890 | 63,631 | — |
| Natural Gas | 1 | 09/2022 | USD | 91,270 | 11,598 | — |
| Natural Gas | 6 | 09/2022 | USD | 547,620 | — | (35,780) |
| Natural Gas | 3 | 10/2022 | USD | 275,670 | — | (13,365) |
| Natural Gas | 1 | 11/2022 | USD | 93,260 | — | (5,052) |
| Natural Gas E-mini | 3 | 09/2022 | USD | 68,453 | — | (2,550) |
| Nikkei 225 Index | 2 | 09/2022 | JPY | 56,240,000 | 140 | — |
| Nikkei 225 Index | 8 | 09/2022 | JPY | 224,960,000 | — | (36,990) |
| NY Harbor ULSD | 2 | 10/2022 | USD | 303,156 | — | (6,694) |
| NY Harbor ULSD Heat Oil | 6 | 09/2022 | USD | 924,185 | 103,208 | — |
| NY Harbor ULSD Heat Oil | 5 | 09/2022 | USD | 770,154 | — | (10,038) |
| NY Harbor ULSD Heat Oil | 1 | 11/2022 | USD | 148,957 | — | (9,179) |
| NY Harbor ULSD Heat Oil | 2 | 12/2022 | USD | 292,614 | 4,579 | — |
| RBOB Gasoline | 6 | 09/2022 | USD | 612,562 | — | (60,295) |
| RBOB Gasoline | 1 | 10/2022 | USD | 100,292 | — | (11,270) |
| Robusta Coffee | 2 | 11/2022 | USD | 45,000 | 158 | — |
| Robusta Coffee | 1 | 01/2023 | USD | 22,380 | 959 | — |
| Russell 2000 Index E-mini | 1 | 09/2022 | USD | 92,230 | — | (6,840) |
| S&P Mid 400 Index E-mini | 1 | 09/2022 | USD | 243,030 | — | (16,627) |
| S&P/TSX 60 Index | 1 | 09/2022 | CAD | 233,000 | — | (8,262) |
| S&P/TSX 60 Index | 5 | 09/2022 | CAD | 1,165,000 | — | (28,806) |
| SGX Nifty Index | 26 | 09/2022 | USD | 910,520 | — | (5,741) |
| SGX USD/CNH FX | 1 | 09/2022 | CNH | 690,730 | 2,559 | — |
| Soybean | 12 | 11/2022 | USD | 853,500 | — | (5,238) |
| Soybean | 4 | 11/2022 | USD | 284,500 | — | (21,567) |
| Soybean | 5 | 01/2023 | USD | 356,938 | 3,002 | — |
| Soybean Meal | 11 | 12/2022 | USD | 456,610 | 13,091 | — |
| Soybean Meal | 8 | 12/2022 | USD | 332,080 | 583 | — |
| Soybean Meal | 2 | 01/2023 | USD | 81,980 | 1,856 | — |
| Soybean Oil | 11 | 12/2022 | USD | 445,368 | 5,544 | — |
| Soybean Oil | 2 | 12/2022 | USD | 80,976 | 1,601 | — |
| Soybean Oil | 2 | 01/2023 | USD | 79,872 | — | (202) |
| SPI 200 Index | 5 | 09/2022 | AUD | 863,500 | — | (363) |
| SPI 200 Index | 15 | 09/2022 | AUD | 2,590,500 | — | (21,245) |
| Thai SET50 Index | 189 | 09/2022 | THB | 37,399,320 | 22,875 | — |
| TOPIX Index | 14 | 09/2022 | JPY | 274,680,000 | — | (4,513) |
| TOPIX Index | 11 | 09/2022 | JPY | 215,820,000 | — | (21,087) |
| Topix Index Mini | 4 | 09/2022 | JPY | 7,848,000 | — | (124) |
| U.S. Dollar Index | 6 | 09/2022 | USD | 651,990 | 14,611 | — |
| U.S. Treasury 2-Year Note | 50 | 12/2022 | USD | 10,416,406 | — | (23,028) |
| U.S. Treasury 5-Year Note | 171 | 12/2022 | USD | 18,950,274 | — | (89,289) |
| Utilities Select Sector Index E-mini | 1 | 09/2022 | USD | 74,920 | — | (961) |
| Wheat | 1 | 03/2023 | USD | 45,563 | 1,035 | — |
| White Sugar #5 | 3 | 09/2022 | USD | 82,620 | 1,387 | — |
| White Sugar #5 | 1 | 11/2022 | USD | 26,150 | — | (451) |
| WTI Crude | 2 | 09/2022 | USD | 179,100 | — | (642) |
| WTI Crude | 4 | 09/2022 | USD | 358,200 | — | (14,086) |
| WTI Crude | 7 | 10/2022 | USD | 623,210 | — | (4,385) |
| WTI Crude | 1 | 10/2022 | USD | 89,030 | — | (4,672) |
| WTI Crude | 4 | 11/2022 | USD | 353,240 | — | (14,636) |
| WTI Crude | 2 | 12/2022 | USD | 175,040 | — | (7,273) |
| Yen Denominated Nikkei 225 Index | 6 | 09/2022 | JPY | 83,565,000 | 2,798 | — |
| Zinc | 1 | 12/2022 | USD | 86,050 | — | (582) |
| Total | 323,650 | (864,062) | ||||
| 50 | Multi-Manager Alternative Strategies Fund | Annual Report 2022 |
August 31, 2022
| Short futures contracts | ||||||
| Description | Number of contracts | Expiration date | Trading currency | Notional amount | Value/Unrealized appreciation ($) | Value/Unrealized depreciation ($) |
| 1-Month SOFR | (2) | 01/2023 | USD | (802,731) | 1,664 | — |
| 30-Day Fed Funds | (1) | 07/2023 | USD | (400,657) | 3,499 | — |
| 30-Year Euro-Buxl | (8) | 12/2022 | EUR | (1,301,120) | — | (1,504) |
| 3-Month Aluminum | (6) | 11/2022 | USD | (353,850) | 11,221 | — |
| 3-Month Copper | (2) | 11/2022 | USD | (97,500) | 1,845 | — |
| 3-Month Euro Euribor | (163) | 12/2022 | EUR | (40,000,200) | 201,631 | — |
| 3-Month Euro Euribor | (15) | 06/2023 | EUR | (3,657,375) | — | (2,039) |
| 3-Month Euro Euribor | (3) | 09/2024 | EUR | (733,313) | 710 | — |
| 3-Month Euro Euribor | (1) | 12/2024 | EUR | (244,550) | 325 | — |
| 3-Month Euro Euribor | (3) | 06/2025 | EUR | (733,650) | 4,562 | — |
| 3-Month Euro Euribor | (1) | 09/2025 | EUR | (244,475) | 511 | — |
| 3-Month Euro Euribor | (1) | 12/2025 | EUR | (244,375) | 299 | — |
| 3-Month Lead | (1) | 11/2022 | USD | (128,466) | 1,401 | — |
| 3-Month SOFR | (112) | 03/2023 | USD | (26,951,400) | 184,569 | — |
| 3-Month SOFR | (15) | 09/2023 | USD | (3,606,563) | 18,580 | — |
| 3-Month SONIA | (97) | 03/2023 | GBP | (23,353,963) | 203,056 | — |
| 90-Day AUD Bank Bill | (45) | 12/2022 | AUD | (44,625,876) | — | (6,532) |
| Amsterdam Index | (1) | 09/2022 | EUR | (136,014) | 4,537 | — |
| Australian 10-Year Bond | (59) | 09/2022 | AUD | (7,077,594) | 35,851 | — |
| Australian 10-Year Bond | (29) | 09/2022 | AUD | (3,478,817) | — | (37,279) |
| Australian 3-Year Bond | (103) | 09/2022 | AUD | (11,094,271) | 32,628 | — |
| Australian Dollar | (75) | 09/2022 | USD | (5,135,625) | 69,156 | — |
| Australian Dollar | (2) | 09/2022 | USD | (136,950) | 1,902 | — |
| Banker’s Acceptance | (35) | 12/2022 | CAD | (8,382,500) | 11,842 | — |
| Banker’s Acceptance | (1) | 06/2023 | CAD | (239,475) | 1,212 | — |
| Banker’s Acceptance | (4) | 09/2023 | CAD | (958,200) | 1,431 | — |
| British Pound | (155) | 09/2022 | USD | (11,254,938) | 526,615 | — |
| British Pound | (1) | 09/2022 | USD | (72,613) | 1,473 | — |
| CAC40 Index | (6) | 09/2022 | EUR | (367,440) | 3,635 | — |
| Canadian Dollar | (91) | 09/2022 | USD | (6,933,290) | 129,717 | — |
| Canadian Government 10-Year Bond | (36) | 12/2022 | CAD | (4,485,240) | 12,759 | — |
| Canadian Government 10-Year Bond | (23) | 12/2022 | CAD | (2,865,570) | 4,315 | — |
| Canola | (2) | 11/2022 | CAD | (33,416) | — | (111) |
| Cocoa | (18) | 12/2022 | USD | (434,340) | — | (5,657) |
| Copper | (1) | 12/2022 | USD | (194,863) | — | (8,502) |
| Copper | (26) | 12/2022 | USD | (2,287,025) | 68,956 | — |
| Copper | (2) | 12/2022 | USD | (175,925) | 10,334 | — |
| Copper | (1) | 03/2023 | USD | (87,925) | 6,023 | — |
| DAX Index | (1) | 09/2022 | EUR | (321,175) | 20,852 | — |
| DAX Index | (1) | 09/2022 | EUR | (321,175) | 8,710 | — |
| DAX Index Mini | (1) | 09/2022 | EUR | (64,235) | — | — |
| DJIA Index E-mini | (3) | 09/2022 | USD | (472,980) | 9,566 | — |
| DJIA Index Micro E-mini | (1) | 09/2022 | USD | (15,766) | 321 | — |
| Euro Buxl | (5) | 09/2022 | EUR | (823,000) | 33,127 | — |
| Euro FX | (110) | 09/2022 | USD | (13,827,000) | 479,961 | — |
| Euro FX | (1) | 09/2022 | USD | (125,700) | — | (727) |
| Euro FX Micro E-mini | (3) | 09/2022 | USD | (37,710) | 1,542 | — |
| EURO STOXX 50 Index | (8) | 09/2022 | EUR | (281,600) | 3,213 | — |
| EURO STOXX 50 Index | (3) | 09/2022 | EUR | (105,600) | 882 | — |
| EURO STOXX 50 Volatility Index | (3) | 09/2022 | EUR | (8,310) | — | (566) |
| Euro-Bobl | (53) | 09/2022 | EUR | (6,523,240) | 82,332 | — |
| Euro-Bobl | (20) | 09/2022 | EUR | (2,461,600) | 26,015 | — |
| Euro-Bobl | (8) | 09/2022 | EUR | (984,640) | — | (8,899) |
| Euro-BTP | (19) | 09/2022 | EUR | (2,270,690) | 62,977 | — |
| Euro-BTP | (14) | 12/2022 | EUR | (1,646,960) | — | (574) |
| Euro-Bund | (14) | 09/2022 | EUR | (2,071,580) | 49,365 | — |
| Euro-Bund | (3) | 09/2022 | EUR | (443,910) | 12,325 | — |
| Euro-Bund | (20) | 12/2022 | EUR | (2,911,400) | 855 | — |
| Multi-Manager Alternative Strategies Fund | Annual Report 2022 | 51 |
August 31, 2022
| Short futures contracts (continued) | ||||||
| Description | Number of contracts | Expiration date | Trading currency | Notional amount | Value/Unrealized appreciation ($) | Value/Unrealized depreciation ($) |
| Eurodollar 90-Day | (16) | 12/2022 | USD | (3,837,400) | 41,403 | — |
| Eurodollar 90-Day | (14) | 03/2023 | USD | (3,355,450) | 76,380 | — |
| Eurodollar 90-Day | (8) | 06/2024 | USD | (1,932,300) | 27,889 | — |
| Eurodollar 90-Day | (4) | 06/2025 | USD | (968,850) | 11,744 | — |
| Eurodollar 90-Day | (1) | 06/2026 | USD | (242,363) | 824 | — |
| Euro-OAT | (35) | 09/2022 | EUR | (4,830,700) | 118,327 | — |
| Euro-OAT | (20) | 09/2022 | EUR | (2,760,400) | 47,038 | — |
| Euro-Schatz | (210) | 09/2022 | EUR | (22,808,100) | 123,668 | — |
| Euro-Schatz | (96) | 09/2022 | EUR | (10,426,560) | 44,046 | — |
| Feeder Cattle | (1) | 10/2022 | USD | (91,738) | — | (577) |
| Financial Select Sector Index E-mini | (2) | 09/2022 | USD | (203,100) | 8,597 | — |
| FTSE China A50 Index | (60) | 09/2022 | USD | (811,320) | 6,473 | — |
| FTSE China A50 Index | (42) | 09/2022 | USD | (567,924) | — | (2,451) |
| FTSE Taiwan Index | (3) | 09/2022 | USD | (156,840) | 3,025 | — |
| FTSE/JSE Top 40 Index | (4) | 09/2022 | ZAR | (2,430,320) | 533 | — |
| FTSE/MIB Index | (3) | 09/2022 | EUR | (323,520) | 6,790 | — |
| FTSE/MIB Index | (4) | 09/2022 | EUR | (431,360) | — | (6,580) |
| FTSE/MIB Index Mini | (3) | 09/2022 | EUR | (64,704) | — | (29) |
| Gold 100 oz. | (12) | 12/2022 | USD | (2,071,440) | 54,420 | — |
| Gold 100 oz. | (30) | 12/2022 | USD | (5,178,600) | 37,314 | — |
| Gold 100 oz. | (1) | 02/2023 | USD | (173,890) | 568 | — |
| IBEX 35 Index | (1) | 09/2022 | EUR | (78,905) | 1,993 | — |
| IBEX 35 Index | (1) | 09/2022 | EUR | (78,905) | 1,601 | — |
| Indian Rupee | (45) | 09/2022 | USD | (1,128,960) | — | (4,568) |
| Industrials Select Sector Index | (1) | 09/2022 | USD | (93,430) | 2,599 | — |
| Japanese 10-Year Government Bond | (4) | 09/2022 | JPY | (598,120,000) | — | (16,918) |
| Japanese Yen | (131) | 09/2022 | USD | (11,819,475) | 280,702 | — |
| Japanese Yen | (2) | 09/2022 | USD | (180,450) | 5,890 | — |
| KLCI Index | (2) | 09/2022 | MYR | (148,850) | — | (176) |
| Korea 3-Year Bond | (112) | 09/2022 | KRW | (11,589,760,000) | — | (43,714) |
| Lean Hogs | (3) | 10/2022 | USD | (109,830) | — | (1,456) |
| Lean Hogs | (2) | 12/2022 | USD | (67,100) | — | (1,634) |
| Long Gilt | (73) | 12/2022 | GBP | (7,878,890) | 171,745 | — |
| Long Gilt | (34) | 12/2022 | GBP | (3,669,620) | 64,999 | — |
| Lumber | (1) | 11/2022 | USD | (53,196) | — | (1,047) |
| Materials Select Sector Index E-mini | (1) | 09/2022 | USD | (79,710) | 569 | — |
| MSCI EAFE Index | (23) | 09/2022 | USD | (2,101,165) | 36,424 | — |
| MSCI EAFE Index | (5) | 09/2022 | USD | (456,775) | 10,598 | — |
| MSCI Emerging Markets Index | (31) | 09/2022 | USD | (1,521,945) | 87,325 | — |
| MSCI Emerging Markets Index | (10) | 09/2022 | USD | (490,950) | 4,032 | — |
| MSCI Singapore Index | (19) | 09/2022 | SGD | (548,530) | 8,498 | — |
| MSCI Singapore Index | (5) | 09/2022 | SGD | (144,350) | 1,454 | — |
| NASDAQ 100 Index E-mini | (2) | 09/2022 | USD | (491,410) | 7,980 | — |
| New Zealand Dollar | (108) | 09/2022 | USD | (6,612,300) | 222,241 | — |
| New Zealand Dollar | (1) | 09/2022 | USD | (61,225) | 1,578 | — |
| Oat | (1) | 12/2022 | USD | (19,788) | 285 | — |
| OMXS30 Index | (20) | 09/2022 | SEK | (3,838,000) | 24,750 | — |
| OMXS30 Index | (23) | 09/2022 | SEK | (4,413,700) | 8,909 | — |
| Palladium | (1) | 12/2022 | USD | (207,890) | 7,558 | — |
| Platinum | (6) | 10/2022 | USD | (248,100) | 7,695 | — |
| Platinum | (7) | 10/2022 | USD | (289,450) | 6,666 | — |
| Platinum | (1) | 06/2023 | JPY | (1,867,500) | 20 | — |
| Primary Aluminum | (13) | 12/2022 | USD | (767,650) | 4,206 | — |
| Rapeseed | (3) | 10/2022 | EUR | (92,475) | 2,871 | — |
| S&P 500 Index E-mini | (1) | 09/2022 | USD | (197,825) | 3,999 | — |
| S&P 500 Index E-mini | (1) | 09/2022 | USD | (197,825) | 2,017 | — |
| S&P Mid 400 Index E-mini | (2) | 09/2022 | USD | (486,060) | 4,037 | — |
| SGX TSI Iron Ore China 62% | (18) | 10/2022 | USD | (181,098) | 13,755 | — |
| 52 | Multi-Manager Alternative Strategies Fund | Annual Report 2022 |
August 31, 2022
| Short futures contracts (continued) | ||||||
| Description | Number of contracts | Expiration date | Trading currency | Notional amount | Value/Unrealized appreciation ($) | Value/Unrealized depreciation ($) |
| SGX TSI Iron Ore China 62% | (22) | 10/2022 | USD | (221,342) | 810 | — |
| Short Term Euro-BTP | (39) | 09/2022 | EUR | (4,208,880) | 33,420 | — |
| Short Term Euro-BTP | (32) | 09/2022 | EUR | (3,453,440) | — | (26,555) |
| Silver | (35) | 12/2022 | USD | (3,129,350) | 297,675 | — |
| Silver | (7) | 12/2022 | USD | (625,870) | 48,308 | — |
| SOFR 3-Month | (4) | 03/2023 | USD | (962,550) | 21,794 | — |
| South African Rand | (145) | 09/2022 | USD | (4,226,750) | 141,165 | — |
| STOXX Europe 600 Bank Index | (1) | 09/2022 | EUR | (6,253) | — | (121) |
| STOXX Europe 600 Index | (7) | 09/2022 | EUR | (145,320) | 2,015 | — |
| Sugar #11 | (7) | 09/2022 | USD | (140,258) | — | (318) |
| Sugar #11 | (37) | 02/2023 | USD | (736,389) | 5,279 | — |
| Sugar #11 | (2) | 02/2023 | USD | (39,805) | 18 | — |
| Sugar #11 | (1) | 04/2023 | USD | (19,320) | — | (125) |
| Swiss Franc | (37) | 09/2022 | USD | (4,743,863) | 113,717 | — |
| U.S. Long Bond | (20) | 12/2022 | USD | (2,716,875) | 22,280 | — |
| U.S. Long Bond | (15) | 12/2022 | USD | (2,037,656) | 21,074 | — |
| U.S. Long Bond | (13) | 12/2022 | USD | (1,765,969) | 8,301 | ��� |
| U.S. Treasury 10-Year Note | (48) | 12/2022 | USD | (5,611,500) | 40,431 | — |
| U.S. Treasury 10-Year Note | (43) | 12/2022 | USD | (5,026,969) | 24,891 | — |
| U.S. Treasury 2-Year Note | (130) | 12/2022 | USD | (27,082,656) | 71,821 | — |
| U.S. Treasury 2-Year Note | (67) | 12/2022 | USD | (13,957,984) | 23,986 | — |
| U.S. Treasury 5-Year Note | (82) | 12/2022 | USD | (9,087,266) | 46,410 | — |
| U.S. Treasury 5-Year Note | (55) | 12/2022 | USD | (6,095,117) | 27,431 | — |
| U.S. Treasury Ultra 10-Year Note | (172) | 12/2022 | USD | (21,532,250) | 161,385 | — |
| U.S. Treasury Ultra 10-Year Note | (23) | 12/2022 | USD | (2,879,313) | 19,815 | — |
| U.S. Treasury Ultra 10-Year Note | (23) | 12/2022 | USD | (2,879,313) | 16,218 | — |
| U.S. Ultra Treasury Bond | (38) | 12/2022 | USD | (5,681,000) | 14,024 | — |
| U.S. Ultra Treasury Bond | (15) | 12/2022 | USD | (2,242,500) | — | (100) |
| U.S. Ultra Treasury Bond | (5) | 12/2022 | USD | (747,500) | — | (708) |
| U.S. Ultra Treasury Bond | (10) | 12/2022 | USD | (1,495,000) | — | (960) |
| Wheat | (1) | 12/2022 | USD | (41,575) | — | (877) |
| Wheat | (2) | 12/2022 | USD | (91,250) | — | (3,042) |
| Wheat | (4) | 12/2022 | USD | (182,500) | — | (9,672) |
| Wheat | (15) | 12/2022 | USD | (623,625) | — | (18,436) |
| Wheat | (1) | 03/2023 | USD | (42,388) | — | (877) |
| WIG 20 Index | (43) | 09/2022 | PLN | (1,315,800) | 18,624 | — |
| Total | 5,135,229 | (213,331) | ||||
| Call option contracts purchased | ||||||||
| Description | Counterparty | Trading currency | Notional amount | Number of contracts | Exercise price/Rate | Expiration date | Cost ($) | Value ($) |
| Broadcom, Inc. | Goldman Sachs | USD | 1,048,131 | 21 | 550.00 | 12/16/2022 | 74,485 | 37,590 |
| Broadcom, Inc. | Goldman Sachs | USD | 299,466 | 6 | 520.00 | 12/16/2022 | 21,311 | 17,700 |
| ironSource Ltd. | Goldman Sachs | USD | 116,974 | 286 | 5.00 | 12/16/2022 | 24,604 | 12,870 |
| iShares Expanded Tech-Software Sector ETF | Goldman Sachs | USD | 253,152 | 9 | 320.00 | 11/18/2022 | 13,012 | 4,005 |
| iShares Russell 2000 Growth ETF | Goldman Sachs | USD | 182,104 | 8 | 250.00 | 11/18/2022 | 6,535 | 3,480 |
| Unity Software, Inc. | Goldman Sachs | USD | 213,600 | 50 | 60.00 | 10/21/2022 | 36,940 | 4,925 |
| Unity Software, Inc. | Goldman Sachs | USD | 76,896 | 18 | 60.00 | 11/18/2022 | 16,962 | 3,771 |
| Zendesk, Inc. | Goldman Sachs | USD | 1,842,480 | 240 | 80.00 | 10/21/2022 | 12,228 | 3,000 |
| Total | 206,077 | 87,341 | ||||||
| Multi-Manager Alternative Strategies Fund | Annual Report 2022 | 53 |
August 31, 2022
| Put option contracts purchased | ||||||||
| Description | Counterparty | Trading currency | Notional amount | Number of contracts | Exercise price/Rate | Expiration date | Cost ($) | Value ($) |
| Twitter, Inc. | Goldman Sachs | USD | 515,375 | 133 | 30.00 | 10/21/2022 | 30,130 | 14,630 |
| Zendesk, Inc. | Goldman Sachs | USD | 199,602 | 26 | 70.00 | 09/16/2022 | 1,967 | 1,625 |
| Total | 32,097 | 16,255 | ||||||
| Call option contracts written | ||||||||
| Description | Counterparty | Trading currency | Notional amount | Number of contracts | Exercise price/Rate | Expiration date | Premium received ($) | Value ($) |
| Aerojet Rocketdyne Holdings, Inc. | Goldman Sachs | USD | (551,296) | (128) | 40.00 | 12/16/2022 | (61,066) | (64,640) |
| Willis Towers Watson PLC | Goldman Sachs | USD | (889,369) | (43) | 220.00 | 9/16/2022 | (21,430) | (1,720) |
| Zendesk, Inc | Goldman Sachs | USD | (1,842,480) | (240) | 85.00 | 10/21/2022 | (2,134) | (3,600) |
| Total | (84,630) | (69,960) | ||||||
| Cleared interest rate swap contracts | |||||||||||
| Fund receives | Fund pays | Payment frequency | Counterparty | Maturity date | Notional currency | Notional amount | Value ($) | Upfront payments ($) | Upfront receipts ($) | Unrealized appreciation ($) | Unrealized depreciation ($) |
| Fixed rate of 1.390% | 3-Month USD LIBOR | Receives SemiAnnually, Pays Quarterly | Citi | 09/28/2025 | USD | 12,000,000 | (451,272) | — | — | — | (451,272) |
| 3-Month USD LIBOR | Fixed rate of 1.870% | Receives Quarterly, Pays SemiAnnually | Citi | 09/28/2053 | USD | 1,000,000 | 201,712 | — | — | 201,712 | — |
| Total | (249,560) | — | — | 201,712 | (451,272) | ||||||
| Total return swap contracts | ||||||||||||
| Fund receives | Fund pays | Payment frequency | Counterparty | Maturity date | Notional currency | Notional amount | Value ($) | Periodic payments receivable (payable) ($) | Upfront payments ($) | Upfront receipts ($) | Unrealized appreciation ($) | Unrealized depreciation ($) |
| Total return on Distell Group Holdings Ltd | 1-Month ZAR JIBAR plus 1.500% | Monthly | Goldman Sachs | 11/15/2022 | ZAR | 1,464,890 | 1,006 | (514) | — | — | 492 | — |
| Total return on Distell Group Holdings Ltd | 1-Month ZAR JIBAR plus 1.500% | Monthly | Goldman Sachs | 11/15/2022 | ZAR | 471,410 | 324 | (166) | — | — | 158 | — |
| Total return on Distell Group Holdings Ltd | 1-Month ZAR JIBAR plus 1.500% | Monthly | Goldman Sachs | 11/15/2022 | ZAR | 4,660,890 | 3,201 | (3,116) | — | — | 85 | — |
| Total return on Meggitt PLC | SONIA plus 0.550% | Monthly | Goldman Sachs | 08/03/2023 | GBP | 187,530 | 2,151 | (403) | — | — | 1,748 | — |
| Total return on Meggitt PLC | SONIA plus 0.550% | Monthly | Goldman Sachs | 08/03/2023 | GBP | 124,820 | 1,432 | (268) | — | — | 1,164 | — |
| Total return on Meggitt PLC | SONIA plus 0.550% | Monthly | Goldman Sachs | 08/03/2023 | GBP | 109,273 | 1,253 | (375) | — | — | 878 | — |
| Total return on Meggitt PLC | SONIA plus 0.550% | Monthly | Goldman Sachs | 08/03/2023 | GBP | 77,665 | 890 | (133) | — | — | 757 | — |
| Total return on Meggitt PLC | SONIA plus 0.550% | Monthly | Goldman Sachs | 08/03/2023 | GBP | 62,924 | 722 | (120) | — | — | 602 | — |
| Total return on Meggitt PLC | SONIA plus 0.550% | Monthly | Goldman Sachs | 08/03/2023 | GBP | 54,818 | 629 | (97) | — | — | 532 | — |
| Total return on Meggitt PLC | SONIA plus 0.550% | Monthly | Goldman Sachs | 08/03/2023 | GBP | 54,494 | 625 | (94) | — | — | 531 | — |
| Total return on Meggitt PLC | SONIA plus 0.550% | Monthly | Goldman Sachs | 08/03/2023 | GBP | 55,387 | 635 | (119) | — | — | 516 | — |
| 54 | Multi-Manager Alternative Strategies Fund | Annual Report 2022 |
August 31, 2022
| Total return swap contracts (continued) | ||||||||||||
| Fund receives | Fund pays | Payment frequency | Counterparty | Maturity date | Notional currency | Notional amount | Value ($) | Periodic payments receivable (payable) ($) | Upfront payments ($) | Upfront receipts ($) | Unrealized appreciation ($) | Unrealized depreciation ($) |
| Total return on Meggitt PLC | SONIA plus 0.550% | Monthly | Goldman Sachs | 08/03/2023 | GBP | 55,118 | 632 | (118) | — | — | 514 | — |
| Total return on Meggitt PLC | SONIA plus 0.550% | Monthly | Goldman Sachs | 08/03/2023 | GBP | 47,274 | 542 | (81) | — | — | 461 | — |
| Total return on Meggitt PLC | SONIA plus 0.550% | Monthly | Goldman Sachs | 08/03/2023 | GBP | 49,470 | 567 | (106) | — | — | 461 | — |
| Total return on Meggitt PLC | SONIA plus 0.550% | Monthly | Goldman Sachs | 08/03/2023 | GBP | 43,087 | 494 | (86) | — | — | 408 | — |
| Total return on Meggitt PLC | SONIA plus 0.550% | Monthly | Goldman Sachs | 08/03/2023 | GBP | 49,691 | 570 | (170) | — | — | 400 | — |
| Total return on Meggitt PLC | SONIA plus 0.550% | Monthly | Goldman Sachs | 08/03/2023 | GBP | 43,853 | 503 | (150) | — | — | 353 | — |
| Total return on Meggitt PLC | SONIA plus 0.550% | Monthly | Goldman Sachs | 08/03/2023 | GBP | 37,312 | 428 | (80) | — | — | 348 | — |
| Total return on Meggitt PLC | SONIA plus 0.550% | Monthly | Goldman Sachs | 08/03/2023 | GBP | 35,945 | 412 | (77) | — | — | 335 | — |
| Total return on Meggitt PLC | SONIA plus 0.550% | Monthly | Goldman Sachs | 08/03/2023 | GBP | 23,905 | 274 | (41) | — | — | 233 | — |
| Total return on Meggitt PLC | SONIA plus 0.550% | Monthly | Goldman Sachs | 08/03/2023 | GBP | 22,934 | 263 | (49) | — | — | 214 | — |
| Total return on Meggitt PLC | SONIA plus 0.550% | Monthly | Goldman Sachs | 08/03/2023 | GBP | 9,922 | 114 | (21) | — | — | 93 | — |
| Total return on Meggitt PLC | SONIA plus 0.550% | Monthly | Goldman Sachs | 08/03/2023 | GBP | 8,406 | 97 | (29) | — | — | 68 | — |
| Total return on Meggitt PLC | SONIA plus 0.550% | Monthly | Goldman Sachs | 08/03/2023 | GBP | 7,142 | 82 | (15) | — | — | 67 | — |
| Total return on Meggitt PLC | SONIA plus 0.550% | Monthly | Goldman Sachs | 08/03/2023 | GBP | 4,922 | 56 | (9) | — | — | 47 | — |
| Total return on Meggitt PLC | SONIA plus 0.550% | Monthly | Goldman Sachs | 08/03/2023 | GBP | 1,722 | 20 | (3) | — | — | 17 | — |
| Total | 17,922 | (6,440) | — | — | 11,482 | — | ||||||
| Reference index and values for swap contracts as of period end | ||
| Reference index | Reference rate | |
| 1-Month ZAR JIBAR | Johannesburg Interbank Average Rate | 5.600% |
| 3-Month USD LIBOR | London Interbank Offered Rate | 3.100% |
| SONIA | Sterling Overnight Index Average | 1.690% |
| (a) | Represents privately placed and other securities and instruments exempt from Securities and Exchange Commission registration (collectively, private placements), such as Section 4(a)(2) and Rule 144A eligible securities, which are often sold only to qualified institutional buyers. At August 31, 2022, the total value of these securities amounted to $84,692,230, which represents 15.85% of total net assets. |
| (b) | Variable rate security. The interest rate shown was the current rate as of August 31, 2022. |
| (c) | Variable or floating rate security, the interest rate of which adjusts periodically based on changes in current interest rates and prepayments on the underlying pool of assets. The interest rate shown was the current rate as of August 31, 2022. |
| Multi-Manager Alternative Strategies Fund | Annual Report 2022 | 55 |
August 31, 2022
| (d) | Represents interest only securities which have the right to receive the monthly interest payments on an underlying pool of mortgage loans. |
| (e) | Non-income producing investment. |
| (f) | Represents fair value as determined in good faith under procedures approved by the Board of Trustees. At August 31, 2022, the total value of these securities amounted to $11,188,276, which represents 2.09% of total net assets. |
| (g) | Valuation based on significant unobservable inputs. |
| (h) | This security or a portion of this security has been pledged as collateral in connection with derivative contracts. |
| (i) | This security or a portion of this security has been pledged as collateral in connection with investments sold short. |
| (j) | Represents a variable rate security with a step coupon where the rate adjusts according to a schedule for a series of periods, typically lower for an initial period and then increasing to a higher coupon rate thereafter. The interest rate shown was the current rate as of August 31, 2022. |
| (k) | Zero coupon bond. |
| (l) | Principal amounts are denominated in United States Dollars unless otherwise noted. |
| (m) | Represents securities that have defaulted on payment of interest. The Fund has stopped accruing interest on these securities. At August 31, 2022, the total value of these securities amounted to $42,167, which represents 0.01% of total net assets. |
| (n) | Principal and interest may not be guaranteed by a governmental entity. |
| (o) | Represents a security purchased on a when-issued basis. |
| (p) | Represents a security purchased on a forward commitment basis. |
| (q) | The stated interest rate represents the weighted average interest rate at August 31, 2022 of contracts within the senior loan facility. Interest rates on contracts are primarily determined either weekly, monthly or quarterly by reference to the indicated base lending rate and spread and the reset period. These base lending rates are primarily the LIBOR and other short-term rates. Base lending rates may be subject to a floor or minimum rate. The interest rate for senior loans purchased on a when-issued or delayed delivery basis will be determined upon settlement, therefore no interest rate is disclosed. Senior loans often require prepayments from excess cash flows or permit the borrowers to repay at their election. The degree to which borrowers repay cannot be predicted with accuracy. As a result, remaining maturities of senior loans may be less than the stated maturities. Generally, the Fund is contractually obligated to receive approval from the agent bank and/or borrower prior to the disposition of a senior loan. |
| (r) | At August 31, 2022, the Fund had unfunded senior loan commitments pursuant to the terms of the loan agreement. The Fund receives a stated coupon rate until the borrower draws on the loan commitment, at which time the rate will become the stated rate in the loan agreement. |
| Borrower | Unfunded Commitment ($) |
| athenahealth Group, Inc. Delayed Draw Term Loan 02/15/2029 3.500% | 11,000 |
| (s) | The rate shown is the seven-day current annualized yield at August 31, 2022. |
| (t) | As defined in the Investment Company Act of 1940, as amended, an affiliated company is one in which the Fund owns 5% or more of the company’s outstanding voting securities, or a company which is under common ownership or control with the Fund. The value of the holdings and transactions in these affiliated companies during the year ended August 31, 2022 are as follows: |
| Affiliated issuers | Beginning of period($) | Purchases($) | Sales($) | Net change in unrealized appreciation (depreciation)($) | End of period($) | Realized gain (loss)($) | Dividends($) | End of period shares |
| Columbia Short-Term Cash Fund, 2.366% | ||||||||
| 140,760,522 | 569,700,033 | (523,935,425) | (6,184) | 186,518,946 | (54,099) | 982,431 | 186,612,253 | |
| ADR | American Depositary Receipt |
| BAM | Build America Mutual Assurance Co. |
| CMO | Collateralized Mortgage Obligation |
| CVR | Contingent Value Rights |
| FGIC | Financial Guaranty Insurance Corporation |
| FHLMC | Federal Home Loan Mortgage Corporation |
| LIBOR | London Interbank Offered Rate |
| MTA | Monthly Treasury Average |
| NIBOR | Norwegian Interbank Offered Rate |
| SOFR | Secured Overnight Financing Rate |
| TBA | To Be Announced |
| 56 | Multi-Manager Alternative Strategies Fund | Annual Report 2022 |
August 31, 2022
| AUD | Australian Dollar |
| BRL | Brazilian Real |
| CAD | Canada Dollar |
| CHF | Swiss Franc |
| CLP | Chilean Peso |
| CNH | Yuan Offshore Renminbi |
| COP | Colombian Peso |
| EUR | Euro |
| GBP | British Pound |
| HUF | Hungarian Forint |
| IDR | Indonesian Rupiah |
| ILS | Israeli Shekel |
| INR | Indian Rupee |
| JPY | Japanese Yen |
| KRW | South Korean Won |
| MXN | Mexican Peso |
| MYR | Malaysian Ringgit |
| NOK | Norwegian Krone |
| NZD | New Zealand Dollar |
| PHP | Philippine Peso |
| PLN | Polish Zloty |
| SEK | Swedish Krona |
| SGD | Singapore Dollar |
| THB | Thailand Baht |
| TRY | Turkish Lira |
| TWD | New Taiwan Dollar |
| USD | US Dollar |
| ZAR | South African Rand |
| ■ | Level 1 — Valuations based on quoted prices for investments in active markets that the Fund has the ability to access at the measurement date. Valuation adjustments are not applied to Level 1 investments. |
| ■ | Level 2 — Valuations based on other significant observable inputs (including quoted prices for similar securities, interest rates, prepayment speeds, credit risks, etc.). |
| ■ | Level 3 — Valuations based on significant unobservable inputs (including the Fund’s own assumptions and judgment in determining the fair value of investments). |
| Multi-Manager Alternative Strategies Fund | Annual Report 2022 | 57 |
August 31, 2022
Investments falling into the Level 3 category are primarily supported by quoted prices from brokers and dealers participating in the market for those investments. However, these may be classified as Level 3 investments due to lack of market transparency and corroboration to support these quoted prices. Additionally, valuation models may be used as the pricing source for any remaining investments classified as Level 3. These models may rely on one or more significant unobservable inputs and/or significant assumptions by the Investment Manager. Inputs used in valuations may include, but are not limited to, financial statement analysis, capital account balances, discount rates and estimated cash flows, and comparable company data.
| Level 1 ($) | Level 2 ($) | Level 3 ($) | Total ($) | |
| Investments in Securities | ||||
| Asset-Backed Securities — Non-Agency | — | 16,636,259 | — | 16,636,259 |
| Commercial Mortgage-Backed Securities - Agency | — | 2,172,057 | — | 2,172,057 |
| Commercial Mortgage-Backed Securities - Non-Agency | — | 13,602,911 | — | 13,602,911 |
| Common Stocks | ||||
| Communication Services | 11,797,822 | — | — | 11,797,822 |
| Consumer Discretionary | 5,297,065 | — | 3,795,141 | 9,092,206 |
| Consumer Staples | — | 898,443 | — | 898,443 |
| Financials | 11,125,197 | 901,675 | — | 12,026,872 |
| Health Care | 22,887,010 | 1,625,573 | 1,563,986 | 26,076,569 |
| Industrials | 10,019,318 | 3,672,492 | — | 13,691,810 |
| Information Technology | 29,265,466 | 612,794 | 3,862,230 | 33,740,490 |
| Materials | 1,322,593 | — | 1,388,911 | 2,711,504 |
| Real Estate | 2,470,715 | — | — | 2,470,715 |
| Utilities | 5,483,877 | 956,869 | — | 6,440,746 |
| Total Common Stocks | 99,669,063 | 8,667,846 | 10,610,268 | 118,947,177 |
| Convertible Bonds | — | 3,153,736 | — | 3,153,736 |
| Convertible Preferred Stocks | ||||
| Communication Services | — | 461,170 | — | 461,170 |
| Financials | — | 74,688 | — | 74,688 |
| Health Care | — | 399,159 | — | 399,159 |
| Information Technology | — | 47,450 | — | 47,450 |
| Utilities | — | 1,867,411 | — | 1,867,411 |
| Total Convertible Preferred Stocks | — | 2,849,878 | — | 2,849,878 |
| Corporate Bonds & Notes | — | 87,258,020 | — | 87,258,020 |
| Foreign Government Obligations | — | 28,990,756 | — | 28,990,756 |
| Limited Partnerships | ||||
| Energy | 321,386 | — | — | 321,386 |
| Total Limited Partnerships | 321,386 | — | — | 321,386 |
| Municipal Bonds | — | 610,327 | — | 610,327 |
| Preferred Debt | 189,319 | — | — | 189,319 |
| Preferred Stocks | ||||
| Financials | 479,422 | — | — | 479,422 |
| Total Preferred Stocks | 479,422 | — | — | 479,422 |
| Residential Mortgage-Backed Securities - Agency | — | 22,787,859 | — | 22,787,859 |
| Residential Mortgage-Backed Securities - Non-Agency | — | 32,785,828 | 556,698 | 33,342,526 |
| 58 | Multi-Manager Alternative Strategies Fund | Annual Report 2022 |
August 31, 2022
| Level 1 ($) | Level 2 ($) | Level 3 ($) | Total ($) | |
| Rights | ||||
| Health Care | — | — | 21,310 | 21,310 |
| Total Rights | — | — | 21,310 | 21,310 |
| Senior Loans | — | 7,757,175 | 138,649 | 7,895,824 |
| Treasury Bills | 5,466,370 | — | — | 5,466,370 |
| U.S. Government & Agency Obligations | — | 767,219 | — | 767,219 |
| U.S. Treasury Obligations | 6,876,493 | — | — | 6,876,493 |
| Options Purchased Calls | 87,341 | — | — | 87,341 |
| Options Purchased Puts | 16,255 | — | — | 16,255 |
| Money Market Funds | 186,518,946 | — | — | 186,518,946 |
| Total Investments in Securities | 299,624,595 | 228,039,871 | 11,326,925 | 538,991,391 |
| Investments in Securities Sold Short | ||||
| Common Stocks | ||||
| Consumer Discretionary | (236,146) | — | — | (236,146) |
| Financials | (88,647) | — | — | (88,647) |
| Health Care | — | — | (20,890) | (20,890) |
| Industrials | (248,584) | (749,462) | — | (998,046) |
| Information Technology | (1,644,825) | — | — | (1,644,825) |
| Real Estate | (2,397,067) | — | — | (2,397,067) |
| Total Common Stocks | (4,615,269) | (749,462) | (20,890) | (5,385,621) |
| Exchange-Traded Equity Funds | (419,212) | — | — | (419,212) |
| Total Investments in Securities Sold Short | (5,034,481) | (749,462) | (20,890) | (5,804,833) |
| Total Investments in Securities, Net of Securities Sold Short | 294,590,114 | 227,290,409 | 11,306,035 | 533,186,558 |
| Investments in Derivatives | ||||
| Asset | ||||
| Forward Foreign Currency Exchange Contracts | — | 4,388,831 | — | 4,388,831 |
| Futures Contracts | 5,458,879 | — | — | 5,458,879 |
| Swap Contracts | — | 213,194 | — | 213,194 |
| Liability | ||||
| Forward Foreign Currency Exchange Contracts | — | (2,132,297) | — | (2,132,297) |
| Futures Contracts | (1,077,393) | — | — | (1,077,393) |
| Options Contracts Written | (69,960) | — | — | (69,960) |
| Swap Contracts | — | (451,272) | — | (451,272) |
| Total | 298,901,640 | 229,308,865 | 11,306,035 | 539,516,540 |
| Balance as of 08/31/2021 ($) | Increase (decrease) in accrued discounts/ premiums ($) | Realized gain (loss) ($) | Change in unrealized appreciation (depreciation)(a) ($) | Purchases ($) | Sales ($) | Transfers into Level 3 ($) | Transfers out of Level 3 ($) | Balance as of 08/31/2022 ($) | |
| Commercial Mortgage-Backed Securities - Non-Agency | 319,510 | — | — | — | — | — | — | (319,510) | — |
| Common Stocks | 4,955,424 | — | 527,697 | (267,849) | 9,882,538 | (6,898,137) | 2,410,595 | — | 10,610,268 |
| Residential Mortgage-Backed Securities - Non-Agency | — | 187 | — | (163) | 556,674 | — | — | — | 556,698 |
| Rights | — | — | — | 21,310 | — | — | - | — | 21,310 |
| Multi-Manager Alternative Strategies Fund | Annual Report 2022 | 59 |
August 31, 2022
| Balance as of 08/31/2021 ($) | Increase (decrease) in accrued discounts/ premiums ($) | Realized gain (loss) ($) | Change in unrealized appreciation (depreciation)(a) ($) | Purchases ($) | Sales ($) | Transfers into Level 3 ($) | Transfers out of Level 3 ($) | Balance as of 08/31/2022 ($) | |
| Senior Loans | — | (33) | — | (12,645) | — | (9,472) | 160,799 | — | 138,649 |
| Common Stocks - Investments Sold Short | — | — | — | (885) | — | (20,005) | — | — | (20,890) |
| Total Return Swap Contracts | 2,209 | — | —(b) | (2,209) | — | — | — | — | — |
| Total | 5,277,143 | 154 | 527,697 | (262,441) | 10,439,212 | (6,927,614) | 2,571,394 | (319,510) | 11,306,035 |
| 60 | Multi-Manager Alternative Strategies Fund | Annual Report 2022 |
August 31, 2022
| Assets | |
| Investments in securities, at value | |
| Unaffiliated issuers (cost $376,114,278) | $352,368,849 |
| Affiliated issuers (cost $186,528,169) | 186,518,946 |
| Options purchased (cost $238,174) | 103,596 |
| Cash | 37,281 |
| Foreign currency (cost $107,269) | 105,558 |
| Cash collateral held at broker for: | |
| Forward foreign currency exchange contracts | 2,890,000 |
| Other(a) | 5,897,799 |
| Margin deposits on: | |
| Futures contracts | 12,066,676 |
| Swap contracts | 280,027 |
| Unrealized appreciation on forward foreign currency exchange contracts | 4,388,831 |
| Unrealized appreciation on swap contracts | 11,482 |
| Receivable for: | |
| Investments sold | 1,001,901 |
| Investments sold on a delayed delivery basis | 19,847,118 |
| Capital shares sold | 785,124 |
| Dividends | 370,704 |
| Interest | 1,738,808 |
| Foreign tax reclaims | 30,396 |
| Variation margin for futures contracts | 876,098 |
| Variation margin for swap contracts | 11,191 |
| Prepaid expenses | 7,456 |
| Trustees’ deferred compensation plan | 81,673 |
| Total assets | 589,419,514 |
| Liabilities | |
| Securities sold short, at value (proceeds $5,816,744) | 5,804,833 |
| Option contracts written, at value (premiums received $84,630) | 69,960 |
| Unrealized depreciation on forward foreign currency exchange contracts | 2,132,297 |
| Payable for: | |
| Investments purchased | 4,582,200 |
| Investments purchased on a delayed delivery basis | 41,130,998 |
| Capital shares purchased | 526,998 |
| Dividends and interest on securities sold short | 3,460 |
| Variation margin for futures contracts | 549,810 |
| Management services fees | 16,070 |
| Transfer agent fees | 45,981 |
| Compensation of board members | 13,476 |
| Other expenses | 92,878 |
| Trustees’ deferred compensation plan | 81,673 |
| Total liabilities | 55,050,634 |
| Net assets applicable to outstanding capital stock | $534,368,880 |
| Represented by | |
| Paid in capital | 586,148,528 |
| Total distributable earnings (loss) | (51,779,648) |
| Total - representing net assets applicable to outstanding capital stock | $534,368,880 |
| Institutional Class | |
| Net assets | $534,368,880 |
| Shares outstanding | 54,559,021 |
| Net asset value per share | $9.79 |
| (a) | Includes collateral related to options purchased, options contracts written, forward foreign currency exchange contracts, swap contracts and securities sold short. |
| Multi-Manager Alternative Strategies Fund | Annual Report 2022 | 61 |
Year Ended August 31, 2022
| Net investment income | |
| Income: | |
| Dividends — unaffiliated issuers | $957,392 |
| Dividends — affiliated issuers | 982,431 |
| Interest | 7,464,191 |
| Foreign taxes withheld | (39,581) |
| Total income | 9,364,433 |
| Expenses: | |
| Management services fees | 5,796,605 |
| Transfer agent fees | |
| Institutional Class | 527,614 |
| Compensation of board members | 19,745 |
| Custodian fees | 127,872 |
| Printing and postage fees | 69,818 |
| Registration fees | 51,680 |
| Audit fees | 55,910 |
| Legal fees | 16,053 |
| Interest on collateral | 20,077 |
| Dividends and interest on securities sold short | 191,614 |
| Compensation of chief compliance officer | 125 |
| Other | 19,548 |
| Total expenses | 6,896,661 |
| Net investment income | 2,467,772 |
| Realized and unrealized gain (loss) — net | |
| Net realized gain (loss) on: | |
| Investments — unaffiliated issuers | 1,216,480 |
| Investments — affiliated issuers | (54,099) |
| Foreign currency translations | 569,617 |
| Forward foreign currency exchange contracts | 3,093,534 |
| Futures contracts | 31,845,607 |
| Options purchased | (53,638) |
| Options contracts written | 206,793 |
| Securities sold short | (5,483,723) |
| Swap contracts | 87,707 |
| Net realized gain | 31,428,278 |
| Net change in unrealized appreciation (depreciation) on: | |
| Investments — unaffiliated issuers | (31,736,943) |
| Investments — affiliated issuers | (6,184) |
| Foreign currency translations | (109,088) |
| Forward foreign currency exchange contracts | 3,252,408 |
| Futures contracts | 3,833,421 |
| Options purchased | (385,726) |
| Options contracts written | 14,670 |
| Securities sold short | 5,412,016 |
| Swap contracts | (356,626) |
| Foreign capital gains tax | 906 |
| Net change in unrealized appreciation (depreciation) | (20,081,146) |
| Net realized and unrealized gain | 11,347,132 |
| Net increase in net assets resulting from operations | $13,814,904 |
| 62 | Multi-Manager Alternative Strategies Fund | Annual Report 2022 |
| Year Ended August 31, 2022 | Year Ended August 31, 2021 | |
| Operations | ||
| Net investment income | $2,467,772 | $1,135,274 |
| Net realized gain | 31,428,278 | 22,145,903 |
| Net change in unrealized appreciation (depreciation) | (20,081,146) | (3,771,194) |
| Net increase in net assets resulting from operations | 13,814,904 | 19,509,983 |
| Distributions to shareholders | ||
| Net investment income and net realized gains | ||
| Institutional Class | (7,521,528) | (4,299,584) |
| Total distributions to shareholders | (7,521,528) | (4,299,584) |
| Increase in net assets from capital stock activity | 3,155,658 | 29,342,444 |
| Total increase in net assets | 9,449,034 | 44,552,843 |
| Net assets at beginning of year | 524,919,846 | 480,367,003 |
| Net assets at end of year | $534,368,880 | $524,919,846 |
| Year Ended | Year Ended | |||
| August 31, 2022 | August 31, 2021 | |||
| Shares | Dollars ($) | Shares | Dollars ($) | |
| Capital stock activity | ||||
| Institutional Class | ||||
| Subscriptions | 13,339,999 | 128,899,389 | 10,946,873 | 105,214,445 |
| Distributions reinvested | 797,617 | 7,521,528 | 454,502 | 4,299,584 |
| Redemptions | (13,831,115) | (133,265,259) | (8,383,221) | (80,171,585) |
| Net increase | 306,501 | 3,155,658 | 3,018,154 | 29,342,444 |
| Total net increase | 306,501 | 3,155,658 | 3,018,154 | 29,342,444 |
| Multi-Manager Alternative Strategies Fund | Annual Report 2022 | 63 |
| Institutional Class | Year Ended August 31, | ||||
| 2022 | 2021 | 2020 | 2019 | 2018 | |
| Per share data | |||||
| Net asset value, beginning of period | $9.68 | $9.38 | $9.36 | $9.08 | $9.03 |
| Income (loss) from investment operations: | |||||
| Net investment income | 0.05 | 0.02 | 0.08 | 0.22 | 0.11 |
| Net realized and unrealized gain (loss) | 0.20 | 0.36 | 0.13 | 0.19 | (0.06) |
| Total from investment operations | 0.25 | 0.38 | 0.21 | 0.41 | 0.05 |
| Distributions to shareholders | |||||
| Distributions from net investment income | (0.14) | (0.08) | (0.19) | (0.13) | — |
| Total distributions to shareholders | (0.14) | (0.08) | (0.19) | (0.13) | — |
| Net asset value, end of period | $9.79 | $9.68 | $9.38 | $9.36 | $9.08 |
| Total return | 2.60% | 4.12% | 2.34% | 4.62% | 0.55% |
| Ratios to average net assets | |||||
| Total gross expenses(a) | 1.31%(b),(c) | 1.36%(b),(c) | 1.39%(b) | 1.27% | 1.34%(b) |
| Total net expenses(a),(d) | 1.31%(b),(c) | 1.36%(b),(c) | 1.39%(b) | 1.27% | 1.34%(b) |
| Net investment income | 0.47% | 0.23% | 0.91% | 2.43% | 1.18% |
| Supplemental data | |||||
| Net assets, end of period (in thousands) | $534,369 | $524,920 | $480,367 | $502,726 | $570,839 |
| Portfolio turnover | 171% | 203% | 188% | 226% | 256% |
| Notes to Consolidated Financial Highlights | |
| (a) | In addition to the fees and expenses that the Fund bears directly, the Fund indirectly bears a pro rata share of the fees and expenses of any other funds in which it invests. Such indirect expenses are not included in the Fund’s reported expense ratios. |
| (b) | Ratios include dividends and interest on securities sold short. If dividends and interest on securities sold short had been excluded, expenses would have been lower by: |
| Class | 8/31/2022 | 8/31/2021 | 8/31/2020 | 8/31/2019 | 8/31/2018 |
| Institutional Class | 0.04% | 0.10% | 0.10% | —% | 0.07% |
| (c) | Ratios include interest on collateral expense which is less than 0.01%. |
| (d) | Total net expenses include the impact of certain fee waivers/expense reimbursements made by the Investment Manager and certain of its affiliates, if applicable. |
| 64 | Multi-Manager Alternative Strategies Fund | Annual Report 2022 |
August 31, 2022
| ASGM Offshore Fund, Ltd. | ASMF Offshore Fund, Ltd. | |
| % of consolidated fund net assets | 1.85% | 1.26% |
| Net assets | $9,908,617 | $6,749,322 |
| Net investment income (loss) | (59,054) | (77,295) |
| Net realized gain (loss) | 9,178,888 | 3,424,354 |
| Net change in unrealized appreciation (depreciation) | 113,488 | (322,819) |
| Multi-Manager Alternative Strategies Fund | Annual Report 2022 | 65 |
August 31, 2022
| 66 | Multi-Manager Alternative Strategies Fund | Annual Report 2022 |
August 31, 2022
| Multi-Manager Alternative Strategies Fund | Annual Report 2022 | 67 |
August 31, 2022
| 68 | Multi-Manager Alternative Strategies Fund | Annual Report 2022 |
August 31, 2022
| Multi-Manager Alternative Strategies Fund | Annual Report 2022 | 69 |
August 31, 2022
| 70 | Multi-Manager Alternative Strategies Fund | Annual Report 2022 |
August 31, 2022
| Asset derivatives | ||
| Risk exposure category | Consolidated statement of assets and liabilities location | Fair value ($) |
| Equity risk | Component of total distributable earnings (loss) — unrealized appreciation on futures contracts | 330,371* |
| Equity risk | Investments, at value — Options Purchased | 103,596 |
| Equity risk | Component of total distributable earnings (loss) — unrealized appreciation on swap contracts | 11,482* |
| Foreign exchange risk | Unrealized appreciation on forward foreign currency exchange contracts | 4,388,831 |
| Foreign exchange risk | Component of total distributable earnings (loss) — unrealized appreciation on futures contracts | 1,994,171* |
| Interest rate risk | Component of total distributable earnings (loss) — unrealized appreciation on futures contracts | 2,267,784* |
| Interest rate risk | Component of total distributable earnings (loss) — unrealized appreciation on swap contracts | 201,712* |
| Commodity-related investment risk | Component of total distributable earnings (loss) — unrealized appreciation on futures contracts | 866,553* |
| Total | 10,164,500 |
| Liability derivatives | ||
| Risk exposure category | Consolidated statement of assets and liabilities location | Fair value ($) |
| Equity risk | Component of total distributable earnings (loss) — unrealized depreciation on futures contracts | 320,699* |
| Equity risk | Options contracts written, at value | 69,960 |
| Foreign exchange risk | Unrealized depreciation on forward foreign currency exchange contracts | 2,132,297 |
| Foreign exchange risk | Component of total distributable earnings (loss) — unrealized depreciation on futures contracts | 53,704* |
| Interest rate risk | Component of total distributable earnings (loss) — unrealized depreciation on futures contracts | 268,912* |
| Interest rate risk | Component of total distributable earnings (loss) — unrealized depreciation on swap contracts | 451,272* |
| Commodity-related investment risk | Component of total distributable earnings (loss) — unrealized depreciation on futures contracts | 434,078* |
| Total | 3,730,922 |
| * | Includes cumulative appreciation (depreciation) as reported in the tables following the Consolidated Portfolio of Investments. Only the current day’s variation margin is reported in receivables or payables in the Consolidated Statement of Assets and Liabilities. |
| Multi-Manager Alternative Strategies Fund | Annual Report 2022 | 71 |
August 31, 2022
| Amount of realized gain (loss) on derivatives recognized in income | ||||||
| Risk exposure category | Forward foreign currency exchange contracts ($) | Futures contracts ($) | Options contracts written ($) | Options contracts purchased ($) | Swap contracts ($) | Total ($) |
| Commodity-related investment risk | — | 12,620,422 | — | — | (5,775) | 12,614,647 |
| Equity risk | — | (6,248,699) | 206,793 | (53,638) | 123,694 | (5,971,850) |
| Foreign exchange risk | 3,093,534 | 3,900,028 | — | — | — | 6,993,562 |
| Interest rate risk | — | 21,573,856 | — | — | (30,212) | 21,543,644 |
| Total | 3,093,534 | 31,845,607 | 206,793 | (53,638) | 87,707 | 35,180,003 |
| Change in unrealized appreciation (depreciation) on derivatives recognized in income | ||||||
| Risk exposure category | Forward foreign currency exchange contracts ($) | Futures contracts ($) | Options contracts written ($) | Options contracts purchased ($) | Swap contracts ($) | Total ($) |
| Commodity-related investment risk | — | (204,941) | — | — | — | (204,941) |
| Equity risk | — | (927,835) | 14,670 | (385,726) | (130,541) | (1,429,432) |
| Foreign exchange risk | 3,252,408 | 2,494,929 | — | — | — | 5,747,337 |
| Interest rate risk | — | 2,471,268 | — | — | (226,085) | 2,245,183 |
| Total | 3,252,408 | 3,833,421 | 14,670 | (385,726) | (356,626) | 6,358,147 |
| Derivative instrument | Average notional amounts ($)* |
| Futures contracts — long | 96,963,569 |
| Futures contracts — short | 586,056,626 |
| Derivative instrument | Average value ($)* |
| Options contracts — purchased | 182,796 |
| Options contracts — written | (30,483) |
| Derivative instrument | Average unrealized appreciation ($)* | Average unrealized depreciation ($) |
| Forward foreign currency exchange contracts | 3,206,381 | (2,613,979) |
| Interest rate swap contracts | 131,410 | (293,584) |
| Total return swap contracts | 19,081 | (49,591) |
| * | Based on the ending quarterly outstanding amounts for the year ended August 31, 2022. |
| 72 | Multi-Manager Alternative Strategies Fund | Annual Report 2022 |
August 31, 2022
| Multi-Manager Alternative Strategies Fund | Annual Report 2022 | 73 |
August 31, 2022
| 74 | Multi-Manager Alternative Strategies Fund | Annual Report 2022 |
| ANZ Securities ($) | Barclays ($) | BNY Capital Markets ($) | BMO Capital Markets Corp ($) | Citi ($) | Citi ($)(a) | CIBC ($)(a) | Goldman Sachs ($)(a) | Goldman Sachs ($)(a) | HSBC ($) | JPMorgan ($)(a) | JPMorgan ($)(a) | Morgan Stanley ($) | RBC Capital Markets ($) | Standard Chartered ($) | State Street ($) | UBS ($) | Total ($) | |
| Assets | ||||||||||||||||||
| Centrally cleared interest rate swap contracts (b) | - | - | - | - | 11,191 | - | - | - | - | - | - | - | - | - | - | - | - | 11,191 |
| Forward foreign currency exchange contracts | 37,298 | 59,597 | 287 | 7,897 | - | 136,694 | 128,663 | 532,517 | 46,194 | 165,945 | 2,049,447 | 233,879 | 215,008 | 93,771 | 32,905 | 510,862 | 137,867 | 4,388,831 |
| Options purchased calls | - | - | - | - | - | - | - | 87,341 | - | - | - | - | - | - | - | - | - | 87,341 |
| Options purchased puts | - | - | - | - | - | - | - | 16,255 | - | - | - | - | - | - | - | - | - | 16,255 |
| OTC total return swap contracts (c) | - | - | - | - | - | - | - | 11,482 | - | - | - | - | - | - | - | - | - | 11,482 |
| Total assets | 37,298 | 59,597 | 287 | 7,897 | 11,191 | 136,694 | 128,663 | 647,595 | 46,194 | 165,945 | 2,049,447 | 233,879 | 215,008 | 93,771 | 32,905 | 510,862 | 137,867 | 4,515,100 |
| Liabilities | ||||||||||||||||||
| Forward foreign currency exchange contracts | - | 14,603 | - | 2,464 | - | 95,943 | 87,528 | 130,617 | 66,468 | 92,438 | 1,023,033 | 108,223 | 164,306 | 16,310 | 13,046 | 185,042 | 132,276 | 2,132,297 |
| Options contracts written | - | - | - | - | - | - | - | 69,960 | - | - | - | - | - | - | - | - | - | 69,960 |
| Securities borrowed | - | - | - | - | - | - | - | 5,804,833 | - | - | - | - | - | - | - | - | - | 5,804,833 |
| Total liabilities | - | 14,603 | - | 2,464 | - | 95,943 | 87,528 | 6,005,410 | 66,468 | 92,438 | 1,023,033 | 108,223 | 164,306 | 16,310 | 13,046 | 185,042 | 132,276 | 8,007,090 |
| Total financial and derivative net assets | 37,298 | 44,994 | 287 | 5,433 | 11,191 | 40,751 | 41,135 | (5,357,815) | (20,274) | 73,507 | 1,026,414 | 125,656 | 50,702 | 77,461 | 19,859 | 325,820 | 5,591 | (3,491,990) |
| Total collateral received (pledged) (d) | - | - | - | - | - | - | - | (5,357,815) | - | - | - | - | - | - | - | - | - | (5,357,815) |
| Net amount (e) | 37,298 | 44,994 | 287 | 5,433 | 11,191 | 40,751 | 41,135 | - | (20,274) | 73,507 | 1,026,414 | 125,656 | 50,702 | 77,461 | 19,859 | 325,820 | 5,591 | 1,865,825 |
| (a) | Exposure can only be netted across transactions governed under the same master agreement with the same legal entity. |
| (b) | Centrally cleared swaps are included within payable/receivable for variation margin on the Consolidated Statement of Assets and Liabilities. |
| (c) | Over-the-Counter (OTC) Swap Contracts are presented at market value plus periodic payments receivable (payable), which is comprised of unrealized appreciation, unrealized depreciation, upfront payments and upfront receipts. |
| (d) | In some instances, the actual collateral received and/or pledged may be more than the amount shown due to overcollateralization. |
| (e) | Represents the net amount due from/(to) counterparties in the event of default. |
August 31, 2022
| Multi-Manager Alternative Strategies Fund | Annual Report 2022 | 75 |
August 31, 2022
| 76 | Multi-Manager Alternative Strategies Fund | Annual Report 2022 |
August 31, 2022
| Multi-Manager Alternative Strategies Fund | Annual Report 2022 | 77 |
August 31, 2022
| Effective rate (%) | |
| Institutional Class | 0.10 |
| 78 | Multi-Manager Alternative Strategies Fund | Annual Report 2022 |
August 31, 2022
| January 1, 2022 through December 31, 2022 | Prior to January 1, 2022 | |
| Institutional Class | 1.37% | 1.43% |
| Excess of distributions over net investment income ($) | Accumulated net realized gain ($) | Paid in capital ($) |
| 4,799,570 | (6,032,529) | 1,232,959 |
| Year Ended August 31, 2022 | Year Ended August 31, 2021 | ||||
| Ordinary income ($) | Long-term capital gains ($) | Total ($) | Ordinary income ($) | Long-term capital gains ($) | Total ($) |
| 7,521,528 | — | 7,521,528 | 4,299,584 | — | 4,299,584 |
| Multi-Manager Alternative Strategies Fund | Annual Report 2022 | 79 |
August 31, 2022
| Undistributed ordinary income ($) | Undistributed long-term capital gains ($) | Capital loss carryforwards ($) | Net unrealized (depreciation) ($) |
| 23,154,570 | — | (8,594,898) | (59,085,869) |
| Federal tax cost ($) | Gross unrealized appreciation ($) | Gross unrealized (depreciation) ($) | Net unrealized (depreciation) ($) |
| 600,990,220 | 6,220,780 | (65,306,649) | (59,085,869) |
| No expiration short-term ($) | No expiration long-term ($) | Total ($) | Utilized ($) |
| — | (8,594,898) | (8,594,898) | 15,923,200 |
| 80 | Multi-Manager Alternative Strategies Fund | Annual Report 2022 |
August 31, 2022
| Multi-Manager Alternative Strategies Fund | Annual Report 2022 | 81 |
August 31, 2022
| 82 | Multi-Manager Alternative Strategies Fund | Annual Report 2022 |
August 31, 2022
| Multi-Manager Alternative Strategies Fund | Annual Report 2022 | 83 |
August 31, 2022
| 84 | Multi-Manager Alternative Strategies Fund | Annual Report 2022 |
| Multi-Manager Alternative Strategies Fund | Annual Report 2022 | 85 |
| Qualified dividend income | Dividends received deduction |
| 10.23% | 10.82% |
| Name, address, year of birth | Position held with the Columbia Funds and length of service | Principal occupation(s) during past five years and other relevant professional experience | Number of Funds in the Columbia Funds Complex* overseen | Other directorships held by Trustee during the past five years |
| George S. Batejan c/o Columbia Management Investment Advisers, LLC 290 Congress Street Boston, MA 02210 1953 | Trustee since 2017 | Executive Vice President, Global Head of Technology and Operations, Janus Capital Group, Inc., 2010-2016 | 176 | Former Chairman of the Board, NICSA (National Investment Company Services Association) (Executive Committee, Nominating Committee and Governance Committee), 2014-2016; former Director, Intech Investment Management, 2011-2016; former Board Member, Metro Denver Chamber of Commerce, 2015-2016; former Advisory Board Member, University of Colorado Business School, 2015-2018 |
| 86 | Multi-Manager Alternative Strategies Fund | Annual Report 2022 |
(Unaudited)
Independent trustees (continued)
| Name, address, year of birth | Position held with the Columbia Funds and length of service | Principal occupation(s) during past five years and other relevant professional experience | Number of Funds in the Columbia Funds Complex* overseen | Other directorships held by Trustee during the past five years |
| Kathleen Blatz c/o Columbia Management Investment Advisers, LLC 290 Congress Street Boston, MA 02210 1954 | Trustee since 2006 | Attorney, specializing in arbitration and mediation; Chief Justice, Minnesota Supreme Court, 1998-2006; Associate Justice, Minnesota Supreme Court, 1996-1998; Fourth Judicial District Court Judge, Hennepin County, 1994-1996; Attorney in private practice and public service, 1984-1993; State Representative, Minnesota House of Representatives, 1979-1993, which included service on the Tax and Financial Institutions and Insurance Committees; Member and Interim Chair, Minnesota Sports Facilities Authority, January 2017-July 2017; Interim President and Chief Executive Officer, Blue Cross and Blue Shield of Minnesota (health care insurance), February-July 2018, April-October 2021 | 176 | Former Trustee, Blue Cross and Blue Shield of Minnesota, 2009-2021 (Chair of the Business Development Committee, 2014-2017; Chair of the Governance Committee, 2017-2019); former Member and Chair of the Board, Minnesota Sports Facilities Authority, January 2017-July 2017; former Director, Robina Foundation, 2009-2020 (Chair, 2014-2020); Director, Schulze Family Foundation, since 2021 |
| Pamela G. Carlton c/o Columbia Management Investment Advisers, LLC 290 Congress Street Boston, MA 02210 1954 | Trustee since 2007 | President, Springboard — Partners in Cross Cultural Leadership (consulting company) since 2003; Managing Director of US Equity Research, JP Morgan Chase, 1999-2003; Director of US Equity Research, Chase Asset Management, 1996-1999; Co-Director Latin America Research, 1993-1996, COO Global Research, 1992-1996, Co-Director of US Research, 1991-1992, Investment Banker, 1982-1991, Morgan Stanley; Attorney, Cleary Gottlieb Steen & Hamilton LLP, 1980-1982 | 176 | Trustee, New York Presbyterian Hospital Board (Executive Committee and Chair of People Committee) since 1996; Director, DR Bank (Audit Committee) since 2017; Director, Evercore Inc. (Audit Committee) since 2019; Director, Apollo Commercial Real Estate Finance, Inc. since 2021; the Governing Council of the Independent Directors Council (IDC), since 2021 |
| Janet Langford Carrig c/o Columbia Management Investment Advisers, LLC 290 Congress Street Boston, MA 02210 1957 | Trustee since 1996 | Senior Vice President, General Counsel and Corporate Secretary, ConocoPhillips (independent energy company), September 2007-October 2018 | 174 | Director, EQT Corporation (natural gas producer) since 2019; former Director, Whiting Petroleum Corporation (independent oil and gas company), 2020-2022 |
| J. Kevin Connaughton c/o Columbia Management Investment Advisers, LLC 290 Congress Street Boston, MA 02210 1964 | Trustee since 2020 | Member, FINRA National Adjudicatory Council since January 2020; Adjunct Professor of Finance, Bentley University since January 2018; Consultant to Independent Trustees of CFVIT and CFST I from March 2016 to June 2020 with respect to CFVIT and to December 2020 with respect to CFST I; Managing Director and General Manager of Mutual Fund Products, Columbia Management Investment Advisers, LLC, May 2010-February 2015; President, Columbia Funds, 2008-2015; and senior officer of Columbia Funds and affiliated funds, 2003-2015 | 174 | Former Director, The Autism Project, March 2015-December 2021; former Member of the Investment Committee, St. Michael’s College, November 2015-February 2020; former Trustee, St. Michael’s College, June 2017-September 2019; former Trustee, New Century Portfolios, January 2015-December 2017 |
| Multi-Manager Alternative Strategies Fund | Annual Report 2022 | 87 |
(Unaudited)
Independent trustees (continued)
| Name, address, year of birth | Position held with the Columbia Funds and length of service | Principal occupation(s) during past five years and other relevant professional experience | Number of Funds in the Columbia Funds Complex* overseen | Other directorships held by Trustee during the past five years |
| Olive M. Darragh c/o Columbia Management Investment Advisers, LLC 290 Congress Street Boston, MA 02210 1962 | Trustee since 2020 | Managing Director of Darragh Inc. (strategy and talent management consulting firm) since 2010; Founder and CEO, Zolio, Inc. (investment management talent identification platform) since 2004; Consultant to Independent Trustees of CFVIT and CFST I from June 2019 to June 2020 with respect to CFVIT and to December 2020 with respect to CFST I; Partner, Tudor Investments, 2004-2010; Senior Partner, McKinsey & Company (consulting), 1990-2004; Touche Ross CPA, 1985-1988 | 174 | Former Director, University of Edinburgh Business School (Member of US Board); former Director, Boston Public Library Foundation |
| Patricia M. Flynn c/o Columbia Management Investment Advisers, LLC 290 Congress Street Boston, MA 02210 1950 | Trustee since 2004 | Trustee Professor of Economics and Management, Bentley University since 1976 (also teaches and conducts research on corporate governance); Dean, McCallum Graduate School of Business, Bentley University, 1992-2002 | 176 | Trustee, MA Taxpayers Foundation since 1997; former Board of Governors, Innovation Institute, MA Technology Collaborative, 2010-2020; former Board of Directors, The MA Business Roundtable, 2003-2019 |
| Brian J. Gallagher c/o Columbia Management Investment Advisers, LLC 290 Congress Street Boston, MA 02210 1954 | Trustee since 2017 | Retired; Partner with Deloitte & Touche LLP and its predecessors, 1977-2016 | 176 | Trustee, Catholic Schools Foundation since 2004 |
| Douglas A. Hacker c/o Columbia Management Investment Advisers, LLC 290 Congress Street Boston, MA 02210 1955 | Co-Chair since 2021; Chair of CFST I and CFVIT since 2014; Trustee of CFST I and CFVIT since 1996 and CFST, CFST II, CFVST II, CET I and CET II since 2021 | Independent business executive since May 2006; Executive Vice President – Strategy of United Airlines, December 2002 - May 2006; President of UAL Loyalty Services (airline marketing company), September 2001-December 2002; Executive Vice President and Chief Financial Officer of United Airlines, July 1999-September 2001 | 176 | Director, Spartan Nash Company (food distributor); Director, Aircastle Limited (Chair of Audit Committee) (aircraft leasing); former Director, Nash Finch Company (food distributor), 2005-2013; former Director, SeaCube Container Leasing Ltd. (container leasing), 2010-2013; and former Director, Travelport Worldwide Limited (travel information technology), 2014-2019 |
| Nancy T. Lukitsh c/o Columbia Management Investment Advisers, LLC 290 Congress Street Boston, MA 02210 1956 | Trustee since 2011 | Senior Vice President, Partner and Director of Marketing, Wellington Management Company, LLP (investment adviser), 1997-2010; Chair, Wellington Management Portfolios (commingled non-U.S. investment pools), 2007 -2010; Director, Wellington Trust Company, NA and other Wellington affiliates, 1997-2010 | 174 | None |
| 88 | Multi-Manager Alternative Strategies Fund | Annual Report 2022 |
(Unaudited)
Independent trustees (continued)
| Name, address, year of birth | Position held with the Columbia Funds and length of service | Principal occupation(s) during past five years and other relevant professional experience | Number of Funds in the Columbia Funds Complex* overseen | Other directorships held by Trustee during the past five years |
| David M. Moffett c/o Columbia Management Investment Advisers, LLC 290 Congress Street Boston, MA 02210 1952 | Trustee since 2011 | Retired; Consultant to Bridgewater and Associates | 174 | Director, CSX Corporation (transportation suppliers); Director, Genworth Financial, Inc. (financial and insurance products and services); Director, PayPal Holdings Inc. (payment and data processing services); Trustee, University of Oklahoma Foundation; former Director, eBay Inc. (online trading community), 2007-2015; and former Director, CIT Bank, CIT Group Inc. (commercial and consumer finance), 2010-2016 |
| Catherine James Paglia c/o Columbia Management Investment Advisers, LLC 290 Congress Street Boston, MA 02210 1952 | Co-Chair since 2021; Chair of CFST, CFST II, CFVST II, CET I and CET II since 2020; Trustee of CFST, CFST II and CFVST II since 2004 and CFST I and CFVIT since 2021 | Director, Enterprise Asset Management, Inc. (private real estate and asset management company) since September 1998; Managing Director and Partner, Interlaken Capital, Inc., 1989-1997; Vice President, 1982-1985, Principal, 1985-1987, Managing Director, 1987-1989, Morgan Stanley; Vice President, Investment Banking, 1980-1982, Associate, Investment Banking, 1976-1980, Dean Witter Reynolds, Inc. | 176 | Director, Valmont Industries, Inc. (irrigation systems manufacturer) since 2012; Trustee, Carleton College (on the Investment Committee); Trustee, Carnegie Endowment for International Peace (on the Investment Committee) |
| Minor M. Shaw c/o Columbia Management Investment Advisers, LLC 290 Congress Street Boston, MA 02210 1947 | Trustee since 2003 | President, Micco LLC (private investments) since 2011; President, Micco Corp. (family investment business), 1998-2011 | 176 | Director, Blue Cross Blue Shield of South Carolina (Chair of Compensation Committee) since April 2008; Trustee, Hollingsworth Funds (on the Investment Committee) since 2016 (previously Board Chair from 2016-2019); Former Advisory Board member, Duke Energy Corp., 2016-2020; Chair of the Duke Endowment; Chair of Greenville – Spartanburg Airport Commission; former Trustee, BofA Funds Series Trust (11 funds), 2003-2011; former Director, Piedmont Natural Gas, 2004-2016; former Director, National Association of Corporate Directors, Carolinas Chapter, 2013-2018; Chair, Daniel-Mickel Foundation since 1998 |
| Multi-Manager Alternative Strategies Fund | Annual Report 2022 | 89 |
(Unaudited)
Independent trustees (continued)
| Name, address, year of birth | Position held with the Columbia Funds and length of service | Principal occupation(s) during past five years and other relevant professional experience | Number of Funds in the Columbia Funds Complex* overseen | Other directorships held by Trustee during the past five years |
| Natalie A. Trunow c/o Columbia Management Investment Advisers, LLC 290 Congress Street Boston, MA 02210 1967 | Trustee since 2020 | Chief Executive Officer, Millennial Portfolio Solutions LLC (asset management and consulting services), January 2016-January 2021; Non-executive Member of the Investment Committee and Valuation Committee, Sarona Asset Management Inc. (private equity firm) since September 2019; Advisor, Horizon Investments (asset management and consulting services), August 2018-January 2021; Advisor, Paradigm Asset Management, November 2016-December 2021; Consultant to Independent Trustees of CFVIT and CFST I from September 2016 to June 2020 with respect to CFVIT and to December 2020 with respect to CFST I; Director of Investments/Consultant, Casey Family Programs, April 2016-November 2016; Senior Vice President and Chief Investment Officer, Calvert Investments, August 2008-January 2016; Section Head and Portfolio Manager, General Motors Asset Management, June 1997-August 2008 | 174 | Former Director, Investment Committee, Health Services for Children with Special Needs, Inc., 2012-2019; Director, Chair of Audit Committee, Consumer Credit Counseling Services (formerly Guidewell Financial Solutions), since 2019; Independent Director, Investment Committee and Valuation Committee, Sarona Asset Management, since 2019 |
| Sandra L. Yeager c/o Columbia Management Investment Advisers, LLC 290 Congress Street Boston, MA 02210 1964 | Trustee since 2017 | Retired; President and founder, Hanoverian Capital, LLC (SEC registered investment advisor firm), 2008-2016; Managing Director, DuPont Capital, 2006-2008; Managing Director, Morgan Stanley Investment Management, 2004-2006; Senior Vice President, Alliance Bernstein, 1990-2004 | 176 | Former Director, NAPE Education Foundation, October 2016-October 2020 |
| * | The term “Columbia Funds Complex” as used herein includes Columbia Seligman Premium Technology Growth Fund, Tri-Continental Corporation and each series of Columbia Fund Series Trust (CFST), Columbia Funds Series Trust I (CFST I), Columbia Funds Series Trust II (CFST II), Columbia ETF Trust I (CET I), Columbia ETF Trust II (CET II), Columbia Funds Variable Insurance Trust (CFVIT) and Columbia Funds Variable Series Trust II (CFVST II). Messrs. Batejan, Beckman, Gallagher and Hacker and Mses. Blatz, Carlton, Flynn, Paglia, Shaw and Yeager serve as Directors of Columbia Seligman Premium Technology Growth Fund and Tri-Continental Corporation. |
| Name, address, year of birth | Position held with the Columbia Funds and length of service | Principal occupation(s) during the past five years and other relevant professional experience | Number of Funds in the Columbia Funds Complex overseen | Other directorships held by Trustee during the past five years |
| Daniel J. Beckman c/o Columbia Management Investment Advisers, LLC 290 Congress Street Boston, MA 02210 1962 | Trustee since November 2021 and President since June 2021 | Vice President – Head of North America Product, Columbia Management Investment Advisers, LLC since April 2015; President and Principal Executive Officer of the Columbia Funds since June 2021; officer of Columbia Funds and affiliated funds, 2020-2021 | 176 | Director, Ameriprise Trust Company, since October 2016; Director, Columbia Management Investment Distributors, Inc. since November 2018; Board of Governors, Columbia Wanger Asset Management, LLC since January 2022 |
| * | Interested person (as defined under the 1940 Act) by reason of being an officer, director, security holder and/or employee of the Investment Manager or Ameriprise Financial. |
| 90 | Multi-Manager Alternative Strategies Fund | Annual Report 2022 |
(Unaudited)
The Statement of Additional Information has additional information about the Fund’s Board members and is available, without charge, upon request by calling 800.345.6611, visiting columbiathreadneedleus.com/investor/ or contacting your financial intermediary.
| Name, address and year of birth | Position and year first appointed to position for any Fund in the Columbia Funds Complex or a predecessor thereof | Principal occupation(s) during past five years |
| Michael G. Clarke 290 Congress Street Boston, MA 02210 1969 | Chief Financial Officer and Principal Financial Officer (2009) and Senior Vice President (2019) | Senior Vice President and Head of Global Operations & Investor Services, Columbia Management Investment Advisers, LLC, since March 2022 (previously Vice President, Head of North American Operations, and Co-Head of Global Operations, June 2019 to February 2022 and Vice President – Accounting and Tax, May 2010 - May 2019); senior officer of Columbia Funds and affiliated funds since 2002. |
| Joseph Beranek 5890 Ameriprise Financial Center Minneapolis, MN 55474 1965 | Treasurer and Chief Accounting Officer (Principal Accounting Officer) (2019) and Principal Financial Officer (2020), CFST, CFST I, CFST II, CFVIT and CFVST II; Assistant Treasurer, CET I and CET II | Vice President – Mutual Fund Accounting and Financial Reporting, Columbia Management Investment Advisers, LLC, since December 2018 and March 2017, respectively (previously Vice President – Pricing and Corporate Actions, May 2010 - March 2017). |
| Marybeth Pilat 290 Congress Street Boston, MA 02210 1968 | Treasurer and Chief Accounting Officer (Principal Accounting Officer) and Principal Financial Officer (2020) for CET I and CET II; Assistant Treasurer, CFST, CFST I, CFST II, CFVIT and CFVST II | Vice President – Product Pricing and Administration, Columbia Management Investment Advisers, LLC, since May 2017; Director - Fund Administration, Calvert Investments, August 2015 – March 2017; Vice President - Fund Administration, Legg Mason, May 2015 - July 2015; Vice President - Fund Administration, Columbia Management Investment Advisers, LLC, May 2010 - April 2015. |
| William F. Truscott 290 Congress Street Boston, MA 02210 1960 | Senior Vice President (2001) | Formerly, Trustee/Director of Columbia Funds Complex or legacy funds, November 2001-January 1, 2021; Chief Executive Officer, Global Asset Management, Ameriprise Financial, Inc. since September 2012; Chairman of the Board and President, Columbia Management Investment Advisers, LLC since July 2004 and February 2012, respectively; Chairman of the Board and Chief Executive Officer, Columbia Management Investment Distributors, Inc. since November 2008 and February 2012, respectively; Chairman of the Board and Director, Threadneedle Asset Management Holdings, Sàrl since March 2013 and December 2008, respectively; senior executive of various entities affiliated with Columbia Threadneedle. |
| Christopher O. Petersen 5228 Ameriprise Financial Center Minneapolis, MN 55474 1970 | Senior Vice President and Assistant Secretary (2021) | Formerly, Trustee/Director of funds within the Columbia Funds Complex, July 1, 2020 - November 22, 2021; Senior Vice President and Assistant General Counsel, Ameriprise Financial, Inc. since September 2021 (previously Vice President and Lead Chief Counsel, January 2015 - September 2021); formerly, President and Principal Executive Officer of the Columbia Funds, 2015 - 2021; officer of Columbia Funds and affiliated funds since 2007. |
| Thomas P. McGuire 290 Congress Street Boston, MA 02210 1972 | Senior Vice President and Chief Compliance Officer (2012) | Vice President – Asset Management Compliance, Ameriprise Financial, Inc., since May 2010; Chief Compliance Officer, Columbia Acorn/Wanger Funds since December 2015; formerly, Chief Compliance Officer, Ameriprise Certificate Company, September 2010 – September 2020. |
| Multi-Manager Alternative Strategies Fund | Annual Report 2022 | 91 |
(Unaudited)
Fund officers (continued)
| Name, address and year of birth | Position and year first appointed to position for any Fund in the Columbia Funds Complex or a predecessor thereof | Principal occupation(s) during past five years |
| Ryan C. Larrenaga 290 Congress Street Boston, MA 02210 1970 | Senior Vice President (2017), Chief Legal Officer (2017), and Secretary (2015) | Vice President and Chief Counsel, Ameriprise Financial, Inc. since August 2018 (previously Vice President and Group Counsel, August 2011 - August 2018); Chief Legal Officer, Columbia Acorn/Wanger Funds, since September 2020; officer of Columbia Funds and affiliated funds since 2005. |
| Michael E. DeFao 290 Congress Street Boston, MA 02210 1968 | Vice President (2011) and Assistant Secretary (2010) | Vice President and Chief Counsel, Ameriprise Financial, Inc. since May 2010; Vice President, Chief Legal Officer and Assistant Secretary, Columbia Management Investment Advisers, LLC since October 2021 (previously Vice President and Assistant Secretary, May 2010 – September 2021). |
| Lyn Kephart-Strong 5228 Ameriprise Financial Center Minneapolis, MN 55474 1960 | Vice President (2015) | President, Columbia Management Investment Services Corp. since October 2014; Vice President & Resolution Officer, Ameriprise Trust Company since August 2009. |
| • | the Fund had sufficient liquidity to both meet redemptions and operate effectively on behalf of shareholders; |
| • | there were no material changes to the Program during the period; |
| • | the implementation of the Program was effective to manage the Fund’s liquidity risk; and |
| • | the Program operated adequately during the period. |
| 92 | Multi-Manager Alternative Strategies Fund | Annual Report 2022 |
| • | Information on the investment performance of the Fund relative to the performance of a group of mutual funds determined to be comparable to the Fund by Broadridge, as well as performance relative to benchmarks; |
| • | Information on the Fund’s management fees and total expenses, including information comparing the Fund’s expenses to those of a group of comparable mutual funds, as determined by Broadridge; |
| • | The Investment Manager’s agreement to contractually limit or cap total operating expenses for the Fund so that total operating expenses (excluding certain fees and expenses, such as transaction costs and certain other investment related expenses, interest, taxes, acquired fund fees and expenses and infrequent and/or unusual expenses) would not exceed a specified annual rate, as a percentage of the Fund’s net assets; |
| • | Terms of the Advisory Agreements; |
| • | Subadvisory fees payable by the Investment Manager under the Subadvisory Agreements; |
| • | Descriptions of other agreements and arrangements with affiliates of the Investment Manager relating to the operations of the Fund, including agreements with respect to the provision of transfer agency and shareholder services to the Fund; |
| • | Descriptions of various services performed by the Investment Manager and the Subadvisers under the Advisory Agreements, including portfolio management and portfolio trading practices; |
| Multi-Manager Alternative Strategies Fund | Annual Report 2022 | 93 |
| • | Information regarding any recently negotiated management fees of similarly-managed portfolios of other institutional clients of the Investment Manager; |
| • | Information regarding the resources of the Investment Manager and Subadvisers, including information regarding senior management, portfolio managers and other personnel; |
| • | Information regarding the capabilities of the Investment Manager and the Subadvisers with respect to compliance monitoring services; |
| • | The profitability to the Investment Manager and its affiliates from their relationships with the Fund; and |
| • | Report provided by the Board’s independent fee consultant, JDL Consultants, LLC (JDL). |
| 94 | Multi-Manager Alternative Strategies Fund | Annual Report 2022 |
| Multi-Manager Alternative Strategies Fund | Annual Report 2022 | 95 |
| 96 | Multi-Manager Alternative Strategies Fund | Annual Report 2022 |
columbiathreadneedleus.com/investor/. The Fund is distributed by Columbia Management Investment Distributors, Inc., member FINRA, and managed by Columbia Management Investment Advisers, LLC.

August 31, 2022

| 3 | |
| 5 | |
| 8 | |
| 9 | |
| 35 | |
| 37 | |
| 38 | |
| 40 | |
| 44 | |
| 59 | |
| 60 | |
| 60 | |
| 66 | |
| 67 |
(Unaudited)
| Average annual total returns (%) (for the period ended August 31, 2022) | |||||
| Inception | 1 Year | 5 Years | 10 Years | ||
| Class A | Excluding sales charges | 11/01/02 | -12.57 | 6.96 | 8.48 |
| Including sales charges | -17.59 | 5.70 | 7.84 | ||
| Advisor Class* | 11/08/12 | -12.36 | 7.22 | 8.76 | |
| Class C | Excluding sales charges | 10/13/03 | -13.23 | 6.16 | 7.67 |
| Including sales charges | -14.03 | 6.16 | 7.67 | ||
| Institutional Class | 10/01/91 | -12.36 | 7.22 | 8.75 | |
| Institutional 2 Class | 03/07/11 | -12.32 | 7.27 | 8.84 | |
| Institutional 3 Class* | 11/08/12 | -12.27 | 7.32 | 8.88 | |
| Class R | 09/27/10 | -12.78 | 6.69 | 8.22 | |
| Blended Benchmark | -11.07 | 7.53 | 8.49 | ||
| S&P 500 Index | -11.23 | 11.82 | 13.08 | ||
| Bloomberg U.S. Aggregate Bond Index | -11.52 | 0.52 | 1.35 | ||
| * | The returns shown for periods prior to the share class inception date (including returns for the Life of the Fund, if shown, which are since Fund inception) include the returns of the Fund’s oldest share class. These returns are adjusted to reflect any higher class-related operating expenses of the newer share classes, as applicable. Please visit investor.columbiathreadneedleus.com/investment-products/mutual-funds/appended-performance for more information. |
| Columbia Balanced Fund | Annual Report 2022 | 3 |
(Unaudited)

| Portfolio breakdown (%) (at August 31, 2022) | |
| Asset-Backed Securities — Non-Agency | 6.8 |
| Commercial Mortgage-Backed Securities - Non-Agency | 6.1 |
| Common Stocks | 53.3 |
| Convertible Bonds | 0.0(a) |
| Corporate Bonds & Notes | 7.2 |
| Exchange-Traded Equity Funds | 0.8 |
| Foreign Government Obligations | 0.0(a) |
| Money Market Funds | 7.4 |
| Residential Mortgage-Backed Securities - Agency | 7.3 |
| Residential Mortgage-Backed Securities - Non-Agency | 10.8 |
| Senior Loans | 0.0(a) |
| U.S. Treasury Obligations | 0.3 |
| Total | 100.0 |
| (a) | Rounds to zero. |
| 4 | Columbia Balanced Fund | Annual Report 2022 |
(Unaudited)
| • | Stock selection within the financials and consumer discretionary sectors detracted from performance versus the benchmark during the period. |
| • | An overweighted allocation to the communication services sector also weighed on results versus the benchmark. |
| • | Shares of cable and broadband provider Comcast Corp. declined during the period. Struggling against the rising tide of streaming services, Comcast continued to lose subscribers quarter over quarter. Comcast has taken strides to pivot is business to more profitable endeavors, namely its streaming service Peacock. |
| • | Medtronic was also a relative detractor. The company’s shares had significantly underperformed through the first five months of 2022, and the Fund sold the long-term holding after losing conviction that the leading medical device company would begin to thrive again in the post-COVID normalization period. |
| • | Adobe, Inc., a provider of software solutions for creative and marketing professionals, saw its share price tumble during the period along with many other higher growth technology names, as investors rotated away from growth to value on concerns of higher inflation and a slowing economy. |
| Columbia Balanced Fund | Annual Report 2022 | 5 |
(Unaudited)
| • | Shares of camera and social media company Snap, Inc. moved lower during the period as the company reported earnings which came in below expectations and provided weaker-than-expected guidance. The company pointed to headwinds stemming from global supply chain issues that placed pressure on overall advertising budgets as a reason for the shortfall in guidance. Snap also attributed the shortfall in forward-looking guidance to increased headwinds related to changes made in the way Apple, Inc. tracks how users interact with mobile advertising campaigns. We considered this level of change a violation of our investment thesis and, therefore, sold out of the Fund’s position in Snap. |
| • | Within the fixed-income portion of the Fund, overweight exposure to credit sectors, such as non-agency MBS, ABS, CMBS, and high-yield corporates, and an underweight allocation to government sectors, hurt relative performance as all credit-related sectors generated negative excess returns during the period. |
| • | The duration and yield curve positioning in the fixed-income portion of the Fund shifted during the period, the net impact of which detracted from relative performance. |
| ○ | At the beginning of the period, the Fund’s duration was slightly shorter than that of the benchmark. As 2022 progressed, we believed the chances of recession were increasing and extended the Fund’s duration to be longer than that of the benchmark. |
| ○ | This was also reflected in the Fund’s yield curve positioning, as exposure to shorter maturities decreased while exposure to longer maturities increased over the period. Compared to August 31, 2021, the 2-year Treasury yield increased 328 basis points (bps) from 0.21% to 3.49% while the 10-year Treasury yield rose 188 bps from 1.31% to 3.19%. (A basis point is 1/100 of a percent.) The slope of the yield curve flattened considerably, and inverted between certain tenors, as economic growth concerns increased. The yield difference between the 10-year Treasury and the 2-year Treasury was -30 bps in August 2022 versus 110 bps in the prior year. |
| • | Within the equity portion of the Fund, stock selection within the health care, information technology, materials and communication services sectors was beneficial to Fund performance relative to the benchmark during the period. |
| • | An overweight to the energy sector, as well as an underweighted allocation to the consumer discretionary sector, contributed to relative performance during the period. |
| • | The Fund’s cash position (while small, as it typically is, at less than 2%) also helped during a down period for equities. |
| • | All three of the Fund’s holdings in the energy sector were top relative contributors as energy was by far the best performing sector during the period. Chevron Corp., EOG Resources, Inc. and Canadian Natural Resources LTD all benefitted from the strong oil market during the Fund’s fiscal year, particularly the first half of 2022. |
| • | A position in Raytheon Technologies Corp. was also additive to Fund performance relative to the benchmark. Execution for the aerospace and defense company remained very solid with margin progress in its aerospace segment continuing, while the near-term weakness in its defense segment was trumped by building long-term demand drivers for the conflict in Ukraine. |
| • | In the health care sector, Fund holdings Vertex Pharmaceuticals Incorporated and Eli Lily and Company performed well. |
| ○ | Vertex Pharmaceuticals, a leading biotech company, is focused on developing innovative medicines. The company’s key cystic fibrosis therapy, Trikafta, continued to gain penetration outside of U.S. markets as well as among younger populations. Overall, Vertex continued to deliver solid operational performance and pipeline visibility increased during the period with multiple late-stage programs in development. |
| ○ | Eli Lilly’s drug Tirzepatide has a best-in-class profile in the treatment of both type 2 diabetes and obesity. Today, there are 100 million patients with obesity in the United States and less than 3% receive any care. Given the robust clinical data for Tirzepatide in the treatment of obesity, Eli Lilly has an opportunity to make a major difference in this population and help prevent downstream issues such as diabetes. |
| • | Within the fixed-income portion of the Fund, positioning within the agency MBS and investment-grade corporate sectors were additive to relative performance. |
| 6 | Columbia Balanced Fund | Annual Report 2022 |
(Unaudited)
| ○ | Agency MBS generated negative excess returns over the year, which was beneficial to performance as the Fund was underweight the sector. Early in the period we decreased the Fund’s exposure to the sector because we believed that mortgages faced headwinds due, in part, to heightened interest rate volatility and the potential slowing of purchases by the Fed. Positioning within the sector was also additive to relative performance as the Fund was underweight lower coupons, which underperformed by the widest margin. |
| ○ | Investment-grade corporate performance lagged Treasuries over the period as well. The Fund had less exposure to the sector versus the benchmark, which was additive to relative performance, as we believed other sectors were more attractive. |
| Columbia Balanced Fund | Annual Report 2022 | 7 |
(Unaudited)
| March 1, 2022 — August 31, 2022 | |||||||
| Account value at the beginning of the period ($) | Account value at the end of the period ($) | Expenses paid during the period ($) | Fund’s annualized expense ratio (%) | ||||
| Actual | Hypothetical | Actual | Hypothetical | Actual | Hypothetical | Actual | |
| Class A | 1,000.00 | 1,000.00 | 905.60 | 1,020.52 | 4.47 | 4.74 | 0.93 |
| Advisor Class | 1,000.00 | 1,000.00 | 906.90 | 1,021.78 | 3.27 | 3.47 | 0.68 |
| Class C | 1,000.00 | 1,000.00 | 902.30 | 1,016.74 | 8.06 | 8.54 | 1.68 |
| Institutional Class | 1,000.00 | 1,000.00 | 906.80 | 1,021.78 | 3.27 | 3.47 | 0.68 |
| Institutional 2 Class | 1,000.00 | 1,000.00 | 907.00 | 1,021.98 | 3.08 | 3.26 | 0.64 |
| Institutional 3 Class | 1,000.00 | 1,000.00 | 907.30 | 1,022.23 | 2.84 | 3.01 | 0.59 |
| Class R | 1,000.00 | 1,000.00 | 904.60 | 1,019.26 | 5.66 | 6.01 | 1.18 |
| 8 | Columbia Balanced Fund | Annual Report 2022 |
August 31, 2022
| Asset-Backed Securities — Non-Agency 7.3% | ||||
| Issuer | Coupon Rate | Principal Amount ($) | Value ($) | |
| ACM Auto Trust(a) | ||||
| Subordinated Series 2022-1A Class C | ||||
| 04/20/2029 | 5.480% | 10,625,000 | 10,533,091 | |
| ALM Ltd.(a),(b) | ||||
| Series 2022-20A Class A2 | ||||
| 3-month Term SOFR + 2.000% Floor 2.000% 07/15/2037 | 3.035% | 8,450,000 | 8,032,190 | |
| American Credit Acceptance Receivables Trust(a) | ||||
| Series 2020-1 Class D | ||||
| 03/13/2026 | 2.390% | 18,025,000 | 17,784,851 | |
| Subordinated Series 2021-1 Class C | ||||
| 03/15/2027 | 0.830% | 8,225,000 | 8,073,355 | |
| Subordinated Series 2021-2 Class E | ||||
| 07/13/2027 | 2.540% | 3,850,000 | 3,591,256 | |
| Apidos CLO XI(a),(b) | ||||
| Series 2012-11A Class BR3 | ||||
| 3-month USD LIBOR + 1.650% Floor 1.650% 04/17/2034 | 4.390% | 12,575,000 | 12,069,083 | |
| Apidos CLO XXVIII(a),(b) | ||||
| Series 2017-28A Class A1B | ||||
| 3-month USD LIBOR + 1.150% Floor 1.150% 01/20/2031 | 3.860% | 5,925,000 | 5,796,179 | |
| Aqua Finance Trust(a) | ||||
| Series 2021-A Class A | ||||
| 07/17/2046 | 1.540% | 4,367,229 | 4,048,703 | |
| Ares LVIII CLO Ltd.(a),(b) | ||||
| Series 2020-58A Class DR | ||||
| 3-month Term SOFR + 3.200% Floor 3.200% 01/15/2035 | 5.528% | 3,025,000 | 2,750,917 | |
| ARES XLVII CLO Ltd.(a),(b) | ||||
| Series 2018-47A Class B | ||||
| 3-month USD LIBOR + 1.450% Floor 1.450% 04/15/2030 | 3.962% | 3,450,000 | 3,315,809 | |
| Avant Loans Funding Trust(a) | ||||
| Subordinated Series 2021-REV1 Class C | ||||
| 07/15/2030 | 2.300% | 2,100,000 | 1,939,284 | |
| Bain Capital Credit CLO Ltd.(a),(b) | ||||
| Series 2021-7A Class B | ||||
| 3-month USD LIBOR + 1.650% Floor 1.650% 01/22/2035 | 4.409% | 15,750,000 | 14,959,192 | |
| Asset-Backed Securities — Non-Agency (continued) | ||||
| Issuer | Coupon Rate | Principal Amount ($) | Value ($) | |
| Ballyrock CLO Ltd.(a),(b) | ||||
| Series 2018-1A Class A1 | ||||
| 3-month USD LIBOR + 1.000% 04/20/2031 | 3.710% | 3,450,000 | 3,398,305 | |
| Barings CLO Ltd.(a),(b) | ||||
| Series 2018-4A Class B | ||||
| 3-month USD LIBOR + 1.700% Floor 1.700% 10/15/2030 | 4.212% | 22,000,000 | 21,366,312 | |
| Basswood Park CLO Ltd.(a),(b) | ||||
| Series 2021-1A Class A | ||||
| 3-month USD LIBOR + 1.000% Floor 1.000% 04/20/2034 | 3.710% | 6,725,000 | 6,543,802 | |
| Carbone CLO Ltd.(a),(b) | ||||
| Series 2017-1A Class A1 | ||||
| 3-month USD LIBOR + 1.140% Floor 1.140% 01/20/2031 | 3.850% | 12,000,000 | 11,843,748 | |
| Carlyle CLO Ltd.(a),(b) | ||||
| Series C17A Class CR | ||||
| 3-month USD LIBOR + 2.800% 04/30/2031 | 5.582% | 1,925,000 | 1,767,217 | |
| Carlyle Group LP(a),(b) | ||||
| Series 2017-5A Class A2 | ||||
| 3-month USD LIBOR + 1.400% 01/20/2030 | 4.110% | 2,000,000 | 1,902,952 | |
| Carlyle US CLO Ltd.(a),(b) | ||||
| Series 2016-4A Class A2R | ||||
| 3-month USD LIBOR + 1.450% Floor 1.450% 10/20/2027 | 4.160% | 21,575,000 | 20,843,672 | |
| Carmax Auto Owner Trust | ||||
| Subordinated Series 2021-1 Class C | ||||
| 12/15/2026 | 0.940% | 1,650,000 | 1,517,705 | |
| Cascade Funding Mortgage Trust(a) | ||||
| CMO Series 2021-GRN1 Class A | ||||
| 03/20/2041 | 1.100% | 4,391,009 | 4,140,540 | |
| Crossroads Asset Trust(a) | ||||
| Subordinated Series 2021-A Class B | ||||
| 06/20/2025 | 1.120% | 1,175,000 | 1,136,229 | |
| Drive Auto Receivables Trust | ||||
| Subordinated Series 2020-2 Class D | ||||
| 05/15/2028 | 3.050% | 1,875,000 | 1,843,677 | |
| Subordinated Series 2021-2 Class D | ||||
| 03/15/2029 | 1.390% | 22,110,000 | 20,766,955 | |
| Columbia Balanced Fund | Annual Report 2022 | 9 |
August 31, 2022
| Asset-Backed Securities — Non-Agency (continued) | ||||
| Issuer | Coupon Rate | Principal Amount ($) | Value ($) | |
| Dryden CLO Ltd.(a),(b) | ||||
| Series 2018-55A Class A1 | ||||
| 3-month USD LIBOR + 1.020% 04/15/2031 | 3.532% | 8,450,000 | 8,330,830 | |
| Dryden Senior Loan Fund(a),(b) | ||||
| Series 2015-41A Class AR | ||||
| 3-month USD LIBOR + 0.970% Floor 0.970% 04/15/2031 | 3.482% | 13,175,000 | 12,932,106 | |
| Series 2016-42A Class BR | ||||
| 3-month USD LIBOR + 1.550% 07/15/2030 | 4.062% | 6,025,000 | 5,798,960 | |
| DT Auto Owner Trust(a) | ||||
| Series 2019-3A Class D | ||||
| 04/15/2025 | 2.960% | 10,025,000 | 9,947,552 | |
| Series 2020-2A Class D | ||||
| 03/16/2026 | 4.730% | 850,000 | 844,339 | |
| Subordinated Series 2020-1A Class D | ||||
| 11/17/2025 | 2.550% | 8,900,000 | 8,709,328 | |
| Subordinated Series 2020-3A Class D | ||||
| 06/15/2026 | 1.840% | 6,125,000 | 5,822,314 | |
| Exeter Automobile Receivables Trust(a) | ||||
| Series 2019-4A Class D | ||||
| 09/15/2025 | 2.580% | 8,925,000 | 8,764,169 | |
| Subordinated Series 2020-1A Class D | ||||
| 12/15/2025 | 2.730% | 6,500,000 | 6,356,992 | |
| Subordinated Series 2020-2A Class D | ||||
| 04/15/2026 | 4.730% | 2,200,000 | 2,198,528 | |
| Exeter Automobile Receivables Trust | ||||
| Subordinated Series 2020-3A Class D | ||||
| 07/15/2026 | 1.730% | 3,775,000 | 3,658,734 | |
| Subordinated Series 2021-1A Class D | ||||
| 11/16/2026 | 1.080% | 7,752,000 | 7,312,869 | |
| Subordinated Series 2021-3A Class D | ||||
| 06/15/2027 | 1.550% | 25,630,000 | 23,167,810 | |
| Foundation Finance Trust(a) | ||||
| Series 2019-1A Class A | ||||
| 11/15/2034 | 3.860% | 1,429,570 | 1,407,184 | |
| Foursight Capital Automobile Receivables Trust(a) | ||||
| Subordinated Series 2021-1 Class D | ||||
| 03/15/2027 | 1.320% | 5,075,000 | 4,804,922 | |
| Freed ABS Trust(a) | ||||
| Subordinated Series 2021-1CP Class C | ||||
| 03/20/2028 | 2.830% | 600,000 | 589,288 | |
| GLS Auto Receivables Issuer Trust(a) | ||||
| Subordinated Series 2019-4A Class C | ||||
| 08/15/2025 | 3.060% | 6,125,000 | 6,050,237 | |
| Subordinated Series 2020-1A Class C | ||||
| 11/17/2025 | 2.720% | 9,550,000 | 9,368,843 | |
| Asset-Backed Securities — Non-Agency (continued) | ||||
| Issuer | Coupon Rate | Principal Amount ($) | Value ($) | |
| GoldentTree Loan Management US CLO 1 Ltd.(a),(b) | ||||
| Series 2021-10A Class A | ||||
| 3-month USD LIBOR + 1.100% Floor 1.100% 07/20/2034 | 3.810% | 9,175,000 | 8,962,103 | |
| Hilton Grand Vacations Trust(a) | ||||
| Series 2018-AA Class A | ||||
| 02/25/2032 | 3.540% | 1,269,484 | 1,248,049 | |
| Series 2019-AA Class A | ||||
| 07/25/2033 | 2.340% | 2,972,299 | 2,895,689 | |
| Jay Park CLO Ltd.(a),(b) | ||||
| Series 2016-1A Class A2R | ||||
| 3-month USD LIBOR + 1.450% 10/20/2027 | 4.160% | 25,675,000 | 24,995,742 | |
| LendingPoint Asset Securitization Trust(a) | ||||
| Subordinated Series 2020-REV1 Class B | ||||
| 10/15/2028 | 4.494% | 10,200,000 | 10,000,851 | |
| LL ABS Trust(a) | ||||
| Series 2021-1A Class A | ||||
| 05/15/2029 | 1.070% | 2,835,270 | 2,742,661 | |
| Madison Park Funding XLVIII Ltd.(a),(b) | ||||
| Series 2021-48A Class A | ||||
| 3-month USD LIBOR + 1.150% Floor 1.150% 04/19/2033 | 3.888% | 3,025,000 | 2,974,277 | |
| Madison Park Funding XXXIII Ltd.(a),(b) | ||||
| Series 2019-33A Class BR | ||||
| 3-month Term SOFR + 1.800% Floor 1.800% 10/15/2032 | 4.128% | 16,325,000 | 15,676,228 | |
| Magnetite XII Ltd.(a),(b) | ||||
| Series 2015-12A Class ARR | ||||
| 3-month USD LIBOR + 1.100% Floor 1.100% 10/15/2031 | 3.612% | 13,830,000 | 13,599,661 | |
| MVW Owner Trust(a) | ||||
| Series 2016-1A Class A | ||||
| 12/20/2033 | 2.250% | 478,201 | 468,133 | |
| Series 2017-1A Class A | ||||
| 12/20/2034 | 2.420% | 2,624,271 | 2,575,547 | |
| NRZ Advance Receivables Trust(a) | ||||
| Series 2020-T3 Class AT3 | ||||
| 10/15/2052 | 1.317% | 4,490,000 | 4,468,223 | |
| Octagon Investment Partners 39 Ltd.(a),(b) | ||||
| Series 2018-3A Class B | ||||
| 3-month USD LIBOR + 1.850% Floor 1.650% 10/20/2030 | 4.560% | 22,575,000 | 21,844,654 | |
| 10 | Columbia Balanced Fund | Annual Report 2022 |
August 31, 2022
| Asset-Backed Securities — Non-Agency (continued) | ||||
| Issuer | Coupon Rate | Principal Amount ($) | Value ($) | |
| OHA Credit Funding Ltd.(a),(b) | ||||
| Series 2019-4A Class AR | ||||
| 3-month USD LIBOR + 1.150% Floor 1.150% 10/22/2036 | 3.909% | 8,625,000 | 8,432,507 | |
| Series 2021-8A Class A | ||||
| 3-month USD LIBOR + 1.190% Floor 1.190% 01/18/2034 | 3.930% | 4,025,000 | 3,950,928 | |
| Pagaya AI Debt Trust(a) | ||||
| Subordinated Series 2022-1 Class B | ||||
| 10/15/2029 | 3.344% | 4,324,966 | 3,914,285 | |
| Palmer Square Loan Funding Ltd.(a),(b) | ||||
| Series 2021-4A Class B | ||||
| 3-month USD LIBOR + 1.750% Floor 1.750% 10/15/2029 | 4.262% | 10,000,000 | 9,349,350 | |
| Race Point IX CLO Ltd.(a),(b) | ||||
| Series 2015-9A Class A2R | ||||
| 3-month USD LIBOR + 0.450% Floor 1.450% 10/15/2030 | 3.962% | 12,200,000 | 11,638,715 | |
| Redding Ridge Asset Management Ltd.(a),(b) | ||||
| Series 2018-4A Class A2 | ||||
| 3-month USD LIBOR + 1.550% 04/15/2030 | 4.062% | 3,000,000 | 2,898,753 | |
| Research-Driven Pagaya Motor Asset Trust IV(a) | ||||
| Series 2021-2A Class A | ||||
| 03/25/2030 | 2.650% | 5,991,296 | 5,285,815 | |
| Santander Consumer Auto Receivables Trust(a) | ||||
| Subordinated Series 2021-AA Class C | ||||
| 11/16/2026 | 1.030% | 1,275,000 | 1,172,835 | |
| Subordinated Series 2021-AA Class D | ||||
| 01/15/2027 | 1.570% | 1,050,000 | 962,415 | |
| Santander Drive Auto Receivables Trust | ||||
| Series 2020-2 Class D | ||||
| 09/15/2026 | 2.220% | 5,825,000 | 5,704,908 | |
| Subordinated Series 2020-3 Class D | ||||
| 11/16/2026 | 1.640% | 41,490,000 | 40,160,876 | |
| SCF Equipment Leasing LLC(a) | ||||
| Series 2019-2A Class B | ||||
| 08/20/2026 | 2.760% | 8,025,000 | 7,739,395 | |
| Series 2020-1A Class C | ||||
| 08/21/2028 | 2.600% | 4,850,000 | 4,390,681 | |
| Sierra Timeshare Receivables Funding LLC(a) | ||||
| Series 2018-2A Class A | ||||
| 06/20/2035 | 3.500% | 898,770 | 895,713 | |
| Series 2018-3A Class A | ||||
| 09/20/2035 | 3.690% | 624,206 | 615,005 | |
| Asset-Backed Securities — Non-Agency (continued) | ||||
| Issuer | Coupon Rate | Principal Amount ($) | Value ($) | |
| Theorem Funding Trust(a) | ||||
| Subordinated Series 2021-1A Class B | ||||
| 12/15/2027 | 1.840% | 4,200,000 | 3,861,835 | |
| United Auto Credit Securitization Trust(a) | ||||
| Series 2020-1 Class D | ||||
| 02/10/2025 | 2.880% | 4,380,836 | 4,380,377 | |
| Upstart Pass-Through Trust(a) | ||||
| Series 2021-ST10 Class A | ||||
| 01/20/2030 | 2.250% | 16,545,033 | 15,826,143 | |
| Series 2021-ST2 Class A | ||||
| 04/20/2027 | 2.500% | 1,054,120 | 1,004,522 | |
| Series 2021-ST7 Class A | ||||
| 09/20/2029 | 1.850% | 3,844,747 | 3,619,260 | |
| Series 2021-ST9 Class A | ||||
| 11/20/2029 | 1.700% | 2,165,514 | 1,994,019 | |
| Upstart Securitization Trust(a) | ||||
| Series 2020-2 Class A | ||||
| 11/20/2030 | 2.309% | 2,330,366 | 2,280,760 | |
| Subordinated Series 2021-2 Class B | ||||
| 06/20/2031 | 1.750% | 2,860,000 | 2,726,106 | |
| Subordinated Series 2021-3 Class B | ||||
| 07/20/2031 | 1.660% | 2,844,000 | 2,607,087 | |
| VSE Voi Mortgage LLC(a) | ||||
| Series 2018-A Class A | ||||
| 02/20/2036 | 3.560% | 1,457,904 | 1,426,513 | |
| Total Asset-Backed Securities — Non-Agency (Cost $596,769,813) | 575,320,650 | |||
| Commercial Mortgage-Backed Securities - Non-Agency 6.5% | ||||
| 1211 Avenue of the Americas Trust(a) | ||||
| Series 2015-1211 Class A1A2 | ||||
| 08/10/2035 | 3.901% | 7,955,000 | 7,616,639 | |
| American Homes 4 Rent Trust(a) | ||||
| Series 2014-SFR2 Class A | ||||
| 10/17/2036 | 3.786% | 2,614,828 | 2,573,052 | |
| Series 2014-SFR3 Class A | ||||
| 12/17/2036 | 3.678% | 3,045,925 | 3,007,396 | |
| Series 2015-SFR1 Class A | ||||
| 04/17/2052 | 3.467% | 3,175,142 | 3,089,260 | |
| Series 2015-SFR2 Class A | ||||
| 10/17/2052 | 3.732% | 2,398,203 | 2,368,825 | |
| AMSR Trust(a) | ||||
| Subordinated Series 2020-SFR2 Class C | ||||
| 07/17/2037 | 2.533% | 2,799,000 | 2,638,696 | |
| Ashford Hospitality Trust(a),(b) | ||||
| Series 2018-KEYS Class B | ||||
| 1-month USD LIBOR + 1.450% Floor 1.450% 05/15/2035 | 3.841% | 16,800,000 | 16,292,884 | |
| Columbia Balanced Fund | Annual Report 2022 | 11 |
August 31, 2022
| Commercial Mortgage-Backed Securities - Non-Agency (continued) | ||||
| Issuer | Coupon Rate | Principal Amount ($) | Value ($) | |
| BBCMS Trust(a),(b) | ||||
| Subordinated Series 2018-BXH Class B | ||||
| 1-month USD LIBOR + 1.250% Floor 1.250% 10/15/2037 | 3.641% | 7,370,000 | 7,029,432 | |
| Subordinated Series 2018-BXH Class C | ||||
| 1-month USD LIBOR + 1.500% Floor 1.500% 10/15/2037 | 3.891% | 3,975,000 | 3,776,424 | |
| BB-UBS Trust(a) | ||||
| Series 2012-SHOW Class A | ||||
| 11/05/2036 | 3.430% | 8,475,000 | 8,082,277 | |
| BHMS Mortgage Trust(a),(b) | ||||
| Series 2018-ATLS Class A | ||||
| 1-month USD LIBOR + 1.250% Floor 1.250% 07/15/2035 | 3.641% | 14,823,000 | 14,329,216 | |
| BPR Trust(a),(b) | ||||
| Subordinated Series 2021-TY Class D | ||||
| 1-month USD LIBOR + 2.350% Floor 2.350% 09/15/2038 | 4.741% | 6,000,000 | 5,725,783 | |
| BX Commercial Mortgage Trust(a),(b) | ||||
| Series 2019-XL Class C | ||||
| 1-month USD LIBOR + 1.250% Floor 1.250% 10/15/2036 | 3.641% | 6,056,250 | 5,935,287 | |
| BX Mortgage Trust(a),(b) | ||||
| Series 2021-PAC Class D | ||||
| 1-month USD LIBOR + 1.298% Floor 1.298% 10/15/2036 | 3.690% | 14,175,000 | 13,201,039 | |
| BX Trust(a),(b) | ||||
| Series 2019-ATL Class C | ||||
| 1-month USD LIBOR + 1.587% Floor 1.587%, Cap 1.587% 10/15/2036 | 3.978% | 4,422,000 | 4,256,397 | |
| Subordinated Series 2019-ATL Class D | ||||
| 1-month USD LIBOR + 1.887% Floor 1.887% 10/15/2036 | 4.278% | 3,895,000 | 3,690,787 | |
| CIM Retail Portfolio Trust(a),(b) | ||||
| Series 2021-RETL Class D | ||||
| 1-month USD LIBOR + 3.050% Floor 3.050% 08/15/2036 | 5.441% | 18,562,500 | 18,339,175 | |
| Citigroup Commercial Mortgage Trust(a),(c) | ||||
| Subordinated Series 2020-420K Class C | ||||
| 11/10/2042 | 3.422% | 2,500,000 | 2,124,481 | |
| Subordinated Series 2020-420K Class D | ||||
| 11/10/2042 | 3.422% | 2,250,000 | 1,779,501 | |
| Commercial Mortgage-Backed Securities - Non-Agency (continued) | ||||
| Issuer | Coupon Rate | Principal Amount ($) | Value ($) | |
| CLNY Trust(a),(b) | ||||
| Series 2019-IKPR Class D | ||||
| 1-month USD LIBOR + 2.025% Floor 2.025% 11/15/2038 | 4.416% | 11,925,000 | 11,188,537 | |
| COMM Mortgage Trust(a),(c) | ||||
| Subordinated Series 2020-CBM Class D | ||||
| 02/10/2037 | 3.754% | 2,925,000 | 2,666,305 | |
| COMM Mortgage Trust(a) | ||||
| Subordinated Series 2020-CX Class B | ||||
| 11/10/2046 | 2.446% | 3,275,000 | 2,620,776 | |
| CSAIL Commercial Mortgage Trust | ||||
| Series 2019-C16 Class A3 | ||||
| 06/15/2052 | 3.329% | 23,720,000 | 21,907,937 | |
| Extended Stay America Trust(a),(b) | ||||
| Series 2021-ESH Class E | ||||
| 1-month USD LIBOR + 2.850% Floor 2.850% 07/15/2038 | 5.241% | 1,913,225 | 1,846,305 | |
| Series 2021-ESH Class F | ||||
| 1-month USD LIBOR + 3.700% Floor 3.700% 07/15/2038 | 5.699% | 1,987,766 | 1,910,786 | |
| FirstKey Homes Trust(a) | ||||
| Subordinated Series 2020-SFR1 Class D | ||||
| 08/17/2037 | 2.241% | 4,225,000 | 3,965,176 | |
| Subordinated Series 2020-SFR2 Class D | ||||
| 10/19/2037 | 1.968% | 18,600,000 | 16,957,488 | |
| GS Mortgage Securities Corp II(a),(b) | ||||
| Series 2022-ECI Class A | ||||
| 1-month Term SOFR + 2.195% Floor 2.195% 08/15/2039 | 4.358% | 9,075,000 | 9,053,069 | |
| GS Mortgage Securities Corp. Trust(a) | ||||
| Series 2017-485L Class A | ||||
| 02/10/2037 | 3.721% | 3,835,000 | 3,586,052 | |
| GS Mortgage Securities Corp. Trust(a),(b) | ||||
| Subordinated CMO Series 2021-IP Class D | ||||
| 1-month USD LIBOR + 2.100% Floor 2.100% 10/15/2036 | 4.491% | 5,425,000 | 5,045,146 | |
| Home Partners of America Trust(a) | ||||
| Subordinated Series 2019-2 Class D | ||||
| 10/19/2039 | 3.121% | 6,447,584 | 5,652,465 | |
| Subordinated Series 2021-2 Class B | ||||
| 12/17/2026 | 2.302% | 41,589,264 | 37,065,787 | |
| Invitation Homes Trust(a),(b) | ||||
| Series 2018-SFR1 Class A | ||||
| 1-month USD LIBOR + 0.700% 03/17/2037 | 2.856% | 11,370,436 | 11,242,513 | |
| 12 | Columbia Balanced Fund | Annual Report 2022 |
August 31, 2022
| Commercial Mortgage-Backed Securities - Non-Agency (continued) | ||||
| Issuer | Coupon Rate | Principal Amount ($) | Value ($) | |
| Series 2018-SFR4 Class A | ||||
| 1-month USD LIBOR + 1.100% Floor 1.000% 01/17/2038 | 3.480% | 20,039,447 | 19,888,011 | |
| JPMBB Commercial Mortgage Securities Trust(c) | ||||
| Series 2013-C14 Class ASB | ||||
| 08/15/2046 | 3.761% | 1,091,715 | 1,083,508 | |
| JPMorgan Chase Commercial Mortgage Securities Trust(a),(c) | ||||
| Subordinated Series 2021-2NU Class B | ||||
| 01/05/2040 | 2.146% | 3,800,000 | 3,187,392 | |
| Subordinated Series 2021-2NU Class C | ||||
| 01/05/2040 | 2.146% | 1,500,000 | 1,230,807 | |
| KKR Industrial Portfolio Trust(a),(b) | ||||
| Subordinated Series 2021-KDIP Class D | ||||
| 1-month USD LIBOR + 1.250% Floor 1.250% 12/15/2037 | 3.641% | 2,325,000 | 2,220,377 | |
| Life Mortgage Trust(a),(b) | ||||
| Subordinated Series 2021-BMR Class D | ||||
| 1-month USD LIBOR + 1.400% Floor 1.400% 03/15/2038 | 3.791% | 4,472,514 | 4,282,729 | |
| Morgan Stanley Bank of America Merrill Lynch Trust | ||||
| Series 2016-C29 Class A3 | ||||
| 05/15/2049 | 3.058% | 5,928,750 | 5,603,252 | |
| Series 2017-C34 Class A3 | ||||
| 11/15/2052 | 3.276% | 14,135,000 | 13,193,025 | |
| Morgan Stanley Capital I Trust | ||||
| Series 2015-UBS8 Class A3 | ||||
| 12/15/2048 | 3.540% | 10,754,415 | 10,327,143 | |
| Morgan Stanley Capital I Trust(a),(c) | ||||
| Series 2019-MEAD Class D | ||||
| 11/10/2036 | 3.283% | 7,392,500 | 6,711,032 | |
| One New York Plaza Trust(a),(b) | ||||
| Subordinated Series 2020-1NYP Class C | ||||
| 1-month USD LIBOR + 2.200% Floor 2.200% 01/15/2036 | 4.591% | 6,950,000 | 6,574,011 | |
| Subordinated Series 2020-1NYP Class D | ||||
| 1-month USD LIBOR + 2.750% Floor 2.750% 01/15/2036 | 5.141% | 2,600,000 | 2,427,079 | |
| Progress Residential Trust(a) | ||||
| Series 2019-SFR3 Class C | ||||
| 09/17/2036 | 2.721% | 4,750,000 | 4,579,817 | |
| Series 2019-SFR3 Class D | ||||
| 09/17/2036 | 2.871% | 7,049,000 | 6,793,044 | |
| Series 2019-SFR4 Class C | ||||
| 10/17/2036 | 3.036% | 17,766,000 | 17,284,529 | |
| Commercial Mortgage-Backed Securities - Non-Agency (continued) | ||||
| Issuer | Coupon Rate | Principal Amount ($) | Value ($) | |
| Series 2020-SFR1 Class C | ||||
| 04/17/2037 | 2.183% | 2,075,000 | 1,953,426 | |
| Series 2020-SFR1 Class D | ||||
| 04/17/2037 | 2.383% | 4,200,000 | 3,920,154 | |
| Series 2020-SFR2 Class A | ||||
| 06/17/2037 | 2.078% | 2,575,000 | 2,448,891 | |
| Series 2022-SFR5 Class A | ||||
| 06/17/2039 | 4.451% | 12,975,000 | 12,806,028 | |
| Subordinated Series 2020-SFR2 Class C | ||||
| 06/17/2037 | 3.077% | 600,000 | 580,762 | |
| Subordinated Series 2020-SFR2 Class D | ||||
| 06/17/2037 | 3.874% | 775,000 | 742,576 | |
| Subordinated Series 2021-SFR8 Class D | ||||
| 10/17/2038 | 2.082% | 11,910,000 | 10,357,801 | |
| RBS Commercial Funding, Inc., Trust(a),(c) | ||||
| Series 2013-GSP Class A | ||||
| 01/15/2032 | 3.961% | 7,141,000 | 6,960,601 | |
| SFO Commercial Mortgage Trust(a),(b) | ||||
| Subordinated Series 2021-555 Class E | ||||
| 1-month USD LIBOR + 2.900% Floor 2.900% 05/15/2038 | 5.291% | 3,025,000 | 2,821,142 | |
| SPGN TFLM Mortgage Trust(a),(b) | ||||
| Series 2022 Class A | ||||
| 1-month Term SOFR + 1.550% Floor 1.550% 02/15/2039 | 3.857% | 30,525,000 | 29,783,890 | |
| STAR Trust(a),(b) | ||||
| Series 2022-SFR3 Class A | ||||
| 1-month Term SOFR + 1.650% Floor 1.650% 05/17/2024 | 3.947% | 16,947,944 | 16,906,011 | |
| Subordinated Series 2022-SFR3 Class B | ||||
| 1-month Term SOFR + 1.950% Floor 1.950% 05/17/2024 | 4.247% | 12,100,000 | 12,030,495 | |
| Tricon American Homes(a) | ||||
| Series 2020-SFR1 Class C | ||||
| 07/17/2038 | 2.249% | 4,100,000 | 3,730,351 | |
| Tricon American Homes Trust(a) | ||||
| Subordinated Series 2020-SFR2 Class D | ||||
| 11/17/2039 | 2.281% | 6,775,000 | 5,818,085 | |
| UBS-Barclays Commercial Mortgage Trust | ||||
| Series 2012-C4 Class A5 | ||||
| 12/10/2045 | 2.850% | 2,156,888 | 2,154,871 | |
| Series 2013-C5 Class A4 | ||||
| 03/10/2046 | 3.185% | 10,528,308 | 10,484,662 | |
| Columbia Balanced Fund | Annual Report 2022 | 13 |
August 31, 2022
| Commercial Mortgage-Backed Securities - Non-Agency (continued) | ||||
| Issuer | Coupon Rate | Principal Amount ($) | Value ($) | |
| Wells Fargo Commercial Mortgage Trust | ||||
| Series 2015-C28 Class A3 | ||||
| 05/15/2048 | 3.290% | 6,658,082 | 6,416,917 | |
| Wells Fargo Commercial Mortgage Trust(a),(b) | ||||
| Series 2020-SDAL Class D | ||||
| 1-month USD LIBOR + 2.090% Floor 2.090%, Cap 4.500% 02/15/2037 | 4.470% | 3,400,000 | 3,208,786 | |
| Series 2021-FCMT Class A | ||||
| 1-month USD LIBOR + 1.200% Floor 1.200% 05/15/2031 | 3.591% | 4,750,000 | 4,558,393 | |
| Series 2021-FCMT Class D | ||||
| 1-month USD LIBOR + 3.500% Floor 3.500% 05/15/2031 | 5.891% | 3,925,000 | 3,744,990 | |
| WF-RBS Commercial Mortgage Trust | ||||
| Series 2013-C15 Class A3 | ||||
| 08/15/2046 | 3.881% | 3,519,658 | 3,497,838 | |
| Total Commercial Mortgage-Backed Securities - Non-Agency (Cost $545,632,838) | 510,877,319 | |||
| Common Stocks 57.3% | ||
| Issuer | Shares | Value ($) |
| Communication Services 5.9% | ||
| Entertainment 1.6% | ||
| Endeavor Group Holdings, Inc., Class A(d) | 826,070 | 18,685,703 |
| Take-Two Interactive Software, Inc.(d) | 486,776 | 59,659,267 |
| Walt Disney Co. (The)(d) | 381,112 | 42,715,033 |
| Total | 121,060,003 | |
| Interactive Media & Services 2.7% | ||
| Alphabet, Inc., Class A(d) | 811,035 | 87,770,208 |
| Alphabet, Inc., Class C(d) | 803,047 | 87,652,580 |
| Meta Platforms, Inc., Class A(d) | 227,583 | 37,080,098 |
| Total | 212,502,886 | |
| Media 0.5% | ||
| Comcast Corp., Class A | 1,152,717 | 41,716,828 |
| Wireless Telecommunication Services 1.1% | ||
| T-Mobile US, Inc.(d) | 592,474 | 85,292,557 |
| Total Communication Services | 460,572,274 | |
| Consumer Discretionary 4.7% | ||
| Automobiles 0.6% | ||
| Tesla, Inc.(d) | 173,886 | 47,924,720 |
| Common Stocks (continued) | ||
| Issuer | Shares | Value ($) |
| Hotels, Restaurants & Leisure 0.4% | ||
| Chipotle Mexican Grill, Inc.(d) | 3,417 | 5,456,266 |
| McDonald’s Corp. | 113,505 | 28,635,041 |
| Total | 34,091,307 | |
| Internet & Direct Marketing Retail 2.7% | ||
| Amazon.com, Inc.(d) | 1,654,742 | 209,771,643 |
| Specialty Retail 0.6% | ||
| Lowe’s Companies, Inc. | 104,821 | 20,349,949 |
| TJX Companies, Inc. (The) | 366,002 | 22,820,225 |
| Total | 43,170,174 | |
| Textiles, Apparel & Luxury Goods 0.4% | ||
| Tapestry, Inc. | 962,564 | 33,429,848 |
| Total Consumer Discretionary | 368,387,692 | |
| Consumer Staples 4.0% | ||
| Beverages 0.4% | ||
| Monster Beverage Corp.(d) | 339,969 | 30,199,446 |
| Food & Staples Retailing 2.0% | ||
| Sysco Corp. | 624,156 | 51,318,106 |
| Walmart, Inc. | 783,444 | 103,845,502 |
| Total | 155,163,608 | |
| Food Products 0.9% | ||
| Mondelez International, Inc., Class A | 1,168,342 | 72,273,636 |
| Household Products 0.5% | ||
| Procter & Gamble Co. (The) | 324,807 | 44,803,878 |
| Personal Products 0.2% | ||
| Coty, Inc., Class A(d) | 1,845,415 | 13,859,067 |
| Total Consumer Staples | 316,299,635 | |
| Energy 2.8% | ||
| Oil, Gas & Consumable Fuels 2.8% | ||
| Canadian Natural Resources Ltd. | 936,406 | 51,324,413 |
| Chevron Corp. | 666,982 | 105,423,175 |
| EOG Resources, Inc. | 508,064 | 61,628,163 |
| Total | 218,375,751 | |
| Total Energy | 218,375,751 | |
| 14 | Columbia Balanced Fund | Annual Report 2022 |
August 31, 2022
| Common Stocks (continued) | ||
| Issuer | Shares | Value ($) |
| Financials 6.3% | ||
| Banks 2.7% | ||
| Bank of America Corp. | 2,380,465 | 80,007,429 |
| JPMorgan Chase & Co. | 355,267 | 40,404,516 |
| Wells Fargo & Co. | 2,166,086 | 94,679,619 |
| Total | 215,091,564 | |
| Capital Markets 1.6% | ||
| BlackRock, Inc. | 42,901 | 28,588,797 |
| MSCI, Inc. | 64,041 | 28,769,779 |
| State Street Corp. | 1,005,668 | 68,737,408 |
| Total | 126,095,984 | |
| Consumer Finance 0.1% | ||
| American Express Co. | 31,623 | 4,806,696 |
| Diversified Financial Services 1.7% | ||
| Berkshire Hathaway, Inc., Class B(d) | 463,782 | 130,229,985 |
| Insurance 0.2% | ||
| Aon PLC, Class A | 65,538 | 18,302,142 |
| Total Financials | 494,526,371 | |
| Health Care 8.5% | ||
| Biotechnology 1.5% | ||
| BioMarin Pharmaceutical, Inc.(d) | 411,573 | 36,712,312 |
| Horizon Therapeutics PLC(d) | 240,594 | 14,245,571 |
| Vertex Pharmaceuticals, Inc.(d) | 230,986 | 65,082,615 |
| Total | 116,040,498 | |
| Health Care Equipment & Supplies 1.5% | ||
| Abbott Laboratories | 507,398 | 52,084,405 |
| Baxter International, Inc. | 443,507 | 25,483,912 |
| Boston Scientific Corp.(d) | 1,052,145 | 42,411,965 |
| Total | 119,980,282 | |
| Health Care Providers & Services 1.9% | ||
| CVS Health Corp. | 810,553 | 79,555,777 |
| Elevance Health, Inc. | 140,283 | 68,052,686 |
| Total | 147,608,463 | |
| Life Sciences Tools & Services 0.7% | ||
| IQVIA Holdings, Inc.(d) | 132,043 | 28,080,264 |
| Thermo Fisher Scientific, Inc. | 50,990 | 27,805,867 |
| Total | 55,886,131 | |
| Common Stocks (continued) | ||
| Issuer | Shares | Value ($) |
| Pharmaceuticals 2.9% | ||
| Eli Lilly & Co. | 282,372 | 85,058,918 |
| Johnson & Johnson | 906,178 | 146,202,758 |
| Total | 231,261,676 | |
| Total Health Care | 670,777,050 | |
| Industrials 4.7% | ||
| Aerospace & Defense 1.6% | ||
| Raytheon Technologies Corp. | 1,381,651 | 124,003,177 |
| Airlines 0.4% | ||
| Southwest Airlines Co.(d) | 912,008 | 33,470,694 |
| Industrial Conglomerates 1.1% | ||
| General Electric Co. | 560,946 | 41,195,874 |
| Honeywell International, Inc. | 221,747 | 41,987,795 |
| Total | 83,183,669 | |
| Road & Rail 1.6% | ||
| Uber Technologies, Inc.(d) | 2,310,188 | 66,441,007 |
| Union Pacific Corp. | 257,550 | 57,822,550 |
| Total | 124,263,557 | |
| Total Industrials | 364,921,097 | |
| Information Technology 16.3% | ||
| Electronic Equipment, Instruments & Components 0.6% | ||
| TE Connectivity Ltd. | 340,038 | 42,916,196 |
| IT Services 3.2% | ||
| Fidelity National Information Services, Inc. | 439,140 | 40,124,222 |
| Global Payments, Inc. | 299,180 | 37,167,131 |
| International Business Machines Corp. | 142,461 | 18,299,116 |
| MasterCard, Inc., Class A | 213,478 | 69,245,859 |
| PayPal Holdings, Inc.(d) | 345,062 | 32,242,593 |
| Visa, Inc., Class A | 282,969 | 56,228,770 |
| Total | 253,307,691 | |
| Semiconductors & Semiconductor Equipment 1.5% | ||
| Advanced Micro Devices, Inc.(d) | 305,281 | 25,909,199 |
| Lam Research Corp. | 88,119 | 38,588,191 |
| Marvell Technology, Inc. | 262,296 | 12,280,699 |
| NVIDIA Corp. | 247,482 | 37,354,933 |
| Total | 114,133,022 | |
| Columbia Balanced Fund | Annual Report 2022 | 15 |
August 31, 2022
| Common Stocks (continued) | ||
| Issuer | Shares | Value ($) |
| Software 7.2% | ||
| Adobe, Inc.(d) | 221,173 | 82,594,845 |
| Intuit, Inc. | 189,899 | 81,994,590 |
| Microsoft Corp. | 1,197,405 | 313,085,485 |
| Palo Alto Networks, Inc.(d) | 100,627 | 56,030,120 |
| Salesforce, Inc.(d) | 217,347 | 33,932,214 |
| Total | 567,637,254 | |
| Technology Hardware, Storage & Peripherals 3.8% | ||
| Apple, Inc. | 1,909,288 | 300,178,259 |
| Total Information Technology | 1,278,172,422 | |
| Materials 1.5% | ||
| Chemicals 1.5% | ||
| Corteva, Inc. | 567,850 | 34,883,025 |
| Ecolab, Inc. | 187,937 | 30,789,719 |
| International Flavors & Fragrances, Inc. | 460,050 | 50,826,324 |
| Total | 116,499,068 | |
| Total Materials | 116,499,068 | |
| Real Estate 0.9% | ||
| Equity Real Estate Investment Trusts (REITS) 0.9% | ||
| American Tower Corp. | 276,545 | 70,256,258 |
| Total Real Estate | 70,256,258 | |
| Utilities 1.7% | ||
| Electric Utilities 1.0% | ||
| American Electric Power Co., Inc. | 759,389 | 76,090,778 |
| Multi-Utilities 0.7% | ||
| Public Service Enterprise Group, Inc. | 867,073 | 55,804,818 |
| Total Utilities | 131,895,596 | |
| Total Common Stocks (Cost $2,995,947,617) | 4,490,683,214 | |
| Convertible Bonds 0.0% | ||||
| Issuer | Coupon Rate | Principal Amount ($) | Value ($) | |
| Cable and Satellite 0.0% | ||||
| DISH Network Corp. | ||||
| Subordinated | ||||
| 08/15/2026 | 3.375% | 438,000 | 315,168 | |
| Total Convertible Bonds (Cost $416,242) | 315,168 | |||
| Corporate Bonds & Notes 7.8% | ||||
| Issuer | Coupon Rate | Principal Amount ($) | Value ($) | |
| Aerospace & Defense 0.3% | ||||
| BAE Systems PLC(a) | ||||
| 04/15/2030 | 3.400% | 7,500,000 | 6,837,627 | |
| Boeing Co. (The) | ||||
| 05/01/2040 | 5.705% | 10,000,000 | 9,567,327 | |
| Bombardier, Inc.(a) | ||||
| 04/15/2027 | 7.875% | 285,000 | 272,622 | |
| Northrop Grumman Corp. | ||||
| 02/15/2031 | 7.750% | 2,319,000 | 2,767,614 | |
| TransDigm, Inc.(a) | ||||
| 12/15/2025 | 8.000% | 393,000 | 402,492 | |
| 03/15/2026 | 6.250% | 1,044,000 | 1,025,292 | |
| TransDigm, Inc. | ||||
| 11/15/2027 | 5.500% | 369,000 | 332,043 | |
| 05/01/2029 | 4.875% | 285,000 | 243,682 | |
| Total | 21,448,699 | |||
| Airlines 0.0% | ||||
| Air Canada(a) | ||||
| 08/15/2026 | 3.875% | 183,000 | 163,373 | |
| American Airlines, Inc./AAdvantage Loyalty IP Ltd.(a) | ||||
| 04/20/2026 | 5.500% | 827,175 | 787,495 | |
| 04/20/2029 | 5.750% | 237,298 | 214,355 | |
| Hawaiian Brand Intellectual Property Ltd./Miles Loyalty Ltd.(a) | ||||
| 01/20/2026 | 5.750% | 267,484 | 244,228 | |
| United Airlines, Inc.(a) | ||||
| 04/15/2026 | 4.375% | 245,000 | 223,366 | |
| 04/15/2029 | 4.625% | 252,000 | 221,189 | |
| Total | 1,854,006 | |||
| Automotive 0.1% | ||||
| Ford Motor Co. | ||||
| 02/12/2032 | 3.250% | 200,000 | 156,227 | |
| Ford Motor Credit Co. LLC | ||||
| 11/13/2025 | 3.375% | 481,000 | 437,369 | |
| 01/09/2027 | 4.271% | 350,000 | 321,304 | |
| 05/28/2027 | 4.950% | 355,000 | 333,498 | |
| 08/17/2027 | 4.125% | 277,000 | 249,698 | |
| 02/16/2028 | 2.900% | 162,000 | 135,266 | |
| 11/13/2030 | 4.000% | 194,000 | 163,441 | |
| IAA Spinco, Inc.(a) | ||||
| 06/15/2027 | 5.500% | 725,000 | 683,362 | |
| IHO Verwaltungs GmbH(a),(e) | ||||
| 09/15/2026 | 4.750% | 264,544 | 228,508 | |
| KAR Auction Services, Inc.(a) | ||||
| 06/01/2025 | 5.125% | 625,000 | 617,651 | |
| Panther BF Aggregator 2 LP/Finance Co., Inc.(a) | ||||
| 05/15/2026 | 6.250% | 93,000 | 91,991 | |
| 05/15/2027 | 8.500% | 353,000 | 346,994 | |
| 16 | Columbia Balanced Fund | Annual Report 2022 |
August 31, 2022
| Corporate Bonds & Notes (continued) | ||||
| Issuer | Coupon Rate | Principal Amount ($) | Value ($) | |
| Tenneco, Inc.(a) | ||||
| 01/15/2029 | 7.875% | 313,000 | 314,714 | |
| Total | 4,080,023 | |||
| Banking 1.9% | ||||
| Bank of America Corp.(f) | ||||
| 04/23/2040 | 4.078% | 28,000,000 | 24,444,970 | |
| Citigroup, Inc.(f) | ||||
| 01/25/2033 | 3.057% | 9,000,000 | 7,624,926 | |
| Citigroup, Inc. | ||||
| Subordinated | ||||
| 03/09/2026 | 4.600% | 9,134,000 | 9,122,261 | |
| Discover Bank | ||||
| 09/13/2028 | 4.650% | 4,950,000 | 4,760,270 | |
| Goldman Sachs Group, Inc. (The)(f) | ||||
| 02/24/2033 | 3.102% | 20,500,000 | 17,445,308 | |
| HSBC Holdings PLC(f) | ||||
| 05/24/2032 | 2.804% | 13,000,000 | 10,328,541 | |
| JPMorgan Chase & Co.(f) | ||||
| Subordinated | ||||
| 05/13/2031 | 2.956% | 27,000,000 | 23,274,485 | |
| Morgan Stanley(f) | ||||
| 01/22/2031 | 2.699% | 20,425,000 | 17,684,210 | |
| PNC Financial Services Group, Inc. (The)(f) | ||||
| Subordinated | ||||
| 06/06/2033 | 4.626% | 7,040,000 | 6,674,529 | |
| State Street Corp. | ||||
| Subordinated | ||||
| 03/03/2031 | 2.200% | 8,371,000 | 6,965,595 | |
| Wells Fargo & Co.(f) | ||||
| 04/30/2041 | 3.068% | 21,750,000 | 16,696,773 | |
| Total | 145,021,868 | |||
| Brokerage/Asset Managers/Exchanges 0.0% | ||||
| AG TTMT Escrow Issuer LLC(a) | ||||
| 09/30/2027 | 8.625% | 229,000 | 229,077 | |
| Hightower Holding LLC(a) | ||||
| 04/15/2029 | 6.750% | 293,000 | 247,057 | |
| NFP Corp(a) | ||||
| 10/01/2030 | 7.500% | 262,000 | 258,180 | |
| NFP Corp.(a) | ||||
| 08/15/2028 | 4.875% | 290,000 | 257,292 | |
| 08/15/2028 | 6.875% | 867,000 | 714,351 | |
| Total | 1,705,957 | |||
| Corporate Bonds & Notes (continued) | ||||
| Issuer | Coupon Rate | Principal Amount ($) | Value ($) | |
| Building Materials 0.0% | ||||
| Beacon Roofing Supply, Inc.(a) | ||||
| 11/15/2026 | 4.500% | 310,000 | 292,589 | |
| 05/15/2029 | 4.125% | 186,000 | 157,104 | |
| Interface, Inc.(a) | ||||
| 12/01/2028 | 5.500% | 145,000 | 128,266 | |
| James Hardie International Finance DAC(a) | ||||
| 01/15/2028 | 5.000% | 238,000 | 219,430 | |
| SRS Distribution, Inc.(a) | ||||
| 07/01/2028 | 4.625% | 142,000 | 126,192 | |
| 07/01/2029 | 6.125% | 276,000 | 226,726 | |
| 12/01/2029 | 6.000% | 344,000 | 280,204 | |
| Standard Industries, Inc.(a) | ||||
| 02/15/2027 | 5.000% | 61,000 | 56,184 | |
| White Cap Buyer LLC(a) | ||||
| 10/15/2028 | 6.875% | 394,000 | 346,766 | |
| Total | 1,833,461 | |||
| Cable and Satellite 0.2% | ||||
| CCO Holdings LLC/Capital Corp.(a) | ||||
| 05/01/2027 | 5.125% | 426,000 | 404,639 | |
| 02/01/2028 | 5.000% | 151,000 | 137,850 | |
| 03/01/2030 | 4.750% | 642,000 | 551,653 | |
| 08/15/2030 | 4.500% | 682,000 | 573,989 | |
| 02/01/2032 | 4.750% | 277,000 | 229,413 | |
| Comcast Corp. | ||||
| 08/15/2035 | 4.400% | 2,825,000 | 2,728,930 | |
| CSC Holdings LLC(a) | ||||
| 02/01/2028 | 5.375% | 258,000 | 233,185 | |
| 02/01/2029 | 6.500% | 361,000 | 332,161 | |
| 01/15/2030 | 5.750% | 335,000 | 259,322 | |
| 12/01/2030 | 4.125% | 298,000 | 241,380 | |
| 02/15/2031 | 3.375% | 233,000 | 174,775 | |
| DIRECTV Holdings LLC/Financing Co., Inc.(a) | ||||
| 08/15/2027 | 5.875% | 335,000 | 306,559 | |
| DISH DBS Corp. | ||||
| 03/15/2023 | 5.000% | 33,000 | 32,332 | |
| 06/01/2029 | 5.125% | 324,000 | 191,889 | |
| DISH DBS Corp.(a) | ||||
| 12/01/2028 | 5.750% | 388,000 | 298,631 | |
| Radiate Holdco LLC/Finance, Inc.(a) | ||||
| 09/15/2026 | 4.500% | 316,000 | 272,540 | |
| 09/15/2028 | 6.500% | 419,000 | 312,184 | |
| Sirius XM Radio, Inc.(a) | ||||
| 09/01/2026 | 3.125% | 204,000 | 181,714 | |
| 07/01/2029 | 5.500% | 227,000 | 212,384 | |
| Time Warner Cable LLC | ||||
| 05/01/2037 | 6.550% | 8,210,000 | 8,073,679 | |
| Columbia Balanced Fund | Annual Report 2022 | 17 |
August 31, 2022
| Corporate Bonds & Notes (continued) | ||||
| Issuer | Coupon Rate | Principal Amount ($) | Value ($) | |
| Videotron Ltd.(a) | ||||
| 06/15/2029 | 3.625% | 197,000 | 163,848 | |
| Virgin Media Finance PLC(a) | ||||
| 07/15/2030 | 5.000% | 299,000 | 236,644 | |
| Virgin Media Secured Finance PLC(a) | ||||
| 05/15/2029 | 5.500% | 303,000 | 271,332 | |
| 08/15/2030 | 4.500% | 192,000 | 159,705 | |
| VZ Secured Financing BV(a) | ||||
| 01/15/2032 | 5.000% | 387,000 | 315,360 | |
| Ziggo Bond Co. BV(a) | ||||
| 02/28/2030 | 5.125% | 241,000 | 192,736 | |
| Ziggo Bond Finance BV(a) | ||||
| 01/15/2027 | 6.000% | 332,000 | 299,058 | |
| Ziggo BV(a) | ||||
| 01/15/2030 | 4.875% | 425,000 | 363,548 | |
| Total | 17,751,440 | |||
| Chemicals 0.1% | ||||
| Avient Corp.(a) | ||||
| 08/01/2030 | 7.125% | 217,000 | 214,599 | |
| Axalta Coating Systems LLC(a) | ||||
| 02/15/2029 | 3.375% | 119,000 | 100,121 | |
| Axalta Coating Systems LLC/Dutch Holding B BV(a) | ||||
| 06/15/2027 | 4.750% | 553,000 | 512,347 | |
| Cheever Escrow Issuer LLC(a) | ||||
| 10/01/2027 | 7.125% | 209,000 | 201,316 | |
| Dow Chemical Co. (The) | ||||
| 10/01/2034 | 4.250% | 5,000,000 | 4,632,959 | |
| Element Solutions, Inc.(a) | ||||
| 09/01/2028 | 3.875% | 387,000 | 336,208 | |
| HB Fuller Co. | ||||
| 10/15/2028 | 4.250% | 516,000 | 455,451 | |
| Herens Holdco Sarl(a) | ||||
| 05/15/2028 | 4.750% | 256,000 | 215,040 | |
| INEOS Quattro Finance 2 Plc(a) | ||||
| 01/15/2026 | 3.375% | 162,000 | 140,908 | |
| Ingevity Corp.(a) | ||||
| 11/01/2028 | 3.875% | 198,000 | 170,779 | |
| Innophos Holdings, Inc.(a) | ||||
| 02/15/2028 | 9.375% | 278,000 | 272,167 | |
| Iris Holdings, Inc.(a),(e) | ||||
| 02/15/2026 | 8.750% | 135,000 | 109,080 | |
| Olympus Water US Holding Corp.(a) | ||||
| 10/01/2028 | 4.250% | 467,000 | 381,390 | |
| 10/01/2029 | 6.250% | 42,000 | 31,620 | |
| SPCM SA(a) | ||||
| 03/15/2027 | 3.125% | 133,000 | 118,973 | |
| Corporate Bonds & Notes (continued) | ||||
| Issuer | Coupon Rate | Principal Amount ($) | Value ($) | |
| WR Grace Holdings LLC(a) | ||||
| 10/01/2024 | 5.625% | 133,000 | 130,935 | |
| 06/15/2027 | 4.875% | 427,000 | 396,803 | |
| 08/15/2029 | 5.625% | 606,000 | 480,416 | |
| Total | 8,901,112 | |||
| Construction Machinery 0.0% | ||||
| H&E Equipment Services, Inc.(a) | ||||
| 12/15/2028 | 3.875% | 106,000 | 89,583 | |
| Herc Holdings, Inc.(a) | ||||
| 07/15/2027 | 5.500% | 117,000 | 110,565 | |
| United Rentals North America, Inc. | ||||
| 01/15/2030 | 5.250% | 198,000 | 187,260 | |
| Total | 387,408 | |||
| Consumer Cyclical Services 0.0% | ||||
| Arches Buyer, Inc.(a) | ||||
| 06/01/2028 | 4.250% | 306,000 | 246,169 | |
| 12/01/2028 | 6.125% | 378,000 | 295,731 | |
| Match Group, Inc.(a) | ||||
| 02/15/2029 | 5.625% | 191,000 | 180,176 | |
| Staples, Inc.(a) | ||||
| 04/15/2026 | 7.500% | 117,000 | 98,908 | |
| Uber Technologies, Inc.(a) | ||||
| 05/15/2025 | 7.500% | 359,000 | 363,169 | |
| 01/15/2028 | 6.250% | 247,000 | 237,527 | |
| 08/15/2029 | 4.500% | 558,000 | 484,924 | |
| Total | 1,906,604 | |||
| Consumer Products 0.0% | ||||
| CD&R Smokey Buyer, Inc.(a) | ||||
| 07/15/2025 | 6.750% | 388,000 | 362,571 | |
| Mattel, Inc.(a) | ||||
| 04/01/2026 | 3.375% | 113,000 | 102,758 | |
| 04/01/2029 | 3.750% | 222,000 | 198,060 | |
| Prestige Brands, Inc.(a) | ||||
| 01/15/2028 | 5.125% | 399,000 | 367,560 | |
| Scotts Miracle-Gro Co. (The) | ||||
| 02/01/2032 | 4.375% | 136,000 | 102,661 | |
| Spectrum Brands, Inc.(a) | ||||
| 10/01/2029 | 5.000% | 114,000 | 99,495 | |
| Tempur Sealy International, Inc.(a) | ||||
| 10/15/2031 | 3.875% | 212,000 | 163,265 | |
| Total | 1,396,370 | |||
| Diversified Manufacturing 0.2% | ||||
| Carrier Global Corp. | ||||
| 04/05/2040 | 3.377% | 10,375,000 | 8,190,098 | |
| 18 | Columbia Balanced Fund | Annual Report 2022 |
August 31, 2022
| Corporate Bonds & Notes (continued) | ||||
| Issuer | Coupon Rate | Principal Amount ($) | Value ($) | |
| Gates Global LLC/Co.(a) | ||||
| 01/15/2026 | 6.250% | 524,000 | 496,854 | |
| GE Capital International Funding Co. Unlimited Co. | ||||
| 11/15/2035 | 4.418% | 6,500,000 | 6,129,485 | |
| Madison IAQ LLC(a) | ||||
| 06/30/2028 | 4.125% | 207,000 | 178,255 | |
| 06/30/2029 | 5.875% | 213,000 | 175,408 | |
| Resideo Funding, Inc.(a) | ||||
| 09/01/2029 | 4.000% | 554,000 | 470,437 | |
| Stevens Holding Co., Inc.(a) | ||||
| 10/01/2026 | 6.125% | 71,000 | 70,752 | |
| Vertical Holdco GmbH(a) | ||||
| 07/15/2028 | 7.625% | 182,000 | 162,878 | |
| Vertical US Newco, Inc.(a) | ||||
| 07/15/2027 | 5.250% | 151,000 | 137,434 | |
| WESCO Distribution, Inc.(a) | ||||
| 06/15/2025 | 7.125% | 268,000 | 269,092 | |
| 06/15/2028 | 7.250% | 264,000 | 266,543 | |
| Total | 16,547,236 | |||
| Electric 0.8% | ||||
| Berkshire Hathaway Energy Co. | ||||
| 10/15/2050 | 4.250% | 2,099,000 | 1,922,619 | |
| Calpine Corp.(a) | ||||
| 02/15/2028 | 4.500% | 188,000 | 172,018 | |
| CenterPoint Energy, Inc. | ||||
| 06/01/2031 | 2.650% | 5,875,000 | 5,018,204 | |
| Clearway Energy Operating LLC(a) | ||||
| 03/15/2028 | 4.750% | 368,000 | 344,702 | |
| 02/15/2031 | 3.750% | 479,000 | 401,935 | |
| 01/15/2032 | 3.750% | 102,000 | 85,501 | |
| CMS Energy Corp. | ||||
| 03/01/2044 | 4.875% | 1,612,000 | 1,512,315 | |
| Consolidated Edison Co. of New York, Inc. | ||||
| 12/01/2045 | 4.500% | 2,500,000 | 2,297,318 | |
| Dominion Energy, Inc. | ||||
| 08/15/2032 | 4.350% | 4,610,000 | 4,449,048 | |
| Emera US Finance LP | ||||
| 06/15/2046 | 4.750% | 7,485,000 | 6,572,772 | |
| Eversource Energy | ||||
| 03/01/2032 | 3.375% | 3,625,000 | 3,261,437 | |
| Exelon Corp.(a) | ||||
| 03/15/2052 | 4.100% | 6,865,000 | 5,932,528 | |
| Indiana Michigan Power Co. | ||||
| 03/15/2037 | 6.050% | 3,700,000 | 4,039,741 | |
| Leeward Renewable Energy Operations LLC(a) | ||||
| 07/01/2029 | 4.250% | 80,000 | 66,127 | |
| Corporate Bonds & Notes (continued) | ||||
| Issuer | Coupon Rate | Principal Amount ($) | Value ($) | |
| NextEra Energy Operating Partners LP(a) | ||||
| 09/15/2027 | 4.500% | 305,000 | 282,011 | |
| NRG Energy, Inc.(a) | ||||
| 02/15/2029 | 3.375% | 190,000 | 157,075 | |
| 06/15/2029 | 5.250% | 154,000 | 137,730 | |
| 02/15/2031 | 3.625% | 272,000 | 216,017 | |
| 02/15/2032 | 3.875% | 483,000 | 381,883 | |
| Pennsylvania Electric Co.(a) | ||||
| 06/01/2029 | 3.600% | 6,400,000 | 5,978,006 | |
| PG&E Corp. | ||||
| 07/01/2030 | 5.250% | 220,000 | 190,332 | |
| Progress Energy, Inc. | ||||
| 03/01/2031 | 7.750% | 5,500,000 | 6,358,599 | |
| Southern Co. (The) | ||||
| 07/01/2046 | 4.400% | 6,000,000 | 5,290,454 | |
| Vistra Operations Co. LLC(a) | ||||
| 09/01/2026 | 5.500% | 75,000 | 72,390 | |
| 02/15/2027 | 5.625% | 354,000 | 342,207 | |
| 07/31/2027 | 5.000% | 379,000 | 353,029 | |
| 05/01/2029 | 4.375% | 113,000 | 98,471 | |
| Xcel Energy, Inc. | ||||
| 06/01/2030 | 3.400% | 6,000,000 | 5,502,617 | |
| Total | 61,437,086 | |||
| Environmental 0.1% | ||||
| GFL Environmental, Inc.(a) | ||||
| 12/15/2026 | 5.125% | 319,000 | 309,109 | |
| Waste Connections, Inc. | ||||
| 01/15/2033 | 4.200% | 7,300,000 | 7,007,300 | |
| Waste Pro USA, Inc.(a) | ||||
| 02/15/2026 | 5.500% | 517,000 | 471,826 | |
| Total | 7,788,235 | |||
| Finance Companies 0.0% | ||||
| Navient Corp. | ||||
| 06/25/2025 | 6.750% | 200,000 | 193,088 | |
| Provident Funding Associates LP/Finance Corp.(a) | ||||
| 06/15/2025 | 6.375% | 291,000 | 273,632 | |
| Quicken Loans LLC/Co-Issuer, Inc.(a) | ||||
| 03/01/2031 | 3.875% | 353,000 | 276,792 | |
| Rocket Mortgage LLC/Co-Issuer, Inc.(a) | ||||
| 10/15/2033 | 4.000% | 587,000 | 437,734 | |
| Springleaf Finance Corp. | ||||
| 03/15/2024 | 6.125% | 221,000 | 215,900 | |
| Total | 1,397,146 | |||
| Columbia Balanced Fund | Annual Report 2022 | 19 |
August 31, 2022
| Corporate Bonds & Notes (continued) | ||||
| Issuer | Coupon Rate | Principal Amount ($) | Value ($) | |
| Food and Beverage 0.4% | ||||
| Anheuser-Busch InBev Worldwide, Inc. | ||||
| 01/15/2042 | 4.950% | 8,825,000 | 8,596,224 | |
| Bacardi Ltd.(a) | ||||
| 05/15/2038 | 5.150% | 8,350,000 | 7,891,090 | |
| Darling Ingredients, Inc.(a) | ||||
| 06/15/2030 | 6.000% | 275,000 | 275,268 | |
| FAGE International SA/USA Dairy Industry, Inc.(a) | ||||
| 08/15/2026 | 5.625% | 464,000 | 427,447 | |
| JBS USA LUX SA/Food Co./Finance, Inc.(a) | ||||
| 12/01/2031 | 3.750% | 191,000 | 166,619 | |
| Kraft Heinz Foods Co. | ||||
| 06/01/2046 | 4.375% | 11,530,000 | 9,784,278 | |
| Pilgrim’s Pride Corp.(a) | ||||
| 04/15/2031 | 4.250% | 515,000 | 443,942 | |
| 03/01/2032 | 3.500% | 556,000 | 451,829 | |
| Post Holdings, Inc.(a) | ||||
| 03/01/2027 | 5.750% | 182,000 | 178,434 | |
| 01/15/2028 | 5.625% | 152,000 | 144,402 | |
| 04/15/2030 | 4.625% | 322,000 | 279,730 | |
| 09/15/2031 | 4.500% | 115,000 | 97,780 | |
| Primo Water Holdings, Inc.(a) | ||||
| 04/30/2029 | 4.375% | 621,000 | 531,323 | |
| Simmons Foods, Inc./Prepared Foods, Inc./Pet Food, Inc./Feed(a) | ||||
| 03/01/2029 | 4.625% | 149,000 | 131,883 | |
| US Foods, Inc.(a) | ||||
| 04/15/2025 | 6.250% | 58,000 | 58,236 | |
| 02/15/2029 | 4.750% | 269,000 | 238,946 | |
| 06/01/2030 | 4.625% | 175,000 | 151,027 | |
| Total | 29,848,458 | |||
| Gaming 0.0% | ||||
| Boyd Gaming Corp. | ||||
| 12/01/2027 | 4.750% | 240,000 | 224,360 | |
| Boyd Gaming Corp.(a) | ||||
| 06/15/2031 | 4.750% | 166,000 | 144,613 | |
| Caesars Entertainment, Inc.(a) | ||||
| 10/15/2029 | 4.625% | 594,000 | 477,977 | |
| Colt Merger Sub, Inc.(a) | ||||
| 07/01/2025 | 5.750% | 310,000 | 304,606 | |
| 07/01/2025 | 6.250% | 311,000 | 303,645 | |
| 07/01/2027 | 8.125% | 269,000 | 264,713 | |
| International Game Technology PLC(a) | ||||
| 02/15/2025 | 6.500% | 113,000 | 112,195 | |
| 04/15/2026 | 4.125% | 122,000 | 112,146 | |
| Midwest Gaming Borrower LLC(a) | ||||
| 05/01/2029 | 4.875% | 261,000 | 229,473 | |
| Corporate Bonds & Notes (continued) | ||||
| Issuer | Coupon Rate | Principal Amount ($) | Value ($) | |
| Scientific Games Holdings LP/US FinCo, Inc.(a) | ||||
| 03/01/2030 | 6.625% | 434,000 | 387,028 | |
| Wynn Resorts Finance LLC/Capital Corp.(a) | ||||
| 04/15/2025 | 7.750% | 160,000 | 159,548 | |
| Total | 2,720,304 | |||
| Health Care 0.4% | ||||
| Acadia Healthcare Co., Inc.(a) | ||||
| 07/01/2028 | 5.500% | 318,000 | 300,666 | |
| 04/15/2029 | 5.000% | 161,000 | 149,334 | |
| AdaptHealth LLC(a) | ||||
| 03/01/2030 | 5.125% | 618,000 | 530,740 | |
| Avantor Funding, Inc.(a) | ||||
| 07/15/2028 | 4.625% | 283,000 | 257,556 | |
| 11/01/2029 | 3.875% | 339,000 | 294,386 | |
| Becton Dickinson and Co. | ||||
| 12/15/2044 | 4.685% | 5,087,000 | 4,823,176 | |
| Catalent Pharma Solutions, Inc.(a) | ||||
| 04/01/2030 | 3.500% | 136,000 | 112,330 | |
| Change Healthcare Holdings LLC/Finance, Inc.(a) | ||||
| 03/01/2025 | 5.750% | 312,000 | 308,125 | |
| Charles River Laboratories International, Inc.(a) | ||||
| 05/01/2028 | 4.250% | 160,000 | 146,974 | |
| 03/15/2029 | 3.750% | 122,000 | 105,315 | |
| CHS/Community Health Systems, Inc.(a) | ||||
| 03/15/2026 | 8.000% | 118,000 | 110,366 | |
| 03/15/2027 | 5.625% | 75,000 | 63,610 | |
| 04/15/2029 | 6.875% | 240,000 | 149,752 | |
| 05/15/2030 | 5.250% | 442,000 | 334,550 | |
| Cigna Corp. | ||||
| 07/15/2046 | 4.800% | 3,000,000 | 2,798,955 | |
| CVS Health Corp. | ||||
| 03/25/2048 | 5.050% | 7,500,000 | 7,218,923 | |
| HCA, Inc.(a) | ||||
| 03/15/2052 | 4.625% | 9,675,000 | 8,006,653 | |
| Mozart Debt Merger Sub, Inc.(a) | ||||
| 04/01/2029 | 3.875% | 58,000 | 49,111 | |
| 10/01/2029 | 5.250% | 102,000 | 85,736 | |
| Owens & Minor, Inc.(a) | ||||
| 04/01/2030 | 6.625% | 284,000 | 261,915 | |
| Select Medical Corp.(a) | ||||
| 08/15/2026 | 6.250% | 811,000 | 779,292 | |
| Tenet Healthcare Corp. | ||||
| 07/15/2024 | 4.625% | 106,000 | 103,857 | |
| Tenet Healthcare Corp.(a) | ||||
| 02/01/2027 | 6.250% | 370,000 | 356,701 | |
| 11/01/2027 | 5.125% | 237,000 | 219,686 | |
| 10/01/2028 | 6.125% | 331,000 | 303,478 | |
| 01/15/2030 | 4.375% | 186,000 | 162,749 | |
| 20 | Columbia Balanced Fund | Annual Report 2022 |
August 31, 2022
| Corporate Bonds & Notes (continued) | ||||
| Issuer | Coupon Rate | Principal Amount ($) | Value ($) | |
| 06/15/2030 | 6.125% | 179,000 | 171,891 | |
| Total | 28,205,827 | |||
| Healthcare Insurance 0.2% | ||||
| Anthem, Inc. | ||||
| 03/01/2028 | 4.101% | 1,500,000 | 1,469,429 | |
| Centene Corp. | ||||
| 12/15/2029 | 4.625% | 476,000 | 448,429 | |
| 02/15/2030 | 3.375% | 173,000 | 148,392 | |
| 08/01/2031 | 2.625% | 152,000 | 121,467 | |
| UnitedHealth Group, Inc. | ||||
| 05/15/2062 | 4.950% | 10,920,000 | 10,957,141 | |
| Total | 13,144,858 | |||
| Home Construction 0.0% | ||||
| Meritage Homes Corp. | ||||
| 06/01/2025 | 6.000% | 302,000 | 301,301 | |
| Meritage Homes Corp.(a) | ||||
| 04/15/2029 | 3.875% | 276,000 | 235,715 | |
| Shea Homes LP/Funding Corp.(a) | ||||
| 02/15/2028 | 4.750% | 167,000 | 139,320 | |
| Taylor Morrison Communities, Inc.(a) | ||||
| 06/15/2027 | 5.875% | 70,000 | 67,675 | |
| 08/01/2030 | 5.125% | 201,000 | 172,510 | |
| Taylor Morrison Communities, Inc./Holdings II(a) | ||||
| 04/15/2023 | 5.875% | 227,000 | 226,387 | |
| Total | 1,142,908 | |||
| Independent Energy 0.1% | ||||
| Apache Corp. | ||||
| 09/01/2040 | 5.100% | 180,000 | 154,992 | |
| 02/01/2042 | 5.250% | 105,000 | 89,998 | |
| 04/15/2043 | 4.750% | 263,000 | 208,410 | |
| Callon Petroleum Co. | ||||
| 07/01/2026 | 6.375% | 588,000 | 550,779 | |
| CNX Resources Corp.(a) | ||||
| 03/14/2027 | 7.250% | 333,000 | 330,982 | |
| 01/15/2029 | 6.000% | 176,000 | 165,584 | |
| Colgate Energy Partners III LLC(a) | ||||
| 07/01/2029 | 5.875% | 392,000 | 364,871 | |
| CrownRock LP/Finance, Inc.(a) | ||||
| 10/15/2025 | 5.625% | 329,000 | 324,079 | |
| 05/01/2029 | 5.000% | 267,000 | 247,112 | |
| Endeavor Energy Resources LP/Finance, Inc.(a) | ||||
| 01/30/2028 | 5.750% | 346,000 | 341,935 | |
| Corporate Bonds & Notes (continued) | ||||
| Issuer | Coupon Rate | Principal Amount ($) | Value ($) | |
| Hilcorp Energy I LP/Finance Co.(a) | ||||
| 11/01/2028 | 6.250% | 379,000 | 359,358 | |
| 02/01/2029 | 5.750% | 103,000 | 94,642 | |
| 04/15/2030 | 6.000% | 131,000 | 120,844 | |
| 04/15/2032 | 6.250% | 121,000 | 108,820 | |
| Matador Resources Co. | ||||
| 09/15/2026 | 5.875% | 425,000 | 416,546 | |
| Occidental Petroleum Corp. | ||||
| 09/01/2030 | 6.625% | 1,487,000 | 1,589,622 | |
| 09/15/2036 | 6.450% | 649,000 | 694,157 | |
| SM Energy Co. | ||||
| 09/15/2026 | 6.750% | 253,000 | 248,290 | |
| Southwestern Energy Co. | ||||
| 02/01/2032 | 4.750% | 570,000 | 507,609 | |
| Total | 6,918,630 | |||
| Integrated Energy 0.0% | ||||
| Cenovus Energy, Inc. | ||||
| 02/15/2052 | 3.750% | 4,675,000 | 3,596,506 | |
| Leisure 0.1% | ||||
| Carnival Corp.(a) | ||||
| 03/01/2026 | 7.625% | 111,000 | 94,409 | |
| 03/01/2027 | 5.750% | 757,000 | 584,904 | |
| 08/01/2028 | 4.000% | 341,000 | 284,205 | |
| 05/01/2029 | 6.000% | 274,000 | 207,625 | |
| Cedar Fair LP/Canada’s Wonderland Co./Magnum Management Corp./Millennium Operations LLC(a) | ||||
| 05/01/2025 | 5.500% | 139,000 | 136,740 | |
| Cedar Fair LP/Canada’s Wonderland Co./Magnum Management Corp./Millennium Operations LLC | ||||
| 10/01/2028 | 6.500% | 359,000 | 351,547 | |
| Cinemark USA, Inc.(a) | ||||
| 05/01/2025 | 8.750% | 88,000 | 90,920 | |
| 03/15/2026 | 5.875% | 238,000 | 211,263 | |
| Live Nation Entertainment, Inc.(a) | ||||
| 03/15/2026 | 5.625% | 291,000 | 282,869 | |
| 05/15/2027 | 6.500% | 204,000 | 203,719 | |
| 10/15/2027 | 4.750% | 109,000 | 99,893 | |
| NCL Corp., Ltd.(a) | ||||
| 03/15/2026 | 5.875% | 152,000 | 121,668 | |
| NCL Finance Ltd.(a) | ||||
| 03/15/2028 | 6.125% | 78,000 | 60,389 | |
| Royal Caribbean Cruises Ltd.(a) | ||||
| 07/01/2026 | 4.250% | 392,000 | 303,705 | |
| 08/31/2026 | 5.500% | 120,000 | 95,998 | |
| 07/15/2027 | 5.375% | 118,000 | 92,281 | |
| 04/01/2028 | 5.500% | 255,000 | 192,569 | |
| Royal Caribbean Cruises Ltd. | ||||
| 03/15/2028 | 3.700% | 208,000 | 141,557 | |
| Columbia Balanced Fund | Annual Report 2022 | 21 |
August 31, 2022
| Corporate Bonds & Notes (continued) | ||||
| Issuer | Coupon Rate | Principal Amount ($) | Value ($) | |
| Six Flags Entertainment Corp.(a) | ||||
| 07/31/2024 | 4.875% | 335,000 | 322,956 | |
| Total | 3,879,217 | |||
| Life Insurance 0.4% | ||||
| CoreBridge Financial, Inc.(a) | ||||
| 04/05/2052 | 4.400% | 8,500,000 | 6,989,069 | |
| Five Corners Funding Trust II(a) | ||||
| 05/15/2030 | 2.850% | 9,500,000 | 8,248,657 | |
| MetLife, Inc. | ||||
| 07/15/2052 | 5.000% | 1,193,000 | 1,206,616 | |
| Peachtree Corners Funding Trust(a) | ||||
| 02/15/2025 | 3.976% | 2,000,000 | 1,971,525 | |
| Teachers Insurance & Annuity Association of America(a) | ||||
| Subordinated | ||||
| 09/15/2044 | 4.900% | 2,800,000 | 2,722,844 | |
| Voya Financial, Inc. | ||||
| 06/15/2046 | 4.800% | 7,528,000 | 6,683,453 | |
| Total | 27,822,164 | |||
| Lodging 0.0% | ||||
| Hilton Domestic Operating Co., Inc.(a) | ||||
| 05/01/2028 | 5.750% | 230,000 | 224,962 | |
| Media and Entertainment 0.2% | ||||
| Cengage Learning, Inc.(a) | ||||
| 06/15/2024 | 9.500% | 176,000 | 169,210 | |
| Clear Channel Outdoor Holdings, Inc.(a) | ||||
| 04/15/2028 | 7.750% | 312,000 | 254,009 | |
| 06/01/2029 | 7.500% | 290,000 | 233,181 | |
| Clear Channel Worldwide Holdings, Inc.(a) | ||||
| 08/15/2027 | 5.125% | 559,000 | 501,686 | |
| iHeartCommunications, Inc. | ||||
| 05/01/2026 | 6.375% | 40,481 | 38,274 | |
| 05/01/2027 | 8.375% | 551,365 | 485,141 | |
| iHeartCommunications, Inc.(a) | ||||
| 08/15/2027 | 5.250% | 170,000 | 153,067 | |
| 01/15/2028 | 4.750% | 318,000 | 272,679 | |
| Magallanes, Inc.(a) | ||||
| 03/15/2062 | 5.391% | 13,497,000 | 10,853,719 | |
| Outfront Media Capital LLC/Corp.(a) | ||||
| 08/15/2027 | 5.000% | 287,000 | 263,513 | |
| 03/15/2030 | 4.625% | 194,000 | 161,967 | |
| Roblox Corp.(a) | ||||
| 05/01/2030 | 3.875% | 344,000 | 289,224 | |
| Scripps Escrow II, Inc.(a) | ||||
| 01/15/2029 | 3.875% | 46,000 | 39,015 | |
| 01/15/2031 | 5.375% | 88,000 | 72,807 | |
| Corporate Bonds & Notes (continued) | ||||
| Issuer | Coupon Rate | Principal Amount ($) | Value ($) | |
| Scripps Escrow, Inc.(a) | ||||
| 07/15/2027 | 5.875% | 71,000 | 64,317 | |
| Univision Communications, Inc.(a) | ||||
| 05/01/2029 | 4.500% | 157,000 | 137,270 | |
| 06/30/2030 | 7.375% | 210,000 | 208,352 | |
| Total | 14,197,431 | |||
| Metals and Mining 0.1% | ||||
| Allegheny Technologies, Inc. | ||||
| 10/01/2029 | 4.875% | 189,000 | 169,813 | |
| 10/01/2031 | 5.125% | 301,000 | 264,816 | |
| Constellium NV(a) | ||||
| 02/15/2026 | 5.875% | 523,000 | 505,383 | |
| Constellium SE(a) | ||||
| 06/15/2028 | 5.625% | 595,000 | 538,067 | |
| 04/15/2029 | 3.750% | 849,000 | 701,836 | |
| Hudbay Minerals, Inc.(a) | ||||
| 04/01/2026 | 4.500% | 803,000 | 729,247 | |
| 04/01/2029 | 6.125% | 274,000 | 241,411 | |
| Kaiser Aluminum Corp.(a) | ||||
| 03/01/2028 | 4.625% | 187,000 | 159,426 | |
| 06/01/2031 | 4.500% | 479,000 | 377,687 | |
| Novelis Corp.(a) | ||||
| 11/15/2026 | 3.250% | 177,000 | 157,530 | |
| 01/30/2030 | 4.750% | 330,000 | 288,413 | |
| 08/15/2031 | 3.875% | 170,000 | 137,176 | |
| Total | 4,270,805 | |||
| Midstream 0.5% | ||||
| Cheniere Energy Partners LP | ||||
| 10/01/2029 | 4.500% | 122,000 | 112,398 | |
| 03/01/2031 | 4.000% | 237,000 | 206,713 | |
| 01/31/2032 | 3.250% | 407,000 | 325,554 | |
| Cheniere Energy, Inc. | ||||
| 10/15/2028 | 4.625% | 158,000 | 152,155 | |
| CNX Midstream Partners LP(a) | ||||
| 04/15/2030 | 4.750% | 220,000 | 184,803 | |
| Delek Logistics Partners LP/Finance Corp. | ||||
| 05/15/2025 | 6.750% | 194,000 | 190,471 | |
| DT Midstream, Inc.(a) | ||||
| 06/15/2029 | 4.125% | 199,000 | 174,911 | |
| 06/15/2031 | 4.375% | 232,000 | 199,691 | |
| Energy Transfer Partners LP | ||||
| 02/01/2042 | 6.500% | 3,000,000 | 3,025,189 | |
| EQM Midstream Partners LP | ||||
| 08/01/2024 | 4.000% | 141,000 | 133,929 | |
| 22 | Columbia Balanced Fund | Annual Report 2022 |
August 31, 2022
| Corporate Bonds & Notes (continued) | ||||
| Issuer | Coupon Rate | Principal Amount ($) | Value ($) | |
| EQM Midstream Partners LP(a) | ||||
| 07/01/2025 | 6.000% | 358,000 | 346,283 | |
| 06/01/2027 | 7.500% | 91,000 | 90,086 | |
| 07/01/2027 | 6.500% | 202,000 | 195,368 | |
| 06/01/2030 | 7.500% | 109,000 | 108,245 | |
| 01/15/2031 | 4.750% | 791,000 | 683,673 | |
| Holly Energy Partners LP/Finance Corp.(a) | ||||
| 04/15/2027 | 6.375% | 236,000 | 232,767 | |
| 02/01/2028 | 5.000% | 267,000 | 246,551 | |
| Kinder Morgan Energy Partners LP | ||||
| 03/01/2044 | 5.500% | 7,000,000 | 6,555,384 | |
| MPLX LP | ||||
| 02/15/2049 | 5.500% | 5,100,000 | 4,855,713 | |
| NuStar Logistics LP | ||||
| 06/01/2026 | 6.000% | 220,000 | 208,349 | |
| 04/28/2027 | 5.625% | 245,000 | 225,188 | |
| 10/01/2030 | 6.375% | 246,000 | 223,954 | |
| Plains All American Pipeline LP/Finance Corp. | ||||
| 01/15/2037 | 6.650% | 9,660,000 | 9,687,834 | |
| Rockpoint Gas Storage Canada Ltd.(a) | ||||
| 03/31/2023 | 7.000% | 184,000 | 182,772 | |
| Targa Resources Partners LP/Finance Corp. | ||||
| 03/01/2030 | 5.500% | 257,000 | 248,743 | |
| TransMontaigne Partners LP/TLP Finance Corp. | ||||
| 02/15/2026 | 6.125% | 235,000 | 201,775 | |
| Venture Global Calcasieu Pass LLC(a) | ||||
| 08/15/2029 | 3.875% | 308,000 | 270,420 | |
| 08/15/2031 | 4.125% | 514,000 | 448,119 | |
| 11/01/2033 | 3.875% | 267,000 | 221,849 | |
| Western Gas Partners LP | ||||
| 08/15/2048 | 5.500% | 177,000 | 156,414 | |
| Western Midstream Operating LP | ||||
| 03/01/2028 | 4.500% | 397,000 | 368,950 | |
| Williams Companies, Inc. (The) | ||||
| 09/15/2045 | 5.100% | 6,500,000 | 6,083,750 | |
| Total | 36,548,001 | |||
| Natural Gas 0.1% | ||||
| NiSource, Inc. | ||||
| 02/15/2044 | 4.800% | 8,502,000 | 7,796,019 | |
| Oil Field Services 0.0% | ||||
| Archrock Partners LP/Finance Corp.(a) | ||||
| 04/01/2028 | 6.250% | 169,000 | 154,239 | |
| Transocean Sentry Ltd.(a) | ||||
| 05/15/2023 | 5.375% | 396,840 | 384,926 | |
| USA Compression Partners LP/Finance Corp. | ||||
| 09/01/2027 | 6.875% | 161,000 | 149,129 | |
| Total | 688,294 | |||
| Corporate Bonds & Notes (continued) | ||||
| Issuer | Coupon Rate | Principal Amount ($) | Value ($) | |
| Other Industry 0.0% | ||||
| Picasso Finance Sub, Inc.(a) | ||||
| 06/15/2025 | 6.125% | 219,000 | 219,694 | |
| Other REIT 0.0% | ||||
| Blackstone Mortgage Trust, Inc.(a) | ||||
| 01/15/2027 | 3.750% | 175,000 | 153,578 | |
| Ladder Capital Finance Holdings LLLP/Corp.(a) | ||||
| 10/01/2025 | 5.250% | 498,000 | 481,544 | |
| 02/01/2027 | 4.250% | 169,000 | 147,541 | |
| 06/15/2029 | 4.750% | 510,000 | 434,180 | |
| Park Intermediate Holdings LLC/Domestic Property/Finance Co-Issuer(a) | ||||
| 10/01/2028 | 5.875% | 276,000 | 253,704 | |
| Park Intermediate Holdings LLC/PK Domestic Property LLC/Finance Co-Issuer(a) | ||||
| 05/15/2029 | 4.875% | 155,000 | 136,584 | |
| RLJ Lodging Trust LP(a) | ||||
| 07/01/2026 | 3.750% | 138,000 | 124,012 | |
| 09/15/2029 | 4.000% | 129,000 | 108,497 | |
| Total | 1,839,640 | |||
| Packaging 0.0% | ||||
| Ardagh Metal Packaging Finance USA LLC/PLC(a) | ||||
| 06/15/2027 | 6.000% | 354,000 | 347,930 | |
| 09/01/2029 | 4.000% | 602,000 | 494,954 | |
| Ardagh Packaging Finance PLC/Holdings USA, Inc.(a) | ||||
| 08/15/2026 | 4.125% | 226,000 | 195,106 | |
| Canpack SA/US LLC(a) | ||||
| 11/15/2029 | 3.875% | 428,000 | 350,772 | |
| Trivium Packaging Finance BV(a) | ||||
| 08/15/2026 | 5.500% | 388,000 | 372,385 | |
| Total | 1,761,147 | |||
| Pharmaceuticals 0.3% | ||||
| AbbVie, Inc. | ||||
| 03/15/2035 | 4.550% | 1,750,000 | 1,678,489 | |
| 11/06/2042 | 4.400% | 8,285,000 | 7,489,054 | |
| Amgen, Inc. | ||||
| 09/01/2053 | 2.770% | 12,184,000 | 8,093,114 | |
| AstraZeneca Finance LLC | ||||
| 05/28/2031 | 2.250% | 5,550,000 | 4,811,568 | |
| Bausch Health Companies, Inc.(a) | ||||
| 02/01/2027 | 6.125% | 130,000 | 96,613 | |
| 08/15/2027 | 5.750% | 170,000 | 124,212 | |
| 06/01/2028 | 4.875% | 96,000 | 66,270 | |
| 02/15/2029 | 5.000% | 199,000 | 77,644 | |
| 02/15/2031 | 5.250% | 80,000 | 30,688 | |
| Bristol Myers Squibb Co. | ||||
| 02/20/2048 | 4.550% | 4,298,000 | 4,169,305 | |
| Columbia Balanced Fund | Annual Report 2022 | 23 |
August 31, 2022
| Corporate Bonds & Notes (continued) | ||||
| Issuer | Coupon Rate | Principal Amount ($) | Value ($) | |
| Grifols Escrow Issuer SA(a) | ||||
| 10/15/2028 | 4.750% | 211,000 | 178,869 | |
| Organon Finance 1 LLC(a) | ||||
| 04/30/2028 | 4.125% | 144,000 | 129,089 | |
| 04/30/2031 | 5.125% | 415,000 | 363,145 | |
| Total | 27,308,060 | |||
| Property & Casualty 0.2% | ||||
| Alliant Holdings Intermediate LLC/Co-Issuer(a) | ||||
| 10/15/2027 | 4.250% | 451,000 | 409,345 | |
| 10/15/2027 | 6.750% | 721,000 | 656,846 | |
| 11/01/2029 | 5.875% | 197,000 | 171,372 | |
| American International Group, Inc. | ||||
| 06/30/2050 | 4.375% | 2,000,000 | 1,795,529 | |
| AssuredPartners, Inc.(a) | ||||
| 08/15/2025 | 7.000% | 120,000 | 115,349 | |
| 01/15/2029 | 5.625% | 372,000 | 312,263 | |
| Berkshire Hathaway Finance Corp. | ||||
| 03/15/2052 | 3.850% | 8,000,000 | 6,892,030 | |
| BroadStreet Partners, Inc.(a) | ||||
| 04/15/2029 | 5.875% | 417,000 | 345,882 | |
| HUB International Ltd.(a) | ||||
| 05/01/2026 | 7.000% | 295,000 | 289,082 | |
| 12/01/2029 | 5.625% | 378,000 | 331,830 | |
| Loews Corp. | ||||
| 05/15/2030 | 3.200% | 4,000,000 | 3,596,102 | |
| Radian Group, Inc. | ||||
| 03/15/2027 | 4.875% | 126,000 | 117,417 | |
| Ryan Specialty Group LLC(a) | ||||
| 02/01/2030 | 4.375% | 106,000 | 95,611 | |
| USI, Inc.(a) | ||||
| 05/01/2025 | 6.875% | 232,000 | 225,205 | |
| Total | 15,353,863 | |||
| Railroads 0.1% | ||||
| CSX Corp. | ||||
| 03/15/2044 | 4.100% | 6,290,000 | 5,575,471 | |
| Union Pacific Corp. | ||||
| 09/15/2037 | 3.600% | 4,500,000 | 4,012,640 | |
| Total | 9,588,111 | |||
| Restaurants 0.0% | ||||
| 1011778 BC ULC/New Red Finance, Inc.(a) | ||||
| 01/15/2028 | 3.875% | 359,000 | 319,307 | |
| 10/15/2030 | 4.000% | 117,000 | 94,943 | |
| IRB Holding Corp.(a) | ||||
| 06/15/2025 | 7.000% | 361,000 | 363,399 | |
| Total | 777,649 | |||
| Corporate Bonds & Notes (continued) | ||||
| Issuer | Coupon Rate | Principal Amount ($) | Value ($) | |
| Retailers 0.1% | ||||
| Asbury Automotive Group, Inc.(a) | ||||
| 11/15/2029 | 4.625% | 248,000 | 212,719 | |
| 02/15/2032 | 5.000% | 270,000 | 225,568 | |
| Group 1 Automotive, Inc.(a) | ||||
| 08/15/2028 | 4.000% | 237,000 | 202,548 | |
| L Brands, Inc.(a) | ||||
| 07/01/2025 | 9.375% | 33,000 | 34,917 | |
| 10/01/2030 | 6.625% | 311,000 | 282,649 | |
| L Brands, Inc. | ||||
| 06/15/2029 | 7.500% | 143,000 | 137,555 | |
| Lowe’s Companies, Inc. | ||||
| 04/01/2052 | 4.250% | 6,000,000 | 5,118,655 | |
| PetSmart, Inc./Finance Corp.(a) | ||||
| 02/15/2028 | 4.750% | 263,000 | 236,709 | |
| 02/15/2029 | 7.750% | 217,000 | 203,719 | |
| Total | 6,655,039 | |||
| Supermarkets 0.0% | ||||
| Albertsons Companies LLC/Safeway, Inc./New Albertsons LP/Albertsons LLC(a) | ||||
| 03/15/2026 | 7.500% | 95,000 | 97,265 | |
| 02/15/2028 | 5.875% | 158,000 | 150,591 | |
| Albertsons Companies, Inc./Safeway, Inc./New Albertsons LP/Albertsons LLC(a) | ||||
| 03/15/2026 | 3.250% | 130,000 | 117,264 | |
| Total | 365,120 | |||
| Technology 0.4% | ||||
| Black Knight InfoServ LLC(a) | ||||
| 09/01/2028 | 3.625% | 254,000 | 222,730 | |
| Boxer Parent Co., Inc.(a) | ||||
| 10/02/2025 | 7.125% | 88,000 | 87,623 | |
| Broadcom, Inc.(a) | ||||
| 02/15/2051 | 3.750% | 9,047,000 | 6,677,554 | |
| Camelot Finance SA(a) | ||||
| 11/01/2026 | 4.500% | 118,000 | 109,702 | |
| Clarivate Science Holdings Corp.(a) | ||||
| 07/01/2028 | 3.875% | 160,000 | 137,300 | |
| 07/01/2029 | 4.875% | 452,000 | 374,125 | |
| CommScope Technologies LLC(a) | ||||
| 06/15/2025 | 6.000% | 168,000 | 152,591 | |
| Condor Merger Sub, Inc.(a) | ||||
| 02/15/2030 | 7.375% | 264,000 | 220,053 | |
| Dun & Bradstreet Corp. (The)(a) | ||||
| 12/15/2029 | 5.000% | 233,000 | 206,752 | |
| Entegris Escrow Corp.(a) | ||||
| 06/15/2030 | 5.950% | 319,000 | 302,770 | |
| 24 | Columbia Balanced Fund | Annual Report 2022 |
August 31, 2022
| Corporate Bonds & Notes (continued) | ||||
| Issuer | Coupon Rate | Principal Amount ($) | Value ($) | |
| Gartner, Inc.(a) | ||||
| 10/01/2030 | 3.750% | 260,000 | 223,036 | |
| HealthEquity, Inc.(a) | ||||
| 10/01/2029 | 4.500% | 165,000 | 145,040 | |
| Helios Software Holdings, Inc.(a) | ||||
| 05/01/2028 | 4.625% | 176,000 | 141,965 | |
| International Business Machines Corp. | ||||
| 05/15/2040 | 2.850% | 3,100,000 | 2,366,061 | |
| ION Trading Technologies Sarl(a) | ||||
| 05/15/2028 | 5.750% | 200,000 | 170,137 | |
| Iron Mountain, Inc.(a) | ||||
| 09/15/2027 | 4.875% | 91,000 | 83,502 | |
| 03/15/2028 | 5.250% | 159,000 | 146,823 | |
| 07/15/2028 | 5.000% | 350,000 | 319,501 | |
| 07/15/2030 | 5.250% | 167,000 | 147,796 | |
| Logan Merger Sub, Inc.(a) | ||||
| 09/01/2027 | 5.500% | 532,000 | 390,793 | |
| Minerva Merger Sub, Inc.(a) | ||||
| 02/15/2030 | 6.500% | 409,000 | 347,159 | |
| NCR Corp.(a) | ||||
| 09/01/2027 | 5.750% | 154,000 | 149,096 | |
| 10/01/2028 | 5.000% | 426,000 | 401,058 | |
| 04/15/2029 | 5.125% | 348,000 | 324,922 | |
| Nielsen Finance LLC/Co.(a) | ||||
| 07/15/2029 | 4.500% | 197,000 | 197,916 | |
| NXP BV/Funding LLC/USA, Inc. | ||||
| 05/01/2030 | 3.400% | 7,995,000 | 7,077,551 | |
| Oracle Corp. | ||||
| 04/15/2038 | 6.500% | 4,500,000 | 4,624,956 | |
| Plantronics, Inc.(a) | ||||
| 03/01/2029 | 4.750% | 608,000 | 608,972 | |
| QUALCOMM, Inc. | ||||
| 05/20/2050 | 3.250% | 2,125,000 | 1,728,335 | |
| RELX Capital, Inc. | ||||
| 05/20/2032 | 4.750% | 5,123,000 | 5,145,474 | |
| Sensata Technologies BV(a) | ||||
| 09/01/2030 | 5.875% | 207,000 | 202,293 | |
| Shift4 Payments LLC/Finance Sub, Inc.(a) | ||||
| 11/01/2026 | 4.625% | 354,000 | 330,624 | |
| Tempo Acquisition LLC/Finance Corp.(a) | ||||
| 06/01/2025 | 5.750% | 284,000 | 282,607 | |
| Verscend Escrow Corp.(a) | ||||
| 08/15/2026 | 9.750% | 409,000 | 413,284 | |
| ZoomInfo Technologies LLC/Finance Corp.(a) | ||||
| 02/01/2029 | 3.875% | 575,000 | 501,890 | |
| Total | 34,961,991 | |||
| Corporate Bonds & Notes (continued) | ||||
| Issuer | Coupon Rate | Principal Amount ($) | Value ($) | |
| Transportation Services 0.1% | ||||
| ERAC USA Finance LLC(a) | ||||
| 10/15/2037 | 7.000% | 5,050,000 | 5,720,831 | |
| Wireless 0.2% | ||||
| Altice France Holding SA(a) | ||||
| 02/15/2028 | 6.000% | 547,000 | 373,966 | |
| Altice France SA(a) | ||||
| 02/01/2027 | 8.125% | 209,000 | 198,862 | |
| 01/15/2028 | 5.500% | 582,000 | 481,562 | |
| 07/15/2029 | 5.125% | 200,000 | 151,981 | |
| American Tower Corp. | ||||
| 08/15/2029 | 3.800% | 4,750,000 | 4,379,486 | |
| Sprint Capital Corp. | ||||
| 03/15/2032 | 8.750% | 236,000 | 284,761 | |
| Sprint Corp. | ||||
| 03/01/2026 | 7.625% | 282,000 | 298,800 | |
| T-Mobile US, Inc. | ||||
| 10/15/2052 | 3.400% | 8,000,000 | 5,792,113 | |
| Vmed O2 UK Financing I PLC(a) | ||||
| 01/31/2031 | 4.250% | 165,000 | 132,926 | |
| 07/15/2031 | 4.750% | 331,000 | 272,669 | |
| Total | 12,367,126 | |||
| Wirelines 0.2% | ||||
| AT&T, Inc. | ||||
| 09/15/2053 | 3.500% | 13,115,000 | 9,741,155 | |
| Front Range BidCo, Inc.(a) | ||||
| 03/01/2027 | 4.000% | 257,000 | 219,162 | |
| Frontier Communications Holdings LLC(a) | ||||
| 05/15/2030 | 8.750% | 163,000 | 167,753 | |
| Iliad Holding SAS(a) | ||||
| 10/15/2026 | 6.500% | 339,000 | 311,426 | |
| 10/15/2028 | 7.000% | 505,000 | 465,022 | |
| Verizon Communications, Inc. | ||||
| 03/22/2061 | 3.700% | 10,000,000 | 7,717,313 | |
| Total | 18,621,831 | |||
| Total Corporate Bonds & Notes (Cost $700,627,798) | 610,001,137 | |||
| Exchange-Traded Equity Funds 0.8% | ||
| Shares | Value ($) | |
| International Mid Large Cap 0.8% | ||
| iShares Core MSCI EAFE ETF | 1,079,495 | 62,923,764 |
| Total Exchange-Traded Equity Funds (Cost $72,408,419) | 62,923,764 | |
| Columbia Balanced Fund | Annual Report 2022 | 25 |
August 31, 2022
| Foreign Government Obligations(g) 0.0% | ||||
| Issuer | Coupon Rate | Principal Amount ($) | Value ($) | |
| Canada 0.0% | ||||
| NOVA Chemicals Corp.(a) | ||||
| 06/01/2024 | 4.875% | 145,000 | 139,504 | |
| 06/01/2027 | 5.250% | 217,000 | 191,666 | |
| 05/15/2029 | 4.250% | 290,000 | 238,573 | |
| Total | 569,743 | |||
| Total Foreign Government Obligations (Cost $632,425) | 569,743 | |||
| Residential Mortgage-Backed Securities - Agency 7.8% | ||||
| Federal Home Loan Mortgage Corp. | ||||
| 10/01/2026- 05/01/2046 | 3.500% | 1,113,979 | 1,100,022 | |
| 10/01/2031- 10/01/2039 | 6.000% | 123,604 | 129,932 | |
| 06/01/2032- 07/01/2032 | 7.000% | 114,200 | 119,796 | |
| 12/01/2036- 01/01/2039 | 5.500% | 54,743 | 58,143 | |
| 03/01/2038 | 6.500% | 1,470 | 1,533 | |
| 10/01/2038- 05/01/2041 | 5.000% | 128,675 | 134,385 | |
| 05/01/2039- 10/01/2040 | 4.500% | 368,189 | 376,717 | |
| 12/01/2042 | 3.000% | 304,196 | 290,125 | |
| CMO Series 1614 Class MZ | ||||
| 11/15/2023 | 6.500% | 771 | 778 | |
| Federal Home Loan Mortgage Corp.(b) | ||||
| 12-month USD LIBOR + 1.712% Cap 11.104% 08/01/2036 | 2.985% | 6,622 | 6,792 | |
| 12-month USD LIBOR + 1.765% Cap 11.140% 12/01/2036 | 2.015% | 558 | 554 | |
| Federal Home Loan Mortgage Corp.(h) | ||||
| 01/01/2038 | 6.000% | 161,740 | 174,526 | |
| 05/01/2038 | 5.500% | 94,289 | 99,792 | |
| 11/01/2039- 06/01/2041 | 4.500% | 879,881 | 900,338 | |
| 05/01/2041 | 5.000% | 225,400 | 231,411 | |
| 01/01/2043- 06/01/2046 | 3.500% | 901,165 | 877,507 | |
| 08/01/2043- 05/01/2045 | 3.000% | 4,975,385 | 4,718,336 | |
| Federal National Mortgage Association(h) | ||||
| 12/01/2025- 03/01/2046 | 3.500% | 5,238,677 | 5,131,858 | |
| 07/01/2027- 09/01/2049 | 3.000% | 3,429,341 | 3,261,504 | |
| 10/01/2043- 02/01/2044 | 4.500% | 588,315 | 598,142 | |
| 08/01/2044 | 4.000% | 142,555 | 142,450 | |
| Residential Mortgage-Backed Securities - Agency (continued) | ||||
| Issuer | Coupon Rate | Principal Amount ($) | Value ($) | |
| Federal National Mortgage Association | ||||
| 01/01/2026- 05/01/2027 | 3.500% | 395,052 | 389,845 | |
| 01/01/2029- 06/01/2044 | 4.000% | 670,749 | 671,495 | |
| 06/01/2031 | 7.000% | 54,823 | 57,591 | |
| 07/01/2032- 03/01/2037 | 6.500% | 188,555 | 196,786 | |
| 06/01/2037- 02/01/2038 | 5.500% | 61,439 | 64,964 | |
| 05/01/2040- 06/01/2044 | 4.500% | 838,738 | 855,238 | |
| 08/01/2043 | 3.000% | 108,354 | 103,026 | |
| Series 2006-M2 Class A2A | ||||
| 10/25/2032 | 5.271% | 301,200 | 301,636 | |
| Uniform Mortgage-Backed Security TBA(i) | ||||
| 09/19/2037- 09/14/2052 | 3.000% | 173,650,000 | 161,664,439 | |
| 09/19/2037- 09/14/2052 | 3.500% | 153,900,000 | 147,861,429 | |
| 09/14/2052 | 2.000% | 51,775,000 | 44,658,292 | |
| 09/14/2052 | 2.500% | 136,975,000 | 122,496,315 | |
| 09/14/2052 | 4.000% | 120,600,000 | 117,886,500 | |
| Total Residential Mortgage-Backed Securities - Agency (Cost $632,443,915) | 615,562,197 | |||
| Residential Mortgage-Backed Securities - Non-Agency 11.6% | ||||
| 510 Asset Backed Trust(a),(c) | ||||
| CMO Series 2021-NPL2 Class A1 | ||||
| 06/25/2061 | 2.116% | 9,678,233 | 8,952,991 | |
| Ajax Mortgage Loan Trust(a),(c) | ||||
| CMO Series 2021-A Class A1 | ||||
| 09/25/2065 | 1.065% | 16,062,799 | 14,576,222 | |
| CMO Series 2021-B Class A | ||||
| 06/25/2066 | 2.239% | 7,567,527 | 7,028,136 | |
| Angel Oak Mortgage Trust(a),(c) | ||||
| CMO Series 2020-6 Class A3 | ||||
| 05/25/2065 | 1.775% | 884,499 | 823,406 | |
| CMO Series 2020-6 Class M1 | ||||
| 05/25/2065 | 2.805% | 2,575,000 | 2,305,378 | |
| CMO Series 2020-R1 Class A1 | ||||
| 04/25/2053 | 0.990% | 4,534,052 | 4,280,955 | |
| Angel Oak Mortgage Trust I LLC(a),(c) | ||||
| CMO Series 2018-3 Class A3 | ||||
| 09/25/2048 | 3.853% | 220,239 | 219,086 | |
| CMO Series 2019-2 Class A3 | ||||
| 03/25/2049 | 3.833% | 66,487 | 66,154 | |
| 26 | Columbia Balanced Fund | Annual Report 2022 |
August 31, 2022
| Residential Mortgage-Backed Securities - Non-Agency (continued) | ||||
| Issuer | Coupon Rate | Principal Amount ($) | Value ($) | |
| Bellemeade Re Ltd.(a),(b) | ||||
| CMO Series 2020-3A Class M1B | ||||
| 1-month USD LIBOR + 2.850% Floor 2.850% 10/25/2030 | 5.294% | 1,926,767 | 1,925,832 | |
| CMO Series 2021-1A Class M1C | ||||
| 30-day Average SOFR + 2.950% Floor 2.950% 03/25/2031 | 4.464% | 5,337,000 | 5,224,088 | |
| CMO Series 2021-3A Class M1A | ||||
| 30-day Average SOFR + 1.000% Floor 1.000% 09/25/2031 | 3.183% | 11,651,000 | 11,396,503 | |
| BRAVO Residential Funding Trust(a),(c) | ||||
| CMO Series 2020-NQM1 Class A1 | ||||
| 05/25/2060 | 1.449% | 1,419,102 | 1,382,189 | |
| CMO Series 2020-RPL1 Class A1 | ||||
| 05/26/2059 | 2.500% | 4,356,917 | 4,195,602 | |
| CMO Series 2021-A Class A1 | ||||
| 10/25/2059 | 1.991% | 8,140,699 | 7,754,757 | |
| CMO Series 2021-B Class A1 | ||||
| 04/01/2069 | 2.115% | 5,981,840 | 5,652,428 | |
| CMO Series 2021-NQM1 Class A1 | ||||
| 02/25/2049 | 0.941% | 8,814,465 | 8,268,976 | |
| CMO Series 2021-NQM1 Class A3 | ||||
| 02/25/2049 | 1.332% | 3,570,635 | 3,318,498 | |
| CMO Series 2021-NQM2 Class A3 | ||||
| 03/25/2060 | 1.435% | 2,319,393 | 2,211,579 | |
| CMO Series 2022-NQM3 Class A1 | ||||
| 07/25/2062 | 5.108% | 7,225,000 | 7,224,866 | |
| Subordinated CMO Series 2021-NQM2 Class B1 | ||||
| 03/25/2060 | 3.044% | 2,725,000 | 2,489,202 | |
| CHNGE Mortgage Trust(a),(c) | ||||
| CMO Series 2022-1 Class A1 | ||||
| 01/25/2067 | 3.007% | 14,909,557 | 13,987,321 | |
| CMO Series 2022-NQM1 Class A1 | ||||
| 06/25/2067 | 5.189% | 5,975,000 | 5,954,475 | |
| CIM Trust(a),(b) | ||||
| CMO Series 2018-R6 Class A1 | ||||
| 1-month USD LIBOR + 1.076% Floor 1.076% 09/25/2058 | 3.640% | 7,706,243 | 7,617,963 | |
| CIM Trust(a),(c) | ||||
| CMO Series 2021-NR1 Class A1 | ||||
| 07/25/2055 | 2.569% | 6,451,376 | 6,085,382 | |
| CMO Series 2021-NR2 Class A1 | ||||
| 07/25/2059 | 2.568% | 4,856,939 | 4,610,283 | |
| Residential Mortgage-Backed Securities - Non-Agency (continued) | ||||
| Issuer | Coupon Rate | Principal Amount ($) | Value ($) | |
| COLT Mortgage Loan Trust(a),(c) | ||||
| CMO Series 2020-2 Class A1 | ||||
| 03/25/2065 | 1.853% | 260,537 | 258,571 | |
| CMO Series 2021-2R Class A1 | ||||
| 07/27/2054 | 0.798% | 2,595,438 | 2,326,060 | |
| CMO Series 2021-HX1 Class M1 | ||||
| 10/25/2066 | 2.355% | 3,250,000 | 2,399,838 | |
| CMO Series 2022-1 Class A1 | ||||
| 12/27/2066 | 2.284% | 15,600,884 | 14,180,060 | |
| CMO Series 2022-4 Class A1 | ||||
| 03/25/2067 | 4.301% | 13,222,102 | 12,902,120 | |
| Connecticut Avenue Securities Trust(a),(b) | ||||
| CMO Series 2020-R01 Class 1M2 | ||||
| 1-month USD LIBOR + 2.050% 01/25/2040 | 4.494% | 3,562,107 | 3,490,345 | |
| CMO Series 2022-R04 Class 1M2 | ||||
| 30-day Average SOFR + 3.100% 03/25/2042 | 5.283% | 7,200,000 | 7,159,692 | |
| Credit Suisse Mortgage Trust(a),(c) | ||||
| CMO Series 2021-AFC1 Class A1 | ||||
| 03/25/2056 | 0.830% | 4,616,789 | 3,860,590 | |
| CMO Series 2021-NQM1 Class A3 | ||||
| 05/25/2065 | 1.199% | 1,682,680 | 1,592,869 | |
| CMO Series 2021-NQM1 Class M1 | ||||
| 05/25/2065 | 2.130% | 1,075,000 | 893,647 | |
| CMO Series 2021-RPL1 Class A1 | ||||
| 09/27/2060 | 1.668% | 11,068,941 | 10,458,116 | |
| CMO Series 2021-RPL2 Class M1 | ||||
| 01/25/2060 | 2.750% | 4,775,000 | 3,963,759 | |
| CMO Series 2021-RPL2 Class M2 | ||||
| 01/25/2060 | 3.250% | 2,525,000 | 2,068,788 | |
| CMO Series 2022-ATH3 Class A1 | ||||
| 08/25/2067 | 4.991% | 7,475,000 | 7,464,708 | |
| CSMC Trust(a),(c) | ||||
| CMO Series 2018-RPL9 Class A | ||||
| 09/25/2057 | 3.850% | 10,355,412 | 9,999,798 | |
| CMO Series 2021-RPL4 Class A1 | ||||
| 12/27/2060 | 1.796% | 7,679,413 | 7,185,751 | |
| Subordinated CMO Series 2020-RPL3 Class A1 | ||||
| 03/25/2060 | 2.691% | 5,351,174 | 5,181,107 | |
| Subordinated CMO Series 2020-RPL4 Class A1 | ||||
| 01/25/2060 | 2.000% | 4,372,284 | 3,996,476 | |
| CSMC Trust(a) | ||||
| CMO Series 2019-AFC1 Class A1 | ||||
| 07/25/2049 | 2.573% | 2,945,530 | 2,786,879 | |
| Columbia Balanced Fund | Annual Report 2022 | 27 |
August 31, 2022
| Residential Mortgage-Backed Securities - Non-Agency (continued) | ||||
| Issuer | Coupon Rate | Principal Amount ($) | Value ($) | |
| Eagle Re Ltd.(a),(b) | ||||
| CMO Series 2021-1 Class M1C | ||||
| 30-day Average SOFR + 2.700% Floor 2.700% 10/25/2033 | 4.214% | 2,925,000 | 2,915,414 | |
| CMO Series 2021-2 Class M1B | ||||
| 30-day Average SOFR + 2.050% Floor 2.050% 04/25/2034 | 3.564% | 11,950,000 | 11,982,132 | |
| Subordinated CMO Series 2020-1 Class M1A | ||||
| 1-month USD LIBOR + 0.900% 01/25/2030 | 3.344% | 2,546,097 | 2,533,280 | |
| Ellington Financial Mortgage Trust(a),(c) | ||||
| CMO Series 2019-2 Class A3 | ||||
| 11/25/2059 | 3.046% | 775,789 | 735,596 | |
| CMO Series 2020-1 Class A1 | ||||
| 05/25/2065 | 2.006% | 265,860 | 257,723 | |
| CMO Series 2022-2 Class A1 | ||||
| 04/25/2067 | 4.299% | 35,036,270 | 34,494,129 | |
| Equifirst Mortgage Loan Trust(c) | ||||
| CMO Series 2003-1 Class IF1 | ||||
| 12/25/2032 | 4.010% | 24,493 | 22,767 | |
| Freddie Mac STACR REMIC Trust(a),(b) | ||||
| CMO Series 2020-DNA1 Class M2 | ||||
| 1-month USD LIBOR + 1.700% 01/25/2050 | 4.144% | 4,070,935 | 4,040,404 | |
| CMO Series 2021-DNA1 Class M2 | ||||
| 30-day Average SOFR + 1.800% 01/25/2051 | 3.983% | 3,828,935 | 3,774,012 | |
| CMO Series 2021-DNA5 Class M2 | ||||
| 30-day Average SOFR + 1.650% 01/25/2034 | 3.833% | 3,301,038 | 3,280,829 | |
| CMO Series 2021-HQA1 Class M1 | ||||
| 30-day Average SOFR + 0.700% 08/25/2033 | 2.883% | 1,405,694 | 1,401,343 | |
| CMO Series 2022-DNA3 Class M1B | ||||
| 30-day Average SOFR + 2.900% 04/25/2042 | 4.414% | 7,000,000 | 6,921,779 | |
| CMO Series 2022-DNA4 Class M1A | ||||
| 30-day Average SOFR + 2.200% 05/25/2042 | 4.383% | 18,911,447 | 18,950,641 | |
| Freddie Mac STACR Trust(a),(b) | ||||
| CMO Series 2019-DNA4 Class M2 | ||||
| 1-month USD LIBOR + 1.950% 10/25/2049 | 4.394% | 1,121,565 | 1,091,062 | |
| Freddie Mac Structured Agency Credit Risk Debt Notes(a),(c) | ||||
| CMO Series 2022-DNA2 Class M1B | ||||
| 02/25/2042 | 4.583% | 16,150,000 | 15,682,669 | |
| Residential Mortgage-Backed Securities - Non-Agency (continued) | ||||
| Issuer | Coupon Rate | Principal Amount ($) | Value ($) | |
| Freddie Mac Structured Agency Credit Risk Debt Notes(a),(b) | ||||
| CMO Series 2022-DNA5 Class M1A | ||||
| 30-day Average SOFR + 2.950% 06/25/2042 | 5.133% | 12,909,391 | 13,203,369 | |
| Subordinated CMO Series 2021-DNA7 Class M1 | ||||
| 30-day Average SOFR + 0.850% 11/25/2041 | 2.364% | 28,325,000 | 27,962,607 | |
| GCAT LLC(a),(c) | ||||
| CMO Series 2020-3 Class A1 | ||||
| 09/25/2025 | 2.981% | 7,111,553 | 6,953,443 | |
| GCAT Trust(a),(c) | ||||
| CMO Series 2019-RPL1 Class A1 | ||||
| 10/25/2068 | 2.650% | 5,807,296 | 5,545,233 | |
| CMO Series 2021-CM2 Class A1 | ||||
| 08/25/2066 | 2.352% | 20,550,154 | 19,510,931 | |
| CMO Series 2022-NQM3 Class A1 | ||||
| 04/25/2067 | 4.349% | 34,668,767 | 33,853,878 | |
| Genworth Mortgage Insurance Corp.(a),(b) | ||||
| CMO Series 2021-3 Class M1A | ||||
| 30-day Average SOFR + 1.900% Floor 1.900% 02/25/2034 | 3.414% | 2,375,000 | 2,329,520 | |
| GS Mortgage-Backed Securities Trust(a),(c) | ||||
| CMO Series 2019-SL1 Class A1 | ||||
| 01/25/2059 | 2.625% | 1,537,252 | 1,530,560 | |
| CMO Series 2020-NQM1 Class A1 | ||||
| 09/27/2060 | 1.382% | 2,681,928 | 2,557,621 | |
| Home Re Ltd.(a),(b) | ||||
| CMO Series 2021-1 Class M1B | ||||
| 1-month USD LIBOR + 1.550% 07/25/2033 | 3.994% | 9,375,000 | 9,343,713 | |
| Homeward Opportunities Fund I Trust(a),(c) | ||||
| CMO Series 2020-2 Class A3 | ||||
| 05/25/2065 | 3.196% | 3,450,000 | 3,336,094 | |
| Homeward Opportunities Fund Trust(a),(c) | ||||
| CMO Series 2020-BPL1 Class A1 | ||||
| 08/25/2025 | 3.228% | 2,605,582 | 2,601,106 | |
| Imperial Fund Mortgage Trust(a),(c) | ||||
| CMO Series 2021-NQM2 Class A3 | ||||
| 09/25/2056 | 1.516% | 6,159,369 | 5,357,929 | |
| Legacy Mortgage Asset Trust(a),(c) | ||||
| CMO Series 2021-GS1 Class A1 | ||||
| 10/25/2066 | 1.892% | 7,732,961 | 7,204,320 | |
| CMO Series 2021-GS2 Class A1 | ||||
| 04/25/2061 | 1.750% | 15,390,879 | 14,399,844 | |
| MetLife Securitization Trust(a),(c) | ||||
| CMO Series 2018-1A Class A | ||||
| 03/25/2057 | 3.750% | 2,575,694 | 2,483,353 | |
| 28 | Columbia Balanced Fund | Annual Report 2022 |
August 31, 2022
| Residential Mortgage-Backed Securities - Non-Agency (continued) | ||||
| Issuer | Coupon Rate | Principal Amount ($) | Value ($) | |
| MFA Trust(a),(c) | ||||
| CMO Series 2020-NQM3 Class M1 | ||||
| 01/26/2065 | 2.654% | 2,925,000 | 2,743,049 | |
| CMO Series 2021-NQM1 Class A1 | ||||
| 04/25/2065 | 1.153% | 5,153,131 | 4,729,086 | |
| CMO Series 2022-NQM2 Class A1 | ||||
| 05/25/2067 | 4.000% | 33,573,434 | 32,409,420 | |
| MFRA Trust(a),(c) | ||||
| CMO Series 2021-INV1 Class A1 | ||||
| 01/25/2056 | 0.852% | 1,779,465 | 1,684,787 | |
| CMO Series 2021-INV1 Class A2 | ||||
| 01/25/2056 | 1.057% | 368,535 | 346,330 | |
| CMO Series 2021-INV1 Class A3 | ||||
| 01/25/2056 | 1.262% | 568,597 | 532,053 | |
| Mill City Mortgage Loan Trust(a),(c) | ||||
| CMO Series 2018-3 Class A1 | ||||
| 08/25/2058 | 3.472% | 5,540,772 | 5,408,770 | |
| CMO Series 2021-NMR1 Class M1 | ||||
| 11/25/2060 | 1.850% | 7,225,000 | 6,442,027 | |
| New Residential Mortgage Loan Trust(a) | ||||
| CMO Series 2016-3A Class A1 | ||||
| 09/25/2056 | 3.750% | 893,145 | 863,545 | |
| NRZ Excess Spread-Collateralized Notes(a) | ||||
| Series 2020-PLS1 Class A | ||||
| 12/25/2025 | 3.844% | 3,128,485 | 2,946,972 | |
| Oaktown Re VI Ltd.(a),(b) | ||||
| CMO Series 2021-1A Class M1B | ||||
| 30-day Average SOFR + 2.050% Floor 2.050% 10/25/2033 | 4.233% | 5,275,000 | 5,188,918 | |
| OBX Trust(a),(b) | ||||
| CMO Series 2020-EXP3 Class 2A1A | ||||
| 1-month USD LIBOR + 0.950% 01/25/2060 | 3.344% | 1,496,743 | 1,490,087 | |
| Oceanview Mortgage Loan Trust(a) | ||||
| CMO Series 2020-1 Class A1A | ||||
| 05/28/2050 | 1.733% | 2,095,109 | 1,979,003 | |
| Preston Ridge Partners Mortgage(a),(c) | ||||
| CMO Series 2021-4 Class A1 | ||||
| 04/25/2026 | 1.867% | 15,701,037 | 14,779,906 | |
| Preston Ridge Partners Mortgage Trust(a),(c) | ||||
| CMO Series 2020-6 Class A1 | ||||
| 11/25/2025 | 2.363% | 3,992,071 | 3,809,095 | |
| CMO Series 2021-1 Class A1 | ||||
| 01/25/2026 | 2.115% | 6,789,167 | 6,460,655 | |
| CMO Series 2021-10 Class A1 | ||||
| 10/25/2026 | 2.487% | 9,190,707 | 8,644,413 | |
| CMO Series 2021-2 Class A1 | ||||
| 03/25/2026 | 2.115% | 5,631,163 | 5,308,888 | |
| Residential Mortgage-Backed Securities - Non-Agency (continued) | ||||
| Issuer | Coupon Rate | Principal Amount ($) | Value ($) | |
| CMO Series 2021-3 Class A1 | ||||
| 04/25/2026 | 1.867% | 9,633,578 | 9,062,546 | |
| CMO Series 2021-9 Class A1 | ||||
| 10/25/2026 | 2.363% | 14,997,838 | 14,029,356 | |
| Pretium Mortgage Credit Partners LLC(a),(c) | ||||
| CMO Series 2021-NPL6 Class A1 | ||||
| 07/25/2051 | 2.487% | 25,205,838 | 23,728,491 | |
| PRKCM Trust(a),(c) | ||||
| CMO Series 2021-AFC2 Class A3 | ||||
| 11/25/2056 | 2.893% | 12,941,000 | 8,816,452 | |
| CMO Series 2021-AFC2 Class M1 | ||||
| 11/25/2056 | 3.443% | 9,528,000 | 7,294,682 | |
| Subordinated CMO Series 2021-AFC2 Class B1 | ||||
| 11/25/2056 | 3.701% | 8,383,000 | 6,121,927 | |
| PRPM LLC(a),(c) | ||||
| CMO Series 2021-RPL1 Class A1 | ||||
| 07/25/2051 | 1.319% | 4,312,359 | 3,969,144 | |
| Radnor Re Ltd.(a),(b) | ||||
| CMO Series 2020-1 Class M1A | ||||
| 1-month USD LIBOR + 0.950% Floor 0.950% 02/25/2030 | 3.209% | 2,763,066 | 2,725,513 | |
| Subordinated CMO Series 2021-2 Class M1A | ||||
| 30-day Average SOFR + 1.850% Floor 1.850% 11/25/2031 | 3.364% | 3,000,777 | 2,982,259 | |
| Subordinated CMO Series 2021-2 Class M1B | ||||
| 30-day Average SOFR + 3.700% Floor 3.700% 11/25/2031 | 5.214% | 4,775,000 | 4,861,301 | |
| Residential Mortgage Loan Trust(a),(c) | ||||
| CMO Series 2020-1 Class A3 | ||||
| 01/26/2060 | 2.684% | 1,240,562 | 1,207,169 | |
| Starwood Mortgage Residential Trust(a),(c) | ||||
| CMO Series 2019-INV1 Class A3 | ||||
| 09/27/2049 | 2.916% | 3,470,593 | 3,386,275 | |
| CMO Series 2020-2 Class A3 | ||||
| 04/25/2060 | 3.000% | 6,125,000 | 5,976,599 | |
| CMO Series 2020-INV1 Class A3 | ||||
| 11/25/2055 | 1.593% | 1,038,373 | 959,149 | |
| CMO Series 2021-4 Class M1 | ||||
| 08/25/2056 | 2.400% | 3,475,000 | 2,826,940 | |
| Toorak Mortgage Corp., Ltd.(c) | ||||
| CMO Series 2019-2 Class A1 | ||||
| 09/25/2022 | 3.721% | 1,391,796 | 1,390,857 | |
| Toorak Mortgage Corp., Ltd.(a),(c) | ||||
| CMO Series 2020-1 Class A1 | ||||
| 03/25/2023 | 2.734% | 16,025,135 | 15,932,615 | |
| Columbia Balanced Fund | Annual Report 2022 | 29 |
August 31, 2022
| Residential Mortgage-Backed Securities - Non-Agency (continued) | ||||
| Issuer | Coupon Rate | Principal Amount ($) | Value ($) | |
| CMO Series 2021-1 Class A1 | ||||
| 06/25/2024 | 2.240% | 5,800,000 | 5,613,595 | |
| Towd Point HE Trust(a),(c) | ||||
| CMO Series 2021-HE1 Class M2 | ||||
| 02/25/2063 | 2.500% | 2,800,000 | 2,609,013 | |
| Towd Point Mortgage Trust(a),(c) | ||||
| CMO Series 2018-1 Class A1 | ||||
| 01/25/2058 | 3.000% | 1,119,239 | 1,093,238 | |
| CMO Series 2018-6 Class A1A | ||||
| 03/25/2058 | 3.750% | 4,337,206 | 4,269,270 | |
| Towd Point Mortgage Trust(a),(b) | ||||
| CMO Series 2019-HY1 Class A1 | ||||
| 1-month USD LIBOR + 1.000% 10/25/2048 | 3.444% | 3,416,246 | 3,377,873 | |
| CMO Series 2019-HY2 Class A1 | ||||
| 1-month USD LIBOR + 1.000% Floor 1.000% 05/25/2058 | 3.444% | 4,029,974 | 3,969,537 | |
| TVC Mortgage Trust(a) | ||||
| CMO Series 2020-RTL1 Class A1 | ||||
| 09/25/2024 | 3.474% | 959,168 | 957,670 | |
| VCAT Asset Securitization LLC(a),(c) | ||||
| CMO Series 2021-NPL6 Class A1 | ||||
| 09/25/2051 | 1.917% | 28,205,797 | 26,398,116 | |
| VCAT LLC(a),(c) | ||||
| CMO Series 2021-NPL1 Class A1 | ||||
| 12/26/2050 | 2.289% | 1,190,800 | 1,140,432 | |
| Vericrest Opportunity Loan Transferee(a),(c) | ||||
| CMO Series 2021-NP11 Class A1 | ||||
| 08/25/2051 | 1.868% | 13,823,776 | 12,867,090 | |
| Vericrest Opportunity Loan Transferee XCII LLC(a),(c) | ||||
| CMO Series 2021-NPL1 Class A1 | ||||
| 02/27/2051 | 1.893% | 10,009,184 | 9,454,042 | |
| Vericrest Opportunity Loan Transferee XCIII LLC(a),(c) | ||||
| CMO Series 2021-NPL2 Class A1 | ||||
| 02/27/2051 | 1.893% | 8,250,484 | 7,796,684 | |
| Vericrest Opportunity Loan Transferee XCIV LLC(a),(c) | ||||
| CMO Series 2021-NPL3 Class A1 | ||||
| 02/27/2051 | 2.240% | 9,780,772 | 9,312,810 | |
| Vericrest Opportunity Loan Transferee XCIX LLC(a),(c) | ||||
| CMO Series 2021-NPL8 Class A1 | ||||
| 04/25/2051 | 2.116% | 6,248,156 | 5,942,087 | |
| Vericrest Opportunity Loan Transferee XCVI LLC(a),(c) | ||||
| CMO Series 2021-NPL5 Class A1 | ||||
| 03/27/2051 | 2.116% | 6,104,717 | 5,730,557 | |
| Vericrest Opportunity Loan Transferee XCVII LLC(a),(c) | ||||
| CMO Series 2021-NPL6 Class A1 | ||||
| 04/25/2051 | 2.240% | 24,467,028 | 23,210,477 | |
| Residential Mortgage-Backed Securities - Non-Agency (continued) | ||||
| Issuer | Coupon Rate | Principal Amount ($) | Value ($) | |
| Vericrest Opportunity Loan Trust CI LLC(a),(c) | ||||
| CMO Series 2021-NP10 Class A1 | ||||
| 05/25/2051 | 1.992% | 17,375,807 | 16,204,468 | |
| Verus Securitization Trust(a),(c) | ||||
| CMO Series 2019-4 Class A3 | ||||
| 11/25/2059 | 3.000% | 4,140,987 | 4,095,917 | |
| CMO Series 2020-1 Class M1 | ||||
| 01/25/2060 | 3.021% | 6,350,000 | 5,965,117 | |
| CMO Series 2020-2 Class A1 | ||||
| 05/25/2060 | 2.226% | 896,608 | 879,795 | |
| CMO Series 2020-INV1 Class A1 | ||||
| 03/25/2060 | 1.977% | 343,628 | 338,386 | |
| CMO Series 2021-R1 Class A2 | ||||
| 10/25/2063 | 1.057% | 1,356,207 | 1,264,833 | |
| CMO Series 2021-R1 Class A3 | ||||
| 10/25/2063 | 1.262% | 1,728,070 | 1,607,696 | |
| CMO Series 2022-1 Class A1 | ||||
| 01/25/2067 | 2.724% | 23,705,678 | 21,706,841 | |
| CMO Series 2022-4 Class A1 | ||||
| 04/25/2067 | 4.474% | 3,114,452 | 3,050,442 | |
| Visio Trust(a),(c) | ||||
| CMO Series 2019-2 Class A3 | ||||
| 11/25/2054 | 3.076% | 2,314,499 | 2,244,914 | |
| Visio Trust(a) | ||||
| CMO Series 2020-1R Class A2 | ||||
| 11/25/2055 | 1.567% | 1,262,429 | 1,205,089 | |
| CMO Series 2020-1R Class A3 | ||||
| 11/25/2055 | 1.873% | 1,436,511 | 1,369,625 | |
| Total Residential Mortgage-Backed Securities - Non-Agency (Cost $960,443,392) | 910,692,640 | |||
| Senior Loans 0.0% | ||||
| Borrower | Coupon Rate | Principal Amount ($) | Value ($) | |
| Chemicals 0.0% | ||||
| WR Grace Holdings LLC(b),(j) | ||||
| Term Loan | ||||
| 1-month USD LIBOR + 3.750% Floor 0.500% 09/22/2028 | 6.063% | 213,925 | 209,469 | |
| Consumer Cyclical Services 0.0% | ||||
| 8th Avenue Food & Provisions, Inc.(b),(j) | ||||
| 2nd Lien Term Loan | ||||
| 1-month USD LIBOR + 7.750% 10/01/2026 | 10.274% | 32,969 | 27,298 | |
| 30 | Columbia Balanced Fund | Annual Report 2022 |
August 31, 2022
| Senior Loans (continued) | ||||
| Borrower | Coupon Rate | Principal Amount ($) | Value ($) | |
| Consumer Products 0.0% | ||||
| SWF Holdings I Corp.(b),(j) | ||||
| 1st Lien Term Loan | ||||
| 1-month USD LIBOR + 4.000% Floor 0.750% 10/06/2028 | 6.368% | 240,968 | 209,842 | |
| Media and Entertainment 0.0% | ||||
| Cengage Learning, Inc.(b),(j) | ||||
| Tranche B 1st Lien Term Loan | ||||
| 1-month USD LIBOR + 4.750% Floor 1.000% 07/14/2026 | 7.814% | 352,878 | 332,839 | |
| Technology 0.0% | ||||
| Ascend Learning LLC(b),(j) | ||||
| 1st Lien Term Loan | ||||
| 1-month USD LIBOR + 3.500% Floor 0.500% 12/11/2028 | 2.500% | 249,745 | 237,705 | |
| 2nd Lien Term Loan | ||||
| 1-month USD LIBOR + 5.750% Floor 0.500% 12/10/2029 | 8.274% | 150,000 | 134,400 | |
| DCert Buyer, Inc.(b),(j) | ||||
| 2nd Lien Term Loan | ||||
| 1-month USD LIBOR + 7.000% 02/19/2029 | 9.903% | 233,000 | 220,884 | |
| Epicore Software Corp.(b),(j) | ||||
| 2nd Lien Term Loan | ||||
| 1-month USD LIBOR + 7.750% Floor 1.000% 07/31/2028 | 10.274% | 104,000 | 103,436 | |
| UKG, Inc.(b),(j) | ||||
| 1st Lien Term Loan | ||||
| 1-month USD LIBOR + 3.250% Floor 0.500% 05/04/2026 | 5.535% | 150,149 | 145,243 | |
| Senior Loans (continued) | ||||
| Borrower | Coupon Rate | Principal Amount ($) | Value ($) | |
| 2nd Lien Term Loan | ||||
| 1-month USD LIBOR + 5.250% Floor 0.500% 05/03/2027 | 7.535% | 291,000 | 282,770 | |
| Total | 1,124,438 | |||
| Total Senior Loans (Cost $2,012,218) | 1,903,886 | |||
| U.S. Treasury Obligations 0.4% | ||||
| Issuer | Coupon Rate | Principal Amount ($) | Value ($) | |
| U.S. Treasury(h) | ||||
| 02/15/2045 | 2.500% | 34,480,000 | 28,505,262 | |
| Total U.S. Treasury Obligations (Cost $33,126,413) | 28,505,262 | |||
| Money Market Funds 8.0% | ||
| Shares | Value ($) | |
| Columbia Short-Term Cash Fund, 2.366%(k),(l) | 626,606,236 | 626,292,933 |
| Total Money Market Funds (Cost $626,367,578) | 626,292,933 | |
| Total Investments in Securities (Cost: $7,166,828,668) | 8,433,647,913 | |
| Other Assets & Liabilities, Net | (590,167,428) | |
| Net Assets | 7,843,480,485 | |
| Long futures contracts | ||||||
| Description | Number of contracts | Expiration date | Trading currency | Notional amount | Value/Unrealized appreciation ($) | Value/Unrealized depreciation ($) |
| U.S. Treasury 10-Year Note | 8,600 | 12/2022 | USD | 1,005,393,750 | — | (2,422,551) |
| U.S. Ultra Treasury Bond | 215 | 12/2022 | USD | 32,142,500 | 322,049 | — |
| Total | 322,049 | (2,422,551) | ||||
| Columbia Balanced Fund | Annual Report 2022 | 31 |
August 31, 2022
| Short futures contracts | ||||||
| Description | Number of contracts | Expiration date | Trading currency | Notional amount | Value/Unrealized appreciation ($) | Value/Unrealized depreciation ($) |
| U.S. Treasury 2-Year Note | (1,650) | 12/2022 | USD | (343,741,408) | 620,802 | — |
| U.S. Treasury 2-Year Note | (350) | 12/2022 | USD | (72,914,844) | — | (5,604) |
| U.S. Treasury 5-Year Note | (625) | 12/2022 | USD | (69,262,696) | 228,354 | — |
| Total | 849,156 | (5,604) | ||||
| (a) | Represents privately placed and other securities and instruments exempt from Securities and Exchange Commission registration (collectively, private placements), such as Section 4(a)(2) and Rule 144A eligible securities, which are often sold only to qualified institutional buyers. At August 31, 2022, the total value of these securities amounted to $1,975,014,750, which represents 25.18% of total net assets. |
| (b) | Variable rate security. The interest rate shown was the current rate as of August 31, 2022. |
| (c) | Variable or floating rate security, the interest rate of which adjusts periodically based on changes in current interest rates and prepayments on the underlying pool of assets. The interest rate shown was the current rate as of August 31, 2022. |
| (d) | Non-income producing investment. |
| (e) | Payment-in-kind security. Interest can be paid by issuing additional par of the security or in cash. |
| (f) | Represents a variable rate security with a step coupon where the rate adjusts according to a schedule for a series of periods, typically lower for an initial period and then increasing to a higher coupon rate thereafter. The interest rate shown was the current rate as of August 31, 2022. |
| (g) | Principal and interest may not be guaranteed by a governmental entity. |
| (h) | This security or a portion of this security has been pledged as collateral in connection with derivative contracts. |
| (i) | Represents a security purchased on a when-issued basis. |
| (j) | The stated interest rate represents the weighted average interest rate at August 31, 2022 of contracts within the senior loan facility. Interest rates on contracts are primarily determined either weekly, monthly or quarterly by reference to the indicated base lending rate and spread and the reset period. These base lending rates are primarily the LIBOR and other short-term rates. Base lending rates may be subject to a floor or minimum rate. The interest rate for senior loans purchased on a when-issued or delayed delivery basis will be determined upon settlement, therefore no interest rate is disclosed. Senior loans often require prepayments from excess cash flows or permit the borrowers to repay at their election. The degree to which borrowers repay cannot be predicted with accuracy. As a result, remaining maturities of senior loans may be less than the stated maturities. Generally, the Fund is contractually obligated to receive approval from the agent bank and/or borrower prior to the disposition of a senior loan. |
| (k) | The rate shown is the seven-day current annualized yield at August 31, 2022. |
| (l) | As defined in the Investment Company Act of 1940, as amended, an affiliated company is one in which the Fund owns 5% or more of the company’s outstanding voting securities, or a company which is under common ownership or control with the Fund. The value of the holdings and transactions in these affiliated companies during the year ended August 31, 2022 are as follows: |
| Affiliated issuers | Beginning of period($) | Purchases($) | Sales($) | Net change in unrealized appreciation (depreciation)($) | End of period($) | Realized gain (loss)($) | Dividends($) | End of period shares |
| Columbia Short-Term Cash Fund, 2.366% | ||||||||
| 635,247,260 | 2,888,826,596 | (2,897,689,899) | (91,024) | 626,292,933 | (151,206) | 2,961,331 | 626,606,236 | |
| CMO | Collateralized Mortgage Obligation |
| LIBOR | London Interbank Offered Rate |
| SOFR | Secured Overnight Financing Rate |
| TBA | To Be Announced |
| USD | US Dollar |
| 32 | Columbia Balanced Fund | Annual Report 2022 |
August 31, 2022
pricing an investment. An investment’s level within the fair value hierarchy is based on the lowest level of any input that is deemed significant to the asset’s or liability’s fair value measurement. The input levels are not necessarily an indication of the risk or liquidity associated with investments at that level. For example, certain U.S. government securities are generally high quality and liquid, however, they are reflected as Level 2 because the inputs used to determine fair value may not always be quoted prices in an active market.
| ■ | Level 1 — Valuations based on quoted prices for investments in active markets that the Fund has the ability to access at the measurement date. Valuation adjustments are not applied to Level 1 investments. |
| ■ | Level 2 — Valuations based on other significant observable inputs (including quoted prices for similar securities, interest rates, prepayment speeds, credit risks, etc.). |
| ■ | Level 3 — Valuations based on significant unobservable inputs (including the Fund’s own assumptions and judgment in determining the fair value of investments). |
| Level 1 ($) | Level 2 ($) | Level 3 ($) | Total ($) | |
| Investments in Securities | ||||
| Asset-Backed Securities — Non-Agency | — | 575,320,650 | — | 575,320,650 |
| Commercial Mortgage-Backed Securities - Non-Agency | — | 510,877,319 | — | 510,877,319 |
| Common Stocks | ||||
| Communication Services | 460,572,274 | — | — | 460,572,274 |
| Consumer Discretionary | 368,387,692 | — | — | 368,387,692 |
| Consumer Staples | 316,299,635 | — | — | 316,299,635 |
| Energy | 218,375,751 | — | — | 218,375,751 |
| Financials | 494,526,371 | — | — | 494,526,371 |
| Health Care | 670,777,050 | — | — | 670,777,050 |
| Industrials | 364,921,097 | — | — | 364,921,097 |
| Information Technology | 1,278,172,422 | — | — | 1,278,172,422 |
| Materials | 116,499,068 | — | — | 116,499,068 |
| Real Estate | 70,256,258 | — | — | 70,256,258 |
| Utilities | 131,895,596 | — | — | 131,895,596 |
| Total Common Stocks | 4,490,683,214 | — | — | 4,490,683,214 |
| Convertible Bonds | — | 315,168 | — | 315,168 |
| Corporate Bonds & Notes | — | 610,001,137 | — | 610,001,137 |
| Exchange-Traded Equity Funds | 62,923,764 | — | — | 62,923,764 |
| Foreign Government Obligations | — | 569,743 | — | 569,743 |
| Residential Mortgage-Backed Securities - Agency | — | 615,562,197 | — | 615,562,197 |
| Residential Mortgage-Backed Securities - Non-Agency | — | 910,692,640 | — | 910,692,640 |
| Senior Loans | — | 1,903,886 | — | 1,903,886 |
| U.S. Treasury Obligations | 28,505,262 | — | — | 28,505,262 |
| Money Market Funds | 626,292,933 | — | — | 626,292,933 |
| Total Investments in Securities | 5,208,405,173 | 3,225,242,740 | — | 8,433,647,913 |
| Columbia Balanced Fund | Annual Report 2022 | 33 |
August 31, 2022
| Level 1 ($) | Level 2 ($) | Level 3 ($) | Total ($) | |
| Investments in Derivatives | ||||
| Asset | ||||
| Futures Contracts | 1,171,205 | — | — | 1,171,205 |
| Liability | ||||
| Futures Contracts | (2,428,155) | — | — | (2,428,155) |
| Total | 5,207,148,223 | 3,225,242,740 | — | 8,432,390,963 |
| 34 | Columbia Balanced Fund | Annual Report 2022 |
August 31, 2022
| Assets | |
| Investments in securities, at value | |
| Unaffiliated issuers (cost $6,540,461,090) | $7,807,354,980 |
| Affiliated issuers (cost $626,367,578) | 626,292,933 |
| Foreign currency (cost $734,933) | 734,933 |
| Cash collateral held at broker for: | |
| TBA | 14,334,000 |
| Receivable for: | |
| Investments sold | 13,320,368 |
| Capital shares sold | 8,271,119 |
| Dividends | 8,073,152 |
| Interest | 13,871,210 |
| Foreign tax reclaims | 117,451 |
| Variation margin for futures contracts | 116,693 |
| Prepaid expenses | 80,693 |
| Trustees’ deferred compensation plan | 344,433 |
| Total assets | 8,492,911,965 |
| Liabilities | |
| Due to custodian | 894,599 |
| Payable for: | |
| Investments purchased | 25,351,757 |
| Investments purchased on a delayed delivery basis | 611,194,846 |
| Capital shares purchased | 8,785,997 |
| Variation margin for futures contracts | 1,706,253 |
| Management services fees | 123,622 |
| Distribution and/or service fees | 56,594 |
| Transfer agent fees | 726,840 |
| Compensation of board members | 77,639 |
| Other expenses | 168,900 |
| Trustees’ deferred compensation plan | 344,433 |
| Total liabilities | 649,431,480 |
| Net assets applicable to outstanding capital stock | $7,843,480,485 |
| Represented by | |
| Paid in capital | 6,324,005,346 |
| Total distributable earnings (loss) | 1,519,475,139 |
| Total - representing net assets applicable to outstanding capital stock | $7,843,480,485 |
| Columbia Balanced Fund | Annual Report 2022 | 35 |
August 31, 2022
| Class A | |
| Net assets | $3,085,212,924 |
| Shares outstanding | 70,166,855 |
| Net asset value per share | $43.97 |
| Maximum sales charge | 5.75% |
| Maximum offering price per share (calculated by dividing the net asset value per share by 1.0 minus the maximum sales charge for Class A shares) | $46.65 |
| Advisor Class | |
| Net assets | $335,333,079 |
| Shares outstanding | 7,554,141 |
| Net asset value per share | $44.39 |
| Class C | |
| Net assets | $1,224,470,455 |
| Shares outstanding | 28,004,590 |
| Net asset value per share | $43.72 |
| Institutional Class | |
| Net assets | $2,100,253,637 |
| Shares outstanding | 47,869,463 |
| Net asset value per share | $43.87 |
| Institutional 2 Class | |
| Net assets | $333,147,519 |
| Shares outstanding | 7,587,546 |
| Net asset value per share | $43.91 |
| Institutional 3 Class | |
| Net assets | $650,888,899 |
| Shares outstanding | 14,657,061 |
| Net asset value per share | $44.41 |
| Class R | |
| Net assets | $114,173,972 |
| Shares outstanding | 2,596,810 |
| Net asset value per share | $43.97 |
| 36 | Columbia Balanced Fund | Annual Report 2022 |
Year Ended August 31, 2022
| Net investment income | |
| Income: | |
| Dividends — unaffiliated issuers | $74,376,986 |
| Dividends — affiliated issuers | 2,961,331 |
| Interest | 74,243,430 |
| Foreign taxes withheld | (557,509) |
| Total income | 151,024,238 |
| Expenses: | |
| Management services fees | 49,506,664 |
| Distribution and/or service fees | |
| Class A | 8,391,921 |
| Class C | 14,448,053 |
| Class R | 654,613 |
| Transfer agent fees | |
| Class A | 3,119,385 |
| Advisor Class | 344,024 |
| Class C | 1,340,831 |
| Institutional Class | 2,159,892 |
| Institutional 2 Class | 232,817 |
| Institutional 3 Class | 49,307 |
| Class R | 121,563 |
| Compensation of board members | 122,423 |
| Custodian fees | 78,491 |
| Printing and postage fees | 331,745 |
| Registration fees | 291,416 |
| Audit fees | 42,000 |
| Legal fees | 102,467 |
| Interest on collateral | 5,145 |
| Interest on interfund lending | 460 |
| Compensation of chief compliance officer | 2,191 |
| Other | 122,697 |
| Total expenses | 81,468,105 |
| Expense reduction | (1,080) |
| Total net expenses | 81,467,025 |
| Net investment income | 69,557,213 |
| Realized and unrealized gain (loss) — net | |
| Net realized gain (loss) on: | |
| Investments — unaffiliated issuers | 496,319,428 |
| Investments — affiliated issuers | (151,206) |
| Foreign currency translations | (1,654) |
| Futures contracts | (129,825,987) |
| Net realized gain | 366,340,581 |
| Net change in unrealized appreciation (depreciation) on: | |
| Investments — unaffiliated issuers | (1,591,986,943) |
| Investments — affiliated issuers | (91,024) |
| Futures contracts | (810,009) |
| Net change in unrealized appreciation (depreciation) | (1,592,887,976) |
| Net realized and unrealized loss | (1,226,547,395) |
| Net decrease in net assets resulting from operations | $(1,156,990,182) |
| Columbia Balanced Fund | Annual Report 2022 | 37 |
| Year Ended August 31, 2022 | Year Ended August 31, 2021 | |
| Operations | ||
| Net investment income | $69,557,213 | $56,677,454 |
| Net realized gain | 366,340,581 | 706,931,135 |
| Net change in unrealized appreciation (depreciation) | (1,592,887,976) | 816,391,073 |
| Net increase (decrease) in net assets resulting from operations | (1,156,990,182) | 1,579,999,662 |
| Distributions to shareholders | ||
| Net investment income and net realized gains | ||
| Class A | (301,333,013) | (141,966,093) |
| Advisor Class | (33,598,968) | (15,011,008) |
| Class C | (124,430,082) | (63,372,992) |
| Institutional Class | (217,188,113) | (99,779,426) |
| Institutional 2 Class | (37,022,415) | (18,318,381) |
| Institutional 3 Class | (64,433,085) | (30,699,777) |
| Class R | (11,695,427) | (6,076,797) |
| Total distributions to shareholders | (789,701,103) | (375,224,474) |
| Increase in net assets from capital stock activity | 464,141,127 | 528,901,030 |
| Total increase (decrease) in net assets | (1,482,550,158) | 1,733,676,218 |
| Net assets at beginning of year | 9,326,030,643 | 7,592,354,425 |
| Net assets at end of year | $7,843,480,485 | $9,326,030,643 |
| 38 | Columbia Balanced Fund | Annual Report 2022 |
| Year Ended | Year Ended | |||
| August 31, 2022 | August 31, 2021 | |||
| Shares | Dollars ($) | Shares | Dollars ($) | |
| Capital stock activity | ||||
| Class A | ||||
| Subscriptions | 10,083,787 | 492,333,678 | 10,896,558 | 548,300,898 |
| Distributions reinvested | 5,680,179 | 286,850,006 | 2,819,018 | 135,724,323 |
| Redemptions | (10,295,565) | (500,840,484) | (10,916,265) | (544,114,980) |
| Net increase | 5,468,401 | 278,343,200 | 2,799,311 | 139,910,241 |
| Advisor Class | ||||
| Subscriptions | 1,822,291 | 91,396,595 | 2,321,842 | 116,680,468 |
| Distributions reinvested | 659,706 | 33,574,129 | 308,498 | 15,002,822 |
| Redemptions | (1,838,487) | (89,442,525) | (995,741) | (50,363,279) |
| Net increase | 643,510 | 35,528,199 | 1,634,599 | 81,320,011 |
| Class C | ||||
| Subscriptions | 3,488,168 | 172,317,393 | 4,550,853 | 228,898,710 |
| Distributions reinvested | 2,369,562 | 119,709,620 | 1,263,322 | 60,501,665 |
| Redemptions | (7,425,517) | (358,773,357) | (8,047,269) | (404,051,454) |
| Net decrease | (1,567,787) | (66,746,344) | (2,233,094) | (114,651,079) |
| Institutional Class | ||||
| Subscriptions | 8,968,338 | 439,290,675 | 10,701,939 | 538,016,200 |
| Distributions reinvested | 3,732,782 | 187,780,068 | 1,788,288 | 86,013,626 |
| Redemptions | (9,666,031) | (465,381,836) | (7,032,852) | (352,051,710) |
| Net increase | 3,035,089 | 161,688,907 | 5,457,375 | 271,978,116 |
| Institutional 2 Class | ||||
| Subscriptions | 1,749,381 | 85,011,500 | 3,572,908 | 175,157,920 |
| Distributions reinvested | 734,813 | 37,002,816 | 376,989 | 18,151,770 |
| Redemptions | (3,051,743) | (149,515,640) | (1,803,036) | (89,839,069) |
| Net increase (decrease) | (567,549) | (27,501,324) | 2,146,861 | 103,470,621 |
| Institutional 3 Class | ||||
| Subscriptions | 3,081,999 | 152,927,781 | 3,127,170 | 158,978,431 |
| Distributions reinvested | 1,122,400 | 57,108,962 | 569,151 | 27,676,022 |
| Redemptions | (2,590,162) | (127,143,105) | (2,565,468) | (129,465,845) |
| Net increase | 1,614,237 | 82,893,638 | 1,130,853 | 57,188,608 |
| Class R | ||||
| Subscriptions | 363,397 | 17,819,827 | 395,796 | 19,902,755 |
| Distributions reinvested | 225,446 | 11,406,732 | 121,910 | 5,862,266 |
| Redemptions | (606,040) | (29,291,708) | (731,244) | (36,080,509) |
| Net decrease | (17,197) | (65,149) | (213,538) | (10,315,488) |
| Total net increase | 8,608,704 | 464,141,127 | 10,722,367 | 528,901,030 |
| Columbia Balanced Fund | Annual Report 2022 | 39 |
| Net asset value, beginning of period | Net investment income (loss) | Net realized and unrealized gain (loss) | Total from investment operations | Distributions from net investment income | Distributions from net realized gains | Total distributions to shareholders | |
| Class A | |||||||
| Year Ended 8/31/2022 | $54.93 | 0.40 | (6.73) | (6.33) | (0.34) | (4.29) | (4.63) |
| Year Ended 8/31/2021 | $47.73 | 0.36 | 9.19 | 9.55 | (0.37) | (1.98) | (2.35) |
| Year Ended 8/31/2020 | $42.24 | 0.53 | 6.67 | 7.20 | (0.63) | (1.08) | (1.71) |
| Year Ended 8/31/2019 | $42.53 | 0.63 | 1.19 | 1.82 | (0.60) | (1.51) | (2.11) |
| Year Ended 8/31/2018 | $40.56 | 0.48 | 2.57 | 3.05 | (0.46) | (0.62) | (1.08) |
| Advisor Class | |||||||
| Year Ended 8/31/2022 | $55.42 | 0.52 | (6.79) | (6.27) | (0.47) | (4.29) | (4.76) |
| Year Ended 8/31/2021 | $48.13 | 0.49 | 9.27 | 9.76 | (0.49) | (1.98) | (2.47) |
| Year Ended 8/31/2020 | $42.58 | 0.64 | 6.72 | 7.36 | (0.73) | (1.08) | (1.81) |
| Year Ended 8/31/2019 | $42.86 | 0.73 | 1.21 | 1.94 | (0.71) | (1.51) | (2.22) |
| Year Ended 8/31/2018 | $40.87 | 0.58 | 2.59 | 3.17 | (0.56) | (0.62) | (1.18) |
| Class C | |||||||
| Year Ended 8/31/2022 | $54.68 | 0.03 | (6.69) | (6.66) | (0.01) | (4.29) | (4.30) |
| Year Ended 8/31/2021 | $47.56 | (0.02) | 9.16 | 9.14 | (0.04) | (1.98) | (2.02) |
| Year Ended 8/31/2020 | $42.08 | 0.21 | 6.65 | 6.86 | (0.30) | (1.08) | (1.38) |
| Year Ended 8/31/2019 | $42.38 | 0.32 | 1.19 | 1.51 | (0.30) | (1.51) | (1.81) |
| Year Ended 8/31/2018 | $40.42 | 0.17 | 2.56 | 2.73 | (0.15) | (0.62) | (0.77) |
| Institutional Class | |||||||
| Year Ended 8/31/2022 | $54.83 | 0.52 | (6.72) | (6.20) | (0.47) | (4.29) | (4.76) |
| Year Ended 8/31/2021 | $47.65 | 0.48 | 9.17 | 9.65 | (0.49) | (1.98) | (2.47) |
| Year Ended 8/31/2020 | $42.17 | 0.64 | 6.65 | 7.29 | (0.73) | (1.08) | (1.81) |
| Year Ended 8/31/2019 | $42.47 | 0.73 | 1.19 | 1.92 | (0.71) | (1.51) | (2.22) |
| Year Ended 8/31/2018 | $40.50 | 0.58 | 2.57 | 3.15 | (0.56) | (0.62) | (1.18) |
| Institutional 2 Class | |||||||
| Year Ended 8/31/2022 | $54.87 | 0.53 | (6.71) | (6.18) | (0.49) | (4.29) | (4.78) |
| Year Ended 8/31/2021 | $47.68 | 0.50 | 9.18 | 9.68 | (0.51) | (1.98) | (2.49) |
| Year Ended 8/31/2020 | $42.20 | 0.66 | 6.65 | 7.31 | (0.75) | (1.08) | (1.83) |
| Year Ended 8/31/2019 | $42.50 | 0.75 | 1.19 | 1.94 | (0.73) | (1.51) | (2.24) |
| Year Ended 8/31/2018 | $40.53 | 0.60 | 2.57 | 3.17 | (0.58) | (0.62) | (1.20) |
| 40 | Columbia Balanced Fund | Annual Report 2022 |
| Net asset value, end of period | Total return | Total gross expense ratio to average net assets(a) | Total net expense ratio to average net assets(a),(b) | Net investment income (loss) ratio to average net assets | Portfolio turnover | Net assets, end of period (000’s) | |
| Class A | |||||||
| Year Ended 8/31/2022 | $43.97 | (12.57%) | 0.92%(c),(d) | 0.92%(c),(d),(e) | 0.81% | 121% | $3,085,213 |
| Year Ended 8/31/2021 | $54.93 | 20.72% | 0.93%(c) | 0.93%(c),(e) | 0.71% | 124% | $3,553,866 |
| Year Ended 8/31/2020 | $47.73 | 17.59% | 0.95% | 0.95%(e) | 1.23% | 140% | $2,954,559 |
| Year Ended 8/31/2019 | $42.24 | 4.79% | 0.95% | 0.95% | 1.55% | 119% | $2,685,001 |
| Year Ended 8/31/2018 | $42.53 | 7.63% | 0.95% | 0.95%(e) | 1.16% | 76% | $2,798,246 |
| Advisor Class | |||||||
| Year Ended 8/31/2022 | $44.39 | (12.36%) | 0.67%(c),(d) | 0.67%(c),(d),(e) | 1.06% | 121% | $335,333 |
| Year Ended 8/31/2021 | $55.42 | 21.03% | 0.68%(c) | 0.68%(c),(e) | 0.95% | 124% | $382,964 |
| Year Ended 8/31/2020 | $48.13 | 17.89% | 0.70% | 0.70%(e) | 1.48% | 140% | $253,954 |
| Year Ended 8/31/2019 | $42.58 | 5.04% | 0.70% | 0.70% | 1.80% | 119% | $248,877 |
| Year Ended 8/31/2018 | $42.86 | 7.89% | 0.70% | 0.70%(e) | 1.41% | 76% | $262,644 |
| Class C | |||||||
| Year Ended 8/31/2022 | $43.72 | (13.23%) | 1.67%(c),(d) | 1.67%(c),(d),(e) | 0.05% | 121% | $1,224,470 |
| Year Ended 8/31/2021 | $54.68 | 19.82% | 1.68%(c) | 1.68%(c),(e) | (0.04%) | 124% | $1,616,952 |
| Year Ended 8/31/2020 | $47.56 | 16.73% | 1.70% | 1.70%(e) | 0.48% | 140% | $1,512,696 |
| Year Ended 8/31/2019 | $42.08 | 4.00% | 1.70% | 1.70% | 0.80% | 119% | $1,443,468 |
| Year Ended 8/31/2018 | $42.38 | 6.83% | 1.70% | 1.70%(e) | 0.42% | 76% | $1,591,465 |
| Institutional Class | |||||||
| Year Ended 8/31/2022 | $43.87 | (12.36%) | 0.67%(c),(d) | 0.67%(c),(d),(e) | 1.06% | 121% | $2,100,254 |
| Year Ended 8/31/2021 | $54.83 | 21.01% | 0.68%(c) | 0.68%(c),(e) | 0.96% | 124% | $2,458,182 |
| Year Ended 8/31/2020 | $47.65 | 17.90% | 0.70% | 0.70%(e) | 1.48% | 140% | $1,876,178 |
| Year Ended 8/31/2019 | $42.17 | 5.04% | 0.70% | 0.70% | 1.80% | 119% | $1,672,560 |
| Year Ended 8/31/2018 | $42.47 | 7.91% | 0.70% | 0.70%(e) | 1.42% | 76% | $1,872,366 |
| Institutional 2 Class | |||||||
| Year Ended 8/31/2022 | $43.91 | (12.32%) | 0.64%(c),(d) | 0.64%(c),(d) | 1.09% | 121% | $333,148 |
| Year Ended 8/31/2021 | $54.87 | 21.07% | 0.64%(c) | 0.64%(c) | 1.00% | 124% | $447,431 |
| Year Ended 8/31/2020 | $47.68 | 17.95% | 0.65% | 0.65% | 1.52% | 140% | $286,454 |
| Year Ended 8/31/2019 | $42.20 | 5.09% | 0.65% | 0.65% | 1.84% | 119% | $245,737 |
| Year Ended 8/31/2018 | $42.50 | 7.96% | 0.65% | 0.65% | 1.46% | 76% | $279,242 |
| Columbia Balanced Fund | Annual Report 2022 | 41 |
| Net asset value, beginning of period | Net investment income (loss) | Net realized and unrealized gain (loss) | Total from investment operations | Distributions from net investment income | Distributions from net realized gains | Total distributions to shareholders | |
| Institutional 3 Class | |||||||
| Year Ended 8/31/2022 | $55.44 | 0.57 | (6.79) | (6.22) | (0.52) | (4.29) | (4.81) |
| Year Ended 8/31/2021 | $48.15 | 0.53 | 9.27 | 9.80 | (0.53) | (1.98) | (2.51) |
| Year Ended 8/31/2020 | $42.60 | 0.68 | 6.72 | 7.40 | (0.77) | (1.08) | (1.85) |
| Year Ended 8/31/2019 | $42.88 | 0.78 | 1.20 | 1.98 | (0.75) | (1.51) | (2.26) |
| Year Ended 8/31/2018 | $40.88 | 0.63 | 2.59 | 3.22 | (0.60) | (0.62) | (1.22) |
| Class R | |||||||
| Year Ended 8/31/2022 | $54.92 | 0.27 | (6.71) | (6.44) | (0.22) | (4.29) | (4.51) |
| Year Ended 8/31/2021 | $47.73 | 0.23 | 9.18 | 9.41 | (0.24) | (1.98) | (2.22) |
| Year Ended 8/31/2020 | $42.23 | 0.42 | 6.68 | 7.10 | (0.52) | (1.08) | (1.60) |
| Year Ended 8/31/2019 | $42.53 | 0.53 | 1.18 | 1.71 | (0.50) | (1.51) | (2.01) |
| Year Ended 8/31/2018 | $40.56 | 0.38 | 2.57 | 2.95 | (0.36) | (0.62) | (0.98) |
| Notes to Financial Highlights | |
| (a) | In addition to the fees and expenses that the Fund bears directly, the Fund indirectly bears a pro rata share of the fees and expenses of any other funds in which it invests. Such indirect expenses are not included in the Fund’s reported expense ratios. |
| (b) | Total net expenses include the impact of certain fee waivers/expense reimbursements made by the Investment Manager and certain of its affiliates, if applicable. |
| (c) | Ratios include interest on collateral expense which is less than 0.01%. |
| (d) | Ratios include interfund lending expense which is less than 0.01%. |
| (e) | The benefits derived from expense reductions had an impact of less than 0.01%. |
| 42 | Columbia Balanced Fund | Annual Report 2022 |
| Net asset value, end of period | Total return | Total gross expense ratio to average net assets(a) | Total net expense ratio to average net assets(a),(b) | Net investment income (loss) ratio to average net assets | Portfolio turnover | Net assets, end of period (000’s) | |
| Institutional 3 Class | |||||||
| Year Ended 8/31/2022 | $44.41 | (12.27%) | 0.59%(c),(d) | 0.59%(c),(d) | 1.15% | 121% | $650,889 |
| Year Ended 8/31/2021 | $55.44 | 21.13% | 0.59%(c) | 0.59%(c) | 1.05% | 124% | $723,074 |
| Year Ended 8/31/2020 | $48.15 | 18.00% | 0.61% | 0.61% | 1.56% | 140% | $573,567 |
| Year Ended 8/31/2019 | $42.60 | 5.14% | 0.61% | 0.61% | 1.90% | 119% | $377,342 |
| Year Ended 8/31/2018 | $42.88 | 8.01% | 0.60% | 0.60% | 1.53% | 76% | $308,783 |
| Class R | |||||||
| Year Ended 8/31/2022 | $43.97 | (12.78%) | 1.17%(c),(d) | 1.17%(c),(d),(e) | 0.56% | 121% | $114,174 |
| Year Ended 8/31/2021 | $54.92 | 20.40% | 1.18%(c) | 1.18%(c),(e) | 0.47% | 124% | $143,562 |
| Year Ended 8/31/2020 | $47.73 | 17.32% | 1.20% | 1.20%(e) | 0.98% | 140% | $134,948 |
| Year Ended 8/31/2019 | $42.23 | 4.50% | 1.20% | 1.20% | 1.30% | 119% | $127,735 |
| Year Ended 8/31/2018 | $42.53 | 7.36% | 1.20% | 1.20%(e) | 0.91% | 76% | $133,485 |
| Columbia Balanced Fund | Annual Report 2022 | 43 |
August 31, 2022
| 44 | Columbia Balanced Fund | Annual Report 2022 |
August 31, 2022
| Columbia Balanced Fund | Annual Report 2022 | 45 |
August 31, 2022
| 46 | Columbia Balanced Fund | Annual Report 2022 |
August 31, 2022
| Asset derivatives | ||
| Risk exposure category | Statement of assets and liabilities location | Fair value ($) |
| Interest rate risk | Component of total distributable earnings (loss) — unrealized appreciation on futures contracts | 1,171,205* |
| Liability derivatives | ||
| Risk exposure category | Statement of assets and liabilities location | Fair value ($) |
| Interest rate risk | Component of total distributable earnings (loss) — unrealized depreciation on futures contracts | 2,428,155* |
| * | Includes cumulative appreciation (depreciation) as reported in the tables following the Portfolio of Investments. Only the current day’s variation margin is reported in receivables or payables in the Statement of Assets and Liabilities. |
| Columbia Balanced Fund | Annual Report 2022 | 47 |
August 31, 2022
| Amount of realized gain (loss) on derivatives recognized in income | |
| Risk exposure category | Futures contracts ($) |
| Interest rate risk | (129,825,987) |
| Change in unrealized appreciation (depreciation) on derivatives recognized in income | |
| Risk exposure category | Futures contracts ($) |
| Interest rate risk | (810,009) |
| Derivative instrument | Average notional amounts ($) |
| Futures contracts — long | 1,032,565,567* |
| Futures contracts — short | 44,678,808** |
| * | Based on the ending quarterly outstanding amounts for the year ended August 31, 2022. |
| ** | Based on the ending daily outstanding amounts for the year ended August 31, 2022. |
| 48 | Columbia Balanced Fund | Annual Report 2022 |
August 31, 2022
| Columbia Balanced Fund | Annual Report 2022 | 49 |
August 31, 2022
| 50 | Columbia Balanced Fund | Annual Report 2022 |
August 31, 2022
| Columbia Balanced Fund | Annual Report 2022 | 51 |
August 31, 2022
| Effective rate (%) | |
| Class A | 0.09 |
| Advisor Class | 0.09 |
| Class C | 0.09 |
| Institutional Class | 0.09 |
| Institutional 2 Class | 0.06 |
| Institutional 3 Class | 0.01 |
| Class R | 0.09 |
| 52 | Columbia Balanced Fund | Annual Report 2022 |
August 31, 2022
| Front End (%) | CDSC (%) | Amount ($) | |
| Class A | 5.75 | 0.50 - 1.00(a) | 4,219,296 |
| Class C | — | 1.00(b) | 105,601 |
| (a) | This charge is imposed on certain investments of between $1 million and $50 million redeemed within 18 months after purchase, as follows: 1.00% if redeemed within 12 months after purchase, and 0.50% if redeemed more than 12, but less than 18, months after purchase, with certain limited exceptions. |
| (b) | This charge applies to redemptions within 12 months after purchase, with certain limited exceptions. |
| January 1, 2022 through December 31, 2022 | Prior to January 1, 2022 | |
| Class A | 1.08% | 1.08% |
| Advisor Class | 0.83 | 0.83 |
| Class C | 1.83 | 1.83 |
| Institutional Class | 0.83 | 0.83 |
| Institutional 2 Class | 0.80 | 0.79 |
| Institutional 3 Class | 0.75 | 0.74 |
| Class R | 1.33 | 1.33 |
| Columbia Balanced Fund | Annual Report 2022 | 53 |
August 31, 2022
| Undistributed net investment income ($) | Accumulated net realized gain ($) | Paid in capital ($) |
| 253,038 | (253,038) | — |
| Year Ended August 31, 2022 | Year Ended August 31, 2021 | ||||
| Ordinary income ($) | Long-term capital gains ($) | Total ($) | Ordinary income ($) | Long-term capital gains ($) | Total ($) |
| 198,579,497 | 591,121,606 | 789,701,103 | 58,906,315 | 316,318,159 | 375,224,474 |
| Undistributed ordinary income ($) | Undistributed long-term capital gains ($) | Capital loss carryforwards ($) | Net unrealized appreciation ($) |
| 17,176,983 | 267,812,510 | — | 1,234,902,183 |
| Federal tax cost ($) | Gross unrealized appreciation ($) | Gross unrealized (depreciation) ($) | Net unrealized appreciation ($) |
| 7,197,488,780 | 1,595,849,944 | (360,947,761) | 1,234,902,183 |
| 54 | Columbia Balanced Fund | Annual Report 2022 |
August 31, 2022
| Borrower or lender | Average loan balance ($) | Weighted average interest rate (%) | Number of days with outstanding loans |
| Borrower | 5,800,000 | 2.85 | 1 |
| Columbia Balanced Fund | Annual Report 2022 | 55 |
August 31, 2022
| 56 | Columbia Balanced Fund | Annual Report 2022 |
August 31, 2022
| Columbia Balanced Fund | Annual Report 2022 | 57 |
August 31, 2022
| 58 | Columbia Balanced Fund | Annual Report 2022 |
| Columbia Balanced Fund | Annual Report 2022 | 59 |
| Qualified dividend income | Dividends received deduction | Section 199A dividends | Capital gain dividend |
| 53.18% | 46.83% | 0.21% | $395,470,269 |
| Name, address, year of birth | Position held with the Columbia Funds and length of service | Principal occupation(s) during past five years and other relevant professional experience | Number of Funds in the Columbia Funds Complex* overseen | Other directorships held by Trustee during the past five years |
| George S. Batejan c/o Columbia Management Investment Advisers, LLC 290 Congress Street Boston, MA 02210 1953 | Trustee since 2017 | Executive Vice President, Global Head of Technology and Operations, Janus Capital Group, Inc., 2010-2016 | 176 | Former Chairman of the Board, NICSA (National Investment Company Services Association) (Executive Committee, Nominating Committee and Governance Committee), 2014-2016; former Director, Intech Investment Management, 2011-2016; former Board Member, Metro Denver Chamber of Commerce, 2015-2016; former Advisory Board Member, University of Colorado Business School, 2015-2018 |
| 60 | Columbia Balanced Fund | Annual Report 2022 |
(Unaudited)
Independent trustees (continued)
| Name, address, year of birth | Position held with the Columbia Funds and length of service | Principal occupation(s) during past five years and other relevant professional experience | Number of Funds in the Columbia Funds Complex* overseen | Other directorships held by Trustee during the past five years |
| Kathleen Blatz c/o Columbia Management Investment Advisers, LLC 290 Congress Street Boston, MA 02210 1954 | Trustee since 2006 | Attorney, specializing in arbitration and mediation; Chief Justice, Minnesota Supreme Court, 1998-2006; Associate Justice, Minnesota Supreme Court, 1996-1998; Fourth Judicial District Court Judge, Hennepin County, 1994-1996; Attorney in private practice and public service, 1984-1993; State Representative, Minnesota House of Representatives, 1979-1993, which included service on the Tax and Financial Institutions and Insurance Committees; Member and Interim Chair, Minnesota Sports Facilities Authority, January 2017-July 2017; Interim President and Chief Executive Officer, Blue Cross and Blue Shield of Minnesota (health care insurance), February-July 2018, April-October 2021 | 176 | Former Trustee, Blue Cross and Blue Shield of Minnesota, 2009-2021 (Chair of the Business Development Committee, 2014-2017; Chair of the Governance Committee, 2017-2019); former Member and Chair of the Board, Minnesota Sports Facilities Authority, January 2017-July 2017; former Director, Robina Foundation, 2009-2020 (Chair, 2014-2020); Director, Schulze Family Foundation, since 2021 |
| Pamela G. Carlton c/o Columbia Management Investment Advisers, LLC 290 Congress Street Boston, MA 02210 1954 | Trustee since 2007 | President, Springboard — Partners in Cross Cultural Leadership (consulting company) since 2003; Managing Director of US Equity Research, JP Morgan Chase, 1999-2003; Director of US Equity Research, Chase Asset Management, 1996-1999; Co-Director Latin America Research, 1993-1996, COO Global Research, 1992-1996, Co-Director of US Research, 1991-1992, Investment Banker, 1982-1991, Morgan Stanley; Attorney, Cleary Gottlieb Steen & Hamilton LLP, 1980-1982 | 176 | Trustee, New York Presbyterian Hospital Board (Executive Committee and Chair of People Committee) since 1996; Director, DR Bank (Audit Committee) since 2017; Director, Evercore Inc. (Audit Committee) since 2019; Director, Apollo Commercial Real Estate Finance, Inc. since 2021; the Governing Council of the Independent Directors Council (IDC), since 2021 |
| Janet Langford Carrig c/o Columbia Management Investment Advisers, LLC 290 Congress Street Boston, MA 02210 1957 | Trustee since 1996 | Senior Vice President, General Counsel and Corporate Secretary, ConocoPhillips (independent energy company), September 2007-October 2018 | 174 | Director, EQT Corporation (natural gas producer) since 2019; former Director, Whiting Petroleum Corporation (independent oil and gas company), 2020-2022 |
| J. Kevin Connaughton c/o Columbia Management Investment Advisers, LLC 290 Congress Street Boston, MA 02210 1964 | Trustee since 2020 | Member, FINRA National Adjudicatory Council since January 2020; Adjunct Professor of Finance, Bentley University since January 2018; Consultant to Independent Trustees of CFVIT and CFST I from March 2016 to June 2020 with respect to CFVIT and to December 2020 with respect to CFST I; Managing Director and General Manager of Mutual Fund Products, Columbia Management Investment Advisers, LLC, May 2010-February 2015; President, Columbia Funds, 2008-2015; and senior officer of Columbia Funds and affiliated funds, 2003-2015 | 174 | Former Director, The Autism Project, March 2015-December 2021; former Member of the Investment Committee, St. Michael’s College, November 2015-February 2020; former Trustee, St. Michael’s College, June 2017-September 2019; former Trustee, New Century Portfolios, January 2015-December 2017 |
| Columbia Balanced Fund | Annual Report 2022 | 61 |
(Unaudited)
Independent trustees (continued)
| Name, address, year of birth | Position held with the Columbia Funds and length of service | Principal occupation(s) during past five years and other relevant professional experience | Number of Funds in the Columbia Funds Complex* overseen | Other directorships held by Trustee during the past five years |
| Olive M. Darragh c/o Columbia Management Investment Advisers, LLC 290 Congress Street Boston, MA 02210 1962 | Trustee since 2020 | Managing Director of Darragh Inc. (strategy and talent management consulting firm) since 2010; Founder and CEO, Zolio, Inc. (investment management talent identification platform) since 2004; Consultant to Independent Trustees of CFVIT and CFST I from June 2019 to June 2020 with respect to CFVIT and to December 2020 with respect to CFST I; Partner, Tudor Investments, 2004-2010; Senior Partner, McKinsey & Company (consulting), 1990-2004; Touche Ross CPA, 1985-1988 | 174 | Former Director, University of Edinburgh Business School (Member of US Board); former Director, Boston Public Library Foundation |
| Patricia M. Flynn c/o Columbia Management Investment Advisers, LLC 290 Congress Street Boston, MA 02210 1950 | Trustee since 2004 | Trustee Professor of Economics and Management, Bentley University since 1976 (also teaches and conducts research on corporate governance); Dean, McCallum Graduate School of Business, Bentley University, 1992-2002 | 176 | Trustee, MA Taxpayers Foundation since 1997; former Board of Governors, Innovation Institute, MA Technology Collaborative, 2010-2020; former Board of Directors, The MA Business Roundtable, 2003-2019 |
| Brian J. Gallagher c/o Columbia Management Investment Advisers, LLC 290 Congress Street Boston, MA 02210 1954 | Trustee since 2017 | Retired; Partner with Deloitte & Touche LLP and its predecessors, 1977-2016 | 176 | Trustee, Catholic Schools Foundation since 2004 |
| Douglas A. Hacker c/o Columbia Management Investment Advisers, LLC 290 Congress Street Boston, MA 02210 1955 | Co-Chair since 2021; Chair of CFST I and CFVIT since 2014; Trustee of CFST I and CFVIT since 1996 and CFST, CFST II, CFVST II, CET I and CET II since 2021 | Independent business executive since May 2006; Executive Vice President – Strategy of United Airlines, December 2002 - May 2006; President of UAL Loyalty Services (airline marketing company), September 2001-December 2002; Executive Vice President and Chief Financial Officer of United Airlines, July 1999-September 2001 | 176 | Director, Spartan Nash Company (food distributor); Director, Aircastle Limited (Chair of Audit Committee) (aircraft leasing); former Director, Nash Finch Company (food distributor), 2005-2013; former Director, SeaCube Container Leasing Ltd. (container leasing), 2010-2013; and former Director, Travelport Worldwide Limited (travel information technology), 2014-2019 |
| Nancy T. Lukitsh c/o Columbia Management Investment Advisers, LLC 290 Congress Street Boston, MA 02210 1956 | Trustee since 2011 | Senior Vice President, Partner and Director of Marketing, Wellington Management Company, LLP (investment adviser), 1997-2010; Chair, Wellington Management Portfolios (commingled non-U.S. investment pools), 2007 -2010; Director, Wellington Trust Company, NA and other Wellington affiliates, 1997-2010 | 174 | None |
| 62 | Columbia Balanced Fund | Annual Report 2022 |
(Unaudited)
Independent trustees (continued)
| Name, address, year of birth | Position held with the Columbia Funds and length of service | Principal occupation(s) during past five years and other relevant professional experience | Number of Funds in the Columbia Funds Complex* overseen | Other directorships held by Trustee during the past five years |
| David M. Moffett c/o Columbia Management Investment Advisers, LLC 290 Congress Street Boston, MA 02210 1952 | Trustee since 2011 | Retired; Consultant to Bridgewater and Associates | 174 | Director, CSX Corporation (transportation suppliers); Director, Genworth Financial, Inc. (financial and insurance products and services); Director, PayPal Holdings Inc. (payment and data processing services); Trustee, University of Oklahoma Foundation; former Director, eBay Inc. (online trading community), 2007-2015; and former Director, CIT Bank, CIT Group Inc. (commercial and consumer finance), 2010-2016 |
| Catherine James Paglia c/o Columbia Management Investment Advisers, LLC 290 Congress Street Boston, MA 02210 1952 | Co-Chair since 2021; Chair of CFST, CFST II, CFVST II, CET I and CET II since 2020; Trustee of CFST, CFST II and CFVST II since 2004 and CFST I and CFVIT since 2021 | Director, Enterprise Asset Management, Inc. (private real estate and asset management company) since September 1998; Managing Director and Partner, Interlaken Capital, Inc., 1989-1997; Vice President, 1982-1985, Principal, 1985-1987, Managing Director, 1987-1989, Morgan Stanley; Vice President, Investment Banking, 1980-1982, Associate, Investment Banking, 1976-1980, Dean Witter Reynolds, Inc. | 176 | Director, Valmont Industries, Inc. (irrigation systems manufacturer) since 2012; Trustee, Carleton College (on the Investment Committee); Trustee, Carnegie Endowment for International Peace (on the Investment Committee) |
| Minor M. Shaw c/o Columbia Management Investment Advisers, LLC 290 Congress Street Boston, MA 02210 1947 | Trustee since 2003 | President, Micco LLC (private investments) since 2011; President, Micco Corp. (family investment business), 1998-2011 | 176 | Director, Blue Cross Blue Shield of South Carolina (Chair of Compensation Committee) since April 2008; Trustee, Hollingsworth Funds (on the Investment Committee) since 2016 (previously Board Chair from 2016-2019); Former Advisory Board member, Duke Energy Corp., 2016-2020; Chair of the Duke Endowment; Chair of Greenville – Spartanburg Airport Commission; former Trustee, BofA Funds Series Trust (11 funds), 2003-2011; former Director, Piedmont Natural Gas, 2004-2016; former Director, National Association of Corporate Directors, Carolinas Chapter, 2013-2018; Chair, Daniel-Mickel Foundation since 1998 |
| Columbia Balanced Fund | Annual Report 2022 | 63 |
(Unaudited)
Independent trustees (continued)
| Name, address, year of birth | Position held with the Columbia Funds and length of service | Principal occupation(s) during past five years and other relevant professional experience | Number of Funds in the Columbia Funds Complex* overseen | Other directorships held by Trustee during the past five years |
| Natalie A. Trunow c/o Columbia Management Investment Advisers, LLC 290 Congress Street Boston, MA 02210 1967 | Trustee since 2020 | Chief Executive Officer, Millennial Portfolio Solutions LLC (asset management and consulting services), January 2016-January 2021; Non-executive Member of the Investment Committee and Valuation Committee, Sarona Asset Management Inc. (private equity firm) since September 2019; Advisor, Horizon Investments (asset management and consulting services), August 2018-January 2021; Advisor, Paradigm Asset Management, November 2016-December 2021; Consultant to Independent Trustees of CFVIT and CFST I from September 2016 to June 2020 with respect to CFVIT and to December 2020 with respect to CFST I; Director of Investments/Consultant, Casey Family Programs, April 2016-November 2016; Senior Vice President and Chief Investment Officer, Calvert Investments, August 2008-January 2016; Section Head and Portfolio Manager, General Motors Asset Management, June 1997-August 2008 | 174 | Former Director, Investment Committee, Health Services for Children with Special Needs, Inc., 2012-2019; Director, Chair of Audit Committee, Consumer Credit Counseling Services (formerly Guidewell Financial Solutions), since 2019; Independent Director, Investment Committee and Valuation Committee, Sarona Asset Management, since 2019 |
| Sandra L. Yeager c/o Columbia Management Investment Advisers, LLC 290 Congress Street Boston, MA 02210 1964 | Trustee since 2017 | Retired; President and founder, Hanoverian Capital, LLC (SEC registered investment advisor firm), 2008-2016; Managing Director, DuPont Capital, 2006-2008; Managing Director, Morgan Stanley Investment Management, 2004-2006; Senior Vice President, Alliance Bernstein, 1990-2004 | 176 | Former Director, NAPE Education Foundation, October 2016-October 2020 |
| * | The term “Columbia Funds Complex” as used herein includes Columbia Seligman Premium Technology Growth Fund, Tri-Continental Corporation and each series of Columbia Fund Series Trust (CFST), Columbia Funds Series Trust I (CFST I), Columbia Funds Series Trust II (CFST II), Columbia ETF Trust I (CET I), Columbia ETF Trust II (CET II), Columbia Funds Variable Insurance Trust (CFVIT) and Columbia Funds Variable Series Trust II (CFVST II). Messrs. Batejan, Beckman, Gallagher and Hacker and Mses. Blatz, Carlton, Flynn, Paglia, Shaw and Yeager serve as Directors of Columbia Seligman Premium Technology Growth Fund and Tri-Continental Corporation. |
| Name, address, year of birth | Position held with the Columbia Funds and length of service | Principal occupation(s) during the past five years and other relevant professional experience | Number of Funds in the Columbia Funds Complex overseen | Other directorships held by Trustee during the past five years |
| Daniel J. Beckman c/o Columbia Management Investment Advisers, LLC 290 Congress Street Boston, MA 02210 1962 | Trustee since November 2021 and President since June 2021 | Vice President – Head of North America Product, Columbia Management Investment Advisers, LLC since April 2015; President and Principal Executive Officer of the Columbia Funds since June 2021; officer of Columbia Funds and affiliated funds, 2020-2021 | 176 | Director, Ameriprise Trust Company, since October 2016; Director, Columbia Management Investment Distributors, Inc. since November 2018; Board of Governors, Columbia Wanger Asset Management, LLC since January 2022 |
| * | Interested person (as defined under the 1940 Act) by reason of being an officer, director, security holder and/or employee of the Investment Manager or Ameriprise Financial. |
| 64 | Columbia Balanced Fund | Annual Report 2022 |
(Unaudited)
The Statement of Additional Information has additional information about the Fund’s Board members and is available, without charge, upon request by calling 800.345.6611, visiting columbiathreadneedleus.com/investor/ or contacting your financial intermediary.
| Name, address and year of birth | Position and year first appointed to position for any Fund in the Columbia Funds Complex or a predecessor thereof | Principal occupation(s) during past five years |
| Michael G. Clarke 290 Congress Street Boston, MA 02210 1969 | Chief Financial Officer and Principal Financial Officer (2009) and Senior Vice President (2019) | Senior Vice President and Head of Global Operations & Investor Services, Columbia Management Investment Advisers, LLC, since March 2022 (previously Vice President, Head of North American Operations, and Co-Head of Global Operations, June 2019 to February 2022 and Vice President – Accounting and Tax, May 2010 - May 2019); senior officer of Columbia Funds and affiliated funds since 2002. |
| Joseph Beranek 5890 Ameriprise Financial Center Minneapolis, MN 55474 1965 | Treasurer and Chief Accounting Officer (Principal Accounting Officer) (2019) and Principal Financial Officer (2020), CFST, CFST I, CFST II, CFVIT and CFVST II; Assistant Treasurer, CET I and CET II | Vice President – Mutual Fund Accounting and Financial Reporting, Columbia Management Investment Advisers, LLC, since December 2018 and March 2017, respectively (previously Vice President – Pricing and Corporate Actions, May 2010 - March 2017). |
| Marybeth Pilat 290 Congress Street Boston, MA 02210 1968 | Treasurer and Chief Accounting Officer (Principal Accounting Officer) and Principal Financial Officer (2020) for CET I and CET II; Assistant Treasurer, CFST, CFST I, CFST II, CFVIT and CFVST II | Vice President – Product Pricing and Administration, Columbia Management Investment Advisers, LLC, since May 2017; Director - Fund Administration, Calvert Investments, August 2015 – March 2017; Vice President - Fund Administration, Legg Mason, May 2015 - July 2015; Vice President - Fund Administration, Columbia Management Investment Advisers, LLC, May 2010 - April 2015. |
| William F. Truscott 290 Congress Street Boston, MA 02210 1960 | Senior Vice President (2001) | Formerly, Trustee/Director of Columbia Funds Complex or legacy funds, November 2001-January 1, 2021; Chief Executive Officer, Global Asset Management, Ameriprise Financial, Inc. since September 2012; Chairman of the Board and President, Columbia Management Investment Advisers, LLC since July 2004 and February 2012, respectively; Chairman of the Board and Chief Executive Officer, Columbia Management Investment Distributors, Inc. since November 2008 and February 2012, respectively; Chairman of the Board and Director, Threadneedle Asset Management Holdings, Sàrl since March 2013 and December 2008, respectively; senior executive of various entities affiliated with Columbia Threadneedle. |
| Christopher O. Petersen 5228 Ameriprise Financial Center Minneapolis, MN 55474 1970 | Senior Vice President and Assistant Secretary (2021) | Formerly, Trustee/Director of funds within the Columbia Funds Complex, July 1, 2020 - November 22, 2021; Senior Vice President and Assistant General Counsel, Ameriprise Financial, Inc. since September 2021 (previously Vice President and Lead Chief Counsel, January 2015 - September 2021); formerly, President and Principal Executive Officer of the Columbia Funds, 2015 - 2021; officer of Columbia Funds and affiliated funds since 2007. |
| Thomas P. McGuire 290 Congress Street Boston, MA 02210 1972 | Senior Vice President and Chief Compliance Officer (2012) | Vice President – Asset Management Compliance, Ameriprise Financial, Inc., since May 2010; Chief Compliance Officer, Columbia Acorn/Wanger Funds since December 2015; formerly, Chief Compliance Officer, Ameriprise Certificate Company, September 2010 – September 2020. |
| Columbia Balanced Fund | Annual Report 2022 | 65 |
(Unaudited)
Fund officers (continued)
| Name, address and year of birth | Position and year first appointed to position for any Fund in the Columbia Funds Complex or a predecessor thereof | Principal occupation(s) during past five years |
| Ryan C. Larrenaga 290 Congress Street Boston, MA 02210 1970 | Senior Vice President (2017), Chief Legal Officer (2017), and Secretary (2015) | Vice President and Chief Counsel, Ameriprise Financial, Inc. since August 2018 (previously Vice President and Group Counsel, August 2011 - August 2018); Chief Legal Officer, Columbia Acorn/Wanger Funds, since September 2020; officer of Columbia Funds and affiliated funds since 2005. |
| Michael E. DeFao 290 Congress Street Boston, MA 02210 1968 | Vice President (2011) and Assistant Secretary (2010) | Vice President and Chief Counsel, Ameriprise Financial, Inc. since May 2010; Vice President, Chief Legal Officer and Assistant Secretary, Columbia Management Investment Advisers, LLC since October 2021 (previously Vice President and Assistant Secretary, May 2010 – September 2021). |
| Lyn Kephart-Strong 5228 Ameriprise Financial Center Minneapolis, MN 55474 1960 | Vice President (2015) | President, Columbia Management Investment Services Corp. since October 2014; Vice President & Resolution Officer, Ameriprise Trust Company since August 2009. |
| • | the Fund had sufficient liquidity to both meet redemptions and operate effectively on behalf of shareholders; |
| • | there were no material changes to the Program during the period; |
| • | the implementation of the Program was effective to manage the Fund’s liquidity risk; and |
| • | the Program operated adequately during the period. |
| 66 | Columbia Balanced Fund | Annual Report 2022 |
| • | Information on the investment performance of the Fund relative to the performance of a group of mutual funds determined to be comparable to the Fund by Broadridge, as well as performance relative to benchmarks; |
| • | Information on the Fund’s management fees and total expenses, including information comparing the Fund’s expenses to those of a group of comparable mutual funds, as determined by Broadridge; |
| • | The Investment Manager’s agreement to contractually limit or cap total operating expenses for the Fund so that total operating expenses (excluding certain fees and expenses, such as transaction costs and certain other investment related expenses, interest, taxes, acquired fund fees and expenses and infrequent and/or unusual expenses) would not exceed a specified annual rate, as a percentage of the Fund’s net assets; |
| • | Terms of the Management Agreement; |
| • | Descriptions of other agreements and arrangements with affiliates of the Investment Manager relating to the operations of the Fund, including agreements with respect to the provision of transfer agency and shareholder services to the Fund; |
| • | Descriptions of various services performed by the Investment Manager under the Management Agreement, including portfolio management and portfolio trading practices; |
| • | Information regarding any recently negotiated management fees of similarly-managed portfolios of other institutional clients of the Investment Manager; |
| • | Information regarding the resources of the Investment Manager, including information regarding senior management, portfolio managers and other personnel; |
| • | Information regarding the capabilities of the Investment Manager with respect to compliance monitoring services; |
| • | The profitability to the Investment Manager and its affiliates from their relationships with the Fund; and |
| • | Report provided by the Board’s independent fee consultant, JDL Consultants, LLC (JDL). |
| Columbia Balanced Fund | Annual Report 2022 | 67 |
(Unaudited)
Following an analysis and discussion of the foregoing, and the factors identified below, the Board, including all of the Independent Trustees, approved the renewal of the Management Agreement.
| 68 | Columbia Balanced Fund | Annual Report 2022 |
(Unaudited)
Comparative fees, costs of services provided and the profits realized by the Investment Manager and its affiliates from their relationships with the Fund
| Columbia Balanced Fund | Annual Report 2022 | 69 |
(Unaudited)
Conclusion
| 70 | Columbia Balanced Fund | Annual Report 2022 |
columbiathreadneedleus.com/investor/. The Fund is distributed by Columbia Management Investment Distributors, Inc., member FINRA, and managed by Columbia Management Investment Advisers, LLC.

August 31, 2022

| 3 | |
| 5 | |
| 7 | |
| 8 | |
| 12 | |
| 14 | |
| 15 | |
| 18 | |
| 22 | |
| 32 | |
| 33 | |
| 33 | |
| 39 | |
| 40 |
(Unaudited)

| Average annual total returns (%) (for the period ended August 31, 2022) | |||||
| Inception | 1 Year | 5 Years | 10 Years | ||
| Class A | Excluding sales charges | 11/01/98 | -13.34 | 10.44 | 12.63 |
| Including sales charges | -18.33 | 9.14 | 11.96 | ||
| Advisor Class* | 11/08/12 | -13.09 | 10.72 | 12.91 | |
| Class C | Excluding sales charges | 12/09/02 | -13.95 | 9.62 | 11.79 |
| Including sales charges | -14.70 | 9.62 | 11.79 | ||
| Institutional Class | 12/14/92 | -13.09 | 10.72 | 12.91 | |
| Institutional 2 Class* | 11/08/12 | -13.03 | 10.81 | 13.03 | |
| Institutional 3 Class* | 11/08/12 | -13.00 | 10.86 | 13.08 | |
| Class R | 09/27/10 | -13.55 | 10.16 | 12.35 | |
| Class V | Excluding sales charges | 02/12/93 | -13.32 | 10.44 | 12.61 |
| Including sales charges | -18.30 | 9.14 | 11.95 | ||
| Russell 1000 Index | -12.96 | 11.61 | 12.98 | ||
| * | The returns shown for periods prior to the share class inception date (including returns for the Life of the Fund, if shown, which are since Fund inception) include the returns of the Fund’s oldest share class. These returns are adjusted to reflect any higher class-related operating expenses of the newer share classes, as applicable. Please visit columbiathreadneedleus.com/investor/investment-products/mutual-funds/appended-performance for more information. |
| Columbia Contrarian Core Fund | Annual Report 2022 | 3 |
(Unaudited)
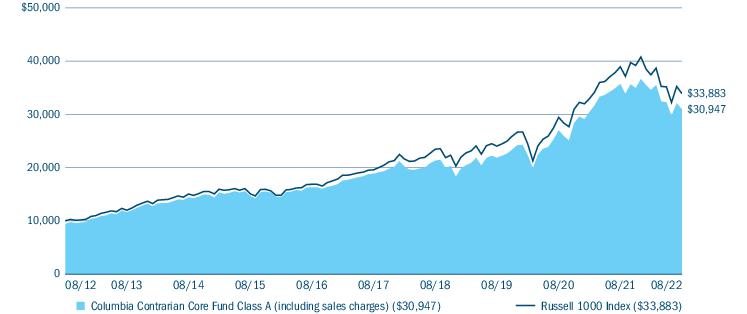
| Portfolio breakdown (%) (at August 31, 2022) | |
| Common Stocks | 97.3 |
| Money Market Funds | 2.7 |
| Total | 100.0 |
| Equity sector breakdown (%) (at August 31, 2022) | |
| Communication Services | 10.3 |
| Consumer Discretionary | 8.2 |
| Consumer Staples | 7.1 |
| Energy | 4.9 |
| Financials | 11.0 |
| Health Care | 14.9 |
| Industrials | 8.1 |
| Information Technology | 28.4 |
| Materials | 2.6 |
| Real Estate | 1.6 |
| Utilities | 2.9 |
| Total | 100.0 |
| 4 | Columbia Contrarian Core Fund | Annual Report 2022 |
(Unaudited)
| • | Stock selection within the financials and consumer discretionary sectors detracted from performance versus the benchmark during the period. |
| • | An overweighted allocation to the communication services sector also weighed on results versus the benchmark. |
| • | Shares of cable and broadband provider Comcast Corp. declined during the period. Struggling against the rising tide of streaming services, Comcast continued to lose subscribers quarter over quarter. Comcast has taken strides to pivot its business to more profitable endeavors, namely its streaming service Peacock TV LLC. |
| • | Medtronic was also a relative detractor. The company’s shares had significantly underperformed through the first five months of 2022, and the Fund sold the long-term holding after losing conviction that the leading medical device company would begin to thrive again in the post-COVID period. |
| • | Adobe, Inc., a provider of software solutions for creative and marketing professionals, saw its share price tumble during the period along with many other higher growth technology names as investors rotated away from growth to value on concerns of higher inflation and a slowing economy. |
| • | Shares of camera and social media company Snap, Inc. moved lower during the period as the company reported earnings which came in below expectations and provided weaker-than-expected guidance. The company pointed to headwinds stemming from global supply chain issues that placed pressure on overall advertising budgets as a reason for the shortfall in guidance. Snap also attributed the shortfall in forward-looking guidance to increased headwinds related to changes made in the way Apple Inc. tracks how users interact with mobile advertising campaigns. We considered this level of change a violation of our investment thesis and, therefore, sold out of the Fund’s position in Snap. |
| • | Stock selection within the health care, information technology, materials and communication services sectors was beneficial to Fund performance relative to the benchmark during the period. |
| • | An overweight to the energy sector, as well as an underweighted allocation to the consumer discretionary sector, contributed to relative performance during the period. |
| Columbia Contrarian Core Fund | Annual Report 2022 | 5 |
(Unaudited)
| • | The Fund’s cash position (while small, as it typically is, at less than 2%) also helped during a down period for equities. |
| • | All three of the Fund’s holdings in the energy sector were top relative contributors as energy was by far the best performing sector during the period. Chevron Corp., EOG Resources, Inc. and Canadian Natural Resources LTD all benefitted from the strong oil market during the Fund’s fiscal year, particularly during the first half of 2022. |
| ○ | Shares of Chevron, the global integrated oil company, performed well in a strong oil market after the company continued to post strong financial results. |
| ○ | EOG Resources, an oil and natural gas exploration and production company, traded higher on the increase in global energy prices, driven, in turn, by geopolitical conflict and reduced global supply. In addition, EOG’s production of oil, natural gas liquids and natural gas came in above company guidance with capital expenditures below the low end of the guidance range. |
| ○ | Canadian Natural Resources LTD also benefited from a strong oil market and executed well, as reflected in its financial results throughout the period. Highlights during the period included the company significantly reducing its net debt as well as increasing earnings and quarterly dividends. |
| • | A position in Raytheon Technologies Corp. was also additive to Fund performance relative to the benchmark. Execution for the aerospace and defense company remained solid with margin progress in its aerospace segment continuing, while the near-term weakness in its defense segment was trumped by building long-term demand drivers for the conflict in Ukraine. |
| • | In the health care sector, Fund holdings of Vertex Pharmaceuticals Incorporated (Vertex) and Eli Lily and Company (Eli Lilly) performed well. |
| ○ | Vertex, a leading biotech company, is focused on developing innovative medicines. The company’s key cystic fibrosis therapy, Trikafta, continued to gain penetration outside of U.S. markets as well as among younger populations. Overall, Vertex continued to deliver solid operational performance and pipeline visibility increased during the period with multiple late-stage programs in development. |
| ○ | Eli Lilly’s drug Tirzepatide has a best-in-class profile in the treatment of both type 2 diabetes and obesity. Today, there are 100 million patients with obesity in the United States and less than 3% receive any care. Given the robust clinical data for Tirzepatide in the treatment of obesity, Eli Lilly has an opportunity to make a major difference in this population and help prevent downstream issues such as diabetes. |
| 6 | Columbia Contrarian Core Fund | Annual Report 2022 |
(Unaudited)
| March 1, 2022 — August 31, 2022 | |||||||
| Account value at the beginning of the period ($) | Account value at the end of the period ($) | Expenses paid during the period ($) | Fund’s annualized expense ratio (%) | ||||
| Actual | Hypothetical | Actual | Hypothetical | Actual | Hypothetical | Actual | |
| Class A | 1,000.00 | 1,000.00 | 894.50 | 1,020.16 | 4.78 | 5.09 | 1.00 |
| Advisor Class | 1,000.00 | 1,000.00 | 895.90 | 1,021.42 | 3.58 | 3.82 | 0.75 |
| Class C | 1,000.00 | 1,000.00 | 891.30 | 1,016.38 | 8.34 | 8.89 | 1.75 |
| Institutional Class | 1,000.00 | 1,000.00 | 896.00 | 1,021.42 | 3.58 | 3.82 | 0.75 |
| Institutional 2 Class | 1,000.00 | 1,000.00 | 896.10 | 1,021.78 | 3.25 | 3.47 | 0.68 |
| Institutional 3 Class | 1,000.00 | 1,000.00 | 896.50 | 1,022.03 | 3.01 | 3.21 | 0.63 |
| Class R | 1,000.00 | 1,000.00 | 893.60 | 1,018.90 | 5.97 | 6.36 | 1.25 |
| Class V | 1,000.00 | 1,000.00 | 894.70 | 1,020.16 | 4.78 | 5.09 | 1.00 |
| Columbia Contrarian Core Fund | Annual Report 2022 | 7 |
August 31, 2022
| Common Stocks 97.3% | ||
| Issuer | Shares | Value ($) |
| Communication Services 10.0% | ||
| Entertainment 2.6% | ||
| Endeavor Group Holdings, Inc., Class A(a) | 1,865,823 | 42,204,916 |
| Take-Two Interactive Software, Inc.(a) | 1,113,598 | 136,482,571 |
| Walt Disney Co. (The)(a) | 874,068 | 97,965,542 |
| Total | 276,653,029 | |
| Interactive Media & Services 4.6% | ||
| Alphabet, Inc., Class A(a) | 1,857,861 | 201,057,717 |
| Alphabet, Inc., Class C(a) | 1,839,563 | 200,788,302 |
| Meta Platforms, Inc., Class A(a) | 521,669 | 84,995,530 |
| Total | 486,841,549 | |
| Media 0.9% | ||
| Comcast Corp., Class A | 2,642,164 | 95,619,915 |
| Wireless Telecommunication Services 1.9% | ||
| T-Mobile US, Inc.(a) | 1,357,332 | 195,401,515 |
| Total Communication Services | 1,054,516,008 | |
| Consumer Discretionary 8.0% | ||
| Automobiles 1.0% | ||
| Tesla, Inc.(a) | 398,343 | 109,787,314 |
| Hotels, Restaurants & Leisure 0.8% | ||
| Chipotle Mexican Grill, Inc.(a) | 7,902 | 12,617,914 |
| McDonald’s Corp. | 262,154 | 66,136,211 |
| Total | 78,754,125 | |
| Internet & Direct Marketing Retail 4.6% | ||
| Amazon.com, Inc.(a) | 3,788,361 | 480,250,524 |
| Specialty Retail 0.9% | ||
| Lowe’s Companies, Inc. | 241,381 | 46,861,707 |
| TJX Companies, Inc. (The) | 838,954 | 52,308,782 |
| Total | 99,170,489 | |
| Textiles, Apparel & Luxury Goods 0.7% | ||
| Tapestry, Inc. | 2,199,990 | 76,405,653 |
| Total Consumer Discretionary | 844,368,105 | |
| Consumer Staples 6.9% | ||
| Beverages 0.6% | ||
| Monster Beverage Corp.(a) | 779,501 | 69,243,074 |
| Common Stocks (continued) | ||
| Issuer | Shares | Value ($) |
| Food & Staples Retailing 3.4% | ||
| Sysco Corp. | 1,428,377 | 117,441,157 |
| Walmart, Inc. | 1,794,475 | 237,857,661 |
| Total | 355,298,818 | |
| Food Products 1.6% | ||
| Mondelez International, Inc., Class A | 2,675,930 | 165,533,030 |
| Household Products 1.0% | ||
| Procter & Gamble Co. (The) | 744,264 | 102,663,776 |
| Personal Products 0.3% | ||
| Coty, Inc., Class A(a) | 4,227,074 | 31,745,326 |
| Total Consumer Staples | 724,484,024 | |
| Energy 4.7% | ||
| Oil, Gas & Consumable Fuels 4.7% | ||
| Canadian Natural Resources Ltd. | 2,145,145 | 117,575,397 |
| Chevron Corp. | 1,527,118 | 241,376,271 |
| EOG Resources, Inc. | 1,163,873 | 141,177,795 |
| Total | 500,129,463 | |
| Total Energy | 500,129,463 | |
| Financials 10.7% | ||
| Banks 4.7% | ||
| Bank of America Corp. | 5,451,902 | 183,238,426 |
| JPMorgan Chase & Co. | 816,914 | 92,907,629 |
| Wells Fargo & Co. | 4,956,868 | 216,664,701 |
| Total | 492,810,756 | |
| Capital Markets 2.7% | ||
| BlackRock, Inc. | 98,438 | 65,598,099 |
| MSCI, Inc. | 146,586 | 65,852,295 |
| State Street Corp. | 2,297,677 | 157,046,223 |
| Total | 288,496,617 | |
| Consumer Finance 0.1% | ||
| American Express Co. | 74,423 | 11,312,296 |
| Diversified Financial Services 2.8% | ||
| Berkshire Hathaway, Inc., Class B(a) | 1,062,133 | 298,246,946 |
| 8 | Columbia Contrarian Core Fund | Annual Report 2022 |
August 31, 2022
| Common Stocks (continued) | ||
| Issuer | Shares | Value ($) |
| Insurance 0.4% | ||
| Aon PLC, Class A | 150,836 | 42,122,461 |
| Total Financials | 1,132,989,076 | |
| Health Care 14.5% | ||
| Biotechnology 2.5% | ||
| BioMarin Pharmaceutical, Inc.(a) | 941,530 | 83,984,476 |
| Horizon Therapeutics PLC(a) | 551,695 | 32,665,861 |
| Vertex Pharmaceuticals, Inc.(a) | 528,711 | 148,969,611 |
| Total | 265,619,948 | |
| Health Care Equipment & Supplies 2.6% | ||
| Abbott Laboratories | 1,162,351 | 119,315,330 |
| Baxter International, Inc. | 1,016,241 | 58,393,208 |
| Boston Scientific Corp.(a) | 2,410,263 | 97,157,702 |
| Total | 274,866,240 | |
| Health Care Providers & Services 3.2% | ||
| CVS Health Corp. | 1,856,202 | 182,186,226 |
| Elevance Health, Inc. | 321,014 | 155,727,102 |
| Total | 337,913,328 | |
| Life Sciences Tools & Services 1.2% | ||
| IQVIA Holdings, Inc.(a) | 302,803 | 64,394,086 |
| Thermo Fisher Scientific, Inc. | 117,345 | 63,990,575 |
| Total | 128,384,661 | |
| Pharmaceuticals 5.0% | ||
| Eli Lilly & Co. | 646,487 | 194,741,279 |
| Johnson & Johnson | 2,075,880 | 334,922,479 |
| Total | 529,663,758 | |
| Total Health Care | 1,536,447,935 | |
| Industrials 7.9% | ||
| Aerospace & Defense 2.7% | ||
| Raytheon Technologies Corp. | 3,165,748 | 284,125,883 |
| Airlines 0.7% | ||
| Southwest Airlines Co.(a) | 2,089,777 | 76,694,816 |
| Industrial Conglomerates 1.8% | ||
| General Electric Co. | 1,278,020 | 93,857,789 |
| Honeywell International, Inc. | 509,228 | 96,422,322 |
| Total | 190,280,111 | |
| Common Stocks (continued) | ||
| Issuer | Shares | Value ($) |
| Road & Rail 2.7% | ||
| Uber Technologies, Inc.(a) | 5,295,254 | 152,291,505 |
| Union Pacific Corp. | 590,177 | 132,500,638 |
| Total | 284,792,143 | |
| Total Industrials | 835,892,953 | |
| Information Technology 27.7% | ||
| Electronic Equipment, Instruments & Components 0.9% | ||
| TE Connectivity Ltd. | 779,206 | 98,343,589 |
| IT Services 5.5% | ||
| Fidelity National Information Services, Inc. | 1,000,504 | 91,416,050 |
| Global Payments, Inc. | 669,488 | 83,170,494 |
| International Business Machines Corp. | 327,969 | 42,127,618 |
| MasterCard, Inc., Class A | 488,938 | 158,596,819 |
| PayPal Holdings, Inc.(a) | 790,356 | 73,850,865 |
| Visa, Inc., Class A | 648,659 | 128,895,030 |
| Total | 578,056,876 | |
| Semiconductors & Semiconductor Equipment 2.5% | ||
| Advanced Micro Devices, Inc.(a) | 700,161 | 59,422,664 |
| Lam Research Corp. | 201,640 | 88,300,173 |
| Marvell Technology, Inc. | 601,815 | 28,176,978 |
| NVIDIA Corp. | 567,198 | 85,612,866 |
| Total | 261,512,681 | |
| Software 12.3% | ||
| Adobe, Inc.(a) | 506,326 | 189,082,382 |
| Intuit, Inc. | 434,494 | 187,605,819 |
| Microsoft Corp. | 2,740,417 | 716,536,833 |
| Palo Alto Networks, Inc.(a) | 230,351 | 128,261,740 |
| Salesforce, Inc.(a) | 498,072 | 77,759,001 |
| Total | 1,299,245,775 | |
| Technology Hardware, Storage & Peripherals 6.5% | ||
| Apple, Inc. | 4,373,221 | 687,557,806 |
| Total Information Technology | 2,924,716,727 | |
| Columbia Contrarian Core Fund | Annual Report 2022 | 9 |
August 31, 2022
| Common Stocks (continued) | ||
| Issuer | Shares | Value ($) |
| Materials 2.5% | ||
| Chemicals 2.5% | ||
| Corteva, Inc. | 1,301,116 | 79,927,556 |
| Ecolab, Inc. | 430,575 | 70,541,102 |
| International Flavors & Fragrances, Inc. | 1,054,022 | 116,448,351 |
| Total | 266,917,009 | |
| Total Materials | 266,917,009 | |
| Real Estate 1.5% | ||
| Equity Real Estate Investment Trusts (REITS) 1.5% | ||
| American Tower Corp. | 633,088 | 160,836,006 |
| Total Real Estate | 160,836,006 | |
| Utilities 2.9% | ||
| Electric Utilities 1.7% | ||
| American Electric Power Co., Inc. | 1,741,840 | 174,532,368 |
| Common Stocks (continued) | ||
| Issuer | Shares | Value ($) |
| Multi-Utilities 1.2% | ||
| Public Service Enterprise Group, Inc. | 1,967,358 | 126,619,161 |
| Total Utilities | 301,151,529 | |
| Total Common Stocks (Cost $6,876,378,302) | 10,282,448,835 | |
| Money Market Funds 2.8% | ||
| Shares | Value ($) | |
| Columbia Short-Term Cash Fund, 2.366%(b),(c) | 289,320,708 | 289,176,047 |
| Total Money Market Funds (Cost $289,162,366) | 289,176,047 | |
| Total Investments in Securities (Cost: $7,165,540,668) | 10,571,624,882 | |
| Other Assets & Liabilities, Net | (6,537,036) | |
| Net Assets | 10,565,087,846 | |
| (a) | Non-income producing investment. |
| (b) | The rate shown is the seven-day current annualized yield at August 31, 2022. |
| (c) | As defined in the Investment Company Act of 1940, as amended, an affiliated company is one in which the Fund owns 5% or more of the company’s outstanding voting securities, or a company which is under common ownership or control with the Fund. The value of the holdings and transactions in these affiliated companies during the year ended August 31, 2022 are as follows: |
| Affiliated issuers | Beginning of period($) | Purchases($) | Sales($) | Net change in unrealized appreciation (depreciation)($) | End of period($) | Realized gain (loss)($) | Dividends($) | End of period shares |
| Columbia Short-Term Cash Fund, 2.366% | ||||||||
| 101,164,946 | 2,546,251,428 | (2,358,253,984) | 13,657 | 289,176,047 | (122,031) | 1,284,004 | 289,320,708 | |
| ■ | Level 1 — Valuations based on quoted prices for investments in active markets that the Fund has the ability to access at the measurement date. Valuation adjustments are not applied to Level 1 investments. |
| ■ | Level 2 — Valuations based on other significant observable inputs (including quoted prices for similar securities, interest rates, prepayment speeds, credit risks, etc.). |
| ■ | Level 3 — Valuations based on significant unobservable inputs (including the Fund’s own assumptions and judgment in determining the fair value of investments). |
| 10 | Columbia Contrarian Core Fund | Annual Report 2022 |
August 31, 2022
Investments falling into the Level 3 category are primarily supported by quoted prices from brokers and dealers participating in the market for those investments. However, these may be classified as Level 3 investments due to lack of market transparency and corroboration to support these quoted prices. Additionally, valuation models may be used as the pricing source for any remaining investments classified as Level 3. These models may rely on one or more significant unobservable inputs and/or significant assumptions by the Investment Manager. Inputs used in valuations may include, but are not limited to, financial statement analysis, capital account balances, discount rates and estimated cash flows, and comparable company data.
| Level 1 ($) | Level 2 ($) | Level 3 ($) | Total ($) | |
| Investments in Securities | ||||
| Common Stocks | ||||
| Communication Services | 1,054,516,008 | — | — | 1,054,516,008 |
| Consumer Discretionary | 844,368,105 | — | — | 844,368,105 |
| Consumer Staples | 724,484,024 | — | — | 724,484,024 |
| Energy | 500,129,463 | — | — | 500,129,463 |
| Financials | 1,132,989,076 | — | — | 1,132,989,076 |
| Health Care | 1,536,447,935 | — | — | 1,536,447,935 |
| Industrials | 835,892,953 | — | — | 835,892,953 |
| Information Technology | 2,924,716,727 | — | — | 2,924,716,727 |
| Materials | 266,917,009 | — | — | 266,917,009 |
| Real Estate | 160,836,006 | — | — | 160,836,006 |
| Utilities | 301,151,529 | — | — | 301,151,529 |
| Total Common Stocks | 10,282,448,835 | — | — | 10,282,448,835 |
| Money Market Funds | 289,176,047 | — | — | 289,176,047 |
| Total Investments in Securities | 10,571,624,882 | — | — | 10,571,624,882 |
| Columbia Contrarian Core Fund | Annual Report 2022 | 11 |
August 31, 2022
| Assets | |
| Investments in securities, at value | |
| Unaffiliated issuers (cost $6,876,378,302) | $10,282,448,835 |
| Affiliated issuers (cost $289,162,366) | 289,176,047 |
| Foreign currency (cost $1,680,677) | 1,680,677 |
| Receivable for: | |
| Investments sold | 28,546,573 |
| Capital shares sold | 2,665,459 |
| Dividends | 16,435,763 |
| Foreign tax reclaims | 396,594 |
| Prepaid expenses | 110,913 |
| Trustees’ deferred compensation plan | 775,969 |
| Total assets | 10,622,236,830 |
| Liabilities | |
| Due to custodian | 1,708,119 |
| Payable for: | |
| Investments purchased | 33,764,412 |
| Capital shares purchased | 19,317,011 |
| Management services fees | 178,520 |
| Distribution and/or service fees | 24,815 |
| Transfer agent fees | 1,090,025 |
| Compensation of board members | 104,541 |
| Other expenses | 185,572 |
| Trustees’ deferred compensation plan | 775,969 |
| Total liabilities | 57,148,984 |
| Net assets applicable to outstanding capital stock | $10,565,087,846 |
| Represented by | |
| Paid in capital | 6,293,785,505 |
| Total distributable earnings (loss) | 4,271,302,341 |
| Total - representing net assets applicable to outstanding capital stock | $10,565,087,846 |
| 12 | Columbia Contrarian Core Fund | Annual Report 2022 |
August 31, 2022
| Class A | |
| Net assets | $1,671,377,486 |
| Shares outstanding | 60,071,480 |
| Net asset value per share | $27.82 |
| Maximum sales charge | 5.75% |
| Maximum offering price per share (calculated by dividing the net asset value per share by 1.0 minus the maximum sales charge for Class A shares) | $29.52 |
| Advisor Class | |
| Net assets | $570,718,434 |
| Shares outstanding | 19,792,264 |
| Net asset value per share | $28.84 |
| Class C | |
| Net assets | $378,576,103 |
| Shares outstanding | 15,815,341 |
| Net asset value per share | $23.94 |
| Institutional Class | |
| Net assets | $4,351,596,968 |
| Shares outstanding | 154,552,970 |
| Net asset value per share | $28.16 |
| Institutional 2 Class | |
| Net assets | $667,505,336 |
| Shares outstanding | 23,163,219 |
| Net asset value per share | $28.82 |
| Institutional 3 Class | |
| Net assets | $2,642,361,867 |
| Shares outstanding | 91,599,321 |
| Net asset value per share | $28.85 |
| Class R | |
| Net assets | $113,471,959 |
| Shares outstanding | 4,081,775 |
| Net asset value per share | $27.80 |
| Class V | |
| Net assets | $169,479,693 |
| Shares outstanding | 6,176,007 |
| Net asset value per share | $27.44 |
| Maximum sales charge | 5.75% |
| Maximum offering price per share (calculated by dividing the net asset value per share by 1.0 minus the maximum sales charge for Class V shares) | $29.11 |
| Columbia Contrarian Core Fund | Annual Report 2022 | 13 |
Year Ended August 31, 2022
| Net investment income | |
| Income: | |
| Dividends — unaffiliated issuers | $157,711,172 |
| Dividends — affiliated issuers | 1,284,004 |
| Interfund lending | 1,294 |
| Foreign taxes withheld | (1,233,430) |
| Total income | 157,763,040 |
| Expenses: | |
| Management services fees | 73,066,834 |
| Distribution and/or service fees | |
| Class A | 4,746,205 |
| Class C | 4,700,353 |
| Class R | 652,043 |
| Class V | 484,102 |
| Transfer agent fees | |
| Class A | 2,413,838 |
| Advisor Class | 817,125 |
| Class C | 597,168 |
| Institutional Class | 6,228,875 |
| Institutional 2 Class | 430,047 |
| Institutional 3 Class | 180,017 |
| Class R | 165,772 |
| Class V | 246,182 |
| Compensation of board members | 164,592 |
| Custodian fees | 62,259 |
| Printing and postage fees | 389,602 |
| Registration fees | 245,062 |
| Audit fees | 29,706 |
| Legal fees | 136,436 |
| Compensation of chief compliance officer | 3,056 |
| Other | 167,683 |
| Total expenses | 95,926,957 |
| Expense reduction | (4,264) |
| Total net expenses | 95,922,693 |
| Net investment income | 61,840,347 |
| Realized and unrealized gain (loss) — net | |
| Net realized gain (loss) on: | |
| Investments — unaffiliated issuers | 1,156,886,203 |
| Investments — affiliated issuers | (122,031) |
| Foreign currency translations | (3,716) |
| Net realized gain | 1,156,760,456 |
| Net change in unrealized appreciation (depreciation) on: | |
| Investments — unaffiliated issuers | (2,864,255,712) |
| Investments — affiliated issuers | 13,657 |
| Foreign currency translations | (833) |
| Net change in unrealized appreciation (depreciation) | (2,864,242,888) |
| Net realized and unrealized loss | (1,707,482,432) |
| Net decrease in net assets resulting from operations | $(1,645,642,085) |
| 14 | Columbia Contrarian Core Fund | Annual Report 2022 |
| Year Ended August 31, 2022 | Year Ended August 31, 2021 | |
| Operations | ||
| Net investment income | $61,840,347 | $56,214,447 |
| Net realized gain | 1,156,760,456 | 1,433,957,844 |
| Net change in unrealized appreciation (depreciation) | (2,864,242,888) | 1,820,968,250 |
| Net increase (decrease) in net assets resulting from operations | (1,645,642,085) | 3,311,140,541 |
| Distributions to shareholders | ||
| Net investment income and net realized gains | ||
| Class A | (248,040,955) | (121,933,982) |
| Advisor Class | (83,993,104) | (44,172,711) |
| Class C | (71,648,177) | (40,970,431) |
| Institutional Class | (648,750,792) | (327,244,245) |
| Institutional 2 Class | (101,640,489) | (52,880,480) |
| Institutional 3 Class | (399,260,986) | (191,447,614) |
| Class R | (16,900,701) | (8,820,479) |
| Class V | (25,882,833) | (13,110,291) |
| Total distributions to shareholders | (1,596,118,037) | (800,580,233) |
| Increase in net assets from capital stock activity | 624,160,386 | 220,109,742 |
| Total increase (decrease) in net assets | (2,617,599,736) | 2,730,670,050 |
| Net assets at beginning of year | 13,182,687,582 | 10,452,017,532 |
| Net assets at end of year | $10,565,087,846 | $13,182,687,582 |
| Columbia Contrarian Core Fund | Annual Report 2022 | 15 |
| Year Ended | Year Ended | |||
| August 31, 2022 | August 31, 2021 | |||
| Shares | Dollars ($) | Shares | Dollars ($) | |
| Capital stock activity | ||||
| Class A | ||||
| Subscriptions | 7,173,174 | 225,974,029 | 8,207,783 | 263,211,026 |
| Distributions reinvested | 7,052,274 | 228,282,119 | 3,825,008 | 112,722,971 |
| Redemptions | (10,586,589) | (331,438,652) | (10,935,142) | (346,698,701) |
| Net increase | 3,638,859 | 122,817,496 | 1,097,649 | 29,235,296 |
| Advisor Class | ||||
| Subscriptions | 3,894,443 | 126,057,847 | 4,253,055 | 141,742,720 |
| Distributions reinvested | 2,426,602 | 81,266,896 | 1,400,438 | 42,517,289 |
| Redemptions | (5,207,867) | (168,960,931) | (6,109,142) | (206,309,952) |
| Net increase (decrease) | 1,113,178 | 38,363,812 | (455,649) | (22,049,943) |
| Class C | ||||
| Subscriptions | 1,356,379 | 37,187,816 | 1,524,554 | 43,303,748 |
| Distributions reinvested | 2,477,529 | 69,370,813 | 1,503,216 | 39,248,973 |
| Redemptions | (5,166,302) | (140,541,479) | (6,541,940) | (184,574,174) |
| Net decrease | (1,332,394) | (33,982,850) | (3,514,170) | (102,021,453) |
| Institutional Class | ||||
| Subscriptions | 18,000,362 | 572,977,701 | 20,159,310 | 642,463,808 |
| Distributions reinvested | 18,595,718 | 608,079,971 | 10,263,303 | 305,128,008 |
| Redemptions | (25,901,207) | (821,657,440) | (27,245,363) | (877,443,216) |
| Net increase | 10,694,873 | 359,400,232 | 3,177,250 | 70,148,600 |
| Institutional 2 Class | ||||
| Subscriptions | 2,116,482 | 68,996,293 | 5,224,951 | 171,256,732 |
| Distributions reinvested | 3,036,132 | 101,558,621 | 1,742,501 | 52,832,640 |
| Redemptions | (4,780,790) | (156,247,153) | (5,517,999) | (181,402,077) |
| Net increase | 371,824 | 14,307,761 | 1,449,453 | 42,687,295 |
| Institutional 3 Class | ||||
| Subscriptions | 11,315,637 | 364,235,729 | 18,037,556 | 579,266,441 |
| Distributions reinvested | 9,291,200 | 310,976,452 | 4,752,273 | 144,183,977 |
| Redemptions | (17,531,135) | (567,306,226) | (15,394,023) | (512,019,370) |
| Net increase | 3,075,702 | 107,905,955 | 7,395,806 | 211,431,048 |
| Class R | ||||
| Subscriptions | 414,445 | 13,254,917 | 544,807 | 17,453,631 |
| Distributions reinvested | 517,344 | 16,761,949 | 294,359 | 8,686,521 |
| Redemptions | (775,349) | (24,498,125) | (1,106,598) | (35,520,408) |
| Net increase (decrease) | 156,440 | 5,518,741 | (267,432) | (9,380,256) |
| Class V | ||||
| Subscriptions | 198,920 | 6,295,381 | 114,209 | 3,357,298 |
| Distributions reinvested | 586,499 | 18,726,926 | 322,454 | 9,389,850 |
| Redemptions | (491,137) | (15,193,068) | (401,460) | (12,687,993) |
| Net increase | 294,282 | 9,829,239 | 35,203 | 59,155 |
| Total net increase | 18,012,764 | 624,160,386 | 8,918,110 | 220,109,742 |
| 16 | Columbia Contrarian Core Fund | Annual Report 2022 |
| Net asset value, beginning of period | Net investment income (loss) | Net realized and unrealized gain (loss) | Total from investment operations | Distributions from net investment income | Distributions from net realized gains | Total distributions to shareholders | |
| Class A | |||||||
| Year Ended 8/31/2022 | $36.54 | 0.10 | (4.35) | (4.25) | (0.07) | (4.40) | (4.47) |
| Year Ended 8/31/2021 | $29.79 | 0.09 | 8.94 | 9.03 | (0.17) | (2.11) | (2.28) |
| Year Ended 8/31/2020 | $25.48 | 0.18 | 5.65 | 5.83 | (0.23) | (1.29) | (1.52) |
| Year Ended 8/31/2019 | $27.19 | 0.22 | 0.19 | 0.41 | (0.22) | (1.90) | (2.12) |
| Year Ended 8/31/2018 | $25.41 | 0.18 | 3.05 | 3.23 | (0.18) | (1.27) | (1.45) |
| Advisor Class | |||||||
| Year Ended 8/31/2022 | $37.70 | 0.19 | (4.49) | (4.30) | (0.16) | (4.40) | (4.56) |
| Year Ended 8/31/2021 | $30.66 | 0.18 | 9.21 | 9.39 | (0.24) | (2.11) | (2.35) |
| Year Ended 8/31/2020 | $26.19 | 0.25 | 5.80 | 6.05 | (0.29) | (1.29) | (1.58) |
| Year Ended 8/31/2019 | $27.89 | 0.29 | 0.19 | 0.48 | (0.28) | (1.90) | (2.18) |
| Year Ended 8/31/2018 | $26.02 | 0.25 | 3.13 | 3.38 | (0.24) | (1.27) | (1.51) |
| Class C | |||||||
| Year Ended 8/31/2022 | $32.19 | (0.12) | (3.73) | (3.85) | — | (4.40) | (4.40) |
| Year Ended 8/31/2021 | $26.53 | (0.13) | 7.90 | 7.77 | — | (2.11) | (2.11) |
| Year Ended 8/31/2020 | $22.84 | (0.02) | 5.04 | 5.02 | (0.04) | (1.29) | (1.33) |
| Year Ended 8/31/2019 | $24.57 | 0.04 | 0.15 | 0.19 | (0.02) | (1.90) | (1.92) |
| Year Ended 8/31/2018 | $23.09 | (0.01) | 2.76 | 2.75 | — | (1.27) | (1.27) |
| Institutional Class | |||||||
| Year Ended 8/31/2022 | $36.92 | 0.18 | (4.38) | (4.20) | (0.16) | (4.40) | (4.56) |
| Year Ended 8/31/2021 | $30.07 | 0.18 | 9.02 | 9.20 | (0.24) | (2.11) | (2.35) |
| Year Ended 8/31/2020 | $25.71 | 0.24 | 5.70 | 5.94 | (0.29) | (1.29) | (1.58) |
| Year Ended 8/31/2019 | $27.42 | 0.29 | 0.18 | 0.47 | (0.28) | (1.90) | (2.18) |
| Year Ended 8/31/2018 | $25.61 | 0.25 | 3.07 | 3.32 | (0.24) | (1.27) | (1.51) |
| Institutional 2 Class | |||||||
| Year Ended 8/31/2022 | $37.68 | 0.21 | (4.49) | (4.28) | (0.18) | (4.40) | (4.58) |
| Year Ended 8/31/2021 | $30.64 | 0.20 | 9.21 | 9.41 | (0.26) | (2.11) | (2.37) |
| Year Ended 8/31/2020 | $26.17 | 0.27 | 5.80 | 6.07 | (0.31) | (1.29) | (1.60) |
| Year Ended 8/31/2019 | $27.88 | 0.32 | 0.18 | 0.50 | (0.31) | (1.90) | (2.21) |
| Year Ended 8/31/2018 | $26.01 | 0.28 | 3.13 | 3.41 | (0.27) | (1.27) | (1.54) |
| 18 | Columbia Contrarian Core Fund | Annual Report 2022 |
| Net asset value, end of period | Total return | Total gross expense ratio to average net assets(a) | Total net expense ratio to average net assets(a),(b) | Net investment income (loss) ratio to average net assets | Portfolio turnover | Net assets, end of period (000’s) | |
| Class A | |||||||
| Year Ended 8/31/2022 | $27.82 | (13.34%) | 0.99% | 0.99%(c) | 0.32% | 49% | $1,671,377 |
| Year Ended 8/31/2021 | $36.54 | 32.15% | 1.00%(d) | 1.00%(c),(d) | 0.29% | 47% | $2,061,801 |
| Year Ended 8/31/2020 | $29.79 | 23.80% | 1.02% | 1.02%(c) | 0.67% | 51% | $1,648,211 |
| Year Ended 8/31/2019 | $25.48 | 2.49% | 1.03%(d) | 1.03%(d) | 0.91% | 53% | $1,568,622 |
| Year Ended 8/31/2018 | $27.19 | 13.09% | 1.02% | 1.02%(c) | 0.70% | 63% | $1,912,203 |
| Advisor Class | |||||||
| Year Ended 8/31/2022 | $28.84 | (13.09%) | 0.74% | 0.74%(c) | 0.57% | 49% | $570,718 |
| Year Ended 8/31/2021 | $37.70 | 32.47% | 0.75%(d) | 0.75%(c),(d) | 0.54% | 47% | $704,253 |
| Year Ended 8/31/2020 | $30.66 | 24.06% | 0.77% | 0.77%(c) | 0.92% | 51% | $586,655 |
| Year Ended 8/31/2019 | $26.19 | 2.74% | 0.78%(d) | 0.78%(d) | 1.16% | 53% | $610,686 |
| Year Ended 8/31/2018 | $27.89 | 13.39% | 0.77% | 0.77%(c) | 0.95% | 63% | $743,515 |
| Class C | |||||||
| Year Ended 8/31/2022 | $23.94 | (13.95%) | 1.74% | 1.74%(c) | (0.44%) | 49% | $378,576 |
| Year Ended 8/31/2021 | $32.19 | 31.14% | 1.75%(d) | 1.75%(c),(d) | (0.45%) | 47% | $552,047 |
| Year Ended 8/31/2020 | $26.53 | 22.85% | 1.77% | 1.77%(c) | (0.08%) | 51% | $548,126 |
| Year Ended 8/31/2019 | $22.84 | 1.73% | 1.78%(d) | 1.78%(d) | 0.16% | 53% | $561,716 |
| Year Ended 8/31/2018 | $24.57 | 12.23% | 1.77% | 1.77%(c) | (0.05%) | 63% | $708,041 |
| Institutional Class | |||||||
| Year Ended 8/31/2022 | $28.16 | (13.09%) | 0.74% | 0.74%(c) | 0.57% | 49% | $4,351,597 |
| Year Ended 8/31/2021 | $36.92 | 32.47% | 0.75%(d) | 0.75%(c),(d) | 0.54% | 47% | $5,311,382 |
| Year Ended 8/31/2020 | $30.07 | 24.08% | 0.77% | 0.77%(c) | 0.92% | 51% | $4,230,127 |
| Year Ended 8/31/2019 | $25.71 | 2.75% | 0.78%(d) | 0.78%(d) | 1.16% | 53% | $3,961,440 |
| Year Ended 8/31/2018 | $27.42 | 13.37% | 0.77% | 0.77%(c) | 0.95% | 63% | $4,889,699 |
| Institutional 2 Class | |||||||
| Year Ended 8/31/2022 | $28.82 | (13.03%) | 0.67% | 0.67% | 0.64% | 49% | $667,505 |
| Year Ended 8/31/2021 | $37.68 | 32.58% | 0.68%(d) | 0.68%(d) | 0.61% | 47% | $858,820 |
| Year Ended 8/31/2020 | $30.64 | 24.19% | 0.69% | 0.69% | 1.00% | 51% | $653,968 |
| Year Ended 8/31/2019 | $26.17 | 2.81% | 0.68%(d) | 0.68%(d) | 1.25% | 53% | $638,213 |
| Year Ended 8/31/2018 | $27.88 | 13.50% | 0.68% | 0.68% | 1.04% | 63% | $894,849 |
| Columbia Contrarian Core Fund | Annual Report 2022 | 19 |
| Net asset value, beginning of period | Net investment income (loss) | Net realized and unrealized gain (loss) | Total from investment operations | Distributions from net investment income | Distributions from net realized gains | Total distributions to shareholders | |
| Institutional 3 Class | |||||||
| Year Ended 8/31/2022 | $37.72 | 0.22 | (4.49) | (4.27) | (0.20) | (4.40) | (4.60) |
| Year Ended 8/31/2021 | $30.67 | 0.22 | 9.21 | 9.43 | (0.27) | (2.11) | (2.38) |
| Year Ended 8/31/2020 | $26.19 | 0.28 | 5.81 | 6.09 | (0.32) | (1.29) | (1.61) |
| Year Ended 8/31/2019 | $27.89 | 0.33 | 0.19 | 0.52 | (0.32) | (1.90) | (2.22) |
| Year Ended 8/31/2018 | $26.03 | 0.29 | 3.12 | 3.41 | (0.28) | (1.27) | (1.55) |
| Class R | |||||||
| Year Ended 8/31/2022 | $36.52 | 0.02 | (4.34) | (4.32) | — | (4.40) | (4.40) |
| Year Ended 8/31/2021 | $29.78 | 0.01 | 8.94 | 8.95 | (0.10) | (2.11) | (2.21) |
| Year Ended 8/31/2020 | $25.48 | 0.11 | 5.64 | 5.75 | (0.16) | (1.29) | (1.45) |
| Year Ended 8/31/2019 | $27.18 | 0.16 | 0.19 | 0.35 | (0.15) | (1.90) | (2.05) |
| Year Ended 8/31/2018 | $25.41 | 0.12 | 3.04 | 3.16 | (0.12) | (1.27) | (1.39) |
| Class V | |||||||
| Year Ended 8/31/2022 | $36.09 | 0.10 | (4.28) | (4.18) | (0.07) | (4.40) | (4.47) |
| Year Ended 8/31/2021 | $29.45 | 0.09 | 8.83 | 8.92 | (0.17) | (2.11) | (2.28) |
| Year Ended 8/31/2020 | $25.22 | 0.17 | 5.58 | 5.75 | (0.23) | (1.29) | (1.52) |
| Year Ended 8/31/2019 | $26.93 | 0.22 | 0.19 | 0.41 | (0.22) | (1.90) | (2.12) |
| Year Ended 8/31/2018 | $25.18 | 0.18 | 3.02 | 3.20 | (0.18) | (1.27) | (1.45) |
| Notes to Financial Highlights | |
| (a) | In addition to the fees and expenses that the Fund bears directly, the Fund indirectly bears a pro rata share of the fees and expenses of any other funds in which it invests. Such indirect expenses are not included in the Fund’s reported expense ratios. |
| (b) | Total net expenses include the impact of certain fee waivers/expense reimbursements made by the Investment Manager and certain of its affiliates, if applicable. |
| (c) | The benefits derived from expense reductions had an impact of less than 0.01%. |
| (d) | Ratios include interfund lending expense which is less than 0.01%. |
| 20 | Columbia Contrarian Core Fund | Annual Report 2022 |
| Net asset value, end of period | Total return | Total gross expense ratio to average net assets(a) | Total net expense ratio to average net assets(a),(b) | Net investment income (loss) ratio to average net assets | Portfolio turnover | Net assets, end of period (000’s) | |
| Institutional 3 Class | |||||||
| Year Ended 8/31/2022 | $28.85 | (13.00%) | 0.62% | 0.62% | 0.69% | 49% | $2,642,362 |
| Year Ended 8/31/2021 | $37.72 | 32.64% | 0.63%(d) | 0.63%(d) | 0.66% | 47% | $3,338,749 |
| Year Ended 8/31/2020 | $30.67 | 24.26% | 0.64% | 0.64% | 1.05% | 51% | $2,487,886 |
| Year Ended 8/31/2019 | $26.19 | 2.90% | 0.64%(d) | 0.64%(d) | 1.30% | 53% | $2,123,062 |
| Year Ended 8/31/2018 | $27.89 | 13.50% | 0.63% | 0.63% | 1.10% | 63% | $2,101,809 |
| Class R | |||||||
| Year Ended 8/31/2022 | $27.80 | (13.55%) | 1.24% | 1.24%(c) | 0.07% | 49% | $113,472 |
| Year Ended 8/31/2021 | $36.52 | 31.83% | 1.25%(d) | 1.25%(c),(d) | 0.04% | 47% | $143,336 |
| Year Ended 8/31/2020 | $29.78 | 23.47% | 1.27% | 1.27%(c) | 0.42% | 51% | $124,853 |
| Year Ended 8/31/2019 | $25.48 | 2.24% | 1.28%(d) | 1.28%(d) | 0.66% | 53% | $124,951 |
| Year Ended 8/31/2018 | $27.18 | 12.78% | 1.27% | 1.27%(c) | 0.45% | 63% | $145,912 |
| Class V | |||||||
| Year Ended 8/31/2022 | $27.44 | (13.32%) | 0.99% | 0.99%(c) | 0.32% | 49% | $169,480 |
| Year Ended 8/31/2021 | $36.09 | 32.14% | 1.00%(d) | 1.00%(c),(d) | 0.29% | 47% | $212,301 |
| Year Ended 8/31/2020 | $29.45 | 23.73% | 1.02% | 1.02%(c) | 0.67% | 51% | $172,192 |
| Year Ended 8/31/2019 | $25.22 | 2.52% | 1.03%(d) | 1.03%(d) | 0.91% | 53% | $150,836 |
| Year Ended 8/31/2018 | $26.93 | 13.09% | 1.02% | 1.02%(c) | 0.70% | 63% | $163,335 |
| Columbia Contrarian Core Fund | Annual Report 2022 | 21 |
August 31, 2022
| 22 | Columbia Contrarian Core Fund | Annual Report 2022 |
August 31, 2022
| Columbia Contrarian Core Fund | Annual Report 2022 | 23 |
August 31, 2022
| 24 | Columbia Contrarian Core Fund | Annual Report 2022 |
August 31, 2022
| Effective rate (%) | |
| Class A | 0.13 |
| Advisor Class | 0.13 |
| Class C | 0.13 |
| Institutional Class | 0.13 |
| Institutional 2 Class | 0.06 |
| Institutional 3 Class | 0.01 |
| Class R | 0.13 |
| Class V | 0.13 |
| Columbia Contrarian Core Fund | Annual Report 2022 | 25 |
August 31, 2022
| Front End (%) | CDSC (%) | Amount ($) | |
| Class A | 5.75 | 0.50 - 1.00(a) | 1,446,495 |
| Class C | — | 1.00(b) | 17,072 |
| Class V | 5.75 | 0.50 - 1.00(a) | 69 |
| (a) | This charge is imposed on certain investments of between $1 million and $50 million redeemed within 18 months after purchase, as follows: 1.00% if redeemed within 12 months after purchase, and 0.50% if redeemed more than 12, but less than 18, months after purchase, with certain limited exceptions. |
| (b) | This charge applies to redemptions within 12 months after purchase, with certain limited exceptions. |
| 26 | Columbia Contrarian Core Fund | Annual Report 2022 |
August 31, 2022
| Fee rate(s) contractual through December 31, 2022 | |
| Class A | 1.03% |
| Advisor Class | 0.78 |
| Class C | 1.78 |
| Institutional Class | 0.78 |
| Institutional 2 Class | 0.71 |
| Institutional 3 Class | 0.66 |
| Class R | 1.28 |
| Class V | 1.03 |
| Undistributed net investment income ($) | Accumulated net realized gain ($) | Paid in capital ($) |
| (17,882,660) | 17,882,660 | — |
| Columbia Contrarian Core Fund | Annual Report 2022 | 27 |
August 31, 2022
| Year Ended August 31, 2022 | Year Ended August 31, 2021 | ||||
| Ordinary income ($) | Long-term capital gains ($) | Total ($) | Ordinary income ($) | Long-term capital gains ($) | Total ($) |
| 242,751,172 | 1,353,366,865 | 1,596,118,037 | 75,522,227 | 725,058,006 | 800,580,233 |
| Undistributed ordinary income ($) | Undistributed long-term capital gains ($) | Capital loss carryforwards ($) | Net unrealized appreciation ($) |
| 24,150,680 | 894,140,530 | — | 3,353,885,542 |
| Federal tax cost ($) | Gross unrealized appreciation ($) | Gross unrealized (depreciation) ($) | Net unrealized appreciation ($) |
| 7,217,739,339 | 3,589,088,782 | (235,203,240) | 3,353,885,542 |
| 28 | Columbia Contrarian Core Fund | Annual Report 2022 |
August 31, 2022
| Borrower or lender | Average loan balance ($) | Weighted average interest rate (%) | Number of days with outstanding loans |
| Lender | 4,222,222 | 1.24 | 9 |
| Columbia Contrarian Core Fund | Annual Report 2022 | 29 |
August 31, 2022
| 30 | Columbia Contrarian Core Fund | Annual Report 2022 |
August 31, 2022
| Columbia Contrarian Core Fund | Annual Report 2022 | 31 |
| 32 | Columbia Contrarian Core Fund | Annual Report 2022 |
| Qualified dividend income | Dividends received deduction | Capital gain dividend |
| 70.74% | 64.27% | $1,240,644,790 |
| Name, address, year of birth | Position held with the Columbia Funds and length of service | Principal occupation(s) during past five years and other relevant professional experience | Number of Funds in the Columbia Funds Complex* overseen | Other directorships held by Trustee during the past five years |
| George S. Batejan c/o Columbia Management Investment Advisers, LLC 290 Congress Street Boston, MA 02210 1953 | Trustee since 2017 | Executive Vice President, Global Head of Technology and Operations, Janus Capital Group, Inc., 2010-2016 | 176 | Former Chairman of the Board, NICSA (National Investment Company Services Association) (Executive Committee, Nominating Committee and Governance Committee), 2014-2016; former Director, Intech Investment Management, 2011-2016; former Board Member, Metro Denver Chamber of Commerce, 2015-2016; former Advisory Board Member, University of Colorado Business School, 2015-2018 |
| Columbia Contrarian Core Fund | Annual Report 2022 | 33 |
(Unaudited)
Independent trustees (continued)
| Name, address, year of birth | Position held with the Columbia Funds and length of service | Principal occupation(s) during past five years and other relevant professional experience | Number of Funds in the Columbia Funds Complex* overseen | Other directorships held by Trustee during the past five years |
| Kathleen Blatz c/o Columbia Management Investment Advisers, LLC 290 Congress Street Boston, MA 02210 1954 | Trustee since 2006 | Attorney, specializing in arbitration and mediation; Chief Justice, Minnesota Supreme Court, 1998-2006; Associate Justice, Minnesota Supreme Court, 1996-1998; Fourth Judicial District Court Judge, Hennepin County, 1994-1996; Attorney in private practice and public service, 1984-1993; State Representative, Minnesota House of Representatives, 1979-1993, which included service on the Tax and Financial Institutions and Insurance Committees; Member and Interim Chair, Minnesota Sports Facilities Authority, January 2017-July 2017; Interim President and Chief Executive Officer, Blue Cross and Blue Shield of Minnesota (health care insurance), February-July 2018, April-October 2021 | 176 | Former Trustee, Blue Cross and Blue Shield of Minnesota, 2009-2021 (Chair of the Business Development Committee, 2014-2017; Chair of the Governance Committee, 2017-2019); former Member and Chair of the Board, Minnesota Sports Facilities Authority, January 2017-July 2017; former Director, Robina Foundation, 2009-2020 (Chair, 2014-2020); Director, Schulze Family Foundation, since 2021 |
| Pamela G. Carlton c/o Columbia Management Investment Advisers, LLC 290 Congress Street Boston, MA 02210 1954 | Trustee since 2007 | President, Springboard — Partners in Cross Cultural Leadership (consulting company) since 2003; Managing Director of US Equity Research, JP Morgan Chase, 1999-2003; Director of US Equity Research, Chase Asset Management, 1996-1999; Co-Director Latin America Research, 1993-1996, COO Global Research, 1992-1996, Co-Director of US Research, 1991-1992, Investment Banker, 1982-1991, Morgan Stanley; Attorney, Cleary Gottlieb Steen & Hamilton LLP, 1980-1982 | 176 | Trustee, New York Presbyterian Hospital Board (Executive Committee and Chair of People Committee) since 1996; Director, DR Bank (Audit Committee) since 2017; Director, Evercore Inc. (Audit Committee) since 2019; Director, Apollo Commercial Real Estate Finance, Inc. since 2021; the Governing Council of the Independent Directors Council (IDC), since 2021 |
| Janet Langford Carrig c/o Columbia Management Investment Advisers, LLC 290 Congress Street Boston, MA 02210 1957 | Trustee since 1996 | Senior Vice President, General Counsel and Corporate Secretary, ConocoPhillips (independent energy company), September 2007-October 2018 | 174 | Director, EQT Corporation (natural gas producer) since 2019; former Director, Whiting Petroleum Corporation (independent oil and gas company), 2020-2022 |
| J. Kevin Connaughton c/o Columbia Management Investment Advisers, LLC 290 Congress Street Boston, MA 02210 1964 | Trustee since 2020 | Member, FINRA National Adjudicatory Council since January 2020; Adjunct Professor of Finance, Bentley University since January 2018; Consultant to Independent Trustees of CFVIT and CFST I from March 2016 to June 2020 with respect to CFVIT and to December 2020 with respect to CFST I; Managing Director and General Manager of Mutual Fund Products, Columbia Management Investment Advisers, LLC, May 2010-February 2015; President, Columbia Funds, 2008-2015; and senior officer of Columbia Funds and affiliated funds, 2003-2015 | 174 | Former Director, The Autism Project, March 2015-December 2021; former Member of the Investment Committee, St. Michael’s College, November 2015-February 2020; former Trustee, St. Michael’s College, June 2017-September 2019; former Trustee, New Century Portfolios, January 2015-December 2017 |
| 34 | Columbia Contrarian Core Fund | Annual Report 2022 |
(Unaudited)
Independent trustees (continued)
| Name, address, year of birth | Position held with the Columbia Funds and length of service | Principal occupation(s) during past five years and other relevant professional experience | Number of Funds in the Columbia Funds Complex* overseen | Other directorships held by Trustee during the past five years |
| Olive M. Darragh c/o Columbia Management Investment Advisers, LLC 290 Congress Street Boston, MA 02210 1962 | Trustee since 2020 | Managing Director of Darragh Inc. (strategy and talent management consulting firm) since 2010; Founder and CEO, Zolio, Inc. (investment management talent identification platform) since 2004; Consultant to Independent Trustees of CFVIT and CFST I from June 2019 to June 2020 with respect to CFVIT and to December 2020 with respect to CFST I; Partner, Tudor Investments, 2004-2010; Senior Partner, McKinsey & Company (consulting), 1990-2004; Touche Ross CPA, 1985-1988 | 174 | Former Director, University of Edinburgh Business School (Member of US Board); former Director, Boston Public Library Foundation |
| Patricia M. Flynn c/o Columbia Management Investment Advisers, LLC 290 Congress Street Boston, MA 02210 1950 | Trustee since 2004 | Trustee Professor of Economics and Management, Bentley University since 1976 (also teaches and conducts research on corporate governance); Dean, McCallum Graduate School of Business, Bentley University, 1992-2002 | 176 | Trustee, MA Taxpayers Foundation since 1997; former Board of Governors, Innovation Institute, MA Technology Collaborative, 2010-2020; former Board of Directors, The MA Business Roundtable, 2003-2019 |
| Brian J. Gallagher c/o Columbia Management Investment Advisers, LLC 290 Congress Street Boston, MA 02210 1954 | Trustee since 2017 | Retired; Partner with Deloitte & Touche LLP and its predecessors, 1977-2016 | 176 | Trustee, Catholic Schools Foundation since 2004 |
| Douglas A. Hacker c/o Columbia Management Investment Advisers, LLC 290 Congress Street Boston, MA 02210 1955 | Co-Chair since 2021; Chair of CFST I and CFVIT since 2014; Trustee of CFST I and CFVIT since 1996 and CFST, CFST II, CFVST II, CET I and CET II since 2021 | Independent business executive since May 2006; Executive Vice President – Strategy of United Airlines, December 2002 - May 2006; President of UAL Loyalty Services (airline marketing company), September 2001-December 2002; Executive Vice President and Chief Financial Officer of United Airlines, July 1999-September 2001 | 176 | Director, Spartan Nash Company (food distributor); Director, Aircastle Limited (Chair of Audit Committee) (aircraft leasing); former Director, Nash Finch Company (food distributor), 2005-2013; former Director, SeaCube Container Leasing Ltd. (container leasing), 2010-2013; and former Director, Travelport Worldwide Limited (travel information technology), 2014-2019 |
| Nancy T. Lukitsh c/o Columbia Management Investment Advisers, LLC 290 Congress Street Boston, MA 02210 1956 | Trustee since 2011 | Senior Vice President, Partner and Director of Marketing, Wellington Management Company, LLP (investment adviser), 1997-2010; Chair, Wellington Management Portfolios (commingled non-U.S. investment pools), 2007 -2010; Director, Wellington Trust Company, NA and other Wellington affiliates, 1997-2010 | 174 | None |
| Columbia Contrarian Core Fund | Annual Report 2022 | 35 |
(Unaudited)
Independent trustees (continued)
| Name, address, year of birth | Position held with the Columbia Funds and length of service | Principal occupation(s) during past five years and other relevant professional experience | Number of Funds in the Columbia Funds Complex* overseen | Other directorships held by Trustee during the past five years |
| David M. Moffett c/o Columbia Management Investment Advisers, LLC 290 Congress Street Boston, MA 02210 1952 | Trustee since 2011 | Retired; Consultant to Bridgewater and Associates | 174 | Director, CSX Corporation (transportation suppliers); Director, Genworth Financial, Inc. (financial and insurance products and services); Director, PayPal Holdings Inc. (payment and data processing services); Trustee, University of Oklahoma Foundation; former Director, eBay Inc. (online trading community), 2007-2015; and former Director, CIT Bank, CIT Group Inc. (commercial and consumer finance), 2010-2016 |
| Catherine James Paglia c/o Columbia Management Investment Advisers, LLC 290 Congress Street Boston, MA 02210 1952 | Co-Chair since 2021; Chair of CFST, CFST II, CFVST II, CET I and CET II since 2020; Trustee of CFST, CFST II and CFVST II since 2004 and CFST I and CFVIT since 2021 | Director, Enterprise Asset Management, Inc. (private real estate and asset management company) since September 1998; Managing Director and Partner, Interlaken Capital, Inc., 1989-1997; Vice President, 1982-1985, Principal, 1985-1987, Managing Director, 1987-1989, Morgan Stanley; Vice President, Investment Banking, 1980-1982, Associate, Investment Banking, 1976-1980, Dean Witter Reynolds, Inc. | 176 | Director, Valmont Industries, Inc. (irrigation systems manufacturer) since 2012; Trustee, Carleton College (on the Investment Committee); Trustee, Carnegie Endowment for International Peace (on the Investment Committee) |
| Minor M. Shaw c/o Columbia Management Investment Advisers, LLC 290 Congress Street Boston, MA 02210 1947 | Trustee since 2003 | President, Micco LLC (private investments) since 2011; President, Micco Corp. (family investment business), 1998-2011 | 176 | Director, Blue Cross Blue Shield of South Carolina (Chair of Compensation Committee) since April 2008; Trustee, Hollingsworth Funds (on the Investment Committee) since 2016 (previously Board Chair from 2016-2019); Former Advisory Board member, Duke Energy Corp., 2016-2020; Chair of the Duke Endowment; Chair of Greenville – Spartanburg Airport Commission; former Trustee, BofA Funds Series Trust (11 funds), 2003-2011; former Director, Piedmont Natural Gas, 2004-2016; former Director, National Association of Corporate Directors, Carolinas Chapter, 2013-2018; Chair, Daniel-Mickel Foundation since 1998 |
| 36 | Columbia Contrarian Core Fund | Annual Report 2022 |
(Unaudited)
Independent trustees (continued)
| Name, address, year of birth | Position held with the Columbia Funds and length of service | Principal occupation(s) during past five years and other relevant professional experience | Number of Funds in the Columbia Funds Complex* overseen | Other directorships held by Trustee during the past five years |
| Natalie A. Trunow c/o Columbia Management Investment Advisers, LLC 290 Congress Street Boston, MA 02210 1967 | Trustee since 2020 | Chief Executive Officer, Millennial Portfolio Solutions LLC (asset management and consulting services), January 2016-January 2021; Non-executive Member of the Investment Committee and Valuation Committee, Sarona Asset Management Inc. (private equity firm) since September 2019; Advisor, Horizon Investments (asset management and consulting services), August 2018-January 2021; Advisor, Paradigm Asset Management, November 2016-December 2021; Consultant to Independent Trustees of CFVIT and CFST I from September 2016 to June 2020 with respect to CFVIT and to December 2020 with respect to CFST I; Director of Investments/Consultant, Casey Family Programs, April 2016-November 2016; Senior Vice President and Chief Investment Officer, Calvert Investments, August 2008-January 2016; Section Head and Portfolio Manager, General Motors Asset Management, June 1997-August 2008 | 174 | Former Director, Investment Committee, Health Services for Children with Special Needs, Inc., 2012-2019; Director, Chair of Audit Committee, Consumer Credit Counseling Services (formerly Guidewell Financial Solutions), since 2019; Independent Director, Investment Committee and Valuation Committee, Sarona Asset Management, since 2019 |
| Sandra L. Yeager c/o Columbia Management Investment Advisers, LLC 290 Congress Street Boston, MA 02210 1964 | Trustee since 2017 | Retired; President and founder, Hanoverian Capital, LLC (SEC registered investment advisor firm), 2008-2016; Managing Director, DuPont Capital, 2006-2008; Managing Director, Morgan Stanley Investment Management, 2004-2006; Senior Vice President, Alliance Bernstein, 1990-2004 | 176 | Former Director, NAPE Education Foundation, October 2016-October 2020 |
| * | The term “Columbia Funds Complex” as used herein includes Columbia Seligman Premium Technology Growth Fund, Tri-Continental Corporation and each series of Columbia Fund Series Trust (CFST), Columbia Funds Series Trust I (CFST I), Columbia Funds Series Trust II (CFST II), Columbia ETF Trust I (CET I), Columbia ETF Trust II (CET II), Columbia Funds Variable Insurance Trust (CFVIT) and Columbia Funds Variable Series Trust II (CFVST II). Messrs. Batejan, Beckman, Gallagher and Hacker and Mses. Blatz, Carlton, Flynn, Paglia, Shaw and Yeager serve as Directors of Columbia Seligman Premium Technology Growth Fund and Tri-Continental Corporation. |
| Name, address, year of birth | Position held with the Columbia Funds and length of service | Principal occupation(s) during the past five years and other relevant professional experience | Number of Funds in the Columbia Funds Complex overseen | Other directorships held by Trustee during the past five years |
| Daniel J. Beckman c/o Columbia Management Investment Advisers, LLC 290 Congress Street Boston, MA 02210 1962 | Trustee since November 2021 and President since June 2021 | Vice President – Head of North America Product, Columbia Management Investment Advisers, LLC since April 2015; President and Principal Executive Officer of the Columbia Funds since June 2021; officer of Columbia Funds and affiliated funds, 2020-2021 | 176 | Director, Ameriprise Trust Company, since October 2016; Director, Columbia Management Investment Distributors, Inc. since November 2018; Board of Governors, Columbia Wanger Asset Management, LLC since January 2022 |
| * | Interested person (as defined under the 1940 Act) by reason of being an officer, director, security holder and/or employee of the Investment Manager or Ameriprise Financial. |
| Columbia Contrarian Core Fund | Annual Report 2022 | 37 |
(Unaudited)
The Statement of Additional Information has additional information about the Fund’s Board members and is available, without charge, upon request by calling 800.345.6611, visiting columbiathreadneedleus.com/investor/ or contacting your financial intermediary.
| Name, address and year of birth | Position and year first appointed to position for any Fund in the Columbia Funds Complex or a predecessor thereof | Principal occupation(s) during past five years |
| Michael G. Clarke 290 Congress Street Boston, MA 02210 1969 | Chief Financial Officer and Principal Financial Officer (2009) and Senior Vice President (2019) | Senior Vice President and Head of Global Operations & Investor Services, Columbia Management Investment Advisers, LLC, since March 2022 (previously Vice President, Head of North American Operations, and Co-Head of Global Operations, June 2019 to February 2022 and Vice President – Accounting and Tax, May 2010 - May 2019); senior officer of Columbia Funds and affiliated funds since 2002. |
| Joseph Beranek 5890 Ameriprise Financial Center Minneapolis, MN 55474 1965 | Treasurer and Chief Accounting Officer (Principal Accounting Officer) (2019) and Principal Financial Officer (2020), CFST, CFST I, CFST II, CFVIT and CFVST II; Assistant Treasurer, CET I and CET II | Vice President – Mutual Fund Accounting and Financial Reporting, Columbia Management Investment Advisers, LLC, since December 2018 and March 2017, respectively (previously Vice President – Pricing and Corporate Actions, May 2010 - March 2017). |
| Marybeth Pilat 290 Congress Street Boston, MA 02210 1968 | Treasurer and Chief Accounting Officer (Principal Accounting Officer) and Principal Financial Officer (2020) for CET I and CET II; Assistant Treasurer, CFST, CFST I, CFST II, CFVIT and CFVST II | Vice President – Product Pricing and Administration, Columbia Management Investment Advisers, LLC, since May 2017; Director - Fund Administration, Calvert Investments, August 2015 – March 2017; Vice President - Fund Administration, Legg Mason, May 2015 - July 2015; Vice President - Fund Administration, Columbia Management Investment Advisers, LLC, May 2010 - April 2015. |
| William F. Truscott 290 Congress Street Boston, MA 02210 1960 | Senior Vice President (2001) | Formerly, Trustee/Director of Columbia Funds Complex or legacy funds, November 2001-January 1, 2021; Chief Executive Officer, Global Asset Management, Ameriprise Financial, Inc. since September 2012; Chairman of the Board and President, Columbia Management Investment Advisers, LLC since July 2004 and February 2012, respectively; Chairman of the Board and Chief Executive Officer, Columbia Management Investment Distributors, Inc. since November 2008 and February 2012, respectively; Chairman of the Board and Director, Threadneedle Asset Management Holdings, Sàrl since March 2013 and December 2008, respectively; senior executive of various entities affiliated with Columbia Threadneedle. |
| Christopher O. Petersen 5228 Ameriprise Financial Center Minneapolis, MN 55474 1970 | Senior Vice President and Assistant Secretary (2021) | Formerly, Trustee/Director of funds within the Columbia Funds Complex, July 1, 2020 - November 22, 2021; Senior Vice President and Assistant General Counsel, Ameriprise Financial, Inc. since September 2021 (previously Vice President and Lead Chief Counsel, January 2015 - September 2021); formerly, President and Principal Executive Officer of the Columbia Funds, 2015 - 2021; officer of Columbia Funds and affiliated funds since 2007. |
| Thomas P. McGuire 290 Congress Street Boston, MA 02210 1972 | Senior Vice President and Chief Compliance Officer (2012) | Vice President – Asset Management Compliance, Ameriprise Financial, Inc., since May 2010; Chief Compliance Officer, Columbia Acorn/Wanger Funds since December 2015; formerly, Chief Compliance Officer, Ameriprise Certificate Company, September 2010 – September 2020. |
| 38 | Columbia Contrarian Core Fund | Annual Report 2022 |
(Unaudited)
Fund officers (continued)
| Name, address and year of birth | Position and year first appointed to position for any Fund in the Columbia Funds Complex or a predecessor thereof | Principal occupation(s) during past five years |
| Ryan C. Larrenaga 290 Congress Street Boston, MA 02210 1970 | Senior Vice President (2017), Chief Legal Officer (2017), and Secretary (2015) | Vice President and Chief Counsel, Ameriprise Financial, Inc. since August 2018 (previously Vice President and Group Counsel, August 2011 - August 2018); Chief Legal Officer, Columbia Acorn/Wanger Funds, since September 2020; officer of Columbia Funds and affiliated funds since 2005. |
| Michael E. DeFao 290 Congress Street Boston, MA 02210 1968 | Vice President (2011) and Assistant Secretary (2010) | Vice President and Chief Counsel, Ameriprise Financial, Inc. since May 2010; Vice President, Chief Legal Officer and Assistant Secretary, Columbia Management Investment Advisers, LLC since October 2021 (previously Vice President and Assistant Secretary, May 2010 – September 2021). |
| Lyn Kephart-Strong 5228 Ameriprise Financial Center Minneapolis, MN 55474 1960 | Vice President (2015) | President, Columbia Management Investment Services Corp. since October 2014; Vice President & Resolution Officer, Ameriprise Trust Company since August 2009. |
| • | the Fund had sufficient liquidity to both meet redemptions and operate effectively on behalf of shareholders; |
| • | there were no material changes to the Program during the period; |
| • | the implementation of the Program was effective to manage the Fund’s liquidity risk; and |
| • | the Program operated adequately during the period. |
| Columbia Contrarian Core Fund | Annual Report 2022 | 39 |
| • | Information on the investment performance of the Fund relative to the performance of a group of mutual funds determined to be comparable to the Fund by Broadridge, as well as performance relative to benchmarks; |
| • | Information on the Fund’s management fees and total expenses, including information comparing the Fund’s expenses to those of a group of comparable mutual funds, as determined by Broadridge; |
| • | The Investment Manager’s agreement to contractually limit or cap total operating expenses for the Fund so that total operating expenses (excluding certain fees and expenses, such as transaction costs and certain other investment related expenses, interest, taxes, acquired fund fees and expenses and infrequent and/or unusual expenses) would not exceed a specified annual rate, as a percentage of the Fund’s net assets; |
| • | Terms of the Management Agreement; |
| • | Descriptions of other agreements and arrangements with affiliates of the Investment Manager relating to the operations of the Fund, including agreements with respect to the provision of transfer agency and shareholder services to the Fund; |
| • | Descriptions of various services performed by the Investment Manager under the Management Agreement, including portfolio management and portfolio trading practices; |
| • | Information regarding any recently negotiated management fees of similarly-managed portfolios of other institutional clients of the Investment Manager; |
| • | Information regarding the resources of the Investment Manager, including information regarding senior management, portfolio managers and other personnel; |
| • | Information regarding the capabilities of the Investment Manager with respect to compliance monitoring services; |
| • | The profitability to the Investment Manager and its affiliates from their relationships with the Fund; and |
| • | Report provided by the Board’s independent fee consultant, JDL Consultants, LLC (JDL). |
| 40 | Columbia Contrarian Core Fund | Annual Report 2022 |
(Unaudited)
Following an analysis and discussion of the foregoing, and the factors identified below, the Board, including all of the Independent Trustees, approved the renewal of the Management Agreement.
| Columbia Contrarian Core Fund | Annual Report 2022 | 41 |
(Unaudited)
Comparative fees, costs of services provided and the profits realized by the Investment Manager and its affiliates from their relationships with the Fund
| 42 | Columbia Contrarian Core Fund | Annual Report 2022 |
(Unaudited)
On June 23, 2022, the Board, including all of the Independent Trustees, determined that fees payable under the Management Agreement were fair and reasonable in light of the extent and quality of services provided and approved the renewal of the Management Agreement.
| Columbia Contrarian Core Fund | Annual Report 2022 | 43 |
columbiathreadneedleus.com/investor/. The Fund is distributed by Columbia Management Investment Distributors, Inc., member FINRA, and managed by Columbia Management Investment Advisers, LLC.

August 31, 2022

| 3 | |
| 5 | |
| 7 | |
| 8 | |
| 13 | |
| 15 | |
| 16 | |
| 18 | |
| 22 | |
| 34 | |
| 35 | |
| 35 | |
| 41 | |
| 42 |
(Unaudited)
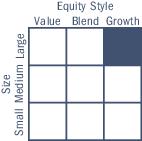
| Average annual total returns (%) (for the period ended August 31, 2022) | |||||
| Inception | 1 Year | 5 Years | 10 Years | ||
| Class A | Excluding sales charges | 09/28/07 | -36.71 | -0.65 | 3.07 |
| Including sales charges | -40.34 | -1.82 | 2.47 | ||
| Advisor Class* | 03/19/13 | -36.52 | -0.38 | 3.34 | |
| Class C | Excluding sales charges | 09/28/07 | -37.18 | -1.39 | 2.31 |
| Including sales charges | -37.80 | -1.39 | 2.31 | ||
| Institutional Class | 01/02/98 | -36.52 | -0.40 | 3.34 | |
| Institutional 2 Class* | 11/08/12 | -36.44 | -0.26 | 3.49 | |
| Institutional 3 Class* | 11/08/12 | -36.41 | -0.22 | 3.54 | |
| Class R | 09/27/10 | -36.85 | -0.90 | 2.82 | |
| MSCI Emerging Markets Index (Net) | -21.80 | 0.59 | 2.92 | ||
| MSCI EAFE Index (Net) | -19.80 | 1.63 | 5.00 | ||
| * | The returns shown for periods prior to the share class inception date (including returns for the Life of the Fund, if shown, which are since Fund inception) include the returns of the Fund’s oldest share class. These returns are adjusted to reflect any higher class-related operating expenses of the newer share classes, as applicable. Please visit columbiathreadneedleus.com/investor/investment-products/mutual-funds/appended-performance for more information. |
| Columbia Emerging Markets Fund | Annual Report 2022 | 3 |
(Unaudited)
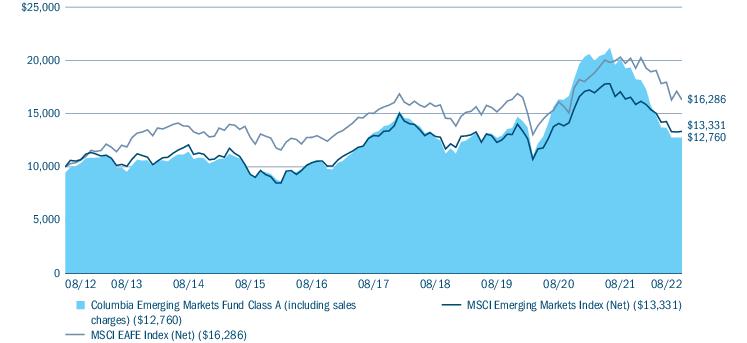
| Equity sector breakdown (%) (at August 31, 2022) | |
| Communication Services | 9.2 |
| Consumer Discretionary | 20.3 |
| Consumer Staples | 2.3 |
| Energy | 4.3 |
| Financials | 25.5 |
| Health Care | 7.2 |
| Industrials | 5.2 |
| Information Technology | 24.3 |
| Materials | 0.2 |
| Real Estate | 1.5 |
| Total | 100.0 |
| Country breakdown (%) (at August 31, 2022) | |
| Argentina | 2.9 |
| Brazil | 7.7 |
| Canada | 0.7 |
| China | 31.6 |
| Hong Kong | 3.9 |
| India | 14.3 |
| Indonesia | 7.6 |
| Kazakhstan | 0.3 |
| Malaysia | 0.4 |
| Mexico | 1.5 |
| Philippines | 0.6 |
| Poland | 0.8 |
| Russian Federation | 0.0(a) |
| South Africa | 1.3 |
| South Korea | 10.1 |
| Taiwan | 13.0 |
| Thailand | 2.1 |
| United States(b) | 0.6 |
| Uruguay | 0.6 |
| Total | 100.0 |
| (a) | Rounds to zero. |
| (b) | Includes investments in Money Market Funds. |
| 4 | Columbia Emerging Markets Fund | Annual Report 2022 |
(Unaudited)
| • | The Fund’s underperformance during the period was primarily attributable to negative stock selection across a wide range of both sectors and countries. In broad terms, the market’s rotation out of cyclical and growth-oriented stocks and into more defensive and value-oriented areas hurt Fund performance. |
| • | In sector terms, the largest negative impact on performance relative to the benchmark came from stock selection within the communication services, consumer discretionary and information technology sectors. |
| • | In terms of country allocation, while the underweight to China throughout the period was beneficial, this was offset by the portfolio’s overweights to Hong Kong and Argentina. |
| • | Having a zero weight to Saudi Arabia during the period also hurt the Fund during the period, as the country has become a more significant weight in the benchmark (4.6% as of August 31, 2022) and the Fund management team did not think it was prudent to invest in any Saudi companies. |
| • | Stock selection within Brazil and China detracted significantly from performance relative to the benchmark during the period. |
| • | Individual positions that detracted most notably included Singapore-based consumer internet company Sea Ltd. as results have softened in the company’s gaming business. In addition, Sea’s apps were banned in India as fallout from the ongoing China-India border dispute, as the company’s largest shareholder is Chinese internet giant Tencent. |
| • | A number of Russian stocks were among the leading detractors as that market became essentially un-investable following Russia’s invasion of Ukraine. Notable detractors among Russian stocks held included search engine provider Yandex NV, low-cost retailer Fix Price Group Ltd. and e-commerce firm Ozon Holdings PLC. By the first week in March the decision was made to sell out of the Fund’s Russian holdings to the extent possible and to value the remaining shares |
| Columbia Emerging Markets Fund | Annual Report 2022 | 5 |
(Unaudited)
| at zero. Elsewhere, fintech/payments company Pagseguro Digital Ltd. was among the biggest laggards as higher interest rates weighed on consumer spending and demand for credit in the Brazilian market. We added to the position on weakness on a constructive view of the company’s long-term growth prospects. |
| • | In sector terms, the Fund’s underweight to the materials sector proved beneficial. |
| • | In country terms, an overweight to Indonesia led positive contributions. |
| • | With respect to individual stocks held, a number of leading positive contributors came from within the financials sector, including a pair of Indonesian banks, PT Bank Central Asia Tbk and PT Bank Rakyat Indonesia Persero Tbk, and Indian bank ICICI Bank Ltd. All were viewed as featuring high quality assets and have benefited from improved net interest margins as interest rates have moved higher. |
| • | A lack of exposure to Russian energy company Gazprom and Russian bank Sberbank also proved additive given the fallout from the Russia-Ukraine conflict. |
| • | During the period, we initiated a position in Chinese e-commerce and social media company Pinduoduo, Inc. on weakness in the information technology sector, benefiting performance. |
| 6 | Columbia Emerging Markets Fund | Annual Report 2022 |
(Unaudited)
| March 1, 2022 — August 31, 2022 | |||||||
| Account value at the beginning of the period ($) | Account value at the end of the period ($) | Expenses paid during the period ($) | Fund’s annualized expense ratio (%) | ||||
| Actual | Hypothetical | Actual | Hypothetical | Actual | Hypothetical | Actual | |
| Class A | 1,000.00 | 1,000.00 | 812.70 | 1,017.80 | 6.72 | 7.48 | 1.47 |
| Advisor Class | 1,000.00 | 1,000.00 | 813.50 | 1,019.11 | 5.53 | 6.16 | 1.21 |
| Class C | 1,000.00 | 1,000.00 | 809.50 | 1,014.01 | 10.13 | 11.27 | 2.22 |
| Institutional Class | 1,000.00 | 1,000.00 | 814.00 | 1,019.06 | 5.58 | 6.21 | 1.22 |
| Institutional 2 Class | 1,000.00 | 1,000.00 | 814.70 | 1,019.56 | 5.12 | 5.70 | 1.12 |
| Institutional 3 Class | 1,000.00 | 1,000.00 | 814.90 | 1,019.76 | 4.94 | 5.50 | 1.08 |
| Class R | 1,000.00 | 1,000.00 | 812.00 | 1,016.53 | 7.86 | 8.74 | 1.72 |
| Columbia Emerging Markets Fund | Annual Report 2022 | 7 |
August 31, 2022
| Common Stocks 97.4% | ||
| Issuer | Shares | Value ($) |
| Argentina 2.9% | ||
| Globant SA(a) | 84,556 | 17,821,868 |
| MercadoLibre, Inc.(a) | 30,745 | 26,298,043 |
| Total | 44,119,911 | |
| Brazil 6.6% | ||
| Afya Ltd., Class A(a) | 526,037 | 6,849,002 |
| Banco BTG Pactual SA | 1,631,266 | 8,027,143 |
| Itaú Unibanco Holding SA, ADR | 3,986,583 | 19,693,720 |
| Localiza Rent a Car SA | 1,385,582 | 16,249,107 |
| NU Holdings Ltd., Class A(a) | 1,818,543 | 8,910,861 |
| Pagseguro Digital Ltd., Class A(a) | 728,959 | 11,328,023 |
| Petro Rio SA(a) | 3,809,746 | 20,028,555 |
| XP, Inc., Class A(a) | 511,734 | 9,845,762 |
| Total | 100,932,173 | |
| Canada 0.7% | ||
| Parex Resources, Inc. | 668,344 | 10,691,672 |
| China 31.7% | ||
| Alibaba Group Holding Ltd.(a) | 1,754,640 | 20,933,816 |
| Bafang Electric Suzhou Co., Ltd., Class A | 289,303 | 6,150,666 |
| Baidu, Inc. Class A(a) | 1,037,200 | 18,514,618 |
| Beijing Kingsoft Office Software, Inc., Class A | 168,410 | 4,381,275 |
| Beijing Oriental Yuhong Waterproof Technology Co., Ltd., Class A | 709,656 | 3,110,283 |
| Bilibili, Inc.(a) | 150,720 | 3,748,641 |
| China Animal Healthcare Ltd.(a),(b),(c) | 6,354,000 | 1 |
| China Tourism Group Duty Free Corp., Ltd., Class A | 461,087 | 13,027,340 |
| Contemporary Amperex Technology Co., Ltd., Class A(a) | 125,000 | 8,681,330 |
| Full Truck Alliance Co., Ltd., ADR(a) | 971,610 | 7,675,719 |
| JD.com, Inc., ADR | 718,149 | 45,595,280 |
| JD.com, Inc., Class A | 277,088 | 8,771,262 |
| KE Holdings, Inc., ADR(a) | 590,639 | 10,655,128 |
| Kingdee International Software Group Co., Ltd.(a) | 3,238,000 | 6,284,644 |
| Kuaishou Technology(a) | 1,352,700 | 11,720,451 |
| Li Ning Co., Ltd. | 2,952,000 | 26,887,741 |
| Medlive Technology Co., Ltd.(d) | 3,037,573 | 4,828,670 |
| Meituan, Class B(a) | 2,427,500 | 58,301,806 |
| Common Stocks (continued) | ||
| Issuer | Shares | Value ($) |
| Midea Group Co., Ltd., Class A | 2,347,100 | 18,007,745 |
| NetEase, Inc. | 404,100 | 7,216,175 |
| NetEase, Inc., ADR | 240,501 | 21,286,743 |
| New Horizon Health Ltd.(a) | 2,039,500 | 5,214,126 |
| Pinduoduo, Inc., ADR(a) | 135,079 | 9,631,133 |
| Shenzhen Mindray Bio-Medical Electronics Co., Ltd., Class A | 386,047 | 16,648,392 |
| Shenzhou International Group Holdings Ltd. | 1,190,400 | 12,441,234 |
| Silergy Corp. | 492,000 | 8,434,603 |
| Tencent Holdings Ltd. | 1,740,600 | 71,940,354 |
| WuXi AppTec Co., Ltd., Class H | 1,125,802 | 12,709,186 |
| WuXi Biologics Cayman, Inc.(a) | 3,737,500 | 32,972,608 |
| Zhejiang Sanhua Intelligent Controls Co., Ltd., Class A | 1,191,500 | 4,412,234 |
| Total | 480,183,204 | |
| Hong Kong 3.9% | ||
| AIA Group Ltd. | 3,244,600 | 31,217,064 |
| Hong Kong Exchanges and Clearing Ltd. | 205,800 | 8,292,614 |
| Techtronic Industries Co., Ltd. | 1,648,764 | 19,445,925 |
| Total | 58,955,603 | |
| India 14.3% | ||
| Apollo Hospitals Enterprise Ltd. | 407,341 | 21,885,788 |
| AU Small Finance Bank Ltd. | 1,638,870 | 12,888,471 |
| Bajaj Finance Ltd. | 79,632 | 7,186,892 |
| Balkrishna Industries Ltd. | 340,270 | 8,643,913 |
| Cholamandalam Investment and Finance Co., Ltd. | 1,836,004 | 17,987,542 |
| Divi’s Laboratories Ltd. | 155,893 | 7,038,380 |
| Dixon Technologies India Ltd. | 87,253 | 4,436,851 |
| Eicher Motors Ltd. | 288,487 | 12,040,082 |
| Godrej Properties Ltd.(a) | 220,526 | 3,846,363 |
| HDFC Bank Ltd., ADR | 456,705 | 27,881,840 |
| HDFC Life Insurance Co., Ltd. | 856,994 | 6,141,401 |
| ICICI Bank Ltd., ADR | 1,798,687 | 39,283,324 |
| Infosys Ltd., ADR | 783,975 | 14,346,742 |
| InterGlobe Aviation Ltd.(a) | 244,696 | 6,110,668 |
| Reliance Industries Ltd. | 819,453 | 26,845,336 |
| Total | 216,563,593 | |
| 8 | Columbia Emerging Markets Fund | Annual Report 2022 |
August 31, 2022
| Common Stocks (continued) | ||
| Issuer | Shares | Value ($) |
| Indonesia 7.7% | ||
| PT Ace Hardware Indonesia Tbk | 67,388,500 | 3,268,972 |
| PT Astra International Tbk | 31,481,400 | 14,771,675 |
| PT Bank BTPN Syariah Tbk | 42,338,800 | 8,437,243 |
| PT Bank Central Asia Tbk | 79,303,400 | 43,793,170 |
| PT Bank Rakyat Indonesia Persero Tbk | 157,112,029 | 45,881,287 |
| Total | 116,152,347 | |
| Kazakhstan 0.3% | ||
| Kaspi.KZ JSC, GDR(b),(c),(d) | 85,683 | 5,151,282 |
| Malaysia 0.4% | ||
| Public Bank Bhd | 5,196,000 | 5,456,012 |
| Mexico 1.5% | ||
| Grupo Financiero Banorte SAB de CV, Class O | 1,214,653 | 7,174,631 |
| Wal-Mart de Mexico SAB de CV, Class V | 4,756,288 | 15,586,337 |
| Total | 22,760,968 | |
| Philippines 0.6% | ||
| Ayala Land, Inc. | 17,252,700 | 8,758,027 |
| Poland 0.8% | ||
| Dino Polska SA(a) | 168,311 | 12,278,885 |
| Russian Federation 0.0% | ||
| Detsky Mir PJSC(b),(c),(e) | 5,893,953 | 0 |
| Fix Price Group Ltd., GDR(b),(c),(d),(e) | 2,678,663 | 3 |
| Ozon Holdings PLC, ADR(a),(b),(c),(e) | 375,545 | 0 |
| TCS Group Holding PLC, GDR(a),(b),(c),(e) | 171,169 | 0 |
| Yandex NV, Class A(a),(b),(c),(e) | 477,611 | 1 |
| Total | 4 | |
| South Africa 1.3% | ||
| Capitec Bank Holdings Ltd. | 107,216 | 12,748,556 |
| Clicks Group Ltd. | 403,712 | 7,024,112 |
| Total | 19,772,668 | |
| South Korea 9.0% | ||
| Coupang, Inc.(a) | 582,100 | 9,837,490 |
| Hana Financial Group, Inc. | 398,940 | 11,627,773 |
| Samsung Biologics Co., Ltd.(a) | 12,976 | 8,070,544 |
| Samsung Electro-Mechanics Co., Ltd. | 112,710 | 11,669,610 |
| Samsung Electronics Co., Ltd. | 1,194,282 | 52,907,617 |
| Samsung SDI Co., Ltd. | 40,424 | 17,871,518 |
| Common Stocks (continued) | ||
| Issuer | Shares | Value ($) |
| SK Hynix, Inc. | 349,846 | 24,596,960 |
| Total | 136,581,512 | |
| Taiwan 13.0% | ||
| ASMedia Technology, Inc. | 263,000 | 7,938,410 |
| Cathay Financial Holding Co., Ltd. | 11,959,000 | 17,398,267 |
| Chailease Holding Co., Ltd. | 728,700 | 4,678,771 |
| Delta Electronics | 1,515,000 | 12,970,907 |
| MediaTek, Inc. | 573,000 | 12,397,850 |
| Parade Technologies Ltd. | 272,000 | 7,614,273 |
| Sea Ltd. ADR(a) | 65,009 | 4,030,558 |
| Taiwan Semiconductor Manufacturing Co., Ltd. | 7,193,048 | 117,748,731 |
| Unimicron Technology Corp. | 2,509,281 | 12,294,789 |
| Total | 197,072,556 | |
| Thailand 2.1% | ||
| Kasikornbank PCL, Foreign Registered Shares | 3,760,900 | 15,797,278 |
| Muangthai Capital PCL, Foreign Registered Shares | 7,961,200 | 9,262,005 |
| PTT Exploration & Production PCL | 1,429,700 | 6,612,407 |
| Total | 31,671,690 | |
| Uruguay 0.6% | ||
| Dlocal Ltd.(a) | 386,131 | 9,603,078 |
| Total Common Stocks (Cost $1,280,306,211) | 1,476,705,185 | |
| Preferred Stocks 2.2% | |||
| Issuer | Shares | Value ($) | |
| Brazil 1.1% | |||
| Azul SA(a) | 5,122,893 | 16,159,210 | |
| South Korea 1.1% | |||
| Samsung Electronics Co., Ltd. | 408,983 | 16,544,248 | |
| Total Preferred Stocks (Cost $37,631,623) | 32,703,458 | ||
| Columbia Emerging Markets Fund | Annual Report 2022 | 9 |
August 31, 2022
| Money Market Funds 0.5% | ||
| Shares | Value ($) | |
| Columbia Short-Term Cash Fund, 2.366%(f),(g) | 8,437,226 | 8,433,007 |
| Total Money Market Funds (Cost $8,433,006) | 8,433,007 | |
| Total Investments in Securities (Cost $1,326,370,840) | 1,517,841,650 | |
| Other Assets & Liabilities, Net | (2,236,111) | |
| Net Assets | $1,515,605,539 | |
| (a) | Non-income producing investment. |
| (b) | Represents fair value as determined in good faith under procedures approved by the Board of Trustees. At August 31, 2022, the total value of these securities amounted to $5,151,287, which represents 0.34% of total net assets. |
| (c) | Valuation based on significant unobservable inputs. |
| (d) | Represents privately placed and other securities and instruments exempt from Securities and Exchange Commission registration (collectively, private placements), such as Section 4(a)(2) and Rule 144A eligible securities, which are often sold only to qualified institutional buyers. At August 31, 2022, the total value of these securities amounted to $9,979,955, which represents 0.66% of total net assets. |
| (e) | Denotes a restricted security, which is subject to legal or contractual restrictions on resale under federal securities laws. Disposal of a restricted investment may involve time-consuming negotiations and expenses, and prompt sale at an acceptable price may be difficult to achieve. Private placement securities are generally considered to be restricted, although certain of those securities may be traded between qualified institutional investors under the provisions of Section 4(a)(2) and Rule 144A. The Fund will not incur any registration costs upon such a trade. These securities are valued at fair value determined in good faith under consistently applied procedures established by the Fund’s Board of Trustees. At August 31, 2022, the total market value of these securities amounted to $4, which represents less than 0.01% of total net assets. Additional information on these securities is as follows: |
| Security | Acquisition Dates | Shares | Cost ($) | Value ($) |
| Detsky Mir PJSC | 02/08/2017-12/13/2021 | 5,893,953 | 8,677,339 | — |
| Fix Price Group Ltd., GDR | 03/05/2021-03/08/2021 | 2,678,663 | 26,134,618 | 3 |
| Ozon Holdings PLC, ADR | 11/24/2020-12/13/2021 | 375,545 | 16,861,518 | — |
| TCS Group Holding PLC, GDR | 11/21/2017-01/25/2022 | 171,169 | 3,700,340 | — |
| Yandex NV, Class A | 10/30/2015-12/13/2021 | 477,611 | 10,731,002 | 1 |
| 66,104,817 | 4 |
| (f) | The rate shown is the seven-day current annualized yield at August 31, 2022. |
| (g) | As defined in the Investment Company Act of 1940, as amended, an affiliated company is one in which the Fund owns 5% or more of the company’s outstanding voting securities, or a company which is under common ownership or control with the Fund. The value of the holdings and transactions in these affiliated companies during the year ended August 31, 2022 are as follows: |
| Affiliated issuers | Beginning of period($) | Purchases($) | Sales($) | Net change in unrealized appreciation (depreciation)($) | End of period($) | Realized gain (loss)($) | Dividends($) | End of period shares |
| Columbia Short-Term Cash Fund, 2.366% | ||||||||
| 77,639,295 | 695,511,539 | (764,717,828) | 1 | 8,433,007 | (9,007) | 77,539 | 8,437,226 | |
| ADR | American Depositary Receipt |
| GDR | Global Depositary Receipt |
| 10 | Columbia Emerging Markets Fund | Annual Report 2022 |
August 31, 2022
pricing an investment. An investment’s level within the fair value hierarchy is based on the lowest level of any input that is deemed significant to the asset’s or liability’s fair value measurement. The input levels are not necessarily an indication of the risk or liquidity associated with investments at that level. For example, certain U.S. government securities are generally high quality and liquid, however, they are reflected as Level 2 because the inputs used to determine fair value may not always be quoted prices in an active market.
| ■ | Level 1 — Valuations based on quoted prices for investments in active markets that the Fund has the ability to access at the measurement date. Valuation adjustments are not applied to Level 1 investments. |
| ■ | Level 2 — Valuations based on other significant observable inputs (including quoted prices for similar securities, interest rates, prepayment speeds, credit risks, etc.). |
| ■ | Level 3 — Valuations based on significant unobservable inputs (including the Fund’s own assumptions and judgment in determining the fair value of investments). |
| Level 1 ($) | Level 2 ($) | Level 3 ($) | Total ($) | |
| Investments in Securities | ||||
| Common Stocks | ||||
| Argentina | 44,119,911 | — | — | 44,119,911 |
| Brazil | 100,932,173 | — | — | 100,932,173 |
| Canada | 10,691,672 | — | — | 10,691,672 |
| China | 94,844,003 | 385,339,200 | 1 | 480,183,204 |
| Hong Kong | — | 58,955,603 | — | 58,955,603 |
| India | 81,511,906 | 135,051,687 | — | 216,563,593 |
| Indonesia | — | 116,152,347 | — | 116,152,347 |
| Kazakhstan | — | — | 5,151,282 | 5,151,282 |
| Malaysia | — | 5,456,012 | — | 5,456,012 |
| Mexico | 22,760,968 | — | — | 22,760,968 |
| Philippines | — | 8,758,027 | — | 8,758,027 |
| Poland | — | 12,278,885 | — | 12,278,885 |
| Russian Federation | — | — | 4 | 4 |
| South Africa | — | 19,772,668 | — | 19,772,668 |
| South Korea | 9,837,490 | 126,744,022 | — | 136,581,512 |
| Taiwan | 4,030,558 | 193,041,998 | — | 197,072,556 |
| Columbia Emerging Markets Fund | Annual Report 2022 | 11 |
August 31, 2022
| Level 1 ($) | Level 2 ($) | Level 3 ($) | Total ($) | |
| Thailand | — | 31,671,690 | — | 31,671,690 |
| Uruguay | 9,603,078 | — | — | 9,603,078 |
| Total Common Stocks | 378,331,759 | 1,093,222,139 | 5,151,287 | 1,476,705,185 |
| Preferred Stocks | ||||
| Brazil | 16,159,210 | — | — | 16,159,210 |
| South Korea | — | 16,544,248 | — | 16,544,248 |
| Total Preferred Stocks | 16,159,210 | 16,544,248 | — | 32,703,458 |
| Money Market Funds | 8,433,007 | — | — | 8,433,007 |
| Total Investments in Securities | 402,923,976 | 1,109,766,387 | 5,151,287 | 1,517,841,650 |
| 12 | Columbia Emerging Markets Fund | Annual Report 2022 |
August 31, 2022
| Assets | |
| Investments in securities, at value | |
| Unaffiliated issuers (cost $1,317,937,834) | $1,509,408,643 |
| Affiliated issuers (cost $8,433,006) | 8,433,007 |
| Foreign currency (cost $3,162,823) | 3,044,614 |
| Receivable for: | |
| Capital shares sold | 803,964 |
| Dividends | 1,562,062 |
| Foreign tax reclaims | 158,920 |
| Prepaid expenses | 20,733 |
| Trustees’ deferred compensation plan | 136,844 |
| Total assets | 1,523,568,787 |
| Liabilities | |
| Due to custodian | 11,106 |
| Payable for: | |
| Capital shares purchased | 2,368,573 |
| Foreign capital gains taxes deferred | 4,865,506 |
| Management services fees | 41,631 |
| Distribution and/or service fees | 1,757 |
| Transfer agent fees | 170,055 |
| Compensation of board members | 25,605 |
| Other expenses | 342,171 |
| Trustees’ deferred compensation plan | 136,844 |
| Total liabilities | 7,963,248 |
| Net assets applicable to outstanding capital stock | $1,515,605,539 |
| Represented by | |
| Paid in capital | 1,475,417,765 |
| Total distributable earnings (loss) | 40,187,774 |
| Total - representing net assets applicable to outstanding capital stock | $1,515,605,539 |
| Columbia Emerging Markets Fund | Annual Report 2022 | 13 |
August 31, 2022
| Class A | |
| Net assets | $206,162,005 |
| Shares outstanding | 17,333,821 |
| Net asset value per share | $11.89 |
| Maximum sales charge | 5.75% |
| Maximum offering price per share (calculated by dividing the net asset value per share by 1.0 minus the maximum sales charge for Class A shares) | $12.62 |
| Advisor Class | |
| Net assets | $69,817,624 |
| Shares outstanding | 5,735,947 |
| Net asset value per share | $12.17 |
| Class C | |
| Net assets | $10,705,590 |
| Shares outstanding | 976,521 |
| Net asset value per share | $10.96 |
| Institutional Class | |
| Net assets | $520,117,008 |
| Shares outstanding | 43,061,499 |
| Net asset value per share | $12.08 |
| Institutional 2 Class | |
| Net assets | $174,659,681 |
| Shares outstanding | 14,344,976 |
| Net asset value per share | $12.18 |
| Institutional 3 Class | |
| Net assets | $529,222,972 |
| Shares outstanding | 43,249,869 |
| Net asset value per share | $12.24 |
| Class R | |
| Net assets | $4,920,659 |
| Shares outstanding | 421,963 |
| Net asset value per share | $11.66 |
| 14 | Columbia Emerging Markets Fund | Annual Report 2022 |
Year Ended August 31, 2022
| Net investment income | |
| Income: | |
| Dividends — unaffiliated issuers | $25,837,668 |
| Dividends — affiliated issuers | 77,539 |
| Interfund lending | 41 |
| Non-cash dividends - unaffiliated issuers | 1,335,792 |
| Foreign taxes withheld | (3,715,952) |
| Total income | 23,535,088 |
| Expenses: | |
| Management services fees | 19,068,491 |
| Distribution and/or service fees | |
| Class A | 685,862 |
| Class C | 157,106 |
| Class R | 28,748 |
| Transfer agent fees | |
| Class A | 434,915 |
| Advisor Class | 204,793 |
| Class C | 24,961 |
| Institutional Class | 869,694 |
| Institutional 2 Class | 163,502 |
| Institutional 3 Class | 46,636 |
| Class R | 9,095 |
| Compensation of board members | 38,539 |
| Custodian fees | 652,964 |
| Printing and postage fees | 151,742 |
| Registration fees | 188,985 |
| Audit fees | 72,079 |
| Legal fees | 31,959 |
| Line of credit interest | 74 |
| Interest on interfund lending | 3,090 |
| Compensation of chief compliance officer | 542 |
| Other | 261,934 |
| Total expenses | 23,095,711 |
| Expense reduction | (880) |
| Total net expenses | 23,094,831 |
| Net investment income | 440,257 |
| Realized and unrealized gain (loss) — net | |
| Net realized gain (loss) on: | |
| Investments — unaffiliated issuers | (97,667,025) |
| Investments — affiliated issuers | (9,007) |
| Foreign currency translations | (1,018,625) |
| Net realized loss | (98,694,657) |
| Net change in unrealized appreciation (depreciation) on: | |
| Investments — unaffiliated issuers | (836,677,578) |
| Investments — affiliated issuers | 1 |
| Foreign currency translations | (131,150) |
| Foreign capital gains tax | 8,432,478 |
| Net change in unrealized appreciation (depreciation) | (828,376,249) |
| Net realized and unrealized loss | (927,070,906) |
| Net decrease in net assets resulting from operations | $(926,630,649) |
| Columbia Emerging Markets Fund | Annual Report 2022 | 15 |
| Year Ended August 31, 2022 | Year Ended August 31, 2021 | |
| Operations | ||
| Net investment income (loss) | $440,257 | $(3,206,740) |
| Net realized gain (loss) | (98,694,657) | 38,833,288 |
| Net change in unrealized appreciation (depreciation) | (828,376,249) | 305,272,347 |
| Net increase (decrease) in net assets resulting from operations | (926,630,649) | 340,898,895 |
| Distributions to shareholders | ||
| Net investment income and net realized gains | ||
| Class A | (4,204,394) | (3,194,126) |
| Advisor Class | (1,411,194) | (619,352) |
| Class C | (218,247) | (87,144) |
| Institutional Class | (7,979,325) | (3,945,614) |
| Institutional 2 Class | (5,275,351) | (3,656,749) |
| Institutional 3 Class | (11,836,745) | (9,328,016) |
| Class R | (81,634) | (50,972) |
| Return of capital | ||
| Class A | (408,081) | — |
| Advisor Class | (128,585) | — |
| Class C | (26,609) | — |
| Institutional Class | (727,061) | — |
| Institutional 2 Class | (467,543) | — |
| Institutional 3 Class | (1,036,205) | — |
| Class R | (8,502) | — |
| Total distributions to shareholders | (33,809,476) | (20,881,973) |
| Increase in net assets from capital stock activity | 118,266,067 | 530,458,563 |
| Total increase (decrease) in net assets | (842,174,058) | 850,475,485 |
| Net assets at beginning of year | 2,357,779,597 | 1,507,304,112 |
| Net assets at end of year | $1,515,605,539 | $2,357,779,597 |
| 16 | Columbia Emerging Markets Fund | Annual Report 2022 |
| Year Ended | Year Ended | |||
| August 31, 2022 | August 31, 2021 | |||
| Shares | Dollars ($) | Shares | Dollars ($) | |
| Capital stock activity | ||||
| Class A | ||||
| Subscriptions | 2,357,203 | 35,630,861 | 3,671,868 | 69,441,078 |
| Fund reorganization | 269,775 | 4,637,897 | — | — |
| Distributions reinvested | 258,838 | 4,467,536 | 168,671 | 3,091,734 |
| Redemptions | (4,236,227) | (62,139,731) | (3,149,296) | (57,365,904) |
| Net increase (decrease) | (1,350,411) | (17,403,437) | 691,243 | 15,166,908 |
| Advisor Class | ||||
| Subscriptions | 7,901,905 | 117,952,439 | 4,203,972 | 82,382,206 |
| Fund reorganization | 9,411,874 | 165,298,388 | — | — |
| Distributions reinvested | 87,134 | 1,536,164 | 26,973 | 504,132 |
| Redemptions | (17,456,431) | (261,311,962) | (1,202,144) | (22,737,423) |
| Net increase (decrease) | (55,518) | 23,475,029 | 3,028,801 | 60,148,915 |
| Class C | ||||
| Subscriptions | 143,007 | 2,013,232 | 682,139 | 12,162,196 |
| Distributions reinvested | 14,975 | 239,603 | 5,055 | 86,387 |
| Redemptions | (465,227) | (6,552,094) | (489,088) | (8,579,697) |
| Net increase (decrease) | (307,245) | (4,299,259) | 198,106 | 3,668,886 |
| Institutional Class | ||||
| Subscriptions | 37,723,359 | 563,198,392 | 16,148,631 | 310,607,876 |
| Distributions reinvested | 338,369 | 5,921,453 | 151,822 | 2,816,299 |
| Redemptions | (23,369,942) | (329,853,633) | (4,418,164) | (82,797,147) |
| Net increase | 14,691,786 | 239,266,212 | 11,882,289 | 230,627,028 |
| Institutional 2 Class | ||||
| Subscriptions | 5,843,799 | 90,934,570 | 8,398,539 | 163,216,583 |
| Distributions reinvested | 325,360 | 5,732,848 | 186,067 | 3,473,868 |
| Redemptions | (11,926,285) | (167,447,607) | (3,498,294) | (66,979,362) |
| Net increase (decrease) | (5,757,126) | (70,780,189) | 5,086,312 | 99,711,089 |
| Institutional 3 Class | ||||
| Subscriptions | 13,440,227 | 198,900,011 | 15,959,517 | 313,844,968 |
| Distributions reinvested | 320,281 | 5,672,176 | 241,286 | 4,524,119 |
| Redemptions | (17,589,054) | (257,209,551) | (10,504,918) | (197,360,590) |
| Net increase (decrease) | (3,828,546) | (52,637,364) | 5,695,885 | 121,008,497 |
| Class R | ||||
| Subscriptions | 182,414 | 2,680,376 | 163,380 | 3,011,052 |
| Distributions reinvested | 4,809 | 81,518 | 2,322 | 41,897 |
| Redemptions | (139,013) | (2,116,819) | (165,570) | (2,925,709) |
| Net increase | 48,210 | 645,075 | 132 | 127,240 |
| Total net increase | 3,441,150 | 118,266,067 | 26,582,768 | 530,458,563 |
| Columbia Emerging Markets Fund | Annual Report 2022 | 17 |
| Net asset value, beginning of period | Net investment income (loss) | Net realized and unrealized gain (loss) | Total from investment operations | Distributions from net investment income | Distributions from net realized gains | Tax return of capital | Total distributions to shareholders | |
| Class A | ||||||||
| Year Ended 8/31/2022 | $19.06 | (0.04) | (6.88) | (6.92) | (0.16) | (0.07) | (0.02) | (0.25) |
| Year Ended 8/31/2021 | $15.60 | (0.08) | 3.72 | 3.64 | (0.18) | — | — | (0.18) |
| Year Ended 8/31/2020 | $12.15 | (0.04) | 3.51 | 3.47 | (0.02) | — | — | (0.02) |
| Year Ended 8/31/2019 | $12.15 | 0.01 | (0.01) | 0.00(f) | — | — | — | — |
| Year Ended 8/31/2018 | $12.62 | 0.02 | (0.47) | (0.45) | (0.02) | — | — | (0.02) |
| Advisor Class | ||||||||
| Year Ended 8/31/2022 | $19.46 | 0.00(f) | (7.02) | (7.02) | (0.18) | (0.07) | (0.02) | (0.27) |
| Year Ended 8/31/2021 | $15.92 | (0.03) | 3.79 | 3.76 | (0.22) | — | — | (0.22) |
| Year Ended 8/31/2020 | $12.39 | (0.01) | 3.59 | 3.58 | (0.05) | — | — | (0.05) |
| Year Ended 8/31/2019 | $12.38 | 0.04 | (0.02) | 0.02 | (0.01) | — | — | (0.01) |
| Year Ended 8/31/2018 | $12.84 | 0.02 | (0.43) | (0.41) | (0.05) | — | — | (0.05) |
| Class C | ||||||||
| Year Ended 8/31/2022 | $17.67 | (0.15) | (6.35) | (6.50) | (0.12) | (0.07) | (0.02) | (0.21) |
| Year Ended 8/31/2021 | $14.50 | (0.20) | 3.45 | 3.25 | (0.08) | — | — | (0.08) |
| Year Ended 8/31/2020 | $11.36 | (0.13) | 3.27 | 3.14 | — | — | — | — |
| Year Ended 8/31/2019 | $11.45 | (0.08) | (0.01) | (0.09) | — | — | — | — |
| Year Ended 8/31/2018 | $11.96 | (0.08) | (0.43) | (0.51) | — | — | — | — |
| Institutional Class | ||||||||
| Year Ended 8/31/2022 | $19.32 | 0.01 | (6.98) | (6.97) | (0.18) | (0.07) | (0.02) | (0.27) |
| Year Ended 8/31/2021 | $15.80 | (0.03) | 3.77 | 3.74 | (0.22) | — | — | (0.22) |
| Year Ended 8/31/2020 | $12.30 | (0.01) | 3.56 | 3.55 | (0.05) | — | — | (0.05) |
| Year Ended 8/31/2019 | $12.29 | 0.05 | (0.03) | 0.02 | (0.01) | — | — | (0.01) |
| Year Ended 8/31/2018 | $12.76 | 0.05 | (0.47) | (0.42) | (0.05) | — | — | (0.05) |
| Institutional 2 Class | ||||||||
| Year Ended 8/31/2022 | $19.46 | 0.01 | (7.02) | (7.01) | (0.18) | (0.07) | (0.02) | (0.27) |
| Year Ended 8/31/2021 | $15.92 | (0.02) | 3.79 | 3.77 | (0.23) | — | — | (0.23) |
| Year Ended 8/31/2020 | $12.38 | 0.01 | 3.60 | 3.61 | (0.07) | — | — | (0.07) |
| Year Ended 8/31/2019 | $12.37 | 0.07 | (0.03) | 0.04 | (0.03) | — | — | (0.03) |
| Year Ended 8/31/2018 | $12.84 | 0.08 | (0.49) | (0.41) | (0.06) | — | — | (0.06) |
| 18 | Columbia Emerging Markets Fund | Annual Report 2022 |
| Net asset value, end of period | Total return | Total gross expense ratio to average net assets(a) | Total net expense ratio to average net assets(a),(b) | Net investment income (loss) ratio to average net assets | Portfolio turnover | Net assets, end of period (000’s) | |
| Class A | |||||||
| Year Ended 8/31/2022 | $11.89 | (36.71%) | 1.44%(c),(d) | 1.44%(c),(d),(e) | (0.27%) | 48% | $206,162 |
| Year Ended 8/31/2021 | $19.06 | 23.40% | 1.43%(c) | 1.43%(c),(e) | (0.45%) | 16% | $356,033 |
| Year Ended 8/31/2020 | $15.60 | 28.56% | 1.55%(c) | 1.54%(c),(e) | (0.29%) | 29% | $280,741 |
| Year Ended 8/31/2019 | $12.15 | 0.00% | 1.58%(c) | 1.58%(c) | 0.12% | 38% | $249,512 |
| Year Ended 8/31/2018 | $12.15 | (3.58%) | 1.54% | 1.54%(e) | 0.12% | 39% | $276,209 |
| Advisor Class | |||||||
| Year Ended 8/31/2022 | $12.17 | (36.52%) | 1.19%(c),(d) | 1.19%(c),(d),(e) | 0.03% | 48% | $69,818 |
| Year Ended 8/31/2021 | $19.46 | 23.65% | 1.18%(c) | 1.18%(c),(e) | (0.17%) | 16% | $112,719 |
| Year Ended 8/31/2020 | $15.92 | 28.92% | 1.30%(c) | 1.29%(c),(e) | (0.07%) | 29% | $43,986 |
| Year Ended 8/31/2019 | $12.39 | 0.20% | 1.33%(c) | 1.33%(c) | 0.36% | 38% | $23,161 |
| Year Ended 8/31/2018 | $12.38 | (3.26%) | 1.29% | 1.29%(e) | 0.14% | 39% | $24,379 |
| Class C | |||||||
| Year Ended 8/31/2022 | $10.96 | (37.18%) | 2.19%(c),(d) | 2.19%(c),(d),(e) | (1.04%) | 48% | $10,706 |
| Year Ended 8/31/2021 | $17.67 | 22.45% | 2.18%(c) | 2.18%(c),(e) | (1.19%) | 16% | $22,680 |
| Year Ended 8/31/2020 | $14.50 | 27.64% | 2.30%(c) | 2.29%(c),(e) | (1.04%) | 29% | $15,742 |
| Year Ended 8/31/2019 | $11.36 | (0.79%) | 2.33%(c) | 2.33%(c) | (0.69%) | 38% | $14,830 |
| Year Ended 8/31/2018 | $11.45 | (4.26%) | 2.29% | 2.29%(e) | (0.62%) | 39% | $22,177 |
| Institutional Class | |||||||
| Year Ended 8/31/2022 | $12.08 | (36.52%) | 1.20%(c),(d) | 1.20%(c),(d),(e) | 0.05% | 48% | $520,117 |
| Year Ended 8/31/2021 | $19.32 | 23.70% | 1.18%(c) | 1.18%(c),(e) | (0.18%) | 16% | $547,997 |
| Year Ended 8/31/2020 | $15.80 | 28.89% | 1.30%(c) | 1.29%(c),(e) | (0.04%) | 29% | $260,558 |
| Year Ended 8/31/2019 | $12.30 | 0.20% | 1.33%(c) | 1.33%(c) | 0.41% | 38% | $210,844 |
| Year Ended 8/31/2018 | $12.29 | (3.35%) | 1.29% | 1.29%(e) | 0.40% | 39% | $203,193 |
| Institutional 2 Class | |||||||
| Year Ended 8/31/2022 | $12.18 | (36.44%) | 1.09%(c),(d) | 1.09%(c),(d) | 0.04% | 48% | $174,660 |
| Year Ended 8/31/2021 | $19.46 | 23.77% | 1.08%(c) | 1.08%(c) | (0.09%) | 16% | $391,145 |
| Year Ended 8/31/2020 | $15.92 | 29.19% | 1.16%(c) | 1.15%(c) | 0.10% | 29% | $238,994 |
| Year Ended 8/31/2019 | $12.38 | 0.36% | 1.18%(c) | 1.18%(c) | 0.55% | 38% | $161,554 |
| Year Ended 8/31/2018 | $12.37 | (3.22%) | 1.16% | 1.16% | 0.58% | 39% | $155,442 |
| Columbia Emerging Markets Fund | Annual Report 2022 | 19 |
| Net asset value, beginning of period | Net investment income (loss) | Net realized and unrealized gain (loss) | Total from investment operations | Distributions from net investment income | Distributions from net realized gains | Tax return of capital | Total distributions to shareholders | |
| Institutional 3 Class | ||||||||
| Year Ended 8/31/2022 | $19.55 | 0.02 | (7.05) | (7.03) | (0.19) | (0.07) | (0.02) | (0.28) |
| Year Ended 8/31/2021 | $15.99 | (0.01) | 3.81 | 3.80 | (0.24) | — | — | (0.24) |
| Year Ended 8/31/2020 | $12.44 | 0.02 | 3.60 | 3.62 | (0.07) | — | — | (0.07) |
| Year Ended 8/31/2019 | $12.43 | 0.07 | (0.02) | 0.05 | (0.04) | — | — | (0.04) |
| Year Ended 8/31/2018 | $12.90 | 0.07 | (0.47) | (0.40) | (0.07) | — | — | (0.07) |
| Class R | ||||||||
| Year Ended 8/31/2022 | $18.72 | (0.07) | (6.75) | (6.82) | (0.15) | (0.07) | (0.02) | (0.24) |
| Year Ended 8/31/2021 | $15.34 | (0.13) | 3.66 | 3.53 | (0.15) | — | — | (0.15) |
| Year Ended 8/31/2020 | $11.96 | (0.07) | 3.45 | 3.38 | — | — | — | — |
| Year Ended 8/31/2019 | $11.99 | (0.02) | (0.01) | (0.03) | — | — | — | — |
| Year Ended 8/31/2018 | $12.47 | (0.02) | (0.46) | (0.48) | — | — | — | — |
| Notes to Financial Highlights | |
| (a) | In addition to the fees and expenses that the Fund bears directly, the Fund indirectly bears a pro rata share of the fees and expenses of any other funds in which it invests. Such indirect expenses are not included in the Fund’s reported expense ratios. |
| (b) | Total net expenses include the impact of certain fee waivers/expense reimbursements made by the Investment Manager and certain of its affiliates, if applicable. |
| (c) | Ratios include interfund lending expense which is less than 0.01%. |
| (d) | Ratios include line of credit interest expense which is less than 0.01%. |
| (e) | The benefits derived from expense reductions had an impact of less than 0.01%. |
| (f) | Rounds to zero. |
| 20 | Columbia Emerging Markets Fund | Annual Report 2022 |
| Net asset value, end of period | Total return | Total gross expense ratio to average net assets(a) | Total net expense ratio to average net assets(a),(b) | Net investment income (loss) ratio to average net assets | Portfolio turnover | Net assets, end of period (000’s) | |
| Institutional 3 Class | |||||||
| Year Ended 8/31/2022 | $12.24 | (36.41%) | 1.04%(c),(d) | 1.04%(c),(d) | 0.13% | 48% | $529,223 |
| Year Ended 8/31/2021 | $19.55 | 23.84% | 1.03%(c) | 1.03%(c) | (0.03%) | 16% | $920,211 |
| Year Ended 8/31/2020 | $15.99 | 29.18% | 1.11%(c) | 1.10%(c) | 0.16% | 29% | $661,552 |
| Year Ended 8/31/2019 | $12.44 | 0.43% | 1.13%(c) | 1.13%(c) | 0.58% | 38% | $609,791 |
| Year Ended 8/31/2018 | $12.43 | (3.18%) | 1.10% | 1.10% | 0.54% | 39% | $673,688 |
| Class R | |||||||
| Year Ended 8/31/2022 | $11.66 | (36.85%) | 1.69%(c),(d) | 1.69%(c),(d),(e) | (0.50%) | 48% | $4,921 |
| Year Ended 8/31/2021 | $18.72 | 23.04% | 1.68%(c) | 1.68%(c),(e) | (0.69%) | 16% | $6,996 |
| Year Ended 8/31/2020 | $15.34 | 28.26% | 1.80%(c) | 1.79%(c),(e) | (0.54%) | 29% | $5,731 |
| Year Ended 8/31/2019 | $11.96 | (0.25%) | 1.83%(c) | 1.83%(c) | (0.16%) | 38% | $7,125 |
| Year Ended 8/31/2018 | $11.99 | (3.85%) | 1.79% | 1.79%(e) | (0.17%) | 39% | $9,847 |
| Columbia Emerging Markets Fund | Annual Report 2022 | 21 |
August 31, 2022
| 22 | Columbia Emerging Markets Fund | Annual Report 2022 |
August 31, 2022
| Columbia Emerging Markets Fund | Annual Report 2022 | 23 |
August 31, 2022
| 24 | Columbia Emerging Markets Fund | Annual Report 2022 |
August 31, 2022
| Effective rate (%) | |
| Class A | 0.16 |
| Advisor Class | 0.16 |
| Class C | 0.16 |
| Institutional Class | 0.16 |
| Institutional 2 Class | 0.06 |
| Institutional 3 Class | 0.01 |
| Class R | 0.16 |
| Columbia Emerging Markets Fund | Annual Report 2022 | 25 |
August 31, 2022
| Front End (%) | CDSC (%) | Amount ($) | |
| Class A | 5.75 | 0.50 - 1.00(a) | 146,900 |
| Class C | — | 1.00(b) | 3,891 |
| (a) | This charge is imposed on certain investments of between $1 million and $50 million redeemed within 18 months after purchase, as follows: 1.00% if redeemed within 12 months after purchase, and 0.50% if redeemed more than 12, but less than 18, months after purchase, with certain limited exceptions. |
| (b) | This charge applies to redemptions within 12 months after purchase, with certain limited exceptions. |
| Fee rate(s) contractual through December 31, 2023 | |
| Class A | 1.47% |
| Advisor Class | 1.22 |
| Class C | 2.22 |
| Institutional Class | 1.22 |
| Institutional 2 Class | 1.11 |
| Institutional 3 Class | 1.07 |
| Class R | 1.72 |
| 26 | Columbia Emerging Markets Fund | Annual Report 2022 |
August 31, 2022
| Excess of distributions over net investment income ($) | Accumulated net realized (loss) ($) | Paid in capital ($) |
| 2,754,071 | (2,854,454) | 100,383 |
| Year Ended August 31, 2022 | Year Ended August 31, 2021 | |||||
| Ordinary income ($) | Long-term capital gains ($) | Tax return of capital ($) | Total ($) | Ordinary income ($) | Long-term capital gains ($) | Total ($) |
| 21,951,272 | 9,055,618 | 2,802,586 | 33,809,476 | 20,026,532 | 855,441 | 20,881,973 |
| Undistributed ordinary income ($) | Undistributed long-term capital gains ($) | Capital loss carryforwards ($) | Net unrealized appreciation ($) |
| — | — | — | 174,552,443 |
| Federal tax cost ($) | Gross unrealized appreciation ($) | Gross unrealized (depreciation) ($) | Net unrealized appreciation ($) |
| 1,343,289,207 | 411,113,273 | (236,560,830) | 174,552,443 |
| Columbia Emerging Markets Fund | Annual Report 2022 | 27 |
August 31, 2022
| Late year ordinary losses ($) | Post-October capital losses ($) |
| 20,808,706 | 108,399,274 |
| Borrower or lender | Average loan balance ($) | Weighted average interest rate (%) | Number of days with outstanding loans |
| Borrower | 3,590,000 | 1.53 | 20 |
| Lender | 2,400,000 | 0.61 | 1 |
| 28 | Columbia Emerging Markets Fund | Annual Report 2022 |
August 31, 2022
| Average loan balance ($) | Weighted average interest rate (%) | Days outstanding |
| 1,000,000 | 2.65 | 1 |
| Shares | |
| Class A | 269,775 |
| Advisor Class | 9,411,874 |
| Columbia Emerging Markets Fund | Annual Report 2022 | 29 |
August 31, 2022
| ($) | |
| Net investment income | 47,000 |
| Net realized loss | (47,692,000) |
| Net change in unrealized appreciation/(depreciation) | (895,002,000) |
| Net decrease in net assets from operations | (942,647,000) |
| 30 | Columbia Emerging Markets Fund | Annual Report 2022 |
August 31, 2022
| Columbia Emerging Markets Fund | Annual Report 2022 | 31 |
August 31, 2022
| 32 | Columbia Emerging Markets Fund | Annual Report 2022 |
August 31, 2022
| Columbia Emerging Markets Fund | Annual Report 2022 | 33 |
| 34 | Columbia Emerging Markets Fund | Annual Report 2022 |
| Qualified dividend income | Capital gain dividend | Foreign taxes paid to foreign countries | Foreign taxes paid per share to foreign countries | Foreign source income | Foreign source income per share |
| 48.05% | $9,508,399 | $11,425,970 | $0.09 | $27,172,995 | $0.22 |
| Name, address, year of birth | Position held with the Columbia Funds and length of service | Principal occupation(s) during past five years and other relevant professional experience | Number of Funds in the Columbia Funds Complex* overseen | Other directorships held by Trustee during the past five years |
| George S. Batejan c/o Columbia Management Investment Advisers, LLC 290 Congress Street Boston, MA 02210 1953 | Trustee since 2017 | Executive Vice President, Global Head of Technology and Operations, Janus Capital Group, Inc., 2010-2016 | 176 | Former Chairman of the Board, NICSA (National Investment Company Services Association) (Executive Committee, Nominating Committee and Governance Committee), 2014-2016; former Director, Intech Investment Management, 2011-2016; former Board Member, Metro Denver Chamber of Commerce, 2015-2016; former Advisory Board Member, University of Colorado Business School, 2015-2018 |
| Columbia Emerging Markets Fund | Annual Report 2022 | 35 |
(Unaudited)
Independent trustees (continued)
| Name, address, year of birth | Position held with the Columbia Funds and length of service | Principal occupation(s) during past five years and other relevant professional experience | Number of Funds in the Columbia Funds Complex* overseen | Other directorships held by Trustee during the past five years |
| Kathleen Blatz c/o Columbia Management Investment Advisers, LLC 290 Congress Street Boston, MA 02210 1954 | Trustee since 2006 | Attorney, specializing in arbitration and mediation; Chief Justice, Minnesota Supreme Court, 1998-2006; Associate Justice, Minnesota Supreme Court, 1996-1998; Fourth Judicial District Court Judge, Hennepin County, 1994-1996; Attorney in private practice and public service, 1984-1993; State Representative, Minnesota House of Representatives, 1979-1993, which included service on the Tax and Financial Institutions and Insurance Committees; Member and Interim Chair, Minnesota Sports Facilities Authority, January 2017-July 2017; Interim President and Chief Executive Officer, Blue Cross and Blue Shield of Minnesota (health care insurance), February-July 2018, April-October 2021 | 176 | Former Trustee, Blue Cross and Blue Shield of Minnesota, 2009-2021 (Chair of the Business Development Committee, 2014-2017; Chair of the Governance Committee, 2017-2019); former Member and Chair of the Board, Minnesota Sports Facilities Authority, January 2017-July 2017; former Director, Robina Foundation, 2009-2020 (Chair, 2014-2020); Director, Schulze Family Foundation, since 2021 |
| Pamela G. Carlton c/o Columbia Management Investment Advisers, LLC 290 Congress Street Boston, MA 02210 1954 | Trustee since 2007 | President, Springboard — Partners in Cross Cultural Leadership (consulting company) since 2003; Managing Director of US Equity Research, JP Morgan Chase, 1999-2003; Director of US Equity Research, Chase Asset Management, 1996-1999; Co-Director Latin America Research, 1993-1996, COO Global Research, 1992-1996, Co-Director of US Research, 1991-1992, Investment Banker, 1982-1991, Morgan Stanley; Attorney, Cleary Gottlieb Steen & Hamilton LLP, 1980-1982 | 176 | Trustee, New York Presbyterian Hospital Board (Executive Committee and Chair of People Committee) since 1996; Director, DR Bank (Audit Committee) since 2017; Director, Evercore Inc. (Audit Committee) since 2019; Director, Apollo Commercial Real Estate Finance, Inc. since 2021; the Governing Council of the Independent Directors Council (IDC), since 2021 |
| Janet Langford Carrig c/o Columbia Management Investment Advisers, LLC 290 Congress Street Boston, MA 02210 1957 | Trustee since 1996 | Senior Vice President, General Counsel and Corporate Secretary, ConocoPhillips (independent energy company), September 2007-October 2018 | 174 | Director, EQT Corporation (natural gas producer) since 2019; former Director, Whiting Petroleum Corporation (independent oil and gas company), 2020-2022 |
| J. Kevin Connaughton c/o Columbia Management Investment Advisers, LLC 290 Congress Street Boston, MA 02210 1964 | Trustee since 2020 | Member, FINRA National Adjudicatory Council since January 2020; Adjunct Professor of Finance, Bentley University since January 2018; Consultant to Independent Trustees of CFVIT and CFST I from March 2016 to June 2020 with respect to CFVIT and to December 2020 with respect to CFST I; Managing Director and General Manager of Mutual Fund Products, Columbia Management Investment Advisers, LLC, May 2010-February 2015; President, Columbia Funds, 2008-2015; and senior officer of Columbia Funds and affiliated funds, 2003-2015 | 174 | Former Director, The Autism Project, March 2015-December 2021; former Member of the Investment Committee, St. Michael’s College, November 2015-February 2020; former Trustee, St. Michael’s College, June 2017-September 2019; former Trustee, New Century Portfolios, January 2015-December 2017 |
| 36 | Columbia Emerging Markets Fund | Annual Report 2022 |
(Unaudited)
Independent trustees (continued)
| Name, address, year of birth | Position held with the Columbia Funds and length of service | Principal occupation(s) during past five years and other relevant professional experience | Number of Funds in the Columbia Funds Complex* overseen | Other directorships held by Trustee during the past five years |
| Olive M. Darragh c/o Columbia Management Investment Advisers, LLC 290 Congress Street Boston, MA 02210 1962 | Trustee since 2020 | Managing Director of Darragh Inc. (strategy and talent management consulting firm) since 2010; Founder and CEO, Zolio, Inc. (investment management talent identification platform) since 2004; Consultant to Independent Trustees of CFVIT and CFST I from June 2019 to June 2020 with respect to CFVIT and to December 2020 with respect to CFST I; Partner, Tudor Investments, 2004-2010; Senior Partner, McKinsey & Company (consulting), 1990-2004; Touche Ross CPA, 1985-1988 | 174 | Former Director, University of Edinburgh Business School (Member of US Board); former Director, Boston Public Library Foundation |
| Patricia M. Flynn c/o Columbia Management Investment Advisers, LLC 290 Congress Street Boston, MA 02210 1950 | Trustee since 2004 | Trustee Professor of Economics and Management, Bentley University since 1976 (also teaches and conducts research on corporate governance); Dean, McCallum Graduate School of Business, Bentley University, 1992-2002 | 176 | Trustee, MA Taxpayers Foundation since 1997; former Board of Governors, Innovation Institute, MA Technology Collaborative, 2010-2020; former Board of Directors, The MA Business Roundtable, 2003-2019 |
| Brian J. Gallagher c/o Columbia Management Investment Advisers, LLC 290 Congress Street Boston, MA 02210 1954 | Trustee since 2017 | Retired; Partner with Deloitte & Touche LLP and its predecessors, 1977-2016 | 176 | Trustee, Catholic Schools Foundation since 2004 |
| Douglas A. Hacker c/o Columbia Management Investment Advisers, LLC 290 Congress Street Boston, MA 02210 1955 | Co-Chair since 2021; Chair of CFST I and CFVIT since 2014; Trustee of CFST I and CFVIT since 1996 and CFST, CFST II, CFVST II, CET I and CET II since 2021 | Independent business executive since May 2006; Executive Vice President – Strategy of United Airlines, December 2002 - May 2006; President of UAL Loyalty Services (airline marketing company), September 2001-December 2002; Executive Vice President and Chief Financial Officer of United Airlines, July 1999-September 2001 | 176 | Director, Spartan Nash Company (food distributor); Director, Aircastle Limited (Chair of Audit Committee) (aircraft leasing); former Director, Nash Finch Company (food distributor), 2005-2013; former Director, SeaCube Container Leasing Ltd. (container leasing), 2010-2013; and former Director, Travelport Worldwide Limited (travel information technology), 2014-2019 |
| Nancy T. Lukitsh c/o Columbia Management Investment Advisers, LLC 290 Congress Street Boston, MA 02210 1956 | Trustee since 2011 | Senior Vice President, Partner and Director of Marketing, Wellington Management Company, LLP (investment adviser), 1997-2010; Chair, Wellington Management Portfolios (commingled non-U.S. investment pools), 2007 -2010; Director, Wellington Trust Company, NA and other Wellington affiliates, 1997-2010 | 174 | None |
| Columbia Emerging Markets Fund | Annual Report 2022 | 37 |
(Unaudited)
Independent trustees (continued)
| Name, address, year of birth | Position held with the Columbia Funds and length of service | Principal occupation(s) during past five years and other relevant professional experience | Number of Funds in the Columbia Funds Complex* overseen | Other directorships held by Trustee during the past five years |
| David M. Moffett c/o Columbia Management Investment Advisers, LLC 290 Congress Street Boston, MA 02210 1952 | Trustee since 2011 | Retired; Consultant to Bridgewater and Associates | 174 | Director, CSX Corporation (transportation suppliers); Director, Genworth Financial, Inc. (financial and insurance products and services); Director, PayPal Holdings Inc. (payment and data processing services); Trustee, University of Oklahoma Foundation; former Director, eBay Inc. (online trading community), 2007-2015; and former Director, CIT Bank, CIT Group Inc. (commercial and consumer finance), 2010-2016 |
| Catherine James Paglia c/o Columbia Management Investment Advisers, LLC 290 Congress Street Boston, MA 02210 1952 | Co-Chair since 2021; Chair of CFST, CFST II, CFVST II, CET I and CET II since 2020; Trustee of CFST, CFST II and CFVST II since 2004 and CFST I and CFVIT since 2021 | Director, Enterprise Asset Management, Inc. (private real estate and asset management company) since September 1998; Managing Director and Partner, Interlaken Capital, Inc., 1989-1997; Vice President, 1982-1985, Principal, 1985-1987, Managing Director, 1987-1989, Morgan Stanley; Vice President, Investment Banking, 1980-1982, Associate, Investment Banking, 1976-1980, Dean Witter Reynolds, Inc. | 176 | Director, Valmont Industries, Inc. (irrigation systems manufacturer) since 2012; Trustee, Carleton College (on the Investment Committee); Trustee, Carnegie Endowment for International Peace (on the Investment Committee) |
| Minor M. Shaw c/o Columbia Management Investment Advisers, LLC 290 Congress Street Boston, MA 02210 1947 | Trustee since 2003 | President, Micco LLC (private investments) since 2011; President, Micco Corp. (family investment business), 1998-2011 | 176 | Director, Blue Cross Blue Shield of South Carolina (Chair of Compensation Committee) since April 2008; Trustee, Hollingsworth Funds (on the Investment Committee) since 2016 (previously Board Chair from 2016-2019); Former Advisory Board member, Duke Energy Corp., 2016-2020; Chair of the Duke Endowment; Chair of Greenville – Spartanburg Airport Commission; former Trustee, BofA Funds Series Trust (11 funds), 2003-2011; former Director, Piedmont Natural Gas, 2004-2016; former Director, National Association of Corporate Directors, Carolinas Chapter, 2013-2018; Chair, Daniel-Mickel Foundation since 1998 |
| 38 | Columbia Emerging Markets Fund | Annual Report 2022 |
(Unaudited)
Independent trustees (continued)
| Name, address, year of birth | Position held with the Columbia Funds and length of service | Principal occupation(s) during past five years and other relevant professional experience | Number of Funds in the Columbia Funds Complex* overseen | Other directorships held by Trustee during the past five years |
| Natalie A. Trunow c/o Columbia Management Investment Advisers, LLC 290 Congress Street Boston, MA 02210 1967 | Trustee since 2020 | Chief Executive Officer, Millennial Portfolio Solutions LLC (asset management and consulting services), January 2016-January 2021; Non-executive Member of the Investment Committee and Valuation Committee, Sarona Asset Management Inc. (private equity firm) since September 2019; Advisor, Horizon Investments (asset management and consulting services), August 2018-January 2021; Advisor, Paradigm Asset Management, November 2016-December 2021; Consultant to Independent Trustees of CFVIT and CFST I from September 2016 to June 2020 with respect to CFVIT and to December 2020 with respect to CFST I; Director of Investments/Consultant, Casey Family Programs, April 2016-November 2016; Senior Vice President and Chief Investment Officer, Calvert Investments, August 2008-January 2016; Section Head and Portfolio Manager, General Motors Asset Management, June 1997-August 2008 | 174 | Former Director, Investment Committee, Health Services for Children with Special Needs, Inc., 2012-2019; Director, Chair of Audit Committee, Consumer Credit Counseling Services (formerly Guidewell Financial Solutions), since 2019; Independent Director, Investment Committee and Valuation Committee, Sarona Asset Management, since 2019 |
| Sandra L. Yeager c/o Columbia Management Investment Advisers, LLC 290 Congress Street Boston, MA 02210 1964 | Trustee since 2017 | Retired; President and founder, Hanoverian Capital, LLC (SEC registered investment advisor firm), 2008-2016; Managing Director, DuPont Capital, 2006-2008; Managing Director, Morgan Stanley Investment Management, 2004-2006; Senior Vice President, Alliance Bernstein, 1990-2004 | 176 | Former Director, NAPE Education Foundation, October 2016-October 2020 |
| * | The term “Columbia Funds Complex” as used herein includes Columbia Seligman Premium Technology Growth Fund, Tri-Continental Corporation and each series of Columbia Fund Series Trust (CFST), Columbia Funds Series Trust I (CFST I), Columbia Funds Series Trust II (CFST II), Columbia ETF Trust I (CET I), Columbia ETF Trust II (CET II), Columbia Funds Variable Insurance Trust (CFVIT) and Columbia Funds Variable Series Trust II (CFVST II). Messrs. Batejan, Beckman, Gallagher and Hacker and Mses. Blatz, Carlton, Flynn, Paglia, Shaw and Yeager serve as Directors of Columbia Seligman Premium Technology Growth Fund and Tri-Continental Corporation. |
| Name, address, year of birth | Position held with the Columbia Funds and length of service | Principal occupation(s) during the past five years and other relevant professional experience | Number of Funds in the Columbia Funds Complex overseen | Other directorships held by Trustee during the past five years |
| Daniel J. Beckman c/o Columbia Management Investment Advisers, LLC 290 Congress Street Boston, MA 02210 1962 | Trustee since November 2021 and President since June 2021 | Vice President – Head of North America Product, Columbia Management Investment Advisers, LLC since April 2015; President and Principal Executive Officer of the Columbia Funds since June 2021; officer of Columbia Funds and affiliated funds, 2020-2021 | 176 | Director, Ameriprise Trust Company, since October 2016; Director, Columbia Management Investment Distributors, Inc. since November 2018; Board of Governors, Columbia Wanger Asset Management, LLC since January 2022 |
| * | Interested person (as defined under the 1940 Act) by reason of being an officer, director, security holder and/or employee of the Investment Manager or Ameriprise Financial. |
| Columbia Emerging Markets Fund | Annual Report 2022 | 39 |
(Unaudited)
The Statement of Additional Information has additional information about the Fund’s Board members and is available, without charge, upon request by calling 800.345.6611, visiting columbiathreadneedleus.com/investor/ or contacting your financial intermediary.
| Name, address and year of birth | Position and year first appointed to position for any Fund in the Columbia Funds Complex or a predecessor thereof | Principal occupation(s) during past five years |
| Michael G. Clarke 290 Congress Street Boston, MA 02210 1969 | Chief Financial Officer and Principal Financial Officer (2009) and Senior Vice President (2019) | Senior Vice President and Head of Global Operations & Investor Services, Columbia Management Investment Advisers, LLC, since March 2022 (previously Vice President, Head of North American Operations, and Co-Head of Global Operations, June 2019 to February 2022 and Vice President – Accounting and Tax, May 2010 - May 2019); senior officer of Columbia Funds and affiliated funds since 2002. |
| Joseph Beranek 5890 Ameriprise Financial Center Minneapolis, MN 55474 1965 | Treasurer and Chief Accounting Officer (Principal Accounting Officer) (2019) and Principal Financial Officer (2020), CFST, CFST I, CFST II, CFVIT and CFVST II; Assistant Treasurer, CET I and CET II | Vice President – Mutual Fund Accounting and Financial Reporting, Columbia Management Investment Advisers, LLC, since December 2018 and March 2017, respectively (previously Vice President – Pricing and Corporate Actions, May 2010 - March 2017). |
| Marybeth Pilat 290 Congress Street Boston, MA 02210 1968 | Treasurer and Chief Accounting Officer (Principal Accounting Officer) and Principal Financial Officer (2020) for CET I and CET II; Assistant Treasurer, CFST, CFST I, CFST II, CFVIT and CFVST II | Vice President – Product Pricing and Administration, Columbia Management Investment Advisers, LLC, since May 2017; Director - Fund Administration, Calvert Investments, August 2015 – March 2017; Vice President - Fund Administration, Legg Mason, May 2015 - July 2015; Vice President - Fund Administration, Columbia Management Investment Advisers, LLC, May 2010 - April 2015. |
| William F. Truscott 290 Congress Street Boston, MA 02210 1960 | Senior Vice President (2001) | Formerly, Trustee/Director of Columbia Funds Complex or legacy funds, November 2001-January 1, 2021; Chief Executive Officer, Global Asset Management, Ameriprise Financial, Inc. since September 2012; Chairman of the Board and President, Columbia Management Investment Advisers, LLC since July 2004 and February 2012, respectively; Chairman of the Board and Chief Executive Officer, Columbia Management Investment Distributors, Inc. since November 2008 and February 2012, respectively; Chairman of the Board and Director, Threadneedle Asset Management Holdings, Sàrl since March 2013 and December 2008, respectively; senior executive of various entities affiliated with Columbia Threadneedle. |
| Christopher O. Petersen 5228 Ameriprise Financial Center Minneapolis, MN 55474 1970 | Senior Vice President and Assistant Secretary (2021) | Formerly, Trustee/Director of funds within the Columbia Funds Complex, July 1, 2020 - November 22, 2021; Senior Vice President and Assistant General Counsel, Ameriprise Financial, Inc. since September 2021 (previously Vice President and Lead Chief Counsel, January 2015 - September 2021); formerly, President and Principal Executive Officer of the Columbia Funds, 2015 - 2021; officer of Columbia Funds and affiliated funds since 2007. |
| Thomas P. McGuire 290 Congress Street Boston, MA 02210 1972 | Senior Vice President and Chief Compliance Officer (2012) | Vice President – Asset Management Compliance, Ameriprise Financial, Inc., since May 2010; Chief Compliance Officer, Columbia Acorn/Wanger Funds since December 2015; formerly, Chief Compliance Officer, Ameriprise Certificate Company, September 2010 – September 2020. |
| 40 | Columbia Emerging Markets Fund | Annual Report 2022 |
(Unaudited)
Fund officers (continued)
| Name, address and year of birth | Position and year first appointed to position for any Fund in the Columbia Funds Complex or a predecessor thereof | Principal occupation(s) during past five years |
| Ryan C. Larrenaga 290 Congress Street Boston, MA 02210 1970 | Senior Vice President (2017), Chief Legal Officer (2017), and Secretary (2015) | Vice President and Chief Counsel, Ameriprise Financial, Inc. since August 2018 (previously Vice President and Group Counsel, August 2011 - August 2018); Chief Legal Officer, Columbia Acorn/Wanger Funds, since September 2020; officer of Columbia Funds and affiliated funds since 2005. |
| Michael E. DeFao 290 Congress Street Boston, MA 02210 1968 | Vice President (2011) and Assistant Secretary (2010) | Vice President and Chief Counsel, Ameriprise Financial, Inc. since May 2010; Vice President, Chief Legal Officer and Assistant Secretary, Columbia Management Investment Advisers, LLC since October 2021 (previously Vice President and Assistant Secretary, May 2010 – September 2021). |
| Lyn Kephart-Strong 5228 Ameriprise Financial Center Minneapolis, MN 55474 1960 | Vice President (2015) | President, Columbia Management Investment Services Corp. since October 2014; Vice President & Resolution Officer, Ameriprise Trust Company since August 2009. |
| • | the Fund had sufficient liquidity to both meet redemptions and operate effectively on behalf of shareholders; |
| • | there were no material changes to the Program during the period; |
| • | the implementation of the Program was effective to manage the Fund’s liquidity risk; and |
| • | the Program operated adequately during the period. |
| Columbia Emerging Markets Fund | Annual Report 2022 | 41 |
| • | Information on the investment performance of the Fund relative to the performance of a group of mutual funds determined to be comparable to the Fund by Broadridge, as well as performance relative to benchmarks; |
| • | Information on the Fund’s management fees and total expenses, including information comparing the Fund’s expenses to those of a group of comparable mutual funds, as determined by Broadridge; |
| • | The Investment Manager’s agreement to contractually limit or cap total operating expenses for the Fund so that total operating expenses (excluding certain fees and expenses, such as transaction costs and certain other investment related expenses, interest, taxes, acquired fund fees and expenses and infrequent and/or unusual expenses) would not exceed a specified annual rate, as a percentage of the Fund’s net assets; |
| • | Terms of the Management Agreement; |
| • | Descriptions of other agreements and arrangements with affiliates of the Investment Manager relating to the operations of the Fund, including agreements with respect to the provision of transfer agency and shareholder services to the Fund; |
| • | Descriptions of various services performed by the Investment Manager under the Management Agreement, including portfolio management and portfolio trading practices; |
| • | Information regarding any recently negotiated management fees of similarly-managed portfolios of other institutional clients of the Investment Manager; |
| • | Information regarding the resources of the Investment Manager, including information regarding senior management, portfolio managers and other personnel; |
| • | Information regarding the capabilities of the Investment Manager with respect to compliance monitoring services; |
| • | The profitability to the Investment Manager and its affiliates from their relationships with the Fund; and |
| �� | Report provided by the Board’s independent fee consultant, JDL Consultants, LLC (JDL). |
| 42 | Columbia Emerging Markets Fund | Annual Report 2022 |
(Unaudited)
Following an analysis and discussion of the foregoing, and the factors identified below, the Board, including all of the Independent Trustees, approved the renewal of the Management Agreement.
| Columbia Emerging Markets Fund | Annual Report 2022 | 43 |
(Unaudited)
Comparative fees, costs of services provided and the profits realized by the Investment Manager and its affiliates from their relationships with the Fund
| 44 | Columbia Emerging Markets Fund | Annual Report 2022 |
(Unaudited)
On June 23, 2022, the Board, including all of the Independent Trustees, determined that fees payable under the Management Agreement were fair and reasonable in light of the extent and quality of services provided and approved the renewal of the Management Agreement.
| Columbia Emerging Markets Fund | Annual Report 2022 | 45 |
columbiathreadneedleus.com/investor/. The Fund is distributed by Columbia Management Investment Distributors, Inc., member FINRA, and managed by Columbia Management Investment Advisers, LLC.

August 31, 2022

| 3 | |
| 5 | |
| 7 | |
| 8 | |
| 12 | |
| 13 | |
| 14 | |
| 16 | |
| 20 | |
| 31 | |
| 32 | |
| 32 | |
| 38 | |
| 39 |
(Unaudited)

| Average annual total returns (%) (for the period ended August 31, 2022) | |||||
| Inception | 1 Year | 5 Years | 10 Years | ||
| Class A | Excluding sales charges | 05/16/97 | -34.36 | -0.32 | 6.19 |
| Including sales charges | -38.14 | -1.50 | 5.56 | ||
| Advisor Class* | 03/19/13 | -34.19 | -0.07 | 6.43 | |
| Class C | Excluding sales charges | 05/16/97 | -34.85 | -1.07 | 5.39 |
| Including sales charges | -35.51 | -1.07 | 5.39 | ||
| Institutional Class | 05/16/97 | -34.20 | -0.07 | 6.45 | |
| Institutional 2 Class* | 11/08/12 | -34.14 | 0.00 | 6.56 | |
| Institutional 3 Class* | 03/01/17 | -34.10 | 0.06 | 6.41 | |
| MSCI China Index (Net) | -28.19 | -2.34 | 4.65 | ||
| Hang Seng Index | -23.60 | -6.58 | 0.12 | ||
| * | The returns shown for periods prior to the share class inception date (including returns for the Life of the Fund, if shown, which are since Fund inception) include the returns of the Fund’s oldest share class. Since the Fund launched more than one share class at its inception, Class A shares were used. These returns are adjusted to reflect any higher class-related operating expenses of the newer share classes, as applicable. Please visit columbiathreadneedleus.com/investor/investment-products/mutual-funds/appended-performance for more information. |
| Columbia Greater China Fund | Annual Report 2022 | 3 |
(Unaudited)
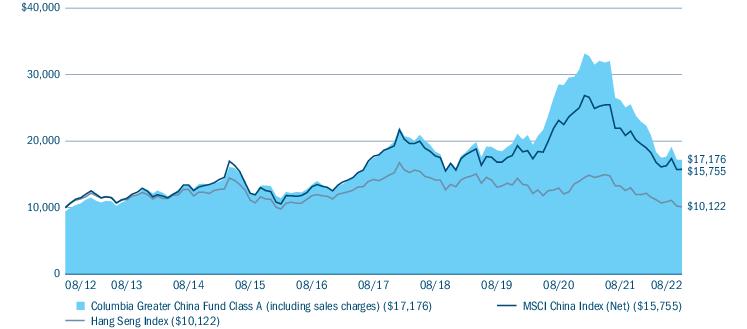
| Equity sector breakdown (%) (at August 31, 2022) | |
| Communication Services | 21.3 |
| Consumer Discretionary | 33.7 |
| Consumer Staples | 9.5 |
| Financials | 12.0 |
| Health Care | 10.2 |
| Industrials | 6.2 |
| Information Technology | 3.9 |
| Materials | 0.8 |
| Real Estate | 2.4 |
| Total | 100.0 |
| Country breakdown (%) (at August 31, 2022) | |
| China | 89.3 |
| Hong Kong | 6.9 |
| United States(a) | 3.8 |
| Total | 100.0 |
| (a) | Includes investments in Money Market Funds. |
| 4 | Columbia Greater China Fund | Annual Report 2022 |
(Unaudited)
| • | Positive contributions to the Fund’s performance relative to the benchmark were led by positioning in the consumer staples and consumer discretionary sectors. |
| • | The Fund’s underweight to information technology stocks was also a positive. |
| • | In terms of individual stocks held, notably positive contributors included online delivery platforms Meituan and JD.com, Inc., which were beneficiaries of COVID-related lockdowns. |
| • | A lack of exposure to electric vehicle (EV) manufacturer NIO proved additive as the company suffered from COVID-related production disruptions and an industry-wide supply bottleneck around EV batteries. |
| • | A zero weighting to consumer electronics company Xiaomi Inc. also contributed. |
| • | A position initiated during the period in social media company Pinduoduo, Inc. on weakness in the technology sector benefited performance. |
| Columbia Greater China Fund | Annual Report 2022 | 5 |
(Unaudited)
| • | Property manager China Resources Land Ltd. was viewed by the market as positioned to emerge as a winner once the unwinding of China’s overleveraged property sector is completed. |
| • | Finally, Kweichow Moutai Co., Ltd. continued to benefit from its dominant position as a provider of China’s most popular spirit, notwithstanding the country’s broader economic downturn. |
| • | The Fund’s underperformance relative to the benchmark was primarily driven by stock selection, most notably within the health care, industrials and communication services sectors. |
| • | Sector allocation weighed on return to a lesser extent, with an underweight to health care and a lack of any exposure to energy detracting. |
| • | In terms of individual names that weighed most notably on return, sentiment around Country Garden Services Holdings Co., Ltd., a property management company with a strong product pipeline and strong operating efficiency, suffered from the larger property sector crisis. |
| • | Shares of knitwear manufacturer Shenzhou International Group Holdings Ltd., a leading supplier to top sportswear brands such as Nike and Adidas, declined sharply on supply chain disruption concerns. |
| • | Wuxi Biologics Cayman, Ltd., a biopharmaceutical company, saw its share price impacted by geopolitical concerns as the company was added to the U.S. commerce department’s unverified list. |
| • | New Horizon Health Ltd., a provider of cancer screening technology, was also hurt by blacklist speculation around Chinese healthcare companies. |
| • | Finally, shares of integrated circuit manufacturer Silergy Corp. fell over the period amid concerns surrounding the semiconductor supply chain and weakening demand. |
| 6 | Columbia Greater China Fund | Annual Report 2022 |
(Unaudited)
| March 1, 2022 — August 31, 2022 | |||||||
| Account value at the beginning of the period ($) | Account value at the end of the period ($) | Expenses paid during the period ($) | Fund’s annualized expense ratio (%) | ||||
| Actual | Hypothetical | Actual | Hypothetical | Actual | Hypothetical | Actual | |
| Class A | 1,000.00 | 1,000.00 | 823.00 | 1,017.59 | 6.94 | 7.68 | 1.51 |
| Advisor Class | 1,000.00 | 1,000.00 | 824.00 | 1,018.85 | 5.79 | 6.41 | 1.26 |
| Class C | 1,000.00 | 1,000.00 | 819.90 | 1,013.76 | 10.41 | 11.52 | 2.27 |
| Institutional Class | 1,000.00 | 1,000.00 | 824.10 | 1,018.85 | 5.79 | 6.41 | 1.26 |
| Institutional 2 Class | 1,000.00 | 1,000.00 | 824.50 | 1,019.26 | 5.43 | 6.01 | 1.18 |
| Institutional 3 Class | 1,000.00 | 1,000.00 | 824.70 | 1,019.56 | 5.15 | 5.70 | 1.12 |
| Columbia Greater China Fund | Annual Report 2022 | 7 |
August 31, 2022
| Common Stocks 96.1% | ||
| Issuer | Shares | Value ($) |
| Communication Services 20.5% | ||
| Entertainment 3.1% | ||
| Bilibili, Inc.(a) | 16,900 | 420,330 |
| NetEase, Inc., ADR | 42,210 | 3,736,007 |
| Total | 4,156,337 | |
| Interactive Media & Services 17.4% | ||
| Baidu, Inc. Class A(a) | 27,350 | 488,213 |
| Baidu, Inc., ADR, Class A(a) | 20,672 | 2,976,148 |
| Kuaishou Technology(a) | 329,600 | 2,855,815 |
| Tencent Holdings Ltd. | 407,300 | 16,834,026 |
| Total | 23,154,202 | |
| Total Communication Services | 27,310,539 | |
| Consumer Discretionary 32.4% | ||
| Automobiles 1.2% | ||
| NIO, Inc., Class A(a) | 43,100 | 856,857 |
| Xpeng, Inc., ADR(a) | 39,474 | 731,058 |
| Total | 1,587,915 | |
| Household Durables 1.5% | ||
| Midea Group Co., Ltd., Class A | 266,575 | 2,045,254 |
| Internet & Direct Marketing Retail 21.3% | ||
| Alibaba Group Holding Ltd.(a) | 160,900 | 1,919,625 |
| Alibaba Group Holding Ltd., ADR(a) | 61,896 | 5,905,497 |
| JD.com, Inc., ADR | 134,484 | 8,538,389 |
| JD.com, Inc., Class A | 35,576 | 1,126,164 |
| Meituan, Class B(a) | 400,300 | 9,614,094 |
| Pinduoduo, Inc., ADR(a) | 19,011 | 1,355,484 |
| Total | 28,459,253 | |
| Leisure Products 0.7% | ||
| Bafang Electric Suzhou Co., Ltd., Class A | 46,593 | 990,581 |
| Specialty Retail 1.8% | ||
| China Tourism Group Duty Free Corp., Ltd., Class A | 82,600 | 2,333,742 |
| Textiles, Apparel & Luxury Goods 5.9% | ||
| Li Ning Co., Ltd. | 493,000 | 4,490,398 |
| Shenzhou International Group Holdings Ltd. | 322,100 | 3,366,366 |
| Total | 7,856,764 | |
| Total Consumer Discretionary | 43,273,509 | |
| Common Stocks (continued) | ||
| Issuer | Shares | Value ($) |
| Consumer Staples 9.1% | ||
| Beverages 4.6% | ||
| China Resources Beer Holdings Co., Ltd. | 248,000 | 1,728,814 |
| Kweichow Moutai Co., Ltd., Class A | 13,400 | 3,732,306 |
| Wuliangye Yibin Co., Ltd., Class A | 25,933 | 626,168 |
| Total | 6,087,288 | |
| Food Products 4.1% | ||
| China Mengniu Dairy Co., Ltd.(a) | 1,045,000 | 4,732,050 |
| Foshan Haitian Flavouring & Food Co., Ltd., Class A | 62,677 | 730,680 |
| Total | 5,462,730 | |
| Personal Products 0.4% | ||
| Proya Cosmetics Co., Ltd., Class A | 24,580 | 569,601 |
| Total Consumer Staples | 12,119,619 | |
| Financials 11.5% | ||
| Banks 4.6% | ||
| China Construction Bank Corp., Class H | 2,511,340 | 1,552,469 |
| China Merchants Bank Co., Ltd., Class H | 605,000 | 3,094,038 |
| Industrial & Commercial Bank of China Ltd., Class H | 2,872,000 | 1,459,100 |
| Total | 6,105,607 | |
| Capital Markets 2.0% | ||
| Hong Kong Exchanges and Clearing Ltd. | 65,700 | 2,647,350 |
| Insurance 4.9% | ||
| AIA Group Ltd. | 493,000 | 4,743,270 |
| Ping An Insurance Group Co. of China Ltd., Class H | 316,000 | 1,858,600 |
| Total | 6,601,870 | |
| Total Financials | 15,354,827 | |
| Health Care 9.8% | ||
| Biotechnology 1.7% | ||
| BeiGene Ltd., ADR(a) | 5,092 | 874,093 |
| Zai Lab Ltd., ADR(a) | 29,287 | 1,353,352 |
| Total | 2,227,445 | |
| Health Care Equipment & Supplies 1.6% | ||
| Shenzhen Mindray Bio-Medical Electronics Co., Ltd., Class A | 48,800 | 2,104,514 |
| Health Care Providers & Services 0.8% | ||
| New Horizon Health Ltd.(a) | 425,500 | 1,087,821 |
| 8 | Columbia Greater China Fund | Annual Report 2022 |
August 31, 2022
| Common Stocks (continued) | ||
| Issuer | Shares | Value ($) |
| Health Care Technology 0.5% | ||
| Medlive Technology Co., Ltd.(b) | 430,984 | 685,113 |
| Life Sciences Tools & Services 5.2% | ||
| WuXi AppTec Co., Ltd., Class H | 166,478 | 1,879,371 |
| WuXi Biologics Cayman, Inc.(a) | 580,500 | 5,121,231 |
| Total | 7,000,602 | |
| Pharmaceuticals —% | ||
| China Animal Healthcare Ltd.(a),(c),(d) | 1,050,000 | 0 |
| Total Health Care | 13,105,495 | |
| Industrials 6.0% | ||
| Electrical Equipment 2.3% | ||
| Contemporary Amperex Technology Co., Ltd., Class A(a) | 18,000 | 1,250,112 |
| Sungrow Power Supply Co., Ltd., Class A | 112,800 | 1,808,493 |
| Total | 3,058,605 | |
| Machinery 2.1% | ||
| Shenzhen Inovance Technology Co., Ltd., Class A | 41,700 | 361,183 |
| Techtronic Industries Co., Ltd. | 150,000 | 1,769,137 |
| Zhejiang Sanhua Intelligent Controls Co., Ltd., Class A | 166,500 | 616,565 |
| Total | 2,746,885 | |
| Road & Rail 1.6% | ||
| Full Truck Alliance Co., Ltd., ADR(a) | 270,391 | 2,136,089 |
| Total Industrials | 7,941,579 | |
| Information Technology 3.7% | ||
| IT Services 0.9% | ||
| GDS Holdings Ltd., Class A(a) | 356,500 | 1,217,548 |
| Semiconductors & Semiconductor Equipment 1.2% | ||
| Silergy Corp. | 92,000 | 1,577,202 |
| Software 1.6% | ||
| Beijing Kingsoft Office Software, Inc., Class A | 19,272 | 501,371 |
| Glodon Co., Ltd., Class A | 96,500 | 684,523 |
| Kingdee International Software Group Co., Ltd.(a) | 517,000 | 1,003,447 |
| Total | 2,189,341 | |
| Total Information Technology | 4,984,091 | |
| Common Stocks (continued) | ||
| Issuer | Shares | Value ($) |
| Materials 0.8% | ||
| Chemicals 0.3% | ||
| Skshu Paint Co., Ltd., Class A(a) | 26,339 | 355,034 |
| Construction Materials 0.5% | ||
| Beijing Oriental Yuhong Waterproof Technology Co., Ltd., Class A | 162,200 | 710,891 |
| Total Materials | 1,065,925 | |
| Real Estate 2.3% | ||
| Real Estate Management & Development 2.3% | ||
| China Resources Land Ltd. | 534,000 | 2,186,329 |
| KE Holdings, Inc., ADR(a) | 52,539 | 947,803 |
| Total | 3,134,132 | |
| Total Real Estate | 3,134,132 | |
| Total Common Stocks (Cost $101,156,828) | 128,289,716 | |
| Money Market Funds 3.8% | ||
| Shares | Value ($) | |
| Columbia Short-Term Cash Fund, 2.366%(e),(f) | 5,043,833 | 5,041,311 |
| Total Money Market Funds (Cost $5,040,996) | 5,041,311 | |
| Total Investments in Securities (Cost: $106,197,824) | 133,331,027 | |
| Other Assets & Liabilities, Net | 106,612 | |
| Net Assets | 133,437,639 | |
| Columbia Greater China Fund | Annual Report 2022 | 9 |
August 31, 2022
| (a) | Non-income producing investment. |
| (b) | Represents privately placed and other securities and instruments exempt from Securities and Exchange Commission registration (collectively, private placements), such as Section 4(a)(2) and Rule 144A eligible securities, which are often sold only to qualified institutional buyers. At August 31, 2022, the total value of these securities amounted to $685,113, which represents 0.51% of total net assets. |
| (c) | Represents fair value as determined in good faith under procedures approved by the Board of Trustees. At August 31, 2022, the total value of these securities amounted to $0, which represents less than 0.01% of total net assets. |
| (d) | Valuation based on significant unobservable inputs. |
| (e) | The rate shown is the seven-day current annualized yield at August 31, 2022. |
| (f) | As defined in the Investment Company Act of 1940, as amended, an affiliated company is one in which the Fund owns 5% or more of the company’s outstanding voting securities, or a company which is under common ownership or control with the Fund. The value of the holdings and transactions in these affiliated companies during the year ended August 31, 2022 are as follows: |
| Affiliated issuers | Beginning of period($) | Purchases($) | Sales($) | Net change in unrealized appreciation (depreciation)($) | End of period($) | Realized gain (loss)($) | Dividends($) | End of period shares |
| Columbia Short-Term Cash Fund, 2.366% | ||||||||
| 6,538,670 | 115,900,766 | (117,398,417) | 292 | 5,041,311 | (1,040) | 16,831 | 5,043,833 | |
| ADR | American Depositary Receipt |
| ■ | Level 1 — Valuations based on quoted prices for investments in active markets that the Fund has the ability to access at the measurement date. Valuation adjustments are not applied to Level 1 investments. |
| ■ | Level 2 — Valuations based on other significant observable inputs (including quoted prices for similar securities, interest rates, prepayment speeds, credit risks, etc.). |
| ■ | Level 3 — Valuations based on significant unobservable inputs (including the Fund’s own assumptions and judgment in determining the fair value of investments). |
| 10 | Columbia Greater China Fund | Annual Report 2022 |
August 31, 2022
additional valuation matters, which may include the need to review back-testing results, review time-sensitive information or approve related valuation actions. The Committee reports to the Board, with members of the Committee meeting with the Board at each of its regularly scheduled meetings to discuss valuation matters and actions during the period, similar to those described earlier.
| Level 1 ($) | Level 2 ($) | Level 3 ($) | Total ($) | |
| Investments in Securities | ||||
| Common Stocks | ||||
| Communication Services | 6,712,155 | 20,598,384 | — | 27,310,539 |
| Consumer Discretionary | 16,530,428 | 26,743,081 | — | 43,273,509 |
| Consumer Staples | — | 12,119,619 | — | 12,119,619 |
| Financials | — | 15,354,827 | — | 15,354,827 |
| Health Care | 2,227,445 | 10,878,050 | 0* | 13,105,495 |
| Industrials | 2,136,089 | 5,805,490 | — | 7,941,579 |
| Information Technology | — | 4,984,091 | — | 4,984,091 |
| Materials | — | 1,065,925 | — | 1,065,925 |
| Real Estate | 947,803 | 2,186,329 | — | 3,134,132 |
| Total Common Stocks | 28,553,920 | 99,735,796 | 0* | 128,289,716 |
| Money Market Funds | 5,041,311 | — | — | 5,041,311 |
| Total Investments in Securities | 33,595,231 | 99,735,796 | 0* | 133,331,027 |
| * | Rounds to zero. |
| Columbia Greater China Fund | Annual Report 2022 | 11 |
August 31, 2022
| Assets | |
| Investments in securities, at value | |
| Unaffiliated issuers (cost $101,156,828) | $128,289,716 |
| Affiliated issuers (cost $5,040,996) | 5,041,311 |
| Cash | 3,110 |
| Receivable for: | |
| Capital shares sold | 103,831 |
| Dividends | 78,770 |
| Prepaid expenses | 4,587 |
| Trustees’ deferred compensation plan | 76,583 |
| Total assets | 133,597,908 |
| Liabilities | |
| Payable for: | |
| Capital shares purchased | 18,448 |
| Management services fees | 3,392 |
| Distribution and/or service fees | 355 |
| Transfer agent fees | 15,674 |
| Compensation of board members | 10,888 |
| Audit fees | 14,777 |
| Custodian fees | 13,860 |
| Other expenses | 6,292 |
| Trustees’ deferred compensation plan | 76,583 |
| Total liabilities | 160,269 |
| Net assets applicable to outstanding capital stock | $133,437,639 |
| Represented by | |
| Paid in capital | 124,921,515 |
| Total distributable earnings (loss) | 8,516,124 |
| Total - representing net assets applicable to outstanding capital stock | $133,437,639 |
| Class A | |
| Net assets | $46,147,562 |
| Shares outstanding | 1,182,879 |
| Net asset value per share | $39.01 |
| Maximum sales charge | 5.75% |
| Maximum offering price per share (calculated by dividing the net asset value per share by 1.0 minus the maximum sales charge for Class A shares) | $41.39 |
| Advisor Class | |
| Net assets | $674,421 |
| Shares outstanding | 15,309 |
| Net asset value per share | $44.05 |
| Class C | |
| Net assets | $1,743,488 |
| Shares outstanding | 50,447 |
| Net asset value per share | $34.56 |
| Institutional Class | |
| Net assets | $65,817,163 |
| Shares outstanding | 1,524,997 |
| Net asset value per share | $43.16 |
| Institutional 2 Class | |
| Net assets | $3,109,119 |
| Shares outstanding | 70,183 |
| Net asset value per share | $44.30 |
| Institutional 3 Class | |
| Net assets | $15,945,886 |
| Shares outstanding | 369,640 |
| Net asset value per share | $43.14 |
| 12 | Columbia Greater China Fund | Annual Report 2022 |
Year Ended August 31, 2022
| Net investment income | |
| Income: | |
| Dividends — unaffiliated issuers | $1,763,887 |
| Dividends — affiliated issuers | 16,831 |
| Interfund lending | 445 |
| Foreign taxes withheld | (80,444) |
| Total income | 1,700,719 |
| Expenses: | |
| Management services fees | 1,508,633 |
| Distribution and/or service fees | |
| Class A | 153,223 |
| Class C | 24,005 |
| Transfer agent fees | |
| Class A | 89,296 |
| Advisor Class | 1,521 |
| Class C | 3,487 |
| Institutional Class | 87,245 |
| Institutional 2 Class | 2,746 |
| Institutional 3 Class | 1,738 |
| Compensation of board members | 15,231 |
| Custodian fees | 36,902 |
| Printing and postage fees | 23,085 |
| Registration fees | 97,326 |
| Audit fees | 30,260 |
| Legal fees | 12,197 |
| Line of credit interest | 2,927 |
| Interest on interfund lending | 254 |
| Compensation of chief compliance officer | 44 |
| Other | 24,980 |
| Total expenses | 2,115,100 |
| Fees waived by transfer agent | |
| Class A | (828) |
| Advisor Class | (12) |
| Class C | (31) |
| Institutional Class | (1,058) |
| Expense reduction | (160) |
| Total net expenses | 2,113,011 |
| Net investment loss | (412,292) |
| Realized and unrealized gain (loss) — net | |
| Net realized gain (loss) on: | |
| Investments — unaffiliated issuers | (15,276,698) |
| Investments — affiliated issuers | (1,040) |
| Foreign currency translations | (36,729) |
| Net realized loss | (15,314,467) |
| Net change in unrealized appreciation (depreciation) on: | |
| Investments — unaffiliated issuers | (56,051,349) |
| Investments — affiliated issuers | 292 |
| Foreign currency translations | 68 |
| Net change in unrealized appreciation (depreciation) | (56,050,989) |
| Net realized and unrealized loss | (71,365,456) |
| Net decrease in net assets resulting from operations | $(71,777,748) |
| Columbia Greater China Fund | Annual Report 2022 | 13 |
| Year Ended August 31, 2022 | Year Ended August 31, 2021 | |
| Operations | ||
| Net investment loss | $(412,292) | $(1,131,532) |
| Net realized loss | (15,314,467) | (2,149,685) |
| Net change in unrealized appreciation (depreciation) | (56,050,989) | (18,235,693) |
| Net decrease in net assets resulting from operations | (71,777,748) | (21,516,910) |
| Distributions to shareholders | ||
| Net investment income and net realized gains | ||
| Class A | — | (4,592,165) |
| Advisor Class | — | (161,955) |
| Class C | — | (152,215) |
| Institutional Class | — | (1,820,458) |
| Institutional 2 Class | — | (158,257) |
| Institutional 3 Class | — | (1,442,565) |
| Total distributions to shareholders | — | (8,327,615) |
| Increase (decrease) in net assets from capital stock activity | (6,138,495) | 77,044,198 |
| Total increase (decrease) in net assets | (77,916,243) | 47,199,673 |
| Net assets at beginning of year | 211,353,882 | 164,154,209 |
| Net assets at end of year | $133,437,639 | $211,353,882 |
| 14 | Columbia Greater China Fund | Annual Report 2022 |
| Year Ended | Year Ended | |||
| August 31, 2022 | August 31, 2021 | |||
| Shares | Dollars ($) | Shares | Dollars ($) | |
| Capital stock activity | ||||
| Class A | ||||
| Subscriptions | 254,962 | 11,442,751 | 415,084 | 29,682,433 |
| Distributions reinvested | — | — | 60,988 | 4,134,362 |
| Redemptions | (457,054) | (20,899,443) | (446,184) | (30,797,662) |
| Net increase (decrease) | (202,092) | (9,456,692) | 29,888 | 3,019,133 |
| Advisor Class | ||||
| Subscriptions | 5,986 | 324,200 | 94,307 | 7,716,093 |
| Distributions reinvested | — | — | 2,123 | 161,780 |
| Redemptions | (17,189) | (978,233) | (110,534) | (8,748,543) |
| Net decrease | (11,203) | (654,033) | (14,104) | (870,670) |
| Class C | ||||
| Subscriptions | 14,355 | 574,846 | 52,111 | 3,408,887 |
| Distributions reinvested | — | — | 2,454 | 149,308 |
| Redemptions | (33,041) | (1,455,956) | (26,589) | (1,704,206) |
| Net increase (decrease) | (18,686) | (881,110) | 27,976 | 1,853,989 |
| Institutional Class | ||||
| Subscriptions | 1,413,896 | 73,432,999 | 915,867 | 63,922,003 |
| Distributions reinvested | — | — | 21,226 | 1,585,134 |
| Redemptions | (990,458) | (53,556,308) | (263,124) | (19,117,940) |
| Net increase | 423,438 | 19,876,691 | 673,969 | 46,389,197 |
| Institutional 2 Class | ||||
| Subscriptions | 22,085 | 1,323,234 | 86,117 | 6,927,041 |
| Distributions reinvested | — | — | 2,065 | 158,078 |
| Redemptions | (61,369) | (3,559,081) | (15,973) | (1,280,200) |
| Net increase (decrease) | (39,284) | (2,235,847) | 72,209 | 5,804,919 |
| Institutional 3 Class | ||||
| Subscriptions | 116,611 | 6,916,413 | 465,837 | 37,131,293 |
| Distributions reinvested | — | — | 19,050 | 1,418,675 |
| Redemptions | (418,998) | (19,703,917) | (243,076) | (17,702,338) |
| Net increase (decrease) | (302,387) | (12,787,504) | 241,811 | 20,847,630 |
| Total net increase (decrease) | (150,214) | (6,138,495) | 1,031,749 | 77,044,198 |
| Columbia Greater China Fund | Annual Report 2022 | 15 |
| Net asset value, beginning of period | Net investment income (loss) | Net realized and unrealized gain (loss) | Total from investment operations | Distributions from net investment income | Distributions from net realized gains | Total distributions to shareholders | |
| Class A | |||||||
| Year Ended 8/31/2022 | $59.43 | (0.23) | (20.19) | (20.42) | — | — | — |
| Year Ended 8/31/2021 | $67.81 | (0.51) | (4.70) | (5.21) | — | (3.17) | (3.17) |
| Year Ended 8/31/2020 | $45.00 | (0.24) | 23.82 | 23.58 | — | (0.77) | (0.77) |
| Year Ended 8/31/2019 | $47.25 | 0.00(g) | 0.20(h) | 0.20 | — | (2.45) | (2.45) |
| Year Ended 8/31/2018 | $45.67 | (0.10) | 2.62 | 2.52 | (0.28) | (0.66) | (0.94) |
| Advisor Class | |||||||
| Year Ended 8/31/2022 | $66.94 | (0.16) | (22.73) | (22.89) | — | — | — |
| Year Ended 8/31/2021 | $75.94 | (0.46) | (5.24) | (5.70) | — | (3.30) | (3.30) |
| Year Ended 8/31/2020 | $50.19 | 0.00(g) | 26.52 | 26.52 | — | (0.77) | (0.77) |
| Year Ended 8/31/2019 | $52.25 | (0.12) | 0.51(h) | 0.39 | — | (2.45) | (2.45) |
| Year Ended 8/31/2018 | $50.38 | 0.12 | 2.80 | 2.92 | (0.39) | (0.66) | (1.05) |
| Class C | |||||||
| Year Ended 8/31/2022 | $53.05 | (0.53) | (17.96) | (18.49) | — | — | — |
| Year Ended 8/31/2021 | $61.16 | (0.87) | (4.22) | (5.09) | — | (3.02) | (3.02) |
| Year Ended 8/31/2020 | $40.96 | (0.59) | 21.56 | 20.97 | — | (0.77) | (0.77) |
| Year Ended 8/31/2019 | $43.57 | (0.41) | 0.25(h) | (0.16) | — | (2.45) | (2.45) |
| Year Ended 8/31/2018 | $42.24 | (0.43) | 2.42 | 1.99 | — | (0.66) | (0.66) |
| Institutional Class | |||||||
| Year Ended 8/31/2022 | $65.59 | (0.00)(g) | (22.43) | (22.43) | — | — | — |
| Year Ended 8/31/2021 | $74.47 | (0.34) | (5.24) | (5.58) | — | (3.30) | (3.30) |
| Year Ended 8/31/2020 | $49.23 | (0.12) | 26.13 | 26.01 | — | (0.77) | (0.77) |
| Year Ended 8/31/2019 | $51.30 | 0.08 | 0.30(h) | 0.38 | — | (2.45) | (2.45) |
| Year Ended 8/31/2018 | $49.49 | 0.03 | 2.83 | 2.86 | (0.39) | (0.66) | (1.05) |
| 16 | Columbia Greater China Fund | Annual Report 2022 |
| Net asset value, end of period | Total return | Total gross expense ratio to average net assets(a) | Total net expense ratio to average net assets(a),(b) | Net investment income (loss) ratio to average net assets | Portfolio turnover | Net assets, end of period (000’s) | |
| Class A | |||||||
| Year Ended 8/31/2022 | $39.01 | (34.36%) | 1.50%(c),(d) | 1.50%(c),(d),(e),(f) | (0.47%) | 65% | $46,148 |
| Year Ended 8/31/2021 | $59.43 | (8.26%) | 1.44% | 1.44%(e) | (0.72%) | 19% | $82,311 |
| Year Ended 8/31/2020 | $67.81 | 53.06% | 1.50%(c) | 1.50%(c),(e) | (0.47%) | 27% | $91,892 |
| Year Ended 8/31/2019 | $45.00 | 1.28% | 1.53%(c) | 1.53%(c) | 0.00%(g) | 18% | $65,762 |
| Year Ended 8/31/2018 | $47.25 | 5.41% | 1.51%(d) | 1.51%(d),(e) | (0.20%) | 26% | $73,210 |
| Advisor Class | |||||||
| Year Ended 8/31/2022 | $44.05 | (34.19%) | 1.24%(c),(d) | 1.24%(c),(d),(e),(f) | (0.29%) | 65% | $674 |
| Year Ended 8/31/2021 | $66.94 | (8.03%) | 1.19% | 1.19%(e) | (0.58%) | 19% | $1,775 |
| Year Ended 8/31/2020 | $75.94 | 53.43% | 1.25%(c) | 1.25%(c),(e) | 0.01% | 27% | $3,084 |
| Year Ended 8/31/2019 | $50.19 | 1.53% | 1.29%(c) | 1.29%(c) | (0.23%) | 18% | $1,027 |
| Year Ended 8/31/2018 | $52.25 | 5.69% | 1.26%(d) | 1.26%(d),(e) | 0.22% | 26% | $2,008 |
| Class C | |||||||
| Year Ended 8/31/2022 | $34.56 | (34.85%) | 2.25%(c),(d) | 2.25%(c),(d),(e),(f) | (1.24%) | 65% | $1,743 |
| Year Ended 8/31/2021 | $53.05 | (8.95%) | 2.19% | 2.19%(e) | (1.38%) | 19% | $3,667 |
| Year Ended 8/31/2020 | $61.16 | 51.91% | 2.25%(c) | 2.25%(c),(e) | (1.28%) | 27% | $2,517 |
| Year Ended 8/31/2019 | $40.96 | 0.53% | 2.28%(c) | 2.28%(c) | (1.02%) | 18% | $2,554 |
| Year Ended 8/31/2018 | $43.57 | 4.63% | 2.26%(d) | 2.26%(d),(e) | (0.90%) | 26% | $5,585 |
| Institutional Class | |||||||
| Year Ended 8/31/2022 | $43.16 | (34.20%) | 1.25%(c),(d) | 1.25%(c),(d),(e),(f) | (0.00%)(g) | 65% | $65,817 |
| Year Ended 8/31/2021 | $65.59 | (8.03%) | 1.20% | 1.20%(e) | (0.44%) | 19% | $72,247 |
| Year Ended 8/31/2020 | $74.47 | 53.44% | 1.25%(c) | 1.25%(c),(e) | (0.22%) | 27% | $31,844 |
| Year Ended 8/31/2019 | $49.23 | 1.54% | 1.28%(c) | 1.28%(c) | 0.17% | 18% | $31,244 |
| Year Ended 8/31/2018 | $51.30 | 5.68% | 1.26%(d) | 1.26%(d),(e) | 0.05% | 26% | $42,542 |
| Columbia Greater China Fund | Annual Report 2022 | 17 |
| Net asset value, beginning of period | Net investment income (loss) | Net realized and unrealized gain (loss) | Total from investment operations | Distributions from net investment income | Distributions from net realized gains | Total distributions to shareholders | |
| Institutional 2 Class | |||||||
| Year Ended 8/31/2022 | $67.26 | (0.11) | (22.85) | (22.96) | — | — | — |
| Year Ended 8/31/2021 | $76.28 | (0.19) | (5.49) | (5.68) | — | (3.34) | (3.34) |
| Year Ended 8/31/2020 | $50.38 | (0.10) | 26.77 | 26.67 | — | (0.77) | (0.77) |
| Year Ended 8/31/2019 | $52.38 | 0.16 | 0.29(h) | 0.45 | — | (2.45) | (2.45) |
| Year Ended 8/31/2018 | $50.52 | 0.11 | 2.84 | 2.95 | (0.43) | (0.66) | (1.09) |
| Institutional 3 Class | |||||||
| Year Ended 8/31/2022 | $65.46 | (0.15) | (22.17) | (22.32) | — | — | — |
| Year Ended 8/31/2021 | $74.32 | (0.17) | (5.32) | (5.49) | — | (3.37) | (3.37) |
| Year Ended 8/31/2020 | $49.08 | (0.02) | 26.03 | 26.01 | — | (0.77) | (0.77) |
| Year Ended 8/31/2019 | $51.08 | 0.20 | 0.25(h) | 0.45 | — | (2.45) | (2.45) |
| Year Ended 8/31/2018 | $49.25 | 0.09 | 2.83 | 2.92 | (0.43) | (0.66) | (1.09) |
| Notes to Financial Highlights | |
| (a) | In addition to the fees and expenses that the Fund bears directly, the Fund indirectly bears a pro rata share of the fees and expenses of any other funds in which it invests. Such indirect expenses are not included in the Fund’s reported expense ratios. |
| (b) | Total net expenses include the impact of certain fee waivers/expense reimbursements made by the Investment Manager and certain of its affiliates, if applicable. |
| (c) | Ratios include interfund lending expense which is less than 0.01%. |
| (d) | Ratios include line of credit interest expense which is less than 0.01%. |
| (e) | The benefits derived from expense reductions had an impact of less than 0.01%. |
| (f) | Ratios include the impact of voluntary waivers paid by the Investment Manager. If the Investment Manager had not paid these voluntary waivers, the Fund’s net expense ratio would increase by less than 0.01%. |
| (g) | Rounds to zero. |
| (h) | Calculation of the net gain (loss) per share (both realized and unrealized) does not correlate to the aggregate realized and unrealized gain (loss) presented in the Statement of Operations due to the timing of subscriptions and redemptions of Fund shares in relation to fluctuations in the market value of the portfolio. |
| 18 | Columbia Greater China Fund | Annual Report 2022 |
| Net asset value, end of period | Total return | Total gross expense ratio to average net assets(a) | Total net expense ratio to average net assets(a),(b) | Net investment income (loss) ratio to average net assets | Portfolio turnover | Net assets, end of period (000’s) | |
| Institutional 2 Class | |||||||
| Year Ended 8/31/2022 | $44.30 | (34.14%) | 1.16%(c),(d) | 1.16%(c),(d) | (0.20%) | 65% | $3,109 |
| Year Ended 8/31/2021 | $67.26 | (7.97%) | 1.14% | 1.14% | (0.24%) | 19% | $7,362 |
| Year Ended 8/31/2020 | $76.28 | 53.53% | 1.17%(c) | 1.17%(c) | (0.17%) | 27% | $2,842 |
| Year Ended 8/31/2019 | $50.38 | 1.65% | 1.20%(c) | 1.20%(c) | 0.32% | 18% | $3,001 |
| Year Ended 8/31/2018 | $52.38 | 5.73% | 1.18%(d) | 1.18%(d) | 0.19% | 26% | $2,330 |
| Institutional 3 Class | |||||||
| Year Ended 8/31/2022 | $43.14 | (34.10%) | 1.11%(c),(d) | 1.11%(c),(d) | (0.27%) | 65% | $15,946 |
| Year Ended 8/31/2021 | $65.46 | (7.93%) | 1.08% | 1.08% | (0.22%) | 19% | $43,992 |
| Year Ended 8/31/2020 | $74.32 | 53.60% | 1.12%(c) | 1.12%(c) | (0.04%) | 27% | $31,974 |
| Year Ended 8/31/2019 | $49.08 | 1.69% | 1.14%(c) | 1.14%(c) | 0.42% | 18% | $5,391 |
| Year Ended 8/31/2018 | $51.08 | 5.82% | 1.13%(d) | 1.13%(d) | 0.17% | 26% | $4,768 |
| Columbia Greater China Fund | Annual Report 2022 | 19 |
August 31, 2022
| 20 | Columbia Greater China Fund | Annual Report 2022 |
August 31, 2022
| Columbia Greater China Fund | Annual Report 2022 | 21 |
August 31, 2022
| 22 | Columbia Greater China Fund | Annual Report 2022 |
August 31, 2022
| Effective rate (%) | |
| Class A | 0.14 |
| Advisor Class | 0.14 |
| Class C | 0.14 |
| Institutional Class | 0.14 |
| Institutional 2 Class | 0.06 |
| Institutional 3 Class | 0.01 |
| Columbia Greater China Fund | Annual Report 2022 | 23 |
August 31, 2022
| Front End (%) | CDSC (%) | Amount ($) | |
| Class A | 5.75 | 0.50 - 1.00(a) | 64,064 |
| Class C | — | 1.00(b) | 2,836 |
| (a) | This charge is imposed on certain investments of between $1 million and $50 million redeemed within 18 months after purchase, as follows: 1.00% if redeemed within 12 months after purchase, and 0.50% if redeemed more than 12, but less than 18, months after purchase, with certain limited exceptions. |
| (b) | This charge applies to redemptions within 12 months after purchase, with certain limited exceptions. |
| January 1, 2022 through December 31, 2022 | Prior to January 1, 2022 | |
| Class A | 1.72% | 1.80% |
| Advisor Class | 1.47 | 1.55 |
| Class C | 2.47 | 2.55 |
| Institutional Class | 1.47 | 1.55 |
| Institutional 2 Class | 1.40 | 1.49 |
| Institutional 3 Class | 1.35 | 1.43 |
| 24 | Columbia Greater China Fund | Annual Report 2022 |
August 31, 2022
| Excess of distributions over net investment income ($) | Accumulated net realized (loss) ($) | Paid in capital ($) |
| 850,028 | 36,729 | (886,757) |
| Year Ended August 31, 2022 | Year Ended August 31, 2021 | ||||
| Ordinary income ($) | Long-term capital gains ($) | Total ($) | Ordinary income ($) | Long-term capital gains ($) | Total ($) |
| — | — | — | 535,628 | 7,791,987 | 8,327,615 |
| Undistributed ordinary income ($) | Undistributed long-term capital gains ($) | Capital loss carryforwards ($) | Net unrealized appreciation ($) |
| — | — | (16,156,260) | 24,784,979 |
| Federal tax cost ($) | Gross unrealized appreciation ($) | Gross unrealized (depreciation) ($) | Net unrealized appreciation ($) |
| 108,546,048 | 36,635,939 | (11,850,960) | 24,784,979 |
| No expiration short-term ($) | No expiration long-term ($) | Total ($) | Utilized ($) |
| (16,156,260) | — | (16,156,260) | — |
| Late year ordinary losses ($) | Post-October capital losses ($) |
| 26,739 | — |
| Columbia Greater China Fund | Annual Report 2022 | 25 |
August 31, 2022
| Borrower or lender | Average loan balance ($) | Weighted average interest rate (%) | Number of days with outstanding loans |
| Borrower | 2,960,000 | 0.66 | 5 |
| Lender | 4,900,000 | 1.73 | 2 |
| 26 | Columbia Greater China Fund | Annual Report 2022 |
August 31, 2022
| Average loan balance ($) | Weighted average interest rate (%) | Days outstanding |
| 22,625,000 | 1.16 | 4 |
| Columbia Greater China Fund | Annual Report 2022 | 27 |
August 31, 2022
| 28 | Columbia Greater China Fund | Annual Report 2022 |
August 31, 2022
| Columbia Greater China Fund | Annual Report 2022 | 29 |
August 31, 2022
| 30 | Columbia Greater China Fund | Annual Report 2022 |
| Columbia Greater China Fund | Annual Report 2022 | 31 |
| Foreign taxes paid to foreign countries | Foreign taxes paid per share to foreign countries | Foreign source income | Foreign source income per share |
| $80,445 | $0.03 | $1,763,887 | $0.55 |
| Name, address, year of birth | Position held with the Columbia Funds and length of service | Principal occupation(s) during past five years and other relevant professional experience | Number of Funds in the Columbia Funds Complex* overseen | Other directorships held by Trustee during the past five years |
| George S. Batejan c/o Columbia Management Investment Advisers, LLC 290 Congress Street Boston, MA 02210 1953 | Trustee since 2017 | Executive Vice President, Global Head of Technology and Operations, Janus Capital Group, Inc., 2010-2016 | 176 | Former Chairman of the Board, NICSA (National Investment Company Services Association) (Executive Committee, Nominating Committee and Governance Committee), 2014-2016; former Director, Intech Investment Management, 2011-2016; former Board Member, Metro Denver Chamber of Commerce, 2015-2016; former Advisory Board Member, University of Colorado Business School, 2015-2018 |
| 32 | Columbia Greater China Fund | Annual Report 2022 |
(Unaudited)
Independent trustees (continued)
| Name, address, year of birth | Position held with the Columbia Funds and length of service | Principal occupation(s) during past five years and other relevant professional experience | Number of Funds in the Columbia Funds Complex* overseen | Other directorships held by Trustee during the past five years |
| Kathleen Blatz c/o Columbia Management Investment Advisers, LLC 290 Congress Street Boston, MA 02210 1954 | Trustee since 2006 | Attorney, specializing in arbitration and mediation; Chief Justice, Minnesota Supreme Court, 1998-2006; Associate Justice, Minnesota Supreme Court, 1996-1998; Fourth Judicial District Court Judge, Hennepin County, 1994-1996; Attorney in private practice and public service, 1984-1993; State Representative, Minnesota House of Representatives, 1979-1993, which included service on the Tax and Financial Institutions and Insurance Committees; Member and Interim Chair, Minnesota Sports Facilities Authority, January 2017-July 2017; Interim President and Chief Executive Officer, Blue Cross and Blue Shield of Minnesota (health care insurance), February-July 2018, April-October 2021 | 176 | Former Trustee, Blue Cross and Blue Shield of Minnesota, 2009-2021 (Chair of the Business Development Committee, 2014-2017; Chair of the Governance Committee, 2017-2019); former Member and Chair of the Board, Minnesota Sports Facilities Authority, January 2017-July 2017; former Director, Robina Foundation, 2009-2020 (Chair, 2014-2020); Director, Schulze Family Foundation, since 2021 |
| Pamela G. Carlton c/o Columbia Management Investment Advisers, LLC 290 Congress Street Boston, MA 02210 1954 | Trustee since 2007 | President, Springboard — Partners in Cross Cultural Leadership (consulting company) since 2003; Managing Director of US Equity Research, JP Morgan Chase, 1999-2003; Director of US Equity Research, Chase Asset Management, 1996-1999; Co-Director Latin America Research, 1993-1996, COO Global Research, 1992-1996, Co-Director of US Research, 1991-1992, Investment Banker, 1982-1991, Morgan Stanley; Attorney, Cleary Gottlieb Steen & Hamilton LLP, 1980-1982 | 176 | Trustee, New York Presbyterian Hospital Board (Executive Committee and Chair of People Committee) since 1996; Director, DR Bank (Audit Committee) since 2017; Director, Evercore Inc. (Audit Committee) since 2019; Director, Apollo Commercial Real Estate Finance, Inc. since 2021; the Governing Council of the Independent Directors Council (IDC), since 2021 |
| Janet Langford Carrig c/o Columbia Management Investment Advisers, LLC 290 Congress Street Boston, MA 02210 1957 | Trustee since 1996 | Senior Vice President, General Counsel and Corporate Secretary, ConocoPhillips (independent energy company), September 2007-October 2018 | 174 | Director, EQT Corporation (natural gas producer) since 2019; former Director, Whiting Petroleum Corporation (independent oil and gas company), 2020-2022 |
| J. Kevin Connaughton c/o Columbia Management Investment Advisers, LLC 290 Congress Street Boston, MA 02210 1964 | Trustee since 2020 | Member, FINRA National Adjudicatory Council since January 2020; Adjunct Professor of Finance, Bentley University since January 2018; Consultant to Independent Trustees of CFVIT and CFST I from March 2016 to June 2020 with respect to CFVIT and to December 2020 with respect to CFST I; Managing Director and General Manager of Mutual Fund Products, Columbia Management Investment Advisers, LLC, May 2010-February 2015; President, Columbia Funds, 2008-2015; and senior officer of Columbia Funds and affiliated funds, 2003-2015 | 174 | Former Director, The Autism Project, March 2015-December 2021; former Member of the Investment Committee, St. Michael’s College, November 2015-February 2020; former Trustee, St. Michael’s College, June 2017-September 2019; former Trustee, New Century Portfolios, January 2015-December 2017 |
| Columbia Greater China Fund | Annual Report 2022 | 33 |
(Unaudited)
Independent trustees (continued)
| Name, address, year of birth | Position held with the Columbia Funds and length of service | Principal occupation(s) during past five years and other relevant professional experience | Number of Funds in the Columbia Funds Complex* overseen | Other directorships held by Trustee during the past five years |
| Olive M. Darragh c/o Columbia Management Investment Advisers, LLC 290 Congress Street Boston, MA 02210 1962 | Trustee since 2020 | Managing Director of Darragh Inc. (strategy and talent management consulting firm) since 2010; Founder and CEO, Zolio, Inc. (investment management talent identification platform) since 2004; Consultant to Independent Trustees of CFVIT and CFST I from June 2019 to June 2020 with respect to CFVIT and to December 2020 with respect to CFST I; Partner, Tudor Investments, 2004-2010; Senior Partner, McKinsey & Company (consulting), 1990-2004; Touche Ross CPA, 1985-1988 | 174 | Former Director, University of Edinburgh Business School (Member of US Board); former Director, Boston Public Library Foundation |
| Patricia M. Flynn c/o Columbia Management Investment Advisers, LLC 290 Congress Street Boston, MA 02210 1950 | Trustee since 2004 | Trustee Professor of Economics and Management, Bentley University since 1976 (also teaches and conducts research on corporate governance); Dean, McCallum Graduate School of Business, Bentley University, 1992-2002 | 176 | Trustee, MA Taxpayers Foundation since 1997; former Board of Governors, Innovation Institute, MA Technology Collaborative, 2010-2020; former Board of Directors, The MA Business Roundtable, 2003-2019 |
| Brian J. Gallagher c/o Columbia Management Investment Advisers, LLC 290 Congress Street Boston, MA 02210 1954 | Trustee since 2017 | Retired; Partner with Deloitte & Touche LLP and its predecessors, 1977-2016 | 176 | Trustee, Catholic Schools Foundation since 2004 |
| Douglas A. Hacker c/o Columbia Management Investment Advisers, LLC 290 Congress Street Boston, MA 02210 1955 | Co-Chair since 2021; Chair of CFST I and CFVIT since 2014; Trustee of CFST I and CFVIT since 1996 and CFST, CFST II, CFVST II, CET I and CET II since 2021 | Independent business executive since May 2006; Executive Vice President – Strategy of United Airlines, December 2002 - May 2006; President of UAL Loyalty Services (airline marketing company), September 2001-December 2002; Executive Vice President and Chief Financial Officer of United Airlines, July 1999-September 2001 | 176 | Director, Spartan Nash Company (food distributor); Director, Aircastle Limited (Chair of Audit Committee) (aircraft leasing); former Director, Nash Finch Company (food distributor), 2005-2013; former Director, SeaCube Container Leasing Ltd. (container leasing), 2010-2013; and former Director, Travelport Worldwide Limited (travel information technology), 2014-2019 |
| Nancy T. Lukitsh c/o Columbia Management Investment Advisers, LLC 290 Congress Street Boston, MA 02210 1956 | Trustee since 2011 | Senior Vice President, Partner and Director of Marketing, Wellington Management Company, LLP (investment adviser), 1997-2010; Chair, Wellington Management Portfolios (commingled non-U.S. investment pools), 2007 -2010; Director, Wellington Trust Company, NA and other Wellington affiliates, 1997-2010 | 174 | None |
| 34 | Columbia Greater China Fund | Annual Report 2022 |
(Unaudited)
Independent trustees (continued)
| Name, address, year of birth | Position held with the Columbia Funds and length of service | Principal occupation(s) during past five years and other relevant professional experience | Number of Funds in the Columbia Funds Complex* overseen | Other directorships held by Trustee during the past five years |
| David M. Moffett c/o Columbia Management Investment Advisers, LLC 290 Congress Street Boston, MA 02210 1952 | Trustee since 2011 | Retired; Consultant to Bridgewater and Associates | 174 | Director, CSX Corporation (transportation suppliers); Director, Genworth Financial, Inc. (financial and insurance products and services); Director, PayPal Holdings Inc. (payment and data processing services); Trustee, University of Oklahoma Foundation; former Director, eBay Inc. (online trading community), 2007-2015; and former Director, CIT Bank, CIT Group Inc. (commercial and consumer finance), 2010-2016 |
| Catherine James Paglia c/o Columbia Management Investment Advisers, LLC 290 Congress Street Boston, MA 02210 1952 | Co-Chair since 2021; Chair of CFST, CFST II, CFVST II, CET I and CET II since 2020; Trustee of CFST, CFST II and CFVST II since 2004 and CFST I and CFVIT since 2021 | Director, Enterprise Asset Management, Inc. (private real estate and asset management company) since September 1998; Managing Director and Partner, Interlaken Capital, Inc., 1989-1997; Vice President, 1982-1985, Principal, 1985-1987, Managing Director, 1987-1989, Morgan Stanley; Vice President, Investment Banking, 1980-1982, Associate, Investment Banking, 1976-1980, Dean Witter Reynolds, Inc. | 176 | Director, Valmont Industries, Inc. (irrigation systems manufacturer) since 2012; Trustee, Carleton College (on the Investment Committee); Trustee, Carnegie Endowment for International Peace (on the Investment Committee) |
| Minor M. Shaw c/o Columbia Management Investment Advisers, LLC 290 Congress Street Boston, MA 02210 1947 | Trustee since 2003 | President, Micco LLC (private investments) since 2011; President, Micco Corp. (family investment business), 1998-2011 | 176 | Director, Blue Cross Blue Shield of South Carolina (Chair of Compensation Committee) since April 2008; Trustee, Hollingsworth Funds (on the Investment Committee) since 2016 (previously Board Chair from 2016-2019); Former Advisory Board member, Duke Energy Corp., 2016-2020; Chair of the Duke Endowment; Chair of Greenville – Spartanburg Airport Commission; former Trustee, BofA Funds Series Trust (11 funds), 2003-2011; former Director, Piedmont Natural Gas, 2004-2016; former Director, National Association of Corporate Directors, Carolinas Chapter, 2013-2018; Chair, Daniel-Mickel Foundation since 1998 |
| Columbia Greater China Fund | Annual Report 2022 | 35 |
(Unaudited)
Independent trustees (continued)
| Name, address, year of birth | Position held with the Columbia Funds and length of service | Principal occupation(s) during past five years and other relevant professional experience | Number of Funds in the Columbia Funds Complex* overseen | Other directorships held by Trustee during the past five years |
| Natalie A. Trunow c/o Columbia Management Investment Advisers, LLC 290 Congress Street Boston, MA 02210 1967 | Trustee since 2020 | Chief Executive Officer, Millennial Portfolio Solutions LLC (asset management and consulting services), January 2016-January 2021; Non-executive Member of the Investment Committee and Valuation Committee, Sarona Asset Management Inc. (private equity firm) since September 2019; Advisor, Horizon Investments (asset management and consulting services), August 2018-January 2021; Advisor, Paradigm Asset Management, November 2016-December 2021; Consultant to Independent Trustees of CFVIT and CFST I from September 2016 to June 2020 with respect to CFVIT and to December 2020 with respect to CFST I; Director of Investments/Consultant, Casey Family Programs, April 2016-November 2016; Senior Vice President and Chief Investment Officer, Calvert Investments, August 2008-January 2016; Section Head and Portfolio Manager, General Motors Asset Management, June 1997-August 2008 | 174 | Former Director, Investment Committee, Health Services for Children with Special Needs, Inc., 2012-2019; Director, Chair of Audit Committee, Consumer Credit Counseling Services (formerly Guidewell Financial Solutions), since 2019; Independent Director, Investment Committee and Valuation Committee, Sarona Asset Management, since 2019 |
| Sandra L. Yeager c/o Columbia Management Investment Advisers, LLC 290 Congress Street Boston, MA 02210 1964 | Trustee since 2017 | Retired; President and founder, Hanoverian Capital, LLC (SEC registered investment advisor firm), 2008-2016; Managing Director, DuPont Capital, 2006-2008; Managing Director, Morgan Stanley Investment Management, 2004-2006; Senior Vice President, Alliance Bernstein, 1990-2004 | 176 | Former Director, NAPE Education Foundation, October 2016-October 2020 |
| * | The term “Columbia Funds Complex” as used herein includes Columbia Seligman Premium Technology Growth Fund, Tri-Continental Corporation and each series of Columbia Fund Series Trust (CFST), Columbia Funds Series Trust I (CFST I), Columbia Funds Series Trust II (CFST II), Columbia ETF Trust I (CET I), Columbia ETF Trust II (CET II), Columbia Funds Variable Insurance Trust (CFVIT) and Columbia Funds Variable Series Trust II (CFVST II). Messrs. Batejan, Beckman, Gallagher and Hacker and Mses. Blatz, Carlton, Flynn, Paglia, Shaw and Yeager serve as Directors of Columbia Seligman Premium Technology Growth Fund and Tri-Continental Corporation. |
| Name, address, year of birth | Position held with the Columbia Funds and length of service | Principal occupation(s) during the past five years and other relevant professional experience | Number of Funds in the Columbia Funds Complex overseen | Other directorships held by Trustee during the past five years |
| Daniel J. Beckman c/o Columbia Management Investment Advisers, LLC 290 Congress Street Boston, MA 02210 1962 | Trustee since November 2021 and President since June 2021 | Vice President – Head of North America Product, Columbia Management Investment Advisers, LLC since April 2015; President and Principal Executive Officer of the Columbia Funds since June 2021; officer of Columbia Funds and affiliated funds, 2020-2021 | 176 | Director, Ameriprise Trust Company, since October 2016; Director, Columbia Management Investment Distributors, Inc. since November 2018; Board of Governors, Columbia Wanger Asset Management, LLC since January 2022 |
| * | Interested person (as defined under the 1940 Act) by reason of being an officer, director, security holder and/or employee of the Investment Manager or Ameriprise Financial. |
| 36 | Columbia Greater China Fund | Annual Report 2022 |
(Unaudited)
The Statement of Additional Information has additional information about the Fund’s Board members and is available, without charge, upon request by calling 800.345.6611, visiting columbiathreadneedleus.com/investor/ or contacting your financial intermediary.
| Name, address and year of birth | Position and year first appointed to position for any Fund in the Columbia Funds Complex or a predecessor thereof | Principal occupation(s) during past five years |
| Michael G. Clarke 290 Congress Street Boston, MA 02210 1969 | Chief Financial Officer and Principal Financial Officer (2009) and Senior Vice President (2019) | Senior Vice President and Head of Global Operations & Investor Services, Columbia Management Investment Advisers, LLC, since March 2022 (previously Vice President, Head of North American Operations, and Co-Head of Global Operations, June 2019 to February 2022 and Vice President – Accounting and Tax, May 2010 - May 2019); senior officer of Columbia Funds and affiliated funds since 2002. |
| Joseph Beranek 5890 Ameriprise Financial Center Minneapolis, MN 55474 1965 | Treasurer and Chief Accounting Officer (Principal Accounting Officer) (2019) and Principal Financial Officer (2020), CFST, CFST I, CFST II, CFVIT and CFVST II; Assistant Treasurer, CET I and CET II | Vice President – Mutual Fund Accounting and Financial Reporting, Columbia Management Investment Advisers, LLC, since December 2018 and March 2017, respectively (previously Vice President – Pricing and Corporate Actions, May 2010 - March 2017). |
| Marybeth Pilat 290 Congress Street Boston, MA 02210 1968 | Treasurer and Chief Accounting Officer (Principal Accounting Officer) and Principal Financial Officer (2020) for CET I and CET II; Assistant Treasurer, CFST, CFST I, CFST II, CFVIT and CFVST II | Vice President – Product Pricing and Administration, Columbia Management Investment Advisers, LLC, since May 2017; Director - Fund Administration, Calvert Investments, August 2015 – March 2017; Vice President - Fund Administration, Legg Mason, May 2015 - July 2015; Vice President - Fund Administration, Columbia Management Investment Advisers, LLC, May 2010 - April 2015. |
| William F. Truscott 290 Congress Street Boston, MA 02210 1960 | Senior Vice President (2001) | Formerly, Trustee/Director of Columbia Funds Complex or legacy funds, November 2001-January 1, 2021; Chief Executive Officer, Global Asset Management, Ameriprise Financial, Inc. since September 2012; Chairman of the Board and President, Columbia Management Investment Advisers, LLC since July 2004 and February 2012, respectively; Chairman of the Board and Chief Executive Officer, Columbia Management Investment Distributors, Inc. since November 2008 and February 2012, respectively; Chairman of the Board and Director, Threadneedle Asset Management Holdings, Sàrl since March 2013 and December 2008, respectively; senior executive of various entities affiliated with Columbia Threadneedle. |
| Christopher O. Petersen 5228 Ameriprise Financial Center Minneapolis, MN 55474 1970 | Senior Vice President and Assistant Secretary (2021) | Formerly, Trustee/Director of funds within the Columbia Funds Complex, July 1, 2020 - November 22, 2021; Senior Vice President and Assistant General Counsel, Ameriprise Financial, Inc. since September 2021 (previously Vice President and Lead Chief Counsel, January 2015 - September 2021); formerly, President and Principal Executive Officer of the Columbia Funds, 2015 - 2021; officer of Columbia Funds and affiliated funds since 2007. |
| Thomas P. McGuire 290 Congress Street Boston, MA 02210 1972 | Senior Vice President and Chief Compliance Officer (2012) | Vice President – Asset Management Compliance, Ameriprise Financial, Inc., since May 2010; Chief Compliance Officer, Columbia Acorn/Wanger Funds since December 2015; formerly, Chief Compliance Officer, Ameriprise Certificate Company, September 2010 – September 2020. |
| Columbia Greater China Fund | Annual Report 2022 | 37 |
(Unaudited)
Fund officers (continued)
| Name, address and year of birth | Position and year first appointed to position for any Fund in the Columbia Funds Complex or a predecessor thereof | Principal occupation(s) during past five years |
| Ryan C. Larrenaga 290 Congress Street Boston, MA 02210 1970 | Senior Vice President (2017), Chief Legal Officer (2017), and Secretary (2015) | Vice President and Chief Counsel, Ameriprise Financial, Inc. since August 2018 (previously Vice President and Group Counsel, August 2011 - August 2018); Chief Legal Officer, Columbia Acorn/Wanger Funds, since September 2020; officer of Columbia Funds and affiliated funds since 2005. |
| Michael E. DeFao 290 Congress Street Boston, MA 02210 1968 | Vice President (2011) and Assistant Secretary (2010) | Vice President and Chief Counsel, Ameriprise Financial, Inc. since May 2010; Vice President, Chief Legal Officer and Assistant Secretary, Columbia Management Investment Advisers, LLC since October 2021 (previously Vice President and Assistant Secretary, May 2010 – September 2021). |
| Lyn Kephart-Strong 5228 Ameriprise Financial Center Minneapolis, MN 55474 1960 | Vice President (2015) | President, Columbia Management Investment Services Corp. since October 2014; Vice President & Resolution Officer, Ameriprise Trust Company since August 2009. |
| • | the Fund had sufficient liquidity to both meet redemptions and operate effectively on behalf of shareholders; |
| • | there were no material changes to the Program during the period; |
| • | the implementation of the Program was effective to manage the Fund’s liquidity risk; and |
| • | the Program operated adequately during the period. |
| 38 | Columbia Greater China Fund | Annual Report 2022 |
| • | Information on the investment performance of the Fund relative to the performance of a group of mutual funds determined to be comparable to the Fund by Broadridge, as well as performance relative to benchmarks; |
| • | Information on the Fund’s management fees and total expenses, including information comparing the Fund’s expenses to those of a group of comparable mutual funds, as determined by Broadridge; |
| • | The Investment Manager’s agreement to contractually limit or cap total operating expenses for the Fund so that total operating expenses (excluding certain fees and expenses, such as transaction costs and certain other investment related expenses, interest, taxes, acquired fund fees and expenses and infrequent and/or unusual expenses) would not exceed a specified annual rate, as a percentage of the Fund’s net assets; |
| • | Terms of the Management Agreement; |
| • | Descriptions of other agreements and arrangements with affiliates of the Investment Manager relating to the operations of the Fund, including agreements with respect to the provision of transfer agency and shareholder services to the Fund; |
| • | Descriptions of various services performed by the Investment Manager under the Management Agreement, including portfolio management and portfolio trading practices; |
| • | Information regarding any recently negotiated management fees of similarly-managed portfolios of other institutional clients of the Investment Manager; |
| • | Information regarding the resources of the Investment Manager, including information regarding senior management, portfolio managers and other personnel; |
| • | Information regarding the capabilities of the Investment Manager with respect to compliance monitoring services; |
| • | The profitability to the Investment Manager and its affiliates from their relationships with the Fund; and |
| • | Report provided by the Board’s independent fee consultant, JDL Consultants, LLC (JDL). |
| Columbia Greater China Fund | Annual Report 2022 | 39 |
(Unaudited)
Following an analysis and discussion of the foregoing, and the factors identified below, the Board, including all of the Independent Trustees, approved the renewal of the Management Agreement.
| 40 | Columbia Greater China Fund | Annual Report 2022 |
(Unaudited)
Comparative fees, costs of services provided and the profits realized by the Investment Manager and its affiliates from their relationships with the Fund
| Columbia Greater China Fund | Annual Report 2022 | 41 |
(Unaudited)
On June 23, 2022, the Board, including all of the Independent Trustees, determined that fees payable under the Management Agreement were fair and reasonable in light of the extent and quality of services provided and approved the renewal of the Management Agreement.
| 42 | Columbia Greater China Fund | Annual Report 2022 |
columbiathreadneedleus.com/investor/. The Fund is distributed by Columbia Management Investment Distributors, Inc., member FINRA, and managed by Columbia Management Investment Advisers, LLC.

August 31, 2022

| 3 | |
| 5 | |
| 7 | |
| 8 | |
| 11 | |
| 13 | |
| 14 | |
| 16 | |
| 20 | |
| 30 | |
| 31 | |
| 31 | |
| 37 | |
| 38 |
(Unaudited)
| Average annual total returns (%) (for the period ended August 31, 2022) | |||||
| Inception | 1 Year | 5 Years | 10 Years | ||
| Class A | Excluding sales charges | 11/01/02 | -28.97 | 9.34 | 10.33 |
| Including sales charges | -33.05 | 8.06 | 9.68 | ||
| Advisor Class* | 11/08/12 | -28.79 | 9.62 | 10.59 | |
| Class C | Excluding sales charges | 10/13/03 | -29.50 | 8.52 | 9.50 |
| Including sales charges | -30.02 | 8.52 | 9.50 | ||
| Institutional Class | 11/20/85 | -28.78 | 9.62 | 10.60 | |
| Institutional 2 Class | 03/07/11 | -28.75 | 9.69 | 10.70 | |
| Institutional 3 Class | 07/15/09 | -28.71 | 9.73 | 10.76 | |
| Class R | 01/23/06 | -29.11 | 9.07 | 10.05 | |
| Class V | Excluding sales charges | 11/01/02 | -28.96 | 9.35 | 10.31 |
| Including sales charges | -33.05 | 8.05 | 9.66 | ||
| Russell Midcap Growth Index | -26.69 | 10.16 | 12.06 | ||
| Russell Midcap Index | -14.82 | 9.17 | 11.61 | ||
| * | The returns shown for periods prior to the share class inception date (including returns for the Life of the Fund, if shown, which are since Fund inception) include the returns of the Fund’s oldest share class. These returns are adjusted to reflect any higher class-related operating expenses of the newer share classes, as applicable. Please visit columbiathreadneedleus.com/investor/investment-products/mutual-funds/appended-performance for more information. |
| Columbia Select Mid Cap Growth Fund | Annual Report 2022 | 3 |
(Unaudited)
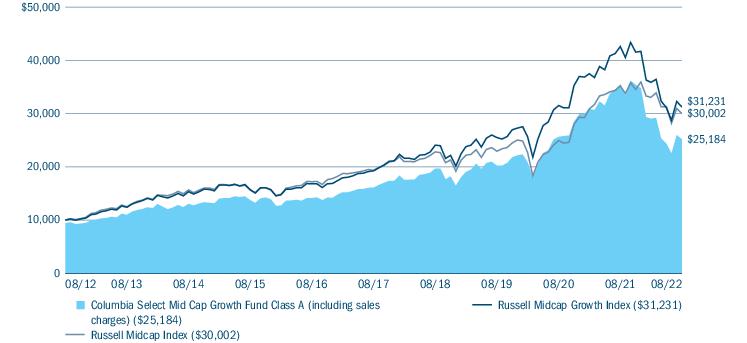
| Portfolio breakdown (%) (at August 31, 2022) | |
| Common Stocks | 97.9 |
| Money Market Funds | 2.1 |
| Total | 100.0 |
| Equity sector breakdown (%) (at August 31, 2022) | |
| Communication Services | 5.9 |
| Consumer Discretionary | 14.2 |
| Energy | 3.2 |
| Financials | 5.5 |
| Health Care | 21.3 |
| Industrials | 18.2 |
| Information Technology | 30.2 |
| Materials | 1.5 |
| Total | 100.0 |
| 4 | Columbia Select Mid Cap Growth Fund | Annual Report 2022 |
(Unaudited)
| • | During the period, the growth style was out of favor as value stocks and more established companies fared better given their larger profit margins which provide a buffer in an environment of high and rising inflation. |
| • | Allocation among sectors was a primary driver of underperformance. Most notably, the Fund’s underweight to the energy sector, which was the only sector with positive returns in the aftermath from the Russian invasion of Ukraine, detracted from performance versus the benchmark. |
| • | In addition, the Fund’s underweight allocations to defensives, namely the consumer staples sector, which suffered less serious declines, also hurt. |
| • | The Fund was also negatively impacted by stock selection among some of our capital goods holdings, namely Kornit Digital Ltd., Generac Holdings, Inc. and Ingersoll Rand, Inc. |
| • | In addition, the Fund was hurt by some of its holdings in the healthcare equipment industry, namely, Align Technology, Inc., Amedisys, Inc. and Doximity, Inc. The Fund’s holding in Align Technology was sold. |
| • | 10x Genomics, Inc., a biotechnology and life sciences company that designs and manufactures gene sequencing technology used in scientific research, was the Fund’s largest detractor. We believe the stock’s fundamentals remain robust, highlighted by the company’s strong competitive position and innovative approach, but it lost ground amid the broader downturn in companies with high future earnings expectations. We sold the position. |
| • | DocuSign, Inc., a provider of e-signing solutions, was another detractor of note. The stock was caught up in the broader sell-off in faster growing companies, and the company offered revenue guidance that was below expectations. |
| • | HubSpot, Inc. is a leading CRM platform that provides software and support to help companies market and sell more effectively. HubSpot suffered from a harsh sell-off in growth stocks during the period. The company was also negatively impacted by the fallout of the pandemic as companies slashed operating budgets, closed offices, and asked sales teams to transform their entire sales process to sell virtually. |
| Columbia Select Mid Cap Growth Fund | Annual Report 2022 | 5 |
(Unaudited)
| • | There weren’t many areas that didn’t experience a decline during the 12-month period. Albeit underweight, the Fund’s holdings in the energy sector (which held up nicely during the period) were a positive contributor, particularly Devon Energy Corp., Pioneer Natural Resources Co. and Antero Resources Corp. The position in Pioneer Natural Resources was sold. |
| • | In addition, the Fund’s holding in the materials sector, Albemarle Corp., delivered strong performance during the period. |
| • | The Fund’s underweight to media and entertainment names, which were down significantly, was a notable contributor to overall performance. |
| • | Booze Allen Hamilton Holdings Corp. is a management and information technology consulting firm with a reputation of being one of the highest quality names in the defense services sector. Investors have been positive about the company’s strong organic growth and ability to control costs, and are optimistic over their prospects to continue to grow market share given that its defense capabilities are well‐aligned with customer priorities now and into the future. |
| • | Cadence Design Systems, Inc. is a multinational computational software company that produces software, hardware, and silicon structures for designing integrated circuits, systems on chips and printed circuit boards. The company performed well on strong earnings and growth across its product portfolio, against a rapidly expanding customer base. This has largely been driven by the strength of the semiconductor industry, systems companies investing more in silicon and the convergence of systems and chip designs. Investors were also optimistic of the pending acquisition of OpenEye Scientific, which will accelerate Cadence’s Intelligent System Design strategy and extend its computational software competency in the life sciences market. |
| • | Albemarle is a global specialty chemicals company with leading positions in lithium, bromine and catalysts. Performance in the period was helped by strong sales numbers that have been helped by favorable market dynamics in the Lithium and Bromine businesses. Both businesses are critical for transitioning to greener energy and advancing electrification and digitization. Also, the company managed to have a strong 2021 by effectively responding to several challenges during the year. |
| 6 | Columbia Select Mid Cap Growth Fund | Annual Report 2022 |
(Unaudited)
| March 1, 2022 — August 31, 2022 | |||||||
| Account value at the beginning of the period ($) | Account value at the end of the period ($) | Expenses paid during the period ($) | Fund’s annualized expense ratio (%) | ||||
| Actual | Hypothetical | Actual | Hypothetical | Actual | Hypothetical | Actual | |
| Class A | 1,000.00 | 1,000.00 | 867.30 | 1,019.36 | 5.46 | 5.90 | 1.16 |
| Advisor Class | 1,000.00 | 1,000.00 | 868.50 | 1,020.62 | 4.29 | 4.63 | 0.91 |
| Class C | 1,000.00 | 1,000.00 | 864.10 | 1,015.58 | 8.97 | 9.70 | 1.91 |
| Institutional Class | 1,000.00 | 1,000.00 | 868.60 | 1,020.62 | 4.29 | 4.63 | 0.91 |
| Institutional 2 Class | 1,000.00 | 1,000.00 | 869.10 | 1,020.92 | 4.00 | 4.33 | 0.85 |
| Institutional 3 Class | 1,000.00 | 1,000.00 | 869.30 | 1,021.17 | 3.77 | 4.08 | 0.80 |
| Class R | 1,000.00 | 1,000.00 | 866.70 | 1,018.10 | 6.63 | 7.17 | 1.41 |
| Class V | 1,000.00 | 1,000.00 | 867.70 | 1,019.36 | 5.46 | 5.90 | 1.16 |
| Columbia Select Mid Cap Growth Fund | Annual Report 2022 | 7 |
August 31, 2022
| Common Stocks 97.4% | ||
| Issuer | Shares | Value ($) |
| Communication Services 5.7% | ||
| Entertainment 3.9% | ||
| Live Nation Entertainment, Inc.(a) | 163,359 | 14,761,119 |
| Roblox Corp., Class A(a) | 378,281 | 14,794,570 |
| Take-Two Interactive Software, Inc.(a) | 236,519 | 28,987,769 |
| Total | 58,543,458 | |
| Media 1.8% | ||
| Trade Desk, Inc. (The), Class A(a) | 421,783 | 26,445,794 |
| Total Communication Services | 84,989,252 | |
| Consumer Discretionary 13.9% | ||
| Diversified Consumer Services 1.3% | ||
| Bright Horizons Family Solutions, Inc.(a) | 278,054 | 18,963,283 |
| Hotels, Restaurants & Leisure 7.2% | ||
| Chipotle Mexican Grill, Inc.(a) | 32,631 | 52,105,181 |
| Churchill Downs, Inc. | 114,030 | 22,474,173 |
| Planet Fitness, Inc., Class A(a) | 472,134 | 31,987,078 |
| Total | 106,566,432 | |
| Internet & Direct Marketing Retail 1.8% | ||
| Etsy, Inc.(a) | 249,867 | 26,388,454 |
| Specialty Retail 3.6% | ||
| Five Below, Inc.(a) | 224,866 | 28,755,864 |
| Floor & Decor Holdings, Inc.(a) | 146,204 | 11,895,157 |
| Williams-Sonoma, Inc. | 89,425 | 13,301,969 |
| Total | 53,952,990 | |
| Total Consumer Discretionary | 205,871,159 | |
| Energy 3.2% | ||
| Oil, Gas & Consumable Fuels 3.2% | ||
| Antero Resources Corp.(a) | 212,696 | 8,524,856 |
| Devon Energy Corp. | 543,793 | 38,402,661 |
| Total | 46,927,517 | |
| Total Energy | 46,927,517 | |
| Financials 5.3% | ||
| Banks 0.8% | ||
| Western Alliance Bancorp | 158,847 | 12,186,742 |
| Common Stocks (continued) | ||
| Issuer | Shares | Value ($) |
| Capital Markets 4.5% | ||
| Ares Management Corp., Class A | 494,660 | 36,674,092 |
| MSCI, Inc. | 67,248 | 30,210,492 |
| Total | 66,884,584 | |
| Total Financials | 79,071,326 | |
| Health Care 20.7% | ||
| Health Care Equipment & Supplies 8.4% | ||
| DexCom, Inc.(a) | 376,553 | 30,956,422 |
| Edwards Lifesciences Corp.(a) | 367,140 | 33,079,314 |
| Insulet Corp.(a) | 77,855 | 19,889,617 |
| Intuitive Surgical, Inc.(a) | 200,394 | 41,229,062 |
| Total | 125,154,415 | |
| Health Care Providers & Services 1.3% | ||
| Amedisys, Inc.(a) | 165,012 | 19,545,671 |
| Health Care Technology 1.1% | ||
| Doximity, Inc., Class A(a) | 486,112 | 16,134,057 |
| Life Sciences Tools & Services 9.9% | ||
| Bio-Techne Corp. | 138,437 | 45,934,781 |
| IQVIA Holdings, Inc.(a) | 188,135 | 40,008,789 |
| Repligen Corp.(a) | 277,993 | 60,983,325 |
| Total | 146,926,895 | |
| Total Health Care | 307,761,038 | |
| Industrials 17.7% | ||
| Commercial Services & Supplies 4.2% | ||
| Cintas Corp. | 102,606 | 41,744,225 |
| Rollins, Inc. | 630,841 | 21,297,192 |
| Total | 63,041,417 | |
| Electrical Equipment 3.6% | ||
| AMETEK, Inc. | 247,195 | 29,702,951 |
| Generac Holdings, Inc.(a) | 105,994 | 23,362,138 |
| Total | 53,065,089 | |
| Machinery 2.6% | ||
| Ingersoll Rand, Inc. | 368,181 | 17,440,734 |
| Middleby Corp. (The)(a) | 143,796 | 20,680,741 |
| Total | 38,121,475 | |
| 8 | Columbia Select Mid Cap Growth Fund | Annual Report 2022 |
August 31, 2022
| Common Stocks (continued) | ||
| Issuer | Shares | Value ($) |
| Professional Services 5.8% | ||
| Booz Allen Hamilton Holding Corp. | 332,721 | 31,841,399 |
| CoStar Group, Inc.(a) | 780,398 | 54,346,917 |
| Total | 86,188,316 | |
| Trading Companies & Distributors 1.5% | ||
| SiteOne Landscape Supply, Inc.(a) | 174,520 | 21,842,923 |
| Total Industrials | 262,259,220 | |
| Information Technology 29.4% | ||
| Electronic Equipment, Instruments & Components 5.4% | ||
| Amphenol Corp., Class A | 481,659 | 35,416,386 |
| CDW Corp. | 262,677 | 44,838,964 |
| Total | 80,255,350 | |
| IT Services 4.9% | ||
| EPAM Systems, Inc.(a) | 84,198 | 35,910,447 |
| MongoDB, Inc.(a) | 62,860 | 20,294,980 |
| VeriSign, Inc.(a) | 86,869 | 15,829,269 |
| Total | 72,034,696 | |
| Semiconductors & Semiconductor Equipment 3.4% | ||
| Marvell Technology, Inc. | 578,837 | 27,101,148 |
| Monolithic Power Systems, Inc. | 52,322 | 23,711,284 |
| Total | 50,812,432 | |
| Software 15.7% | ||
| ANSYS, Inc.(a) | 87,052 | 21,615,012 |
| Bill.com Holdings, Inc.(a) | 105,945 | 17,150,377 |
| Cadence Design Systems, Inc.(a) | 226,578 | 39,372,459 |
| Crowdstrike Holdings, Inc., Class A(a) | 166,286 | 30,365,486 |
| Common Stocks (continued) | ||
| Issuer | Shares | Value ($) |
| Datadog, Inc., Class A(a) | 144,536 | 15,169,053 |
| HubSpot, Inc.(a) | 57,023 | 19,219,032 |
| Paycom Software, Inc.(a) | 78,883 | 27,703,710 |
| ServiceNow, Inc.(a) | 81,446 | 35,398,060 |
| Zscaler, Inc.(a) | 169,522 | 26,994,683 |
| Total | 232,987,872 | |
| Total Information Technology | 436,090,350 | |
| Materials 1.5% | ||
| Chemicals 1.5% | ||
| Albemarle Corp. | 81,173 | 21,751,117 |
| Total Materials | 21,751,117 | |
| Total Common Stocks (Cost $1,415,045,558) | 1,444,720,979 | |
| Money Market Funds 2.1% | ||
| Shares | Value ($) | |
| Columbia Short-Term Cash Fund, 2.366%(b),(c) | 31,106,628 | 31,091,075 |
| Total Money Market Funds (Cost $31,089,210) | 31,091,075 | |
| Total Investments in Securities (Cost: $1,446,134,768) | 1,475,812,054 | |
| Other Assets & Liabilities, Net | 6,789,568 | |
| Net Assets | 1,482,601,622 | |
| (a) | Non-income producing investment. |
| (b) | The rate shown is the seven-day current annualized yield at August 31, 2022. |
| (c) | As defined in the Investment Company Act of 1940, as amended, an affiliated company is one in which the Fund owns 5% or more of the company’s outstanding voting securities, or a company which is under common ownership or control with the Fund. The value of the holdings and transactions in these affiliated companies during the year ended August 31, 2022 are as follows: |
| Affiliated issuers | Beginning of period($) | Purchases($) | Sales($) | Net change in unrealized appreciation (depreciation)($) | End of period($) | Realized gain (loss)($) | Dividends($) | End of period shares |
| Columbia Short-Term Cash Fund, 2.366% | ||||||||
| 54,027,082 | 685,511,230 | (708,449,092) | 1,855 | 31,091,075 | (8,674) | 125,634 | 31,106,628 | |
| Columbia Select Mid Cap Growth Fund | Annual Report 2022 | 9 |
August 31, 2022
| ■ | Level 1 — Valuations based on quoted prices for investments in active markets that the Fund has the ability to access at the measurement date. Valuation adjustments are not applied to Level 1 investments. |
| ■ | Level 2 — Valuations based on other significant observable inputs (including quoted prices for similar securities, interest rates, prepayment speeds, credit risks, etc.). |
| ■ | Level 3 — Valuations based on significant unobservable inputs (including the Fund’s own assumptions and judgment in determining the fair value of investments). |
| Level 1 ($) | Level 2 ($) | Level 3 ($) | Total ($) | |
| Investments in Securities | ||||
| Common Stocks | ||||
| Communication Services | 84,989,252 | — | — | 84,989,252 |
| Consumer Discretionary | 205,871,159 | — | — | 205,871,159 |
| Energy | 46,927,517 | — | — | 46,927,517 |
| Financials | 79,071,326 | — | — | 79,071,326 |
| Health Care | 307,761,038 | — | — | 307,761,038 |
| Industrials | 262,259,220 | — | — | 262,259,220 |
| Information Technology | 436,090,350 | — | — | 436,090,350 |
| Materials | 21,751,117 | — | — | 21,751,117 |
| Total Common Stocks | 1,444,720,979 | — | — | 1,444,720,979 |
| Money Market Funds | 31,091,075 | — | — | 31,091,075 |
| Total Investments in Securities | 1,475,812,054 | — | — | 1,475,812,054 |
| 10 | Columbia Select Mid Cap Growth Fund | Annual Report 2022 |
August 31, 2022
| Assets | |
| Investments in securities, at value | |
| Unaffiliated issuers (cost $1,415,045,558) | $1,444,720,979 |
| Affiliated issuers (cost $31,089,210) | 31,091,075 |
| Receivable for: | |
| Investments sold | 7,054,317 |
| Capital shares sold | 340,690 |
| Dividends | 360,462 |
| Prepaid expenses | 21,018 |
| Trustees’ deferred compensation plan | 231,224 |
| Total assets | 1,483,819,765 |
| Liabilities | |
| Payable for: | |
| Capital shares purchased | 670,544 |
| Management services fees | 31,575 |
| Distribution and/or service fees | 5,343 |
| Transfer agent fees | 146,369 |
| Compensation of board members | 70,138 |
| Other expenses | 62,950 |
| Trustees’ deferred compensation plan | 231,224 |
| Total liabilities | 1,218,143 |
| Net assets applicable to outstanding capital stock | $1,482,601,622 |
| Represented by | |
| Paid in capital | 1,507,566,357 |
| Total distributable earnings (loss) | (24,964,735) |
| Total - representing net assets applicable to outstanding capital stock | $1,482,601,622 |
| Columbia Select Mid Cap Growth Fund | Annual Report 2022 | 11 |
August 31, 2022
| Class A | |
| Net assets | $718,493,483 |
| Shares outstanding | 39,251,235 |
| Net asset value per share | $18.30 |
| Maximum sales charge | 5.75% |
| Maximum offering price per share (calculated by dividing the net asset value per share by 1.0 minus the maximum sales charge for Class A shares) | $19.42 |
| Advisor Class | |
| Net assets | $9,813,498 |
| Shares outstanding | 443,398 |
| Net asset value per share | $22.13 |
| Class C | |
| Net assets | $6,073,425 |
| Shares outstanding | 505,122 |
| Net asset value per share | $12.02 |
| Institutional Class | |
| Net assets | $607,007,526 |
| Shares outstanding | 28,972,387 |
| Net asset value per share | $20.95 |
| Institutional 2 Class | |
| Net assets | $34,937,095 |
| Shares outstanding | 1,639,558 |
| Net asset value per share | $21.31 |
| Institutional 3 Class | |
| Net assets | $81,228,954 |
| Shares outstanding | 3,804,203 |
| Net asset value per share | $21.35 |
| Class R | |
| Net assets | $5,332,804 |
| Shares outstanding | 319,176 |
| Net asset value per share | $16.71 |
| Class V | |
| Net assets | $19,714,837 |
| Shares outstanding | 1,085,546 |
| Net asset value per share | $18.16 |
| Maximum sales charge | 5.75% |
| Maximum offering price per share (calculated by dividing the net asset value per share by 1.0 minus the maximum sales charge for Class V shares) | $19.27 |
| 12 | Columbia Select Mid Cap Growth Fund | Annual Report 2022 |
Year Ended August 31, 2022
| Net investment income | |
| Income: | |
| Dividends — unaffiliated issuers | $5,788,712 |
| Dividends — affiliated issuers | 125,634 |
| Interfund lending | 147 |
| Total income | 5,914,493 |
| Expenses: | |
| Management services fees | 13,959,543 |
| Distribution and/or service fees | |
| Class A | 2,255,430 |
| Class C | 78,273 |
| Class R | 37,168 |
| Class V | 63,949 |
| Transfer agent fees | |
| Class A | 952,594 |
| Advisor Class | 12,006 |
| Class C | 8,255 |
| Institutional Class | 803,567 |
| Institutional 2 Class | 23,752 |
| Institutional 3 Class | 6,138 |
| Class R | 7,798 |
| Class V | 27,015 |
| Compensation of board members | 34,129 |
| Custodian fees | 17,874 |
| Printing and postage fees | 110,048 |
| Registration fees | 164,026 |
| Audit fees | 29,500 |
| Legal fees | 30,337 |
| Compensation of chief compliance officer | 525 |
| Other | 40,266 |
| Total expenses | 18,662,193 |
| Expense reduction | (1,914) |
| Total net expenses | 18,660,279 |
| Net investment loss | (12,745,786) |
| Realized and unrealized gain (loss) — net | |
| Net realized gain (loss) on: | |
| Investments — unaffiliated issuers | 10,621,419 |
| Investments — affiliated issuers | (8,674) |
| Net realized gain | 10,612,745 |
| Net change in unrealized appreciation (depreciation) on: | |
| Investments — unaffiliated issuers | (647,573,736) |
| Investments — affiliated issuers | 1,855 |
| Net change in unrealized appreciation (depreciation) | (647,571,881) |
| Net realized and unrealized loss | (636,959,136) |
| Net decrease in net assets resulting from operations | $(649,704,922) |
| Columbia Select Mid Cap Growth Fund | Annual Report 2022 | 13 |
| Year Ended August 31, 2022 | Year Ended August 31, 2021 | |
| Operations | ||
| Net investment loss | $(12,745,786) | $(14,724,392) |
| Net realized gain | 10,612,745 | 517,597,707 |
| Net change in unrealized appreciation (depreciation) | (647,571,881) | 174,452,265 |
| Net increase (decrease) in net assets resulting from operations | (649,704,922) | 677,325,580 |
| Distributions to shareholders | ||
| Net investment income and net realized gains | ||
| Class A | (211,060,179) | (147,133,187) |
| Advisor Class | (2,100,305) | (1,314,595) |
| Class C | (2,510,037) | (2,319,152) |
| Institutional Class | (162,847,839) | (113,281,354) |
| Institutional 2 Class | (8,803,972) | (6,409,983) |
| Institutional 3 Class | (23,347,460) | (15,141,047) |
| Class R | (1,960,122) | (1,322,722) |
| Class V | (6,008,042) | (4,160,470) |
| Total distributions to shareholders | (418,637,956) | (291,082,510) |
| Increase in net assets from capital stock activity | 212,842,508 | 43,849,618 |
| Total increase (decrease) in net assets | (855,500,370) | 430,092,688 |
| Net assets at beginning of year | 2,338,101,992 | 1,908,009,304 |
| Net assets at end of year | $1,482,601,622 | $2,338,101,992 |
| 14 | Columbia Select Mid Cap Growth Fund | Annual Report 2022 |
| Year Ended | Year Ended | |||
| August 31, 2022 | August 31, 2021 | |||
| Shares | Dollars ($) | Shares | Dollars ($) | |
| Capital stock activity | ||||
| Class A | ||||
| Subscriptions | 1,462,100 | 34,861,392 | 1,238,052 | 35,112,717 |
| Fund reorganization | 727,078 | 14,957,282 | — | — |
| Distributions reinvested | 8,139,033 | 203,720,000 | 5,443,509 | 141,803,418 |
| Redemptions | (6,554,585) | (143,283,045) | (6,802,108) | (192,358,949) |
| Net increase (decrease) | 3,773,626 | 110,255,629 | (120,547) | (15,442,814) |
| Advisor Class | ||||
| Subscriptions | 139,671 | 3,904,665 | 142,914 | 4,670,660 |
| Fund reorganization | 61,087 | 1,517,138 | — | — |
| Distributions reinvested | 35,264 | 1,065,327 | 25,248 | 766,543 |
| Redemptions | (150,115) | (4,047,003) | (70,783) | (2,335,289) |
| Net increase | 85,907 | 2,440,127 | 97,379 | 3,101,914 |
| Class C | ||||
| Subscriptions | 105,087 | 1,550,433 | 67,150 | 1,412,859 |
| Distributions reinvested | 151,433 | 2,503,191 | 122,429 | 2,318,808 |
| Redemptions | (178,899) | (2,489,140) | (329,484) | (6,876,542) |
| Net increase (decrease) | 77,621 | 1,564,484 | (139,905) | (3,144,875) |
| Institutional Class | ||||
| Subscriptions | 1,168,096 | 32,137,960 | 1,329,347 | 42,187,517 |
| Distributions reinvested | 5,250,416 | 150,161,894 | 3,605,027 | 104,581,824 |
| Redemptions | (4,498,134) | (113,565,009) | (2,964,268) | (93,604,939) |
| Net increase | 1,920,378 | 68,734,845 | 1,970,106 | 53,164,402 |
| Institutional 2 Class | ||||
| Subscriptions | 585,260 | 16,330,560 | 256,295 | 8,256,493 |
| Distributions reinvested | 301,920 | 8,776,807 | 217,427 | 6,392,355 |
| Redemptions | (604,231) | (15,665,304) | (555,509) | (17,779,154) |
| Net increase (decrease) | 282,949 | 9,442,063 | (81,787) | (3,130,306) |
| Institutional 3 Class | ||||
| Subscriptions | 1,129,985 | 33,690,941 | 545,119 | 17,357,580 |
| Distributions reinvested | 328,192 | 9,556,950 | 144,872 | 4,265,021 |
| Redemptions | (1,065,826) | (25,416,292) | (449,240) | (14,441,012) |
| Net increase | 392,351 | 17,831,599 | 240,751 | 7,181,589 |
| Class R | ||||
| Subscriptions | 70,282 | 1,493,540 | 84,155 | 2,258,380 |
| Distributions reinvested | 81,682 | 1,869,702 | 47,281 | 1,147,506 |
| Redemptions | (181,645) | (3,746,730) | (84,644) | (2,305,622) |
| Net increase (decrease) | (29,681) | (383,488) | 46,792 | 1,100,264 |
| Class V | ||||
| Subscriptions | 26,778 | 657,348 | 19,625 | 515,286 |
| Distributions reinvested | 209,642 | 5,205,418 | 137,974 | 3,572,158 |
| Redemptions | (155,777) | (2,905,517) | (110,293) | (3,068,000) |
| Net increase | 80,643 | 2,957,249 | 47,306 | 1,019,444 |
| Total net increase | 6,583,794 | 212,842,508 | 2,060,095 | 43,849,618 |
| Columbia Select Mid Cap Growth Fund | Annual Report 2022 | 15 |
| Net asset value, beginning of period | Net investment income (loss) | Net realized and unrealized gain (loss) | Total from investment operations | Distributions from net realized gains | Total distributions to shareholders | |
| Class A | ||||||
| Year Ended 8/31/2022 | $31.98 | (0.18) | (7.46) | (7.64) | (6.04) | (6.04) |
| Year Ended 8/31/2021 | $27.17 | (0.24) | 9.61 | 9.37 | (4.56) | (4.56) |
| Year Ended 8/31/2020 | $23.44 | (0.14) | 6.01 | 5.87 | (2.14) | (2.14) |
| Year Ended 8/31/2019 | $28.83 | (0.07) | 0.09 | 0.02 | (5.41) | (5.41) |
| Year Ended 8/31/2018 | $26.90 | (0.10) | 5.54 | 5.44 | (3.51) | (3.51) |
| Advisor Class | ||||||
| Year Ended 8/31/2022 | $37.34 | (0.15) | (8.97) | (9.12) | (6.09) | (6.09) |
| Year Ended 8/31/2021 | $31.03 | (0.19) | 11.12 | 10.93 | (4.62) | (4.62) |
| Year Ended 8/31/2020 | $26.43 | (0.09) | 6.83 | 6.74 | (2.14) | (2.14) |
| Year Ended 8/31/2019 | $31.71 | (0.02) | 0.20 | 0.18 | (5.46) | (5.46) |
| Year Ended 8/31/2018 | $29.26 | (0.05) | 6.07 | 6.02 | (3.57) | (3.57) |
| Class C | ||||||
| Year Ended 8/31/2022 | $23.12 | (0.24) | (4.97) | (5.21) | (5.89) | (5.89) |
| Year Ended 8/31/2021 | $20.72 | (0.33) | 7.09 | 6.76 | (4.36) | (4.36) |
| Year Ended 8/31/2020 | $18.48 | (0.24) | 4.62 | 4.38 | (2.14) | (2.14) |
| Year Ended 8/31/2019 | $23.99 | (0.20) | (0.04)(e) | (0.24) | (5.27) | (5.27) |
| Year Ended 8/31/2018 | $22.91 | (0.26) | 4.64 | 4.38 | (3.30) | (3.30) |
| Institutional Class | ||||||
| Year Ended 8/31/2022 | $35.68 | (0.15) | (8.49) | (8.64) | (6.09) | (6.09) |
| Year Ended 8/31/2021 | $29.83 | (0.18) | 10.65 | 10.47 | (4.62) | (4.62) |
| Year Ended 8/31/2020 | $25.49 | (0.08) | 6.56 | 6.48 | (2.14) | (2.14) |
| Year Ended 8/31/2019 | $30.80 | (0.01) | 0.16 | 0.15 | (5.46) | (5.46) |
| Year Ended 8/31/2018 | $28.52 | (0.04) | 5.89 | 5.85 | (3.57) | (3.57) |
| Institutional 2 Class | ||||||
| Year Ended 8/31/2022 | $36.18 | (0.13) | (8.64) | (8.77) | (6.10) | (6.10) |
| Year Ended 8/31/2021 | $30.19 | (0.17) | 10.79 | 10.62 | (4.63) | (4.63) |
| Year Ended 8/31/2020 | $25.75 | (0.07) | 6.65 | 6.58 | (2.14) | (2.14) |
| Year Ended 8/31/2019 | $31.06 | 0.00(f) | 0.16 | 0.16 | (5.47) | (5.47) |
| Year Ended 8/31/2018 | $28.73 | (0.02) | 5.95 | 5.93 | (3.60) | (3.60) |
| 16 | Columbia Select Mid Cap Growth Fund | Annual Report 2022 |
| Net asset value, end of period | Total return | Total gross expense ratio to average net assets(a) | Total net expense ratio to average net assets(a),(b) | Net investment income (loss) ratio to average net assets | Portfolio turnover | Net assets, end of period (000’s) | |
| Class A | |||||||
| Year Ended 8/31/2022 | $18.30 | (28.97%) | 1.13% | 1.13%(c) | (0.81%) | 70% | $718,493 |
| Year Ended 8/31/2021 | $31.98 | 38.29% | 1.11%(d) | 1.11%(c),(d) | (0.83%) | 82% | $1,134,636 |
| Year Ended 8/31/2020 | $27.17 | 26.66% | 1.15% | 1.15%(c) | (0.58%) | 63% | $967,087 |
| Year Ended 8/31/2019 | $23.44 | 2.78% | 1.17% | 1.17% | (0.31%) | 89% | $810,161 |
| Year Ended 8/31/2018 | $28.83 | 22.23% | 1.16% | 1.16%(c) | (0.38%) | 140% | $922,862 |
| Advisor Class | |||||||
| Year Ended 8/31/2022 | $22.13 | (28.79%) | 0.88% | 0.88%(c) | (0.56%) | 70% | $9,813 |
| Year Ended 8/31/2021 | $37.34 | 38.65% | 0.86%(d) | 0.86%(c),(d) | (0.58%) | 82% | $13,348 |
| Year Ended 8/31/2020 | $31.03 | 26.95% | 0.90% | 0.90%(c) | (0.33%) | 63% | $8,071 |
| Year Ended 8/31/2019 | $26.43 | 3.08% | 0.92% | 0.92% | (0.06%) | 89% | $17,075 |
| Year Ended 8/31/2018 | $31.71 | 22.50% | 0.91% | 0.91%(c) | (0.16%) | 140% | $15,488 |
| Class C | |||||||
| Year Ended 8/31/2022 | $12.02 | (29.50%) | 1.88% | 1.88%(c) | (1.56%) | 70% | $6,073 |
| Year Ended 8/31/2021 | $23.12 | 37.28% | 1.86%(d) | 1.86%(c),(d) | (1.57%) | 82% | $9,886 |
| Year Ended 8/31/2020 | $20.72 | 25.67% | 1.90% | 1.90%(c) | (1.32%) | 63% | $11,759 |
| Year Ended 8/31/2019 | $18.48 | 2.03% | 1.92% | 1.92% | (1.05%) | 89% | $12,863 |
| Year Ended 8/31/2018 | $23.99 | 21.27% | 1.91% | 1.91%(c) | (1.15%) | 140% | $17,458 |
| Institutional Class | |||||||
| Year Ended 8/31/2022 | $20.95 | (28.78%) | 0.88% | 0.88%(c) | (0.56%) | 70% | $607,008 |
| Year Ended 8/31/2021 | $35.68 | 38.67% | 0.86%(d) | 0.86%(c),(d) | (0.58%) | 82% | $965,229 |
| Year Ended 8/31/2020 | $29.83 | 26.92% | 0.90% | 0.90%(c) | (0.33%) | 63% | $748,236 |
| Year Ended 8/31/2019 | $25.49 | 3.07% | 0.92% | 0.92% | (0.05%) | 89% | $652,043 |
| Year Ended 8/31/2018 | $30.80 | 22.49% | 0.91% | 0.91%(c) | (0.13%) | 140% | $758,444 |
| Institutional 2 Class | |||||||
| Year Ended 8/31/2022 | $21.31 | (28.75%) | 0.83% | 0.83% | (0.51%) | 70% | $34,937 |
| Year Ended 8/31/2021 | $36.18 | 38.73% | 0.82%(d) | 0.82%(d) | (0.53%) | 82% | $49,076 |
| Year Ended 8/31/2020 | $30.19 | 27.05% | 0.84% | 0.84% | (0.26%) | 63% | $43,423 |
| Year Ended 8/31/2019 | $25.75 | 3.11% | 0.84% | 0.84% | 0.02% | 89% | $46,284 |
| Year Ended 8/31/2018 | $31.06 | 22.60% | 0.83% | 0.83% | (0.06%) | 140% | $48,792 |
| Columbia Select Mid Cap Growth Fund | Annual Report 2022 | 17 |
| Net asset value, beginning of period | Net investment income (loss) | Net realized and unrealized gain (loss) | Total from investment operations | Distributions from net realized gains | Total distributions to shareholders | |
| Institutional 3 Class | ||||||
| Year Ended 8/31/2022 | $36.23 | (0.12) | (8.65) | (8.77) | (6.11) | (6.11) |
| Year Ended 8/31/2021 | $30.22 | (0.16) | 10.81 | 10.65 | (4.64) | (4.64) |
| Year Ended 8/31/2020 | $25.77 | (0.06) | 6.65 | 6.59 | (2.14) | (2.14) |
| Year Ended 8/31/2019 | $31.07 | 0.02 | 0.16 | 0.18 | (5.48) | (5.48) |
| Year Ended 8/31/2018 | $28.74 | (0.00)(f) | 5.94 | 5.94 | (3.61) | (3.61) |
| Class R | ||||||
| Year Ended 8/31/2022 | $29.74 | (0.23) | (6.81) | (7.04) | (5.99) | (5.99) |
| Year Ended 8/31/2021 | $25.55 | (0.29) | 8.97 | 8.68 | (4.49) | (4.49) |
| Year Ended 8/31/2020 | $22.22 | (0.18) | 5.65 | 5.47 | (2.14) | (2.14) |
| Year Ended 8/31/2019 | $27.64 | (0.12) | 0.07 | (0.05) | (5.37) | (5.37) |
| Year Ended 8/31/2018 | $25.93 | (0.16) | 5.31 | 5.15 | (3.44) | (3.44) |
| Class V | ||||||
| Year Ended 8/31/2022 | $31.78 | (0.18) | (7.40) | (7.58) | (6.04) | (6.04) |
| Year Ended 8/31/2021 | $27.02 | (0.24) | 9.56 | 9.32 | (4.56) | (4.56) |
| Year Ended 8/31/2020 | $23.33 | (0.14) | 5.97 | 5.83 | (2.14) | (2.14) |
| Year Ended 8/31/2019 | $28.71 | (0.07) | 0.10 | 0.03 | (5.41) | (5.41) |
| Year Ended 8/31/2018 | $26.81 | (0.10) | 5.51 | 5.41 | (3.51) | (3.51) |
| Notes to Financial Highlights | |
| (a) | In addition to the fees and expenses that the Fund bears directly, the Fund indirectly bears a pro rata share of the fees and expenses of any other funds in which it invests. Such indirect expenses are not included in the Fund’s reported expense ratios. |
| (b) | Total net expenses include the impact of certain fee waivers/expense reimbursements made by the Investment Manager and certain of its affiliates, if applicable. |
| (c) | The benefits derived from expense reductions had an impact of less than 0.01%. |
| (d) | Ratios include interfund lending expense which is less than 0.01%. |
| (e) | Calculation of the net gain (loss) per share (both realized and unrealized) does not correlate to the aggregate realized and unrealized gain (loss) presented in the Statement of Operations due to the timing of subscriptions and redemptions of Fund shares in relation to fluctuations in the market value of the portfolio. |
| (f) | Rounds to zero. |
| 18 | Columbia Select Mid Cap Growth Fund | Annual Report 2022 |
| Net asset value, end of period | Total return | Total gross expense ratio to average net assets(a) | Total net expense ratio to average net assets(a),(b) | Net investment income (loss) ratio to average net assets | Portfolio turnover | Net assets, end of period (000’s) | |
| Institutional 3 Class | |||||||
| Year Ended 8/31/2022 | $21.35 | (28.71%) | 0.78% | 0.78% | (0.46%) | 70% | $81,229 |
| Year Ended 8/31/2021 | $36.23 | 38.80% | 0.77%(d) | 0.77%(d) | (0.48%) | 82% | $123,615 |
| Year Ended 8/31/2020 | $30.22 | 27.07% | 0.79% | 0.79% | (0.22%) | 63% | $95,842 |
| Year Ended 8/31/2019 | $25.77 | 3.18% | 0.79% | 0.79% | 0.08% | 89% | $86,115 |
| Year Ended 8/31/2018 | $31.07 | 22.66% | 0.78% | 0.78% | (0.01%) | 140% | $135,728 |
| Class R | |||||||
| Year Ended 8/31/2022 | $16.71 | (29.11%) | 1.38% | 1.38%(c) | (1.06%) | 70% | $5,333 |
| Year Ended 8/31/2021 | $29.74 | 37.94% | 1.36%(d) | 1.36%(c),(d) | (1.08%) | 82% | $10,376 |
| Year Ended 8/31/2020 | $25.55 | 26.31% | 1.40% | 1.40%(c) | (0.82%) | 63% | $7,717 |
| Year Ended 8/31/2019 | $22.22 | 2.56% | 1.42% | 1.42% | (0.55%) | 89% | $10,593 |
| Year Ended 8/31/2018 | $27.64 | 21.89% | 1.41% | 1.41%(c) | (0.63%) | 140% | $13,414 |
| Class V | |||||||
| Year Ended 8/31/2022 | $18.16 | (28.96%) | 1.13% | 1.13%(c) | (0.81%) | 70% | $19,715 |
| Year Ended 8/31/2021 | $31.78 | 38.32% | 1.11%(d) | 1.11%(c),(d) | (0.83%) | 82% | $31,936 |
| Year Ended 8/31/2020 | $27.02 | 26.61% | 1.15% | 1.15%(c) | (0.57%) | 63% | $25,875 |
| Year Ended 8/31/2019 | $23.33 | 2.83% | 1.17% | 1.17% | (0.31%) | 89% | $23,279 |
| Year Ended 8/31/2018 | $28.71 | 22.19% | 1.16% | 1.16%(c) | (0.37%) | 140% | $25,566 |
| Columbia Select Mid Cap Growth Fund | Annual Report 2022 | 19 |
August 31, 2022
| 20 | Columbia Select Mid Cap Growth Fund | Annual Report 2022 |
August 31, 2022
| Columbia Select Mid Cap Growth Fund | Annual Report 2022 | 21 |
August 31, 2022
| 22 | Columbia Select Mid Cap Growth Fund | Annual Report 2022 |
August 31, 2022
| Effective rate (%) | |
| Class A | 0.11 |
| Advisor Class | 0.11 |
| Class C | 0.11 |
| Institutional Class | 0.11 |
| Institutional 2 Class | 0.06 |
| Institutional 3 Class | 0.01 |
| Class R | 0.10 |
| Class V | 0.11 |
| Columbia Select Mid Cap Growth Fund | Annual Report 2022 | 23 |
August 31, 2022
| Front End (%) | CDSC (%) | Amount ($) | |
| Class A | 5.75 | 0.50 - 1.00(a) | 192,844 |
| Class C | — | 1.00(b) | 196 |
| Class V | 5.75 | 0.50 - 1.00(a) | 484 |
| (a) | This charge is imposed on certain investments of between $1 million and $50 million redeemed within 18 months after purchase, as follows: 1.00% if redeemed within 12 months after purchase, and 0.50% if redeemed more than 12, but less than 18, months after purchase, with certain limited exceptions. |
| (b) | This charge applies to redemptions within 12 months after purchase, with certain limited exceptions. |
| January 1, 2022 through December 31, 2023 | Prior to January 1, 2022 | |
| Class A | 1.20% | 1.20% |
| Advisor Class | 0.95 | 0.95 |
| Class C | 1.95 | 1.95 |
| Institutional Class | 0.95 | 0.95 |
| Institutional 2 Class | 0.91 | 0.90 |
| Institutional 3 Class | 0.86 | 0.86 |
| Class R | 1.45 | 1.45 |
| Class V | 1.20 | 1.20 |
| 24 | Columbia Select Mid Cap Growth Fund | Annual Report 2022 |
August 31, 2022
| Excess of distributions over net investment income ($) | Accumulated net realized (loss) ($) | Paid in capital ($) |
| 5,625,652 | 145,193 | (5,770,845) |
| Year Ended August 31, 2022 | Year Ended August 31, 2021 | ||||
| Ordinary income ($) | Long-term capital gains ($) | Total ($) | Ordinary income ($) | Long-term capital gains ($) | Total ($) |
| 99,503,002 | 319,134,954 | 418,637,956 | 42,144,230 | 248,938,280 | 291,082,510 |
| Undistributed ordinary income ($) | Undistributed long-term capital gains ($) | Capital loss carryforwards ($) | Net unrealized appreciation ($) |
| — | — | — | 25,707,718 |
| Federal tax cost ($) | Gross unrealized appreciation ($) | Gross unrealized (depreciation) ($) | Net unrealized appreciation ($) |
| 1,450,104,336 | 216,510,457 | (190,802,739) | 25,707,718 |
| Columbia Select Mid Cap Growth Fund | Annual Report 2022 | 25 |
August 31, 2022
| Late year ordinary losses ($) | Post-October capital losses ($) |
| 7,172,963 | 43,200,381 |
| Borrower or lender | Average loan balance ($) | Weighted average interest rate (%) | Number of days with outstanding loans |
| Lender | 1,400,000 | 0.70 | 6 |
| 26 | Columbia Select Mid Cap Growth Fund | Annual Report 2022 |
August 31, 2022
| Shares | |
| Class A | 727,078 |
| Advisor Class | 61,087 |
| ($) | |
| Net investment loss | (12,840,000) |
| Net realized gain | 16,706,000 |
| Net change in unrealized appreciation/(depreciation) | (654,550,000) |
| Net decrease in net assets from operations | (650,684,000) |
| Columbia Select Mid Cap Growth Fund | Annual Report 2022 | 27 |
August 31, 2022
| 28 | Columbia Select Mid Cap Growth Fund | Annual Report 2022 |
August 31, 2022
| Columbia Select Mid Cap Growth Fund | Annual Report 2022 | 29 |
| 30 | Columbia Select Mid Cap Growth Fund | Annual Report 2022 |
| Qualified dividend income | Dividends received deduction | Capital gain dividend |
| 4.18% | 4.04% | $60,293,275 |
| Name, address, year of birth | Position held with the Columbia Funds and length of service | Principal occupation(s) during past five years and other relevant professional experience | Number of Funds in the Columbia Funds Complex* overseen | Other directorships held by Trustee during the past five years |
| George S. Batejan c/o Columbia Management Investment Advisers, LLC 290 Congress Street Boston, MA 02210 1953 | Trustee since 2017 | Executive Vice President, Global Head of Technology and Operations, Janus Capital Group, Inc., 2010-2016 | 176 | Former Chairman of the Board, NICSA (National Investment Company Services Association) (Executive Committee, Nominating Committee and Governance Committee), 2014-2016; former Director, Intech Investment Management, 2011-2016; former Board Member, Metro Denver Chamber of Commerce, 2015-2016; former Advisory Board Member, University of Colorado Business School, 2015-2018 |
| Columbia Select Mid Cap Growth Fund | Annual Report 2022 | 31 |
(Unaudited)
Independent trustees (continued)
| Name, address, year of birth | Position held with the Columbia Funds and length of service | Principal occupation(s) during past five years and other relevant professional experience | Number of Funds in the Columbia Funds Complex* overseen | Other directorships held by Trustee during the past five years |
| Kathleen Blatz c/o Columbia Management Investment Advisers, LLC 290 Congress Street Boston, MA 02210 1954 | Trustee since 2006 | Attorney, specializing in arbitration and mediation; Chief Justice, Minnesota Supreme Court, 1998-2006; Associate Justice, Minnesota Supreme Court, 1996-1998; Fourth Judicial District Court Judge, Hennepin County, 1994-1996; Attorney in private practice and public service, 1984-1993; State Representative, Minnesota House of Representatives, 1979-1993, which included service on the Tax and Financial Institutions and Insurance Committees; Member and Interim Chair, Minnesota Sports Facilities Authority, January 2017-July 2017; Interim President and Chief Executive Officer, Blue Cross and Blue Shield of Minnesota (health care insurance), February-July 2018, April-October 2021 | 176 | Former Trustee, Blue Cross and Blue Shield of Minnesota, 2009-2021 (Chair of the Business Development Committee, 2014-2017; Chair of the Governance Committee, 2017-2019); former Member and Chair of the Board, Minnesota Sports Facilities Authority, January 2017-July 2017; former Director, Robina Foundation, 2009-2020 (Chair, 2014-2020); Director, Schulze Family Foundation, since 2021 |
| Pamela G. Carlton c/o Columbia Management Investment Advisers, LLC 290 Congress Street Boston, MA 02210 1954 | Trustee since 2007 | President, Springboard — Partners in Cross Cultural Leadership (consulting company) since 2003; Managing Director of US Equity Research, JP Morgan Chase, 1999-2003; Director of US Equity Research, Chase Asset Management, 1996-1999; Co-Director Latin America Research, 1993-1996, COO Global Research, 1992-1996, Co-Director of US Research, 1991-1992, Investment Banker, 1982-1991, Morgan Stanley; Attorney, Cleary Gottlieb Steen & Hamilton LLP, 1980-1982 | 176 | Trustee, New York Presbyterian Hospital Board (Executive Committee and Chair of People Committee) since 1996; Director, DR Bank (Audit Committee) since 2017; Director, Evercore Inc. (Audit Committee) since 2019; Director, Apollo Commercial Real Estate Finance, Inc. since 2021; the Governing Council of the Independent Directors Council (IDC), since 2021 |
| Janet Langford Carrig c/o Columbia Management Investment Advisers, LLC 290 Congress Street Boston, MA 02210 1957 | Trustee since 1996 | Senior Vice President, General Counsel and Corporate Secretary, ConocoPhillips (independent energy company), September 2007-October 2018 | 174 | Director, EQT Corporation (natural gas producer) since 2019; former Director, Whiting Petroleum Corporation (independent oil and gas company), 2020-2022 |
| J. Kevin Connaughton c/o Columbia Management Investment Advisers, LLC 290 Congress Street Boston, MA 02210 1964 | Trustee since 2020 | Member, FINRA National Adjudicatory Council since January 2020; Adjunct Professor of Finance, Bentley University since January 2018; Consultant to Independent Trustees of CFVIT and CFST I from March 2016 to June 2020 with respect to CFVIT and to December 2020 with respect to CFST I; Managing Director and General Manager of Mutual Fund Products, Columbia Management Investment Advisers, LLC, May 2010-February 2015; President, Columbia Funds, 2008-2015; and senior officer of Columbia Funds and affiliated funds, 2003-2015 | 174 | Former Director, The Autism Project, March 2015-December 2021; former Member of the Investment Committee, St. Michael’s College, November 2015-February 2020; former Trustee, St. Michael’s College, June 2017-September 2019; former Trustee, New Century Portfolios, January 2015-December 2017 |
| 32 | Columbia Select Mid Cap Growth Fund | Annual Report 2022 |
(Unaudited)
Independent trustees (continued)
| Name, address, year of birth | Position held with the Columbia Funds and length of service | Principal occupation(s) during past five years and other relevant professional experience | Number of Funds in the Columbia Funds Complex* overseen | Other directorships held by Trustee during the past five years |
| Olive M. Darragh c/o Columbia Management Investment Advisers, LLC 290 Congress Street Boston, MA 02210 1962 | Trustee since 2020 | Managing Director of Darragh Inc. (strategy and talent management consulting firm) since 2010; Founder and CEO, Zolio, Inc. (investment management talent identification platform) since 2004; Consultant to Independent Trustees of CFVIT and CFST I from June 2019 to June 2020 with respect to CFVIT and to December 2020 with respect to CFST I; Partner, Tudor Investments, 2004-2010; Senior Partner, McKinsey & Company (consulting), 1990-2004; Touche Ross CPA, 1985-1988 | 174 | Former Director, University of Edinburgh Business School (Member of US Board); former Director, Boston Public Library Foundation |
| Patricia M. Flynn c/o Columbia Management Investment Advisers, LLC 290 Congress Street Boston, MA 02210 1950 | Trustee since 2004 | Trustee Professor of Economics and Management, Bentley University since 1976 (also teaches and conducts research on corporate governance); Dean, McCallum Graduate School of Business, Bentley University, 1992-2002 | 176 | Trustee, MA Taxpayers Foundation since 1997; former Board of Governors, Innovation Institute, MA Technology Collaborative, 2010-2020; former Board of Directors, The MA Business Roundtable, 2003-2019 |
| Brian J. Gallagher c/o Columbia Management Investment Advisers, LLC 290 Congress Street Boston, MA 02210 1954 | Trustee since 2017 | Retired; Partner with Deloitte & Touche LLP and its predecessors, 1977-2016 | 176 | Trustee, Catholic Schools Foundation since 2004 |
| Douglas A. Hacker c/o Columbia Management Investment Advisers, LLC 290 Congress Street Boston, MA 02210 1955 | Co-Chair since 2021; Chair of CFST I and CFVIT since 2014; Trustee of CFST I and CFVIT since 1996 and CFST, CFST II, CFVST II, CET I and CET II since 2021 | Independent business executive since May 2006; Executive Vice President – Strategy of United Airlines, December 2002 - May 2006; President of UAL Loyalty Services (airline marketing company), September 2001-December 2002; Executive Vice President and Chief Financial Officer of United Airlines, July 1999-September 2001 | 176 | Director, Spartan Nash Company (food distributor); Director, Aircastle Limited (Chair of Audit Committee) (aircraft leasing); former Director, Nash Finch Company (food distributor), 2005-2013; former Director, SeaCube Container Leasing Ltd. (container leasing), 2010-2013; and former Director, Travelport Worldwide Limited (travel information technology), 2014-2019 |
| Nancy T. Lukitsh c/o Columbia Management Investment Advisers, LLC 290 Congress Street Boston, MA 02210 1956 | Trustee since 2011 | Senior Vice President, Partner and Director of Marketing, Wellington Management Company, LLP (investment adviser), 1997-2010; Chair, Wellington Management Portfolios (commingled non-U.S. investment pools), 2007 -2010; Director, Wellington Trust Company, NA and other Wellington affiliates, 1997-2010 | 174 | None |
| Columbia Select Mid Cap Growth Fund | Annual Report 2022 | 33 |
(Unaudited)
Independent trustees (continued)
| Name, address, year of birth | Position held with the Columbia Funds and length of service | Principal occupation(s) during past five years and other relevant professional experience | Number of Funds in the Columbia Funds Complex* overseen | Other directorships held by Trustee during the past five years |
| David M. Moffett c/o Columbia Management Investment Advisers, LLC 290 Congress Street Boston, MA 02210 1952 | Trustee since 2011 | Retired; Consultant to Bridgewater and Associates | 174 | Director, CSX Corporation (transportation suppliers); Director, Genworth Financial, Inc. (financial and insurance products and services); Director, PayPal Holdings Inc. (payment and data processing services); Trustee, University of Oklahoma Foundation; former Director, eBay Inc. (online trading community), 2007-2015; and former Director, CIT Bank, CIT Group Inc. (commercial and consumer finance), 2010-2016 |
| Catherine James Paglia c/o Columbia Management Investment Advisers, LLC 290 Congress Street Boston, MA 02210 1952 | Co-Chair since 2021; Chair of CFST, CFST II, CFVST II, CET I and CET II since 2020; Trustee of CFST, CFST II and CFVST II since 2004 and CFST I and CFVIT since 2021 | Director, Enterprise Asset Management, Inc. (private real estate and asset management company) since September 1998; Managing Director and Partner, Interlaken Capital, Inc., 1989-1997; Vice President, 1982-1985, Principal, 1985-1987, Managing Director, 1987-1989, Morgan Stanley; Vice President, Investment Banking, 1980-1982, Associate, Investment Banking, 1976-1980, Dean Witter Reynolds, Inc. | 176 | Director, Valmont Industries, Inc. (irrigation systems manufacturer) since 2012; Trustee, Carleton College (on the Investment Committee); Trustee, Carnegie Endowment for International Peace (on the Investment Committee) |
| Minor M. Shaw c/o Columbia Management Investment Advisers, LLC 290 Congress Street Boston, MA 02210 1947 | Trustee since 2003 | President, Micco LLC (private investments) since 2011; President, Micco Corp. (family investment business), 1998-2011 | 176 | Director, Blue Cross Blue Shield of South Carolina (Chair of Compensation Committee) since April 2008; Trustee, Hollingsworth Funds (on the Investment Committee) since 2016 (previously Board Chair from 2016-2019); Former Advisory Board member, Duke Energy Corp., 2016-2020; Chair of the Duke Endowment; Chair of Greenville – Spartanburg Airport Commission; former Trustee, BofA Funds Series Trust (11 funds), 2003-2011; former Director, Piedmont Natural Gas, 2004-2016; former Director, National Association of Corporate Directors, Carolinas Chapter, 2013-2018; Chair, Daniel-Mickel Foundation since 1998 |
| 34 | Columbia Select Mid Cap Growth Fund | Annual Report 2022 |
(Unaudited)
Independent trustees (continued)
| Name, address, year of birth | Position held with the Columbia Funds and length of service | Principal occupation(s) during past five years and other relevant professional experience | Number of Funds in the Columbia Funds Complex* overseen | Other directorships held by Trustee during the past five years |
| Natalie A. Trunow c/o Columbia Management Investment Advisers, LLC 290 Congress Street Boston, MA 02210 1967 | Trustee since 2020 | Chief Executive Officer, Millennial Portfolio Solutions LLC (asset management and consulting services), January 2016-January 2021; Non-executive Member of the Investment Committee and Valuation Committee, Sarona Asset Management Inc. (private equity firm) since September 2019; Advisor, Horizon Investments (asset management and consulting services), August 2018-January 2021; Advisor, Paradigm Asset Management, November 2016-December 2021; Consultant to Independent Trustees of CFVIT and CFST I from September 2016 to June 2020 with respect to CFVIT and to December 2020 with respect to CFST I; Director of Investments/Consultant, Casey Family Programs, April 2016-November 2016; Senior Vice President and Chief Investment Officer, Calvert Investments, August 2008-January 2016; Section Head and Portfolio Manager, General Motors Asset Management, June 1997-August 2008 | 174 | Former Director, Investment Committee, Health Services for Children with Special Needs, Inc., 2012-2019; Director, Chair of Audit Committee, Consumer Credit Counseling Services (formerly Guidewell Financial Solutions), since 2019; Independent Director, Investment Committee and Valuation Committee, Sarona Asset Management, since 2019 |
| Sandra L. Yeager c/o Columbia Management Investment Advisers, LLC 290 Congress Street Boston, MA 02210 1964 | Trustee since 2017 | Retired; President and founder, Hanoverian Capital, LLC (SEC registered investment advisor firm), 2008-2016; Managing Director, DuPont Capital, 2006-2008; Managing Director, Morgan Stanley Investment Management, 2004-2006; Senior Vice President, Alliance Bernstein, 1990-2004 | 176 | Former Director, NAPE Education Foundation, October 2016-October 2020 |
| * | The term “Columbia Funds Complex” as used herein includes Columbia Seligman Premium Technology Growth Fund, Tri-Continental Corporation and each series of Columbia Fund Series Trust (CFST), Columbia Funds Series Trust I (CFST I), Columbia Funds Series Trust II (CFST II), Columbia ETF Trust I (CET I), Columbia ETF Trust II (CET II), Columbia Funds Variable Insurance Trust (CFVIT) and Columbia Funds Variable Series Trust II (CFVST II). Messrs. Batejan, Beckman, Gallagher and Hacker and Mses. Blatz, Carlton, Flynn, Paglia, Shaw and Yeager serve as Directors of Columbia Seligman Premium Technology Growth Fund and Tri-Continental Corporation. |
| Name, address, year of birth | Position held with the Columbia Funds and length of service | Principal occupation(s) during the past five years and other relevant professional experience | Number of Funds in the Columbia Funds Complex overseen | Other directorships held by Trustee during the past five years |
| Daniel J. Beckman c/o Columbia Management Investment Advisers, LLC 290 Congress Street Boston, MA 02210 1962 | Trustee since November 2021 and President since June 2021 | Vice President – Head of North America Product, Columbia Management Investment Advisers, LLC since April 2015; President and Principal Executive Officer of the Columbia Funds since June 2021; officer of Columbia Funds and affiliated funds, 2020-2021 | 176 | Director, Ameriprise Trust Company, since October 2016; Director, Columbia Management Investment Distributors, Inc. since November 2018; Board of Governors, Columbia Wanger Asset Management, LLC since January 2022 |
| * | Interested person (as defined under the 1940 Act) by reason of being an officer, director, security holder and/or employee of the Investment Manager or Ameriprise Financial. |
| Columbia Select Mid Cap Growth Fund | Annual Report 2022 | 35 |
(Unaudited)
The Statement of Additional Information has additional information about the Fund’s Board members and is available, without charge, upon request by calling 800.345.6611, visiting columbiathreadneedleus.com/investor/ or contacting your financial intermediary.
| Name, address and year of birth | Position and year first appointed to position for any Fund in the Columbia Funds Complex or a predecessor thereof | Principal occupation(s) during past five years |
| Michael G. Clarke 290 Congress Street Boston, MA 02210 1969 | Chief Financial Officer and Principal Financial Officer (2009) and Senior Vice President (2019) | Senior Vice President and Head of Global Operations & Investor Services, Columbia Management Investment Advisers, LLC, since March 2022 (previously Vice President, Head of North American Operations, and Co-Head of Global Operations, June 2019 to February 2022 and Vice President – Accounting and Tax, May 2010 - May 2019); senior officer of Columbia Funds and affiliated funds since 2002. |
| Joseph Beranek 5890 Ameriprise Financial Center Minneapolis, MN 55474 1965 | Treasurer and Chief Accounting Officer (Principal Accounting Officer) (2019) and Principal Financial Officer (2020), CFST, CFST I, CFST II, CFVIT and CFVST II; Assistant Treasurer, CET I and CET II | Vice President – Mutual Fund Accounting and Financial Reporting, Columbia Management Investment Advisers, LLC, since December 2018 and March 2017, respectively (previously Vice President – Pricing and Corporate Actions, May 2010 - March 2017). |
| Marybeth Pilat 290 Congress Street Boston, MA 02210 1968 | Treasurer and Chief Accounting Officer (Principal Accounting Officer) and Principal Financial Officer (2020) for CET I and CET II; Assistant Treasurer, CFST, CFST I, CFST II, CFVIT and CFVST II | Vice President – Product Pricing and Administration, Columbia Management Investment Advisers, LLC, since May 2017; Director - Fund Administration, Calvert Investments, August 2015 – March 2017; Vice President - Fund Administration, Legg Mason, May 2015 - July 2015; Vice President - Fund Administration, Columbia Management Investment Advisers, LLC, May 2010 - April 2015. |
| William F. Truscott 290 Congress Street Boston, MA 02210 1960 | Senior Vice President (2001) | Formerly, Trustee/Director of Columbia Funds Complex or legacy funds, November 2001-January 1, 2021; Chief Executive Officer, Global Asset Management, Ameriprise Financial, Inc. since September 2012; Chairman of the Board and President, Columbia Management Investment Advisers, LLC since July 2004 and February 2012, respectively; Chairman of the Board and Chief Executive Officer, Columbia Management Investment Distributors, Inc. since November 2008 and February 2012, respectively; Chairman of the Board and Director, Threadneedle Asset Management Holdings, Sàrl since March 2013 and December 2008, respectively; senior executive of various entities affiliated with Columbia Threadneedle. |
| Christopher O. Petersen 5228 Ameriprise Financial Center Minneapolis, MN 55474 1970 | Senior Vice President and Assistant Secretary (2021) | Formerly, Trustee/Director of funds within the Columbia Funds Complex, July 1, 2020 - November 22, 2021; Senior Vice President and Assistant General Counsel, Ameriprise Financial, Inc. since September 2021 (previously Vice President and Lead Chief Counsel, January 2015 - September 2021); formerly, President and Principal Executive Officer of the Columbia Funds, 2015 - 2021; officer of Columbia Funds and affiliated funds since 2007. |
| Thomas P. McGuire 290 Congress Street Boston, MA 02210 1972 | Senior Vice President and Chief Compliance Officer (2012) | Vice President – Asset Management Compliance, Ameriprise Financial, Inc., since May 2010; Chief Compliance Officer, Columbia Acorn/Wanger Funds since December 2015; formerly, Chief Compliance Officer, Ameriprise Certificate Company, September 2010 – September 2020. |
| 36 | Columbia Select Mid Cap Growth Fund | Annual Report 2022 |
(Unaudited)
Fund officers (continued)
| Name, address and year of birth | Position and year first appointed to position for any Fund in the Columbia Funds Complex or a predecessor thereof | Principal occupation(s) during past five years |
| Ryan C. Larrenaga 290 Congress Street Boston, MA 02210 1970 | Senior Vice President (2017), Chief Legal Officer (2017), and Secretary (2015) | Vice President and Chief Counsel, Ameriprise Financial, Inc. since August 2018 (previously Vice President and Group Counsel, August 2011 - August 2018); Chief Legal Officer, Columbia Acorn/Wanger Funds, since September 2020; officer of Columbia Funds and affiliated funds since 2005. |
| Michael E. DeFao 290 Congress Street Boston, MA 02210 1968 | Vice President (2011) and Assistant Secretary (2010) | Vice President and Chief Counsel, Ameriprise Financial, Inc. since May 2010; Vice President, Chief Legal Officer and Assistant Secretary, Columbia Management Investment Advisers, LLC since October 2021 (previously Vice President and Assistant Secretary, May 2010 – September 2021). |
| Lyn Kephart-Strong 5228 Ameriprise Financial Center Minneapolis, MN 55474 1960 | Vice President (2015) | President, Columbia Management Investment Services Corp. since October 2014; Vice President & Resolution Officer, Ameriprise Trust Company since August 2009. |
| • | the Fund had sufficient liquidity to both meet redemptions and operate effectively on behalf of shareholders; |
| • | there were no material changes to the Program during the period; |
| • | the implementation of the Program was effective to manage the Fund’s liquidity risk; and |
| • | the Program operated adequately during the period. |
| Columbia Select Mid Cap Growth Fund | Annual Report 2022 | 37 |
| • | Information on the investment performance of the Fund relative to the performance of a group of mutual funds determined to be comparable to the Fund by Broadridge, as well as performance relative to benchmarks; |
| • | Information on the Fund’s management fees and total expenses, including information comparing the Fund’s expenses to those of a group of comparable mutual funds, as determined by Broadridge; |
| • | The Investment Manager’s agreement to contractually limit or cap total operating expenses for the Fund so that total operating expenses (excluding certain fees and expenses, such as transaction costs and certain other investment related expenses, interest, taxes, acquired fund fees and expenses and infrequent and/or unusual expenses) would not exceed a specified annual rate, as a percentage of the Fund’s net assets; |
| • | Terms of the Management Agreement; |
| • | Descriptions of other agreements and arrangements with affiliates of the Investment Manager relating to the operations of the Fund, including agreements with respect to the provision of transfer agency and shareholder services to the Fund; |
| • | Descriptions of various services performed by the Investment Manager under the Management Agreement, including portfolio management and portfolio trading practices; |
| • | Information regarding any recently negotiated management fees of similarly-managed portfolios of other institutional clients of the Investment Manager; |
| • | Information regarding the resources of the Investment Manager, including information regarding senior management, portfolio managers and other personnel; |
| • | Information regarding the capabilities of the Investment Manager with respect to compliance monitoring services; |
| • | The profitability to the Investment Manager and its affiliates from their relationships with the Fund; and |
| • | Report provided by the Board’s independent fee consultant, JDL Consultants, LLC (JDL). |
| 38 | Columbia Select Mid Cap Growth Fund | Annual Report 2022 |
(Unaudited)
Following an analysis and discussion of the foregoing, and the factors identified below, the Board, including all of the Independent Trustees, approved the renewal of the Management Agreement.
| Columbia Select Mid Cap Growth Fund | Annual Report 2022 | 39 |
(Unaudited)
Comparative fees, costs of services provided and the profits realized by the Investment Manager and its affiliates from their relationships with the Fund
| 40 | Columbia Select Mid Cap Growth Fund | Annual Report 2022 |
(Unaudited)
On June 23, 2022, the Board, including all of the Independent Trustees, determined that fees payable under the Management Agreement were fair and reasonable in light of the extent and quality of services provided and approved the renewal of the Management Agreement.
| Columbia Select Mid Cap Growth Fund | Annual Report 2022 | 41 |
columbiathreadneedleus.com/investor/. The Fund is distributed by Columbia Management Investment Distributors, Inc., member FINRA, and managed by Columbia Management Investment Advisers, LLC.

August 31, 2022

| 3 | |
| 5 | |
| 7 | |
| 8 | |
| 12 | |
| 14 | |
| 15 | |
| 18 | |
| 22 | |
| 32 | |
| 33 | |
| 33 | |
| 39 | |
| 40 |
(Unaudited)
| Average annual total returns (%) (for the period ended August 31, 2022) | |||||
| Inception | 1 Year | 5 Years | 10 Years | ||
| Class A | Excluding sales charges | 11/01/05 | -40.10 | 11.02 | 11.88 |
| Including sales charges | -43.53 | 9.71 | 11.22 | ||
| Advisor Class* | 11/08/12 | -39.96 | 11.29 | 12.16 | |
| Class C | Excluding sales charges | 11/01/05 | -40.57 | 10.18 | 11.04 |
| Including sales charges | -41.09 | 10.18 | 11.04 | ||
| Institutional Class | 10/01/96 | -39.96 | 11.29 | 12.16 | |
| Institutional 2 Class* | 02/28/13 | -39.89 | 11.41 | 12.32 | |
| Institutional 3 Class | 07/15/09 | -39.88 | 11.46 | 12.34 | |
| Class R | 09/27/10 | -40.26 | 10.73 | 11.60 | |
| Russell 2000 Growth Index | -25.26 | 6.69 | 10.16 | ||
| Russell 2000 Index | -17.88 | 6.95 | 10.01 | ||
| * | The returns shown for periods prior to the share class inception date (including returns for the Life of the Fund, if shown, which are since Fund inception) include the returns of the Fund’s oldest share class. These returns are adjusted to reflect any higher class-related operating expenses of the newer share classes, as applicable. Please visit columbiathreadneedleus.com/investor/investment-products/mutual-funds/appended-performance for more information. |
| Columbia Small Cap Growth Fund | Annual Report 2022 | 3 |
(Unaudited)
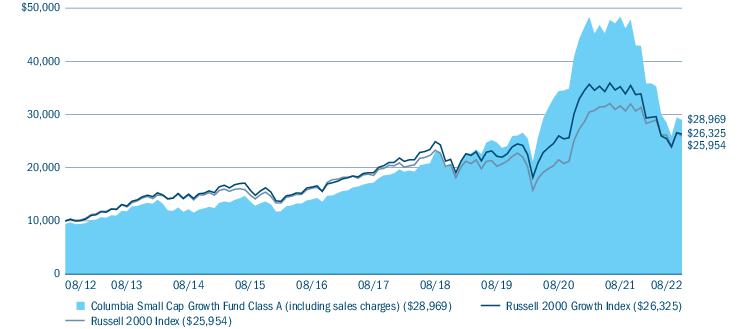
| Portfolio breakdown (%) (at August 31, 2022) | |
| Common Stocks | 99.2 |
| Money Market Funds | 0.8 |
| Total | 100.0 |
| Equity sector breakdown (%) (at August 31, 2022) | |
| Consumer Discretionary | 16.3 |
| Consumer Staples | 3.8 |
| Energy | 5.3 |
| Financials | 2.5 |
| Health Care | 32.1 |
| Industrials | 21.0 |
| Information Technology | 16.8 |
| Materials | 2.2 |
| Total | 100.0 |
| 4 | Columbia Small Cap Growth Fund | Annual Report 2022 |
(Unaudited)
| • | Selections within the health care, information technology, industrials, financials and consumer discretionary sector weighed most on Fund performance during the period. |
| • | From an allocation perspective, an overweight to the health care sector and an underweight to the energy sector detracted most. |
| • | Kornit Digital Ltd., an Israeli-American international company that manufactures, markets and services a range of digital printing applications for the textile industry, was the largest individual detractor during the period. Kornit experienced several years of robust demand for their equipment as Kornit’s customers scrambled to meet rocketing e-commerce demand. However, the recalibration of e-commerce growth coupled with macro headwinds resulted in a greater-than-expected pause in demand. |
| • | Heska Corp., a pet healthcare company, reported earnings that were below top- and bottom-line consensus. The company cited supply chain headwinds for the shortfall and negative impact on earnings. Analysts noted the company was reporting earnings compared to the same period from a year ago — a period which saw outsized growth due to pandemic-induced increased pet ownership and the resulting higher demand for veterinary services. |
| • | Caesars Entertainment, Inc. engages in the management of casinos and resorts under the Caesars, Harrah’s, Horseshoe and Eldorado brands. During the period, the company reported earnings that missed expectations driven by a wider-than-expected loss in the company’s digital segment. While the company has taken steps to rein in spending in both their digital and brick and mortar operations, the company carries a large debt load that investors have avoided in the current rising rate environment. |
| • | Selections with the materials and consumer staples sectors contributed to Fund performance during the period. |
| • | Underweight allocations to the communication services and real estate sectors were also additive. |
| • | Livent Corp. was the largest contributor to Fund performance relative to the benchmark during the period. Livent engages in the production of performance lithium compounds. Its products include battery-grade lithium hydroxide, butyllithium and purity lithium metal which are used in various performance applications. The company has benefited |
| Columbia Small Cap Growth Fund | Annual Report 2022 | 5 |
(Unaudited)
| from the increased demand for their lithium products used in electric vehicles as well as the higher price of the commodity. Livent is viewed as a large producer of high-quality lithium and has gained market share, as the safety of the company’s products has been demonstrated in the marketplace. | |
| • | Advanced Drainage Systems, Inc. engages in the manufacture of thermoplastic corrugated pipe, which provides a suite of water management products and drainage solutions for use in the construction and infrastructure marketplace. The company reported strong earnings growth during the period and has a considerable competitive advantage as the only plastic pipe manufacturer of scale. |
| • | Northern Oil and Gas, Inc. is an independent energy company engaged in the acquisition, exploration, exploitation, development, and production of crude oil and natural gas properties in the United States. The company delivered strong results during the period. |
| 6 | Columbia Small Cap Growth Fund | Annual Report 2022 |
(Unaudited)
| March 1, 2022 — August 31, 2022 | |||||||
| Account value at the beginning of the period ($) | Account value at the end of the period ($) | Expenses paid during the period ($) | Fund’s annualized expense ratio (%) | ||||
| Actual | Hypothetical | Actual | Hypothetical | Actual | Hypothetical | Actual | |
| Class A | 1,000.00 | 1,000.00 | 807.90 | 1,018.75 | 5.83 | 6.51 | 1.28 |
| Advisor Class | 1,000.00 | 1,000.00 | 809.00 | 1,020.01 | 4.70 | 5.24 | 1.03 |
| Class C | 1,000.00 | 1,000.00 | 804.50 | 1,014.97 | 9.23 | 10.31 | 2.03 |
| Institutional Class | 1,000.00 | 1,000.00 | 808.80 | 1,020.01 | 4.70 | 5.24 | 1.03 |
| Institutional 2 Class | 1,000.00 | 1,000.00 | 809.50 | 1,020.67 | 4.10 | 4.58 | 0.90 |
| Institutional 3 Class | 1,000.00 | 1,000.00 | 809.40 | 1,020.92 | 3.88 | 4.33 | 0.85 |
| Class R | 1,000.00 | 1,000.00 | 806.50 | 1,017.49 | 6.97 | 7.78 | 1.53 |
| Columbia Small Cap Growth Fund | Annual Report 2022 | 7 |
August 31, 2022
| Common Stocks 97.2% | ||
| Issuer | Shares | Value ($) |
| Consumer Discretionary 15.9% | ||
| Hotels, Restaurants & Leisure 10.7% | ||
| Caesars Entertainment, Inc.(a) | 453,135 | 19,539,181 |
| Churchill Downs, Inc. | 44,723 | 8,814,456 |
| Kura Sushi USA, Inc., Class A(a) | 157,313 | 11,760,720 |
| Papa John’s International, Inc. | 281,600 | 22,761,728 |
| Planet Fitness, Inc., Class A(a) | 984,123 | 66,674,333 |
| SeaWorld Entertainment, Inc.(a) | 400,124 | 20,106,231 |
| Texas Roadhouse, Inc. | 111,443 | 9,891,681 |
| Wingstop, Inc. | 122,163 | 13,909,479 |
| Total | 173,457,809 | |
| Internet & Direct Marketing Retail 1.2% | ||
| Xometry, Inc., Class A(a) | 381,520 | 18,698,295 |
| Specialty Retail 4.0% | ||
| Asbury Automotive Group, Inc.(a) | 50,273 | 8,771,633 |
| Five Below, Inc.(a) | 63,053 | 8,063,218 |
| Floor & Decor Holdings, Inc.(a) | 347,114 | 28,241,195 |
| Lithia Motors, Inc., Class A | 74,976 | 19,901,629 |
| Total | 64,977,675 | |
| Total Consumer Discretionary | 257,133,779 | |
| Consumer Staples 3.7% | ||
| Beverages 1.4% | ||
| Celsius Holdings, Inc.(a) | 213,341 | 22,078,660 |
| Food & Staples Retailing 2.3% | ||
| BJ’s Wholesale Club Holdings, Inc.(a) | 500,047 | 37,248,501 |
| Total Consumer Staples | 59,327,161 | |
| Energy 5.2% | ||
| Oil, Gas & Consumable Fuels 5.2% | ||
| Antero Resources Corp.(a) | 709,955 | 28,454,996 |
| Matador Resources Co. | 237,171 | 14,135,392 |
| Northern Oil and Gas, Inc. | 1,294,576 | 40,960,385 |
| Total | 83,550,773 | |
| Total Energy | 83,550,773 | |
| Common Stocks (continued) | ||
| Issuer | Shares | Value ($) |
| Financials 2.4% | ||
| Banks 1.5% | ||
| Live Oak Bancshares, Inc. | 470,476 | 17,050,050 |
| Triumph Bancorp, Inc.(a) | 120,239 | 7,443,997 |
| Total | 24,494,047 | |
| Capital Markets 0.5% | ||
| Open Lending Corp., Class A(a) | 791,712 | 7,687,523 |
| Insurance 0.4% | ||
| Goosehead Insurance, Inc., Class A(a) | 136,534 | 7,099,768 |
| Total Financials | 39,281,338 | |
| Health Care 31.2% | ||
| Biotechnology 4.3% | ||
| Arrowhead Pharmaceuticals, Inc.(a) | 250,999 | 9,967,170 |
| Intellia Therapeutics, Inc.(a) | 140,190 | 8,419,812 |
| Iovance Biotherapeutics, Inc.(a) | 526,820 | 5,647,510 |
| Natera, Inc.(a) | 564,288 | 27,796,827 |
| Revolution Medicines, Inc.(a) | 436,158 | 9,085,171 |
| Vericel Corp.(a) | 366,846 | 9,152,808 |
| Total | 70,069,298 | |
| Health Care Equipment & Supplies 9.0% | ||
| Axonics, Inc.(a) | 792,468 | 57,255,813 |
| BioLife Solutions, Inc.(a) | 742,728 | 17,535,808 |
| Heska Corp.(a) | 375,208 | 34,170,192 |
| ICU Medical, Inc.(a) | 121,530 | 19,323,270 |
| Inspire Medical Systems, Inc.(a) | 93,581 | 17,919,826 |
| Total | 146,204,909 | |
| Health Care Providers & Services 7.4% | ||
| Addus HomeCare Corp.(a) | 271,253 | 24,201,193 |
| Amedisys, Inc.(a) | 250,369 | 29,656,208 |
| Chemed Corp. | 138,505 | 65,954,696 |
| Total | 119,812,097 | |
| Health Care Technology 2.2% | ||
| Doximity, Inc., Class A(a) | 798,219 | 26,492,889 |
| Sharecare, Inc.(a) | 4,887,545 | 8,944,207 |
| Total | 35,437,096 | |
| 8 | Columbia Small Cap Growth Fund | Annual Report 2022 |
August 31, 2022
| Common Stocks (continued) | ||
| Issuer | Shares | Value ($) |
| Life Sciences Tools & Services 8.3% | ||
| Bio-Techne Corp. | 133,976 | 44,454,577 |
| Caris Life Sciences, Inc.(a),(b),(c),(d) | 2,777,778 | 9,416,667 |
| Codexis, Inc.(a) | 1,566,944 | 10,984,277 |
| DNA Script(a),(b),(c),(d) | 11,675 | 4,621,429 |
| Olink Holding AB ADR(a) | 613,604 | 9,289,965 |
| Repligen Corp.(a) | 253,167 | 55,537,245 |
| Total | 134,304,160 | |
| Total Health Care | 505,827,560 | |
| Industrials 20.4% | ||
| Aerospace & Defense 5.1% | ||
| Aerojet Rocketdyne Holdings, Inc.(a) | 536,815 | 23,120,622 |
| Axon Enterprise, Inc.(a) | 312,849 | 36,503,221 |
| Curtiss-Wright Corp. | 159,245 | 23,439,272 |
| Total | 83,063,115 | |
| Building Products 4.8% | ||
| Advanced Drainage Systems, Inc. | 404,500 | 54,890,650 |
| Simpson Manufacturing Co., Inc. | 254,726 | 23,597,817 |
| Total | 78,488,467 | |
| Machinery 7.8% | ||
| Evoqua Water Technologies Corp.(a) | 1,066,631 | 37,417,415 |
| Helios Technologies, Inc. | 487,656 | 26,635,771 |
| Hillman Solutions Corp.(a) | 2,460,000 | 20,639,400 |
| Kornit Digital Ltd.(a) | 678,826 | 21,097,912 |
| RBC Bearings, Inc.(a) | 85,588 | 20,599,320 |
| Total | 126,389,818 | |
| Trading Companies & Distributors 2.7% | ||
| SiteOne Landscape Supply, Inc.(a) | 345,044 | 43,185,707 |
| Total Industrials | 331,127,107 | |
| Information Technology 16.3% | ||
| Electronic Equipment, Instruments & Components 0.7% | ||
| 908 Devices, Inc.(a) | 580,853 | 11,704,188 |
| Common Stocks (continued) | ||
| Issuer | Shares | Value ($) |
| IT Services 0.9% | ||
| Flywire Corp.(a) | 590,117 | 14,670,309 |
| Semiconductors & Semiconductor Equipment 3.9% | ||
| Onto Innovation, Inc.(a) | 662,704 | 47,045,357 |
| SiTime Corp.(a) | 146,963 | 15,638,333 |
| Total | 62,683,690 | |
| Software 10.8% | ||
| Bill.com Holdings, Inc.(a) | 254,243 | 41,156,857 |
| Five9, Inc.(a) | 463,973 | 45,520,391 |
| LiveVox Holdings, Inc.(a) | 2,839,934 | 6,077,459 |
| Paylocity Holding Corp.(a) | 265,889 | 64,079,249 |
| Workiva, Inc., Class A(a) | 277,748 | 18,856,311 |
| Total | 175,690,267 | |
| Total Information Technology | 264,748,454 | |
| Materials 2.1% | ||
| Chemicals 2.1% | ||
| Livent Corp.(a) | 1,054,132 | 33,921,968 |
| Total Materials | 33,921,968 | |
| Total Common Stocks (Cost $1,681,463,073) | 1,574,918,140 | |
| Money Market Funds 0.8% | ||
| Shares | Value ($) | |
| Columbia Short-Term Cash Fund, 2.366%(e),(f) | 13,480,001 | 13,473,261 |
| Total Money Market Funds (Cost $13,472,422) | 13,473,261 | |
| Total Investments in Securities (Cost: $1,694,935,495) | 1,588,391,401 | |
| Other Assets & Liabilities, Net | 32,345,526 | |
| Net Assets | 1,620,736,927 | |
| Columbia Small Cap Growth Fund | Annual Report 2022 | 9 |
August 31, 2022
| (a) | Non-income producing investment. |
| (b) | Represents fair value as determined in good faith under procedures approved by the Board of Trustees. At August 31, 2022, the total value of these securities amounted to $14,038,096, which represents 0.87% of total net assets. |
| (c) | Denotes a restricted security, which is subject to legal or contractual restrictions on resale under federal securities laws. Disposal of a restricted investment may involve time-consuming negotiations and expenses, and prompt sale at an acceptable price may be difficult to achieve. Private placement securities are generally considered to be restricted, although certain of those securities may be traded between qualified institutional investors under the provisions of Section 4(a)(2) and Rule 144A. The Fund will not incur any registration costs upon such a trade. These securities are valued at fair value determined in good faith under consistently applied procedures established by the Fund’s Board of Trustees. At August 31, 2022, the total market value of these securities amounted to $14,038,096, which represents 0.87% of total net assets. Additional information on these securities is as follows: |
| Security | Acquisition Dates | Shares | Cost ($) | Value ($) |
| Caris Life Sciences, Inc. | 05/11/2021 | 2,777,778 | 22,520,810 | 9,416,667 |
| DNA Script | 10/01/2021 | 11,675 | 10,180,303 | 4,621,429 |
| 32,701,113 | 14,038,096 |
| (d) | Valuation based on significant unobservable inputs. |
| (e) | The rate shown is the seven-day current annualized yield at August 31, 2022. |
| (f) | As defined in the Investment Company Act of 1940, as amended, an affiliated company is one in which the Fund owns 5% or more of the company’s outstanding voting securities, or a company which is under common ownership or control with the Fund. The value of the holdings and transactions in these affiliated companies during the year ended August 31, 2022 are as follows: |
| Affiliated issuers | Beginning of period($) | Purchases($) | Sales($) | Net change in unrealized appreciation (depreciation)($) | End of period($) | Realized gain (loss)($) | Dividends($) | End of period shares |
| Columbia Short-Term Cash Fund, 2.366% | ||||||||
| 19,286,204 | 955,559,934 | (961,371,230) | (1,647) | 13,473,261 | (18,901) | 333,159 | 13,480,001 | |
| ADR | American Depositary Receipt |
| ■ | Level 1 — Valuations based on quoted prices for investments in active markets that the Fund has the ability to access at the measurement date. Valuation adjustments are not applied to Level 1 investments. |
| ■ | Level 2 — Valuations based on other significant observable inputs (including quoted prices for similar securities, interest rates, prepayment speeds, credit risks, etc.). |
| ■ | Level 3 — Valuations based on significant unobservable inputs (including the Fund’s own assumptions and judgment in determining the fair value of investments). |
| 10 | Columbia Small Cap Growth Fund | Annual Report 2022 |
August 31, 2022
The Committee meets at least monthly to review and approve valuation matters, which may include a description of specific valuation determinations, data regarding pricing information received from approved pricing vendors and brokers and the results of Board-approved valuation control policies and procedures (the Policies). The Policies address, among other things, instances when market quotations are or are not readily available, including recommendations of third party pricing vendors and a determination of appropriate pricing methodologies; events that require specific valuation determinations and assessment of fair value techniques; securities with a potential for stale pricing, including those that are illiquid, restricted, or in default; and the effectiveness of third party pricing vendors, including periodic reviews of vendors. The Committee meets more frequently, as needed, to discuss additional valuation matters, which may include the need to review back-testing results, review time-sensitive information or approve related valuation actions. The Committee reports to the Board, with members of the Committee meeting with the Board at each of its regularly scheduled meetings to discuss valuation matters and actions during the period, similar to those described earlier.
| Level 1 ($) | Level 2 ($) | Level 3 ($) | Total ($) | |
| Investments in Securities | ||||
| Common Stocks | ||||
| Consumer Discretionary | 257,133,779 | — | — | 257,133,779 |
| Consumer Staples | 59,327,161 | — | — | 59,327,161 |
| Energy | 83,550,773 | — | — | 83,550,773 |
| Financials | 39,281,338 | — | — | 39,281,338 |
| Health Care | 491,789,464 | — | 14,038,096 | 505,827,560 |
| Industrials | 331,127,107 | — | — | 331,127,107 |
| Information Technology | 264,748,454 | — | — | 264,748,454 |
| Materials | 33,921,968 | — | — | 33,921,968 |
| Total Common Stocks | 1,560,880,044 | — | 14,038,096 | 1,574,918,140 |
| Money Market Funds | 13,473,261 | — | — | 13,473,261 |
| Total Investments in Securities | 1,574,353,305 | — | 14,038,096 | 1,588,391,401 |
| Columbia Small Cap Growth Fund | Annual Report 2022 | 11 |
August 31, 2022
| Assets | |
| Investments in securities, at value | |
| Unaffiliated issuers (cost $1,681,463,073) | $1,574,918,140 |
| Affiliated issuers (cost $13,472,422) | 13,473,261 |
| Receivable for: | |
| Investments sold | 33,858,799 |
| Capital shares sold | 1,797,914 |
| Dividends | 200,779 |
| Prepaid expenses | 25,660 |
| Trustees’ deferred compensation plan | 144,180 |
| Total assets | 1,624,418,733 |
| Liabilities | |
| Payable for: | |
| Investments purchased | 1,199,037 |
| Capital shares purchased | 1,865,989 |
| Management services fees | 36,439 |
| Distribution and/or service fees | 3,284 |
| Transfer agent fees | 301,608 |
| Compensation of board members | 34,218 |
| Other expenses | 97,051 |
| Trustees’ deferred compensation plan | 144,180 |
| Total liabilities | 3,681,806 |
| Net assets applicable to outstanding capital stock | $1,620,736,927 |
| Represented by | |
| Paid in capital | 2,091,751,950 |
| Total distributable earnings (loss) | (471,015,023) |
| Total - representing net assets applicable to outstanding capital stock | $1,620,736,927 |
| 12 | Columbia Small Cap Growth Fund | Annual Report 2022 |
August 31, 2022
| Class A | |
| Net assets | $350,816,497 |
| Shares outstanding | 19,869,772 |
| Net asset value per share | $17.66 |
| Maximum sales charge | 5.75% |
| Maximum offering price per share (calculated by dividing the net asset value per share by 1.0 minus the maximum sales charge for Class A shares) | $18.74 |
| Advisor Class | |
| Net assets | $64,035,168 |
| Shares outstanding | 3,059,753 |
| Net asset value per share | $20.93 |
| Class C | |
| Net assets | $28,015,654 |
| Shares outstanding | 2,224,742 |
| Net asset value per share | $12.59 |
| Institutional Class | |
| Net assets | $769,676,675 |
| Shares outstanding | 39,654,353 |
| Net asset value per share | $19.41 |
| Institutional 2 Class | |
| Net assets | $55,108,403 |
| Shares outstanding | 2,789,430 |
| Net asset value per share | $19.76 |
| Institutional 3 Class | |
| Net assets | $345,911,948 |
| Shares outstanding | 17,225,322 |
| Net asset value per share | $20.08 |
| Class R | |
| Net assets | $7,172,582 |
| Shares outstanding | 420,602 |
| Net asset value per share | $17.05 |
| Columbia Small Cap Growth Fund | Annual Report 2022 | 13 |
Year Ended August 31, 2022
| Net investment income | |
| Income: | |
| Dividends — unaffiliated issuers | $3,656,330 |
| Dividends — affiliated issuers | 333,159 |
| Interfund lending | 1,402 |
| Total income | 3,990,891 |
| Expenses: | |
| Management services fees | 18,758,335 |
| Distribution and/or service fees | |
| Class A | 1,180,752 |
| Class C | 376,933 |
| Class R | 48,978 |
| Transfer agent fees | |
| Class A | 754,398 |
| Advisor Class | 169,662 |
| Class C | 60,280 |
| Institutional Class | 1,830,804 |
| Institutional 2 Class | 67,525 |
| Institutional 3 Class | 27,096 |
| Class R | 15,626 |
| Compensation of board members | 43,476 |
| Custodian fees | 22,166 |
| Printing and postage fees | 217,238 |
| Registration fees | 280,607 |
| Audit fees | 29,500 |
| Legal fees | 35,027 |
| Interest on interfund lending | 553 |
| Compensation of chief compliance officer | 698 |
| Other | 57,463 |
| Total expenses | 23,977,117 |
| Expense reduction | (2,018) |
| Total net expenses | 23,975,099 |
| Net investment loss | (19,984,208) |
| Realized and unrealized gain (loss) — net | |
| Net realized gain (loss) on: | |
| Investments — unaffiliated issuers | (351,101,286) |
| Investments — affiliated issuers | (18,901) |
| Foreign currency translations | (22,643) |
| Net realized loss | (351,142,830) |
| Net change in unrealized appreciation (depreciation) on: | |
| Investments — unaffiliated issuers | (892,662,101) |
| Investments — affiliated issuers | (1,647) |
| Net change in unrealized appreciation (depreciation) | (892,663,748) |
| Net realized and unrealized loss | (1,243,806,578) |
| Net decrease in net assets resulting from operations | $(1,263,790,786) |
| 14 | Columbia Small Cap Growth Fund | Annual Report 2022 |
| Year Ended August 31, 2022 | Year Ended August 31, 2021 | |
| Operations | ||
| Net investment loss | $(19,984,208) | $(22,643,971) |
| Net realized gain (loss) | (351,142,830) | 360,202,177 |
| Net change in unrealized appreciation (depreciation) | (892,663,748) | 404,393,727 |
| Net increase (decrease) in net assets resulting from operations | (1,263,790,786) | 741,951,933 |
| Distributions to shareholders | ||
| Net investment income and net realized gains | ||
| Class A | (57,492,433) | (37,457,376) |
| Advisor Class | (12,410,914) | (8,450,117) |
| Class C | (5,910,264) | (2,479,771) |
| Institutional Class | (136,485,916) | (73,253,029) |
| Institutional 2 Class | (17,426,341) | (10,189,693) |
| Institutional 3 Class | (45,889,170) | (18,841,542) |
| Class R | (1,203,822) | (578,530) |
| Total distributions to shareholders | (276,818,860) | (151,250,058) |
| Increase (decrease) in net assets from capital stock activity | (204,178,262) | 1,210,827,969 |
| Total increase (decrease) in net assets | (1,744,787,908) | 1,801,529,844 |
| Net assets at beginning of year | 3,365,524,835 | 1,563,994,991 |
| Net assets at end of year | $1,620,736,927 | $3,365,524,835 |
| Columbia Small Cap Growth Fund | Annual Report 2022 | 15 |
| Year Ended | Year Ended | |||
| August 31, 2022 | August 31, 2021 | |||
| Shares | Dollars ($) | Shares | Dollars ($) | |
| Capital stock activity | ||||
| Class A | ||||
| Subscriptions | 2,473,026 | 56,656,316 | 6,128,818 | 185,902,543 |
| Distributions reinvested | 1,898,399 | 50,307,569 | 1,177,743 | 33,271,231 |
| Redemptions | (4,844,423) | (110,340,811) | (3,504,891) | (106,517,260) |
| Net increase (decrease) | (472,998) | (3,376,926) | 3,801,670 | 112,656,514 |
| Advisor Class | ||||
| Subscriptions | 600,209 | 16,430,183 | 5,959,634 | 213,744,248 |
| Distributions reinvested | 384,942 | 12,071,778 | 251,704 | 8,276,024 |
| Redemptions | (2,747,685) | (77,859,742) | (4,293,820) | (152,349,421) |
| Net increase (decrease) | (1,762,534) | (49,357,781) | 1,917,518 | 69,670,851 |
| Class C | ||||
| Subscriptions | 515,889 | 8,935,276 | 1,286,398 | 29,654,984 |
| Distributions reinvested | 294,340 | 5,595,396 | 111,843 | 2,353,188 |
| Redemptions | (669,130) | (10,484,224) | (374,053) | (8,616,868) |
| Net increase | 141,099 | 4,046,448 | 1,024,188 | 23,391,304 |
| Institutional Class | ||||
| Subscriptions | 21,144,653 | 530,673,815 | 30,078,699 | 995,162,672 |
| Distributions reinvested | 3,767,302 | 109,553,154 | 1,910,816 | 58,662,040 |
| Redemptions | (31,695,388) | (761,043,563) | (14,095,962) | (469,131,093) |
| Net increase (decrease) | (6,783,433) | (120,816,594) | 17,893,553 | 584,693,619 |
| Institutional 2 Class | ||||
| Subscriptions | 275,940 | 6,876,592 | 7,700,703 | 260,780,151 |
| Distributions reinvested | 588,823 | 17,417,388 | 326,907 | 10,189,693 |
| Redemptions | (4,642,383) | (118,704,973) | (5,247,208) | (179,099,916) |
| Net increase (decrease) | (3,777,620) | (94,410,993) | 2,780,402 | 91,869,928 |
| Institutional 3 Class | ||||
| Subscriptions | 6,466,302 | 170,183,577 | 13,628,463 | 466,393,110 |
| Distributions reinvested | 1,434,744 | 43,114,069 | 548,269 | 17,336,259 |
| Redemptions | (5,955,910) | (153,259,675) | (4,749,632) | (162,149,574) |
| Net increase | 1,945,136 | 60,037,971 | 9,427,100 | 321,579,795 |
| Class R | ||||
| Subscriptions | 87,559 | 1,903,952 | 360,489 | 10,364,869 |
| Distributions reinvested | 46,933 | 1,203,822 | 21,083 | 578,530 |
| Redemptions | (154,475) | (3,408,161) | (132,909) | (3,977,441) |
| Net increase (decrease) | (19,983) | (300,387) | 248,663 | 6,965,958 |
| Total net increase (decrease) | (10,730,333) | (204,178,262) | 37,093,094 | 1,210,827,969 |
| 16 | Columbia Small Cap Growth Fund | Annual Report 2022 |
| Net asset value, beginning of period | Net investment income (loss) | Net realized and unrealized gain (loss) | Total from investment operations | Distributions from net realized gains | Total distributions to shareholders | |
| Class A | ||||||
| Year Ended 8/31/2022 | $32.70 | (0.25) | (11.90) | (12.15) | (2.89) | (2.89) |
| Year Ended 8/31/2021 | $25.05 | (0.31) | 10.14 | 9.83 | (2.18) | (2.18) |
| Year Ended 8/31/2020 | $19.72 | (0.18) | 7.28 | 7.10 | (1.77) | (1.77) |
| Year Ended 8/31/2019 | $22.05 | (0.15) | 1.12 | 0.97 | (3.30) | (3.30) |
| Year Ended 8/31/2018 | $19.46 | (0.15) | 5.87 | 5.72 | (3.13) | (3.13) |
| Advisor Class | ||||||
| Year Ended 8/31/2022 | $38.14 | (0.23) | (14.03) | (14.26) | (2.95) | (2.95) |
| Year Ended 8/31/2021 | $28.90 | (0.28) | 11.76 | 11.48 | (2.24) | (2.24) |
| Year Ended 8/31/2020 | $22.48 | (0.15) | 8.38 | 8.23 | (1.81) | (1.81) |
| Year Ended 8/31/2019 | $24.61 | (0.11) | 1.33 | 1.22 | (3.35) | (3.35) |
| Year Ended 8/31/2018 | $21.38 | (0.12) | 6.53 | 6.41 | (3.18) | (3.18) |
| Class C | ||||||
| Year Ended 8/31/2022 | $24.22 | (0.30) | (8.60) | (8.90) | (2.73) | (2.73) |
| Year Ended 8/31/2021 | $19.01 | (0.41) | 7.63 | 7.22 | (2.01) | (2.01) |
| Year Ended 8/31/2020 | $15.34 | (0.25) | 5.54 | 5.29 | (1.62) | (1.62) |
| Year Ended 8/31/2019 | $17.93 | (0.22) | 0.78 | 0.56 | (3.15) | (3.15) |
| Year Ended 8/31/2018 | $16.35 | (0.25) | 4.82 | 4.57 | (2.99) | (2.99) |
| Institutional Class | ||||||
| Year Ended 8/31/2022 | $35.61 | (0.21) | (13.04) | (13.25) | (2.95) | (2.95) |
| Year Ended 8/31/2021 | $27.10 | (0.26) | 11.01 | 10.75 | (2.24) | (2.24) |
| Year Ended 8/31/2020 | $21.20 | (0.14) | 7.85 | 7.71 | (1.81) | (1.81) |
| Year Ended 8/31/2019 | $23.42 | (0.11) | 1.24 | 1.13 | (3.35) | (3.35) |
| Year Ended 8/31/2018 | $20.49 | (0.11) | 6.22 | 6.11 | (3.18) | (3.18) |
| Institutional 2 Class | ||||||
| Year Ended 8/31/2022 | $36.17 | (0.20) | (13.24) | (13.44) | (2.97) | (2.97) |
| Year Ended 8/31/2021 | $27.49 | (0.24) | 11.18 | 10.94 | (2.26) | (2.26) |
| Year Ended 8/31/2020 | $21.47 | (0.13) | 7.98 | 7.85 | (1.83) | (1.83) |
| Year Ended 8/31/2019 | $23.68 | (0.09) | 1.26 | 1.17 | (3.38) | (3.38) |
| Year Ended 8/31/2018 | $20.68 | (0.09) | 6.29 | 6.20 | (3.20) | (3.20) |
| 18 | Columbia Small Cap Growth Fund | Annual Report 2022 |
| Net asset value, end of period | Total return | Total gross expense ratio to average net assets(a) | Total net expense ratio to average net assets(a),(b) | Net investment income (loss) ratio to average net assets | Portfolio turnover | Net assets, end of period (000’s) | |
| Class A | |||||||
| Year Ended 8/31/2022 | $17.66 | (40.10%) | 1.24%(c) | 1.24%(c),(d) | (1.07%) | 56% | $350,816 |
| Year Ended 8/31/2021 | $32.70 | 40.63% | 1.21% | 1.21%(d) | (1.03%) | 50% | $665,217 |
| Year Ended 8/31/2020 | $25.05 | 39.06% | 1.29%(c),(e) | 1.29%(c),(d),(e) | (0.89%) | 76% | $414,360 |
| Year Ended 8/31/2019 | $19.72 | 7.76% | 1.33%(c) | 1.33%(c) | (0.79%) | 113% | $265,473 |
| Year Ended 8/31/2018 | $22.05 | 33.62% | 1.35%(e) | 1.34%(d),(e) | (0.79%) | 156% | $249,156 |
| Advisor Class | |||||||
| Year Ended 8/31/2022 | $20.93 | (39.96%) | 0.99%(c) | 0.99%(c),(d) | (0.82%) | 56% | $64,035 |
| Year Ended 8/31/2021 | $38.14 | 40.97% | 0.96% | 0.96%(d) | (0.80%) | 50% | $183,909 |
| Year Ended 8/31/2020 | $28.90 | 39.42% | 1.04%(c),(e) | 1.04%(c),(d),(e) | (0.66%) | 76% | $83,934 |
| Year Ended 8/31/2019 | $22.48 | 8.05% | 1.07%(c) | 1.07%(c) | (0.54%) | 113% | $20,203 |
| Year Ended 8/31/2018 | $24.61 | 33.91% | 1.10%(e) | 1.09%(d),(e) | (0.53%) | 156% | $8,913 |
| Class C | |||||||
| Year Ended 8/31/2022 | $12.59 | (40.57%) | 1.99%(c) | 1.99%(c),(d) | (1.82%) | 56% | $28,016 |
| Year Ended 8/31/2021 | $24.22 | 39.58% | 1.96% | 1.96%(d) | (1.79%) | 50% | $50,471 |
| Year Ended 8/31/2020 | $19.01 | 38.03% | 2.04%(c),(e) | 2.04%(c),(d),(e) | (1.65%) | 76% | $20,142 |
| Year Ended 8/31/2019 | $15.34 | 6.93% | 2.08%(c) | 2.08%(c) | (1.54%) | 113% | $8,887 |
| Year Ended 8/31/2018 | $17.93 | 32.58% | 2.10%(e) | 2.09%(d),(e) | (1.54%) | 156% | $8,401 |
| Institutional Class | |||||||
| Year Ended 8/31/2022 | $19.41 | (39.96%) | 0.99%(c) | 0.99%(c),(d) | (0.82%) | 56% | $769,677 |
| Year Ended 8/31/2021 | $35.61 | 41.00% | 0.96% | 0.96%(d) | (0.79%) | 50% | $1,653,559 |
| Year Ended 8/31/2020 | $27.10 | 39.35% | 1.04%(c),(e) | 1.04%(c),(d),(e) | (0.65%) | 76% | $773,636 |
| Year Ended 8/31/2019 | $21.20 | 8.08% | 1.08%(c) | 1.08%(c) | (0.54%) | 113% | $283,781 |
| Year Ended 8/31/2018 | $23.42 | 33.91% | 1.10%(e) | 1.09%(d),(e) | (0.54%) | 156% | $226,120 |
| Institutional 2 Class | |||||||
| Year Ended 8/31/2022 | $19.76 | (39.89%) | 0.88%(c) | 0.88%(c) | (0.72%) | 56% | $55,108 |
| Year Ended 8/31/2021 | $36.17 | 41.11% | 0.88% | 0.88% | (0.72%) | 50% | $237,521 |
| Year Ended 8/31/2020 | $27.49 | 39.50% | 0.96%(c),(e) | 0.96%(c),(e) | (0.58%) | 76% | $104,108 |
| Year Ended 8/31/2019 | $21.47 | 8.16% | 0.97%(c) | 0.97%(c) | (0.45%) | 113% | $26,190 |
| Year Ended 8/31/2018 | $23.68 | 34.07% | 0.99%(e) | 0.98%(e) | (0.43%) | 156% | $21,024 |
| Columbia Small Cap Growth Fund | Annual Report 2022 | 19 |
| Net asset value, beginning of period | Net investment income (loss) | Net realized and unrealized gain (loss) | Total from investment operations | Distributions from net realized gains | Total distributions to shareholders | |
| Institutional 3 Class | ||||||
| Year Ended 8/31/2022 | $36.71 | (0.17) | (13.48) | (13.65) | (2.98) | (2.98) |
| Year Ended 8/31/2021 | $27.87 | (0.23) | 11.34 | 11.11 | (2.27) | (2.27) |
| Year Ended 8/31/2020 | $21.75 | (0.12) | 8.08 | 7.96 | (1.84) | (1.84) |
| Year Ended 8/31/2019 | $23.93 | (0.08) | 1.29 | 1.21 | (3.39) | (3.39) |
| Year Ended 8/31/2018 | $20.87 | (0.08) | 6.35 | 6.27 | (3.21) | (3.21) |
| Class R | ||||||
| Year Ended 8/31/2022 | $31.70 | (0.30) | (11.51) | (11.81) | (2.84) | (2.84) |
| Year Ended 8/31/2021 | $24.35 | (0.38) | 9.86 | 9.48 | (2.13) | (2.13) |
| Year Ended 8/31/2020 | $19.22 | (0.23) | 7.08 | 6.85 | (1.72) | (1.72) |
| Year Ended 8/31/2019 | $21.57 | (0.19) | 1.09 | 0.90 | (3.25) | (3.25) |
| Year Ended 8/31/2018 | $19.10 | (0.20) | 5.75 | 5.55 | (3.08) | (3.08) |
| Notes to Financial Highlights | |
| (a) | In addition to the fees and expenses that the Fund bears directly, the Fund indirectly bears a pro rata share of the fees and expenses of any other funds in which it invests. Such indirect expenses are not included in the Fund’s reported expense ratios. |
| (b) | Total net expenses include the impact of certain fee waivers/expense reimbursements made by the Investment Manager and certain of its affiliates, if applicable. |
| (c) | Ratios include interfund lending expense which is less than 0.01%. |
| (d) | The benefits derived from expense reductions had an impact of less than 0.01%. |
| (e) | Ratios include line of credit interest expense which is less than 0.01%. |
| 20 | Columbia Small Cap Growth Fund | Annual Report 2022 |
| Net asset value, end of period | Total return | Total gross expense ratio to average net assets(a) | Total net expense ratio to average net assets(a),(b) | Net investment income (loss) ratio to average net assets | Portfolio turnover | Net assets, end of period (000’s) | |
| Institutional 3 Class | |||||||
| Year Ended 8/31/2022 | $20.08 | (39.88%) | 0.84%(c) | 0.84%(c) | (0.66%) | 56% | $345,912 |
| Year Ended 8/31/2021 | $36.71 | 41.18% | 0.83% | 0.83% | (0.67%) | 50% | $560,880 |
| Year Ended 8/31/2020 | $27.87 | 39.55% | 0.90%(c),(e) | 0.90%(c),(e) | (0.52%) | 76% | $163,142 |
| Year Ended 8/31/2019 | $21.75 | 8.26% | 0.92%(c) | 0.92%(c) | (0.38%) | 113% | $66,685 |
| Year Ended 8/31/2018 | $23.93 | 34.12% | 0.94%(e) | 0.93%(e) | (0.38%) | 156% | $64,214 |
| Class R | |||||||
| Year Ended 8/31/2022 | $17.05 | (40.26%) | 1.49%(c) | 1.49%(c),(d) | (1.32%) | 56% | $7,173 |
| Year Ended 8/31/2021 | $31.70 | 40.27% | 1.46% | 1.46%(d) | (1.30%) | 50% | $13,968 |
| Year Ended 8/31/2020 | $24.35 | 38.67% | 1.54%(c),(e) | 1.54%(c),(d),(e) | (1.16%) | 76% | $4,674 |
| Year Ended 8/31/2019 | $19.22 | 7.53% | 1.58%(c) | 1.58%(c) | (1.03%) | 113% | $1,511 |
| Year Ended 8/31/2018 | $21.57 | 33.26% | 1.60%(e) | 1.59%(d),(e) | (1.04%) | 156% | $1,651 |
| Columbia Small Cap Growth Fund | Annual Report 2022 | 21 |
August 31, 2022
| 22 | Columbia Small Cap Growth Fund | Annual Report 2022 |
August 31, 2022
| Columbia Small Cap Growth Fund | Annual Report 2022 | 23 |
August 31, 2022
| 24 | Columbia Small Cap Growth Fund | Annual Report 2022 |
August 31, 2022
| Effective rate (%) | |
| Class A | 0.16 |
| Advisor Class | 0.16 |
| Class C | 0.16 |
| Institutional Class | 0.16 |
| Institutional 2 Class | 0.05 |
| Institutional 3 Class | 0.01 |
| Class R | 0.16 |
| Columbia Small Cap Growth Fund | Annual Report 2022 | 25 |
August 31, 2022
| Front End (%) | CDSC (%) | Amount ($) | |
| Class A | 5.75 | 0.50 - 1.00(a) | 361,827 |
| Class C | — | 1.00(b) | 10,791 |
| (a) | This charge is imposed on certain investments of between $1 million and $50 million redeemed within 18 months after purchase, as follows: 1.00% if redeemed within 12 months after purchase, and 0.50% if redeemed more than 12, but less than 18, months after purchase, with certain limited exceptions. |
| (b) | This charge applies to redemptions within 12 months after purchase, with certain limited exceptions. |
| January 1, 2022 through December 31, 2022 | Prior to January 1, 2022 | |
| Class A | 1.30% | 1.31% |
| Advisor Class | 1.05 | 1.06 |
| Class C | 2.05 | 2.06 |
| Institutional Class | 1.05 | 1.06 |
| Institutional 2 Class | 0.96 | 1.00 |
| Institutional 3 Class | 0.92 | 0.94 |
| Class R | 1.55 | 1.56 |
| 26 | Columbia Small Cap Growth Fund | Annual Report 2022 |
August 31, 2022
| Excess of distributions over net investment income ($) | Accumulated net realized (loss) ($) | Paid in capital ($) |
| 8,956,328 | 447,914 | (9,404,242) |
| Year Ended August 31, 2022 | Year Ended August 31, 2021 | ||||
| Ordinary income ($) | Long-term capital gains ($) | Total ($) | Ordinary income ($) | Long-term capital gains ($) | Total ($) |
| 88,786,002 | 188,032,858 | 276,818,860 | 38,607,415 | 112,642,643 | 151,250,058 |
| Undistributed ordinary income ($) | Undistributed long-term capital gains ($) | Capital loss carryforwards ($) | Net unrealized (depreciation) ($) |
| — | — | (349,831,649) | (109,953,174) |
| Federal tax cost ($) | Gross unrealized appreciation ($) | Gross unrealized (depreciation) ($) | Net unrealized (depreciation) ($) |
| 1,698,344,575 | 231,419,162 | (341,372,336) | (109,953,174) |
| No expiration short-term ($) | No expiration long-term ($) | Total ($) | Utilized ($) |
| (349,596,766) | (234,883) | (349,831,649) | — |
| Columbia Small Cap Growth Fund | Annual Report 2022 | 27 |
August 31, 2022
| Late year ordinary losses ($) | Post-October capital losses ($) |
| 11,054,142 | — |
| Borrower or lender | Average loan balance ($) | Weighted average interest rate (%) | Number of days with outstanding loans |
| Borrower | 3,280,000 | 0.61 | 10 |
| Lender | 8,200,000 | 1.10 | 7 |
| 28 | Columbia Small Cap Growth Fund | Annual Report 2022 |
August 31, 2022
| Columbia Small Cap Growth Fund | Annual Report 2022 | 29 |
August 31, 2022
| 30 | Columbia Small Cap Growth Fund | Annual Report 2022 |
August 31, 2022
| Columbia Small Cap Growth Fund | Annual Report 2022 | 31 |
| 32 | Columbia Small Cap Growth Fund | Annual Report 2022 |
| Qualified dividend income | Dividends received deduction |
| 3.02% | 3.02% |
| Name, address, year of birth | Position held with the Columbia Funds and length of service | Principal occupation(s) during past five years and other relevant professional experience | Number of Funds in the Columbia Funds Complex* overseen | Other directorships held by Trustee during the past five years |
| George S. Batejan c/o Columbia Management Investment Advisers, LLC 290 Congress Street Boston, MA 02210 1953 | Trustee since 2017 | Executive Vice President, Global Head of Technology and Operations, Janus Capital Group, Inc., 2010-2016 | 176 | Former Chairman of the Board, NICSA (National Investment Company Services Association) (Executive Committee, Nominating Committee and Governance Committee), 2014-2016; former Director, Intech Investment Management, 2011-2016; former Board Member, Metro Denver Chamber of Commerce, 2015-2016; former Advisory Board Member, University of Colorado Business School, 2015-2018 |
| Columbia Small Cap Growth Fund | Annual Report 2022 | 33 |
(Unaudited)
Independent trustees (continued)
| Name, address, year of birth | Position held with the Columbia Funds and length of service | Principal occupation(s) during past five years and other relevant professional experience | Number of Funds in the Columbia Funds Complex* overseen | Other directorships held by Trustee during the past five years |
| Kathleen Blatz c/o Columbia Management Investment Advisers, LLC 290 Congress Street Boston, MA 02210 1954 | Trustee since 2006 | Attorney, specializing in arbitration and mediation; Chief Justice, Minnesota Supreme Court, 1998-2006; Associate Justice, Minnesota Supreme Court, 1996-1998; Fourth Judicial District Court Judge, Hennepin County, 1994-1996; Attorney in private practice and public service, 1984-1993; State Representative, Minnesota House of Representatives, 1979-1993, which included service on the Tax and Financial Institutions and Insurance Committees; Member and Interim Chair, Minnesota Sports Facilities Authority, January 2017-July 2017; Interim President and Chief Executive Officer, Blue Cross and Blue Shield of Minnesota (health care insurance), February-July 2018, April-October 2021 | 176 | Former Trustee, Blue Cross and Blue Shield of Minnesota, 2009-2021 (Chair of the Business Development Committee, 2014-2017; Chair of the Governance Committee, 2017-2019); former Member and Chair of the Board, Minnesota Sports Facilities Authority, January 2017-July 2017; former Director, Robina Foundation, 2009-2020 (Chair, 2014-2020); Director, Schulze Family Foundation, since 2021 |
| Pamela G. Carlton c/o Columbia Management Investment Advisers, LLC 290 Congress Street Boston, MA 02210 1954 | Trustee since 2007 | President, Springboard — Partners in Cross Cultural Leadership (consulting company) since 2003; Managing Director of US Equity Research, JP Morgan Chase, 1999-2003; Director of US Equity Research, Chase Asset Management, 1996-1999; Co-Director Latin America Research, 1993-1996, COO Global Research, 1992-1996, Co-Director of US Research, 1991-1992, Investment Banker, 1982-1991, Morgan Stanley; Attorney, Cleary Gottlieb Steen & Hamilton LLP, 1980-1982 | 176 | Trustee, New York Presbyterian Hospital Board (Executive Committee and Chair of People Committee) since 1996; Director, DR Bank (Audit Committee) since 2017; Director, Evercore Inc. (Audit Committee) since 2019; Director, Apollo Commercial Real Estate Finance, Inc. since 2021; the Governing Council of the Independent Directors Council (IDC), since 2021 |
| Janet Langford Carrig c/o Columbia Management Investment Advisers, LLC 290 Congress Street Boston, MA 02210 1957 | Trustee since 1996 | Senior Vice President, General Counsel and Corporate Secretary, ConocoPhillips (independent energy company), September 2007-October 2018 | 174 | Director, EQT Corporation (natural gas producer) since 2019; former Director, Whiting Petroleum Corporation (independent oil and gas company), 2020-2022 |
| J. Kevin Connaughton c/o Columbia Management Investment Advisers, LLC 290 Congress Street Boston, MA 02210 1964 | Trustee since 2020 | Member, FINRA National Adjudicatory Council since January 2020; Adjunct Professor of Finance, Bentley University since January 2018; Consultant to Independent Trustees of CFVIT and CFST I from March 2016 to June 2020 with respect to CFVIT and to December 2020 with respect to CFST I; Managing Director and General Manager of Mutual Fund Products, Columbia Management Investment Advisers, LLC, May 2010-February 2015; President, Columbia Funds, 2008-2015; and senior officer of Columbia Funds and affiliated funds, 2003-2015 | 174 | Former Director, The Autism Project, March 2015-December 2021; former Member of the Investment Committee, St. Michael’s College, November 2015-February 2020; former Trustee, St. Michael’s College, June 2017-September 2019; former Trustee, New Century Portfolios, January 2015-December 2017 |
| 34 | Columbia Small Cap Growth Fund | Annual Report 2022 |
(Unaudited)
Independent trustees (continued)
| Name, address, year of birth | Position held with the Columbia Funds and length of service | Principal occupation(s) during past five years and other relevant professional experience | Number of Funds in the Columbia Funds Complex* overseen | Other directorships held by Trustee during the past five years |
| Olive M. Darragh c/o Columbia Management Investment Advisers, LLC 290 Congress Street Boston, MA 02210 1962 | Trustee since 2020 | Managing Director of Darragh Inc. (strategy and talent management consulting firm) since 2010; Founder and CEO, Zolio, Inc. (investment management talent identification platform) since 2004; Consultant to Independent Trustees of CFVIT and CFST I from June 2019 to June 2020 with respect to CFVIT and to December 2020 with respect to CFST I; Partner, Tudor Investments, 2004-2010; Senior Partner, McKinsey & Company (consulting), 1990-2004; Touche Ross CPA, 1985-1988 | 174 | Former Director, University of Edinburgh Business School (Member of US Board); former Director, Boston Public Library Foundation |
| Patricia M. Flynn c/o Columbia Management Investment Advisers, LLC 290 Congress Street Boston, MA 02210 1950 | Trustee since 2004 | Trustee Professor of Economics and Management, Bentley University since 1976 (also teaches and conducts research on corporate governance); Dean, McCallum Graduate School of Business, Bentley University, 1992-2002 | 176 | Trustee, MA Taxpayers Foundation since 1997; former Board of Governors, Innovation Institute, MA Technology Collaborative, 2010-2020; former Board of Directors, The MA Business Roundtable, 2003-2019 |
| Brian J. Gallagher c/o Columbia Management Investment Advisers, LLC 290 Congress Street Boston, MA 02210 1954 | Trustee since 2017 | Retired; Partner with Deloitte & Touche LLP and its predecessors, 1977-2016 | 176 | Trustee, Catholic Schools Foundation since 2004 |
| Douglas A. Hacker c/o Columbia Management Investment Advisers, LLC 290 Congress Street Boston, MA 02210 1955 | Co-Chair since 2021; Chair of CFST I and CFVIT since 2014; Trustee of CFST I and CFVIT since 1996 and CFST, CFST II, CFVST II, CET I and CET II since 2021 | Independent business executive since May 2006; Executive Vice President – Strategy of United Airlines, December 2002 - May 2006; President of UAL Loyalty Services (airline marketing company), September 2001-December 2002; Executive Vice President and Chief Financial Officer of United Airlines, July 1999-September 2001 | 176 | Director, Spartan Nash Company (food distributor); Director, Aircastle Limited (Chair of Audit Committee) (aircraft leasing); former Director, Nash Finch Company (food distributor), 2005-2013; former Director, SeaCube Container Leasing Ltd. (container leasing), 2010-2013; and former Director, Travelport Worldwide Limited (travel information technology), 2014-2019 |
| Nancy T. Lukitsh c/o Columbia Management Investment Advisers, LLC 290 Congress Street Boston, MA 02210 1956 | Trustee since 2011 | Senior Vice President, Partner and Director of Marketing, Wellington Management Company, LLP (investment adviser), 1997-2010; Chair, Wellington Management Portfolios (commingled non-U.S. investment pools), 2007 -2010; Director, Wellington Trust Company, NA and other Wellington affiliates, 1997-2010 | 174 | None |
| Columbia Small Cap Growth Fund | Annual Report 2022 | 35 |
(Unaudited)
Independent trustees (continued)
| Name, address, year of birth | Position held with the Columbia Funds and length of service | Principal occupation(s) during past five years and other relevant professional experience | Number of Funds in the Columbia Funds Complex* overseen | Other directorships held by Trustee during the past five years |
| David M. Moffett c/o Columbia Management Investment Advisers, LLC 290 Congress Street Boston, MA 02210 1952 | Trustee since 2011 | Retired; Consultant to Bridgewater and Associates | 174 | Director, CSX Corporation (transportation suppliers); Director, Genworth Financial, Inc. (financial and insurance products and services); Director, PayPal Holdings Inc. (payment and data processing services); Trustee, University of Oklahoma Foundation; former Director, eBay Inc. (online trading community), 2007-2015; and former Director, CIT Bank, CIT Group Inc. (commercial and consumer finance), 2010-2016 |
| Catherine James Paglia c/o Columbia Management Investment Advisers, LLC 290 Congress Street Boston, MA 02210 1952 | Co-Chair since 2021; Chair of CFST, CFST II, CFVST II, CET I and CET II since 2020; Trustee of CFST, CFST II and CFVST II since 2004 and CFST I and CFVIT since 2021 | Director, Enterprise Asset Management, Inc. (private real estate and asset management company) since September 1998; Managing Director and Partner, Interlaken Capital, Inc., 1989-1997; Vice President, 1982-1985, Principal, 1985-1987, Managing Director, 1987-1989, Morgan Stanley; Vice President, Investment Banking, 1980-1982, Associate, Investment Banking, 1976-1980, Dean Witter Reynolds, Inc. | 176 | Director, Valmont Industries, Inc. (irrigation systems manufacturer) since 2012; Trustee, Carleton College (on the Investment Committee); Trustee, Carnegie Endowment for International Peace (on the Investment Committee) |
| Minor M. Shaw c/o Columbia Management Investment Advisers, LLC 290 Congress Street Boston, MA 02210 1947 | Trustee since 2003 | President, Micco LLC (private investments) since 2011; President, Micco Corp. (family investment business), 1998-2011 | 176 | Director, Blue Cross Blue Shield of South Carolina (Chair of Compensation Committee) since April 2008; Trustee, Hollingsworth Funds (on the Investment Committee) since 2016 (previously Board Chair from 2016-2019); Former Advisory Board member, Duke Energy Corp., 2016-2020; Chair of the Duke Endowment; Chair of Greenville – Spartanburg Airport Commission; former Trustee, BofA Funds Series Trust (11 funds), 2003-2011; former Director, Piedmont Natural Gas, 2004-2016; former Director, National Association of Corporate Directors, Carolinas Chapter, 2013-2018; Chair, Daniel-Mickel Foundation since 1998 |
| 36 | Columbia Small Cap Growth Fund | Annual Report 2022 |
(Unaudited)
Independent trustees (continued)
| Name, address, year of birth | Position held with the Columbia Funds and length of service | Principal occupation(s) during past five years and other relevant professional experience | Number of Funds in the Columbia Funds Complex* overseen | Other directorships held by Trustee during the past five years |
| Natalie A. Trunow c/o Columbia Management Investment Advisers, LLC 290 Congress Street Boston, MA 02210 1967 | Trustee since 2020 | Chief Executive Officer, Millennial Portfolio Solutions LLC (asset management and consulting services), January 2016-January 2021; Non-executive Member of the Investment Committee and Valuation Committee, Sarona Asset Management Inc. (private equity firm) since September 2019; Advisor, Horizon Investments (asset management and consulting services), August 2018-January 2021; Advisor, Paradigm Asset Management, November 2016-December 2021; Consultant to Independent Trustees of CFVIT and CFST I from September 2016 to June 2020 with respect to CFVIT and to December 2020 with respect to CFST I; Director of Investments/Consultant, Casey Family Programs, April 2016-November 2016; Senior Vice President and Chief Investment Officer, Calvert Investments, August 2008-January 2016; Section Head and Portfolio Manager, General Motors Asset Management, June 1997-August 2008 | 174 | Former Director, Investment Committee, Health Services for Children with Special Needs, Inc., 2012-2019; Director, Chair of Audit Committee, Consumer Credit Counseling Services (formerly Guidewell Financial Solutions), since 2019; Independent Director, Investment Committee and Valuation Committee, Sarona Asset Management, since 2019 |
| Sandra L. Yeager c/o Columbia Management Investment Advisers, LLC 290 Congress Street Boston, MA 02210 1964 | Trustee since 2017 | Retired; President and founder, Hanoverian Capital, LLC (SEC registered investment advisor firm), 2008-2016; Managing Director, DuPont Capital, 2006-2008; Managing Director, Morgan Stanley Investment Management, 2004-2006; Senior Vice President, Alliance Bernstein, 1990-2004 | 176 | Former Director, NAPE Education Foundation, October 2016-October 2020 |
| * | The term “Columbia Funds Complex” as used herein includes Columbia Seligman Premium Technology Growth Fund, Tri-Continental Corporation and each series of Columbia Fund Series Trust (CFST), Columbia Funds Series Trust I (CFST I), Columbia Funds Series Trust II (CFST II), Columbia ETF Trust I (CET I), Columbia ETF Trust II (CET II), Columbia Funds Variable Insurance Trust (CFVIT) and Columbia Funds Variable Series Trust II (CFVST II). Messrs. Batejan, Beckman, Gallagher and Hacker and Mses. Blatz, Carlton, Flynn, Paglia, Shaw and Yeager serve as Directors of Columbia Seligman Premium Technology Growth Fund and Tri-Continental Corporation. |
| Name, address, year of birth | Position held with the Columbia Funds and length of service | Principal occupation(s) during the past five years and other relevant professional experience | Number of Funds in the Columbia Funds Complex overseen | Other directorships held by Trustee during the past five years |
| Daniel J. Beckman c/o Columbia Management Investment Advisers, LLC 290 Congress Street Boston, MA 02210 1962 | Trustee since November 2021 and President since June 2021 | Vice President – Head of North America Product, Columbia Management Investment Advisers, LLC since April 2015; President and Principal Executive Officer of the Columbia Funds since June 2021; officer of Columbia Funds and affiliated funds, 2020-2021 | 176 | Director, Ameriprise Trust Company, since October 2016; Director, Columbia Management Investment Distributors, Inc. since November 2018; Board of Governors, Columbia Wanger Asset Management, LLC since January 2022 |
| * | Interested person (as defined under the 1940 Act) by reason of being an officer, director, security holder and/or employee of the Investment Manager or Ameriprise Financial. |
| Columbia Small Cap Growth Fund | Annual Report 2022 | 37 |
(Unaudited)
The Statement of Additional Information has additional information about the Fund’s Board members and is available, without charge, upon request by calling 800.345.6611, visiting columbiathreadneedleus.com/investor/ or contacting your financial intermediary.
| Name, address and year of birth | Position and year first appointed to position for any Fund in the Columbia Funds Complex or a predecessor thereof | Principal occupation(s) during past five years |
| Michael G. Clarke 290 Congress Street Boston, MA 02210 1969 | Chief Financial Officer and Principal Financial Officer (2009) and Senior Vice President (2019) | Senior Vice President and Head of Global Operations & Investor Services, Columbia Management Investment Advisers, LLC, since March 2022 (previously Vice President, Head of North American Operations, and Co-Head of Global Operations, June 2019 to February 2022 and Vice President – Accounting and Tax, May 2010 - May 2019); senior officer of Columbia Funds and affiliated funds since 2002. |
| Joseph Beranek 5890 Ameriprise Financial Center Minneapolis, MN 55474 1965 | Treasurer and Chief Accounting Officer (Principal Accounting Officer) (2019) and Principal Financial Officer (2020), CFST, CFST I, CFST II, CFVIT and CFVST II; Assistant Treasurer, CET I and CET II | Vice President – Mutual Fund Accounting and Financial Reporting, Columbia Management Investment Advisers, LLC, since December 2018 and March 2017, respectively (previously Vice President – Pricing and Corporate Actions, May 2010 - March 2017). |
| Marybeth Pilat 290 Congress Street Boston, MA 02210 1968 | Treasurer and Chief Accounting Officer (Principal Accounting Officer) and Principal Financial Officer (2020) for CET I and CET II; Assistant Treasurer, CFST, CFST I, CFST II, CFVIT and CFVST II | Vice President – Product Pricing and Administration, Columbia Management Investment Advisers, LLC, since May 2017; Director - Fund Administration, Calvert Investments, August 2015 – March 2017; Vice President - Fund Administration, Legg Mason, May 2015 - July 2015; Vice President - Fund Administration, Columbia Management Investment Advisers, LLC, May 2010 - April 2015. |
| William F. Truscott 290 Congress Street Boston, MA 02210 1960 | Senior Vice President (2001) | Formerly, Trustee/Director of Columbia Funds Complex or legacy funds, November 2001-January 1, 2021; Chief Executive Officer, Global Asset Management, Ameriprise Financial, Inc. since September 2012; Chairman of the Board and President, Columbia Management Investment Advisers, LLC since July 2004 and February 2012, respectively; Chairman of the Board and Chief Executive Officer, Columbia Management Investment Distributors, Inc. since November 2008 and February 2012, respectively; Chairman of the Board and Director, Threadneedle Asset Management Holdings, Sàrl since March 2013 and December 2008, respectively; senior executive of various entities affiliated with Columbia Threadneedle. |
| Christopher O. Petersen 5228 Ameriprise Financial Center Minneapolis, MN 55474 1970 | Senior Vice President and Assistant Secretary (2021) | Formerly, Trustee/Director of funds within the Columbia Funds Complex, July 1, 2020 - November 22, 2021; Senior Vice President and Assistant General Counsel, Ameriprise Financial, Inc. since September 2021 (previously Vice President and Lead Chief Counsel, January 2015 - September 2021); formerly, President and Principal Executive Officer of the Columbia Funds, 2015 - 2021; officer of Columbia Funds and affiliated funds since 2007. |
| Thomas P. McGuire 290 Congress Street Boston, MA 02210 1972 | Senior Vice President and Chief Compliance Officer (2012) | Vice President – Asset Management Compliance, Ameriprise Financial, Inc., since May 2010; Chief Compliance Officer, Columbia Acorn/Wanger Funds since December 2015; formerly, Chief Compliance Officer, Ameriprise Certificate Company, September 2010 – September 2020. |
| 38 | Columbia Small Cap Growth Fund | Annual Report 2022 |
(Unaudited)
Fund officers (continued)
| Name, address and year of birth | Position and year first appointed to position for any Fund in the Columbia Funds Complex or a predecessor thereof | Principal occupation(s) during past five years |
| Ryan C. Larrenaga 290 Congress Street Boston, MA 02210 1970 | Senior Vice President (2017), Chief Legal Officer (2017), and Secretary (2015) | Vice President and Chief Counsel, Ameriprise Financial, Inc. since August 2018 (previously Vice President and Group Counsel, August 2011 - August 2018); Chief Legal Officer, Columbia Acorn/Wanger Funds, since September 2020; officer of Columbia Funds and affiliated funds since 2005. |
| Michael E. DeFao 290 Congress Street Boston, MA 02210 1968 | Vice President (2011) and Assistant Secretary (2010) | Vice President and Chief Counsel, Ameriprise Financial, Inc. since May 2010; Vice President, Chief Legal Officer and Assistant Secretary, Columbia Management Investment Advisers, LLC since October 2021 (previously Vice President and Assistant Secretary, May 2010 – September 2021). |
| Lyn Kephart-Strong 5228 Ameriprise Financial Center Minneapolis, MN 55474 1960 | Vice President (2015) | President, Columbia Management Investment Services Corp. since October 2014; Vice President & Resolution Officer, Ameriprise Trust Company since August 2009. |
| • | the Fund had sufficient liquidity to both meet redemptions and operate effectively on behalf of shareholders; |
| • | there were no material changes to the Program during the period; |
| • | the implementation of the Program was effective to manage the Fund’s liquidity risk; and |
| • | the Program operated adequately during the period. |
| Columbia Small Cap Growth Fund | Annual Report 2022 | 39 |
| • | Information on the investment performance of the Fund relative to the performance of a group of mutual funds determined to be comparable to the Fund by Broadridge, as well as performance relative to benchmarks; |
| • | Information on the Fund’s management fees and total expenses, including information comparing the Fund’s expenses to those of a group of comparable mutual funds, as determined by Broadridge; |
| • | The Investment Manager’s agreement to contractually limit or cap total operating expenses for the Fund so that total operating expenses (excluding certain fees and expenses, such as transaction costs and certain other investment related expenses, interest, taxes, acquired fund fees and expenses and infrequent and/or unusual expenses) would not exceed a specified annual rate, as a percentage of the Fund’s net assets; |
| • | Terms of the Management Agreement; |
| • | Descriptions of other agreements and arrangements with affiliates of the Investment Manager relating to the operations of the Fund, including agreements with respect to the provision of transfer agency and shareholder services to the Fund; |
| • | Descriptions of various services performed by the Investment Manager under the Management Agreement, including portfolio management and portfolio trading practices; |
| • | Information regarding any recently negotiated management fees of similarly-managed portfolios of other institutional clients of the Investment Manager; |
| • | Information regarding the resources of the Investment Manager, including information regarding senior management, portfolio managers and other personnel; |
| • | Information regarding the capabilities of the Investment Manager with respect to compliance monitoring services; |
| • | The profitability to the Investment Manager and its affiliates from their relationships with the Fund; and |
| • | Report provided by the Board’s independent fee consultant, JDL Consultants, LLC (JDL). |
| 40 | Columbia Small Cap Growth Fund | Annual Report 2022 |
(Unaudited)
Following an analysis and discussion of the foregoing, and the factors identified below, the Board, including all of the Independent Trustees, approved the renewal of the Management Agreement.
| Columbia Small Cap Growth Fund | Annual Report 2022 | 41 |
(Unaudited)
Comparative fees, costs of services provided and the profits realized by the Investment Manager and its affiliates from their relationships with the Fund
| 42 | Columbia Small Cap Growth Fund | Annual Report 2022 |
(Unaudited)
On June 23, 2022, the Board, including all of the Independent Trustees, determined that fees payable under the Management Agreement were fair and reasonable in light of the extent and quality of services provided and approved the renewal of the Management Agreement.
| Columbia Small Cap Growth Fund | Annual Report 2022 | 43 |
columbiathreadneedleus.com/investor/. The Fund is distributed by Columbia Management Investment Distributors, Inc., member FINRA, and managed by Columbia Management Investment Advisers, LLC.

August 31, 2022

| 3 | |
| 6 | |
| 8 | |
| 9 | |
| 54 | |
| 56 | |
| 58 | |
| 60 | |
| 64 | |
| 85 | |
| 86 | |
| 92 | |
| 92 |
(Unaudited)
| Average annual total returns (%) (for the period ended August 31, 2022) | |||||
| Inception | 1 Year | 5 Years | 10 Years | ||
| Class A | Excluding sales charges | 04/21/77 | -9.64 | 1.77 | 2.84 |
| Including sales charges | -13.94 | 0.79 | 2.33 | ||
| Advisor Class* | 11/08/12 | -9.40 | 2.01 | 3.08 | |
| Class C | Excluding sales charges | 07/01/97 | -10.31 | 1.01 | 2.10 |
| Including sales charges | -11.18 | 1.01 | 2.10 | ||
| Institutional Class | 01/29/99 | -9.39 | 2.04 | 3.10 | |
| Institutional 2 Class | 03/07/11 | -9.35 | 2.06 | 3.18 | |
| Institutional 3 Class* | 06/13/13 | -9.34 | 2.11 | 3.18 | |
| Class R | 09/27/10 | -9.83 | 1.51 | 2.59 | |
| Bloomberg U.S. Aggregate Bond Index | -11.52 | 0.52 | 1.35 | ||
| ICE BofA US Cash Pay High Yield Constrained Index | -10.37 | 2.40 | 4.41 | ||
| FTSE Non-U.S. World Government Bond (All Maturities) Index - Unhedged | -25.62 | -4.12 | -2.29 | ||
| JPMorgan Emerging Markets Bond Index-Global | -18.82 | -1.08 | 1.74 | ||
| * | The returns shown for periods prior to the share class inception date (including returns for the Life of the Fund, if shown, which are since Fund inception) include the returns of the Fund’s oldest share class. These returns are adjusted to reflect any higher class-related operating expenses of the newer share classes, as applicable. Please visit columbiathreadneedleus.com/investor/investment-products/mutual-funds/appended-performance for more information. |
| Columbia Strategic Income Fund | Annual Report 2022 | 3 |
(Unaudited)
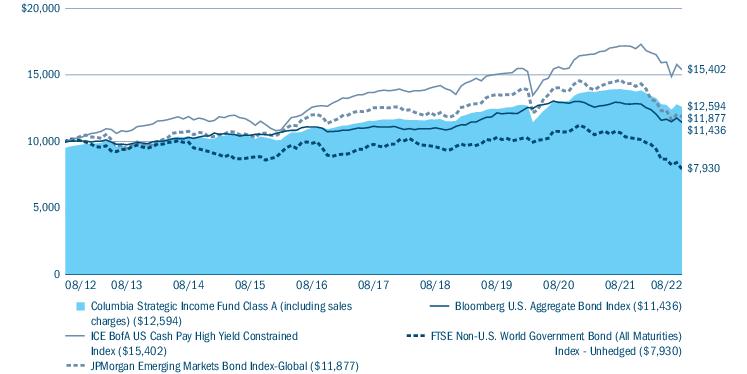
| 4 | Columbia Strategic Income Fund | Annual Report 2022 |
(Unaudited)
| Portfolio breakdown (%) (at August 31, 2022) | |
| Asset-Backed Securities — Non-Agency | 2.9 |
| Commercial Mortgage-Backed Securities - Non-Agency | 3.6 |
| Common Stocks | 0.0(a) |
| Convertible Bonds | 0.1 |
| Convertible Preferred Stocks | 0.0(a) |
| Corporate Bonds & Notes | 36.1 |
| Foreign Government Obligations | 5.1 |
| Inflation-Indexed Bonds | 0.1 |
| Money Market Funds | 5.4 |
| Options Purchased Calls | 0.6 |
| Residential Mortgage-Backed Securities - Agency | 21.4 |
| Residential Mortgage-Backed Securities - Non-Agency | 16.9 |
| Senior Loans | 7.7 |
| U.S. Government & Agency Obligations | 0.1 |
| Warrants | 0.0(a) |
| Total | 100.0 |
| (a) | Rounds to zero. |
| Quality breakdown (%) (at August 31, 2022) | |
| AAA rating | 22.8 |
| AA rating | 1.1 |
| A rating | 8.3 |
| BBB rating | 17.3 |
| BB rating | 22.7 |
| B rating | 17.9 |
| CCC rating | 3.0 |
| CC rating | 0.0(a) |
| C rating | 0.0(a) |
| Not rated | 6.9 |
| Total | 100.0 |
| (a) | Rounds to zero. |
| Columbia Strategic Income Fund | Annual Report 2022 | 5 |
(Unaudited)
| • | Relative to the benchmark, the Fund’s duration positioning boosted its results most. Duration is a measure of the Fund’s sensitivity to changes in interest rates. |
| ○ | The Fund held a shorter duration stance than that of the benchmark throughout the annual period as part of our strategy to balance exposure across risk factors. |
| ○ | The Fund’s shorter duration stance was most pronounced near the turn of the calendar year. |
| ○ | As interest rates rose during the annual period in response to greater inflationary pressures and the Fed’s efforts to rein in inflation by hiking interest rates, the Fund’s duration positioning proved beneficial. |
| • | Positioning within the mortgage-backed securities sector added value. |
| ○ | The Fund held an underweight in agency mortgage-backed securities, which performed poorly, and an overweight in non-agency mortgage-backed securities, which performed better. |
| ○ | The Fed’s transition from quantitative easing to quantitative tightening, as well as the rapid rise in mortgage rates, led to the poor performance of agency mortgage-backed securities. |
| 6 | Columbia Strategic Income Fund | Annual Report 2022 |
(Unaudited)
| • | To a lesser degree, yield curve positioning contributed positively to the Fund’s relative results. The Fund was positioned for a steeper yield curve from September 2021 into the beginning of 2022 and was then re-positioned for a flatter yield curve for most of the remainder of the annual period. |
| • | The Fund’s exposure to several sectors that are not components of the benchmark detracted most from relative results. These sectors include emerging markets debt and high-yield corporate credit. |
| ○ | These sectors have higher credit sensitivity relative to the broader fixed-income market during a period of high volatility and liquidity-driven sell-offs as was seen during the annual period. |
| ○ | Notably, the Fund did not have significant exposure to the sovereign debt of Russia or Ukraine prior to the war, but the ripple effects of the war on the emerging markets debt sector overall dampened the Fund’s relative results. |
| Columbia Strategic Income Fund | Annual Report 2022 | 7 |
(Unaudited)
| March 1, 2022 — August 31, 2022 | |||||||
| Account value at the beginning of the period ($) | Account value at the end of the period ($) | Expenses paid during the period ($) | Fund’s annualized expense ratio (%) | ||||
| Actual | Hypothetical | Actual | Hypothetical | Actual | Hypothetical | Actual | |
| Class A | 1,000.00 | 1,000.00 | 937.60 | 1,020.52 | 4.54 | 4.74 | 0.93 |
| Advisor Class | 1,000.00 | 1,000.00 | 938.80 | 1,021.78 | 3.32 | 3.47 | 0.68 |
| Class C | 1,000.00 | 1,000.00 | 933.70 | 1,016.74 | 8.19 | 8.54 | 1.68 |
| Institutional Class | 1,000.00 | 1,000.00 | 938.90 | 1,021.78 | 3.32 | 3.47 | 0.68 |
| Institutional 2 Class | 1,000.00 | 1,000.00 | 939.10 | 1,021.98 | 3.13 | 3.26 | 0.64 |
| Institutional 3 Class | 1,000.00 | 1,000.00 | 939.10 | 1,022.23 | 2.88 | 3.01 | 0.59 |
| Class R | 1,000.00 | 1,000.00 | 936.50 | 1,019.26 | 5.76 | 6.01 | 1.18 |
| 8 | Columbia Strategic Income Fund | Annual Report 2022 |
August 31, 2022
| Asset-Backed Securities — Non-Agency 3.2% | ||||
| Issuer | Coupon Rate | Principal Amount ($) | Value ($) | |
| ARES XLIV CLO Ltd.(a),(b) | ||||
| Series 2017-44A Class DR | ||||
| 3-month USD LIBOR + 6.870% Floor 6.870% 04/15/2034 | 9.382% | 15,000,000 | 13,902,720 | |
| Bain Capital Credit CLO Ltd.(a),(b) | ||||
| Series 2021-5A Class E | ||||
| 3-month USD LIBOR + 6.500% Floor 6.500% 10/23/2034 | 9.283% | 13,320,000 | 11,896,678 | |
| Series 2021-6A Class E | ||||
| 3-month USD LIBOR + 6.500% Floor 6.500% 10/21/2034 | 9.232% | 11,450,000 | 10,209,209 | |
| Series 2021-7A Class E | ||||
| 3-month USD LIBOR + 6.750% Floor 6.750% 01/22/2035 | 9.509% | 15,350,000 | 13,869,155 | |
| Ballyrock CLO Ltd.(a),(b) | ||||
| Series 2021-18A Class D | ||||
| 3-month USD LIBOR + 6.500% Floor 6.500% 01/15/2035 | 9.012% | 13,050,000 | 11,680,063 | |
| Barings CLO Ltd.(a),(b) | ||||
| Series 2021-2A Class E | ||||
| 3-month USD LIBOR + 6.250% Floor 6.250% 07/15/2034 | 8.762% | 8,350,000 | 7,576,556 | |
| Carlyle Global Market Strategies CLO Ltd.(a),(b) | ||||
| Series 2016-3A Class ERR | ||||
| 3-month USD LIBOR + 7.000% Floor 7.000% 07/20/2034 | 9.710% | 11,400,000 | 10,114,798 | |
| LendingPoint Asset Securitization Trust(a),(c),(d) | ||||
| Subordinated Series 2021-1 Class B | ||||
| 04/15/2027 | 2.853% | 9,589,207 | 9,535,268 | |
| LendingPoint Asset Securitization Trust(a) | ||||
| Subordinated Series 2021-A Class C | ||||
| 12/15/2028 | 2.750% | 16,000,000 | 15,329,919 | |
| Madison Park Funding XXII Ltd.(a),(b) | ||||
| Series 2016-22A Class DR | ||||
| 3-month USD LIBOR + 3.500% Floor 3.500% 01/15/2033 | 6.012% | 10,900,000 | 10,196,231 | |
| Octagon 55 Ltd.(a),(b) | ||||
| Series 2021-1A Class E | ||||
| 3-month USD LIBOR + 6.500% Floor 6.500% 07/20/2034 | 9.210% | 9,700,000 | 8,913,660 | |
| Asset-Backed Securities — Non-Agency (continued) | ||||
| Issuer | Coupon Rate | Principal Amount ($) | Value ($) | |
| Octagon Investment Partners 48 Ltd.(a),(b) | ||||
| Series 2020-3A Class ER | ||||
| 3-month USD LIBOR + 6.700% Floor 6.700% 10/20/2034 | 9.410% | 12,750,000 | 11,682,532 | |
| Pagaya AI Debt Selection Trust(a) | ||||
| Subordinated Series 2020-3 Class C | ||||
| 05/17/2027 | 6.430% | 11,534,000 | 11,403,796 | |
| PAGAYA AI Debt Trust(a),(d) | ||||
| Subordinated Series 2022-3 Class B | ||||
| 03/15/2030 | 8.050% | 13,934,962 | 13,934,962 | |
| Prosper Pass-Through Trust(a),(d) | ||||
| Series 2019-ST2 Class A | ||||
| 11/15/2025 | 3.750% | 1,702,770 | 1,719,797 | |
| Upstart Pass-Through Trust(a) | ||||
| Series 2020-ST6 Class A | ||||
| 01/20/2027 | 3.000% | 5,410,031 | 5,183,605 | |
| Upstart Securitization Trust(a) | ||||
| Subordinated Series 2021-4 Class C | ||||
| 09/20/2031 | 3.190% | 9,200,000 | 7,928,247 | |
| Voya CLO Ltd.(a),(b) | ||||
| Series 2021-1A Class E | ||||
| 3-month USD LIBOR + 6.350% Floor 6.350% 07/15/2034 | 8.862% | 6,900,000 | 6,126,427 | |
| Total Asset-Backed Securities — Non-Agency (Cost $195,316,165) | 181,203,623 | |||
| Commercial Mortgage-Backed Securities - Non-Agency 3.9% | ||||
| BFLD Trust(a),(b) | ||||
| Subordinated Series 2019-DPLO Class D | ||||
| 1-month USD LIBOR + 1.840% Floor 1.840% 10/15/2034 | 4.231% | 3,485,000 | 3,362,768 | |
| Subordinated Series 2019-DPLO Class E | ||||
| 1-month USD LIBOR + 2.240% Floor 2.240% 10/15/2034 | 4.631% | 11,510,000 | 10,964,016 | |
| Braemar Hotels & Resorts Trust(a),(b) | ||||
| Series 2018-PRME Class E | ||||
| 1-month USD LIBOR + 2.400% Floor 2.400% 06/15/2035 | 4.791% | 8,700,000 | 8,049,839 | |
| Subordinated Series 2018-PRME Class D | ||||
| 1-month USD LIBOR + 1.800% Floor 1.925% 06/15/2035 | 4.191% | 13,700,000 | 13,170,210 | |
| Columbia Strategic Income Fund | Annual Report 2022 | 9 |
August 31, 2022
| Commercial Mortgage-Backed Securities - Non-Agency (continued) | ||||
| Issuer | Coupon Rate | Principal Amount ($) | Value ($) | |
| BX Commercial Mortgage Trust(a),(b) | ||||
| Subordinated Series 2021-MFM1 Class E | ||||
| 1-month USD LIBOR + 2.250% Floor 2.250% 01/15/2034 | 4.641% | 7,000,000 | 6,621,160 | |
| BX Trust(a) | ||||
| Series 2019-OC11 Class E | ||||
| 12/09/2041 | 4.076% | 7,208,000 | 5,943,011 | |
| BX Trust(a),(e) | ||||
| Subordinated Series 2019-OC11 Class D | ||||
| 12/09/2041 | 4.076% | 6,000,000 | 5,222,270 | |
| CLNY Trust(a),(b) | ||||
| Series 2019-IKPR Class E | ||||
| 1-month USD LIBOR + 2.721% Floor 2.721% 11/15/2038 | 5.112% | 8,490,000 | 7,906,675 | |
| Series 2019-IKPR Class F | ||||
| 1-month USD LIBOR + 3.417% Floor 3.417% 11/15/2038 | 5.808% | 16,035,000 | 14,833,105 | |
| Cold Storage Trust(a),(b) | ||||
| Subordinated Series 2020-ICE5 Class F | ||||
| 1-month USD LIBOR + 3.492% Floor 3.333% 11/15/2037 | 5.884% | 6,536,887 | 6,243,361 | |
| COMM Mortgage Trust(a),(e) | ||||
| Subordinated Series 2020-CBM Class F | ||||
| 02/10/2037 | 3.754% | 4,000,000 | 3,480,206 | |
| Credit Suisse Mortgage Capital Certificates OA LLC(a) | ||||
| Subordinated Series 2014-USA Class E | ||||
| 09/15/2037 | 4.373% | 7,525,000 | 5,918,353 | |
| Subordinated Series 2014-USA Class F | ||||
| 09/15/2037 | 4.373% | 20,960,000 | 15,095,717 | |
| CSMC Trust(a),(e) | ||||
| Subordinated Series 2019-UVIL Class E | ||||
| 12/15/2041 | 3.393% | 15,300,000 | 11,527,575 | |
| Hilton USA Trust(a),(e) | ||||
| Series 2016-HHV Class F | ||||
| 11/05/2038 | 4.333% | 28,590,000 | 24,782,664 | |
| Hilton USA Trust(a) | ||||
| Subordinated Series 2016-SFP Class E | ||||
| 11/05/2035 | 5.519% | 11,500,000 | 11,070,452 | |
| Morgan Stanley Capital I Trust(a),(e) | ||||
| Series 2019-MEAD Class E | ||||
| 11/10/2036 | 3.283% | 15,500,000 | 13,552,802 | |
| Progress Residential Trust(a) | ||||
| Series 2020-SFR1 Class F | ||||
| 04/17/2037 | 3.431% | 17,000,000 | 15,804,082 | |
| Subordinated Series 2020-SFR2 Class F | ||||
| 06/17/2037 | 6.152% | 12,000,000 | 11,833,997 | |
| Commercial Mortgage-Backed Securities - Non-Agency (continued) | ||||
| Issuer | Coupon Rate | Principal Amount ($) | Value ($) | |
| UBS Commercial Mortgage Trust(a),(b) | ||||
| Series 2018-NYCH Class C | ||||
| 1-month USD LIBOR + 1.500% Floor 1.500% 02/15/2032 | 3.891% | 10,941,000 | 10,486,603 | |
| Series 2018-NYCH Class E | ||||
| 1-month USD LIBOR + 2.900% Floor 3.200% 02/15/2032 | 5.291% | 9,645,000 | 9,044,521 | |
| Wells Fargo Commercial Mortgage Trust(a),(b) | ||||
| Subordinated Series 2017-SMP Class D | ||||
| 1-month USD LIBOR + 1.775% Floor 1.650% 12/15/2034 | 4.166% | 9,790,000 | 9,453,810 | |
| Total Commercial Mortgage-Backed Securities - Non-Agency (Cost $237,107,503) | 224,367,197 | |||
| Common Stocks 0.0% | ||
| Issuer | Shares | Value ($) |
| Consumer Discretionary 0.0% | ||
| Multiline Retail 0.0% | ||
| Belk, Inc.(f) | 50 | 481 |
| Total Consumer Discretionary | 481 | |
| Energy 0.0% | ||
| Energy Equipment & Services 0.0% | ||
| Covia Holdings Corp.(f) | 74,466 | 1,065,795 |
| McDermott International Ltd.(f) | 47,856 | 22,181 |
| Total | 1,087,976 | |
| Oil, Gas & Consumable Fuels 0.0% | ||
| New Frontera Holdings(f) | 14,302 | 4,469 |
| Southcross Energy Partners LLC(d),(f) | 14,393 | 432 |
| Southcross Energy Partners LLC, Class A(d),(f) | 272,263 | 20,420 |
| Total | 25,321 | |
| Total Energy | 1,113,297 | |
| Industrials 0.0% | ||
| Machinery 0.0% | ||
| TNT Crane and Rigging, Inc.(f) | 23,468 | 287,483 |
| Total Industrials | 287,483 | |
| 10 | Columbia Strategic Income Fund | Annual Report 2022 |
August 31, 2022
| Common Stocks (continued) | ||
| Issuer | Shares | Value ($) |
| Information Technology 0.0% | ||
| Communications Equipment 0.0% | ||
| Riverbed Technology, Inc.(f) | 13,308 | 29,943 |
| Total Information Technology | 29,943 | |
| Total Common Stocks (Cost $1,185,171) | 1,431,204 | |
| Convertible Bonds 0.1% | ||||
| Issuer | Coupon Rate | Principal Amount ($) | Value ($) | |
| Cable and Satellite 0.1% | ||||
| DISH Network Corp. | ||||
| Subordinated | ||||
| 08/15/2026 | 3.375% | 9,468,000 | 6,812,807 | |
| Total Convertible Bonds (Cost $8,932,048) | 6,812,807 | |||
| Convertible Preferred Stocks 0.0% | |||
| Issuer | Shares | Value ($) | |
| Information Technology 0.0% | |||
| Communications Equipment 0.0% | |||
| Riverbed Technology, Inc. | 7.000% | 14,204 | 71,020 |
| Total Information Technology | 71,020 | ||
| Total Convertible Preferred Stocks (Cost $307,751) | 71,020 | ||
| Corporate Bonds & Notes 39.5% | ||||
| Issuer | Coupon Rate | Principal Amount ($) | Value ($) | |
| Aerospace & Defense 0.9% | ||||
| Boeing Co. (The) | ||||
| 05/01/2025 | 4.875% | 350,000 | 351,221 | |
| 08/01/2059 | 3.950% | 23,958,000 | 16,715,481 | |
| 05/01/2060 | 5.930% | 7,549,000 | 7,208,096 | |
| Bombardier, Inc.(a) | ||||
| 04/15/2027 | 7.875% | 2,816,000 | 2,693,695 | |
| Howmet Aerospace, Inc. | ||||
| 01/15/2029 | 3.000% | 5,006,000 | 4,230,719 | |
| TransDigm, Inc.(a) | ||||
| 12/15/2025 | 8.000% | 2,772,000 | 2,838,953 | |
| 03/15/2026 | 6.250% | 8,643,000 | 8,488,122 | |
| TransDigm, Inc. | ||||
| 06/15/2026 | 6.375% | 1,566,000 | 1,503,669 | |
| 11/15/2027 | 5.500% | 4,776,000 | 4,297,663 | |
| 01/15/2029 | 4.625% | 2,458,000 | 2,081,334 | |
| Total | 50,408,953 | |||
| Corporate Bonds & Notes (continued) | ||||
| Issuer | Coupon Rate | Principal Amount ($) | Value ($) | |
| Airlines 0.3% | ||||
| Air Canada(a) | ||||
| 08/15/2026 | 3.875% | 2,022,000 | 1,805,138 | |
| American Airlines, Inc.(a) | ||||
| 07/15/2025 | 11.750% | 2,307,000 | 2,548,518 | |
| American Airlines, Inc./AAdvantage Loyalty IP Ltd.(a) | ||||
| 04/20/2026 | 5.500% | 7,804,098 | 7,429,729 | |
| 04/20/2029 | 5.750% | 230,425 | 208,146 | |
| Hawaiian Brand Intellectual Property Ltd./Miles Loyalty Ltd.(a) | ||||
| 01/20/2026 | 5.750% | 4,536,720 | 4,142,286 | |
| United Airlines, Inc.(a) | ||||
| 04/15/2026 | 4.375% | 1,693,000 | 1,543,506 | |
| Total | 17,677,323 | |||
| Automotive 0.6% | ||||
| American Axle & Manufacturing, Inc. | ||||
| 04/01/2027 | 6.500% | 195,000 | 182,255 | |
| Ford Motor Co. | ||||
| 02/12/2032 | 3.250% | 3,984,000 | 3,112,044 | |
| 01/15/2043 | 4.750% | 5,753,000 | 4,318,860 | |
| Ford Motor Credit Co. LLC | ||||
| 09/08/2024 | 3.664% | 3,700,000 | 3,547,645 | |
| 06/16/2025 | 5.125% | 4,449,000 | 4,324,754 | |
| 11/13/2025 | 3.375% | 1,036,000 | 942,026 | |
| 08/17/2027 | 4.125% | 4,839,000 | 4,362,045 | |
| 02/16/2028 | 2.900% | 1,231,000 | 1,027,855 | |
| 11/13/2030 | 4.000% | 498,000 | 419,554 | |
| Goodyear Tire & Rubber Co. (The) | ||||
| 07/15/2029 | 5.000% | 4,437,000 | 3,979,447 | |
| IAA Spinco, Inc.(a) | ||||
| 06/15/2027 | 5.500% | 1,497,000 | 1,411,025 | |
| IHO Verwaltungs GmbH(a),(g) | ||||
| 05/15/2029 | 6.375% | 643,000 | 567,685 | |
| KAR Auction Services, Inc.(a) | ||||
| 06/01/2025 | 5.125% | 1,518,000 | 1,500,152 | |
| Panther BF Aggregator 2 LP/Finance Co., Inc.(a) | ||||
| 05/15/2027 | 8.500% | 3,927,000 | 3,860,188 | |
| Tenneco, Inc.(a) | ||||
| 01/15/2029 | 7.875% | 1,897,000 | 1,907,387 | |
| Total | 35,462,922 | |||
| Banking 7.6% | ||||
| Bank of America Corp.(h) | ||||
| 10/22/2030 | 2.884% | 41,540,000 | 36,091,871 | |
| 10/24/2031 | 1.922% | 47,155,000 | 37,337,782 | |
| 10/20/2032 | 2.572% | 19,830,000 | 16,251,257 | |
| 02/04/2033 | 2.972% | 35,980,000 | 30,361,507 | |
| Columbia Strategic Income Fund | Annual Report 2022 | 11 |
August 31, 2022
| Corporate Bonds & Notes (continued) | ||||
| Issuer | Coupon Rate | Principal Amount ($) | Value ($) | |
| Citigroup, Inc.(h) | ||||
| 06/03/2031 | 2.572% | 5,572,000 | 4,658,117 | |
| 01/25/2033 | 3.057% | 33,061,000 | 28,009,743 | |
| Goldman Sachs Group, Inc. (The)(h) | ||||
| 07/21/2032 | 2.383% | 42,449,000 | 34,257,597 | |
| 10/21/2032 | 2.650% | 31,561,000 | 25,944,921 | |
| HSBC Holdings PLC(h) | ||||
| 05/24/2032 | 2.804% | 12,449,000 | 9,890,770 | |
| 11/22/2032 | 2.871% | 36,469,000 | 28,997,424 | |
| JPMorgan Chase & Co.(h) | ||||
| 10/15/2030 | 2.739% | 3,322,000 | 2,877,090 | |
| 11/19/2031 | 1.764% | 195,000 | 153,327 | |
| 04/22/2032 | 2.580% | 48,337,000 | 39,987,371 | |
| 11/08/2032 | 2.545% | 53,175,000 | 43,812,845 | |
| Morgan Stanley(h) | ||||
| 07/21/2032 | 2.239% | 9,994,000 | 8,059,811 | |
| 10/20/2032 | 2.511% | 19,354,000 | 15,870,481 | |
| Subordinated | ||||
| 04/20/2037 | 5.297% | 10,130,000 | 9,728,548 | |
| Wells Fargo & Co.(h) | ||||
| 02/11/2031 | 2.572% | 50,120,000 | 42,679,973 | |
| 03/02/2033 | 3.350% | 17,034,000 | 14,855,535 | |
| Total | 429,825,970 | |||
| Brokerage/Asset Managers/Exchanges 0.3% | ||||
| AG Issuer LLC(a) | ||||
| 03/01/2028 | 6.250% | 57,000 | 52,575 | |
| AG TTMT Escrow Issuer LLC(a) | ||||
| 09/30/2027 | 8.625% | 2,692,000 | 2,692,908 | |
| Hightower Holding LLC(a) | ||||
| 04/15/2029 | 6.750% | 2,280,000 | 1,922,489 | |
| NFP Corp(a) | ||||
| 10/01/2030 | 7.500% | 2,568,000 | 2,530,562 | |
| NFP Corp.(a) | ||||
| 08/15/2028 | 4.875% | 2,419,000 | 2,146,169 | |
| 08/15/2028 | 6.875% | 8,366,000 | 6,893,034 | |
| Total | 16,237,737 | |||
| Building Materials 0.3% | ||||
| American Builders & Contractors Supply Co., Inc.(a) | ||||
| 01/15/2028 | 4.000% | 2,879,000 | 2,634,297 | |
| Beacon Roofing Supply, Inc.(a) | ||||
| 11/15/2026 | 4.500% | 2,420,000 | 2,284,083 | |
| 05/15/2029 | 4.125% | 1,447,000 | 1,222,201 | |
| Cemex SAB de CV(a) | ||||
| 06/05/2027 | 7.375% | 350,000 | 354,275 | |
| James Hardie International Finance DAC(a) | ||||
| 01/15/2028 | 5.000% | 1,493,000 | 1,376,510 | |
| Corporate Bonds & Notes (continued) | ||||
| Issuer | Coupon Rate | Principal Amount ($) | Value ($) | |
| SRS Distribution, Inc.(a) | ||||
| 07/01/2028 | 4.625% | 3,231,000 | 2,871,299 | |
| 07/01/2029 | 6.125% | 2,178,000 | 1,789,166 | |
| 12/01/2029 | 6.000% | 2,378,000 | 1,936,990 | |
| White Cap Buyer LLC(a) | ||||
| 10/15/2028 | 6.875% | 1,730,000 | 1,522,602 | |
| Total | 15,991,423 | |||
| Cable and Satellite 2.3% | ||||
| CCO Holdings LLC/Capital Corp.(a) | ||||
| 05/01/2027 | 5.125% | 3,596,000 | 3,415,686 | |
| 02/01/2028 | 5.000% | 2,860,000 | 2,610,931 | |
| 06/01/2029 | 5.375% | 1,545,000 | 1,412,107 | |
| 03/01/2030 | 4.750% | 1,653,000 | 1,420,378 | |
| 08/15/2030 | 4.500% | 4,927,000 | 4,146,692 | |
| 02/01/2031 | 4.250% | 866,000 | 707,170 | |
| 02/01/2032 | 4.750% | 2,722,000 | 2,254,376 | |
| CCO Holdings LLC/Capital Corp. | ||||
| 05/01/2032 | 4.500% | 9,589,000 | 7,775,431 | |
| Charter Communications Operating LLC/Capital | ||||
| 05/01/2047 | 5.375% | 4,290,000 | 3,656,221 | |
| 06/30/2062 | 3.950% | 6,305,000 | 4,173,465 | |
| 04/01/2063 | 5.500% | 34,589,000 | 28,946,666 | |
| CSC Holdings LLC | ||||
| 06/01/2024 | 5.250% | 710,000 | 694,822 | |
| CSC Holdings LLC(a) | ||||
| 02/01/2028 | 5.375% | 3,391,000 | 3,064,852 | |
| 02/01/2029 | 6.500% | 2,383,000 | 2,192,631 | |
| 01/15/2030 | 5.750% | 2,654,000 | 2,054,451 | |
| 12/01/2030 | 4.125% | 3,068,000 | 2,485,080 | |
| 12/01/2030 | 4.625% | 2,412,000 | 1,723,745 | |
| 02/15/2031 | 3.375% | 2,160,000 | 1,620,232 | |
| 11/15/2031 | 5.000% | 1,621,000 | 1,163,708 | |
| DIRECTV Holdings LLC/Financing Co., Inc.(a) | ||||
| 08/15/2027 | 5.875% | 2,147,000 | 1,964,721 | |
| DISH DBS Corp.(a) | ||||
| 12/01/2028 | 5.750% | 5,022,000 | 3,865,267 | |
| DISH DBS Corp. | ||||
| 06/01/2029 | 5.125% | 9,845,000 | 5,830,705 | |
| Radiate Holdco LLC/Finance, Inc.(a) | ||||
| 09/15/2026 | 4.500% | 3,415,000 | 2,945,333 | |
| 09/15/2028 | 6.500% | 5,130,000 | 3,822,209 | |
| Sirius XM Radio, Inc.(a) | ||||
| 09/01/2026 | 3.125% | 2,513,000 | 2,238,470 | |
| 08/01/2027 | 5.000% | 574,000 | 540,304 | |
| 07/15/2028 | 4.000% | 500,000 | 436,081 | |
| 07/01/2029 | 5.500% | 1,278,000 | 1,195,712 | |
| 07/01/2030 | 4.125% | 2,187,000 | 1,854,346 | |
| Videotron Ltd.(a) | ||||
| 06/15/2029 | 3.625% | 18,114,000 | 15,065,705 | |
| 12 | Columbia Strategic Income Fund | Annual Report 2022 |
August 31, 2022
| Corporate Bonds & Notes (continued) | ||||
| Issuer | Coupon Rate | Principal Amount ($) | Value ($) | |
| Virgin Media Finance PLC(a) | ||||
| 07/15/2030 | 5.000% | 4,644,000 | 3,675,504 | |
| Virgin Media Secured Finance PLC(a) | ||||
| 05/15/2029 | 5.500% | 2,577,000 | 2,307,664 | |
| VZ Secured Financing BV(a) | ||||
| 01/15/2032 | 5.000% | 5,066,000 | 4,128,197 | |
| Ziggo Bond Co. BV(a) | ||||
| 02/28/2030 | 5.125% | 1,818,000 | 1,453,918 | |
| Ziggo Bond Finance BV(a) | ||||
| 01/15/2027 | 6.000% | 1,956,000 | 1,761,918 | |
| Ziggo BV(a) | ||||
| 01/15/2030 | 4.875% | 5,065,000 | 4,332,635 | |
| Total | 132,937,333 | |||
| Chemicals 0.8% | ||||
| Avient Corp.(a) | ||||
| 08/01/2030 | 7.125% | 2,176,000 | 2,151,924 | |
| Axalta Coating Systems LLC(a) | ||||
| 02/15/2029 | 3.375% | 1,492,000 | 1,255,296 | |
| Axalta Coating Systems LLC/Dutch Holding B BV(a) | ||||
| 06/15/2027 | 4.750% | 1,456,000 | 1,348,963 | |
| Braskem Netherlands Finance BV(a) | ||||
| 01/10/2028 | 4.500% | 500,000 | 464,282 | |
| 01/31/2030 | 4.500% | 9,000,000 | 7,956,566 | |
| Cheever Escrow Issuer LLC(a) | ||||
| 10/01/2027 | 7.125% | 2,823,000 | 2,719,205 | |
| Element Solutions, Inc.(a) | ||||
| 09/01/2028 | 3.875% | 4,241,000 | 3,684,384 | |
| HB Fuller Co. | ||||
| 10/15/2028 | 4.250% | 3,430,000 | 3,027,516 | |
| Herens Holdco Sarl(a) | ||||
| 05/15/2028 | 4.750% | 2,382,000 | 2,000,880 | |
| Illuminate Buyer LLC/Holdings IV, Inc.(a) | ||||
| 07/01/2028 | 9.000% | 2,058,000 | 1,800,083 | |
| INEOS Quattro Finance 2 Plc(a) | ||||
| 01/15/2026 | 3.375% | 1,561,000 | 1,357,765 | |
| Ingevity Corp.(a) | ||||
| 11/01/2028 | 3.875% | 2,159,000 | 1,862,183 | |
| Innophos Holdings, Inc.(a) | ||||
| 02/15/2028 | 9.375% | 1,917,000 | 1,876,780 | |
| Iris Holdings, Inc.(a),(g) | ||||
| 02/15/2026 | 8.750% | 1,047,000 | 845,972 | |
| Olympus Water US Holding Corp.(a) | ||||
| 10/01/2028 | 4.250% | 3,005,000 | 2,454,130 | |
| SPCM SA(a) | ||||
| 03/15/2027 | 3.125% | 1,001,000 | 895,426 | |
| Corporate Bonds & Notes (continued) | ||||
| Issuer | Coupon Rate | Principal Amount ($) | Value ($) | |
| Unifrax Escrow Issuer Corp.(a) | ||||
| 09/30/2028 | 5.250% | 1,512,000 | 1,232,819 | |
| WR Grace Holdings LLC(a) | ||||
| 06/15/2027 | 4.875% | 4,613,000 | 4,286,773 | |
| 08/15/2029 | 5.625% | 5,715,000 | 4,530,653 | |
| Total | 45,751,600 | |||
| Construction Machinery 0.2% | ||||
| H&E Equipment Services, Inc.(a) | ||||
| 12/15/2028 | 3.875% | 6,880,000 | 5,814,430 | |
| Herc Holdings, Inc.(a) | ||||
| 07/15/2027 | 5.500% | 1,295,000 | 1,223,776 | |
| Ritchie Bros. Auctioneers, Inc.(a) | ||||
| 01/15/2025 | 5.375% | 1,235,000 | 1,226,357 | |
| United Rentals North America, Inc. | ||||
| 07/15/2030 | 4.000% | 897,000 | 780,285 | |
| 01/15/2032 | 3.750% | 997,000 | 835,360 | |
| Total | 9,880,208 | |||
| Consumer Cyclical Services 0.4% | ||||
| APX Group, Inc.(a) | ||||
| 07/15/2029 | 5.750% | 685,000 | 561,797 | |
| Arches Buyer, Inc.(a) | ||||
| 06/01/2028 | 4.250% | 3,340,000 | 2,686,937 | |
| 12/01/2028 | 6.125% | 2,464,000 | 1,927,728 | |
| ASGN, Inc.(a) | ||||
| 05/15/2028 | 4.625% | 2,024,000 | 1,797,243 | |
| Staples, Inc.(a) | ||||
| 04/15/2026 | 7.500% | 2,014,000 | 1,702,573 | |
| Uber Technologies, Inc.(a) | ||||
| 05/15/2025 | 7.500% | 2,461,000 | 2,489,581 | |
| 08/15/2029 | 4.500% | 13,892,000 | 12,072,703 | |
| Total | 23,238,562 | |||
| Consumer Products 0.2% | ||||
| CD&R Smokey Buyer, Inc.(a) | ||||
| 07/15/2025 | 6.750% | 1,637,000 | 1,529,715 | |
| Mattel, Inc.(a) | ||||
| 12/15/2027 | 5.875% | 1,314,000 | 1,310,604 | |
| Newell Brands, Inc. | ||||
| 04/01/2046 | 6.000% | 6,740,000 | 5,392,285 | |
| Prestige Brands, Inc.(a) | ||||
| 01/15/2028 | 5.125% | 934,000 | 860,403 | |
| Spectrum Brands, Inc. | ||||
| 07/15/2025 | 5.750% | 1,006,000 | 990,978 | |
| Spectrum Brands, Inc.(a) | ||||
| 10/01/2029 | 5.000% | 1,308,000 | 1,141,574 | |
| Columbia Strategic Income Fund | Annual Report 2022 | 13 |
August 31, 2022
| Corporate Bonds & Notes (continued) | ||||
| Issuer | Coupon Rate | Principal Amount ($) | Value ($) | |
| Tempur Sealy International, Inc.(a) | ||||
| 10/15/2031 | 3.875% | 1,884,000 | 1,450,908 | |
| Total | 12,676,467 | |||
| Diversified Manufacturing 1.2% | ||||
| Carrier Global Corp. | ||||
| 02/15/2030 | 2.722% | 16,226,000 | 14,033,714 | |
| 04/05/2050 | 3.577% | 21,790,000 | 16,605,670 | |
| Gates Global LLC/Co.(a) | ||||
| 01/15/2026 | 6.250% | 2,554,000 | 2,421,690 | |
| GE Capital International Funding Co. Unlimited Co. | ||||
| 11/15/2035 | 4.418% | 14,038,000 | 13,237,801 | |
| General Electric Co.(b) | ||||
| Junior Subordinated | ||||
| 3-month USD LIBOR + 3.330% 12/31/2049 | 5.159% | 13,800,000 | 13,064,459 | |
| Madison IAQ LLC(a) | ||||
| 06/30/2028 | 4.125% | 1,254,000 | 1,079,864 | |
| 06/30/2029 | 5.875% | 2,297,000 | 1,891,601 | |
| Resideo Funding, Inc.(a) | ||||
| 09/01/2029 | 4.000% | 1,882,000 | 1,598,128 | |
| Vertical US Newco, Inc.(a) | ||||
| 07/15/2027 | 5.250% | 608,000 | 553,378 | |
| WESCO Distribution, Inc.(a) | ||||
| 06/15/2025 | 7.125% | 3,205,000 | 3,218,053 | |
| 06/15/2028 | 7.250% | 1,288,000 | 1,300,408 | |
| Total | 69,004,766 | |||
| Electric 2.3% | ||||
| AEP Texas, Inc. | ||||
| 01/15/2050 | 3.450% | 11,560,000 | 8,780,330 | |
| Calpine Corp.(a) | ||||
| 02/15/2028 | 4.500% | 2,035,000 | 1,862,005 | |
| Clearway Energy Operating LLC(a) | ||||
| 02/15/2031 | 3.750% | 7,347,000 | 6,164,965 | |
| 01/15/2032 | 3.750% | 4,484,000 | 3,758,696 | |
| Duke Energy Corp. | ||||
| 09/01/2046 | 3.750% | 7,780,000 | 6,106,765 | |
| Emera US Finance LP | ||||
| 06/15/2046 | 4.750% | 15,730,000 | 13,812,920 | |
| Georgia Power Co. | ||||
| 03/15/2042 | 4.300% | 8,185,000 | 7,274,087 | |
| Leeward Renewable Energy Operations LLC(a) | ||||
| 07/01/2029 | 4.250% | 3,086,000 | 2,550,856 | |
| NextEra Energy Operating Partners LP(a) | ||||
| 07/15/2024 | 4.250% | 2,319,000 | 2,243,286 | |
| 09/15/2027 | 4.500% | 6,630,000 | 6,130,275 | |
| Corporate Bonds & Notes (continued) | ||||
| Issuer | Coupon Rate | Principal Amount ($) | Value ($) | |
| NRG Energy, Inc.(a) | ||||
| 02/15/2029 | 3.375% | 1,229,000 | 1,016,029 | |
| 06/15/2029 | 5.250% | 2,109,000 | 1,886,179 | |
| 02/15/2031 | 3.625% | 6,846,000 | 5,436,955 | |
| 02/15/2032 | 3.875% | 14,895,000 | 11,776,708 | |
| Pacific Gas and Electric Co. | ||||
| 07/01/2050 | 4.950% | 19,380,000 | 15,505,585 | |
| Pattern Energy Operations LP/Inc.(a) | ||||
| 08/15/2028 | 4.500% | 1,034,000 | 937,151 | |
| PG&E Corp. | ||||
| 07/01/2028 | 5.000% | 1,845,000 | 1,639,161 | |
| Southern Co. (The) | ||||
| 07/01/2046 | 4.400% | 9,510,000 | 8,385,370 | |
| TerraForm Power Operating LLC(a) | ||||
| 01/31/2028 | 5.000% | 1,141,000 | 1,049,537 | |
| 01/15/2030 | 4.750% | 3,263,000 | 2,908,576 | |
| Vistra Operations Co. LLC(a) | ||||
| 02/15/2027 | 5.625% | 1,291,000 | 1,247,991 | |
| 07/31/2027 | 5.000% | 1,280,000 | 1,192,287 | |
| 05/01/2029 | 4.375% | 1,871,000 | 1,630,435 | |
| Xcel Energy, Inc. | ||||
| 12/01/2029 | 2.600% | 4,408,000 | 3,859,748 | |
| 06/01/2030 | 3.400% | 14,082,000 | 12,914,642 | |
| Total | 130,070,539 | |||
| Environmental 0.3% | ||||
| Covanta Holding Corp.(a) | ||||
| 12/01/2029 | 4.875% | 1,262,000 | 1,074,572 | |
| GFL Environmental, Inc.(a) | ||||
| 06/01/2025 | 4.250% | 1,809,000 | 1,734,306 | |
| 08/01/2025 | 3.750% | 2,533,000 | 2,384,600 | |
| 12/15/2026 | 5.125% | 1,425,000 | 1,380,816 | |
| 08/01/2028 | 4.000% | 2,000,000 | 1,698,546 | |
| 09/01/2028 | 3.500% | 2,070,000 | 1,801,045 | |
| Waste Pro USA, Inc.(a) | ||||
| 02/15/2026 | 5.500% | 5,579,000 | 5,091,516 | |
| Total | 15,165,401 | |||
| Finance Companies 0.6% | ||||
| Navient Corp. | ||||
| 01/25/2023 | 5.500% | 1,992,000 | 1,982,344 | |
| 09/25/2023 | 7.250% | 524,000 | 525,476 | |
| 06/25/2025 | 6.750% | 878,000 | 847,657 | |
| Provident Funding Associates LP/Finance Corp.(a) | ||||
| 06/15/2025 | 6.375% | 3,141,000 | 2,953,526 | |
| Quicken Loans LLC/Co-Issuer, Inc.(a) | ||||
| 03/01/2029 | 3.625% | 4,226,000 | 3,419,847 | |
| 03/01/2031 | 3.875% | 3,811,000 | 2,988,258 | |
| Rocket Mortgage LLC/Co-Issuer, Inc.(a) | ||||
| 10/15/2033 | 4.000% | 19,824,000 | 14,783,026 | |
| 14 | Columbia Strategic Income Fund | Annual Report 2022 |
August 31, 2022
| Corporate Bonds & Notes (continued) | ||||
| Issuer | Coupon Rate | Principal Amount ($) | Value ($) | |
| Springleaf Finance Corp. | ||||
| 03/15/2023 | 5.625% | 2,537,000 | 2,524,331 | |
| 03/15/2024 | 6.125% | 3,440,000 | 3,360,618 | |
| Total | 33,385,083 | |||
| Food and Beverage 2.3% | ||||
| Anheuser-Busch Companies LLC/InBev Worldwide, Inc. | ||||
| 02/01/2046 | 4.900% | 27,295,000 | 25,917,706 | |
| Bacardi Ltd.(a) | ||||
| 05/15/2048 | 5.300% | 20,083,000 | 19,119,428 | |
| Darling Ingredients, Inc.(a) | ||||
| 04/15/2027 | 5.250% | 2,845,000 | 2,793,756 | |
| FAGE International SA/USA Dairy Industry, Inc.(a) | ||||
| 08/15/2026 | 5.625% | 10,218,000 | 9,413,057 | |
| Grupo Bimbo SAB de CV(a) | ||||
| 06/27/2024 | 3.875% | 2,166,000 | 2,154,296 | |
| Kraft Heinz Foods Co. | ||||
| 06/01/2046 | 4.375% | 28,291,000 | 24,007,545 | |
| Lamb Weston Holdings, Inc.(a) | ||||
| 05/15/2028 | 4.875% | 893,000 | 853,714 | |
| 01/31/2030 | 4.125% | 2,124,000 | 1,913,118 | |
| 01/31/2032 | 4.375% | 2,110,000 | 1,874,345 | |
| Pilgrim’s Pride Corp.(a) | ||||
| 09/30/2027 | 5.875% | 3,370,000 | 3,319,091 | |
| 04/15/2031 | 4.250% | 4,780,000 | 4,120,476 | |
| 03/01/2032 | 3.500% | 28,039,000 | 22,785,680 | |
| Post Holdings, Inc.(a) | ||||
| 03/01/2027 | 5.750% | 1,840,000 | 1,803,945 | |
| 04/15/2030 | 4.625% | 1,287,000 | 1,118,054 | |
| 09/15/2031 | 4.500% | 2,918,000 | 2,481,051 | |
| Primo Water Holdings, Inc.(a) | ||||
| 04/30/2029 | 4.375% | 2,296,000 | 1,964,439 | |
| Simmons Foods, Inc./Prepared Foods, Inc./Pet Food, Inc./Feed(a) | ||||
| 03/01/2029 | 4.625% | 3,314,000 | 2,933,289 | |
| US Foods, Inc.(a) | ||||
| 04/15/2025 | 6.250% | 177,000 | 177,721 | |
| 02/15/2029 | 4.750% | 967,000 | 858,963 | |
| 06/01/2030 | 4.625% | 1,757,000 | 1,516,311 | |
| Total | 131,125,985 | |||
| Gaming 0.7% | ||||
| Boyd Gaming Corp. | ||||
| 12/01/2027 | 4.750% | 1,260,000 | 1,177,891 | |
| Boyd Gaming Corp.(a) | ||||
| 06/15/2031 | 4.750% | 2,548,000 | 2,219,719 | |
| Caesars Entertainment, Inc.(a) | ||||
| 10/15/2029 | 4.625% | 5,516,000 | 4,438,584 | |
| Corporate Bonds & Notes (continued) | ||||
| Issuer | Coupon Rate | Principal Amount ($) | Value ($) | |
| Colt Merger Sub, Inc.(a) | ||||
| 07/01/2025 | 5.750% | 2,596,000 | 2,550,832 | |
| 07/01/2025 | 6.250% | 5,374,000 | 5,246,907 | |
| 07/01/2027 | 8.125% | 2,322,000 | 2,284,996 | |
| International Game Technology PLC(a) | ||||
| 02/15/2025 | 6.500% | 1,761,000 | 1,748,461 | |
| 04/15/2026 | 4.125% | 1,446,000 | 1,329,204 | |
| MGM Resorts International | ||||
| 05/01/2025 | 6.750% | 200,000 | 200,040 | |
| Midwest Gaming Borrower LLC(a) | ||||
| 05/01/2029 | 4.875% | 4,992,000 | 4,388,997 | |
| Penn National Gaming, Inc.(a) | ||||
| 07/01/2029 | 4.125% | 1,853,000 | 1,500,950 | |
| Scientific Games Holdings LP/US FinCo, Inc.(a) | ||||
| 03/01/2030 | 6.625% | 3,087,000 | 2,752,892 | |
| Scientific Games International, Inc.(a) | ||||
| 07/01/2025 | 8.625% | 1,839,000 | 1,892,820 | |
| 05/15/2028 | 7.000% | 1,446,000 | 1,420,646 | |
| 11/15/2029 | 7.250% | 2,450,000 | 2,411,060 | |
| Wynn Las Vegas LLC/Capital Corp.(a) | ||||
| 03/01/2025 | 5.500% | 2,369,000 | 2,268,210 | |
| Wynn Resorts Finance LLC/Capital Corp.(a) | ||||
| 04/15/2025 | 7.750% | 329,000 | 328,070 | |
| Total | 38,160,279 | |||
| Health Care 1.8% | ||||
| Acadia Healthcare Co., Inc.(a) | ||||
| 07/01/2028 | 5.500% | 1,125,000 | 1,063,675 | |
| 04/15/2029 | 5.000% | 1,372,000 | 1,272,585 | |
| AdaptHealth LLC(a) | ||||
| 08/01/2029 | 4.625% | 1,012,000 | 829,568 | |
| 03/01/2030 | 5.125% | 3,368,000 | 2,892,448 | |
| Avantor Funding, Inc.(a) | ||||
| 07/15/2028 | 4.625% | 1,819,000 | 1,655,460 | |
| 11/01/2029 | 3.875% | 4,553,000 | 3,953,799 | |
| Catalent Pharma Solutions, Inc.(a) | ||||
| 07/15/2027 | 5.000% | 342,000 | 322,914 | |
| 02/15/2029 | 3.125% | 586,000 | 486,779 | |
| 04/01/2030 | 3.500% | 1,389,000 | 1,147,256 | |
| Change Healthcare Holdings LLC/Finance, Inc.(a) | ||||
| 03/01/2025 | 5.750% | 1,138,000 | 1,123,865 | |
| Charles River Laboratories International, Inc.(a) | ||||
| 05/01/2028 | 4.250% | 455,000 | 417,959 | |
| 03/15/2029 | 3.750% | 1,124,000 | 970,279 | |
| 03/15/2031 | 4.000% | 975,000 | 830,786 | |
| CHS/Community Health Systems, Inc.(a) | ||||
| 03/15/2027 | 5.625% | 578,000 | 490,220 | |
| 04/15/2029 | 6.875% | 2,712,000 | 1,692,193 | |
| 05/15/2030 | 5.250% | 5,131,000 | 3,883,651 | |
| 02/15/2031 | 4.750% | 3,273,000 | 2,416,990 | |
| Columbia Strategic Income Fund | Annual Report 2022 | 15 |
August 31, 2022
| Corporate Bonds & Notes (continued) | ||||
| Issuer | Coupon Rate | Principal Amount ($) | Value ($) | |
| CVS Health Corp. | ||||
| 03/25/2048 | 5.050% | 1,845,000 | 1,775,855 | |
| HCA, Inc. | ||||
| 09/01/2028 | 5.625% | 2,835,000 | 2,851,334 | |
| 02/01/2029 | 5.875% | 2,135,000 | 2,172,458 | |
| HCA, Inc.(a) | ||||
| 03/15/2052 | 4.625% | 40,687,000 | 33,670,977 | |
| Indigo Merger Sub, Inc.(a) | ||||
| 07/15/2026 | 2.875% | 1,424,000 | 1,267,556 | |
| IQVIA, Inc.(a) | ||||
| 10/15/2026 | 5.000% | 823,000 | 797,270 | |
| 05/15/2027 | 5.000% | 1,864,000 | 1,801,319 | |
| Mozart Debt Merger Sub, Inc.(a) | ||||
| 10/01/2029 | 5.250% | 1,017,000 | 854,842 | |
| Owens & Minor, Inc.(a) | ||||
| 04/01/2030 | 6.625% | 1,976,000 | 1,822,340 | |
| Radiology Partners, Inc.(a) | ||||
| 02/01/2028 | 9.250% | 2,411,000 | 1,809,173 | |
| RP Escrow Issuer LLC(a) | ||||
| 12/15/2025 | 5.250% | 7,315,000 | 6,598,517 | |
| Select Medical Corp.(a) | ||||
| 08/15/2026 | 6.250% | 4,045,000 | 3,886,851 | |
| Surgery Center Holdings, Inc.(a) | ||||
| 07/01/2025 | 6.750% | 1,837,000 | 1,771,546 | |
| 04/15/2027 | 10.000% | 1,363,000 | 1,368,539 | |
| Syneos Health, Inc.(a) | ||||
| 01/15/2029 | 3.625% | 719,000 | 607,552 | |
| Tenet Healthcare Corp. | ||||
| 07/15/2024 | 4.625% | 342,000 | 335,087 | |
| Tenet Healthcare Corp.(a) | ||||
| 02/01/2027 | 6.250% | 2,592,000 | 2,498,832 | |
| 11/01/2027 | 5.125% | 2,761,000 | 2,559,299 | |
| 10/01/2028 | 6.125% | 4,212,000 | 3,861,782 | |
| 01/15/2030 | 4.375% | 1,872,000 | 1,637,994 | |
| US Acute Care Solutions LLC(a) | ||||
| 03/01/2026 | 6.375% | 2,468,000 | 2,224,262 | |
| Total | 101,623,812 | |||
| Healthcare Insurance 0.2% | ||||
| Centene Corp. | ||||
| 10/15/2030 | 3.000% | 4,611,000 | 3,851,073 | |
| 08/01/2031 | 2.625% | 7,507,000 | 5,999,042 | |
| Total | 9,850,115 | |||
| Home Construction 0.3% | ||||
| Meritage Homes Corp. | ||||
| 06/06/2027 | 5.125% | 2,373,000 | 2,224,582 | |
| Corporate Bonds & Notes (continued) | ||||
| Issuer | Coupon Rate | Principal Amount ($) | Value ($) | |
| Meritage Homes Corp.(a) | ||||
| 04/15/2029 | 3.875% | 9,096,000 | 7,768,332 | |
| Shea Homes LP/Funding Corp.(a) | ||||
| 02/15/2028 | 4.750% | 2,763,000 | 2,305,033 | |
| Taylor Morrison Communities, Inc.(a) | ||||
| 01/15/2028 | 5.750% | 1,294,000 | 1,193,809 | |
| Taylor Morrison Communities, Inc./Holdings II(a) | ||||
| 04/15/2023 | 5.875% | 1,265,000 | 1,261,586 | |
| 03/01/2024 | 5.625% | 695,000 | 691,260 | |
| Total | 15,444,602 | |||
| Independent Energy 1.6% | ||||
| Apache Corp. | ||||
| 01/15/2030 | 4.250% | 497,000 | 449,104 | |
| 09/01/2040 | 5.100% | 1,534,000 | 1,320,879 | |
| 02/01/2042 | 5.250% | 408,000 | 349,705 | |
| 04/15/2043 | 4.750% | 1,601,000 | 1,268,688 | |
| 01/15/2044 | 4.250% | 2,001,000 | 1,500,772 | |
| Callon Petroleum Co. | ||||
| 07/01/2026 | 6.375% | 6,352,000 | 5,949,906 | |
| Callon Petroleum Co.(a) | ||||
| 08/01/2028 | 8.000% | 6,021,000 | 5,778,989 | |
| CNX Resources Corp.(a) | ||||
| 03/14/2027 | 7.250% | 2,433,000 | 2,418,257 | |
| 01/15/2029 | 6.000% | 1,638,000 | 1,541,056 | |
| Colgate Energy Partners III LLC(a) | ||||
| 07/01/2029 | 5.875% | 3,953,000 | 3,679,430 | |
| Comstock Resources, Inc.(a) | ||||
| 03/01/2029 | 6.750% | 999,000 | 954,612 | |
| 01/15/2030 | 5.875% | 1,426,000 | 1,313,416 | |
| CrownRock LP/Finance, Inc.(a) | ||||
| 05/01/2029 | 5.000% | 1,142,000 | 1,056,937 | |
| Hilcorp Energy I LP/Finance Co.(a) | ||||
| 11/01/2028 | 6.250% | 1,262,000 | 1,196,594 | |
| 02/01/2029 | 5.750% | 3,120,000 | 2,866,821 | |
| 04/15/2030 | 6.000% | 1,459,000 | 1,345,883 | |
| Matador Resources Co. | ||||
| 09/15/2026 | 5.875% | 2,756,000 | 2,701,181 | |
| Occidental Petroleum Corp. | ||||
| 07/15/2025 | 8.000% | 3,785,000 | 4,101,438 | |
| 09/01/2030 | 6.625% | 4,862,000 | 5,197,541 | |
| 01/01/2031 | 6.125% | 6,973,000 | 7,261,816 | |
| 09/15/2036 | 6.450% | 19,770,000 | 21,145,587 | |
| 03/15/2040 | 6.200% | 1,485,000 | 1,510,557 | |
| 03/15/2046 | 6.600% | 5,307,000 | 5,846,257 | |
| Southwestern Energy Co. | ||||
| 02/01/2029 | 5.375% | 938,000 | 887,750 | |
| 02/01/2032 | 4.750% | 7,949,000 | 7,078,916 | |
| Total | 88,722,092 | |||
| 16 | Columbia Strategic Income Fund | Annual Report 2022 |
August 31, 2022
| Corporate Bonds & Notes (continued) | ||||
| Issuer | Coupon Rate | Principal Amount ($) | Value ($) | |
| Integrated Energy 0.1% | ||||
| Cenovus Energy, Inc. | ||||
| 02/15/2052 | 3.750% | 4,960,000 | 3,815,758 | |
| Leisure 0.6% | ||||
| Carnival Corp.(a) | ||||
| 03/01/2026 | 7.625% | 12,452,000 | 10,590,839 | |
| 03/01/2027 | 5.750% | 3,034,000 | 2,344,250 | |
| Cedar Fair LP/Canada’s Wonderland Co./Magnum Management Corp./Millennium Operations LLC(a) | ||||
| 05/01/2025 | 5.500% | 684,000 | 672,881 | |
| Cedar Fair LP/Canada’s Wonderland Co./Magnum Management Corp./Millennium Operations LLC | ||||
| 10/01/2028 | 6.500% | 782,000 | 765,765 | |
| Cinemark USA, Inc.(a) | ||||
| 03/15/2026 | 5.875% | 5,595,000 | 4,966,457 | |
| NCL Corp., Ltd.(a) | ||||
| 03/15/2026 | 5.875% | 2,526,000 | 2,021,937 | |
| Royal Caribbean Cruises Ltd. | ||||
| 11/15/2022 | 5.250% | 500,000 | 501,458 | |
| Royal Caribbean Cruises Ltd.(a) | ||||
| 07/01/2026 | 4.250% | 2,766,000 | 2,142,977 | |
| 08/31/2026 | 5.500% | 9,110,000 | 7,287,839 | |
| 07/15/2027 | 5.375% | 1,151,000 | 900,127 | |
| Six Flags Entertainment Corp.(a) | ||||
| 07/31/2024 | 4.875% | 1,889,000 | 1,821,086 | |
| Total | 34,015,616 | |||
| Life Insurance 1.1% | ||||
| Five Corners Funding Trust(a) | ||||
| 11/15/2023 | 4.419% | 10,756,000 | 10,745,537 | |
| Guardian Life Insurance Co. of America (The)(a) | ||||
| Subordinated | ||||
| 06/19/2064 | 4.875% | 9,685,000 | 9,203,426 | |
| Massachusetts Mutual Life Insurance Co.(a) | ||||
| Subordinated | ||||
| 10/15/2070 | 3.729% | 7,877,000 | 5,882,028 | |
| Peachtree Corners Funding Trust(a) | ||||
| 02/15/2025 | 3.976% | 25,683,000 | 25,317,339 | |
| Teachers Insurance & Annuity Association of America(a) | ||||
| Subordinated | ||||
| 09/15/2044 | 4.900% | 8,875,000 | 8,630,441 | |
| Total | 59,778,771 | |||
| Lodging 0.0% | ||||
| Hilton Domestic Operating Co., Inc.(a) | ||||
| 05/01/2025 | 5.375% | 966,000 | 957,069 | |
| Corporate Bonds & Notes (continued) | ||||
| Issuer | Coupon Rate | Principal Amount ($) | Value ($) | |
| Wyndham Hotels & Resorts, Inc.(a) | ||||
| 08/15/2028 | 4.375% | 1,955,000 | 1,748,050 | |
| Total | 2,705,119 | |||
| Media and Entertainment 1.8% | ||||
| Cengage Learning, Inc.(a) | ||||
| 06/15/2024 | 9.500% | 9,716,000 | 9,341,164 | |
| Clear Channel International BV(a) | ||||
| 08/01/2025 | 6.625% | 3,019,000 | 2,870,292 | |
| Clear Channel Outdoor Holdings, Inc.(a) | ||||
| 04/15/2028 | 7.750% | 3,499,000 | 2,848,648 | |
| 06/01/2029 | 7.500% | 4,188,000 | 3,367,460 | |
| Clear Channel Worldwide Holdings, Inc.(a) | ||||
| 08/15/2027 | 5.125% | 3,368,000 | 3,022,678 | |
| iHeartCommunications, Inc. | ||||
| 05/01/2026 | 6.375% | 1,407,936 | 1,331,174 | |
| iHeartCommunications, Inc.(a) | ||||
| 08/15/2027 | 5.250% | 3,659,000 | 3,294,533 | |
| Magallanes, Inc.(a) | ||||
| 03/15/2052 | 5.141% | 15,080,000 | 12,140,797 | |
| 03/15/2062 | 5.391% | 39,359,000 | 31,650,852 | |
| Netflix, Inc. | ||||
| 04/15/2028 | 4.875% | 3,047,000 | 2,957,118 | |
| 11/15/2028 | 5.875% | 6,157,000 | 6,236,551 | |
| 05/15/2029 | 6.375% | 338,000 | 352,100 | |
| Netflix, Inc.(a) | ||||
| 11/15/2029 | 5.375% | 1,315,000 | 1,293,559 | |
| 06/15/2030 | 4.875% | 13,193,000 | 12,556,547 | |
| Outfront Media Capital LLC/Corp.(a) | ||||
| 08/15/2027 | 5.000% | 1,420,000 | 1,303,791 | |
| 01/15/2029 | 4.250% | 811,000 | 681,697 | |
| 03/15/2030 | 4.625% | 2,185,000 | 1,824,214 | |
| Playtika Holding Corp.(a) | ||||
| 03/15/2029 | 4.250% | 3,370,000 | 2,868,323 | |
| Roblox Corp.(a) | ||||
| 05/01/2030 | 3.875% | 2,812,000 | 2,364,237 | |
| Univision Communications, Inc.(a) | ||||
| 05/01/2029 | 4.500% | 1,237,000 | 1,081,548 | |
| 06/30/2030 | 7.375% | 1,319,000 | 1,308,652 | |
| Total | 104,695,935 | |||
| Metals and Mining 0.4% | ||||
| Allegheny Technologies, Inc. | ||||
| 10/01/2029 | 4.875% | 818,000 | 734,958 | |
| 10/01/2031 | 5.125% | 3,121,000 | 2,745,815 | |
| Constellium SE(a) | ||||
| 06/15/2028 | 5.625% | 1,795,000 | 1,623,244 | |
| 04/15/2029 | 3.750% | 7,890,000 | 6,522,361 | |
| Columbia Strategic Income Fund | Annual Report 2022 | 17 |
August 31, 2022
| Corporate Bonds & Notes (continued) | ||||
| Issuer | Coupon Rate | Principal Amount ($) | Value ($) | |
| Hudbay Minerals, Inc.(a) | ||||
| 04/01/2029 | 6.125% | 6,673,000 | 5,879,333 | |
| Kaiser Aluminum Corp.(a) | ||||
| 03/01/2028 | 4.625% | 560,000 | 477,426 | |
| 06/01/2031 | 4.500% | 4,144,000 | 3,267,507 | |
| Novelis Corp.(a) | ||||
| 11/15/2026 | 3.250% | 1,369,000 | 1,218,410 | |
| 01/30/2030 | 4.750% | 2,010,000 | 1,756,697 | |
| 08/15/2031 | 3.875% | 1,651,000 | 1,332,220 | |
| Total | 25,557,971 | |||
| Midstream 2.6% | ||||
| Cheniere Energy Partners LP | ||||
| 10/01/2029 | 4.500% | 1,343,000 | 1,237,295 | |
| 03/01/2031 | 4.000% | 1,740,000 | 1,517,642 | |
| 01/31/2032 | 3.250% | 4,397,000 | 3,517,106 | |
| Cheniere Energy, Inc. | ||||
| 10/15/2028 | 4.625% | 1,989,000 | 1,915,416 | |
| CNX Midstream Partners LP(a) | ||||
| 04/15/2030 | 4.750% | 2,202,000 | 1,849,708 | |
| DCP Midstream Operating LP | ||||
| 05/15/2029 | 5.125% | 1,532,000 | 1,495,020 | |
| 04/01/2044 | 5.600% | 1,252,000 | 1,201,250 | |
| Delek Logistics Partners LP/Finance Corp. | ||||
| 05/15/2025 | 6.750% | 1,292,000 | 1,268,501 | |
| DT Midstream, Inc.(a) | ||||
| 06/15/2029 | 4.125% | 1,588,000 | 1,395,770 | |
| 06/15/2031 | 4.375% | 2,964,000 | 2,551,223 | |
| Enterprise Products Operating LLC | ||||
| 03/15/2044 | 4.850% | 2,287,000 | 2,129,578 | |
| 01/31/2060 | 3.950% | 5,461,000 | 4,261,263 | |
| EQM Midstream Partners LP(a) | ||||
| 07/01/2025 | 6.000% | 2,976,000 | 2,878,601 | |
| 07/01/2027 | 6.500% | 1,236,000 | 1,195,421 | |
| 01/15/2029 | 4.500% | 2,159,000 | 1,879,410 | |
| 01/15/2031 | 4.750% | 12,404,000 | 10,720,968 | |
| EQM Midstream Partners LP | ||||
| 07/15/2048 | 6.500% | 10,829,000 | 9,170,768 | |
| Galaxy Pipeline Assets Bidco Ltd.(a) | ||||
| 03/31/2036 | 2.625% | 12,000,000 | 10,093,066 | |
| 09/30/2040 | 3.250% | 3,925,000 | 3,215,646 | |
| Holly Energy Partners LP/Finance Corp.(a) | ||||
| 04/15/2027 | 6.375% | 1,191,000 | 1,174,686 | |
| 02/01/2028 | 5.000% | 1,667,000 | 1,539,331 | |
| Kinder Morgan Energy Partners LP | ||||
| 03/01/2043 | 5.000% | 1,737,000 | 1,555,235 | |
| Kinder Morgan, Inc. | ||||
| 02/15/2046 | 5.050% | 15,628,000 | 14,195,757 | |
| Corporate Bonds & Notes (continued) | ||||
| Issuer | Coupon Rate | Principal Amount ($) | Value ($) | |
| NuStar Logistics LP | ||||
| 10/01/2025 | 5.750% | 2,682,000 | 2,561,211 | |
| 06/01/2026 | 6.000% | 752,000 | 712,175 | |
| 04/28/2027 | 5.625% | 1,573,000 | 1,445,796 | |
| Plains All American Pipeline LP/Finance Corp. | ||||
| 06/15/2044 | 4.700% | 26,497,000 | 20,933,522 | |
| Rockies Express Pipeline LLC(a) | ||||
| 05/15/2025 | 3.600% | 1,393,000 | 1,282,767 | |
| Rockpoint Gas Storage Canada Ltd.(a) | ||||
| 03/31/2023 | 7.000% | 2,629,000 | 2,611,455 | |
| Superior Plus LP/General Partner, Inc.(a) | ||||
| 03/15/2029 | 4.500% | 1,181,000 | 1,041,368 | |
| TransMontaigne Partners LP/TLP Finance Corp. | ||||
| 02/15/2026 | 6.125% | 2,648,000 | 2,273,616 | |
| Venture Global Calcasieu Pass LLC(a) | ||||
| 08/15/2029 | 3.875% | 4,429,000 | 3,888,605 | |
| 08/15/2031 | 4.125% | 8,868,000 | 7,731,361 | |
| 11/01/2033 | 3.875% | 13,243,000 | 11,003,569 | |
| Williams Companies, Inc. (The) | ||||
| 09/15/2045 | 5.100% | 10,500,000 | 9,827,596 | |
| Total | 147,271,702 | |||
| Natural Gas 0.4% | ||||
| NiSource, Inc. | ||||
| 05/01/2030 | 3.600% | 7,970,000 | 7,345,098 | |
| 02/15/2043 | 5.250% | 4,755,000 | 4,637,381 | |
| 05/15/2047 | 4.375% | 13,773,000 | 12,149,192 | |
| Total | 24,131,671 | |||
| Oil Field Services 0.2% | ||||
| Transocean Sentry Ltd.(a) | ||||
| 05/15/2023 | 5.375% | 10,980,748 | 10,651,060 | |
| Other Industry 0.0% | ||||
| Booz Allen Hamilton, Inc.(a) | ||||
| 09/01/2028 | 3.875% | 1,358,000 | 1,208,687 | |
| Hillenbrand, Inc. | ||||
| 03/01/2031 | 3.750% | 1,167,000 | 983,964 | |
| Total | 2,192,651 | |||
| Other REIT 0.3% | ||||
| Blackstone Mortgage Trust, Inc.(a) | ||||
| 01/15/2027 | 3.750% | 2,997,000 | 2,630,132 | |
| Ladder Capital Finance Holdings LLLP/Corp.(a) | ||||
| 10/01/2025 | 5.250% | 3,838,000 | 3,711,173 | |
| 02/01/2027 | 4.250% | 1,293,000 | 1,128,819 | |
| 06/15/2029 | 4.750% | 5,315,000 | 4,524,840 | |
| Park Intermediate Holdings LLC/Domestic Property/Finance Co-Issuer(a) | ||||
| 10/01/2028 | 5.875% | 1,816,000 | 1,669,301 | |
| 18 | Columbia Strategic Income Fund | Annual Report 2022 |
August 31, 2022
| Corporate Bonds & Notes (continued) | ||||
| Issuer | Coupon Rate | Principal Amount ($) | Value ($) | |
| Park Intermediate Holdings LLC/PK Domestic Property LLC/Finance Co-Issuer(a) | ||||
| 05/15/2029 | 4.875% | 1,571,000 | 1,384,344 | |
| RHP Hotel Properties LP/Finance Corp.(a) | ||||
| 02/15/2029 | 4.500% | 860,000 | 748,896 | |
| RLJ Lodging Trust LP(a) | ||||
| 07/01/2026 | 3.750% | 1,102,000 | 990,299 | |
| 09/15/2029 | 4.000% | 1,270,000 | 1,068,146 | |
| Service Properties Trust | ||||
| 03/15/2024 | 4.650% | 957,000 | 892,324 | |
| Total | 18,748,274 | |||
| Packaging 0.3% | ||||
| Ardagh Metal Packaging Finance USA LLC/PLC(a) | ||||
| 06/15/2027 | 6.000% | 1,033,000 | 1,015,287 | |
| 09/01/2029 | 4.000% | 3,939,000 | 3,238,580 | |
| Ardagh Packaging Finance PLC/Holdings USA, Inc.(a) | ||||
| 08/15/2026 | 4.125% | 1,940,000 | 1,674,801 | |
| Berry Global, Inc. | ||||
| 01/15/2026 | 1.570% | 350,000 | 312,146 | |
| BWAY Holding Co.(a) | ||||
| 04/15/2024 | 5.500% | 2,004,000 | 1,950,428 | |
| CANPACK SA/Eastern PA Land Investment Holding LLC(a) | ||||
| 11/01/2025 | 3.125% | 1,018,000 | 917,802 | |
| Canpack SA/US LLC(a) | ||||
| 11/15/2029 | 3.875% | 4,288,000 | 3,514,273 | |
| Trivium Packaging Finance BV(a) | ||||
| 08/15/2026 | 5.500% | 3,592,000 | 3,447,444 | |
| 08/15/2027 | 8.500% | 1,408,000 | 1,338,215 | |
| Total | 17,408,976 | |||
| Pharmaceuticals 0.6% | ||||
| AbbVie, Inc. | ||||
| 11/14/2048 | 4.875% | 4,449,000 | 4,292,702 | |
| 11/21/2049 | 4.250% | 9,722,000 | 8,553,224 | |
| Amgen, Inc. | ||||
| 02/22/2062 | 4.400% | 4,738,000 | 4,108,837 | |
| Bausch Health Companies, Inc.(a) | ||||
| 04/01/2026 | 9.250% | 916,000 | 549,285 | |
| 02/01/2027 | 6.125% | 2,070,000 | 1,538,378 | |
| 06/01/2028 | 4.875% | 2,868,000 | 1,979,811 | |
| 01/30/2030 | 5.250% | 1,740,000 | 643,050 | |
| Endo Dac/Finance LLC/Finco, Inc.(a),(i) | ||||
| 06/30/2028 | 0.000% | 911,000 | 50,839 | |
| Grifols Escrow Issuer SA(a) | ||||
| 10/15/2028 | 4.750% | 1,726,000 | 1,463,169 | |
| Jazz Securities DAC(a) | ||||
| 01/15/2029 | 4.375% | 1,660,000 | 1,497,454 | |
| Corporate Bonds & Notes (continued) | ||||
| Issuer | Coupon Rate | Principal Amount ($) | Value ($) | |
| Organon Finance 1 LLC(a) | ||||
| 04/30/2028 | 4.125% | 4,589,000 | 4,113,818 | |
| 04/30/2031 | 5.125% | 3,943,000 | 3,450,319 | |
| Total | 32,240,886 | |||
| Property & Casualty 0.6% | ||||
| Alliant Holdings Intermediate LLC/Co-Issuer(a) | ||||
| 10/15/2027 | 4.250% | 1,693,000 | 1,536,631 | |
| 10/15/2027 | 6.750% | 3,396,000 | 3,093,826 | |
| 11/01/2029 | 5.875% | 2,406,000 | 2,092,994 | |
| AssuredPartners, Inc.(a) | ||||
| 08/15/2025 | 7.000% | 817,000 | 785,334 | |
| 01/15/2029 | 5.625% | 2,393,000 | 2,008,723 | |
| Berkshire Hathaway Finance Corp. | ||||
| 03/15/2052 | 3.850% | 18,110,000 | 15,601,833 | |
| BroadStreet Partners, Inc.(a) | ||||
| 04/15/2029 | 5.875% | 3,525,000 | 2,923,823 | |
| GTCR AP Finance, Inc.(a) | ||||
| 05/15/2027 | 8.000% | 1,091,000 | 1,067,312 | |
| HUB International Ltd.(a) | ||||
| 05/01/2026 | 7.000% | 3,379,000 | 3,311,218 | |
| 12/01/2029 | 5.625% | 3,087,000 | 2,709,946 | |
| Ryan Specialty Group LLC(a) | ||||
| 02/01/2030 | 4.375% | 858,000 | 773,906 | |
| USI, Inc.(a) | ||||
| 05/01/2025 | 6.875% | 944,000 | 916,353 | |
| Total | 36,821,899 | |||
| Restaurants 0.2% | ||||
| 1011778 BC ULC/New Red Finance, Inc.(a) | ||||
| 04/15/2025 | 5.750% | 2,011,000 | 2,025,784 | |
| 01/15/2028 | 3.875% | 3,236,000 | 2,878,215 | |
| Fertitta Entertainment LLC/Finance Co., Inc.(a) | ||||
| 01/15/2030 | 6.750% | 3,347,000 | 2,731,704 | |
| IRB Holding Corp.(a) | ||||
| 06/15/2025 | 7.000% | 3,646,000 | 3,670,227 | |
| Yum! Brands, Inc. | ||||
| 04/01/2032 | 5.375% | 2,405,000 | 2,215,477 | |
| Total | 13,521,407 | |||
| Retailers 0.4% | ||||
| Asbury Automotive Group, Inc.(a) | ||||
| 11/15/2029 | 4.625% | 701,000 | 601,275 | |
| 02/15/2032 | 5.000% | 701,000 | 585,643 | |
| Group 1 Automotive, Inc.(a) | ||||
| 08/15/2028 | 4.000% | 999,000 | 853,777 | |
| L Brands, Inc. | ||||
| 02/01/2028 | 5.250% | 1,053,000 | 945,191 | |
| 11/01/2035 | 6.875% | 2,968,000 | 2,593,736 | |
| Columbia Strategic Income Fund | Annual Report 2022 | 19 |
August 31, 2022
| Corporate Bonds & Notes (continued) | ||||
| Issuer | Coupon Rate | Principal Amount ($) | Value ($) | |
| LCM Investments Holdings II LLC(a) | ||||
| 05/01/2029 | 4.875% | 3,325,000 | 2,811,324 | |
| Lowe’s Companies, Inc. | ||||
| 10/15/2050 | 3.000% | 1,562,000 | 1,071,394 | |
| 04/01/2062 | 4.450% | 9,118,000 | 7,677,592 | |
| PetSmart, Inc./Finance Corp.(a) | ||||
| 02/15/2028 | 4.750% | 2,066,000 | 1,859,469 | |
| 02/15/2029 | 7.750% | 2,190,000 | 2,055,965 | |
| Total | 21,055,366 | |||
| Supermarkets 0.1% | ||||
| Albertsons Companies LLC/Safeway, Inc./New Albertsons LP/Albertsons LLC(a) | ||||
| 03/15/2026 | 7.500% | 1,085,000 | 1,110,870 | |
| Albertsons Companies, Inc./Safeway, Inc./New Albertsons LP/Albertsons LLC(a) | ||||
| 03/15/2026 | 3.250% | 2,743,000 | 2,474,281 | |
| 01/15/2027 | 4.625% | 649,000 | 594,795 | |
| Total | 4,179,946 | |||
| Technology 2.6% | ||||
| Black Knight InfoServ LLC(a) | ||||
| 09/01/2028 | 3.625% | 2,302,000 | 2,018,599 | |
| Block, Inc. | ||||
| 06/01/2031 | 3.500% | 1,723,000 | 1,416,108 | |
| Boxer Parent Co., Inc.(a) | ||||
| 10/02/2025 | 7.125% | 447,000 | 445,085 | |
| Broadcom, Inc.(a) | ||||
| 04/15/2034 | 3.469% | 12,989,000 | 10,525,742 | |
| 11/15/2036 | 3.187% | 3,156,000 | 2,341,369 | |
| Camelot Finance SA(a) | ||||
| 11/01/2026 | 4.500% | 924,000 | 859,026 | |
| Clarivate Science Holdings Corp.(a) | ||||
| 07/01/2028 | 3.875% | 1,277,000 | 1,095,825 | |
| 07/01/2029 | 4.875% | 3,176,000 | 2,628,805 | |
| Condor Merger Sub, Inc.(a) | ||||
| 02/15/2030 | 7.375% | 2,806,000 | 2,338,896 | |
| Entegris Escrow Corp.(a) | ||||
| 04/15/2029 | 4.750% | 936,000 | 861,359 | |
| 06/15/2030 | 5.950% | 3,323,000 | 3,153,929 | |
| Everi Holdings, Inc.(a) | ||||
| 07/15/2029 | 5.000% | 424,000 | 374,126 | |
| Gartner, Inc.(a) | ||||
| 07/01/2028 | 4.500% | 1,484,000 | 1,371,117 | |
| 06/15/2029 | 3.625% | 6,225,000 | 5,380,979 | |
| 10/01/2030 | 3.750% | 16,143,000 | 13,847,968 | |
| HealthEquity, Inc.(a) | ||||
| 10/01/2029 | 4.500% | 3,147,000 | 2,766,303 | |
| Helios Software Holdings, Inc.(a) | ||||
| 05/01/2028 | 4.625% | 2,367,000 | 1,909,269 | |
| Corporate Bonds & Notes (continued) | ||||
| Issuer | Coupon Rate | Principal Amount ($) | Value ($) | |
| ION Trading Technologies Sarl(a) | ||||
| 05/15/2028 | 5.750% | 2,087,000 | 1,775,377 | |
| Iron Mountain, Inc.(a) | ||||
| 09/15/2029 | 4.875% | 664,000 | 576,226 | |
| 07/15/2030 | 5.250% | 2,592,000 | 2,293,933 | |
| Lenovo Group Ltd.(a) | ||||
| 04/24/2025 | 5.875% | 5,000,000 | 5,016,851 | |
| Logan Merger Sub, Inc.(a) | ||||
| 09/01/2027 | 5.500% | 5,973,000 | 4,387,613 | |
| Minerva Merger Sub, Inc.(a) | ||||
| 02/15/2030 | 6.500% | 4,425,000 | 3,755,943 | |
| NCR Corp.(a) | ||||
| 10/01/2028 | 5.000% | 2,796,000 | 2,632,298 | |
| 04/15/2029 | 5.125% | 3,426,000 | 3,198,802 | |
| 09/01/2029 | 6.125% | 1,130,000 | 1,081,771 | |
| Nielsen Finance LLC/Co.(a) | ||||
| 10/01/2028 | 5.625% | 5,302,000 | 5,323,002 | |
| 07/15/2029 | 4.500% | 1,890,000 | 1,898,789 | |
| 07/15/2031 | 4.750% | 2,364,000 | 2,350,822 | |
| NXP BV/Funding LLC/USA, Inc. | ||||
| 05/01/2030 | 3.400% | 2,210,000 | 1,956,396 | |
| 01/15/2033 | 5.000% | 7,610,000 | 7,363,646 | |
| 02/15/2042 | 3.125% | 6,320,000 | 4,514,247 | |
| Oracle Corp. | ||||
| 04/01/2050 | 3.600% | 21,389,000 | 14,575,694 | |
| 03/25/2061 | 4.100% | 6,662,000 | 4,645,174 | |
| Plantronics, Inc.(a) | ||||
| 03/01/2029 | 4.750% | 5,490,000 | 5,498,778 | |
| PTC, Inc.(a) | ||||
| 02/15/2025 | 3.625% | 349,000 | 328,041 | |
| 02/15/2028 | 4.000% | 1,072,000 | 980,931 | |
| Sabre GLBL, Inc.(a) | ||||
| 09/01/2025 | 7.375% | 598,000 | 566,806 | |
| Sensata Technologies BV(a) | ||||
| 09/01/2030 | 5.875% | 2,018,000 | 1,972,112 | |
| Shift4 Payments LLC/Finance Sub, Inc.(a) | ||||
| 11/01/2026 | 4.625% | 4,503,000 | 4,205,648 | |
| Switch Ltd.(a) | ||||
| 09/15/2028 | 3.750% | 866,000 | 858,863 | |
| 06/15/2029 | 4.125% | 3,099,000 | 3,098,777 | |
| Tempo Acquisition LLC/Finance Corp.(a) | ||||
| 06/01/2025 | 5.750% | 725,000 | 721,445 | |
| Tencent Holdings Ltd.(a) | ||||
| 06/03/2050 | 3.240% | 6,400,000 | 4,266,030 | |
| Verscend Escrow Corp.(a) | ||||
| 08/15/2026 | 9.750% | 2,565,000 | 2,591,866 | |
| 20 | Columbia Strategic Income Fund | Annual Report 2022 |
August 31, 2022
| Corporate Bonds & Notes (continued) | ||||
| Issuer | Coupon Rate | Principal Amount ($) | Value ($) | |
| ZoomInfo Technologies LLC/Finance Corp.(a) | ||||
| 02/01/2029 | 3.875% | 3,650,000 | 3,185,908 | |
| Total | 148,956,294 | |||
| Transportation Services 0.1% | ||||
| Adani Ports & Special Economic Zone Ltd.(a) | ||||
| 08/04/2027 | 4.200% | 3,267,000 | 3,011,011 | |
| 07/03/2029 | 4.375% | 5,000,000 | 4,474,430 | |
| Total | 7,485,441 | |||
| Wireless 1.2% | ||||
| Altice France Holding SA(a) | ||||
| 02/15/2028 | 6.000% | 3,633,000 | 2,483,762 | |
| Altice France SA(a) | ||||
| 02/01/2027 | 8.125% | 1,139,000 | 1,083,749 | |
| 01/15/2028 | 5.500% | 871,000 | 720,689 | |
| 07/15/2029 | 5.125% | 5,232,000 | 3,975,814 | |
| 10/15/2029 | 5.500% | 1,316,000 | 1,039,387 | |
| American Tower Corp. | ||||
| 08/15/2029 | 3.800% | 12,821,000 | 11,820,924 | |
| 06/15/2030 | 2.100% | 3,570,000 | 2,884,789 | |
| Millicom International Cellular SA(a) | ||||
| 03/25/2029 | 6.250% | 2,700,000 | 2,566,759 | |
| SBA Communications Corp. | ||||
| 02/15/2027 | 3.875% | 1,176,000 | 1,074,989 | |
| 02/01/2029 | 3.125% | 5,224,000 | 4,303,254 | |
| Sprint Capital Corp. | ||||
| 11/15/2028 | 6.875% | 3,743,000 | 3,952,723 | |
| 03/15/2032 | 8.750% | 1,214,000 | 1,464,827 | |
| Sprint Corp. | ||||
| 06/15/2024 | 7.125% | 831,000 | 859,630 | |
| T-Mobile US, Inc. | ||||
| 02/15/2029 | 2.625% | 2,607,000 | 2,237,726 | |
| 02/15/2031 | 2.875% | 4,892,000 | 4,136,062 | |
| 04/15/2031 | 3.500% | 20,231,000 | 17,822,425 | |
| Vmed O2 UK Financing I PLC(a) | ||||
| 01/31/2031 | 4.250% | 931,000 | 750,027 | |
| 07/15/2031 | 4.750% | 3,870,000 | 3,188,006 | |
| Total | 66,365,542 | |||
| Wirelines 0.7% | ||||
| AT&T, Inc. | ||||
| 12/01/2057 | 3.800% | 14,280,000 | 10,798,155 | |
| CenturyLink, Inc. | ||||
| 12/01/2023 | 6.750% | 779,000 | 788,136 | |
| 04/01/2024 | 7.500% | 2,603,000 | 2,656,208 | |
| 04/01/2025 | 5.625% | 1,660,000 | 1,612,216 | |
| CenturyLink, Inc.(a) | ||||
| 12/15/2026 | 5.125% | 1,420,000 | 1,227,641 | |
| 02/15/2027 | 4.000% | 747,000 | 649,521 | |
| Corporate Bonds & Notes (continued) | ||||
| Issuer | Coupon Rate | Principal Amount ($) | Value ($) | |
| Front Range BidCo, Inc.(a) | ||||
| 03/01/2027 | 4.000% | 3,038,000 | 2,590,721 | |
| 03/01/2028 | 6.125% | 1,895,000 | 1,451,872 | |
| Frontier Communications Holdings LLC(a) | ||||
| 10/15/2027 | 5.875% | 2,060,000 | 1,926,044 | |
| 05/15/2030 | 8.750% | 822,000 | 845,969 | |
| Iliad Holding SAS(a) | ||||
| 10/15/2026 | 6.500% | 5,813,000 | 5,340,173 | |
| 10/15/2028 | 7.000% | 4,689,000 | 4,317,801 | |
| Network i2i Ltd.(a),(h) | ||||
| 12/31/2049 | 5.650% | 7,100,000 | 6,824,480 | |
| Total | 41,028,937 | |||
| Total Corporate Bonds & Notes (Cost $2,576,961,950) | 2,245,270,394 | |||
| Foreign Government Obligations(j),(k) 5.6% | ||||
| Angola 0.1% | ||||
| Angolan Government International Bond(a) | ||||
| 11/26/2029 | 8.000% | 10,040,000 | 8,346,405 | |
| Argentina 0.0% | ||||
| Argentine Republic Government International Bond | ||||
| 07/09/2029 | 1.000% | 9,405 | 2,190 | |
| Argentine Republic Government International Bond(h) | ||||
| 07/09/2030 | 0.500% | 85,626 | 20,550 | |
| 07/09/2035 | 1.500% | 156,873 | 35,408 | |
| Total | 58,148 | |||
| Azerbaijan 0.1% | ||||
| Republic of Azerbaijan International Bond(a) | ||||
| 09/01/2032 | 3.500% | 6,524,000 | 5,635,856 | |
| Brazil 0.2% | ||||
| Brazilian Government International Bond | ||||
| 06/12/2030 | 3.875% | 2,024,000 | 1,767,998 | |
| 01/07/2041 | 5.625% | 11,000,000 | 9,407,895 | |
| Total | 11,175,893 | |||
| Canada 0.2% | ||||
| MEGlobal Canada ULC(a) | ||||
| 05/18/2025 | 5.000% | 4,950,000 | 4,987,438 | |
| NOVA Chemicals Corp.(a) | ||||
| 06/01/2027 | 5.250% | 3,264,000 | 2,882,935 | |
| 05/15/2029 | 4.250% | 2,216,000 | 1,823,030 | |
| Total | 9,693,403 | |||
| Columbia Strategic Income Fund | Annual Report 2022 | 21 |
August 31, 2022
| Foreign Government Obligations(j),(k) (continued) | ||||
| Issuer | Coupon Rate | Principal Amount ($) | Value ($) | |
| Colombia 0.5% | ||||
| Colombia Government International Bond | ||||
| 04/22/2032 | 3.250% | 5,980,000 | 4,411,046 | |
| 02/26/2044 | 5.625% | 6,725,000 | 4,888,057 | |
| 06/15/2045 | 5.000% | 11,200,000 | 7,520,354 | |
| 05/15/2049 | 5.200% | 7,147,000 | 4,869,011 | |
| Ecopetrol SA | ||||
| 04/29/2030 | 6.875% | 8,000,000 | 7,429,303 | |
| Total | 29,117,771 | |||
| Dominican Republic 0.3% | ||||
| Dominican Republic International Bond(a) | ||||
| 02/15/2023 | 8.900% | DOP | 42,000,000 | 787,697 |
| 01/25/2027 | 5.950% | 4,475,000 | 4,392,039 | |
| 01/30/2030 | 4.500% | 2,295,000 | 1,929,485 | |
| 09/23/2032 | 4.875% | 500,000 | 404,150 | |
| 04/30/2044 | 7.450% | 7,900,000 | 7,218,144 | |
| 01/27/2045 | 6.850% | 4,881,000 | 4,155,156 | |
| Total | 18,886,671 | |||
| Egypt 0.3% | ||||
| Egypt Government International Bond(a) | ||||
| 04/16/2026 | 4.750% | EUR | 2,100,000 | 1,655,742 |
| 03/01/2029 | 7.600% | 1,250,000 | 984,698 | |
| 02/16/2031 | 5.875% | 500,000 | 340,443 | |
| 04/11/2031 | 6.375% | EUR | 4,000,000 | 2,694,536 |
| 05/29/2032 | 7.625% | 8,162,000 | 5,722,115 | |
| 01/31/2047 | 8.500% | 5,700,000 | 3,632,027 | |
| 02/21/2048 | 7.903% | 3,000,000 | 1,803,114 | |
| 03/01/2049 | 8.700% | 965,000 | 611,599 | |
| Total | 17,444,274 | |||
| Ghana 0.1% | ||||
| Ghana Government International Bond(a) | ||||
| 02/11/2035 | 7.875% | 2,400,000 | 875,901 | |
| 03/26/2051 | 8.950% | 5,000,000 | 1,788,494 | |
| Total | 2,664,395 | |||
| Guatemala 0.1% | ||||
| Guatemala Government Bond(a) | ||||
| 06/01/2050 | 6.125% | 5,000,000 | 4,562,114 | |
| India 0.1% | ||||
| Export-Import Bank of India(a) | ||||
| 01/15/2030 | 3.250% | 6,200,000 | 5,518,722 | |
| Indonesia 0.4% | ||||
| Indonesia Asahan Aluminium Persero PT(a) | ||||
| 05/15/2050 | 5.800% | 6,000,000 | 5,106,573 | |
| Indonesia Government International Bond(a) | ||||
| 01/15/2045 | 5.125% | 3,600,000 | 3,531,819 | |
| Foreign Government Obligations(j),(k) (continued) | ||||
| Issuer | Coupon Rate | Principal Amount ($) | Value ($) | |
| Indonesia Treasury Bond | ||||
| 04/15/2039 | 8.375% | IDR | 68,305,000,000 | 5,086,538 |
| PT Pertamina Persero(a) | ||||
| 05/30/2044 | 6.450% | 5,800,000 | 6,039,235 | |
| PT Saka Energi Indonesia(a) | ||||
| 05/05/2024 | 4.450% | 2,782,000 | 2,546,296 | |
| 05/05/2024 | 4.450% | 2,596,000 | 2,376,055 | |
| Total | 24,686,516 | |||
| Ivory Coast 0.2% | ||||
| Ivory Coast Government International Bond(a) | ||||
| 10/17/2031 | 5.875% | EUR | 8,830,000 | 7,146,036 |
| 06/15/2033 | 6.125% | 3,847,000 | 3,261,324 | |
| Total | 10,407,360 | |||
| Kazakhstan 0.1% | ||||
| Kazakhstan Government International Bond(a) | ||||
| 07/21/2045 | 6.500% | 1,500,000 | 1,504,785 | |
| KazMunayGas National Co. JSC(a) | ||||
| 04/19/2027 | 4.750% | 4,800,000 | 4,427,019 | |
| Total | 5,931,804 | |||
| Malaysia 0.1% | ||||
| Petronas Capital Ltd.(a) | ||||
| 04/21/2030 | 3.500% | 4,800,000 | 4,603,114 | |
| Mexico 0.8% | ||||
| Mexican Bonos | ||||
| 05/31/2029 | 8.500% | MXN | 220,000,000 | 10,618,117 |
| Mexico Government International Bond | ||||
| 04/16/2030 | 3.250% | 4,000,000 | 3,570,920 | |
| 05/29/2031 | 7.750% | MXN | 140,000,000 | 6,408,921 |
| 08/14/2041 | 4.280% | 300,000 | 241,417 | |
| Petroleos Mexicanos | ||||
| 01/28/2031 | 5.950% | 2,235,000 | 1,683,909 | |
| 02/16/2032 | 6.700% | 12,449,000 | 9,725,040 | |
| 09/21/2047 | 6.750% | 8,542,000 | 5,384,805 | |
| 01/23/2050 | 7.690% | 15,000,000 | 10,330,710 | |
| Total | 47,963,839 | |||
| Oman 0.1% | ||||
| Oman Government International Bond(a) | ||||
| 01/17/2048 | 6.750% | 6,506,000 | 5,789,973 | |
| Oman Sovereign Sukuk Co.(a) | ||||
| 06/01/2024 | 4.397% | 500,000 | 499,226 | |
| Total | 6,289,199 | |||
| Panama 0.1% | ||||
| Panama Government International Bond | ||||
| 01/19/2033 | 3.298% | 6,779,000 | 5,763,713 | |
| 22 | Columbia Strategic Income Fund | Annual Report 2022 |
August 31, 2022
| Foreign Government Obligations(j),(k) (continued) | ||||
| Issuer | Coupon Rate | Principal Amount ($) | Value ($) | |
| Paraguay 0.1% | ||||
| Paraguay Government International Bond(a) | ||||
| 03/27/2027 | 4.700% | 2,000,000 | 1,982,913 | |
| 08/11/2044 | 6.100% | 2,939,000 | 2,745,543 | |
| Total | 4,728,456 | |||
| Qatar 0.4% | ||||
| Qatar Government International Bond(a) | ||||
| 04/16/2030 | 3.750% | 2,000,000 | 2,005,858 | |
| 03/14/2049 | 4.817% | 15,614,000 | 16,110,085 | |
| Qatar Petroleum(a) | ||||
| 07/12/2031 | 2.250% | 6,077,000 | 5,298,742 | |
| Total | 23,414,685 | |||
| Romania 0.2% | ||||
| Romanian Government International Bond(a) | ||||
| 04/03/2049 | 4.625% | EUR | 9,500,000 | 7,072,436 |
| 02/14/2051 | 4.000% | 2,246,000 | 1,544,030 | |
| Total | 8,616,466 | |||
| Russian Federation 0.1% | ||||
| Russian Foreign Bond - Eurobond(a),(c),(d),(i),(l) | ||||
| 03/21/2029 | 0.000% | 4,600,000 | 1,610,338 | |
| 03/28/2035 | 0.000% | 4,800,000 | 1,799,446 | |
| Total | 3,409,784 | |||
| Saudi Arabia 0.3% | ||||
| Saudi Arabian Oil Co.(a) | ||||
| 11/24/2030 | 2.250% | 10,238,000 | 8,896,712 | |
| Saudi Government International Bond(a) | ||||
| 10/22/2030 | 3.250% | 3,000,000 | 2,890,376 | |
| 04/17/2049 | 5.000% | 5,000,000 | 4,965,133 | |
| Total | 16,752,221 | |||
| South Africa 0.3% | ||||
| Republic of South Africa Government International Bond | ||||
| 09/30/2029 | 4.850% | 4,800,000 | 4,246,157 | |
| 09/30/2049 | 5.750% | 16,025,000 | 11,396,529 | |
| Total | 15,642,686 | |||
| Ukraine 0.1% | ||||
| NAK Naftogaz Ukraine via Kondor Finance PLC(a) | ||||
| 11/08/2026 | 7.625% | 4,200,000 | 890,203 | |
| Ukraine Government International Bond(a) | ||||
| 09/01/2028 | 7.750% | 9,800,000 | 2,017,147 | |
| 09/25/2034 | 7.375% | 12,900,000 | 2,311,909 | |
| 03/15/2035 | 7.253% | 6,000,000 | 1,049,554 | |
| Total | 6,268,813 | |||
| Foreign Government Obligations(j),(k) (continued) | ||||
| Issuer | Coupon Rate | Principal Amount ($) | Value ($) | |
| United Arab Emirates 0.3% | ||||
| DP World Crescent Ltd.(a) | ||||
| 07/18/2029 | 3.875% | 5,600,000 | 5,405,847 | |
| DP World Ltd.(a) | ||||
| 09/25/2048 | 5.625% | 6,091,000 | 5,986,132 | |
| DP World PLC(a) | ||||
| 07/02/2037 | 6.850% | 3,650,000 | 4,040,466 | |
| 09/30/2049 | 4.700% | 2,000,000 | 1,719,288 | |
| Total | 17,151,733 | |||
| United Kingdom 0.0% | ||||
| NAK Naftogaz Ukraine via Kondor Finance PLC(a) | ||||
| 07/19/2024 | 7.125% | EUR | 3,800,000 | 801,002 |
| Total Foreign Government Obligations (Cost $407,930,288) | 315,535,043 | |||
| Inflation-Indexed Bonds(j) 0.1% | ||||
| Mexico 0.1% | ||||
| Mexican Udibonos | ||||
| 11/15/2040 | 4.000% | MXN | 134,554,734 | 6,554,615 |
| Total Inflation-Indexed Bonds (Cost $8,564,465) | 6,554,615 | |||
| Residential Mortgage-Backed Securities - Agency 23.4% | ||||
| Federal Home Loan Mortgage Corp. | ||||
| 12/01/2022 | 5.000% | 256 | 263 | |
| 05/01/2052 | 3.000% | 64,311,502 | 59,924,709 | |
| 07/01/2052- 08/01/2052 | 4.000% | 65,326,961 | 64,594,509 | |
| Federal Home Loan Mortgage Corp.(m) | ||||
| CMO Series 304 Class C69 | ||||
| 12/15/2042 | 4.000% | 2,750,362 | 537,298 | |
| CMO Series 4147 Class CI | ||||
| 01/15/2041 | 3.500% | 2,568,374 | 131,733 | |
| Federal Home Loan Mortgage Corp.(b),(m) | ||||
| CMO Series 318 Class S1 | ||||
| -1.0 x 1-month USD LIBOR + 5.950% Cap 5.950% 11/15/2043 | 3.559% | 5,148,771 | 615,081 | |
| CMO Series 4620 Class AS | ||||
| -1.0 x 1-month USD LIBOR + 0.440% 11/15/2042 | 0.367% | 9,977,878 | 441,762 | |
| CMO Series 4903 Class SA | ||||
| -1.0 x 1-month USD LIBOR + 6.050% Cap 6.050% 08/25/2049 | 3.606% | 28,192,705 | 3,661,984 | |
| Columbia Strategic Income Fund | Annual Report 2022 | 23 |
August 31, 2022
| Residential Mortgage-Backed Securities - Agency (continued) | ||||
| Issuer | Coupon Rate | Principal Amount ($) | Value ($) | |
| CMO STRIPS Series 326 Class S1 | ||||
| -1.0 x 1-month USD LIBOR + 6.000% Cap 6.000% 03/15/2044 | 3.609% | 895,797 | 104,166 | |
| Federal Home Loan Mortgage Corp.(e),(m) | ||||
| CMO Series 4515 Class SA | ||||
| 08/15/2038 | 0.214% | 4,694,376 | 164,701 | |
| Federal National Mortgage Association | ||||
| 01/01/2023 | 5.500% | 1,836 | 1,881 | |
| 08/01/2032- 05/01/2052 | 3.000% | 268,217,020 | 250,094,525 | |
| 05/01/2052 | 3.500% | 169,760,020 | 163,973,363 | |
| Federal National Mortgage Association(e),(m) | ||||
| CMO Series 2006-5 Class N1 | ||||
| 08/25/2034 | 0.000% | 3,565,172 | 36 | |
| Federal National Mortgage Association(m) | ||||
| CMO Series 2012-129 Class IC | ||||
| 01/25/2041 | 3.500% | 1,278,284 | 63,625 | |
| CMO Series 2012-131 Class MI | ||||
| 01/25/2040 | 3.500% | 1,647,648 | 74,304 | |
| CMO Series 2012-133 Class EI | ||||
| 07/25/2031 | 3.500% | 544,908 | 14,270 | |
| CMO Series 2013-1 Class AI | ||||
| 02/25/2043 | 3.500% | 1,841,672 | 258,434 | |
| CMO Series 2013-6 Class MI | ||||
| 02/25/2040 | 3.500% | 185,292 | 978 | |
| Federal National Mortgage Association(b),(m) | ||||
| CMO Series 2013-101 Class CS | ||||
| -1.0 x 1-month USD LIBOR + 5.900% Cap 5.900% 10/25/2043 | 3.456% | 6,969,827 | 846,012 | |
| CMO Series 2014-93 Class ES | ||||
| -1.0 x 1-month USD LIBOR + 6.150% Cap 6.150% 01/25/2045 | 3.706% | 11,975,109 | 1,703,611 | |
| CMO Series 2016-26 Class SA | ||||
| -1.0 x 1-month USD LIBOR + 6.050% Cap 6.050% 05/25/2046 | 3.606% | 11,132,720 | 2,043,619 | |
| CMO Series 2016-31 Class VS | ||||
| -1.0 x 1-month USD LIBOR + 6.000% Cap 6.000% 06/25/2046 | 3.556% | 6,911,768 | 831,095 | |
| Residential Mortgage-Backed Securities - Agency (continued) | ||||
| Issuer | Coupon Rate | Principal Amount ($) | Value ($) | |
| CMO Series 2016-42 Class SB | ||||
| -1.0 x 1-month USD LIBOR + 6.000% Cap 6.000% 07/25/2046 | 3.556% | 25,080,175 | 3,614,658 | |
| CMO Series 2017-47 Class SE | ||||
| -1.0 x 1-month USD LIBOR + 6.100% Cap 6.100% 06/25/2047 | 3.656% | 8,023,689 | 1,450,802 | |
| CMO Series 2017-56 Class SB | ||||
| -1.0 x 1-month USD LIBOR + 6.150% Cap 6.150% 07/25/2047 | 3.706% | 26,468,860 | 4,044,201 | |
| CMO Series 2018-76 Class SN | ||||
| -1.0 x 1-month USD LIBOR + 6.150% Cap 6.150% 10/25/2048 | 3.706% | 8,456,485 | 1,232,067 | |
| CMO Series 2019-67 Class SE | ||||
| -1.0 x 1-month USD LIBOR + 6.050% Cap 6.050% 11/25/2049 | 3.606% | 24,175,198 | 4,094,589 | |
| CMO Series 2019-8 Class SG | ||||
| -1.0 x 1-month USD LIBOR + 6.000% Cap 6.000% 03/25/2049 | 3.556% | 26,177,426 | 3,261,074 | |
| Government National Mortgage Association | ||||
| 08/15/2031 | 7.000% | 17,541 | 18,476 | |
| 04/15/2034 | 5.000% | 90,597 | 94,638 | |
| Government National Mortgage Association(m) | ||||
| CMO Series 2014-190 Class AI | ||||
| 12/20/2038 | 3.500% | 7,986,388 | 758,723 | |
| CMO Series 2020-138 Class GI | ||||
| 09/20/2050 | 3.000% | 38,789,509 | 5,783,993 | |
| CMO Series 2020-191 Class UG | ||||
| 12/20/2050 | 3.500% | 47,224,442 | 7,918,609 | |
| CMO Series 2021-140 Class IW | ||||
| 08/20/2051 | 3.500% | 53,665,344 | 8,622,287 | |
| CMO Series 2021-57 Class KI | ||||
| 03/20/2051 | 3.500% | 49,389,444 | 8,186,320 | |
| CMO Series 2021-89 Class IO | ||||
| 05/20/2051 | 3.000% | 55,024,919 | 8,500,062 | |
| CMO Series 2021-9 Class MI | ||||
| 01/20/2051 | 2.500% | 49,455,389 | 6,471,005 | |
| 24 | Columbia Strategic Income Fund | Annual Report 2022 |
August 31, 2022
| Residential Mortgage-Backed Securities - Agency (continued) | ||||
| Issuer | Coupon Rate | Principal Amount ($) | Value ($) | |
| Government National Mortgage Association(b),(m) | ||||
| CMO Series 2016-20 Class SQ | ||||
| -1.0 x 1-month USD LIBOR + 6.100% Cap 6.100% 02/20/2046 | 3.732% | 10,922,256 | 1,248,491 | |
| CMO Series 2017-129 Class SA | ||||
| -1.0 x 1-month USD LIBOR + 6.200% Cap 6.200% 08/20/2047 | 3.832% | 8,637,847 | 1,037,635 | |
| CMO Series 2017-133 Class SM | ||||
| -1.0 x 1-month USD LIBOR + 6.250% Cap 6.250% 09/20/2047 | 3.882% | 9,893,949 | 1,096,814 | |
| CMO Series 2017-141 Class ES | ||||
| -1.0 x 1-month USD LIBOR + 6.200% Cap 6.200% 09/20/2047 | 3.832% | 12,982,947 | 1,604,451 | |
| CMO Series 2018-124 Class SA | ||||
| -1.0 x 1-month USD LIBOR + 6.200% Cap 6.200% 09/20/2048 | 3.832% | 15,946,635 | 1,724,769 | |
| CMO Series 2018-155 Class ES | ||||
| -1.0 x 1-month USD LIBOR + 6.100% Cap 6.100% 11/20/2048 | 3.732% | 12,367,741 | 1,295,720 | |
| CMO Series 2018-168 Class SA | ||||
| -1.0 x 1-month USD LIBOR + 6.100% Cap 6.100% 12/20/2048 | 3.732% | 11,111,400 | 1,188,703 | |
| CMO Series 2018-67 Class SP | ||||
| -1.0 x 1-month USD LIBOR + 6.200% Cap 6.200% 05/20/2048 | 3.832% | 9,610,452 | 1,070,493 | |
| CMO Series 2019-152 Class BS | ||||
| -1.0 x 1-month USD LIBOR + 6.050% Cap 6.050% 12/20/2049 | 3.682% | 25,362,905 | 2,820,812 | |
| CMO Series 2019-23 Class LS | ||||
| -1.0 x 1-month USD LIBOR + 6.050% Cap 6.050% 02/20/2049 | 3.682% | 7,481,455 | 918,709 | |
| Residential Mortgage-Backed Securities - Agency (continued) | ||||
| Issuer | Coupon Rate | Principal Amount ($) | Value ($) | |
| CMO Series 2019-23 Class QS | ||||
| -1.0 x 1-month USD LIBOR + 6.050% Cap 6.050% 02/20/2049 | 3.682% | 22,076,960 | 2,578,030 | |
| CMO Series 2019-29 Class DS | ||||
| -1.0 x 1-month USD LIBOR + 6.050% Cap 6.050% 03/20/2049 | 3.682% | 17,454,240 | 1,723,716 | |
| CMO Series 2019-41 Class AS | ||||
| -1.0 x 1-month USD LIBOR + 6.050% Cap 6.050% 03/20/2049 | 3.682% | 17,113,018 | 1,984,585 | |
| CMO Series 2019-5 Class SH | ||||
| -1.0 x 1-month USD LIBOR + 6.150% Cap 6.150% 01/20/2049 | 3.782% | 11,651,130 | 1,337,944 | |
| CMO Series 2019-59 Class JS | ||||
| -1.0 x 1-month USD LIBOR + 6.150% Cap 6.150% 05/20/2049 | 3.782% | 11,228,639 | 1,267,518 | |
| CMO Series 2021-155 Class SG | ||||
| -1.0 x 1-month USD LIBOR + 6.300% Cap 6.300% 09/20/2051 | 3.932% | 51,830,339 | 8,048,028 | |
| Government National Mortgage Association TBA(n) | ||||
| 09/21/2052 | 3.000% | 32,000,000 | 30,067,500 | |
| Uniform Mortgage-Backed Security TBA(n) | ||||
| 09/19/2037 | 3.000% | 19,000,000 | 18,424,805 | |
| 09/14/2052 | 3.500% | 142,500,000 | 136,031,268 | |
| 09/14/2052 | 4.000% | 511,000,000 | 499,502,500 | |
| Total Residential Mortgage-Backed Securities - Agency (Cost $1,381,671,410) | 1,329,105,954 | |||
| Residential Mortgage-Backed Securities - Non-Agency 18.4% | ||||
| 510 Asset Backed Trust(a),(e) | ||||
| CMO Series 2021-NPL2 Class A1 | ||||
| 06/25/2061 | 2.116% | 19,267,511 | 17,823,693 | |
| Bellemeade Re Ltd.(a),(b) | ||||
| CMO Series 2019-2A Class M1B | ||||
| 1-month USD LIBOR + 1.450% Floor 1.450% 04/25/2029 | 3.894% | 2,300,087 | 2,294,528 | |
| Columbia Strategic Income Fund | Annual Report 2022 | 25 |
August 31, 2022
| Residential Mortgage-Backed Securities - Non-Agency (continued) | ||||
| Issuer | Coupon Rate | Principal Amount ($) | Value ($) | |
| CMO Series 2019-2A Class M2 | ||||
| 1-month USD LIBOR + 3.100% Floor 3.100% 04/25/2029 | 5.544% | 10,208,580 | 10,035,572 | |
| CMO Series 2019-4A Class M1C | ||||
| 1-month USD LIBOR + 2.500% Floor 2.500% 10/25/2029 | 4.944% | 14,313,506 | 14,351,153 | |
| CMO Series 2020-2A Class M1C | ||||
| 1-month USD LIBOR + 4.000% Floor 4.000% 08/26/2030 | 6.444% | 4,057,487 | 4,069,539 | |
| CMO Series 2020-3A Class M2 | ||||
| 1-month USD LIBOR + 4.850% Floor 4.850% 10/25/2030 | 7.294% | 13,800,000 | 13,953,631 | |
| CMO Series 2020-4A Class M2B | ||||
| 1-month USD LIBOR + 3.600% Floor 3.600% 06/25/2030 | 6.044% | 4,079,590 | 4,128,973 | |
| CMO Series 2021-1A Class M1C | ||||
| 30-day Average SOFR + 2.950% Floor 2.950% 03/25/2031 | 4.464% | 15,000,000 | 14,682,654 | |
| BRAVO Residential Funding Trust(a),(e) | ||||
| CMO Series 2021-B Class A1 | ||||
| 04/01/2069 | 2.115% | 15,493,947 | 14,640,715 | |
| BVRT Financing Trust(a),(b) | ||||
| CMO Series 2021-1F Class M3 | ||||
| 30-day Average SOFR + 2.800% Floor 2.800% 03/15/2038 | 2.838% | 1,914,328 | 1,906,856 | |
| BVRT Financing Trust(a),(b),(d) | ||||
| CMO Series 2021-2F Class M2 | ||||
| 30-day Average SOFR + 2.500% Floor 2.500% 01/10/2032 | 3.761% | 5,498,099 | 5,513,521 | |
| CMO Series 2021-3F Class M2 | ||||
| 30-day Average SOFR + 2.900% Floor 2.900% 07/12/2033 | 4.187% | 20,000,000 | 20,000,000 | |
| Residential Mortgage-Backed Securities - Non-Agency (continued) | ||||
| Issuer | Coupon Rate | Principal Amount ($) | Value ($) | |
| BVRT Financing Trust(a),(b),(c),(d) | ||||
| CMO Series 2021-CRT1 Class M4 | ||||
| 1-month USD LIBOR + 3.500% Floor 3.500% 07/10/2032 | 3.589% | 41,000,000 | 40,125,675 | |
| CHL GMSR Issuer Trust(a),(b) | ||||
| CMO Series 2018-GT1 Class A | ||||
| 1-month USD LIBOR + 1.000% 05/25/2023 | 5.194% | 13,500,000 | 13,268,457 | |
| CIM Trust(a),(e) | ||||
| CMO Series 2021-NR4 Class A1 | ||||
| 10/25/2061 | 2.816% | 12,044,929 | 11,216,314 | |
| Citigroup Mortgage Loan Trust, Inc.(a),(e) | ||||
| CMO Series 2010-6 Class 2A2 | ||||
| 09/25/2035 | 3.189% | 215,498 | 206,549 | |
| Citigroup Mortgage Loan Trust, Inc.(a) | ||||
| Subordinated CMO Series 2014-C Class B1 | ||||
| 02/25/2054 | 4.250% | 3,067,225 | 2,914,525 | |
| Connecticut Avenue Securities Trust(a),(b) | ||||
| CMO Series 2019-HRP1 Class M2 | ||||
| 1-month USD LIBOR + 2.150% 11/25/2039 | 4.594% | 9,273,545 | 9,132,910 | |
| Subordinated CMO Series 2022-R01 Class 1B2 | ||||
| 30-day Average SOFR + 6.000% 12/25/2041 | 8.183% | 34,900,000 | 31,118,672 | |
| Subordinated CMO Series 2022-R02 Class 2B1 | ||||
| 30-day Average SOFR + 4.500% 01/25/2042 | 6.683% | 19,600,000 | 19,214,729 | |
| Subordinated CMO Series 2022-R07 Class 1B2 | ||||
| 30-day Average SOFR + 12.000% 06/25/2042 | 14.183% | 11,850,000 | 12,939,641 | |
| CSMC Trust(a),(e) | ||||
| CMO Series 2020-RPL2 Class A12 | ||||
| 02/25/2060 | 3.436% | 7,854,046 | 7,530,749 | |
| CTS Corp.(a) | ||||
| CMO Series 2015-6R Class 3A2 | ||||
| 02/27/2036 | 3.750% | 2,782,521 | 2,687,981 | |
| Eagle Re Ltd.(a),(b) | ||||
| CMO Series 2019-1 Class M2 | ||||
| 1-month USD LIBOR + 3.300% 04/25/2029 | 5.744% | 16,541,000 | 16,370,889 | |
| 26 | Columbia Strategic Income Fund | Annual Report 2022 |
August 31, 2022
| Residential Mortgage-Backed Securities - Non-Agency (continued) | ||||
| Issuer | Coupon Rate | Principal Amount ($) | Value ($) | |
| CMO Series 2021-1 Class M1C | ||||
| 30-day Average SOFR + 2.700% Floor 2.700% 10/25/2033 | 4.214% | 12,725,000 | 12,683,299 | |
| Subordinated CMO Series 2020-1 Class M1B | ||||
| 1-month USD LIBOR + 1.450% 01/25/2030 | 3.894% | 41,100,000 | 40,845,949 | |
| Subordinated CMO Series 2020-1 Class M1C | ||||
| 1-month USD LIBOR + 1.800% 01/25/2030 | 4.244% | 9,650,000 | 9,477,443 | |
| Fannie Mae Connecticut Avenue Securities(a),(b) | ||||
| Subordinated CMO Series 2021-R02 Class 2B1 | ||||
| 30-day Average SOFR + 3.300% 11/25/2041 | 8.383% | 9,800,000 | 9,256,791 | |
| Freddie Mac STACR REMIC Trust(a),(b) | ||||
| CMO Series 2021-HQA1 Class M2 | ||||
| 30-day Average SOFR + 2.250% 08/25/2033 | 4.433% | 2,000,000 | 1,924,341 | |
| CMO Series 2022-HQA1 Class M2 | ||||
| 30-day Average SOFR + 5.250% 03/25/2042 | 7.433% | 17,250,000 | 17,096,882 | |
| Subordinated CMO Series 2020-DNA4 Class B1 | ||||
| 1-month USD LIBOR + 6.000% 08/25/2050 | 8.444% | 18,400,000 | 19,467,147 | |
| Subordinated CMO Series 2020-DNA6 Class B1 | ||||
| 30-day Average SOFR + 3.000% 12/25/2050 | 5.183% | 15,400,000 | 14,518,607 | |
| Subordinated CMO Series 2021-DNA1 Class B1 | ||||
| 30-day Average SOFR + 2.650% 01/25/2051 | 4.833% | 10,400,000 | 9,595,836 | |
| Subordinated CMO Series 2021-DNA5 Class B1 | ||||
| 30-day Average SOFR + 3.050% 01/25/2034 | 5.233% | 23,500,000 | 21,687,182 | |
| Subordinated CMO Series 2021-HQA1 Class B2 | ||||
| 30-day Average SOFR + 5.000% 08/25/2033 | 7.183% | 12,250,000 | 10,075,037 | |
| Freddie Mac Structured Agency Credit Risk Debt Notes(a),(b) | ||||
| CMO Series 2020-HQA5 Class M2 | ||||
| 30-day Average SOFR + 2.600% 11/25/2050 | 4.783% | 12,931,888 | 13,025,131 | |
| Residential Mortgage-Backed Securities - Non-Agency (continued) | ||||
| Issuer | Coupon Rate | Principal Amount ($) | Value ($) | |
| Subordinated CMO Series 2020-HQA5 Class B1 | ||||
| 30-day Average SOFR + 4.000% 11/25/2050 | 6.183% | 18,650,000 | 18,649,895 | |
| Subordinated CMO Series 2022-DNA2 Class B1 | ||||
| 30-day Average SOFR + 4.750% 02/25/2042 | 6.933% | 19,550,000 | 18,581,145 | |
| Freddie Mac Structured Agency Credit Risk Debt Notes(a),(e) | ||||
| Subordinated CMO Series 2022-DNA2 Class B2 | ||||
| 02/25/2042 | 10.683% | 16,300,000 | 15,449,702 | |
| Glebe Funding Trust (The)(a),(d) | ||||
| CMO Series 2021-1 Class PT | ||||
| 10/27/2023 | 3.000% | 18,193,192 | 17,579,172 | |
| Home Re Ltd.(a),(b) | ||||
| CMO Series 2018-1 Class M2 | ||||
| 1-month USD LIBOR + 3.000% 10/25/2028 | 5.444% | 9,457,907 | 9,386,781 | |
| Loan Revolving Advance Investment Trust(a),(b),(c),(d) | ||||
| CMO Series 2021-2 Class A1X | ||||
| 1-month USD LIBOR + 2.750% Floor 2.750% 06/30/2023 | 4.721% | 36,100,000 | 36,100,000 | |
| Mortgage Acquisition Trust I LLC(a),(d) | ||||
| CMO Series 2021-1 Class PT | ||||
| 11/29/2023 | 3.500% | 8,241,628 | 8,088,385 | |
| Mortgage Insurance-Linked Notes(a),(b) | ||||
| CMO Series 2020-1 Class M1C | ||||
| 1-month USD LIBOR + 1.750% Floor 1.750% 02/25/2030 | 4.194% | 4,150,000 | 4,021,180 | |
| CMO Series 2020-1 Class M2A | ||||
| 1-month USD LIBOR + 2.000% Floor 2.000% 01/25/2030 | 4.444% | 7,700,000 | 7,181,216 | |
| New York Mortgage Trust(a),(e) | ||||
| CMO Series 2021-BPL1 Class A1 | ||||
| 05/25/2026 | 2.239% | 19,240,000 | 18,733,976 | |
| NRZ Excess Spread-Collateralized Notes(a) | ||||
| Series 2020-PLS1 Class A | ||||
| 12/25/2025 | 3.844% | 7,644,262 | 7,200,746 | |
| Oaktown Re III Ltd.(a),(b) | ||||
| CMO Series 2019-1A Class M1A | ||||
| 1-month USD LIBOR + 1.400% Floor 1.400% 07/25/2029 | 3.844% | 281,128 | 280,425 | |
| Columbia Strategic Income Fund | Annual Report 2022 | 27 |
August 31, 2022
| Residential Mortgage-Backed Securities - Non-Agency (continued) | ||||
| Issuer | Coupon Rate | Principal Amount ($) | Value ($) | |
| CMO Series 2019-1A Class M1B | ||||
| 1-month USD LIBOR + 1.950% Floor 1.950% 07/25/2029 | 4.394% | 7,700,000 | 7,600,032 | |
| Oaktown Re VI Ltd.(a),(b) | ||||
| CMO Series 2021-1A Class M1C | ||||
| 30-day Average SOFR + 3.000% Floor 3.000% 10/25/2033 | 5.183% | 9,800,000 | 9,656,403 | |
| PMT Credit Risk Transfer Trust(a),(b) | ||||
| Series 2019-2R Class A | ||||
| 1-month USD LIBOR + 2.750% Floor 2.750% 05/27/2023 | 5.243% | 5,699,966 | 5,576,778 | |
| PNMAC GMSR Issuer Trust(a),(b) | ||||
| CMO Series 2018-GT1 Class A | ||||
| 1-month USD LIBOR + 2.850% Floor 2.850% 02/25/2023 | 5.294% | 56,500,000 | 55,917,875 | |
| CMO Series 2018-GT2 Class A | ||||
| 1-month USD LIBOR + 2.650% 08/25/2025 | 5.094% | 85,550,000 | 83,462,435 | |
| Point Securitization Trust(a),(e) | ||||
| CMO Series 2021-1 Class A1 | ||||
| 02/25/2052 | 3.228% | 23,052,440 | 21,922,941 | |
| Preston Ridge Partners Mortgage(a),(e) | ||||
| CMO Series 2021-4 Class A1 | ||||
| 04/25/2026 | 1.867% | 14,417,779 | 13,571,933 | |
| Preston Ridge Partners Mortgage Trust(a),(e) | ||||
| CMO Series 2021-1 Class A1 | ||||
| 01/25/2026 | 2.115% | 3,761,311 | 3,579,310 | |
| CMO Series 2021-2 Class A1 | ||||
| 03/25/2026 | 2.115% | 12,929,558 | 12,189,591 | |
| CMO Series 2021-3 Class A1 | ||||
| 04/25/2026 | 1.867% | 13,838,711 | 13,018,420 | |
| Pretium Mortgage Credit Partners(a),(e) | ||||
| CMO Series 2022-NPL1 Class A1 | ||||
| 01/25/2052 | 2.981% | 20,593,345 | 19,040,796 | |
| Pretium Mortgage Credit Partners I LLC(a),(e) | ||||
| CMO Series 2021-NPL1 Class A1 | ||||
| 09/27/2060 | 2.240% | 8,187,194 | 7,804,522 | |
| Pretium Mortgage Credit Partners LLC(a),(e) | ||||
| CMO Series 2021-RN2 Class A1 | ||||
| 07/25/2051 | 1.744% | 10,517,254 | 9,659,730 | |
| Residential Mortgage-Backed Securities - Non-Agency (continued) | ||||
| Issuer | Coupon Rate | Principal Amount ($) | Value ($) | |
| Radnor Re Ltd.(a),(b) | ||||
| CMO Series 2018-1 Class M2 | ||||
| 1-month USD LIBOR + 2.700% 03/25/2028 | 5.144% | 10,031,862 | 10,063,570 | |
| CMO Series 2021-1 Class M2 | ||||
| 30-day Average SOFR + 3.150% 12/27/2033 | 5.333% | 18,984,000 | 18,312,365 | |
| Stonnington Mortgage Trust(a),(c),(d),(e) | ||||
| CMO Series 2020-1 Class A | ||||
| 07/28/2024 | 3.500% | 2,643,426 | 2,643,426 | |
| Toorak Mortgage Corp., Ltd.(a),(e) | ||||
| CMO Series 2021-1 Class A1 | ||||
| 06/25/2024 | 2.240% | 15,000,000 | 14,517,918 | |
| Triangle Re Ltd.(a),(b) | ||||
| CMO Series 2021-1 Class M1C | ||||
| 1-month USD LIBOR + 3.400% Floor 3.400% 08/25/2033 | 5.844% | 9,573,857 | 9,577,591 | |
| CMO Series 2021-2 Class M1C | ||||
| 1-month USD LIBOR + 4.500% Floor 4.500% 10/25/2033 | 6.944% | 19,500,000 | 19,826,418 | |
| CMO Series 2021-2 Class M2 | ||||
| 1-month USD LIBOR + 5.500% Floor 5.500% 10/25/2033 | 7.944% | 10,750,000 | 10,840,424 | |
| VCAT Asset Securitization LLC(a),(e) | ||||
| CMO Series 2021-NPL6 Class A1 | ||||
| 09/25/2051 | 1.917% | 21,853,140 | 20,452,594 | |
| VCAT LLC(a),(e) | ||||
| CMO Series 2021-NPL5 Class A1 | ||||
| 08/25/2051 | 1.868% | 24,830,329 | 22,938,034 | |
| Vericrest Opportunity Loan Transferee(a),(e) | ||||
| CMO Series 2021-NPL4 Class A1 | ||||
| 03/27/2051 | 2.240% | 9,837,755 | 9,398,235 | |
| Verus Securitization Trust(a),(e) | ||||
| Subordinated CMO Series 2019-INV3 Class B1 | ||||
| 11/25/2059 | 3.731% | 7,300,000 | 6,915,789 | |
| Visio Trust(a),(e) | ||||
| CMO Series 2019-2 Class M1 | ||||
| 11/25/2054 | 3.260% | 4,200,000 | 3,990,608 | |
| Subordinated CMO Series 2019-2 Class B1 | ||||
| 11/25/2054 | 3.910% | 3,600,000 | 3,402,042 | |
| Total Residential Mortgage-Backed Securities - Non-Agency (Cost $1,071,335,234) | 1,046,913,974 | |||
| 28 | Columbia Strategic Income Fund | Annual Report 2022 |
August 31, 2022
| Senior Loans 8.4% | ||||
| Borrower | Coupon Rate | Principal Amount ($) | Value ($) | |
| Aerospace & Defense 0.0% | ||||
| TransDigm, Inc.(b),(o) | ||||
| Tranche E Term Loan | ||||
| 1-month USD LIBOR + 2.250% 05/30/2025 | 4.774% | 1,533,408 | 1,495,226 | |
| Tranche F Term Loan | ||||
| 1-month USD LIBOR + 2.250% 12/09/2025 | 4.774% | 938,776 | 913,082 | |
| Total | 2,408,308 | |||
| Airlines 0.2% | ||||
| AAdvantage Loyalty IP Ltd./American Airlines, Inc.(b),(o) | ||||
| Term Loan | ||||
| 1-month USD LIBOR + 4.750% Floor 0.750% 04/20/2028 | 7.460% | 3,189,781 | 3,135,300 | |
| American Airlines, Inc.(b),(o) | ||||
| Term Loan | ||||
| 3-month USD LIBOR + 1.750% 06/27/2025 | 4.243% | 2,179,446 | 2,016,293 | |
| Kestrel Bidco, Inc.(b),(o) | ||||
| Term Loan | ||||
| 3-month USD LIBOR + 3.000% Floor 1.000% 12/11/2026 | 5.030% | 1,447,974 | 1,321,015 | |
| United AirLines, Inc.(b),(o) | ||||
| Tranche B Term Loan | ||||
| 3-month USD LIBOR + 3.750% Floor 0.750% 04/21/2028 | 6.533% | 2,801,242 | 2,718,773 | |
| Total | 9,191,381 | |||
| Automotive 0.1% | ||||
| Clarios Global LP(b),(o) | ||||
| 1st Lien Term Loan | ||||
| 1-month USD LIBOR + 3.250% 04/30/2026 | 5.774% | 1,690,416 | 1,643,084 | |
| First Brands Group LLC(b),(o) | ||||
| 1st Lien Term Loan | ||||
| 1-month Term SOFR + 5.000% Floor 1.000% 03/30/2027 | 8.368% | 3,150,619 | 3,045,263 | |
| Senior Loans (continued) | ||||
| Borrower | Coupon Rate | Principal Amount ($) | Value ($) | |
| RealTruck Group, Inc.(b),(o) | ||||
| Term Loan | ||||
| 1-month USD LIBOR + 3.500% Floor 0.750% 01/31/2028 | 6.024% | 2,213,138 | 2,009,175 | |
| Total | 6,697,522 | |||
| Brokerage/Asset Managers/Exchanges 0.2% | ||||
| AlixPartners LLP(b),(o) | ||||
| Term Loan | ||||
| 1-month USD LIBOR + 2.750% Floor 0.500% 02/04/2028 | 5.274% | 1,476,238 | 1,440,380 | |
| Allspring Buyer LLC(b),(o) | ||||
| Term Loan | ||||
| 1-month USD LIBOR + 3.250% Floor 0.500% 11/01/2028 | 5.563% | 1,327,318 | 1,307,409 | |
| Citadel Securities LP(b),(o) | ||||
| Term Loan | ||||
| 1-Month Term SOFR + 2.500% 02/02/2028 | 5.070% | 2,957,513 | 2,889,135 | |
| Russell Investments US Institutional Holdco, Inc.(b),(o) | ||||
| Term Loan | ||||
| 1-month USD LIBOR + 3.500% Floor 1.000% 05/30/2025 | 5.000% | 2,466,439 | 2,329,256 | |
| VFH Parent LLC(b),(o) | ||||
| Term Loan | ||||
| SOFR + 3.000% 01/13/2029 | 5.397% | 2,288,313 | 2,224,423 | |
| Total | 10,190,603 | |||
| Building Materials 0.3% | ||||
| Cornerstone Building Brands, Inc.(b),(o) | ||||
| Tranche B Term Loan | ||||
| 1-month USD LIBOR + 3.250% 04/12/2028 | 5.641% | 1,402,959 | 1,252,843 | |
| Covia Holdings LLC(b),(o) | ||||
| Term Loan | ||||
| 1-month USD LIBOR + 4.000% Floor 1.000% 07/31/2026 | 6.285% | 1,750,241 | 1,678,586 | |
| Columbia Strategic Income Fund | Annual Report 2022 | 29 |
August 31, 2022
| Senior Loans (continued) | ||||
| Borrower | Coupon Rate | Principal Amount ($) | Value ($) | |
| CP Atlas Buyer, Inc.(b),(o) | ||||
| Tranche B Term Loan | ||||
| 1-month USD LIBOR + 3.750% Floor 0.500% 11/23/2027 | 6.274% | 1,003,844 | 927,612 | |
| CPG International LLC(b),(o) | ||||
| Term Loan | ||||
| 1-month Term SOFR + 2.500% Floor 0.500% 04/28/2029 | 4.092% | 1,176,541 | 1,141,245 | |
| Hunter Douglas Holding BV(b),(o) | ||||
| Tranche B1 Term Loan | ||||
| 1-month Term SOFR + 3.500% Floor 0.500% 02/26/2029 | 6.340% | 1,196,407 | 1,042,668 | |
| LBM Acquisition LLC(b),(o) | ||||
| 1st Lien Term Loan | ||||
| 1-month USD LIBOR + 3.750% Floor 0.750% 12/17/2027 | 7.121% | 1,457,254 | 1,326,465 | |
| Park River Holdings, Inc.(b),(o) | ||||
| 1st Lien Term Loan | ||||
| 1-month USD LIBOR + 3.250% Floor 0.750% 12/28/2027 | 5.527% | 2,272,591 | 2,059,536 | |
| QUIKRETE Holdings, Inc.(b),(o) | ||||
| 1st Lien Term Loan | ||||
| 3-month USD LIBOR + 2.625% 02/01/2027 | 5.149% | 2,199,260 | 2,114,390 | |
| SRS Distribution, Inc.(b),(o) | ||||
| Term Loan | ||||
| 1-month USD LIBOR + 3.500% Floor 0.500% 06/02/2028 | 6.306% | 1,980,000 | 1,910,700 | |
| US Silica Co.(b),(o) | ||||
| Term Loan | ||||
| 3-month USD LIBOR + 4.000% Floor 1.000% 05/01/2025 | 6.563% | 1,837,048 | 1,792,279 | |
| Senior Loans (continued) | ||||
| Borrower | Coupon Rate | Principal Amount ($) | Value ($) | |
| White Cap Supply Holdings LLC(b),(o) | ||||
| Term Loan | ||||
| 1-month Term SOFR + 3.750% Floor 0.500% 10/19/2027 | 6.205% | 1,869,331 | 1,802,634 | |
| Total | 17,048,958 | |||
| Cable and Satellite 0.3% | ||||
| Cogeco Communications Finance LP(b),(o) | ||||
| Tranche B Term Loan | ||||
| 3-month USD LIBOR + 2.000% 01/03/2025 | 4.524% | 3,332,353 | 3,254,609 | |
| CSC Holdings LLC(b),(o) | ||||
| Term Loan | ||||
| 3-month USD LIBOR + 2.250% 07/17/2025 | 4.641% | 1,492,126 | 1,442,707 | |
| 3-month USD LIBOR + 2.250% 01/15/2026 | 4.641% | 1,462,196 | 1,413,460 | |
| 3-month USD LIBOR + 2.500% 04/15/2027 | 4.891% | 991,758 | 954,775 | |
| Direct TV Financing LLC(b),(o) | ||||
| Term Loan | ||||
| 1-month USD LIBOR + 5.000% Floor 0.750% 08/02/2027 | 7.524% | 2,487,144 | 2,374,601 | |
| Iridium Satellite LLC(b),(o) | ||||
| Tranche B2 Term Loan | ||||
| 1-month USD LIBOR + 2.500% Floor 1.000% 11/04/2026 | 5.024% | 2,348,268 | 2,315,980 | |
| Radiate Holdco LLC(b),(o) | ||||
| Term Loan | ||||
| 1-month USD LIBOR + 3.250% Floor 0.750% 09/25/2026 | 5.774% | 1,653,693 | 1,574,945 | |
| Telesat Canada(b),(o) | ||||
| Tranche B5 Term Loan | ||||
| 1-month USD LIBOR + 2.750% 12/07/2026 | 5.340% | 2,179,765 | 1,469,401 | |
| Virgin Media Bristol LLC(b),(o) | ||||
| Tranche N Term Loan | ||||
| 3-month USD LIBOR + 2.500% 01/31/2028 | 4.891% | 1,175,000 | 1,147,094 | |
| 30 | Columbia Strategic Income Fund | Annual Report 2022 |
August 31, 2022
| Senior Loans (continued) | ||||
| Borrower | Coupon Rate | Principal Amount ($) | Value ($) | |
| Tranche Q Term Loan | ||||
| 1-month USD LIBOR + 3.250% 01/31/2029 | 5.641% | 1,000,000 | 986,250 | |
| Total | 16,933,822 | |||
| Chemicals 0.4% | ||||
| Aruba Investments Holdings LLC(b),(o) | ||||
| 1st Lien Term Loan | ||||
| 1-month USD LIBOR + 4.000% Floor 0.750% 11/24/2027 | 6.444% | 1,110,980 | 1,066,540 | |
| Ascend Performance Materials Operations LLC(b),(o) | ||||
| Term Loan | ||||
| 1-month USD LIBOR + 4.750% Floor 0.750% 08/27/2026 | 7.000% | 1,906,566 | 1,897,510 | |
| Chemours Co. (The)(b),(o) | ||||
| Tranche B2 Term Loan | ||||
| 3-month USD LIBOR + 1.750% 04/03/2025 | 4.280% | 1,410,312 | 1,373,291 | |
| ColourOz Investment 1 GmbH(b),(o) | ||||
| Tranche C 1st Lien Term Loan | ||||
| 3-month USD LIBOR + 4.250% Floor 1.000% 09/21/2023 | 6.801% | 353,429 | 284,511 | |
| ColourOz Investment 2 LLC(b),(o) | ||||
| Tranche B2 1st Lien Term Loan | ||||
| 3-month USD LIBOR + 4.250% Floor 1.000% 09/21/2023 | 5.250% | 2,137,958 | 1,721,056 | |
| Diamond BV(b),(o) | ||||
| Term Loan | ||||
| 1-month USD LIBOR + 2.750% Floor 0.500% 09/29/2028 | 5.555% | 2,239,192 | 2,154,281 | |
| Herens Holdco SARL(b),(o) | ||||
| Tranche B Term Loan | ||||
| 1-month USD LIBOR + 4.000% Floor 0.750% 07/03/2028 | 6.250% | 1,478,170 | 1,358,690 | |
| Senior Loans (continued) | ||||
| Borrower | Coupon Rate | Principal Amount ($) | Value ($) | |
| INEOS Styrolution Group GmbH(b),(o) | ||||
| Tranche B Term Loan | ||||
| 1-month USD LIBOR + 2.750% Floor 0.500% 01/29/2026 | 5.274% | 1,980,000 | 1,928,857 | |
| Ineos US Finance LLC(b),(o) | ||||
| Term Loan | ||||
| 3-month USD LIBOR + 2.000% 04/01/2024 | 4.593% | 1,687,071 | 1,665,510 | |
| Innophos Holdings, Inc.(b),(o) | ||||
| Term Loan | ||||
| 1-month USD LIBOR + 3.250% 02/05/2027 | 5.774% | 610,937 | 597,955 | |
| Messer Industries GmbH(b),(o) | ||||
| Tranche B1 Term Loan | ||||
| 3-month USD LIBOR + 2.500% 03/02/2026 | 4.750% | 1,175,815 | 1,152,004 | |
| Momentive Performance Materials, Inc.(b),(o) | ||||
| 1st Lien Term Loan | ||||
| 3-month USD LIBOR + 3.250% 05/15/2024 | 5.780% | 1,455,000 | 1,426,351 | |
| Nouryon Finance BV(b),(o) | ||||
| Term Loan | ||||
| 1-month USD LIBOR + 2.750% 10/01/2025 | 5.000% | 2,723,581 | 2,650,725 | |
| PMHC II, Inc.(b),(o) | ||||
| Term Loan | ||||
| 3-month Term SOFR + 4.250% Floor 0.500% 04/23/2029 | 6.977% | 1,634,413 | 1,459,629 | |
| Schenectady International Group, Inc.(b),(d),(o) | ||||
| Term Loan | ||||
| 3-month USD LIBOR + 4.750% 10/15/2025 | 7.205% | 2,056,061 | 1,840,175 | |
| Sparta US Holdco LLC(b),(o) | ||||
| 1st Lien Term Loan | ||||
| 1-month USD LIBOR + 3.250% Floor 0.750% 08/02/2028 | 5.612% | 992,506 | 962,235 | |
| Columbia Strategic Income Fund | Annual Report 2022 | 31 |
August 31, 2022
| Senior Loans (continued) | ||||
| Borrower | Coupon Rate | Principal Amount ($) | Value ($) | |
| Tronox Finance LLC(b),(o) | ||||
| 1st Lien Term Loan | ||||
| 1-month USD LIBOR + 2.250% 03/10/2028 | 4.547% | 1,392,119 | 1,351,010 | |
| Total | 24,890,330 | |||
| Construction Machinery 0.1% | ||||
| Columbus McKinnon Corp.(b),(o) | ||||
| Term Loan | ||||
| 1-month USD LIBOR + 2.750% Floor 0.500% 05/14/2028 | 5.063% | 1,285,022 | 1,265,746 | |
| PECF USS Intermediate Holding III Corp.(b),(o) | ||||
| Term Loan | ||||
| 1-month USD LIBOR + 4.250% Floor 0.500% 12/15/2028 | 6.774% | 2,054,314 | 1,908,972 | |
| Total | 3,174,718 | |||
| Consumer Cyclical Services 0.5% | ||||
| 8th Avenue Food & Provisions, Inc.(b),(o) | ||||
| 1st Lien Term Loan | ||||
| 1-month USD LIBOR + 3.750% 10/01/2025 | 2.500% | 879,464 | 771,730 | |
| 2nd Lien Term Loan | ||||
| 1-month USD LIBOR + 7.750% 10/01/2026 | 10.274% | 1,686,397 | 1,396,337 | |
| Allied Universal Holdco LLC(b),(o) | ||||
| Term Loan | ||||
| 1-month USD LIBOR + 3.750% Floor 0.500% 05/12/2028 | 6.274% | 2,907,913 | 2,770,166 | |
| Amentum Government Services Holdings LLC(b),(o) | ||||
| Tranche 1 1st Lien Term Loan | ||||
| 1-month USD LIBOR + 4.000% 01/29/2027 | 6.524% | 963,772 | 934,859 | |
| Tranche 3 1st Lien Term Loan | ||||
| 1-month Term SOFR + 4.000% Floor 0.500% 02/15/2029 | 5.016% | 1,157,801 | 1,125,243 | |
| Senior Loans (continued) | ||||
| Borrower | Coupon Rate | Principal Amount ($) | Value ($) | |
| APX Group, Inc.(b),(o) | ||||
| Term Loan | ||||
| 1-month USD LIBOR + 3.500% Floor 0.500% 07/10/2028 | 5.878% | 1,153,321 | 1,121,420 | |
| Cast & Crew LLC(b),(o) | ||||
| 1st Lien Term Loan | ||||
| 1-month Term SOFR + 3.750% Floor 0.500% 12/29/2028 | 6.205% | 1,828,028 | 1,788,414 | |
| Conservice Midco LLC(b),(o) | ||||
| 1st Lien Term Loan | ||||
| 1-month USD LIBOR + 4.250% 05/13/2027 | 6.774% | 2,446,213 | 2,372,827 | |
| CSC Holdings LLC(b),(o),(p) | ||||
| Tranche B Term Loan | ||||
| 1-month Term SOFR + 3.250% Floor 0.500% 08/31/2029 | 3.250% | 658,340 | 646,819 | |
| Prime Security Services Borrower LLC(b),(o) | ||||
| Tranche B1 1st Lien Term Loan | ||||
| 1-month USD LIBOR + 2.750% Floor 0.750% 09/23/2026 | 5.107% | 1,702,195 | 1,660,440 | |
| Signal Parent, Inc.(b),(o) | ||||
| Term Loan | ||||
| 1-month USD LIBOR + 3.500% Floor 0.750% 04/03/2028 | 6.024% | 1,853,141 | 1,389,856 | |
| Sotheby’s(b),(d),(o) | ||||
| Term Loan | ||||
| 1-month USD LIBOR + 4.500% Floor 0.500% 01/15/2027 | 7.012% | 1,364,038 | 1,350,397 | |
| Staples, Inc.(b),(o) | ||||
| Tranche B1 Term Loan | ||||
| 3-month USD LIBOR + 5.000% 04/16/2026 | 7.782% | 1,206,557 | 1,059,828 | |
| TruGreen LP(b),(o) | ||||
| 1st Lien Term Loan | ||||
| 1-month USD LIBOR + 4.000% Floor 0.750% 11/02/2027 | 6.524% | 2,093,125 | 2,004,167 | |
| 32 | Columbia Strategic Income Fund | Annual Report 2022 |
August 31, 2022
| Senior Loans (continued) | ||||
| Borrower | Coupon Rate | Principal Amount ($) | Value ($) | |
| Uber Technologies, Inc.(b),(o) | ||||
| Term Loan | ||||
| 3-month USD LIBOR + 3.500% Floor 1.000% 04/04/2025 | 6.570% | 2,722,325 | 2,699,975 | |
| WaterBridge Midstream Operating LLC(b),(o) | ||||
| Term Loan | ||||
| 3-month USD LIBOR + 5.750% Floor 1.000% 06/22/2026 | 9.127% | 1,154,374 | 1,130,871 | |
| WW International, Inc.(b),(o) | ||||
| Term Loan | ||||
| 1-month USD LIBOR + 3.500% Floor 0.500% 04/13/2028 | 6.030% | 1,771,875 | 1,301,779 | |
| Total | 25,525,128 | |||
| Consumer Products 0.2% | ||||
| Energizer Holdings, Inc.(b),(o) | ||||
| Term Loan | ||||
| 1-month USD LIBOR + 2.250% Floor 0.500% 12/22/2027 | 4.625% | 1,708,826 | 1,670,377 | |
| Kronos Acquisition Holdings, Inc.(b),(o) | ||||
| Tranche B1 Term Loan | ||||
| 1-month USD LIBOR + 3.750% Floor 0.500% 12/22/2026 | 6.820% | 1,495,247 | 1,438,801 | |
| Osmosis Buyer Ltd.(b),(o) | ||||
| Tranche B Term Loan | ||||
| 1-month USD LIBOR + 4.000% Floor 0.500% 07/31/2028 | 6.037% | 2,067,129 | 1,982,501 | |
| Serta Simmons Bedding LLC(b),(o) | ||||
| 1st Lien Term Loan | ||||
| 3-month USD LIBOR + 3.500% Floor 1.000% 11/08/2023 | 6.223% | 1,126,746 | 147,570 | |
| SRAM LLC(b),(o) | ||||
| Term Loan | ||||
| 1-month USD LIBOR + 2.750% Floor 0.500% 05/18/2028 | 5.367% | 1,330,852 | 1,297,581 | |
| Senior Loans (continued) | ||||
| Borrower | Coupon Rate | Principal Amount ($) | Value ($) | |
| SWF Holdings I Corp.(b),(o) | ||||
| 1st Lien Term Loan | ||||
| 1-month USD LIBOR + 4.000% Floor 0.750% 10/06/2028 | 6.368% | 2,066,227 | 1,799,333 | |
| Thor Industries, Inc.(b),(o) | ||||
| Tranche B1 Term Loan | ||||
| 1-month USD LIBOR + 3.000% 02/01/2026 | 5.500% | 1,426,691 | 1,412,424 | |
| Weber-Stephen Products LLC(b),(o) | ||||
| Tranche B Term Loan | ||||
| 1-month USD LIBOR + 3.250% Floor 0.750% 10/30/2027 | 5.774% | 2,445,096 | 2,070,482 | |
| Total | 11,819,069 | |||
| Diversified Manufacturing 0.3% | ||||
| Brookfield WEC Holdings, Inc.(b),(o) | ||||
| 1st Lien Term Loan | ||||
| 1-month USD LIBOR + 2.750% Floor 0.500% 08/01/2025 | 5.274% | 2,167,393 | 2,112,949 | |
| DXP Enterprises, Inc.(b),(o) | ||||
| Term Loan | ||||
| 1-month USD LIBOR + 4.750% Floor 1.000% 12/23/2027 | 7.274% | 1,231,250 | 1,178,306 | |
| EWT Holdings III Corp.(b),(o) | ||||
| Term Loan | ||||
| 1-month USD LIBOR + 2.500% 04/01/2028 | 5.063% | 1,230,019 | 1,213,106 | |
| Filtration Group Corp.(b),(o) | ||||
| Term Loan | ||||
| 3-month USD LIBOR + 3.000% 03/31/2025 | 5.524% | 2,058,221 | 2,020,596 | |
| 1-month USD LIBOR + 3.500% Floor 0.500% 10/21/2028 | 6.024% | 621,683 | 604,276 | |
| Gates Global LLC(b),(o) | ||||
| Tranche B3 Term Loan | ||||
| 1-month USD LIBOR + 2.500% Floor 0.750% 03/31/2027 | 5.024% | 1,753,177 | 1,716,115 | |
| Columbia Strategic Income Fund | Annual Report 2022 | 33 |
August 31, 2022
| Senior Loans (continued) | ||||
| Borrower | Coupon Rate | Principal Amount ($) | Value ($) | |
| Madison IAQ LLC(b),(o) | ||||
| Term Loan | ||||
| 3-month USD LIBOR + 3.250% 06/21/2028 | 4.524% | 1,667,976 | 1,606,811 | |
| TK Elevator Midco GmbH(b),(o) | ||||
| Tranche B1 Term Loan | ||||
| 1-month USD LIBOR + 3.500% Floor 0.500% 07/30/2027 | 6.871% | 3,280,958 | 3,180,495 | |
| Vertiv Group Corp.(b),(o) | ||||
| Tranche B Term Loan | ||||
| 1-month USD LIBOR + 2.750% 03/02/2027 | 5.112% | 1,453,950 | 1,398,817 | |
| Total | 15,031,471 | |||
| Electric 0.2% | ||||
| Calpine Construction Finance Co., LP(b),(o) | ||||
| Tranche B Term Loan | ||||
| 3-month USD LIBOR + 2.000% 01/15/2025 | 4.524% | 997,389 | 976,823 | |
| Carroll County Energy LLC(b),(o) | ||||
| Term Loan | ||||
| 3-month USD LIBOR + 3.500% 02/16/2026 | 5.750% | 406,679 | 381,135 | |
| Constellation Renewables LLC(b),(o) | ||||
| Term Loan | ||||
| 1-month USD LIBOR + 2.500% Floor 1.000% 12/15/2027 | 5.570% | 2,767,423 | 2,726,908 | |
| CPV Shore Holdings LLC(b),(o) | ||||
| Tranche B Term Loan | ||||
| 3-month USD LIBOR + 3.750% 12/29/2025 | 6.280% | 887,607 | 813,900 | |
| Edgewater Generation LLC(b),(o) | ||||
| Term Loan | ||||
| 3-month USD LIBOR + 3.750% 12/13/2025 | 6.274% | 1,376,514 | 1,204,739 | |
| EFS Cogen Holdings I LLC(b),(o) | ||||
| Tranche B Term Loan | ||||
| 3-month USD LIBOR + 3.500% Floor 1.000% 10/01/2027 | 5.760% | 923,665 | 887,873 | |
| Senior Loans (continued) | ||||
| Borrower | Coupon Rate | Principal Amount ($) | Value ($) | |
| Invenergy Thermal Operating I LLC(b),(o) | ||||
| Term Loan | ||||
| 1-Month Term SOFR + 3.750% 08/28/2025 | 6.320% | 559,268 | 543,889 | |
| Lightstone Holdco LLC(b),(o) | ||||
| Tranche B Term Loan | ||||
| 1-month Term SOFR + 5.750% Floor 1.000% 02/01/2027 | 8.051% | 321,079 | 287,825 | |
| Tranche C Term Loan | ||||
| 1-month Term SOFR + 5.750% Floor 1.000% 02/01/2027 | 8.051% | 18,160 | 16,279 | |
| LMBE-MC Holdco II LLC(b),(d),(o) | ||||
| Term Loan | ||||
| 3-month USD LIBOR + 4.000% Floor 1.000% 12/03/2025 | 6.285% | 1,384,891 | 1,350,269 | |
| Nautilus Power LLC(b),(o) | ||||
| Term Loan | ||||
| 3-month USD LIBOR + 4.250% Floor 1.000% 05/16/2024 | 6.774% | 499,560 | 382,103 | |
| New Frontera Holdings LLC(b),(o) | ||||
| 1st Lien Term Loan | ||||
| 1-month USD LIBOR + 13.000% 07/28/2026 | 15.250% | 217,161 | 207,389 | |
| 2nd Lien Term Loan | ||||
| 1-month USD LIBOR + 1.500% 07/28/2028 | 3.750% | 75,277 | 16,937 | |
| PG&E Corp.(b),(o) | ||||
| Term Loan | ||||
| 1-month USD LIBOR + 3.000% Floor 1.000% 06/23/2025 | 5.563% | 2,433,748 | 2,383,564 | |
| West Deptford Energy Holdings LLC(b),(o) | ||||
| Term Loan | ||||
| 3-month USD LIBOR + 3.750% 08/03/2026 | 6.274% | 491,008 | 352,912 | |
| 34 | Columbia Strategic Income Fund | Annual Report 2022 |
August 31, 2022
| Senior Loans (continued) | ||||
| Borrower | Coupon Rate | Principal Amount ($) | Value ($) | |
| WIN Waste Innovations Holdings, Inc.(b),(o) | ||||
| Term Loan | ||||
| 1-month USD LIBOR + 2.750% Floor 0.500% 03/24/2028 | 5.000% | 483,778 | 473,043 | |
| Total | 13,005,588 | |||
| Environmental 0.1% | ||||
| EnergySolutions LLC(b),(o) | ||||
| Term Loan | ||||
| 3-month USD LIBOR + 3.750% Floor 1.000% 05/09/2025 | 6.000% | 1,157,247 | 1,072,988 | |
| GFL Environmental, Inc.(b),(o) | ||||
| Term Loan | ||||
| 3-month USD LIBOR + 3.000% Floor 1.000% 05/30/2025 | 5.806% | 1,474,906 | 1,465,068 | |
| Harsco Corp.(b),(o) | ||||
| Tranche B3 Term Loan | ||||
| 1-month USD LIBOR + 2.250% Floor 0.500% 03/10/2028 | 4.750% | 1,872,973 | 1,757,467 | |
| Rockwood Service Corp.(b),(o) | ||||
| Term Loan | ||||
| 1-month USD LIBOR + 4.250% 01/23/2027 | 6.743% | 930,070 | 909,144 | |
| Total | 5,204,667 | |||
| Food and Beverage 0.1% | ||||
| Aramark Intermediate HoldCo Corp.(b),(o) | ||||
| Tranche B5 Term Loan | ||||
| 1-month USD LIBOR + 2.500% 04/06/2028 | 5.024% | 1,023,518 | 1,015,842 | |
| Del Monte Foods, Inc.(b),(o) | ||||
| 1st Lien Term Loan | ||||
| 1-month Term SOFR + 4.250% Floor 0.500% 05/16/2029 | 6.647% | 1,721,314 | 1,655,697 | |
| Naked Juice LLC(b),(o) | ||||
| 1st Lien Term Loan | ||||
| 3-month Term SOFR + 3.250% Floor 0.500% 01/24/2029 | 5.405% | 300,000 | 287,142 | |
| Senior Loans (continued) | ||||
| Borrower | Coupon Rate | Principal Amount ($) | Value ($) | |
| Primary Products Finance LLC(b),(o) | ||||
| Tranche B Term Loan | ||||
| 1-Month Term SOFR + 4.000% Floor 0.500% 04/01/2029 | 6.077% | 1,969,133 | 1,918,054 | |
| Triton Water Holdings, Inc.(b),(o) | ||||
| 1st Lien Term Loan | ||||
| 1-month USD LIBOR + 3.500% Floor 0.500% 03/31/2028 | 5.750% | 1,870,001 | 1,745,179 | |
| United Natural Foods, Inc.(b),(o) | ||||
| Term Loan | ||||
| 3-Month Term SOFR + 3.250% 10/22/2025 | 5.820% | 1,242,971 | 1,229,633 | |
| Total | 7,851,547 | |||
| Gaming 0.4% | ||||
| Bally’s Corp.(b),(o) | ||||
| Tranche B Term Loan | ||||
| 1-month USD LIBOR + 3.250% Floor 0.500% 10/02/2028 | 5.623% | 1,936,373 | 1,842,459 | |
| Caesars Resort Collection LLC(b),(o) | ||||
| Tranche B Term Loan | ||||
| 3-month USD LIBOR + 2.750% 12/23/2024 | 5.274% | 3,482,886 | 3,433,812 | |
| Tranche B1 Term Loan | ||||
| 1-month USD LIBOR + 3.500% 07/21/2025 | 6.024% | 563,055 | 557,707 | |
| CBAC Borrower LLC(b),(o) | ||||
| Tranche B Term Loan | ||||
| 3-month USD LIBOR + 4.000% 07/08/2024 | 6.524% | 1,498,967 | 1,465,240 | |
| Fertitta Entertainment LLC(b),(o) | ||||
| Tranche B Term Loan | ||||
| 1-month Term SOFR + 4.000% Floor 0.500% 01/27/2029 | 6.459% | 2,650,186 | 2,542,854 | |
| Flutter Entertainment PLC(b),(o) | ||||
| Term Loan | ||||
| 3-month USD LIBOR + 2.250% 07/21/2026 | 4.500% | 2,423,473 | 2,363,904 | |
| Columbia Strategic Income Fund | Annual Report 2022 | 35 |
August 31, 2022
| Senior Loans (continued) | ||||
| Borrower | Coupon Rate | Principal Amount ($) | Value ($) | |
| HRNI Holdings LLC(b),(o) | ||||
| Tranche B Term Loan | ||||
| 1-month USD LIBOR + 4.250% Floor 0.750% 12/11/2028 | 6.743% | 3,227,697 | 3,098,589 | |
| PCI Gaming Authority(b),(o) | ||||
| Tranche B Term Loan | ||||
| 3-month USD LIBOR + 2.500% 05/29/2026 | 5.024% | 2,688,266 | 2,626,275 | |
| Penn National Gaming, Inc.(b),(o) | ||||
| Tranche B Term Loan | ||||
| 1-month Term SOFR + 2.750% Floor 0.500% 05/03/2029 | 5.305% | 817,418 | 800,358 | |
| Scientific Games Holdings LP(b),(o) | ||||
| 1st Lien Term Loan | ||||
| 1-month Term SOFR + 3.500% Floor 0.500% 04/04/2029 | 5.617% | 1,243,670 | 1,196,174 | |
| Scientific Games International, Inc.(b),(o) | ||||
| Tranche B Term Loan | ||||
| 1-month Term SOFR + 3.000% Floor 0.500% 04/14/2029 | 5.407% | 1,338,546 | 1,315,121 | |
| Total | 21,242,493 | |||
| Health Care 0.4% | ||||
| Change Healthcare Holdings LLC(b),(o) | ||||
| Term Loan | ||||
| 3-month USD LIBOR + 2.500% Floor 1.000% 03/01/2024 | 5.024% | 1,793,360 | 1,780,663 | |
| CHG Healthcare Services, Inc.(b),(o) | ||||
| 1st Lien Term Loan | ||||
| 1-month USD LIBOR + 3.250% Floor 0.500% 09/29/2028 | 4.750% | 1,985,000 | 1,932,278 | |
| Element Materials(b),(o),(p),(q) | ||||
| Delayed Draw Term Loan | ||||
| 1-month Term SOFR + 4.250% Floor 0.500% 06/22/2029 | 3.250% | 382,986 | 375,805 | |
| Senior Loans (continued) | ||||
| Borrower | Coupon Rate | Principal Amount ($) | Value ($) | |
| Element Materials Technology Group US Holdings, Inc.(b),(o) | ||||
| Tranche B 1st Lien Term Loan | ||||
| 1-month Term SOFR + 4.250% Floor 0.500% 06/22/2029 | 6.360% | 829,804 | 814,245 | |
| Envision Healthcare Corp.(b),(o) | ||||
| Term Loan | ||||
| 1-month Term SOFR + 3.750% 03/31/2027 | 6.315% | 317,814 | 77,864 | |
| 1-month Term SOFR + 4.250% 03/31/2027 | 6.825% | 676,316 | 338,158 | |
| 1-month Term SOFR + 7.875% 03/31/2027 | 10.631% | 114,061 | 108,928 | |
| ICON PLC(b),(o) | ||||
| Term Loan | ||||
| 3-month USD LIBOR + 2.250% 07/03/2028 | 4.563% | 1,619,902 | 1,592,769 | |
| 3-month USD LIBOR + 2.250% 07/03/2028 | 4.563% | 403,600 | 396,839 | |
| LifePoint Health, Inc.(b),(o) | ||||
| Tranche B 1st Lien Term Loan | ||||
| 3-month USD LIBOR + 3.750% 11/16/2025 | 6.274% | 1,522,274 | 1,473,272 | |
| Medline Borrower LP(b),(o) | ||||
| Term Loan | ||||
| 1-month USD LIBOR + 3.250% Floor 0.500% 10/23/2028 | 5.774% | 3,420,286 | 3,257,207 | |
| National Mentor Holdings, Inc.(b),(o) | ||||
| 1st Lien Term Loan | ||||
| 1-month USD LIBOR + 3.750% Floor 0.750% 03/02/2028 | 6.130% | 1,934,101 | 1,634,315 | |
| Tranche C 1st Lien Term Loan | ||||
| 1-month USD LIBOR + 3.750% Floor 0.750% 03/02/2028 | 6.010% | 62,745 | 53,020 | |
| Owens & Minor, Inc.(b),(o) | ||||
| Tranche B1 Term Loan | ||||
| 1-month Term SOFR + 3.750% Floor 0.500% 03/29/2029 | 6.305% | 629,160 | 622,868 | |
| 36 | Columbia Strategic Income Fund | Annual Report 2022 |
August 31, 2022
| Senior Loans (continued) | ||||
| Borrower | Coupon Rate | Principal Amount ($) | Value ($) | |
| Phoenix Guarantor, Inc.(b),(o) | ||||
| Tranche B1 1st Lien Term Loan | ||||
| 1-month USD LIBOR + 3.250% 03/05/2026 | 5.774% | 1,962,335 | 1,894,262 | |
| Pluto Acquisition I, Inc.(b),(o) | ||||
| 1st Lien Term Loan | ||||
| 1-month USD LIBOR + 4.000% 06/22/2026 | 3.000% | 1,933,594 | 1,658,057 | |
| Radiology Partners, Inc.(b),(o) | ||||
| Tranche B 1st Lien Term Loan | ||||
| 1-month USD LIBOR + 4.250% 07/09/2025 | 6.659% | 1,500,000 | 1,396,245 | |
| Surgery Center Holdings, Inc.(b),(o) | ||||
| Term Loan | ||||
| 1-month USD LIBOR + 3.750% Floor 0.750% 08/31/2026 | 6.140% | 1,975,000 | 1,913,637 | |
| Total | 21,320,432 | |||
| Independent Energy 0.1% | ||||
| Hamilton Projects Acquiror LLC(b),(o) | ||||
| Term Loan | ||||
| 1-month USD LIBOR + 4.500% Floor 1.000% 06/17/2027 | 6.750% | 1,231,650 | 1,208,039 | |
| Oryx Midstream Services Permian Basin LLC(b),(o) | ||||
| Term Loan | ||||
| 1-month USD LIBOR + 3.250% Floor 0.500% 10/05/2028 | 6.211% | 2,141,168 | 2,101,021 | |
| Parkway Generation LLC(b),(o) | ||||
| Tranche B Term Loan | ||||
| 1-month USD LIBOR + 4.750% Floor 0.750% 02/18/2029 | 7.274% | 2,347,255 | 2,292,987 | |
| Tranche C Term Loan | ||||
| 1-month USD LIBOR + 4.750% Floor 0.750% 02/18/2029 | 7.274% | 329,439 | 321,753 | |
| Total | 5,923,800 | |||
| Senior Loans (continued) | ||||
| Borrower | Coupon Rate | Principal Amount ($) | Value ($) | |
| Leisure 0.4% | ||||
| Alterra Mountain Co.(b),(o) | ||||
| Tranche B2 Term Loan | ||||
| 1-month USD LIBOR + 3.500% Floor 0.500% 08/17/2028 | 6.024% | 2,401,887 | 2,332,832 | |
| Carnival Corp.(b),(o) | ||||
| Tranche B Term Loan | ||||
| 1-month USD LIBOR + 3.250% Floor 0.750% 10/18/2028 | 6.127% | 3,390,170 | 3,152,858 | |
| Crown Finance US, Inc.(b),(o) | ||||
| Term Loan | ||||
| 3-month USD LIBOR + 2.500% 02/28/2025 | 4.000% | 1,919,036 | 1,228,509 | |
| Tranche B1 Term Loan | ||||
| 1-month USD LIBOR + 7.000% 05/23/2024 | 7.000% | 970,609 | 1,115,745 | |
| Formula One Management Ltd.(b),(o) | ||||
| Tranche B3 Term Loan | ||||
| 3-month USD LIBOR + 2.500% Floor 1.000% 02/01/2024 | 5.024% | 3,098,574 | 3,068,890 | |
| Life Time, Inc.(b),(o) | ||||
| Term Loan | ||||
| 1-month USD LIBOR + 4.750% Floor 1.000% 12/16/2024 | 7.820% | 1,170,727 | 1,153,412 | |
| NAI Entertainment Holdings LLC(b),(d),(o) | ||||
| Tranche B Term Loan | ||||
| 3-month USD LIBOR + 2.500% Floor 1.000% 05/08/2025 | 5.030% | 2,019,184 | 1,978,800 | |
| Six Flags Theme Parks, Inc.(b),(o) | ||||
| Tranche B Term Loan | ||||
| 3-month USD LIBOR + 1.750% 04/17/2026 | 4.250% | 799,375 | 772,900 | |
| UFC Holdings LLC(b),(o) | ||||
| Tranche B3 1st Lien Term Loan | ||||
| 1-month USD LIBOR + 2.750% Floor 0.750% 04/29/2026 | 5.520% | 2,710,567 | 2,629,250 | |
| Columbia Strategic Income Fund | Annual Report 2022 | 37 |
August 31, 2022
| Senior Loans (continued) | ||||
| Borrower | Coupon Rate | Principal Amount ($) | Value ($) | |
| William Morris Endeavor Entertainment LLC(b),(o) | ||||
| Tranche B1 1st Lien Term Loan | ||||
| 3-month USD LIBOR + 2.750% 05/18/2025 | 5.280% | 2,708,529 | 2,615,085 | |
| Total | 20,048,281 | |||
| Lodging 0.1% | ||||
| Hilton Grand Vacations Borrower LLC(b),(o) | ||||
| Term Loan | ||||
| 1-month USD LIBOR + 3.000% Floor 0.500% 08/02/2028 | 5.524% | 2,245,227 | 2,192,846 | |
| Playa Resorts Holding BV(b),(o) | ||||
| Term Loan | ||||
| 1-month USD LIBOR + 2.750% Floor 1.000% 04/29/2024 | 5.270% | 4,993,920 | 4,884,253 | |
| Total | 7,077,099 | |||
| Media and Entertainment 0.7% | ||||
| AppLovin Corp.(b),(o) | ||||
| Term Loan | ||||
| 1-month USD LIBOR + 3.000% Floor 0.500% 10/25/2028 | 5.250% | 2,621,457 | 2,544,465 | |
| Cengage Learning, Inc.(b),(o) | ||||
| Tranche B 1st Lien Term Loan | ||||
| 1-month USD LIBOR + 4.750% Floor 1.000% 07/14/2026 | 7.814% | 1,968,099 | 1,856,331 | |
| Clear Channel Outdoor Holdings, Inc.(b),(o) | ||||
| Tranche B Term Loan | ||||
| 3-month USD LIBOR + 3.500% 08/21/2026 | 6.305% | 1,949,684 | 1,801,566 | |
| CMG Media Corp.(b),(o) | ||||
| Tranche B 1st Lien Term Loan | ||||
| 1-month USD LIBOR + 3.500% 12/17/2026 | 6.024% | 1,079,650 | 1,045,911 | |
| Creative Artists Agency LLC(b),(o) | ||||
| Term Loan | ||||
| 1-month USD LIBOR + 3.750% 11/27/2026 | 6.274% | 1,937,406 | 1,913,673 | |
| Senior Loans (continued) | ||||
| Borrower | Coupon Rate | Principal Amount ($) | Value ($) | |
| Tranche B2 Term Loan | ||||
| 1-month Term SOFR + 4.250% Floor 1.000% 11/27/2026 | 6.705% | 381,405 | 378,545 | |
| Cumulus Media New Holdings, Inc.(b),(o) | ||||
| Term Loan | ||||
| 3-month USD LIBOR + 3.750% Floor 1.000% 03/31/2026 | 6.274% | 1,418,469 | 1,361,730 | |
| Diamond Sports Group LLC(b),(o) | ||||
| 1st Lien Term Loan | ||||
| 1-month Term SOFR + 8.000% Floor 1.000% 05/25/2026 | 10.387% | 964,194 | 906,044 | |
| 2nd Lien Term Loan | ||||
| 1-month Term SOFR + 3.250% 08/24/2026 | 5.637% | 1,702,072 | 308,807 | |
| Dotdash Meredith, Inc.(b),(o) | ||||
| Tranche B Term Loan | ||||
| 1-month Term SOFR + 4.000% Floor 0.500% 12/01/2028 | 6.407% | 1,888,163 | 1,751,271 | |
| E.W. Scripps Co. (The)(b),(o) | ||||
| Tranche B2 Term Loan | ||||
| 1-month USD LIBOR + 2.563% 05/01/2026 | 5.086% | 2,943,296 | 2,886,284 | |
| Emerald Expositions Holding, Inc.(b),(o) | ||||
| Term Loan | ||||
| 3-month USD LIBOR + 2.750% 05/22/2024 | 5.274% | 1,631,327 | 1,570,152 | |
| Entravision Communications Corp.(b),(o) | ||||
| Tranche B Term Loan | ||||
| 3-month USD LIBOR + 2.750% 11/29/2024 | 5.274% | 471,533 | 462,103 | |
| Gray Television, Inc.(b),(o) | ||||
| Tranche B2 Term Loan | ||||
| 3-month USD LIBOR + 2.250% Floor 1.000% 02/07/2024 | 4.873% | 1,373,955 | 1,362,125 | |
| Tranche C Term Loan | ||||
| 3-month USD LIBOR + 2.500% 01/02/2026 | 4.873% | 1,701,415 | 1,668,884 | |
| 38 | Columbia Strategic Income Fund | Annual Report 2022 |
August 31, 2022
| Senior Loans (continued) | ||||
| Borrower | Coupon Rate | Principal Amount ($) | Value ($) | |
| iHeartCommunications, Inc.(b),(o) | ||||
| Term Loan | ||||
| 1-month USD LIBOR + 3.000% 05/01/2026 | 5.524% | 1,108,872 | 1,070,261 | |
| 1-month USD LIBOR + 3.250% Floor 0.750% 05/01/2026 | 5.774% | 891,600 | 860,840 | |
| Indy US Bidco LLC(b),(o) | ||||
| Term Loan | ||||
| 1-month USD LIBOR + 3.750% 03/06/2028 | 6.274% | 1,995,986 | 1,904,510 | |
| Learfield Communications LLC(b),(o) | ||||
| 1st Lien Term Loan | ||||
| 3-month USD LIBOR + 3.250% Floor 1.000% 12/01/2023 | 5.780% | 654,016 | 570,276 | |
| Lions Gate Capital Holdings LLC(b),(o) | ||||
| Tranche B Term Loan | ||||
| 3-month USD LIBOR + 2.250% 03/24/2025 | 4.774% | 1,485,027 | 1,452,550 | |
| NASCAR Holdings LLC(b),(o) | ||||
| Term Loan | ||||
| 3-month USD LIBOR + 2.500% 10/19/2026 | 5.024% | 959,056 | 942,426 | |
| NEP Group, Inc.(b),(o) | ||||
| 1st Lien Term Loan | ||||
| 3-month USD LIBOR + 3.250% 10/20/2025 | 5.774% | 1,463,563 | 1,398,492 | |
| Nexstar Media, Inc.(b),(o) | ||||
| Tranche B4 Term Loan | ||||
| 3-month USD LIBOR + 2.500% 09/18/2026 | 5.024% | 1,211,134 | 1,199,785 | |
| Playtika Holding Corp.(b),(o) | ||||
| Tranche B1 Term Loan | ||||
| 1-month USD LIBOR + 2.750% 03/13/2028 | 5.274% | 2,619,684 | 2,559,116 | |
| Pug LLC(b),(o) | ||||
| Tranche B Term Loan | ||||
| 1-month USD LIBOR + 3.500% 02/12/2027 | 6.024% | 2,622,217 | 2,455,051 | |
| Senior Loans (continued) | ||||
| Borrower | Coupon Rate | Principal Amount ($) | Value ($) | |
| Sinclair Television Group, Inc.(b),(o) | ||||
| Tranche B3 Term Loan | ||||
| 1-month USD LIBOR + 3.000% 04/01/2028 | 5.530% | 1,240,434 | 1,172,793 | |
| Univision Communications, Inc.(b),(o) | ||||
| 1st Lien Term Loan | ||||
| 1-month USD LIBOR + 3.250% Floor 0.750% 03/15/2026 | 5.774% | 990,000 | 965,606 | |
| 1-month USD LIBOR + 3.250% Floor 0.750% 01/31/2029 | 5.774% | 1,246,875 | 1,207,287 | |
| 1-month Term SOFR + 4.250% Floor 0.500% 06/24/2029 | 6.254% | 200,000 | 196,000 | |
| Total | 39,772,884 | |||
| Midstream 0.2% | ||||
| AL GCX Holdings LLC(b),(o) | ||||
| Term Loan | ||||
| 1-month Term SOFR + 3.750% Floor 0.500% 05/17/2029 | 6.066% | 1,176,542 | 1,161,470 | |
| CQP Holdco LP(b),(o) | ||||
| Term Loan | ||||
| 1-month USD LIBOR + 3.750% Floor 0.500% 06/05/2028 | 6.000% | 1,378,519 | 1,349,915 | |
| GIP III Stetson I LP(b),(o) | ||||
| Term Loan | ||||
| 3-month USD LIBOR + 4.250% 07/18/2025 | 6.774% | 1,442,419 | 1,378,116 | |
| ITT Holdings LLC(b),(o) | ||||
| Term Loan | ||||
| 1-month USD LIBOR + 2.750% Floor 0.500% 07/10/2028 | 5.274% | 1,554,655 | 1,500,242 | |
| Prairie ECI Acquiror LP(b),(o) | ||||
| Term Loan | ||||
| 1-month USD LIBOR + 4.750% 03/11/2026 | 7.274% | 1,462,500 | 1,390,969 | |
| Columbia Strategic Income Fund | Annual Report 2022 | 39 |
August 31, 2022
| Senior Loans (continued) | ||||
| Borrower | Coupon Rate | Principal Amount ($) | Value ($) | |
| Traverse Midstream Partners LLC(b),(o) | ||||
| Term Loan | ||||
| 1-month Term SOFR + 4.250% Floor 1.000% 09/27/2024 | 5.250% | 2,340,541 | 2,320,061 | |
| Total | 9,100,773 | |||
| Oil Field Services 0.0% | ||||
| Lealand Finance Co. BV(b),(o) | ||||
| Term Loan | ||||
| 3-month USD LIBOR + 1.000% 06/30/2025 | 3.524% | 114,408 | 57,490 | |
| Lealand Finance Company BV(b),(o) | ||||
| Term Loan | ||||
| 1-month USD LIBOR + 3.000% 06/28/2024 | 5.524% | 8,649 | 5,190 | |
| MRC Global, Inc.(b),(o) | ||||
| Term Loan | ||||
| 3-month USD LIBOR + 3.000% 09/20/2024 | 5.524% | 1,033,585 | 1,004,304 | |
| Total | 1,066,984 | |||
| Other Financial Institutions 0.1% | ||||
| 19th Holdings Golf LLC(b),(o) | ||||
| Term Loan | ||||
| 1-month Term SOFR + 3.000% Floor 0.500% 02/07/2029 | 5.387% | 1,080,316 | 1,004,694 | |
| FinCo I LLC(b),(o) | ||||
| Term Loan | ||||
| 1-month USD LIBOR + 2.500% 06/27/2025 | 5.024% | 943,475 | 932,568 | |
| Freeport LNG Investments LLP(b),(o) | ||||
| Tranche B Term Loan | ||||
| 1-month USD LIBOR + 3.500% Floor 0.500% 12/21/2028 | 6.210% | 2,477,544 | 2,373,637 | |
| IGT Holding IV AB(b),(o) | ||||
| Tranche B2 Term Loan | ||||
| 1-month USD LIBOR + 3.400% Floor 0.500% 03/31/2028 | 5.650% | 1,838,346 | 1,790,089 | |
| Senior Loans (continued) | ||||
| Borrower | Coupon Rate | Principal Amount ($) | Value ($) | |
| Trans Union LLC(b),(o) | ||||
| Tranche B6 Term Loan | ||||
| 1-month USD LIBOR + 2.250% Floor 0.500% 12/01/2028 | 4.774% | 1,313,126 | 1,287,100 | |
| Total | 7,388,088 | |||
| Other Industry 0.1% | ||||
| APi Group, Inc.(b),(o) | ||||
| Term Loan | ||||
| 3-month USD LIBOR + 2.500% 10/01/2026 | 5.024% | 1,189,111 | 1,169,419 | |
| Hillman Group, Inc. (The)(b),(o),(p),(q) | ||||
| Delayed Draw Term Loan | ||||
| 1-month USD LIBOR + 2.750% Floor 0.500% 07/14/2028 | 2.944% | 421,688 | 409,037 | |
| Hillman Group, Inc. (The)(b),(o) | ||||
| Term Loan | ||||
| 1-month USD LIBOR + 2.750% Floor 0.500% 07/14/2028 | 5.194% | 1,748,391 | 1,695,940 | |
| Vericast Corp.(b),(o) | ||||
| Term Loan | ||||
| 1-month USD LIBOR + 7.750% Floor 1.000% 06/16/2026 | 10.000% | 469,136 | 352,504 | |
| WireCo WorldGroup, Inc.(b),(o) | ||||
| Term Loan | ||||
| 1-month USD LIBOR + 4.250% Floor 0.500% 11/13/2028 | 7.188% | 1,295,772 | 1,271,476 | |
| Total | 4,898,376 | |||
| Packaging 0.2% | ||||
| Anchor Glass Container Corp.(b),(o) | ||||
| 1st Lien Term Loan | ||||
| 3-month USD LIBOR + 2.750% Floor 1.000% 12/07/2023 | 5.102% | 796,289 | 630,860 | |
| Charter Next Generation, Inc.(b),(o) | ||||
| 1st Lien Term Loan | ||||
| 1-month USD LIBOR + 3.750% Floor 0.750% 12/01/2027 | 6.556% | 2,167,990 | 2,102,170 | |
| 40 | Columbia Strategic Income Fund | Annual Report 2022 |
August 31, 2022
| Senior Loans (continued) | ||||
| Borrower | Coupon Rate | Principal Amount ($) | Value ($) | |
| Graham Packaging Co., Inc.(b),(o) | ||||
| Term Loan | ||||
| 1-month USD LIBOR + 3.000% Floor 0.750% 08/04/2027 | 5.524% | 390,248 | 380,491 | |
| Mauser Packaging Solutions Holding Co.(b),(o) | ||||
| Term Loan | ||||
| 3-month USD LIBOR + 3.250% 04/03/2024 | 5.623% | 1,979,167 | 1,934,279 | |
| Packaging Coordinators Midco, Inc.(b),(o) | ||||
| Tranche B 1st Lien Term Loan | ||||
| 3-month USD LIBOR + 3.750% 11/30/2027 | 6.000% | 2,237,348 | 2,175,127 | |
| Pactiv Evergreen, Inc.(b),(o) | ||||
| Tranche B2 Term Loan | ||||
| 1-month USD LIBOR + 3.250% 02/05/2026 | 5.774% | 1,034,250 | 1,007,535 | |
| Tranche B3 Term Loan | ||||
| 1-month USD LIBOR + 3.500% Floor 0.500% 09/24/2028 | 6.024% | 1,161,721 | 1,128,531 | |
| Tosca Services LLC(b),(o) | ||||
| Term Loan | ||||
| 1-Month Term SOFR + 3.500% Floor 0.750% 08/18/2027 | 5.955% | 985,000 | 869,263 | |
| Twist Beauty International Holdings S.A.(b),(d),(o) | ||||
| Tranche B2 Term Loan | ||||
| 3-month USD LIBOR + 2.750% Floor 1.000% 04/20/2024 | 4.000% | 187,331 | 166,725 | |
| Total | 10,394,981 | |||
| Pharmaceuticals 0.1% | ||||
| Elanco Animal Health, Inc.(b),(o) | ||||
| Term Loan | ||||
| 1-month USD LIBOR + 1.750% 08/01/2027 | 4.123% | 1,183,767 | 1,141,412 | |
| Grifols Worldwide Operations Ltd.(b),(o) | ||||
| Tranche B Term Loan | ||||
| 1-month USD LIBOR + 2.000% 11/15/2027 | 4.524% | 772,860 | 746,243 | |
| Senior Loans (continued) | ||||
| Borrower | Coupon Rate | Principal Amount ($) | Value ($) | |
| Jazz Pharmaceuticals PLC(b),(o) | ||||
| Term Loan | ||||
| 1-month USD LIBOR + 3.500% Floor 0.500% 05/05/2028 | 6.024% | 1,877,260 | 1,839,038 | |
| Mallinckrodt International Finance SA(b),(o) | ||||
| Term Loan | ||||
| 3-month USD LIBOR + 5.500% Floor 0.750% 09/30/2027 | 7.503% | 885,493 | 680,448 | |
| Organon & Co.(b),(o) | ||||
| Term Loan | ||||
| 1-month USD LIBOR + 3.000% Floor 0.500% 06/02/2028 | 4.625% | 1,580,675 | 1,560,917 | |
| Sunshine Luxembourg VII SARL(b),(o) | ||||
| Tranche B3 Term Loan | ||||
| 1-month USD LIBOR + 3.750% Floor 0.750% 10/01/2026 | 6.000% | 2,130,267 | 2,049,061 | |
| Total | 8,017,119 | |||
| Property & Casualty 0.2% | ||||
| Asurion LLC(b),(o) | ||||
| Tranche B3 2nd Lien Term Loan | ||||
| 1-month USD LIBOR + 5.250% 01/31/2028 | 7.774% | 1,000,000 | 855,000 | |
| Tranche B4 2nd Lien Term Loan | ||||
| 1-month USD LIBOR + 5.250% 01/20/2029 | 7.774% | 2,144,019 | 1,819,736 | |
| Tranche B7 Term Loan | ||||
| 3-month USD LIBOR + 3.000% 11/03/2024 | 5.524% | 2,936,485 | 2,819,554 | |
| Tranche B8 Term Loan | ||||
| 1-month USD LIBOR + 3.250% 12/23/2026 | 5.774% | 830,020 | 758,879 | |
| Hub International Ltd.(b),(o) | ||||
| Term Loan | ||||
| 1-month USD LIBOR + 3.000% Floor 0.750% 04/25/2025 | 5.766% | 2,466,614 | 2,412,151 | |
| Columbia Strategic Income Fund | Annual Report 2022 | 41 |
August 31, 2022
| Senior Loans (continued) | ||||
| Borrower | Coupon Rate | Principal Amount ($) | Value ($) | |
| Sedgwick Claims Management Services, Inc.(b),(o) | ||||
| Term Loan | ||||
| 3-month USD LIBOR + 3.250% 12/31/2025 | 5.774% | 1,937,292 | 1,892,734 | |
| USI, Inc.(b),(o) | ||||
| Term Loan | ||||
| 3-month USD LIBOR + 3.000% 05/16/2024 | 5.250% | 1,707,653 | 1,685,949 | |
| 1-month USD LIBOR + 3.250% 12/02/2026 | 5.500% | 982,392 | 967,047 | |
| Total | 13,211,050 | |||
| Restaurants 0.1% | ||||
| 1011778 BC ULC(b),(o) | ||||
| Tranche B4 Term Loan | ||||
| 3-month USD LIBOR + 1.750% 11/19/2026 | 4.274% | 2,608,042 | 2,529,254 | |
| Carrols Restaurant Group, Inc.(b),(o) | ||||
| Term Loan | ||||
| 3-month USD LIBOR + 3.250% 04/30/2026 | 5.710% | 603,152 | 524,742 | |
| IRB Holding Corp.(b),(o) | ||||
| Tranche B Term Loan | ||||
| 3-month USD LIBOR + 2.750% Floor 1.000% 02/05/2025 | 5.274% | 1,078,747 | 1,054,929 | |
| 1-month Term SOFR + 3.000% Floor 0.750% 12/15/2027 | 5.387% | 844,286 | 815,614 | |
| Whatabrands LLC(b),(o) | ||||
| Tranche B Term Loan | ||||
| 1-month USD LIBOR + 3.250% Floor 0.500% 08/03/2028 | 5.774% | 3,199,709 | 3,028,716 | |
| Total | 7,953,255 | |||
| Retailers 0.1% | ||||
| Belk, Inc.(b),(o) | ||||
| 1st Lien Term Loan | ||||
| 3-month USD LIBOR + 7.500% Floor 1.000% 07/31/2025 | 10.480% | 299,690 | 269,293 | |
| Senior Loans (continued) | ||||
| Borrower | Coupon Rate | Principal Amount ($) | Value ($) | |
| Great Outdoors Group LLC(b),(o) | ||||
| Tranche B2 Term Loan | ||||
| 1-month USD LIBOR + 3.750% Floor 0.750% 03/06/2028 | 6.274% | 3,833,004 | 3,702,681 | |
| Harbor Freight Tools USA, Inc.(b),(o) | ||||
| Term Loan | ||||
| 1-month USD LIBOR + 2.750% Floor 0.500% 10/19/2027 | 5.274% | 1,443,907 | 1,376,375 | |
| PetSmart LLC(b),(o) | ||||
| Term Loan | ||||
| 1-month USD LIBOR + 3.750% Floor 0.750% 02/11/2028 | 6.270% | 2,962,519 | 2,888,456 | |
| Total | 8,236,805 | |||
| Technology 2.0% | ||||
| Arches Buyer, Inc.(b),(o) | ||||
| Term Loan | ||||
| 1-month USD LIBOR + 3.250% Floor 0.500% 12/06/2027 | 5.774% | 2,235,955 | 2,107,858 | |
| Ascend Learning LLC(b),(o) | ||||
| 1st Lien Term Loan | ||||
| 1-month USD LIBOR + 3.500% Floor 0.500% 12/11/2028 | 2.500% | 1,907,598 | 1,815,633 | |
| 2nd Lien Term Loan | ||||
| 1-month USD LIBOR + 5.750% Floor 0.500% 12/10/2029 | 8.274% | 1,753,172 | 1,570,842 | |
| athenahealth Group, Inc.(b),(o),(p),(q) | ||||
| Delayed Draw Term Loan | ||||
| 1-month Term SOFR + 3.500% Floor 0.500% 02/15/2029 | 3.500% | 455,013 | 434,538 | |
| athenahealth Group, Inc.(b),(o) | ||||
| Term Loan | ||||
| 1-month Term SOFR + 3.500% Floor 0.500% 02/15/2029 | 5.800% | 2,684,578 | 2,563,772 | |
| 42 | Columbia Strategic Income Fund | Annual Report 2022 |
August 31, 2022
| Senior Loans (continued) | ||||
| Borrower | Coupon Rate | Principal Amount ($) | Value ($) | |
| Atlas CC Acquisition Corp.(b),(o) | ||||
| Tranche B 1st Lien Term Loan | ||||
| 1-month USD LIBOR + 4.250% Floor 0.750% 05/25/2028 | 3.250% | 2,138,958 | 2,016,866 | |
| Tranche C 1st Lien Term Loan | ||||
| 1-month USD LIBOR + 4.250% Floor 0.750% 05/25/2028 | 7.320% | 435,042 | 410,210 | |
| Atlas Purchaser, Inc.(b),(o) | ||||
| 1st Lien Term Loan | ||||
| 1-month USD LIBOR + 5.250% Floor 0.750% 05/08/2028 | 8.117% | 1,971,266 | 1,616,083 | |
| Avaya, Inc.(b),(o) | ||||
| Tranche B1 Term Loan | ||||
| 1-month USD LIBOR + 4.250% 12/15/2027 | 6.641% | 1,843,084 | 1,041,343 | |
| Tranche B2 Term Loan | ||||
| 1-month USD LIBOR + 4.000% 12/15/2027 | 6.391% | 1,511,557 | 845,535 | |
| Camelot U.S. Acquisition 1 Co.(b),(o) | ||||
| Term Loan | ||||
| 1-month USD LIBOR + 3.000% 10/30/2026 | 5.524% | 2,458,324 | 2,395,342 | |
| 1-month USD LIBOR + 3.000% Floor 1.000% 10/30/2026 | 5.524% | 1,034,250 | 1,005,808 | |
| Central Parent Inc.(b),(o) | ||||
| 1st Lien Term Loan B | ||||
| 1-month Term SOFR + 4.500% Floor 0.500% 07/06/2029 | 6.610% | 479,059 | 466,349 | |
| Cloudera, Inc.(b),(o) | ||||
| 1st Lien Term Loan | ||||
| 1-month USD LIBOR + 3.750% Floor 0.500% 10/08/2028 | 6.274% | 1,563,424 | 1,491,116 | |
| CommScope, Inc.(b),(o) | ||||
| Term Loan | ||||
| 3-month USD LIBOR + 3.250% 04/06/2026 | 5.774% | 3,877,216 | 3,711,233 | |
| Senior Loans (continued) | ||||
| Borrower | Coupon Rate | Principal Amount ($) | Value ($) | |
| CoreLogic, Inc.(b),(o) | ||||
| 1st Lien Term Loan | ||||
| 1-month USD LIBOR + 3.500% Floor 0.500% 06/02/2028 | 6.063% | 1,977,519 | 1,693,250 | |
| Cornerstone OnDemand, Inc.(b),(o) | ||||
| 1st Lien Term Loan | ||||
| 1-month USD LIBOR + 3.750% Floor 0.500% 10/16/2028 | 6.274% | 1,505,244 | 1,412,416 | |
| Cyxtera DC Holdings, Inc.(b),(o) | ||||
| 1st Lien Term Loan | ||||
| 3-month USD LIBOR + 3.000% Floor 1.000% 05/01/2024 | 5.790% | 1,938,788 | 1,872,656 | |
| Dawn Acquisition LLC(b),(o) | ||||
| Term Loan | ||||
| 3-month USD LIBOR + 3.750% 12/31/2025 | 6.000% | 2,803,879 | 2,182,932 | |
| DCert Buyer, Inc.(b),(o) | ||||
| 1st Lien Term Loan | ||||
| 3-Month Term SOFR + 4.000% 10/16/2026 | 6.903% | 2,582,593 | 2,508,705 | |
| Dun & Bradstreet Corp. (The)(b),(o) | ||||
| Term Loan | ||||
| 3-month USD LIBOR + 3.250% 02/06/2026 | 5.743% | 2,003,810 | 1,944,697 | |
| Tranche B2 Term Loan | ||||
| 1-month Term SOFR + 3.250% 01/18/2029 | 5.690% | 494,933 | 482,149 | |
| Endurance International Group Holdings, Inc.(b),(o) | ||||
| Term Loan | ||||
| 1-month USD LIBOR + 3.500% Floor 0.750% 02/10/2028 | 5.873% | 3,122,308 | 2,921,325 | |
| Entegris, Inc.(b),(o) | ||||
| Tranche B Term Loan | ||||
| 1-month Term SOFR + 3.000% 07/06/2029 | 5.786% | 558,131 | 556,339 | |
| Everi Holdings, Inc.(b),(o) | ||||
| Tranche B Term Loan | ||||
| 1-month USD LIBOR + 2.500% 08/03/2028 | 4.750% | 1,873,941 | 1,843,227 | |
| Columbia Strategic Income Fund | Annual Report 2022 | 43 |
August 31, 2022
| Senior Loans (continued) | ||||
| Borrower | Coupon Rate | Principal Amount ($) | Value ($) | |
| Evertec Group LLC(b),(o) | ||||
| Tranche B Term Loan | ||||
| 3-month USD LIBOR + 3.500% 11/27/2024 | 6.024% | 1,861,344 | 1,845,057 | |
| GoTo Group, Inc.(b),(o) | ||||
| 1st Lien Term Loan | ||||
| 1-month USD LIBOR + 4.750% 08/31/2027 | 7.118% | 2,457,456 | 1,906,986 | |
| Idemia Group SAS(b),(o) | ||||
| Tranche B3 Term Loan | ||||
| 1-month USD LIBOR + 4.250% Floor 0.750% 01/10/2026 | 6.750% | 1,776,495 | 1,732,083 | |
| Idera, Inc.(b),(o) | ||||
| Tranche B1 1st Lien Term Loan | ||||
| 1-month USD LIBOR + 3.750% Floor 0.750% 03/02/2028 | 6.130% | 1,973,358 | 1,901,824 | |
| II-VI, Inc.(b),(o) | ||||
| Tranche B Term Loan | ||||
| 1-month USD LIBOR + 2.750% Floor 0.500% 07/02/2029 | 5.123% | 1,991,720 | 1,946,070 | |
| Informatica LLC(b),(o) | ||||
| Term Loan | ||||
| 1-month USD LIBOR + 2.750% 10/27/2028 | 5.313% | 2,269,333 | 2,209,763 | |
| Ingram Micro, Inc.(b),(o) | ||||
| Term Loan | ||||
| 1-month USD LIBOR + 3.500% Floor 0.500% 06/30/2028 | 5.750% | 2,781,566 | 2,670,303 | |
| ION Trading Finance Ltd.(b),(o) | ||||
| Term Loan | ||||
| 1-month USD LIBOR + 4.750% 04/01/2028 | 7.000% | 924,284 | 897,322 | |
| Loyalty Ventures, Inc.(b),(o) | ||||
| Tranche B Term Loan | ||||
| 1-month USD LIBOR + 4.500% Floor 0.500% 11/03/2027 | 7.024% | 1,770,245 | 1,279,002 | |
| Senior Loans (continued) | ||||
| Borrower | Coupon Rate | Principal Amount ($) | Value ($) | |
| Lummus Technology Holdings V LLC(b),(o) | ||||
| Tranche B Term Loan | ||||
| 1-month USD LIBOR + 3.500% Floor 1.000% 06/30/2027 | 6.024% | 1,877,174 | 1,808,732 | |
| MA FinanceCo LLC(b),(o) | ||||
| Tranche B4 Term Loan | ||||
| 1-month USD LIBOR + 4.250% Floor 1.000% 06/05/2025 | 5.915% | 1,549,121 | 1,526,860 | |
| McAfee LLC(b),(o) | ||||
| Tranche B1 Term Loan | ||||
| 1-month Term SOFR + 3.750% Floor 0.500% 03/01/2029 | 6.157% | 1,801,851 | 1,705,001 | |
| Misys Ltd.(b),(o) | ||||
| 1st Lien Term Loan | ||||
| 3-month USD LIBOR + 3.500% Floor 1.000% 06/13/2024 | 6.871% | 3,078,723 | 2,874,388 | |
| Mitchell International, Inc.(b),(o) | ||||
| 1st Lien Term Loan | ||||
| 1-month USD LIBOR + 3.750% Floor 0.500% 10/15/2028 | 6.734% | 1,153,206 | 1,098,786 | |
| Mitnick Corporate Purchaser, Inc.(b),(o) | ||||
| Term Loan | ||||
| 1-month Term SOFR + 4.750% Floor 0.500% 05/02/2029 | 7.393% | 792,081 | 769,808 | |
| MKS Instruments, inc.(b),(o) | ||||
| Term Loan | ||||
| 1-Month Term SOFR + 2.750% Floor 0.500% 08/17/2029 | 5.146% | 1,178,798 | 1,164,063 | |
| Monotype Imaging Holdings, Inc.(b),(o) | ||||
| 1st Lien Term Loan | ||||
| 1-month USD LIBOR + 5.000% Floor 0.750% 10/09/2026 | 7.250% | 1,432,922 | 1,379,187 | |
| 44 | Columbia Strategic Income Fund | Annual Report 2022 |
August 31, 2022
| Senior Loans (continued) | ||||
| Borrower | Coupon Rate | Principal Amount ($) | Value ($) | |
| Natel Engineering Co., Inc.(b),(d),(o) | ||||
| Term Loan | ||||
| 3-month USD LIBOR + 6.250% Floor 1.000% 04/30/2026 | 7.743% | 2,475,310 | 2,289,662 | |
| NCR Corp.(b),(o) | ||||
| Term Loan | ||||
| 1-month USD LIBOR + 2.500% 08/28/2026 | 5.310% | 1,469,773 | 1,447,727 | |
| NortonLifeLock, Inc.(b),(o),(p) | ||||
| Term Loan | ||||
| SOFR + 2.000% Floor 0.500% 01/28/2029 | 2.500% | 1,855,248 | 1,797,271 | |
| Peraton Corp.(b),(o) | ||||
| Tranche B 1st Lien Term Loan | ||||
| 3-month USD LIBOR + 3.750% Floor 0.750% 02/01/2028 | 6.274% | 3,112,512 | 3,019,137 | |
| Pitney Bowes, Inc.(b),(o) | ||||
| Tranche B Term Loan | ||||
| 1-month USD LIBOR + 4.000% 03/17/2028 | 6.530% | 2,241,892 | 2,073,750 | |
| Presidio Holdings, Inc.(b),(o) | ||||
| Term Loan | ||||
| 1-month USD LIBOR + 3.500% 01/22/2027 | 6.297% | 1,720,536 | 1,691,149 | |
| Proofpoint, Inc.(b),(o) | ||||
| 1st Lien Term Loan | ||||
| 1-month USD LIBOR + 3.250% Floor 0.500% 08/31/2028 | 6.320% | 1,990,000 | 1,911,892 | |
| Rackspace Technology Global, Inc.(b),(o) | ||||
| Tranche B 1st Lien Term Loan | ||||
| 1-month USD LIBOR + 2.750% Floor 0.750% 02/15/2028 | 5.617% | 1,224,400 | 985,471 | |
| Riverbed Technology LLC(b),(o) | ||||
| Term Loan | ||||
| 1-month USD LIBOR + 6.000% Floor 1.000% 12/07/2026 | 7.630% | 1,624,188 | 745,778 | |
| Senior Loans (continued) | ||||
| Borrower | Coupon Rate | Principal Amount ($) | Value ($) | |
| Sabre GLBL, Inc.(b),(o) | ||||
| Tranche B Term Loan | ||||
| 1-month Term SOFR + 4.250% Floor 0.500% 06/30/2028 | 6.805% | 216,087 | 204,921 | |
| Tranche B1 Term Loan | ||||
| 1-month USD LIBOR + 3.500% Floor 0.500% 12/17/2027 | 6.024% | 631,332 | 590,296 | |
| Tranche B2 Term Loan | ||||
| 1-month USD LIBOR + 3.500% Floor 0.500% 12/17/2027 | 6.024% | 1,006,381 | 940,966 | |
| Seattle SpinCo, Inc.(b),(d),(o) | ||||
| Tranche B1 Term Loan | ||||
| 1-month Term SOFR + 4.000% Floor 0.500% 02/26/2027 | 6.400% | 675,483 | 665,351 | |
| Sitel Group(b),(o) | ||||
| Term Loan | ||||
| 1-month USD LIBOR + 3.750% Floor 0.500% 08/28/2028 | 6.010% | 281,840 | 275,640 | |
| Sophia LP(b),(o) | ||||
| Tranche B 1st Lien Term Loan | ||||
| 1-month USD LIBOR + 3.500% Floor 0.500% 10/07/2027 | 5.750% | 2,167,124 | 2,089,931 | |
| Sovos Compliance LLC(b),(o) | ||||
| 1st Lien Term Loan | ||||
| 1-month USD LIBOR + 4.500% Floor 0.500% 08/11/2028 | 7.024% | 798,815 | 775,705 | |
| SS&C Technologies Holdings, Inc.(b),(o) | ||||
| Tranche B3 Term Loan | ||||
| 1-month USD LIBOR + 1.750% 04/16/2025 | 4.274% | 184,403 | 180,110 | |
| Tranche B4 Term Loan | ||||
| 1-month USD LIBOR + 1.750% 04/16/2025 | 4.274% | 149,696 | 146,211 | |
| Tranche B5 Term Loan | ||||
| 3-month USD LIBOR + 1.750% 04/16/2025 | 4.274% | 1,373,566 | 1,339,996 | |
| Columbia Strategic Income Fund | Annual Report 2022 | 45 |
August 31, 2022
| Senior Loans (continued) | ||||
| Borrower | Coupon Rate | Principal Amount ($) | Value ($) | |
| Tempo Acquisition LLC(b),(o) | ||||
| Tranche B1 Term Loan | ||||
| 1-month Term SOFR + 3.000% Floor 0.500% 08/31/2028 | 5.455% | 2,636,808 | 2,591,982 | |
| TIBCO Software, Inc.(b),(o) | ||||
| 2nd Lien Term Loan | ||||
| 1-month USD LIBOR + 7.250% 03/03/2028 | 9.780% | 750,000 | 745,312 | |
| Tranche B3 Term Loan | ||||
| 1-month USD LIBOR + 3.750% 06/30/2026 | 6.280% | 1,494,028 | 1,485,064 | |
| TTM Technologies, Inc.(b),(o) | ||||
| Tranche B Term Loan | ||||
| 3-month USD LIBOR + 2.500% 09/28/2024 | 4.873% | 949,828 | 943,892 | |
| UKG, Inc.(b),(o) | ||||
| 1st Lien Term Loan | ||||
| 3-month USD LIBOR + 3.750% 05/04/2026 | 6.274% | 1,945,000 | 1,891,765 | |
| 1-month USD LIBOR + 3.250% Floor 0.500% 05/04/2026 | 5.535% | 967,650 | 936,027 | |
| 2nd Lien Term Loan | ||||
| 1-month USD LIBOR + 5.250% Floor 0.500% 05/03/2027 | 7.535% | 2,147,411 | 2,086,683 | |
| Ultra Clean Holdings, Inc.(b),(o) | ||||
| Tranche B Term Loan | ||||
| 1-month USD LIBOR + 3.750% 08/27/2025 | 6.274% | 1,526,854 | 1,501,569 | |
| Veritas US, Inc.(b),(o) | ||||
| Tranche B Term Loan | ||||
| 1-month USD LIBOR + 5.000% Floor 1.000% 09/01/2025 | 7.250% | 1,802,959 | 1,431,856 | |
| Verscend Holdings Corp.(b),(o) | ||||
| Tranche B1 Term Loan | ||||
| 1-month USD LIBOR + 4.000% 08/27/2025 | 6.524% | 2,479,939 | 2,458,761 | |
| Senior Loans (continued) | ||||
| Borrower | Coupon Rate | Principal Amount ($) | Value ($) | |
| Virtusa Corp.(b),(o) | ||||
| Tranche B1 Term Loan | ||||
| 1-month Term SOFR + 3.750% Floor 0.750% 02/15/2029 | 6.305% | 1,717,257 | 1,671,115 | |
| Xperi Holding Corp.(b),(o) | ||||
| Tranche B Term Loan | ||||
| 1-month USD LIBOR + 3.500% 06/08/2028 | 6.024% | 2,345,839 | 2,294,535 | |
| Total | 112,834,984 | |||
| Transportation Services 0.1% | ||||
| First Student Bidco, Inc.(b),(o) | ||||
| Term Loan B | ||||
| 1-month Term SOFR + 4.000% Floor 0.500% 07/21/2028 | 6.154% | 757,562 | 729,865 | |
| Term Loan C | ||||
| 1-month Term SOFR + 4.000% Floor 0.500% 07/21/2028 | 6.154% | 52,608 | 50,685 | |
| Tranche B Term Loan | ||||
| 1-month USD LIBOR + 3.000% Floor 0.500% 07/21/2028 | 5.232% | 1,638,360 | 1,572,826 | |
| Tranche C Term Loan | ||||
| 1-month USD LIBOR + 3.000% Floor 0.500% 07/21/2028 | 5.232% | 607,803 | 583,491 | |
| Total | 2,936,867 | |||
| Wireless 0.1% | ||||
| Numericable US LLC(b),(o) | ||||
| Tranche B11 Term Loan | ||||
| 3-month USD LIBOR + 2.750% 07/31/2025 | 5.556% | 1,913,862 | 1,847,470 | |
| SBA Senior Finance II LLC(b),(o) | ||||
| Term Loan | ||||
| 3-month USD LIBOR + 1.750% 04/11/2025 | 4.280% | 1,423,176 | 1,388,579 | |
| Total | 3,236,049 | |||
| 46 | Columbia Strategic Income Fund | Annual Report 2022 |
August 31, 2022
| Senior Loans (continued) | ||||
| Borrower | Coupon Rate | Principal Amount ($) | Value ($) | |
| Wirelines 0.0% | ||||
| Zayo Group Holdings, Inc.(b),(o) | ||||
| Term Loan | ||||
| 1-month USD LIBOR + 3.000% 03/09/2027 | 5.524% | 2,252,138 | 2,048,049 | |
| Total Senior Loans (Cost $500,652,734) | 475,681,481 | |||
| U.S. Government & Agency Obligations 0.1% | ||||
| Issuer | Coupon Rate | Principal Amount ($) | Value ($) | |
| Federal Farm Credit Banks Funding Corp. | ||||
| 10/20/2026 | 1.140% | 2,000,000 | 1,797,997 | |
| 11/30/2026 | 1.540% | 2,500,000 | 2,286,743 | |
| Total U.S. Government & Agency Obligations (Cost $4,500,000) | 4,084,740 | |||
| Warrants 0.0% | ||
| Issuer | Shares | Value ($) |
| Communication Services 0.0% | ||
| Diversified Telecommunication Services 0.0% | ||
| Windstream Corp.(f) | 11,272 | 183,170 |
| Entertainment 0.0% | ||
| Cineworld Finance US, Inc.(f) | 281,073 | 42,161 |
| Warrants (continued) | ||
| Issuer | Shares | Value ($) |
| Media 0.0% | ||
| iHeartCommunications, Inc.(d),(f) | 11,995 | 83,965 |
| Total Communication Services | 309,296 | |
| Financials 0.0% | ||
| Capital Markets 0.0% | ||
| Spectacle BidCo Holdings, Inc.(f) | 95,238 | 208,482 |
| Total Financials | 208,482 | |
| Total Warrants (Cost $419,946) | 517,778 | |
| Options Purchased Calls 0.6% | ||||
| Value ($) | ||||
| (Cost $49,041,037) | 36,073,206 | |||
| Money Market Funds 5.9% | ||
| Shares | Value ($) | |
| Columbia Short-Term Cash Fund, 2.366%(r),(s) | 336,250,671 | 336,082,546 |
| Total Money Market Funds (Cost $336,047,317) | 336,082,546 | |
| Total Investments in Securities (Cost: $6,779,973,019) | 6,209,705,582 | |
| Other Assets & Liabilities, Net | (524,459,665) | |
| Net Assets | 5,685,245,917 | |
| Forward foreign currency exchange contracts | |||||
| Currency to be sold | Currency to be purchased | Counterparty | Settlement date | Unrealized appreciation ($) | Unrealized depreciation ($) |
| 385,000,000 MXN | 18,656,536 USD | Citi | 09/15/2022 | — | (405,020) |
| 22,000,000 EUR | 22,390,390 USD | UBS | 09/15/2022 | 262,042 | — |
| Total | 262,042 | (405,020) | |||
| Long futures contracts | ||||||
| Description | Number of contracts | Expiration date | Trading currency | Notional amount | Value/Unrealized appreciation ($) | Value/Unrealized depreciation ($) |
| Long Gilt | 1,187 | 12/2022 | GBP | 128,112,910 | — | (2,690,029) |
| U.S. Long Bond | 873 | 12/2022 | USD | 118,591,594 | — | (963,464) |
| U.S. Treasury 10-Year Note | 1,730 | 12/2022 | USD | 202,247,813 | — | (397,572) |
| U.S. Ultra Treasury Bond | 541 | 12/2022 | USD | 80,879,500 | — | (66,441) |
| Total | — | (4,117,506) | ||||
| Columbia Strategic Income Fund | Annual Report 2022 | 47 |
August 31, 2022
| Short futures contracts | ||||||
| Description | Number of contracts | Expiration date | Trading currency | Notional amount | Value/Unrealized appreciation ($) | Value/Unrealized depreciation ($) |
| 90-Day Euro$ | (6,240) | 03/2023 | USD | (1,495,572,000) | 4,115,433 | — |
| Euro-Bobl | (2,438) | 09/2022 | EUR | (300,069,040) | 4,995,046 | — |
| Euro-Schatz | (7,157) | 09/2022 | EUR | (777,321,770) | 4,962,906 | — |
| Japanese 10-Year Government Bond | (360) | 09/2022 | JPY | (53,830,800,000) | — | (7,177,207) |
| U.S. Treasury 2-Year Note | (3,238) | 12/2022 | USD | (674,566,472) | 1,383,649 | — |
| U.S. Treasury 5-Year Note | (9,569) | 12/2022 | USD | (1,060,439,575) | 3,115,571 | — |
| Total | 18,572,605 | (7,177,207) | ||||
| Call option contracts purchased | ||||||||
| Description | Counterparty | Trading currency | Notional amount | Number of contracts | Exercise price/Rate | Expiration date | Cost ($) | Value ($) |
| 10-Year OTC interest rate swap with Citi to receive exercise rate and pay SOFR | Citi | USD | 160,690,000 | 160,690,000 | 2.25 | 04/27/2023 | 3,856,560 | 1,768,329 |
| 10-Year OTC interest rate swap with Citi to receive exercise rate and pay SOFR | Citi | USD | 321,500,000 | 321,500,000 | 2.50 | 05/12/2023 | 9,612,850 | 5,655,635 |
| 10-Year OTC interest rate swap with Citi to receive exercise rate and pay SOFR | Citi | USD | 216,840,000 | 216,840,000 | 2.25 | 05/26/2023 | 4,445,220 | 2,690,095 |
| 10-Year OTC interest rate swap with Citi to receive exercise rate and pay SOFR | Citi | USD | 329,200,000 | 329,200,000 | 2.90 | 06/21/2023 | 10,715,460 | 11,208,602 |
| 10-Year OTC interest rate swap with Citi to receive exercise rate and pay SOFR | Citi | USD | 323,100,000 | 323,100,000 | 2.75 | 06/26/2023 | 10,492,672 | 9,094,910 |
| 10-Year OTC interest rate swap with Morgan Stanley to receive exercise rate and pay SOFR | Morgan Stanley | USD | 321,500,000 | 321,500,000 | 2.50 | 05/12/2023 | 9,918,275 | 5,655,635 |
| Total | 49,041,037 | 36,073,206 | ||||||
| Cleared interest rate swap contracts | |||||||||||
| Fund receives | Fund pays | Payment frequency | Counterparty | Maturity date | Notional currency | Notional amount | Value ($) | Upfront payments ($) | Upfront receipts ($) | Unrealized appreciation ($) | Unrealized depreciation ($) |
| Fixed rate of 6.230% | 28-Day MXN TIIE-Banxico | Receives Monthly, Pays Monthly | Morgan Stanley | 01/09/2026 | MXN | 580,000,000 | (2,366,845) | — | — | — | (2,366,845) |
| Fixed rate of 5.985% | 28-Day MXN TIIE-Banxico | Receives Monthly, Pays Monthly | Morgan Stanley | 01/21/2026 | MXN | 211,000,000 | (951,651) | — | — | — | (951,651) |
| 3-Month USD LIBOR | Fixed rate of 1.781% | Receives Quarterly, Pays SemiAnnually | Morgan Stanley | 08/09/2049 | USD | 53,500,000 | 12,595,109 | — | — | 12,595,109 | — |
| Total | 9,276,613 | — | — | 12,595,109 | (3,318,496) | ||||||
| Credit default swap contracts - buy protection | ||||||||||||
| Reference entity | Counterparty | Maturity date | Pay fixed rate (%) | Payment frequency | Notional currency | Notional amount | Value ($) | Periodic payments receivable (payable) ($) | Upfront payments ($) | Upfront receipts ($) | Unrealized appreciation ($) | Unrealized depreciation ($) |
| Markit CMBX North America Index, Series 11 BBB- | JPMorgan | 11/18/2054 | 3.000 | Monthly | USD | 4,400,000 | 519,063 | (2,567) | 151,073 | — | 365,423 | — |
| Cleared credit default swap contracts - buy protection | |||||||||||
| Reference entity | Counterparty | Maturity date | Pay fixed rate (%) | Payment frequency | Notional currency | Notional amount | Value ($) | Upfront payments ($) | Upfront receipts ($) | Unrealized appreciation ($) | Unrealized depreciation ($) |
| Markit CDX North America High Yield Index, Series 38 | Morgan Stanley | 06/20/2027 | 5.000 | Quarterly | USD | 820,100,160 | 29,753,731 | — | — | 29,753,731 | — |
| 48 | Columbia Strategic Income Fund | Annual Report 2022 |
August 31, 2022
| Credit default swap contracts - sell protection | |||||||||||||
| Reference entity | Counterparty | Maturity date | Receive fixed rate (%) | Payment frequency | Implied credit spread (%)* | Notional currency | Notional amount | Value ($) | Periodic payments receivable (payable) ($) | Upfront payments ($) | Upfront receipts ($) | Unrealized appreciation ($) | Unrealized depreciation ($) |
| Markit CMBX North America Index, Series 10 BBB- | Citi | 11/17/2059 | 3.000 | Monthly | 7.694 | USD | 11,500,000 | (1,786,094) | 6,708 | — | (2,531,624) | 752,238 | — |
| Markit CMBX North America Index, Series 10 BBB- | Citi | 11/17/2059 | 3.000 | Monthly | 7.694 | USD | 10,000,000 | (1,553,125) | 5,833 | — | (1,202,010) | — | (345,282) |
| Markit CMBX North America Index, Series 10 BBB- | Citi | 11/17/2059 | 3.000 | Monthly | 7.694 | USD | 18,000,000 | (2,795,625) | 10,500 | — | (2,174,111) | — | (611,014) |
| Markit CMBX North America Index, Series 10 BBB- | Goldman Sachs International | 11/17/2059 | 3.000 | Monthly | 7.694 | USD | 14,000,000 | (2,174,375) | 8,167 | — | (1,591,971) | — | (574,237) |
| Markit CMBX North America Index, Series 10 BBB- | JPMorgan | 11/17/2059 | 3.000 | Monthly | 7.694 | USD | 9,500,000 | (1,475,469) | 5,542 | — | (2,071,067) | 601,140 | — |
| Markit CMBX North America Index, Series 10 BBB- | JPMorgan | 11/17/2059 | 3.000 | Monthly | 7.694 | USD | 9,500,000 | (1,475,469) | 5,542 | — | (1,604,318) | 134,391 | — |
| Markit CMBX North America Index, Series 10 BBB- | JPMorgan | 11/17/2059 | 3.000 | Monthly | 7.694 | USD | 10,000,000 | (1,553,125) | 5,833 | — | (1,626,170) | 78,878 | — |
| Markit CMBX North America Index, Series 10 BBB- | JPMorgan | 11/17/2059 | 3.000 | Monthly | 7.694 | USD | 7,500,000 | (1,164,844) | 4,375 | — | (1,180,239) | 19,770 | — |
| Markit CMBX North America Index, Series 10 BBB- | Morgan Stanley | 11/17/2059 | 3.000 | Monthly | 7.694 | USD | 12,000,000 | (1,863,750) | 7,000 | — | (2,367,636) | 510,886 | — |
| Markit CMBX North America Index, Series 10 BBB- | Morgan Stanley | 11/17/2059 | 3.000 | Monthly | 7.694 | USD | 15,000,000 | (2,329,688) | 8,750 | — | (2,439,255) | 118,317 | — |
| Total | (18,171,564) | 68,250 | — | (18,788,401) | 2,215,620 | (1,530,533) | |||||||
| * | Implied credit spreads, represented in absolute terms, utilized in determining the market value of credit default swap agreements on corporate or sovereign issues as of period end serve as an indicator of the current status of the payment/performance risk and represent the likelihood or risk of default for the credit derivative. The implied credit spread of a particular referenced entity reflects the cost of buying/selling protection and may include upfront payments required to be made to enter into the agreement. Wider credit spreads represent a deterioration of the referenced entity’s credit soundness and a greater likelihood or risk of default or other credit event occurring as defined under the terms of the agreement. |
| Reference index and values for swap contracts as of period end | ||
| Reference index | Reference rate | |
| 28-Day MXN TIIE-Banxico | Interbank Equilibrium Interest Rate | 8.821% |
| 3-Month USD LIBOR | London Interbank Offered Rate | 3.100% |
| (a) | Represents privately placed and other securities and instruments exempt from Securities and Exchange Commission registration (collectively, private placements), such as Section 4(a)(2) and Rule 144A eligible securities, which are often sold only to qualified institutional buyers. At August 31, 2022, the total value of these securities amounted to $2,787,481,019, which represents 49.03% of total net assets. |
| (b) | Variable rate security. The interest rate shown was the current rate as of August 31, 2022. |
| (c) | Represents fair value as determined in good faith under procedures approved by the Board of Trustees. At August 31, 2022, the total value of these securities amounted to $91,814,153, which represents 1.61% of total net assets. |
| (d) | Valuation based on significant unobservable inputs. |
| (e) | Variable or floating rate security, the interest rate of which adjusts periodically based on changes in current interest rates and prepayments on the underlying pool of assets. The interest rate shown was the current rate as of August 31, 2022. |
| Columbia Strategic Income Fund | Annual Report 2022 | 49 |
August 31, 2022
| (f) | Non-income producing investment. |
| (g) | Payment-in-kind security. Interest can be paid by issuing additional par of the security or in cash. |
| (h) | Represents a variable rate security with a step coupon where the rate adjusts according to a schedule for a series of periods, typically lower for an initial period and then increasing to a higher coupon rate thereafter. The interest rate shown was the current rate as of August 31, 2022. |
| (i) | Represents securities that have defaulted on payment of interest. The Fund has stopped accruing interest on these securities. At August 31, 2022, the total value of these securities amounted to $3,460,623, which represents 0.06% of total net assets. |
| (j) | Principal amounts are denominated in United States Dollars unless otherwise noted. |
| (k) | Principal and interest may not be guaranteed by a governmental entity. |
| (l) | Denotes a restricted security, which is subject to legal or contractual restrictions on resale under federal securities laws. Disposal of a restricted investment may involve time-consuming negotiations and expenses, and prompt sale at an acceptable price may be difficult to achieve. Private placement securities are generally considered to be restricted, although certain of those securities may be traded between qualified institutional investors under the provisions of Section 4(a)(2) and Rule 144A. The Fund will not incur any registration costs upon such a trade. These securities are valued at fair value determined in good faith under consistently applied procedures established by the Fund’s Board of Trustees. At August 31, 2022, the total market value of these securities amounted to $3,409,784, which represents 0.06% of total net assets. Additional information on these securities is as follows: |
| Security | Acquisition Dates | Shares | Cost ($) | Value ($) |
| Russian Foreign Bond - Eurobond | 06/25/2020 | 4,600,000 | 5,106,523 | 1,610,338 |
| Russian Foreign Bond - Eurobond | 08/06/2020 | 4,800,000 | 5,956,197 | 1,799,446 |
| 11,062,720 | 3,409,784 |
| (m) | Represents interest only securities which have the right to receive the monthly interest payments on an underlying pool of mortgage loans. |
| (n) | Represents a security purchased on a when-issued basis. |
| (o) | The stated interest rate represents the weighted average interest rate at August 31, 2022 of contracts within the senior loan facility. Interest rates on contracts are primarily determined either weekly, monthly or quarterly by reference to the indicated base lending rate and spread and the reset period. These base lending rates are primarily the LIBOR and other short-term rates. Base lending rates may be subject to a floor or minimum rate. The interest rate for senior loans purchased on a when-issued or delayed delivery basis will be determined upon settlement, therefore no interest rate is disclosed. Senior loans often require prepayments from excess cash flows or permit the borrowers to repay at their election. The degree to which borrowers repay cannot be predicted with accuracy. As a result, remaining maturities of senior loans may be less than the stated maturities. Generally, the Fund is contractually obligated to receive approval from the agent bank and/or borrower prior to the disposition of a senior loan. |
| (p) | Represents a security purchased on a forward commitment basis. |
| (q) | At August 31, 2022, the Fund had unfunded senior loan commitments pursuant to the terms of the loan agreement. The Fund receives a stated coupon rate until the borrower draws on the loan commitment, at which time the rate will become the stated rate in the loan agreement. |
| Borrower | Unfunded Commitment ($) |
| athenahealth Group, Inc. Delayed Draw Term Loan 02/15/2029 3.500% | 455,013 |
| Element Materials Delayed Draw Term Loan 06/22/2029 3.250% | 382,986 |
| Hillman Group, Inc. (The) Delayed Draw Term Loan 07/14/2028 2.944% | 388,186 |
| (r) | The rate shown is the seven-day current annualized yield at August 31, 2022. |
| (s) | As defined in the Investment Company Act of 1940, as amended, an affiliated company is one in which the Fund owns 5% or more of the company’s outstanding voting securities, or a company which is under common ownership or control with the Fund. The value of the holdings and transactions in these affiliated companies during the year ended August 31, 2022 are as follows: |
| Affiliated issuers | Beginning of period($) | Purchases($) | Sales($) | Net change in unrealized appreciation (depreciation)($) | End of period($) | Realized gain (loss)($) | Dividends($) | End of period shares |
| Columbia Short-Term Cash Fund, 2.366% | ||||||||
| 346,572,782 | 2,517,261,551 | (2,527,833,183) | 81,396 | 336,082,546 | (224,573) | 1,796,886 | 336,250,671 | |
| 50 | Columbia Strategic Income Fund | Annual Report 2022 |
August 31, 2022
| CMO | Collateralized Mortgage Obligation |
| LIBOR | London Interbank Offered Rate |
| SOFR | Secured Overnight Financing Rate |
| STRIPS | Separate Trading of Registered Interest and Principal Securities |
| TBA | To Be Announced |
| DOP | Dominican Republic Peso |
| EUR | Euro |
| GBP | British Pound |
| IDR | Indonesian Rupiah |
| JPY | Japanese Yen |
| MXN | Mexican Peso |
| USD | US Dollar |
| ■ | Level 1 — Valuations based on quoted prices for investments in active markets that the Fund has the ability to access at the measurement date. Valuation adjustments are not applied to Level 1 investments. |
| ■ | Level 2 — Valuations based on other significant observable inputs (including quoted prices for similar securities, interest rates, prepayment speeds, credit risks, etc.). |
| ■ | Level 3 — Valuations based on significant unobservable inputs (including the Fund’s own assumptions and judgment in determining the fair value of investments). |
| Columbia Strategic Income Fund | Annual Report 2022 | 51 |
August 31, 2022
The following table is a summary of the inputs used to value the Fund’s investments at August 31, 2022:
| Level 1 ($) | Level 2 ($) | Level 3 ($) | Total ($) | |
| Investments in Securities | ||||
| Asset-Backed Securities — Non-Agency | — | 156,013,596 | 25,190,027 | 181,203,623 |
| Commercial Mortgage-Backed Securities - Non-Agency | — | 224,367,197 | — | 224,367,197 |
| Common Stocks | ||||
| Consumer Discretionary | — | 481 | — | 481 |
| Energy | — | 1,092,445 | 20,852 | 1,113,297 |
| Industrials | — | 287,483 | — | 287,483 |
| Information Technology | — | 29,943 | — | 29,943 |
| Total Common Stocks | — | 1,410,352 | 20,852 | 1,431,204 |
| Convertible Bonds | — | 6,812,807 | — | 6,812,807 |
| Convertible Preferred Stocks | ||||
| Information Technology | — | 71,020 | — | 71,020 |
| Total Convertible Preferred Stocks | — | 71,020 | — | 71,020 |
| Corporate Bonds & Notes | — | 2,245,270,394 | — | 2,245,270,394 |
| Foreign Government Obligations | — | 312,125,259 | 3,409,784 | 315,535,043 |
| Inflation-Indexed Bonds | — | 6,554,615 | — | 6,554,615 |
| Residential Mortgage-Backed Securities - Agency | — | 1,329,105,954 | — | 1,329,105,954 |
| Residential Mortgage-Backed Securities - Non-Agency | — | 916,863,795 | 130,050,179 | 1,046,913,974 |
| Senior Loans | — | 466,040,102 | 9,641,379 | 475,681,481 |
| U.S. Government & Agency Obligations | — | 4,084,740 | — | 4,084,740 |
| Warrants | ||||
| Communication Services | — | 225,331 | 83,965 | 309,296 |
| Financials | — | 208,482 | — | 208,482 |
| Total Warrants | — | 433,813 | 83,965 | 517,778 |
| Options Purchased Calls | — | 36,073,206 | — | 36,073,206 |
| Money Market Funds | 336,082,546 | — | — | 336,082,546 |
| Total Investments in Securities | 336,082,546 | 5,705,226,850 | 168,396,186 | 6,209,705,582 |
| Investments in Derivatives | ||||
| Asset | ||||
| Forward Foreign Currency Exchange Contracts | — | 262,042 | — | 262,042 |
| Futures Contracts | 18,572,605 | — | — | 18,572,605 |
| Swap Contracts | — | 44,929,883 | — | 44,929,883 |
| Liability | ||||
| Forward Foreign Currency Exchange Contracts | — | (405,020) | — | (405,020) |
| Futures Contracts | (11,294,713) | — | — | (11,294,713) |
| Swap Contracts | — | (4,849,029) | — | (4,849,029) |
| Total | 343,360,438 | 5,745,164,726 | 168,396,186 | 6,256,921,350 |
| 52 | Columbia Strategic Income Fund | Annual Report 2022 |
August 31, 2022
The following table is a reconciliation of Level 3 assets for which significant observable and unobservable inputs were used to determine fair value:
| Balance as of 08/31/2021 ($) | Increase (decrease) in accrued discounts/ premiums ($) | Realized gain (loss) ($) | Change in unrealized appreciation (depreciation)(a) ($) | Purchases ($) | Sales ($) | Transfers into Level 3 ($) | Transfers out of Level 3 ($) | Balance as of 08/31/2022 ($) | |
| Asset-Backed Securities — Non-Agency | 25,931,070 | — | 139 | (146,215) | 13,934,961 | (14,529,928) | — | — | 25,190,027 |
| Common Stocks | 145,661 | — | 69,352 | 96,904 | — | (291,662) | 597 | — | 20,852 |
| Foreign Government Obligations | — | (191,357) | — | (7,507,675) | — | — | 11,108,816 | — | 3,409,784 |
| Residential Mortgage-Backed Securities — Agency | 8,565,728 | — | — | — | — | — | — | (8,565,728) | — |
| Residential Mortgage-Backed Securities — Non-Agency | 233,322,028 | 378,032 | — | (3,257,822) | 36,100,000 | (136,492,059) | — | — | 130,050,179 |
| Senior Loans | 8,861,686 | 78,393 | 97,829 | (513,840) | 1,173,964 | (7,481,196) | 7,429,732 | (5,189) | 9,641,379 |
| Warrants | 323,037 | — | — | (197,918) | — | — | — | (41,154) | 83,965 |
| Total | 277,149,210 | 265,068 | 167,320 | (11,526,566) | 51,208,925 | (158,794,845) | 18,539,145 | (8,612,071) | 168,396,186 |
| Columbia Strategic Income Fund | Annual Report 2022 | 53 |
August 31, 2022
| Assets | |
| Investments in securities, at value | |
| Unaffiliated issuers (cost $6,394,884,665) | $5,837,549,830 |
| Affiliated issuers (cost $336,047,317) | 336,082,546 |
| Options purchased (cost $49,041,037) | 36,073,206 |
| Cash | 1,439,741 |
| Cash collateral held at broker for: | |
| Swap contracts | 12,776,000 |
| TBA | 12,946,000 |
| Margin deposits on: | |
| Futures contracts | 39,014,932 |
| Swap contracts | 57,808,658 |
| Unrealized appreciation on forward foreign currency exchange contracts | 262,042 |
| Unrealized appreciation on swap contracts | 2,581,043 |
| Upfront payments on swap contracts | 151,073 |
| Receivable for: | |
| Investments sold | 13,044,894 |
| Investments sold on a delayed delivery basis | 80,884,542 |
| Capital shares sold | 3,741,825 |
| Dividends | 593,726 |
| Interest | 48,437,070 |
| Foreign tax reclaims | 87,674 |
| Variation margin for futures contracts | 1,428,185 |
| Variation margin for swap contracts | 1,372,411 |
| Prepaid expenses | 58,072 |
| Trustees’ deferred compensation plan | 364,913 |
| Total assets | 6,486,698,383 |
| Liabilities | |
| Foreign currency (cost $673) | 673 |
| Unrealized depreciation on forward foreign currency exchange contracts | 405,020 |
| Unrealized depreciation on swap contracts | 1,530,533 |
| Upfront receipts on swap contracts | 18,788,401 |
| Payable for: | |
| Investments purchased | 4,655,066 |
| Investments purchased on a delayed delivery basis | 764,954,823 |
| Capital shares purchased | 7,006,322 |
| Variation margin for futures contracts | 2,743,545 |
| Management services fees | 86,629 |
| Distribution and/or service fees | 13,222 |
| Transfer agent fees | 525,818 |
| Compensation of board members | 111,565 |
| Other expenses | 265,936 |
| Trustees’ deferred compensation plan | 364,913 |
| Total liabilities | 801,452,466 |
| Net assets applicable to outstanding capital stock | $5,685,245,917 |
| Represented by | |
| Paid in capital | 6,403,022,430 |
| Total distributable earnings (loss) | (717,776,513) |
| Total - representing net assets applicable to outstanding capital stock | $5,685,245,917 |
| 54 | Columbia Strategic Income Fund | Annual Report 2022 |
August 31, 2022
| Class A | |
| Net assets | $1,036,081,010 |
| Shares outstanding | 47,440,205 |
| Net asset value per share | $21.84 |
| Maximum sales charge | 4.75% |
| Maximum offering price per share (calculated by dividing the net asset value per share by 1.0 minus the maximum sales charge for Class A shares) | $22.93 |
| Advisor Class | |
| Net assets | $298,389,225 |
| Shares outstanding | 13,948,782 |
| Net asset value per share | $21.39 |
| Class C | |
| Net assets | $214,759,593 |
| Shares outstanding | 9,835,907 |
| Net asset value per share | $21.83 |
| Institutional Class | |
| Net assets | $3,231,979,608 |
| Shares outstanding | 150,884,972 |
| Net asset value per share | $21.42 |
| Institutional 2 Class | |
| Net assets | $413,637,231 |
| Shares outstanding | 19,294,360 |
| Net asset value per share | $21.44 |
| Institutional 3 Class | |
| Net assets | $477,712,852 |
| Shares outstanding | 22,374,260 |
| Net asset value per share | $21.35 |
| Class R | |
| Net assets | $12,686,398 |
| Shares outstanding | 576,508 |
| Net asset value per share | $22.01 |
| Columbia Strategic Income Fund | Annual Report 2022 | 55 |
Year Ended August 31, 2022
| Net investment income | |
| Income: | |
| Dividends — unaffiliated issuers | $6,922 |
| Dividends — affiliated issuers | 1,796,886 |
| Interest | 272,944,610 |
| Interfund lending | 16 |
| Foreign taxes withheld | (18,153) |
| Total income | 274,730,281 |
| Expenses: | |
| Management services fees | 35,741,762 |
| Distribution and/or service fees | |
| Class A | 2,861,648 |
| Class C | 2,582,899 |
| Class R | 77,808 |
| Transfer agent fees | |
| Class A | 1,100,118 |
| Advisor Class | 339,168 |
| Class C | 247,916 |
| Institutional Class | 3,582,382 |
| Institutional 2 Class | 284,609 |
| Institutional 3 Class | 40,003 |
| Class R | 14,927 |
| Compensation of board members | 91,576 |
| Custodian fees | 289,207 |
| Printing and postage fees | 351,595 |
| Registration fees | 346,112 |
| Audit fees | 54,804 |
| Legal fees | 79,375 |
| Interest on collateral | 487,908 |
| Compensation of chief compliance officer | 1,643 |
| Other | 94,518 |
| Total expenses | 48,669,978 |
| Expense reduction | (2,212) |
| Total net expenses | 48,667,766 |
| Net investment income | 226,062,515 |
| 56 | Columbia Strategic Income Fund | Annual Report 2022 |
Year Ended August 31, 2022
| Realized and unrealized gain (loss) — net | |
| Net realized gain (loss) on: | |
| Investments — unaffiliated issuers | (202,152,723) |
| Investments — affiliated issuers | (224,573) |
| Foreign currency translations | 3,258,176 |
| Forward foreign currency exchange contracts | 3,371,213 |
| Futures contracts | 53,824,841 |
| Options purchased | 78,228,520 |
| Options contracts written | (77,150,220) |
| Swap contracts | (51,447,583) |
| Net realized loss | (192,292,349) |
| Net change in unrealized appreciation (depreciation) on: | |
| Investments — unaffiliated issuers | (753,721,970) |
| Investments — affiliated issuers | 81,396 |
| Foreign currency translations | (54,518) |
| Forward foreign currency exchange contracts | 350,417 |
| Futures contracts | 5,878,611 |
| Options purchased | (16,469,100) |
| Options contracts written | (1,605,712) |
| Swap contracts | 64,449,137 |
| Foreign capital gains tax | 3 |
| Net change in unrealized appreciation (depreciation) | (701,091,736) |
| Net realized and unrealized loss | (893,384,085) |
| Net decrease in net assets resulting from operations | $(667,321,570) |
| Columbia Strategic Income Fund | Annual Report 2022 | 57 |
| Year Ended August 31, 2022 | Year Ended August 31, 2021 | |
| Operations | ||
| Net investment income | $226,062,515 | $195,336,144 |
| Net realized gain (loss) | (192,292,349) | 102,276,953 |
| Net change in unrealized appreciation (depreciation) | (701,091,736) | 85,972,422 |
| Net increase (decrease) in net assets resulting from operations | (667,321,570) | 383,585,519 |
| Distributions to shareholders | ||
| Net investment income and net realized gains | ||
| Class A | (47,487,869) | (35,187,516) |
| Advisor Class | (15,554,372) | (8,880,812) |
| Class C | (8,968,170) | (6,566,114) |
| Institutional Class | (169,394,995) | (116,017,231) |
| Institutional 2 Class | (22,844,906) | (12,961,450) |
| Institutional 3 Class | (23,213,250) | (12,375,377) |
| Class R | (621,845) | (339,697) |
| Total distributions to shareholders | (288,085,407) | (192,328,197) |
| Increase (decrease) in net assets from capital stock activity | (18,610,193) | 1,189,138,142 |
| Total increase (decrease) in net assets | (974,017,170) | 1,380,395,464 |
| Net assets at beginning of year | 6,659,263,087 | 5,278,867,623 |
| Net assets at end of year | $5,685,245,917 | $6,659,263,087 |
| 58 | Columbia Strategic Income Fund | Annual Report 2022 |
| Year Ended | Year Ended | |||
| August 31, 2022 | August 31, 2021 | |||
| Shares | Dollars ($) | Shares(a) | Dollars ($) | |
| Capital stock activity | ||||
| Class A | ||||
| Subscriptions | 6,104,860 | 144,592,287 | 9,488,087 | 237,558,059 |
| Fund reorganization | 2,720,908 | 66,623,684 | — | — |
| Distributions reinvested | 1,888,726 | 44,513,990 | 1,319,704 | 32,931,513 |
| Redemptions | (10,572,480) | (246,319,310) | (8,826,615) | (220,547,429) |
| Net increase | 142,014 | 9,410,651 | 1,981,176 | 49,942,143 |
| Advisor Class | ||||
| Subscriptions | 5,007,338 | 117,004,721 | 9,053,316 | 223,157,939 |
| Fund reorganization | 1,900,358 | 45,591,874 | — | — |
| Distributions reinvested | 671,814 | 15,512,875 | 361,913 | 8,874,614 |
| Redemptions | (8,659,199) | (198,789,671) | (2,524,201) | (61,775,935) |
| Net increase (decrease) | (1,079,689) | (20,680,201) | 6,891,028 | 170,256,618 |
| Class C | ||||
| Subscriptions | 1,530,437 | 36,814,745 | 2,801,732 | 70,134,587 |
| Distributions reinvested | 345,221 | 8,170,975 | 240,742 | 6,004,548 |
| Redemptions | (3,341,253) | (77,668,623) | (3,277,600) | (82,139,648) |
| Net decrease | (1,465,595) | (32,682,903) | (235,126) | (6,000,513) |
| Institutional Class | ||||
| Subscriptions | 56,071,862 | 1,303,611,260 | 59,376,316 | 1,460,407,130 |
| Distributions reinvested | 6,175,424 | 142,981,414 | 3,998,130 | 98,011,729 |
| Redemptions | (69,146,186) | (1,570,804,397) | (34,716,221) | (849,782,680) |
| Net increase (decrease) | (6,898,900) | (124,211,723) | 28,658,225 | 708,636,179 |
| Institutional 2 Class | ||||
| Subscriptions | 11,818,805 | 277,874,908 | 11,239,237 | 276,328,993 |
| Distributions reinvested | 980,927 | 22,684,813 | 523,398 | 12,849,078 |
| Redemptions | (12,718,682) | (286,111,305) | (4,591,819) | (112,982,707) |
| Net increase | 81,050 | 14,448,416 | 7,170,816 | 176,195,364 |
| Institutional 3 Class | ||||
| Subscriptions | 12,181,340 | 287,282,196 | 7,986,665 | 196,029,607 |
| Distributions reinvested | 601,991 | 13,870,044 | 392,025 | 9,572,318 |
| Redemptions | (7,294,797) | (164,066,674) | (5,056,142) | (123,997,465) |
| Net increase | 5,488,534 | 137,085,566 | 3,322,548 | 81,604,460 |
| Class R | ||||
| Subscriptions | 173,196 | 4,209,736 | 504,855 | 12,722,139 |
| Distributions reinvested | 25,880 | 617,786 | 13,397 | 337,466 |
| Redemptions | (289,197) | (6,807,521) | (180,477) | (4,555,714) |
| Net increase (decrease) | (90,121) | (1,979,999) | 337,775 | 8,503,891 |
| Total net increase (decrease) | (3,822,707) | (18,610,193) | 48,126,442 | 1,189,138,142 |
| (a) | Share activity has been adjusted on a retroactive basis to reflect a 4 to 1 reverse stock split completed after the close of business on September 11, 2020. |
| Columbia Strategic Income Fund | Annual Report 2022 | 59 |
| Net asset value, beginning of period | Net investment income | Net realized and unrealized gain (loss) | Total from investment operations | Distributions from net investment income | Distributions from net realized gains | Total distributions to shareholders | |
| Class A(c) | |||||||
| Year Ended 8/31/2022 | $25.20 | 0.78 | (3.15) | (2.37) | (0.71) | (0.28) | (0.99) |
| Year Ended 8/31/2021 | $24.32 | 0.79 | 0.86 | 1.65 | (0.77) | — | (0.77) |
| Year Ended 8/31/2020 | $24.06 | 0.84 | 0.26 | 1.10 | (0.84) | — | (0.84) |
| Year Ended 8/31/2019 | $23.57 | 1.00 | 0.57 | 1.57 | (0.92) | (0.16) | (1.08) |
| Year Ended 8/31/2018 | $24.35 | 0.96 | (0.70) | 0.26 | (0.80) | (0.24) | (1.04) |
| Advisor Class(c) | |||||||
| Year Ended 8/31/2022 | $24.70 | 0.82 | (3.08) | (2.26) | (0.77) | (0.28) | (1.05) |
| Year Ended 8/31/2021 | $23.85 | 0.83 | 0.85 | 1.68 | (0.83) | — | (0.83) |
| Year Ended 8/31/2020 | $23.62 | 0.88 | 0.23 | 1.11 | (0.88) | — | (0.88) |
| Year Ended 8/31/2019 | $23.16 | 1.04 | 0.54 | 1.58 | (0.96) | (0.16) | (1.12) |
| Year Ended 8/31/2018 | $23.95 | 1.00 | (0.67) | 0.33 | (0.88) | (0.24) | (1.12) |
| Class C(c) | |||||||
| Year Ended 8/31/2022 | $25.19 | 0.60 | (3.15) | (2.55) | (0.53) | (0.28) | (0.81) |
| Year Ended 8/31/2021 | $24.31 | 0.60 | 0.86 | 1.46 | (0.58) | — | (0.58) |
| Year Ended 8/31/2020 | $24.06 | 0.64 | 0.29 | 0.93 | (0.68) | — | (0.68) |
| Year Ended 8/31/2019 | $23.57 | 0.80 | 0.57 | 1.37 | (0.72) | (0.16) | (0.88) |
| Year Ended 8/31/2018 | $24.36 | 0.76 | (0.67) | 0.09 | (0.64) | (0.24) | (0.88) |
| Institutional Class(c) | |||||||
| Year Ended 8/31/2022 | $24.73 | 0.82 | (3.09) | (2.27) | (0.76) | (0.28) | (1.04) |
| Year Ended 8/31/2021 | $23.88 | 0.84 | 0.84 | 1.68 | (0.83) | — | (0.83) |
| Year Ended 8/31/2020 | $23.65 | 0.88 | 0.23 | 1.11 | (0.88) | — | (0.88) |
| Year Ended 8/31/2019 | $23.18 | 1.04 | 0.55 | 1.59 | (0.96) | (0.16) | (1.12) |
| Year Ended 8/31/2018 | $23.97 | 1.00 | (0.67) | 0.33 | (0.88) | (0.24) | (1.12) |
| Institutional 2 Class(c) | |||||||
| Year Ended 8/31/2022 | $24.75 | 0.83 | (3.09) | (2.26) | (0.77) | (0.28) | (1.05) |
| Year Ended 8/31/2021 | $23.90 | 0.85 | 0.83 | 1.68 | (0.83) | — | (0.83) |
| Year Ended 8/31/2020 | $23.66 | 0.88 | 0.28 | 1.16 | (0.92) | — | (0.92) |
| Year Ended 8/31/2019 | $23.19 | 1.04 | 0.55 | 1.59 | (0.96) | (0.16) | (1.12) |
| Year Ended 8/31/2018 | $23.98 | 1.00 | (0.67) | 0.33 | (0.88) | (0.24) | (1.12) |
| Institutional 3 Class(c) | |||||||
| Year Ended 8/31/2022 | $24.66 | 0.84 | (3.09) | (2.25) | (0.78) | (0.28) | (1.06) |
| Year Ended 8/31/2021 | $23.81 | 0.86 | 0.84 | 1.70 | (0.85) | — | (0.85) |
| Year Ended 8/31/2020 | $23.58 | 0.88 | 0.27 | 1.15 | (0.92) | — | (0.92) |
| Year Ended 8/31/2019 | $23.12 | 1.04 | 0.58 | 1.62 | (1.00) | (0.16) | (1.16) |
| Year Ended 8/31/2018 | $23.91 | 1.00 | (0.67) | 0.33 | (0.88) | (0.24) | (1.12) |
| 60 | Columbia Strategic Income Fund | Annual Report 2022 |
| Net asset value, end of period | Total return | Total gross expense ratio to average net assets(a) | Total net expense ratio to average net assets(a),(b) | Net investment income ratio to average net assets | Portfolio turnover | Net assets, end of period (000’s) | |
| Class A(c) | |||||||
| Year Ended 8/31/2022 | $21.84 | (9.64%) | 0.92%(d) | 0.92%(d),(e) | 3.30% | 136% | $1,036,081 |
| Year Ended 8/31/2021 | $25.20 | 6.84% | 0.92%(d) | 0.92%(d),(e) | 3.17% | 126% | $1,191,823 |
| Year Ended 8/31/2020 | $24.32 | 4.84% | 0.93%(d) | 0.93%(d),(e) | 3.51% | 173% | $1,101,890 |
| Year Ended 8/31/2019 | $24.06 | 6.75% | 0.95%(d) | 0.95%(d) | 4.20% | 179% | $1,101,847 |
| Year Ended 8/31/2018 | $23.57 | 1.03% | 0.94%(d) | 0.94%(d),(e) | 3.94% | 152% | $1,059,907 |
| Advisor Class(c) | |||||||
| Year Ended 8/31/2022 | $21.39 | (9.40%) | 0.67%(d) | 0.67%(d),(e) | 3.54% | 136% | $298,389 |
| Year Ended 8/31/2021 | $24.70 | 7.16% | 0.67%(d) | 0.67%(d),(e) | 3.39% | 126% | $371,251 |
| Year Ended 8/31/2020 | $23.85 | 5.02% | 0.68%(d) | 0.68%(d),(e) | 3.76% | 173% | $194,094 |
| Year Ended 8/31/2019 | $23.62 | 6.96% | 0.70%(d) | 0.70%(d) | 4.42% | 179% | $285,983 |
| Year Ended 8/31/2018 | $23.16 | 1.30% | 0.69%(d) | 0.69%(d),(e) | 4.21% | 152% | $143,983 |
| Class C(c) | |||||||
| Year Ended 8/31/2022 | $21.83 | (10.31%) | 1.67%(d) | 1.67%(d),(e) | 2.53% | 136% | $214,760 |
| Year Ended 8/31/2021 | $25.19 | 6.01% | 1.67%(d) | 1.67%(d),(e) | 2.42% | 126% | $284,727 |
| Year Ended 8/31/2020 | $24.31 | 4.06% | 1.69%(d) | 1.69%(d),(e) | 2.76% | 173% | $280,497 |
| Year Ended 8/31/2019 | $24.06 | 5.97% | 1.70%(d) | 1.70%(d) | 3.45% | 179% | $282,018 |
| Year Ended 8/31/2018 | $23.57 | 0.28% | 1.69%(d) | 1.69%(d),(e) | 3.19% | 152% | $306,303 |
| Institutional Class(c) | |||||||
| Year Ended 8/31/2022 | $21.42 | (9.39%) | 0.67%(d) | 0.67%(d),(e) | 3.54% | 136% | $3,231,980 |
| Year Ended 8/31/2021 | $24.73 | 7.11% | 0.67%(d) | 0.67%(d),(e) | 3.41% | 126% | $3,902,593 |
| Year Ended 8/31/2020 | $23.88 | 5.02% | 0.68%(d) | 0.68%(d),(e) | 3.76% | 173% | $3,083,643 |
| Year Ended 8/31/2019 | $23.65 | 6.96% | 0.70%(d) | 0.70%(d) | 4.44% | 179% | $2,843,762 |
| Year Ended 8/31/2018 | $23.18 | 1.47% | 0.69%(d) | 0.69%(d),(e) | 4.20% | 152% | $2,398,468 |
| Institutional 2 Class(c) | |||||||
| Year Ended 8/31/2022 | $21.44 | (9.35%) | 0.63%(d) | 0.63%(d) | 3.60% | 136% | $413,637 |
| Year Ended 8/31/2021 | $24.75 | 7.23% | 0.63%(d) | 0.63%(d) | 3.44% | 126% | $475,594 |
| Year Ended 8/31/2020 | $23.90 | 5.06% | 0.64%(d) | 0.64%(d) | 3.80% | 173% | $287,777 |
| Year Ended 8/31/2019 | $23.66 | 7.00% | 0.66%(d) | 0.66%(d) | 4.49% | 179% | $287,753 |
| Year Ended 8/31/2018 | $23.19 | 1.35% | 0.65%(d) | 0.65%(d) | 4.26% | 152% | $257,953 |
| Institutional 3 Class(c) | |||||||
| Year Ended 8/31/2022 | $21.35 | (9.34%) | 0.59%(d) | 0.59%(d) | 3.67% | 136% | $477,713 |
| Year Ended 8/31/2021 | $24.66 | 7.26% | 0.59%(d) | 0.59%(d) | 3.50% | 126% | $416,355 |
| Year Ended 8/31/2020 | $23.81 | 5.13% | 0.60%(d) | 0.60%(d) | 3.84% | 173% | $322,913 |
| Year Ended 8/31/2019 | $23.58 | 7.08% | 0.60%(d) | 0.60%(d) | 4.55% | 179% | $192,494 |
| Year Ended 8/31/2018 | $23.12 | 1.40% | 0.60%(d) | 0.60%(d) | 4.31% | 152% | $189,195 |
| Columbia Strategic Income Fund | Annual Report 2022 | 61 |
| Net asset value, beginning of period | Net investment income | Net realized and unrealized gain (loss) | Total from investment operations | Distributions from net investment income | Distributions from net realized gains | Total distributions to shareholders | |
| Class R(c) | |||||||
| Year Ended 8/31/2022 | $25.38 | 0.72 | (3.16) | (2.44) | (0.65) | (0.28) | (0.93) |
| Year Ended 8/31/2021 | $24.49 | 0.73 | 0.86 | 1.59 | (0.70) | — | (0.70) |
| Year Ended 8/31/2020 | $24.23 | 0.80 | 0.26 | 1.06 | (0.80) | — | (0.80) |
| Year Ended 8/31/2019 | $23.73 | 0.92 | 0.58 | 1.50 | (0.84) | (0.16) | (1.00) |
| Year Ended 8/31/2018 | $24.51 | 0.88 | (0.66) | 0.22 | (0.76) | (0.24) | (1.00) |
| Notes to Financial Highlights | |
| (a) | In addition to the fees and expenses that the Fund bears directly, the Fund indirectly bears a pro rata share of the fees and expenses of any other funds in which it invests. Such indirect expenses are not included in the Fund’s reported expense ratios. |
| (b) | Total net expenses include the impact of certain fee waivers/expense reimbursements made by the Investment Manager and certain of its affiliates, if applicable. |
| (c) | Per share amounts have been adjusted on a retroactive basis to reflect a 4 to 1 reverse stock split completed after the close of business on September 11, 2020. |
| (d) | Ratios include interest on collateral expense. For the periods indicated below, if interest on collateral expense had been excluded, expenses would have been lower by: |
| Class | 8/31/2022 | 8/31/2021 | 8/31/2020 | 8/31/2019 | 8/31/2018 |
| Class A | 0.01% | less than 0.01% | less than 0.01% | less than 0.01% | less than 0.01% |
| Advisor Class | 0.01% | less than 0.01% | less than 0.01% | 0.01% | less than 0.01% |
| Class C | 0.01% | less than 0.01% | less than 0.01% | less than 0.01% | less than 0.01% |
| Institutional Class | 0.01% | less than 0.01% | less than 0.01% | less than 0.01% | less than 0.01% |
| Institutional 2 Class | 0.01% | less than 0.01% | less than 0.01% | less than 0.01% | less than 0.01% |
| Institutional 3 Class | 0.01% | less than 0.01% | less than 0.01% | less than 0.01% | less than 0.01% |
| Class R | 0.01% | less than 0.01% | less than 0.01% | less than 0.01% | less than 0.01% |
| (e) | The benefits derived from expense reductions had an impact of less than 0.01%. |
| 62 | Columbia Strategic Income Fund | Annual Report 2022 |
| Net asset value, end of period | Total return | Total gross expense ratio to average net assets(a) | Total net expense ratio to average net assets(a),(b) | Net investment income ratio to average net assets | Portfolio turnover | Net assets, end of period (000’s) | |
| Class R(c) | |||||||
| Year Ended 8/31/2022 | $22.01 | (9.83%) | 1.17%(d) | 1.17%(d),(e) | 3.02% | 136% | $12,686 |
| Year Ended 8/31/2021 | $25.38 | 6.62% | 1.17%(d) | 1.17%(d),(e) | 2.89% | 126% | $16,920 |
| Year Ended 8/31/2020 | $24.49 | 4.38% | 1.18%(d) | 1.18%(d),(e) | 3.26% | 173% | $8,053 |
| Year Ended 8/31/2019 | $24.23 | 6.62% | 1.20%(d) | 1.20%(d) | 3.95% | 179% | $9,287 |
| Year Ended 8/31/2018 | $23.73 | 0.77% | 1.19%(d) | 1.19%(d),(e) | 3.70% | 152% | $7,075 |
| Columbia Strategic Income Fund | Annual Report 2022 | 63 |
August 31, 2022
| 64 | Columbia Strategic Income Fund | Annual Report 2022 |
August 31, 2022
| Columbia Strategic Income Fund | Annual Report 2022 | 65 |
August 31, 2022
| 66 | Columbia Strategic Income Fund | Annual Report 2022 |
August 31, 2022
| Columbia Strategic Income Fund | Annual Report 2022 | 67 |
August 31, 2022
| 68 | Columbia Strategic Income Fund | Annual Report 2022 |
August 31, 2022
| Columbia Strategic Income Fund | Annual Report 2022 | 69 |
August 31, 2022
| Asset derivatives | ||
| Risk exposure category | Statement of assets and liabilities location | Fair value ($) |
| Credit risk | Component of total distributable earnings (loss) — unrealized appreciation on swap contracts | 32,334,774* |
| Credit risk | Upfront payments on swap contracts | 151,073 |
| Foreign exchange risk | Unrealized appreciation on forward foreign currency exchange contracts | 262,042 |
| Interest rate risk | Component of total distributable earnings (loss) — unrealized appreciation on futures contracts | 18,572,605* |
| Interest rate risk | Investments, at value — Options purchased | 36,073,206 |
| Interest rate risk | Component of total distributable earnings (loss) — unrealized appreciation on swap contracts | 12,595,109* |
| Total | 99,988,809 |
| 70 | Columbia Strategic Income Fund | Annual Report 2022 |
August 31, 2022
| Liability derivatives | ||
| Risk exposure category | Statement of assets and liabilities location | Fair value ($) |
| Credit risk | Component of total distributable earnings (loss) — unrealized depreciation on swap contracts | 1,530,533* |
| Credit risk | Upfront receipts on swap contracts | 18,788,401 |
| Foreign exchange risk | Unrealized depreciation on forward foreign currency exchange contracts | 405,020 |
| Interest rate risk | Component of total distributable earnings (loss) — unrealized depreciation on futures contracts | 11,294,713* |
| Interest rate risk | Component of total distributable earnings (loss) — unrealized depreciation on swap contracts | 3,318,496* |
| Total | 35,337,163 |
| * | Includes cumulative appreciation (depreciation) as reported in the tables following the Portfolio of Investments. Only the current day’s variation margin is reported in receivables or payables in the Statement of Assets and Liabilities. |
| Amount of realized gain (loss) on derivatives recognized in income | ||||||
| Risk exposure category | Forward foreign currency exchange contracts ($) | Futures contracts ($) | Options contracts written ($) | Options contracts purchased ($) | Swap contracts ($) | Total ($) |
| Credit risk | — | — | — | — | (12,459,105) | (12,459,105) |
| Foreign exchange risk | 3,371,213 | — | — | — | — | 3,371,213 |
| Interest rate risk | — | 53,824,841 | (77,150,220) | 78,228,520 | (38,988,478) | 15,914,663 |
| Total | 3,371,213 | 53,824,841 | (77,150,220) | 78,228,520 | (51,447,583) | 6,826,771 |
| Change in unrealized appreciation (depreciation) on derivatives recognized in income | ||||||
| Risk exposure category | Forward foreign currency exchange contracts ($) | Futures contracts ($) | Options contracts written ($) | Options contracts purchased ($) | Swap contracts ($) | Total ($) |
| Credit risk | — | — | — | — | 28,026,605 | 28,026,605 |
| Foreign exchange risk | 350,417 | — | — | — | — | 350,417 |
| Interest rate risk | — | 5,878,611 | (1,605,712) | (16,469,100) | 36,422,532 | 24,226,331 |
| Total | 350,417 | 5,878,611 | (1,605,712) | (16,469,100) | 64,449,137 | 52,603,353 |
| Derivative instrument | Average notional amounts ($)* |
| Futures contracts — long | 837,936,564 |
| Futures contracts — short | 2,582,061,578 |
| Credit default swap contracts — buy protection | 589,175,540 |
| Credit default swap contracts — sell protection | 216,900,000 |
| Derivative instrument | Average value ($)* |
| Options contracts — purchased | 39,323,773 |
| Options contracts — written | (22,337,828) |
| Columbia Strategic Income Fund | Annual Report 2022 | 71 |
August 31, 2022
| Derivative instrument | Average unrealized appreciation ($)* | Average unrealized depreciation ($)* |
| Forward foreign currency exchange contracts | 402,571 | (158,966) |
| Interest rate swap contracts | 6,563,878 | (4,173,100) |
| * | Based on the ending quarterly outstanding amounts for the year ended August 31, 2022. |
| 72 | Columbia Strategic Income Fund | Annual Report 2022 |
August 31, 2022
| Columbia Strategic Income Fund | Annual Report 2022 | 73 |
August 31, 2022
| Citi ($) (a) | Citi ($) (a) | Goldman Sachs International ($) | JPMorgan ($) | Morgan Stanley ($) (a) | Morgan Stanley ($) (a) | UBS ($) | Total ($) | |
| Assets | ||||||||
| Centrally cleared credit default swap contracts (b) | - | - | - | - | - | 1,004,943 | - | 1,004,943 |
| Centrally cleared interest rate swap contracts (b) | - | - | - | - | - | 367,468 | - | 367,468 |
| Forward foreign currency exchange contracts | - | - | - | - | - | - | 262,042 | 262,042 |
| Options purchased calls | 30,417,571 | - | - | - | 5,655,635 | - | - | 36,073,206 |
| OTC credit default swap contracts (c) | - | 752,238 | - | 1,350,675 | 629,203 | - | - | 2,732,116 |
| Total assets | 30,417,571 | 752,238 | - | 1,350,675 | 6,284,838 | 1,372,411 | 262,042 | 40,439,775 |
| Liabilities | ||||||||
| Forward foreign currency exchange contracts | 405,020 | - | - | - | - | - | - | 405,020 |
| OTC credit default swap contracts (c) | - | 6,864,041 | 2,166,208 | 6,481,794 | 4,806,891 | - | - | 20,318,934 |
| Total liabilities | 405,020 | 6,864,041 | 2,166,208 | 6,481,794 | 4,806,891 | - | - | 20,723,954 |
| Total financial and derivative net assets | 30,012,551 | (6,111,803) | (2,166,208) | (5,131,119) | 1,477,947 | 1,372,411 | 262,042 | 19,715,821 |
| Total collateral received (pledged) (d) | 30,012,551 | (5,756,000) | (2,000,000) | (5,020,000) | 1,477,947 | - | - | 18,714,498 |
| Net amount (e) | - | (355,803) | (166,208) | (111,119) | - | 1,372,411 | 262,042 | 1,001,323 |
| (a) | Exposure can only be netted across transactions governed under the same master agreement with the same legal entity. |
| (b) | Centrally cleared swaps are included within payable/receivable for variation margin in the Statement of Assets and Liabilities. |
| (c) | Over-the-Counter (OTC) swap contracts are presented at market value plus periodic payments receivable (payable), which is comprised of unrealized appreciation, unrealized depreciation, upfront payments and upfront receipts. |
| (d) | In some instances, the actual collateral received and/or pledged may be more than the amount shown due to overcollateralization. |
| (e) | Represents the net amount due from/(to) counterparties in the event of default. |
| 74 | Columbia Strategic Income Fund | Annual Report 2022 |
August 31, 2022
| Columbia Strategic Income Fund | Annual Report 2022 | 75 |
August 31, 2022
| Purchases ($) | Sales ($) | Net realized gain (loss) ($) |
| — | 115,099,040 | (5,029,644) |
| 76 | Columbia Strategic Income Fund | Annual Report 2022 |
August 31, 2022
| Effective rate (%) | |
| Class A | 0.10 |
| Advisor Class | 0.10 |
| Class C | 0.10 |
| Institutional Class | 0.10 |
| Institutional 2 Class | 0.06 |
| Institutional 3 Class | 0.01 |
| Class R | 0.10 |
| Columbia Strategic Income Fund | Annual Report 2022 | 77 |
August 31, 2022
| Front End (%) | CDSC (%) | Amount ($) | |
| Class A | 4.75 | 0.50 - 1.00(a) | 785,198 |
| Class C | — | 1.00(b) | 38,974 |
| (a) | This charge is imposed on certain investments of between $1 million and $50 million redeemed within 18 months after purchase, as follows: 1.00% if redeemed within 12 months after purchase, and 0.50% if redeemed more than 12, but less than 18, months after purchase, with certain limited exceptions. |
| (b) | This charge applies to redemptions within 12 months after purchase, with certain limited exceptions. |
| Fee rate(s) contractual through December 31, 2023 | |
| Class A | 0.98% |
| Advisor Class | 0.73 |
| Class C | 1.73 |
| Institutional Class | 0.73 |
| Institutional 2 Class | 0.70 |
| Institutional 3 Class | 0.65 |
| Class R | 1.23 |
| 78 | Columbia Strategic Income Fund | Annual Report 2022 |
August 31, 2022
| Undistributed net investment income ($) | Accumulated net realized (loss) ($) | Paid in capital ($) |
| 7,130,552 | (7,558,889) | 428,337 |
| Year Ended August 31, 2022 | Year Ended August 31, 2021 | ||||
| Ordinary income ($) | Long-term capital gains ($) | Total ($) | Ordinary income ($) | Long-term capital gains ($) | Total ($) |
| 243,209,871 | 44,875,536 | 288,085,407 | 192,328,197 | — | 192,328,197 |
| Undistributed ordinary income ($) | Undistributed long-term capital gains ($) | Capital loss carryforwards ($) | Net unrealized (depreciation) ($) |
| 23,896,969 | — | (198,874,587) | (542,278,639) |
| Federal tax cost ($) | Gross unrealized appreciation ($) | Gross unrealized (depreciation) ($) | Net unrealized (depreciation) ($) |
| 6,780,562,661 | 51,092,734 | (593,371,373) | (542,278,639) |
| No expiration short-term ($) | No expiration long-term ($) | Total ($) | Utilized ($) |
| (83,287,149) | (115,587,438) | (198,874,587) | — |
| Columbia Strategic Income Fund | Annual Report 2022 | 79 |
August 31, 2022
| Borrower or lender | Average loan balance ($) | Weighted average interest rate (%) | Number of days with outstanding loans |
| Lender | 200,000 | 2.85 | 1 |
| 80 | Columbia Strategic Income Fund | Annual Report 2022 |
August 31, 2022
| Shares | |
| Class A | 2,720,908 |
| Advisor Class | 1,900,358 |
| ($) | |
| Net investment income | 226,993,000 |
| Net realized loss | (190,398,000) |
| Net change in unrealized appreciation/(depreciation) | (705,646,000) |
| Net decrease in net assets from operations | (669,051,000) |
| Columbia Strategic Income Fund | Annual Report 2022 | 81 |
August 31, 2022
| 82 | Columbia Strategic Income Fund | Annual Report 2022 |
August 31, 2022
| Columbia Strategic Income Fund | Annual Report 2022 | 83 |
August 31, 2022
| 84 | Columbia Strategic Income Fund | Annual Report 2022 |
| Columbia Strategic Income Fund | Annual Report 2022 | 85 |
| Name, address, year of birth | Position held with the Columbia Funds and length of service | Principal occupation(s) during past five years and other relevant professional experience | Number of Funds in the Columbia Funds Complex* overseen | Other directorships held by Trustee during the past five years |
| George S. Batejan c/o Columbia Management Investment Advisers, LLC 290 Congress Street Boston, MA 02210 1953 | Trustee since 2017 | Executive Vice President, Global Head of Technology and Operations, Janus Capital Group, Inc., 2010-2016 | 176 | Former Chairman of the Board, NICSA (National Investment Company Services Association) (Executive Committee, Nominating Committee and Governance Committee), 2014-2016; former Director, Intech Investment Management, 2011-2016; former Board Member, Metro Denver Chamber of Commerce, 2015-2016; former Advisory Board Member, University of Colorado Business School, 2015-2018 |
| Kathleen Blatz c/o Columbia Management Investment Advisers, LLC 290 Congress Street Boston, MA 02210 1954 | Trustee since 2006 | Attorney, specializing in arbitration and mediation; Chief Justice, Minnesota Supreme Court, 1998-2006; Associate Justice, Minnesota Supreme Court, 1996-1998; Fourth Judicial District Court Judge, Hennepin County, 1994-1996; Attorney in private practice and public service, 1984-1993; State Representative, Minnesota House of Representatives, 1979-1993, which included service on the Tax and Financial Institutions and Insurance Committees; Member and Interim Chair, Minnesota Sports Facilities Authority, January 2017-July 2017; Interim President and Chief Executive Officer, Blue Cross and Blue Shield of Minnesota (health care insurance), February-July 2018, April-October 2021 | 176 | Former Trustee, Blue Cross and Blue Shield of Minnesota, 2009-2021 (Chair of the Business Development Committee, 2014-2017; Chair of the Governance Committee, 2017-2019); former Member and Chair of the Board, Minnesota Sports Facilities Authority, January 2017-July 2017; former Director, Robina Foundation, 2009-2020 (Chair, 2014-2020); Director, Schulze Family Foundation, since 2021 |
| Pamela G. Carlton c/o Columbia Management Investment Advisers, LLC 290 Congress Street Boston, MA 02210 1954 | Trustee since 2007 | President, Springboard — Partners in Cross Cultural Leadership (consulting company) since 2003; Managing Director of US Equity Research, JP Morgan Chase, 1999-2003; Director of US Equity Research, Chase Asset Management, 1996-1999; Co-Director Latin America Research, 1993-1996, COO Global Research, 1992-1996, Co-Director of US Research, 1991-1992, Investment Banker, 1982-1991, Morgan Stanley; Attorney, Cleary Gottlieb Steen & Hamilton LLP, 1980-1982 | 176 | Trustee, New York Presbyterian Hospital Board (Executive Committee and Chair of People Committee) since 1996; Director, DR Bank (Audit Committee) since 2017; Director, Evercore Inc. (Audit Committee) since 2019; Director, Apollo Commercial Real Estate Finance, Inc. since 2021; the Governing Council of the Independent Directors Council (IDC), since 2021 |
| 86 | Columbia Strategic Income Fund | Annual Report 2022 |
(Unaudited)
Independent trustees (continued)
| Name, address, year of birth | Position held with the Columbia Funds and length of service | Principal occupation(s) during past five years and other relevant professional experience | Number of Funds in the Columbia Funds Complex* overseen | Other directorships held by Trustee during the past five years |
| Janet Langford Carrig c/o Columbia Management Investment Advisers, LLC 290 Congress Street Boston, MA 02210 1957 | Trustee since 1996 | Senior Vice President, General Counsel and Corporate Secretary, ConocoPhillips (independent energy company), September 2007-October 2018 | 174 | Director, EQT Corporation (natural gas producer) since 2019; former Director, Whiting Petroleum Corporation (independent oil and gas company), 2020-2022 |
| J. Kevin Connaughton c/o Columbia Management Investment Advisers, LLC 290 Congress Street Boston, MA 02210 1964 | Trustee since 2020 | Member, FINRA National Adjudicatory Council since January 2020; Adjunct Professor of Finance, Bentley University since January 2018; Consultant to Independent Trustees of CFVIT and CFST I from March 2016 to June 2020 with respect to CFVIT and to December 2020 with respect to CFST I; Managing Director and General Manager of Mutual Fund Products, Columbia Management Investment Advisers, LLC, May 2010-February 2015; President, Columbia Funds, 2008-2015; and senior officer of Columbia Funds and affiliated funds, 2003-2015 | 174 | Former Director, The Autism Project, March 2015-December 2021; former Member of the Investment Committee, St. Michael’s College, November 2015-February 2020; former Trustee, St. Michael’s College, June 2017-September 2019; former Trustee, New Century Portfolios, January 2015-December 2017 |
| Olive M. Darragh c/o Columbia Management Investment Advisers, LLC 290 Congress Street Boston, MA 02210 1962 | Trustee since 2020 | Managing Director of Darragh Inc. (strategy and talent management consulting firm) since 2010; Founder and CEO, Zolio, Inc. (investment management talent identification platform) since 2004; Consultant to Independent Trustees of CFVIT and CFST I from June 2019 to June 2020 with respect to CFVIT and to December 2020 with respect to CFST I; Partner, Tudor Investments, 2004-2010; Senior Partner, McKinsey & Company (consulting), 1990-2004; Touche Ross CPA, 1985-1988 | 174 | Former Director, University of Edinburgh Business School (Member of US Board); former Director, Boston Public Library Foundation |
| Patricia M. Flynn c/o Columbia Management Investment Advisers, LLC 290 Congress Street Boston, MA 02210 1950 | Trustee since 2004 | Trustee Professor of Economics and Management, Bentley University since 1976 (also teaches and conducts research on corporate governance); Dean, McCallum Graduate School of Business, Bentley University, 1992-2002 | 176 | Trustee, MA Taxpayers Foundation since 1997; former Board of Governors, Innovation Institute, MA Technology Collaborative, 2010-2020; former Board of Directors, The MA Business Roundtable, 2003-2019 |
| Brian J. Gallagher c/o Columbia Management Investment Advisers, LLC 290 Congress Street Boston, MA 02210 1954 | Trustee since 2017 | Retired; Partner with Deloitte & Touche LLP and its predecessors, 1977-2016 | 176 | Trustee, Catholic Schools Foundation since 2004 |
| Columbia Strategic Income Fund | Annual Report 2022 | 87 |
(Unaudited)
Independent trustees (continued)
| Name, address, year of birth | Position held with the Columbia Funds and length of service | Principal occupation(s) during past five years and other relevant professional experience | Number of Funds in the Columbia Funds Complex* overseen | Other directorships held by Trustee during the past five years |
| Douglas A. Hacker c/o Columbia Management Investment Advisers, LLC 290 Congress Street Boston, MA 02210 1955 | Co-Chair since 2021; Chair of CFST I and CFVIT since 2014; Trustee of CFST I and CFVIT since 1996 and CFST, CFST II, CFVST II, CET I and CET II since 2021 | Independent business executive since May 2006; Executive Vice President – Strategy of United Airlines, December 2002 - May 2006; President of UAL Loyalty Services (airline marketing company), September 2001-December 2002; Executive Vice President and Chief Financial Officer of United Airlines, July 1999-September 2001 | 176 | Director, Spartan Nash Company (food distributor); Director, Aircastle Limited (Chair of Audit Committee) (aircraft leasing); former Director, Nash Finch Company (food distributor), 2005-2013; former Director, SeaCube Container Leasing Ltd. (container leasing), 2010-2013; and former Director, Travelport Worldwide Limited (travel information technology), 2014-2019 |
| Nancy T. Lukitsh c/o Columbia Management Investment Advisers, LLC 290 Congress Street Boston, MA 02210 1956 | Trustee since 2011 | Senior Vice President, Partner and Director of Marketing, Wellington Management Company, LLP (investment adviser), 1997-2010; Chair, Wellington Management Portfolios (commingled non-U.S. investment pools), 2007 -2010; Director, Wellington Trust Company, NA and other Wellington affiliates, 1997-2010 | 174 | None |
| David M. Moffett c/o Columbia Management Investment Advisers, LLC 290 Congress Street Boston, MA 02210 1952 | Trustee since 2011 | Retired; Consultant to Bridgewater and Associates | 174 | Director, CSX Corporation (transportation suppliers); Director, Genworth Financial, Inc. (financial and insurance products and services); Director, PayPal Holdings Inc. (payment and data processing services); Trustee, University of Oklahoma Foundation; former Director, eBay Inc. (online trading community), 2007-2015; and former Director, CIT Bank, CIT Group Inc. (commercial and consumer finance), 2010-2016 |
| Catherine James Paglia c/o Columbia Management Investment Advisers, LLC 290 Congress Street Boston, MA 02210 1952 | Co-Chair since 2021; Chair of CFST, CFST II, CFVST II, CET I and CET II since 2020; Trustee of CFST, CFST II and CFVST II since 2004 and CFST I and CFVIT since 2021 | Director, Enterprise Asset Management, Inc. (private real estate and asset management company) since September 1998; Managing Director and Partner, Interlaken Capital, Inc., 1989-1997; Vice President, 1982-1985, Principal, 1985-1987, Managing Director, 1987-1989, Morgan Stanley; Vice President, Investment Banking, 1980-1982, Associate, Investment Banking, 1976-1980, Dean Witter Reynolds, Inc. | 176 | Director, Valmont Industries, Inc. (irrigation systems manufacturer) since 2012; Trustee, Carleton College (on the Investment Committee); Trustee, Carnegie Endowment for International Peace (on the Investment Committee) |
| 88 | Columbia Strategic Income Fund | Annual Report 2022 |
(Unaudited)
Independent trustees (continued)
| Name, address, year of birth | Position held with the Columbia Funds and length of service | Principal occupation(s) during past five years and other relevant professional experience | Number of Funds in the Columbia Funds Complex* overseen | Other directorships held by Trustee during the past five years |
| Minor M. Shaw c/o Columbia Management Investment Advisers, LLC 290 Congress Street Boston, MA 02210 1947 | Trustee since 2003 | President, Micco LLC (private investments) since 2011; President, Micco Corp. (family investment business), 1998-2011 | 176 | Director, Blue Cross Blue Shield of South Carolina (Chair of Compensation Committee) since April 2008; Trustee, Hollingsworth Funds (on the Investment Committee) since 2016 (previously Board Chair from 2016-2019); Former Advisory Board member, Duke Energy Corp., 2016-2020; Chair of the Duke Endowment; Chair of Greenville – Spartanburg Airport Commission; former Trustee, BofA Funds Series Trust (11 funds), 2003-2011; former Director, Piedmont Natural Gas, 2004-2016; former Director, National Association of Corporate Directors, Carolinas Chapter, 2013-2018; Chair, Daniel-Mickel Foundation since 1998 |
| Natalie A. Trunow c/o Columbia Management Investment Advisers, LLC 290 Congress Street Boston, MA 02210 1967 | Trustee since 2020 | Chief Executive Officer, Millennial Portfolio Solutions LLC (asset management and consulting services), January 2016-January 2021; Non-executive Member of the Investment Committee and Valuation Committee, Sarona Asset Management Inc. (private equity firm) since September 2019; Advisor, Horizon Investments (asset management and consulting services), August 2018-January 2021; Advisor, Paradigm Asset Management, November 2016-December 2021; Consultant to Independent Trustees of CFVIT and CFST I from September 2016 to June 2020 with respect to CFVIT and to December 2020 with respect to CFST I; Director of Investments/Consultant, Casey Family Programs, April 2016-November 2016; Senior Vice President and Chief Investment Officer, Calvert Investments, August 2008-January 2016; Section Head and Portfolio Manager, General Motors Asset Management, June 1997-August 2008 | 174 | Former Director, Investment Committee, Health Services for Children with Special Needs, Inc., 2012-2019; Director, Chair of Audit Committee, Consumer Credit Counseling Services (formerly Guidewell Financial Solutions), since 2019; Independent Director, Investment Committee and Valuation Committee, Sarona Asset Management, since 2019 |
| Sandra L. Yeager c/o Columbia Management Investment Advisers, LLC 290 Congress Street Boston, MA 02210 1964 | Trustee since 2017 | Retired; President and founder, Hanoverian Capital, LLC (SEC registered investment advisor firm), 2008-2016; Managing Director, DuPont Capital, 2006-2008; Managing Director, Morgan Stanley Investment Management, 2004-2006; Senior Vice President, Alliance Bernstein, 1990-2004 | 176 | Former Director, NAPE Education Foundation, October 2016-October 2020 |
| Columbia Strategic Income Fund | Annual Report 2022 | 89 |
(Unaudited)
| * | The term “Columbia Funds Complex” as used herein includes Columbia Seligman Premium Technology Growth Fund, Tri-Continental Corporation and each series of Columbia Fund Series Trust (CFST), Columbia Funds Series Trust I (CFST I), Columbia Funds Series Trust II (CFST II), Columbia ETF Trust I (CET I), Columbia ETF Trust II (CET II), Columbia Funds Variable Insurance Trust (CFVIT) and Columbia Funds Variable Series Trust II (CFVST II). Messrs. Batejan, Beckman, Gallagher and Hacker and Mses. Blatz, Carlton, Flynn, Paglia, Shaw and Yeager serve as Directors of Columbia Seligman Premium Technology Growth Fund and Tri-Continental Corporation. |
| Name, address, year of birth | Position held with the Columbia Funds and length of service | Principal occupation(s) during the past five years and other relevant professional experience | Number of Funds in the Columbia Funds Complex overseen | Other directorships held by Trustee during the past five years |
| Daniel J. Beckman c/o Columbia Management Investment Advisers, LLC 290 Congress Street Boston, MA 02210 1962 | Trustee since November 2021 and President since June 2021 | Vice President – Head of North America Product, Columbia Management Investment Advisers, LLC since April 2015; President and Principal Executive Officer of the Columbia Funds since June 2021; officer of Columbia Funds and affiliated funds, 2020-2021 | 176 | Director, Ameriprise Trust Company, since October 2016; Director, Columbia Management Investment Distributors, Inc. since November 2018; Board of Governors, Columbia Wanger Asset Management, LLC since January 2022 |
| * | Interested person (as defined under the 1940 Act) by reason of being an officer, director, security holder and/or employee of the Investment Manager or Ameriprise Financial. |
| Name, address and year of birth | Position and year first appointed to position for any Fund in the Columbia Funds Complex or a predecessor thereof | Principal occupation(s) during past five years |
| Michael G. Clarke 290 Congress Street Boston, MA 02210 1969 | Chief Financial Officer and Principal Financial Officer (2009) and Senior Vice President (2019) | Senior Vice President and Head of Global Operations & Investor Services, Columbia Management Investment Advisers, LLC, since March 2022 (previously Vice President, Head of North American Operations, and Co-Head of Global Operations, June 2019 to February 2022 and Vice President – Accounting and Tax, May 2010 - May 2019); senior officer of Columbia Funds and affiliated funds since 2002. |
| Joseph Beranek 5890 Ameriprise Financial Center Minneapolis, MN 55474 1965 | Treasurer and Chief Accounting Officer (Principal Accounting Officer) (2019) and Principal Financial Officer (2020), CFST, CFST I, CFST II, CFVIT and CFVST II; Assistant Treasurer, CET I and CET II | Vice President – Mutual Fund Accounting and Financial Reporting, Columbia Management Investment Advisers, LLC, since December 2018 and March 2017, respectively (previously Vice President – Pricing and Corporate Actions, May 2010 - March 2017). |
| 90 | Columbia Strategic Income Fund | Annual Report 2022 |
(Unaudited)
Fund officers (continued)
| Name, address and year of birth | Position and year first appointed to position for any Fund in the Columbia Funds Complex or a predecessor thereof | Principal occupation(s) during past five years |
| Marybeth Pilat 290 Congress Street Boston, MA 02210 1968 | Treasurer and Chief Accounting Officer (Principal Accounting Officer) and Principal Financial Officer (2020) for CET I and CET II; Assistant Treasurer, CFST, CFST I, CFST II, CFVIT and CFVST II | Vice President – Product Pricing and Administration, Columbia Management Investment Advisers, LLC, since May 2017; Director - Fund Administration, Calvert Investments, August 2015 – March 2017; Vice President - Fund Administration, Legg Mason, May 2015 - July 2015; Vice President - Fund Administration, Columbia Management Investment Advisers, LLC, May 2010 - April 2015. |
| William F. Truscott 290 Congress Street Boston, MA 02210 1960 | Senior Vice President (2001) | Formerly, Trustee/Director of Columbia Funds Complex or legacy funds, November 2001-January 1, 2021; Chief Executive Officer, Global Asset Management, Ameriprise Financial, Inc. since September 2012; Chairman of the Board and President, Columbia Management Investment Advisers, LLC since July 2004 and February 2012, respectively; Chairman of the Board and Chief Executive Officer, Columbia Management Investment Distributors, Inc. since November 2008 and February 2012, respectively; Chairman of the Board and Director, Threadneedle Asset Management Holdings, Sàrl since March 2013 and December 2008, respectively; senior executive of various entities affiliated with Columbia Threadneedle. |
| Christopher O. Petersen 5228 Ameriprise Financial Center Minneapolis, MN 55474 1970 | Senior Vice President and Assistant Secretary (2021) | Formerly, Trustee/Director of funds within the Columbia Funds Complex, July 1, 2020 - November 22, 2021; Senior Vice President and Assistant General Counsel, Ameriprise Financial, Inc. since September 2021 (previously Vice President and Lead Chief Counsel, January 2015 - September 2021); formerly, President and Principal Executive Officer of the Columbia Funds, 2015 - 2021; officer of Columbia Funds and affiliated funds since 2007. |
| Thomas P. McGuire 290 Congress Street Boston, MA 02210 1972 | Senior Vice President and Chief Compliance Officer (2012) | Vice President – Asset Management Compliance, Ameriprise Financial, Inc., since May 2010; Chief Compliance Officer, Columbia Acorn/Wanger Funds since December 2015; formerly, Chief Compliance Officer, Ameriprise Certificate Company, September 2010 – September 2020. |
| Ryan C. Larrenaga 290 Congress Street Boston, MA 02210 1970 | Senior Vice President (2017), Chief Legal Officer (2017), and Secretary (2015) | Vice President and Chief Counsel, Ameriprise Financial, Inc. since August 2018 (previously Vice President and Group Counsel, August 2011 - August 2018); Chief Legal Officer, Columbia Acorn/Wanger Funds, since September 2020; officer of Columbia Funds and affiliated funds since 2005. |
| Michael E. DeFao 290 Congress Street Boston, MA 02210 1968 | Vice President (2011) and Assistant Secretary (2010) | Vice President and Chief Counsel, Ameriprise Financial, Inc. since May 2010; Vice President, Chief Legal Officer and Assistant Secretary, Columbia Management Investment Advisers, LLC since October 2021 (previously Vice President and Assistant Secretary, May 2010 – September 2021). |
| Lyn Kephart-Strong 5228 Ameriprise Financial Center Minneapolis, MN 55474 1960 | Vice President (2015) | President, Columbia Management Investment Services Corp. since October 2014; Vice President & Resolution Officer, Ameriprise Trust Company since August 2009. |
| Columbia Strategic Income Fund | Annual Report 2022 | 91 |
| • | the Fund had sufficient liquidity to both meet redemptions and operate effectively on behalf of shareholders; |
| • | there were no material changes to the Program during the period; |
| • | the implementation of the Program was effective to manage the Fund’s liquidity risk; and |
| • | the Program operated adequately during the period. |
| 92 | Columbia Strategic Income Fund | Annual Report 2022 |
(Unaudited)
| • | Information on the investment performance of the Fund relative to the performance of a group of mutual funds determined to be comparable to the Fund by Broadridge, as well as performance relative to benchmarks; |
| • | Information on the Fund’s management fees and total expenses, including information comparing the Fund’s expenses to those of a group of comparable mutual funds, as determined by Broadridge; |
| • | The Investment Manager’s agreement to contractually limit or cap total operating expenses for the Fund so that total operating expenses (excluding certain fees and expenses, such as transaction costs and certain other investment related expenses, interest, taxes, acquired fund fees and expenses and infrequent and/or unusual expenses) would not exceed a specified annual rate, as a percentage of the Fund’s net assets; |
| • | Terms of the Management Agreement; |
| • | Descriptions of other agreements and arrangements with affiliates of the Investment Manager relating to the operations of the Fund, including agreements with respect to the provision of transfer agency and shareholder services to the Fund; |
| • | Descriptions of various services performed by the Investment Manager under the Management Agreement, including portfolio management and portfolio trading practices; |
| • | Information regarding any recently negotiated management fees of similarly-managed portfolios of other institutional clients of the Investment Manager; |
| • | Information regarding the resources of the Investment Manager, including information regarding senior management, portfolio managers and other personnel; |
| • | Information regarding the capabilities of the Investment Manager with respect to compliance monitoring services; |
| • | The profitability to the Investment Manager and its affiliates from their relationships with the Fund; and |
| • | Report provided by the Board’s independent fee consultant, JDL Consultants, LLC (JDL). |
| Columbia Strategic Income Fund | Annual Report 2022 | 93 |
(Unaudited)
into account the organization and strength of the Fund’s and its service providers’ compliance programs. The Board also reviewed the financial condition of the Investment Manager and its affiliates and each entity’s ability to carry out its responsibilities under the Management Agreement and the Fund’s other service agreements.
| 94 | Columbia Strategic Income Fund | Annual Report 2022 |
(Unaudited)
of the Funds. It also took into account the indirect economic benefits flowing to the Investment Manager or its affiliates in connection with managing or distributing the Funds, such as the enhanced ability to offer various other financial products to Ameriprise Financial customers, soft dollar benefits and overall reputational advantages. The Board noted that the fees paid by the Fund should permit the Investment Manager to offer competitive compensation to its personnel, make necessary investments in its business and earn an appropriate profit. After reviewing these and related factors, the Board concluded, within the context of their overall conclusions, that the costs of services provided and the profitability to the Investment Manager and its affiliates from their relationships with the Fund supported the continuation of the Management Agreement.
| Columbia Strategic Income Fund | Annual Report 2022 | 95 |
columbiathreadneedleus.com/investor/. The Fund is distributed by Columbia Management Investment Distributors, Inc., member FINRA, and managed by Columbia Management Investment Advisers, LLC.

August 31, 2022

| 3 | |
| 6 | |
| 8 | |
| 9 | |
| 13 | |
| 15 | |
| 16 | |
| 18 | |
| 22 | |
| 33 | |
| 34 | |
| 34 | |
| 41 | |
| 41 |
(Unaudited)

| Average annual total returns (%) (for the period ended August 31, 2022) | |||||
| Inception | 1 Year | 5 Years | 10 Years | ||
| Class A | Excluding sales charges | 11/01/02 | -18.02 | 2.34 | 4.25 |
| Including sales charges | -22.74 | 1.13 | 3.63 | ||
| Advisor Class* | 03/19/13 | -17.78 | 2.60 | 4.52 | |
| Class C | Excluding sales charges | 10/13/03 | -18.61 | 1.58 | 3.48 |
| Including sales charges | -19.35 | 1.58 | 3.48 | ||
| Institutional Class | 11/09/00 | -17.78 | 2.60 | 4.52 | |
| Institutional 2 Class* | 01/08/14 | -17.66 | 2.74 | 4.65 | |
| Institutional 3 Class | 07/15/09 | -17.63 | 2.79 | 4.73 | |
| Class R | 09/27/10 | -18.22 | 2.08 | 3.99 | |
| MSCI ACWI ex USA Index (Net) | -19.52 | 1.67 | 4.48 | ||
| MSCI ACWI ex USA Value Index (Net) | -13.57 | 0.21 | 3.28 | ||
| * | The returns shown for periods prior to the share class inception date (including returns for the Life of the Fund, if shown, which are since Fund inception) include the returns of the Fund’s oldest share class. These returns are adjusted to reflect any higher class-related operating expenses of the newer share classes, as applicable. Please visit columbiathreadneedleus.com/investor/investment-products/mutual-funds/appended-performance for more information. |
| Columbia International Dividend Income Fund | Annual Report 2022 | 3 |
(Unaudited)
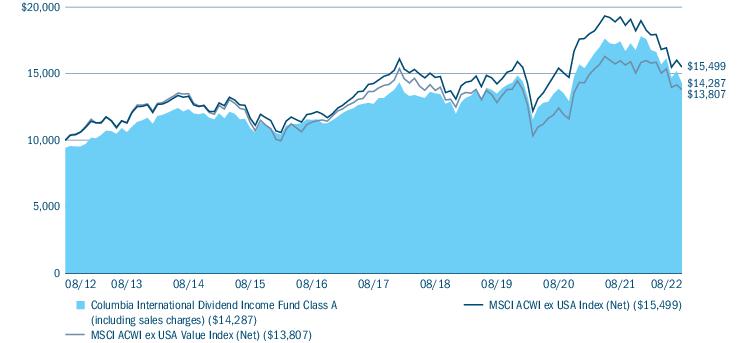
| 4 | Columbia International Dividend Income Fund | Annual Report 2022 |
(Unaudited)
| Equity sector breakdown (%) (at August 31, 2022) | |
| Communication Services | 9.3 |
| Consumer Discretionary | 7.0 |
| Consumer Staples | 10.3 |
| Energy | 7.6 |
| Financials | 20.6 |
| Health Care | 9.1 |
| Industrials | 11.0 |
| Information Technology | 11.9 |
| Materials | 10.2 |
| Utilities | 3.0 |
| Total | 100.0 |
| Country breakdown (%) (at August 31, 2022) | |
| Australia | 2.0 |
| Canada | 6.9 |
| China | 3.8 |
| Denmark | 4.9 |
| Finland | 0.8 |
| France | 10.2 |
| Germany | 10.9 |
| Hong Kong | 5.3 |
| Indonesia | 1.5 |
| Ireland | 1.3 |
| Japan | 8.5 |
| Jersey | 0.9 |
| Netherlands | 1.9 |
| Norway | 2.4 |
| Singapore | 1.8 |
| South Korea | 3.0 |
| Spain | 3.1 |
| Sweden | 0.9 |
| Switzerland | 7.6 |
| Taiwan | 3.9 |
| United Kingdom | 15.4 |
| United States(a) | 3.0 |
| Total | 100.0 |
| (a) | Includes investments in Money Market Funds. |
| Columbia International Dividend Income Fund | Annual Report 2022 | 5 |
(Unaudited)
| • | Positive contributions to the Fund’s performance relative to its primary benchmark over the period were driven by both security selection and sector allocation. |
| • | Selection within the information technology sector led positive contributions to relative performance, in large part due to a lack of exposure to more expensive stocks within the sector, such as e-commerce platform provider Shopify. |
| • | A lack of exposure to semiconductor equipment company ASML was also a notable contributor. ASML’s photolithography technology is integral to the mass production of the advanced chips used to power a wide array of products, and its business has suffered from a pronounced downturn in demand. |
| • | An overweight to and selection within the energy sector also contributed to performance. Most notably, Norwegian oil & gas company Equinor ASA was a prime beneficiary of the move rise higher in energy prices seen in the wake of the Russia-Ukraine conflict. |
| • | Selection within the communication services sector proved additive as well. Within China, the Fund’s lack of exposure to Tencent helped performance as the government’s stepped-up oversight of key industries weighed on shares of internet platform providers. |
| • | Conversely, an overweight to video game developer NetEase, Inc. supported performance. Several new games developed by NetEase competitors were approved by regulators for distribution, which the market interpreted as a sign that the Chinese government’s broader crackdown on gaming may be easing. |
| • | Outside of China, an overweight to Deutsche Telekom AG contributed, in large part due to the German telecommunication services company’s stake in T-Mobile as shares of the U.S. mobile phone carrier have risen on strong business results and the announcement of a large share buyback. |
| • | Selection within the health care sector was positive, highlighted by an overweight to Novo Nordisk A/S. Sentiment with respect to the Danish pharmaceutical company has been boosted by regulatory approval of its blockbuster Type-2 diabetes drug as a treatment for obesity, which has created another large market opportunity. |
| 6 | Columbia International Dividend Income Fund | Annual Report 2022 |
(Unaudited)
| • | Detractors from relative performance included selection within the materials sector, most notably overweights to Akzo Nobel AV, a Dutch paint and coatings manufacturer, and Evonik Industries AG, a German provider of specialty chemicals with a wide variety of industrial applications. Sentiment with respect to both stocks suffered from concerns over limited access to Russian gas and the impact this could have on the European economy. |
| • | Selection within the financials sector also weighed on performance as shares of European banks viewed as vulnerable to weaker conditions in the wake of Russia’s invasion of Ukraine suffered. |
| ○ | In particular, Austria-based Erste Group Bank AG was a laggard given its focus on Central and Eastern European markets. The Fund’s position in Erste Group Bank AG was sold. |
| ○ | That said, an overweight to DBS Group Holdings Ltd. was one of the top positive contributors as the Singapore-based bank was viewed as positioned to benefit from a higher interest rate regime driven by the Fed’s embarking on an aggressive rate hiking trajectory. |
| • | Uncertainty around Russian gas supplies weighed on shares of German electric utility E.ON SE. |
| • | Shares of Germany-based Siemens AG sold off as well as the industrial giant exited the Russia market where it has been heavily involved in developing high speed rail service. |
| • | Within consumer discretionary, Adidas AG sold off as China lockdowns severely constrained the sneaker and apparel manufacturer’s sales into that market. |
| Columbia International Dividend Income Fund | Annual Report 2022 | 7 |
(Unaudited)
| March 1, 2022 — August 31, 2022 | |||||||
| Account value at the beginning of the period ($) | Account value at the end of the period ($) | Expenses paid during the period ($) | Fund’s annualized expense ratio (%) | ||||
| Actual | Hypothetical | Actual | Hypothetical | Actual | Hypothetical | Actual | |
| Class A | 1,000.00 | 1,000.00 | 851.50 | 1,018.80 | 5.93 | 6.46 | 1.27 |
| Advisor Class | 1,000.00 | 1,000.00 | 852.60 | 1,020.06 | 4.76 | 5.19 | 1.02 |
| Class C | 1,000.00 | 1,000.00 | 848.50 | 1,015.02 | 9.41 | 10.26 | 2.02 |
| Institutional Class | 1,000.00 | 1,000.00 | 852.70 | 1,020.06 | 4.76 | 5.19 | 1.02 |
| Institutional 2 Class | 1,000.00 | 1,000.00 | 853.40 | 1,020.77 | 4.11 | 4.48 | 0.88 |
| Institutional 3 Class | 1,000.00 | 1,000.00 | 853.40 | 1,021.02 | 3.88 | 4.23 | 0.83 |
| Class R | 1,000.00 | 1,000.00 | 850.60 | 1,017.54 | 7.09 | 7.73 | 1.52 |
| 8 | Columbia International Dividend Income Fund | Annual Report 2022 |
August 31, 2022
| Common Stocks 96.5% | ||
| Issuer | Shares | Value ($) |
| Australia 2.0% | ||
| carsales.com Ltd. | 331,190 | 5,049,211 |
| Transurban Group | 401,381 | 3,808,090 |
| Total | 8,857,301 | |
| Canada 6.8% | ||
| Canadian National Railway Co. | 92,487 | 10,999,006 |
| Manulife Financial Corp. | 326,156 | 5,642,261 |
| Nutrien Ltd. | 47,128 | 4,326,511 |
| TC Energy Corp. | 193,381 | 9,318,981 |
| Total | 30,286,759 | |
| China 3.8% | ||
| NetEase, Inc., ADR | 81,429 | 7,207,281 |
| Ping An Insurance Group Co. of China Ltd., Class H | 1,630,500 | 9,590,023 |
| Total | 16,797,304 | |
| Denmark 4.8% | ||
| Novo Nordisk A/S, Class B | 120,425 | 12,875,099 |
| Tryg AS | 376,863 | 8,515,513 |
| Total | 21,390,612 | |
| Finland 0.8% | ||
| UPM-Kymmene OYJ | 105,213 | 3,574,536 |
| France 10.2% | ||
| AXA SA | 190,248 | 4,480,648 |
| BNP Paribas SA | 172,699 | 8,025,355 |
| L’Oreal SA | 18,806 | 6,458,810 |
| LVMH Moet Hennessy Louis Vuitton SE | 9,963 | 6,428,794 |
| Schneider Electric SE | 36,834 | 4,377,993 |
| TotalEnergies SE | 251,115 | 12,713,879 |
| VINCI SA | 26,318 | 2,427,927 |
| Total | 44,913,406 | |
| Germany 10.9% | ||
| Adidas AG | 28,062 | 4,161,121 |
| Deutsche Telekom AG, Registered Shares | 513,369 | 9,675,586 |
| E.ON SE | 582,066 | 4,964,784 |
| Evonik Industries AG | 197,447 | 3,681,423 |
| Muenchener Rueckversicherungs-Gesellschaft AG in Muenchen, Registered Shares | 17,569 | 4,197,598 |
| Common Stocks (continued) | ||
| Issuer | Shares | Value ($) |
| SAP SE | 83,273 | 7,092,311 |
| Siemens AG, Registered Shares | 93,881 | 9,509,591 |
| Vantage Towers AG | 185,682 | 4,814,022 |
| Total | 48,096,436 | |
| Hong Kong 5.3% | ||
| AIA Group Ltd. | 1,169,000 | 11,247,226 |
| Hong Kong Exchanges and Clearing Ltd. | 217,000 | 8,743,912 |
| Techtronic Industries Co., Ltd. | 294,000 | 3,467,508 |
| Total | 23,458,646 | |
| Indonesia 1.5% | ||
| PT Bank Rakyat Indonesia Persero Tbk | 22,946,252 | 6,700,974 |
| Ireland 1.3% | ||
| CRH PLC | 154,781 | 5,715,694 |
| Japan 8.5% | ||
| Disco Corp. | 15,400 | 3,739,271 |
| Japan Exchange Group, Inc. | 358,000 | 5,334,996 |
| Rohm Co., Ltd. | 88,700 | 6,636,356 |
| Tokyo Electron Ltd. | 10,200 | 3,199,098 |
| Toyota Motor Corp. | 883,300 | 13,218,645 |
| Yahoo! Japan Corp. | 1,816,500 | 5,340,284 |
| Total | 37,468,650 | |
| Jersey 0.8% | ||
| Amcor PLC | 309,991 | 3,752,578 |
| Netherlands 1.9% | ||
| Akzo Nobel NV | 84,869 | 5,346,864 |
| ING Groep NV | 325,678 | 2,854,385 |
| Total | 8,201,249 | |
| Norway 2.4% | ||
| Equinor ASA | 267,736 | 10,391,009 |
| Singapore 1.8% | ||
| DBS Group Holdings Ltd. | 337,200 | 7,851,198 |
| South Korea 3.0% | ||
| Samsung Electronics Co., Ltd. | 299,202 | 13,254,880 |
| Spain 3.1% | ||
| Iberdrola SA | 735,047 | 7,653,089 |
| Columbia International Dividend Income Fund | Annual Report 2022 | 9 |
August 31, 2022
| Common Stocks (continued) | ||
| Issuer | Shares | Value ($) |
| Industria de Diseno Textil SA | 285,386 | 6,161,893 |
| Total | 13,814,982 | |
| Sweden 0.9% | ||
| Alleima AB(a) | 46,999 | 188,703 |
| Sandvik AB | 234,997 | 3,663,721 |
| Total | 3,852,424 | |
| Switzerland 7.6% | ||
| Nestlé SA, Registered Shares | 115,928 | 13,566,239 |
| Novartis AG, ADR | 87,051 | 7,009,346 |
| Novartis AG, Registered Shares | 20,461 | 1,655,051 |
| Roche Holding AG, Genusschein Shares | 34,963 | 11,266,535 |
| Total | 33,497,171 | |
| Taiwan 3.8% | ||
| MediaTek, Inc. | 162,000 | 3,505,151 |
| Taiwan Semiconductor Manufacturing Co., Ltd. | 822,000 | 13,455,973 |
| Total | 16,961,124 | |
| United Kingdom 15.3% | ||
| 3i Group PLC | 325,231 | 4,578,043 |
| Anglo American PLC | 369,058 | 11,859,486 |
| BT Group PLC | 4,255,678 | 7,444,460 |
| Diageo PLC | 146,357 | 6,358,684 |
| Common Stocks (continued) | ||
| Issuer | Shares | Value ($) |
| Experian PLC | 288,523 | 8,755,363 |
| GSK PLC | 380,504 | 6,082,363 |
| Haleon PLC(a) | 718,033 | 2,159,169 |
| Linde PLC | 18,371 | 5,170,851 |
| Reckitt Benckiser Group PLC | 142,341 | 10,983,259 |
| Unilever PLC | 95,561 | 4,351,323 |
| Total | 67,743,001 | |
| Total Common Stocks (Cost $443,057,139) | 426,579,934 | |
| Money Market Funds 2.9% | ||
| Shares | Value ($) | |
| Columbia Short-Term Cash Fund, 2.366%(b),(c) | 12,964,058 | 12,957,576 |
| Total Money Market Funds (Cost $12,956,224) | 12,957,576 | |
| Total Investments in Securities (Cost $456,013,363) | 439,537,510 | |
| Other Assets & Liabilities, Net | 2,729,231 | |
| Net Assets | $442,266,741 | |
| (a) | Non-income producing investment. |
| (b) | The rate shown is the seven-day current annualized yield at August 31, 2022. |
| (c) | As defined in the Investment Company Act of 1940, as amended, an affiliated company is one in which the Fund owns 5% or more of the company’s outstanding voting securities, or a company which is under common ownership or control with the Fund. The value of the holdings and transactions in these affiliated companies during the year ended August 31, 2022 are as follows: |
| Affiliated issuers | Beginning of period($) | Purchases($) | Sales($) | Net change in unrealized appreciation (depreciation)($) | End of period($) | Realized gain (loss)($) | Dividends($) | End of period shares |
| Columbia Short-Term Cash Fund, 2.366% | ||||||||
| 17,052,705 | 127,364,579 | (131,461,060) | 1,352 | 12,957,576 | (7,143) | 51,441 | 12,964,058 | |
| ADR | American Depositary Receipt |
| 10 | Columbia International Dividend Income Fund | Annual Report 2022 |
August 31, 2022
pricing an investment. An investment’s level within the fair value hierarchy is based on the lowest level of any input that is deemed significant to the asset’s or liability’s fair value measurement. The input levels are not necessarily an indication of the risk or liquidity associated with investments at that level. For example, certain U.S. government securities are generally high quality and liquid, however, they are reflected as Level 2 because the inputs used to determine fair value may not always be quoted prices in an active market.
| ■ | Level 1 — Valuations based on quoted prices for investments in active markets that the Fund has the ability to access at the measurement date. Valuation adjustments are not applied to Level 1 investments. |
| ■ | Level 2 — Valuations based on other significant observable inputs (including quoted prices for similar securities, interest rates, prepayment speeds, credit risks, etc.). |
| ■ | Level 3 — Valuations based on significant unobservable inputs (including the Fund’s own assumptions and judgment in determining the fair value of investments). |
| Level 1 ($) | Level 2 ($) | Level 3 ($) | Total ($) | |
| Investments in Securities | ||||
| Common Stocks | ||||
| Australia | — | 8,857,301 | — | 8,857,301 |
| Canada | 30,286,759 | — | — | 30,286,759 |
| China | 7,207,281 | 9,590,023 | — | 16,797,304 |
| Denmark | — | 21,390,612 | — | 21,390,612 |
| Finland | — | 3,574,536 | — | 3,574,536 |
| France | — | 44,913,406 | — | 44,913,406 |
| Germany | — | 48,096,436 | — | 48,096,436 |
| Hong Kong | — | 23,458,646 | — | 23,458,646 |
| Indonesia | — | 6,700,974 | — | 6,700,974 |
| Ireland | — | 5,715,694 | — | 5,715,694 |
| Japan | — | 37,468,650 | — | 37,468,650 |
| Jersey | — | 3,752,578 | — | 3,752,578 |
| Netherlands | — | 8,201,249 | — | 8,201,249 |
| Norway | — | 10,391,009 | — | 10,391,009 |
| Singapore | — | 7,851,198 | — | 7,851,198 |
| South Korea | — | 13,254,880 | — | 13,254,880 |
| Spain | — | 13,814,982 | — | 13,814,982 |
| Sweden | — | 3,852,424 | — | 3,852,424 |
| Switzerland | 7,009,346 | 26,487,825 | — | 33,497,171 |
| Columbia International Dividend Income Fund | Annual Report 2022 | 11 |
August 31, 2022
| Level 1 ($) | Level 2 ($) | Level 3 ($) | Total ($) | |
| Taiwan | — | 16,961,124 | — | 16,961,124 |
| United Kingdom | — | 67,743,001 | — | 67,743,001 |
| Total Common Stocks | 44,503,386 | 382,076,548 | — | 426,579,934 |
| Money Market Funds | 12,957,576 | — | — | 12,957,576 |
| Total Investments in Securities | 57,460,962 | 382,076,548 | — | 439,537,510 |
| 12 | Columbia International Dividend Income Fund | Annual Report 2022 |
August 31, 2022
| Assets | |
| Investments in securities, at value | |
| Unaffiliated issuers (cost $443,057,139) | $426,579,934 |
| Affiliated issuers (cost $12,956,224) | 12,957,576 |
| Receivable for: | |
| Capital shares sold | 327,625 |
| Dividends | 1,190,953 |
| Foreign tax reclaims | 1,510,083 |
| Expense reimbursement due from Investment Manager | 1,465 |
| Prepaid expenses | 7,234 |
| Trustees’ deferred compensation plan | 184,042 |
| Total assets | 442,758,912 |
| Liabilities | |
| Payable for: | |
| Capital shares purchased | 182,523 |
| Management services fees | 9,368 |
| Distribution and/or service fees | 534 |
| Transfer agent fees | 38,629 |
| Compensation of board members | 13,271 |
| Custodian fees | 36,735 |
| Other expenses | 27,069 |
| Trustees’ deferred compensation plan | 184,042 |
| Total liabilities | 492,171 |
| Net assets applicable to outstanding capital stock | $442,266,741 |
| Represented by | |
| Paid in capital | 460,183,768 |
| Total distributable earnings (loss) | (17,917,027) |
| Total - representing net assets applicable to outstanding capital stock | $442,266,741 |
| Columbia International Dividend Income Fund | Annual Report 2022 | 13 |
August 31, 2022
| Class A | |
| Net assets | $71,241,721 |
| Shares outstanding | 4,391,766 |
| Net asset value per share | $16.22 |
| Maximum sales charge | 5.75% |
| Maximum offering price per share (calculated by dividing the net asset value per share by 1.0 minus the maximum sales charge for Class A shares) | $17.21 |
| Advisor Class | |
| Net assets | $4,714,855 |
| Shares outstanding | 287,740 |
| Net asset value per share | $16.39 |
| Class C | |
| Net assets | $1,529,019 |
| Shares outstanding | 102,066 |
| Net asset value per share | $14.98 |
| Institutional Class | |
| Net assets | $303,027,552 |
| Shares outstanding | 18,604,715 |
| Net asset value per share | $16.29 |
| Institutional 2 Class | |
| Net assets | $18,344,438 |
| Shares outstanding | 1,129,745 |
| Net asset value per share | $16.24 |
| Institutional 3 Class | |
| Net assets | $43,291,634 |
| Shares outstanding | 2,661,269 |
| Net asset value per share | $16.27 |
| Class R | |
| Net assets | $117,522 |
| Shares outstanding | 7,260 |
| Net asset value per share | $16.19 |
| 14 | Columbia International Dividend Income Fund | Annual Report 2022 |
Year Ended August 31, 2022
| Net investment income | |
| Income: | |
| Dividends — unaffiliated issuers | $16,611,000 |
| Dividends — affiliated issuers | 51,441 |
| Interfund lending | 43 |
| European Union tax reclaim | 343,231 |
| Foreign taxes withheld | (1,858,749) |
| Total income | 15,146,966 |
| Expenses: | |
| Management services fees | 3,772,810 |
| Distribution and/or service fees | |
| Class A | 199,738 |
| Class C | 13,737 |
| Class R | 543 |
| Transfer agent fees | |
| Class A | 194,630 |
| Advisor Class | 6,232 |
| Class C | 3,386 |
| Institutional Class | 862,053 |
| Institutional 2 Class | 6,033 |
| Institutional 3 Class | 2,342 |
| Class R | 265 |
| Compensation of board members | 19,338 |
| Custodian fees | 87,741 |
| Printing and postage fees | 53,638 |
| Registration fees | 122,370 |
| Audit fees | 47,466 |
| Legal fees | 15,685 |
| Interest on interfund lending | 45 |
| Compensation of chief compliance officer | 117 |
| Other | 31,153 |
| Total expenses | 5,439,322 |
| Fees waived or expenses reimbursed by Investment Manager and its affiliates | (338,460) |
| Expense reduction | (43,058) |
| Total net expenses | 5,057,804 |
| Net investment income | 10,089,162 |
| Realized and unrealized gain (loss) — net | |
| Net realized gain (loss) on: | |
| Investments — unaffiliated issuers | (3,155,592) |
| Investments — affiliated issuers | (7,143) |
| Foreign currency translations | (105,201) |
| Net realized loss | (3,267,936) |
| Net change in unrealized appreciation (depreciation) on: | |
| Investments — unaffiliated issuers | (102,256,011) |
| Investments — affiliated issuers | 1,352 |
| Foreign currency translations | (204,745) |
| Net change in unrealized appreciation (depreciation) | (102,459,404) |
| Net realized and unrealized loss | (105,727,340) |
| Net decrease in net assets resulting from operations | $(95,638,178) |
| Columbia International Dividend Income Fund | Annual Report 2022 | 15 |
| Year Ended August 31, 2022 | Year Ended August 31, 2021 | |
| Operations | ||
| Net investment income | $10,089,162 | $8,250,395 |
| Net realized gain (loss) | (3,267,936) | 36,008,475 |
| Net change in unrealized appreciation (depreciation) | (102,459,404) | 64,149,839 |
| Net increase (decrease) in net assets resulting from operations | (95,638,178) | 108,408,709 |
| Distributions to shareholders | ||
| Net investment income and net realized gains | ||
| Class A | (6,997,862) | (2,303,223) |
| Advisor Class | (88,243) | (10,794) |
| Class C | (98,059) | (27,948) |
| Institutional Class | (31,742,875) | (11,403,641) |
| Institutional 2 Class | (297,512) | (26,907) |
| Institutional 3 Class | (3,793,474) | (1,315,078) |
| Class R | (8,699) | (3,266) |
| Total distributions to shareholders | (43,026,724) | (15,090,857) |
| Increase (decrease) in net assets from capital stock activity | 78,972,472 | (27,098,761) |
| Total increase (decrease) in net assets | (59,692,430) | 66,219,091 |
| Net assets at beginning of year | 501,959,171 | 435,740,080 |
| Net assets at end of year | $442,266,741 | $501,959,171 |
| 16 | Columbia International Dividend Income Fund | Annual Report 2022 |
| Year Ended | Year Ended | |||
| August 31, 2022 | August 31, 2021 | |||
| Shares | Dollars ($) | Shares | Dollars ($) | |
| Capital stock activity | ||||
| Class A | ||||
| Subscriptions | 715,307 | 13,769,011 | 211,277 | 4,459,140 |
| Distributions reinvested | 333,971 | 6,501,856 | 106,040 | 2,102,272 |
| Redemptions | (484,762) | (9,281,657) | (529,408) | (10,555,991) |
| Net increase (decrease) | 564,516 | 10,989,210 | (212,091) | (3,994,579) |
| Advisor Class | ||||
| Subscriptions | 280,694 | 5,372,578 | 11,379 | 245,823 |
| Distributions reinvested | 4,687 | 88,019 | 536 | 10,715 |
| Redemptions | (22,122) | (404,467) | (3,837) | (80,623) |
| Net increase | 263,259 | 5,056,130 | 8,078 | 175,915 |
| Class C | ||||
| Subscriptions | 80,731 | 1,436,401 | 14,316 | 284,333 |
| Distributions reinvested | 5,454 | 98,059 | 1,508 | 27,661 |
| Redemptions | (27,149) | (456,370) | (39,424) | (757,440) |
| Net increase (decrease) | 59,036 | 1,078,090 | (23,600) | (445,446) |
| Institutional Class | ||||
| Subscriptions | 2,241,537 | 44,297,229 | 279,598 | 5,728,444 |
| Distributions reinvested | 1,579,441 | 30,850,576 | 557,992 | 11,085,963 |
| Redemptions | (2,466,694) | (46,580,101) | (1,910,186) | (38,174,177) |
| Net increase (decrease) | 1,354,284 | 28,567,704 | (1,072,596) | (21,359,770) |
| Institutional 2 Class | ||||
| Subscriptions | 1,199,470 | 23,185,790 | 20,911 | 446,799 |
| Distributions reinvested | 16,250 | 297,288 | 1,353 | 26,826 |
| Redemptions | (142,313) | (2,544,162) | (15,223) | (287,868) |
| Net increase | 1,073,407 | 20,938,916 | 7,041 | 185,757 |
| Institutional 3 Class | ||||
| Subscriptions | 2,115,335 | 37,705,293 | 96,542 | 2,054,514 |
| Distributions reinvested | 194,484 | 3,793,098 | 66,245 | 1,314,465 |
| Redemptions | (1,601,196) | (29,166,554) | (260,124) | (5,036,683) |
| Net increase (decrease) | 708,623 | 12,331,837 | (97,337) | (1,667,704) |
| Class R | ||||
| Subscriptions | 4,872 | 83,553 | 343 | 6,876 |
| Distributions reinvested | 446 | 8,699 | 165 | 3,266 |
| Redemptions | (4,308) | (81,667) | (160) | (3,076) |
| Net increase | 1,010 | 10,585 | 348 | 7,066 |
| Total net increase (decrease) | 4,024,135 | 78,972,472 | (1,390,157) | (27,098,761) |
| Columbia International Dividend Income Fund | Annual Report 2022 | 17 |
| Net asset value, beginning of period | Net investment income | Net realized and unrealized gain (loss) | Total from investment operations | Distributions from net investment income | Distributions from net realized gains | Total distributions to shareholders | |
| Class A | |||||||
| Year Ended 8/31/2022 | $21.61 | 0.35(c) | (3.97) | (3.62) | (0.42) | (1.35) | (1.77) |
| Year Ended 8/31/2021 | $17.70 | 0.30 | 4.20 | 4.50 | (0.20) | (0.39) | (0.59) |
| Year Ended 8/31/2020 | $17.88 | 0.37 | 0.07 | 0.44 | (0.42) | (0.20) | (0.62) |
| Year Ended 8/31/2019 | $18.83 | 0.45 | (0.54) | (0.09) | (0.49) | (0.37) | (0.86) |
| Year Ended 8/31/2018 | $18.24 | 0.48 | 0.65 | 1.13 | (0.54) | — | (0.54) |
| Advisor Class | |||||||
| Year Ended 8/31/2022 | $21.81 | 0.45(c) | (4.05) | (3.60) | (0.47) | (1.35) | (1.82) |
| Year Ended 8/31/2021 | $17.86 | 0.36 | 4.23 | 4.59 | (0.25) | (0.39) | (0.64) |
| Year Ended 8/31/2020 | $18.04 | 0.40 | 0.08 | 0.48 | (0.46) | (0.20) | (0.66) |
| Year Ended 8/31/2019 | $18.99 | 0.51 | (0.55) | (0.04) | (0.54) | (0.37) | (0.91) |
| Year Ended 8/31/2018 | $18.39 | 0.54 | 0.64 | 1.18 | (0.58) | — | (0.58) |
| Class C | |||||||
| Year Ended 8/31/2022 | $20.07 | 0.24(c) | (3.71) | (3.47) | (0.27) | (1.35) | (1.62) |
| Year Ended 8/31/2021 | $16.50 | 0.11 | 3.95 | 4.06 | (0.10) | (0.39) | (0.49) |
| Year Ended 8/31/2020 | $16.70 | 0.22 | 0.06 | 0.28 | (0.28) | (0.20) | (0.48) |
| Year Ended 8/31/2019 | $17.63 | 0.29 | (0.49) | (0.20) | (0.36) | (0.37) | (0.73) |
| Year Ended 8/31/2018 | $17.10 | 0.31 | 0.62 | 0.93 | (0.40) | — | (0.40) |
| Institutional Class | |||||||
| Year Ended 8/31/2022 | $21.69 | 0.40(c) | (3.98) | (3.58) | (0.47) | (1.35) | (1.82) |
| Year Ended 8/31/2021 | $17.76 | 0.35 | 4.22 | 4.57 | (0.25) | (0.39) | (0.64) |
| Year Ended 8/31/2020 | $17.95 | 0.41 | 0.06 | 0.47 | (0.46) | (0.20) | (0.66) |
| Year Ended 8/31/2019 | $18.90 | 0.50 | (0.54) | (0.04) | (0.54) | (0.37) | (0.91) |
| Year Ended 8/31/2018 | $18.30 | 0.53 | 0.65 | 1.18 | (0.58) | — | (0.58) |
| Institutional 2 Class | |||||||
| Year Ended 8/31/2022 | $21.63 | 0.55(c) | (4.09) | (3.54) | (0.50) | (1.35) | (1.85) |
| Year Ended 8/31/2021 | $17.72 | 0.38 | 4.20 | 4.58 | (0.28) | (0.39) | (0.67) |
| Year Ended 8/31/2020 | $17.90 | 0.44 | 0.07 | 0.51 | (0.49) | (0.20) | (0.69) |
| Year Ended 8/31/2019 | $18.85 | 0.56 | (0.58) | (0.02) | (0.56) | (0.37) | (0.93) |
| Year Ended 8/31/2018 | $18.26 | 0.56 | 0.64 | 1.20 | (0.61) | — | (0.61) |
| 18 | Columbia International Dividend Income Fund | Annual Report 2022 |
| Net asset value, end of period | Total return | Total gross expense ratio to average net assets(a) | Total net expense ratio to average net assets(a),(b) | Net investment income ratio to average net assets | Portfolio turnover | Net assets, end of period (000’s) | |
| Class A | |||||||
| Year Ended 8/31/2022 | $16.22 | (18.02%) | 1.34%(d) | 1.26%(d),(e) | 1.82% | 34% | $71,242 |
| Year Ended 8/31/2021 | $21.61 | 25.78% | 1.34%(d),(f) | 1.24%(d),(e),(f) | 1.51% | 28% | $82,701 |
| Year Ended 8/31/2020 | $17.70 | 2.65% | 1.38%(d) | 1.24%(d),(e) | 2.09% | 91% | $71,493 |
| Year Ended 8/31/2019 | $17.88 | (0.16%) | 1.44% | 1.25% | 2.56% | 56% | $78,887 |
| Year Ended 8/31/2018 | $18.83 | 6.21% | 1.44% | 1.26%(e) | 2.52% | 39% | $93,177 |
| Advisor Class | |||||||
| Year Ended 8/31/2022 | $16.39 | (17.78%) | 1.12%(d) | 1.02%(d),(e) | 2.50% | 34% | $4,715 |
| Year Ended 8/31/2021 | $21.81 | 26.08% | 1.09%(d),(f) | 0.99%(d),(e),(f) | 1.77% | 28% | $534 |
| Year Ended 8/31/2020 | $17.86 | 2.90% | 1.12%(d) | 0.98%(d),(e) | 2.16% | 91% | $293 |
| Year Ended 8/31/2019 | $18.04 | 0.10% | 1.19% | 1.00% | 2.84% | 56% | $1,027 |
| Year Ended 8/31/2018 | $18.99 | 6.47% | 1.19% | 1.01%(e) | 2.82% | 39% | $1,141 |
| Class C | |||||||
| Year Ended 8/31/2022 | $14.98 | (18.61%) | 2.10%(d) | 2.01%(d),(e) | 1.37% | 34% | $1,529 |
| Year Ended 8/31/2021 | $20.07 | 24.86% | 2.09%(d),(f) | 1.99%(d),(e),(f) | 0.62% | 28% | $864 |
| Year Ended 8/31/2020 | $16.50 | 1.83% | 2.13%(d) | 1.98%(d),(e) | 1.30% | 91% | $1,100 |
| Year Ended 8/31/2019 | $16.70 | (0.86%) | 2.19% | 2.00% | 1.72% | 56% | $1,745 |
| Year Ended 8/31/2018 | $17.63 | 5.42% | 2.19% | 2.01%(e) | 1.76% | 39% | $3,268 |
| Institutional Class | |||||||
| Year Ended 8/31/2022 | $16.29 | (17.78%) | 1.09%(d) | 1.01%(d),(e) | 2.06% | 34% | $303,028 |
| Year Ended 8/31/2021 | $21.69 | 26.11% | 1.09%(d),(f) | 0.99%(d),(e),(f) | 1.76% | 28% | $374,189 |
| Year Ended 8/31/2020 | $17.76 | 2.86% | 1.13%(d) | 0.99%(d),(e) | 2.34% | 91% | $325,493 |
| Year Ended 8/31/2019 | $17.95 | 0.10% | 1.19% | 1.00% | 2.83% | 56% | $354,127 |
| Year Ended 8/31/2018 | $18.90 | 6.51% | 1.19% | 1.01%(e) | 2.78% | 39% | $395,163 |
| Institutional 2 Class | |||||||
| Year Ended 8/31/2022 | $16.24 | (17.66%) | 0.92%(d) | 0.88%(d) | 3.06% | 34% | $18,344 |
| Year Ended 8/31/2021 | $21.63 | 26.23% | 0.91%(d),(f) | 0.86%(d),(f) | 1.88% | 28% | $1,219 |
| Year Ended 8/31/2020 | $17.72 | 3.07% | 0.90%(d) | 0.86%(d) | 2.49% | 91% | $873 |
| Year Ended 8/31/2019 | $17.90 | 0.23% | 0.91% | 0.87% | 3.13% | 56% | $1,337 |
| Year Ended 8/31/2018 | $18.85 | 6.62% | 0.91% | 0.88% | 2.93% | 39% | $553 |
| Columbia International Dividend Income Fund | Annual Report 2022 | 19 |
| Net asset value, beginning of period | Net investment income | Net realized and unrealized gain (loss) | Total from investment operations | Distributions from net investment income | Distributions from net realized gains | Total distributions to shareholders | |
| Institutional 3 Class | |||||||
| Year Ended 8/31/2022 | $21.67 | 0.43(c) | (3.97) | (3.54) | (0.51) | (1.35) | (1.86) |
| Year Ended 8/31/2021 | $17.75 | 0.39 | 4.21 | 4.60 | (0.29) | (0.39) | (0.68) |
| Year Ended 8/31/2020 | $17.94 | 0.45 | 0.06 | 0.51 | (0.50) | (0.20) | (0.70) |
| Year Ended 8/31/2019 | $18.89 | 0.51 | (0.52) | (0.01) | (0.57) | (0.37) | (0.94) |
| Year Ended 8/31/2018 | $18.29 | 0.57 | 0.65 | 1.22 | (0.62) | — | (0.62) |
| Class R | |||||||
| Year Ended 8/31/2022 | $21.57 | 0.31(c) | (3.97) | (3.66) | (0.37) | (1.35) | (1.72) |
| Year Ended 8/31/2021 | $17.67 | 0.26 | 4.19 | 4.45 | (0.16) | (0.39) | (0.55) |
| Year Ended 8/31/2020 | $17.85 | 0.32 | 0.07 | 0.39 | (0.37) | (0.20) | (0.57) |
| Year Ended 8/31/2019 | $18.80 | 0.25 | (0.38) | (0.13) | (0.45) | (0.37) | (0.82) |
| Year Ended 8/31/2018 | $18.21 | 0.43 | 0.65 | 1.08 | (0.49) | — | (0.49) |
| Notes to Financial Highlights | |
| (a) | In addition to the fees and expenses that the Fund bears directly, the Fund indirectly bears a pro rata share of the fees and expenses of any other funds in which it invests. Such indirect expenses are not included in the Fund’s reported expense ratios. |
| (b) | Total net expenses include the impact of certain fee waivers/expense reimbursements made by the Investment Manager and certain of its affiliates, if applicable. |
| (c) | Net investment income per share includes European Union tax reclaims. The effect of these reclaims amounted to $0.01 per share. |
| (d) | Ratios include interfund lending expense which is less than 0.01%. |
| (e) | The benefits derived from expense reductions had an impact of: |
| Class | 8/31/2022 | 8/31/2021 | 8/31/2020 | 8/31/2019 | 8/31/2018 |
| Class A | 0.01% | 0.01% | 0.02% | —% | 0.01% |
| Advisor Class | 0.00% | 0.01% | 0.03% | —% | 0.02% |
| Class C | 0.01% | 0.02% | 0.02% | —% | 0.02% |
| Institutional Class | 0.01% | 0.01% | 0.02% | —% | 0.02% |
| Class R | 0.01% | 0.01% | 0.02% | —% | 0.01% |
| (f) | Ratios include line of credit interest expense which is less than 0.01%. |
| 20 | Columbia International Dividend Income Fund | Annual Report 2022 |
| Net asset value, end of period | Total return | Total gross expense ratio to average net assets(a) | Total net expense ratio to average net assets(a),(b) | Net investment income ratio to average net assets | Portfolio turnover | Net assets, end of period (000’s) | |
| Institutional 3 Class | |||||||
| Year Ended 8/31/2022 | $16.27 | (17.63%) | 0.85%(d) | 0.82%(d) | 2.24% | 34% | $43,292 |
| Year Ended 8/31/2021 | $21.67 | 26.30% | 0.86%(d),(f) | 0.81%(d),(f) | 1.95% | 28% | $42,318 |
| Year Ended 8/31/2020 | $17.75 | 3.07% | 0.85%(d) | 0.81%(d) | 2.58% | 91% | $36,384 |
| Year Ended 8/31/2019 | $17.94 | 0.29% | 0.85% | 0.81% | 2.87% | 56% | $47,630 |
| Year Ended 8/31/2018 | $18.89 | 6.72% | 0.85% | 0.82% | 2.98% | 39% | $63,148 |
| Class R | |||||||
| Year Ended 8/31/2022 | $16.19 | (18.22%) | 1.59%(d) | 1.50%(d),(e) | 1.61% | 34% | $118 |
| Year Ended 8/31/2021 | $21.57 | 25.48% | 1.59%(d),(f) | 1.49%(d),(e),(f) | 1.28% | 28% | $135 |
| Year Ended 8/31/2020 | $17.67 | 2.37% | 1.63%(d) | 1.49%(d),(e) | 1.84% | 91% | $104 |
| Year Ended 8/31/2019 | $17.85 | (0.41%) | 1.70% | 1.50% | 1.41% | 56% | $117 |
| Year Ended 8/31/2018 | $18.80 | 5.95% | 1.69% | 1.51%(e) | 2.27% | 39% | $1,705 |
| Columbia International Dividend Income Fund | Annual Report 2022 | 21 |
August 31, 2022
| 22 | Columbia International Dividend Income Fund | Annual Report 2022 |
August 31, 2022
| Columbia International Dividend Income Fund | Annual Report 2022 | 23 |
August 31, 2022
| 24 | Columbia International Dividend Income Fund | Annual Report 2022 |
August 31, 2022
| Columbia International Dividend Income Fund | Annual Report 2022 | 25 |
August 31, 2022
| Effective rate (%) | |
| Class A | 0.24 |
| Advisor Class | 0.25 |
| Class C | 0.25 |
| Institutional Class | 0.24 |
| Institutional 2 Class | 0.06 |
| Institutional 3 Class | 0.01 |
| Class R | 0.24 |
| Front End (%) | CDSC (%) | Amount ($) | |
| Class A | 5.75 | 0.50 - 1.00(a) | 88,871 |
| Class C | — | 1.00(b) | 100 |
| (a) | This charge is imposed on certain investments of between $1 million and $50 million redeemed within 18 months after purchase, as follows: 1.00% if redeemed within 12 months after purchase, and 0.50% if redeemed more than 12, but less than 18, months after purchase, with certain limited exceptions. |
| (b) | This charge applies to redemptions within 12 months after purchase, with certain limited exceptions. |
| 26 | Columbia International Dividend Income Fund | Annual Report 2022 |
August 31, 2022
| January 1, 2022 through December 31, 2022 | Prior to January 1, 2022 | |
| Class A | 1.27% | 1.25% |
| Advisor Class | 1.02 | 1.00 |
| Class C | 2.02 | 2.00 |
| Institutional Class | 1.02 | 1.00 |
| Institutional 2 Class | 0.88 | 0.85 |
| Institutional 3 Class | 0.83 | 0.81 |
| Class R | 1.52 | 1.50 |
| Undistributed net investment income ($) | Accumulated net realized (loss) ($) | Paid in capital ($) |
| (164,078) | 164,078 | — |
| Columbia International Dividend Income Fund | Annual Report 2022 | 27 |
August 31, 2022
| Year Ended August 31, 2022 | Year Ended August 31, 2021 | ||||
| Ordinary income ($) | Long-term capital gains ($) | Total ($) | Ordinary income ($) | Long-term capital gains ($) | Total ($) |
| 28,074,412 | 14,952,312 | 43,026,724 | 5,896,404 | 9,194,453 | 15,090,857 |
| Undistributed ordinary income ($) | Undistributed long-term capital gains ($) | Capital loss carryforwards ($) | Net unrealized (depreciation) ($) |
| 3,221,818 | — | — | (17,364,454) |
| Federal tax cost ($) | Gross unrealized appreciation ($) | Gross unrealized (depreciation) ($) | Net unrealized (depreciation) ($) |
| 456,901,964 | 33,207,563 | (50,572,017) | (17,364,454) |
| Late year ordinary losses ($) | Post-October capital losses ($) |
| — | 3,383,414 |
| 28 | Columbia International Dividend Income Fund | Annual Report 2022 |
August 31, 2022
| Borrower or lender | Average loan balance ($) | Weighted average interest rate (%) | Number of days with outstanding loans |
| Borrower | 1,200,000 | 1.35 | 1 |
| Lender | 2,600,000 | 0.60 | 1 |
| Columbia International Dividend Income Fund | Annual Report 2022 | 29 |
August 31, 2022
| 30 | Columbia International Dividend Income Fund | Annual Report 2022 |
August 31, 2022
| Columbia International Dividend Income Fund | Annual Report 2022 | 31 |
August 31, 2022
| 32 | Columbia International Dividend Income Fund | Annual Report 2022 |
| Columbia International Dividend Income Fund | Annual Report 2022 | 33 |
| Qualified dividend income | Dividends received deduction | Capital gain dividend | Foreign taxes paid to foreign countries | Foreign taxes paid per share to foreign countries | Foreign source income | Foreign source income per share |
| 61.91% | 0.33% | $413,215 | $1,515,518 | $0.06 | $16,611,000 | $0.61 |
| 34 | Columbia International Dividend Income Fund | Annual Report 2022 |
(Unaudited)
Independent trustees
| Name, address, year of birth | Position held with the Columbia Funds and length of service | Principal occupation(s) during past five years and other relevant professional experience | Number of Funds in the Columbia Funds Complex* overseen | Other directorships held by Trustee during the past five years |
| George S. Batejan c/o Columbia Management Investment Advisers, LLC 290 Congress Street Boston, MA 02210 1953 | Trustee since 2017 | Executive Vice President, Global Head of Technology and Operations, Janus Capital Group, Inc., 2010-2016 | 176 | Former Chairman of the Board, NICSA (National Investment Company Services Association) (Executive Committee, Nominating Committee and Governance Committee), 2014-2016; former Director, Intech Investment Management, 2011-2016; former Board Member, Metro Denver Chamber of Commerce, 2015-2016; former Advisory Board Member, University of Colorado Business School, 2015-2018 |
| Kathleen Blatz c/o Columbia Management Investment Advisers, LLC 290 Congress Street Boston, MA 02210 1954 | Trustee since 2006 | Attorney, specializing in arbitration and mediation; Chief Justice, Minnesota Supreme Court, 1998-2006; Associate Justice, Minnesota Supreme Court, 1996-1998; Fourth Judicial District Court Judge, Hennepin County, 1994-1996; Attorney in private practice and public service, 1984-1993; State Representative, Minnesota House of Representatives, 1979-1993, which included service on the Tax and Financial Institutions and Insurance Committees; Member and Interim Chair, Minnesota Sports Facilities Authority, January 2017-July 2017; Interim President and Chief Executive Officer, Blue Cross and Blue Shield of Minnesota (health care insurance), February-July 2018, April-October 2021 | 176 | Former Trustee, Blue Cross and Blue Shield of Minnesota, 2009-2021 (Chair of the Business Development Committee, 2014-2017; Chair of the Governance Committee, 2017-2019); former Member and Chair of the Board, Minnesota Sports Facilities Authority, January 2017-July 2017; former Director, Robina Foundation, 2009-2020 (Chair, 2014-2020); Director, Schulze Family Foundation, since 2021 |
| Pamela G. Carlton c/o Columbia Management Investment Advisers, LLC 290 Congress Street Boston, MA 02210 1954 | Trustee since 2007 | President, Springboard — Partners in Cross Cultural Leadership (consulting company) since 2003; Managing Director of US Equity Research, JP Morgan Chase, 1999-2003; Director of US Equity Research, Chase Asset Management, 1996-1999; Co-Director Latin America Research, 1993-1996, COO Global Research, 1992-1996, Co-Director of US Research, 1991-1992, Investment Banker, 1982-1991, Morgan Stanley; Attorney, Cleary Gottlieb Steen & Hamilton LLP, 1980-1982 | 176 | Trustee, New York Presbyterian Hospital Board (Executive Committee and Chair of People Committee) since 1996; Director, DR Bank (Audit Committee) since 2017; Director, Evercore Inc. (Audit Committee) since 2019; Director, Apollo Commercial Real Estate Finance, Inc. since 2021; the Governing Council of the Independent Directors Council (IDC), since 2021 |
| Janet Langford Carrig c/o Columbia Management Investment Advisers, LLC 290 Congress Street Boston, MA 02210 1957 | Trustee since 1996 | Senior Vice President, General Counsel and Corporate Secretary, ConocoPhillips (independent energy company), September 2007-October 2018 | 174 | Director, EQT Corporation (natural gas producer) since 2019; former Director, Whiting Petroleum Corporation (independent oil and gas company), 2020-2022 |
| Columbia International Dividend Income Fund | Annual Report 2022 | 35 |
(Unaudited)
Independent trustees (continued)
| Name, address, year of birth | Position held with the Columbia Funds and length of service | Principal occupation(s) during past five years and other relevant professional experience | Number of Funds in the Columbia Funds Complex* overseen | Other directorships held by Trustee during the past five years |
| J. Kevin Connaughton c/o Columbia Management Investment Advisers, LLC 290 Congress Street Boston, MA 02210 1964 | Trustee since 2020 | Member, FINRA National Adjudicatory Council since January 2020; Adjunct Professor of Finance, Bentley University since January 2018; Consultant to Independent Trustees of CFVIT and CFST I from March 2016 to June 2020 with respect to CFVIT and to December 2020 with respect to CFST I; Managing Director and General Manager of Mutual Fund Products, Columbia Management Investment Advisers, LLC, May 2010-February 2015; President, Columbia Funds, 2008-2015; and senior officer of Columbia Funds and affiliated funds, 2003-2015 | 174 | Former Director, The Autism Project, March 2015-December 2021; former Member of the Investment Committee, St. Michael’s College, November 2015-February 2020; former Trustee, St. Michael’s College, June 2017-September 2019; former Trustee, New Century Portfolios, January 2015-December 2017 |
| Olive M. Darragh c/o Columbia Management Investment Advisers, LLC 290 Congress Street Boston, MA 02210 1962 | Trustee since 2020 | Managing Director of Darragh Inc. (strategy and talent management consulting firm) since 2010; Founder and CEO, Zolio, Inc. (investment management talent identification platform) since 2004; Consultant to Independent Trustees of CFVIT and CFST I from June 2019 to June 2020 with respect to CFVIT and to December 2020 with respect to CFST I; Partner, Tudor Investments, 2004-2010; Senior Partner, McKinsey & Company (consulting), 1990-2004; Touche Ross CPA, 1985-1988 | 174 | Former Director, University of Edinburgh Business School (Member of US Board); former Director, Boston Public Library Foundation |
| Patricia M. Flynn c/o Columbia Management Investment Advisers, LLC 290 Congress Street Boston, MA 02210 1950 | Trustee since 2004 | Trustee Professor of Economics and Management, Bentley University since 1976 (also teaches and conducts research on corporate governance); Dean, McCallum Graduate School of Business, Bentley University, 1992-2002 | 176 | Trustee, MA Taxpayers Foundation since 1997; former Board of Governors, Innovation Institute, MA Technology Collaborative, 2010-2020; former Board of Directors, The MA Business Roundtable, 2003-2019 |
| Brian J. Gallagher c/o Columbia Management Investment Advisers, LLC 290 Congress Street Boston, MA 02210 1954 | Trustee since 2017 | Retired; Partner with Deloitte & Touche LLP and its predecessors, 1977-2016 | 176 | Trustee, Catholic Schools Foundation since 2004 |
| Douglas A. Hacker c/o Columbia Management Investment Advisers, LLC 290 Congress Street Boston, MA 02210 1955 | Co-Chair since 2021; Chair of CFST I and CFVIT since 2014; Trustee of CFST I and CFVIT since 1996 and CFST, CFST II, CFVST II, CET I and CET II since 2021 | Independent business executive since May 2006; Executive Vice President – Strategy of United Airlines, December 2002 - May 2006; President of UAL Loyalty Services (airline marketing company), September 2001-December 2002; Executive Vice President and Chief Financial Officer of United Airlines, July 1999-September 2001 | 176 | Director, Spartan Nash Company (food distributor); Director, Aircastle Limited (Chair of Audit Committee) (aircraft leasing); former Director, Nash Finch Company (food distributor), 2005-2013; former Director, SeaCube Container Leasing Ltd. (container leasing), 2010-2013; and former Director, Travelport Worldwide Limited (travel information technology), 2014-2019 |
| 36 | Columbia International Dividend Income Fund | Annual Report 2022 |
(Unaudited)
Independent trustees (continued)
| Name, address, year of birth | Position held with the Columbia Funds and length of service | Principal occupation(s) during past five years and other relevant professional experience | Number of Funds in the Columbia Funds Complex* overseen | Other directorships held by Trustee during the past five years |
| Nancy T. Lukitsh c/o Columbia Management Investment Advisers, LLC 290 Congress Street Boston, MA 02210 1956 | Trustee since 2011 | Senior Vice President, Partner and Director of Marketing, Wellington Management Company, LLP (investment adviser), 1997-2010; Chair, Wellington Management Portfolios (commingled non-U.S. investment pools), 2007 -2010; Director, Wellington Trust Company, NA and other Wellington affiliates, 1997-2010 | 174 | None |
| David M. Moffett c/o Columbia Management Investment Advisers, LLC 290 Congress Street Boston, MA 02210 1952 | Trustee since 2011 | Retired; Consultant to Bridgewater and Associates | 174 | Director, CSX Corporation (transportation suppliers); Director, Genworth Financial, Inc. (financial and insurance products and services); Director, PayPal Holdings Inc. (payment and data processing services); Trustee, University of Oklahoma Foundation; former Director, eBay Inc. (online trading community), 2007-2015; and former Director, CIT Bank, CIT Group Inc. (commercial and consumer finance), 2010-2016 |
| Catherine James Paglia c/o Columbia Management Investment Advisers, LLC 290 Congress Street Boston, MA 02210 1952 | Co-Chair since 2021; Chair of CFST, CFST II, CFVST II, CET I and CET II since 2020; Trustee of CFST, CFST II and CFVST II since 2004 and CFST I and CFVIT since 2021 | Director, Enterprise Asset Management, Inc. (private real estate and asset management company) since September 1998; Managing Director and Partner, Interlaken Capital, Inc., 1989-1997; Vice President, 1982-1985, Principal, 1985-1987, Managing Director, 1987-1989, Morgan Stanley; Vice President, Investment Banking, 1980-1982, Associate, Investment Banking, 1976-1980, Dean Witter Reynolds, Inc. | 176 | Director, Valmont Industries, Inc. (irrigation systems manufacturer) since 2012; Trustee, Carleton College (on the Investment Committee); Trustee, Carnegie Endowment for International Peace (on the Investment Committee) |
| Columbia International Dividend Income Fund | Annual Report 2022 | 37 |
(Unaudited)
Independent trustees (continued)
| Name, address, year of birth | Position held with the Columbia Funds and length of service | Principal occupation(s) during past five years and other relevant professional experience | Number of Funds in the Columbia Funds Complex* overseen | Other directorships held by Trustee during the past five years |
| Minor M. Shaw c/o Columbia Management Investment Advisers, LLC 290 Congress Street Boston, MA 02210 1947 | Trustee since 2003 | President, Micco LLC (private investments) since 2011; President, Micco Corp. (family investment business), 1998-2011 | 176 | Director, Blue Cross Blue Shield of South Carolina (Chair of Compensation Committee) since April 2008; Trustee, Hollingsworth Funds (on the Investment Committee) since 2016 (previously Board Chair from 2016-2019); Former Advisory Board member, Duke Energy Corp., 2016-2020; Chair of the Duke Endowment; Chair of Greenville – Spartanburg Airport Commission; former Trustee, BofA Funds Series Trust (11 funds), 2003-2011; former Director, Piedmont Natural Gas, 2004-2016; former Director, National Association of Corporate Directors, Carolinas Chapter, 2013-2018; Chair, Daniel-Mickel Foundation since 1998 |
| Natalie A. Trunow c/o Columbia Management Investment Advisers, LLC 290 Congress Street Boston, MA 02210 1967 | Trustee since 2020 | Chief Executive Officer, Millennial Portfolio Solutions LLC (asset management and consulting services), January 2016-January 2021; Non-executive Member of the Investment Committee and Valuation Committee, Sarona Asset Management Inc. (private equity firm) since September 2019; Advisor, Horizon Investments (asset management and consulting services), August 2018-January 2021; Advisor, Paradigm Asset Management, November 2016-December 2021; Consultant to Independent Trustees of CFVIT and CFST I from September 2016 to June 2020 with respect to CFVIT and to December 2020 with respect to CFST I; Director of Investments/Consultant, Casey Family Programs, April 2016-November 2016; Senior Vice President and Chief Investment Officer, Calvert Investments, August 2008-January 2016; Section Head and Portfolio Manager, General Motors Asset Management, June 1997-August 2008 | 174 | Former Director, Investment Committee, Health Services for Children with Special Needs, Inc., 2012-2019; Director, Chair of Audit Committee, Consumer Credit Counseling Services (formerly Guidewell Financial Solutions), since 2019; Independent Director, Investment Committee and Valuation Committee, Sarona Asset Management, since 2019 |
| Sandra L. Yeager c/o Columbia Management Investment Advisers, LLC 290 Congress Street Boston, MA 02210 1964 | Trustee since 2017 | Retired; President and founder, Hanoverian Capital, LLC (SEC registered investment advisor firm), 2008-2016; Managing Director, DuPont Capital, 2006-2008; Managing Director, Morgan Stanley Investment Management, 2004-2006; Senior Vice President, Alliance Bernstein, 1990-2004 | 176 | Former Director, NAPE Education Foundation, October 2016-October 2020 |
| 38 | Columbia International Dividend Income Fund | Annual Report 2022 |
(Unaudited)
| * | The term “Columbia Funds Complex” as used herein includes Columbia Seligman Premium Technology Growth Fund, Tri-Continental Corporation and each series of Columbia Fund Series Trust (CFST), Columbia Funds Series Trust I (CFST I), Columbia Funds Series Trust II (CFST II), Columbia ETF Trust I (CET I), Columbia ETF Trust II (CET II), Columbia Funds Variable Insurance Trust (CFVIT) and Columbia Funds Variable Series Trust II (CFVST II). Messrs. Batejan, Beckman, Gallagher and Hacker and Mses. Blatz, Carlton, Flynn, Paglia, Shaw and Yeager serve as Directors of Columbia Seligman Premium Technology Growth Fund and Tri-Continental Corporation. |
| Name, address, year of birth | Position held with the Columbia Funds and length of service | Principal occupation(s) during the past five years and other relevant professional experience | Number of Funds in the Columbia Funds Complex overseen | Other directorships held by Trustee during the past five years |
| Daniel J. Beckman c/o Columbia Management Investment Advisers, LLC 290 Congress Street Boston, MA 02210 1962 | Trustee since November 2021 and President since June 2021 | Vice President – Head of North America Product, Columbia Management Investment Advisers, LLC since April 2015; President and Principal Executive Officer of the Columbia Funds since June 2021; officer of Columbia Funds and affiliated funds, 2020-2021 | 176 | Director, Ameriprise Trust Company, since October 2016; Director, Columbia Management Investment Distributors, Inc. since November 2018; Board of Governors, Columbia Wanger Asset Management, LLC since January 2022 |
| * | Interested person (as defined under the 1940 Act) by reason of being an officer, director, security holder and/or employee of the Investment Manager or Ameriprise Financial. |
| Name, address and year of birth | Position and year first appointed to position for any Fund in the Columbia Funds Complex or a predecessor thereof | Principal occupation(s) during past five years |
| Michael G. Clarke 290 Congress Street Boston, MA 02210 1969 | Chief Financial Officer and Principal Financial Officer (2009) and Senior Vice President (2019) | Senior Vice President and Head of Global Operations & Investor Services, Columbia Management Investment Advisers, LLC, since March 2022 (previously Vice President, Head of North American Operations, and Co-Head of Global Operations, June 2019 to February 2022 and Vice President – Accounting and Tax, May 2010 - May 2019); senior officer of Columbia Funds and affiliated funds since 2002. |
| Joseph Beranek 5890 Ameriprise Financial Center Minneapolis, MN 55474 1965 | Treasurer and Chief Accounting Officer (Principal Accounting Officer) (2019) and Principal Financial Officer (2020), CFST, CFST I, CFST II, CFVIT and CFVST II; Assistant Treasurer, CET I and CET II | Vice President – Mutual Fund Accounting and Financial Reporting, Columbia Management Investment Advisers, LLC, since December 2018 and March 2017, respectively (previously Vice President – Pricing and Corporate Actions, May 2010 - March 2017). |
| Columbia International Dividend Income Fund | Annual Report 2022 | 39 |
(Unaudited)
Fund officers (continued)
| Name, address and year of birth | Position and year first appointed to position for any Fund in the Columbia Funds Complex or a predecessor thereof | Principal occupation(s) during past five years |
| Marybeth Pilat 290 Congress Street Boston, MA 02210 1968 | Treasurer and Chief Accounting Officer (Principal Accounting Officer) and Principal Financial Officer (2020) for CET I and CET II; Assistant Treasurer, CFST, CFST I, CFST II, CFVIT and CFVST II | Vice President – Product Pricing and Administration, Columbia Management Investment Advisers, LLC, since May 2017; Director - Fund Administration, Calvert Investments, August 2015 – March 2017; Vice President - Fund Administration, Legg Mason, May 2015 - July 2015; Vice President - Fund Administration, Columbia Management Investment Advisers, LLC, May 2010 - April 2015. |
| William F. Truscott 290 Congress Street Boston, MA 02210 1960 | Senior Vice President (2001) | Formerly, Trustee/Director of Columbia Funds Complex or legacy funds, November 2001-January 1, 2021; Chief Executive Officer, Global Asset Management, Ameriprise Financial, Inc. since September 2012; Chairman of the Board and President, Columbia Management Investment Advisers, LLC since July 2004 and February 2012, respectively; Chairman of the Board and Chief Executive Officer, Columbia Management Investment Distributors, Inc. since November 2008 and February 2012, respectively; Chairman of the Board and Director, Threadneedle Asset Management Holdings, Sàrl since March 2013 and December 2008, respectively; senior executive of various entities affiliated with Columbia Threadneedle. |
| Christopher O. Petersen 5228 Ameriprise Financial Center Minneapolis, MN 55474 1970 | Senior Vice President and Assistant Secretary (2021) | Formerly, Trustee/Director of funds within the Columbia Funds Complex, July 1, 2020 - November 22, 2021; Senior Vice President and Assistant General Counsel, Ameriprise Financial, Inc. since September 2021 (previously Vice President and Lead Chief Counsel, January 2015 - September 2021); formerly, President and Principal Executive Officer of the Columbia Funds, 2015 - 2021; officer of Columbia Funds and affiliated funds since 2007. |
| Thomas P. McGuire 290 Congress Street Boston, MA 02210 1972 | Senior Vice President and Chief Compliance Officer (2012) | Vice President – Asset Management Compliance, Ameriprise Financial, Inc., since May 2010; Chief Compliance Officer, Columbia Acorn/Wanger Funds since December 2015; formerly, Chief Compliance Officer, Ameriprise Certificate Company, September 2010 – September 2020. |
| Ryan C. Larrenaga 290 Congress Street Boston, MA 02210 1970 | Senior Vice President (2017), Chief Legal Officer (2017), and Secretary (2015) | Vice President and Chief Counsel, Ameriprise Financial, Inc. since August 2018 (previously Vice President and Group Counsel, August 2011 - August 2018); Chief Legal Officer, Columbia Acorn/Wanger Funds, since September 2020; officer of Columbia Funds and affiliated funds since 2005. |
| Michael E. DeFao 290 Congress Street Boston, MA 02210 1968 | Vice President (2011) and Assistant Secretary (2010) | Vice President and Chief Counsel, Ameriprise Financial, Inc. since May 2010; Vice President, Chief Legal Officer and Assistant Secretary, Columbia Management Investment Advisers, LLC since October 2021 (previously Vice President and Assistant Secretary, May 2010 – September 2021). |
| Lyn Kephart-Strong 5228 Ameriprise Financial Center Minneapolis, MN 55474 1960 | Vice President (2015) | President, Columbia Management Investment Services Corp. since October 2014; Vice President & Resolution Officer, Ameriprise Trust Company since August 2009. |
| 40 | Columbia International Dividend Income Fund | Annual Report 2022 |
| • | the Fund had sufficient liquidity to both meet redemptions and operate effectively on behalf of shareholders; |
| • | there were no material changes to the Program during the period; |
| • | the implementation of the Program was effective to manage the Fund’s liquidity risk; and |
| • | the Program operated adequately during the period. |
| Columbia International Dividend Income Fund | Annual Report 2022 | 41 |
(Unaudited)
| • | Information on the investment performance of the Fund relative to the performance of a group of mutual funds determined to be comparable to the Fund by Broadridge, as well as performance relative to benchmarks; |
| • | Information on the Fund’s management fees and total expenses, including information comparing the Fund’s expenses to those of a group of comparable mutual funds, as determined by Broadridge; |
| • | The Investment Manager’s agreement to contractually limit or cap total operating expenses for the Fund so that total operating expenses (excluding certain fees and expenses, such as transaction costs and certain other investment related expenses, interest, taxes, acquired fund fees and expenses and infrequent and/or unusual expenses) would not exceed a specified annual rate, as a percentage of the Fund’s net assets; |
| • | Terms of the Management Agreement; |
| • | Descriptions of other agreements and arrangements with affiliates of the Investment Manager relating to the operations of the Fund, including agreements with respect to the provision of transfer agency and shareholder services to the Fund; |
| • | Descriptions of various services performed by the Investment Manager under the Management Agreement, including portfolio management and portfolio trading practices; |
| • | Information regarding any recently negotiated management fees of similarly-managed portfolios of other institutional clients of the Investment Manager; |
| • | Information regarding the resources of the Investment Manager, including information regarding senior management, portfolio managers and other personnel; |
| • | Information regarding the capabilities of the Investment Manager with respect to compliance monitoring services; |
| • | The profitability to the Investment Manager and its affiliates from their relationships with the Fund; and |
| • | Report provided by the Board’s independent fee consultant, JDL Consultants, LLC (JDL). |
| 42 | Columbia International Dividend Income Fund | Annual Report 2022 |
(Unaudited)
into account the organization and strength of the Fund’s and its service providers’ compliance programs. The Board also reviewed the financial condition of the Investment Manager and its affiliates and each entity’s ability to carry out its responsibilities under the Management Agreement and the Fund’s other service agreements.
| Columbia International Dividend Income Fund | Annual Report 2022 | 43 |
(Unaudited)
of the Funds. It also took into account the indirect economic benefits flowing to the Investment Manager or its affiliates in connection with managing or distributing the Funds, such as the enhanced ability to offer various other financial products to Ameriprise Financial customers, soft dollar benefits and overall reputational advantages. The Board noted that the fees paid by the Fund should permit the Investment Manager to offer competitive compensation to its personnel, make necessary investments in its business and earn an appropriate profit. After reviewing these and related factors, the Board concluded, within the context of their overall conclusions, that the costs of services provided and the profitability to the Investment Manager and its affiliates from their relationships with the Fund supported the continuation of the Management Agreement.
| 44 | Columbia International Dividend Income Fund | Annual Report 2022 |
columbiathreadneedleus.com/investor/. The Fund is distributed by Columbia Management Investment Distributors, Inc., member FINRA, and managed by Columbia Management Investment Advisers, LLC.

August 31, 2022

| 3 | |
| 6 | |
| 8 | |
| 9 | |
| 13 | |
| 14 | |
| 15 | |
| 18 | |
| 22 | |
| 31 | |
| 32 | |
| 32 | |
| 38 | |
| 39 |
(Unaudited)

| Average annual total returns (%) (for the period ended August 31, 2022) | |||||
| Inception | 1 Year | 5 Years | 10 Years | ||
| Class A | Excluding sales charges | 11/01/02 | -24.57 | 15.29 | 19.07 |
| Including sales charges | -28.91 | 13.93 | 18.37 | ||
| Advisor Class* | 11/08/12 | -24.38 | 15.57 | 19.37 | |
| Class C | Excluding sales charges | 10/13/03 | -25.12 | 14.43 | 18.18 |
| Including sales charges | -25.84 | 14.43 | 18.18 | ||
| Institutional Class | 11/09/00 | -24.38 | 15.57 | 19.37 | |
| Institutional 2 Class* | 11/08/12 | -24.33 | 15.65 | 19.49 | |
| Institutional 3 Class* | 03/01/16 | -24.29 | 15.71 | 19.47 | |
| S&P Global 1200 Information Technology Index (Net) | -19.04 | 16.74 | 16.91 | ||
| * | The returns shown for periods prior to the share class inception date (including returns for the Life of the Fund, if shown, which are since Fund inception) include the returns of the Fund’s oldest share class. These returns are adjusted to reflect any higher class-related operating expenses of the newer share classes, as applicable. Please visit columbiathreadneedleus.com/investor/investment-products/mutual-funds/appended-performance for more information. |
| Columbia Global Technology Growth Fund | Annual Report 2022 | 3 |
(Unaudited)
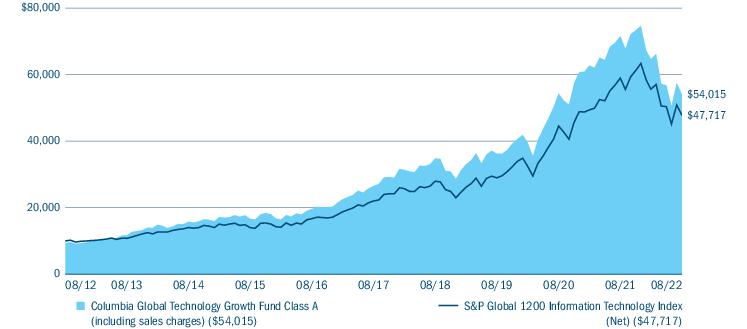
| Equity sector breakdown (%) (at August 31, 2022) | |
| Communication Services | 9.9 |
| Consumer Discretionary | 6.6 |
| Health Care | 0.2 |
| Industrials | 0.6 |
| Information Technology | 82.0 |
| Materials | 0.3 |
| Real Estate | 0.4 |
| Total | 100.0 |
| Equity sub-industry breakdown (%) (at August 31, 2022) | |
| Information Technology | |
| Application Software | 10.9 |
| Communications Equipment | 2.2 |
| Data Processing & Outsourced Services | 10.0 |
| Electronic Components | 0.7 |
| Electronic Equipment & Instruments | 1.0 |
| Electronic Manufacturing Services | 0.6 |
| Internet Services & Infrastructure | 2.2 |
| IT Consulting & Other Services | 2.0 |
| Semiconductor Equipment | 6.7 |
| Semiconductors | 17.2 |
| Systems Software | 14.4 |
| Technology Distributors | 0.5 |
| Technology Hardware, Storage & Peripherals | 13.6 |
| Total | 82.0 |
| 4 | Columbia Global Technology Growth Fund | Annual Report 2022 |
(Unaudited)
| Country breakdown (%) (at August 31, 2022) | |
| Canada | 0.4 |
| France | 0.2 |
| Germany | 0.4 |
| Ireland | 1.4 |
| Israel | 0.2 |
| Japan | 0.5 |
| Netherlands | 3.7 |
| Norway | 0.2 |
| South Korea | 1.0 |
| Taiwan | 2.0 |
| United States(a) | 90.0 |
| Total | 100.0 |
| (a) | Includes investments in Money Market Funds. |
| Columbia Global Technology Growth Fund | Annual Report 2022 | 5 |
(Unaudited)
| • | The Fund’s underperformance of its benchmark during the period was driven by security selection and, secondarily, industry allocations. |
| ○ | Selections within IT services and software were the largest areas of detraction. |
| ○ | Out-of-benchmark allocations to the communication services and consumer discretionary sectors detracted from relative results. An underweighted allocation to the technology hardware industry also weighed on relative results. |
| • | Apple, Inc. was a sizable weight in the portfolio but was still significantly underweight compared to the benchmark’s position, which attributed to the bulk of Apple’s detraction for the Fund versus the benchmark during the period. |
| • | Shopify, Inc. suffered from a painful e-commerce normalization following a pull forward in demand during the COVID-19 pandemic, as shares of the pandemic darling declined over 50% during the first quarter of 2022. The e-commerce enabler reported results that called into question the company’s trajectory of continued hyper-growth and also pointed to higher investments needed to fund new growth. While Shopify did report quarterly revenue that came in ahead of investor expectations, market sentiment soured at the prospect of a second straight year of heavy reinvestment back into the business and the potential for lower near-term profits. |
| • | Shares of Block, Inc. (formerly known as Square) came under pressure even after the company hosted an illustrative analyst day that outlined various monetization engines, the potential for market share gains and the company’s ever evolving ecosystem. With the uncertain macro, the company did not provide long-term guidance, disappointing investors who also were looking for more details about profit metrics as the company continues to invest aggressively. Block continues to be focused on growth at scale with strong unit economics and is still in the early innings of penetrating a significant profit opportunity for its thriving ecosystem of financial applications. |
| • | Stock selection within the communications equipment and electronic equipment industries benefited Fund performance versus the benchmark during the period. |
| • | Synopsys, Inc., which provides electronic design automation software used to design and test semiconductors, returned solid performance after the company reported a beat-and-raise during the period (better-than-expected results and outlook) with strength across all business segments and all geographies. The company, which straddles both the software and semiconductor industries, provided an outlook that came in ahead of peers, many of which were negatively impacted by supply chain constraints. Synopsys expects continued double-digit long-term growth with |
| 6 | Columbia Global Technology Growth Fund | Annual Report 2022 |
(Unaudited)
| continued margin expansion and smart capital allocation. The company’s strong results stand out against an uncertain semiconductor industry plagued by COVID-19-related disruptions and supplier shortages, which highlights the criticality of the company’s software used to design semiconductor components. | |
| • | Having an underweight position in shares of PayPal Holdings, Inc. contributed to relative results during the period. PayPal continued to be impacted by similar economic reopening dynamics as Shopify, as the company reported a second straight quarter of disappointing earnings results during the period. Most concerning is that the company reported net new active customers that came in nearly half as much as it had guided in the prior quarter. The lack of visibility and waning engagement on the platform caused the company to remove its mid-term guidance for total users on the platform. While the company needs to earn back investor trust and the stock has shed over half of its value since all-time highs experienced during the pandemic, the company’s underlying long-term growth trajectory remains intact, and the company remains a market share gainer. |
| • | Palo Alto Networks, Inc. was a beneficiary of the potential for a significant increase in cyber threats and new forms of technological warfare resulting from the tragic Russian invasion of Ukraine. Increasing threat levels across the board and prospects of increased budget spends to secure cyber assets drove Palo Alto Networks to rise appreciably during the period. The company also reported strong results, as security spend remains the top budget priority for companies across the Forbes Global 2000. |
| Columbia Global Technology Growth Fund | Annual Report 2022 | 7 |
(Unaudited)
| March 1, 2022 — August 31, 2022 | |||||||
| Account value at the beginning of the period ($) | Account value at the end of the period ($) | Expenses paid during the period ($) | Fund’s annualized expense ratio (%) | ||||
| Actual | Hypothetical | Actual | Hypothetical | Actual | Hypothetical | Actual | |
| Class A | 1,000.00 | 1,000.00 | 835.90 | 1,019.21 | 5.51 | 6.06 | 1.19 |
| Advisor Class | 1,000.00 | 1,000.00 | 837.00 | 1,020.52 | 4.31 | 4.74 | 0.93 |
| Class C | 1,000.00 | 1,000.00 | 832.90 | 1,015.43 | 8.96 | 9.86 | 1.94 |
| Institutional Class | 1,000.00 | 1,000.00 | 837.00 | 1,020.52 | 4.31 | 4.74 | 0.93 |
| Institutional 2 Class | 1,000.00 | 1,000.00 | 837.20 | 1,020.77 | 4.08 | 4.48 | 0.88 |
| Institutional 3 Class | 1,000.00 | 1,000.00 | 837.50 | 1,021.02 | 3.84 | 4.23 | 0.83 |
| 8 | Columbia Global Technology Growth Fund | Annual Report 2022 |
August 31, 2022
| Common Stocks 98.6% | ||
| Issuer | Shares | Value ($) |
| Canada 0.4% | ||
| Shopify, Inc., Class A(a) | 293,274 | 9,282,122 |
| France 0.2% | ||
| Capgemini SE | 29,603 | 5,114,745 |
| Germany 0.4% | ||
| SAP SE, ADR | 100,005 | 8,522,426 |
| Ireland 1.4% | ||
| Accenture PLC, Class A | 101,450 | 29,264,267 |
| Israel 0.2% | ||
| Global-e Online Ltd.(a) | 146,092 | 4,615,046 |
| Japan 0.5% | ||
| Keyence Corp. | 29,800 | 11,189,127 |
| Netherlands 3.7% | ||
| Adyen NV(a) | 708 | 1,092,547 |
| ASML Holding NV | 87,825 | 43,028,980 |
| NXP Semiconductors NV | 142,060 | 23,380,235 |
| STMicroelectronics NV, Registered Shares | 351,232 | 12,257,997 |
| Total | 79,759,759 | |
| Norway 0.1% | ||
| SmartCraft ASA(a) | 1,661,863 | 3,043,506 |
| South Korea 1.0% | ||
| Samsung Electronics Co., Ltd. | 502,688 | 22,269,468 |
| Taiwan 2.0% | ||
| Taiwan Semiconductor Manufacturing Co., Ltd., ADR | 508,193 | 42,357,887 |
| United States 88.7% | ||
| Activision Blizzard, Inc. | 276,309 | 21,687,493 |
| Adobe, Inc.(a) | 81,962 | 30,607,889 |
| Advanced Micro Devices, Inc.(a) | 323,582 | 27,462,404 |
| Airbnb, Inc., Class A(a) | 82,428 | 9,324,255 |
| Akamai Technologies, Inc.(a) | 54,851 | 4,951,948 |
| Alphabet, Inc., Class A(a) | 1,090,375 | 118,000,382 |
| Amazon.com, Inc.(a) | 675,651 | 85,652,277 |
| Amphenol Corp., Class A | 137,002 | 10,073,757 |
| Analog Devices, Inc. | 160,529 | 24,324,959 |
| ANSYS, Inc.(a) | 45,219 | 11,227,878 |
| Common Stocks (continued) | ||
| Issuer | Shares | Value ($) |
| Apple, Inc. | 1,508,404 | 237,151,277 |
| Applied Materials, Inc. | 308,150 | 28,987,671 |
| Arista Networks, Inc.(a) | 108,269 | 12,979,288 |
| Atlassian Corp. PLC, Class A(a) | 64,731 | 16,031,279 |
| Autodesk, Inc.(a) | 34,086 | 6,876,510 |
| Automatic Data Processing, Inc. | 94,249 | 23,035,398 |
| Bill.com Holdings, Inc.(a) | 29,573 | 4,787,277 |
| Block, Inc., Class A(a) | 139,998 | 9,647,262 |
| Booking Holdings, Inc.(a) | 4,810 | 9,022,646 |
| Broadcom, Inc. | 122,480 | 61,130,993 |
| Cadence Design Systems, Inc.(a) | 92,457 | 16,066,253 |
| CDW Corp. | 56,387 | 9,625,261 |
| Cisco Systems, Inc. | 463,538 | 20,729,419 |
| Cognizant Technology Solutions Corp., Class A | 66,384 | 4,193,477 |
| Comcast Corp., Class A | 110,417 | 3,995,991 |
| Corning, Inc. | 131,163 | 4,501,514 |
| Crowdstrike Holdings, Inc., Class A(a) | 108,087 | 19,737,767 |
| Doximity, Inc., Class A(a) | 52,949 | 1,757,377 |
| Electronic Arts, Inc. | 56,157 | 7,124,639 |
| EngageSmart, Inc.(a) | 240,649 | 4,805,761 |
| EPAM Systems, Inc.(a) | 3,460 | 1,475,690 |
| Fidelity National Information Services, Inc. | 162,703 | 14,866,173 |
| Fiserv, Inc.(a) | 98,439 | 9,961,042 |
| Flywire Corp.(a) | 89,046 | 2,213,684 |
| Fortinet, Inc.(a) | 355,024 | 17,286,119 |
| Global Payments, Inc. | 75,918 | 9,431,293 |
| HP, Inc. | 191,080 | 5,485,907 |
| Intel Corp. | 352,357 | 11,247,235 |
| Intuit, Inc. | 71,901 | 31,045,414 |
| Keysight Technologies, Inc.(a) | 65,686 | 10,765,279 |
| KLA Corp. | 35,615 | 12,256,190 |
| Lam Research Corp. | 135,741 | 59,442,341 |
| Livent Corp.(a) | 223,877 | 7,204,362 |
| Marvell Technology, Inc. | 683,105 | 31,982,976 |
| MasterCard, Inc., Class A | 169,961 | 55,130,250 |
| Match Group, Inc.(a) | 79,950 | 4,519,574 |
| Meta Platforms, Inc., Class A(a) | 91,396 | 14,891,150 |
| Columbia Global Technology Growth Fund | Annual Report 2022 | 9 |
August 31, 2022
| Common Stocks (continued) | ||
| Issuer | Shares | Value ($) |
| Microchip Technology, Inc. | 161,156 | 10,515,429 |
| Micron Technology, Inc. | 335,050 | 18,940,377 |
| Microsoft Corp. | 822,430 | 215,040,772 |
| MongoDB, Inc.(a) | 35,225 | 11,372,744 |
| Motorola Solutions, Inc. | 56,554 | 13,765,809 |
| NetApp, Inc. | 217,373 | 15,679,114 |
| Netflix, Inc.(a) | 30,622 | 6,845,854 |
| NVIDIA Corp. | 405,521 | 61,209,340 |
| Oracle Corp. | 212,271 | 15,739,895 |
| Palo Alto Networks, Inc.(a) | 31,276 | 17,414,790 |
| Paycom Software, Inc.(a) | 23,745 | 8,339,244 |
| PayPal Holdings, Inc.(a) | 195,352 | 18,253,691 |
| QUALCOMM, Inc. | 158,971 | 21,027,094 |
| RingCentral, Inc., Class A(a) | 37,166 | 1,599,625 |
| Salesforce, Inc.(a) | 140,897 | 21,996,840 |
| SBA Communications Corp. | 26,988 | 8,777,847 |
| SentinelOne, Inc., Class A(a) | 122,660 | 3,349,845 |
| ServiceNow, Inc.(a) | 41,092 | 17,859,405 |
| Sharecare, Inc.(a) | 692,612 | 1,267,480 |
| Shift4 Payments, Inc., Class A(a) | 92,739 | 4,200,149 |
| Snowflake, Inc., Class A(a) | 28,022 | 5,070,581 |
| Splunk, Inc.(a) | 37,880 | 3,410,336 |
| Synopsys, Inc.(a) | 170,551 | 59,014,057 |
| Take-Two Interactive Software, Inc.(a) | 34,731 | 4,256,631 |
| TE Connectivity Ltd. | 106,425 | 13,431,899 |
| Tesla, Inc.(a) | 87,780 | 24,193,046 |
| Common Stocks (continued) | ||
| Issuer | Shares | Value ($) |
| Texas Instruments, Inc. | 118,801 | 19,627,113 |
| Thoughtworks Holding, Inc.(a) | 215,999 | 2,842,547 |
| T-Mobile US, Inc.(a) | 80,299 | 11,559,844 |
| Toast, Inc., Class A(a) | 121,245 | 2,295,168 |
| Trade Desk, Inc. (The), Class A(a) | 103,858 | 6,511,897 |
| Twilio, Inc., Class A(a) | 43,954 | 3,058,319 |
| Uber Technologies, Inc.(a) | 446,653 | 12,845,740 |
| VeriSign, Inc.(a) | 75,732 | 13,799,885 |
| Visa, Inc., Class A | 317,228 | 63,036,376 |
| Visteon Corp.(a) | 64,499 | 7,728,915 |
| Walt Disney Co. (The)(a) | 82,846 | 9,285,380 |
| Warner Bros Discovery, Inc.(a) | 145,640 | 1,928,274 |
| Western Digital Corp.(a) | 215,415 | 9,103,438 |
| Workday, Inc., Class A(a) | 26,640 | 4,383,878 |
| Total | 1,915,283,649 | |
| Total Common Stocks (Cost $953,964,700) | 2,130,702,002 | |
| Money Market Funds 1.4% | ||
| Shares | Value ($) | |
| Columbia Short-Term Cash Fund, 2.366%(b),(c) | 28,868,407 | 28,853,973 |
| Total Money Market Funds (Cost $28,850,983) | 28,853,973 | |
| Total Investments in Securities (Cost $982,815,683) | 2,159,555,975 | |
| Other Assets & Liabilities, Net | 874,349 | |
| Net Assets | $2,160,430,324 | |
| (a) | Non-income producing investment. |
| (b) | The rate shown is the seven-day current annualized yield at August 31, 2022. |
| (c) | As defined in the Investment Company Act of 1940, as amended, an affiliated company is one in which the Fund owns 5% or more of the company’s outstanding voting securities, or a company which is under common ownership or control with the Fund. The value of the holdings and transactions in these affiliated companies during the year ended August 31, 2022 are as follows: |
| Affiliated issuers | Beginning of period($) | Purchases($) | Sales($) | Net change in unrealized appreciation (depreciation)($) | End of period($) | Realized gain (loss)($) | Dividends($) | End of period shares |
| Columbia Short-Term Cash Fund, 2.366% | ||||||||
| 36,353,432 | 267,016,693 | (274,510,949) | (5,203) | 28,853,973 | (8,374) | 178,381 | 28,868,407 | |
| ADR | American Depositary Receipt |
| 10 | Columbia Global Technology Growth Fund | Annual Report 2022 |
August 31, 2022
| ■ | Level 1 — Valuations based on quoted prices for investments in active markets that the Fund has the ability to access at the measurement date. Valuation adjustments are not applied to Level 1 investments. |
| ■ | Level 2 — Valuations based on other significant observable inputs (including quoted prices for similar securities, interest rates, prepayment speeds, credit risks, etc.). |
| ■ | Level 3 — Valuations based on significant unobservable inputs (including the Fund’s own assumptions and judgment in determining the fair value of investments). |
| Level 1 ($) | Level 2 ($) | Level 3 ($) | Total ($) | |
| Investments in Securities | ||||
| Common Stocks | ||||
| Canada | 9,282,122 | — | — | 9,282,122 |
| France | — | 5,114,745 | — | 5,114,745 |
| Germany | 8,522,426 | — | — | 8,522,426 |
| Ireland | 29,264,267 | — | — | 29,264,267 |
| Israel | 4,615,046 | — | — | 4,615,046 |
| Japan | — | 11,189,127 | — | 11,189,127 |
| Netherlands | 78,667,212 | 1,092,547 | — | 79,759,759 |
| Norway | — | 3,043,506 | — | 3,043,506 |
| South Korea | — | 22,269,468 | — | 22,269,468 |
| Taiwan | 42,357,887 | — | — | 42,357,887 |
| United States | 1,915,283,649 | — | — | 1,915,283,649 |
| Total Common Stocks | 2,087,992,609 | 42,709,393 | — | 2,130,702,002 |
| Money Market Funds | 28,853,973 | — | — | 28,853,973 |
| Total Investments in Securities | 2,116,846,582 | 42,709,393 | — | 2,159,555,975 |
| Columbia Global Technology Growth Fund | Annual Report 2022 | 11 |
August 31, 2022
The Fund’s assets assigned to the Level 2 input category are generally valued using the market approach, in which a security’s value is determined through reference to prices and information from market transactions for similar or identical assets. These assets include certain foreign securities for which a third party statistical pricing service may be employed for purposes of fair market valuation. The model utilized by such third party statistical pricing service takes into account a security’s correlation to available market data including, but not limited to, intraday index, ADR, and exchange-traded fund movements.
| 12 | Columbia Global Technology Growth Fund | Annual Report 2022 |
August 31, 2022
| Assets | |
| Investments in securities, at value | |
| Unaffiliated issuers (cost $953,964,700) | $2,130,702,002 |
| Affiliated issuers (cost $28,850,983) | 28,853,973 |
| Receivable for: | |
| Capital shares sold | 1,440,317 |
| Dividends | 1,393,540 |
| Foreign tax reclaims | 73,210 |
| Prepaid expenses | 27,994 |
| Trustees’ deferred compensation plan | 111,012 |
| Total assets | 2,162,602,048 |
| Liabilities | |
| Payable for: | |
| Capital shares purchased | 1,647,027 |
| Management services fees | 48,059 |
| Distribution and/or service fees | 7,834 |
| Transfer agent fees | 237,953 |
| Compensation of board members | 31,736 |
| Other expenses | 88,103 |
| Trustees’ deferred compensation plan | 111,012 |
| Total liabilities | 2,171,724 |
| Net assets applicable to outstanding capital stock | $2,160,430,324 |
| Represented by | |
| Paid in capital | 946,758,624 |
| Total distributable earnings (loss) | 1,213,671,700 |
| Total - representing net assets applicable to outstanding capital stock | $2,160,430,324 |
| Class A | |
| Net assets | $521,027,381 |
| Shares outstanding | 10,446,385 |
| Net asset value per share | $49.88 |
| Maximum sales charge | 5.75% |
| Maximum offering price per share (calculated by dividing the net asset value per share by 1.0 minus the maximum sales charge for Class A shares) | $52.92 |
| Advisor Class | |
| Net assets | $85,830,708 |
| Shares outstanding | 1,616,983 |
| Net asset value per share | $53.08 |
| Class C | |
| Net assets | $152,316,797 |
| Shares outstanding | 3,497,826 |
| Net asset value per share | $43.55 |
| Institutional Class | |
| Net assets | $813,075,742 |
| Shares outstanding | 15,542,701 |
| Net asset value per share | $52.31 |
| Institutional 2 Class | |
| Net assets | $152,756,126 |
| Shares outstanding | 2,855,306 |
| Net asset value per share | $53.50 |
| Institutional 3 Class | |
| Net assets | $435,423,570 |
| Shares outstanding | 8,109,062 |
| Net asset value per share | $53.70 |
| Columbia Global Technology Growth Fund | Annual Report 2022 | 13 |
Year Ended August 31, 2022
| Net investment income | |
| Income: | |
| Dividends — unaffiliated issuers | $18,448,204 |
| Dividends — affiliated issuers | 178,381 |
| Foreign taxes withheld | (641,751) |
| Total income | 17,984,834 |
| Expenses: | |
| Management services fees | 21,893,401 |
| Distribution and/or service fees | |
| Class A | 1,602,302 |
| Class C | 2,009,686 |
| Transfer agent fees | |
| Class A | 706,581 |
| Advisor Class | 127,149 |
| Class C | 221,452 |
| Institutional Class | 1,317,200 |
| Institutional 2 Class | 110,098 |
| Institutional 3 Class | 24,044 |
| Compensation of board members | 47,996 |
| Custodian fees | 73,849 |
| Printing and postage fees | 121,722 |
| Registration fees | 130,778 |
| Audit fees | 32,760 |
| Legal fees | 38,330 |
| Compensation of chief compliance officer | 772 |
| Other | 50,264 |
| Total expenses | 28,508,384 |
| Expense reduction | (120) |
| Total net expenses | 28,508,264 |
| Net investment loss | (10,523,430) |
| Realized and unrealized gain (loss) — net | |
| Net realized gain (loss) on: | |
| Investments — unaffiliated issuers | 86,467,150 |
| Investments — affiliated issuers | (8,374) |
| Foreign currency translations | (43,174) |
| Net realized gain | 86,415,602 |
| Net change in unrealized appreciation (depreciation) on: | |
| Investments — unaffiliated issuers | (820,646,540) |
| Investments — affiliated issuers | (5,203) |
| Foreign currency translations | (7,557) |
| Net change in unrealized appreciation (depreciation) | (820,659,300) |
| Net realized and unrealized loss | (734,243,698) |
| Net decrease in net assets resulting from operations | $(744,767,128) |
| 14 | Columbia Global Technology Growth Fund | Annual Report 2022 |
| Year Ended August 31, 2022 | Year Ended August 31, 2021 | |
| Operations | ||
| Net investment loss | $(10,523,430) | $(12,282,576) |
| Net realized gain | 86,415,602 | 146,471,228 |
| Net change in unrealized appreciation (depreciation) | (820,659,300) | 648,458,841 |
| Net increase (decrease) in net assets resulting from operations | (744,767,128) | 782,647,493 |
| Distributions to shareholders | ||
| Net investment income and net realized gains | ||
| Class A | (30,250,343) | (5,485,992) |
| Advisor Class | (5,648,183) | (1,354,857) |
| Class C | (9,216,658) | (2,302,759) |
| Institutional Class | (58,805,302) | (12,661,305) |
| Institutional 2 Class | (9,361,729) | (2,045,536) |
| Institutional 3 Class | (19,242,649) | (3,255,656) |
| Total distributions to shareholders | (132,524,864) | (27,106,105) |
| Decrease in net assets from capital stock activity | (189,662,493) | (85,497,066) |
| Total increase (decrease) in net assets | (1,066,954,485) | 670,044,322 |
| Net assets at beginning of year | 3,227,384,809 | 2,557,340,487 |
| Net assets at end of year | $2,160,430,324 | $3,227,384,809 |
| Columbia Global Technology Growth Fund | Annual Report 2022 | 15 |
| Year Ended | Year Ended | |||
| August 31, 2022 | August 31, 2021 | |||
| Shares | Dollars ($) | Shares | Dollars ($) | |
| Capital stock activity | ||||
| Class A | ||||
| Subscriptions | 1,621,216 | 97,434,247 | 2,601,093 | 151,912,989 |
| Distributions reinvested | 403,671 | 26,932,912 | 85,071 | 4,843,078 |
| Redemptions | (2,211,457) | (129,855,926) | (2,329,655) | (136,127,504) |
| Net increase (decrease) | (186,570) | (5,488,767) | 356,509 | 20,628,563 |
| Advisor Class | ||||
| Subscriptions | 424,128 | 27,391,632 | 779,152 | 48,269,560 |
| Distributions reinvested | 77,045 | 5,460,919 | 21,781 | 1,313,805 |
| Redemptions | (921,483) | (59,197,248) | (2,847,580) | (158,868,584) |
| Net decrease | (420,310) | (26,344,697) | (2,046,647) | (109,285,219) |
| Class C | ||||
| Subscriptions | 295,862 | 16,031,913 | 527,979 | 27,251,116 |
| Distributions reinvested | 147,721 | 8,650,536 | 42,629 | 2,141,276 |
| Redemptions | (948,069) | (49,328,340) | (1,013,612) | (52,557,189) |
| Net decrease | (504,486) | (24,645,891) | (443,004) | (23,164,797) |
| Institutional Class | ||||
| Subscriptions | 3,589,971 | 218,299,110 | 3,824,124 | 232,020,778 |
| Distributions reinvested | 625,016 | 43,657,376 | 155,026 | 9,222,520 |
| Redemptions | (8,331,772) | (494,807,490) | (5,045,996) | (313,649,025) |
| Net decrease | (4,116,785) | (232,851,004) | (1,066,846) | (72,405,727) |
| Institutional 2 Class | ||||
| Subscriptions | 514,999 | 32,257,304 | 949,181 | 59,312,190 |
| Distributions reinvested | 131,098 | 9,361,729 | 33,666 | 2,045,536 |
| Redemptions | (1,016,556) | (67,563,321) | (1,026,308) | (64,203,980) |
| Net decrease | (370,459) | (25,944,288) | (43,461) | (2,846,254) |
| Institutional 3 Class | ||||
| Subscriptions | 4,106,347 | 249,400,923 | 3,117,845 | 196,817,802 |
| Distributions reinvested | 267,546 | 19,169,684 | 53,263 | 3,246,413 |
| Redemptions | (2,293,150) | (142,958,453) | (1,572,241) | (98,487,847) |
| Net increase | 2,080,743 | 125,612,154 | 1,598,867 | 101,576,368 |
| Total net decrease | (3,517,867) | (189,662,493) | (1,644,582) | (85,497,066) |
| 16 | Columbia Global Technology Growth Fund | Annual Report 2022 |
| Net asset value, beginning of period | Net investment income (loss) | Net realized and unrealized gain (loss) | Total from investment operations | Distributions from net realized gains | Total distributions to shareholders | |
| Class A | ||||||
| Year Ended 8/31/2022 | $68.96 | (0.31) | (15.91) | (16.22) | (2.86) | (2.86) |
| Year Ended 8/31/2021 | $52.81 | (0.34) | 17.02 | 16.68 | (0.53) | (0.53) |
| Year Ended 8/31/2020 | $35.69 | (0.14) | 17.76 | 17.62 | (0.50) | (0.50) |
| Year Ended 8/31/2019 | $36.28 | (0.05) | 1.10 | 1.05 | (1.64) | (1.64) |
| Year Ended 8/31/2018 | $28.59 | (0.11) | 8.86 | 8.75 | (1.06) | (1.06) |
| Advisor Class | ||||||
| Year Ended 8/31/2022 | $73.19 | (0.18) | (16.90) | (17.08) | (3.03) | (3.03) |
| Year Ended 8/31/2021 | $55.95 | (0.20) | 18.04 | 17.84 | (0.60) | (0.60) |
| Year Ended 8/31/2020 | $37.69 | (0.04) | 18.80 | 18.76 | (0.50) | (0.50) |
| Year Ended 8/31/2019 | $38.21 | 0.04 | 1.16 | 1.20 | (1.72) | (1.72) |
| Year Ended 8/31/2018 | $30.05 | (0.02) | 9.31 | 9.29 | (1.13) | (1.13) |
| Class C | ||||||
| Year Ended 8/31/2022 | $60.51 | (0.67) | (13.93) | (14.60) | (2.36) | (2.36) |
| Year Ended 8/31/2021 | $46.75 | (0.69) | 14.98 | 14.29 | (0.53) | (0.53) |
| Year Ended 8/31/2020 | $31.88 | (0.40) | 15.77 | 15.37 | (0.50) | (0.50) |
| Year Ended 8/31/2019 | $32.54 | (0.27) | 0.99 | 0.72 | (1.38) | (1.38) |
| Year Ended 8/31/2018 | $25.78 | (0.32) | 7.97 | 7.65 | (0.89) | (0.89) |
| Institutional Class | ||||||
| Year Ended 8/31/2022 | $72.17 | (0.17) | (16.66) | (16.83) | (3.03) | (3.03) |
| Year Ended 8/31/2021 | $55.18 | (0.20) | 17.79 | 17.59 | (0.60) | (0.60) |
| Year Ended 8/31/2020 | $37.17 | (0.04) | 18.55 | 18.51 | (0.50) | (0.50) |
| Year Ended 8/31/2019 | $37.72 | 0.03 | 1.15 | 1.18 | (1.73) | (1.73) |
| Year Ended 8/31/2018 | $29.68 | (0.03) | 9.20 | 9.17 | (1.13) | (1.13) |
| Institutional 2 Class | ||||||
| Year Ended 8/31/2022 | $73.74 | (0.14) | (17.03) | (17.17) | (3.07) | (3.07) |
| Year Ended 8/31/2021 | $56.36 | (0.17) | 18.18 | 18.01 | (0.63) | (0.63) |
| Year Ended 8/31/2020 | $37.94 | (0.01) | 18.93 | 18.92 | (0.50) | (0.50) |
| Year Ended 8/31/2019 | $38.45 | 0.06 | 1.18 | 1.24 | (1.75) | (1.75) |
| Year Ended 8/31/2018 | $30.23 | (0.00)(d) | 9.37 | 9.37 | (1.15) | (1.15) |
| 18 | Columbia Global Technology Growth Fund | Annual Report 2022 |
| Net asset value, end of period | Total return | Total gross expense ratio to average net assets(a) | Total net expense ratio to average net assets(a),(b) | Net investment income (loss) ratio to average net assets | Portfolio turnover | Net assets, end of period (000’s) | |
| Class A | |||||||
| Year Ended 8/31/2022 | $49.88 | (24.57%) | 1.18% | 1.18%(c) | (0.52%) | 8% | $521,027 |
| Year Ended 8/31/2021 | $68.96 | 31.80% | 1.18% | 1.18%(c) | (0.57%) | 18% | $733,206 |
| Year Ended 8/31/2020 | $52.81 | 49.88% | 1.22% | 1.22%(c) | (0.35%) | 12% | $542,684 |
| Year Ended 8/31/2019 | $35.69 | 4.08% | 1.24% | 1.24% | (0.16%) | 40% | $333,217 |
| Year Ended 8/31/2018 | $36.28 | 31.32% | 1.25% | 1.25%(c) | (0.33%) | 28% | $372,730 |
| Advisor Class | |||||||
| Year Ended 8/31/2022 | $53.08 | (24.38%) | 0.92% | 0.92%(c) | (0.27%) | 8% | $85,831 |
| Year Ended 8/31/2021 | $73.19 | 32.12% | 0.93% | 0.93%(c) | (0.32%) | 18% | $149,110 |
| Year Ended 8/31/2020 | $55.95 | 50.26% | 0.97% | 0.97%(c) | (0.10%) | 12% | $228,489 |
| Year Ended 8/31/2019 | $37.69 | 4.33% | 0.99% | 0.99% | 0.11% | 40% | $135,472 |
| Year Ended 8/31/2018 | $38.21 | 31.65% | 1.01% | 1.01%(c) | (0.05%) | 28% | $104,061 |
| Class C | |||||||
| Year Ended 8/31/2022 | $43.55 | (25.12%) | 1.92% | 1.92%(c) | (1.27%) | 8% | $152,317 |
| Year Ended 8/31/2021 | $60.51 | 30.80% | 1.93% | 1.93%(c) | (1.32%) | 18% | $242,186 |
| Year Ended 8/31/2020 | $46.75 | 48.77% | 1.97% | 1.97%(c) | (1.10%) | 12% | $207,808 |
| Year Ended 8/31/2019 | $31.88 | 3.31% | 1.99% | 1.99% | (0.90%) | 40% | $139,366 |
| Year Ended 8/31/2018 | $32.54 | 30.31% | 2.00% | 2.00%(c) | (1.08%) | 28% | $139,590 |
| Institutional Class | |||||||
| Year Ended 8/31/2022 | $52.31 | (24.38%) | 0.92% | 0.92%(c) | (0.27%) | 8% | $813,076 |
| Year Ended 8/31/2021 | $72.17 | 32.11% | 0.93% | 0.93%(c) | (0.32%) | 18% | $1,418,896 |
| Year Ended 8/31/2020 | $55.18 | 50.29% | 0.97% | 0.97%(c) | (0.10%) | 12% | $1,143,613 |
| Year Ended 8/31/2019 | $37.17 | 4.32% | 0.99% | 0.99% | 0.09% | 40% | $693,232 |
| Year Ended 8/31/2018 | $37.72 | 31.64% | 1.00% | 1.00%(c) | (0.09%) | 28% | $686,134 |
| Institutional 2 Class | |||||||
| Year Ended 8/31/2022 | $53.50 | (24.33%) | 0.87% | 0.87% | (0.22%) | 8% | $152,756 |
| Year Ended 8/31/2021 | $73.74 | 32.20% | 0.87% | 0.87% | (0.26%) | 18% | $237,884 |
| Year Ended 8/31/2020 | $56.36 | 50.35% | 0.90% | 0.90% | (0.03%) | 12% | $184,262 |
| Year Ended 8/31/2019 | $37.94 | 4.42% | 0.92% | 0.92% | 0.17% | 40% | $130,115 |
| Year Ended 8/31/2018 | $38.45 | 31.73% | 0.93% | 0.93% | (0.00%)(d) | 28% | $101,134 |
| Columbia Global Technology Growth Fund | Annual Report 2022 | 19 |
| Net asset value, beginning of period | Net investment income (loss) | Net realized and unrealized gain (loss) | Total from investment operations | Distributions from net realized gains | Total distributions to shareholders | |
| Institutional 3 Class | ||||||
| Year Ended 8/31/2022 | $74.00 | (0.11) | (17.09) | (17.20) | (3.10) | (3.10) |
| Year Ended 8/31/2021 | $56.55 | (0.14) | 18.25 | 18.11 | (0.66) | (0.66) |
| Year Ended 8/31/2020 | $38.04 | 0.01 | 19.00 | 19.01 | (0.50) | (0.50) |
| Year Ended 8/31/2019 | $38.55 | 0.08 | 1.18 | 1.26 | (1.77) | (1.77) |
| Year Ended 8/31/2018 | $30.31 | 0.01 | 9.39 | 9.40 | (1.16) | (1.16) |
| Notes to Financial Highlights | |
| (a) | In addition to the fees and expenses that the Fund bears directly, the Fund indirectly bears a pro rata share of the fees and expenses of any other funds in which it invests. Such indirect expenses are not included in the Fund’s reported expense ratios. |
| (b) | Total net expenses include the impact of certain fee waivers/expense reimbursements made by the Investment Manager and certain of its affiliates, if applicable. |
| (c) | The benefits derived from expense reductions had an impact of less than 0.01%. |
| (d) | Rounds to zero. |
| 20 | Columbia Global Technology Growth Fund | Annual Report 2022 |
| Net asset value, end of period | Total return | Total gross expense ratio to average net assets(a) | Total net expense ratio to average net assets(a),(b) | Net investment income (loss) ratio to average net assets | Portfolio turnover | Net assets, end of period (000’s) | |
| Institutional 3 Class | |||||||
| Year Ended 8/31/2022 | $53.70 | (24.29%) | 0.82% | 0.82% | (0.16%) | 8% | $435,424 |
| Year Ended 8/31/2021 | $74.00 | 32.27% | 0.82% | 0.82% | (0.21%) | 18% | $446,103 |
| Year Ended 8/31/2020 | $56.55 | 50.46% | 0.85% | 0.85% | 0.02% | 12% | $250,485 |
| Year Ended 8/31/2019 | $38.04 | 4.47% | 0.87% | 0.87% | 0.22% | 40% | $102,746 |
| Year Ended 8/31/2018 | $38.55 | 31.77% | 0.88% | 0.88% | 0.03% | 28% | $64,995 |
| Columbia Global Technology Growth Fund | Annual Report 2022 | 21 |
August 31, 2022
| 22 | Columbia Global Technology Growth Fund | Annual Report 2022 |
August 31, 2022
| Columbia Global Technology Growth Fund | Annual Report 2022 | 23 |
August 31, 2022
| 24 | Columbia Global Technology Growth Fund | Annual Report 2022 |
August 31, 2022
| Effective rate (%) | |
| Class A | 0.11 |
| Advisor Class | 0.11 |
| Class C | 0.11 |
| Institutional Class | 0.11 |
| Institutional 2 Class | 0.06 |
| Institutional 3 Class | 0.01 |
| Columbia Global Technology Growth Fund | Annual Report 2022 | 25 |
August 31, 2022
| Front End (%) | CDSC (%) | Amount ($) | |
| Class A | 5.75 | 0.50 - 1.00(a) | 889,753 |
| Class C | — | 1.00(b) | 9,791 |
| (a) | This charge is imposed on certain investments of between $1 million and $50 million redeemed within 18 months after purchase, as follows: 1.00% if redeemed within 12 months after purchase, and 0.50% if redeemed more than 12, but less than 18, months after purchase, with certain limited exceptions. |
| (b) | This charge applies to redemptions within 12 months after purchase, with certain limited exceptions. |
| January 1, 2022 through December 31, 2022 | Prior to January 1, 2022 | |
| Class A | 1.37% | 1.38% |
| Advisor Class | 1.12 | 1.13 |
| Class C | 2.12 | 2.13 |
| Institutional Class | 1.12 | 1.13 |
| Institutional 2 Class | 1.07 | 1.07 |
| Institutional 3 Class | 1.02 | 1.02 |
| 26 | Columbia Global Technology Growth Fund | Annual Report 2022 |
August 31, 2022
| Excess of distributions over net investment income ($) | Accumulated net realized gain ($) | Paid in capital ($) |
| 4,864,413 | (14,925,413) | 10,061,000 |
| Year Ended August 31, 2022 | Year Ended August 31, 2021 | ||||
| Ordinary income ($) | Long-term capital gains ($) | Total ($) | Ordinary income ($) | Long-term capital gains ($) | Total ($) |
| 34,587,710 | 97,937,154 | 132,524,864 | 2,579,075 | 24,527,030 | 27,106,105 |
| Undistributed ordinary income ($) | Undistributed long-term capital gains ($) | Capital loss carryforwards ($) | Net unrealized appreciation ($) |
| — | 60,238,495 | — | 1,171,098,892 |
| Federal tax cost ($) | Gross unrealized appreciation ($) | Gross unrealized (depreciation) ($) | Net unrealized appreciation ($) |
| 988,457,083 | 1,252,735,013 | (81,636,121) | 1,171,098,892 |
| Late year ordinary losses ($) | Post-October capital losses ($) |
| 5,666,075 | 11,852,672 |
| Columbia Global Technology Growth Fund | Annual Report 2022 | 27 |
August 31, 2022
| 28 | Columbia Global Technology Growth Fund | Annual Report 2022 |
August 31, 2022
| Columbia Global Technology Growth Fund | Annual Report 2022 | 29 |
August 31, 2022
| 30 | Columbia Global Technology Growth Fund | Annual Report 2022 |
| Columbia Global Technology Growth Fund | Annual Report 2022 | 31 |
| Qualified dividend income | Dividends received deduction | Capital gain dividend |
| 60.13% | 48.55% | $94,088,106 |
| Name, address, year of birth | Position held with the Columbia Funds and length of service | Principal occupation(s) during past five years and other relevant professional experience | Number of Funds in the Columbia Funds Complex* overseen | Other directorships held by Trustee during the past five years |
| George S. Batejan c/o Columbia Management Investment Advisers, LLC 290 Congress Street Boston, MA 02210 1953 | Trustee since 2017 | Executive Vice President, Global Head of Technology and Operations, Janus Capital Group, Inc., 2010-2016 | 176 | Former Chairman of the Board, NICSA (National Investment Company Services Association) (Executive Committee, Nominating Committee and Governance Committee), 2014-2016; former Director, Intech Investment Management, 2011-2016; former Board Member, Metro Denver Chamber of Commerce, 2015-2016; former Advisory Board Member, University of Colorado Business School, 2015-2018 |
| 32 | Columbia Global Technology Growth Fund | Annual Report 2022 |
(Unaudited)
Independent trustees (continued)
| Name, address, year of birth | Position held with the Columbia Funds and length of service | Principal occupation(s) during past five years and other relevant professional experience | Number of Funds in the Columbia Funds Complex* overseen | Other directorships held by Trustee during the past five years |
| Kathleen Blatz c/o Columbia Management Investment Advisers, LLC 290 Congress Street Boston, MA 02210 1954 | Trustee since 2006 | Attorney, specializing in arbitration and mediation; Chief Justice, Minnesota Supreme Court, 1998-2006; Associate Justice, Minnesota Supreme Court, 1996-1998; Fourth Judicial District Court Judge, Hennepin County, 1994-1996; Attorney in private practice and public service, 1984-1993; State Representative, Minnesota House of Representatives, 1979-1993, which included service on the Tax and Financial Institutions and Insurance Committees; Member and Interim Chair, Minnesota Sports Facilities Authority, January 2017-July 2017; Interim President and Chief Executive Officer, Blue Cross and Blue Shield of Minnesota (health care insurance), February-July 2018, April-October 2021 | 176 | Former Trustee, Blue Cross and Blue Shield of Minnesota, 2009-2021 (Chair of the Business Development Committee, 2014-2017; Chair of the Governance Committee, 2017-2019); former Member and Chair of the Board, Minnesota Sports Facilities Authority, January 2017-July 2017; former Director, Robina Foundation, 2009-2020 (Chair, 2014-2020); Director, Schulze Family Foundation, since 2021 |
| Pamela G. Carlton c/o Columbia Management Investment Advisers, LLC 290 Congress Street Boston, MA 02210 1954 | Trustee since 2007 | President, Springboard — Partners in Cross Cultural Leadership (consulting company) since 2003; Managing Director of US Equity Research, JP Morgan Chase, 1999-2003; Director of US Equity Research, Chase Asset Management, 1996-1999; Co-Director Latin America Research, 1993-1996, COO Global Research, 1992-1996, Co-Director of US Research, 1991-1992, Investment Banker, 1982-1991, Morgan Stanley; Attorney, Cleary Gottlieb Steen & Hamilton LLP, 1980-1982 | 176 | Trustee, New York Presbyterian Hospital Board (Executive Committee and Chair of People Committee) since 1996; Director, DR Bank (Audit Committee) since 2017; Director, Evercore Inc. (Audit Committee) since 2019; Director, Apollo Commercial Real Estate Finance, Inc. since 2021; the Governing Council of the Independent Directors Council (IDC), since 2021 |
| Janet Langford Carrig c/o Columbia Management Investment Advisers, LLC 290 Congress Street Boston, MA 02210 1957 | Trustee since 1996 | Senior Vice President, General Counsel and Corporate Secretary, ConocoPhillips (independent energy company), September 2007-October 2018 | 174 | Director, EQT Corporation (natural gas producer) since 2019; former Director, Whiting Petroleum Corporation (independent oil and gas company), 2020-2022 |
| J. Kevin Connaughton c/o Columbia Management Investment Advisers, LLC 290 Congress Street Boston, MA 02210 1964 | Trustee since 2020 | Member, FINRA National Adjudicatory Council since January 2020; Adjunct Professor of Finance, Bentley University since January 2018; Consultant to Independent Trustees of CFVIT and CFST I from March 2016 to June 2020 with respect to CFVIT and to December 2020 with respect to CFST I; Managing Director and General Manager of Mutual Fund Products, Columbia Management Investment Advisers, LLC, May 2010-February 2015; President, Columbia Funds, 2008-2015; and senior officer of Columbia Funds and affiliated funds, 2003-2015 | 174 | Former Director, The Autism Project, March 2015-December 2021; former Member of the Investment Committee, St. Michael’s College, November 2015-February 2020; former Trustee, St. Michael’s College, June 2017-September 2019; former Trustee, New Century Portfolios, January 2015-December 2017 |
| Columbia Global Technology Growth Fund | Annual Report 2022 | 33 |
(Unaudited)
Independent trustees (continued)
| Name, address, year of birth | Position held with the Columbia Funds and length of service | Principal occupation(s) during past five years and other relevant professional experience | Number of Funds in the Columbia Funds Complex* overseen | Other directorships held by Trustee during the past five years |
| Olive M. Darragh c/o Columbia Management Investment Advisers, LLC 290 Congress Street Boston, MA 02210 1962 | Trustee since 2020 | Managing Director of Darragh Inc. (strategy and talent management consulting firm) since 2010; Founder and CEO, Zolio, Inc. (investment management talent identification platform) since 2004; Consultant to Independent Trustees of CFVIT and CFST I from June 2019 to June 2020 with respect to CFVIT and to December 2020 with respect to CFST I; Partner, Tudor Investments, 2004-2010; Senior Partner, McKinsey & Company (consulting), 1990-2004; Touche Ross CPA, 1985-1988 | 174 | Former Director, University of Edinburgh Business School (Member of US Board); former Director, Boston Public Library Foundation |
| Patricia M. Flynn c/o Columbia Management Investment Advisers, LLC 290 Congress Street Boston, MA 02210 1950 | Trustee since 2004 | Trustee Professor of Economics and Management, Bentley University since 1976 (also teaches and conducts research on corporate governance); Dean, McCallum Graduate School of Business, Bentley University, 1992-2002 | 176 | Trustee, MA Taxpayers Foundation since 1997; former Board of Governors, Innovation Institute, MA Technology Collaborative, 2010-2020; former Board of Directors, The MA Business Roundtable, 2003-2019 |
| Brian J. Gallagher c/o Columbia Management Investment Advisers, LLC 290 Congress Street Boston, MA 02210 1954 | Trustee since 2017 | Retired; Partner with Deloitte & Touche LLP and its predecessors, 1977-2016 | 176 | Trustee, Catholic Schools Foundation since 2004 |
| Douglas A. Hacker c/o Columbia Management Investment Advisers, LLC 290 Congress Street Boston, MA 02210 1955 | Co-Chair since 2021; Chair of CFST I and CFVIT since 2014; Trustee of CFST I and CFVIT since 1996 and CFST, CFST II, CFVST II, CET I and CET II since 2021 | Independent business executive since May 2006; Executive Vice President – Strategy of United Airlines, December 2002 - May 2006; President of UAL Loyalty Services (airline marketing company), September 2001-December 2002; Executive Vice President and Chief Financial Officer of United Airlines, July 1999-September 2001 | 176 | Director, Spartan Nash Company (food distributor); Director, Aircastle Limited (Chair of Audit Committee) (aircraft leasing); former Director, Nash Finch Company (food distributor), 2005-2013; former Director, SeaCube Container Leasing Ltd. (container leasing), 2010-2013; and former Director, Travelport Worldwide Limited (travel information technology), 2014-2019 |
| Nancy T. Lukitsh c/o Columbia Management Investment Advisers, LLC 290 Congress Street Boston, MA 02210 1956 | Trustee since 2011 | Senior Vice President, Partner and Director of Marketing, Wellington Management Company, LLP (investment adviser), 1997-2010; Chair, Wellington Management Portfolios (commingled non-U.S. investment pools), 2007 -2010; Director, Wellington Trust Company, NA and other Wellington affiliates, 1997-2010 | 174 | None |
| 34 | Columbia Global Technology Growth Fund | Annual Report 2022 |
(Unaudited)
Independent trustees (continued)
| Name, address, year of birth | Position held with the Columbia Funds and length of service | Principal occupation(s) during past five years and other relevant professional experience | Number of Funds in the Columbia Funds Complex* overseen | Other directorships held by Trustee during the past five years |
| David M. Moffett c/o Columbia Management Investment Advisers, LLC 290 Congress Street Boston, MA 02210 1952 | Trustee since 2011 | Retired; Consultant to Bridgewater and Associates | 174 | Director, CSX Corporation (transportation suppliers); Director, Genworth Financial, Inc. (financial and insurance products and services); Director, PayPal Holdings Inc. (payment and data processing services); Trustee, University of Oklahoma Foundation; former Director, eBay Inc. (online trading community), 2007-2015; and former Director, CIT Bank, CIT Group Inc. (commercial and consumer finance), 2010-2016 |
| Catherine James Paglia c/o Columbia Management Investment Advisers, LLC 290 Congress Street Boston, MA 02210 1952 | Co-Chair since 2021; Chair of CFST, CFST II, CFVST II, CET I and CET II since 2020; Trustee of CFST, CFST II and CFVST II since 2004 and CFST I and CFVIT since 2021 | Director, Enterprise Asset Management, Inc. (private real estate and asset management company) since September 1998; Managing Director and Partner, Interlaken Capital, Inc., 1989-1997; Vice President, 1982-1985, Principal, 1985-1987, Managing Director, 1987-1989, Morgan Stanley; Vice President, Investment Banking, 1980-1982, Associate, Investment Banking, 1976-1980, Dean Witter Reynolds, Inc. | 176 | Director, Valmont Industries, Inc. (irrigation systems manufacturer) since 2012; Trustee, Carleton College (on the Investment Committee); Trustee, Carnegie Endowment for International Peace (on the Investment Committee) |
| Minor M. Shaw c/o Columbia Management Investment Advisers, LLC 290 Congress Street Boston, MA 02210 1947 | Trustee since 2003 | President, Micco LLC (private investments) since 2011; President, Micco Corp. (family investment business), 1998-2011 | 176 | Director, Blue Cross Blue Shield of South Carolina (Chair of Compensation Committee) since April 2008; Trustee, Hollingsworth Funds (on the Investment Committee) since 2016 (previously Board Chair from 2016-2019); Former Advisory Board member, Duke Energy Corp., 2016-2020; Chair of the Duke Endowment; Chair of Greenville – Spartanburg Airport Commission; former Trustee, BofA Funds Series Trust (11 funds), 2003-2011; former Director, Piedmont Natural Gas, 2004-2016; former Director, National Association of Corporate Directors, Carolinas Chapter, 2013-2018; Chair, Daniel-Mickel Foundation since 1998 |
| Columbia Global Technology Growth Fund | Annual Report 2022 | 35 |
(Unaudited)
Independent trustees (continued)
| Name, address, year of birth | Position held with the Columbia Funds and length of service | Principal occupation(s) during past five years and other relevant professional experience | Number of Funds in the Columbia Funds Complex* overseen | Other directorships held by Trustee during the past five years |
| Natalie A. Trunow c/o Columbia Management Investment Advisers, LLC 290 Congress Street Boston, MA 02210 1967 | Trustee since 2020 | Chief Executive Officer, Millennial Portfolio Solutions LLC (asset management and consulting services), January 2016-January 2021; Non-executive Member of the Investment Committee and Valuation Committee, Sarona Asset Management Inc. (private equity firm) since September 2019; Advisor, Horizon Investments (asset management and consulting services), August 2018-January 2021; Advisor, Paradigm Asset Management, November 2016-December 2021; Consultant to Independent Trustees of CFVIT and CFST I from September 2016 to June 2020 with respect to CFVIT and to December 2020 with respect to CFST I; Director of Investments/Consultant, Casey Family Programs, April 2016-November 2016; Senior Vice President and Chief Investment Officer, Calvert Investments, August 2008-January 2016; Section Head and Portfolio Manager, General Motors Asset Management, June 1997-August 2008 | 174 | Former Director, Investment Committee, Health Services for Children with Special Needs, Inc., 2012-2019; Director, Chair of Audit Committee, Consumer Credit Counseling Services (formerly Guidewell Financial Solutions), since 2019; Independent Director, Investment Committee and Valuation Committee, Sarona Asset Management, since 2019 |
| Sandra L. Yeager c/o Columbia Management Investment Advisers, LLC 290 Congress Street Boston, MA 02210 1964 | Trustee since 2017 | Retired; President and founder, Hanoverian Capital, LLC (SEC registered investment advisor firm), 2008-2016; Managing Director, DuPont Capital, 2006-2008; Managing Director, Morgan Stanley Investment Management, 2004-2006; Senior Vice President, Alliance Bernstein, 1990-2004 | 176 | Former Director, NAPE Education Foundation, October 2016-October 2020 |
| * | The term “Columbia Funds Complex” as used herein includes Columbia Seligman Premium Technology Growth Fund, Tri-Continental Corporation and each series of Columbia Fund Series Trust (CFST), Columbia Funds Series Trust I (CFST I), Columbia Funds Series Trust II (CFST II), Columbia ETF Trust I (CET I), Columbia ETF Trust II (CET II), Columbia Funds Variable Insurance Trust (CFVIT) and Columbia Funds Variable Series Trust II (CFVST II). Messrs. Batejan, Beckman, Gallagher and Hacker and Mses. Blatz, Carlton, Flynn, Paglia, Shaw and Yeager serve as Directors of Columbia Seligman Premium Technology Growth Fund and Tri-Continental Corporation. |
| Name, address, year of birth | Position held with the Columbia Funds and length of service | Principal occupation(s) during the past five years and other relevant professional experience | Number of Funds in the Columbia Funds Complex overseen | Other directorships held by Trustee during the past five years |
| Daniel J. Beckman c/o Columbia Management Investment Advisers, LLC 290 Congress Street Boston, MA 02210 1962 | Trustee since November 2021 and President since June 2021 | Vice President – Head of North America Product, Columbia Management Investment Advisers, LLC since April 2015; President and Principal Executive Officer of the Columbia Funds since June 2021; officer of Columbia Funds and affiliated funds, 2020-2021 | 176 | Director, Ameriprise Trust Company, since October 2016; Director, Columbia Management Investment Distributors, Inc. since November 2018; Board of Governors, Columbia Wanger Asset Management, LLC since January 2022 |
| * | Interested person (as defined under the 1940 Act) by reason of being an officer, director, security holder and/or employee of the Investment Manager or Ameriprise Financial. |
| 36 | Columbia Global Technology Growth Fund | Annual Report 2022 |
(Unaudited)
The Statement of Additional Information has additional information about the Fund’s Board members and is available, without charge, upon request by calling 800.345.6611, visiting columbiathreadneedleus.com/investor/ or contacting your financial intermediary.
| Name, address and year of birth | Position and year first appointed to position for any Fund in the Columbia Funds Complex or a predecessor thereof | Principal occupation(s) during past five years |
| Michael G. Clarke 290 Congress Street Boston, MA 02210 1969 | Chief Financial Officer and Principal Financial Officer (2009) and Senior Vice President (2019) | Senior Vice President and Head of Global Operations & Investor Services, Columbia Management Investment Advisers, LLC, since March 2022 (previously Vice President, Head of North American Operations, and Co-Head of Global Operations, June 2019 to February 2022 and Vice President – Accounting and Tax, May 2010 - May 2019); senior officer of Columbia Funds and affiliated funds since 2002. |
| Joseph Beranek 5890 Ameriprise Financial Center Minneapolis, MN 55474 1965 | Treasurer and Chief Accounting Officer (Principal Accounting Officer) (2019) and Principal Financial Officer (2020), CFST, CFST I, CFST II, CFVIT and CFVST II; Assistant Treasurer, CET I and CET II | Vice President – Mutual Fund Accounting and Financial Reporting, Columbia Management Investment Advisers, LLC, since December 2018 and March 2017, respectively (previously Vice President – Pricing and Corporate Actions, May 2010 - March 2017). |
| Marybeth Pilat 290 Congress Street Boston, MA 02210 1968 | Treasurer and Chief Accounting Officer (Principal Accounting Officer) and Principal Financial Officer (2020) for CET I and CET II; Assistant Treasurer, CFST, CFST I, CFST II, CFVIT and CFVST II | Vice President – Product Pricing and Administration, Columbia Management Investment Advisers, LLC, since May 2017; Director - Fund Administration, Calvert Investments, August 2015 – March 2017; Vice President - Fund Administration, Legg Mason, May 2015 - July 2015; Vice President - Fund Administration, Columbia Management Investment Advisers, LLC, May 2010 - April 2015. |
| William F. Truscott 290 Congress Street Boston, MA 02210 1960 | Senior Vice President (2001) | Formerly, Trustee/Director of Columbia Funds Complex or legacy funds, November 2001-January 1, 2021; Chief Executive Officer, Global Asset Management, Ameriprise Financial, Inc. since September 2012; Chairman of the Board and President, Columbia Management Investment Advisers, LLC since July 2004 and February 2012, respectively; Chairman of the Board and Chief Executive Officer, Columbia Management Investment Distributors, Inc. since November 2008 and February 2012, respectively; Chairman of the Board and Director, Threadneedle Asset Management Holdings, Sàrl since March 2013 and December 2008, respectively; senior executive of various entities affiliated with Columbia Threadneedle. |
| Christopher O. Petersen 5228 Ameriprise Financial Center Minneapolis, MN 55474 1970 | Senior Vice President and Assistant Secretary (2021) | Formerly, Trustee/Director of funds within the Columbia Funds Complex, July 1, 2020 - November 22, 2021; Senior Vice President and Assistant General Counsel, Ameriprise Financial, Inc. since September 2021 (previously Vice President and Lead Chief Counsel, January 2015 - September 2021); formerly, President and Principal Executive Officer of the Columbia Funds, 2015 - 2021; officer of Columbia Funds and affiliated funds since 2007. |
| Thomas P. McGuire 290 Congress Street Boston, MA 02210 1972 | Senior Vice President and Chief Compliance Officer (2012) | Vice President – Asset Management Compliance, Ameriprise Financial, Inc., since May 2010; Chief Compliance Officer, Columbia Acorn/Wanger Funds since December 2015; formerly, Chief Compliance Officer, Ameriprise Certificate Company, September 2010 – September 2020. |
| Columbia Global Technology Growth Fund | Annual Report 2022 | 37 |
(Unaudited)
Fund officers (continued)
| Name, address and year of birth | Position and year first appointed to position for any Fund in the Columbia Funds Complex or a predecessor thereof | Principal occupation(s) during past five years |
| Ryan C. Larrenaga 290 Congress Street Boston, MA 02210 1970 | Senior Vice President (2017), Chief Legal Officer (2017), and Secretary (2015) | Vice President and Chief Counsel, Ameriprise Financial, Inc. since August 2018 (previously Vice President and Group Counsel, August 2011 - August 2018); Chief Legal Officer, Columbia Acorn/Wanger Funds, since September 2020; officer of Columbia Funds and affiliated funds since 2005. |
| Michael E. DeFao 290 Congress Street Boston, MA 02210 1968 | Vice President (2011) and Assistant Secretary (2010) | Vice President and Chief Counsel, Ameriprise Financial, Inc. since May 2010; Vice President, Chief Legal Officer and Assistant Secretary, Columbia Management Investment Advisers, LLC since October 2021 (previously Vice President and Assistant Secretary, May 2010 – September 2021). |
| Lyn Kephart-Strong 5228 Ameriprise Financial Center Minneapolis, MN 55474 1960 | Vice President (2015) | President, Columbia Management Investment Services Corp. since October 2014; Vice President & Resolution Officer, Ameriprise Trust Company since August 2009. |
| • | the Fund had sufficient liquidity to both meet redemptions and operate effectively on behalf of shareholders; |
| • | there were no material changes to the Program during the period; |
| • | the implementation of the Program was effective to manage the Fund’s liquidity risk; and |
| • | the Program operated adequately during the period. |
| 38 | Columbia Global Technology Growth Fund | Annual Report 2022 |
| • | Information on the investment performance of the Fund relative to the performance of a group of mutual funds determined to be comparable to the Fund by Broadridge, as well as performance relative to benchmarks; |
| • | Information on the Fund’s management fees and total expenses, including information comparing the Fund’s expenses to those of a group of comparable mutual funds, as determined by Broadridge; |
| • | The Investment Manager’s agreement to contractually limit or cap total operating expenses for the Fund so that total operating expenses (excluding certain fees and expenses, such as transaction costs and certain other investment related expenses, interest, taxes, acquired fund fees and expenses and infrequent and/or unusual expenses) would not exceed a specified annual rate, as a percentage of the Fund’s net assets; |
| • | Terms of the Management Agreement; |
| • | Descriptions of other agreements and arrangements with affiliates of the Investment Manager relating to the operations of the Fund, including agreements with respect to the provision of transfer agency and shareholder services to the Fund; |
| • | Descriptions of various services performed by the Investment Manager under the Management Agreement, including portfolio management and portfolio trading practices; |
| • | Information regarding any recently negotiated management fees of similarly-managed portfolios of other institutional clients of the Investment Manager; |
| • | Information regarding the resources of the Investment Manager, including information regarding senior management, portfolio managers and other personnel; |
| • | Information regarding the capabilities of the Investment Manager with respect to compliance monitoring services; |
| • | The profitability to the Investment Manager and its affiliates from their relationships with the Fund; and |
| • | Report provided by the Board’s independent fee consultant, JDL Consultants, LLC (JDL). |
| Columbia Global Technology Growth Fund ��| Annual Report 2022 | 39 |
(Unaudited)
Following an analysis and discussion of the foregoing, and the factors identified below, the Board, including all of the Independent Trustees, approved the renewal of the Management Agreement.
| 40 | Columbia Global Technology Growth Fund | Annual Report 2022 |
(Unaudited)
Comparative fees, costs of services provided and the profits realized by the Investment Manager and its affiliates from their relationships with the Fund
| Columbia Global Technology Growth Fund | Annual Report 2022 | 41 |
(Unaudited)
On June 23, 2022, the Board, including all of the Independent Trustees, determined that fees payable under the Management Agreement were fair and reasonable in light of the extent and quality of services provided and approved the renewal of the Management Agreement.
| 42 | Columbia Global Technology Growth Fund | Annual Report 2022 |
columbiathreadneedleus.com/investor/. The Fund is distributed by Columbia Management Investment Distributors, Inc., member FINRA, and managed by Columbia Management Investment Advisers, LLC.

August 31, 2022

| 3 | |
| 6 | |
| 10 | |
| 11 | |
| 91 | |
| 92 | |
| 93 | |
| 94 | |
| 96 | |
| 113 | |
| 114 | |
| 114 | |
| 120 | |
| 121 |
(Unaudited)
| Average annual total returns (%) (for the period ended August 31, 2022) | |||||
| Inception | 1 Year | 5 Years | 10 Years | ||
| Institutional Class* | 01/03/17 | -12.40 | 0.49 | 1.45 | |
| Institutional 3 Class* | 12/18/19 | -12.28 | 0.49 | 1.46 | |
| Bloomberg U.S. Aggregate Bond Index | -11.52 | 0.52 | 1.35 | ||
| * | The returns shown for periods prior to the share class inception date (including returns for the Life of the Fund, if shown, which are since Fund inception) include the returns of the Fund’s oldest share class. Returns shown for periods prior to the inception date of a class include the returns of the Fund’s Class A shares for the period from April 20, 2012 (the inception date of the Fund) through January 2, 2017, and for Institutional 3 Class shares, include the returns of the Fund’s Institutional Class shares for the period from January 3, 2017 through the inception date of the class. Class A shares were offered prior to the Fund’s Institutional Class shares but have since been merged into the Fund’s Institutional Class shares. These returns are adjusted to reflect any higher class-related operating expenses of the newer share classes, as applicable. Please visit columbiathreadneedleus.com/investor/investment-products/mutual-funds/appended-performance for more information. |
| Multi-Manager Total Return Bond Strategies Fund | Annual Report 2022 | 3 |
(Unaudited)
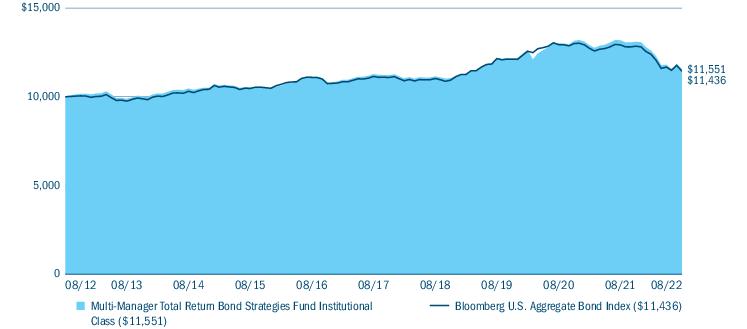
| Portfolio breakdown (%) (at August 31, 2022) | |
| Asset-Backed Securities — Non-Agency | 10.0 |
| Commercial Mortgage-Backed Securities - Agency | 0.9 |
| Commercial Mortgage-Backed Securities - Non-Agency | 5.4 |
| Common Stocks | 0.0(a) |
| Convertible Bonds | 0.0(a) |
| Corporate Bonds & Notes | 30.2 |
| Foreign Government Obligations | 1.6 |
| Inflation-Indexed Bonds | 0.0(a) |
| Money Market Funds | 10.2 |
| Municipal Bonds | 0.4 |
| Residential Mortgage-Backed Securities - Agency | 21.0 |
| Residential Mortgage-Backed Securities - Non-Agency | 4.2 |
| Rights | 0.0(a) |
| Senior Loans | 0.6 |
| Treasury Bills | 2.0 |
| U.S. Government & Agency Obligations | 0.1 |
| U.S. Treasury Obligations | 13.4 |
| Total | 100.0 |
| (a) | Rounds to zero. |
| Quality breakdown (%) (at August 31, 2022) | |
| AAA rating | 53.9 |
| AA rating | 3.9 |
| A rating | 13.2 |
| BBB rating | 18.7 |
| BB rating | 4.8 |
| B rating | 2.3 |
| CCC rating | 0.8 |
| CC rating | 0.3 |
| C rating | 0.0(a) |
| Not rated | 2.1 |
| Total | 100.0 |
| (a) | Rounds to zero. |
| 4 | Multi-Manager Total Return Bond Strategies Fund | Annual Report 2022 |
(Unaudited)
| Market exposure through derivatives investments (% of notional exposure) (at August 31, 2022)(a) | |||
| Long | Short | Net | |
| Fixed Income Derivative Contracts | 118.8 | (18.7) | 100.1 |
| Foreign Currency Derivative Contracts | — | (0.1) | (0.1) |
| Total Notional Market Value of Derivative Contracts | 118.8 | (18.8) | 100.0 |
| Multi-Manager Total Return Bond Strategies Fund | Annual Report 2022 | 5 |
(Unaudited)
| 6 | Multi-Manager Total Return Bond Strategies Fund | Annual Report 2022 |
(Unaudited)
| • | Positive issue selection drove our portion of the Fund to outperform the benchmark during the period. |
| • | Issue selection was positive in investment-grade corporate bonds and securitized credit. |
| • | Securitized credit provided the largest benefit to performance as positive excess return from holdings in CMBS and ABS-car loans sectors drove results. Investment-grade corporate bonds also positively contributed as holdings in technology, banking, and consumer non-cyclical benefitted performance. |
| • | Sector allocation was the primary detractor from excess returns for the period. |
| • | Having a tilt toward risk sectors in our portion of the Fund in a period when risk-free assets outperformed risk assets, detracted during the period. |
| • | Our portion of the Fund had an underweight allocation to government securities including U.S. Treasuries and agency MBS, and an overweight to corporate bonds, which detracted from results versus the benchmark during the period. |
| • | Sector allocation and security selection detracted from performance in our portion of the Fund for the period. |
| ○ | Overweight allocations in high yield, collateralized loan obligations (CLOs), CMBS and investment-grade corporates detracted from performance. |
| ○ | Positioning in investment-grade corporates, emerging markets, Treasuries and high yield hurt performance. |
| ○ | Within credit, positioning in foreign non-corporates, health care and pharmaceutical and banking were negative. |
| ○ | Overweights to Ukraine, Bausch Health Companies and Viatris weighed on performance. |
| • | Duration positioning detracted from relative performance over the reporting period. Specifically, a long duration position in U.S. rates for most of the period limited results. |
| • | Yield curve positioning added value. Our portion of the Fund was positioned in a curve flattener stance for most of the period, which added value as the curve flattened over the period. |
| • | Although overall sector allocation was negative for the period, an underweight to MBS added to performance. |
| ○ | Positioning in municipals, CLOs and MBS also contributed. |
| ○ | Within credit, positioning in upstream energy, education revenue municipals and electric utilities added to performance. |
| • | Looking at specific issuers, overweights to Occidental Petroleum, Vistra and Bombardier were additive. |
| Multi-Manager Total Return Bond Strategies Fund | Annual Report 2022 | 7 |
(Unaudited)
| • | Securitized credit holdings detracted from performance in our portion of the Fund during the period, mainly from a position in residential MBS. |
| ○ | An overweight to agency MBS was maintained throughout the year, which was a drag given that the sector lagged duration-adjusted Treasuries by nearly 150 bps. With the Fed embarking on its most aggressive hiking cycle in decades, sustained rate volatility and investors worrying about outright MBS sales from the Fed, the sector faltered throughout the year. |
| ○ | On the non-agency side, restrictive monetary policy and a slowdown in home price appreciation from prior levels also weighed on non-agency MBS. |
| ○ | Small positions in ABS and CMBS detracted on the margin as yield spreads in both sectors widened in sympathy with broader markets. |
| • | Our portion of the Fund maintained a curve-steepening bias throughout the period. This positioning weighed on returns as the underweight to longer maturities and overweight to shorter maturities throughout the year was a drag given the rapid increase in short rates in conjunction with the Fed’s rate hikes. |
| • | Our portion of the Fund was positioned with a shorter duration than that of the benchmark for the first seven months of the period. As rates began to rise on the Fed’s comments of tapering in late 2021 and eventual announcement of forthcoming rate hikes in early 2022, this positioning helped insulate our portion of the Fund from the negative effects of climbing rates. With Treasury yields surging in March and prices approaching fair value, we added duration in a disciplined manner, moving to an overweight duration position in April as Treasury yields continued their ascent, with the overweight maintained through the end of the reporting period. |
| • | Corporate credit was additive from a positioning standpoint. The Fund entered the period positioned defensively with a relative underweight to corporate credit overall, which was maintained for a majority of the year. With investment-grade corporates declining nearly 15%, our portion of the Fund was able to avoid the worst of the downdraft from widening yield spreads and declining prices. |
| • | As spreads widened, sector allocation weighed on performance for the period. Overweights in corporate sectors versus U.S. Treasuries in our portion of the Fund were headwinds amid the risk-off sentiment in 2022. |
| 8 | Multi-Manager Total Return Bond Strategies Fund | Annual Report 2022 |
(Unaudited)
| • | Relative to security selection, negative contributions from within ABS largely reflected allocations to higher yielding CLOs, emerging markets sovereign debt and corporates that included Russian exposure, as well as selection within investment-grade corporate bonds. |
| • | Our portion of the Fund maintained a more defensive stance with regard to both duration and yield curve positioning during the period, which contributed to relative performance. The portfolio generally held a modest underweight position throughout the reporting period, ending the reporting period in a neutral duration position. |
| • | Sector allocation also contributed, particularly an overweight to ABS, reflecting the sector’s lower beta characteristics. Our decision to allocate to non-agency residential MBS and single-family credit risk transfer (CRT) bonds added to performance, underpinned by the strong housing market and resilient consumers. CRT bonds are agency mortgage securities not guaranteed by Fannie Mae and Freddie Mac. |
| • | Relative to security selection, selection within agency MBS, which included collateralized mortgage obligations, as well as CMBS also added to performance for the reporting period. |
| Multi-Manager Total Return Bond Strategies Fund | Annual Report 2022 | 9 |
(Unaudited)
| March 1, 2022 — August 31, 2022 | |||||||
| Account value at the beginning of the period ($) | Account value at the end of the period ($) | Expenses paid during the period ($) | Fund’s annualized expense ratio (%) | ||||
| Actual | Hypothetical | Actual | Hypothetical | Actual | Hypothetical | Actual | |
| Institutional Class | 1,000.00 | 1,000.00 | 916.60 | 1,022.74 | 2.37 | 2.50 | 0.49 |
| Institutional 3 Class | 1,000.00 | 1,000.00 | 916.80 | 1,022.84 | 2.27 | 2.40 | 0.47 |
| 10 | Multi-Manager Total Return Bond Strategies Fund | Annual Report 2022 |
August 31, 2022
| Asset-Backed Securities — Non-Agency 11.1% | ||||
| Issuer | Coupon Rate | Principal Amount ($) | Value ($) | |
| Affirm Asset Securitization Trust(a) | ||||
| Series 2021-B Class A | ||||
| 08/17/2026 | 1.030% | 2,510,000 | 2,375,964 | |
| Series 2022-A Class A | ||||
| 05/17/2027 | 4.300% | 525,000 | 510,119 | |
| AGL CLO 11 Ltd.(a),(b) | ||||
| Series 2021-11A Class AJ | ||||
| 3-month USD LIBOR + 1.350% Floor 1.350% 04/15/2034 | 3.862% | 12,200,000 | 11,671,703 | |
| AGL CLO 12 Ltd.(a),(b) | ||||
| Series 2021-12A Class C | ||||
| 3-month USD LIBOR + 1.850% Floor 1.850% 07/20/2034 | 4.560% | 1,000,000 | 932,942 | |
| AGL CLO Ltd.(a),(b) | ||||
| Series 2021-13A Class A1 | ||||
| 3-month USD LIBOR + 1.160% Floor 1.160% 10/20/2034 | 3.870% | 5,250,000 | 5,108,497 | |
| AIG CLO(a),(b) | ||||
| Series 2021-1A Class C | ||||
| 3-month USD LIBOR + 1.750% Floor 1.750% 04/22/2034 | 4.509% | 1,750,000 | 1,609,928 | |
| AIG CLO Ltd.(a),(b) | ||||
| Series 2019-2A Class AR | ||||
| 3-month USD LIBOR + 1.100% Floor 1.100% 10/25/2033 | 3.883% | 12,500,000 | 12,236,275 | |
| Series 2021-2A Class A | ||||
| 3-month USD LIBOR + 1.170% Floor 1.170% 07/20/2034 | 3.880% | 6,950,000 | 6,767,319 | |
| AIMCO CLO Ltd.(a),(b) | ||||
| Series 2020-11A Class AR | ||||
| 3-month USD LIBOR + 1.130% Floor 1.130% 10/17/2034 | 3.870% | 4,000,000 | 3,903,100 | |
| Allegro CLO VII Ltd.(a),(b) | ||||
| Series 2018-1A Class A | ||||
| 3-month USD LIBOR + 1.100% Floor 1.100% 06/13/2031 | 3.612% | 7,500,000 | 7,356,293 | |
| American Credit Acceptance Receivables Trust(a) | ||||
| Subordinated Series 2020-4 Class C | ||||
| 12/14/2026 | 1.310% | 2,543,586 | 2,510,065 | |
| Subordinated Series 2021-1 Class B | ||||
| 03/13/2025 | 0.610% | 11,933 | 11,915 | |
| Asset-Backed Securities — Non-Agency (continued) | ||||
| Issuer | Coupon Rate | Principal Amount ($) | Value ($) | |
| Subordinated Series 2021-3 Class B | ||||
| 02/13/2026 | 0.660% | 2,430,000 | 2,406,012 | |
| Americredit Automobile Receivables Trust | ||||
| Subordinated Series 2022-1 Class B | ||||
| 04/19/2027 | 2.770% | 2,175,000 | 2,100,457 | |
| AmeriCredit Automobile Receivables Trust | ||||
| Series 2019-2 Class B | ||||
| 07/18/2024 | 2.540% | 1,699,225 | 1,697,953 | |
| Series 2020-1 Class D | ||||
| 12/18/2025 | 1.800% | 950,000 | 911,316 | |
| Series 2020-2 Class D | ||||
| 03/18/2026 | 2.130% | 500,000 | 479,573 | |
| Series 2021-2 Class B | ||||
| 01/19/2027 | 0.690% | 2,380,000 | 2,249,149 | |
| Series 2022-2 Class A3 | ||||
| 04/18/2028 | 4.380% | 2,090,000 | 2,077,859 | |
| Subordinated Series 2019-1 Class D | ||||
| 03/18/2025 | 3.620% | 2,250,000 | 2,224,658 | |
| Subordinated Series 2019-3 Class D | ||||
| 09/18/2025 | 2.580% | 1,450,000 | 1,409,526 | |
| Subordinated Series 2020-2 Class B | ||||
| 02/18/2026 | 0.970% | 540,000 | 528,229 | |
| Subordinated Series 2021-2 Class C | ||||
| 01/19/2027 | 1.010% | 2,905,000 | 2,711,510 | |
| Subordinated Series 2021-3 Class C | ||||
| 08/18/2027 | 1.410% | 3,080,000 | 2,856,018 | |
| Anchorage Capital CLO Ltd.(a),(b) | ||||
| Series 2013-1A Class A1R | ||||
| 3-month USD LIBOR + 1.250% 10/13/2030 | 3.705% | 5,250,000 | 5,188,234 | |
| Series 2016-8A Class AR2 | ||||
| 3-month USD LIBOR + 1.200% Floor 1.200% 10/27/2034 | 3.969% | 11,500,000 | 11,203,599 | |
| Series 2021-21A Class B | ||||
| 3-month USD LIBOR + 1.750% Floor 1.750% 10/20/2034 | 4.460% | 10,000,000 | 9,596,690 | |
| Apidos CLO XXII(a),(b) | ||||
| Series 2015-22A Class A1R | ||||
| 3-month USD LIBOR + 1.060% 04/20/2031 | 3.770% | 6,400,000 | 6,308,435 | |
| Apidos CLO XXIV(a),(b) | ||||
| Series 2016-24A | ||||
| 3-month USD LIBOR + 2.050% Floor 2.050% 10/20/2030 | 4.760% | 2,900,000 | 2,747,019 | |
| Multi-Manager Total Return Bond Strategies Fund | Annual Report 2022 | 11 |
August 31, 2022
| Asset-Backed Securities — Non-Agency (continued) | ||||
| Issuer | Coupon Rate | Principal Amount ($) | Value ($) | |
| Applebee’s Funding LLC/IHOP Funding LLC(a) | ||||
| Series 2019-1A Class A2I | ||||
| 06/07/2049 | 4.194% | 1,039,500 | 1,013,990 | |
| Series 2019-1A Class AII | ||||
| 06/07/2049 | 4.723% | 495,000 | 457,343 | |
| Aqua Finance Trust(a) | ||||
| Series 2020-AA Class A | ||||
| 07/17/2046 | 1.900% | 873,284 | 828,761 | |
| Series 2021-A Class A | ||||
| 07/17/2046 | 1.540% | 2,405,556 | 2,230,105 | |
| ArrowMark Colorado Holdings(a),(b) | ||||
| Series 2017-6A Class A1 | ||||
| 3-month USD LIBOR + 1.280% 07/15/2029 | 3.792% | 1,959,692 | 1,939,162 | |
| Atrium XII(a),(b) | ||||
| Series 2012A Class AR | ||||
| 3-month USD LIBOR + 0.830% 04/22/2027 | 3.589% | 12,630,567 | 12,480,592 | |
| Avis Budget Rental Car Funding AESOP LLC(a) | ||||
| Series 2017-2A Class A | ||||
| 03/20/2024 | 2.970% | 750,000 | 747,166 | |
| Series 2020-1A Class A | ||||
| 08/20/2026 | 2.330% | 115,000 | 108,019 | |
| Series 2020-2A Class A | ||||
| 02/20/2027 | 2.020% | 1,600,000 | 1,463,923 | |
| Bain Capital Credit CLO Ltd.(a),(b) | ||||
| Series 2019-3A Class AR | ||||
| 3-month USD LIBOR + 1.160% Floor 1.160% 10/21/2034 | 3.892% | 17,250,000 | 16,773,106 | |
| Balboa Bay Loan Funding Ltd.(a),(b) | ||||
| Series 2020-1A Class AR | ||||
| 3-month USD LIBOR + 1.120% Floor 1.120% 01/20/2032 | 3.830% | 13,750,000 | 13,508,137 | |
| Barings CLO Ltd.(a),(b) | ||||
| Series 2020-2A Class AR | ||||
| 3-month USD LIBOR + 1.010% Floor 1.010% 10/15/2033 | 3.522% | 7,500,000 | 7,381,140 | |
| Series 2020-4A Class A | ||||
| 3-month USD LIBOR + 1.220% Floor 1.220% 01/20/2032 | 3.930% | 6,500,000 | 6,397,833 | |
| Beacon Container Finance II LLC(a) | ||||
| Series 2021-1A Class A | ||||
| 10/22/2046 | 2.250% | 2,200,000 | 1,984,141 | |
| Asset-Backed Securities — Non-Agency (continued) | ||||
| Issuer | Coupon Rate | Principal Amount ($) | Value ($) | |
| Benefit Street Partners CLO X Ltd.(a),(b) | ||||
| Series 2016-10A Class BRR | ||||
| 3-month USD LIBOR + 2.150% Floor 2.150% 04/20/2034 | 4.860% | 2,810,000 | 2,611,518 | |
| BlueMountain CLO XXVIII Ltd.(a),(b) | ||||
| Series 2021-28A Class C | ||||
| 3-month USD LIBOR + 2.000% Floor 2.000% 04/15/2034 | 4.512% | 1,300,000 | 1,200,295 | |
| BlueMountain CLO XXXI Ltd.(a),(b) | ||||
| Series 2021-31A Class A2 | ||||
| 3-month USD LIBOR + 1.400% Floor 1.400% 04/19/2034 | 4.138% | 3,600,000 | 3,451,817 | |
| BlueMountain Fuji US CLO II Ltd.(a),(b) | ||||
| Series 2017-2A Class A1AR | ||||
| 3-month USD LIBOR + 1.000% 10/20/2030 | 3.710% | 11,500,000 | 11,336,412 | |
| Bojangles Issuer LLC(a) | ||||
| Series 2020-1A Class A2 | ||||
| 10/20/2050 | 3.832% | 1,592,000 | 1,463,487 | |
| Canyon Capital CLO Ltd.(a),(b) | ||||
| Series 2019-1A Class A1R | ||||
| 3-month USD LIBOR + 1.100% Floor 1.100% 04/15/2032 | 3.612% | 17,500,000 | 17,189,235 | |
| CARDS II Trust(a) | ||||
| Subordinated Series 2021-1A Class B | ||||
| 04/15/2027 | 0.931% | 2,850,000 | 2,687,354 | |
| Carlyle Global Market Strategies CLO Ltd.(a),(b) | ||||
| Series 2013-3A Class A1AR | ||||
| 3-month USD LIBOR + 1.100% Floor 1.100% 10/15/2030 | 3.612% | 3,975,454 | 3,922,067 | |
| Series 2014-3RA Class A1A | ||||
| 3-month USD LIBOR + 1.050% 07/27/2031 | 3.819% | 21,572,361 | 21,174,265 | |
| Carlyle US CLO Ltd.(a),(b) | ||||
| Series 2017-2A Class A2R | ||||
| 3-month USD LIBOR + 1.600% Floor 1.600% 07/20/2031 | 4.310% | 2,100,000 | 1,998,669 | |
| Series 2020-1A Class BR | ||||
| 3-month USD LIBOR + 2.000% Floor 2.000% 07/20/2034 | 4.710% | 1,250,000 | 1,152,295 | |
| Carmax Auto Owner Trust | ||||
| Series 2019-2 Class C | ||||
| 02/18/2025 | 3.160% | 3,270,000 | 3,246,780 | |
| 12 | Multi-Manager Total Return Bond Strategies Fund | Annual Report 2022 |
August 31, 2022
| Asset-Backed Securities — Non-Agency (continued) | ||||
| Issuer | Coupon Rate | Principal Amount ($) | Value ($) | |
| Carvana Auto Receivables Trust | ||||
| Series 2021-N2 Class B | ||||
| 03/10/2028 | 0.750% | 587,610 | 556,453 | |
| Series 2021-P4 Class A3 | ||||
| 01/11/2027 | 1.310% | 6,320,000 | 6,002,109 | |
| Subordinated Series 2021-N4 Class C | ||||
| 09/11/2028 | 1.720% | 1,795,000 | 1,725,058 | |
| Carvana Auto Receivables Trust(c) | ||||
| Series 2022-P3 Class A3 | ||||
| 11/10/2027 | 4.610% | 1,165,000 | 1,164,763 | |
| Chancelight, Inc.(a),(b) | ||||
| Series 2012-2 Class A | ||||
| 1-month USD LIBOR + 0.730% Floor 0.730% 04/25/2039 | 3.174% | 409,096 | 407,899 | |
| CIFC Funding IV Ltd.(a),(b) | ||||
| Series 2015-4A Class BR2 | ||||
| 3-month USD LIBOR + 1.900% Floor 1.900% 04/20/2034 | 4.610% | 6,300,000 | 5,858,446 | |
| CIFC Funding Ltd.(a),(b) | ||||
| Series 2019-6A Class A2 | ||||
| 3-month USD LIBOR + 1.750% Floor 1.750% 01/16/2033 | 4.490% | 2,000,000 | 1,945,800 | |
| CIT Education Loan Trust(a),(b) | ||||
| Series 2007-1 Class B | ||||
| 3-month USD LIBOR + 0.300% Floor 0.300% 06/25/2042 | 2.497% | 457,154 | 427,024 | |
| CLI Funding VIII LLC(a) | ||||
| Series 2022-1A Class A1 | ||||
| 01/18/2047 | 2.720% | 2,834,400 | 2,524,239 | |
| Commonbond Student Loan Trust(a) | ||||
| Series 2018-CGS Class B | ||||
| 02/25/2046 | 4.250% | 185,623 | 178,705 | |
| Series 2020-AGS Class A | ||||
| 08/25/2050 | 1.980% | 1,182,605 | 1,118,188 | |
| Credit Acceptance Auto Loan Trust(a) | ||||
| Series 2019-3A Class A | ||||
| 11/15/2028 | 2.380% | 293,244 | 292,953 | |
| Series 2020-2A Class A | ||||
| 07/16/2029 | 1.370% | 2,032,390 | 2,004,175 | |
| Series 2020-3A Class B | ||||
| 12/17/2029 | 1.770% | 2,105,000 | 1,990,180 | |
| Series 2021-3A Class A | ||||
| 05/15/2030 | 1.000% | 2,125,000 | 2,032,228 | |
| Series 2021-4 Class A | ||||
| 10/15/2030 | 1.260% | 1,890,000 | 1,768,889 | |
| Asset-Backed Securities — Non-Agency (continued) | ||||
| Issuer | Coupon Rate | Principal Amount ($) | Value ($) | |
| Crown Point CLO Ltd.(a),(b) | ||||
| Series 2021-11A Class A | ||||
| 3-month USD LIBOR + 1.120% Floor 1.120% 01/17/2034 | 3.860% | 14,250,000 | 13,928,449 | |
| DB Master Finance LLC(a) | ||||
| Series 2017-1A Class A2II | ||||
| 11/20/2047 | 4.030% | 1,193,750 | 1,120,702 | |
| Series 2019-1A Class A23 | ||||
| 05/20/2049 | 4.352% | 1,164,000 | 1,100,576 | |
| Series 2019-1A Class A2II | ||||
| 05/20/2049 | 4.021% | 630,500 | 590,291 | |
| Subordinated Series 2021-1A Class A23 | ||||
| 11/20/2051 | 2.791% | 4,367,000 | 3,544,388 | |
| Diamond Resorts Owner Trust(a) | ||||
| Series 2018-1 Class A | ||||
| 01/21/2031 | 3.700% | 795,983 | 783,446 | |
| Domino’s Pizza Master Issuer LLC(a) | ||||
| Series 2018-1A Class A2I | ||||
| 07/25/2048 | 4.116% | 1,443,750 | 1,393,083 | |
| Series 2021-1A Class A2II | ||||
| 04/25/2051 | 3.151% | 3,160,000 | 2,728,779 | |
| Donlen Fleet Lease Funding 2 LLC(a) | ||||
| Series 2021-2 Class A2 | ||||
| 12/11/2034 | 0.560% | 3,236,583 | 3,138,756 | |
| Drive Auto Receivables Trust | ||||
| Subordinated Series 2021-1 Class B | ||||
| 07/15/2025 | 0.650% | 1,579,575 | 1,572,485 | |
| Subordinated Series 2021-2 Class B | ||||
| 12/15/2025 | 0.580% | 3,255,000 | 3,212,439 | |
| Subordinated Series 2021-3 Class B | ||||
| 05/15/2026 | 1.110% | 2,745,000 | 2,614,331 | |
| Driven Brands Funding LLC(a) | ||||
| Series 2019-1A Class A2 | ||||
| 04/20/2049 | 4.641% | 1,737,000 | 1,674,106 | |
| Dryden 86 CLO Ltd.(a),(b) | ||||
| Series 2020-86A Class CR | ||||
| 3-month USD LIBOR + 2.000% Floor 2.000% 07/17/2034 | 4.740% | 3,000,000 | 2,817,990 | |
| Dryden CLO Ltd.(a),(b) | ||||
| Series 2019-75A Class AR2 | ||||
| 3-month USD LIBOR + 1.040% Floor 1.040% 04/15/2034 | 3.552% | 4,000,000 | 3,891,260 | |
| Series 2019-75A Class CR2 | ||||
| 3-month USD LIBOR + 1.800% Floor 1.800% 04/15/2034 | 4.312% | 5,000,000 | 4,599,205 | |
| Multi-Manager Total Return Bond Strategies Fund | Annual Report 2022 | 13 |
August 31, 2022
| Asset-Backed Securities — Non-Agency (continued) | ||||
| Issuer | Coupon Rate | Principal Amount ($) | Value ($) | |
| DT Auto Owner Trust(a) | ||||
| Series 2020-2A Class C | ||||
| 03/16/2026 | 3.280% | 1,055,000 | 1,044,311 | |
| Series 2021-1A Class B | ||||
| 09/15/2025 | 0.620% | 60,000 | 59,005 | |
| Series 2021-2A Class B | ||||
| 01/15/2027 | 0.810% | 1,795,000 | 1,745,722 | |
| Subordinated Series 2021-4A Class C | ||||
| 09/15/2027 | 1.500% | 2,550,000 | 2,404,555 | |
| Subordinated Series 2022-2A Class B | ||||
| 01/15/2027 | 4.220% | 4,445,000 | 4,356,768 | |
| Eaton Vance CLO Ltd.(a),(b) | ||||
| Series 2019-1A Class AR | ||||
| 3-month USD LIBOR + 1.100% Floor 1.100% 04/15/2031 | 3.612% | 4,670,000 | 4,581,223 | |
| Education Loan Asset-Backed Trust I(a),(b) | ||||
| Series 2013-1 Class A2 | ||||
| 1-month USD LIBOR + 0.800% Floor 0.800% 04/26/2032 | 3.244% | 2,851,207 | 2,818,607 | |
| EFS Volunteer No. 2 LLC(a),(b) | ||||
| Series 2012-1 Class A2 | ||||
| 1-month USD LIBOR + 1.350% Floor 1.350% 03/25/2036 | 3.794% | 1,361,577 | 1,343,238 | |
| ELFI Graduate Loan Program LLC(a) | ||||
| Series 2019-A Class A | ||||
| 03/25/2044 | 2.540% | 829,585 | 762,256 | |
| ELFI Graduate Loan Program LLC(a),(d) | ||||
| Subordinated Series 2019-A Class B | ||||
| 03/25/2044 | 2.940% | 444,129 | 430,044 | |
| Ellington CLO II Ltd.(a),(b) | ||||
| Series 2017-2A Class A | ||||
| 3-month USD LIBOR + 1.700% Floor 1.700% 02/15/2029 | 4.605% | 9,489,639 | 9,453,066 | |
| Elmwood CLO II Ltd.(a),(b) | ||||
| Series 2019-2A Class AR | ||||
| 3-month USD LIBOR + 1.150% Floor 1.150% 04/20/2034 | 3.860% | 27,250,000 | 26,626,084 | |
| Elmwood CLO VII Ltd.(a),(b) | ||||
| Series 2020-4A Class A | ||||
| 3-month USD LIBOR + 1.390% Floor 1.390% 01/17/2034 | 4.130% | 2,000,000 | 1,973,732 | |
| Enterprise Fleet Financing LLC(a) | ||||
| Series 2022-3 Class A2 | ||||
| 07/20/2029 | 4.380% | 1,175,000 | 1,174,613 | |
| Asset-Backed Securities — Non-Agency (continued) | ||||
| Issuer | Coupon Rate | Principal Amount ($) | Value ($) | |
| Exeter Automobile Receivables Trust(a) | ||||
| Series 2020-2A Class C | ||||
| 05/15/2025 | 3.280% | 908,359 | 906,209 | |
| Subordinated Series 2022-1A Class E | ||||
| 10/15/2029 | 5.020% | 2,900,000 | 2,652,615 | |
| Exeter Automobile Receivables Trust | ||||
| Series 2022-3A Class B | ||||
| 12/15/2026 | 4.860% | 3,815,000 | 3,789,844 | |
| Subordinated Series 2020-3A Class C | ||||
| 07/15/2025 | 1.320% | 515,976 | 510,893 | |
| Subordinated Series 2020-3A Class D | ||||
| 07/15/2026 | 1.730% | 400,000 | 387,680 | |
| Subordinated Series 2021-1A Class B | ||||
| 02/18/2025 | 0.500% | 412,610 | 411,833 | |
| Subordinated Series 2021-2A Class B | ||||
| 09/15/2025 | 0.570% | 2,026,104 | 2,007,252 | |
| Subordinated Series 2021-3A Class B | ||||
| 01/15/2026 | 0.690% | 2,640,000 | 2,584,518 | |
| Subordinated Series 2021-4 Class B | ||||
| 05/15/2026 | 1.050% | 4,250,000 | 4,111,118 | |
| Flagship Credit Auto Trust(a) | ||||
| Series 2020-2 Class C | ||||
| 04/15/2026 | 3.800% | 235,000 | 234,121 | |
| Subordinated Series 2020-1 Class B | ||||
| 02/17/2025 | 2.050% | 924,704 | 922,261 | |
| Subordinated Series 2020-4 Class C | ||||
| 02/16/2027 | 1.280% | 585,000 | 561,527 | |
| Subordinated Series 2021-2 Class B | ||||
| 06/15/2027 | 0.930% | 1,800,000 | 1,708,965 | |
| Subordinated Series 2021-3 Class B | ||||
| 07/15/2027 | 0.950% | 1,325,000 | 1,235,892 | |
| Flatiron CLO 21 Ltd.(a),(b) | ||||
| Series 2021-1A Class C | ||||
| 3-month USD LIBOR + 1.850% Floor 1.850% 07/19/2034 | 4.588% | 2,000,000 | 1,840,474 | |
| Ford Credit Auto Owner Trust(a) | ||||
| Series 2017-2 Class A | ||||
| 03/15/2029 | 2.360% | 7,075,000 | 7,073,052 | |
| Series 2018-1 Class A | ||||
| 07/15/2031 | 3.190% | 7,110,000 | 6,947,603 | |
| Series 2021-1 Class A | ||||
| 10/17/2033 | 1.370% | 3,415,000 | 3,101,005 | |
| Subordinated Series 2021-2 Class C | ||||
| 05/15/2034 | 2.110% | 3,900,000 | 3,426,474 | |
| Subordinated Series 2021-2 Class D | ||||
| 05/15/2034 | 2.600% | 2,300,000 | 1,972,827 | |
| 14 | Multi-Manager Total Return Bond Strategies Fund | Annual Report 2022 |
August 31, 2022
| Asset-Backed Securities — Non-Agency (continued) | ||||
| Issuer | Coupon Rate | Principal Amount ($) | Value ($) | |
| Foursight Capital Automobile Receivables Trust(a) | ||||
| Series 2022-1 Class A3 | ||||
| 12/15/2026 | 1.830% | 2,405,000 | 2,293,051 | |
| Series 2022-2 Class A3 | ||||
| 06/15/2027 | 4.590% | 2,130,000 | 2,112,724 | |
| Global SC Finance II SRL(a) | ||||
| Series 2014-1A Class A2 | ||||
| 07/17/2029 | 3.090% | 735,349 | 715,362 | |
| GLS Auto Receivables Issuer Trust(a) | ||||
| Subordinated Series 2019-4A Class B | ||||
| 09/16/2024 | 2.780% | 495,634 | 494,573 | |
| Subordinated Series 2020-4A Class C | ||||
| 11/17/2025 | 1.140% | 1,540,000 | 1,510,539 | |
| Subordinated Series 2021-1A Class B | ||||
| 04/15/2025 | 0.820% | 1,201,306 | 1,195,551 | |
| Subordinated Series 2021-3A Class B | ||||
| 11/17/2025 | 0.780% | 2,060,000 | 1,981,569 | |
| Subordinated Series 2021-4A Class B | ||||
| 04/15/2026 | 1.530% | 5,855,000 | 5,597,631 | |
| GM Financial Automobile Leasing Trust | ||||
| Subordinated Series 2022-3 Class C | ||||
| 08/20/2026 | 5.130% | 2,350,000 | 2,335,309 | |
| GM Financial Consumer Automobile Receivables Trust | ||||
| Series 2020-2 Class A3 | ||||
| 12/16/2024 | 1.490% | 413,171 | 408,988 | |
| GMF Floorplan Owner Revolving Trust(a) | ||||
| Series 2020-1 Class A | ||||
| 08/15/2025 | 0.680% | 1,115,000 | 1,079,787 | |
| Goal Capital Funding Trust(b) | ||||
| Series 2006-1 Class B | ||||
| 3-month USD LIBOR + 0.450% Floor 0.450% 08/25/2042 | 3.447% | 572,395 | 520,691 | |
| GoodLeap Sustainable Home Solutions Trust(a) | ||||
| Series 2021-3CS Class A | ||||
| 05/20/2048 | 2.100% | 3,151,913 | 2,684,634 | |
| Greenwood Park CLO Ltd.(a),(b) | ||||
| Series 2018-1A Class A2 | ||||
| 3-month USD LIBOR + 1.010% Floor 1.010% 04/15/2031 | 3.522% | 15,000,000 | 14,741,370 | |
| Greywolf CLO III Ltd.(a),(b) | ||||
| Series 2020-3RA Class A1R | ||||
| 3-month USD LIBOR + 1.290% Floor 1.290% 04/15/2033 | 4.056% | 6,500,000 | 6,356,136 | |
| Asset-Backed Securities — Non-Agency (continued) | ||||
| Issuer | Coupon Rate | Principal Amount ($) | Value ($) | |
| Greywolf CLO VII Ltd.(a),(b) | ||||
| Series 2018-2A Class A1 | ||||
| 3-month USD LIBOR + 1.180% Floor 1.180% 10/20/2031 | 3.890% | 6,250,000 | 6,152,969 | |
| Helios Issuer LLC(a) | ||||
| Series 2020-AA Class A | ||||
| 06/20/2047 | 2.980% | 1,081,344 | 956,352 | |
| Henderson Receivables LLC(a) | ||||
| Series 2013-3A Class A | ||||
| 01/17/2073 | 4.080% | 1,581,205 | 1,494,723 | |
| Series 2014-2A Class A | ||||
| 01/17/2073 | 3.610% | 1,995,193 | 1,915,587 | |
| Hilton Grand Vacations Trust(a) | ||||
| Subordinated Series 2022-2A Class C | ||||
| 01/25/2037 | 5.570% | 295,000 | 290,160 | |
| HPS Loan Management Ltd.(a),(b) | ||||
| Series 2010-A16 Class A1RR | ||||
| 3-month USD LIBOR + 1.140% Floor 1.140% 04/20/2034 | 3.850% | 9,750,000 | 9,479,369 | |
| Series 2021-16A Class A1 | ||||
| 3-month USD LIBOR + 1.140% Floor 1.140% 01/23/2035 | 3.923% | 7,300,000 | 7,087,643 | |
| ICG US CLO Ltd.(a),(b) | ||||
| Series 2014-3A Class A1RR | ||||
| 3-month USD LIBOR + 1.030% 04/25/2031 | 3.813% | 7,232,319 | 7,106,021 | |
| JG Wentworth XLIII LLC(a) | ||||
| Series 2019-1A Class A | ||||
| 08/17/2071 | 3.820% | 1,031,544 | 967,718 | |
| JPMorgan Chase Bank NA(a) | ||||
| Series 2021-3 Class E | ||||
| 02/26/2029 | 2.102% | 543,632 | 524,469 | |
| Subordinated Series 2021-1 Class D | ||||
| 09/25/2028 | 1.174% | 507,369 | 489,677 | |
| Subordinated Series 2021-2 Class D | ||||
| 12/26/2028 | 1.138% | 1,105,934 | 1,067,407 | |
| Kayne CLO Ltd.(a),(b) | ||||
| Series 2019-6A Class A2 | ||||
| 3-month USD LIBOR + 1.850% Floor 1.850% 01/20/2033 | 4.560% | 1,500,000 | 1,474,707 | |
| Kayne Ltd.(a),(b) | ||||
| Series 2018-1A Class CR | ||||
| 3-month USD LIBOR + 1.750% Floor 1.750% 07/15/2031 | 4.262% | 1,820,000 | 1,720,231 | |
| Multi-Manager Total Return Bond Strategies Fund | Annual Report 2022 | 15 |
August 31, 2022
| Asset-Backed Securities — Non-Agency (continued) | ||||
| Issuer | Coupon Rate | Principal Amount ($) | Value ($) | |
| Series 2021-10A Class C | ||||
| 3-month USD LIBOR + 1.750% Floor 1.750% 04/23/2034 | 4.533% | 1,600,000 | 1,483,594 | |
| KKR CLO Ltd.(a),(b) | ||||
| Series 2032A Class A1 | ||||
| 3-month USD LIBOR + 1.320% Floor 1.320% 01/15/2032 | 3.832% | 17,000,000 | 16,761,150 | |
| Lending Funding Trust(a) | ||||
| Series 2020-2A Class A | ||||
| 04/21/2031 | 2.320% | 700,000 | 636,272 | |
| Lendmark Funding Trust(a) | ||||
| Series 2019-2A Class A | ||||
| 04/20/2028 | 2.780% | 2,000,000 | 1,957,150 | |
| Series 2021-1A Class A | ||||
| 11/20/2031 | 1.900% | 5,000,000 | 4,315,127 | |
| Subordinated Series 2021-1A Class B | ||||
| 11/20/2031 | 2.470% | 200,000 | 165,473 | |
| Subordinated Series 2021-1A Class C | ||||
| 11/20/2031 | 3.410% | 100,000 | 82,126 | |
| loanDepot GMSR Master Trust(a),(b) | ||||
| Series 2018-GT1 Class A | ||||
| 1-month USD LIBOR + 2.800% Floor 2.800% 10/16/2023 | 5.187% | 1,300,000 | 1,268,799 | |
| Loanpal Solar Loan Ltd.(a) | ||||
| Series 2020-2GF Class A | ||||
| 07/20/2047 | 2.750% | 1,518,138 | 1,303,491 | |
| Logan CLO I Ltd.(a),(b) | ||||
| Series 2021-1A Class A | ||||
| 3-month USD LIBOR + 1.160% Floor 1.160% 07/20/2034 | 3.870% | 15,000,000 | 14,684,715 | |
| Madison Park Funding LIX Ltd.(a),(b) | ||||
| Series 2021-59A Class A | ||||
| 3-month USD LIBOR + 1.140% Floor 1.140% 01/18/2034 | 3.880% | 12,500,000 | 12,278,112 | |
| Madison Park Funding XLVIII Ltd.(a),(b) | ||||
| Series 2021-48A Class A | ||||
| 3-month USD LIBOR + 1.150% Floor 1.150% 04/19/2033 | 3.888% | 6,500,000 | 6,391,008 | |
| Series 2021-48A Class C | ||||
| 3-month USD LIBOR + 2.000% Floor 2.000% 04/19/2033 | 4.738% | 1,520,000 | 1,446,996 | |
| Asset-Backed Securities — Non-Agency (continued) | ||||
| Issuer | Coupon Rate | Principal Amount ($) | Value ($) | |
| Madison Park Funding XXI Ltd.(a),(b) | ||||
| Series 2016-21A Class AARR | ||||
| 3-month USD LIBOR + 1.080% Floor 1.080% 10/15/2032 | 3.592% | 17,000,000 | 16,664,437 | |
| Series 2016-21A Class ABRR | ||||
| 3-month USD LIBOR + 1.400% Floor 1.400% 10/15/2032 | 3.912% | 1,750,000 | 1,688,827 | |
| Madison Park Funding XXXVIII Ltd.(a),(b) | ||||
| Series 2021-38A Class A | ||||
| 3-month USD LIBOR + 1.120% Floor 1.120% 07/17/2034 | 3.860% | 15,000,000 | 14,648,520 | |
| Magnetite XVII Ltd.(a),(b) | ||||
| Series 2016-17A Class AR | ||||
| 3-month USD LIBOR + 1.100% 07/20/2031 | 3.810% | 1,050,000 | 1,032,722 | |
| Marathon CLO Ltd.(a),(b) | ||||
| Series 2020-15A Class A1S | ||||
| 3-month USD LIBOR + 1.700% Floor 1.700% 11/15/2031 | 4.605% | 20,500,000 | 20,347,480 | |
| Mariner Finance Issuance Trust(a) | ||||
| Series 2019-AA Class A | ||||
| 07/20/2032 | 2.960% | 1,166,155 | 1,156,445 | |
| Series 2020-AA Class A | ||||
| 08/21/2034 | 2.190% | 1,000,000 | 947,901 | |
| Marlette Funding Trust(a) | ||||
| Series 2021-1A Class C | ||||
| 06/16/2031 | 1.410% | 700,000 | 669,961 | |
| Series 2021-3A Class A | ||||
| 12/15/2031 | 0.650% | 1,547,723 | 1,523,774 | |
| Subordinated Series 2018-4A Class C | ||||
| 12/15/2028 | 4.910% | 245,267 | 244,755 | |
| Massachusetts Educational Financing Authority | ||||
| Series 2018-A Class A | ||||
| 05/25/2033 | 3.850% | 1,613,667 | 1,575,788 | |
| Merlin Aviation Holdings DAC(a) | ||||
| Series 2016-1 Class A | ||||
| 12/15/2032 | 4.500% | 715,579 | 561,622 | |
| MF1 Ltd.(a),(b) | ||||
| Series 2021-FL6 Class D | ||||
| 1-month USD LIBOR + 2.550% Floor 2.550% 07/16/2036 | 4.927% | 7,000,000 | 6,744,968 | |
| Series 2022-FL8 Class A | ||||
| 30-day Average SOFR + 1.350% Floor 1.350% 02/19/2037 | 2.822% | 3,450,000 | 3,373,069 | |
| 16 | Multi-Manager Total Return Bond Strategies Fund | Annual Report 2022 |
August 31, 2022
| Asset-Backed Securities — Non-Agency (continued) | ||||
| Issuer | Coupon Rate | Principal Amount ($) | Value ($) | |
| MidOcean Credit CLO VIII(a),(b) | ||||
| Series 2018-8A Class B | ||||
| 3-month USD LIBOR + 1.650% 02/20/2031 | 4.634% | 6,600,000 | 6,298,743 | |
| Mid-State Capital Corp. Trust(a) | ||||
| Series 2006-1 Class A | ||||
| 10/15/2040 | 5.787% | 639,513 | 631,578 | |
| Mill City Solar Loan Ltd.(a) | ||||
| Series 2019-1A Class A | ||||
| 03/20/2043 | 4.340% | 1,096,356 | 1,066,107 | |
| Series 2019-2GS Class A | ||||
| 07/20/2043 | 3.690% | 1,167,084 | 1,096,586 | |
| Mosaic Solar Loan Trust(a) | ||||
| Series 2018-1A Class A | ||||
| 06/22/2043 | 4.010% | 567,094 | 545,137 | |
| Series 2019-1A Class A | ||||
| 12/21/2043 | 4.370% | 1,185,338 | 1,127,178 | |
| Series 2020-2A Class A | ||||
| 08/20/2046 | 1.440% | 2,099,609 | 1,778,055 | |
| Series 2021-2A Class B | ||||
| 04/22/2047 | 2.090% | 1,067,044 | 894,730 | |
| Subordinated Series 2018-2GS Class B | ||||
| 02/22/2044 | 4.740% | 1,384,393 | 1,331,734 | |
| Subordinated Series 2020-2A Class B | ||||
| 08/20/2046 | 2.210% | 1,338,881 | 1,176,551 | |
| Mosaic Solar Loans LLC(a) | ||||
| Series 2017-2A Class A | ||||
| 06/22/2043 | 3.820% | 599,691 | 565,573 | |
| Navient Private Education Refi Loan Trust(a) | ||||
| Series 2020-BA Class A2 | ||||
| 01/15/2069 | 2.120% | 1,316,461 | 1,184,607 | |
| Series 2020-DA Class A | ||||
| 05/15/2069 | 1.690% | 949,518 | 877,948 | |
| Series 2020-FA Class A | ||||
| 07/15/2069 | 1.220% | 879,900 | 806,169 | |
| Series 2020-GA Class A | ||||
| 09/16/2069 | 1.170% | 1,630,205 | 1,497,702 | |
| Series 2020-HA Class A | ||||
| 01/15/2069 | 1.310% | 871,273 | 775,593 | |
| Series 2021-A Class A | ||||
| 05/15/2069 | 0.840% | 842,302 | 757,938 | |
| Navient Student Loan Trust(b) | ||||
| Series 2014-3 Class A | ||||
| 1-month USD LIBOR + 0.620% Floor 0.620% 03/25/2083 | 3.064% | 4,280,189 | 4,248,283 | |
| Asset-Backed Securities — Non-Agency (continued) | ||||
| Issuer | Coupon Rate | Principal Amount ($) | Value ($) | |
| Series 2014-4 Class A | ||||
| 1-month USD LIBOR + 0.620% Floor 0.620% 03/25/2083 | 3.064% | 1,861,364 | 1,848,343 | |
| Nelnet Student Loan Trust(a),(b) | ||||
| Series 2006-1 Class A6 | ||||
| 3-month USD LIBOR + 0.450% 08/23/2036 | 1.955% | 6,556,002 | 6,352,731 | |
| Series 2014-4A Class A2 | ||||
| 1-month USD LIBOR + 0.950% Floor 0.950% 11/25/2048 | 3.394% | 4,210,000 | 4,095,051 | |
| Neuberger Berman CLO XVII Ltd.(a),(b) | ||||
| Series 2014-17A Class CR2 | ||||
| 3-month USD LIBOR + 2.000% Floor 2.000% 04/22/2029 | 4.759% | 2,000,000 | 1,903,934 | |
| Neuberger Berman Loan Advisers CLO Ltd.(a),(b) | ||||
| Series 2019-33A Class CR | ||||
| 3-month USD LIBOR + 1.900% Floor 1.900% 10/16/2033 | 4.640% | 2,000,000 | 1,877,788 | |
| Series 2021-40A Class C | ||||
| 3-month USD LIBOR + 1.750% Floor 1.750% 04/16/2033 | 4.490% | 4,650,000 | 4,370,121 | |
| New Economy Assets Phase 1 Sponsor LLC(a) | ||||
| Series 2021-1 Class A1 | ||||
| 10/20/2061 | 1.910% | 5,030,000 | 4,369,431 | |
| NextGear Floorplan Master Owner Trust(a) | ||||
| Subordinated Series 2020-1A Class A2 | ||||
| 02/18/2025 | 1.550% | 2,515,000 | 2,482,564 | |
| OCP CLO Ltd.(a),(b) | ||||
| Series 2020-18A Class CR | ||||
| 3-month USD LIBOR + 1.950% Floor 1.950% 07/20/2032 | 4.660% | 500,000 | 471,493 | |
| Octagon Investment Partners 32 Ltd.(a),(b) | ||||
| Series 2017-1A Class A2R | ||||
| 3-month USD LIBOR + 1.200% Floor 1.200% 07/15/2029 | 3.712% | 7,400,000 | 7,159,914 | |
| Octagon Investment Partners 46 Ltd.(a),(b) | ||||
| Series 2020-2A Class AR | ||||
| 3-month USD LIBOR + 1.160% Floor 1.160% 07/15/2036 | 1.288% | 7,900,000 | 7,703,282 | |
| OHA Credit Funding Ltd.(a),(b) | ||||
| Series 2021-8A Class C | ||||
| 3-month USD LIBOR + 1.900% Floor 1.900% 01/18/2034 | 4.640% | 1,350,000 | 1,271,790 | |
| Multi-Manager Total Return Bond Strategies Fund | Annual Report 2022 | 17 |
August 31, 2022
| Asset-Backed Securities — Non-Agency (continued) | ||||
| Issuer | Coupon Rate | Principal Amount ($) | Value ($) | |
| OHA Credit Partners VII Ltd.(a),(b) | ||||
| Series 2012-7A Class CR3 | ||||
| 3-month USD LIBOR + 1.800% Floor 1.800% 02/20/2034 | 4.784% | 5,000,000 | 4,657,570 | |
| OneMain Direct Auto Receivables Trust(a) | ||||
| Series 2019-1A Class A | ||||
| 09/14/2027 | 3.630% | 6,900,000 | 6,742,867 | |
| Subordinated Series 2019-1A Class B | ||||
| 11/14/2028 | 3.950% | 1,500,000 | 1,426,359 | |
| Subordinated Series 2019-1A Class D | ||||
| 04/14/2031 | 4.680% | 2,900,000 | 2,746,675 | |
| Subordinated Series 2021-1A Class C | ||||
| 07/14/2028 | 1.420% | 7,367,000 | 6,512,193 | |
| Subordinated Series 2021-1A Class D | ||||
| 11/14/2030 | 1.620% | 900,000 | 785,820 | |
| OneMain Financial Issuance Trust(a) | ||||
| Series 2020-2A Class A | ||||
| 09/14/2035 | 1.750% | 2,700,000 | 2,422,764 | |
| Series 2022-S1 Class A | ||||
| 05/14/2035 | 4.130% | 7,275,000 | 7,052,358 | |
| OneMain Financial Issuance Trust(a),(c) | ||||
| Series 2022-2 Class D | ||||
| 10/14/2034 | 6.550% | 6,280,000 | 6,278,426 | |
| Oscar US Funding XII LLC(a) | ||||
| Series 2021-1A Class A4 | ||||
| 04/10/2028 | 1.000% | 2,050,000 | 1,893,709 | |
| OZLM Funding IV Ltd.(a),(b) | ||||
| Series 2013-4A | ||||
| 3-month USD LIBOR + 1.250% Floor 1.250% 10/22/2030 | 4.009% | 13,736,345 | 13,579,173 | |
| Pagaya AI Debt Trust(a) | ||||
| Series 2022-1 Class A | ||||
| 10/15/2029 | 2.030% | 2,286,973 | 2,206,989 | |
| Palmer Square CLO Ltd.(a),(b) | ||||
| Series 2014-1A Class A1R2 | ||||
| 3-month USD LIBOR + 1.130% Floor 1.130% 01/17/2031 | 3.870% | 8,000,000 | 7,909,344 | |
| Series 2020-3A Class BR | ||||
| 3-month USD LIBOR + 1.950% Floor 1.950% 11/15/2031 | 4.855% | 2,000,000 | 1,901,070 | |
| Park Avenue Institutional Advisers CLO Ltd.(a),(b) | ||||
| Series 2017-1A Class A1R | ||||
| 3-month USD LIBOR + 1.240% Floor 1.240% 02/14/2034 | 4.145% | 5,000,000 | 4,869,200 | |
| Asset-Backed Securities — Non-Agency (continued) | ||||
| Issuer | Coupon Rate | Principal Amount ($) | Value ($) | |
| Series 2019-2A Class A1 | ||||
| 3-month USD LIBOR + 1.180% Floor 1.180% 10/15/2034 | 3.692% | 15,000,000 | 14,584,545 | |
| Planet Fitness Master Issuer LLC(a) | ||||
| Series 2018-1A Class A2II | ||||
| 09/05/2048 | 4.666% | 3,878,875 | 3,736,113 | |
| Prestige Auto Receivables Trust(a) | ||||
| Subordinated Series 2021-1A Class C | ||||
| 02/15/2028 | 1.530% | 2,525,000 | 2,361,649 | |
| Primose Funding LLC(a) | ||||
| Series 2019-1A Class A2 | ||||
| 07/30/2049 | 4.475% | 1,458,750 | 1,356,108 | |
| Regional Management Issuance Trust(a) | ||||
| Series 2022-1 Class A | ||||
| 03/15/2032 | 3.070% | 2,800,000 | 2,581,617 | |
| Rockford Tower CLO Ltd.(a),(b) | ||||
| Series 2021-1A Class B | ||||
| 3-month USD LIBOR + 1.650% Floor 1.650% 07/20/2034 | 4.360% | 7,900,000 | 7,542,343 | |
| Series 2021-3A Class B | ||||
| 3-month USD LIBOR + 1.750% Floor 1.750% 10/20/2034 | 4.460% | 10,000,000 | 9,550,330 | |
| Santander Bank Auto Credit-Linked Notes(a) | ||||
| Subordinated Series 2022-A Class C | ||||
| 05/15/2032 | 7.375% | 1,465,610 | 1,452,052 | |
| Santander Consumer Auto Receivables Trust(a) | ||||
| Series 2020-AA Class C | ||||
| 02/17/2026 | 3.710% | 1,310,000 | 1,302,049 | |
| Santander Drive Auto Receivables Trust | ||||
| Series 2020-2 Class D | ||||
| 09/15/2026 | 2.220% | 700,000 | 685,568 | |
| Series 2021-2 Class C | ||||
| 06/15/2026 | 0.900% | 2,845,000 | 2,768,706 | |
| Subordinated Series 2020-2 Class C | ||||
| 09/15/2025 | 1.460% | 1,364,921 | 1,358,089 | |
| Subordinated Series 2020-3 Class D | ||||
| 11/16/2026 | 1.640% | 2,900,000 | 2,807,099 | |
| Subordinated Series 2020-4 Class C | ||||
| 01/15/2026 | 1.010% | 2,425,000 | 2,395,889 | |
| Subordinated Series 2020-4 Class D | ||||
| 01/15/2027 | 1.480% | 1,800,000 | 1,736,534 | |
| Subordinated Series 2022-1 Class B | ||||
| 08/17/2026 | 2.360% | 4,005,000 | 3,862,437 | |
| Subordinated Series 2022-3 Class B | ||||
| 08/16/2027 | 4.130% | 3,710,000 | 3,627,069 | |
| 18 | Multi-Manager Total Return Bond Strategies Fund | Annual Report 2022 |
August 31, 2022
| Asset-Backed Securities — Non-Agency (continued) | ||||
| Issuer | Coupon Rate | Principal Amount ($) | Value ($) | |
| Subordinated Series 2022-4 Class B | ||||
| 11/15/2027 | 4.420% | 3,505,000 | 3,464,909 | |
| Subordinated Series 2022-5 Class B | ||||
| 03/15/2027 | 4.430% | 1,880,000 | 1,870,583 | |
| SCF Equipment Leasing LLC(a) | ||||
| Series 2022-1A Class A3 | ||||
| 07/20/2029 | 2.920% | 2,440,000 | 2,315,311 | |
| Shackleton VR CLO Ltd.(a),(b) | ||||
| Series 2014-5RA Class A | ||||
| 3-month USD LIBOR + 1.100% Floor 1.100% 05/07/2031 | 3.963% | 11,000,000 | 10,771,750 | |
| Sixth Street CLO XVI Ltd.(a),(b) | ||||
| Series 2020-16A Class A1A | ||||
| 3-month USD LIBOR + 1.320% Floor 1.320% 10/20/2032 | 4.030% | 25,250,000 | 24,973,967 | |
| S-Jets Ltd.(a) | ||||
| Series 2017-1 Class A | ||||
| 08/15/2042 | 3.970% | 1,480,429 | 1,241,650 | |
| SLM Student Loan Trust(b) | ||||
| Series 2008-2 Class B | ||||
| 3-month USD LIBOR + 1.200% Floor 1.200% 01/25/2083 | 3.983% | 1,165,000 | 917,135 | |
| Series 2008-3 Class B | ||||
| 3-month USD LIBOR + 1.200% Floor 1.200% 04/26/2083 | 3.983% | 1,165,000 | 975,232 | |
| Series 2008-4 Class B | ||||
| 3-month USD LIBOR + 1.850% Floor 1.850% 04/25/2073 | 4.633% | 1,165,000 | 1,119,738 | |
| Series 2008-5 Class B | ||||
| 3-month USD LIBOR + 1.850% Floor 1.850% 07/25/2073 | 4.633% | 4,060,000 | 3,981,427 | |
| Series 2008-6 Class A4 | ||||
| 3-month USD LIBOR + 1.100% Floor 1.100% 07/25/2023 | 3.883% | 4,142,605 | 4,045,539 | |
| Series 2008-6 Class B | ||||
| 3-month USD LIBOR + 1.850% Floor 1.850% 07/26/2083 | 4.633% | 1,165,000 | 1,088,584 | |
| Series 2008-7 Class B | ||||
| 3-month USD LIBOR + 1.850% Floor 1.850% 07/26/2083 | 4.633% | 1,165,000 | 1,047,992 | |
| Asset-Backed Securities — Non-Agency (continued) | ||||
| Issuer | Coupon Rate | Principal Amount ($) | Value ($) | |
| Series 2008-8 Class B | ||||
| 3-month USD LIBOR + 2.250% Floor 2.250% 10/25/2075 | 5.033% | 1,165,000 | 1,127,831 | |
| Series 2008-9 Class B | ||||
| 3-month USD LIBOR + 2.250% Floor 2.250% 10/25/2083 | 5.033% | 1,165,000 | 1,098,084 | |
| Series 2012-2 Class A | ||||
| 1-month USD LIBOR + 0.700% Floor 0.700% 01/25/2029 | 3.144% | 4,961,995 | 4,733,544 | |
| Series 2012-7 Class A3 | ||||
| 1-month USD LIBOR + 0.650% Floor 0.650% 05/26/2026 | 3.094% | 2,400,525 | 2,296,753 | |
| SMB Private Education Loan Trust(a) | ||||
| Series 2020-PTA Class A2A | ||||
| 09/15/2054 | 1.600% | 2,823,423 | 2,576,883 | |
| SoFi Consumer Loan Program Trust(a) | ||||
| Subordinated Series 2019-4 Class D | ||||
| 08/25/2028 | 3.480% | 350,000 | 348,963 | |
| SoFi Professional Loan Program LLC(a) | ||||
| Series 2016-B Class A2B | ||||
| 10/25/2032 | 2.740% | 61,120 | 61,044 | |
| Series 2016-C Class A2B | ||||
| 12/27/2032 | 2.360% | 14,017 | 13,998 | |
| Series 2017-A Class A2B | ||||
| 03/26/2040 | 2.400% | 50,069 | 49,850 | |
| Series 2017-D Class A2FX | ||||
| 09/25/2040 | 2.650% | 303,820 | 292,042 | |
| Series 2017-E Class A2B | ||||
| 11/26/2040 | 2.720% | 22,844 | 22,738 | |
| Series 2018-A Class A2B | ||||
| 02/25/2042 | 2.950% | 95,747 | 94,192 | |
| Series 2019-A Class BFX | ||||
| 06/15/2048 | 4.110% | 2,500,000 | 2,363,192 | |
| Subordinated Series 2018-B Class BFX | ||||
| 08/25/2047 | 3.830% | 2,700,000 | 2,588,966 | |
| Subordinated Series 2019-B Class BFX | ||||
| 08/17/2048 | 3.730% | 2,500,000 | 2,344,445 | |
| SoFi Professional Loan Program LLC(a),(b) | ||||
| Series 2016-D Class A1 | ||||
| 1-month USD LIBOR + 0.950% 01/25/2039 | 3.394% | 43,711 | 43,578 | |
| SoFi Professional Loan Program Trust(a) | ||||
| Subordinated Series 2020-B Class BFX | ||||
| 05/15/2046 | 2.730% | 2,200,000 | 2,035,404 | |
| Multi-Manager Total Return Bond Strategies Fund | Annual Report 2022 | 19 |
August 31, 2022
| Asset-Backed Securities — Non-Agency (continued) | ||||
| Issuer | Coupon Rate | Principal Amount ($) | Value ($) | |
| Sonic Capital LLC(a) | ||||
| Series 2020-1A Class A2I | ||||
| 01/20/2050 | 3.845% | 1,862,000 | 1,713,019 | |
| Sound Point CLO II Ltd.(a),(b) | ||||
| Series 2013-1A Class A1R | ||||
| 3-month USD LIBOR + 1.070% Floor 1.070% 01/26/2031 | 3.836% | 6,000,000 | 5,899,116 | |
| Sunnova Sol II Issuer LLC(a) | ||||
| Series 2020-2A Class A | ||||
| 11/01/2055 | 2.730% | 2,871,826 | 2,394,319 | |
| Sunnova Sol III Issuer LLC(a) | ||||
| Series 2021-1 Class A | ||||
| 04/28/2056 | 2.580% | 2,519,373 | 2,162,191 | |
| Sunrun Athena Issuer LLC(a) | ||||
| Series 2018-1 Class A | ||||
| 04/30/2049 | 5.310% | 1,829,437 | 1,784,808 | |
| Sunrun Callisto Issuer LLC(a) | ||||
| Series 2019-1A Class A | ||||
| 06/30/2054 | 3.980% | 1,497,818 | 1,410,994 | |
| Synchrony Credit Card Master Note Trust | ||||
| Series 2017-2 Class A | ||||
| 10/15/2025 | 2.620% | 5,400,000 | 5,397,222 | |
| Taco Bell Funding LLC(a) | ||||
| Series 2021-1A Class A2I | ||||
| 08/25/2051 | 1.946% | 2,481,250 | 2,134,889 | |
| TCI-Flatiron CLO Ltd.(a),(b) | ||||
| Series 2018-1A Class CR | ||||
| 3-month USD LIBOR + 1.750% Floor 1.750% 01/29/2032 | 4.556% | 2,300,000 | 2,173,840 | |
| TCW CLO Ltd.(a),(b) | ||||
| Series 2017-1A Class A1RR | ||||
| 3-month USD LIBOR + 1.180% Floor 1.180% 10/29/2034 | 3.986% | 6,750,000 | 6,605,969 | |
| Series 2017-1A Class BRR | ||||
| 3-month USD LIBOR + 1.700% Floor 1.700% 10/29/2034 | 4.506% | 6,500,000 | 6,248,086 | |
| Series 2021-1A Class C | ||||
| 3-month USD LIBOR + 1.900% Floor 1.900% 03/18/2034 | 4.610% | 3,150,000 | 2,926,114 | |
| Telos CLO Ltd.(a),(b) | ||||
| Series 2013-4A Class AR | ||||
| 3-month USD LIBOR + 1.240% Floor 1.240% 01/17/2030 | 3.980% | 11,957,003 | 11,809,693 | |
| Asset-Backed Securities — Non-Agency (continued) | ||||
| Issuer | Coupon Rate | Principal Amount ($) | Value ($) | |
| Textainer Marine Containers VII Ltd.(a) | ||||
| Series 2021-2A Class A | ||||
| 04/20/2046 | 2.230% | 3,930,672 | 3,470,763 | |
| THL Credit Wind River CLO Ltd.(a),(b) | ||||
| Series 2019-1A Class AR | ||||
| 3-month USD LIBOR + 1.160% Floor 1.160% 07/20/2034 | 3.870% | 10,000,000 | 9,726,020 | |
| TIAA CLO I Ltd.(a),(b) | ||||
| Series 2016-1A Class AR | ||||
| 3-month USD LIBOR + 1.200% Floor 1.200% 07/20/2031 | 3.910% | 6,750,000 | 6,611,834 | |
| Toyota Auto Loan Extended Note Trust(a) | ||||
| Series 2020-1A Class A | ||||
| 05/25/2033 | 1.350% | 1,405,000 | 1,289,307 | |
| Trafigura Securitisation Finance PLC(a) | ||||
| Subordinated Series 2021-1A Class B | ||||
| 01/15/2025 | 1.780% | 1,550,000 | 1,375,045 | |
| Tralee CLO VI Ltd.(a),(b) | ||||
| Series 2019-6A Class A1R | ||||
| 3-month USD LIBOR + 1.170% Floor 1.170% 10/25/2032 | 3.953% | 25,000,000 | 24,378,225 | |
| Tralee CLO VII Ltd(a),(b) | ||||
| Series 2021-7A Class A1 | ||||
| 3-month USD LIBOR + 1.320% Floor 1.320% 04/25/2034 | 4.103% | 9,250,000 | 9,067,988 | |
| Trestles CLO V LTD.(a),(b) | ||||
| Series 2021-5A Class B1 | ||||
| 3-month USD LIBOR + 1.650% Floor 1.650% 10/20/2034 | 4.360% | 6,800,000 | 6,489,192 | |
| Trinitas CLO VII Ltd.(a),(b) | ||||
| Series 2017-7A Class A1R | ||||
| 3-month USD LIBOR + 1.200% Floor 1.200% 01/25/2035 | 3.983% | 4,000,000 | 3,863,324 | |
| Triton Container Finance VIII LLC(a) | ||||
| Series 2021-1A Class A | ||||
| 03/20/2046 | 1.860% | 2,814,667 | 2,423,449 | |
| United Auto Credit Securitization Trust(a) | ||||
| Series 2022-1 Class B | ||||
| 03/10/2025 | 2.100% | 1,205,000 | 1,180,151 | |
| Subordinated Series 2022-2 Class C | ||||
| 05/10/2027 | 5.810% | 1,995,000 | 1,974,663 | |
| 20 | Multi-Manager Total Return Bond Strategies Fund | Annual Report 2022 |
August 31, 2022
| Asset-Backed Securities — Non-Agency (continued) | ||||
| Issuer | Coupon Rate | Principal Amount ($) | Value ($) | |
| Venture CLO Ltd.(a),(b) | ||||
| Series 2017-28AA Class A1R | ||||
| 3-month USD LIBOR + 1.210% Floor 1.210% 10/20/2034 | 3.920% | 12,500,000 | 12,088,387 | |
| Venture XXVII CLO Ltd.(a),(b) | ||||
| Series 2017-27A Class CR | ||||
| 3-month USD LIBOR + 2.300% 07/20/2030 | 5.010% | 4,100,000 | 3,851,175 | |
| Voya CLO Ltd.(a),(b) | ||||
| Series 2013-1A Class A1AR | ||||
| 3-month USD LIBOR + 1.210% Floor 1.210% 10/15/2030 | 3.722% | 7,469,179 | 7,379,519 | |
| Series 2016-1A Class A1R | ||||
| 3-month USD LIBOR + 1.070% Floor 1.007% 01/20/2031 | 3.780% | 10,000,000 | 9,868,170 | |
| Wachovia Student Loan Trust(a),(b) | ||||
| Series 2006-1 Class A6 | ||||
| 3-month USD LIBOR + 0.170% Floor 0.170% 04/25/2040 | 2.953% | 5,257,180 | 5,051,955 | |
| Wellfleet CLO Ltd.(a),(b) | ||||
| Series 2019-1A Class A1R | ||||
| 3-month USD LIBOR + 1.120% Floor 1.120% 07/20/2032 | 3.830% | 15,000,000 | 14,681,310 | |
| Wendy’s Funding LLC(a) | ||||
| Series 2018-1A Class A2II | ||||
| 03/15/2048 | 3.884% | 955,000 | 889,445 | |
| Series 2019-1A Class A2I | ||||
| 06/15/2049 | 3.783% | 3,156,750 | 2,967,415 | |
| Series 2021-1A Class A2II | ||||
| 06/15/2051 | 2.775% | 2,277,000 | 1,862,547 | |
| Westlake Automobile Receivables Trust(a) | ||||
| Series 2020-2A Class B | ||||
| 07/15/2025 | 1.320% | 747,703 | 746,398 | |
| Series 2020-2A Class C | ||||
| 07/15/2025 | 2.010% | 1,280,000 | 1,266,162 | |
| Series 2021-2A Class C | ||||
| 07/15/2026 | 0.890% | 1,650,000 | 1,561,644 | |
| Subordinated Series 2020-3A Class C | ||||
| 11/17/2025 | 1.240% | 210,000 | 204,349 | |
| Subordinated Series 2021-1A Class B | ||||
| 03/16/2026 | 0.640% | 4,960,000 | 4,858,445 | |
| Subordinated Series 2021-2A Class B | ||||
| 07/15/2026 | 0.620% | 2,170,000 | 2,093,170 | |
| Subordinated Series 2021-3 Class C | ||||
| 01/15/2027 | 1.580% | 6,225,000 | 5,869,091 | |
| Asset-Backed Securities — Non-Agency (continued) | ||||
| Issuer | Coupon Rate | Principal Amount ($) | Value ($) | |
| Wind River CLO Ltd.(a),(b) | ||||
| Series 2016-1A Class A1R2 | ||||
| 3-month USD LIBOR + 1.210% Floor 1.210% 10/15/2034 | 3.722% | 4,250,000 | 4,138,986 | |
| World Omni Select Auto Trust | ||||
| Series 2020-A Class A3 | ||||
| 07/15/2025 | 0.550% | 1,105,814 | 1,095,543 | |
| Subordinated Series 2021-A Class B | ||||
| 08/16/2027 | 0.850% | 2,170,000 | 2,040,719 | |
| York CLO-4 Ltd.(a),(b) | ||||
| Series 2016-2A Class A1R | ||||
| 3-month USD LIBOR + 1.090% 04/20/2032 | 3.800% | 10,500,000 | 10,333,859 | |
| Zais CLO 7 Ltd.(a),(b) | ||||
| Series 2017-2A Class A | ||||
| 3-month USD LIBOR + 1.290% 04/15/2030 | 3.802% | 3,789,251 | 3,737,047 | |
| Zais CLO 8 Ltd.(a),(b) | ||||
| Series 2018-1A Class A | ||||
| 3-month USD LIBOR + 0.950% 04/15/2029 | 3.462% | 2,758,653 | 2,728,106 | |
| Zais CLO 9 Ltd.(a),(b) | ||||
| Series 2018-2A Class A | ||||
| 3-month USD LIBOR + 1.200% Floor 1.200% 07/20/2031 | 3.910% | 12,613,399 | 12,345,566 | |
| Zaxby’s Funding LLC(a) | ||||
| Series 2021-1A Class A2 | ||||
| 07/30/2051 | 3.238% | 5,593,500 | 4,763,027 | |
| Total Asset-Backed Securities — Non-Agency (Cost $1,220,875,578) | 1,179,110,929 | |||
| Commercial Mortgage-Backed Securities - Agency 1.0% | ||||
| Federal Home Loan Mortgage Corp. Multifamily ML Certificates(d),(e) | ||||
| Series 2021-ML08 Class XUS | ||||
| 07/25/2037 | 1.869% | 7,833,483 | 1,201,981 | |
| Federal Home Loan Mortgage Corp. Multifamily Structured Pass-Through Certificates(d),(e) | ||||
| CMO Series K028 Class X1 | ||||
| 02/25/2023 | 0.337% | 104,928,725 | 54,238 | |
| CMO Series K055 Class X1 | ||||
| 03/25/2026 | 1.483% | 2,017,294 | 79,885 | |
| CMO Series K057 Class X1 | ||||
| 07/25/2026 | 1.305% | 2,364,821 | 85,966 | |
| CMO Series K059 Class X1 | ||||
| 09/25/2026 | 0.426% | 7,073,026 | 71,766 | |
| CMO Series K060 Class X1 | ||||
| 10/25/2026 | 0.191% | 25,748,770 | 86,140 | |
| Multi-Manager Total Return Bond Strategies Fund | Annual Report 2022 | 21 |
August 31, 2022
| Commercial Mortgage-Backed Securities - Agency (continued) | ||||
| Issuer | Coupon Rate | Principal Amount ($) | Value ($) | |
| CMO Series K152 Class X1 | ||||
| 01/25/2031 | 1.101% | 4,073,250 | 237,639 | |
| Series 20K129 Class X1 (FHLMC) | ||||
| 05/25/2031 | 1.159% | 12,805,643 | 876,855 | |
| Series 20K141 Class X1 (FHLMC) | ||||
| 02/25/2032 | 0.407% | 7,249,681 | 182,190 | |
| Series 20K142 Class X1 (FHLMC) | ||||
| 12/25/2031 | 0.403% | 17,582,581 | 427,644 | |
| Series 20K143 Class X1 (FHLMC) | ||||
| 04/25/2055 | 0.450% | 7,947,980 | 224,608 | |
| Series 20K144 Class X1 (FHLMC) | ||||
| 04/25/2032 | 0.435% | 10,398,217 | 288,541 | |
| Series K069 Class X1 | ||||
| 09/25/2027 | 0.478% | 36,800,216 | 576,527 | |
| Series K091 Class X1 | ||||
| 03/25/2029 | 0.705% | 39,326,800 | 1,229,993 | |
| Series K095 Class X1 | ||||
| 06/25/2029 | 1.084% | 75,243,839 | 3,925,629 | |
| Series K106 Class X1 | ||||
| 01/25/2030 | 1.477% | 99,634,693 | 7,919,075 | |
| Series K108 Class X1 | ||||
| 03/25/2030 | 1.810% | 2,258,839 | 228,466 | |
| Series K137 Class X1 | ||||
| 11/25/2031 | 0.299% | 275,138,351 | 4,167,878 | |
| Series K145 Class X1 | ||||
| 06/25/2055 | 0.430% | 4,664,043 | 125,785 | |
| Series K146 Class X1 | ||||
| 06/25/2032 | 0.352% | 15,769,286 | 331,910 | |
| Series K147 Class X1 | ||||
| 06/25/2032 | 0.487% | 12,199,026 | 375,029 | |
| Series K-1516 Class X1 | ||||
| 05/25/2035 | 1.630% | 1,193,580 | 162,469 | |
| Series K-1517 Class X1 | ||||
| 07/25/2035 | 1.443% | 6,787,058 | 817,142 | |
| Series K1521 Class X1 | ||||
| 08/25/2036 | 1.096% | 8,597,354 | 797,211 | |
| Series K728 Class X1 | ||||
| 08/25/2024 | 0.502% | 256,148,874 | 1,883,668 | |
| Series K729 Class X1 | ||||
| 10/25/2024 | 0.469% | 162,014,612 | 924,002 | |
| Series K735 Class X1 | ||||
| 05/25/2026 | 1.094% | 12,762,226 | 373,217 | |
| Federal Home Loan Mortgage Corp. Multifamily Structured Pass-Through Certificates | ||||
| Series K056 Class A2 | ||||
| 05/25/2026 | 2.525% | 6,137,000 | 5,866,584 | |
| Commercial Mortgage-Backed Securities - Agency (continued) | ||||
| Issuer | Coupon Rate | Principal Amount ($) | Value ($) | |
| Series K074 Class A2 | ||||
| 01/25/2028 | 3.600% | 8,660,000 | 8,593,065 | |
| Series K155 Class A3 | ||||
| 04/25/2033 | 3.750% | 6,935,000 | 6,836,143 | |
| Federal Home Loan Mortgage Corp. Multifamily Structured Pass-Through Certificates(d) | ||||
| Series K157 Class A3 | ||||
| 08/25/2033 | 3.990% | 11,850,000 | 11,836,088 | |
| Series Q006 Class APT1 | ||||
| 07/25/2026 | 2.886% | 4,299,504 | 4,151,517 | |
| Federal National Mortgage Association | ||||
| 11/01/2031 | 3.400% | 1,500,000 | 1,426,520 | |
| 09/01/2033 | 1.820% | 6,595,000 | 5,354,164 | |
| 03/01/2035 | 2.510% | 3,000,000 | 2,602,054 | |
| 06/01/2037 | 3.560% | 10,500,000 | 9,868,378 | |
| 04/01/2040 | 2.455% | 3,495,000 | 2,722,138 | |
| Federal National Mortgage Association(d),(e) | ||||
| Series 2020-M43 Class X1 | ||||
| 08/25/2034 | 2.189% | 38,730,928 | 4,361,215 | |
| Government National Mortgage Association(d),(e) | ||||
| CMO Series 2011-38 Class IO | ||||
| 04/16/2053 | 0.530% | 1,376,119 | 12,223 | |
| CMO Series 2013-162 Class IO | ||||
| 09/16/2046 | 0.057% | 17,545,007 | 56,195 | |
| CMO Series 2014-134 Class IA | ||||
| 01/16/2055 | 0.210% | 13,020,500 | 74,618 | |
| CMO Series 2015-101 Class IO | ||||
| 03/16/2052 | 0.319% | 3,890,785 | 58,607 | |
| CMO Series 2015-114 | ||||
| 03/15/2057 | 0.373% | 1,527,314 | 27,354 | |
| CMO Series 2015-120 Class IO | ||||
| 03/16/2057 | 0.689% | 7,773,627 | 183,544 | |
| CMO Series 2015-125 Class IB | ||||
| 01/16/2055 | 1.119% | 15,558,175 | 447,932 | |
| CMO Series 2015-125 Class IO | ||||
| 07/16/2055 | 0.654% | 19,262,790 | 360,451 | |
| CMO Series 2015-146 Class IC | ||||
| 07/16/2055 | 0.395% | 6,430,035 | 65,071 | |
| CMO Series 2015-171 Class IO | ||||
| 11/16/2055 | 0.804% | 6,121,588 | 193,794 | |
| CMO Series 2015-174 Class IO | ||||
| 11/16/2055 | 0.412% | 6,512,485 | 139,190 | |
| CMO Series 2015-21 Class IO | ||||
| 07/16/2056 | 0.680% | 3,873,658 | 106,293 | |
| CMO Series 2015-29 Class EI | ||||
| 09/16/2049 | 0.708% | 6,852,249 | 149,741 | |
| CMO Series 2015-41 Class IO | ||||
| 09/16/2056 | 0.292% | 1,358,569 | 21,150 | |
| 22 | Multi-Manager Total Return Bond Strategies Fund | Annual Report 2022 |
August 31, 2022
| Commercial Mortgage-Backed Securities - Agency (continued) | ||||
| Issuer | Coupon Rate | Principal Amount ($) | Value ($) | |
| CMO Series 2015-6 Class IO | ||||
| 02/16/2051 | 0.489% | 2,106,500 | 25,809 | |
| CMO Series 2015-70 Class IO | ||||
| 12/16/2049 | 0.587% | 6,580,282 | 142,189 | |
| CMO Series 2016-39 Class IO | ||||
| 01/16/2056 | 0.691% | 3,651,174 | 108,843 | |
| CMO Series 2022-17 Class IO | ||||
| 06/16/2064 | 0.802% | 6,425,388 | 446,153 | |
| CMO Series 2022-4 Class IO | ||||
| 03/16/2064 | 0.873% | 16,241,866 | 1,201,690 | |
| CMO Series 2022-43 Class IO | ||||
| 09/16/2061 | 0.741% | 13,133,065 | 850,380 | |
| Series 2014-101 Class IO | ||||
| 04/16/2056 | 0.642% | 11,147,558 | 200,445 | |
| Series 2016-152 Class IO | ||||
| 08/15/2058 | 0.733% | 12,156,903 | 462,415 | |
| Series 2017-168 Class IO | ||||
| 12/16/2059 | 0.581% | 17,228,018 | 666,826 | |
| Series 2018-110 Class IA | ||||
| 11/16/2059 | 0.654% | 21,916,169 | 947,802 | |
| Series 2018-2 Class IO | ||||
| 12/16/2059 | 0.707% | 7,366,663 | 362,118 | |
| Series 2020-108 Class IO | ||||
| 06/16/2062 | 0.847% | 9,085,281 | 579,424 | |
| Series 2021-106 Class IO | ||||
| 04/16/2063 | 0.858% | 9,684,074 | 708,103 | |
| Series 2021-132 Class BI | ||||
| 04/16/2063 | 0.924% | 12,454,170 | 915,729 | |
| Series 2021-133 Class IO | ||||
| 07/16/2063 | 0.879% | 12,174,377 | 899,857 | |
| Series 2021-144 Class IO | ||||
| 04/16/2063 | 0.825% | 12,270,347 | 845,761 | |
| Series 2021-145 Class IO | ||||
| 07/16/2061 | 0.772% | 2,580,095 | 173,076 | |
| Series 2021-151 Class IO | ||||
| 04/16/2063 | 0.916% | 10,923,340 | 846,601 | |
| Series 2021-163 Class IO | ||||
| 03/16/2064 | 0.796% | 11,511,042 | 813,146 | |
| Series 2021-186 Class IO | ||||
| 05/16/2063 | 0.765% | 12,784,985 | 837,496 | |
| Series 2021-52 Class IO | ||||
| 04/16/2063 | 0.718% | 10,683,491 | 679,548 | |
| Series 2022-132 Class IO | ||||
| 10/16/2064 | 0.539% | 11,080,000 | 676,110 | |
| Commercial Mortgage-Backed Securities - Agency (continued) | ||||
| Issuer | Coupon Rate | Principal Amount ($) | Value ($) | |
| Government National Mortgage Association(b) | ||||
| CMO Series 2013-H08 Class FA | ||||
| 1-month USD LIBOR + 0.350% Floor 0.350%, Cap 10.550% 03/20/2063 | 2.148% | 190,439 | 189,082 | |
| Total Commercial Mortgage-Backed Securities - Agency (Cost $134,424,745) | 106,748,086 | |||
| Commercial Mortgage-Backed Securities - Non-Agency 5.9% | ||||
| Arbor Multifamily Mortgage Securities Trust(a) | ||||
| Series 2021-MF2 Class A4 | ||||
| 06/15/2054 | 2.252% | 18,000,000 | 15,203,678 | |
| Arbor Realty Commercial Real Estate Notes Ltd.(a),(b) | ||||
| Series 2021-FL4 Class D | ||||
| 1-month USD LIBOR + 2.900% Floor 2.900% 11/15/2036 | 5.291% | 3,250,000 | 3,068,586 | |
| Series 2022-FL1 Class A | ||||
| 30-day Average SOFR + 1.450% Floor 1.450% 01/15/2037 | 3.333% | 7,100,000 | 6,966,460 | |
| BAMLL Commercial Mortgage Securities Trust(a) | ||||
| Series 2019-BPR Class AM | ||||
| 11/05/2032 | 3.287% | 6,325,000 | 5,902,296 | |
| Banc of America Merrill Lynch Commercial Mortgage, Inc.(d),(e) | ||||
| Series 2019-BN18 Class XA | ||||
| 05/15/2062 | 1.040% | 59,725,443 | 2,717,215 | |
| BANK(d),(e) | ||||
| Series 2017-BNK8 Class XA | ||||
| 11/15/2050 | 0.843% | 31,625,611 | 942,282 | |
| BANK(d) | ||||
| Series 2021-BN37 Class A5 | ||||
| 11/15/2064 | 2.618% | 5,605,000 | 4,863,003 | |
| Series 2022-BNK40 Class A4 | ||||
| 03/15/2064 | 3.507% | 2,945,000 | 2,731,750 | |
| BANK(a) | ||||
| Subordinated Series 2017-BNK6 Class D | ||||
| 07/15/2060 | 3.100% | 2,380,000 | 1,854,015 | |
| BBCMS Mortgage Trust(a) | ||||
| Series 2016-ETC Class A | ||||
| 08/14/2036 | 2.937% | 13,500,000 | 12,195,144 | |
| Subordinated Series 2016-ETC Class B | ||||
| 08/14/2036 | 3.189% | 900,000 | 783,622 | |
| Subordinated Series 2016-ETC Class C | ||||
| 08/14/2036 | 3.391% | 770,000 | 632,332 | |
| BBCMS Mortgage Trust(d),(e) | ||||
| Series 2018-C2 Class XA | ||||
| 12/15/2051 | 0.926% | 61,050,127 | 2,236,004 | |
| Multi-Manager Total Return Bond Strategies Fund | Annual Report 2022 | 23 |
August 31, 2022
| Commercial Mortgage-Backed Securities - Non-Agency (continued) | ||||
| Issuer | Coupon Rate | Principal Amount ($) | Value ($) | |
| BBCMS Mortgage Trust(a),(b) | ||||
| Series 2020-BID Class A | ||||
| 1-month USD LIBOR + 2.140% Floor 1.840% 10/15/2037 | 4.531% | 3,850,000 | 3,798,013 | |
| BBCMS Mortgage Trust | ||||
| Series 2021-C12 Class A5 | ||||
| 11/15/2054 | 2.689% | 5,580,000 | 4,846,197 | |
| BBCMS Mortgage Trust(a),(d) | ||||
| Subordinated Series 2016-ETC Class D | ||||
| 08/14/2036 | 3.729% | 2,790,000 | 2,233,185 | |
| BB-UBS Trust(a) | ||||
| Series 2012-TFT Class A | ||||
| 06/05/2030 | 2.892% | 2,494,271 | 2,421,035 | |
| Benchmark Mortgage Trust(d),(e) | ||||
| 03/15/2053 | 1.539% | 25,332,239 | 1,624,057 | |
| Series 2019-B10 Class XA | ||||
| 03/15/2062 | 1.385% | 29,786,046 | 1,645,012 | |
| Series 2020-B20 Class XA | ||||
| 10/15/2053 | 1.734% | 14,519,998 | 1,209,175 | |
| Benchmark Mortgage Trust | ||||
| Series 2021-B26 Class A4 | ||||
| 06/15/2054 | 2.295% | 10,600,000 | 9,148,951 | |
| Series 2021-B31 Class A5 | ||||
| 12/15/2054 | 2.669% | 4,440,000 | 3,850,366 | |
| BMD2 Re-Remic Trust(a),(f) | ||||
| Series 2019-FRR1 Class 3AB | ||||
| 05/25/2052 | 0.000% | 2,821,000 | 1,875,109 | |
| Subordinated Series 2019-FRR1 Class 2C | ||||
| 05/25/2052 | 0.000% | 14,258,000 | 11,535,771 | |
| BPR Trust(a),(b) | ||||
| Series 2021-NRD Class A | ||||
| 1-month USD LIBOR + 1.525% Floor 1.525% 12/15/2023 | 3.822% | 3,045,000 | 2,920,606 | |
| Series 2022-OANA Class A | ||||
| 1-month Term SOFR + 1.898% Floor 1.898% 04/15/2037 | 4.205% | 2,300,000 | 2,265,496 | |
| BWAY Mortgage Trust(a) | ||||
| Series 2015-1740 Class A | ||||
| 01/10/2035 | 2.917% | 6,850,000 | 6,282,645 | |
| BX Commercial Mortgage Trust(a),(b) | ||||
| Series 2020-VKNG Class A | ||||
| 1-month USD LIBOR + 0.930% Floor 0.930% 10/15/2037 | 3.321% | 7,193,334 | 7,015,666 | |
| Commercial Mortgage-Backed Securities - Non-Agency (continued) | ||||
| Issuer | Coupon Rate | Principal Amount ($) | Value ($) | |
| Series 2021-VOLT Class G | ||||
| 1-month USD LIBOR + 2.850% Floor 2.850% 09/15/2036 | 5.241% | 3,000,000 | 2,823,209 | |
| Series 2022-CSMO Class A | ||||
| 1-month Term SOFR + 2.115% Floor 2.115% 06/15/2027 | 4.073% | 5,918,000 | 5,873,698 | |
| Subordinated Series 2021-IRON Class E | ||||
| 1-month USD LIBOR + 2.350% Floor 2.350% 02/15/2038 | 4.741% | 3,000,000 | 2,845,687 | |
| Subordinated Series 2021-SOAR Class F | ||||
| 1-month USD LIBOR + 2.350% Floor 2.350% 06/15/2038 | 4.741% | 17,690,987 | 16,366,647 | |
| Subordinated Series 2022-CSMO Class B | ||||
| 1-month Term SOFR + 3.141% Floor 3.141% 06/15/2027 | 5.099% | 3,490,000 | 3,459,481 | |
| BX Commercial Mortgage Trust(a),(d) | ||||
| Subordinated Series 2020-VIV3 Class B | ||||
| 03/09/2044 | 3.662% | 5,780,000 | 5,016,961 | |
| BX Trust(a) | ||||
| Series 2019-OC11 Class A | ||||
| 12/09/2041 | 3.202% | 1,115,000 | 987,233 | |
| BX Trust(a),(b) | ||||
| Subordinated Series 2022-VAMF Class E | ||||
| 1-month USD LIBOR + 2.700% Floor 2.700% 01/15/2039 | 5.007% | 5,000,000 | 4,700,574 | |
| BXHPP Trust(a),(b) | ||||
| Series 2021-FILM Class A | ||||
| 1-month USD LIBOR + 0.650% Floor 0.650% 08/15/2036 | 3.041% | 7,000,000 | 6,627,935 | |
| CALI Mortgage Trust(a) | ||||
| Series 2019-101C Class A | ||||
| 03/10/2039 | 3.957% | 2,380,000 | 2,220,840 | |
| CAMB Commercial Mortgage Trust(a) | ||||
| Series 2021-CX2 Class A | ||||
| 11/10/2046 | 2.700% | 7,200,000 | 6,137,649 | |
| Cantor Commercial Real Estate Lending(d),(e) | ||||
| Series 2019-CF2 Class XA | ||||
| 11/15/2052 | 1.325% | 44,331,498 | 2,591,460 | |
| Cantor Commercial Real Estate Lending | ||||
| Series 2019-CF3 Class A3 | ||||
| 01/15/2053 | 2.752% | 16,100,000 | 14,349,309 | |
| CD Mortgage Trust | ||||
| Series 2016-CD1 Class A3 | ||||
| 08/10/2049 | 2.459% | 14,750,906 | 13,751,338 | |
| 24 | Multi-Manager Total Return Bond Strategies Fund | Annual Report 2022 |
August 31, 2022
| Commercial Mortgage-Backed Securities - Non-Agency (continued) | ||||
| Issuer | Coupon Rate | Principal Amount ($) | Value ($) | |
| Series 2017-CD6 Class A4 | ||||
| 11/13/2050 | 3.190% | 20,000,000 | 18,702,222 | |
| CD Mortgage Trust(d),(e) | ||||
| Series 2019-CD8 Class XA | ||||
| 08/15/2057 | 1.548% | 46,833,862 | 3,516,853 | |
| CFCRE Commercial Mortgage Trust | ||||
| Series 2016-C4 Class A4 | ||||
| 05/10/2058 | 3.283% | 5,900,000 | 5,611,132 | |
| CFCRE Commercial Mortgage Trust(d),(e) | ||||
| Series 2016-C4 Class XA | ||||
| 05/10/2058 | 1.770% | 54,289,319 | 2,405,457 | |
| Citigroup Commercial Mortgage Trust | ||||
| Series 2015-GC35 Class A3 | ||||
| 11/10/2048 | 3.549% | 10,000,000 | 9,619,478 | |
| Series 2019-C7 Class A4 | ||||
| 12/15/2072 | 3.102% | 3,985,000 | 3,630,738 | |
| Series 2019-GC43 Class A3 | ||||
| 11/10/2052 | 2.782% | 10,000,000 | 8,888,371 | |
| Citigroup Commercial Mortgage Trust(a),(b) | ||||
| Series 2021-PRM2 Class F | ||||
| 1-month USD LIBOR + 3.750% Floor 3.750% 10/15/2036 | 6.141% | 1,500,000 | 1,428,235 | |
| Citigroup Commercial Mortgage Trust(a),(d) | ||||
| Subordinated Series 2016-C2 Class E | ||||
| 08/10/2049 | 4.577% | 2,420,000 | 1,706,323 | |
| CityLine Commercial Mortgage Trust(a),(d) | ||||
| Subordinated Series 2016-CLNE Class B | ||||
| 11/10/2031 | 2.871% | 3,600,000 | 3,469,669 | |
| Subordinated Series 2016-CLNE Class C | ||||
| 11/10/2031 | 2.871% | 1,350,000 | 1,294,018 | |
| COMM Mortgage Trust(a) | ||||
| Series 2013-CR7 Class AM | ||||
| 03/10/2046 | 3.314% | 4,250,000 | 4,198,523 | |
| COMM Mortgage Trust | ||||
| Series 2013-CR8 Class A4 | ||||
| 06/10/2046 | 3.334% | 227,620 | 225,571 | |
| COMM Mortgage Trust(a),(d) | ||||
| Subordinated Series 2013-CR10 Class E | ||||
| 08/10/2046 | 5.032% | 1,220,000 | 1,139,978 | |
| Subordinated Series 2013-CR7 Class D | ||||
| 03/10/2046 | 4.531% | 8,575,000 | 8,368,717 | |
| Subordinated Series 2020-CBM Class F | ||||
| 02/10/2037 | 3.754% | 2,513,000 | 2,186,439 | |
| Commercial Mortgage Pass-Through Certificates(a) | ||||
| Series 2012-LTRT Class A2 | ||||
| 10/05/2030 | 3.400% | 3,893,000 | 3,708,083 | |
| Commercial Mortgage-Backed Securities - Non-Agency (continued) | ||||
| Issuer | Coupon Rate | Principal Amount ($) | Value ($) | |
| Commercial Mortgage Trust | ||||
| Series 2013-CR13 Class A3 | ||||
| 11/12/2046 | 3.928% | 2,644,161 | 2,619,778 | |
| Series 2014-UBS2 Class A5 | ||||
| 03/10/2047 | 3.961% | 1,165,000 | 1,152,053 | |
| Series 2014-UBS4 Class A5 | ||||
| 08/10/2047 | 3.694% | 5,000,000 | 4,928,468 | |
| Series 2014-UBS6 Class A4 | ||||
| 12/10/2047 | 3.378% | 3,398,951 | 3,299,534 | |
| Series 2015-DC1 Class A5 | ||||
| 02/10/2048 | 3.350% | 790,000 | 767,650 | |
| Series 2015-LC19 Class A4 | ||||
| 02/10/2048 | 3.183% | 835,000 | 808,348 | |
| Series 2015-PC1 Class A5 | ||||
| 07/10/2050 | 3.902% | 2,755,000 | 2,704,581 | |
| Series 2016-COR1 Class A3 | ||||
| 10/10/2049 | 2.826% | 8,410,989 | 7,868,853 | |
| Commercial Mortgage Trust(d) | ||||
| Series 2013-CR9 Class A4 | ||||
| 07/10/2045 | 4.411% | 2,217,662 | 2,198,484 | |
| Credit Suisse Mortgage Capital Certificates OA LLC(a) | ||||
| Series 2014-USA Class A2 | ||||
| 09/15/2037 | 3.953% | 14,090,000 | 13,198,640 | |
| CSAIL Commercial Mortgage Trust | ||||
| Series 2019-C18 Class A4 | ||||
| 12/15/2052 | 2.968% | 3,345,000 | 2,992,062 | |
| CSAIL Commercial Mortgage Trust(a) | ||||
| Subordinated Series 2020-C19 Class E | ||||
| 03/15/2053 | 2.500% | 800,000 | 535,287 | |
| CSWF Trust(a),(b) | ||||
| Subordinated Series 2021-SOP2 Class E | ||||
| 1-month USD LIBOR + 3.367% Floor 3.367% 06/15/2034 | 5.758% | 16,000,000 | 15,258,733 | |
| DBGS Mortgage Trust(a),(b) | ||||
| Series 2018-BIOD Class E | ||||
| 1-month USD LIBOR + 1.700% Floor 1.700% 05/15/2035 | 4.091% | 2,741,288 | 2,666,096 | |
| Series 2018-BIOD Class F | ||||
| 1-month USD LIBOR + 2.000% Floor 2.000% 05/15/2035 | 4.391% | 10,782,400 | 10,306,273 | |
| DBJPM Mortgage Trust(a) | ||||
| Series 2016-SFC Class A | ||||
| 08/10/2036 | 2.833% | 1,500,000 | 1,366,366 | |
| DBJPM Mortgage Trust(d),(e) | ||||
| Series 2020-C9 Class XA | ||||
| 09/15/2053 | 1.828% | 46,332,067 | 3,472,218 | |
| Multi-Manager Total Return Bond Strategies Fund | Annual Report 2022 | 25 |
August 31, 2022
| Commercial Mortgage-Backed Securities - Non-Agency (continued) | ||||
| Issuer | Coupon Rate | Principal Amount ($) | Value ($) | |
| DBUBS Mortgage Trust(a) | ||||
| Series 2017-BRBK Class A | ||||
| 10/10/2034 | 3.452% | 2,800,000 | 2,695,230 | |
| DBUBS Mortgage Trust(a),(b) | ||||
| Subordinated Series 2011-LC2A Class F | ||||
| 1-month USD LIBOR + 3.650% Floor 3.650%, Cap 4.000% 07/10/2044 | 4.000% | 162,560 | 161,108 | |
| DBWF Mortgage Trust(a),(d) | ||||
| Series 2016-85T Class D | ||||
| 12/10/2036 | 3.935% | 2,000,000 | 1,794,137 | |
| Series 2016-85T Class E | ||||
| 12/10/2036 | 3.935% | 2,000,000 | 1,697,996 | |
| Extended Stay America Trust(a),(b) | ||||
| Series 2021-ESH Class E | ||||
| 1-month USD LIBOR + 2.850% Floor 2.850% 07/15/2038 | 5.241% | 2,981,649 | 2,877,359 | |
| FirstKey Homes Trust(a) | ||||
| Series 2020-SFR1 Class A | ||||
| 08/17/2037 | 1.339% | 6,184,774 | 5,721,789 | |
| GAM Investments(a),(g) | ||||
| Subordinated Series 2021-F Class A | ||||
| 09/27/2051 | 0.000% | 2,186,000 | 1,771,738 | |
| Subordinated Series 2021-F Class D | ||||
| 09/27/2051 | 0.000% | 1,777,000 | 1,372,572 | |
| Subordinated Series 2021-F Class E | ||||
| 09/27/2051 | 0.000% | 1,798,000 | 1,505,290 | |
| Subordinated Series 2021-F Class G | ||||
| 09/27/2051 | 0.000% | 1,797,000 | 1,436,288 | |
| Subordinated Series 2021-F Class H | ||||
| 09/27/2051 | 0.000% | 1,510,000 | 936,195 | |
| GAM Investments(a) | ||||
| Subordinated Series 2021-F Class B | ||||
| 09/27/2051 | 2.071% | 2,104,000 | 1,840,748 | |
| Subordinated Series 2021-F Class C | ||||
| 09/27/2051 | 1.079% | 1,778,000 | 1,472,015 | |
| Subordinated Series 2021-F Class F | ||||
| 09/27/2051 | 2.435% | 2,364,000 | 1,852,879 | |
| GAM Re-REMIC Trust(a),(g) | ||||
| Series 2021-FRR1 Class 1B | ||||
| 07/28/2027 | 0.000% | 3,690,000 | 2,771,647 | |
| Series 2021-FRR1 Class 2B | ||||
| 12/29/2027 | 0.000% | 4,900,000 | 3,413,531 | |
| GAM Resecuritization Trust(a),(d) | ||||
| Series 2022-FRR3 Class BK71 | ||||
| 01/29/2052 | 2.030% | 3,736,000 | 2,968,964 | |
| Series 2022-FRR3 Class CK71 | ||||
| 01/29/2052 | 1.410% | 1,245,000 | 885,483 | |
| Commercial Mortgage-Backed Securities - Non-Agency (continued) | ||||
| Issuer | Coupon Rate | Principal Amount ($) | Value ($) | |
| GAM Resecuritization Trust(a),(g) | ||||
| Series 2022-FRR3 Class D728 | ||||
| 01/29/2052 | 0.000% | 1,446,000 | 1,205,473 | |
| Subordinated Series 2022-FRR3 Class BK89 | ||||
| 01/29/2052 | 0.000% | 2,769,000 | 1,814,526 | |
| Subordinated Series 2022-FRR3 Class CK89 | ||||
| 01/29/2052 | 0.000% | 1,450,000 | 868,380 | |
| Subordinated Series 2022-FRR3 Class EK41 | ||||
| 01/29/2052 | 0.000% | 776,000 | 627,102 | |
| GAM Resecuritization Trust(f) | ||||
| Subordinated Series 2022-FRR3 Class BK61 | ||||
| 11/27/2049 | 0.000% | 2,543,000 | 1,936,662 | |
| Subordinated Series 2022-FRR3 Class C728 | ||||
| 08/27/2050 | 0.000% | 1,446,000 | 1,246,761 | |
| Subordinated Series 2022-FRR3 Class CK47 | ||||
| 05/27/2048 | 0.000% | 1,474,000 | 1,200,634 | |
| Subordinated Series 2022-FRR3 Class CK61 | ||||
| 11/27/2049 | 0.000% | 1,784,000 | 1,259,778 | |
| Subordinated Series 2022-FRR3 Class DK27 | ||||
| 12/27/2045 | 0.000% | 1,954,000 | 1,885,171 | |
| Subordinated Series 2022-FRR3 Class DK41 | ||||
| 10/27/2047 | 0.000% | 1,165,000 | 970,189 | |
| Subordinated Series 2022-FRR3 Class DK47 | ||||
| 05/27/2048 | 0.000% | 1,473,000 | 1,151,905 | |
| Subordinated Series 2022-FRR3 Class EK2 | ||||
| 12/27/2045 | 0.000% | 486,000 | 465,321 | |
| Greystone Commercial Capital Trust(a),(b) | ||||
| Series 2021-3 Class A | ||||
| 1-month USD LIBOR + 2.230% Floor 2.230% 08/17/2023 | 4.386% | 8,500,000 | 8,355,769 | |
| GS Mortgage Securities Corp II(a),(d) | ||||
| Series 2017-375H Class A | ||||
| 09/10/2037 | 3.591% | 5,000,000 | 4,638,446 | |
| GS Mortgage Securities Corp. II(a) | ||||
| Series 2012-BWTR Class A | ||||
| 11/05/2034 | 2.954% | 3,857,000 | 3,739,116 | |
| GS Mortgage Securities Trust(a),(d) | ||||
| Series 2013-PEMB Class A | ||||
| 03/05/2033 | 3.668% | 830,000 | 765,542 | |
| GS Mortgage Securities Trust | ||||
| Series 2016-GS2 Class A3 | ||||
| 05/10/2049 | 2.791% | 4,500,000 | 4,229,772 | |
| Series 2017-GS7 Class A3 | ||||
| 08/10/2050 | 3.167% | 10,000,000 | 9,431,414 | |
| Series 2017-GS8 Class A3 | ||||
| 11/10/2050 | 3.205% | 20,000,000 | 18,591,642 | |
| 26 | Multi-Manager Total Return Bond Strategies Fund | Annual Report 2022 |
August 31, 2022
| Commercial Mortgage-Backed Securities - Non-Agency (continued) | ||||
| Issuer | Coupon Rate | Principal Amount ($) | Value ($) | |
| Series 2020-GC45 Class A5 | ||||
| 02/13/2053 | 2.911% | 1,810,000 | 1,629,838 | |
| Hudson Yards Mortgage Trust(a) | ||||
| Series 2019-30HY Class A | ||||
| 07/10/2039 | 3.228% | 2,160,000 | 1,946,376 | |
| Hudsons Bay Simon JV Trust(a) | ||||
| Series 2015-HB10 Class A10 | ||||
| 08/05/2034 | 4.155% | 1,820,000 | 1,629,801 | |
| Series 2015-HB7 Class A7 | ||||
| 08/05/2034 | 3.914% | 2,520,000 | 2,267,509 | |
| IMT Trust(a) | ||||
| Series 2017-APTS Class AFX | ||||
| 06/15/2034 | 3.478% | 5,410,000 | 5,257,204 | |
| INTOWN Mortgage Trust(a),(b) | ||||
| Subordinated Series 2022-STAY Class D | ||||
| 1-month Term SOFR + 4.134% Floor 4.134% 08/15/2037 | 6.384% | 2,500,000 | 2,490,801 | |
| JPMBB Commercial Mortgage Securities Trust(d) | ||||
| Series 2013-C14 Class A4 | ||||
| 08/15/2046 | 4.133% | 2,585,512 | 2,561,948 | |
| JPMBB Commercial Mortgage Securities Trust | ||||
| Series 2014-C26 Class A3 | ||||
| 01/15/2048 | 3.231% | 287,381 | 279,484 | |
| JPMBB Commercial Mortgage Securities Trust(a),(d) | ||||
| Subordinated Series 2013-C17 Class F | ||||
| 01/15/2047 | 3.867% | 1,840,000 | 1,501,457 | |
| Subordinated Series 2014-C19 Class D | ||||
| 04/15/2047 | 4.807% | 874,000 | 814,403 | |
| JPMDB Commercial Mortgage Securities Trust | ||||
| Series 2016-C4 Class A2 | ||||
| 12/15/2049 | 2.882% | 8,174,742 | 7,605,268 | |
| Series 2019-COR6 Class A3 | ||||
| 11/13/2052 | 2.795% | 7,500,000 | 6,725,530 | |
| JPMorgan Chase Commercial Mortgage Securities Trust(d) | ||||
| Series 2013-C13 Class A4 | ||||
| 01/15/2046 | 3.994% | 3,937,120 | 3,914,043 | |
| JPMorgan Chase Commercial Mortgage Securities Trust(a) | ||||
| Series 2019-OSB Class A | ||||
| 06/05/2039 | 3.397% | 2,110,000 | 1,922,337 | |
| JPMorgan Chase Commercial Mortgage Securities Trust(a),(b) | ||||
| Series 2021-HTL5 Class A | ||||
| 1-month USD LIBOR + 1.115% Floor 1.115% 11/15/2038 | 3.506% | 7,080,000 | 6,836,783 | |
| Series 2022-ACB Class E | ||||
| 30-day Average SOFR + 3.350% Floor 3.350% 03/15/2039 | 5.233% | 6,450,000 | 6,369,382 | |
| Commercial Mortgage-Backed Securities - Non-Agency (continued) | ||||
| Issuer | Coupon Rate | Principal Amount ($) | Value ($) | |
| Subordinated Series 2021-NYAH Class H | ||||
| 1-month USD LIBOR + 3.390% Floor 3.390% 06/15/2038 | 5.781% | 3,500,000 | 3,296,064 | |
| Ladder Capital Commercial Mortgage(a) | ||||
| Series 2017-LC26 Class A4 | ||||
| 07/12/2050 | 3.551% | 4,500,000 | 4,267,645 | |
| Life Mortgage Trust(a),(b) | ||||
| Subordinated Series 2021-BMR Class F | ||||
| 1-month USD LIBOR + 2.350% Floor 2.350% 03/15/2038 | 4.741% | 1,867,643 | 1,770,861 | |
| LSTAR Commercial Mortgage Trust(a) | ||||
| Series 2017-5 Class A4 | ||||
| 03/10/2050 | 3.390% | 800,000 | 778,371 | |
| LSTAR Commercial Mortgage Trust(a),(d) | ||||
| Subordinated Series 2016-4 Class F | ||||
| 03/10/2049 | 4.755% | 8,000,000 | 5,764,676 | |
| Med Trust(a),(b) | ||||
| Series 2021-MDLN Class A | ||||
| 1-month USD LIBOR + 0.950% Floor 0.950% 11/15/2038 | 3.341% | 2,810,000 | 2,717,164 | |
| MHP MHIL(a),(b) | ||||
| Subordinated Series 2022 Class E | ||||
| 30-day Average SOFR + 2.611% Floor 2.611% 01/15/2027 | 4.569% | 3,000,000 | 2,820,123 | |
| MKT Mortgage Trust(a) | ||||
| Series 2020-525M Class A | ||||
| 02/12/2040 | 2.694% | 1,575,000 | 1,320,724 | |
| Morgan Stanley Bank of America Merrill Lynch Trust | ||||
| Series 2013-C12 Class A4 | ||||
| 10/15/2046 | 4.259% | 1,885,000 | 1,878,178 | |
| Series 2015-C21 Class A3 | ||||
| 03/15/2048 | 3.077% | 477,359 | 456,211 | |
| Series 2016-C29 Class ASB | ||||
| 05/15/2049 | 3.140% | 775,037 | 754,554 | |
| Morgan Stanley Capital I Trust | ||||
| Series 2016-UB11 Class A3 | ||||
| 08/15/2049 | 2.531% | 8,300,158 | 7,689,838 | |
| Morgan Stanley Capital I Trust(d),(e) | ||||
| Series 2021-L5 Class XA | ||||
| 05/15/2054 | 1.421% | 13,586,243 | 1,023,954 | |
| Progress Residential Trust(a) | ||||
| Subordinated Series 2021-SFR1 Class G | ||||
| 04/17/2038 | 3.861% | 3,830,000 | 3,451,650 | |
| RBS Commercial Funding, Inc., Trust(a),(d) | ||||
| Series 2013-GSP Class A | ||||
| 01/15/2032 | 3.961% | 1,180,000 | 1,150,190 | |
| Multi-Manager Total Return Bond Strategies Fund | Annual Report 2022 | 27 |
August 31, 2022
| Commercial Mortgage-Backed Securities - Non-Agency (continued) | ||||
| Issuer | Coupon Rate | Principal Amount ($) | Value ($) | |
| RFM Re-REMIC Trust(a),(g) | ||||
| Series 2022-FRR1 Class AB55 | ||||
| 03/28/2049 | 0.000% | 1,150,000 | 910,055 | |
| Series 2022-FRR1 Class CK55 | ||||
| 03/28/2049 | 0.000% | 360,000 | 270,903 | |
| Series 2022-FRR1 Class CK60 | ||||
| 11/08/2049 | 0.000% | 450,000 | 323,382 | |
| Series 2022-FRR1 Class CK64 | ||||
| 03/01/2050 | 0.000% | 420,000 | 292,691 | |
| RFM Re-REMIC Trust(a),(d) | ||||
| Series 2022-FRR1 Class AB60 | ||||
| 11/08/2049 | 2.470% | 970,000 | 823,124 | |
| Series 2022-FRR1 Class AB64 | ||||
| 03/01/2050 | 2.314% | 1,460,000 | 1,215,505 | |
| SG Commercial Mortgage Securities Trust | ||||
| Series 2016-C5 Class A4 | ||||
| 10/10/2048 | 3.055% | 5,120,000 | 4,807,381 | |
| SPGN TFLM Mortgage Trust(a),(b) | ||||
| Series 2022 Class A | ||||
| 1-month Term SOFR + 1.550% Floor 1.550% 02/15/2039 | 3.857% | 5,670,000 | 5,532,339 | |
| Starwood Retail Property Trust(a),(b) | ||||
| Series 2014-STAR Class A | ||||
| 1-month USD LIBOR + 1.470% Floor 1.220% 11/15/2027 | 3.861% | 2,461,743 | 1,686,294 | |
| UBS Commercial Mortgage Trust | ||||
| Series 2018-C10 Class A3 | ||||
| 05/15/2051 | 4.048% | 5,500,000 | 5,261,242 | |
| UBS-Barclays Commercial Mortgage Trust | ||||
| Series 2012-C4 Class A5 | ||||
| 12/10/2045 | 2.850% | 651,754 | 651,144 | |
| Series 2013-C5 Class A4 | ||||
| 03/10/2046 | 3.185% | 2,600,989 | 2,590,206 | |
| Series 2013-C6 Class A4 | ||||
| 04/10/2046 | 3.244% | 1,935,000 | 1,917,165 | |
| Wells Fargo Commercial Mortgage Trust | ||||
| Series 2015-LC20 Class A4 | ||||
| 04/15/2050 | 2.925% | 1,965,000 | 1,876,380 | |
| Series 2015-SG1 Class A4 | ||||
| 09/15/2048 | 3.789% | 9,036,083 | 8,730,475 | |
| Series 2018-C45 Class A3 | ||||
| 06/15/2051 | 3.920% | 18,629,500 | 17,735,446 | |
| Series 2021-C61 Class A4 | ||||
| 11/15/2054 | 2.658% | 7,990,000 | 6,802,162 | |
| Wells Fargo Commercial Mortgage Trust(d),(e) | ||||
| Series 2021-C59 Class XA | ||||
| 04/15/2054 | 1.673% | 20,588,035 | 1,842,462 | |
| Commercial Mortgage-Backed Securities - Non-Agency (continued) | ||||
| Issuer | Coupon Rate | Principal Amount ($) | Value ($) | |
| Series 2021-C60 Class XA | ||||
| 08/15/2054 | 1.675% | 4,136,337 | 376,809 | |
| Wells Fargo Commercial Mortgage Trust(d) | ||||
| Series 2022-C62 Class A4 | ||||
| 04/15/2055 | 4.000% | 5,330,000 | 5,060,898 | |
| WFRBS Commercial Mortgage Trust(a) | ||||
| Subordinated Series 2014-C21 Class D | ||||
| 08/15/2047 | 3.497% | 700,000 | 609,361 | |
| WF-RBS Commercial Mortgage Trust | ||||
| Series 2014-C24 Class A3 | ||||
| 11/15/2047 | 3.428% | 509,995 | 497,785 | |
| WF-RBS Commercial Mortgage Trust(a),(d) | ||||
| Subordinated Series 2013-C14 Class D | ||||
| 06/15/2046 | 4.090% | 1,250,000 | 1,056,533 | |
| Total Commercial Mortgage-Backed Securities - Non-Agency (Cost $682,482,731) | 632,083,604 | |||
| Common Stocks 0.0% | ||
| Issuer | Shares | Value ($) |
| Communication Services 0.0% | ||
| Media 0.0% | ||
| Intelsat Jackson Holdings SA(h),(i),(j) | 2,500,000 | 2 |
| Intelsat Jackson Holdings SA(h),(i),(j) | 832,000 | 1 |
| Intelsat Jackson Holdings SA(h),(i),(j) | 6,033,000 | 6 |
| Intelsat Jackson Series A, CVR(h),(i),(j) | 9,292 | 0 |
| Intelsat Jackson Series B, CVR(h),(i),(j) | 9,292 | 0 |
| Total | 9 | |
| Total Communication Services | 9 | |
| Energy 0.0% | ||
| Oil, Gas & Consumable Fuels 0.0% | ||
| Prairie Provident Resources, Inc.(i),(j) | 1,728 | 363 |
| Total Energy | 363 | |
| Financials 0.0% | ||
| Diversified Financial Services 0.0% | ||
| Intelsat Emergence SA(i) | 88,738 | 2,558,627 |
| Total Financials | 2,558,627 | |
| Total Common Stocks (Cost $3,030,179) | 2,558,999 | |
| 28 | Multi-Manager Total Return Bond Strategies Fund | Annual Report 2022 |
August 31, 2022
| Convertible Bonds 0.1% | ||||
| Issuer | Coupon Rate | Principal Amount ($) | Value ($) | |
| Banking 0.1% | ||||
| Bangkok Bank PCL(a),(k) | ||||
| 12/31/2049 | 5.000% | 1,750,000 | 1,639,534 | |
| Credit Agricole SA(a),(k) | ||||
| 12/31/2049 | 4.750% | 2,368,000 | 1,864,522 | |
| HSBC Holdings PLC(k) | ||||
| 12/31/2049 | 4.700% | 1,265,000 | 990,254 | |
| Nordea Bank Abp(a),(k) | ||||
| 12/31/2049 | 3.750% | 1,115,000 | 828,898 | |
| Total | 5,323,208 | |||
| Wireless 0.0% | ||||
| Digicel Group 0.5 Ltd.(a),(l) | ||||
| Subordinated | ||||
| 12/30/2049 | 7.000% | 17,483 | 7,430 | |
| Total Convertible Bonds (Cost $6,499,016) | 5,330,638 | |||
| Corporate Bonds & Notes 33.3% | ||||
| Aerospace & Defense 0.3% | ||||
| BAE Systems PLC(a) | ||||
| 04/15/2030 | 3.400% | 690,000 | 629,062 | |
| Boeing Co. (The) | ||||
| 02/04/2024 | 1.433% | 5,100,000 | 4,890,063 | |
| 05/01/2025 | 4.875% | 761,000 | 763,654 | |
| 02/01/2028 | 3.250% | 794,000 | 720,002 | |
| 05/01/2030 | 5.150% | 1,160,000 | 1,141,357 | |
| 02/01/2031 | 3.625% | 4,203,000 | 3,729,538 | |
| 02/01/2035 | 3.250% | 1,240,000 | 957,230 | |
| 11/01/2048 | 3.850% | 245,000 | 174,270 | |
| 05/01/2050 | 5.805% | 270,000 | 258,981 | |
| 08/01/2059 | 3.950% | 3,500,000 | 2,441,948 | |
| Bombardier, Inc.(a) | ||||
| 12/01/2024 | 7.500% | 2,286,000 | 2,278,441 | |
| 03/15/2025 | 7.500% | 2,839,000 | 2,779,420 | |
| 04/15/2027 | 7.875% | 6,175,000 | 5,906,808 | |
| Embraer Netherlands Finance BV | ||||
| 06/15/2025 | 5.050% | 780,000 | 771,400 | |
| Northrop Grumman Corp. | ||||
| 10/15/2047 | 4.030% | 409,000 | 360,900 | |
| Teledyne Technologies, Inc. | ||||
| 04/01/2026 | 1.600% | 1,543,000 | 1,384,340 | |
| Textron, Inc. | ||||
| 03/01/2024 | 4.300% | 665,000 | 665,104 | |
| 03/01/2025 | 3.875% | 289,000 | 285,098 | |
| Corporate Bonds & Notes (continued) | ||||
| Issuer | Coupon Rate | Principal Amount ($) | Value ($) | |
| United Technologies Corp. | ||||
| 08/16/2023 | 3.650% | 49,000 | 48,809 | |
| 11/16/2038 | 4.450% | 1,043,000 | 985,840 | |
| 06/01/2042 | 4.500% | 1,689,000 | 1,600,345 | |
| 05/04/2047 | 4.050% | 528,000 | 462,003 | |
| Total | 33,234,613 | |||
| Airlines 0.2% | ||||
| Alaska Airlines Pass-Through Trust(a) | ||||
| Series 2020-1 Class A | ||||
| 02/15/2029 | 4.800% | 763,117 | 759,325 | |
| American Airlines Pass-Through Trust | ||||
| Series 2015-2 Class A | ||||
| 09/22/2027 | 4.000% | 1,422,992 | 1,201,411 | |
| Series 2015-2 Class AA | ||||
| 09/22/2027 | 3.600% | 118,821 | 109,749 | |
| Series 2016-1 Class A | ||||
| 07/15/2029 | 4.100% | 1,330,139 | 1,063,120 | |
| Series 2016-2 Class AA | ||||
| 06/15/2028 | 3.200% | 742,000 | 662,375 | |
| Series 2016-3 | ||||
| 10/15/2028 | 3.250% | 653,479 | 522,806 | |
| Series 2017-2 Class AA | ||||
| 10/15/2029 | 3.350% | 137,114 | 122,409 | |
| Continental Airlines Pass-Through Trust | ||||
| 10/29/2024 | 4.000% | 1,454,517 | 1,384,136 | |
| Series 2012-1 Class A | ||||
| 04/11/2024 | 4.150% | 220,027 | 211,370 | |
| Delta Air Lines Pass-Through Trust | ||||
| 06/10/2028 | 2.000% | 5,942,782 | 5,207,627 | |
| 06/10/2028 | 2.500% | 980,681 | 844,520 | |
| Delta Air Lines, Inc./SkyMiles IP Ltd.(a) | ||||
| 10/20/2028 | 4.750% | 1,164,155 | 1,113,943 | |
| Mileage Plus Holdings LLC/Intellectual Property Assets Ltd.(a) | ||||
| 06/20/2027 | 6.500% | 954,066 | 956,934 | |
| Southwest Airlines Co. | ||||
| 06/15/2027 | 5.125% | 1,665,000 | 1,699,073 | |
| U.S. Airways Pass-Through Trust | ||||
| 10/01/2024 | 5.900% | 832,237 | 811,620 | |
| 06/03/2025 | 4.625% | 2,145,306 | 1,917,066 | |
| United Airlines Pass-Through Trust | ||||
| Series 2014-1 Class A | ||||
| 04/11/2026 | 4.000% | 462,887 | 429,070 | |
| Series 2016-2 Class A | ||||
| 04/07/2030 | 3.100% | 768,218 | 622,639 | |
| Series 2019-2 Class A | ||||
| 05/01/2028 | 2.900% | 537,263 | 450,014 | |
| Multi-Manager Total Return Bond Strategies Fund | Annual Report 2022 | 29 |
August 31, 2022
| Corporate Bonds & Notes (continued) | ||||
| Issuer | Coupon Rate | Principal Amount ($) | Value ($) | |
| United Airlines, Inc. Pass-Through Trust | ||||
| 08/15/2025 | 4.300% | 148,365 | 139,963 | |
| 10/15/2027 | 5.875% | 2,307,669 | 2,290,963 | |
| Total | 22,520,133 | |||
| Apartment REIT 0.0% | ||||
| American Homes 4 Rent LP | ||||
| 07/15/2031 | 2.375% | 542,000 | 433,507 | |
| 04/15/2032 | 3.625% | 630,000 | 550,002 | |
| 04/15/2052 | 4.300% | 561,000 | 451,834 | |
| Invitation Homes Operating Partnership LP | ||||
| 11/15/2028 | 2.300% | 1,164,000 | 971,539 | |
| Total | 2,406,882 | |||
| Automotive 0.7% | ||||
| Adient Global Holdings Ltd.(a) | ||||
| 08/15/2026 | 4.875% | 2,700,000 | 2,477,097 | |
| Allison Transmission. Inc.(a) | ||||
| 01/30/2031 | 3.750% | 1,550,000 | 1,252,374 | |
| American Axle & Manufacturing, Inc. | ||||
| 03/15/2026 | 6.250% | 1,007,000 | 977,450 | |
| 04/01/2027 | 6.500% | 900,000 | 841,177 | |
| American Honda Finance Corp. | ||||
| 01/12/2029 | 2.250% | 3,435,000 | 3,020,334 | |
| Aptiv PLC | ||||
| 12/01/2051 | 3.100% | 1,905,000 | 1,189,589 | |
| BorgWarner, Inc.(a) | ||||
| 10/01/2025 | 5.000% | 126,000 | 126,107 | |
| Cooper-Standard Automotive, Inc.(a) | ||||
| 11/15/2026 | 5.625% | 1,800,000 | 900,581 | |
| Dana, Inc. | ||||
| 06/15/2028 | 5.625% | 2,400,000 | 2,158,943 | |
| Denso Corp.(a) | ||||
| 09/16/2026 | 1.239% | 4,070,000 | 3,612,329 | |
| Ford Motor Co. | ||||
| 01/15/2043 | 4.750% | 2,600,000 | 1,951,858 | |
| Ford Motor Credit Co. LLC | ||||
| 11/01/2022 | 3.350% | 6,065,000 | 6,054,949 | |
| 01/09/2024 | 3.810% | 2,585,000 | 2,529,586 | |
| 05/03/2029 | 5.113% | 1,040,000 | 961,528 | |
| General Motors Co. | ||||
| 10/01/2025 | 6.125% | 529,000 | 544,788 | |
| 10/01/2027 | 6.800% | 1,850,000 | 1,963,204 | |
| 10/15/2029 | 5.400% | 4,470,000 | 4,359,946 | |
| 04/01/2035 | 5.000% | 5,365,000 | 4,818,943 | |
| 04/01/2038 | 5.150% | 1,550,000 | 1,363,382 | |
| 10/02/2043 | 6.250% | 723,000 | 690,976 | |
| 04/01/2045 | 5.200% | 1,500,000 | 1,273,682 | |
| Corporate Bonds & Notes (continued) | ||||
| Issuer | Coupon Rate | Principal Amount ($) | Value ($) | |
| General Motors Financial Co., Inc. | ||||
| 04/07/2025 | 3.800% | 2,535,000 | 2,471,681 | |
| 07/13/2025 | 4.300% | 1,060,000 | 1,044,109 | |
| 03/01/2026 | 5.250% | 2,260,000 | 2,272,118 | |
| 02/26/2027 | 2.350% | 1,389,000 | 1,233,303 | |
| 04/09/2027 | 5.000% | 4,078,000 | 4,020,544 | |
| 06/21/2030 | 3.600% | 1,710,000 | 1,478,683 | |
| Harley-Davidson Financial Services, Inc.(a) | ||||
| 06/08/2025 | 3.350% | 1,155,000 | 1,107,425 | |
| 02/14/2027 | 3.050% | 2,955,000 | 2,637,556 | |
| Honda Motor Co., Ltd. | ||||
| 03/10/2032 | 2.967% | 825,000 | 742,049 | |
| Hyundai Capital America(a) | ||||
| 06/14/2024 | 0.875% | 2,480,000 | 2,320,506 | |
| 09/15/2028 | 2.100% | 1,460,000 | 1,210,953 | |
| Hyundai Capital Services, Inc.(a) | ||||
| 04/24/2025 | 2.125% | 3,320,000 | 3,099,952 | |
| Kia Corp.(a) | ||||
| 04/16/2024 | 1.000% | 1,405,000 | 1,331,111 | |
| Magna International, Inc. | ||||
| 06/15/2024 | 3.625% | 1,100,000 | 1,091,266 | |
| Nissan Motor Co., Ltd.(a) | ||||
| 09/17/2030 | 4.810% | 1,293,000 | 1,161,046 | |
| Toyota Motor Credit Corp. | ||||
| 01/13/2027 | 1.900% | 400,000 | 367,692 | |
| 06/29/2029 | 4.450% | 3,753,000 | 3,777,539 | |
| Volkswagen Group of America Finance LLC(a) | ||||
| 05/13/2025 | 3.350% | 1,685,000 | 1,633,501 | |
| 06/08/2027 | 4.350% | 3,890,000 | 3,789,504 | |
| Total | 79,859,361 | |||
| Banking 11.2% | ||||
| ABN AMRO Bank NV(a),(k) | ||||
| 12/13/2029 | 2.470% | 4,805,000 | 4,033,295 | |
| Subordinated | ||||
| 03/13/2037 | 3.324% | 1,441,000 | 1,123,885 | |
| Ally Financial, Inc. | ||||
| 06/09/2027 | 4.750% | 7,545,000 | 7,359,297 | |
| American Express Co. | ||||
| 03/04/2027 | 2.550% | 5,590,000 | 5,190,851 | |
| American Express Co.(k) | ||||
| 08/03/2033 | 4.420% | 8,897,000 | 8,589,070 | |
| ANZ New Zealand International Ltd.(a) | ||||
| 02/18/2025 | 2.166% | 3,390,000 | 3,221,863 | |
| ASB Bank Ltd.(a) | ||||
| 10/22/2026 | 1.625% | 753,000 | 670,443 | |
| ASB Bank Ltd.(a),(k) | ||||
| Subordinated | ||||
| 06/17/2032 | 5.284% | 4,416,000 | 4,317,958 | |
| 30 | Multi-Manager Total Return Bond Strategies Fund | Annual Report 2022 |
August 31, 2022
| Corporate Bonds & Notes (continued) | ||||
| Issuer | Coupon Rate | Principal Amount ($) | Value ($) | |
| Banco Bilbao Vizcaya Argentaria SA | ||||
| 09/18/2023 | 0.875% | 5,400,000 | 5,214,480 | |
| Banco Santander SA(a) | ||||
| 11/09/2022 | 4.125% | 150,000 | 149,800 | |
| Banco Santander SA | ||||
| 02/23/2023 | 3.125% | 800,000 | 797,212 | |
| 05/24/2024 | 3.892% | 10,400,000 | 10,303,375 | |
| 05/28/2025 | 2.746% | 1,000,000 | 941,216 | |
| 03/25/2026 | 1.849% | 2,000,000 | 1,779,920 | |
| 08/18/2027 | 5.294% | 6,000,000 | 5,877,870 | |
| Banco Santander SA(b) | ||||
| 3-month USD LIBOR + 1.120% 04/12/2023 | 3.543% | 1,400,000 | 1,402,333 | |
| Banco Santander SA(k) | ||||
| Subordinated | ||||
| 11/22/2032 | 3.225% | 1,000,000 | 762,506 | |
| Bank of America Corp. | ||||
| 01/11/2023 | 3.300% | 2,000,000 | 1,998,788 | |
| Subordinated | ||||
| 01/22/2025 | 4.000% | 795,000 | 788,378 | |
| 04/21/2025 | 3.950% | 2,500,000 | 2,473,505 | |
| 03/03/2026 | 4.450% | 2,000,000 | 1,991,919 | |
| Bank of America Corp.(k) | ||||
| 12/20/2023 | 3.004% | 1,294,000 | 1,289,333 | |
| 03/05/2024 | 3.550% | 6,088,000 | 6,062,453 | |
| 03/15/2025 | 3.458% | 2,515,000 | 2,473,101 | |
| 04/02/2026 | 3.384% | 5,390,000 | 5,206,286 | |
| 07/22/2027 | 1.734% | 13,410,000 | 11,901,407 | |
| 04/27/2028 | 4.376% | 2,650,000 | 2,585,979 | |
| 03/05/2029 | 3.970% | 2,159,000 | 2,036,878 | |
| 06/14/2029 | 2.087% | 11,540,000 | 9,818,359 | |
| 02/07/2030 | 3.974% | 3,850,000 | 3,607,394 | |
| 07/23/2030 | 3.194% | 33,500,000 | 29,815,940 | |
| 02/13/2031 | 2.496% | 8,712,000 | 7,313,600 | |
| 07/23/2031 | 1.898% | 616,000 | 486,766 | |
| 04/22/2032 | 2.687% | 3,011,000 | 2,501,344 | |
| 07/21/2032 | 2.299% | 785,000 | 627,079 | |
| 10/20/2032 | 2.572% | 9,960,000 | 8,162,507 | |
| 02/04/2033 | 2.972% | 1,928,000 | 1,626,931 | |
| 04/27/2033 | 4.571% | 1,600,000 | 1,530,253 | |
| 06/19/2041 | 2.676% | 3,113,000 | 2,233,683 | |
| 03/15/2050 | 4.330% | 1,413,000 | 1,266,778 | |
| Subordinated | ||||
| 03/08/2037 | 3.846% | 3,568,000 | 3,086,033 | |
| Bank of Ireland Group PLC(a) | ||||
| 11/25/2023 | 4.500% | 3,780,000 | 3,758,675 | |
| Bank of Ireland Group PLC(a),(k) | ||||
| 09/30/2027 | 2.029% | 3,840,000 | 3,298,398 | |
| Bank of Montreal | ||||
| 01/10/2025 | 1.500% | 7,990,000 | 7,518,748 | |
| 03/08/2027 | 2.650% | 3,035,000 | 2,823,527 | |
| Corporate Bonds & Notes (continued) | ||||
| Issuer | Coupon Rate | Principal Amount ($) | Value ($) | |
| Bank of Montreal(k) | ||||
| Subordinated | ||||
| 12/15/2032 | 3.803% | 849,000 | 774,980 | |
| Bank of New York Mellon Corp. (The) | ||||
| 01/29/2023 | 2.950% | 995,000 | 992,306 | |
| 04/24/2025 | 1.600% | 3,885,000 | 3,658,264 | |
| Bank of New York Mellon Corp. (The)(k) | ||||
| 06/13/2033 | 4.289% | 1,956,000 | 1,906,790 | |
| Bank of New Zealand(a) | ||||
| 02/21/2025 | 2.000% | 3,915,000 | 3,700,102 | |
| 01/27/2027 | 2.285% | 4,455,000 | 4,062,898 | |
| Bank of Nova Scotia (The) | ||||
| 05/01/2023 | 1.625% | 8,550,000 | 8,434,186 | |
| 04/11/2025 | 3.450% | 2,340,000 | 2,288,670 | |
| 02/02/2027 | 1.950% | 707,000 | 636,440 | |
| Bank of Nova Scotia (The)(k) | ||||
| 12/31/2049 | 4.900% | 1,089,000 | 1,036,110 | |
| Subordinated | ||||
| 05/04/2037 | 4.588% | 3,588,000 | 3,240,273 | |
| Banque Federative du Credit Mutuel SA(a) | ||||
| 11/21/2024 | 2.375% | 5,255,000 | 5,027,180 | |
| 07/13/2027 | 4.753% | 5,280,000 | 5,247,704 | |
| Barclays PLC | ||||
| 03/16/2025 | 3.650% | 270,000 | 262,306 | |
| Subordinated | ||||
| 05/09/2028 | 4.836% | 995,000 | 942,008 | |
| Barclays PLC(k) | ||||
| 05/07/2025 | 3.932% | 6,190,000 | 6,053,653 | |
| 08/09/2028 | 5.501% | 7,070,000 | 6,955,366 | |
| 06/24/2031 | 2.645% | 3,175,000 | 2,528,158 | |
| 03/10/2032 | 2.667% | 12,020,000 | 9,402,864 | |
| BNP Paribas SA(a) | ||||
| 03/01/2023 | 3.500% | 895,000 | 892,748 | |
| 01/09/2025 | 3.375% | 1,235,000 | 1,200,061 | |
| BNP Paribas SA(a),(k) | ||||
| 06/09/2026 | 2.219% | 1,570,000 | 1,449,091 | |
| 01/13/2027 | 1.323% | 580,000 | 509,526 | |
| 01/20/2028 | 2.591% | 2,620,000 | 2,326,047 | |
| 09/30/2028 | 1.904% | 3,535,000 | 2,982,757 | |
| 09/15/2029 | 2.159% | 3,900,000 | 3,212,152 | |
| 04/19/2032 | 2.871% | 3,775,000 | 3,062,717 | |
| 01/20/2033 | 3.132% | 7,920,000 | 6,468,899 | |
| BPCE SA(a) | ||||
| 01/11/2028 | 3.250% | 460,000 | 420,720 | |
| 10/01/2029 | 2.700% | 2,350,000 | 2,032,149 | |
| Subordinated | ||||
| 10/22/2023 | 5.700% | 545,000 | 548,187 | |
| 07/11/2024 | 4.625% | 4,200,000 | 4,149,312 | |
| 07/21/2024 | 5.150% | 3,363,000 | 3,347,732 | |
| Multi-Manager Total Return Bond Strategies Fund | Annual Report 2022 | 31 |
August 31, 2022
| Corporate Bonds & Notes (continued) | ||||
| Issuer | Coupon Rate | Principal Amount ($) | Value ($) | |
| BPCE SA(a),(k) | ||||
| 01/20/2032 | 2.277% | 885,000 | 687,137 | |
| Canadian Imperial Bank of Commerce | ||||
| 01/28/2025 | 2.250% | 3,117,000 | 2,972,071 | |
| 08/04/2025 | 3.945% | 7,005,000 | 6,923,217 | |
| Capital One Financial Corp.(k) | ||||
| 12/06/2024 | 1.343% | 8,945,000 | 8,583,184 | |
| 11/02/2027 | 1.878% | 1,339,000 | 1,178,162 | |
| 05/10/2028 | 4.927% | 3,018,000 | 2,982,296 | |
| 03/01/2030 | 3.273% | 816,000 | 717,552 | |
| 07/26/2030 | 5.247% | 789,000 | 778,210 | |
| 11/02/2032 | 2.618% | 1,000,000 | 794,298 | |
| Subordinated | ||||
| 07/29/2032 | 2.359% | 1,575,000 | 1,215,630 | |
| Citigroup, Inc.(k) | ||||
| 05/01/2025 | 0.981% | 1,410,000 | 1,327,907 | |
| 04/08/2026 | 3.106% | 4,210,000 | 4,041,535 | |
| 06/09/2027 | 1.462% | 7,108,000 | 6,269,301 | |
| 02/24/2028 | 3.070% | 1,445,000 | 1,337,877 | |
| 11/05/2030 | 2.976% | 14,780,000 | 12,871,935 | |
| 01/29/2031 | 2.666% | 5,550,000 | 4,707,992 | |
| 03/31/2031 | 4.412% | 955,000 | 908,634 | |
| 06/03/2031 | 2.572% | 5,105,000 | 4,267,711 | |
| 05/01/2032 | 2.561% | 6,495,000 | 5,324,324 | |
| 01/25/2033 | 3.057% | 6,020,000 | 5,100,228 | |
| 12/31/2049 | 4.700% | 10,225,000 | 8,658,112 | |
| 12/31/2049 | 5.000% | 1,100,000 | 1,021,654 | |
| Citigroup, Inc. | ||||
| 05/01/2026 | 3.400% | 1,300,000 | 1,255,758 | |
| Subordinated | ||||
| 06/10/2025 | 4.400% | 4,250,000 | 4,233,289 | |
| 05/18/2046 | 4.750% | 395,000 | 355,702 | |
| Citizens Bank NA(k) | ||||
| 08/09/2028 | 4.575% | 5,200,000 | 5,139,990 | |
| Citizens Financial Group, Inc.(k) | ||||
| Subordinated | ||||
| 05/21/2037 | 5.641% | 5,060,000 | 4,939,402 | |
| Comerica Bank | ||||
| 07/23/2024 | 2.500% | 3,995,000 | 3,875,718 | |
| Comerica Bank(k) | ||||
| Subordinated | ||||
| 08/25/2033 | 5.332% | 1,413,000 | 1,391,755 | |
| Comerica, Inc. | ||||
| 07/31/2023 | 3.700% | 2,250,000 | 2,242,647 | |
| Commonwealth Bank of Australia(a) | ||||
| 03/14/2027 | 2.552% | 3,780,000 | 3,520,477 | |
| Subordinated | ||||
| 09/12/2039 | 3.743% | 435,000 | 348,105 | |
| Corporate Bonds & Notes (continued) | ||||
| Issuer | Coupon Rate | Principal Amount ($) | Value ($) | |
| Cooperatieve Rabobank UA(a),(k) | ||||
| 06/24/2026 | 1.339% | 970,000 | 878,598 | |
| 02/24/2027 | 1.106% | 2,500,000 | 2,196,499 | |
| 12/15/2027 | 1.980% | 3,515,000 | 3,109,094 | |
| 08/22/2028 | 4.655% | 2,224,000 | 2,178,428 | |
| 04/06/2033 | 3.758% | 795,000 | 708,956 | |
| Cooperatieve Rabobank UA | ||||
| Subordinated | ||||
| 08/04/2025 | 4.375% | 584,000 | 574,704 | |
| Credit Agricole SA(a) | ||||
| 04/24/2023 | 3.750% | 530,000 | 528,836 | |
| Credit Agricole SA(a),(k) | ||||
| 06/16/2026 | 1.907% | 5,925,000 | 5,435,937 | |
| Credit Suisse AG | ||||
| 02/21/2025 | 3.700% | 1,650,000 | 1,596,467 | |
| 07/09/2027 | 5.000% | 12,715,000 | 12,348,985 | |
| Credit Suisse Group AG | ||||
| 05/05/2023 | 1.000% | 893,000 | 873,563 | |
| Credit Suisse Group AG(a),(k) | ||||
| 12/14/2023 | 2.997% | 6,429,000 | 6,379,751 | |
| 06/05/2026 | 2.193% | 5,263,000 | 4,705,365 | |
| 02/02/2027 | 1.305% | 4,520,000 | 3,814,981 | |
| 08/11/2028 | 6.442% | 8,745,000 | 8,556,285 | |
| 05/14/2032 | 3.091% | 5,680,000 | 4,293,664 | |
| 08/12/2033 | 6.537% | 14,315,000 | 13,700,032 | |
| Credit Suisse Group AG(a) | ||||
| Subordinated | ||||
| 08/08/2023 | 6.500% | 1,030,000 | 1,033,964 | |
| Credit Suisse Group Funding Guernsey Ltd. | ||||
| 09/15/2022 | 3.800% | 750,000 | 749,843 | |
| 06/09/2023 | 3.800% | 4,890,000 | 4,858,669 | |
| Danske Bank A/S(a) | ||||
| 09/12/2023 | 3.875% | 1,350,000 | 1,337,618 | |
| 06/12/2028 | 4.375% | 878,000 | 814,727 | |
| Danske Bank A/S(a),(k) | ||||
| 03/28/2025 | 3.773% | 3,905,000 | 3,804,715 | |
| 09/10/2025 | 0.976% | 5,665,000 | 5,197,455 | |
| 09/11/2026 | 1.621% | 1,245,000 | 1,102,077 | |
| Deutsche Bank AG(k) | ||||
| 07/14/2026 | 6.119% | 6,950,000 | 6,953,158 | |
| 01/07/2028 | 2.552% | 484,000 | 412,003 | |
| Subordinated | ||||
| 01/14/2032 | 3.729% | 2,000,000 | 1,475,079 | |
| Discover Bank | ||||
| 08/08/2023 | 4.200% | 5,500,000 | 5,500,475 | |
| 03/13/2026 | 4.250% | 789,000 | 770,752 | |
| Discover Financial Services | ||||
| 11/21/2022 | 3.850% | 1,000,000 | 1,000,353 | |
| 11/06/2024 | 3.950% | 1,495,000 | 1,479,370 | |
| 32 | Multi-Manager Total Return Bond Strategies Fund | Annual Report 2022 |
August 31, 2022
| Corporate Bonds & Notes (continued) | ||||
| Issuer | Coupon Rate | Principal Amount ($) | Value ($) | |
| DNB Bank ASA(a) | ||||
| 12/02/2022 | 2.150% | 625,000 | 622,651 | |
| DNB Bank ASA(a),(k) | ||||
| 03/28/2025 | 2.968% | 6,425,000 | 6,261,264 | |
| 09/16/2026 | 1.127% | 3,950,000 | 3,526,847 | |
| 03/30/2028 | 1.605% | 4,585,000 | 3,975,475 | |
| Federation des Caisses Desjardins du Quebec(a) | ||||
| 02/10/2025 | 2.050% | 1,983,000 | 1,860,093 | |
| Fifth Third Bancorp(k) | ||||
| 07/28/2030 | 4.772% | 5,430,000 | 5,404,352 | |
| Global Bank Corp.(a),(k) | ||||
| 04/16/2029 | 5.250% | 400,000 | 374,641 | |
| Goldman Sachs Group, Inc. (The) | ||||
| 02/23/2023 | 3.200% | 2,925,000 | 2,919,486 | |
| 12/06/2023 | 1.217% | 7,505,000 | 7,253,285 | |
| Subordinated | ||||
| 10/21/2025 | 4.250% | 1,295,000 | 1,280,213 | |
| 05/22/2045 | 5.150% | 2,399,000 | 2,273,636 | |
| Goldman Sachs Group, Inc. (The)(b) | ||||
| 3-month USD LIBOR + 0.750% 02/23/2023 | 3.708% | 1,402,000 | 1,402,515 | |
| Goldman Sachs Group, Inc. (The)(k) | ||||
| 09/29/2025 | 3.272% | 4,160,000 | 4,052,261 | |
| 03/09/2027 | 1.431% | 11,330,000 | 10,077,928 | |
| 09/10/2027 | 1.542% | 1,270,000 | 1,114,540 | |
| 10/21/2027 | 1.948% | 2,865,000 | 2,541,820 | |
| 04/22/2032 | 2.615% | 12,585,000 | 10,366,464 | |
| 07/21/2032 | 2.383% | 19,430,000 | 15,680,584 | |
| 10/21/2032 | 2.650% | 2,415,000 | 1,985,266 | |
| 12/31/2049 | 3.650% | 2,135,000 | 1,737,799 | |
| HSBC Holdings PLC(k) | ||||
| 03/11/2025 | 3.803% | 573,000 | 562,047 | |
| 05/24/2025 | 0.976% | 4,064,000 | 3,791,811 | |
| 11/07/2025 | 2.633% | 1,148,000 | 1,089,532 | |
| 03/10/2026 | 2.999% | 929,000 | 880,248 | |
| 04/18/2026 | 1.645% | 604,000 | 550,588 | |
| 06/04/2026 | 2.099% | 1,379,000 | 1,266,713 | |
| 05/24/2027 | 1.589% | 4,447,000 | 3,874,700 | |
| 03/13/2028 | 4.041% | 1,150,000 | 1,081,608 | |
| 06/09/2028 | 4.755% | 2,905,000 | 2,798,543 | |
| 08/11/2028 | 5.210% | 9,113,000 | 8,894,902 | |
| 09/22/2028 | 2.013% | 7,515,000 | 6,336,483 | |
| 08/17/2029 | 2.206% | 5,910,000 | 4,893,616 | |
| 08/11/2033 | 5.402% | 2,767,000 | 2,630,433 | |
| Junior Subordinated | ||||
| 12/31/2049 | 6.000% | 877,000 | 806,760 | |
| HSBC Holdings PLC | ||||
| 03/08/2026 | 4.300% | 2,500,000 | 2,470,678 | |
| Huntington Bancshares, Inc.(k) | ||||
| 08/04/2028 | 4.443% | 3,690,000 | 3,614,333 | |
| Corporate Bonds & Notes (continued) | ||||
| Issuer | Coupon Rate | Principal Amount ($) | Value ($) | |
| Huntington National Bank (The)(k) | ||||
| 05/16/2025 | 4.008% | 1,945,000 | 1,931,682 | |
| ING Groep NV(k) | ||||
| 03/28/2028 | 4.017% | 669,000 | 634,423 | |
| Intesa Sanpaolo SpA(a),(k) | ||||
| Subordinated | ||||
| 06/01/2032 | 4.198% | 1,100,000 | 799,719 | |
| JPMorgan Chase & Co.(k) | ||||
| 04/23/2024 | 3.559% | 6,449,000 | 6,415,786 | |
| 07/23/2024 | 3.797% | 2,578,000 | 2,562,878 | |
| 06/23/2025 | 0.969% | 4,760,000 | 4,459,024 | |
| 12/10/2025 | 1.561% | 2,540,000 | 2,369,487 | |
| 02/24/2026 | 2.595% | 1,333,000 | 1,266,040 | |
| 04/26/2026 | 4.080% | 2,925,000 | 2,886,713 | |
| 02/04/2027 | 1.040% | 4,299,000 | 3,784,969 | |
| 04/22/2027 | 1.578% | 9,480,000 | 8,469,962 | |
| 09/22/2027 | 1.470% | 4,275,000 | 3,747,654 | |
| 02/24/2028 | 2.947% | 3,208,000 | 2,967,946 | |
| 01/23/2029 | 3.509% | 13,570,000 | 12,572,367 | |
| 04/23/2029 | 4.005% | 3,180,000 | 3,012,437 | |
| 06/01/2029 | 2.069% | 1,151,000 | 984,504 | |
| 12/05/2029 | 4.452% | 1,150,000 | 1,112,836 | |
| 06/14/2030 | 4.565% | 5,895,000 | 5,735,202 | |
| 10/15/2030 | 2.739% | 1,990,000 | 1,723,483 | |
| 02/04/2032 | 1.953% | 3,030,000 | 2,402,941 | |
| 04/22/2032 | 2.580% | 7,260,000 | 6,005,923 | |
| 11/08/2032 | 2.545% | 11,305,000 | 9,314,607 | |
| 01/25/2033 | 2.963% | 2,380,000 | 2,022,567 | |
| 07/25/2033 | 4.912% | 2,228,000 | 2,208,669 | |
| 11/19/2041 | 2.525% | 614,000 | 428,489 | |
| 04/22/2042 | 3.157% | 2,480,000 | 1,922,358 | |
| 11/15/2048 | 3.964% | 3,054,000 | 2,557,183 | |
| 12/31/2049 | 4.000% | 4,500,000 | 3,847,500 | |
| 12/31/2049 | 4.600% | 7,625,000 | 6,683,577 | |
| 12/31/2049 | 5.000% | 1,290,000 | 1,191,636 | |
| 04/22/2052 | 3.328% | 933,000 | 704,295 | |
| JPMorgan Chase & Co. | ||||
| Subordinated | ||||
| 05/01/2023 | 3.375% | 1,000,000 | 998,265 | |
| 09/10/2024 | 3.875% | 8,813,000 | 8,776,685 | |
| KeyBank NA | ||||
| 08/08/2025 | 4.150% | 2,825,000 | 2,803,448 | |
| Kookmin Bank(a) | ||||
| Subordinated | ||||
| 11/04/2030 | 2.500% | 550,000 | 456,545 | |
| Lloyds Banking Group PLC | ||||
| 08/16/2023 | 4.050% | 2,940,000 | 2,937,000 | |
| 03/12/2024 | 3.900% | 2,600,000 | 2,587,666 | |
| 03/22/2028 | 4.375% | 1,975,000 | 1,903,760 | |
| Subordinated | ||||
| 11/04/2024 | 4.500% | 5,560,000 | 5,530,071 | |
| Multi-Manager Total Return Bond Strategies Fund | Annual Report 2022 | 33 |
August 31, 2022
| Corporate Bonds & Notes (continued) | ||||
| Issuer | Coupon Rate | Principal Amount ($) | Value ($) | |
| Lloyds Banking Group PLC(k) | ||||
| 11/07/2023 | 2.907% | 7,968,000 | 7,944,750 | |
| 02/05/2026 | 2.438% | 695,000 | 654,006 | |
| 03/18/2026 | 3.511% | 2,665,000 | 2,567,760 | |
| 08/11/2026 | 4.716% | 6,205,000 | 6,122,984 | |
| 05/11/2027 | 1.627% | 1,175,000 | 1,039,425 | |
| 08/11/2033 | 4.976% | 3,245,000 | 3,084,134 | |
| Macquarie Group Ltd.(a),(k) | ||||
| 10/14/2025 | 1.201% | 1,295,000 | 1,196,641 | |
| 01/14/2033 | 2.871% | 6,005,000 | 4,821,996 | |
| 06/21/2033 | 4.442% | 1,815,000 | 1,653,967 | |
| 11/09/2033 | 5.491% | 7,455,000 | 7,271,035 | |
| Mitsubishi UFJ Financial Group, Inc. | ||||
| 07/17/2025 | 1.412% | 1,684,000 | 1,545,003 | |
| 09/13/2026 | 2.757% | 255,000 | 237,623 | |
| Mitsubishi UFJ Financial Group, Inc.(k) | ||||
| 04/17/2026 | 3.837% | 3,150,000 | 3,081,638 | |
| 07/20/2027 | 1.538% | 254,000 | 224,237 | |
| Mizuho Financial Group, Inc.(k) | ||||
| 09/11/2024 | 3.922% | 2,668,000 | 2,647,881 | |
| 05/25/2026 | 2.226% | 797,000 | 739,541 | |
| Mizuho Financial Group, Inc.(a) | ||||
| 04/12/2026 | 3.477% | 225,000 | 214,421 | |
| Morgan Stanley(k) | ||||
| 05/30/2025 | 0.790% | 14,562,000 | 13,617,284 | |
| 10/21/2025 | 1.164% | 2,030,000 | 1,885,993 | |
| 02/18/2026 | 2.630% | 2,012,000 | 1,915,381 | |
| 04/28/2026 | 2.188% | 828,000 | 777,589 | |
| 05/04/2027 | 1.593% | 5,653,000 | 5,041,636 | |
| 07/20/2027 | 1.512% | 962,000 | 852,382 | |
| 01/21/2028 | 2.475% | 552,000 | 501,751 | |
| 04/20/2028 | 4.210% | 1,928,000 | 1,876,988 | |
| 07/22/2028 | 3.591% | 7,245,000 | 6,843,757 | |
| 01/24/2029 | 3.772% | 4,315,000 | 4,062,609 | |
| 01/23/2030 | 4.431% | 2,885,000 | 2,809,625 | |
| 02/13/2032 | 1.794% | 1,008,000 | 794,134 | |
| 04/28/2032 | 1.928% | 5,704,000 | 4,506,073 | |
| 07/21/2032 | 2.239% | 9,978,000 | 8,046,907 | |
| 10/20/2032 | 2.511% | 6,841,000 | 5,609,691 | |
| 01/21/2033 | 2.943% | 3,610,000 | 3,079,050 | |
| 07/20/2033 | 4.889% | 771,000 | 767,684 | |
| 04/22/2039 | 4.457% | 299,000 | 278,850 | |
| Subordinated | ||||
| 09/16/2036 | 2.484% | 1,615,000 | 1,249,023 | |
| 04/20/2037 | 5.297% | 3,424,000 | 3,288,307 | |
| Morgan Stanley | ||||
| 07/23/2025 | 4.000% | 1,671,000 | 1,662,033 | |
| 01/27/2026 | 3.875% | 6,556,000 | 6,467,824 | |
| Subordinated | ||||
| 09/08/2026 | 4.350% | 9,045,000 | 8,941,214 | |
| National Australia Bank Ltd.(a) | ||||
| 01/12/2025 | 1.388% | 5,595,000 | 5,261,627 | |
| Corporate Bonds & Notes (continued) | ||||
| Issuer | Coupon Rate | Principal Amount ($) | Value ($) | |
| Subordinated | ||||
| 08/21/2030 | 2.332% | 920,000 | 731,040 | |
| National Bank of Canada(k) | ||||
| 06/09/2025 | 3.750% | 7,465,000 | 7,354,160 | |
| Nationwide Building Society(a),(k) | ||||
| 03/08/2024 | 3.766% | 3,370,000 | 3,353,820 | |
| 08/01/2024 | 4.363% | 7,040,000 | 6,990,431 | |
| 02/16/2028 | 2.972% | 2,610,000 | 2,356,260 | |
| Nationwide Building Society(a) | ||||
| 10/13/2026 | 1.500% | 1,070,000 | 945,991 | |
| 07/27/2027 | 4.850% | 10,110,000 | 10,043,475 | |
| NatWest Group PLC(k) | ||||
| 06/25/2024 | 4.519% | 962,000 | 957,040 | |
| 09/30/2028 | 5.516% | 1,815,000 | 1,816,719 | |
| NatWest Markets PLC(a) | ||||
| 09/29/2022 | 3.625% | 3,020,000 | 3,023,764 | |
| Nordea Bank Abp(a) | ||||
| 09/30/2026 | 1.500% | 7,925,000 | 7,019,177 | |
| Northern Trust Corp.(k) | ||||
| Subordinated | ||||
| 05/08/2032 | 3.375% | 1,345,000 | 1,253,520 | |
| Oversea-Chinese Banking Corp., Ltd.(a),(k) | ||||
| Subordinated | ||||
| 09/10/2030 | 1.832% | 535,000 | 489,796 | |
| Royal Bank of Canada | ||||
| 05/04/2027 | 3.625% | 3,180,000 | 3,068,409 | |
| 08/03/2027 | 4.240% | 7,415,000 | 7,311,333 | |
| Royal Bank of Scotland Group PLC(k) | ||||
| 03/22/2025 | 4.269% | 8,215,000 | 8,116,893 | |
| 05/22/2028 | 3.073% | 706,000 | 638,211 | |
| Santander Holdings USA, Inc. | ||||
| 06/02/2025 | 3.450% | 4,110,000 | 3,930,419 | |
| Santander Holdings USA, Inc.(k) | ||||
| 01/06/2028 | 2.490% | 706,000 | 613,897 | |
| Santander UK Group Holdings PLC(k) | ||||
| 11/15/2024 | 4.796% | 7,820,000 | 7,779,827 | |
| 03/15/2025 | 1.089% | 5,545,000 | 5,189,698 | |
| 08/21/2026 | 1.532% | 445,000 | 397,663 | |
| 06/14/2027 | 1.673% | 1,762,000 | 1,527,612 | |
| Societe Generale SA(a) | ||||
| 03/28/2024 | 3.875% | 5,055,000 | 4,979,302 | |
| 01/22/2025 | 2.625% | 445,000 | 420,081 | |
| 06/15/2027 | 4.677% | 3,130,000 | 3,094,713 | |
| Societe Generale SA(a),(k) | ||||
| 01/19/2028 | 2.797% | 4,285,000 | 3,787,395 | |
| 01/21/2033 | 3.337% | 3,070,000 | 2,473,022 | |
| 34 | Multi-Manager Total Return Bond Strategies Fund | Annual Report 2022 |
August 31, 2022
| Corporate Bonds & Notes (continued) | ||||
| Issuer | Coupon Rate | Principal Amount ($) | Value ($) | |
| Standard Chartered PLC(a),(k) | ||||
| 11/23/2025 | 1.822% | 1,445,000 | 1,336,090 | |
| 03/30/2026 | 3.971% | 1,226,000 | 1,184,081 | |
| 01/14/2027 | 1.456% | 712,000 | 623,623 | |
| 01/12/2028 | 2.608% | 3,404,000 | 3,018,037 | |
| 06/29/2032 | 2.678% | 2,350,000 | 1,852,100 | |
| State Street Corp.(k) | ||||
| 11/18/2027 | 1.684% | 1,985,000 | 1,787,990 | |
| 08/04/2033 | 4.164% | 1,935,000 | 1,869,886 | |
| Sumitomo Mitsui Financial Group, Inc. | ||||
| 09/27/2024 | 2.448% | 745,000 | 714,224 | |
| 09/17/2028 | 1.902% | 5,900,000 | 4,952,062 | |
| Sumitomo Mitsui Trust Bank Ltd.(a) | ||||
| 03/25/2024 | 0.850% | 5,715,000 | 5,412,047 | |
| 03/10/2025 | 2.550% | 1,045,000 | 997,909 | |
| 09/12/2025 | 1.050% | 829,000 | 747,808 | |
| 03/10/2027 | 2.800% | 781,000 | 727,627 | |
| Svenska Handelsbanken AB(a),(k) | ||||
| 06/11/2027 | 1.418% | 932,000 | 828,552 | |
| Swedbank AB(a) | ||||
| 04/04/2025 | 3.356% | 5,315,000 | 5,186,154 | |
| Synchrony Bank | ||||
| 08/22/2025 | 5.400% | 3,625,000 | 3,619,207 | |
| Synchrony Financial | ||||
| 06/13/2025 | 4.875% | 6,805,000 | 6,705,795 | |
| Toronto-Dominion Bank (The) | ||||
| 03/10/2027 | 2.800% | 797,000 | 747,460 | |
| 06/08/2027 | 4.108% | 5,935,000 | 5,874,529 | |
| 03/10/2032 | 3.200% | 2,530,000 | 2,247,976 | |
| 06/08/2032 | 4.456% | 5,070,000 | 4,973,529 | |
| Truist Financial Corp.(k) | ||||
| 03/02/2027 | 1.267% | 340,000 | 305,793 | |
| 06/07/2029 | 1.887% | 1,610,000 | 1,381,114 | |
| 12/31/2049 | 5.100% | 821,000 | 778,022 | |
| Subordinated | ||||
| 07/28/2033 | 4.916% | 5,190,000 | 4,986,219 | |
| Truist Financial Corp. | ||||
| 08/03/2027 | 1.125% | 735,000 | 631,024 | |
| U.S. Bancorp(k) | ||||
| Junior Subordinated | ||||
| 12/31/2049 | 5.300% | 2,980,000 | 2,655,252 | |
| UBS AG(a) | ||||
| 08/09/2024 | 0.700% | 3,985,000 | 3,724,758 | |
| 01/13/2025 | 1.375% | 1,770,000 | 1,655,405 | |
| UBS Group AG(a),(k) | ||||
| 07/30/2024 | 1.008% | 990,000 | 959,366 | |
| 05/12/2026 | 4.488% | 4,880,000 | 4,831,201 | |
| 01/30/2027 | 1.364% | 912,000 | 806,381 | |
| 08/05/2027 | 4.703% | 7,430,000 | 7,281,653 | |
| 08/10/2027 | 1.494% | 460,000 | 400,149 | |
| Corporate Bonds & Notes (continued) | ||||
| Issuer | Coupon Rate | Principal Amount ($) | Value ($) | |
| 05/12/2028 | 4.751% | 1,320,000 | 1,294,056 | |
| 02/11/2032 | 2.095% | 558,000 | 435,779 | |
| 08/05/2033 | 4.988% | 648,000 | 626,707 | |
| 02/11/2043 | 3.179% | 1,172,000 | 861,653 | |
| UBS Group AG(a),(b) | ||||
| SOFR + 1.580% 05/12/2026 | 3.870% | 3,055,000 | 3,057,828 | |
| UniCredit SpA(a),(k) | ||||
| 09/22/2026 | 2.569% | 5,195,000 | 4,529,014 | |
| US Bancorp(k) | ||||
| Subordinated | ||||
| 07/22/2033 | 4.967% | 2,360,000 | 2,339,117 | |
| Wells Fargo & Co. | ||||
| 01/24/2024 | 3.750% | 2,409,000 | 2,402,913 | |
| Subordinated | ||||
| 12/07/2046 | 4.750% | 340,000 | 310,278 | |
| Wells Fargo & Co.(k) | ||||
| 06/02/2024 | 1.654% | 2,135,000 | 2,092,432 | |
| 10/30/2025 | 2.406% | 1,215,000 | 1,160,523 | |
| 02/11/2026 | 2.164% | 1,477,000 | 1,387,981 | |
| 04/25/2026 | 3.908% | 1,035,000 | 1,013,799 | |
| 04/30/2026 | 2.188% | 2,313,000 | 2,164,665 | |
| 08/15/2026 | 4.540% | 6,990,000 | 6,941,381 | |
| 03/24/2028 | 3.526% | 1,405,000 | 1,326,798 | |
| 05/22/2028 | 3.584% | 1,700,000 | 1,603,247 | |
| 06/02/2028 | 2.393% | 10,677,000 | 9,550,799 | |
| 07/25/2028 | 4.808% | 14,890,000 | 14,811,170 | |
| 02/11/2031 | 2.572% | 6,775,000 | 5,769,290 | |
| 03/02/2033 | 3.350% | 11,310,000 | 9,863,573 | |
| 07/25/2033 | 4.897% | 5,615,000 | 5,532,671 | |
| 04/30/2041 | 3.068% | 5,230,000 | 4,014,902 | |
| 04/04/2051 | 5.013% | 1,130,000 | 1,115,718 | |
| 04/25/2053 | 4.611% | 602,000 | 555,063 | |
| Westpac Banking Corp. | ||||
| 08/26/2025 | 3.735% | 5,625,000 | 5,572,436 | |
| 11/20/2028 | 1.953% | 2,622,000 | 2,281,732 | |
| Westpac Banking Corp.(k) | ||||
| Subordinated | ||||
| 08/10/2033 | 5.405% | 5,485,000 | 5,308,380 | |
| Total | 1,189,663,447 | |||
| Brokerage/Asset Managers/Exchanges 0.4% | ||||
| Ares Finance Co. IV LLC(a) | ||||
| 02/01/2052 | 3.650% | 3,415,000 | 2,370,127 | |
| Blackstone Holdings Finance Co. LLC(a) | ||||
| 08/05/2028 | 1.625% | 643,000 | 544,091 | |
| 01/30/2032 | 2.000% | 617,000 | 485,883 | |
| 08/05/2051 | 2.850% | 1,303,000 | 871,321 | |
| 01/30/2052 | 3.200% | 1,763,000 | 1,283,747 | |
| Blue Owl Finance LLC(a) | ||||
| 02/15/2032 | 4.375% | 5,635,000 | 4,735,419 | |
| Multi-Manager Total Return Bond Strategies Fund | Annual Report 2022 | 35 |
August 31, 2022
| Corporate Bonds & Notes (continued) | ||||
| Issuer | Coupon Rate | Principal Amount ($) | Value ($) | |
| Brookfield Finance, Inc. | ||||
| 06/02/2026 | 4.250% | 964,000 | 950,426 | |
| Charles Schwab Corp. (The) | ||||
| 03/03/2032 | 2.900% | 2,865,000 | 2,528,036 | |
| Charles Schwab Corp. (The)(k) | ||||
| 12/31/2049 | 5.375% | 2,845,000 | 2,836,038 | |
| CI Financial Corp. | ||||
| 06/15/2051 | 4.100% | 684,000 | 447,574 | |
| CME Group, Inc. | ||||
| 03/15/2032 | 2.650% | 1,334,000 | 1,174,380 | |
| Depository Trust & Clearing Corp. (The)(a),(k) | ||||
| 12/31/2049 | 3.375% | 673,000 | 541,749 | |
| Hunt Companies, Inc.(a) | ||||
| 04/15/2029 | 5.250% | 2,150,000 | 1,827,929 | |
| Intercontinental Exchange, Inc. | ||||
| 06/15/2030 | 2.100% | 809,000 | 683,164 | |
| 09/15/2032 | 1.850% | 3,230,000 | 2,548,550 | |
| 03/15/2033 | 4.600% | 5,423,000 | 5,369,580 | |
| 09/15/2040 | 2.650% | 775,000 | 574,516 | |
| 09/21/2048 | 4.250% | 1,170,000 | 1,049,005 | |
| Jefferies Group LLC | ||||
| 01/20/2043 | 6.500% | 600,000 | 606,843 | |
| KKR Group Finance Co. XII LLC(a) | ||||
| 05/17/2032 | 4.850% | 1,220,000 | 1,187,393 | |
| Nomura Holdings, Inc. | ||||
| 01/22/2027 | 2.329% | 7,865,000 | 7,011,324 | |
| 07/14/2031 | 2.608% | 1,100,000 | 880,381 | |
| Raymond James Financial, Inc. | ||||
| 07/15/2046 | 4.950% | 1,745,000 | 1,701,711 | |
| Stifel Financial Corp. | ||||
| 05/15/2030 | 4.000% | 3,755,000 | 3,403,454 | |
| Total | 45,612,641 | |||
| Building Materials 0.2% | ||||
| Builders FirstSource, Inc.(a) | ||||
| 03/01/2030 | 5.000% | 1,310,000 | 1,163,021 | |
| Cemex SAB de CV(a) | ||||
| 09/17/2030 | 5.200% | 1,050,000 | 952,297 | |
| Cemex SAB de CV(a),(k) | ||||
| Subordinated | ||||
| 12/31/2049 | 5.125% | 625,000 | 521,689 | |
| Ferguson Finance PLC(a) | ||||
| 04/20/2032 | 4.650% | 2,785,000 | 2,585,529 | |
| Fortune Brands Home & Security, Inc. | ||||
| 03/25/2032 | 4.000% | 569,000 | 504,243 | |
| 03/25/2052 | 4.500% | 4,290,000 | 3,265,541 | |
| Martin Marietta Materials, Inc. | ||||
| 03/15/2030 | 2.500% | 3,380,000 | 2,850,549 | |
| Corporate Bonds & Notes (continued) | ||||
| Issuer | Coupon Rate | Principal Amount ($) | Value ($) | |
| Standard Industries, Inc.(a) | ||||
| 07/15/2030 | 4.375% | 3,120,000 | 2,478,438 | |
| Summit Materials LLC/Finance Corp.(a) | ||||
| 01/15/2029 | 5.250% | 2,385,000 | 2,168,221 | |
| Total | 16,489,528 | |||
| Cable and Satellite 0.6% | ||||
| CCO Holdings LLC/Capital Corp.(a) | ||||
| 06/01/2029 | 5.375% | 100,000 | 91,399 | |
| 02/01/2031 | 4.250% | 1,725,000 | 1,408,624 | |
| 02/01/2032 | 4.750% | 2,511,000 | 2,079,624 | |
| CCO Holdings LLC/Holdings Capital Corp.(a) | ||||
| 01/15/2034 | 4.250% | 2,125,000 | 1,617,736 | |
| Charter Communications Operating LLC/Capital | ||||
| 07/23/2025 | 4.908% | 952,000 | 949,785 | |
| 01/15/2029 | 2.250% | 616,000 | 505,026 | |
| 10/23/2035 | 6.384% | 1,775,000 | 1,768,470 | |
| 03/01/2042 | 3.500% | 862,000 | 599,726 | |
| 10/23/2045 | 6.484% | 4,170,000 | 3,971,126 | |
| 04/01/2048 | 5.750% | 1,360,000 | 1,203,676 | |
| 03/01/2050 | 4.800% | 2,625,000 | 2,062,272 | |
| 04/01/2051 | 3.700% | 2,305,000 | 1,534,759 | |
| 06/01/2052 | 3.900% | 3,954,000 | 2,682,007 | |
| 04/01/2053 | 5.250% | 4,165,000 | 3,489,585 | |
| 04/01/2061 | 3.850% | 941,000 | 612,171 | |
| Comcast Corp. | ||||
| 10/15/2025 | 3.950% | 3,095,000 | 3,089,514 | |
| 02/01/2030 | 2.650% | 723,000 | 640,371 | |
| 03/01/2038 | 3.900% | 822,000 | 740,158 | |
| 03/01/2048 | 4.000% | 1,375,000 | 1,178,933 | |
| 02/01/2050 | 3.450% | 1,900,000 | 1,495,035 | |
| Cox Communications, Inc.(a) | ||||
| 08/15/2024 | 3.150% | 780,000 | 757,315 | |
| 06/15/2031 | 2.600% | 1,975,000 | 1,643,985 | |
| CSC Holdings LLC(a) | ||||
| 04/15/2027 | 5.500% | 3,550,000 | 3,363,812 | |
| 02/01/2028 | 5.375% | 1,193,000 | 1,078,257 | |
| 04/01/2028 | 7.500% | 300,000 | 267,018 | |
| 01/15/2030 | 5.750% | 1,600,000 | 1,238,554 | |
| 02/15/2031 | 3.375% | 1,000,000 | 750,107 | |
| 11/15/2031 | 5.000% | 5,000,000 | 3,589,474 | |
| DISH DBS Corp. | ||||
| 11/15/2024 | 5.875% | 2,000,000 | 1,825,435 | |
| 07/01/2026 | 7.750% | 2,039,000 | 1,606,150 | |
| 06/01/2029 | 5.125% | 1,400,000 | 829,150 | |
| Intelsat Jackson Holdings SA(a) | ||||
| 03/15/2030 | 6.500% | 5,833,000 | 5,300,290 | |
| Sirius XM Radio, Inc.(a) | ||||
| 07/01/2029 | 5.500% | 1,330,000 | 1,244,364 | |
| 36 | Multi-Manager Total Return Bond Strategies Fund | Annual Report 2022 |
August 31, 2022
| Corporate Bonds & Notes (continued) | ||||
| Issuer | Coupon Rate | Principal Amount ($) | Value ($) | |
| Time Warner Cable LLC | ||||
| 05/01/2037 | 6.550% | 235,000 | 231,098 | |
| 11/15/2040 | 5.875% | 2,655,000 | 2,386,127 | |
| 09/01/2041 | 5.500% | 6,634,000 | 5,729,623 | |
| Viasat, Inc.(a) | ||||
| 04/15/2027 | 5.625% | 1,415,000 | 1,306,217 | |
| Total | 64,866,973 | |||
| Chemicals 0.4% | ||||
| Albemarle Corp. | ||||
| 06/01/2032 | 5.050% | 485,000 | 473,770 | |
| Alpek SAB de CV(a) | ||||
| 02/25/2031 | 3.250% | 400,000 | 340,709 | |
| Braskem Netherlands Finance BV(a) | ||||
| 01/31/2030 | 4.500% | 400,000 | 353,625 | |
| Cabot Corp. | ||||
| 07/01/2029 | 4.000% | 2,710,000 | 2,488,956 | |
| 06/30/2032 | 5.000% | 1,800,000 | 1,723,762 | |
| Celanese U.S. Holdings LLC | ||||
| 11/15/2022 | 4.625% | 100,000 | 100,002 | |
| Celanese US Holdings LLC | ||||
| 08/05/2026 | 1.400% | 964,000 | 810,532 | |
| 07/15/2032 | 6.379% | 800,000 | 794,621 | |
| CF Industries, Inc. | ||||
| 03/15/2034 | 5.150% | 3,125,000 | 3,015,061 | |
| 06/01/2043 | 4.950% | 1,700,000 | 1,512,648 | |
| Dow Chemical Co. (The) | ||||
| 10/01/2034 | 4.250% | 714,000 | 661,587 | |
| 11/15/2042 | 4.375% | 456,000 | 399,191 | |
| Eastman Chemical Co. | ||||
| 10/15/2044 | 4.650% | 2,511,000 | 2,192,358 | |
| Ecolab, Inc. | ||||
| 08/18/2055 | 2.750% | 333,000 | 234,869 | |
| Element Solutions, Inc.(a) | ||||
| 09/01/2028 | 3.875% | 1,510,000 | 1,311,818 | |
| FMC Corp. | ||||
| 10/01/2049 | 4.500% | 340,000 | 286,409 | |
| GC Treasury Center Co., Ltd.(a) | ||||
| 03/18/2031 | 2.980% | 750,000 | 626,272 | |
| Huntsman International LLC | ||||
| 06/15/2031 | 2.950% | 2,375,000 | 1,897,728 | |
| Ingevity Corp.(a) | ||||
| 11/01/2028 | 3.875% | 1,510,000 | 1,302,407 | |
| International Flavors & Fragrances, Inc. | ||||
| 09/26/2048 | 5.000% | 3,305,000 | 3,059,100 | |
| LYB International Finance III LLC | ||||
| 05/01/2050 | 4.200% | 2,125,000 | 1,721,765 | |
| 04/01/2051 | 3.625% | 3,960,000 | 2,937,691 | |
| Corporate Bonds & Notes (continued) | ||||
| Issuer | Coupon Rate | Principal Amount ($) | Value ($) | |
| LyondellBasell Industries NV | ||||
| 04/15/2024 | 5.750% | 713,000 | 727,727 | |
| 02/26/2055 | 4.625% | 885,000 | 745,525 | |
| Mosaic Co. (The) | ||||
| 11/15/2033 | 5.450% | 1,173,000 | 1,193,159 | |
| 11/15/2043 | 5.625% | 985,000 | 974,525 | |
| PPG Industries, Inc. | ||||
| 03/15/2026 | 1.200% | 972,000 | 870,735 | |
| RPM International, Inc. | ||||
| 01/15/2032 | 2.950% | 300,000 | 244,196 | |
| Sasol Financing International Ltd. | ||||
| 11/14/2022 | 4.500% | 3,800,000 | 3,793,061 | |
| Sasol Financing USA LLC | ||||
| 03/27/2024 | 5.875% | 600,000 | 599,249 | |
| Sherwin-Williams Co. (The) | ||||
| 08/08/2024 | 4.050% | 4,430,000 | 4,424,813 | |
| TPC Group Inc.(a) | ||||
| 08/01/2024 | 10.875% | 246,422 | 248,270 | |
| Total | 42,066,141 | |||
| Construction Machinery 0.2% | ||||
| Ashtead Capital, Inc.(a) | ||||
| 08/11/2032 | 5.500% | 625,000 | 614,205 | |
| Caterpillar Financial Services Corp. | ||||
| 08/12/2027 | 3.600% | 9,865,000 | 9,682,615 | |
| CNH Industrial Capital LLC | ||||
| 05/23/2025 | 3.950% | 5,880,000 | 5,779,745 | |
| H&E Equipment Services, Inc.(a) | ||||
| 12/15/2028 | 3.875% | 5,359,000 | 4,529,001 | |
| John Deere Capital Corp. | ||||
| 04/18/2029 | 3.350% | 642,000 | 614,305 | |
| United Rentals North America, Inc. | ||||
| 01/15/2030 | 5.250% | 3,000,000 | 2,837,272 | |
| 02/15/2031 | 3.875% | 1,664,000 | 1,436,790 | |
| Total | 25,493,933 | |||
| Consumer Cyclical Services 0.1% | ||||
| ADT Security Corp. (The)(a) | ||||
| 08/01/2029 | 4.125% | 1,475,000 | 1,265,203 | |
| Allied Universal Holdco LLC/Finance Corp.(a) | ||||
| 07/15/2026 | 6.625% | 2,300,000 | 2,153,156 | |
| 06/01/2029 | 6.000% | 1,300,000 | 973,909 | |
| Allied Universal Holdco LLC/Finance Corp./Atlas Luxco 4 Sarl(a) | ||||
| 06/01/2028 | 4.625% | 1,910,000 | 1,601,147 | |
| 06/01/2028 | 4.625% | 990,000 | 841,055 | |
| ANGI Group LLC(a) | ||||
| 08/15/2028 | 3.875% | 1,630,000 | 1,236,431 | |
| Multi-Manager Total Return Bond Strategies Fund | Annual Report 2022 | 37 |
August 31, 2022
| Corporate Bonds & Notes (continued) | ||||
| Issuer | Coupon Rate | Principal Amount ($) | Value ($) | |
| CBRE Services, Inc. | ||||
| 04/01/2031 | 2.500% | 837,000 | 670,919 | |
| Expedia Group, Inc.(a) | ||||
| 05/01/2025 | 6.250% | 1,094,000 | 1,122,514 | |
| WASH Multifamily Acquisition, Inc.(a) | ||||
| 04/15/2026 | 5.750% | 300,000 | 289,348 | |
| Total | 10,153,682 | |||
| Consumer Products 0.2% | ||||
| Brunswick Corp. | ||||
| 09/15/2032 | 4.400% | 3,005,000 | 2,592,563 | |
| Central Garden & Pet Co. | ||||
| 10/15/2030 | 4.125% | 1,045,000 | 876,939 | |
| Clorox Co. (The) | ||||
| 05/01/2032 | 4.600% | 1,500,000 | 1,484,119 | |
| GSK Consumer Healthcare Capital US LLC(a) | ||||
| 03/24/2029 | 3.375% | 555,000 | 505,256 | |
| Hasbro, Inc. | ||||
| 11/19/2024 | 3.000% | 647,000 | 629,817 | |
| 11/19/2026 | 3.550% | 599,000 | 570,444 | |
| JAB Holdings BV(a) | ||||
| 04/08/2052 | 4.500% | 2,205,000 | 1,589,024 | |
| Mead Johnson Nutrition Co. | ||||
| 11/15/2025 | 4.125% | 616,000 | 617,661 | |
| Newell Brands, Inc. | ||||
| 06/01/2025 | 4.875% | 4,150,000 | 4,063,402 | |
| Prestige Brands, Inc.(a) | ||||
| 04/01/2031 | 3.750% | 1,495,000 | 1,198,627 | |
| Scotts Miracle-Gro Co. (The) | ||||
| 12/15/2026 | 5.250% | 235,000 | 223,936 | |
| Spectrum Brands, Inc.(a) | ||||
| 07/15/2030 | 5.500% | 1,343,000 | 1,166,111 | |
| 03/15/2031 | 3.875% | 2,750,000 | 2,135,498 | |
| SWF Escrow Issuer Corp.(a) | ||||
| 10/01/2029 | 6.500% | 950,000 | 689,678 | |
| Tempur Sealy International, Inc.(a) | ||||
| 04/15/2029 | 4.000% | 1,135,000 | 934,404 | |
| Total | 19,277,479 | |||
| Diversified Manufacturing 0.2% | ||||
| Amphenol Corp. | ||||
| 03/01/2025 | 2.050% | 1,015,000 | 965,317 | |
| Amsted Industries, Inc.(a) | ||||
| 05/15/2030 | 4.625% | 1,685,000 | 1,503,250 | |
| Eaton Corp. | ||||
| 03/15/2033 | 4.150% | 2,354,000 | 2,269,713 | |
| 08/23/2052 | 4.700% | 2,090,000 | 2,032,507 | |
| Corporate Bonds & Notes (continued) | ||||
| Issuer | Coupon Rate | Principal Amount ($) | Value ($) | |
| EnerSys(a) | ||||
| 04/30/2023 | 5.000% | 200,000 | 198,433 | |
| GE Capital International Funding Co. Unlimited Co. | ||||
| 11/15/2035 | 4.418% | 720,000 | 678,958 | |
| General Electric Co. | ||||
| 03/15/2032 | 6.750% | 353,000 | 400,111 | |
| General Electric Co.(b) | ||||
| 3-month USD LIBOR + 0.480% 08/15/2036 | 3.385% | 5,380,000 | 4,343,190 | |
| Griffon Corp. | ||||
| 03/01/2028 | 5.750% | 525,000 | 485,710 | |
| Kennametal, Inc. | ||||
| 06/15/2028 | 4.625% | 1,370,000 | 1,316,682 | |
| Parker-Hannifin Corp. | ||||
| 09/15/2029 | 4.500% | 1,946,000 | 1,914,887 | |
| Roper Technologies, Inc. | ||||
| 09/15/2027 | 1.400% | 573,000 | 490,769 | |
| Timken Co. (The) | ||||
| 12/15/2028 | 4.500% | 3,685,000 | 3,523,868 | |
| Valmont Industries, Inc. | ||||
| 10/01/2054 | 5.250% | 2,050,000 | 1,937,098 | |
| WW Grainger, Inc. | ||||
| 02/15/2025 | 1.850% | 2,525,000 | 2,399,477 | |
| Total | 24,459,970 | |||
| Electric 2.9% | ||||
| AEP Texas Central Co.(a) | ||||
| 10/01/2025 | 3.850% | 1,828,000 | 1,785,249 | |
| AEP Texas Central Co. | ||||
| 02/15/2033 | 6.650% | 1,385,000 | 1,527,008 | |
| AEP Texas, Inc. | ||||
| 01/15/2050 | 3.450% | 942,000 | 715,491 | |
| AEP Transmission Co. LLC | ||||
| 12/01/2047 | 3.750% | 2,150,000 | 1,787,975 | |
| 08/15/2051 | 2.750% | 1,095,000 | 762,617 | |
| AES Corp. (The)(a) | ||||
| 07/15/2025 | 3.300% | 2,730,000 | 2,591,966 | |
| AES Corp. (The) | ||||
| 01/15/2026 | 1.375% | 662,000 | 588,045 | |
| Alabama Power Co. | ||||
| 12/01/2023 | 3.550% | 964,000 | 958,763 | |
| 09/01/2032 | 3.940% | 3,680,000 | 3,554,443 | |
| 10/01/2049 | 3.450% | 673,000 | 529,785 | |
| Alfa Desarrollo SpA(a) | ||||
| 09/27/2051 | 4.550% | 1,371,293 | 994,451 | |
| 38 | Multi-Manager Total Return Bond Strategies Fund | Annual Report 2022 |
August 31, 2022
| Corporate Bonds & Notes (continued) | ||||
| Issuer | Coupon Rate | Principal Amount ($) | Value ($) | |
| Alliant Energy Finance LLC(a) | ||||
| 06/15/2023 | 3.750% | 2,417,000 | 2,401,897 | |
| 06/15/2028 | 4.250% | 3,100,000 | 2,990,482 | |
| 03/01/2032 | 3.600% | 782,000 | 707,692 | |
| Ameren Corp. | ||||
| 02/15/2026 | 3.650% | 590,000 | 574,157 | |
| 03/15/2028 | 1.750% | 2,740,000 | 2,350,439 | |
| American Electric Power Co., Inc. | ||||
| 03/01/2050 | 3.250% | 691,000 | 492,015 | |
| Junior Subordinated | ||||
| 03/15/2024 | 2.031% | 3,165,000 | 3,065,332 | |
| American Electric Power Co., Inc.(k) | ||||
| 02/15/2062 | 3.875% | 3,891,000 | 3,311,526 | |
| American Transmission Systems, Inc.(a) | ||||
| 01/15/2032 | 2.650% | 2,893,000 | 2,435,847 | |
| 09/01/2044 | 5.000% | 749,000 | 726,098 | |
| Appalachian Power Co. | ||||
| 04/01/2031 | 2.700% | 694,000 | 589,631 | |
| 08/01/2032 | 4.500% | 3,220,000 | 3,103,632 | |
| 05/01/2050 | 3.700% | 444,000 | 351,173 | |
| Arizona Public Service Co. | ||||
| 08/15/2048 | 4.200% | 570,000 | 475,278 | |
| Avangrid, Inc. | ||||
| 04/15/2025 | 3.200% | 1,614,000 | 1,562,696 | |
| 06/01/2029 | 3.800% | 3,190,000 | 2,981,630 | |
| Baltimore Gas and Electric Co. | ||||
| 06/15/2031 | 2.250% | 884,000 | 749,741 | |
| Berkshire Hathaway Energy Co. | ||||
| 05/15/2031 | 1.650% | 921,000 | 738,210 | |
| Berkshire Hathaway Energy Co.(a) | ||||
| 05/01/2053 | 4.600% | 996,000 | 950,888 | |
| Black Hills Corp. | ||||
| 11/30/2023 | 4.250% | 286,000 | 286,240 | |
| 10/15/2029 | 3.050% | 488,000 | 426,158 | |
| 06/15/2030 | 2.500% | 679,000 | 562,186 | |
| 05/01/2033 | 4.350% | 241,000 | 220,552 | |
| Calpine Corp.(a) | ||||
| 02/15/2028 | 4.500% | 2,500,000 | 2,287,475 | |
| 03/15/2028 | 5.125% | 575,000 | 513,613 | |
| 02/01/2029 | 4.625% | 2,000,000 | 1,710,871 | |
| 02/01/2031 | 5.000% | 4,045,000 | 3,411,315 | |
| Cleveland Electric Illuminating Co. (The)(a) | ||||
| 04/01/2028 | 3.500% | 3,293,000 | 3,065,297 | |
| Cleveland Electric Illuminating Co. (The) | ||||
| 12/15/2036 | 5.950% | 1,279,000 | 1,335,776 | |
| CMS Energy Corp. | ||||
| 02/15/2027 | 2.950% | 80,000 | 74,009 | |
| Corporate Bonds & Notes (continued) | ||||
| Issuer | Coupon Rate | Principal Amount ($) | Value ($) | |
| CMS Energy Corp.(k) | ||||
| 06/01/2050 | 4.750% | 2,514,000 | 2,314,965 | |
| 12/01/2050 | 3.750% | 759,000 | 614,620 | |
| Commonwealth Edison Co. | ||||
| 08/15/2047 | 3.750% | 409,000 | 350,607 | |
| Consolidated Edison Co. of New York, Inc. | ||||
| 03/01/2035 | 5.300% | 171,000 | 174,700 | |
| 06/15/2046 | 3.850% | 1,310,000 | 1,100,444 | |
| 06/15/2047 | 3.875% | 1,640,000 | 1,373,140 | |
| 12/01/2054 | 4.625% | 375,000 | 349,077 | |
| 11/15/2057 | 4.000% | 544,000 | 446,030 | |
| Consumers Energy Co. | ||||
| 09/01/2052 | 4.200% | 604,000 | 562,244 | |
| Dominion Energy, Inc. | ||||
| 08/15/2026 | 2.850% | 750,000 | 708,278 | |
| Junior Subordinated | ||||
| 08/15/2024 | 3.071% | 1,755,000 | 1,703,113 | |
| Dominion Energy, Inc.(k) | ||||
| 12/31/2049 | 4.350% | 2,216,000 | 1,989,561 | |
| 12/31/2049 | 4.650% | 6,277,000 | 5,790,042 | |
| DTE Energy Co. | ||||
| 10/01/2024 | 2.529% | 2,165,000 | 2,086,270 | |
| 10/01/2026 | 2.850% | 10,155,000 | 9,540,215 | |
| DTE Energy Co.(k) | ||||
| 11/01/2024 | 4.220% | 6,505,000 | 6,480,435 | |
| Duke Energy Carolinas LLC | ||||
| 04/15/2031 | 2.550% | 370,000 | 323,626 | |
| 12/15/2041 | 4.250% | 19,000 | 17,423 | |
| 09/30/2042 | 4.000% | 615,000 | 543,721 | |
| 06/01/2045 | 3.750% | 157,000 | 132,600 | |
| 12/01/2047 | 3.700% | 46,000 | 37,960 | |
| Duke Energy Corp. | ||||
| 04/15/2024 | 3.750% | 3,373,000 | 3,359,753 | |
| 09/15/2025 | 0.900% | 1,750,000 | 1,588,331 | |
| 09/01/2026 | 2.650% | 4,710,000 | 4,406,560 | |
| 06/15/2031 | 2.550% | 1,500,000 | 1,252,134 | |
| 08/15/2032 | 4.500% | 1,395,000 | 1,344,610 | |
| 09/01/2046 | 3.750% | 1,416,000 | 1,111,463 | |
| 08/15/2052 | 5.000% | 5,325,000 | 5,060,312 | |
| Duke Energy Corp.(k) | ||||
| 12/31/2049 | 4.875% | 213,000 | 201,285 | |
| Duke Energy Florida LLC | ||||
| 12/15/2031 | 2.400% | 1,234,000 | 1,050,647 | |
| 07/15/2048 | 4.200% | 189,000 | 170,928 | |
| Duke Energy Indiana LLC | ||||
| 10/01/2049 | 3.250% | 299,000 | 227,823 | |
| Duke Energy Ohio, Inc. | ||||
| 06/01/2030 | 2.125% | 430,000 | 363,358 | |
| 06/15/2046 | 3.700% | 2,981,000 | 2,439,438 | |
| Multi-Manager Total Return Bond Strategies Fund | Annual Report 2022 | 39 |
August 31, 2022
| Corporate Bonds & Notes (continued) | ||||
| Issuer | Coupon Rate | Principal Amount ($) | Value ($) | |
| Duke Energy Progress LLC | ||||
| 05/15/2042 | 4.100% | 1,434,000 | 1,282,595 | |
| 03/15/2043 | 4.100% | 475,000 | 427,096 | |
| 03/30/2044 | 4.375% | 770,000 | 710,314 | |
| 08/15/2045 | 4.200% | 329,000 | 295,094 | |
| 10/15/2046 | 3.700% | 312,000 | 257,682 | |
| 09/15/2047 | 3.600% | 940,000 | 781,273 | |
| Duquesne Light Holdings, Inc.(a) | ||||
| 10/01/2030 | 2.532% | 463,000 | 376,906 | |
| Edison International | ||||
| 08/15/2025 | 4.700% | 9,230,000 | 9,151,843 | |
| Enel Finance International NV(a) | ||||
| 04/06/2028 | 3.500% | 2,370,000 | 2,155,301 | |
| Entergy Arkansas LLC | ||||
| 04/01/2049 | 4.200% | 941,000 | 854,132 | |
| 06/15/2051 | 2.650% | 212,000 | 145,011 | |
| 06/15/2052 | 3.350% | 317,000 | 245,588 | |
| Entergy Corp. | ||||
| 09/15/2025 | 0.900% | 3,770,000 | 3,386,433 | |
| 06/15/2030 | 2.800% | 348,000 | 297,635 | |
| 06/15/2031 | 2.400% | 801,000 | 650,744 | |
| Entergy Louisiana LLC | ||||
| 10/01/2026 | 2.400% | 2,409,000 | 2,228,585 | |
| 09/15/2052 | 4.750% | 4,101,000 | 3,974,856 | |
| Entergy Mississippi LLC | ||||
| 06/01/2049 | 3.850% | 1,178,000 | 982,549 | |
| Entergy Texas, Inc. | ||||
| 12/01/2027 | 3.450% | 2,510,000 | 2,378,191 | |
| 03/30/2029 | 4.000% | 348,000 | 337,675 | |
| Evergy Metro, Inc. | ||||
| 06/01/2030 | 2.250% | 572,000 | 488,488 | |
| Eversource Energy | ||||
| 08/15/2025 | 0.800% | 662,000 | 598,258 | |
| 08/15/2026 | 1.400% | 752,000 | 669,084 | |
| 03/01/2027 | 2.900% | 1,335,000 | 1,252,610 | |
| 07/01/2027 | 4.600% | 4,920,000 | 4,930,783 | |
| 03/01/2032 | 3.375% | 659,000 | 592,907 | |
| Exelon Corp. | ||||
| 04/15/2030 | 4.050% | 68,000 | 65,352 | |
| 04/15/2046 | 4.450% | 1,050,000 | 940,954 | |
| FirstEnergy Transmission LLC(a) | ||||
| 09/15/2028 | 2.866% | 3,224,000 | 2,861,607 | |
| Florida Power & Light Co. | ||||
| 12/04/2051 | 2.875% | 518,000 | 386,527 | |
| Fortis, Inc. | ||||
| 10/04/2026 | 3.055% | 460,000 | 430,631 | |
| Georgia Power Co. | ||||
| 09/15/2024 | 2.200% | 848,000 | 819,735 | |
| 05/15/2052 | 5.125% | 580,000 | 583,924 | |
| Corporate Bonds & Notes (continued) | ||||
| Issuer | Coupon Rate | Principal Amount ($) | Value ($) | |
| Gulf Power Co. | ||||
| 10/01/2044 | 4.550% | 1,350,000 | 1,271,462 | |
| Indiana Michigan Power Co. | ||||
| 05/01/2051 | 3.250% | 1,327,000 | 994,430 | |
| Inkia Energy Ltd.(a) | ||||
| 11/09/2027 | 5.875% | 1,675,000 | 1,596,344 | |
| Interstate Power and Light Co. | ||||
| 11/30/2051 | 3.100% | 3,194,000 | 2,301,258 | |
| Interstate Power and Light, Co. | ||||
| 12/01/2024 | 3.250% | 792,000 | 776,988 | |
| IPALCO Enterprises, Inc. | ||||
| 05/01/2030 | 4.250% | 1,590,000 | 1,467,109 | |
| Jersey Central Power & Light Co.(a) | ||||
| 04/01/2024 | 4.700% | 1,600,000 | 1,590,722 | |
| 01/15/2026 | 4.300% | 2,000,000 | 1,965,938 | |
| 03/01/2032 | 2.750% | 336,000 | 284,219 | |
| Jersey Central Power & Light Co. | ||||
| 06/01/2037 | 6.150% | 1,985,000 | 2,045,059 | |
| Kansas City Power & Light Co. | ||||
| 08/15/2025 | 3.650% | 665,000 | 654,708 | |
| Metropolitan Edison Co.(a) | ||||
| 01/15/2029 | 4.300% | 1,928,000 | 1,879,723 | |
| MidAmerican Energy Co. | ||||
| 10/15/2044 | 4.400% | 106,000 | 99,176 | |
| Mississippi Power Co. | ||||
| 03/15/2042 | 4.250% | 414,000 | 361,010 | |
| Mong Duong Finance Holdings BV(a) | ||||
| 05/07/2029 | 5.125% | 300,000 | 248,844 | |
| Monongahela Power Co.(a) | ||||
| 05/15/2027 | 3.550% | 617,000 | 583,471 | |
| Narragansett Electric Co. (The)(a) | ||||
| 04/09/2030 | 3.395% | 2,179,000 | 2,028,352 | |
| National Rural Utilities Cooperative Finance Corp. | ||||
| 02/07/2024 | 2.950% | 3,765,000 | 3,724,772 | |
| 03/15/2030 | 2.400% | 1,347,000 | 1,174,626 | |
| 06/15/2031 | 1.650% | 930,000 | 737,794 | |
| 04/15/2032 | 2.750% | 1,233,000 | 1,064,718 | |
| 12/15/2032 | 4.150% | 1,119,000 | 1,087,274 | |
| National Rural Utilities Cooperative Finance Corp.(k) | ||||
| 04/30/2043 | 4.750% | 1,529,000 | 1,426,516 | |
| Subordinated | ||||
| 04/20/2046 | 5.250% | 1,687,000 | 1,576,088 | |
| New England Power Co.(a) | ||||
| 10/06/2050 | 2.807% | 3,670,000 | 2,516,588 | |
| NextEra Energy Capital Holdings, Inc.(b) | ||||
| 3-month USD LIBOR + 0.270% 02/22/2023 | 3.254% | 3,000,000 | 2,992,298 | |
| 40 | Multi-Manager Total Return Bond Strategies Fund | Annual Report 2022 |
August 31, 2022
| Corporate Bonds & Notes (continued) | ||||
| Issuer | Coupon Rate | Principal Amount ($) | Value ($) | |
| NextEra Energy Capital Holdings, Inc. | ||||
| 09/01/2024 | 4.255% | 7,152,000 | 7,158,779 | |
| 01/15/2027 | 1.875% | 2,192,000 | 1,967,080 | |
| 06/15/2028 | 1.900% | 678,000 | 587,117 | |
| 01/15/2032 | 2.440% | 600,000 | 500,229 | |
| 07/15/2032 | 5.000% | 3,226,000 | 3,285,738 | |
| NextEra Energy Capital Holdings, Inc.(k) | ||||
| 03/15/2082 | 3.800% | 3,812,000 | 3,204,499 | |
| NRG Energy, Inc.(a) | ||||
| 12/02/2025 | 2.000% | 560,000 | 507,461 | |
| 12/02/2027 | 2.450% | 2,420,000 | 2,077,100 | |
| 02/15/2029 | 3.375% | 542,000 | 448,078 | |
| 06/15/2029 | 5.250% | 3,000,000 | 2,683,043 | |
| NRG Energy, Inc. | ||||
| 01/15/2027 | 6.625% | 954,000 | 950,723 | |
| NSTAR Electric Co. | ||||
| 08/15/2031 | 1.950% | 524,000 | 436,935 | |
| Oglethorpe Power Corp. | ||||
| 08/01/2050 | 3.750% | 651,000 | 502,129 | |
| Oncor Electric Delivery Co. LLC(a) | ||||
| 06/01/2052 | 4.600% | 2,400,000 | 2,363,677 | |
| Pacific Gas and Electric Co.(b) | ||||
| SOFR + 1.150% 11/14/2022 | 3.440% | 680,000 | 679,140 | |
| Pacific Gas and Electric Co. | ||||
| 06/08/2025 | 4.950% | 3,650,000 | 3,628,562 | |
| 07/01/2030 | 4.550% | 5,735,000 | 5,104,639 | |
| 04/15/2042 | 4.450% | 562,000 | 422,921 | |
| 03/15/2045 | 4.300% | 948,000 | 695,710 | |
| 03/15/2046 | 4.250% | 424,000 | 308,116 | |
| PacifiCorp | ||||
| 02/15/2050 | 4.150% | 137,000 | 122,491 | |
| 03/15/2051 | 3.300% | 680,000 | 526,772 | |
| PECO Energy Co. | ||||
| 10/01/2044 | 4.150% | 280,000 | 253,465 | |
| 09/15/2047 | 3.700% | 105,000 | 90,410 | |
| 05/15/2052 | 4.600% | 2,500,000 | 2,469,431 | |
| Pennsylvania Electric Co.(a) | ||||
| 03/15/2028 | 3.250% | 1,990,000 | 1,842,656 | |
| Public Service Electric and Gas Co. | ||||
| 12/01/2047 | 3.600% | 105,000 | 88,073 | |
| Public Service Enterprise Group, Inc. | ||||
| 08/15/2025 | 0.800% | 642,000 | 579,646 | |
| 08/15/2030 | 1.600% | 466,000 | 372,197 | |
| 11/15/2031 | 2.450% | 2,062,000 | 1,719,019 | |
| Puget Energy, Inc. | ||||
| 03/15/2032 | 4.224% | 1,795,000 | 1,659,152 | |
| South Carolina Electric & Gas Co. | ||||
| 05/15/2033 | 5.300% | 676,000 | 716,098 | |
| Corporate Bonds & Notes (continued) | ||||
| Issuer | Coupon Rate | Principal Amount ($) | Value ($) | |
| Southern California Edison Co.(b) | ||||
| SOFR + 0.470% 12/02/2022 | 2.760% | 4,825,000 | 4,820,213 | |
| Southern California Edison Co. | ||||
| 06/01/2052 | 5.450% | 2,525,000 | 2,519,246 | |
| Southern Co. (The) | ||||
| 07/01/2036 | 4.250% | 595,000 | 545,495 | |
| Southern Co. (The)(k) | ||||
| 01/15/2051 | 4.000% | 1,166,000 | 1,083,793 | |
| 09/15/2051 | 3.750% | 1,737,000 | 1,507,918 | |
| Junior Subordinated | ||||
| 08/01/2027 | 5.113% | 932,000 | 932,269 | |
| Southwestern Electric Power Co. | ||||
| 03/15/2026 | 1.650% | 1,096,000 | 993,630 | |
| 10/01/2026 | 2.750% | 6,450,000 | 6,011,596 | |
| Tampa Electric Co. | ||||
| 05/15/2044 | 4.350% | 434,000 | 391,999 | |
| 07/15/2052 | 5.000% | 2,250,000 | 2,257,545 | |
| Toledo Edison Co. (The) | ||||
| 05/15/2037 | 6.150% | 951,000 | 1,058,617 | |
| Tucson Electric Power Co. | ||||
| 03/15/2023 | 3.850% | 2,480,000 | 2,474,561 | |
| 12/01/2048 | 4.850% | 259,000 | 249,661 | |
| 06/15/2050 | 4.000% | 2,690,000 | 2,225,727 | |
| Union Electric Co. | ||||
| 09/15/2042 | 3.900% | 590,000 | 513,948 | |
| Virginia Electric & Power Co. | ||||
| 09/01/2022 | 3.450% | 1,446,000 | 1,445,973 | |
| 03/15/2027 | 3.500% | 1,446,000 | 1,405,935 | |
| 09/15/2047 | 3.800% | 942,000 | 803,323 | |
| Vistra Corp.(a),(k) | ||||
| 12/31/2049 | 7.000% | 425,000 | 395,250 | |
| 12/31/2049 | 8.000% | 4,650,000 | 4,452,375 | |
| Vistra Operations Co. LLC(a) | ||||
| 07/15/2024 | 3.550% | 2,505,000 | 2,414,868 | |
| 05/13/2025 | 5.125% | 8,436,000 | 8,366,955 | |
| 02/15/2027 | 5.625% | 2,950,000 | 2,851,723 | |
| 07/31/2027 | 5.000% | 2,000,000 | 1,862,948 | |
| 05/01/2029 | 4.375% | 1,125,000 | 980,353 | |
| Vistra Operations Co., LLC(a) | ||||
| 01/30/2027 | 3.700% | 885,000 | 803,051 | |
| WEC Energy Group, Inc. | ||||
| 10/15/2027 | 1.375% | 1,094,000 | 944,206 | |
| 12/15/2028 | 2.200% | 746,000 | 647,217 | |
| Wisconsin Electric Power Co. | ||||
| 06/15/2028 | 1.700% | 680,000 | 592,729 | |
| Wisconsin Public Service Corp. | ||||
| 12/01/2042 | 3.671% | 814,000 | 679,269 | |
| Total | 305,636,691 | |||
| Multi-Manager Total Return Bond Strategies Fund | Annual Report 2022 | 41 |
August 31, 2022
| Corporate Bonds & Notes (continued) | ||||
| Issuer | Coupon Rate | Principal Amount ($) | Value ($) | |
| Environmental 0.0% | ||||
| Waste Connections, Inc. | ||||
| 01/15/2033 | 4.200% | 833,000 | 799,600 | |
| 04/01/2050 | 3.050% | 885,000 | 657,408 | |
| Waste Pro USA, Inc.(a) | ||||
| 02/15/2026 | 5.500% | 1,650,000 | 1,505,826 | |
| Total | 2,962,834 | |||
| Finance Companies 1.0% | ||||
| AerCap Ireland Capital DAC/Global Aviation Trust | ||||
| 01/16/2024 | 4.875% | 1,856,000 | 1,846,586 | |
| 02/15/2024 | 3.150% | 3,225,000 | 3,124,519 | |
| 10/01/2025 | 4.450% | 1,889,000 | 1,831,851 | |
| 10/29/2026 | 2.450% | 445,000 | 392,185 | |
| 10/29/2028 | 3.000% | 5,655,000 | 4,846,742 | |
| 01/30/2032 | 3.300% | 2,913,000 | 2,342,969 | |
| 10/29/2033 | 3.400% | 2,372,000 | 1,873,687 | |
| Air Lease Corp. | ||||
| 03/01/2025 | 3.250% | 2,500,000 | 2,396,625 | |
| 07/01/2025 | 3.375% | 2,750,000 | 2,610,249 | |
| 01/15/2026 | 2.875% | 2,075,000 | 1,914,018 | |
| 08/15/2026 | 1.875% | 2,285,000 | 1,996,700 | |
| 12/01/2027 | 3.625% | 465,000 | 422,795 | |
| Aircastle Ltd.(a) | ||||
| 01/26/2028 | 2.850% | 3,335,000 | 2,723,862 | |
| Ares Capital Corp. | ||||
| 03/01/2025 | 4.250% | 210,000 | 204,291 | |
| 06/15/2028 | 2.875% | 3,285,000 | 2,722,561 | |
| Aviation Capital Group LLC(a) | ||||
| 05/01/2023 | 3.875% | 3,381,000 | 3,341,221 | |
| 01/30/2024 | 4.375% | 466,000 | 453,956 | |
| 12/15/2024 | 5.500% | 1,030,000 | 1,009,873 | |
| 09/20/2026 | 1.950% | 630,000 | 528,609 | |
| Avolon Holdings Funding Ltd.(a) | ||||
| 07/01/2024 | 3.950% | 750,000 | 717,313 | |
| 02/15/2025 | 2.875% | 2,905,000 | 2,671,165 | |
| 02/21/2026 | 2.125% | 1,051,000 | 910,174 | |
| 04/15/2026 | 4.250% | 1,281,000 | 1,183,820 | |
| 11/18/2027 | 2.528% | 3,017,000 | 2,470,347 | |
| 02/21/2028 | 2.750% | 477,000 | 389,182 | |
| Bain Capital Specialty Finance, Inc. | ||||
| 10/13/2026 | 2.550% | 3,250,000 | 2,753,725 | |
| Barings BDC, Inc.(a) | ||||
| 11/23/2026 | 3.300% | 1,230,000 | 1,059,885 | |
| Blackstone Private Credit Fund | ||||
| 12/15/2026 | 2.625% | 8,155,000 | 6,887,656 | |
| 01/15/2029 | 4.000% | 592,000 | 510,653 | |
| Blackstone Secured Lending Fund | ||||
| 09/30/2028 | 2.850% | 3,560,000 | 2,830,849 | |
| Corporate Bonds & Notes (continued) | ||||
| Issuer | Coupon Rate | Principal Amount ($) | Value ($) | |
| FirstCash, Inc.(a) | ||||
| 01/01/2030 | 5.625% | 1,500,000 | 1,342,141 | |
| FS KKR Capital Corp. | ||||
| 10/12/2028 | 3.125% | 3,955,000 | 3,225,194 | |
| GATX Corp. | ||||
| 03/15/2033 | 4.900% | 1,645,000 | 1,576,561 | |
| Golub Capital BDC, Inc. | ||||
| 08/24/2026 | 2.500% | 4,625,000 | 4,019,697 | |
| Hercules Capital, Inc. | ||||
| 01/20/2027 | 3.375% | 4,585,000 | 3,926,156 | |
| Main Street Capital Corp. | ||||
| 05/01/2024 | 5.200% | 971,000 | 974,238 | |
| 07/14/2026 | 3.000% | 6,480,000 | 5,649,957 | |
| Morgan Stanley Direct Lending Fund | ||||
| 02/11/2027 | 4.500% | 3,375,000 | 3,104,291 | |
| Navient Corp. | ||||
| 03/15/2027 | 5.000% | 1,395,000 | 1,201,971 | |
| Oaktree Specialty Lending Corp. | ||||
| 02/25/2025 | 3.500% | 860,000 | 828,211 | |
| Owl Rock Capital Corp. | ||||
| 07/22/2025 | 3.750% | 1,075,000 | 1,009,953 | |
| 01/15/2026 | 4.250% | 1,370,000 | 1,290,978 | |
| OWL Rock Core Income Corp. | ||||
| 03/21/2025 | 5.500% | 3,225,000 | 3,089,769 | |
| Owl Rock Technology Finance Corp.(a) | ||||
| 12/15/2025 | 4.750% | 6,475,000 | 6,020,873 | |
| Park Aerospace Holdings Ltd.(a) | ||||
| 03/15/2023 | 4.500% | 3,105,000 | 3,086,230 | |
| 02/15/2024 | 5.500% | 379,000 | 375,180 | |
| Quicken Loans LLC/Co-Issuer, Inc.(a) | ||||
| 03/01/2031 | 3.875% | 1,335,000 | 1,046,792 | |
| SMBC Aviation Capital Finance DAC(a) | ||||
| 10/15/2026 | 1.900% | 1,206,000 | 1,032,561 | |
| Springleaf Finance Corp. | ||||
| 03/15/2024 | 6.125% | 2,600,000 | 2,540,002 | |
| Total | 104,308,823 | |||
| Food and Beverage 0.9% | ||||
| Anheuser-Busch Companies LLC/InBev Worldwide, Inc. | ||||
| 02/01/2036 | 4.700% | 1,186,000 | 1,142,511 | |
| 02/01/2046 | 4.900% | 12,251,000 | 11,632,820 | |
| Anheuser-Busch InBev Worldwide, Inc. | ||||
| 01/23/2039 | 5.450% | 840,000 | 861,891 | |
| 04/15/2048 | 4.600% | 1,180,000 | 1,073,068 | |
| 01/23/2049 | 5.550% | 2,915,000 | 3,029,480 | |
| B&G Foods, Inc. | ||||
| 04/01/2025 | 5.250% | 2,200,000 | 1,963,830 | |
| 42 | Multi-Manager Total Return Bond Strategies Fund | Annual Report 2022 |
August 31, 2022
| Corporate Bonds & Notes (continued) | ||||
| Issuer | Coupon Rate | Principal Amount ($) | Value ($) | |
| Bacardi Ltd.(a) | ||||
| 05/15/2048 | 5.300% | 1,060,000 | 1,009,142 | |
| Brown-Forman Corp. | ||||
| 04/15/2025 | 3.500% | 1,645,000 | 1,626,885 | |
| Campbell Soup Co. | ||||
| 04/24/2050 | 3.125% | 3,875,000 | 2,744,034 | |
| Cargill Inc.(a) | ||||
| 11/10/2031 | 2.125% | 1,352,000 | 1,122,880 | |
| Cargill, Inc.(a) | ||||
| 04/22/2025 | 3.500% | 2,449,000 | 2,413,889 | |
| 04/23/2030 | 2.125% | 750,000 | 639,204 | |
| 04/22/2052 | 4.375% | 523,000 | 500,169 | |
| Coca-Cola Europacific Partners PLC(a) | ||||
| 05/03/2024 | 0.800% | 6,295,000 | 5,945,246 | |
| Constellation Brands, Inc. | ||||
| 12/01/2025 | 4.750% | 578,000 | 586,231 | |
| 05/09/2032 | 4.750% | 2,640,000 | 2,600,813 | |
| Diageo Capital PLC | ||||
| 04/29/2032 | 2.125% | 173,000 | 143,839 | |
| JBS SA/Food Co./Finance, Inc.(a) | ||||
| 04/15/2029 | 6.500% | 223,000 | 229,015 | |
| 05/15/2032 | 3.000% | 3,255,000 | 2,681,257 | |
| JBS USA LUX SA/Food Co./Finance, Inc.(a) | ||||
| 02/01/2028 | 5.125% | 2,025,000 | 2,026,166 | |
| 02/02/2029 | 3.000% | 1,955,000 | 1,690,944 | |
| 12/01/2031 | 3.750% | 3,055,000 | 2,665,030 | |
| 04/01/2033 | 5.750% | 5,400,000 | 5,378,927 | |
| 02/02/2052 | 4.375% | 630,000 | 495,107 | |
| 12/01/2052 | 6.500% | 2,535,000 | 2,649,710 | |
| Keurig Dr Pepper, Inc. | ||||
| 04/15/2032 | 4.050% | 821,000 | 765,609 | |
| 04/15/2052 | 4.500% | 1,123,000 | 977,108 | |
| Kraft Heinz Foods Co. | ||||
| 01/26/2039 | 6.875% | 796,000 | 880,891 | |
| 10/01/2039 | 4.625% | 2,029,000 | 1,801,732 | |
| 06/04/2042 | 5.000% | 3,000,000 | 2,797,854 | |
| 06/01/2046 | 4.375% | 535,000 | 453,997 | |
| 10/01/2049 | 4.875% | 4,985,000 | 4,520,302 | |
| Lamb Weston Holdings, Inc.(a) | ||||
| 01/31/2032 | 4.375% | 1,375,000 | 1,221,433 | |
| Mars, Inc.(a) | ||||
| 04/01/2039 | 3.875% | 1,040,000 | 934,482 | |
| 07/16/2040 | 2.375% | 964,000 | 695,989 | |
| PepsiCo, Inc. | ||||
| 07/18/2032 | 3.900% | 2,072,000 | 2,029,640 | |
| 07/18/2052 | 4.200% | 640,000 | 626,972 | |
| Pilgrim’s Pride Corp.(a) | ||||
| 04/15/2031 | 4.250% | 3,455,000 | 2,978,294 | |
| 03/01/2032 | 3.500% | 3,795,000 | 3,083,978 | |
| Corporate Bonds & Notes (continued) | ||||
| Issuer | Coupon Rate | Principal Amount ($) | Value ($) | |
| Post Holdings, Inc.(a) | ||||
| 03/01/2027 | 5.750% | 2,676,000 | 2,623,563 | |
| 12/15/2029 | 5.500% | 2,080,000 | 1,906,710 | |
| 04/15/2030 | 4.625% | 1,349,000 | 1,171,915 | |
| Primo Water Holdings, Inc.(a) | ||||
| 04/30/2029 | 4.375% | 1,510,000 | 1,291,944 | |
| Smithfield Foods, Inc.(a) | ||||
| 02/01/2027 | 4.250% | 2,500,000 | 2,390,834 | |
| 10/15/2030 | 3.000% | 2,020,000 | 1,650,722 | |
| Viterra Finance BV(a) | ||||
| 04/21/2026 | 2.000% | 1,125,000 | 985,901 | |
| Total | 92,641,958 | |||
| Foreign Agencies 0.0% | ||||
| PT Bank Mandiri Persero Tbk(a) | ||||
| 04/11/2024 | 3.750% | 850,000 | 840,783 | |
| Gaming 0.3% | ||||
| Caesars Entertainment, Inc.(a) | ||||
| 10/15/2029 | 4.625% | 2,845,000 | 2,289,298 | |
| GLP Capital LP/Financing II, Inc. | ||||
| 11/01/2023 | 5.375% | 740,000 | 737,196 | |
| 09/01/2024 | 3.350% | 610,000 | 580,499 | |
| 06/01/2025 | 5.250% | 1,839,000 | 1,813,969 | |
| 04/15/2026 | 5.375% | 5,080,000 | 5,002,625 | |
| 01/15/2029 | 5.300% | 765,000 | 741,246 | |
| 01/15/2030 | 4.000% | 2,190,000 | 1,919,564 | |
| Golden Entertainment, Inc.(a) | ||||
| 04/15/2026 | 7.625% | 1,720,000 | 1,758,617 | |
| International Game Technology PLC(a) | ||||
| 02/15/2025 | 6.500% | 1,775,000 | 1,762,361 | |
| MGM Resorts International | ||||
| 05/01/2025 | 6.750% | 1,150,000 | 1,150,231 | |
| 09/01/2026 | 4.625% | 188,000 | 171,362 | |
| 04/15/2027 | 5.500% | 1,500,000 | 1,382,382 | |
| Penn National Gaming, Inc.(a) | ||||
| 07/01/2029 | 4.125% | 460,000 | 372,605 | |
| Premier Entertainment Sub LLC/Finance Corp.(a) | ||||
| 09/01/2031 | 5.875% | 2,825,000 | 1,975,284 | |
| Scientific Games International, Inc.(a) | ||||
| 07/01/2025 | 8.625% | 1,400,000 | 1,440,973 | |
| VICI Properties LP | ||||
| 05/15/2032 | 5.125% | 2,715,000 | 2,587,246 | |
| 05/15/2052 | 5.625% | 1,765,000 | 1,633,770 | |
| VICI Properties LP/Note Co., Inc.(a) | ||||
| 06/15/2025 | 4.625% | 220,000 | 212,975 | |
| 09/01/2026 | 4.500% | 2,740,000 | 2,580,512 | |
| 02/01/2027 | 5.750% | 975,000 | 959,711 | |
| 02/15/2027 | 3.750% | 2,085,000 | 1,890,375 | |
| 01/15/2028 | 4.500% | 75,000 | 69,722 | |
| Multi-Manager Total Return Bond Strategies Fund | Annual Report 2022 | 43 |
August 31, 2022
| Corporate Bonds & Notes (continued) | ||||
| Issuer | Coupon Rate | Principal Amount ($) | Value ($) | |
| 02/15/2029 | 3.875% | 1,570,000 | 1,397,707 | |
| Wynn Resorts Finance LLC/Capital Corp.(a) | ||||
| 10/01/2029 | 5.125% | 1,000,000 | 839,496 | |
| Total | 35,269,726 | |||
| Health Care 1.2% | ||||
| Abbott Laboratories | ||||
| 11/30/2023 | 3.400% | 2,454,000 | 2,447,937 | |
| 11/30/2046 | 4.900% | 205,000 | 215,969 | |
| Barnabas Health, Inc. | ||||
| 07/01/2028 | 4.000% | 3,200,000 | 3,121,654 | |
| Baxter International, Inc. | ||||
| 02/01/2027 | 1.915% | 670,000 | 602,143 | |
| 12/01/2028 | 2.272% | 1,325,000 | 1,147,792 | |
| Becton Dickinson and Co. | ||||
| 12/15/2024 | 3.734% | 44,000 | 43,440 | |
| 08/22/2032 | 4.298% | 5,000,000 | 4,861,974 | |
| 05/15/2044 | 4.875% | 1,555,000 | 1,402,936 | |
| Bio-Rad Laboratories, Inc. | ||||
| 03/15/2027 | 3.300% | 428,000 | 404,081 | |
| Cigna Corp. | ||||
| 07/15/2023 | 3.750% | 1,388,000 | 1,385,541 | |
| 03/01/2027 | 3.400% | 2,190,000 | 2,094,021 | |
| 03/15/2030 | 2.400% | 1,440,000 | 1,234,134 | |
| 08/15/2038 | 4.800% | 3,429,000 | 3,308,616 | |
| 07/15/2046 | 4.800% | 2,070,000 | 1,931,279 | |
| 12/15/2048 | 4.900% | 486,000 | 462,496 | |
| 03/15/2050 | 3.400% | 892,000 | 671,329 | |
| 03/15/2051 | 3.400% | 1,215,000 | 916,183 | |
| CommonSpirit Health | ||||
| 10/01/2025 | 1.547% | 3,000,000 | 2,732,971 | |
| 10/01/2030 | 2.782% | 1,485,000 | 1,245,325 | |
| 11/01/2042 | 4.350% | 500,000 | 447,636 | |
| CVS Health Corp. | ||||
| 07/20/2025 | 3.875% | 1,002,000 | 994,867 | |
| 03/25/2028 | 4.300% | 1,017,000 | 1,005,810 | |
| 09/15/2031 | 2.125% | 903,000 | 735,780 | |
| 07/20/2035 | 4.875% | 1,000,000 | 974,652 | |
| 03/25/2038 | 4.780% | 8,665,000 | 8,296,526 | |
| 04/01/2040 | 4.125% | 1,899,000 | 1,658,398 | |
| 08/21/2040 | 2.700% | 996,000 | 714,803 | |
| 07/20/2045 | 5.125% | 701,000 | 671,109 | |
| 03/25/2048 | 5.050% | 9,587,000 | 9,227,708 | |
| DaVita, Inc.(a) | ||||
| 06/01/2030 | 4.625% | 2,065,000 | 1,655,812 | |
| Dentsply Sirona, Inc. | ||||
| 06/01/2030 | 3.250% | 1,347,000 | 1,109,925 | |
| DH Europe Finance II Sarl | ||||
| 11/15/2024 | 2.200% | 3,735,000 | 3,586,597 | |
| Duke University Health System, Inc. | ||||
| 06/01/2047 | 3.920% | 875,000 | 778,863 | |
| Corporate Bonds & Notes (continued) | ||||
| Issuer | Coupon Rate | Principal Amount ($) | Value ($) | |
| Embecta Corp.(a) | ||||
| 02/15/2030 | 5.000% | 1,500,000 | 1,316,271 | |
| Fresenius Medical Care US Finance III, Inc.(a) | ||||
| 12/01/2026 | 1.875% | 3,805,000 | 3,252,322 | |
| HCA, Inc. | ||||
| 02/01/2025 | 5.375% | 2,900,000 | 2,925,380 | |
| 04/15/2025 | 5.250% | 1,659,000 | 1,673,747 | |
| 06/15/2025 | 7.690% | 750,000 | 796,351 | |
| 06/15/2026 | 5.250% | 3,135,000 | 3,144,886 | |
| 02/15/2027 | 4.500% | 679,000 | 663,605 | |
| 12/01/2027 | 7.050% | 10,000 | 10,732 | |
| 06/15/2029 | 4.125% | 3,850,000 | 3,568,313 | |
| 09/01/2030 | 3.500% | 3,874,000 | 3,369,613 | |
| 07/15/2031 | 2.375% | 2,251,000 | 1,786,118 | |
| 06/15/2047 | 5.500% | 5,244,000 | 4,836,821 | |
| 06/15/2049 | 5.250% | 3,225,000 | 2,882,516 | |
| HCA, Inc.(a) | ||||
| 03/15/2027 | 3.125% | 1,687,000 | 1,549,888 | |
| 03/15/2032 | 3.625% | 2,067,000 | 1,786,455 | |
| Laboratory Corp. of America Holdings | ||||
| 11/01/2023 | 4.000% | 330,000 | 329,398 | |
| 09/01/2024 | 3.250% | 2,561,000 | 2,515,887 | |
| Legacy LifePoint Health LLC(a) | ||||
| 02/15/2027 | 4.375% | 1,575,000 | 1,369,184 | |
| Mayo Clinic | ||||
| 11/15/2052 | 4.128% | 750,000 | 699,117 | |
| McKesson Corp. | ||||
| 08/15/2026 | 1.300% | 4,931,000 | 4,392,532 | |
| Memorial Sloan-Kettering Cancer Center | ||||
| 07/01/2052 | 4.125% | 4,630,000 | 4,241,724 | |
| Mozart Debt Merger Sub, Inc.(a) | ||||
| 04/01/2029 | 3.875% | 3,870,000 | 3,276,864 | |
| 10/01/2029 | 5.250% | 2,475,000 | 2,080,367 | |
| New York and Presbyterian Hospital (The) | ||||
| 08/01/2116 | 4.763% | 785,000 | 732,788 | |
| 08/01/2119 | 3.954% | 305,000 | 238,197 | |
| NYU Langone Hospitals | ||||
| 07/01/2043 | 5.750% | 705,000 | 762,338 | |
| PerkinElmer, Inc. | ||||
| 09/15/2028 | 1.900% | 189,000 | 159,668 | |
| 09/15/2029 | 3.300% | 511,000 | 456,110 | |
| RegionalCare Hospital Partners Holdings, Inc./LifePoint Health, Inc.(a) | ||||
| 12/01/2026 | 9.750% | 2,875,000 | 2,747,705 | |
| Tenet Healthcare Corp. | ||||
| 07/15/2024 | 4.625% | 535,000 | 524,186 | |
| Tenet Healthcare Corp.(a) | ||||
| 11/01/2027 | 5.125% | 2,000,000 | 1,853,893 | |
| 10/01/2028 | 6.125% | 3,325,000 | 3,048,534 | |
| 06/01/2029 | 4.250% | 1,375,000 | 1,186,729 | |
| 01/15/2030 | 4.375% | 1,175,000 | 1,028,121 | |
| 44 | Multi-Manager Total Return Bond Strategies Fund | Annual Report 2022 |
August 31, 2022
| Corporate Bonds & Notes (continued) | ||||
| Issuer | Coupon Rate | Principal Amount ($) | Value ($) | |
| Texas Health Resources | ||||
| 11/15/2055 | 4.330% | 700,000 | 671,943 | |
| Universal Health Services, Inc.(a) | ||||
| 09/01/2026 | 1.650% | 2,485,000 | 2,142,052 | |
| 10/15/2030 | 2.650% | 2,485,000 | 1,955,294 | |
| Total | 132,063,956 | |||
| Healthcare Insurance 0.3% | ||||
| Aetna, Inc. | ||||
| 06/15/2036 | 6.625% | 624,000 | 696,937 | |
| 05/15/2042 | 4.500% | 1,651,000 | 1,472,870 | |
| Anthem, Inc. | ||||
| 03/15/2031 | 2.550% | 504,000 | 432,295 | |
| 05/15/2032 | 4.100% | 552,000 | 531,029 | |
| Centene Corp. | ||||
| 12/15/2027 | 4.250% | 4,010,000 | 3,806,884 | |
| 07/15/2028 | 2.450% | 3,832,000 | 3,234,639 | |
| 12/15/2029 | 4.625% | 850,000 | 800,766 | |
| Health Care Service Corp., a Mutual Legal Reserve Co.(a) | ||||
| 06/01/2025 | 1.500% | 577,000 | 529,900 | |
| Humana, Inc. | ||||
| 04/01/2025 | 4.500% | 1,120,000 | 1,127,356 | |
| 02/03/2027 | 1.350% | 901,000 | 787,298 | |
| 08/15/2029 | 3.125% | 173,000 | 157,220 | |
| 02/03/2032 | 2.150% | 1,014,000 | 822,285 | |
| Molina Healthcare, Inc.(a) | ||||
| 06/15/2028 | 4.375% | 4,250,000 | 3,919,258 | |
| 11/15/2030 | 3.875% | 1,500,000 | 1,298,163 | |
| UnitedHealth Group, Inc. | ||||
| 05/15/2032 | 4.200% | 848,000 | 841,033 | |
| 08/15/2039 | 3.500% | 617,000 | 530,174 | |
| 05/15/2040 | 2.750% | 366,000 | 283,041 | |
| 05/15/2041 | 3.050% | 190,000 | 152,042 | |
| 07/15/2045 | 4.750% | 443,000 | 438,281 | |
| 10/15/2047 | 3.750% | 473,000 | 407,254 | |
| 05/15/2051 | 3.250% | 3,750,000 | 2,937,794 | |
| 05/15/2052 | 4.750% | 3,626,000 | 3,598,430 | |
| Wellpoint, Inc. | ||||
| 08/15/2024 | 3.500% | 1,928,000 | 1,906,738 | |
| Total | 30,711,687 | |||
| Healthcare REIT 0.2% | ||||
| Diversified Healthcare Trust | ||||
| 06/15/2025 | 9.750% | 1,587,000 | 1,559,659 | |
| 03/01/2031 | 4.375% | 1,500,000 | 1,029,030 | |
| Healthcare Realty Holdings LP | ||||
| 05/01/2025 | 3.875% | 440,000 | 426,079 | |
| 03/15/2030 | 2.400% | 995,000 | 796,488 | |
| Healthcare Trust of America Holdings LP | ||||
| 02/15/2030 | 3.100% | 1,246,000 | 1,071,391 | |
| 03/15/2031 | 2.000% | 3,525,000 | 2,744,686 | |
| Corporate Bonds & Notes (continued) | ||||
| Issuer | Coupon Rate | Principal Amount ($) | Value ($) | |
| MPT Operating Partnership LP/Finance Corp. | ||||
| 03/15/2031 | 3.500% | 1,420,000 | 1,066,019 | |
| Omega Healthcare Investors, Inc. | ||||
| 01/15/2025 | 4.500% | 975,000 | 965,678 | |
| Sabra Health Care LP | ||||
| 12/01/2031 | 3.200% | 574,000 | 455,970 | |
| Senior Housing Properties Trust | ||||
| 05/01/2024 | 4.750% | 1,100,000 | 1,003,720 | |
| Ventas Realty LP | ||||
| 09/30/2043 | 5.700% | 225,000 | 225,553 | |
| Welltower, Inc. | ||||
| 06/01/2031 | 2.800% | 8,255,000 | 6,976,534 | |
| Total | 18,320,807 | |||
| Home Construction 0.2% | ||||
| Ashton Woods USA LLC/Finance Co.(a) | ||||
| 01/15/2028 | 6.625% | 1,700,000 | 1,536,480 | |
| Brookfield Residential Properties, Inc./US Corp.(a) | ||||
| 09/15/2027 | 6.250% | 1,560,000 | 1,387,346 | |
| 02/15/2030 | 4.875% | 2,575,000 | 1,990,002 | |
| Century Communities, Inc. | ||||
| 06/01/2027 | 6.750% | 2,500,000 | 2,451,109 | |
| Empire Communities Corp.(a) | ||||
| 12/15/2025 | 7.000% | 4,225,000 | 3,633,861 | |
| KB Home | ||||
| 06/15/2031 | 4.000% | 1,075,000 | 848,180 | |
| M/I Homes, Inc. | ||||
| 02/01/2028 | 4.950% | 675,000 | 598,624 | |
| Mattamy Group Corp.(a) | ||||
| 03/01/2030 | 4.625% | 4,500,000 | 3,631,258 | |
| MDC Holdings, Inc. | ||||
| 08/06/2061 | 3.966% | 3,540,000 | 2,051,084 | |
| Meritage Homes Corp. | ||||
| 06/06/2027 | 5.125% | 2,000,000 | 1,874,911 | |
| PulteGroup, Inc. | ||||
| 03/01/2026 | 5.500% | 737,000 | 746,203 | |
| Taylor Morrison Communities, Inc.(a) | ||||
| 01/15/2028 | 5.750% | 2,000,000 | 1,845,145 | |
| 08/01/2030 | 5.125% | 1,114,000 | 956,099 | |
| Taylor Morrison Communities, Inc./Holdings II(a) | ||||
| 04/15/2023 | 5.875% | 3,446,000 | 3,436,698 | |
| Total | 26,987,000 | |||
| Independent Energy 0.5% | ||||
| Aker BP ASA(a) | ||||
| 01/15/2026 | 2.875% | 2,875,000 | 2,684,864 | |
| 01/15/2030 | 3.750% | 300,000 | 270,385 | |
| Multi-Manager Total Return Bond Strategies Fund | Annual Report 2022 | 45 |
August 31, 2022
| Corporate Bonds & Notes (continued) | ||||
| Issuer | Coupon Rate | Principal Amount ($) | Value ($) | |
| Antero Resources Corp.(a) | ||||
| 02/01/2029 | 7.625% | 600,000 | 610,331 | |
| 03/01/2030 | 5.375% | 920,000 | 866,206 | |
| Apache Corp. | ||||
| 09/01/2040 | 5.100% | 2,560,000 | 2,204,335 | |
| Ascent Resources Utica Holdings LLC/ARU Finance Corp.(a) | ||||
| 11/01/2026 | 7.000% | 600,000 | 588,839 | |
| 11/01/2027 | 9.000% | 150,000 | 182,223 | |
| 12/31/2028 | 8.250% | 2,500,000 | 2,480,900 | |
| Canadian Natural Resources Ltd. | ||||
| 06/30/2033 | 6.450% | 730,000 | 770,477 | |
| 02/01/2039 | 6.750% | 289,000 | 312,586 | |
| Chesapeake Energy Corp.(a) | ||||
| 02/01/2026 | 5.500% | 2,000,000 | 1,928,744 | |
| ConocoPhillips Co.(a) | ||||
| 03/15/2042 | 3.758% | 1,928,000 | 1,694,361 | |
| Continental Resources, Inc. | ||||
| 04/15/2023 | 4.500% | 385,000 | 384,961 | |
| 06/01/2024 | 3.800% | 1,683,000 | 1,658,884 | |
| 06/01/2044 | 4.900% | 737,000 | 576,015 | |
| Coterra Energy, Inc.(a) | ||||
| 05/15/2027 | 3.900% | 1,850,000 | 1,766,114 | |
| Devon Energy Corp. | ||||
| 09/15/2024 | 5.250% | 78,000 | 79,322 | |
| 07/15/2041 | 5.600% | 1,875,000 | 1,854,673 | |
| Diamondback Energy, Inc. | ||||
| 12/01/2026 | 3.250% | 1,905,000 | 1,827,950 | |
| 12/01/2029 | 3.500% | 1,509,000 | 1,371,596 | |
| 03/24/2031 | 3.125% | 3,997,000 | 3,464,199 | |
| Energean Israel Finance Ltd.(a) | ||||
| 03/30/2024 | 4.500% | 850,000 | 818,411 | |
| 03/30/2026 | 4.875% | 1,321,000 | 1,218,366 | |
| 03/30/2028 | 5.375% | 2,637,000 | 2,377,086 | |
| Hilcorp Energy I LP/Finance Co.(a) | ||||
| 04/15/2030 | 6.000% | 825,000 | 761,038 | |
| 04/15/2032 | 6.250% | 1,050,000 | 944,307 | |
| Lundin Energy Finance BV(a) | ||||
| 07/15/2026 | 2.000% | 8,157,000 | 7,266,897 | |
| 07/15/2031 | 3.100% | 1,575,000 | 1,322,311 | |
| Occidental Petroleum Corp.(g) | ||||
| 10/10/2036 | 0.000% | 4,783,000 | 2,486,363 | |
| Pioneer Natural Resources Co. | ||||
| 05/15/2023 | 0.550% | 3,235,000 | 3,157,423 | |
| Santos Finance Ltd.(a) | ||||
| 04/29/2031 | 3.649% | 652,000 | 548,505 | |
| Total | 48,478,672 | |||
| Corporate Bonds & Notes (continued) | ||||
| Issuer | Coupon Rate | Principal Amount ($) | Value ($) | |
| Integrated Energy 0.2% | ||||
| BP Capital Markets America, Inc. | ||||
| 08/10/2030 | 1.749% | 591,000 | 489,867 | |
| BP Capital Markets PLC(k) | ||||
| 12/31/2059 | 4.875% | 825,000 | 754,875 | |
| Cenovus Energy, Inc. | ||||
| 04/15/2027 | 4.250% | 5,000,000 | 4,922,728 | |
| 06/15/2047 | 5.400% | 711,000 | 692,192 | |
| 02/15/2052 | 3.750% | 3,750,000 | 2,884,898 | |
| Chevron Corp. | ||||
| 05/11/2050 | 3.078% | 1,540,000 | 1,224,476 | |
| Exxon Mobil Corp. | ||||
| 04/15/2051 | 3.452% | 2,735,000 | 2,260,799 | |
| Reliance Industries Ltd.(a) | ||||
| 01/12/2032 | 2.875% | 1,450,000 | 1,226,024 | |
| 01/12/2052 | 3.625% | 1,300,000 | 985,786 | |
| Shell International Finance BV | ||||
| 11/13/2028 | 3.875% | 398,000 | 390,240 | |
| 05/11/2035 | 4.125% | 1,094,000 | 1,041,424 | |
| Total Capital International SA | ||||
| 06/29/2041 | 2.986% | 977,000 | 779,385 | |
| Total | 17,652,694 | |||
| Leisure 0.0% | ||||
| AMC Entertainment Holdings, Inc.(a),(l) | ||||
| 06/15/2026 | 12.000% | 670,233 | 535,667 | |
| Life Insurance 1.2% | ||||
| AIG Global Funding(a) | ||||
| 06/17/2024 | 0.650% | 3,880,000 | 3,647,469 | |
| 09/22/2025 | 0.900% | 3,545,000 | 3,183,300 | |
| Athene Global Funding(a) | ||||
| 06/29/2026 | 1.608% | 2,930,000 | 2,548,364 | |
| 03/08/2027 | 3.205% | 4,925,000 | 4,472,565 | |
| 03/24/2028 | 2.500% | 3,905,000 | 3,341,416 | |
| 08/19/2028 | 1.985% | 4,380,000 | 3,599,771 | |
| 01/07/2029 | 2.717% | 320,000 | 272,068 | |
| 10/04/2031 | 2.646% | 1,520,000 | 1,194,801 | |
| Brighthouse Financial Global Funding(a) | ||||
| 01/13/2025 | 1.750% | 3,210,000 | 2,976,196 | |
| Brighthouse Financial, Inc.(a) | ||||
| 12/15/2023 | 1.200% | 4,580,000 | 4,397,332 | |
| CNO Global Funding(a) | ||||
| 01/06/2029 | 2.650% | 6,107,000 | 5,272,863 | |
| Corebridge Financial, Inc.(a) | ||||
| 04/05/2032 | 3.900% | 2,885,000 | 2,593,185 | |
| Corebridge Financial, Inc.(a),(k) | ||||
| 12/15/2052 | 6.875% | 2,459,000 | 2,388,798 | |
| 46 | Multi-Manager Total Return Bond Strategies Fund | Annual Report 2022 |
August 31, 2022
| Corporate Bonds & Notes (continued) | ||||
| Issuer | Coupon Rate | Principal Amount ($) | Value ($) | |
| CoreBridge Financial, Inc.(a) | ||||
| 04/05/2029 | 3.850% | 3,099,000 | 2,852,195 | |
| Empower Finance 2020 LP(a) | ||||
| 09/17/2027 | 1.357% | 555,000 | 476,551 | |
| Equitable Financial Life Global Funding(a) | ||||
| 03/08/2028 | 1.800% | 2,475,000 | 2,138,273 | |
| F&G Global Funding(a) | ||||
| 07/07/2025 | 5.150% | 7,270,000 | 7,188,696 | |
| 09/20/2028 | 2.000% | 3,740,000 | 3,128,562 | |
| GA Global Funding Trust(a) | ||||
| 12/08/2023 | 1.250% | 2,260,000 | 2,163,299 | |
| 01/06/2027 | 2.250% | 5,780,000 | 5,195,092 | |
| Great-West Lifeco US Finance 2020 LP(a) | ||||
| 08/12/2025 | 0.904% | 4,190,000 | 3,765,913 | |
| Hill City Funding Trust(a) | ||||
| 08/15/2041 | 4.046% | 3,985,000 | 2,894,098 | |
| Jackson Financial, Inc.(a) | ||||
| 11/23/2051 | 4.000% | 1,720,000 | 1,192,761 | |
| Jackson National Life Global Funding(a) | ||||
| 01/12/2025 | 1.750% | 5,525,000 | 5,170,684 | |
| Lincoln National Corp. | ||||
| 06/15/2040 | 7.000% | 930,000 | 1,051,427 | |
| Manulife Financial Corp. | ||||
| 03/16/2032 | 3.703% | 1,010,000 | 930,069 | |
| MassMutual Global Funding II(a) | ||||
| 08/26/2025 | 4.150% | 1,830,000 | 1,824,989 | |
| Metropolitan Life Global Funding I(a) | ||||
| 08/25/2029 | 4.300% | 4,965,000 | 4,833,296 | |
| New York Life Global Funding(a) | ||||
| 08/01/2031 | 1.850% | 3,755,000 | 3,037,674 | |
| New York Life Insurance Co.(a) | ||||
| Subordinated | ||||
| 05/15/2050 | 3.750% | 2,545,000 | 2,128,337 | |
| Northwestern Mutual Global Funding(a) | ||||
| 06/01/2028 | 1.700% | 1,265,000 | 1,104,900 | |
| Northwestern Mutual Life Insurance Co. (The)(a) | ||||
| Subordinated | ||||
| 09/30/2059 | 3.625% | 1,024,000 | 781,208 | |
| Pine Street Trust II(a) | ||||
| 02/15/2049 | 5.568% | 1,890,000 | 1,828,425 | |
| Principal Financial Group, Inc. | ||||
| 05/15/2023 | 3.125% | 667,000 | 662,533 | |
| Protective Life Global Funding(a) | ||||
| 01/13/2025 | 1.646% | 4,430,000 | 4,129,638 | |
| 07/06/2027 | 4.714% | 7,280,000 | 7,264,131 | |
| Corporate Bonds & Notes (continued) | ||||
| Issuer | Coupon Rate | Principal Amount ($) | Value ($) | |
| Reliance Standard Life Global Funding II(a) | ||||
| 09/19/2023 | 3.850% | 1,465,000 | 1,455,788 | |
| 05/07/2025 | 2.750% | 4,340,000 | 4,126,268 | |
| RGA Global Funding(a) | ||||
| 01/18/2029 | 2.700% | 4,390,000 | 3,838,519 | |
| Teachers Insurance & Annuity Association of America(a) | ||||
| Subordinated | ||||
| 09/15/2044 | 4.900% | 2,040,000 | 1,983,786 | |
| 05/15/2047 | 4.270% | 4,785,000 | 4,264,242 | |
| 05/15/2050 | 3.300% | 3,980,000 | 3,048,184 | |
| Total | 124,347,666 | |||
| Lodging 0.1% | ||||
| Marriott International, Inc. | ||||
| 12/01/2023 | 4.150% | 3,885,000 | 3,887,245 | |
| 10/15/2032 | 3.500% | 3,400,000 | 2,915,492 | |
| Total | 6,802,737 | |||
| Media and Entertainment 0.4% | ||||
| Diamond Sports Group LLC/Finance Co.(a) | ||||
| 08/15/2026 | 5.375% | 11,148,000 | 2,119,463 | |
| Discovery Communications LLC | ||||
| 05/15/2049 | 5.300% | 1,799,000 | 1,482,614 | |
| 09/15/2055 | 4.000% | 2,636,000 | 1,743,845 | |
| Gray Television, Inc.(a) | ||||
| 05/15/2027 | 7.000% | 1,310,000 | 1,293,031 | |
| Interpublic Group of Companies, Inc. (The) | ||||
| 04/15/2024 | 4.200% | 333,000 | 331,156 | |
| Magallanes, Inc.(a) | ||||
| 03/15/2027 | 3.755% | 2,401,000 | 2,242,662 | |
| 03/15/2032 | 4.279% | 639,000 | 555,071 | |
| 03/15/2042 | 5.050% | 7,139,000 | 5,834,031 | |
| 03/15/2052 | 5.141% | 18,371,000 | 14,790,357 | |
| Meta Platforms, Inc.(a) | ||||
| 08/15/2027 | 3.500% | 1,534,000 | 1,485,993 | |
| 08/15/2032 | 3.850% | 1,893,000 | 1,780,080 | |
| 08/15/2052 | 4.450% | 1,622,000 | 1,476,009 | |
| 08/15/2062 | 4.650% | 2,201,000 | 1,984,060 | |
| Prosus NV(a) | ||||
| 01/19/2052 | 4.987% | 2,505,000 | 1,806,988 | |
| Sinclair Television Group, Inc.(a) | ||||
| 02/15/2027 | 5.125% | 1,440,000 | 1,238,629 | |
| Take-Two Interactive Software, Inc. | ||||
| 04/14/2032 | 4.000% | 770,000 | 709,987 | |
| Viacom, Inc. | ||||
| 04/30/2036 | 6.875% | 1,955,000 | 2,018,112 | |
| 04/01/2044 | 5.250% | 2,312,000 | 1,960,001 | |
| Multi-Manager Total Return Bond Strategies Fund | Annual Report 2022 | 47 |
August 31, 2022
| Corporate Bonds & Notes (continued) | ||||
| Issuer | Coupon Rate | Principal Amount ($) | Value ($) | |
| Walt Disney Co. (The) | ||||
| 03/15/2033 | 6.550% | 1,000,000 | 1,157,403 | |
| Total | 46,009,492 | |||
| Metals and Mining 0.2% | ||||
| Anglo American Capital PLC(a) | ||||
| 03/17/2028 | 2.250% | 530,000 | 451,463 | |
| 04/01/2030 | 5.625% | 149,000 | 148,073 | |
| First Quantum Minerals Ltd.(a) | ||||
| 04/01/2025 | 7.500% | 2,800,000 | 2,762,248 | |
| Freeport-McMoRan, Inc. | ||||
| 03/01/2030 | 4.250% | 1,209,000 | 1,098,166 | |
| 11/14/2034 | 5.400% | 5,000,000 | 4,732,163 | |
| Glencore Funding LLC(a) | ||||
| 03/12/2024 | 4.125% | 1,375,000 | 1,364,228 | |
| Kinross Gold Corp. | ||||
| 07/15/2027 | 4.500% | 1,239,000 | 1,199,963 | |
| Newmont Corp. | ||||
| 10/01/2030 | 2.250% | 3,215,000 | 2,642,097 | |
| Novelis Corp.(a) | ||||
| 01/30/2030 | 4.750% | 1,245,000 | 1,088,103 | |
| Nucor Corp. | ||||
| 05/23/2025 | 3.950% | 2,445,000 | 2,427,206 | |
| 05/23/2027 | 4.300% | 690,000 | 686,263 | |
| 04/01/2032 | 3.125% | 686,000 | 603,105 | |
| POSCO(a) | ||||
| 08/04/2025 | 4.375% | 650,000 | 646,402 | |
| 08/04/2027 | 4.500% | 650,000 | 639,635 | |
| Rain CII Carbon LLC/Corp.(a) | ||||
| 04/01/2025 | 7.250% | 1,805,000 | 1,692,301 | |
| Rio Tinto Finance USA, Ltd. | ||||
| 11/02/2051 | 2.750% | 216,000 | 156,519 | |
| Southern Copper Corp. | ||||
| 11/08/2022 | 3.500% | 130,000 | 129,546 | |
| 04/23/2025 | 3.875% | 600,000 | 587,631 | |
| Steel Dynamics, Inc. | ||||
| 06/15/2025 | 2.400% | 491,000 | 464,859 | |
| 10/15/2027 | 1.650% | 747,000 | 638,231 | |
| 01/15/2031 | 3.250% | 1,510,000 | 1,304,627 | |
| Teck Resources Ltd. | ||||
| 08/15/2040 | 6.000% | 669,000 | 638,828 | |
| 02/01/2043 | 5.400% | 574,000 | 509,823 | |
| Total | 26,611,480 | |||
| Midstream 1.1% | ||||
| AmeriGas Partners LP/Finance Corp. | ||||
| 05/20/2024 | 5.625% | 2,500,000 | 2,469,247 | |
| 08/20/2026 | 5.875% | 2,300,000 | 2,201,116 | |
| Corporate Bonds & Notes (continued) | ||||
| Issuer | Coupon Rate | Principal Amount ($) | Value ($) | |
| Boardwalk Pipelines LP | ||||
| 09/01/2032 | 3.600% | 1,980,000 | 1,671,259 | |
| Cheniere Corpus Christi Holdings LLC | ||||
| 06/30/2027 | 5.125% | 177,000 | 176,821 | |
| 11/15/2029 | 3.700% | 265,000 | 243,956 | |
| Colonial Enterprises, Inc.(a) | ||||
| 05/15/2030 | 3.250% | 3,505,000 | 3,182,864 | |
| Colorado Interstate Gas Co. LLC/Issuing Corp.(a) | ||||
| 08/15/2026 | 4.150% | 2,290,000 | 2,240,081 | |
| Crestwood Midstream Partners LP/Finance Corp.(a) | ||||
| 05/01/2027 | 5.625% | 2,595,000 | 2,417,250 | |
| EIG Pearl Holdings Sarl(a) | ||||
| 08/31/2036 | 3.545% | 900,000 | 788,995 | |
| Enable Midstream Partners LP | ||||
| 05/15/2028 | 4.950% | 3,405,000 | 3,324,306 | |
| Enbridge, Inc.(k) | ||||
| 07/15/2080 | 5.750% | 1,213,000 | 1,165,517 | |
| Energy Transfer Operating LP | ||||
| 03/15/2023 | 4.250% | 1,890,000 | 1,890,415 | |
| 01/15/2024 | 5.875% | 2,481,000 | 2,514,227 | |
| 06/01/2027 | 5.500% | 1,758,000 | 1,779,155 | |
| 06/15/2028 | 4.950% | 1,000,000 | 983,767 | |
| 04/15/2047 | 5.300% | 1,338,000 | 1,170,147 | |
| Energy Transfer Partners LP | ||||
| 03/15/2035 | 4.900% | 134,000 | 121,918 | |
| 06/15/2038 | 5.800% | 646,000 | 605,270 | |
| 10/01/2043 | 5.950% | 280,000 | 263,928 | |
| 03/15/2045 | 5.150% | 2,220,000 | 1,927,660 | |
| Energy Transfer Partners LP/Regency Finance Corp. | ||||
| 11/01/2023 | 4.500% | 2,409,000 | 2,408,616 | |
| Enterprise Products Operating LLC | ||||
| 02/15/2024 | 3.900% | 500,000 | 498,227 | |
| 02/15/2045 | 5.100% | 1,230,000 | 1,175,695 | |
| 05/15/2046 | 4.900% | 1,400,000 | 1,306,408 | |
| Enterprise Products Operating LLC(b) | ||||
| 3-month USD LIBOR + 2.986% 08/16/2077 | 5.908% | 324,000 | 291,419 | |
| Galaxy Pipeline Assets Bidco Ltd.(a) | ||||
| 03/31/2034 | 2.160% | �� | 821,535 | 716,498 |
| 09/30/2040 | 2.940% | 442,175 | 369,272 | |
| Kinder Morgan Energy Partners LP | ||||
| 09/01/2024 | 4.250% | 482,000 | 481,472 | |
| 03/15/2032 | 7.750% | 635,000 | 720,940 | |
| 09/01/2039 | 6.500% | 1,000,000 | 1,030,083 | |
| Kinder Morgan, Inc. | ||||
| 06/01/2045 | 5.550% | 578,000 | 561,906 | |
| 08/01/2052 | 5.450% | 817,000 | 793,701 | |
| Magellan Midstream Partners LP | ||||
| 09/15/2046 | 4.250% | 320,000 | 263,840 | |
| 48 | Multi-Manager Total Return Bond Strategies Fund | Annual Report 2022 |
August 31, 2022
| Corporate Bonds & Notes (continued) | ||||
| Issuer | Coupon Rate | Principal Amount ($) | Value ($) | |
| MPLX LP | ||||
| 12/01/2024 | 4.875% | 325,000 | 327,265 | |
| 06/01/2025 | 4.875% | 200,000 | 201,003 | |
| 03/01/2026 | 1.750% | 651,000 | 589,195 | |
| 03/15/2028 | 4.000% | 2,434,000 | 2,329,307 | |
| 08/15/2030 | 2.650% | 376,000 | 313,807 | |
| 09/01/2032 | 4.950% | 3,155,000 | 3,056,873 | |
| 03/01/2047 | 5.200% | 1,771,000 | 1,607,118 | |
| 12/01/2047 | 5.200% | 520,000 | 468,590 | |
| 04/15/2048 | 4.700% | 808,000 | 690,315 | |
| 02/15/2049 | 5.500% | 921,000 | 876,885 | |
| 03/14/2052 | 4.950% | 1,655,000 | 1,457,476 | |
| NGPL PipeCo LLC(a) | ||||
| 08/15/2027 | 4.875% | 412,000 | 399,246 | |
| Northern Natural Gas Co.(a) | ||||
| 10/16/2051 | 3.400% | 496,000 | 363,529 | |
| ONEOK Partners LP | ||||
| 02/01/2041 | 6.125% | 274,000 | 264,717 | |
| 09/15/2043 | 6.200% | 721,000 | 684,509 | |
| ONEOK, Inc. | ||||
| 09/15/2025 | 2.200% | 506,000 | 472,295 | |
| 03/15/2030 | 3.100% | 292,000 | 252,165 | |
| 07/13/2047 | 4.950% | 2,050,000 | 1,767,630 | |
| 03/15/2050 | 4.500% | 6,830,000 | 5,494,728 | |
| 01/15/2051 | 7.150% | 1,035,000 | 1,104,659 | |
| Plains All American Pipeline LP/Finance Corp. | ||||
| 10/15/2025 | 4.650% | 1,807,000 | 1,789,151 | |
| 12/15/2026 | 4.500% | 771,000 | 751,441 | |
| 12/15/2029 | 3.550% | 1,197,000 | 1,049,385 | |
| 09/15/2030 | 3.800% | 650,000 | 575,985 | |
| 06/01/2042 | 5.150% | 2,303,000 | 1,926,470 | |
| 02/15/2045 | 4.900% | 1,054,000 | 856,734 | |
| Rockies Express Pipeline LLC(a) | ||||
| 07/15/2029 | 4.950% | 2,435,000 | 2,195,364 | |
| 05/15/2030 | 4.800% | 1,500,000 | 1,274,347 | |
| Ruby Pipeline LLC(a),(m) | ||||
| 04/01/2022 | 7.750% | 1,727,273 | 1,470,019 | |
| Sabine Pass Liquefaction LLC | ||||
| 03/15/2027 | 5.000% | 2,472,000 | 2,464,421 | |
| 05/15/2030 | 4.500% | 2,810,000 | 2,690,329 | |
| Southern Natural Gas Co. LLC | ||||
| 02/15/2031 | 7.350% | 2,910,000 | 3,241,696 | |
| Sunoco Logistics Partners Operations LP | ||||
| 04/01/2044 | 5.300% | 1,239,000 | 1,088,488 | |
| 05/15/2045 | 5.350% | 25,000 | 22,123 | |
| 10/01/2047 | 5.400% | 2,585,000 | 2,300,603 | |
| Tallgrass Energy Partners LP/Finance Corp.(a) | ||||
| 10/01/2025 | 7.500% | 1,875,000 | 1,877,070 | |
| 01/15/2028 | 5.500% | 142,000 | 121,974 | |
| Targa Resources Corp. | ||||
| 07/01/2052 | 6.250% | 3,102,000 | 3,162,183 | |
| Corporate Bonds & Notes (continued) | ||||
| Issuer | Coupon Rate | Principal Amount ($) | Value ($) | |
| Targa Resources Partners LP/Finance Corp. | ||||
| 01/15/2028 | 5.000% | 837,000 | 815,259 | |
| Texas Eastern Transmission LP(a) | ||||
| 10/15/2022 | 2.800% | 1,000,000 | 997,682 | |
| Transcontinental Gas Pipe Line Co. LLC | ||||
| 05/15/2030 | 3.250% | 242,000 | 216,098 | |
| 03/15/2048 | 4.600% | 4,875,000 | 4,413,811 | |
| TransMontaigne Partners LP/TLP Finance Corp. | ||||
| 02/15/2026 | 6.125% | 1,500,000 | 1,287,925 | |
| Venture Global Calcasieu Pass LLC(a) | ||||
| 08/15/2029 | 3.875% | 750,000 | 658,490 | |
| Western Gas Partners LP | ||||
| 03/01/2048 | 5.300% | 2,430,000 | 2,134,978 | |
| Williams Companies, Inc. (The) | ||||
| 01/15/2025 | 3.900% | 1,050,000 | 1,036,767 | |
| 09/15/2025 | 4.000% | 2,327,000 | 2,294,178 | |
| Williams Cos, Inc. (The) | ||||
| 08/15/2052 | 5.300% | 5,105,000 | 4,976,243 | |
| Williams Partners LP | ||||
| 03/04/2024 | 4.300% | 2,787,000 | 2,786,517 | |
| 03/04/2044 | 5.400% | 341,000 | 325,218 | |
| Total | 115,278,237 | |||
| Natural Gas 0.2% | ||||
| Boston Gas Co.(a) | ||||
| 08/01/2027 | 3.150% | 1,472,000 | 1,359,706 | |
| KeySpan Corp. | ||||
| 11/15/2030 | 8.000% | 670,000 | 763,176 | |
| NiSource, Inc. | ||||
| 02/15/2031 | 1.700% | 795,000 | 624,820 | |
| 06/15/2041 | 5.950% | 394,000 | 405,757 | |
| ONE Gas, Inc. | ||||
| 03/11/2024 | 1.100% | 1,032,000 | 992,989 | |
| Piedmont Natural Gas Co., Inc. | ||||
| 06/01/2050 | 3.350% | 453,000 | 333,224 | |
| Promigas SA ESP/Gases del Pacifico SAC(a) | ||||
| 10/16/2029 | 3.750% | 300,000 | 255,263 | |
| Sempra Energy | ||||
| 04/01/2029 | 3.700% | 1,875,000 | 1,755,067 | |
| 02/01/2038 | 3.800% | 933,000 | 798,936 | |
| 02/01/2048 | 4.000% | 1,148,000 | 958,377 | |
| Sempra Energy(k) | ||||
| 12/31/2049 | 4.875% | 764,000 | 736,798 | |
| 04/01/2052 | 4.125% | 5,768,000 | 4,880,290 | |
| South Jersey Industries, Inc. | ||||
| Junior Subordinated | ||||
| 04/15/2031 | 5.020% | 1,848,000 | 1,603,544 | |
| Multi-Manager Total Return Bond Strategies Fund | Annual Report 2022 | 49 |
August 31, 2022
| Corporate Bonds & Notes (continued) | ||||
| Issuer | Coupon Rate | Principal Amount ($) | Value ($) | |
| Southern Co. Gas Capital Corp. | ||||
| 03/15/2041 | 5.875% | 1,940,000 | 2,015,304 | |
| 05/30/2047 | 4.400% | 443,000 | 383,428 | |
| Southwest Gas Corp. | ||||
| 03/15/2032 | 4.050% | 302,000 | 274,916 | |
| 08/15/2051 | 3.180% | 2,930,000 | 1,956,187 | |
| Washington Gas Light Co. | ||||
| 09/15/2049 | 3.650% | 587,000 | 477,785 | |
| Total | 20,575,567 | |||
| Office REIT 0.2% | ||||
| Boston Properties LP | ||||
| 01/30/2031 | 3.250% | 259,000 | 222,926 | |
| Hudson Pacific Properties LP | ||||
| 11/01/2027 | 3.950% | 2,725,000 | 2,554,296 | |
| Kilroy Realty LP | ||||
| 11/15/2033 | 2.650% | 2,601,000 | 1,973,288 | |
| Office Properties Income Trust | ||||
| 02/01/2025 | 4.500% | 1,270,000 | 1,190,936 | |
| 02/01/2027 | 2.400% | 1,455,000 | 1,104,259 | |
| 10/15/2031 | 3.450% | 3,285,000 | 2,179,060 | |
| Piedmont Operating Partnership LP | ||||
| 08/15/2030 | 3.150% | 1,675,000 | 1,380,423 | |
| 04/01/2032 | 2.750% | 2,339,000 | 1,784,155 | |
| SL Green Operating Partnership LP | ||||
| 10/15/2022 | 3.250% | 6,055,000 | 6,045,250 | |
| Total | 18,434,593 | |||
| Oil Field Services 0.1% | ||||
| Baker Hughes Holdings LLC/Co-Obligor, Inc. | ||||
| 12/15/2026 | 2.061% | 523,000 | 476,301 | |
| Schlumberger Holdings Corp.(a) | ||||
| 05/01/2024 | 3.750% | 608,000 | 603,258 | |
| 05/17/2028 | 3.900% | 2,053,000 | 1,958,146 | |
| Transocean Phoenix 2 Ltd.(a) | ||||
| 10/15/2024 | 7.750% | 900,000 | 883,566 | |
| Transocean Poseidon Ltd.(a) | ||||
| 02/01/2027 | 6.875% | 975,625 | 924,577 | |
| Transocean Proteus Ltd.(a) | ||||
| 12/01/2024 | 6.250% | 1,757,700 | 1,698,893 | |
| Total | 6,544,741 | |||
| Other Financial Institutions 0.2% | ||||
| Five Point Operating Co. LP/Capital Corp.(a) | ||||
| 11/15/2025 | 7.875% | 2,350,000 | 2,083,398 | |
| Greystar Real Estate Partners LLC(a) | ||||
| 12/01/2025 | 5.750% | 2,175,000 | 2,154,875 | |
| Corporate Bonds & Notes (continued) | ||||
| Issuer | Coupon Rate | Principal Amount ($) | Value ($) | |
| Greystone Commercial Capital Trust(a),(b),(j) | ||||
| 1-month USD LIBOR + 2.270% 05/31/2025 | 4.650% | 9,200,000 | 9,016,000 | |
| Howard Hughes Corp. (The)(a) | ||||
| 08/01/2028 | 5.375% | 500,000 | 444,905 | |
| 02/01/2031 | 4.375% | 750,000 | 600,402 | |
| LeasePlan Corp NV(a) | ||||
| 10/24/2024 | 2.875% | 3,440,000 | 3,275,961 | |
| Mitsubishi UFJ Lease & Finance Co., Ltd.(a) | ||||
| 09/19/2022 | 2.652% | 3,905,000 | 3,902,673 | |
| Nationstar Mortgage Holdings Inc.(a) | ||||
| 08/15/2028 | 5.500% | 1,150,000 | 969,014 | |
| Nationstar Mortgage Holdings, Inc.(a) | ||||
| 12/15/2030 | 5.125% | 700,000 | 551,013 | |
| ORIX Corp. | ||||
| 12/04/2024 | 3.250% | 1,560,000 | 1,526,167 | |
| Total | 24,524,408 | |||
| Other Industry 0.2% | ||||
| AECOM | ||||
| 03/15/2027 | 5.125% | 710,000 | 693,248 | |
| CK Hutchison International 21 Ltd.(a) | ||||
| 04/15/2031 | 2.500% | 2,100,000 | 1,811,202 | |
| Gohl Capital Ltd.(a) | ||||
| 01/24/2027 | 4.250% | 1,050,000 | 951,605 | |
| Massachusetts Institute of Technology | ||||
| 07/01/2114 | 4.678% | 1,768,000 | 1,723,658 | |
| 07/01/2116 | 3.885% | 1,850,000 | 1,484,493 | |
| Northwestern University | ||||
| 12/01/2057 | 3.662% | 1,350,000 | 1,180,053 | |
| PowerTeam Services LLC(a) | ||||
| 12/04/2025 | 9.033% | 594,000 | 487,869 | |
| President and Fellows of Harvard College | ||||
| 07/15/2046 | 3.150% | 3,031,000 | 2,554,221 | |
| 07/15/2056 | 3.300% | 2,230,000 | 1,840,109 | |
| Trustees of the University of Pennsylvania (The) | ||||
| 09/01/2112 | 4.674% | 1,620,000 | 1,537,027 | |
| University of Southern California | ||||
| 10/01/2039 | 3.028% | 4,525,000 | 3,819,283 | |
| Total | 18,082,768 | |||
| Other REIT 0.2% | ||||
| American Assets Trust LP | ||||
| 02/01/2031 | 3.375% | 3,115,000 | 2,607,057 | |
| American Campus Communities Operating Partnership LP | ||||
| 04/15/2023 | 3.750% | 2,400,000 | 2,405,204 | |
| CubeSmart LP | ||||
| 12/15/2028 | 2.250% | 959,000 | 810,703 | |
| 50 | Multi-Manager Total Return Bond Strategies Fund | Annual Report 2022 |
August 31, 2022
| Corporate Bonds & Notes (continued) | ||||
| Issuer | Coupon Rate | Principal Amount ($) | Value ($) | |
| Extra Space Storage LP | ||||
| 04/01/2029 | 3.900% | 1,375,000 | 1,278,157 | |
| Host Hotels & Resorts LP | ||||
| 06/15/2025 | 4.000% | 1,050,000 | 1,019,918 | |
| 02/01/2026 | 4.500% | 520,000 | 508,381 | |
| Ladder Capital Finance Holdings LLLP/Corp.(a) | ||||
| 06/15/2029 | 4.750% | 2,745,000 | 2,336,912 | |
| Life Storage LP | ||||
| 12/15/2027 | 3.875% | 2,000,000 | 1,888,498 | |
| 10/15/2030 | 2.200% | 936,000 | 752,258 | |
| 10/15/2031 | 2.400% | 1,950,000 | 1,558,592 | |
| Park Intermediate Holdings LLC/Domestic Property/Finance Co-Issuer(a) | ||||
| 06/01/2025 | 7.500% | 2,150,000 | 2,171,719 | |
| Public Storage | ||||
| 11/09/2028 | 1.950% | 472,000 | 414,118 | |
| Sun Communities Operating LP | ||||
| 04/15/2032 | 4.200% | 1,106,000 | 988,177 | |
| WP Carey, Inc. | ||||
| 04/01/2033 | 2.250% | 4,080,000 | 3,104,940 | |
| Total | 21,844,634 | |||
| Packaging 0.2% | ||||
| Amcor Flexibles North America, Inc. | ||||
| 05/17/2025 | 4.000% | 3,022,000 | 2,963,793 | |
| Ardagh Packaging Finance PLC/Holdings USA, Inc.(a) | ||||
| 08/15/2027 | 5.250% | 3,000,000 | 2,188,774 | |
| Ball Corp. | ||||
| 03/15/2026 | 4.875% | 600,000 | 581,021 | |
| Berry Global Escrow Corp.(a) | ||||
| 07/15/2026 | 4.875% | 1,680,000 | 1,640,096 | |
| Berry Global, Inc. | ||||
| 02/15/2024 | 0.950% | 805,000 | 762,750 | |
| 01/15/2026 | 1.570% | 3,405,000 | 3,036,738 | |
| 01/15/2027 | 1.650% | 1,163,000 | 1,001,480 | |
| Pactiv Evergreen Group Issuer LLC/Inc.(a) | ||||
| 10/15/2028 | 4.375% | 1,475,000 | 1,299,652 | |
| Reynolds Group Issuer, Inc./LLC(a) | ||||
| 10/15/2027 | 4.000% | 1,000,000 | 875,982 | |
| Sealed Air Corp.(a) | ||||
| 10/15/2026 | 1.573% | 857,000 | 749,128 | |
| Silgan Holdings, Inc. | ||||
| 02/01/2028 | 4.125% | 1,320,000 | 1,209,224 | |
| Sonoco Products Co. | ||||
| 02/01/2027 | 2.250% | 1,377,000 | 1,251,648 | |
| Trivium Packaging Finance BV(a) | ||||
| 08/15/2026 | 5.500% | 1,450,000 | 1,391,646 | |
| Total | 18,951,932 | |||
| Corporate Bonds & Notes (continued) | ||||
| Issuer | Coupon Rate | Principal Amount ($) | Value ($) | |
| Paper 0.0% | ||||
| Cascades, Inc./USA(a) | ||||
| 01/15/2028 | 5.375% | 1,180,000 | 1,063,406 | |
| Celulosa Arauco y Constitucion SA | ||||
| 11/02/2027 | 3.875% | 700,000 | 646,321 | |
| Celulosa Arauco y Constitucion SA(a) | ||||
| 04/30/2029 | 4.250% | 500,000 | 460,814 | |
| Inversiones CMPC SA(a) | ||||
| 04/04/2027 | 4.375% | 1,025,000 | 993,285 | |
| Klabin Austria GmbH(a) | ||||
| 01/12/2031 | 3.200% | 500,000 | 396,544 | |
| Suzano Austria GmbH | ||||
| 01/15/2029 | 6.000% | 275,000 | 274,896 | |
| 01/15/2030 | 5.000% | 825,000 | 771,450 | |
| 01/15/2031 | 3.750% | 1,000,000 | 846,973 | |
| Total | 5,453,689 | |||
| Pharmaceuticals 0.9% | ||||
| AbbVie, Inc. | ||||
| 11/06/2022 | 2.900% | 2,093,000 | 2,091,238 | |
| 11/21/2026 | 2.950% | 838,000 | 791,110 | |
| 03/15/2035 | 4.550% | 4,650,000 | 4,459,984 | |
| 05/14/2035 | 4.500% | 4,972,000 | 4,732,146 | |
| 05/14/2036 | 4.300% | 1,926,000 | 1,797,653 | |
| 11/21/2039 | 4.050% | 7,095,000 | 6,256,947 | |
| 10/01/2042 | 4.625% | 1,000,000 | 918,745 | |
| 11/06/2042 | 4.400% | 3,793,000 | 3,428,603 | |
| 05/14/2045 | 4.700% | 2,329,000 | 2,177,472 | |
| 05/14/2046 | 4.450% | 511,000 | 463,432 | |
| 11/21/2049 | 4.250% | 4,555,000 | 4,007,399 | |
| Amgen, Inc. | ||||
| 03/01/2033 | 4.200% | 3,930,000 | 3,796,149 | |
| 01/15/2052 | 3.000% | 4,360,000 | 3,072,630 | |
| 03/01/2053 | 4.875% | 535,000 | 519,084 | |
| Bausch Health Companies, Inc.(a) | ||||
| 01/30/2028 | 5.000% | 1,100,000 | 413,460 | |
| 02/15/2029 | 5.000% | 100,000 | 39,017 | |
| 02/15/2029 | 6.250% | 3,475,000 | 1,311,523 | |
| 05/30/2029 | 7.250% | 2,000,000 | 737,069 | |
| 01/30/2030 | 5.250% | 1,200,000 | 443,483 | |
| 02/15/2031 | 5.250% | 1,200,000 | 460,327 | |
| Bayer US Finance II LLC(a) | ||||
| 07/15/2024 | 3.375% | 3,555,000 | 3,475,462 | |
| 12/15/2025 | 4.250% | 1,445,000 | 1,421,448 | |
| 12/15/2028 | 4.375% | 4,480,000 | 4,311,907 | |
| 07/15/2034 | 4.200% | 844,000 | 754,347 | |
| 06/25/2038 | 4.625% | 1,000,000 | 892,603 | |
| 07/15/2044 | 4.400% | 2,799,000 | 2,275,418 | |
| 06/25/2048 | 4.875% | 3,505,000 | 3,191,194 | |
| Bayer US Finance LLC(a) | ||||
| 10/08/2024 | 3.375% | 520,000 | 509,814 | |
| Multi-Manager Total Return Bond Strategies Fund | Annual Report 2022 | 51 |
August 31, 2022
| Corporate Bonds & Notes (continued) | ||||
| Issuer | Coupon Rate | Principal Amount ($) | Value ($) | |
| Bristol Myers Squibb Co. | ||||
| 06/15/2039 | 4.125% | 1,346,000 | 1,258,462 | |
| 03/15/2052 | 3.700% | 2,420,000 | 2,051,159 | |
| Bristol-Myers Squibb Co. | ||||
| 08/15/2025 | 3.875% | 74,000 | 73,277 | |
| 05/15/2044 | 4.625% | 555,000 | 542,023 | |
| 11/15/2047 | 4.350% | 2,060,000 | 1,940,163 | |
| CSL Finance PLC(a) | ||||
| 04/27/2029 | 4.050% | 926,000 | 899,444 | |
| 04/27/2032 | 4.250% | 657,000 | 637,821 | |
| 04/27/2042 | 4.625% | 540,000 | 512,739 | |
| 04/27/2052 | 4.750% | 945,000 | 908,215 | |
| 04/27/2062 | 4.950% | 402,000 | 385,772 | |
| Grifols Escrow Issuer SA(a) | ||||
| 10/15/2028 | 4.750% | 1,000,000 | 847,722 | |
| Jazz Securities DAC(a) | ||||
| 01/15/2029 | 4.375% | 963,000 | 868,704 | |
| Johnson & Johnson | ||||
| 12/05/2033 | 4.375% | 1,975,000 | 2,014,681 | |
| 03/03/2037 | 3.625% | 2,280,000 | 2,117,400 | |
| 01/15/2038 | 3.400% | 2,790,000 | 2,500,334 | |
| 03/01/2046 | 3.700% | 409,000 | 365,339 | |
| Merck & Co., Inc. | ||||
| 12/10/2051 | 2.750% | 538,000 | 389,482 | |
| 12/10/2061 | 2.900% | 538,000 | 373,898 | |
| Mylan NV | ||||
| 06/15/2046 | 5.250% | 290,000 | 228,819 | |
| Mylan, Inc.(a) | ||||
| 01/15/2023 | 3.125% | 2,480,000 | 2,464,965 | |
| Mylan, Inc. | ||||
| 04/15/2048 | 5.200% | 4,263,000 | 3,297,694 | |
| Organon Finance 1 LLC(a) | ||||
| 04/30/2028 | 4.125% | 1,350,000 | 1,210,210 | |
| Roche Holdings, Inc.(a) | ||||
| 12/13/2051 | 2.607% | 840,000 | 598,295 | |
| Royalty Pharma PLC | ||||
| 09/02/2025 | 1.200% | 385,000 | 349,990 | |
| 09/02/2027 | 1.750% | 489,000 | 425,234 | |
| 09/02/2030 | 2.200% | 3,075,000 | 2,492,498 | |
| 09/02/2050 | 3.550% | 1,642,000 | 1,131,751 | |
| Shire Acquisitions Investments Ireland DAC | ||||
| 09/23/2023 | 2.875% | 1,050,000 | 1,036,525 | |
| Viatris, Inc. | ||||
| 06/22/2030 | 2.700% | 1,117,000 | 880,947 | |
| 06/22/2040 | 3.850% | 6,447,000 | 4,475,574 | |
| 06/22/2050 | 4.000% | 3,243,000 | 2,097,531 | |
| Total | 98,126,332 | |||
| Corporate Bonds & Notes (continued) | ||||
| Issuer | Coupon Rate | Principal Amount ($) | Value ($) | |
| Property & Casualty 0.7% | ||||
| Alleghany Corp. | ||||
| 05/15/2030 | 3.625% | 936,000 | 879,208 | |
| 09/15/2044 | 4.900% | 38,000 | 36,630 | |
| 08/15/2051 | 3.250% | 212,000 | 160,676 | |
| Alliant Holdings Intermediate LLC/Co-Issuer(a) | ||||
| 10/15/2027 | 6.750% | 300,000 | 273,306 | |
| American International Group, Inc. | ||||
| 04/01/2026 | 3.900% | 333,000 | 327,153 | |
| 06/30/2050 | 4.375% | 603,000 | 541,352 | |
| Aon Corp./Global Holdings PLC | ||||
| 12/02/2031 | 2.600% | 4,495,000 | 3,782,219 | |
| Arch Capital Finance LLC | ||||
| 12/15/2046 | 5.031% | 970,000 | 907,682 | |
| Arthur J. Gallagher & Co. | ||||
| 03/09/2052 | 3.050% | 6,725,000 | 4,677,287 | |
| Assurant, Inc. | ||||
| 09/27/2023 | 4.200% | 1,770,000 | 1,762,911 | |
| 02/22/2030 | 3.700% | 1,174,000 | 1,039,069 | |
| Berkshire Hathaway Finance Corp. | ||||
| 10/15/2050 | 2.850% | 386,000 | 281,643 | |
| 03/15/2052 | 3.850% | 3,853,000 | 3,319,374 | |
| Berkshire Hathaway, Inc. | ||||
| 03/15/2026 | 3.125% | 4,674,000 | 4,575,444 | |
| Chubb INA Holdings, Inc. | ||||
| 09/15/2030 | 1.375% | 1,130,000 | 903,933 | |
| CNA Financial Corp. | ||||
| 08/15/2027 | 3.450% | 3,828,000 | 3,612,284 | |
| Everest Reinsurance Holdings, Inc. | ||||
| 10/15/2052 | 3.125% | 5,665,000 | 3,933,197 | |
| Fairfax Financial Holdings Ltd. | ||||
| 03/03/2031 | 3.375% | 6,300,000 | 5,370,699 | |
| Fairfax Financial Holdings Ltd.(a) | ||||
| 08/16/2032 | 5.625% | 3,190,000 | 3,124,832 | |
| Farmers Exchange Capital(a) | ||||
| Subordinated | ||||
| 07/15/2028 | 7.050% | 800,000 | 860,656 | |
| 07/15/2048 | 7.200% | 1,290,000 | 1,486,686 | |
| Farmers Exchange Capital II(a),(k) | ||||
| Subordinated | ||||
| 11/01/2053 | 6.151% | 2,700,000 | 2,751,111 | |
| Farmers Insurance Exchange(a) | ||||
| 05/01/2024 | 8.625% | 1,165,000 | 1,227,800 | |
| Hartford Financial Services Group Inc. (The)(a),(b) | ||||
| 3-month USD LIBOR + 2.125% 02/12/2047 | 5.030% | 2,265,000 | 1,884,193 | |
| Hartford Financial Services Group, Inc. (The) | ||||
| 10/15/2036 | 5.950% | 283,000 | 302,805 | |
| 52 | Multi-Manager Total Return Bond Strategies Fund | Annual Report 2022 |
August 31, 2022
| Corporate Bonds & Notes (continued) | ||||
| Issuer | Coupon Rate | Principal Amount ($) | Value ($) | |
| Liberty Mutual Group, Inc.(a) | ||||
| 06/15/2023 | 4.250% | 275,000 | 274,519 | |
| 10/15/2050 | 3.951% | 2,080,000 | 1,596,509 | |
| 06/15/2052 | 5.500% | 1,031,000 | 1,005,059 | |
| Markel Corp. | ||||
| 05/20/2049 | 5.000% | 5,095,000 | 4,819,843 | |
| Muenchener Rueckversicherungs-Gesellschaft AG in Muenchen(a),(k) | ||||
| Subordinated | ||||
| 05/23/2042 | 5.875% | 1,205,000 | 1,242,905 | |
| Nationwide Mutual Insurance Co.(a),(b) | ||||
| Subordinated | ||||
| 3-month USD LIBOR + 2.290% 12/15/2024 | 4.119% | 5,725,000 | 5,721,482 | |
| Old Republic International Corp. | ||||
| 06/11/2051 | 3.850% | 1,009,000 | 764,512 | |
| PartnerRe Finance B LLC(k) | ||||
| 10/01/2050 | 4.500% | 2,400,000 | 2,161,706 | |
| Trustage Financial Group, Inc.(a) | ||||
| 04/15/2032 | 4.625% | 2,135,000 | 1,937,792 | |
| Willis North America, Inc. | ||||
| 09/15/2029 | 2.950% | 2,000,000 | 1,725,134 | |
| WR Berkley Corp. | ||||
| 05/12/2050 | 4.000% | 1,480,000 | 1,225,697 | |
| XLIT Ltd. | ||||
| 03/31/2045 | 5.500% | 619,000 | 629,631 | |
| Total | 71,126,939 | |||
| Railroads 0.2% | ||||
| Burlington Northern Santa Fe LLC | ||||
| 03/15/2043 | 4.450% | 304,000 | 290,899 | |
| 09/01/2043 | 5.150% | 953,000 | 990,917 | |
| 08/01/2046 | 3.900% | 711,000 | 626,929 | |
| 01/15/2053 | 4.450% | 5,184,000 | 5,013,939 | |
| Canadian National Railway Co. | ||||
| 08/05/2052 | 4.400% | 5,320,000 | 5,088,308 | |
| CSX Corp. | ||||
| 11/15/2032 | 4.100% | 522,000 | 503,765 | |
| 05/30/2042 | 4.750% | 482,000 | 464,005 | |
| 11/15/2052 | 4.500% | 1,117,000 | 1,041,031 | |
| 08/01/2054 | 4.500% | 231,000 | 214,127 | |
| 11/01/2066 | 4.250% | 2,355,000 | 2,014,954 | |
| Kansas City Southern | ||||
| 05/01/2050 | 3.500% | 3,280,000 | 2,554,920 | |
| Norfolk Southern Corp. | ||||
| 05/15/2121 | 4.100% | 372,000 | 277,142 | |
| Union Pacific Corp. | ||||
| 02/14/2042 | 3.375% | 1,500,000 | 1,261,283 | |
| 02/14/2053 | 3.500% | 1,760,000 | 1,428,322 | |
| Total | 21,770,541 | |||
| Corporate Bonds & Notes (continued) | ||||
| Issuer | Coupon Rate | Principal Amount ($) | Value ($) | |
| Refining 0.1% | ||||
| Marathon Petroleum Corp. | ||||
| 12/15/2026 | 5.125% | 578,000 | 594,017 | |
| 09/15/2044 | 4.750% | 487,000 | 429,180 | |
| 09/15/2054 | 5.000% | 266,000 | 236,383 | |
| Phillips 66 | ||||
| 02/15/2024 | 0.900% | 333,000 | 318,589 | |
| 12/15/2030 | 2.150% | 659,000 | 540,677 | |
| Phillips 66 Co.(a) | ||||
| 02/15/2045 | 4.680% | 1,300,000 | 1,181,935 | |
| Valero Energy Corp. | ||||
| 04/15/2025 | 2.850% | 459,000 | 444,082 | |
| 12/01/2031 | 2.800% | 3,235,000 | 2,722,864 | |
| Total | 6,467,727 | |||
| Restaurants 0.0% | ||||
| 1011778 BC ULC/New Red Finance, Inc.(a) | ||||
| 10/15/2030 | 4.000% | 1,510,000 | 1,225,334 | |
| Brinker International, Inc.(a) | ||||
| 10/01/2024 | 5.000% | 1,850,000 | 1,791,053 | |
| Fertitta Entertainment LLC/Finance Co., Inc.(a) | ||||
| 01/15/2029 | 4.625% | 1,500,000 | 1,309,961 | |
| 01/15/2030 | 6.750% | 300,000 | 244,850 | |
| McDonald’s Corp. | ||||
| 09/01/2049 | 3.625% | 910,000 | 737,919 | |
| Total | 5,309,117 | |||
| Retail REIT 0.1% | ||||
| Brixmor Operating Partnership LP | ||||
| 08/16/2031 | 2.500% | 915,000 | 708,564 | |
| Kimco Realty Corp. | ||||
| 03/01/2024 | 2.700% | 2,158,000 | 2,113,096 | |
| 02/01/2033 | 4.600% | 3,780,000 | 3,654,988 | |
| Kite Realty Group LP | ||||
| 10/01/2026 | 4.000% | 320,000 | 304,322 | |
| Realty Income Corp. | ||||
| 06/01/2026 | 4.875% | 664,000 | 674,276 | |
| 08/15/2027 | 3.950% | 193,000 | 188,766 | |
| Simon Property Group LP | ||||
| 02/01/2028 | 1.750% | 805,000 | 697,015 | |
| Total | 8,341,027 | |||
| Retailers 0.4% | ||||
| Alimentation Couche-Tard, Inc.(a) | ||||
| 07/26/2027 | 3.550% | 2,000,000 | 1,871,375 | |
| Multi-Manager Total Return Bond Strategies Fund | Annual Report 2022 | 53 |
August 31, 2022
| Corporate Bonds & Notes (continued) | ||||
| Issuer | Coupon Rate | Principal Amount ($) | Value ($) | |
| Amazon.com, Inc. | ||||
| 02/22/2023 | 2.400% | 3,635,000 | 3,616,186 | |
| 05/12/2031 | 2.100% | 1,147,000 | 984,590 | |
| 04/13/2032 | 3.600% | 1,339,000 | 1,286,590 | |
| 05/12/2041 | 2.875% | 1,777,000 | 1,418,786 | |
| 04/13/2052 | 3.950% | 640,000 | 581,805 | |
| 04/13/2062 | 4.100% | 645,000 | 583,401 | |
| Asbury Automotive Group, Inc. | ||||
| 03/01/2030 | 4.750% | 1,375,000 | 1,173,384 | |
| AutoNation, Inc. | ||||
| 11/15/2024 | 3.500% | 2,185,000 | 2,132,174 | |
| 10/01/2025 | 4.500% | 2,465,000 | 2,453,234 | |
| AutoZone, Inc. | ||||
| 04/21/2026 | 3.125% | 415,000 | 398,235 | |
| 01/15/2031 | 1.650% | 1,175,000 | 924,613 | |
| Best Buy Co., Inc. | ||||
| 10/01/2030 | 1.950% | 1,000,000 | 800,226 | |
| Dick’s Sporting Goods, Inc. | ||||
| 01/15/2052 | 4.100% | 2,690,000 | 1,796,972 | |
| Falabella SA(a) | ||||
| 10/30/2027 | 3.750% | 450,000 | 425,763 | |
| 01/15/2032 | 3.375% | 515,000 | 428,053 | |
| Gap Inc. (The)(a) | ||||
| 10/01/2029 | 3.625% | 1,550,000 | 1,078,415 | |
| Gap, Inc. (The)(a) | ||||
| 10/01/2031 | 3.875% | 1,750,000 | 1,214,868 | |
| Home Depot, Inc. (The) | ||||
| 04/15/2052 | 3.625% | 386,000 | 323,573 | |
| Kontoor Brands, Inc.(a) | ||||
| 11/15/2029 | 4.125% | 475,000 | 406,457 | |
| L Brands, Inc. | ||||
| 07/01/2036 | 6.750% | 2,800,000 | 2,416,610 | |
| Lowe’s Companies, Inc. | ||||
| 04/01/2052 | 4.250% | 944,000 | 805,335 | |
| 04/01/2062 | 4.450% | 539,000 | 453,852 | |
| Magic MergeCo, Inc.(a) | ||||
| 05/01/2029 | 7.875% | 1,400,000 | 930,184 | |
| Rent-A-Center, Inc.(a) | ||||
| 02/15/2029 | 6.375% | 300,000 | 253,313 | |
| Sally Holdings LLC/Capital, Inc. | ||||
| 12/01/2025 | 5.625% | 2,000,000 | 1,943,953 | |
| Sonic Automotive Inc.(a) | ||||
| 11/15/2031 | 4.875% | 1,620,000 | 1,351,009 | |
| Tapestry, Inc. | ||||
| 03/15/2032 | 3.050% | 1,120,000 | 893,026 | |
| Target Corp. | ||||
| 01/15/2052 | 2.950% | 526,000 | 396,468 | |
| Corporate Bonds & Notes (continued) | ||||
| Issuer | Coupon Rate | Principal Amount ($) | Value ($) | |
| Tractor Supply Co. | ||||
| 11/01/2030 | 1.750% | 3,885,000 | 3,070,857 | |
| Walgreens Boots Alliance Inc. | ||||
| 11/17/2023 | 0.950% | 5,730,000 | 5,528,814 | |
| Wolverine World Wide, Inc.(a) | ||||
| 08/15/2029 | 4.000% | 1,530,000 | 1,250,951 | |
| Total | 43,193,072 | |||
| Supermarkets 0.1% | ||||
| Ahold Finance U.S.A. LLC | ||||
| 05/01/2029 | 6.875% | 1,800,000 | 1,968,776 | |
| Albertsons Companies LLC/Safeway, Inc./New Albertsons LP/Albertsons LLC(a) | ||||
| 03/15/2029 | 3.500% | 1,520,000 | 1,249,009 | |
| C&S Group Enterprises LLC(a) | ||||
| 12/15/2028 | 5.000% | 2,700,000 | 2,012,515 | |
| InRetail Consumer(a) | ||||
| 03/22/2028 | 3.250% | 1,300,000 | 1,119,458 | |
| Total | 6,349,758 | |||
| Supranational 0.1% | ||||
| Corporación Andina de Fomento | ||||
| 01/06/2023 | 2.750% | 3,000,000 | 2,990,694 | |
| Inter-American Development Bank | ||||
| 10/15/2025 | 6.800% | 2,500,000 | 2,710,728 | |
| 07/15/2027 | 6.750% | 4,000,000 | 4,522,061 | |
| International Bank for Reconstruction & Development(g) | ||||
| 09/17/2030 | 0.000% | 1,550,000 | 1,156,695 | |
| North American Development Bank | ||||
| 10/26/2022 | 2.400% | 514,000 | 513,486 | |
| Total | 11,893,664 | |||
| Technology 1.9% | ||||
| Advanced Micro Devices, Inc. | ||||
| 06/01/2032 | 3.924% | 882,000 | 852,925 | |
| 06/01/2052 | 4.393% | 1,163,000 | 1,098,635 | |
| Apple, Inc. | ||||
| 08/08/2032 | 3.350% | 612,000 | 578,627 | |
| 02/23/2036 | 4.500% | 371,000 | 383,156 | |
| 05/11/2050 | 2.650% | 5,095,000 | 3,727,244 | |
| 02/08/2051 | 2.650% | 2,647,000 | 1,935,370 | |
| 08/08/2052 | 3.950% | 6,558,000 | 6,050,727 | |
| 02/08/2061 | 2.800% | 1,887,000 | 1,326,292 | |
| 08/05/2061 | 2.850% | 749,000 | 531,533 | |
| 08/08/2062 | 4.100% | 537,000 | 493,288 | |
| Avnet, Inc. | ||||
| 06/01/2032 | 5.500% | 3,896,000 | 3,714,143 | |
| Black Knight InfoServ LLC(a) | ||||
| 09/01/2028 | 3.625% | 1,500,000 | 1,315,334 | |
| 54 | Multi-Manager Total Return Bond Strategies Fund | Annual Report 2022 |
August 31, 2022
| Corporate Bonds & Notes (continued) | ||||
| Issuer | Coupon Rate | Principal Amount ($) | Value ($) | |
| Boxer Parent Co., Inc.(a) | ||||
| 03/01/2026 | 9.125% | 2,500,000 | 2,435,561 | |
| Broadcom, Inc. | ||||
| 10/15/2024 | 3.625% | 320,000 | 316,469 | |
| Broadcom, Inc.(a) | ||||
| 04/15/2029 | 4.000% | 2,765,000 | 2,563,196 | |
| 04/15/2034 | 3.469% | 1,400,000 | 1,134,501 | |
| 11/15/2035 | 3.137% | 9,021,000 | 6,839,047 | |
| 11/15/2036 | 3.187% | 6,720,000 | 4,985,425 | |
| CDW LLC/Finance Corp. | ||||
| 05/01/2025 | 4.125% | 2,500,000 | 2,463,876 | |
| 12/01/2028 | 3.276% | 5,270,000 | 4,636,287 | |
| 02/15/2029 | 3.250% | 857,000 | 745,321 | |
| Citrix Systems, Inc. | ||||
| 03/01/2026 | 1.250% | 777,000 | 761,706 | |
| 03/01/2030 | 3.300% | 184,000 | 180,666 | |
| CommScope Technologies LLC(a) | ||||
| 06/15/2025 | 6.000% | 2,573,000 | 2,336,999 | |
| 03/15/2027 | 5.000% | 455,000 | 359,354 | |
| CommScope, Inc.(a) | ||||
| 09/01/2029 | 4.750% | 1,500,000 | 1,274,885 | |
| Corning, Inc. | ||||
| 11/15/2079 | 5.450% | 438,000 | 402,165 | |
| Dell International LLC/EMC Corp. | ||||
| 06/15/2026 | 6.020% | 870,000 | 903,919 | |
| DXC Technology Co. | ||||
| 09/15/2026 | 1.800% | 612,000 | 539,065 | |
| 09/15/2028 | 2.375% | 6,457,000 | 5,493,927 | |
| Fidelity National Information Services, Inc. | ||||
| 03/01/2041 | 3.100% | 2,890,000 | 2,101,086 | |
| 07/15/2052 | 5.625% | 2,635,000 | 2,617,725 | |
| Fiserv, Inc. | ||||
| 07/01/2024 | 2.750% | 699,000 | 681,743 | |
| 07/01/2029 | 3.500% | 776,000 | 709,233 | |
| Flex Ltd. | ||||
| 06/15/2029 | 4.875% | 1,205,000 | 1,138,231 | |
| Global Payments, Inc. | ||||
| 11/15/2024 | 1.500% | 3,215,000 | 3,006,967 | |
| 02/15/2025 | 2.650% | 2,891,000 | 2,753,006 | |
| 03/01/2026 | 1.200% | 1,217,000 | 1,073,701 | |
| 08/15/2052 | 5.950% | 5,865,000 | 5,686,856 | |
| HP, Inc. | ||||
| 01/15/2028 | 4.750% | 6,485,000 | 6,386,312 | |
| 04/15/2029 | 4.000% | 2,009,000 | 1,884,178 | |
| 06/17/2031 | 2.650% | 794,000 | 630,934 | |
| Infor, Inc.(a) | ||||
| 07/15/2023 | 1.450% | 2,511,000 | 2,436,915 | |
| Corporate Bonds & Notes (continued) | ||||
| Issuer | Coupon Rate | Principal Amount ($) | Value ($) | |
| Intel Corp. | ||||
| 08/05/2027 | 3.750% | 749,000 | 735,555 | |
| 08/05/2032 | 4.150% | 1,535,000 | 1,485,062 | |
| 08/12/2041 | 2.800% | 1,687,000 | 1,252,043 | |
| 11/15/2049 | 3.250% | 4,155,000 | 3,095,114 | |
| 08/12/2051 | 3.050% | 1,685,000 | 1,210,642 | |
| 08/05/2052 | 4.900% | 3,132,000 | 3,054,752 | |
| 02/15/2060 | 3.100% | 527,000 | 360,752 | |
| 08/12/2061 | 3.200% | 671,000 | 471,726 | |
| 08/05/2062 | 5.050% | 626,000 | 606,884 | |
| International Business Machines Corp. | ||||
| 07/27/2027 | 4.150% | 1,118,000 | 1,111,094 | |
| 05/15/2029 | 3.500% | 928,000 | 876,108 | |
| 07/27/2032 | 4.400% | 4,248,000 | 4,177,803 | |
| 07/27/2052 | 4.900% | 1,107,000 | 1,072,243 | |
| Jabil, Inc. | ||||
| 05/15/2027 | 4.250% | 1,890,000 | 1,829,679 | |
| KLA Corp. | ||||
| 07/15/2052 | 4.950% | 1,768,000 | 1,779,607 | |
| 07/15/2062 | 5.250% | 895,000 | 912,138 | |
| Kyndryl Holdings Inc.(a) | ||||
| 10/15/2026 | 2.050% | 720,000 | 596,715 | |
| 10/15/2028 | 2.700% | 1,623,000 | 1,254,646 | |
| 10/15/2031 | 3.150% | 584,000 | 409,054 | |
| Leidos, Inc. | ||||
| 02/15/2031 | 2.300% | 845,000 | 663,490 | |
| Lenovo Group Ltd.(a) | ||||
| 07/27/2032 | 6.536% | 1,355,000 | 1,339,138 | |
| Marvell Technology, Inc. | ||||
| 06/22/2023 | 4.200% | 3,740,000 | 3,724,935 | |
| Microchip Technology, Inc. | ||||
| 09/01/2023 | 2.670% | 6,239,000 | 6,148,711 | |
| 02/15/2024 | 0.972% | 345,000 | 327,949 | |
| Microsoft Corp. | ||||
| 03/17/2052 | 2.921% | 2,813,000 | 2,218,826 | |
| 03/17/2062 | 3.041% | 4,290,000 | 3,283,869 | |
| NCR Corp.(a) | ||||
| 04/15/2029 | 5.125% | 900,000 | 840,316 | |
| NetApp, Inc. | ||||
| 06/22/2025 | 1.875% | 1,845,000 | 1,723,179 | |
| NXP BV/Funding LLC | ||||
| 03/01/2026 | 5.350% | 1,056,000 | 1,074,405 | |
| NXP BV/Funding LLC/USA, Inc. | ||||
| 05/01/2030 | 3.400% | 342,000 | 302,755 | |
| 11/30/2051 | 3.250% | 600,000 | 407,498 | |
| Open Text Holdings, Inc.(a) | ||||
| 12/01/2031 | 4.125% | 1,475,000 | 1,169,335 | |
| Multi-Manager Total Return Bond Strategies Fund | Annual Report 2022 | 55 |
August 31, 2022
| Corporate Bonds & Notes (continued) | ||||
| Issuer | Coupon Rate | Principal Amount ($) | Value ($) | |
| Oracle Corp. | ||||
| 11/15/2027 | 3.250% | 2,409,000 | 2,227,598 | |
| 03/25/2028 | 2.300% | 903,000 | 785,614 | |
| 03/25/2031 | 2.875% | 1,620,000 | 1,343,124 | |
| 11/15/2037 | 3.800% | 2,730,000 | 2,127,385 | |
| 03/25/2041 | 3.650% | 739,000 | 540,351 | |
| 11/15/2047 | 4.000% | 938,000 | 680,744 | |
| 04/01/2050 | 3.600% | 2,363,000 | 1,610,284 | |
| 03/25/2051 | 3.950% | 5,342,000 | 3,842,097 | |
| PayPal Holdings, Inc. | ||||
| 10/01/2026 | 2.650% | 964,000 | 914,945 | |
| 10/01/2029 | 2.850% | 251,000 | 227,297 | |
| 06/01/2032 | 4.400% | 663,000 | 652,997 | |
| 06/01/2052 | 5.050% | 4,586,000 | 4,494,872 | |
| 06/01/2062 | 5.250% | 1,721,000 | 1,703,734 | |
| Qorvo, Inc.(a) | ||||
| 12/15/2024 | 1.750% | 1,200,000 | 1,121,247 | |
| QUALCOMM, Inc. | ||||
| 05/20/2052 | 4.500% | 5,120,000 | 4,958,427 | |
| Renesas Electronics Corp.(a) | ||||
| 11/25/2026 | 2.170% | 545,000 | 483,385 | |
| S&P Global, Inc.(a) | ||||
| 08/01/2028 | 4.750% | 1,875,000 | 1,920,970 | |
| 03/01/2029 | 2.700% | 1,348,000 | 1,227,408 | |
| 03/01/2032 | 2.900% | 1,549,000 | 1,374,970 | |
| 03/01/2052 | 3.700% | 2,919,000 | 2,511,376 | |
| S&P Global, Inc. | ||||
| 08/15/2030 | 1.250% | 592,000 | 473,715 | |
| Salesforce.com, Inc. | ||||
| 07/15/2041 | 2.700% | 936,000 | 713,725 | |
| Seagate HDD Cayman | ||||
| 03/01/2024 | 4.875% | 2,305,000 | 2,270,638 | |
| 07/15/2031 | 3.375% | 1,445,000 | 1,129,702 | |
| Sensata Technologies, Inc.(a) | ||||
| 02/15/2031 | 3.750% | 1,435,000 | 1,196,726 | |
| TD SYNNEX Corp. | ||||
| 08/09/2026 | 1.750% | 314,000 | 274,770 | |
| Tempo Acquisition LLC/Finance Corp.(a) | ||||
| 06/01/2025 | 5.750% | 1,550,000 | 1,542,399 | |
| Tencent Holdings Ltd.(a) | ||||
| 04/22/2051 | 3.840% | 2,760,000 | 2,046,819 | |
| Texas Instruments, Inc. | ||||
| 08/16/2032 | 3.650% | 696,000 | 672,520 | |
| 08/16/2052 | 4.100% | 2,901,000 | 2,768,049 | |
| TSMC Arizona Corp. | ||||
| 04/22/2052 | 4.500% | 1,345,000 | 1,316,586 | |
| TSMC Global Ltd.(a) | ||||
| 07/22/2032 | 4.625% | 1,000,000 | 1,002,280 | |
| Corporate Bonds & Notes (continued) | ||||
| Issuer | Coupon Rate | Principal Amount ($) | Value ($) | |
| Visa, Inc. | ||||
| 12/14/2035 | 4.150% | 1,030,000 | 1,020,868 | |
| 12/14/2045 | 4.300% | 260,000 | 250,917 | |
| VMware, Inc. | ||||
| 08/15/2026 | 1.400% | 1,441,000 | 1,271,491 | |
| 08/15/2028 | 1.800% | 621,000 | 516,909 | |
| Western Digital Corp. | ||||
| 02/01/2032 | 3.100% | 490,000 | 369,371 | |
| Western Union Co. (The) | ||||
| 06/09/2023 | 4.250% | 3,050,000 | 3,046,040 | |
| 03/15/2026 | 1.350% | 140,000 | 123,971 | |
| Total | 197,758,874 | |||
| Tobacco 0.4% | ||||
| Altria Group, Inc. | ||||
| 02/14/2029 | 4.800% | 89,000 | 86,169 | |
| 05/06/2030 | 3.400% | 1,280,000 | 1,107,813 | |
| 02/04/2032 | 2.450% | 1,079,000 | 815,345 | |
| 02/14/2039 | 5.800% | 299,000 | 277,377 | |
| 02/04/2041 | 3.400% | 3,910,000 | 2,638,927 | |
| 02/14/2049 | 5.950% | 249,000 | 223,470 | |
| 02/04/2051 | 3.700% | 1,852,000 | 1,205,818 | |
| BAT Capital Corp. | ||||
| 04/02/2027 | 4.700% | 800,000 | 779,135 | |
| 08/15/2027 | 3.557% | 748,000 | 687,534 | |
| 03/25/2028 | 2.259% | 3,280,000 | 2,757,223 | |
| 03/25/2031 | 2.726% | 2,253,000 | 1,802,638 | |
| 03/16/2032 | 4.742% | 2,695,000 | 2,425,503 | |
| 08/15/2037 | 4.390% | 1,409,000 | 1,115,015 | |
| 09/25/2040 | 3.734% | 562,000 | 391,439 | |
| 08/15/2047 | 4.540% | 5,800,000 | 4,237,965 | |
| 03/16/2052 | 5.650% | 2,800,000 | 2,389,483 | |
| BAT International Finance PLC | ||||
| 03/16/2028 | 4.448% | 8,000,000 | 7,573,198 | |
| Imperial Brands Finance PLC(a) | ||||
| 07/26/2024 | 3.125% | 2,000,000 | 1,926,160 | |
| 07/21/2025 | 4.250% | 2,000,000 | 1,957,085 | |
| 07/27/2027 | 6.125% | 3,060,000 | 3,106,450 | |
| Reynolds American, Inc. | ||||
| 06/12/2025 | 4.450% | 1,325,000 | 1,313,160 | |
| 08/15/2035 | 5.700% | 1,045,000 | 960,679 | |
| 08/04/2041 | 7.000% | 1,127,000 | 1,121,651 | |
| 09/15/2043 | 6.150% | 501,000 | 456,005 | |
| 08/15/2045 | 5.850% | 4,327,000 | 3,695,182 | |
| Vector Group Ltd.(a) | ||||
| 02/01/2029 | 5.750% | 3,250,000 | 2,817,806 | |
| Total | 47,868,230 | |||
| Transportation Services 0.3% | ||||
| Element Fleet Management Corp.(a) | ||||
| 06/15/2025 | 3.850% | 3,850,000 | 3,710,766 | |
| 56 | Multi-Manager Total Return Bond Strategies Fund | Annual Report 2022 |
August 31, 2022
| Corporate Bonds & Notes (continued) | ||||
| Issuer | Coupon Rate | Principal Amount ($) | Value ($) | |
| ERAC USA Finance LLC(a) | ||||
| 11/01/2025 | 3.800% | 2,500,000 | 2,424,335 | |
| 12/01/2026 | 3.300% | 3,435,000 | 3,244,854 | |
| 03/15/2042 | 5.625% | 1,689,000 | 1,667,687 | |
| 11/01/2046 | 4.200% | 1,041,000 | 859,532 | |
| FedEx Corp. | ||||
| 02/01/2035 | 3.900% | 311,000 | 283,047 | |
| 02/15/2048 | 4.050% | 780,000 | 659,029 | |
| FedEx Corp. Pass-Through Trust | ||||
| Series 2020-1 Class AA | ||||
| 02/20/2034 | 1.875% | 658,181 | 570,399 | |
| GXO Logistics, Inc. | ||||
| 07/15/2026 | 1.650% | 476,000 | 402,532 | |
| Penske Truck Leasing Co. LP/Finance Corp.(a) | ||||
| 11/15/2025 | 1.200% | 842,000 | 746,242 | |
| Penske Truck Leasing Co. LP/PTL Finance Corp.(a) | ||||
| 06/15/2026 | 1.700% | 1,236,000 | 1,094,241 | |
| Penske Truck Leasing Co., LP/Finance Corp.(a) | ||||
| 08/01/2023 | 4.125% | 5,245,000 | 5,226,251 | |
| 07/15/2025 | 4.000% | 905,000 | 884,636 | |
| Ryder System, Inc. | ||||
| 06/01/2025 | 4.625% | 2,395,000 | 2,392,214 | |
| 06/15/2027 | 4.300% | 630,000 | 614,609 | |
| Triton Container International Ltd.(a) | ||||
| 04/15/2026 | 2.050% | 617,000 | 535,908 | |
| 06/15/2031 | 3.150% | 558,000 | 436,213 | |
| TTX Co.(a) | ||||
| 01/15/2025 | 3.600% | 1,620,000 | 1,576,966 | |
| XPO Logistics, Inc.(a) | ||||
| 05/01/2025 | 6.250% | 1,057,000 | 1,070,756 | |
| Total | 28,400,217 | |||
| Treasury 0.0% | ||||
| Romanian Government International Bond(a) | ||||
| 05/25/2034 | 6.000% | 5,488,000 | 5,242,444 | |
| Wireless 0.7% | ||||
| American Tower Corp. | ||||
| 02/15/2024 | 5.000% | 665,000 | 671,812 | |
| 03/15/2027 | 3.650% | 684,000 | 650,455 | |
| Crown Castle International Corp. | ||||
| 07/15/2026 | 1.050% | 401,000 | 351,532 | |
| 03/15/2027 | 2.900% | 3,594,000 | 3,328,199 | |
| 04/01/2041 | 2.900% | 1,652,000 | 1,191,964 | |
| Digicel Group 0.5 Ltd.(a),(l) | ||||
| 04/01/2025 | 8.000% | 102,292 | 66,418 | |
| Digicel Holdings Bermuda Ltd./International Finance Ltd.(a) | ||||
| 05/25/2024 | 8.750% | 700,000 | 664,768 | |
| Corporate Bonds & Notes (continued) | ||||
| Issuer | Coupon Rate | Principal Amount ($) | Value ($) | |
| Digicel International Finance Ltd./Holdings(a),(l) | ||||
| 12/31/2025 | 13.000% | 831,537 | 699,045 | |
| Digicel International Finance Ltd./Holdings(a) | ||||
| Subordinated | ||||
| 12/31/2026 | 8.000% | 500,000 | 326,437 | |
| Digicel International Finance Ltd./Holdings Bermuda Ltd.(a) | ||||
| 05/25/2024 | 8.750% | 2,425,000 | 2,311,996 | |
| Digicel Ltd.(a) | ||||
| 03/01/2023 | 6.750% | 2,600,000 | 1,652,502 | |
| Millicom International Cellular SA(a) | ||||
| 04/27/2031 | 4.500% | 500,000 | 412,502 | |
| Rogers Communications, Inc.(a) | ||||
| 03/15/2032 | 3.800% | 446,000 | 406,024 | |
| 03/15/2052 | 4.550% | 388,000 | 341,601 | |
| SK Telecom Co., Ltd.(a) | ||||
| 04/16/2023 | 3.750% | 2,490,000 | 2,486,635 | |
| Sprint Capital Corp. | ||||
| 03/15/2032 | 8.750% | 275,000 | 331,818 | |
| Sprint Corp. | ||||
| 09/15/2023 | 7.875% | 3,216,000 | 3,314,190 | |
| 06/15/2024 | 7.125% | 5,225,000 | 5,405,015 | |
| Sprint Spectrum Co. I/II/III LLC(a) | ||||
| 03/20/2025 | 4.738% | 6,170,313 | 6,191,199 | |
| 03/20/2028 | 5.152% | 8,275,000 | 8,367,346 | |
| Summit Digitel Infrastructure Pvt., Ltd.(a) | ||||
| 08/12/2031 | 2.875% | 900,000 | 701,546 | |
| T-Mobile US, Inc. | ||||
| 04/15/2027 | 3.750% | 7,580,000 | 7,270,881 | |
| 02/01/2028 | 4.750% | 961,000 | 939,214 | |
| 02/15/2028 | 2.050% | 1,548,000 | 1,344,688 | |
| 02/15/2029 | 2.625% | 597,000 | 512,437 | |
| 04/15/2030 | 3.875% | 7,131,000 | 6,591,555 | |
| 02/15/2031 | 2.550% | 2,165,000 | 1,803,708 | |
| 04/15/2031 | 3.500% | 512,000 | 451,045 | |
| 11/15/2031 | 2.250% | 4,015,000 | 3,230,484 | |
| 04/15/2040 | 4.375% | 4,308,000 | 3,802,428 | |
| 02/15/2041 | 3.000% | 4,844,000 | 3,512,201 | |
| 04/15/2050 | 4.500% | 1,020,000 | 889,434 | |
| Vmed O2 UK Financing I PLC(a) | ||||
| 07/15/2031 | 4.750% | 2,895,000 | 2,384,826 | |
| Vodafone Group PLC | ||||
| 02/19/2043 | 4.375% | 1,182,000 | 1,011,736 | |
| 05/30/2048 | 5.250% | 3,255,000 | 3,042,017 | |
| 06/19/2049 | 4.875% | 3,150,000 | 2,802,896 | |
| 06/19/2059 | 5.125% | 494,000 | 448,022 | |
| Total | 79,910,576 | |||
| Multi-Manager Total Return Bond Strategies Fund | Annual Report 2022 | 57 |
August 31, 2022
| Corporate Bonds & Notes (continued) | ||||
| Issuer | Coupon Rate | Principal Amount ($) | Value ($) | |
| Wirelines 0.7% | ||||
| AT&T, Inc. | ||||
| 12/01/2033 | 2.550% | 4,331,000 | 3,457,178 | |
| 05/15/2035 | 4.500% | 1,001,000 | 939,751 | |
| 03/01/2037 | 5.250% | 2,205,000 | 2,210,361 | |
| 03/01/2039 | 4.850% | 1,086,000 | 1,020,845 | |
| 06/01/2041 | 3.500% | 659,000 | 519,834 | |
| 05/15/2046 | 4.750% | 2,220,000 | 2,042,020 | |
| 09/15/2053 | 3.500% | 9,224,000 | 6,851,118 | |
| 09/15/2055 | 3.550% | 5,071,000 | 3,705,068 | |
| 12/01/2057 | 3.800% | 12,292,000 | 9,294,883 | |
| 09/15/2059 | 3.650% | 5,008,000 | 3,629,244 | |
| C&W Senior Financing DAC(a) | ||||
| 09/15/2027 | 6.875% | 385,000 | 341,564 | |
| CenturyLink, Inc. | ||||
| 12/01/2023 | 6.750% | 2,925,000 | 2,959,304 | |
| Front Range BidCo, Inc.(a) | ||||
| 03/01/2027 | 4.000% | 1,500,000 | 1,279,158 | |
| Frontier Communications Corp.(a) | ||||
| 05/01/2028 | 5.000% | 269,000 | 235,851 | |
| GCI LLC(a) | ||||
| 10/15/2028 | 4.750% | 1,175,000 | 1,049,128 | |
| Iliad Holding SAS(a) | ||||
| 10/15/2026 | 6.500% | 550,000 | 505,263 | |
| 10/15/2028 | 7.000% | 500,000 | 460,418 | |
| Level 3 Financing, Inc.(a) | ||||
| 03/01/2027 | 3.400% | 2,865,000 | 2,548,861 | |
| 11/15/2029 | 3.875% | 7,240,000 | 6,171,948 | |
| Lumen Technologies, Inc.(a) | ||||
| 06/15/2029 | 5.375% | 3,000,000 | 2,341,051 | |
| Qwest Corp. | ||||
| 09/15/2025 | 7.250% | 3,978,000 | 4,144,543 | |
| Telecom Italia Capital SA | ||||
| 06/04/2038 | 7.721% | 1,550,000 | 1,337,947 | |
| Total Play Telecomunicaciones SA de CV(a) | ||||
| 09/20/2028 | 6.375% | 1,270,000 | 1,000,032 | |
| Verizon Communications, Inc. | ||||
| 02/15/2025 | 3.376% | 2,527,000 | 2,493,877 | |
| 03/22/2028 | 2.100% | 1,149,000 | 1,016,319 | |
| 12/03/2029 | 4.016% | 530,000 | 508,437 | |
| 03/15/2032 | 2.355% | 3,021,000 | 2,477,454 | |
| 08/10/2033 | 4.500% | 1,192,000 | 1,150,103 | |
| 11/01/2034 | 4.400% | 3,565,000 | 3,371,253 | |
| 03/22/2041 | 3.400% | 2,127,000 | 1,713,239 | |
| 11/01/2041 | 4.750% | 1,061,000 | 1,007,324 | |
| 03/22/2050 | 4.000% | 274,000 | 233,279 | |
| 03/22/2051 | 3.550% | 428,000 | 336,343 | |
| 10/30/2056 | 2.987% | 347,000 | 233,694 | |
| Corporate Bonds & Notes (continued) | ||||
| Issuer | Coupon Rate | Principal Amount ($) | Value ($) | |
| 03/22/2061 | 3.700% | 1,320,000 | 1,018,685 | |
| Total | 73,605,377 | |||
| Total Corporate Bonds & Notes (Cost $3,939,087,673) | 3,551,341,920 | |||
| Foreign Government Obligations(n),(o) 1.8% | ||||
| Australia 0.0% | ||||
| NBN Co., Ltd.(a) | ||||
| 05/05/2026 | 1.450% | 581,000 | 520,578 | |
| 01/08/2027 | 1.625% | 1,230,000 | 1,085,703 | |
| Total | 1,606,281 | |||
| Azerbaijan 0.0% | ||||
| Southern Gas Corridor CJSC(a) | ||||
| 03/24/2026 | 6.875% | 450,000 | 473,278 | |
| Bahrain 0.0% | ||||
| Bahrain Government International Bond(a) | ||||
| 01/26/2026 | 7.000% | 320,000 | 329,144 | |
| Bermuda 0.0% | ||||
| Bermuda Government International Bond(a) | ||||
| 08/20/2030 | 2.375% | 1,105,000 | 933,015 | |
| Brazil 0.0% | ||||
| Brazil Minas SPE via State of Minas Gerais(a) | ||||
| 02/15/2028 | 5.333% | 1,740,000 | 1,702,794 | |
| Brazilian Government International Bond | ||||
| 06/06/2025 | 2.875% | 1,300,000 | 1,243,920 | |
| 04/07/2026 | 6.000% | 225,000 | 234,364 | |
| 06/12/2030 | 3.875% | 800,000 | 698,813 | |
| Total | 3,879,891 | |||
| Canada 0.0% | ||||
| Province of British Columbia | ||||
| 09/01/2036 | 7.250% | 2,000,000 | 2,752,496 | |
| Province of Manitoba | ||||
| 06/22/2026 | 2.125% | 300,000 | 281,917 | |
| Province of Quebec(k) | ||||
| 03/02/2026 | 7.485% | 230,000 | 255,869 | |
| Total | 3,290,282 | |||
| Chile 0.0% | ||||
| Chile Government International Bond | ||||
| 01/31/2031 | 2.450% | 200,000 | 168,934 | |
| 01/27/2032 | 2.550% | 1,298,000 | 1,081,958 | |
| Corporación Nacional del Cobre de Chile(a) | ||||
| 11/04/2044 | 4.875% | 200,000 | 176,160 | |
| 58 | Multi-Manager Total Return Bond Strategies Fund | Annual Report 2022 |
August 31, 2022
| Foreign Government Obligations(n),(o) (continued) | ||||
| Issuer | Coupon Rate | Principal Amount ($) | Value ($) | |
| Empresa Nacional del Petroleo(a) | ||||
| 08/05/2026 | 3.750% | 750,000 | 696,030 | |
| 11/06/2029 | 5.250% | 450,000 | 433,089 | |
| Total | 2,556,171 | |||
| Colombia 0.1% | ||||
| Colombia Government International Bond | ||||
| 01/28/2026 | 4.500% | 700,000 | 662,074 | |
| 03/15/2029 | 4.500% | 250,000 | 219,077 | |
| 01/30/2030 | 3.000% | 1,605,000 | 1,243,124 | |
| Ecopetrol SA | ||||
| 09/18/2023 | 5.875% | 1,362,000 | 1,363,631 | |
| 04/29/2030 | 6.875% | 2,400,000 | 2,228,791 | |
| Total | 5,716,697 | |||
| Croatia 0.0% | ||||
| Croatia Government International Bond(a) | ||||
| 01/26/2024 | 6.000% | 500,000 | 513,064 | |
| 01/26/2024 | 6.000% | 300,000 | 307,839 | |
| Total | 820,903 | |||
| Dominican Republic 0.1% | ||||
| Dominican Republic International Bond(a) | ||||
| 01/27/2025 | 5.500% | 100,000 | 99,856 | |
| 01/27/2025 | 5.500% | 100,000 | 99,856 | |
| 07/19/2028 | 6.000% | 1,400,000 | 1,340,587 | |
| 07/19/2028 | 6.000% | 275,000 | 263,330 | |
| 02/22/2029 | 5.500% | 2,655,000 | 2,426,714 | |
| 02/22/2029 | 5.500% | 161,000 | 147,157 | |
| 01/30/2030 | 4.500% | 2,028,000 | 1,705,009 | |
| 09/23/2032 | 4.875% | 1,000,000 | 808,300 | |
| Total | 6,890,809 | |||
| Egypt 0.0% | ||||
| Egypt Government International Bond(a) | ||||
| 10/06/2025 | 5.250% | 850,000 | 726,717 | |
| 03/01/2029 | 7.600% | 300,000 | 236,328 | |
| Total | 963,045 | |||
| France 0.0% | ||||
| Dexia Credit Local SA(a) | ||||
| 09/26/2023 | 3.250% | 1,500,000 | 1,492,694 | |
| Guatemala 0.0% | ||||
| Guatemala Government Bond(a) | ||||
| 10/07/2033 | 3.700% | 1,053,000 | 854,046 | |
| Hong Kong 0.0% | ||||
| Airport Authority(a) | ||||
| 01/12/2052 | 3.250% | 3,040,000 | 2,390,306 | |
| Foreign Government Obligations(n),(o) (continued) | ||||
| Issuer | Coupon Rate | Principal Amount ($) | Value ($) | |
| Hungary 0.0% | ||||
| Hungary Government International Bond(a) | ||||
| 06/16/2029 | 5.250% | 1,360,000 | 1,313,587 | |
| 09/22/2031 | 2.125% | 900,000 | 658,968 | |
| Total | 1,972,555 | |||
| India 0.1% | ||||
| Export-Import Bank of India(a) | ||||
| 08/05/2026 | 3.375% | 860,000 | 821,949 | |
| 02/01/2028 | 3.875% | 1,025,000 | 974,604 | |
| 01/13/2031 | 2.250% | 1,630,000 | 1,325,786 | |
| Indian Railway Finance Corp., Ltd.(a) | ||||
| 01/21/2032 | 3.570% | 1,110,000 | 961,447 | |
| Power Finance Corp., Ltd.(a) | ||||
| 12/06/2028 | 6.150% | 546,000 | 563,498 | |
| Total | 4,647,284 | |||
| Indonesia 0.2% | ||||
| Freeport Indonesia PT(a) | ||||
| 04/14/2032 | 5.315% | 1,045,000 | 968,916 | |
| Indonesia Government International Bond | ||||
| 02/14/2030 | 2.850% | 560,000 | 513,242 | |
| Indonesia Government International Bond(a) | ||||
| 01/17/2038 | 7.750% | 1,000,000 | 1,228,020 | |
| 07/18/2047 | 4.750% | 1,000,000 | 949,211 | |
| Lembaga Pembiayaan Ekspor Indonesia(a) | ||||
| 04/06/2024 | 3.875% | 1,450,000 | 1,437,443 | |
| Perusahaan Penerbit SBSN Indonesia III(a) | ||||
| 06/23/2030 | 2.800% | 1,000,000 | 903,057 | |
| PT Hutama Karya Persero(a) | ||||
| 05/11/2030 | 3.750% | 800,000 | 750,746 | |
| PT Pertamina Persero(a) | ||||
| 01/21/2030 | 3.100% | 625,000 | 562,221 | |
| 08/25/2030 | 3.100% | 2,174,000 | 1,946,795 | |
| 02/09/2031 | 2.300% | 1,200,000 | 999,424 | |
| 05/20/2043 | 5.625% | 250,000 | 239,725 | |
| PT Perusahaan Gas Negara Persero Tbk(a) | ||||
| 05/16/2024 | 5.125% | 525,000 | 527,607 | |
| PT Perusahaan Listrik Negara(a) | ||||
| 05/15/2027 | 4.125% | 5,000,000 | 4,840,492 | |
| 05/21/2028 | 5.450% | 2,000,000 | 2,036,336 | |
| 05/21/2028 | 5.450% | 500,000 | 509,084 | |
| 01/25/2029 | 5.375% | 200,000 | 201,265 | |
| 06/30/2030 | 3.000% | 750,000 | 638,148 | |
| Total | 19,251,732 | |||
| Israel 0.0% | ||||
| Israel Electric Corp., Ltd.(a) | ||||
| 08/14/2028 | 4.250% | 2,900,000 | 2,863,834 | |
| Multi-Manager Total Return Bond Strategies Fund | Annual Report 2022 | 59 |
August 31, 2022
| Foreign Government Obligations(n),(o) (continued) | ||||
| Issuer | Coupon Rate | Principal Amount ($) | Value ($) | |
| Italy 0.1% | ||||
| Republic of Italy Government International Bond | ||||
| 10/17/2029 | 2.875% | 1,700,000 | 1,459,021 | |
| 06/15/2033 | 5.375% | 8,270,000 | 8,309,072 | |
| Total | 9,768,093 | |||
| Ivory Coast 0.0% | ||||
| Ivory Coast Government International Bond(a),(k) | ||||
| 12/31/2032 | 5.750% | 877,723 | 785,991 | |
| Japan 0.0% | ||||
| Japan Bank for International Cooperation | ||||
| 05/23/2024 | 2.500% | 600,000 | 587,245 | |
| Japan Finance Organization for Municipalities(a) | ||||
| 03/12/2024 | 3.000% | 400,000 | 395,377 | |
| Total | 982,622 | |||
| Kazakhstan 0.1% | ||||
| Development Bank of Kazakhstan JSC(a) | ||||
| 05/06/2031 | 2.950% | 500,000 | 388,486 | |
| KazMunayGas National Co. JSC(a) | ||||
| 04/24/2025 | 4.750% | 950,000 | 926,394 | |
| 04/19/2027 | 4.750% | 1,125,000 | 1,037,583 | |
| 04/19/2027 | 4.750% | 300,000 | 276,689 | |
| 04/24/2030 | 5.375% | 1,362,000 | 1,270,375 | |
| KazTransGas JSC(a) | ||||
| 09/26/2027 | 4.375% | 200,000 | 181,528 | |
| Total | 4,081,055 | |||
| Malaysia 0.1% | ||||
| Misc Capital Two Labuan Ltd.(a) | ||||
| 04/06/2027 | 3.750% | 3,700,000 | 3,479,216 | |
| Petronas Capital Ltd.(a) | ||||
| 04/21/2030 | 3.500% | 1,300,000 | 1,246,677 | |
| 01/28/2032 | 2.480% | 200,000 | 174,005 | |
| Total | 4,899,898 | |||
| Marshall Islands 0.0% | ||||
| Nakilat, Inc.(a) | ||||
| 12/31/2033 | 6.067% | 1,070,973 | 1,138,176 | |
| Mexico 0.4% | ||||
| Comision Federal de Electricidad(a) | ||||
| 05/15/2029 | 4.688% | 3,647,000 | 3,286,170 | |
| Mexico City Airport Trust(a) | ||||
| 10/31/2026 | 4.250% | 1,435,000 | 1,353,717 | |
| 07/31/2047 | 5.500% | 2,150,000 | 1,616,601 | |
| Foreign Government Obligations(n),(o) (continued) | ||||
| Issuer | Coupon Rate | Principal Amount ($) | Value ($) | |
| Mexico Government International Bond | ||||
| 01/11/2028 | 3.750% | 1,270,000 | 1,225,248 | |
| 04/22/2029 | 4.500% | 1,500,000 | 1,470,548 | |
| 05/24/2031 | 2.659% | 2,368,000 | 1,961,121 | |
| 05/19/2033 | 4.875% | 3,845,000 | 3,685,816 | |
| 08/14/2041 | 4.280% | 350,000 | 281,653 | |
| 05/24/2061 | 3.771% | 550,000 | 367,344 | |
| 04/19/2071 | 3.750% | 750,000 | 492,290 | |
| Pemex Project Funding Master Trust | ||||
| 06/15/2038 | 6.625% | 50,000 | 33,434 | |
| Petroleos Mexicanos | ||||
| 12/20/2022 | 1.700% | 51,250 | 49,927 | |
| 08/04/2026 | 6.875% | 2,000,000 | 1,874,858 | |
| 03/13/2027 | 6.500% | 13,777,000 | 12,171,069 | |
| 02/12/2028 | 5.350% | 276,000 | 224,881 | |
| 01/23/2029 | 6.500% | 625,000 | 519,641 | |
| 01/28/2031 | 5.950% | 3,025,000 | 2,279,116 | |
| 02/16/2032 | 6.700% | 1,848,000 | 1,443,640 | |
| 06/15/2035 | 6.625% | 900,000 | 646,140 | |
| 01/23/2045 | 6.375% | 940,000 | 588,580 | |
| 01/23/2046 | 5.625% | 300,000 | 177,781 | |
| 09/21/2047 | 6.750% | 5,135,000 | 3,237,061 | |
| 01/23/2050 | 7.690% | 2,161,000 | 1,488,311 | |
| 01/28/2060 | 6.950% | 800,000 | 502,860 | |
| Total | 40,977,807 | |||
| Morocco 0.0% | ||||
| Morocco Government International Bond(a) | ||||
| 12/15/2027 | 2.375% | 1,300,000 | 1,121,772 | |
| 12/15/2050 | 4.000% | 350,000 | 228,926 | |
| OCP SA(a) | ||||
| 06/23/2031 | 3.750% | 350,000 | 287,446 | |
| Total | 1,638,144 | |||
| Netherlands 0.1% | ||||
| Equate Petrochemical BV(a) | ||||
| 04/28/2028 | 2.625% | 700,000 | 625,805 | |
| Petrobras Global Finance BV | ||||
| 05/23/2026 | 8.750% | 400,000 | 449,927 | |
| 01/17/2027 | 7.375% | 3,085,000 | 3,287,666 | |
| Total | 4,363,398 | |||
| Norway 0.0% | ||||
| Equinor ASA | ||||
| 04/06/2030 | 3.125% | 826,000 | 765,202 | |
| Oman 0.0% | ||||
| Oman Government International Bond(a) | ||||
| 01/17/2028 | 5.625% | 800,000 | 787,135 | |
| 10/28/2032 | 7.375% | 1,325,000 | 1,429,542 | |
| Total | 2,216,677 | |||
| 60 | Multi-Manager Total Return Bond Strategies Fund | Annual Report 2022 |
August 31, 2022
| Foreign Government Obligations(n),(o) (continued) | ||||
| Issuer | Coupon Rate | Principal Amount ($) | Value ($) | |
| Panama 0.0% | ||||
| Banco Nacional de Panama(a) | ||||
| 08/11/2030 | 2.500% | 875,000 | 706,825 | |
| 08/11/2030 | 2.500% | 600,000 | 484,680 | |
| Panama Government International Bond | ||||
| 03/16/2025 | 3.750% | 200,000 | 198,048 | |
| 01/23/2030 | 3.160% | 1,150,000 | 1,011,758 | |
| 09/29/2032 | 2.252% | 200,000 | 155,437 | |
| 01/19/2033 | 3.298% | 650,000 | 552,650 | |
| Total | 3,109,398 | |||
| Paraguay 0.0% | ||||
| Paraguay Government International Bond(a) | ||||
| 04/28/2031 | 4.950% | 540,000 | 520,176 | |
| 01/29/2033 | 2.739% | 431,000 | 340,760 | |
| Total | 860,936 | |||
| Peru 0.1% | ||||
| Corporación Financiera de Desarrollo SA(a) | ||||
| 09/28/2027 | 2.400% | 600,000 | 503,456 | |
| Peruvian Government International Bond | ||||
| 08/25/2027 | 4.125% | 512,000 | 502,438 | |
| 06/20/2030 | 2.844% | 990,000 | 860,101 | |
| 01/23/2031 | 2.783% | 620,000 | 529,224 | |
| 12/01/2032 | 1.862% | 825,000 | 627,987 | |
| 03/14/2037 | 6.550% | 1,785,000 | 1,955,587 | |
| 12/01/2060 | 2.780% | 600,000 | 375,244 | |
| Petroleos del Peru SA(a) | ||||
| 06/19/2032 | 4.750% | 2,100,000 | 1,675,306 | |
| Total | 7,029,343 | |||
| Philippines 0.0% | ||||
| Philippine Government International Bond | ||||
| 05/05/2030 | 2.457% | 600,000 | 539,245 | |
| 06/10/2031 | 1.648% | 870,000 | 722,518 | |
| 01/15/2032 | 6.375% | 400,000 | 456,092 | |
| 10/23/2034 | 6.375% | 275,000 | 316,521 | |
| Total | 2,034,376 | |||
| Qatar 0.1% | ||||
| Ooredoo International Finance Ltd.(a) | ||||
| 04/08/2031 | 2.625% | 850,000 | 760,567 | |
| Qatar Energy(a) | ||||
| 07/12/2031 | 2.250% | 500,000 | 435,967 | |
| Qatar Government International Bond(a) | ||||
| 04/23/2028 | 4.500% | 1,106,000 | 1,150,994 | |
| 04/16/2030 | 3.750% | 640,000 | 641,875 | |
| 04/23/2048 | 5.103% | 1,910,000 | 2,048,387 | |
| Foreign Government Obligations(n),(o) (continued) | ||||
| Issuer | Coupon Rate | Principal Amount ($) | Value ($) | |
| Qatar Petroleum(a) | ||||
| 07/12/2041 | 3.125% | 1,200,000 | 971,705 | |
| Total | 6,009,495 | |||
| Romania 0.0% | ||||
| Romanian Government International Bond(a) | ||||
| 08/22/2023 | 4.375% | 150,000 | 150,049 | |
| 02/14/2031 | 3.000% | 1,600,000 | 1,270,639 | |
| 03/27/2032 | 3.625% | 900,000 | 726,260 | |
| 12/02/2040 | 2.625% | EUR | 500,000 | 291,436 |
| Total | 2,438,384 | |||
| Russian Federation 0.0% | ||||
| Gazprom OAO Via Gaz Capital SA(a) | ||||
| 02/06/2028 | 4.950% | 800,000 | 400,751 | |
| Gazprom PJSC via Gaz Finance PLC(a) | ||||
| 01/27/2029 | 2.950% | 750,000 | 376,984 | |
| 02/25/2030 | 3.250% | 3,400,000 | 1,667,988 | |
| Russian Foreign Bond - Eurobond(a),(h),(j),(m),(p) | ||||
| 09/16/2023 | 0.000% | 200,000 | 104,776 | |
| 05/27/2026 | 0.000% | 800,000 | 294,740 | |
| 06/23/2027 | 0.000% | 1,000,000 | 369,387 | |
| Total | 3,214,626 | |||
| Saudi Arabia 0.0% | ||||
| SA Global Sukuk Ltd.(a) | ||||
| 06/17/2026 | 1.602% | 400,000 | 367,460 | |
| Saudi Arabian Oil Co.(a) | ||||
| 11/24/2050 | 3.250% | 600,000 | 448,571 | |
| Saudi Government International Bond(a) | ||||
| 10/26/2026 | 3.250% | 1,200,000 | 1,182,565 | |
| 03/04/2028 | 3.625% | 400,000 | 397,048 | |
| 10/22/2030 | 3.250% | 505,000 | 486,547 | |
| 02/02/2061 | 3.450% | 575,000 | 439,214 | |
| Total | 3,321,405 | |||
| Serbia 0.1% | ||||
| Serbia International Bond(a) | ||||
| 12/01/2030 | 2.125% | 6,640,000 | 4,799,060 | |
| South Africa 0.1% | ||||
| Eskom Holdings SOC Ltd.(a) | ||||
| 08/06/2023 | 6.750% | 200,000 | 194,450 | |
| 02/11/2025 | 7.125% | 950,000 | 891,290 | |
| Republic of South Africa Government International Bond | ||||
| 10/12/2028 | 4.300% | 1,275,000 | 1,128,783 | |
| 09/30/2029 | 4.850% | 3,925,000 | 3,472,118 | |
| South Africa Government International Bond | ||||
| 01/17/2024 | 4.665% | 1,100,000 | 1,091,817 | |
| Total | 6,778,458 | |||
| Multi-Manager Total Return Bond Strategies Fund | Annual Report 2022 | 61 |
August 31, 2022
| Foreign Government Obligations(n),(o) (continued) | ||||
| Issuer | Coupon Rate | Principal Amount ($) | Value ($) | |
| South Korea 0.0% | ||||
| Korea Development Bank (The) | ||||
| 09/14/2022 | 3.000% | 200,000 | 199,988 | |
| Turkey 0.0% | ||||
| Turkey Government International Bond | ||||
| 03/23/2023 | 3.250% | 1,080,000 | 1,061,117 | |
| Ukraine 0.0% | ||||
| Ukraine Government International Bond(a) | ||||
| 09/01/2024 | 7.750% | 2,410,000 | 692,677 | |
| 02/01/2026 | 8.994% | 1,000,000 | 211,671 | |
| 09/01/2027 | 7.750% | 3,050,000 | 607,441 | |
| 11/01/2030 | 9.750% | 3,850,000 | 815,796 | |
| Total | 2,327,585 | |||
| United Arab Emirates 0.0% | ||||
| Abu Dhabi Government International Bond(a) | ||||
| 09/30/2029 | 2.500% | 1,129,000 | 1,048,541 | |
| DP World Crescent Ltd.(a) | ||||
| 09/26/2028 | 4.848% | 740,000 | 751,296 | |
| 07/18/2029 | 3.875% | 600,000 | 579,198 | |
| DP World Ltd.(a) | ||||
| 07/02/2037 | 6.850% | 300,000 | 332,093 | |
| Total | 2,711,128 | |||
| United Kingdom 0.0% | ||||
| Gazprom PJSC via Gaz Finance PLC(a),(k) | ||||
| 12/31/2049 | 4.599% | 2,425,000 | 861,003 | |
| United States 0.1% | ||||
| Antares Holdings LP(a) | ||||
| 01/15/2027 | 2.750% | 746,000 | 614,143 | |
| 07/15/2027 | 3.750% | 4,605,000 | 3,818,626 | |
| BOC Aviation USA Corp.(a) | ||||
| 04/29/2024 | 1.625% | 2,015,000 | 1,919,757 | |
| Citgo Holding, Inc.(a) | ||||
| 08/01/2024 | 9.250% | 25,000 | 24,901 | |
| DAE Funding LLC(a) | ||||
| 08/01/2024 | 1.550% | 1,910,000 | 1,785,977 | |
| Total | 8,163,404 | |||
| Uruguay 0.0% | ||||
| Uruguay Government International Bond | ||||
| 01/23/2031 | 4.375% | 615,000 | 628,112 | |
| 04/20/2055 | 4.975% | 1,000,000 | 1,005,600 | |
| Total | 1,633,712 | |||
| Foreign Government Obligations(n),(o) (continued) | ||||
| Issuer | Coupon Rate | Principal Amount ($) | Value ($) | |
| Virgin Islands 0.0% | ||||
| 1MDB Global Investments Ltd(a) | ||||
| 03/09/2023 | 4.400% | 2,800,000 | 2,679,337 | |
| Sinopec Group Overseas Development Ltd.(a) | ||||
| 04/28/2025 | 3.250% | 400,000 | 391,770 | |
| 04/28/2025 | 3.250% | 300,000 | 293,828 | |
| Total | 3,364,935 | |||
| Total Foreign Government Obligations (Cost $229,216,513) | 192,467,383 | |||
| Inflation-Indexed Bonds 0.0% | ||||
| United States 0.0% | ||||
| U.S. Treasury Inflation-Indexed Bond | ||||
| 02/15/2052 | 0.125% | 5,091,169 | 3,991,241 | |
| Total Inflation-Indexed Bonds (Cost $4,152,717) | 3,991,241 | |||
| Municipal Bonds 0.4% | ||||
| Issue Description | Coupon Rate | Principal Amount ($) | Value ($) | |
| Higher Education 0.1% | ||||
| University of California | ||||
| Refunding Revenue Bonds | ||||
| Taxable General | ||||
| Series 2017AX | ||||
| 07/01/2025 | 3.063% | 5,700,000 | 5,594,595 | |
| University of Michigan | ||||
| Revenue Bonds | ||||
| Taxable | ||||
| Series 2022A | ||||
| 04/01/2052 | 3.504% | 2,840,000 | 2,451,952 | |
| 04/01/2122 | 4.454% | 4,020,000 | 3,597,932 | |
| University of Virginia | ||||
| Refunding Revenue Bonds | ||||
| Taxable | ||||
| Series 2021B | ||||
| 11/01/2051 | 2.584% | 2,020,000 | 1,433,776 | |
| Revenue Bonds | ||||
| Taxable | ||||
| Series 2017C | ||||
| 09/01/2117 | 4.179% | 725,000 | 652,402 | |
| Total | 13,730,657 | |||
| Hospital 0.1% | ||||
| California Health Facilities Financing Authority | ||||
| Refunding Revenue Bonds | ||||
| Cedars-Sinai Health System | ||||
| Series 2021 | ||||
| 08/15/2051 | 3.000% | 1,785,000 | 1,368,945 | |
| 62 | Multi-Manager Total Return Bond Strategies Fund | Annual Report 2022 |
August 31, 2022
| Municipal Bonds (continued) | ||||
| Issue Description | Coupon Rate | Principal Amount ($) | Value ($) | |
| Regents of the University of California Medical Center | ||||
| Revenue Bonds | ||||
| Taxable | ||||
| Series 2020N | ||||
| 05/15/2060 | 3.256% | 5,650,000 | 4,159,135 | |
| Total | 5,528,080 | |||
| Local General Obligation 0.1% | ||||
| City of New York | ||||
| Unlimited General Obligation Bonds | ||||
| Series 2010 (BAM) | ||||
| 03/01/2036 | 5.968% | 3,100,000 | 3,506,825 | |
| Unlimited General Obligation Refunding Bonds | ||||
| Series 2021D | ||||
| 08/01/2030 | 1.823% | 515,000 | 428,195 | |
| Los Angeles Unified School District | ||||
| Unlimited General Obligation Bonds | ||||
| Taxable Build America Bonds | ||||
| Series 2009 | ||||
| 07/01/2034 | 5.750% | 2,685,000 | 2,927,008 | |
| Total | 6,862,028 | |||
| Sales Tax 0.0% | ||||
| Puerto Rico Sales Tax Financing Corp.(q) | ||||
| Revenue Bonds | ||||
| Series 2019A1 | ||||
| 07/01/2058 | 5.000% | 2,740,000 | 2,651,243 | |
| Special Non Property Tax 0.1% | ||||
| New York City Transitional Finance Authority | ||||
| Refunding Revenue Bonds | ||||
| Future Tax Secured | ||||
| Subordinated Series 2020B-3 | ||||
| 08/01/2035 | 2.000% | 3,000,000 | 2,245,708 | |
| Revenue Bonds | ||||
| Future Tax Secured | ||||
| Subordinated Series 2020D-3 | ||||
| 11/01/2032 | 2.400% | 1,045,000 | 862,955 | |
| New York State Dormitory Authority | ||||
| Refunding Revenue Bonds | ||||
| Taxable | ||||
| Series 2020F | ||||
| 02/15/2032 | 2.957% | 1,250,000 | 1,118,527 | |
| State of Illinois | ||||
| Revenue Bonds | ||||
| Taxable Sales Tax | ||||
| Series 2013 | ||||
| 06/15/2028 | 3.350% | 2,500,000 | 2,310,383 | |
| Total | 6,537,573 | |||
| Municipal Bonds (continued) | ||||
| Issue Description | Coupon Rate | Principal Amount ($) | Value ($) | |
| Transportation 0.0% | ||||
| Metropolitan Transportation Authority | ||||
| Revenue Bonds | ||||
| Taxable Green Bonds | ||||
| Series 2020C-2 | ||||
| 11/15/2049 | 5.175% | 810,000 | 804,727 | |
| Turnpike / Bridge / Toll Road 0.0% | ||||
| Bay Area Toll Authority | ||||
| Revenue Bonds | ||||
| Series 2009 (BAM) | ||||
| 04/01/2049 | 6.263% | 1,920,000 | 2,349,090 | |
| Pennsylvania Turnpike Commission | ||||
| Revenue Bonds | ||||
| Build America Bonds | ||||
| Series 2009 | ||||
| 12/01/2039 | 6.105% | 1,620,000 | 1,851,925 | |
| Texas Private Activity Bond Surface Transportation Corp. | ||||
| Revenue Bonds | ||||
| Taxable North Tarrant Express Managed Lanes Project | ||||
| Series 2019 | ||||
| 12/31/2049 | 3.922% | 875,000 | 737,132 | |
| Total | 4,938,147 | |||
| Water & Sewer 0.0% | ||||
| City of San Francisco Public Utilities Commission Water | ||||
| Refunding Revenue Bonds | ||||
| Taxable Green Bonds | ||||
| 11/01/2041 | 2.825% | 2,515,000 | 1,978,858 | |
| Total Municipal Bonds (Cost $49,221,366) | 43,031,313 | |||
| Residential Mortgage-Backed Securities - Agency 23.3% | ||||
| Issuer | Coupon Rate | Principal Amount ($) | Value ($) | |
| Fannie Mae REMICS | ||||
| CMO Series 2011-84 Class Z | ||||
| 09/25/2041 | 5.250% | 1,112,727 | 1,136,293 | |
| Federal Home Loan Mortgage Corp. | ||||
| 08/01/2024- 02/01/2025 | 8.000% | 3,931 | 3,999 | |
| 10/01/2028- 07/01/2032 | 7.000% | 110,262 | 116,014 | |
| 03/01/2031- 03/01/2052 | 3.000% | 61,800,370 | 57,813,468 | |
| 10/01/2031- 07/01/2037 | 6.000% | 406,552 | 438,407 | |
| 04/01/2033- 09/01/2039 | 5.500% | 677,983 | 714,781 | |
| 05/01/2033- 03/01/2052 | 3.500% | 59,939,995 | 58,224,523 | |
| Multi-Manager Total Return Bond Strategies Fund | Annual Report 2022 | 63 |
August 31, 2022
| Residential Mortgage-Backed Securities - Agency (continued) | ||||
| Issuer | Coupon Rate | Principal Amount ($) | Value ($) | |
| 10/01/2039- 08/01/2048 | 5.000% | 799,749 | 824,664 | |
| 09/01/2040- 04/01/2049 | 4.000% | 14,205,476 | 14,165,070 | |
| 09/01/2040- 06/01/2052 | 4.500% | 8,517,742 | 8,539,330 | |
| 06/01/2050- 04/01/2052 | 2.500% | 162,300,030 | 145,444,516 | |
| 05/01/2051- 04/01/2052 | 2.000% | 47,267,290 | 40,834,694 | |
| CMO Series 2060 Class Z | ||||
| 05/15/2028 | 6.500% | 68,739 | 72,144 | |
| CMO Series 2310 Class Z | ||||
| 04/15/2031 | 6.000% | 58,235 | 61,461 | |
| CMO Series 2725 Class TA | ||||
| 12/15/2033 | 4.500% | 1,525,000 | 1,556,681 | |
| CMO Series 2882 Class ZC | ||||
| 11/15/2034 | 6.000% | 2,921,476 | 3,005,889 | |
| CMO Series 2953 Class LZ | ||||
| 03/15/2035 | 6.000% | 2,788,148 | 2,979,903 | |
| CMO Series 3028 Class ZE | ||||
| 09/15/2035 | 5.500% | 144,216 | 134,491 | |
| CMO Series 3032 Class PZ | ||||
| 09/15/2035 | 5.800% | 345,965 | 392,291 | |
| CMO Series 3071 Class ZP | ||||
| 11/15/2035 | 5.500% | 7,571,582 | 8,197,601 | |
| CMO Series 3121 Class EZ | ||||
| 03/15/2036 | 6.000% | 96,339 | 102,447 | |
| CMO Series 3181 Class AZ | ||||
| 07/15/2036 | 6.500% | 39,507 | 42,908 | |
| CMO Series 353 Class 300 | ||||
| 12/15/2046 | 3.000% | 6,335,220 | 5,970,561 | |
| CMO Series 3740 Class BA | ||||
| 10/15/2040 | 4.000% | 1,262,058 | 1,250,587 | |
| CMO Series 3747 Class HY | ||||
| 10/15/2040 | 4.500% | 2,991,000 | 3,002,504 | |
| CMO Series 3753 Class KZ | ||||
| 11/15/2040 | 4.500% | 6,180,726 | 6,304,285 | |
| CMO Series 3769 Class ZC | ||||
| 12/15/2040 | 4.500% | 3,059,190 | 3,120,704 | |
| CMO Series 3841 Class JZ | ||||
| 04/15/2041 | 5.000% | 264,010 | 275,232 | |
| CMO Series 3888 Class ZG | ||||
| 07/15/2041 | 4.000% | 596,577 | 585,142 | |
| CMO Series 3926 Class NY | ||||
| 09/15/2041 | 4.000% | 503,538 | 498,933 | |
| CMO Series 3928 Class MB | ||||
| 09/15/2041 | 4.500% | 1,060,822 | 1,068,732 | |
| Residential Mortgage-Backed Securities - Agency (continued) | ||||
| Issuer | Coupon Rate | Principal Amount ($) | Value ($) | |
| CMO Series 3934 Class CB | ||||
| 10/15/2041 | 4.000% | 2,922,191 | 2,894,805 | |
| CMO Series 3982 Class TZ | ||||
| 01/15/2042 | 4.000% | 1,076,904 | 1,060,644 | |
| CMO Series 4027 Class AB | ||||
| 12/15/2040 | 4.000% | 1,356,037 | 1,362,817 | |
| CMO Series 4057 Class ZB | ||||
| 06/15/2042 | 3.500% | 6,652,657 | 6,465,489 | |
| CMO Series 4057 Class ZL | ||||
| 06/15/2042 | 3.500% | 7,576,002 | 7,174,241 | |
| CMO Series 4077 Class KM | ||||
| 11/15/2041 | 3.500% | 43,900 | 43,563 | |
| CMO Series 4091 Class KB | ||||
| 08/15/2042 | 3.000% | 6,500,000 | 6,015,753 | |
| CMO Series 4182 Class QN | ||||
| 02/15/2033 | 3.000% | 106,910 | 105,527 | |
| CMO Series 4361 Class VB | ||||
| 02/15/2038 | 3.000% | 4,575,214 | 4,535,016 | |
| CMO Series 4421 Class PB | ||||
| 12/15/2044 | 4.000% | 5,941,237 | 5,867,388 | |
| CMO Series 4440 Class ZX | ||||
| 01/15/2045 | 4.000% | 11,939,336 | 12,059,358 | |
| CMO Series 4463 Class ZA | ||||
| 04/15/2045 | 4.000% | 5,212,694 | 5,176,229 | |
| CMO Series 4495 Class PA | ||||
| 09/15/2043 | 3.500% | 155,546 | 154,282 | |
| CMO Series 4682 Class HZ | ||||
| 04/15/2047 | 3.500% | 3,494,067 | 3,382,274 | |
| CMO Series 4771 Class HZ | ||||
| 03/15/2048 | 3.500% | 9,362,499 | 8,887,012 | |
| CMO Series 4774 Class KA | ||||
| 12/15/2045 | 4.500% | 382,521 | 378,369 | |
| CMO Series 4787 Class PY | ||||
| 05/15/2048 | 4.000% | 1,220,086 | 1,204,167 | |
| CMO Series 4793 Class CD | ||||
| 06/15/2048 | 3.000% | 897,129 | 843,674 | |
| CMO Series 4839 Class A | ||||
| 04/15/2051 | 4.000% | 2,699,659 | 2,745,101 | |
| CMO Series 4941 Class CZ | ||||
| 11/25/2049 | 3.000% | 1,083,172 | 982,994 | |
| Federal Home Loan Mortgage Corp.(b),(e) | ||||
| -1.0 x 1-month USD LIBOR + 6.100% Cap 6.100% 11/15/2043 | 3.709% | 14,718,366 | 1,472,290 | |
| 64 | Multi-Manager Total Return Bond Strategies Fund | Annual Report 2022 |
August 31, 2022
| Residential Mortgage-Backed Securities - Agency (continued) | ||||
| Issuer | Coupon Rate | Principal Amount ($) | Value ($) | |
| CMO Series 2013-4258 Class SJ | ||||
| -1.0 x 1-month USD LIBOR + 6.650% Cap 6.650% 10/15/2043 | 4.259% | 3,431,898 | 583,361 | |
| CMO Series 2014-4313 Class MS | ||||
| -1.0 x 1-month USD LIBOR + 6.150% Cap 6.150% 04/15/2039 | 3.759% | 5,237,019 | 525,897 | |
| CMO Series 3404 Class AS | ||||
| -1.0 x 1-month USD LIBOR + 5.895% Cap 5.895% 01/15/2038 | 3.504% | 1,723,253 | 173,627 | |
| CMO Series 3578 Class DI | ||||
| -1.0 x 1-month USD LIBOR + 6.650% Cap 6.650% 04/15/2036 | 4.259% | 2,638,690 | 233,024 | |
| CMO Series 3892 Class SC | ||||
| -1.0 x 1-month USD LIBOR + 5.950% Cap 5.950% 07/15/2041 | 3.559% | 4,180,151 | 379,693 | |
| CMO Series 3997 Class SK | ||||
| -1.0 x 1-month USD LIBOR + 6.600% Cap 6.600% 11/15/2041 | 4.209% | 9,165,159 | 613,810 | |
| CMO Series 4087 Class SC | ||||
| -1.0 x 1-month USD LIBOR + 5.550% Cap 5.550% 07/15/2042 | 3.159% | 4,931,425 | 384,819 | |
| CMO Series 4281 Class SA | ||||
| -1.0 x 1-month USD LIBOR + 6.100% Cap 6.100% 12/15/2043 | 3.709% | 8,080,435 | 703,549 | |
| CMO Series 4635 Class SE | ||||
| -1.0 x 1-month USD LIBOR + 6.100% Cap 6.100% 12/15/2046 | 3.709% | 12,807,101 | 1,107,972 | |
| CMO Series 4910 Class SG | ||||
| 1-month LIBID + 6.050% Cap 6.050% 09/25/2049 | 3.606% | 17,278,265 | 2,532,995 | |
| Residential Mortgage-Backed Securities - Agency (continued) | ||||
| Issuer | Coupon Rate | Principal Amount ($) | Value ($) | |
| Federal Home Loan Mortgage Corp.(r) | ||||
| 03/01/2051- 01/01/2052 | 2.500% | 26,177,081 | 23,466,258 | |
| 06/01/2052 | 5.000% | 5,767,578 | 5,839,285 | |
| Federal Home Loan Mortgage Corp.(b) | ||||
| CMO Series 1486 Class FA | ||||
| 1-month USD LIBOR + 1.300% Floor 1.300%, Cap 10.000% 04/15/2023 | 3.691% | 12,927 | 12,952 | |
| CMO Series 2380 Class F | ||||
| 1-month USD LIBOR + 0.450% Floor 0.450%, Cap 8.500% 11/15/2031 | 2.841% | 101,325 | 101,544 | |
| CMO Series 2557 Class FG | ||||
| 1-month USD LIBOR + 0.400% Floor 0.400%, Cap 8.000% 01/15/2033 | 2.791% | 267,051 | 267,357 | |
| CMO Series 2962 Class PF | ||||
| 1-month USD LIBOR + 0.250% Floor 0.250%, Cap 7.000% 03/15/2035 | 2.641% | 100,378 | 100,225 | |
| CMO Series 2981 Class FU | ||||
| 1-month USD LIBOR + 0.200% Floor 0.200%, Cap 8.000% 05/15/2030 | 2.591% | 262,779 | 260,688 | |
| CMO Series 3065 Class EB | ||||
| -3.0 x 1-month USD LIBOR + 19.890% Cap 19.890% 11/15/2035 | 12.717% | 356,438 | 386,237 | |
| CMO Series 3081 Class GC | ||||
| -3.7 x 1-month USD LIBOR + 23.833% Cap 23.833% 12/15/2035 | 15.066% | 605,704 | 697,568 | |
| CMO Series 3085 Class FV | ||||
| 1-month USD LIBOR + 0.700% Floor 0.700%, Cap 8.000% 08/15/2035 | 3.091% | 505,871 | 510,795 | |
| CMO Series 3564 Class FC | ||||
| 1-month USD LIBOR + 1.250% Floor 1.250%, Cap 6.500% 01/15/2037 | 3.814% | 254,227 | 257,986 | |
| CMO Series 3680 Class FA | ||||
| 1-month USD LIBOR + 1.000% Floor 1.000%, Cap 6.000% 06/15/2040 | 3.391% | 570,455 | 577,444 | |
| CMO Series 3852 Class QN | ||||
| -3.6 x 1-month USD LIBOR + 27.211% Cap 5.500% 05/15/2041 | 5.500% | 22,033 | 21,639 | |
| Multi-Manager Total Return Bond Strategies Fund | Annual Report 2022 | 65 |
August 31, 2022
| Residential Mortgage-Backed Securities - Agency (continued) | ||||
| Issuer | Coupon Rate | Principal Amount ($) | Value ($) | |
| CMO Series 4048 Class FJ | ||||
| 1-month USD LIBOR + 0.400% Floor 0.400%, Cap 9,999.000% 07/15/2037 | 2.964% | 172,251 | 171,004 | |
| CMO Series 5115 Class FD | ||||
| 30-day Average SOFR + 0.250% Floor 0.250%, Cap 4.000% 08/15/2043 | 2.133% | 7,615,769 | 7,282,427 | |
| Federal Home Loan Mortgage Corp.(e) | ||||
| CMO Series 303 Class C30 | ||||
| 12/15/2042 | 4.500% | 7,673,055 | 1,303,072 | |
| CMO Series 364 Class C15 | ||||
| 12/15/2046 | 3.500% | 4,687,404 | 864,991 | |
| CMO Series 4146 Class IA | ||||
| 12/15/2032 | 3.500% | 5,658,064 | 652,059 | |
| CMO Series 4186 Class IB | ||||
| 03/15/2033 | 3.000% | 5,690,761 | 574,093 | |
| CMO Series 4627 Class PI | ||||
| 05/15/2044 | 3.500% | 2,006,653 | 105,887 | |
| CMO Series 4698 Class BI | ||||
| 07/15/2047 | 5.000% | 13,257,456 | 2,414,880 | |
| CMO Series 5048 Class HI | ||||
| 01/15/2042 | 4.500% | 3,412,651 | 581,591 | |
| CMO Series 5078 Class NI | ||||
| 06/15/2042 | 4.000% | 2,740,000 | 608,659 | |
| Federal Home Loan Mortgage Corp.(d),(e) | ||||
| CMO Series 351 Class 213 | ||||
| 02/15/2046 | 4.336% | 316,678 | 59,631 | |
| CMO Series 364 Class 141 | ||||
| 12/15/2046 | 2.772% | 358,159 | 52,461 | |
| CMO Series 364 Class 151 | ||||
| 12/15/2046 | 3.373% | 360,785 | 59,066 | |
| CMO Series 364 Class 158 | ||||
| 12/15/2046 | 3.880% | 199,655 | 36,305 | |
| CMO Series 364 Class 167 | ||||
| 12/15/2046 | 2.533% | 335,718 | 43,012 | |
| CMO Series 364 Class C23 | ||||
| 12/15/2046 | 2.939% | 4,499,046 | 658,546 | |
| CMO Series 364 Class C24 | ||||
| 12/15/2046 | 3.459% | 2,561,823 | 435,386 | |
| CMO Series 364 Class C25 | ||||
| 12/15/2046 | 4.093% | 801,045 | 155,922 | |
| CMO Series 368 Class C15 | ||||
| 01/25/2048 | 3.252% | 5,209,619 | 669,011 | |
| CMO Series 3833 Class LI | ||||
| 10/15/2040 | 0.633% | 6,622,231 | 293,440 | |
| Residential Mortgage-Backed Securities - Agency (continued) | ||||
| Issuer | Coupon Rate | Principal Amount ($) | Value ($) | |
| CMO Series 5094 Class IO | ||||
| 12/15/2048 | 1.579% | 14,080,893 | 1,168,925 | |
| Federal Home Loan Mortgage Corp. Multifamily Structured Pass-Through Certificates(d),(e) | ||||
| CMO Series K051 Class X1 | ||||
| 09/25/2025 | 0.644% | 17,093,014 | 222,207 | |
| CMO Series K058 Class X1 | ||||
| 08/25/2026 | 1.045% | 2,372,993 | 71,412 | |
| CMO Series KW02 Class X1 | ||||
| 12/25/2026 | 0.426% | 10,660,140 | 68,790 | |
| Federal Home Loan Mortgage Corp. REMICS(b),(e) | ||||
| CMO Series 204236 Class IS | ||||
| -1.0 x 1-month USD LIBOR + 6.000% Cap 6.000% 08/15/2043 | 3.609% | 12,230,269 | 1,362,309 | |
| Federal Home Loan Mortgage Corp. REMICS | ||||
| CMO Series 3843 Class JZ | ||||
| 04/15/2041 | 5.100% | 981,859 | 1,033,055 | |
| CMO Series 4372 Class Z | ||||
| 08/15/2044 | 3.000% | 2,872,163 | 2,658,994 | |
| CMO Series 4402 Class YB | ||||
| 10/15/2044 | 3.000% | 2,789,562 | 2,652,784 | |
| CMO Series 4612 Class HZ | ||||
| 08/15/2046 | 2.500% | 6,958,905 | 6,032,593 | |
| CMO Series 4753 Class VZ | ||||
| 12/15/2047 | 3.000% | 1,147,205 | 988,943 | |
| CMO Series 4755 Class Z | ||||
| 02/15/2048 | 3.000% | 1,147,198 | 1,057,959 | |
| Federal Home Loan Mortgage Corp. REMICS(e) | ||||
| CMO Series 4257 Class IK | ||||
| 12/15/2042 | 4.000% | 4,286,326 | 765,588 | |
| CMO Series 5058 Class NI | ||||
| 06/25/2050 | 3.000% | 17,088,886 | 3,095,021 | |
| CMO Series 5079 Class DI | ||||
| 02/25/2051 | 6.500% | 12,681,291 | 2,745,867 | |
| CMO Series 5088 Class IB | ||||
| 03/25/2051 | 2.500% | 26,110,679 | 3,760,087 | |
| CMO Series 5095 Class AI | ||||
| 04/25/2051 | 3.500% | 25,471,691 | 4,383,915 | |
| CMO Series 5113 Class MI | ||||
| 06/25/2051 | 3.500% | 19,613,026 | 3,737,519 | |
| CMO Series 5115 Class GI | ||||
| 09/25/2050 | 3.000% | 11,735,991 | 2,233,307 | |
| CMO Series 5153 Class JI | ||||
| 10/25/2051 | 3.500% | 9,838,620 | 1,693,898 | |
| CMO Series 5217 Class PI | ||||
| 04/25/2052 | 3.500% | 6,470,235 | 864,557 | |
| 66 | Multi-Manager Total Return Bond Strategies Fund | Annual Report 2022 |
August 31, 2022
| Residential Mortgage-Backed Securities - Agency (continued) | ||||
| Issuer | Coupon Rate | Principal Amount ($) | Value ($) | |
| Federal Home Loan Mortgage Corp. REMICS(d),(e) | ||||
| CMO Series 5065 Class EI | ||||
| 11/25/2044 | 5.434% | 1,666,226 | 388,010 | |
| Federal National Mortgage Association | ||||
| 06/01/2024 | 9.000% | 14 | 14 | |
| 02/01/2025- 08/01/2027 | 8.000% | 10,516 | 10,827 | |
| 03/01/2026- 07/01/2038 | 7.000% | 359,720 | 385,423 | |
| 04/01/2027- 06/01/2032 | 7.500% | 26,900 | 28,011 | |
| 05/01/2029- 10/01/2040 | 6.000% | 1,257,693 | 1,351,700 | |
| 08/01/2029- 05/01/2052 | 3.000% | 96,414,374 | 90,178,882 | |
| 01/01/2031- 05/01/2052 | 2.500% | 107,470,298 | 96,619,634 | |
| 03/01/2033- 04/01/2041 | 5.500% | 638,888 | 673,269 | |
| 10/01/2033- 02/01/2052 | 3.500% | 63,067,984 | 61,287,703 | |
| 07/01/2039- 10/01/2041 | 5.000% | 2,082,127 | 2,169,157 | |
| 08/01/2040- 04/01/2052 | 2.000% | 175,155,947 | 152,003,416 | |
| 10/01/2040- 06/01/2056 | 4.500% | 6,466,339 | 6,584,755 | |
| 02/01/2041- 05/01/2052 | 4.000% | 62,976,259 | 62,372,836 | |
| CMO Series 2003-22 Class Z | ||||
| 04/25/2033 | 6.000% | 96,810 | 102,423 | |
| CMO Series 2003-33 Class PT | ||||
| 05/25/2033 | 4.500% | 4,838 | 4,903 | |
| CMO Series 2007-50 Class DZ | ||||
| 06/25/2037 | 5.500% | 486,605 | 506,866 | |
| CMO Series 2010-139 Class HA | ||||
| 11/25/2040 | 4.000% | 1,562,815 | 1,558,104 | |
| CMO Series 2010-37 Class A1 | ||||
| 05/25/2035 | 5.410% | 165,963 | 166,061 | |
| CMO Series 2011-18 Class ZK | ||||
| 03/25/2041 | 4.000% | 3,441,033 | 3,373,360 | |
| CMO Series 2011-53 Class WT | ||||
| 06/25/2041 | 4.500% | 326,385 | 330,994 | |
| CMO Series 2011-87 Class GB | ||||
| 09/25/2041 | 4.500% | 7,000,000 | 7,179,981 | |
| CMO Series 2012-121 Class GZ | ||||
| 11/25/2042 | 3.500% | 11,589,629 | 11,363,411 | |
| CMO Series 2012-68 Class ZA | ||||
| 07/25/2042 | 3.500% | 8,779,261 | 8,582,767 | |
| CMO Series 2012-94 | ||||
| 09/25/2042 | 3.500% | 10,563,891 | 10,209,663 | |
| Residential Mortgage-Backed Securities - Agency (continued) | ||||
| Issuer | Coupon Rate | Principal Amount ($) | Value ($) | |
| CMO Series 2013-106 Class LA | ||||
| 08/25/2041 | 4.000% | 1,786,519 | 1,801,509 | |
| CMO Series 2013-16 Class GD | ||||
| 03/25/2033 | 3.000% | 1,391,591 | 1,368,297 | |
| CMO Series 2013-66 Class AP | ||||
| 05/25/2043 | 6.000% | 146,305 | 149,043 | |
| CMO Series 2016-9 Class A | ||||
| 09/25/2043 | 3.000% | 15,068 | 15,019 | |
| CMO Series 2018-38 Class PA | ||||
| 06/25/2047 | 3.500% | 566,856 | 554,787 | |
| CMO Series 2018-55 Class PA | ||||
| 01/25/2047 | 3.500% | 1,649,268 | 1,652,741 | |
| CMO Series 2018-64 Class ET | ||||
| 09/25/2048 | 3.000% | 3,025,230 | 2,868,132 | |
| CMO Series 2018-94D Class KD | ||||
| 12/25/2048 | 3.500% | 817,150 | 793,459 | |
| CMO Series 2019-9 Class DZ | ||||
| 03/25/2049 | 4.000% | 3,887,243 | 3,833,103 | |
| CMO Series 98-17 Class Z | ||||
| 04/18/2028 | 6.500% | 50,241 | 51,131 | |
| Federal National Mortgage Association(r) | ||||
| 12/01/2050- 12/01/2051 | 2.000% | 12,927,059 | 11,195,495 | |
| 06/01/2052 | 4.500% | 1,009,019 | 1,005,847 | |
| 07/01/2052 | 5.000% | 10,508,503 | 10,635,341 | |
| 08/01/2052 | 5.500% | 1,870,294 | 1,918,081 | |
| Federal National Mortgage Association(b) | ||||
| CMO Series 2002-59 Class HF | ||||
| 1-month USD LIBOR + 0.350% Floor 0.350%, Cap 8.000% 08/17/2032 | 2.730% | 44,535 | 44,501 | |
| CMO Series 2004-93 Class FC | ||||
| 1-month USD LIBOR + 0.200% Floor 0.200%, Cap 8.000% 12/25/2034 | 2.644% | 357,373 | 354,892 | |
| CMO Series 2006-71 Class SH | ||||
| -2.6 x 1-month USD LIBOR + 15.738% Cap 15.738% 05/25/2035 | 9.328% | 150,099 | 147,702 | |
| CMO Series 2007-90 Class F | ||||
| 1-month USD LIBOR + 0.490% Floor 0.490%, Cap 7.000% 09/25/2037 | 2.934% | 138,976 | 139,003 | |
| CMO Series 2007-W7 Class 1A4 | ||||
| -6.0 x 1-month USD LIBOR + 39.180% Cap 39.180% 07/25/2037 | 24.518% | 49,917 | 65,790 | |
| Multi-Manager Total Return Bond Strategies Fund | Annual Report 2022 | 67 |
August 31, 2022
| Residential Mortgage-Backed Securities - Agency (continued) | ||||
| Issuer | Coupon Rate | Principal Amount ($) | Value ($) | |
| CMO Series 2008-15 Class AS | ||||
| -5.0 x 1-month USD LIBOR + 33.000% Cap 33.000% 08/25/2036 | 20.782% | 277,310 | 365,532 | |
| CMO Series 2010-142 Class HS | ||||
| -2.0 x 1-month USD LIBOR + 10.000% Cap 10.000% 12/25/2040 | 4.872% | 470,694 | 346,654 | |
| CMO Series 2010-150 Class FL | ||||
| 1-month USD LIBOR + 0.550% Floor 0.550%, Cap 7.000% 10/25/2040 | 2.994% | 109,399 | 109,624 | |
| CMO Series 2012-1 Class FA | ||||
| 1-month USD LIBOR + 0.500% Floor 0.500%, Cap 6.500% 02/25/2042 | 2.944% | 885,828 | 888,349 | |
| CMO Series 2012-115 Class MT | ||||
| -3.0 x 1-month USD LIBOR + 13.500% Cap 4.500% 10/25/2042 | 4.500% | 322,530 | 243,242 | |
| CMO Series 2016-32 Class GT | ||||
| -4.5 x 1-month USD LIBOR + 18.000% Cap 4.500% 01/25/2043 | 4.500% | 32,299 | 23,910 | |
| Federal National Mortgage Association(b),(e) | ||||
| CMO Series 2004-29 Class PS | ||||
| -1.0 x 1-month USD LIBOR + 7.600% Cap 7.600% 05/25/2034 | 5.156% | 1,193,137 | 165,518 | |
| CMO Series 2006-43 Class SJ | ||||
| -1.0 x 1-month USD LIBOR + 6.590% Cap 6.590% 06/25/2036 | 4.146% | 862,386 | 99,256 | |
| CMO Series 2009-100 Class SA | ||||
| -1.0 x 1-month USD LIBOR + 6.200% Cap 6.200% 12/25/2039 | 3.756% | 2,667,934 | 349,951 | |
| CMO Series 2009-87 Class NS | ||||
| -1.0 x 1-month USD LIBOR + 6.250% Cap 6.250% 11/25/2039 | 3.806% | 4,534,344 | 407,516 | |
| Residential Mortgage-Backed Securities - Agency (continued) | ||||
| Issuer | Coupon Rate | Principal Amount ($) | Value ($) | |
| CMO Series 2010-131 Class SA | ||||
| -1.0 x 1-month USD LIBOR + 6.600% Cap 6.600% 11/25/2040 | 4.156% | 3,735,579 | 466,495 | |
| CMO Series 2010-21 Class SA | ||||
| -1.0 x 1-month USD LIBOR + 6.250% Cap 6.250% 03/25/2040 | 3.806% | 6,693,542 | 652,551 | |
| CMO Series 2010-57 Class SA | ||||
| -1.0 x 1-month USD LIBOR + 6.450% Cap 6.450% 06/25/2040 | 4.006% | 1,629,553 | 182,941 | |
| CMO Series 2011-131 Class ST | ||||
| -1.0 x 1-month USD LIBOR + 6.540% Cap 6.540% 12/25/2041 | 4.096% | 20,478,497 | 2,835,983 | |
| CMO Series 2011-47 Class GS | ||||
| -1.0 x 1-month USD LIBOR + 5.930% Cap 5.930% 06/25/2041 | 3.486% | 5,532,864 | 512,983 | |
| CMO Series 2012-17 Class MS | ||||
| -1.0 x 1-month USD LIBOR + 6.700% Cap 6.700% 03/25/2027 | 4.256% | 1,953,455 | 60,621 | |
| CMO Series 2013-10 Class SJ | ||||
| -1.0 x 1-month USD LIBOR + 6.150% Cap 6.150% 02/25/2043 | 3.706% | 4,496,953 | 484,927 | |
| CMO Series 2013-19 Class KS | ||||
| -1.0 x 3-month USD LIBOR + 6.200% Cap 6.200% 10/25/2041 | 3.756% | 4,722,994 | 379,287 | |
| CMO Series 2013-34 Class SC | ||||
| -1.0 x 1-month USD LIBOR + 6.150% Cap 6.150% 04/25/2043 | 3.706% | 12,513,333 | 2,168,271 | |
| CMO Series 2014-40 Class HS | ||||
| -1.0 x 1-month USD LIBOR + 6.700% Cap 6.700% 07/25/2044 | 4.256% | 3,339,973 | 592,104 | |
| 68 | Multi-Manager Total Return Bond Strategies Fund | Annual Report 2022 |
August 31, 2022
| Residential Mortgage-Backed Securities - Agency (continued) | ||||
| Issuer | Coupon Rate | Principal Amount ($) | Value ($) | |
| CMO Series 2014-52 Class SL | ||||
| -1.0 x 1-month USD LIBOR + 6.100% Cap 6.100% 09/25/2044 | 3.656% | 5,758,836 | 744,073 | |
| CMO Series 2015-81 Class SD | ||||
| -1.0 x 1-month USD LIBOR + 6.700% Cap 6.700% 01/25/2037 | 4.256% | 4,141,141 | 430,097 | |
| CMO Series 2016-19 Class SA | ||||
| -1.0 x 1-month USD LIBOR + 6.100% Cap 6.100% 04/25/2046 | 3.656% | 5,217,510 | 492,537 | |
| CMO Series 2016-32 Class SA | ||||
| -1.0 x 1-month USD LIBOR + 6.100% Cap 6.100% 10/25/2034 | 3.656% | 2,390,316 | 219,065 | |
| CMO Series 2016-60 Class QS | ||||
| -1.0 x 1-month USD LIBOR + 6.100% Cap 6.100% 09/25/2046 | 3.656% | 7,095,466 | 731,626 | |
| CMO Series 2016-60 Class SD | ||||
| -1.0 x 1-month USD LIBOR + 6.100% Cap 6.100% 09/25/2046 | 3.656% | 22,925,264 | 2,152,916 | |
| CMO Series 2016-60 Class SE | ||||
| -1.0 x 1-month USD LIBOR + 6.250% Cap 6.250% 09/25/2046 | 3.806% | 6,702,654 | 587,110 | |
| CMO Series 2016-82 Class SG | ||||
| -1.0 x 1-month USD LIBOR + 6.100% Cap 6.100% 11/25/2046 | 3.656% | 9,493,427 | 824,253 | |
| CMO Series 2016-88 Class BS | ||||
| -1.0 x 1-month USD LIBOR + 6.100% Cap 6.100% 12/25/2046 | 3.656% | 6,826,639 | 742,900 | |
| CMO Series 2016-93 Class SL | ||||
| -1.0 x 1-month USD LIBOR + 6.650% Cap 6.650% 12/25/2046 | 4.206% | 4,382,515 | 409,130 | |
| Residential Mortgage-Backed Securities - Agency (continued) | ||||
| Issuer | Coupon Rate | Principal Amount ($) | Value ($) | |
| CMO Series 2017-26 Class SA | ||||
| -1.0 x 1-month USD LIBOR + 6.150% Cap 6.150% 04/25/2047 | 3.706% | 6,563,183 | 549,463 | |
| CMO Series 2017-57 Class SD | ||||
| -1.0 x 1-month USD LIBOR + 3.950% Cap 2.750% 08/25/2047 | 1.506% | 6,662,570 | 262,556 | |
| CMO Series 2018-43 Class SE | ||||
| -1.0 x 1-month USD LIBOR + 6.250% Cap 6.250% 09/25/2038 | 3.806% | 4,928,720 | 523,183 | |
| CMO Series 2018-61 Class SA | ||||
| 1-month USD LIBOR + 6.200% Cap 6.200% 08/25/2048 | 3.756% | 3,482,863 | 360,089 | |
| CMO Series 2019-35 Class SH | ||||
| -1.0 x 1-month USD LIBOR + 6.150% Cap 6.150% 07/25/2049 | 3.706% | 14,954,851 | 1,362,815 | |
| CMO Series 2019-39 Class SB | ||||
| -1.0 x 1-month USD LIBOR + 6.100% Cap 6.100% 08/25/2049 | 3.656% | 12,671,164 | 1,169,205 | |
| Federal National Mortgage Association(e) | ||||
| CMO Series 2013-16 Class MI | ||||
| 03/25/2043 | 4.000% | 4,407,745 | 528,941 | |
| CMO Series 2013-23 Class AI | ||||
| 03/25/2043 | 5.000% | 5,120,977 | 929,298 | |
| CMO Series 2013-35 Class IB | ||||
| 04/25/2033 | 3.000% | 6,989,861 | 732,004 | |
| CMO Series 2013-41 Class HI | ||||
| 02/25/2033 | 3.000% | 7,945,105 | 591,697 | |
| CMO Series 2015-54 Class GI | ||||
| 07/25/2045 | 5.500% | 21,292,919 | 3,837,991 | |
| CMO Series 2020-42 Class AI | ||||
| 06/25/2050 | 2.500% | 20,644,511 | 2,399,957 | |
| CMO Series 2020-72 Class LI | ||||
| 12/25/2040 | 5.000% | 6,000,000 | 1,306,742 | |
| CMO Series 2021-33 Class AI | ||||
| 05/25/2047 | 2.500% | 36,977,679 | 4,650,709 | |
| CMO Series 385 Class 8 | ||||
| 12/25/2037 | 5.500% | 2,157,068 | 451,015 | |
| CMO Series 426 Class C58 | ||||
| 03/25/2052 | 3.000% | 42,699,363 | 6,810,822 | |
| Multi-Manager Total Return Bond Strategies Fund | Annual Report 2022 | 69 |
August 31, 2022
| Residential Mortgage-Backed Securities - Agency (continued) | ||||
| Issuer | Coupon Rate | Principal Amount ($) | Value ($) | |
| Federal National Mortgage Association(d),(e) | ||||
| CMO Series 2021-24 Class IO | ||||
| 03/25/2059 | 1.181% | 8,315,953 | 591,932 | |
| Federal National Mortgage Association REMICS | ||||
| CMO Series 2012-105 Class Z | ||||
| 10/25/2042 | 3.500% | 2,828,440 | 2,736,211 | |
| CMO Series 2013-18 Class ZA | ||||
| 03/25/2043 | 3.000% | 3,955,335 | 3,748,900 | |
| CMO Series 2013-70 Class JZ | ||||
| 07/25/2043 | 3.000% | 13,029,182 | 11,940,024 | |
| CMO Series 2018-11 Class BX | ||||
| 12/25/2047 | 4.000% | 10,042,105 | 9,899,822 | |
| CMO Series 2019-70 Class CB | ||||
| 12/25/2049 | 3.500% | 3,037,376 | 2,917,093 | |
| Federal National Mortgage Association REMICS(b),(e) | ||||
| CMO Series 2017-14 Class DS | ||||
| -1.0 x 1-month USD LIBOR + 6.050% Cap 6.050% 03/25/2047 | 3.606% | 9,944,068 | 1,243,728 | |
| CMO Series 3908 Class XS | ||||
| -1.0 x 1-month USD LIBOR + 6.450% Cap 6.450% 06/15/2039 | 4.059% | 10,243,923 | 1,270,084 | |
| Federal National Mortgage Association REMICS(e) | ||||
| CMO Series 2022-5 Class LI | ||||
| 02/25/2052 | 3.000% | 32,593,106 | 4,334,945 | |
| Government National Mortgage Association | ||||
| 05/15/2040- 10/20/2048 | 5.000% | 2,639,913 | 2,725,037 | |
| 05/20/2041- 08/20/2048 | 4.500% | 3,971,839 | 4,025,573 | |
| 02/15/2042- 10/20/2048 | 4.000% | 6,112,025 | 6,103,173 | |
| 03/20/2046- 07/20/2049 | 3.500% | 13,328,842 | 13,024,281 | |
| 12/20/2046- 11/20/2051 | 3.000% | 37,822,425 | 35,756,872 | |
| 08/20/2051- 04/20/2052 | 2.500% | 25,064,811 | 22,961,300 | |
| CMO Series 2005-45 Class ZA | ||||
| 06/16/2035 | 6.000% | 1,536,637 | 1,727,369 | |
| CMO Series 2009-104 Class YD | ||||
| 11/20/2039 | 5.000% | 1,495,281 | 1,530,130 | |
| CMO Series 2009-55 Class LX | ||||
| 07/20/2039 | 5.000% | 1,853,533 | 1,895,330 | |
| CMO Series 2009-67 Class DB | ||||
| 08/20/2039 | 5.000% | 2,055,516 | 2,113,595 | |
| Residential Mortgage-Backed Securities - Agency (continued) | ||||
| Issuer | Coupon Rate | Principal Amount ($) | Value ($) | |
| CMO Series 2010-108 Class WL | ||||
| 04/16/2040 | 4.000% | 2,051,286 | 2,070,083 | |
| CMO Series 2010-120 Class AY | ||||
| 09/20/2040 | 4.000% | 1,866,550 | 1,877,027 | |
| CMO Series 2010-135 Class PE | ||||
| 10/16/2040 | 4.000% | 3,936,533 | 3,977,444 | |
| CMO Series 2014-3 Class EP | ||||
| 02/16/2043 | 2.750% | 6,068,825 | 5,864,927 | |
| CMO Series 2016-111 Class PB | ||||
| 08/20/2046 | 2.500% | 1,097,000 | 883,611 | |
| CMO Series 2018-1 Class LZ | ||||
| 01/20/2048 | 3.000% | 4,247,979 | 3,963,700 | |
| CMO Series 2018-115 Class DE | ||||
| 08/20/2048 | 3.500% | 1,632,787 | 1,576,801 | |
| CMO Series 2018-147 Class BZ | ||||
| 10/20/2048 | 3.500% | 3,922,284 | 3,818,721 | |
| CMO Series 2018-53 Class AL | ||||
| 11/20/2045 | 3.500% | 733,755 | 724,711 | |
| Government National Mortgage Association(r) | ||||
| 10/20/2051 | 2.500% | 8,260,662 | 7,561,702 | |
| 12/20/2051 | 3.000% | 3,104,711 | 2,921,324 | |
| Government National Mortgage Association(b) | ||||
| 1-year CMT + 1.137% 03/20/2066 | 3.156% | 243,066 | 243,860 | |
| 1-year CMT + 0.700% 04/20/2066 | 2.721% | 368,358 | 368,161 | |
| CMO Series 2003-60 Class GS | ||||
| -1.7 x 1-month USD LIBOR + 12.417% Cap 12.417% 05/16/2033 | 8.439% | 37,267 | 36,641 | |
| CMO Series 2006-37 Class AS | ||||
| -6.0 x 1-month USD LIBOR + 39.660% Cap 39.660% 07/20/2036 | 25.451% | 589,171 | 803,830 | |
| CMO Series 2010-H03 Class FA | ||||
| 1-month USD LIBOR + 0.550% Floor 0.550%, Cap 10.690% 03/20/2060 | 2.918% | 464,345 | 462,231 | |
| CMO Series 2010-H26 Class LF | ||||
| 1-month USD LIBOR + 0.350% Floor 0.350%, Cap 13.898% 08/20/2058 | 2.138% | 194,494 | 193,762 | |
| CMO Series 2011-114 Class KF | ||||
| 1-month USD LIBOR + 0.450% Floor 0.450%, Cap 6.500% 03/20/2041 | 2.818% | 62,446 | 62,456 | |
| 70 | Multi-Manager Total Return Bond Strategies Fund | Annual Report 2022 |
August 31, 2022
| Residential Mortgage-Backed Securities - Agency (continued) | ||||
| Issuer | Coupon Rate | Principal Amount ($) | Value ($) | |
| CMO Series 2012-H20 Class BA | ||||
| 1-month USD LIBOR + 0.700% Floor 0.700%, Cap 10.500% 09/20/2062 | 2.358% | 97,323 | 96,884 | |
| CMO Series 2012-H21 Class CF | ||||
| 1-month USD LIBOR + 0.700% Floor 0.700% 05/20/2061 | 2.498% | 2,250 | 2,244 | |
| CMO Series 2012-H21 Class DF | ||||
| 1-month USD LIBOR + 0.650% Floor 0.650% 05/20/2061 | 2.448% | 2,006 | 1,998 | |
| CMO Series 2012-H25 Class FA | ||||
| 1-month USD LIBOR + 0.700% Floor 0.700% 12/20/2061 | 2.498% | 26,531 | 26,517 | |
| CMO Series 2013-115 Class EF | ||||
| 1-month USD LIBOR + 0.250% Floor 0.250%, Cap 6.500% 04/16/2028 | 2.637% | 96,375 | 96,132 | |
| CMO Series 2013-H02 Class FD | ||||
| 1-month USD LIBOR + 0.340% Floor 0.340%, Cap 10.500% 12/20/2062 | 2.138% | 146,906 | 145,685 | |
| CMO Series 2013-H05 Class FB | ||||
| 1-month USD LIBOR + 0.400% Floor 0.400% 02/20/2062 | 2.198% | 1,882 | 1,858 | |
| CMO Series 2013-H08 Class BF | ||||
| 1-month USD LIBOR + 0.400% Floor 0.400%, Cap 10.000% 03/20/2063 | 2.198% | 946,568 | 937,642 | |
| CMO Series 2013-H14 Class FD | ||||
| 1-month USD LIBOR + 0.470% Floor 0.470%, Cap 11.000% 06/20/2063 | 2.268% | 708,100 | 703,304 | |
| CMO Series 2013-H17 Class FA | ||||
| 1-month USD LIBOR + 0.550% Floor 0.550%, Cap 11.000% 07/20/2063 | 2.348% | 212,206 | 211,370 | |
| CMO Series 2013-H18 Class EA | ||||
| 1-month USD LIBOR + 0.500% Floor 0.500%, Cap 10.190% 07/20/2063 | 2.298% | 267,351 | 266,298 | |
| CMO Series 2013-H19 Class FC | ||||
| 1-month USD LIBOR + 0.600% Floor 0.600%, Cap 11.000% 08/20/2063 | 2.398% | 1,378,399 | 1,373,866 | |
| Residential Mortgage-Backed Securities - Agency (continued) | ||||
| Issuer | Coupon Rate | Principal Amount ($) | Value ($) | |
| CMO Series 2015-H26 Class FC | ||||
| 1-month USD LIBOR + 0.600% Floor 0.600%, Cap 11.000% 08/20/2065 | 2.398% | 199,027 | 198,354 | |
| CMO Series 2017-H03 Class FB | ||||
| 1-month USD LIBOR + 0.650% Floor 0.650%, Cap 15.000% 06/20/2066 | 2.448% | 2,564,043 | 2,555,476 | |
| CMO Series 2018-H04 Class FM | ||||
| 1-month USD LIBOR + 0.300% Floor 0.300%, Cap 11.000% 03/20/2068 | 2.098% | 2,299,074 | 2,274,367 | |
| CMO Series 2019-H01 Class FL | ||||
| 1-month USD LIBOR + 0.450% Floor 0.450%, Cap 11.000% 12/20/2068 | 2.248% | 494,370 | 490,459 | |
| CMO Series 2019-H10 Class FM | ||||
| 1-month USD LIBOR + 0.400% Floor 0.400%, Cap 11.000% 05/20/2069 | 2.198% | 1,971,052 | 1,951,384 | |
| CMO Series 2020-H13 Class FM | ||||
| 1-month USD LIBOR + 0.400% Floor 0.400%, Cap 11.000% 08/20/2070 | 2.198% | 2,866,680 | 2,843,552 | |
| CMO Series 2022-H09 Class EF | ||||
| 30-day Average SOFR + 0.450% Floor 0.450%, Cap 11.000% 04/20/2072 | 2.508% | 7,335,618 | 7,278,822 | |
| Government National Mortgage Association(b),(e) | ||||
| CMO Series 2010-31 Class ES | ||||
| -1.0 x 1-month USD LIBOR + 5.000% Cap 5.000% 03/20/2040 | 2.632% | 7,571,957 | 541,031 | |
| CMO Series 2011-13 Class S | ||||
| 1-month LIBID + 5.950% Cap 5.950% 01/16/2041 | 3.563% | 5,084,885 | 454,849 | |
| CMO Series 2011-30 Class SB | ||||
| 1-month LIBID + 6.600% Cap 6.600% 02/20/2041 | 4.232% | 2,574,021 | 298,306 | |
| CMO Series 2015-155 Class SA | ||||
| -1.0 x 1-month USD LIBOR + 5.700% Cap 5.700% 10/20/2045 | 3.332% | 3,204,642 | 343,636 | |
| Multi-Manager Total Return Bond Strategies Fund | Annual Report 2022 | 71 |
August 31, 2022
| Residential Mortgage-Backed Securities - Agency (continued) | ||||
| Issuer | Coupon Rate | Principal Amount ($) | Value ($) | |
| CMO Series 2017-93 Class CS | ||||
| -1.0 x 1-month USD LIBOR + 6.200% Cap 6.200% 06/20/2047 | 3.832% | 9,930,063 | 1,215,643 | |
| CMO Series 2019-123 Class SP | ||||
| -1.0 x 1-month USD LIBOR + 6.100% Cap 6.100% 10/20/2049 | 3.732% | 13,118,788 | 1,172,181 | |
| CMO Series 2019-13 Class SA | ||||
| -1.0 x 1-month USD LIBOR + 6.100% Cap 6.100% 01/20/2049 | 3.732% | 10,588,257 | 1,241,519 | |
| CMO Series 2019-6 Class SJ | ||||
| -1.0 x 1-month USD LIBOR + 6.100% Cap 6.100% 01/20/2049 | 3.732% | 8,290,251 | 767,310 | |
| CMO Series 2019-86 Class SG | ||||
| -1.0 x 1-month USD LIBOR + 5.600% Cap 5.600% 07/20/2049 | 3.232% | 4,680,252 | 433,795 | |
| Government National Mortgage Association(d) | ||||
| CMO Series 2010-H17 Class XQ | ||||
| 07/20/2060 | 5.211% | 4,073 | 4,026 | |
| CMO Series 2017-H04 Class DA | ||||
| 12/20/2066 | 4.327% | 728 | 724 | |
| Series 2003-72 Class Z | ||||
| 11/16/2045 | 5.303% | 345,344 | 344,148 | |
| Government National Mortgage Association(d),(e) | ||||
| CMO Series 2014-150 Class IO | ||||
| 07/16/2056 | 0.382% | 11,509,274 | 210,133 | |
| CMO Series 2014-H05 Class AI | ||||
| 02/20/2064 | 1.305% | 4,543,145 | 200,398 | |
| CMO Series 2014-H14 Class BI | ||||
| 06/20/2064 | 1.605% | 5,148,347 | 228,643 | |
| CMO Series 2014-H15 Class HI | ||||
| 05/20/2064 | 1.429% | 6,211,424 | 216,375 | |
| CMO Series 2014-H20 Class HI | ||||
| 10/20/2064 | 1.311% | 2,145,467 | 115,505 | |
| CMO Series 2015-163 Class IO | ||||
| 12/16/2057 | 0.760% | 1,890,467 | 58,905 | |
| CMO Series 2015-189 Class IG | ||||
| 01/16/2057 | 0.736% | 8,394,552 | 260,605 | |
| CMO Series 2015-30 Class IO | ||||
| 07/16/2056 | 0.675% | 2,963,524 | 88,092 | |
| Residential Mortgage-Backed Securities - Agency (continued) | ||||
| Issuer | Coupon Rate | Principal Amount ($) | Value ($) | |
| CMO Series 2015-32 Class IO | ||||
| 09/16/2049 | 0.611% | 4,689,879 | 105,555 | |
| CMO Series 2015-73 Class IO | ||||
| 11/16/2055 | 0.522% | 1,622,611 | 28,262 | |
| CMO Series 2015-9 Class IO | ||||
| 02/16/2049 | 0.623% | 9,535,076 | 206,364 | |
| CMO Series 2015-H22 Class BI | ||||
| 09/20/2065 | 1.757% | 2,076,677 | 94,141 | |
| CMO Series 2016-72 Class IO | ||||
| 12/16/2055 | 0.775% | 6,894,189 | 211,099 | |
| CMO Series 2021-33 Class IO | ||||
| 10/16/2062 | 0.839% | 8,004,135 | 547,734 | |
| CMO Series 2021-40 Class IO | ||||
| 02/16/2063 | 0.824% | 7,067,868 | 486,226 | |
| CMO Series 2021-H03 Class IO | ||||
| 04/20/2070 | 2.678% | 17,360,613 | 416,655 | |
| CMO Series 2021-H08 Class IA | ||||
| 01/20/2068 | 2.739% | 2,046,422 | 122,148 | |
| Government National Mortgage Association(e) | ||||
| CMO Series 2016-88 Class PI | ||||
| 07/20/2046 | 4.000% | 6,612,488 | 1,092,148 | |
| CMO Series 2017-101 Class AI | ||||
| 07/20/2047 | 4.000% | 4,452,646 | 623,630 | |
| CMO Series 2017-52 Class AI | ||||
| 04/20/2047 | 6.000% | 3,368,526 | 579,408 | |
| CMO Series 2017-68 Class TI | ||||
| 05/20/2047 | 5.500% | 1,371,754 | 224,313 | |
| CMO Series 2019-108 Class MI | ||||
| 07/20/2049 | 3.500% | 8,774,982 | 1,246,877 | |
| CMO Series 2019-99 Class AI | ||||
| 08/16/2049 | 4.000% | 5,428,460 | 1,203,125 | |
| CMO Series 2020-134 Class AI | ||||
| 09/20/2050 | 3.000% | 10,830,925 | 1,490,080 | |
| Government National Mortgage Association TBA(c) | ||||
| 10/21/2051- 09/21/2052 | 4.000% | 12,755,000 | 12,565,026 | |
| 09/21/2052 | 2.500% | 35,325,000 | 32,238,202 | |
| 09/21/2052 | 3.000% | 2,200,000 | 2,067,141 | |
| 09/21/2052 | 3.500% | 42,000,000 | 40,552,801 | |
| 09/21/2052 | 4.500% | 5,750,000 | 5,759,194 | |
| Seasoned Credit Risk Transfer Trust | ||||
| CMO Series 2018-2 Class MV (FHLMC) | ||||
| 11/25/2057 | 3.500% | 4,199,342 | 4,062,762 | |
| 72 | Multi-Manager Total Return Bond Strategies Fund | Annual Report 2022 |
August 31, 2022
| Residential Mortgage-Backed Securities - Agency (continued) | ||||
| Issuer | Coupon Rate | Principal Amount ($) | Value ($) | |
| Uniform Mortgage-Backed Security TBA(c) | ||||
| 09/19/2037- 10/13/2052 | 2.000% | 172,758,000 | 149,673,954 | |
| 09/19/2037- 10/13/2052 | 2.500% | 189,823,000 | 170,267,780 | |
| 09/19/2037- 10/13/2052 | 3.000% | 125,450,000 | 116,259,303 | |
| 10/18/2037- 09/14/2052 | 4.000% | 194,069,000 | 189,740,631 | |
| 09/14/2052- 10/13/2052 | 3.500% | 134,575,000 | 128,449,103 | |
| 09/14/2052- 10/13/2052 | 4.500% | 281,400,000 | 279,935,491 | |
| Total Residential Mortgage-Backed Securities - Agency (Cost $2,586,022,449) | 2,476,066,678 | |||
| Residential Mortgage-Backed Securities - Non-Agency(n) 4.6% | ||||
| ACE Securities Corp. Home Equity Loan Trust(b) | ||||
| CMO Series 2006-OP1 Class A2D | ||||
| 1-month USD LIBOR + 0.480% Floor 0.240% 04/25/2036 | 2.924% | 8,640,354 | 7,750,857 | |
| Ajax Mortgage Loan Trust(a),(d) | ||||
| CMO Series 2019-F Class A1 | ||||
| 07/25/2059 | 2.860% | 5,320,382 | 5,106,019 | |
| Arroyo Mortgage Trust(a) | ||||
| CMO Series 2022-1 Class A3 | ||||
| 12/25/2056 | 3.650% | 1,000,000 | 850,260 | |
| Banc of America Funding Trust | ||||
| CMO Series 2006-3 Class 4A14 | ||||
| 03/25/2036 | 6.000% | 378,977 | 330,170 | |
| CMO Series 2006-3 Class 5A3 | ||||
| 03/25/2036 | 5.500% | 396,436 | 350,411 | |
| Banc of America Funding Trust(s) | ||||
| CMO Series 2006-D Class 3A1 | ||||
| 05/20/2036 | 3.404% | 715,607 | 648,739 | |
| Banc of America Funding Trust(b) | ||||
| CMO Series 2007-C Class 7A1 | ||||
| 1-month USD LIBOR + 0.420% Floor 0.420% 05/20/2047 | 2.788% | 1,627,319 | 1,514,300 | |
| Bayview MSR Opportunity Master Fund Trust(a),(d) | ||||
| Subordinated CMO Series 2021-5 Class B1 | ||||
| 11/25/2051 | 3.490% | 982,427 | 845,060 | |
| Subordinated CMO Series 2022-2 Class B3A | ||||
| 12/25/2051 | 3.414% | 1,481,827 | 1,112,317 | |
| Bellemeade Re Ltd.(a),(b) | ||||
| CMO Series 2019-1A Class M2 | ||||
| 1-month USD LIBOR + 2.700% Floor 2.700% 03/25/2029 | 5.073% | 2,290,000 | 2,294,312 | |
| Residential Mortgage-Backed Securities - Non-Agency(n) (continued) | ||||
| Issuer | Coupon Rate | Principal Amount ($) | Value ($) | |
| CMO Series 2021-3A Class M1C | ||||
| 30-day Average SOFR + 1.550% Floor 1.550% 09/25/2031 | 3.733% | 2,200,000 | 2,034,555 | |
| CMO Series 2022-1 Class M1C | ||||
| 30-day Average SOFR + 3.700% Floor 3.700% 01/26/2032 | 5.908% | 2,500,000 | 2,481,951 | |
| BRAVO Residential Funding Trust(a),(d) | ||||
| CMO Series 2021-B Class A1 | ||||
| 04/01/2069 | 2.115% | 3,011,840 | 2,845,982 | |
| BVRT Financing Trust(a),(b),(h),(j) | ||||
| CMO Series 2021-4F Class A | ||||
| 1-month USD LIBOR + 0.000% 09/14/2026 | 2.050% | 4,104,032 | 4,083,512 | |
| Carrington Mortgage Loan Trust(b) | ||||
| CMO Series 2006-NC3 Class A3 | ||||
| 1-month USD LIBOR + 0.150% Floor 0.150%, Cap 12.500% 08/25/2036 | 2.594% | 1,547,050 | 1,469,487 | |
| CMO Series 2006-NC3 Class A4 | ||||
| 1-month USD LIBOR + 0.240% Floor 0.240%, Cap 12.500% 08/25/2036 | 2.684% | 9,300,000 | 7,512,368 | |
| Central Park Funding Trust(a),(b) | ||||
| CMO Series 2021-2 Class PT | ||||
| 1-month USD LIBOR + 3.000% 10/27/2022 | 3.093% | 6,948,228 | 6,871,181 | |
| Chase Mortgage Finance Corp.(a),(d) | ||||
| Subordinated CMO Series 2019-1 Class B2 | ||||
| 03/25/2050 | 3.913% | 941,440 | 832,105 | |
| Subordinated Series 2016-SH1 Class M2 | ||||
| 04/25/2045 | 3.750% | 233,080 | 209,482 | |
| CIM Group(a),(d) | ||||
| CMO Series 2020-R7 Class A1A | ||||
| 12/27/2061 | 2.250% | 7,218,489 | 6,737,614 | |
| CIM Trust(a),(b) | ||||
| CMO Series 2018-R6 Class A1 | ||||
| 1-month USD LIBOR + 1.076% Floor 1.076% 09/25/2058 | 3.640% | 3,532,028 | 3,491,566 | |
| CIM Trust(a),(d) | ||||
| CMO Series 2019-J2 Class B1 | ||||
| 10/25/2049 | 3.769% | 839,422 | 812,204 | |
| CMO Series 2019-R5 Class M2 | ||||
| 09/25/2059 | 3.250% | 1,100,000 | 1,006,047 | |
| CMO Series 2020-R4 Class A1A | ||||
| 06/25/2060 | 3.300% | 6,856,810 | 6,529,345 | |
| Multi-Manager Total Return Bond Strategies Fund | Annual Report 2022 | 73 |
August 31, 2022
| Residential Mortgage-Backed Securities - Non-Agency(n) (continued) | ||||
| Issuer | Coupon Rate | Principal Amount ($) | Value ($) | |
| CMO Series 2020-R6 Class A1A | ||||
| 12/25/2060 | 2.250% | 4,547,403 | 4,218,738 | |
| CMO Series 2021-NR2 Class A1 | ||||
| 07/25/2059 | 2.568% | 6,576,558 | 6,242,572 | |
| CMO Series 2021-R3 Class A1A | ||||
| 06/25/2057 | 1.951% | 9,346,015 | 8,504,069 | |
| CMO Series 2022-I1 Class A1 | ||||
| 02/25/2067 | 4.350% | 6,585,168 | 6,455,641 | |
| Citicorp Mortgage Securities Trust | ||||
| CMO Series 2007-8 Class 1A3 | ||||
| 09/25/2037 | 6.000% | 243,419 | 236,634 | |
| Citigroup Mortgage Loan Trust(a),(d),(h),(j) | ||||
| CMO Series 2022-A Class A1 | ||||
| 09/25/2062 | 6.170% | 2,400,000 | 2,399,997 | |
| Citigroup Mortgage Loan Trust, Inc.(a),(d) | ||||
| Subordinated CMO Series 2021-J2 Class B3W | ||||
| 07/25/2051 | 2.772% | 484,007 | 372,655 | |
| Connecticut Avenue Securities Trust(a),(b) | ||||
| CMO Series 2019-R01 Class 2M2 | ||||
| 1-month USD LIBOR + 2.450% 07/25/2031 | 4.894% | 286,344 | 287,056 | |
| CMO Series 2019-R02 Class 1M2 | ||||
| 1-month USD LIBOR + 2.300% 08/25/2031 | 4.744% | 116,705 | 116,121 | |
| CMO Series 2020-R02 Class 2M2 | ||||
| 1-month USD LIBOR + 2.000% 01/25/2040 | 4.444% | 327,566 | 323,669 | |
| CMO Series 2020-SBT1 Class 1M2 | ||||
| 1-month USD LIBOR + 3.650% 02/25/2040 | 6.094% | 1,500,000 | 1,513,097 | |
| CMO Series 2020-SBT1 Class 2M2 | ||||
| 1-month USD LIBOR + 3.650% 02/25/2040 | 6.094% | 3,500,000 | 3,543,155 | |
| CMO Series 2022-R07 Class 1M2 | ||||
| 30-day Average SOFR + 4.650% 06/25/2042 | 6.833% | 2,700,000 | 2,816,574 | |
| Subordinated CMO Series 2019-R05 Class 1B1 | ||||
| 1-month USD LIBOR + 4.100% 07/25/2039 | 6.544% | 1,784,936 | 1,797,614 | |
| Subordinated CMO Series 2020-R02 Class 2B1 | ||||
| 1-month USD LIBOR + 3.000% 01/25/2040 | 5.444% | 2,500,000 | 2,335,450 | |
| Subordinated CMO Series 2022-R04 Class 1B1 | ||||
| 30-day Average SOFR + 5.250% 03/25/2042 | 7.433% | 750,000 | 745,937 | |
| Residential Mortgage-Backed Securities - Non-Agency(n) (continued) | ||||
| Issuer | Coupon Rate | Principal Amount ($) | Value ($) | |
| Countrywide Home Loan Mortgage Pass-Through Trust(d) | ||||
| CMO Series 2007-HY5 Class 1A1 | ||||
| 09/25/2047 | 3.859% | 309,910 | 256,610 | |
| Credit Suisse Mortgage Capital Trust(a),(d) | ||||
| CMO Series 2021-RP11 Class PT | ||||
| 10/25/2061 | 3.759% | 8,233,285 | 6,915,254 | |
| Credit Suisse Mortgage Trust(a),(d) | ||||
| CMO Series 2022-ATH2 Class A1 | ||||
| 05/25/2067 | 4.570% | 7,125,487 | 7,012,700 | |
| CMO Series 2022-ATH3 Class A3 | ||||
| 08/25/2067 | 6.392% | 1,764,494 | 1,764,350 | |
| CMO Series 2022-JR1 Class A1 | ||||
| 10/25/2066 | 4.267% | 6,355,639 | 6,136,001 | |
| Credit-Based Asset Servicing & Securitization LLC(d) | ||||
| CMO Series 2007-CB1 Class AF3 | ||||
| 01/25/2037 | 5.737% | 3,513,221 | 1,222,341 | |
| CSMC Trust(a),(d) | ||||
| CMO Series 2018-RPL9 Class A | ||||
| 09/25/2057 | 3.850% | 5,762,186 | 5,564,308 | |
| CMO Series 2020-RPL2 Class A12 | ||||
| 02/25/2060 | 3.436% | 3,740,022 | 3,586,071 | |
| CMO Series 2020-RPL6 Class A1 | ||||
| 03/25/2059 | 2.688% | 2,774,997 | 2,755,403 | |
| CSMCM Trust(a) | ||||
| CMO Series 2021-RP11 Class CERT | ||||
| 10/27/2061 | 3.778% | 342,918 | 290,604 | |
| CSMCM Trust Certificates(a),(d),(h),(j) | ||||
| CMO Series 2018-RPL4 Class CERT | ||||
| 07/25/2050 | 3.735% | 1,623,762 | 1,526,900 | |
| Deephaven Residential Mortgage Trust(a),(d) | ||||
| CMO Series 2021-4 Class M1 | ||||
| 11/25/2066 | 3.257% | 2,000,000 | 1,513,568 | |
| CMO Series 2022-2 Class A3 | ||||
| 03/25/2067 | 4.300% | 1,981,859 | 1,909,877 | |
| Domino’s Pizza Master Issuer LLC(a) | ||||
| CMO Series 2015-1A Class A2II | ||||
| 10/25/2045 | 4.474% | 1,885,000 | 1,830,128 | |
| Downey Savings & Loan Association Mortgage Loan Trust(b) | ||||
| CMO Series 2005-AR6 Class 2A1A | ||||
| 1-month USD LIBOR + 0.580% Floor 0.290%, Cap 11.000% 10/19/2045 | 2.946% | 1,152,804 | 995,711 | |
| CMO Series 2006-AR2 Class 2A1A | ||||
| 1-month USD LIBOR + 0.200% Floor 0.200% 10/19/2036 | 2.566% | 1,904,361 | 1,367,663 | |
| 74 | Multi-Manager Total Return Bond Strategies Fund | Annual Report 2022 |
August 31, 2022
| Residential Mortgage-Backed Securities - Non-Agency(n) (continued) | ||||
| Issuer | Coupon Rate | Principal Amount ($) | Value ($) | |
| Eagle Re Ltd.(a),(b) | ||||
| CMO Series 2019-1 Class M1B | ||||
| 1-month USD LIBOR + 1.800% 04/25/2029 | 4.244% | 493,283 | 491,594 | |
| CMO Series 2021-2 Class M1C | ||||
| 30-day Average SOFR + 3.450% Floor 3.450% 04/25/2034 | 4.964% | 1,500,000 | 1,489,227 | |
| Fannie Mae Connecticut Avenue Securities(b) | ||||
| CMO Series 2015-C02 Class 1M2 | ||||
| 1-month USD LIBOR + 4.000% Floor 4.000% 05/25/2025 | 6.444% | 812,435 | 830,091 | |
| CMO Series 2015-C03 Class 1M2 | ||||
| 1-month USD LIBOR + 5.000% Floor 5.000% 07/25/2025 | 7.444% | 151,077 | 155,906 | |
| CMO Series 2015-C04 Class 1M2 | ||||
| 1-month USD LIBOR + 5.700% 04/25/2028 | 8.144% | 1,309,689 | 1,375,413 | |
| CMO Series 2015-C04 Class 2M2 | ||||
| 1-month USD LIBOR + 5.550% 04/25/2028 | 7.994% | 1,262,641 | 1,303,677 | |
| CMO Series 2017-C04 Class 2M2 | ||||
| 1-month USD LIBOR + 2.850% 11/25/2029 | 5.294% | 2,646,796 | 2,711,768 | |
| CMO Series 2017-C07 Class 2M2 | ||||
| 1-month USD LIBOR + 2.500% 05/25/2030 | 4.944% | 1,877,413 | 1,908,953 | |
| CMO Series 2018-C06 Class 1M2 | ||||
| 1-month USD LIBOR + 2.000% Floor 2.000% 03/25/2031 | 4.444% | 2,964,913 | 2,974,565 | |
| CMO Series 2018-C06 Class 2M2 | ||||
| 1-month USD LIBOR + 2.100% Floor 2.100% 03/25/2031 | 4.544% | 1,788,187 | 1,791,591 | |
| Federal Home Loan Mortgage Corp. Structured Agency Credit Risk Debt Notes(a),(b) | ||||
| CMO Series 2022-HQA2 Class M2 | ||||
| 30-day Average SOFR + 6.000% 07/25/2042 | 8.183% | 2,000,000 | 2,043,400 | |
| First Franklin Mortgage Loan Trust(b) | ||||
| CMO Series 2006-FF18 Class A2D | ||||
| 1-month USD LIBOR + 0.210% Floor 0.210% 12/25/2037 | 2.654% | 1,324,832 | 1,213,018 | |
| Residential Mortgage-Backed Securities - Non-Agency(n) (continued) | ||||
| Issuer | Coupon Rate | Principal Amount ($) | Value ($) | |
| CMO Series 2007-FF2 Class A2B | ||||
| 1-month USD LIBOR + 0.100% Floor 0.100% 03/25/2037 | 2.544% | 3,425,344 | 1,771,367 | |
| First Horizon Mortgage Pass-Through Trust(d) | ||||
| CMO Series 2007-AR1 Class 1A1 | ||||
| 05/25/2037 | 2.846% | 198,634 | 89,002 | |
| Flagstar Mortgage Trust(a),(d) | ||||
| Subordinated CMO Series 2018-5 Class B3 | ||||
| 09/25/2048 | 4.536% | 919,059 | 859,568 | |
| Subordinated CMO Series 2019-2 Class B1 | ||||
| 12/25/2049 | 4.042% | 882,464 | 837,093 | |
| Subordinated CMO Series 2019-2 Class B2 | ||||
| 12/25/2049 | 4.042% | 943,812 | 839,909 | |
| Freddie Mac STACR REMIC Trust(a),(b) | ||||
| CMO Series 2020-DNA2 Class M2 | ||||
| 1-month USD LIBOR + 1.850% 02/25/2050 | 4.294% | 1,424,891 | 1,423,239 | |
| CMO Series 2020-HQA1 Class M2 | ||||
| 1-month USD LIBOR + 1.900% 01/25/2050 | 4.344% | 57,377 | 57,315 | |
| CMO Series 2020-HQA2 Class M2 | ||||
| 1-month USD LIBOR + 3.100% 03/25/2050 | 5.544% | 1,584,379 | 1,615,793 | |
| CMO Series 2020-HQA3 Class M2 | ||||
| 1-month USD LIBOR + 3.600% 07/25/2050 | 6.044% | 218,972 | 219,210 | |
| CMO Series 2021-DNA5 Class M2 | ||||
| 30-day Average SOFR + 1.650% 01/25/2034 | 3.833% | 1,338,259 | 1,330,066 | |
| CMO Series 2021-HQA1 Class B1 | ||||
| 30-day Average SOFR + 3.000% 08/25/2033 | 5.183% | 6,000,000 | 5,401,349 | |
| CMO Series 2021-HQA1 Class M2 | ||||
| 30-day Average SOFR + 2.250% 08/25/2033 | 4.433% | 11,700,000 | 11,257,395 | |
| CMO Series 2021-HQA3 Class M2 | ||||
| 30-day Average SOFR + 2.100% 09/25/2041 | 4.283% | 3,810,000 | 3,482,825 | |
| CMO Series 2021-HQA4 Class M2 | ||||
| 30-day Average SOFR + 2.350% 12/25/2041 | 4.533% | 3,000,000 | 2,757,200 | |
| Multi-Manager Total Return Bond Strategies Fund | Annual Report 2022 | 75 |
August 31, 2022
| Residential Mortgage-Backed Securities - Non-Agency(n) (continued) | ||||
| Issuer | Coupon Rate | Principal Amount ($) | Value ($) | |
| CMO Series 2022-DNA1 Class M2 | ||||
| 30-day Average SOFR + 2.500% 01/25/2042 | 4.683% | 2,000,000 | 1,825,348 | |
| CMO Series 2022-DNA3 Class M1B | ||||
| 30-day Average SOFR + 2.900% 04/25/2042 | 4.414% | 3,940,000 | 3,895,973 | |
| CMO Series 2022-DNA5 Class M2 | ||||
| 30-day Average SOFR + 6.750% 06/25/2042 | 8.933% | 3,000,000 | 3,169,740 | |
| CMO Series 2022-HQA3 Class M2 | ||||
| 30-day Average SOFR + 5.350% 08/25/2042 | 7.158% | 2,000,000 | 1,995,803 | |
| Subordinated CMO Series 2021-DNA3 Class B1 | ||||
| 30-day Average SOFR + 3.500% 10/25/2033 | 5.683% | 2,025,000 | 1,902,242 | |
| Subordinated CMO Series 2021-DNA6 Class B1 | ||||
| 30-day Average SOFR + 3.400% 10/25/2041 | 3.400% | 2,000,000 | 1,895,825 | |
| Subordinated CMO Series 2021-DNA7 Class M2 | ||||
| 30-day Average SOFR + 1.800% 11/25/2041 | 3.314% | 860,000 | 808,399 | |
| Subordinated CMO Series 2021-HQA3 Class B1 | ||||
| 30-day Average SOFR + 3.350% 09/25/2041 | 5.533% | 1,220,000 | 1,107,126 | |
| Subordinated CMO Series 2021-HQA4 Class B1 | ||||
| 30-day Average SOFR + 3.750% 12/25/2041 | 5.933% | 6,000,000 | 5,476,339 | |
| Subordinated CMO Series 2022-DNA1 Class B1 | ||||
| 30-day Average SOFR + 3.400% 01/25/2042 | 5.583% | 3,000,000 | 2,737,683 | |
| Freddie Mac Structured Agency Credit Risk Debt Notes(a),(b) | ||||
| CMO Series 2020-HQA5 Class M2 | ||||
| 30-day Average SOFR + 2.600% 11/25/2050 | 4.783% | 5,747,141 | 5,788,580 | |
| CMO Series 2021-DNA2 Class M2 | ||||
| 30-day Average SOFR + 2.300% 08/25/2033 | 4.483% | 1,000,000 | 985,022 | |
| Residential Mortgage-Backed Securities - Non-Agency(n) (continued) | ||||
| Issuer | Coupon Rate | Principal Amount ($) | Value ($) | |
| Subordinated CMO Series 2020-HQA5 Class B1 | ||||
| 30-day Average SOFR + 4.000% 11/25/2050 | 6.183% | 1,805,000 | 1,804,990 | |
| Subordinated CMO Series 2021-DNA7 Class B1 | ||||
| 30-day Average SOFR + 3.650% 11/25/2041 | 5.164% | 810,000 | 768,548 | |
| Galton Funding Mortgage Trust(a),(d) | ||||
| CMO Series 2019-1 Class B1 | ||||
| 02/25/2059 | 4.250% | 1,617,989 | 1,577,548 | |
| CMO Series 2019-1 Class B2 | ||||
| 02/25/2059 | 4.500% | 908,623 | 883,526 | |
| Subordinated CMO Series 2018-2 Class B2 | ||||
| 10/25/2058 | 4.750% | 474,513 | 440,808 | |
| GCAT LLC(a),(d),(h),(j) | ||||
| CMO Series 2021-1 Class A1 | ||||
| 11/25/2049 | 2.487% | 7,035,422 | 6,596,890 | |
| Genworth Mortgage Insurance Corp.(a),(b) | ||||
| CMO Series 2021-3 Class M1B | ||||
| 30-day Average SOFR + 2.900% Floor 2.900% 02/25/2034 | 4.414% | 1,000,000 | 973,612 | |
| GS Mortgage-Backed Securities Corp. Trust(a),(d) | ||||
| CMO Series 2019-PJ3 Class A1 | ||||
| 03/25/2050 | 3.500% | 23,993 | 23,379 | |
| GS Mortgage-Backed Securities Trust(a),(d) | ||||
| Subordinated CMO Series 2021-GR3 Class B3 | ||||
| 04/25/2052 | 3.392% | 1,013,843 | 757,711 | |
| GSAMP Trust(b) | ||||
| CMO Series 2004-OPT Class M1 | ||||
| 1-month USD LIBOR + 0.870% Floor 0.580% 11/25/2034 | 3.314% | 1,033,197 | 1,005,617 | |
| GSR Mortgage Loan Trust(d) | ||||
| CMO Series 2006-AR2 Class 2A1 | ||||
| 04/25/2036 | 2.747% | 1,003,422 | 727,795 | |
| HarborView Mortgage Loan Trust(b) | ||||
| CMO Series 2006-10 Class 1A1A | ||||
| 1-month USD LIBOR + 0.200% Floor 0.200% 11/19/2036 | 2.566% | 5,815,925 | 4,929,222 | |
| HSI Asset Securitization Corp. Trust(b) | ||||
| CMO Series 2006-OPT1 Class M1 | ||||
| 1-month USD LIBOR + 0.540% Floor 0.360% 12/25/2035 | 2.984% | 1,834,290 | 1,818,426 | |
| 76 | Multi-Manager Total Return Bond Strategies Fund | Annual Report 2022 |
August 31, 2022
| Residential Mortgage-Backed Securities - Non-Agency(n) (continued) | ||||
| Issuer | Coupon Rate | Principal Amount ($) | Value ($) | |
| JPMorgan Alternative Loan Trust(b) | ||||
| CMO Series 2007-S1 Class A1 | ||||
| 1-month USD LIBOR + 0.560% Floor 0.280%, Cap 11.500% 04/25/2047 | 3.004% | 2,593,133 | 2,465,072 | |
| JPMorgan Mortgage Acquisition Trust(b) | ||||
| CMO Series 2007-CH5 Class A5 | ||||
| 1-month USD LIBOR + 0.260% Floor 0.260% 06/25/2037 | 2.704% | 1,017,330 | 1,013,095 | |
| JPMorgan Mortgage Trust | ||||
| CMO Series 2006-S2 Class 2A2 | ||||
| 12/31/2049 | 5.875% | 7,045 | 28,412 | |
| JPMorgan Mortgage Trust(a),(d) | ||||
| CMO Series 2018-5 Class A13 | ||||
| 10/25/2048 | 3.500% | 916,192 | 836,218 | |
| CMO Series 2018-6 Class 1A10 | ||||
| 12/25/2048 | 3.500% | 154,258 | 144,538 | |
| CMO Series 2019-1 Class A3 | ||||
| 05/25/2049 | 4.000% | 335,603 | 326,078 | |
| CMO Series 2019-2 Class A3 | ||||
| 08/25/2049 | 4.000% | 114,914 | 112,675 | |
| CMO Series 2019-5 Class A3 | ||||
| 11/25/2049 | 4.000% | 248,440 | 244,297 | |
| CMO Series 2019-8 Class A15 | ||||
| 03/25/2050 | 3.500% | 158,949 | 149,008 | |
| CMO Series 2019-9 Class B2A | ||||
| 05/25/2050 | 3.427% | 1,424,239 | 1,243,881 | |
| CMO Series 2019-HYB1 Class B1 | ||||
| 10/25/2049 | 3.718% | 957,296 | 944,751 | |
| CMO Series 2019-INV2 Class A3 | ||||
| 02/25/2050 | 3.500% | 146,841 | 140,328 | |
| CMO Series 2019-LTV2 Class A18 | ||||
| 12/25/2049 | 4.000% | 13,888 | 13,684 | |
| CMO Series 2019-LTV3 Class B3 | ||||
| 03/25/2050 | 4.389% | 1,598,337 | 1,473,559 | |
| CMO Series 2020-1 Class A15 | ||||
| 06/25/2050 | 3.500% | 469,102 | 432,157 | |
| CMO Series 2020-2 Class A15 | ||||
| 07/25/2050 | 3.500% | 309,668 | 283,401 | |
| CMO Series 2020-5 Class A15 | ||||
| 12/25/2050 | 3.000% | 225,120 | 199,461 | |
| CMO Series 2020-5 Class B1 | ||||
| 12/25/2050 | 3.598% | 955,098 | 909,737 | |
| CMO Series 2021-13 Class A3 | ||||
| 04/25/2052 | 2.500% | 10,555,587 | 9,049,354 | |
| Subordinated CMO Series 2017-1 Class B4 | ||||
| 01/25/2047 | 3.450% | 423,955 | 357,396 | |
| Residential Mortgage-Backed Securities - Non-Agency(n) (continued) | ||||
| Issuer | Coupon Rate | Principal Amount ($) | Value ($) | |
| Subordinated CMO Series 2017-3 Class B1 | ||||
| 08/25/2047 | 3.756% | 1,288,117 | 1,212,819 | |
| Subordinated CMO Series 2017-6 Class B2 | ||||
| 12/25/2048 | 3.771% | 539,897 | 484,430 | |
| Subordinated CMO Series 2018-8 Class B1 | ||||
| 01/25/2049 | 4.065% | 1,101,673 | 1,051,529 | |
| Subordinated CMO Series 2018-8 Class B2 | ||||
| 01/25/2049 | 4.065% | 918,061 | 843,899 | |
| Subordinated CMO Series 2019-2 Class B2 | ||||
| 08/25/2049 | 4.514% | 2,149,543 | 2,092,185 | |
| Subordinated CMO Series 2019-6 Class B1 | ||||
| 12/25/2049 | 4.232% | 941,934 | 909,998 | |
| Subordinated CMO Series 2019-8 Class B3A | ||||
| 03/25/2050 | 3.427% | 1,890,879 | 1,690,710 | |
| Subordinated CMO Series 2019-LTV1 Class B2 | ||||
| 06/25/2049 | 4.571% | 1,857,574 | 1,766,445 | |
| Subordinated CMO Series 2019-LTV2 Class B2 | ||||
| 12/25/2049 | 4.710% | 1,132,091 | 1,068,723 | |
| Subordinated CMO Series 2019-LTV2 Class B3 | ||||
| 12/25/2049 | 4.710% | 943,409 | 903,509 | |
| Subordinated CMO Series 2020-8 Class B2 | ||||
| 03/25/2051 | 3.515% | 1,906,049 | 1,603,007 | |
| Subordinated CMO Series 2022-LTV2 Class A1 | ||||
| 11/25/2052 | 3.309% | 1,597,968 | 1,237,675 | |
| JPMorgan Mortgage Trust(a),(b) | ||||
| CMO Series 2018-7FRB Class A1 | ||||
| 1-month USD LIBOR + 0.750% 04/25/2046 | 3.194% | 692,568 | 671,389 | |
| JPMorgan Trust(a),(d) | ||||
| Subordinated CMO Series 2015-3 Class B3 | ||||
| 05/25/2045 | 3.586% | 480,392 | 452,128 | |
| Legacy Mortgage Asset Trust(a),(d) | ||||
| CMO Series 2019-PR1 Class A1 | ||||
| 09/25/2059 | 3.858% | 7,570,780 | 7,515,741 | |
| CMO Series 2020-GS1 Class A1 | ||||
| 10/25/2059 | 2.882% | 3,373,952 | 3,316,462 | |
| CMO Series 2020-GS2 Class A1 | ||||
| 03/25/2060 | 2.750% | 12,490,470 | 12,468,884 | |
| CMO Series 2020-SL1 Class A | ||||
| 01/25/2060 | 2.734% | 797,874 | 773,102 | |
| CMO Series 2021-GS1 Class A1 | ||||
| 10/25/2066 | 1.892% | 1,059,931 | 987,472 | |
| CMO Series 2021-SL1 Class A | ||||
| 09/25/2060 | 1.991% | 1,157,467 | 1,135,869 | |
| Multi-Manager Total Return Bond Strategies Fund | Annual Report 2022 | 77 |
August 31, 2022
| Residential Mortgage-Backed Securities - Non-Agency(n) (continued) | ||||
| Issuer | Coupon Rate | Principal Amount ($) | Value ($) | |
| Lehman XS Trust(b) | ||||
| CMO Series 2005-4 Class 1A3 | ||||
| 1-month USD LIBOR + 0.800% Floor 0.800% 10/25/2035 | 3.244% | 42,865 | 42,797 | |
| CMO Series 2005-5N Class 3A1A | ||||
| 1-month USD LIBOR + 0.300% Floor 0.300% 11/25/2035 | 2.744% | 510,017 | 504,436 | |
| CMO Series 2006-2N Class 1A1 | ||||
| 1-month USD LIBOR + 0.520% Floor 0.260% 02/25/2046 | 2.964% | 1,166,523 | 1,053,799 | |
| Loan Revolving Advance Investment Trust(a),(b),(h),(j) | ||||
| CMO Series 2021-2 Class A1X | ||||
| 1-month USD LIBOR + 2.750% Floor 2.750% 06/30/2023 | 4.721% | 10,400,000 | 10,400,000 | |
| Long Beach Mortgage Loan Trust(b) | ||||
| CMO Series 2006-10 Class 1A | ||||
| 1-month USD LIBOR + 0.150% Floor 0.150% 11/25/2036 | 2.594% | 3,811,433 | 2,718,349 | |
| CMO Series 2006-11 Class 2A2 | ||||
| 1-month USD LIBOR + 0.100% Floor 0.100% 12/25/2036 | 2.544% | 30,463,487 | 12,044,066 | |
| MASTR Alternative Loan Trust | ||||
| CMO Series 2004-12 Class 4A1 | ||||
| 12/25/2034 | 5.500% | 369,453 | 358,805 | |
| Mello Mortgage Capital Acceptance Trust(a),(d) | ||||
| Subordinated CMO Series 2021-INV1 Class B3 | ||||
| 06/25/2051 | 2.981% | 1,985,958 | 1,442,554 | |
| Merrill Lynch First Franklin Mortgage Loan Trust(b) | ||||
| CMO Series 2007-1 Class A2D | ||||
| 1-month USD LIBOR + 0.340% Floor 0.340% 04/25/2037 | 3.124% | 16,666,879 | 7,194,172 | |
| Morgan Stanley Resecuritization Trust(a),(d) | ||||
| CMO Series 2015-R4 Class 4B1 | ||||
| 08/26/2047 | 3.300% | 436,795 | 434,751 | |
| MortgageIT Trust(b) | ||||
| CMO Series 2005-5 Class A1 | ||||
| 1-month USD LIBOR + 0.520% Floor 0.260%, Cap 11.500% 12/25/2035 | 2.964% | 509,241 | 488,335 | |
| MRA Issuance Trust(a),(b) | ||||
| CMO Series 2020-7 Class A | ||||
| 1-month USD LIBOR + 1.300% Floor 1.300% 09/15/2022 | 3.673% | 10,191,000 | 10,188,156 | |
| Residential Mortgage-Backed Securities - Non-Agency(n) (continued) | ||||
| Issuer | Coupon Rate | Principal Amount ($) | Value ($) | |
| New Residential Mortgage Loan Trust(a),(b) | ||||
| CMO Series 2018-4A Class A1S | ||||
| 1-month USD LIBOR + 0.750% Floor 0.750% 01/25/2048 | 3.194% | 1,154,566 | 1,135,151 | |
| Oaktown Re II Ltd.(a),(b) | ||||
| CMO Series 2018-1A Class M1 | ||||
| 1-month USD LIBOR + 1.550% 07/25/2028 | 3.994% | 247,864 | 247,266 | |
| Oaktown Re III Ltd.(a),(b) | ||||
| CMO Series 2019-1A Class M1A | ||||
| 1-month USD LIBOR + 1.400% Floor 1.400% 07/25/2029 | 3.844% | 92,752 | 92,520 | |
| Oaktown Re V Ltd.(a),(b) | ||||
| CMO Series 2020-2A Class M1B | ||||
| 1-month USD LIBOR + 3.600% Floor 3.600% 10/25/2030 | 6.044% | 193,198 | 193,766 | |
| Oaktown Re VI Ltd.(a),(b) | ||||
| CMO Series 2021-1A Class M1A | ||||
| 30-day Average SOFR + 1.650% Floor 1.650% 10/25/2033 | 3.833% | 807,723 | 806,352 | |
| CMO Series 2021-1A Class M1B | ||||
| 30-day Average SOFR + 2.050% Floor 2.050% 10/25/2033 | 4.233% | 915,000 | 900,068 | |
| CMO Series 2021-1A Class M1C | ||||
| 30-day Average SOFR + 3.000% Floor 3.000% 10/25/2033 | 5.183% | 2,250,000 | 2,217,031 | |
| Oaktown Re VII Ltd.(a),(b) | ||||
| CMO Series 2021-2 Class M1B | ||||
| 30-day Average SOFR + 2.900% Floor 2.900% 04/25/2034 | 4.414% | 2,200,000 | 2,160,341 | |
| CMO Series 2021-2 Class M1C | ||||
| 30-day Average SOFR + 3.350% Floor 3.350% 04/25/2034 | 4.864% | 2,000,000 | 1,969,485 | |
| OBX Trust(a),(d) | ||||
| CMO Series 2019-EXP1 Class 1A3 | ||||
| 01/25/2059 | 4.000% | 79,750 | 78,285 | |
| CMO Series 2019-INV2 Class A25 | ||||
| 05/27/2049 | 4.000% | 104,163 | 100,004 | |
| 78 | Multi-Manager Total Return Bond Strategies Fund | Annual Report 2022 |
August 31, 2022
| Residential Mortgage-Backed Securities - Non-Agency(n) (continued) | ||||
| Issuer | Coupon Rate | Principal Amount ($) | Value ($) | |
| Opteum Mortgage Acceptance Corp. Asset Backed Pass-Through Certificates(b) | ||||
| CMO Series 2005-4 Class M2 | ||||
| 1-month USD LIBOR + 0.750% Floor 0.500% 11/25/2035 | 3.194% | 11,526,000 | 11,124,096 | |
| Preston Ridge Partners Mortgage Trust(a),(d),(h),(j) | ||||
| CMO Series 2022-4 Class A1 | ||||
| 08/25/2027 | 5.000% | 3,315,000 | 3,212,567 | |
| Pretium Mortgage Credit Partners LLC(a),(d) | ||||
| CMO Series 2021-RN2 Class A1 | ||||
| 07/25/2051 | 1.744% | 6,930,903 | 6,365,792 | |
| CMO Series 2022-RN2 Class A1 | ||||
| 06/25/2052 | 5.000% | 8,706,597 | 8,255,207 | |
| CMO Series 2022-RN2 Class A2 | ||||
| 06/25/2052 | 6.500% | 13,780,000 | 12,754,545 | |
| Pretium Mortgage Credit Partners LLC(a),(d),(h),(j) | ||||
| CMO Series 2022-RN3 Class A1 | ||||
| 08/25/2052 | 5.000% | 10,600,000 | 10,366,800 | |
| Radnor RE Ltd.(a),(b) | ||||
| CMO Series 2021-1 Class M1C | ||||
| 30-day Average SOFR + 2.700% Floor 2.700% 12/27/2033 | 4.883% | 3,000,000 | 2,932,166 | |
| RALI Trust(d) | ||||
| CMO Series 2005-QA4 Class A41 | ||||
| 04/25/2035 | 3.426% | 36,949 | 36,189 | |
| RALI Trust(d),(e) | ||||
| CMO Series 2006-QS18 Class 1AV | ||||
| 12/25/2036 | 0.461% | 21,897,239 | 267,409 | |
| CMO Series 2007-QS1 Class 2AV | ||||
| 01/25/2037 | 0.173% | 23,707,249 | 137,893 | |
| Rathlin Residential(a),(b) | ||||
| CMO Series 2021-1A Class A | ||||
| 1-month EURIBOR + 2.000% 09/27/2075 | 1.869% | EUR | 3,197,544 | 3,066,559 |
| RFMSI Trust(d) | ||||
| CMO Series 2005-SA5 Class 1A | ||||
| 11/25/2035 | 3.109% | 641,592 | 409,453 | |
| CMO Series 2006-SA4 Class 2A1 | ||||
| 11/25/2036 | 4.826% | 159,767 | 135,059 | |
| Seasoned Credit Risk Transfer Trust(d) | ||||
| CMO Series 2017-3SC Class HT (FHLMC) | ||||
| 07/25/2056 | 3.250% | 17,827,528 | 17,009,015 | |
| Seasoned Credit Risk Transfer Trust | ||||
| CMO Series 2017-4 Class M45T | ||||
| 06/25/2057 | 4.500% | 392,823 | 394,903 | |
| CMO Series 2018-2 Class HT (FHLMC) | ||||
| 11/25/2057 | 3.000% | 288,927 | 271,423 | |
| Residential Mortgage-Backed Securities - Non-Agency(n) (continued) | ||||
| Issuer | Coupon Rate | Principal Amount ($) | Value ($) | |
| CMO Series 2018-3 Class HT (FHLMC) | ||||
| 08/25/2057 | 3.000% | 313,507 | 293,934 | |
| CMO Series 2018-4 Class HT (FHLMC) | ||||
| 03/25/2058 | 3.000% | 260,032 | 243,746 | |
| CMO Series 2019-1 Class HT (FHLMC) | ||||
| 07/25/2058 | 3.000% | 311,578 | 292,607 | |
| CMO Series 2019-2 Class HT (FHLMC) | ||||
| 08/25/2058 | 3.000% | 197,476 | 185,527 | |
| CMO Series 2019-3 Class HT (FHLMC) | ||||
| 10/25/2058 | 3.000% | 63,909 | 60,041 | |
| Sequoia Mortgage Trust(a),(d) | ||||
| CMO Series 2019-4 Class A19 | ||||
| 11/25/2049 | 3.500% | 155,359 | 147,418 | |
| CMO Series 2019-CH2 Class A1 | ||||
| 08/25/2049 | 4.500% | 55,652 | 55,108 | |
| Subordinated CMO Series 2015-1 Class B1 | ||||
| 01/25/2045 | 3.917% | 333,069 | 319,089 | |
| Subordinated CMO Series 2018-6 Class B1 | ||||
| 07/25/2048 | 4.169% | 1,129,584 | 1,039,789 | |
| Subordinated CMO Series 2019-2 Class B2 | ||||
| 06/25/2049 | 4.254% | 1,829,410 | 1,683,344 | |
| Subordinated CMO Series 2020-3 Class B2 | ||||
| 04/25/2050 | 3.329% | 1,006,037 | 835,789 | |
| Structured Adjustable Rate Mortgage Loan Trust(d) | ||||
| CMO Series 2004-20 Class 1A2 | ||||
| 01/25/2035 | 3.503% | 417,040 | 402,700 | |
| CMO Series 2006-5 Class 1A1 | ||||
| 06/25/2036 | 3.155% | 717,538 | 664,177 | |
| Texas Capital Bank NA(a),(b) | ||||
| CMO Series 2021 Class NOTE | ||||
| 3-month USD LIBOR + 4.500% 09/30/2024 | 6.750% | 7,340,000 | 7,145,754 | |
| Toorak Mortgage Corp., Ltd.(a),(d) | ||||
| CMO Series 2022-INV2 Class A1 | ||||
| 06/25/2057 | 4.350% | 6,214,095 | 6,101,813 | |
| Verus Securitization Trust(a),(d) | ||||
| CMO Series 2022-INV1 Class A3 | ||||
| 08/25/2067 | 5.830% | 2,000,000 | 1,974,391 | |
| WaMu Asset-Backed Certificates Trust(b) | ||||
| CMO Series 2007-HE1 Class 2A3 | ||||
| 1-month USD LIBOR + 0.150% Floor 0.150% 01/25/2037 | 2.594% | 3,459,959 | 1,758,940 | |
| WaMu Mortgage Pass-Through Certificates Trust(d) | ||||
| CMO Series 2003-AR8 Class A | ||||
| 08/25/2033 | 4.154% | 239,802 | 234,939 | |
| CMO Series 2004-AR4 Class A6 | ||||
| 06/25/2034 | 3.468% | 1,808,183 | 1,747,224 | |
| Multi-Manager Total Return Bond Strategies Fund | Annual Report 2022 | 79 |
August 31, 2022
| Residential Mortgage-Backed Securities - Non-Agency(n) (continued) | ||||
| Issuer | Coupon Rate | Principal Amount ($) | Value ($) | |
| CMO Series 2004-AR7 Class A6 | ||||
| 07/25/2034 | 3.467% | 820,732 | 789,263 | |
| CMO Series 2007-HY1 Class 3A3 | ||||
| 02/25/2037 | 3.186% | 2,364,891 | 2,212,153 | |
| CMO Series 2007-HY3 Class 1A1 | ||||
| 03/25/2037 | 2.920% | 420,727 | 344,742 | |
| WaMu Mortgage Pass-Through Certificates Trust(b) | ||||
| CMO Series 2005-AR11 Class A1A | ||||
| 1-month USD LIBOR + 0.640% Floor 0.320%, Cap 10.500% 08/25/2045 | 3.084% | 619,105 | 595,196 | |
| CMO Series 2005-AR17 Class A1A1 | ||||
| 1-month USD LIBOR + 0.540% Floor 0.270%, Cap 10.500% 12/25/2045 | 2.984% | 2,124,642 | 1,960,501 | |
| CMO Series 2005-AR2 Class 2A1A | ||||
| 1-month USD LIBOR + 0.620% Floor 0.310%, Cap 10.500% 01/25/2045 | 3.064% | 554,682 | 535,653 | |
| CMO Series 2005-AR8 Class 2A1A | ||||
| 1-month USD LIBOR + 0.580% Floor 0.290%, Cap 10.500% 07/25/2045 | 3.024% | 1,896,075 | 1,764,829 | |
| CMO Series 2005-AR9 Class A1A | ||||
| 1-month USD LIBOR + 0.640% Floor 0.320%, Cap 10.500% 07/25/2045 | 3.084% | 484,676 | 450,448 | |
| CMO Series 2006-AR4 Class 1A1A | ||||
| 1-year MTA + 0.940% Floor 0.940% 05/25/2046 | 2.044% | 1,213,098 | 1,095,909 | |
| CMO Series 2006-AR5 Class A12A | ||||
| 1-year MTA + 0.980% Floor 0.980% 06/25/2046 | 2.084% | 336,885 | 319,852 | |
| CMO Series 2007-OC2 Class A3 | ||||
| 1-month USD LIBOR + 0.310% Floor 0.310% 06/25/2037 | 3.064% | 1,867,322 | 1,750,278 | |
| Wells Fargo Mortgage-Backed Securities Trust(a),(d) | ||||
| CMO Series 2019-1 Class A1 | ||||
| 11/25/2048 | 3.953% | 59,684 | 58,906 | |
| Subordinated CMO Series 2018-1 Class B3 | ||||
| 07/25/2047 | 3.668% | 1,077,742 | 960,396 | |
| Subordinated CMO Series 2020-1 Class B3 | ||||
| 12/25/2049 | 3.373% | 1,924,179 | 1,572,860 | |
| Total Residential Mortgage-Backed Securities - Non-Agency (Cost $520,580,583) | 494,062,957 | |||
| Rights 0.0% | ||
| Issuer | Shares | Value ($) |
| Materials 0.0% | ||
| Chemicals 0.0% | ||
| TPC Group, Inc.(h),(i),(j) | 700,569 | 1 |
| Total Materials | 1 | |
| Total Rights (Cost $—) | 1 | |
| Senior Loans 0.7% | ||||
| Borrower | Coupon Rate | Principal Amount ($) | Value ($) | |
| Aerospace & Defense 0.0% | ||||
| TransDigm, Inc.(b),(t) | ||||
| Tranche E Term Loan | ||||
| 1-month USD LIBOR + 2.250% 05/30/2025 | 4.774% | 726,338 | 708,252 | |
| Tranche F Term Loan | ||||
| 1-month USD LIBOR + 2.250% 12/09/2025 | 4.774% | 226,139 | 219,950 | |
| Total | 928,202 | |||
| Airlines 0.0% | ||||
| American Airlines, Inc.(b),(t) | ||||
| Term Loan | ||||
| 1-month USD LIBOR + 1.750% 01/29/2027 | 4.274% | 172,737 | 158,595 | |
| United AirLines, Inc.(b),(t) | ||||
| Tranche B Term Loan | ||||
| 3-month USD LIBOR + 3.750% Floor 0.750% 04/21/2028 | 6.533% | 1,087,846 | 1,055,820 | |
| Total | 1,214,415 | |||
| Automotive 0.1% | ||||
| Clarios Global LP(b),(t) | ||||
| 1st Lien Term Loan | ||||
| 1-month USD LIBOR + 3.250% 04/30/2026 | 5.774% | 1,686,524 | 1,639,302 | |
| Tenneco, Inc.(b),(t) | ||||
| Tranche A Term Loan | ||||
| 3-month USD LIBOR + 2.000% 09/29/2023 | 4.524% | 8,626,181 | 8,496,788 | |
| Total | 10,136,090 | |||
| Cable and Satellite 0.1% | ||||
| Charter Communications Operating LLC(b),(t) | ||||
| Tranche B2 Term Loan | ||||
| 3-month USD LIBOR + 1.750% 02/01/2027 | 4.280% | 243,734 | 235,945 | |
| 80 | Multi-Manager Total Return Bond Strategies Fund | Annual Report 2022 |
August 31, 2022
| Senior Loans (continued) | ||||
| Borrower | Coupon Rate | Principal Amount ($) | Value ($) | |
| CSC Holdings LLC(b),(t) | ||||
| Term Loan | ||||
| 3-month USD LIBOR + 2.250% 07/17/2025 | 4.641% | 689,091 | 666,268 | |
| 3-month USD LIBOR + 2.500% 04/15/2027 | 4.891% | 3,971,032 | 3,822,952 | |
| Direct TV Financing LLC(b),(t) | ||||
| Term Loan | ||||
| 1-month USD LIBOR + 5.000% Floor 0.750% 08/02/2027 | 7.524% | 1,352,125 | 1,290,941 | |
| Virgin Media Bristol LLC(b),(t) | ||||
| Tranche N Term Loan | ||||
| 3-month USD LIBOR + 2.500% 01/31/2028 | 4.891% | 1,250,000 | 1,220,313 | |
| Total | 7,236,419 | |||
| Chemicals 0.0% | ||||
| TPC Group, Inc.(b),(h),(j),(r),(t),(u),(v) | ||||
| Debtor in Posession Term Loan | ||||
| 3-Month Term SOFR + 10.000% Floor 1.000% 03/01/2023 | 12.412% | 125,160 | 125,160 | |
| Consumer Cyclical Services 0.1% | ||||
| Amentum Government Services Holdings LLC(b),(t) | ||||
| Tranche 1 1st Lien Term Loan | ||||
| 1-month USD LIBOR + 4.000% 01/29/2027 | 6.524% | 312,082 | 302,719 | |
| Intrado Corp.(b),(t) | ||||
| Tranche B Term Loan | ||||
| 3-month USD LIBOR + 4.000% Floor 1.000% 10/10/2024 | 6.524% | 653,228 | 531,858 | |
| Tranche B1 Term Loan | ||||
| 3-month USD LIBOR + 3.500% Floor 1.000% 10/10/2024 | 6.024% | 496,459 | 403,746 | |
| Prepaid Legal Services, Inc.(b),(t) | ||||
| 1st Lien Term Loan | ||||
| 3-month USD LIBOR + 3.750% Floor 0.500% 12/15/2028 | 2.750% | 506,509 | 492,266 | |
| Prime Security Services Borrower LLC(b),(r),(t) | ||||
| Tranche B1 1st Lien Term Loan | ||||
| 1-month USD LIBOR + 2.750% Floor 0.750% 09/23/2026 | 5.107% | 453,142 | 442,027 | |
| Senior Loans (continued) | ||||
| Borrower | Coupon Rate | Principal Amount ($) | Value ($) | |
| Safe Fleet Holdings LLC(b),(t) | ||||
| Term Loan | ||||
| 3-Month Term SOFR + 3.750% Floor 0.500% 02/23/2029 | 6.150% | 170,224 | 165,916 | |
| Spin Holdco, Inc.(b),(t) | ||||
| Term Loan | ||||
| 1-month USD LIBOR + 4.000% Floor 0.750% 03/04/2028 | 5.611% | 732,983 | 687,171 | |
| TruGreen LP(b),(t) | ||||
| 1st Lien Term Loan | ||||
| 1-month USD LIBOR + 4.000% Floor 0.750% 11/02/2027 | 6.524% | 288,985 | 276,703 | |
| Total | 3,302,406 | |||
| Consumer Products 0.0% | ||||
| Acuity Specialty Products, Inc.(b),(t) | ||||
| 1st Lien Term Loan | ||||
| 3-month USD LIBOR + 4.000% Floor 1.000% 08/12/2024 | 5.000% | 279,128 | 242,842 | |
| AI Aqua Merger Sub, Inc.(b),(r),(t) | ||||
| Delayed Draw Term Loan | ||||
| 1-month Term SOFR + 4.000% Floor 0.500% 07/31/2028 | 4.922% | 63,635 | 61,116 | |
| Tranche B Term Loan | ||||
| 1-month Term SOFR + 4.000% Floor 0.500% 07/31/2028 | 4.922% | 279,994 | 268,911 | |
| Total | 572,869 | |||
| Diversified Manufacturing 0.0% | ||||
| Vertiv Group Corp.(b),(t) | ||||
| Tranche B Term Loan | ||||
| 1-month USD LIBOR + 2.750% 03/02/2027 | 5.112% | 911,493 | 876,929 | |
| Electric 0.0% | ||||
| Vistra Operations Co. LLC(b),(t) | ||||
| Term Loan | ||||
| 3-month USD LIBOR + 1.750% 12/31/2025 | 4.245% | 282,057 | 276,108 | |
| Finance Companies 0.0% | ||||
| Avolon Borrower 1 LLC(b),(t) | ||||
| Tranche B3 Term Loan | ||||
| 3-month USD LIBOR + 1.750% Floor 0.750% 01/15/2025 | 4.118% | 175,812 | 172,882 | |
| Multi-Manager Total Return Bond Strategies Fund | Annual Report 2022 | 81 |
August 31, 2022
| Senior Loans (continued) | ||||
| Borrower | Coupon Rate | Principal Amount ($) | Value ($) | |
| Tranche B5 Term Loan | ||||
| 1-month USD LIBOR + 2.250% Floor 0.500% 12/01/2027 | 4.618% | 1,979,900 | 1,943,766 | |
| DTI HOLDCO INC(b),(r),(t) | ||||
| 3-month USD LIBOR + 4.750% 04/26/2029 | 3.750% | 87,961 | 83,704 | |
| Total | 2,200,352 | |||
| Food and Beverage 0.0% | ||||
| Hostess Brands LLC(b),(t) | ||||
| Tranche B 1st Lien Term Loan | ||||
| 3-month USD LIBOR + 2.250% Floor 0.750% 08/03/2025 | 4.979% | 481,844 | 474,414 | |
| Naked Juice LLC(b),(t) | ||||
| 1st Lien Term Loan | ||||
| 3-month Term SOFR + 3.250% Floor 0.500% 01/24/2029 | 5.405% | 1,564,637 | 1,497,577 | |
| Total | 1,971,991 | |||
| Gaming 0.0% | ||||
| Caesars Resort Collection LLC(b),(t) | ||||
| Tranche B Term Loan | ||||
| 3-month USD LIBOR + 2.750% 12/23/2024 | 5.274% | 4,544 | 4,480 | |
| Fertitta Entertainment LLC(b),(t) | ||||
| Tranche B Term Loan | ||||
| 1-month Term SOFR + 4.000% Floor 0.500% 01/27/2029 | 6.459% | 546,407 | 524,277 | |
| Scientific Games International, Inc.(b),(t) | ||||
| Tranche B Term Loan | ||||
| 1-month Term SOFR + 3.000% Floor 0.500% 04/14/2029 | 5.407% | 458,790 | 450,761 | |
| Total | 979,518 | |||
| Health Care 0.1% | ||||
| Avantor Funding, Inc.(b),(t) | ||||
| Tranche B5 Term Loan | ||||
| 1-month USD LIBOR + 2.250% Floor 0.500% 11/08/2027 | 1.250% | 930,876 | 914,297 | |
| Bausch & Lomb Corp.(b),(t) | ||||
| Term Loan | ||||
| 1-month Term SOFR + 3.250% Floor 0.500% 05/10/2027 | 5.653% | 140,061 | 131,308 | |
| Senior Loans (continued) | ||||
| Borrower | Coupon Rate | Principal Amount ($) | Value ($) | |
| Change Healthcare Holdings LLC(b),(t) | ||||
| Term Loan | ||||
| 3-month USD LIBOR + 2.500% Floor 1.000% 03/01/2024 | 5.024% | 4,240,195 | 4,210,174 | |
| Gainwell Acquisition Corp.(b),(t) | ||||
| Tranche B 1st Lien Term Loan | ||||
| 1-month USD LIBOR + 4.000% Floor 0.750% 10/01/2027 | 6.250% | 746,212 | 728,027 | |
| ICON PLC(b),(r),(t) | ||||
| Term Loan | ||||
| 3-month USD LIBOR + 2.250% 07/03/2028 | 4.563% | 412,024 | 405,123 | |
| 3-month USD LIBOR + 2.250% 07/03/2028 | 4.563% | 102,656 | 100,936 | |
| Medline Borrower LP(b),(t) | ||||
| Term Loan | ||||
| 1-month USD LIBOR + 3.250% Floor 0.500% 10/23/2028 | 5.774% | 498,750 | 474,970 | |
| Petvet Care Centers LLC(b),(t) | ||||
| Term Loan | ||||
| 1-month USD LIBOR + 3.500% Floor 0.750% 02/14/2025 | 6.024% | 128,370 | 124,091 | |
| Total | 7,088,926 | |||
| Independent Energy 0.0% | ||||
| Ascent Resources Utica Holdings(b),(t) | ||||
| 2nd Lien Term Loan | ||||
| 1-month USD LIBOR + 10.000% Floor 1.000% 11/01/2025 | 10.000% | 287,000 | 302,607 | |
| Media and Entertainment 0.0% | ||||
| Diamond Sports Group LLC(b),(t) | ||||
| 1st Lien Term Loan | ||||
| 1-month Term SOFR + 8.000% Floor 1.000% 05/25/2026 | 10.387% | 332,995 | 312,912 | |
| 2nd Lien Term Loan | ||||
| 1-month Term SOFR + 3.250% 08/24/2026 | 5.637% | 1,612,530 | 292,562 | |
| Total | 605,474 | |||
| Other Financial Institutions 0.0% | ||||
| Deerfield Dakota Holdings LLC(b),(t) | ||||
| 1st Lien Term Loan | ||||
| 1-month Term SOFR + 3.750% Floor 1.000% 04/09/2027 | 6.205% | 589,818 | 573,969 | |
| 82 | Multi-Manager Total Return Bond Strategies Fund | Annual Report 2022 |
August 31, 2022
| Senior Loans (continued) | ||||
| Borrower | Coupon Rate | Principal Amount ($) | Value ($) | |
| Trans Union LLC(b),(t) | ||||
| Tranche B6 Term Loan | ||||
| 1-month USD LIBOR + 2.250% Floor 0.500% 12/01/2028 | 4.774% | 797,525 | 781,719 | |
| Total | 1,355,688 | |||
| Other Industry 0.0% | ||||
| Adtalem Global Education, Inc.(b),(t) | ||||
| Tranche B Term Loan | ||||
| 1-month USD LIBOR + 4.000% Floor 0.750% 08/12/2028 | 6.368% | 646,230 | 638,960 | |
| Artera Services LLC(b),(t) | ||||
| 1st Lien Term Loan | ||||
| 3-month USD LIBOR + 3.250% Floor 1.000% 03/06/2025 | 5.500% | 451,462 | 363,472 | |
| Total | 1,002,432 | |||
| Packaging 0.0% | ||||
| Berry Global, Inc.(b),(t) | ||||
| Tranche Z Term Loan | ||||
| 1-month USD LIBOR + 1.750% 07/01/2026 | 4.178% | 2,246,297 | 2,193,307 | |
| Pharmaceuticals 0.1% | ||||
| Elanco Animal Health, Inc.(b),(t) | ||||
| Term Loan | ||||
| 1-month USD LIBOR + 1.750% 08/01/2027 | 4.123% | 1,931,862 | 1,862,740 | |
| Grifols Worldwide Operations Ltd.(b),(t) | ||||
| Tranche B Term Loan | ||||
| 1-month USD LIBOR + 2.000% 11/15/2027 | 4.524% | 2,103,536 | 2,031,090 | |
| Horizon Therapeutics USA, Inc.(b),(t) | ||||
| Tranche B2 Term Loan | ||||
| 1-month USD LIBOR + 1.750% Floor 0.500% 03/15/2028 | 4.313% | 1,059,069 | 1,030,696 | |
| Jazz Pharmaceuticals PLC(b),(t) | ||||
| Term Loan | ||||
| 1-month USD LIBOR + 3.500% Floor 0.500% 05/05/2028 | 6.024% | 1,345,722 | 1,318,323 | |
| Organon & Co.(b),(t) | ||||
| Term Loan | ||||
| 1-month USD LIBOR + 3.000% Floor 0.500% 06/02/2028 | 4.625% | 3,149,909 | 3,110,536 | |
| Total | 9,353,385 | |||
| Senior Loans (continued) | ||||
| Borrower | Coupon Rate | Principal Amount ($) | Value ($) | |
| Property & Casualty 0.1% | ||||
| Acrisure LLC(b),(t) | ||||
| 1st Lien Term Loan | ||||
| 1-month USD LIBOR + 3.500% 02/15/2027 | 6.024% | 1,666,476 | 1,593,217 | |
| AmWINS Group, Inc.(b),(t) | ||||
| Term Loan | ||||
| 1-month USD LIBOR + 2.250% Floor 0.750% 02/19/2028 | 4.774% | 2,856,517 | 2,785,761 | |
| Total | 4,378,978 | |||
| Restaurants 0.0% | ||||
| 1011778 BC ULC(b),(t) | ||||
| Tranche B4 Term Loan | ||||
| 3-month USD LIBOR + 1.750% 11/19/2026 | 4.274% | 547,823 | 531,273 | |
| Retailers 0.0% | ||||
| Michaels Companies, Inc. (The)(b),(t) | ||||
| Tranche B Term Loan | ||||
| 1-month USD LIBOR + 4.250% Floor 0.750% 04/15/2028 | 6.500% | 1,980,000 | 1,635,361 | |
| Technology 0.1% | ||||
| athenahealth Group, Inc.(b),(r),(t),(v) | ||||
| Delayed Draw Term Loan | ||||
| 1-month Term SOFR + 3.500% Floor 0.500% 02/15/2029 | 3.500% | 251,929 | 240,593 | |
| athenahealth Group, Inc.(b),(t) | ||||
| Term Loan | ||||
| 1-month Term SOFR + 3.500% Floor 0.500% 02/15/2029 | 5.800% | 1,486,384 | 1,419,497 | |
| Central Parent Inc.(b),(t) | ||||
| 1st Lien Term Loan B | ||||
| 1-month Term SOFR + 4.500% Floor 0.500% 07/06/2029 | 6.610% | 482,176 | 469,384 | |
| CommScope, Inc.(b),(t) | ||||
| Term Loan | ||||
| 3-month USD LIBOR + 3.250% 04/06/2026 | 5.774% | 1,716,684 | 1,643,193 | |
| Entegris, Inc.(b),(t) | ||||
| Tranche B Term Loan | ||||
| 1-month Term SOFR + 3.000% 07/06/2029 | 5.786% | 450,000 | 448,555 | |
| Multi-Manager Total Return Bond Strategies Fund | Annual Report 2022 | 83 |
August 31, 2022
| Senior Loans (continued) | ||||
| Borrower | Coupon Rate | Principal Amount ($) | Value ($) | |
| II-VI, Inc.(b),(t) | ||||
| Tranche B Term Loan | ||||
| 1-month USD LIBOR + 2.750% Floor 0.500% 07/02/2029 | 5.123% | 146,106 | 142,757 | |
| Ingram Micro, Inc.(b),(t) | ||||
| Term Loan | ||||
| 1-month USD LIBOR + 3.500% Floor 0.500% 06/30/2028 | 5.750% | 298,897 | 286,941 | |
| Peraton Corp.(b),(t) | ||||
| Tranche B 1st Lien Term Loan | ||||
| 3-month USD LIBOR + 3.750% Floor 0.750% 02/01/2028 | 6.274% | 2,617,719 | 2,539,187 | |
| Project Alpha Intermediate Holding, Inc.(b),(t) | ||||
| Term Loan | ||||
| 1-month USD LIBOR + 4.000% 04/26/2024 | 6.530% | 285,000 | 277,342 | |
| Proofpoint, Inc.(b),(t) | ||||
| 1st Lien Term Loan | ||||
| 1-month USD LIBOR + 3.250% Floor 0.500% 08/31/2028 | 6.320% | 160,655 | 154,349 | |
| Total | 7,621,798 | |||
| Wireless 0.0% | ||||
| Digicel International Finance Ltd.(b),(t) | ||||
| Tranche B 1st Lien Term Loan | ||||
| 3-month USD LIBOR + 3.250% 05/27/2024 | 5.774% | 2,739,954 | 2,515,634 | |
| SBA Senior Finance II LLC(b),(t) | ||||
| Term Loan | ||||
| 3-month USD LIBOR + 1.750% 04/11/2025 | 4.280% | 715,200 | 697,813 | |
| Total | 3,213,447 | |||
| Wirelines 0.0% | ||||
| Lumen Technologies, Inc.(b),(t) | ||||
| Tranche B Term Loan | ||||
| 1-month USD LIBOR + 2.250% 03/15/2027 | 4.774% | 243,750 | 229,125 | |
| Telenet Financing USD LLC(b),(t) | ||||
| Term Loan | ||||
| 6-month USD LIBOR + 2.000% 04/30/2028 | 4.391% | 750,000 | 724,688 | |
| Senior Loans (continued) | ||||
| Borrower | Coupon Rate | Principal Amount ($) | Value ($) | |
| Zayo Group Holdings, Inc.(b),(t) | ||||
| Term Loan | ||||
| 1-month Term SOFR + 4.250% Floor 0.500% 03/09/2027 | 6.705% | 306,564 | 287,459 | |
| 1-month USD LIBOR + 3.000% 03/09/2027 | 5.524% | 1,613,487 | 1,467,273 | |
| Total | 2,708,545 | |||
| Total Senior Loans (Cost $73,718,039) | 71,811,680 | |||
| Treasury Bills 2.2% | ||||
| Issuer | Yield | Principal Amount ($) | Value ($) | |
| United States 2.2% | ||||
| U.S. Treasury Bills | ||||
| 10/06/2022 | 2.230% | 14,000,000 | 13,969,227 | |
| 10/27/2022 | 2.480% | 58,000,000 | 57,776,404 | |
| 11/03/2022 | 2.620% | 5,000,000 | 4,977,166 | |
| 11/10/2022 | 2.600% | 2,000,000 | 1,989,919 | |
| 11/25/2022 | 2.810% | 3,000,000 | 2,980,293 | |
| 01/19/2023 | 3.080% | 15,485,000 | 15,303,138 | |
| 02/16/2023 | 3.270% | 15,000,000 | 14,776,477 | |
| 05/18/2023 | 3.120% | 102,290,000 | 100,067,966 | |
| U.S. Treasury Bills(w) | ||||
| 01/12/2023 | 3.040% | 20,000,000 | 19,778,925 | |
| Total | 231,619,515 | |||
| Total Treasury Bills (Cost $231,755,494) | 231,619,515 | |||
| U.S. Government & Agency Obligations 0.1% | ||||
| Issuer | Coupon Rate | Principal Amount ($) | Value ($) | |
| Federal National Mortgage Association(g) | ||||
| STRIPS | ||||
| 05/15/2030 | 0.000% | 295,000 | 224,080 | |
| Residual Funding Corp.(g) | ||||
| STRIPS | ||||
| 01/15/2030 | 0.000% | 7,351,000 | 5,638,197 | |
| 04/15/2030 | 0.000% | 425,000 | 322,956 | |
| Resolution Funding Corp.(g) | ||||
| STRIPS | ||||
| 04/15/2030 | 0.000% | 3,000,000 | 2,280,949 | |
| Tennessee Valley Authority Principal STRIP(g) | ||||
| 09/15/2024 | 0.000% | 445,000 | 409,843 | |
| Total U.S. Government & Agency Obligations (Cost $9,170,840) | 8,876,025 | |||
| 84 | Multi-Manager Total Return Bond Strategies Fund | Annual Report 2022 |
August 31, 2022
| U.S. Treasury Obligations 14.8% | ||||
| Issuer | Coupon Rate | Principal Amount ($) | Value ($) | |
| U.S. Treasury | ||||
| 07/31/2024 | 3.000% | 68,965,000 | 68,366,944 | |
| 08/31/2024 | 3.250% | 148,385,000 | 147,759,001 | |
| 08/15/2025 | 3.125% | 53,797,000 | 53,259,030 | |
| 06/30/2027 | 3.250% | 125,350,000 | 124,742,836 | |
| 07/31/2027 | 2.750% | 80,230,000 | 78,073,819 | |
| 08/31/2027 | 3.125% | 206,905,000 | 205,078,418 | |
| 03/31/2028 | 1.250% | 27,775,000 | 24,800,037 | |
| 07/31/2029 | 2.625% | 2,380,000 | 2,281,825 | |
| 05/15/2032 | 2.875% | 57,600,000 | 56,160,000 | |
| 08/15/2032 | 2.750% | 62,368,900 | 60,185,988 | |
| 11/15/2040 | 1.375% | 31,900,000 | 22,454,609 | |
| 08/15/2041 | 1.750% | 76,745,000 | 57,043,119 | |
| 11/15/2041 | 2.000% | 247,169,000 | 192,019,417 | |
| 02/15/2042 | 2.375% | 92,620,000 | 76,816,712 | |
| 05/15/2042 | 3.250% | 55,835,000 | 53,427,116 | |
| 08/15/2042 | 3.375% | 78,841,000 | 76,968,526 | |
| 11/15/2042 | 2.750% | 27,195,000 | 23,842,366 | |
| 05/15/2043 | 2.875% | 335,000 | 298,569 | |
| 05/15/2046 | 2.500% | 5,650,000 | 4,655,070 | |
| 08/15/2049 | 2.250% | 7,360,000 | 5,898,350 | |
| 05/15/2050 | 1.250% | 40,235,000 | 24,882,833 | |
| 11/15/2050 | 1.625% | 31,720,000 | 21,708,375 | |
| 11/15/2051 | 1.875% | 880,000 | 641,300 | |
| 02/15/2052 | 2.250% | 3,825,000 | 3,058,207 | |
| 05/15/2052 | 2.875% | 48,220,600 | 44,468,435 | |
| 08/15/2052 | 3.000% | 18,270,000 | 17,322,244 | |
| U.S. Treasury(w) | ||||
| 05/15/2041 | 2.250% | 86,850,000 | 70,837,031 | |
| 08/15/2043 | 3.625% | 7,130,000 | 7,164,536 | |
| 05/15/2045 | 3.000% | 10,035,000 | 9,070,699 | |
| U.S. Treasury(g) | ||||
| STRIPS | ||||
| 11/15/2038 | 0.000% | 2,860,000 | 1,626,737 | |
| 02/15/2039 | 0.000% | 1,570,000 | 884,352 | |
| 05/15/2039 | 0.000% | 4,595,000 | 2,573,738 | |
| 02/15/2040 | 0.000% | 5,735,000 | 3,114,150 | |
| 11/15/2040 | 0.000% | 3,590,000 | 1,867,782 | |
| U.S. Treasury Obligations (continued) | ||||
| Issuer | Coupon Rate | Principal Amount ($) | Value ($) | |
| 05/15/2041 | 0.000% | 7,400,000 | 3,747,984 | |
| 08/15/2041 | 0.000% | 4,455,000 | 2,224,716 | |
| 11/15/2041 | 0.000% | 3,500,000 | 1,716,367 | |
| 05/15/2042 | 0.000% | 400,000 | 192,016 | |
| 08/15/2042 | 0.000% | 5,510,000 | 2,609,286 | |
| 11/15/2043 | 0.000% | 9,279,000 | 4,193,673 | |
| 02/15/2044 | 0.000% | 5,980,000 | 2,675,116 | |
| 08/15/2044 | 0.000% | 1,255,000 | 549,504 | |
| 02/15/2045 | 0.000% | 8,770,000 | 3,862,226 | |
| 02/15/2045 | 0.000% | 935,000 | 402,415 | |
| U.S. Treasury(g),(w) | ||||
| STRIPS | ||||
| 05/15/2043 | 0.000% | 18,965,000 | 8,708,343 | |
| Total U.S. Treasury Obligations (Cost $1,715,530,963) | 1,574,233,817 | |||
| Money Market Funds 11.3% | ||
| Shares | Value ($) | |
| Columbia Short-Term Cash Fund, 2.366%(x),(y) | 1,203,510,583 | 1,202,908,828 |
| Total Money Market Funds (Cost $1,202,899,151) | 1,202,908,828 | |
| Total Investments in Securities (Cost: $12,608,668,037) | 11,776,243,614 | |
| Other Assets & Liabilities, Net | (1,127,349,246) | |
| Net Assets | 10,648,894,368 | |
| Forward foreign currency exchange contracts | |||||
| Currency to be sold | Currency to be purchased | Counterparty | Settlement date | Unrealized appreciation ($) | Unrealized depreciation ($) |
| 1,136,871 EUR | 1,169,780 USD | Morgan Stanley | 10/07/2022 | 24,565 | — |
| Long futures contracts | ||||||
| Description | Number of contracts | Expiration date | Trading currency | Notional amount | Value/Unrealized appreciation ($) | Value/Unrealized depreciation ($) |
| U.S. Long Bond | 252 | 12/2022 | USD | 34,232,625 | — | (189,654) |
| U.S. Long Bond | 920 | 12/2022 | USD | 124,976,250 | — | (1,209,404) |
| U.S. Treasury 10-Year Note | 644 | 12/2022 | USD | 75,287,625 | — | (479,956) |
| Multi-Manager Total Return Bond Strategies Fund | Annual Report 2022 | 85 |
August 31, 2022
| Long futures contracts (continued) | ||||||
| Description | Number of contracts | Expiration date | Trading currency | Notional amount | Value/Unrealized appreciation ($) | Value/Unrealized depreciation ($) |
| U.S. Treasury 10-Year Note | 3,370 | 12/2022 | USD | 393,974,063 | — | (2,828,531) |
| U.S. Treasury 2-Year Note | 383 | 12/2022 | USD | 79,789,672 | — | (95,902) |
| U.S. Treasury 2-Year Note | 1,860 | 12/2022 | USD | 387,490,314 | — | (826,381) |
| U.S. Treasury 2-Year Note | 3,255 | 12/2022 | USD | 678,108,050 | — | (1,393,944) |
| U.S. Treasury 5-Year Note | 1,657 | 12/2022 | USD | 183,629,259 | — | (805,032) |
| U.S. Treasury 5-Year Note | 1,313 | 12/2022 | USD | 145,507,071 | — | (1,175,355) |
| U.S. Treasury Ultra 10-Year Note | 49 | 12/2022 | USD | 6,134,188 | — | (49,476) |
| U.S. Treasury Ultra 10-Year Note | 358 | 12/2022 | USD | 44,817,125 | — | (261,930) |
| U.S. Ultra Treasury Bond | 223 | 12/2022 | USD | 33,338,500 | 77,891 | — |
| U.S. Ultra Treasury Bond | 92 | 12/2022 | USD | 13,754,000 | — | (55,368) |
| U.S. Ultra Treasury Bond | 711 | 12/2022 | USD | 106,294,500 | — | (524,242) |
| U.S. Ultra Treasury Bond | 511 | 12/2022 | USD | 76,394,500 | — | (663,099) |
| Total | 77,891 | (10,558,274) | ||||
| Short futures contracts | ||||||
| Description | Number of contracts | Expiration date | Trading currency | Notional amount | Value/Unrealized appreciation ($) | Value/Unrealized depreciation ($) |
| U.S. Long Bond | (539) | 12/2022 | USD | (73,219,781) | 453,735 | — |
| U.S. Treasury 5-Year Note | (1,201) | 12/2022 | USD | (133,095,196) | 490,986 | — |
| U.S. Treasury Ultra 10-Year Note | (254) | 12/2022 | USD | (31,797,625) | 236,956 | — |
| Total | 1,181,677 | — | ||||
| Cleared interest rate swap contracts | |||||||||||
| Fund receives | Fund pays | Payment frequency | Counterparty | Maturity date | Notional currency | Notional amount | Value ($) | Upfront payments ($) | Upfront receipts ($) | Unrealized appreciation ($) | Unrealized depreciation ($) |
| Fixed rate of 1.390% | 3-Month USD LIBOR | Receives SemiAnnually, Pays Quarterly | Citi | 09/28/2025 | USD | 223,000,000 | (8,386,144) | — | — | — | (8,386,144) |
| 3-Month USD LIBOR | Fixed rate of 1.870% | Receives Quarterly, Pays SemiAnnually | Citi | 09/28/2053 | USD | 19,000,000 | 3,832,523 | — | — | 3,832,523 | — |
| Total | (4,553,621) | — | — | 3,832,523 | (8,386,144) | ||||||
| Cleared credit default swap contracts - buy protection | |||||||||||
| Reference entity | Counterparty | Maturity date | Pay fixed rate (%) | Payment frequency | Notional currency | Notional amount | Value ($) | Upfront payments ($) | Upfront receipts ($) | Unrealized appreciation ($) | Unrealized depreciation ($) |
| Markit CDX North America High Yield Index, Series 38 | Morgan Stanley | 06/20/2027 | 5.000 | Quarterly | USD | 89,706,757 | 1,176,913 | — | — | 1,176,913 | — |
| Markit CDX North America High Yield Index, Series 38 | Morgan Stanley | 06/20/2027 | 5.000 | Quarterly | USD | 11,748,577 | (128,445) | — | — | — | (128,445) |
| Markit CDX North America Investment Grade Index, Series 38 | Morgan Stanley | 06/20/2027 | 1.000 | Quarterly | USD | 52,240,000 | 147,557 | — | — | 147,557 | — |
| Total | 1,196,025 | — | — | 1,324,470 | (128,445) | ||||||
| Reference index and values for swap contracts as of period end | ||
| Reference index | Reference rate | |
| 3-Month USD LIBOR | London Interbank Offered Rate | 3.100% |
| 86 | Multi-Manager Total Return Bond Strategies Fund | Annual Report 2022 |
August 31, 2022
| (a) | Represents privately placed and other securities and instruments exempt from Securities and Exchange Commission registration (collectively, private placements), such as Section 4(a)(2) and Rule 144A eligible securities, which are often sold only to qualified institutional buyers. At August 31, 2022, the total value of these securities amounted to $2,995,117,975, which represents 28.13% of total net assets. |
| (b) | Variable rate security. The interest rate shown was the current rate as of August 31, 2022. |
| (c) | Represents a security purchased on a when-issued basis. |
| (d) | Variable or floating rate security, the interest rate of which adjusts periodically based on changes in current interest rates and prepayments on the underlying pool of assets. The interest rate shown was the current rate as of August 31, 2022. |
| (e) | Represents interest only securities which have the right to receive the monthly interest payments on an underlying pool of mortgage loans. |
| (f) | Represents principal only securities which have the right to receive the principal portion only on an underlying pool of mortgage loans. |
| (g) | Zero coupon bond. |
| (h) | Represents fair value as determined in good faith under procedures approved by the Board of Trustees. At August 31, 2022, the total value of these securities amounted to $39,480,739, which represents 0.37% of total net assets. |
| (i) | Non-income producing investment. |
| (j) | Valuation based on significant unobservable inputs. |
| (k) | Represents a variable rate security with a step coupon where the rate adjusts according to a schedule for a series of periods, typically lower for an initial period and then increasing to a higher coupon rate thereafter. The interest rate shown was the current rate as of August 31, 2022. |
| (l) | Payment-in-kind security. Interest can be paid by issuing additional par of the security or in cash. |
| (m) | Represents securities that have defaulted on payment of interest. The Fund has stopped accruing interest on these securities. At August 31, 2022, the total value of these securities amounted to $2,238,922, which represents 0.02% of total net assets. |
| (n) | Principal amounts are denominated in United States Dollars unless otherwise noted. |
| (o) | Principal and interest may not be guaranteed by a governmental entity. |
| (p) | Denotes a restricted security, which is subject to legal or contractual restrictions on resale under federal securities laws. Disposal of a restricted investment may involve time-consuming negotiations and expenses, and prompt sale at an acceptable price may be difficult to achieve. Private placement securities are generally considered to be restricted, although certain of those securities may be traded between qualified institutional investors under the provisions of Section 4(a)(2) and Rule 144A. The Fund will not incur any registration costs upon such a trade. These securities are valued at fair value determined in good faith under consistently applied procedures established by the Fund’s Board of Trustees. At August 31, 2022, the total market value of these securities amounted to $768,903, which represents 0.01% of total net assets. Additional information on these securities is as follows: |
| Security | Acquisition Dates | Shares | Cost ($) | Value ($) |
| Russian Foreign Bond - Eurobond | 12/16/2015 | 200,000 | 200,767 | 104,776 |
| Russian Foreign Bond - Eurobond | 12/06/2018-05/30/2019 | 800,000 | 806,332 | 294,740 |
| Russian Foreign Bond - Eurobond | 12/06/2018-05/30/2019 | 1,000,000 | 984,936 | 369,387 |
| 1,992,035 | 768,903 |
| (q) | Municipal obligations include debt obligations issued by or on behalf of territories, possessions, or sovereign nations within the territorial boundaries of the United States. At August 31, 2022, the total value of these securities amounted to $2,651,243, which represents 0.02% of total net assets. |
| (r) | Represents a security purchased on a forward commitment basis. |
| (s) | Represents a variable rate security where the coupon adjusts periodically through an auction process. |
| (t) | The stated interest rate represents the weighted average interest rate at August 31, 2022 of contracts within the senior loan facility. Interest rates on contracts are primarily determined either weekly, monthly or quarterly by reference to the indicated base lending rate and spread and the reset period. These base lending rates are primarily the LIBOR and other short-term rates. Base lending rates may be subject to a floor or minimum rate. The interest rate for senior loans purchased on a when-issued or delayed delivery basis will be determined upon settlement, therefore no interest rate is disclosed. Senior loans often require prepayments from excess cash flows or permit the borrowers to repay at their election. The degree to which borrowers repay cannot be predicted with accuracy. As a result, remaining maturities of senior loans may be less than the stated maturities. Generally, the Fund is contractually obligated to receive approval from the agent bank and/or borrower prior to the disposition of a senior loan. |
| (u) | The borrower filed for protection under Chapter 11 of the U.S. Federal Bankruptcy Code. |
| (v) | At August 31, 2022, the Fund had unfunded senior loan commitments pursuant to the terms of the loan agreement. The Fund receives a stated coupon rate until the borrower draws on the loan commitment, at which time the rate will become the stated rate in the loan agreement. |
| (w) | This security or a portion of this security has been pledged as collateral in connection with derivative contracts. |
| (x) | The rate shown is the seven-day current annualized yield at August 31, 2022. |
| Multi-Manager Total Return Bond Strategies Fund | Annual Report 2022 | 87 |
August 31, 2022
| (y) | As defined in the Investment Company Act of 1940, as amended, an affiliated company is one in which the Fund owns 5% or more of the company’s outstanding voting securities, or a company which is under common ownership or control with the Fund. The value of the holdings and transactions in these affiliated companies during the year ended August 31, 2022 are as follows: |
| Affiliated issuers | Beginning of period($) | Purchases($) | Sales($) | Net change in unrealized appreciation (depreciation)($) | End of period($) | Realized gain (loss)($) | Dividends($) | End of period shares |
| Columbia Short-Term Cash Fund, 2.366% | ||||||||
| 949,725,033 | 7,468,250,927 | (7,215,076,809) | 9,677 | 1,202,908,828 | (426,117) | 5,980,354 | 1,203,510,583 | |
| BAM | Build America Mutual Assurance Co. |
| CMO | Collateralized Mortgage Obligation |
| CMT | Constant Maturity Treasury |
| CVR | Contingent Value Rights |
| EURIBOR | Euro Interbank Offered Rate |
| FHLMC | Federal Home Loan Mortgage Corporation |
| LIBID | London Interbank Bid Rate |
| LIBOR | London Interbank Offered Rate |
| MTA | Monthly Treasury Average |
| SOFR | Secured Overnight Financing Rate |
| STRIPS | Separate Trading of Registered Interest and Principal Securities |
| TBA | To Be Announced |
| EUR | Euro |
| USD | US Dollar |
| ■ | Level 1 — Valuations based on quoted prices for investments in active markets that the Fund has the ability to access at the measurement date. Valuation adjustments are not applied to Level 1 investments. |
| ■ | Level 2 — Valuations based on other significant observable inputs (including quoted prices for similar securities, interest rates, prepayment speeds, credit risks, etc.). |
| ■ | Level 3 — Valuations based on significant unobservable inputs (including the Fund’s own assumptions and judgment in determining the fair value of investments). |
| 88 | Multi-Manager Total Return Bond Strategies Fund | Annual Report 2022 |
August 31, 2022
The Fund’s Board of Trustees (the Board) has designated the Investment Manager, through its Valuation Committee (the Committee), as valuation designee, responsible for determining the fair value of the assets of the Fund for which market quotations are not readily available using valuation procedures approved by the Board. The Committee consists of voting and non-voting members from various groups within the Investment Manager’s organization, including operations and accounting, trading and investments, compliance, risk management and legal.
| Level 1 ($) | Level 2 ($) | Level 3 ($) | Total ($) | |
| Investments in Securities | ||||
| Asset-Backed Securities — Non-Agency | — | 1,179,110,929 | — | 1,179,110,929 |
| Commercial Mortgage-Backed Securities - Agency | — | 106,748,086 | — | 106,748,086 |
| Commercial Mortgage-Backed Securities - Non-Agency | — | 632,083,604 | — | 632,083,604 |
| Common Stocks | ||||
| Communication Services | — | — | 9 | 9 |
| Energy | — | — | 363 | 363 |
| Financials | — | 2,558,627 | — | 2,558,627 |
| Total Common Stocks | — | 2,558,627 | 372 | 2,558,999 |
| Convertible Bonds | — | 5,330,638 | — | 5,330,638 |
| Corporate Bonds & Notes | — | 3,542,325,920 | 9,016,000 | 3,551,341,920 |
| Foreign Government Obligations | — | 191,698,480 | 768,903 | 192,467,383 |
| Inflation-Indexed Bonds | — | 3,991,241 | — | 3,991,241 |
| Municipal Bonds | — | 43,031,313 | — | 43,031,313 |
| Residential Mortgage-Backed Securities - Agency | — | 2,476,066,678 | — | 2,476,066,678 |
| Residential Mortgage-Backed Securities - Non-Agency | — | 455,476,291 | 38,586,666 | 494,062,957 |
| Rights | ||||
| Materials | — | — | 1 | 1 |
| Total Rights | — | — | 1 | 1 |
| Senior Loans | — | 71,686,520 | 125,160 | 71,811,680 |
| Treasury Bills | 231,619,515 | — | — | 231,619,515 |
| U.S. Government & Agency Obligations | — | 8,876,025 | — | 8,876,025 |
| U.S. Treasury Obligations | 1,533,285,412 | 40,948,405 | — | 1,574,233,817 |
| Money Market Funds | 1,202,908,828 | — | — | 1,202,908,828 |
| Total Investments in Securities | 2,967,813,755 | 8,759,932,757 | 48,497,102 | 11,776,243,614 |
| Investments in Derivatives | ||||
| Asset | ||||
| Forward Foreign Currency Exchange Contracts | — | 24,565 | — | 24,565 |
| Futures Contracts | 1,259,568 | — | — | 1,259,568 |
| Swap Contracts | — | 5,156,993 | — | 5,156,993 |
| Liability | ||||
| Futures Contracts | (10,558,274) | — | — | (10,558,274) |
| Swap Contracts | — | (8,514,589) | — | (8,514,589) |
| Total | 2,958,515,049 | 8,756,599,726 | 48,497,102 | 11,763,611,877 |
| Multi-Manager Total Return Bond Strategies Fund | Annual Report 2022 | 89 |
August 31, 2022
The following table is a reconciliation of Level 3 assets for which significant observable and unobservable inputs were used to determine fair value:
| Balance as of 08/31/2021 ($) | Increase (decrease) in accrued discounts/ premiums ($) | Realized gain (loss) ($) | Change in unrealized appreciation (depreciation)(a) ($) | Purchases ($) | Sales ($) | Transfers into Level 3 ($) | Transfers out of Level 3 ($) | Balance as of 08/31/2022 ($) | |
| Asset-Backed Securities — Non-Agency | 1,551,938 | — | — | — | — | — | — | (1,551,938) | — |
| Commercial Mortgage-Backed Securities — Non-Agency | 8,500,000 | — | — | — | — | — | — | (8,500,000) | — |
| Common Stocks | 648 | — | — | (276) | — | — | — | — | 372 |
| Corporate Bonds & Notes | 9,200,000 | — | — | (184,000) | — | — | — | — | 9,016,000 |
| Foreign Government Obligation | — | 449 | — | (1,480,955) | — | — | 2,249,409 | — | 768,903 |
| Residential Mortgage-Backed Securities — Non-Agency | 58,200,000 | 339 | 8,437 | (607,319) | 45,678,837 | (66,842,636) | 2,149,008 | — | 38,586,666 |
| Rights | — | — | — | 1 | — | — | — | — | 1 |
| Senior Loans | — | 256 | — | 818 | 124,086 | — | — | — | 125,160 |
| Total | 77,452,586 | 1,044 | 8,437 | (2,271,731) | 45,802,923 | (66,842,636) | 4,398,417 | (10,051,938) | 48,497,102 |
| 90 | Multi-Manager Total Return Bond Strategies Fund | Annual Report 2022 |
August 31, 2022
| Assets | |
| Investments in securities, at value | |
| Unaffiliated issuers (cost $11,405,768,886) | $10,573,334,786 |
| Affiliated issuers (cost $1,202,899,151) | 1,202,908,828 |
| Foreign currency (cost $944,679) | 868,365 |
| Cash collateral held at broker for: | |
| TBA | 10,784,931 |
| Margin deposits on: | |
| Futures contracts | 16,980,340 |
| Swap contracts | 13,189,668 |
| Unrealized appreciation on forward foreign currency exchange contracts | 24,565 |
| Receivable for: | |
| Investments sold | 55,777,199 |
| Investments sold on a delayed delivery basis | 734,429,748 |
| Capital shares sold | 36,326,022 |
| Dividends | 2,142,166 |
| Interest | 60,677,353 |
| Foreign tax reclaims | 231,041 |
| Variation margin for futures contracts | 509,875 |
| Variation margin for swap contracts | 359,326 |
| Expense reimbursement due from Investment Manager | 3,801 |
| Prepaid expenses | 98,216 |
| Trustees’ deferred compensation plan | 408,404 |
| Total assets | 12,709,054,634 |
| Liabilities | |
| Due to custodian | 257,923 |
| Cash collateral due to broker for: | |
| TBA | 659,000 |
| Payable for: | |
| Investments purchased | 66,869,258 |
| Investments purchased on a delayed delivery basis | 1,950,396,575 |
| Capital shares purchased | 11,669,391 |
| Distributions to shareholders | 26,429,491 |
| Dividends and interest on securities sold short | 19,139 |
| Variation margin for futures contracts | 2,681,511 |
| Management services fees | 129,695 |
| Transfer agent fees | 342,502 |
| Compensation of board members | 91,777 |
| Other expenses | 205,600 |
| Trustees’ deferred compensation plan | 408,404 |
| Total liabilities | 2,060,160,266 |
| Net assets applicable to outstanding capital stock | $10,648,894,368 |
| Represented by | |
| Paid in capital | 12,044,346,962 |
| Total distributable earnings (loss) | (1,395,452,594) |
| Total - representing net assets applicable to outstanding capital stock | $10,648,894,368 |
| Institutional Class | |
| Net assets | $10,648,885,610 |
| Shares outstanding | 1,191,404,860 |
| Net asset value per share | $8.94 |
| Institutional 3 Class | |
| Net assets | $8,758 |
| Shares outstanding | 978 |
| Net asset value per share | $8.96 |
| Multi-Manager Total Return Bond Strategies Fund | Annual Report 2022 | 91 |
Year Ended August 31, 2022
| Net investment income | |
| Income: | |
| Dividends — unaffiliated issuers | $32,222 |
| Dividends — affiliated issuers | 5,980,354 |
| Interest | 272,402,983 |
| Interfund lending | 214 |
| Foreign taxes withheld | (71,864) |
| Total income | 278,343,909 |
| Expenses: | |
| Management services fees | 46,955,056 |
| Transfer agent fees | |
| Institutional Class | 4,460,751 |
| Institutional 3 Class | 1 |
| Compensation of board members | 144,217 |
| Custodian fees | 181,360 |
| Printing and postage fees | 282,729 |
| Registration fees | 286,121 |
| Audit fees | 52,760 |
| Legal fees | 120,198 |
| Interest on collateral | 17,065 |
| Compensation of chief compliance officer | 2,627 |
| Other | 140,894 |
| Total expenses | 52,643,779 |
| Fees waived or expenses reimbursed by Investment Manager and its affiliates | (884,933) |
| Total net expenses | 51,758,846 |
| Net investment income | 226,585,063 |
| Realized and unrealized gain (loss) — net | |
| Net realized gain (loss) on: | |
| Investments — unaffiliated issuers | (362,618,479) |
| Investments — affiliated issuers | (426,117) |
| Foreign currency translations | 36,605 |
| Forward foreign currency exchange contracts | 165,290 |
| Futures contracts | (157,540,630) |
| Swap contracts | 2,663,380 |
| Net realized loss | (517,719,951) |
| Net change in unrealized appreciation (depreciation) on: | |
| Investments — unaffiliated issuers | (1,091,766,770) |
| Investments — affiliated issuers | 9,677 |
| Foreign currency translations | (76,501) |
| Forward foreign currency exchange contracts | 24,565 |
| Futures contracts | (10,157,077) |
| Swap contracts | (3,357,596) |
| Net change in unrealized appreciation (depreciation) | (1,105,323,702) |
| Net realized and unrealized loss | (1,623,043,653) |
| Net decrease in net assets resulting from operations | $(1,396,458,590) |
| 92 | Multi-Manager Total Return Bond Strategies Fund | Annual Report 2022 |
| Year Ended August 31, 2022 | Year Ended August 31, 2021 | |
| Operations | ||
| Net investment income | $226,585,063 | $189,112,588 |
| Net realized gain (loss) | (517,719,951) | 35,466,129 |
| Net change in unrealized appreciation (depreciation) | (1,105,323,702) | (78,637,310) |
| Net increase (decrease) in net assets resulting from operations | (1,396,458,590) | 145,941,407 |
| Distributions to shareholders | ||
| Net investment income and net realized gains | ||
| Institutional Class | (261,010,283) | (410,564,172) |
| Institutional 3 Class | (236) | (434) |
| Total distributions to shareholders | (261,010,519) | (410,564,606) |
| Increase in net assets from capital stock activity | 1,442,995,396 | 1,723,782,304 |
| Total increase (decrease) in net assets | (214,473,713) | 1,459,159,105 |
| Net assets at beginning of year | 10,863,368,081 | 9,404,208,976 |
| Net assets at end of year | $10,648,894,368 | $10,863,368,081 |
| Year Ended | Year Ended | |||
| August 31, 2022 | August 31, 2021 | |||
| Shares | Dollars ($) | Shares | Dollars ($) | |
| Capital stock activity | ||||
| Institutional Class | ||||
| Subscriptions | 319,164,611 | 3,047,317,715 | 306,366,880 | 3,205,953,706 |
| Distributions reinvested | 26,909,143 | 261,010,283 | 39,061,667 | 410,564,171 |
| Redemptions | (193,550,074) | (1,865,332,602) | (180,717,454) | (1,892,735,573) |
| Net increase | 152,523,680 | 1,442,995,396 | 164,711,093 | 1,723,782,304 |
| Total net increase | 152,523,680 | 1,442,995,396 | 164,711,093 | 1,723,782,304 |
| Multi-Manager Total Return Bond Strategies Fund | Annual Report 2022 | 93 |
| Net asset value, beginning of period | Net investment income | Net realized and unrealized gain (loss) | Total from investment operations | Distributions from net investment income | Distributions from net realized gains | Total distributions to shareholders | |
| Institutional Class | |||||||
| Year Ended 8/31/2022 | $10.46 | 0.21 | (1.49) | (1.28) | (0.20) | (0.04) | (0.24) |
| Year Ended 8/31/2021 | $10.76 | 0.19 | (0.05) | 0.14 | (0.20) | (0.24) | (0.44) |
| Year Ended 8/31/2020 | $10.38 | 0.27 | 0.42 | 0.69 | (0.28) | (0.03) | (0.31) |
| Year Ended 8/31/2019 | $9.80 | 0.30 | 0.59 | 0.89 | (0.31) | — | (0.31) |
| Year Ended 8/31/2018 | $10.17 | 0.26 | (0.38) | (0.12) | (0.25) | (0.00)(c) | (0.25) |
| Institutional 3 Class | |||||||
| Year Ended 8/31/2022 | $10.47 | 0.21 | (1.48) | (1.27) | (0.20) | (0.04) | (0.24) |
| Year Ended 8/31/2021 | $10.77 | 0.20 | (0.06) | 0.14 | (0.20) | (0.24) | (0.44) |
| Year Ended 8/31/2020(f) | $10.23 | 0.19 | 0.53 | 0.72 | (0.18) | — | (0.18) |
| Notes to Financial Highlights | |
| (a) | In addition to the fees and expenses that the Fund bears directly, the Fund indirectly bears a pro rata share of the fees and expenses of any other funds in which it invests. Such indirect expenses are not included in the Fund’s reported expense ratios. |
| (b) | Total net expenses include the impact of certain fee waivers/expense reimbursements made by the Investment Manager and certain of its affiliates, if applicable. |
| (c) | Rounds to zero. |
| (d) | Ratios include interest on collateral expense which is less than 0.01%. |
| (e) | Ratios include interfund lending expense which is less than 0.01%. |
| (f) | Institutional 3 Class shares commenced operations on December 18, 2019. Per share data and total return reflect activity from that date. |
| (g) | Annualized. |
| 94 | Multi-Manager Total Return Bond Strategies Fund | Annual Report 2022 |
| Net asset value, end of period | Total return | Total gross expense ratio to average net assets(a) | Total net expense ratio to average net assets(a),(b) | Net investment income ratio to average net assets | Portfolio turnover | Net assets, end of period (000’s) | |
| Institutional Class | |||||||
| Year Ended 8/31/2022 | $8.94 | (12.40%) | 0.50%(d) | 0.49%(d) | 2.15% | 284% | $10,648,886 |
| Year Ended 8/31/2021 | $10.46 | 1.36% | 0.50%(d) | 0.49%(d) | 1.86% | 232% | $10,863,358 |
| Year Ended 8/31/2020 | $10.76 | 6.77% | 0.51% | 0.49% | 2.59% | 184% | $9,404,198 |
| Year Ended 8/31/2019 | $10.38 | 9.33% | 0.52%(e) | 0.52%(e) | 3.05% | 219% | $8,398,508 |
| Year Ended 8/31/2018 | $9.80 | (1.16%) | 0.52% | 0.52% | 2.66% | 228% | $7,969,883 |
| Institutional 3 Class | |||||||
| Year Ended 8/31/2022 | $8.96 | (12.28%) | 0.46%(d) | 0.46%(d) | 2.16% | 284% | $9 |
| Year Ended 8/31/2021 | $10.47 | 1.37% | 0.47%(d) | 0.45%(d) | 1.89% | 232% | $10 |
| Year Ended 8/31/2020(f) | $10.77 | 7.11% | 0.48%(g) | 0.46%(g) | 2.53%(g) | 184% | $11 |
| Multi-Manager Total Return Bond Strategies Fund | Annual Report 2022 | 95 |
August 31, 2022
| 96 | Multi-Manager Total Return Bond Strategies Fund | Annual Report 2022 |
August 31, 2022
| Multi-Manager Total Return Bond Strategies Fund | Annual Report 2022 | 97 |
August 31, 2022
| 98 | Multi-Manager Total Return Bond Strategies Fund | Annual Report 2022 |
August 31, 2022
| Multi-Manager Total Return Bond Strategies Fund | Annual Report 2022 | 99 |
August 31, 2022
| 100 | Multi-Manager Total Return Bond Strategies Fund | Annual Report 2022 |
August 31, 2022
| Asset derivatives | ||
| Risk exposure category | Statement of assets and liabilities location | Fair value ($) |
| Credit risk | Component of total distributable earnings (loss) — unrealized appreciation on swap contracts | 1,324,470* |
| Foreign exchange risk | Unrealized appreciation on forward foreign currency exchange contracts | 24,565 |
| Interest rate risk | Component of total distributable earnings (loss) — unrealized appreciation on futures contracts | 1,259,568* |
| Interest rate risk | Component of total distributable earnings (loss) — unrealized appreciation on swap contracts | 3,832,523* |
| Total | 6,441,126 |
| Liability derivatives | ||
| Risk exposure category | Statement of assets and liabilities location | Fair value ($) |
| Credit risk | Component of total distributable earnings (loss) — unrealized depreciation on swap contracts | 128,445* |
| Interest rate risk | Component of total distributable earnings (loss) — unrealized depreciation on futures contracts | 10,558,274* |
| Interest rate risk | Component of total distributable earnings (loss) — unrealized depreciation on swap contracts | 8,386,144* |
| Total | 19,072,863 |
| * | Includes cumulative appreciation (depreciation) as reported in the tables following the Portfolio of Investments. Only the current day’s variation margin is reported in receivables or payables in the Statement of Assets and Liabilities. |
| Multi-Manager Total Return Bond Strategies Fund | Annual Report 2022 | 101 |
August 31, 2022
| Amount of realized gain (loss) on derivatives recognized in income | ||||
| Risk exposure category | Forward foreign currency exchange contracts ($) | Futures contracts ($) | Swap contracts ($) | Total ($) |
| Credit risk | — | — | 2,736,263 | 2,736,263 |
| Equity risk | — | 7,469 | — | 7,469 |
| Foreign exchange risk | 165,290 | — | — | 165,290 |
| Interest rate risk | — | (157,548,099) | (72,883) | (157,620,982) |
| Total | 165,290 | (157,540,630) | 2,663,380 | (154,711,960) |
| Change in unrealized appreciation (depreciation) on derivatives recognized in income | ||||
| Risk exposure category | Forward foreign currency exchange contracts ($) | Futures contracts ($) | Swap contracts ($) | Total ($) |
| Credit risk | — | — | 1,196,025 | 1,196,025 |
| Foreign exchange risk | 24,565 | — | — | 24,565 |
| Interest rate risk | — | (10,157,077) | (4,553,621) | (14,710,698) |
| Total | 24,565 | (10,157,077) | (3,357,596) | (13,490,108) |
| Derivative instrument | Average notional amounts ($) |
| Futures contracts — long | 1,900,490,069* |
| Futures contracts — short | 608,393,773* |
| Credit default swap contracts — buy protection | 18,267,825** |
| Credit default swap contracts — sell protection | 18,264,060* |
| Derivative instrument | Average unrealized appreciation ($) | Average unrealized depreciation ($) |
| Forward foreign currency exchange contracts | 7,723** | (1,255)** |
| Interest rate swap contracts | 2,505,926* | (5,488,211)* |
| * | Based on the ending quarterly outstanding amounts for the year ended August 31, 2022. |
| ** | Based on the ending daily outstanding amounts for the year ended August 31, 2022. |
| 102 | Multi-Manager Total Return Bond Strategies Fund | Annual Report 2022 |
August 31, 2022
| Multi-Manager Total Return Bond Strategies Fund | Annual Report 2022 | 103 |
August 31, 2022
| Citi ($) | Morgan Stanley ($)(a) | Morgan Stanley ($)(a) | Total ($) | |
| Assets | ||||
| Centrally cleared credit default swap contracts (b) | - | 148,631 | - | 148,631 |
| Centrally cleared interest rate swap contracts (b) | 210,695 | - | - | 210,695 |
| Forward foreign currency exchange contracts | - | - | 24,565 | 24,565 |
| Total assets | 210,695 | 148,631 | 24,565 | 383,891 |
| Total financial and derivative net assets | 210,695 | 148,631 | 24,565 | 383,891 |
| Total collateral received (pledged) (c) | - | - | - | - |
| Net amount (d) | 210,695 | 148,631 | 24,565 | 383,891 |
| (a) | Exposure can only be netted across transactions governed under the same master agreement with the same legal entity. |
| (b) | Centrally cleared swaps are included within payable/receivable for variation margin in the Statement of Assets and Liabilities. |
| (c) | In some instances, the actual collateral received and/or pledged may be more than the amount shown due to overcollateralization. |
| (d) | Represents the net amount due from/(to) counterparties in the event of default. |
| 104 | Multi-Manager Total Return Bond Strategies Fund | Annual Report 2022 |
August 31, 2022
| Multi-Manager Total Return Bond Strategies Fund | Annual Report 2022 | 105 |
August 31, 2022
| 106 | Multi-Manager Total Return Bond Strategies Fund | Annual Report 2022 |
August 31, 2022
| Effective rate (%) | |
| Institutional Class | 0.04 |
| Institutional 3 Class | 0.02 |
| January 1, 2022 through December 31, 2022 | Prior to January 1, 2022 | |
| Institutional Class | 0.49 | 0.49 |
| Institutional 3 Class | 0.47 | 0.46 |
| Multi-Manager Total Return Bond Strategies Fund | Annual Report 2022 | 107 |
August 31, 2022
| Undistributed net investment income ($) | Accumulated net realized (loss) ($) | Paid in capital ($) |
| 3,175,900 | (3,175,901) | 1 |
| Year Ended August 31, 2022 | Year Ended August 31, 2021 | ||||
| Ordinary income ($) | Long-term capital gains ($) | Total ($) | Ordinary income ($) | Long-term capital gains ($) | Total ($) |
| 222,977,263 | 38,033,256 | 261,010,519 | 409,746,957 | 817,649 | 410,564,606 |
| Undistributed ordinary income ($) | Undistributed long-term capital gains ($) | Capital loss carryforwards ($) | Net unrealized (depreciation) ($) |
| 37,635,026 | — | (528,816,557) | (877,268,212) |
| Federal tax cost ($) | Gross unrealized appreciation ($) | Gross unrealized (depreciation) ($) | Net unrealized (depreciation) ($) |
| 12,640,880,089 | 16,320,878 | (893,589,090) | (877,268,212) |
| 108 | Multi-Manager Total Return Bond Strategies Fund | Annual Report 2022 |
August 31, 2022
| No expiration short-term ($) | No expiration long-term ($) | Total ($) | Utilized ($) |
| (350,681,507) | (178,135,050) | (528,816,557) | — |
| Borrower or lender | Average loan balance ($) | Weighted average interest rate (%) | Number of days with outstanding loans |
| Lender | 900,000 | 2.85 | 3 |
| Multi-Manager Total Return Bond Strategies Fund | Annual Report 2022 | 109 |
August 31, 2022
| 110 | Multi-Manager Total Return Bond Strategies Fund | Annual Report 2022 |
August 31, 2022
| Multi-Manager Total Return Bond Strategies Fund | Annual Report 2022 | 111 |
August 31, 2022
| 112 | Multi-Manager Total Return Bond Strategies Fund | Annual Report 2022 |
| Multi-Manager Total Return Bond Strategies Fund | Annual Report 2022 | 113 |
| Section 163(j) Interest Dividends | |
| 100.00% |
| Name, address, year of birth | Position held with the Columbia Funds and length of service | Principal occupation(s) during past five years and other relevant professional experience | Number of Funds in the Columbia Funds Complex* overseen | Other directorships held by Trustee during the past five years |
| George S. Batejan c/o Columbia Management Investment Advisers, LLC 290 Congress Street Boston, MA 02210 1953 | Trustee since 2017 | Executive Vice President, Global Head of Technology and Operations, Janus Capital Group, Inc., 2010-2016 | 176 | Former Chairman of the Board, NICSA (National Investment Company Services Association) (Executive Committee, Nominating Committee and Governance Committee), 2014-2016; former Director, Intech Investment Management, 2011-2016; former Board Member, Metro Denver Chamber of Commerce, 2015-2016; former Advisory Board Member, University of Colorado Business School, 2015-2018 |
| 114 | Multi-Manager Total Return Bond Strategies Fund | Annual Report 2022 |
(Unaudited)
Independent trustees (continued)
| Name, address, year of birth | Position held with the Columbia Funds and length of service | Principal occupation(s) during past five years and other relevant professional experience | Number of Funds in the Columbia Funds Complex* overseen | Other directorships held by Trustee during the past five years |
| Kathleen Blatz c/o Columbia Management Investment Advisers, LLC 290 Congress Street Boston, MA 02210 1954 | Trustee since 2006 | Attorney, specializing in arbitration and mediation; Chief Justice, Minnesota Supreme Court, 1998-2006; Associate Justice, Minnesota Supreme Court, 1996-1998; Fourth Judicial District Court Judge, Hennepin County, 1994-1996; Attorney in private practice and public service, 1984-1993; State Representative, Minnesota House of Representatives, 1979-1993, which included service on the Tax and Financial Institutions and Insurance Committees; Member and Interim Chair, Minnesota Sports Facilities Authority, January 2017-July 2017; Interim President and Chief Executive Officer, Blue Cross and Blue Shield of Minnesota (health care insurance), February-July 2018, April-October 2021 | 176 | Former Trustee, Blue Cross and Blue Shield of Minnesota, 2009-2021 (Chair of the Business Development Committee, 2014-2017; Chair of the Governance Committee, 2017-2019); former Member and Chair of the Board, Minnesota Sports Facilities Authority, January 2017-July 2017; former Director, Robina Foundation, 2009-2020 (Chair, 2014-2020); Director, Schulze Family Foundation, since 2021 |
| Pamela G. Carlton c/o Columbia Management Investment Advisers, LLC 290 Congress Street Boston, MA 02210 1954 | Trustee since 2007 | President, Springboard — Partners in Cross Cultural Leadership (consulting company) since 2003; Managing Director of US Equity Research, JP Morgan Chase, 1999-2003; Director of US Equity Research, Chase Asset Management, 1996-1999; Co-Director Latin America Research, 1993-1996, COO Global Research, 1992-1996, Co-Director of US Research, 1991-1992, Investment Banker, 1982-1991, Morgan Stanley; Attorney, Cleary Gottlieb Steen & Hamilton LLP, 1980-1982 | 176 | Trustee, New York Presbyterian Hospital Board (Executive Committee and Chair of People Committee) since 1996; Director, DR Bank (Audit Committee) since 2017; Director, Evercore Inc. (Audit Committee) since 2019; Director, Apollo Commercial Real Estate Finance, Inc. since 2021; the Governing Council of the Independent Directors Council (IDC), since 2021 |
| Janet Langford Carrig c/o Columbia Management Investment Advisers, LLC 290 Congress Street Boston, MA 02210 1957 | Trustee since 1996 | Senior Vice President, General Counsel and Corporate Secretary, ConocoPhillips (independent energy company), September 2007-October 2018 | 174 | Director, EQT Corporation (natural gas producer) since 2019; former Director, Whiting Petroleum Corporation (independent oil and gas company), 2020-2022 |
| J. Kevin Connaughton c/o Columbia Management Investment Advisers, LLC 290 Congress Street Boston, MA 02210 1964 | Trustee since 2020 | Member, FINRA National Adjudicatory Council since January 2020; Adjunct Professor of Finance, Bentley University since January 2018; Consultant to Independent Trustees of CFVIT and CFST I from March 2016 to June 2020 with respect to CFVIT and to December 2020 with respect to CFST I; Managing Director and General Manager of Mutual Fund Products, Columbia Management Investment Advisers, LLC, May 2010-February 2015; President, Columbia Funds, 2008-2015; and senior officer of Columbia Funds and affiliated funds, 2003-2015 | 174 | Former Director, The Autism Project, March 2015-December 2021; former Member of the Investment Committee, St. Michael’s College, November 2015-February 2020; former Trustee, St. Michael’s College, June 2017-September 2019; former Trustee, New Century Portfolios, January 2015-December 2017 |
| Multi-Manager Total Return Bond Strategies Fund | Annual Report 2022 | 115 |
(Unaudited)
Independent trustees (continued)
| Name, address, year of birth | Position held with the Columbia Funds and length of service | Principal occupation(s) during past five years and other relevant professional experience | Number of Funds in the Columbia Funds Complex* overseen | Other directorships held by Trustee during the past five years |
| Olive M. Darragh c/o Columbia Management Investment Advisers, LLC 290 Congress Street Boston, MA 02210 1962 | Trustee since 2020 | Managing Director of Darragh Inc. (strategy and talent management consulting firm) since 2010; Founder and CEO, Zolio, Inc. (investment management talent identification platform) since 2004; Consultant to Independent Trustees of CFVIT and CFST I from June 2019 to June 2020 with respect to CFVIT and to December 2020 with respect to CFST I; Partner, Tudor Investments, 2004-2010; Senior Partner, McKinsey & Company (consulting), 1990-2004; Touche Ross CPA, 1985-1988 | 174 | Former Director, University of Edinburgh Business School (Member of US Board); former Director, Boston Public Library Foundation |
| Patricia M. Flynn c/o Columbia Management Investment Advisers, LLC 290 Congress Street Boston, MA 02210 1950 | Trustee since 2004 | Trustee Professor of Economics and Management, Bentley University since 1976 (also teaches and conducts research on corporate governance); Dean, McCallum Graduate School of Business, Bentley University, 1992-2002 | 176 | Trustee, MA Taxpayers Foundation since 1997; former Board of Governors, Innovation Institute, MA Technology Collaborative, 2010-2020; former Board of Directors, The MA Business Roundtable, 2003-2019 |
| Brian J. Gallagher c/o Columbia Management Investment Advisers, LLC 290 Congress Street Boston, MA 02210 1954 | Trustee since 2017 | Retired; Partner with Deloitte & Touche LLP and its predecessors, 1977-2016 | 176 | Trustee, Catholic Schools Foundation since 2004 |
| Douglas A. Hacker c/o Columbia Management Investment Advisers, LLC 290 Congress Street Boston, MA 02210 1955 | Co-Chair since 2021; Chair of CFST I and CFVIT since 2014; Trustee of CFST I and CFVIT since 1996 and CFST, CFST II, CFVST II, CET I and CET II since 2021 | Independent business executive since May 2006; Executive Vice President – Strategy of United Airlines, December 2002 - May 2006; President of UAL Loyalty Services (airline marketing company), September 2001-December 2002; Executive Vice President and Chief Financial Officer of United Airlines, July 1999-September 2001 | 176 | Director, Spartan Nash Company (food distributor); Director, Aircastle Limited (Chair of Audit Committee) (aircraft leasing); former Director, Nash Finch Company (food distributor), 2005-2013; former Director, SeaCube Container Leasing Ltd. (container leasing), 2010-2013; and former Director, Travelport Worldwide Limited (travel information technology), 2014-2019 |
| Nancy T. Lukitsh c/o Columbia Management Investment Advisers, LLC 290 Congress Street Boston, MA 02210 1956 | Trustee since 2011 | Senior Vice President, Partner and Director of Marketing, Wellington Management Company, LLP (investment adviser), 1997-2010; Chair, Wellington Management Portfolios (commingled non-U.S. investment pools), 2007 -2010; Director, Wellington Trust Company, NA and other Wellington affiliates, 1997-2010 | 174 | None |
| 116 | Multi-Manager Total Return Bond Strategies Fund | Annual Report 2022 |
(Unaudited)
Independent trustees (continued)
| Name, address, year of birth | Position held with the Columbia Funds and length of service | Principal occupation(s) during past five years and other relevant professional experience | Number of Funds in the Columbia Funds Complex* overseen | Other directorships held by Trustee during the past five years |
| David M. Moffett c/o Columbia Management Investment Advisers, LLC 290 Congress Street Boston, MA 02210 1952 | Trustee since 2011 | Retired; Consultant to Bridgewater and Associates | 174 | Director, CSX Corporation (transportation suppliers); Director, Genworth Financial, Inc. (financial and insurance products and services); Director, PayPal Holdings Inc. (payment and data processing services); Trustee, University of Oklahoma Foundation; former Director, eBay Inc. (online trading community), 2007-2015; and former Director, CIT Bank, CIT Group Inc. (commercial and consumer finance), 2010-2016 |
| Catherine James Paglia c/o Columbia Management Investment Advisers, LLC 290 Congress Street Boston, MA 02210 1952 | Co-Chair since 2021; Chair of CFST, CFST II, CFVST II, CET I and CET II since 2020; Trustee of CFST, CFST II and CFVST II since 2004 and CFST I and CFVIT since 2021 | Director, Enterprise Asset Management, Inc. (private real estate and asset management company) since September 1998; Managing Director and Partner, Interlaken Capital, Inc., 1989-1997; Vice President, 1982-1985, Principal, 1985-1987, Managing Director, 1987-1989, Morgan Stanley; Vice President, Investment Banking, 1980-1982, Associate, Investment Banking, 1976-1980, Dean Witter Reynolds, Inc. | 176 | Director, Valmont Industries, Inc. (irrigation systems manufacturer) since 2012; Trustee, Carleton College (on the Investment Committee); Trustee, Carnegie Endowment for International Peace (on the Investment Committee) |
| Minor M. Shaw c/o Columbia Management Investment Advisers, LLC 290 Congress Street Boston, MA 02210 1947 | Trustee since 2003 | President, Micco LLC (private investments) since 2011; President, Micco Corp. (family investment business), 1998-2011 | 176 | Director, Blue Cross Blue Shield of South Carolina (Chair of Compensation Committee) since April 2008; Trustee, Hollingsworth Funds (on the Investment Committee) since 2016 (previously Board Chair from 2016-2019); Former Advisory Board member, Duke Energy Corp., 2016-2020; Chair of the Duke Endowment; Chair of Greenville – Spartanburg Airport Commission; former Trustee, BofA Funds Series Trust (11 funds), 2003-2011; former Director, Piedmont Natural Gas, 2004-2016; former Director, National Association of Corporate Directors, Carolinas Chapter, 2013-2018; Chair, Daniel-Mickel Foundation since 1998 |
| Multi-Manager Total Return Bond Strategies Fund | Annual Report 2022 | 117 |
(Unaudited)
Independent trustees (continued)
| Name, address, year of birth | Position held with the Columbia Funds and length of service | Principal occupation(s) during past five years and other relevant professional experience | Number of Funds in the Columbia Funds Complex* overseen | Other directorships held by Trustee during the past five years |
| Natalie A. Trunow c/o Columbia Management Investment Advisers, LLC 290 Congress Street Boston, MA 02210 1967 | Trustee since 2020 | Chief Executive Officer, Millennial Portfolio Solutions LLC (asset management and consulting services), January 2016-January 2021; Non-executive Member of the Investment Committee and Valuation Committee, Sarona Asset Management Inc. (private equity firm) since September 2019; Advisor, Horizon Investments (asset management and consulting services), August 2018-January 2021; Advisor, Paradigm Asset Management, November 2016-December 2021; Consultant to Independent Trustees of CFVIT and CFST I from September 2016 to June 2020 with respect to CFVIT and to December 2020 with respect to CFST I; Director of Investments/Consultant, Casey Family Programs, April 2016-November 2016; Senior Vice President and Chief Investment Officer, Calvert Investments, August 2008-January 2016; Section Head and Portfolio Manager, General Motors Asset Management, June 1997-August 2008 | 174 | Former Director, Investment Committee, Health Services for Children with Special Needs, Inc., 2012-2019; Director, Chair of Audit Committee, Consumer Credit Counseling Services (formerly Guidewell Financial Solutions), since 2019; Independent Director, Investment Committee and Valuation Committee, Sarona Asset Management, since 2019 |
| Sandra L. Yeager c/o Columbia Management Investment Advisers, LLC 290 Congress Street Boston, MA 02210 1964 | Trustee since 2017 | Retired; President and founder, Hanoverian Capital, LLC (SEC registered investment advisor firm), 2008-2016; Managing Director, DuPont Capital, 2006-2008; Managing Director, Morgan Stanley Investment Management, 2004-2006; Senior Vice President, Alliance Bernstein, 1990-2004 | 176 | Former Director, NAPE Education Foundation, October 2016-October 2020 |
| * | The term “Columbia Funds Complex” as used herein includes Columbia Seligman Premium Technology Growth Fund, Tri-Continental Corporation and each series of Columbia Fund Series Trust (CFST), Columbia Funds Series Trust I (CFST I), Columbia Funds Series Trust II (CFST II), Columbia ETF Trust I (CET I), Columbia ETF Trust II (CET II), Columbia Funds Variable Insurance Trust (CFVIT) and Columbia Funds Variable Series Trust II (CFVST II). Messrs. Batejan, Beckman, Gallagher and Hacker and Mses. Blatz, Carlton, Flynn, Paglia, Shaw and Yeager serve as Directors of Columbia Seligman Premium Technology Growth Fund and Tri-Continental Corporation. |
| Name, address, year of birth | Position held with the Columbia Funds and length of service | Principal occupation(s) during the past five years and other relevant professional experience | Number of Funds in the Columbia Funds Complex overseen | Other directorships held by Trustee during the past five years |
| Daniel J. Beckman c/o Columbia Management Investment Advisers, LLC 290 Congress Street Boston, MA 02210 1962 | Trustee since November 2021 and President since June 2021 | Vice President – Head of North America Product, Columbia Management Investment Advisers, LLC since April 2015; President and Principal Executive Officer of the Columbia Funds since June 2021; officer of Columbia Funds and affiliated funds, 2020-2021 | 176 | Director, Ameriprise Trust Company, since October 2016; Director, Columbia Management Investment Distributors, Inc. since November 2018; Board of Governors, Columbia Wanger Asset Management, LLC since January 2022 |
| * | Interested person (as defined under the 1940 Act) by reason of being an officer, director, security holder and/or employee of the Investment Manager or Ameriprise Financial. |
| 118 | Multi-Manager Total Return Bond Strategies Fund | Annual Report 2022 |
(Unaudited)
The Statement of Additional Information has additional information about the Fund’s Board members and is available, without charge, upon request by calling 800.345.6611, visiting columbiathreadneedleus.com/investor/ or contacting your financial intermediary.
| Name, address and year of birth | Position and year first appointed to position for any Fund in the Columbia Funds Complex or a predecessor thereof | Principal occupation(s) during past five years |
| Michael G. Clarke 290 Congress Street Boston, MA 02210 1969 | Chief Financial Officer and Principal Financial Officer (2009) and Senior Vice President (2019) | Senior Vice President and Head of Global Operations & Investor Services, Columbia Management Investment Advisers, LLC, since March 2022 (previously Vice President, Head of North American Operations, and Co-Head of Global Operations, June 2019 to February 2022 and Vice President – Accounting and Tax, May 2010 - May 2019); senior officer of Columbia Funds and affiliated funds since 2002. |
| Joseph Beranek 5890 Ameriprise Financial Center Minneapolis, MN 55474 1965 | Treasurer and Chief Accounting Officer (Principal Accounting Officer) (2019) and Principal Financial Officer (2020), CFST, CFST I, CFST II, CFVIT and CFVST II; Assistant Treasurer, CET I and CET II | Vice President – Mutual Fund Accounting and Financial Reporting, Columbia Management Investment Advisers, LLC, since December 2018 and March 2017, respectively (previously Vice President – Pricing and Corporate Actions, May 2010 - March 2017). |
| Marybeth Pilat 290 Congress Street Boston, MA 02210 1968 | Treasurer and Chief Accounting Officer (Principal Accounting Officer) and Principal Financial Officer (2020) for CET I and CET II; Assistant Treasurer, CFST, CFST I, CFST II, CFVIT and CFVST II | Vice President – Product Pricing and Administration, Columbia Management Investment Advisers, LLC, since May 2017; Director - Fund Administration, Calvert Investments, August 2015 – March 2017; Vice President - Fund Administration, Legg Mason, May 2015 - July 2015; Vice President - Fund Administration, Columbia Management Investment Advisers, LLC, May 2010 - April 2015. |
| William F. Truscott 290 Congress Street Boston, MA 02210 1960 | Senior Vice President (2001) | Formerly, Trustee/Director of Columbia Funds Complex or legacy funds, November 2001-January 1, 2021; Chief Executive Officer, Global Asset Management, Ameriprise Financial, Inc. since September 2012; Chairman of the Board and President, Columbia Management Investment Advisers, LLC since July 2004 and February 2012, respectively; Chairman of the Board and Chief Executive Officer, Columbia Management Investment Distributors, Inc. since November 2008 and February 2012, respectively; Chairman of the Board and Director, Threadneedle Asset Management Holdings, Sàrl since March 2013 and December 2008, respectively; senior executive of various entities affiliated with Columbia Threadneedle. |
| Christopher O. Petersen 5228 Ameriprise Financial Center Minneapolis, MN 55474 1970 | Senior Vice President and Assistant Secretary (2021) | Formerly, Trustee/Director of funds within the Columbia Funds Complex, July 1, 2020 - November 22, 2021; Senior Vice President and Assistant General Counsel, Ameriprise Financial, Inc. since September 2021 (previously Vice President and Lead Chief Counsel, January 2015 - September 2021); formerly, President and Principal Executive Officer of the Columbia Funds, 2015 - 2021; officer of Columbia Funds and affiliated funds since 2007. |
| Thomas P. McGuire 290 Congress Street Boston, MA 02210 1972 | Senior Vice President and Chief Compliance Officer (2012) | Vice President – Asset Management Compliance, Ameriprise Financial, Inc., since May 2010; Chief Compliance Officer, Columbia Acorn/Wanger Funds since December 2015; formerly, Chief Compliance Officer, Ameriprise Certificate Company, September 2010 – September 2020. |
| Multi-Manager Total Return Bond Strategies Fund | Annual Report 2022 | 119 |
(Unaudited)
Fund officers (continued)
| Name, address and year of birth | Position and year first appointed to position for any Fund in the Columbia Funds Complex or a predecessor thereof | Principal occupation(s) during past five years |
| Ryan C. Larrenaga 290 Congress Street Boston, MA 02210 1970 | Senior Vice President (2017), Chief Legal Officer (2017), and Secretary (2015) | Vice President and Chief Counsel, Ameriprise Financial, Inc. since August 2018 (previously Vice President and Group Counsel, August 2011 - August 2018); Chief Legal Officer, Columbia Acorn/Wanger Funds, since September 2020; officer of Columbia Funds and affiliated funds since 2005. |
| Michael E. DeFao 290 Congress Street Boston, MA 02210 1968 | Vice President (2011) and Assistant Secretary (2010) | Vice President and Chief Counsel, Ameriprise Financial, Inc. since May 2010; Vice President, Chief Legal Officer and Assistant Secretary, Columbia Management Investment Advisers, LLC since October 2021 (previously Vice President and Assistant Secretary, May 2010 – September 2021). |
| Lyn Kephart-Strong 5228 Ameriprise Financial Center Minneapolis, MN 55474 1960 | Vice President (2015) | President, Columbia Management Investment Services Corp. since October 2014; Vice President & Resolution Officer, Ameriprise Trust Company since August 2009. |
| • | the Fund had sufficient liquidity to both meet redemptions and operate effectively on behalf of shareholders; |
| • | there were no material changes to the Program during the period; |
| • | the implementation of the Program was effective to manage the Fund’s liquidity risk; and |
| • | the Program operated adequately during the period. |
| 120 | Multi-Manager Total Return Bond Strategies Fund | Annual Report 2022 |
| • | Information on the investment performance of the Fund relative to the performance of a group of mutual funds determined to be comparable to the Fund by Broadridge, as well as performance relative to benchmarks; |
| • | Information on the Fund’s management fees and total expenses, including information comparing the Fund’s expenses to those of a group of comparable mutual funds, as determined by Broadridge; |
| • | The Investment Manager’s agreement to contractually limit or cap total operating expenses for the Fund so that total operating expenses (excluding certain fees and expenses, such as transaction costs and certain other investment related expenses, interest, taxes, acquired fund fees and expenses and infrequent and/or unusual expenses) would not exceed a specified annual rate, as a percentage of the Fund’s net assets; |
| • | Terms of the Advisory Agreements; |
| • | Subadvisory fees payable by the Investment Manager under the Subadvisory Agreements; |
| • | Descriptions of other agreements and arrangements with affiliates of the Investment Manager relating to the operations of the Fund, including agreements with respect to the provision of transfer agency and shareholder services to the Fund; |
| • | Descriptions of various services performed by the Investment Manager and the Subadvisers under the Advisory Agreements, including portfolio management and portfolio trading practices; |
| • | Information regarding any recently negotiated management fees of similarly-managed portfolios of other institutional clients of the Investment Manager; |
| Multi-Manager Total Return Bond Strategies Fund | Annual Report 2022 | 121 |
| • | Information regarding the resources of the Investment Manager and Subadvisers, including information regarding senior management, portfolio managers and other personnel; |
| • | Information regarding the capabilities of the Investment Manager and the Subadvisers with respect to compliance monitoring services; |
| • | The profitability to the Investment Manager and its affiliates from their relationships with the Fund; and |
| • | Report provided by the Board’s independent fee consultant, JDL Consultants, LLC (JDL). |
| 122 | Multi-Manager Total Return Bond Strategies Fund | Annual Report 2022 |
| Multi-Manager Total Return Bond Strategies Fund | Annual Report 2022 | 123 |
| 124 | Multi-Manager Total Return Bond Strategies Fund | Annual Report 2022 |
columbiathreadneedleus.com/investor/. The Fund is distributed by Columbia Management Investment Distributors, Inc., member FINRA, and managed by Columbia Management Investment Advisers, LLC.

August 31, 2022

| 3 | |
| 5 | |
| 11 | |
| 12 | |
| 28 | |
| 29 | |
| 30 | |
| 32 | |
| 34 | |
| 42 | |
| 43 | |
| 43 | |
| 49 | |
| 50 |
(Unaudited)

| Average annual total returns (%) (for the period ended August 31, 2022) | |||||
| Inception | 1 Year | 5 Years | 10 Years | ||
| Institutional Class* | 01/03/17 | -15.57 | 7.62 | 10.17 | |
| Institutional 3 Class* | 12/18/19 | -15.33 | 7.73 | 10.22 | |
| Russell 2000 Index | -17.88 | 6.95 | 10.01 | ||
| * | The returns shown for periods prior to the share class inception date (including returns for the Life of the Fund, if shown, which are since Fund inception) include the returns of the Fund’s oldest share class. Returns shown for periods prior to the inception date of each class include the returns of the Fund’s Class A shares for the period prior to January 3, 2017, and for Institutional 3 Class shares, include the returns of the Fund’s Institutional Class shares for the period from January 3, 2017 through the inception date of the class. Class A shares were offered prior to the Fund’s Institutional Class shares but have since been merged into the Fund’s Institutional Class shares. These returns are adjusted to reflect any higher class-related operating expenses of the newer share classes, as applicable. Please visit columbiathreadneedleus.com/investor/investment-products/mutual-funds/appended-performance for more information. |
| Multi-Manager Small Cap Equity Strategies Fund | Annual Report 2022 | 3 |
(Unaudited)
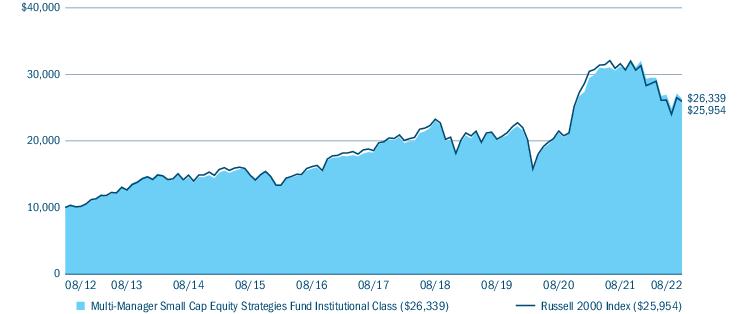
| Portfolio breakdown (%) (at August 31, 2022) | |
| Common Stocks | 98.7 |
| Exchange-Traded Equity Funds | 0.2 |
| Money Market Funds | 1.1 |
| Total | 100.0 |
| Equity sector breakdown (%) (at August 31, 2022) | |
| Communication Services | 1.2 |
| Consumer Discretionary | 9.7 |
| Consumer Staples | 3.0 |
| Energy | 4.9 |
| Financials | 19.5 |
| Health Care | 14.4 |
| Industrials | 22.3 |
| Information Technology | 14.5 |
| Materials | 3.5 |
| Real Estate | 4.6 |
| Utilities | 2.4 |
| Total | 100.0 |
| 4 | Multi-Manager Small Cap Equity Strategies Fund | Annual Report 2022 |
(Unaudited)
| • | Performance in our portion of the Fund relative to our benchmark was driven by strong sector allocations and stock selection. |
| • | Underweights to the health care and communication services sector benefited relative performance. |
| • | Selections within the materials, communication services and energy sectors contributed to relative performance. |
| • | Not owning shares in movie chain operator AMC Entertainment Holdings, Inc. was a positive contributor to relative performance. Shares in the “meme” stock, which was driven up to dizzying heights earlier in the period by retail investors, gave back those gains during the rest of the period. We are bottom-up investors and believe that stock prices will track fundamentals over time and so have not invested in the name. |
| • | Our position in oil and natural gas exploration and production companies Ovintiv, Inc. and Matador Resources Co. were top performers. Both companies benefited from rising oil prices during the period. We exited our position in Ovintiv late in the period. |
| • | Stock selection within the financials and consumer discretionary sectors detracted most from performance relative to the benchmark during the period. |
| Multi-Manager Small Cap Equity Strategies Fund | Annual Report 2022 | 5 |
(Unaudited)
| • | Our holding in property and casualty insurance underwriter Argo Group International Holdings, Ltd. detracted from results. Shares declined after the company pre-announced that their first quarter 2022 results would be negatively affected by adverse reserve developments and non-operating charges from the prior year. |
| • | Fitness company F45 Training Holdings, Inc. was a notable detractor from relative performance within consumer discretionary. Macro-related concerns around the consumer and fears of a looming recession weighed on the stock. We decided to exit the name. |
| • | Residential solar and energy storage company Sunnova Energy International, Inc. saw its stock price decline during the period, challenged by a macro environment of high inflation and rising interest rates. We sold our position early in the period. |
| • | Top contributing sectors to relative performance in our portion of the Fund were the information technology, health care and utilities sectors. |
| ○ | Within information technology, strong stock selection was the largest contributor to relative returns during the period. |
| ○ | A large underweight to the health care sector, the benchmark’s worst performing sector, added to relative return. A key contributor was our underweight to the very poor-performing biotechnology industry. |
| ○ | An overweight, relative to the benchmark in the utilities sector, as well as strong stock selection, also contributed. |
| • | Vocera Communications, Inc. was a top individual contributor in our portion of the portfolio. On January 6, 2022, the company announced a definitive agreement to be acquired by Stryker Corp. in an all-cash transaction for $79.25 per share. This price represented a 27% premium to the prior day’s close. The acquisition closed on February 23, 2022. |
| • | Simulations Plus, Inc., which provides modeling and simulation software services sold into the biotechnology and pharmaceutical industries, was also additive to performance in our portion of the Fund. The company’s stock moved higher at the end of the period after reporting better-than-expected fiscal third quarter revenues and earnings. |
| • | RBC Bearings Inc., a manufacturer of precision components and bearings for industrial applications across a variety of industries was also among the top contributors in our portion of the portfolio. While the company has faced supply chain disruptions and shutdowns of its customer facilities during the pandemic, its revenues and operating income have rebounded as global economies have reopened and demand has reaccelerated. |
| • | A lack of exposure to the energy sector, by far the best-performing sector in the benchmark during the period, detracted from our portion of the Fund’s performance versus the benchmark. |
| • | While our overweight to the industrials sector helped, it was not enough to offset the negative effects of our stock selection within the sector. |
| • | Within the financials sector, both an underweight allocation and stock selection detracted from relative returns in our portion of the Fund. |
| 6 | Multi-Manager Small Cap Equity Strategies Fund | Annual Report 2022 |
(Unaudited)
| • | A position in Trex Company, Inc., a market share leader in composite decking sold into the residential market, detracted from the Fund’s performance during the period. The stock has corrected due to concerns about the housing market given higher interest rates and the possibility of some pull-forward in demand during the pandemic. |
| • | Fox Factory Holding Corp. is a leading player in high-end suspension products in the power vehicle and mountain bike markets. The stock was down due to concerns about semiconductor chip supplies as well as a potential slowdown in the mountain bike segment. |
| • | Neogen Corp. (NEOG) develops and manufactures products for the food and animal safety market. The company has experienced slower-than-expected growth over the past year. Also, the company is preparing to merge with 3M’s food and animal safety unit, which is an acquisition of roughly the same size as NEOG currently. These factors have weighed on the stock price but we believe the company remains well-positioned for long-term growth. |
| • | The financial sector was the biggest positive contributor to our portion of the Fund during the period. While the overweight position was modestly helpful, positive stock selection in the sector was the dominant driver. Banks, consumer finance, and insurance were all positive. |
| • | The communication services sector was the next largest positive contributor relative to our benchmark in the period. The underweight position in the sector helped. |
| • | The overweight position in energy was the third largest positive contributor in the period. While the portfolio’s energy stocks failed to keep pace with the benchmark’s energy stocks, the overweight position and high absolute performance of our holdings within the sector benefited the portfolio. |
| • | The largest individual contributor to relative performance in our portion of the Fund was not owning meme stock AMC Entertainment, which was a large benchmark constituent that declined -74%. We did not own or trade the stock at any point. |
| • | Kosmos Energy Ltd. was the second largest positive contributor to relative performance. The offshore exploration & production company was extremely undervalued at the period’s outset and rose along with commodity prices. It benefited from liquid natural gas pricing and the company announced a promising discovery in the Gulf of Mexico. |
| • | Nextier Oilfield Solutions, Inc. was the third largest positive contributor to relative performance. Capital spending in the industry improved, which benefited Nextier’s oilfield service businesses. Its quarterly results and forecasts surpassed analyst expectations. We exited the position in lieu of better valuation opportunities as the stock price rose. |
| • | An overweight position in the consumer discretionary sector detracted as investors shunned most cyclical sectors in the period. Positive stock selection in the sector was not enough to compensate for the negative impact of the overweight position. |
| • | An underweight position and negative stock selection in the consumer staples sector hurt relative performance. The non-cyclical sector was one of three with a positive return over the period for our benchmark, and our underweight position hurt. |
| • | Our underweight position in the utilities sector also hurt. This is another defensive sector that had a positive return for our benchmark. Fortunately, positive stock selection in the sector offset the negative impact from the overweight exposure in our portion of the Fund. |
| Multi-Manager Small Cap Equity Strategies Fund | Annual Report 2022 | 7 |
(Unaudited)
| • | Kirkland’s, Inc. and Vera Bradley Inc. were the largest individual detractors to relative performance in our portion of the Fund over the period. Both companies are specialty retailers that declined along with the rest of the sector. |
| ○ | We exited the position in Kirkland’s after its poor results increased our concern about the company’s ability to service its debt. |
| ○ | We maintained the position in Vera Bradley. We are more comfortable with the company’s balance sheet and prospects for a reversion toward more acceptable returns on capital. |
| • | Siriuspoint Ltd. is an insurance company that reported weak results and had some management turnover that triggered a stock price decline. We maintained a position in the company and viewed its issues as largely transitory. |
| • | A combination of sector allocation and stock selection that favored companies with higher expected growth underperformed companies with low valuations and lower expected growth during the one-year period ending August 2022. |
| ○ | Negative stock selection and a relative underweight to the energy sector detracted the most in our portion of the Fund during the period. |
| ○ | A combination of stock selection and an overweight to technology was the second largest detractor. |
| ○ | Stock selection within the consumer discretionary sector was the third largest detractor. |
| • | Everbridge, Inc., a provider of critical event management software to enterprises and governments, was the top individual detractor. Underperformance in the fourth quarter of 2021 occurred after the company announced 2022 revenue growth guidance that fell short of expectations. |
| • | Smartsheet, Inc., a cloud-based platform for work management, was the second largest detractor. Shares fell in the first quarter of 2022, despite reporting outstanding results and outlook, as the market became more concerned over elevated spending levels by collaboration tool companies. |
| • | Duck Creek Technologies, Inc., an insurance software provider, was the third largest detractor. Shares were down materially in the fourth quarter of 2021, after the company reported disappointing earnings results. |
| • | Stock selection in the health care, real estate and consumer staples sectors contributed to performance in our portion of the Fund during the period. |
| • | iRhythm Technologies, Inc., a leading digital health care solutions company that offers cardiac rhythm monitoring devices for palpitation, shortness of breath and fatigue, was the top contributor during the period. Shares rose in the fourth quarter of 2021 after the news of increased product reimbursement rates were announced by a Medicare billing company. Shares further rose in the first quarter of 2022 after Novitas, a Medicare Administrative Contractor, announced the doubling of certain Medicare rates for cardiac monitoring. |
| • | ShockWave Medical, Inc., a medical device company pioneering a sonic treatment to reduce intravascular plaque, was the second largest contributor during the period. Shares rose after the company provided strong earnings and upgraded 2022 guidance. |
| • | Evolent Health, Inc., a leading health care company that delivers value-based care solutions, was the third largest contributor during the period. Shares rose after the company reported solid first quarter 2022 results and guidance, showing what we believe to be increasing traction with adoption of value-based care. |
| 8 | Multi-Manager Small Cap Equity Strategies Fund | Annual Report 2022 |
(Unaudited)
| • | During the reporting period, the market sectors that detracted the most, on a relative basis, were energy, industrials, and real estate. |
| • | Security selection was negative in each of the three sectors. |
| • | An underweight of energy also detracted from performance, while an underweight of real estate benefited the portfolio. |
| • | We were overweight industrials. |
| • | The portfolio had positive absolute returns in energy and industrials, and a negative absolute return in real estate. |
| • | Emergent BioSolutions, Inc. engages in the development, manufacture, and commercialization of medical countermeasures. It offers products for civilian and military populations that address accidental, intentional, and naturally occurring public health threats. The company reported disappointing financial results for its second quarter, including earnings and revenue that were below consensus estimates. In addition, company management lowered its guidance for the year. |
| • | 2U, Inc. engages in the provision of education technology for nonprofit colleges and universities. 2U reported disappointing second quarter results, including revenue and operating results, that failed to meet consensus expectations. The company also announced its Chief Operating Officer would be stepping down and that it was implementing a plan to reduce expenses, including layoffs and rationalizing its real estate footprint. |
| • | CoreCivic, Inc. engages in the development and management of prisons and other correctional facilities. In August 2022, the company reported second quarter results that were below expectations. They also lowered their guidance for the year, although CoreCivic’s board authorized an increase in its share repurchase program. |
| • | During the reporting period, the market sectors with positive contributions to our portion of the Fund, relative to our benchmark, were the consumer discretionary and consumer staples sectors. Security selection was positive in both sectors. The portfolio had positive absolute returns in both sectors, and we were overweight both sectors as well. |
| • | Foot Locker, Inc. engages in the retail of athletic shoes and apparel. The company’s stock price reacted favorably to the company’s second quarter 2022 earnings release. While reported revenue was in line with consensus estimates, earnings per share topped expectations by a wide margin. Analysts also had a favorable opinion of the naming of a highly regarded retail executive as the new CEO. |
| • | Goodyear Tire & Rubber Co. (GT) engages in the development, manufacture, distribution, and sale of tires. GT’s stock price responded favorably to strong sales and improved earnings, which reflected the benefits of strong pricing and a recent acquisition. |
| • | American Axle & Manufacturing Holdings, Inc. engages in the design, engineering, and manufacture of driveline systems and related components. The company reported positive financial results for the second quarter, including earning per share and revenue, that were higher than consensus estimates. Company management also provided improved guidance for the year. Following the report, the stock price reacted favorably. |
| Multi-Manager Small Cap Equity Strategies Fund | Annual Report 2022 | 9 |
(Unaudited)
| 10 | Multi-Manager Small Cap Equity Strategies Fund | Annual Report 2022 |
(Unaudited)
| March 1, 2022 — August 31, 2022 | |||||||
| Account value at the beginning of the period ($) | Account value at the end of the period ($) | Expenses paid during the period ($) | Fund’s annualized expense ratio (%) | ||||
| Actual | Hypothetical | Actual | Hypothetical | Actual | Hypothetical | Actual | |
| Institutional Class | 1,000.00 | 1,000.00 | 892.60 | 1,020.21 | 4.72 | 5.04 | 0.99 |
| Institutional 3 Class | 1,000.00 | 1,000.00 | 894.70 | 1,021.12 | 3.87 | 4.13 | 0.81 |
| Multi-Manager Small Cap Equity Strategies Fund | Annual Report 2022 | 11 |
August 31, 2022
| Common Stocks 98.6% | ||
| Issuer | Shares | Value ($) |
| Communication Services 1.2% | ||
| Diversified Telecommunication Services 0.1% | ||
| Bandwidth, Inc., Class A(a) | 18,589 | 288,129 |
| EchoStar Corp., Class A(a) | 23,799 | 438,140 |
| Total | 726,269 | |
| Entertainment 0.0% | ||
| Playtika Holding Corp.(a) | 44,929 | 473,102 |
| Interactive Media & Services 0.5% | ||
| Bumble, Inc., Class A(a) | 56,567 | 1,417,003 |
| Eventbrite, Inc., Class A(a) | 61,988 | 440,735 |
| Outbrain, Inc.(a) | 34,500 | 152,145 |
| Shutterstock, Inc. | 56,840 | 3,149,505 |
| TrueCar, Inc.(a) | 101,823 | 221,974 |
| Ziff Davis, Inc.(a) | 15,000 | 1,159,200 |
| Total | 6,540,562 | |
| Media 0.5% | ||
| comScore, Inc.(a) | 26,434 | 57,626 |
| Emerald Holding, Inc.(a) | 94,500 | 361,935 |
| Entravision Communications Corp., Class A | 57,300 | 291,084 |
| Loyalty Ventures, Inc.(a) | 28,917 | 61,015 |
| Nexstar Media Group, Inc., Class A | 20,500 | 3,922,060 |
| Stagwell, Inc.(a) | 133,000 | 901,740 |
| TEGNA, Inc. | 16,600 | 355,240 |
| Total | 5,950,700 | |
| Wireless Telecommunication Services 0.1% | ||
| Telephone and Data Systems, Inc. | 89,037 | 1,448,632 |
| United States Cellular Corp.(a) | 4,901 | 140,120 |
| Total | 1,588,752 | |
| Total Communication Services | 15,279,385 | |
| Common Stocks (continued) | ||
| Issuer | Shares | Value ($) |
| Consumer Discretionary 9.6% | ||
| Auto Components 1.3% | ||
| Adient PLC(a) | 35,800 | 1,188,560 |
| American Axle & Manufacturing Holdings, Inc.(a) | 184,604 | 1,910,651 |
| Fox Factory Holding Corp.(a) | 101,302 | 9,442,359 |
| Goodyear Tire & Rubber Co. (The)(a) | 265,848 | 3,729,848 |
| Modine Manufacturing Co.(a) | 31,247 | 468,080 |
| Total | 16,739,498 | |
| Automobiles 0.2% | ||
| Thor Industries, Inc. | 11,100 | 899,211 |
| Winnebago Industries, Inc. | 21,777 | 1,253,920 |
| Total | 2,153,131 | |
| Diversified Consumer Services 0.6% | ||
| 2U, Inc.(a) | 96,100 | 684,232 |
| Adtalem Global Education, Inc.(a) | 30,200 | 1,138,238 |
| Bright Horizons Family Solutions, Inc.(a) | 15,206 | 1,037,049 |
| European Wax Center, Inc., Class A | 14,007 | 302,971 |
| frontdoor, Inc.(a) | 86,549 | 2,032,170 |
| Graham Holdings Co., Class B | 1,000 | 565,430 |
| Grand Canyon Education, Inc.(a) | 3,744 | 304,687 |
| Perdoceo Education Corp.(a) | 86,132 | 997,409 |
| Total | 7,062,186 | |
| Hotels, Restaurants & Leisure 2.1% | ||
| Bloomin’ Brands, Inc. | 13,500 | 272,970 |
| Bluegreen Vacations Holding Corp. | 7,625 | 158,905 |
| Boyd Gaming Corp. | 35,667 | 1,941,355 |
| Brinker International, Inc.(a) | 34,000 | 833,340 |
| Dine Brands Global, Inc. | 8,600 | 572,760 |
| El Pollo Loco Holdings, Inc.(a) | 53,800 | 486,890 |
| International Game Technology PLC | 187,100 | 3,356,574 |
| Jack in the Box, Inc. | 4,700 | 375,342 |
| Life Time Group Holdings, Inc.(a) | 152,758 | 1,810,182 |
| Light & Wonder, Inc.(a) | 29,400 | 1,447,362 |
| Marriott Vacations Worldwide Corp. | 21,633 | 3,080,972 |
| Papa John’s International, Inc. | 19,349 | 1,563,980 |
| Planet Fitness, Inc., Class A(a) | 54,113 | 3,666,156 |
| 12 | Multi-Manager Small Cap Equity Strategies Fund | Annual Report 2022 |
August 31, 2022
| Common Stocks (continued) | ||
| Issuer | Shares | Value ($) |
| Red Rock Resorts, Inc., Class A | 37,000 | 1,414,140 |
| Ruth’s Hospitality Group, Inc. | 36,200 | 659,564 |
| Six Flags Entertainment Corp.(a) | 72,030 | 1,595,464 |
| Texas Roadhouse, Inc. | 37,612 | 3,338,441 |
| Travel + Leisure Co. | 18,700 | 792,880 |
| Xponential Fitness, Inc., Class A(a) | 10,300 | 188,799 |
| Total | 27,556,076 | |
| Household Durables 1.0% | ||
| Beazer Homes USA, Inc.(a) | 45,227 | 644,033 |
| Century Communities, Inc. | 12,400 | 578,956 |
| Ethan Allen Interiors, Inc. | 39,900 | 948,423 |
| GoPro, Inc., Class A(a) | 32,149 | 195,787 |
| Green Brick Partners, Inc.(a) | 11,500 | 280,140 |
| Helen of Troy Ltd.(a) | 15,478 | 1,913,545 |
| Hooker Furnishings Corp. | 36,300 | 576,081 |
| KB Home | 55,100 | 1,578,615 |
| La-Z-Boy, Inc. | 22,400 | 591,136 |
| LGI Homes, Inc.(a) | 5,600 | 531,496 |
| M/I Homes, Inc.(a) | 13,008 | 562,466 |
| Meritage Homes Corp.(a) | 6,800 | 532,780 |
| Sonos, Inc.(a) | 110,600 | 1,663,424 |
| Taylor Morrison Home Corp., Class A(a) | 21,200 | 532,332 |
| Tri Pointe Homes, Inc.(a) | 32,500 | 563,225 |
| Tupperware Brands Corp.(a) | 43,000 | 483,320 |
| Universal Electronics, Inc.(a) | 7,316 | 162,635 |
| VOXX International Corp.(a) | 15,280 | 147,299 |
| Total | 12,485,693 | |
| Internet & Direct Marketing Retail 0.3% | ||
| Global-e Online Ltd.(a) | 34,888 | 1,102,112 |
| Poshmark, Inc., Class A(a) | 19,000 | 205,580 |
| Quotient Technology, Inc.(a) | 147,337 | 274,047 |
| Stitch Fix, Inc., Class A(a) | 29,429 | 147,733 |
| Xometry, Inc., Class A(a) | 39,876 | 1,954,323 |
| Total | 3,683,795 | |
| Common Stocks (continued) | ||
| Issuer | Shares | Value ($) |
| Leisure Products 0.2% | ||
| Johnson Outdoors, Inc., Class A | 18,900 | 1,155,546 |
| Smith & Wesson Brands, Inc. | 52,135 | 693,396 |
| Vista Outdoor, Inc.(a) | 31,200 | 877,344 |
| Total | 2,726,286 | |
| Multiline Retail 0.2% | ||
| Franchise Group, Inc. | 11,900 | 403,291 |
| Macy’s, Inc. | 141,500 | 2,450,780 |
| Total | 2,854,071 | |
| Specialty Retail 3.1% | ||
| Aaron’s Co., Inc. (The) | 142,073 | 1,690,669 |
| American Eagle Outfitters, Inc. | 46,500 | 523,590 |
| Asbury Automotive Group, Inc.(a) | 5,500 | 959,640 |
| Big 5 Sporting Goods Corp. | 49,800 | 609,552 |
| Boot Barn Holdings, Inc.(a) | 8,600 | 572,932 |
| Cato Corp. (The), Class A | 51,700 | 558,877 |
| Children’s Place, Inc. (The)(a) | 5,700 | 240,426 |
| Container Store Group, Inc. (The)(a) | 33,929 | 230,039 |
| Floor & Decor Holdings, Inc.(a) | 18,484 | 1,503,858 |
| Foot Locker, Inc. | 87,559 | 3,225,674 |
| Genesco, Inc.(a) | 70,712 | 4,000,885 |
| Group 1 Automotive, Inc. | 17,921 | 3,200,511 |
| Guess?, Inc. | 32,600 | 569,522 |
| Haverty Furniture Companies, Inc. | 51,579 | 1,383,349 |
| Hibbett, Inc. | 37,600 | 2,203,360 |
| Lithia Motors, Inc., Class A | 7,228 | 1,918,600 |
| LL Flooring Holdings, Inc.(a) | 27,300 | 222,222 |
| MarineMax, Inc.(a) | 33,224 | 1,207,360 |
| National Vision Holdings, Inc.(a) | 94,578 | 3,142,827 |
| OneWater Marine, Inc., Class A(a) | 32,000 | 1,275,200 |
| Petco Health & Wellness Co., Inc.(a) | 255,363 | 3,810,016 |
| Rent-A-Center, Inc. | 39,400 | 1,018,096 |
| Signet Jewelers Ltd. | 41,100 | 2,686,707 |
| Sleep Number Corp.(a) | 6,800 | 281,724 |
| Sonic Automotive, Inc., Class A | 21,800 | 1,159,542 |
| Tilly’s, Inc. | 73,775 | 553,312 |
| TravelCenters of America, Inc.(a) | 5,800 | 313,664 |
| Multi-Manager Small Cap Equity Strategies Fund | Annual Report 2022 | 13 |
August 31, 2022
| Common Stocks (continued) | ||
| Issuer | Shares | Value ($) |
| Urban Outfitters, Inc.(a) | 15,300 | 307,989 |
| Zumiez, Inc.(a) | 14,700 | 381,612 |
| Total | 39,751,755 | |
| Textiles, Apparel & Luxury Goods 0.6% | ||
| Carter’s, Inc. | 3,900 | 288,015 |
| Crocs, Inc.(a) | 38,600 | 2,844,820 |
| G-III Apparel Group Ltd.(a) | 27,700 | 583,639 |
| Kontoor Brands, Inc. | 16,600 | 618,018 |
| Lakeland Industries, Inc.(a) | 32,300 | 436,050 |
| Movado Group, Inc. | 30,962 | 987,378 |
| Rocky Brands, Inc. | 49,900 | 1,303,887 |
| Unifi, Inc.(a) | 8,010 | 90,994 |
| Vera Bradley, Inc.(a) | 183,903 | 728,256 |
| Total | 7,881,057 | |
| Total Consumer Discretionary | 122,893,548 | |
| Consumer Staples 2.9% | ||
| Beverages 0.0% | ||
| Boston Beer Co., Inc. (The), Class A(a) | 1,556 | 524,497 |
| Food & Staples Retailing 1.4% | ||
| Albertsons Companies, Inc., Class A | 12,180 | 335,072 |
| Andersons, Inc. (The) | 26,107 | 966,742 |
| BJ’s Wholesale Club Holdings, Inc.(a) | 23,300 | 1,735,617 |
| Grocery Outlet Holding Corp.(a) | 73,235 | 2,938,188 |
| Natural Grocers by Vitamin Cottage, Inc. | 17,600 | 252,736 |
| Performance Food Group, Inc.(a) | 74,911 | 3,744,052 |
| SpartanNash Co. | 37,728 | 1,148,063 |
| The Chefs’ Warehouse(a) | 86,800 | 2,893,912 |
| United Natural Foods, Inc.(a) | 96,800 | 4,266,944 |
| Total | 18,281,326 | |
| Food Products 0.5% | ||
| B&G Foods, Inc. | 25,100 | 543,666 |
| Fresh Del Monte Produce, Inc. | 7,363 | 201,304 |
| Freshpet, Inc.(a) | 29,050 | 1,264,547 |
| Hain Celestial Group, Inc. (The)(a) | 41,505 | 840,891 |
| Sovos Brands, Inc.(a) | 15,051 | 229,829 |
| TreeHouse Foods, Inc.(a) | 78,500 | 3,658,100 |
| Total | 6,738,337 | |
| Common Stocks (continued) | ||
| Issuer | Shares | Value ($) |
| Household Products 0.4% | ||
| Central Garden & Pet Co.(a) | 13,800 | 550,896 |
| Energizer Holdings, Inc. | 38,900 | 1,093,090 |
| WD-40 Co. | 16,200 | 3,064,392 |
| Total | 4,708,378 | |
| Personal Products 0.6% | ||
| BellRing Brands, Inc.(a) | 47,200 | 1,118,168 |
| Edgewell Personal Care Co. | 48,626 | 1,894,469 |
| Herbalife Nutrition Ltd.(a) | 116,884 | 3,049,503 |
| Medifast, Inc. | 3,600 | 451,728 |
| Nature’s Sunshine Products, Inc.(a) | 7,517 | 72,915 |
| Nu Skin Enterprises, Inc., Class A | 12,000 | 491,280 |
| Usana Health Sciences, Inc.(a) | 8,700 | 561,324 |
| Total | 7,639,387 | |
| Total Consumer Staples | 37,891,925 | |
| Energy 4.8% | ||
| Energy Equipment & Services 1.4% | ||
| Cactus, Inc., Class A | 85,271 | 3,406,576 |
| ChampionX Corp. | 41,400 | 902,934 |
| Dril-Quip, Inc.(a) | 47,700 | 1,055,601 |
| Expro Group Holdings NV(a) | 103,149 | 1,394,575 |
| Helix Energy Solutions Group, Inc.(a) | 224,800 | 971,136 |
| Helmerich & Payne, Inc. | 43,900 | 1,876,725 |
| Liberty Energy, Inc., Class A(a) | 41,800 | 627,000 |
| Matrix Service Co.(a) | 103,600 | 588,448 |
| National Energy Services Reunited Corp.(a) | 158,200 | 1,110,564 |
| Newpark Resources, Inc.(a) | 283,369 | 816,103 |
| Noble Corp.(a) | 10,500 | 318,675 |
| Precision Drilling Corp.(a) | 18,200 | 1,118,026 |
| ProPetro Holding Corp.(a) | 192,507 | 1,763,364 |
| Solaris Oilfield Infrastructure, Inc., Class A | 58,600 | 627,020 |
| TechnipFMC PLC(a) | 68,400 | 559,512 |
| Tidewater, Inc.(a) | 55,300 | 1,225,448 |
| US Silica Holdings, Inc.(a) | 13,234 | 185,673 |
| Total | 18,547,380 | |
| 14 | Multi-Manager Small Cap Equity Strategies Fund | Annual Report 2022 |
August 31, 2022
| Common Stocks (continued) | ||
| Issuer | Shares | Value ($) |
| Oil, Gas & Consumable Fuels 3.4% | ||
| Antero Resources Corp.(a) | 82,700 | 3,314,616 |
| Berry Corp. | 118,700 | 1,086,105 |
| California Resources Corp. | 20,900 | 1,044,164 |
| Centennial Resource Development, Inc., Class A(a) | 109,900 | 904,477 |
| Chesapeake Energy Corp. | 30,800 | 3,095,092 |
| Chord Energy Corp. | 19,220 | 2,720,591 |
| Civitas Resources, Inc. | 17,300 | 1,162,387 |
| Clean Energy Fuels Corp.(a) | 158,400 | 1,064,448 |
| CONSOL Energy, Inc. | 2,038 | 146,288 |
| Crescent Energy Co., Class A | 65,600 | 1,123,728 |
| Denbury, Inc.(a) | 6,400 | 569,152 |
| Equitrans Midstream Corp. | 305,600 | 2,832,912 |
| Golar LNG Ltd.(a) | 126,200 | 3,441,474 |
| Kinetik Holdings, Inc. | 22,700 | 836,949 |
| Kosmos Energy Ltd.(a) | 159,600 | 1,128,372 |
| Laredo Petroleum, Inc.(a) | 8,100 | 628,641 |
| Matador Resources Co. | 79,109 | 4,714,896 |
| Murphy Oil Corp. | 36,300 | 1,414,611 |
| Northern Oil and Gas, Inc. | 32,300 | 1,021,972 |
| Par Pacific Holdings, Inc.(a) | 37,800 | 710,640 |
| PBF Energy, Inc., Class A(a) | 40,557 | 1,385,427 |
| Plains GP Holdings LP, Class A(a) | 40,489 | 485,058 |
| Ranger Oil Corp. | 31,900 | 1,243,781 |
| REX American Resources Corp.(a) | 37,158 | 1,125,887 |
| SM Energy Co. | 63,610 | 2,803,293 |
| Talos Energy, Inc.(a) | 33,700 | 698,601 |
| World Fuel Services Corp. | 102,927 | 2,655,517 |
| Total | 43,359,079 | |
| Total Energy | 61,906,459 | |
| Financials 19.2% | ||
| Banks 11.4% | ||
| 1st Source Corp. | 19,171 | 904,679 |
| ACNB Corp. | 6,600 | 234,696 |
| Amalgamated Financial Corp. | 37,566 | 845,235 |
| American National Bankshares, Inc. | 2,940 | 96,814 |
| Ameris Bancorp | 93,200 | 4,350,576 |
| Associated Banc-Corp. | 185,952 | 3,726,478 |
| Atlantic Union Bankshares Corp. | 121,024 | 3,927,229 |
| Common Stocks (continued) | ||
| Issuer | Shares | Value ($) |
| Banc of California, Inc. | 43,375 | 732,170 |
| Bancorp, Inc. (The)(a) | 130,765 | 3,101,746 |
| Bank of Marin Bancorp | 14,379 | 444,311 |
| BankUnited, Inc. | 70,094 | 2,596,983 |
| Bankwell Financial Group, Inc. | 3,274 | 103,196 |
| Banner Corp. | 18,042 | 1,096,232 |
| Bar Harbor Bankshares | 3,823 | 108,306 |
| Baycom Corp. | 20,764 | 386,418 |
| BCB Bancorp, Inc. | 22,648 | 407,664 |
| Berkshire Hills Bancorp, Inc. | 67,772 | 1,911,848 |
| Brookline Bancorp, Inc. | 43,300 | 539,951 |
| Business First Bancshares, Inc. | 4,812 | 113,515 |
| Byline Bancorp, Inc. | 12,033 | 262,440 |
| Cadence Bank | 23,250 | 592,410 |
| Camden National Corp. | 14,000 | 633,220 |
| Capital Bancorp, Inc. | 4,178 | 103,489 |
| Capital City Bank Group, Inc. | 5,694 | 181,809 |
| Capstar Financial Holdings, Inc. | 8,980 | 180,947 |
| Carter Bankshares, Inc.(a) | 23,017 | 379,090 |
| Cathay General Bancorp | 120,468 | 5,052,428 |
| CBTX, Inc. | 4,994 | 148,821 |
| Central Pacific Financial Corp. | 70,651 | 1,539,485 |
| Central Valley Community Bancorp | 24,415 | 434,587 |
| Chemung Financial Corp. | 1,552 | 69,949 |
| City Holding Co. | 1,269 | 107,878 |
| Civista Bancshares, Inc. | 12,500 | 264,375 |
| CNB Financial Corp. | 15,977 | 420,515 |
| Columbia Banking System, Inc. | 30,600 | 916,470 |
| Comerica, Inc. | 4,451 | 357,415 |
| Community Bank System, Inc. | 51,200 | 3,347,456 |
| Community Financial Corp. (The) | 4,100 | 155,021 |
| Community Trust Bancorp, Inc. | 25,161 | 1,063,052 |
| ConnectOne Bancorp, Inc. | 47,099 | 1,178,888 |
| CrossFirst Bankshares, Inc.(a) | 17,900 | 235,922 |
| Customers Bancorp, Inc.(a) | 61,073 | 2,118,622 |
| Eagle Bancorp, Inc. | 24,500 | 1,188,985 |
| Enterprise Financial Services Corp. | 13,300 | 608,076 |
| FB Financial Corp. | 24,952 | 988,598 |
| Financial Institutions, Inc. | 21,570 | 561,467 |
| Multi-Manager Small Cap Equity Strategies Fund | Annual Report 2022 | 15 |
August 31, 2022
| Common Stocks (continued) | ||
| Issuer | Shares | Value ($) |
| First BanCorp | 166,570 | 2,381,951 |
| First BanCorp | 946 | 34,444 |
| First Bancshares, Inc. (The) | 13,392 | 400,421 |
| First Busey Corp. | 37,000 | 851,000 |
| First Business Financial Services, Inc. | 12,704 | 422,789 |
| First Commonwealth Financial Corp. | 89,334 | 1,204,222 |
| First Financial Bancorp | 41,000 | 884,780 |
| First Financial Bankshares, Inc. | 88,516 | 3,762,815 |
| First Financial Corp. | 27,458 | 1,276,797 |
| First Hawaiian, Inc. | 49,400 | 1,270,074 |
| First Internet Bancorp | 19,427 | 712,388 |
| First Merchants Corp. | 14,831 | 590,570 |
| First Mid Bancshares, Inc. | 7,900 | 279,265 |
| First of Long Island Corp. (The) | 30,369 | 559,093 |
| First Western Financial, Inc.(a) | 3,663 | 97,179 |
| Flushing Financial Corp. | 54,900 | 1,133,685 |
| FNB Corp. | 102,300 | 1,219,416 |
| Fulton Financial Corp. | 36,754 | 596,517 |
| Great Southern Bancorp, Inc. | 15,686 | 922,023 |
| Guaranty Bancshares, Inc. | 3,420 | 118,503 |
| Hancock Whitney Corp. | 100,916 | 4,867,179 |
| Hanmi Financial Corp. | 67,049 | 1,657,451 |
| HarborOne Bancorp, Inc. | 25,511 | 347,970 |
| Heartland Financial U.S.A., Inc. | 27,792 | 1,241,469 |
| Heritage Commerce Corp. | 9,375 | 105,844 |
| Heritage Financial Corp. | 13,528 | 351,593 |
| Hilltop Holdings, Inc. | 42,700 | 1,127,280 |
| HomeStreet, Inc. | 58,962 | 2,052,467 |
| HomeTrust Bancshares, Inc. | 7,192 | 166,998 |
| Hope Bancorp, Inc. | 85,200 | 1,232,844 |
| Horizon Bancorp, Inc. | 38,439 | 727,266 |
| Independent Bank Corp. | 39,400 | 3,082,262 |
| Independent Bank Corp. | 70,361 | 1,443,808 |
| Independent Bank Group, Inc. | 46,400 | 3,125,504 |
| International Bancshares Corp. | 20,900 | 872,157 |
| Investar Holding Corp. | 15,700 | 339,120 |
| Lakeland Bancorp, Inc. | 60,849 | 991,230 |
| Live Oak Bancshares, Inc. | 24,800 | 898,752 |
| Macatawa Bank Corp. | 44,108 | 419,908 |
| Common Stocks (continued) | ||
| Issuer | Shares | Value ($) |
| Mercantile Bank Corp. | 21,868 | 723,393 |
| Meta Financial Group, Inc. | 22,433 | 739,392 |
| Midland States Bancorp, Inc. | 33,210 | 833,239 |
| MidWestOne Financial Group, Inc. | 18,249 | 556,595 |
| National Bank Holdings Corp., Class A | 2,779 | 111,521 |
| National Bankshares, Inc. | 6,200 | 208,630 |
| NBT Bancorp, Inc. | 9,565 | 370,931 |
| Nicolet Bankshares, Inc.(a) | 6,085 | 465,989 |
| Northeast Bank | 7,600 | 294,652 |
| Northrim BanCorp, Inc. | 8,200 | 332,510 |
| OceanFirst Financial Corp. | 83,497 | 1,623,182 |
| OFG Bancorp | 46,835 | 1,273,912 |
| Old National Bancorp | 69,490 | 1,159,788 |
| Old Second Bancorp, Inc. | 12,819 | 175,877 |
| Origin Bancorp, Inc. | 2,590 | 105,802 |
| Orrstown Financial Services, Inc. | 11,300 | 290,749 |
| Pacific Premier Bancorp, Inc. | 90,400 | 2,961,504 |
| PacWest Bancorp | 44,300 | 1,166,419 |
| Parke Bancorp, Inc. | 10,300 | 228,454 |
| PCB Bancorp | 23,900 | 448,842 |
| Peapack-Gladstone Financial Corp. | 28,870 | 972,053 |
| Peoples Bancorp, Inc. | 20,100 | 600,789 |
| Pinnacle Financial Partners, Inc. | 25,246 | 2,037,605 |
| Popular, Inc. | 47,500 | 3,667,950 |
| Preferred Bank | 10,518 | 713,541 |
| Premier Financial Corp. | 34,700 | 937,594 |
| Primis Financial Corp. | 29,133 | 381,934 |
| QCR Holdings, Inc. | 10,580 | 590,893 |
| RBB Bancorp | 29,881 | 660,370 |
| Renasant Corp. | 82,100 | 2,737,214 |
| Republic Bancorp, Inc. | 13,900 | 590,750 |
| S&T Bancorp, Inc. | 36,058 | 1,068,759 |
| Sandy Spring Bancorp, Inc. | 86,900 | 3,347,388 |
| Sierra Bancorp | 15,764 | 326,630 |
| Silvergate Capital Corp., Class A(a) | 20,316 | 1,851,194 |
| Simmons First National Corp., Class A | 26,100 | 615,699 |
| SmartFinancial, Inc. | 4,531 | 113,683 |
| South Plains Financial, Inc. | 4,244 | 115,140 |
| Southern First Bancshares, Inc.(a) | 1,118 | 48,197 |
| 16 | Multi-Manager Small Cap Equity Strategies Fund | Annual Report 2022 |
August 31, 2022
| Common Stocks (continued) | ||
| Issuer | Shares | Value ($) |
| Texas Capital Bancshares, Inc.(a) | 62,025 | 3,661,336 |
| Third Coast Bancshares, Inc.(a) | 3,180 | 57,876 |
| Towne Bank | 29,752 | 847,634 |
| Trico Bancshares | 17,323 | 817,472 |
| Triumph Bancorp, Inc.(a) | 29,012 | 1,796,133 |
| Trustmark Corp. | 43,094 | 1,359,185 |
| UMB Financial Corp. | 64,374 | 5,759,542 |
| United Community Banks, Inc. | 3,315 | 111,152 |
| Univest Corporation of Pennsylvania | 12,681 | 314,489 |
| Washington Federal, Inc. | 76,154 | 2,437,690 |
| Washington Trust Bancorp, Inc. | 11,300 | 572,119 |
| Wintrust Financial Corp. | 10,800 | 910,872 |
| Total | 146,582,760 | |
| Capital Markets 1.7% | ||
| Affiliated Managers Group, Inc. | 4,900 | 624,064 |
| Artisan Partners Asset Management, Inc., Class A | 17,300 | 584,048 |
| B Riley Financial, Inc. | 17,800 | 885,906 |
| Diamond Hill Investment Group, Inc. | 3,100 | 530,255 |
| Evercore, Inc., Class A | 21,333 | 1,998,689 |
| Federated Hermes, Inc., Class B | 26,200 | 892,372 |
| Focus Financial Partners, Inc., Class A(a) | 147,658 | 5,780,810 |
| Greenhill & Co., Inc. | 65,734 | 514,040 |
| Houlihan Lokey, Inc., Class A | 36,500 | 2,865,250 |
| Janus Henderson Group PLC | 36,800 | 861,120 |
| Perella Weinberg Partners | 89,200 | 641,348 |
| Silvercrest Asset Management Group, Inc., Class A | 17,600 | 314,512 |
| Stifel Financial Corp. | 41,300 | 2,449,503 |
| StoneX Group, Inc.(a) | 9,157 | 850,136 |
| Victory Capital Holdings, Inc., Class A | 34,400 | 921,232 |
| Virtu Financial, Inc. Class A | 39,600 | 909,216 |
| Virtus Investment Partners, Inc. | 3,100 | 592,875 |
| Total | 22,215,376 | |
| Consumer Finance 1.0% | ||
| Bread Financial Holdings, Inc. | 14,200 | 545,706 |
| Encore Capital Group, Inc.(a) | 10,310 | 563,751 |
| Enova International, Inc.(a) | 31,171 | 1,089,115 |
| Ezcorp, Inc., Class A(a) | 47,496 | 415,590 |
| Green Dot Corp., Class A(a) | 43,059 | 873,667 |
| Navient Corp. | 236,228 | 3,635,549 |
| Common Stocks (continued) | ||
| Issuer | Shares | Value ($) |
| Oportun Financial Corp.(a) | 26,095 | 133,346 |
| PROG Holdings, Inc.(a) | 63,278 | 1,173,174 |
| SLM Corp. | 236,112 | 3,607,791 |
| World Acceptance Corp.(a) | 5,156 | 599,333 |
| Total | 12,637,022 | |
| Diversified Financial Services 0.2% | ||
| Jackson Financial, Inc., Class A | 66,811 | 2,088,512 |
| Insurance 2.2% | ||
| American Equity Investment Life Holding Co. | 91,031 | 3,459,178 |
| AMERISAFE, Inc. | 52,683 | 2,519,301 |
| Argo Group International Holdings Ltd. | 66,600 | 1,307,358 |
| Assured Guaranty Ltd. | 21,700 | 1,108,219 |
| Axis Capital Holdings Ltd. | 19,800 | 1,052,370 |
| Bright Health Group, Inc.(a) | 20,559 | 31,044 |
| Brighthouse Financial, Inc.(a) | 28,777 | 1,368,346 |
| CNO Financial Group, Inc. | 172,936 | 3,183,752 |
| Donegal Group, Inc., Class A | 11,793 | 171,234 |
| eHealth, Inc.(a) | 22,339 | 142,970 |
| Employers Holdings, Inc. | 55,489 | 2,172,949 |
| Enstar Group Ltd.(a) | 6,100 | 1,154,425 |
| GoHealth, Inc.(a) | 16,100 | 7,276 |
| Greenlight Capital Re Ltd., Class A(a) | 33,100 | 261,159 |
| Horace Mann Educators Corp. | 26,204 | 937,317 |
| James River Group Holdings Ltd. | 14,739 | 350,199 |
| Kemper Corp. | 19,000 | 874,000 |
| Mercury General Corp. | 7,200 | 229,680 |
| National Western Life Group, Inc., Class A | 2,900 | 551,899 |
| Oscar Health, Inc., Class A(a) | 79,915 | 529,837 |
| Primerica, Inc. | 2,400 | 304,200 |
| ProAssurance Corp. | 41,411 | 885,781 |
| Reinsurance Group of America, Inc. | 9,133 | 1,144,913 |
| Selectquote, Inc.(a) | 396,609 | 440,236 |
| SiriusPoint Ltd.(a) | 246,075 | 1,099,955 |
| Stewart Information Services Corp. | 28,170 | 1,426,529 |
| Trean Insurance Group, Inc.(a) | 62,900 | 279,905 |
| United Fire Group, Inc. | 11,970 | 352,277 |
| White Mountains Insurance Group Ltd. | 760 | 1,041,200 |
| Total | 28,387,509 | |
| Multi-Manager Small Cap Equity Strategies Fund | Annual Report 2022 | 17 |
August 31, 2022
| Common Stocks (continued) | ||
| Issuer | Shares | Value ($) |
| Mortgage Real Estate Investment Trusts (REITS) 0.8% | ||
| Apollo Commercial Real Estate Finance, Inc. | 24,300 | 283,095 |
| Arlington Asset Investment Corp., Class A(a) | 69,800 | 223,360 |
| Blackstone Mortgage Trust, Inc. | 111,700 | 3,237,066 |
| Granite Point Mortgage Trust, Inc. | 31,800 | 299,556 |
| Great Ajax Corp. | 27,561 | 249,427 |
| Hannon Armstrong Sustainable Infrastructure Capital, Inc. | 74,000 | 2,924,480 |
| MFA Financial, Inc. | 18,725 | 204,664 |
| New York Mortgage Trust, Inc. | 187,400 | 524,720 |
| Starwood Property Trust, Inc. | 78,400 | 1,797,712 |
| TPG RE Finance Trust, Inc. | 23,700 | 219,462 |
| Total | 9,963,542 | |
| Thrifts & Mortgage Finance 1.9% | ||
| Axos Financial, Inc.(a) | 81,500 | 3,405,070 |
| Bridgewater Bancshares, Inc.(a) | 25,304 | 434,723 |
| Enact Holdings, Inc. | 11,700 | 297,180 |
| Essent Group Ltd. | 28,500 | 1,139,715 |
| Federal Agricultural Mortgage Corp. | 8,900 | 972,236 |
| FS Bancorp, Inc. | 10,780 | 320,274 |
| Home Bancorp, Inc. | 9,365 | 365,610 |
| Luther Burbank Corp. | 28,426 | 372,665 |
| Merchants Bancorp | 22,493 | 606,636 |
| MGIC Investment Corp. | 242,400 | 3,463,896 |
| New York Community Bancorp, Inc. | 119,000 | 1,165,010 |
| NMI Holdings, Inc., Class A(a) | 50,900 | 1,044,977 |
| Northeast Community Bancorp, Inc. | 25,700 | 325,876 |
| Northfield Bancorp, Inc. | 46,570 | 686,442 |
| Ocwen Financial Corp.(a) | 4,495 | 117,679 |
| Provident Financial Services, Inc. | 27,600 | 641,148 |
| Radian Group, Inc. | 176,100 | 3,717,471 |
| Southern Missouri Bancorp, Inc. | 7,382 | 389,253 |
| Territorial Bancorp, Inc. | 12,700 | 264,287 |
| TrustCo Bank Corp. | 22,340 | 744,815 |
| Waterstone Financial, Inc. | 37,402 | 646,680 |
| William Penn Bancorp | 13,100 | 150,650 |
| WSFS Financial Corp. | 78,500 | 3,795,475 |
| Total | 25,067,768 | |
| Total Financials | 246,942,489 | |
| Common Stocks (continued) | ||
| Issuer | Shares | Value ($) |
| Health Care 14.2% | ||
| Biotechnology 5.3% | ||
| 2seventy bio, Inc.(a) | 3,399 | 50,067 |
| ACADIA Pharmaceuticals, Inc.(a) | 63,966 | 1,050,961 |
| Adagio Therapeutics, Inc.(a) | 25,905 | 118,127 |
| ADC Therapeutics SA(a) | 77,103 | 525,842 |
| Adverum Biotechnologies, Inc.(a) | 40,394 | 46,857 |
| Agios Pharmaceuticals, Inc.(a) | 32,102 | 818,601 |
| Akebia Therapeutics, Inc.(a) | 155,272 | 56,566 |
| Alector, Inc.(a) | 67,017 | 693,626 |
| Alkermes PLC(a) | 29,800 | 705,366 |
| Allogene Therapeutics, Inc.(a) | 119,291 | 1,635,480 |
| Alpine Immune Sciences, Inc.(a) | 4,100 | 30,791 |
| Amicus Therapeutics, Inc.(a) | 243,360 | 2,732,933 |
| Anika Therapeutics, Inc.(a) | 8,279 | 187,105 |
| Apellis Pharmaceuticals, Inc.(a) | 31,796 | 1,923,976 |
| Arbutus Biopharma Corp.(a) | 36,600 | 81,252 |
| Arcutis Biotherapeutics, Inc.(a) | 52,025 | 1,402,074 |
| Arrowhead Pharmaceuticals, Inc.(a) | 59,838 | 2,376,167 |
| Atara Biotherapeutics, Inc.(a) | 184,487 | 739,793 |
| Biohaven Pharmaceutical Holding Co., Ltd.(a) | 4,070 | 607,855 |
| Blueprint Medicines Corp.(a) | 34,596 | 2,533,119 |
| BridgeBio Pharma, Inc.(a) | 41,422 | 434,931 |
| C4 Therapeutics, Inc.(a) | 38,538 | 388,463 |
| CareDx, Inc.(a) | 59,275 | 1,161,197 |
| Clementia Pharmaceuticals, Inc.(a),(b),(c),(d) | 134,864 | 0 |
| Coherus Biosciences, Inc.(a) | 151,930 | 1,698,577 |
| Cytokinetics, Inc.(a) | 18,300 | 969,168 |
| CytomX Therapeutics, Inc.(a) | 74,853 | 112,280 |
| Deciphera Pharmaceuticals, Inc.(a) | 68,919 | 1,118,555 |
| Dyne Therapeutics, Inc.(a) | 22,940 | 224,812 |
| Emergent BioSolutions, Inc.(a) | 106,362 | 2,554,815 |
| Enanta Pharmaceuticals, Inc.(a) | 22,579 | 1,374,610 |
| Exelixis, Inc.(a) | 71,706 | 1,272,064 |
| Fate Therapeutics, Inc.(a) | 30,111 | 787,102 |
| FibroGen, Inc.(a) | 26,526 | 329,983 |
| G1 Therapeutics, Inc.(a) | 76,739 | 1,113,483 |
| Generation Bio Co.(a) | 13,600 | 69,632 |
| Gritstone bio, Inc.(a) | 37,967 | 124,911 |
| 18 | Multi-Manager Small Cap Equity Strategies Fund | Annual Report 2022 |
August 31, 2022
| Common Stocks (continued) | ||
| Issuer | Shares | Value ($) |
| Halozyme Therapeutics, Inc.(a) | 95,369 | 3,884,379 |
| Heron Therapeutics, Inc.(a) | 246,231 | 1,007,085 |
| Icosavax, Inc.(a) | 12,087 | 57,051 |
| Immunovant, Inc.(a) | 24,801 | 127,725 |
| Insmed, Inc.(a) | 32,000 | 787,840 |
| Ionis Pharmaceuticals, Inc.(a) | 2,649 | 112,636 |
| Iovance Biotherapeutics, Inc.(a) | 92,950 | 996,424 |
| Ironwood Pharmaceuticals, Inc.(a) | 48,800 | 525,088 |
| iTeos Therapeutics, Inc.(a) | 44,425 | 985,347 |
| Jounce Therapeutics, Inc.(a) | 9,357 | 34,247 |
| Kiniksa Pharmaceuticals(a) | 26,964 | 316,018 |
| Kodiak Sciences, Inc.(a) | 13,400 | 134,134 |
| Kronos Bio, Inc.(a) | 92,170 | 368,680 |
| Lineage Cell Therapeutics, Inc.(a) | 43,600 | 61,476 |
| Mersana Therapeutics, Inc.(a) | 25,630 | 192,225 |
| Myriad Genetics, Inc.(a) | 54,800 | 1,224,232 |
| Natera, Inc.(a) | 39,509 | 1,946,213 |
| PMV Pharmaceuticals, Inc.(a) | 80,295 | 1,117,706 |
| Praxis Precision Medicines, Inc.(a) | 6,600 | 20,592 |
| Protagonist Therapeutics, Inc.(a) | 8,700 | 75,864 |
| Recursion Pharmaceuticals, Inc., Class A(a) | 51,457 | 540,813 |
| REGENXBIO, Inc.(a) | 72,956 | 2,152,202 |
| Relay Therapeutics, Inc.(a) | 81,719 | 1,877,085 |
| Revolution Medicines, Inc.(a) | 54,254 | 1,130,111 |
| Sage Therapeutics, Inc.(a) | 63,932 | 2,407,679 |
| Sana Biotechnology, Inc.(a) | 43,167 | 293,967 |
| Silverback Therapeutics, Inc.(a) | 37,290 | 202,858 |
| Sutro Biopharma, Inc.(a) | 81,171 | 459,428 |
| Syndax Pharmaceuticals, Inc.(a) | 43,500 | 1,027,035 |
| Tango Therapeutics, Inc.(a) | 28,000 | 114,800 |
| Travere Therapeutics, Inc.(a) | 52,867 | 1,414,721 |
| Twist Bioscience Corp.(a) | 65,122 | 2,612,695 |
| Vanda Pharmaceuticals, Inc.(a) | 202,081 | 2,138,017 |
| Vericel Corp.(a) | 132,699 | 3,310,840 |
| Verve Therapeutics, Inc.(a) | 39,884 | 1,529,950 |
| Vir Biotechnology, Inc.(a) | 42,800 | 1,016,500 |
| Total | 68,254,804 | |
| Common Stocks (continued) | ||
| Issuer | Shares | Value ($) |
| Health Care Equipment & Supplies 4.4% | ||
| Accuray, Inc.(a) | 79,874 | 190,100 |
| Angiodynamics, Inc.(a) | 34,055 | 753,978 |
| Avanos Medical, Inc.(a) | 3,782 | 93,151 |
| CONMED Corp. | 29,760 | 2,635,843 |
| Cue Health, Inc.(a) | 7,558 | 25,168 |
| Figs, Inc., Class A(a) | 72,734 | 840,805 |
| Haemonetics Corp.(a) | 41,300 | 3,098,739 |
| Inmode Ltd.(a) | 4,600 | 146,924 |
| Integer Holdings Corp.(a) | 9,000 | 567,630 |
| iRhythm Technologies, Inc.(a) | 27,781 | 4,096,309 |
| LeMaitre Vascular, Inc. | 97,386 | 4,808,921 |
| Merit Medical Systems, Inc.(a) | 150,282 | 8,901,203 |
| Mesa Laboratories, Inc. | 27,084 | 4,627,572 |
| Neogen Corp.(a) | 211,143 | 4,412,889 |
| Nevro Corp.(a) | 33,544 | 1,520,214 |
| NuVasive, Inc.(a) | 53,121 | 2,258,174 |
| Omnicell, Inc.(a) | 73,696 | 7,538,364 |
| OraSure Technologies, Inc.(a) | 126,587 | 517,741 |
| Orthofix Medical, Inc.(a) | 13,597 | 270,580 |
| Outset Medical, Inc.(a) | 113,608 | 2,077,890 |
| SeaSpine Holdings Corp.(a) | 17,180 | 109,952 |
| Shockwave Medical, Inc.(a) | 20,205 | 5,998,056 |
| Sight Sciences, Inc.(a) | 18,425 | 128,422 |
| Tactile Systems Technology, Inc.(a) | 14,544 | 119,988 |
| Varex Imaging Corp.(a) | 39,133 | 825,315 |
| Zimvie, Inc.(a) | 8,979 | 136,660 |
| Zynex, Inc. | 34,700 | 310,218 |
| Total | 57,010,806 | |
| Health Care Providers & Services 1.2% | ||
| Acadia Healthcare Co., Inc.(a) | 42,309 | 3,466,376 |
| Accolade, Inc.(a) | 110,520 | 1,125,094 |
| AdaptHealth Corp.(a) | 124,700 | 2,240,859 |
| agilon health, Inc.(a) | 8,624 | 179,207 |
| Amedisys, Inc.(a) | 14,896 | 1,764,431 |
| Cano Health, Inc.(a) | 360,811 | 2,226,204 |
| National Research Corp., Class A | 39,693 | 1,353,928 |
| Multi-Manager Small Cap Equity Strategies Fund | Annual Report 2022 | 19 |
August 31, 2022
| Common Stocks (continued) | ||
| Issuer | Shares | Value ($) |
| Patterson Companies, Inc. | 9,800 | 273,322 |
| Tenet Healthcare Corp.(a) | 47,200 | 2,666,800 |
| Total | 15,296,221 | |
| Health Care Technology 1.4% | ||
| Allscripts Healthcare Solutions, Inc.(a) | 125,150 | 2,127,550 |
| Certara, Inc.(a) | 14,050 | 220,163 |
| Computer Programs & Systems, Inc.(a) | 23,093 | 704,567 |
| Definitive Healthcare Corp.(a) | 153,650 | 3,085,292 |
| Evolent Health, Inc., Class A(a) | 118,709 | 4,362,556 |
| HealthStream, Inc.(a) | 21,581 | 477,588 |
| NextGen Healthcare, Inc.(a) | 13,839 | 237,200 |
| Simulations Plus, Inc. | 115,319 | 6,924,906 |
| Total | 18,139,822 | |
| Life Sciences Tools & Services 1.1% | ||
| Azenta, Inc. | 77,476 | 4,083,760 |
| Berkeley Lights, Inc.(a) | 125,496 | 460,570 |
| Harvard Bioscience, Inc.(a) | 4,600 | 15,180 |
| Personalis, Inc.(a) | 107,024 | 354,249 |
| Rapid Micro Biosystems, Inc., Class A(a) | 50,856 | 169,351 |
| Repligen Corp.(a) | 32,325 | 7,091,135 |
| Seer, Inc.(a) | 27,805 | 280,831 |
| Stevanato Group SpA | 82,025 | 1,361,615 |
| Total | 13,816,691 | |
| Pharmaceuticals 0.8% | ||
| Arvinas, Inc.(a) | 43,894 | 1,858,472 |
| Atea Pharmaceuticals, Inc.(a) | 22,410 | 168,075 |
| Athira Pharma, Inc.(a) | 34,042 | 115,062 |
| Nektar Therapeutics(a) | 48,132 | 189,640 |
| Organon & Co. | 8,968 | 255,857 |
| Phibro Animal Health Corp., Class A | 15,600 | 231,036 |
| Prestige Consumer Healthcare, Inc.(a) | 61,600 | 3,115,728 |
| Reata Pharmaceuticals, Inc., Class A(a) | 3,200 | 76,512 |
| Revance Therapeutics, Inc.(a) | 116,644 | 2,321,216 |
| Taro Pharmaceutical Industries Ltd.(a) | 27,200 | 915,552 |
| Tricida, Inc.(a) | 21,720 | 271,934 |
| Total | 9,519,084 | |
| Total Health Care | 182,037,428 | |
| Common Stocks (continued) | ||
| Issuer | Shares | Value ($) |
| Industrials 22.0% | ||
| Aerospace & Defense 2.0% | ||
| AAR Corp.(a) | 13,800 | 591,744 |
| Aerojet Rocketdyne Holdings, Inc.(a) | 6,540 | 281,678 |
| AerSale Corp.(a) | 12,583 | 242,600 |
| Axon Enterprise, Inc.(a) | 44,171 | 5,153,872 |
| Hexcel Corp. | 48,732 | 2,859,107 |
| Mercury Systems, Inc.(a) | 121,718 | 5,858,287 |
| Moog, Inc., Class A | 51,240 | 3,841,975 |
| National Presto Industries, Inc. | 15,300 | 1,043,766 |
| Parsons Corp.(a) | 105,862 | 4,380,570 |
| V2X, Inc.(a) | 31,900 | 1,105,654 |
| Total | 25,359,253 | |
| Air Freight & Logistics 0.2% | ||
| Atlas Air Worldwide Holdings, Inc.(a) | 5,900 | 589,528 |
| Forward Air Corp. | 8,500 | 824,840 |
| GXO Logistics, Inc.(a) | 27,466 | 1,218,941 |
| Radiant Logistics, Inc.(a) | 25,369 | 177,583 |
| Total | 2,810,892 | |
| Airlines 0.1% | ||
| Frontier Group Holdings, Inc.(a) | 92,236 | 1,189,844 |
| Mesa Air Group, Inc.(a) | 109,300 | 265,599 |
| Spirit Airlines, Inc.(a) | 12,400 | 281,232 |
| Total | 1,736,675 | |
| Building Products 2.3% | ||
| AAON, Inc. | 133,762 | 7,688,639 |
| Advanced Drainage Systems, Inc. | 23,461 | 3,183,658 |
| American Woodmark Corp.(a) | 10,900 | 564,947 |
| Caesarstone Ltd. | 346 | 3,526 |
| Carlisle Companies, Inc. | 6,458 | 1,909,372 |
| JELD-WEN Holding, Inc.(a) | 97,400 | 1,086,010 |
| Masonite International Corp.(a) | 13,800 | 1,129,116 |
| PGT, Inc.(a) | 29,200 | 610,864 |
| Quanex Building Products Corp. | 27,067 | 603,594 |
| Simpson Manufacturing Co., Inc. | 94,624 | 8,765,967 |
| Trex Company, Inc.(a) | 76,275 | 3,568,907 |
| UFP Industries, Inc. | 3,794 | 301,206 |
| Total | 29,415,806 | |
| 20 | Multi-Manager Small Cap Equity Strategies Fund | Annual Report 2022 |
August 31, 2022
| Common Stocks (continued) | ||
| Issuer | Shares | Value ($) |
| Commercial Services & Supplies 2.4% | ||
| ABM Industries, Inc. | 66,500 | 3,085,600 |
| ACCO Brands Corp. | 193,986 | 1,150,337 |
| ACV Auctions, Inc., Class A(a) | 119,250 | 1,014,818 |
| BrightView Holdings, Inc.(a) | 18,116 | 183,334 |
| Brink’s Co. (The) | 14,500 | 801,560 |
| Casella Waste Systems, Inc., Class A(a) | 177,471 | 14,540,199 |
| CoreCivic, Inc.(a) | 181,983 | 1,734,298 |
| Ennis, Inc. | 6,249 | 132,666 |
| Healthcare Services Group, Inc. | 84,900 | 1,194,543 |
| Interface, Inc. | 42,000 | 469,140 |
| Kimball International, Inc., Class B | 140,818 | 1,077,258 |
| Matthews International Corp., Class A | 18,598 | 465,136 |
| MillerKnoll, Inc. | 30,100 | 833,168 |
| MSA Safety, Inc. | 24,999 | 2,971,381 |
| Steelcase, Inc., Class A | 58,280 | 651,570 |
| Total | 30,305,008 | |
| Construction & Engineering 1.7% | ||
| API Group Corp.(a) | 176,200 | 2,739,910 |
| Argan, Inc. | 10,090 | 349,013 |
| Construction Partners, Inc., Class A(a) | 238,999 | 6,993,111 |
| EMCOR Group, Inc. | 27,600 | 3,282,192 |
| Fluor Corp.(a) | 45,300 | 1,197,732 |
| Great Lakes Dredge & Dock Corp.(a) | 83,204 | 796,262 |
| MYR Group, Inc.(a) | 3,200 | 297,408 |
| Primoris Services Corp. | 64,681 | 1,311,084 |
| Sterling Infrastructure, Inc.(a) | 25,200 | 637,308 |
| Tutor Perini Corp.(a) | 141,206 | 957,377 |
| Valmont Industries, Inc. | 10,586 | 2,930,416 |
| Total | 21,491,813 | |
| Electrical Equipment 1.6% | ||
| Atkore, Inc.(a) | 9,300 | 785,013 |
| AZZ, Inc. | 29,400 | 1,252,734 |
| Bloom Energy Corp., Class A(a) | 225,155 | 5,721,189 |
| Encore Wire Corp. | 26,544 | 3,453,374 |
| EnerSys | 19,000 | 1,185,030 |
| GrafTech International Ltd. | 118,900 | 699,132 |
| Powell Industries, Inc. | 30,082 | 741,822 |
| Common Stocks (continued) | ||
| Issuer | Shares | Value ($) |
| Preformed Line Products Co. | 5,000 | 389,000 |
| Shoals Technologies Group, Inc., Class A(a) | 99,752 | 2,630,460 |
| Sunrun, Inc.(a) | 90,300 | 2,982,609 |
| Thermon(a) | 51,900 | 910,845 |
| Vertiv Holdings Co. | 27,702 | 319,404 |
| Total | 21,070,612 | |
| Machinery 4.8% | ||
| AGCO Corp. | 4,042 | 439,406 |
| Allison Transmission Holdings, Inc. | 30,200 | 1,095,052 |
| Astec Industries, Inc. | 12,327 | 470,645 |
| Barnes Group, Inc. | 38,267 | 1,188,190 |
| Blue Bird Corp.(a) | 14,000 | 166,180 |
| Chart Industries, Inc.(a) | 16,666 | 3,230,871 |
| Douglas Dynamics, Inc. | 127,910 | 3,722,181 |
| Enerpac Tool Group Corp. | 30,000 | 582,000 |
| EnPro Industries, Inc. | 6,600 | 597,696 |
| ESCO Technologies, Inc. | 51,637 | 4,204,801 |
| Evoqua Water Technologies Corp.(a) | 188,661 | 6,618,228 |
| Flowserve Corp. | 39,400 | 1,200,518 |
| Gates Industrial Corp. PLC(a) | 50,400 | 540,288 |
| Greenbrier Companies, Inc. (The) | 38,032 | 1,084,292 |
| Helios Technologies, Inc. | 87,961 | 4,804,430 |
| Hillenbrand, Inc. | 27,200 | 1,133,424 |
| Hillman Solutions Corp.(a) | 360,030 | 3,020,652 |
| Hyster-Yale Materials Handling, Inc. | 9,200 | 267,996 |
| ITT, Inc. | 34,016 | 2,467,180 |
| John Bean Technologies Corp. | 63,610 | 6,568,369 |
| LB Foster Co., Class A(a) | 14,200 | 186,020 |
| Manitowoc Co., Inc. (The)(a) | 48,854 | 466,556 |
| Miller Industries, Inc. | 17,800 | 418,478 |
| Mueller Industries, Inc. | 9,300 | 587,481 |
| Mueller Water Products, Inc., Class A | 46,700 | 526,776 |
| Omega Flex, Inc. | 28,626 | 2,891,799 |
| Proto Labs, Inc.(a) | 12,500 | 480,000 |
| RBC Bearings, Inc.(a) | 36,077 | 8,683,012 |
| REV Group, Inc. | 34,799 | 400,884 |
| Timken Co. (The) | 19,500 | 1,228,305 |
| Multi-Manager Small Cap Equity Strategies Fund | Annual Report 2022 | 21 |
August 31, 2022
| Common Stocks (continued) | ||
| Issuer | Shares | Value ($) |
| Trinity Industries, Inc. | 32,709 | 797,445 |
| Wabash National Corp. | 114,516 | 1,883,788 |
| Total | 61,952,943 | |
| Marine 0.0% | ||
| Costamare, Inc. | 3,877 | 43,733 |
| Matson, Inc. | 6,700 | 493,522 |
| Total | 537,255 | |
| Professional Services 2.7% | ||
| Barrett Business Services, Inc. | 5,864 | 472,873 |
| BGSF, Inc. | 15,300 | 185,104 |
| Exponent, Inc. | 108,241 | 10,159,500 |
| Heidrick & Struggles International, Inc. | 51,781 | 1,473,687 |
| ICF International, Inc. | 41,800 | 4,245,208 |
| KBR, Inc. | 128,502 | 6,206,647 |
| Kelly Services, Inc., Class A | 52,852 | 851,446 |
| Kforce, Inc. | 43,509 | 2,380,812 |
| Korn/Ferry International | 18,800 | 1,145,296 |
| ManpowerGroup, Inc. | 11,800 | 865,176 |
| Resources Connection, Inc. | 67,238 | 1,313,831 |
| Science Applications International Corp. | 34,900 | 3,178,343 |
| TrueBlue, Inc.(a) | 95,474 | 1,961,036 |
| Total | 34,438,959 | |
| Road & Rail 1.0% | ||
| ArcBest Corp. | 70,422 | 5,671,084 |
| Covenant Logistics Group, Inc., Class A | 27,611 | 776,421 |
| Heartland Express, Inc. | 58,700 | 889,305 |
| Lyft, Inc., Class A(a) | 72,490 | 1,067,778 |
| PAM Transportation Services, Inc.(a) | 8,900 | 264,419 |
| Saia, Inc.(a) | 12,122 | 2,507,193 |
| Schneider National, Inc., Class B | 29,797 | 681,159 |
| Werner Enterprises, Inc. | 26,382 | 1,049,740 |
| Total | 12,907,099 | |
| Trading Companies & Distributors 3.2% | ||
| Air Lease Corp. | 47,214 | 1,716,701 |
| Applied Industrial Technologies, Inc. | 39,394 | 4,176,552 |
| Beacon Roofing Supply, Inc.(a) | 53,600 | 2,943,176 |
| BlueLinx Holdings, Inc.(a) | 11,100 | 778,110 |
| Boise Cascade Co. | 58,456 | 3,643,563 |
| Common Stocks (continued) | ||
| Issuer | Shares | Value ($) |
| Core & Main, Inc., Class A(a) | 79,004 | 1,862,124 |
| DXP Enterprises, Inc.(a) | 19,917 | 529,394 |
| GMS, Inc.(a) | 6,000 | 289,200 |
| Herc Holdings Inc | 24,300 | 2,734,479 |
| NOW, Inc.(a) | 102,426 | 1,241,403 |
| Rush Enterprises, Inc., Class A | 59,562 | 2,802,988 |
| SiteOne Landscape Supply, Inc.(a) | 59,185 | 7,407,595 |
| Titan Machinery, Inc.(a) | 42,372 | 1,304,210 |
| Transcat, Inc.(a) | 30,338 | 2,247,742 |
| Triton International Ltd. | 60,500 | 3,605,195 |
| Univar, Inc.(a) | 62,900 | 1,586,338 |
| WESCO International, Inc.(a) | 12,849 | 1,691,956 |
| Total | 40,560,726 | |
| Total Industrials | 282,587,041 | |
| Information Technology 14.3% | ||
| Communications Equipment 0.5% | ||
| Aviat Networks, Inc.(a) | 6,577 | 205,860 |
| Casa Systems, Inc.(a) | 84,900 | 329,412 |
| Ciena Corp.(a) | 40,102 | 2,034,775 |
| Comtech Telecommunications Corp. | 27,200 | 307,088 |
| Digi International, Inc.(a) | 232 | 7,682 |
| EMCORE Corp.(a) | 46,774 | 111,322 |
| Extreme Networks, Inc.(a) | 103,700 | 1,486,021 |
| NETGEAR, Inc.(a) | 54,693 | 1,290,208 |
| Netscout Systems, Inc.(a) | 16,563 | 525,710 |
| Ribbon Communications, Inc.(a) | 49,993 | 175,475 |
| Total | 6,473,553 | |
| Electronic Equipment, Instruments & Components 2.3% | ||
| Avnet, Inc. | 36,634 | 1,607,866 |
| Belden, Inc. | 19,200 | 1,257,216 |
| Benchmark Electronics, Inc. | 35,098 | 963,440 |
| ePlus, Inc.(a) | 21,942 | 1,033,907 |
| FARO Technologies, Inc.(a) | 4,252 | 142,655 |
| II-VI, Inc.(a) | 25,710 | 1,214,283 |
| Insight Enterprises, Inc.(a) | 9,800 | 892,976 |
| Itron, Inc.(a) | 43,949 | 2,091,093 |
| Kimball Electronics, Inc.(a) | 34,054 | 733,523 |
| Littelfuse, Inc. | 8,783 | 2,083,503 |
| Methode Electronics, Inc. | 30,800 | 1,246,168 |
| 22 | Multi-Manager Small Cap Equity Strategies Fund | Annual Report 2022 |
August 31, 2022
| Common Stocks (continued) | ||
| Issuer | Shares | Value ($) |
| Novanta, Inc.(a) | 65,954 | 8,817,390 |
| PC Connection, Inc. | 18,311 | 909,691 |
| Plexus Corp.(a) | 13,100 | 1,227,863 |
| Sanmina Corp.(a) | 20,000 | 970,400 |
| Scansource, Inc.(a) | 33,148 | 960,298 |
| TTM Technologies, Inc.(a) | 69,700 | 1,096,381 |
| Vishay Intertechnology, Inc. | 60,300 | 1,186,101 |
| Vontier Corp. | 48,400 | 1,060,928 |
| Total | 29,495,682 | |
| IT Services 1.6% | ||
| Cass Information Systems, Inc. | 29,000 | 1,063,720 |
| Computer Services, Inc. | 58,492 | 3,319,421 |
| Conduent, Inc.(a) | 35,264 | 144,230 |
| DigitalOcean Holdings, Inc.(a) | 65,806 | 2,769,775 |
| ExlService Holdings, Inc.(a) | 42,276 | 7,090,108 |
| Flywire Corp.(a) | 31,735 | 788,932 |
| Globant SA(a) | 12,924 | 2,723,991 |
| MAXIMUS, Inc. | 9,200 | 557,428 |
| Paysafe Ltd.(a) | 124,342 | 205,164 |
| Remitly Global, Inc.(a) | 107,306 | 1,180,366 |
| Repay Holdings Corp.(a) | 52,444 | 487,205 |
| SolarWinds Corp.(a) | 20,898 | 189,545 |
| Unisys Corp.(a) | 5,551 | 51,680 |
| Total | 20,571,565 | |
| Semiconductors & Semiconductor Equipment 1.5% | ||
| ACM Research, Inc., Class A(a) | 63,400 | 1,070,826 |
| Cirrus Logic, Inc.(a) | 15,672 | 1,201,886 |
| Diodes, Inc.(a) | 47,400 | 3,373,458 |
| Impinj, Inc.(a) | 7,110 | 634,781 |
| MagnaChip Semiconductor Corp.(a) | 166,700 | 1,950,390 |
| MKS Instruments, Inc. | 23,017 | 2,292,723 |
| Photronics, Inc.(a) | 39,000 | 655,200 |
| Semtech Corp.(a) | 22,236 | 1,027,081 |
| SMART Global Holdings, Inc.(a) | 109,700 | 2,012,995 |
| Ultra Clean Holdings, Inc.(a) | 59,000 | 1,726,930 |
| Wolfspeed, Inc.(a) | 27,955 | 3,172,054 |
| Total | 19,118,324 | |
| Common Stocks (continued) | ||
| Issuer | Shares | Value ($) |
| Software 8.1% | ||
| Altair Engineering, Inc., Class A(a) | 111,793 | 5,814,354 |
| Blackline, Inc.(a) | 111,324 | 7,563,353 |
| CCC Intelligent Solutions Holdings, Inc.(a) | 89,200 | 852,752 |
| Cerence, Inc.(a) | 46,919 | 938,849 |
| ChannelAdvisor Corp.(a) | 25,654 | 387,119 |
| Clearwater Analytics Holdings, Inc., Class A(a) | 72,725 | 1,119,965 |
| Confluent, Inc., Class A(a) | 77,213 | 2,112,548 |
| Consensus Cloud Solutions, Inc.(a) | 9,257 | 466,090 |
| CyberArk Software Ltd.(a) | 29,293 | 4,226,394 |
| Descartes Systems Group, Inc. (The)(a) | 141,210 | 9,941,184 |
| Duck Creek Technologies, Inc.(a) | 24,592 | 292,645 |
| Ebix, Inc. | 23,300 | 606,266 |
| Elastic NV(a) | 33,409 | 2,803,349 |
| Embark Technology, Inc.(a) | 16,697 | 151,943 |
| Envestnet, Inc.(a) | 45,996 | 2,408,811 |
| Everbridge, Inc.(a) | 33,795 | 1,344,365 |
| EverCommerce, Inc.(a) | 19,751 | 229,902 |
| Five9, Inc.(a) | 25,004 | 2,453,142 |
| HashiCorp, Inc., Class A(a) | 79,984 | 2,827,434 |
| Informatica, Inc., Class A(a) | 34,021 | 750,843 |
| Instructure Holdings, Inc.(a) | 23,161 | 526,450 |
| Intelligent Systems Corp.(a) | 11,900 | 288,575 |
| Jamf Holding Corp.(a) | 3,400 | 81,430 |
| JFrog Ltd.(a) | 63,188 | 1,336,426 |
| Model N, Inc.(a) | 258,950 | 7,742,605 |
| NCR Corp.(a) | 28,900 | 897,345 |
| New Relic, Inc.(a) | 38,616 | 2,344,377 |
| Nutanix, Inc., Class A(a) | 57,095 | 987,744 |
| ON24, Inc.(a) | 9,860 | 88,346 |
| Paycor HCM, Inc.(a) | 278,034 | 8,238,147 |
| PROS Holdings, Inc.(a) | 181,148 | 3,776,936 |
| Q2 Holdings, Inc.(a) | 129,042 | 5,125,548 |
| SecureWorks Corp., Class A(a) | 10,838 | 112,715 |
| SentinelOne, Inc., Class A(a) | 89,895 | 2,455,032 |
| Smartsheet, Inc., Class A(a) | 71,587 | 2,381,699 |
| Sprout Social, Inc., Class A(a) | 15,854 | 951,874 |
| SPS Commerce, Inc.(a) | 85,675 | 10,462,631 |
| Telos Corp.(a) | 120,700 | 1,194,930 |
| Multi-Manager Small Cap Equity Strategies Fund | Annual Report 2022 | 23 |
August 31, 2022
| Common Stocks (continued) | ||
| Issuer | Shares | Value ($) |
| Vertex, Inc.(a) | 278,869 | 3,814,928 |
| Workiva, Inc., Class A(a) | 45,080 | 3,060,481 |
| Xperi Holding Corp. | 38,400 | 610,944 |
| Total | 103,770,471 | |
| Technology Hardware, Storage & Peripherals 0.3% | ||
| Avid Technology, Inc.(a) | 23,309 | 637,501 |
| Diebold, Inc.(a) | 35,400 | 123,192 |
| Quantum Corp.(a) | 52,960 | 83,147 |
| Super Micro Computer, Inc.(a) | 12,100 | 787,468 |
| Xerox Holdings Corp. | 143,083 | 2,378,040 |
| Total | 4,009,348 | |
| Total Information Technology | 183,438,943 | |
| Materials 3.4% | ||
| Chemicals 2.0% | ||
| AdvanSix, Inc. | 42,088 | 1,526,111 |
| Ashland, Inc. | 33,400 | 3,398,784 |
| Avient Corp. | 38,100 | 1,669,923 |
| Balchem Corp. | 48,732 | 6,423,852 |
| Cabot Corp. | 52,300 | 3,764,031 |
| Chase Corp. | 7,300 | 643,568 |
| Ecovyst, Inc.(a) | 173,664 | 1,604,655 |
| FutureFuel Corp. | 37,900 | 276,291 |
| Hawkins, Inc. | 7,000 | 268,240 |
| HB Fuller Co. | 46,800 | 3,035,448 |
| Ingevity Corp.(a) | 4,600 | 322,644 |
| Innospec, Inc. | 6,400 | 598,144 |
| Koppers Holdings, Inc. | 13,494 | 308,068 |
| NewMarket Corp. | 1,000 | 287,210 |
| Tredegar Corp. | 54,200 | 553,382 |
| Trinseo PLC | 33,175 | 880,133 |
| Valhi, Inc. | 2,420 | 84,555 |
| Total | 25,645,039 | |
| Containers & Packaging 0.3% | ||
| O-I Glass, Inc.(a) | 223,200 | 2,903,832 |
| Pactiv Evergreen, Inc. | 20,367 | 226,074 |
| TriMas Corp. | 19,200 | 528,384 |
| Total | 3,658,290 | |
| Common Stocks (continued) | ||
| Issuer | Shares | Value ($) |
| Metals & Mining 1.0% | ||
| Arconic Corp.(a) | 25,220 | 635,796 |
| ATI, Inc.(a) | 99,100 | 2,966,063 |
| Commercial Metals Co. | 16,100 | 652,211 |
| Compass Minerals International, Inc. | 8,200 | 332,018 |
| Constellium SE(a) | 20,900 | 278,388 |
| Kaiser Aluminum Corp. | 16,247 | 1,165,885 |
| Materion Corp. | 34,100 | 2,943,171 |
| Olympic Steel, Inc. | 10,100 | 265,832 |
| Ryerson Holding Corp. | 22,400 | 638,400 |
| Schnitzer Steel Industries, Inc., Class A | 28,057 | 927,003 |
| SunCoke Energy, Inc. | 45,826 | 301,993 |
| Warrior Met Coal, Inc. | 34,920 | 1,136,646 |
| Worthington Industries, Inc. | 6,200 | 316,138 |
| Total | 12,559,544 | |
| Paper & Forest Products 0.1% | ||
| Clearwater Paper Corp.(a) | 12,913 | 549,319 |
| Glatfelter Corp. | 35,744 | 174,073 |
| Mercer International, Inc. | 66,836 | 1,084,080 |
| Sylvamo Corp. | 8,868 | 394,094 |
| Total | 2,201,566 | |
| Total Materials | 44,064,439 | |
| Real Estate 4.6% | ||
| Equity Real Estate Investment Trusts (REITS) 3.7% | ||
| Alexander’s, Inc. | 4,500 | 1,066,050 |
| American Assets Trust, Inc. | 98,800 | 2,742,688 |
| Apple Hospitality REIT, Inc. | 355,546 | 5,656,737 |
| Armada Hoffler Properties, Inc. | 22,365 | 293,652 |
| Braemar Hotels & Resorts, Inc. | 184,618 | 950,783 |
| Centerspace | 44,004 | 3,317,022 |
| CTO Realty Growth, Inc. | 13,868 | 292,754 |
| CubeSmart | 40,428 | 1,861,709 |
| Equity Commonwealth(a) | 85,469 | 2,248,689 |
| First Industrial Realty Trust, Inc. | 45,900 | 2,326,212 |
| Hersha Hospitality Trust(a) | 10,766 | 104,430 |
| Independence Realty Trust, Inc. | 98,800 | 1,921,660 |
| Industrial Logistics Properties Trust | 13,633 | 102,111 |
| NetSTREIT Corp. | 70,100 | 1,378,166 |
| 24 | Multi-Manager Small Cap Equity Strategies Fund | Annual Report 2022 |
August 31, 2022
| Common Stocks (continued) | ||
| Issuer | Shares | Value ($) |
| Orion Office REIT, Inc. | 3,300 | 32,571 |
| Park Hotels & Resorts, Inc. | 89,032 | 1,246,448 |
| Pebblebrook Hotel Trust | 63,700 | 1,122,394 |
| Piedmont Office Realty Trust, Inc. | 117,423 | 1,383,243 |
| PotlatchDeltic Corp. | 61,500 | 2,854,830 |
| RLJ Lodging Trust | 187,686 | 2,263,493 |
| Sabra Health Care REIT, Inc. | 230,100 | 3,444,597 |
| Sunstone Hotel Investors, Inc.(a) | 170,467 | 1,856,386 |
| Tanger Factory Outlet Centers, Inc. | 235,500 | 3,631,410 |
| Terreno Realty Corp. | 51,517 | 3,142,022 |
| Whitestone REIT | 34,229 | 336,813 |
| Xenia Hotels & Resorts, Inc.(a) | 83,118 | 1,318,252 |
| Total | 46,895,122 | |
| Real Estate Management & Development 0.9% | ||
| FirstService Corp. | 57,250 | 7,160,257 |
| Forestar Group, Inc.(a) | 15,041 | 187,110 |
| Marcus & Millichap, Inc. | 30,400 | 1,136,352 |
| RE/MAX Holdings, Inc., Class A | 36,400 | 828,464 |
| RMR Group, Inc. (The), Class A | 38,300 | 997,332 |
| Seritage Growth Properties, Class A(a) | 86,900 | 1,089,726 |
| Zillow Group, Inc., Class A(a) | 12,845 | 429,023 |
| Total | 11,828,264 | |
| Total Real Estate | 58,723,386 | |
| Utilities 2.4% | ||
| Electric Utilities 1.1% | ||
| Allete, Inc. | 30,140 | 1,783,685 |
| Hawaiian Electric Industries, Inc. | 29,500 | 1,154,040 |
| Otter Tail Corp. | 17,800 | 1,344,612 |
| PNM Resources, Inc. | 25,400 | 1,204,722 |
| Portland General Electric Co. | 160,956 | 8,316,597 |
| Total | 13,803,656 | |
| Common Stocks (continued) | ||
| Issuer | Shares | Value ($) |
| Gas Utilities 0.8% | ||
| New Jersey Resources Corp. | 89,400 | 3,946,116 |
| Northwest Natural Holding Co. | 21,771 | 1,036,517 |
| ONE Gas, Inc. | 47,600 | 3,725,652 |
| South Jersey Industries, Inc. | 37,000 | 1,252,450 |
| Spire, Inc. | 16,000 | 1,118,240 |
| Total | 11,078,975 | |
| Independent Power and Renewable Electricity Producers 0.3% | ||
| Clearway Energy, Inc., Class C | 102,100 | 3,787,910 |
| Multi-Utilities 0.2% | ||
| Avista Corp. | 27,500 | 1,117,325 |
| Black Hills Corp. | 16,200 | 1,222,776 |
| Total | 2,340,101 | |
| Total Utilities | 31,010,642 | |
| Total Common Stocks (Cost $1,261,170,411) | 1,266,775,685 | |
| Exchange-Traded Equity Funds 0.2% | ||
| Shares | Value ($) | |
| Sector 0.2% | ||
| SPDR S&P Biotech ETF(a) | 28,900 | 2,418,930 |
| Total Exchange-Traded Equity Funds (Cost $2,664,835) | 2,418,930 | |
| Money Market Funds 1.1% | ||
| Columbia Short-Term Cash Fund, 2.366%(e),(f) | 14,334,986 | 14,327,819 |
| Total Money Market Funds (Cost $14,327,946) | 14,327,819 | |
| Total Investments in Securities (Cost: $1,278,163,192) | 1,283,522,434 | |
| Other Assets & Liabilities, Net | 1,581,498 | |
| Net Assets | 1,285,103,932 | |
| Multi-Manager Small Cap Equity Strategies Fund | Annual Report 2022 | 25 |
August 31, 2022
| (a) | Non-income producing investment. |
| (b) | Represents fair value as determined in good faith under procedures approved by the Board of Trustees. At August 31, 2022, the total value of these securities amounted to $0, which represents less than 0.01% of total net assets. |
| (c) | Denotes a restricted security, which is subject to legal or contractual restrictions on resale under federal securities laws. Disposal of a restricted investment may involve time-consuming negotiations and expenses, and prompt sale at an acceptable price may be difficult to achieve. Private placement securities are generally considered to be restricted, although certain of those securities may be traded between qualified institutional investors under the provisions of Section 4(a)(2) and Rule 144A. The Fund will not incur any registration costs upon such a trade. These securities are valued at fair value determined in good faith under consistently applied procedures established by the Fund’s Board of Trustees. At August 31, 2022, the total market value of these securities amounted to $0, which represents less than 0.01% of total net assets. Additional information on these securities is as follows: |
| Security | Acquisition Dates | Shares | Cost ($) | Value ($) |
| Clementia Pharmaceuticals, Inc. | 04/23/2019 | 134,864 | — | — |
| (d) | Valuation based on significant unobservable inputs. |
| (e) | The rate shown is the seven-day current annualized yield at August 31, 2022. |
| (f) | As defined in the Investment Company Act of 1940, as amended, an affiliated company is one in which the Fund owns 5% or more of the company’s outstanding voting securities, or a company which is under common ownership or control with the Fund. The value of the holdings and transactions in these affiliated companies during the year ended August 31, 2022 are as follows: |
| Affiliated issuers | Beginning of period($) | Purchases($) | Sales($) | Net change in unrealized appreciation (depreciation)($) | End of period($) | Realized gain (loss)($) | Dividends($) | End of period shares |
| Columbia Short-Term Cash Fund, 2.366% | ||||||||
| 35,234,038 | 323,412,071 | (344,318,186) | (104) | 14,327,819 | (8,676) | 163,641 | 14,334,986 | |
| ■ | Level 1 — Valuations based on quoted prices for investments in active markets that the Fund has the ability to access at the measurement date. Valuation adjustments are not applied to Level 1 investments. |
| ■ | Level 2 — Valuations based on other significant observable inputs (including quoted prices for similar securities, interest rates, prepayment speeds, credit risks, etc.). |
| ■ | Level 3 — Valuations based on significant unobservable inputs (including the Fund’s own assumptions and judgment in determining the fair value of investments). |
| 26 | Multi-Manager Small Cap Equity Strategies Fund | Annual Report 2022 |
August 31, 2022
additional valuation matters, which may include the need to review back-testing results, review time-sensitive information or approve related valuation actions. The Committee reports to the Board, with members of the Committee meeting with the Board at each of its regularly scheduled meetings to discuss valuation matters and actions during the period, similar to those described earlier.
| Level 1 ($) | Level 2 ($) | Level 3 ($) | Total ($) | |
| Investments in Securities | ||||
| Common Stocks | ||||
| Communication Services | 15,279,385 | — | — | 15,279,385 |
| Consumer Discretionary | 122,893,548 | — | — | 122,893,548 |
| Consumer Staples | 37,891,925 | — | — | 37,891,925 |
| Energy | 61,906,459 | — | — | 61,906,459 |
| Financials | 246,942,489 | — | — | 246,942,489 |
| Health Care | 182,037,428 | — | 0* | 182,037,428 |
| Industrials | 282,587,041 | — | — | 282,587,041 |
| Information Technology | 180,119,522 | 3,319,421 | — | 183,438,943 |
| Materials | 44,064,439 | — | — | 44,064,439 |
| Real Estate | 58,723,386 | — | — | 58,723,386 |
| Utilities | 31,010,642 | — | — | 31,010,642 |
| Total Common Stocks | 1,263,456,264 | 3,319,421 | 0* | 1,266,775,685 |
| Exchange-Traded Equity Funds | 2,418,930 | — | — | 2,418,930 |
| Money Market Funds | 14,327,819 | — | — | 14,327,819 |
| Total Investments in Securities | 1,280,203,013 | 3,319,421 | 0* | 1,283,522,434 |
| * | Rounds to zero. |
| Multi-Manager Small Cap Equity Strategies Fund | Annual Report 2022 | 27 |
August 31, 2022
| Assets | |
| Investments in securities, at value | |
| Unaffiliated issuers (cost $1,263,835,246) | $1,269,194,615 |
| Affiliated issuers (cost $14,327,946) | 14,327,819 |
| Receivable for: | |
| Investments sold | 1,449,137 |
| Capital shares sold | 1,508,889 |
| Dividends | 1,021,680 |
| Foreign tax reclaims | 4,285 |
| Expense reimbursement due from Investment Manager | 8,393 |
| Prepaid expenses | 16,742 |
| Trustees’ deferred compensation plan | 106,959 |
| Total assets | 1,287,638,519 |
| Liabilities | |
| Payable for: | |
| Investments purchased | 625,891 |
| Capital shares purchased | 1,219,204 |
| Management services fees | 29,359 |
| Transfer agent fees | 383,683 |
| Compensation of board members | 20,381 |
| Other expenses | 149,110 |
| Trustees’ deferred compensation plan | 106,959 |
| Total liabilities | 2,534,587 |
| Net assets applicable to outstanding capital stock | $1,285,103,932 |
| Represented by | |
| Paid in capital | 1,186,484,463 |
| Total distributable earnings (loss) | 98,619,469 |
| Total - representing net assets applicable to outstanding capital stock | $1,285,103,932 |
| Institutional Class | |
| Net assets | $1,285,101,403 |
| Shares outstanding | 82,624,712 |
| Net asset value per share | $15.55 |
| Institutional 3 Class | |
| Net assets | $2,529 |
| Shares outstanding | 163 |
| Net asset value per share(a) | $15.55 |
| (a) | Net asset value per share rounds to this amount due to fractional shares outstanding. |
| 28 | Multi-Manager Small Cap Equity Strategies Fund | Annual Report 2022 |
Year Ended August 31, 2022
| Net investment income | |
| Income: | |
| Dividends — unaffiliated issuers | $15,745,412 |
| Dividends — affiliated issuers | 163,641 |
| Foreign taxes withheld | (29,910) |
| Total income | 15,879,143 |
| Expenses: | |
| Management services fees | 11,665,000 |
| Transfer agent fees | |
| Institutional Class | 4,271,199 |
| Institutional 3 Class | 1 |
| Compensation of board members | 30,709 |
| Custodian fees | 64,213 |
| Printing and postage fees | 299,258 |
| Registration fees | 80,013 |
| Audit fees | 54,500 |
| Legal fees | 26,296 |
| Interest on interfund lending | 71 |
| Compensation of chief compliance officer | 341 |
| Other | 27,036 |
| Total expenses | 16,518,637 |
| Fees waived or expenses reimbursed by Investment Manager and its affiliates | (2,484,999) |
| Total net expenses | 14,033,638 |
| Net investment income | 1,845,505 |
| Realized and unrealized gain (loss) — net | |
| Net realized gain (loss) on: | |
| Investments — unaffiliated issuers | 138,610,614 |
| Investments — affiliated issuers | (8,676) |
| Net realized gain | 138,601,938 |
| Net change in unrealized appreciation (depreciation) on: | |
| Investments — unaffiliated issuers | (363,318,877) |
| Investments — affiliated issuers | (104) |
| Net change in unrealized appreciation (depreciation) | (363,318,981) |
| Net realized and unrealized loss | (224,717,043) |
| Net decrease in net assets resulting from operations | $(222,871,538) |
| Multi-Manager Small Cap Equity Strategies Fund | Annual Report 2022 | 29 |
| Year Ended August 31, 2022 | Year Ended August 31, 2021 | |
| Operations | ||
| Net investment income | $1,845,505 | $136,781 |
| Net realized gain | 138,601,938 | 272,337,278 |
| Net change in unrealized appreciation (depreciation) | (363,318,981) | 246,069,171 |
| Net increase (decrease) in net assets resulting from operations | (222,871,538) | 518,543,230 |
| Distributions to shareholders | ||
| Net investment income and net realized gains | ||
| Institutional Class | (213,409,162) | (4,309,601) |
| Institutional 3 Class | (529) | (13) |
| Total distributions to shareholders | (213,409,691) | (4,309,614) |
| Increase (decrease) in net assets from capital stock activity | 237,772,579 | (198,212,420) |
| Total increase (decrease) in net assets | (198,508,650) | 316,021,196 |
| Net assets at beginning of year | 1,483,612,582 | 1,167,591,386 |
| Net assets at end of year | $1,285,103,932 | $1,483,612,582 |
| Year Ended | Year Ended | |||
| August 31, 2022 | August 31, 2021 | |||
| Shares | Dollars ($) | Shares | Dollars ($) | |
| Capital stock activity | ||||
| Institutional Class | ||||
| Subscriptions | 21,496,910 | 377,218,941 | 18,593,212 | 368,720,535 |
| Distributions reinvested | 11,448,989 | 213,409,162 | 241,164 | 4,309,601 |
| Redemptions | (18,945,152) | (352,855,524) | (29,323,851) | (571,242,556) |
| Net increase (decrease) | 14,000,747 | 237,772,579 | (10,489,475) | (198,212,420) |
| Total net increase (decrease) | 14,000,747 | 237,772,579 | (10,489,475) | (198,212,420) |
| 30 | Multi-Manager Small Cap Equity Strategies Fund | Annual Report 2022 |
| Multi-Manager Small Cap Equity Strategies Fund | Annual Report 2022 | 31 |
| Net asset value, beginning of period | Net investment income (loss) | Net realized and unrealized gain (loss) | Total from investment operations | Distributions from net investment income | Distributions from net realized gains | Total distributions to shareholders | |
| Institutional Class | |||||||
| Year Ended 8/31/2022 | $21.62 | 0.02 | (2.85) | (2.83) | (0.01) | (3.23) | (3.24) |
| Year Ended 8/31/2021 | $14.76 | 0.00(d) | 6.92 | 6.92 | (0.06) | — | (0.06) |
| Year Ended 8/31/2020 | $14.39 | 0.04 | 0.80 | 0.84 | (0.05) | (0.42) | (0.47) |
| Year Ended 8/31/2019 | $17.75 | 0.03 | (2.37) | (2.34) | (0.02) | (1.00) | (1.02) |
| Year Ended 8/31/2018 | $15.18 | (0.01) | 3.80 | 3.79 | (0.01) | (1.21) | (1.22) |
| Institutional 3 Class | |||||||
| Year Ended 8/31/2022 | $21.58 | 0.05 | (2.83) | (2.78) | (0.02) | (3.23) | (3.25) |
| Year Ended 8/31/2021 | $14.73 | 0.03 | 6.90 | 6.93 | (0.08) | — | (0.08) |
| Year Ended 8/31/2020(f) | $15.37 | 0.04 | (0.68)(g) | (0.64) | — | — | — |
| Notes to Financial Highlights | |
| (a) | In addition to the fees and expenses that the Fund bears directly, the Fund indirectly bears a pro rata share of the fees and expenses of any other funds in which it invests. Such indirect expenses are not included in the Fund’s reported expense ratios. |
| (b) | Total net expenses include the impact of certain fee waivers/expense reimbursements made by the Investment Manager and certain of its affiliates, if applicable. |
| (c) | Ratios include interfund lending expense which is less than 0.01%. |
| (d) | Rounds to zero. |
| (e) | Ratios include line of credit interest expense which is less than 0.01%. |
| (f) | Institutional 3 Class shares commenced operations on December 18, 2019. Per share data and total return reflect activity from that date. |
| (g) | Calculation of the net gain (loss) per share (both realized and unrealized) does not correlate to the aggregate realized and unrealized gain (loss) presented in the Statement of Operations due to the timing of subscriptions and redemptions of Fund shares in relation to fluctuations in the market value of the portfolio. |
| (h) | Annualized. |
| 32 | Multi-Manager Small Cap Equity Strategies Fund | Annual Report 2022 |
| Net asset value, end of period | Total return | Total gross expense ratio to average net assets(a) | Total net expense ratio to average net assets(a),(b) | Net investment income (loss) ratio to average net assets | Portfolio turnover | Net assets, end of period (000’s) | |
| Institutional Class | |||||||
| Year Ended 8/31/2022 | $15.55 | (15.57%) | 1.17%(c) | 0.99%(c) | 0.13% | 59% | $1,285,101 |
| Year Ended 8/31/2021 | $21.62 | 46.94% | 1.13% | 0.99% | 0.01% | 59% | $1,483,609 |
| Year Ended 8/31/2020 | $14.76 | 5.76% | 1.09% | 0.99% | 0.26% | 83% | $1,167,589 |
| Year Ended 8/31/2019 | $14.39 | (12.85%) | 1.06% | 1.05% | 0.22% | 97% | $1,664,350 |
| Year Ended 8/31/2018 | $17.75 | 26.26% | 1.17%(e) | 1.09%(e) | (0.04%) | 82% | $1,794,886 |
| Institutional 3 Class | |||||||
| Year Ended 8/31/2022 | $15.55 | (15.33%) | 0.84%(c) | 0.81%(c) | 0.30% | 59% | $3 |
| Year Ended 8/31/2021 | $21.58 | 47.18% | 0.86% | 0.81% | 0.16% | 59% | $4 |
| Year Ended 8/31/2020(f) | $14.73 | (4.16%) | 0.86%(h) | 0.81%(h) | 0.38%(h) | 83% | $2 |
| Multi-Manager Small Cap Equity Strategies Fund | Annual Report 2022 | 33 |
August 31, 2022
| 34 | Multi-Manager Small Cap Equity Strategies Fund | Annual Report 2022 |
August 31, 2022
| Multi-Manager Small Cap Equity Strategies Fund | Annual Report 2022 | 35 |
August 31, 2022
| 36 | Multi-Manager Small Cap Equity Strategies Fund | Annual Report 2022 |
August 31, 2022
| Effective rate (%) | |
| Institutional Class | 0.30 |
| Institutional 3 Class | 0.02 |
| Fee rate(s) contractual through December 31, 2022 | |
| Institutional Class | 0.99% |
| Institutional 3 Class | 0.81 |
| Multi-Manager Small Cap Equity Strategies Fund | Annual Report 2022 | 37 |
August 31, 2022
| Undistributed net investment income ($) | Accumulated net realized gain ($) | Paid in capital ($) |
| 95,541 | (11,050,062) | 10,954,521 |
| Year Ended August 31, 2022 | Year Ended August 31, 2021 | ||||
| Ordinary income ($) | Long-term capital gains ($) | Total ($) | Ordinary income ($) | Long-term capital gains ($) | Total ($) |
| 84,087,244 | 129,322,447 | 213,409,691 | 4,309,614 | — | 4,309,614 |
| Undistributed ordinary income ($) | Undistributed long-term capital gains ($) | Capital loss carryforwards ($) | Net unrealized (depreciation) ($) |
| 1,220,203 | 113,217,521 | — | (15,691,505) |
| Federal tax cost ($) | Gross unrealized appreciation ($) | Gross unrealized (depreciation) ($) | Net unrealized (depreciation) ($) |
| 1,299,213,939 | 144,156,536 | (159,848,041) | (15,691,505) |
| 38 | Multi-Manager Small Cap Equity Strategies Fund | Annual Report 2022 |
August 31, 2022
| Borrower or lender | Average loan balance ($) | Weighted average interest rate (%) | Number of days with outstanding loans |
| Borrower | 300,000 | 2.85 | 3 |
| Multi-Manager Small Cap Equity Strategies Fund | Annual Report 2022 | 39 |
August 31, 2022
| 40 | Multi-Manager Small Cap Equity Strategies Fund | Annual Report 2022 |
August 31, 2022
| Multi-Manager Small Cap Equity Strategies Fund | Annual Report 2022 | 41 |
| 42 | Multi-Manager Small Cap Equity Strategies Fund | Annual Report 2022 |
| Qualified dividend income | Dividends received deduction | Capital gain dividend |
| 13.18% | 12.98% | $140,285,516 |
| Name, address, year of birth | Position held with the Columbia Funds and length of service | Principal occupation(s) during past five years and other relevant professional experience | Number of Funds in the Columbia Funds Complex* overseen | Other directorships held by Trustee during the past five years |
| George S. Batejan c/o Columbia Management Investment Advisers, LLC 290 Congress Street Boston, MA 02210 1953 | Trustee since 2017 | Executive Vice President, Global Head of Technology and Operations, Janus Capital Group, Inc., 2010-2016 | 176 | Former Chairman of the Board, NICSA (National Investment Company Services Association) (Executive Committee, Nominating Committee and Governance Committee), 2014-2016; former Director, Intech Investment Management, 2011-2016; former Board Member, Metro Denver Chamber of Commerce, 2015-2016; former Advisory Board Member, University of Colorado Business School, 2015-2018 |
| Multi-Manager Small Cap Equity Strategies Fund | Annual Report 2022 | 43 |
(Unaudited)
Independent trustees (continued)
| Name, address, year of birth | Position held with the Columbia Funds and length of service | Principal occupation(s) during past five years and other relevant professional experience | Number of Funds in the Columbia Funds Complex* overseen | Other directorships held by Trustee during the past five years |
| Kathleen Blatz c/o Columbia Management Investment Advisers, LLC 290 Congress Street Boston, MA 02210 1954 | Trustee since 2006 | Attorney, specializing in arbitration and mediation; Chief Justice, Minnesota Supreme Court, 1998-2006; Associate Justice, Minnesota Supreme Court, 1996-1998; Fourth Judicial District Court Judge, Hennepin County, 1994-1996; Attorney in private practice and public service, 1984-1993; State Representative, Minnesota House of Representatives, 1979-1993, which included service on the Tax and Financial Institutions and Insurance Committees; Member and Interim Chair, Minnesota Sports Facilities Authority, January 2017-July 2017; Interim President and Chief Executive Officer, Blue Cross and Blue Shield of Minnesota (health care insurance), February-July 2018, April-October 2021 | 176 | Former Trustee, Blue Cross and Blue Shield of Minnesota, 2009-2021 (Chair of the Business Development Committee, 2014-2017; Chair of the Governance Committee, 2017-2019); former Member and Chair of the Board, Minnesota Sports Facilities Authority, January 2017-July 2017; former Director, Robina Foundation, 2009-2020 (Chair, 2014-2020); Director, Schulze Family Foundation, since 2021 |
| Pamela G. Carlton c/o Columbia Management Investment Advisers, LLC 290 Congress Street Boston, MA 02210 1954 | Trustee since 2007 | President, Springboard — Partners in Cross Cultural Leadership (consulting company) since 2003; Managing Director of US Equity Research, JP Morgan Chase, 1999-2003; Director of US Equity Research, Chase Asset Management, 1996-1999; Co-Director Latin America Research, 1993-1996, COO Global Research, 1992-1996, Co-Director of US Research, 1991-1992, Investment Banker, 1982-1991, Morgan Stanley; Attorney, Cleary Gottlieb Steen & Hamilton LLP, 1980-1982 | 176 | Trustee, New York Presbyterian Hospital Board (Executive Committee and Chair of People Committee) since 1996; Director, DR Bank (Audit Committee) since 2017; Director, Evercore Inc. (Audit Committee) since 2019; Director, Apollo Commercial Real Estate Finance, Inc. since 2021; the Governing Council of the Independent Directors Council (IDC), since 2021 |
| Janet Langford Carrig c/o Columbia Management Investment Advisers, LLC 290 Congress Street Boston, MA 02210 1957 | Trustee since 1996 | Senior Vice President, General Counsel and Corporate Secretary, ConocoPhillips (independent energy company), September 2007-October 2018 | 174 | Director, EQT Corporation (natural gas producer) since 2019; former Director, Whiting Petroleum Corporation (independent oil and gas company), 2020-2022 |
| J. Kevin Connaughton c/o Columbia Management Investment Advisers, LLC 290 Congress Street Boston, MA 02210 1964 | Trustee since 2020 | Member, FINRA National Adjudicatory Council since January 2020; Adjunct Professor of Finance, Bentley University since January 2018; Consultant to Independent Trustees of CFVIT and CFST I from March 2016 to June 2020 with respect to CFVIT and to December 2020 with respect to CFST I; Managing Director and General Manager of Mutual Fund Products, Columbia Management Investment Advisers, LLC, May 2010-February 2015; President, Columbia Funds, 2008-2015; and senior officer of Columbia Funds and affiliated funds, 2003-2015 | 174 | Former Director, The Autism Project, March 2015-December 2021; former Member of the Investment Committee, St. Michael’s College, November 2015-February 2020; former Trustee, St. Michael’s College, June 2017-September 2019; former Trustee, New Century Portfolios, January 2015-December 2017 |
| 44 | Multi-Manager Small Cap Equity Strategies Fund | Annual Report 2022 |
(Unaudited)
Independent trustees (continued)
| Name, address, year of birth | Position held with the Columbia Funds and length of service | Principal occupation(s) during past five years and other relevant professional experience | Number of Funds in the Columbia Funds Complex* overseen | Other directorships held by Trustee during the past five years |
| Olive M. Darragh c/o Columbia Management Investment Advisers, LLC 290 Congress Street Boston, MA 02210 1962 | Trustee since 2020 | Managing Director of Darragh Inc. (strategy and talent management consulting firm) since 2010; Founder and CEO, Zolio, Inc. (investment management talent identification platform) since 2004; Consultant to Independent Trustees of CFVIT and CFST I from June 2019 to June 2020 with respect to CFVIT and to December 2020 with respect to CFST I; Partner, Tudor Investments, 2004-2010; Senior Partner, McKinsey & Company (consulting), 1990-2004; Touche Ross CPA, 1985-1988 | 174 | Former Director, University of Edinburgh Business School (Member of US Board); former Director, Boston Public Library Foundation |
| Patricia M. Flynn c/o Columbia Management Investment Advisers, LLC 290 Congress Street Boston, MA 02210 1950 | Trustee since 2004 | Trustee Professor of Economics and Management, Bentley University since 1976 (also teaches and conducts research on corporate governance); Dean, McCallum Graduate School of Business, Bentley University, 1992-2002 | 176 | Trustee, MA Taxpayers Foundation since 1997; former Board of Governors, Innovation Institute, MA Technology Collaborative, 2010-2020; former Board of Directors, The MA Business Roundtable, 2003-2019 |
| Brian J. Gallagher c/o Columbia Management Investment Advisers, LLC 290 Congress Street Boston, MA 02210 1954 | Trustee since 2017 | Retired; Partner with Deloitte & Touche LLP and its predecessors, 1977-2016 | 176 | Trustee, Catholic Schools Foundation since 2004 |
| Douglas A. Hacker c/o Columbia Management Investment Advisers, LLC 290 Congress Street Boston, MA 02210 1955 | Co-Chair since 2021; Chair of CFST I and CFVIT since 2014; Trustee of CFST I and CFVIT since 1996 and CFST, CFST II, CFVST II, CET I and CET II since 2021 | Independent business executive since May 2006; Executive Vice President – Strategy of United Airlines, December 2002 - May 2006; President of UAL Loyalty Services (airline marketing company), September 2001-December 2002; Executive Vice President and Chief Financial Officer of United Airlines, July 1999-September 2001 | 176 | Director, Spartan Nash Company (food distributor); Director, Aircastle Limited (Chair of Audit Committee) (aircraft leasing); former Director, Nash Finch Company (food distributor), 2005-2013; former Director, SeaCube Container Leasing Ltd. (container leasing), 2010-2013; and former Director, Travelport Worldwide Limited (travel information technology), 2014-2019 |
| Nancy T. Lukitsh c/o Columbia Management Investment Advisers, LLC 290 Congress Street Boston, MA 02210 1956 | Trustee since 2011 | Senior Vice President, Partner and Director of Marketing, Wellington Management Company, LLP (investment adviser), 1997-2010; Chair, Wellington Management Portfolios (commingled non-U.S. investment pools), 2007 -2010; Director, Wellington Trust Company, NA and other Wellington affiliates, 1997-2010 | 174 | None |
| Multi-Manager Small Cap Equity Strategies Fund | Annual Report 2022 | 45 |
(Unaudited)
Independent trustees (continued)
| Name, address, year of birth | Position held with the Columbia Funds and length of service | Principal occupation(s) during past five years and other relevant professional experience | Number of Funds in the Columbia Funds Complex* overseen | Other directorships held by Trustee during the past five years |
| David M. Moffett c/o Columbia Management Investment Advisers, LLC 290 Congress Street Boston, MA 02210 1952 | Trustee since 2011 | Retired; Consultant to Bridgewater and Associates | 174 | Director, CSX Corporation (transportation suppliers); Director, Genworth Financial, Inc. (financial and insurance products and services); Director, PayPal Holdings Inc. (payment and data processing services); Trustee, University of Oklahoma Foundation; former Director, eBay Inc. (online trading community), 2007-2015; and former Director, CIT Bank, CIT Group Inc. (commercial and consumer finance), 2010-2016 |
| Catherine James Paglia c/o Columbia Management Investment Advisers, LLC 290 Congress Street Boston, MA 02210 1952 | Co-Chair since 2021; Chair of CFST, CFST II, CFVST II, CET I and CET II since 2020; Trustee of CFST, CFST II and CFVST II since 2004 and CFST I and CFVIT since 2021 | Director, Enterprise Asset Management, Inc. (private real estate and asset management company) since September 1998; Managing Director and Partner, Interlaken Capital, Inc., 1989-1997; Vice President, 1982-1985, Principal, 1985-1987, Managing Director, 1987-1989, Morgan Stanley; Vice President, Investment Banking, 1980-1982, Associate, Investment Banking, 1976-1980, Dean Witter Reynolds, Inc. | 176 | Director, Valmont Industries, Inc. (irrigation systems manufacturer) since 2012; Trustee, Carleton College (on the Investment Committee); Trustee, Carnegie Endowment for International Peace (on the Investment Committee) |
| Minor M. Shaw c/o Columbia Management Investment Advisers, LLC 290 Congress Street Boston, MA 02210 1947 | Trustee since 2003 | President, Micco LLC (private investments) since 2011; President, Micco Corp. (family investment business), 1998-2011 | 176 | Director, Blue Cross Blue Shield of South Carolina (Chair of Compensation Committee) since April 2008; Trustee, Hollingsworth Funds (on the Investment Committee) since 2016 (previously Board Chair from 2016-2019); Former Advisory Board member, Duke Energy Corp., 2016-2020; Chair of the Duke Endowment; Chair of Greenville – Spartanburg Airport Commission; former Trustee, BofA Funds Series Trust (11 funds), 2003-2011; former Director, Piedmont Natural Gas, 2004-2016; former Director, National Association of Corporate Directors, Carolinas Chapter, 2013-2018; Chair, Daniel-Mickel Foundation since 1998 |
| 46 | Multi-Manager Small Cap Equity Strategies Fund | Annual Report 2022 |
(Unaudited)
Independent trustees (continued)
| Name, address, year of birth | Position held with the Columbia Funds and length of service | Principal occupation(s) during past five years and other relevant professional experience | Number of Funds in the Columbia Funds Complex* overseen | Other directorships held by Trustee during the past five years |
| Natalie A. Trunow c/o Columbia Management Investment Advisers, LLC 290 Congress Street Boston, MA 02210 1967 | Trustee since 2020 | Chief Executive Officer, Millennial Portfolio Solutions LLC (asset management and consulting services), January 2016-January 2021; Non-executive Member of the Investment Committee and Valuation Committee, Sarona Asset Management Inc. (private equity firm) since September 2019; Advisor, Horizon Investments (asset management and consulting services), August 2018-January 2021; Advisor, Paradigm Asset Management, November 2016-December 2021; Consultant to Independent Trustees of CFVIT and CFST I from September 2016 to June 2020 with respect to CFVIT and to December 2020 with respect to CFST I; Director of Investments/Consultant, Casey Family Programs, April 2016-November 2016; Senior Vice President and Chief Investment Officer, Calvert Investments, August 2008-January 2016; Section Head and Portfolio Manager, General Motors Asset Management, June 1997-August 2008 | 174 | Former Director, Investment Committee, Health Services for Children with Special Needs, Inc., 2012-2019; Director, Chair of Audit Committee, Consumer Credit Counseling Services (formerly Guidewell Financial Solutions), since 2019; Independent Director, Investment Committee and Valuation Committee, Sarona Asset Management, since 2019 |
| Sandra L. Yeager c/o Columbia Management Investment Advisers, LLC 290 Congress Street Boston, MA 02210 1964 | Trustee since 2017 | Retired; President and founder, Hanoverian Capital, LLC (SEC registered investment advisor firm), 2008-2016; Managing Director, DuPont Capital, 2006-2008; Managing Director, Morgan Stanley Investment Management, 2004-2006; Senior Vice President, Alliance Bernstein, 1990-2004 | 176 | Former Director, NAPE Education Foundation, October 2016-October 2020 |
| * | The term “Columbia Funds Complex” as used herein includes Columbia Seligman Premium Technology Growth Fund, Tri-Continental Corporation and each series of Columbia Fund Series Trust (CFST), Columbia Funds Series Trust I (CFST I), Columbia Funds Series Trust II (CFST II), Columbia ETF Trust I (CET I), Columbia ETF Trust II (CET II), Columbia Funds Variable Insurance Trust (CFVIT) and Columbia Funds Variable Series Trust II (CFVST II). Messrs. Batejan, Beckman, Gallagher and Hacker and Mses. Blatz, Carlton, Flynn, Paglia, Shaw and Yeager serve as Directors of Columbia Seligman Premium Technology Growth Fund and Tri-Continental Corporation. |
| Name, address, year of birth | Position held with the Columbia Funds and length of service | Principal occupation(s) during the past five years and other relevant professional experience | Number of Funds in the Columbia Funds Complex overseen | Other directorships held by Trustee during the past five years |
| Daniel J. Beckman c/o Columbia Management Investment Advisers, LLC 290 Congress Street Boston, MA 02210 1962 | Trustee since November 2021 and President since June 2021 | Vice President – Head of North America Product, Columbia Management Investment Advisers, LLC since April 2015; President and Principal Executive Officer of the Columbia Funds since June 2021; officer of Columbia Funds and affiliated funds, 2020-2021 | 176 | Director, Ameriprise Trust Company, since October 2016; Director, Columbia Management Investment Distributors, Inc. since November 2018; Board of Governors, Columbia Wanger Asset Management, LLC since January 2022 |
| * | Interested person (as defined under the 1940 Act) by reason of being an officer, director, security holder and/or employee of the Investment Manager or Ameriprise Financial. |
| Multi-Manager Small Cap Equity Strategies Fund | Annual Report 2022 | 47 |
(Unaudited)
The Statement of Additional Information has additional information about the Fund’s Board members and is available, without charge, upon request by calling 800.345.6611, visiting columbiathreadneedleus.com/investor/ or contacting your financial intermediary.
| Name, address and year of birth | Position and year first appointed to position for any Fund in the Columbia Funds Complex or a predecessor thereof | Principal occupation(s) during past five years |
| Michael G. Clarke 290 Congress Street Boston, MA 02210 1969 | Chief Financial Officer and Principal Financial Officer (2009) and Senior Vice President (2019) | Senior Vice President and Head of Global Operations & Investor Services, Columbia Management Investment Advisers, LLC, since March 2022 (previously Vice President, Head of North American Operations, and Co-Head of Global Operations, June 2019 to February 2022 and Vice President – Accounting and Tax, May 2010 - May 2019); senior officer of Columbia Funds and affiliated funds since 2002. |
| Joseph Beranek 5890 Ameriprise Financial Center Minneapolis, MN 55474 1965 | Treasurer and Chief Accounting Officer (Principal Accounting Officer) (2019) and Principal Financial Officer (2020), CFST, CFST I, CFST II, CFVIT and CFVST II; Assistant Treasurer, CET I and CET II | Vice President – Mutual Fund Accounting and Financial Reporting, Columbia Management Investment Advisers, LLC, since December 2018 and March 2017, respectively (previously Vice President – Pricing and Corporate Actions, May 2010 - March 2017). |
| Marybeth Pilat 290 Congress Street Boston, MA 02210 1968 | Treasurer and Chief Accounting Officer (Principal Accounting Officer) and Principal Financial Officer (2020) for CET I and CET II; Assistant Treasurer, CFST, CFST I, CFST II, CFVIT and CFVST II | Vice President – Product Pricing and Administration, Columbia Management Investment Advisers, LLC, since May 2017; Director - Fund Administration, Calvert Investments, August 2015 – March 2017; Vice President - Fund Administration, Legg Mason, May 2015 - July 2015; Vice President - Fund Administration, Columbia Management Investment Advisers, LLC, May 2010 - April 2015. |
| William F. Truscott 290 Congress Street Boston, MA 02210 1960 | Senior Vice President (2001) | Formerly, Trustee/Director of Columbia Funds Complex or legacy funds, November 2001-January 1, 2021; Chief Executive Officer, Global Asset Management, Ameriprise Financial, Inc. since September 2012; Chairman of the Board and President, Columbia Management Investment Advisers, LLC since July 2004 and February 2012, respectively; Chairman of the Board and Chief Executive Officer, Columbia Management Investment Distributors, Inc. since November 2008 and February 2012, respectively; Chairman of the Board and Director, Threadneedle Asset Management Holdings, Sàrl since March 2013 and December 2008, respectively; senior executive of various entities affiliated with Columbia Threadneedle. |
| Christopher O. Petersen 5228 Ameriprise Financial Center Minneapolis, MN 55474 1970 | Senior Vice President and Assistant Secretary (2021) | Formerly, Trustee/Director of funds within the Columbia Funds Complex, July 1, 2020 - November 22, 2021; Senior Vice President and Assistant General Counsel, Ameriprise Financial, Inc. since September 2021 (previously Vice President and Lead Chief Counsel, January 2015 - September 2021); formerly, President and Principal Executive Officer of the Columbia Funds, 2015 - 2021; officer of Columbia Funds and affiliated funds since 2007. |
| Thomas P. McGuire 290 Congress Street Boston, MA 02210 1972 | Senior Vice President and Chief Compliance Officer (2012) | Vice President – Asset Management Compliance, Ameriprise Financial, Inc., since May 2010; Chief Compliance Officer, Columbia Acorn/Wanger Funds since December 2015; formerly, Chief Compliance Officer, Ameriprise Certificate Company, September 2010 – September 2020. |
| 48 | Multi-Manager Small Cap Equity Strategies Fund | Annual Report 2022 |
(Unaudited)
Fund officers (continued)
| Name, address and year of birth | Position and year first appointed to position for any Fund in the Columbia Funds Complex or a predecessor thereof | Principal occupation(s) during past five years |
| Ryan C. Larrenaga 290 Congress Street Boston, MA 02210 1970 | Senior Vice President (2017), Chief Legal Officer (2017), and Secretary (2015) | Vice President and Chief Counsel, Ameriprise Financial, Inc. since August 2018 (previously Vice President and Group Counsel, August 2011 - August 2018); Chief Legal Officer, Columbia Acorn/Wanger Funds, since September 2020; officer of Columbia Funds and affiliated funds since 2005. |
| Michael E. DeFao 290 Congress Street Boston, MA 02210 1968 | Vice President (2011) and Assistant Secretary (2010) | Vice President and Chief Counsel, Ameriprise Financial, Inc. since May 2010; Vice President, Chief Legal Officer and Assistant Secretary, Columbia Management Investment Advisers, LLC since October 2021 (previously Vice President and Assistant Secretary, May 2010 – September 2021). |
| Lyn Kephart-Strong 5228 Ameriprise Financial Center Minneapolis, MN 55474 1960 | Vice President (2015) | President, Columbia Management Investment Services Corp. since October 2014; Vice President & Resolution Officer, Ameriprise Trust Company since August 2009. |
| • | the Fund had sufficient liquidity to both meet redemptions and operate effectively on behalf of shareholders; |
| • | there were no material changes to the Program during the period; |
| • | the implementation of the Program was effective to manage the Fund’s liquidity risk; and |
| • | the Program operated adequately during the period. |
| Multi-Manager Small Cap Equity Strategies Fund | Annual Report 2022 | 49 |
| • | Terms of the Subadvisory Agreement; |
| • | Subadvisory fees payable by the Investment Manager under the Subadvisory Agreement; |
| • | Descriptions of various services proposed to be performed by Jacobs Levy under the Subadvisory Agreement, including portfolio management and portfolio trading practices; |
| • | Information regarding the experience and resources of Jacobs Levy, including information regarding senior management, portfolio managers, and other personnel; |
| • | Information regarding the capabilities of Jacobs Levy’s compliance program; and |
| • | The profitability to the Investment Manager and its affiliates from their relationships with the Fund. |
| 50 | Multi-Manager Small Cap Equity Strategies Fund | Annual Report 2022 |
| • | Information on the investment performance of the Fund relative to the performance of a group of mutual funds determined to be comparable to the Fund by Broadridge, as well as performance relative to benchmarks; |
| • | Information on the Fund’s management fees and total expenses, including information comparing the Fund’s expenses to those of a group of comparable mutual funds, as determined by Broadridge; |
| • | The Investment Manager’s agreement to contractually limit or cap total operating expenses for the Fund so that total operating expenses (excluding certain fees and expenses, such as transaction costs and certain other investment related expenses, interest, taxes, acquired fund fees and expenses and infrequent and/or unusual expenses) would not exceed a specified annual rate, as a percentage of the Fund’s net assets; |
| • | Terms of the Renewal Advisory Agreements; |
| • | Subadvisory fees payable by the Investment Manager under the Renewal Subadvisory Agreements; |
| • | Descriptions of other agreements and arrangements with affiliates of the Investment Manager relating to the operations of the Fund, including agreements with respect to the provision of transfer agency and shareholder services to the Fund; |
| • | Descriptions of various services performed by the Investment Manager and the Subadvisers under the Renewal Advisory Agreements, including portfolio management and portfolio trading practices; |
| • | Information regarding any recently negotiated management fees of similarly-managed portfolios of other institutional clients of the Investment Manager; |
| • | Information regarding the resources of the Investment Manager and Subadvisers, including information regarding senior management, portfolio managers and other personnel; |
| • | Information regarding the capabilities of the Investment Manager and the Subadvisers with respect to compliance monitoring services; |
| • | The profitability to the Investment Manager and its affiliates from their relationships with the Fund; and |
| • | Report provided by the Board’s independent fee consultant, JDL Consultants, LLC (JDL). |
| Multi-Manager Small Cap Equity Strategies Fund | Annual Report 2022 | 51 |
| 52 | Multi-Manager Small Cap Equity Strategies Fund | Annual Report 2022 |
| Multi-Manager Small Cap Equity Strategies Fund | Annual Report 2022 | 53 |
| 54 | Multi-Manager Small Cap Equity Strategies Fund | Annual Report 2022 |
| Multi-Manager Small Cap Equity Strategies Fund | Annual Report 2022 | 55 |
columbiathreadneedleus.com/investor/. The Fund is distributed by Columbia Management Investment Distributors, Inc., member FINRA, and managed by Columbia Management Investment Advisers, LLC.

August 31, 2022

| 3 | |
| 6 | |
| 10 | |
| 11 | |
| 21 | |
| 22 | |
| 23 | |
| 24 | |
| 26 | |
| 35 | |
| 36 | |
| 36 | |
| 42 | |
| 43 |
(Unaudited)
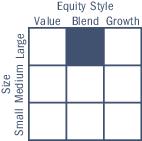
| Average annual total returns (%) (for the period ended August 31, 2022) | ||||
| Inception | 1 Year | Life | ||
| Institutional Class | 05/17/18 | -23.66 | 0.29 | |
| Institutional 3 Class* | 12/18/19 | -23.42 | 0.38 | |
| MSCI EAFE Index (Net) | -19.80 | 0.01 | ||
| Multi-Manager International Equity Strategies Fund | Annual Report 2022 | 3 |
(Unaudited)
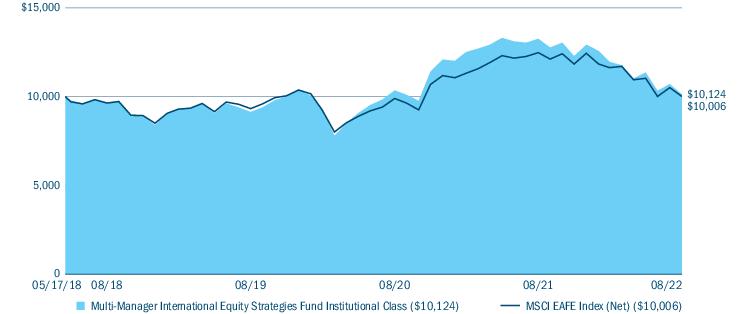
| Equity sector breakdown (%) (at August 31, 2022) | |
| Communication Services | 4.7 |
| Consumer Discretionary | 9.0 |
| Consumer Staples | 9.6 |
| Energy | 6.8 |
| Financials | 16.0 |
| Health Care | 11.2 |
| Industrials | 17.6 |
| Information Technology | 14.1 |
| Materials | 7.2 |
| Real Estate | 0.0(a) |
| Utilities | 3.8 |
| Total | 100.0 |
| (a) | Rounds to zero. |
| 4 | Multi-Manager International Equity Strategies Fund | Annual Report 2022 |
(Unaudited)
| Country breakdown (%) (at August 31, 2022) | |
| Argentina | 1.1 |
| Australia | 2.5 |
| Austria | 0.1 |
| Belgium | 0.6 |
| Brazil | 0.7 |
| Canada | 2.4 |
| China | 2.8 |
| Denmark | 1.9 |
| Finland | 0.6 |
| France | 10.5 |
| Germany | 9.7 |
| Hong Kong | 2.4 |
| Ireland | 2.4 |
| Israel | 0.1 |
| Italy | 3.7 |
| Japan | 15.3 |
| Netherlands | 6.0 |
| Norway | 0.9 |
| Panama | 0.3 |
| Portugal | 0.1 |
| Russian Federation | 0.0(a) |
| South Africa | 0.4 |
| South Korea | 2.8 |
| Spain | 3.4 |
| Sweden | 2.8 |
| Switzerland | 7.1 |
| Taiwan | 1.3 |
| Turkey | 0.4 |
| United Kingdom | 14.0 |
| United States(b) | 3.7 |
| Total | 100.0 |
| (a) | Rounds to zero. |
| (b) | Includes investments in Money Market Funds. |
| Multi-Manager International Equity Strategies Fund | Annual Report 2022 | 5 |
(Unaudited)
| • | Energy was the top contributing sector in our portion of the Fund during the period. |
| ○ | Our opportunistic positioning to the Brazilian basket and overweight positioning to the Japanese, UK, and Italian energy baskets were the main drivers of the outperformance. |
| ○ | Positive selection within Japanese energy also contributed positively. |
| • | Industrials was also a top contributor, largely due to our opportunistic exposure to Turkish industrials. |
| • | Underweight positioning to German industrials and positive selection Japanese and Danish industrials baskets also aided results. |
| • | From a country perspective, Brazil was the top contributor for the period, as our opportunistic exposure to Brazilian energy was the main driver of the outperformance. |
| • | Turkey was also a top country contributor, as opportunistic positioning to both industrials and financials contributed positively to value added. |
| • | Japan was a top country contributor over the period, primarily due to both overweight positioning and positive selection within energy (noted above) and financials. |
| • | Individual holdings that contributed notably during the period included Brazilian energy company Petroleo Brasileiro SA, Japanese energy company Inpex Corp., and Turkish industrials company Turk Hava Yollari AO. |
| 6 | Multi-Manager International Equity Strategies Fund | Annual Report 2022 |
(Unaudited)
| • | Information technology was the top sector detractor in our portion of the Fund. Overweight positioning to both Dutch and Japanese IT, coupled with our opportunistic positioning to South Korean IT, detracted from results. |
| • | The consumer discretionary sector was also a top detractor for our portion of the Fund, largely due to both underweight positioning and negative selection within Japanese consumer discretionary. |
| • | Overweight positioning to German consumer discretionary also weighed on results. |
| • | In terms of country allocations, Russia was the largest detracting country in our portion of the portfolio over the period. Our positioning to Russian energy and financials weighed on results. |
| • | South Korea was also a top country detractor, primarily due to our opportunistic positioning to South Korean IT (noted above). |
| • | Belgium detracted from relative performance, as average overweight positioning to both consumer staples and communication services drove the underperformance. |
| • | Individual holdings that detracted most in our portion of the Fund included Dutch IT firm ASML Holding NV, UK healthcare company GSK PLC (formerly GlaxoSmithKline), and Russian energy company Gazprom PJSC. |
| • | The three sectors which detracted most from performance on a relative basis were the industrials, consumer discretionary and health care sectors. |
| • | The performance of the industrial and consumer discretionary sectors has been affected by fears around a recession in Europe. |
| • | Our health care exposure detracted due to our relative underweight to this sector. |
| • | The three largest individual detractors relative to our benchmark were MercadoLibre, Inc., Sea Ltd., and Kingspan Group PLC. |
| ○ | Both MercadoLibre, a dominant Brazilian online platform, and Sea, a Singaporean internet platform with reach across the ASEAM (Association of Southeast Asian Nations), have continued to enjoy strong top line growth but have been punished by the market for investing in future growth at the expense of short-term profitability. |
| ○ | Kingspan, an Irish-listed manufacturer of highly efficient insulation panels, has been executing well but has suffered from general malaise towards European industrials and some margin pressure following a rise in raw material costs. We believe the company is very well placed to deliver long duration growth as its insulation panels, which greatly reduce energy costs, will be in high demand for many years. |
| • | Detractors at the country level were Brazil, UK and a lack of direct exposure to India. |
| • | The largest relative contributors in our portion of the Fund from a sectoral view were the information technology, real estate and utilities sectors. |
| • | The three strongest individual contributors, relative to our benchmark, were Shopify, Inc., Deutsche Boerse and Ritchie Bros Auctioneers, Inc. |
| Multi-Manager International Equity Strategies Fund | Annual Report 2022 | 7 |
(Unaudited)
| ○ | Shopify, a Canadian domiciled provider of online services was purchased recently after its shares had fallen by almost three quarters. The company has since enjoyed a rebound after delivering results that were better than the market had feared. |
| ○ | Both Ritchie Bros, a Canadian auctioneer business, and German stock exchange Deutsche Boerse, have held up well in a challenging environment. The latter is a beneficiary of high market volatility and rising interest rates. |
| • | At the country level, Spain, Taiwan and Germany were among the top contributors relative to our benchmark. |
| • | The underperformance of our portion of the Fund relative to the MSCI EAFE Value Index (Net) was due primarily to stock selection, particularly selections within the industrials and materials sectors. |
| • | Our portion of the Fund’s allocation to the information technology sector also weighed on relative results. |
| • | Our portion of the Fund maintained overweight positions in the industrials and information technology sectors and an underweight position in the materials sector. Within the MSCI EAFE Value Index (Net), all three sectors delivered negative absolute returns in base currency terms. |
| • | Rolls-Royce Holdings PLC, a jet engine manufacturer in the United Kingdom, was the largest individual detractor in our portion of the Fund during the period. The pandemic created a demand shock for air travel, particularly long-haul flights, which delayed the company’s cash flow improvement. During the pandemic, the company materially improved its cost structure and continued to solidify its balance sheet through the sale of non-core assets. Concerns related to the impact of slowing economic growth on air traffic, Covid restrictions in China, and uncertainty related to the CEO search have weighed on the share price. |
| • | Enel SpA, an Italian electric, gas & renewables power generation & distribution company, was another top detractor in our portion of the Fund. The company’s share price has been weak due to increased Italian macroeconomic concerns, as Italian bond yields increased during the second quarter of 2022 on prospects of the European Central Bank raising interest rates. There have also been concerns that high energy prices caused by the conflict in Ukraine could result in unfavorable windfall taxes on utilities. |
| • | A position in Alstom SA, a French rolling stock, signaling, & services provider for the rail industry, also detracted. In the third quarter of 2021, the company announced its expectation of a meaningful near-term free cash flow burn in the first half of 2022, driven by contracts from recent acquisition Bombardier Transport. In the first quarter of 2022, the stock was weak due to concerns about the company’s exposure in Russia. |
| • | The bottom three country-level alpha drivers were the United Kingdom, Japan, and South Korea. We currently maintain overweight positions in the United Kingdom and South Korea (which is not included in the benchmark), and an underweight position in Japan. All three countries posted negative absolute returns. |
| • | The top sector contributors in our portion of the Fund during the period were consumer discretionary, consumer staples, and real estate, due primarily to stock selection in consumer discretionary and staples and allocation in real estate sectors. |
| • | Our portion of the Fund maintained an overweight position in consumer staples and underweight positions in consumer discretionary and real estate. Within the benchmark, all three sectors delivered negative absolute returns in base currency terms. |
| 8 | Multi-Manager International Equity Strategies Fund | Annual Report 2022 |
(Unaudited)
| • | Energy companies accounted for three of the largest individual contributors during the period. Oil prices began climbing steadily in the latter portion of 2021, due to increased demand as many countries eased COVID-19 lockdowns. Then, in the first quarter of 2022, Russia’s invasion of Ukraine precipitated sharply higher commodity prices. |
| ○ | Our position in French integrated oil and gas company TotalEnergies SE was the top individual contributor in our portion of the Fund during the period. The stock performed well. The company also committed to 5% dividend growth and $2 billion of share buybacks during the first half of 2022. |
| ○ | U.K. energy supermajor Shell PLC was also a top contributor. The stock performed well, and Shell’s free cash flow generation supported an increase in shareholder returns via dividend growth and share buybacks. We exited the position in August 2022 following the strong performance, due to relative value considerations. |
| ○ | BP PLC, another U.K. energy supermajor also added to performance in our portion of the Fund. The company’s stock performed well as a result of increased energy prices during the period. The company reiterated its commitment to return at least 60% of excess free cash flow to shareholders and we believe the dividend yield remains well-supported. |
| • | From a country perspective, the top three contributors were Germany, Switzerland and Peru. We maintained an overweight position in Switzerland, an underweight position in Germany, and no longer held securities in Peru at period end. Germany and Switzerland delivered negative absolute returns in base currency terms and Peru delivered a positive return in the period. |
| Multi-Manager International Equity Strategies Fund | Annual Report 2022 | 9 |
(Unaudited)
| March 1, 2022 — August 31, 2022 | |||||||
| Account value at the beginning of the period ($) | Account value at the end of the period ($) | Expenses paid during the period ($) | Fund’s annualized expense ratio (%) | ||||
| Actual | Hypothetical | Actual | Hypothetical | Actual | Hypothetical | Actual | |
| Institutional Class | 1,000.00 | 1,000.00 | 846.30 | 1,020.21 | 4.61 | 5.04 | 0.99 |
| Institutional 3 Class | 1,000.00 | 1,000.00 | 847.50 | 1,020.87 | 4.00 | 4.38 | 0.86 |
| 10 | Multi-Manager International Equity Strategies Fund | Annual Report 2022 |
August 31, 2022
| Common Stocks 94.9% | ||
| Issuer | Shares | Value ($) |
| Argentina 1.1% | ||
| MercadoLibre, Inc.(a) | 27,610 | 23,616,490 |
| Australia 2.5% | ||
| APA Group | 40,937 | 308,699 |
| Aurizon Holdings Ltd. | 25,745 | 65,112 |
| BHP Group Ltd. | 398,403 | 10,868,441 |
| Brambles Ltd. | 65,954 | 555,084 |
| Cochlear Ltd. | 31,839 | 4,635,028 |
| Coles Group Ltd. | 314,373 | 3,762,787 |
| Computershare Ltd. | 5,600 | 93,395 |
| Downer EDI Ltd. | 39,918 | 136,516 |
| Metcash Ltd. | 71,054 | 198,837 |
| Origin Energy Ltd. | 144,280 | 614,497 |
| Rio Tinto Ltd. | 81,226 | 5,158,938 |
| Rio Tinto PLC, ADR | 208,177 | 11,718,283 |
| Seven Group Holdings Ltd. | 47,144 | 592,964 |
| South32 Ltd. | 711,336 | 1,958,812 |
| Treasury Wine Estates Ltd. | 108,021 | 968,977 |
| Washington H Soul Pattinson & Co., Ltd. | 60,602 | 1,056,179 |
| Wesfarmers Ltd. | 121,731 | 3,894,045 |
| Whitehaven Coal Ltd. | 114,457 | 609,668 |
| Woodside Energy Group Ltd. | 195,888 | 4,550,188 |
| Woodside Energy Group Ltd., ADR | 15,107 | 344,591 |
| Woolworths Group Ltd. | 156,812 | 3,865,846 |
| Total | 55,956,887 | |
| Austria 0.1% | ||
| Andritz AG | 3,339 | 153,782 |
| OMV AG | 63,123 | 2,543,369 |
| Total | 2,697,151 | |
| Belgium 0.6% | ||
| Anheuser-Busch InBev SA/NV | 212,106 | 10,243,557 |
| Etablissements Franz Colruyt NV | 5,182 | 144,023 |
| Proximus SADP | 85,180 | 1,084,257 |
| Umicore SA | 56,781 | 1,804,844 |
| Total | 13,276,681 | |
| Common Stocks (continued) | ||
| Issuer | Shares | Value ($) |
| Brazil 0.5% | ||
| Petroleo Brasileiro SA, ADR | 498,614 | 7,125,194 |
| Petroleo Brasileiro SA, ADR | 341,818 | 4,354,761 |
| Total | 11,479,955 | |
| Canada 2.4% | ||
| Alimentation Couche-Tard, Inc. | 175,246 | 7,531,034 |
| Canadian National Railway Co. | 137,445 | 16,345,631 |
| Constellation Software, Inc. | 6,011 | 9,048,515 |
| Ritchie Bros. Auctioneers, Inc. | 128,190 | 8,888,695 |
| Shopify, Inc., Class A(a) | 146,824 | 4,646,980 |
| Topicus.com, Inc.(a) | 117,487 | 6,083,006 |
| Total | 52,543,861 | |
| China 2.8% | ||
| Alibaba Group Holding Ltd.(a) | 532,532 | 6,353,398 |
| Beijing Capital International Airport Co., Ltd., Class H(a) | 8,236,000 | 5,169,381 |
| Hangzhou Tigermed Consulting Co., Ltd., Class H(b) | 273,900 | 2,711,846 |
| JD.com, Inc., Class A | 17,633 | 558,175 |
| Meituan, Class B(a) | 423,800 | 10,178,499 |
| Ping An Healthcare and Technology Co., Ltd.(a) | 1,018,000 | 2,755,862 |
| Ping An Insurance Group Co. of China Ltd., Class H | 1,551,500 | 9,125,373 |
| Tencent Holdings Ltd. | 412,200 | 17,036,547 |
| Tencent Music Entertainment Group, ADR(a) | 930,360 | 4,754,140 |
| WuXi Biologics Cayman, Inc.(a) | 361,500 | 3,189,190 |
| Total | 61,832,411 | |
| Denmark 1.9% | ||
| Ambu A/S | 209,577 | 2,107,056 |
| AP Moller - Maersk A/S, Class A | 778 | 1,817,492 |
| AP Moller - Maersk A/S, Class B | 1,115 | 2,675,057 |
| Chr. Hansen Holding A/S | 100,487 | 5,855,089 |
| DSV A/S | 73,641 | 10,881,791 |
| Novo Nordisk A/S, Class B | 78,342 | 8,375,844 |
| Novozymes AS, Class B | 184,207 | 10,572,306 |
| Total | 42,284,635 | |
| Multi-Manager International Equity Strategies Fund | Annual Report 2022 | 11 |
August 31, 2022
| Common Stocks (continued) | ||
| Issuer | Shares | Value ($) |
| Finland 0.6% | ||
| Kesko OYJ, Class A | 4,379 | 90,175 |
| KONE OYJ, Class B | 195,621 | 7,823,373 |
| Nokia OYJ, ADR | 275,325 | 1,390,391 |
| Nordea Bank | 81,398 | 754,777 |
| Nordea Bank Abp | 417,779 | 3,873,584 |
| Total | 13,932,300 | |
| France 10.4% | ||
| Air Liquide SA | 129,154 | 16,184,653 |
| Alstom SA | 835,498 | 17,122,066 |
| Amundi SA | 4,289 | 217,468 |
| AXA SA | 812,024 | 19,124,478 |
| BNP Paribas SA | 296,308 | 13,769,488 |
| Capgemini SE | 2,987 | 516,088 |
| Carrefour SA | 498,750 | 8,324,379 |
| Christian Dior SE | 743 | 462,886 |
| Credit Agricole SA | 66,932 | 616,020 |
| Danone SA | 569,441 | 29,964,166 |
| Dassault Systemes SE | 371,850 | 14,339,718 |
| Edenred | 241,649 | 12,222,454 |
| Engie SA | 742,015 | 8,812,984 |
| Nexans SA | 45,373 | 4,145,574 |
| Orange SA | 609,272 | 6,170,330 |
| Orange SA, ADR | 42,936 | 433,224 |
| Pernod Ricard SA | 49,637 | 9,107,810 |
| Publicis Groupe SA | 16,490 | 805,130 |
| Sanofi | 254,115 | 20,773,860 |
| Sanofi, ADR | 99,187 | 4,069,643 |
| Sartorius Stedim Biotech | 8,027 | 2,935,967 |
| TotalEnergies SE | 309,572 | 15,673,540 |
| TotalEnergies SE, ADR | 206,952 | 10,453,145 |
| Valeo | 197,754 | 3,777,438 |
| VINCI SA | 136,453 | 12,588,264 |
| Total | 232,610,773 | |
| Common Stocks (continued) | ||
| Issuer | Shares | Value ($) |
| Germany 8.9% | ||
| Allianz SE, Registered Shares | 50,177 | 8,481,744 |
| BASF SE | 28,751 | 1,216,134 |
| Bayer AG, ADR | 25,604 | 337,973 |
| Bayer AG, Registered Shares | 386,320 | 20,431,690 |
| Bayerische Motoren Werke AG | 87,540 | 6,449,829 |
| Beiersdorf AG | 16,006 | 1,615,646 |
| Beiersdorf AG, ADR | 11,780 | 237,367 |
| BioNTech SE, ADR | 26,408 | 3,819,653 |
| Continental AG | 5,345 | 307,735 |
| Covestro AG | 29,505 | 889,633 |
| Deutsche Boerse AG | 98,691 | 16,686,132 |
| Deutsche Post AG | 119,587 | 4,364,821 |
| Deutsche Telekom AG, ADR | 17,978 | 340,324 |
| Deutsche Telekom AG, Registered Shares | 1,254,173 | 23,637,694 |
| E.ON SE | 265,050 | 2,260,768 |
| Evonik Industries AG | 78,161 | 1,457,321 |
| Fresenius Medical Care AG & Co. KGaA | 42,165 | 1,443,704 |
| Fresenius SE & Co. KGaA | 54,215 | 1,341,186 |
| Henkel AG & Co. KGaA | 37,852 | 2,367,240 |
| Mercedes-Benz Group AG, Registered Shares | 131,316 | 7,362,321 |
| Merck KGaA | 248 | 42,601 |
| Muenchener Rueckversicherungs-Gesellschaft AG in Muenchen, Registered Shares | 25,830 | 6,171,322 |
| Rational AG | 17,543 | 9,462,014 |
| RWE AG | 408,312 | 15,588,288 |
| SAP SE | 514,385 | 43,809,857 |
| SAP SE, ADR | 52,710 | 4,491,946 |
| Scout24 SE | 254,316 | 14,651,913 |
| Siemens Healthineers AG, ADR | 845 | 20,656 |
| Total | 199,287,512 | |
| Hong Kong 2.4% | ||
| AIA Group Ltd. | 2,395,800 | 23,050,558 |
| CK Hutchison Holdings Ltd. | 245,500 | 1,585,355 |
| CK Hutchison Holdings Ltd., ADR | 4,406 | 28,110 |
| Futu Holdings Ltd., ADR(a) | 50,442 | 2,476,198 |
| Hong Kong Exchanges and Clearing Ltd. | 228,680 | 9,214,553 |
| Jardine Matheson Holdings Ltd. | 33,100 | 1,755,349 |
| Sands China Ltd.(a) | 7,016,800 | 15,690,247 |
| 12 | Multi-Manager International Equity Strategies Fund | Annual Report 2022 |
August 31, 2022
| Common Stocks (continued) | ||
| Issuer | Shares | Value ($) |
| WH Group Ltd. | 350,000 | 238,463 |
| Total | 54,038,833 | |
| Ireland 2.4% | ||
| CRH PLC | 369,430 | 13,572,120 |
| Kingspan Group PLC | 33,951 | 1,922,264 |
| Kingspan Group PLC | 138,469 | 7,907,966 |
| Ryanair Holdings PLC, ADR(a) | 408,403 | 29,694,982 |
| Total | 53,097,332 | |
| Israel 0.1% | ||
| Airport City Ltd.(a) | 9,029 | 188,948 |
| Bank Hapoalim BM | 22,181 | 229,960 |
| Bank Leumi Le-Israel BM | 80,660 | 852,675 |
| Israel Chemicals Ltd. | 33,989 | 324,550 |
| Mizrahi Tefahot Bank Ltd. | 7,805 | 317,435 |
| ZIM Integrated Shipping Services Ltd. | 4,345 | 156,811 |
| Total | 2,070,379 | |
| Italy 3.7% | ||
| Davide Campari-Milano NV | 104,611 | 1,026,322 |
| Enel SpA | 5,744,515 | 26,993,883 |
| Enel SpA, ADR | 30,974 | 144,184 |
| ENI SpA | 833,106 | 9,841,418 |
| ENI SpA, ADR | 76,442 | 1,805,560 |
| FinecoBank Banca Fineco SpA | 698,853 | 7,556,206 |
| Immobiliare Grande Distribuzione SIIQ SpA | 56,617 | 192,063 |
| Intesa Sanpaolo SpA | 808,804 | 1,392,347 |
| UniCredit SpA | 3,389,402 | 33,168,300 |
| Total | 82,120,283 | |
| Japan 15.2% | ||
| AGC, Inc. | 43,000 | 1,459,375 |
| Air Water, Inc. | 20,200 | 252,703 |
| Alfresa Holdings Corp. | 12,200 | 145,991 |
| Anritsu Corp. | 47,000 | 554,025 |
| Asahi Group Holdings Ltd. | 49,800 | 1,669,707 |
| Asahi Yukizai Corp. | 10,000 | 164,585 |
| Astellas Pharma, Inc. | 195,000 | 2,764,669 |
| Awa Bank Ltd. (The) | 23,300 | 317,607 |
| Brother Industries Ltd. | 89,300 | 1,708,980 |
| Canon, Inc. | 227,200 | 5,441,283 |
| Common Stocks (continued) | ||
| Issuer | Shares | Value ($) |
| Canon, Inc., ADR | 33,147 | 791,550 |
| Chiba Bank Ltd. (The) | 25,700 | 138,827 |
| Chori Co., Ltd. | 2,600 | 38,012 |
| Chubu Electric Power Co., Inc. | 343,300 | 3,490,953 |
| Dai Nippon Toryo Co., Ltd. | 1,200 | 6,413 |
| Daicel Corp. | 248,800 | 1,562,518 |
| Dai-ichi Life Holdings, Inc. | 238,900 | 4,127,717 |
| Daiken Corp. | 7,100 | 99,204 |
| Dainichiseika Color & Chemicals Manufacturing Co., Ltd. | 3,900 | 50,154 |
| Denso Corp. | 206,873 | 11,291,281 |
| Electric Power Development Co., Ltd. | 176,800 | 2,723,467 |
| ENEOS Holdings, Inc. | 164,400 | 621,256 |
| Enomoto Co., Ltd. | 9,600 | 106,509 |
| FANUC Corp. | 182,450 | 29,392,562 |
| FUJIFILM Holdings Corp. | 70,500 | 3,579,060 |
| FUJIFILM Holdings Corp., ADR | 1,500 | 76,238 |
| Fujikura Ltd. | 94,100 | 668,232 |
| Fujitsu Ltd. | 10,600 | 1,247,337 |
| Furukawa Electric Co., Ltd. | 32,800 | 574,599 |
| Gunma Bank Ltd. (The) | 195,100 | 545,594 |
| Harima Chemicals Group, Inc. | 12,500 | 83,426 |
| Hirose Electric Co., Ltd. | 1,900 | 269,225 |
| Hokkaido Electric Power Co., Inc. | 43,200 | 158,566 |
| Honda Motor Co., Ltd. | 157,600 | 4,195,669 |
| Honda Motor Co., Ltd. ADR | 14,075 | 373,269 |
| Hoya Corp. | 7,300 | 744,430 |
| Hoya Corp., ADR | 9,192 | 936,481 |
| Hyakugo Bank Ltd. (The) | 143,600 | 329,735 |
| Idemitsu Kosan Co., Ltd. | 10,500 | 276,856 |
| Inpex Corp. | 1,039,000 | 11,942,918 |
| ITOCHU Corp. | 28,000 | 770,580 |
| ITOCHU ENEX Co., Ltd. | 44,900 | 352,270 |
| Iwaki Co., Ltd. | 9,000 | 80,256 |
| Japan Exchange Group, Inc. | 509,403 | 7,591,238 |
| Japan Petroleum Exploration Co., Ltd. | 4,700 | 133,905 |
| Japan Post Holdings Co., Ltd. | 463,100 | 3,194,828 |
| Japan Post Insurance Co., Ltd. | 40,300 | 617,300 |
| Japan Tobacco, Inc. | 199,000 | 3,371,743 |
| Multi-Manager International Equity Strategies Fund | Annual Report 2022 | 13 |
August 31, 2022
| Common Stocks (continued) | ||
| Issuer | Shares | Value ($) |
| Kajima Corp. | 98,900 | 1,040,680 |
| Kansai Electric Power Co., Inc. (The) | 437,200 | 4,237,190 |
| Kao Corp. | 17,700 | 766,415 |
| Keyence Corp. | 35,700 | 13,404,424 |
| Kirin Holdings Co., Ltd. | 319,700 | 5,262,831 |
| Kissei Pharmaceutical Co., Ltd. | 29,200 | 519,909 |
| Konoike Transport Co., Ltd. | 7,600 | 72,125 |
| Kuraray Co., Ltd. | 277,900 | 2,110,881 |
| Kyocera Corp. | 79,300 | 4,407,794 |
| Kyocera Corp., ADR | 20,155 | 1,123,137 |
| Marubeni Corp. | 81,700 | 851,500 |
| Mebuki Financial Group, Inc. | 367,600 | 704,531 |
| Mimaki Engineering Co., Ltd. | 900 | 4,464 |
| Mitsubishi Chemical Group Corp. | 168,200 | 883,043 |
| Mitsubishi Electric Corp. | 167,600 | 1,694,460 |
| Mitsubishi Pencil Co., Ltd. | 28,900 | 289,773 |
| Mitsui & Co., Ltd. | 211,300 | 4,959,026 |
| Mitsui Chemicals, Inc. | 57,000 | 1,280,535 |
| Mitsui OSK Lines Ltd. | 140,400 | 3,657,926 |
| Mizuho Financial Group, Inc. | 36,800 | 421,374 |
| MonotaRO Co., Ltd | 581,480 | 10,433,085 |
| MS&AD Insurance Group Holdings, Inc. | 61,700 | 1,840,877 |
| MS&AD Insurance Group Holdings, Inc., ADR | 3,300 | 49,055 |
| Murata Manufacturing Co., Ltd. | 234,300 | 12,616,217 |
| NGK Insulators Ltd. | 40,200 | 573,955 |
| Nidec Corp. | 158,444 | 10,525,754 |
| Nikon Corp. | 8,700 | 99,312 |
| Nintendo Co., Ltd. | 17,485 | 7,157,431 |
| Nippon Coke & Engineering Co., Ltd. | 186,500 | 134,960 |
| Nippon Electric Glass Co., Ltd. | 2,600 | 48,966 |
| Nippon Sanso Holdings Corp. | 60,900 | 1,107,597 |
| Nippon Steel Corp. | 72,200 | 1,140,480 |
| Nippon Telegraph & Telephone Corp. | 93,400 | 2,531,541 |
| Nippon Yusen KK | 32,700 | 2,494,166 |
| Nishi-Nippon Financial Holdings, Inc. | 5,600 | 29,711 |
| Nissan Motor Co., Ltd. | 573,400 | 2,255,867 |
| Nomura Holdings, Inc. | 477,200 | 1,727,890 |
| NS United Kaiun Kaisha Ltd. | 1,100 | 37,934 |
| NTT Data Corp. | 140,200 | 1,972,946 |
| Common Stocks (continued) | ||
| Issuer | Shares | Value ($) |
| Obic Co., Ltd. | 2,300 | 340,168 |
| Okinawa Electric Power Co., Inc. (The) | 73,300 | 597,685 |
| Okumura Corp. | 45,100 | 949,939 |
| ORIX Corp. | 159,400 | 2,620,120 |
| Osaka Gas Co., Ltd. | 96,300 | 1,622,019 |
| Otsuka Holdings Co., Ltd. | 59,600 | 1,946,689 |
| Press Kogyo Co., Ltd. | 64,300 | 203,378 |
| Qol Holdings Co., Ltd. | 27,500 | 249,412 |
| Recruit Holdings Co., Ltd. | 15,200 | 483,217 |
| Ricoh Co., Ltd. | 132,800 | 1,043,735 |
| San-Ai Obbli Co., Ltd. | 38,500 | 304,642 |
| Sanshin Electronics Co., Ltd. | 4,600 | 56,788 |
| SCSK Corp. | 36,700 | 597,597 |
| Seikitokyu Kogyo Co., Ltd. | 53,100 | 289,451 |
| Seiko Epson Corp. | 176,800 | 2,778,203 |
| Seino Holdings Corp. | 12,100 | 96,084 |
| Seven & I Holdings Co., Ltd. | 2,600 | 103,286 |
| Shikoku Electric Power Co., Inc. | 53,400 | 311,465 |
| Shimadzu Corp. | 53,600 | 1,565,445 |
| Shimano, Inc. | 51,933 | 9,187,436 |
| Shin-Etsu Chemical Co., Ltd. | 28,500 | 3,309,786 |
| Shiseido Co., Ltd. | 236,447 | 8,931,504 |
| SMC Corp. | 19,888 | 9,435,458 |
| Sojitz Corp. | 114,500 | 1,926,570 |
| Sompo Holdings, Inc. | 82,300 | 3,528,714 |
| Sony Group Corp. | 164,323 | 13,064,222 |
| Starzen Co., Ltd. | 4,000 | 60,796 |
| Sumitomo Chemical Co., Ltd. | 193,000 | 759,711 |
| Sumitomo Heavy Industries Ltd. | 4,100 | 86,063 |
| Sumitomo Mitsui Financial Group, Inc. | 543,800 | 16,402,782 |
| Sumitomo Pharma Co., Ltd. | 37,700 | 280,826 |
| Suntory Beverage & Food Ltd. | 59,100 | 2,158,726 |
| Suzuken Co., Ltd. | 6,600 | 158,171 |
| Sysmex Corp. | 2,600 | 158,930 |
| Taisho Pharmaceutical Holdings Co., Ltd. | 4,800 | 178,475 |
| Takara Standard Co., Ltd. | 2,700 | 25,656 |
| Takeda Pharmaceutical Co., Ltd. | 673,400 | 18,612,812 |
| Takeda Pharmaceutical Co., Ltd. ADR | 35,791 | 492,126 |
| Teijin Ltd. | 149,900 | 1,584,815 |
| 14 | Multi-Manager International Equity Strategies Fund | Annual Report 2022 |
August 31, 2022
| Common Stocks (continued) | ||
| Issuer | Shares | Value ($) |
| Tokio Marine Holdings, Inc. | 85,000 | 4,710,648 |
| Tokio Marine Holdings, Inc., ADR | 4,930 | 273,344 |
| Tokuyama Corp. | 4,400 | 57,953 |
| Tokyo Electric Power Co. Holdings, Inc.(a) | 91,000 | 355,398 |
| Tokyo Electron Ltd. | 7,900 | 2,477,733 |
| Tokyo Gas Co., Ltd. | 203,300 | 3,814,156 |
| Toray Industries, Inc. | 530,900 | 3,029,550 |
| Tosoh Corp. | 64,300 | 831,389 |
| Toyo Seikan Group Holdings Ltd. | 23,900 | 282,830 |
| Toyota Tsusho Corp. | 10,600 | 371,086 |
| Trend Micro, Inc. | 3,500 | 215,488 |
| Tsubakimoto Chain Co. | 6,200 | 143,267 |
| Wakita & Co., Ltd. | 20,700 | 166,489 |
| Yamaichi Electronics Co., Ltd. | 6,800 | 100,645 |
| Yamazen Corp. | 23,100 | 154,687 |
| Yokohama Rubber Co., Ltd. (The) | 14,400 | 235,508 |
| Yuasa Trading Co., Ltd. | 12,200 | 307,366 |
| Total | 339,533,304 | |
| Netherlands 6.0% | ||
| Adyen NV(a) | 6,005 | 9,266,586 |
| Akzo Nobel NV | 256,343 | 16,149,962 |
| ASML Holding NV | 50,803 | 24,797,720 |
| ASML Holding NV | 5,296 | 2,594,722 |
| ASR Nederland NV | 45,468 | 1,855,742 |
| IMCD NV | 110,964 | 15,308,135 |
| ING Groep NV | 1,951,138 | 17,100,631 |
| ING Groep NV ADR | 24,072 | 211,352 |
| Just Eat Takeaway.com NV(a) | 46,217 | 771,703 |
| Koninklijke Philips NV | 707,983 | 11,758,180 |
| NN Group NV | 101,260 | 4,161,578 |
| NN Group NV, ADR | 23,969 | 490,526 |
| Prosus NV(a) | 88,713 | 5,483,305 |
| Randstad NV | 43,299 | 2,016,467 |
| Shell PLC | 380,301 | 10,065,819 |
| Shell PLC | 163,009 | 4,316,004 |
| Stellantis NV | 381,518 | 5,077,825 |
| Stellantis NV | 198,845 | 2,648,720 |
| Wolters Kluwer NV, ADR | 3,099 | 302,633 |
| Total | 134,377,610 | |
| Common Stocks (continued) | ||
| Issuer | Shares | Value ($) |
| Norway 0.9% | ||
| Aker Carbon Capture ASA(a) | 3,712,339 | 7,949,852 |
| Equinor ASA | 52,687 | 2,044,817 |
| Equinor ASA, ADR | 96,750 | 3,752,932 |
| Telenor ASA | 93,177 | 1,019,636 |
| Yara International ASA | 115,709 | 4,894,200 |
| Total | 19,661,437 | |
| Panama 0.3% | ||
| Copa Holdings SA, Class A(a) | 88,462 | 6,298,494 |
| Portugal 0.1% | ||
| EDP-Energias de Portugal SA | 300,114 | 1,433,223 |
| Jeronimo Martins SGPS SA | 14,252 | 315,992 |
| Sonae SGPS SA | 361,654 | 363,513 |
| Total | 2,112,728 | |
| Russian Federation —% | ||
| Gazprom PJSC(a),(c),(d),(e) | 979,710 | 0 |
| Gazprom PJSC, ADR(a),(c),(d),(e) | 133,745 | 0 |
| Lukoil PJSC(c),(d),(e) | 28,413 | — |
| Lukoil PJSC, ADR(c),(d),(e) | 2,838 | — |
| Magnit PJSC GDR(b),(c),(d),(e) | 317,925 | 0 |
| MMC Norilsk Nickel PJSC, ADR(c),(d),(e) | 202,015 | 0 |
| Rosneft Oil Co. PJSC(c),(d),(e) | 563,548 | 0 |
| Sberbank of Russia PJSC(a),(c),(d),(e),(f) | 436,630 | 0 |
| Total | 0 | |
| South Africa 0.4% | ||
| Discovery Ltd.(a) | 1,245,958 | 8,927,218 |
| South Korea 2.7% | ||
| Coupang, Inc.(a) | 405,330 | 6,850,077 |
| Hana Financial Group, Inc. | 44,584 | 1,299,475 |
| Kia Motors Corp. | 36,413 | 2,182,517 |
| Samsung Electronics Co., Ltd. | 592,028 | 26,227,299 |
| Samsung Electronics Co., Ltd. GDR | 14,177 | 15,503,533 |
| SK Hynix, Inc. | 116,315 | 8,177,871 |
| Total | 60,240,772 | |
| Multi-Manager International Equity Strategies Fund | Annual Report 2022 | 15 |
August 31, 2022
| Common Stocks (continued) | ||
| Issuer | Shares | Value ($) |
| Spain 3.4% | ||
| Aena SME SA(a) | 104,500 | 12,834,867 |
| Amadeus IT Group SA, Class A(a) | 620,891 | 32,776,439 |
| CaixaBank SA | 1,293,113 | 3,904,558 |
| Iberdrola SA | 811,896 | 8,453,218 |
| Iberdrola SA, ADR | 2,122 | 88,074 |
| Industria de Diseno Textil SA | 561,976 | 12,133,868 |
| Mapfre SA | 150,458 | 249,600 |
| Repsol SA | 317,486 | 4,123,534 |
| Repsol SA, ADR | 4,279 | 55,413 |
| Telefonica SA | 510,253 | 2,105,823 |
| Total | 76,725,394 | |
| Sweden 2.8% | ||
| Atlas Copco AB, Class B | 1,460,127 | 13,295,609 |
| Electrolux AB | 9,635 | 121,835 |
| Epiroc AB, Class B | 731,396 | 9,957,105 |
| Essity AB, Class B | 112,482 | 2,495,218 |
| Investor AB, Class B | 267,426 | 4,214,955 |
| Lundin Energy AB | 354,248 | 673,786 |
| Skandinaviska Enskilda Banken AB, Class A | 48,894 | 487,410 |
| Svenska Handelsbanken AB, Class A | 664,072 | 5,438,865 |
| Swedbank AB, Class A | 1,185,983 | 15,328,725 |
| Swedish Match AB | 54,811 | 550,255 |
| Tele2 AB, Class B | 158,436 | 1,687,307 |
| Telia Co. AB | 2,198,879 | 7,739,470 |
| Total | 61,990,540 | |
| Switzerland 7.0% | ||
| ABB Ltd., ADR | 67,309 | 1,855,709 |
| Cie Financiere Richemont SA, Class A, Registered Shares | 113,831 | 12,729,542 |
| Credit Suisse Group AG, Registered Shares | 65,963 | 340,377 |
| Kuehne & Nagel International AG | 34,914 | 8,069,011 |
| Nestlé SA, Registered Shares | 175,042 | 20,483,936 |
| Novartis AG, Registered Shares | 524,605 | 42,434,286 |
| Roche Holding AG, ADR | 31,005 | 1,254,772 |
| Roche Holding AG, Genusschein Shares | 119,355 | 38,461,152 |
| Swiss Life Holding AG, Registered Shares | 3,595 | 1,879,025 |
| Swiss Re AG | 116,463 | 9,055,662 |
| Temenos AG, Registered Shares | 54,894 | 4,495,494 |
| Common Stocks (continued) | ||
| Issuer | Shares | Value ($) |
| Wizz Air Holdings PLC(a) | 105,715 | 2,611,079 |
| Zurich Insurance Group AG | 29,840 | 13,245,967 |
| Total | 156,916,012 | |
| Taiwan 1.2% | ||
| Evergreen Marine Corp. Taiwan Ltd. | 327,000 | 937,089 |
| Sea Ltd. ADR(a) | 52,972 | 3,284,264 |
| Taiwan Semiconductor Manufacturing Co., Ltd. | 1,445,400 | 23,660,904 |
| Total | 27,882,257 | |
| Turkey 0.4% | ||
| Ford Otomotiv Sanayi AS | 25,927 | 471,096 |
| Haci Omer Sabanci Holding AS | 924,263 | 1,293,539 |
| KOC Holding AS | 380,488 | 949,280 |
| Turk Hava Yollari AO(a) | 1,010,926 | 4,054,477 |
| Turkiye Garanti Bankasi AS | 2,138,970 | 2,698,320 |
| Turkiye Halk Bankasi AS(a) | 1,195,299 | 563,170 |
| Total | 10,029,882 | |
| United Kingdom 13.9% | ||
| Anglo American PLC | 166,636 | 5,354,761 |
| Anglo American PLC, ADR | 13,503 | 217,331 |
| AstraZeneca PLC | 150,411 | 18,604,688 |
| Barclays Bank PLC | 8,967,661 | 17,098,561 |
| Barclays Bank PLC, ADR | 272,611 | 2,123,640 |
| BP PLC | 2,685,353 | 13,721,951 |
| BP PLC, ADR | 521,146 | 16,072,143 |
| British American Tobacco PLC | 285,062 | 11,417,514 |
| British American Tobacco, ADR | 126,063 | 5,048,823 |
| Compass Group PLC | 819,613 | 17,630,744 |
| Diageo PLC, ADR | 8,040 | 1,418,175 |
| Experian PLC | 352,822 | 10,706,546 |
| GSK PLC | 539,873 | 8,629,875 |
| GSK PLC, ADR | 379,276 | 12,318,884 |
| Haleon PLC(a) | 125,659 | 377,864 |
| Haleon PLC, ADR(a) | 5,500 | 32,890 |
| Oxford Nanopore Technologies PLC(a) | 1,013,579 | 3,217,026 |
| Prudential PLC | 2,394,157 | 25,127,070 |
| Reckitt Benckiser Group PLC | 319,654 | 24,665,014 |
| RELX PLC | 469,025 | 12,300,232 |
| RELX PLC | 365,362 | 9,561,603 |
| 16 | Multi-Manager International Equity Strategies Fund | Annual Report 2022 |
August 31, 2022
| Common Stocks (continued) | ||
| Issuer | Shares | Value ($) |
| Rio Tinto PLC | 488,324 | 26,960,502 |
| Rolls-Royce Holdings PLC(a) | 31,942,873 | 28,468,097 |
| Shell PLC, ADR | 270,765 | 14,345,130 |
| Unilever PLC | 500,427 | 22,700,531 |
| Unilever PLC | 36,790 | 1,675,215 |
| Unilever PLC, ADR | 26,367 | 1,196,798 |
| Vodafone Group PLC, ADR | 26,858 | 360,434 |
| Total | 311,352,042 | |
| United States 0.2% | ||
| Spotify Technology SA(a) | 47,926 | 5,183,197 |
| Total Common Stocks (Cost $2,338,216,643) | 2,122,076,370 | |
| Exchange-Traded Equity Funds 0.2% | ||
| Shares | Value ($) | |
| United States 0.2% | ||
| iShares MSCI Eurozone ETF | 121,822 | 4,303,971 |
| Total Exchange-Traded Equity Funds (Cost $4,568,700) | 4,303,971 | |
| Preferred Stocks 1.0% | |||
| Issuer | Shares | Value ($) | |
| Brazil 0.2% | |||
| Petroleo Brasileiro SA | 783,100 | 5,003,507 | |
| Germany 0.7% | |||
| BMW AG | 2,878 | 200,090 | |
| Henkel AG & Co. KGaA | 163,467 | 10,549,116 | |
| Volkswagen AG | 38,883 | 5,530,683 | |
| Total | 16,279,889 | ||
| Preferred Stocks (continued) | |||
| Issuer | Shares | Value ($) | |
| South Korea 0.1% | |||
| Samsung Electronics Co., Ltd. | 55,507 | 2,245,378 | |
| Total Preferred Stocks (Cost $23,934,670) | 23,528,774 | ||
| Warrants 0.0% | ||
| Issuer | Shares | Value ($) |
| Switzerland 0.0% | ||
| Cie Financiere Richemont SA(a) | 43,768 | 28,209 |
| Total Warrants (Cost $11,702) | 28,209 | |
| Money Market Funds 3.3% | ||
| Shares | Value ($) | |
| Columbia Short-Term Cash Fund, 2.366%(g),(h) | 72,953,509 | 72,917,032 |
| Total Money Market Funds (Cost $72,911,286) | 72,917,032 | |
| Total Investments in Securities (Cost $2,439,643,001) | 2,222,854,356 | |
| Other Assets & Liabilities, Net | 13,903,715 | |
| Net Assets | $2,236,758,071 | |
| (a) | Non-income producing investment. |
| (b) | Represents privately placed and other securities and instruments exempt from Securities and Exchange Commission registration (collectively, private placements), such as Section 4(a)(2) and Rule 144A eligible securities, which are often sold only to qualified institutional buyers. At August 31, 2022, the total value of these securities amounted to $2,711,846, which represents 0.12% of total net assets. |
| (c) | Represents fair value as determined in good faith under procedures approved by the Board of Trustees. At August 31, 2022, the total value of these securities amounted to $0, which represents less than 0.01% of total net assets. |
| Multi-Manager International Equity Strategies Fund | Annual Report 2022 | 17 |
August 31, 2022
| (d) | Denotes a restricted security, which is subject to legal or contractual restrictions on resale under federal securities laws. Disposal of a restricted investment may involve time-consuming negotiations and expenses, and prompt sale at an acceptable price may be difficult to achieve. Private placement securities are generally considered to be restricted, although certain of those securities may be traded between qualified institutional investors under the provisions of Section 4(a)(2) and Rule 144A. The Fund will not incur any registration costs upon such a trade. These securities are valued at fair value determined in good faith under consistently applied procedures established by the Fund’s Board of Trustees. At August 31, 2022, the total market value of these securities amounted to $0, which represents less than 0.01% of total net assets. Additional information on these securities is as follows: |
| Security | Acquisition Dates | Shares | Cost ($) | Value ($) |
| Gazprom PJSC | 03/18/2021-06/10/2021 | 979,710 | 2,970,597 | — |
| Gazprom PJSC, ADR | 11/11/2020-06/09/2021 | 133,745 | 850,023 | — |
| Lukoil PJSC | 03/30/2020-05/12/2021 | 28,413 | 1,845,515 | — |
| Lukoil PJSC, ADR | 12/29/2021 | 2,838 | 248,559 | — |
| Magnit PJSC GDR | 05/23/2018-11/22/2021 | 317,925 | 5,002,872 | — |
| MMC Norilsk Nickel PJSC, ADR | 08/07/2019-11/22/2021 | 202,015 | 4,978,927 | — |
| Rosneft Oil Co. PJSC | 03/31/2020-03/16/2021 | 563,548 | 3,458,257 | — |
| Sberbank of Russia PJSC | 03/29/2021-04/08/2021 | 436,630 | 1,642,454 | — |
| 20,997,204 | — |
| (e) | Valuation based on significant unobservable inputs. |
| (f) | On May 25, 2022, the Office of Foreign Assets Control (OFAC) license permitting the holding of the Sberbank position expired, and the position is now considered blocked property. As such the security has been segregated on the Fund’s books and records and cannot be sold or transferred at this time. |
| (g) | The rate shown is the seven-day current annualized yield at August 31, 2022. |
| (h) | As defined in the Investment Company Act of 1940, as amended, an affiliated company is one in which the Fund owns 5% or more of the company’s outstanding voting securities, or a company which is under common ownership or control with the Fund. The value of the holdings and transactions in these affiliated companies during the year ended August 31, 2022 are as follows: |
| Affiliated issuers | Beginning of period($) | Purchases($) | Sales($) | Net change in unrealized appreciation (depreciation)($) | End of period($) | Realized gain (loss)($) | Dividends($) | End of period shares |
| Columbia Short-Term Cash Fund, 2.366% | ||||||||
| 37,898,936 | 811,883,801 | (776,870,940) | 5,235 | 72,917,032 | (26,973) | 356,102 | 72,953,509 | |
| ADR | American Depositary Receipt |
| GDR | Global Depositary Receipt |
| ■ | Level 1 — Valuations based on quoted prices for investments in active markets that the Fund has the ability to access at the measurement date. Valuation adjustments are not applied to Level 1 investments. |
| ■ | Level 2 — Valuations based on other significant observable inputs (including quoted prices for similar securities, interest rates, prepayment speeds, credit risks, etc.). |
| ■ | Level 3 — Valuations based on significant unobservable inputs (including the Fund’s own assumptions and judgment in determining the fair value of investments). |
| 18 | Multi-Manager International Equity Strategies Fund | Annual Report 2022 |
August 31, 2022
Foreign equity securities actively traded in markets where there is a significant delay in the local close relative to the New York Stock Exchange are classified as Level 2. The values of these securities may include an adjustment to reflect the impact of market movements following the close of local trading, as described in Note 2 to the financial statements – Security valuation.
| Level 1 ($) | Level 2 ($) | Level 3 ($) | Total ($) | |
| Investments in Securities | ||||
| Common Stocks | ||||
| Argentina | 23,616,490 | — | — | 23,616,490 |
| Australia | 12,062,874 | 43,894,013 | — | 55,956,887 |
| Austria | — | 2,697,151 | — | 2,697,151 |
| Belgium | — | 13,276,681 | — | 13,276,681 |
| Brazil | 11,479,955 | — | — | 11,479,955 |
| Canada | 52,543,861 | — | — | 52,543,861 |
| China | 4,754,140 | 57,078,271 | — | 61,832,411 |
| Denmark | — | 42,284,635 | — | 42,284,635 |
| Finland | 1,390,391 | 12,541,909 | — | 13,932,300 |
| France | 14,956,012 | 217,654,761 | — | 232,610,773 |
| Germany | 8,311,599 | 190,975,913 | — | 199,287,512 |
| Hong Kong | 2,476,198 | 51,562,635 | — | 54,038,833 |
| Ireland | 29,694,982 | 23,402,350 | — | 53,097,332 |
| Israel | 156,811 | 1,913,568 | — | 2,070,379 |
| Italy | 1,805,560 | 80,314,723 | — | 82,120,283 |
| Japan | 1,656,945 | 337,876,359 | — | 339,533,304 |
| Netherlands | 2,806,074 | 131,571,536 | — | 134,377,610 |
| Norway | 3,752,932 | 15,908,505 | — | 19,661,437 |
| Panama | 6,298,494 | — | — | 6,298,494 |
| Portugal | — | 2,112,728 | — | 2,112,728 |
| Russian Federation | — | — | 0* | 0* |
| South Africa | — | 8,927,218 | — | 8,927,218 |
| South Korea | 6,850,077 | 53,390,695 | — | 60,240,772 |
| Spain | — | 76,725,394 | — | 76,725,394 |
| Sweden | — | 61,990,540 | — | 61,990,540 |
| Switzerland | 1,855,709 | 155,060,303 | — | 156,916,012 |
| Taiwan | 3,284,264 | 24,597,993 | — | 27,882,257 |
| Turkey | — | 10,029,882 | — | 10,029,882 |
| Multi-Manager International Equity Strategies Fund | Annual Report 2022 | 19 |
August 31, 2022
| Level 1 ($) | Level 2 ($) | Level 3 ($) | Total ($) | |
| United Kingdom | 52,916,917 | 258,435,125 | — | 311,352,042 |
| United States | 5,183,197 | — | — | 5,183,197 |
| Total Common Stocks | 247,853,482 | 1,874,222,888 | 0* | 2,122,076,370 |
| Exchange-Traded Equity Funds | 4,303,971 | — | — | 4,303,971 |
| Preferred Stocks | ||||
| Brazil | 5,003,507 | — | — | 5,003,507 |
| Germany | — | 16,279,889 | — | 16,279,889 |
| South Korea | — | 2,245,378 | — | 2,245,378 |
| Total Preferred Stocks | 5,003,507 | 18,525,267 | — | 23,528,774 |
| Warrants | ||||
| Switzerland | — | 28,209 | — | 28,209 |
| Total Warrants | — | 28,209 | — | 28,209 |
| Money Market Funds | 72,917,032 | — | — | 72,917,032 |
| Total Investments in Securities | 330,077,992 | 1,892,776,364 | 0* | 2,222,854,356 |
| * | Rounds to zero. |
| 20 | Multi-Manager International Equity Strategies Fund | Annual Report 2022 |
August 31, 2022
| Assets | |
| Investments in securities, at value | |
| Unaffiliated issuers (cost $2,366,731,715) | $2,149,937,324 |
| Affiliated issuers (cost $72,911,286) | 72,917,032 |
| Cash | 6,906 |
| Foreign currency (cost $311,040) | 309,727 |
| Receivable for: | |
| Investments sold | 9,241,565 |
| Capital shares sold | 2,066,977 |
| Dividends | 7,434,615 |
| Foreign tax reclaims | 6,844,281 |
| Prepaid expenses | 24,241 |
| Trustees’ deferred compensation plan | 46,714 |
| Total assets | 2,248,829,382 |
| Liabilities | |
| Payable for: | |
| Investments purchased | 9,271,455 |
| Capital shares purchased | 2,110,458 |
| Management services fees | 48,401 |
| Transfer agent fees | 311,480 |
| Compensation of board members | 28,337 |
| Other expenses | 254,466 |
| Trustees’ deferred compensation plan | 46,714 |
| Total liabilities | 12,071,311 |
| Net assets applicable to outstanding capital stock | $2,236,758,071 |
| Represented by | |
| Paid in capital | 2,505,430,368 |
| Total distributable earnings (loss) | (268,672,297) |
| Total - representing net assets applicable to outstanding capital stock | $2,236,758,071 |
| Institutional Class | |
| Net assets | $2,236,755,732 |
| Shares outstanding | 238,918,540 |
| Net asset value per share | $9.36 |
| Institutional 3 Class | |
| Net assets | $2,339 |
| Shares outstanding | 249 |
| Net asset value per share | $9.39 |
| Multi-Manager International Equity Strategies Fund | Annual Report 2022 | 21 |
Year Ended August 31, 2022
| Net investment income | |
| Income: | |
| Dividends — unaffiliated issuers | $85,633,821 |
| Dividends — affiliated issuers | 356,102 |
| Interfund lending | 155 |
| Non-cash dividends - unaffiliated issuers | 4,658,828 |
| Foreign taxes withheld | (9,683,982) |
| Total income | 80,964,924 |
| Expenses: | |
| Management services fees | 19,924,955 |
| Transfer agent fees | |
| Institutional Class | 3,588,046 |
| Compensation of board members | 44,943 |
| Custodian fees | 443,928 |
| Printing and postage fees | 246,913 |
| Registration fees | 91,886 |
| Audit fees | 91,767 |
| Legal fees | 37,048 |
| Interest on interfund lending | 266 |
| Compensation of chief compliance officer | 658 |
| Other | 182,588 |
| Total expenses | 24,652,998 |
| Net investment income | 56,311,926 |
| Realized and unrealized gain (loss) — net | |
| Net realized gain (loss) on: | |
| Investments — unaffiliated issuers | (51,428,543) |
| Investments — affiliated issuers | (26,973) |
| Foreign currency translations | (978,693) |
| Net realized loss | (52,434,209) |
| Net change in unrealized appreciation (depreciation) on: | |
| Investments — unaffiliated issuers | (701,937,721) |
| Investments — affiliated issuers | 5,235 |
| Foreign currency translations | (848,685) |
| Net change in unrealized appreciation (depreciation) | (702,781,171) |
| Net realized and unrealized loss | (755,215,380) |
| Net decrease in net assets resulting from operations | $(698,903,454) |
| 22 | Multi-Manager International Equity Strategies Fund | Annual Report 2022 |
| Year Ended August 31, 2022 | Year Ended August 31, 2021 | |
| Operations | ||
| Net investment income | $56,311,926 | $26,978,326 |
| Net realized gain (loss) | (52,434,209) | 202,751,890 |
| Net change in unrealized appreciation (depreciation) | (702,781,171) | 290,870,613 |
| Net increase (decrease) in net assets resulting from operations | (698,903,454) | 520,600,829 |
| Distributions to shareholders | ||
| Net investment income and net realized gains | ||
| Institutional Class | (90,994,416) | (27,299,569) |
| Institutional 3 Class | (100) | (41) |
| Total distributions to shareholders | (90,994,516) | (27,299,610) |
| Increase (decrease) in net assets from capital stock activity | 495,046,513 | (6,961,645) |
| Total increase (decrease) in net assets | (294,851,457) | 486,339,574 |
| Net assets at beginning of year | 2,531,609,528 | 2,045,269,954 |
| Net assets at end of year | $2,236,758,071 | $2,531,609,528 |
| Year Ended | Year Ended | |||
| August 31, 2022 | August 31, 2021 | |||
| Shares | Dollars ($) | Shares | Dollars ($) | |
| Capital stock activity | ||||
| Institutional Class | ||||
| Subscriptions | 78,383,736 | 910,675,109 | 56,133,011 | 677,194,228 |
| Distributions reinvested | 7,919,444 | 90,994,416 | 2,373,876 | 27,299,569 |
| Redemptions | (47,240,328) | (506,623,012) | (62,741,203) | (711,455,442) |
| Net increase (decrease) | 39,062,852 | 495,046,513 | (4,234,316) | (6,961,645) |
| Total net increase (decrease) | 39,062,852 | 495,046,513 | (4,234,316) | (6,961,645) |
| Multi-Manager International Equity Strategies Fund | Annual Report 2022 | 23 |
| Net asset value, beginning of period | Net investment income | Net realized and unrealized gain (loss) | Total from investment operations | Distributions from net investment income | Distributions from net realized gains | Total distributions to shareholders | |
| Institutional Class | |||||||
| Year Ended 8/31/2022 | $12.67 | 0.24 | (3.17) | (2.93) | (0.14) | (0.24) | (0.38) |
| Year Ended 8/31/2021 | $10.02 | 0.15 | 2.65 | 2.80 | (0.15) | — | (0.15) |
| Year Ended 8/31/2020 | $9.06 | 0.11 | 1.10 | 1.21 | (0.25) | — | (0.25) |
| Year Ended 8/31/2019 | $9.67 | 0.23 | (0.77) | (0.54) | (0.07) | — | (0.07) |
| Year Ended 8/31/2018(e) | $10.00 | 0.04 | (0.37) | (0.33) | — | — | — |
| Institutional 3 Class | |||||||
| Year Ended 8/31/2022 | $12.69 | 0.26 | (3.16) | (2.90) | (0.16) | (0.24) | (0.40) |
| Year Ended 8/31/2021 | $10.05 | 0.17 | 2.63 | 2.80 | (0.16) | — | (0.16) |
| Year Ended 8/31/2020(g) | $10.04 | 0.10 | (0.09)(h) | 0.01 | — | — | — |
| Notes to Financial Highlights | |
| (a) | In addition to the fees and expenses that the Fund bears directly, the Fund indirectly bears a pro rata share of the fees and expenses of any other funds in which it invests. Such indirect expenses are not included in the Fund’s reported expense ratios. |
| (b) | Total net expenses include the impact of certain fee waivers/expense reimbursements made by the Investment Manager and certain of its affiliates, if applicable. |
| (c) | Ratios include interfund lending expense which is less than 0.01%. |
| (d) | Ratios include line of credit interest expense which is less than 0.01%. |
| (e) | Institutional Class shares commenced operations on May 17, 2018. Per share data and total return reflect activity from that date. |
| (f) | Annualized. |
| (g) | Institutional 3 Class shares commenced operations on December 18, 2019. Per share data and total return reflect activity from that date. |
| (h) | Calculation of the net gain (loss) per share (both realized and unrealized) does not correlate to the aggregate realized and unrealized gain (loss) presented in the Statement of Operations due to the timing of subscriptions and redemptions of Fund shares in relation to fluctuations in the market value of the portfolio. |
| 24 | Multi-Manager International Equity Strategies Fund | Annual Report 2022 |
| Net asset value, end of period | Total return | Total gross expense ratio to average net assets(a) | Total net expense ratio to average net assets(a),(b) | Net investment income ratio to average net assets | Portfolio turnover | Net assets, end of period (000’s) | |
| Institutional Class | |||||||
| Year Ended 8/31/2022 | $9.36 | (23.66%) | 0.96%(c) | 0.96%(c) | 2.20% | 59% | $2,236,756 |
| Year Ended 8/31/2021 | $12.67 | 28.10% | 0.99%(c) | 0.99%(c) | 1.24% | 82% | $2,531,606 |
| Year Ended 8/31/2020 | $10.02 | 13.34% | 1.00%(c),(d) | 0.98%(c),(d) | 1.22% | 89% | $2,045,267 |
| Year Ended 8/31/2019 | $9.06 | (5.53%) | 1.02%(c) | 1.02%(c) | 2.54% | 63% | $1,901,132 |
| Year Ended 8/31/2018(e) | $9.67 | (3.30%) | 1.05%(f) | 1.05%(f) | 1.51%(f) | 17% | $2,043,274 |
| Institutional 3 Class | |||||||
| Year Ended 8/31/2022 | $9.39 | (23.42%) | 0.80%(c) | 0.80%(c) | 2.34% | 59% | $2 |
| Year Ended 8/31/2021 | $12.69 | 28.07% | 0.83%(c) | 0.81%(c) | 1.43% | 82% | $3 |
| Year Ended 8/31/2020(g) | $10.05 | 0.10% | 0.86%(c),(f) | 0.84%(c),(f) | 1.57%(f) | 89% | $3 |
| Multi-Manager International Equity Strategies Fund | Annual Report 2022 | 25 |
August 31, 2022
| 26 | Multi-Manager International Equity Strategies Fund | Annual Report 2022 |
August 31, 2022
| Multi-Manager International Equity Strategies Fund | Annual Report 2022 | 27 |
August 31, 2022
| 28 | Multi-Manager International Equity Strategies Fund | Annual Report 2022 |
August 31, 2022
| Effective rate (%) | |
| Institutional Class | 0.14 |
| Institutional 3 Class | 0.01 |
| Multi-Manager International Equity Strategies Fund | Annual Report 2022 | 29 |
August 31, 2022
| January 1, 2022 through December 31, 2022 | Prior to January 1, 2022 | |
| Institutional Class | 0.99 | 0.99 |
| Institutional 3 Class | 0.87 | 0.84 |
| Undistributed net investment income ($) | Accumulated net realized (loss) ($) | Paid in capital ($) |
| (71,797) | 71,797 | — |
| Year Ended August 31, 2022 | Year Ended August 31, 2021 | ||||
| Ordinary income ($) | Long-term capital gains ($) | Total ($) | Ordinary income ($) | Long-term capital gains ($) | Total ($) |
| 81,782,319 | 9,212,197 | 90,994,516 | 27,299,610 | — | 27,299,610 |
| 30 | Multi-Manager International Equity Strategies Fund | Annual Report 2022 |
August 31, 2022
| Undistributed ordinary income ($) | Undistributed long-term capital gains ($) | Capital loss carryforwards ($) | Net unrealized (depreciation) ($) |
| 44,077,425 | — | — | (268,786,699) |
| Federal tax cost ($) | Gross unrealized appreciation ($) | Gross unrealized (depreciation) ($) | Net unrealized (depreciation) ($) |
| 2,491,641,055 | 64,285,363 | (333,072,062) | (268,786,699) |
| Late year ordinary losses ($) | Post-October capital losses ($) |
| — | 43,210,363 |
| Multi-Manager International Equity Strategies Fund | Annual Report 2022 | 31 |
August 31, 2022
| Borrower or lender | Average loan balance ($) | Weighted average interest rate (%) | Number of days with outstanding loans |
| Borrower | 1,775,000 | 1.35 | 4 |
| Lender | 1,475,000 | 2.29 | 4 |
| 32 | Multi-Manager International Equity Strategies Fund | Annual Report 2022 |
August 31, 2022
| Multi-Manager International Equity Strategies Fund | Annual Report 2022 | 33 |
August 31, 2022
| 34 | Multi-Manager International Equity Strategies Fund | Annual Report 2022 |
| Multi-Manager International Equity Strategies Fund | Annual Report 2022 | 35 |
| Qualified dividend income | Capital gain dividend | Foreign taxes paid to foreign countries | Foreign taxes paid per share to foreign countries | Foreign source income | Foreign source income per share |
| 72.00% | $9,672,807 | $9,654,100 | $0.04 | $90,112,027 | $0.38 |
| Name, address, year of birth | Position held with the Columbia Funds and length of service | Principal occupation(s) during past five years and other relevant professional experience | Number of Funds in the Columbia Funds Complex* overseen | Other directorships held by Trustee during the past five years |
| George S. Batejan c/o Columbia Management Investment Advisers, LLC 290 Congress Street Boston, MA 02210 1953 | Trustee since 2017 | Executive Vice President, Global Head of Technology and Operations, Janus Capital Group, Inc., 2010-2016 | 176 | Former Chairman of the Board, NICSA (National Investment Company Services Association) (Executive Committee, Nominating Committee and Governance Committee), 2014-2016; former Director, Intech Investment Management, 2011-2016; former Board Member, Metro Denver Chamber of Commerce, 2015-2016; former Advisory Board Member, University of Colorado Business School, 2015-2018 |
| 36 | Multi-Manager International Equity Strategies Fund | Annual Report 2022 |
(Unaudited)
Independent trustees (continued)
| Name, address, year of birth | Position held with the Columbia Funds and length of service | Principal occupation(s) during past five years and other relevant professional experience | Number of Funds in the Columbia Funds Complex* overseen | Other directorships held by Trustee during the past five years |
| Kathleen Blatz c/o Columbia Management Investment Advisers, LLC 290 Congress Street Boston, MA 02210 1954 | Trustee since 2006 | Attorney, specializing in arbitration and mediation; Chief Justice, Minnesota Supreme Court, 1998-2006; Associate Justice, Minnesota Supreme Court, 1996-1998; Fourth Judicial District Court Judge, Hennepin County, 1994-1996; Attorney in private practice and public service, 1984-1993; State Representative, Minnesota House of Representatives, 1979-1993, which included service on the Tax and Financial Institutions and Insurance Committees; Member and Interim Chair, Minnesota Sports Facilities Authority, January 2017-July 2017; Interim President and Chief Executive Officer, Blue Cross and Blue Shield of Minnesota (health care insurance), February-July 2018, April-October 2021 | 176 | Former Trustee, Blue Cross and Blue Shield of Minnesota, 2009-2021 (Chair of the Business Development Committee, 2014-2017; Chair of the Governance Committee, 2017-2019); former Member and Chair of the Board, Minnesota Sports Facilities Authority, January 2017-July 2017; former Director, Robina Foundation, 2009-2020 (Chair, 2014-2020); Director, Schulze Family Foundation, since 2021 |
| Pamela G. Carlton c/o Columbia Management Investment Advisers, LLC 290 Congress Street Boston, MA 02210 1954 | Trustee since 2007 | President, Springboard — Partners in Cross Cultural Leadership (consulting company) since 2003; Managing Director of US Equity Research, JP Morgan Chase, 1999-2003; Director of US Equity Research, Chase Asset Management, 1996-1999; Co-Director Latin America Research, 1993-1996, COO Global Research, 1992-1996, Co-Director of US Research, 1991-1992, Investment Banker, 1982-1991, Morgan Stanley; Attorney, Cleary Gottlieb Steen & Hamilton LLP, 1980-1982 | 176 | Trustee, New York Presbyterian Hospital Board (Executive Committee and Chair of People Committee) since 1996; Director, DR Bank (Audit Committee) since 2017; Director, Evercore Inc. (Audit Committee) since 2019; Director, Apollo Commercial Real Estate Finance, Inc. since 2021; the Governing Council of the Independent Directors Council (IDC), since 2021 |
| Janet Langford Carrig c/o Columbia Management Investment Advisers, LLC 290 Congress Street Boston, MA 02210 1957 | Trustee since 1996 | Senior Vice President, General Counsel and Corporate Secretary, ConocoPhillips (independent energy company), September 2007-October 2018 | 174 | Director, EQT Corporation (natural gas producer) since 2019; former Director, Whiting Petroleum Corporation (independent oil and gas company), 2020-2022 |
| J. Kevin Connaughton c/o Columbia Management Investment Advisers, LLC 290 Congress Street Boston, MA 02210 1964 | Trustee since 2020 | Member, FINRA National Adjudicatory Council since January 2020; Adjunct Professor of Finance, Bentley University since January 2018; Consultant to Independent Trustees of CFVIT and CFST I from March 2016 to June 2020 with respect to CFVIT and to December 2020 with respect to CFST I; Managing Director and General Manager of Mutual Fund Products, Columbia Management Investment Advisers, LLC, May 2010-February 2015; President, Columbia Funds, 2008-2015; and senior officer of Columbia Funds and affiliated funds, 2003-2015 | 174 | Former Director, The Autism Project, March 2015-December 2021; former Member of the Investment Committee, St. Michael’s College, November 2015-February 2020; former Trustee, St. Michael’s College, June 2017-September 2019; former Trustee, New Century Portfolios, January 2015-December 2017 |
| Multi-Manager International Equity Strategies Fund | Annual Report 2022 | 37 |
(Unaudited)
Independent trustees (continued)
| Name, address, year of birth | Position held with the Columbia Funds and length of service | Principal occupation(s) during past five years and other relevant professional experience | Number of Funds in the Columbia Funds Complex* overseen | Other directorships held by Trustee during the past five years |
| Olive M. Darragh c/o Columbia Management Investment Advisers, LLC 290 Congress Street Boston, MA 02210 1962 | Trustee since 2020 | Managing Director of Darragh Inc. (strategy and talent management consulting firm) since 2010; Founder and CEO, Zolio, Inc. (investment management talent identification platform) since 2004; Consultant to Independent Trustees of CFVIT and CFST I from June 2019 to June 2020 with respect to CFVIT and to December 2020 with respect to CFST I; Partner, Tudor Investments, 2004-2010; Senior Partner, McKinsey & Company (consulting), 1990-2004; Touche Ross CPA, 1985-1988 | 174 | Former Director, University of Edinburgh Business School (Member of US Board); former Director, Boston Public Library Foundation |
| Patricia M. Flynn c/o Columbia Management Investment Advisers, LLC 290 Congress Street Boston, MA 02210 1950 | Trustee since 2004 | Trustee Professor of Economics and Management, Bentley University since 1976 (also teaches and conducts research on corporate governance); Dean, McCallum Graduate School of Business, Bentley University, 1992-2002 | 176 | Trustee, MA Taxpayers Foundation since 1997; former Board of Governors, Innovation Institute, MA Technology Collaborative, 2010-2020; former Board of Directors, The MA Business Roundtable, 2003-2019 |
| Brian J. Gallagher c/o Columbia Management Investment Advisers, LLC 290 Congress Street Boston, MA 02210 1954 | Trustee since 2017 | Retired; Partner with Deloitte & Touche LLP and its predecessors, 1977-2016 | 176 | Trustee, Catholic Schools Foundation since 2004 |
| Douglas A. Hacker c/o Columbia Management Investment Advisers, LLC 290 Congress Street Boston, MA 02210 1955 | Co-Chair since 2021; Chair of CFST I and CFVIT since 2014; Trustee of CFST I and CFVIT since 1996 and CFST, CFST II, CFVST II, CET I and CET II since 2021 | Independent business executive since May 2006; Executive Vice President – Strategy of United Airlines, December 2002 - May 2006; President of UAL Loyalty Services (airline marketing company), September 2001-December 2002; Executive Vice President and Chief Financial Officer of United Airlines, July 1999-September 2001 | 176 | Director, Spartan Nash Company (food distributor); Director, Aircastle Limited (Chair of Audit Committee) (aircraft leasing); former Director, Nash Finch Company (food distributor), 2005-2013; former Director, SeaCube Container Leasing Ltd. (container leasing), 2010-2013; and former Director, Travelport Worldwide Limited (travel information technology), 2014-2019 |
| Nancy T. Lukitsh c/o Columbia Management Investment Advisers, LLC 290 Congress Street Boston, MA 02210 1956 | Trustee since 2011 | Senior Vice President, Partner and Director of Marketing, Wellington Management Company, LLP (investment adviser), 1997-2010; Chair, Wellington Management Portfolios (commingled non-U.S. investment pools), 2007 -2010; Director, Wellington Trust Company, NA and other Wellington affiliates, 1997-2010 | 174 | None |
| 38 | Multi-Manager International Equity Strategies Fund | Annual Report 2022 |
(Unaudited)
Independent trustees (continued)
| Name, address, year of birth | Position held with the Columbia Funds and length of service | Principal occupation(s) during past five years and other relevant professional experience | Number of Funds in the Columbia Funds Complex* overseen | Other directorships held by Trustee during the past five years |
| David M. Moffett c/o Columbia Management Investment Advisers, LLC 290 Congress Street Boston, MA 02210 1952 | Trustee since 2011 | Retired; Consultant to Bridgewater and Associates | 174 | Director, CSX Corporation (transportation suppliers); Director, Genworth Financial, Inc. (financial and insurance products and services); Director, PayPal Holdings Inc. (payment and data processing services); Trustee, University of Oklahoma Foundation; former Director, eBay Inc. (online trading community), 2007-2015; and former Director, CIT Bank, CIT Group Inc. (commercial and consumer finance), 2010-2016 |
| Catherine James Paglia c/o Columbia Management Investment Advisers, LLC 290 Congress Street Boston, MA 02210 1952 | Co-Chair since 2021; Chair of CFST, CFST II, CFVST II, CET I and CET II since 2020; Trustee of CFST, CFST II and CFVST II since 2004 and CFST I and CFVIT since 2021 | Director, Enterprise Asset Management, Inc. (private real estate and asset management company) since September 1998; Managing Director and Partner, Interlaken Capital, Inc., 1989-1997; Vice President, 1982-1985, Principal, 1985-1987, Managing Director, 1987-1989, Morgan Stanley; Vice President, Investment Banking, 1980-1982, Associate, Investment Banking, 1976-1980, Dean Witter Reynolds, Inc. | 176 | Director, Valmont Industries, Inc. (irrigation systems manufacturer) since 2012; Trustee, Carleton College (on the Investment Committee); Trustee, Carnegie Endowment for International Peace (on the Investment Committee) |
| Minor M. Shaw c/o Columbia Management Investment Advisers, LLC 290 Congress Street Boston, MA 02210 1947 | Trustee since 2003 | President, Micco LLC (private investments) since 2011; President, Micco Corp. (family investment business), 1998-2011 | 176 | Director, Blue Cross Blue Shield of South Carolina (Chair of Compensation Committee) since April 2008; Trustee, Hollingsworth Funds (on the Investment Committee) since 2016 (previously Board Chair from 2016-2019); Former Advisory Board member, Duke Energy Corp., 2016-2020; Chair of the Duke Endowment; Chair of Greenville – Spartanburg Airport Commission; former Trustee, BofA Funds Series Trust (11 funds), 2003-2011; former Director, Piedmont Natural Gas, 2004-2016; former Director, National Association of Corporate Directors, Carolinas Chapter, 2013-2018; Chair, Daniel-Mickel Foundation since 1998 |
| Multi-Manager International Equity Strategies Fund | Annual Report 2022 | 39 |
(Unaudited)
Independent trustees (continued)
| Name, address, year of birth | Position held with the Columbia Funds and length of service | Principal occupation(s) during past five years and other relevant professional experience | Number of Funds in the Columbia Funds Complex* overseen | Other directorships held by Trustee during the past five years |
| Natalie A. Trunow c/o Columbia Management Investment Advisers, LLC 290 Congress Street Boston, MA 02210 1967 | Trustee since 2020 | Chief Executive Officer, Millennial Portfolio Solutions LLC (asset management and consulting services), January 2016-January 2021; Non-executive Member of the Investment Committee and Valuation Committee, Sarona Asset Management Inc. (private equity firm) since September 2019; Advisor, Horizon Investments (asset management and consulting services), August 2018-January 2021; Advisor, Paradigm Asset Management, November 2016-December 2021; Consultant to Independent Trustees of CFVIT and CFST I from September 2016 to June 2020 with respect to CFVIT and to December 2020 with respect to CFST I; Director of Investments/Consultant, Casey Family Programs, April 2016-November 2016; Senior Vice President and Chief Investment Officer, Calvert Investments, August 2008-January 2016; Section Head and Portfolio Manager, General Motors Asset Management, June 1997-August 2008 | 174 | Former Director, Investment Committee, Health Services for Children with Special Needs, Inc., 2012-2019; Director, Chair of Audit Committee, Consumer Credit Counseling Services (formerly Guidewell Financial Solutions), since 2019; Independent Director, Investment Committee and Valuation Committee, Sarona Asset Management, since 2019 |
| Sandra L. Yeager c/o Columbia Management Investment Advisers, LLC 290 Congress Street Boston, MA 02210 1964 | Trustee since 2017 | Retired; President and founder, Hanoverian Capital, LLC (SEC registered investment advisor firm), 2008-2016; Managing Director, DuPont Capital, 2006-2008; Managing Director, Morgan Stanley Investment Management, 2004-2006; Senior Vice President, Alliance Bernstein, 1990-2004 | 176 | Former Director, NAPE Education Foundation, October 2016-October 2020 |
| * | The term “Columbia Funds Complex” as used herein includes Columbia Seligman Premium Technology Growth Fund, Tri-Continental Corporation and each series of Columbia Fund Series Trust (CFST), Columbia Funds Series Trust I (CFST I), Columbia Funds Series Trust II (CFST II), Columbia ETF Trust I (CET I), Columbia ETF Trust II (CET II), Columbia Funds Variable Insurance Trust (CFVIT) and Columbia Funds Variable Series Trust II (CFVST II). Messrs. Batejan, Beckman, Gallagher and Hacker and Mses. Blatz, Carlton, Flynn, Paglia, Shaw and Yeager serve as Directors of Columbia Seligman Premium Technology Growth Fund and Tri-Continental Corporation. |
| Name, address, year of birth | Position held with the Columbia Funds and length of service | Principal occupation(s) during the past five years and other relevant professional experience | Number of Funds in the Columbia Funds Complex overseen | Other directorships held by Trustee during the past five years |
| Daniel J. Beckman c/o Columbia Management Investment Advisers, LLC 290 Congress Street Boston, MA 02210 1962 | Trustee since November 2021 and President since June 2021 | Vice President – Head of North America Product, Columbia Management Investment Advisers, LLC since April 2015; President and Principal Executive Officer of the Columbia Funds since June 2021; officer of Columbia Funds and affiliated funds, 2020-2021 | 176 | Director, Ameriprise Trust Company, since October 2016; Director, Columbia Management Investment Distributors, Inc. since November 2018; Board of Governors, Columbia Wanger Asset Management, LLC since January 2022 |
| * | Interested person (as defined under the 1940 Act) by reason of being an officer, director, security holder and/or employee of the Investment Manager or Ameriprise Financial. |
| 40 | Multi-Manager International Equity Strategies Fund | Annual Report 2022 |
(Unaudited)
The Statement of Additional Information has additional information about the Fund’s Board members and is available, without charge, upon request by calling 800.345.6611, visiting columbiathreadneedleus.com/investor/ or contacting your financial intermediary.
| Name, address and year of birth | Position and year first appointed to position for any Fund in the Columbia Funds Complex or a predecessor thereof | Principal occupation(s) during past five years |
| Michael G. Clarke 290 Congress Street Boston, MA 02210 1969 | Chief Financial Officer and Principal Financial Officer (2009) and Senior Vice President (2019) | Senior Vice President and Head of Global Operations & Investor Services, Columbia Management Investment Advisers, LLC, since March 2022 (previously Vice President, Head of North American Operations, and Co-Head of Global Operations, June 2019 to February 2022 and Vice President – Accounting and Tax, May 2010 - May 2019); senior officer of Columbia Funds and affiliated funds since 2002. |
| Joseph Beranek 5890 Ameriprise Financial Center Minneapolis, MN 55474 1965 | Treasurer and Chief Accounting Officer (Principal Accounting Officer) (2019) and Principal Financial Officer (2020), CFST, CFST I, CFST II, CFVIT and CFVST II; Assistant Treasurer, CET I and CET II | Vice President – Mutual Fund Accounting and Financial Reporting, Columbia Management Investment Advisers, LLC, since December 2018 and March 2017, respectively (previously Vice President – Pricing and Corporate Actions, May 2010 - March 2017). |
| Marybeth Pilat 290 Congress Street Boston, MA 02210 1968 | Treasurer and Chief Accounting Officer (Principal Accounting Officer) and Principal Financial Officer (2020) for CET I and CET II; Assistant Treasurer, CFST, CFST I, CFST II, CFVIT and CFVST II | Vice President – Product Pricing and Administration, Columbia Management Investment Advisers, LLC, since May 2017; Director - Fund Administration, Calvert Investments, August 2015 – March 2017; Vice President - Fund Administration, Legg Mason, May 2015 - July 2015; Vice President - Fund Administration, Columbia Management Investment Advisers, LLC, May 2010 - April 2015. |
| William F. Truscott 290 Congress Street Boston, MA 02210 1960 | Senior Vice President (2001) | Formerly, Trustee/Director of Columbia Funds Complex or legacy funds, November 2001-January 1, 2021; Chief Executive Officer, Global Asset Management, Ameriprise Financial, Inc. since September 2012; Chairman of the Board and President, Columbia Management Investment Advisers, LLC since July 2004 and February 2012, respectively; Chairman of the Board and Chief Executive Officer, Columbia Management Investment Distributors, Inc. since November 2008 and February 2012, respectively; Chairman of the Board and Director, Threadneedle Asset Management Holdings, Sàrl since March 2013 and December 2008, respectively; senior executive of various entities affiliated with Columbia Threadneedle. |
| Christopher O. Petersen 5228 Ameriprise Financial Center Minneapolis, MN 55474 1970 | Senior Vice President and Assistant Secretary (2021) | Formerly, Trustee/Director of funds within the Columbia Funds Complex, July 1, 2020 - November 22, 2021; Senior Vice President and Assistant General Counsel, Ameriprise Financial, Inc. since September 2021 (previously Vice President and Lead Chief Counsel, January 2015 - September 2021); formerly, President and Principal Executive Officer of the Columbia Funds, 2015 - 2021; officer of Columbia Funds and affiliated funds since 2007. |
| Thomas P. McGuire 290 Congress Street Boston, MA 02210 1972 | Senior Vice President and Chief Compliance Officer (2012) | Vice President – Asset Management Compliance, Ameriprise Financial, Inc., since May 2010; Chief Compliance Officer, Columbia Acorn/Wanger Funds since December 2015; formerly, Chief Compliance Officer, Ameriprise Certificate Company, September 2010 – September 2020. |
| Multi-Manager International Equity Strategies Fund | Annual Report 2022 | 41 |
(Unaudited)
Fund officers (continued)
| Name, address and year of birth | Position and year first appointed to position for any Fund in the Columbia Funds Complex or a predecessor thereof | Principal occupation(s) during past five years |
| Ryan C. Larrenaga 290 Congress Street Boston, MA 02210 1970 | Senior Vice President (2017), Chief Legal Officer (2017), and Secretary (2015) | Vice President and Chief Counsel, Ameriprise Financial, Inc. since August 2018 (previously Vice President and Group Counsel, August 2011 - August 2018); Chief Legal Officer, Columbia Acorn/Wanger Funds, since September 2020; officer of Columbia Funds and affiliated funds since 2005. |
| Michael E. DeFao 290 Congress Street Boston, MA 02210 1968 | Vice President (2011) and Assistant Secretary (2010) | Vice President and Chief Counsel, Ameriprise Financial, Inc. since May 2010; Vice President, Chief Legal Officer and Assistant Secretary, Columbia Management Investment Advisers, LLC since October 2021 (previously Vice President and Assistant Secretary, May 2010 – September 2021). |
| Lyn Kephart-Strong 5228 Ameriprise Financial Center Minneapolis, MN 55474 1960 | Vice President (2015) | President, Columbia Management Investment Services Corp. since October 2014; Vice President & Resolution Officer, Ameriprise Trust Company since August 2009. |
| • | the Fund had sufficient liquidity to both meet redemptions and operate effectively on behalf of shareholders; |
| • | there were no material changes to the Program during the period; |
| • | the implementation of the Program was effective to manage the Fund’s liquidity risk; and |
| • | the Program operated adequately during the period. |
| 42 | Multi-Manager International Equity Strategies Fund | Annual Report 2022 |
| • | Information on the investment performance of the Fund relative to the performance of a group of mutual funds determined to be comparable to the Fund by Broadridge, as well as performance relative to benchmarks; |
| • | Information on the Fund’s management fees and total expenses, including information comparing the Fund’s expenses to those of a group of comparable mutual funds, as determined by Broadridge; |
| • | The Investment Manager’s agreement to contractually limit or cap total operating expenses for the Fund so that total operating expenses (excluding certain fees and expenses, such as transaction costs and certain other investment related expenses, interest, taxes, acquired fund fees and expenses and infrequent and/or unusual expenses) would not exceed a specified annual rate, as a percentage of the Fund’s net assets; |
| • | Terms of the Advisory Agreements; |
| • | Subadvisory fees payable by the Investment Manager under the Subadvisory Agreements; |
| • | Descriptions of other agreements and arrangements with affiliates of the Investment Manager relating to the operations of the Fund, including agreements with respect to the provision of transfer agency and shareholder services to the Fund; |
| • | Descriptions of various services performed by the Investment Manager and the Subadvisers under the Advisory Agreements, including portfolio management and portfolio trading practices; |
| Multi-Manager International Equity Strategies Fund | Annual Report 2022 | 43 |
| • | Information regarding any recently negotiated management fees of similarly-managed portfolios of other institutional clients of the Investment Manager; |
| • | Information regarding the resources of the Investment Manager and Subadvisers, including information regarding senior management, portfolio managers and other personnel; |
| • | Information regarding the capabilities of the Investment Manager and the Subadvisers with respect to compliance monitoring services; |
| • | The profitability to the Investment Manager and its affiliates from their relationships with the Fund; and |
| • | Report provided by the Board’s independent fee consultant, JDL Consultants, LLC (JDL). |
| 44 | Multi-Manager International Equity Strategies Fund | Annual Report 2022 |
| Multi-Manager International Equity Strategies Fund | Annual Report 2022 | 45 |
| 46 | Multi-Manager International Equity Strategies Fund | Annual Report 2022 |
columbiathreadneedleus.com/investor/. The Fund is distributed by Columbia Management Investment Distributors, Inc., member FINRA, and managed by Columbia Management Investment Advisers, LLC.

August 31, 2022

| 3 | |
| 5 | |
| 7 | |
| 8 | |
| 12 | |
| 13 | |
| 14 | |
| 15 | |
| 16 | |
| 28 | |
| 29 | |
| 29 | |
| 35 | |
| 36 |
(Unaudited)
| Average annual total returns (%) (for the period ended August 31, 2022) | ||||
| Inception | 1 Year | Life | ||
| Overseas SMA Completion Portfolio | 09/12/19 | -24.44 | 0.45 | |
| MSCI EAFE Value Index (Net) | -13.91 | 0.18 | ||
| Overseas SMA Completion Portfolio | Annual Report 2022 | 3 |
(Unaudited)
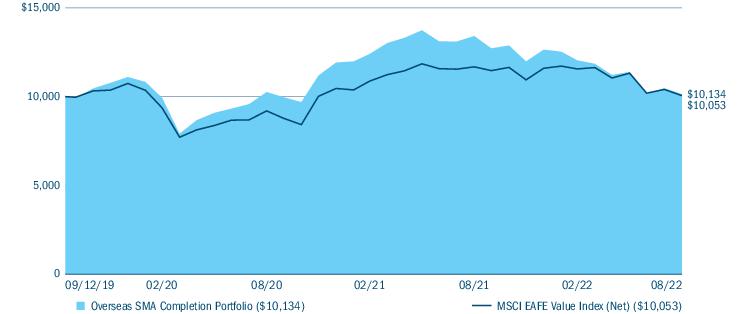
| Equity sector breakdown (%) (at August 31, 2022) | |
| Communication Services | 7.7 |
| Consumer Discretionary | 3.1 |
| Consumer Staples | 15.0 |
| Energy | 7.4 |
| Financials | 23.7 |
| Health Care | 3.7 |
| Industrials | 17.6 |
| Information Technology | 10.5 |
| Materials | 3.4 |
| Real Estate | 2.8 |
| Utilities | 5.1 |
| Total | 100.0 |
| Country breakdown (%) (at August 31, 2022) | |
| Australia | 3.3 |
| Canada | 3.1 |
| China | 2.2 |
| France | 4.6 |
| Germany | 2.7 |
| Greece | 1.3 |
| Hong Kong | 1.9 |
| Ireland | 2.9 |
| Israel | 3.2 |
| Japan | 20.7 |
| Netherlands | 5.7 |
| Norway | 3.2 |
| Singapore | 7.8 |
| South Korea | 3.0 |
| Spain | 4.9 |
| Sweden | 2.2 |
| Taiwan | 3.3 |
| United Kingdom | 14.4 |
| United States(a) | 9.6 |
| Total | 100.0 |
| (a) | Includes investments in Money Market Funds. |
| 4 | Overseas SMA Completion Portfolio | Annual Report 2022 |
(Unaudited)
| • | The Fund underperformed its benchmark by a wide margin, primarily as a result of individual stock selection. |
| • | Key detractors included Duerr AG, a global mechanical and plant engineering firm based in Germany that fell despite reporting strong results marking progress toward resolving supply-chain issues. |
| • | Swedish digital-game provider Stillfront Group AB fell on persistent concerns about slowing organic growth and acquisition plans. |
| • | French cloud and big data provider AtoS declined as investors doubted prospects for a successful breakup of the company into separately traded businesses. |
| • | On the upside, the Fund did benefit marginally from a relative lack of exposure to consumer discretionary stocks. |
| • | From a country perspective, the Fund’s overweight to Canada was a positive (via ownership of global convenience-store operator Alimentation Couche-Tard, Inc.). |
| Overseas SMA Completion Portfolio | Annual Report 2022 | 5 |
(Unaudited)
| • | Please note that sector and country allocations are largely a byproduct of the Fund’s bottom-up stock selection process. |
| 6 | Overseas SMA Completion Portfolio | Annual Report 2022 |
(Unaudited)
| March 1, 2022 — August 31, 2022 | |||||||
| Account value at the beginning of the period ($) | Account value at the end of the period ($) | Expenses paid during the period ($) | Fund’s annualized expense ratio (%) | ||||
| Actual | Hypothetical | Actual | Hypothetical | Actual | Hypothetical | Actual | |
| Overseas SMA Completion Portfolio | 1,000.00 | 1,000.00 | 841.60 | 1,025.21 | 0.00 | 0.00 | 0.00 |
| Overseas SMA Completion Portfolio | Annual Report 2022 | 7 |
August 31, 2022
| Common Stocks 95.0% | ||
| Issuer | Shares | Value ($) |
| Australia 3.2% | ||
| Northern Star Resources Ltd. | 30,172 | 159,466 |
| Canada 3.1% | ||
| Alimentation Couche-Tard, Inc. | 3,548 | 152,472 |
| China 2.2% | ||
| Guangdong Investment Ltd. | 116,000 | 106,274 |
| France 4.6% | ||
| AtoS(a) | 3,260 | 32,892 |
| Eiffage SA | 2,206 | 194,029 |
| Total | 226,921 | |
| Germany 2.7% | ||
| Aroundtown SA | 12,050 | 35,145 |
| Duerr AG | 4,397 | 96,852 |
| Total | 131,997 | |
| Greece 1.3% | ||
| Piraeus Financial Holdings SA(a) | 62,335 | 65,240 |
| Hong Kong 1.9% | ||
| WH Group Ltd. | 134,500 | 91,638 |
| Ireland 2.9% | ||
| Amarin Corp. PLC, ADR(a) | 1,059 | 1,250 |
| Bank of Ireland Group PLC | 23,085 | 142,239 |
| Total | 143,489 | |
| Israel 3.2% | ||
| Bezeq Israeli Telecommunication Corp., Ltd. | 93,622 | 157,838 |
| Japan 20.6% | ||
| BayCurrent Consulting, Inc. | 300 | 88,161 |
| Dai-ichi Life Holdings, Inc. | 9,900 | 171,052 |
| Daiwabo Holdings Co., Ltd. | 11,700 | 164,703 |
| Invincible Investment Corp. | 173 | 53,201 |
| Kinden Corp. | 7,200 | 75,976 |
| MatsukiyoCocokara & Co. | 6,900 | 273,777 |
| Ship Healthcare Holdings, Inc. | 7,300 | 136,476 |
| Takuma Co., Ltd. | 5,100 | 51,239 |
| Total | 1,014,585 | |
| Common Stocks (continued) | ||
| Issuer | Shares | Value ($) |
| Netherlands 5.7% | ||
| ASR Nederland NV | 6,824 | 278,516 |
| Norway 3.2% | ||
| Leroy Seafood Group ASA | 23,592 | 157,635 |
| Singapore 7.7% | ||
| BW LPG Ltd. | 13,676 | 88,898 |
| Venture Corp., Ltd. | 22,400 | 292,652 |
| Total | 381,550 | |
| South Korea 3.0% | ||
| GS Retail Co., Ltd. | 1,414 | 26,730 |
| Hyundai Home Shopping Network Corp. | 771 | 28,720 |
| Youngone Corp. | 2,768 | 91,646 |
| Total | 147,096 | |
| Spain 4.8% | ||
| ACS Actividades de Construccion y Servicios SA | 3,766 | 83,905 |
| Endesa SA | 7,845 | 134,557 |
| Tecnicas Reunidas SA(a) | 3,197 | 19,807 |
| Total | 238,269 | |
| Sweden 2.2% | ||
| Samhallsbyggnadsbolaget i Norden AB | 27,684 | 44,449 |
| Stillfront Group AB(a) | 29,733 | 63,275 |
| Total | 107,724 | |
| Taiwan 3.3% | ||
| Fubon Financial Holding Co., Ltd. | 85,900 | 161,067 |
| United Kingdom 14.3% | ||
| BT Group PLC | 79,488 | 139,049 |
| Crest Nicholson Holdings PLC | 9,214 | 25,041 |
| DCC PLC | 3,428 | 197,296 |
| John Wood Group PLC(a) | 14,349 | 21,483 |
| Just Group PLC | 158,424 | 132,291 |
| Royal Mail PLC | 10,797 | 34,449 |
| TP Icap Group PLC | 87,247 | 155,593 |
| Total | 705,202 | |
| 8 | Overseas SMA Completion Portfolio | Annual Report 2022 |
August 31, 2022
| Common Stocks (continued) | ||
| Issuer | Shares | Value ($) |
| United States 5.1% | ||
| Diversified Energy Co. PLC | 139,478 | 214,530 |
| Insmed, Inc.(a) | 1,170 | 28,805 |
| Quotient Ltd.(a) | 1,771 | 344 |
| Sage Therapeutics, Inc.(a) | 141 | 5,310 |
| Total | 248,989 | |
| Total Common Stocks (Cost $5,314,728) | 4,675,968 | |
| Money Market Funds 4.5% | ||
| Shares | Value ($) | |
| Columbia Short-Term Cash Fund, 2.366%(b),(c) | 223,529 | 223,418 |
| Total Money Market Funds (Cost $223,418) | 223,418 | |
| Total Investments in Securities (Cost $5,538,146) | 4,899,386 | |
| Other Assets & Liabilities, Net | 23,627 | |
| Net Assets | $4,923,013 | |
| Long futures contracts | ||||||
| Description | Number of contracts | Expiration date | Trading currency | Notional amount | Value/Unrealized appreciation ($) | Value/Unrealized depreciation ($) |
| MSCI EAFE Index | 2 | 09/2022 | USD | 182,710 | — | (9,395) |
| (a) | Non-income producing investment. |
| (b) | The rate shown is the seven-day current annualized yield at August 31, 2022. |
| (c) | As defined in the Investment Company Act of 1940, as amended, an affiliated company is one in which the Fund owns 5% or more of the company’s outstanding voting securities, or a company which is under common ownership or control with the Fund. The value of the holdings and transactions in these affiliated companies during the year ended August 31, 2022 are as follows: |
| Affiliated issuers | Beginning of period($) | Purchases($) | Sales($) | Net change in unrealized appreciation (depreciation)($) | End of period($) | Realized gain (loss)($) | Dividends($) | End of period shares |
| Columbia Short-Term Cash Fund, 2.366% | ||||||||
| 228,563 | 4,151,773 | (4,156,918) | — | 223,418 | (109) | 906 | 223,529 | |
| ADR | American Depositary Receipt |
| USD | US Dollar |
| Overseas SMA Completion Portfolio | Annual Report 2022 | 9 |
August 31, 2022
| ■ | Level 1 — Valuations based on quoted prices for investments in active markets that the Fund has the ability to access at the measurement date. Valuation adjustments are not applied to Level 1 investments. |
| ■ | Level 2 — Valuations based on other significant observable inputs (including quoted prices for similar securities, interest rates, prepayment speeds, credit risks, etc.). |
| ■ | Level 3 — Valuations based on significant unobservable inputs (including the Fund’s own assumptions and judgment in determining the fair value of investments). |
| Level 1 ($) | Level 2 ($) | Level 3 ($) | Total ($) | |
| Investments in Securities | ||||
| Common Stocks | ||||
| Australia | — | 159,466 | — | 159,466 |
| Canada | 152,472 | — | — | 152,472 |
| China | — | 106,274 | — | 106,274 |
| France | — | 226,921 | — | 226,921 |
| Germany | — | 131,997 | — | 131,997 |
| Greece | — | 65,240 | — | 65,240 |
| Hong Kong | — | 91,638 | — | 91,638 |
| Ireland | 1,250 | 142,239 | — | 143,489 |
| Israel | — | 157,838 | — | 157,838 |
| Japan | — | 1,014,585 | — | 1,014,585 |
| Netherlands | — | 278,516 | — | 278,516 |
| Norway | — | 157,635 | — | 157,635 |
| Singapore | — | 381,550 | — | 381,550 |
| South Korea | — | 147,096 | — | 147,096 |
| Spain | — | 238,269 | — | 238,269 |
| Sweden | — | 107,724 | — | 107,724 |
| Taiwan | — | 161,067 | — | 161,067 |
| United Kingdom | — | 705,202 | — | 705,202 |
| United States | 34,459 | 214,530 | — | 248,989 |
| Total Common Stocks | 188,181 | 4,487,787 | — | 4,675,968 |
| Money Market Funds | 223,418 | — | — | 223,418 |
| Total Investments in Securities | 411,599 | 4,487,787 | — | 4,899,386 |
| 10 | Overseas SMA Completion Portfolio | Annual Report 2022 |
August 31, 2022
| Level 1 ($) | Level 2 ($) | Level 3 ($) | Total ($) | |
| Investments in Derivatives | ||||
| Liability | ||||
| Futures Contracts | (9,395) | — | — | (9,395) |
| Total | 402,204 | 4,487,787 | — | 4,889,991 |
| Overseas SMA Completion Portfolio | Annual Report 2022 | 11 |
August 31, 2022
| Assets | |
| Investments in securities, at value | |
| Unaffiliated issuers (cost $5,314,728) | $4,675,968 |
| Affiliated issuers (cost $223,418) | 223,418 |
| Margin deposits on: | |
| Futures contracts | 9,460 |
| Receivable for: | |
| Investments sold | 23,423 |
| Capital shares sold | 9,936 |
| Dividends | 15,456 |
| Foreign tax reclaims | 9,730 |
| Expense reimbursement due from Investment Manager | 440 |
| Prepaid expenses | 2,725 |
| Trustees’ deferred compensation plan | 6,539 |
| Total assets | 4,977,095 |
| Liabilities | |
| Due to custodian | 111 |
| Payable for: | |
| Investments purchased | 17,040 |
| Variation margin for futures contracts | 1,380 |
| Transfer agent fees | 12 |
| Compensation of board members | 9,478 |
| Audit fees | 12,805 |
| Custodian fees | 4,650 |
| Other expenses | 2,067 |
| Trustees’ deferred compensation plan | 6,539 |
| Total liabilities | 54,082 |
| Net assets applicable to outstanding capital stock | $4,923,013 |
| Represented by | |
| Paid in capital | 5,957,679 |
| Total distributable earnings (loss) | (1,034,666) |
| Total - representing net assets applicable to outstanding capital stock | $4,923,013 |
| Shares outstanding | 445,681 |
| Net asset value per share | 11.05 |
| 12 | Overseas SMA Completion Portfolio | Annual Report 2022 |
Year Ended August 31, 2022
| Net investment income | |
| Income: | |
| Dividends — unaffiliated issuers | $277,335 |
| Dividends — affiliated issuers | 906 |
| Foreign taxes withheld | (33,721) |
| Total income | 244,520 |
| Expenses: | |
| Transfer agent fees | 395 |
| Compensation of board members | 13,315 |
| Custodian fees | 9,417 |
| Printing and postage fees | 7,976 |
| Registration fees | 31,745 |
| Audit fees | 36,165 |
| Legal fees | 10,694 |
| Line of credit interest | 253 |
| Interest on collateral | 169 |
| Compensation of chief compliance officer | 2 |
| Other | 5,038 |
| Total expenses | 115,169 |
| Fees waived or expenses reimbursed by Investment Manager and its affiliates | (115,169) |
| Total net expenses | — |
| Net investment income | 244,520 |
| Realized and unrealized gain (loss) — net | |
| Net realized gain (loss) on: | |
| Investments — unaffiliated issuers | (338,804) |
| Investments — affiliated issuers | (109) |
| Foreign currency translations | (11,952) |
| Futures contracts | (80,365) |
| Net realized loss | (431,230) |
| Net change in unrealized appreciation (depreciation) on: | |
| Investments — unaffiliated issuers | (1,893,936) |
| Foreign currency translations | (1,694) |
| Futures contracts | (9,374) |
| Net change in unrealized appreciation (depreciation) | (1,905,004) |
| Net realized and unrealized loss | (2,336,234) |
| Net decrease in net assets resulting from operations | $(2,091,714) |
| Overseas SMA Completion Portfolio | Annual Report 2022 | 13 |
| Year Ended August 31, 2022 | Year Ended August 31, 2021 | |
| Operations | ||
| Net investment income | $244,520 | $181,880 |
| Net realized gain (loss) | (431,230) | 148,546 |
| Net change in unrealized appreciation (depreciation) | (1,905,004) | 1,249,834 |
| Net increase (decrease) in net assets resulting from operations | (2,091,714) | 1,580,260 |
| Distributions to shareholders | ||
| Net investment income and net realized gains | (487,293) | (62,050) |
| Total distributions to shareholders | (487,293) | (62,050) |
| Increase (decrease) in net assets from capital stock activity | (520,215) | 4,207,749 |
| Total increase (decrease) in net assets | (3,099,222) | 5,725,959 |
| Net assets at beginning of year | 8,022,235 | 2,296,276 |
| Net assets at end of year | $4,923,013 | $8,022,235 |
| Year Ended | Year Ended | |||
| August 31, 2022 | August 31, 2021 | |||
| Shares | Dollars ($) | Shares | Dollars ($) | |
| Capital stock activity | ||||
| Subscriptions | 189,016 | 2,457,612 | 356,043 | 4,682,391 |
| Distributions reinvested | 36,122 | 487,293 | 4,533 | 62,050 |
| Redemptions | (292,218) | (3,465,120) | (37,007) | (536,692) |
| Total net increase (decrease) | (67,080) | (520,215) | 323,569 | 4,207,749 |
| 14 | Overseas SMA Completion Portfolio | Annual Report 2022 |
| Year Ended August 31, | |||
| 2022 | 2021 | 2020 (a) | |
| Per share data | |||
| Net asset value, beginning of period | $15.65 | $12.14 | $12.00 |
| Income from investment operations: | |||
| Net investment income | 0.45 | 0.41 | 0.31 |
| Net realized and unrealized gain (loss) | (4.10) | 3.30 | 0.01 |
| Total from investment operations | (3.65) | 3.71 | 0.32 |
| Less distributions to shareholders from: | |||
| Net investment income | (0.51) | (0.19) | (0.18) |
| Net realized gains | (0.44) | (0.01) | — |
| Total distributions to shareholders | (0.95) | (0.20) | (0.18) |
| Net asset value, end of period | $11.05 | $15.65 | $12.14 |
| Total return | (24.44%) | 30.77% | 2.57% |
| Ratios to average net assets | |||
| Total gross expenses(b) | 1.60%(c),(d) | 1.73% | 5.92%(e) |
| Total net expenses(b),(f) | 0.00%(c),(d) | 0.00%(g) | 0.00%(e),(g) |
| Net investment income | 3.39% | 2.81% | 2.79%(e) |
| Supplemental data | |||
| Portfolio turnover | 53% | 33% | 47% |
| Net assets, end of period (in thousands) | $4,923 | $8,022 | $2,296 |
| Notes to Financial Highlights | |
| (a) | The Fund commenced operations on September 12, 2019. Per share data and total return reflect activity from that date. |
| (b) | In addition to the fees and expenses that the Fund bears directly, the Fund indirectly bears a pro rata share of the fees and expenses of any other funds in which it invests. Such indirect expenses are not included in the Fund’s reported expense ratios. |
| (c) | Ratios include interest on collateral expense which is less than 0.01%. |
| (d) | Ratios include line of credit interest expense which is less than 0.01%. |
| (e) | Annualized. |
| (f) | Total net expenses include the impact of certain fee waivers/expense reimbursements made by the Investment Manager and certain of its affiliates, if applicable. |
| (g) | Rounds to zero. |
| Overseas SMA Completion Portfolio | Annual Report 2022 | 15 |
August 31, 2022
| 16 | Overseas SMA Completion Portfolio | Annual Report 2022 |
August 31, 2022
| Overseas SMA Completion Portfolio | Annual Report 2022 | 17 |
August 31, 2022
| 18 | Overseas SMA Completion Portfolio | Annual Report 2022 |
August 31, 2022
| Liability derivatives | ||
| Risk exposure category | Statement of assets and liabilities location | Fair value ($) |
| Equity risk | Component of total distributable earnings (loss) — unrealized depreciation on futures contracts | 9,395* |
| * | Includes cumulative appreciation (depreciation) as reported in the tables following the Portfolio of Investments. Only the current day’s variation margin is reported in receivables or payables in the Statement of Assets and Liabilities. |
| Amount of realized gain (loss) on derivatives recognized in income | ||||||
| Risk exposure category | Futures contracts ($) | |||||
| Equity risk | (80,365) | |||||
| Change in unrealized appreciation (depreciation) on derivatives recognized in income | ||||||
| Risk exposure category | Futures contracts ($) | |||||
| Equity risk | (9,374) | |||||
| Derivative instrument | Average notional amounts ($) |
| Futures contracts — long | 229,467* |
| Futures contracts — short | 4,818** |
| * | Based on the ending quarterly outstanding amounts for the year ended August 31, 2022. |
| ** | Based on the ending daily outstanding amounts for the year ended August 31, 2022. |
| Overseas SMA Completion Portfolio | Annual Report 2022 | 19 |
August 31, 2022
| 20 | Overseas SMA Completion Portfolio | Annual Report 2022 |
August 31, 2022
| Overseas SMA Completion Portfolio | Annual Report 2022 | 21 |
August 31, 2022
| Undistributed net investment income ($) | Accumulated net realized (loss) ($) | Paid in capital ($) |
| (10,475) | 10,475 | — |
| Year Ended August 31, 2022 | Year Ended August 31, 2021 | ||||
| Ordinary income ($) | Long-term capital gains ($) | Total ($) | Ordinary income ($) | Long-term capital gains ($) | Total ($) |
| 258,438 | 228,855 | 487,293 | 60,345 | 1,705 | 62,050 |
| Undistributed ordinary income ($) | Undistributed long-term capital gains ($) | Capital loss carryforwards ($) | Net unrealized (depreciation) ($) |
| 130,026 | — | — | (675,644) |
| 22 | Overseas SMA Completion Portfolio | Annual Report 2022 |
August 31, 2022
| Federal tax cost ($) | Gross unrealized appreciation ($) | Gross unrealized (depreciation) ($) | Net unrealized (depreciation) ($) |
| 5,565,635 | 271,260 | (946,904) | (675,644) |
| Late year ordinary losses ($) | Post-October capital losses ($) |
| — | 487,433 |
| Overseas SMA Completion Portfolio | Annual Report 2022 | 23 |
August 31, 2022
| Average loan balance ($) | Weighted average interest rate (%) | Days outstanding |
| 666,667 | 2.45 | 6 |
| 24 | Overseas SMA Completion Portfolio | Annual Report 2022 |
August 31, 2022
| Overseas SMA Completion Portfolio | Annual Report 2022 | 25 |
August 31, 2022
| 26 | Overseas SMA Completion Portfolio | Annual Report 2022 |
August 31, 2022
| Overseas SMA Completion Portfolio | Annual Report 2022 | 27 |
| 28 | Overseas SMA Completion Portfolio | Annual Report 2022 |
| Qualified dividend income | Capital gain dividend | Foreign taxes paid to foreign countries | Foreign taxes paid per share to foreign countries | Foreign source income | Foreign source income per share |
| 76.39% | $89,622 | $24,978 | $0.06 | $277,367 | $0.62 |
| Name, address, year of birth | Position held with the Columbia Funds and length of service | Principal occupation(s) during past five years and other relevant professional experience | Number of Funds in the Columbia Funds Complex* overseen | Other directorships held by Trustee during the past five years |
| George S. Batejan c/o Columbia Management Investment Advisers, LLC 290 Congress Street Boston, MA 02210 1953 | Trustee since 2017 | Executive Vice President, Global Head of Technology and Operations, Janus Capital Group, Inc., 2010-2016 | 176 | Former Chairman of the Board, NICSA (National Investment Company Services Association) (Executive Committee, Nominating Committee and Governance Committee), 2014-2016; former Director, Intech Investment Management, 2011-2016; former Board Member, Metro Denver Chamber of Commerce, 2015-2016; former Advisory Board Member, University of Colorado Business School, 2015-2018 |
| Overseas SMA Completion Portfolio | Annual Report 2022 | 29 |
(Unaudited)
Independent trustees (continued)
| Name, address, year of birth | Position held with the Columbia Funds and length of service | Principal occupation(s) during past five years and other relevant professional experience | Number of Funds in the Columbia Funds Complex* overseen | Other directorships held by Trustee during the past five years |
| Kathleen Blatz c/o Columbia Management Investment Advisers, LLC 290 Congress Street Boston, MA 02210 1954 | Trustee since 2006 | Attorney, specializing in arbitration and mediation; Chief Justice, Minnesota Supreme Court, 1998-2006; Associate Justice, Minnesota Supreme Court, 1996-1998; Fourth Judicial District Court Judge, Hennepin County, 1994-1996; Attorney in private practice and public service, 1984-1993; State Representative, Minnesota House of Representatives, 1979-1993, which included service on the Tax and Financial Institutions and Insurance Committees; Member and Interim Chair, Minnesota Sports Facilities Authority, January 2017-July 2017; Interim President and Chief Executive Officer, Blue Cross and Blue Shield of Minnesota (health care insurance), February-July 2018, April-October 2021 | 176 | Former Trustee, Blue Cross and Blue Shield of Minnesota, 2009-2021 (Chair of the Business Development Committee, 2014-2017; Chair of the Governance Committee, 2017-2019); former Member and Chair of the Board, Minnesota Sports Facilities Authority, January 2017-July 2017; former Director, Robina Foundation, 2009-2020 (Chair, 2014-2020); Director, Schulze Family Foundation, since 2021 |
| Pamela G. Carlton c/o Columbia Management Investment Advisers, LLC 290 Congress Street Boston, MA 02210 1954 | Trustee since 2007 | President, Springboard — Partners in Cross Cultural Leadership (consulting company) since 2003; Managing Director of US Equity Research, JP Morgan Chase, 1999-2003; Director of US Equity Research, Chase Asset Management, 1996-1999; Co-Director Latin America Research, 1993-1996, COO Global Research, 1992-1996, Co-Director of US Research, 1991-1992, Investment Banker, 1982-1991, Morgan Stanley; Attorney, Cleary Gottlieb Steen & Hamilton LLP, 1980-1982 | 176 | Trustee, New York Presbyterian Hospital Board (Executive Committee and Chair of People Committee) since 1996; Director, DR Bank (Audit Committee) since 2017; Director, Evercore Inc. (Audit Committee) since 2019; Director, Apollo Commercial Real Estate Finance, Inc. since 2021; the Governing Council of the Independent Directors Council (IDC), since 2021 |
| Janet Langford Carrig c/o Columbia Management Investment Advisers, LLC 290 Congress Street Boston, MA 02210 1957 | Trustee since 1996 | Senior Vice President, General Counsel and Corporate Secretary, ConocoPhillips (independent energy company), September 2007-October 2018 | 174 | Director, EQT Corporation (natural gas producer) since 2019; former Director, Whiting Petroleum Corporation (independent oil and gas company), 2020-2022 |
| J. Kevin Connaughton c/o Columbia Management Investment Advisers, LLC 290 Congress Street Boston, MA 02210 1964 | Trustee since 2020 | Member, FINRA National Adjudicatory Council since January 2020; Adjunct Professor of Finance, Bentley University since January 2018; Consultant to Independent Trustees of CFVIT and CFST I from March 2016 to June 2020 with respect to CFVIT and to December 2020 with respect to CFST I; Managing Director and General Manager of Mutual Fund Products, Columbia Management Investment Advisers, LLC, May 2010-February 2015; President, Columbia Funds, 2008-2015; and senior officer of Columbia Funds and affiliated funds, 2003-2015 | 174 | Former Director, The Autism Project, March 2015-December 2021; former Member of the Investment Committee, St. Michael’s College, November 2015-February 2020; former Trustee, St. Michael’s College, June 2017-September 2019; former Trustee, New Century Portfolios, January 2015-December 2017 |
| 30 | Overseas SMA Completion Portfolio | Annual Report 2022 |
(Unaudited)
Independent trustees (continued)
| Name, address, year of birth | Position held with the Columbia Funds and length of service | Principal occupation(s) during past five years and other relevant professional experience | Number of Funds in the Columbia Funds Complex* overseen | Other directorships held by Trustee during the past five years |
| Olive M. Darragh c/o Columbia Management Investment Advisers, LLC 290 Congress Street Boston, MA 02210 1962 | Trustee since 2020 | Managing Director of Darragh Inc. (strategy and talent management consulting firm) since 2010; Founder and CEO, Zolio, Inc. (investment management talent identification platform) since 2004; Consultant to Independent Trustees of CFVIT and CFST I from June 2019 to June 2020 with respect to CFVIT and to December 2020 with respect to CFST I; Partner, Tudor Investments, 2004-2010; Senior Partner, McKinsey & Company (consulting), 1990-2004; Touche Ross CPA, 1985-1988 | 174 | Former Director, University of Edinburgh Business School (Member of US Board); former Director, Boston Public Library Foundation |
| Patricia M. Flynn c/o Columbia Management Investment Advisers, LLC 290 Congress Street Boston, MA 02210 1950 | Trustee since 2004 | Trustee Professor of Economics and Management, Bentley University since 1976 (also teaches and conducts research on corporate governance); Dean, McCallum Graduate School of Business, Bentley University, 1992-2002 | 176 | Trustee, MA Taxpayers Foundation since 1997; former Board of Governors, Innovation Institute, MA Technology Collaborative, 2010-2020; former Board of Directors, The MA Business Roundtable, 2003-2019 |
| Brian J. Gallagher c/o Columbia Management Investment Advisers, LLC 290 Congress Street Boston, MA 02210 1954 | Trustee since 2017 | Retired; Partner with Deloitte & Touche LLP and its predecessors, 1977-2016 | 176 | Trustee, Catholic Schools Foundation since 2004 |
| Douglas A. Hacker c/o Columbia Management Investment Advisers, LLC 290 Congress Street Boston, MA 02210 1955 | Co-Chair since 2021; Chair of CFST I and CFVIT since 2014; Trustee of CFST I and CFVIT since 1996 and CFST, CFST II, CFVST II, CET I and CET II since 2021 | Independent business executive since May 2006; Executive Vice President – Strategy of United Airlines, December 2002 - May 2006; President of UAL Loyalty Services (airline marketing company), September 2001-December 2002; Executive Vice President and Chief Financial Officer of United Airlines, July 1999-September 2001 | 176 | Director, Spartan Nash Company (food distributor); Director, Aircastle Limited (Chair of Audit Committee) (aircraft leasing); former Director, Nash Finch Company (food distributor), 2005-2013; former Director, SeaCube Container Leasing Ltd. (container leasing), 2010-2013; and former Director, Travelport Worldwide Limited (travel information technology), 2014-2019 |
| Nancy T. Lukitsh c/o Columbia Management Investment Advisers, LLC 290 Congress Street Boston, MA 02210 1956 | Trustee since 2011 | Senior Vice President, Partner and Director of Marketing, Wellington Management Company, LLP (investment adviser), 1997-2010; Chair, Wellington Management Portfolios (commingled non-U.S. investment pools), 2007 -2010; Director, Wellington Trust Company, NA and other Wellington affiliates, 1997-2010 | 174 | None |
| Overseas SMA Completion Portfolio | Annual Report 2022 | 31 |
(Unaudited)
Independent trustees (continued)
| Name, address, year of birth | Position held with the Columbia Funds and length of service | Principal occupation(s) during past five years and other relevant professional experience | Number of Funds in the Columbia Funds Complex* overseen | Other directorships held by Trustee during the past five years |
| David M. Moffett c/o Columbia Management Investment Advisers, LLC 290 Congress Street Boston, MA 02210 1952 | Trustee since 2011 | Retired; Consultant to Bridgewater and Associates | 174 | Director, CSX Corporation (transportation suppliers); Director, Genworth Financial, Inc. (financial and insurance products and services); Director, PayPal Holdings Inc. (payment and data processing services); Trustee, University of Oklahoma Foundation; former Director, eBay Inc. (online trading community), 2007-2015; and former Director, CIT Bank, CIT Group Inc. (commercial and consumer finance), 2010-2016 |
| Catherine James Paglia c/o Columbia Management Investment Advisers, LLC 290 Congress Street Boston, MA 02210 1952 | Co-Chair since 2021; Chair of CFST, CFST II, CFVST II, CET I and CET II since 2020; Trustee of CFST, CFST II and CFVST II since 2004 and CFST I and CFVIT since 2021 | Director, Enterprise Asset Management, Inc. (private real estate and asset management company) since September 1998; Managing Director and Partner, Interlaken Capital, Inc., 1989-1997; Vice President, 1982-1985, Principal, 1985-1987, Managing Director, 1987-1989, Morgan Stanley; Vice President, Investment Banking, 1980-1982, Associate, Investment Banking, 1976-1980, Dean Witter Reynolds, Inc. | 176 | Director, Valmont Industries, Inc. (irrigation systems manufacturer) since 2012; Trustee, Carleton College (on the Investment Committee); Trustee, Carnegie Endowment for International Peace (on the Investment Committee) |
| Minor M. Shaw c/o Columbia Management Investment Advisers, LLC 290 Congress Street Boston, MA 02210 1947 | Trustee since 2003 | President, Micco LLC (private investments) since 2011; President, Micco Corp. (family investment business), 1998-2011 | 176 | Director, Blue Cross Blue Shield of South Carolina (Chair of Compensation Committee) since April 2008; Trustee, Hollingsworth Funds (on the Investment Committee) since 2016 (previously Board Chair from 2016-2019); Former Advisory Board member, Duke Energy Corp., 2016-2020; Chair of the Duke Endowment; Chair of Greenville – Spartanburg Airport Commission; former Trustee, BofA Funds Series Trust (11 funds), 2003-2011; former Director, Piedmont Natural Gas, 2004-2016; former Director, National Association of Corporate Directors, Carolinas Chapter, 2013-2018; Chair, Daniel-Mickel Foundation since 1998 |
| 32 | Overseas SMA Completion Portfolio | Annual Report 2022 |
(Unaudited)
Independent trustees (continued)
| Name, address, year of birth | Position held with the Columbia Funds and length of service | Principal occupation(s) during past five years and other relevant professional experience | Number of Funds in the Columbia Funds Complex* overseen | Other directorships held by Trustee during the past five years |
| Natalie A. Trunow c/o Columbia Management Investment Advisers, LLC 290 Congress Street Boston, MA 02210 1967 | Trustee since 2020 | Chief Executive Officer, Millennial Portfolio Solutions LLC (asset management and consulting services), January 2016-January 2021; Non-executive Member of the Investment Committee and Valuation Committee, Sarona Asset Management Inc. (private equity firm) since September 2019; Advisor, Horizon Investments (asset management and consulting services), August 2018-January 2021; Advisor, Paradigm Asset Management, November 2016-December 2021; Consultant to Independent Trustees of CFVIT and CFST I from September 2016 to June 2020 with respect to CFVIT and to December 2020 with respect to CFST I; Director of Investments/Consultant, Casey Family Programs, April 2016-November 2016; Senior Vice President and Chief Investment Officer, Calvert Investments, August 2008-January 2016; Section Head and Portfolio Manager, General Motors Asset Management, June 1997-August 2008 | 174 | Former Director, Investment Committee, Health Services for Children with Special Needs, Inc., 2012-2019; Director, Chair of Audit Committee, Consumer Credit Counseling Services (formerly Guidewell Financial Solutions), since 2019; Independent Director, Investment Committee and Valuation Committee, Sarona Asset Management, since 2019 |
| Sandra L. Yeager c/o Columbia Management Investment Advisers, LLC 290 Congress Street Boston, MA 02210 1964 | Trustee since 2017 | Retired; President and founder, Hanoverian Capital, LLC (SEC registered investment advisor firm), 2008-2016; Managing Director, DuPont Capital, 2006-2008; Managing Director, Morgan Stanley Investment Management, 2004-2006; Senior Vice President, Alliance Bernstein, 1990-2004 | 176 | Former Director, NAPE Education Foundation, October 2016-October 2020 |
| * | The term “Columbia Funds Complex” as used herein includes Columbia Seligman Premium Technology Growth Fund, Tri-Continental Corporation and each series of Columbia Fund Series Trust (CFST), Columbia Funds Series Trust I (CFST I), Columbia Funds Series Trust II (CFST II), Columbia ETF Trust I (CET I), Columbia ETF Trust II (CET II), Columbia Funds Variable Insurance Trust (CFVIT) and Columbia Funds Variable Series Trust II (CFVST II). Messrs. Batejan, Beckman, Gallagher and Hacker and Mses. Blatz, Carlton, Flynn, Paglia, Shaw and Yeager serve as Directors of Columbia Seligman Premium Technology Growth Fund and Tri-Continental Corporation. |
| Name, address, year of birth | Position held with the Columbia Funds and length of service | Principal occupation(s) during the past five years and other relevant professional experience | Number of Funds in the Columbia Funds Complex overseen | Other directorships held by Trustee during the past five years |
| Daniel J. Beckman c/o Columbia Management Investment Advisers, LLC 290 Congress Street Boston, MA 02210 1962 | Trustee since November 2021 and President since June 2021 | Vice President – Head of North America Product, Columbia Management Investment Advisers, LLC since April 2015; President and Principal Executive Officer of the Columbia Funds since June 2021; officer of Columbia Funds and affiliated funds, 2020-2021 | 176 | Director, Ameriprise Trust Company, since October 2016; Director, Columbia Management Investment Distributors, Inc. since November 2018; Board of Governors, Columbia Wanger Asset Management, LLC since January 2022 |
| * | Interested person (as defined under the 1940 Act) by reason of being an officer, director, security holder and/or employee of the Investment Manager or Ameriprise Financial. |
| Overseas SMA Completion Portfolio | Annual Report 2022 | 33 |
(Unaudited)
The Statement of Additional Information has additional information about the Fund’s Board members and is available, without charge, upon request by calling 800.345.6611, visiting columbiathreadneedleus.com/investor/ or contacting your financial intermediary.
| Name, address and year of birth | Position and year first appointed to position for any Fund in the Columbia Funds Complex or a predecessor thereof | Principal occupation(s) during past five years |
| Michael G. Clarke 290 Congress Street Boston, MA 02210 1969 | Chief Financial Officer and Principal Financial Officer (2009) and Senior Vice President (2019) | Senior Vice President and Head of Global Operations & Investor Services, Columbia Management Investment Advisers, LLC, since March 2022 (previously Vice President, Head of North American Operations, and Co-Head of Global Operations, June 2019 to February 2022 and Vice President – Accounting and Tax, May 2010 - May 2019); senior officer of Columbia Funds and affiliated funds since 2002. |
| Joseph Beranek 5890 Ameriprise Financial Center Minneapolis, MN 55474 1965 | Treasurer and Chief Accounting Officer (Principal Accounting Officer) (2019) and Principal Financial Officer (2020), CFST, CFST I, CFST II, CFVIT and CFVST II; Assistant Treasurer, CET I and CET II | Vice President – Mutual Fund Accounting and Financial Reporting, Columbia Management Investment Advisers, LLC, since December 2018 and March 2017, respectively (previously Vice President – Pricing and Corporate Actions, May 2010 - March 2017). |
| Marybeth Pilat 290 Congress Street Boston, MA 02210 1968 | Treasurer and Chief Accounting Officer (Principal Accounting Officer) and Principal Financial Officer (2020) for CET I and CET II; Assistant Treasurer, CFST, CFST I, CFST II, CFVIT and CFVST II | Vice President – Product Pricing and Administration, Columbia Management Investment Advisers, LLC, since May 2017; Director - Fund Administration, Calvert Investments, August 2015 – March 2017; Vice President - Fund Administration, Legg Mason, May 2015 - July 2015; Vice President - Fund Administration, Columbia Management Investment Advisers, LLC, May 2010 - April 2015. |
| William F. Truscott 290 Congress Street Boston, MA 02210 1960 | Senior Vice President (2001) | Formerly, Trustee/Director of Columbia Funds Complex or legacy funds, November 2001-January 1, 2021; Chief Executive Officer, Global Asset Management, Ameriprise Financial, Inc. since September 2012; Chairman of the Board and President, Columbia Management Investment Advisers, LLC since July 2004 and February 2012, respectively; Chairman of the Board and Chief Executive Officer, Columbia Management Investment Distributors, Inc. since November 2008 and February 2012, respectively; Chairman of the Board and Director, Threadneedle Asset Management Holdings, Sàrl since March 2013 and December 2008, respectively; senior executive of various entities affiliated with Columbia Threadneedle. |
| Christopher O. Petersen 5228 Ameriprise Financial Center Minneapolis, MN 55474 1970 | Senior Vice President and Assistant Secretary (2021) | Formerly, Trustee/Director of funds within the Columbia Funds Complex, July 1, 2020 - November 22, 2021; Senior Vice President and Assistant General Counsel, Ameriprise Financial, Inc. since September 2021 (previously Vice President and Lead Chief Counsel, January 2015 - September 2021); formerly, President and Principal Executive Officer of the Columbia Funds, 2015 - 2021; officer of Columbia Funds and affiliated funds since 2007. |
| Thomas P. McGuire 290 Congress Street Boston, MA 02210 1972 | Senior Vice President and Chief Compliance Officer (2012) | Vice President – Asset Management Compliance, Ameriprise Financial, Inc., since May 2010; Chief Compliance Officer, Columbia Acorn/Wanger Funds since December 2015; formerly, Chief Compliance Officer, Ameriprise Certificate Company, September 2010 – September 2020. |
| 34 | Overseas SMA Completion Portfolio | Annual Report 2022 |
(Unaudited)
Fund officers (continued)
| Name, address and year of birth | Position and year first appointed to position for any Fund in the Columbia Funds Complex or a predecessor thereof | Principal occupation(s) during past five years |
| Ryan C. Larrenaga 290 Congress Street Boston, MA 02210 1970 | Senior Vice President (2017), Chief Legal Officer (2017), and Secretary (2015) | Vice President and Chief Counsel, Ameriprise Financial, Inc. since August 2018 (previously Vice President and Group Counsel, August 2011 - August 2018); Chief Legal Officer, Columbia Acorn/Wanger Funds, since September 2020; officer of Columbia Funds and affiliated funds since 2005. |
| Michael E. DeFao 290 Congress Street Boston, MA 02210 1968 | Vice President (2011) and Assistant Secretary (2010) | Vice President and Chief Counsel, Ameriprise Financial, Inc. since May 2010; Vice President, Chief Legal Officer and Assistant Secretary, Columbia Management Investment Advisers, LLC since October 2021 (previously Vice President and Assistant Secretary, May 2010 – September 2021). |
| Lyn Kephart-Strong 5228 Ameriprise Financial Center Minneapolis, MN 55474 1960 | Vice President (2015) | President, Columbia Management Investment Services Corp. since October 2014; Vice President & Resolution Officer, Ameriprise Trust Company since August 2009. |
| • | the Fund had sufficient liquidity to both meet redemptions and operate effectively on behalf of shareholders; |
| • | there were no material changes to the Program during the period; |
| • | the implementation of the Program was effective to manage the Fund’s liquidity risk; and |
| • | the Program operated adequately during the period. |
| Overseas SMA Completion Portfolio | Annual Report 2022 | 35 |
| • | Information on the investment performance of the Fund, as well as performance relative to a benchmark; |
| • | Information on the Fund’s management fees and total expenses; |
| • | The Investment Manager’s agreement to contractually limit or cap total operating expenses for the Fund so that total operating expenses (excluding certain fees and expenses, such as transaction costs and certain other investment related expenses, interest, taxes, and infrequent and/or unusual expenses) would not exceed a specified annual rate, as a percentage of the Fund’s net assets; |
| • | Terms of the Management Agreement; |
| • | Descriptions of other agreements and arrangements with affiliates of the Investment Manager relating to the operations of the Fund, including agreements with respect to the provision of transfer agency and shareholder services to the Fund; |
| • | Descriptions of various services performed by the Investment Manager under the Management Agreement, including portfolio management and portfolio trading practices; |
| • | Information regarding any recently negotiated management fees of similarly-managed portfolios of other institutional clients of the Investment Manager; |
| • | Information regarding the resources of the Investment Manager, including information regarding senior management, portfolio managers and other personnel; |
| • | Information regarding the capabilities of the Investment Manager with respect to compliance monitoring services; |
| • | The profitability to the Investment Manager and its affiliates from their relationships with the Fund; and |
| • | Report provided by the Board’s independent fee consultant, JDL Consultants, LLC (JDL). |
| 36 | Overseas SMA Completion Portfolio | Annual Report 2022 |
(Unaudited)
Nature, extent and quality of services provided by the Investment Manager
| Overseas SMA Completion Portfolio | Annual Report 2022 | 37 |
(Unaudited)
The Board considered the reports of JDL, which assisted in the Board’s analysis of the Funds’ performance and expenses and the reasonableness of the Funds’ fee rates. The Board accorded particular weight to the notion that a primary objective of the level of fees is to achieve a rational pricing model applied consistently across the various product lines in the Fund family, while assuring that the overall fees for each Fund (with certain exceptions) are generally in line with the current “pricing philosophy” such that Fund total expense ratios, in general, approximate or are lower than the median expense ratios of funds in the same Lipper comparison universe. The Board considered that the Fund is held exclusively by SMA clients of Columbia Threadneedle Investments, that the Fund does not pay management fees, and that Columbia Threadneedle Investments collects management fees from SMA clients directly or indirectly through SMA program sponsors.
| 38 | Overseas SMA Completion Portfolio | Annual Report 2022 |
columbiathreadneedleus.com/investment-products/managed-accounts/. The Fund is distributed by Columbia Management Investment Distributors, Inc., member FINRA, and managed by Columbia Management Investment Advisers, LLC.

August 31, 2022

| 3 | |
| 5 | |
| 8 | |
| 9 | |
| 11 | |
| 12 | |
| 13 | |
| 14 | |
| 15 | |
| 29 | |
| 30 | |
| 36 | |
| 36 |
(Unaudited)
| Average annual total returns (%) (for the period ended August 31, 2022) | ||||
| Inception | 1 Year | Life | ||
| Multisector Bond SMA Completion Portfolio | 10/29/19 | -6.21 | 0.34 | |
| Bloomberg U.S. Aggregate Bond Index | -11.52 | -1.78 | ||
| Multisector Bond SMA Completion Portfolio | Annual Report 2022 | 3 |
(Unaudited)
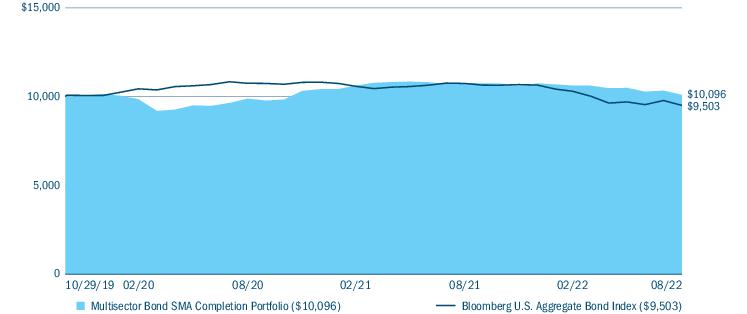
| Portfolio breakdown (%) (at August 31, 2022) | |
| Money Market Funds | 73.7 |
| Residential Mortgage-Backed Securities - Agency | 21.2 |
| U.S. Treasury Obligations | 5.1 |
| Total | 100.0 |
| Quality breakdown (%) (at August 31, 2022) | |
| AAA rating | 100.0 |
| Total | 100.0 |
| Market exposure through derivatives investments (% of notional exposure) (at August 31, 2022)(a) | |||
| Long | Short | Net | |
| Fixed Income Derivative Contracts | 100.0 | 0.0 | 100.0 |
| Total Notional Market Value of Derivative Contracts | 100.0 | 0.0 | 100.0 |
| 4 | Multisector Bond SMA Completion Portfolio | Annual Report 2022 |
(Unaudited)
| • | Relative to the benchmark, the Fund’s duration positioning boosted its results most. Duration is a measure of the Fund’s sensitivity to changes in interest rates. |
| ○ | The Fund held a shorter duration stance than that of the benchmark throughout the annual period as part of our strategy to balance exposure across risk factors. |
| ○ | The Fund’s shorter duration stance was most pronounced near the turn of the calendar year. |
| ○ | As interest rates rose during the annual period in response to greater inflationary pressures and the Fed’s efforts to rein in inflation by hiking interest rates, the Fund’s duration positioning proved beneficial. |
| • | Positioning within the mortgage-backed securities sector added value. |
| ○ | The Fund held an underweight in agency mortgage-backed securities, which performed poorly, and an overweight in non-agency mortgage-backed securities, which performed better. |
| Multisector Bond SMA Completion Portfolio | Annual Report 2022 | 5 |
(Unaudited)
| ○ | The Fed’s transition from quantitative easing to quantitative tightening, as well as the rapid rise in mortgage rates, led to the poor performance of agency mortgage-backed securities. |
| • | To a lesser degree, yield curve positioning contributed positively to the Fund’s relative results. The Fund was positioned for a steeper yield curve from September 2021 into the beginning of 2022 and was then re-positioned for a flatter yield curve for most of the remainder of the annual period. |
| • | The Fund’s exposure to several sectors that are not components of the benchmark detracted most from relative results. These sectors include emerging markets debt and high-yield corporate credit. |
| ○ | These sectors have higher credit sensitivity relative to the broader fixed-income market during a period of high volatility and liquidity-driven sell-offs as was seen during the annual period. |
| ○ | Notably, the Fund did not have significant exposure to the sovereign debt of Russia or Ukraine prior to the war, but the ripple effects of the war on the emerging markets debt sector overall dampened the Fund’s relative results. |
| 6 | Multisector Bond SMA Completion Portfolio | Annual Report 2022 |
(Unaudited)
| Multisector Bond SMA Completion Portfolio | Annual Report 2022 | 7 |
(Unaudited)
| March 1, 2022 — August 31, 2022 | |||||||
| Account value at the beginning of the period ($) | Account value at the end of the period ($) | Expenses paid during the period ($) | Fund’s annualized expense ratio (%) | ||||
| Actual | Hypothetical | Actual | Hypothetical | Actual | Hypothetical | Actual | |
| Multisector Bond SMA Completion Portfolio | 1,000.00 | 1,000.00 | 950.40 | 1,025.21 | 0.00 | 0.00 | 0.00 |
| 8 | Multisector Bond SMA Completion Portfolio | Annual Report 2022 |
August 31, 2022
| Residential Mortgage-Backed Securities - Agency 24.4% | ||||
| Issuer | Coupon Rate | Principal Amount ($) | Value ($) | |
| Uniform Mortgage-Backed Security TBA(a) | ||||
| 09/14/2052 | 4.000% | 750,000 | 733,125 | |
| Total Residential Mortgage-Backed Securities - Agency (Cost $747,334) | 733,125 | |||
| U.S. Treasury Obligations 5.8% | ||||
| U.S. Treasury | ||||
| 05/15/2032 | 2.875% | 180,000 | 175,500 | |
| Total U.S. Treasury Obligations (Cost $181,547) | 175,500 | |||
| Money Market Funds 84.6% | ||
| Shares | Value ($) | |
| Columbia Short-Term Cash Fund, 2.366%(b),(c) | 2,544,404 | 2,543,132 |
| Total Money Market Funds (Cost $2,542,887) | 2,543,132 | |
| Total Investments in Securities (Cost: $3,471,768) | 3,451,757 | |
| Other Assets & Liabilities, Net | (444,805) | |
| Net Assets | 3,006,952 | |
| Cleared credit default swap contracts - sell protection | ||||||||||||
| Reference entity | Counterparty | Maturity date | Receive fixed rate (%) | Payment frequency | Implied credit spread (%)* | Notional currency | Notional amount | Value ($) | Upfront payments ($) | Upfront receipts ($) | Unrealized appreciation ($) | Unrealized depreciation ($) |
| Markit CDX Emerging Markets Index, Series 37 | Morgan Stanley | 06/20/2027 | 1.000 | Quarterly | 3.317 | USD | 1,000,000 | (37,479) | — | — | — | (37,479) |
| Markit CDX North America High Yield Index, Series 38 | Morgan Stanley | 06/20/2027 | 5.000 | Quarterly | 5.320 | USD | 1,980,000 | (105,374) | — | — | — | (105,374) |
| Total | (142,853) | — | — | — | (142,853) | |||||||
| * | Implied credit spreads, represented in absolute terms, utilized in determining the market value of credit default swap agreements on corporate or sovereign issues as of period end serve as an indicator of the current status of the payment/performance risk and represent the likelihood or risk of default for the credit derivative. The implied credit spread of a particular referenced entity reflects the cost of buying/selling protection and may include upfront payments required to be made to enter into the agreement. Wider credit spreads represent a deterioration of the referenced entity’s credit soundness and a greater likelihood or risk of default or other credit event occurring as defined under the terms of the agreement. |
| (a) | Represents a security purchased on a when-issued basis. |
| (b) | The rate shown is the seven-day current annualized yield at August 31, 2022. |
| (c) | As defined in the Investment Company Act of 1940, as amended, an affiliated company is one in which the Fund owns 5% or more of the company’s outstanding voting securities, or a company which is under common ownership or control with the Fund. The value of the holdings and transactions in these affiliated companies during the year ended August 31, 2022 are as follows: |
| Affiliated issuers | Beginning of period($) | Purchases($) | Sales($) | Net change in unrealized appreciation (depreciation)($) | End of period($) | Realized gain (loss)($) | Dividends($) | End of period shares |
| Columbia Short-Term Cash Fund, 2.366% | ||||||||
| 11,277,531 | 36,027,201 | (44,761,771) | 171 | 2,543,132 | (5,456) | 49,305 | 2,544,404 | |
| TBA | To Be Announced |
| Multisector Bond SMA Completion Portfolio | Annual Report 2022 | 9 |
August 31, 2022
| USD | US Dollar |
| ■ | Level 1 — Valuations based on quoted prices for investments in active markets that the Fund has the ability to access at the measurement date. Valuation adjustments are not applied to Level 1 investments. |
| ■ | Level 2 — Valuations based on other significant observable inputs (including quoted prices for similar securities, interest rates, prepayment speeds, credit risks, etc.). |
| ■ | Level 3 — Valuations based on significant unobservable inputs (including the Fund’s own assumptions and judgment in determining the fair value of investments). |
| Level 1 ($) | Level 2 ($) | Level 3 ($) | Total ($) | |
| Investments in Securities | ||||
| Residential Mortgage-Backed Securities - Agency | — | 733,125 | — | 733,125 |
| U.S. Treasury Obligations | 175,500 | — | — | 175,500 |
| Money Market Funds | 2,543,132 | — | — | 2,543,132 |
| Total Investments in Securities | 2,718,632 | 733,125 | — | 3,451,757 |
| Investments in Derivatives | ||||
| Liability | ||||
| Swap Contracts | — | (142,853) | — | (142,853) |
| Total | 2,718,632 | 590,272 | — | 3,308,904 |
| 10 | Multisector Bond SMA Completion Portfolio | Annual Report 2022 |
August 31, 2022
| Assets | |
| Investments in securities, at value | |
| Unaffiliated issuers (cost $928,881) | $908,625 |
| Affiliated issuers (cost $2,542,887) | 2,543,132 |
| Margin deposits on: | |
| Swap contracts | 335,580 |
| Receivable for: | |
| Dividends | 4,389 |
| Interest | 2,616 |
| Expense reimbursement due from Investment Manager | 393 |
| Prepaid expenses | 2,756 |
| Trustees’ deferred compensation plan | 5,523 |
| Total assets | 3,803,014 |
| Liabilities | |
| Payable for: | |
| Investments purchased on a delayed delivery basis | 748,417 |
| Variation margin for swap contracts | 3,550 |
| Compensation of board members | 9,536 |
| Other expenses | 29,036 |
| Trustees’ deferred compensation plan | 5,523 |
| Total liabilities | 796,062 |
| Net assets applicable to outstanding capital stock | $3,006,952 |
| Represented by | |
| Paid in capital | 4,485,765 |
| Total distributable earnings (loss) | (1,478,813) |
| Total - representing net assets applicable to outstanding capital stock | $3,006,952 |
| Shares outstanding | 259,650 |
| Net asset value per share | 11.58 |
| Multisector Bond SMA Completion Portfolio | Annual Report 2022 | 11 |
Year Ended August 31, 2022
| Net investment income | |
| Income: | |
| Dividends — affiliated issuers | $49,305 |
| Interest | 319,427 |
| Total income | 368,732 |
| Expenses: | |
| Transfer agent fees | 1,289 |
| Compensation of board members | 14,056 |
| Custodian fees | 16,193 |
| Printing and postage fees | 9,648 |
| Registration fees | 40,469 |
| Audit fees | 39,500 |
| Legal fees | 10,891 |
| Interest on collateral | 1,767 |
| Compensation of chief compliance officer | 6 |
| Other | 5,118 |
| Total expenses | 138,937 |
| Fees waived or expenses reimbursed by Investment Manager and its affiliates | (138,937) |
| Total net expenses | — |
| Net investment income | 368,732 |
| Realized and unrealized gain (loss) — net | |
| Net realized gain (loss) on: | |
| Investments — unaffiliated issuers | (1,414,166) |
| Investments — affiliated issuers | (5,456) |
| Foreign currency translations | (3,741) |
| Futures contracts | 722,090 |
| Swap contracts | (476,664) |
| Net realized loss | (1,177,937) |
| Net change in unrealized appreciation (depreciation) on: | |
| Investments — unaffiliated issuers | (33,822) |
| Investments — affiliated issuers | 171 |
| Futures contracts | 4,103 |
| Swap contracts | (314,900) |
| Net change in unrealized appreciation (depreciation) | (344,448) |
| Net realized and unrealized loss | (1,522,385) |
| Net decrease in net assets resulting from operations | $(1,153,653) |
| 12 | Multisector Bond SMA Completion Portfolio | Annual Report 2022 |
| Year Ended August 31, 2022 | Year Ended August 31, 2021 | |
| Operations | ||
| Net investment income | $368,732 | $13,000 |
| Net realized gain (loss) | (1,177,937) | 199,879 |
| Net change in unrealized appreciation (depreciation) | (344,448) | 69,758 |
| Net increase (decrease) in net assets resulting from operations | (1,153,653) | 282,637 |
| Distributions to shareholders | ||
| Net investment income and net realized gains | (549,674) | (12,008) |
| Total distributions to shareholders | (549,674) | (12,008) |
| Increase (decrease) in net assets from capital stock activity | (17,569,714) | 19,955,165 |
| Total increase (decrease) in net assets | (19,273,041) | 20,225,794 |
| Net assets at beginning of year | 22,279,993 | 2,054,199 |
| Net assets at end of year | $3,006,952 | $22,279,993 |
| Year Ended | Year Ended | |||
| August 31, 2022 | August 31, 2021 | |||
| Shares | Dollars ($) | Shares | Dollars ($) | |
| Capital stock activity | ||||
| Subscriptions | 1,212,097 | 15,118,959 | 1,575,408 | 19,946,888 |
| Distributions reinvested | 44,574 | 549,674 | 656 | 8,277 |
| Redemptions | (2,748,178) | (33,238,347) | — | — |
| Total net increase (decrease) | (1,491,507) | (17,569,714) | 1,576,064 | 19,955,165 |
| Multisector Bond SMA Completion Portfolio | Annual Report 2022 | 13 |
| Year Ended August 31, | |||
| 2022 | 2021 | 2020 (a) | |
| Per share data | |||
| Net asset value, beginning of period | $12.72 | $11.73 | $12.00 |
| Income from investment operations: | |||
| Net investment income | 0.21 | 0.05 | 0.12 |
| Net realized and unrealized gain (loss) | (0.99) | 0.99 | (0.26) |
| Total from investment operations | (0.78) | 1.04 | (0.14) |
| Less distributions to shareholders from: | |||
| Net investment income | (0.27) | (0.05) | (0.13) |
| Net realized gains | (0.09) | — | — |
| Total distributions to shareholders | (0.36) | (0.05) | (0.13) |
| Net asset value, end of period | $11.58 | $12.72 | $11.73 |
| Total return | (6.21%) | 8.91% | (1.16%) |
| Ratios to average net assets | |||
| Total gross expenses(b) | 0.62%(c) | 3.72%(c) | 5.21%(d) |
| Total net expenses(b),(e) | 0.00%(c) | 0.00%(c),(f) | 0.00%(d) |
| Net investment income | 1.66% | 0.37% | 1.28%(d) |
| Supplemental data | |||
| Portfolio turnover | 372% | 15% | 0% |
| Net assets, end of period (in thousands) | $3,007 | $22,280 | $2,054 |
| Notes to Financial Highlights | |
| (a) | The Fund commenced operations on October 29, 2019. Per share data and total return reflect activity from that date. |
| (b) | In addition to the fees and expenses that the Fund bears directly, the Fund indirectly bears a pro rata share of the fees and expenses of any other funds in which it invests. Such indirect expenses are not included in the Fund’s reported expense ratios. |
| (c) | Ratios include interest on collateral expense. For the periods indicated below, if interest on collateral expense had been excluded, expenses would have been lower by: |
| Class | 8/31/2022 | 8/31/2021 |
| No Class | 0.01% | less than 0.01% |
| (d) | Annualized. |
| (e) | Total net expenses include the impact of certain fee waivers/expense reimbursements made by the Investment Manager and certain of its affiliates, if applicable. |
| (f) | Rounds to zero. |
| 14 | Multisector Bond SMA Completion Portfolio | Annual Report 2022 |
August 31, 2022
| Multisector Bond SMA Completion Portfolio | Annual Report 2022 | 15 |
August 31, 2022
| 16 | Multisector Bond SMA Completion Portfolio | Annual Report 2022 |
August 31, 2022
| Multisector Bond SMA Completion Portfolio | Annual Report 2022 | 17 |
August 31, 2022
| 18 | Multisector Bond SMA Completion Portfolio | Annual Report 2022 |
August 31, 2022
| Liability derivatives | ||
| Risk exposure category | Statement of assets and liabilities location | Fair value ($) |
| Credit risk | Component of total distributable earnings (loss) — unrealized depreciation on swap contracts | 142,853* |
| * | Includes cumulative appreciation (depreciation) as reported in the tables following the Portfolio of Investments. Only the current day’s variation margin is reported in receivables or payables in the Statement of Assets and Liabilities. |
| Amount of realized gain (loss) on derivatives recognized in income | |||
| Risk exposure category | Futures contracts ($) | Swap contracts ($) | Total ($) |
| Credit risk | — | (476,664) | (476,664) |
| Interest rate risk | 722,090 | — | 722,090 |
| Total | 722,090 | (476,664) | 245,426 |
| Change in unrealized appreciation (depreciation) on derivatives recognized in income | |||
| Risk exposure category | Futures contracts ($) | Swap contracts ($) | Total ($) |
| Credit risk | — | (314,900) | (314,900) |
| Interest rate risk | 4,103 | — | 4,103 |
| Total | 4,103 | (314,900) | (310,797) |
| Derivative instrument | Average notional amounts ($)* |
| Futures contracts — long | 428,194 |
| Futures contracts — short | 4,561,047 |
| Credit default swap contracts — sell protection | 10,395,000 |
| * | Based on the ending quarterly outstanding amounts for the year ended August 31, 2022. |
| Multisector Bond SMA Completion Portfolio | Annual Report 2022 | 19 |
August 31, 2022
| 20 | Multisector Bond SMA Completion Portfolio | Annual Report 2022 |
August 31, 2022
| Morgan Stanley ($) | |
| Liabilities | |
| Centrally cleared credit default swap contracts (a) | 3,550 |
| Total financial and derivative net assets | (3,550) |
| Total collateral received (pledged) (b) | (3,550) |
| Net amount (c) | - |
| (a) | Centrally cleared swaps are included within payable/receivable for variation margin in the Statement of Assets and Liabilities. |
| (b) | In some instances, the actual collateral received and/or pledged may be more than the amount shown due to overcollateralization. |
| (c) | Represents the net amount due from/(to) counterparties in the event of default. |
| Multisector Bond SMA Completion Portfolio | Annual Report 2022 | 21 |
August 31, 2022
| 22 | Multisector Bond SMA Completion Portfolio | Annual Report 2022 |
August 31, 2022
| Excess of distributions over net investment income ($) | Accumulated net realized (loss) ($) | Paid in capital ($) |
| 1,157 | (1,051) | (106) |
| Year Ended August 31, 2022 | Year Ended August 31, 2021 | ||||
| Ordinary income ($) | Long-term capital gains ($) | Total ($) | Ordinary income ($) | Long-term capital gains ($) | Total ($) |
| 541,741 | 7,933 | 549,674 | 12,008 | — | 12,008 |
| Multisector Bond SMA Completion Portfolio | Annual Report 2022 | 23 |
August 31, 2022
| Undistributed ordinary income ($) | Undistributed long-term capital gains ($) | Capital loss carryforwards ($) | Net unrealized (depreciation) ($) |
| — | — | — | (162,864) |
| Federal tax cost ($) | Gross unrealized appreciation ($) | Gross unrealized (depreciation) ($) | Net unrealized (depreciation) ($) |
| 3,471,768 | 244 | (163,108) | (162,864) |
| Late year ordinary losses ($) | Post-October capital losses ($) |
| 3,741 | 1,312,208 |
| 24 | Multisector Bond SMA Completion Portfolio | Annual Report 2022 |
August 31, 2022
| Multisector Bond SMA Completion Portfolio | Annual Report 2022 | 25 |
August 31, 2022
| 26 | Multisector Bond SMA Completion Portfolio | Annual Report 2022 |
August 31, 2022
| Multisector Bond SMA Completion Portfolio | Annual Report 2022 | 27 |
August 31, 2022
| 28 | Multisector Bond SMA Completion Portfolio | Annual Report 2022 |
| Multisector Bond SMA Completion Portfolio | Annual Report 2022 | 29 |
| Name, address, year of birth | Position held with the Columbia Funds and length of service | Principal occupation(s) during past five years and other relevant professional experience | Number of Funds in the Columbia Funds Complex* overseen | Other directorships held by Trustee during the past five years |
| George S. Batejan c/o Columbia Management Investment Advisers, LLC 290 Congress Street Boston, MA 02210 1953 | Trustee since 2017 | Executive Vice President, Global Head of Technology and Operations, Janus Capital Group, Inc., 2010-2016 | 176 | Former Chairman of the Board, NICSA (National Investment Company Services Association) (Executive Committee, Nominating Committee and Governance Committee), 2014-2016; former Director, Intech Investment Management, 2011-2016; former Board Member, Metro Denver Chamber of Commerce, 2015-2016; former Advisory Board Member, University of Colorado Business School, 2015-2018 |
| Kathleen Blatz c/o Columbia Management Investment Advisers, LLC 290 Congress Street Boston, MA 02210 1954 | Trustee since 2006 | Attorney, specializing in arbitration and mediation; Chief Justice, Minnesota Supreme Court, 1998-2006; Associate Justice, Minnesota Supreme Court, 1996-1998; Fourth Judicial District Court Judge, Hennepin County, 1994-1996; Attorney in private practice and public service, 1984-1993; State Representative, Minnesota House of Representatives, 1979-1993, which included service on the Tax and Financial Institutions and Insurance Committees; Member and Interim Chair, Minnesota Sports Facilities Authority, January 2017-July 2017; Interim President and Chief Executive Officer, Blue Cross and Blue Shield of Minnesota (health care insurance), February-July 2018, April-October 2021 | 176 | Former Trustee, Blue Cross and Blue Shield of Minnesota, 2009-2021 (Chair of the Business Development Committee, 2014-2017; Chair of the Governance Committee, 2017-2019); former Member and Chair of the Board, Minnesota Sports Facilities Authority, January 2017-July 2017; former Director, Robina Foundation, 2009-2020 (Chair, 2014-2020); Director, Schulze Family Foundation, since 2021 |
| Pamela G. Carlton c/o Columbia Management Investment Advisers, LLC 290 Congress Street Boston, MA 02210 1954 | Trustee since 2007 | President, Springboard — Partners in Cross Cultural Leadership (consulting company) since 2003; Managing Director of US Equity Research, JP Morgan Chase, 1999-2003; Director of US Equity Research, Chase Asset Management, 1996-1999; Co-Director Latin America Research, 1993-1996, COO Global Research, 1992-1996, Co-Director of US Research, 1991-1992, Investment Banker, 1982-1991, Morgan Stanley; Attorney, Cleary Gottlieb Steen & Hamilton LLP, 1980-1982 | 176 | Trustee, New York Presbyterian Hospital Board (Executive Committee and Chair of People Committee) since 1996; Director, DR Bank (Audit Committee) since 2017; Director, Evercore Inc. (Audit Committee) since 2019; Director, Apollo Commercial Real Estate Finance, Inc. since 2021; the Governing Council of the Independent Directors Council (IDC), since 2021 |
| 30 | Multisector Bond SMA Completion Portfolio | Annual Report 2022 |
(Unaudited)
Independent trustees (continued)
| Name, address, year of birth | Position held with the Columbia Funds and length of service | Principal occupation(s) during past five years and other relevant professional experience | Number of Funds in the Columbia Funds Complex* overseen | Other directorships held by Trustee during the past five years |
| Janet Langford Carrig c/o Columbia Management Investment Advisers, LLC 290 Congress Street Boston, MA 02210 1957 | Trustee since 1996 | Senior Vice President, General Counsel and Corporate Secretary, ConocoPhillips (independent energy company), September 2007-October 2018 | 174 | Director, EQT Corporation (natural gas producer) since 2019; former Director, Whiting Petroleum Corporation (independent oil and gas company), 2020-2022 |
| J. Kevin Connaughton c/o Columbia Management Investment Advisers, LLC 290 Congress Street Boston, MA 02210 1964 | Trustee since 2020 | Member, FINRA National Adjudicatory Council since January 2020; Adjunct Professor of Finance, Bentley University since January 2018; Consultant to Independent Trustees of CFVIT and CFST I from March 2016 to June 2020 with respect to CFVIT and to December 2020 with respect to CFST I; Managing Director and General Manager of Mutual Fund Products, Columbia Management Investment Advisers, LLC, May 2010-February 2015; President, Columbia Funds, 2008-2015; and senior officer of Columbia Funds and affiliated funds, 2003-2015 | 174 | Former Director, The Autism Project, March 2015-December 2021; former Member of the Investment Committee, St. Michael’s College, November 2015-February 2020; former Trustee, St. Michael’s College, June 2017-September 2019; former Trustee, New Century Portfolios, January 2015-December 2017 |
| Olive M. Darragh c/o Columbia Management Investment Advisers, LLC 290 Congress Street Boston, MA 02210 1962 | Trustee since 2020 | Managing Director of Darragh Inc. (strategy and talent management consulting firm) since 2010; Founder and CEO, Zolio, Inc. (investment management talent identification platform) since 2004; Consultant to Independent Trustees of CFVIT and CFST I from June 2019 to June 2020 with respect to CFVIT and to December 2020 with respect to CFST I; Partner, Tudor Investments, 2004-2010; Senior Partner, McKinsey & Company (consulting), 1990-2004; Touche Ross CPA, 1985-1988 | 174 | Former Director, University of Edinburgh Business School (Member of US Board); former Director, Boston Public Library Foundation |
| Patricia M. Flynn c/o Columbia Management Investment Advisers, LLC 290 Congress Street Boston, MA 02210 1950 | Trustee since 2004 | Trustee Professor of Economics and Management, Bentley University since 1976 (also teaches and conducts research on corporate governance); Dean, McCallum Graduate School of Business, Bentley University, 1992-2002 | 176 | Trustee, MA Taxpayers Foundation since 1997; former Board of Governors, Innovation Institute, MA Technology Collaborative, 2010-2020; former Board of Directors, The MA Business Roundtable, 2003-2019 |
| Brian J. Gallagher c/o Columbia Management Investment Advisers, LLC 290 Congress Street Boston, MA 02210 1954 | Trustee since 2017 | Retired; Partner with Deloitte & Touche LLP and its predecessors, 1977-2016 | 176 | Trustee, Catholic Schools Foundation since 2004 |
| Multisector Bond SMA Completion Portfolio | Annual Report 2022 | 31 |
(Unaudited)
Independent trustees (continued)
| Name, address, year of birth | Position held with the Columbia Funds and length of service | Principal occupation(s) during past five years and other relevant professional experience | Number of Funds in the Columbia Funds Complex* overseen | Other directorships held by Trustee during the past five years |
| Douglas A. Hacker c/o Columbia Management Investment Advisers, LLC 290 Congress Street Boston, MA 02210 1955 | Co-Chair since 2021; Chair of CFST I and CFVIT since 2014; Trustee of CFST I and CFVIT since 1996 and CFST, CFST II, CFVST II, CET I and CET II since 2021 | Independent business executive since May 2006; Executive Vice President – Strategy of United Airlines, December 2002 - May 2006; President of UAL Loyalty Services (airline marketing company), September 2001-December 2002; Executive Vice President and Chief Financial Officer of United Airlines, July 1999-September 2001 | 176 | Director, Spartan Nash Company (food distributor); Director, Aircastle Limited (Chair of Audit Committee) (aircraft leasing); former Director, Nash Finch Company (food distributor), 2005-2013; former Director, SeaCube Container Leasing Ltd. (container leasing), 2010-2013; and former Director, Travelport Worldwide Limited (travel information technology), 2014-2019 |
| Nancy T. Lukitsh c/o Columbia Management Investment Advisers, LLC 290 Congress Street Boston, MA 02210 1956 | Trustee since 2011 | Senior Vice President, Partner and Director of Marketing, Wellington Management Company, LLP (investment adviser), 1997-2010; Chair, Wellington Management Portfolios (commingled non-U.S. investment pools), 2007 -2010; Director, Wellington Trust Company, NA and other Wellington affiliates, 1997-2010 | 174 | None |
| David M. Moffett c/o Columbia Management Investment Advisers, LLC 290 Congress Street Boston, MA 02210 1952 | Trustee since 2011 | Retired; Consultant to Bridgewater and Associates | 174 | Director, CSX Corporation (transportation suppliers); Director, Genworth Financial, Inc. (financial and insurance products and services); Director, PayPal Holdings Inc. (payment and data processing services); Trustee, University of Oklahoma Foundation; former Director, eBay Inc. (online trading community), 2007-2015; and former Director, CIT Bank, CIT Group Inc. (commercial and consumer finance), 2010-2016 |
| Catherine James Paglia c/o Columbia Management Investment Advisers, LLC 290 Congress Street Boston, MA 02210 1952 | Co-Chair since 2021; Chair of CFST, CFST II, CFVST II, CET I and CET II since 2020; Trustee of CFST, CFST II and CFVST II since 2004 and CFST I and CFVIT since 2021 | Director, Enterprise Asset Management, Inc. (private real estate and asset management company) since September 1998; Managing Director and Partner, Interlaken Capital, Inc., 1989-1997; Vice President, 1982-1985, Principal, 1985-1987, Managing Director, 1987-1989, Morgan Stanley; Vice President, Investment Banking, 1980-1982, Associate, Investment Banking, 1976-1980, Dean Witter Reynolds, Inc. | 176 | Director, Valmont Industries, Inc. (irrigation systems manufacturer) since 2012; Trustee, Carleton College (on the Investment Committee); Trustee, Carnegie Endowment for International Peace (on the Investment Committee) |
| 32 | Multisector Bond SMA Completion Portfolio | Annual Report 2022 |
(Unaudited)
Independent trustees (continued)
| Name, address, year of birth | Position held with the Columbia Funds and length of service | Principal occupation(s) during past five years and other relevant professional experience | Number of Funds in the Columbia Funds Complex* overseen | Other directorships held by Trustee during the past five years |
| Minor M. Shaw c/o Columbia Management Investment Advisers, LLC 290 Congress Street Boston, MA 02210 1947 | Trustee since 2003 | President, Micco LLC (private investments) since 2011; President, Micco Corp. (family investment business), 1998-2011 | 176 | Director, Blue Cross Blue Shield of South Carolina (Chair of Compensation Committee) since April 2008; Trustee, Hollingsworth Funds (on the Investment Committee) since 2016 (previously Board Chair from 2016-2019); Former Advisory Board member, Duke Energy Corp., 2016-2020; Chair of the Duke Endowment; Chair of Greenville – Spartanburg Airport Commission; former Trustee, BofA Funds Series Trust (11 funds), 2003-2011; former Director, Piedmont Natural Gas, 2004-2016; former Director, National Association of Corporate Directors, Carolinas Chapter, 2013-2018; Chair, Daniel-Mickel Foundation since 1998 |
| Natalie A. Trunow c/o Columbia Management Investment Advisers, LLC 290 Congress Street Boston, MA 02210 1967 | Trustee since 2020 | Chief Executive Officer, Millennial Portfolio Solutions LLC (asset management and consulting services), January 2016-January 2021; Non-executive Member of the Investment Committee and Valuation Committee, Sarona Asset Management Inc. (private equity firm) since September 2019; Advisor, Horizon Investments (asset management and consulting services), August 2018-January 2021; Advisor, Paradigm Asset Management, November 2016-December 2021; Consultant to Independent Trustees of CFVIT and CFST I from September 2016 to June 2020 with respect to CFVIT and to December 2020 with respect to CFST I; Director of Investments/Consultant, Casey Family Programs, April 2016-November 2016; Senior Vice President and Chief Investment Officer, Calvert Investments, August 2008-January 2016; Section Head and Portfolio Manager, General Motors Asset Management, June 1997-August 2008 | 174 | Former Director, Investment Committee, Health Services for Children with Special Needs, Inc., 2012-2019; Director, Chair of Audit Committee, Consumer Credit Counseling Services (formerly Guidewell Financial Solutions), since 2019; Independent Director, Investment Committee and Valuation Committee, Sarona Asset Management, since 2019 |
| Sandra L. Yeager c/o Columbia Management Investment Advisers, LLC 290 Congress Street Boston, MA 02210 1964 | Trustee since 2017 | Retired; President and founder, Hanoverian Capital, LLC (SEC registered investment advisor firm), 2008-2016; Managing Director, DuPont Capital, 2006-2008; Managing Director, Morgan Stanley Investment Management, 2004-2006; Senior Vice President, Alliance Bernstein, 1990-2004 | 176 | Former Director, NAPE Education Foundation, October 2016-October 2020 |
| Multisector Bond SMA Completion Portfolio | Annual Report 2022 | 33 |
(Unaudited)
| * | The term “Columbia Funds Complex” as used herein includes Columbia Seligman Premium Technology Growth Fund, Tri-Continental Corporation and each series of Columbia Fund Series Trust (CFST), Columbia Funds Series Trust I (CFST I), Columbia Funds Series Trust II (CFST II), Columbia ETF Trust I (CET I), Columbia ETF Trust II (CET II), Columbia Funds Variable Insurance Trust (CFVIT) and Columbia Funds Variable Series Trust II (CFVST II). Messrs. Batejan, Beckman, Gallagher and Hacker and Mses. Blatz, Carlton, Flynn, Paglia, Shaw and Yeager serve as Directors of Columbia Seligman Premium Technology Growth Fund and Tri-Continental Corporation. |
| Name, address, year of birth | Position held with the Columbia Funds and length of service | Principal occupation(s) during the past five years and other relevant professional experience | Number of Funds in the Columbia Funds Complex overseen | Other directorships held by Trustee during the past five years |
| Daniel J. Beckman c/o Columbia Management Investment Advisers, LLC 290 Congress Street Boston, MA 02210 1962 | Trustee since November 2021 and President since June 2021 | Vice President – Head of North America Product, Columbia Management Investment Advisers, LLC since April 2015; President and Principal Executive Officer of the Columbia Funds since June 2021; officer of Columbia Funds and affiliated funds, 2020-2021 | 176 | Director, Ameriprise Trust Company, since October 2016; Director, Columbia Management Investment Distributors, Inc. since November 2018; Board of Governors, Columbia Wanger Asset Management, LLC since January 2022 |
| * | Interested person (as defined under the 1940 Act) by reason of being an officer, director, security holder and/or employee of the Investment Manager or Ameriprise Financial. |
| Name, address and year of birth | Position and year first appointed to position for any Fund in the Columbia Funds Complex or a predecessor thereof | Principal occupation(s) during past five years |
| Michael G. Clarke 290 Congress Street Boston, MA 02210 1969 | Chief Financial Officer and Principal Financial Officer (2009) and Senior Vice President (2019) | Senior Vice President and Head of Global Operations & Investor Services, Columbia Management Investment Advisers, LLC, since March 2022 (previously Vice President, Head of North American Operations, and Co-Head of Global Operations, June 2019 to February 2022 and Vice President – Accounting and Tax, May 2010 - May 2019); senior officer of Columbia Funds and affiliated funds since 2002. |
| Joseph Beranek 5890 Ameriprise Financial Center Minneapolis, MN 55474 1965 | Treasurer and Chief Accounting Officer (Principal Accounting Officer) (2019) and Principal Financial Officer (2020), CFST, CFST I, CFST II, CFVIT and CFVST II; Assistant Treasurer, CET I and CET II | Vice President – Mutual Fund Accounting and Financial Reporting, Columbia Management Investment Advisers, LLC, since December 2018 and March 2017, respectively (previously Vice President – Pricing and Corporate Actions, May 2010 - March 2017). |
| 34 | Multisector Bond SMA Completion Portfolio | Annual Report 2022 |
(Unaudited)
Fund officers (continued)
| Name, address and year of birth | Position and year first appointed to position for any Fund in the Columbia Funds Complex or a predecessor thereof | Principal occupation(s) during past five years |
| Marybeth Pilat 290 Congress Street Boston, MA 02210 1968 | Treasurer and Chief Accounting Officer (Principal Accounting Officer) and Principal Financial Officer (2020) for CET I and CET II; Assistant Treasurer, CFST, CFST I, CFST II, CFVIT and CFVST II | Vice President – Product Pricing and Administration, Columbia Management Investment Advisers, LLC, since May 2017; Director - Fund Administration, Calvert Investments, August 2015 – March 2017; Vice President - Fund Administration, Legg Mason, May 2015 - July 2015; Vice President - Fund Administration, Columbia Management Investment Advisers, LLC, May 2010 - April 2015. |
| William F. Truscott 290 Congress Street Boston, MA 02210 1960 | Senior Vice President (2001) | Formerly, Trustee/Director of Columbia Funds Complex or legacy funds, November 2001-January 1, 2021; Chief Executive Officer, Global Asset Management, Ameriprise Financial, Inc. since September 2012; Chairman of the Board and President, Columbia Management Investment Advisers, LLC since July 2004 and February 2012, respectively; Chairman of the Board and Chief Executive Officer, Columbia Management Investment Distributors, Inc. since November 2008 and February 2012, respectively; Chairman of the Board and Director, Threadneedle Asset Management Holdings, Sàrl since March 2013 and December 2008, respectively; senior executive of various entities affiliated with Columbia Threadneedle. |
| Christopher O. Petersen 5228 Ameriprise Financial Center Minneapolis, MN 55474 1970 | Senior Vice President and Assistant Secretary (2021) | Formerly, Trustee/Director of funds within the Columbia Funds Complex, July 1, 2020 - November 22, 2021; Senior Vice President and Assistant General Counsel, Ameriprise Financial, Inc. since September 2021 (previously Vice President and Lead Chief Counsel, January 2015 - September 2021); formerly, President and Principal Executive Officer of the Columbia Funds, 2015 - 2021; officer of Columbia Funds and affiliated funds since 2007. |
| Thomas P. McGuire 290 Congress Street Boston, MA 02210 1972 | Senior Vice President and Chief Compliance Officer (2012) | Vice President – Asset Management Compliance, Ameriprise Financial, Inc., since May 2010; Chief Compliance Officer, Columbia Acorn/Wanger Funds since December 2015; formerly, Chief Compliance Officer, Ameriprise Certificate Company, September 2010 – September 2020. |
| Ryan C. Larrenaga 290 Congress Street Boston, MA 02210 1970 | Senior Vice President (2017), Chief Legal Officer (2017), and Secretary (2015) | Vice President and Chief Counsel, Ameriprise Financial, Inc. since August 2018 (previously Vice President and Group Counsel, August 2011 - August 2018); Chief Legal Officer, Columbia Acorn/Wanger Funds, since September 2020; officer of Columbia Funds and affiliated funds since 2005. |
| Michael E. DeFao 290 Congress Street Boston, MA 02210 1968 | Vice President (2011) and Assistant Secretary (2010) | Vice President and Chief Counsel, Ameriprise Financial, Inc. since May 2010; Vice President, Chief Legal Officer and Assistant Secretary, Columbia Management Investment Advisers, LLC since October 2021 (previously Vice President and Assistant Secretary, May 2010 – September 2021). |
| Lyn Kephart-Strong 5228 Ameriprise Financial Center Minneapolis, MN 55474 1960 | Vice President (2015) | President, Columbia Management Investment Services Corp. since October 2014; Vice President & Resolution Officer, Ameriprise Trust Company since August 2009. |
| Multisector Bond SMA Completion Portfolio | Annual Report 2022 | 35 |
| • | the Fund had sufficient liquidity to both meet redemptions and operate effectively on behalf of shareholders; |
| • | there were no material changes to the Program during the period; |
| • | the implementation of the Program was effective to manage the Fund’s liquidity risk; and |
| • | the Program operated adequately during the period. |
| • | Information on the investment performance of the Fund, as well as performance relative to a benchmark; |
| 36 | Multisector Bond SMA Completion Portfolio | Annual Report 2022 |
(Unaudited)
| • | Information on the Fund’s management fees and total expenses; |
| • | The Investment Manager’s agreement to contractually limit or cap total operating expenses for the Fund so that total operating expenses (excluding certain fees and expenses, such as transaction costs and certain other investment related expenses, interest, taxes, and infrequent and/or unusual expenses) would not exceed a specified annual rate, as a percentage of the Fund’s net assets; |
| • | Terms of the Management Agreement; |
| • | Descriptions of other agreements and arrangements with affiliates of the Investment Manager relating to the operations of the Fund, including agreements with respect to the provision of transfer agency and shareholder services to the Fund; |
| • | Descriptions of various services performed by the Investment Manager under the Management Agreement, including portfolio management and portfolio trading practices; |
| • | Information regarding any recently negotiated management fees of similarly-managed portfolios of other institutional clients of the Investment Manager; |
| • | Information regarding the resources of the Investment Manager, including information regarding senior management, portfolio managers and other personnel; |
| • | Information regarding the capabilities of the Investment Manager with respect to compliance monitoring services; |
| • | The profitability to the Investment Manager and its affiliates from their relationships with the Fund; and |
| • | Report provided by the Board’s independent fee consultant, JDL Consultants, LLC (JDL). |
| Multisector Bond SMA Completion Portfolio | Annual Report 2022 | 37 |
(Unaudited)
In addition, the Board discussed the acceptability of the terms of the Management Agreement, noting that no changes were proposed from the form of agreement previously approved. The Board also noted the wide array of legal and compliance services provided to the Fund under the Management Agreement.
| 38 | Multisector Bond SMA Completion Portfolio | Annual Report 2022 |
(Unaudited)
Economies of scale
| Multisector Bond SMA Completion Portfolio | Annual Report 2022 | 39 |
columbiathreadneedleus.com/investment-products/managed-accounts/. The Fund is distributed by Columbia Management Investment Distributors, Inc., member FINRA, and managed by Columbia Management Investment Advisers, LLC.
Item 2. Code of Ethics.
(a) | The registrant has adopted a code of ethics that applies to the registrant’s principal executive officer, principal financial officer, principal accounting officer or controller, or persons performing similar functions, regardless of whether these individuals are employed by the registrant or a third party. |
(b) | During the period covered by this report, there were not any amendments to a provision of the code of ethics that applies to the registrant’s principal executive officer, principal financial officer, principal accounting officer or controller, or persons performing similar functions, regardless of whether these individuals are employed by the registrant or a third party, and that relates to any element of the code of ethics definition enumerated in paragraph (b) of this Item. |
(c) | During the period covered by this report, there were no waivers, including any implicit waivers, from a provision of the code of ethics to the registrant’s principal executive officer, principal financial officer, principal accounting officer or controller, or persons performing similar functions, regardless of whether these individuals are employed by the registrant or a third party that relates to one or more of the items set forth in paragraph (b) of this Item. |
Item 3. Audit Committee Financial Expert.
The registrant’s Board of Trustees has determined that David M. Moffett, Brian J. Gallagher, J. Kevin Connaughton, and Sandra L. Yeager, each of whom are members of the registrant’s Board of Trustees and Audit Committee, each qualify as an audit committee financial expert. Mr. Moffett, Mr. Gallagher, Mr. Connaughton, and Ms. Yeager are each independent trustees, as defined in paragraph (a)(2) of this item’s instructions.
Item 4. Principal Accountant Fees and Services.
Fee information below is disclosed for the fifteen series of the registrant whose reports to stockholders are included in this annual filing.
(a) Audit Fees. Aggregate Audit Fees billed by the principal accountant for professional services rendered during the fiscal years ended August 31, 2022 and August 31, 2021 are approximately as follows:
2022 | 2021 |
$527,800 | $522,500 |
Audit Fees include amounts related to the audit of the registrant’s annual financial statements or services that are normally provided by the accountant in connection with statutory and regulatory filings or engagements for those fiscal years.
(b) Audit-Related Fees. Aggregate Audit-Related Fees billed to the registrant by the principal accountant for professional services rendered during the fiscal years ended August 31, 2022 and August 31, 2021 are approximately as follows:
2022 | 2021 |
$25,000 | $29,300 |
Audit-Related Fees include amounts for assurance and related services by the principal accountant that are reasonably related to the performance of the audit of the registrant’s financial statements and are not reported in Audit Fees above.
During the fiscal years ended August 31, 2022 and August 31, 2021, there were no Audit-Related Fees billed by the registrant’s principal accountant to the registrant’s investment adviser (not including any sub-adviser whose role is primarily portfolio management and is subcontracted with or overseen by another investment adviser) and any entity controlling, controlled by, or under common control with the adviser that provides ongoing services to the registrant for an engagement that related directly to the operations and financial reporting of the registrant.
(c) Tax Fees. Aggregate Tax Fees billed by the principal accountant to the registrant for professional services rendered during the fiscal years ended August 31, 2022 and August 31, 2021 are approximately as follows:
2022 | 2021 |
$226,300 | $21,600 |
Tax Fees include amounts for the review of annual tax returns, the review of required shareholder distribution calculations and typically include amounts for professional services by the principal accountant for tax compliance, tax advice and tax planning. Fiscal years 2021 and 2022 also include Tax Fees for foreign tax filings.
During the fiscal years ended August 31, 2022 and August 31, 2021, there were no Tax Fees billed by the registrant’s principal accountant to the registrant’s investment adviser (not including any sub-adviser whose role is primarily portfolio management and is subcontracted with or overseen by another investment adviser) and any entity controlling, controlled by, or under common control with the adviser that provides ongoing services to the registrant for an engagement that related directly to the operations and financial reporting of the registrant.
(d) All Other Fees. Aggregate All Other Fees billed by the principal accountant to the registrant for professional services rendered during the fiscal years ended August 31, 2022 and August 31, 2021 are approximately as follows:
2022 | 2021 |
$0 | $0 |
All Other Fees, if any, include amounts for products and services provided by the principal accountant, other than the services reported in paragraphs (a) through (c) above.
Aggregate All Other Fees billed by the registrant’s principal accountant to the registrant’s investment adviser (not including any sub-adviser whose role is primarily portfolio management and is subcontracted with or overseen by another investment adviser) and any entity controlling, controlled by, or under common control with the adviser that provides ongoing services to the registrant for an engagement that related directly to the operations and financial reporting of the registrant during the fiscal years ended August 31, 2022 and August 31, 2021 are approximately as follows:
2022 | 2021 |
$535,000 | $538,000 |
In fiscal years 2022 and 2021, All Other Fees primarily consists of fees billed for internal control examinations of the registrant’s transfer agent and investment adviser.
(e)(1) Audit Committee Pre-Approval Policies and Procedures
The registrant’s Audit Committee is required to pre-approve the engagement of the registrant’s independent auditors to provide audit and non-audit services to the registrant and non-audit services to its investment adviser (excluding any sub-adviser whose role is primarily portfolio management and is sub-contracted or overseen by another investment adviser (the “Adviser”) or any entity controlling, controlled by or under common control with the Adviser that provides ongoing services to the Fund (a “Control Affiliate”) if the engagement relates directly to the operations and financial reporting of the registrant.
The Audit Committee has adopted a Policy for Engagement of Independent Auditors for Audit and Non-Audit Services (the “Policy”). The Policy sets forth the understanding of the Audit Committee regarding the engagement of the registrant’s independent accountants to provide (i) audit and permissible audit-related, tax and other services to the registrant (“Fund Services”); (ii) non-audit services to the registrant’s Adviser and any Control Affiliates, that relates directly to the operations and financial reporting of a Fund (“Fund-related Adviser Services”); and (iii) certain other audit and non-audit services to the registrant’s Adviser and its Control Affiliates. A service will require specific pre-approval by the Audit Committee if it is to be provided by the Fund’s independent auditor; provided, however, that pre-approval of non-audit services to the Fund, the Adviser or Control Affiliates may be waived if certain de minimis requirements set forth in the SEC’s rules are met.
Under the Policy, the Audit Committee may delegate pre-approval authority to any pre-designated member or members who are independent board members. The member(s) to whom such authority is delegated must report, for informational purposes only, any pre-approval decisions to the Audit Committee at its next regular meeting. The Audit Committee's responsibilities with respect to the pre-approval of services performed by the independent auditor may not be delegated to management.
On an annual basis, at a regularly scheduled Audit Committee meeting, the Fund’s Treasurer or other Fund officer shall submit to the Audit Committee a schedule of the types of Fund Services and Fund-related Adviser Services that are subject to specific pre-approval. This schedule will provide a description of each type of service that is subject to specific pre-approval, along with total projected fees for each service. The pre-approval will generally cover a one-year period. The Audit Committee will review and approve the types of services and the projected fees for the next one-year period and may add to, or subtract from, the list of pre-approved services from time to time, based on subsequent determinations. This specific approval acknowledges that the Audit Committee is in agreement with the specific types of services that the independent auditor will be permitted to perform and the projected fees for each service.
The Fund’s Treasurer or other Fund officer shall report to the Audit Committee at each of its regular meetings regarding all Fund Services or Fund-related Adviser Services provided since the last such report was rendered, including a description of the services, by category, with forecasted fees for the annual reporting period, proposed changes requiring specific pre-approval and a description of services provided by the independent auditor, by category, with actual fees during the current reporting period.
*****
(e)(2) None, or 0%, of the Audit-Related Fees, Tax Fees and All Other Fees paid by the Fund or affiliated entities relating directly to the operations and financial reporting of the Registrant disclosed above were approved by the audit committee pursuant to paragraphs (c)(7)(i)(C) of Rule 2-01 of Regulation S-X (which permits audit committee approval after the start of the engagement with respect to services other than audit, review or attest services, if certain conditions are satisfied).
(f) Not applicable.
(g) The aggregate non-audit fees billed by the registrant’s accountant for services rendered to the registrant, and rendered to the registrant’s investment adviser (not including any sub-adviser whose role is primarily portfolio management and is subcontracted with or overseen by another investment adviser), and any entity controlling, controlled by, or under common control with the adviser that provides ongoing services to the registrant for the fiscal years ended August 31, 2022 and August 31, 2021 are approximately as follows:
2022 | 2021 |
$786,300 | $588,900 |
(h) The registrant’s Audit Committee of the Board of Directors has considered whether the provision of non-audit services that were rendered to the registrant’s adviser (not including any sub-adviser whose role is primarily portfolio management and is subcontracted with or overseen by another investment adviser), and any entity controlling, controlled by, or under common control with the investment adviser that provides ongoing services to the registrant that were not pre-approved pursuant to paragraph (c)(7)(ii) of Rule 2-01 of Regulation S-X, is compatible with maintaining the principal accountant’s independence.
Item 5. Audit Committee of Listed Registrants.
Not applicable.
Item 6. Investments
(a) | The registrant’s “Schedule I – Investments in securities of unaffiliated issuers” (as set forth in 17 CFR 210.12-12) is included in Item 1 of this Form N-CSR. |
(b) | Not applicable. |
Item 7. Disclosure of Proxy Voting Policies and Procedures for Closed-End Management Investment Companies.
Not applicable.
Item 8. Portfolio Managers of Closed-End Management Investment Companies.
Not applicable.
Item 9. Purchases of Equity Securities by Closed-End Management Investment Company and Affiliated Purchasers.
Not applicable.
Item 10. Submission of Matters to a Vote of Security Holders.
There were no material changes to the procedures by which shareholders may recommend nominees to the registrant's board of directors.
Item 11. Controls and Procedures.
(c) | The registrant’s principal executive officer and principal financial officer, based on their evaluation of the registrant’s disclosure controls and procedures as of a date within 90 days of the filing of this report, have concluded that such controls and procedures are adequately designed to ensure that information required to be disclosed by the registrant in Form N-CSR is accumulated and communicated to the registrant’s management, including the principal executive officer and principal financial officer, or persons performing similar functions, as appropriate to allow timely decisions regarding required disclosure. |
(d) | There was no change in the registrant's internal control over financial reporting that occurred during the period covered by this report that has materially affected, or is reasonably likely to materially affect, the registrant's internal control over financial reporting. |
Item 12. Disclosure of Securities Lending Activities for Closed-End Management Investment Companies
Not applicable.
Item 13. Exhibits.
SIGNATURES
Pursuant to the requirements of the Securities Exchange Act of 1934 and the Investment Company Act of 1940, the registrant has duly caused this report to be signed on its behalf by the undersigned, thereunto duly
authorized. |
|
| ||
(registrant) |
| Columbia Funds Series Trust I |
| |
By (Signature and Title) | /s/ Daniel J. Beckman |
| ||
|
|
| Daniel J. Beckman, President and Principal Executive Officer |
|
Date |
| October 25, 2022 |
| |
Pursuant to the requirements of the Securities Exchange Act of 1934 and the Investment Company Act of 1940, this report has been signed below by the following persons on behalf of the registrant and in the capacities and on the dates indicated.
By (Signature and Title) | /s/ Daniel J. Beckman | ||
|
| Daniel J. Beckman, President and Principal Executive Officer | |
Date |
| October 25, 2022 |
|
By (Signature and Title) | /s/ Michael G. Clarke | ||
|
| Michael G. Clarke, Chief Financial Officer, Principal Financial Officer | |
|
| and Senior Vice President | |
Date |
| October 25, 2022 |
|
By (Signature and Title) | /s/ Joseph Beranek | ||
|
| Joseph Beranek, Treasurer, Chief Accounting Officer and Principal | |
|
| Financial Officer | |
Date |
| October 25, 2022 |
|