UNITED STATES
SECURITIES AND EXCHANGE COMMISSION
Washington, D.C. 20549
FORM N-CSR
CERTIFIED SHAREHOLDER REPORT OF REGISTERED MANAGEMENT INVESTMENT COMPANIES
Investment Company Act file number 811-04367
Columbia Funds Series Trust I
(Exact name of registrant as specified in charter)
290 Congress Street
Boston, MA 02210
(Address of principal executive offices) (Zip code)
Daniel J. Beckman
c/o Columbia Management Investment Advisers, LLC
290 Congress Street
Boston, MA 02210
Ryan C. Larrenaga, Esq.
c/o Columbia Management Investment Advisers, LLC
290 Congress Street
Boston, MA 02210
(Name and address of agent for service)
Registrant's telephone number, including area code: (800) 345-6611
Date of fiscal year end: April 30
Date of reporting period: April 30, 2023
Form N-CSR is to be used by management investment companies to file reports with the Commission not later than 10 days after the transmission to stockholders of any report that is required to be transmitted to stockholders under Rule 30e-1 under the Investment Company Act of 1940 (17 CFR 270.30e-1). The Commission may use the information provided on Form N-CSR in its regulatory, disclosure review, inspection, and policymaking roles.
A registrant is required to disclose the information specified by Form N-CSR, and the Commission will make this information public. A registrant is not required to respond to the collection of information contained in Form N-CSR unless the Form displays a currently valid Office of Management and Budget ("OMB") control number. Please direct comments concerning the accuracy of the information collection burden estimate and any suggestions for reducing the burden to Secretary, Securities and Exchange Commission, 100 F Street, NE, Washington, DC 20549. The OMB has reviewed this collection of information under the clearance requirements of 44 U.S.C. § 3507.
Item 1. Reports to Stockholders.

April 30, 2023

| 3 | |
| 6 | |
| 10 | |
| 11 | |
| 26 | |
| 27 | |
| 28 | |
| 29 | |
| 30 | |
| 43 | |
| 44 | |
| 44 | |
| 50 |
(Unaudited)
| Average annual total returns (%) (for the period ended April 30, 2023) | ||||||
| Inception | 1 Year | 5 Years | Life | |||
| Institutional Class* | 01/03/17 | -3.44 | 1.57 | 3.33 | ||
| HFRX Equity Hedge Index | 0.22 | 2.80 | 3.94 | |||
| Wilshire Liquid Alternative Equity Hedge Index | 0.83 | 3.11 | 3.48 | |||
| MSCI World Index (Net) | 3.18 | 8.14 | 10.15 | |||
| Multi-Manager Directional Alternative Strategies Fund | Annual Report 2023 | 3 |
(Unaudited)

| Portfolio breakdown — long positions (%) (at April 30, 2023) | |
| Common Stocks | 122.8 |
| Exchange-Traded Equity Funds | 1.7 |
| Preferred Stocks | 0.1 |
| Put Option Contracts Purchased | 0.1 |
| Money Market Funds(a) | 18.1 |
| Total | 142.8 |
| (a) | Includes investments in Money Market Funds, including investing for the purpose of covering obligations relating to the Fund’s investment in derivatives. For a description of the Fund’s investments in derivatives, see Investments in derivatives following the Portfolio of Investments and the derivative instruments discussion in Note 2 to the Notes to Financial Statements. |
| Portfolio breakdown — short positions (%) (at April 30, 2023) | |
| Common Stocks | (42.8) |
| Equity sector breakdown — long positions (%) (at April 30, 2023) | |
| Communication Services | 4.0 |
| Consumer Discretionary | 10.8 |
| Consumer Staples | 9.0 |
| Energy | 6.6 |
| Financials | 14.1 |
| Health Care | 15.5 |
| Industrials | 12.9 |
| Information Technology | 15.2 |
| Materials | 3.5 |
| Real Estate | 2.4 |
| Utilities | 6.0 |
| Total | 100.0 |
| 4 | Multi-Manager Directional Alternative Strategies Fund | Annual Report 2023 |
(Unaudited)
| Equity sector breakdown — short positions (%) (at April 30, 2023) | |
| Communication Services | (3.8) |
| Consumer Discretionary | (17.7) |
| Consumer Staples | (5.3) |
| Energy | (6.8) |
| Financials | (14.2) |
| Health Care | (8.5) |
| Industrials | (21.6) |
| Information Technology | (10.7) |
| Materials | (6.3) |
| Real Estate | (4.7) |
| Utilities | (0.4) |
| Total | (100.0) |
| Multi-Manager Directional Alternative Strategies Fund | Annual Report 2023 | 5 |
(Unaudited)
| 6 | Multi-Manager Directional Alternative Strategies Fund | Annual Report 2023 |
(Unaudited)
| • | Our portion of the Fund maintained an overweight position to lower beta sectors and an underweight position to high beta sectors. During this period, low beta sectors substantially underperformed the market and high beta sectors substantially outperformed the market. |
| • | Short positions in aerospace and defense company Rolls-Royce Holdings PLC and long positions in real estate investment trust Medical Properties Trust, Inc. and energy producer Uniper SE were the largest negative contributors to performance. These holdings exhibited factor exposures which were not rewarded by the market environment. |
| • | In addition, underweight exposures to the information technology and health care sectors were the greatest negative contributors from a sector weighting perspective. |
| • | Country allocations that had negative contributions were the United Kingdom and Italy. |
| • | Stock selection within Germany also detracted. |
| • | Our stock selection model performed reasonably well during most of the period, as stocks we forecasted to do well outperformed stocks we thought would do poorly. This was primarily the result of favoring certain valuation characteristics which outperformed during the trailing 12-month period. Specifically, an emphasis to companies with strong book value and earnings relative to their price positively impacted results as these characteristics were rewarded by investors. |
| • | Short positions within our portion of the Fund in food retailer Ocado Group PLC, electric vehicle manufacturer Rivian Automotive, Inc. and online payments platform Affirm Holdings, Inc. were the largest positive contributors to performance. These holdings exhibited factor exposures which were rewarded by the market environment. |
| • | In addition, an underweight exposure to the communication services sector was the greatest positive contributor from a sector weighting perspective. |
| • | Countries allocations that made positive contributions within our portion of the Fund were underweight positions to the Netherlands, Germany and Japan. |
| • | In addition, while an underweight position in the United States detracted slightly from performance, stock selection was particularly strong within the United States and added significant value overall. |
| • | Overweight positions to Denmark and strong stock selection in Japan also contributed during the period. |
| Multi-Manager Directional Alternative Strategies Fund | Annual Report 2023 | 7 |
(Unaudited)
| • | The Fund’s outperformance relative to its benchmark was a result of positive security selection and sector allocation. |
| • | Long positions in the industrials, energy and consumer discretionary stocks were the top contributors to performance during the reporting period. |
| ○ | Within the industrials sector, positions in defense-related companies including Howmet Aerospace, Inc., BWX Technologies, Inc. and Curtiss-Wright Corp. outperformed as the Ukrainian conflict resulted in increased defense spending in the United States and Europe. |
| ○ | In the energy sector, positions in refiner Marathon Petroleum Corp. and oil services company Schlumberger NV outperformed during the 12-month period as they reported strong earnings and have been returning cash to shareholders. |
| ○ | Within the consumer discretionary sector, a position in AutoZone, Inc. contributed as the company continued to gain share with commercial customers resulting in better-than expected sales and earnings. |
| • | Short positions in the financials, real estate and information technology sectors were significant positive contributors. |
| ○ | In the financials sector, capital markets shorts were down sharply, led by investment banking company Credit Suisse Group AG. |
| ○ | In the real estate sector, a short position in WeWork, Inc., a company which provides coworking office space, was down significantly as free cash flow losses accelerated and cash on their balance sheet dwindled. |
| ○ | In the information technology sector, high P/E software shorts continued to see multiple compression as long-term interest rates moved higher. |
| • | Long positions in the information technology, real estate and financials sectors detracted from performance during the reporting period. |
| ○ | Within the information technology sector, IT services company Cognizant Technology Solutions Corp. underperformed due to declining sales. |
| ○ | In real estate, apartment real estate investment trust (REIT) operator Essex Property Trust, Inc. experienced softening in lease rates on the West Coast. |
| ○ | In the financial sector, regional banks Fifth Third Bancorp and KeyCorp detracted as future net interest margins were in doubt as funding costs rose. |
| • | Short positions in the consumer discretionary and industrials sectors were the top detractors to performance in our portion of the Fund during the period. |
| ○ | Within the consumer discretionary sector, shorts in fast-casual restaurants Wingstop, Inc. and Chipotle Mexican Grill, Inc. and household durable firm La-Z-Boy, Inc. detracted. |
| ○ | Within industrials, a short position in General Electric Co. rose on aerospace segment strength, but free cash flow at the company remained elusive. |
| 8 | Multi-Manager Directional Alternative Strategies Fund | Annual Report 2023 |
(Unaudited)
| • | The short portfolio was the largest detractor during the period. |
| • | Short positions within the industrials and consumer discretionary sectors detracted. |
| • | Within the long portfolio, positions in the consumer discretionary sector were the most notable detractors during the period. |
| • | Top individual detractors included a modest long position in Amazon.com, Inc., a long position in NIO, Inc., as well as a short position in Old Dominion Freight Line, Inc. |
| • | Long positions within utilities contributed. |
| • | Short positions in the real estate sector contributed. |
| • | Top individual contributors include long positions in Fiserv, Inc., Ferrari NV and Constellation Energy Corp. The position in Constellation Energy was closed during the period. |
| Multi-Manager Directional Alternative Strategies Fund | Annual Report 2023 | 9 |
(Unaudited)
| November 1, 2022 — April 30, 2023 | |||||||
| Account value at the beginning of the period ($) | Account value at the end of the period ($) | Expenses paid during the period ($) | Fund’s annualized expense ratio (%) | ||||
| Actual | Hypothetical | Actual | Hypothetical | Actual | Hypothetical | Actual | |
| Institutional Class | 1,000.00 | 1,000.00 | 1,002.00 | 1,011.72 | 12.81 | 12.87 | 2.61 |
| 10 | Multi-Manager Directional Alternative Strategies Fund | Annual Report 2023 |
April 30, 2023
| Common Stocks 86.6% | ||
| Issuer | Shares | Value ($) |
| Communication Services 3.5% | ||
| Diversified Telecommunication Services 0.4% | ||
| Bandwidth, Inc., Class A(a),(b) | 24,434 | 297,362 |
| Deutsche Telekom AG, Registered Shares | 26,991 | 650,800 |
| Total | 948,162 | |
| Entertainment 0.9% | ||
| Activision Blizzard, Inc.(a) | 10,413 | 809,194 |
| Bollore SA | 74,044 | 500,194 |
| Live Nation Entertainment, Inc.(a),(b) | 4,355 | 295,182 |
| Netflix, Inc.(a),(b) | 1,233 | 406,804 |
| Take-Two Interactive Software, Inc.(a) | 3,312 | 411,649 |
| Total | 2,423,023 | |
| Interactive Media & Services 0.9% | ||
| Alphabet, Inc., Class A(a),(b) | 14,869 | 1,596,038 |
| Alphabet, Inc., Class C(a),(b) | 3,666 | 396,735 |
| Meta Platforms, Inc., Class A(a) | 1,853 | 445,313 |
| Total | 2,438,086 | |
| Media 1.1% | ||
| Future PLC | 31,653 | 449,151 |
| Interpublic Group of Companies, Inc. (The)(b) | 13,605 | 486,107 |
| Nexstar Media Group, Inc., Class A | 8,611 | 1,493,578 |
| TEGNA, Inc. | 28,353 | 484,836 |
| Total | 2,913,672 | |
| Wireless Telecommunication Services 0.2% | ||
| T-Mobile US, Inc.(a) | 2,744 | 394,862 |
| Total Communication Services | 9,117,805 | |
| Consumer Discretionary 9.3% | ||
| Auto Components 0.0% | ||
| Holley, Inc.(a),(b) | 38,808 | 93,527 |
| Automobiles 0.7% | ||
| Mazda Motor Corp. | 139,000 | 1,257,879 |
| NIO, Inc., ADR(a) | 4,937 | 38,854 |
| Tesla, Inc.(a) | 3,641 | 598,253 |
| Total | 1,894,986 | |
| Common Stocks (continued) | ||
| Issuer | Shares | Value ($) |
| Broadline Retail 0.9% | ||
| Alibaba Group Holding Ltd., ADR(a) | 14,109 | 1,194,891 |
| Amazon.com, Inc.(a) | 3,696 | 389,743 |
| eBay, Inc. | 7,484 | 347,482 |
| MercadoLibre, Inc.(a),(b) | 306 | 390,912 |
| Total | 2,323,028 | |
| Distributors 0.1% | ||
| LKQ Corp.(b) | 5,860 | 338,298 |
| Diversified Consumer Services 0.3% | ||
| frontdoor, Inc.(a) | 10,244 | 280,276 |
| H&R Block, Inc. | 10,407 | 352,901 |
| Perdoceo Education Corp.(a),(b) | 1,681 | 21,820 |
| Total | 654,997 | |
| Hotels, Restaurants & Leisure 4.1% | ||
| Booking Holdings, Inc.(a),(b) | 621 | 1,668,199 |
| Boyd Gaming Corp. | 7,507 | 520,986 |
| Domino’s Pizza, Inc.(b) | 1,220 | 387,313 |
| Entain PLC | 23,316 | 424,847 |
| Flutter Entertainment PLC(a) | 4,045 | 810,609 |
| Genting Singapore Ltd. | 757,300 | 644,255 |
| International Game Technology PLC | 14,271 | 401,586 |
| Marriott International, Inc., Class A | 13,530 | 2,291,170 |
| Restaurant Brands International, Inc. | 9,095 | 637,832 |
| Royal Caribbean Cruises Ltd.(a) | 30,481 | 1,994,372 |
| Wyndham Hotels & Resorts, Inc. | 6,651 | 453,731 |
| Wynn Macau Ltd.(a) | 480,800 | 520,173 |
| Total | 10,755,073 | |
| Household Durables 0.8% | ||
| Garmin Ltd. | 1,384 | 135,867 |
| Mohawk Industries, Inc.(a) | 3,445 | 364,826 |
| NVR, Inc.(a) | 140 | 817,600 |
| Tempur Sealy International, Inc.(b) | 12,653 | 474,108 |
| Whirlpool Corp.(b) | 1,404 | 195,984 |
| Total | 1,988,385 | |
| Leisure Products 0.2% | ||
| Topgolf Callaway Brands Corp.(a),(b) | 17,775 | 394,072 |
| Multi-Manager Directional Alternative Strategies Fund | Annual Report 2023 | 11 |
April 30, 2023
| Common Stocks (continued) | ||
| Issuer | Shares | Value ($) |
| Specialty Retail 1.8% | ||
| Arhaus, Inc.(a),(b) | 21,491 | 172,358 |
| AutoZone, Inc.(a),(b) | 830 | 2,210,547 |
| O’Reilly Automotive, Inc.(a) | 629 | 576,988 |
| Ross Stores, Inc. | 5,817 | 620,848 |
| TJX Companies, Inc. (The) | 6,582 | 518,793 |
| ZOZO, Inc. | 20,800 | 437,723 |
| Total | 4,537,257 | |
| Textiles, Apparel & Luxury Goods 0.4% | ||
| lululemon athletica, Inc.(a),(b) | 2,790 | 1,060,005 |
| Total Consumer Discretionary | 24,039,628 | |
| Consumer Staples 7.8% | ||
| Beverages 1.6% | ||
| Brown-Forman Corp., Class B | 24,515 | 1,595,681 |
| Coca-Cola Europacific Partners PLC(b) | 22,525 | 1,452,187 |
| Keurig Dr. Pepper, Inc.(b) | 32,094 | 1,049,474 |
| Total | 4,097,342 | |
| Consumer Staples Distribution & Retail 2.9% | ||
| Albertsons Companies, Inc., Class A | 21,921 | 458,149 |
| Dollar General Corp. | 3,258 | 721,517 |
| Jeronimo Martins SGPS SA | 27,703 | 699,091 |
| Kesko OYJ, Class B | 9,170 | 191,175 |
| Kroger Co. (The) | 8,564 | 416,467 |
| U.S. Foods Holding Corp.(a),(b) | 14,227 | 546,317 |
| Walgreens Boots Alliance, Inc.(b) | 5,133 | 180,938 |
| Walmart, Inc. | 28,034 | 4,232,293 |
| Total | 7,445,947 | |
| Food Products 2.2% | ||
| Cal-Maine Foods, Inc.(b) | 10,170 | 483,075 |
| ConAgra Foods, Inc.(b) | 47,007 | 1,784,386 |
| Hershey Co. (The)(b) | 4,387 | 1,197,914 |
| Kraft Heinz Co. (The)(b) | 17,115 | 672,106 |
| Mowi ASA | 26,916 | 513,538 |
| Nomad Foods Ltd.(a) | 13,772 | 258,914 |
| WH Group Ltd. | 1,608,000 | 895,236 |
| Total | 5,805,169 | |
| Common Stocks (continued) | ||
| Issuer | Shares | Value ($) |
| Household Products 0.8% | ||
| Clorox Co. (The)(b) | 1,803 | 298,613 |
| Kimberly-Clark Corp.(b) | 7,399 | 1,072,041 |
| Procter & Gamble Co. (The) | 5,021 | 785,184 |
| Total | 2,155,838 | |
| Tobacco 0.3% | ||
| Philip Morris International, Inc. | 7,661 | 765,870 |
| Total Consumer Staples | 20,270,166 | |
| Energy 5.7% | ||
| Energy Equipment & Services 0.9% | ||
| Halliburton Co.(b) | 27,334 | 895,189 |
| Noble Corp PLC(a) | 15,881 | 610,624 |
| Schlumberger NV | 19,210 | 948,014 |
| Total | 2,453,827 | |
| Oil, Gas & Consumable Fuels 4.8% | ||
| ARC Resources Ltd. | 85,500 | 1,062,084 |
| BP PLC, ADR | 16,750 | 674,690 |
| Canadian Natural Resources Ltd. | 11,463 | 698,899 |
| Cenovus Energy, Inc. | 45,361 | 761,346 |
| HF Sinclair Corp.(b) | 21,025 | 927,413 |
| Kosmos Energy Ltd.(a),(b) | 50,863 | 325,523 |
| Marathon Petroleum Corp.(b) | 17,155 | 2,092,910 |
| MEG Energy Corp.(a) | 35,802 | 596,150 |
| Peabody Energy Corp.(a) | 20,708 | 497,406 |
| Phillips 66(b) | 12,042 | 1,192,158 |
| Saras SpA(a) | 231,136 | 298,834 |
| Shell PLC, ADR | 10,977 | 680,354 |
| Texas Pacific Land Corp.(b) | 229 | 338,382 |
| TORM PLC | 15,315 | 479,352 |
| Valero Energy Corp.(b) | 15,436 | 1,770,046 |
| Total | 12,395,547 | |
| Total Energy | 14,849,374 | |
| Financials 12.2% | ||
| Banks 3.3% | ||
| Bank of America Corp.(b) | 42,097 | 1,232,600 |
| DBS Group Holdings Ltd. | 6,200 | 153,202 |
| East West Bancorp, Inc.(b) | 8,522 | 440,502 |
| Fifth Third Bancorp(b) | 20,171 | 528,480 |
| 12 | Multi-Manager Directional Alternative Strategies Fund | Annual Report 2023 |
April 30, 2023
| Common Stocks (continued) | ||
| Issuer | Shares | Value ($) |
| Hana Financial Group, Inc. | 5,461 | 171,605 |
| Huntington Bancshares, Inc.(b) | 58,429 | 654,405 |
| ING Groep NV | 22,373 | 277,476 |
| JPMorgan Chase & Co.(b) | 10,070 | 1,392,077 |
| NatWest Group PLC | 81,285 | 267,761 |
| Nordea Bank Abp | 43,435 | 482,531 |
| Regions Financial Corp. | 12,865 | 234,915 |
| Truist Financial Corp. | 15,922 | 518,739 |
| UniCredit SpA | 36,655 | 726,336 |
| United Overseas Bank Ltd. | 12,000 | 254,856 |
| Wells Fargo & Co. | 32,970 | 1,310,557 |
| Total | 8,646,042 | |
| Capital Markets 0.9% | ||
| Charles Schwab Corp. (The) | 3,750 | 195,900 |
| Goldman Sachs Group, Inc. (The) | 875 | 300,510 |
| Hargreaves Lansdown PLC | 41,128 | 416,390 |
| Partners Group Holding AG | 1,111 | 1,078,485 |
| S&P Global, Inc.(b) | 382 | 138,506 |
| UBS Group AG, Registered Shares | 12,166 | 246,361 |
| Total | 2,376,152 | |
| Consumer Finance 0.3% | ||
| Discover Financial Services | 3,956 | 409,327 |
| SLM Corp.(b) | 15,065 | 226,276 |
| Synchrony Financial(b) | 2,590 | 76,431 |
| Total | 712,034 | |
| Financial Services 5.0% | ||
| Berkshire Hathaway, Inc., Class B(a) | 10,791 | 3,545,383 |
| Fiserv, Inc.(a),(b) | 37,041 | 4,523,447 |
| FleetCor Technologies, Inc.(a) | 3,426 | 732,890 |
| Industrivarden AB, Class C | 25,633 | 731,989 |
| MasterCard, Inc., Class A(b) | 3,686 | 1,400,791 |
| Visa, Inc., Class A(b) | 9,244 | 2,151,356 |
| Total | 13,085,856 | |
| Insurance 2.7% | ||
| Allstate Corp. (The)(b) | 4,037 | 467,323 |
| American International Group, Inc.(b) | 2,768 | 146,815 |
| Aon PLC, Class A | 1,742 | 566,464 |
| Arthur J Gallagher & Co. | 1,795 | 373,468 |
| Common Stocks (continued) | ||
| Issuer | Shares | Value ($) |
| Chubb Ltd. | 1,731 | 348,900 |
| Everest Re Group Ltd. | 1,222 | 461,916 |
| Fairfax Financial Holdings Ltd. | 600 | 419,294 |
| Hartford Financial Services Group, Inc. (The)(b) | 2,043 | 145,033 |
| MetLife, Inc.(b) | 15,922 | 976,496 |
| Prudential Financial, Inc.(b) | 14,092 | 1,226,004 |
| RenaissanceRe Holdings Ltd. | 3,155 | 679,618 |
| Sampo OYJ, Class A | 8,786 | 445,581 |
| White Mountains Insurance Group Ltd. | 169 | 242,032 |
| WR Berkley Corp. | 7,413 | 436,774 |
| Total | 6,935,718 | |
| Total Financials | 31,755,802 | |
| Health Care 13.5% | ||
| Biotechnology 2.9% | ||
| AbbVie, Inc.(b) | 8,138 | 1,229,815 |
| Amgen, Inc. | 3,931 | 942,418 |
| Arcturus Therapeutics Holdings, Inc.(a),(b) | 4,537 | 120,775 |
| Catalyst Pharmaceuticals, Inc.(a),(b) | 21,626 | 344,286 |
| Eagle Pharmaceuticals, Inc.(a),(b) | 11,047 | 310,200 |
| Gilead Sciences, Inc.(b) | 19,795 | 1,627,347 |
| Halozyme Therapeutics, Inc.(a),(b) | 7,466 | 239,883 |
| Incyte Corp.(a),(b) | 7,168 | 533,371 |
| Kiniksa Pharmaceuticals(a),(b) | 27,381 | 294,346 |
| United Therapeutics Corp.(a),(b) | 2,772 | 637,920 |
| Vertex Pharmaceuticals, Inc.(a),(b) | 3,050 | 1,039,226 |
| Vir Biotechnology, Inc.(a),(b) | 4,063 | 102,184 |
| Total | 7,421,771 | |
| Health Care Equipment & Supplies 1.0% | ||
| Abbott Laboratories(b) | 503 | 55,566 |
| Boston Scientific Corp.(a) | 4,730 | 246,528 |
| Envista Holdings Corp.(a),(b) | 8,128 | 312,847 |
| IDEXX Laboratories, Inc.(a),(b) | 837 | 411,938 |
| Medtronic PLC | 2,414 | 219,553 |
| Stryker Corp.(b) | 727 | 217,845 |
| Zimmer Biomet Holdings, Inc. | 8,681 | 1,201,798 |
| Total | 2,666,075 | |
| Multi-Manager Directional Alternative Strategies Fund | Annual Report 2023 | 13 |
April 30, 2023
| Common Stocks (continued) | ||
| Issuer | Shares | Value ($) |
| Health Care Providers & Services 5.8% | ||
| Amedisys, Inc.(a) | 846 | 67,934 |
| AmerisourceBergen Corp. | 455 | 75,917 |
| Centene Corp.(a),(b) | 12,338 | 850,458 |
| Cigna Group (The)(b) | 6,281 | 1,590,915 |
| CVS Health Corp.(b) | 13,079 | 958,821 |
| Elevance Health, Inc.(b) | 1,355 | 635,021 |
| HCA Healthcare, Inc. | 1,080 | 310,316 |
| Humana, Inc. | 4,801 | 2,546,883 |
| Molina Healthcare, Inc.(a) | 362 | 107,836 |
| R1 RCM, Inc.(a) | 12,226 | 190,603 |
| UnitedHealth Group, Inc.(b) | 15,882 | 7,815,373 |
| Total | 15,150,077 | |
| Life Sciences Tools & Services 1.1% | ||
| Avantor, Inc.(a),(b) | 19,434 | 378,574 |
| ICON PLC(a) | 1,818 | 350,311 |
| IQVIA Holdings, Inc.(a) | 1,656 | 311,709 |
| Mettler-Toledo International, Inc.(a),(b) | 8 | 11,932 |
| Sartorius Stedim Biotech | 4,732 | 1,267,696 |
| Sotera Health Co.(a) | 11,051 | 185,325 |
| Syneos Health, Inc.(a) | 969 | 38,043 |
| Thermo Fisher Scientific, Inc. | 333 | 184,782 |
| Total | 2,728,372 | |
| Pharmaceuticals 2.7% | ||
| AstraZeneca PLC | 2,962 | 435,897 |
| Bristol-Myers Squibb Co.(b) | 16,501 | 1,101,772 |
| Harmony Biosciences Holdings, Inc.(a),(b) | 21,802 | 702,896 |
| Johnson & Johnson(b) | 3,086 | 505,178 |
| Merck & Co., Inc. | 548 | 63,278 |
| Nippon Shinyaku Co., Ltd. | 10,000 | 457,287 |
| Novo Nordisk A/S, Class B | 12,010 | 1,997,918 |
| Otsuka Holdings Co., Ltd. | 9,600 | 326,599 |
| Pfizer, Inc. | 2,060 | 80,113 |
| Roche Holding AG | 1,188 | 402,021 |
| Sanofi | 5,342 | 575,698 |
| Common Stocks (continued) | ||
| Issuer | Shares | Value ($) |
| SIGA Technologies, Inc.(b) | 21,545 | 125,607 |
| UCB SA | 2,376 | 220,867 |
| Total | 6,995,131 | |
| Total Health Care | 34,961,426 | |
| Industrials 11.2% | ||
| Aerospace & Defense 1.6% | ||
| Airbus Group SE | 3,097 | 433,687 |
| Axon Enterprise, Inc.(a),(b) | 1,179 | 248,427 |
| BWX Technologies, Inc. | 8,283 | 534,916 |
| Curtiss-Wright Corp. | 2,145 | 364,285 |
| Hexcel Corp. | 5,775 | 416,262 |
| Howmet Aerospace, Inc.(b) | 15,229 | 674,493 |
| Lockheed Martin Corp.(b) | 2,010 | 933,545 |
| Textron, Inc. | 7,035 | 470,923 |
| Total | 4,076,538 | |
| Air Freight & Logistics 0.1% | ||
| United Parcel Service, Inc., Class B(b) | 863 | 155,176 |
| Building Products 0.8% | ||
| Advanced Drainage Systems, Inc. | 1,538 | 131,837 |
| Allegion PLC | 3,901 | 430,983 |
| Carlisle Companies, Inc. | 1,664 | 359,174 |
| Lennox International, Inc. | 2,584 | 728,456 |
| Masco Corp. | 5,288 | 282,961 |
| Resideo Technologies, Inc.(a),(b) | 13,793 | 245,515 |
| Total | 2,178,926 | |
| Commercial Services & Supplies 0.9% | ||
| Brink’s Co. (The) | 3,991 | 250,834 |
| Clean Harbors, Inc.(a) | 4,647 | 674,559 |
| Copart, Inc.(a) | 6,679 | 527,975 |
| Ritchie Bros. Auctioneers, Inc. | 200 | 11,443 |
| Rollins, Inc.(b) | 19,516 | 824,551 |
| Total | 2,289,362 | |
| Construction & Engineering 0.7% | ||
| ACS Actividades de Construccion y Servicios SA | 23,361 | 803,207 |
| Eiffage SA | 3,582 | 426,344 |
| Taisei Corp. | 4,900 | 166,653 |
| Valmont Industries, Inc. | 1,322 | 384,120 |
| Total | 1,780,324 | |
| 14 | Multi-Manager Directional Alternative Strategies Fund | Annual Report 2023 |
April 30, 2023
| Common Stocks (continued) | ||
| Issuer | Shares | Value ($) |
| Electrical Equipment 1.1% | ||
| Acuity Brands, Inc. | 2,330 | 366,696 |
| AMETEK, Inc. | 4,484 | 618,478 |
| Eaton Corp. PLC | 2,894 | 483,645 |
| Encore Wire Corp.(b) | 931 | 145,543 |
| Hubbell, Inc.(b) | 1,979 | 532,984 |
| nVent Electric PLC | 12,143 | 509,156 |
| Sensata Technologies Holding | 4,158 | 180,665 |
| Total | 2,837,167 | |
| Industrial Conglomerates 0.3% | ||
| CK Hutchison Holdings Ltd. | 53,500 | 357,670 |
| Siemens AG, Registered Shares | 3,052 | 503,068 |
| Total | 860,738 | |
| Machinery 3.1% | ||
| AGCO Corp. | 2,067 | 256,184 |
| Allison Transmission Holdings, Inc. | 7,959 | 388,320 |
| Andritz AG | 6,549 | 425,330 |
| Caterpillar, Inc.(b) | 4,230 | 925,524 |
| Daimler Truck Holding AG(a) | 12,973 | 428,667 |
| Deere & Co. | 1,122 | 424,138 |
| Dover Corp. | 2,718 | 397,263 |
| Fortive Corp. | 8,261 | 521,187 |
| Mitsubishi Heavy Industries Ltd. | 24,100 | 913,878 |
| Otis Worldwide Corp. | 6,264 | 534,319 |
| PACCAR, Inc.(b) | 15,428 | 1,152,317 |
| Parker-Hannifin Corp. | 2,100 | 682,248 |
| Volvo AB | 6,272 | 132,817 |
| Wabash National Corp.(b) | 20,466 | 525,362 |
| Westinghouse Air Brake Technologies Corp.(b) | 4,684 | 457,486 |
| Total | 8,165,040 | |
| Marine Transportation 0.2% | ||
| AP Moller - Maersk A/S, Class A | 313 | 559,391 |
| Passenger Airlines 0.1% | ||
| Deutsche Lufthansa AG, Registered Shares(a) | 30,306 | 325,787 |
| Professional Services 1.7% | ||
| ASGN, Inc.(a) | 4,970 | 355,802 |
| BayCurrent Consulting, Inc. | 29,100 | 1,011,516 |
| Concentrix Corp. | 3,815 | 368,186 |
| Common Stocks (continued) | ||
| Issuer | Shares | Value ($) |
| FTI Consulting, Inc.(a),(b) | 3,805 | 686,803 |
| Leidos Holdings, Inc. | 3,863 | 360,263 |
| Science Applications International Corp. | 7,659 | 781,448 |
| SS&C Technologies Holdings, Inc. | 8,948 | 523,816 |
| TransUnion(b) | 4,896 | 336,894 |
| Total | 4,424,728 | |
| Trading Companies & Distributors 0.5% | ||
| Ferguson PLC | 2,931 | 412,744 |
| Titan Machinery, Inc.(a),(b) | 7,461 | 233,902 |
| WESCO International, Inc. | 3,795 | 546,480 |
| Total | 1,193,126 | |
| Transportation Infrastructure 0.1% | ||
| Grupo Aeroportuario del Pacifico SAB de CV | 18,200 | 323,611 |
| Total Industrials | 29,169,914 | |
| Information Technology 13.1% | ||
| Communications Equipment 0.4% | ||
| Cisco Systems, Inc.(b) | 18,190 | 859,478 |
| Juniper Networks, Inc. | 8,301 | 250,275 |
| Total | 1,109,753 | |
| Electronic Equipment, Instruments & Components 0.6% | ||
| Arrow Electronics, Inc.(a),(b) | 2,129 | 243,622 |
| Flex Ltd.(a),(b) | 29,953 | 616,133 |
| Jabil, Inc.(b) | 10,061 | 786,267 |
| Total | 1,646,022 | |
| IT Services 1.2% | ||
| Accenture PLC, Class A(b) | 2,517 | 705,490 |
| Amdocs Ltd. | 2,062 | 188,157 |
| Capgemini SE | 2,962 | 540,142 |
| Cognizant Technology Solutions Corp., Class A | 6,698 | 399,938 |
| VeriSign, Inc.(a),(b) | 6,585 | 1,460,553 |
| Total | 3,294,280 | |
| Semiconductors & Semiconductor Equipment 6.0% | ||
| Advanced Micro Devices, Inc.(a) | 4,380 | 391,441 |
| Applied Materials, Inc. | 3,331 | 376,503 |
| ASML Holding NV | 545 | 345,864 |
| Axcelis Technologies, Inc.(a),(b) | 1,874 | 221,694 |
| Broadcom, Inc.(b) | 1,808 | 1,132,712 |
| First Solar, Inc.(a),(b) | 5,174 | 944,669 |
| Multi-Manager Directional Alternative Strategies Fund | Annual Report 2023 | 15 |
April 30, 2023
| Common Stocks (continued) | ||
| Issuer | Shares | Value ($) |
| KLA Corp. | 583 | 225,353 |
| Lam Research Corp. | 780 | 408,782 |
| Lattice Semiconductor Corp.(a),(b) | 2,031 | 161,871 |
| Microchip Technology, Inc.(b) | 14,616 | 1,066,822 |
| Micron Technology, Inc. | 5,547 | 357,005 |
| NVIDIA Corp.(b) | 11,516 | 3,195,575 |
| NXP Semiconductors NV | 20,580 | 3,369,769 |
| QUALCOMM, Inc.(b) | 2,743 | 320,382 |
| Taiwan Semiconductor Manufacturing Co., Ltd., ADR | 32,560 | 2,744,808 |
| Teradyne, Inc. | 2,721 | 248,645 |
| Total | 15,511,895 | |
| Software 2.7% | ||
| Adobe, Inc.(a),(b) | 3,610 | 1,362,992 |
| Check Point Software Technologies Ltd.(a) | 4,585 | 583,946 |
| Constellation Software, Inc. | 200 | 391,456 |
| Dropbox, Inc., Class A(a),(b) | 38,455 | 782,175 |
| Fair Isaac Corp.(a),(b) | 550 | 400,372 |
| Gen Digital, Inc.(b) | 16,541 | 292,279 |
| Microsoft Corp.(b) | 8,781 | 2,698,050 |
| Oracle Corp.(b) | 4,645 | 439,974 |
| Total | 6,951,244 | |
| Technology Hardware, Storage & Peripherals 2.2% | ||
| Apple, Inc.(b) | 12,657 | 2,147,640 |
| Dell Technologies, Inc. | 12,241 | 532,361 |
| NetApp, Inc.(b) | 20,591 | 1,294,968 |
| Seagate Technology Holdings PLC | 27,550 | 1,619,113 |
| Western Digital Corp.(a) | 1,629 | 56,103 |
| Total | 5,650,185 | |
| Total Information Technology | 34,163,379 | |
| Materials 3.0% | ||
| Chemicals 2.0% | ||
| Albemarle Corp.(b) | 3,835 | 711,239 |
| Corteva, Inc.(b) | 14,536 | 888,440 |
| DuPont de Nemours, Inc.(b) | 6,531 | 455,341 |
| EMS-Chemie Holding AG, Registered Shares | 556 | 456,644 |
| FMC Corp. | 5,299 | 654,851 |
| Olin Corp. | 3,490 | 193,346 |
| Common Stocks (continued) | ||
| Issuer | Shares | Value ($) |
| Solvay SA | 14,542 | 1,745,311 |
| Tosoh Corp. | 4,700 | 62,794 |
| Total | 5,167,966 | |
| Construction Materials 0.0% | ||
| Holcim Ltd., Registered Shares(a) | 129 | 8,523 |
| Containers & Packaging 0.2% | ||
| Avery Dennison Corp. | 2,350 | 410,028 |
| Packaging Corp. of America | 200 | 27,052 |
| Total | 437,080 | |
| Metals & Mining 0.8% | ||
| Glencore PLC | 69,825 | 412,151 |
| Norsk Hydro ASA | 52,862 | 389,015 |
| Pilbara Minerals Ltd. | 141,125 | 401,672 |
| Rio Tinto Ltd. | 5,013 | 375,998 |
| Steel Dynamics, Inc.(b) | 5,837 | 606,756 |
| Total | 2,185,592 | |
| Total Materials | 7,799,161 | |
| Real Estate 2.1% | ||
| Hotel & Resort REITs 0.1% | ||
| Host Hotels & Resorts, Inc.(b) | 13,275 | 214,657 |
| Industrial REITs 0.1% | ||
| Americold Realty Trust, Inc.(b) | 10,221 | 302,439 |
| Real Estate Management & Development 0.1% | ||
| Swire Pacific Ltd., Class A | 45,500 | 361,185 |
| Residential REITs 0.2% | ||
| Equity LifeStyle Properties, Inc. | 3,085 | 212,556 |
| Essex Property Trust, Inc. | 1,679 | 368,927 |
| Total | 581,483 | |
| Retail REITs 0.7% | ||
| Link REIT (The) | 237,800 | 1,555,424 |
| Regency Centers Corp.(b) | 3,951 | 242,710 |
| Total | 1,798,134 | |
| 16 | Multi-Manager Directional Alternative Strategies Fund | Annual Report 2023 |
April 30, 2023
| Common Stocks (continued) | ||
| Issuer | Shares | Value ($) |
| Specialized REITs 0.9% | ||
| Lamar Advertising Co., Class A | 4,128 | 436,247 |
| Public Storage(b) | 4,851 | 1,430,221 |
| VICI Properties, Inc. | 10,263 | 348,326 |
| Total | 2,214,794 | |
| Total Real Estate | 5,472,692 | |
| Utilities 5.2% | ||
| Electric Utilities 4.2% | ||
| American Electric Power Co., Inc.(b) | 2,957 | 273,286 |
| Chubu Electric Power Co., Inc. | 197,800 | 2,205,938 |
| Elia Group SA/NV | 1,058 | 145,073 |
| Entergy Corp. | 4,816 | 518,105 |
| FirstEnergy Corp. | 10,089 | 401,542 |
| Kansai Electric Power Co., Inc. (The) | 190,800 | 2,059,632 |
| NextEra Energy, Inc. | 15,034 | 1,152,055 |
| NRG Energy, Inc.(b) | 252 | 8,611 |
| PG&E Corp.(a) | 241,690 | 4,135,316 |
| Total | 10,899,558 | |
| Gas Utilities 0.3% | ||
| Naturgy Energy Group SA | 16,049 | 499,706 |
| Tokyo Gas Co., Ltd. | 7,600 | 155,671 |
| Total | 655,377 | |
| Independent Power and Renewable Electricity Producers 0.4% | ||
| AES Corp. (The) | 15,624 | 369,664 |
| Brookfield Renewable Corp., Class A | 14,100 | 471,128 |
| Clearway Energy, Inc., Class A(b) | 11,381 | 329,821 |
| Total | 1,170,613 | |
| Multi-Utilities 0.3% | ||
| CenterPoint Energy, Inc. | 15,859 | 483,224 |
| Consolidated Edison, Inc.(b) | 2,359 | 232,291 |
| Total | 715,515 | |
| Total Utilities | 13,441,063 | |
| Total Common Stocks (Cost $203,642,686) | 225,040,410 | |
| Exchange-Traded Equity Funds 1.2% | ||
| Shares | Value ($) | |
| U.S. Large Cap 1.2% | ||
| SPDR S&P 500 ETF Trust | 7,683 | 3,195,590 |
| Total Exchange-Traded Equity Funds (Cost $3,112,637) | 3,195,590 | |
| Preferred Stocks 0.1% | |||
| Issuer | Shares | Value ($) | |
| Consumer Discretionary 0.1% | |||
| Automobiles 0.1% | |||
| BMW AG | 1,717 | 182,508 | |
| Total Consumer Discretionary | 182,508 | ||
| Total Preferred Stocks (Cost $129,055) | 182,508 | ||
| Put Option Contracts Purchased 0.1% | ||||
| Value ($) | ||||
| (Cost $236,506) | 100,820 | |||
| Money Market Funds 12.8% | ||
| Shares | Value ($) | |
| Columbia Short-Term Cash Fund, 5.046%(c),(d) | 33,260,630 | 33,247,325 |
| Total Money Market Funds (Cost $33,243,643) | 33,247,325 | |
| Total Investments (Cost $240,364,527) | 261,766,653 | |
| Investments in Securities Sold Short | ||
| Common Stocks (30.2)% | ||
| Issuer | Shares | Value ($) |
| Communication Services (1.2)% | ||
| Diversified Telecommunication Services (0.3)% | ||
| AT&T, Inc. | (14,661) | (259,060) |
| Proximus SADP | (7,948) | (67,753) |
| Telia Co. AB | (129,140) | (359,548) |
| Total | (686,361) | |
| Entertainment (0.3)% | ||
| Lions Gate Entertainment Corp.(a) | (22,755) | (261,683) |
| Madison Square Garden Entertainment Corp.(a) | (2,363) | (76,254) |
| Roblox Corp. Class A(a) | (8,074) | (287,434) |
| Warner Music Group Corp., Class A | (5,407) | (164,751) |
| Total | (790,122) | |
| Multi-Manager Directional Alternative Strategies Fund | Annual Report 2023 | 17 |
April 30, 2023
| Common Stocks (continued) | ||
| Issuer | Shares | Value ($) |
| Interactive Media & Services (0.3)% | ||
| Angi, Inc.(a) | (80,923) | (186,123) |
| Rumble, Inc.(a) | (6,685) | (53,213) |
| Snap, Inc.(a) | (59,493) | (518,184) |
| Total | (757,520) | |
| Media (0.3)% | ||
| Clear Channel Outdoor Holdings, Inc.(a) | (126,403) | (160,532) |
| iHeartMedia, Inc., Class A(a) | (13,584) | (47,137) |
| ViacomCBS, Inc., Class B | (23,692) | (552,734) |
| Total | (760,403) | |
| Total Communication Services | (2,994,406) | |
| Consumer Discretionary (5.3)% | ||
| Auto Components (0.3)% | ||
| Nokian Renkaat OYJ | (40,770) | (397,196) |
| QuantumScape Corp.(a) | (58,254) | (407,778) |
| Total | (804,974) | |
| Automobiles (0.4)% | ||
| Lucid Group, Inc.(a) | (80,619) | (640,115) |
| Rivian Automotive, Inc.(a) | (33,649) | (431,380) |
| Total | (1,071,495) | |
| Broadline Retail (0.2)% | ||
| Etsy, Inc.(a) | (1,655) | (167,205) |
| Rakuten Group, Inc. | (85,800) | (427,966) |
| Total | (595,171) | |
| Diversified Consumer Services (0.1)% | ||
| Pearson PLC | (16,468) | (183,220) |
| WW International, Inc.(a) | (26,178) | (218,586) |
| Total | (401,806) | |
| Hotels, Restaurants & Leisure (1.7)% | ||
| Accor SA(a) | (5,702) | (202,290) |
| Carnival Corp.(a) | (27,262) | (251,083) |
| Cheesecake Factory, Inc. (The) | (5,409) | (182,229) |
| Chipotle Mexican Grill, Inc.(a) | (153) | (316,346) |
| Choice Hotels International, Inc. | (2,843) | (362,539) |
| Delivery Hero SE(a) | (25,930) | (1,036,453) |
| DoorDash, Inc., Class A(a) | (1,251) | (76,549) |
| Genius Sports Ltd.(a) | (16,530) | (61,326) |
| Golden Entertainment, Inc., ADR(a) | (3,940) | (166,110) |
| Common Stocks (continued) | ||
| Issuer | Shares | Value ($) |
| Hyatt Hotels Corp., Class A(a) | (2,258) | (258,089) |
| Krispy Kreme, Inc. | (8,704) | (133,868) |
| Life Time Group Holdings, Inc.(a) | (12,249) | (254,657) |
| Portillo’s, Inc., Class A(a) | (6,249) | (135,103) |
| Sabre Corp.(a) | (43,368) | (173,472) |
| Scientific Games Corp.(a) | (1,981) | (119,435) |
| Shake Shack, Inc., Class A(a) | (2,374) | (130,119) |
| Soho House & Co., Inc., Class A(a) | (22,864) | (149,302) |
| Wingstop, Inc. | (1,689) | (337,986) |
| Total | (4,346,956) | |
| Household Durables (0.6)% | ||
| Electrolux AB, Class B | (6,428) | (96,967) |
| LGI Homes, Inc.(a) | (2,541) | (301,871) |
| Mohawk Industries, Inc.(a) | (11,945) | (1,264,976) |
| Total | (1,663,814) | |
| Leisure Products (0.2)% | ||
| Acushnet Holdings Corp. | (5,378) | (269,599) |
| Mattel, Inc.(a) | (7,737) | (139,266) |
| Total | (408,865) | |
| Specialty Retail (1.4)% | ||
| Dick’s Sporting Goods, Inc. | (3,480) | (504,635) |
| Five Below, Inc.(a) | (1,214) | (239,595) |
| Floor & Decor Holdings, Inc., Class A(a) | (3,517) | (349,379) |
| Home Depot, Inc. (The) | (4,710) | (1,415,543) |
| Lowe’s Companies, Inc. | (1,346) | (279,739) |
| Overstock.com, Inc.(a) | (17,966) | (365,788) |
| Revolve Group, Inc.(a) | (3,983) | (82,249) |
| RH(a) | (363) | (92,612) |
| Stitch Fix, Inc., Class A(a) | (13,661) | (46,584) |
| Wayfair, Inc., Class A(a) | (1,796) | (62,555) |
| Williams-Sonoma Inc | (774) | (93,685) |
| Total | (3,532,364) | |
| Textiles, Apparel & Luxury Goods (0.4)% | ||
| Adidas AG | (5,495) | (967,702) |
| Lululemon Athletica, Inc.(a) | (169) | (64,208) |
| Total | (1,031,910) | |
| Total Consumer Discretionary | (13,857,355) | |
| 18 | Multi-Manager Directional Alternative Strategies Fund | Annual Report 2023 |
April 30, 2023
| Common Stocks (continued) | ||
| Issuer | Shares | Value ($) |
| Consumer Staples (1.6)% | ||
| Beverages (0.2)% | ||
| Coca-Cola Bottlers Japan Holdings, Inc. | (24,200) | (260,785) |
| National Beverage Corp.(a) | (6,413) | (318,726) |
| Total | (579,511) | |
| Consumer Staples Distribution & Retail (0.2)% | ||
| Walgreens Boots Alliance, Inc. | (11,883) | (418,876) |
| Food Products (0.6)% | ||
| B&G Foods, Inc. | (14,013) | (224,769) |
| Beyond Meat, Inc.(a) | (6,095) | (82,526) |
| Freshpet, Inc.(a) | (4,308) | (297,123) |
| Hormel Foods Corp. | (8,646) | (349,644) |
| Kagome Co., Ltd. | (4,900) | (119,015) |
| Kellogg Co. | (2,650) | (184,891) |
| McCormick & Co., Inc. | (3,692) | (324,342) |
| Total | (1,582,310) | |
| Household Products (0.6)% | ||
| Central Garden & Pet Co., Class A(a) | (7,466) | (263,774) |
| Clorox Co. (The) | (1,540) | (255,055) |
| Kimberly-Clark Corp. | (4,237) | (613,899) |
| WD-40 Co. | (2,188) | (416,595) |
| Total | (1,549,323) | |
| Personal Care Products (0.0)% | ||
| Euglena Co., Ltd.(a) | (8,700) | (56,984) |
| Total Consumer Staples | (4,187,004) | |
| Energy (2.1)% | ||
| Energy Equipment & Services (0.0)% | ||
| Petrofac Ltd.(a) | (32,896) | (29,539) |
| Oil, Gas & Consumable Fuels (2.1)% | ||
| Callon Petroleum Co.(a) | (7,672) | (254,250) |
| Cameco Corp. | (28,000) | (769,827) |
| Capricorn Energy PLC(a) | (71,919) | (198,303) |
| Chesapeake Energy Corp. | (3,601) | (297,731) |
| Comstock Resources, Inc. | (25,588) | (294,262) |
| Denison Mines Corp.(a) | (27,200) | (29,913) |
| Energy Fuels, Inc.(a) | (85,700) | (487,058) |
| Gevo, Inc.(a) | (225,410) | (261,475) |
| Kinetik Holdings, Inc. | (3,732) | (114,946) |
| Common Stocks (continued) | ||
| Issuer | Shares | Value ($) |
| Matador Resources Co. | (5,366) | (263,095) |
| NexGen Energy Ltd.(a) | (165,400) | (643,361) |
| NextDecade Corp.(a) | (60,547) | (377,208) |
| Occidental Petroleum Corp. | (9,469) | (582,627) |
| Permian Resources Corp. | (19,094) | (199,532) |
| Tellurian, Inc.(a) | (205,633) | (291,999) |
| Vital Energy, Inc.(a) | (5,219) | (242,840) |
| Total | (5,308,427) | |
| Total Energy | (5,337,966) | |
| Financials (4.3)% | ||
| Banks (1.5)% | ||
| Bank of Hawaii Corp. | (7,344) | (355,670) |
| Commerce Bancshares, Inc. | (9,465) | (528,603) |
| Commonwealth Bank of Australia | (9,379) | (620,666) |
| Community Bank System, Inc. | (9,334) | (466,327) |
| Cullen/Frost Bankers, Inc. | (2,145) | (236,486) |
| CVB Financial Corp. | (4,016) | (60,120) |
| First Financial Bankshares, Inc. | (17,490) | (511,757) |
| Glacier Bancorp, Inc. | (9,651) | (320,703) |
| Hang Seng Bank Ltd. | (36,200) | (536,587) |
| United Bankshares, Inc. | (5,670) | (187,847) |
| Westamerica Bancorporation | (1,042) | (42,211) |
| Total | (3,866,977) | |
| Capital Markets (0.8)% | ||
| Ashmore Group PLC | (118,312) | (362,650) |
| B. Riley Financial, Inc. | (12,990) | (409,185) |
| Coinbase Global, Inc., Class A(a) | (613) | (32,973) |
| Credit Suisse Group AG, Registered Shares | (151,146) | (136,008) |
| Deutsche Bank AG | (17,648) | (193,999) |
| Moody’s Corp. | (1,493) | (467,488) |
| T Rowe Price Group, Inc. | (4,966) | (557,831) |
| Total | (2,160,134) | |
| Consumer Finance (0.3)% | ||
| Ally Financial, Inc. | (11,994) | (316,402) |
| Credit Acceptance Corp.(a) | (544) | (266,288) |
| SoFi Technologies, Inc.(a) | (37,105) | (231,164) |
| Total | (813,854) | |
| Multi-Manager Directional Alternative Strategies Fund | Annual Report 2023 | 19 |
April 30, 2023
| Common Stocks (continued) | ||
| Issuer | Shares | Value ($) |
| Financial Services (0.5)% | ||
| Affirm Holdings, Inc.(a) | (3,848) | (37,941) |
| Kinnevik AB, Class B(a) | (4,334) | (71,199) |
| Rocket Cos, Inc., Class A(a) | (14,091) | (125,551) |
| Toast, Inc. Class A(a) | (50,525) | (919,555) |
| Total | (1,154,246) | |
| Insurance (1.2)% | ||
| Aegon NV | (221,523) | (1,010,749) |
| Brown & Brown, Inc. | (2,512) | (161,748) |
| Cincinnati Financial Corp. | (2,226) | (236,935) |
| Erie Indemnity Co., Class A | (929) | (201,899) |
| Kinsale Capital Group, Inc. | (963) | (314,622) |
| Prudential PLC | (35,025) | (535,919) |
| RLI Corp. | (3,300) | (458,865) |
| Selective Insurance Group, Inc. | (1,223) | (117,812) |
| Trupanion, Inc.(a) | (2,026) | (71,133) |
| Total | (3,109,682) | |
| Total Financials | (11,104,893) | |
| Health Care (2.6)% | ||
| Biotechnology (0.7)% | ||
| Alnylam Pharmaceuticals, Inc.(a) | (3,700) | (737,040) |
| Argenx SE(a) | (1,218) | (469,841) |
| Ascendis Pharma A/S ADR(a) | (1,592) | (111,376) |
| Celldex Therapeutics, Inc.(a) | (2,912) | (91,553) |
| Idorsia Ltd.(a) | (8,322) | (80,428) |
| Karuna Therapeutics, Inc.(a) | (699) | (138,710) |
| Mirati Therapeutics, Inc.(a) | (1,175) | (52,064) |
| Myriad Genetics, Inc.(a) | (6,677) | (142,153) |
| Total | (1,823,165) | |
| Health Care Equipment & Supplies (0.4)% | ||
| Ambu A/S(a) | (5,280) | (83,954) |
| Figs, Inc.(a) | (18,686) | (134,539) |
| Glaukos Corp.(a) | (2,613) | (124,144) |
| Neogen Corp.(a) | (10,759) | (185,270) |
| Novocure Ltd.(a) | (5,870) | (386,833) |
| Tandem Diabetes Care, Inc.(a) | (2,680) | (106,074) |
| Total | (1,020,814) | |
| Common Stocks (continued) | ||
| Issuer | Shares | Value ($) |
| Health Care Providers & Services (0.1)% | ||
| Guardant Health, Inc.(a) | (3,547) | (80,020) |
| ModivCare, Inc.(a) | (1,376) | (87,514) |
| Total | (167,534) | |
| Health Care Technology (0.2)% | ||
| Definitive Healthcare Corp.(a) | (12,214) | (130,690) |
| Doximity, Inc., Class A(a) | (5,389) | (198,046) |
| GoodRx Holdings, Inc., Class A(a) | (27,750) | (129,592) |
| Teladoc Health, Inc.(a) | (7,069) | (187,541) |
| Total | (645,869) | |
| Life Sciences Tools & Services (0.4)% | ||
| Oxford Nanopore Technologies PLC(a) | (28,353) | (81,808) |
| Waters Corp.(a) | (2,632) | (790,547) |
| West Pharmaceutical Services | (411) | (148,470) |
| Total | (1,020,825) | |
| Pharmaceuticals (0.8)% | ||
| Cassava Sciences, Inc.(a) | (12,646) | (293,640) |
| Corcept Therapeutics, Inc.(a) | (5,658) | (127,475) |
| Eisai Co., Ltd. | (17,300) | (998,267) |
| Hikma Pharmaceuticals PLC | (1,395) | (32,309) |
| Intra-Cellular Therapies, Inc.(a) | (2,984) | (185,456) |
| Nippon Shinyaku Co., Ltd. | (2,700) | (123,467) |
| Revance Therapeutics, Inc.(a) | (3,942) | (125,474) |
| Ventyx Biosciences, Inc.(a) | (2,870) | (107,912) |
| Total | (1,994,000) | |
| Total Health Care | (6,672,207) | |
| Industrials (6.5)% | ||
| Aerospace & Defense (0.8)% | ||
| AeroVironment, Inc.(a) | (2,633) | (265,117) |
| Airbus Group SE | (2,531) | (354,427) |
| Boeing Co. (The)(a) | (4,638) | (959,046) |
| Kratos Defense & Security Solutions, Inc.(a) | (33,651) | (434,098) |
| Total | (2,012,688) | |
| Air Freight & Logistics (0.5)% | ||
| FedEx Corp. | (3,598) | (819,553) |
| InPost SA(a) | (46,265) | (496,555) |
| Total | (1,316,108) | |
| 20 | Multi-Manager Directional Alternative Strategies Fund | Annual Report 2023 |
April 30, 2023
| Common Stocks (continued) | ||
| Issuer | Shares | Value ($) |
| Building Products (0.9)% | ||
| Allegion PLC | (803) | (88,715) |
| AZEK Co., Inc. (The)(a) | (20,956) | (568,746) |
| Hayward Holdings, Inc.(a) | (33,687) | (405,592) |
| Johnson Controls International PLC | (6,591) | (394,405) |
| Masco Corp. | (18,315) | (980,036) |
| Total | (2,437,494) | |
| Commercial Services & Supplies (0.1)% | ||
| Healthcare Services Group, Inc. | (10,484) | (163,655) |
| Construction & Engineering (0.4)% | ||
| Ameresco, Inc., Class A(a) | (5,669) | (235,830) |
| Ferrovial SA | (14,004) | (439,073) |
| WorleyParsons Ltd. | (28,976) | (291,136) |
| Total | (966,039) | |
| Electrical Equipment (1.0)% | ||
| Array Technologies, Inc.(a) | (23,104) | (472,477) |
| Generac Holdings, Inc.(a) | (4,194) | (428,711) |
| Nidec Corp. | (4,700) | (232,566) |
| NuScale Power Corp.(a) | (19,273) | (170,952) |
| Plug Power, Inc.(a) | (80,416) | (726,156) |
| PowerCell Sweden AB(a) | (25,953) | (220,300) |
| Regal Rexnord Corp. | (2,957) | (384,883) |
| Vestas Wind Systems A/S(a) | (3,486) | (96,460) |
| Total | (2,732,505) | |
| Ground Transportation (0.6)% | ||
| JB Hunt Transport Services, Inc. | (8,091) | (1,418,271) |
| U-Haul Holding Co. | (3,790) | (205,039) |
| Total | (1,623,310) | |
| Industrial Conglomerates (0.3)% | ||
| General Electric Co. | (5,459) | (540,277) |
| Investment AB Latour, Class B | (6,584) | (142,555) |
| Total | (682,832) | |
| Machinery (1.7)% | ||
| Husqvarna AB | (55,308) | (477,376) |
| Kennametal, Inc. | (15,204) | (394,696) |
| Makita Corp. | (15,600) | (440,087) |
| Oshkosh Corp. | (4,359) | (333,550) |
| Pentair PLC | (7,176) | (416,782) |
| Common Stocks (continued) | ||
| Issuer | Shares | Value ($) |
| Proto Labs, Inc.(a) | (7,014) | (201,793) |
| Stanley Black & Decker, Inc. | (21,323) | (1,841,028) |
| VAT Group AG | (1,037) | (365,843) |
| Total | (4,471,155) | |
| Passenger Airlines (0.2)% | ||
| Joby Aviation, Inc.(a) | (121,700) | (526,961) |
| Total Industrials | (16,932,747) | |
| Information Technology (3.2)% | ||
| Communications Equipment (0.0)% | ||
| Infinera Corp.(a) | (21,802) | (138,007) |
| Electronic Equipment, Instruments & Components (0.3)% | ||
| Cognex Corp. | (6,389) | (304,692) |
| Itron, Inc.(a) | (4,566) | (243,824) |
| Novanta, Inc.(a) | (1,976) | (302,012) |
| Total | (850,528) | |
| Semiconductors & Semiconductor Equipment (1.1)% | ||
| Entegris, Inc. | (8,453) | (633,299) |
| GCL Technology Holdings Ltd.(a) | (1,519,000) | (381,407) |
| Micron Technology, Inc. | (15,448) | (994,233) |
| REC Silicon ASA(a) | (2,517) | (3,786) |
| Wolfspeed, Inc.(a) | (17,244) | (802,708) |
| Total | (2,815,433) | |
| Software (1.2)% | ||
| Appfolio, Inc., Class A(a) | (2,606) | (363,850) |
| BlackBerry Ltd.(a) | (53,327) | (208,508) |
| Blackline, Inc.(a) | (5,301) | (295,319) |
| BrainChip Holdings Ltd.(a) | (1,373,946) | (371,928) |
| Ceridian HCM Holding, Inc.(a) | (2,473) | (156,986) |
| Guidewire Software, Inc.(a) | (4,631) | (352,836) |
| Jamf Holding Corp.(a) | (19,404) | (367,124) |
| Palantir Technologies, Inc., Class A(a) | (55,534) | (430,388) |
| Unity Software, Inc.(a) | (11,980) | (323,101) |
| Wisetech Global Ltd. | (6,422) | (294,164) |
| Total | (3,164,204) | |
| Technology Hardware, Storage & Peripherals (0.6)% | ||
| Western Digital Corp.(a) | (41,987) | (1,446,032) |
| Total Information Technology | (8,414,204) | |
| Multi-Manager Directional Alternative Strategies Fund | Annual Report 2023 | 21 |
April 30, 2023
| Common Stocks (continued) | ||
| Issuer | Shares | Value ($) |
| Materials (1.9)% | ||
| Chemicals (1.1)% | ||
| CF Industries Holdings, Inc. | (19,158) | (1,371,330) |
| Huntsman Corp. | (7,319) | (196,076) |
| JSR Corp. | (17,300) | (401,420) |
| Mitsui Chemicals, Inc. | (11,300) | (285,901) |
| Sherwin-Williams Co. (The) | (2,078) | (493,608) |
| Sociedad Quimica y Minera de Chile SA, ADR | (1,995) | (134,622) |
| Total | (2,882,957) | |
| Construction Materials (0.0)% | ||
| Siam Cement PCL (The), NVDR | (13,200) | (121,629) |
| Containers & Packaging (0.1)% | ||
| Ball Corp. | (2,664) | (141,672) |
| Metals & Mining (0.7)% | ||
| Alcoa Corp. | (23,740) | (881,704) |
| Allkem Ltd.(a) | (43,627) | (358,287) |
| Filo Mining Corp.(a) | (10,500) | (174,683) |
| Kumba Iron Ore Ltd. | (8,256) | (200,759) |
| Leo Lithium Ltd.(a) | (112,261) | (39,428) |
| Southern Copper Corp. | (1,810) | (139,062) |
| Total | (1,793,923) | |
| Total Materials | (4,940,181) | |
| Real Estate (1.4)% | ||
| Diversified REITs (0.1)% | ||
| Nomura Real Estate Master Fund, Inc. | (171) | (200,088) |
| Industrial REITs (0.1)% | ||
| Rexford Industrial Realty, Inc. | (1,331) | (74,230) |
| Segro PLC | (18,801) | (197,935) |
| Total | (272,165) | |
| Office REITs (0.6)% | ||
| Alexandria Real Estate Equities, Inc. | (1,178) | (146,284) |
| Boston Properties, Inc. | (14,295) | (762,781) |
| SL Green Realty Corp. | (8,750) | (207,113) |
| Vornado Realty Trust | (39,325) | (590,268) |
| Total | (1,706,446) | |
| Common Stocks (continued) | ||
| Issuer | Shares | Value ($) |
| Real Estate Management & Development (0.2)% | ||
| Aroundtown SA | (9,073) | (12,361) |
| Howard Hughes Corp. (The)(a) | (3,774) | (291,995) |
| IWG PLC(a) | (8,218) | (17,551) |
| Zillow Group, Inc., Class C(a) | (3,585) | (156,091) |
| Total | (477,998) | |
| Residential REITs (0.2)% | ||
| AvalonBay Communities, Inc. | (1,379) | (248,730) |
| Camden Property Trust | (1,497) | (164,745) |
| Mid-America Apartment Communities, Inc. | (1,357) | (208,707) |
| Total | (622,182) | |
| Retail REITs (0.1)% | ||
| Unibail-Rodamco-Westfield(a) | (3,110) | (166,777) |
| Specialized REITs (0.1)% | ||
| Digital Realty Trust, Inc. | (2,173) | (215,453) |
| Total Real Estate | (3,661,109) | |
| Utilities (0.1)% | ||
| Electric Utilities (0.1)% | ||
| Avangrid, Inc. | (8,705) | (350,463) |
| Total Utilities | (350,463) | |
| Total Common Stocks (Proceeds $84,817,354) | (78,452,535) | |
| Total Investments in Securities Sold Short (Proceeds $84,817,354) | (78,452,535) | |
| Total Investments in Securities, Net of Securities Sold Short | 183,314,118 | |
| Other Assets & Liabilities, Net | 76,448,881 | |
| Net Assets | 259,762,999 | |
| 22 | Multi-Manager Directional Alternative Strategies Fund | Annual Report 2023 |
April 30, 2023
| Put option contracts purchased | ||||||||
| Description | Counterparty | Trading currency | Notional amount | Number of contracts | Exercise price/Rate | Expiration date | Cost ($) | Value ($) |
| NASDAQ 100 Index | Citi | USD | 13,245,990 | 10 | 11,800.00 | 06/16/2023 | 154,419 | 65,450 |
| S&P 500 Index | Citi | USD | 3,752,532 | 9 | 4,000.00 | 06/16/2023 | 82,087 | 35,370 |
| Total | 236,506 | 100,820 | ||||||
| Call option contracts written | ||||||||
| Description | Counterparty | Trading currency | Notional amount | Number of contracts | Exercise price/Rate | Expiration date | Premium received ($) | Value ($) |
| Allstate Corp. | Morgan Stanley | USD | (231,520) | (20) | 120.00 | 5/19/2023 | (4,763) | (3,150) |
| AutoZone, Inc. | Morgan Stanley | USD | (266,331) | (1) | 2,750.00 | 5/19/2023 | (2,609) | (1,470) |
| Canadian Natural Resources Ltd. | Morgan Stanley | USD | (524,342) | (86) | 55.00 | 6/16/2023 | (62,734) | (59,770) |
| Restaurant Brands International, Inc. | Morgan Stanley | USD | (385,715) | (55) | 70.00 | 5/19/2023 | (6,104) | (9,900) |
| Total | (76,210) | (74,290) | ||||||
| Put option contracts written | ||||||||
| Description | Counterparty | Trading currency | Notional amount | Number of contracts | Exercise price/Rate | Expiration date | Premium received ($) | Value ($) |
| Revolve Group, Inc. | Morgan Stanley | USD | (16,520) | (8) | 20.00 | 05/19/2023 | (816) | (1,020) |
| Revolve Group, Inc. | Morgan Stanley | USD | (16,520) | (8) | 22.50 | 05/19/2023 | (1,656) | (2,120) |
| Total | (2,472) | (3,140) | ||||||
| Total return swap contracts | ||||||||||||
| Fund receives | Fund pays | Payment frequency | Counterparty | Maturity date | Notional currency | Notional amount | Value ($) | Periodic payments receivable (payable) ($) | Upfront payments ($) | Upfront receipts ($) | Unrealized appreciation ($) | Unrealized depreciation ($) |
| Total return on Samsung Electronics Co., Ltd. | 1-Day Overnight Fed Funds Effective Rate plus 0.800% | Monthly | Macquarie | 09/19/2023 | USD | 179,291 | (1,960) | 430 | — | — | — | (1,530) |
| Reference index and values for swap contracts as of period end | ||
| Reference index | Reference rate | |
| 1-Day Overnight Fed Funds Effective Rate | Overnight Federal Funds Effective Rate | 4.830% |
| (a) | Non-income producing investment. |
| (b) | This security or a portion of this security has been pledged as collateral in connection with investments sold short and/or derivative contracts. |
| (c) | The rate shown is the seven-day current annualized yield at April 30, 2023. |
| (d) | As defined in the Investment Company Act of 1940, as amended, an affiliated company is one in which the Fund owns 5% or more of the company’s outstanding voting securities, or a company which is under common ownership or control with the Fund. The value of the holdings and transactions in these affiliated companies during the year ended April 30, 2023 are as follows: |
| Affiliated issuers | Beginning of period($) | Purchases($) | Sales($) | Net change in unrealized appreciation (depreciation)($) | End of period($) | Realized gain (loss)($) | Dividends($) | End of period shares |
| Columbia Short-Term Cash Fund, 5.046% | ||||||||
| 42,562,256 | 358,579,883 | (367,895,143) | 329 | 33,247,325 | (5,074) | 1,062,787 | 33,260,630 | |
| Multi-Manager Directional Alternative Strategies Fund | Annual Report 2023 | 23 |
April 30, 2023
| ADR | American Depositary Receipt |
| NVDR | Non-Voting Depositary Receipt |
| USD | US Dollar |
| ■ | Level 1 — Valuations based on quoted prices for investments in active markets that the Fund has the ability to access at the measurement date. Valuation adjustments are not applied to Level 1 investments. |
| ■ | Level 2 — Valuations based on other significant observable inputs (including quoted prices for similar securities, interest rates, prepayment speeds, credit risks, etc.). |
| ■ | Level 3 — Valuations based on significant unobservable inputs (including the Fund’s own assumptions and judgment in determining the fair value of investments). |
| Level 1 ($) | Level 2 ($) | Level 3 ($) | Total ($) | |
| Investments in Securities | ||||
| Common Stocks | ||||
| Communication Services | 7,517,660 | 1,600,145 | — | 9,117,805 |
| Consumer Discretionary | 19,944,142 | 4,095,486 | — | 24,039,628 |
| Consumer Staples | 17,971,126 | 2,299,040 | — | 20,270,166 |
| Energy | 14,071,188 | 778,186 | — | 14,849,374 |
| Financials | 26,749,590 | 5,006,212 | — | 31,755,802 |
| Health Care | 29,277,443 | 5,683,983 | — | 34,961,426 |
| Industrials | 22,681,899 | 6,488,015 | — | 29,169,914 |
| Information Technology | 33,277,373 | 886,006 | — | 34,163,379 |
| Materials | 3,947,053 | 3,852,108 | — | 7,799,161 |
| 24 | Multi-Manager Directional Alternative Strategies Fund | Annual Report 2023 |
April 30, 2023
| Level 1 ($) | Level 2 ($) | Level 3 ($) | Total ($) | |
| Real Estate | 3,556,083 | 1,916,609 | — | 5,472,692 |
| Utilities | 8,375,043 | 5,066,020 | — | 13,441,063 |
| Total Common Stocks | 187,368,600 | 37,671,810 | — | 225,040,410 |
| Exchange-Traded Equity Funds | 3,195,590 | — | — | 3,195,590 |
| Preferred Stocks | ||||
| Consumer Discretionary | — | 182,508 | — | 182,508 |
| Total Preferred Stocks | — | 182,508 | — | 182,508 |
| Put Option Contracts Purchased | 100,820 | — | — | 100,820 |
| Money Market Funds | 33,247,325 | — | — | 33,247,325 |
| Total Investments in Securities | 223,912,335 | 37,854,318 | — | 261,766,653 |
| Investments in Securities Sold Short | ||||
| Common Stocks | ||||
| Communication Services | (2,567,105) | (427,301) | — | (2,994,406) |
| Consumer Discretionary | (10,545,561) | (3,311,794) | — | (13,857,355) |
| Consumer Staples | (3,750,220) | (436,784) | — | (4,187,004) |
| Energy | (5,110,124) | (227,842) | — | (5,337,966) |
| Financials | (7,637,116) | (3,467,777) | — | (11,104,893) |
| Health Care | (4,802,133) | (1,870,074) | — | (6,672,207) |
| Industrials | (13,376,369) | (3,556,378) | — | (16,932,747) |
| Information Technology | (7,362,919) | (1,051,285) | — | (8,414,204) |
| Materials | (3,532,757) | (1,407,424) | — | (4,940,181) |
| Real Estate | (3,066,397) | (594,712) | — | (3,661,109) |
| Utilities | (350,463) | — | — | (350,463) |
| Total Common Stocks | (62,101,164) | (16,351,371) | — | (78,452,535) |
| Total Investments in Securities Sold Short | (62,101,164) | (16,351,371) | — | (78,452,535) |
| Total Investments in Securities, Net of Securities Sold Short | 161,811,171 | 21,502,947 | — | 183,314,118 |
| Investments in Derivatives | ||||
| Liability | ||||
| Call Option Contracts Written | (74,290) | — | — | (74,290) |
| Put Option Contracts Written | (3,140) | — | — | (3,140) |
| Swap Contracts | — | (1,530) | — | (1,530) |
| Total | 161,733,741 | 21,501,417 | — | 183,235,158 |
| Multi-Manager Directional Alternative Strategies Fund | Annual Report 2023 | 25 |
April 30, 2023
| Assets | |
| Investments in securities, at value | |
| Unaffiliated issuers (cost $206,884,378) | $228,418,508 |
| Affiliated issuers (cost $33,243,643) | 33,247,325 |
| Option contracts purchased (cost $236,506) | 100,820 |
| Cash collateral held at broker for: | |
| Swap contracts | 60,000 |
| Securities sold short | 82,688,690 |
| Receivable for: | |
| Investments sold | 1,106,896 |
| Capital shares sold | 295,353 |
| Dividends | 374,592 |
| Interest | 173,401 |
| Foreign tax reclaims | 301,445 |
| Expense reimbursement due from Investment Manager | 2,341 |
| Prepaid expenses | 2,260 |
| Trustees’ deferred compensation plan | 36,456 |
| Total assets | 346,808,087 |
| Liabilities | |
| Securities sold short, at value (proceeds $84,817,354) | 78,452,535 |
| Option contracts written, at value (premiums received $78,682) | 77,430 |
| Due to custodian | 1,976 |
| Foreign currency (cost $6,999) | 7,063 |
| Unrealized depreciation on swap contracts | 1,530 |
| Payable for: | |
| Investments purchased | 7,726,352 |
| Capital shares purchased | 359,129 |
| Dividends and interest on securities sold short | 79,922 |
| Management services fees | 11,356 |
| Transfer agent fees | 44,355 |
| Compensation of board members | 14,999 |
| Other expenses | 231,985 |
| Trustees’ deferred compensation plan | 36,456 |
| Total liabilities | 87,045,088 |
| Net assets applicable to outstanding capital stock | $259,762,999 |
| Represented by | |
| Paid in capital | 249,228,323 |
| Total distributable earnings (loss) | 10,534,676 |
| Total - representing net assets applicable to outstanding capital stock | $259,762,999 |
| Institutional Class | |
| Net assets | $259,762,999 |
| Shares outstanding | 40,492,136 |
| Net asset value per share | $6.42 |
| 26 | Multi-Manager Directional Alternative Strategies Fund | Annual Report 2023 |
Year Ended April 30, 2023
| Net investment income | |
| Income: | |
| Dividends — unaffiliated issuers | $5,393,849 |
| Dividends — affiliated issuers | 1,062,787 |
| Interest | 1,545,065 |
| Interfund lending | 1,945 |
| Foreign taxes withheld | (242,011) |
| Total income | 7,761,635 |
| Expenses: | |
| Management services fees | 4,179,165 |
| Transfer agent fees | |
| Institutional Class | 584,508 |
| Compensation of board members | 18,409 |
| Custodian fees | 387,250 |
| Printing and postage fees | 73,293 |
| Registration fees | 43,530 |
| Accounting services fees | 83,996 |
| Legal fees | 16,077 |
| Dividends and interest on securities sold short | 1,338,908 |
| Interest on interfund lending | 27 |
| Compensation of chief compliance officer | 51 |
| Other | 108,643 |
| Total expenses | 6,833,857 |
| Fees waived or expenses reimbursed by Investment Manager and its affiliates | (688,882) |
| Total net expenses | 6,144,975 |
| Net investment income | 1,616,660 |
| Realized and unrealized gain (loss) — net | |
| Net realized gain (loss) on: | |
| Investments — unaffiliated issuers | (11,649,837) |
| Investments — affiliated issuers | (5,074) |
| Foreign currency translations | (1,007,325) |
| Option contracts purchased | (59,877) |
| Option contracts written | 154,222 |
| Securities sold short | 6,562,210 |
| Swap contracts | 142 |
| Net realized loss | (6,005,539) |
| Net change in unrealized appreciation (depreciation) on: | |
| Investments — unaffiliated issuers | 4,030,972 |
| Investments — affiliated issuers | 329 |
| Foreign currency translations | 760,790 |
| Option contracts purchased | (135,686) |
| Option contracts written | 1,252 |
| Securities sold short | (9,288,658) |
| Swap contracts | (26,652) |
| Net change in unrealized appreciation (depreciation) | (4,657,653) |
| Net realized and unrealized loss | (10,663,192) |
| Net decrease in net assets resulting from operations | $(9,046,532) |
| Multi-Manager Directional Alternative Strategies Fund | Annual Report 2023 | 27 |
| Year Ended April 30, 2023 | Year Ended April 30, 2022 | |
| Operations | ||
| Net investment income (loss) | $1,616,660 | $(2,699,534) |
| Net realized gain (loss) | (6,005,539) | 43,103,719 |
| Net change in unrealized appreciation (depreciation) | (4,657,653) | (11,258,958) |
| Net increase (decrease) in net assets resulting from operations | (9,046,532) | 29,145,227 |
| Distributions to shareholders | ||
| Net investment income and net realized gains | ||
| Institutional Class | (27,498,020) | (19,622,766) |
| Total distributions to shareholders | (27,498,020) | (19,622,766) |
| Increase (decrease) in net assets from capital stock activity | 29,607,127 | (21,172,260) |
| Total decrease in net assets | (6,937,425) | (11,649,799) |
| Net assets at beginning of year | 266,700,424 | 278,350,223 |
| Net assets at end of year | $259,762,999 | $266,700,424 |
| Year Ended | Year Ended | |||
| April 30, 2023 | April 30, 2022 | |||
| Shares | Dollars ($) | Shares | Dollars ($) | |
| Capital stock activity | ||||
| Institutional Class | ||||
| Subscriptions | 10,452,906 | 73,487,604 | 7,824,223 | 58,217,586 |
| Distributions reinvested | 4,198,171 | 27,498,020 | 2,767,668 | 19,622,766 |
| Redemptions | (10,094,867) | (71,378,497) | (13,156,101) | (99,012,612) |
| Net increase (decrease) | 4,556,210 | 29,607,127 | (2,564,210) | (21,172,260) |
| Total net increase (decrease) | 4,556,210 | 29,607,127 | (2,564,210) | (21,172,260) |
| 28 | Multi-Manager Directional Alternative Strategies Fund | Annual Report 2023 |
| Institutional Class | Year Ended April 30, | ||||
| 2023 | 2022 | 2021 | 2020 | 2019 | |
| Per share data | |||||
| Net asset value, beginning of period | $7.42 | $7.23 | $6.00 | $6.78 | $10.82 |
| Income (loss) from investment operations: | |||||
| Net investment income (loss) | 0.04 | (0.07) | (0.08) | (0.01) | (0.01) |
| Net realized and unrealized gain (loss) | (0.28) | 0.80 | 1.31 | (0.72) | (0.80) |
| Total from investment operations | (0.24) | 0.73 | 1.23 | (0.73) | (0.81) |
| Distributions to shareholders | |||||
| Distributions from net investment income | (0.15) | (0.08) | — | — | (0.06) |
| Distributions from net realized gains | (0.61) | (0.46) | — | (0.05) | (3.17) |
| Total distributions to shareholders | (0.76) | (0.54) | — | (0.05) | (3.23) |
| Net asset value, end of period | $6.42 | $7.42 | $7.23 | $6.00 | $6.78 |
| Total return | (3.44%) | 10.42% | 20.50% | (10.81%) | (5.65%) |
| Ratios to average net assets | |||||
| Total gross expenses(a) | 2.62%(b),(c) | 2.61%(b),(c),(d) | 2.90%(b),(c),(d) | 2.31%(b),(d) | 2.16%(b),(c),(d) |
| Total net expenses(a),(e) | 2.35%(b),(c) | 2.43%(b),(c),(d) | 2.71%(b),(c),(d) | 2.19%(b),(d) | 2.12%(b),(c),(d) |
| Net investment income (loss) | 0.62% | (1.00%) | (1.31%) | (0.14%) | (0.11%) |
| Supplemental data | |||||
| Net assets, end of period (in thousands) | $259,763 | $266,700 | $278,350 | $221,159 | $251,976 |
| Portfolio turnover | 399% | 323% | 254% | 197% | 146%(f) |
| Notes to Financial Highlights | |
| (a) | In addition to the fees and expenses that the Fund bears directly, the Fund indirectly bears a pro rata share of the fees and expenses of any other funds in which it invests. Such indirect expenses are not included in the Fund’s reported expense ratios. |
| (b) | Ratios include dividends and interest on securities sold short. If dividends and interest on securities sold short had been excluded, expenses would have been lower by: |
| Class | 4/30/2023 | 4/30/2022 | 4/30/2021 | 4/30/2020 | 4/30/2019 |
| Institutional Class | 0.51% | 0.59% | 0.87% | 0.32% | 0.19% |
| (c) | Ratios include interfund lending expense which is less than 0.01%. |
| (d) | Ratios include interest on collateral expense which is less than 0.01%. |
| (e) | Total net expenses include the impact of certain fee waivers/expense reimbursements made by the Investment Manager and certain of its affiliates, if applicable. |
| (f) | The rate for the year ended April 30, 2019, as disclosed in the April 30, 2020 and 2019 financial statements was calculated and presented incorrectly and has been corrected. |
| Multi-Manager Directional Alternative Strategies Fund | Annual Report 2023 | 29 |
April 30, 2023
| 30 | Multi-Manager Directional Alternative Strategies Fund | Annual Report 2023 |
April 30, 2023
| Multi-Manager Directional Alternative Strategies Fund | Annual Report 2023 | 31 |
April 30, 2023
| 32 | Multi-Manager Directional Alternative Strategies Fund | Annual Report 2023 |
April 30, 2023
| Multi-Manager Directional Alternative Strategies Fund | Annual Report 2023 | 33 |
April 30, 2023
| Asset derivatives | ||
| Risk exposure category | Statement of assets and liabilities location | Fair value ($) |
| Equity risk | Investments, at value — Option contracts purchased | 100,820 |
| Liability derivatives | ||
| Risk exposure category | Statement of assets and liabilities location | Fair value ($) |
| Equity risk | Option contracts written, at value | 77,430 |
| Equity risk | Component of total distributable earnings (loss) — unrealized depreciation on swap contracts | 1,530* |
| Total | 78,960 |
| * | Includes cumulative appreciation (depreciation) as reported in the tables following the Portfolio of Investments. Only the current day’s variation margin is reported in receivables or payables in the Statement of Assets and Liabilities. |
| Amount of realized gain (loss) on derivatives recognized in income | ||||
| Risk exposure category | Option contracts purchased ($) | Option contracts written ($) | Swap contracts ($) | Total ($) |
| Equity risk | (59,877) | 154,222 | 142 | 94,487 |
| Change in unrealized appreciation (depreciation) on derivatives recognized in income | ||||
| Risk exposure category | Option contracts purchased ($) | Option contracts written ($) | Swap contracts ($) | Total ($) |
| Equity risk | (135,686) | 1,252 | (26,652) | (161,086) |
| Derivative instrument | Average value ($) |
| Option contracts purchased | 19,182* |
| Option contracts written | (50,205)** |
| Derivative instrument | Average unrealized appreciation ($)** | Average unrealized depreciation ($)** |
| Total return swap contracts | 9,591 | (383) |
| * | Based on the ending daily outstanding amounts for the year ended April 30, 2023. |
| ** | Based on the ending quarterly outstanding amounts for the year ended April 30, 2023. |
| 34 | Multi-Manager Directional Alternative Strategies Fund | Annual Report 2023 |
April 30, 2023
| Citi ($) | JPMorgan ($) | Macquarie ($) | Morgan Stanley ($) | Total ($) | |
| Assets | |||||
| Put option contracts purchased | 100,820 | - | - | - | 100,820 |
| Total assets | 100,820 | - | - | - | 100,820 |
| Liabilities | |||||
| Call option contracts written | - | - | - | 74,290 | 74,290 |
| Put option contracts written | - | - | - | 3,140 | 3,140 |
| OTC total return swap contracts (a) | - | - | 1,530 | - | 1,530 |
| Securities borrowed | 13,395,670 | 4,223,012 | - | 60,833,853 | 78,452,535 |
| Total liabilities | 13,395,670 | 4,223,012 | 1,530 | 60,911,283 | 78,531,495 |
| Total financial and derivative net assets | (13,294,850) | (4,223,012) | (1,530) | (60,911,283) | (78,430,675) |
| Total collateral received (pledged) (b) | (13,294,850) | (4,223,012) | (1,530) | (60,911,283) | (78,430,675) |
| Net amount (c) | - | - | - | - | - |
| (a) | Over-the-Counter (OTC) swap contracts are presented at market value plus periodic payments receivable (payable), which is comprised of unrealized appreciation, unrealized depreciation, upfront payments and upfront receipts. |
| (b) | In some instances, the actual collateral received and/or pledged may be more than the amount shown due to overcollateralization. |
| (c) | Represents the net amount due from/(to) counterparties in the event of default. |
| Multi-Manager Directional Alternative Strategies Fund | Annual Report 2023 | 35 |
April 30, 2023
| 36 | Multi-Manager Directional Alternative Strategies Fund | Annual Report 2023 |
April 30, 2023
| Multi-Manager Directional Alternative Strategies Fund | Annual Report 2023 | 37 |
April 30, 2023
| Effective rate (%) | |
| Institutional Class | 0.22 |
| Fee rate(s) contractual through August 31, 2023 | |
| Institutional Class | 1.84% |
| Undistributed net investment income ($) | Accumulated net realized (loss) ($) | Paid in capital ($) |
| (613,694) | 613,693 | 1 |
| 38 | Multi-Manager Directional Alternative Strategies Fund | Annual Report 2023 |
April 30, 2023
| Year Ended April 30, 2023 | Year Ended April 30, 2022 | ||||
| Ordinary income ($) | Long-term capital gains ($) | Total ($) | Ordinary income ($) | Long-term capital gains ($) | Total ($) |
| 15,634,193 | 11,863,827 | 27,498,020 | 2,950,230 | 16,672,536 | 19,622,766 |
| Undistributed ordinary income ($) | Undistributed long-term capital gains ($) | Capital loss carryforwards ($) | Net unrealized appreciation ($) |
| 938,228 | — | (7,018,378) | 16,746,141 |
| Federal tax cost ($) | Gross unrealized appreciation ($) | Gross unrealized (depreciation) ($) | Net unrealized appreciation ($) |
| 166,489,017 | 25,676,220 | (8,930,079) | 16,746,141 |
| No expiration short-term ($) | No expiration long-term ($) | Total ($) | Utilized ($) |
| (7,018,378) | — | (7,018,378) | — |
| Multi-Manager Directional Alternative Strategies Fund | Annual Report 2023 | 39 |
April 30, 2023
| Borrower or lender | Average loan balance ($) | Weighted average interest rate (%) | Number of days with outstanding loans |
| Borrower | 200,000 | 4.85 | 1 |
| Lender | 2,375,000 | 4.32 | 8 |
| 40 | Multi-Manager Directional Alternative Strategies Fund | Annual Report 2023 |
April 30, 2023
| Multi-Manager Directional Alternative Strategies Fund | Annual Report 2023 | 41 |
April 30, 2023
| 42 | Multi-Manager Directional Alternative Strategies Fund | Annual Report 2023 |
| Multi-Manager Directional Alternative Strategies Fund | Annual Report 2023 | 43 |
| Qualified dividend income | Dividends received deduction | Section 199A dividends |
| 4.45% | 2.85% | 0.08% |
| Name, address, year of birth | Position held with the Columbia Funds and length of service | Principal occupation(s) during past five years and other relevant professional experience | Number of Funds in the Columbia Funds Complex* overseen | Other directorships held by Trustee during the past five years and other relevant Board experience |
| George S. Batejan c/o Columbia Management Investment Advisers, LLC 290 Congress Street Boston, MA 02210 1954 | Trustee since 2017 | Executive Vice President, Global Head of Technology and Operations, Janus Capital Group, Inc., 2010-2016 | 174 | Former Chairman of the Board, NICSA (National Investment Company Services Association) (Executive Committee, Nominating Committee and Governance Committee), 2014-2016; former Director, Intech Investment Management, 2011-2016; former Board Member, Metro Denver Chamber of Commerce, 2015-2016; former Advisory Board Member, University of Colorado Business School, 2015-2018; former Board Member, Chase Bank International, 1993-1994 |
| 44 | Multi-Manager Directional Alternative Strategies Fund | Annual Report 2023 |
(Unaudited)
Independent trustees (continued)
| Name, address, year of birth | Position held with the Columbia Funds and length of service | Principal occupation(s) during past five years and other relevant professional experience | Number of Funds in the Columbia Funds Complex* overseen | Other directorships held by Trustee during the past five years and other relevant Board experience |
| Kathleen Blatz c/o Columbia Management Investment Advisers, LLC 290 Congress Street Boston, MA 02210 1954 | Trustee since 2006 | Attorney, specializing in arbitration and mediation; Chief Justice, Minnesota Supreme Court, 1998-2006; Associate Justice, Minnesota Supreme Court, 1996-1998; Fourth Judicial District Court Judge, Hennepin County, 1994-1996; Attorney in private practice and public service, 1984-1993; State Representative, Minnesota House of Representatives, 1979-1993, which included service on the Tax and Financial Institutions and Insurance Committees; Member and Interim Chair, Minnesota Sports Facilities Authority, January-July 2017; Interim President and Chief Executive Officer, Blue Cross and Blue Shield of Minnesota (health care insurance), February-July 2018, April-October 2021 | 174 | Former Trustee, Blue Cross and Blue Shield of Minnesota, 2009-2021 (Chair of the Business Development Committee, 2014-2017; Chair of the Governance Committee, 2017-2019); former Member and Chair of the Board, Minnesota Sports Facilities Authority, January 2017-July 2017; former Director, Robina Foundation, 2009-2020 (Chair, 2014-2020); Director, Richard M. Schulze Family Foundation, since 2021 |
| Pamela G. Carlton c/o Columbia Management Investment Advisers, LLC 290 Congress Street Boston, MA 02210 1954 | Chair since 2023; Trustee since 2007 | President, Springboard — Partners in Cross Cultural Leadership (consulting company), since 2003; Managing Director of US Equity Research, JP Morgan Chase, 1999-2003; Director of US Equity Research, Chase Asset Management, 1996-1999; Co-Director Latin America Research, 1993-1996, COO Global Research, 1992-1996, Co-Director of US Research, 1991-1992, Investment Banker, 1982-1991, Morgan Stanley; Attorney, Cleary Gottlieb Steen & Hamilton LLP, 1980-1982 | 174 | Trustee, New York Presbyterian Hospital Board, since 1996; Director, DR Bank (Audit Committee) since 2017; Director, Evercore Inc. (Audit Committee, Nominating and Governance Committee), since 2019; Director, Apollo Commercial Real Estate Finance, Inc. (Chair, Nominating and Governance Committee) (financial services), since 2021; the Governing Council of the Independent Directors Council (IDC), since 2021 |
| Janet Langford Carrig c/o Columbia Management Investment Advisers, LLC 290 Congress Street Boston, MA 02210 1957 | Trustee since 1996 | Senior Vice President, General Counsel and Corporate Secretary, ConocoPhillips (independent energy company), September 2007-October 2018 | 174 | Director, EQT Corporation (natural gas producer), since 2019; former Director, Whiting Petroleum Corporation (independent oil and gas company), 2020-2022 |
| J. Kevin Connaughton c/o Columbia Management Investment Advisers, LLC 290 Congress Street Boston, MA 02210 1964 | Trustee since 2020 | CEO and President, RhodeWay Financial (non-profit financial planning firm), since December 2022; Member, FINRA National Adjudicatory Council, since January 2020; Adjunct Professor of Finance, Bentley University since January 2018; Consultant to Independent Trustees of CFVIT and CFST I from March 2016 to June 2020 with respect to CFVIT and to December 2020 with respect to CFST I; Managing Director and General Manager of Mutual Fund Products, Columbia Management Investment Advisers, LLC, May 2010-February 2015; President, Columbia Funds, 2008-2015; and senior officer of Columbia Funds and affiliated funds, 2003-2015 | 172 | Former Director, The Autism Project, March 2015-December 2021; former Member of the Investment Committee, St. Michael’s College, November 2015-February 2020; former Trustee, St. Michael’s College, June 2017-September 2019; former Trustee, New Century Portfolios (former mutual fund complex), January 2015-December 2017 |
| Multi-Manager Directional Alternative Strategies Fund | Annual Report 2023 | 45 |
(Unaudited)
Independent trustees (continued)
| Name, address, year of birth | Position held with the Columbia Funds and length of service | Principal occupation(s) during past five years and other relevant professional experience | Number of Funds in the Columbia Funds Complex* overseen | Other directorships held by Trustee during the past five years and other relevant Board experience |
| Olive M. Darragh c/o Columbia Management Investment Advisers, LLC 290 Congress Street Boston, MA 02210 1962 | Trustee since 2020 | Managing Director of Darragh Inc. (strategy and talent management consulting firm), since 2010; Founder and CEO, Zolio, Inc. (investment management talent identification platform), since 2004; Consultant to Independent Trustees of CFVIT and CFST I from June 2019 to June 2020 with respect to CFVIT and to December 2020 with respect to CFST I; Partner, Tudor Investments, 2004-2010; Senior Partner, McKinsey & Company (consulting), 1990-2004; Touche Ross CPA, 1985-1988 | 172 | Treasurer, Edinburgh University US Trust Board, since January 2023; Member, HBS Community Action Partners Board, since September 2022; former Director, University of Edinburgh Business School (Member of US Board), 2004-2019; former Director, Boston Public Library Foundation, 2008-2017 |
| Patricia M. Flynn c/o Columbia Management Investment Advisers, LLC 290 Congress Street Boston, MA 02210 1950 | Trustee since 2004 | Professor of Economics and Management, Bentley University, since 2002; Dean, McCallum Graduate School of Business, Bentley University, 1992-2002 | 174 | Former Trustee, MA Taxpayers Foundation, 1997-2022; former Director, The MA Business Roundtable, 2003-2019; former Chairperson, Innovation Index Advisory Committee, MA Technology Collaborative, 1997-2020 |
| Brian J. Gallagher c/o Columbia Management Investment Advisers, LLC 290 Congress Street Boston, MA 02210 1954 | Trustee since 2017 | Retired; Partner with Deloitte & Touche LLP and its predecessors, 1977-2016 | 174 | Trustee, Catholic Schools Foundation, since 2004 |
| Douglas A. Hacker c/o Columbia Management Investment Advisers, LLC 290 Congress Street Boston, MA 02210 1955 | Trustee since 1996 | Independent business executive, since May 2006; Executive Vice President – Strategy of United Airlines, December 2002 - May 2006; President of UAL Loyalty Services (airline marketing company), September 2001-December 2002; Executive Vice President and Chief Financial Officer of United Airlines, July 1999-September 2001 | 174 | Director, SpartanNash Company since November 2013 (Chair of the Board, since May 2021) (food distributor); Director, Aircastle Limited (Chair of Audit Committee) (aircraft leasing), since August 2006; former Director, Nash Finch Company (food distributor), 2005-2013; former Director, SeaCube Container Leasing Ltd. (container leasing), 2010-2013; and former Director, Travelport Worldwide Limited (travel information technology), 2014-2019 |
| Nancy T. Lukitsh c/o Columbia Management Investment Advisers, LLC 290 Congress Street Boston, MA 02210 1956 | Trustee since 2011 | Senior Vice President, Partner and Director of Marketing, Wellington Management Company, LLP (investment adviser), 1997-2010; Chair, Wellington Management Portfolios (commingled non-U.S. investment pools), 2007-2010; Director, Wellington Trust Company, NA and other Wellington affiliates, 1997-2010 | 172 | None |
| 46 | Multi-Manager Directional Alternative Strategies Fund | Annual Report 2023 |
(Unaudited)
Independent trustees (continued)
| Name, address, year of birth | Position held with the Columbia Funds and length of service | Principal occupation(s) during past five years and other relevant professional experience | Number of Funds in the Columbia Funds Complex* overseen | Other directorships held by Trustee during the past five years and other relevant Board experience |
| David M. Moffett c/o Columbia Management Investment Advisers, LLC 290 Congress Street Boston, MA 02210 1952 | Trustee since 2011 | Retired; former Chief Executive Officer of Freddie Mac and Chief Financial Officer of U.S. Bank | 172 | Director, CSX Corporation (transportation suppliers); Director, PayPal Holdings Inc. (payment and data processing services); Trustee, University of Oklahoma Foundation; former Director, eBay Inc. (online trading community), 2007-2015; and former Director, CIT Bank, CIT Group Inc. (commercial and consumer finance), 2010-2016; former Senior Adviser to The Carlyle Group (financial services), March 2008-September 2008; former Governance Consultant to Bridgewater Associates, January 2013-December 2015 |
| Catherine James Paglia c/o Columbia Management Investment Advisers, LLC 290 Congress Street Boston, MA 02210 1952 | Trustee since 2004 | Director, Enterprise Asset Management, Inc. (private real estate and asset management company), since September 1998; Managing Director and Partner, Interlaken Capital, Inc., 1989-1997; Vice President, 1982-1985, Principal, 1985-1987, Managing Director, 1987-1989, Morgan Stanley; Vice President, Investment Banking, 1980-1982, Associate, Investment Banking, 1976-1980, Dean Witter Reynolds, Inc. | 174 | Director, Valmont Industries, Inc. (irrigation systems manufacturer), since 2012; Trustee, Carleton College (on the Investment Committee), since 1987; Trustee, Carnegie Endowment for International Peace (on the Investment Committee), since 2009 |
| Natalie A. Trunow c/o Columbia Management Investment Advisers, LLC 290 Congress Street Boston, MA 02210 1967 | Trustee since 2020 | Chief Executive Officer, Millennial Portfolio Solutions LLC (asset management and consulting services), January 2016-January 2021; Non-executive Member of the Investment Committee and Valuation Committee, Sarona Asset Management Inc. (private equity firm) since September 2019; Advisor, Horizon Investments (asset management and consulting services), August 2018-January 2022; Advisor, Paradigm Asset Management, November 2016-January 2022; Consultant to Independent Trustees of CFVIT and CFST I from September 2016 to June 2020 with respect to CFVIT and to December 2020 with respect to CFST I; Director of Investments/Consultant, Casey Family Programs, April 2016-November 2016; Senior Vice President and Chief Investment Officer, Calvert Investments, August 2008-January 2016; Section Head and Portfolio Manager, General Motors Asset Management, June 1997-August 2008 | 172 | Independent Director, Investment Committee, Health Services for Children with Special Needs, Inc., 2010-2021; Independent Director, (Executive Committee and Chair, Audit Committee), Consumer Credit Counseling Services (formerly Guidewell Financial Solutions), since 2016; Independent Director, (Investment Committee), Sarona Asset Management, since 2019 |
| Multi-Manager Directional Alternative Strategies Fund | Annual Report 2023 | 47 |
(Unaudited)
Independent trustees (continued)
| Name, address, year of birth | Position held with the Columbia Funds and length of service | Principal occupation(s) during past five years and other relevant professional experience | Number of Funds in the Columbia Funds Complex* overseen | Other directorships held by Trustee during the past five years and other relevant Board experience |
| Sandra L. Yeager c/o Columbia Management Investment Advisers, LLC 290 Congress Street Boston, MA 02210 1964 | Trustee since 2017 | Retired; President and founder, Hanoverian Capital, LLC (SEC registered investment advisor firm), 2008-2016; Managing Director, DuPont Capital, 2006-2008; Managing Director, Morgan Stanley Investment Management, 2004-2006; Senior Vice President, Alliance Bernstein, 1990-2004 | 174 | Former Director, NAPE (National Alliance for Partnerships in Equity) Education Foundation, October 2016-October 2020; Advisory Board, Jennersville YMCA, since 2022 |
| Name, address, year of birth | Position held with the Columbia Funds and length of service | Principal occupation(s) during the past five years and other relevant professional experience | Number of Funds in the Columbia Funds Complex overseen | Other directorships held by Trustee during the past five years and other relevant Board experience |
| Daniel J. Beckman c/o Columbia Management Investment Advisers, LLC 290 Congress Street Boston, MA 02210 1962 | Trustee since November 2021 and President since June 2021 | Vice President – Head of North America Product, Columbia Management Investment Advisers, LLC, since April 2015; President and Principal Executive Officer of the Columbia Funds, since June 2021; officer of Columbia Funds and affiliated funds, 2020-2021 | 174 | Director, Ameriprise Trust Company, since October 2016; Director, Columbia Management Investment Distributors, Inc. since November 2018; Board of Governors, Columbia Wanger Asset Management, LLC since, January 2022; Director, Columbia Threadneedle Canada, Inc., since December 2022 |
| * | The term “Columbia Funds Complex” as used herein includes Columbia Seligman Premium Technology Growth Fund, Tri-Continental Corporation and each series of Columbia Funds Series Trust (CFST), Columbia Funds Series Trust I (CFST I), Columbia Funds Series Trust II (CFST II), Columbia ETF Trust I (CET I), Columbia ETF Trust II (CET II), Columbia Funds Variable Insurance Trust (CFVIT) and Columbia Funds Variable Series Trust II (CFVST II). Messrs. Batejan, Beckman, Gallagher and Hacker and Mses. Blatz, Carlton, Carrig, Flynn, Paglia, and Yeager serve as directors of Columbia Seligman Premium Technology Growth Fund and Tri-Continental Corporation. |
| ** | Interested person (as defined under the 1940 Act) by reason of being an officer, director, security holder and/or employee of the Investment Manager or Ameriprise Financial. |
| 48 | Multi-Manager Directional Alternative Strategies Fund | Annual Report 2023 |
(Unaudited)
The Board has appointed officers who are responsible for day-to-day business decisions based on policies it has established. The officers serve at the pleasure of the Board. The following table provides basic information about the Officers of the Fund as of the printing of this report, including principal occupations during the past five years, although their specific titles may have varied over the period. In addition to Mr. Beckman, who is President and Principal Executive Officer, the Fund’s other officers are:
| Name, address and year of birth | Position and year first appointed to position for any Fund in the Columbia Funds Complex or a predecessor thereof | Principal occupation(s) during past five years |
| Michael G. Clarke 290 Congress Street Boston, MA 02210 1969 | Chief Financial Officer and Principal Financial Officer (2009) and Senior Vice President (2019) | Senior Vice President and Head of North America Operations & Investor Services, Columbia Management Investment Advisers, LLC, since June 2023 (previously Senior Vice President and Head of Global Operations, March 2022 – June 2023, Vice President, Head of North America Operations, and Co-Head of Global Operations, June 2019 - February 2022 and Vice President – Accounting and Tax, May 2010 - May 2019); senior officer of Columbia Funds and affiliated funds, since 2002. |
| Joseph Beranek 5890 Ameriprise Financial Center Minneapolis, MN 55474 1965 | Treasurer and Chief Accounting Officer (Principal Accounting Officer) (2019) and Principal Financial Officer (2020), CFST, CFST I, CFST II, CFVIT and CFVST II; Assistant Treasurer, CET I and CET II | Vice President – Mutual Fund Accounting and Financial Reporting, Columbia Management Investment Advisers, LLC, since December 2018 and March 2017, respectively. |
| Marybeth Pilat 290 Congress Street Boston, MA 02210 1968 | Treasurer and Chief Accounting Officer (Principal Accounting Officer) and Principal Financial Officer (2020) for CET I and CET II; Assistant Treasurer, CFST, CFST I, CFST II, CFVIT and CFVST II | Vice President – Product Pricing and Administration, Columbia Management Investment Advisers, LLC, since May 2017. |
| William F. Truscott 290 Congress Street Boston, MA 02210 1960 | Senior Vice President (2001) | Formerly, Trustee/Director of Columbia Funds Complex or legacy funds, November 2001-January 1, 2021; Chief Executive Officer, Global Asset Management, Ameriprise Financial, Inc., since September 2012; Chairman of the Board and President, Columbia Management Investment Advisers, LLC, since July 2004 and February 2012, respectively; Chairman of the Board and Chief Executive Officer, Columbia Management Investment Distributors, Inc., since November 2008 and February 2012, respectively; Chairman of the Board and Director, Threadneedle Asset Management Holdings, Sàrl, since March 2013 and December 2008, respectively; senior executive of various entities affiliated with Columbia Threadneedle. |
| Christopher O. Petersen 5228 Ameriprise Financial Center Minneapolis, MN 55474 1970 | Senior Vice President and Assistant Secretary (2021) | Formerly, Trustee/Director of funds within the Columbia Funds Complex, July 1, 2020 - November 22, 2021; Senior Vice President and Assistant General Counsel, Ameriprise Financial, Inc., since September 2021 (previously Vice President and Lead Chief Counsel, January 2015 - September 2021); formerly, President and Principal Executive Officer of the Columbia Funds, 2015 - 2021; officer of Columbia Funds and affiliated funds, since 2007. |
| Thomas P. McGuire 290 Congress Street Boston, MA 02210 1972 | Senior Vice President and Chief Compliance Officer (2012) | Vice President – Asset Management Compliance, Ameriprise Financial, Inc., since May 2010; Chief Compliance Officer, Columbia Acorn/Wanger Funds, since December 2015; formerly, Chief Compliance Officer, Ameriprise Certificate Company, September 2010 – September 2020. |
| Ryan C. Larrenaga 290 Congress Street Boston, MA 02210 1970 | Senior Vice President (2017), Chief Legal Officer (2017), and Secretary (2015) | Vice President and Chief Counsel, Ameriprise Financial, Inc., since August 2018 (previously Vice President and Group Counsel, August 2011 - August 2018); Chief Legal Officer, Columbia Acorn/Wanger Funds, since September 2020; officer of Columbia Funds and affiliated funds, since 2005. |
| Multi-Manager Directional Alternative Strategies Fund | Annual Report 2023 | 49 |
(Unaudited)
Fund officers (continued)
| Name, address and year of birth | Position and year first appointed to position for any Fund in the Columbia Funds Complex or a predecessor thereof | Principal occupation(s) during past five years |
| Michael E. DeFao 290 Congress Street Boston, MA 02210 1968 | Vice President (2011) and Assistant Secretary (2010) | Vice President and Chief Counsel, Ameriprise Financial, Inc., since May 2010; Vice President, Chief Legal Officer and Assistant Secretary, Columbia Management Investment Advisers, LLC, since October 2021 (previously Vice President and Assistant Secretary, May 2010 – September 2021). |
| Lyn Kephart-Strong 5228 Ameriprise Financial Center Minneapolis, MN 55474 1960 | Vice President (2015) | Vice President, Global Investment Operations Services, Columbia Management Investment Advisers, LLC, since 2010; President, Columbia Management Investment Services Corp., since October 2014; President, Ameriprise Trust Company, since January 2017. |
| • | the Fund had sufficient liquidity to both meet redemptions and operate effectively on behalf of shareholders; |
| • | there were no material changes to the Program during the period; |
| • | the implementation of the Program was effective to manage the Fund’s liquidity risk; and |
| • | the Program operated adequately during the period. |
| 50 | Multi-Manager Directional Alternative Strategies Fund | Annual Report 2023 |
columbiathreadneedleus.com/investor/. The Fund is distributed by Columbia Management Investment Distributors, Inc., member FINRA, and managed by Columbia Management Investment Advisers, LLC.

April 30, 2023

| 3 | |
| 6 | |
| 8 | |
| 9 | |
| 37 | |
| 39 | |
| 41 | |
| 44 | |
| 48 | |
| 67 | |
| 68 | |
| 68 | |
| 74 |
(Unaudited)
| Average annual total returns (%) (for the period ended April 30, 2023) | ||||||
| Inception | 1 Year | 5 Years | 10 Years | |||
| Class A | Excluding sales charges | 07/31/00 | -3.27 | 1.34 | 1.46 | |
| Including sales charges | -6.18 | 0.73 | 1.16 | |||
| Advisor Class | 11/08/12 | -3.04 | 1.59 | 1.71 | ||
| Class C | Excluding sales charges | 02/01/02 | -3.99 | 0.58 | 0.73 | |
| Including sales charges | -4.92 | 0.58 | 0.73 | |||
| Institutional Class | 12/05/78 | -3.02 | 1.58 | 1.72 | ||
| Institutional 2 Class | 11/08/12 | -2.96 | 1.67 | 1.78 | ||
| Institutional 3 Class | 11/08/12 | -2.90 | 1.71 | 1.84 | ||
| Class R | 01/23/06 | -3.54 | 1.09 | 1.21 | ||
| Bloomberg U.S. Aggregate Bond Index | -0.43 | 1.18 | 1.32 | |||
| Columbia Total Return Bond Fund | Annual Report 2023 | 3 |
(Unaudited)
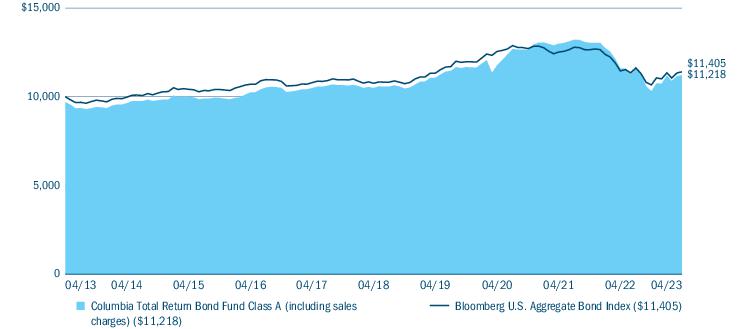
| Portfolio breakdown (%) (at April 30, 2023) | |
| Asset-Backed Securities — Non-Agency | 10.2 |
| Call Option Contracts Purchased | 0.2 |
| Commercial Mortgage-Backed Securities - Agency | 0.2 |
| Commercial Mortgage-Backed Securities - Non-Agency | 3.4 |
| Common Stocks | 0.0(a) |
| Convertible Bonds | 0.0(a) |
| Corporate Bonds & Notes | 22.6 |
| Foreign Government Obligations | 2.1 |
| Money Market Funds | 6.3 |
| Residential Mortgage-Backed Securities - Agency | 30.2 |
| Residential Mortgage-Backed Securities - Non-Agency | 23.1 |
| Senior Loans | 0.1 |
| U.S. Treasury Obligations | 1.6 |
| Total | 100.0 |
| (a) | Rounds to zero. |
| Quality breakdown (%) (at April 30, 2023) | |
| AAA rating | 37.6 |
| AA rating | 3.4 |
| A rating | 13.8 |
| BBB rating | 18.2 |
| BB rating | 9.5 |
| B rating | 6.3 |
| CCC rating | 1.3 |
| CC rating | 0.0(a) |
| Not rated | 9.9 |
| Total | 100.0 |
| (a) | Rounds to zero. |
| 4 | Columbia Total Return Bond Fund | Annual Report 2023 |
(Unaudited)
| Market exposure through derivatives investments (% of notional exposure) (at April 30, 2023)(a) | |||
| Long | Short | Net | |
| Fixed Income Derivative Contracts | 144.2 | (43.9) | 100.3 |
| Foreign Currency Derivative Contracts | — | (0.3) | (0.3) |
| Total Notional Market Value of Derivative Contracts | 144.2 | (44.2) | 100.0 |
| Columbia Total Return Bond Fund | Annual Report 2023 | 5 |
(Unaudited)
| • | The Fund’s underperformance relative to the benchmark was largely the result of its positioning with respect to interest rates. Specifically, the Fund had an above-benchmark stance with respect to duration and corresponding interest rate sensitivity as U.S. Treasury yields moved higher for much of the period. |
| • | The Fund’s positioning along the yield curve also detracted. |
| • | Moreover, as rates moved higher, performance for the Fund’s mortgage-backed security holdings suffered as prepayments ground to a halt and durations extended for these issues at a time when investors were seeking to reduce interest rate risk. |
| • | Sector allocation also detracted from relative performance, most notably out-of-benchmark exposure to below-investment-grade, high-yield corporate bonds. |
| • | In terms of selection, a tilt toward single-asset, single-borrower issues within commercial mortgage-backed securities detracted, along with holdings within government-related issues. |
| • | Security selection led positive contributions to the Fund’s performance relative to the benchmark. |
| • | Most notably, within financials, the Fund favored the large, global systemically important banks subject to the most rigorous capital requirements while avoiding the regional and second-tier banks that were most negatively impacted by fears of a banking crisis. |
| • | Selection within agency and non-agency mortgage-backed securities also proved additive. |
| 6 | Columbia Total Return Bond Fund | Annual Report 2023 |
(Unaudited)
| Columbia Total Return Bond Fund | Annual Report 2023 | 7 |
(Unaudited)
| November 1, 2022 — April 30, 2023 | |||||||
| Account value at the beginning of the period ($) | Account value at the end of the period ($) | Expenses paid during the period ($) | Fund’s annualized expense ratio (%) | ||||
| Actual | Hypothetical | Actual | Hypothetical | Actual | Hypothetical | Actual | |
| Class A | 1,000.00 | 1,000.00 | 1,087.90 | 1,020.84 | 3.84 | 3.72 | 0.75 |
| Advisor Class | 1,000.00 | 1,000.00 | 1,089.40 | 1,022.07 | 2.56 | 2.48 | 0.50 |
| Class C | 1,000.00 | 1,000.00 | 1,083.90 | 1,017.16 | 7.66 | 7.42 | 1.50 |
| Institutional Class | 1,000.00 | 1,000.00 | 1,089.60 | 1,022.07 | 2.56 | 2.48 | 0.50 |
| Institutional 2 Class | 1,000.00 | 1,000.00 | 1,089.80 | 1,022.46 | 2.15 | 2.08 | 0.42 |
| Institutional 3 Class | 1,000.00 | 1,000.00 | 1,089.90 | 1,022.71 | 1.90 | 1.84 | 0.37 |
| Class R | 1,000.00 | 1,000.00 | 1,086.60 | 1,019.62 | 5.12 | 4.95 | 1.00 |
| 8 | Columbia Total Return Bond Fund | Annual Report 2023 |
April 30, 2023
| Asset-Backed Securities — Non-Agency 12.4% | ||||
| Issuer | Coupon Rate | Principal Amount ($) | Value ($) | |
| Affirm Asset Securitization Trust(a),(b) | ||||
| Series 2023-A Class 1A | ||||
| 01/18/2028 | 6.610% | 7,000,000 | 6,982,500 | |
| Affirm Asset Securitization Trust(a) | ||||
| Series 2023-A Class A | ||||
| 01/18/2028 | 6.610% | 7,950,000 | 7,887,032 | |
| Ares LVIII CLO Ltd.(a),(c) | ||||
| Series 2020-58A Class DR | ||||
| 3-month Term SOFR + 3.200% Floor 3.200% 01/15/2035 | 8.186% | 5,000,000 | 4,470,190 | |
| Ares XLVI CLO Ltd.(a),(c) | ||||
| Series 2017-46A Class B1 | ||||
| 3-month USD LIBOR + 1.350% Floor 1.350% 01/15/2030 | 6.610% | 7,780,000 | 7,564,089 | |
| Atrium XIII(a),(c) | ||||
| Series 2013A Class B | ||||
| 3-month USD LIBOR + 1.500% Floor 1.500% 11/21/2030 | 6.773% | 2,250,000 | 2,196,792 | |
| Bain Capital Credit CLO Ltd.(a),(c) | ||||
| Series 2020-3A Class DR | ||||
| 3-month USD LIBOR + 3.250% Floor 3.250% 10/23/2034 | 8.523% | 8,250,000 | 7,513,605 | |
| Series 2020-4A Class D | ||||
| 3-month USD LIBOR + 4.250% Floor 4.250% 10/20/2033 | 9.500% | 3,750,000 | 3,546,499 | |
| Carlyle Group LP(a),(c) | ||||
| Series 2017-5A Class A2 | ||||
| 3-month USD LIBOR + 1.400% 01/20/2030 | 6.650% | 3,810,000 | 3,672,444 | |
| Carlyle US CLO Ltd.(a),(c) | ||||
| Series 2019-3R Class CR | ||||
| 3-month USD LIBOR + 3.200% Floor 3.200% 10/20/2032 | 8.450% | 13,400,000 | 12,555,746 | |
| Cent CLO Ltd.(a),(c) | ||||
| Series 2018-C17A Class A2R | ||||
| 3-month USD LIBOR + 1.600% Floor 1.600% 04/30/2031 | 6.402% | 9,300,000 | 9,063,222 | |
| Dryden CLO Ltd.(a),(c) | ||||
| Series 2018-57A Class B | ||||
| 3-month USD LIBOR + 1.350% Floor 1.350% 05/15/2031 | 6.214% | 7,000,000 | 6,772,360 | |
| Asset-Backed Securities — Non-Agency (continued) | ||||
| Issuer | Coupon Rate | Principal Amount ($) | Value ($) | |
| DT Auto Owner Trust(a) | ||||
| Series 2023-2A Class A | ||||
| 04/15/2027 | 5.880% | 27,000,000 | 27,023,795 | |
| Exeter Automobile Receivables Trust(a) | ||||
| Subordinated Series 2021-2A Class E | ||||
| 07/17/2028 | 2.900% | 6,000,000 | 5,383,073 | |
| Goldentree Loan Opportunities XI Ltd.(a),(c) | ||||
| Series 2015-11A Class BR2 | ||||
| 3-month USD LIBOR + 1.350% 01/18/2031 | 6.612% | 5,000,000 | 4,903,865 | |
| LendingPoint Asset Securitization Trust(a) | ||||
| Subordinated Series 2022-A Class C | ||||
| 06/15/2029 | 2.820% | 4,020,000 | 3,819,933 | |
| LP LMS Asset Securitization Trust(a) | ||||
| Series 2021-2A Class A | ||||
| 01/15/2029 | 1.750% | 3,393,088 | 3,301,573 | |
| Lucali CLO Ltd.(a),(c) | ||||
| Series 2020-1A Class D | ||||
| 3-month USD LIBOR + 3.600% Floor 3.600% 01/15/2033 | 8.860% | 5,000,000 | 4,721,410 | |
| Madison Park Funding XLVII Ltd.(a),(c) | ||||
| Series 2020-47A Class D | ||||
| 3-month USD LIBOR + 4.100% Floor 4.000% 01/19/2034 | 9.265% | 6,800,000 | 6,588,064 | |
| Madison Park Funding XXVII Ltd.(a),(c) | ||||
| Series 2018-27A Class A2 | ||||
| 3-month USD LIBOR + 1.350% 04/20/2030 | 6.600% | 14,000,000 | 13,633,088 | |
| Marlette Funding Trust(a) | ||||
| Series 2020-2A Class D | ||||
| 09/16/2030 | 4.650% | 1,485,331 | 1,459,821 | |
| Series 2021-1A Class B | ||||
| 06/16/2031 | 1.000% | 679,452 | 675,836 | |
| Marlette Funding Trust(a),(d) | ||||
| Series 2023-2A Class A | ||||
| 06/15/2033 | 6.040% | 13,000,000 | 13,020,371 | |
| Netcredit Combined Receivables LLC(a),(b) | ||||
| Series 2023-A Class A | ||||
| 12/20/2027 | 7.780% | 9,894,184 | 9,795,242 | |
| Octagon 55 Ltd.(a),(c) | ||||
| Series 2021-1A Class D | ||||
| 3-month USD LIBOR + 3.100% Floor 3.100% 07/20/2034 | 8.350% | 8,750,000 | 8,188,801 | |
| Columbia Total Return Bond Fund | Annual Report 2023 | 9 |
April 30, 2023
| Asset-Backed Securities — Non-Agency (continued) | ||||
| Issuer | Coupon Rate | Principal Amount ($) | Value ($) | |
| Octagon Investment Partners 35 Ltd.(a),(c) | ||||
| Series 2018-1A Class A2 | ||||
| 3-month USD LIBOR + 1.400% Floor 1.400% 01/20/2031 | 6.650% | 9,350,000 | 9,082,038 | |
| Oportun Issuance Trust(a) | ||||
| Series 2021-B Class A | ||||
| 05/08/2031 | 1.470% | 15,100,000 | 13,708,940 | |
| Subordinated Series 2021-B Class B | ||||
| 05/08/2031 | 1.960% | 3,100,000 | 2,706,059 | |
| OZLM Funding IV Ltd.(a),(c) | ||||
| Series 2013-4A Class D2R | ||||
| 3-month USD LIBOR + 7.250% Floor 7.250% 10/22/2030 | 12.523% | 1,000,000 | 849,615 | |
| Pagaya AI Debt Selection Trust(a) | ||||
| Series 2021-2 Class NOTE | ||||
| 01/25/2029 | 3.000% | 4,115,706 | 3,894,013 | |
| Series 2021-5 Class A | ||||
| 08/15/2029 | 1.530% | 4,594,929 | 4,486,814 | |
| Series 2021-HG1 Class A | ||||
| 01/16/2029 | 1.220% | 2,904,001 | 2,760,517 | |
| Subordinated Series 2021-3 Class B | ||||
| 05/15/2029 | 1.740% | 6,199,662 | 5,788,242 | |
| Subordinated Series 2021-5 Class B | ||||
| 08/15/2029 | 2.630% | 9,248,910 | 8,504,491 | |
| Subordinated Series 2021-HG1 Class B | ||||
| 01/16/2029 | 1.820% | 671,894 | 643,895 | |
| Pagaya AI Debt Trust(a) | ||||
| Series 2022-2 Class A | ||||
| 01/15/2030 | 4.970% | 4,590,666 | 4,518,036 | |
| Series 2023-1 Class A | ||||
| 07/15/2030 | 7.556% | 11,885,584 | 11,872,225 | |
| Series 2023-3 Class A | ||||
| 12/16/2030 | 7.600% | 19,400,000 | 19,521,941 | |
| Subordinated Series 2022-1 Class B | ||||
| 10/15/2029 | 3.344% | 10,598,598 | 9,681,200 | |
| PAGAYA AI Debt Trust(a) | ||||
| Subordinated Series 2022-3 Class B | ||||
| 03/15/2030 | 8.050% | 6,999,321 | 6,864,002 | |
| Palmer Square Loan Funding Ltd.(a),(c) | ||||
| Series 2021-4A Class B | ||||
| 3-month USD LIBOR + 1.750% Floor 1.750% 10/15/2029 | 7.010% | 15,000,000 | 14,175,015 | |
| Prosper Pass-Through Trust(a),(b) | ||||
| Series 2019-ST2 Class A | ||||
| 11/15/2025 | 3.750% | 81,162 | 81,162 | |
| Asset-Backed Securities — Non-Agency (continued) | ||||
| Issuer | Coupon Rate | Principal Amount ($) | Value ($) | |
| Research-Driven Pagaya Motor Asset Trust IV(a) | ||||
| Series 2021-2A Class A | ||||
| 03/25/2030 | 2.650% | 4,662,083 | 4,143,797 | |
| Stewart Park CLO Ltd.(a),(c) | ||||
| Series 2017-1A Class BR | ||||
| 3-month USD LIBOR + 1.370% Floor 1.370% 01/15/2030 | 6.630% | 5,828,571 | 5,655,276 | |
| Theorem Funding Trust(a) | ||||
| Series 2022-3A Class A | ||||
| 04/15/2029 | 7.600% | 11,588,520 | 11,666,508 | |
| Series 2023-1A Class A | ||||
| 04/15/2029 | 7.580% | 8,000,000 | 8,005,141 | |
| Upstart Pass-Through Trust(a) | ||||
| Series 2020-ST6 Class A | ||||
| 01/20/2027 | 3.000% | 1,480,972 | 1,440,521 | |
| Series 2021-ST10 Class A | ||||
| 01/20/2030 | 2.250% | 4,096,257 | 3,902,881 | |
| Series 2021-ST4 Class A | ||||
| 07/20/2027 | 2.000% | 3,711,721 | 3,524,957 | |
| Series 2021-ST5 Class A | ||||
| 07/20/2027 | 2.000% | 3,460,493 | 3,292,210 | |
| Upstart Securitization Trust(a) | ||||
| Series 2023-1 Class A | ||||
| 02/20/2033 | 6.590% | 5,258,267 | 5,239,569 | |
| Voya CLO Ltd.(a),(c) | ||||
| Series 2021-1A Class D | ||||
| 3-month USD LIBOR + 3.150% Floor 3.150% 07/15/2034 | 8.410% | 8,350,000 | 7,524,310 | |
| Total Asset-Backed Securities — Non-Agency (Cost $360,869,254) | 348,272,726 | |||
| Commercial Mortgage-Backed Securities - Agency 0.2% | ||||
| FRESB Mortgage Trust(e) | ||||
| Series 2018-SB45 Class A10F (FHLMC) | ||||
| 11/25/2027 | 3.160% | 3,222,432 | 3,094,443 | |
| Government National Mortgage Association(e),(f) | ||||
| Series 2019-147 Class IO | ||||
| 06/16/2061 | 0.397% | 58,817,590 | 2,267,812 | |
| Total Commercial Mortgage-Backed Securities - Agency (Cost $8,831,266) | 5,362,255 | |||
| Commercial Mortgage-Backed Securities - Non-Agency 4.1% | ||||
| American Homes 4 Rent Trust(a) | ||||
| Series 2014-SFR3 Class A | ||||
| 12/17/2036 | 3.678% | 1,349,904 | 1,310,009 | |
| 10 | Columbia Total Return Bond Fund | Annual Report 2023 |
April 30, 2023
| Commercial Mortgage-Backed Securities - Non-Agency (continued) | ||||
| Issuer | Coupon Rate | Principal Amount ($) | Value ($) | |
| BAMLL Commercial Mortgage Securities Trust(a),(e) | ||||
| Series 2013-WBRK Class A | ||||
| 03/10/2037 | 3.652% | 3,000,000 | 2,764,025 | |
| BAMLL Commercial Mortgage Securities Trust(a),(c) | ||||
| Series 2019-RLJ Class D | ||||
| 1-month USD LIBOR + 1.950% Floor 1.950% 04/15/2036 | 6.898% | 7,730,000 | 7,608,940 | |
| BBCMS Trust(a),(c) | ||||
| Subordinated Series 2018-BXH Class E | ||||
| 1-month USD LIBOR + 2.250% Floor 2.250% 10/15/2037 | 7.198% | 4,790,000 | 4,547,365 | |
| BFLD Trust(a),(c) | ||||
| Series 2019-DPLO Class F | ||||
| 1-month USD LIBOR + 2.540% Floor 2.540% 10/15/2034 | 7.488% | 1,800,000 | 1,736,450 | |
| Subordinated Series 2019-DPLO Class D | ||||
| 1-month USD LIBOR + 1.840% Floor 1.840% 10/15/2034 | 6.788% | 1,600,000 | 1,569,734 | |
| Braemar Hotels & Resorts Trust(a),(c) | ||||
| Series 2018-PRME Class E | ||||
| 1-month USD LIBOR + 2.400% Floor 2.400% 06/15/2035 | 7.348% | 6,850,000 | 6,214,581 | |
| Subordinated Series 2018-PRME Class D | ||||
| 1-month USD LIBOR + 1.800% Floor 1.925% 06/15/2035 | 6.748% | 3,100,000 | 2,817,914 | |
| BX Trust(a),(c) | ||||
| Series 2019-ATL Class C | ||||
| 1-month USD LIBOR + 1.587% Floor 1.587% 10/15/2036 | 6.535% | 4,361,000 | 4,186,780 | |
| Subordinated Series 2019-ATL Class D | ||||
| 1-month USD LIBOR + 1.887% Floor 1.887% 10/15/2036 | 6.835% | 3,801,000 | 3,573,227 | |
| BX Trust(a) | ||||
| Series 2019-OC11 Class E | ||||
| 12/09/2041 | 4.076% | 2,850,000 | 2,331,597 | |
| CLNY Trust(a),(c) | ||||
| Subordinated Series 2019-IKPR Class E | ||||
| 1-month USD LIBOR + 2.721% Floor 2.721% 11/15/2038 | 7.725% | 8,500,000 | 7,664,826 | |
| Commercial Mortgage-Backed Securities - Non-Agency (continued) | ||||
| Issuer | Coupon Rate | Principal Amount ($) | Value ($) | |
| Cold Storage Trust(a),(c) | ||||
| Subordinated Series 2020-ICE5 Class F | ||||
| 1-month USD LIBOR + 3.492% Floor 3.492% 11/15/2037 | 8.440% | 7,618,176 | 7,424,575 | |
| COMM Mortgage Trust(a),(e) | ||||
| Subordinated Series 2020-CBM Class E | ||||
| 02/10/2037 | 3.754% | 4,850,000 | 4,348,716 | |
| Subordinated Series 2020-CX Class D | ||||
| 11/10/2046 | 2.773% | 5,600,000 | 4,167,844 | |
| Credit Suisse Mortgage Capital Certificates OA LLC(a) | ||||
| Subordinated Series 2014-USA Class E | ||||
| 09/15/2037 | 4.373% | 8,285,000 | 4,397,029 | |
| Subordinated Series 2014-USA Class F | ||||
| 09/15/2037 | 4.373% | 7,750,000 | 2,831,739 | |
| Extended Stay America Trust(a),(c) | ||||
| Series 2021-ESH Class D | ||||
| 1-month USD LIBOR + 2.250% Floor 2.250% 07/15/2038 | 7.198% | 13,227,405 | 12,698,435 | |
| Hilton USA Trust(a) | ||||
| Subordinated Series 2016-SFP Class E | ||||
| 11/05/2035 | 5.519% | 5,500,000 | 4,948,128 | |
| Morgan Stanley Capital I Trust(a),(e) | ||||
| Series 2019-MEAD Class E | ||||
| 11/10/2036 | 3.283% | 6,200,000 | 5,430,431 | |
| Progress Residential Trust(a) | ||||
| Series 2020-SFR1 Class E | ||||
| 04/17/2037 | 3.032% | 8,750,000 | 8,125,770 | |
| Subordinated Series 2019-SFR3 Class F | ||||
| 09/17/2036 | 3.867% | 1,225,000 | 1,173,053 | |
| Subordinated Series 2019-SFR4 Class F | ||||
| 10/17/2036 | 3.684% | 765,000 | 730,685 | |
| Subordinated Series 2020-SFR2 Class E | ||||
| 06/17/2037 | 5.115% | 2,800,000 | 2,703,615 | |
| UBS Commercial Mortgage Trust(a),(c) | ||||
| Series 2018-NYCH Class B | ||||
| 1-month USD LIBOR + 1.250% Floor 1.250% 02/15/2032 | 6.198% | 4,800,000 | 4,611,770 | |
| Wells Fargo Commercial Mortgage Trust(a),(c) | ||||
| Series 2017-SMP Class A | ||||
| 1-month USD LIBOR + 0.875% Floor 0.875% 12/15/2034 | 5.823% | 4,555,000 | 4,316,720 | |
| Total Commercial Mortgage-Backed Securities - Non-Agency (Cost $128,389,262) | 114,233,958 | |||
| Columbia Total Return Bond Fund | Annual Report 2023 | 11 |
April 30, 2023
| Common Stocks 0.0% | ||
| Issuer | Shares | Value ($) |
| Financials 0.0% | ||
| Financial Services 0.0% | ||
| Mr. Cooper Group, Inc.(g) | 4,518 | 209,184 |
| Total Financials | 209,184 | |
| Industrials 0.0% | ||
| Passenger Airlines 0.0% | ||
| United Airlines Holdings, Inc.(g) | 1,493 | 65,393 |
| Total Industrials | 65,393 | |
| Total Common Stocks (Cost $1,511,077) | 274,577 | |
| Convertible Bonds 0.0% | ||||
| Issuer | Coupon Rate | Principal Amount ($) | Value ($) | |
| Cable and Satellite 0.0% | ||||
| DISH Network Corp. | ||||
| Subordinated | ||||
| 08/15/2026 | 3.375% | 572,000 | 269,412 | |
| Total Convertible Bonds (Cost $547,348) | 269,412 | |||
| Corporate Bonds & Notes(h) 27.4% | ||||
| Aerospace & Defense 0.7% | ||||
| Boeing Co. (The) | ||||
| 08/01/2059 | 3.950% | 9,596,000 | 7,042,605 | |
| 05/01/2060 | 5.930% | 4,074,000 | 4,026,938 | |
| Howmet Aerospace, Inc. | ||||
| 01/15/2029 | 3.000% | 1,280,000 | 1,152,221 | |
| Northrop Grumman Corp. | ||||
| 03/15/2053 | 4.950% | 1,443,000 | 1,426,188 | |
| Spirit AeroSystems, Inc.(a) | ||||
| 11/30/2029 | 9.375% | 574,000 | 617,195 | |
| TransDigm, Inc.(a) | ||||
| 03/15/2026 | 6.250% | 2,883,000 | 2,896,821 | |
| 08/15/2028 | 6.750% | 640,000 | 649,740 | |
| TransDigm, Inc. | ||||
| 06/15/2026 | 6.375% | 668,000 | 667,574 | |
| 11/15/2027 | 5.500% | 512,000 | 491,398 | |
| 01/15/2029 | 4.625% | 50,000 | 45,269 | |
| 05/01/2029 | 4.875% | 543,000 | 493,315 | |
| Total | 19,509,264 | |||
| Airlines 0.2% | ||||
| Air Canada(a) | ||||
| 08/15/2026 | 3.875% | 435,000 | 402,609 | |
| American Airlines, Inc.(a) | ||||
| 07/15/2025 | 11.750% | 550,000 | 605,754 | |
| Corporate Bonds & Notes(h) (continued) | ||||
| Issuer | Coupon Rate | Principal Amount ($) | Value ($) | |
| American Airlines, Inc./AAdvantage Loyalty IP Ltd.(a) | ||||
| 04/20/2026 | 5.500% | 1,269,643 | 1,247,272 | |
| 04/20/2029 | 5.750% | 814,571 | 774,755 | |
| Hawaiian Brand Intellectual Property Ltd./Miles Loyalty Ltd.(a) | ||||
| 01/20/2026 | 5.750% | 1,152,100 | 1,072,988 | |
| United Airlines, Inc.(a) | ||||
| 04/15/2026 | 4.375% | 820,000 | 783,044 | |
| 04/15/2029 | 4.625% | 240,000 | 217,200 | |
| Total | 5,103,622 | |||
| Automotive 0.5% | ||||
| American Axle & Manufacturing, Inc. | ||||
| 04/01/2027 | 6.500% | 29,000 | 26,858 | |
| Clarios Global LP/US Finance Co.(a),(d) | ||||
| 05/15/2028 | 6.750% | 960,000 | 961,783 | |
| Ford Motor Co. | ||||
| 02/12/2032 | 3.250% | 750,000 | 579,896 | |
| 01/15/2043 | 4.750% | 3,582,000 | 2,693,843 | |
| 12/08/2046 | 5.291% | 1,500,000 | 1,210,353 | |
| Ford Motor Credit Co. LLC | ||||
| 09/08/2024 | 3.664% | 934,000 | 902,887 | |
| 11/13/2025 | 3.375% | 679,000 | 630,656 | |
| 01/09/2027 | 4.271% | 630,000 | 582,870 | |
| 08/17/2027 | 4.125% | 363,000 | 332,859 | |
| 02/16/2028 | 2.900% | 221,000 | 191,383 | |
| 02/10/2029 | 2.900% | 929,000 | 769,123 | |
| 11/13/2030 | 4.000% | 1,330,000 | 1,140,076 | |
| Goodyear Tire & Rubber Co. (The) | ||||
| 07/15/2029 | 5.000% | 328,000 | 290,429 | |
| KAR Auction Services, Inc.(a) | ||||
| 06/01/2025 | 5.125% | 402,000 | 400,020 | |
| Panther BF Aggregator 2 LP/Finance Co., Inc.(a) | ||||
| 05/15/2026 | 6.250% | 985,000 | 979,384 | |
| 05/15/2027 | 8.500% | 1,089,000 | 1,096,788 | |
| ZF North America Capital, Inc.(a) | ||||
| 04/14/2030 | 7.125% | 340,000 | 351,106 | |
| Total | 13,140,314 | |||
| Banking 6.0% | ||||
| Ally Financial, Inc. | ||||
| 05/21/2024 | 3.875% | 185,000 | 180,119 | |
| Subordinated | ||||
| 11/20/2025 | 5.750% | 327,000 | 317,227 | |
| Bank of America Corp.(i) | ||||
| 07/23/2031 | 1.898% | 11,485,000 | 9,227,984 | |
| 10/20/2032 | 2.572% | 27,137,000 | 22,289,002 | |
| 02/04/2033 | 2.972% | 18,480,000 | 15,609,940 | |
| Subordinated | ||||
| 09/21/2036 | 2.482% | 1,006,000 | 768,891 | |
| 12 | Columbia Total Return Bond Fund | Annual Report 2023 |
April 30, 2023
| Corporate Bonds & Notes(h) (continued) | ||||
| Issuer | Coupon Rate | Principal Amount ($) | Value ($) | |
| Citigroup, Inc.(i) | ||||
| 01/25/2033 | 3.057% | 17,722,000 | 15,104,686 | |
| Goldman Sachs Group, Inc. (The)(i) | ||||
| 07/21/2032 | 2.383% | 17,727,000 | 14,479,192 | |
| 10/21/2032 | 2.650% | 5,411,000 | 4,497,109 | |
| HSBC Holdings PLC(i) | ||||
| 05/24/2032 | 2.804% | 2,577,000 | 2,108,949 | |
| 11/22/2032 | 2.871% | 16,017,000 | 13,098,059 | |
| 03/09/2034 | 6.254% | 4,623,000 | 4,822,277 | |
| JPMorgan Chase & Co.(i) | ||||
| 10/15/2030 | 2.739% | 4,175,000 | 3,660,296 | |
| 11/19/2031 | 1.764% | 7,725,000 | 6,180,798 | |
| 04/22/2032 | 2.580% | 21,517,000 | 18,083,787 | |
| 11/08/2032 | 2.545% | 15,753,000 | 13,115,305 | |
| Morgan Stanley(i) | ||||
| 07/21/2032 | 2.239% | 3,556,000 | 2,873,248 | |
| Subordinated | ||||
| 09/16/2036 | 2.484% | 1,460,000 | 1,120,729 | |
| Washington Mutual Bank(b),(j),(k) | ||||
| Subordinated | ||||
| 01/15/2015 | 0.000% | 27,379,000 | 41,069 | |
| Wells Fargo & Co.(i) | ||||
| 10/30/2030 | 2.879% | 1,254,000 | 1,097,162 | |
| 02/11/2031 | 2.572% | 17,691,000 | 15,123,125 | |
| 04/25/2053 | 4.611% | 5,033,000 | 4,510,009 | |
| Total | 168,308,963 | |||
| Brokerage/Asset Managers/Exchanges 0.2% | ||||
| AG Issuer LLC(a) | ||||
| 03/01/2028 | 6.250% | 385,000 | 358,744 | |
| AG TTMT Escrow Issuer LLC(a) | ||||
| 09/30/2027 | 8.625% | 567,000 | 582,157 | |
| Hightower Holding LLC(a) | ||||
| 04/15/2029 | 6.750% | 450,000 | 390,273 | |
| NFP Corp(a) | ||||
| 10/01/2030 | 7.500% | 640,000 | 628,995 | |
| NFP Corp.(a) | ||||
| 08/15/2028 | 4.875% | 471,000 | 429,040 | |
| 08/15/2028 | 6.875% | 2,276,000 | 1,986,824 | |
| Total | 4,376,033 | |||
| Building Materials 0.1% | ||||
| American Builders & Contractors Supply Co., Inc.(a) | ||||
| 01/15/2028 | 4.000% | 661,000 | 606,088 | |
| 11/15/2029 | 3.875% | 553,000 | 477,194 | |
| Beacon Roofing Supply, Inc.(a) | ||||
| 11/15/2026 | 4.500% | 463,000 | 440,228 | |
| James Hardie International Finance DAC(a) | ||||
| 01/15/2028 | 5.000% | 250,000 | 236,822 | |
| Corporate Bonds & Notes(h) (continued) | ||||
| Issuer | Coupon Rate | Principal Amount ($) | Value ($) | |
| SRS Distribution, Inc.(a) | ||||
| 07/01/2028 | 4.625% | 525,000 | 463,538 | |
| 07/01/2029 | 6.125% | 556,000 | 459,857 | |
| 12/01/2029 | 6.000% | 447,000 | 363,994 | |
| White Cap Buyer LLC(a) | ||||
| 10/15/2028 | 6.875% | 1,180,000 | 1,031,919 | |
| Total | 4,079,640 | |||
| Cable and Satellite 1.3% | ||||
| CCO Holdings LLC/Capital Corp.(a) | ||||
| 05/01/2027 | 5.125% | 396,000 | 374,473 | |
| 06/01/2029 | 5.375% | 233,000 | 213,886 | |
| 03/01/2030 | 4.750% | 862,000 | 742,020 | |
| 08/15/2030 | 4.500% | 1,140,000 | 961,525 | |
| 02/01/2031 | 4.250% | 194,000 | 159,640 | |
| 02/01/2032 | 4.750% | 619,000 | 512,263 | |
| CCO Holdings LLC/Capital Corp. | ||||
| 05/01/2032 | 4.500% | 2,448,000 | 1,963,503 | |
| Charter Communications Operating LLC/Capital | ||||
| 05/01/2047 | 5.375% | 1,980,000 | 1,615,841 | |
| 12/01/2061 | 4.400% | 9,591,000 | 6,424,903 | |
| 06/30/2062 | 3.950% | 11,685,000 | 7,209,994 | |
| 04/01/2063 | 5.500% | 1,076,000 | 857,542 | |
| CSC Holdings LLC | ||||
| 06/01/2024 | 5.250% | 586,000 | 571,498 | |
| CSC Holdings LLC(a) | ||||
| 02/01/2028 | 5.375% | 640,000 | 524,845 | |
| 01/15/2030 | 5.750% | 402,000 | 205,039 | |
| 12/01/2030 | 4.125% | 941,000 | 676,056 | |
| 12/01/2030 | 4.625% | 241,000 | 117,557 | |
| 02/15/2031 | 3.375% | 961,000 | 661,568 | |
| 11/15/2031 | 5.000% | 159,000 | 76,176 | |
| DIRECTV Holdings LLC/Financing Co., Inc.(a) | ||||
| 08/15/2027 | 5.875% | 366,000 | 321,200 | |
| DISH DBS Corp. | ||||
| 07/01/2026 | 7.750% | 799,000 | 461,323 | |
| 06/01/2029 | 5.125% | 1,341,000 | 619,950 | |
| DISH Network Corp.(a) | ||||
| 11/15/2027 | 11.750% | 1,492,000 | 1,410,862 | |
| Radiate Holdco LLC/Finance, Inc.(a) | ||||
| 09/15/2026 | 4.500% | 807,000 | 631,603 | |
| 09/15/2028 | 6.500% | 1,464,000 | 682,276 | |
| Sirius XM Radio, Inc.(a) | ||||
| 09/01/2026 | 3.125% | 411,000 | 367,861 | |
| 08/01/2027 | 5.000% | 347,000 | 319,236 | |
| 07/15/2028 | 4.000% | 813,000 | 687,113 | |
| 07/01/2030 | 4.125% | 244,000 | 195,638 | |
| Videotron Ltd.(a) | ||||
| 06/15/2029 | 3.625% | 4,632,000 | 4,034,560 | |
| Virgin Media Finance PLC(a) | ||||
| 07/15/2030 | 5.000% | 542,000 | 456,129 | |
| Columbia Total Return Bond Fund | Annual Report 2023 | 13 |
April 30, 2023
| Corporate Bonds & Notes(h) (continued) | ||||
| Issuer | Coupon Rate | Principal Amount ($) | Value ($) | |
| Virgin Media Secured Finance PLC(a) | ||||
| 05/15/2029 | 5.500% | 316,000 | 290,585 | |
| VZ Secured Financing BV(a) | ||||
| 01/15/2032 | 5.000% | 1,165,000 | 972,445 | |
| Ziggo Bond Co. BV(a) | ||||
| 02/28/2030 | 5.125% | 373,000 | 302,965 | |
| Ziggo Bond Finance BV(a) | ||||
| 01/15/2027 | 6.000% | 335,000 | 317,820 | |
| Ziggo BV(a) | ||||
| 01/15/2030 | 4.875% | 1,110,000 | 955,056 | |
| Total | 36,894,951 | |||
| Chemicals 0.4% | ||||
| Avient Corp.(a) | ||||
| 08/01/2030 | 7.125% | 544,000 | 556,367 | |
| Axalta Coating Systems LLC(a) | ||||
| 02/15/2029 | 3.375% | 221,000 | 192,228 | |
| Axalta Coating Systems LLC/Dutch Holding B BV(a) | ||||
| 06/15/2027 | 4.750% | 408,000 | 394,373 | |
| Braskem Netherlands Finance BV(a) | ||||
| 01/31/2030 | 4.500% | 1,500,000 | 1,260,236 | |
| Cheever Escrow Issuer LLC(a) | ||||
| 10/01/2027 | 7.125% | 695,000 | 662,758 | |
| Element Solutions, Inc.(a) | ||||
| 09/01/2028 | 3.875% | 618,000 | 546,068 | |
| HB Fuller Co. | ||||
| 10/15/2028 | 4.250% | 633,000 | 581,005 | |
| Herens Holdco Sarl(a) | ||||
| 05/15/2028 | 4.750% | 949,000 | 787,000 | |
| Illuminate Buyer LLC/Holdings IV, Inc.(a) | ||||
| 07/01/2028 | 9.000% | 829,000 | 736,804 | |
| INEOS Quattro Finance 2 Plc(a) | ||||
| 01/15/2026 | 3.375% | 739,000 | 682,208 | |
| Ingevity Corp.(a) | ||||
| 11/01/2028 | 3.875% | 494,000 | 434,810 | |
| Innophos Holdings, Inc.(a) | ||||
| 02/15/2028 | 9.375% | 305,000 | 308,913 | |
| Iris Holdings, Inc.(a),(l) | ||||
| 02/15/2026 | 8.750% | 188,000 | 173,507 | |
| Olympus Water US Holding Corp.(a) | ||||
| 10/01/2028 | 4.250% | 568,000 | 483,429 | |
| 10/01/2029 | 6.250% | 742,000 | 596,553 | |
| SPCM SA(a) | ||||
| 03/15/2027 | 3.125% | 190,000 | 170,700 | |
| Unifrax Escrow Issuer Corp.(a) | ||||
| 09/30/2028 | 5.250% | 284,000 | 234,035 | |
| Corporate Bonds & Notes(h) (continued) | ||||
| Issuer | Coupon Rate | Principal Amount ($) | Value ($) | |
| WR Grace Holdings LLC(a) | ||||
| 06/15/2027 | 4.875% | 836,000 | 795,259 | |
| 08/15/2029 | 5.625% | 1,743,000 | 1,504,122 | |
| 03/01/2031 | 7.375% | 159,000 | 159,371 | |
| Total | 11,259,746 | |||
| Construction Machinery 0.1% | ||||
| H&E Equipment Services, Inc.(a) | ||||
| 12/15/2028 | 3.875% | 1,248,000 | 1,078,193 | |
| Herc Holdings, Inc.(a) | ||||
| 07/15/2027 | 5.500% | 87,000 | 83,082 | |
| Ritchie Bros Holdings, Inc.(a) | ||||
| 03/15/2028 | 6.750% | 135,000 | 139,694 | |
| 03/15/2031 | 7.750% | 325,000 | 345,307 | |
| United Rentals North America, Inc. | ||||
| 05/15/2027 | 5.500% | 179,000 | 177,841 | |
| 02/15/2031 | 3.875% | 194,000 | 170,588 | |
| 01/15/2032 | 3.750% | 203,000 | 174,154 | |
| Total | 2,168,859 | |||
| Consumer Cyclical Services 0.2% | ||||
| APX Group, Inc.(a) | ||||
| 07/15/2029 | 5.750% | 98,000 | 87,609 | |
| Arches Buyer, Inc.(a) | ||||
| 06/01/2028 | 4.250% | 1,119,000 | 962,720 | |
| 12/01/2028 | 6.125% | 765,000 | 663,302 | |
| ASGN, Inc.(a) | ||||
| 05/15/2028 | 4.625% | 268,000 | 248,033 | |
| Match Group, Inc.(a) | ||||
| 12/15/2027 | 5.000% | 348,000 | 328,338 | |
| 06/01/2028 | 4.625% | 682,000 | 629,139 | |
| Staples, Inc.(a) | ||||
| 04/15/2026 | 7.500% | 278,000 | 234,839 | |
| Uber Technologies, Inc.(a) | ||||
| 05/15/2025 | 7.500% | 463,000 | 469,969 | |
| 09/15/2027 | 7.500% | 327,000 | 337,373 | |
| 01/15/2028 | 6.250% | 1,129,000 | 1,139,286 | |
| 08/15/2029 | 4.500% | 2,043,000 | 1,883,133 | |
| Total | 6,983,741 | |||
| Consumer Products 0.2% | ||||
| CD&R Smokey Buyer, Inc.(a) | ||||
| 07/15/2025 | 6.750% | 1,565,000 | 1,377,334 | |
| Mattel, Inc.(a) | ||||
| 04/01/2026 | 3.375% | 166,000 | 156,985 | |
| 12/15/2027 | 5.875% | 300,000 | 300,363 | |
| 04/01/2029 | 3.750% | 765,000 | 690,782 | |
| Mattel, Inc. | ||||
| 10/01/2040 | 6.200% | 925,000 | 880,633 | |
| 11/01/2041 | 5.450% | 28,000 | 24,903 | |
| 14 | Columbia Total Return Bond Fund | Annual Report 2023 |
April 30, 2023
| Corporate Bonds & Notes(h) (continued) | ||||
| Issuer | Coupon Rate | Principal Amount ($) | Value ($) | |
| Newell Brands, Inc. | ||||
| 06/01/2025 | 4.875% | 371,000 | 361,354 | |
| 09/15/2027 | 6.375% | 215,000 | 211,506 | |
| 09/15/2029 | 6.625% | 304,000 | 300,490 | |
| Prestige Brands, Inc.(a) | ||||
| 01/15/2028 | 5.125% | 214,000 | 207,573 | |
| Spectrum Brands, Inc. | ||||
| 07/15/2025 | 5.750% | 136,000 | 135,097 | |
| Spectrum Brands, Inc.(a) | ||||
| 10/01/2029 | 5.000% | 618,000 | 561,683 | |
| 07/15/2030 | 5.500% | 45,000 | 41,475 | |
| 03/15/2031 | 3.875% | 247,000 | 202,641 | |
| Tempur Sealy International, Inc.(a) | ||||
| 10/15/2031 | 3.875% | 318,000 | 263,364 | |
| Total | 5,716,183 | |||
| Diversified Manufacturing 0.4% | ||||
| Carrier Global Corp. | ||||
| 02/15/2030 | 2.722% | 8,257,000 | 7,228,791 | |
| Chart Industries, Inc.(a) | ||||
| 01/01/2030 | 7.500% | 340,000 | 350,691 | |
| 01/01/2031 | 9.500% | 117,000 | 123,799 | |
| Gates Global LLC/Co.(a) | ||||
| 01/15/2026 | 6.250% | 1,444,000 | 1,431,213 | |
| Madison IAQ LLC(a) | ||||
| 06/30/2028 | 4.125% | 741,000 | 652,170 | |
| 06/30/2029 | 5.875% | 587,000 | 459,605 | |
| Resideo Funding, Inc.(a) | ||||
| 09/01/2029 | 4.000% | 757,000 | 646,380 | |
| Vertical US Newco, Inc.(a) | ||||
| 07/15/2027 | 5.250% | 229,000 | 214,040 | |
| WESCO Distribution, Inc.(a) | ||||
| 06/15/2025 | 7.125% | 1,091,000 | 1,109,249 | |
| 06/15/2028 | 7.250% | 287,000 | 294,965 | |
| Total | 12,510,903 | |||
| Electric 1.3% | ||||
| AEP Texas, Inc. | ||||
| 01/15/2050 | 3.450% | 3,890,000 | 2,892,234 | |
| Clearway Energy Operating LLC(a) | ||||
| 02/15/2031 | 3.750% | 1,016,000 | 868,932 | |
| 01/15/2032 | 3.750% | 956,000 | 802,421 | |
| Duke Energy Corp. | ||||
| 09/01/2046 | 3.750% | 8,515,000 | 6,670,817 | |
| Duke Energy Ohio, Inc. | ||||
| 04/01/2053 | 5.650% | 860,000 | 911,023 | |
| Emera US Finance LP | ||||
| 06/15/2046 | 4.750% | 7,655,000 | 6,360,097 | |
| Corporate Bonds & Notes(h) (continued) | ||||
| Issuer | Coupon Rate | Principal Amount ($) | Value ($) | |
| FirstEnergy Corp. | ||||
| 03/01/2050 | 3.400% | 1,537,000 | 1,075,178 | |
| Georgia Power Co. | ||||
| 03/15/2042 | 4.300% | 2,286,000 | 2,025,746 | |
| Leeward Renewable Energy Operations LLC(a) | ||||
| 07/01/2029 | 4.250% | 135,000 | 122,059 | |
| NextEra Energy Operating Partners LP(a) | ||||
| 07/15/2024 | 4.250% | 988,000 | 974,089 | |
| NRG Energy, Inc. | ||||
| 01/15/2028 | 5.750% | 15,000 | 14,634 | |
| NRG Energy, Inc.(a) | ||||
| 02/15/2029 | 3.375% | 182,000 | 154,238 | |
| 06/15/2029 | 5.250% | 768,000 | 709,140 | |
| 02/15/2032 | 3.875% | 2,283,000 | 1,842,936 | |
| Pacific Gas and Electric Co. | ||||
| 07/01/2050 | 4.950% | 9,515,000 | 7,753,018 | |
| 04/01/2053 | 6.700% | 523,000 | 533,919 | |
| Pattern Energy Operations LP/Inc.(a) | ||||
| 08/15/2028 | 4.500% | 132,000 | 122,688 | |
| PG&E Corp. | ||||
| 07/01/2028 | 5.000% | 80,000 | 75,413 | |
| TerraForm Power Operating LLC(a) | ||||
| 01/15/2030 | 4.750% | 494,000 | 458,156 | |
| Vistra Operations Co. LLC(a) | ||||
| 09/01/2026 | 5.500% | 68,000 | 66,746 | |
| 02/15/2027 | 5.625% | 209,000 | 203,805 | |
| 07/31/2027 | 5.000% | 712,000 | 676,755 | |
| 05/01/2029 | 4.375% | 1,377,000 | 1,232,274 | |
| Total | 36,546,318 | |||
| Environmental 0.1% | ||||
| Clean Harbors, Inc.(a) | ||||
| 02/01/2031 | 6.375% | 95,000 | 96,984 | |
| GFL Environmental, Inc.(a) | ||||
| 08/01/2025 | 3.750% | 852,000 | 824,411 | |
| 12/15/2026 | 5.125% | 274,000 | 269,878 | |
| 08/01/2028 | 4.000% | 343,000 | 313,322 | |
| 09/01/2028 | 3.500% | 299,000 | 272,288 | |
| 06/15/2029 | 4.750% | 504,000 | 469,029 | |
| Waste Pro USA, Inc.(a) | ||||
| 02/15/2026 | 5.500% | 1,255,000 | 1,167,216 | |
| Total | 3,413,128 | |||
| Finance Companies 0.4% | ||||
| Navient Corp. | ||||
| 06/25/2025 | 6.750% | 79,000 | 77,875 | |
| 06/15/2026 | 6.750% | 579,000 | 564,085 | |
| 03/15/2027 | 5.000% | 508,000 | 457,948 | |
| Columbia Total Return Bond Fund | Annual Report 2023 | 15 |
April 30, 2023
| Corporate Bonds & Notes(h) (continued) | ||||
| Issuer | Coupon Rate | Principal Amount ($) | Value ($) | |
| OneMain Finance Corp. | ||||
| 01/15/2027 | 3.500% | 725,000 | 619,052 | |
| 09/15/2030 | 4.000% | 335,000 | 253,604 | |
| Provident Funding Associates LP/Finance Corp.(a) | ||||
| 06/15/2025 | 6.375% | 524,000 | 461,871 | |
| Quicken Loans LLC/Co-Issuer, Inc.(a) | ||||
| 03/01/2029 | 3.625% | 2,049,000 | 1,731,646 | |
| 03/01/2031 | 3.875% | 975,000 | 788,437 | |
| Rocket Mortgage LLC/Co-Issuer, Inc.(a) | ||||
| 10/15/2033 | 4.000% | 5,070,000 | 3,967,501 | |
| Springleaf Finance Corp. | ||||
| 03/15/2024 | 6.125% | 840,000 | 826,484 | |
| 03/15/2025 | 6.875% | 181,000 | 176,926 | |
| Total | 9,925,429 | |||
| Food and Beverage 1.0% | ||||
| Bacardi Ltd.(a) | ||||
| 05/15/2048 | 5.300% | 9,130,000 | 8,543,422 | |
| Becle SAB de CV(a) | ||||
| 10/14/2031 | 2.500% | 3,000,000 | 2,468,741 | |
| Constellation Brands, Inc.(d) | ||||
| 05/01/2033 | 4.900% | 7,848,000 | 7,876,009 | |
| Darling Ingredients, Inc.(a) | ||||
| 06/15/2030 | 6.000% | 720,000 | 712,508 | |
| FAGE International SA/USA Dairy Industry, Inc.(a) | ||||
| 08/15/2026 | 5.625% | 1,199,000 | 1,116,959 | |
| Grupo Bimbo SAB de CV(a) | ||||
| 06/27/2024 | 3.875% | 971,000 | 957,062 | |
| Lamb Weston Holdings, Inc.(a) | ||||
| 01/31/2030 | 4.125% | 422,000 | 386,435 | |
| 01/31/2032 | 4.375% | 421,000 | 384,809 | |
| MHP SE(a) | ||||
| 05/10/2024 | 7.750% | 581,000 | 337,412 | |
| Pilgrim’s Pride Corp.(a) | ||||
| 09/30/2027 | 5.875% | 491,000 | 488,438 | |
| Post Holdings, Inc.(a) | ||||
| 03/01/2027 | 5.750% | 622,000 | 617,622 | |
| 04/15/2030 | 4.625% | 624,000 | 563,356 | |
| 09/15/2031 | 4.500% | 864,000 | 756,054 | |
| Primo Water Holdings, Inc.(a) | ||||
| 04/30/2029 | 4.375% | 1,247,000 | 1,101,388 | |
| Simmons Foods, Inc./Prepared Foods, Inc./Pet Food, Inc./Feed(a) | ||||
| 03/01/2029 | 4.625% | 773,000 | 638,672 | |
| Triton Water Holdings, Inc.(a) | ||||
| 04/01/2029 | 6.250% | 275,000 | 230,953 | |
| Corporate Bonds & Notes(h) (continued) | ||||
| Issuer | Coupon Rate | Principal Amount ($) | Value ($) | |
| US Foods, Inc.(a) | ||||
| 04/15/2025 | 6.250% | 379,000 | 380,587 | |
| 02/15/2029 | 4.750% | 585,000 | 544,067 | |
| 06/01/2030 | 4.625% | 328,000 | 299,750 | |
| Total | 28,404,244 | |||
| Gaming 0.4% | ||||
| Boyd Gaming Corp. | ||||
| 12/01/2027 | 4.750% | 332,000 | 320,101 | |
| Boyd Gaming Corp.(a) | ||||
| 06/15/2031 | 4.750% | 497,000 | 453,553 | |
| Caesars Entertainment, Inc.(a) | ||||
| 10/15/2029 | 4.625% | 1,823,000 | 1,597,267 | |
| 02/15/2030 | 7.000% | 969,000 | 978,364 | |
| Churchill Downs, Inc.(a) | ||||
| 05/01/2031 | 6.750% | 310,000 | 312,207 | |
| Colt Merger Sub, Inc.(a) | ||||
| 07/01/2025 | 5.750% | 501,000 | 504,692 | |
| 07/01/2025 | 6.250% | 1,369,000 | 1,370,886 | |
| 07/01/2027 | 8.125% | 769,000 | 784,019 | |
| International Game Technology PLC(a) | ||||
| 02/15/2025 | 6.500% | 200,000 | 202,443 | |
| 04/15/2026 | 4.125% | 352,000 | 338,670 | |
| MGM Resorts International | ||||
| 05/01/2025 | 6.750% | 2,000,000 | 2,017,776 | |
| Midwest Gaming Borrower LLC(a) | ||||
| 05/01/2029 | 4.875% | 408,000 | 366,612 | |
| Penn National Gaming, Inc.(a) | ||||
| 01/15/2027 | 5.625% | 355,000 | 337,699 | |
| 07/01/2029 | 4.125% | 373,000 | 315,775 | |
| Scientific Games Holdings LP/US FinCo, Inc.(a) | ||||
| 03/01/2030 | 6.625% | 680,000 | 603,158 | |
| Scientific Games International, Inc.(a) | ||||
| 07/01/2025 | 8.625% | 122,000 | 124,787 | |
| 05/15/2028 | 7.000% | 88,000 | 88,070 | |
| 11/15/2029 | 7.250% | 406,000 | 407,078 | |
| Wynn Las Vegas LLC/Capital Corp.(a) | ||||
| 03/01/2025 | 5.500% | 137,000 | 135,175 | |
| Wynn Resorts Finance LLC/Capital Corp.(a) | ||||
| 10/01/2029 | 5.125% | 165,000 | 152,047 | |
| Total | 11,410,379 | |||
| Health Care 1.0% | ||||
| Acadia Healthcare Co., Inc.(a) | ||||
| 07/01/2028 | 5.500% | 195,000 | 188,270 | |
| 04/15/2029 | 5.000% | 669,000 | 633,433 | |
| AdaptHealth LLC(a) | ||||
| 08/01/2029 | 4.625% | 138,000 | 112,644 | |
| 03/01/2030 | 5.125% | 686,000 | 567,632 | |
| 16 | Columbia Total Return Bond Fund | Annual Report 2023 |
April 30, 2023
| Corporate Bonds & Notes(h) (continued) | ||||
| Issuer | Coupon Rate | Principal Amount ($) | Value ($) | |
| Avantor Funding, Inc.(a) | ||||
| 07/15/2028 | 4.625% | 326,000 | 305,223 | |
| 11/01/2029 | 3.875% | 858,000 | 757,261 | |
| Becton Dickinson Euro Finance SARL | ||||
| 08/13/2041 | 1.336% | EUR | 890,000 | 614,447 |
| Catalent Pharma Solutions, Inc.(a) | ||||
| 02/15/2029 | 3.125% | 106,000 | 89,224 | |
| 04/01/2030 | 3.500% | 498,000 | 421,296 | |
| Charles River Laboratories International, Inc.(a) | ||||
| 05/01/2028 | 4.250% | 28,000 | 25,595 | |
| 03/15/2029 | 3.750% | 215,000 | 189,503 | |
| 03/15/2031 | 4.000% | 185,000 | 161,027 | |
| CHS/Community Health Systems, Inc.(a) | ||||
| 04/15/2029 | 6.875% | 422,000 | 312,266 | |
| 05/15/2030 | 5.250% | 1,921,000 | 1,599,033 | |
| 02/15/2031 | 4.750% | 307,000 | 247,574 | |
| Encompass Health Corp. | ||||
| 02/01/2028 | 4.500% | 422,000 | 398,017 | |
| GE Healthcare Holding LLC(a) | ||||
| 11/15/2027 | 5.650% | 3,190,000 | 3,293,861 | |
| 11/22/2052 | 6.377% | 1,528,000 | 1,714,027 | |
| HCA, Inc. | ||||
| 06/15/2026 | 5.250% | 293,000 | 293,817 | |
| HCA, Inc.(a) | ||||
| 03/15/2027 | 3.125% | 484,000 | 454,432 | |
| 03/15/2052 | 4.625% | 8,975,000 | 7,440,650 | |
| Indigo Merger Sub, Inc.(a) | ||||
| 07/15/2026 | 2.875% | 281,000 | 257,218 | |
| IQVIA, Inc.(a) | ||||
| 10/15/2026 | 5.000% | 653,000 | 641,437 | |
| Mozart Debt Merger Sub, Inc.(a) | ||||
| 04/01/2029 | 3.875% | 135,000 | 118,097 | |
| 10/01/2029 | 5.250% | 1,964,000 | 1,698,638 | |
| Select Medical Corp.(a) | ||||
| 08/15/2026 | 6.250% | 1,178,000 | 1,154,220 | |
| Tenet Healthcare Corp. | ||||
| 07/15/2024 | 4.625% | 341,000 | 337,944 | |
| 01/01/2026 | 4.875% | 220,000 | 216,601 | |
| 02/01/2027 | 6.250% | 389,000 | 387,412 | |
| 11/01/2027 | 5.125% | 521,000 | 505,916 | |
| 06/15/2028 | 4.625% | 846,000 | 801,672 | |
| 10/01/2028 | 6.125% | 1,164,000 | 1,129,164 | |
| 06/01/2029 | 4.250% | 84,000 | 77,048 | |
| 01/15/2030 | 4.375% | 633,000 | 582,437 | |
| Total | 27,727,036 | |||
| Healthcare Insurance 1.0% | ||||
| Aetna, Inc. | ||||
| 11/15/2042 | 4.125% | 972,000 | 827,127 | |
| Corporate Bonds & Notes(h) (continued) | ||||
| Issuer | Coupon Rate | Principal Amount ($) | Value ($) | |
| Centene Corp. | ||||
| 02/15/2030 | 3.375% | 615,000 | 543,145 | |
| 10/15/2030 | 3.000% | 14,096,000 | 12,033,589 | |
| 08/01/2031 | 2.625% | 4,372,000 | 3,574,382 | |
| UnitedHealth Group, Inc. | ||||
| 02/15/2030 | 5.300% | 5,114,000 | 5,395,907 | |
| 04/15/2063 | 5.200% | 5,858,000 | 5,967,100 | |
| Total | 28,341,250 | |||
| Home Construction 0.1% | ||||
| Meritage Homes Corp. | ||||
| 06/01/2025 | 6.000% | 277,000 | 279,868 | |
| Meritage Homes Corp.(a) | ||||
| 04/15/2029 | 3.875% | 1,914,000 | 1,727,250 | |
| Shea Homes LP/Funding Corp. | ||||
| 02/15/2028 | 4.750% | 692,000 | 632,994 | |
| Taylor Morrison Communities, Inc.(a) | ||||
| 01/15/2028 | 5.750% | 84,000 | 83,351 | |
| Total | 2,723,463 | |||
| Independent Energy 1.4% | ||||
| Apache Corp. | ||||
| 02/01/2042 | 5.250% | 227,000 | 192,155 | |
| 04/15/2043 | 4.750% | 246,000 | 191,977 | |
| Baytex Energy Corp.(a) | ||||
| 04/30/2030 | 8.500% | 463,000 | 465,417 | |
| Callon Petroleum Co. | ||||
| 07/01/2026 | 6.375% | 812,000 | 783,065 | |
| Callon Petroleum Co.(a) | ||||
| 08/01/2028 | 8.000% | 215,000 | 212,186 | |
| Centennial Resource Production LLC(a) | ||||
| 04/01/2027 | 6.875% | 121,000 | 119,583 | |
| CNX Resources Corp.(a) | ||||
| 03/14/2027 | 7.250% | 29,000 | 28,837 | |
| 01/15/2029 | 6.000% | 305,000 | 282,171 | |
| 01/15/2031 | 7.375% | 880,000 | 849,139 | |
| Colgate Energy Partners III LLC(a) | ||||
| 07/01/2029 | 5.875% | 1,930,000 | 1,822,445 | |
| Comstock Resources, Inc.(a) | ||||
| 03/01/2029 | 6.750% | 191,000 | 172,886 | |
| 01/15/2030 | 5.875% | 286,000 | 245,985 | |
| CrownRock LP/Finance, Inc.(a) | ||||
| 10/15/2025 | 5.625% | 973,000 | 960,959 | |
| 05/01/2029 | 5.000% | 1,697,000 | 1,605,580 | |
| Endeavor Energy Resources LP/Finance, Inc.(a) | ||||
| 01/30/2028 | 5.750% | 213,000 | 212,011 | |
| Columbia Total Return Bond Fund | Annual Report 2023 | 17 |
April 30, 2023
| Corporate Bonds & Notes(h) (continued) | ||||
| Issuer | Coupon Rate | Principal Amount ($) | Value ($) | |
| Hilcorp Energy I LP/Finance Co.(a) | ||||
| 11/01/2028 | 6.250% | 22,000 | 21,065 | |
| 02/01/2029 | 5.750% | 264,000 | 246,552 | |
| 04/15/2030 | 6.000% | 300,000 | 279,677 | |
| 02/01/2031 | 6.000% | 282,000 | 260,972 | |
| 04/15/2032 | 6.250% | 334,000 | 312,748 | |
| Matador Resources Co. | ||||
| 09/15/2026 | 5.875% | 422,000 | 414,753 | |
| Matador Resources Co.(a) | ||||
| 04/15/2028 | 6.875% | 320,000 | 322,389 | |
| Occidental Petroleum Corp. | ||||
| 09/01/2030 | 6.625% | 896,000 | 955,605 | |
| 01/01/2031 | 6.125% | 3,429,000 | 3,589,382 | |
| 09/15/2036 | 6.450% | 9,723,000 | 10,354,709 | |
| 03/15/2040 | 6.200% | 672,000 | 691,163 | |
| 03/15/2046 | 6.600% | 12,797,000 | 13,652,934 | |
| Southwestern Energy Co. | ||||
| 02/01/2029 | 5.375% | 144,000 | 136,097 | |
| 02/01/2032 | 4.750% | 1,327,000 | 1,172,494 | |
| Total | 40,554,936 | |||
| Integrated Energy 0.1% | ||||
| Cenovus Energy, Inc. | ||||
| 02/15/2052 | 3.750% | 2,315,000 | 1,680,197 | |
| Lukoil International Finance BV(a),(m) | ||||
| 04/24/2023 | 4.563% | 971,000 | 874,240 | |
| Total | 2,554,437 | |||
| Leisure 0.4% | ||||
| Carnival Corp.(a) | ||||
| 03/01/2026 | 7.625% | 862,000 | 790,926 | |
| 03/01/2027 | 5.750% | 1,866,000 | 1,535,520 | |
| 08/01/2028 | 4.000% | 623,000 | 540,175 | |
| 05/01/2029 | 6.000% | 271,000 | 212,867 | |
| Carnival Holdings Bermuda Ltd.(a) | ||||
| 05/01/2028 | 10.375% | 461,000 | 495,603 | |
| Cedar Fair LP/Canada’s Wonderland Co./Magnum Management Corp./Millennium Op | ||||
| 04/15/2027 | 5.375% | 342,000 | 327,573 | |
| Cedar Fair LP/Canada’s Wonderland Co./Magnum Management Corp./Millennium Operations LLC(a) | ||||
| 05/01/2025 | 5.500% | 651,000 | 649,325 | |
| Cedar Fair LP/Canada’s Wonderland Co./Magnum Management Corp./Millennium Operations LLC | ||||
| 10/01/2028 | 6.500% | 334,000 | 328,534 | |
| Cinemark USA, Inc.(a) | ||||
| 05/01/2025 | 8.750% | 93,000 | 94,861 | |
| 03/15/2026 | 5.875% | 831,000 | 794,059 | |
| 07/15/2028 | 5.250% | 262,000 | 234,418 | |
| Live Nation Entertainment, Inc.(a) | ||||
| 03/15/2026 | 5.625% | 345,000 | 336,727 | |
| Corporate Bonds & Notes(h) (continued) | ||||
| Issuer | Coupon Rate | Principal Amount ($) | Value ($) | |
| NCL Corp., Ltd.(a) | ||||
| 02/15/2029 | 7.750% | 104,000 | 88,653 | |
| NCL Finance Ltd.(a) | ||||
| 03/15/2028 | 6.125% | 113,000 | 91,667 | |
| Royal Caribbean Cruises Ltd.(a) | ||||
| 07/01/2026 | 4.250% | 675,000 | 604,181 | |
| 08/31/2026 | 5.500% | 657,000 | 602,784 | |
| 07/15/2027 | 5.375% | 266,000 | 236,374 | |
| 08/15/2027 | 11.625% | 515,000 | 547,986 | |
| 01/15/2029 | 8.250% | 400,000 | 420,142 | |
| 01/15/2030 | 7.250% | 675,000 | 677,167 | |
| Royal Caribbean Cruises Ltd. | ||||
| 03/15/2028 | 3.700% | 330,000 | 267,765 | |
| Six Flags Entertainment Corp.(a) | ||||
| 07/31/2024 | 4.875% | 491,000 | 491,040 | |
| Six Flags Entertainment Corp.(a),(d) | ||||
| 05/15/2031 | 7.250% | 497,000 | 487,211 | |
| Six Flags Theme Parks, Inc.(a) | ||||
| 07/01/2025 | 7.000% | 31,000 | 31,356 | |
| Total | 10,886,914 | |||
| Life Insurance 0.1% | ||||
| Peachtree Corners Funding Trust(a) | ||||
| 02/15/2025 | 3.976% | 2,100,000 | 2,044,304 | |
| Voya Financial, Inc. | ||||
| 06/15/2046 | 4.800% | 82,000 | 69,246 | |
| Total | 2,113,550 | |||
| Lodging 0.0% | ||||
| Hilton Domestic Operating Co., Inc.(a) | ||||
| 05/01/2025 | 5.375% | 61,000 | 60,953 | |
| 05/01/2028 | 5.750% | 67,000 | 66,841 | |
| 02/15/2032 | 3.625% | 253,000 | 215,889 | |
| Marriott Ownership Resorts, Inc.(a) | ||||
| 06/15/2029 | 4.500% | 188,000 | 164,010 | |
| Wyndham Hotels & Resorts, Inc.(a) | ||||
| 08/15/2028 | 4.375% | 312,000 | 290,181 | |
| Total | 797,874 | |||
| Media and Entertainment 1.2% | ||||
| Cengage Learning, Inc.(a) | ||||
| 06/15/2024 | 9.500% | 548,000 | 548,733 | |
| Clear Channel International BV(a) | ||||
| 08/01/2025 | 6.625% | 289,000 | 285,226 | |
| Clear Channel Outdoor Holdings, Inc.(a) | ||||
| 04/15/2028 | 7.750% | 716,000 | 543,896 | |
| 06/01/2029 | 7.500% | 1,217,000 | 900,667 | |
| Clear Channel Worldwide Holdings, Inc.(a) | ||||
| 08/15/2027 | 5.125% | 847,000 | 765,084 | |
| 18 | Columbia Total Return Bond Fund | Annual Report 2023 |
April 30, 2023
| Corporate Bonds & Notes(h) (continued) | ||||
| Issuer | Coupon Rate | Principal Amount ($) | Value ($) | |
| iHeartCommunications, Inc. | ||||
| 05/01/2026 | 6.375% | 772,634 | 664,984 | |
| 05/01/2027 | 8.375% | 1,211,507 | 793,339 | |
| iHeartCommunications, Inc.(a) | ||||
| 01/15/2028 | 4.750% | 846,000 | 658,253 | |
| Magallanes, Inc.(a) | ||||
| 03/15/2062 | 5.391% | 32,019,000 | 25,700,371 | |
| Netflix, Inc. | ||||
| 05/15/2029 | 4.625% | EUR | 1,696,000 | 1,912,000 |
| Outfront Media Capital LLC/Corp.(a) | ||||
| 08/15/2027 | 5.000% | 180,000 | 166,188 | |
| 01/15/2029 | 4.250% | 139,000 | 118,727 | |
| 03/15/2030 | 4.625% | 97,000 | 82,067 | |
| Playtika Holding Corp.(a) | ||||
| 03/15/2029 | 4.250% | 600,000 | 514,099 | |
| Roblox Corp.(a) | ||||
| 05/01/2030 | 3.875% | 469,000 | 396,243 | |
| Univision Communications, Inc.(a) | ||||
| 05/01/2029 | 4.500% | 243,000 | 209,510 | |
| 06/30/2030 | 7.375% | 540,000 | 517,979 | |
| Total | 34,777,366 | |||
| Metals and Mining 0.2% | ||||
| Allegheny Technologies, Inc. | ||||
| 10/01/2029 | 4.875% | 108,000 | 99,499 | |
| 10/01/2031 | 5.125% | 777,000 | 702,655 | |
| Commercial Metals Co. | ||||
| 02/15/2031 | 3.875% | 60,000 | 52,481 | |
| Constellium NV(a) | ||||
| 02/15/2026 | 5.875% | 614,000 | 611,203 | |
| Constellium SE(a) | ||||
| 06/15/2028 | 5.625% | 988,000 | 948,242 | |
| 04/15/2029 | 3.750% | 1,309,000 | 1,128,072 | |
| Hudbay Minerals, Inc.(a) | ||||
| 04/01/2029 | 6.125% | 441,000 | 414,351 | |
| Kaiser Aluminum Corp.(a) | ||||
| 03/01/2028 | 4.625% | 83,000 | 73,247 | |
| 06/01/2031 | 4.500% | 507,000 | 401,214 | |
| Novelis Corp.(a) | ||||
| 11/15/2026 | 3.250% | 256,000 | 234,400 | |
| 01/30/2030 | 4.750% | 554,000 | 501,451 | |
| 08/15/2031 | 3.875% | 309,000 | 258,718 | |
| Total | 5,425,533 | |||
| Midstream 1.8% | ||||
| CNX Midstream Partners LP(a) | ||||
| 04/15/2030 | 4.750% | 451,000 | 378,892 | |
| Delek Logistics Partners LP/Finance Corp. | ||||
| 05/15/2025 | 6.750% | 96,000 | 94,411 | |
| Corporate Bonds & Notes(h) (continued) | ||||
| Issuer | Coupon Rate | Principal Amount ($) | Value ($) | |
| DT Midstream, Inc.(a) | ||||
| 06/15/2029 | 4.125% | 891,000 | 790,507 | |
| 06/15/2031 | 4.375% | 626,000 | 544,707 | |
| EQM Midstream Partners LP(a) | ||||
| 07/01/2025 | 6.000% | 106,000 | 104,079 | |
| 07/01/2027 | 6.500% | 281,000 | 273,968 | |
| 01/15/2029 | 4.500% | 315,000 | 268,310 | |
| 01/15/2031 | 4.750% | 2,619,000 | 2,157,045 | |
| EQM Midstream Partners LP | ||||
| 07/15/2048 | 6.500% | 6,358,000 | 4,822,305 | |
| Galaxy Pipeline Assets Bidco Ltd.(a) | ||||
| 09/30/2040 | 3.250% | 3,995,000 | 3,184,886 | |
| Hess Midstream Operations LP(a) | ||||
| 02/15/2030 | 4.250% | 202,000 | 179,488 | |
| Holly Energy Partners LP/Finance Corp.(a) | ||||
| 04/15/2027 | 6.375% | 246,000 | 243,024 | |
| 02/01/2028 | 5.000% | 486,000 | 453,788 | |
| ITT Holdings LLC(a) | ||||
| 08/01/2029 | 6.500% | 324,000 | 268,949 | |
| Kinder Morgan, Inc. | ||||
| 02/15/2046 | 5.050% | 2,270,000 | 1,996,853 | |
| 08/01/2052 | 5.450% | 5,818,000 | 5,370,356 | |
| MPLX LP | ||||
| 03/14/2052 | 4.950% | 1,972,000 | 1,705,119 | |
| NuStar Logistics LP | ||||
| 10/01/2025 | 5.750% | 832,000 | 820,022 | |
| 06/01/2026 | 6.000% | 191,000 | 187,615 | |
| 04/28/2027 | 5.625% | 111,000 | 106,641 | |
| Plains All American Pipeline LP/Finance Corp. | ||||
| 06/15/2044 | 4.700% | 11,015,000 | 8,748,511 | |
| Sunoco LP/Finance Corp. | ||||
| 04/15/2027 | 6.000% | 779,000 | 775,086 | |
| TransMontaigne Partners LP/TLP Finance Corp. | ||||
| 02/15/2026 | 6.125% | 868,000 | 754,675 | |
| Venture Global Calcasieu Pass LLC(a) | ||||
| 08/15/2029 | 3.875% | 1,179,000 | 1,061,442 | |
| 08/15/2031 | 4.125% | 3,380,000 | 2,995,089 | |
| 11/01/2033 | 3.875% | 6,510,000 | 5,488,809 | |
| Western Midstream Operating LP(i) | ||||
| 02/01/2050 | 5.500% | 5,215,000 | 4,433,376 | |
| Williams Companies, Inc. (The) | ||||
| 09/15/2045 | 5.100% | 2,916,000 | 2,670,784 | |
| Total | 50,878,737 | |||
| Natural Gas 0.3% | ||||
| NiSource, Inc. | ||||
| 05/15/2047 | 4.375% | 8,669,000 | 7,655,127 | |
| Columbia Total Return Bond Fund | Annual Report 2023 | 19 |
April 30, 2023
| Corporate Bonds & Notes(h) (continued) | ||||
| Issuer | Coupon Rate | Principal Amount ($) | Value ($) | |
| Oil Field Services 0.1% | ||||
| Archrock Partners LP/Finance Corp.(a) | ||||
| 04/01/2028 | 6.250% | 67,000 | 64,290 | |
| Nabors Industries Ltd.(a) | ||||
| 01/15/2026 | 7.250% | 650,000 | 613,018 | |
| Nabors Industries, Inc.(a) | ||||
| 05/15/2027 | 7.375% | 285,000 | 276,461 | |
| Transocean Titan Financing Ltd.(a) | ||||
| 02/01/2028 | 8.375% | 734,000 | 748,939 | |
| USA Compression Partners LP/Finance Corp. | ||||
| 04/01/2026 | 6.875% | 103,000 | 101,908 | |
| Total | 1,804,616 | |||
| Other Industry 0.0% | ||||
| Hillenbrand, Inc. | ||||
| 03/01/2031 | 3.750% | 224,000 | 192,380 | |
| Other REIT 0.2% | ||||
| Blackstone Mortgage Trust, Inc.(a) | ||||
| 01/15/2027 | 3.750% | 555,000 | 468,872 | |
| Digital Dutch Finco BV(a) | ||||
| 03/15/2030 | 1.500% | EUR | 1,680,000 | 1,454,664 |
| Ladder Capital Finance Holdings LLLP/Corp.(a) | ||||
| 10/01/2025 | 5.250% | 531,000 | 498,997 | |
| 02/01/2027 | 4.250% | 893,000 | 760,563 | |
| 06/15/2029 | 4.750% | 2,141,000 | 1,693,983 | |
| Park Intermediate Holdings LLC/Domestic Property/Finance Co-Issuer(a) | ||||
| 10/01/2028 | 5.875% | 256,000 | 236,570 | |
| Park Intermediate Holdings LLC/PK Domestic Property LLC/Finance Co-Issuer(a) | ||||
| 05/15/2029 | 4.875% | 311,000 | 270,164 | |
| RHP Hotel Properties LP/Finance Corp.(a) | ||||
| 02/15/2029 | 4.500% | 156,000 | 140,474 | |
| RLJ Lodging Trust LP(a) | ||||
| 07/01/2026 | 3.750% | 219,000 | 203,071 | |
| 09/15/2029 | 4.000% | 241,000 | 202,961 | |
| Service Properties Trust | ||||
| 03/15/2024 | 4.650% | 147,000 | 144,090 | |
| Total | 6,074,409 | |||
| Packaging 0.2% | ||||
| Ardagh Metal Packaging Finance USA LLC/PLC(a) | ||||
| 06/15/2027 | 6.000% | 632,000 | 629,152 | |
| 09/01/2029 | 4.000% | 1,215,000 | 989,598 | |
| Ardagh Packaging Finance PLC/Holdings USA, Inc.(a) | ||||
| 08/15/2026 | 4.125% | 1,004,000 | 946,730 | |
| Berry Global, Inc.(a) | ||||
| 04/15/2028 | 5.500% | 1,470,000 | 1,468,390 | |
| Corporate Bonds & Notes(h) (continued) | ||||
| Issuer | Coupon Rate | Principal Amount ($) | Value ($) | |
| CANPACK SA/Eastern PA Land Investment Holding LLC(a) | ||||
| 11/01/2025 | 3.125% | 147,000 | 130,647 | |
| Canpack SA/US LLC(a) | ||||
| 11/15/2029 | 3.875% | 755,000 | 608,279 | |
| Trivium Packaging Finance BV(a) | ||||
| 08/15/2026 | 5.500% | 799,000 | 775,694 | |
| 08/15/2027 | 8.500% | 373,000 | 360,252 | |
| Total | 5,908,742 | |||
| Pharmaceuticals 1.2% | ||||
| 1375209 BC Ltd.(a) | ||||
| 01/30/2028 | 9.000% | 123,000 | 121,729 | |
| AbbVie, Inc. | ||||
| 06/15/2044 | 4.850% | 2,170,000 | 2,069,139 | |
| Amgen, Inc. | ||||
| 03/02/2063 | 5.750% | 27,148,000 | 28,082,435 | |
| Bausch Health Companies, Inc.(a) | ||||
| 11/01/2025 | 5.500% | 167,000 | 145,282 | |
| 02/01/2027 | 6.125% | 462,000 | 333,663 | |
| 08/15/2027 | 5.750% | 409,000 | 282,526 | |
| 06/01/2028 | 4.875% | 150,000 | 99,172 | |
| 09/30/2028 | 11.000% | 220,000 | 178,807 | |
| 10/15/2030 | 14.000% | 43,000 | 27,513 | |
| Endo Dac/Finance LLC/Finco, Inc.(a),(k) | ||||
| 06/30/2028 | 0.000% | 220,000 | 12,630 | |
| Grifols Escrow Issuer SA(a) | ||||
| 10/15/2028 | 4.750% | 337,000 | 270,813 | |
| Organon Finance 1 LLC(a) | ||||
| 04/30/2028 | 4.125% | 726,000 | 668,037 | |
| 04/30/2031 | 5.125% | 745,000 | 663,130 | |
| Total | 32,954,876 | |||
| Property & Casualty 0.6% | ||||
| Alliant Holdings Intermediate LLC/Co-Issuer(a) | ||||
| 10/15/2027 | 4.250% | 472,000 | 434,472 | |
| 10/15/2027 | 6.750% | 786,000 | 733,550 | |
| 04/15/2028 | 6.750% | 1,147,000 | 1,145,566 | |
| 11/01/2029 | 5.875% | 1,796,000 | 1,564,450 | |
| AssuredPartners, Inc.(a) | ||||
| 08/15/2025 | 7.000% | 1,065,000 | 1,054,372 | |
| 01/15/2029 | 5.625% | 1,290,000 | 1,118,465 | |
| Berkshire Hathaway Finance Corp. | ||||
| 03/15/2052 | 3.850% | 6,795,000 | 5,777,338 | |
| BroadStreet Partners, Inc.(a) | ||||
| 04/15/2029 | 5.875% | 683,000 | 594,825 | |
| GTCR AP Finance, Inc.(a) | ||||
| 05/15/2027 | 8.000% | 186,000 | 181,545 | |
| 20 | Columbia Total Return Bond Fund | Annual Report 2023 |
April 30, 2023
| Corporate Bonds & Notes(h) (continued) | ||||
| Issuer | Coupon Rate | Principal Amount ($) | Value ($) | |
| HUB International Ltd.(a) | ||||
| 05/01/2026 | 7.000% | 331,000 | 329,533 | |
| 12/01/2029 | 5.625% | 1,716,000 | 1,532,706 | |
| Ryan Specialty Group LLC(a) | ||||
| 02/01/2030 | 4.375% | 87,000 | 78,059 | |
| USI, Inc.(a) | ||||
| 05/01/2025 | 6.875% | 1,115,000 | 1,102,425 | |
| Total | 15,647,306 | |||
| Restaurants 0.1% | ||||
| 1011778 BC ULC/New Red Finance, Inc.(a) | ||||
| 04/15/2025 | 5.750% | 755,000 | 757,452 | |
| 10/15/2030 | 4.000% | 547,000 | 478,185 | |
| Fertitta Entertainment LLC/Finance Co., Inc.(a) | ||||
| 01/15/2030 | 6.750% | 636,000 | 515,164 | |
| IRB Holding Corp.(a) | ||||
| 06/15/2025 | 7.000% | 1,015,000 | 1,025,473 | |
| Yum! Brands, Inc. | ||||
| 03/15/2031 | 3.625% | 223,000 | 197,289 | |
| 04/01/2032 | 5.375% | 507,000 | 494,628 | |
| Total | 3,468,191 | |||
| Retailers 0.7% | ||||
| Asbury Automotive Group, Inc.(a) | ||||
| 11/15/2029 | 4.625% | 131,000 | 116,705 | |
| 02/15/2032 | 5.000% | 905,000 | 780,084 | |
| Group 1 Automotive, Inc.(a) | ||||
| 08/15/2028 | 4.000% | 153,000 | 135,729 | |
| Hanesbrands, Inc.(a) | ||||
| 02/15/2031 | 9.000% | 273,000 | 279,573 | |
| L Brands, Inc.(a) | ||||
| 07/01/2025 | 9.375% | 28,000 | 30,008 | |
| 10/01/2030 | 6.625% | 789,000 | 757,580 | |
| L Brands, Inc. | ||||
| 06/15/2029 | 7.500% | 63,000 | 64,132 | |
| 11/01/2035 | 6.875% | 135,000 | 121,564 | |
| LCM Investments Holdings II LLC(a) | ||||
| 05/01/2029 | 4.875% | 254,000 | 216,412 | |
| Lithia Motors, Inc.(a) | ||||
| 01/15/2031 | 4.375% | 325,000 | 279,084 | |
| Lowe’s Companies, Inc. | ||||
| 04/01/2062 | 4.450% | 4,219,000 | 3,455,178 | |
| 09/15/2062 | 5.800% | 11,305,000 | 11,374,160 | |
| PetSmart, Inc./Finance Corp.(a) | ||||
| 02/15/2028 | 4.750% | 406,000 | 383,700 | |
| 02/15/2029 | 7.750% | 1,083,000 | 1,067,380 | |
| Corporate Bonds & Notes(h) (continued) | ||||
| Issuer | Coupon Rate | Principal Amount ($) | Value ($) | |
| Wolverine World Wide, Inc.(a) | ||||
| 08/15/2029 | 4.000% | 325,000 | 269,999 | |
| Total | 19,331,288 | |||
| Supermarkets 0.1% | ||||
| Albertsons Companies LLC/Safeway, Inc./New Albertsons LP/Albertsons LLC(a) | ||||
| 03/15/2026 | 7.500% | 76,000 | 78,467 | |
| Albertsons Companies, Inc./Safeway, Inc./New Albertsons LP/Albertsons LLC(a) | ||||
| 03/15/2026 | 3.250% | 841,000 | 794,869 | |
| 01/15/2027 | 4.625% | 688,000 | 665,816 | |
| Total | 1,539,152 | |||
| Technology 1.4% | ||||
| Black Knight InfoServ LLC(a) | ||||
| 09/01/2028 | 3.625% | 181,000 | 163,469 | |
| Block, Inc. | ||||
| 06/01/2026 | 2.750% | 151,000 | 136,527 | |
| 06/01/2031 | 3.500% | 214,000 | 174,324 | |
| Boxer Parent Co., Inc.(a) | ||||
| 10/02/2025 | 7.125% | 63,000 | 62,838 | |
| Broadcom, Inc.(a) | ||||
| 11/15/2036 | 3.187% | 9,347,000 | 7,118,707 | |
| Camelot Finance SA(a) | ||||
| 11/01/2026 | 4.500% | 657,000 | 620,984 | |
| Clarivate Science Holdings Corp.(a) | ||||
| 07/01/2028 | 3.875% | 252,000 | 226,953 | |
| 07/01/2029 | 4.875% | 1,249,000 | 1,125,775 | |
| Cloud Software Group, Inc.(a) | ||||
| 09/30/2029 | 9.000% | 872,000 | 749,276 | |
| CommScope Technologies LLC(a) | ||||
| 06/15/2025 | 6.000% | 99,000 | 93,019 | |
| Condor Merger Sub, Inc.(a) | ||||
| 02/15/2030 | 7.375% | 1,286,000 | 1,068,958 | |
| Dun & Bradstreet Corp. (The)(a) | ||||
| 12/15/2029 | 5.000% | 182,000 | 161,008 | |
| Entegris Escrow Corp.(a) | ||||
| 04/15/2029 | 4.750% | 236,000 | 219,536 | |
| 06/15/2030 | 5.950% | 1,139,000 | 1,082,069 | |
| Gartner, Inc.(a) | ||||
| 07/01/2028 | 4.500% | 137,000 | 129,080 | |
| 06/15/2029 | 3.625% | 2,336,000 | 2,069,728 | |
| 10/01/2030 | 3.750% | 7,149,000 | 6,243,305 | |
| HealthEquity, Inc.(a) | ||||
| 10/01/2029 | 4.500% | 669,000 | 597,877 | |
| Helios Software Holdings, Inc.(a) | ||||
| 05/01/2028 | 4.625% | 749,000 | 636,656 | |
| ION Trading Technologies Sarl(a) | ||||
| 05/15/2028 | 5.750% | 730,000 | 610,387 | |
| Columbia Total Return Bond Fund | Annual Report 2023 | 21 |
April 30, 2023
| Corporate Bonds & Notes(h) (continued) | ||||
| Issuer | Coupon Rate | Principal Amount ($) | Value ($) | |
| Iron Mountain, Inc.(a) | ||||
| 07/15/2028 | 5.000% | 140,000 | 131,771 | |
| 09/15/2029 | 4.875% | 42,000 | 38,388 | |
| 07/15/2030 | 5.250% | 517,000 | 476,589 | |
| Logan Merger Sub, Inc.(a) | ||||
| 09/01/2027 | 5.500% | 1,160,000 | 651,689 | |
| Minerva Merger Sub, Inc.(a) | ||||
| 02/15/2030 | 6.500% | 991,000 | 812,845 | |
| NCR Corp.(a) | ||||
| 09/01/2027 | 5.750% | 91,000 | 89,066 | |
| 10/01/2028 | 5.000% | 516,000 | 450,225 | |
| 04/15/2029 | 5.125% | 679,000 | 587,409 | |
| 09/01/2029 | 6.125% | 184,000 | 180,304 | |
| 10/01/2030 | 5.250% | 235,000 | 197,171 | |
| Neptune Bidco US, Inc.(a) | ||||
| 04/15/2029 | 9.290% | 957,000 | 900,776 | |
| NXP BV/Funding LLC/USA, Inc. | ||||
| 05/01/2030 | 3.400% | 1,090,000 | 979,452 | |
| 01/15/2033 | 5.000% | 3,969,000 | 3,882,408 | |
| 02/15/2042 | 3.125% | 2,907,000 | 2,067,577 | |
| Picard Midco, Inc.(a) | ||||
| 03/31/2029 | 6.500% | 1,485,000 | 1,336,872 | |
| PTC, Inc.(a) | ||||
| 02/15/2025 | 3.625% | 149,000 | 143,650 | |
| Sabre GLBL, Inc.(a) | ||||
| 04/15/2025 | 9.250% | 73,000 | 67,333 | |
| 09/01/2025 | 7.375% | 100,000 | 88,850 | |
| 12/15/2027 | 11.250% | 90,000 | 78,972 | |
| Sensata Technologies BV(a) | ||||
| 09/01/2030 | 5.875% | 496,000 | 487,319 | |
| Shift4 Payments LLC/Finance Sub, Inc.(a) | ||||
| 11/01/2026 | 4.625% | 606,000 | 570,075 | |
| Tempo Acquisition LLC/Finance Corp.(a) | ||||
| 06/01/2025 | 5.750% | 192,000 | 192,964 | |
| Verscend Escrow Corp.(a) | ||||
| 08/15/2026 | 9.750% | 497,000 | 501,081 | |
| ZoomInfo Technologies LLC/Finance Corp.(a) | ||||
| 02/01/2029 | 3.875% | 1,281,000 | 1,104,661 | |
| Total | 39,307,923 | |||
| Transportation Services 0.4% | ||||
| ERAC USA Finance LLC(a),(d) | ||||
| 05/01/2028 | 4.600% | 10,874,000 | 10,847,566 | |
| Wireless 1.0% | ||||
| Altice France Holding SA(a) | ||||
| 02/15/2028 | 6.000% | 559,000 | 343,996 | |
| Corporate Bonds & Notes(h) (continued) | ||||
| Issuer | Coupon Rate | Principal Amount ($) | Value ($) | |
| Altice France SA(a) | ||||
| 02/01/2027 | 8.125% | 85,000 | 75,931 | |
| 01/15/2028 | 5.500% | 830,000 | 653,475 | |
| 07/15/2029 | 5.125% | 881,000 | 652,869 | |
| 10/15/2029 | 5.500% | 975,000 | 730,976 | |
| American Tower Corp. | ||||
| 08/15/2029 | 3.800% | 7,011,000 | 6,571,470 | |
| 06/15/2030 | 2.100% | 1,950,000 | 1,604,886 | |
| SBA Communications Corp. | ||||
| 02/15/2027 | 3.875% | 375,000 | 349,378 | |
| 02/01/2029 | 3.125% | 576,000 | 493,939 | |
| Sprint Corp. | ||||
| 06/15/2024 | 7.125% | 669,000 | 680,024 | |
| 02/15/2025 | 7.625% | 741,000 | 763,592 | |
| T-Mobile US, Inc. | ||||
| 02/15/2031 | 2.875% | 10,526,000 | 9,120,171 | |
| 04/15/2031 | 3.500% | 3,692,000 | 3,336,077 | |
| Vmed O2 UK Financing I PLC(a) | ||||
| 01/31/2031 | 4.250% | 1,220,000 | 1,012,169 | |
| 07/15/2031 | 4.750% | 1,477,000 | 1,257,762 | |
| Total | 27,646,715 | |||
| Wirelines 0.3% | ||||
| AT&T, Inc. | ||||
| 03/01/2029 | 4.350% | 2,355,000 | 2,313,702 | |
| 12/01/2057 | 3.800% | 2,254,000 | 1,653,986 | |
| Front Range BidCo, Inc.(a) | ||||
| 03/01/2027 | 4.000% | 90,000 | 68,070 | |
| Frontier Communications Holdings LLC(a) | ||||
| 05/15/2030 | 8.750% | 599,000 | 592,516 | |
| 03/15/2031 | 8.625% | 576,000 | 561,699 | |
| Iliad Holding SAS(a) | ||||
| 10/15/2026 | 6.500% | 1,160,000 | 1,115,950 | |
| 10/15/2028 | 7.000% | 1,654,000 | 1,571,821 | |
| Total | 7,877,744 | |||
| Total Corporate Bonds & Notes (Cost $869,658,257) | 766,788,848 | |||
| Foreign Government Obligations(n) 2.6% | ||||
| Canada 0.0% | ||||
| NOVA Chemicals Corp.(a) | ||||
| 05/01/2025 | 5.000% | 75,000 | 72,786 | |
| 06/01/2027 | 5.250% | 445,000 | 402,898 | |
| 05/15/2029 | 4.250% | 441,000 | 357,115 | |
| Total | 832,799 | |||
| 22 | Columbia Total Return Bond Fund | Annual Report 2023 |
April 30, 2023
| Foreign Government Obligations(n) (continued) | ||||
| Issuer | Coupon Rate | Principal Amount ($) | Value ($) | |
| Colombia 0.4% | ||||
| Colombia Government International Bond | ||||
| 04/15/2031 | 3.125% | 3,793,000 | 2,809,862 | |
| 04/22/2032 | 3.250% | 2,860,000 | 2,068,194 | |
| 05/15/2049 | 5.200% | 4,442,000 | 2,986,559 | |
| Ecopetrol SA | ||||
| 04/29/2030 | 6.875% | 4,400,000 | 3,941,143 | |
| Total | 11,805,758 | |||
| Dominican Republic 0.0% | ||||
| Dominican Republic International Bond(a) | ||||
| 01/25/2027 | 5.950% | 785,000 | 780,117 | |
| Egypt 0.1% | ||||
| Egypt Government International Bond(a) | ||||
| 02/16/2031 | 5.875% | 4,255,000 | 2,270,155 | |
| 01/31/2047 | 8.500% | 1,015,000 | 535,395 | |
| Total | 2,805,550 | |||
| India 0.1% | ||||
| Export-Import Bank of India(a) | ||||
| 01/15/2030 | 3.250% | 2,250,000 | 2,012,768 | |
| Indonesia 0.1% | ||||
| PT Indonesia Asahan Aluminium Persero(a) | ||||
| 05/15/2025 | 4.750% | 342,000 | 338,826 | |
| 05/15/2030 | 5.450% | 1,700,000 | 1,701,035 | |
| Total | 2,039,861 | |||
| Ivory Coast 0.1% | ||||
| Ivory Coast Government International Bond(a) | ||||
| 06/15/2033 | 6.125% | 2,801,000 | 2,366,030 | |
| Mexico 1.0% | ||||
| Petroleos Mexicanos | ||||
| 03/13/2027 | 6.500% | 5,751,000 | 5,164,435 | |
| 02/12/2028 | 5.350% | 3,007,000 | 2,497,860 | |
| 09/21/2047 | 6.750% | 14,016,000 | 8,636,372 | |
| 01/23/2050 | 7.690% | 6,500,000 | 4,352,647 | |
| 01/28/2060 | 6.950% | 11,185,000 | 6,840,823 | |
| Total | 27,492,137 | |||
| Paraguay 0.1% | ||||
| Paraguay Government International Bond(a) | ||||
| 08/11/2044 | 6.100% | 2,465,000 | 2,345,900 | |
| Qatar 0.2% | ||||
| Qatar Government International Bond(a) | ||||
| 03/14/2049 | 4.817% | 2,400,000 | 2,377,306 | |
| Foreign Government Obligations(n) (continued) | ||||
| Issuer | Coupon Rate | Principal Amount ($) | Value ($) | |
| Qatar Petroleum(a) | ||||
| 07/12/2031 | 2.250% | 5,762,000 | 4,971,651 | |
| Total | 7,348,957 | |||
| Russian Federation 0.0% | ||||
| Gazprom OAO Via Gaz Capital SA(a),(m) | ||||
| 02/06/2028 | 4.950% | 1,320,000 | 951,989 | |
| Saudi Arabia 0.1% | ||||
| Saudi Government International Bond(a) | ||||
| 04/17/2049 | 5.000% | 2,550,000 | 2,416,889 | |
| South Africa 0.1% | ||||
| Republic of South Africa Government International Bond | ||||
| 09/30/2029 | 4.850% | 2,300,000 | 2,067,027 | |
| Ukraine 0.0% | ||||
| Ukraine Government International Bond(a) | ||||
| 09/25/2034 | 7.375% | 800,000 | 129,105 | |
| United Arab Emirates 0.3% | ||||
| DP World Ltd.(a) | ||||
| 09/25/2048 | 5.625% | 3,620,000 | 3,526,863 | |
| DP World PLC(a) | ||||
| 07/02/2037 | 6.850% | 3,540,000 | 3,960,461 | |
| Total | 7,487,324 | |||
| Total Foreign Government Obligations (Cost $93,922,043) | 72,882,211 | |||
| Residential Mortgage-Backed Securities - Agency 36.7% | ||||
| Federal Home Loan Mortgage Corp. | ||||
| 04/01/2026 | 4.000% | 50,190 | 49,811 | |
| 12/01/2046- 08/01/2052 | 3.500% | 50,101,610 | 46,694,822 | |
| 12/01/2051 | 2.500% | 21,860,001 | 19,058,645 | |
| 02/01/2052- 05/01/2052 | 3.000% | 70,939,433 | 63,920,546 | |
| 02/01/2053 | 4.500% | 26,629,125 | 26,218,511 | |
| Federal Home Loan Mortgage Corp.(o) | ||||
| 09/01/2049 | 3.000% | 4,693,780 | 4,250,411 | |
| Federal Home Loan Mortgage Corp.(c),(f) | ||||
| CMO Series 3922 Class SH | ||||
| -1.0 x 1-month USD LIBOR + 5.900% Cap 5.900% 09/15/2041 | 0.952% | 216,959 | 19,782 | |
| CMO Series 4097 Class ST | ||||
| -1.0 x 1-month USD LIBOR + 6.050% Cap 6.050% 08/15/2042 | 1.102% | 614,332 | 69,422 | |
| Columbia Total Return Bond Fund | Annual Report 2023 | 23 |
April 30, 2023
| Residential Mortgage-Backed Securities - Agency (continued) | ||||
| Issuer | Coupon Rate | Principal Amount ($) | Value ($) | |
| CMO Series 4620 Class AS | ||||
| -1.0 x 30-day Average SOFR + 0.554% 11/15/2042 | 0.000% | 647,284 | 33,000 | |
| CMO Series 4903 Class SA | ||||
| -1.0 x 1-month USD LIBOR + 6.050% Cap 6.050% 08/25/2049 | 1.030% | 10,749,189 | 1,304,168 | |
| CMO Series 4979 Class KS | ||||
| -1.0 x 1-month USD LIBOR + 6.050% Cap 6.050% 06/25/2048 | 1.030% | 5,092,214 | 718,436 | |
| CMO STRIPS Series 2012-278 Class S1 | ||||
| -1.0 x 1-month USD LIBOR + 6.050% Cap 6.050% 09/15/2042 | 1.102% | 807,027 | 89,713 | |
| CMO STRIPS Series 309 Class S4 | ||||
| -1.0 x 1-month USD LIBOR + 5.970% Cap 5.970% 08/15/2043 | 1.022% | 397,958 | 43,147 | |
| Federal Home Loan Mortgage Corp.(f) | ||||
| CMO Series 4176 Class BI | ||||
| 03/15/2043 | 3.500% | 759,798 | 102,388 | |
| Federal Home Loan Mortgage Corp. REMICS(c),(f) | ||||
| CMO Series 4703 Class SA | ||||
| -1.0 x 1-month USD LIBOR + 6.150% Cap 6.150% 07/15/2047 | 1.202% | 20,531,905 | 2,687,875 | |
| Federal Home Loan Mortgage Corp. REMICS(f) | ||||
| CMO Series 5034 Class GI | ||||
| 11/25/2050 | 2.500% | 19,312,133 | 2,920,157 | |
| CMO Series 5078 Class TI | ||||
| 02/25/2051 | 2.500% | 24,778,644 | 3,919,828 | |
| CMO Series 5187 Class IK | ||||
| 01/25/2052 | 3.000% | 22,896,167 | 4,419,592 | |
| Federal National Mortgage Association(c) | ||||
| 6-month USD LIBOR + 1.415% Floor 1.415%, Cap 11.040% 06/01/2032 | 3.665% | 2,403 | 2,340 | |
| 1-year CMT + 2.305% Floor 2.305%, Cap 10.430% 07/01/2037 | 4.055% | 47,411 | 46,839 | |
| Federal National Mortgage Association(o) | ||||
| 08/01/2043- 02/01/2048 | 4.000% | 9,539,688 | 9,317,725 | |
| 04/01/2049- 11/01/2051 | 3.000% | 35,034,180 | 31,783,686 | |
| Residential Mortgage-Backed Securities - Agency (continued) | ||||
| Issuer | Coupon Rate | Principal Amount ($) | Value ($) | |
| Federal National Mortgage Association | ||||
| 06/01/2045- 05/01/2052 | 3.500% | 84,500,183 | 78,941,602 | |
| 09/01/2048- 07/01/2052 | 4.000% | 22,256,054 | 21,751,763 | |
| 11/01/2049- 04/01/2052 | 3.000% | 19,744,856 | 17,865,111 | |
| 01/01/2052 | 2.500% | 28,490,872 | 24,729,086 | |
| 09/01/2052 | 5.000% | 24,674,121 | 24,931,095 | |
| CMO Series 2017-72 Class B | ||||
| 09/25/2047 | 3.000% | 5,063,903 | 4,721,028 | |
| Federal National Mortgage Association(c),(f) | ||||
| CMO Series 2013-101 Class CS | ||||
| -1.0 x 1-month USD LIBOR + 5.900% Cap 5.900% 10/25/2043 | 0.880% | 1,967,022 | 224,501 | |
| CMO Series 2014-93 Class ES | ||||
| -1.0 x 1-month USD LIBOR + 6.150% Cap 6.150% 01/25/2045 | 1.130% | 1,186,483 | 153,719 | |
| CMO Series 2016-31 Class VS | ||||
| -1.0 x 1-month USD LIBOR + 6.000% Cap 6.000% 06/25/2046 | 0.980% | 891,083 | 97,126 | |
| CMO Series 2016-53 Class KS | ||||
| -1.0 x 1-month USD LIBOR + 6.000% Cap 6.000% 08/25/2046 | 0.980% | 3,873,187 | 468,641 | |
| CMO Series 2016-57 Class SA | ||||
| -1.0 x 1-month USD LIBOR + 6.000% Cap 6.000% 08/25/2046 | 0.980% | 8,769,988 | 1,076,786 | |
| CMO Series 2017-109 Class SA | ||||
| -1.0 x 1-month USD LIBOR + 6.150% Cap 6.150% 01/25/2048 | 1.130% | 4,367,515 | 616,212 | |
| CMO Series 2017-20 Class SA | ||||
| -1.0 x 1-month USD LIBOR + 6.100% Cap 6.100% 04/25/2047 | 1.080% | 3,762,966 | 484,927 | |
| CMO Series 2017-54 Class NS | ||||
| -1.0 x 1-month USD LIBOR + 6.150% Cap 6.150% 07/25/2047 | 1.130% | 3,285,318 | 476,433 | |
| 24 | Columbia Total Return Bond Fund | Annual Report 2023 |
April 30, 2023
| Residential Mortgage-Backed Securities - Agency (continued) | ||||
| Issuer | Coupon Rate | Principal Amount ($) | Value ($) | |
| CMO Series 2017-54 Class SN | ||||
| -1.0 x 1-month USD LIBOR + 6.150% Cap 6.150% 07/25/2047 | 1.130% | 6,812,721 | 1,016,226 | |
| CMO Series 2018-66 Class SM | ||||
| -1.0 x 1-month USD LIBOR + 6.200% Cap 6.200% 09/25/2048 | 1.180% | 4,592,976 | 598,128 | |
| CMO Series 2018-67 MS Class MS | ||||
| -1.0 x 1-month USD LIBOR + 6.200% Cap 6.200% 09/25/2048 | 1.180% | 3,428,386 | 475,449 | |
| CMO Series 2018-74 Class SA | ||||
| -1.0 x 1-month USD LIBOR + 6.150% Cap 6.150% 10/25/2048 | 1.130% | 6,500,089 | 821,876 | |
| CMO Series 2019-33 Class SB | ||||
| -1.0 x 1-month USD LIBOR + 6.050% Cap 6.050% 07/25/2049 | 1.030% | 15,606,231 | 1,900,594 | |
| CMO Series 2019-60 Class SH | ||||
| -1.0 x 1-month USD LIBOR + 6.050% Cap 6.050% 10/25/2049 | 1.030% | 9,899,558 | 1,254,108 | |
| CMO Series 2019-67 Class SE | ||||
| -1.0 x 1-month USD LIBOR + 6.050% Cap 6.050% 11/25/2049 | 1.030% | 8,458,805 | 1,331,286 | |
| Federal National Mortgage Association(f) | ||||
| CMO Series 2020-76 Class EI | ||||
| 11/25/2050 | 2.500% | 13,283,240 | 2,034,795 | |
| CMO Series 429 Class C3 | ||||
| 09/25/2052 | 2.500% | 35,387,654 | 5,641,050 | |
| Freddie Mac REMICS(f) | ||||
| CMO Series 5123 Class IG | ||||
| 08/25/2048 | 2.500% | 14,639,820 | 1,939,198 | |
| CMO Series 5152 Class XI | ||||
| 11/25/2050 | 2.500% | 40,875,205 | 5,386,776 | |
| CMO Series 5287 Class NI | ||||
| 05/25/2051 | 3.500% | 21,348,153 | 4,135,146 | |
| Freddie Mac STACR REMIC Trust(a),(c) | ||||
| Subordinated CMO Series 2021-HQA2 Class B2 | ||||
| 30-day Average SOFR + 5.450% 12/25/2033 | 10.265% | 5,000,000 | 4,167,970 | |
| Residential Mortgage-Backed Securities - Agency (continued) | ||||
| Issuer | Coupon Rate | Principal Amount ($) | Value ($) | |
| Government National Mortgage Association(c) | ||||
| 1-year CMT + 1.500% Floor 1.500%, Cap 11.500% 07/20/2025 | 2.625% | 2,518 | 2,478 | |
| Government National Mortgage Association | ||||
| 12/15/2038- 01/15/2039 | 6.000% | 29,244 | 30,586 | |
| 02/15/2039 | 5.500% | 15,926 | 16,491 | |
| 10/15/2040- 04/15/2041 | 4.000% | 418,185 | 412,150 | |
| Government National Mortgage Association(o) | ||||
| 04/20/2048 | 4.500% | 3,623,019 | 3,604,449 | |
| Government National Mortgage Association(f) | ||||
| CMO Series 2014-184 Class CI | ||||
| 11/16/2041 | 3.500% | 3,582,828 | 426,197 | |
| CMO Series 2020-175 Class KI | ||||
| 11/20/2050 | 2.500% | 24,569,671 | 3,394,961 | |
| CMO Series 2020-191 Class UG | ||||
| 12/20/2050 | 3.500% | 16,670,138 | 2,688,898 | |
| CMO Series 2021-119 Class QI | ||||
| 07/20/2051 | 3.000% | 21,691,360 | 3,120,406 | |
| CMO Series 2021-16 Class KI | ||||
| 01/20/2051 | 2.500% | 21,952,702 | 3,038,906 | |
| CMO Series 2021-89 Class IO | ||||
| 05/20/2051 | 3.000% | 23,564,745 | 3,428,510 | |
| CMO Series 2021-97 Class IQ | ||||
| 06/20/2051 | 2.500% | 14,325,872 | 1,848,000 | |
| Government National Mortgage Association(c),(f) | ||||
| CMO Series 2017-130 Class GS | ||||
| -1.0 x 1-month USD LIBOR + 6.200% Cap 6.200% 08/20/2047 | 1.247% | 9,511,218 | 1,717,383 | |
| CMO Series 2017-130 Class HS | ||||
| -1.0 x 1-month USD LIBOR + 6.200% Cap 6.200% 08/20/2047 | 1.247% | 4,550,880 | 506,059 | |
| CMO Series 2017-149 Class BS | ||||
| -1.0 x 1-month USD LIBOR + 6.200% Cap 6.200% 10/20/2047 | 1.247% | 5,811,122 | 729,278 | |
| CMO Series 2017-163 Class SA | ||||
| -1.0 x 1-month USD LIBOR + 6.200% Cap 6.200% 11/20/2047 | 1.247% | 2,352,745 | 250,485 | |
| Columbia Total Return Bond Fund | Annual Report 2023 | 25 |
April 30, 2023
| Residential Mortgage-Backed Securities - Agency (continued) | ||||
| Issuer | Coupon Rate | Principal Amount ($) | Value ($) | |
| CMO Series 2017-37 Class SB | ||||
| -1.0 x 1-month USD LIBOR + 6.150% Cap 6.150% 03/20/2047 | 1.197% | 3,497,375 | 384,235 | |
| CMO Series 2018-103 Class SA | ||||
| -1.0 x 1-month USD LIBOR + 6.200% Cap 6.200% 08/20/2048 | 1.247% | 3,348,667 | 403,387 | |
| CMO Series 2018-112 Class LS | ||||
| -1.0 x 1-month USD LIBOR + 6.200% Cap 6.200% 08/20/2048 | 1.247% | 4,197,363 | 501,228 | |
| CMO Series 2018-125 Class SK | ||||
| -1.0 x 1-month USD LIBOR + 6.250% Cap 6.250% 09/20/2048 | 1.297% | 5,329,758 | 498,315 | |
| CMO Series 2018-134 Class KS | ||||
| -1.0 x 1-month USD LIBOR + 6.200% Cap 6.200% 10/20/2048 | 1.247% | 4,214,232 | 496,925 | |
| CMO Series 2018-139 Class SC | ||||
| -1.0 x 1-month USD LIBOR + 6.150% Cap 6.150% 10/20/2048 | 1.197% | 2,955,992 | 332,234 | |
| CMO Series 2018-148 Class SB | ||||
| -1.0 x 1-month USD LIBOR + 6.200% Cap 6.200% 01/20/2048 | 1.247% | 8,309,247 | 1,009,139 | |
| CMO Series 2018-151 Class SA | ||||
| -1.0 x 1-month USD LIBOR + 6.150% Cap 6.150% 11/20/2048 | 1.197% | 7,083,209 | 817,722 | |
| CMO Series 2018-89 Class MS | ||||
| -1.0 x 1-month USD LIBOR + 6.200% Cap 6.200% 06/20/2048 | 1.247% | 4,360,695 | 428,351 | |
| CMO Series 2018-89 Class SM | ||||
| -1.0 x 1-month USD LIBOR + 6.200% Cap 6.200% 06/20/2048 | 1.247% | 5,526,187 | 487,679 | |
| Residential Mortgage-Backed Securities - Agency (continued) | ||||
| Issuer | Coupon Rate | Principal Amount ($) | Value ($) | |
| CMO Series 2018-91 Class DS | ||||
| -1.0 x 1-month USD LIBOR + 6.200% Cap 6.200% 07/20/2048 | 1.247% | 4,163,001 | 475,706 | |
| CMO Series 2019-20 Class JS | ||||
| -1.0 x 1-month USD LIBOR + 6.000% Cap 6.000% 02/20/2049 | 1.047% | 6,723,792 | 778,181 | |
| CMO Series 2019-5 Class SH | ||||
| -1.0 x 1-month USD LIBOR + 6.150% Cap 6.150% 01/20/2049 | 1.197% | 4,775,767 | 561,785 | |
| CMO Series 2019-56 Class SG | ||||
| -1.0 x 1-month USD LIBOR + 6.150% Cap 6.150% 05/20/2049 | 1.197% | 5,274,316 | 618,551 | |
| CMO Series 2019-59 Class KS | ||||
| -1.0 x 1-month USD LIBOR + 6.050% Cap 6.050% 05/20/2049 | 1.097% | 5,170,401 | 606,106 | |
| CMO Series 2019-85 Class SC | ||||
| -1.0 x 1-month USD LIBOR + 6.150% Cap 6.150% 07/20/2049 | 1.197% | 4,664,700 | 501,249 | |
| CMO Series 2019-90 Class SD | ||||
| -1.0 x 1-month USD LIBOR + 6.150% 07/20/2049 | 1.197% | 7,578,788 | 908,869 | |
| CMO Series 2020-21 Class VS | ||||
| -1.0 x 1-month USD LIBOR + 6.050% Cap 6.050% 02/20/2050 | 1.097% | 3,564,708 | 448,926 | |
| CMO Series 2020-62 Class SG | ||||
| -1.0 x 1-month USD LIBOR + 6.150% Cap 6.150% 05/20/2050 | 1.197% | 6,399,812 | 737,736 | |
| CMO Series 2021-116 Class YS | ||||
| -1.0 x 1-month USD LIBOR + 6.200% Cap 6.200% 09/20/2050 | 1.247% | 26,922,121 | 3,620,166 | |
| 26 | Columbia Total Return Bond Fund | Annual Report 2023 |
April 30, 2023
| Residential Mortgage-Backed Securities - Agency (continued) | ||||
| Issuer | Coupon Rate | Principal Amount ($) | Value ($) | |
| CMO Series 2022-18 Class SL | ||||
| -1.0 x 30-day Average SOFR + 6.300% Cap 6.300% 01/20/2052 | 1.510% | 24,086,210 | 3,438,280 | |
| CMO Series 2022-63 Class GS | ||||
| -1.0 x 30-day Average SOFR + 5.500% Cap 5.500% 04/20/2052 | 0.710% | 25,351,007 | 2,985,842 | |
| Government National Mortgage Association TBA(d) | ||||
| 05/18/2053 | 4.000% | 96,000,000 | 92,298,750 | |
| 05/18/2053 | 4.500% | 50,000,000 | 49,054,688 | |
| 05/18/2053 | 5.000% | 75,000,000 | 74,663,086 | |
| Uniform Mortgage-Backed Security TBA(d) | ||||
| 05/16/2038 | 3.000% | 32,000,000 | 30,416,387 | |
| 05/11/2053 | 4.000% | 62,000,000 | 59,263,281 | |
| 05/11/2053 | 4.500% | 126,100,000 | 123,267,675 | |
| 05/11/2053 | 5.000% | 128,000,000 | 127,265,000 | |
| Total Residential Mortgage-Backed Securities - Agency (Cost $1,050,712,956) | 1,027,396,192 | |||
| Residential Mortgage-Backed Securities - Non-Agency 28.0% | ||||
| 510 Asset Backed Trust(a),(e) | ||||
| CMO Series 2021-NPL2 Class A1 | ||||
| 06/25/2061 | 2.116% | 7,011,326 | 6,443,638 | |
| American Mortgage Trust(b),(e),(j) | ||||
| CMO Series 2093-3 Class 3A | ||||
| 07/27/2023 | 8.188% | 35 | 21 | |
| Angel Oak Mortgage Trust I LLC(a),(e) | ||||
| CMO Series 2018-3 Class M1 | ||||
| 09/25/2048 | 4.421% | 3,960,119 | 3,878,476 | |
| Bellemeade Re Ltd.(a),(c) | ||||
| CMO Series 2019-2A Class M1C | ||||
| 1-month USD LIBOR + 2.000% Floor 2.000% 04/25/2029 | 7.020% | 3,774,498 | 3,771,615 | |
| CMO Series 2019-2A Class M2 | ||||
| 1-month USD LIBOR + 3.100% Floor 3.100% 04/25/2029 | 8.120% | 10,964,000 | 11,168,260 | |
| CMO Series 2019-4A Class M1C | ||||
| 1-month USD LIBOR + 2.500% Floor 2.500% 10/25/2029 | 7.520% | 2,637,595 | 2,644,313 | |
| CMO Series 2020-4A Class M2B | ||||
| 1-month USD LIBOR + 3.600% Floor 3.600% 06/25/2030 | 8.620% | 2,951,258 | 2,947,113 | |
| Residential Mortgage-Backed Securities - Non-Agency (continued) | ||||
| Issuer | Coupon Rate | Principal Amount ($) | Value ($) | |
| CMO Series 2021-2A Class M1B | ||||
| 30-day Average SOFR + 1.500% Floor 1.500% 06/25/2031 | 6.060% | 8,000,000 | 7,787,067 | |
| Subordinated CMO Series 2018-3A Class B1 | ||||
| 1-month USD LIBOR + 3.900% Floor 3.900% 10/25/2028 | 8.920% | 6,000,000 | 6,064,041 | |
| BRAVO Residential Funding Trust(a),(e) | ||||
| CMO Series 2021-A Class A1 | ||||
| 10/25/2059 | 1.991% | 7,162,177 | 6,841,566 | |
| BVRT Financing Trust(a),(b),(c) | ||||
| CMO Series 2021-3F Class M1 | ||||
| 30-day Average SOFR + 1.750% Floor 1.750% 07/12/2033 | 3.608% | 5,470,954 | 5,470,954 | |
| CMO Series 2021-3F Class M2 | ||||
| 30-day Average SOFR + 2.900% Floor 2.900% 07/12/2033 | 4.187% | 15,300,000 | 15,300,000 | |
| CMO Series 2021-CRT1 Class M3 | ||||
| 1-month USD LIBOR + 2.750% Floor 3.000% 01/10/2033 | 3.000% | 3,308,328 | 3,178,807 | |
| CMO Series 2021-CRT3 Class B1 | ||||
| 30-day Average SOFR + 4.300% Floor 4.300% 01/10/2031 | 4.338% | 10,000,000 | 10,000,000 | |
| CHNGE Mortgage Trust(a),(e) | ||||
| CMO Series 2022-5 Class A1 | ||||
| 01/25/2058 | 6.000% | 8,596,256 | 8,527,111 | |
| Citigroup Mortgage Loan Trust, Inc.(a) | ||||
| Subordinated CMO Series 2014-C Class B1 | ||||
| 02/25/2054 | 4.250% | 3,662,695 | 3,536,384 | |
| COLT Mortgage Loan Trust(a),(e) | ||||
| CMO Series 2021-3 Class A1 | ||||
| 09/27/2066 | 0.956% | 7,502,119 | 6,009,457 | |
| CMO Series 2021-5 Class A3 | ||||
| 11/26/2066 | 2.807% | 6,400,000 | 4,399,705 | |
| CMO Series 2021-6 Class A3 | ||||
| 12/25/2066 | 3.006% | 8,426,000 | 6,015,968 | |
| Connecticut Avenue Securities Trust(a),(c) | ||||
| CMO Series 2019-HRP1 Class M2 | ||||
| 1-month USD LIBOR + 2.150% 11/25/2039 | 7.170% | 3,884,052 | 3,876,911 | |
| CMO Series 2022-R01 Class 1M2 | ||||
| 30-day Average SOFR + 1.900% 12/25/2041 | 6.715% | 15,000,000 | 14,527,873 | |
| Columbia Total Return Bond Fund | Annual Report 2023 | 27 |
April 30, 2023
| Residential Mortgage-Backed Securities - Non-Agency (continued) | ||||
| Issuer | Coupon Rate | Principal Amount ($) | Value ($) | |
| Subordinated CMO Series 2022-R01 Class 1B2 | ||||
| 30-day Average SOFR + 6.000% 12/25/2041 | 10.815% | 19,800,000 | 18,251,379 | |
| Credit Suisse Mortgage Trust(a),(e) | ||||
| CMO Series 2021-NQM1 Class A3 | ||||
| 05/25/2065 | 1.199% | 1,782,271 | 1,520,448 | |
| CSMC Trust(a),(e) | ||||
| CMO Series 2020-RPL2 Class A12 | ||||
| 02/25/2060 | 3.476% | 13,861,444 | 13,995,672 | |
| Deephaven Residential Mortgage Trust(a),(e) | ||||
| CMO Series 2020-2 Class M1 | ||||
| 05/25/2065 | 4.112% | 7,190,000 | 6,637,125 | |
| CMO Series 2021-4 Class A1 | ||||
| 11/25/2066 | 1.931% | 6,549,129 | 5,713,450 | |
| CMO Series 2021-4 Class A3 | ||||
| 11/25/2066 | 2.239% | 6,794,721 | 5,839,046 | |
| Eagle Re Ltd.(a),(c) | ||||
| CMO Series 2018-1 Class B1 | ||||
| 1-month USD LIBOR + 4.000% Floor 4.000% 11/25/2028 | 9.020% | 3,000,000 | 3,114,549 | |
| Subordinated CMO Series 2020-1 Class M1B | ||||
| 1-month USD LIBOR + 1.450% 01/25/2030 | 6.470% | 8,683,272 | 8,674,897 | |
| Ellington Financial Mortgage Trust(a),(e) | ||||
| CMO Series 2019-2 Class M1 | ||||
| 11/25/2059 | 3.469% | 2,500,000 | 2,206,975 | |
| FMC GMSR Issuer Trust(a),(e) | ||||
| CMO Series 2020-GT1 Class A | ||||
| 01/25/2026 | 4.450% | 10,500,000 | 9,607,945 | |
| Freddie Mac STACR(c) | ||||
| CMO Series 2020-CS01 Class M3 | ||||
| 1-month USD LIBOR + 0.000% 04/25/2033 | 4.000% | 12,551,440 | 11,974,134 | |
| CMO Series 2020-CS02 Class M4 | ||||
| 1-month USD LIBOR + 0.000% 06/25/2033 | 4.617% | 7,500,000 | 6,696,078 | |
| Freddie Mac STACR REMIC Trust(a),(c) | ||||
| CMO Series 2021-DNA5 Class M2 | ||||
| 30-day Average SOFR + 1.650% 01/25/2034 | 6.465% | 3,520,627 | 3,493,066 | |
| CMO Series 2021-HQA1 Class M2 | ||||
| 30-day Average SOFR + 2.250% 08/25/2033 | 7.065% | 12,165,092 | 11,849,925 | |
| CMO Series 2022-DNA1 Class M1B | ||||
| 30-day Average SOFR + 1.850% 01/25/2042 | 6.665% | 7,900,000 | 7,648,739 | |
| CMO Series 2022-HQA1 Class M2 | ||||
| 30-day Average SOFR + 5.250% 03/25/2042 | 10.065% | 16,582,000 | 16,749,238 | |
| Residential Mortgage-Backed Securities - Non-Agency (continued) | ||||
| Issuer | Coupon Rate | Principal Amount ($) | Value ($) | |
| Subordinated CMO Series 2020-HQA3 Class B1 | ||||
| 1-month USD LIBOR + 5.750% 07/25/2050 | 10.770% | 7,198,628 | 7,700,466 | |
| Subordinated CMO Series 2021-DNA5 Class B2 | ||||
| 30-day Average SOFR + 5.500% 01/25/2034 | 10.315% | 16,000,000 | 13,639,365 | |
| Freddie Mac STACR Trust(a),(c) | ||||
| Subordinated CMO Series 2019-DNA4 Class B1 | ||||
| 1-month USD LIBOR + 2.700% 10/25/2049 | 7.720% | 8,625,000 | 8,684,104 | |
| Freddie Mac Structured Agency Credit Risk Debt Notes(a),(c) | ||||
| CMO Series 2019-CS03 Class M2 | ||||
| 1-month USD LIBOR + 0.000% 10/25/2032 | 5.020% | 12,000,000 | 11,444,219 | |
| CMO Series 2020-HQA5 Class M2 | ||||
| 30-day Average SOFR + 2.600% 11/25/2050 | 7.415% | 9,159,415 | 9,188,406 | |
| Subordinated CMO Series 2020-HQA5 Class B1 | ||||
| 30-day Average SOFR + 4.000% 11/25/2050 | 8.815% | 8,500,000 | 8,588,175 | |
| Subordinated CMO Series 2022-DNA2 Class B2 | ||||
| 30-day Average SOFR + 8.500% 02/25/2042 | 13.315% | 8,750,000 | 8,138,013 | |
| GCAT LLC(a),(e) | ||||
| CMO Series 2021-CM1 Class A1 | ||||
| 04/25/2065 | 1.469% | 7,881,709 | 7,418,556 | |
| GCAT Trust(a),(e) | ||||
| CMO Series 2021-NQM6 Class A2 | ||||
| 08/25/2066 | 2.710% | 4,100,000 | 3,119,811 | |
| CMO Series 2021-NQM6 Class A3 | ||||
| 08/25/2066 | 2.810% | 7,500,000 | 5,250,642 | |
| CMO Series 2021-NQM7 Class A3 | ||||
| 08/25/2066 | 2.891% | 10,000,000 | 7,187,867 | |
| Genworth Mortgage Insurance Corp.(a),(c) | ||||
| CMO Series 2021-3 Class M1B | ||||
| 30-day Average SOFR + 2.900% Floor 2.900% 02/25/2034 | 7.460% | 18,000,000 | 17,698,808 | |
| Glebe Funding Trust (The)(a),(b) | ||||
| CMO Series 2021-1 Class PT | ||||
| 10/27/2023 | 3.000% | 12,787,579 | 11,892,449 | |
| Home Re Ltd.(a),(c) | ||||
| CMO Series 2020-1 Class M1C | ||||
| 1-month USD LIBOR + 4.150% Floor 4.150% 10/25/2030 | 9.170% | 140,071 | 140,279 | |
| Subordinated CMO Series 2019-1 Class B1 | ||||
| 1-month USD LIBOR + 4.350% 05/25/2029 | 9.370% | 7,323,000 | 7,279,894 | |
| 28 | Columbia Total Return Bond Fund | Annual Report 2023 |
April 30, 2023
| Residential Mortgage-Backed Securities - Non-Agency (continued) | ||||
| Issuer | Coupon Rate | Principal Amount ($) | Value ($) | |
| Homeward Opportunities Fund Trust(a),(i) | ||||
| CMO Series 2020-BPL1 Class A1 | ||||
| 08/25/2025 | 3.228% | 2,721,202 | 2,660,384 | |
| Imperial Fund Mortgage Trust(a),(e) | ||||
| CMO Series 2021-NQM4 Class A2 | ||||
| 01/25/2057 | 2.296% | 3,677,062 | 3,186,064 | |
| Legacy Mortgage Asset Trust(a),(e) | ||||
| CMO Series 2021-GS1 Class A1 | ||||
| 10/25/2066 | 1.892% | 5,578,530 | 5,158,928 | |
| CMO Series 2021-GS2 Class A1 | ||||
| 04/25/2061 | 1.750% | 4,503,175 | 4,244,477 | |
| CMO Series 2021-SL2 Class A | ||||
| 10/25/2068 | 1.875% | 7,966,720 | 7,158,393 | |
| MFA Trust(a),(e) | ||||
| CMO Series 2020-NQM1 Class M1 | ||||
| 08/25/2049 | 3.071% | 2,800,000 | 2,475,681 | |
| CMO Series 2020-NQM2 Class M1 | ||||
| 04/25/2065 | 3.034% | 12,854,000 | 10,637,646 | |
| Mill City Mortgage Loan Trust(a),(e) | ||||
| CMO Series 2023-NQM1 Class A1 | ||||
| 10/25/2067 | 6.050% | 8,324,601 | 8,324,284 | |
| Mortgage Acquisition Trust I LLC(a),(b) | ||||
| CMO Series 2021-1 Class PT | ||||
| 11/29/2023 | 3.500% | 5,091,580 | 4,633,338 | |
| Mortgage Insurance-Linked Notes(a),(c) | ||||
| CMO Series 2020-1 Class M1C | ||||
| 1-month USD LIBOR + 1.750% Floor 1.750% 01/25/2030 | 6.770% | 2,387,788 | 2,327,107 | |
| New York Mortgage Trust(a),(e) | ||||
| CMO Series 2021-BPL1 Class A1 | ||||
| 05/25/2026 | 2.239% | 8,280,000 | 8,009,432 | |
| NRZ Excess Spread-Collateralized Notes(a) | ||||
| Series 2020-PLS1 Class A | ||||
| 12/25/2025 | 3.844% | 2,726,612 | 2,537,571 | |
| Oaktown Re II Ltd.(a),(c) | ||||
| CMO Series 2018-1A Class M1 | ||||
| 1-month USD LIBOR + 1.550% 07/25/2028 | 6.570% | 625,748 | 625,893 | |
| Oaktown Re VI Ltd.(a),(c) | ||||
| CMO Series 2021-1A Class M1B | ||||
| 30-day Average SOFR + 2.050% Floor 2.050% 10/25/2033 | 6.865% | 4,000,000 | 3,989,743 | |
| PMT Credit Risk Transfer Trust(a),(c) | ||||
| Series 2019-2R Class A | ||||
| 1-month USD LIBOR + 2.750% Floor 2.750% 05/27/2023 | 7.768% | 2,301,692 | 2,290,555 | |
| Residential Mortgage-Backed Securities - Non-Agency (continued) | ||||
| Issuer | Coupon Rate | Principal Amount ($) | Value ($) | |
| PNMAC GMSR Issuer Trust(a),(c) | ||||
| CMO Series 2018-GT1 Class A | ||||
| 1-month USD LIBOR + 2.850% Floor 2.850% 02/25/2025 | 7.870% | 26,000,000 | 25,883,148 | |
| CMO Series 2018-GT2 Class A | ||||
| 1-month USD LIBOR + 2.650% 08/25/2025 | 7.670% | 38,450,000 | 37,956,014 | |
| Point Securitization Trust(a),(e) | ||||
| CMO Series 2021-1 Class A1 | ||||
| 02/25/2052 | 3.228% | 9,670,922 | 9,154,373 | |
| Preston Ridge Partners Mortgage Trust(a),(e) | ||||
| CMO Series 2021-1 Class A1 | ||||
| 01/25/2026 | 2.115% | 11,207,235 | 10,759,072 | |
| CMO Series 2021-2 Class A1 | ||||
| 03/25/2026 | 2.115% | 4,440,990 | 4,171,937 | |
| CMO Series 2021-3 Class A1 | ||||
| 04/25/2026 | 1.867% | 12,720,269 | 11,862,746 | |
| CMO Series 2021-7 Class A1 | ||||
| 08/25/2026 | 1.867% | 6,061,073 | 5,657,518 | |
| CMO Series 2021-8 Class A1 | ||||
| 09/25/2026 | 1.743% | 4,903,771 | 4,450,318 | |
| Pretium Mortgage Credit Partners(a),(e) | ||||
| CMO Series 2022-NPL1 Class A1 | ||||
| 01/25/2052 | 2.981% | 18,699,654 | 17,557,960 | |
| Pretium Mortgage Credit Partners I LLC(a),(e) | ||||
| CMO Series 2021-NPL2 Class A1 | ||||
| 06/27/2060 | 1.992% | 7,825,535 | 7,277,012 | |
| Pretium Mortgage Credit Partners LLC(a),(e) | ||||
| CMO Series 2021-RN2 Class A1 | ||||
| 07/25/2051 | 1.744% | 4,599,726 | 4,199,736 | |
| PRPM LLC(a),(e) | ||||
| CMO Series 2021-RPL1 Class A1 | ||||
| 07/25/2051 | 1.319% | 4,218,569 | 3,673,008 | |
| Radnor Re Ltd.(a),(c) | ||||
| CMO Series 2020-1 Class M1B | ||||
| 1-month USD LIBOR + 1.450% Floor 1.450% 01/25/2030 | 6.470% | 11,076,735 | 11,057,614 | |
| Radnor RE Ltd.(a),(c) | ||||
| CMO Series 2021-1 Class M1C | ||||
| 30-day Average SOFR + 2.700% Floor 2.700% 12/27/2033 | 7.515% | 14,000,000 | 13,802,779 | |
| Residential Mortgage Loan Trust(a),(e) | ||||
| CMO Series 2019-3 Class A3 | ||||
| 09/25/2059 | 3.044% | 171,515 | 167,927 | |
| Saluda Grade Alternative Mortgage Trust(a) | ||||
| CMO Series 2020-FIG1 Class A1 | ||||
| 09/25/2050 | 3.568% | 3,879,939 | 3,820,122 | |
| Columbia Total Return Bond Fund | Annual Report 2023 | 29 |
April 30, 2023
| Residential Mortgage-Backed Securities - Non-Agency (continued) | ||||
| Issuer | Coupon Rate | Principal Amount ($) | Value ($) | |
| SG Residential Mortgage Trust(a),(e) | ||||
| CMO Series 2019-3 Class M1 | ||||
| 09/25/2059 | 3.526% | 3,801,000 | 3,490,313 | |
| Stanwich Mortgage Loan Co. LLC(a),(e) | ||||
| CMO Series 2021-NPB1 Class A1 | ||||
| 10/16/2026 | 2.735% | 7,691,966 | 7,058,195 | |
| Starwood Mortgage Residential Trust(a),(e) | ||||
| CMO Series 2020-3 Class M1 | ||||
| 04/25/2065 | 3.544% | 6,500,000 | 5,418,152 | |
| CMO Series 2021-3 Class A1 | ||||
| 06/25/2056 | 1.127% | 2,158,443 | 1,773,789 | |
| CMO Series 2021-6 Class A3 | ||||
| 11/25/2066 | 2.933% | 13,954,000 | 9,319,944 | |
| CMO Series 2022-2 Class A1 | ||||
| 02/25/2067 | 3.130% | 2,859,789 | 2,675,861 | |
| Stonnington Mortgage Trust(a),(b),(e),(j) | ||||
| CMO Series 2020-1 Class A | ||||
| 07/28/2024 | 3.500% | 1,241,042 | 1,222,426 | |
| Toorak Mortgage Corp., Ltd.(a),(e) | ||||
| CMO Series 2021-1 Class A1 | ||||
| 06/25/2024 | 2.240% | 15,000,000 | 14,405,682 | |
| Triangle Re Ltd.(a),(c) | ||||
| CMO Series 2021-2 Class M1B | ||||
| 1-month USD LIBOR + 2.600% Floor 2.600% 10/25/2033 | 7.620% | 6,139,367 | 6,155,159 | |
| CMO Series 2021-2 Class M1C | ||||
| 1-month USD LIBOR + 4.500% Floor 4.500% 10/25/2033 | 9.520% | 4,800,000 | 4,984,396 | |
| VCAT Asset Securitization LLC(a),(e) | ||||
| CMO Series 2021-NPL6 Class A1 | ||||
| 09/25/2051 | 1.917% | 9,024,235 | 8,409,019 | |
| VCAT LLC(a),(e) | ||||
| CMO Series 2021-NPL5 Class A1 | ||||
| 08/25/2051 | 1.868% | 10,171,840 | 9,469,056 | |
| Vericrest Opportunity Loan Transferee CVI LLC(a),(e) | ||||
| CMO Series 2021-NP12 Class A1 | ||||
| 12/26/2051 | 2.734% | 20,696,084 | 19,051,608 | |
| Vericrest Opportunity Loan Transferee XCIX LLC(a),(e) | ||||
| CMO Series 2021-NPL8 Class A1 | ||||
| 04/25/2051 | 2.116% | 5,478,498 | 5,067,735 | |
| Vericrest Opportunity Loan Transferee XCVI LLC(a),(e) | ||||
| CMO Series 2021-NPL5 Class A1 | ||||
| 03/27/2051 | 2.116% | 6,780,985 | 6,419,377 | |
| Verus Securitization Trust(a),(e) | ||||
| CMO Series 2020-1 Class M1 | ||||
| 01/25/2060 | 3.021% | 13,245,000 | 10,670,400 | |
| Residential Mortgage-Backed Securities - Non-Agency (continued) | ||||
| Issuer | Coupon Rate | Principal Amount ($) | Value ($) | |
| CMO Series 2020-4 Class M1 | ||||
| 05/25/2065 | 3.291% | 4,000,000 | 3,482,231 | |
| CMO Series 2021-5 Class A2 | ||||
| 09/25/2066 | 1.218% | 2,078,852 | 1,688,164 | |
| CMO Series 2021-5 Class A3 | ||||
| 09/25/2066 | 1.373% | 3,936,116 | 3,201,460 | |
| CMO Series 2021-5 Class M1 | ||||
| 09/25/2066 | 2.331% | 2,600,000 | 1,621,447 | |
| CMO Series 2021-7 Class A3 | ||||
| 10/25/2066 | 2.240% | 6,719,422 | 5,614,358 | |
| CMO Series 2021-R1 Class A1 | ||||
| 10/25/2063 | 0.820% | 1,883,769 | 1,689,164 | |
| Subordinated CMO Series 2021-8 Class B1 | ||||
| 11/25/2066 | 4.242% | 12,412,000 | 8,390,624 | |
| Visio Trust(a),(e) | ||||
| CMO Series 2019-2 Class A3 | ||||
| 11/25/2054 | 3.076% | 1,051,987 | 985,164 | |
| Visio Trust(a) | ||||
| CMO Series 2021-1R Class A1 | ||||
| 05/25/2056 | 1.280% | 7,381,636 | 6,754,395 | |
| CMO Series 2021-1R Class A2 | ||||
| 05/25/2056 | 1.484% | 2,337,582 | 2,130,443 | |
| Total Residential Mortgage-Backed Securities - Non-Agency (Cost $835,736,348) | 784,592,342 | |||
| Senior Loans 0.1% | ||||
| Borrower | Coupon Rate | Principal Amount ($) | Value ($) | |
| Chemicals 0.0% | ||||
| WR Grace Holdings LLC(c),(p) | ||||
| Term Loan | ||||
| 1-month USD LIBOR + 3.750% Floor 0.500% 09/22/2028 | 8.938% | 518,437 | 518,178 | |
| Consumer Cyclical Services 0.0% | ||||
| 8th Avenue Food & Provisions, Inc.(c),(p) | ||||
| 1st Lien Term Loan | ||||
| 1-month Term SOFR + 3.750% 10/01/2025 | 8.847% | 379,822 | 333,465 | |
| 2nd Lien Term Loan | ||||
| 1-month USD LIBOR + 7.750% 10/01/2026 | 12.847% | 32,969 | 21,077 | |
| Total | 354,542 | |||
| 30 | Columbia Total Return Bond Fund | Annual Report 2023 |
April 30, 2023
| Senior Loans (continued) | ||||
| Borrower | Coupon Rate | Principal Amount ($) | Value ($) | |
| Media and Entertainment 0.0% | ||||
| Cengage Learning, Inc.(c),(p) | ||||
| Tranche B 1st Lien Term Loan | ||||
| 3-month USD LIBOR + 4.750% Floor 1.000% 07/14/2026 | 9.880% | 709,156 | 691,328 | |
| Technology 0.1% | ||||
| Ascend Learning LLC(c),(p) | ||||
| 1st Lien Term Loan | ||||
| 1-month Term SOFR + 3.500% Floor 0.500% 12/11/2028 | 8.582% | 560,900 | 511,558 | |
| 2nd Lien Term Loan | ||||
| 1-month Term SOFR + 5.750% Floor 0.500% 12/10/2029 | 10.832% | 338,000 | 292,792 | |
| DCert Buyer, Inc.(c),(p) | ||||
| 2nd Lien Term Loan | ||||
| 1-month USD LIBOR + 7.000% 02/19/2029 | 11.696% | 404,000 | 371,805 | |
| UKG, Inc.(c),(p) | ||||
| 1st Lien Term Loan | ||||
| 3-month Term SOFR + 3.250% Floor 0.500% 05/04/2026 | 8.271% | 336,564 | 327,308 | |
| 2nd Lien Term Loan | ||||
| 3-month Term SOFR + 5.250% Floor 0.500% 05/03/2027 | 10.271% | 657,000 | 630,175 | |
| Total | 2,133,638 | |||
| Total Senior Loans (Cost $3,912,464) | 3,697,686 | |||
| U.S. Treasury Obligations 1.9% | ||||
| Issuer | Coupon Rate | Principal Amount ($) | Value ($) | |
| U.S. Treasury | ||||
| 06/30/2025 | 2.750% | 20,000,000 | 19,482,813 | |
| 08/15/2025 | 2.000% | 15,000,000 | 14,368,359 | |
| 08/15/2045 | 2.875% | 14,000,000 | 11,965,625 | |
| 02/15/2046 | 2.500% | 9,000,000 | 7,170,469 | |
| Total U.S. Treasury Obligations (Cost $54,212,565) | 52,987,266 | |||
| Call Option Contracts Purchased 0.3% | ||||
| Value ($) | ||||
| (Cost $25,587,562) | 7,579,167 | |||
| Money Market Funds 7.6% | ||
| Shares | Value ($) | |
| Columbia Short-Term Cash Fund, 5.046%(q),(r) | 214,462,099 | 214,376,314 |
| Total Money Market Funds (Cost $214,358,462) | 214,376,314 | |
| Total Investments in Securities (Cost: $3,648,248,864) | 3,398,712,954 | |
| Other Assets & Liabilities, Net | (595,915,760) | |
| Net Assets | 2,802,797,194 | |
| Forward foreign currency exchange contracts | |||||
| Currency to be sold | Currency to be purchased | Counterparty | Settlement date | Unrealized appreciation ($) | Unrealized depreciation ($) |
| 3,494,900 EUR | 3,849,597 USD | Citi | 06/09/2023 | — | (10,359) |
| Columbia Total Return Bond Fund | Annual Report 2023 | 31 |
April 30, 2023
| Long futures contracts | ||||||
| Description | Number of contracts | Expiration date | Trading currency | Notional amount | Value/Unrealized appreciation ($) | Value/Unrealized depreciation ($) |
| U.S. Treasury 10-Year Note | 3,902 | 06/2023 | USD | 449,522,594 | 11,078,082 | — |
| U.S. Treasury 5-Year Note | 1,799 | 06/2023 | USD | 197,426,196 | 1,306,773 | — |
| U.S. Treasury Ultra Bond | 847 | 06/2023 | USD | 119,771,094 | 4,807,655 | — |
| Total | 17,192,510 | — | ||||
| Short futures contracts | ||||||
| Description | Number of contracts | Expiration date | Trading currency | Notional amount | Value/Unrealized appreciation ($) | Value/Unrealized depreciation ($) |
| Euro-Bobl | (307) | 06/2023 | EUR | (36,216,790) | — | (865,126) |
| Euro-Bund | (271) | 06/2023 | EUR | (36,736,760) | — | (1,295,393) |
| Japanese 10-Year Government Bond | (41) | 06/2023 | JPY | (6,092,600,000) | — | (955,105) |
| U.S. Treasury 2-Year Note | (325) | 06/2023 | USD | (67,003,320) | 372,690 | — |
| Total | 372,690 | (3,115,624) | ||||
| Call option contracts purchased | ||||||||
| Description | Counterparty | Trading currency | Notional amount | Number of contracts | Exercise price/Rate | Expiration date | Cost ($) | Value ($) |
| 10-Year OTC interest rate swap with Citi to receive exercise rate and pay SOFR | Citi | USD | 162,420,000 | 162,420,000 | 2.50 | 05/12/2023 | 4,856,358 | 12,880 |
| 10-Year OTC interest rate swap with Citi to receive exercise rate and pay SOFR | Citi | USD | 110,230,000 | 110,230,000 | 2.25 | 05/26/2023 | 2,259,715 | 10,858 |
| 10-Year OTC interest rate swap with Citi to receive exercise rate and pay SOFR | Citi | USD | 162,300,000 | 162,300,000 | 2.75 | 06/26/2023 | 5,270,692 | 669,455 |
| 10-Year OTC interest rate swap with Citi to receive exercise rate and pay SOFR | Citi | USD | 60,310,000 | 60,310,000 | 2.75 | 07/11/2023 | 2,110,850 | 333,327 |
| 10-Year OTC interest rate swap with Citi to receive exercise rate and pay SOFR | Citi | USD | 15,000,000 | 15,000,000 | 3.50 | 10/27/2023 | 570,000 | 711,577 |
| 10-Year OTC interest rate swap with Citi to receive exercise rate and pay SOFR | Citi | USD | 113,470,000 | 113,470,000 | 3.30 | 11/14/2023 | 3,631,040 | 4,272,543 |
| 10-Year OTC interest rate swap with Morgan Stanley to receive exercise rate and pay SOFR | Morgan Stanley | USD | 162,420,000 | 162,420,000 | 2.50 | 05/12/2023 | 5,010,657 | 12,880 |
| 10-Year OTC interest rate swap with Morgan Stanley to receive exercise rate and pay SOFR | Morgan Stanley | USD | 55,000,000 | 55,000,000 | 3.00 | 01/10/2024 | 1,878,250 | 1,555,647 |
| Total | 25,587,562 | 7,579,167 | ||||||
| Call option contracts written | ||||||||
| Description | Counterparty | Trading currency | Notional amount | Number of contracts | Exercise price/Rate | Expiration date | Premium received ($) | Value ($) |
| 10-Year OTC interest rate swap with Citi to receive SOFR and pay exercise rate | Citi | USD | (150,000,000) | (150,000,000) | 2.90 | 5/04/2023 | (1,125,000) | (36,360) |
| Put option contracts written | ||||||||
| Description | Counterparty | Trading currency | Notional amount | Number of contracts | Exercise price/Rate | Expiration date | Premium received ($) | Value ($) |
| 10-Year OTC interest rate swap with Citi to receive exercise rate and pay SOFR | Citi | USD | (100,000,000) | (100,000,000) | 3.30 | 05/03/2023 | (1,300,000) | (124,520) |
| 10-Year OTC interest rate swap with Morgan Stanley to receive exercise rate and pay SOFR | Morgan Stanley | USD | (82,800,000) | (82,800,000) | 3.55 | 05/15/2023 | (993,600) | (66,447) |
| 5-Year OTC interest rate swap with Citi to receive exercise rate and pay SOFR | Citi | USD | (157,590,000) | (157,590,000) | 3.95 | 05/16/2023 | (1,213,443) | (28,209) |
| Total | (3,507,043) | (219,176) | ||||||
| 32 | Columbia Total Return Bond Fund | Annual Report 2023 |
April 30, 2023
| Credit default swap contracts - buy protection | ||||||||||||
| Reference entity | Counterparty | Maturity date | Pay fixed rate (%) | Payment frequency | Notional currency | Notional amount | Value ($) | Periodic payments receivable (payable) ($) | Upfront payments ($) | Upfront receipts ($) | Unrealized appreciation ($) | Unrealized depreciation ($) |
| Markit CMBX North America Index, Series 11 BBB- | Citi | 11/18/2054 | 3.000 | Monthly | USD | 7,000,000 | 1,798,125 | (2,333) | 1,758,140 | — | 37,652 | — |
| Markit CMBX North America Index, Series 12 BBB- | Citi | 08/17/2061 | 3.000 | Monthly | USD | 5,800,000 | 1,725,500 | (1,933) | 1,589,132 | — | 134,435 | — |
| Markit CMBX North America Index, Series 11 BBB- | Goldman Sachs International | 11/18/2054 | 3.000 | Monthly | USD | 1,700,000 | 436,687 | (566) | 258,625 | — | 177,496 | — |
| Markit CMBX North America Index, Series 10 BBB- | JPMorgan | 11/17/2059 | 3.000 | Monthly | USD | 8,000,000 | 2,360,000 | (2,667) | 322,825 | — | 2,034,508 | — |
| Markit CMBX North America Index, Series 11 BBB- | JPMorgan | 11/18/2054 | 3.000 | Monthly | USD | 1,700,000 | 436,688 | (567) | 57,179 | — | 378,942 | — |
| Markit CMBX North America Index, Series 11 BBB- | Morgan Stanley | 11/17/2059 | 3.000 | Monthly | USD | 1,000,000 | 295,000 | (333) | 57,725 | — | 236,942 | — |
| Markit CMBX North America Index, Series 16 BBB- | Morgan Stanley | 04/17/2065 | 3.000 | Monthly | USD | 5,780,000 | 1,560,600 | (1,927) | 1,353,007 | — | 205,666 | — |
| Total | 8,612,600 | (10,326) | 5,396,633 | — | 3,205,641 | — | ||||||
| Cleared credit default swap contracts - buy protection | |||||||||||
| Reference entity | Counterparty | Maturity date | Pay fixed rate (%) | Payment frequency | Notional currency | Notional amount | Value ($) | Upfront payments ($) | Upfront receipts ($) | Unrealized appreciation ($) | Unrealized depreciation ($) |
| Markit CDX North America High Yield Index, Series 39 | Morgan Stanley | 12/20/2027 | 5.000 | Quarterly | USD | 230,670,000 | (67,587) | — | — | — | (67,587) |
| Credit default swap contracts - sell protection | |||||||||||||
| Reference entity | Counterparty | Maturity date | Receive fixed rate (%) | Payment frequency | Implied credit spread (%)* | Notional currency | Notional amount | Value ($) | Periodic payments receivable (payable) ($) | Upfront payments ($) | Upfront receipts ($) | Unrealized appreciation ($) | Unrealized depreciation ($) |
| Markit CMBX North America Index, Series 10 BBB- | Citi | 11/17/2059 | 3.000 | Monthly | 14.967 | USD | 4,000,000 | (1,180,000) | 1,333 | — | (865,015) | — | (313,652) |
| Markit CMBX North America Index, Series 10 BBB- | Citi | 11/17/2059 | 3.000 | Monthly | 14.967 | USD | 7,000,000 | (2,065,000) | 2,334 | — | (830,557) | — | (1,232,109) |
| Markit CMBX North America Index, Series 10 BBB- | JPMorgan | 11/17/2059 | 3.000 | Monthly | 14.967 | USD | 5,000,000 | (1,475,000) | 1,666 | — | (1,070,787) | — | (402,547) |
| Markit CMBX North America Index, Series 10 BBB- | JPMorgan | 11/17/2059 | 3.000 | Monthly | 14.967 | USD | 5,000,000 | (1,475,000) | 1,667 | — | (829,467) | — | (643,866) |
| Markit CMBX North America Index, Series 10 BBB- | JPMorgan | 11/17/2059 | 3.000 | Monthly | 14.967 | USD | 5,000,000 | (1,475,000) | 1,667 | — | (798,727) | — | (674,606) |
| Markit CMBX North America Index, Series 10 BBB- | Morgan Stanley | 11/17/2059 | 3.000 | Monthly | 14.967 | USD | 3,000,000 | (885,000) | 1,000 | — | (564,265) | — | (319,735) |
| Markit CMBX North America Index, Series 8 BBB- | Morgan Stanley | 10/17/2057 | 3.000 | Monthly | 21.670 | USD | 7,000,000 | (1,443,750) | 2,333 | — | (1,426,607) | — | (14,810) |
| Total | (9,998,750) | 12,000 | — | (6,385,425) | — | (3,601,325) | |||||||
| Columbia Total Return Bond Fund | Annual Report 2023 | 33 |
April 30, 2023
| (a) | Represents privately placed and other securities and instruments exempt from Securities and Exchange Commission registration (collectively, private placements), such as Section 4(a)(2) and Rule 144A eligible securities, which are often sold only to qualified institutional buyers. At April 30, 2023, the total value of these securities amounted to $1,566,450,512, which represents 55.89% of total net assets. |
| (b) | Valuation based on significant unobservable inputs. |
| (c) | Variable rate security. The interest rate shown was the current rate as of April 30, 2023. |
| (d) | Represents a security purchased on a when-issued basis. |
| (e) | Variable or floating rate security, the interest rate of which adjusts periodically based on changes in current interest rates and prepayments on the underlying pool of assets. The interest rate shown was the current rate as of April 30, 2023. |
| (f) | Represents interest only securities which have the right to receive the monthly interest payments on an underlying pool of mortgage loans. |
| (g) | Non-income producing investment. |
| (h) | Principal amounts are denominated in United States Dollars unless otherwise noted. |
| (i) | Represents a variable rate security with a step coupon where the rate adjusts according to a schedule for a series of periods, typically lower for an initial period and then increasing to a higher coupon rate thereafter. The interest rate shown was the current rate as of April 30, 2023. |
| (j) | Represents fair value as determined in good faith under procedures approved by the Board of Trustees. At April 30, 2023, the total value of these securities amounted to $1,263,516, which represents 0.05% of total net assets. |
| (k) | Represents a security in default. |
| (l) | Payment-in-kind security. Interest can be paid by issuing additional par of the security or in cash. |
| (m) | As a result of sanctions and restricted cross-border payments, certain income and/or principal has not been recognized by the Fund. The Fund will continue to monitor the net realizable value and record the income when it is considered collectible. |
| (n) | Principal and interest may not be guaranteed by a governmental entity. |
| (o) | This security or a portion of this security has been pledged as collateral in connection with derivative contracts. |
| (p) | The stated interest rate represents the weighted average interest rate at April 30, 2023 of contracts within the senior loan facility. Interest rates on contracts are primarily determined either weekly, monthly or quarterly by reference to the indicated base lending rate and spread and the reset period. These base lending rates are primarily the LIBOR and other short-term rates. Base lending rates may be subject to a floor or minimum rate. The interest rate for senior loans purchased on a when-issued or delayed delivery basis will be determined upon settlement, therefore no interest rate is disclosed. Senior loans often require prepayments from excess cash flows or permit the borrowers to repay at their election. The degree to which borrowers repay cannot be predicted with accuracy. As a result, remaining maturities of senior loans may be less than the stated maturities. Generally, the Fund is contractually obligated to receive approval from the agent bank and/or borrower prior to the disposition of a senior loan. |
| (q) | The rate shown is the seven-day current annualized yield at April 30, 2023. |
| (r) | As defined in the Investment Company Act of 1940, as amended, an affiliated company is one in which the Fund owns 5% or more of the company’s outstanding voting securities, or a company which is under common ownership or control with the Fund. The value of the holdings and transactions in these affiliated companies during the year ended April 30, 2023 are as follows: |
| Affiliated issuers | Beginning of period($) | Purchases($) | Sales($) | Net change in unrealized appreciation (depreciation)($) | End of period($) | Realized gain (loss)($) | Dividends($) | End of period shares |
| Columbia Short-Term Cash Fund, 5.046% | ||||||||
| 121,311,912 | 1,429,067,468 | (1,336,007,702) | 4,636 | 214,376,314 | (54,150) | 4,496,185 | 214,462,099 | |
| CMO | Collateralized Mortgage Obligation |
| CMT | Constant Maturity Treasury |
| FHLMC | Federal Home Loan Mortgage Corporation |
| LIBOR | London Interbank Offered Rate |
| SOFR | Secured Overnight Financing Rate |
| STRIPS | Separate Trading of Registered Interest and Principal Securities |
| TBA | To Be Announced |
| 34 | Columbia Total Return Bond Fund | Annual Report 2023 |
April 30, 2023
| EUR | Euro |
| JPY | Japanese Yen |
| USD | US Dollar |
| ■ | Level 1 — Valuations based on quoted prices for investments in active markets that the Fund has the ability to access at the measurement date. Valuation adjustments are not applied to Level 1 investments. |
| ■ | Level 2 — Valuations based on other significant observable inputs (including quoted prices for similar securities, interest rates, prepayment speeds, credit risks, etc.). |
| ■ | Level 3 — Valuations based on significant unobservable inputs (including the Fund’s own assumptions and judgment in determining the fair value of investments). |
| Level 1 ($) | Level 2 ($) | Level 3 ($) | Total ($) | |
| Investments in Securities | ||||
| Asset-Backed Securities — Non-Agency | — | 331,413,822 | 16,858,904 | 348,272,726 |
| Commercial Mortgage-Backed Securities - Agency | — | 5,362,255 | — | 5,362,255 |
| Commercial Mortgage-Backed Securities - Non-Agency | — | 114,233,958 | — | 114,233,958 |
| Common Stocks | ||||
| Financials | 209,184 | — | — | 209,184 |
| Industrials | 65,393 | — | — | 65,393 |
| Total Common Stocks | 274,577 | — | — | 274,577 |
| Convertible Bonds | — | 269,412 | — | 269,412 |
| Corporate Bonds & Notes | — | 766,747,779 | 41,069 | 766,788,848 |
| Foreign Government Obligations | — | 72,882,211 | — | 72,882,211 |
| Residential Mortgage-Backed Securities - Agency | — | 1,027,396,192 | — | 1,027,396,192 |
| Residential Mortgage-Backed Securities - Non-Agency | — | 732,894,347 | 51,697,995 | 784,592,342 |
| Senior Loans | — | 3,697,686 | — | 3,697,686 |
| U.S. Treasury Obligations | — | 52,987,266 | — | 52,987,266 |
| Columbia Total Return Bond Fund | Annual Report 2023 | 35 |
April 30, 2023
| Level 1 ($) | Level 2 ($) | Level 3 ($) | Total ($) | |
| Call Option Contracts Purchased | — | 7,579,167 | — | 7,579,167 |
| Money Market Funds | 214,376,314 | — | — | 214,376,314 |
| Total Investments in Securities | 214,650,891 | 3,115,464,095 | 68,597,968 | 3,398,712,954 |
| Investments in Derivatives | ||||
| Asset | ||||
| Futures Contracts | 17,565,200 | — | — | 17,565,200 |
| Swap Contracts | — | 3,205,641 | — | 3,205,641 |
| Liability | ||||
| Forward Foreign Currency Exchange Contracts | — | (10,359) | — | (10,359) |
| Futures Contracts | (3,115,624) | — | — | (3,115,624) |
| Call Option Contracts Written | — | (36,360) | — | (36,360) |
| Put Option Contracts Written | — | (219,176) | — | (219,176) |
| Swap Contracts | — | (3,668,912) | — | (3,668,912) |
| Total | 229,100,467 | 3,114,734,929 | 68,597,968 | 3,412,433,364 |
| Balance as of 04/30/2022 ($) | Increase (decrease) in accrued discounts/ premiums ($) | Realized gain (loss) ($) | Change in unrealized appreciation (depreciation)(a) ($) | Purchases ($) | Sales ($) | Transfers into Level 3 ($) | Transfers out of Level 3 ($) | Balance as of 04/30/2023 ($) | |
| Asset-Backed Securities — Non-Agency | 15,192,448 | (356,554) | 856,382 | (741,423) | 17,630,343 | (7,968,186) | — | (7,754,106) | 16,858,904 |
| Corporate Bonds & Notes | 41,069 | — | — | — | — | — | — | — | 41,069 |
| Residential Mortgage-Backed Securities — Non-Agency | 114,128,474 | (16,380) | 99,686 | (1,078,531) | — | (61,435,254) | — | — | 51,697,995 |
| Total | 129,361,991 | (372,934) | 956,068 | (1,819,954) | 17,630,343 | (69,403,440) | — | (7,754,106) | 68,597,968 |
| 36 | Columbia Total Return Bond Fund | Annual Report 2023 |
April 30, 2023
| Assets | |
| Investments in securities, at value | |
| Unaffiliated issuers (cost $3,408,302,840) | $3,176,757,473 |
| Affiliated issuers (cost $214,358,462) | 214,376,314 |
| Option contracts purchased (cost $25,587,562) | 7,579,167 |
| Cash collateral held at broker for: | |
| Swap contracts | 3,220,000 |
| TBA | 6,688,023 |
| Margin deposits on: | |
| Swap contracts | 13,875,278 |
| Unrealized appreciation on swap contracts | 3,205,641 |
| Upfront payments on swap contracts | 5,396,633 |
| Receivable for: | |
| Investments sold | 6,174,932 |
| Investments sold on a delayed delivery basis | 102,333,316 |
| Capital shares sold | 14,370,605 |
| Dividends | 869,617 |
| Interest | 16,329,045 |
| Foreign tax reclaims | 7,731 |
| Variation margin for futures contracts | 3,787,375 |
| Expense reimbursement due from Investment Manager | 11,715 |
| Prepaid expenses | 15,664 |
| Trustees’ deferred compensation plan | 332,517 |
| Total assets | 3,575,331,046 |
| Liabilities | |
| Option contracts written, at value (premiums received $4,632,043) | 255,536 |
| Due to custodian | 316,735 |
| Unrealized depreciation on forward foreign currency exchange contracts | 10,359 |
| Unrealized depreciation on swap contracts | 3,601,325 |
| Upfront receipts on swap contracts | 6,385,425 |
| Payable for: | |
| Investments purchased | 50,460,660 |
| Investments purchased on a delayed delivery basis | 697,319,744 |
| Capital shares purchased | 2,720,181 |
| Distributions to shareholders | 4,878,576 |
| Variation margin for futures contracts | 911,698 |
| Variation margin for swap contracts | 4,838,308 |
| Management services fees | 36,496 |
| Distribution and/or service fees | 4,743 |
| Transfer agent fees | 306,859 |
| Compensation of board members | 42,729 |
| Other expenses | 111,961 |
| Trustees’ deferred compensation plan | 332,517 |
| Total liabilities | 772,533,852 |
| Net assets applicable to outstanding capital stock | $2,802,797,194 |
| Represented by | |
| Paid in capital | 3,445,659,989 |
| Total distributable earnings (loss) | (642,862,795) |
| Total - representing net assets applicable to outstanding capital stock | $2,802,797,194 |
| Columbia Total Return Bond Fund | Annual Report 2023 | 37 |
April 30, 2023
| Class A | |
| Net assets | $621,570,249 |
| Shares outstanding | 20,247,039 |
| Net asset value per share | $30.70 |
| Maximum sales charge | 3.00% |
| Maximum offering price per share (calculated by dividing the net asset value per share by 1.0 minus the maximum sales charge for Class A shares) | $31.65 |
| Advisor Class | |
| Net assets | $264,456,462 |
| Shares outstanding | 8,625,140 |
| Net asset value per share | $30.66 |
| Class C | |
| Net assets | $16,427,751 |
| Shares outstanding | 535,057 |
| Net asset value per share | $30.70 |
| Institutional Class | |
| Net assets | $1,307,981,373 |
| Shares outstanding | 42,581,958 |
| Net asset value per share | $30.72 |
| Institutional 2 Class | |
| Net assets | $274,094,064 |
| Shares outstanding | 8,940,752 |
| Net asset value per share | $30.66 |
| Institutional 3 Class | |
| Net assets | $313,214,887 |
| Shares outstanding | 10,195,792 |
| Net asset value per share | $30.72 |
| Class R | |
| Net assets | $5,052,408 |
| Shares outstanding | 164,505 |
| Net asset value per share | $30.71 |
| 38 | Columbia Total Return Bond Fund | Annual Report 2023 |
Year Ended April 30, 2023
| Net investment income | |
| Income: | |
| Dividends — affiliated issuers | $4,496,185 |
| Interest | 123,266,153 |
| Interfund lending | 2,074 |
| Total income | 127,764,412 |
| Expenses: | |
| Management services fees | 12,914,722 |
| Distribution and/or service fees | |
| Class A | 1,531,221 |
| Class C | 147,231 |
| Class R | 28,256 |
| Transfer agent fees | |
| Class A | 787,294 |
| Advisor Class | 373,466 |
| Class C | 18,928 |
| Institutional Class | 1,645,478 |
| Institutional 2 Class | 84,868 |
| Institutional 3 Class | 23,136 |
| Class R | 7,261 |
| Compensation of board members | 56,686 |
| Custodian fees | 57,529 |
| Printing and postage fees | 155,556 |
| Registration fees | 224,434 |
| Accounting services fees | 56,990 |
| Legal fees | 48,620 |
| Interest on collateral | 295,195 |
| Compensation of chief compliance officer | 481 |
| Other | 54,547 |
| Total expenses | 18,511,899 |
| Fees waived or expenses reimbursed by Investment Manager and its affiliates | (3,917,486) |
| Fees waived by transfer agent | |
| Institutional 2 Class | (9,820) |
| Institutional 3 Class | (23,136) |
| Expense reduction | (1,683) |
| Total net expenses | 14,559,774 |
| Net investment income | 113,204,638 |
| Columbia Total Return Bond Fund | Annual Report 2023 | 39 |
Year Ended April 30, 2023
| Realized and unrealized gain (loss) — net | |
| Net realized gain (loss) on: | |
| Investments — unaffiliated issuers | $(146,739,861) |
| Investments — affiliated issuers | (54,150) |
| Foreign currency translations | 209,005 |
| Forward foreign currency exchange contracts | (880,715) |
| Futures contracts | (94,539,300) |
| Option contracts purchased | 7,870,794 |
| Option contracts written | (31,711,183) |
| Swap contracts | (20,751,286) |
| Net realized loss | (286,596,696) |
| Net change in unrealized appreciation (depreciation) on: | |
| Investments — unaffiliated issuers | 30,445,984 |
| Investments — affiliated issuers | 4,636 |
| Foreign currency translations | 1,713 |
| Forward foreign currency exchange contracts | (122,479) |
| Futures contracts | 33,539,722 |
| Option contracts purchased | (35,179,390) |
| Option contracts written | 39,770,517 |
| Swap contracts | (5,965,107) |
| Net change in unrealized appreciation (depreciation) | 62,495,596 |
| Net realized and unrealized loss | (224,101,100) |
| Net decrease in net assets resulting from operations | $(110,896,462) |
| 40 | Columbia Total Return Bond Fund | Annual Report 2023 |
| Year Ended April 30, 2023 | Year Ended April 30, 2022 | |
| Operations | ||
| Net investment income | $113,204,638 | $88,163,629 |
| Net realized loss | (286,596,696) | (145,343,382) |
| Net change in unrealized appreciation (depreciation) | 62,495,596 | (350,962,116) |
| Net decrease in net assets resulting from operations | (110,896,462) | (408,141,869) |
| Distributions to shareholders | ||
| Net investment income and net realized gains | ||
| Class A | (20,978,581) | (20,545,842) |
| Advisor Class | (10,698,456) | (10,992,351) |
| Class C | (389,030) | (365,555) |
| Institutional Class | (47,006,366) | (39,125,903) |
| Institutional 2 Class | (5,384,392) | (6,621,970) |
| Institutional 3 Class | (12,457,516) | (13,245,990) |
| Class R | (181,261) | (147,159) |
| Total distributions to shareholders | (97,095,602) | (91,044,770) |
| Increase (decrease) in net assets from capital stock activity | (182,861,501) | 1,148,230,395 |
| Total increase (decrease) in net assets | (390,853,565) | 649,043,756 |
| Net assets at beginning of year | 3,193,650,759 | 2,544,607,003 |
| Net assets at end of year | $2,802,797,194 | $3,193,650,759 |
| Columbia Total Return Bond Fund | Annual Report 2023 | 41 |
| Year Ended | Year Ended | |||
| April 30, 2023 | April 30, 2022 | |||
| Shares | Dollars ($) | Shares | Dollars ($) | |
| Capital stock activity | ||||
| Class A | ||||
| Subscriptions | 2,905,622 | 89,205,065 | 3,044,452 | 113,585,218 |
| Fund reorganization | — | — | 1,160,251 | 43,249,882 |
| Distributions reinvested | 658,285 | 20,098,093 | 539,052 | 19,810,483 |
| Redemptions | (4,609,085) | (142,309,477) | (4,293,120) | (156,197,661) |
| Net increase (decrease) | (1,045,178) | (33,006,319) | 450,635 | 20,447,922 |
| Advisor Class | ||||
| Subscriptions | 2,384,891 | 73,731,809 | 4,447,352 | 164,193,332 |
| Fund reorganization | — | — | 22,289,843 | 829,852,611 |
| Distributions reinvested | 340,701 | 10,402,385 | 294,563 | 10,666,605 |
| Redemptions | (5,034,516) | (154,910,307) | (20,328,558) | (718,469,434) |
| Net increase (decrease) | (2,308,924) | (70,776,113) | 6,703,200 | 286,243,114 |
| Class C | ||||
| Subscriptions | 211,304 | 6,480,416 | 191,880 | 7,174,826 |
| Distributions reinvested | 12,072 | 368,005 | 9,468 | 348,440 |
| Redemptions | (186,563) | (5,739,939) | (245,685) | (9,028,183) |
| Net increase (decrease) | 36,813 | 1,108,482 | (44,337) | (1,504,917) |
| Institutional Class | ||||
| Subscriptions | 18,265,651 | 562,848,690 | 33,295,466 | 1,210,427,840 |
| Distributions reinvested | 1,436,661 | 43,885,983 | 915,801 | 33,518,142 |
| Redemptions | (22,689,272) | (693,946,716) | (16,764,044) | (602,857,360) |
| Net increase (decrease) | (2,986,960) | (87,212,043) | 17,447,223 | 641,088,622 |
| Institutional 2 Class | ||||
| Subscriptions | 7,214,082 | 220,022,628 | 6,069,976 | 224,354,721 |
| Distributions reinvested | 175,765 | 5,378,164 | 180,719 | 6,615,919 |
| Redemptions | (4,822,569) | (151,546,763) | (4,012,675) | (143,682,213) |
| Net increase | 2,567,278 | 73,854,029 | 2,238,020 | 87,288,427 |
| Institutional 3 Class | ||||
| Subscriptions | 5,350,071 | 164,475,815 | 5,326,489 | 198,016,596 |
| Distributions reinvested | 222,256 | 6,795,490 | 187,435 | 6,885,479 |
| Redemptions | (7,719,233) | (237,241,565) | (2,548,127) | (92,789,213) |
| Net increase (decrease) | (2,146,906) | (65,970,260) | 2,965,797 | 112,112,862 |
| Class R | ||||
| Subscriptions | 28,342 | 869,254 | 109,119 | 4,081,279 |
| Distributions reinvested | 5,849 | 178,470 | 3,963 | 145,150 |
| Redemptions | (62,951) | (1,907,001) | (45,604) | (1,672,064) |
| Net increase (decrease) | (28,760) | (859,277) | 67,478 | 2,554,365 |
| Total net increase (decrease) | (5,912,637) | (182,861,501) | 29,828,016 | 1,148,230,395 |
| 42 | Columbia Total Return Bond Fund | Annual Report 2023 |
| Net asset value, beginning of period | Net investment income | Net realized and unrealized gain (loss) | Total from investment operations | Distributions from net investment income | Distributions from net realized gains | Total distributions to shareholders | |
| Class A | |||||||
| Year Ended 4/30/2023 | $32.85 | 1.24 | (2.34) | (1.10) | (1.05) | — | (1.05) |
| Year Ended 4/30/2022 | $37.76 | 0.91 | (4.87) | (3.96) | (0.87) | (0.08) | (0.95) |
| Year Ended 4/30/2021(e) | $36.96 | 1.16 | 2.64 | 3.80 | (1.13) | (1.87) | (3.00) |
| Year Ended 4/30/2020(e) | $36.19 | 1.12 | 1.17 | 2.29 | (1.04) | (0.48) | (1.52) |
| Year Ended 4/30/2019(e) | $35.33 | 1.12 | 0.74 | 1.86 | (1.00) | — | (1.00) |
| Advisor Class | |||||||
| Year Ended 4/30/2023 | $32.81 | 1.30 | (2.32) | (1.02) | (1.13) | — | (1.13) |
| Year Ended 4/30/2022 | $37.71 | 0.98 | (4.84) | (3.86) | (0.96) | (0.08) | (1.04) |
| Year Ended 4/30/2021(e) | $36.91 | 1.26 | 2.64 | 3.90 | (1.23) | (1.87) | (3.10) |
| Year Ended 4/30/2020(e) | $36.16 | 1.20 | 1.15 | 2.35 | (1.12) | (0.48) | (1.60) |
| Year Ended 4/30/2019(e) | $35.29 | 1.24 | 0.75 | 1.99 | (1.12) | — | (1.12) |
| Class C | |||||||
| Year Ended 4/30/2023 | $32.85 | 1.01 | (2.34) | (1.33) | (0.82) | — | (0.82) |
| Year Ended 4/30/2022 | $37.77 | 0.64 | (4.89) | (4.25) | (0.59) | (0.08) | (0.67) |
| Year Ended 4/30/2021(e) | $36.96 | 0.87 | 2.65 | 3.52 | (0.84) | (1.87) | (2.71) |
| Year Ended 4/30/2020(e) | $36.19 | 0.84 | 1.17 | 2.01 | (0.76) | (0.48) | (1.24) |
| Year Ended 4/30/2019(e) | $35.33 | 0.84 | 0.78 | 1.62 | (0.76) | — | (0.76) |
| Institutional Class | |||||||
| Year Ended 4/30/2023 | $32.87 | 1.31 | (2.33) | (1.02) | (1.13) | — | (1.13) |
| Year Ended 4/30/2022 | $37.78 | 1.01 | (4.87) | (3.86) | (0.97) | (0.08) | (1.05) |
| Year Ended 4/30/2021(e) | $36.98 | 1.26 | 2.64 | 3.90 | (1.23) | (1.87) | (3.10) |
| Year Ended 4/30/2020(e) | $36.21 | 1.24 | 1.13 | 2.37 | (1.12) | (0.48) | (1.60) |
| Year Ended 4/30/2019(e) | $35.34 | 1.20 | 0.79 | 1.99 | (1.12) | — | (1.12) |
| Institutional 2 Class | |||||||
| Year Ended 4/30/2023 | $32.81 | 1.35 | (2.35) | (1.00) | (1.15) | — | (1.15) |
| Year Ended 4/30/2022 | $37.71 | 1.03 | (4.86) | (3.83) | (0.99) | (0.08) | (1.07) |
| Year Ended 4/30/2021(e) | $36.91 | 1.28 | 2.64 | 3.92 | (1.25) | (1.87) | (3.12) |
| Year Ended 4/30/2020(e) | $36.15 | 1.24 | 1.16 | 2.40 | (1.16) | (0.48) | (1.64) |
| Year Ended 4/30/2019(e) | $35.29 | 1.28 | 0.70 | 1.98 | (1.12) | — | (1.12) |
| 44 | Columbia Total Return Bond Fund | Annual Report 2023 |
| Net asset value, end of period | Total return | Total gross expense ratio to average net assets(a) | Total net expense ratio to average net assets(a),(b) | Net investment income ratio to average net assets | Portfolio turnover | Net assets, end of period (000’s) | |
| Class A | |||||||
| Year Ended 4/30/2023 | $30.70 | (3.27%) | 0.90%(c) | 0.75%(c),(d) | 4.02% | 247% | $621,570 |
| Year Ended 4/30/2022 | $32.85 | (10.72%) | 0.87%(c) | 0.74%(c),(d) | 2.48% | 173% | $699,471 |
| Year Ended 4/30/2021(e) | $37.76 | 10.36% | 0.88%(c) | 0.74%(c),(d) | 3.00% | 295% | $786,976 |
| Year Ended 4/30/2020(e) | $36.96 | 6.34% | 0.90%(c) | 0.74%(c),(d) | 3.05% | 272% | $694,852 |
| Year Ended 4/30/2019(e) | $36.19 | 5.45% | 0.91%(c) | 0.86%(c),(d) | 3.19% | 262% | $681,416 |
| Advisor Class | |||||||
| Year Ended 4/30/2023 | $30.66 | (3.04%) | 0.64%(c) | 0.50%(c),(d) | 4.24% | 247% | $264,456 |
| Year Ended 4/30/2022 | $32.81 | (10.49%) | 0.62%(c) | 0.49%(c),(d) | 2.69% | 173% | $358,749 |
| Year Ended 4/30/2021(e) | $37.71 | 10.62% | 0.63%(c) | 0.49%(c),(d) | 3.27% | 295% | $159,565 |
| Year Ended 4/30/2020(e) | $36.91 | 6.61% | 0.65%(c) | 0.49%(c),(d) | 3.32% | 272% | $93,369 |
| Year Ended 4/30/2019(e) | $36.16 | 5.72% | 0.66%(c) | 0.61%(c),(d) | 3.53% | 262% | $15,272 |
| Class C | |||||||
| Year Ended 4/30/2023 | $30.70 | (3.99%) | 1.65%(c) | 1.50%(c),(d) | 3.28% | 247% | $16,428 |
| Year Ended 4/30/2022 | $32.85 | (11.42%) | 1.62%(c) | 1.49%(c),(d) | 1.73% | 173% | $16,370 |
| Year Ended 4/30/2021(e) | $37.77 | 9.57% | 1.63%(c) | 1.49%(c),(d) | 2.25% | 295% | $20,492 |
| Year Ended 4/30/2020(e) | $36.96 | 5.55% | 1.65%(c) | 1.50%(c),(d) | 2.30% | 272% | $20,696 |
| Year Ended 4/30/2019(e) | $36.19 | 4.66% | 1.66%(c) | 1.61%(c),(d) | 2.37% | 262% | $18,905 |
| Institutional Class | |||||||
| Year Ended 4/30/2023 | $30.72 | (3.02%) | 0.65%(c) | 0.50%(c),(d) | 4.26% | 247% | $1,307,981 |
| Year Ended 4/30/2022 | $32.87 | (10.49%) | 0.62%(c) | 0.49%(c),(d) | 2.75% | 173% | $1,497,858 |
| Year Ended 4/30/2021(e) | $37.78 | 10.70% | 0.63%(c) | 0.49%(c),(d) | 3.26% | 295% | $1,062,540 |
| Year Ended 4/30/2020(e) | $36.98 | 6.61% | 0.65%(c) | 0.49%(c),(d) | 3.30% | 272% | $710,558 |
| Year Ended 4/30/2019(e) | $36.21 | 5.60% | 0.66%(c) | 0.61%(c),(d) | 3.42% | 262% | $949,377 |
| Institutional 2 Class | |||||||
| Year Ended 4/30/2023 | $30.66 | (2.96%) | 0.57%(c) | 0.42%(c) | 4.40% | 247% | $274,094 |
| Year Ended 4/30/2022 | $32.81 | (10.43%) | 0.55%(c) | 0.42%(c) | 2.80% | 173% | $209,091 |
| Year Ended 4/30/2021(e) | $37.71 | 10.69% | 0.57%(c) | 0.43%(c) | 3.33% | 295% | $155,945 |
| Year Ended 4/30/2020(e) | $36.91 | 6.69% | 0.57%(c) | 0.42%(c) | 3.38% | 272% | $84,295 |
| Year Ended 4/30/2019(e) | $36.15 | 5.81% | 0.58%(c) | 0.53%(c) | 3.64% | 262% | $80,083 |
| Columbia Total Return Bond Fund | Annual Report 2023 | 45 |
| Net asset value, beginning of period | Net investment income | Net realized and unrealized gain (loss) | Total from investment operations | Distributions from net investment income | Distributions from net realized gains | Total distributions to shareholders | |
| Institutional 3 Class | |||||||
| Year Ended 4/30/2023 | $32.87 | 1.35 | (2.33) | (0.98) | (1.17) | — | (1.17) |
| Year Ended 4/30/2022 | $37.79 | 1.05 | (4.88) | (3.83) | (1.01) | (0.08) | (1.09) |
| Year Ended 4/30/2021(e) | $36.98 | 1.29 | 2.66 | 3.95 | (1.27) | (1.87) | (3.14) |
| Year Ended 4/30/2020(e) | $36.21 | 1.24 | 1.17 | 2.41 | (1.16) | (0.48) | (1.64) |
| Year Ended 4/30/2019(e) | $35.35 | 1.28 | 0.74 | 2.02 | (1.16) | — | (1.16) |
| Class R | |||||||
| Year Ended 4/30/2023 | $32.87 | 1.15 | (2.33) | (1.18) | (0.98) | — | (0.98) |
| Year Ended 4/30/2022 | $37.78 | 0.82 | (4.87) | (4.05) | (0.78) | (0.08) | (0.86) |
| Year Ended 4/30/2021(e) | $36.97 | 1.06 | 2.66 | 3.72 | (1.04) | (1.87) | (2.91) |
| Year Ended 4/30/2020(e) | $36.20 | 1.04 | 1.17 | 2.21 | (0.96) | (0.48) | (1.44) |
| Year Ended 4/30/2019(e) | $35.33 | 1.04 | 0.75 | 1.79 | (0.92) | — | (0.92) |
| Notes to Financial Highlights | |
| (a) | In addition to the fees and expenses that the Fund bears directly, the Fund indirectly bears a pro rata share of the fees and expenses of any other funds in which it invests. Such indirect expenses are not included in the Fund’s reported expense ratios. |
| (b) | Total net expenses include the impact of certain fee waivers/expense reimbursements made by the Investment Manager and certain of its affiliates, if applicable. |
| (c) | Ratios include interest on collateral expense. For the periods indicated below, if interest on collateral expense had been excluded, expenses would have been lower by: |
| Class | 4/30/2023 | 4/30/2022 | 4/30/2021 | 4/30/2020 | 4/30/2019 |
| Class A | 0.01% | less than 0.01% | less than 0.01% | less than 0.01% | less than 0.01% |
| Advisor Class | 0.01% | less than 0.01% | less than 0.01% | less than 0.01% | less than 0.01% |
| Class C | 0.01% | less than 0.01% | less than 0.01% | less than 0.01% | less than 0.01% |
| Institutional Class | 0.01% | less than 0.01% | less than 0.01% | less than 0.01% | less than 0.01% |
| Institutional 2 Class | 0.01% | less than 0.01% | less than 0.01% | less than 0.01% | less than 0.01% |
| Institutional 3 Class | 0.01% | less than 0.01% | less than 0.01% | less than 0.01% | less than 0.01% |
| Class R | 0.01% | less than 0.01% | less than 0.01% | less than 0.01% | less than 0.01% |
| (d) | The benefits derived from expense reductions had an impact of less than 0.01%. |
| (e) | Per share amounts have been adjusted on a retroactive basis to reflect a 4 to 1 reverse stock split completed after the close of business on September 11, 2020. |
| 46 | Columbia Total Return Bond Fund | Annual Report 2023 |
| Net asset value, end of period | Total return | Total gross expense ratio to average net assets(a) | Total net expense ratio to average net assets(a),(b) | Net investment income ratio to average net assets | Portfolio turnover | Net assets, end of period (000’s) | |
| Institutional 3 Class | |||||||
| Year Ended 4/30/2023 | $30.72 | (2.90%) | 0.52%(c) | 0.37%(c) | 4.38% | 247% | $313,215 |
| Year Ended 4/30/2022 | $32.87 | (10.41%) | 0.50%(c) | 0.37%(c) | 2.85% | 173% | $405,759 |
| Year Ended 4/30/2021(e) | $37.79 | 10.73% | 0.52%(c) | 0.38%(c) | 3.32% | 295% | $354,336 |
| Year Ended 4/30/2020(e) | $36.98 | 6.86% | 0.53%(c) | 0.37%(c) | 3.42% | 272% | $525,287 |
| Year Ended 4/30/2019(e) | $36.21 | 5.73% | 0.53%(c) | 0.49%(c) | 3.56% | 262% | $258,172 |
| Class R | |||||||
| Year Ended 4/30/2023 | $30.71 | (3.54%) | 1.15%(c) | 1.00%(c),(d) | 3.75% | 247% | $5,052 |
| Year Ended 4/30/2022 | $32.87 | (10.94%) | 1.12%(c) | 0.99%(c),(d) | 2.24% | 173% | $6,352 |
| Year Ended 4/30/2021(e) | $37.78 | 10.15% | 1.13%(c) | 0.99%(c),(d) | 2.76% | 295% | $4,752 |
| Year Ended 4/30/2020(e) | $36.97 | 6.08% | 1.15%(c) | 1.00%(c),(d) | 2.79% | 272% | $2,501 |
| Year Ended 4/30/2019(e) | $36.20 | 5.19% | 1.16%(c) | 1.11%(c),(d) | 2.97% | 262% | $2,380 |
| Columbia Total Return Bond Fund | Annual Report 2023 | 47 |
April 30, 2023
| 48 | Columbia Total Return Bond Fund | Annual Report 2023 |
April 30, 2023
| Columbia Total Return Bond Fund | Annual Report 2023 | 49 |
April 30, 2023
| 50 | Columbia Total Return Bond Fund | Annual Report 2023 |
April 30, 2023
| Columbia Total Return Bond Fund | Annual Report 2023 | 51 |
April 30, 2023
| 52 | Columbia Total Return Bond Fund | Annual Report 2023 |
April 30, 2023
| Columbia Total Return Bond Fund | Annual Report 2023 | 53 |
April 30, 2023
| Asset derivatives | ||
| Risk exposure category | Statement of assets and liabilities location | Fair value ($) |
| Credit risk | Component of total distributable earnings (loss) — unrealized appreciation on swap contracts | 3,205,641* |
| Credit risk | Upfront payments on swap contracts | 5,396,633 |
| Interest rate risk | Component of total distributable earnings (loss) — unrealized appreciation on futures contracts | 17,565,200* |
| Interest rate risk | Investments, at value — Option contracts purchased | 7,579,167 |
| Total | 33,746,641 |
| Liability derivatives | ||
| Risk exposure category | Statement of assets and liabilities location | Fair value ($) |
| Credit risk | Component of total distributable earnings (loss) — unrealized depreciation on swap contracts | 3,668,912* |
| Credit risk | Upfront receipts on swap contracts | 6,385,425 |
| Foreign exchange risk | Unrealized depreciation on forward foreign currency exchange contracts | 10,359 |
| Interest rate risk | Component of total distributable earnings (loss) — unrealized depreciation on futures contracts | 3,115,624* |
| Interest rate risk | Option contracts written, at value | 255,536 |
| Total | 13,435,856 |
| * | Includes cumulative appreciation (depreciation) as reported in the tables following the Portfolio of Investments. Only the current day’s variation margin is reported in receivables or payables in the Statement of Assets and Liabilities. |
| Amount of realized gain (loss) on derivatives recognized in income | ||||||
| Risk exposure category | Forward foreign currency exchange contracts ($) | Futures contracts ($) | Option contracts purchased ($) | Option contracts written ($) | Swap contracts ($) | Total ($) |
| Credit risk | — | — | — | — | (20,751,286) | (20,751,286) |
| Foreign exchange risk | (880,715) | — | — | — | — | (880,715) |
| Interest rate risk | — | (94,539,300) | 7,870,794 | (31,711,183) | — | (118,379,689) |
| Total | (880,715) | (94,539,300) | 7,870,794 | (31,711,183) | (20,751,286) | (140,011,690) |
| Change in unrealized appreciation (depreciation) on derivatives recognized in income | ||||||
| Risk exposure category | Forward foreign currency exchange contracts ($) | Futures contracts ($) | Option contracts purchased ($) | Option contracts written ($) | Swap contracts ($) | Total ($) |
| Credit risk | — | — | — | — | (5,965,107) | (5,965,107) |
| Foreign exchange risk | (122,479) | — | — | — | — | (122,479) |
| Interest rate risk | — | 33,539,722 | (35,179,390) | 39,770,517 | — | 38,130,849 |
| Total | (122,479) | 33,539,722 | (35,179,390) | 39,770,517 | (5,965,107) | 32,043,263 |
| 54 | Columbia Total Return Bond Fund | Annual Report 2023 |
April 30, 2023
| Derivative instrument | Average notional amounts ($)* |
| Futures contracts — long | 772,301,683 |
| Futures contracts — short | 627,585,785 |
| Credit default swap contracts — buy protection | 313,989,095 |
| Credit default swap contracts — sell protection | 55,762,500 |
| Derivative instrument | Average value ($)* |
| Option contracts purchased | 15,496,936 |
| Option contracts written | (2,360,301) |
| Derivative instrument | Average unrealized appreciation ($)* | Average unrealized depreciation ($)* |
| Forward foreign currency exchange contracts | 67,523 | (36,016) |
| * | Based on the ending quarterly outstanding amounts for the year ended April 30, 2023. |
| Columbia Total Return Bond Fund | Annual Report 2023 | 55 |
April 30, 2023
| 56 | Columbia Total Return Bond Fund | Annual Report 2023 |
April 30, 2023
| Citi ($)(a) | Citi ($)(a) | Goldman Sachs International ($) | JPMorgan ($) | Morgan Stanley ($)(a) | Morgan Stanley ($)(a) | Total ($) | ||
| Assets | ||||||||
| Call option contracts purchased | 6,010,640 | - | - | - | 1,568,527 | - | 7,579,167 | |
| OTC credit default swap contracts (b) | - | 3,519,359 | 436,121 | 2,793,454 | 1,853,340 | - | 8,602,274 | |
| Total assets | 6,010,640 | 3,519,359 | 436,121 | 2,793,454 | 3,421,867 | - | 16,181,441 | |
| Liabilities | ||||||||
| Centrally cleared credit default swap contracts (c) | - | - | - | - | - | 4,838,308 | 4,838,308 | |
| Forward foreign currency exchange contracts | 10,359 | - | - | - | - | - | 10,359 | |
| Call option contracts written | 36,360 | - | - | - | - | - | 36,360 | |
| Put option contracts written | 152,729 | - | - | - | 66,447 | - | 219,176 | |
| OTC credit default swap contracts (b) | - | 3,241,333 | - | 4,420,000 | 2,325,417 | - | 9,986,750 | |
| Total liabilities | 199,448 | 3,241,333 | - | 4,420,000 | 2,391,864 | 4,838,308 | 15,090,953 | |
| Total financial and derivative net assets | 5,811,192 | 278,026 | 436,121 | (1,626,546) | 1,030,003 | (4,838,308) | 1,090,488 | |
| Total collateral received (pledged) (d) | 5,391,000 | - | 420,000 | (1,626,546) | 889,000 | (4,838,308) | 235,146 | |
| Net amount (e) | 420,192 | 278,026 | 16,121 | - | 141,003 | - | 855,342 |
| (a) | Exposure can only be netted across transactions governed under the same master agreement with the same legal entity. |
| (b) | Over-the-Counter (OTC) Swap Contracts are presented at market value plus periodic payments receivable (payable), which is comprised of unrealized appreciation, unrealized depreciation, upfront payments and upfront receipts. |
| (c) | Centrally cleared swaps are included within payable/receivable for variation margin on the Statement of Assets and Liabilities. |
| (d) | In some instances, the actual collateral received and/or pledged may be more than the amount shown due to overcollateralization. |
| (e) | Represents the net amount due from/(to) counterparties in the event of default. |
| Columbia Total Return Bond Fund | Annual Report 2023 | 57 |
April 30, 2023
| 58 | Columbia Total Return Bond Fund | Annual Report 2023 |
April 30, 2023
| Columbia Total Return Bond Fund | Annual Report 2023 | 59 |
April 30, 2023
| Effective rate (%) | |
| Class A | 0.13 |
| Advisor Class | 0.13 |
| Class C | 0.13 |
| Institutional Class | 0.13 |
| Institutional 2 Class | 0.05 |
| Institutional 3 Class | 0.00 |
| Class R | 0.13 |
| 60 | Columbia Total Return Bond Fund | Annual Report 2023 |
April 30, 2023
| Front End (%) | CDSC (%) | Amount ($) | |
| Class A | 3.00 | 0.50 - 1.00(a) | 229,402 |
| Class C | — | 1.00(b) | 4,591 |
| (a) | This charge is imposed on certain investments of between $1 million and $50 million redeemed within 18 months after purchase, as follows: 1.00% if redeemed within 12 months after purchase, and 0.50% if redeemed more than 12, but less than 18, months after purchase, with certain limited exceptions. |
| (b) | This charge applies to redemptions within 12 months after purchase, with certain limited exceptions. |
| Fee rate(s) contractual through August 31, 2024 | |
| Class A | 0.74% |
| Advisor Class | 0.49 |
| Class C | 1.49 |
| Institutional Class | 0.49 |
| Institutional 2 Class | 0.42 |
| Institutional 3 Class | 0.37 |
| Class R | 0.99 |
| Columbia Total Return Bond Fund | Annual Report 2023 | 61 |
April 30, 2023
| Undistributed net investment income ($) | Accumulated net realized (loss) ($) | Paid in capital ($) |
| (12,452,411) | 12,452,411 | — |
| Year Ended April 30, 2023 | Year Ended April 30, 2022 | ||||
| Ordinary income ($) | Long-term capital gains ($) | Total ($) | Ordinary income ($) | Long-term capital gains ($) | Total ($) |
| 97,095,602 | — | 97,095,602 | 84,107,203 | 6,937,567 | 91,044,770 |
| Undistributed ordinary income ($) | Undistributed long-term capital gains ($) | Capital loss carryforwards ($) | Net unrealized (depreciation) ($) |
| 8,747,607 | — | (388,222,421) | (258,136,611) |
| Federal tax cost ($) | Gross unrealized appreciation ($) | Gross unrealized (depreciation) ($) | Net unrealized (depreciation) ($) |
| 3,669,581,183 | 10,975,561 | (269,112,172) | (258,136,611) |
| No expiration short-term ($) | No expiration long-term ($) | Total ($) | Utilized ($) |
| (188,894,279) | (199,328,142) | (388,222,421) | — |
| 62 | Columbia Total Return Bond Fund | Annual Report 2023 |
April 30, 2023
| Borrower or lender | Average loan balance ($) | Weighted average interest rate (%) | Number of days with outstanding loans |
| Lender | 2,285,714 | 4.35 | 7 |
| Columbia Total Return Bond Fund | Annual Report 2023 | 63 |
April 30, 2023
| Shares | |
| Class A | 1,160,251 |
| Advisor Class | 22,289,843 |
| ($) | |
| Net investment income | 104,475,000 |
| Net realized loss | (114,922,000) |
| Net change in unrealized appreciation/(depreciation) | (384,820,000) |
| Net decrease in net assets from operations | (395,267,000) |
| 64 | Columbia Total Return Bond Fund | Annual Report 2023 |
April 30, 2023
| Columbia Total Return Bond Fund | Annual Report 2023 | 65 |
April 30, 2023
| 66 | Columbia Total Return Bond Fund | Annual Report 2023 |
| Columbia Total Return Bond Fund | Annual Report 2023 | 67 |
| Section 163(j) Interest Dividends | |
| 100.00% |
| Name, address, year of birth | Position held with the Columbia Funds and length of service | Principal occupation(s) during past five years and other relevant professional experience | Number of Funds in the Columbia Funds Complex* overseen | Other directorships held by Trustee during the past five years and other relevant Board experience |
| George S. Batejan c/o Columbia Management Investment Advisers, LLC 290 Congress Street Boston, MA 02210 1954 | Trustee since 2017 | Executive Vice President, Global Head of Technology and Operations, Janus Capital Group, Inc., 2010-2016 | 174 | Former Chairman of the Board, NICSA (National Investment Company Services Association) (Executive Committee, Nominating Committee and Governance Committee), 2014-2016; former Director, Intech Investment Management, 2011-2016; former Board Member, Metro Denver Chamber of Commerce, 2015-2016; former Advisory Board Member, University of Colorado Business School, 2015-2018; former Board Member, Chase Bank International, 1993-1994 |
| 68 | Columbia Total Return Bond Fund | Annual Report 2023 |
(Unaudited)
Independent trustees (continued)
| Name, address, year of birth | Position held with the Columbia Funds and length of service | Principal occupation(s) during past five years and other relevant professional experience | Number of Funds in the Columbia Funds Complex* overseen | Other directorships held by Trustee during the past five years and other relevant Board experience |
| Kathleen Blatz c/o Columbia Management Investment Advisers, LLC 290 Congress Street Boston, MA 02210 1954 | Trustee since 2006 | Attorney, specializing in arbitration and mediation; Chief Justice, Minnesota Supreme Court, 1998-2006; Associate Justice, Minnesota Supreme Court, 1996-1998; Fourth Judicial District Court Judge, Hennepin County, 1994-1996; Attorney in private practice and public service, 1984-1993; State Representative, Minnesota House of Representatives, 1979-1993, which included service on the Tax and Financial Institutions and Insurance Committees; Member and Interim Chair, Minnesota Sports Facilities Authority, January-July 2017; Interim President and Chief Executive Officer, Blue Cross and Blue Shield of Minnesota (health care insurance), February-July 2018, April-October 2021 | 174 | Former Trustee, Blue Cross and Blue Shield of Minnesota, 2009-2021 (Chair of the Business Development Committee, 2014-2017; Chair of the Governance Committee, 2017-2019); former Member and Chair of the Board, Minnesota Sports Facilities Authority, January 2017-July 2017; former Director, Robina Foundation, 2009-2020 (Chair, 2014-2020); Director, Richard M. Schulze Family Foundation, since 2021 |
| Pamela G. Carlton c/o Columbia Management Investment Advisers, LLC 290 Congress Street Boston, MA 02210 1954 | Chair since 2023; Trustee since 2007 | President, Springboard — Partners in Cross Cultural Leadership (consulting company), since 2003; Managing Director of US Equity Research, JP Morgan Chase, 1999-2003; Director of US Equity Research, Chase Asset Management, 1996-1999; Co-Director Latin America Research, 1993-1996, COO Global Research, 1992-1996, Co-Director of US Research, 1991-1992, Investment Banker, 1982-1991, Morgan Stanley; Attorney, Cleary Gottlieb Steen & Hamilton LLP, 1980-1982 | 174 | Trustee, New York Presbyterian Hospital Board, since 1996; Director, DR Bank (Audit Committee) since 2017; Director, Evercore Inc. (Audit Committee, Nominating and Governance Committee), since 2019; Director, Apollo Commercial Real Estate Finance, Inc. (Chair, Nominating and Governance Committee) (financial services), since 2021; the Governing Council of the Independent Directors Council (IDC), since 2021 |
| Janet Langford Carrig c/o Columbia Management Investment Advisers, LLC 290 Congress Street Boston, MA 02210 1957 | Trustee since 1996 | Senior Vice President, General Counsel and Corporate Secretary, ConocoPhillips (independent energy company), September 2007-October 2018 | 174 | Director, EQT Corporation (natural gas producer), since 2019; former Director, Whiting Petroleum Corporation (independent oil and gas company), 2020-2022 |
| J. Kevin Connaughton c/o Columbia Management Investment Advisers, LLC 290 Congress Street Boston, MA 02210 1964 | Trustee since 2020 | CEO and President, RhodeWay Financial (non-profit financial planning firm), since December 2022; Member, FINRA National Adjudicatory Council, since January 2020; Adjunct Professor of Finance, Bentley University since January 2018; Consultant to Independent Trustees of CFVIT and CFST I from March 2016 to June 2020 with respect to CFVIT and to December 2020 with respect to CFST I; Managing Director and General Manager of Mutual Fund Products, Columbia Management Investment Advisers, LLC, May 2010-February 2015; President, Columbia Funds, 2008-2015; and senior officer of Columbia Funds and affiliated funds, 2003-2015 | 172 | Former Director, The Autism Project, March 2015-December 2021; former Member of the Investment Committee, St. Michael’s College, November 2015-February 2020; former Trustee, St. Michael’s College, June 2017-September 2019; former Trustee, New Century Portfolios (former mutual fund complex), January 2015-December 2017 |
| Columbia Total Return Bond Fund | Annual Report 2023 | 69 |
(Unaudited)
Independent trustees (continued)
| Name, address, year of birth | Position held with the Columbia Funds and length of service | Principal occupation(s) during past five years and other relevant professional experience | Number of Funds in the Columbia Funds Complex* overseen | Other directorships held by Trustee during the past five years and other relevant Board experience |
| Olive M. Darragh c/o Columbia Management Investment Advisers, LLC 290 Congress Street Boston, MA 02210 1962 | Trustee since 2020 | Managing Director of Darragh Inc. (strategy and talent management consulting firm), since 2010; Founder and CEO, Zolio, Inc. (investment management talent identification platform), since 2004; Consultant to Independent Trustees of CFVIT and CFST I from June 2019 to June 2020 with respect to CFVIT and to December 2020 with respect to CFST I; Partner, Tudor Investments, 2004-2010; Senior Partner, McKinsey & Company (consulting), 1990-2004; Touche Ross CPA, 1985-1988 | 172 | Treasurer, Edinburgh University US Trust Board, since January 2023; Member, HBS Community Action Partners Board, since September 2022; former Director, University of Edinburgh Business School (Member of US Board), 2004-2019; former Director, Boston Public Library Foundation, 2008-2017 |
| Patricia M. Flynn c/o Columbia Management Investment Advisers, LLC 290 Congress Street Boston, MA 02210 1950 | Trustee since 2004 | Professor of Economics and Management, Bentley University, since 2002; Dean, McCallum Graduate School of Business, Bentley University, 1992-2002 | 174 | Former Trustee, MA Taxpayers Foundation, 1997-2022; former Director, The MA Business Roundtable, 2003-2019; former Chairperson, Innovation Index Advisory Committee, MA Technology Collaborative, 1997-2020 |
| Brian J. Gallagher c/o Columbia Management Investment Advisers, LLC 290 Congress Street Boston, MA 02210 1954 | Trustee since 2017 | Retired; Partner with Deloitte & Touche LLP and its predecessors, 1977-2016 | 174 | Trustee, Catholic Schools Foundation, since 2004 |
| Douglas A. Hacker c/o Columbia Management Investment Advisers, LLC 290 Congress Street Boston, MA 02210 1955 | Trustee since 1996 | Independent business executive, since May 2006; Executive Vice President – Strategy of United Airlines, December 2002 - May 2006; President of UAL Loyalty Services (airline marketing company), September 2001-December 2002; Executive Vice President and Chief Financial Officer of United Airlines, July 1999-September 2001 | 174 | Director, SpartanNash Company since November 2013 (Chair of the Board, since May 2021) (food distributor); Director, Aircastle Limited (Chair of Audit Committee) (aircraft leasing), since August 2006; former Director, Nash Finch Company (food distributor), 2005-2013; former Director, SeaCube Container Leasing Ltd. (container leasing), 2010-2013; and former Director, Travelport Worldwide Limited (travel information technology), 2014-2019 |
| Nancy T. Lukitsh c/o Columbia Management Investment Advisers, LLC 290 Congress Street Boston, MA 02210 1956 | Trustee since 2011 | Senior Vice President, Partner and Director of Marketing, Wellington Management Company, LLP (investment adviser), 1997-2010; Chair, Wellington Management Portfolios (commingled non-U.S. investment pools), 2007-2010; Director, Wellington Trust Company, NA and other Wellington affiliates, 1997-2010 | 172 | None |
| 70 | Columbia Total Return Bond Fund | Annual Report 2023 |
(Unaudited)
Independent trustees (continued)
| Name, address, year of birth | Position held with the Columbia Funds and length of service | Principal occupation(s) during past five years and other relevant professional experience | Number of Funds in the Columbia Funds Complex* overseen | Other directorships held by Trustee during the past five years and other relevant Board experience |
| David M. Moffett c/o Columbia Management Investment Advisers, LLC 290 Congress Street Boston, MA 02210 1952 | Trustee since 2011 | Retired; former Chief Executive Officer of Freddie Mac and Chief Financial Officer of U.S. Bank | 172 | Director, CSX Corporation (transportation suppliers); Director, PayPal Holdings Inc. (payment and data processing services); Trustee, University of Oklahoma Foundation; former Director, eBay Inc. (online trading community), 2007-2015; and former Director, CIT Bank, CIT Group Inc. (commercial and consumer finance), 2010-2016; former Senior Adviser to The Carlyle Group (financial services), March 2008-September 2008; former Governance Consultant to Bridgewater Associates, January 2013-December 2015 |
| Catherine James Paglia c/o Columbia Management Investment Advisers, LLC 290 Congress Street Boston, MA 02210 1952 | Trustee since 2004 | Director, Enterprise Asset Management, Inc. (private real estate and asset management company), since September 1998; Managing Director and Partner, Interlaken Capital, Inc., 1989-1997; Vice President, 1982-1985, Principal, 1985-1987, Managing Director, 1987-1989, Morgan Stanley; Vice President, Investment Banking, 1980-1982, Associate, Investment Banking, 1976-1980, Dean Witter Reynolds, Inc. | 174 | Director, Valmont Industries, Inc. (irrigation systems manufacturer), since 2012; Trustee, Carleton College (on the Investment Committee), since 1987; Trustee, Carnegie Endowment for International Peace (on the Investment Committee), since 2009 |
| Natalie A. Trunow c/o Columbia Management Investment Advisers, LLC 290 Congress Street Boston, MA 02210 1967 | Trustee since 2020 | Chief Executive Officer, Millennial Portfolio Solutions LLC (asset management and consulting services), January 2016-January 2021; Non-executive Member of the Investment Committee and Valuation Committee, Sarona Asset Management Inc. (private equity firm) since September 2019; Advisor, Horizon Investments (asset management and consulting services), August 2018-January 2022; Advisor, Paradigm Asset Management, November 2016-January 2022; Consultant to Independent Trustees of CFVIT and CFST I from September 2016 to June 2020 with respect to CFVIT and to December 2020 with respect to CFST I; Director of Investments/Consultant, Casey Family Programs, April 2016-November 2016; Senior Vice President and Chief Investment Officer, Calvert Investments, August 2008-January 2016; Section Head and Portfolio Manager, General Motors Asset Management, June 1997-August 2008 | 172 | Independent Director, Investment Committee, Health Services for Children with Special Needs, Inc., 2010-2021; Independent Director, (Executive Committee and Chair, Audit Committee), Consumer Credit Counseling Services (formerly Guidewell Financial Solutions), since 2016; Independent Director, (Investment Committee), Sarona Asset Management, since 2019 |
| Columbia Total Return Bond Fund | Annual Report 2023 | 71 |
(Unaudited)
Independent trustees (continued)
| Name, address, year of birth | Position held with the Columbia Funds and length of service | Principal occupation(s) during past five years and other relevant professional experience | Number of Funds in the Columbia Funds Complex* overseen | Other directorships held by Trustee during the past five years and other relevant Board experience |
| Sandra L. Yeager c/o Columbia Management Investment Advisers, LLC 290 Congress Street Boston, MA 02210 1964 | Trustee since 2017 | Retired; President and founder, Hanoverian Capital, LLC (SEC registered investment advisor firm), 2008-2016; Managing Director, DuPont Capital, 2006-2008; Managing Director, Morgan Stanley Investment Management, 2004-2006; Senior Vice President, Alliance Bernstein, 1990-2004 | 174 | Former Director, NAPE (National Alliance for Partnerships in Equity) Education Foundation, October 2016-October 2020; Advisory Board, Jennersville YMCA, since 2022 |
| Name, address, year of birth | Position held with the Columbia Funds and length of service | Principal occupation(s) during the past five years and other relevant professional experience | Number of Funds in the Columbia Funds Complex overseen | Other directorships held by Trustee during the past five years and other relevant Board experience |
| Daniel J. Beckman c/o Columbia Management Investment Advisers, LLC 290 Congress Street Boston, MA 02210 1962 | Trustee since November 2021 and President since June 2021 | Vice President – Head of North America Product, Columbia Management Investment Advisers, LLC, since April 2015; President and Principal Executive Officer of the Columbia Funds, since June 2021; officer of Columbia Funds and affiliated funds, 2020-2021 | 174 | Director, Ameriprise Trust Company, since October 2016; Director, Columbia Management Investment Distributors, Inc. since November 2018; Board of Governors, Columbia Wanger Asset Management, LLC since, January 2022; Director, Columbia Threadneedle Canada, Inc., since December 2022 |
| * | The term “Columbia Funds Complex” as used herein includes Columbia Seligman Premium Technology Growth Fund, Tri-Continental Corporation and each series of Columbia Funds Series Trust (CFST), Columbia Funds Series Trust I (CFST I), Columbia Funds Series Trust II (CFST II), Columbia ETF Trust I (CET I), Columbia ETF Trust II (CET II), Columbia Funds Variable Insurance Trust (CFVIT) and Columbia Funds Variable Series Trust II (CFVST II). Messrs. Batejan, Beckman, Gallagher and Hacker and Mses. Blatz, Carlton, Carrig, Flynn, Paglia, and Yeager serve as directors of Columbia Seligman Premium Technology Growth Fund and Tri-Continental Corporation. |
| ** | Interested person (as defined under the 1940 Act) by reason of being an officer, director, security holder and/or employee of the Investment Manager or Ameriprise Financial. |
| 72 | Columbia Total Return Bond Fund | Annual Report 2023 |
(Unaudited)
The Board has appointed officers who are responsible for day-to-day business decisions based on policies it has established. The officers serve at the pleasure of the Board. The following table provides basic information about the Officers of the Fund as of the printing of this report, including principal occupations during the past five years, although their specific titles may have varied over the period. In addition to Mr. Beckman, who is President and Principal Executive Officer, the Fund’s other officers are:
| Name, address and year of birth | Position and year first appointed to position for any Fund in the Columbia Funds Complex or a predecessor thereof | Principal occupation(s) during past five years |
| Michael G. Clarke 290 Congress Street Boston, MA 02210 1969 | Chief Financial Officer and Principal Financial Officer (2009) and Senior Vice President (2019) | Senior Vice President and Head of North America Operations & Investor Services, Columbia Management Investment Advisers, LLC, since June 2023 (previously Senior Vice President and Head of Global Operations, March 2022 – June 2023, Vice President, Head of North America Operations, and Co-Head of Global Operations, June 2019 - February 2022 and Vice President – Accounting and Tax, May 2010 - May 2019); senior officer of Columbia Funds and affiliated funds, since 2002. |
| Joseph Beranek 5890 Ameriprise Financial Center Minneapolis, MN 55474 1965 | Treasurer and Chief Accounting Officer (Principal Accounting Officer) (2019) and Principal Financial Officer (2020), CFST, CFST I, CFST II, CFVIT and CFVST II; Assistant Treasurer, CET I and CET II | Vice President – Mutual Fund Accounting and Financial Reporting, Columbia Management Investment Advisers, LLC, since December 2018 and March 2017, respectively. |
| Marybeth Pilat 290 Congress Street Boston, MA 02210 1968 | Treasurer and Chief Accounting Officer (Principal Accounting Officer) and Principal Financial Officer (2020) for CET I and CET II; Assistant Treasurer, CFST, CFST I, CFST II, CFVIT and CFVST II | Vice President – Product Pricing and Administration, Columbia Management Investment Advisers, LLC, since May 2017. |
| William F. Truscott 290 Congress Street Boston, MA 02210 1960 | Senior Vice President (2001) | Formerly, Trustee/Director of Columbia Funds Complex or legacy funds, November 2001-January 1, 2021; Chief Executive Officer, Global Asset Management, Ameriprise Financial, Inc., since September 2012; Chairman of the Board and President, Columbia Management Investment Advisers, LLC, since July 2004 and February 2012, respectively; Chairman of the Board and Chief Executive Officer, Columbia Management Investment Distributors, Inc., since November 2008 and February 2012, respectively; Chairman of the Board and Director, Threadneedle Asset Management Holdings, Sàrl, since March 2013 and December 2008, respectively; senior executive of various entities affiliated with Columbia Threadneedle. |
| Christopher O. Petersen 5228 Ameriprise Financial Center Minneapolis, MN 55474 1970 | Senior Vice President and Assistant Secretary (2021) | Formerly, Trustee/Director of funds within the Columbia Funds Complex, July 1, 2020 - November 22, 2021; Senior Vice President and Assistant General Counsel, Ameriprise Financial, Inc., since September 2021 (previously Vice President and Lead Chief Counsel, January 2015 - September 2021); formerly, President and Principal Executive Officer of the Columbia Funds, 2015 - 2021; officer of Columbia Funds and affiliated funds, since 2007. |
| Thomas P. McGuire 290 Congress Street Boston, MA 02210 1972 | Senior Vice President and Chief Compliance Officer (2012) | Vice President – Asset Management Compliance, Ameriprise Financial, Inc., since May 2010; Chief Compliance Officer, Columbia Acorn/Wanger Funds, since December 2015; formerly, Chief Compliance Officer, Ameriprise Certificate Company, September 2010 – September 2020. |
| Ryan C. Larrenaga 290 Congress Street Boston, MA 02210 1970 | Senior Vice President (2017), Chief Legal Officer (2017), and Secretary (2015) | Vice President and Chief Counsel, Ameriprise Financial, Inc., since August 2018 (previously Vice President and Group Counsel, August 2011 - August 2018); Chief Legal Officer, Columbia Acorn/Wanger Funds, since September 2020; officer of Columbia Funds and affiliated funds, since 2005. |
| Columbia Total Return Bond Fund | Annual Report 2023 | 73 |
(Unaudited)
Fund officers (continued)
| Name, address and year of birth | Position and year first appointed to position for any Fund in the Columbia Funds Complex or a predecessor thereof | Principal occupation(s) during past five years |
| Michael E. DeFao 290 Congress Street Boston, MA 02210 1968 | Vice President (2011) and Assistant Secretary (2010) | Vice President and Chief Counsel, Ameriprise Financial, Inc., since May 2010; Vice President, Chief Legal Officer and Assistant Secretary, Columbia Management Investment Advisers, LLC, since October 2021 (previously Vice President and Assistant Secretary, May 2010 – September 2021). |
| Lyn Kephart-Strong 5228 Ameriprise Financial Center Minneapolis, MN 55474 1960 | Vice President (2015) | Vice President, Global Investment Operations Services, Columbia Management Investment Advisers, LLC, since 2010; President, Columbia Management Investment Services Corp., since October 2014; President, Ameriprise Trust Company, since January 2017. |
| • | the Fund had sufficient liquidity to both meet redemptions and operate effectively on behalf of shareholders; |
| • | there were no material changes to the Program during the period; |
| • | the implementation of the Program was effective to manage the Fund’s liquidity risk; and |
| • | the Program operated adequately during the period. |
| 74 | Columbia Total Return Bond Fund | Annual Report 2023 |
columbiathreadneedleus.com/investor/. The Fund is distributed by Columbia Management Investment Distributors, Inc., member FINRA, and managed by Columbia Management Investment Advisers, LLC.

April 30, 2023

| 3 | |
| 5 | |
| 7 | |
| 8 | |
| 23 | |
| 25 | |
| 26 | |
| 28 | |
| 32 | |
| 46 | |
| 47 | |
| 47 | |
| 53 |
(Unaudited)
| Average annual total returns (%) (for the period ended April 30, 2023) | |||||
| Inception | 1 Year | 5 Years | 10 Years | ||
| Class A | Excluding sales charges | 07/31/00 | 1.51 | 2.18 | 2.04 |
| Including sales charges | -3.31 | 1.20 | 1.54 | ||
| Advisor Class | 11/08/12 | 1.65 | 2.41 | 2.29 | |
| Class C | Excluding sales charges | 07/15/02 | 0.95 | 1.60 | 1.44 |
| Including sales charges | -0.03 | 1.60 | 1.44 | ||
| Institutional Class | 03/05/86 | 1.76 | 2.44 | 2.29 | |
| Institutional 2 Class | 11/08/12 | 1.86 | 2.54 | 2.41 | |
| Institutional 3 Class | 11/08/12 | 1.80 | 2.57 | 2.45 | |
| Blended Benchmark | 0.78 | 2.16 | 2.49 | ||
| Bloomberg U.S. Corporate Bond Index | 0.68 | 1.97 | 2.21 | ||
| Columbia Corporate Income Fund | Annual Report 2023 | 3 |
(Unaudited)
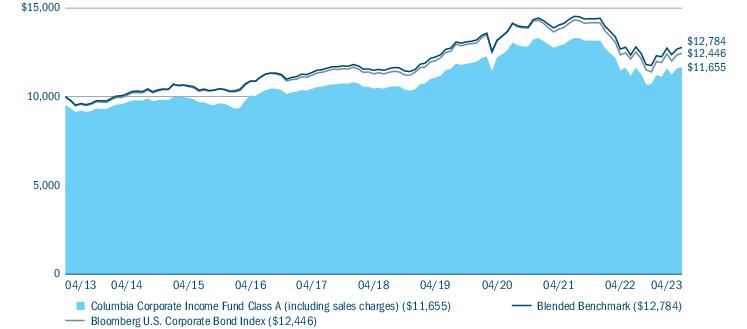
| Portfolio breakdown (%) (at April 30, 2023) | |
| Common Stocks | 0.0(a) |
| Convertible Bonds | 0.0(a) |
| Corporate Bonds & Notes | 90.5 |
| Foreign Government Obligations | 0.0(a) |
| Money Market Funds | 5.7 |
| Senior Loans | 0.2 |
| U.S. Treasury Obligations | 3.6 |
| Total | 100.0 |
| (a) | Rounds to zero. |
| Quality breakdown (%) (at April 30, 2023) | |
| AAA rating | 4.6 |
| AA rating | 6.0 |
| A rating | 26.1 |
| BBB rating | 48.5 |
| BB rating | 6.9 |
| B rating | 6.3 |
| CCC rating | 1.5 |
| Not rated | 0.1 |
| Total | 100.0 |
| 4 | Columbia Corporate Income Fund | Annual Report 2023 |
(Unaudited)
| • | Positive contributions to the Fund’s performance relative to the benchmark over the 12-month period were highlighted by individual bond selection within the industrials and utilities sectors. |
| • | In terms of individual names, an overweight to Netflix Inc. was the top contributor to performance over the period. |
| • | The Fund’s credit risk profile within both investment-grade and high-yield corporate bonds was higher than that of the benchmark, which contributed to performance as credit spreads narrowed over the latter part of the period. |
| • | The Fund’s allocation across industries contributed to relative performance as well. In particular, overweight exposure to the aerospace & defense and food & beverage segments was additive, along with underweights in both office and retail real estate investment trusts (REITs). |
| • | The Fund’s stance with respect to duration (and corresponding interest rate sensitivity) and positioning along the yield curve also proved beneficial. Duration and yield curve positioning are generally not a meaningful source of relative performance for the Fund as the management team seeks to maintain portfolio duration within a fairly narrow band around that of the benchmark. |
| • | While detractors from the Fund’s performance were limited, an overweight allocation to the life insurance industry weighed on return relative to the benchmark. |
| Columbia Corporate Income Fund | Annual Report 2023 | 5 |
(Unaudited)
| 6 | Columbia Corporate Income Fund | Annual Report 2023 |
(Unaudited)
| November 1, 2022 — April 30, 2023 | |||||||
| Account value at the beginning of the period ($) | Account value at the end of the period ($) | Expenses paid during the period ($) | Fund’s annualized expense ratio (%) | ||||
| Actual | Hypothetical | Actual | Hypothetical | Actual | Hypothetical | Actual | |
| Class A | 1,000.00 | 1,000.00 | 1,089.10 | 1,020.25 | 4.46 | 4.31 | 0.87 |
| Advisor Class | 1,000.00 | 1,000.00 | 1,090.60 | 1,021.48 | 3.18 | 3.07 | 0.62 |
| Class C | 1,000.00 | 1,000.00 | 1,087.40 | 1,017.56 | 7.27 | 7.02 | 1.42 |
| Institutional Class | 1,000.00 | 1,000.00 | 1,090.40 | 1,021.48 | 3.18 | 3.07 | 0.62 |
| Institutional 2 Class | 1,000.00 | 1,000.00 | 1,091.00 | 1,021.97 | 2.67 | 2.58 | 0.52 |
| Institutional 3 Class | 1,000.00 | 1,000.00 | 1,091.30 | 1,022.22 | 2.41 | 2.33 | 0.47 |
| Columbia Corporate Income Fund | Annual Report 2023 | 7 |
April 30, 2023
| Common Stocks 0.0% | ||
| Issuer | Shares | Value ($) |
| Financials 0.0% | ||
| Financial Services 0.0% | ||
| Mr. Cooper Group, Inc.(a) | 1,782 | 82,507 |
| Total Financials | 82,507 | |
| Total Common Stocks (Cost $1,077,470) | 82,507 | |
| Convertible Bonds 0.0% | ||||
| Issuer | Coupon Rate | Principal Amount ($) | Value ($) | |
| Cable and Satellite 0.0% | ||||
| DISH Network Corp. | ||||
| Subordinated | ||||
| 08/15/2026 | 3.375% | 471,000 | 221,841 | |
| Total Convertible Bonds (Cost $451,248) | 221,841 | |||
| Corporate Bonds & Notes 91.9% | ||||
| Aerospace & Defense 4.4% | ||||
| BAE Systems Holdings, Inc.(b) | ||||
| 10/07/2024 | 3.800% | 3,635,000 | 3,565,640 | |
| BAE Systems PLC(b) | ||||
| 02/15/2031 | 1.900% | 29,890,000 | 24,412,499 | |
| Boeing Co. (The) | ||||
| 05/01/2034 | 3.600% | 7,309,000 | 6,282,730 | |
| 08/01/2059 | 3.950% | 13,826,000 | 10,147,047 | |
| 05/01/2060 | 5.930% | 3,065,000 | 3,029,594 | |
| Bombardier, Inc.(b) | ||||
| 04/15/2027 | 7.875% | 200,000 | 199,506 | |
| Howmet Aerospace, Inc. | ||||
| 01/15/2029 | 3.000% | 9,685,000 | 8,718,171 | |
| Moog, Inc.(b) | ||||
| 12/15/2027 | 4.250% | 139,000 | 130,711 | |
| Northrop Grumman Corp. | ||||
| 03/15/2053 | 4.950% | 4,720,000 | 4,665,008 | |
| Raytheon Technologies Corp. | ||||
| 03/15/2032 | 2.375% | 4,340,000 | 3,662,626 | |
| Spirit AeroSystems, Inc.(b) | ||||
| 11/30/2029 | 9.375% | 225,000 | 241,932 | |
| TransDigm, Inc.(b) | ||||
| 03/15/2026 | 6.250% | 5,391,000 | 5,416,845 | |
| 08/15/2028 | 6.750% | 567,000 | 575,629 | |
| Corporate Bonds & Notes (continued) | ||||
| Issuer | Coupon Rate | Principal Amount ($) | Value ($) | |
| TransDigm, Inc. | ||||
| 06/15/2026 | 6.375% | 622,000 | 621,604 | |
| 05/01/2029 | 4.875% | 664,000 | 603,243 | |
| Total | 72,272,785 | |||
| Airlines 0.3% | ||||
| Air Canada(b) | ||||
| 08/15/2026 | 3.875% | 520,000 | 481,279 | |
| American Airlines, Inc.(b) | ||||
| 07/15/2025 | 11.750% | 400,000 | 440,548 | |
| American Airlines, Inc./AAdvantage Loyalty IP Ltd.(b) | ||||
| 04/20/2026 | 5.500% | 2,322,207 | 2,281,291 | |
| 04/20/2029 | 5.750% | 179,155 | 170,398 | |
| Delta Air Lines, Inc. | ||||
| 04/19/2028 | 4.375% | 135,000 | 127,280 | |
| Hawaiian Brand Intellectual Property Ltd./Miles Loyalty Ltd.(b) | ||||
| 01/20/2026 | 5.750% | 482,739 | 449,591 | |
| United Airlines, Inc.(b) | ||||
| 04/15/2026 | 4.375% | 219,000 | 209,130 | |
| 04/15/2029 | 4.625% | 245,000 | 221,725 | |
| United Airlines, Inc. Pass-Through Trust | ||||
| 10/15/2027 | 5.875% | 1,185,828 | 1,182,380 | |
| Total | 5,563,622 | |||
| Automotive 0.9% | ||||
| American Axle & Manufacturing, Inc. | ||||
| 03/15/2026 | 6.250% | 197,000 | 189,189 | |
| Clarios Global LP(b) | ||||
| 05/15/2025 | 6.750% | 80,000 | 80,096 | |
| Ford Motor Co. | ||||
| 02/12/2032 | 3.250% | 2,908,000 | 2,248,452 | |
| 12/08/2046 | 5.291% | 2,000,000 | 1,613,804 | |
| Ford Motor Credit Co. LLC | ||||
| 09/08/2024 | 3.664% | 1,168,000 | 1,129,092 | |
| 06/16/2025 | 5.125% | 256,000 | 249,234 | |
| 08/04/2025 | 4.134% | 1,500,000 | 1,423,147 | |
| 11/13/2025 | 3.375% | 1,251,000 | 1,161,930 | |
| 08/17/2027 | 4.125% | 554,000 | 507,999 | |
| 02/10/2029 | 2.900% | 1,642,000 | 1,359,418 | |
| 11/13/2030 | 4.000% | 214,000 | 183,441 | |
| General Motors Co. | ||||
| 04/01/2048 | 5.400% | 2,835,000 | 2,432,211 | |
| Goodyear Tire & Rubber Co. (The) | ||||
| 07/15/2029 | 5.000% | 223,000 | 197,456 | |
| KAR Auction Services, Inc.(b) | ||||
| 06/01/2025 | 5.125% | 204,000 | 202,995 | |
| 8 | Columbia Corporate Income Fund | Annual Report 2023 |
April 30, 2023
| Corporate Bonds & Notes (continued) | ||||
| Issuer | Coupon Rate | Principal Amount ($) | Value ($) | |
| Panther BF Aggregator 2 LP/Finance Co., Inc.(b) | ||||
| 05/15/2026 | 6.250% | 60,000 | 59,658 | |
| 05/15/2027 | 8.500% | 703,000 | 708,028 | |
| ZF North America Capital, Inc.(b) | ||||
| 04/14/2030 | 7.125% | 314,000 | 324,257 | |
| Total | 14,070,407 | |||
| Banking 15.5% | ||||
| Ally Financial, Inc. | ||||
| 05/21/2024 | 3.875% | 171,000 | 166,489 | |
| Subordinated | ||||
| 11/20/2025 | 5.750% | 300,000 | 291,034 | |
| Bank of America Corp.(c) | ||||
| 10/22/2030 | 2.884% | 9,530,000 | 8,292,491 | |
| 07/23/2031 | 1.898% | 19,015,000 | 15,278,199 | |
| 10/24/2031 | 1.922% | 34,690,000 | 27,695,402 | |
| 10/20/2032 | 2.572% | 6,270,000 | 5,149,871 | |
| 02/04/2033 | 2.972% | 11,010,000 | 9,300,078 | |
| Subordinated | ||||
| 09/21/2036 | 2.482% | 9,289,000 | 7,099,630 | |
| Citigroup, Inc.(c) | ||||
| 06/03/2031 | 2.572% | 12,483,000 | 10,559,148 | |
| 01/25/2033 | 3.057% | 19,390,000 | 16,526,343 | |
| Goldman Sachs Group, Inc. (The)(c) | ||||
| 07/21/2032 | 2.383% | 7,385,000 | 6,031,975 | |
| 10/21/2032 | 2.650% | 22,412,000 | 18,626,725 | |
| HSBC Holdings PLC(c) | ||||
| 05/24/2032 | 2.804% | 3,705,000 | 3,032,075 | |
| 11/22/2032 | 2.871% | 16,329,000 | 13,353,200 | |
| 03/09/2034 | 6.254% | 5,638,000 | 5,881,030 | |
| JPMorgan Chase & Co.(c) | ||||
| 10/15/2030 | 2.739% | 18,187,000 | 15,944,861 | |
| 11/19/2031 | 1.764% | 3,635,000 | 2,908,376 | |
| 04/22/2032 | 2.580% | 16,805,000 | 14,123,625 | |
| 11/08/2032 | 2.545% | 20,138,000 | 16,766,077 | |
| Morgan Stanley(c) | ||||
| 07/21/2032 | 2.239% | 13,464,000 | 10,878,913 | |
| 10/20/2032 | 2.511% | 5,837,000 | 4,800,865 | |
| Subordinated | ||||
| 09/16/2036 | 2.484% | 6,269,000 | 4,812,225 | |
| Washington Mutual Bank(d),(e),(f) | ||||
| Subordinated | ||||
| 01/15/2015 | 0.000% | 6,350,000 | 9,525 | |
| Wells Fargo & Co.(c) | ||||
| 10/30/2030 | 2.879% | 13,846,000 | 12,114,273 | |
| 02/11/2031 | 2.572% | 18,759,000 | 16,036,103 | |
| 04/25/2053 | 4.611% | 7,690,000 | 6,890,914 | |
| Total | 252,569,447 | |||
| Corporate Bonds & Notes (continued) | ||||
| Issuer | Coupon Rate | Principal Amount ($) | Value ($) | |
| Brokerage/Asset Managers/Exchanges 0.3% | ||||
| AG Issuer LLC(b) | ||||
| 03/01/2028 | 6.250% | 350,000 | 326,131 | |
| AG TTMT Escrow Issuer LLC(b) | ||||
| 09/30/2027 | 8.625% | 448,000 | 459,976 | |
| Hightower Holding LLC(b) | ||||
| 04/15/2029 | 6.750% | 455,000 | 394,609 | |
| NFP Corp(b) | ||||
| 10/01/2030 | 7.500% | 2,497,000 | 2,454,064 | |
| NFP Corp.(b) | ||||
| 08/15/2028 | 4.875% | 492,000 | 448,169 | |
| 08/15/2028 | 6.875% | 1,340,000 | 1,169,747 | |
| Total | 5,252,696 | |||
| Building Materials 0.2% | ||||
| American Builders & Contractors Supply Co., Inc.(b) | ||||
| 01/15/2028 | 4.000% | 455,000 | 417,201 | |
| Beacon Roofing Supply, Inc.(b) | ||||
| 11/15/2026 | 4.500% | 550,000 | 522,950 | |
| Interface, Inc.(b) | ||||
| 12/01/2028 | 5.500% | 210,000 | 168,361 | |
| James Hardie International Finance DAC(b) | ||||
| 01/15/2028 | 5.000% | 572,000 | 541,849 | |
| SRS Distribution, Inc.(b) | ||||
| 07/01/2028 | 4.625% | 551,000 | 486,494 | |
| 07/01/2029 | 6.125% | 439,000 | 363,088 | |
| 12/01/2029 | 6.000% | 488,000 | 397,380 | |
| White Cap Buyer LLC(b) | ||||
| 10/15/2028 | 6.875% | 567,000 | 495,846 | |
| Total | 3,393,169 | |||
| Cable and Satellite 2.5% | ||||
| CCO Holdings LLC/Capital Corp.(b) | ||||
| 05/01/2027 | 5.125% | 324,000 | 306,387 | |
| 03/01/2030 | 4.750% | 1,263,000 | 1,087,206 | |
| 02/01/2031 | 4.250% | 1,353,000 | 1,113,365 | |
| 02/01/2032 | 4.750% | 531,000 | 439,437 | |
| CCO Holdings LLC/Capital Corp. | ||||
| 05/01/2032 | 4.500% | 381,000 | 305,594 | |
| Charter Communications Operating LLC/Capital | ||||
| 05/01/2047 | 5.375% | 19,808,000 | 16,164,938 | |
| 12/01/2061 | 4.400% | 2,768,000 | 1,854,252 | |
| 06/30/2062 | 3.950% | 2,456,000 | 1,515,425 | |
| 04/01/2063 | 5.500% | 843,000 | 671,848 | |
| Comcast Corp. | ||||
| 11/01/2056 | 2.937% | 4,717,000 | 3,129,875 | |
| Columbia Corporate Income Fund | Annual Report 2023 | 9 |
April 30, 2023
| Corporate Bonds & Notes (continued) | ||||
| Issuer | Coupon Rate | Principal Amount ($) | Value ($) | |
| CSC Holdings LLC(b) | ||||
| 01/15/2030 | 5.750% | 664,000 | 338,672 | |
| 12/01/2030 | 4.125% | 1,316,000 | 945,473 | |
| 02/15/2031 | 3.375% | 504,000 | 346,962 | |
| DIRECTV Holdings LLC/Financing Co., Inc.(b) | ||||
| 08/15/2027 | 5.875% | 298,000 | 261,523 | |
| DISH DBS Corp. | ||||
| 07/01/2026 | 7.750% | 1,153,000 | 665,713 | |
| 06/01/2029 | 5.125% | 833,000 | 385,100 | |
| DISH Network Corp.(b) | ||||
| 11/15/2027 | 11.750% | 996,000 | 941,835 | |
| NBCUniversal Media LLC | ||||
| 01/15/2043 | 4.450% | 1,810,000 | 1,659,602 | |
| Radiate Holdco LLC/Finance, Inc.(b) | ||||
| 09/15/2026 | 4.500% | 346,000 | 270,799 | |
| 09/15/2028 | 6.500% | 1,027,000 | 478,619 | |
| Sirius XM Radio, Inc.(b) | ||||
| 09/01/2026 | 3.125% | 1,933,000 | 1,730,110 | |
| 07/15/2028 | 4.000% | 1,000,000 | 845,158 | |
| 07/01/2030 | 4.125% | 461,000 | 369,627 | |
| Videotron Ltd.(b) | ||||
| 06/15/2029 | 3.625% | 255,000 | 222,110 | |
| Virgin Media Finance PLC(b) | ||||
| 07/15/2030 | 5.000% | 1,806,000 | 1,519,867 | |
| Virgin Media Secured Finance PLC(b) | ||||
| 05/15/2029 | 5.500% | 168,000 | 154,488 | |
| VZ Secured Financing BV(b) | ||||
| 01/15/2032 | 5.000% | 990,000 | 826,370 | |
| Ziggo Bond Co. BV(b) | ||||
| 02/28/2030 | 5.125% | 509,000 | 413,430 | |
| Ziggo Bond Finance BV(b) | ||||
| 01/15/2027 | 6.000% | 501,000 | 475,307 | |
| Ziggo BV(b) | ||||
| 01/15/2030 | 4.875% | 1,000,000 | 860,411 | |
| Total | 40,299,503 | |||
| Chemicals 0.6% | ||||
| Avient Corp.(b) | ||||
| 08/01/2030 | 7.125% | 428,000 | 437,730 | |
| Axalta Coating Systems LLC(b) | ||||
| 02/15/2029 | 3.375% | 650,000 | 565,376 | |
| Axalta Coating Systems LLC/Dutch Holding B BV(b) | ||||
| 06/15/2027 | 4.750% | 265,000 | 256,149 | |
| Cheever Escrow Issuer LLC(b) | ||||
| 10/01/2027 | 7.125% | 554,000 | 528,299 | |
| Element Solutions, Inc.(b) | ||||
| 09/01/2028 | 3.875% | 533,000 | 470,962 | |
| Corporate Bonds & Notes (continued) | ||||
| Issuer | Coupon Rate | Principal Amount ($) | Value ($) | |
| HB Fuller Co. | ||||
| 10/15/2028 | 4.250% | 818,000 | 750,809 | |
| Herens Holdco Sarl(b) | ||||
| 05/15/2028 | 4.750% | 714,000 | 592,116 | |
| Illuminate Buyer LLC/Holdings IV, Inc.(b) | ||||
| 07/01/2028 | 9.000% | 355,000 | 315,519 | |
| Innophos Holdings, Inc.(b) | ||||
| 02/15/2028 | 9.375% | 401,000 | 406,144 | |
| Iris Holdings, Inc.(b),(g) | ||||
| 02/15/2026 | 8.750% | 245,000 | 226,114 | |
| Olympus Water US Holding Corp.(b) | ||||
| 10/01/2028 | 4.250% | 432,000 | 367,678 | |
| 10/01/2029 | 6.250% | 393,000 | 315,964 | |
| SPCM SA(b) | ||||
| 03/15/2027 | 3.125% | 46,000 | 41,327 | |
| Unifrax Escrow Issuer Corp.(b) | ||||
| 09/30/2028 | 5.250% | 219,000 | 180,470 | |
| 09/30/2029 | 7.500% | 123,000 | 88,975 | |
| WR Grace Holdings LLC(b) | ||||
| 06/15/2027 | 4.875% | 4,348,000 | 4,136,106 | |
| 08/15/2029 | 5.625% | 675,000 | 582,492 | |
| 03/01/2031 | 7.375% | 149,000 | 149,348 | |
| Total | 10,411,578 | |||
| Construction Machinery 2.0% | ||||
| Caterpillar Financial Services Corp. | ||||
| 01/06/2026 | 4.800% | 15,400,000 | 15,642,362 | |
| H&E Equipment Services, Inc.(b) | ||||
| 12/15/2028 | 3.875% | 895,000 | 773,224 | |
| John Deere Capital Corp. | ||||
| 01/09/2026 | 4.800% | 15,400,000 | 15,636,649 | |
| Ritchie Bros Holdings, Inc.(b) | ||||
| 03/15/2028 | 6.750% | 125,000 | 129,346 | |
| 03/15/2031 | 7.750% | 292,000 | 310,245 | |
| United Rentals North America, Inc. | ||||
| 05/15/2027 | 5.500% | 49,000 | 48,683 | |
| 02/15/2031 | 3.875% | 181,000 | 159,157 | |
| 01/15/2032 | 3.750% | 211,000 | 181,017 | |
| Total | 32,880,683 | |||
| Consumer Cyclical Services 0.3% | ||||
| APX Group, Inc.(b) | ||||
| 07/15/2029 | 5.750% | 68,000 | 60,790 | |
| Arches Buyer, Inc.(b) | ||||
| 06/01/2028 | 4.250% | 600,000 | 516,204 | |
| 12/01/2028 | 6.125% | 612,000 | 530,642 | |
| Match Group Holdings II LLC(b) | ||||
| 10/01/2031 | 3.625% | 590,000 | 481,562 | |
| 10 | Columbia Corporate Income Fund | Annual Report 2023 |
April 30, 2023
| Corporate Bonds & Notes (continued) | ||||
| Issuer | Coupon Rate | Principal Amount ($) | Value ($) | |
| Match Group, Inc.(b) | ||||
| 06/01/2028 | 4.625% | 174,000 | 160,514 | |
| Staples, Inc.(b) | ||||
| 04/15/2026 | 7.500% | 338,000 | 285,523 | |
| Uber Technologies, Inc.(b) | ||||
| 05/15/2025 | 7.500% | 778,000 | 789,711 | |
| 01/15/2028 | 6.250% | 257,000 | 259,341 | |
| 08/15/2029 | 4.500% | 1,635,000 | 1,507,059 | |
| Total | 4,591,346 | |||
| Consumer Products 0.2% | ||||
| CD&R Smokey Buyer, Inc.(b) | ||||
| 07/15/2025 | 6.750% | 962,000 | 846,642 | |
| Mattel, Inc.(b) | ||||
| 04/01/2026 | 3.375% | 171,000 | 161,714 | |
| 04/01/2029 | 3.750% | 532,000 | 480,387 | |
| Mattel, Inc. | ||||
| 11/01/2041 | 5.450% | 54,000 | 48,027 | |
| Newell Brands, Inc. | ||||
| 06/01/2025 | 4.875% | 92,000 | 89,608 | |
| 09/15/2027 | 6.375% | 169,000 | 166,254 | |
| 09/15/2029 | 6.625% | 240,000 | 237,229 | |
| Prestige Brands, Inc.(b) | ||||
| 01/15/2028 | 5.125% | 509,000 | 493,712 | |
| 04/01/2031 | 3.750% | 237,000 | 200,725 | |
| Spectrum Brands, Inc. | ||||
| 07/15/2025 | 5.750% | 209,000 | 207,613 | |
| Spectrum Brands, Inc.(b) | ||||
| 10/01/2029 | 5.000% | 492,000 | 447,165 | |
| 07/15/2030 | 5.500% | 36,000 | 33,180 | |
| Tempur Sealy International, Inc.(b) | ||||
| 10/15/2031 | 3.875% | 303,000 | 250,942 | |
| Total | 3,663,198 | |||
| Diversified Manufacturing 1.7% | ||||
| BWX Technologies, Inc.(b) | ||||
| 06/30/2028 | 4.125% | 231,000 | 214,131 | |
| Carrier Global Corp. | ||||
| 02/15/2030 | 2.722% | 27,543,000 | 24,113,187 | |
| Chart Industries, Inc.(b) | ||||
| 01/01/2030 | 7.500% | 282,000 | 290,867 | |
| 01/01/2031 | 9.500% | 97,000 | 102,637 | |
| Gates Global LLC/Co.(b) | ||||
| 01/15/2026 | 6.250% | 807,000 | 799,854 | |
| Madison IAQ LLC(b) | ||||
| 06/30/2028 | 4.125% | 600,000 | 528,073 | |
| 06/30/2029 | 5.875% | 538,000 | 421,239 | |
| Resideo Funding, Inc.(b) | ||||
| 09/01/2029 | 4.000% | 422,000 | 360,333 | |
| Corporate Bonds & Notes (continued) | ||||
| Issuer | Coupon Rate | Principal Amount ($) | Value ($) | |
| Vertical US Newco, Inc.(b) | ||||
| 07/15/2027 | 5.250% | 526,000 | 491,638 | |
| WESCO Distribution, Inc.(b) | ||||
| 06/15/2025 | 7.125% | 302,000 | 307,052 | |
| 06/15/2028 | 7.250% | 603,000 | 619,735 | |
| Total | 28,248,746 | |||
| Electric 11.5% | ||||
| AEP Texas, Inc. | ||||
| 01/15/2050 | 3.450% | 14,242,000 | 10,588,997 | |
| AES Corp. (The) | ||||
| 01/15/2031 | 2.450% | 6,605,000 | 5,420,766 | |
| American Electric Power Co., Inc. | ||||
| 11/01/2032 | 5.950% | 3,021,000 | 3,228,547 | |
| American Transmission Systems, Inc.(b) | ||||
| 01/15/2032 | 2.650% | 6,334,000 | 5,357,827 | |
| CenterPoint Energy, Inc. | ||||
| 09/01/2024 | 2.500% | 3,517,000 | 3,384,069 | |
| Clearway Energy Operating LLC(b) | ||||
| 03/15/2028 | 4.750% | 1,709,000 | 1,624,784 | |
| 02/15/2031 | 3.750% | 1,052,000 | 899,721 | |
| 01/15/2032 | 3.750% | 215,000 | 180,461 | |
| CMS Energy Corp. | ||||
| 11/15/2025 | 3.600% | 8,564,000 | 8,262,854 | |
| Dominion Energy, Inc. | ||||
| 08/15/2052 | 4.850% | 3,710,000 | 3,384,858 | |
| DTE Energy Co. | ||||
| 11/01/2024 | 4.220% | 11,569,000 | 11,430,299 | |
| 06/15/2029 | 3.400% | 8,476,000 | 7,827,735 | |
| Duke Energy Corp. | ||||
| 06/15/2031 | 2.550% | 11,525,000 | 9,709,785 | |
| 08/15/2052 | 5.000% | 1,652,000 | 1,552,259 | |
| Duke Energy Ohio, Inc. | ||||
| 04/01/2053 | 5.650% | 2,314,000 | 2,451,288 | |
| Emera US Finance LP | ||||
| 06/15/2046 | 4.750% | 7,153,000 | 5,943,014 | |
| Eversource Energy | ||||
| 10/01/2024 | 2.900% | 5,000,000 | 4,844,508 | |
| 08/15/2030 | 1.650% | 26,512,000 | 21,588,888 | |
| Exelon Corp. | ||||
| 03/15/2032 | 3.350% | 10,315,000 | 9,282,722 | |
| 03/15/2053 | 5.600% | 10,375,000 | 10,682,011 | |
| FirstEnergy Corp. | ||||
| 03/01/2050 | 3.400% | 2,000,000 | 1,399,061 | |
| Georgia Power Co. | ||||
| 03/15/2042 | 4.300% | 5,099,000 | 4,518,495 | |
| Jersey Central Power & Light Co.(b) | ||||
| 03/01/2032 | 2.750% | 1,783,000 | 1,509,562 | |
| Columbia Corporate Income Fund | Annual Report 2023 | 11 |
April 30, 2023
| Corporate Bonds & Notes (continued) | ||||
| Issuer | Coupon Rate | Principal Amount ($) | Value ($) | |
| Leeward Renewable Energy Operations LLC(b) | ||||
| 07/01/2029 | 4.250% | 130,000 | 117,538 | |
| NextEra Energy Operating Partners LP(b) | ||||
| 09/15/2027 | 4.500% | 425,000 | 400,157 | |
| NRG Energy, Inc. | ||||
| 01/15/2028 | 5.750% | 7,000 | 6,829 | |
| NRG Energy, Inc.(b) | ||||
| 06/15/2029 | 5.250% | 2,298,000 | 2,121,880 | |
| Pacific Gas and Electric Co. | ||||
| 07/01/2050 | 4.950% | 19,020,000 | 15,497,888 | |
| 04/01/2053 | 6.700% | 1,257,000 | 1,283,243 | |
| PG&E Corp. | ||||
| 07/01/2030 | 5.250% | 398,000 | 366,937 | |
| Southern California Edison Co. | ||||
| 04/01/2047 | 4.000% | 1,665,000 | 1,376,703 | |
| Vistra Operations Co. LLC(b) | ||||
| 09/01/2026 | 5.500% | 159,000 | 156,067 | |
| 02/15/2027 | 5.625% | 408,000 | 397,859 | |
| 07/31/2027 | 5.000% | 252,000 | 239,526 | |
| 05/01/2029 | 4.375% | 310,000 | 277,418 | |
| WEC Energy Group, Inc. | ||||
| 10/01/2027 | 5.150% | 7,652,000 | 7,818,966 | |
| 10/15/2027 | 1.375% | 7,695,000 | 6,715,180 | |
| 01/15/2028 | 4.750% | 11,138,000 | 11,198,654 | |
| Xcel Energy, Inc. | ||||
| 11/15/2031 | 2.350% | 5,588,000 | 4,613,754 | |
| Total | 187,661,110 | |||
| Environmental 0.6% | ||||
| Clean Harbors, Inc.(b) | ||||
| 02/01/2031 | 6.375% | 90,000 | 91,880 | |
| GFL Environmental, Inc.(b) | ||||
| 06/01/2025 | 4.250% | 95,000 | 92,421 | |
| 08/01/2025 | 3.750% | 7,660,000 | 7,411,956 | |
| 12/15/2026 | 5.125% | 364,000 | 358,525 | |
| 08/01/2028 | 4.000% | 320,000 | 292,312 | |
| 06/15/2029 | 4.750% | 509,000 | 473,682 | |
| Waste Pro USA, Inc.(b) | ||||
| 02/15/2026 | 5.500% | 941,000 | 875,179 | |
| Total | 9,595,955 | |||
| Finance Companies 0.3% | ||||
| Navient Corp. | ||||
| 10/25/2024 | 5.875% | 111,000 | 109,227 | |
| 06/15/2026 | 6.750% | 475,000 | 462,764 | |
| OneMain Finance Corp. | ||||
| 09/15/2030 | 4.000% | 303,000 | 229,379 | |
| Provident Funding Associates LP/Finance Corp.(b) | ||||
| 06/15/2025 | 6.375% | 325,000 | 286,466 | |
| Corporate Bonds & Notes (continued) | ||||
| Issuer | Coupon Rate | Principal Amount ($) | Value ($) | |
| Quicken Loans LLC/Co-Issuer, Inc.(b) | ||||
| 03/01/2029 | 3.625% | 321,000 | 271,283 | |
| Rocket Mortgage LLC/Co-Issuer, Inc.(b) | ||||
| 10/15/2033 | 4.000% | 3,812,000 | 2,983,060 | |
| Springleaf Finance Corp. | ||||
| 03/15/2024 | 6.125% | 585,000 | 575,587 | |
| Total | 4,917,766 | |||
| Food and Beverage 5.1% | ||||
| Bacardi Ltd.(b) | ||||
| 05/15/2038 | 5.150% | 3,790,000 | 3,678,130 | |
| 05/15/2048 | 5.300% | 10,923,000 | 10,221,227 | |
| Constellation Brands, Inc.(h) | ||||
| 05/01/2033 | 4.900% | 22,300,000 | 22,379,588 | |
| Darling Ingredients, Inc.(b) | ||||
| 06/15/2030 | 6.000% | 552,000 | 546,256 | |
| FAGE International SA/USA Dairy Industry, Inc.(b) | ||||
| 08/15/2026 | 5.625% | 2,056,000 | 1,915,319 | |
| Lamb Weston Holdings, Inc.(b) | ||||
| 01/31/2032 | 4.375% | 463,000 | 423,198 | |
| Mars, Inc.(b) | ||||
| 04/20/2033 | 4.750% | 14,205,000 | 14,360,360 | |
| Mondelez International, Inc. | ||||
| 03/17/2027 | 2.625% | 7,780,000 | 7,287,900 | |
| Nestle Holdings, Inc.(b) | ||||
| 03/13/2026 | 5.250% | 16,725,000 | 17,194,371 | |
| Post Holdings, Inc.(b) | ||||
| 03/01/2027 | 5.750% | 910,000 | 903,595 | |
| 04/15/2030 | 4.625% | 736,000 | 664,471 | |
| 09/15/2031 | 4.500% | 523,000 | 457,657 | |
| Primo Water Holdings, Inc.(b) | ||||
| 04/30/2029 | 4.375% | 309,000 | 272,918 | |
| Simmons Foods, Inc./Prepared Foods, Inc./Pet Food, Inc./Feed(b) | ||||
| 03/01/2029 | 4.625% | 653,000 | 539,525 | |
| Triton Water Holdings, Inc.(b) | ||||
| 04/01/2029 | 6.250% | 510,000 | 428,313 | |
| US Foods, Inc.(b) | ||||
| 02/15/2029 | 4.750% | 523,000 | 486,405 | |
| 06/01/2030 | 4.625% | 354,000 | 323,510 | |
| Total | 82,082,743 | |||
| Gaming 0.6% | ||||
| Boyd Gaming Corp. | ||||
| 12/01/2027 | 4.750% | 205,000 | 197,653 | |
| Boyd Gaming Corp.(b) | ||||
| 06/15/2031 | 4.750% | 503,000 | 459,028 | |
| 12 | Columbia Corporate Income Fund | Annual Report 2023 |
April 30, 2023
| Corporate Bonds & Notes (continued) | ||||
| Issuer | Coupon Rate | Principal Amount ($) | Value ($) | |
| Caesars Entertainment, Inc.(b) | ||||
| 10/15/2029 | 4.625% | 1,543,000 | 1,351,938 | |
| 02/15/2030 | 7.000% | 913,000 | 921,823 | |
| Churchill Downs, Inc.(b) | ||||
| 05/01/2031 | 6.750% | 284,000 | 286,022 | |
| Colt Merger Sub, Inc.(b) | ||||
| 07/01/2025 | 5.750% | 664,000 | 668,893 | |
| 07/01/2025 | 6.250% | 625,000 | 625,861 | |
| 07/01/2027 | 8.125% | 56,000 | 57,094 | |
| International Game Technology PLC(b) | ||||
| 04/15/2026 | 4.125% | 2,003,000 | 1,927,145 | |
| MGM Resorts International | ||||
| 05/01/2025 | 6.750% | 1,375,000 | 1,387,221 | |
| Midwest Gaming Borrower LLC(b) | ||||
| 05/01/2029 | 4.875% | 414,000 | 372,003 | |
| Penn National Gaming, Inc.(b) | ||||
| 07/01/2029 | 4.125% | 242,000 | 204,873 | |
| Scientific Games Holdings LP/US FinCo, Inc.(b) | ||||
| 03/01/2030 | 6.625% | 719,000 | 637,751 | |
| Scientific Games International, Inc.(b) | ||||
| 07/01/2025 | 8.625% | 104,000 | 106,376 | |
| 11/15/2029 | 7.250% | 579,000 | 580,537 | |
| Wynn Resorts Finance LLC/Capital Corp.(b) | ||||
| 10/01/2029 | 5.125% | 126,000 | 116,109 | |
| Total | 9,900,327 | |||
| Health Care 2.6% | ||||
| Acadia Healthcare Co., Inc.(b) | ||||
| 07/01/2028 | 5.500% | 1,258,000 | 1,214,584 | |
| 04/15/2029 | 5.000% | 109,000 | 103,205 | |
| AdaptHealth LLC(b) | ||||
| 08/01/2029 | 4.625% | 235,000 | 191,821 | |
| 03/01/2030 | 5.125% | 749,000 | 619,761 | |
| Avantor Funding, Inc.(b) | ||||
| 07/15/2028 | 4.625% | 914,000 | 855,749 | |
| 11/01/2029 | 3.875% | 941,000 | 830,516 | |
| Catalent Pharma Solutions, Inc.(b) | ||||
| 04/01/2030 | 3.500% | 501,000 | 423,834 | |
| Charles River Laboratories International, Inc.(b) | ||||
| 03/15/2029 | 3.750% | 148,000 | 130,449 | |
| 03/15/2031 | 4.000% | 194,000 | 168,861 | |
| CHS/Community Health Systems, Inc.(b) | ||||
| 04/15/2029 | 6.875% | 459,000 | 339,645 | |
| 05/15/2030 | 5.250% | 1,288,000 | 1,072,126 | |
| 02/15/2031 | 4.750% | 244,000 | 196,769 | |
| CVS Health Corp. | ||||
| 07/20/2045 | 5.125% | 9,530,000 | 9,001,237 | |
| Encompass Health Corp. | ||||
| 02/01/2028 | 4.500% | 1,000,000 | 943,167 | |
| Corporate Bonds & Notes (continued) | ||||
| Issuer | Coupon Rate | Principal Amount ($) | Value ($) | |
| GE Healthcare Holding LLC(b) | ||||
| 11/15/2027 | 5.650% | 5,867,000 | 6,058,020 | |
| 11/22/2052 | 6.377% | 2,810,000 | 3,152,105 | |
| HCA, Inc.(b) | ||||
| 03/15/2052 | 4.625% | 13,111,000 | 10,869,566 | |
| Indigo Merger Sub, Inc.(b) | ||||
| 07/15/2026 | 2.875% | 200,000 | 183,074 | |
| Mozart Debt Merger Sub, Inc.(b) | ||||
| 04/01/2029 | 3.875% | 100,000 | 87,479 | |
| 10/01/2029 | 5.250% | 1,422,000 | 1,229,869 | |
| Select Medical Corp.(b) | ||||
| 08/15/2026 | 6.250% | 1,121,000 | 1,098,371 | |
| Tenet Healthcare Corp. | ||||
| 01/01/2026 | 4.875% | 405,000 | 398,743 | |
| 02/01/2027 | 6.250% | 394,000 | 392,392 | |
| 11/01/2027 | 5.125% | 1,793,000 | 1,741,088 | |
| 10/01/2028 | 6.125% | 721,000 | 699,422 | |
| Total | 42,001,853 | |||
| Healthcare Insurance 3.2% | ||||
| Aetna, Inc. | ||||
| 11/15/2042 | 4.125% | 2,686,000 | 2,285,662 | |
| Centene Corp. | ||||
| 02/15/2030 | 3.375% | 7,594,000 | 6,706,730 | |
| 10/15/2030 | 3.000% | 2,046,000 | 1,746,646 | |
| 03/01/2031 | 2.500% | 11,897,000 | 9,704,571 | |
| UnitedHealth Group, Inc. | ||||
| 02/15/2030 | 5.300% | 22,077,000 | 23,293,986 | |
| 04/15/2063 | 5.200% | 7,295,000 | 7,430,863 | |
| Total | 51,168,458 | |||
| Home Construction 0.1% | ||||
| Meritage Homes Corp. | ||||
| 06/01/2025 | 6.000% | 330,000 | 333,416 | |
| Meritage Homes Corp.(b) | ||||
| 04/15/2029 | 3.875% | 423,000 | 381,727 | |
| Shea Homes LP/Funding Corp. | ||||
| 02/15/2028 | 4.750% | 171,000 | 156,419 | |
| 04/01/2029 | 4.750% | 65,000 | 57,934 | |
| Taylor Morrison Communities, Inc.(b) | ||||
| 01/15/2028 | 5.750% | 193,000 | 191,510 | |
| 08/01/2030 | 5.125% | 355,000 | 333,970 | |
| Total | 1,454,976 | |||
| Independent Energy 1.1% | ||||
| Apache Corp. | ||||
| 02/01/2042 | 5.250% | 748,000 | 633,181 | |
| 04/15/2043 | 4.750% | 403,000 | 314,499 | |
| Columbia Corporate Income Fund | Annual Report 2023 | 13 |
April 30, 2023
| Corporate Bonds & Notes (continued) | ||||
| Issuer | Coupon Rate | Principal Amount ($) | Value ($) | |
| Baytex Energy Corp.(b) | ||||
| 04/30/2030 | 8.500% | 423,000 | 425,208 | |
| Callon Petroleum Co. | ||||
| 07/01/2026 | 6.375% | 922,000 | 889,145 | |
| Callon Petroleum Co.(b) | ||||
| 08/01/2028 | 8.000% | 191,000 | 188,500 | |
| Canadian Natural Resources Ltd. | ||||
| 06/01/2027 | 3.850% | 4,885,000 | 4,695,769 | |
| Centennial Resource Production LLC(b) | ||||
| 04/01/2027 | 6.875% | 114,000 | 112,665 | |
| CNX Resources Corp.(b) | ||||
| 03/14/2027 | 7.250% | 57,000 | 56,679 | |
| 01/15/2029 | 6.000% | 519,000 | 480,153 | |
| 01/15/2031 | 7.375% | 200,000 | 192,986 | |
| Colgate Energy Partners III LLC(b) | ||||
| 07/01/2029 | 5.875% | 1,402,000 | 1,323,870 | |
| Comstock Resources, Inc.(b) | ||||
| 03/01/2029 | 6.750% | 235,000 | 212,713 | |
| 01/15/2030 | 5.875% | 174,000 | 149,655 | |
| CrownRock LP/Finance, Inc.(b) | ||||
| 10/15/2025 | 5.625% | 219,000 | 216,290 | |
| 05/01/2029 | 5.000% | 153,000 | 144,758 | |
| Endeavor Energy Resources LP/Finance, Inc.(b) | ||||
| 01/30/2028 | 5.750% | 158,000 | 157,266 | |
| Hilcorp Energy I LP/Finance Co.(b) | ||||
| 02/01/2029 | 5.750% | 731,000 | 682,687 | |
| 04/15/2030 | 6.000% | 226,000 | 210,690 | |
| 02/01/2031 | 6.000% | 300,000 | 277,629 | |
| 04/15/2032 | 6.250% | 353,000 | 330,539 | |
| Matador Resources Co. | ||||
| 09/15/2026 | 5.875% | 520,000 | 511,070 | |
| Matador Resources Co.(b) | ||||
| 04/15/2028 | 6.875% | 297,000 | 299,217 | |
| Occidental Petroleum Corp. | ||||
| 09/01/2030 | 6.625% | 593,000 | 632,449 | |
| 01/01/2031 | 6.125% | 1,173,000 | 1,227,864 | |
| 09/15/2036 | 6.450% | 208,000 | 221,514 | |
| 08/15/2039 | 4.300% | 1,250,000 | 1,024,282 | |
| 03/15/2046 | 6.600% | 1,048,000 | 1,118,096 | |
| Southwestern Energy Co. | ||||
| 02/01/2029 | 5.375% | 227,000 | 214,543 | |
| 02/01/2032 | 4.750% | 1,134,000 | 1,001,965 | |
| Total | 17,945,882 | |||
| Integrated Energy 0.3% | ||||
| BP Capital Markets America, Inc. | ||||
| 03/17/2052 | 3.001% | 755,000 | 534,921 | |
| Corporate Bonds & Notes (continued) | ||||
| Issuer | Coupon Rate | Principal Amount ($) | Value ($) | |
| Cenovus Energy, Inc. | ||||
| 02/15/2052 | 3.750% | 5,913,000 | 4,291,579 | |
| Total | 4,826,500 | |||
| Leisure 0.5% | ||||
| Carnival Corp.(b) | ||||
| 03/01/2027 | 5.750% | 1,309,000 | 1,077,168 | |
| 08/01/2028 | 4.000% | 740,000 | 641,620 | |
| 05/01/2029 | 6.000% | 572,000 | 449,299 | |
| Carnival Holdings Bermuda Ltd.(b) | ||||
| 05/01/2028 | 10.375% | 354,000 | 380,572 | |
| Cedar Fair LP/Canada’s Wonderland Co./Magnum Management Corp./Millennium Operations LLC(b) | ||||
| 05/01/2025 | 5.500% | 300,000 | 299,228 | |
| Cedar Fair LP/Canada’s Wonderland Co./Magnum Management Corp./Millennium Operations LLC | ||||
| 10/01/2028 | 6.500% | 472,000 | 464,275 | |
| Cinemark USA, Inc.(b) | ||||
| 05/01/2025 | 8.750% | 121,000 | 123,421 | |
| 03/15/2026 | 5.875% | 701,000 | 669,838 | |
| 07/15/2028 | 5.250% | 250,000 | 223,681 | |
| Live Nation Entertainment, Inc.(b) | ||||
| 05/15/2027 | 6.500% | 258,000 | 259,589 | |
| 10/15/2027 | 4.750% | 398,000 | 369,174 | |
| NCL Corp., Ltd.(b) | ||||
| 02/15/2029 | 7.750% | 112,000 | 95,473 | |
| Royal Caribbean Cruises Ltd.(b) | ||||
| 07/01/2026 | 4.250% | 292,000 | 261,364 | |
| 08/31/2026 | 5.500% | 426,000 | 390,846 | |
| 07/15/2027 | 5.375% | 226,000 | 200,829 | |
| 08/15/2027 | 11.625% | 605,000 | 643,751 | |
| 01/15/2029 | 8.250% | 525,000 | 551,436 | |
| 01/15/2030 | 7.250% | 630,000 | 632,023 | |
| Royal Caribbean Cruises Ltd. | ||||
| 03/15/2028 | 3.700% | 368,000 | 298,598 | |
| Six Flags Entertainment Corp.(b),(h) | ||||
| 05/15/2031 | 7.250% | 435,000 | 426,432 | |
| Total | 8,458,617 | |||
| Life Insurance 8.5% | ||||
| Five Corners Funding Trust(b) | ||||
| 11/15/2023 | 4.419% | 23,065,000 | 22,915,620 | |
| Five Corners Funding Trust III(b) | ||||
| 02/15/2033 | 5.791% | 12,016,000 | 12,329,582 | |
| Guardian Life Global Funding(b) | ||||
| 12/10/2025 | 0.875% | 13,510,000 | 12,142,722 | |
| MassMutual Global Funding II(b) | ||||
| 04/10/2026 | 4.500% | 12,530,000 | 12,488,678 | |
| 14 | Columbia Corporate Income Fund | Annual Report 2023 |
April 30, 2023
| Corporate Bonds & Notes (continued) | ||||
| Issuer | Coupon Rate | Principal Amount ($) | Value ($) | |
| New York Life Insurance Co.(b) | ||||
| Subordinated | ||||
| 05/15/2050 | 3.750% | 2,780,000 | 2,226,980 | |
| Northwestern Mutual Global Funding(b) | ||||
| 01/14/2026 | 0.800% | 8,667,000 | 7,831,719 | |
| 06/01/2028 | 1.700% | 4,830,000 | 4,223,639 | |
| Northwestern Mutual Life Insurance Co. (The)(b) | ||||
| Subordinated | ||||
| 09/30/2059 | 3.625% | 8,678,000 | 6,322,066 | |
| Pacific Life Global Funding II(b) | ||||
| 04/14/2026 | 1.375% | 17,139,000 | 15,481,034 | |
| Peachtree Corners Funding Trust(b) | ||||
| 02/15/2025 | 3.976% | 19,150,000 | 18,642,108 | |
| Principal Life Global Funding II(b) | ||||
| 11/21/2024 | 2.250% | 11,590,000 | 11,081,864 | |
| 08/16/2026 | 1.250% | 1,000,000 | 889,100 | |
| Teachers Insurance & Annuity Association of America(b) | ||||
| Subordinated | ||||
| 09/15/2044 | 4.900% | 4,715,000 | 4,378,310 | |
| 05/15/2050 | 3.300% | 9,334,000 | 6,636,320 | |
| Voya Financial, Inc. | ||||
| 06/15/2046 | 4.800% | 895,000 | 755,794 | |
| Total | 138,345,536 | |||
| Lodging 0.0% | ||||
| Hilton Domestic Operating Co., Inc.(b) | ||||
| 05/01/2025 | 5.375% | 310,000 | 309,759 | |
| Marriott Ownership Resorts, Inc.(b) | ||||
| 06/15/2029 | 4.500% | 128,000 | 111,666 | |
| Total | 421,425 | |||
| Media and Entertainment 2.7% | ||||
| Cengage Learning, Inc.(b) | ||||
| 06/15/2024 | 9.500% | 524,000 | 524,701 | |
| Clear Channel International BV(b) | ||||
| 08/01/2025 | 6.625% | 274,000 | 270,421 | |
| Clear Channel Outdoor Holdings, Inc.(b) | ||||
| 04/15/2028 | 7.750% | 1,353,000 | 1,027,782 | |
| 06/01/2029 | 7.500% | 433,000 | 320,451 | |
| iHeartCommunications, Inc. | ||||
| 05/01/2026 | 6.375% | 496,962 | 427,721 | |
| 05/01/2027 | 8.375% | 884,518 | 579,215 | |
| iHeartCommunications, Inc.(b) | ||||
| 08/15/2027 | 5.250% | 102,000 | 80,588 | |
| 01/15/2028 | 4.750% | 749,000 | 582,780 | |
| Magallanes, Inc.(b) | ||||
| 03/15/2062 | 5.391% | 33,176,000 | 26,629,049 | |
| Netflix, Inc.(b) | ||||
| 11/15/2029 | 5.375% | 10,762,000 | 11,019,030 | |
| Corporate Bonds & Notes (continued) | ||||
| Issuer | Coupon Rate | Principal Amount ($) | Value ($) | |
| Outfront Media Capital LLC/Corp.(b) | ||||
| 01/15/2029 | 4.250% | 216,000 | 184,496 | |
| 03/15/2030 | 4.625% | 367,000 | 310,500 | |
| Playtika Holding Corp.(b) | ||||
| 03/15/2029 | 4.250% | 503,000 | 430,986 | |
| Roblox Corp.(b) | ||||
| 05/01/2030 | 3.875% | 537,000 | 453,694 | |
| Scripps Escrow, Inc.(b) | ||||
| 07/15/2027 | 5.875% | 564,000 | 407,315 | |
| Univision Communications, Inc.(b) | ||||
| 05/01/2029 | 4.500% | 248,000 | 213,821 | |
| 06/30/2030 | 7.375% | 431,000 | 413,424 | |
| Total | 43,875,974 | |||
| Metals and Mining 0.4% | ||||
| Allegheny Technologies, Inc. | ||||
| 10/01/2029 | 4.875% | 122,000 | 112,397 | |
| 10/01/2031 | 5.125% | 590,000 | 533,547 | |
| Constellium NV(b) | ||||
| 02/15/2026 | 5.875% | 376,000 | 374,287 | |
| Constellium SE(b) | ||||
| 06/15/2028 | 5.625% | 893,000 | 857,065 | |
| 04/15/2029 | 3.750% | 491,000 | 423,135 | |
| Hudbay Minerals, Inc.(b) | ||||
| 04/01/2026 | 4.500% | 344,000 | 320,341 | |
| 04/01/2029 | 6.125% | 403,000 | 378,647 | |
| Kaiser Aluminum Corp.(b) | ||||
| 03/01/2028 | 4.625% | 91,000 | 80,308 | |
| 06/01/2031 | 4.500% | 486,000 | 384,596 | |
| Novelis Corp.(b) | ||||
| 11/15/2026 | 3.250% | 370,000 | 338,781 | |
| 01/30/2030 | 4.750% | 2,336,000 | 2,114,422 | |
| 08/15/2031 | 3.875% | 367,000 | 307,280 | |
| Total | 6,224,806 | |||
| Midstream 3.5% | ||||
| CNX Midstream Partners LP(b) | ||||
| 04/15/2030 | 4.750% | 485,000 | 407,455 | |
| DT Midstream, Inc.(b) | ||||
| 06/15/2029 | 4.125% | 318,000 | 282,134 | |
| 06/15/2031 | 4.375% | 637,000 | 554,278 | |
| Enterprise Products Operating LLC | ||||
| 03/15/2044 | 4.850% | 1,846,000 | 1,719,746 | |
| 02/15/2045 | 5.100% | 1,991,000 | 1,916,168 | |
| 01/31/2060 | 3.950% | 2,846,000 | 2,218,097 | |
| EQM Midstream Partners LP | ||||
| 08/01/2024 | 4.000% | 562,000 | 543,711 | |
| 07/15/2048 | 6.500% | 230,000 | 174,446 | |
| Columbia Corporate Income Fund | Annual Report 2023 | 15 |
April 30, 2023
| Corporate Bonds & Notes (continued) | ||||
| Issuer | Coupon Rate | Principal Amount ($) | Value ($) | |
| EQM Midstream Partners LP(b) | ||||
| 07/01/2025 | 6.000% | 212,000 | 208,158 | |
| 07/01/2027 | 6.500% | 307,000 | 299,317 | |
| 01/15/2029 | 4.500% | 333,000 | 283,642 | |
| 01/15/2031 | 4.750% | 1,171,000 | 964,452 | |
| Hess Midstream Operations LP(b) | ||||
| 02/15/2030 | 4.250% | 143,000 | 127,063 | |
| Holly Energy Partners LP/Finance Corp.(b) | ||||
| 04/15/2027 | 6.375% | 274,000 | 270,686 | |
| ITT Holdings LLC(b) | ||||
| 08/01/2029 | 6.500% | 210,000 | 174,318 | |
| Kinder Morgan Energy Partners LP | ||||
| 03/01/2043 | 5.000% | 5,946,000 | 5,240,064 | |
| Kinder Morgan, Inc. | ||||
| 02/15/2046 | 5.050% | 1,600,000 | 1,407,474 | |
| 08/01/2052 | 5.450% | 5,773,000 | 5,328,819 | |
| MPLX LP | ||||
| 04/15/2048 | 4.700% | 1,199,000 | 1,003,860 | |
| 03/14/2052 | 4.950% | 4,687,000 | 4,052,685 | |
| NuStar Logistics LP | ||||
| 10/01/2025 | 5.750% | 182,000 | 179,380 | |
| 06/01/2026 | 6.000% | 132,000 | 129,661 | |
| 04/28/2027 | 5.625% | 647,000 | 621,593 | |
| Plains All American Pipeline LP/Finance Corp. | ||||
| 06/15/2044 | 4.700% | 12,969,000 | 10,300,449 | |
| Sunoco LP/Finance Corp. | ||||
| 04/15/2027 | 6.000% | 316,000 | 314,412 | |
| TransMontaigne Partners LP/TLP Finance Corp. | ||||
| 02/15/2026 | 6.125% | 747,000 | 649,473 | |
| Venture Global Calcasieu Pass LLC(b) | ||||
| 08/15/2029 | 3.875% | 699,000 | 629,302 | |
| 08/15/2031 | 4.125% | 1,016,000 | 900,299 | |
| 11/01/2033 | 3.875% | 562,000 | 473,842 | |
| Western Gas Partners LP | ||||
| 08/15/2048 | 5.500% | 3,186,000 | 2,711,002 | |
| Western Midstream Operating LP(c) | ||||
| 02/01/2050 | 5.500% | 5,040,000 | 4,284,605 | |
| Williams Companies, Inc. (The) | ||||
| 09/15/2045 | 5.100% | 2,955,000 | 2,706,505 | |
| Williams Cos, Inc. (The) | ||||
| 08/15/2052 | 5.300% | 6,184,000 | 5,801,643 | |
| Total | 56,878,739 | |||
| Natural Gas 2.1% | ||||
| NiSource, Inc. | ||||
| 03/30/2028 | 5.250% | 2,128,000 | 2,173,677 | |
| 02/15/2031 | 1.700% | 33,581,000 | 26,985,680 | |
| 05/15/2047 | 4.375% | 5,429,000 | 4,794,058 | |
| Total | 33,953,415 | |||
| Corporate Bonds & Notes (continued) | ||||
| Issuer | Coupon Rate | Principal Amount ($) | Value ($) | |
| Oil Field Services 0.1% | ||||
| Nabors Industries Ltd.(b) | ||||
| 01/15/2026 | 7.250% | 404,000 | 381,014 | |
| 01/15/2028 | 7.500% | 89,000 | 81,186 | |
| Nabors Industries, Inc.(b) | ||||
| 05/15/2027 | 7.375% | 213,000 | 206,618 | |
| Transocean Titan Financing Ltd.(b) | ||||
| 02/01/2028 | 8.375% | 695,000 | 709,146 | |
| Total | 1,377,964 | |||
| Other Industry 0.0% | ||||
| Hillenbrand, Inc. | ||||
| 03/01/2031 | 3.750% | 215,000 | 184,650 | |
| Other REIT 0.4% | ||||
| Blackstone Mortgage Trust, Inc.(b) | ||||
| 01/15/2027 | 3.750% | 621,000 | 524,630 | |
| Ladder Capital Finance Holdings LLLP/Corp.(b) | ||||
| 10/01/2025 | 5.250% | 558,000 | 524,370 | |
| 02/01/2027 | 4.250% | 390,000 | 332,161 | |
| 06/15/2029 | 4.750% | 3,536,000 | 2,797,723 | |
| Park Intermediate Holdings LLC/Domestic Property/Finance Co-Issuer(b) | ||||
| 10/01/2028 | 5.875% | 384,000 | 354,856 | |
| Park Intermediate Holdings LLC/PK Domestic Property LLC/Finance Co-Issuer(b) | ||||
| 05/15/2029 | 4.875% | 317,000 | 275,376 | |
| RHP Hotel Properties LP/Finance Corp.(b) | ||||
| 02/15/2029 | 4.500% | 216,000 | 194,503 | |
| RLJ Lodging Trust LP(b) | ||||
| 07/01/2026 | 3.750% | 222,000 | 205,852 | |
| 09/15/2029 | 4.000% | 275,000 | 231,594 | |
| Service Properties Trust | ||||
| 03/15/2024 | 4.650% | 209,000 | 204,863 | |
| 10/01/2024 | 4.350% | 98,000 | 93,494 | |
| 12/15/2027 | 5.500% | 129,000 | 113,447 | |
| Total | 5,852,869 | |||
| Packaging 0.2% | ||||
| Ardagh Metal Packaging Finance USA LLC/PLC(b) | ||||
| 06/15/2027 | 6.000% | 501,000 | 498,742 | |
| 09/01/2029 | 4.000% | 769,000 | 626,338 | |
| Ardagh Packaging Finance PLC/Holdings USA, Inc.(b) | ||||
| 08/15/2026 | 4.125% | 594,000 | 560,117 | |
| Berry Global, Inc.(b) | ||||
| 04/15/2028 | 5.500% | 695,000 | 694,239 | |
| Canpack SA/US LLC(b) | ||||
| 11/15/2029 | 3.875% | 829,000 | 667,898 | |
| 16 | Columbia Corporate Income Fund | Annual Report 2023 |
April 30, 2023
| Corporate Bonds & Notes (continued) | ||||
| Issuer | Coupon Rate | Principal Amount ($) | Value ($) | |
| Trivium Packaging Finance BV(b) | ||||
| 08/15/2026 | 5.500% | 178,000 | 172,808 | |
| 08/15/2027 | 8.500% | 399,000 | 385,363 | |
| Total | 3,605,505 | |||
| Pharmaceuticals 2.1% | ||||
| 1375209 BC Ltd.(b) | ||||
| 01/30/2028 | 9.000% | 97,000 | 95,998 | |
| AbbVie, Inc. | ||||
| 05/14/2035 | 4.500% | 3,064,000 | 2,985,195 | |
| 06/15/2044 | 4.850% | 1,764,000 | 1,682,010 | |
| Amgen, Inc. | ||||
| 03/02/2063 | 5.750% | 26,459,000 | 27,369,720 | |
| Bausch Health Companies, Inc.(b) | ||||
| 02/01/2027 | 6.125% | 486,000 | 350,996 | |
| 06/01/2028 | 4.875% | 152,000 | 100,494 | |
| 09/30/2028 | 11.000% | 173,000 | 140,607 | |
| 10/15/2030 | 14.000% | 34,000 | 21,754 | |
| Endo Dac/Finance LLC/Finco, Inc.(b),(e) | ||||
| 06/30/2028 | 0.000% | 260,000 | 14,926 | |
| Grifols Escrow Issuer SA(b) | ||||
| 10/15/2028 | 4.750% | 352,000 | 282,867 | |
| Organon Finance 1 LLC(b) | ||||
| 04/30/2028 | 4.125% | 419,000 | 385,548 | |
| 04/30/2031 | 5.125% | 808,000 | 719,207 | |
| Total | 34,149,322 | |||
| Property & Casualty 0.4% | ||||
| Alliant Holdings Intermediate LLC/Co-Issuer(b) | ||||
| 10/15/2027 | 4.250% | 32,000 | 29,456 | |
| 10/15/2027 | 6.750% | 834,000 | 778,347 | |
| 04/15/2028 | 6.750% | 1,068,000 | 1,066,665 | |
| 11/01/2029 | 5.875% | 332,000 | 289,197 | |
| AssuredPartners, Inc.(b) | ||||
| 08/15/2025 | 7.000% | 568,000 | 562,332 | |
| 01/15/2029 | 5.625% | 608,000 | 527,152 | |
| BroadStreet Partners, Inc.(b) | ||||
| 04/15/2029 | 5.875% | 716,000 | 623,564 | |
| GTCR AP Finance, Inc.(b) | ||||
| 05/15/2027 | 8.000% | 39,000 | 38,066 | |
| HUB International Ltd.(b) | ||||
| 05/01/2026 | 7.000% | 1,250,000 | 1,244,461 | |
| 12/01/2029 | 5.625% | 622,000 | 555,561 | |
| Ryan Specialty Group LLC(b) | ||||
| 02/01/2030 | 4.375% | 75,000 | 67,292 | |
| USI, Inc.(b) | ||||
| 05/01/2025 | 6.875% | 321,000 | 317,380 | |
| Total | 6,099,473 | |||
| Corporate Bonds & Notes (continued) | ||||
| Issuer | Coupon Rate | Principal Amount ($) | Value ($) | |
| Railroads 0.8% | ||||
| Norfolk Southern Corp. | ||||
| 08/15/2052 | 4.050% | 2,265,000 | 1,895,078 | |
| Union Pacific Corp. | ||||
| 07/15/2025 | 3.750% | 5,315,000 | 5,234,222 | |
| 02/21/2026 | 4.750% | 5,933,000 | 5,998,747 | |
| Total | 13,128,047 | |||
| Restaurants 0.1% | ||||
| Fertitta Entertainment LLC/Finance Co., Inc.(b) | ||||
| 01/15/2030 | 6.750% | 605,000 | 490,054 | |
| IRB Holding Corp.(b) | ||||
| 06/15/2025 | 7.000% | 874,000 | 883,018 | |
| Yum! Brands, Inc. | ||||
| 04/01/2032 | 5.375% | 558,000 | 544,384 | |
| Total | 1,917,456 | |||
| Retailers 2.4% | ||||
| Amazon.com, Inc. | ||||
| 12/01/2032 | 4.700% | 16,900,000 | 17,382,142 | |
| Asbury Automotive Group, Inc.(b) | ||||
| 11/15/2029 | 4.625% | 142,000 | 126,505 | |
| Group 1 Automotive, Inc.(b) | ||||
| 08/15/2028 | 4.000% | 100,000 | 88,712 | |
| Hanesbrands, Inc.(b) | ||||
| 02/15/2031 | 9.000% | 253,000 | 259,091 | |
| L Brands, Inc.(b) | ||||
| 07/01/2025 | 9.375% | 37,000 | 39,654 | |
| 10/01/2030 | 6.625% | 498,000 | 478,168 | |
| L Brands, Inc. | ||||
| 06/15/2029 | 7.500% | 113,000 | 115,030 | |
| 11/01/2035 | 6.875% | 227,000 | 204,408 | |
| LCM Investments Holdings II LLC(b) | ||||
| 05/01/2029 | 4.875% | 273,000 | 232,601 | |
| Lithia Motors, Inc.(b) | ||||
| 01/15/2031 | 4.375% | 255,000 | 218,974 | |
| Lowe’s Companies, Inc. | ||||
| 04/01/2062 | 4.450% | 9,805,000 | 8,029,870 | |
| 09/15/2062 | 5.800% | 9,753,000 | 9,812,665 | |
| PetSmart, Inc./Finance Corp.(b) | ||||
| 02/15/2028 | 4.750% | 423,000 | 399,766 | |
| 02/15/2029 | 7.750% | 603,000 | 594,303 | |
| Wolverine World Wide, Inc.(b) | ||||
| 08/15/2029 | 4.000% | 257,000 | 213,506 | |
| Total | 38,195,395 | |||
| Columbia Corporate Income Fund | Annual Report 2023 | 17 |
April 30, 2023
| Corporate Bonds & Notes (continued) | ||||
| Issuer | Coupon Rate | Principal Amount ($) | Value ($) | |
| Supermarkets 0.1% | ||||
| Albertsons Companies LLC/Safeway, Inc./New Albertsons LP/Albertsons LLC(b) | ||||
| 03/15/2026 | 7.500% | 147,000 | 151,772 | |
| Albertsons Companies, Inc./Safeway, Inc./New Albertsons LP/Albertsons LLC(b) | ||||
| 03/15/2026 | 3.250% | 223,000 | 210,768 | |
| 01/15/2027 | 4.625% | 339,000 | 328,069 | |
| Total | 690,609 | |||
| Technology 6.0% | ||||
| Black Knight InfoServ LLC(b) | ||||
| 09/01/2028 | 3.625% | 595,000 | 537,369 | |
| Block, Inc. | ||||
| 06/01/2026 | 2.750% | 103,000 | 93,128 | |
| 06/01/2031 | 3.500% | 217,000 | 176,768 | |
| Boxer Parent Co., Inc.(b) | ||||
| 10/02/2025 | 7.125% | 82,000 | 81,789 | |
| Broadcom, Inc.(b) | ||||
| 11/15/2036 | 3.187% | 14,846,000 | 11,306,764 | |
| Clarivate Science Holdings Corp.(b) | ||||
| 07/01/2028 | 3.875% | 258,000 | 232,357 | |
| 07/01/2029 | 4.875% | 695,000 | 626,432 | |
| Cloud Software Group, Inc.(b) | ||||
| 09/30/2029 | 9.000% | 809,000 | 695,143 | |
| Condor Merger Sub, Inc.(b) | ||||
| 02/15/2030 | 7.375% | 940,000 | 781,354 | |
| Dun & Bradstreet Corp. (The)(b) | ||||
| 12/15/2029 | 5.000% | 197,000 | 174,278 | |
| Entegris Escrow Corp.(b) | ||||
| 04/15/2029 | 4.750% | 180,000 | 167,443 | |
| 06/15/2030 | 5.950% | 633,000 | 601,361 | |
| Fidelity National Information Services, Inc. | ||||
| 07/15/2052 | 5.625% | 4,019,000 | 3,871,892 | |
| Gartner, Inc.(b) | ||||
| 07/01/2028 | 4.500% | 2,178,000 | 2,052,087 | |
| 06/15/2029 | 3.625% | 137,000 | 121,384 | |
| HealthEquity, Inc.(b) | ||||
| 10/01/2029 | 4.500% | 626,000 | 559,448 | |
| Helios Software Holdings, Inc.(b) | ||||
| 05/01/2028 | 4.625% | 476,000 | 404,604 | |
| Intel Corp. | ||||
| 08/05/2062 | 5.050% | 4,075,000 | 3,753,428 | |
| International Business Machines Corp. | ||||
| 05/15/2029 | 3.500% | 16,635,000 | 15,604,724 | |
| 02/06/2053 | 5.100% | 3,090,000 | 2,981,666 | |
| ION Trading Technologies Sarl(b) | ||||
| 05/15/2028 | 5.750% | 494,000 | 413,056 | |
| Corporate Bonds & Notes (continued) | ||||
| Issuer | Coupon Rate | Principal Amount ($) | Value ($) | |
| Iron Mountain, Inc.(b) | ||||
| 07/15/2030 | 5.250% | 827,000 | 762,358 | |
| Logan Merger Sub, Inc.(b) | ||||
| 09/01/2027 | 5.500% | 1,368,000 | 768,543 | |
| Microchip Technology, Inc. | ||||
| 02/15/2024 | 0.972% | 8,629,000 | 8,338,552 | |
| Minerva Merger Sub, Inc.(b) | ||||
| 02/15/2030 | 6.500% | 1,042,000 | 854,677 | |
| MSCI, Inc.(b) | ||||
| 11/01/2031 | 3.625% | 7,585,000 | 6,454,439 | |
| NCR Corp.(b) | ||||
| 09/01/2027 | 5.750% | 274,000 | 268,177 | |
| 10/01/2028 | 5.000% | 424,000 | 369,952 | |
| 04/15/2029 | 5.125% | 895,000 | 774,273 | |
| 09/01/2029 | 6.125% | 215,000 | 210,682 | |
| 10/01/2030 | 5.250% | 220,000 | 184,585 | |
| Neptune Bidco US, Inc.(b) | ||||
| 04/15/2029 | 9.290% | 736,000 | 692,760 | |
| NXP BV/Funding LLC/USA, Inc. | ||||
| 05/01/2030 | 3.400% | 1,375,000 | 1,235,547 | |
| 05/11/2031 | 2.500% | 15,995,000 | 13,230,883 | |
| 01/15/2033 | 5.000% | 2,407,000 | 2,354,486 | |
| Picard Midco, Inc.(b) | ||||
| 03/31/2029 | 6.500% | 1,058,000 | 952,465 | |
| Sabre GLBL, Inc.(b) | ||||
| 12/15/2027 | 11.250% | 74,000 | 64,932 | |
| Shift4 Payments LLC/Finance Sub, Inc.(b) | ||||
| 11/01/2026 | 4.625% | 912,000 | 857,935 | |
| Tempo Acquisition LLC/Finance Corp.(b) | ||||
| 06/01/2025 | 5.750% | 175,000 | 175,879 | |
| Thomson Reuters Corp. | ||||
| 08/15/2035 | 5.500% | 8,075,000 | 8,184,962 | |
| VeriSign, Inc. | ||||
| 06/15/2031 | 2.700% | 6,364,000 | 5,409,495 | |
| Verscend Escrow Corp.(b) | ||||
| 08/15/2026 | 9.750% | 505,000 | 509,147 | |
| ZoomInfo Technologies LLC/Finance Corp.(b) | ||||
| 02/01/2029 | 3.875% | 441,000 | 380,293 | |
| Total | 98,271,497 | |||
| Tobacco 0.3% | ||||
| Reynolds American, Inc. | ||||
| 08/15/2035 | 5.700% | 5,325,000 | 5,089,442 | |
| 18 | Columbia Corporate Income Fund | Annual Report 2023 |
April 30, 2023
| Corporate Bonds & Notes (continued) | ||||
| Issuer | Coupon Rate | Principal Amount ($) | Value ($) | |
| Transportation Services 1.3% | ||||
| ERAC USA Finance LLC(b),(h) | ||||
| 05/01/2028 | 4.600% | 12,528,000 | 12,497,546 | |
| 05/01/2053 | 5.400% | 8,237,000 | 8,288,415 | |
| Total | 20,785,961 | |||
| Wireless 2.8% | ||||
| Altice France Holding SA(b) | ||||
| 05/15/2027 | 10.500% | 329,000 | 242,152 | |
| 02/15/2028 | 6.000% | 343,000 | 211,075 | |
| Altice France SA(b) | ||||
| 02/01/2027 | 8.125% | 372,000 | 332,311 | |
| 01/15/2028 | 5.500% | 1,647,000 | 1,296,714 | |
| 07/15/2029 | 5.125% | 1,059,000 | 784,777 | |
| 10/15/2029 | 5.500% | 120,000 | 89,966 | |
| American Tower Corp. | ||||
| 08/15/2029 | 3.800% | 4,746,000 | 4,448,466 | |
| 06/15/2030 | 2.100% | 2,850,000 | 2,345,602 | |
| SBA Communications Corp. | ||||
| 02/15/2027 | 3.875% | 277,000 | 258,074 | |
| 02/01/2029 | 3.125% | 110,000 | 94,329 | |
| Sprint Corp. | ||||
| 06/15/2024 | 7.125% | 316,000 | 321,208 | |
| 03/01/2026 | 7.625% | 552,000 | 584,623 | |
| T-Mobile US, Inc. | ||||
| 02/15/2029 | 2.625% | 20,007,000 | 17,686,670 | |
| 02/15/2031 | 2.875% | 7,549,000 | 6,540,772 | |
| 04/15/2031 | 3.500% | 9,810,000 | 8,864,278 | |
| Vmed O2 UK Financing I PLC(b) | ||||
| 01/31/2031 | 4.250% | 1,059,000 | 878,596 | |
| 07/15/2031 | 4.750% | 849,000 | 722,979 | |
| Total | 45,702,592 | |||
| Wirelines 2.9% | ||||
| AT&T, Inc. | ||||
| 05/15/2035 | 4.500% | 2,000,000 | 1,881,783 | |
| 12/01/2057 | 3.800% | 10,117,000 | 7,423,857 | |
| Front Range BidCo, Inc.(b) | ||||
| 03/01/2027 | 4.000% | 172,000 | 130,089 | |
| Frontier Communications Holdings LLC(b) | ||||
| 05/15/2030 | 8.750% | 326,000 | 322,471 | |
| 03/15/2031 | 8.625% | 540,000 | 526,593 | |
| Iliad Holding SAS(b) | ||||
| 10/15/2026 | 6.500% | 1,150,000 | 1,106,329 | |
| 10/15/2028 | 7.000% | 1,037,000 | 985,477 | |
| Telefonica Emisiones SAU | ||||
| 03/06/2048 | 4.895% | 5,905,000 | 4,899,440 | |
| Corporate Bonds & Notes (continued) | ||||
| Issuer | Coupon Rate | Principal Amount ($) | Value ($) | |
| Verizon Communications, Inc. | ||||
| 03/21/2031 | 2.550% | 35,595,000 | 30,314,538 | |
| Total | 47,590,577 | |||
| Total Corporate Bonds & Notes (Cost $1,626,821,850) | 1,495,572,621 | |||
| Foreign Government Obligations(i) 0.0% | ||||
| Canada 0.0% | ||||
| NOVA Chemicals Corp.(b) | ||||
| 06/01/2027 | 5.250% | 251,000 | 227,253 | |
| 05/15/2029 | 4.250% | 313,000 | 253,462 | |
| Total | 480,715 | |||
| Total Foreign Government Obligations (Cost $560,420) | 480,715 | |||
| Senior Loans 0.2% | ||||
| Borrower | Coupon Rate | Principal Amount ($) | Value ($) | |
| Chemicals 0.0% | ||||
| WR Grace Holdings LLC(j),(k) | ||||
| Term Loan | ||||
| 1-month USD LIBOR + 3.750% Floor 0.500% 09/22/2028 | 8.938% | 383,150 | 382,958 | |
| Consumer Cyclical Services 0.0% | ||||
| 8th Avenue Food & Provisions, Inc.(j),(k) | ||||
| 1st Lien Term Loan | ||||
| 1-month Term SOFR + 3.750% 10/01/2025 | 8.847% | 331,325 | 290,887 | |
| 2nd Lien Term Loan | ||||
| 1-month USD LIBOR + 7.750% 10/01/2026 | 12.847% | 78,084 | 49,918 | |
| Total | 340,805 | |||
| Media and Entertainment 0.1% | ||||
| Cengage Learning, Inc.(j),(k) | ||||
| Tranche B 1st Lien Term Loan | ||||
| 3-month USD LIBOR + 4.750% Floor 1.000% 07/14/2026 | 9.880% | 459,322 | 447,775 | |
| Technology 0.1% | ||||
| Ascend Learning LLC(j),(k) | ||||
| 1st Lien Term Loan | ||||
| 1-month Term SOFR + 3.500% Floor 0.500% 12/11/2028 | 8.582% | 407,837 | 371,960 | |
| Columbia Corporate Income Fund | Annual Report 2023 | 19 |
April 30, 2023
| Senior Loans (continued) | ||||
| Borrower | Coupon Rate | Principal Amount ($) | Value ($) | |
| 2nd Lien Term Loan | ||||
| 1-month Term SOFR + 5.750% Floor 0.500% 12/10/2029 | 10.832% | 246,000 | 213,098 | |
| DCert Buyer, Inc.(j),(k) | ||||
| 2nd Lien Term Loan | ||||
| 1-month USD LIBOR + 7.000% 02/19/2029 | 11.696% | 357,000 | 328,551 | |
| UKG, Inc.(j),(k) | ||||
| 1st Lien Term Loan | ||||
| 3-month Term SOFR + 3.250% Floor 0.500% 05/04/2026 | 8.271% | 244,534 | 237,809 | |
| 2nd Lien Term Loan | ||||
| 3-month Term SOFR + 5.250% Floor 0.500% 05/03/2027 | 10.271% | 478,000 | 458,483 | |
| Total | 1,609,901 | |||
| Total Senior Loans (Cost $2,973,737) | 2,781,439 | |||
| U.S. Treasury Obligations 3.6% | ||||
| Issuer | Coupon Rate | Principal Amount ($) | Value ($) | |
| U.S. Treasury | ||||
| 03/31/2025 | 3.875% | 16,005,000 | 15,940,605 | |
| 01/31/2028 | 3.500% | 16,115,000 | 16,098,633 | |
| 08/15/2032 | 2.750% | 22,437,100 | 21,234,611 | |
| 08/15/2047 | 2.750% | 7,344,700 | 6,114,463 | |
| Total U.S. Treasury Obligations (Cost $59,126,836) | 59,388,312 | |||
| Money Market Funds 5.8% | ||
| Shares | Value ($) | |
| Columbia Short-Term Cash Fund, 5.046%(l),(m) | 93,643,958 | 93,606,501 |
| Total Money Market Funds (Cost $93,613,920) | 93,606,501 | |
| Total Investments in Securities (Cost: $1,784,625,481) | 1,652,133,936 | |
| Other Assets & Liabilities, Net | (24,643,954) | |
| Net Assets | 1,627,489,982 | |
| Long futures contracts | ||||||
| Description | Number of contracts | Expiration date | Trading currency | Notional amount | Value/Unrealized appreciation ($) | Value/Unrealized depreciation ($) |
| U.S. Long Bond | 789 | 06/2023 | USD | 103,876,781 | 4,072,089 | — |
| U.S. Treasury 2-Year Note | 491 | 06/2023 | USD | 101,226,554 | 994,731 | — |
| U.S. Treasury 5-Year Note | 1,933 | 06/2023 | USD | 212,131,649 | 3,777,955 | — |
| Total | 8,844,775 | — | ||||
| Short futures contracts | ||||||
| Description | Number of contracts | Expiration date | Trading currency | Notional amount | Value/Unrealized appreciation ($) | Value/Unrealized depreciation ($) |
| U.S. Treasury 10-Year Note | (2,068) | 06/2023 | USD | (238,240,063) | — | (6,563,797) |
| U.S. Treasury Ultra 10-Year Note | (904) | 06/2023 | USD | (109,793,625) | — | (1,646,002) |
| U.S. Treasury Ultra Bond | (181) | 06/2023 | USD | (25,594,531) | 87,043 | — |
| Total | 87,043 | (8,209,799) | ||||
| (a) | Non-income producing investment. |
| (b) | Represents privately placed and other securities and instruments exempt from Securities and Exchange Commission registration (collectively, private placements), such as Section 4(a)(2) and Rule 144A eligible securities, which are often sold only to qualified institutional buyers. At April 30, 2023, the total value of these securities amounted to $492,637,816, which represents 30.27% of total net assets. |
| (c) | Represents a variable rate security with a step coupon where the rate adjusts according to a schedule for a series of periods, typically lower for an initial period and then increasing to a higher coupon rate thereafter. The interest rate shown was the current rate as of April 30, 2023. |
| (d) | Represents fair value as determined in good faith under procedures approved by the Board of Trustees. At April 30, 2023, the total value of these securities amounted to $9,525, which represents less than 0.01% of total net assets. |
| 20 | Columbia Corporate Income Fund | Annual Report 2023 |
April 30, 2023
| (e) | Represents a security in default. |
| (f) | Valuation based on significant unobservable inputs. |
| (g) | Payment-in-kind security. Interest can be paid by issuing additional par of the security or in cash. |
| (h) | Represents a security purchased on a when-issued basis. |
| (i) | Principal and interest may not be guaranteed by a governmental entity. |
| (j) | The stated interest rate represents the weighted average interest rate at April 30, 2023 of contracts within the senior loan facility. Interest rates on contracts are primarily determined either weekly, monthly or quarterly by reference to the indicated base lending rate and spread and the reset period. These base lending rates are primarily the LIBOR and other short-term rates. Base lending rates may be subject to a floor or minimum rate. The interest rate for senior loans purchased on a when-issued or delayed delivery basis will be determined upon settlement, therefore no interest rate is disclosed. Senior loans often require prepayments from excess cash flows or permit the borrowers to repay at their election. The degree to which borrowers repay cannot be predicted with accuracy. As a result, remaining maturities of senior loans may be less than the stated maturities. Generally, the Fund is contractually obligated to receive approval from the agent bank and/or borrower prior to the disposition of a senior loan. |
| (k) | Variable rate security. The interest rate shown was the current rate as of April 30, 2023. |
| (l) | The rate shown is the seven-day current annualized yield at April 30, 2023. |
| (m) | As defined in the Investment Company Act of 1940, as amended, an affiliated company is one in which the Fund owns 5% or more of the company’s outstanding voting securities, or a company which is under common ownership or control with the Fund. The value of the holdings and transactions in these affiliated companies during the year ended April 30, 2023 are as follows: |
| Affiliated issuers | Beginning of period($) | Purchases($) | Sales($) | Net change in unrealized appreciation (depreciation)($) | End of period($) | Realized gain (loss)($) | Dividends($) | End of period shares |
| Columbia Short-Term Cash Fund, 5.046% | ||||||||
| 108,888,867 | 833,779,883 | (849,048,460) | (13,789) | 93,606,501 | (35,232) | 2,310,524 | 93,643,958 | |
| LIBOR | London Interbank Offered Rate |
| SOFR | Secured Overnight Financing Rate |
| USD | US Dollar |
| ■ | Level 1 — Valuations based on quoted prices for investments in active markets that the Fund has the ability to access at the measurement date. Valuation adjustments are not applied to Level 1 investments. |
| ■ | Level 2 — Valuations based on other significant observable inputs (including quoted prices for similar securities, interest rates, prepayment speeds, credit risks, etc.). |
| ■ | Level 3 — Valuations based on significant unobservable inputs (including the Fund’s own assumptions and judgment in determining the fair value of investments). |
| Columbia Corporate Income Fund | Annual Report 2023 | 21 |
April 30, 2023
The Fund’s Board of Trustees (the Board) has designated the Investment Manager, through its Valuation Committee (the Committee), as valuation designee, responsible for determining the fair value of the assets of the Fund for which market quotations are not readily available using valuation procedures approved by the Board. The Committee consists of voting and non-voting members from various groups within the Investment Manager’s organization, including operations and accounting, trading and investments, compliance, risk management and legal.
| Level 1 ($) | Level 2 ($) | Level 3 ($) | Total ($) | |
| Investments in Securities | ||||
| Common Stocks | ||||
| Financials | 82,507 | — | — | 82,507 |
| Total Common Stocks | 82,507 | — | — | 82,507 |
| Convertible Bonds | — | 221,841 | — | 221,841 |
| Corporate Bonds & Notes | — | 1,495,563,096 | 9,525 | 1,495,572,621 |
| Foreign Government Obligations | — | 480,715 | — | 480,715 |
| Senior Loans | — | 2,781,439 | — | 2,781,439 |
| U.S. Treasury Obligations | — | 59,388,312 | — | 59,388,312 |
| Money Market Funds | 93,606,501 | — | — | 93,606,501 |
| Total Investments in Securities | 93,689,008 | 1,558,435,403 | 9,525 | 1,652,133,936 |
| Investments in Derivatives | ||||
| Asset | ||||
| Futures Contracts | 8,931,818 | — | — | 8,931,818 |
| Liability | ||||
| Futures Contracts | (8,209,799) | — | — | (8,209,799) |
| Total | 94,411,027 | 1,558,435,403 | 9,525 | 1,652,855,955 |
| 22 | Columbia Corporate Income Fund | Annual Report 2023 |
April 30, 2023
| Assets | |
| Investments in securities, at value | |
| Unaffiliated issuers (cost $1,691,011,561) | $1,558,527,435 |
| Affiliated issuers (cost $93,613,920) | 93,606,501 |
| Cash | 4,706 |
| Margin deposits on: | |
| Futures contracts | 4,571,912 |
| Receivable for: | |
| Investments sold | 154,315 |
| Capital shares sold | 5,978,221 |
| Dividends | 292,321 |
| Interest | 15,709,098 |
| Foreign tax reclaims | 14,986 |
| Variation margin for futures contracts | 1,510,523 |
| Expense reimbursement due from Investment Manager | 3,709 |
| Prepaid expenses | 9,483 |
| Trustees’ deferred compensation plan | 174,121 |
| Total assets | 1,680,557,331 |
| Liabilities | |
| Payable for: | |
| Investments purchased on a delayed delivery basis | 43,358,073 |
| Capital shares purchased | 1,924,272 |
| Distributions to shareholders | 5,343,451 |
| Variation margin for futures contracts | 2,013,306 |
| Management services fees | 21,719 |
| Distribution and/or service fees | 715 |
| Transfer agent fees | 163,301 |
| Compensation of board members | 28,226 |
| Other expenses | 40,165 |
| Trustees’ deferred compensation plan | 174,121 |
| Total liabilities | 53,067,349 |
| Net assets applicable to outstanding capital stock | $1,627,489,982 |
| Represented by | |
| Paid in capital | 1,876,509,870 |
| Total distributable earnings (loss) | (249,019,888) |
| Total - representing net assets applicable to outstanding capital stock | $1,627,489,982 |
| Columbia Corporate Income Fund | Annual Report 2023 | 23 |
April 30, 2023
| Class A | |
| Net assets | $93,140,748 |
| Shares outstanding | 10,294,170 |
| Net asset value per share | $9.05 |
| Maximum sales charge | 4.75% |
| Maximum offering price per share (calculated by dividing the net asset value per share by 1.0 minus the maximum sales charge for Class A shares) | $9.50 |
| Advisor Class | |
| Net assets | $115,910,851 |
| Shares outstanding | 12,830,365 |
| Net asset value per share | $9.03 |
| Class C | |
| Net assets | $3,785,293 |
| Shares outstanding | 418,494 |
| Net asset value per share | $9.05 |
| Institutional Class | |
| Net assets | $577,091,623 |
| Shares outstanding | 63,783,143 |
| Net asset value per share | $9.05 |
| Institutional 2 Class | |
| Net assets | $72,771,247 |
| Shares outstanding | 8,053,870 |
| Net asset value per share | $9.04 |
| Institutional 3 Class | |
| Net assets | $764,790,220 |
| Shares outstanding | 84,576,536 |
| Net asset value per share | $9.04 |
| 24 | Columbia Corporate Income Fund | Annual Report 2023 |
Year Ended April 30, 2023
| Net investment income | |
| Income: | |
| Dividends — affiliated issuers | $2,310,524 |
| Interest | 60,316,211 |
| Interfund lending | 1,128 |
| Total income | 62,627,863 |
| Expenses: | |
| Management services fees | 7,340,794 |
| Distribution and/or service fees | |
| Class A | 240,948 |
| Class C | 22,437 |
| Transfer agent fees | |
| Class A | 170,499 |
| Advisor Class | 242,969 |
| Class C | 5,104 |
| Institutional Class | 779,091 |
| Institutional 2 Class | 33,430 |
| Institutional 3 Class | 48,790 |
| Compensation of board members | 37,208 |
| Custodian fees | 14,838 |
| Printing and postage fees | 45,643 |
| Registration fees | 151,640 |
| Accounting services fees | 34,090 |
| Legal fees | 32,432 |
| Compensation of chief compliance officer | 287 |
| Other | 28,984 |
| Total expenses | 9,229,184 |
| Fees waived or expenses reimbursed by Investment Manager and its affiliates | (874,999) |
| Fees waived by transfer agent | |
| Institutional 2 Class | (3,934) |
| Institutional 3 Class | (48,790) |
| Expense reduction | (1,001) |
| Total net expenses | 8,300,460 |
| Net investment income | 54,327,403 |
| Realized and unrealized gain (loss) — net | |
| Net realized gain (loss) on: | |
| Investments — unaffiliated issuers | (102,455,704) |
| Investments — affiliated issuers | (35,232) |
| Futures contracts | 6,980,079 |
| Net realized loss | (95,510,857) |
| Net change in unrealized appreciation (depreciation) on: | |
| Investments — unaffiliated issuers | 68,657,700 |
| Investments — affiliated issuers | (13,789) |
| Futures contracts | (4,988,500) |
| Net change in unrealized appreciation (depreciation) | 63,655,411 |
| Net realized and unrealized loss | (31,855,446) |
| Net increase in net assets resulting from operations | $22,471,957 |
| Columbia Corporate Income Fund | Annual Report 2023 | 25 |
| Year Ended April 30, 2023 | Year Ended April 30, 2022 | |
| Operations | ||
| Net investment income | $54,327,403 | $37,488,969 |
| Net realized loss | (95,510,857) | (2,173,302) |
| Net change in unrealized appreciation (depreciation) | 63,655,411 | (226,095,867) |
| Net increase (decrease) in net assets resulting from operations | 22,471,957 | (190,780,200) |
| Distributions to shareholders | ||
| Net investment income and net realized gains | ||
| Class A | (3,226,634) | (3,854,952) |
| Advisor Class | (4,930,641) | (2,031,592) |
| Class C | (80,248) | (130,378) |
| Institutional Class | (15,586,268) | (18,611,079) |
| Institutional 2 Class | (2,232,056) | (2,203,410) |
| Institutional 3 Class | (28,891,488) | (43,577,361) |
| Total distributions to shareholders | (54,947,335) | (70,408,772) |
| Increase in net assets from capital stock activity | 61,746,003 | 399,692,269 |
| Total increase in net assets | 29,270,625 | 138,503,297 |
| Net assets at beginning of year | 1,598,219,357 | 1,459,716,060 |
| Net assets at end of year | $1,627,489,982 | $1,598,219,357 |
| 26 | Columbia Corporate Income Fund | Annual Report 2023 |
| Year Ended | Year Ended | |||
| April 30, 2023 | April 30, 2022 | |||
| Shares | Dollars ($) | Shares | Dollars ($) | |
| Capital stock activity | ||||
| Class A | ||||
| Subscriptions | 1,145,923 | 10,257,140 | 638,607 | 6,769,881 |
| Fund reorganization | — | — | 5,714,967 | 59,304,731 |
| Distributions reinvested | 341,069 | 3,036,558 | 343,238 | 3,605,192 |
| Redemptions | (2,893,914) | (25,940,328) | (3,212,631) | (32,315,030) |
| Net increase (decrease) | (1,406,922) | (12,646,630) | 3,484,181 | 37,364,774 |
| Advisor Class | ||||
| Subscriptions | 2,491,183 | 22,372,358 | 877,829 | 8,954,563 |
| Fund reorganization | — | — | 24,537,894 | 254,220,549 |
| Distributions reinvested | 372,622 | 3,316,303 | 145,363 | 1,444,471 |
| Redemptions | (10,773,206) | (94,579,339) | (5,808,925) | (57,624,830) |
| Net increase (decrease) | (7,909,401) | (68,890,678) | 19,752,161 | 206,994,753 |
| Class C | ||||
| Subscriptions | 238,787 | 2,117,148 | 53,093 | 553,091 |
| Distributions reinvested | 8,647 | 76,996 | 11,849 | 125,621 |
| Redemptions | (111,909) | (994,134) | (195,053) | (2,044,510) |
| Net increase (decrease) | 135,525 | 1,200,010 | (130,111) | (1,365,798) |
| Institutional Class | ||||
| Subscriptions | 33,329,267 | 299,094,986 | 8,951,136 | 94,457,557 |
| Distributions reinvested | 1,502,621 | 13,398,413 | 1,360,579 | 14,368,616 |
| Redemptions | (12,341,543) | (110,298,480) | (9,054,166) | (95,583,271) |
| Net increase | 22,490,345 | 202,194,919 | 1,257,549 | 13,242,902 |
| Institutional 2 Class | ||||
| Subscriptions | 5,052,342 | 43,885,536 | 2,215,006 | 22,835,824 |
| Distributions reinvested | 251,152 | 2,230,890 | 208,806 | 2,202,458 |
| Redemptions | (2,801,937) | (25,252,147) | (1,448,999) | (15,704,938) |
| Net increase | 2,501,557 | 20,864,279 | 974,813 | 9,333,344 |
| Institutional 3 Class | ||||
| Subscriptions | 18,212,248 | 163,568,303 | 17,930,828 | 191,386,445 |
| Distributions reinvested | 2,969,420 | 26,431,298 | 3,706,220 | 39,133,542 |
| Redemptions | (30,449,107) | (270,975,498) | (9,092,452) | (96,397,693) |
| Net increase (decrease) | (9,267,439) | (80,975,897) | 12,544,596 | 134,122,294 |
| Total net increase | 6,543,665 | 61,746,003 | 37,883,189 | 399,692,269 |
| Columbia Corporate Income Fund | Annual Report 2023 | 27 |
| Net asset value, beginning of period | Net investment income | Net realized and unrealized gain (loss) | Total from investment operations | Distributions from net investment income | Distributions from net realized gains | Total distributions to shareholders | |
| Class A | |||||||
| Year Ended 4/30/2023 | $9.22 | 0.29 | (0.16) | 0.13 | (0.30) | — | (0.30) |
| Year Ended 4/30/2022 | $10.77 | 0.21 | (1.32) | (1.11) | (0.22) | (0.22) | (0.44) |
| Year Ended 4/30/2021 | $10.87 | 0.23 | 0.38 | 0.61 | (0.24) | (0.47) | (0.71) |
| Year Ended 4/30/2020 | $10.15 | 0.29 | 0.72 | 1.01 | (0.29) | — | (0.29) |
| Year Ended 4/30/2019 | $9.88 | 0.30 | 0.27 | 0.57 | (0.30) | — | (0.30) |
| Advisor Class | |||||||
| Year Ended 4/30/2023 | $9.21 | 0.31 | (0.17) | 0.14 | (0.32) | — | (0.32) |
| Year Ended 4/30/2022 | $10.76 | 0.25 | (1.34) | (1.09) | (0.24) | (0.22) | (0.46) |
| Year Ended 4/30/2021 | $10.85 | 0.27 | 0.37 | 0.64 | (0.26) | (0.47) | (0.73) |
| Year Ended 4/30/2020 | $10.14 | 0.32 | 0.71 | 1.03 | (0.32) | — | (0.32) |
| Year Ended 4/30/2019 | $9.87 | 0.33 | 0.27 | 0.60 | (0.33) | — | (0.33) |
| Class C | |||||||
| Year Ended 4/30/2023 | $9.22 | 0.25 | (0.17) | 0.08 | (0.25) | — | (0.25) |
| Year Ended 4/30/2022 | $10.77 | 0.15 | (1.32) | (1.17) | (0.16) | (0.22) | (0.38) |
| Year Ended 4/30/2021 | $10.86 | 0.17 | 0.38 | 0.55 | (0.17) | (0.47) | (0.64) |
| Year Ended 4/30/2020 | $10.15 | 0.23 | 0.71 | 0.94 | (0.23) | — | (0.23) |
| Year Ended 4/30/2019 | $9.88 | 0.24 | 0.27 | 0.51 | (0.24) | — | (0.24) |
| Institutional Class | |||||||
| Year Ended 4/30/2023 | $9.22 | 0.32 | (0.17) | 0.15 | (0.32) | — | (0.32) |
| Year Ended 4/30/2022 | $10.77 | 0.24 | (1.33) | (1.09) | (0.24) | (0.22) | (0.46) |
| Year Ended 4/30/2021 | $10.87 | 0.26 | 0.37 | 0.63 | (0.26) | (0.47) | (0.73) |
| Year Ended 4/30/2020 | $10.15 | 0.32 | 0.72 | 1.04 | (0.32) | — | (0.32) |
| Year Ended 4/30/2019 | $9.88 | 0.33 | 0.27 | 0.60 | (0.33) | — | (0.33) |
| Institutional 2 Class | |||||||
| Year Ended 4/30/2023 | $9.21 | 0.33 | (0.17) | 0.16 | (0.33) | — | (0.33) |
| Year Ended 4/30/2022 | $10.76 | 0.25 | (1.32) | (1.07) | (0.26) | (0.22) | (0.48) |
| Year Ended 4/30/2021 | $10.85 | 0.27 | 0.38 | 0.65 | (0.27) | (0.47) | (0.74) |
| Year Ended 4/30/2020 | $10.14 | 0.33 | 0.71 | 1.04 | (0.33) | — | (0.33) |
| Year Ended 4/30/2019 | $9.87 | 0.35 | 0.26 | 0.61 | (0.34) | — | (0.34) |
| 28 | Columbia Corporate Income Fund | Annual Report 2023 |
| Net asset value, end of period | Total return | Total gross expense ratio to average net assets(a) | Total net expense ratio to average net assets(a),(b) | Net investment income ratio to average net assets | Portfolio turnover | Net assets, end of period (000’s) | |
| Class A | |||||||
| Year Ended 4/30/2023 | $9.05 | 1.51% | 0.94% | 0.87%(c) | 3.31% | 79% | $93,141 |
| Year Ended 4/30/2022 | $9.22 | (10.79%) | 0.92% | 0.87%(c) | 2.03% | 80% | $107,905 |
| Year Ended 4/30/2021 | $10.77 | 5.47% | 0.93% | 0.88%(c) | 2.10% | 74% | $88,537 |
| Year Ended 4/30/2020 | $10.87 | 10.10% | 0.95% | 0.91%(c) | 2.77% | 91% | $68,880 |
| Year Ended 4/30/2019 | $10.15 | 5.93% | 0.93% | 0.91%(c) | 3.07% | 65% | $60,085 |
| Advisor Class | |||||||
| Year Ended 4/30/2023 | $9.03 | 1.65% | 0.69% | 0.62%(c) | 3.51% | 79% | $115,911 |
| Year Ended 4/30/2022 | $9.21 | (10.58%) | 0.67% | 0.62%(c) | 2.54% | 80% | $190,943 |
| Year Ended 4/30/2021 | $10.76 | 5.83% | 0.68% | 0.63%(c) | 2.38% | 74% | $10,624 |
| Year Ended 4/30/2020 | $10.85 | 10.28% | 0.70% | 0.66%(c) | 3.02% | 91% | $18,086 |
| Year Ended 4/30/2019 | $10.14 | 6.20% | 0.68% | 0.66%(c) | 3.32% | 65% | $8,289 |
| Class C | |||||||
| Year Ended 4/30/2023 | $9.05 | 0.95% | 1.50% | 1.42%(c) | 2.82% | 79% | $3,785 |
| Year Ended 4/30/2022 | $9.22 | (11.28%) | 1.54% | 1.42%(c) | 1.41% | 80% | $2,609 |
| Year Ended 4/30/2021 | $10.77 | 4.96% | 1.68% | 1.45%(c) | 1.53% | 74% | $4,450 |
| Year Ended 4/30/2020 | $10.86 | 9.35% | 1.70% | 1.51%(c) | 2.17% | 91% | $5,646 |
| Year Ended 4/30/2019 | $10.15 | 5.29% | 1.68% | 1.51%(c) | 2.45% | 65% | $5,045 |
| Institutional Class | |||||||
| Year Ended 4/30/2023 | $9.05 | 1.76% | 0.70% | 0.62%(c) | 3.62% | 79% | $577,092 |
| Year Ended 4/30/2022 | $9.22 | (10.57%) | 0.67% | 0.62%(c) | 2.24% | 80% | $380,743 |
| Year Ended 4/30/2021 | $10.77 | 5.73% | 0.68% | 0.63%(c) | 2.36% | 74% | $431,331 |
| Year Ended 4/30/2020 | $10.87 | 10.37% | 0.70% | 0.66%(c) | 3.02% | 91% | $364,875 |
| Year Ended 4/30/2019 | $10.15 | 6.19% | 0.68% | 0.66%(c) | 3.31% | 65% | $579,312 |
| Institutional 2 Class | |||||||
| Year Ended 4/30/2023 | $9.04 | 1.86% | 0.57% | 0.52% | 3.74% | 79% | $72,771 |
| Year Ended 4/30/2022 | $9.21 | (10.49%) | 0.56% | 0.52% | 2.34% | 80% | $51,119 |
| Year Ended 4/30/2021 | $10.76 | 5.94% | 0.58% | 0.53% | 2.45% | 74% | $49,251 |
| Year Ended 4/30/2020 | $10.85 | 10.39% | 0.58% | 0.56% | 3.13% | 91% | $6,267 |
| Year Ended 4/30/2019 | $10.14 | 6.29% | 0.59% | 0.58% | 3.52% | 65% | $8,052 |
| Columbia Corporate Income Fund | Annual Report 2023 | 29 |
| Net asset value, beginning of period | Net investment income | Net realized and unrealized gain (loss) | Total from investment operations | Distributions from net investment income | Distributions from net realized gains | Total distributions to shareholders | |
| Institutional 3 Class | |||||||
| Year Ended 4/30/2023 | $9.22 | 0.33 | (0.18) | 0.15 | (0.33) | — | (0.33) |
| Year Ended 4/30/2022 | $10.77 | 0.25 | (1.32) | (1.07) | (0.26) | (0.22) | (0.48) |
| Year Ended 4/30/2021 | $10.86 | 0.28 | 0.38 | 0.66 | (0.28) | (0.47) | (0.75) |
| Year Ended 4/30/2020 | $10.15 | 0.33 | 0.72 | 1.05 | (0.34) | — | (0.34) |
| Year Ended 4/30/2019 | $9.88 | 0.34 | 0.27 | 0.61 | (0.34) | — | (0.34) |
| Notes to Financial Highlights | |
| (a) | In addition to the fees and expenses that the Fund bears directly, the Fund indirectly bears a pro rata share of the fees and expenses of any other funds in which it invests. Such indirect expenses are not included in the Fund’s reported expense ratios. |
| (b) | Total net expenses include the impact of certain fee waivers/expense reimbursements made by the Investment Manager and certain of its affiliates, if applicable. |
| (c) | The benefits derived from expense reductions had an impact of less than 0.01%. |
| 30 | Columbia Corporate Income Fund | Annual Report 2023 |
| Net asset value, end of period | Total return | Total gross expense ratio to average net assets(a) | Total net expense ratio to average net assets(a),(b) | Net investment income ratio to average net assets | Portfolio turnover | Net assets, end of period (000’s) | |
| Institutional 3 Class | |||||||
| Year Ended 4/30/2023 | $9.04 | 1.80% | 0.52% | 0.47% | 3.71% | 79% | $764,790 |
| Year Ended 4/30/2022 | $9.22 | (10.43%) | 0.51% | 0.47% | 2.39% | 80% | $864,900 |
| Year Ended 4/30/2021 | $10.77 | 5.99% | 0.52% | 0.47% | 2.49% | 74% | $875,524 |
| Year Ended 4/30/2020 | $10.86 | 10.44% | 0.53% | 0.50% | 3.17% | 91% | $556,117 |
| Year Ended 4/30/2019 | $10.15 | 6.34% | 0.53% | 0.52% | 3.44% | 65% | $442,521 |
| Columbia Corporate Income Fund | Annual Report 2023 | 31 |
April 30, 2023
| 32 | Columbia Corporate Income Fund | Annual Report 2023 |
April 30, 2023
| Columbia Corporate Income Fund | Annual Report 2023 | 33 |
April 30, 2023
| 34 | Columbia Corporate Income Fund | Annual Report 2023 |
April 30, 2023
| Asset derivatives | ||
| Risk exposure category | Statement of assets and liabilities location | Fair value ($) |
| Interest rate risk | Component of total distributable earnings (loss) — unrealized appreciation on futures contracts | 8,931,818* |
| Liability derivatives | ||
| Risk exposure category | Statement of assets and liabilities location | Fair value ($) |
| Interest rate risk | Component of total distributable earnings (loss) — unrealized depreciation on futures contracts | 8,209,799* |
| * | Includes cumulative appreciation (depreciation) as reported in the tables following the Portfolio of Investments. Only the current day’s variation margin is reported in receivables or payables in the Statement of Assets and Liabilities. |
| Amount of realized gain (loss) on derivatives recognized in income | ||||||
| Risk exposure category | Futures contracts ($) | |||||
| Interest rate risk | 6,980,079 | |||||
| Change in unrealized appreciation (depreciation) on derivatives recognized in income | ||||||
| Risk exposure category | Futures contracts ($) | |||||
| Interest rate risk | (4,988,500) | |||||
| Derivative instrument | Average notional amounts ($)* |
| Futures contracts — long | 388,268,122 |
| Futures contracts — short | 341,763,672 |
| * | Based on the ending quarterly outstanding amounts for the year ended April 30, 2023. |
| Columbia Corporate Income Fund | Annual Report 2023 | 35 |
April 30, 2023
| 36 | Columbia Corporate Income Fund | Annual Report 2023 |
April 30, 2023
| Columbia Corporate Income Fund | Annual Report 2023 | 37 |
April 30, 2023
| 38 | Columbia Corporate Income Fund | Annual Report 2023 |
April 30, 2023
| Effective rate (%) | |
| Class A | 0.18 |
| Advisor Class | 0.17 |
| Class C | 0.18 |
| Institutional Class | 0.18 |
| Institutional 2 Class | 0.05 |
| Institutional 3 Class | 0.00 |
| Front End (%) | CDSC (%) | Amount ($) | |
| Class A | 4.75 | 0.50 - 1.00(a) | 36,893 |
| Class C | — | 1.00(b) | 316 |
| (a) | This charge is imposed on certain investments of between $1 million and $50 million redeemed within 18 months after purchase, as follows: 1.00% if redeemed within 12 months after purchase, and 0.50% if redeemed more than 12, but less than 18, months after purchase, with certain limited exceptions. |
| (b) | This charge applies to redemptions within 12 months after purchase, with certain limited exceptions. |
| Columbia Corporate Income Fund | Annual Report 2023 | 39 |
April 30, 2023
| September 1, 2021 through August 31, 2024 | |||||
| Class A | 0.87% | ||||
| Advisor Class | 0.62 | ||||
| Class C | 1.42 | ||||
| Institutional Class | 0.62 | ||||
| Institutional 2 Class | 0.52 | ||||
| Institutional 3 Class | 0.47 |
| Excess of distributions over net investment income ($) | Accumulated net realized (loss) ($) | Paid in capital ($) |
| 403,125 | (403,124) | (1) |
| 40 | Columbia Corporate Income Fund | Annual Report 2023 |
April 30, 2023
| Year Ended April 30, 2023 | Year Ended April 30, 2022 | ||||
| Ordinary income ($) | Long-term capital gains ($) | Total ($) | Ordinary income ($) | Long-term capital gains ($) | Total ($) |
| 54,947,335 | — | 54,947,335 | 47,640,113 | 22,768,659 | 70,408,772 |
| Undistributed ordinary income ($) | Undistributed long-term capital gains ($) | Capital loss carryforwards ($) | Net unrealized (depreciation) ($) |
| 5,187,007 | — | (107,765,180) | (140,896,845) |
| Federal tax cost ($) | Gross unrealized appreciation ($) | Gross unrealized (depreciation) ($) | Net unrealized (depreciation) ($) |
| 1,793,752,799 | 3,356,097 | (144,252,942) | (140,896,845) |
| No expiration short-term ($) | No expiration long-term ($) | Total ($) | Utilized ($) |
| (44,928,785) | (62,836,395) | (107,765,180) | — |
| Columbia Corporate Income Fund | Annual Report 2023 | 41 |
April 30, 2023
| Borrower or lender | Average loan balance ($) | Weighted average interest rate (%) | Number of days with outstanding loans |
| Lender | 850,000 | 4.75 | 10 |
| 42 | Columbia Corporate Income Fund | Annual Report 2023 |
April 30, 2023
| Shares | |
| Class A | 5,714,967 |
| Advisor Class | 24,537,894 |
| ($) | |
| Net investment income | 45,018,000 |
| Net realized gain | 9,130,000 |
| Net change in unrealized appreciation/(depreciation) | (240,761,000) |
| Net decrease in net assets from operations | (186,613,000) |
| Columbia Corporate Income Fund | Annual Report 2023 | 43 |
April 30, 2023
| 44 | Columbia Corporate Income Fund | Annual Report 2023 |
April 30, 2023
| Columbia Corporate Income Fund | Annual Report 2023 | 45 |
| 46 | Columbia Corporate Income Fund | Annual Report 2023 |
| Section 163(j) Interest Dividends | |
| 99.80% |
| Name, address, year of birth | Position held with the Columbia Funds and length of service | Principal occupation(s) during past five years and other relevant professional experience | Number of Funds in the Columbia Funds Complex* overseen | Other directorships held by Trustee during the past five years and other relevant Board experience |
| George S. Batejan c/o Columbia Management Investment Advisers, LLC 290 Congress Street Boston, MA 02210 1954 | Trustee since 2017 | Executive Vice President, Global Head of Technology and Operations, Janus Capital Group, Inc., 2010-2016 | 174 | Former Chairman of the Board, NICSA (National Investment Company Services Association) (Executive Committee, Nominating Committee and Governance Committee), 2014-2016; former Director, Intech Investment Management, 2011-2016; former Board Member, Metro Denver Chamber of Commerce, 2015-2016; former Advisory Board Member, University of Colorado Business School, 2015-2018; former Board Member, Chase Bank International, 1993-1994 |
| Columbia Corporate Income Fund | Annual Report 2023 | 47 |
(Unaudited)
Independent trustees (continued)
| Name, address, year of birth | Position held with the Columbia Funds and length of service | Principal occupation(s) during past five years and other relevant professional experience | Number of Funds in the Columbia Funds Complex* overseen | Other directorships held by Trustee during the past five years and other relevant Board experience |
| Kathleen Blatz c/o Columbia Management Investment Advisers, LLC 290 Congress Street Boston, MA 02210 1954 | Trustee since 2006 | Attorney, specializing in arbitration and mediation; Chief Justice, Minnesota Supreme Court, 1998-2006; Associate Justice, Minnesota Supreme Court, 1996-1998; Fourth Judicial District Court Judge, Hennepin County, 1994-1996; Attorney in private practice and public service, 1984-1993; State Representative, Minnesota House of Representatives, 1979-1993, which included service on the Tax and Financial Institutions and Insurance Committees; Member and Interim Chair, Minnesota Sports Facilities Authority, January-July 2017; Interim President and Chief Executive Officer, Blue Cross and Blue Shield of Minnesota (health care insurance), February-July 2018, April-October 2021 | 174 | Former Trustee, Blue Cross and Blue Shield of Minnesota, 2009-2021 (Chair of the Business Development Committee, 2014-2017; Chair of the Governance Committee, 2017-2019); former Member and Chair of the Board, Minnesota Sports Facilities Authority, January 2017-July 2017; former Director, Robina Foundation, 2009-2020 (Chair, 2014-2020); Director, Richard M. Schulze Family Foundation, since 2021 |
| Pamela G. Carlton c/o Columbia Management Investment Advisers, LLC 290 Congress Street Boston, MA 02210 1954 | Chair since 2023; Trustee since 2007 | President, Springboard — Partners in Cross Cultural Leadership (consulting company), since 2003; Managing Director of US Equity Research, JP Morgan Chase, 1999-2003; Director of US Equity Research, Chase Asset Management, 1996-1999; Co-Director Latin America Research, 1993-1996, COO Global Research, 1992-1996, Co-Director of US Research, 1991-1992, Investment Banker, 1982-1991, Morgan Stanley; Attorney, Cleary Gottlieb Steen & Hamilton LLP, 1980-1982 | 174 | Trustee, New York Presbyterian Hospital Board, since 1996; Director, DR Bank (Audit Committee) since 2017; Director, Evercore Inc. (Audit Committee, Nominating and Governance Committee), since 2019; Director, Apollo Commercial Real Estate Finance, Inc. (Chair, Nominating and Governance Committee) (financial services), since 2021; the Governing Council of the Independent Directors Council (IDC), since 2021 |
| Janet Langford Carrig c/o Columbia Management Investment Advisers, LLC 290 Congress Street Boston, MA 02210 1957 | Trustee since 1996 | Senior Vice President, General Counsel and Corporate Secretary, ConocoPhillips (independent energy company), September 2007-October 2018 | 174 | Director, EQT Corporation (natural gas producer), since 2019; former Director, Whiting Petroleum Corporation (independent oil and gas company), 2020-2022 |
| J. Kevin Connaughton c/o Columbia Management Investment Advisers, LLC 290 Congress Street Boston, MA 02210 1964 | Trustee since 2020 | CEO and President, RhodeWay Financial (non-profit financial planning firm), since December 2022; Member, FINRA National Adjudicatory Council, since January 2020; Adjunct Professor of Finance, Bentley University since January 2018; Consultant to Independent Trustees of CFVIT and CFST I from March 2016 to June 2020 with respect to CFVIT and to December 2020 with respect to CFST I; Managing Director and General Manager of Mutual Fund Products, Columbia Management Investment Advisers, LLC, May 2010-February 2015; President, Columbia Funds, 2008-2015; and senior officer of Columbia Funds and affiliated funds, 2003-2015 | 172 | Former Director, The Autism Project, March 2015-December 2021; former Member of the Investment Committee, St. Michael’s College, November 2015-February 2020; former Trustee, St. Michael’s College, June 2017-September 2019; former Trustee, New Century Portfolios (former mutual fund complex), January 2015-December 2017 |
| 48 | Columbia Corporate Income Fund | Annual Report 2023 |
(Unaudited)
Independent trustees (continued)
| Name, address, year of birth | Position held with the Columbia Funds and length of service | Principal occupation(s) during past five years and other relevant professional experience | Number of Funds in the Columbia Funds Complex* overseen | Other directorships held by Trustee during the past five years and other relevant Board experience |
| Olive M. Darragh c/o Columbia Management Investment Advisers, LLC 290 Congress Street Boston, MA 02210 1962 | Trustee since 2020 | Managing Director of Darragh Inc. (strategy and talent management consulting firm), since 2010; Founder and CEO, Zolio, Inc. (investment management talent identification platform), since 2004; Consultant to Independent Trustees of CFVIT and CFST I from June 2019 to June 2020 with respect to CFVIT and to December 2020 with respect to CFST I; Partner, Tudor Investments, 2004-2010; Senior Partner, McKinsey & Company (consulting), 1990-2004; Touche Ross CPA, 1985-1988 | 172 | Treasurer, Edinburgh University US Trust Board, since January 2023; Member, HBS Community Action Partners Board, since September 2022; former Director, University of Edinburgh Business School (Member of US Board), 2004-2019; former Director, Boston Public Library Foundation, 2008-2017 |
| Patricia M. Flynn c/o Columbia Management Investment Advisers, LLC 290 Congress Street Boston, MA 02210 1950 | Trustee since 2004 | Professor of Economics and Management, Bentley University, since 2002; Dean, McCallum Graduate School of Business, Bentley University, 1992-2002 | 174 | Former Trustee, MA Taxpayers Foundation, 1997-2022; former Director, The MA Business Roundtable, 2003-2019; former Chairperson, Innovation Index Advisory Committee, MA Technology Collaborative, 1997-2020 |
| Brian J. Gallagher c/o Columbia Management Investment Advisers, LLC 290 Congress Street Boston, MA 02210 1954 | Trustee since 2017 | Retired; Partner with Deloitte & Touche LLP and its predecessors, 1977-2016 | 174 | Trustee, Catholic Schools Foundation, since 2004 |
| Douglas A. Hacker c/o Columbia Management Investment Advisers, LLC 290 Congress Street Boston, MA 02210 1955 | Trustee since 1996 | Independent business executive, since May 2006; Executive Vice President – Strategy of United Airlines, December 2002 - May 2006; President of UAL Loyalty Services (airline marketing company), September 2001-December 2002; Executive Vice President and Chief Financial Officer of United Airlines, July 1999-September 2001 | 174 | Director, SpartanNash Company since November 2013 (Chair of the Board, since May 2021) (food distributor); Director, Aircastle Limited (Chair of Audit Committee) (aircraft leasing), since August 2006; former Director, Nash Finch Company (food distributor), 2005-2013; former Director, SeaCube Container Leasing Ltd. (container leasing), 2010-2013; and former Director, Travelport Worldwide Limited (travel information technology), 2014-2019 |
| Nancy T. Lukitsh c/o Columbia Management Investment Advisers, LLC 290 Congress Street Boston, MA 02210 1956 | Trustee since 2011 | Senior Vice President, Partner and Director of Marketing, Wellington Management Company, LLP (investment adviser), 1997-2010; Chair, Wellington Management Portfolios (commingled non-U.S. investment pools), 2007-2010; Director, Wellington Trust Company, NA and other Wellington affiliates, 1997-2010 | 172 | None |
| Columbia Corporate Income Fund | Annual Report 2023 | 49 |
(Unaudited)
Independent trustees (continued)
| Name, address, year of birth | Position held with the Columbia Funds and length of service | Principal occupation(s) during past five years and other relevant professional experience | Number of Funds in the Columbia Funds Complex* overseen | Other directorships held by Trustee during the past five years and other relevant Board experience |
| David M. Moffett c/o Columbia Management Investment Advisers, LLC 290 Congress Street Boston, MA 02210 1952 | Trustee since 2011 | Retired; former Chief Executive Officer of Freddie Mac and Chief Financial Officer of U.S. Bank | 172 | Director, CSX Corporation (transportation suppliers); Director, PayPal Holdings Inc. (payment and data processing services); Trustee, University of Oklahoma Foundation; former Director, eBay Inc. (online trading community), 2007-2015; and former Director, CIT Bank, CIT Group Inc. (commercial and consumer finance), 2010-2016; former Senior Adviser to The Carlyle Group (financial services), March 2008-September 2008; former Governance Consultant to Bridgewater Associates, January 2013-December 2015 |
| Catherine James Paglia c/o Columbia Management Investment Advisers, LLC 290 Congress Street Boston, MA 02210 1952 | Trustee since 2004 | Director, Enterprise Asset Management, Inc. (private real estate and asset management company), since September 1998; Managing Director and Partner, Interlaken Capital, Inc., 1989-1997; Vice President, 1982-1985, Principal, 1985-1987, Managing Director, 1987-1989, Morgan Stanley; Vice President, Investment Banking, 1980-1982, Associate, Investment Banking, 1976-1980, Dean Witter Reynolds, Inc. | 174 | Director, Valmont Industries, Inc. (irrigation systems manufacturer), since 2012; Trustee, Carleton College (on the Investment Committee), since 1987; Trustee, Carnegie Endowment for International Peace (on the Investment Committee), since 2009 |
| Natalie A. Trunow c/o Columbia Management Investment Advisers, LLC 290 Congress Street Boston, MA 02210 1967 | Trustee since 2020 | Chief Executive Officer, Millennial Portfolio Solutions LLC (asset management and consulting services), January 2016-January 2021; Non-executive Member of the Investment Committee and Valuation Committee, Sarona Asset Management Inc. (private equity firm) since September 2019; Advisor, Horizon Investments (asset management and consulting services), August 2018-January 2022; Advisor, Paradigm Asset Management, November 2016-January 2022; Consultant to Independent Trustees of CFVIT and CFST I from September 2016 to June 2020 with respect to CFVIT and to December 2020 with respect to CFST I; Director of Investments/Consultant, Casey Family Programs, April 2016-November 2016; Senior Vice President and Chief Investment Officer, Calvert Investments, August 2008-January 2016; Section Head and Portfolio Manager, General Motors Asset Management, June 1997-August 2008 | 172 | Independent Director, Investment Committee, Health Services for Children with Special Needs, Inc., 2010-2021; Independent Director, (Executive Committee and Chair, Audit Committee), Consumer Credit Counseling Services (formerly Guidewell Financial Solutions), since 2016; Independent Director, (Investment Committee), Sarona Asset Management, since 2019 |
| 50 | Columbia Corporate Income Fund | Annual Report 2023 |
(Unaudited)
Independent trustees (continued)
| Name, address, year of birth | Position held with the Columbia Funds and length of service | Principal occupation(s) during past five years and other relevant professional experience | Number of Funds in the Columbia Funds Complex* overseen | Other directorships held by Trustee during the past five years and other relevant Board experience |
| Sandra L. Yeager c/o Columbia Management Investment Advisers, LLC 290 Congress Street Boston, MA 02210 1964 | Trustee since 2017 | Retired; President and founder, Hanoverian Capital, LLC (SEC registered investment advisor firm), 2008-2016; Managing Director, DuPont Capital, 2006-2008; Managing Director, Morgan Stanley Investment Management, 2004-2006; Senior Vice President, Alliance Bernstein, 1990-2004 | 174 | Former Director, NAPE (National Alliance for Partnerships in Equity) Education Foundation, October 2016-October 2020; Advisory Board, Jennersville YMCA, since 2022 |
| Name, address, year of birth | Position held with the Columbia Funds and length of service | Principal occupation(s) during the past five years and other relevant professional experience | Number of Funds in the Columbia Funds Complex overseen | Other directorships held by Trustee during the past five years and other relevant Board experience |
| Daniel J. Beckman c/o Columbia Management Investment Advisers, LLC 290 Congress Street Boston, MA 02210 1962 | Trustee since November 2021 and President since June 2021 | Vice President – Head of North America Product, Columbia Management Investment Advisers, LLC, since April 2015; President and Principal Executive Officer of the Columbia Funds, since June 2021; officer of Columbia Funds and affiliated funds, 2020-2021 | 174 | Director, Ameriprise Trust Company, since October 2016; Director, Columbia Management Investment Distributors, Inc. since November 2018; Board of Governors, Columbia Wanger Asset Management, LLC since, January 2022; Director, Columbia Threadneedle Canada, Inc., since December 2022 |
| * | The term “Columbia Funds Complex” as used herein includes Columbia Seligman Premium Technology Growth Fund, Tri-Continental Corporation and each series of Columbia Funds Series Trust (CFST), Columbia Funds Series Trust I (CFST I), Columbia Funds Series Trust II (CFST II), Columbia ETF Trust I (CET I), Columbia ETF Trust II (CET II), Columbia Funds Variable Insurance Trust (CFVIT) and Columbia Funds Variable Series Trust II (CFVST II). Messrs. Batejan, Beckman, Gallagher and Hacker and Mses. Blatz, Carlton, Carrig, Flynn, Paglia, and Yeager serve as directors of Columbia Seligman Premium Technology Growth Fund and Tri-Continental Corporation. |
| ** | Interested person (as defined under the 1940 Act) by reason of being an officer, director, security holder and/or employee of the Investment Manager or Ameriprise Financial. |
| Columbia Corporate Income Fund | Annual Report 2023 | 51 |
(Unaudited)
The Board has appointed officers who are responsible for day-to-day business decisions based on policies it has established. The officers serve at the pleasure of the Board. The following table provides basic information about the Officers of the Fund as of the printing of this report, including principal occupations during the past five years, although their specific titles may have varied over the period. In addition to Mr. Beckman, who is President and Principal Executive Officer, the Fund’s other officers are:
| Name, address and year of birth | Position and year first appointed to position for any Fund in the Columbia Funds Complex or a predecessor thereof | Principal occupation(s) during past five years |
| Michael G. Clarke 290 Congress Street Boston, MA 02210 1969 | Chief Financial Officer and Principal Financial Officer (2009) and Senior Vice President (2019) | Senior Vice President and Head of North America Operations & Investor Services, Columbia Management Investment Advisers, LLC, since June 2023 (previously Senior Vice President and Head of Global Operations, March 2022 – June 2023, Vice President, Head of North America Operations, and Co-Head of Global Operations, June 2019 - February 2022 and Vice President – Accounting and Tax, May 2010 - May 2019); senior officer of Columbia Funds and affiliated funds, since 2002. |
| Joseph Beranek 5890 Ameriprise Financial Center Minneapolis, MN 55474 1965 | Treasurer and Chief Accounting Officer (Principal Accounting Officer) (2019) and Principal Financial Officer (2020), CFST, CFST I, CFST II, CFVIT and CFVST II; Assistant Treasurer, CET I and CET II | Vice President – Mutual Fund Accounting and Financial Reporting, Columbia Management Investment Advisers, LLC, since December 2018 and March 2017, respectively. |
| Marybeth Pilat 290 Congress Street Boston, MA 02210 1968 | Treasurer and Chief Accounting Officer (Principal Accounting Officer) and Principal Financial Officer (2020) for CET I and CET II; Assistant Treasurer, CFST, CFST I, CFST II, CFVIT and CFVST II | Vice President – Product Pricing and Administration, Columbia Management Investment Advisers, LLC, since May 2017. |
| William F. Truscott 290 Congress Street Boston, MA 02210 1960 | Senior Vice President (2001) | Formerly, Trustee/Director of Columbia Funds Complex or legacy funds, November 2001-January 1, 2021; Chief Executive Officer, Global Asset Management, Ameriprise Financial, Inc., since September 2012; Chairman of the Board and President, Columbia Management Investment Advisers, LLC, since July 2004 and February 2012, respectively; Chairman of the Board and Chief Executive Officer, Columbia Management Investment Distributors, Inc., since November 2008 and February 2012, respectively; Chairman of the Board and Director, Threadneedle Asset Management Holdings, Sàrl, since March 2013 and December 2008, respectively; senior executive of various entities affiliated with Columbia Threadneedle. |
| Christopher O. Petersen 5228 Ameriprise Financial Center Minneapolis, MN 55474 1970 | Senior Vice President and Assistant Secretary (2021) | Formerly, Trustee/Director of funds within the Columbia Funds Complex, July 1, 2020 - November 22, 2021; Senior Vice President and Assistant General Counsel, Ameriprise Financial, Inc., since September 2021 (previously Vice President and Lead Chief Counsel, January 2015 - September 2021); formerly, President and Principal Executive Officer of the Columbia Funds, 2015 - 2021; officer of Columbia Funds and affiliated funds, since 2007. |
| Thomas P. McGuire 290 Congress Street Boston, MA 02210 1972 | Senior Vice President and Chief Compliance Officer (2012) | Vice President – Asset Management Compliance, Ameriprise Financial, Inc., since May 2010; Chief Compliance Officer, Columbia Acorn/Wanger Funds, since December 2015; formerly, Chief Compliance Officer, Ameriprise Certificate Company, September 2010 – September 2020. |
| Ryan C. Larrenaga 290 Congress Street Boston, MA 02210 1970 | Senior Vice President (2017), Chief Legal Officer (2017), and Secretary (2015) | Vice President and Chief Counsel, Ameriprise Financial, Inc., since August 2018 (previously Vice President and Group Counsel, August 2011 - August 2018); Chief Legal Officer, Columbia Acorn/Wanger Funds, since September 2020; officer of Columbia Funds and affiliated funds, since 2005. |
| 52 | Columbia Corporate Income Fund | Annual Report 2023 |
(Unaudited)
Fund officers (continued)
| Name, address and year of birth | Position and year first appointed to position for any Fund in the Columbia Funds Complex or a predecessor thereof | Principal occupation(s) during past five years |
| Michael E. DeFao 290 Congress Street Boston, MA 02210 1968 | Vice President (2011) and Assistant Secretary (2010) | Vice President and Chief Counsel, Ameriprise Financial, Inc., since May 2010; Vice President, Chief Legal Officer and Assistant Secretary, Columbia Management Investment Advisers, LLC, since October 2021 (previously Vice President and Assistant Secretary, May 2010 – September 2021). |
| Lyn Kephart-Strong 5228 Ameriprise Financial Center Minneapolis, MN 55474 1960 | Vice President (2015) | Vice President, Global Investment Operations Services, Columbia Management Investment Advisers, LLC, since 2010; President, Columbia Management Investment Services Corp., since October 2014; President, Ameriprise Trust Company, since January 2017. |
| • | the Fund had sufficient liquidity to both meet redemptions and operate effectively on behalf of shareholders; |
| • | there were no material changes to the Program during the period; |
| • | the implementation of the Program was effective to manage the Fund’s liquidity risk; and |
| • | the Program operated adequately during the period. |
| Columbia Corporate Income Fund | Annual Report 2023 | 53 |
columbiathreadneedleus.com/investor/. The Fund is distributed by Columbia Management Investment Distributors, Inc., member FINRA, and managed by Columbia Management Investment Advisers, LLC.

April 30, 2023

| 3 | |
| 5 | |
| 6 | |
| 7 | |
| 11 | |
| 12 | |
| 13 | |
| 16 | |
| 20 | |
| 28 | |
| 29 | |
| 29 | |
| 35 |
(Unaudited)
| Average annual total returns (%) (for the period ended April 30, 2023) | ||||||
| Inception | 1 Year | 5 Years | 10 Years | |||
| Class A | 11/25/02 | -1.26 | 0.67 | 0.51 | ||
| Class C | Excluding sales charges | 11/25/02 | -1.90 | 0.00 | -0.16 | |
| Including sales charges | -2.87 | 0.00 | -0.16 | |||
| Institutional Class | 06/04/91 | -1.02 | 0.84 | 0.68 | ||
| Institutional 2 Class | 11/08/12 | -1.02 | 0.84 | 0.67 | ||
| Institutional 3 Class* | 03/01/17 | -1.00 | 0.85 | 0.68 | ||
| FTSE USBIG Treasury Index | -1.04 | 1.01 | 0.86 | |||
| * | The returns shown for periods prior to the share class inception date (including returns for the Life of the Fund, if shown, which are since Fund inception) include the returns of the Fund’s oldest share class. These returns are adjusted to reflect any higher class-related operating expenses of the newer share classes, as applicable. Please visit columbiathreadneedleus.com/investor/investment-products/mutual-funds/appended-performance for more information. |
| Columbia U.S. Treasury Index Fund | Annual Report 2023 | 3 |
(Unaudited)
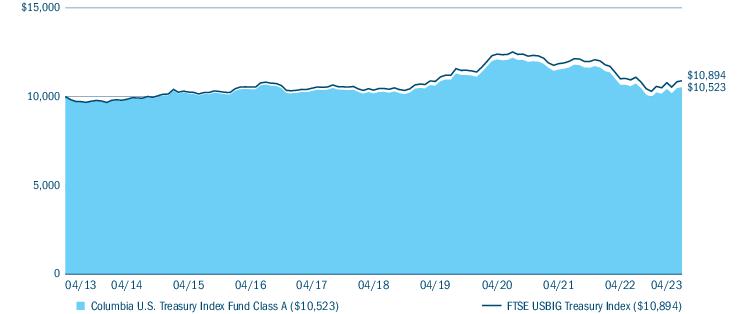
| Portfolio breakdown (%) (at April 30, 2023) | |
| Money Market Funds | 0.3 |
| U.S. Treasury Obligations | 99.7 |
| Total | 100.0 |
| Quality breakdown (%) (at April 30, 2023) | |
| AAA rating | 100.0 |
| Total | 100.0 |
| 4 | Columbia U.S. Treasury Index Fund | Annual Report 2023 |
(Unaudited)
| • | The Fund attempts to match the return of its benchmark, the unmanaged FTSE USBIG Treasury Index. |
| • | The negative return for the benchmark was driven by securities with longer than 10-year maturities with a total return of -7.33%. |
| • | The front end of the yield curve actually posted a positive return of 0.93% as the shorter duration (interest rate sensitivity) of these issues mitigated the negative price pressure and the benchmark was able to capture the higher yields as the market priced higher. |
| Columbia U.S. Treasury Index Fund | Annual Report 2023 | 5 |
(Unaudited)
| November 1, 2022 — April 30, 2023 | |||||||
| Account value at the beginning of the period ($) | Account value at the end of the period ($) | Expenses paid during the period ($) | Fund’s annualized expense ratio (%) | ||||
| Actual | Hypothetical | Actual | Hypothetical | Actual | Hypothetical | Actual | |
| Class A | 1,000.00 | 1,000.00 | 1,055.30 | 1,022.95 | 1.61 | 1.59 | 0.32 |
| Class C | 1,000.00 | 1,000.00 | 1,051.90 | 1,019.76 | 4.88 | 4.80 | 0.97 |
| Institutional Class | 1,000.00 | 1,000.00 | 1,057.10 | 1,023.69 | 0.86 | 0.84 | 0.17 |
| Institutional 2 Class | 1,000.00 | 1,000.00 | 1,057.20 | 1,023.69 | 0.86 | 0.84 | 0.17 |
| Institutional 3 Class | 1,000.00 | 1,000.00 | 1,056.80 | 1,023.69 | 0.86 | 0.84 | 0.17 |
| 6 | Columbia U.S. Treasury Index Fund | Annual Report 2023 |
April 30, 2023
| U.S. Treasury Obligations 99.1% | ||||
| Issuer | Coupon Rate | Principal Amount ($) | Value ($) | |
| U.S. Treasury | ||||
| 04/30/2024 | 2.250% | 3,269,000 | 3,186,253 | |
| 04/30/2024 | 2.500% | 5,548,000 | 5,421,870 | |
| 05/15/2024 | 0.250% | 3,575,000 | 3,410,354 | |
| 05/15/2024 | 2.500% | 6,789,000 | 6,629,087 | |
| 05/31/2024 | 2.000% | 5,566,000 | 5,402,064 | |
| 05/31/2024 | 2.500% | 3,610,000 | 3,522,711 | |
| 06/15/2024 | 0.250% | 5,958,000 | 5,669,409 | |
| 06/30/2024 | 1.750% | 3,540,000 | 3,423,844 | |
| 06/30/2024 | 2.000% | 2,523,000 | 2,447,113 | |
| 06/30/2024 | 3.000% | 5,474,000 | 5,370,507 | |
| 07/15/2024 | 0.375% | 4,660,000 | 4,430,459 | |
| 07/31/2024 | 1.750% | 5,053,000 | 4,878,514 | |
| 07/31/2024 | 2.125% | 2,640,000 | 2,560,594 | |
| 07/31/2024 | 3.000% | 4,847,000 | 4,753,279 | |
| 08/15/2024 | 0.375% | 5,951,000 | 5,642,059 | |
| 08/15/2024 | 2.375% | 6,973,000 | 6,782,604 | |
| 08/31/2024 | 1.250% | 2,535,000 | 2,427,956 | |
| 08/31/2024 | 1.875% | 3,131,000 | 3,023,617 | |
| 08/31/2024 | 3.250% | 5,805,000 | 5,710,442 | |
| 09/15/2024 | 0.375% | 6,794,000 | 6,426,699 | |
| 09/30/2024 | 1.500% | 4,452,000 | 4,273,920 | |
| 09/30/2024 | 2.125% | 3,081,000 | 2,984,117 | |
| 09/30/2024 | 4.250% | 4,908,000 | 4,894,388 | |
| 10/15/2024 | 0.625% | 8,143,000 | 7,709,131 | |
| 10/31/2024 | 1.500% | 4,952,000 | 4,745,602 | |
| 10/31/2024 | 2.250% | 3,416,000 | 3,310,184 | |
| 10/31/2024 | 4.375% | 6,329,000 | 6,326,280 | |
| 11/15/2024 | 0.750% | 4,291,000 | 4,062,370 | |
| 11/15/2024 | 2.250% | 5,395,000 | 5,225,142 | |
| 11/30/2024 | 1.500% | 2,174,000 | 2,081,095 | |
| 11/30/2024 | 2.125% | 346,000 | 334,458 | |
| 11/30/2024 | 4.500% | 3,726,000 | 3,734,878 | |
| 12/15/2024 | 1.000% | 6,928,000 | 6,572,940 | |
| 12/31/2024 | 1.750% | 4,831,000 | 4,637,571 | |
| 12/31/2024 | 2.250% | 1,789,000 | 1,730,997 | |
| 12/31/2024 | 4.250% | 3,969,000 | 3,967,295 | |
| 01/15/2025 | 1.125% | 5,967,000 | 5,662,357 | |
| 01/31/2025 | 1.375% | 3,425,000 | 3,263,383 | |
| 01/31/2025 | 2.500% | 2,209,000 | 2,145,405 | |
| 01/31/2025 | 4.125% | 5,038,000 | 5,030,128 | |
| 02/15/2025 | 1.500% | 6,436,000 | 6,138,335 | |
| 02/15/2025 | 2.000% | 5,435,000 | 5,230,975 | |
| 02/28/2025 | 1.125% | 3,322,000 | 3,146,168 | |
| 02/28/2025 | 2.750% | 2,043,000 | 1,992,643 | |
| 02/28/2025 | 4.625% | 4,925,000 | 4,965,978 | |
| 03/15/2025 | 1.750% | 5,249,000 | 5,024,277 | |
| 03/31/2025 | 0.500% | 4,875,000 | 4,557,173 | |
| 03/31/2025 | 2.625% | 1,424,000 | 1,385,563 | |
| 03/31/2025 | 3.875% | 6,942,000 | 6,914,069 | |
| 04/15/2025 | 2.625% | 5,882,000 | 5,719,785 | |
| 04/30/2025 | 0.375% | 4,205,000 | 3,909,993 | |
| 04/30/2025 | 2.875% | 3,597,000 | 3,513,679 | |
| 05/15/2025 | 2.125% | 5,903,000 | 5,679,793 | |
| 05/15/2025 | 2.750% | 4,352,000 | 4,241,500 | |
| U.S. Treasury Obligations (continued) | ||||
| Issuer | Coupon Rate | Principal Amount ($) | Value ($) | |
| 05/31/2025 | 0.250% | 5,499,000 | 5,087,434 | |
| 05/31/2025 | 2.875% | 2,362,000 | 2,307,563 | |
| 06/15/2025 | 2.875% | 5,192,000 | 5,072,341 | |
| 06/30/2025 | 0.250% | 5,929,000 | 5,479,693 | |
| 06/30/2025 | 2.750% | 3,280,000 | 3,195,181 | |
| 07/15/2025 | 3.000% | 5,781,000 | 5,661,767 | |
| 07/31/2025 | 0.250% | 5,390,000 | 4,964,695 | |
| 07/31/2025 | 2.875% | 2,468,000 | 2,410,928 | |
| 08/15/2025 | 2.000% | 6,371,000 | 6,102,721 | |
| 08/15/2025 | 3.125% | 4,667,000 | 4,583,140 | |
| 08/31/2025 | 0.250% | 4,979,000 | 4,575,234 | |
| 08/31/2025 | 2.750% | 2,414,000 | 2,352,141 | |
| 09/15/2025 | 3.500% | 5,489,000 | 5,438,827 | |
| 09/30/2025 | 0.250% | 5,798,000 | 5,323,289 | |
| 09/30/2025 | 3.000% | 2,420,000 | 2,369,520 | |
| 10/15/2025 | 4.250% | 4,515,000 | 4,552,390 | |
| 10/31/2025 | 0.250% | 6,091,000 | 5,570,886 | |
| 10/31/2025 | 3.000% | 3,111,000 | 3,045,863 | |
| 11/15/2025 | 2.250% | 6,847,000 | 6,581,679 | |
| 11/15/2025 | 4.500% | 3,964,000 | 4,024,079 | |
| 11/30/2025 | 0.375% | 6,265,000 | 5,738,348 | |
| 11/30/2025 | 2.875% | 3,722,000 | 3,633,021 | |
| 12/15/2025 | 4.000% | 2,640,000 | 2,651,550 | |
| 12/31/2025 | 0.375% | 6,784,000 | 6,207,890 | |
| 01/15/2026 | 3.875% | 4,463,000 | 4,469,625 | |
| 01/31/2026 | 0.375% | 7,101,000 | 6,472,451 | |
| 01/31/2026 | 2.625% | 2,446,000 | 2,371,473 | |
| 02/15/2026 | 1.625% | 5,126,000 | 4,834,459 | |
| 02/15/2026 | 4.000% | 4,164,000 | 4,187,748 | |
| 02/15/2026 | 6.000% | 485,000 | 512,130 | |
| 02/28/2026 | 2.500% | 3,002,000 | 2,899,510 | |
| 03/15/2026 | 4.625% | 7,643,000 | 7,826,313 | |
| 03/31/2026 | 0.750% | 7,887,000 | 7,250,494 | |
| 03/31/2026 | 2.250% | 2,475,000 | 2,374,647 | |
| 04/30/2026 | 0.750% | 7,190,000 | 6,586,152 | |
| 04/30/2026 | 2.375% | 3,631,000 | 3,492,568 | |
| 05/15/2026 | 1.625% | 5,906,000 | 5,551,179 | |
| 05/31/2026 | 0.750% | 6,266,000 | 5,727,026 | |
| 05/31/2026 | 2.125% | 4,135,000 | 3,943,756 | |
| 06/30/2026 | 0.875% | 5,732,000 | 5,254,632 | |
| 06/30/2026 | 1.875% | 3,287,000 | 3,108,783 | |
| 07/31/2026 | 0.625% | 6,384,000 | 5,788,991 | |
| 07/31/2026 | 1.875% | 3,061,000 | 2,890,971 | |
| 08/15/2026 | 1.500% | 6,599,000 | 6,155,114 | |
| 08/31/2026 | 0.750% | 7,260,000 | 6,596,391 | |
| 08/31/2026 | 1.375% | 2,513,000 | 2,331,789 | |
| 09/30/2026 | 0.875% | 6,604,000 | 6,018,411 | |
| 09/30/2026 | 1.625% | 1,997,000 | 1,867,195 | |
| 10/31/2026 | 1.125% | 6,524,000 | 5,983,222 | |
| 10/31/2026 | 1.625% | 2,647,000 | 2,472,670 | |
| 11/15/2026 | 2.000% | 6,170,000 | 5,833,060 | |
| 11/30/2026 | 1.250% | 6,559,000 | 6,034,792 | |
| 11/30/2026 | 1.625% | 2,088,000 | 1,947,549 | |
| 12/31/2026 | 1.250% | 6,122,000 | 5,623,153 | |
| 12/31/2026 | 1.750% | 2,844,000 | 2,661,806 | |
| Columbia U.S. Treasury Index Fund | Annual Report 2023 | 7 |
April 30, 2023
| U.S. Treasury Obligations (continued) | ||||
| Issuer | Coupon Rate | Principal Amount ($) | Value ($) | |
| 01/31/2027 | 1.500% | 8,303,000 | 7,687,410 | |
| 02/15/2027 | 2.250% | 5,499,000 | 5,236,079 | |
| 02/28/2027 | 1.125% | 1,558,000 | 1,421,675 | |
| 02/28/2027 | 1.875% | 6,011,000 | 5,638,130 | |
| 03/31/2027 | 0.625% | 2,295,000 | 2,048,108 | |
| 03/31/2027 | 2.500% | 5,662,000 | 5,433,308 | |
| 04/30/2027 | 0.500% | 3,879,000 | 3,435,945 | |
| 04/30/2027 | 2.750% | 5,533,000 | 5,356,636 | |
| 05/15/2027 | 2.375% | 6,142,000 | 5,861,771 | |
| 05/31/2027 | 0.500% | 3,520,000 | 3,109,700 | |
| 05/31/2027 | 2.625% | 5,278,000 | 5,084,198 | |
| 06/30/2027 | 0.500% | 4,342,000 | 3,828,084 | |
| 06/30/2027 | 3.250% | 4,978,000 | 4,912,275 | |
| 07/31/2027 | 0.375% | 5,003,000 | 4,376,843 | |
| 07/31/2027 | 2.750% | 5,098,000 | 4,932,315 | |
| 08/15/2027 | 2.250% | 4,827,000 | 4,576,222 | |
| 08/31/2027 | 0.500% | 4,015,000 | 3,523,476 | |
| 08/31/2027 | 3.125% | 4,979,000 | 4,891,867 | |
| 09/30/2027 | 0.375% | 6,086,000 | 5,298,624 | |
| 09/30/2027 | 4.125% | 4,610,000 | 4,714,445 | |
| 10/31/2027 | 0.500% | 5,435,000 | 4,748,407 | |
| 10/31/2027 | 4.125% | 5,507,000 | 5,635,640 | |
| 11/15/2027 | 2.250% | 5,016,000 | 4,743,647 | |
| 11/30/2027 | 0.625% | 5,833,000 | 5,117,546 | |
| 11/30/2027 | 3.875% | 5,486,000 | 5,566,147 | |
| 12/31/2027 | 0.625% | 6,839,000 | 5,988,399 | |
| 12/31/2027 | 3.875% | 5,385,000 | 5,462,409 | |
| 01/31/2028 | 0.750% | 6,823,000 | 5,997,310 | |
| 01/31/2028 | 3.500% | 4,885,000 | 4,880,039 | |
| 02/15/2028 | 2.750% | 7,535,000 | 7,275,396 | |
| 02/29/2028 | 1.125% | 7,100,000 | 6,345,625 | |
| 02/29/2028 | 4.000% | 10,045,000 | 10,266,304 | |
| 03/31/2028 | 1.250% | 6,533,000 | 5,864,899 | |
| 04/30/2028 | 1.250% | 7,084,000 | 6,348,482 | |
| 05/15/2028 | 2.875% | 6,915,000 | 6,704,849 | |
| 05/31/2028 | 1.250% | 6,920,000 | 6,193,941 | |
| 06/30/2028 | 1.250% | 6,631,000 | 5,922,830 | |
| 07/31/2028 | 1.000% | 6,671,000 | 5,868,917 | |
| 08/15/2028 | 2.875% | 7,563,000 | 7,329,020 | |
| 08/31/2028 | 1.125% | 7,179,000 | 6,347,246 | |
| 09/30/2028 | 1.250% | 6,660,000 | 5,914,912 | |
| 10/31/2028 | 1.375% | 6,477,000 | 5,782,747 | |
| 11/15/2028 | 3.125% | 6,402,000 | 6,270,459 | |
| 11/15/2028 | 5.250% | 993,000 | 1,076,862 | |
| 11/30/2028 | 1.500% | 6,559,000 | 5,888,240 | |
| 12/31/2028 | 1.375% | 6,195,000 | 5,521,778 | |
| 01/31/2029 | 1.750% | 5,669,000 | 5,148,604 | |
| 02/15/2029 | 2.625% | 6,400,000 | 6,098,500 | |
| 02/15/2029 | 5.250% | 277,000 | 300,805 | |
| 02/28/2029 | 1.875% | 5,616,000 | 5,132,936 | |
| 03/31/2029 | 2.375% | 5,307,000 | 4,981,946 | |
| 04/30/2029 | 2.875% | 8,454,000 | 8,158,110 | |
| 05/15/2029 | 2.375% | 5,248,000 | 4,922,870 | |
| 05/31/2029 | 2.750% | 5,054,000 | 4,841,969 | |
| 06/30/2029 | 3.250% | 4,794,000 | 4,721,341 | |
| 07/31/2029 | 2.625% | 3,938,000 | 3,742,946 | |
| 08/15/2029 | 1.625% | 4,893,000 | 4,389,556 | |
| U.S. Treasury Obligations (continued) | ||||
| Issuer | Coupon Rate | Principal Amount ($) | Value ($) | |
| 08/31/2029 | 3.125% | 3,813,000 | 3,729,591 | |
| 09/30/2029 | 3.875% | 4,136,000 | 4,221,951 | |
| 10/31/2029 | 4.000% | 3,648,000 | 3,751,740 | |
| 11/15/2029 | 1.750% | 3,865,000 | 3,491,182 | |
| 11/30/2029 | 3.875% | 4,657,000 | 4,758,144 | |
| 12/31/2029 | 3.875% | 3,715,000 | 3,799,168 | |
| 01/31/2030 | 3.500% | 3,989,000 | 3,991,493 | |
| 02/15/2030 | 1.500% | 6,690,000 | 5,903,925 | |
| 02/28/2030 | 4.000% | 4,023,000 | 4,147,462 | |
| 05/15/2030 | 0.625% | 9,150,000 | 7,547,320 | |
| 05/15/2030 | 6.250% | 687,000 | 804,434 | |
| 08/15/2030 | 0.625% | 12,227,000 | 10,033,782 | |
| 11/15/2030 | 0.875% | 12,586,000 | 10,507,343 | |
| 02/15/2031 | 1.125% | 12,586,000 | 10,690,234 | |
| 02/15/2031 | 5.375% | 1,250,000 | 1,413,086 | |
| 05/15/2031 | 1.625% | 12,330,000 | 10,809,942 | |
| 08/15/2031 | 1.250% | 13,070,000 | 11,054,361 | |
| 11/15/2031 | 1.375% | 12,762,000 | 10,851,688 | |
| 02/15/2032 | 1.875% | 11,668,000 | 10,313,418 | |
| 05/15/2032 | 2.875% | 11,556,000 | 11,061,259 | |
| 08/15/2032 | 2.750% | 12,132,000 | 11,481,801 | |
| 11/15/2032 | 4.125% | 11,409,000 | 12,043,626 | |
| 02/15/2033 | 3.500% | 10,491,000 | 10,553,290 | |
| 02/15/2036 | 4.500% | 729,000 | 813,860 | |
| 05/15/2037 | 5.000% | 666,000 | 779,948 | |
| 02/15/2038 | 4.375% | 767,000 | 844,539 | |
| 05/15/2038 | 4.500% | 736,000 | 820,065 | |
| 02/15/2039 | 3.500% | 721,000 | 716,156 | |
| 05/15/2039 | 4.250% | 1,393,000 | 1,510,099 | |
| 08/15/2039 | 4.500% | 1,476,000 | 1,646,663 | |
| 11/15/2039 | 4.375% | 1,678,000 | 1,840,818 | |
| 02/15/2040 | 4.625% | 1,628,000 | 1,839,894 | |
| 05/15/2040 | 1.125% | 4,494,000 | 3,010,980 | |
| 05/15/2040 | 4.375% | 1,564,000 | 1,714,291 | |
| 08/15/2040 | 1.125% | 5,538,000 | 3,680,174 | |
| 08/15/2040 | 3.875% | 1,489,000 | 1,532,274 | |
| 11/15/2040 | 1.375% | 6,156,000 | 4,258,221 | |
| 11/15/2040 | 4.250% | 1,640,000 | 1,767,613 | |
| 02/15/2041 | 1.875% | 7,376,000 | 5,541,220 | |
| 02/15/2041 | 4.750% | 1,542,000 | 1,764,626 | |
| 05/15/2041 | 2.250% | 6,498,000 | 5,180,124 | |
| 05/15/2041 | 4.375% | 1,334,000 | 1,457,187 | |
| 08/15/2041 | 1.750% | 8,469,000 | 6,158,551 | |
| 08/15/2041 | 3.750% | 1,493,000 | 1,496,266 | |
| 11/15/2041 | 2.000% | 7,182,000 | 5,441,487 | |
| 11/15/2041 | 3.125% | 1,514,000 | 1,384,127 | |
| 02/15/2042 | 2.375% | 5,897,000 | 4,758,142 | |
| 02/15/2042 | 3.125% | 1,649,000 | 1,504,197 | |
| 05/15/2042 | 3.000% | 1,389,000 | 1,239,031 | |
| 05/15/2042 | 3.250% | 5,148,000 | 4,767,531 | |
| 08/15/2042 | 2.750% | 1,659,000 | 1,418,186 | |
| 08/15/2042 | 3.375% | 4,660,000 | 4,389,137 | |
| 11/15/2042 | 2.750% | 2,482,000 | 2,115,129 | |
| 11/15/2042 | 4.000% | 4,338,000 | 4,468,140 | |
| 02/15/2043 | 3.125% | 2,141,000 | 1,934,260 | |
| 02/15/2043 | 3.875% | 3,190,000 | 3,223,894 | |
| 05/15/2043 | 2.875% | 3,512,000 | 3,045,563 | |
| 8 | Columbia U.S. Treasury Index Fund | Annual Report 2023 |
April 30, 2023
| U.S. Treasury Obligations (continued) | ||||
| Issuer | Coupon Rate | Principal Amount ($) | Value ($) | |
| 08/15/2043 | 3.625% | 2,459,000 | 2,397,525 | |
| 11/15/2043 | 3.750% | 2,473,000 | 2,454,453 | |
| 02/15/2044 | 3.625% | 2,826,000 | 2,745,636 | |
| 05/15/2044 | 3.375% | 2,463,000 | 2,301,366 | |
| 08/15/2044 | 3.125% | 3,082,000 | 2,762,243 | |
| 11/15/2044 | 3.000% | 2,882,000 | 2,527,154 | |
| 02/15/2045 | 2.500% | 3,593,000 | 2,879,453 | |
| 05/15/2045 | 3.000% | 1,866,000 | 1,631,001 | |
| 08/15/2045 | 2.875% | 2,513,000 | 2,147,830 | |
| 11/15/2045 | 3.000% | 1,425,000 | 1,244,426 | |
| 02/15/2046 | 2.500% | 2,897,000 | 2,308,094 | |
| 05/15/2046 | 2.500% | 2,905,000 | 2,312,652 | |
| 08/15/2046 | 2.250% | 3,714,000 | 2,808,132 | |
| 11/15/2046 | 2.875% | 1,604,000 | 1,369,415 | |
| 02/15/2047 | 3.000% | 3,099,000 | 2,701,456 | |
| 05/15/2047 | 3.000% | 2,771,000 | 2,414,667 | |
| 08/15/2047 | 2.750% | 3,505,000 | 2,917,913 | |
| 11/15/2047 | 2.750% | 5,334,000 | 4,442,222 | |
| 02/15/2048 | 3.000% | 3,927,000 | 3,426,921 | |
| 05/15/2048 | 3.125% | 4,397,000 | 3,928,445 | |
| 08/15/2048 | 3.000% | 4,938,000 | 4,316,121 | |
| 11/15/2048 | 3.375% | 4,900,000 | 4,588,391 | |
| 02/15/2049 | 3.000% | 5,204,000 | 4,560,818 | |
| 05/15/2049 | 2.875% | 5,231,000 | 4,481,496 | |
| 08/15/2049 | 2.250% | 5,108,000 | 3,843,770 | |
| 11/15/2049 | 2.375% | 4,785,000 | 3,700,151 | |
| 02/15/2050 | 2.000% | 5,840,000 | 4,143,662 | |
| 05/15/2050 | 1.250% | 6,710,000 | 3,911,720 | |
| U.S. Treasury Obligations (continued) | ||||
| Issuer | Coupon Rate | Principal Amount ($) | Value ($) | |
| 08/15/2050 | 1.375% | 7,479,000 | 4,499,086 | |
| 11/15/2050 | 1.625% | 7,584,000 | 4,873,905 | |
| 02/15/2051 | 1.875% | 8,495,000 | 5,812,438 | |
| 05/15/2051 | 2.375% | 8,399,000 | 6,456,731 | |
| 08/15/2051 | 2.000% | 8,331,000 | 5,862,941 | |
| 11/15/2051 | 1.875% | 7,884,000 | 5,369,743 | |
| 02/15/2052 | 2.250% | 7,321,000 | 5,462,152 | |
| 05/15/2052 | 2.875% | 6,896,000 | 5,900,390 | |
| 08/15/2052 | 3.000% | 6,511,000 | 5,718,489 | |
| 11/15/2052 | 4.000% | 6,714,000 | 7,127,331 | |
| 02/15/2053 | 3.625% | 5,658,000 | 5,610,261 | |
| Total U.S. Treasury Obligations (Cost $1,261,763,106) | 1,182,081,225 | |||
| Money Market Funds 0.3% | ||
| Shares | Value ($) | |
| Columbia Short-Term Cash Fund, 5.046%(a),(b) | 3,629,368 | 3,627,916 |
| Total Money Market Funds (Cost $3,627,699) | 3,627,916 | |
| Total Investments in Securities (Cost: $1,265,390,805) | 1,185,709,141 | |
| Other Assets & Liabilities, Net | 7,410,322 | |
| Net Assets | 1,193,119,463 | |
| (a) | The rate shown is the seven-day current annualized yield at April 30, 2023. |
| (b) | As defined in the Investment Company Act of 1940, as amended, an affiliated company is one in which the Fund owns 5% or more of the company’s outstanding voting securities, or a company which is under common ownership or control with the Fund. The value of the holdings and transactions in these affiliated companies during the year ended April 30, 2023 are as follows: |
| Affiliated issuers | Beginning of period($) | Purchases($) | Sales($) | Net change in unrealized appreciation (depreciation)($) | End of period($) | Realized gain (loss)($) | Dividends($) | End of period shares |
| Columbia Short-Term Cash Fund, 5.046% | ||||||||
| 12,203,954 | 150,452,514 | (159,027,500) | (1,052) | 3,627,916 | (1,913) | 151,130 | 3,629,368 | |
| ■ | Level 1 — Valuations based on quoted prices for investments in active markets that the Fund has the ability to access at the measurement date. Valuation adjustments are not applied to Level 1 investments. |
| ■ | Level 2 — Valuations based on other significant observable inputs (including quoted prices for similar securities, interest rates, prepayment speeds, credit risks, etc.). |
| ■ | Level 3 — Valuations based on significant unobservable inputs (including the Fund’s own assumptions and judgment in determining the fair value of investments). |
| Columbia U.S. Treasury Index Fund | Annual Report 2023 | 9 |
April 30, 2023
Inputs that are used in determining fair value of an investment may include price information, credit data, volatility statistics, and other factors. These inputs can be either observable or unobservable. The availability of observable inputs can vary between investments, and is affected by various factors such as the type of investment, and the volume and level of activity for that investment or similar investments in the marketplace. The inputs will be considered by the Investment Manager, along with any other relevant factors in the calculation of an investment’s fair value. The Fund uses prices and inputs that are current as of the measurement date, which may include periods of market dislocations. During these periods, the availability of prices and inputs may be reduced for many investments. This condition could cause an investment to be reclassified between the various levels within the hierarchy.
| Level 1 ($) | Level 2 ($) | Level 3 ($) | Total ($) | |
| Investments in Securities | ||||
| U.S. Treasury Obligations | — | 1,182,081,225 | — | 1,182,081,225 |
| Money Market Funds | 3,627,916 | — | — | 3,627,916 |
| Total Investments in Securities | 3,627,916 | 1,182,081,225 | — | 1,185,709,141 |
| 10 | Columbia U.S. Treasury Index Fund | Annual Report 2023 |
April 30, 2023
| Assets | |
| Investments in securities, at value | |
| Unaffiliated issuers (cost $1,261,763,106) | $1,182,081,225 |
| Affiliated issuers (cost $3,627,699) | 3,627,916 |
| Receivable for: | |
| Investments sold | 12,852,447 |
| Capital shares sold | 2,477,825 |
| Dividends | 20,795 |
| Interest | 8,345,290 |
| Expense reimbursement due from Investment Manager | 7,525 |
| Trustees’ deferred compensation plan | 122,827 |
| Total assets | 1,209,535,850 |
| Liabilities | |
| Payable for: | |
| Investments purchased | 13,391,398 |
| Capital shares purchased | 513,216 |
| Distributions to shareholders | 2,349,510 |
| Management services fees | 12,983 |
| Distribution and/or service fees | 300 |
| Compensation of board members | 26,153 |
| Trustees’ deferred compensation plan | 122,827 |
| Total liabilities | 16,416,387 |
| Net assets applicable to outstanding capital stock | $1,193,119,463 |
| Represented by | |
| Paid in capital | 1,338,437,505 |
| Total distributable earnings (loss) | (145,318,042) |
| Total - representing net assets applicable to outstanding capital stock | $1,193,119,463 |
| Class A | |
| Net assets | $68,565,009 |
| Shares outstanding | 6,719,426 |
| Net asset value per share | $10.20 |
| Class C | |
| Net assets | $887,562 |
| Shares outstanding | 86,980 |
| Net asset value per share | $10.20 |
| Institutional Class | |
| Net assets | $498,883,646 |
| Shares outstanding | 48,872,551 |
| Net asset value per share | $10.21 |
| Institutional 2 Class | |
| Net assets | $28,313,548 |
| Shares outstanding | 2,779,907 |
| Net asset value per share | $10.19 |
| Institutional 3 Class | |
| Net assets | $596,469,698 |
| Shares outstanding | 58,105,895 |
| Net asset value per share | $10.27 |
| Columbia U.S. Treasury Index Fund | Annual Report 2023 | 11 |
Year Ended April 30, 2023
| Net investment income | |
| Income: | |
| Dividends — affiliated issuers | $151,130 |
| Interest | 24,172,082 |
| Interfund lending | 310 |
| Total income | 24,323,522 |
| Expenses: | |
| Management services fees | 4,563,742 |
| Distribution and/or service fees | |
| Class A | 90,559 |
| Class C | 13,108 |
| Compensation of board members | 32,047 |
| Total expenses | 4,699,456 |
| Fees waived or expenses reimbursed by Investment Manager and its affiliates | (2,656,199) |
| Expense reduction | (580) |
| Total net expenses | 2,042,677 |
| Net investment income | 22,280,845 |
| Realized and unrealized gain (loss) — net | |
| Net realized gain (loss) on: | |
| Investments — unaffiliated issuers | (60,256,874) |
| Investments — affiliated issuers | (1,913) |
| Net realized loss | (60,258,787) |
| Net change in unrealized appreciation (depreciation) on: | |
| Investments — unaffiliated issuers | 23,293,532 |
| Investments — affiliated issuers | (1,052) |
| Net change in unrealized appreciation (depreciation) | 23,292,480 |
| Net realized and unrealized loss | (36,966,307) |
| Net decrease in net assets resulting from operations | $(14,685,462) |
| 12 | Columbia U.S. Treasury Index Fund | Annual Report 2023 |
| Year Ended April 30, 2023 | Year Ended April 30, 2022 | |
| Operations | ||
| Net investment income | $22,280,845 | $17,605,832 |
| Net realized loss | (60,258,787) | (970,887) |
| Net change in unrealized appreciation (depreciation) | 23,292,480 | (124,254,422) |
| Net decrease in net assets resulting from operations | (14,685,462) | (107,619,477) |
| Distributions to shareholders | ||
| Net investment income and net realized gains | ||
| Class A | (1,129,848) | (508,052) |
| Class C | (17,057) | (25,091) |
| Institutional Class | (9,181,389) | (7,204,929) |
| Institutional 2 Class | (432,012) | (725,831) |
| Institutional 3 Class | (11,631,519) | (12,283,759) |
| Total distributions to shareholders | (22,391,825) | (20,747,662) |
| Increase (decrease) in net assets from capital stock activity | (62,638,706) | 182,947,241 |
| Total increase (decrease) in net assets | (99,715,993) | 54,580,102 |
| Net assets at beginning of year | 1,292,835,456 | 1,238,255,354 |
| Net assets at end of year | $1,193,119,463 | $1,292,835,456 |
| Columbia U.S. Treasury Index Fund | Annual Report 2023 | 13 |
| Year Ended | Year Ended | |||
| April 30, 2023 | April 30, 2022 | |||
| Shares | Dollars ($) | Shares | Dollars ($) | |
| Capital stock activity | ||||
| Class A | ||||
| Subscriptions | 4,981,834 | 51,719,018 | 823,155 | 9,394,626 |
| Distributions reinvested | 37,842 | 383,115 | 25,050 | 286,578 |
| Redemptions | (1,675,602) | (17,122,290) | (1,667,328) | (19,113,195) |
| Net increase (decrease) | 3,344,074 | 34,979,843 | (819,123) | (9,431,991) |
| Class C | ||||
| Subscriptions | 4,772 | 48,327 | 20,460 | 237,356 |
| Distributions reinvested | 1,682 | 17,057 | 2,179 | 25,022 |
| Redemptions | (160,991) | (1,623,685) | (360,822) | (4,116,126) |
| Net decrease | (154,537) | (1,558,301) | (338,183) | (3,853,748) |
| Institutional Class | ||||
| Subscriptions | 12,613,230 | 126,812,970 | 7,139,052 | 81,835,936 |
| Distributions reinvested | 880,119 | 8,914,230 | 611,158 | 6,987,861 |
| Redemptions | (6,904,405) | (70,132,989) | (12,069,469) | (137,444,941) |
| Net increase (decrease) | 6,588,944 | 65,594,211 | (4,319,259) | (48,621,144) |
| Institutional 2 Class | ||||
| Subscriptions | 1,917,292 | 19,249,047 | 1,498,220 | 17,118,267 |
| Distributions reinvested | 21,859 | 220,532 | 13,042 | 149,480 |
| Redemptions | (3,325,044) | (34,809,795) | (1,968,952) | (22,484,879) |
| Net decrease | (1,385,893) | (15,340,216) | (457,690) | (5,217,132) |
| Institutional 3 Class | ||||
| Subscriptions | 32,582,117 | 333,437,917 | 30,992,063 | 359,650,385 |
| Distributions reinvested | 1,137,179 | 11,596,979 | 1,066,894 | 12,261,812 |
| Redemptions | (48,027,100) | (491,349,139) | (10,775,546) | (121,840,941) |
| Net increase (decrease) | (14,307,804) | (146,314,243) | 21,283,411 | 250,071,256 |
| Total net increase (decrease) | (5,915,216) | (62,638,706) | 15,349,156 | 182,947,241 |
| 14 | Columbia U.S. Treasury Index Fund | Annual Report 2023 |
| Net asset value, beginning of period | Net investment income | Net realized and unrealized gain (loss) | Total from investment operations | Distributions from net investment income | Distributions from net realized gains | Total distributions to shareholders | |
| Class A | |||||||
| Year Ended 4/30/2023 | $10.52 | 0.19 | (0.33) | (0.14) | (0.18) | — | (0.18) |
| Year Ended 4/30/2022 | $11.52 | 0.12 | (0.98) | (0.86) | (0.12) | (0.02) | (0.14) |
| Year Ended 4/30/2021 | $12.30 | 0.14 | (0.71) | (0.57) | (0.14) | (0.07) | (0.21) |
| Year Ended 4/30/2020 | $11.00 | 0.21 | 1.30 | 1.51 | (0.21) | — | (0.21) |
| Year Ended 4/30/2019 | $10.75 | 0.21 | 0.25 | 0.46 | (0.21) | — | (0.21) |
| Class C | |||||||
| Year Ended 4/30/2023 | $10.52 | 0.11 | (0.31) | (0.20) | (0.12) | — | (0.12) |
| Year Ended 4/30/2022 | $11.52 | 0.04 | (0.97) | (0.93) | (0.05) | (0.02) | (0.07) |
| Year Ended 4/30/2021 | $12.29 | 0.06 | (0.70) | (0.64) | (0.06) | (0.07) | (0.13) |
| Year Ended 4/30/2020 | $11.00 | 0.13 | 1.29 | 1.42 | (0.13) | — | (0.13) |
| Year Ended 4/30/2019 | $10.75 | 0.13 | 0.25 | 0.38 | (0.13) | — | (0.13) |
| Institutional Class | |||||||
| Year Ended 4/30/2023 | $10.52 | 0.20 | (0.31) | (0.11) | (0.20) | — | (0.20) |
| Year Ended 4/30/2022 | $11.53 | 0.14 | (0.99) | (0.85) | (0.14) | (0.02) | (0.16) |
| Year Ended 4/30/2021 | $12.30 | 0.16 | (0.70) | (0.54) | (0.16) | (0.07) | (0.23) |
| Year Ended 4/30/2020 | $11.01 | 0.23 | 1.29 | 1.52 | (0.23) | — | (0.23) |
| Year Ended 4/30/2019 | $10.75 | 0.22 | 0.27 | 0.49 | (0.23) | — | (0.23) |
| Institutional 2 Class | |||||||
| Year Ended 4/30/2023 | $10.50 | 0.20 | (0.31) | (0.11) | (0.20) | — | (0.20) |
| Year Ended 4/30/2022 | $11.50 | 0.13 | (0.97) | (0.84) | (0.14) | (0.02) | (0.16) |
| Year Ended 4/30/2021 | $12.27 | 0.16 | (0.70) | (0.54) | (0.16) | (0.07) | (0.23) |
| Year Ended 4/30/2020 | $10.98 | 0.23 | 1.29 | 1.52 | (0.23) | — | (0.23) |
| Year Ended 4/30/2019 | $10.73 | 0.23 | 0.25 | 0.48 | (0.23) | — | (0.23) |
| 16 | Columbia U.S. Treasury Index Fund | Annual Report 2023 |
| Net asset value, end of period | Total return | Total gross expense ratio to average net assets(a) | Total net expense ratio to average net assets(a),(b) | Net investment income ratio to average net assets | Portfolio turnover | Net assets, end of period (000’s) | |
| Class A | |||||||
| Year Ended 4/30/2023 | $10.20 | (1.26%) | 0.56% | 0.32%(c) | 1.86% | 56% | $68,565 |
| Year Ended 4/30/2022 | $10.52 | (7.54%) | 0.59% | 0.32%(c) | 1.03% | 31% | $35,499 |
| Year Ended 4/30/2021 | $11.52 | (4.66%) | 0.65% | 0.32%(c),(d) | 1.20% | 40% | $48,338 |
| Year Ended 4/30/2020 | $12.30 | 13.88% | 0.65% | 0.33%(c),(d) | 1.83% | 54% | $51,890 |
| Year Ended 4/30/2019 | $11.00 | 4.32% | 0.65% | 0.35%(c),(d) | 1.93% | 50% | $35,707 |
| Class C | |||||||
| Year Ended 4/30/2023 | $10.20 | (1.90%) | 1.20% | 0.97%(c) | 1.04% | 56% | $888 |
| Year Ended 4/30/2022 | $10.52 | (8.14%) | 1.29% | 0.97%(c) | 0.37% | 31% | $2,540 |
| Year Ended 4/30/2021 | $11.52 | (5.22%) | 1.40% | 0.99%(c),(d) | 0.53% | 40% | $6,680 |
| Year Ended 4/30/2020 | $12.29 | 13.00% | 1.41% | 1.03%(c),(d) | 1.12% | 54% | $6,910 |
| Year Ended 4/30/2019 | $11.00 | 3.59% | 1.40% | 1.05%(c),(d) | 1.23% | 50% | $2,801 |
| Institutional Class | |||||||
| Year Ended 4/30/2023 | $10.21 | (1.02%) | 0.40% | 0.17%(c) | 1.98% | 56% | $498,884 |
| Year Ended 4/30/2022 | $10.52 | (7.48%) | 0.40% | 0.17%(c) | 1.18% | 31% | $444,883 |
| Year Ended 4/30/2021 | $11.53 | (4.44%) | 0.40% | 0.17%(c) | 1.35% | 40% | $537,273 |
| Year Ended 4/30/2020 | $12.30 | 13.95% | 0.40% | 0.18%(c) | 1.98% | 54% | $581,931 |
| Year Ended 4/30/2019 | $11.01 | 4.57% | 0.40% | 0.20%(c) | 2.08% | 50% | $323,226 |
| Institutional 2 Class | |||||||
| Year Ended 4/30/2023 | $10.19 | (1.02%) | 0.40% | 0.17% | 1.94% | 56% | $28,314 |
| Year Ended 4/30/2022 | $10.50 | (7.42%) | 0.40% | 0.17% | 1.18% | 31% | $43,738 |
| Year Ended 4/30/2021 | $11.50 | (4.45%) | 0.40% | 0.17% | 1.35% | 40% | $53,191 |
| Year Ended 4/30/2020 | $12.27 | 13.98% | 0.40% | 0.18% | 1.98% | 54% | $51,284 |
| Year Ended 4/30/2019 | $10.98 | 4.48% | 0.40% | 0.20% | 2.10% | 50% | $35,855 |
| Columbia U.S. Treasury Index Fund | Annual Report 2023 | 17 |
| Net asset value, beginning of period | Net investment income | Net realized and unrealized gain (loss) | Total from investment operations | Distributions from net investment income | Distributions from net realized gains | Total distributions to shareholders | |
| Institutional 3 Class | |||||||
| Year Ended 4/30/2023 | $10.58 | 0.20 | (0.31) | (0.11) | (0.20) | — | (0.20) |
| Year Ended 4/30/2022 | $11.59 | 0.14 | (0.99) | (0.85) | (0.14) | (0.02) | (0.16) |
| Year Ended 4/30/2021 | $12.37 | 0.16 | (0.71) | (0.55) | (0.16) | (0.07) | (0.23) |
| Year Ended 4/30/2020 | $11.07 | 0.23 | 1.30 | 1.53 | (0.23) | — | (0.23) |
| Year Ended 4/30/2019 | $10.81 | 0.23 | 0.26 | 0.49 | (0.23) | — | (0.23) |
| Notes to Financial Highlights | |
| (a) | In addition to the fees and expenses that the Fund bears directly, the Fund indirectly bears a pro rata share of the fees and expenses of any other funds in which it invests. Such indirect expenses are not included in the Fund’s reported expense ratios. |
| (b) | Total net expenses include the impact of certain fee waivers/expense reimbursements made by the Investment Manager and certain of its affiliates, if applicable. |
| (c) | The benefits derived from expense reductions had an impact of less than 0.01%. |
| (d) | Ratios include the impact of voluntary waivers paid by the Investment Manager. For the periods indicated below, if the Investment Manager had not paid these voluntary waivers, the Fund’s net expense ratio would increase by: |
| 4/30/2021 | 4/30/2020 | 4/30/2019 | |
| Class A | 0.03% | 0.10% | 0.10% |
| Class C | 0.05% | 0.15% | 0.15% |
| 18 | Columbia U.S. Treasury Index Fund | Annual Report 2023 |
| Net asset value, end of period | Total return | Total gross expense ratio to average net assets(a) | Total net expense ratio to average net assets(a),(b) | Net investment income ratio to average net assets | Portfolio turnover | Net assets, end of period (000’s) | |
| Institutional 3 Class | |||||||
| Year Ended 4/30/2023 | $10.27 | (1.00%) | 0.40% | 0.17% | 1.94% | 56% | $596,470 |
| Year Ended 4/30/2022 | $10.58 | (7.44%) | 0.40% | 0.17% | 1.19% | 31% | $766,175 |
| Year Ended 4/30/2021 | $11.59 | (4.49%) | 0.40% | 0.17% | 1.33% | 40% | $592,772 |
| Year Ended 4/30/2020 | $12.37 | 13.97% | 0.40% | 0.18% | 2.00% | 54% | $415,616 |
| Year Ended 4/30/2019 | $11.07 | 4.56% | 0.40% | 0.20% | 2.10% | 50% | $445,200 |
| Columbia U.S. Treasury Index Fund | Annual Report 2023 | 19 |
April 30, 2023
| 20 | Columbia U.S. Treasury Index Fund | Annual Report 2023 |
April 30, 2023
| Columbia U.S. Treasury Index Fund | Annual Report 2023 | 21 |
April 30, 2023
| 22 | Columbia U.S. Treasury Index Fund | Annual Report 2023 |
April 30, 2023
| Fee rate(s) contractual through August 31, 2023 | |
| Class A | 0.32% |
| Class C | 0.97 |
| Institutional Class | 0.17 |
| Institutional 2 Class | 0.17 |
| Institutional 3 Class | 0.17 |
| Columbia U.S. Treasury Index Fund | Annual Report 2023 | 23 |
April 30, 2023
| Year Ended April 30, 2023 | Year Ended April 30, 2022 | ||||
| Ordinary income ($) | Long-term capital gains ($) | Total ($) | Ordinary income ($) | Long-term capital gains ($) | Total ($) |
| 22,391,825 | — | 22,391,825 | 17,854,919 | 2,892,743 | 20,747,662 |
| Undistributed ordinary income ($) | Undistributed long-term capital gains ($) | Capital loss carryforwards ($) | Net unrealized (depreciation) ($) |
| 1,972,315 | — | (60,390,821) | (84,402,056) |
| Federal tax cost ($) | Gross unrealized appreciation ($) | Gross unrealized (depreciation) ($) | Net unrealized (depreciation) ($) |
| 1,270,111,197 | 3,879,149 | (88,281,205) | (84,402,056) |
| No expiration short-term ($) | No expiration long-term ($) | Total ($) | Utilized ($) |
| (7,906,155) | (52,484,666) | (60,390,821) | — |
| 24 | Columbia U.S. Treasury Index Fund | Annual Report 2023 |
April 30, 2023
| Borrower or lender | Average loan balance ($) | Weighted average interest rate (%) | Number of days with outstanding loans |
| Lender | 3,100,000 | 3.60 | 1 |
| Columbia U.S. Treasury Index Fund | Annual Report 2023 | 25 |
April 30, 2023
| 26 | Columbia U.S. Treasury Index Fund | Annual Report 2023 |
April 30, 2023
| Columbia U.S. Treasury Index Fund | Annual Report 2023 | 27 |
| 28 | Columbia U.S. Treasury Index Fund | Annual Report 2023 |
| Section 163(j) Interest Dividends | |
| 100.00% |
| Name, address, year of birth | Position held with the Columbia Funds and length of service | Principal occupation(s) during past five years and other relevant professional experience | Number of Funds in the Columbia Funds Complex* overseen | Other directorships held by Trustee during the past five years and other relevant Board experience |
| George S. Batejan c/o Columbia Management Investment Advisers, LLC 290 Congress Street Boston, MA 02210 1954 | Trustee since 2017 | Executive Vice President, Global Head of Technology and Operations, Janus Capital Group, Inc., 2010-2016 | 174 | Former Chairman of the Board, NICSA (National Investment Company Services Association) (Executive Committee, Nominating Committee and Governance Committee), 2014-2016; former Director, Intech Investment Management, 2011-2016; former Board Member, Metro Denver Chamber of Commerce, 2015-2016; former Advisory Board Member, University of Colorado Business School, 2015-2018; former Board Member, Chase Bank International, 1993-1994 |
| Columbia U.S. Treasury Index Fund | Annual Report 2023 | 29 |
(Unaudited)
Independent trustees (continued)
| Name, address, year of birth | Position held with the Columbia Funds and length of service | Principal occupation(s) during past five years and other relevant professional experience | Number of Funds in the Columbia Funds Complex* overseen | Other directorships held by Trustee during the past five years and other relevant Board experience |
| Kathleen Blatz c/o Columbia Management Investment Advisers, LLC 290 Congress Street Boston, MA 02210 1954 | Trustee since 2006 | Attorney, specializing in arbitration and mediation; Chief Justice, Minnesota Supreme Court, 1998-2006; Associate Justice, Minnesota Supreme Court, 1996-1998; Fourth Judicial District Court Judge, Hennepin County, 1994-1996; Attorney in private practice and public service, 1984-1993; State Representative, Minnesota House of Representatives, 1979-1993, which included service on the Tax and Financial Institutions and Insurance Committees; Member and Interim Chair, Minnesota Sports Facilities Authority, January-July 2017; Interim President and Chief Executive Officer, Blue Cross and Blue Shield of Minnesota (health care insurance), February-July 2018, April-October 2021 | 174 | Former Trustee, Blue Cross and Blue Shield of Minnesota, 2009-2021 (Chair of the Business Development Committee, 2014-2017; Chair of the Governance Committee, 2017-2019); former Member and Chair of the Board, Minnesota Sports Facilities Authority, January 2017-July 2017; former Director, Robina Foundation, 2009-2020 (Chair, 2014-2020); Director, Richard M. Schulze Family Foundation, since 2021 |
| Pamela G. Carlton c/o Columbia Management Investment Advisers, LLC 290 Congress Street Boston, MA 02210 1954 | Chair since 2023; Trustee since 2007 | President, Springboard — Partners in Cross Cultural Leadership (consulting company), since 2003; Managing Director of US Equity Research, JP Morgan Chase, 1999-2003; Director of US Equity Research, Chase Asset Management, 1996-1999; Co-Director Latin America Research, 1993-1996, COO Global Research, 1992-1996, Co-Director of US Research, 1991-1992, Investment Banker, 1982-1991, Morgan Stanley; Attorney, Cleary Gottlieb Steen & Hamilton LLP, 1980-1982 | 174 | Trustee, New York Presbyterian Hospital Board, since 1996; Director, DR Bank (Audit Committee) since 2017; Director, Evercore Inc. (Audit Committee, Nominating and Governance Committee), since 2019; Director, Apollo Commercial Real Estate Finance, Inc. (Chair, Nominating and Governance Committee) (financial services), since 2021; the Governing Council of the Independent Directors Council (IDC), since 2021 |
| Janet Langford Carrig c/o Columbia Management Investment Advisers, LLC 290 Congress Street Boston, MA 02210 1957 | Trustee since 1996 | Senior Vice President, General Counsel and Corporate Secretary, ConocoPhillips (independent energy company), September 2007-October 2018 | 174 | Director, EQT Corporation (natural gas producer), since 2019; former Director, Whiting Petroleum Corporation (independent oil and gas company), 2020-2022 |
| J. Kevin Connaughton c/o Columbia Management Investment Advisers, LLC 290 Congress Street Boston, MA 02210 1964 | Trustee since 2020 | CEO and President, RhodeWay Financial (non-profit financial planning firm), since December 2022; Member, FINRA National Adjudicatory Council, since January 2020; Adjunct Professor of Finance, Bentley University since January 2018; Consultant to Independent Trustees of CFVIT and CFST I from March 2016 to June 2020 with respect to CFVIT and to December 2020 with respect to CFST I; Managing Director and General Manager of Mutual Fund Products, Columbia Management Investment Advisers, LLC, May 2010-February 2015; President, Columbia Funds, 2008-2015; and senior officer of Columbia Funds and affiliated funds, 2003-2015 | 172 | Former Director, The Autism Project, March 2015-December 2021; former Member of the Investment Committee, St. Michael’s College, November 2015-February 2020; former Trustee, St. Michael’s College, June 2017-September 2019; former Trustee, New Century Portfolios (former mutual fund complex), January 2015-December 2017 |
| 30 | Columbia U.S. Treasury Index Fund | Annual Report 2023 |
(Unaudited)
Independent trustees (continued)
| Name, address, year of birth | Position held with the Columbia Funds and length of service | Principal occupation(s) during past five years and other relevant professional experience | Number of Funds in the Columbia Funds Complex* overseen | Other directorships held by Trustee during the past five years and other relevant Board experience |
| Olive M. Darragh c/o Columbia Management Investment Advisers, LLC 290 Congress Street Boston, MA 02210 1962 | Trustee since 2020 | Managing Director of Darragh Inc. (strategy and talent management consulting firm), since 2010; Founder and CEO, Zolio, Inc. (investment management talent identification platform), since 2004; Consultant to Independent Trustees of CFVIT and CFST I from June 2019 to June 2020 with respect to CFVIT and to December 2020 with respect to CFST I; Partner, Tudor Investments, 2004-2010; Senior Partner, McKinsey & Company (consulting), 1990-2004; Touche Ross CPA, 1985-1988 | 172 | Treasurer, Edinburgh University US Trust Board, since January 2023; Member, HBS Community Action Partners Board, since September 2022; former Director, University of Edinburgh Business School (Member of US Board), 2004-2019; former Director, Boston Public Library Foundation, 2008-2017 |
| Patricia M. Flynn c/o Columbia Management Investment Advisers, LLC 290 Congress Street Boston, MA 02210 1950 | Trustee since 2004 | Professor of Economics and Management, Bentley University, since 2002; Dean, McCallum Graduate School of Business, Bentley University, 1992-2002 | 174 | Former Trustee, MA Taxpayers Foundation, 1997-2022; former Director, The MA Business Roundtable, 2003-2019; former Chairperson, Innovation Index Advisory Committee, MA Technology Collaborative, 1997-2020 |
| Brian J. Gallagher c/o Columbia Management Investment Advisers, LLC 290 Congress Street Boston, MA 02210 1954 | Trustee since 2017 | Retired; Partner with Deloitte & Touche LLP and its predecessors, 1977-2016 | 174 | Trustee, Catholic Schools Foundation, since 2004 |
| Douglas A. Hacker c/o Columbia Management Investment Advisers, LLC 290 Congress Street Boston, MA 02210 1955 | Trustee since 1996 | Independent business executive, since May 2006; Executive Vice President – Strategy of United Airlines, December 2002 - May 2006; President of UAL Loyalty Services (airline marketing company), September 2001-December 2002; Executive Vice President and Chief Financial Officer of United Airlines, July 1999-September 2001 | 174 | Director, SpartanNash Company since November 2013 (Chair of the Board, since May 2021) (food distributor); Director, Aircastle Limited (Chair of Audit Committee) (aircraft leasing), since August 2006; former Director, Nash Finch Company (food distributor), 2005-2013; former Director, SeaCube Container Leasing Ltd. (container leasing), 2010-2013; and former Director, Travelport Worldwide Limited (travel information technology), 2014-2019 |
| Nancy T. Lukitsh c/o Columbia Management Investment Advisers, LLC 290 Congress Street Boston, MA 02210 1956 | Trustee since 2011 | Senior Vice President, Partner and Director of Marketing, Wellington Management Company, LLP (investment adviser), 1997-2010; Chair, Wellington Management Portfolios (commingled non-U.S. investment pools), 2007-2010; Director, Wellington Trust Company, NA and other Wellington affiliates, 1997-2010 | 172 | None |
| Columbia U.S. Treasury Index Fund | Annual Report 2023 | 31 |
(Unaudited)
Independent trustees (continued)
| Name, address, year of birth | Position held with the Columbia Funds and length of service | Principal occupation(s) during past five years and other relevant professional experience | Number of Funds in the Columbia Funds Complex* overseen | Other directorships held by Trustee during the past five years and other relevant Board experience |
| David M. Moffett c/o Columbia Management Investment Advisers, LLC 290 Congress Street Boston, MA 02210 1952 | Trustee since 2011 | Retired; former Chief Executive Officer of Freddie Mac and Chief Financial Officer of U.S. Bank | 172 | Director, CSX Corporation (transportation suppliers); Director, PayPal Holdings Inc. (payment and data processing services); Trustee, University of Oklahoma Foundation; former Director, eBay Inc. (online trading community), 2007-2015; and former Director, CIT Bank, CIT Group Inc. (commercial and consumer finance), 2010-2016; former Senior Adviser to The Carlyle Group (financial services), March 2008-September 2008; former Governance Consultant to Bridgewater Associates, January 2013-December 2015 |
| Catherine James Paglia c/o Columbia Management Investment Advisers, LLC 290 Congress Street Boston, MA 02210 1952 | Trustee since 2004 | Director, Enterprise Asset Management, Inc. (private real estate and asset management company), since September 1998; Managing Director and Partner, Interlaken Capital, Inc., 1989-1997; Vice President, 1982-1985, Principal, 1985-1987, Managing Director, 1987-1989, Morgan Stanley; Vice President, Investment Banking, 1980-1982, Associate, Investment Banking, 1976-1980, Dean Witter Reynolds, Inc. | 174 | Director, Valmont Industries, Inc. (irrigation systems manufacturer), since 2012; Trustee, Carleton College (on the Investment Committee), since 1987; Trustee, Carnegie Endowment for International Peace (on the Investment Committee), since 2009 |
| Natalie A. Trunow c/o Columbia Management Investment Advisers, LLC 290 Congress Street Boston, MA 02210 1967 | Trustee since 2020 | Chief Executive Officer, Millennial Portfolio Solutions LLC (asset management and consulting services), January 2016-January 2021; Non-executive Member of the Investment Committee and Valuation Committee, Sarona Asset Management Inc. (private equity firm) since September 2019; Advisor, Horizon Investments (asset management and consulting services), August 2018-January 2022; Advisor, Paradigm Asset Management, November 2016-January 2022; Consultant to Independent Trustees of CFVIT and CFST I from September 2016 to June 2020 with respect to CFVIT and to December 2020 with respect to CFST I; Director of Investments/Consultant, Casey Family Programs, April 2016-November 2016; Senior Vice President and Chief Investment Officer, Calvert Investments, August 2008-January 2016; Section Head and Portfolio Manager, General Motors Asset Management, June 1997-August 2008 | 172 | Independent Director, Investment Committee, Health Services for Children with Special Needs, Inc., 2010-2021; Independent Director, (Executive Committee and Chair, Audit Committee), Consumer Credit Counseling Services (formerly Guidewell Financial Solutions), since 2016; Independent Director, (Investment Committee), Sarona Asset Management, since 2019 |
| 32 | Columbia U.S. Treasury Index Fund | Annual Report 2023 |
(Unaudited)
Independent trustees (continued)
| Name, address, year of birth | Position held with the Columbia Funds and length of service | Principal occupation(s) during past five years and other relevant professional experience | Number of Funds in the Columbia Funds Complex* overseen | Other directorships held by Trustee during the past five years and other relevant Board experience |
| Sandra L. Yeager c/o Columbia Management Investment Advisers, LLC 290 Congress Street Boston, MA 02210 1964 | Trustee since 2017 | Retired; President and founder, Hanoverian Capital, LLC (SEC registered investment advisor firm), 2008-2016; Managing Director, DuPont Capital, 2006-2008; Managing Director, Morgan Stanley Investment Management, 2004-2006; Senior Vice President, Alliance Bernstein, 1990-2004 | 174 | Former Director, NAPE (National Alliance for Partnerships in Equity) Education Foundation, October 2016-October 2020; Advisory Board, Jennersville YMCA, since 2022 |
| Name, address, year of birth | Position held with the Columbia Funds and length of service | Principal occupation(s) during the past five years and other relevant professional experience | Number of Funds in the Columbia Funds Complex overseen | Other directorships held by Trustee during the past five years and other relevant Board experience |
| Daniel J. Beckman c/o Columbia Management Investment Advisers, LLC 290 Congress Street Boston, MA 02210 1962 | Trustee since November 2021 and President since June 2021 | Vice President – Head of North America Product, Columbia Management Investment Advisers, LLC, since April 2015; President and Principal Executive Officer of the Columbia Funds, since June 2021; officer of Columbia Funds and affiliated funds, 2020-2021 | 174 | Director, Ameriprise Trust Company, since October 2016; Director, Columbia Management Investment Distributors, Inc. since November 2018; Board of Governors, Columbia Wanger Asset Management, LLC since, January 2022; Director, Columbia Threadneedle Canada, Inc., since December 2022 |
| * | The term “Columbia Funds Complex” as used herein includes Columbia Seligman Premium Technology Growth Fund, Tri-Continental Corporation and each series of Columbia Funds Series Trust (CFST), Columbia Funds Series Trust I (CFST I), Columbia Funds Series Trust II (CFST II), Columbia ETF Trust I (CET I), Columbia ETF Trust II (CET II), Columbia Funds Variable Insurance Trust (CFVIT) and Columbia Funds Variable Series Trust II (CFVST II). Messrs. Batejan, Beckman, Gallagher and Hacker and Mses. Blatz, Carlton, Carrig, Flynn, Paglia, and Yeager serve as directors of Columbia Seligman Premium Technology Growth Fund and Tri-Continental Corporation. |
| ** | Interested person (as defined under the 1940 Act) by reason of being an officer, director, security holder and/or employee of the Investment Manager or Ameriprise Financial. |
| Columbia U.S. Treasury Index Fund | Annual Report 2023 | 33 |
(Unaudited)
The Board has appointed officers who are responsible for day-to-day business decisions based on policies it has established. The officers serve at the pleasure of the Board. The following table provides basic information about the Officers of the Fund as of the printing of this report, including principal occupations during the past five years, although their specific titles may have varied over the period. In addition to Mr. Beckman, who is President and Principal Executive Officer, the Fund’s other officers are:
| Name, address and year of birth | Position and year first appointed to position for any Fund in the Columbia Funds Complex or a predecessor thereof | Principal occupation(s) during past five years |
| Michael G. Clarke 290 Congress Street Boston, MA 02210 1969 | Chief Financial Officer and Principal Financial Officer (2009) and Senior Vice President (2019) | Senior Vice President and Head of North America Operations & Investor Services, Columbia Management Investment Advisers, LLC, since June 2023 (previously Senior Vice President and Head of Global Operations, March 2022 – June 2023, Vice President, Head of North America Operations, and Co-Head of Global Operations, June 2019 - February 2022 and Vice President – Accounting and Tax, May 2010 - May 2019); senior officer of Columbia Funds and affiliated funds, since 2002. |
| Joseph Beranek 5890 Ameriprise Financial Center Minneapolis, MN 55474 1965 | Treasurer and Chief Accounting Officer (Principal Accounting Officer) (2019) and Principal Financial Officer (2020), CFST, CFST I, CFST II, CFVIT and CFVST II; Assistant Treasurer, CET I and CET II | Vice President – Mutual Fund Accounting and Financial Reporting, Columbia Management Investment Advisers, LLC, since December 2018 and March 2017, respectively. |
| Marybeth Pilat 290 Congress Street Boston, MA 02210 1968 | Treasurer and Chief Accounting Officer (Principal Accounting Officer) and Principal Financial Officer (2020) for CET I and CET II; Assistant Treasurer, CFST, CFST I, CFST II, CFVIT and CFVST II | Vice President – Product Pricing and Administration, Columbia Management Investment Advisers, LLC, since May 2017. |
| William F. Truscott 290 Congress Street Boston, MA 02210 1960 | Senior Vice President (2001) | Formerly, Trustee/Director of Columbia Funds Complex or legacy funds, November 2001-January 1, 2021; Chief Executive Officer, Global Asset Management, Ameriprise Financial, Inc., since September 2012; Chairman of the Board and President, Columbia Management Investment Advisers, LLC, since July 2004 and February 2012, respectively; Chairman of the Board and Chief Executive Officer, Columbia Management Investment Distributors, Inc., since November 2008 and February 2012, respectively; Chairman of the Board and Director, Threadneedle Asset Management Holdings, Sàrl, since March 2013 and December 2008, respectively; senior executive of various entities affiliated with Columbia Threadneedle. |
| Christopher O. Petersen 5228 Ameriprise Financial Center Minneapolis, MN 55474 1970 | Senior Vice President and Assistant Secretary (2021) | Formerly, Trustee/Director of funds within the Columbia Funds Complex, July 1, 2020 - November 22, 2021; Senior Vice President and Assistant General Counsel, Ameriprise Financial, Inc., since September 2021 (previously Vice President and Lead Chief Counsel, January 2015 - September 2021); formerly, President and Principal Executive Officer of the Columbia Funds, 2015 - 2021; officer of Columbia Funds and affiliated funds, since 2007. |
| Thomas P. McGuire 290 Congress Street Boston, MA 02210 1972 | Senior Vice President and Chief Compliance Officer (2012) | Vice President – Asset Management Compliance, Ameriprise Financial, Inc., since May 2010; Chief Compliance Officer, Columbia Acorn/Wanger Funds, since December 2015; formerly, Chief Compliance Officer, Ameriprise Certificate Company, September 2010 – September 2020. |
| Ryan C. Larrenaga 290 Congress Street Boston, MA 02210 1970 | Senior Vice President (2017), Chief Legal Officer (2017), and Secretary (2015) | Vice President and Chief Counsel, Ameriprise Financial, Inc., since August 2018 (previously Vice President and Group Counsel, August 2011 - August 2018); Chief Legal Officer, Columbia Acorn/Wanger Funds, since September 2020; officer of Columbia Funds and affiliated funds, since 2005. |
| 34 | Columbia U.S. Treasury Index Fund | Annual Report 2023 |
(Unaudited)
Fund officers (continued)
| Name, address and year of birth | Position and year first appointed to position for any Fund in the Columbia Funds Complex or a predecessor thereof | Principal occupation(s) during past five years |
| Michael E. DeFao 290 Congress Street Boston, MA 02210 1968 | Vice President (2011) and Assistant Secretary (2010) | Vice President and Chief Counsel, Ameriprise Financial, Inc., since May 2010; Vice President, Chief Legal Officer and Assistant Secretary, Columbia Management Investment Advisers, LLC, since October 2021 (previously Vice President and Assistant Secretary, May 2010 – September 2021). |
| Lyn Kephart-Strong 5228 Ameriprise Financial Center Minneapolis, MN 55474 1960 | Vice President (2015) | Vice President, Global Investment Operations Services, Columbia Management Investment Advisers, LLC, since 2010; President, Columbia Management Investment Services Corp., since October 2014; President, Ameriprise Trust Company, since January 2017. |
| • | the Fund had sufficient liquidity to both meet redemptions and operate effectively on behalf of shareholders; |
| • | there were no material changes to the Program during the period; |
| • | the implementation of the Program was effective to manage the Fund’s liquidity risk; and |
| • | the Program operated adequately during the period. |
| Columbia U.S. Treasury Index Fund | Annual Report 2023 | 35 |
columbiathreadneedleus.com/investor/. The Fund is distributed by Columbia Management Investment Distributors, Inc., member FINRA, and managed by Columbia Management Investment Advisers, LLC.

April 30, 2023

| 3 | |
| 5 | |
| 7 | |
| 8 | |
| 15 | |
| 17 | |
| 18 | |
| 20 | |
| 24 | |
| 34 | |
| 35 | |
| 35 | |
| 41 |
(Unaudited)

| Average annual total returns (%) (for the period ended April 30, 2023) | ||||||
| Inception | 1 Year | 5 Years | 10 Years | |||
| Class A | Excluding sales charges | 07/25/86 | -0.90 | 5.06 | 8.20 | |
| Including sales charges | -6.61 | 3.82 | 7.56 | |||
| Advisor Class | 11/08/12 | -0.64 | 5.32 | 8.47 | ||
| Class C | Excluding sales charges | 01/15/96 | -1.62 | 4.27 | 7.39 | |
| Including sales charges | -2.50 | 4.27 | 7.39 | |||
| Institutional Class | 07/31/95 | -0.64 | 5.32 | 8.47 | ||
| Institutional 2 Class | 11/08/12 | -0.59 | 5.44 | 8.61 | ||
| Institutional 3 Class | 07/15/09 | -0.53 | 5.49 | 8.66 | ||
| Class R | 09/27/10 | -1.14 | 4.79 | 7.93 | ||
| Russell 2000 Value Index | -7.99 | 3.66 | 6.96 | |||
| Columbia Small Cap Value Fund I | Annual Report 2023 | 3 |
(Unaudited)
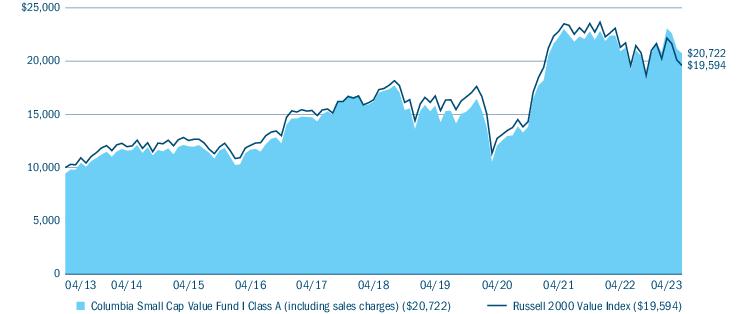
| Portfolio breakdown (%) (at April 30, 2023) | |
| Common Stocks | 99.6 |
| Money Market Funds | 0.4 |
| Total | 100.0 |
| Equity sector breakdown (%) (at April 30, 2023) | |
| Communication Services | 1.8 |
| Consumer Discretionary | 12.4 |
| Consumer Staples | 2.7 |
| Energy | 6.0 |
| Financials | 22.8 |
| Health Care | 9.5 |
| Industrials | 18.8 |
| Information Technology | 10.7 |
| Materials | 8.4 |
| Real Estate | 6.0 |
| Utilities | 0.9 |
| Total | 100.0 |
| 4 | Columbia Small Cap Value Fund I | Annual Report 2023 |
(Unaudited)
| • | The Fund’s outperformance of its benchmark was driven primarily by strong, broad-based stock selection, particularly within the industrials, financials, health care, materials and information technology sectors. |
| • | Sector allocation also helped relative results, particularly underweights to the poor-performing real estate, financials and communication services sectors. Overweights to information technology, industrials and materials also helped. |
| Columbia Small Cap Value Fund I | Annual Report 2023 | 5 |
(Unaudited)
| • | Top individual contributors during the period included: |
| ○ | Shares of space technology provider Maxar Technologies, Inc. rose sharply on news that it was being acquired by a private equity firm. |
| ○ | Solar energy systems makers Array Technologies, Inc. and Shoals Technologies Group, Inc., both experienced a rise in share price on strong results and expectations for market growth. |
| ○ | Thermal management solutions provider Modine Manufacturing Co. pleased investors with strong results and guidance across all business lines. |
| ○ | Electronic equipment maker Bel Fuse, Inc. reported record results and expectations for continued strength in end markets. |
| • | Security selection within energy was a notable detractor to relative results, as was an underweight to utilities. |
| • | Notable individual detractors included: |
| ○ | Commercial real estate developer and operator Hudson Pacific Properties, Inc., whose share price fell on worries over its exposure to West Coast markets hampered by the bank crisis and tech slowdown. |
| ○ | California bank Silvergate Capital Corp., was hurt by concerns over its focus on crypto currencies. |
| ○ | North Carolina-based office REIT Highwoods Properties, Inc. saw its share price fall on a poor earnings growth outlook despite a quicker recovery for office rentals in Sunbelt markets. |
| 6 | Columbia Small Cap Value Fund I | Annual Report 2023 |
(Unaudited)
| November 1, 2022 — April 30, 2023 | |||||||
| Account value at the beginning of the period ($) | Account value at the end of the period ($) | Expenses paid during the period ($) | Fund’s annualized expense ratio (%) | ||||
| Actual | Hypothetical | Actual | Hypothetical | Actual | Hypothetical | Actual | |
| Class A | 1,000.00 | 1,000.00 | 999.00 | 1,018.44 | 6.08 | 6.14 | 1.24 |
| Advisor Class | 1,000.00 | 1,000.00 | 1,000.50 | 1,019.67 | 4.86 | 4.90 | 0.99 |
| Class C | 1,000.00 | 1,000.00 | 995.70 | 1,014.76 | 9.74 | 9.83 | 1.99 |
| Institutional Class | 1,000.00 | 1,000.00 | 1,000.50 | 1,019.67 | 4.86 | 4.90 | 0.99 |
| Institutional 2 Class | 1,000.00 | 1,000.00 | 1,000.80 | 1,020.11 | 4.42 | 4.46 | 0.90 |
| Institutional 3 Class | 1,000.00 | 1,000.00 | 1,001.00 | 1,020.35 | 4.17 | 4.21 | 0.85 |
| Class R | 1,000.00 | 1,000.00 | 998.20 | 1,017.21 | 7.30 | 7.37 | 1.49 |
| Columbia Small Cap Value Fund I | Annual Report 2023 | 7 |
April 30, 2023
| Common Stocks 99.3% | ||
| Issuer | Shares | Value ($) |
| Communication Services 1.8% | ||
| Entertainment 0.4% | ||
| Gaia, Inc.(a),(b) | 792,948 | 2,410,562 |
| Playstudios, Inc.(b) | 685,534 | 3,002,639 |
| Total | 5,413,201 | |
| Media 1.4% | ||
| Criteo SA, ADR(b) | 218,880 | 6,883,776 |
| Innovid Corp.(b) | 2,110,655 | 1,981,905 |
| Integral Ad Science Holding Corp.(b) | 504,090 | 7,929,336 |
| Total | 16,795,017 | |
| Total Communication Services | 22,208,218 | |
| Consumer Discretionary 12.3% | ||
| Auto Components 1.0% | ||
| Gentherm, Inc.(b) | 93,888 | 5,600,419 |
| Modine Manufacturing Co.(b) | 339,113 | 7,090,853 |
| Total | 12,691,272 | |
| Broadline Retail 0.1% | ||
| Redbubble Ltd.(b) | 5,806,344 | 1,570,499 |
| Distributors 0.1% | ||
| Educational Development Corp.(b) | 387,336 | 817,279 |
| Diversified Consumer Services 0.5% | ||
| Stride, Inc.(b) | 141,560 | 6,081,417 |
| Hotels, Restaurants & Leisure 0.4% | ||
| PlayAGS, Inc.(b) | 844,689 | 4,459,958 |
| Household Durables 4.7% | ||
| Cavco Industries, Inc.(b) | 24,607 | 7,387,513 |
| Century Communities, Inc. | 126,330 | 8,507,062 |
| Ethan Allen Interiors, Inc. | 139,263 | 3,889,616 |
| Hamilton Beach Brands Holding Co. | 448,808 | 4,492,568 |
| Legacy Housing Corp.(b) | 232,535 | 5,022,756 |
| Lifetime Brands, Inc. | 115,627 | 566,572 |
| Lovesac Co. (The)(b) | 109,113 | 2,868,581 |
| Meritage Homes Corp. | 93,957 | 12,031,194 |
| Tri Pointe Homes, Inc.(b) | 384,973 | 11,041,026 |
| Universal Electronics, Inc.(b) | 239,445 | 2,406,422 |
| Total | 58,213,310 | |
| Common Stocks (continued) | ||
| Issuer | Shares | Value ($) |
| Leisure Products 0.7% | ||
| Latham Group, Inc.(b) | 1,257,520 | 3,030,623 |
| Malibu Boats, Inc., Class A(b) | 100,922 | 5,727,324 |
| Total | 8,757,947 | |
| Specialty Retail 2.9% | ||
| 1-800-Flowers.com, Inc., Class A(b) | 340,014 | 3,131,529 |
| American Eagle Outfitters, Inc. | 430,750 | 5,767,743 |
| Brilliant Earth Group, Inc., Class A(b) | 468,320 | 1,957,578 |
| National Vision Holdings, Inc.(b) | 225,720 | 4,749,149 |
| Overstock.com, Inc.(b) | 284,470 | 5,791,809 |
| ThredUp, Inc., Class A(b) | 1,709,646 | 4,513,465 |
| Urban Outfitters, Inc.(b) | 341,590 | 9,243,425 |
| Total | 35,154,698 | |
| Textiles, Apparel & Luxury Goods 1.9% | ||
| Canada Goose Holdings, Inc.(b) | 264,650 | 5,192,433 |
| Culp, Inc.(b) | 296,602 | 1,619,447 |
| Fossil Group, Inc.(b) | 994,277 | 3,340,771 |
| Movado Group, Inc. | 165,236 | 4,233,346 |
| Steven Madden Ltd. | 270,970 | 9,494,789 |
| Total | 23,880,786 | |
| Total Consumer Discretionary | 151,627,166 | |
| Consumer Staples 2.7% | ||
| Consumer Staples Distribution & Retail 0.7% | ||
| Andersons, Inc. (The) | 173,975 | 7,776,682 |
| Food Products 1.1% | ||
| Fresh Del Monte Produce, Inc. | 234,654 | 6,736,917 |
| Hain Celestial Group, Inc. (The)(b) | 383,882 | 6,883,004 |
| Total | 13,619,921 | |
| Household Products 0.3% | ||
| Oil-Dri Corp of America | 94,915 | 4,022,498 |
| Personal Care Products 0.6% | ||
| Honest Co., Inc. (The)(b) | 1,137,336 | 1,887,978 |
| Olaplex Holdings, Inc.(b) | 1,483,416 | 5,488,639 |
| Total | 7,376,617 | |
| Total Consumer Staples | 32,795,718 | |
| 8 | Columbia Small Cap Value Fund I | Annual Report 2023 |
April 30, 2023
| Common Stocks (continued) | ||
| Issuer | Shares | Value ($) |
| Energy 5.9% | ||
| Energy Equipment & Services 2.5% | ||
| ChampionX Corp. | 288,530 | 7,813,392 |
| Expro Group Holdings NV(b) | 394,722 | 7,851,021 |
| Natural Gas Services Group, Inc.(b) | 356,114 | 3,667,974 |
| Newpark Resources, Inc.(b) | 1,343,444 | 5,373,776 |
| Pason Systems, Inc. | 554,920 | 4,833,049 |
| Profire Energy, Inc.(b) | 1,667,695 | 1,934,526 |
| Total | 31,473,738 | |
| Oil, Gas & Consumable Fuels 3.4% | ||
| CVR Energy, Inc. | 261,760 | 6,894,758 |
| Delek U.S. Holdings, Inc. | 273,420 | 5,946,885 |
| Kinetik Holdings, Inc. | 200,185 | 6,165,698 |
| Murphy Oil Corp. | 273,010 | 10,022,197 |
| Ring Energy, Inc.(b) | 2,327,210 | 4,212,250 |
| Talos Energy, Inc.(b) | 361,560 | 4,928,063 |
| W&T Offshore, Inc.(b) | 767,511 | 3,354,023 |
| Total | 41,523,874 | |
| Total Energy | 72,997,612 | |
| Financials 22.6% | ||
| Banks 12.1% | ||
| Ameris Bancorp | 217,324 | 7,280,354 |
| Bank of Marin Bancorp | 101,795 | 1,794,646 |
| BankUnited, Inc. | 279,606 | 6,305,115 |
| Banner Corp. | 147,986 | 7,387,461 |
| Brookline Bancorp, Inc. | 366,430 | 3,495,742 |
| Capital Bancorp, Inc. | 204,030 | 3,437,905 |
| Capital City Bank Group, Inc. | 100,547 | 3,062,662 |
| Central Pacific Financial Corp. | 192,481 | 3,056,598 |
| Central Valley Community Bancorp | 176,730 | 2,580,258 |
| Columbia Banking System, Inc. | 479,270 | 10,237,207 |
| Community Trust Bancorp, Inc. | 96,353 | 3,469,672 |
| First BanCorp | 599,656 | 7,045,958 |
| First BanCorp | 163,218 | 5,023,850 |
| First Community Corp. | 204,486 | 4,341,238 |
| First Financial Corp. | 91,000 | 3,144,050 |
| Hilltop Holdings, Inc. | 273,780 | 8,492,656 |
| HomeStreet, Inc. | 125,107 | 1,221,044 |
| Common Stocks (continued) | ||
| Issuer | Shares | Value ($) |
| Northrim BanCorp, Inc. | 148,076 | 5,116,026 |
| OFG Bancorp | 265,231 | 6,781,957 |
| Plumas Bancorp | 79,624 | 3,050,395 |
| Popular, Inc. | 173,884 | 10,434,779 |
| Provident Financial Holdings, Inc. | 194,301 | 2,650,266 |
| Riverview Bancorp, Inc. | 429,555 | 2,201,469 |
| Sierra Bancorp | 175,597 | 2,878,035 |
| Southern First Bancshares, Inc.(b) | 150,104 | 4,139,868 |
| Territorial Bancorp, Inc. | 167,330 | 2,802,778 |
| Towne Bank | 286,744 | 6,792,965 |
| UMB Financial Corp. | 172,052 | 10,944,228 |
| Washington Federal, Inc. | 234,740 | 6,582,110 |
| Western New England Bancorp, Inc. | 528,094 | 3,575,196 |
| Total | 149,326,488 | |
| Capital Markets 0.7% | ||
| StoneX Group, Inc.(b) | 93,519 | 9,171,408 |
| Consumer Finance 0.7% | ||
| Ezcorp, Inc., Class A(b) | 326,695 | 2,812,844 |
| PROG Holdings, Inc.(b) | 182,083 | 5,504,369 |
| Total | 8,317,213 | |
| Financial Services 5.7% | ||
| Alerus Financial Corp. | 178,896 | 2,574,314 |
| Cass Information Systems, Inc. | 95,622 | 3,497,853 |
| Essent Group Ltd. | 300,390 | 12,757,563 |
| EVERTEC, Inc. | 213,810 | 7,417,069 |
| International Money Express, Inc.(b) | 175,771 | 4,531,376 |
| MGIC Investment Corp. | 774,445 | 11,515,997 |
| NMI Holdings, Inc., Class A(b) | 376,817 | 8,817,518 |
| Payoneer Global, Inc.(b) | 1,101,358 | 6,013,415 |
| Radian Group, Inc. | 564,790 | 13,707,453 |
| Total | 70,832,558 | |
| Insurance 3.4% | ||
| Employers Holdings, Inc. | 123,944 | 4,906,943 |
| Global Indemnity Group LLC | 213,103 | 5,932,787 |
| Greenlight Capital Re Ltd., Class A(b) | 277,576 | 2,714,693 |
| Horace Mann Educators Corp. | 223,100 | 6,978,568 |
| Mercury General Corp. | 240,133 | 7,302,445 |
| Columbia Small Cap Value Fund I | Annual Report 2023 | 9 |
April 30, 2023
| Common Stocks (continued) | ||
| Issuer | Shares | Value ($) |
| National Western Life Group, Inc., Class A | 28,496 | 7,265,910 |
| ProAssurance Corp. | 370,180 | 6,648,433 |
| Total | 41,749,779 | |
| Total Financials | 279,397,446 | |
| Health Care 9.5% | ||
| Biotechnology 4.3% | ||
| Arcutis Biotherapeutics, Inc.(b) | 237,970 | 3,293,505 |
| Arrowhead Pharmaceuticals, Inc.(b) | 173,509 | 6,143,954 |
| Atara Biotherapeutics, Inc.(b) | 687,470 | 1,863,044 |
| Insmed, Inc.(b) | 303,520 | 5,918,640 |
| IVERIC bio, Inc.(b) | 134,840 | 4,434,888 |
| Natera, Inc.(b) | 121,940 | 6,184,797 |
| Replimune Group, Inc.(b) | 131,569 | 2,201,149 |
| Sage Therapeutics, Inc.(b) | 194,850 | 9,518,422 |
| SpringWorks Therapeutics, Inc.(b) | 156,868 | 3,667,574 |
| Travere Therapeutics, Inc.(b) | 145,470 | 3,137,788 |
| uniQure NV(b) | 174,810 | 3,393,062 |
| Zentalis Pharmaceuticals, Inc.(b) | 122,540 | 2,699,556 |
| Total | 52,456,379 | |
| Health Care Equipment & Supplies 0.5% | ||
| LivaNova PLC(b) | 59,950 | 2,871,605 |
| Zimvie, Inc.(b) | 469,921 | 3,867,450 |
| Total | 6,739,055 | |
| Health Care Providers & Services 2.2% | ||
| Amedisys, Inc.(b) | 98,322 | 7,895,257 |
| Encompass Health Corp. | 161,530 | 10,362,149 |
| Enhabit, Inc.(b) | 491,405 | 6,019,711 |
| National HealthCare Corp. | 51,532 | 2,984,218 |
| Total | 27,261,335 | |
| Life Sciences Tools & Services 0.2% | ||
| Codexis, Inc.(b) | 500,073 | 1,960,286 |
| Pharmaceuticals 2.3% | ||
| ANI Pharmaceuticals, Inc.(b) | 123,734 | 4,667,246 |
| Perrigo Co. PLC | 373,629 | 13,895,263 |
| Supernus Pharmaceuticals, Inc.(b) | 200,895 | 7,404,990 |
| Taro Pharmaceutical Industries Ltd.(b) | 105,150 | 2,649,780 |
| Total | 28,617,279 | |
| Total Health Care | 117,034,334 | |
| Common Stocks (continued) | ||
| Issuer | Shares | Value ($) |
| Industrials 18.7% | ||
| Aerospace & Defense 0.9% | ||
| Moog, Inc., Class A | 127,380 | 11,478,212 |
| Air Freight & Logistics 0.9% | ||
| Forward Air Corp. | 59,790 | 6,308,443 |
| Radiant Logistics, Inc.(b) | 719,402 | 4,748,053 |
| Total | 11,056,496 | |
| Building Products 2.1% | ||
| AZEK Co., Inc. (The)(b) | 210,796 | 5,721,003 |
| AZZ, Inc. | 162,840 | 6,143,953 |
| Resideo Technologies, Inc.(b) | 205,969 | 3,666,248 |
| UFP Industries, Inc. | 136,705 | 10,734,077 |
| Total | 26,265,281 | |
| Commercial Services & Supplies 0.9% | ||
| Healthcare Services Group, Inc. | 433,839 | 6,772,227 |
| HNI Corp. | 184,860 | 4,802,663 |
| Total | 11,574,890 | |
| Construction & Engineering 0.7% | ||
| MDU Resources Group, Inc. | 283,140 | 8,273,351 |
| Electrical Equipment 1.2% | ||
| Encore Wire Corp. | 65,663 | 10,265,097 |
| Thermon(b) | 206,680 | 4,294,810 |
| Total | 14,559,907 | |
| Ground Transportation 2.1% | ||
| Hertz Global Holdings, Inc.(b) | 530,560 | 8,849,741 |
| Marten Transport Ltd. | 334,505 | 6,753,656 |
| Schneider National, Inc., Class B | 374,818 | 9,808,987 |
| Total | 25,412,384 | |
| Machinery 4.5% | ||
| CIRCOR International, Inc.(b) | 155,137 | 4,319,014 |
| Gorman-Rupp Co. | 135,478 | 3,325,985 |
| Greenbrier Companies, Inc. (The) | 165,120 | 4,367,424 |
| Hurco Companies, Inc. | 196,635 | 4,410,523 |
| John Bean Technologies Corp. | 99,800 | 10,849,258 |
| LB Foster Co., Class A(b) | 191,511 | 2,141,093 |
| Manitex International, Inc.(b) | 604,886 | 3,127,261 |
| Miller Industries, Inc. | 81,100 | 2,643,860 |
| 10 | Columbia Small Cap Value Fund I | Annual Report 2023 |
April 30, 2023
| Common Stocks (continued) | ||
| Issuer | Shares | Value ($) |
| Mueller Industries, Inc. | 163,210 | 11,726,638 |
| Standex International Corp. | 70,614 | 8,672,105 |
| Total | 55,583,161 | |
| Marine Transportation 1.0% | ||
| Costamare, Inc. | 610,400 | 5,511,912 |
| Kirby Corp.(b) | 98,431 | 7,071,283 |
| Total | 12,583,195 | |
| Passenger Airlines 0.7% | ||
| JetBlue Airways Corp.(b) | 1,258,230 | 8,983,762 |
| Professional Services 2.1% | ||
| IBEX Holdings Ltd.(b) | 185,431 | 3,795,773 |
| Korn/Ferry International | 160,895 | 7,726,178 |
| MAXIMUS, Inc. | 80,240 | 6,712,076 |
| Red Violet, Inc.(b) | 198,980 | 3,402,558 |
| TaskUS, Inc., Class A(b) | 286,522 | 3,856,586 |
| Total | 25,493,171 | |
| Trading Companies & Distributors 1.6% | ||
| BlueLinx Holdings, Inc.(b) | 51,440 | 3,603,886 |
| H&E Equipment Services, Inc. | 137,466 | 5,017,509 |
| Karat Packaging, Inc. | 215,460 | 2,921,638 |
| Textainer Group Holdings Ltd. | 230,012 | 8,073,421 |
| Total | 19,616,454 | |
| Total Industrials | 230,880,264 | |
| Information Technology 10.6% | ||
| Communications Equipment 1.6% | ||
| Applied Optoelectronics, Inc.(b) | 844,199 | 1,637,746 |
| KVH Industries, Inc.(b) | 209,740 | 2,206,465 |
| Lumentum Holdings, Inc.(b) | 203,588 | 9,823,121 |
| Netscout Systems, Inc.(b) | 232,664 | 6,330,787 |
| Total | 19,998,119 | |
| Electronic Equipment, Instruments & Components 5.0% | ||
| Airgain, Inc.(b) | 360,403 | 2,115,566 |
| Bel Fuse, Inc., Class B | 147,318 | 5,985,530 |
| ePlus, Inc.(b) | 127,725 | 5,561,146 |
| FARO Technologies, Inc.(b) | 174,500 | 4,074,575 |
| IPG Photonics Corp.(b) | 54,060 | 6,215,819 |
| Knowles Corp.(b) | 465,570 | 7,858,822 |
| Luna Innovations, Inc.(b) | 572,627 | 3,596,098 |
| Common Stocks (continued) | ||
| Issuer | Shares | Value ($) |
| OSI Systems, Inc.(b) | 79,370 | 8,965,635 |
| Powerfleet, Inc.(b) | 1,028,025 | 2,950,432 |
| Vishay Intertechnology, Inc. | 467,970 | 9,963,081 |
| Vishay Precision Group, Inc.(b) | 111,809 | 4,197,310 |
| Total | 61,484,014 | |
| IT Services 1.1% | ||
| DigitalOcean Holdings, Inc.(b) | 197,280 | 6,222,211 |
| Kyndryl Holdings, Inc.(b) | 556,219 | 8,042,927 |
| Total | 14,265,138 | |
| Semiconductors & Semiconductor Equipment 1.7% | ||
| Cohu, Inc.(b) | 225,232 | 7,621,851 |
| MagnaChip Semiconductor Corp.(b) | 257,740 | 2,288,731 |
| SMART Global Holdings, Inc.(b) | 282,710 | 4,359,388 |
| Synaptics, Inc.(b) | 51,790 | 4,586,523 |
| Valens Semiconductor Ltd.(b) | 821,304 | 2,135,390 |
| Total | 20,991,883 | |
| Software 1.0% | ||
| Cerence, Inc.(b) | 220,964 | 5,645,630 |
| Cognyte Software Ltd.(b) | 468,514 | 1,949,018 |
| Mitek Systems, Inc.(b) | 288,201 | 2,599,573 |
| Upland Software, Inc.(b) | 467,607 | 1,716,118 |
| Total | 11,910,339 | |
| Technology Hardware, Storage & Peripherals 0.2% | ||
| Nano Dimension Ltd., ADR(b) | 1,091,140 | 2,695,116 |
| Total Information Technology | 131,344,609 | |
| Materials 8.3% | ||
| Chemicals 1.1% | ||
| Aspen Aerogels, Inc.(b) | 778,910 | 4,875,976 |
| Tronox Holdings PLC, Class A | 615,978 | 8,432,739 |
| Total | 13,308,715 | |
| Construction Materials 1.9% | ||
| Eagle Materials, Inc. | 86,807 | 12,865,666 |
| Summit Materials, Inc., Class A(b) | 383,125 | 10,501,456 |
| Total | 23,367,122 | |
| Containers & Packaging 0.6% | ||
| Greif, Inc., Class A | 112,439 | 7,060,045 |
| Columbia Small Cap Value Fund I | Annual Report 2023 | 11 |
April 30, 2023
| Common Stocks (continued) | ||
| Issuer | Shares | Value ($) |
| Metals & Mining 3.3% | ||
| Ampco-Pittsburgh Corp.(b) | 620,435 | 1,873,714 |
| Capstone Copper Corp.(b) | 1,579,461 | 7,426,037 |
| Centerra Gold, Inc. | 801,630 | 5,419,737 |
| Copper Mountain Mining Corp.(b) | 2,843,127 | 5,351,127 |
| ERO Copper Corp.(b) | 309,584 | 6,096,395 |
| Ferroglobe PLC(b) | 827,755 | 3,344,130 |
| MP Materials Corp.(b) | 5,574 | 120,789 |
| Olympic Steel, Inc. | 73,429 | 3,419,589 |
| Torex Gold Resources, Inc.(b) | 303,898 | 4,986,273 |
| Universal Stainless & Alloy Products, Inc.(b) | 319,533 | 3,025,977 |
| Total | 41,063,768 | |
| Paper & Forest Products 1.4% | ||
| Clearwater Paper Corp.(b) | 94,853 | 3,424,193 |
| Glatfelter Corp. | 906,012 | 4,095,174 |
| Louisiana-Pacific Corp. | 170,120 | 10,162,969 |
| Total | 17,682,336 | |
| Total Materials | 102,481,986 | |
| Real Estate 6.0% | ||
| Diversified REITs 0.5% | ||
| American Assets Trust, Inc. | 370,710 | 6,746,922 |
| Hotel & Resort REITs 2.6% | ||
| Park Hotels & Resorts, Inc. | 630,340 | 7,595,597 |
| Pebblebrook Hotel Trust | 582,411 | 8,287,708 |
| RLJ Lodging Trust | 744,871 | 7,523,197 |
| Sunstone Hotel Investors, Inc. | 937,022 | 8,929,820 |
| Total | 32,336,322 | |
| Common Stocks (continued) | ||
| Issuer | Shares | Value ($) |
| Real Estate Management & Development 0.6% | ||
| Forestar Group, Inc.(b) | 352,609 | 6,819,458 |
| Retail REITs 0.7% | ||
| Macerich Co. (The) | 825,130 | 8,243,049 |
| Specialized REITs 1.6% | ||
| Outfront Media, Inc. | 495,810 | 8,260,195 |
| PotlatchDeltic Corp. | 239,553 | 11,074,535 |
| Total | 19,334,730 | |
| Total Real Estate | 73,480,481 | |
| Utilities 0.9% | ||
| Gas Utilities 0.9% | ||
| National Fuel Gas Co. | 145,540 | 8,135,686 |
| RGC Resources, Inc. | 177,237 | 3,394,089 |
| Total | 11,529,775 | |
| Total Utilities | 11,529,775 | |
| Total Common Stocks (Cost $1,026,849,345) | 1,225,777,609 | |
| Money Market Funds 0.3% | ||
| Shares | Value ($) | |
| Columbia Short-Term Cash Fund, 5.046%(a),(c) | 4,422,821 | 4,421,052 |
| Total Money Market Funds (Cost $4,420,937) | 4,421,052 | |
| Total Investments in Securities (Cost: $1,031,270,282) | 1,230,198,661 | |
| Other Assets & Liabilities, Net | 4,402,232 | |
| Net Assets | 1,234,600,893 | |
| 12 | Columbia Small Cap Value Fund I | Annual Report 2023 |
April 30, 2023
| (a) | As defined in the Investment Company Act of 1940, as amended, an affiliated company is one in which the Fund owns 5% or more of the company’s outstanding voting securities, or a company which is under common ownership or control with the Fund. The value of the holdings and transactions in these affiliated companies during the year ended April 30, 2023 are as follows: |
| Affiliated issuers | Beginning of period($) | Purchases($) | Sales($) | Net change in unrealized appreciation (depreciation)($) | End of period($) | Realized gain (loss)($) | Dividends($) | End of period shares |
| Columbia Short-Term Cash Fund, 5.046% | ||||||||
| 4,496,306 | 415,809,700 | (415,885,066) | 112 | 4,421,052 | (2,199) | 222,249 | 4,422,821 | |
| Gaia, Inc.‡ | ||||||||
| — | 1,964,292 | (1,171,759) | (2,149,736) | 2,410,562 | (626,977) | — | 792,948 | |
| Total | 4,496,306 | (2,149,624) | 6,831,614 | (629,176) | 222,249 | |||
| ‡ | Issuer was not an affiliate at the beginning of period. |
| (b) | Non-income producing investment. |
| (c) | The rate shown is the seven-day current annualized yield at April 30, 2023. |
| ADR | American Depositary Receipt |
| ■ | Level 1 — Valuations based on quoted prices for investments in active markets that the Fund has the ability to access at the measurement date. Valuation adjustments are not applied to Level 1 investments. |
| ■ | Level 2 — Valuations based on other significant observable inputs (including quoted prices for similar securities, interest rates, prepayment speeds, credit risks, etc.). |
| ■ | Level 3 — Valuations based on significant unobservable inputs (including the Fund’s own assumptions and judgment in determining the fair value of investments). |
| Columbia Small Cap Value Fund I | Annual Report 2023 | 13 |
April 30, 2023
The following table is a summary of the inputs used to value the Fund’s investments at April 30, 2023:
| Level 1 ($) | Level 2 ($) | Level 3 ($) | Total ($) | |
| Investments in Securities | ||||
| Common Stocks | ||||
| Communication Services | 22,208,218 | — | — | 22,208,218 |
| Consumer Discretionary | 150,056,667 | 1,570,499 | — | 151,627,166 |
| Consumer Staples | 32,795,718 | — | — | 32,795,718 |
| Energy | 72,997,612 | — | — | 72,997,612 |
| Financials | 279,397,446 | — | — | 279,397,446 |
| Health Care | 117,034,334 | — | — | 117,034,334 |
| Industrials | 230,880,264 | — | — | 230,880,264 |
| Information Technology | 131,344,609 | — | — | 131,344,609 |
| Materials | 102,481,986 | — | — | 102,481,986 |
| Real Estate | 73,480,481 | — | — | 73,480,481 |
| Utilities | 11,529,775 | — | — | 11,529,775 |
| Total Common Stocks | 1,224,207,110 | 1,570,499 | — | 1,225,777,609 |
| Money Market Funds | 4,421,052 | — | — | 4,421,052 |
| Total Investments in Securities | 1,228,628,162 | 1,570,499 | — | 1,230,198,661 |
| 14 | Columbia Small Cap Value Fund I | Annual Report 2023 |
April 30, 2023
| Assets | |
| Investments in securities, at value | |
| Unaffiliated issuers (cost $1,022,289,047) | $1,223,367,047 |
| Affiliated issuers (cost $8,981,235) | 6,831,614 |
| Receivable for: | |
| Investments sold | 8,359,399 |
| Capital shares sold | 1,336,575 |
| Dividends | 333,386 |
| Foreign tax reclaims | 3,740 |
| Prepaid expenses | 6,526 |
| Trustees’ deferred compensation plan | 338,725 |
| Total assets | 1,240,577,012 |
| Liabilities | |
| Payable for: | |
| Investments purchased | 4,335,143 |
| Capital shares purchased | 996,780 |
| Management services fees | 27,186 |
| Distribution and/or service fees | 1,785 |
| Transfer agent fees | 180,987 |
| Compensation of board members | 24,287 |
| Other expenses | 71,226 |
| Trustees’ deferred compensation plan | 338,725 |
| Total liabilities | 5,976,119 |
| Net assets applicable to outstanding capital stock | $1,234,600,893 |
| Represented by | |
| Paid in capital | 1,044,275,676 |
| Total distributable earnings (loss) | 190,325,217 |
| Total - representing net assets applicable to outstanding capital stock | $1,234,600,893 |
| Columbia Small Cap Value Fund I | Annual Report 2023 | 15 |
April 30, 2023
| Class A | |
| Net assets | $233,599,102 |
| Shares outstanding | 6,137,243 |
| Net asset value per share | $38.06 |
| Maximum sales charge | 5.75% |
| Maximum offering price per share (calculated by dividing the net asset value per share by 1.0 minus the maximum sales charge for Class A shares) | $40.38 |
| Advisor Class | |
| Net assets | $65,397,628 |
| Shares outstanding | 1,430,209 |
| Net asset value per share | $45.73 |
| Class C | |
| Net assets | $6,017,903 |
| Shares outstanding | 286,899 |
| Net asset value per share | $20.98 |
| Institutional Class | |
| Net assets | $612,677,061 |
| Shares outstanding | 13,922,645 |
| Net asset value per share | $44.01 |
| Institutional 2 Class | |
| Net assets | $138,904,525 |
| Shares outstanding | 3,031,889 |
| Net asset value per share | $45.81 |
| Institutional 3 Class | |
| Net assets | $176,273,426 |
| Shares outstanding | 3,971,585 |
| Net asset value per share | $44.38 |
| Class R | |
| Net assets | $1,731,248 |
| Shares outstanding | 45,818 |
| Net asset value per share | $37.79 |
| 16 | Columbia Small Cap Value Fund I | Annual Report 2023 |
Year Ended April 30, 2023
| Net investment income | |
| Income: | |
| Dividends — unaffiliated issuers | $20,070,965 |
| Dividends — affiliated issuers | 222,249 |
| Foreign taxes withheld | (176,857) |
| Total income | 20,116,357 |
| Expenses: | |
| Management services fees | 10,199,208 |
| Distribution and/or service fees | |
| Class A | 604,962 |
| Class C | 64,836 |
| Class R | 9,621 |
| Transfer agent fees | |
| Class A | 355,242 |
| Advisor Class | 85,418 |
| Class C | 9,520 |
| Institutional Class | 979,254 |
| Institutional 2 Class | 63,758 |
| Institutional 3 Class | 12,611 |
| Class R | 2,824 |
| Compensation of board members | 33,585 |
| Custodian fees | 27,644 |
| Printing and postage fees | 140,543 |
| Registration fees | 152,963 |
| Accounting services fees | 32,840 |
| Legal fees | 29,971 |
| Interest on interfund lending | 1,246 |
| Compensation of chief compliance officer | 249 |
| Other | 39,755 |
| Total expenses | 12,846,050 |
| Expense reduction | (2,680) |
| Total net expenses | 12,843,370 |
| Net investment income | 7,272,987 |
| Realized and unrealized gain (loss) — net | |
| Net realized gain (loss) on: | |
| Investments — unaffiliated issuers | 12,285,072 |
| Investments — affiliated issuers | (629,176) |
| Foreign currency translations | (3,413) |
| Net realized gain | 11,652,483 |
| Net change in unrealized appreciation (depreciation) on: | |
| Investments — unaffiliated issuers | (16,329,481) |
| Investments — affiliated issuers | (2,149,624) |
| Foreign currency translations | (658) |
| Net change in unrealized appreciation (depreciation) | (18,479,763) |
| Net realized and unrealized loss | (6,827,280) |
| Net increase in net assets resulting from operations | $445,707 |
| Columbia Small Cap Value Fund I | Annual Report 2023 | 17 |
| Year Ended April 30, 2023 | Year Ended April 30, 2022 | |
| Operations | ||
| Net investment income | $7,272,987 | $2,934,562 |
| Net realized gain | 11,652,483 | 140,463,201 |
| Net change in unrealized appreciation (depreciation) | (18,479,763) | (212,547,027) |
| Net increase (decrease) in net assets resulting from operations | 445,707 | (69,149,264) |
| Distributions to shareholders | ||
| Net investment income and net realized gains | ||
| Class A | (13,945,771) | (34,661,347) |
| Advisor Class | (2,764,530) | (6,688,259) |
| Class C | (633,272) | (1,744,634) |
| Institutional Class | (28,176,888) | (51,903,589) |
| Institutional 2 Class | (5,246,792) | (12,568,941) |
| Institutional 3 Class | (8,710,054) | (20,943,537) |
| Class R | (113,858) | (329,937) |
| Total distributions to shareholders | (59,591,165) | (128,840,244) |
| Increase in net assets from capital stock activity | 147,585,905 | 257,119,317 |
| Total increase in net assets | 88,440,447 | 59,129,809 |
| Net assets at beginning of year | 1,146,160,446 | 1,087,030,637 |
| Net assets at end of year | $1,234,600,893 | $1,146,160,446 |
| 18 | Columbia Small Cap Value Fund I | Annual Report 2023 |
| Year Ended | Year Ended | |||
| April 30, 2023 | April 30, 2022 | |||
| Shares | Dollars ($) | Shares | Dollars ($) | |
| Capital stock activity | ||||
| Class A | ||||
| Subscriptions | 583,191 | 22,595,872 | 628,215 | 29,444,739 |
| Distributions reinvested | 362,208 | 12,817,394 | 693,929 | 31,789,734 |
| Redemptions | (934,811) | (35,949,994) | (1,004,933) | (46,390,939) |
| Net increase (decrease) | 10,588 | (536,728) | 317,211 | 14,843,534 |
| Advisor Class | ||||
| Subscriptions | 674,898 | 32,214,091 | 1,155,300 | 63,891,992 |
| Distributions reinvested | 57,135 | 2,432,012 | 108,730 | 5,887,738 |
| Redemptions | (509,459) | (23,528,750) | (1,006,847) | (56,195,509) |
| Net increase | 222,574 | 11,117,353 | 257,183 | 13,584,221 |
| Class C | ||||
| Subscriptions | 67,987 | 1,473,734 | 90,981 | 2,646,075 |
| Distributions reinvested | 30,691 | 597,238 | 62,233 | 1,683,680 |
| Redemptions | (118,478) | (2,541,729) | (119,948) | (3,311,185) |
| Net increase (decrease) | (19,800) | (470,757) | 33,266 | 1,018,570 |
| Institutional Class | ||||
| Subscriptions | 8,205,125 | 353,422,764 | 5,939,467 | 306,524,158 |
| Distributions reinvested | 568,409 | 23,351,820 | 779,290 | 40,687,924 |
| Redemptions | (6,316,981) | (281,131,997) | (3,163,933) | (165,504,371) |
| Net increase | 2,456,553 | 95,642,587 | 3,554,824 | 181,707,711 |
| Institutional 2 Class | ||||
| Subscriptions | 1,267,764 | 58,607,741 | 645,557 | 35,674,714 |
| Distributions reinvested | 122,865 | 5,246,792 | 231,712 | 12,568,941 |
| Redemptions | (520,518) | (24,090,097) | (735,537) | (39,935,484) |
| Net increase | 870,111 | 39,764,436 | 141,732 | 8,308,171 |
| Institutional 3 Class | ||||
| Subscriptions | 863,431 | 39,079,011 | 1,330,426 | 70,352,538 |
| Distributions reinvested | 147,320 | 6,094,970 | 299,125 | 15,740,695 |
| Redemptions | (953,022) | (42,957,800) | (903,984) | (48,368,264) |
| Net increase | 57,729 | 2,216,181 | 725,567 | 37,724,969 |
| Class R | ||||
| Subscriptions | 4,862 | 184,687 | 18,879 | 895,719 |
| Distributions reinvested | 3,243 | 113,671 | 7,230 | 329,493 |
| Redemptions | (11,560) | (445,525) | (28,200) | (1,293,071) |
| Net decrease | (3,455) | (147,167) | (2,091) | (67,859) |
| Total net increase | 3,594,300 | 147,585,905 | 5,027,692 | 257,119,317 |
| Columbia Small Cap Value Fund I | Annual Report 2023 | 19 |
| Net asset value, beginning of period | Net investment income (loss) | Net realized and unrealized gain (loss) | Total from investment operations | Distributions from net investment income | Distributions from net realized gains | Total distributions to shareholders | |
| Class A | |||||||
| Year Ended 4/30/2023 | $40.91 | 0.14 | (0.69) | (0.55) | (0.13) | (2.17) | (2.30) |
| Year Ended 4/30/2022 | $49.30 | 0.02 | (2.46) | (2.44) | (0.07) | (5.88) | (5.95) |
| Year Ended 4/30/2021 | $26.90 | 0.19 | 22.41 | 22.60 | (0.17) | (0.03) | (0.20) |
| Year Ended 4/30/2020 | $36.62 | 0.18 | (8.59) | (8.41) | (0.17) | (1.14) | (1.31) |
| Year Ended 4/30/2019 | $40.70 | 0.08 | (1.08) | (1.00) | (0.13) | (2.95) | (3.08) |
| Advisor Class | |||||||
| Year Ended 4/30/2023 | $48.60 | 0.28 | (0.78) | (0.50) | (0.20) | (2.17) | (2.37) |
| Year Ended 4/30/2022 | $57.47 | 0.15 | (2.94) | (2.79) | (0.20) | (5.88) | (6.08) |
| Year Ended 4/30/2021 | $31.32 | 0.37 | 26.06 | 26.43 | (0.25) | (0.03) | (0.28) |
| Year Ended 4/30/2020 | $42.37 | 0.30 | (9.98) | (9.68) | (0.23) | (1.14) | (1.37) |
| Year Ended 4/30/2019 | $46.56 | 0.21 | (1.25) | (1.04) | (0.20) | (2.95) | (3.15) |
| Class C | |||||||
| Year Ended 4/30/2023 | $23.70 | (0.08) | (0.47) | (0.55) | — | (2.17) | (2.17) |
| Year Ended 4/30/2022 | $31.15 | (0.20) | (1.37) | (1.57) | — | (5.88) | (5.88) |
| Year Ended 4/30/2021 | $17.06 | (0.04) | 14.16 | 14.12 | — | (0.03) | (0.03) |
| Year Ended 4/30/2020 | $23.72 | (0.04) | (5.48) | (5.52) | — | (1.14) | (1.14) |
| Year Ended 4/30/2019 | $27.55 | (0.16) | (0.72) | (0.88) | — | (2.95) | (2.95) |
| Institutional Class | |||||||
| Year Ended 4/30/2023 | $46.87 | 0.27 | (0.76) | (0.49) | (0.20) | (2.17) | (2.37) |
| Year Ended 4/30/2022 | $55.63 | 0.15 | (2.82) | (2.67) | (0.21) | (5.88) | (6.09) |
| Year Ended 4/30/2021 | $30.33 | 0.33 | 25.25 | 25.58 | (0.25) | (0.03) | (0.28) |
| Year Ended 4/30/2020 | $41.07 | 0.30 | (9.67) | (9.37) | (0.23) | (1.14) | (1.37) |
| Year Ended 4/30/2019 | $45.24 | 0.20 | (1.22) | (1.02) | (0.20) | (2.95) | (3.15) |
| Institutional 2 Class | |||||||
| Year Ended 4/30/2023 | $48.68 | 0.32 | (0.79) | (0.47) | (0.23) | (2.17) | (2.40) |
| Year Ended 4/30/2022 | $57.55 | 0.21 | (2.94) | (2.73) | (0.26) | (5.88) | (6.14) |
| Year Ended 4/30/2021 | $31.36 | 0.40 | 26.11 | 26.51 | (0.29) | (0.03) | (0.32) |
| Year Ended 4/30/2020 | $42.40 | 0.36 | (10.00) | (9.64) | (0.26) | (1.14) | (1.40) |
| Year Ended 4/30/2019 | $46.57 | 0.27 | (1.25) | (0.98) | (0.24) | (2.95) | (3.19) |
| 20 | Columbia Small Cap Value Fund I | Annual Report 2023 |
| Net asset value, end of period | Total return | Total gross expense ratio to average net assets(a) | Total net expense ratio to average net assets(a),(b) | Net investment income (loss) ratio to average net assets | Portfolio turnover | Net assets, end of period (000’s) | |
| Class A | |||||||
| Year Ended 4/30/2023 | $38.06 | (0.90%) | 1.24%(c) | 1.24%(c),(d) | 0.36% | 72% | $233,599 |
| Year Ended 4/30/2022 | $40.91 | (5.94%) | 1.26%(c) | 1.26%(c),(d) | 0.04% | 58% | $250,665 |
| Year Ended 4/30/2021 | $49.30 | 84.29% | 1.33%(c) | 1.31%(c),(d) | 0.53% | 43% | $286,411 |
| Year Ended 4/30/2020 | $26.90 | (23.69%) | 1.37%(c),(e) | 1.32%(c),(d),(e) | 0.55% | 60% | $152,006 |
| Year Ended 4/30/2019 | $36.62 | (2.38%) | 1.36%(c),(e) | 1.32%(c),(d),(e) | 0.21% | 62% | $234,765 |
| Advisor Class | |||||||
| Year Ended 4/30/2023 | $45.73 | (0.64%) | 0.99%(c) | 0.99%(c),(d) | 0.61% | 72% | $65,398 |
| Year Ended 4/30/2022 | $48.60 | (5.71%) | 1.01%(c) | 1.01%(c),(d) | 0.28% | 58% | $58,696 |
| Year Ended 4/30/2021 | $57.47 | 84.74% | 1.08%(c) | 1.06%(c),(d) | 0.87% | 43% | $54,621 |
| Year Ended 4/30/2020 | $31.32 | (23.49%) | 1.12%(c),(e) | 1.07%(c),(d),(e) | 0.79% | 60% | $19,077 |
| Year Ended 4/30/2019 | $42.37 | (2.14%) | 1.12%(c),(e) | 1.07%(c),(d),(e) | 0.48% | 62% | $29,064 |
| Class C | |||||||
| Year Ended 4/30/2023 | $20.98 | (1.62%) | 1.99%(c) | 1.99%(c),(d) | (0.39%) | 72% | $6,018 |
| Year Ended 4/30/2022 | $23.70 | (6.66%) | 2.01%(c) | 2.01%(c),(d) | (0.71%) | 58% | $7,269 |
| Year Ended 4/30/2021 | $31.15 | 82.90% | 2.08%(c) | 2.05%(c),(d) | (0.19%) | 43% | $8,516 |
| Year Ended 4/30/2020 | $17.06 | (24.24%) | 2.12%(c),(e) | 2.07%(c),(d),(e) | (0.20%) | 60% | $3,178 |
| Year Ended 4/30/2019 | $23.72 | (3.15%) | 2.10%(c),(e) | 2.07%(c),(d),(e) | (0.59%) | 62% | $7,969 |
| Institutional Class | |||||||
| Year Ended 4/30/2023 | $44.01 | (0.64%) | 0.99%(c) | 0.99%(c),(d) | 0.60% | 72% | $612,677 |
| Year Ended 4/30/2022 | $46.87 | (5.70%) | 1.01%(c) | 1.01%(c),(d) | 0.30% | 58% | $537,447 |
| Year Ended 4/30/2021 | $55.63 | 84.72% | 1.07%(c) | 1.05%(c),(d) | 0.77% | 43% | $440,126 |
| Year Ended 4/30/2020 | $30.33 | (23.48%) | 1.12%(c),(e) | 1.07%(c),(d),(e) | 0.79% | 60% | $106,186 |
| Year Ended 4/30/2019 | $41.07 | (2.16%) | 1.11%(c),(e) | 1.07%(c),(d),(e) | 0.47% | 62% | $192,878 |
| Institutional 2 Class | |||||||
| Year Ended 4/30/2023 | $45.81 | (0.59%) | 0.90%(c) | 0.90%(c) | 0.68% | 72% | $138,905 |
| Year Ended 4/30/2022 | $48.68 | (5.60%) | 0.91%(c) | 0.91%(c) | 0.39% | 58% | $105,229 |
| Year Ended 4/30/2021 | $57.55 | 84.97% | 0.95%(c) | 0.93%(c) | 0.93% | 43% | $116,249 |
| Year Ended 4/30/2020 | $31.36 | (23.39%) | 0.98%(c),(e) | 0.94%(c),(e) | 0.96% | 60% | $52,825 |
| Year Ended 4/30/2019 | $42.40 | (2.01%) | 0.97%(c),(e) | 0.94%(c),(e) | 0.61% | 62% | $39,831 |
| Columbia Small Cap Value Fund I | Annual Report 2023 | 21 |
| Net asset value, beginning of period | Net investment income (loss) | Net realized and unrealized gain (loss) | Total from investment operations | Distributions from net investment income | Distributions from net realized gains | Total distributions to shareholders | |
| Institutional 3 Class | |||||||
| Year Ended 4/30/2023 | $47.23 | 0.33 | (0.77) | (0.44) | (0.24) | (2.17) | (2.41) |
| Year Ended 4/30/2022 | $56.01 | 0.23 | (2.84) | (2.61) | (0.29) | (5.88) | (6.17) |
| Year Ended 4/30/2021 | $30.53 | 0.39 | 25.43 | 25.82 | (0.31) | (0.03) | (0.34) |
| Year Ended 4/30/2020 | $41.30 | 0.37 | (9.72) | (9.35) | (0.28) | (1.14) | (1.42) |
| Year Ended 4/30/2019 | $45.45 | 0.28 | (1.22) | (0.94) | (0.26) | (2.95) | (3.21) |
| Class R | |||||||
| Year Ended 4/30/2023 | $40.66 | 0.04 | (0.68) | (0.64) | (0.06) | (2.17) | (2.23) |
| Year Ended 4/30/2022 | $49.08 | (0.09) | (2.45) | (2.54) | — | (5.88) | (5.88) |
| Year Ended 4/30/2021 | $26.79 | 0.11 | 22.30 | 22.41 | (0.09) | (0.03) | (0.12) |
| Year Ended 4/30/2020 | $36.50 | 0.10 | (8.56) | (8.46) | (0.11) | (1.14) | (1.25) |
| Year Ended 4/30/2019 | $40.61 | (0.01) | (1.09) | (1.10) | (0.06) | (2.95) | (3.01) |
| Notes to Financial Highlights | |
| (a) | In addition to the fees and expenses that the Fund bears directly, the Fund indirectly bears a pro rata share of the fees and expenses of any other funds in which it invests. Such indirect expenses are not included in the Fund’s reported expense ratios. |
| (b) | Total net expenses include the impact of certain fee waivers/expense reimbursements made by the Investment Manager and certain of its affiliates, if applicable. |
| (c) | Ratios include interfund lending expense which is less than 0.01%. |
| (d) | The benefits derived from expense reductions had an impact of less than 0.01%. |
| (e) | Ratios include line of credit interest expense which is less than 0.01%. |
| 22 | Columbia Small Cap Value Fund I | Annual Report 2023 |
| Net asset value, end of period | Total return | Total gross expense ratio to average net assets(a) | Total net expense ratio to average net assets(a),(b) | Net investment income (loss) ratio to average net assets | Portfolio turnover | Net assets, end of period (000’s) | |
| Institutional 3 Class | |||||||
| Year Ended 4/30/2023 | $44.38 | (0.53%) | 0.85%(c) | 0.85%(c) | 0.74% | 72% | $176,273 |
| Year Ended 4/30/2022 | $47.23 | (5.55%) | 0.86%(c) | 0.86%(c) | 0.44% | 58% | $184,850 |
| Year Ended 4/30/2021 | $56.01 | 85.03% | 0.90%(c) | 0.88%(c) | 0.96% | 43% | $178,586 |
| Year Ended 4/30/2020 | $30.53 | (23.34%) | 0.93%(c),(e) | 0.89%(c),(e) | 1.01% | 60% | $96,875 |
| Year Ended 4/30/2019 | $41.30 | (1.97%) | 0.92%(c),(e) | 0.89%(c),(e) | 0.64% | 62% | $108,132 |
| Class R | |||||||
| Year Ended 4/30/2023 | $37.79 | (1.14%) | 1.49%(c) | 1.49%(c),(d) | 0.11% | 72% | $1,731 |
| Year Ended 4/30/2022 | $40.66 | (6.17%) | 1.51%(c) | 1.51%(c),(d) | (0.20%) | 58% | $2,003 |
| Year Ended 4/30/2021 | $49.08 | 83.85% | 1.58%(c) | 1.56%(c),(d) | 0.30% | 43% | $2,521 |
| Year Ended 4/30/2020 | $26.79 | (23.87%) | 1.62%(c),(e) | 1.57%(c),(d),(e) | 0.31% | 60% | $1,487 |
| Year Ended 4/30/2019 | $36.50 | (2.67%) | 1.60%(c),(e) | 1.57%(c),(d),(e) | (0.03%) | 62% | $2,048 |
| Columbia Small Cap Value Fund I | Annual Report 2023 | 23 |
April 30, 2023
| 24 | Columbia Small Cap Value Fund I | Annual Report 2023 |
April 30, 2023
| Columbia Small Cap Value Fund I | Annual Report 2023 | 25 |
April 30, 2023
| 26 | Columbia Small Cap Value Fund I | Annual Report 2023 |
April 30, 2023
| Purchases ($) | Sales ($) | Net realized gain (loss) ($) |
| 55,840,900 | — | — |
| Columbia Small Cap Value Fund I | Annual Report 2023 | 27 |
April 30, 2023
| Effective rate (%) | |
| Class A | 0.15 |
| Advisor Class | 0.15 |
| Class C | 0.15 |
| Institutional Class | 0.15 |
| Institutional 2 Class | 0.06 |
| Institutional 3 Class | 0.01 |
| Class R | 0.15 |
| Front End (%) | CDSC (%) | Amount ($) | |
| Class A | 5.75 | 0.50 - 1.00(a) | 101,630 |
| Class C | — | 1.00(b) | 310 |
| (a) | This charge is imposed on certain investments of between $1 million and $50 million redeemed within 18 months after purchase, as follows: 1.00% if redeemed within 12 months after purchase, and 0.50% if redeemed more than 12, but less than 18, months after purchase, with certain limited exceptions. |
| (b) | This charge applies to redemptions within 12 months after purchase, with certain limited exceptions. |
| 28 | Columbia Small Cap Value Fund I | Annual Report 2023 |
April 30, 2023
| Fee rate(s) contractual through August 31, 2023 | |
| Class A | 1.27% |
| Advisor Class | 1.02 |
| Class C | 2.02 |
| Institutional Class | 1.02 |
| Institutional 2 Class | 0.93 |
| Institutional 3 Class | 0.88 |
| Class R | 1.52 |
| Undistributed net investment income ($) | Accumulated net realized (loss) ($) | Paid in capital ($) |
| (242,494) | (1,194,506) | 1,437,000 |
| Columbia Small Cap Value Fund I | Annual Report 2023 | 29 |
April 30, 2023
| Year Ended April 30, 2023 | Year Ended April 30, 2022 | ||||
| Ordinary income ($) | Long-term capital gains ($) | Total ($) | Ordinary income ($) | Long-term capital gains ($) | Total ($) |
| 5,775,857 | 53,815,308 | 59,591,165 | 28,353,615 | 100,486,629 | 128,840,244 |
| Undistributed ordinary income ($) | Undistributed long-term capital gains ($) | Capital loss carryforwards ($) | Net unrealized appreciation ($) |
| 1,213,710 | 17,235,760 | (6,421,266) | 191,000,766 |
| Federal tax cost ($) | Gross unrealized appreciation ($) | Gross unrealized (depreciation) ($) | Net unrealized appreciation ($) |
| 1,039,197,895 | 261,190,239 | (70,189,473) | 191,000,766 |
| No expiration short-term ($) | No expiration long-term ($) | Total ($) | Utilized ($) |
| (6,421,266) | — | (6,421,266) | 599,961 |
| Late year ordinary losses ($) | Post-October capital losses ($) |
| — | 12,341,043 |
| 30 | Columbia Small Cap Value Fund I | Annual Report 2023 |
April 30, 2023
| Borrower or lender | Average loan balance ($) | Weighted average interest rate (%) | Number of days with outstanding loans |
| Borrower | 1,621,429 | 2.82 | 14 |
| Columbia Small Cap Value Fund I | Annual Report 2023 | 31 |
April 30, 2023
| 32 | Columbia Small Cap Value Fund I | Annual Report 2023 |
April 30, 2023
| Columbia Small Cap Value Fund I | Annual Report 2023 | 33 |
| 34 | Columbia Small Cap Value Fund I | Annual Report 2023 |
| Qualified dividend income | Dividends received deduction | Capital gain dividend |
| 100.00% | 100.00% | $19,559,632 |
| Name, address, year of birth | Position held with the Columbia Funds and length of service | Principal occupation(s) during past five years and other relevant professional experience | Number of Funds in the Columbia Funds Complex* overseen | Other directorships held by Trustee during the past five years and other relevant Board experience |
| George S. Batejan c/o Columbia Management Investment Advisers, LLC 290 Congress Street Boston, MA 02210 1954 | Trustee since 2017 | Executive Vice President, Global Head of Technology and Operations, Janus Capital Group, Inc., 2010-2016 | 174 | Former Chairman of the Board, NICSA (National Investment Company Services Association) (Executive Committee, Nominating Committee and Governance Committee), 2014-2016; former Director, Intech Investment Management, 2011-2016; former Board Member, Metro Denver Chamber of Commerce, 2015-2016; former Advisory Board Member, University of Colorado Business School, 2015-2018; former Board Member, Chase Bank International, 1993-1994 |
| Columbia Small Cap Value Fund I | Annual Report 2023 | 35 |
(Unaudited)
Independent trustees (continued)
| Name, address, year of birth | Position held with the Columbia Funds and length of service | Principal occupation(s) during past five years and other relevant professional experience | Number of Funds in the Columbia Funds Complex* overseen | Other directorships held by Trustee during the past five years and other relevant Board experience |
| Kathleen Blatz c/o Columbia Management Investment Advisers, LLC 290 Congress Street Boston, MA 02210 1954 | Trustee since 2006 | Attorney, specializing in arbitration and mediation; Chief Justice, Minnesota Supreme Court, 1998-2006; Associate Justice, Minnesota Supreme Court, 1996-1998; Fourth Judicial District Court Judge, Hennepin County, 1994-1996; Attorney in private practice and public service, 1984-1993; State Representative, Minnesota House of Representatives, 1979-1993, which included service on the Tax and Financial Institutions and Insurance Committees; Member and Interim Chair, Minnesota Sports Facilities Authority, January-July 2017; Interim President and Chief Executive Officer, Blue Cross and Blue Shield of Minnesota (health care insurance), February-July 2018, April-October 2021 | 174 | Former Trustee, Blue Cross and Blue Shield of Minnesota, 2009-2021 (Chair of the Business Development Committee, 2014-2017; Chair of the Governance Committee, 2017-2019); former Member and Chair of the Board, Minnesota Sports Facilities Authority, January 2017-July 2017; former Director, Robina Foundation, 2009-2020 (Chair, 2014-2020); Director, Richard M. Schulze Family Foundation, since 2021 |
| Pamela G. Carlton c/o Columbia Management Investment Advisers, LLC 290 Congress Street Boston, MA 02210 1954 | Chair since 2023; Trustee since 2007 | President, Springboard — Partners in Cross Cultural Leadership (consulting company), since 2003; Managing Director of US Equity Research, JP Morgan Chase, 1999-2003; Director of US Equity Research, Chase Asset Management, 1996-1999; Co-Director Latin America Research, 1993-1996, COO Global Research, 1992-1996, Co-Director of US Research, 1991-1992, Investment Banker, 1982-1991, Morgan Stanley; Attorney, Cleary Gottlieb Steen & Hamilton LLP, 1980-1982 | 174 | Trustee, New York Presbyterian Hospital Board, since 1996; Director, DR Bank (Audit Committee) since 2017; Director, Evercore Inc. (Audit Committee, Nominating and Governance Committee), since 2019; Director, Apollo Commercial Real Estate Finance, Inc. (Chair, Nominating and Governance Committee) (financial services), since 2021; the Governing Council of the Independent Directors Council (IDC), since 2021 |
| Janet Langford Carrig c/o Columbia Management Investment Advisers, LLC 290 Congress Street Boston, MA 02210 1957 | Trustee since 1996 | Senior Vice President, General Counsel and Corporate Secretary, ConocoPhillips (independent energy company), September 2007-October 2018 | 174 | Director, EQT Corporation (natural gas producer), since 2019; former Director, Whiting Petroleum Corporation (independent oil and gas company), 2020-2022 |
| J. Kevin Connaughton c/o Columbia Management Investment Advisers, LLC 290 Congress Street Boston, MA 02210 1964 | Trustee since 2020 | CEO and President, RhodeWay Financial (non-profit financial planning firm), since December 2022; Member, FINRA National Adjudicatory Council, since January 2020; Adjunct Professor of Finance, Bentley University since January 2018; Consultant to Independent Trustees of CFVIT and CFST I from March 2016 to June 2020 with respect to CFVIT and to December 2020 with respect to CFST I; Managing Director and General Manager of Mutual Fund Products, Columbia Management Investment Advisers, LLC, May 2010-February 2015; President, Columbia Funds, 2008-2015; and senior officer of Columbia Funds and affiliated funds, 2003-2015 | 172 | Former Director, The Autism Project, March 2015-December 2021; former Member of the Investment Committee, St. Michael’s College, November 2015-February 2020; former Trustee, St. Michael’s College, June 2017-September 2019; former Trustee, New Century Portfolios (former mutual fund complex), January 2015-December 2017 |
| 36 | Columbia Small Cap Value Fund I | Annual Report 2023 |
(Unaudited)
Independent trustees (continued)
| Name, address, year of birth | Position held with the Columbia Funds and length of service | Principal occupation(s) during past five years and other relevant professional experience | Number of Funds in the Columbia Funds Complex* overseen | Other directorships held by Trustee during the past five years and other relevant Board experience |
| Olive M. Darragh c/o Columbia Management Investment Advisers, LLC 290 Congress Street Boston, MA 02210 1962 | Trustee since 2020 | Managing Director of Darragh Inc. (strategy and talent management consulting firm), since 2010; Founder and CEO, Zolio, Inc. (investment management talent identification platform), since 2004; Consultant to Independent Trustees of CFVIT and CFST I from June 2019 to June 2020 with respect to CFVIT and to December 2020 with respect to CFST I; Partner, Tudor Investments, 2004-2010; Senior Partner, McKinsey & Company (consulting), 1990-2004; Touche Ross CPA, 1985-1988 | 172 | Treasurer, Edinburgh University US Trust Board, since January 2023; Member, HBS Community Action Partners Board, since September 2022; former Director, University of Edinburgh Business School (Member of US Board), 2004-2019; former Director, Boston Public Library Foundation, 2008-2017 |
| Patricia M. Flynn c/o Columbia Management Investment Advisers, LLC 290 Congress Street Boston, MA 02210 1950 | Trustee since 2004 | Professor of Economics and Management, Bentley University, since 2002; Dean, McCallum Graduate School of Business, Bentley University, 1992-2002 | 174 | Former Trustee, MA Taxpayers Foundation, 1997-2022; former Director, The MA Business Roundtable, 2003-2019; former Chairperson, Innovation Index Advisory Committee, MA Technology Collaborative, 1997-2020 |
| Brian J. Gallagher c/o Columbia Management Investment Advisers, LLC 290 Congress Street Boston, MA 02210 1954 | Trustee since 2017 | Retired; Partner with Deloitte & Touche LLP and its predecessors, 1977-2016 | 174 | Trustee, Catholic Schools Foundation, since 2004 |
| Douglas A. Hacker c/o Columbia Management Investment Advisers, LLC 290 Congress Street Boston, MA 02210 1955 | Trustee since 1996 | Independent business executive, since May 2006; Executive Vice President – Strategy of United Airlines, December 2002 - May 2006; President of UAL Loyalty Services (airline marketing company), September 2001-December 2002; Executive Vice President and Chief Financial Officer of United Airlines, July 1999-September 2001 | 174 | Director, SpartanNash Company since November 2013 (Chair of the Board, since May 2021) (food distributor); Director, Aircastle Limited (Chair of Audit Committee) (aircraft leasing), since August 2006; former Director, Nash Finch Company (food distributor), 2005-2013; former Director, SeaCube Container Leasing Ltd. (container leasing), 2010-2013; and former Director, Travelport Worldwide Limited (travel information technology), 2014-2019 |
| Nancy T. Lukitsh c/o Columbia Management Investment Advisers, LLC 290 Congress Street Boston, MA 02210 1956 | Trustee since 2011 | Senior Vice President, Partner and Director of Marketing, Wellington Management Company, LLP (investment adviser), 1997-2010; Chair, Wellington Management Portfolios (commingled non-U.S. investment pools), 2007-2010; Director, Wellington Trust Company, NA and other Wellington affiliates, 1997-2010 | 172 | None |
| Columbia Small Cap Value Fund I | Annual Report 2023 | 37 |
(Unaudited)
Independent trustees (continued)
| Name, address, year of birth | Position held with the Columbia Funds and length of service | Principal occupation(s) during past five years and other relevant professional experience | Number of Funds in the Columbia Funds Complex* overseen | Other directorships held by Trustee during the past five years and other relevant Board experience |
| David M. Moffett c/o Columbia Management Investment Advisers, LLC 290 Congress Street Boston, MA 02210 1952 | Trustee since 2011 | Retired; former Chief Executive Officer of Freddie Mac and Chief Financial Officer of U.S. Bank | 172 | Director, CSX Corporation (transportation suppliers); Director, PayPal Holdings Inc. (payment and data processing services); Trustee, University of Oklahoma Foundation; former Director, eBay Inc. (online trading community), 2007-2015; and former Director, CIT Bank, CIT Group Inc. (commercial and consumer finance), 2010-2016; former Senior Adviser to The Carlyle Group (financial services), March 2008-September 2008; former Governance Consultant to Bridgewater Associates, January 2013-December 2015 |
| Catherine James Paglia c/o Columbia Management Investment Advisers, LLC 290 Congress Street Boston, MA 02210 1952 | Trustee since 2004 | Director, Enterprise Asset Management, Inc. (private real estate and asset management company), since September 1998; Managing Director and Partner, Interlaken Capital, Inc., 1989-1997; Vice President, 1982-1985, Principal, 1985-1987, Managing Director, 1987-1989, Morgan Stanley; Vice President, Investment Banking, 1980-1982, Associate, Investment Banking, 1976-1980, Dean Witter Reynolds, Inc. | 174 | Director, Valmont Industries, Inc. (irrigation systems manufacturer), since 2012; Trustee, Carleton College (on the Investment Committee), since 1987; Trustee, Carnegie Endowment for International Peace (on the Investment Committee), since 2009 |
| Natalie A. Trunow c/o Columbia Management Investment Advisers, LLC 290 Congress Street Boston, MA 02210 1967 | Trustee since 2020 | Chief Executive Officer, Millennial Portfolio Solutions LLC (asset management and consulting services), January 2016-January 2021; Non-executive Member of the Investment Committee and Valuation Committee, Sarona Asset Management Inc. (private equity firm) since September 2019; Advisor, Horizon Investments (asset management and consulting services), August 2018-January 2022; Advisor, Paradigm Asset Management, November 2016-January 2022; Consultant to Independent Trustees of CFVIT and CFST I from September 2016 to June 2020 with respect to CFVIT and to December 2020 with respect to CFST I; Director of Investments/Consultant, Casey Family Programs, April 2016-November 2016; Senior Vice President and Chief Investment Officer, Calvert Investments, August 2008-January 2016; Section Head and Portfolio Manager, General Motors Asset Management, June 1997-August 2008 | 172 | Independent Director, Investment Committee, Health Services for Children with Special Needs, Inc., 2010-2021; Independent Director, (Executive Committee and Chair, Audit Committee), Consumer Credit Counseling Services (formerly Guidewell Financial Solutions), since 2016; Independent Director, (Investment Committee), Sarona Asset Management, since 2019 |
| 38 | Columbia Small Cap Value Fund I | Annual Report 2023 |
(Unaudited)
Independent trustees (continued)
| Name, address, year of birth | Position held with the Columbia Funds and length of service | Principal occupation(s) during past five years and other relevant professional experience | Number of Funds in the Columbia Funds Complex* overseen | Other directorships held by Trustee during the past five years and other relevant Board experience |
| Sandra L. Yeager c/o Columbia Management Investment Advisers, LLC 290 Congress Street Boston, MA 02210 1964 | Trustee since 2017 | Retired; President and founder, Hanoverian Capital, LLC (SEC registered investment advisor firm), 2008-2016; Managing Director, DuPont Capital, 2006-2008; Managing Director, Morgan Stanley Investment Management, 2004-2006; Senior Vice President, Alliance Bernstein, 1990-2004 | 174 | Former Director, NAPE (National Alliance for Partnerships in Equity) Education Foundation, October 2016-October 2020; Advisory Board, Jennersville YMCA, since 2022 |
| Name, address, year of birth | Position held with the Columbia Funds and length of service | Principal occupation(s) during the past five years and other relevant professional experience | Number of Funds in the Columbia Funds Complex overseen | Other directorships held by Trustee during the past five years and other relevant Board experience |
| Daniel J. Beckman c/o Columbia Management Investment Advisers, LLC 290 Congress Street Boston, MA 02210 1962 | Trustee since November 2021 and President since June 2021 | Vice President – Head of North America Product, Columbia Management Investment Advisers, LLC, since April 2015; President and Principal Executive Officer of the Columbia Funds, since June 2021; officer of Columbia Funds and affiliated funds, 2020-2021 | 174 | Director, Ameriprise Trust Company, since October 2016; Director, Columbia Management Investment Distributors, Inc. since November 2018; Board of Governors, Columbia Wanger Asset Management, LLC since, January 2022; Director, Columbia Threadneedle Canada, Inc., since December 2022 |
| * | The term “Columbia Funds Complex” as used herein includes Columbia Seligman Premium Technology Growth Fund, Tri-Continental Corporation and each series of Columbia Funds Series Trust (CFST), Columbia Funds Series Trust I (CFST I), Columbia Funds Series Trust II (CFST II), Columbia ETF Trust I (CET I), Columbia ETF Trust II (CET II), Columbia Funds Variable Insurance Trust (CFVIT) and Columbia Funds Variable Series Trust II (CFVST II). Messrs. Batejan, Beckman, Gallagher and Hacker and Mses. Blatz, Carlton, Carrig, Flynn, Paglia, and Yeager serve as directors of Columbia Seligman Premium Technology Growth Fund and Tri-Continental Corporation. |
| ** | Interested person (as defined under the 1940 Act) by reason of being an officer, director, security holder and/or employee of the Investment Manager or Ameriprise Financial. |
| Columbia Small Cap Value Fund I | Annual Report 2023 | 39 |
(Unaudited)
The Board has appointed officers who are responsible for day-to-day business decisions based on policies it has established. The officers serve at the pleasure of the Board. The following table provides basic information about the Officers of the Fund as of the printing of this report, including principal occupations during the past five years, although their specific titles may have varied over the period. In addition to Mr. Beckman, who is President and Principal Executive Officer, the Fund’s other officers are:
| Name, address and year of birth | Position and year first appointed to position for any Fund in the Columbia Funds Complex or a predecessor thereof | Principal occupation(s) during past five years |
| Michael G. Clarke 290 Congress Street Boston, MA 02210 1969 | Chief Financial Officer and Principal Financial Officer (2009) and Senior Vice President (2019) | Senior Vice President and Head of North America Operations & Investor Services, Columbia Management Investment Advisers, LLC, since June 2023 (previously Senior Vice President and Head of Global Operations, March 2022 – June 2023, Vice President, Head of North America Operations, and Co-Head of Global Operations, June 2019 - February 2022 and Vice President – Accounting and Tax, May 2010 - May 2019); senior officer of Columbia Funds and affiliated funds, since 2002. |
| Joseph Beranek 5890 Ameriprise Financial Center Minneapolis, MN 55474 1965 | Treasurer and Chief Accounting Officer (Principal Accounting Officer) (2019) and Principal Financial Officer (2020), CFST, CFST I, CFST II, CFVIT and CFVST II; Assistant Treasurer, CET I and CET II | Vice President – Mutual Fund Accounting and Financial Reporting, Columbia Management Investment Advisers, LLC, since December 2018 and March 2017, respectively. |
| Marybeth Pilat 290 Congress Street Boston, MA 02210 1968 | Treasurer and Chief Accounting Officer (Principal Accounting Officer) and Principal Financial Officer (2020) for CET I and CET II; Assistant Treasurer, CFST, CFST I, CFST II, CFVIT and CFVST II | Vice President – Product Pricing and Administration, Columbia Management Investment Advisers, LLC, since May 2017. |
| William F. Truscott 290 Congress Street Boston, MA 02210 1960 | Senior Vice President (2001) | Formerly, Trustee/Director of Columbia Funds Complex or legacy funds, November 2001-January 1, 2021; Chief Executive Officer, Global Asset Management, Ameriprise Financial, Inc., since September 2012; Chairman of the Board and President, Columbia Management Investment Advisers, LLC, since July 2004 and February 2012, respectively; Chairman of the Board and Chief Executive Officer, Columbia Management Investment Distributors, Inc., since November 2008 and February 2012, respectively; Chairman of the Board and Director, Threadneedle Asset Management Holdings, Sàrl, since March 2013 and December 2008, respectively; senior executive of various entities affiliated with Columbia Threadneedle. |
| Christopher O. Petersen 5228 Ameriprise Financial Center Minneapolis, MN 55474 1970 | Senior Vice President and Assistant Secretary (2021) | Formerly, Trustee/Director of funds within the Columbia Funds Complex, July 1, 2020 - November 22, 2021; Senior Vice President and Assistant General Counsel, Ameriprise Financial, Inc., since September 2021 (previously Vice President and Lead Chief Counsel, January 2015 - September 2021); formerly, President and Principal Executive Officer of the Columbia Funds, 2015 - 2021; officer of Columbia Funds and affiliated funds, since 2007. |
| Thomas P. McGuire 290 Congress Street Boston, MA 02210 1972 | Senior Vice President and Chief Compliance Officer (2012) | Vice President – Asset Management Compliance, Ameriprise Financial, Inc., since May 2010; Chief Compliance Officer, Columbia Acorn/Wanger Funds, since December 2015; formerly, Chief Compliance Officer, Ameriprise Certificate Company, September 2010 – September 2020. |
| Ryan C. Larrenaga 290 Congress Street Boston, MA 02210 1970 | Senior Vice President (2017), Chief Legal Officer (2017), and Secretary (2015) | Vice President and Chief Counsel, Ameriprise Financial, Inc., since August 2018 (previously Vice President and Group Counsel, August 2011 - August 2018); Chief Legal Officer, Columbia Acorn/Wanger Funds, since September 2020; officer of Columbia Funds and affiliated funds, since 2005. |
| 40 | Columbia Small Cap Value Fund I | Annual Report 2023 |
(Unaudited)
Fund officers (continued)
| Name, address and year of birth | Position and year first appointed to position for any Fund in the Columbia Funds Complex or a predecessor thereof | Principal occupation(s) during past five years |
| Michael E. DeFao 290 Congress Street Boston, MA 02210 1968 | Vice President (2011) and Assistant Secretary (2010) | Vice President and Chief Counsel, Ameriprise Financial, Inc., since May 2010; Vice President, Chief Legal Officer and Assistant Secretary, Columbia Management Investment Advisers, LLC, since October 2021 (previously Vice President and Assistant Secretary, May 2010 – September 2021). |
| Lyn Kephart-Strong 5228 Ameriprise Financial Center Minneapolis, MN 55474 1960 | Vice President (2015) | Vice President, Global Investment Operations Services, Columbia Management Investment Advisers, LLC, since 2010; President, Columbia Management Investment Services Corp., since October 2014; President, Ameriprise Trust Company, since January 2017. |
| • | the Fund had sufficient liquidity to both meet redemptions and operate effectively on behalf of shareholders; |
| • | there were no material changes to the Program during the period; |
| • | the implementation of the Program was effective to manage the Fund’s liquidity risk; and |
| • | the Program operated adequately during the period. |
| Columbia Small Cap Value Fund I | Annual Report 2023 | 41 |
columbiathreadneedleus.com/investor/. The Fund is distributed by Columbia Management Investment Distributors, Inc., member FINRA, and managed by Columbia Management Investment Advisers, LLC.

April 30, 2023

| 3 | |
| 5 | |
| 7 | |
| 8 | |
| 22 | |
| 24 | |
| 25 | |
| 28 | |
| 32 | |
| 47 | |
| 48 | |
| 48 | |
| 54 |
(Unaudited)
| Average annual total returns (%) (for the period ended April 30, 2023) | ||||||
| Inception | 1 Year | 5 Years | 10 Years | |||
| Class A | Excluding sales charges | 03/31/08 | -2.12 | 0.96 | 1.07 | |
| Including sales charges | -6.78 | -0.02 | 0.58 | |||
| Advisor Class | 11/08/12 | -1.85 | 1.21 | 1.32 | ||
| Class C | Excluding sales charges | 03/31/08 | -2.82 | 0.20 | 0.33 | |
| Including sales charges | -3.77 | 0.20 | 0.33 | |||
| Institutional Class | 01/09/86 | -1.84 | 1.21 | 1.32 | ||
| Institutional 2 Class | 11/08/12 | -1.78 | 1.29 | 1.41 | ||
| Institutional 3 Class | 07/15/09 | -1.74 | 1.33 | 1.48 | ||
| Class R | 11/16/11 | -2.33 | 0.70 | 0.81 | ||
| Class V | Excluding sales charges | 03/07/11 | -2.03 | 1.04 | 1.16 | |
| Including sales charges | -6.68 | 0.07 | 0.67 | |||
| Bloomberg U.S. Aggregate Bond Index | -0.43 | 1.18 | 1.32 | |||
| Columbia Bond Fund | Annual Report 2023 | 3 |
(Unaudited)
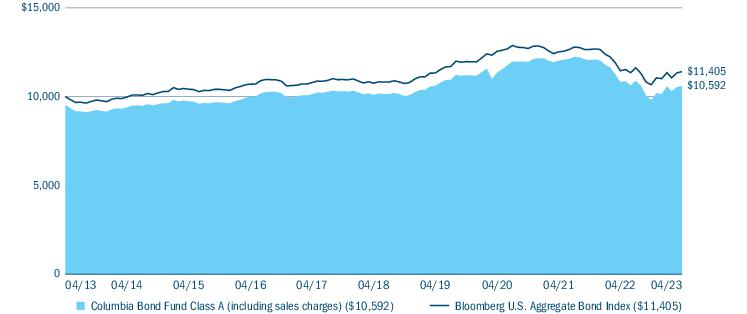
| Portfolio breakdown (%) (at April 30, 2023) | |
| Asset-Backed Securities — Non-Agency | 14.1 |
| Call Option Contracts Purchased | 0.0(a) |
| Commercial Mortgage-Backed Securities - Agency | 0.4 |
| Commercial Mortgage-Backed Securities - Non-Agency | 10.3 |
| Common Stocks | 0.0(a) |
| Corporate Bonds & Notes | 14.2 |
| Money Market Funds | 7.9 |
| Residential Mortgage-Backed Securities - Agency | 30.2 |
| Residential Mortgage-Backed Securities - Non-Agency | 22.9 |
| Total | 100.0 |
| (a) | Rounds to zero. |
| Quality breakdown (%) (at April 30, 2023) | |
| AAA rating | 45.7 |
| AA rating | 12.5 |
| A rating | 18.5 |
| BBB rating | 17.3 |
| BB rating | 0.2 |
| Not rated | 5.8 |
| Total | 100.0 |
| 4 | Columbia Bond Fund | Annual Report 2023 |
(Unaudited)
| • | The Fund’s underperformance relative to the benchmark was largely the result of its positioning with respect to interest rates. Specifically, the Fund had an above-benchmark stance with respect to duration and corresponding interest rate sensitivity as Treasury yields moved higher for much of the period. |
| • | The Fund’s positioning along the yield curve also detracted. |
| • | As rates moved higher, performance for the Fund’s mortgage-backed security holdings suffered as prepayments ground to a halt and durations extended for these issues at a time when investors were seeking to reduce interest rate risk. |
| • | Sector allocation also detracted from relative performance, specifically overweights to commercial mortgage-backed securities, non-agency mortgage-backed securities and agency mortgage-backed securities. |
| • | Security selection led positive contributions to the Fund’s performance relative to the benchmark. |
| Columbia Bond Fund | Annual Report 2023 | 5 |
(Unaudited)
| • | Most notably, within financials, the Fund favored the largest, global systemically important banks subject to the most rigorous capital requirements while avoiding the regional and second-tier banks that were most negatively impacted by fears of a banking crisis. |
| • | Selection within agency mortgage-backed securities also proved additive. |
| 6 | Columbia Bond Fund | Annual Report 2023 |
(Unaudited)
| November 1, 2022 — April 30, 2023 | |||||||
| Account value at the beginning of the period ($) | Account value at the end of the period ($) | Expenses paid during the period ($) | Fund’s annualized expense ratio (%) | ||||
| Actual | Hypothetical | Actual | Hypothetical | Actual | Hypothetical | Actual | |
| Class A | 1,000.00 | 1,000.00 | 1,080.00 | 1,020.74 | 3.93 | 3.82 | 0.77 |
| Advisor Class | 1,000.00 | 1,000.00 | 1,081.40 | 1,021.97 | 2.65 | 2.58 | 0.52 |
| Class C | 1,000.00 | 1,000.00 | 1,076.10 | 1,017.07 | 7.74 | 7.52 | 1.52 |
| Institutional Class | 1,000.00 | 1,000.00 | 1,081.70 | 1,021.97 | 2.65 | 2.58 | 0.52 |
| Institutional 2 Class | 1,000.00 | 1,000.00 | 1,081.90 | 1,022.31 | 2.30 | 2.23 | 0.45 |
| Institutional 3 Class | 1,000.00 | 1,000.00 | 1,081.80 | 1,022.56 | 2.04 | 1.98 | 0.40 |
| Class R | 1,000.00 | 1,000.00 | 1,079.00 | 1,019.52 | 5.20 | 5.05 | 1.02 |
| Class V | 1,000.00 | 1,000.00 | 1,080.70 | 1,021.23 | 3.42 | 3.32 | 0.67 |
| Columbia Bond Fund | Annual Report 2023 | 7 |
April 30, 2023
| Asset-Backed Securities — Non-Agency 17.2% | ||||
| Issuer | Coupon Rate | Principal Amount ($) | Value ($) | |
| ACM Auto Trust(a) | ||||
| Subordinated Series 2022-1A Class C | ||||
| 04/20/2029 | 5.480% | 3,750,000 | 3,717,690 | |
| Affirm Asset Securitization Trust(a),(b) | ||||
| Series 2023-A Class 1A | ||||
| 01/18/2028 | 6.610% | 2,000,000 | 1,995,000 | |
| Affirm Asset Securitization Trust(a) | ||||
| Series 2023-A Class A | ||||
| 01/18/2028 | 6.610% | 2,900,000 | 2,877,031 | |
| American Credit Acceptance Receivables Trust(a),(c) | ||||
| Series 2023-2 Class A | ||||
| 10/13/2026 | 5.890% | 3,300,000 | 3,300,175 | |
| American Credit Acceptance Receivables Trust(a) | ||||
| Subordinated Series 2022-2 Class C | ||||
| 06/13/2028 | 4.410% | 5,000,000 | 4,918,386 | |
| Ares LVIII CLO Ltd.(a),(d) | ||||
| Series 2020-58A Class DR | ||||
| 3-month Term SOFR + 3.200% Floor 3.200% 01/15/2035 | 8.186% | 3,000,000 | 2,682,114 | |
| Avant Loans Funding Trust(a) | ||||
| Subordinated Series 2021-REV1 Class B | ||||
| 07/15/2030 | 1.640% | 3,950,000 | 3,749,828 | |
| Bain Capital Credit CLO Ltd.(a),(d) | ||||
| Series 2018-1A Class B | ||||
| 3-month USD LIBOR + 1.400% 04/23/2031 | 6.673% | 2,000,000 | 1,914,060 | |
| Series 2020-5A Class A1 | ||||
| 3-month USD LIBOR + 1.220% Floor 1.220% 01/20/2032 | 6.470% | 10,000,000 | 9,872,100 | |
| Series 2020-5A Class C | ||||
| 3-month USD LIBOR + 2.350% Floor 2.350% 01/20/2032 | 7.600% | 4,480,000 | 4,309,151 | |
| Carlyle Group LP(a),(d) | ||||
| Series 2017-5A Class A2 | ||||
| 3-month USD LIBOR + 1.400% 01/20/2030 | 6.650% | 2,000,000 | 1,927,792 | |
| Cent CLO Ltd.(a),(d) | ||||
| Series 2018-C17A Class A2R | ||||
| 3-month USD LIBOR + 1.600% Floor 1.600% 04/30/2031 | 6.402% | 1,800,000 | 1,754,172 | |
| Dryden 83 CLO Ltd.(a),(d) | ||||
| Series 2020-83A Class C | ||||
| 3-month USD LIBOR + 2.150% Floor 2.150% 01/18/2032 | 7.412% | 5,000,000 | 4,781,895 | |
| Asset-Backed Securities — Non-Agency (continued) | ||||
| Issuer | Coupon Rate | Principal Amount ($) | Value ($) | |
| Dryden 86 CLO Ltd.(a),(d) | ||||
| Series 2020-86A Class BR | ||||
| 3-month USD LIBOR + 1.700% Floor 1.700% 07/17/2034 | 6.960% | 1,250,000 | 1,216,136 | |
| Dryden CLO Ltd.(a),(d) | ||||
| Series 2018-57A Class B | ||||
| 3-month USD LIBOR + 1.350% Floor 1.350% 05/15/2031 | 6.214% | 1,250,000 | 1,209,350 | |
| DT Auto Owner Trust(a) | ||||
| Series 2023-2A Class A | ||||
| 04/15/2027 | 5.880% | 9,300,000 | 9,308,196 | |
| GLS Auto Receivables Issuer Trust(a) | ||||
| Subordinated Series 2020-3A Class C | ||||
| 05/15/2025 | 1.920% | 759,964 | 755,421 | |
| LendingPoint Asset Securitization Trust(a) | ||||
| Series 2021-B Class A | ||||
| 02/15/2029 | 1.110% | 98,455 | 98,185 | |
| Subordinated Series 2022-A Class C | ||||
| 06/15/2029 | 2.820% | 1,430,000 | 1,358,832 | |
| LendingPoint Pass-Through Trust(a) | ||||
| Series 2022-ST1 Class A | ||||
| 03/15/2028 | 2.500% | 1,822,068 | 1,740,089 | |
| LL ABS Trust(a) | ||||
| Series 2021-1A Class A | ||||
| 05/15/2029 | 1.070% | 553,683 | 539,893 | |
| Lucali CLO Ltd.(a),(d) | ||||
| Series 2020-1A Class C | ||||
| 3-month USD LIBOR + 2.200% Floor 2.200% 01/15/2033 | 7.460% | 6,500,000 | 6,231,245 | |
| Series 2020-1A Class D | ||||
| 3-month USD LIBOR + 3.600% Floor 3.600% 01/15/2033 | 8.860% | 1,500,000 | 1,416,423 | |
| Madison Park Funding XXIV Ltd.(a),(d) | ||||
| Series 2016-24A Class BR | ||||
| 3-month USD LIBOR + 1.750% 10/20/2029 | 7.060% | 5,000,000 | 4,937,240 | |
| Madison Park Funding XXVII Ltd.(a),(d) | ||||
| Series 2018-27A Class A2 | ||||
| 3-month USD LIBOR + 1.350% 04/20/2030 | 6.600% | 3,700,000 | 3,603,030 | |
| Marlette Funding Trust(a) | ||||
| Series 2021-1A Class B | ||||
| 06/16/2031 | 1.000% | 309,624 | 307,976 | |
| 8 | Columbia Bond Fund | Annual Report 2023 |
April 30, 2023
| Asset-Backed Securities — Non-Agency (continued) | ||||
| Issuer | Coupon Rate | Principal Amount ($) | Value ($) | |
| Marlette Funding Trust(a),(c) | ||||
| Series 2023-2A Class A | ||||
| 06/15/2033 | 6.040% | 4,550,000 | 4,557,130 | |
| Octagon Investment Partners 35 Ltd.(a),(d) | ||||
| Series 2018-1A Class A2 | ||||
| 3-month USD LIBOR + 1.400% Floor 1.400% 01/20/2031 | 6.650% | 1,820,000 | 1,767,841 | |
| Octagon Investment Partners XXII Ltd.(a),(d) | ||||
| Series 2014-1A Class BRR | ||||
| 3-month USD LIBOR + 1.450% Floor 1.450% 01/22/2030 | 6.723% | 4,000,000 | 3,913,156 | |
| Oportun Issuance Trust(a) | ||||
| Series 2021-B Class A | ||||
| 05/08/2031 | 1.470% | 6,800,000 | 6,173,562 | |
| OZLM XXI(a),(d) | ||||
| Series 2017-21A Class A1 | ||||
| 3-month USD LIBOR + 1.150% 01/20/2031 | 6.400% | 7,153,003 | 7,059,627 | |
| Pagaya AI Debt Selection Trust(a) | ||||
| Series 2021-1 Class A | ||||
| 11/15/2027 | 1.180% | 1,119,793 | 1,111,938 | |
| Series 2021-3 Class A | ||||
| 05/15/2029 | 1.150% | 1,663,076 | 1,640,533 | |
| Series 2021-5 Class A | ||||
| 08/15/2029 | 1.530% | 1,641,046 | 1,602,433 | |
| Pagaya AI Debt Trust(a) | ||||
| Series 2023-3 Class A | ||||
| 12/16/2030 | 7.600% | 7,200,000 | 7,245,256 | |
| Subordinated Series 2022-1 Class B | ||||
| 10/15/2029 | 3.344% | 4,199,445 | 3,835,947 | |
| Subordinated Series 2022-2 Class B | ||||
| 01/15/2030 | 6.630% | 3,228,808 | 3,087,815 | |
| Research-Driven Pagaya Motor Asset Trust IV(a) | ||||
| Series 2021-2A Class A | ||||
| 03/25/2030 | 2.650% | 1,707,242 | 1,517,447 | |
| RR 1 LLC(a),(d) | ||||
| Series 2017-1A Class A2B | ||||
| 3-month USD LIBOR + 1.600% Floor 1.600% 07/15/2035 | 6.860% | 10,000,000 | 9,492,960 | |
| RR 3 Ltd.(a),(d) | ||||
| Series 2014-14A Class A1R2 | ||||
| 3-month USD LIBOR + 1.090% Floor 1.090% 01/15/2030 | 6.350% | 4,132,610 | 4,099,359 | |
| Theorem Funding Trust(a) | ||||
| Series 2021-1A Class A | ||||
| 12/15/2027 | 1.210% | 705,584 | 696,670 | |
| Asset-Backed Securities — Non-Agency (continued) | ||||
| Issuer | Coupon Rate | Principal Amount ($) | Value ($) | |
| Series 2022-1A Class A | ||||
| 02/15/2028 | 1.850% | 570,416 | 558,921 | |
| Series 2022-3A Class A | ||||
| 04/15/2029 | 7.600% | 4,867,178 | 4,899,933 | |
| Series 2023-1A Class A | ||||
| 04/15/2029 | 7.580% | 2,500,000 | 2,501,607 | |
| Upstart Pass-Through Trust(a) | ||||
| Series 2021-ST1 Class A | ||||
| 02/20/2027 | 2.750% | 631,607 | 610,024 | |
| Series 2021-ST10 Class A | ||||
| 01/20/2030 | 2.250% | 2,825,005 | 2,691,642 | |
| Series 2021-ST6 Class A | ||||
| 08/20/2027 | 1.850% | 2,291,351 | 2,176,048 | |
| Series 2021-ST9 Class A | ||||
| 11/20/2029 | 1.700% | 1,282,222 | 1,211,213 | |
| Upstart Securitization Trust(a) | ||||
| Series 2021-1 Class B | ||||
| 03/20/2031 | 1.890% | 2,696,799 | 2,665,635 | |
| Series 2021-3 Class A | ||||
| 07/20/2031 | 0.830% | 1,564,876 | 1,542,192 | |
| Series 2021-4 Class A | ||||
| 09/20/2031 | 0.840% | 1,435,947 | 1,411,927 | |
| Series 2023-1 Class A | ||||
| 02/20/2033 | 6.590% | 1,928,031 | 1,921,175 | |
| Subordinated Series 2020-3 Class B | ||||
| 11/20/2030 | 3.014% | 598,240 | 596,870 | |
| Subordinated Series 2021-5 Class B | ||||
| 11/20/2031 | 2.490% | 5,000,000 | 4,657,323 | |
| Total Asset-Backed Securities — Non-Agency (Cost $170,431,104) | 165,767,594 | |||
| Commercial Mortgage-Backed Securities - Agency 0.5% | ||||
| Federal Home Loan Mortgage Corp. Multifamily Structured Pass-Through Certificates(e) | ||||
| Series 2017-K070 Class A2 | ||||
| 11/25/2027 | 3.303% | 1,000,000 | 965,949 | |
| Federal National Mortgage Association(e) | ||||
| Series 2017-M15 Class ATS2 | ||||
| 11/25/2027 | 3.205% | 4,059,893 | 3,894,615 | |
| Government National Mortgage Association(e),(f) | ||||
| Series 2019-147 Class IO | ||||
| 06/16/2061 | 0.397% | 5,791,417 | 223,298 | |
| Total Commercial Mortgage-Backed Securities - Agency (Cost $5,649,801) | 5,083,862 | |||
| Commercial Mortgage-Backed Securities - Non-Agency 12.6% | ||||
| American Homes 4 Rent Trust(a) | ||||
| Series 2014-SFR2 Class A | ||||
| 10/17/2036 | 3.786% | 2,314,542 | 2,256,754 | |
| Columbia Bond Fund | Annual Report 2023 | 9 |
April 30, 2023
| Commercial Mortgage-Backed Securities - Non-Agency (continued) | ||||
| Issuer | Coupon Rate | Principal Amount ($) | Value ($) | |
| Series 2014-SFR3 Class A | ||||
| 12/17/2036 | 3.678% | 2,876,983 | 2,791,957 | |
| BAMLL Commercial Mortgage Securities Trust(a),(e) | ||||
| Series 2013-WBRK Class A | ||||
| 03/10/2037 | 3.652% | 1,350,000 | 1,243,811 | |
| BAMLL Commercial Mortgage Securities Trust(a),(d) | ||||
| Series 2018-DSNY Class A | ||||
| 1-month USD LIBOR + 0.850% Floor 0.850% 09/15/2034 | 5.798% | 4,500,000 | 4,460,687 | |
| Series 2019-RLJ Class D | ||||
| 1-month USD LIBOR + 1.950% Floor 1.950% 04/15/2036 | 6.898% | 1,300,000 | 1,279,641 | |
| Subordinated Series 2018-DSNY Class B | ||||
| 1-month USD LIBOR + 1.150% Floor 1.150% 09/15/2034 | 6.098% | 9,325,000 | 9,160,149 | |
| Subordinated Series 2018-DSNY Class D | ||||
| 1-month USD LIBOR + 1.700% Floor 1.700% 09/15/2034 | 6.648% | 1,000,000 | 969,715 | |
| BBCMS Trust(a),(d) | ||||
| Series 2018-BXH Class A | ||||
| 1-month USD LIBOR + 1.000% Floor 1.000% 10/15/2037 | 5.948% | 779,746 | 757,231 | |
| Subordinated Series 2018-BXH Class D | ||||
| 1-month USD LIBOR + 2.000% Floor 2.000% 10/15/2037 | 6.948% | 2,000,000 | 1,907,826 | |
| Braemar Hotels & Resorts Trust(a),(d) | ||||
| Series 2018-PRME Class A | ||||
| 1-month USD LIBOR + 0.820% Floor 0.820% 06/15/2035 | 5.768% | 3,000,000 | 2,898,339 | |
| BX Commercial Mortgage Trust(a) | ||||
| Series 2020-VIV4 Class A | ||||
| 03/09/2044 | 2.843% | 2,500,000 | 2,125,155 | |
| BX Trust(a),(d) | ||||
| Series 2019-ATL Class C | ||||
| 1-month USD LIBOR + 1.587% Floor 1.587% 10/15/2036 | 6.535% | 823,000 | 790,122 | |
| BX Trust(a) | ||||
| Series 2019-OC11 Class A | ||||
| 12/09/2041 | 3.202% | 3,400,000 | 2,976,238 | |
| Citigroup Commercial Mortgage Trust(a),(e) | ||||
| Subordinated Series 2020-420K Class D | ||||
| 11/10/2042 | 3.422% | 2,250,000 | 1,666,901 | |
| Commercial Mortgage-Backed Securities - Non-Agency (continued) | ||||
| Issuer | Coupon Rate | Principal Amount ($) | Value ($) | |
| COMM Mortgage Trust(a),(e) | ||||
| Subordinated Series 2020-CBM Class D | ||||
| 02/10/2037 | 3.754% | 1,750,000 | 1,588,286 | |
| Corevest American Finance Trust(a) | ||||
| Series 2020-4 Class A | ||||
| 12/15/2052 | 1.174% | 7,736,922 | 7,083,041 | |
| Credit Suisse Mortgage Capital Certificates OA LLC(a) | ||||
| Series 2014-USA Class A2 | ||||
| 09/15/2037 | 3.953% | 6,220,000 | 5,600,978 | |
| Hilton USA Trust(a),(e) | ||||
| Subordinated Series 2016-HHV Class C | ||||
| 11/05/2038 | 4.333% | 1,700,000 | 1,577,874 | |
| Hilton USA Trust(a) | ||||
| Subordinated Series 2016-SFP Class D | ||||
| 11/05/2035 | 4.927% | 1,646,000 | 1,497,805 | |
| Invitation Homes Trust(a),(d) | ||||
| Subordinated Series 2018-SFR4 Class C | ||||
| 1-month USD LIBOR + 1.400% Floor 1.400% 01/17/2038 | 6.085% | 1,999,908 | 1,978,863 | |
| JPMorgan Chase Commercial Mortgage Securities Trust(a),(e) | ||||
| Subordinated Series 2021-2NU Class C | ||||
| 01/05/2040 | 2.077% | 1,750,000 | 1,350,727 | |
| Morgan Stanley Capital I Trust(a),(e) | ||||
| Series 2019-MEAD Class D | ||||
| 11/10/2036 | 3.283% | 1,200,000 | 1,056,484 | |
| New Residential Mortgage Loan Trust(a) | ||||
| Series 2022-SFR1 Class A | ||||
| 02/17/2039 | 2.400% | 6,182,813 | 5,586,042 | |
| One New York Plaza Trust(a),(d) | ||||
| Subordinated Series 2020-1NYP Class B | ||||
| 1-month USD LIBOR + 1.500% Floor 1.500% 01/15/2036 | 6.448% | 10,000,000 | 8,806,902 | |
| Subordinated Series 2020-1NYP Class C | ||||
| 1-month USD LIBOR + 2.200% Floor 2.200% 01/15/2036 | 7.148% | 5,000,000 | 4,104,149 | |
| Progress Residential Trust(a) | ||||
| Series 2020-SFR1 Class E | ||||
| 04/17/2037 | 3.032% | 1,800,000 | 1,671,587 | |
| Series 2020-SFR3 Class B | ||||
| 10/17/2027 | 1.495% | 4,000,000 | 3,632,068 | |
| Series 2020-SFR3 Class C | ||||
| 10/17/2027 | 1.695% | 6,250,000 | 5,623,729 | |
| Series 2022-SFR1 Class A | ||||
| 02/17/2041 | 2.709% | 2,987,754 | 2,674,227 | |
| Subordinated Series 2022-SFR4 Class B | ||||
| 05/17/2041 | 4.788% | 6,000,000 | 5,761,964 | |
| 10 | Columbia Bond Fund | Annual Report 2023 |
April 30, 2023
| Commercial Mortgage-Backed Securities - Non-Agency (continued) | ||||
| Issuer | Coupon Rate | Principal Amount ($) | Value ($) | |
| SFO Commercial Mortgage Trust(a),(d) | ||||
| Series 2021-555 Class A | ||||
| 1-month USD LIBOR + 1.150% Floor 1.150% 05/15/2038 | 6.098% | 8,000,000 | 7,079,346 | |
| Tricon American Homes(a) | ||||
| Series 2020-SFR1 Class C | ||||
| 07/17/2038 | 2.249% | 7,000,000 | 6,317,745 | |
| UBS Commercial Mortgage Trust(a),(d) | ||||
| Series 2018-NYCH Class A | ||||
| 1-month USD LIBOR + 0.850% Floor 0.851% 02/15/2032 | 5.798% | 1,737,226 | 1,702,364 | |
| Series 2018-NYCH Class B | ||||
| 1-month USD LIBOR + 1.250% Floor 1.250% 02/15/2032 | 6.198% | 900,000 | 864,707 | |
| Wells Fargo Commercial Mortgage Trust(a),(d) | ||||
| Series 2017-SMP Class A | ||||
| 1-month USD LIBOR + 0.875% Floor 0.875% 12/15/2034 | 5.823% | 4,720,000 | 4,473,088 | |
| Series 2020-SDAL Class D | ||||
| 1-month USD LIBOR + 2.090% Floor 2.090% 02/15/2037 | 7.038% | 5,600,000 | 5,342,941 | |
| Subordinated Series 2017-SMP Class C | ||||
| 1-month USD LIBOR + 1.450% Floor 1.200% 12/15/2034 | 6.273% | 800,000 | 753,664 | |
| Total Commercial Mortgage-Backed Securities - Non-Agency (Cost $131,927,149) | 121,413,107 | |||
| Common Stocks 0.0% | ||
| Issuer | Shares | Value ($) |
| Consumer Staples 0.0% | ||
| Beverages 0.0% | ||
| Crimson Wine Group Ltd.(g) | 3 | 19 |
| Total Consumer Staples | 19 | |
| Energy 0.0% | ||
| Oil, Gas & Consumable Fuels 0.0% | ||
| Vitesse Energy, Inc. | 4 | 74 |
| Total Energy | 74 | |
| Common Stocks (continued) | ||
| Issuer | Shares | Value ($) |
| Financials 0.0% | ||
| Capital Markets 0.0% | ||
| Jefferies Financial Group, Inc. | 39 | 1,250 |
| Total Financials | 1,250 | |
| Total Common Stocks (Cost $—) | 1,343 | |
| Corporate Bonds & Notes 17.4% | ||||
| Issuer | Coupon Rate | Principal Amount ($) | Value ($) | |
| Aerospace & Defense 0.5% | ||||
| Boeing Co. (The) | ||||
| 08/01/2059 | 3.950% | 5,058,000 | 3,712,119 | |
| 05/01/2060 | 5.930% | 361,000 | 356,830 | |
| Northrop Grumman Corp. | ||||
| 03/15/2053 | 4.950% | 512,000 | 506,035 | |
| Total | 4,574,984 | |||
| Banking 6.3% | ||||
| Bank of America Corp.(h) | ||||
| 07/23/2031 | 1.898% | 4,505,000 | 3,619,684 | |
| 10/24/2031 | 1.922% | 2,300,000 | 1,836,247 | |
| 10/20/2032 | 2.572% | 5,507,000 | 4,523,180 | |
| 02/04/2033 | 2.972% | 5,600,000 | 4,730,285 | |
| Subordinated | ||||
| 09/21/2036 | 2.482% | 357,000 | 272,857 | |
| Citigroup, Inc.(h) | ||||
| 06/03/2031 | 2.572% | 864,000 | 730,842 | |
| 01/25/2033 | 3.057% | 5,541,000 | 4,722,665 | |
| Goldman Sachs Group, Inc. (The)(h) | ||||
| 07/21/2032 | 2.383% | 3,506,000 | 2,863,657 | |
| 10/21/2032 | 2.650% | 4,920,000 | 4,089,037 | |
| HSBC Holdings PLC(h) | ||||
| 05/24/2032 | 2.804% | 1,078,000 | 882,207 | |
| 11/22/2032 | 2.871% | 5,039,000 | 4,120,692 | |
| 03/09/2034 | 6.254% | 1,684,000 | 1,756,590 | |
| JPMorgan Chase & Co.(h) | ||||
| 10/15/2030 | 2.739% | 1,812,000 | 1,588,612 | |
| 04/22/2032 | 2.580% | 13,406,000 | 11,266,963 | |
| 11/08/2032 | 2.545% | 3,472,000 | 2,890,645 | |
| Morgan Stanley(h) | ||||
| 07/21/2032 | 2.239% | 1,219,000 | 984,952 | |
| Subordinated | ||||
| 09/16/2036 | 2.484% | 500,000 | 383,811 | |
| Columbia Bond Fund | Annual Report 2023 | 11 |
April 30, 2023
| Corporate Bonds & Notes (continued) | ||||
| Issuer | Coupon Rate | Principal Amount ($) | Value ($) | |
| Wells Fargo & Co.(h) | ||||
| 10/30/2030 | 2.879% | 2,323,000 | 2,032,461 | |
| 02/11/2031 | 2.572% | 7,892,000 | 6,746,464 | |
| 04/25/2053 | 4.611% | 500,000 | 448,044 | |
| Total | 60,489,895 | |||
| Cable and Satellite 0.6% | ||||
| Charter Communications Operating LLC/Capital | ||||
| 05/01/2047 | 5.375% | 610,000 | 497,810 | |
| 12/01/2061 | 4.400% | 2,927,000 | 1,960,764 | |
| 06/30/2062 | 3.950% | 3,670,000 | 2,264,500 | |
| 04/01/2063 | 5.500% | 960,000 | 765,093 | |
| Total | 5,488,167 | |||
| Diversified Manufacturing 0.2% | ||||
| Carrier Global Corp. | ||||
| 02/15/2030 | 2.722% | 2,595,000 | 2,271,856 | |
| Electric 1.2% | ||||
| AEP Texas, Inc. | ||||
| 01/15/2050 | 3.450% | 1,400,000 | 1,040,907 | |
| Duke Energy Corp. | ||||
| 09/01/2046 | 3.750% | 3,035,000 | 2,377,678 | |
| 08/15/2052 | 5.000% | 471,000 | 442,563 | |
| Duke Energy Ohio, Inc. | ||||
| 04/01/2053 | 5.650% | 305,000 | 323,095 | |
| Emera US Finance LP | ||||
| 06/15/2046 | 4.750% | 2,910,000 | 2,417,751 | |
| FirstEnergy Corp. | ||||
| 03/01/2050 | 3.400% | 532,000 | 372,150 | |
| Georgia Power Co. | ||||
| 03/15/2042 | 4.300% | 1,671,000 | 1,480,762 | |
| Pacific Gas and Electric Co. | ||||
| 07/01/2050 | 4.950% | 3,395,000 | 2,766,316 | |
| 04/01/2053 | 6.700% | 233,000 | 237,865 | |
| Total | 11,459,087 | |||
| Food and Beverage 0.6% | ||||
| Bacardi Ltd.(a) | ||||
| 05/15/2048 | 5.300% | 3,330,000 | 3,116,057 | |
| Constellation Brands, Inc.(c) | ||||
| 05/01/2033 | 4.900% | 2,704,000 | 2,713,650 | |
| Total | 5,829,707 | |||
| Health Care 0.8% | ||||
| CVS Health Corp. | ||||
| 07/20/2045 | 5.125% | 2,340,000 | 2,210,167 | |
| GE Healthcare Holding LLC(a) | ||||
| 11/15/2027 | 5.650% | 1,150,000 | 1,187,442 | |
| 11/22/2052 | 6.377% | 555,000 | 622,569 | |
| Corporate Bonds & Notes (continued) | ||||
| Issuer | Coupon Rate | Principal Amount ($) | Value ($) | |
| HCA, Inc.(a) | ||||
| 03/15/2052 | 4.625% | 4,719,000 | 3,912,248 | |
| Total | 7,932,426 | |||
| Healthcare Insurance 1.2% | ||||
| Aetna, Inc. | ||||
| 11/15/2042 | 4.125% | 357,000 | 303,791 | |
| Centene Corp. | ||||
| 10/15/2030 | 3.000% | 6,940,000 | 5,924,596 | |
| UnitedHealth Group, Inc. | ||||
| 02/15/2030 | 5.300% | 1,832,000 | 1,932,988 | |
| 04/15/2063 | 5.200% | 3,045,000 | 3,101,710 | |
| Total | 11,263,085 | |||
| Integrated Energy 0.1% | ||||
| Cenovus Energy, Inc. | ||||
| 02/15/2052 | 3.750% | 840,000 | 609,661 | |
| Life Insurance 0.0% | ||||
| Peachtree Corners Funding Trust(a) | ||||
| 02/15/2025 | 3.976% | 335,000 | 326,115 | |
| Voya Financial, Inc. | ||||
| 06/15/2046 | 4.800% | 30,000 | 25,334 | |
| Total | 351,449 | |||
| Media and Entertainment 0.8% | ||||
| Magallanes, Inc.(a) | ||||
| 03/15/2062 | 5.391% | 9,772,000 | 7,843,594 | |
| Midstream 0.9% | ||||
| Kinder Morgan, Inc. | ||||
| 02/15/2046 | 5.050% | 671,000 | 590,259 | |
| 08/01/2052 | 5.450% | 2,051,000 | 1,893,194 | |
| MPLX LP | ||||
| 03/14/2052 | 4.950% | 706,000 | 610,453 | |
| Plains All American Pipeline LP/Finance Corp. | ||||
| 06/15/2044 | 4.700% | 4,576,000 | 3,634,425 | |
| Western Gas Partners LP | ||||
| 08/15/2048 | 5.500% | 550,000 | 468,001 | |
| Western Midstream Operating LP(h) | ||||
| 02/01/2050 | 5.500% | 1,335,000 | 1,134,910 | |
| Williams Companies, Inc. (The) | ||||
| 09/15/2045 | 5.100% | 821,000 | 751,960 | |
| Total | 9,083,202 | |||
| Natural Gas 0.2% | ||||
| NiSource, Inc. | ||||
| 05/15/2047 | 4.375% | 2,380,000 | 2,101,650 | |
| 12 | Columbia Bond Fund | Annual Report 2023 |
April 30, 2023
| Corporate Bonds & Notes (continued) | ||||
| Issuer | Coupon Rate | Principal Amount ($) | Value ($) | |
| Pharmaceuticals 1.5% | ||||
| AbbVie, Inc. | ||||
| 06/15/2044 | 4.850% | 2,780,000 | 2,650,786 | |
| Amgen, Inc. | ||||
| 03/02/2063 | 5.750% | 11,221,000 | 11,607,227 | |
| Total | 14,258,013 | |||
| Property & Casualty 0.1% | ||||
| Berkshire Hathaway Finance Corp. | ||||
| 03/15/2052 | 3.850% | 777,000 | 660,632 | |
| Retailers 0.5% | ||||
| Lowe’s Companies, Inc. | ||||
| 04/01/2062 | 4.450% | 2,217,000 | 1,815,627 | |
| 09/15/2062 | 5.800% | 3,226,000 | 3,245,735 | |
| Total | 5,061,362 | |||
| Technology 0.4% | ||||
| Broadcom, Inc.(a) | ||||
| 11/15/2036 | 3.187% | 3,417,000 | 2,602,399 | |
| NXP BV/Funding LLC/USA, Inc. | ||||
| 05/01/2030 | 3.400% | 200,000 | 179,716 | |
| 01/15/2033 | 5.000% | 1,254,000 | 1,226,641 | |
| Total | 4,008,756 | |||
| Transportation Services 0.4% | ||||
| ERAC USA Finance LLC(a),(c) | ||||
| 05/01/2028 | 4.600% | 3,769,000 | 3,759,838 | |
| Wireless 0.9% | ||||
| American Tower Corp. | ||||
| 08/15/2029 | 3.800% | 2,461,000 | 2,306,716 | |
| 06/15/2030 | 2.100% | 685,000 | 563,768 | |
| T-Mobile US, Inc. | ||||
| 02/15/2031 | 2.875% | 6,066,000 | 5,255,838 | |
| Total | 8,126,322 | |||
| Wirelines 0.2% | ||||
| AT&T, Inc. | ||||
| 03/01/2029 | 4.350% | 1,292,000 | 1,269,343 | |
| 12/01/2057 | 3.800% | 1,237,000 | 907,711 | |
| Total | 2,177,054 | |||
| Total Corporate Bonds & Notes (Cost $184,341,063) | 167,350,740 | |||
| Residential Mortgage-Backed Securities - Agency 37.1% | ||||
| Federal Home Loan Mortgage Corp.(i) | ||||
| 06/01/2043 | 4.000% | 1,215,559 | 1,190,289 | |
| 05/01/2052 | 3.000% | 9,176,169 | 8,290,015 | |
| Residential Mortgage-Backed Securities - Agency (continued) | ||||
| Issuer | Coupon Rate | Principal Amount ($) | Value ($) | |
| Federal Home Loan Mortgage Corp. | ||||
| 09/01/2051 | 2.500% | 16,758,004 | 14,511,957 | |
| 02/01/2052 | 3.000% | 6,289,698 | 5,676,287 | |
| 08/01/2052 | 4.000% | 14,488,512 | 13,995,965 | |
| 02/01/2053 | 4.500% | 6,962,370 | 6,855,012 | |
| Federal Home Loan Mortgage Corp.(d),(f) | ||||
| CMO Series 4903 Class SA | ||||
| -1.0 x 1-month USD LIBOR + 6.050% Cap 6.050% 08/25/2049 | 1.030% | 1,988,423 | 241,250 | |
| Federal Home Loan Mortgage Corp.(f) | ||||
| CMO Series 5162 Class IA | ||||
| 11/25/2051 | 3.000% | 8,455,567 | 1,236,534 | |
| Federal National Mortgage Association | ||||
| 08/01/2029- 09/01/2045 | 3.000% | 1,652,185 | 1,577,944 | |
| 05/01/2043- 05/01/2052 | 3.500% | 33,862,823 | 31,559,245 | |
| 02/01/2048- 08/01/2052 | 4.000% | 37,248,489 | 36,067,864 | |
| 01/01/2052 | 2.500% | 10,285,513 | 8,927,468 | |
| Federal National Mortgage Association(i) | ||||
| 07/01/2038 | 6.000% | 551,647 | 574,739 | |
| 01/01/2040 | 5.500% | 687,284 | 712,165 | |
| 08/01/2040 | 4.500% | 1,059,176 | 1,048,392 | |
| 10/01/2042 | 3.000% | 1,522,574 | 1,402,004 | |
| 07/01/2045- 02/01/2046 | 3.500% | 1,825,759 | 1,724,692 | |
| 11/01/2045 | 4.000% | 548,555 | 530,253 | |
| Federal National Mortgage Association(d),(f) | ||||
| CMO Series 2016-53 Class KS | ||||
| -1.0 x 1-month USD LIBOR + 6.000% Cap 6.000% 08/25/2046 | 0.980% | 704,216 | 85,208 | |
| CMO Series 2016-57 Class SA | ||||
| -1.0 x 1-month USD LIBOR + 6.000% Cap 6.000% 08/25/2046 | 0.980% | 1,763,881 | 216,571 | |
| CMO Series 2016-93 Class SL | ||||
| -1.0 x 1-month USD LIBOR + 6.650% Cap 6.650% 12/25/2046 | 1.630% | 2,481,659 | 195,601 | |
| CMO Series 2017-109 Class SA | ||||
| -1.0 x 1-month USD LIBOR + 6.150% Cap 6.150% 01/25/2048 | 1.130% | 836,980 | 118,089 | |
| Columbia Bond Fund | Annual Report 2023 | 13 |
April 30, 2023
| Residential Mortgage-Backed Securities - Agency (continued) | ||||
| Issuer | Coupon Rate | Principal Amount ($) | Value ($) | |
| CMO Series 2017-20 Class SA | ||||
| -1.0 x 1-month USD LIBOR + 6.100% Cap 6.100% 04/25/2047 | 1.080% | 728,849 | 93,926 | |
| CMO Series 2017-54 Class SN | ||||
| -1.0 x 1-month USD LIBOR + 6.150% Cap 6.150% 07/25/2047 | 1.130% | 1,472,924 | 219,710 | |
| CMO Series 2018-66 Class SM | ||||
| -1.0 x 1-month USD LIBOR + 6.200% Cap 6.200% 09/25/2048 | 1.180% | 998,473 | 130,028 | |
| CMO Series 2018-74 Class SA | ||||
| -1.0 x 1-month USD LIBOR + 6.150% Cap 6.150% 10/25/2048 | 1.130% | 1,238,388 | 156,583 | |
| CMO Series 2019-33 Class SB | ||||
| -1.0 x 1-month USD LIBOR + 6.050% Cap 6.050% 07/25/2049 | 1.030% | 2,972,615 | 362,018 | |
| CMO Series 2019-60 Class SH | ||||
| -1.0 x 1-month USD LIBOR + 6.050% Cap 6.050% 10/25/2049 | 1.030% | 1,139,616 | 144,370 | |
| CMO Series 2019-67 Class SE | ||||
| -1.0 x 1-month USD LIBOR + 6.050% Cap 6.050% 11/25/2049 | 1.030% | 1,780,801 | 280,271 | |
| Federal National Mortgage Association(f) | ||||
| CMO Series 2021-3 Class TI | ||||
| 02/25/2051 | 2.500% | 11,564,729 | 1,896,409 | |
| Freddie Mac REMICS(f) | ||||
| CMO Series 5152 Class XI | ||||
| 11/25/2050 | 2.500% | 15,235,304 | 2,007,798 | |
| CMO Series 5287 Class NI | ||||
| 05/25/2051 | 3.500% | 7,583,635 | 1,468,953 | |
| Government National Mortgage Association(d) | ||||
| 1-year CMT + 1.500% Cap 10.000% 04/20/2028 | 2.875% | 1,060 | 1,037 | |
| Government National Mortgage Association(i) | ||||
| 04/20/2048 | 4.500% | 724,604 | 720,890 | |
| Residential Mortgage-Backed Securities - Agency (continued) | ||||
| Issuer | Coupon Rate | Principal Amount ($) | Value ($) | |
| Government National Mortgage Association(d),(f) | ||||
| CMO Series 2017-112 Class SJ | ||||
| -1.0 x 1-month USD LIBOR + 5.660% Cap 5.660% 07/20/2047 | 0.707% | 2,552,090 | 208,965 | |
| CMO Series 2017-130 Class HS | ||||
| -1.0 x 1-month USD LIBOR + 6.200% Cap 6.200% 08/20/2047 | 1.247% | 868,805 | 96,611 | |
| CMO Series 2017-149 Class BS | ||||
| -1.0 x 1-month USD LIBOR + 6.200% Cap 6.200% 10/20/2047 | 1.247% | 1,089,585 | 136,740 | |
| CMO Series 2017-163 Class SA | ||||
| -1.0 x 1-month USD LIBOR + 6.200% Cap 6.200% 11/20/2047 | 1.247% | 460,320 | 49,008 | |
| CMO Series 2017-37 Class SB | ||||
| -1.0 x 1-month USD LIBOR + 6.150% Cap 6.150% 03/20/2047 | 1.197% | 657,559 | 72,242 | |
| CMO Series 2018-103 Class SA | ||||
| -1.0 x 1-month USD LIBOR + 6.200% Cap 6.200% 08/20/2048 | 1.247% | 641,828 | 77,316 | |
| CMO Series 2018-112 Class LS | ||||
| -1.0 x 1-month USD LIBOR + 6.200% Cap 6.200% 08/20/2048 | 1.247% | 807,884 | 96,473 | |
| CMO Series 2018-125 Class SK | ||||
| -1.0 x 1-month USD LIBOR + 6.250% Cap 6.250% 09/20/2048 | 1.297% | 1,024,954 | 95,830 | |
| CMO Series 2018-134 Class KS | ||||
| -1.0 x 1-month USD LIBOR + 6.200% Cap 6.200% 10/20/2048 | 1.247% | 823,691 | 97,126 | |
| CMO Series 2018-148 Class SB | ||||
| -1.0 x 1-month USD LIBOR + 6.200% Cap 6.200% 01/20/2048 | 1.247% | 1,553,354 | 188,651 | |
| 14 | Columbia Bond Fund | Annual Report 2023 |
April 30, 2023
| Residential Mortgage-Backed Securities - Agency (continued) | ||||
| Issuer | Coupon Rate | Principal Amount ($) | Value ($) | |
| CMO Series 2018-151 Class SA | ||||
| -1.0 x 1-month USD LIBOR + 6.150% Cap 6.150% 11/20/2048 | 1.197% | 1,348,986 | 155,734 | |
| CMO Series 2018-89 Class MS | ||||
| -1.0 x 1-month USD LIBOR + 6.200% Cap 6.200% 06/20/2048 | 1.247% | 846,249 | 83,127 | |
| CMO Series 2018-91 Class DS | ||||
| -1.0 x 1-month USD LIBOR + 6.200% Cap 6.200% 07/20/2048 | 1.247% | 892,072 | 101,937 | |
| CMO Series 2019-20 Class JS | ||||
| -1.0 x 1-month USD LIBOR + 6.000% Cap 6.000% 02/20/2049 | 1.047% | 1,281,279 | 148,289 | |
| CMO Series 2019-5 Class SH | ||||
| -1.0 x 1-month USD LIBOR + 6.150% Cap 6.150% 01/20/2049 | 1.197% | 912,601 | 107,352 | |
| CMO Series 2019-56 Class SG | ||||
| -1.0 x 1-month USD LIBOR + 6.150% Cap 6.150% 05/20/2049 | 1.197% | 955,305 | 112,034 | |
| CMO Series 2019-59 Class KS | ||||
| -1.0 x 1-month USD LIBOR + 6.050% Cap 6.050% 05/20/2049 | 1.097% | 972,614 | 114,016 | |
| CMO Series 2019-85 Class SC | ||||
| -1.0 x 1-month USD LIBOR + 6.150% Cap 6.150% 07/20/2049 | 1.197% | 929,393 | 99,869 | |
| CMO Series 2019-90 Class SD | ||||
| -1.0 x 1-month USD LIBOR + 6.150% 07/20/2049 | 1.197% | 2,218,182 | 266,010 | |
| CMO Series 2019-92 Class SD | ||||
| -1.0 x 1-month USD LIBOR + 6.100% Cap 6.100% 07/20/2049 | 1.147% | 5,410,855 | 679,280 | |
| Residential Mortgage-Backed Securities - Agency (continued) | ||||
| Issuer | Coupon Rate | Principal Amount ($) | Value ($) | |
| CMO Series 2020-188 Class SA | ||||
| 1-month USD LIBOR + 6.300% Cap 6.300% 12/20/2050 | 1.347% | 11,825,355 | 1,832,321 | |
| CMO Series 2020-21 Class VS | ||||
| -1.0 x 1-month USD LIBOR + 6.050% Cap 6.050% 02/20/2050 | 1.097% | 729,735 | 91,900 | |
| CMO Series 2020-62 Class SG | ||||
| -1.0 x 1-month USD LIBOR + 6.150% Cap 6.150% 05/20/2050 | 1.197% | 1,295,981 | 149,394 | |
| Government National Mortgage Association(f) | ||||
| CMO Series 2020-164 Class CI | ||||
| 11/20/2050 | 3.000% | 7,562,023 | 1,122,361 | |
| CMO Series 2020-175 Class KI | ||||
| 11/20/2050 | 2.500% | 20,474,726 | 2,829,134 | |
| CMO Series 2020-191 Class UG | ||||
| 12/20/2050 | 3.500% | 7,577,335 | 1,222,226 | |
| CMO Series 2021-119 Class QI | ||||
| 07/20/2051 | 3.000% | 8,242,717 | 1,185,754 | |
| CMO Series 2021-139 Class IC | ||||
| 08/20/2051 | 3.000% | 19,798,134 | 3,055,345 | |
| CMO Series 2021-16 Class KI | ||||
| 01/20/2051 | 2.500% | 9,709,849 | 1,344,131 | |
| Government National Mortgage Association TBA(c) | ||||
| 05/18/2053 | 4.000% | 18,000,000 | 17,306,016 | |
| 05/18/2053 | 4.500% | 10,000,000 | 9,810,938 | |
| Uniform Mortgage-Backed Security TBA(c) | ||||
| 05/16/2038- 05/11/2053 | 3.000% | 45,078,000 | 40,614,166 | |
| 05/16/2038- 05/11/2053 | 3.500% | 19,000,000 | 17,810,078 | |
| 05/16/2038- 05/11/2053 | 4.000% | 28,000,000 | 26,917,587 | |
| 05/11/2053 | 4.500% | 43,580,000 | 42,601,152 | |
| 05/11/2053 | 5.000% | 42,000,000 | 41,758,828 | |
| Total Residential Mortgage-Backed Securities - Agency (Cost $363,425,794) | 356,857,478 | |||
| Residential Mortgage-Backed Securities - Non-Agency 28.1% | ||||
| 510 Asset Backed Trust(a),(e) | ||||
| CMO Series 2021-NPL2 Class A1 | ||||
| 06/25/2061 | 2.116% | 2,921,386 | 2,684,849 | |
| Angel Oak Mortgage Trust(a),(e) | ||||
| CMO Series 2020-1 Class M1 | ||||
| 12/25/2059 | 3.161% | 3,000,000 | 2,610,065 | |
| Columbia Bond Fund | Annual Report 2023 | 15 |
April 30, 2023
| Residential Mortgage-Backed Securities - Non-Agency (continued) | ||||
| Issuer | Coupon Rate | Principal Amount ($) | Value ($) | |
| CMO Series 2020-3 Class A1 | ||||
| 04/25/2065 | 1.691% | 2,183,433 | 1,993,706 | |
| CMO Series 2021-5 Class A2 | ||||
| 07/25/2066 | 1.208% | 4,448,381 | 3,704,008 | |
| Angel Oak Mortgage Trust I LLC(a),(e) | ||||
| CMO Series 2018-3 Class M1 | ||||
| 09/25/2048 | 4.421% | 792,850 | 776,504 | |
| Arroyo Mortgage Trust(a),(e) | ||||
| CMO Series 2019-2 Class A3 | ||||
| 04/25/2049 | 3.800% | 170,426 | 157,167 | |
| Arroyo Mortgage Trust(a) | ||||
| CMO Series 2020-1 Class M1 | ||||
| 03/25/2055 | 4.277% | 3,946,000 | 3,451,856 | |
| Bellemeade Re Ltd.(a),(d) | ||||
| CMO Series 2018-1A Class M2 | ||||
| 1-month USD LIBOR + 2.900% 04/25/2028 | 7.920% | 1,887,490 | 1,896,395 | |
| CMO Series 2019-2A Class M1C | ||||
| 1-month USD LIBOR + 2.000% Floor 2.000% 04/25/2029 | 7.020% | 3,055,546 | 3,053,212 | |
| CMO Series 2019-3A Class M1C | ||||
| 1-month USD LIBOR + 1.950% Floor 1.950% 07/25/2029 | 6.970% | 3,142,797 | 3,137,714 | |
| CMO Series 2021-2A Class M1A | ||||
| 30-day Average SOFR + 1.200% Floor 1.200% 06/25/2031 | 5.760% | 2,174,600 | 2,150,191 | |
| CMO Series 2021-2A Class M1B | ||||
| 30-day Average SOFR + 1.500% Floor 1.500% 06/25/2031 | 6.060% | 2,000,000 | 1,946,767 | |
| CMO Series 2022-1 Class M1A | ||||
| 30-day Average SOFR + 1.750% Floor 1.750% 01/26/2032 | 6.574% | 4,900,000 | 4,869,501 | |
| BRAVO Residential Funding Trust(a),(e) | ||||
| CMO Series 2020-NQM1 Class M1 | ||||
| 05/25/2060 | 3.181% | 2,500,000 | 2,258,395 | |
| CMO Series 2020-RPL2 Class A1 | ||||
| 05/25/2059 | 2.000% | 1,845,366 | 1,677,942 | |
| CMO Series 2021-A Class A1 | ||||
| 10/25/2059 | 1.991% | 2,789,479 | 2,664,610 | |
| Bunker Hill Loan Depositary Trust(a),(e) | ||||
| CMO Series 2019-3 Class A2 | ||||
| 11/25/2059 | 2.981% | 855,776 | 814,151 | |
| CMO Series 2019-3 Class A3 | ||||
| 11/25/2059 | 3.135% | 1,246,988 | 1,184,984 | |
| Residential Mortgage-Backed Securities - Non-Agency (continued) | ||||
| Issuer | Coupon Rate | Principal Amount ($) | Value ($) | |
| CMO Series 2020-1 Class A1 | ||||
| 02/25/2055 | 1.724% | 2,812,882 | 2,684,515 | |
| BVRT Financing Trust(a),(b),(d) | ||||
| CMO Series 2021-3F Class M1 | ||||
| 30-day Average SOFR + 1.750% Floor 1.750% 07/12/2033 | 3.608% | 2,139,162 | 2,139,162 | |
| CMO Series 2021-3F Class M2 | ||||
| 30-day Average SOFR + 2.900% Floor 2.900% 07/12/2033 | 4.187% | 6,000,000 | 6,000,000 | |
| CHNGE Mortgage Trust(a),(e) | ||||
| CMO Series 2022-1 Class A1 | ||||
| 01/25/2067 | 3.007% | 4,772,227 | 4,331,889 | |
| CMO Series 2022-2 Class A1 | ||||
| 03/25/2067 | 3.757% | 3,948,879 | 3,776,286 | |
| COLT Mortgage Loan Trust(a),(e) | ||||
| CMO Series 2020-2 Class A2 | ||||
| 03/25/2065 | 3.094% | 350,000 | 334,256 | |
| CMO Series 2021-3 Class A1 | ||||
| 09/27/2066 | 0.956% | 2,885,431 | 2,311,330 | |
| CMO Series 2021-5 Class A2 | ||||
| 11/26/2066 | 2.606% | 4,270,000 | 3,226,580 | |
| Connecticut Avenue Securities Trust(a),(d) | ||||
| CMO Series 2022-R01 Class 1M2 | ||||
| 30-day Average SOFR + 1.900% 12/25/2041 | 6.715% | 2,650,000 | 2,566,591 | |
| CMO Series 2022-R04 Class 1M2 | ||||
| 30-day Average SOFR + 3.100% 03/25/2042 | 7.915% | 4,000,000 | 4,039,515 | |
| Credit Suisse Mortgage Capital Certificates(a),(e) | ||||
| CMO Series 2020-SPT1 Class A1 | ||||
| 04/25/2065 | 1.616% | 185,437 | 181,058 | |
| Credit Suisse Mortgage Trust(a),(e) | ||||
| CMO Series 2021-NQM2 Class A2 | ||||
| 02/25/2066 | 1.384% | 3,334,380 | 2,813,055 | |
| CMO Series 2021-RPL2 Class A1A | ||||
| 01/25/2060 | 1.115% | 3,298,492 | 2,643,830 | |
| CSMC Trust(a),(e) | ||||
| CMO Series 2020-RPL2 Class A12 | ||||
| 02/25/2060 | 3.476% | 866,340 | 874,730 | |
| CMO Series 2020-RPL6 Class A1 | ||||
| 03/25/2059 | 2.688% | 8,852,473 | 8,547,016 | |
| CMO Series 2021-NQM8 Class A1 | ||||
| 10/25/2066 | 1.841% | 3,765,239 | 3,276,837 | |
| CMO Series 2022-NQM1 Class A3 | ||||
| 11/25/2066 | 2.675% | 3,252,115 | 2,693,034 | |
| Subordinated CMO Series 2020-RPL3 Class A1 | ||||
| 03/25/2060 | 2.691% | 2,512,258 | 2,453,660 | |
| 16 | Columbia Bond Fund | Annual Report 2023 |
April 30, 2023
| Residential Mortgage-Backed Securities - Non-Agency (continued) | ||||
| Issuer | Coupon Rate | Principal Amount ($) | Value ($) | |
| Deephaven Residential Mortgage Trust(a),(e) | ||||
| CMO Series 2021-1 Class A2 | ||||
| 05/25/2065 | 0.973% | 645,407 | 593,704 | |
| Eagle Re Ltd.(a),(d) | ||||
| Subordinated CMO Series 2020-1 Class M1B | ||||
| 1-month USD LIBOR + 1.450% 01/25/2030 | 6.470% | 1,759,356 | 1,757,659 | |
| Ellington Financial Mortgage Trust(a),(e) | ||||
| CMO Series 2020-1 Class A3 | ||||
| 05/25/2065 | 3.999% | 550,000 | 514,531 | |
| Freddie Mac STACR(d) | ||||
| CMO Series 2020-CS01 Class M3 | ||||
| 1-month USD LIBOR + 0.000% 04/25/2033 | 4.000% | 5,965,382 | 5,691,003 | |
| Freddie Mac STACR REMIC Trust(a),(d) | ||||
| CMO Series 2021-DNA3 Class M1 | ||||
| 30-day Average SOFR + 0.750% 10/25/2033 | 5.565% | 2,770,591 | 2,756,105 | |
| CMO Series 2022-DNA1 Class M1B | ||||
| 30-day Average SOFR + 1.850% 01/25/2042 | 6.665% | 3,000,000 | 2,904,584 | |
| Subordinated CMO Series 2022-DNA6 Class M1A | ||||
| 30-day Average SOFR + 2.150% 09/25/2042 | 6.965% | 2,404,878 | 2,416,935 | |
| Freddie Mac Structured Agency Credit Risk Debt Notes(d) | ||||
| CMO Series 2020-CS02 Class M3 | ||||
| 1-month USD LIBOR + 0.000% 06/25/2033 | 4.506% | 4,397,275 | 4,361,732 | |
| Freddie Mac Structured Agency Credit Risk Debt Notes(a),(d) | ||||
| CMO Series 2022-DNA2 Class M1B | ||||
| 30-day Average SOFR + 2.400% 02/25/2042 | 7.215% | 3,800,000 | 3,742,479 | |
| FWD Securitization Trust(a),(e) | ||||
| CMO Series 2020-INV1 Class M1 | ||||
| 01/25/2050 | 2.850% | 3,500,000 | 2,800,089 | |
| GCAT LLC(a),(e) | ||||
| CMO Series 2021-CM1 Class A1 | ||||
| 04/25/2065 | 1.469% | 2,679,781 | 2,522,309 | |
| GCAT Trust(a),(e) | ||||
| CMO Series 2021-CM2 Class A1 | ||||
| 08/25/2066 | 2.352% | 2,988,751 | 2,719,271 | |
| CMO Series 2022-NQM2 Class A3 | ||||
| 02/25/2067 | 4.210% | 4,777,389 | 4,383,624 | |
| GS Mortgage-Backed Securities Corp. Trust(a),(e) | ||||
| CMO Series 2021-NQM1 Class A1 | ||||
| 07/25/2061 | 1.017% | 2,411,503 | 2,085,793 | |
| Home Re Ltd.(a),(d) | ||||
| Subordinated CMO Series 2022-1 Class M1A | ||||
| 30-day Average SOFR + 2.850% 10/25/2034 | 7.665% | 2,700,000 | 2,698,653 | |
| Residential Mortgage-Backed Securities - Non-Agency (continued) | ||||
| Issuer | Coupon Rate | Principal Amount ($) | Value ($) | |
| Imperial Fund Mortgage Trust(a),(e) | ||||
| CMO Series 2021-NQM4 Class A2 | ||||
| 01/25/2057 | 2.296% | 1,788,454 | 1,549,642 | |
| Legacy Mortgage Asset Trust(a),(e) | ||||
| CMO Series 2021-GS2 Class A1 | ||||
| 04/25/2061 | 1.750% | 2,063,955 | 1,945,385 | |
| CMO Series 2021-SL2 Class A | ||||
| 10/25/2068 | 1.875% | 2,718,057 | 2,442,275 | |
| MFA Trust(a),(e) | ||||
| CMO Series 2020-NQM2 Class M1 | ||||
| 04/25/2065 | 3.034% | 3,500,000 | 2,896,512 | |
| CMO Series 2020-NQM3 Class A1 | ||||
| 01/26/2065 | 1.014% | 4,803,565 | 4,320,302 | |
| CMO Series 2020-NQM3 Class A2 | ||||
| 01/26/2065 | 1.324% | 1,921,429 | 1,719,767 | |
| CMO Series 2020-NQM3 Class A3 | ||||
| 01/26/2065 | 1.632% | 1,441,072 | 1,286,784 | |
| CMO Series 2021-INV2 Class A3 | ||||
| 11/25/2056 | 2.264% | 2,451,220 | 2,093,671 | |
| MFRA Trust(a),(e) | ||||
| CMO Series 2021-INV1 Class A2 | ||||
| 01/25/2056 | 1.057% | 344,648 | 313,050 | |
| CMO Series 2021-INV1 Class A3 | ||||
| 01/25/2056 | 1.262% | 537,307 | 483,575 | |
| New Residential Mortgage Loan Trust(a),(e) | ||||
| CMO Series 2018-1A Class A1A | ||||
| 12/25/2057 | 4.000% | 6,329,937 | 6,024,671 | |
| NRZ Excess Spread-Collateralized Notes(a) | ||||
| Series 2020-PLS1 Class A | ||||
| 12/25/2025 | 3.844% | 3,181,048 | 2,960,499 | |
| Oaktown Re II Ltd.(a),(d) | ||||
| CMO Series 2018-1A Class M1 | ||||
| 1-month USD LIBOR + 1.550% 07/25/2028 | 6.570% | 250,299 | 250,357 | |
| Oaktown Re III Ltd.(a),(d) | ||||
| CMO Series 2019-1A Class M1B | ||||
| 1-month USD LIBOR + 1.950% Floor 1.950% 07/25/2029 | 6.970% | 963,577 | 963,283 | |
| Oaktown Re VI Ltd.(a),(d) | ||||
| CMO Series 2021-1A Class M1A | ||||
| 30-day Average SOFR + 1.650% Floor 1.650% 10/25/2033 | 6.465% | 241,329 | 241,204 | |
| PMT Credit Risk Transfer Trust(a),(d) | ||||
| Series 2019-2R Class A | ||||
| 1-month USD LIBOR + 2.750% Floor 2.750% 05/27/2023 | 7.768% | 411,017 | 409,028 | |
| Columbia Bond Fund | Annual Report 2023 | 17 |
April 30, 2023
| Residential Mortgage-Backed Securities - Non-Agency (continued) | ||||
| Issuer | Coupon Rate | Principal Amount ($) | Value ($) | |
| PNMAC GMSR Issuer Trust(a),(d) | ||||
| CMO Series 2018-FT1 Class A | ||||
| 1-month USD LIBOR + 3.650% 04/25/2025 | 7.370% | 2,500,000 | 2,498,437 | |
| CMO Series 2018-GT1 Class A | ||||
| 1-month USD LIBOR + 2.850% Floor 2.850% 02/25/2025 | 7.870% | 10,700,000 | 10,651,911 | |
| CMO Series 2018-GT2 Class A | ||||
| 1-month USD LIBOR + 2.650% 08/25/2025 | 7.670% | 3,950,000 | 3,899,252 | |
| Preston Ridge Partners Mortgage Trust(a),(e) | ||||
| CMO Series 2020-6 Class A1 | ||||
| 11/25/2025 | 2.363% | 7,815,612 | 7,477,094 | |
| CMO Series 2021-1 Class A1 | ||||
| 01/25/2026 | 2.115% | 5,273,993 | 5,063,093 | |
| CMO Series 2021-2 Class A1 | ||||
| 03/25/2026 | 2.115% | 2,049,688 | 1,925,509 | |
| CMO Series 2021-3 Class A1 | ||||
| 04/25/2026 | 1.867% | 1,908,040 | 1,779,412 | |
| CMO Series 2021-8 Class A1 | ||||
| 09/25/2026 | 1.743% | 1,430,267 | 1,298,009 | |
| Pretium Mortgage Credit Partners(a),(e) | ||||
| CMO Series 2022-NPL1 Class A1 | ||||
| 01/25/2052 | 2.981% | 3,739,931 | 3,511,592 | |
| PRKCM Trust(a),(e) | ||||
| CMO Series 2021-AFC1 Class A3 | ||||
| 08/25/2056 | 2.069% | 5,476,258 | 4,349,072 | |
| CMO Series 2021-AFC1 Class M1 | ||||
| 08/25/2056 | 3.114% | 4,516,000 | 2,754,059 | |
| PRPM LLC(a),(e) | ||||
| CMO Series 2021-RPL1 Class A1 | ||||
| 07/25/2051 | 1.319% | 3,894,064 | 3,390,469 | |
| Residential Mortgage Loan Trust(a),(e) | ||||
| CMO Series 2019-3 Class A3 | ||||
| 09/25/2059 | 3.044% | 26,799 | 26,239 | |
| Stanwich Mortgage Loan Co. LLC(a),(e) | ||||
| CMO Series 2021-NPB1 Class A1 | ||||
| 10/16/2026 | 2.735% | 2,366,759 | 2,171,753 | |
| Starwood Mortgage Residential Trust(a),(e) | ||||
| CMO Series 2019-INV1 Class A3 | ||||
| 09/27/2049 | 2.916% | 3,305,327 | 3,137,878 | |
| CMO Series 2020-2 Class A3 | ||||
| 04/25/2060 | 3.000% | 6,999,061 | 6,764,114 | |
| CMO Series 2020-3 Class A3 | ||||
| 04/25/2065 | 2.591% | 5,000,000 | 4,202,063 | |
| CMO Series 2020-3 Class M1 | ||||
| 04/25/2065 | 3.544% | 2,800,000 | 2,333,973 | |
| Residential Mortgage-Backed Securities - Non-Agency (continued) | ||||
| Issuer | Coupon Rate | Principal Amount ($) | Value ($) | |
| CMO Series 2020-INV1 Class A2 | ||||
| 11/25/2055 | 1.439% | 3,829,984 | 3,476,608 | |
| CMO Series 2020-INV1 Class A3 | ||||
| 11/25/2055 | 1.593% | 1,449,680 | 1,315,027 | |
| CMO Series 2021-3 Class A1 | ||||
| 06/25/2056 | 1.127% | 863,377 | 709,516 | |
| Stonnington Mortgage Trust(a),(b),(e),(j) | ||||
| CMO Series 2020-1 Class A | ||||
| 07/28/2024 | 3.500% | 925,791 | 911,904 | |
| Towd Point Mortgage Trust(a),(e) | ||||
| CMO Series 2019-4 Class M1B | ||||
| 10/25/2059 | 3.000% | 10,000,000 | 8,444,090 | |
| TRK Trust(a),(e) | ||||
| CMO Series 2021-INV2 Class A1 | ||||
| 11/25/2056 | 1.966% | 5,899,215 | 5,042,406 | |
| Vendee Mortgage Trust(e),(f) | ||||
| CMO Series 1998-1 Class 2IO | ||||
| 03/15/2028 | 0.000% | 441,265 | 0 | |
| CMO Series 1998-3 Class IO | ||||
| 03/15/2029 | 0.000% | 549,016 | 1 | |
| Verus Securitization Trust(a),(e) | ||||
| CMO Series 2019-INV3 Class A3 | ||||
| 11/25/2059 | 3.100% | 307,172 | 292,337 | |
| CMO Series 2020-1 Class A3 | ||||
| 01/25/2060 | 2.724% | 864,956 | 813,068 | |
| CMO Series 2020-4 Class A3 | ||||
| 05/25/2065 | 2.321% | 1,450,085 | 1,356,407 | |
| CMO Series 2021-4 Class A2 | ||||
| 07/25/2066 | 1.247% | 4,097,590 | 3,266,069 | |
| Verus Securitization Trust(a) | ||||
| CMO Series 2020-INV1 Class A2 | ||||
| 03/25/2060 | 3.035% | 4,000,000 | 3,825,668 | |
| CMO Series 2020-INV1 Class A3 | ||||
| 03/25/2060 | 3.889% | 2,800,000 | 2,692,208 | |
| Visio Trust(a) | ||||
| CMO Series 2020-1R Class A3 | ||||
| 11/25/2055 | 1.873% | 1,414,284 | 1,294,884 | |
| CMO Series 2021-1R Class A1 | ||||
| 05/25/2056 | 1.280% | 2,460,545 | 2,251,465 | |
| Total Residential Mortgage-Backed Securities - Non-Agency (Cost $291,092,842) | 270,699,424 | |||
| Call Option Contracts Purchased 0.0% | ||||
| Value ($) | ||||
| (Cost $742,100) | 3,566 | |||
| 18 | Columbia Bond Fund | Annual Report 2023 |
April 30, 2023
| Money Market Funds 9.6% | ||
| Shares | Value ($) | |
| Columbia Short-Term Cash Fund, 5.046%(k),(l) | 92,947,387 | 92,910,208 |
| Total Money Market Funds (Cost $92,910,047) | 92,910,208 | |
| Total Investments in Securities (Cost: $1,240,519,900) | 1,180,087,322 | |
| Other Assets & Liabilities, Net | (216,823,838) | |
| Net Assets | 963,263,484 | |
| Long futures contracts | ||||||
| Description | Number of contracts | Expiration date | Trading currency | Notional amount | Value/Unrealized appreciation ($) | Value/Unrealized depreciation ($) |
| U.S. Treasury 10-Year Note | 2,004 | 06/2023 | USD | 230,867,063 | 5,936,041 | — |
| U.S. Treasury 5-Year Note | 124 | 06/2023 | USD | 13,608,031 | 317,538 | — |
| U.S. Treasury 5-Year Note | 175 | 06/2023 | USD | 19,204,883 | — | (11,252) |
| U.S. Treasury Ultra Bond | 285 | 06/2023 | USD | 40,300,781 | 1,617,688 | — |
| Total | 7,871,267 | (11,252) | ||||
| Short futures contracts | ||||||
| Description | Number of contracts | Expiration date | Trading currency | Notional amount | Value/Unrealized appreciation ($) | Value/Unrealized depreciation ($) |
| U.S. Treasury 2-Year Note | (282) | 06/2023 | USD | (58,138,265) | 310,029 | — |
| Call option contracts purchased | ||||||||
| Description | Counterparty | Trading currency | Notional amount | Number of contracts | Exercise price/Rate | Expiration date | Cost ($) | Value ($) |
| 10-Year OTC interest rate swap with Citi to receive exercise rate and pay SOFR | Citi | USD | 36,200,000 | 36,200,000 | 2.25 | 05/26/2023 | 742,100 | 3,566 |
| (a) | Represents privately placed and other securities and instruments exempt from Securities and Exchange Commission registration (collectively, private placements), such as Section 4(a)(2) and Rule 144A eligible securities, which are often sold only to qualified institutional buyers. At April 30, 2023, the total value of these securities amounted to $571,197,651, which represents 59.30% of total net assets. |
| (b) | Valuation based on significant unobservable inputs. |
| (c) | Represents a security purchased on a when-issued basis. |
| (d) | Variable rate security. The interest rate shown was the current rate as of April 30, 2023. |
| (e) | Variable or floating rate security, the interest rate of which adjusts periodically based on changes in current interest rates and prepayments on the underlying pool of assets. The interest rate shown was the current rate as of April 30, 2023. |
| (f) | Represents interest only securities which have the right to receive the monthly interest payments on an underlying pool of mortgage loans. |
| (g) | Non-income producing investment. |
| (h) | Represents a variable rate security with a step coupon where the rate adjusts according to a schedule for a series of periods, typically lower for an initial period and then increasing to a higher coupon rate thereafter. The interest rate shown was the current rate as of April 30, 2023. |
| (i) | This security or a portion of this security has been pledged as collateral in connection with derivative contracts. |
| (j) | Represents fair value as determined in good faith under procedures approved by the Board of Trustees. At April 30, 2023, the total value of these securities amounted to $911,904, which represents 0.09% of total net assets. |
| (k) | The rate shown is the seven-day current annualized yield at April 30, 2023. |
| Columbia Bond Fund | Annual Report 2023 | 19 |
April 30, 2023
| (l) | As defined in the Investment Company Act of 1940, as amended, an affiliated company is one in which the Fund owns 5% or more of the company’s outstanding voting securities, or a company which is under common ownership or control with the Fund. The value of the holdings and transactions in these affiliated companies during the year ended April 30, 2023 are as follows: |
| Affiliated issuers | Beginning of period($) | Purchases($) | Sales($) | Net change in unrealized appreciation (depreciation)($) | End of period($) | Realized gain (loss)($) | Dividends($) | End of period shares |
| Columbia Short-Term Cash Fund, 5.046% | ||||||||
| 48,458,332 | 487,785,484 | (443,328,581) | (5,027) | 92,910,208 | (9,896) | 1,505,632 | 92,947,387 | |
| CMO | Collateralized Mortgage Obligation |
| CMT | Constant Maturity Treasury |
| LIBOR | London Interbank Offered Rate |
| SOFR | Secured Overnight Financing Rate |
| TBA | To Be Announced |
| USD | US Dollar |
| ■ | Level 1 — Valuations based on quoted prices for investments in active markets that the Fund has the ability to access at the measurement date. Valuation adjustments are not applied to Level 1 investments. |
| ■ | Level 2 — Valuations based on other significant observable inputs (including quoted prices for similar securities, interest rates, prepayment speeds, credit risks, etc.). |
| ■ | Level 3 — Valuations based on significant unobservable inputs (including the Fund’s own assumptions and judgment in determining the fair value of investments). |
| 20 | Columbia Bond Fund | Annual Report 2023 |
April 30, 2023
The following table is a summary of the inputs used to value the Fund’s investments at April 30, 2023:
| Level 1 ($) | Level 2 ($) | Level 3 ($) | Total ($) | |
| Investments in Securities | ||||
| Asset-Backed Securities — Non-Agency | — | 163,772,594 | 1,995,000 | 165,767,594 |
| Commercial Mortgage-Backed Securities - Agency | — | 5,083,862 | — | 5,083,862 |
| Commercial Mortgage-Backed Securities - Non-Agency | — | 121,413,107 | — | 121,413,107 |
| Common Stocks | ||||
| Consumer Staples | — | 19 | — | 19 |
| Energy | 74 | — | — | 74 |
| Financials | 1,250 | — | — | 1,250 |
| Total Common Stocks | 1,324 | 19 | — | 1,343 |
| Corporate Bonds & Notes | — | 167,350,740 | — | 167,350,740 |
| Residential Mortgage-Backed Securities - Agency | — | 356,857,478 | — | 356,857,478 |
| Residential Mortgage-Backed Securities - Non-Agency | — | 261,648,358 | 9,051,066 | 270,699,424 |
| Call Option Contracts Purchased | — | 3,566 | — | 3,566 |
| Money Market Funds | 92,910,208 | — | — | 92,910,208 |
| Total Investments in Securities | 92,911,532 | 1,076,129,724 | 11,046,066 | 1,180,087,322 |
| Investments in Derivatives | ||||
| Asset | ||||
| Futures Contracts | 8,181,296 | — | — | 8,181,296 |
| Liability | ||||
| Futures Contracts | (11,252) | — | — | (11,252) |
| Total | 101,081,576 | 1,076,129,724 | 11,046,066 | 1,188,257,366 |
| Balance as of 04/30/2022 ($) | Increase (decrease) in accrued discounts/ premiums ($) | Realized gain (loss) ($) | Change in unrealized appreciation (depreciation)(a) ($) | Purchases ($) | Sales ($) | Transfers into Level 3 ($) | Transfers out of Level 3 ($) | Balance as of 04/30/2023 ($) | |
| Asset-Backed Securities — Non-Agency | 6,544,011 | 8 | (39,757) | 10,681 | 1,982,631 | (1,154,915) | — | (5,347,659) | 1,995,000 |
| Commercial Mortgage-Backed Securities — Non-Agency | 5,960,625 | — | — | — | — | — | — | (5,960,625) | — |
| Residential Mortgage-Backed Securities — Non-Agency | 18,622,673 | 5 | 4 | (9,251) | — | (9,562,365) | — | — | 9,051,066 |
| Total | 31,127,309 | 13 | (39,753) | 1,430 | 1,982,631 | (10,717,280) | — | (11,308,284) | 11,046,066 |
| Columbia Bond Fund | Annual Report 2023 | 21 |
April 30, 2023
| Assets | |
| Investments in securities, at value | |
| Unaffiliated issuers (cost $1,146,867,753) | $1,087,173,548 |
| Affiliated issuers (cost $92,910,047) | 92,910,208 |
| Option contracts purchased (cost $742,100) | 3,566 |
| Cash collateral held at broker for: | |
| TBA | 2,627,371 |
| Receivable for: | |
| Investments sold on a delayed delivery basis | 16,305,834 |
| Capital shares sold | 3,008,109 |
| Dividends | 298,763 |
| Interest | 3,517,798 |
| Variation margin for futures contracts | 1,515,594 |
| Expense reimbursement due from Investment Manager | 3,512 |
| Prepaid expenses | 7,572 |
| Trustees’ deferred compensation plan | 199,706 |
| Total assets | 1,207,571,581 |
| Liabilities | |
| Due to custodian | 136,586 |
| Payable for: | |
| Investments purchased | 10,565,951 |
| Investments purchased on a delayed delivery basis | 229,696,785 |
| Capital shares purchased | 597,186 |
| Distributions to shareholders | 2,925,092 |
| Variation margin for futures contracts | 39,893 |
| Management services fees | 13,025 |
| Distribution and/or service fees | 656 |
| Transfer agent fees | 18,535 |
| Compensation of board members | 68,709 |
| Other expenses | 45,973 |
| Trustees’ deferred compensation plan | 199,706 |
| Total liabilities | 244,308,097 |
| Net assets applicable to outstanding capital stock | $963,263,484 |
| Represented by | |
| Paid in capital | 1,140,906,167 |
| Total distributable earnings (loss) | (177,642,683) |
| Total - representing net assets applicable to outstanding capital stock | $963,263,484 |
| 22 | Columbia Bond Fund | Annual Report 2023 |
April 30, 2023
| Class A | |
| Net assets | $78,405,870 |
| Shares outstanding | 2,632,618 |
| Net asset value per share | $29.78 |
| Maximum sales charge | 4.75% |
| Maximum offering price per share (calculated by dividing the net asset value per share by 1.0 minus the maximum sales charge for Class A shares) | $31.27 |
| Advisor Class | |
| Net assets | $1,165,631 |
| Shares outstanding | 39,189 |
| Net asset value per share | $29.74 |
| Class C | |
| Net assets | $3,579,495 |
| Shares outstanding | 120,358 |
| Net asset value per share | $29.74 |
| Institutional Class | |
| Net assets | $89,875,295 |
| Shares outstanding | 3,018,045 |
| Net asset value per share | $29.78 |
| Institutional 2 Class | |
| Net assets | $31,527,855 |
| Shares outstanding | 1,061,512 |
| Net asset value per share | $29.70 |
| Institutional 3 Class | |
| Net assets | $752,943,017 |
| Shares outstanding | 25,229,560 |
| Net asset value per share | $29.84 |
| Class R | |
| Net assets | $247,755 |
| Shares outstanding | 8,320 |
| Net asset value per share | $29.78 |
| Class V | |
| Net assets | $5,518,566 |
| Shares outstanding | 185,661 |
| Net asset value per share | $29.72 |
| Maximum sales charge | 4.75% |
| Maximum offering price per share (calculated by dividing the net asset value per share by 1.0 minus the maximum sales charge for Class V shares) | $31.20 |
| Columbia Bond Fund | Annual Report 2023 | 23 |
Year Ended April 30, 2023
| Net investment income | |
| Income: | |
| Dividends — unaffiliated issuers | $49 |
| Dividends — affiliated issuers | 1,505,632 |
| Interest | 34,524,096 |
| Interfund lending | 5,020 |
| Total income | 36,034,797 |
| Expenses: | |
| Management services fees | 4,631,249 |
| Distribution and/or service fees | |
| Class A | 192,059 |
| Class C | 39,787 |
| Class R | 1,454 |
| Class V | 8,548 |
| Transfer agent fees | |
| Class A | 99,265 |
| Advisor Class | 2,855 |
| Class C | 5,139 |
| Institutional Class | 83,826 |
| Institutional 2 Class | 7,209 |
| Institutional 3 Class | 46,355 |
| Class R | 376 |
| Class V | 7,364 |
| Compensation of board members | 24,266 |
| Custodian fees | 30,831 |
| Printing and postage fees | 32,024 |
| Registration fees | 143,350 |
| Accounting services fees | 40,290 |
| Legal fees | 25,021 |
| Interest on collateral | 25,242 |
| Compensation of chief compliance officer | 174 |
| Other | 25,776 |
| Total expenses | 5,472,460 |
| Fees waived or expenses reimbursed by Investment Manager and its affiliates | (1,243,818) |
| Fees waived by transfer agent | |
| Institutional 2 Class | (945) |
| Institutional 3 Class | (46,355) |
| Expense reduction | (826) |
| Total net expenses | 4,180,516 |
| Net investment income | 31,854,281 |
| Realized and unrealized gain (loss) — net | |
| Net realized gain (loss) on: | |
| Investments — unaffiliated issuers | (31,370,925) |
| Investments — affiliated issuers | (9,896) |
| Futures contracts | (48,106,726) |
| Option contracts purchased | 4,482,188 |
| Option contracts written | (8,182,552) |
| Net realized loss | (83,187,911) |
| Net change in unrealized appreciation (depreciation) on: | |
| Investments — unaffiliated issuers | 2,351,949 |
| Investments — affiliated issuers | (5,027) |
| Futures contracts | 28,914,078 |
| Option contracts purchased | (7,117,132) |
| Option contracts written | 8,126,711 |
| Net change in unrealized appreciation (depreciation) | 32,270,579 |
| Net realized and unrealized loss | (50,917,332) |
| Net decrease in net assets resulting from operations | $(19,063,051) |
| 24 | Columbia Bond Fund | Annual Report 2023 |
| Year Ended April 30, 2023 | Year Ended April 30, 2022 | |
| Operations | ||
| Net investment income | $31,854,281 | $20,201,870 |
| Net realized loss | (83,187,911) | (35,518,353) |
| Net change in unrealized appreciation (depreciation) | 32,270,579 | (97,265,103) |
| Net decrease in net assets resulting from operations | (19,063,051) | (112,581,586) |
| Distributions to shareholders | ||
| Net investment income and net realized gains | ||
| Class A | (2,382,407) | (1,343,503) |
| Advisor Class | (67,054) | (51,463) |
| Class C | (91,492) | (42,853) |
| Institutional Class | (2,168,440) | (1,380,038) |
| Institutional 2 Class | (435,234) | (239,345) |
| Institutional 3 Class | (26,451,528) | (16,563,854) |
| Class R | (8,241) | (9,374) |
| Class V | (181,843) | (107,146) |
| Total distributions to shareholders | (31,786,239) | (19,737,576) |
| Increase (decrease) in net assets from capital stock activity | (7,025,916) | 19,410,835 |
| Total decrease in net assets | (57,875,206) | (112,908,327) |
| Net assets at beginning of year | 1,021,138,690 | 1,134,047,017 |
| Net assets at end of year | $963,263,484 | $1,021,138,690 |
| Columbia Bond Fund | Annual Report 2023 | 25 |
| Year Ended | Year Ended | |||
| April 30, 2023 | April 30, 2022 | |||
| Shares | Dollars ($) | Shares | Dollars ($) | |
| Capital stock activity | ||||
| Class A | ||||
| Subscriptions | 507,815 | 15,160,104 | 514,592 | 18,041,620 |
| Distributions reinvested | 69,426 | 2,051,769 | 33,550 | 1,162,376 |
| Redemptions | (534,726) | (15,947,139) | (775,565) | (26,774,023) |
| Net increase (decrease) | 42,515 | 1,264,734 | (227,423) | (7,570,027) |
| Advisor Class | ||||
| Subscriptions | 6,582 | 193,361 | 99,979 | 3,516,270 |
| Distributions reinvested | 2,248 | 66,756 | 1,494 | 51,300 |
| Redemptions | (80,530) | (2,318,622) | (50,685) | (1,764,363) |
| Net increase (decrease) | (71,700) | (2,058,505) | 50,788 | 1,803,207 |
| Class C | ||||
| Subscriptions | 27,540 | 810,763 | 40,771 | 1,428,310 |
| Distributions reinvested | 2,893 | 85,203 | 1,149 | 39,800 |
| Redemptions | (67,225) | (2,016,973) | (102,150) | (3,537,125) |
| Net decrease | (36,792) | (1,121,007) | (60,230) | (2,069,015) |
| Institutional Class | ||||
| Subscriptions | 1,502,427 | 44,900,228 | 874,794 | 30,582,605 |
| Distributions reinvested | 66,293 | 1,961,422 | 35,702 | 1,234,732 |
| Redemptions | (982,374) | (29,580,684) | (755,624) | (26,037,919) |
| Net increase | 586,346 | 17,280,966 | 154,872 | 5,779,418 |
| Institutional 2 Class | ||||
| Subscriptions | 871,494 | 25,807,130 | 255,038 | 8,966,455 |
| Distributions reinvested | 14,730 | 435,234 | 6,934 | 239,285 |
| Redemptions | (210,527) | (6,176,709) | (161,269) | (5,513,463) |
| Net increase | 675,697 | 20,065,655 | 100,703 | 3,692,277 |
| Institutional 3 Class | ||||
| Subscriptions | 982,696 | 29,129,632 | 3,064,643 | 107,828,340 |
| Distributions reinvested | 552,905 | 16,392,158 | 295,435 | 10,247,690 |
| Redemptions | (2,902,845) | (87,494,983) | (2,860,357) | (98,964,763) |
| Net increase (decrease) | (1,367,244) | (41,973,193) | 499,721 | 19,111,267 |
| Class R | ||||
| Subscriptions | 2,294 | 68,770 | 4,102 | 144,331 |
| Distributions reinvested | 277 | 8,168 | 260 | 9,131 |
| Redemptions | (5,160) | (152,998) | (25,317) | (889,864) |
| Net decrease | (2,589) | (76,060) | (20,955) | (736,402) |
| Class V | ||||
| Subscriptions | 1,455 | 43,393 | 585 | 20,248 |
| Distributions reinvested | 4,356 | 128,524 | 2,229 | 77,103 |
| Redemptions | (19,519) | (580,423) | (19,809) | (697,241) |
| Net decrease | (13,708) | (408,506) | (16,995) | (599,890) |
| Total net increase (decrease) | (187,475) | (7,025,916) | 480,481 | 19,410,835 |
| 26 | Columbia Bond Fund | Annual Report 2023 |
| Net asset value, beginning of period | Net investment income | Net realized and unrealized gain (loss) | Total from investment operations | Distributions from net investment income | Distributions from net realized gains | Total distributions to shareholders | |
| Class A | |||||||
| Year Ended 4/30/2023 | $31.39 | 0.93 | (1.62) | (0.69) | (0.92) | — | (0.92) |
| Year Ended 4/30/2022 | $35.38 | 0.50 | (4.00) | (3.50) | (0.49) | — | (0.49) |
| Year Ended 4/30/2021(e) | $34.88 | 0.69 | 1.39 | 2.08 | (0.72) | (0.86) | (1.58) |
| Year Ended 4/30/2020(e) | $33.84 | 0.88 | 1.48 | 2.36 | (0.88) | (0.44) | (1.32) |
| Year Ended 4/30/2019(e) | $33.13 | 0.92 | 0.67 | 1.59 | (0.88) | — | (0.88) |
| Advisor Class | |||||||
| Year Ended 4/30/2023 | $31.34 | 0.94 | (1.54) | (0.60) | (1.00) | — | (1.00) |
| Year Ended 4/30/2022 | $35.33 | 0.58 | (4.00) | (3.42) | (0.57) | — | (0.57) |
| Year Ended 4/30/2021(e) | $34.83 | 0.79 | 1.38 | 2.17 | (0.81) | (0.86) | (1.67) |
| Year Ended 4/30/2020(e) | $33.80 | 0.96 | 1.47 | 2.43 | (0.96) | (0.44) | (1.40) |
| Year Ended 4/30/2019(e) | $33.09 | 1.00 | 0.71 | 1.71 | (1.00) | — | (1.00) |
| Class C | |||||||
| Year Ended 4/30/2023 | $31.34 | 0.69 | (1.59) | (0.90) | (0.70) | — | (0.70) |
| Year Ended 4/30/2022 | $35.33 | 0.24 | (4.01) | (3.77) | (0.22) | — | (0.22) |
| Year Ended 4/30/2021(e) | $34.83 | 0.43 | 1.38 | 1.81 | (0.45) | (0.86) | (1.31) |
| Year Ended 4/30/2020(e) | $33.79 | 0.60 | 1.52 | 2.12 | (0.64) | (0.44) | (1.08) |
| Year Ended 4/30/2019(e) | $33.08 | 0.64 | 0.71 | 1.35 | (0.64) | — | (0.64) |
| Institutional Class | |||||||
| Year Ended 4/30/2023 | $31.38 | 1.01 | (1.61) | (0.60) | (1.00) | — | (1.00) |
| Year Ended 4/30/2022 | $35.37 | 0.59 | (4.01) | (3.42) | (0.57) | — | (0.57) |
| Year Ended 4/30/2021(e) | $34.88 | 0.78 | 1.38 | 2.16 | (0.81) | (0.86) | (1.67) |
| Year Ended 4/30/2020(e) | $33.83 | 0.96 | 1.49 | 2.45 | (0.96) | (0.44) | (1.40) |
| Year Ended 4/30/2019(e) | $33.13 | 1.00 | 0.70 | 1.70 | (1.00) | — | (1.00) |
| Institutional 2 Class | |||||||
| Year Ended 4/30/2023 | $31.30 | 1.06 | (1.64) | (0.58) | (1.02) | — | (1.02) |
| Year Ended 4/30/2022 | $35.28 | 0.61 | (3.99) | (3.38) | (0.60) | — | (0.60) |
| Year Ended 4/30/2021(e) | $34.78 | 0.80 | 1.39 | 2.19 | (0.83) | (0.86) | (1.69) |
| Year Ended 4/30/2020(e) | $33.74 | 1.00 | 1.48 | 2.48 | (1.00) | (0.44) | (1.44) |
| Year Ended 4/30/2019(e) | $33.02 | 1.04 | 0.68 | 1.72 | (1.00) | — | (1.00) |
| Institutional 3 Class | |||||||
| Year Ended 4/30/2023 | $31.45 | 1.04 | (1.61) | (0.57) | (1.04) | — | (1.04) |
| Year Ended 4/30/2022 | $35.45 | 0.63 | (4.01) | (3.38) | (0.62) | — | (0.62) |
| Year Ended 4/30/2021(e) | $34.95 | 0.79 | 1.42 | 2.21 | (0.85) | (0.86) | (1.71) |
| Year Ended 4/30/2020(e) | $33.90 | 1.00 | 1.53 | 2.53 | (1.04) | (0.44) | (1.48) |
| Year Ended 4/30/2019(e) | $33.19 | 1.04 | 0.71 | 1.75 | (1.04) | — | (1.04) |
| 28 | Columbia Bond Fund | Annual Report 2023 |
| Net asset value, end of period | Total return | Total gross expense ratio to average net assets(a) | Total net expense ratio to average net assets(a),(b) | Net investment income ratio to average net assets | Portfolio turnover | Net assets, end of period (000’s) | |
| Class A | |||||||
| Year Ended 4/30/2023 | $29.78 | (2.12%) | 0.91%(c) | 0.77%(c),(d) | 3.10% | 260% | $78,406 |
| Year Ended 4/30/2022 | $31.39 | (10.02%) | 0.90%(c) | 0.77%(c),(d) | 1.44% | 224% | $81,291 |
| Year Ended 4/30/2021(e) | $35.38 | 5.96% | 0.91%(c) | 0.77%(c),(d) | 1.92% | 227% | $99,681 |
| Year Ended 4/30/2020(e) | $34.88 | 7.05% | 0.97% | 0.80%(d) | 2.50% | 229% | $75,375 |
| Year Ended 4/30/2019(e) | $33.84 | 4.98% | 1.01% | 0.83%(d) | 2.73% | 236% | $49,696 |
| Advisor Class | |||||||
| Year Ended 4/30/2023 | $29.74 | (1.85%) | 0.66%(c) | 0.52%(c),(d) | 3.11% | 260% | $1,166 |
| Year Ended 4/30/2022 | $31.34 | (9.81%) | 0.65%(c) | 0.52%(c),(d) | 1.70% | 224% | $3,475 |
| Year Ended 4/30/2021(e) | $35.33 | 6.20% | 0.66%(c) | 0.52%(c),(d) | 2.19% | 227% | $2,123 |
| Year Ended 4/30/2020(e) | $34.83 | 7.32% | 0.71% | 0.55%(d) | 2.74% | 229% | $1,676 |
| Year Ended 4/30/2019(e) | $33.80 | 5.24% | 0.76% | 0.58%(d) | 3.03% | 236% | $738 |
| Class C | |||||||
| Year Ended 4/30/2023 | $29.74 | (2.82%) | 1.66%(c) | 1.52%(c),(d) | 2.31% | 260% | $3,579 |
| Year Ended 4/30/2022 | $31.34 | (10.71%) | 1.65%(c) | 1.52%(c),(d) | 0.69% | 224% | $4,925 |
| Year Ended 4/30/2021(e) | $35.33 | 5.15% | 1.66%(c) | 1.52%(c),(d) | 1.19% | 227% | $7,680 |
| Year Ended 4/30/2020(e) | $34.83 | 6.26% | 1.72% | 1.55%(d) | 1.74% | 229% | $8,519 |
| Year Ended 4/30/2019(e) | $33.79 | 4.20% | 1.76% | 1.59%(d) | 1.96% | 236% | $4,058 |
| Institutional Class | |||||||
| Year Ended 4/30/2023 | $29.78 | (1.84%) | 0.66%(c) | 0.52%(c),(d) | 3.37% | 260% | $89,875 |
| Year Ended 4/30/2022 | $31.38 | (9.80%) | 0.65%(c) | 0.52%(c),(d) | 1.69% | 224% | $76,311 |
| Year Ended 4/30/2021(e) | $35.37 | 6.19% | 0.66%(c) | 0.52%(c),(d) | 2.18% | 227% | $80,542 |
| Year Ended 4/30/2020(e) | $34.88 | 7.32% | 0.72% | 0.55%(d) | 2.76% | 229% | $68,640 |
| Year Ended 4/30/2019(e) | $33.83 | 5.24% | 0.76% | 0.58%(d) | 2.97% | 236% | $51,185 |
| Institutional 2 Class | |||||||
| Year Ended 4/30/2023 | $29.70 | (1.78%) | 0.59%(c) | 0.45%(c) | 3.58% | 260% | $31,528 |
| Year Ended 4/30/2022 | $31.30 | (9.74%) | 0.58%(c) | 0.45%(c) | 1.76% | 224% | $12,075 |
| Year Ended 4/30/2021(e) | $35.28 | 6.24% | 0.60%(c) | 0.45%(c) | 2.23% | 227% | $10,058 |
| Year Ended 4/30/2020(e) | $34.78 | 7.55% | 0.62% | 0.46% | 2.83% | 229% | $6,038 |
| Year Ended 4/30/2019(e) | $33.74 | 5.24% | 0.64% | 0.47% | 3.20% | 236% | $3,687 |
| Institutional 3 Class | |||||||
| Year Ended 4/30/2023 | $29.84 | (1.74%) | 0.54%(c) | 0.40%(c) | 3.47% | 260% | $752,943 |
| Year Ended 4/30/2022 | $31.45 | (9.70%) | 0.53%(c) | 0.40%(c) | 1.81% | 224% | $836,474 |
| Year Ended 4/30/2021(e) | $35.45 | 6.31% | 0.55%(c) | 0.40%(c) | 2.22% | 227% | $925,195 |
| Year Ended 4/30/2020(e) | $34.95 | 7.47% | 0.57% | 0.40% | 2.91% | 229% | $265,665 |
| Year Ended 4/30/2019(e) | $33.90 | 5.41% | 0.58% | 0.42% | 3.14% | 236% | $257,417 |
| Columbia Bond Fund | Annual Report 2023 | 29 |
| Net asset value, beginning of period | Net investment income | Net realized and unrealized gain (loss) | Total from investment operations | Distributions from net investment income | Distributions from net realized gains | Total distributions to shareholders | |
| Class R | |||||||
| Year Ended 4/30/2023 | $31.38 | 0.84 | (1.59) | (0.75) | (0.85) | — | (0.85) |
| Year Ended 4/30/2022 | $35.38 | 0.41 | (4.01) | (3.60) | (0.40) | — | (0.40) |
| Year Ended 4/30/2021(e) | $34.88 | 0.61 | 1.38 | 1.99 | (0.63) | (0.86) | (1.49) |
| Year Ended 4/30/2020(e) | $33.83 | 0.80 | 1.49 | 2.29 | (0.80) | (0.44) | (1.24) |
| Year Ended 4/30/2019(e) | $33.12 | 0.84 | 0.67 | 1.51 | (0.80) | — | (0.80) |
| Class V | |||||||
| Year Ended 4/30/2023 | $31.33 | 0.95 | (1.61) | (0.66) | (0.95) | — | (0.95) |
| Year Ended 4/30/2022 | $35.31 | 0.53 | (3.99) | (3.46) | (0.52) | — | (0.52) |
| Year Ended 4/30/2021(e) | $34.82 | 0.73 | 1.37 | 2.10 | (0.75) | (0.86) | (1.61) |
| Year Ended 4/30/2020(e) | $33.78 | 0.92 | 1.48 | 2.40 | (0.92) | (0.44) | (1.36) |
| Year Ended 4/30/2019(e) | $33.07 | 0.92 | 0.71 | 1.63 | (0.92) | — | (0.92) |
| Notes to Financial Highlights | |
| (a) | In addition to the fees and expenses that the Fund bears directly, the Fund indirectly bears a pro rata share of the fees and expenses of any other funds in which it invests. Such indirect expenses are not included in the Fund’s reported expense ratios. |
| (b) | Total net expenses include the impact of certain fee waivers/expense reimbursements made by the Investment Manager and certain of its affiliates, if applicable. |
| (c) | Ratios include interest on collateral expense which is less than 0.01%. |
| (d) | The benefits derived from expense reductions had an impact of less than 0.01%. |
| (e) | Per share amounts have been adjusted on a retroactive basis to reflect a 4 to 1 reverse stock split completed after the close of business on September 11, 2020. |
| 30 | Columbia Bond Fund | Annual Report 2023 |
| Net asset value, end of period | Total return | Total gross expense ratio to average net assets(a) | Total net expense ratio to average net assets(a),(b) | Net investment income ratio to average net assets | Portfolio turnover | Net assets, end of period (000’s) | |
| Class R | |||||||
| Year Ended 4/30/2023 | $29.78 | (2.33%) | 1.16%(c) | 1.02%(c),(d) | 2.83% | 260% | $248 |
| Year Ended 4/30/2022 | $31.38 | (10.28%) | 1.14%(c) | 1.02%(c),(d) | 1.18% | 224% | $342 |
| Year Ended 4/30/2021(e) | $35.38 | 5.70% | 1.16%(c) | 1.02%(c),(d) | 1.69% | 227% | $1,127 |
| Year Ended 4/30/2020(e) | $34.88 | 6.79% | 1.22% | 1.05%(d) | 2.26% | 229% | $1,225 |
| Year Ended 4/30/2019(e) | $33.83 | 4.71% | 1.26% | 1.08%(d) | 2.51% | 236% | $680 |
| Class V | |||||||
| Year Ended 4/30/2023 | $29.72 | (2.03%) | 0.81%(c) | 0.67%(c),(d) | 3.19% | 260% | $5,519 |
| Year Ended 4/30/2022 | $31.33 | (9.93%) | 0.80%(c) | 0.67%(c),(d) | 1.54% | 224% | $6,246 |
| Year Ended 4/30/2021(e) | $35.31 | 6.10% | 0.81%(c) | 0.67%(c),(d) | 2.04% | 227% | $7,640 |
| Year Ended 4/30/2020(e) | $34.82 | 7.17% | 0.87% | 0.70%(d) | 2.62% | 229% | $8,145 |
| Year Ended 4/30/2019(e) | $33.78 | 4.96% | 0.91% | 0.73%(d) | 2.83% | 236% | $8,242 |
| Columbia Bond Fund | Annual Report 2023 | 31 |
April 30, 2023
| 32 | Columbia Bond Fund | Annual Report 2023 |
April 30, 2023
| Columbia Bond Fund | Annual Report 2023 | 33 |
April 30, 2023
| 34 | Columbia Bond Fund | Annual Report 2023 |
April 30, 2023
| Columbia Bond Fund | Annual Report 2023 | 35 |
April 30, 2023
| Asset derivatives | ||
| Risk exposure category | Statement of assets and liabilities location | Fair value ($) |
| Interest rate risk | Component of total distributable earnings (loss) — unrealized appreciation on futures contracts | 8,181,296* |
| Interest rate risk | Investments, at value — Option contracts purchased | 3,566 |
| Total | 8,184,862 |
| Liability derivatives | ||
| Risk exposure category | Statement of assets and liabilities location | Fair value ($) |
| Interest rate risk | Component of total distributable earnings (loss) — unrealized depreciation on futures contracts | 11,252* |
| * | Includes cumulative appreciation (depreciation) as reported in the tables following the Portfolio of Investments. Only the current day’s variation margin is reported in receivables or payables in the Statement of Assets and Liabilities. |
| Amount of realized gain (loss) on derivatives recognized in income | ||||
| Risk exposure category | Futures contracts ($) | Option contracts purchased ($) | Option contracts written ($) | Total ($) |
| Interest rate risk | (48,106,726) | 4,482,188 | (8,182,552) | (51,807,090) |
| Change in unrealized appreciation (depreciation) on derivatives recognized in income | ||||
| Risk exposure category | Futures contracts ($) | Option contracts purchased ($) | Option contracts written ($) | Total ($) |
| Interest rate risk | 28,914,078 | (7,117,132) | 8,126,711 | 29,923,657 |
| Derivative instrument | Average notional amounts ($)* |
| Futures contracts — long | 301,641,594 |
| Futures contracts — short | 87,140,629 |
| Derivative instrument | Average value ($) |
| Option contracts purchased | 426,981* |
| Option contracts written | (1,041,045)** |
| * | Based on the ending quarterly outstanding amounts for the year ended April 30, 2023. |
| ** | Based on the ending daily outstanding amounts for the year ended April 30, 2023. |
| 36 | Columbia Bond Fund | Annual Report 2023 |
April 30, 2023
| Columbia Bond Fund | Annual Report 2023 | 37 |
April 30, 2023
| Citi ($) | |
| Assets | |
| Call option contracts purchased | 3,566 |
| Total financial and derivative net assets | 3,566 |
| Total collateral received (pledged) (a) | 3,566 |
| Net amount (b) | - |
| (a) | In some instances, the actual collateral received and/or pledged may be more than the amount shown due to overcollateralization. |
| (b) | Represents the net amount due from/(to) counterparties in the event of default. |
| 38 | Columbia Bond Fund | Annual Report 2023 |
April 30, 2023
| Columbia Bond Fund | Annual Report 2023 | 39 |
April 30, 2023
| Effective rate (%) | |
| Class A | 0.13 |
| Advisor Class | 0.13 |
| Class C | 0.13 |
| Institutional Class | 0.13 |
| Institutional 2 Class | 0.05 |
| Institutional 3 Class | 0.00 |
| Class R | 0.13 |
| Class V | 0.13 |
| 40 | Columbia Bond Fund | Annual Report 2023 |
April 30, 2023
| Front End (%) | CDSC (%) | Amount ($) | |
| Class A | 4.75 | 0.50 - 1.00(a) | 51,550 |
| Class C | — | 1.00(b) | 578 |
| Class V | 4.75 | 0.50 - 1.00(a) | 49 |
| (a) | This charge is imposed on certain investments of between $1 million and $50 million redeemed within 18 months after purchase, as follows: 1.00% if redeemed within 12 months after purchase, and 0.50% if redeemed more than 12, but less than 18, months after purchase, with certain limited exceptions. |
| (b) | This charge applies to redemptions within 12 months after purchase, with certain limited exceptions. |
| Columbia Bond Fund | Annual Report 2023 | 41 |
April 30, 2023
| Fee rate(s) contractual through August 31, 2023 | |
| Class A | 0.77% |
| Advisor Class | 0.52 |
| Class C | 1.52 |
| Institutional Class | 0.52 |
| Institutional 2 Class | 0.45 |
| Institutional 3 Class | 0.40 |
| Class R | 1.02 |
| Class V | 0.67 |
| Undistributed net investment income ($) | Accumulated net realized (loss) ($) | Paid in capital ($) |
| 246,471 | (246,471) | — |
| 42 | Columbia Bond Fund | Annual Report 2023 |
April 30, 2023
| Year Ended April 30, 2023 | Year Ended April 30, 2022 | ||||
| Ordinary income ($) | Long-term capital gains ($) | Total ($) | Ordinary income ($) | Long-term capital gains ($) | Total ($) |
| 31,786,239 | — | 31,786,239 | 19,737,576 | — | 19,737,576 |
| Undistributed ordinary income ($) | Undistributed long-term capital gains ($) | Capital loss carryforwards ($) | Net unrealized (depreciation) ($) |
| 3,393,253 | — | (115,375,299) | (62,468,188) |
| Federal tax cost ($) | Gross unrealized appreciation ($) | Gross unrealized (depreciation) ($) | Net unrealized (depreciation) ($) |
| 1,250,725,554 | 3,830,911 | (66,299,099) | (62,468,188) |
| No expiration short-term ($) | No expiration long-term ($) | Total ($) | Utilized ($) |
| (57,211,023) | (58,164,276) | (115,375,299) | — |
| Columbia Bond Fund | Annual Report 2023 | 43 |
April 30, 2023
| Borrower or lender | Average loan balance ($) | Weighted average interest rate (%) | Number of days with outstanding loans |
| Lender | 4,712,500 | 4.75 | 8 |
| 44 | Columbia Bond Fund | Annual Report 2023 |
April 30, 2023
| Columbia Bond Fund | Annual Report 2023 | 45 |
April 30, 2023
| 46 | Columbia Bond Fund | Annual Report 2023 |
| Columbia Bond Fund | Annual Report 2023 | 47 |
| Section 163(j) Interest Dividends | |
| 99.29% |
| Name, address, year of birth | Position held with the Columbia Funds and length of service | Principal occupation(s) during past five years and other relevant professional experience | Number of Funds in the Columbia Funds Complex* overseen | Other directorships held by Trustee during the past five years and other relevant Board experience |
| George S. Batejan c/o Columbia Management Investment Advisers, LLC 290 Congress Street Boston, MA 02210 1954 | Trustee since 2017 | Executive Vice President, Global Head of Technology and Operations, Janus Capital Group, Inc., 2010-2016 | 174 | Former Chairman of the Board, NICSA (National Investment Company Services Association) (Executive Committee, Nominating Committee and Governance Committee), 2014-2016; former Director, Intech Investment Management, 2011-2016; former Board Member, Metro Denver Chamber of Commerce, 2015-2016; former Advisory Board Member, University of Colorado Business School, 2015-2018; former Board Member, Chase Bank International, 1993-1994 |
| 48 | Columbia Bond Fund | Annual Report 2023 |
(Unaudited)
Independent trustees (continued)
| Name, address, year of birth | Position held with the Columbia Funds and length of service | Principal occupation(s) during past five years and other relevant professional experience | Number of Funds in the Columbia Funds Complex* overseen | Other directorships held by Trustee during the past five years and other relevant Board experience |
| Kathleen Blatz c/o Columbia Management Investment Advisers, LLC 290 Congress Street Boston, MA 02210 1954 | Trustee since 2006 | Attorney, specializing in arbitration and mediation; Chief Justice, Minnesota Supreme Court, 1998-2006; Associate Justice, Minnesota Supreme Court, 1996-1998; Fourth Judicial District Court Judge, Hennepin County, 1994-1996; Attorney in private practice and public service, 1984-1993; State Representative, Minnesota House of Representatives, 1979-1993, which included service on the Tax and Financial Institutions and Insurance Committees; Member and Interim Chair, Minnesota Sports Facilities Authority, January-July 2017; Interim President and Chief Executive Officer, Blue Cross and Blue Shield of Minnesota (health care insurance), February-July 2018, April-October 2021 | 174 | Former Trustee, Blue Cross and Blue Shield of Minnesota, 2009-2021 (Chair of the Business Development Committee, 2014-2017; Chair of the Governance Committee, 2017-2019); former Member and Chair of the Board, Minnesota Sports Facilities Authority, January 2017-July 2017; former Director, Robina Foundation, 2009-2020 (Chair, 2014-2020); Director, Richard M. Schulze Family Foundation, since 2021 |
| Pamela G. Carlton c/o Columbia Management Investment Advisers, LLC 290 Congress Street Boston, MA 02210 1954 | Chair since 2023; Trustee since 2007 | President, Springboard — Partners in Cross Cultural Leadership (consulting company), since 2003; Managing Director of US Equity Research, JP Morgan Chase, 1999-2003; Director of US Equity Research, Chase Asset Management, 1996-1999; Co-Director Latin America Research, 1993-1996, COO Global Research, 1992-1996, Co-Director of US Research, 1991-1992, Investment Banker, 1982-1991, Morgan Stanley; Attorney, Cleary Gottlieb Steen & Hamilton LLP, 1980-1982 | 174 | Trustee, New York Presbyterian Hospital Board, since 1996; Director, DR Bank (Audit Committee) since 2017; Director, Evercore Inc. (Audit Committee, Nominating and Governance Committee), since 2019; Director, Apollo Commercial Real Estate Finance, Inc. (Chair, Nominating and Governance Committee) (financial services), since 2021; the Governing Council of the Independent Directors Council (IDC), since 2021 |
| Janet Langford Carrig c/o Columbia Management Investment Advisers, LLC 290 Congress Street Boston, MA 02210 1957 | Trustee since 1996 | Senior Vice President, General Counsel and Corporate Secretary, ConocoPhillips (independent energy company), September 2007-October 2018 | 174 | Director, EQT Corporation (natural gas producer), since 2019; former Director, Whiting Petroleum Corporation (independent oil and gas company), 2020-2022 |
| J. Kevin Connaughton c/o Columbia Management Investment Advisers, LLC 290 Congress Street Boston, MA 02210 1964 | Trustee since 2020 | CEO and President, RhodeWay Financial (non-profit financial planning firm), since December 2022; Member, FINRA National Adjudicatory Council, since January 2020; Adjunct Professor of Finance, Bentley University since January 2018; Consultant to Independent Trustees of CFVIT and CFST I from March 2016 to June 2020 with respect to CFVIT and to December 2020 with respect to CFST I; Managing Director and General Manager of Mutual Fund Products, Columbia Management Investment Advisers, LLC, May 2010-February 2015; President, Columbia Funds, 2008-2015; and senior officer of Columbia Funds and affiliated funds, 2003-2015 | 172 | Former Director, The Autism Project, March 2015-December 2021; former Member of the Investment Committee, St. Michael’s College, November 2015-February 2020; former Trustee, St. Michael’s College, June 2017-September 2019; former Trustee, New Century Portfolios (former mutual fund complex), January 2015-December 2017 |
| Columbia Bond Fund | Annual Report 2023 | 49 |
(Unaudited)
Independent trustees (continued)
| Name, address, year of birth | Position held with the Columbia Funds and length of service | Principal occupation(s) during past five years and other relevant professional experience | Number of Funds in the Columbia Funds Complex* overseen | Other directorships held by Trustee during the past five years and other relevant Board experience |
| Olive M. Darragh c/o Columbia Management Investment Advisers, LLC 290 Congress Street Boston, MA 02210 1962 | Trustee since 2020 | Managing Director of Darragh Inc. (strategy and talent management consulting firm), since 2010; Founder and CEO, Zolio, Inc. (investment management talent identification platform), since 2004; Consultant to Independent Trustees of CFVIT and CFST I from June 2019 to June 2020 with respect to CFVIT and to December 2020 with respect to CFST I; Partner, Tudor Investments, 2004-2010; Senior Partner, McKinsey & Company (consulting), 1990-2004; Touche Ross CPA, 1985-1988 | 172 | Treasurer, Edinburgh University US Trust Board, since January 2023; Member, HBS Community Action Partners Board, since September 2022; former Director, University of Edinburgh Business School (Member of US Board), 2004-2019; former Director, Boston Public Library Foundation, 2008-2017 |
| Patricia M. Flynn c/o Columbia Management Investment Advisers, LLC 290 Congress Street Boston, MA 02210 1950 | Trustee since 2004 | Professor of Economics and Management, Bentley University, since 2002; Dean, McCallum Graduate School of Business, Bentley University, 1992-2002 | 174 | Former Trustee, MA Taxpayers Foundation, 1997-2022; former Director, The MA Business Roundtable, 2003-2019; former Chairperson, Innovation Index Advisory Committee, MA Technology Collaborative, 1997-2020 |
| Brian J. Gallagher c/o Columbia Management Investment Advisers, LLC 290 Congress Street Boston, MA 02210 1954 | Trustee since 2017 | Retired; Partner with Deloitte & Touche LLP and its predecessors, 1977-2016 | 174 | Trustee, Catholic Schools Foundation, since 2004 |
| Douglas A. Hacker c/o Columbia Management Investment Advisers, LLC 290 Congress Street Boston, MA 02210 1955 | Trustee since 1996 | Independent business executive, since May 2006; Executive Vice President – Strategy of United Airlines, December 2002 - May 2006; President of UAL Loyalty Services (airline marketing company), September 2001-December 2002; Executive Vice President and Chief Financial Officer of United Airlines, July 1999-September 2001 | 174 | Director, SpartanNash Company since November 2013 (Chair of the Board, since May 2021) (food distributor); Director, Aircastle Limited (Chair of Audit Committee) (aircraft leasing), since August 2006; former Director, Nash Finch Company (food distributor), 2005-2013; former Director, SeaCube Container Leasing Ltd. (container leasing), 2010-2013; and former Director, Travelport Worldwide Limited (travel information technology), 2014-2019 |
| Nancy T. Lukitsh c/o Columbia Management Investment Advisers, LLC 290 Congress Street Boston, MA 02210 1956 | Trustee since 2011 | Senior Vice President, Partner and Director of Marketing, Wellington Management Company, LLP (investment adviser), 1997-2010; Chair, Wellington Management Portfolios (commingled non-U.S. investment pools), 2007-2010; Director, Wellington Trust Company, NA and other Wellington affiliates, 1997-2010 | 172 | None |
| 50 | Columbia Bond Fund | Annual Report 2023 |
(Unaudited)
Independent trustees (continued)
| Name, address, year of birth | Position held with the Columbia Funds and length of service | Principal occupation(s) during past five years and other relevant professional experience | Number of Funds in the Columbia Funds Complex* overseen | Other directorships held by Trustee during the past five years and other relevant Board experience |
| David M. Moffett c/o Columbia Management Investment Advisers, LLC 290 Congress Street Boston, MA 02210 1952 | Trustee since 2011 | Retired; former Chief Executive Officer of Freddie Mac and Chief Financial Officer of U.S. Bank | 172 | Director, CSX Corporation (transportation suppliers); Director, PayPal Holdings Inc. (payment and data processing services); Trustee, University of Oklahoma Foundation; former Director, eBay Inc. (online trading community), 2007-2015; and former Director, CIT Bank, CIT Group Inc. (commercial and consumer finance), 2010-2016; former Senior Adviser to The Carlyle Group (financial services), March 2008-September 2008; former Governance Consultant to Bridgewater Associates, January 2013-December 2015 |
| Catherine James Paglia c/o Columbia Management Investment Advisers, LLC 290 Congress Street Boston, MA 02210 1952 | Trustee since 2004 | Director, Enterprise Asset Management, Inc. (private real estate and asset management company), since September 1998; Managing Director and Partner, Interlaken Capital, Inc., 1989-1997; Vice President, 1982-1985, Principal, 1985-1987, Managing Director, 1987-1989, Morgan Stanley; Vice President, Investment Banking, 1980-1982, Associate, Investment Banking, 1976-1980, Dean Witter Reynolds, Inc. | 174 | Director, Valmont Industries, Inc. (irrigation systems manufacturer), since 2012; Trustee, Carleton College (on the Investment Committee), since 1987; Trustee, Carnegie Endowment for International Peace (on the Investment Committee), since 2009 |
| Natalie A. Trunow c/o Columbia Management Investment Advisers, LLC 290 Congress Street Boston, MA 02210 1967 | Trustee since 2020 | Chief Executive Officer, Millennial Portfolio Solutions LLC (asset management and consulting services), January 2016-January 2021; Non-executive Member of the Investment Committee and Valuation Committee, Sarona Asset Management Inc. (private equity firm) since September 2019; Advisor, Horizon Investments (asset management and consulting services), August 2018-January 2022; Advisor, Paradigm Asset Management, November 2016-January 2022; Consultant to Independent Trustees of CFVIT and CFST I from September 2016 to June 2020 with respect to CFVIT and to December 2020 with respect to CFST I; Director of Investments/Consultant, Casey Family Programs, April 2016-November 2016; Senior Vice President and Chief Investment Officer, Calvert Investments, August 2008-January 2016; Section Head and Portfolio Manager, General Motors Asset Management, June 1997-August 2008 | 172 | Independent Director, Investment Committee, Health Services for Children with Special Needs, Inc., 2010-2021; Independent Director, (Executive Committee and Chair, Audit Committee), Consumer Credit Counseling Services (formerly Guidewell Financial Solutions), since 2016; Independent Director, (Investment Committee), Sarona Asset Management, since 2019 |
| Columbia Bond Fund | Annual Report 2023 | 51 |
(Unaudited)
Independent trustees (continued)
| Name, address, year of birth | Position held with the Columbia Funds and length of service | Principal occupation(s) during past five years and other relevant professional experience | Number of Funds in the Columbia Funds Complex* overseen | Other directorships held by Trustee during the past five years and other relevant Board experience |
| Sandra L. Yeager c/o Columbia Management Investment Advisers, LLC 290 Congress Street Boston, MA 02210 1964 | Trustee since 2017 | Retired; President and founder, Hanoverian Capital, LLC (SEC registered investment advisor firm), 2008-2016; Managing Director, DuPont Capital, 2006-2008; Managing Director, Morgan Stanley Investment Management, 2004-2006; Senior Vice President, Alliance Bernstein, 1990-2004 | 174 | Former Director, NAPE (National Alliance for Partnerships in Equity) Education Foundation, October 2016-October 2020; Advisory Board, Jennersville YMCA, since 2022 |
| Name, address, year of birth | Position held with the Columbia Funds and length of service | Principal occupation(s) during the past five years and other relevant professional experience | Number of Funds in the Columbia Funds Complex overseen | Other directorships held by Trustee during the past five years and other relevant Board experience |
| Daniel J. Beckman c/o Columbia Management Investment Advisers, LLC 290 Congress Street Boston, MA 02210 1962 | Trustee since November 2021 and President since June 2021 | Vice President – Head of North America Product, Columbia Management Investment Advisers, LLC, since April 2015; President and Principal Executive Officer of the Columbia Funds, since June 2021; officer of Columbia Funds and affiliated funds, 2020-2021 | 174 | Director, Ameriprise Trust Company, since October 2016; Director, Columbia Management Investment Distributors, Inc. since November 2018; Board of Governors, Columbia Wanger Asset Management, LLC since, January 2022; Director, Columbia Threadneedle Canada, Inc., since December 2022 |
| * | The term “Columbia Funds Complex” as used herein includes Columbia Seligman Premium Technology Growth Fund, Tri-Continental Corporation and each series of Columbia Funds Series Trust (CFST), Columbia Funds Series Trust I (CFST I), Columbia Funds Series Trust II (CFST II), Columbia ETF Trust I (CET I), Columbia ETF Trust II (CET II), Columbia Funds Variable Insurance Trust (CFVIT) and Columbia Funds Variable Series Trust II (CFVST II). Messrs. Batejan, Beckman, Gallagher and Hacker and Mses. Blatz, Carlton, Carrig, Flynn, Paglia, and Yeager serve as directors of Columbia Seligman Premium Technology Growth Fund and Tri-Continental Corporation. |
| ** | Interested person (as defined under the 1940 Act) by reason of being an officer, director, security holder and/or employee of the Investment Manager or Ameriprise Financial. |
| 52 | Columbia Bond Fund | Annual Report 2023 |
(Unaudited)
The Board has appointed officers who are responsible for day-to-day business decisions based on policies it has established. The officers serve at the pleasure of the Board. The following table provides basic information about the Officers of the Fund as of the printing of this report, including principal occupations during the past five years, although their specific titles may have varied over the period. In addition to Mr. Beckman, who is President and Principal Executive Officer, the Fund’s other officers are:
| Name, address and year of birth | Position and year first appointed to position for any Fund in the Columbia Funds Complex or a predecessor thereof | Principal occupation(s) during past five years |
| Michael G. Clarke 290 Congress Street Boston, MA 02210 1969 | Chief Financial Officer and Principal Financial Officer (2009) and Senior Vice President (2019) | Senior Vice President and Head of North America Operations & Investor Services, Columbia Management Investment Advisers, LLC, since June 2023 (previously Senior Vice President and Head of Global Operations, March 2022 – June 2023, Vice President, Head of North America Operations, and Co-Head of Global Operations, June 2019 - February 2022 and Vice President – Accounting and Tax, May 2010 - May 2019); senior officer of Columbia Funds and affiliated funds, since 2002. |
| Joseph Beranek 5890 Ameriprise Financial Center Minneapolis, MN 55474 1965 | Treasurer and Chief Accounting Officer (Principal Accounting Officer) (2019) and Principal Financial Officer (2020), CFST, CFST I, CFST II, CFVIT and CFVST II; Assistant Treasurer, CET I and CET II | Vice President – Mutual Fund Accounting and Financial Reporting, Columbia Management Investment Advisers, LLC, since December 2018 and March 2017, respectively. |
| Marybeth Pilat 290 Congress Street Boston, MA 02210 1968 | Treasurer and Chief Accounting Officer (Principal Accounting Officer) and Principal Financial Officer (2020) for CET I and CET II; Assistant Treasurer, CFST, CFST I, CFST II, CFVIT and CFVST II | Vice President – Product Pricing and Administration, Columbia Management Investment Advisers, LLC, since May 2017. |
| William F. Truscott 290 Congress Street Boston, MA 02210 1960 | Senior Vice President (2001) | Formerly, Trustee/Director of Columbia Funds Complex or legacy funds, November 2001-January 1, 2021; Chief Executive Officer, Global Asset Management, Ameriprise Financial, Inc., since September 2012; Chairman of the Board and President, Columbia Management Investment Advisers, LLC, since July 2004 and February 2012, respectively; Chairman of the Board and Chief Executive Officer, Columbia Management Investment Distributors, Inc., since November 2008 and February 2012, respectively; Chairman of the Board and Director, Threadneedle Asset Management Holdings, Sàrl, since March 2013 and December 2008, respectively; senior executive of various entities affiliated with Columbia Threadneedle. |
| Christopher O. Petersen 5228 Ameriprise Financial Center Minneapolis, MN 55474 1970 | Senior Vice President and Assistant Secretary (2021) | Formerly, Trustee/Director of funds within the Columbia Funds Complex, July 1, 2020 - November 22, 2021; Senior Vice President and Assistant General Counsel, Ameriprise Financial, Inc., since September 2021 (previously Vice President and Lead Chief Counsel, January 2015 - September 2021); formerly, President and Principal Executive Officer of the Columbia Funds, 2015 - 2021; officer of Columbia Funds and affiliated funds, since 2007. |
| Thomas P. McGuire 290 Congress Street Boston, MA 02210 1972 | Senior Vice President and Chief Compliance Officer (2012) | Vice President – Asset Management Compliance, Ameriprise Financial, Inc., since May 2010; Chief Compliance Officer, Columbia Acorn/Wanger Funds, since December 2015; formerly, Chief Compliance Officer, Ameriprise Certificate Company, September 2010 – September 2020. |
| Ryan C. Larrenaga 290 Congress Street Boston, MA 02210 1970 | Senior Vice President (2017), Chief Legal Officer (2017), and Secretary (2015) | Vice President and Chief Counsel, Ameriprise Financial, Inc., since August 2018 (previously Vice President and Group Counsel, August 2011 - August 2018); Chief Legal Officer, Columbia Acorn/Wanger Funds, since September 2020; officer of Columbia Funds and affiliated funds, since 2005. |
| Columbia Bond Fund | Annual Report 2023 | 53 |
(Unaudited)
Fund officers (continued)
| Name, address and year of birth | Position and year first appointed to position for any Fund in the Columbia Funds Complex or a predecessor thereof | Principal occupation(s) during past five years |
| Michael E. DeFao 290 Congress Street Boston, MA 02210 1968 | Vice President (2011) and Assistant Secretary (2010) | Vice President and Chief Counsel, Ameriprise Financial, Inc., since May 2010; Vice President, Chief Legal Officer and Assistant Secretary, Columbia Management Investment Advisers, LLC, since October 2021 (previously Vice President and Assistant Secretary, May 2010 – September 2021). |
| Lyn Kephart-Strong 5228 Ameriprise Financial Center Minneapolis, MN 55474 1960 | Vice President (2015) | Vice President, Global Investment Operations Services, Columbia Management Investment Advisers, LLC, since 2010; President, Columbia Management Investment Services Corp., since October 2014; President, Ameriprise Trust Company, since January 2017. |
| • | the Fund had sufficient liquidity to both meet redemptions and operate effectively on behalf of shareholders; |
| • | there were no material changes to the Program during the period; |
| • | the implementation of the Program was effective to manage the Fund’s liquidity risk; and |
| • | the Program operated adequately during the period. |
| 54 | Columbia Bond Fund | Annual Report 2023 |
columbiathreadneedleus.com/investor/. The Fund is distributed by Columbia Management Investment Distributors, Inc., member FINRA, and managed by Columbia Management Investment Advisers, LLC.
Item 2. Code of Ethics.
(a) | The registrant has adopted a code of ethics that applies to the registrant’s principal executive officer, principal financial officer, principal accounting officer or controller, or persons performing similar functions, regardless of whether these individuals are employed by the registrant or a third party. |
(b) | During the period covered by this report, there were not any amendments to a provision of the code of ethics that applies to the registrant’s principal executive officer, principal financial officer, principal accounting officer or controller, or persons performing similar functions, regardless of whether these individuals are employed by the registrant or a third party, and that relates to any element of the code of ethics definition enumerated in paragraph (b) of this Item. |
(c) | During the period covered by this report, there were no waivers, including any implicit waivers, from a provision of the code of ethics to the registrant’s principal executive officer, principal financial officer, principal accounting officer or controller, or persons performing similar functions, regardless of whether these individuals are employed by the registrant or a third party that relates to one or more of the items set forth in paragraph (b) of this Item. |
Item 3. Audit Committee Financial Expert.
The registrant’s Board of Trustees has determined that David M. Moffett, Brian J. Gallagher, J. Kevin Connaughton, Sandra L. Yeager, and Douglas A. Hacker, each of whom are members of the registrant’s Board of Trustees and Audit Committee, each qualify as an audit committee financial expert. Mr. Moffett, Mr. Gallagher, Mr. Connaughton, Ms. Yeager, and Mr. Hacker are each independent trustees, as defined in paragraph (a)(2) of this item’s instructions.
Item 4. Principal Accountant Fees and Services.
Fee information below is disclosed for the six series of the registrant whose reports to stockholders are included in this annual filing.
(a) Audit Fees. Aggregate Audit Fees billed by the principal accountant for professional services rendered during the fiscal years ended April 30, 2023 and April 30, 2022 are approximately as follows:
2023 | 2022 |
$231,500 | $238,300 |
Audit Fees include amounts related to the audit of the registrant’s annual financial statements or services that are normally provided by the accountant in connection with statutory and regulatory filings or engagements for those fiscal years.
(b) Audit-Related Fees. Aggregate Audit-Related Fees billed to the registrant by the principal accountant for professional services rendered during the fiscal years ended April 30, 2023 and April 30, 2022 are approximately as follows:
2023 | 2022 |
$25,000 | $30,500 |
Audit-Related Fees include amounts for assurance and related services by the principal accountant that are reasonably related to the performance of the audit of the registrant’s financial statements and are not reported in Audit Fees above.
During the fiscal years ended April 30, 2023 and April 30, 2022, there were no Audit-Related Fees billed by the registrant’s principal accountant to the registrant’s investment adviser (not including any sub-adviser whose role is primarily portfolio management and is subcontracted with or overseen by another investment adviser) and any entity controlling, controlled by, or under common control with the adviser that provides ongoing services to the registrant for an engagement that related directly to the operations and financial reporting of the registrant.
(c) Tax Fees. Aggregate Tax Fees billed by the principal accountant to the registrant for professional services rendered during the fiscal years ended April 30, 2023 and April 30, 2022 are approximately as follows:
2023 | 2022 |
$75,000 | $30,300 |
Tax Fees include amounts for the review of annual tax returns, the review of required shareholder distribution calculations and typically include amounts for professional services by the principal accountant for tax compliance, tax advice and tax planning.
During the fiscal years ended April 30, 2023 and April 30, 2022, there were no Tax Fees billed by the registrant’s principal accountant to the registrant’s investment adviser (not including any sub-adviser whose role is primarily portfolio management and is subcontracted with or overseen by another investment adviser) and any entity controlling, controlled by, or under common control with the adviser that provides ongoing services to the registrant for an engagement that related directly to the operations and financial reporting of the registrant.
(d) All Other Fees. Aggregate All Other Fees billed by the principal accountant to the registrant for professional services rendered during the fiscal years ended April 30, 2023 and April 30, 2022 are approximately as follows:
2023 | 2022 |
$0 | $0 |
All Other Fees, if any, include amounts for products and services provided by the principal accountant, other than the services reported in paragraphs (a) through (c) above.
Aggregate All Other Fees billed by the registrant’s principal accountant to the registrant’s investment adviser (not including any sub-adviser whose role is primarily portfolio management and is subcontracted with or overseen by another investment adviser) and any entity controlling, controlled by, or under common control with the adviser that provides ongoing services to the registrant for an engagement that related directly to the operations and financial reporting of the registrant during the fiscal years ended April 30, 2023 and April 30, 2022 are approximately as follows:
2023 | 2022 |
$541,000 | $535,000 |
In fiscal years 2023 and 2022, All Other Fees primarily consists of fees billed for internal control examinations of the registrant’s transfer agent and investment adviser.
(e)(1) Audit Committee Pre-Approval Policies and Procedures
The registrant’s Audit Committee is required to pre-approve the engagement of the registrant’s independent auditors to provide audit and non-audit services to the registrant and non-audit services to its investment adviser (excluding any sub-adviser whose role is primarily portfolio management and is sub-contracted or overseen by another investment adviser (the “Adviser”) or any entity controlling, controlled by or under common control with the Adviser that provides ongoing services to the Fund (a “Control Affiliate”) if the engagement relates directly to the operations and financial reporting of the registrant.
The Audit Committee has adopted a Policy for Engagement of Independent Auditors for Audit and Non-Audit Services (the “Policy”). The Policy sets forth the understanding of the Audit Committee regarding the engagement of the registrant’s independent accountants to provide (i) audit and permissible audit-related, tax and other services to the registrant (“Fund Services”); (ii) non-audit services to the registrant’s Adviser and any Control Affiliates, that relates directly to the operations and financial reporting of a Fund (“Fund-related Adviser Services”); and (iii) certain other audit and non-audit services to the registrant’s Adviser and its Control Affiliates. A service will require specific pre-approval by the Audit Committee if it is to be provided by the Fund’s independent auditor; provided, however, that pre-approval of non-audit services to the Fund, the Adviser or Control Affiliates may be waived if certain de minimis requirements set forth in the SEC’s rules are met.
Under the Policy, the Audit Committee may delegate pre-approval authority to any pre-designated member or members who are independent board members. The member(s) to whom such authority is delegated must report, for informational purposes only, any pre-approval decisions to the Audit Committee at its next regular meeting. The Audit Committee's responsibilities with respect to the pre-approval of services performed by the independent auditor may not be delegated to management.
On an annual basis, at a regularly scheduled Audit Committee meeting, the Fund’s Treasurer or other Fund officer shall submit to the Audit Committee a schedule of the types of Fund Services and Fund-related Adviser Services that are subject to specific pre-approval. This schedule will provide a description of each type of service that is subject to specific pre-approval, along with total projected fees for each service. The pre-approval will generally cover a one-year period. The Audit Committee will review and approve the types of services and the projected fees for the next one-year period and may add to, or subtract from, the list of pre-approved services from time to time, based on subsequent determinations. This specific approval acknowledges that the Audit Committee is in agreement with the specific types of services that the independent auditor will be permitted to perform and the projected fees for each service.
The Fund’s Treasurer or other Fund officer shall report to the Audit Committee at each of its regular meetings regarding all Fund Services or Fund-related Adviser Services provided since the last such report was rendered, including a description of the services, by category, with forecasted fees for the annual reporting period, proposed changes requiring specific pre-approval and a description of services provided by the independent auditor, by category, with actual fees during the current reporting period.
*****
(e)(2) None, or 0%, of the Audit-Related Fees, Tax Fees and All Other Fees paid by the Fund or affiliated entities relating directly to the operations and financial reporting of the Registrant disclosed above were approved by the audit committee pursuant to paragraphs (c)(7)(i)(C) of Rule 2-01 of Regulation S-X (which permits audit committee approval after the start of the engagement with respect to services other than audit, review or attest services, if certain conditions are satisfied).
(f) Not applicable.
(g) The aggregate non-audit fees billed by the registrant’s accountant for services rendered to the registrant, and rendered to the registrant’s investment adviser (not including any sub-adviser whose role is primarily portfolio management and is subcontracted with or overseen by another investment adviser), and any entity controlling, controlled by, or under common control with the adviser that provides ongoing services to the registrant for the fiscal years ended April 30, 2023 and April 30, 2022 are approximately as follows:
2023 | 2022 |
$641,000 | $595,800 |
(h) The registrant’s Audit Committee of the Board of Directors has considered whether the provision of non-audit services that were rendered to the registrant’s adviser (not including any sub-adviser whose role is primarily portfolio management and is subcontracted with or overseen by another investment adviser), and any entity controlling, controlled by, or under common control with the investment adviser that provides ongoing services to the registrant that were not pre-approved pursuant to paragraph (c)(7)(ii) of Rule 2-01 of Regulation S-X, is compatible with maintaining the principal accountant’s independence.
Item 5. Audit Committee of Listed Registrants.
Not applicable.
Item 6. Investments
(a) | The registrant’s “Schedule I – Investments in securities of unaffiliated issuers” (as set forth in 17 CFR 210.12-12) is included in Item 1 of this Form N-CSR. |
(b) | Not applicable. |
Item 7. Disclosure of Proxy Voting Policies and Procedures for Closed-End Management Investment Companies.
Not applicable.
Item 8. Portfolio Managers of Closed-End Management Investment Companies.
Not applicable.
Item 9. Purchases of Equity Securities by Closed-End Management Investment Company and Affiliated Purchasers.
Not applicable.
Item 10. Submission of Matters to a Vote of Security Holders.
There were no material changes to the procedures by which shareholders may recommend nominees to the registrant's board of directors.
Item 11. Controls and Procedures.
(a) | The registrant’s principal executive officer and principal financial officer, based on their evaluation of the registrant’s disclosure controls and procedures as of a date within 90 days of the filing of this report, have concluded that such controls and procedures are adequately designed to ensure that information required to be disclosed by the registrant in Form N-CSR is accumulated and communicated to the registrant’s management, including the principal executive officer and principal financial officer, or persons performing similar functions, as appropriate to allow timely decisions regarding required disclosure. |
(b) | There was no change in the registrant's internal control over financial reporting that occurred during the period covered by this report that has materially affected, or is reasonably likely to materially affect, the registrant's internal control over financial reporting. |
Item 12. Disclosure of Securities Lending Activities for Closed-End Management Investment Companies
Not applicable.
Item 13. Exhibits.
SIGNATURES
Pursuant to the requirements of the Securities Exchange Act of 1934 and the Investment Company Act of 1940, the registrant has duly caused this report to be signed on its behalf by the undersigned, thereunto duly authorized.
(registrant) | Columbia Funds Series Trust I |
|
|
By (Signature and Title) | /s/ Daniel J. Beckman |
| Daniel J. Beckman, President and Principal Executive Officer |
|
|
Date | June 22, 2023 |
|
|
|
|
Pursuant to the requirements of the Securities Exchange Act of 1934 and the Investment Company Act of 1940, this report has been signed below by the following persons on behalf of the registrant and in the capacities and on the dates indicated.
By (Signature and Title) | /s/ Daniel J. Beckman |
| Daniel J. Beckman, President and Principal Executive Officer |
|
|
Date | June 22, 2023 |
By (Signature and Title) | /s/ Michael G. Clarke |
| Michael G. Clarke, Chief Financial Officer, |
| Principal Financial Officer and Senior Vice President |
|
|
Date | June 22, 2023 |
By (Signature and Title) | /s/ Joseph Beranek |
| Joseph Beranek, Treasurer, Chief Accounting |
| Officer and Principal Financial Officer |
|
|
Date | June 22, 2023 |