UNITED STATES
SECURITIES AND EXCHANGE COMMISSION
Washington, D.C. 20549
FORM N-CSR
CERTIFIED SHAREHOLDER REPORT OF REGISTERED MANAGEMENT INVESTMENT COMPANIES
Investment Company Act file number 811-04367
Columbia Funds Series Trust I
(Exact name of registrant as specified in charter)
290 Congress Street
Boston, MA 02210
(Address of principal executive offices) (Zip code)
Daniel J. Beckman
c/o Columbia Management Investment Advisers, LLC
290 Congress Street
Boston, MA 02210
Ryan C. Larrenaga, Esq.
c/o Columbia Management Investment Advisers, LLC
290 Congress Street
Boston, MA 02210
(Name and address of agent for service)
Registrant's telephone number, including area code: (800) 345-6611
Date of fiscal year end: May 31
Date of reporting period: May 31, 2023
Form N-CSR is to be used by management investment companies to file reports with the Commission not later than 10 days after the transmission to stockholders of any report that is required to be transmitted to stockholders under Rule 30e-1 under the Investment Company Act of 1940 (17 CFR 270.30e-1). The Commission may use the information provided on Form N-CSR in its regulatory, disclosure review, inspection, and policymaking roles.
A registrant is required to disclose the information specified by Form N-CSR, and the Commission will make this information public. A registrant is not required to respond to the collection of information contained in Form N-CSR unless the Form displays a currently valid Office of Management and Budget ("OMB") control number. Please direct comments concerning the accuracy of the information collection burden estimate and any suggestions for reducing the burden to Secretary, Securities and Exchange Commission, 100 F Street, NE, Washington, DC 20549. The OMB has reviewed this collection of information under the clearance requirements of 44 U.S.C. § 3507.
Item 1. Reports to Stockholders.

May 31, 2023

| 3 | |
| 5 | |
| 9 | |
| 10 | |
| 37 | |
| 39 | |
| 41 | |
| 44 | |
| 48 | |
| 70 | |
| 71 | |
| 77 |
(Unaudited)
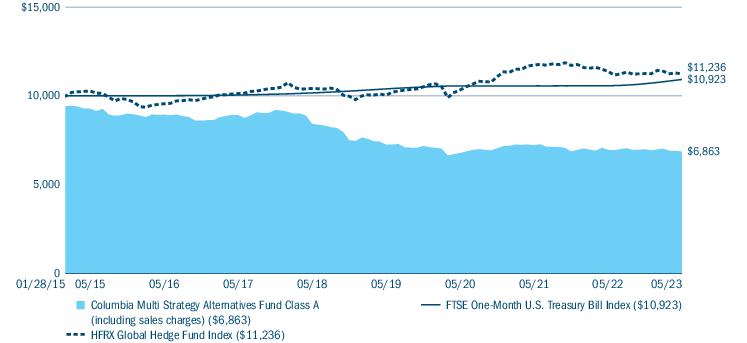
| Average annual total returns (%) (for the period ended May 31, 2023) | |||||
| Inception | 1 Year | 5 Years | Life | ||
| Class A | Excluding sales charges | 01/28/15 | -1.38 | -4.03 | -3.73 |
| Including sales charges | -7.06 | -5.16 | -4.42 | ||
| Advisor Class | 01/28/15 | -1.09 | -3.77 | -3.49 | |
| Class C | Excluding sales charges | 01/28/15 | -2.11 | -4.75 | -4.45 |
| Including sales charges | -3.09 | -4.75 | -4.45 | ||
| Institutional Class | 01/28/15 | -1.15 | -3.78 | -3.51 | |
| Institutional 2 Class | 01/28/15 | -1.11 | -3.73 | -3.43 | |
| Institutional 3 Class | 01/28/15 | -1.05 | -3.66 | -3.37 | |
| Class R | 01/28/15 | -1.61 | -4.25 | -3.97 | |
| FTSE One-Month U.S. Treasury Bill Index | 3.32 | 1.45 | 1.06 | ||
| HFRX Global Hedge Fund Index | -1.26 | 1.52 | 1.41 | ||
| Columbia Multi Strategy Alternatives Fund | Annual Report 2023 | 3 |
(Unaudited)
| Portfolio breakdown (%) (at May 31, 2023) | |
| Asset-Backed Securities — Non-Agency | 3.7 |
| Call Option Contracts Purchased | 0.4 |
| Commercial Mortgage-Backed Securities - Agency | 0.1 |
| Commercial Mortgage-Backed Securities - Non-Agency | 2.3 |
| Money Market Funds(a) | 35.0 |
| Put Option Contracts Purchased | 0.0(b) |
| Residential Mortgage-Backed Securities - Agency | 27.6 |
| Residential Mortgage-Backed Securities - Non-Agency | 12.9 |
| Treasury Bills | 18.0 |
| Total | 100.0 |
| (a) | Includes investments in Money Market Funds, including investing for the purpose of covering obligations relating to the Fund’s investment in derivatives. For a description of the Fund’s investments in derivatives, see Investments in derivatives following the Consolidated Portfolio of Investments and the derivative instruments discussion in Note 2 to the Notes to Consolidated Financial Statements. |
| (b) | Rounds to zero. |
| Market exposure through derivatives investments (% of notional exposure) (at May 31, 2023)(a) | |||
| Long | Short | Net | |
| Fixed Income Derivative Contracts | 305.1 | (379.3) | (74.2) |
| Commodities Derivative Contracts | 38.4 | (46.9) | (8.5) |
| Equity Derivative Contracts | 53.2 | (67.8) | (14.6) |
| Foreign Currency Derivative Contracts | 488.7 | (491.4) | (2.7) |
| Total Notional Market Value of Derivative Contracts | 885.4 | (985.4) | (100.0) |
| 4 | Columbia Multi Strategy Alternatives Fund | Annual Report 2023 |
(Unaudited)
| • | The most significant detractor during the period came from the Mortgage Opportunities non-traditional bond strategy held within our portion of the portfolio, as the past 12-months have been one of the worst periods on record for the Mortgage Opportunities strategy as well as the overall agency mortgage-backed securities (MBS) sector. |
| Columbia Multi Strategy Alternatives Fund | Annual Report 2023 | 5 |
(Unaudited)
| ○ | Wary of recession risk, we had meaningfully increased allocations to agency MBS, preferring long duration and higher quality credit risk in response to already elevated interest rates and deteriorating economic data. MBS cash flows (and duration) continued to extend as mortgage rates skyrocketed during the period in response to the Fed’s unprecedented hiking campaign. This rapid rise in mortgage rates caused prepayments and refinancing to grind to a halt. Markets also experienced a historic increase in interest rate volatility. Unfortunately, these dynamics drove both relative and absolute underperformance within the sleeve. |
| • | Within our G10 Currency strategy, long positions in the Swedish Krona (SEK), British Pound (GBP), Canadian Dollar (CAD), Norwegian Krone (NOK), and New Zealand Dollar (NZD) and short positions in the Swiss Franc (CHF) detracted from performance. |
| • | The GTAA strategy, which invests on a long/short basis across both equity and fixed-income markets, experienced another challenging year, as both equity and fixed-income positioning hurt performance in our portion of the Fund during the period. |
| ○ | Relative overweights (long positions) in emerging market equity and underweights to UK equities hurt performance in the period. |
| ○ | Relative long positions in United Kingdom and short positions in European fixed-income-related markets detracted from returns. |
| • | Within the Commodity Futures Long/Short strategy, losses came from grains, industrial metals and soft commodities. Within grains, longs in soybean meal and corn detracted most as grain markets sold off due to the extension of the Ukrainian Grain Corridor and better than expected production out of South America. |
| • | Within our G10 Currency strategy sleeve, short positions in foreign currencies, notably the Japanese Yen (JPY), Euro (EUR) and Australian Dollar (AUD), contributed to performance during the period and offset some of the detraction from the strategy’s long currency positions. |
| • | During this period, the G10 Currency strategy was generally positively correlated to risk assets and commodities, and negatively correlated to the U.S. Dollar and U.S. interest rates. |
| • | Within the Commodity Futures Long/Short strategy sleeve, short positioning in natural gas was the largest positive contributor within the sleeve as the natural gas market sold off due to plentiful storage and weak weather induced demand. |
| • | For systematic views, positions in fixed income and commodities contributed positively over the reporting period. Notably, directional strategies in fixed income and commodities were profitable over the period. |
| 6 | Columbia Multi Strategy Alternatives Fund | Annual Report 2023 |
(Unaudited)
| ○ | Within fixed income, directional short positions in bonds and interest rates, as well as a yield curve flattener, benefited our portion of the Fund over the period as inflationary concerns led to global rate hikes and rising yields, particularly at the front end of the yield curve. |
| ○ | In commodities, directional positioning was profitable across commodity sectors. In particular, short positions in agricultural commodities such as wheat profited. Wheat supply remained high following Russia’s invasion of Ukraine due to the Black Sea grain export agreement. |
| ○ | Short positions in industrial metals, such as aluminum and zinc, also drove gains in recent months as prices fell in conjunction with poor industrial production data out of China. |
| • | For discretionary views, positive performance was driven by fixed income. Directional discretionary fixed-income positioning generally aligned with systematic positioning over the period, also benefiting from rising yields. |
| • | At the country level, exposures to the United Kingdom, United States and Canada were the top three contributors. |
| • | For systematic views, equities and currencies detracted from our portion of the Fund. Notable detractors among these asset classes include emerging equity index selection and developed currency selection. From a factor perspective, momentum in equities and value in currencies detracted. |
| • | Within emerging equity index selection, time varying exposure to Brazil and a long position in Taiwan drove losses. |
| ○ | A short position in Brazil during the third quarter of 2022 detracted as markets began to price an end to the central bank’s rate hiking cycle, leading to a decrease in bond yields. |
| ○ | A long position in Brazil in the fourth quarter of 2022 detracted as President Lula da Silva signaled that he would prioritize social spending over fiscal austerity. |
| ○ | A long position in Taiwan detracted in 2022 as semiconductor companies underperformed amid a slowdown in demand. |
| • | Within developed currency selection, losses primarily came from a long position in the Australian dollar and a short position in the Swiss Franc. |
| • | The country positions that detracted the most from the strategy were Australia, Germany and Switzerland. |
| • | The largest detractor from performance in our portion of the Fund was our relative value positioning within the equity country selection. Over the period, we had losses from our underweights in Poland and Taiwan and overweight in South Korea. Our strategy suffered from the weak macro factor performance. |
| • | Currency selection also detracted, primarily driven by an overweight in the South African Rand and an underweight in the Polish Zloty. |
| • | From a country allocation perspective, the largest detracting positions over the period were long positioning of the South African Rand, the Norwegian Krone and the Canadian Dollar. |
| Columbia Multi Strategy Alternatives Fund | Annual Report 2023 | 7 |
(Unaudited)
| • | Our sovereign bond relative value strategy was the largest positive contributor to performance over the period. Within the strategy, we particularly benefited from positions in German, Canadian, and UK bonds. Risk and value factors drove gains. |
| • | Our top performing country allocation over the period was short positioning in the New Zealand Dollar, followed by positioning in the Turkey country equity and Swedish Krona. |
| 8 | Columbia Multi Strategy Alternatives Fund | Annual Report 2023 |
(Unaudited)
| December 1, 2022 — May 31, 2023 | |||||||
| Account value at the beginning of the period ($) | Account value at the end of the period ($) | Expenses paid during the period ($) | Fund’s annualized expense ratio (%) | ||||
| Actual | Hypothetical | Actual | Hypothetical | Actual | Hypothetical | Actual | |
| Class A | 1,000.00 | 1,000.00 | 981.30 | 1,018.30 | 6.57 | 6.69 | 1.33 |
| Advisor Class | 1,000.00 | 1,000.00 | 982.50 | 1,019.55 | 5.34 | 5.44 | 1.08 |
| Class C | 1,000.00 | 1,000.00 | 977.80 | 1,014.61 | 10.21 | 10.40 | 2.07 |
| Institutional Class | 1,000.00 | 1,000.00 | 982.60 | 1,019.55 | 5.34 | 5.44 | 1.08 |
| Institutional 2 Class | 1,000.00 | 1,000.00 | 982.70 | 1,019.80 | 5.09 | 5.19 | 1.03 |
| Institutional 3 Class | 1,000.00 | 1,000.00 | 982.90 | 1,020.04 | 4.84 | 4.94 | 0.98 |
| Class R | 1,000.00 | 1,000.00 | 980.30 | 1,017.15 | 7.70 | 7.85 | 1.56 |
| Columbia Multi Strategy Alternatives Fund | Annual Report 2023 | 9 |
May 31, 2023
| Asset-Backed Securities — Non-Agency 4.4% | ||||
| Issuer | Coupon Rate | Principal Amount ($) | Value ($) | |
| ACHV ABS Trust(a) | ||||
| Subordinated Series 2023-1PL Class C | ||||
| 03/18/2030 | 7.420% | 200,000 | 199,914 | |
| Affirm Asset Securitization Trust(a) | ||||
| Series 2023-A Class 1A | ||||
| 01/18/2028 | 6.610% | 1,000,000 | 999,224 | |
| ARES XLIV CLO Ltd.(a),(b) | ||||
| Series 2017-44A Class DR | ||||
| 3-month USD LIBOR + 6.870% Floor 6.870% 04/15/2034 | 12.130% | 1,500,000 | 1,332,795 | |
| Bain Capital Credit CLO Ltd.(a),(b) | ||||
| Series 2020-4A Class E | ||||
| 3-month USD LIBOR + 7.950% Floor 7.950% 10/20/2033 | 13.200% | 400,000 | 384,771 | |
| Consumer Loan Underlying Bond Credit Trust(a),(c),(d) | ||||
| Subordinated Series 2018-P1 Class CERT | ||||
| 07/15/2025 | 0.000% | 100,000 | 95,500 | |
| Subordinated Series 2018-P2 Class CERT | ||||
| 10/15/2025 | 0.000% | 100,000 | 260,000 | |
| Exeter Automobile Receivables Trust(a) | ||||
| Subordinated Series 2021-2A Class E | ||||
| 07/17/2028 | 2.900% | 900,000 | 820,854 | |
| GLS Auto Receivables Issuer Trust(a) | ||||
| Subordinated Series 2022-1A-B Class B | ||||
| 05/15/2026 | 2.840% | 450,000 | 437,897 | |
| LendingClub Receivables Trust(a),(c),(d) | ||||
| Series 2020-2 Class R | ||||
| 02/15/2046 | 0.000% | 85,000 | 191,250 | |
| Lendingpoint Asset Securitization Trust(a) | ||||
| Series 2022-C Class A | ||||
| 02/15/2030 | 6.560% | 539,182 | 538,241 | |
| LendingPoint Asset Securitization Trust(a),(d),(e) | ||||
| Subordinated Series 2021-1 Class D | ||||
| 04/15/2027 | 7.226% | 1,000,000 | 995,000 | |
| LendingPoint Asset Securitization Trust(a) | ||||
| Subordinated Series 2021-A Class C | ||||
| 12/15/2028 | 2.750% | 2,000,000 | 1,937,624 | |
| LL ABS Trust(a) | ||||
| Series 2021-1A Class A | ||||
| 05/15/2029 | 1.070% | 818,296 | 797,515 | |
| LP LMS Asset Securitization Trust(a) | ||||
| Series 2021-2A Class A | ||||
| 01/15/2029 | 1.750% | 303,964 | 296,107 | |
| LP LMS Asset Securitization Trust(a),(d),(e) | ||||
| Subordinated Series 2021-2A Class B | ||||
| 01/15/2029 | 2.330% | 500,000 | 472,695 | |
| Asset-Backed Securities — Non-Agency (continued) | ||||
| Issuer | Coupon Rate | Principal Amount ($) | Value ($) | |
| Marlette Funding Trust(a) | ||||
| Series 2021-1A Class D | ||||
| 06/16/2031 | 2.470% | 100,000 | 92,949 | |
| Subordinated Series 2022-3A Class B | ||||
| 11/15/2032 | 5.950% | 2,000,000 | 1,984,561 | |
| Netcredit Combined Receivables LLC(a),(d) | ||||
| Series 2023-A Class A | ||||
| 12/20/2027 | 7.780% | 1,108,278 | 1,097,195 | |
| Octagon Investment Partners 47 Ltd.(a),(b) | ||||
| Series 2020-1A Class ER | ||||
| 3-month USD LIBOR + 6.250% Floor 6.250% 07/20/2034 | 11.500% | 750,000 | 666,343 | |
| Pagaya AI Debt Selection Trust(a),(d) | ||||
| Series 2020-2 Class NOTE | ||||
| 12/15/2027 | 7.500% | 17,694 | 17,562 | |
| Pagaya AI Debt Selection Trust(a),(c),(d) | ||||
| Series 2020-3 Class CERT | ||||
| 05/17/2027 | 0.000% | 3,200,000 | 315,200 | |
| Series 2021-1 Class CERT | ||||
| 11/15/2027 | 0.000% | 696,200 | 18,797 | |
| Subordinated Series 2021-5 Class | ||||
| 08/15/2029 | 0.000% | 865,000 | 112,450 | |
| Pagaya AI Debt Selection Trust(a) | ||||
| Series 2021-2 Class NOTE | ||||
| 01/25/2029 | 3.000% | 321,579 | 303,595 | |
| Series 2021-5 Class A | ||||
| 08/15/2029 | 1.530% | 132,000 | 129,254 | |
| Pagaya AI Debt Trust(a) | ||||
| Series 2022-1 Class A | ||||
| 10/15/2029 | 2.030% | 983,201 | 951,899 | |
| Series 2023-1 Class A | ||||
| 07/15/2030 | 7.556% | 999,441 | 995,436 | |
| Subordinated Series 2022-2 Class B | ||||
| 01/15/2030 | 6.630% | 399,976 | 379,842 | |
| Subordinated Series 2022-3 Class B | ||||
| 03/14/2030 | 8.050% | 799,922 | 800,483 | |
| Subordinated Series 2022-5 Class B | ||||
| 06/17/2030 | 10.310% | 440,000 | 442,372 | |
| Subordinated Series 2023-1 Class B | ||||
| 07/15/2030 | 9.435% | 2,850,000 | 2,827,117 | |
| Palmer Square Loan Funding Ltd.(a),(b) | ||||
| Series 2020-4A Class D | ||||
| 3-month USD LIBOR + 7.050% Floor 7.050% 11/25/2028 | 12.446% | 1,000,000 | 959,674 | |
| 10 | Columbia Multi Strategy Alternatives Fund | Annual Report 2023 |
May 31, 2023
| Asset-Backed Securities — Non-Agency (continued) | ||||
| Issuer | Coupon Rate | Principal Amount ($) | Value ($) | |
| Prosper Pass-Through Trust(a),(d) | ||||
| Series 2019-ST2 Class A | ||||
| 11/15/2025 | 3.750% | 8,254 | 8,254 | |
| Research-Driven Pagaya Motor Asset Trust IV(a) | ||||
| Series 2021-2A Class A | ||||
| 03/25/2030 | 2.650% | 636,011 | 562,367 | |
| RR 16 Ltd.(a),(b) | ||||
| Series 2021-16A Class D | ||||
| 3-month USD LIBOR + 6.250% Floor 6.250% 07/15/2036 | 11.510% | 266,667 | 242,044 | |
| Santander Drive Auto Receivables Trust | ||||
| Series 2023-2 Class A2 | ||||
| 03/16/2026 | 5.870% | 950,000 | 948,986 | |
| Theorem Funding Trust(a) | ||||
| Series 2020-1A Class C | ||||
| 10/15/2026 | 6.250% | 823,958 | 821,707 | |
| Series 2023-1A Class A | ||||
| 04/15/2029 | 7.580% | 1,922,771 | 1,926,551 | |
| Subordinated Series 2021-1A Class B | ||||
| 12/15/2027 | 1.840% | 1,000,000 | 953,515 | |
| Subordinated Series 2022-1A Class B | ||||
| 02/15/2028 | 3.100% | 2,000,000 | 1,882,014 | |
| Upstart Pass-Through Trust(a) | ||||
| Series 2021-ST1 Class A | ||||
| 02/20/2027 | 2.750% | 198,960 | 192,052 | |
| Series 2021-ST7 Class A | ||||
| 09/20/2029 | 1.850% | 130,559 | 124,998 | |
| Upstart Securitization Trust(a) | ||||
| Subordinated Series 2021-4 Class B | ||||
| 09/20/2031 | 1.840% | 800,000 | 749,671 | |
| Subordinated Series 2023-1 Class B | ||||
| 02/20/2033 | 8.350% | 1,500,000 | 1,470,575 | |
| US Auto Funding(a) | ||||
| Subordinated Series 2021-1A Class D | ||||
| 03/15/2027 | 4.360% | 1,125,000 | 818,373 | |
| Total Asset-Backed Securities — Non-Agency (Cost $35,675,200) | 32,555,223 | |||
| Commercial Mortgage-Backed Securities - Agency 0.1% | ||||
| Government National Mortgage Association(f),(g) | ||||
| Series 2019-102 Class IB | ||||
| 03/16/2060 | 0.834% | 1,337,852 | 76,031 | |
| Series 2019-109 Class IO | ||||
| 04/16/2060 | 0.803% | 2,430,387 | 133,823 | |
| Series 2019-131 Class IO | ||||
| 07/16/2061 | 0.802% | 2,687,027 | 145,906 | |
| Series 2020-19 Class IO | ||||
| 12/16/2061 | 0.694% | 1,741,522 | 90,986 | |
| Commercial Mortgage-Backed Securities - Agency (continued) | ||||
| Issuer | Coupon Rate | Principal Amount ($) | Value ($) | |
| Series 2020-3 Class IO | ||||
| 02/16/2062 | 0.615% | 1,972,723 | 91,075 | |
| Total Commercial Mortgage-Backed Securities - Agency (Cost $1,425,953) | 537,821 | |||
| Commercial Mortgage-Backed Securities - Non-Agency 2.8% | ||||
| BAMLL Commercial Mortgage Securities Trust(a),(f) | ||||
| Subordinated Series 2013-WBRK Class E | ||||
| 03/10/2037 | 3.534% | 500,000 | 328,175 | |
| BAMLL Commercial Mortgage Securities Trust(a),(b) | ||||
| Subordinated Series 2018-DSNY Class D | ||||
| 1-month USD LIBOR + 1.700% Floor 1.700% 09/15/2034 | 6.808% | 2,065,000 | 2,023,832 | |
| Subordinated Series 2019-RLJ Class C | ||||
| 1-month USD LIBOR + 1.600% Floor 1.600% 04/15/2036 | 6.707% | 1,250,000 | 1,224,148 | |
| BBCMS Trust(a),(b) | ||||
| Series 2018-BXH Class A | ||||
| 1-month USD LIBOR + 1.000% Floor 1.000% 10/15/2037 | 6.107% | 64,589 | 62,942 | |
| BFLD Trust(a),(b) | ||||
| Series 2019-DPLO Class G | ||||
| 1-month USD LIBOR + 3.190% Floor 3.190% 10/15/2034 | 8.297% | 1,000,000 | 973,793 | |
| BHMS Mortgage Trust(a),(b) | ||||
| Series 2018-ATLS Class A | ||||
| 1-month USD LIBOR + 1.250% Floor 1.250% 07/15/2035 | 6.358% | 1,000,000 | 970,048 | |
| Braemar Hotels & Resorts Trust(a),(b) | ||||
| Series 2018-PRME Class E | ||||
| 1-month USD LIBOR + 2.400% Floor 2.400% 06/15/2035 | 7.508% | 1,000,000 | 910,891 | |
| BXP Trust(a),(f) | ||||
| Subordinated Series 2021-601L Class E | ||||
| 01/15/2044 | 2.776% | 1,500,000 | 804,172 | |
| CLNY Trust(a),(b) | ||||
| Subordinated Series 2019-IKPR Class E | ||||
| 1-month USD LIBOR + 2.721% Floor 2.721% 11/15/2038 | 7.895% | 300,000 | 270,932 | |
| Subordinated Series 2019-IKPR Class F | ||||
| 1-month USD LIBOR + 3.417% Floor 3.417% 11/15/2038 | 8.591% | 1,350,000 | 1,214,198 | |
| Columbia Multi Strategy Alternatives Fund | Annual Report 2023 | 11 |
May 31, 2023
| Commercial Mortgage-Backed Securities - Non-Agency (continued) | ||||
| Issuer | Coupon Rate | Principal Amount ($) | Value ($) | |
| Cold Storage Trust(a),(b) | ||||
| Subordinated Series 2020-ICE5 Class F | ||||
| 1-month USD LIBOR + 3.492% Floor 3.492% 11/15/2037 | 8.600% | 294,897 | 287,708 | |
| COMM Mortgage Trust(a),(f) | ||||
| Subordinated Series 2020-CBM Class F | ||||
| 02/10/2037 | 3.633% | 2,200,000 | 1,919,045 | |
| Credit Suisse Mortgage Capital Certificates OA LLC(a) | ||||
| Subordinated Series 2014-USA Class E | ||||
| 09/15/2037 | 4.373% | 4,600,000 | 2,434,136 | |
| CSMC Trust(a),(f) | ||||
| Subordinated Series 2019-UVIL Class E | ||||
| 12/15/2041 | 3.283% | 600,000 | 422,884 | |
| Hilton USA Trust(a),(f) | ||||
| Series 2016-HHV Class F | ||||
| 11/05/2038 | 4.194% | 3,000,000 | 2,675,195 | |
| Hilton USA Trust(a) | ||||
| Subordinated Series 2016-SFP Class F | ||||
| 11/05/2035 | 6.155% | 1,700,000 | 1,124,391 | |
| Home Partners of America Trust(a) | ||||
| Series 2019-2 Class F | ||||
| 10/19/2039 | 3.866% | 330,205 | 278,137 | |
| Morgan Stanley Capital I Trust(a),(f) | ||||
| Series 2019-MEAD Class E | ||||
| 11/10/2036 | 3.177% | 600,000 | 526,346 | |
| Progress Residential Trust(a) | ||||
| Series 2020-SFR1 Class F | ||||
| 04/17/2037 | 3.431% | 575,000 | 527,555 | |
| Subordinated Series 2020-SFR2 Class F | ||||
| 06/17/2037 | 6.152% | 500,000 | 481,188 | |
| Wells Fargo Commercial Mortgage Trust(a),(b) | ||||
| Series 2017-SMP Class A | ||||
| 1-month USD LIBOR + 0.875% Floor 0.875% 12/15/2034 | 5.982% | 1,000,000 | 954,893 | |
| Total Commercial Mortgage-Backed Securities - Non-Agency (Cost $23,819,713) | 20,414,609 | |||
| Residential Mortgage-Backed Securities - Agency 32.6% | ||||
| Fannie Mae REMICS(b),(g) | ||||
| CMO Series 2017-81 Class SM | ||||
| -1.0 x 1-month USD LIBOR + 6.200% Cap 6.200% 10/25/2047 | 1.062% | 2,078,020 | 228,579 | |
| Federal Home Loan Mortgage Corp. | ||||
| 08/01/2052 | 3.500% | 2,946,980 | 2,708,899 | |
| 09/01/2052 | 4.500% | 4,833,174 | 4,684,854 | |
| Residential Mortgage-Backed Securities - Agency (continued) | ||||
| Issuer | Coupon Rate | Principal Amount ($) | Value ($) | |
| Federal Home Loan Mortgage Corp.(b),(g) | ||||
| CMO Series 2013-101 Class HS | ||||
| -1.0 x 1-month USD LIBOR + 6.500% Cap 6.500% 10/25/2043 | 1.362% | 719,687 | 88,730 | |
| CMO Series 4987 Class KS | ||||
| -1.0 x 1-month USD LIBOR + 6.080% Cap 6.080% 06/24/2050 | 0.942% | 1,290,857 | 193,069 | |
| CMO Series 4993 Class MS | ||||
| -1.0 x 1-month USD LIBOR + 6.050% Cap 6.050% 07/25/2050 | 0.912% | 1,883,231 | 293,445 | |
| Federal Home Loan Mortgage Corp.(g) | ||||
| CMO Series 390 Class C29 | ||||
| 06/15/2052 | 2.000% | 19,646,608 | 2,525,334 | |
| Federal Home Loan Mortgage Corp. REMICS(b),(g) | ||||
| CMO Series 4606 Class SL | ||||
| -1.0 x 1-month USD LIBOR + 6.000% Cap 6.000% 12/15/2044 | 0.893% | 3,653,398 | 371,482 | |
| Federal Home Loan Mortgage Corp. REMICS(g) | ||||
| CMO Series 5105 Class ID | ||||
| 05/25/2051 | 3.000% | 2,752,779 | 502,591 | |
| CMO Series 5183 Class IO | ||||
| 01/25/2052 | 3.000% | 4,710,861 | 777,294 | |
| Federal National Mortgage Association | ||||
| 05/01/2052 | 3.500% | 3,769,604 | 3,465,561 | |
| Federal National Mortgage Association(b),(g) | ||||
| CMO Series 2016-53 Class AS | ||||
| -1.0 x 1-month USD LIBOR + 6.000% Cap 6.000% 08/25/2046 | 0.862% | 13,715,989 | 2,116,306 | |
| CMO Series 2020-38 Class WS | ||||
| -1.0 x 1-month USD LIBOR + 5.000% Cap 5.000% 06/25/2050 | 0.000% | 3,006,436 | 280,126 | |
| Federal National Mortgage Association REMICS(b),(g) | ||||
| CMO Series 2020-34 Class S | ||||
| -1.0 x 1-month USD LIBOR + 6.050% Cap 6.050% 06/25/2050 | 0.912% | 3,270,664 | 409,262 | |
| 12 | Columbia Multi Strategy Alternatives Fund | Annual Report 2023 |
May 31, 2023
| Residential Mortgage-Backed Securities - Agency (continued) | ||||
| Issuer | Coupon Rate | Principal Amount ($) | Value ($) | |
| CMO Series 2020-54 Class AS | ||||
| -1.0 x 1-month USD LIBOR + 6.150% Cap 6.150% 08/25/2050 | 1.012% | 2,140,785 | 275,733 | |
| Freddie Mac STACR REMIC Trust(a),(b) | ||||
| Subordinated CMO Series 2021-HQA2 Class B2 | ||||
| 30-day Average SOFR + 5.450% 12/25/2033 | 10.423% | 800,000 | 686,835 | |
| Government National Mortgage Association(b),(g) | ||||
| CMO Series 2019-103 Class SA | ||||
| -1.0 x 1-month USD LIBOR + 6.050% Cap 6.050% 08/20/2049 | 0.902% | 2,162,967 | 240,973 | |
| CMO Series 2019-120 Class CS | ||||
| -1.0 x 1-month USD LIBOR + 3.400% Cap 3.400% 09/20/2049 | 0.000% | 19,782,709 | 268,337 | |
| CMO Series 2019-92 Class SD | ||||
| -1.0 x 1-month USD LIBOR + 6.100% Cap 6.100% 07/20/2049 | 0.952% | 2,680,888 | 314,643 | |
| CMO Series 2019-98 Class SB | ||||
| -1.0 x 1-month USD LIBOR + 6.100% Cap 6.100% 08/20/2049 | 0.952% | 7,963,977 | 864,207 | |
| CMO Series 2020-104 Class SA | ||||
| -1.0 x 1-month USD LIBOR + 6.200% Cap 6.200% 07/20/2050 | 1.052% | 1,392,247 | 166,500 | |
| CMO Series 2020-133 Class DS | ||||
| -1.0 x 1-month USD LIBOR + 6.300% Cap 6.300% 09/20/2050 | 1.152% | 5,571,514 | 631,827 | |
| CMO Series 2020-160 Class AS | ||||
| -1.0 x 1-month USD LIBOR + 6.300% Cap 6.300% 10/20/2050 | 1.152% | 8,094,010 | 1,146,829 | |
| CMO Series 2020-34 Class SA | ||||
| -1.0 x 1-month USD LIBOR + 6.050% Cap 6.050% 03/20/2050 | 0.902% | 2,084,573 | 246,710 | |
| Residential Mortgage-Backed Securities - Agency (continued) | ||||
| Issuer | Coupon Rate | Principal Amount ($) | Value ($) | |
| CMO Series 2020-78 Class SD | ||||
| -1.0 x 1-month USD LIBOR + 6.150% Cap 6.150% 06/20/2050 | 1.002% | 2,387,301 | 259,855 | |
| CMO Series 2021-117 Class HS | ||||
| -1.0 x 1-month USD LIBOR + 6.300% Cap 6.300% 07/20/2051 | 1.152% | 2,389,557 | 287,195 | |
| CMO Series 2021-119 Class SC | ||||
| -1.0 x 1-month USD LIBOR + 6.300% Cap 6.300% 07/20/2051 | 1.152% | 3,243,539 | 424,905 | |
| CMO Series 2021-122 Class SB | ||||
| -1.0 x 1-month USD LIBOR + 2.600% Cap 2.600% 07/20/2051 | 0.000% | 7,621,468 | 101,241 | |
| CMO Series 2021-122 Class SG | ||||
| -1.0 x 1-month USD LIBOR + 6.300% Cap 6.300% 07/20/2051 | 1.152% | 3,882,815 | 441,822 | |
| CMO Series 2021-142 Class SL | ||||
| -1.0 x 1-month USD LIBOR + 6.300% Cap 6.300% 08/20/2051 | 1.152% | 5,056,987 | 634,379 | |
| CMO Series 2021-156 Class SA | ||||
| -1.0 x 1-month USD LIBOR + 6.300% Cap 6.300% 09/20/2051 | 1.152% | 3,791,739 | 509,869 | |
| CMO Series 2021-160 Class S | ||||
| -1.0 x 30-day Average SOFR + 2.650% Cap 2.650% 09/20/2051 | 0.000% | 5,867,163 | 75,977 | |
| CMO Series 2021-161 Class SL | ||||
| -1.0 x 1-month USD LIBOR + 6.300% Cap 6.300% 09/20/2051 | 1.152% | 3,433,536 | 464,048 | |
| CMO Series 2021-193 Class ES | ||||
| 30-day Average SOFR + 1.700% 11/20/2051 | 0.000% | 21,023,527 | 125,216 | |
| Columbia Multi Strategy Alternatives Fund | Annual Report 2023 | 13 |
May 31, 2023
| Residential Mortgage-Backed Securities - Agency (continued) | ||||
| Issuer | Coupon Rate | Principal Amount ($) | Value ($) | |
| CMO Series 2021-42 Class SD | ||||
| -1.0 x 1-month USD LIBOR + 6.300% Cap 6.300% 11/20/2050 | 1.152% | 3,604,432 | 495,719 | |
| CMO Series 2021-96 Class US | ||||
| -1.0 x 30-day Average SOFR + 3.250% Cap 3.250% 06/20/2051 | 0.000% | 3,547,559 | 49,519 | |
| CMO Series 2021-97 Class CS | ||||
| -1.0 x 1-month USD LIBOR + 6.300% Cap 6.300% 06/20/2051 | 1.152% | 3,477,862 | 418,276 | |
| CMO Series 2022-46 Class SE | ||||
| -1.0 x 30-day Average SOFR + 3.450% Cap 3.450% 03/20/2052 | 0.000% | 3,268,432 | 69,058 | |
| Government National Mortgage Association(g) | ||||
| CMO Series 2020-104 Class IY | ||||
| 07/20/2050 | 3.000% | 2,493,041 | 360,681 | |
| CMO Series 2020-129 Class GI | ||||
| 09/20/2050 | 3.000% | 2,514,795 | 386,204 | |
| CMO Series 2020-129 Class YI | ||||
| 09/20/2050 | 2.500% | 3,105,787 | 406,593 | |
| CMO Series 2020-138 Class JI | ||||
| 09/20/2050 | 2.500% | 4,634,051 | 652,856 | |
| CMO Series 2020-146 Class NI | ||||
| 10/20/2050 | 2.000% | 19,474,357 | 2,274,544 | |
| CMO Series 2020-153 Class CI | ||||
| 10/20/2050 | 2.500% | 3,074,240 | 422,001 | |
| CMO Series 2020-164 Class CI | ||||
| 11/20/2050 | 3.000% | 2,239,790 | 332,315 | |
| CMO Series 2020-175 Class KI | ||||
| 11/20/2050 | 2.500% | 3,247,579 | 447,156 | |
| CMO Series 2020-191 Class UC | ||||
| 12/20/2050 | 4.000% | 2,233,069 | 381,191 | |
| CMO Series 2021-158 Class VI | ||||
| 09/20/2051 | 3.000% | 2,523,020 | 403,818 | |
| CMO Series 2021-160 Class CI | ||||
| 09/20/2051 | 2.500% | 5,040,679 | 672,528 | |
| CMO Series 2021-24 Class MI | ||||
| 02/20/2051 | 3.000% | 2,082,732 | 314,703 | |
| CMO Series 2021-25 Class GI | ||||
| 02/20/2051 | 2.500% | 4,243,997 | 643,905 | |
| CMO Series 2021-7 Class IT | ||||
| 01/16/2051 | 3.000% | 1,800,340 | 357,166 | |
| Residential Mortgage-Backed Securities - Agency (continued) | ||||
| Issuer | Coupon Rate | Principal Amount ($) | Value ($) | |
| Government National Mortgage Association TBA(h) | ||||
| 06/20/2053 | 4.500% | 20,000,000 | 19,433,984 | |
| Uniform Mortgage-Backed Security TBA(h) | ||||
| 06/13/2053 | 3.000% | 34,000,000 | 30,176,992 | |
| 06/13/2053 | 3.500% | 28,700,000 | 26,367,004 | |
| 06/13/2053 | 4.000% | 46,500,000 | 43,927,969 | |
| 06/13/2053 | 4.500% | 62,000,000 | 60,051,602 | |
| 06/13/2053 | 5.000% | 25,000,000 | 24,626,465 | |
| Total Residential Mortgage-Backed Securities - Agency (Cost $252,598,860) | 240,484,882 | |||
| Residential Mortgage-Backed Securities - Non-Agency 15.2% | ||||
| 510 Asset Backed Trust(a),(f) | ||||
| CMO Series 2021-NPL2 Class A1 | ||||
| 06/25/2061 | 2.116% | 691,257 | 636,129 | |
| Ajax Mortgage Loan Trust(a),(f) | ||||
| CMO Series 2021-C Class A | ||||
| 01/25/2061 | 2.115% | 288,889 | 271,885 | |
| Angel Oak Mortgage Trust(a),(f) | ||||
| CMO Series 2021-5 Class A3 | ||||
| 07/25/2066 | 1.311% | 370,293 | 306,497 | |
| Angel Oak Mortgage Trust I LLC(a),(f) | ||||
| Subordinated CMO Series 2019-2 Class B2 | ||||
| 03/25/2049 | 6.286% | 2,700,000 | 2,598,957 | |
| Arroyo Mortgage Trust(a) | ||||
| CMO Series 2020-1 Class M1 | ||||
| 03/25/2055 | 4.277% | 1,870,000 | 1,615,404 | |
| Bellemeade Re Ltd.(a),(b) | ||||
| CMO Series 2019-4A Class M1C | ||||
| 1-month USD LIBOR + 2.500% Floor 2.500% 10/25/2029 | 7.638% | 132,549 | 132,908 | |
| CMO Series 2020-3A Class M2 | ||||
| 1-month USD LIBOR + 4.850% Floor 4.850% 10/25/2030 | 9.988% | 650,000 | 664,224 | |
| CMO Series 2020-4A Class M2B | ||||
| 1-month USD LIBOR + 3.600% Floor 3.600% 06/25/2030 | 8.738% | 168,654 | 168,429 | |
| Subordinated CMO Series 2019-4A Class B1 | ||||
| 1-month USD LIBOR + 3.850% Floor 3.850% 10/25/2029 | 8.988% | 950,000 | 953,370 | |
| Subordinated CMO Series 2020-4A Class B1 | ||||
| 1-month USD LIBOR + 5.000% Floor 5.000% 06/25/2030 | 10.138% | 800,000 | 820,054 | |
| BRAVO Residential Funding Trust(a),(f) | ||||
| CMO Series 2020-NQM1 Class B1 | ||||
| 05/25/2060 | 5.086% | 300,000 | 268,985 | |
| 14 | Columbia Multi Strategy Alternatives Fund | Annual Report 2023 |
May 31, 2023
| Residential Mortgage-Backed Securities - Non-Agency (continued) | ||||
| Issuer | Coupon Rate | Principal Amount ($) | Value ($) | |
| CMO Series 2020-NQM1 Class B2 | ||||
| 05/25/2060 | 5.762% | 430,000 | 400,897 | |
| CMO Series 2021-A Class A1 | ||||
| 10/25/2059 | 1.991% | 2,082,979 | 1,976,887 | |
| Subordinated CMO Series 2021-NQM2 Class B1 | ||||
| 03/25/2060 | 3.044% | 200,000 | 155,791 | |
| Subordinated CMO Series 2021-NQM2 Class B2 | ||||
| 03/25/2060 | 4.099% | 300,000 | 229,210 | |
| BRAVO Residential Funding Trust(a),(b) | ||||
| CMO Series 2021-HE2 Class B1 | ||||
| 30-day Average SOFR + 2.400% 11/25/2069 | 6.088% | 338,000 | 320,863 | |
| Subordinated CMO Series 2021-HE2 Class B2 | ||||
| 30-day Average SOFR + 3.400% 11/25/2069 | 8.215% | 353,000 | 340,689 | |
| BVRT Financing Trust(a),(b),(d) | ||||
| CMO Series 2021-3F Class M2 | ||||
| 30-day Average SOFR + 2.900% Floor 2.900% 07/12/2033 | 4.187% | 3,000,000 | 3,000,000 | |
| CMO Series 2021-CRT1 Class M4 | ||||
| 1-month USD LIBOR + 3.500% Floor 3.500% 07/10/2032 | 3.589% | 1,875,000 | 1,804,069 | |
| CHNGE Mortgage Trust(a),(f) | ||||
| Subordinated CMO Series 2023-1 Class B1 | ||||
| 03/25/2058 | 8.413% | 223,000 | 207,368 | |
| Subordinated CMO Series 2023-1 Class B2 | ||||
| 03/25/2058 | 8.413% | 300,000 | 259,077 | |
| CIM Trust(a),(f) | ||||
| CMO Series 2021-NR1 Class A1 | ||||
| 07/25/2055 | 2.569% | 854,016 | 817,056 | |
| CMO Series 2021-NR4 Class A1 | ||||
| 10/25/2061 | 2.816% | 457,536 | 426,479 | |
| COLT Mortgage Loan Trust(a),(f) | ||||
| CMO Series 2020-2 Class M1 | ||||
| 03/25/2065 | 5.250% | 200,000 | 192,763 | |
| CMO Series 2021-3 Class A3 | ||||
| 09/27/2066 | 1.419% | 571,188 | 448,549 | |
| Subordinated CMO Series 2021-4 Class B1 | ||||
| 10/25/2066 | 3.764% | 400,000 | 265,888 | |
| Subordinated Series 2021-3 Class B1 | ||||
| 09/27/2066 | 3.059% | 200,000 | 108,119 | |
| Connecticut Avenue Securities Trust(a),(b) | ||||
| Subordinated CMO Series 2021-R03 Class 1B2 | ||||
| 30-day Average SOFR + 5.500% Floor 5.500% 12/25/2041 | 10.473% | 1,200,000 | 1,106,247 | |
| Residential Mortgage-Backed Securities - Non-Agency (continued) | ||||
| Issuer | Coupon Rate | Principal Amount ($) | Value ($) | |
| Subordinated CMO Series 2022-R01 Class 1B2 | ||||
| 30-day Average SOFR + 6.000% 12/25/2041 | 10.973% | 3,500,000 | 3,274,692 | |
| Subordinated CMO Series 2022-R02 Class 2B2 | ||||
| 30-day Average SOFR + 7.650% 01/25/2042 | 12.623% | 2,600,000 | 2,475,979 | |
| Subordinated CMO Series 2022-R07 Class 1B2 | ||||
| 30-day Average SOFR + 12.000% 06/25/2042 | 16.973% | 550,000 | 591,472 | |
| Credit Suisse Mortgage Trust(a),(f) | ||||
| CMO Series 2022-JR1 Class A1 | ||||
| 10/25/2066 | 4.267% | 1,624,778 | 1,551,202 | |
| CSMC Trust(a),(f) | ||||
| CMO Series 2020-RPL2 Class A12 | ||||
| 02/25/2060 | 3.483% | 1,383,289 | 1,386,783 | |
| CMO Series 2021-JR2 Class A1 | ||||
| 11/25/2061 | 2.215% | 354,983 | 337,777 | |
| CMO Series 2022-RPL3 Class A1 | ||||
| 03/25/2061 | 3.613% | 888,454 | 851,683 | |
| Eagle Re Ltd.(a),(b) | ||||
| CMO Series 2019-1 Class M1B | ||||
| 1-month USD LIBOR + 1.800% 04/25/2029 | 6.938% | 481,252 | 480,617 | |
| CMO Series 2019-1 Class M2 | ||||
| 1-month USD LIBOR + 3.300% 04/25/2029 | 8.438% | 1,500,000 | 1,516,601 | |
| Fannie Mae Connecticut Avenue Securities(a),(b) | ||||
| Subordinated CMO Series 2021-R02 Class 2B2 | ||||
| 30-day Average SOFR + 6.200% 11/25/2041 | 11.173% | 1,100,000 | 1,039,144 | |
| Freddie Mac STACR(b) | ||||
| CMO Series 2020-CS02 Class M4 | ||||
| 1-month USD LIBOR + 0.000% 06/25/2033 | 4.617% | 3,100,000 | 2,942,712 | |
| Freddie Mac STACR REMIC Trust(a),(b) | ||||
| CMO Series 2022-HQA1 Class M2 | ||||
| 30-day Average SOFR + 5.250% 03/25/2042 | 10.223% | 800,000 | 808,418 | |
| CMO Series 2023-HQA1 Class M2 | ||||
| 30-day Average SOFR + 5.500% 05/25/2043 | 10.423% | 350,000 | 353,063 | |
| Subordinated CMO Series 2020-DNA6 Class B2 | ||||
| 30-day Average SOFR + 5.650% 12/25/2050 | 10.623% | 1,000,000 | 955,728 | |
| Subordinated CMO Series 2020-HQA1 Class B1 | ||||
| 1-month USD LIBOR + 2.350% 01/25/2050 | 7.488% | 1,942,000 | 1,870,919 | |
| Subordinated CMO Series 2020-HQA3 Class B1 | ||||
| 1-month USD LIBOR + 5.750% 07/25/2050 | 10.888% | 932,177 | 1,000,575 | |
| Columbia Multi Strategy Alternatives Fund | Annual Report 2023 | 15 |
May 31, 2023
| Residential Mortgage-Backed Securities - Non-Agency (continued) | ||||
| Issuer | Coupon Rate | Principal Amount ($) | Value ($) | |
| Subordinated CMO Series 2020-HQA4 Class B1 | ||||
| 1-month USD LIBOR + 5.250% 09/25/2050 | 10.388% | 2,290,682 | 2,430,746 | |
| Subordinated CMO Series 2021-DNA1 Class B2 | ||||
| 30-day Average SOFR + 4.750% 01/25/2051 | 9.723% | 1,750,000 | 1,516,846 | |
| Subordinated CMO Series 2021-DNA5 Class B2 | ||||
| 30-day Average SOFR + 5.500% 01/25/2034 | 10.473% | 3,250,000 | 2,829,547 | |
| Subordinated CMO Series 2021-DNA6 Class B2 | ||||
| 30-day Average SOFR + 7.500% 10/25/2041 | 12.473% | 900,000 | 847,922 | |
| Subordinated CMO Series 2022-DNA1 Class B2 | ||||
| 30-day Average SOFR + 7.100% 01/25/2042 | 12.073% | 1,650,000 | 1,487,779 | |
| Freddie Mac Structured Agency Credit Risk Debt Notes(a),(b),(d),(e) | ||||
| CMO Series 2019-CS02 Class M2 | ||||
| 1-month USD LIBOR + 0.000% 02/25/2032 | 4.506% | 6,000,000 | 5,733,750 | |
| Freddie Mac Structured Agency Credit Risk Debt Notes(b) | ||||
| CMO Series 2020-CS02 Class M3 | ||||
| 1-month USD LIBOR + 0.000% 06/25/2033 | 4.506% | 490,605 | 488,864 | |
| Freddie Mac Structured Agency Credit Risk Debt Notes(a),(b) | ||||
| Subordinated CMO Series 2020-HQA5 Class B2 | ||||
| 30-day Average SOFR + 7.400% 11/25/2050 | 12.373% | 1,800,000 | 1,831,074 | |
| Subordinated CMO Series 2021-DNA7 Class B2 | ||||
| 30-day Average SOFR + 7.800% 11/25/2041 | 12.615% | 2,950,000 | 2,838,322 | |
| Subordinated CMO Series 2022-DNA2 Class B2 | ||||
| 30-day Average SOFR + 8.500% 02/25/2042 | 13.473% | 1,560,000 | 1,463,899 | |
| GCAT Trust(a),(f) | ||||
| CMO Series 2019-NQM3 Class M1 | ||||
| 11/25/2059 | 3.450% | 600,000 | 511,937 | |
| Genworth Mortgage Insurance Corp.(a),(b) | ||||
| CMO Series 2021-3 Class M1B | ||||
| 30-day Average SOFR + 2.900% Floor 2.900% 02/25/2034 | 7.715% | 2,000,000 | 1,974,325 | |
| Subordinated CMO Series 2021-3 Class B1 | ||||
| 30-day Average SOFR + 4.950% Floor 4.950% 02/25/2034 | 9.765% | 500,000 | 471,549 | |
| Glebe Funding Trust (The)(a),(d) | ||||
| CMO Series 2021-1 Class PT | ||||
| 10/27/2023 | 3.000% | 563,292 | 522,453 | |
| Residential Mortgage-Backed Securities - Non-Agency (continued) | ||||
| Issuer | Coupon Rate | Principal Amount ($) | Value ($) | |
| Home Re Ltd.(a),(b) | ||||
| CMO Series 2018-1 Class M2 | ||||
| 1-month USD LIBOR + 3.000% 10/25/2028 | 8.138% | 456,816 | 460,353 | |
| CMO Series 2020-1 Class M2 | ||||
| 1-month USD LIBOR + 5.250% Floor 5.250% 10/25/2030 | 10.388% | 1,091,809 | 1,102,643 | |
| Homeward Opportunities Fund I Trust(a),(f) | ||||
| Subordinated CMO Series 2020-2 Class B1 | ||||
| 05/25/2065 | 5.450% | 250,000 | 221,125 | |
| Homeward Opportunities Fund Trust(a),(f) | ||||
| CMO Series 2020-BPL1 Class A2 | ||||
| 08/25/2025 | 5.438% | 375,817 | 366,142 | |
| Imperial Fund Mortgage Trust(a),(f) | ||||
| Subordinated CMO Series 2021-NQM3 Class B1 | ||||
| 11/25/2056 | 4.184% | 500,000 | 347,754 | |
| Legacy Mortgage Asset Trust(a),(f) | ||||
| CMO Series 2021-GS1 Class A1 | ||||
| 10/25/2066 | 1.892% | 382,731 | 352,280 | |
| CMO Series 2021-SL2 Class A | ||||
| 10/25/2068 | 1.875% | 673,998 | 603,689 | |
| loanDepot GMSR Master Trust(a),(b) | ||||
| Series 2018-GT1 Class A | ||||
| 1-month USD LIBOR + 2.800% Floor 2.800% 10/16/2023 | 7.905% | 850,000 | 710,661 | |
| Mortgage Acquisition Trust I LLC(a),(d) | ||||
| CMO Series 2021-1 Class PT | ||||
| 11/29/2023 | 3.500% | 539,937 | 488,643 | |
| New Residential Mortgage Loan Trust(a),(f) | ||||
| CMO Series 2022-NQM2 Class A2 | ||||
| 03/27/2062 | 3.699% | 2,570,000 | 1,994,725 | |
| Oaktown Re V Ltd.(a),(b) | ||||
| CMO Series 2020-2A Class M2 | ||||
| 1-month USD LIBOR + 5.250% Floor 5.250% 10/25/2030 | 10.388% | 847,769 | 864,932 | |
| Oaktown Re VI Ltd.(a),(b) | ||||
| CMO Series 2021-1A Class M2 | ||||
| 30-day Average SOFR + 3.950% Floor 3.950% 10/25/2033 | 8.923% | 500,000 | 492,718 | |
| PMT Credit Risk Transfer Trust(a),(b) | ||||
| Series 2019-2R Class A | ||||
| 1-month USD LIBOR + 2.750% Floor 2.750% 05/25/2025 | 8.910% | 678,537 | 673,043 | |
| 16 | Columbia Multi Strategy Alternatives Fund | Annual Report 2023 |
May 31, 2023
| Residential Mortgage-Backed Securities - Non-Agency (continued) | ||||
| Issuer | Coupon Rate | Principal Amount ($) | Value ($) | |
| PNMAC GMSR Issuer Trust(a),(b) | ||||
| CMO Series 2018-FT1 Class A | ||||
| 1-month USD LIBOR + 2.350% 04/25/2025 | 7.488% | 500,000 | 494,738 | |
| CMO Series 2018-GT1 Class A | ||||
| 1-month USD LIBOR + 2.850% Floor 2.850% 02/25/2025 | 7.988% | 2,750,000 | 2,739,928 | |
| CMO Series 2018-GT2 Class A | ||||
| 1-month USD LIBOR + 2.650% 08/25/2025 | 7.788% | 4,250,000 | 4,193,346 | |
| Point Securitization Trust(a),(f) | ||||
| CMO Series 2021-1 Class A1 | ||||
| 02/25/2052 | 3.228% | 921,040 | 868,983 | |
| Preston Ridge Partners Mortgage(a),(f) | ||||
| CMO Series 2021-2 Class A2 | ||||
| 03/25/2026 | 3.770% | 1,000,000 | 882,674 | |
| CMO Series 2021-4 Class A2 | ||||
| 04/25/2026 | 3.474% | 400,000 | 338,901 | |
| Preston Ridge Partners Mortgage LLC(a),(f) | ||||
| CMO Series 2020-6 Class A2 | ||||
| 11/25/2025 | 4.703% | 200,000 | 175,050 | |
| Preston Ridge Partners Mortgage Trust(a),(f) | ||||
| CMO Series 2021-1 Class A1 | ||||
| 01/25/2026 | 2.115% | 650,313 | 623,273 | |
| CMO Series 2021-1 Class A2 | ||||
| 01/25/2026 | 3.720% | 3,250,000 | 2,867,892 | |
| CMO Series 2021-10 Class A1 | ||||
| 10/25/2026 | 2.487% | 861,523 | 799,062 | |
| CMO Series 2021-3 Class A1 | ||||
| 04/25/2026 | 1.867% | 616,171 | 572,856 | |
| CMO Series 2021-5 Class A2 | ||||
| 06/25/2026 | 3.721% | 700,000 | 567,916 | |
| CMO Series 2021-7 Class A1 | ||||
| 08/25/2026 | 1.867% | 1,183,613 | 1,109,728 | |
| Pretium Mortgage Credit Partners(a),(f) | ||||
| CMO Series 2022-NPL1 Class A1 | ||||
| 01/25/2052 | 2.981% | 734,475 | 684,881 | |
| Pretium Mortgage Credit Partners LLC(a),(f) | ||||
| CMO Series 2021-NPL6 Class A2 | ||||
| 07/25/2051 | 5.071% | 400,000 | 356,427 | |
| CMO Series 2021-RN2 Class A1 | ||||
| 07/25/2051 | 1.744% | 411,213 | 373,449 | |
| PRKCM Trust(a),(f) | ||||
| CMO Series 2021-AFC1 Class M1 | ||||
| 08/25/2056 | 3.114% | 2,000,000 | 1,218,900 | |
| PRPM Trust(a),(f) | ||||
| CMO Series 2023-NQM1 Class M1 | ||||
| 01/25/2068 | 6.419% | 1,780,000 | 1,639,355 | |
| Residential Mortgage-Backed Securities - Non-Agency (continued) | ||||
| Issuer | Coupon Rate | Principal Amount ($) | Value ($) | |
| Subordinated CMO Series 2023-NQM1 Class B1 | ||||
| 01/25/2068 | 6.419% | 300,000 | 263,748 | |
| Residential Mortgage Loan Trust(a),(f) | ||||
| CMO Series 2019-3 Class M1 | ||||
| 09/25/2059 | 3.257% | 700,000 | 656,878 | |
| Stanwich Mortgage Loan Co. LLC(a),(f) | ||||
| CMO Series 2021-NPB1 Class A1 | ||||
| 10/16/2026 | 2.735% | 1,711,813 | 1,562,109 | |
| Starwood Mortgage Residential Trust(a),(f) | ||||
| CMO Series 2020-3 Class B1 | ||||
| 04/25/2065 | 4.750% | 250,000 | 217,359 | |
| CMO Series 2021-3 Class A1 | ||||
| 06/25/2056 | 1.127% | 323,400 | 263,044 | |
| Stonnington Mortgage Trust(a),(d),(f) | ||||
| CMO Series 2020-1 Class A | ||||
| 07/28/2024 | 3.500% | 138,996 | 136,911 | |
| Toorak Mortgage Corp., Ltd.(a),(f) | ||||
| CMO Series 2021-1 Class A1 | ||||
| 06/25/2024 | 2.240% | 800,000 | 772,156 | |
| Triangle Re Ltd.(a),(b) | ||||
| Subordinated CMO Series 2021-1 Class B1 | ||||
| 1-month USD LIBOR + 4.500% Floor 4.500% 08/25/2033 | 9.638% | 1,500,000 | 1,517,184 | |
| Subordinated CMO Series 2021-2 Class B1 | ||||
| 1-month USD LIBOR + 7.500% Floor 7.500% 10/25/2033 | 12.638% | 650,000 | 666,017 | |
| VCAT Asset Securitization LLC(a),(f) | ||||
| CMO Series 2021-NPL3 Class A2 | ||||
| 05/25/2051 | 3.967% | 300,000 | 253,748 | |
| CMO Series 2021-NPL6 Class A1 | ||||
| 09/25/2051 | 1.917% | 869,094 | 797,209 | |
| Vericrest Opportunity Loan Transferee(a),(f) | ||||
| CMO Series 2021-NPL4 Class A1 | ||||
| 03/27/2051 | 2.240% | 605,847 | 570,232 | |
| Verus Securitization Trust(a) | ||||
| CMO Series 2020-INV1 Class M1 | ||||
| 03/25/2060 | 5.500% | 550,000 | 543,042 | |
| CMO Series 2021-R2 Class M1 | ||||
| 02/25/2064 | 2.244% | 500,000 | 400,737 | |
| Subordinated CMO Series 2020-INV1 Class B1 | ||||
| 03/25/2060 | 5.750% | 150,000 | 138,243 | |
| Subordinated CMO Series 2020-INV1 Class B2 | ||||
| 03/25/2060 | 6.000% | 150,000 | 138,266 | |
| Verus Securitization Trust(a),(f) | ||||
| CMO Series 2023-1 Class M1 | ||||
| 12/25/2067 | 7.005% | 2,500,000 | 2,431,862 | |
| Columbia Multi Strategy Alternatives Fund | Annual Report 2023 | 17 |
May 31, 2023
| Residential Mortgage-Backed Securities - Non-Agency (continued) | ||||
| Issuer | Coupon Rate | Principal Amount ($) | Value ($) | |
| CMO Series 2023-INV1 Class M1 | ||||
| 02/25/2068 | 7.653% | 800,000 | 794,011 | |
| Subordinated CMO Series 2019-4 Class B1 | ||||
| 11/25/2059 | 3.860% | 500,000 | 429,362 | |
| Subordinated CMO Series 2020-4 Class B2 | ||||
| 05/25/2065 | 5.600% | 327,000 | 249,001 | |
| Subordinated CMO Series 2023-1 Class B1 | ||||
| 12/25/2067 | 7.005% | 1,750,000 | 1,592,823 | |
| Subordinated CMO Series 2023-INV1 Class B1 | ||||
| 02/25/2068 | 7.653% | 450,000 | 417,609 | |
| Subordinated Series 2021-5 Class B1 | ||||
| 09/25/2066 | 3.037% | 300,000 | 180,045 | |
| Subordinated Series 2021-5 Class B2 | ||||
| 09/25/2066 | 3.941% | 250,000 | 151,468 | |
| Visio Trust(a),(f) | ||||
| CMO Series 2019-2 Class M1 | ||||
| 11/25/2054 | 3.260% | 200,000 | 168,879 | |
| Subordinated CMO Series 2019-2 Class B1 | ||||
| 11/25/2054 | 3.910% | 100,000 | 85,098 | |
| Vista Point Securitization Trust(a),(f) | ||||
| Subordinated CMO Series 2020-1 Class B1 | ||||
| 03/25/2065 | 5.365% | 800,000 | 769,915 | |
| Total Residential Mortgage-Backed Securities - Non-Agency (Cost $116,226,540) | 112,236,195 | |||
| Treasury Bills 21.2% | ||||
| Issuer | Yield | Principal Amount ($) | Value ($) | |
| United States 21.2% | ||||
| U.S. Treasury Bills | ||||
| 07/13/2023 | 4.850% | 89,000,000 | 88,494,202 | |
| Treasury Bills (continued) | ||||
| Issuer | Yield | Principal Amount ($) | Value ($) | |
| U.S. Treasury Bills(i) | ||||
| 11/02/2023 | 5.400% | 70,000,000 | 68,431,684 | |
| Total | 156,925,886 | |||
| Total Treasury Bills (Cost $157,059,766) | 156,925,886 | |||
| Call Option Contracts Purchased 0.5% | ||||
| Value ($) | ||||
| (Cost $6,155,500) | 3,909,158 | |||
| Put Option Contracts Purchased 0.0% | ||||
| (Cost $440,000) | 281,120 | |||
| Money Market Funds 41.3% | ||
| Shares | Value ($) | |
| Columbia Short-Term Cash Fund, 5.241%(j),(k) | 305,525,407 | 305,372,644 |
| Total Money Market Funds (Cost $305,423,141) | 305,372,644 | |
| Total Investments in Securities (Cost: $898,824,673) | 872,717,538 | |
| Other Assets & Liabilities, Net | (133,813,745) | |
| Net Assets | 738,903,793 | |
| Forward foreign currency exchange contracts | |||||
| Currency to be sold | Currency to be purchased | Counterparty | Settlement date | Unrealized appreciation ($) | Unrealized depreciation ($) |
| 21,596,000 NOK | 2,023,010 USD | Barclays | 06/14/2023 | 76,286 | — |
| 649,895,000 NOK | 58,166,370 USD | Barclays | 06/14/2023 | — | (417,026) |
| 5,063,000 NZD | 3,061,683 USD | Barclays | 06/14/2023 | 12,400 | — |
| 5,288,553 USD | 8,070,000 AUD | Barclays | 06/14/2023 | — | (36,969) |
| 1,373,882 USD | 1,230,000 CHF | Barclays | 06/14/2023 | — | (21,389) |
| 5,867,442 USD | 5,456,000 EUR | Barclays | 06/14/2023 | — | (31,333) |
| 64,294,427 USD | 671,491,000 NOK | Barclays | 06/14/2023 | — | (3,764,308) |
| 1,833,000 GBP | 2,294,316 USD | Citi | 06/14/2023 | 13,547 | — |
| 64,238,547 USD | 50,724,000 GBP | Citi | 06/14/2023 | — | (1,123,587) |
| 18 | Columbia Multi Strategy Alternatives Fund | Annual Report 2023 |
May 31, 2023
| Forward foreign currency exchange contracts (continued) | |||||
| Currency to be sold | Currency to be purchased | Counterparty | Settlement date | Unrealized appreciation ($) | Unrealized depreciation ($) |
| 61,250,606 USD | 634,763,000 SEK | Citi | 06/14/2023 | — | (2,716,960) |
| 103,505,750 AUD | 69,167,876 USD | Citi | 06/21/2023 | 1,792,740 | — |
| 6,488,750 AUD | 4,216,023 USD | Citi | 06/21/2023 | — | (7,708) |
| 36,939,000 BRL | 7,334,595 USD | Citi | 06/21/2023 | 75,967 | — |
| 129,333,000 BRL | 24,329,359 USD | Citi | 06/21/2023 | — | (1,084,975) |
| 59,849,000 CAD | 44,268,082 USD | Citi | 06/21/2023 | 157,364 | — |
| 38,446,000 CAD | 28,239,494 USD | Citi | 06/21/2023 | — | (96,495) |
| 1,244,000 CHF | 1,373,652 USD | Citi | 06/21/2023 | 4,608 | — |
| 61,758,000 CHF | 67,070,886 USD | Citi | 06/21/2023 | — | (894,863) |
| 73,966,000 CNH | 10,562,153 USD | Citi | 06/21/2023 | 151,806 | — |
| 1,542,013,560 COP | 347,278 USD | Citi | 06/21/2023 | 2,520 | — |
| 19,233,833,500 COP | 4,047,588 USD | Citi | 06/21/2023 | — | (252,655) |
| 391,500,000 CZK | 18,081,050 USD | Citi | 06/21/2023 | 456,347 | — |
| 103,389,000 CZK | 4,607,838 USD | Citi | 06/21/2023 | — | (46,569) |
| 63,314,250 EUR | 68,344,783 USD | Citi | 06/21/2023 | 591,191 | — |
| 34,749,500 EUR | 37,109,737 USD | Citi | 06/21/2023 | — | (76,258) |
| 4,109,000 GBP | 5,172,697 USD | Citi | 06/21/2023 | 59,147 | — |
| 56,777,625 GBP | 69,993,853 USD | Citi | 06/21/2023 | — | (664,520) |
| 175,000,000 HUF | 507,437 USD | Citi | 06/21/2023 | 5,345 | — |
| 6,184,026,000 HUF | 16,905,775 USD | Citi | 06/21/2023 | — | (836,795) |
| 89,460,187,851 IDR | 5,995,406 USD | Citi | 06/21/2023 | 30,291 | — |
| 53,263,671,795 IDR | 3,545,572 USD | Citi | 06/21/2023 | — | (5,996) |
| 38,983,000 ILS | 10,764,548 USD | Citi | 06/21/2023 | 308,272 | — |
| 359,744,875 INR | 4,350,972 USD | Citi | 06/21/2023 | 4,716 | — |
| 329,489,750 INR | 3,965,789 USD | Citi | 06/21/2023 | — | (14,939) |
| 10,921,695,000 JPY | 82,156,989 USD | Citi | 06/21/2023 | 3,529,108 | — |
| 580,000,000 JPY | 4,165,714 USD | Citi | 06/21/2023 | — | (9,844) |
| 41,159,466,000 KRW | 31,571,915 USD | Citi | 06/21/2023 | 461,450 | — |
| 1,400,000,000 KRW | 1,049,332 USD | Citi | 06/21/2023 | — | (8,861) |
| 14,000,000 MXN | 788,545 USD | Citi | 06/21/2023 | 409 | — |
| 387,897,000 MXN | 21,020,182 USD | Citi | 06/21/2023 | — | (816,654) |
| 747,000,000 NOK | 70,936,589 USD | Citi | 06/21/2023 | 3,576,170 | — |
| 97,428,000 NZD | 60,190,634 USD | Citi | 06/21/2023 | 1,514,686 | — |
| 344,448,000 PHP | 6,258,112 USD | Citi | 06/21/2023 | 138,872 | — |
| 1,555,000 PLN | 369,918 USD | Citi | 06/21/2023 | 3,160 | — |
| 69,770,000 PLN | 15,777,401 USD | Citi | 06/21/2023 | — | (678,362) |
| 617,600,500 SEK | 59,085,165 USD | Citi | 06/21/2023 | 2,111,515 | — |
| 133,166 SEK | 12,170 USD | Citi | 06/21/2023 | — | (114) |
| 5,406,000 SGD | 4,050,898 USD | Citi | 06/21/2023 | 50,603 | — |
| 3,522,000 SGD | 2,605,176 USD | Citi | 06/21/2023 | — | (1,010) |
| 208,869,000 TWD | 6,942,411 USD | Citi | 06/21/2023 | 137,019 | — |
| 568,965 USD | 875,749 AUD | Citi | 06/21/2023 | 1,087 | — |
| 81,806,649 USD | 120,344,750 AUD | Citi | 06/21/2023 | — | (3,470,481) |
| 20,649,220 USD | 107,213,332 BRL | Citi | 06/21/2023 | 418,530 | — |
| 16,617,437 USD | 83,823,000 BRL | Citi | 06/21/2023 | — | (145,959) |
| 36,486,017 USD | 49,704,500 CAD | Citi | 06/21/2023 | 147,864 | — |
| 37,589,548 USD | 50,675,000 CAD | Citi | 06/21/2023 | — | (240,376) |
| 15,627,329 USD | 14,280,250 CHF | Citi | 06/21/2023 | 88,333 | — |
| 36,183,117 USD | 32,376,125 CHF | Citi | 06/21/2023 | — | (552,630) |
| 10,434,191 USD | 73,966,000 CNH | Citi | 06/21/2023 | — | (23,844) |
| 5,708,220 USD | 27,170,668,000 COP | Citi | 06/21/2023 | 366,517 | — |
| 7,441,772 USD | 167,000,000 CZK | Citi | 06/21/2023 | 76,300 | — |
| 14,975,417 USD | 328,000,000 CZK | Citi | 06/21/2023 | — | (209,382) |
| 47,767,350 USD | 44,826,000 EUR | Citi | 06/21/2023 | 201,670 | — |
| 98,517,078 USD | 90,502,000 EUR | Citi | 06/21/2023 | — | (1,669,440) |
| 53,658,722 USD | 44,049,375 GBP | Citi | 06/21/2023 | 1,159,653 | — |
| 26,574,918 USD | 21,244,000 GBP | Citi | 06/21/2023 | — | (137,276) |
| 16,735,840 USD | 6,159,026,000 HUF | Citi | 06/21/2023 | 935,003 | — |
| Columbia Multi Strategy Alternatives Fund | Annual Report 2023 | 19 |
May 31, 2023
| Forward foreign currency exchange contracts (continued) | |||||
| Currency to be sold | Currency to be purchased | Counterparty | Settlement date | Unrealized appreciation ($) | Unrealized depreciation ($) |
| 583,289 USD | 200,000,000 HUF | Citi | 06/21/2023 | — | (9,470) |
| 12,308,734 USD | 187,226,407,000 IDR | Citi | 06/21/2023 | 175,335 | — |
| 4,221,672 USD | 63,000,000,000 IDR | Citi | 06/21/2023 | — | (20,895) |
| 7,902,762 USD | 28,890,000 ILS | Citi | 06/21/2023 | — | (153,697) |
| 9,594,186 USD | 799,881,125 INR | Citi | 06/21/2023 | 69,573 | — |
| 3,261,295 USD | 268,022,249 INR | Citi | 06/21/2023 | — | (23,186) |
| 7,051,291 USD | 982,923,750 JPY | Citi | 06/21/2023 | 25,011 | — |
| 56,916,295 USD | 7,570,000,000 JPY | Citi | 06/21/2023 | — | (2,418,063) |
| 5,838,555 USD | 7,729,196,750 KRW | Citi | 06/21/2023 | 3,574 | — |
| 19,372,700 USD | 25,257,277,375 KRW | Citi | 06/21/2023 | — | (281,936) |
| 24,927,848 USD | 462,986,832 MXN | Citi | 06/21/2023 | 1,136,204 | — |
| 225,762 USD | 4,000,000 MXN | Citi | 06/21/2023 | — | (581) |
| 35,756,671 USD | 402,365,250 NOK | Citi | 06/21/2023 | 526,450 | — |
| 29,206,253 USD | 301,539,000 NOK | Citi | 06/21/2023 | — | (2,015,098) |
| 3,883,662 USD | 6,463,833 NZD | Citi | 06/21/2023 | 9,178 | — |
| 48,495,196 USD | 78,036,500 NZD | Citi | 06/21/2023 | — | (1,497,766) |
| 3,998,910 USD | 222,183,428 PHP | Citi | 06/21/2023 | — | (51,743) |
| 8,497,664 USD | 37,652,000 PLN | Citi | 06/21/2023 | 382,835 | — |
| 7,338,136 USD | 30,741,000 PLN | Citi | 06/21/2023 | — | (87,648) |
| 571,671 USD | 6,250,000 SEK | Citi | 06/21/2023 | 4,892 | — |
| 57,130,489 USD | 599,250,000 SEK | Citi | 06/21/2023 | — | (1,849,673) |
| 6,708,079 USD | 8,928,000 SGD | Citi | 06/21/2023 | — | (101,598) |
| 2,692,477 USD | 82,717,250 TWD | Citi | 06/21/2023 | 2,626 | — |
| 4,191,667 USD | 126,000,000 TWD | Citi | 06/21/2023 | — | (86,322) |
| 4,969,833 USD | 98,538,922 ZAR | Citi | 06/21/2023 | 17,929 | — |
| 14,596,972 USD | 273,294,923 ZAR | Citi | 06/21/2023 | — | (763,554) |
| 413,567,390 ZAR | 21,921,263 USD | Citi | 06/21/2023 | 987,649 | — |
| 1,500,000 ZAR | 75,611 USD | Citi | 06/21/2023 | — | (315) |
| 5,610,545,500 CLP | 6,968,061 USD | Citi | 06/22/2023 | 61,373 | — |
| 7,410,545,500 CLP | 9,058,590 USD | Citi | 06/22/2023 | — | (63,933) |
| 6,439,618 USD | 5,300,000,000 CLP | Citi | 06/22/2023 | 84,783 | — |
| 9,658,912 USD | 7,730,272,750 CLP | Citi | 06/22/2023 | — | (142,799) |
| 22,952,083 USD | 20,549,000 CHF | Citi | 06/27/2023 | — | (321,192) |
| 875,750 AUD | 574,005 USD | Citi | 09/20/2023 | 2,030 | — |
| 875,749 AUD | 570,883 USD | Citi | 09/20/2023 | — | (1,092) |
| 34,474,500 CAD | 25,354,361 USD | Citi | 09/20/2023 | — | (102,552) |
| 3,269,125 CHF | 3,660,431 USD | Citi | 09/20/2023 | 25,021 | — |
| 29,391,250 CHF | 32,642,599 USD | Citi | 09/20/2023 | — | (41,757) |
| 430,272,750 CLP | 526,290 USD | Citi | 09/20/2023 | 2,624 | — |
| 1,000,000,000 CLP | 1,214,760 USD | Citi | 09/20/2023 | — | (2,297) |
| 52,656,000 CNH | 7,498,229 USD | Citi | 09/20/2023 | 28,525 | — |
| 36,983,000 CNH | 5,246,083 USD | Citi | 09/20/2023 | — | (271) |
| 13,000,000 CZK | 586,855 USD | Citi | 09/20/2023 | 3,713 | — |
| 336,000,000 CZK | 15,046,580 USD | Citi | 09/20/2023 | — | (25,409) |
| 176,000 EUR | 190,265 USD | Citi | 09/20/2023 | 949 | — |
| 352,000 EUR | 377,834 USD | Citi | 09/20/2023 | — | (798) |
| 459,375 GBP | 568,664 USD | Citi | 09/20/2023 | — | (3,732) |
| 260,000,000 HUF | 729,590 USD | Citi | 09/20/2023 | 524 | — |
| 1,584,465,000 HUF | 4,430,582 USD | Citi | 09/20/2023 | — | (12,421) |
| 31,481,000 ILS | 8,517,263 USD | Citi | 09/20/2023 | 31,399 | — |
| 4,011,124 INR | 48,277 USD | Citi | 09/20/2023 | 15 | — |
| 8,022,250 INR | 96,488 USD | Citi | 09/20/2023 | — | (36) |
| 4,372,923,750 JPY | 31,826,517 USD | Citi | 09/20/2023 | — | (128,659) |
| 14,700,000,000 KRW | 11,207,558 USD | Citi | 09/20/2023 | 19,256 | — |
| 6,943,795,125 KRW | 5,276,592 USD | Citi | 09/20/2023 | — | (8,393) |
| 37,473,832 MXN | 2,062,376 USD | Citi | 09/20/2023 | — | (8,515) |
| 200,365,250 NOK | 17,887,468 USD | Citi | 09/20/2023 | — | (256,334) |
| 6,947,500 NZD | 4,233,611 USD | Citi | 09/20/2023 | 51,741 | — |
| 20 | Columbia Multi Strategy Alternatives Fund | Annual Report 2023 |
May 31, 2023
| Forward foreign currency exchange contracts (continued) | |||||
| Currency to be sold | Currency to be purchased | Counterparty | Settlement date | Unrealized appreciation ($) | Unrealized depreciation ($) |
| 37,814,833 NZD | 22,729,105 USD | Citi | 09/20/2023 | — | (32,568) |
| 312,183,428 PHP | 5,530,088 USD | Citi | 09/20/2023 | 7,014 | — |
| 4,487,000 PLN | 1,062,545 USD | Citi | 09/20/2023 | 9,387 | — |
| 22,250,000 SEK | 2,076,164 USD | Citi | 09/20/2023 | 13,689 | — |
| 26,250,000 SEK | 2,412,786 USD | Citi | 09/20/2023 | — | (20,471) |
| 14,036,000 SGD | 10,411,996 USD | Citi | 09/20/2023 | — | (14,571) |
| 20,717,250 TWD | 680,906 USD | Citi | 09/20/2023 | — | (1,034) |
| 23,340,248 USD | 35,805,750 AUD | Citi | 09/20/2023 | 45,442 | — |
| 6,915,403 USD | 10,548,750 AUD | Citi | 09/20/2023 | — | (25,733) |
| 1,532,182 USD | 2,084,000 CAD | Citi | 09/20/2023 | 6,701 | — |
| 2,199,193 USD | 1,800,000,000 CLP | Citi | 09/20/2023 | — | (8,490) |
| 507,987 USD | 2,333,833,500 COP | Citi | 09/20/2023 | 3,050 | — |
| 6,332,315 USD | 28,642,013,560 COP | Citi | 09/20/2023 | — | (60,602) |
| 137,039 USD | 3,037,000 CZK | Citi | 09/20/2023 | — | (808) |
| 64,236,496 USD | 59,822,500 EUR | Citi | 09/20/2023 | 112,174 | — |
| 9,230,504 USD | 8,538,250 EUR | Citi | 09/20/2023 | — | (46,250) |
| 30,531,947 USD | 24,657,625 GBP | Citi | 09/20/2023 | 192,221 | — |
| 2,975,478 USD | 1,064,026,000 HUF | Citi | 09/20/2023 | 8,160 | — |
| 14,069 USD | 5,000,000 HUF | Citi | 09/20/2023 | — | (48) |
| 2,945,247 USD | 44,263,671,795 IDR | Citi | 09/20/2023 | 146 | — |
| 1,963,320 USD | 29,460,187,851 IDR | Citi | 09/20/2023 | — | (2,980) |
| 1,917,974 USD | 159,489,750 INR | Citi | 09/20/2023 | 1,013 | — |
| 1,682,911 USD | 139,744,875 INR | Citi | 09/20/2023 | — | (1,495) |
| 14,116,049 USD | 255,897,000 MXN | Citi | 09/20/2023 | 25,417 | — |
| 4,356,604 USD | 18,633,000 PLN | Citi | 09/20/2023 | 16,808 | — |
| 368,113 USD | 1,555,000 PLN | Citi | 09/20/2023 | — | (3,134) |
| 12,229 USD | 133,166 SEK | Citi | 09/20/2023 | 115 | — |
| 136,797 USD | 1,466,500 SEK | Citi | 09/20/2023 | — | (859) |
| 1,307,604 USD | 1,761,000 SGD | Citi | 09/20/2023 | 545 | — |
| 2,268,223 USD | 69,000,000 TWD | Citi | 09/20/2023 | 3,020 | — |
| 74,914 USD | 1,500,000 ZAR | Citi | 09/20/2023 | 285 | — |
| 75,357 USD | 1,500,000 ZAR | Citi | 09/20/2023 | — | (158) |
| 21,538,923 ZAR | 1,082,310 USD | Citi | 09/20/2023 | 2,504 | — |
| 184,538,922 ZAR | 9,222,193 USD | Citi | 09/20/2023 | — | (29,251) |
| 57,025,000 CHF | 64,395,736 USD | Goldman Sachs International | 06/14/2023 | 1,691,703 | — |
| 58,129,000 EUR | 64,301,719 USD | Goldman Sachs International | 06/14/2023 | 2,122,987 | — |
| 48,891,000 GBP | 60,884,940 USD | Goldman Sachs International | 06/14/2023 | 50,749 | — |
| 8,664,425,000 JPY | 64,523,138 USD | Goldman Sachs International | 06/14/2023 | 2,215,394 | — |
| 7,343,183 USD | 6,603,000 CHF | Goldman Sachs International | 06/14/2023 | — | (82,600) |
| 2,088,439 USD | 1,917,000 EUR | Goldman Sachs International | 06/14/2023 | — | (37,885) |
| 54,496,401 USD | 43,834,000 GBP | Goldman Sachs International | 06/14/2023 | 45,456 | — |
| 63,930,413 USD | 8,664,425,000 JPY | Goldman Sachs International | 06/14/2023 | — | (1,622,670) |
| 26,995,262 GBP | 33,585,885 USD | Goldman Sachs International | 06/27/2023 | — | (13,543) |
| 6,372,000 SEK | 605,863 USD | HSBC | 06/14/2023 | 18,279 | — |
| 38,020,000 SEK | 3,505,883 USD | HSBC | 06/14/2023 | — | (70) |
| 185,200,000 AUD | 122,883,068 USD | Morgan Stanley | 06/21/2023 | 2,330,585 | — |
| 36,705,000 BRL | 7,354,827 USD | Morgan Stanley | 06/21/2023 | 142,181 | — |
| 29,455,000 BRL | 5,550,792 USD | Morgan Stanley | 06/21/2023 | — | (237,206) |
| 28,200,000 CAD | 20,922,054 USD | Morgan Stanley | 06/21/2023 | 137,710 | — |
| 26,650,000 CAD | 19,497,850 USD | Morgan Stanley | 06/21/2023 | — | (144,092) |
| 6,550,000 CHF | 7,278,465 USD | Morgan Stanley | 06/21/2023 | 70,077 | — |
| 31,650,000 CHF | 34,077,200 USD | Morgan Stanley | 06/21/2023 | — | (754,174) |
| 1,450,000 EUR | 1,551,282 USD | Morgan Stanley | 06/21/2023 | — | (386) |
| 71,350,000 GBP | 86,797,821 USD | Morgan Stanley | 06/21/2023 | — | (1,995,518) |
| 1,419,625,000 INR | 17,250,440 USD | Morgan Stanley | 06/21/2023 | 99,250 | — |
| 8,325,000,000 JPY | 61,244,278 USD | Morgan Stanley | 06/21/2023 | 1,310,621 | — |
| 23,146,130,000 KRW | 17,860,288 USD | Morgan Stanley | 06/21/2023 | 365,240 | — |
| 103,600,000 MXN | 5,663,461 USD | Morgan Stanley | 06/21/2023 | — | (168,747) |
| Columbia Multi Strategy Alternatives Fund | Annual Report 2023 | 21 |
May 31, 2023
| Forward foreign currency exchange contracts (continued) | |||||
| Currency to be sold | Currency to be purchased | Counterparty | Settlement date | Unrealized appreciation ($) | Unrealized depreciation ($) |
| 520,250,000 NOK | 50,105,966 USD | Morgan Stanley | 06/21/2023 | 3,192,635 | — |
| 95,350,000 NZD | 59,472,274 USD | Morgan Stanley | 06/21/2023 | 2,047,800 | — |
| 79,830,000 PLN | 18,026,863 USD | Morgan Stanley | 06/21/2023 | — | (801,624) |
| 584,000,000 SEK | 56,177,481 USD | Morgan Stanley | 06/21/2023 | 2,303,477 | — |
| 92,620,006 USD | 138,550,000 AUD | Morgan Stanley | 06/21/2023 | — | (2,433,470) |
| 7,983,843 USD | 40,815,000 BRL | Morgan Stanley | 06/21/2023 | 36,431 | — |
| 47,012,720 USD | 63,850,000 CAD | Morgan Stanley | 06/21/2023 | 46,868 | — |
| 23,802,930 USD | 32,050,000 CAD | Morgan Stanley | 06/21/2023 | — | (181,007) |
| 17,249,051 USD | 15,800,000 CHF | Morgan Stanley | 06/21/2023 | 139,123 | — |
| 44,207,400 USD | 41,150,000 EUR | Morgan Stanley | 06/21/2023 | — | (172,126) |
| 47,736,784 USD | 39,200,000 GBP | Morgan Stanley | 06/21/2023 | 1,046,662 | — |
| 50,608,559 USD | 40,650,000 GBP | Morgan Stanley | 06/21/2023 | — | (20,623) |
| 11,368,618 USD | 941,890,000 INR | Morgan Stanley | 06/21/2023 | 10,820 | — |
| 13,580,922 USD | 1,120,915,000 INR | Morgan Stanley | 06/21/2023 | — | (38,594) |
| 31,085,318 USD | 4,120,000,000 JPY | Morgan Stanley | 06/21/2023 | — | (1,424,457) |
| 439,350 USD | 587,955,000 KRW | Morgan Stanley | 06/21/2023 | 5,057 | — |
| 6,212,334 USD | 8,012,085,000 KRW | Morgan Stanley | 06/21/2023 | — | (156,384) |
| 19,807,936 USD | 367,165,000 MXN | Morgan Stanley | 06/21/2023 | 861,783 | — |
| 37,710,389 USD | 400,000,000 NOK | Morgan Stanley | 06/21/2023 | — | (1,640,553) |
| 60,573,894 USD | 97,100,000 NZD | Morgan Stanley | 06/21/2023 | — | (2,095,484) |
| 3,151,028 USD | 13,170,000 PLN | Morgan Stanley | 06/21/2023 | — | (44,787) |
| 75,047,632 USD | 793,250,000 SEK | Morgan Stanley | 06/21/2023 | — | (1,870,314) |
| 5,509,426 USD | 117,045,000 TRY | Morgan Stanley | 06/21/2023 | — | (225,356) |
| 26,371,803 USD | 484,340,000 ZAR | Morgan Stanley | 06/21/2023 | — | (1,855,879) |
| 445,570,000 ZAR | 24,051,589 USD | Morgan Stanley | 06/21/2023 | 1,498,093 | — |
| 91,450,000 AUD | 61,159,748 USD | UBS | 06/14/2023 | 1,648,295 | — |
| 101,056,000 NZD | 62,775,785 USD | UBS | 06/14/2023 | 1,912,990 | — |
| 123,912,634 USD | 196,099,000 NZD | UBS | 06/14/2023 | — | (5,808,481) |
| 33,583,996 USD | 26,995,262 GBP | UBS | 06/27/2023 | 15,432 | — |
| Total | 48,127,094 | (54,613,795) | |||
| Long futures contracts | ||||||
| Description | Number of contracts | Expiration date | Trading currency | Notional amount | Value/Unrealized appreciation ($) | Value/Unrealized depreciation ($) |
| 10-Year Mini Japanese Government Bond | 2 | 06/2023 | JPY | 29,722,000 | 4,998 | — |
| Australian 10-Year Bond | 505 | 06/2023 | AUD | 60,555,919 | 248,662 | — |
| Australian 10-Year Bond | 230 | 06/2023 | AUD | 27,579,923 | — | (251,478) |
| Bist 30 Index | 2,504 | 06/2023 | TRY | 145,037,940 | — | (359,659) |
| Brent Crude | 44 | 09/2023 | USD | 3,164,480 | — | (185,935) |
| Brent Crude | 2 | 11/2023 | USD | 142,700 | — | (17,786) |
| Brent Crude | 87 | 11/2023 | USD | 6,207,450 | — | (538,344) |
| Brent Crude | 45 | 01/2024 | USD | 3,186,900 | — | (116,044) |
| Cocoa | 38 | 09/2023 | USD | 1,147,220 | 17,007 | — |
| Coffee | 69 | 07/2023 | USD | 4,622,569 | — | (444,274) |
| Coffee | 23 | 09/2023 | USD | 1,516,706 | — | (7,164) |
| Coffee | 46 | 12/2023 | USD | 2,994,600 | — | (41,791) |
| Coffee | 1 | 03/2024 | USD | 64,969 | 147 | — |
| Coffee | 22 | 03/2024 | USD | 1,429,313 | — | (69,944) |
| Copper | 25 | 09/2023 | USD | 2,283,438 | — | (247,086) |
| Copper | 49 | 12/2023 | USD | 4,499,425 | — | (416,832) |
| Copper | 24 | 03/2024 | USD | 2,212,500 | — | (141,798) |
| Corn | 48 | 07/2023 | USD | 1,425,600 | 39,771 | — |
| Corn | 90 | 09/2023 | USD | 2,323,125 | — | (237,674) |
| Corn | 177 | 12/2023 | USD | 4,617,488 | — | (345,199) |
| Corn | 87 | 03/2024 | USD | 2,310,938 | — | (39,053) |
| Cotton | 174 | 07/2023 | USD | 7,262,760 | 33,562 | — |
| Cotton | 52 | 12/2023 | USD | 2,066,220 | — | (50,823) |
| 22 | Columbia Multi Strategy Alternatives Fund | Annual Report 2023 |
May 31, 2023
| Long futures contracts (continued) | ||||||
| Description | Number of contracts | Expiration date | Trading currency | Notional amount | Value/Unrealized appreciation ($) | Value/Unrealized depreciation ($) |
| Cotton | 17 | 03/2024 | USD | 676,260 | — | (27,411) |
| DAX Index | 16 | 06/2023 | EUR | 6,266,000 | — | (142,340) |
| Euro-Bund | 29 | 06/2023 | EUR | 3,945,450 | 151,832 | — |
| Euro-OAT | 29 | 06/2023 | EUR | 3,785,660 | 139,852 | — |
| Euro-OAT | 95 | 06/2023 | EUR | 12,401,300 | — | (115,880) |
| Euro-Schatz | 73 | 09/2023 | EUR | 7,724,860 | 1,099 | — |
| Feeder Cattle | 32 | 08/2023 | USD | 3,826,800 | 44,065 | — |
| FTSE 100 Index | 41 | 06/2023 | GBP | 3,055,320 | — | (79,224) |
| FTSE 100 Index | 317 | 06/2023 | GBP | 23,622,840 | — | (1,251,426) |
| FTSE China A50 Index | 40 | 06/2023 | USD | 490,440 | — | (8,946) |
| FTSE Taiwan Index | 93 | 06/2023 | USD | 5,283,330 | 13,088 | — |
| FTSE Taiwan Index | 1 | 06/2023 | USD | 56,810 | 1,158 | — |
| FTSE/JSE Top 40 Index | 180 | 06/2023 | ZAR | 126,381,600 | — | (80,193) |
| FTSE/JSE Top 40 Index | 217 | 06/2023 | ZAR | 152,360,040 | — | (328,878) |
| FTSE/MIB Index | 102 | 06/2023 | EUR | 13,307,430 | 234,888 | — |
| FTSE/MIB Index | 93 | 06/2023 | EUR | 12,133,245 | — | (211,318) |
| Gas Oil | 15 | 09/2023 | USD | 988,500 | — | (83,177) |
| Gas Oil | 15 | 11/2023 | USD | 989,625 | — | (77,429) |
| Gas Oil | 31 | 01/2024 | USD | 2,032,050 | — | (150,130) |
| IBEX 35 Index | 1 | 06/2023 | EUR | 90,371 | — | (1,003) |
| IBEX 35 Index | 60 | 06/2023 | EUR | 5,422,260 | — | (94,775) |
| Japanese 10-Year Government Bond | 103 | 06/2023 | JPY | 15,305,800,000 | 1,567,418 | — |
| Japanese 10-Year Government Bond | 22 | 06/2023 | JPY | 3,269,200,000 | 539,901 | — |
| KOSPI 200 Index | 125 | 06/2023 | KRW | 10,593,750,000 | 107,295 | — |
| Lead | 168 | 07/2023 | USD | 8,458,800 | — | (328,281) |
| Lead | 8 | 09/2023 | USD | 402,750 | — | (24,458) |
| Lead | 8 | 11/2023 | USD | 403,350 | — | (24,445) |
| Lead | 16 | 01/2024 | USD | 808,100 | — | (39,484) |
| Lean Hogs | 27 | 10/2023 | USD | 812,160 | — | (92,513) |
| Lean Hogs | 55 | 12/2023 | USD | 1,595,550 | — | (142,181) |
| Lean Hogs | 26 | 02/2024 | USD | 806,780 | — | (20,797) |
| Live Cattle | 24 | 10/2023 | USD | 1,649,040 | 80,968 | — |
| Live Cattle | 46 | 12/2023 | USD | 3,228,280 | 105,928 | — |
| Live Cattle | 23 | 02/2024 | USD | 1,650,710 | 58,921 | — |
| Long Gilt | 563 | 09/2023 | GBP | 54,492,770 | 606,278 | — |
| Mexican Bolsa IPC Index | 2 | 06/2023 | MXN | 1,059,880 | — | (614) |
| Mexican Bolsa IPC Index | 137 | 06/2023 | MXN | 72,601,780 | — | (72,339) |
| MSCI Emerging Markets Index | 594 | 06/2023 | USD | 28,416,960 | — | (306,411) |
| Natural Gas | 167 | 06/2023 | USD | 3,784,220 | — | (429,571) |
| Natural Gas | 108 | 08/2023 | USD | 2,546,640 | — | (318,012) |
| Natural Gas | 87 | 10/2023 | USD | 2,545,620 | — | (172,052) |
| Natural Gas | 140 | 12/2023 | USD | 5,126,800 | — | (182,004) |
| Nickel | 8 | 09/2023 | USD | 990,576 | — | (147,440) |
| Nickel | 7 | 11/2023 | USD | 873,096 | — | (150,665) |
| Nickel | 15 | 01/2024 | USD | 1,886,310 | — | (278,090) |
| NY Harbor ULSD Heat Oil | 8 | 08/2023 | USD | 760,066 | — | (86,139) |
| NY Harbor ULSD Heat Oil | 8 | 10/2023 | USD | 762,989 | — | (81,967) |
| NY Harbor ULSD Heat Oil | 16 | 12/2023 | USD | 1,526,179 | — | (127,363) |
| OMXS30 Index | 422 | 06/2023 | SEK | 94,496,350 | — | (22,332) |
| Primary Aluminum | 33 | 09/2023 | USD | 1,859,946 | — | (113,719) |
| Primary Aluminum | 33 | 11/2023 | USD | 1,876,875 | — | (114,668) |
| Primary Aluminum | 64 | 01/2024 | USD | 3,675,968 | — | (138,773) |
| RBOB Gasoline | 16 | 06/2023 | USD | 1,642,234 | — | (80,821) |
| RBOB Gasoline | 12 | 08/2023 | USD | 1,163,434 | — | (43,344) |
| RBOB Gasoline | 13 | 10/2023 | USD | 1,121,266 | — | (72,853) |
| RBOB Gasoline | 27 | 12/2023 | USD | 2,266,072 | — | (156,760) |
| S&P/TSX 60 Index | 48 | 06/2023 | CAD | 11,295,360 | — | (228,576) |
| SGX CNX Nifty Index | 22 | 06/2023 | USD | 821,216 | 1,522 | — |
| Columbia Multi Strategy Alternatives Fund | Annual Report 2023 | 23 |
May 31, 2023
| Long futures contracts (continued) | ||||||
| Description | Number of contracts | Expiration date | Trading currency | Notional amount | Value/Unrealized appreciation ($) | Value/Unrealized depreciation ($) |
| Soybean | 45 | 07/2023 | USD | 2,924,438 | — | (421,256) |
| Soybean | 81 | 11/2023 | USD | 4,643,325 | — | (529,480) |
| Soybean | 81 | 01/2024 | USD | 4,685,850 | — | (527,584) |
| Soybean Meal | 127 | 07/2023 | USD | 4,996,180 | — | (239,206) |
| Soybean Meal | 74 | 12/2023 | USD | 2,701,000 | — | (318,174) |
| Soybean Meal | 75 | 01/2024 | USD | 2,722,500 | — | (266,618) |
| Soybean Oil | 11 | 07/2023 | USD | 304,920 | — | (61,544) |
| Soybean Oil | 82 | 12/2023 | USD | 2,270,580 | — | (310,640) |
| Soybean Oil | 71 | 01/2024 | USD | 1,965,990 | — | (280,247) |
| SPI 200 Index | 98 | 06/2023 | AUD | 17,395,000 | 37,874 | — |
| SPI 200 Index | 180 | 06/2023 | AUD | 31,950,000 | — | (571,823) |
| Sugar #11 | 54 | 09/2023 | USD | 1,496,275 | 253,453 | — |
| Sugar #11 | 2 | 09/2023 | USD | 55,418 | — | (612) |
| Sugar #11 | 169 | 02/2024 | USD | 4,633,574 | 258,924 | — |
| TOPIX Index | 167 | 06/2023 | JPY | 3,550,420,000 | 975,236 | — |
| U.S. Treasury 10-Year Note | 120 | 09/2023 | USD | 13,736,250 | 7,302 | — |
| U.S. Treasury 2-Year Note | 766 | 09/2023 | USD | 157,664,345 | — | (258,706) |
| U.S. Treasury Ultra Bond | 90 | 09/2023 | USD | 12,318,750 | 170,693 | — |
| Wheat | 1 | 09/2023 | USD | 39,263 | 215 | — |
| Wheat | 19 | 09/2023 | USD | 745,988 | — | (55,397) |
| Wheat | 34 | 09/2023 | USD | 1,033,600 | — | (174,581) |
| Wheat | 39 | 12/2023 | USD | 1,522,950 | — | (123,486) |
| Wheat | 67 | 12/2023 | USD | 2,099,613 | — | (307,148) |
| Wheat | 2 | 03/2024 | USD | 64,200 | 152 | — |
| Wheat | 19 | 03/2024 | USD | 736,250 | — | (44,835) |
| Wheat | 31 | 03/2024 | USD | 995,100 | — | (80,629) |
| WIG 20 Index | 1,095 | 06/2023 | PLN | 41,719,500 | — | (395,022) |
| WTI Crude | 7 | 06/2023 | USD | 476,630 | — | (17,657) |
| WTI Crude | 50 | 08/2023 | USD | 3,407,000 | — | (208,031) |
| WTI Crude | 50 | 10/2023 | USD | 3,382,000 | — | (216,889) |
| WTI Crude | 101 | 12/2023 | USD | 6,771,040 | — | (533,821) |
| Zinc | 13 | 06/2023 | USD | 727,919 | — | (120,768) |
| Zinc | 18 | 09/2023 | USD | 1,012,725 | — | (271,940) |
| Zinc | 18 | 11/2023 | USD | 1,014,075 | — | (264,683) |
| Zinc | 35 | 01/2024 | USD | 1,975,313 | — | (382,933) |
| Total | 5,702,209 | (17,143,396) | ||||
| Short futures contracts | ||||||
| Description | Number of contracts | Expiration date | Trading currency | Notional amount | Value/Unrealized appreciation ($) | Value/Unrealized depreciation ($) |
| Australian 3-Year Bond | (43) | 06/2023 | AUD | (4,620,128) | 36,930 | — |
| Brent Crude | (39) | 06/2023 | USD | (2,831,400) | 124,564 | — |
| Brent Crude | (111) | 07/2023 | USD | (8,046,390) | 438,260 | — |
| CAC40 Index | (237) | 06/2023 | EUR | (16,825,815) | 483,389 | — |
| CAC40 Index | (74) | 06/2023 | EUR | (5,253,630) | 196,168 | — |
| Canadian Government 10-Year Bond | (338) | 09/2023 | CAD | (41,800,460) | — | (42,768) |
| Canadian Government 10-Year Bond | (282) | 09/2023 | CAD | (34,874,940) | — | (214,618) |
| Coffee | (169) | 07/2023 | USD | (11,321,944) | 227,269 | — |
| Copper | (8) | 06/2023 | USD | (1,616,000) | 98,854 | — |
| Copper | (147) | 07/2023 | USD | (13,365,975) | 1,128,042 | — |
| Copper | (8) | 07/2023 | USD | (727,400) | 91,689 | — |
| Copper | (6) | 09/2023 | USD | (1,213,800) | — | (3,728) |
| Corn | (136) | 07/2023 | USD | (4,039,200) | 116,896 | — |
| Corn | (128) | 07/2023 | USD | (3,801,600) | 15,461 | — |
| Corn | (66) | 07/2023 | USD | (1,960,200) | — | (652) |
| Cotton | (75) | 07/2023 | USD | (3,130,500) | 11,184 | — |
| Cotton | (10) | 07/2023 | USD | (417,400) | — | (989) |
| 24 | Columbia Multi Strategy Alternatives Fund | Annual Report 2023 |
May 31, 2023
| Short futures contracts (continued) | ||||||
| Description | Number of contracts | Expiration date | Trading currency | Notional amount | Value/Unrealized appreciation ($) | Value/Unrealized depreciation ($) |
| DAX Index | (12) | 06/2023 | EUR | (4,699,500) | 92,713 | — |
| DJIA Index E-mini | (18) | 06/2023 | USD | (2,968,110) | — | (42,801) |
| Euro STOXX 50 Index | (302) | 06/2023 | EUR | (12,735,340) | 52,250 | — |
| Euro STOXX 50 Index | (24) | 06/2023 | EUR | (1,012,080) | — | (47,370) |
| Euro-Bobl | (22) | 06/2023 | EUR | (2,599,080) | — | (19,594) |
| Euro-BTP | (16) | 06/2023 | EUR | (1,855,360) | — | (25,724) |
| Euro-Bund | (302) | 06/2023 | EUR | (41,087,100) | — | (316,925) |
| Euro-Bund | (285) | 06/2023 | EUR | (38,774,250) | — | (1,407,242) |
| Euro-Buxl 30-Year | (6) | 06/2023 | EUR | (832,200) | — | (12,489) |
| Euro-OAT | (12) | 06/2023 | EUR | (1,566,480) | — | (13,518) |
| Euro-Schatz | (764) | 06/2023 | EUR | (80,693,680) | 152,281 | — |
| FTSE 100 Index | (308) | 06/2023 | GBP | (22,952,160) | 1,166,504 | — |
| FTSE Taiwan Index | (223) | 06/2023 | USD | (12,668,630) | — | (72,567) |
| Gas Oil | (69) | 07/2023 | USD | (4,531,575) | 291,551 | — |
| Gold 100 oz. | (38) | 08/2023 | USD | (7,531,980) | 4,469 | — |
| Gold 100 oz. | (8) | 08/2023 | USD | (1,585,680) | 3,913 | — |
| KLCI Index | (30) | 06/2023 | MYR | (2,083,500) | 3,087 | — |
| Lead | (5) | 06/2023 | USD | (252,565) | 12,249 | — |
| Lead | (1) | 09/2023 | USD | (50,344) | 704 | — |
| Lean Hogs | (19) | 06/2023 | USD | (627,570) | 60,744 | — |
| Lean Hogs | (70) | 07/2023 | USD | (2,333,100) | 56,060 | — |
| Live Cattle | (111) | 08/2023 | USD | (7,444,770) | — | (116,727) |
| Live Cattle | (158) | 08/2023 | USD | (10,597,060) | — | (328,605) |
| Long Gilt | (22) | 09/2023 | GBP | (2,129,380) | — | (300) |
| MSCI Emerging Markets Index | (2) | 06/2023 | USD | (95,680) | 1,964 | — |
| MSCI Singapore Index | (154) | 06/2023 | SGD | (4,378,990) | 62,881 | — |
| NASDAQ 100 Index E-mini | (12) | 06/2023 | USD | (3,432,120) | — | (327,042) |
| Natural Gas | (768) | 06/2023 | USD | (17,402,880) | 2,263,332 | — |
| Natural Gas | (208) | 06/2023 | USD | (4,713,280) | 250,229 | — |
| Nickel | (35) | 06/2023 | USD | (4,299,330) | 1,017,054 | — |
| Nickel | (7) | 06/2023 | USD | (859,866) | 116,670 | — |
| Nickel | (52) | 07/2023 | USD | (6,395,376) | 1,032,880 | — |
| Nickel | (8) | 09/2023 | USD | (990,576) | 41,329 | — |
| Nikkei 225 Index | (9) | 06/2023 | JPY | (277,650,000) | — | (178,924) |
| NY Harbor ULSD Heat Oil | (14) | 06/2023 | USD | (1,323,529) | 102,992 | — |
| NY Harbor ULSD Heat Oil | (13) | 06/2023 | USD | (1,228,991) | 61,843 | — |
| NY Harbor ULSD Heat Oil | (1) | 06/2023 | USD | (94,538) | 4,849 | — |
| OMXS30 Index | (105) | 06/2023 | SEK | (23,512,125) | 11,085 | — |
| Primary Aluminum | (102) | 06/2023 | USD | (5,718,375) | 229,901 | — |
| Primary Aluminum | (20) | 06/2023 | USD | (1,121,250) | 43,191 | — |
| Primary Aluminum | (218) | 07/2023 | USD | (12,254,325) | 312,467 | — |
| Primary Aluminum | (18) | 09/2023 | USD | (1,014,516) | — | (2,069) |
| RBOB Gasoline | (17) | 06/2023 | USD | (1,744,873) | 55,327 | — |
| Russell 2000 Index E-mini | (93) | 06/2023 | USD | (8,145,870) | 73,237 | — |
| S&P 500 Index E-mini | (377) | 06/2023 | USD | (78,990,925) | — | (998,714) |
| S&P 500 Index E-mini | (106) | 06/2023 | USD | (22,209,650) | — | (1,005,139) |
| S&P Mid 400 Index E-mini | (23) | 06/2023 | USD | (5,540,700) | 136,977 | — |
| S&P/TSX 60 Index | (90) | 06/2023 | CAD | (21,178,800) | 15,150 | — |
| S&P/TSX 60 Index | (27) | 06/2023 | CAD | (6,353,640) | 5,382 | — |
| SGX CNX Nifty Index | (62) | 06/2023 | USD | (2,314,336) | — | (20,601) |
| Silver | (35) | 07/2023 | USD | (4,127,725) | 322,563 | — |
| Silver | (5) | 07/2023 | USD | (589,675) | 46,035 | — |
| Soybean | (81) | 07/2023 | USD | (5,263,988) | 615,057 | — |
| Soybean | (58) | 07/2023 | USD | (3,769,275) | 287,637 | — |
| Soybean Meal | (59) | 07/2023 | USD | (2,321,060) | 290,676 | — |
| Soybean Oil | (158) | 07/2023 | USD | (4,379,760) | 631,082 | — |
| Soybean Oil | (38) | 07/2023 | USD | (1,053,360) | 183,176 | — |
| Sugar #11 | (31) | 06/2023 | USD | (870,083) | 22,093 | — |
| Columbia Multi Strategy Alternatives Fund | Annual Report 2023 | 25 |
May 31, 2023
| Short futures contracts (continued) | ||||||
| Description | Number of contracts | Expiration date | Trading currency | Notional amount | Value/Unrealized appreciation ($) | Value/Unrealized depreciation ($) |
| Sugar #11 | (102) | 06/2023 | USD | (2,862,854) | — | (129,764) |
| Sugar #11 | (227) | 06/2023 | USD | (6,371,254) | — | (440,281) |
| Thai SET50 Index | (50) | 06/2023 | THB | (9,217,000) | 934 | — |
| TOPIX Index | (38) | 06/2023 | JPY | (807,880,000) | — | (292,992) |
| TOPIX Index | (106) | 06/2023 | JPY | (2,253,560,000) | — | (791,676) |
| U.S. Long Bond | (10) | 09/2023 | USD | (1,283,438) | — | (20,073) |
| U.S. Treasury 10-Year Note | (2,653) | 09/2023 | USD | (303,685,594) | — | (997,592) |
| U.S. Treasury 2-Year Note | (17) | 09/2023 | USD | (3,499,078) | — | (9,392) |
| U.S. Treasury 5-Year Note | (478) | 09/2023 | USD | (52,139,344) | — | (293,173) |
| U.S. Treasury Ultra Bond | (11) | 09/2023 | USD | (1,505,625) | — | (30,816) |
| U.S. Treasury Ultra Bond | (109) | 09/2023 | USD | (14,919,375) | — | (210,024) |
| Wheat | (233) | 07/2023 | USD | (6,923,013) | 953,856 | — |
| Wheat | (161) | 07/2023 | USD | (4,783,713) | 712,393 | — |
| Wheat | (112) | 07/2023 | USD | (3,327,800) | 642,284 | — |
| Wheat | (46) | 07/2023 | USD | (1,818,150) | 236,409 | — |
| WTI Crude | (157) | 06/2023 | USD | (10,690,130) | 1,229,474 | — |
| WTI Crude | (49) | 06/2023 | USD | (3,336,410) | 155,616 | — |
| Zinc | (39) | 06/2023 | USD | (2,183,756) | 560,546 | — |
| Zinc | (45) | 07/2023 | USD | (2,524,219) | 300,601 | — |
| Zinc | (13) | 09/2023 | USD | (731,413) | 17,349 | — |
| Total | 17,911,752 | (8,414,889) | ||||
| Call option contracts purchased | ||||||||
| Description | Counterparty | Trading currency | Notional amount | Number of contracts | Exercise price/Rate | Expiration date | Cost ($) | Value ($) |
| 10-Year OTC interest rate swap with Citi to receive exercise rate and pay SOFR | Citi | USD | 14,800,000 | 14,800,000 | 2.75 | 06/26/2023 | 480,630 | 8,688 |
| 10-Year OTC interest rate swap with Citi to receive exercise rate and pay SOFR | Citi | USD | 5,600,000 | 5,600,000 | 2.75 | 07/11/2023 | 196,000 | 7,794 |
| 10-Year OTC interest rate swap with Citi to receive exercise rate and pay SOFR | Citi | USD | 25,000,000 | 25,000,000 | 2.00 | 08/03/2023 | 421,250 | 7,945 |
| 10-Year OTC interest rate swap with Citi to receive exercise rate and pay SOFR | Citi | USD | 20,000,000 | 20,000,000 | 3.50 | 10/27/2023 | 710,000 | 672,904 |
| 10-Year OTC interest rate swap with Citi to receive exercise rate and pay SOFR | Citi | USD | 15,000,000 | 15,000,000 | 3.50 | 10/27/2023 | 570,000 | 504,678 |
| 10-Year OTC interest rate swap with Citi to receive exercise rate and pay SOFR | Citi | USD | 12,660,000 | 12,660,000 | 3.30 | 11/14/2023 | 405,120 | 330,427 |
| 10-Year OTC interest rate swap with Citi to receive exercise rate and pay SOFR | Citi | USD | 40,000,000 | 40,000,000 | 3.30 | 11/30/2023 | 1,060,000 | 1,104,236 |
| 10-Year OTC interest rate swap with Citi to receive exercise rate and pay SOFR | Citi | USD | 25,000,000 | 25,000,000 | 3.00 | 11/30/2023 | 768,750 | 429,532 |
| 10-Year OTC interest rate swap with Citi to receive exercise rate and pay SOFR | Citi | USD | 20,000,000 | 20,000,000 | 3.00 | 12/01/2023 | 690,000 | 345,554 |
| 10-Year OTC interest rate swap with Morgan Stanley to receive exercise rate and pay SOFR | Morgan Stanley | USD | 25,000,000 | 25,000,000 | 3.00 | 01/10/2024 | 853,750 | 497,400 |
| Total | 6,155,500 | 3,909,158 | ||||||
| Put option contracts purchased | ||||||||
| Description | Counterparty | Trading currency | Notional amount | Number of contracts | Exercise price/Rate | Expiration date | Cost ($) | Value ($) |
| 5-Year OTC interest rate swap with Morgan Stanley to receive SOFR and pay exercise rate | Morgan Stanley | USD | 40,000,000 | 40,000,000 | 3.75 | 08/25/2023 | 440,000 | 281,120 |
| 26 | Columbia Multi Strategy Alternatives Fund | Annual Report 2023 |
May 31, 2023
| Call option contracts written | ||||||||
| Description | Counterparty | Trading currency | Notional amount | Number of contracts | Exercise price/Rate | Expiration date | Premium received ($) | Value ($) |
| 10-Year OTC interest rate swap with Citi to receive SOFR and pay exercise rate | Citi | USD | (25,000,000) | (25,000,000) | 2.90 | 6/05/2023 | (150,000) | (105) |
| 10-Year OTC interest rate swap with Morgan Stanley to receive SOFR and pay exercise rate | Morgan Stanley | USD | (30,000,000) | (30,000,000) | 2.90 | 6/05/2023 | (225,000) | (126) |
| Total | (375,000) | (231) | ||||||
| Put option contracts written | ||||||||
| Description | Counterparty | Trading currency | Notional amount | Number of contracts | Exercise price/Rate | Expiration date | Premium received ($) | Value ($) |
| 10-Year OTC interest rate swap with Citi to receive exercise rate and pay SOFR | Citi | USD | (17,500,000) | (17,500,000) | 3.30 | 06/15/2023 | (119,875) | (225,838) |
| 10-Year OTC interest rate swap with JPMorgan to receive exercise rate and pay SOFR | JPMorgan | USD | (20,000,000) | (20,000,000) | 3.30 | 06/15/2023 | (140,000) | (258,100) |
| 10-Year OTC interest rate swap with Morgan Stanley to receive exercise rate and pay SOFR | Morgan Stanley | USD | (30,000,000) | (30,000,000) | 3.25 | 06/12/2023 | (225,000) | (446,625) |
| 5-Year OTC interest rate swap with Morgan Stanley to receive exercise rate and pay SOFR | Morgan Stanley | USD | (30,000,000) | (30,000,000) | 3.45 | 06/01/2023 | (141,000) | (147,216) |
| Total | (625,875) | (1,077,779) | ||||||
| Cleared interest rate swap contracts | |||||||||||
| Fund receives | Fund pays | Payment frequency | Counterparty | Maturity date | Notional currency | Notional amount | Value ($) | Upfront payments ($) | Upfront receipts ($) | Unrealized appreciation ($) | Unrealized depreciation ($) |
| 3-Month NZD LIBOR | Fixed rate of 5.000% | Receives Quarterly, Pays SemiAnnually | JPMorgan | 06/11/2025 | NZD | 13,300,000 | 101,938 | — | — | 101,938 | — |
| 3-Month NZD LIBOR | Fixed rate of 4.500% | Receives Quarterly, Pays SemiAnnually | JPMorgan | 06/11/2025 | NZD | 1,000,000 | 5,002 | — | — | 5,002 | — |
| Fixed rate of 3.000% | 3-Month SEK STIBOR | Receives Annually, Pays Quarterly | JPMorgan | 06/18/2025 | SEK | 200,000 | — | — | — | — | — |
| Fixed rate of 3.500% | 6-Month NOK NIBOR | Receives Annually, Pays SemiAnnually | JPMorgan | 06/18/2025 | NOK | 500,000 | (568) | — | — | — | (568) |
| Fixed rate of 3.750% | SOFR | Receives Annually, Pays Annually | JPMorgan | 06/21/2025 | USD | 1,100,000 | (13,546) | — | — | — | (13,546) |
| 6-Month EURIBOR | Fixed rate of 2.500% | Receives SemiAnnually, Pays Annually | JPMorgan | 06/21/2025 | EUR | 17,000,000 | (69,222) | — | — | — | (69,222) |
| 3-Month NZD LIBOR | Fixed rate of 4.500% | Receives Quarterly, Pays SemiAnnually | JPMorgan | 09/10/2025 | NZD | 61,600,000 | 182,727 | — | — | 182,727 | — |
| 3-Month NZD LIBOR | Fixed rate of 5.000% | Receives Quarterly, Pays SemiAnnually | JPMorgan | 09/10/2025 | NZD | 55,800,000 | 160,891 | — | — | 160,891 | — |
| 3-Month AUD BBSW | Fixed rate of 3.500% | Receives Quarterly, Pays Quarterly | JPMorgan | 09/11/2025 | AUD | 70,200,000 | 342,974 | — | — | 342,974 | — |
| 3-Month AUD BBSW | Fixed rate of 4.000% | Receives Quarterly, Pays Quarterly | JPMorgan | 09/11/2025 | AUD | 51,000,000 | 205,938 | — | — | 205,938 | — |
| 3-Month SEK STIBOR | Fixed rate of 3.500% | Receives Quarterly, Pays Annually | JPMorgan | 09/17/2025 | SEK | 974,200,000 | 284,962 | — | — | 284,962 | — |
| Fixed rate of 4.000% | 6-Month NOK NIBOR | Receives Annually, Pays SemiAnnually | JPMorgan | 09/17/2025 | NOK | 173,000,000 | (57,003) | — | — | — | (57,003) |
| Fixed rate of 3.500% | 6-Month NOK NIBOR | Receives Annually, Pays SemiAnnually | JPMorgan | 09/17/2025 | NOK | 180,700,000 | (70,135) | — | — | — | (70,135) |
| Fixed rate of 3.000% | 6-Month NOK NIBOR | Receives Annually, Pays SemiAnnually | JPMorgan | 09/17/2025 | NOK | 214,000,000 | (245,308) | — | — | — | (245,308) |
| Fixed rate of 3.500% | CORRA | Receives SemiAnnually, Pays SemiAnnually | JPMorgan | 09/18/2025 | CAD | 88,400,000 | (162,400) | — | — | — | (162,400) |
| 6-Month EURIBOR | Fixed rate of 3.750% | Receives SemiAnnually, Pays Annually | JPMorgan | 09/20/2025 | EUR | 275,200,000 | 206,119 | — | — | 206,119 | — |
| Columbia Multi Strategy Alternatives Fund | Annual Report 2023 | 27 |
May 31, 2023
| Cleared interest rate swap contracts (continued) | |||||||||||
| Fund receives | Fund pays | Payment frequency | Counterparty | Maturity date | Notional currency | Notional amount | Value ($) | Upfront payments ($) | Upfront receipts ($) | Unrealized appreciation ($) | Unrealized depreciation ($) |
| Fixed rate of 4.000% | SONIA | Receives Annually, Pays Annually | JPMorgan | 09/20/2025 | GBP | 25,300,000 | 33,870 | — | — | 33,870 | — |
| Fixed rate of 4.500% | SOFR | Receives Annually, Pays Annually | JPMorgan | 09/20/2025 | USD | 14,400,000 | 12,685 | — | — | 12,685 | — |
| Fixed rate of 3.500% | SOFR | Receives Annually, Pays Annually | JPMorgan | 09/20/2025 | USD | 2,000,000 | 1,706 | — | — | 1,706 | — |
| 6-Month EURIBOR | Fixed rate of 2.750% | Receives SemiAnnually, Pays Annually | JPMorgan | 09/20/2025 | EUR | 200,000 | (925) | — | — | — | (925) |
| Fixed rate of 4.500% | SOFR | Receives Annually, Pays Annually | JPMorgan | 09/20/2025 | USD | 12,700,000 | (64,516) | — | — | — | (64,516) |
| 6-Month EURIBOR | Fixed rate of 3.750% | Receives SemiAnnually, Pays Annually | JPMorgan | 09/20/2025 | EUR | 60,300,000 | (74,607) | — | — | — | (74,607) |
| Fixed rate of 3.500% | SOFR | Receives Annually, Pays Annually | JPMorgan | 09/20/2025 | USD | 17,100,000 | (138,735) | — | — | — | (138,735) |
| Fixed rate of 4.000% | SONIA | Receives Annually, Pays Annually | JPMorgan | 09/20/2025 | GBP | 139,600,000 | (2,281,089) | — | — | — | (2,281,089) |
| Fixed rate of 5.000% | 3-Month NZD LIBOR | Receives SemiAnnually, Pays Quarterly | JPMorgan | 12/10/2025 | NZD | 300,000 | — | — | — | — | — |
| Fixed rate of 3.500% | 3-Month AUD BBSW | Receives SemiAnnually, Pays Quarterly | JPMorgan | 12/11/2025 | AUD | 7,400,000 | 3,333 | — | — | 3,333 | — |
| 3-Month AUD BBSW | Fixed rate of 4.000% | Receives Quarterly, Pays SemiAnnually | JPMorgan | 12/11/2025 | AUD | 29,400,000 | — | — | — | — | — |
| Fixed rate of 3.500% | 3-Month AUD BBSW | Receives SemiAnnually, Pays Quarterly | JPMorgan | 12/11/2025 | AUD | 15,600,000 | (9,929) | — | — | — | (9,929) |
| 6-Month NOK NIBOR | Fixed rate of 3.500% | Receives SemiAnnually, Pays Annually | JPMorgan | 12/17/2025 | NOK | 12,000,000 | 883 | — | — | 883 | — |
| Fixed rate of 4.000% | 6-Month NOK NIBOR | Receives Annually, Pays SemiAnnually | JPMorgan | 12/17/2025 | NOK | 58,000,000 | — | — | — | — | — |
| Fixed rate of 3.500% | 3-Month SEK STIBOR | Receives Annually, Pays Quarterly | JPMorgan | 12/17/2025 | SEK | 36,000,000 | — | — | — | — | — |
| 6-Month NOK NIBOR | Fixed rate of 3.500% | Receives SemiAnnually, Pays Annually | JPMorgan | 12/17/2025 | NOK | 14,000,000 | (618) | — | — | — | (618) |
| Fixed rate of 4.000% | CORRA | Receives SemiAnnually, Pays SemiAnnually | JPMorgan | 12/18/2025 | CAD | 2,100,000 | — | — | — | — | — |
| Fixed rate of 3.500% | CORRA | Receives SemiAnnually, Pays SemiAnnually | JPMorgan | 12/18/2025 | CAD | 9,800,000 | (9,144) | — | — | — | (9,144) |
| 6-Month EURIBOR | Fixed rate of 3.550% | Receives SemiAnnually, Pays Annually | JPMorgan | 12/20/2025 | EUR | 173,300,000 | 52,230 | — | — | 52,230 | — |
| SOFR | Fixed rate of 4.190% | Receives Annually, Pays Annually | JPMorgan | 12/20/2025 | USD | 32,100,000 | — | — | — | — | — |
| Fixed rate of 4.250% | SONIA | Receives Annually, Pays Annually | JPMorgan | 12/20/2025 | GBP | 37,100,000 | — | — | — | — | — |
| 6-Month EURIBOR | Fixed rate of 3.550% | Receives SemiAnnually, Pays Annually | JPMorgan | 12/20/2025 | EUR | 42,700,000 | (155,712) | — | — | — | (155,712) |
| 6-Month AUD BBSW | Fixed rate of 4.000% | Receives SemiAnnually, Pays SemiAnnually | JPMorgan | 12/07/2028 | AUD | 200,000 | — | — | — | — | — |
| 3-Month NZD LIBOR | Fixed rate of 4.500% | Receives Quarterly, Pays SemiAnnually | JPMorgan | 12/13/2028 | NZD | 300,000 | — | — | — | — | — |
| CORRA | Fixed rate of 3.500% | Receives SemiAnnually, Pays SemiAnnually | JPMorgan | 12/18/2028 | CAD | 500,000 | — | — | — | — | — |
| 6-Month EURIBOR | Fixed rate of 3.190% | Receives SemiAnnually, Pays Annually | JPMorgan | 12/20/2028 | EUR | 500,000 | — | — | — | — | — |
| 6-Month NOK NIBOR | Fixed rate of 3.500% | Receives SemiAnnually, Pays Annually | JPMorgan | 12/20/2028 | NOK | 7,000,000 | — | — | — | — | — |
| 3-Month SEK STIBOR | Fixed rate of 3.000% | Receives Quarterly, Pays Annually | JPMorgan | 12/20/2028 | SEK | 3,000,000 | — | — | — | — | — |
| 28 | Columbia Multi Strategy Alternatives Fund | Annual Report 2023 |
May 31, 2023
| Cleared interest rate swap contracts (continued) | |||||||||||
| Fund receives | Fund pays | Payment frequency | Counterparty | Maturity date | Notional currency | Notional amount | Value ($) | Upfront payments ($) | Upfront receipts ($) | Unrealized appreciation ($) | Unrealized depreciation ($) |
| SONIA | Fixed rate of 3.820% | Receives Annually, Pays Annually | JPMorgan | 12/20/2028 | GBP | 200,000 | — | — | — | — | — |
| SOFR | Fixed rate of 3.630% | Receives Annually, Pays Annually | JPMorgan | 12/20/2028 | USD | 200,000 | — | — | — | — | — |
| Fixed rate of 2.500% | 3-Month SEK STIBOR | Receives Annually, Pays Quarterly | JPMorgan | 06/15/2033 | SEK | 300,000 | (8) | — | — | — | (8) |
| Fixed rate of 2.500% | 6-Month EURIBOR | Receives Annually, Pays SemiAnnually | JPMorgan | 06/21/2033 | EUR | 3,900,000 | 17,703 | — | — | 17,703 | — |
| Fixed rate of 4.500% | 6-Month AUD BBSW | Receives SemiAnnually, Pays SemiAnnually | JPMorgan | 09/08/2033 | AUD | 1,100,000 | 3,586 | — | — | 3,586 | — |
| Fixed rate of 4.500% | 6-Month AUD BBSW | Receives SemiAnnually, Pays SemiAnnually | JPMorgan | 09/08/2033 | AUD | 4,200,000 | (17,556) | — | — | — | (17,556) |
| Fixed rate of 4.000% | 6-Month AUD BBSW | Receives SemiAnnually, Pays SemiAnnually | JPMorgan | 09/08/2033 | AUD | 23,900,000 | (195,826) | — | — | — | (195,826) |
| Fixed rate of 4.500% | 3-Month NZD LIBOR | Receives SemiAnnually, Pays Quarterly | JPMorgan | 09/14/2033 | NZD | 1,700,000 | (7,046) | — | — | — | (7,046) |
| Fixed rate of 4.000% | 3-Month NZD LIBOR | Receives SemiAnnually, Pays Quarterly | JPMorgan | 09/14/2033 | NZD | 900,000 | (8,037) | — | — | — | (8,037) |
| CORRA | Fixed rate of 3.000% | Receives SemiAnnually, Pays SemiAnnually | JPMorgan | 09/18/2033 | CAD | 11,300,000 | (30,786) | — | — | — | (30,786) |
| SONIA | Fixed rate of 3.250% | Receives Annually, Pays Annually | JPMorgan | 09/20/2033 | GBP | 42,800,000 | 2,157,173 | — | — | 2,157,173 | — |
| Fixed rate of 3.250% | 6-Month EURIBOR | Receives Annually, Pays SemiAnnually | JPMorgan | 09/20/2033 | EUR | 54,400,000 | 271,675 | — | — | 271,675 | — |
| Fixed rate of 3.500% | SOFR | Receives Annually, Pays Annually | JPMorgan | 09/20/2033 | USD | 1,400,000 | 876 | — | — | 876 | — |
| SONIA | Fixed rate of 3.250% | Receives Annually, Pays Annually | JPMorgan | 09/20/2033 | GBP | 2,300,000 | (10,845) | — | — | — | (10,845) |
| Fixed rate of 3.500% | SOFR | Receives Annually, Pays Annually | JPMorgan | 09/20/2033 | USD | 8,100,000 | (17,058) | — | — | — | (17,058) |
| 6-Month NOK NIBOR | Fixed rate of 3.000% | Receives SemiAnnually, Pays Annually | JPMorgan | 09/21/2033 | NOK | 54,000,000 | 80,623 | — | — | 80,623 | — |
| 3-Month SEK STIBOR | Fixed rate of 3.000% | Receives Quarterly, Pays Annually | JPMorgan | 09/21/2033 | SEK | 100,000 | — | — | — | — | — |
| Fixed rate of 4.000% | 6-Month AUD BBSW | Receives SemiAnnually, Pays SemiAnnually | JPMorgan | 12/08/2033 | AUD | 9,000,000 | 21,213 | — | — | 21,213 | — |
| 3-Month NZD LIBOR | Fixed rate of 4.500% | Receives Quarterly, Pays SemiAnnually | JPMorgan | 12/14/2033 | NZD | 300,000 | — | — | — | — | — |
| CORRA | Fixed rate of 3.500% | Receives SemiAnnually, Pays SemiAnnually | JPMorgan | 12/18/2033 | CAD | 1,100,000 | — | — | — | — | — |
| Fixed rate of 3.130% | 6-Month EURIBOR | Receives Annually, Pays SemiAnnually | JPMorgan | 12/20/2033 | EUR | 8,200,000 | 147,358 | — | — | 147,358 | — |
| SONIA | Fixed rate of 3.620% | Receives Annually, Pays Annually | JPMorgan | 12/20/2033 | GBP | 9,600,000 | — | — | — | — | — |
| Fixed rate of 3.480% | SOFR | Receives Annually, Pays Annually | JPMorgan | 12/20/2033 | USD | 6,600,000 | — | — | — | — | — |
| Fixed rate of 3.130% | 6-Month EURIBOR | Receives Annually, Pays SemiAnnually | JPMorgan | 12/20/2033 | EUR | 38,900,000 | (77,777) | — | — | — | (77,777) |
| 6-Month NOK NIBOR | Fixed rate of 3.500% | Receives SemiAnnually, Pays Annually | JPMorgan | 12/21/2033 | NOK | 23,000,000 | — | — | — | — | — |
| 3-Month SEK STIBOR | Fixed rate of 3.000% | Receives Quarterly, Pays Annually | JPMorgan | 12/21/2033 | SEK | 56,000,000 | — | — | — | — | — |
| 3-Month NZD LIBOR | Fixed rate of 4.488% | Receives Quarterly, Pays SemiAnnually | Morgan Stanley | 10/05/2032 | NZD | 16,000,000 | (105,956) | — | — | — | (105,956) |
| 3-Month NZD LIBOR | Fixed rate of 4.648% | Receives Quarterly, Pays SemiAnnually | Morgan Stanley | 11/03/2032 | NZD | 7,687,000 | (110,494) | — | — | — | (110,494) |
| Columbia Multi Strategy Alternatives Fund | Annual Report 2023 | 29 |
May 31, 2023
| Cleared interest rate swap contracts (continued) | |||||||||||
| Fund receives | Fund pays | Payment frequency | Counterparty | Maturity date | Notional currency | Notional amount | Value ($) | Upfront payments ($) | Upfront receipts ($) | Unrealized appreciation ($) | Unrealized depreciation ($) |
| Fixed rate of 2.690% | 3-Month SEK STIBOR | Receives Annually, Pays Quarterly | Morgan Stanley | 02/03/2033 | SEK | 57,000,000 | (68,873) | — | — | — | (68,873) |
| Fixed rate of 3.298% | 3-Month SEK STIBOR | Receives Annually, Pays Quarterly | Morgan Stanley | 03/03/2033 | SEK | 29,000,000 | 85,668 | — | — | 85,668 | — |
| 3-Month NZD LIBOR | Fixed rate of 4.665% | Receives Quarterly, Pays SemiAnnually | Morgan Stanley | 03/03/2033 | NZD | 6,000,000 | (91,150) | — | — | — | (91,150) |
| Total | 286,264 | — | — | 4,381,133 | (4,094,869) | ||||||
| Cleared credit default swap contracts - buy protection | |||||||||||
| Reference entity | Counterparty | Maturity date | Pay fixed rate (%) | Payment frequency | Notional currency | Notional amount | Value ($) | Upfront payments ($) | Upfront receipts ($) | Unrealized appreciation ($) | Unrealized depreciation ($) |
| Markit CDX North America High Yield Index, Series 40 | Morgan Stanley | 06/20/2028 | 5.000 | Quarterly | USD | 2,250,000 | (44,117) | — | — | — | (44,117) |
| Credit default swap contracts - sell protection | |||||||||||||
| Reference entity | Counterparty | Maturity date | Receive fixed rate (%) | Payment frequency | Implied credit spread (%)* | Notional currency | Notional amount | Value ($) | Periodic payments receivable (payable) ($) | Upfront payments ($) | Upfront receipts ($) | Unrealized appreciation ($) | Unrealized depreciation ($) |
| Markit CMBX North America Index, Series 10 BBB- | Morgan Stanley | 11/17/2059 | 3.000 | Monthly | 16.577 | USD | 500,000 | (163,881) | 292 | — | (96,670) | — | (66,919) |
| Markit CMBX North America Index, Series 10 BBB- | Morgan Stanley | 11/17/2059 | 3.000 | Monthly | 16.577 | USD | 1,200,000 | (393,313) | 700 | — | (271,847) | — | (120,766) |
| Markit CMBX North America Index, Series 10 BBB- | Morgan Stanley | 11/17/2059 | 3.000 | Monthly | 16.577 | USD | 2,000,000 | (655,522) | 1,167 | — | (307,973) | — | (346,382) |
| Markit CMBX North America Index, Series 10 BBB- | Morgan Stanley | 11/17/2059 | 3.000 | Monthly | 16.577 | USD | 3,500,000 | (1,147,162) | 2,042 | — | (640,494) | — | (504,626) |
| Markit CMBX North America Index, Series 10 BBB- | Morgan Stanley | 11/17/2059 | 3.000 | Monthly | 16.577 | USD | 5,000,000 | (1,638,804) | 2,917 | — | (938,117) | — | (697,770) |
| Total | (3,998,682) | 7,118 | — | (2,255,101) | — | (1,736,463) | |||||||
| 30 | Columbia Multi Strategy Alternatives Fund | Annual Report 2023 |
May 31, 2023
| Total return swap contracts | ||||||||||||
| Fund receives | Fund pays | Payment frequency | Counterparty | Maturity date | Notional currency | Notional amount | Value ($) | Periodic payments receivable (payable) ($) | Upfront payments ($) | Upfront receipts ($) | Unrealized appreciation ($) | Unrealized depreciation ($) |
| SORA minus 0.004% | Total return on MSCI Singapore Net Return SGD Index | Monthly | JPMorgan | 06/21/2023 | SGD | 1,731,473 | 34,070 | 1,581 | — | — | 35,651 | — |
| SORA minus 0.004% | Total return on MSCI Singapore Net Return SGD Index | Monthly | JPMorgan | 06/21/2023 | SGD | 502,510 | 9,888 | 459 | — | — | 10,347 | — |
| ESTR minus 0.005% | Total return on MSCI Netherlands Net Return EUR Index | Monthly | JPMorgan | 06/21/2023 | EUR | 916,830 | 5,631 | 600 | — | — | 6,231 | — |
| 1-Month PLN WIBOR minus 0.010% | Total return on MSCI Poland Net Return PLN Index | Monthly | JPMorgan | 06/21/2023 | PLN | 539,383 | 2,662 | 297 | — | — | 2,959 | — |
| ESTR minus 0.017% | Total return on MSCI France net return EUR Index | Monthly | JPMorgan | 06/21/2023 | EUR | 1,508,104 | — | — | — | — | — | — |
| ESTR minus 0.005% | Total return on MSCI Netherlands Net Return EUR Index | Monthly | JPMorgan | 06/21/2023 | EUR | 3,505,691 | — | — | — | — | — | — |
| 1-Month CAD Canada Bankers’ Acceptances minus 0.009% | Total return on MSCI Canada Net Return CAD Index | Monthly | JPMorgan | 06/21/2023 | CAD | 1,776,798 | — | — | — | — | — | — |
| Total return on MSCI Mexico Net Return MXN Index | 28-Day MXN TIIE-Banxico plus 0.005% | Monthly | JPMorgan | 06/21/2023 | MXN | 256,279 | (156) | (28) | — | — | — | (184) |
| Total return on MSCI Spain Net Return EUR Index | ESTR minus 0.003% | Monthly | JPMorgan | 06/21/2023 | EUR | 107,918 | (1,107) | — | — | — | — | (1,107) |
| Total return on MSCI South Africa Net Return ZAR Index | 1-Month ZAR JIBAR plus 0.008% | Monthly | JPMorgan | 06/21/2023 | ZAR | 2,456,138 | (4,884) | (426) | — | — | — | (5,310) |
| ESTR minus 0.005% | Total return on MSCI Netherlands Net Return EUR Index | Monthly | JPMorgan | 06/21/2023 | EUR | 313,634 | (6,056) | 378 | — | — | — | (5,678) |
| ESTR minus 0.005% | Total return on MSCI Netherlands Net Return EUR Index | Monthly | JPMorgan | 06/21/2023 | EUR | 315,928 | (6,101) | 404 | — | — | — | (5,697) |
| Total return on MSCI South Africa Net Return ZAR Index | 1-Month ZAR JIBAR plus 0.008% | Monthly | JPMorgan | 06/21/2023 | ZAR | 3,389,519 | (6,741) | (587) | — | — | — | (7,328) |
| Total return on MSCI Spain Net Return EUR Index | ESTR minus 0.003% | Monthly | JPMorgan | 06/21/2023 | EUR | 586,668 | (7,655) | (55) | — | — | — | (7,710) |
| Total return on MSCI Spain Net Return EUR Index | ESTR minus 0.003% | Monthly | JPMorgan | 06/21/2023 | EUR | 570,199 | (7,663) | (107) | — | — | — | (7,770) |
| Columbia Multi Strategy Alternatives Fund | Annual Report 2023 | 31 |
May 31, 2023
| Total return swap contracts (continued) | ||||||||||||
| Fund receives | Fund pays | Payment frequency | Counterparty | Maturity date | Notional currency | Notional amount | Value ($) | Periodic payments receivable (payable) ($) | Upfront payments ($) | Upfront receipts ($) | Unrealized appreciation ($) | Unrealized depreciation ($) |
| Total return on MSCI South Africa Net Return ZAR Index | 1-Month ZAR JIBAR plus 0.008% | Monthly | JPMorgan | 06/21/2023 | ZAR | 4,148,492 | (8,250) | (719) | — | — | — | (8,969) |
| Total return on MSCI South Africa Net Return ZAR Index | 1-Month ZAR JIBAR plus 0.008% | Monthly | JPMorgan | 06/21/2023 | ZAR | 4,208,632 | (8,370) | (729) | — | — | — | (9,099) |
| Total return on MSCI South Africa Net Return ZAR Index | 1-Month ZAR JIBAR plus 0.008% | Monthly | JPMorgan | 06/21/2023 | ZAR | 4,385,445 | (8,722) | (760) | — | — | — | (9,482) |
| ESTR minus 0.005% | Total return on MSCI Netherlands Net Return EUR Index | Monthly | JPMorgan | 06/21/2023 | EUR | 562,628 | (10,864) | 678 | — | — | — | (10,186) |
| Total return on MSCI Spain Net Return EUR Index | ESTR minus 0.003% | Monthly | JPMorgan | 06/21/2023 | EUR | 565,241 | (11,402) | (808) | — | — | — | (12,210) |
| Total return on MSCI Italy Net Return EUR Index | ESTR minus 0.008% | Monthly | JPMorgan | 06/21/2023 | EUR | 317,187 | (12,010) | (396) | — | — | — | (12,406) |
| Total return on MSCI Spain Net Return EUR Index | ESTR minus 0.003% | Monthly | JPMorgan | 06/21/2023 | EUR | 608,551 | (12,275) | (564) | — | — | — | (12,839) |
| Total return on MSCI Spain Net Return EUR Index | ESTR minus 0.003% | Monthly | JPMorgan | 06/21/2023 | EUR | 637,518 | (17,052) | (477) | — | — | — | (17,529) |
| ESTR minus 0.005% | Total return on MSCI Netherlands Net Return EUR Index | Monthly | JPMorgan | 06/21/2023 | EUR | 1,010,130 | (19,507) | 1,218 | — | — | — | (18,289) |
| Total return on MSCI Spain Net Return EUR Index | ESTR minus 0.003% | Monthly | JPMorgan | 06/21/2023 | EUR | 595,436 | (18,881) | (390) | — | — | — | (19,271) |
| ESTR minus 0.005% | Total return on MSCI Netherlands Net Return EUR Index | Monthly | JPMorgan | 06/21/2023 | EUR | 1,185,306 | (22,889) | 1,500 | — | — | — | (21,389) |
| ESTR minus 0.005% | Total return on MSCI Netherlands Net Return EUR Index | Monthly | JPMorgan | 06/21/2023 | EUR | 2,482,295 | (47,935) | 3,174 | — | — | — | (44,761) |
| Total return on MSCI Italy Net Return EUR Index | ESTR minus 0.008% | Monthly | JPMorgan | 06/21/2023 | EUR | 6,872,061 | (260,220) | (10,076) | — | — | — | (270,296) |
| Total | (446,489) | (5,833) | — | — | 55,188 | (507,510) | ||||||
| 32 | Columbia Multi Strategy Alternatives Fund | Annual Report 2023 |
May 31, 2023
| Total return swap contracts on futures | ||||||||
| Reference instrument* | Counterparty | Expiration date | Trading currency | Notional amount long(short) | Upfront payments ($) | Upfront receipts ($) | Value/Unrealized appreciation ($) | Value/Unrealized depreciation ($) |
| DTOP Index Jun 23 | Goldman Sachs International | 06/2023 | ZAR | 1,513,920 | — | — | — | (5,214) |
| TAIEX Index Jun 23 | Goldman Sachs International | 06/2023 | TWD | 52,761,600 | — | — | 64,064 | — |
| WIG 20 Index Jun 23 | Goldman Sachs International | 06/2023 | PLN | (5,295,900) | — | — | — | (11,106) |
| Ibovespa Index Jun 23 | Morgan Stanley | 06/2023 | BRL | (53,106,376) | — | — | — | (242,284) |
| KOSPI 200 Index Jun 23 | Morgan Stanley | 06/2023 | KRW | (8,136,000,000) | — | — | — | (314,846) |
| Swiss Market Index Jun 23 | Morgan Stanley | 06/2023 | CHF | (2,692,560) | — | — | — | (199,717) |
| Ibovespa Index Jun 23 | Morgan Stanley International | 06/2023 | BRL | (10,359,560) | — | — | — | (36,722) |
| KOSPI 200 Index Jun 23 | Morgan Stanley International | 06/2023 | KRW | 4,407,000,000 | — | — | 142,372 | — |
| Swiss Market Index Jun 23 | Morgan Stanley International | 06/2023 | CHF | (12,004,330) | — | — | 274,347 | — |
| Total | — | — | 480,783 | (809,889) | ||||
| * | If the notional amount of the swap contract is long and the swap contract’s value is positive (negative), the Fund will receive (pay) the total return. If the notional amount of the swap contract is short and the swap contract’s value is positive (negative), the Fund will pay (receive) the total return. Receipts and payments occur upon termination of the contract. |
| Reference index and values for swap contracts as of period end | ||
| Reference index | Reference rate | |
| 1-Month CAD Canada Bankers’ Acceptances | Canada Bankers’ Acceptances | 4.721% |
| 1-Month PLN WIBOR | Warsaw Interbank Offer Rate | 6.850% |
| 1-Month ZAR JIBAR | Johannesburg Interbank Average Rate | 8.333% |
| 28-Day MXN TIIE-Banxico | Interbank Equilibrium Interest Rate | 11.497% |
| 3-Month AUD BBSW | Bank Bill Swap Rate | 3.982% |
| 3-Month NZD LIBOR | London Interbank Offered Rate | 5.690% |
| 3-Month SEK STIBOR | Stockholm Interbank Offered Rate | 3.705% |
| 6-Month AUD BBSW | Bank Bill Swap Rate | 4.170% |
| 6-Month EURIBOR | Euro Interbank Offered Rate | 3.746% |
| 6-Month NOK NIBOR | Norwegian Interbank Offered Rate | 4.370% |
| ESTR | Euro Short Term Rate | 3.144% |
| CORRA | Canadian Overnight Repo Rate Average | 4.500% |
| SOFR | Secured Overnight Financing Rate | 5.080% |
| SONIA | Sterling Overnight Index Average | 4.428% |
| SORA | Singapore Overnight Rate Average | 3.724% |
| (a) | Represents privately placed and other securities and instruments exempt from Securities and Exchange Commission registration (collectively, private placements), such as Section 4(a)(2) and Rule 144A eligible securities, which are often sold only to qualified institutional buyers. At May 31, 2023, the total value of these securities amounted to $161,512,300, which represents 21.86% of total net assets. |
| (b) | Variable rate security. The interest rate shown was the current rate as of May 31, 2023. |
| (c) | Security represents a pool of loans that generate cash payments generally over fixed periods of time. Such securities entitle the security holders to receive distributions (i.e. principal and interest, net of fees and expenses) that are tied to the payments made by the borrower on the underlying loans. Due to the structure of the security the cash payments received are not known until the time of payment. The interest rate shown is the stated coupon rate as of May 31, 2023 and is not reflective of the cash flow payments. |
| (d) | Valuation based on significant unobservable inputs. |
| Columbia Multi Strategy Alternatives Fund | Annual Report 2023 | 33 |
May 31, 2023
| (e) | Represents fair value as determined in good faith under procedures approved by the Board of Trustees. At May 31, 2023, the total value of these securities amounted to $7,201,445, which represents 0.97% of total net assets. |
| (f) | Variable or floating rate security, the interest rate of which adjusts periodically based on changes in current interest rates and prepayments on the underlying pool of assets. The interest rate shown was the current rate as of May 31, 2023. |
| (g) | Represents interest only securities which have the right to receive the monthly interest payments on an underlying pool of mortgage loans. |
| (h) | Represents a security purchased on a when-issued basis. |
| (i) | This security or a portion of this security has been pledged as collateral in connection with derivative contracts. |
| (j) | The rate shown is the seven-day current annualized yield at May 31, 2023. |
| (k) | As defined in the Investment Company Act of 1940, as amended, an affiliated company is one in which the Fund owns 5% or more of the company’s outstanding voting securities, or a company which is under common ownership or control with the Fund. The value of the holdings and transactions in these affiliated companies during the year ended May 31, 2023 are as follows: |
| Affiliated issuers | Beginning of period($) | Purchases($) | Sales($) | Net change in unrealized appreciation (depreciation)($) | End of period($) | Realized gain (loss)($) | Dividends($) | End of period shares |
| Columbia Short-Term Cash Fund, 5.241% | ||||||||
| 325,728,447 | 867,469,360 | (887,815,657) | (9,506) | 305,372,644 | (31,686) | 11,362,489 | 305,525,407 | |
| CMO | Collateralized Mortgage Obligation |
| LIBOR | London Interbank Offered Rate |
| SOFR | Secured Overnight Financing Rate |
| TBA | To Be Announced |
| AUD | Australian Dollar |
| BRL | Brazilian Real |
| CAD | Canada Dollar |
| CHF | Swiss Franc |
| CLP | Chilean Peso |
| CNH | Yuan Offshore Renminbi |
| COP | Colombian Peso |
| CZK | Czech Koruna |
| EUR | Euro |
| GBP | British Pound |
| HUF | Hungarian Forint |
| IDR | Indonesian Rupiah |
| ILS | Israeli Shekel |
| INR | Indian Rupee |
| JPY | Japanese Yen |
| KRW | South Korean Won |
| MXN | Mexican Peso |
| MYR | Malaysian Ringgit |
| NOK | Norwegian Krone |
| NZD | New Zealand Dollar |
| PHP | Philippine Peso |
| PLN | Polish Zloty |
| SEK | Swedish Krona |
| SGD | Singapore Dollar |
| 34 | Columbia Multi Strategy Alternatives Fund | Annual Report 2023 |
May 31, 2023
| THB | Thai Baht |
| TRY | Turkish Lira |
| TWD | New Taiwan Dollar |
| USD | US Dollar |
| ZAR | South African Rand |
| ■ | Level 1 — Valuations based on quoted prices for investments in active markets that the Fund has the ability to access at the measurement date. Valuation adjustments are not applied to Level 1 investments. |
| ■ | Level 2 — Valuations based on other significant observable inputs (including quoted prices for similar securities, interest rates, prepayment speeds, credit risks, etc.). |
| ■ | Level 3 — Valuations based on significant unobservable inputs (including the Fund’s own assumptions and judgment in determining the fair value of investments). |
| Level 1 ($) | Level 2 ($) | Level 3 ($) | Total ($) | |
| Investments in Securities | ||||
| Asset-Backed Securities — Non-Agency | — | 28,971,320 | 3,583,903 | 32,555,223 |
| Commercial Mortgage-Backed Securities - Agency | — | 537,821 | — | 537,821 |
| Commercial Mortgage-Backed Securities - Non-Agency | — | 20,414,609 | — | 20,414,609 |
| Residential Mortgage-Backed Securities - Agency | — | 240,484,882 | — | 240,484,882 |
| Residential Mortgage-Backed Securities - Non-Agency | — | 100,550,369 | 11,685,826 | 112,236,195 |
| Treasury Bills | — | 156,925,886 | — | 156,925,886 |
| Call Option Contracts Purchased | — | 3,909,158 | — | 3,909,158 |
| Put Option Contracts Purchased | — | 281,120 | — | 281,120 |
| Money Market Funds | 305,372,644 | — | — | 305,372,644 |
| Total Investments in Securities | 305,372,644 | 552,075,165 | 15,269,729 | 872,717,538 |
| Investments in Derivatives |
| Columbia Multi Strategy Alternatives Fund | Annual Report 2023 | 35 |
May 31, 2023
| Level 1 ($) | Level 2 ($) | Level 3 ($) | Total ($) | |
| Asset | ||||
| Forward Foreign Currency Exchange Contracts | — | 48,127,094 | — | 48,127,094 |
| Futures Contracts | 23,613,961 | — | — | 23,613,961 |
| Swap Contracts | — | 4,917,104 | — | 4,917,104 |
| Liability | ||||
| Forward Foreign Currency Exchange Contracts | — | (54,613,795) | — | (54,613,795) |
| Futures Contracts | (25,558,285) | — | — | (25,558,285) |
| Call Option Contracts Written | — | (231) | — | (231) |
| Put Option Contracts Written | — | (1,077,779) | — | (1,077,779) |
| Swap Contracts | — | (7,192,848) | — | (7,192,848) |
| Total | 303,428,320 | 542,234,710 | 15,269,729 | 860,932,759 |
| Balance as of 05/31/2022 ($) | Increase (decrease) in accrued discounts/ premiums ($) | Realized gain (loss) ($) | Change in unrealized appreciation (depreciation)(a) ($) | Purchases ($) | Sales ($) | Transfers into Level 3 ($) | Transfers out of Level 3 ($) | Balance as of 05/31/2023 ($) | |
| Asset-Backed Securities — Non-Agency | 11,283,627 | (8,962,254) | (21,249) | 4,386,323 | 1,286,896 | (4,389,440) | — | — | 3,583,903 |
| Residential Mortgage-Backed Securities — Non-Agency | 12,074,645 | 22,067 | 3 | (23,663) | 5,649,375 | (6,036,601) | — | — | 11,685,826 |
| Total | 23,358,272 | (8,940,187) | (21,246) | 4,362,660 | 6,936,271 | (10,426,041) | — | — | 15,269,729 |
| 36 | Columbia Multi Strategy Alternatives Fund | Annual Report 2023 |
May 31, 2023
| Assets | |
| Investments in securities, at value | |
| Unaffiliated issuers (cost $586,806,032) | $563,154,616 |
| Affiliated issuers (cost $305,423,141) | 305,372,644 |
| Option contracts purchased (cost $6,595,500) | 4,190,278 |
| Cash | 6,347,893 |
| Foreign currency (cost $7,080,662) | 7,014,819 |
| Cash collateral held at broker for: | |
| Forward foreign currency exchange contracts | 2,160,000 |
| Swap contracts | 6,710,000 |
| TBA | 4,253,000 |
| Other(a) | 4,660,000 |
| Margin deposits on: | |
| Futures contracts | 52,561,182 |
| Swap contracts | 5,613,349 |
| Unrealized appreciation on forward foreign currency exchange contracts | 48,127,094 |
| Unrealized appreciation on swap contracts | 535,971 |
| Receivable for: | |
| Investments sold | 4,364,541 |
| Capital shares sold | 370,825 |
| Dividends | 1,333,229 |
| Interest | 1,217,902 |
| Variation margin for futures contracts | 6,853,090 |
| Variation margin for swap contracts | 2,519,580 |
| Expense reimbursement due from Investment Manager | 3,048 |
| Prepaid expenses | 4,814 |
| Trustees’ deferred compensation plan | 64,724 |
| Total assets | 1,027,432,599 |
| Liabilities | |
| Option contracts written, at value (premiums received $1,000,875) | 1,078,010 |
| Unrealized depreciation on forward foreign currency exchange contracts | 54,613,795 |
| Unrealized depreciation on swap contracts | 3,053,862 |
| Upfront receipts on swap contracts | 2,255,101 |
| Cash collateral due to broker for: | |
| Swap contracts | 430,000 |
| Payable for: | |
| Investments purchased | 3,812,184 |
| Investments purchased on a delayed delivery basis | 208,385,462 |
| Capital shares purchased | 1,200,338 |
| Variation margin for futures contracts | 8,995,551 |
| Variation margin for swap contracts | 4,350,418 |
| Management services fees | 19,424 |
| Distribution and/or service fees | 204 |
| Transfer agent fees | 88,574 |
| Compensation of board members | 22,524 |
| Other expenses | 91,480 |
| Trustees’ deferred compensation plan | 64,724 |
| Other liabilities | 67,155 |
| Total liabilities | 288,528,806 |
| Net assets applicable to outstanding capital stock | $738,903,793 |
| Represented by | |
| Paid in capital | 897,890,840 |
| Total distributable earnings (loss) | (158,987,047) |
| Total - representing net assets applicable to outstanding capital stock | $738,903,793 |
| Columbia Multi Strategy Alternatives Fund | Annual Report 2023 | 37 |
May 31, 2023
| Class A | |
| Net assets | $4,979,782 |
| Shares outstanding | 181,364 |
| Net asset value per share | $27.46 |
| Maximum sales charge | 5.75% |
| Maximum offering price per share (calculated by dividing the net asset value per share by 1.0 minus the maximum sales charge for Class A shares) | $29.14 |
| Advisor Class | |
| Net assets | $1,449,123 |
| Shares outstanding | 52,095 |
| Net asset value per share | $27.82 |
| Class C | |
| Net assets | $6,190,959 |
| Shares outstanding | 234,348 |
| Net asset value per share | $26.42 |
| Institutional Class | |
| Net assets | $725,844,678 |
| Shares outstanding | 26,153,243 |
| Net asset value per share | $27.75 |
| Institutional 2 Class | |
| Net assets | $425,474 |
| Shares outstanding | 15,255 |
| Net asset value per share | $27.89 |
| Institutional 3 Class | |
| Net assets | $6,997 |
| Shares outstanding | 250 |
| Net asset value per share | $27.99 |
| Class R | |
| Net assets | $6,780 |
| Shares outstanding | 250 |
| Net asset value per share | $27.12 |
| (a) | Includes collateral related to option contracts purchased, option contracts written and swap contracts. |
| 38 | Columbia Multi Strategy Alternatives Fund | Annual Report 2023 |
Year Ended May 31, 2023
| Net investment income | |
| Income: | |
| Dividends — unaffiliated issuers | $333,247 |
| Dividends — affiliated issuers | 11,362,489 |
| Interest | 22,472,366 |
| Interfund lending | 6,038 |
| Total income | 34,174,140 |
| Expenses: | |
| Management services fees | 7,526,102 |
| Distribution and/or service fees | |
| Class A | 9,802 |
| Class C | 129,912 |
| Class R | 34 |
| Transfer agent fees | |
| Class A | 5,145 |
| Advisor Class | 1,345 |
| Class C | 16,741 |
| Institutional Class | 993,111 |
| Institutional 2 Class | 398 |
| Institutional 3 Class | 3 |
| Class R | 8 |
| Compensation of board members | 28,295 |
| Custodian fees | 132,382 |
| Printing and postage fees | 94,050 |
| Registration fees | 142,437 |
| Accounting services fees | 50,490 |
| Legal fees | 22,996 |
| Interest on collateral | 339,040 |
| Compensation of chief compliance officer | 146 |
| Other | 34,842 |
| Total expenses | 9,527,279 |
| Fees waived or expenses reimbursed by Investment Manager and its affiliates | (1,037,096) |
| Expense reduction | (20) |
| Total net expenses | 8,490,163 |
| Net investment income | 25,683,977 |
| Columbia Multi Strategy Alternatives Fund | Annual Report 2023 | 39 |
Year Ended May 31, 2023
| Realized and unrealized gain (loss) — net | |
| Net realized gain (loss) on: | |
| Investments — unaffiliated issuers | $(2,837,261) |
| Investments — affiliated issuers | (31,686) |
| Foreign currency translations | (2,258,708) |
| Forward foreign currency exchange contracts | 10,309,157 |
| Futures contracts | 724,135 |
| Option contracts purchased | (1,301,509) |
| Option contracts written | (2,252,288) |
| Swap contracts | (4,065,533) |
| Net realized loss | (1,713,693) |
| Net change in unrealized appreciation (depreciation) on: | |
| Investments — unaffiliated issuers | (11,921,942) |
| Investments — affiliated issuers | (9,506) |
| Foreign currency translations | (198,215) |
| Forward sale commitments | 726,562 |
| Forward foreign currency exchange contracts | (14,244,110) |
| Futures contracts | (7,758,566) |
| Option contracts purchased | (2,066,592) |
| Option contracts written | 3,068,327 |
| Swap contracts | (99,501) |
| Net change in unrealized appreciation (depreciation) | (32,503,543) |
| Net realized and unrealized loss | (34,217,236) |
| Net decrease in net assets resulting from operations | $(8,533,259) |
| 40 | Columbia Multi Strategy Alternatives Fund | Annual Report 2023 |
| Year Ended May 31, 2023 | Year Ended May 31, 2022 | |
| Operations | ||
| Net investment income | $25,683,977 | $10,042,916 |
| Net realized loss | (1,713,693) | (18,255,016) |
| Net change in unrealized appreciation (depreciation) | (32,503,543) | (19,304,538) |
| Net decrease in net assets resulting from operations | (8,533,259) | (27,516,638) |
| Distributions to shareholders | ||
| Net investment income and net realized gains | ||
| Class A | (26,674) | (36,833) |
| Advisor Class | (11,736) | (7,417) |
| Class C | — | (1,331) |
| Institutional Class | (5,902,262) | (19,479,617) |
| Institutional 2 Class | (4,687) | (16,578) |
| Institutional 3 Class | (63) | (176) |
| Class R | (21) | (132) |
| Total distributions to shareholders | (5,945,443) | (19,542,084) |
| Increase (decrease) in net assets from capital stock activity | (53,236,488) | 44,080,394 |
| Total decrease in net assets | (67,715,190) | (2,978,328) |
| Net assets at beginning of year | 806,618,983 | 809,597,311 |
| Net assets at end of year | $738,903,793 | $806,618,983 |
| Columbia Multi Strategy Alternatives Fund | Annual Report 2023 | 41 |
| Year Ended | Year Ended | |||
| May 31, 2023 | May 31, 2022 | |||
| Shares | Dollars ($) | Shares | Dollars ($) | |
| Capital stock activity | ||||
| Class A | ||||
| Subscriptions | 135,677 | 3,821,407 | 32,274 | 917,058 |
| Distributions reinvested | 956 | 26,635 | 1,319 | 36,684 |
| Redemptions | (31,633) | (886,353) | (15,870) | (452,919) |
| Net increase | 105,000 | 2,961,689 | 17,723 | 500,823 |
| Advisor Class | ||||
| Subscriptions | 44,369 | 1,270,112 | 21,107 | 632,532 |
| Distributions reinvested | 414 | 11,680 | 257 | 7,231 |
| Redemptions | (3,897) | (110,606) | (17,689) | (523,259) |
| Net increase | 40,886 | 1,171,186 | 3,675 | 116,504 |
| Class C | ||||
| Subscriptions | 246,693 | 6,652,400 | 480,979 | 13,056,328 |
| Distributions reinvested | — | — | 46 | 1,237 |
| Redemptions | (489,109) | (13,101,135) | (8,252) | (224,277) |
| Net increase (decrease) | (242,416) | (6,448,735) | 472,773 | 12,833,288 |
| Institutional Class | ||||
| Subscriptions | 5,650,727 | 159,865,346 | 7,526,146 | 219,144,305 |
| Distributions reinvested | 209,871 | 5,901,570 | 693,364 | 19,476,610 |
| Redemptions | (7,644,047) | (216,457,033) | (7,193,911) | (207,819,869) |
| Net increase (decrease) | (1,783,449) | (50,690,117) | 1,025,599 | 30,801,046 |
| Institutional 2 Class | ||||
| Subscriptions | — | — | 4,876 | 144,203 |
| Distributions reinvested | 164 | 4,627 | 581 | 16,407 |
| Redemptions | (8,284) | (235,138) | (11,164) | (331,877) |
| Net decrease | (8,120) | (230,511) | (5,707) | (171,267) |
| Total net increase (decrease) | (1,888,099) | (53,236,488) | 1,514,063 | 44,080,394 |
| 42 | Columbia Multi Strategy Alternatives Fund | Annual Report 2023 |
| Columbia Multi Strategy Alternatives Fund | Annual Report 2023 | 43 |
| Net asset value, beginning of period | Net investment income (loss) | Net realized and unrealized gain (loss) | Total from investment operations | Distributions from net investment income | Total distributions to shareholders | |
| Class A | ||||||
| Year Ended 5/31/2023 | $28.00 | 0.98 | (1.36) | (0.38) | (0.16) | (0.16) |
| Year Ended 5/31/2022 | $29.65 | 0.47 | (1.52) | (1.05) | (0.60) | (0.60) |
| Year Ended 5/31/2021(e) | $27.84 | 0.19 | 1.62 | 1.81 | — | — |
| Year Ended 5/31/2020(e) | $29.79 | 0.28 | (2.23) | (1.95) | — | — |
| Year Ended 5/31/2019(e) | $34.63 | 0.32 | (5.16) | (4.84) | — | — |
| Advisor Class | ||||||
| Year Ended 5/31/2023 | $28.35 | 1.14 | (1.45) | (0.31) | (0.22) | (0.22) |
| Year Ended 5/31/2022 | $30.03 | 0.20 | (1.21) | (1.01) | (0.67) | (0.67) |
| Year Ended 5/31/2021(e) | $28.12 | 0.28 | 1.63 | 1.91 | — | — |
| Year Ended 5/31/2020(e) | $30.01 | 0.32 | (2.21) | (1.89) | — | — |
| Year Ended 5/31/2019(e) | $34.78 | 0.36 | (5.13) | (4.77) | — | — |
| Class C | ||||||
| Year Ended 5/31/2023 | $26.99 | 0.50 | (1.07) | (0.57) | — | — |
| Year Ended 5/31/2022 | $28.59 | 6.57 | (7.80) | (1.23) | (0.37) | (0.37) |
| Year Ended 5/31/2021(e) | $27.05 | (0.04) | 1.58 | 1.54 | — | — |
| Year Ended 5/31/2020(e) | $29.16 | 0.04 | (2.15) | (2.11) | — | — |
| Year Ended 5/31/2019(e) | $34.15 | 0.08 | (5.07) | (4.99) | — | — |
| Institutional Class | ||||||
| Year Ended 5/31/2023 | $28.30 | 0.93 | (1.25) | (0.32) | (0.23) | (0.23) |
| Year Ended 5/31/2022 | $29.97 | 0.34 | (1.34) | (1.00) | (0.67) | (0.67) |
| Year Ended 5/31/2021(e) | $28.07 | 0.28 | 1.62 | 1.90 | — | — |
| Year Ended 5/31/2020(e) | $29.96 | 0.32 | (2.21) | (1.89) | — | — |
| Year Ended 5/31/2019(e) | $34.73 | 0.40 | (5.17) | (4.77) | — | — |
| Institutional 2 Class | ||||||
| Year Ended 5/31/2023 | $28.44 | 0.89 | (1.20) | (0.31) | (0.24) | (0.24) |
| Year Ended 5/31/2022 | $30.12 | 0.33 | (1.33) | (1.00) | (0.68) | (0.68) |
| Year Ended 5/31/2021(e) | $28.19 | 0.34 | 1.59 | 1.93 | — | — |
| Year Ended 5/31/2020(e) | $30.07 | 0.40 | (2.28) | (1.88) | — | — |
| Year Ended 5/31/2019(e) | $34.84 | 0.44 | (5.21) | (4.77) | — | — |
| 44 | Columbia Multi Strategy Alternatives Fund | Annual Report 2023 |
| Net asset value, end of period | Total return | Total gross expense ratio to average net assets(a) | Total net expense ratio to average net assets(a),(b) | Net investment income (loss) ratio to average net assets | Portfolio turnover | Net assets, end of period (000’s) | |
| Class A | |||||||
| Year Ended 5/31/2023 | $27.46 | (1.38%) | 1.46%(c) | 1.32%(c),(d) | 3.54% | 660% | $4,980 |
| Year Ended 5/31/2022 | $28.00 | (3.54%) | 1.42%(c) | 1.30%(c),(d) | 1.62% | 352% | $2,138 |
| Year Ended 5/31/2021(e) | $29.65 | 6.50% | 1.40%(c),(f) | 1.27%(c),(f) | 0.66% | 555% | $1,739 |
| Year Ended 5/31/2020(e) | $27.84 | (6.58%) | 1.42%(c),(f) | 1.25%(c),(f) | 0.94% | 789% | $2,125 |
| Year Ended 5/31/2019(e) | $29.79 | (13.97%) | 1.45%(c) | 1.24%(c) | 0.98% | 0% | $3,103 |
| Advisor Class | |||||||
| Year Ended 5/31/2023 | $27.82 | (1.09%) | 1.22%(c) | 1.07%(c),(d) | 4.05% | 660% | $1,449 |
| Year Ended 5/31/2022 | $28.35 | (3.34%) | 1.16%(c) | 1.05%(c),(d) | 0.66% | 352% | $318 |
| Year Ended 5/31/2021(e) | $30.03 | 6.79% | 1.16%(c),(f) | 1.02%(c),(f) | 0.97% | 555% | $226 |
| Year Ended 5/31/2020(e) | $28.12 | (6.27%) | 1.17%(c),(f) | 0.99%(c),(f) | 1.15% | 789% | $133 |
| Year Ended 5/31/2019(e) | $30.01 | (13.79%) | 1.20%(c) | 1.01%(c) | 1.07% | 0% | $216 |
| Class C | |||||||
| Year Ended 5/31/2023 | $26.42 | (2.11%) | 2.19%(c) | 2.06%(c),(d) | 1.84% | 660% | $6,191 |
| Year Ended 5/31/2022 | $26.99 | (4.29%) | 2.17%(c) | 2.06%(c),(d) | 24.79% | 352% | $12,869 |
| Year Ended 5/31/2021(e) | $28.59 | 5.73% | 2.15%(c),(f) | 2.02%(c),(f) | (0.14%) | 555% | $114 |
| Year Ended 5/31/2020(e) | $27.05 | (7.27%) | 2.17%(c),(f) | 1.99%(c),(f) | 0.21% | 789% | $220 |
| Year Ended 5/31/2019(e) | $29.16 | (14.64%) | 2.20%(c) | 1.99%(c) | 0.22% | 0% | $493 |
| Institutional Class | |||||||
| Year Ended 5/31/2023 | $27.75 | (1.15%) | 1.20%(c) | 1.06%(c),(d) | 3.29% | 660% | $725,845 |
| Year Ended 5/31/2022 | $28.30 | (3.32%) | 1.17%(c) | 1.05%(c),(d) | 1.15% | 352% | $790,615 |
| Year Ended 5/31/2021(e) | $29.97 | 6.73% | 1.16%(c),(f) | 1.02%(c),(f) | 0.95% | 555% | $806,627 |
| Year Ended 5/31/2020(e) | $28.07 | (6.28%) | 1.17%(c),(f) | 1.00%(c),(f) | 1.17% | 789% | $614,500 |
| Year Ended 5/31/2019(e) | $29.96 | (13.71%) | 1.20%(c) | 0.99%(c) | 1.23% | 0% | $587,203 |
| Institutional 2 Class | |||||||
| Year Ended 5/31/2023 | $27.89 | (1.11%) | 1.13%(c) | 1.02%(c) | 3.12% | 660% | $425 |
| Year Ended 5/31/2022 | $28.44 | (3.29%) | 1.12%(c) | 1.01%(c) | 1.11% | 352% | $665 |
| Year Ended 5/31/2021(e) | $30.12 | 6.81% | 1.11%(c),(f) | 0.98%(c),(f) | 1.14% | 555% | $876 |
| Year Ended 5/31/2020(e) | $28.19 | (6.25%) | 1.10%(c),(f) | 0.92%(c),(f) | 1.28% | 789% | $124 |
| Year Ended 5/31/2019(e) | $30.07 | (13.66%) | 1.11%(c) | 0.90%(c) | 1.32% | 0% | $667 |
| Columbia Multi Strategy Alternatives Fund | Annual Report 2023 | 45 |
| Net asset value, beginning of period | Net investment income (loss) | Net realized and unrealized gain (loss) | Total from investment operations | Distributions from net investment income | Total distributions to shareholders | |
| Institutional 3 Class | ||||||
| Year Ended 5/31/2023 | $28.54 | 0.98 | (1.28) | (0.30) | (0.25) | (0.25) |
| Year Ended 5/31/2022 | $30.22 | 0.39 | (1.37) | (0.98) | (0.70) | (0.70) |
| Year Ended 5/31/2021(e) | $28.27 | 0.23 | 1.72 | 1.95 | — | — |
| Year Ended 5/31/2020(e) | $30.14 | 0.36 | (2.23) | (1.87) | — | — |
| Year Ended 5/31/2019(e) | $34.89 | 0.44 | (5.19) | (4.75) | — | — |
| Class R | ||||||
| Year Ended 5/31/2023 | $27.65 | 0.79 | (1.23) | (0.44) | (0.09) | (0.09) |
| Year Ended 5/31/2022 | $29.30 | 0.21 | (1.33) | (1.12) | (0.53) | (0.53) |
| Year Ended 5/31/2021(e) | $27.57 | 0.13 | 1.60 | 1.73 | — | — |
| Year Ended 5/31/2020(e) | $29.56 | 0.20 | (2.19) | (1.99) | — | — |
| Year Ended 5/31/2019(e) | $34.44 | 0.24 | (5.12) | (4.88) | — | — |
| Notes to Consolidated Financial Highlights | |
| (a) | In addition to the fees and expenses that the Fund bears directly, the Fund indirectly bears a pro rata share of the fees and expenses of any other funds in which it invests. Such indirect expenses are not included in the Fund’s reported expense ratios. |
| (b) | Total net expenses include the impact of certain fee waivers/expense reimbursements made by the Investment Manager and certain of its affiliates, if applicable. |
| (c) | Ratios include interest on collateral expense. For the periods indicated below, if interest on collateral expense had been excluded, expenses would have been lower by: |
| Class | 5/31/2023 | 5/31/2022 | 5/31/2021 | 5/31/2020 | 5/31/2019 |
| Class A | 0.05% | 0.04% | 0.01% | 0.01% | 0.02% |
| Advisor Class | 0.05% | 0.04% | 0.01% | 0.01% | 0.02% |
| Class C | 0.04% | 0.04% | 0.01% | 0.01% | 0.02% |
| Institutional Class | 0.04% | 0.04% | 0.01% | 0.01% | 0.02% |
| Institutional 2 Class | 0.04% | 0.04% | 0.01% | 0.01% | 0.02% |
| Institutional 3 Class | 0.04% | 0.04% | less than 0.01% | 0.01% | 0.02% |
| Class R | 0.04% | 0.04% | 0.01% | 0.01% | 0.02% |
| (d) | The benefits derived from expense reductions had an impact of less than 0.01%. |
| (e) | Per share amounts have been adjusted on a retroactive basis to reflect a 4 to 1 reverse stock split completed after the close of business on September 11, 2020. |
| (f) | Ratios include line of credit interest expense which is less than 0.01%. |
| 46 | Columbia Multi Strategy Alternatives Fund | Annual Report 2023 |
| Net asset value, end of period | Total return | Total gross expense ratio to average net assets(a) | Total net expense ratio to average net assets(a),(b) | Net investment income (loss) ratio to average net assets | Portfolio turnover | Net assets, end of period (000’s) | |
| Institutional 3 Class | |||||||
| Year Ended 5/31/2023 | $27.99 | (1.05%) | 1.08%(c) | 0.97%(c) | 3.43% | 660% | $7 |
| Year Ended 5/31/2022 | $28.54 | (3.21%) | 1.07%(c) | 0.96%(c) | 1.32% | 352% | $7 |
| Year Ended 5/31/2021(e) | $30.22 | 6.86% | 1.03%(c),(f) | 0.90%(c),(f) | 0.79% | 555% | $8 |
| Year Ended 5/31/2020(e) | $28.27 | (6.11%) | 1.05%(c),(f) | 0.88%(c),(f) | 1.30% | 789% | $14,960 |
| Year Ended 5/31/2019(e) | $30.14 | (13.65%) | 1.06%(c) | 0.84%(c) | 1.38% | 0% | $17,670 |
| Class R | |||||||
| Year Ended 5/31/2023 | $27.12 | (1.61%) | 1.66%(c) | 1.55%(c),(d) | 2.85% | 660% | $7 |
| Year Ended 5/31/2022 | $27.65 | (3.83%) | 1.66%(c) | 1.55%(c),(d) | 0.74% | 352% | $7 |
| Year Ended 5/31/2021(e) | $29.30 | 6.31% | 1.63%(c),(f) | 1.51%(c),(f) | 0.45% | 555% | $7 |
| Year Ended 5/31/2020(e) | $27.57 | (6.77%) | 1.63%(c),(f) | 1.47%(c),(f) | 0.71% | 789% | $7 |
| Year Ended 5/31/2019(e) | $29.56 | (14.17%) | 1.69%(c) | 1.48%(c) | 0.75% | 0% | $7 |
| Columbia Multi Strategy Alternatives Fund | Annual Report 2023 | 47 |
May 31, 2023
| CMSAF1 Offshore Fund, Ltd. | CMSAF2 Offshore Fund, Ltd. | CMSAF3 Offshore Fund, Ltd. | |
| % of consolidated fund net assets | 1.85% | 5.77% | 2.91% |
| Net assets | $13,692,693 | $42,670,340 | $21,471,760 |
| Net investment income (loss) | 4,564 | 1,108,450 | 693,136 |
| Net realized gain (loss) | 264,205 | 2,038,349 | 1,530,908 |
| Net change in unrealized appreciation (depreciation) | (1,141,324) | 2,701,273 | (1,008,397) |
| 48 | Columbia Multi Strategy Alternatives Fund | Annual Report 2023 |
May 31, 2023
| Columbia Multi Strategy Alternatives Fund | Annual Report 2023 | 49 |
May 31, 2023
| 50 | Columbia Multi Strategy Alternatives Fund | Annual Report 2023 |
May 31, 2023
| Columbia Multi Strategy Alternatives Fund | Annual Report 2023 | 51 |
May 31, 2023
| 52 | Columbia Multi Strategy Alternatives Fund | Annual Report 2023 |
May 31, 2023
| Columbia Multi Strategy Alternatives Fund | Annual Report 2023 | 53 |
May 31, 2023
| 54 | Columbia Multi Strategy Alternatives Fund | Annual Report 2023 |
May 31, 2023
| Asset derivatives | ||
| Risk exposure category | Consolidated statement of assets and liabilities location | Fair value ($) |
| Equity risk | Component of total distributable earnings (loss) — unrealized appreciation on futures contracts | 3,672,782* |
| Equity risk | Component of total distributable earnings (loss) — unrealized appreciation on swap contracts | 535,971* |
| Foreign exchange risk | Unrealized appreciation on forward foreign currency exchange contracts | 48,127,094 |
| Interest rate risk | Component of total distributable earnings (loss) — unrealized appreciation on futures contracts | 3,627,246* |
| Interest rate risk | Investments, at value — Option contracts purchased | 4,190,278 |
| Interest rate risk | Component of total distributable earnings (loss) — unrealized appreciation on swap contracts | 4,381,133* |
| Commodity-related investment risk | Component of total distributable earnings (loss) — unrealized appreciation on futures contracts | 16,313,933* |
| Total | 80,848,437 |
| Liability derivatives | ||
| Risk exposure category | Consolidated statement of assets and liabilities location | Fair value ($) |
| Credit risk | Component of total distributable earnings (loss) — unrealized depreciation on swap contracts | 1,780,580* |
| Credit risk | Upfront receipts on swap contracts | 2,255,101 |
| Equity risk | Component of total distributable earnings (loss) — unrealized depreciation on futures contracts | 7,932,705* |
| Equity risk | Component of total distributable earnings (loss) — unrealized depreciation on swap contracts | 1,317,399* |
| Foreign exchange risk | Unrealized depreciation on forward foreign currency exchange contracts | 54,613,795 |
| Interest rate risk | Component of total distributable earnings (loss) — unrealized depreciation on futures contracts | 4,240,312* |
| Interest rate risk | Option contracts written, at value | 1,078,010 |
| Interest rate risk | Component of total distributable earnings (loss) — unrealized depreciation on swap contracts | 4,094,869* |
| Commodity-related investment risk | Component of total distributable earnings (loss) — unrealized depreciation on futures contracts | 13,385,268* |
| Total | 90,698,039 |
| * | Includes cumulative appreciation (depreciation) as reported in the tables following the Consolidated Portfolio of Investments. Only the current day’s variation margin for futures and centrally cleared swaps, if any, is reported in receivables or payables in the Consolidated Statement of Assets and Liabilities. |
| Columbia Multi Strategy Alternatives Fund | Annual Report 2023 | 55 |
May 31, 2023
| Amount of realized gain (loss) on derivatives recognized in income | ||||||
| Risk exposure category | Forward foreign currency exchange contracts ($) | Futures contracts ($) | Option contracts purchased ($) | Option contracts written ($) | Swap contracts ($) | Total ($) |
| Commodity-related investment risk | — | 4,100,730 | — | — | — | 4,100,730 |
| Credit risk | — | — | — | — | (2,361,385) | (2,361,385) |
| Equity risk | — | 3,900,415 | — | — | (4,194,048) | (293,633) |
| Foreign exchange risk | 10,309,157 | — | — | — | — | 10,309,157 |
| Interest rate risk | — | (7,277,010) | (1,301,509) | (2,252,288) | 2,489,900 | (8,340,907) |
| Total | 10,309,157 | 724,135 | (1,301,509) | (2,252,288) | (4,065,533) | 3,413,962 |
| Change in unrealized appreciation (depreciation) on derivatives recognized in income | ||||||
| Risk exposure category | Forward foreign currency exchange contracts ($) | Futures contracts ($) | Option contracts purchased ($) | Option contracts written ($) | Swap contracts ($) | Total ($) |
| Commodity-related investment risk | — | 399,645 | — | — | — | 399,645 |
| Credit risk | — | — | — | — | (2,414,456) | (2,414,456) |
| Equity risk | — | (10,344,086) | — | — | (1,354,869) | (11,698,955) |
| Foreign exchange risk | (14,244,110) | — | — | — | — | (14,244,110) |
| Interest rate risk | — | 2,185,875 | (2,066,592) | 3,068,327 | 3,669,824 | 6,857,434 |
| Total | (14,244,110) | (7,758,566) | (2,066,592) | 3,068,327 | (99,501) | (21,100,442) |
| Derivative instrument | Average notional amounts ($)* |
| Futures contracts — long | 788,418,900 |
| Futures contracts — short | 1,066,963,491 |
| Credit default swap contracts — buy protection | 16,087,500 |
| Credit default swap contracts — sell protection | 22,637,500 |
| Derivative instrument | Average value ($)* |
| Option contracts purchased | 3,969,630 |
| Option contracts written | (1,263,923) |
| Derivative instrument | Average unrealized appreciation ($)* | Average unrealized depreciation ($)* |
| Forward foreign currency exchange contracts | 52,607,046 | (53,339,313) |
| Interest rate swap contracts | 8,569,172 | (8,993,116) |
| Total return swap contracts | 518,119 | (1,096,778) |
| * | Based on the ending quarterly outstanding amounts for the year ended May 31, 2023. |
| 56 | Columbia Multi Strategy Alternatives Fund | Annual Report 2023 |
May 31, 2023
| Columbia Multi Strategy Alternatives Fund | Annual Report 2023 | 57 |
May 31, 2023
| 58 | Columbia Multi Strategy Alternatives Fund | Annual Report 2023 |
| Barclays ($) | Citi ($)(a) | Citi ($)(a) | Goldman Sachs International ($)(a) | Goldman Sachs International ($)(a) | HSBC ($) | JPMorgan ($)(a) | JPMorgan ($)(a) | JPMorgan ($)(a) | Morgan Stanley ($)(a) | Morgan Stanley ($)(a) | Morgan Stanley ($)(a) | Morgan Stanley ($)(a) | Morgan Stanley International ($) | UBS ($) | Total ($) | |
| Assets | ||||||||||||||||
| Centrally cleared credit default swap contracts (b) | - | - | - | - | - | - | - | - | - | - | - | 2,997 | - | - | - | 2,997 |
| Centrally cleared interest rate swap contracts (b) | - | - | - | - | - | - | - | 2,478,028 | - | - | - | - | 38,555 | - | - | 2,516,583 |
| Forward foreign currency exchange contracts | 88,686 | 22,659,163 | 13,547 | - | 6,126,289 | 18,279 | - | - | - | 15,644,413 | - | - | - | - | 3,576,717 | 48,127,094 |
| Call option contracts purchased | - | - | 3,411,758 | - | - | - | - | - | - | - | 497,400 | - | - | - | - | 3,909,158 |
| Put option contracts purchased | - | - | - | - | - | - | - | - | - | - | 281,120 | - | - | - | - | 281,120 |
| OTC total return swap contracts (c) | - | - | - | - | - | - | 55,188 | - | - | - | - | - | - | - | - | 55,188 |
| OTC total return swap contracts on futures (c) | - | - | - | 64,064 | - | - | - | - | - | - | - | - | - | 416,719 | - | 480,783 |
| Total assets | 88,686 | 22,659,163 | 3,425,305 | 64,064 | 6,126,289 | 18,279 | 55,188 | 2,478,028 | - | 15,644,413 | 778,520 | 2,997 | 38,555 | 416,719 | 3,576,717 | 55,372,923 |
| Liabilities | ||||||||||||||||
| Centrally cleared interest rate swap contracts (b) | - | - | - | - | - | - | - | 4,290,041 | - | - | - | - | 60,377 | - | - | 4,350,418 |
| Forward foreign currency exchange contracts | 4,271,025 | 22,355,001 | 4,161,739 | - | 1,756,698 | 70 | - | - | - | 16,260,781 | - | - | - | - | 5,808,481 | 54,613,795 |
| Call option contracts written | - | - | 105 | - | - | - | - | - | - | - | 126 | - | - | - | - | 231 |
| Put option contracts written | - | - | 225,838 | - | - | - | - | - | 258,100 | - | 593,841 | - | - | - | - | 1,077,779 |
| OTC credit default swap contracts (c) | - | - | - | - | - | - | - | - | - | - | 3,991,564 | - | - | - | - | 3,991,564 |
| OTC total return swap contracts (c) | - | - | - | - | - | - | 507,510 | - | - | - | - | - | - | - | - | 507,510 |
| OTC total return swap contracts on futures (c) | - | - | - | 16,320 | - | - | - | - | - | 756,847 | - | - | - | 36,722 | - | 809,889 |
| Total liabilities | 4,271,025 | 22,355,001 | 4,387,682 | 16,320 | 1,756,698 | 70 | 507,510 | 4,290,041 | 258,100 | 17,017,628 | 4,585,531 | - | 60,377 | 36,722 | 5,808,481 | 65,351,186 |
| Total financial and derivative net assets | (4,182,339) | 304,162 | (962,377) | 47,744 | 4,369,591 | 18,209 | (452,322) | (1,812,013) | (258,100) | (1,373,215) | (3,807,011) | 2,997 | (21,822) | 379,997 | (2,231,764) | (9,978,263) |
| Total collateral received (pledged) (d) | - | - | - | - | - | - | (452,322) | (1,812,013) | (258,100) | (1,373,215) | (3,807,011) | - | (21,822) | - | (7,724,483) | |
| Net amount (e) | (4,182,339) | 304,162 | (962,377) | 47,744 | 4,369,591 | 18,209 | - | - | - | - | - | 2,997 | - | 379,997 | (2,231,764) | (2,253,780) |
| (a) | Exposure can only be netted across transactions governed under the same master agreement with the same legal entity. |
| (b) | Centrally cleared swaps are included within payable/receivable for variation margin in the Consolidated Statement of Assets and Liabilities. |
| (c) | Over-the-Counter (OTC) swap contracts are presented at market value plus periodic payments receivable (payable), which is comprised of unrealized appreciation, unrealized depreciation, upfront payments and upfront receipts. |
| (d) | In some instances, the actual collateral received and/or pledged may be more than the amount shown due to overcollateralization. |
| (e) | Represents the net amount due from/(to) counterparties in the event of default. |
May 31, 2023
| Columbia Multi Strategy Alternatives Fund | Annual Report 2023 | 59 |
May 31, 2023
| 60 | Columbia Multi Strategy Alternatives Fund | Annual Report 2023 |
May 31, 2023
| Columbia Multi Strategy Alternatives Fund | Annual Report 2023 | 61 |
May 31, 2023
| Effective rate (%) | |
| Class A | 0.13 |
| Advisor Class | 0.13 |
| Class C | 0.13 |
| Institutional Class | 0.13 |
| Institutional 2 Class | 0.07 |
| Institutional 3 Class | 0.02 |
| Class R | 0.11 |
| 62 | Columbia Multi Strategy Alternatives Fund | Annual Report 2023 |
May 31, 2023
| Front End (%) | CDSC (%) | Amount ($) | |
| Class A | 5.75 | 0.50 - 1.00(a) | 5,126 |
| Class C | — | 1.00(b) | 8,390 |
| (a) | This charge is imposed on certain investments of between $1 million and $50 million redeemed within 18 months after purchase, as follows: 1.00% if redeemed within 12 months after purchase, and 0.50% if redeemed more than 12, but less than 18, months after purchase, with certain limited exceptions. |
| (b) | This charge applies to redemptions within 12 months after purchase, with certain limited exceptions. |
| October 1, 2022 through September 30, 2023 | Prior to October 1, 2022 | |
| Class A | 1.27% | 1.27% |
| Advisor Class | 1.02 | 1.02 |
| Class C | 2.02 | 2.02 |
| Institutional Class | 1.02 | 1.02 |
| Institutional 2 Class | 0.97 | 0.98 |
| Institutional 3 Class | 0.92 | 0.93 |
| Class R | 1.52 | 1.52 |
| Columbia Multi Strategy Alternatives Fund | Annual Report 2023 | 63 |
May 31, 2023
| Excess of distributions over net investment income ($) | Accumulated net realized (loss) ($) | Paid in capital ($) |
| 2,056,548 | (1,878,003) | (178,545) |
| Year Ended May 31, 2023 | Year Ended May 31, 2022 | ||||
| Ordinary income ($) | Long-term capital gains ($) | Total ($) | Ordinary income ($) | Long-term capital gains ($) | Total ($) |
| 5,945,443 | — | 5,945,443 | 19,542,084 | — | 19,542,084 |
| Undistributed ordinary income ($) | Undistributed long-term capital gains ($) | Capital loss carryforwards ($) | Net unrealized (depreciation) ($) |
| — | — | (70,345,308) | (81,197,682) |
| Federal tax cost ($) | Gross unrealized appreciation ($) | Gross unrealized (depreciation) ($) | Net unrealized (depreciation) ($) |
| 959,816,024 | — | (81,197,682) | (81,197,682) |
| No expiration short-term ($) | No expiration long-term ($) | Total ($) | Utilized ($) |
| (39,810,397) | (30,534,911) | (70,345,308) | — |
| Late year ordinary losses ($) | Post-October capital losses ($) |
| 2,100,794 | — |
| 64 | Columbia Multi Strategy Alternatives Fund | Annual Report 2023 |
May 31, 2023
| Borrower or lender | Average loan balance ($) | Weighted average interest rate (%) | Number of days with outstanding loans |
| Lender | 7,014,286 | 4.25 | 7 |
| Columbia Multi Strategy Alternatives Fund | Annual Report 2023 | 65 |
May 31, 2023
| 66 | Columbia Multi Strategy Alternatives Fund | Annual Report 2023 |
May 31, 2023
| Columbia Multi Strategy Alternatives Fund | Annual Report 2023 | 67 |
May 31, 2023
| 68 | Columbia Multi Strategy Alternatives Fund | Annual Report 2023 |
May 31, 2023
| Columbia Multi Strategy Alternatives Fund | Annual Report 2023 | 69 |
| 70 | Columbia Multi Strategy Alternatives Fund | Annual Report 2023 |
| Name, address, year of birth | Position held with the Columbia Funds and length of service | Principal occupation(s) during past five years and other relevant professional experience | Number of Funds in the Columbia Funds Complex* overseen | Other directorships held by Trustee during the past five years and other relevant Board experience |
| George S. Batejan c/o Columbia Management Investment Advisers, LLC 290 Congress Street Boston, MA 02210 1954 | Trustee since 2017 | Executive Vice President, Global Head of Technology and Operations, Janus Capital Group, Inc., 2010-2016 | 174 | Former Chairman of the Board, NICSA (National Investment Company Services Association) (Executive Committee, Nominating Committee and Governance Committee), 2014-2016; former Director, Intech Investment Management, 2011-2016; former Board Member, Metro Denver Chamber of Commerce, 2015-2016; former Advisory Board Member, University of Colorado Business School, 2015-2018; former Board Member, Chase Bank International, 1993-1994 |
| Kathleen Blatz c/o Columbia Management Investment Advisers, LLC 290 Congress Street Boston, MA 02210 1954 | Trustee since 2006 | Attorney, specializing in arbitration and mediation; Chief Justice, Minnesota Supreme Court, 1998-2006; Associate Justice, Minnesota Supreme Court, 1996-1998; Fourth Judicial District Court Judge, Hennepin County, 1994-1996; Attorney in private practice and public service, 1984-1993; State Representative, Minnesota House of Representatives, 1979-1993, which included service on the Tax and Financial Institutions and Insurance Committees; Member and Interim Chair, Minnesota Sports Facilities Authority, January-July 2017; Interim President and Chief Executive Officer, Blue Cross and Blue Shield of Minnesota (health care insurance), February-July 2018, April-October 2021 | 174 | Former Trustee, Blue Cross and Blue Shield of Minnesota, 2009-2021 (Chair of the Business Development Committee, 2014-2017; Chair of the Governance Committee, 2017-2019); former Member and Chair of the Board, Minnesota Sports Facilities Authority, January 2017-July 2017; former Director, Robina Foundation, 2009-2020 (Chair, 2014-2020); Director, Richard M. Schulze Family Foundation, since 2021 |
| Columbia Multi Strategy Alternatives Fund | Annual Report 2023 | 71 |
(Unaudited)
Independent trustees (continued)
| Name, address, year of birth | Position held with the Columbia Funds and length of service | Principal occupation(s) during past five years and other relevant professional experience | Number of Funds in the Columbia Funds Complex* overseen | Other directorships held by Trustee during the past five years and other relevant Board experience |
| Pamela G. Carlton c/o Columbia Management Investment Advisers, LLC 290 Congress Street Boston, MA 02210 1954 | Chair since 2023; Trustee since 2007 | President, Springboard — Partners in Cross Cultural Leadership (consulting company), since 2003; Managing Director of US Equity Research, JP Morgan Chase, 1999-2003; Director of US Equity Research, Chase Asset Management, 1996-1999; Co-Director Latin America Research, 1993-1996, COO Global Research, 1992-1996, Co-Director of US Research, 1991-1992, Investment Banker, 1982-1991, Morgan Stanley; Attorney, Cleary Gottlieb Steen & Hamilton LLP, 1980-1982 | 174 | Trustee, New York Presbyterian Hospital Board, since 1996; Director, DR Bank (Audit Committee) since 2017; Director, Evercore Inc. (Audit Committee, Nominating and Governance Committee), since 2019; Director, Apollo Commercial Real Estate Finance, Inc. (Chair, Nominating and Governance Committee) (financial services), since 2021; the Governing Council of the Independent Directors Council (IDC), since 2021 |
| Janet Langford Carrig c/o Columbia Management Investment Advisers, LLC 290 Congress Street Boston, MA 02210 1957 | Trustee since 1996 | Senior Vice President, General Counsel and Corporate Secretary, ConocoPhillips (independent energy company), September 2007-October 2018 | 174 | Director, EQT Corporation (natural gas producer), since 2019; former Director, Whiting Petroleum Corporation (independent oil and gas company), 2020-2022 |
| J. Kevin Connaughton c/o Columbia Management Investment Advisers, LLC 290 Congress Street Boston, MA 02210 1964 | Trustee since 2020 | CEO and President, RhodeWay Financial (non-profit financial planning firm), since December 2022; Member, FINRA National Adjudicatory Council, since January 2020; Adjunct Professor of Finance, Bentley University since January 2018; Consultant to Independent Trustees of CFVIT and CFST I from March 2016 to June 2020 with respect to CFVIT and to December 2020 with respect to CFST I; Managing Director and General Manager of Mutual Fund Products, Columbia Management Investment Advisers, LLC, May 2010-February 2015; President, Columbia Funds, 2008-2015; and senior officer of Columbia Funds and affiliated funds, 2003-2015 | 172 | Former Director, The Autism Project, March 2015-December 2021; former Member of the Investment Committee, St. Michael’s College, November 2015-February 2020; former Trustee, St. Michael’s College, June 2017-September 2019; former Trustee, New Century Portfolios (former mutual fund complex), January 2015-December 2017 |
| Olive M. Darragh c/o Columbia Management Investment Advisers, LLC 290 Congress Street Boston, MA 02210 1962 | Trustee since 2020 | Managing Director of Darragh Inc. (strategy and talent management consulting firm), since 2010; Founder and CEO, Zolio, Inc. (investment management talent identification platform), since 2004; Consultant to Independent Trustees of CFVIT and CFST I from June 2019 to June 2020 with respect to CFVIT and to December 2020 with respect to CFST I; Partner, Tudor Investments, 2004-2010; Senior Partner, McKinsey & Company (consulting), 1990-2004; Touche Ross CPA, 1985-1988 | 172 | Treasurer, Edinburgh University US Trust Board, since January 2023; Member, HBS Community Action Partners Board, since September 2022; former Director, University of Edinburgh Business School (Member of US Board), 2004-2019; former Director, Boston Public Library Foundation, 2008-2017 |
| 72 | Columbia Multi Strategy Alternatives Fund | Annual Report 2023 |
(Unaudited)
Independent trustees (continued)
| Name, address, year of birth | Position held with the Columbia Funds and length of service | Principal occupation(s) during past five years and other relevant professional experience | Number of Funds in the Columbia Funds Complex* overseen | Other directorships held by Trustee during the past five years and other relevant Board experience |
| Patricia M. Flynn c/o Columbia Management Investment Advisers, LLC 290 Congress Street Boston, MA 02210 1950 | Trustee since 2004 | Professor of Economics and Management, Bentley University, since 2002; Dean, McCallum Graduate School of Business, Bentley University, 1992-2002 | 174 | Former Trustee, MA Taxpayers Foundation, 1997-2022; former Director, The MA Business Roundtable, 2003-2019; former Chairperson, Innovation Index Advisory Committee, MA Technology Collaborative, 1997-2020 |
| Brian J. Gallagher c/o Columbia Management Investment Advisers, LLC 290 Congress Street Boston, MA 02210 1954 | Trustee since 2017 | Retired; Partner with Deloitte & Touche LLP and its predecessors, 1977-2016 | 174 | Trustee, Catholic Schools Foundation, since 2004 |
| Douglas A. Hacker c/o Columbia Management Investment Advisers, LLC 290 Congress Street Boston, MA 02210 1955 | Trustee since 1996 | Independent business executive, since May 2006; Executive Vice President – Strategy of United Airlines, December 2002 - May 2006; President of UAL Loyalty Services (airline marketing company), September 2001-December 2002; Executive Vice President and Chief Financial Officer of United Airlines, July 1999-September 2001 | 174 | Director, SpartanNash Company since November 2013 (Chair of the Board, since May 2021) (food distributor); Director, Aircastle Limited (Chair of Audit Committee) (aircraft leasing), since August 2006; former Director, Nash Finch Company (food distributor), 2005-2013; former Director, SeaCube Container Leasing Ltd. (container leasing), 2010-2013; and former Director, Travelport Worldwide Limited (travel information technology), 2014-2019 |
| Nancy T. Lukitsh c/o Columbia Management Investment Advisers, LLC 290 Congress Street Boston, MA 02210 1956 | Trustee since 2011 | Senior Vice President, Partner and Director of Marketing, Wellington Management Company, LLP (investment adviser), 1997-2010; Chair, Wellington Management Portfolios (commingled non-U.S. investment pools), 2007-2010; Director, Wellington Trust Company, NA and other Wellington affiliates, 1997-2010 | 172 | None |
| Columbia Multi Strategy Alternatives Fund | Annual Report 2023 | 73 |
(Unaudited)
Independent trustees (continued)
| Name, address, year of birth | Position held with the Columbia Funds and length of service | Principal occupation(s) during past five years and other relevant professional experience | Number of Funds in the Columbia Funds Complex* overseen | Other directorships held by Trustee during the past five years and other relevant Board experience |
| David M. Moffett c/o Columbia Management Investment Advisers, LLC 290 Congress Street Boston, MA 02210 1952 | Trustee since 2011 | Retired; former Chief Executive Officer of Freddie Mac and Chief Financial Officer of U.S. Bank | 172 | Director, CSX Corporation (transportation suppliers); Director, PayPal Holdings Inc. (payment and data processing services); Trustee, University of Oklahoma Foundation; former Director, eBay Inc. (online trading community), 2007-2015; and former Director, CIT Bank, CIT Group Inc. (commercial and consumer finance), 2010-2016; former Senior Adviser to The Carlyle Group (financial services), March 2008-September 2008; former Governance Consultant to Bridgewater Associates, January 2013-December 2015 |
| Catherine James Paglia c/o Columbia Management Investment Advisers, LLC 290 Congress Street Boston, MA 02210 1952 | Trustee since 2004 | Director, Enterprise Asset Management, Inc. (private real estate and asset management company), since September 1998; Managing Director and Partner, Interlaken Capital, Inc., 1989-1997; Vice President, 1982-1985, Principal, 1985-1987, Managing Director, 1987-1989, Morgan Stanley; Vice President, Investment Banking, 1980-1982, Associate, Investment Banking, 1976-1980, Dean Witter Reynolds, Inc. | 174 | Director, Valmont Industries, Inc. (irrigation systems manufacturer), since 2012; Trustee, Carleton College (on the Investment Committee), since 1987; Trustee, Carnegie Endowment for International Peace (on the Investment Committee), since 2009 |
| Natalie A. Trunow c/o Columbia Management Investment Advisers, LLC 290 Congress Street Boston, MA 02210 1967 | Trustee since 2020 | Chief Executive Officer, Millennial Portfolio Solutions LLC (asset management and consulting services), January 2016-January 2021; Non-executive Member of the Investment Committee and Valuation Committee, Sarona Asset Management Inc. (private equity firm) since September 2019; Advisor, Horizon Investments (asset management and consulting services), August 2018-January 2022; Advisor, Paradigm Asset Management, November 2016-January 2022; Consultant to Independent Trustees of CFVIT and CFST I from September 2016 to June 2020 with respect to CFVIT and to December 2020 with respect to CFST I; Director of Investments/Consultant, Casey Family Programs, April 2016-November 2016; Senior Vice President and Chief Investment Officer, Calvert Investments, August 2008-January 2016; Section Head and Portfolio Manager, General Motors Asset Management, June 1997-August 2008 | 172 | Independent Director, Investment Committee, Health Services for Children with Special Needs, Inc., 2010-2021; Independent Director, (Executive Committee and Chair, Audit Committee), Consumer Credit Counseling Services (formerly Guidewell Financial Solutions), since 2016; Independent Director, (Investment Committee), Sarona Asset Management, since 2019 |
| 74 | Columbia Multi Strategy Alternatives Fund | Annual Report 2023 |
(Unaudited)
Independent trustees (continued)
| Name, address, year of birth | Position held with the Columbia Funds and length of service | Principal occupation(s) during past five years and other relevant professional experience | Number of Funds in the Columbia Funds Complex* overseen | Other directorships held by Trustee during the past five years and other relevant Board experience |
| Sandra L. Yeager c/o Columbia Management Investment Advisers, LLC 290 Congress Street Boston, MA 02210 1964 | Trustee since 2017 | Retired; President and founder, Hanoverian Capital, LLC (SEC registered investment advisor firm), 2008-2016; Managing Director, DuPont Capital, 2006-2008; Managing Director, Morgan Stanley Investment Management, 2004-2006; Senior Vice President, Alliance Bernstein, 1990-2004 | 174 | Former Director, NAPE (National Alliance for Partnerships in Equity) Education Foundation, October 2016-October 2020; Advisory Board, Jennersville YMCA, since 2022 |
| Name, address, year of birth | Position held with the Columbia Funds and length of service | Principal occupation(s) during the past five years and other relevant professional experience | Number of Funds in the Columbia Funds Complex overseen | Other directorships held by Trustee during the past five years and other relevant Board experience |
| Daniel J. Beckman c/o Columbia Management Investment Advisers, LLC 290 Congress Street Boston, MA 02210 1962 | Trustee since November 2021 and President since June 2021 | Vice President – Head of North America Product, Columbia Management Investment Advisers, LLC, since April 2015; President and Principal Executive Officer of the Columbia Funds, since June 2021; officer of Columbia Funds and affiliated funds, 2020-2021 | 174 | Director, Ameriprise Trust Company, since October 2016; Director, Columbia Management Investment Distributors, Inc. since November 2018; Board of Governors, Columbia Wanger Asset Management, LLC since, January 2022; Director, Columbia Threadneedle Canada, Inc., since December 2022 |
| * | The term “Columbia Funds Complex” as used herein includes Columbia Seligman Premium Technology Growth Fund, Tri-Continental Corporation and each series of Columbia Funds Series Trust (CFST), Columbia Funds Series Trust I (CFST I), Columbia Funds Series Trust II (CFST II), Columbia ETF Trust I (CET I), Columbia ETF Trust II (CET II), Columbia Funds Variable Insurance Trust (CFVIT) and Columbia Funds Variable Series Trust II (CFVST II). Messrs. Batejan, Beckman, Gallagher and Hacker and Mses. Blatz, Carlton, Carrig, Flynn, Paglia, and Yeager serve as directors of Columbia Seligman Premium Technology Growth Fund and Tri-Continental Corporation. |
| ** | Interested person (as defined under the 1940 Act) by reason of being an officer, director, security holder and/or employee of the Investment Manager or Ameriprise Financial. |
| Columbia Multi Strategy Alternatives Fund | Annual Report 2023 | 75 |
(Unaudited)
The Board has appointed officers who are responsible for day-to-day business decisions based on policies it has established. The officers serve at the pleasure of the Board. The following table provides basic information about the Officers of the Fund as of the printing of this report, including principal occupations during the past five years, although their specific titles may have varied over the period. In addition to Mr. Beckman, who is President and Principal Executive Officer, the Fund’s other officers are:
| Name, address and year of birth | Position and year first appointed to position for any Fund in the Columbia Funds Complex or a predecessor thereof | Principal occupation(s) during past five years |
| Michael G. Clarke 290 Congress Street Boston, MA 02210 1969 | Chief Financial Officer and Principal Financial Officer (2009) and Senior Vice President (2019) | Senior Vice President and North America Head of Operations & Investor Services, Columbia Management Investment Advisers, LLC, since June 2023 (previously Senior Vice President and Head of Global Operations, March 2022 – June 2023, Vice President, Head of North America Operations, and Co-Head of Global Operations, June 2019 - February 2022 and Vice President – Accounting and Tax, May 2010 - May 2019); senior officer of Columbia Funds and affiliated funds, since 2002. Director, Ameriprise Trust Company, since June 2023. |
| Joseph Beranek 5890 Ameriprise Financial Center Minneapolis, MN 55474 1965 | Treasurer and Chief Accounting Officer (Principal Accounting Officer) (2019) and Principal Financial Officer (2020), CFST, CFST I, CFST II, CFVIT and CFVST II; Assistant Treasurer, CET I and CET II | Vice President – Mutual Fund Accounting and Financial Reporting, Columbia Management Investment Advisers, LLC, since December 2018 and March 2017, respectively. |
| Marybeth Pilat 290 Congress Street Boston, MA 02210 1968 | Treasurer and Chief Accounting Officer (Principal Accounting Officer) and Principal Financial Officer (2020) for CET I and CET II; Assistant Treasurer, CFST, CFST I, CFST II, CFVIT and CFVST II | Vice President – Product Pricing and Administration, Columbia Management Investment Advisers, LLC, since May 2017. |
| William F. Truscott 290 Congress Street Boston, MA 02210 1960 | Senior Vice President (2001) | Formerly, Trustee/Director of Columbia Funds Complex or legacy funds, November 2001 - January 1, 2021; Chief Executive Officer, Global Asset Management, Ameriprise Financial, Inc., since September 2012; Chairman of the Board and President, Columbia Management Investment Advisers, LLC, since July 2004 and February 2012, respectively; Chairman of the Board and Chief Executive Officer, Columbia Management Investment Distributors, Inc., since November 2008 and February 2012, respectively;Chairman of the Board and Director, Threadneedle Asset Management Holdings, Sàrl, since March 2013 and December 2008, respectively; senior executive of various entities affiliated with Columbia Threadneedle. |
| Christopher O. Petersen 5228 Ameriprise Financial Center Minneapolis, MN 55474 1970 | Senior Vice President and Assistant Secretary (2021) | Formerly, Trustee/Director of funds within the Columbia Funds Complex, July 1, 2020 - November 22, 2021; Senior Vice President and Assistant General Counsel, Ameriprise Financial, Inc., since September 2021 (previously Vice President and Lead Chief Counsel, January 2015 - September 2021); formerly, President and Principal Executive Officer of the Columbia Funds, 2015 - 2021; officer of Columbia Funds and affiliated funds, since 2007. |
| Thomas P. McGuire 290 Congress Street Boston, MA 02210 1972 | Senior Vice President and Chief Compliance Officer (2012) | Vice President – Asset Management Compliance, Ameriprise Financial, Inc., since May 2010; Chief Compliance Officer, Columbia Acorn/Wanger Funds, since December 2015; formerly, Chief Compliance Officer, Ameriprise Certificate Company, September 2010 – September 2020. |
| Ryan C. Larrenaga 290 Congress Street Boston, MA 02210 1970 | Senior Vice President (2017), Chief Legal Officer (2017), and Secretary (2015) | Vice President and Chief Counsel, Ameriprise Financial, Inc., since August 2018 (previously Vice President and Group Counsel, August 2011 - August 2018); Chief Legal Officer, Columbia Acorn/Wanger Funds, since September 2020; officer of Columbia Funds and affiliated funds, since 2005. |
| 76 | Columbia Multi Strategy Alternatives Fund | Annual Report 2023 |
(Unaudited)
Fund officers (continued)
| Name, address and year of birth | Position and year first appointed to position for any Fund in the Columbia Funds Complex or a predecessor thereof | Principal occupation(s) during past five years |
| Michael E. DeFao 290 Congress Street Boston, MA 02210 1968 | Vice President (2011) and Assistant Secretary (2010) | Vice President and Chief Counsel, Ameriprise Financial, Inc., since May 2010; Vice President, Chief Legal Officer and Assistant Secretary, Columbia Management Investment Advisers, LLC, since October 2021 (previously Vice President and Assistant Secretary, May 2010 – September 2021). |
| Lyn Kephart-Strong 5903 Ameriprise Financial Center Minneapolis, MN 55474 1960 | Vice President (2015) | Vice President, Global Investment Operations Services, Columbia Management Investment Advisers, LLC, since 2010; Director (since January 2007) and President (since October 2014), Columbia Management Investment Services Corp.; Director (since December 2017) and President (since January 2017), Ameriprise Trust Company. |
| • | the Fund had sufficient liquidity to both meet redemptions and operate effectively on behalf of shareholders; |
| • | there were no material changes to the Program during the period; |
| • | the implementation of the Program was effective to manage the Fund’s liquidity risk; and |
| • | the Program operated adequately during the period. |
| Columbia Multi Strategy Alternatives Fund | Annual Report 2023 | 77 |
columbiathreadneedleus.com/investor/. The Fund is distributed by Columbia Management Investment Distributors, Inc., member FINRA, and managed by Columbia Management Investment Advisers, LLC.

May 31, 2023

| 3 | |
| 5 | |
| 7 | |
| 8 | |
| 16 | |
| 18 | |
| 19 | |
| 22 | |
| 26 | |
| 44 | |
| 45 | |
| 45 | |
| 51 |
(Unaudited)
| Average annual total returns (%) (for the period ended May 31, 2023) | |||||
| Inception | 1 Year | 5 Years | 10 Years | ||
| Class A | Excluding sales charges | 06/19/12 | -5.79 | 3.14 | 4.03 |
| Including sales charges | -11.19 | 1.92 | 3.42 | ||
| Advisor Class* | 10/01/14 | -5.52 | 3.40 | 4.26 | |
| Class C | Excluding sales charges | 06/19/12 | -6.37 | 2.38 | 3.25 |
| Including sales charges | -7.24 | 2.38 | 3.25 | ||
| Institutional Class | 06/19/12 | -5.52 | 3.40 | 4.30 | |
| Institutional 2 Class | 06/19/12 | -5.60 | 3.39 | 4.33 | |
| Institutional 3 Class* | 10/01/14 | -5.47 | 3.45 | 4.33 | |
| Class R | 06/19/12 | -6.02 | 2.88 | 3.77 | |
| Modified Blended Benchmark | -1.12 | 3.81 | 4.86 | ||
| New Blended Benchmark | 1.44 | 5.48 | 6.38 | ||
| FTSE Three-Month U.S. Treasury Bill Index | 3.38 | 1.51 | 0.94 | ||
| * | The returns shown for periods prior to the share class inception date (including returns for the Life of the Fund, if shown, which are since Fund inception) include the returns of the Fund’s oldest share class. Since the Fund launched more than one share class at its inception, Class A shares were used. These returns are adjusted to reflect any higher class-related operating expenses of the newer share classes, as applicable. Please visit columbiathreadneedleus.com/investor/investment-products/mutual-funds/appended-performance for more information. |
| Columbia Adaptive Risk Allocation Fund | Annual Report 2023 | 3 |
(Unaudited)
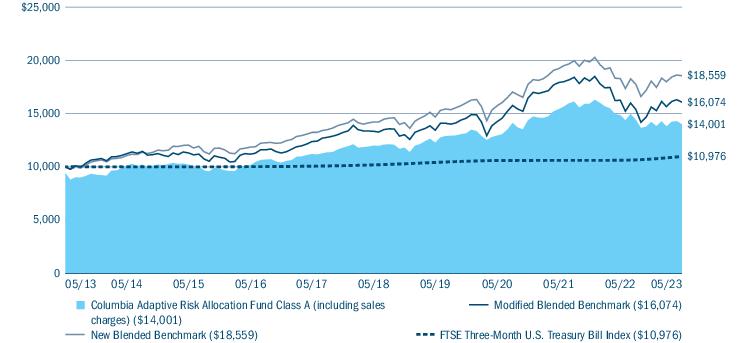
| Portfolio breakdown (%) (at May 31, 2023) | |
| Alternative Strategies Funds | 4.6 |
| Common Stocks | 4.6 |
| Foreign Government Obligations | 12.0 |
| Inflation-Indexed Bonds | 10.8 |
| Money Market Funds(a) | 41.7 |
| Multi-Asset/Tactical Strategies Funds | 0.2 |
| Residential Mortgage-Backed Securities - Agency | 6.8 |
| U.S. Treasury Obligations | 19.3 |
| Total | 100.0 |
| (a) | Includes investments in Money Market Funds, including investing for the purpose of covering obligations relating to the Fund’s investment in derivatives. For a description of the Fund’s investments in derivatives, see Investments in derivatives following the Portfolio of Investments and the derivative instruments discussion in Note 2 to the Notes to Financial Statements. |
| Market exposure by asset class categories (%)(a) (at May 31, 2023) | |
| Equity Assets | 40.1 |
| Inflation-Hedging Assets | 16.8 |
| Spread Assets | 38.6 |
| Interest Rate Assets | 50.1 |
| 4 | Columbia Adaptive Risk Allocation Fund | Annual Report 2023 |
(Unaudited)
| • | Weak performance from interest-rate-related fixed income (global government bonds) detracted from Fund performance during the period. |
| • | Negative returns from commodity-related investments also weighed on the Fund’s results. As noted above, commodities delivered double-digit negative performance during the period. |
| • | Returns from Treasury inflation-protected securities (TIPS) were challenged during a period where real rates shifted from widely negative to positive. The Bloomberg Global Inflation-Linked Bond Index (Unhedged) was down 10.43% during the period. |
| • | The largest contributor to relative performance over the past year came from the adaptive market state classification design feature associated with the investment strategy. |
| ○ | The adaptive feature – where a market state is determined between either capital preservation, neutral, bullish, or highly bullish states – is estimated to have delivered over 50 basis points of excess return for the strategy, versus a static neutral policy risk allocation. (A basis point is 1/100 of a percent.) |
| • | An underweighted tactical allocation to real estate investment trusts (REITs) contributed, as real estate-related securities struggled during the period. The FTSE Nareit All REITs Index returned -15.69% over the 12-month period that ended May 31, 2023. |
| Columbia Adaptive Risk Allocation Fund | Annual Report 2023 | 5 |
(Unaudited)
| • | Strong security selection within the REIT segment of the portfolio also helped boost relative returns and offset some of the aforementioned challenged absolute returns generated by the REIT space overall. |
| 6 | Columbia Adaptive Risk Allocation Fund | Annual Report 2023 |
(Unaudited)
| December 1, 2022 — May 31, 2023 | |||||||
| Account value at the beginning of the period ($) | Account value at the end of the period ($) | Expenses paid during the period ($) | Fund’s annualized expense ratio (%) | ||||
| Actual | Hypothetical | Actual | Hypothetical | Actual | Hypothetical | Actual | |
| Class A | 1,000.00 | 1,000.00 | 984.80 | 1,019.85 | 5.05 | 5.14 | 1.02 |
| Advisor Class | 1,000.00 | 1,000.00 | 986.50 | 1,021.09 | 3.81 | 3.88 | 0.77 |
| Class C | 1,000.00 | 1,000.00 | 981.20 | 1,016.11 | 8.74 | 8.90 | 1.77 |
| Institutional Class | 1,000.00 | 1,000.00 | 986.50 | 1,021.09 | 3.81 | 3.88 | 0.77 |
| Institutional 2 Class | 1,000.00 | 1,000.00 | 985.50 | 1,021.09 | 3.81 | 3.88 | 0.77 |
| Institutional 3 Class | 1,000.00 | 1,000.00 | 986.80 | 1,021.29 | 3.62 | 3.68 | 0.73 |
| Class R | 1,000.00 | 1,000.00 | 983.00 | 1,018.60 | 6.28 | 6.39 | 1.27 |
| Columbia Adaptive Risk Allocation Fund | Annual Report 2023 | 7 |
May 31, 2023
| Alternative Strategies Funds 5.0% | ||
| Shares | Value ($) | |
| Columbia Commodity Strategy Fund, Institutional 3 Class(a) | 18,680,504 | 175,783,540 |
| Total Alternative Strategies Funds (Cost $194,072,565) | 175,783,540 | |
| Common Stocks 5.0% | ||
| Issuer | Shares | Value ($) |
| Consumer Discretionary 0.1% | ||
| Hotels, Restaurants & Leisure 0.1% | ||
| Marriott International, Inc., Class A | 19,689 | 3,303,617 |
| Total Consumer Discretionary | 3,303,617 | |
| Real Estate 4.9% | ||
| Health Care REITs 0.4% | ||
| Healthpeak Properties, Inc. | 106,199 | 2,119,732 |
| Welltower, Inc. | 141,617 | 10,566,044 |
| Total | 12,685,776 | |
| Hotel & Resort REITs 0.0% | ||
| Host Hotels & Resorts, Inc. | 118,267 | 1,963,232 |
| Industrial REITs 1.0% | ||
| First Industrial Realty Trust, Inc. | 115,779 | 6,018,192 |
| Prologis, Inc. | 226,901 | 28,260,520 |
| Total | 34,278,712 | |
| Office REITs 0.2% | ||
| Alexandria Real Estate Equities, Inc. | 54,751 | 6,212,049 |
| Residential REITs 1.3% | ||
| American Homes 4 Rent, Class A | 172,693 | 5,919,916 |
| AvalonBay Communities, Inc. | 47,891 | 8,332,076 |
| Camden Property Trust | 33,997 | 3,551,667 |
| Centerspace | 46,484 | 2,733,724 |
| Equity LifeStyle Properties, Inc. | 131,718 | 8,320,626 |
| Invitation Homes, Inc. | 243,354 | 8,244,833 |
| Sun Communities, Inc. | 38,658 | 4,895,263 |
| UDR, Inc. | 77,009 | 3,054,947 |
| Total | 45,053,052 | |
| Common Stocks (continued) | ||
| Issuer | Shares | Value ($) |
| Retail REITs 0.8% | ||
| Brixmor Property Group, Inc. | 274,447 | 5,497,174 |
| Federal Realty Investment Trust | 54,038 | 4,766,152 |
| Realty Income Corp. | 102,148 | 6,071,677 |
| Simon Property Group, Inc. | 73,731 | 7,752,815 |
| SITE Centers Corp. | 151,770 | 1,809,098 |
| Tanger Factory Outlet Centers, Inc. | 209,198 | 4,261,363 |
| Total | 30,158,279 | |
| Specialized REITs 1.2% | ||
| American Tower Corp. | 18,020 | 3,323,609 |
| Equinix, Inc. | 20,528 | 15,304,650 |
| Extra Space Storage, Inc. | 40,821 | 5,889,246 |
| Gaming and Leisure Properties, Inc. | 126,431 | 6,086,388 |
| Lamar Advertising Co., Class A | 35,363 | 3,178,426 |
| Life Storage, Inc. | 78,002 | 9,936,675 |
| Total | 43,718,994 | |
| Total Real Estate | 174,070,094 | |
| Total Common Stocks (Cost $184,791,907) | 177,373,711 | |
| Foreign Government Obligations(b),(c) 13.1% | ||||
| Issuer | Coupon Rate | Principal Amount ($) | Value ($) | |
| Austria 0.5% | ||||
| Republic of Austria Government Bond(d),(e) | ||||
| 02/20/2030 | 0.000% | EUR | 8,021,000 | 7,128,463 |
| Republic of Austria Government Bond(d) | ||||
| 05/23/2034 | 2.400% | EUR | 9,784,000 | 9,909,888 |
| Total | 17,038,351 | |||
| Belgium 1.3% | ||||
| Kingdom of Belgium Government Bond(d) | ||||
| 06/22/2031 | 1.000% | EUR | 7,756,000 | 7,222,971 |
| 04/22/2033 | 1.250% | EUR | 6,559,000 | 6,051,957 |
| 06/22/2033 | 3.000% | EUR | 25,500,000 | 27,344,445 |
| 03/28/2035 | 5.000% | EUR | 5,372,000 | 6,806,448 |
| Total | 47,425,821 | |||
| China 1.3% | ||||
| China Development Bank | ||||
| 07/18/2032 | 2.960% | CNY | 110,000,000 | 15,541,599 |
| 8 | Columbia Adaptive Risk Allocation Fund | Annual Report 2023 |
May 31, 2023
| Foreign Government Obligations(b),(c) (continued) | ||||
| Issuer | Coupon Rate | Principal Amount ($) | Value ($) | |
| China Government Bond | ||||
| 11/21/2029 | 3.130% | CNY | 38,350,000 | 5,560,682 |
| 05/21/2030 | 2.680% | CNY | 52,200,000 | 7,344,509 |
| 05/15/2032 | 2.760% | CNY | 110,000,000 | 15,487,630 |
| Total | 43,934,420 | |||
| France 1.3% | ||||
| French Republic Government Bond OAT(d),(e) | ||||
| 11/25/2030 | 0.000% | EUR | 12,178,000 | 10,685,700 |
| French Republic Government Bond OAT(d) | ||||
| 05/25/2033 | 3.000% | EUR | 20,300,000 | 21,992,904 |
| 05/25/2036 | 1.250% | EUR | 7,807,000 | 6,746,416 |
| 05/25/2045 | 3.250% | EUR | 4,695,464 | 5,006,401 |
| Total | 44,431,421 | |||
| Italy 1.2% | ||||
| Italy Buoni Poliennali Del Tesoro(d) | ||||
| 05/01/2031 | 6.000% | EUR | 9,990,000 | 12,261,603 |
| 05/01/2033 | 4.400% | EUR | 21,553,000 | 23,713,246 |
| 02/01/2037 | 4.000% | EUR | 7,350,000 | 7,609,340 |
| Total | 43,584,189 | |||
| Japan 4.5% | ||||
| Japan Government 10-Year Bond | ||||
| 06/20/2031 | 0.100% | JPY | 2,812,450,000 | 19,845,415 |
| Japan Government 20-Year Bond | ||||
| 06/20/2041 | 0.400% | JPY | 1,417,800,000 | 9,231,059 |
| 09/20/2041 | 0.500% | JPY | 1,391,000,000 | 9,200,058 |
| 03/20/2042 | 0.800% | JPY | 1,325,400,000 | 9,219,154 |
| 03/20/2043 | 1.100% | JPY | 4,088,000,000 | 29,715,572 |
| Japan Government 30-Year Bond | ||||
| 06/20/2050 | 0.600% | JPY | 1,068,800,000 | 6,519,346 |
| 06/20/2051 | 0.700% | JPY | 1,028,650,000 | 6,392,922 |
| 09/20/2051 | 0.700% | JPY | 1,022,300,000 | 6,344,056 |
| 12/20/2051 | 0.700% | JPY | 1,015,450,000 | 6,300,372 |
| 03/20/2052 | 1.000% | JPY | 968,200,000 | 6,498,732 |
| 03/20/2053 | 1.400% | JPY | 3,042,000,000 | 22,497,372 |
| Japan Government 40-Year Bond | ||||
| 03/20/2063 | 1.300% | JPY | 2,573,000,000 | 17,873,693 |
| Japan Government Twenty-Year Bond | ||||
| 06/20/2042 | 0.900% | JPY | 1,299,700,000 | 9,186,568 |
| Total | 158,824,319 | |||
| Netherlands 1.1% | ||||
| Netherlands Government Bond(d) | ||||
| 07/15/2026 | 0.500% | EUR | 25,223,000 | 25,281,930 |
| Netherlands Government Bond(d),(e) | ||||
| 07/15/2031 | 0.000% | EUR | 14,666,000 | 12,798,173 |
| Total | 38,080,103 | |||
| Foreign Government Obligations(b),(c) (continued) | ||||
| Issuer | Coupon Rate | Principal Amount ($) | Value ($) | |
| Spain 1.5% | ||||
| Spain Government Bond | ||||
| 07/30/2032 | 5.750% | EUR | 9,077,000 | 11,649,881 |
| Spain Government Bond(d) | ||||
| 04/30/2033 | 3.150% | EUR | 29,660,000 | 31,226,435 |
| 07/30/2035 | 1.850% | EUR | 9,888,000 | 8,868,354 |
| 07/30/2041 | 4.700% | EUR | 2,073,000 | 2,483,881 |
| Total | 54,228,551 | |||
| United Kingdom 0.4% | ||||
| United Kingdom Gilt(d) | ||||
| 10/22/2028 | 1.625% | GBP | 10,885,000 | 11,938,737 |
| 01/22/2045 | 3.500% | GBP | 3,257,133 | 3,483,998 |
| Total | 15,422,735 | |||
| Total Foreign Government Obligations (Cost $526,180,333) | 462,969,910 | |||
| Inflation-Indexed Bonds(b) 11.8% | ||||
| Australia 0.4% | ||||
| Australia Government Bond(d) | ||||
| 11/21/2027 | 0.750% | AUD | 4,710,476 | 3,068,381 |
| 08/21/2035 | 2.000% | AUD | 3,794,040 | 2,667,711 |
| 08/21/2040 | 1.250% | AUD | 2,326,490 | 1,462,643 |
| Australia Government Index-Linked Bond(d) | ||||
| 09/20/2025 | 3.000% | AUD | 11,173,094 | 7,732,533 |
| Total | 14,931,268 | |||
| Canada 0.1% | ||||
| Canadian Government Real Return Bond | ||||
| 12/01/2031 | 4.000% | CAD | 2,158,302 | 1,923,902 |
| 12/01/2036 | 3.000% | CAD | 1,465,669 | 1,283,968 |
| 12/01/2041 | 2.000% | CAD | 1,178,519 | 942,938 |
| Total | 4,150,808 | |||
| France 1.4% | ||||
| France Government Bond OAT(d) | ||||
| 07/25/2030 | 0.700% | EUR | 18,565,913 | 20,548,497 |
| 07/25/2032 | 3.150% | EUR | 10,106,153 | 13,562,387 |
| French Republic Government Bond OAT(d) | ||||
| 07/25/2036 | 0.100% | EUR | 5,149,852 | 5,211,780 |
| 07/25/2040 | 1.800% | EUR | 7,287,814 | 9,358,572 |
| Total | 48,681,236 | |||
| Germany 0.7% | ||||
| Bundesrepublik Deutschland Bundesobligation Inflation-Linked Bond(d) | ||||
| 04/15/2030 | 0.500% | EUR | 21,240,222 | 23,542,290 |
| Columbia Adaptive Risk Allocation Fund | Annual Report 2023 | 9 |
May 31, 2023
| Inflation-Indexed Bonds(b) (continued) | ||||
| Issuer | Coupon Rate | Principal Amount ($) | Value ($) | |
| Italy 0.8% | ||||
| Italy Buoni Poliennali Del Tesoro(d) | ||||
| 09/15/2026 | 3.100% | EUR | 2,567,144 | 2,921,134 |
| 05/15/2028 | 1.300% | EUR | 9,396,264 | 9,967,198 |
| 09/15/2035 | 2.350% | EUR | 8,233,043 | 9,202,117 |
| 09/15/2041 | 2.550% | EUR | 6,810,598 | 7,901,960 |
| Total | 29,992,409 | |||
| Japan 0.4% | ||||
| Japanese Government CPI-Linked Bond | ||||
| 03/10/2029 | 0.100% | JPY | 1,700,417,100 | 12,871,312 |
| Spain 0.2% | ||||
| Spain Government Inflation-Linked Bond(d) | ||||
| 11/30/2033 | 0.700% | EUR | 7,328,936 | 7,546,400 |
| Sweden 0.2% | ||||
| Sweden Inflation-Linked Bond(d) | ||||
| 06/01/2032 | 0.125% | SEK | 66,600,924 | 5,932,137 |
| United Kingdom 3.3% | ||||
| United Kingdom Gilt Inflation-Linked Bond(d) | ||||
| 03/22/2029 | 0.125% | GBP | 15,257,505 | 18,508,505 |
| 03/22/2034 | 0.750% | GBP | 14,932,853 | 18,755,658 |
| 11/22/2037 | 1.125% | GBP | 12,226,520 | 15,827,396 |
| 03/22/2044 | 0.125% | GBP | 14,386,715 | 14,692,229 |
| 11/22/2047 | 0.750% | GBP | 11,487,905 | 13,149,572 |
| 03/22/2050 | 0.500% | GBP | 7,528,106 | 8,035,085 |
| 03/22/2052 | 0.250% | GBP | 11,327,738 | 11,168,954 |
| 11/22/2056 | 0.125% | GBP | 8,732,115 | 8,109,093 |
| 11/22/2065 | 0.125% | GBP | 5,075,944 | 4,568,074 |
| 03/22/2068 | 0.125% | GBP | 3,802,868 | 3,395,674 |
| Total | 116,210,240 | |||
| United States 4.3% | ||||
| U.S. Treasury Inflation-Indexed Bond | ||||
| 07/15/2027 | 0.375% | 16,805,854 | 15,936,477 | |
| 01/15/2028 | 0.500% | 19,281,211 | 18,243,343 | |
| 01/15/2029 | 0.875% | 25,245,230 | 24,230,018 | |
| 07/15/2029 | 0.250% | 12,405,340 | 11,484,753 | |
| 07/15/2030 | 0.125% | 18,746,529 | 17,030,025 | |
| 04/15/2032 | 3.375% | 19,215,424 | 22,154,085 | |
| 02/15/2042 | 0.750% | 11,119,116 | 9,457,373 | |
| 02/15/2043 | 0.625% | 10,606,434 | 8,702,219 | |
| 02/15/2045 | 0.750% | 11,296,327 | 9,341,722 | |
| 02/15/2048 | 1.000% | 10,532,606 | 9,072,860 | |
| 02/15/2050 | 0.250% | 12,386,017 | 8,636,573 | |
| Total | 154,289,448 | |||
| Total Inflation-Indexed Bonds (Cost $535,137,044) | 418,147,548 | |||
| Multi-Asset/Tactical Strategies Funds 0.2% | ||
| Shares | Value ($) | |
| Columbia Solutions Aggressive Portfolio(a) | 141,672 | 1,120,628 |
| Columbia Solutions Conservative Portfolio(a) | 704,777 | 6,272,511 |
| Total Multi-Asset/Tactical Strategies Funds (Cost $8,965,031) | 7,393,139 | |
| Residential Mortgage-Backed Securities - Agency 7.5% | ||||
| Issuer | Coupon Rate | Principal Amount ($) | Value ($) | |
| Government National Mortgage Association TBA(f) | ||||
| 06/20/2053 | 3.000% | 32,350,000 | 29,114,368 | |
| 06/20/2053 | 3.500% | 23,150,000 | 21,474,338 | |
| 06/20/2053 | 4.000% | 15,220,000 | 14,463,756 | |
| Uniform Mortgage-Backed Security TBA(f) | ||||
| 06/15/2038 | 2.500% | 19,148,328 | 17,621,698 | |
| 06/15/2038- 06/13/2053 | 3.000% | 77,600,000 | 69,476,179 | |
| 06/13/2053 | 3.500% | 47,900,000 | 44,006,254 | |
| 06/13/2053 | 4.000% | 41,840,000 | 39,525,725 | |
| 06/13/2053 | 4.500% | 29,600,000 | 28,669,797 | |
| Total Residential Mortgage-Backed Securities - Agency (Cost $269,141,742) | 264,352,115 | |||
| U.S. Treasury Obligations 21.0% | ||||
| U.S. Treasury | ||||
| 10/31/2026 | 1.125% | 43,400,000 | 39,494,000 | |
| 06/30/2028 | 1.250% | 33,248,000 | 29,362,140 | |
| 09/30/2028 | 1.250% | 35,892,800 | 31,518,365 | |
| 10/31/2028 | 1.375% | 37,483,000 | 33,087,533 | |
| 11/30/2028 | 1.500% | 34,742,000 | 30,833,525 | |
| 04/30/2029 | 2.875% | 39,089,000 | 37,238,380 | |
| 05/15/2029 | 2.375% | 28,507,000 | 26,406,836 | |
| 08/15/2029 | 1.625% | 28,483,500 | 25,225,700 | |
| 05/31/2030 | 3.750% | 230,600,000 | 231,320,625 | |
| 08/15/2030 | 0.625% | 26,810,000 | 21,682,588 | |
| 02/15/2031 | 1.125% | 24,922,000 | 20,833,234 | |
| 08/15/2031 | 1.250% | 31,458,000 | 26,169,124 | |
| 11/15/2031 | 1.375% | 26,522,000 | 22,174,878 | |
| 05/15/2033 | 3.375% | 173,400,000 | 169,688,156 | |
| Total U.S. Treasury Obligations (Cost $791,813,383) | 745,035,084 | |||
| Money Market Funds 45.6% | ||
| Shares | Value ($) | |
| Columbia Short-Term Cash Fund, 5.241%(a),(g) | 1,613,690,830 | 1,612,883,985 |
| Total Money Market Funds (Cost $1,613,078,208) | 1,612,883,985 | |
| Total Investments in Securities (Cost: $4,123,180,213) | 3,863,939,032 | |
| Other Assets & Liabilities, Net | (325,093,330) | |
| Net Assets | 3,538,845,702 | |
| 10 | Columbia Adaptive Risk Allocation Fund | Annual Report 2023 |
May 31, 2023
| Forward foreign currency exchange contracts | |||||
| Currency to be sold | Currency to be purchased | Counterparty | Settlement date | Unrealized appreciation ($) | Unrealized depreciation ($) |
| 10,994,000 SGD | 8,174,452 USD | Barclays | 06/27/2023 | 37,477 | — |
| 10,891,336 USD | 118,000,000 SEK | Barclays | 06/27/2023 | — | (2,131) |
| 4,226,975 USD | 5,712,000 SGD | Barclays | 06/27/2023 | 640 | — |
| 69,308,000 CHF | 77,413,158 USD | Citi | 06/27/2023 | 1,083,323 | — |
| 445,410,296 EUR | 482,368,215 USD | Citi | 06/27/2023 | 5,556,493 | — |
| 35,143,541,280 JPY | 255,112,192 USD | Citi | 06/27/2023 | 1,863,827 | — |
| 9,808,000,000 JPY | 70,626,697 USD | Citi | 06/27/2023 | — | (50,869) |
| 24,220,607 USD | 37,200,000 AUD | Citi | 06/27/2023 | — | (307) |
| 70,483,439 USD | 9,780,000,000 JPY | Citi | 06/27/2023 | — | (7,644) |
| 98,327,000 AUD | 65,416,953 USD | Goldman Sachs International | 06/27/2023 | 1,397,882 | — |
| 110,000,000 EUR | 117,753,900 USD | Goldman Sachs International | 06/27/2023 | — | (1,100) |
| 197,948,265 GBP | 246,275,355 USD | Goldman Sachs International | 06/27/2023 | — | (99,304) |
| 132,215,000 HKD | 16,901,886 USD | Goldman Sachs International | 06/27/2023 | 6,460 | — |
| 110,782,620 USD | 103,525,000 EUR | Goldman Sachs International | 06/27/2023 | 40,892 | — |
| 9,024,992 USD | 7,254,000 GBP | Goldman Sachs International | 06/27/2023 | 3,639 | — |
| 328,286,000 CNY | 46,785,714 USD | HSBC | 06/27/2023 | 490,511 | — |
| 9,201,817 USD | 72,000,000 HKD | HSBC | 06/27/2023 | — | (1,116) |
| 138,077 USD | 2,489,000 MXN | Morgan Stanley | 06/27/2023 | 1,856 | — |
| 13,870,000 ZAR | 717,749 USD | Morgan Stanley | 06/27/2023 | 16,109 | — |
| 6,372,000 CAD | 4,717,469 USD | State Street | 06/27/2023 | 20,317 | — |
| 35,023,955 USD | 31,800,000 CHF | State Street | 06/27/2023 | — | (2,186) |
| 137,203,000 DKK | 19,957,961 USD | UBS | 06/27/2023 | 228,740 | — |
| 45,698,000 NOK | 4,205,634 USD | UBS | 06/27/2023 | 83,593 | — |
| 204,000 NZD | 127,995 USD | UBS | 06/27/2023 | 5,139 | — |
| 293,810,000 SEK | 27,908,810 USD | UBS | 06/27/2023 | 795,614 | — |
| 9,915,189 USD | 69,000,000 DKK | UBS | 06/27/2023 | 6,724 | — |
| 52,369,701 USD | 42,075,000 GBP | UBS | 06/27/2023 | — | (1,402) |
| 17,922,675 USD | 194,746,000 NOK | UBS | 06/27/2023 | — | (356,238) |
| 18,486,450 USD | 29,464,000 NZD | UBS | 06/27/2023 | — | (742,247) |
| Total | 11,639,236 | (1,264,544) | |||
| Long futures contracts | ||||||
| Description | Number of contracts | Expiration date | Trading currency | Notional amount | Value/Unrealized appreciation ($) | Value/Unrealized depreciation ($) |
| Australian 10-Year Bond | 249 | 06/2023 | AUD | 29,858,265 | 43,902 | — |
| Canadian Government 10-Year Bond | 8 | 09/2023 | CAD | 989,360 | — | (12) |
| Euro-Bobl | 82 | 06/2023 | EUR | 9,687,480 | 253,734 | — |
| Euro-BTP | 325 | 06/2023 | EUR | 37,687,000 | 660,087 | — |
| Euro-Bund | 371 | 06/2023 | EUR | 50,474,550 | 842,249 | — |
| Euro-Buxl 30-Year | 50 | 06/2023 | EUR | 6,935,000 | 81,526 | — |
| Euro-OAT | 382 | 06/2023 | EUR | 49,866,280 | 573,018 | — |
| Long Gilt | 800 | 09/2023 | GBP | 77,432,000 | 105,510 | — |
| MSCI EAFE Index | 35 | 06/2023 | USD | 3,593,450 | 27,550 | — |
| MSCI EAFE Index | 3,034 | 06/2023 | USD | 311,500,780 | — | (14,601,289) |
| MSCI Emerging Markets Index | 3,460 | 06/2023 | USD | 165,526,400 | — | (4,083,523) |
| Russell 2000 Index E-mini | 403 | 06/2023 | USD | 35,298,770 | — | (1,156,207) |
| S&P 500 Index E-mini | 3,584 | 06/2023 | USD | 750,937,600 | 429,708 | — |
| S&P 500 Index E-mini | 21 | 06/2023 | USD | 4,400,025 | — | (35,277) |
| S&P/TSX 60 Index | 203 | 06/2023 | CAD | 47,769,960 | — | (2,123,615) |
| U.S. Treasury 10-Year Note | 175 | 09/2023 | USD | 20,032,031 | 11,994 | — |
| U.S. Treasury 10-Year Note | 1,112 | 09/2023 | USD | 127,289,250 | — | (14,486) |
| Columbia Adaptive Risk Allocation Fund | Annual Report 2023 | 11 |
May 31, 2023
| Long futures contracts (continued) | ||||||
| Description | Number of contracts | Expiration date | Trading currency | Notional amount | Value/Unrealized appreciation ($) | Value/Unrealized depreciation ($) |
| U.S. Treasury 5-Year Note | 845 | 09/2023 | USD | 92,171,016 | — | (3,505) |
| U.S. Treasury Ultra 10-Year Note | 819 | 09/2023 | USD | 98,651,109 | 513,639 | — |
| Total | 3,542,917 | (22,017,914) | ||||
| Short futures contracts | ||||||
| Description | Number of contracts | Expiration date | Trading currency | Notional amount | Value/Unrealized appreciation ($) | Value/Unrealized depreciation ($) |
| FTSE 100 Index | (715) | 06/2023 | GBP | (53,281,800) | 2,288,656 | — |
| FTSE 100 Index | (47) | 06/2023 | GBP | (3,502,440) | — | (70,191) |
| Japanese 10-Year Government Bond | (50) | 06/2023 | JPY | (7,430,000,000) | — | (1,178,478) |
| Total | 2,288,656 | (1,248,669) | ||||
| Cleared credit default swap contracts - sell protection | ||||||||||||
| Reference entity | Counterparty | Maturity date | Receive fixed rate (%) | Payment frequency | Implied credit spread (%)* | Notional currency | Notional amount | Value ($) | Upfront payments ($) | Upfront receipts ($) | Unrealized appreciation ($) | Unrealized depreciation ($) |
| Markit CDX Emerging Markets Index, Series 39 | Morgan Stanley | 06/20/2028 | 1.000 | Quarterly | 2.466 | USD | 215,727,000 | 1,440,751 | — | — | 1,440,751 | — |
| Markit CDX Emerging Markets Index, Series 39 | Morgan Stanley | 06/20/2028 | 1.000 | Quarterly | 2.466 | USD | 49,200,000 | (26,291) | — | — | — | (26,291) |
| Markit CDX North America High Yield Index, Series 40 | Morgan Stanley | 06/20/2028 | 5.000 | Quarterly | 4.709 | USD | 452,116,000 | 9,100,850 | — | — | 9,100,850 | — |
| Markit CDX North America Investment Grade Index, Series 40 | Morgan Stanley | 06/20/2028 | 1.000 | Quarterly | 0.749 | USD | 386,058,000 | 2,703,195 | — | — | 2,703,195 | — |
| Total | 13,218,505 | — | — | 13,244,796 | (26,291) | |||||||
| 12 | Columbia Adaptive Risk Allocation Fund | Annual Report 2023 |
May 31, 2023
| (a) | As defined in the Investment Company Act of 1940, as amended, an affiliated company is one in which the Fund owns 5% or more of the company’s outstanding voting securities, or a company which is under common ownership or control with the Fund. The value of the holdings and transactions in these affiliated companies during the year ended May 31, 2023 are as follows: |
| Affiliated issuers | Beginning of period($) | Purchases($) | Sales($) | Net change in unrealized appreciation (depreciation)($) | End of period($) | Capital gain distributions($) | Realized gain (loss)($) | Dividends — affiliated issuers ($) | End of period shares |
| Columbia Commodity Strategy Fund, Institutional 3 Class | |||||||||
| 164,977,710 | 324,490,317 | (262,114,861) | (51,569,626) | 175,783,540 | — | (42,574,691) | 36,801,805 | 18,680,504 | |
| Columbia Short-Term Cash Fund, 5.241% | |||||||||
| 1,466,080,213 | 3,962,146,034 | (3,815,291,479) | (50,783) | 1,612,883,985 | — | (62,120) | 51,411,445 | 1,613,690,830 | |
| Columbia Solutions Aggressive Portfolio | |||||||||
| 1,162,360 | 94,688 | — | (136,420) | 1,120,628 | — | — | 94,688 | 141,672 | |
| Columbia Solutions Conservative Portfolio | |||||||||
| 6,313,677 | 295,609 | — | (336,775) | 6,272,511 | — | — | 295,609 | 704,777 | |
| Total | 1,638,533,960 | (52,093,604) | 1,796,060,664 | — | (42,636,811) | 88,603,547 | |||
| (b) | Principal amounts are denominated in United States Dollars unless otherwise noted. |
| (c) | Principal and interest may not be guaranteed by a governmental entity. |
| (d) | Represents privately placed and other securities and instruments exempt from Securities and Exchange Commission registration (collectively, private placements), such as Section 4(a)(2) and Rule 144A eligible securities, which are often sold only to qualified institutional buyers. At May 31, 2023, the total value of these securities amounted to $495,397,270, which represents 14.00% of total net assets. |
| (e) | Zero coupon bond. |
| (f) | Represents a security purchased on a when-issued basis. |
| (g) | The rate shown is the seven-day current annualized yield at May 31, 2023. |
| TBA | To Be Announced |
| AUD | Australian Dollar |
| CAD | Canada Dollar |
| CHF | Swiss Franc |
| CNY | China Yuan Renminbi |
| DKK | Danish Krone |
| EUR | Euro |
| GBP | British Pound |
| HKD | Hong Kong Dollar |
| JPY | Japanese Yen |
| MXN | Mexican Peso |
| NOK | Norwegian Krone |
| NZD | New Zealand Dollar |
| SEK | Swedish Krona |
| SGD | Singapore Dollar |
| USD | US Dollar |
| ZAR | South African Rand |
| Columbia Adaptive Risk Allocation Fund | Annual Report 2023 | 13 |
May 31, 2023
| ■ | Level 1 — Valuations based on quoted prices for investments in active markets that the Fund has the ability to access at the measurement date. Valuation adjustments are not applied to Level 1 investments. |
| ■ | Level 2 — Valuations based on other significant observable inputs (including quoted prices for similar securities, interest rates, prepayment speeds, credit risks, etc.). |
| ■ | Level 3 — Valuations based on significant unobservable inputs (including the Fund’s own assumptions and judgment in determining the fair value of investments). |
| Level 1 ($) | Level 2 ($) | Level 3 ($) | Assets at NAV ($) | Total ($) | |
| Investments in Securities | |||||
| Alternative Strategies Funds | 175,783,540 | — | — | — | 175,783,540 |
| Common Stocks | |||||
| Consumer Discretionary | 3,303,617 | — | — | — | 3,303,617 |
| Real Estate | 174,070,094 | — | — | — | 174,070,094 |
| Total Common Stocks | 177,373,711 | — | — | — | 177,373,711 |
| Foreign Government Obligations | — | 462,969,910 | — | — | 462,969,910 |
| Inflation-Indexed Bonds | — | 418,147,548 | — | — | 418,147,548 |
| Multi-Asset/Tactical Strategies Funds | — | — | — | 7,393,139 | 7,393,139 |
| Residential Mortgage-Backed Securities - Agency | — | 264,352,115 | — | — | 264,352,115 |
| U.S. Treasury Obligations | — | 745,035,084 | — | — | 745,035,084 |
| Money Market Funds | 1,612,883,985 | — | — | — | 1,612,883,985 |
| Total Investments in Securities | 1,966,041,236 | 1,890,504,657 | — | 7,393,139 | 3,863,939,032 |
| Investments in Derivatives | |||||
| Asset | |||||
| Forward Foreign Currency Exchange Contracts | — | 11,639,236 | — | — | 11,639,236 |
| Futures Contracts | 5,831,573 | — | — | — | 5,831,573 |
| Swap Contracts | — | 13,244,796 | — | — | 13,244,796 |
| 14 | Columbia Adaptive Risk Allocation Fund | Annual Report 2023 |
May 31, 2023
| Level 1 ($) | Level 2 ($) | Level 3 ($) | Assets at NAV ($) | Total ($) | |
| Liability | |||||
| Forward Foreign Currency Exchange Contracts | — | (1,264,544) | — | — | (1,264,544) |
| Futures Contracts | (23,266,583) | — | — | — | (23,266,583) |
| Swap Contracts | — | (26,291) | — | — | (26,291) |
| Total | 1,948,606,226 | 1,914,097,854 | — | 7,393,139 | 3,870,097,219 |
| Columbia Adaptive Risk Allocation Fund | Annual Report 2023 | 15 |
May 31, 2023
| Assets | |
| Investments in securities, at value | |
| Unaffiliated issuers (cost $2,307,064,409) | $2,067,878,368 |
| Affiliated issuers (cost $1,816,115,804) | 1,796,060,664 |
| Cash | 15 |
| Foreign currency (cost $6,624,817) | 6,613,848 |
| Cash collateral held at broker for: | |
| TBA | 8,541,000 |
| Margin deposits on: | |
| Futures contracts | 128,774,267 |
| Swap contracts | 122,354,025 |
| Unrealized appreciation on forward foreign currency exchange contracts | 11,639,236 |
| Receivable for: | |
| Investments sold | 275,005,166 |
| Investments sold on a delayed delivery basis | 10,317,314 |
| Capital shares sold | 2,840,749 |
| Dividends | 6,709,412 |
| Interest | 5,015,429 |
| Foreign tax reclaims | 306,994 |
| Variation margin for futures contracts | 1,974,723 |
| Variation margin for swap contracts | 8,760,921 |
| Prepaid expenses | 24,482 |
| Trustees’ deferred compensation plan | 136,300 |
| Total assets | 4,452,952,913 |
| Liabilities | |
| Unrealized depreciation on forward foreign currency exchange contracts | 1,264,544 |
| Payable for: | |
| Investments purchased | 600,827,211 |
| Investments purchased on a delayed delivery basis | 279,941,540 |
| Capital shares purchased | 6,668,087 |
| Variation margin for futures contracts | 20,092,603 |
| Variation margin for swap contracts | 4,742,821 |
| Management services fees | 65,343 |
| Distribution and/or service fees | 2,805 |
| Transfer agent fees | 173,160 |
| Compensation of board members | 61,051 |
| Other expenses | 131,746 |
| Trustees’ deferred compensation plan | 136,300 |
| Total liabilities | 914,107,211 |
| Net assets applicable to outstanding capital stock | $3,538,845,702 |
| Represented by | |
| Paid in capital | 4,448,990,064 |
| Total distributable earnings (loss) | (910,144,362) |
| Total - representing net assets applicable to outstanding capital stock | $3,538,845,702 |
| 16 | Columbia Adaptive Risk Allocation Fund | Annual Report 2023 |
May 31, 2023
| Class A | |
| Net assets | $149,172,828 |
| Shares outstanding | 17,611,967 |
| Net asset value per share | $8.47 |
| Maximum sales charge | 5.75% |
| Maximum offering price per share (calculated by dividing the net asset value per share by 1.0 minus the maximum sales charge for Class A shares) | $8.99 |
| Advisor Class | |
| Net assets | $60,582,180 |
| Shares outstanding | 7,136,755 |
| Net asset value per share | $8.49 |
| Class C | |
| Net assets | $63,997,597 |
| Shares outstanding | 7,994,418 |
| Net asset value per share | $8.01 |
| Institutional Class | |
| Net assets | $3,190,279,701 |
| Shares outstanding | 376,188,392 |
| Net asset value per share | $8.48 |
| Institutional 2 Class | |
| Net assets | $54,967,683 |
| Shares outstanding | 6,457,511 |
| Net asset value per share | $8.51 |
| Institutional 3 Class | |
| Net assets | $19,004,651 |
| Shares outstanding | 2,231,201 |
| Net asset value per share | $8.52 |
| Class R | |
| Net assets | $841,062 |
| Shares outstanding | 100,687 |
| Net asset value per share | $8.35 |
| Columbia Adaptive Risk Allocation Fund | Annual Report 2023 | 17 |
Year Ended May 31, 2023
| Net investment income | |
| Income: | |
| Dividends — unaffiliated issuers | $3,222,113 |
| Dividends — affiliated issuers | 88,603,547 |
| Interest | 51,540,615 |
| Interfund lending | 15,658 |
| Foreign taxes withheld | (57,218) |
| Total income | 143,324,715 |
| Expenses: | |
| Management services fees | 26,617,496 |
| Distribution and/or service fees | |
| Class A | 419,544 |
| Class C | 777,638 |
| Class R | 4,236 |
| Transfer agent fees | |
| Class A | 88,040 |
| Advisor Class | 37,655 |
| Class C | 40,799 |
| Institutional Class | 1,800,892 |
| Institutional 2 Class | 34,046 |
| Institutional 3 Class | 3,310 |
| Class R | 444 |
| Compensation of board members | 79,062 |
| Custodian fees | 176,492 |
| Printing and postage fees | 141,628 |
| Registration fees | 241,800 |
| Accounting services fees | 50,490 |
| Legal fees | 63,843 |
| Interest on collateral | 136,538 |
| Compensation of chief compliance officer | 733 |
| Other | 63,443 |
| Total expenses | 30,778,129 |
| Expense reduction | (40) |
| Total net expenses | 30,778,089 |
| Net investment income | 112,546,626 |
| Realized and unrealized gain (loss) — net | |
| Net realized gain (loss) on: | |
| Investments — unaffiliated issuers | (258,273,151) |
| Investments — affiliated issuers | (42,636,811) |
| Foreign currency translations | (2,979,189) |
| Forward foreign currency exchange contracts | 71,494,985 |
| Futures contracts | (136,008,685) |
| Swap contracts | (5,568,424) |
| Net realized loss | (373,971,275) |
| Net change in unrealized appreciation (depreciation) on: | |
| Investments — unaffiliated issuers | 34,410,476 |
| Investments — affiliated issuers | (52,093,604) |
| Foreign currency translations | 109,709 |
| Forward foreign currency exchange contracts | 8,729,637 |
| Futures contracts | 22,283,735 |
| Swap contracts | 17,655,322 |
| Net change in unrealized appreciation (depreciation) | 31,095,275 |
| Net realized and unrealized loss | (342,876,000) |
| Net decrease in net assets resulting from operations | $(230,329,374) |
| 18 | Columbia Adaptive Risk Allocation Fund | Annual Report 2023 |
| Year Ended May 31, 2023 | Year Ended May 31, 2022 | |
| Operations | ||
| Net investment income | $112,546,626 | $134,600,213 |
| Net realized gain (loss) | (373,971,275) | 301,875,906 |
| Net change in unrealized appreciation (depreciation) | 31,095,275 | (586,554,467) |
| Net decrease in net assets resulting from operations | (230,329,374) | (150,078,348) |
| Distributions to shareholders | ||
| Net investment income and net realized gains | ||
| Class A | (11,873,896) | (32,135,555) |
| Advisor Class | (5,273,571) | (15,402,896) |
| Class C | (5,093,443) | (19,874,747) |
| Institutional Class | (251,264,077) | (688,785,814) |
| Institutional 2 Class | (4,075,406) | (10,298,112) |
| Institutional 3 Class | (1,397,994) | (3,879,770) |
| Class R | (58,023) | (143,242) |
| Total distributions to shareholders | (279,036,410) | (770,520,136) |
| Increase (decrease) in net assets from capital stock activity | (95,567,586) | 796,520,568 |
| Total decrease in net assets | (604,933,370) | (124,077,916) |
| Net assets at beginning of year | 4,143,779,072 | 4,267,856,988 |
| Net assets at end of year | $3,538,845,702 | $4,143,779,072 |
| Columbia Adaptive Risk Allocation Fund | Annual Report 2023 | 19 |
| Year Ended | Year Ended | |||
| May 31, 2023 | May 31, 2022 | |||
| Shares | Dollars ($) | Shares | Dollars ($) | |
| Capital stock activity | ||||
| Class A | ||||
| Subscriptions | 2,634,914 | 23,700,063 | 5,594,187 | 60,975,090 |
| Distributions reinvested | 1,304,532 | 11,010,253 | 2,892,709 | 30,402,371 |
| Redemptions | (5,434,560) | (48,034,292) | (3,845,595) | (41,535,809) |
| Net increase (decrease) | (1,495,114) | (13,323,976) | 4,641,301 | 49,841,652 |
| Advisor Class | ||||
| Subscriptions | 1,143,174 | 10,469,562 | 4,316,404 | 50,176,542 |
| Distributions reinvested | 624,051 | 5,273,235 | 1,464,052 | 15,401,823 |
| Redemptions | (3,545,592) | (31,729,001) | (1,956,212) | (21,388,286) |
| Net increase (decrease) | (1,778,367) | (15,986,204) | 3,824,244 | 44,190,079 |
| Class C | ||||
| Subscriptions | 456,117 | 3,888,469 | 1,315,151 | 14,422,781 |
| Distributions reinvested | 625,107 | 5,000,855 | 1,938,855 | 19,369,165 |
| Redemptions | (3,328,572) | (28,096,249) | (2,798,883) | (28,824,303) |
| Net increase (decrease) | (2,247,348) | (19,206,925) | 455,123 | 4,967,643 |
| Institutional Class | ||||
| Subscriptions | 64,767,472 | 582,553,921 | 81,121,176 | 911,145,226 |
| Distributions reinvested | 29,058,557 | 245,254,217 | 63,639,272 | 668,848,747 |
| Redemptions | (98,381,681) | (875,993,796) | (80,310,337) | (897,830,976) |
| Net increase (decrease) | (4,555,652) | (48,185,658) | 64,450,111 | 682,162,997 |
| Institutional 2 Class | ||||
| Subscriptions | 2,999,867 | 26,797,099 | 4,439,815 | 49,138,569 |
| Distributions reinvested | 481,158 | 4,075,406 | 976,124 | 10,298,112 |
| Redemptions | (3,569,514) | (31,668,939) | (4,172,968) | (47,429,487) |
| Net increase (decrease) | (88,489) | (796,434) | 1,242,971 | 12,007,194 |
| Institutional 3 Class | ||||
| Subscriptions | 121,791 | 1,092,634 | 142,545 | 1,630,519 |
| Distributions reinvested | 164,838 | 1,397,826 | 367,700 | 3,879,234 |
| Redemptions | (65,570) | (602,579) | (258,132) | (2,731,456) |
| Net increase | 221,059 | 1,887,881 | 252,113 | 2,778,297 |
| Class R | ||||
| Subscriptions | 8,821 | 76,894 | 50,566 | 577,024 |
| Distributions reinvested | 6,945 | 57,852 | 13,745 | 142,672 |
| Redemptions | (10,310) | (91,016) | (13,213) | (146,990) |
| Net increase | 5,456 | 43,730 | 51,098 | 572,706 |
| Total net increase (decrease) | (9,938,455) | (95,567,586) | 74,916,961 | 796,520,568 |
| 20 | Columbia Adaptive Risk Allocation Fund | Annual Report 2023 |
| Net asset value, beginning of period | Net investment income (loss) | Net realized and unrealized gain (loss) | Total from investment operations | Distributions from net investment income | Distributions from net realized gains | Total distributions to shareholders | |
| Class A | |||||||
| Year Ended 5/31/2023 | $9.69 | 0.24 | (0.80) | (0.56) | (0.66) | — | (0.66) |
| Year Ended 5/31/2022 | $12.10 | 0.32 | (0.59) | (0.27) | (0.42) | (1.72) | (2.14) |
| Year Ended 5/31/2021 | $10.25 | (0.01) | 1.97 | 1.96 | (0.04) | (0.07) | (0.11) |
| Year Ended 5/31/2020 | $10.44 | 0.08 | 0.51 | 0.59 | (0.26) | (0.52) | (0.78) |
| Year Ended 5/31/2019 | $10.81 | 0.20 | 0.01 | 0.21 | (0.35) | (0.23) | (0.58) |
| Advisor Class | |||||||
| Year Ended 5/31/2023 | $9.71 | 0.27 | (0.81) | (0.54) | (0.68) | — | (0.68) |
| Year Ended 5/31/2022 | $12.12 | 0.38 | (0.62) | (0.24) | (0.44) | (1.73) | (2.17) |
| Year Ended 5/31/2021 | $10.37 | 0.02 | 1.98 | 2.00 | (0.10) | (0.15) | (0.25) |
| Year Ended 5/31/2020 | $10.55 | 0.10 | 0.53 | 0.63 | (0.29) | (0.52) | (0.81) |
| Year Ended 5/31/2019 | $10.92 | 0.23 | 0.01 | 0.24 | (0.38) | (0.23) | (0.61) |
| Class C | |||||||
| Year Ended 5/31/2023 | $9.18 | 0.17 | (0.76) | (0.59) | (0.58) | — | (0.58) |
| Year Ended 5/31/2022 | $11.57 | 0.23 | (0.57) | (0.34) | (0.37) | (1.68) | (2.05) |
| Year Ended 5/31/2021 | $9.85 | (0.09) | 1.87 | 1.78 | — | (0.06) | (0.06) |
| Year Ended 5/31/2020 | $10.05 | 0.00(e) | 0.50 | 0.50 | (0.18) | (0.52) | (0.70) |
| Year Ended 5/31/2019 | $10.42 | 0.11 | 0.02 | 0.13 | (0.27) | (0.23) | (0.50) |
| Institutional Class | |||||||
| Year Ended 5/31/2023 | $9.70 | 0.27 | (0.81) | (0.54) | (0.68) | — | (0.68) |
| Year Ended 5/31/2022 | $12.11 | 0.35 | (0.59) | (0.24) | (0.44) | (1.73) | (2.17) |
| Year Ended 5/31/2021 | $10.36 | 0.02 | 1.98 | 2.00 | (0.10) | (0.15) | (0.25) |
| Year Ended 5/31/2020 | $10.55 | 0.11 | 0.51 | 0.62 | (0.29) | (0.52) | (0.81) |
| Year Ended 5/31/2019 | $10.91 | 0.22 | 0.03 | 0.25 | (0.38) | (0.23) | (0.61) |
| Institutional 2 Class | |||||||
| Year Ended 5/31/2023 | $9.74 | 0.26 | (0.81) | (0.55) | (0.68) | — | (0.68) |
| Year Ended 5/31/2022 | $12.15 | 0.32 | (0.56) | (0.24) | (0.44) | (1.73) | (2.17) |
| Year Ended 5/31/2021 | $10.39 | 0.02 | 1.98 | 2.00 | (0.10) | (0.14) | (0.24) |
| Year Ended 5/31/2020 | $10.57 | 0.10 | 0.53 | 0.63 | (0.29) | (0.52) | (0.81) |
| Year Ended 5/31/2019 | $10.93 | 0.22 | 0.03 | 0.25 | (0.38) | (0.23) | (0.61) |
| 22 | Columbia Adaptive Risk Allocation Fund | Annual Report 2023 |
| Net asset value, end of period | Total return | Total gross expense ratio to average net assets(a) | Total net expense ratio to average net assets(a),(b) | Net investment income (loss) ratio to average net assets | Portfolio turnover | Net assets, end of period (000’s) | |
| Class A | |||||||
| Year Ended 5/31/2023 | $8.47 | (5.79%) | 1.02%(c) | 1.02%(c),(d) | 2.71% | 199% | $149,173 |
| Year Ended 5/31/2022 | $9.69 | (3.62%) | 1.00%(c) | 1.00%(c) | 2.82% | 260% | $185,112 |
| Year Ended 5/31/2021 | $12.10 | 19.17% | 1.00%(c) | 1.00%(c) | (0.06%) | 227% | $175,015 |
| Year Ended 5/31/2020 | $10.25 | 5.41% | 1.01%(c) | 1.01%(c),(d) | 0.74% | 314% | $141,074 |
| Year Ended 5/31/2019 | $10.44 | 2.33% | 1.00% | 1.00%(d) | 1.87% | 203% | $120,147 |
| Advisor Class | |||||||
| Year Ended 5/31/2023 | $8.49 | (5.52%) | 0.77%(c) | 0.77%(c),(d) | 2.96% | 199% | $60,582 |
| Year Ended 5/31/2022 | $9.71 | (3.36%) | 0.75%(c) | 0.75%(c) | 3.39% | 260% | $86,570 |
| Year Ended 5/31/2021 | $12.12 | 19.38% | 0.75%(c) | 0.75%(c) | 0.20% | 227% | $61,716 |
| Year Ended 5/31/2020 | $10.37 | 5.71% | 0.76%(c) | 0.76%(c),(d) | 0.98% | 314% | $41,312 |
| Year Ended 5/31/2019 | $10.55 | 2.58% | 0.75% | 0.75%(d) | 2.14% | 203% | $30,420 |
| Class C | |||||||
| Year Ended 5/31/2023 | $8.01 | (6.37%) | 1.77%(c) | 1.77%(c),(d) | 1.95% | 199% | $63,998 |
| Year Ended 5/31/2022 | $9.18 | (4.39%) | 1.75%(c) | 1.75%(c) | 2.11% | 260% | $94,069 |
| Year Ended 5/31/2021 | $11.57 | 18.14% | 1.75%(c) | 1.75%(c) | (0.80%) | 227% | $113,245 |
| Year Ended 5/31/2020 | $9.85 | 4.73% | 1.76%(c) | 1.76%(c),(d) | 0.00% | 314% | $95,090 |
| Year Ended 5/31/2019 | $10.05 | 1.56% | 1.75% | 1.75%(d) | 1.10% | 203% | $94,648 |
| Institutional Class | |||||||
| Year Ended 5/31/2023 | $8.48 | (5.52%) | 0.77%(c) | 0.77%(c),(d) | 2.97% | 199% | $3,190,280 |
| Year Ended 5/31/2022 | $9.70 | (3.37%) | 0.75%(c) | 0.75%(c) | 3.08% | 260% | $3,693,809 |
| Year Ended 5/31/2021 | $12.11 | 19.40% | 0.75%(c) | 0.75%(c) | 0.19% | 227% | $3,831,565 |
| Year Ended 5/31/2020 | $10.36 | 5.62% | 0.76%(c) | 0.76%(c),(d) | 1.00% | 314% | $2,845,593 |
| Year Ended 5/31/2019 | $10.55 | 2.67% | 0.75% | 0.75%(d) | 2.11% | 203% | $2,618,924 |
| Institutional 2 Class | |||||||
| Year Ended 5/31/2023 | $8.51 | (5.60%) | 0.78%(c) | 0.78%(c) | 2.92% | 199% | $54,968 |
| Year Ended 5/31/2022 | $9.74 | (3.36%) | 0.76%(c) | 0.76%(c) | 2.78% | 260% | $63,729 |
| Year Ended 5/31/2021 | $12.15 | 19.38% | 0.76%(c) | 0.76%(c) | 0.17% | 227% | $64,418 |
| Year Ended 5/31/2020 | $10.39 | 5.69% | 0.77%(c) | 0.77%(c) | 0.95% | 314% | $38,829 |
| Year Ended 5/31/2019 | $10.57 | 2.65% | 0.76% | 0.76% | 2.10% | 203% | $22,397 |
| Columbia Adaptive Risk Allocation Fund | Annual Report 2023 | 23 |
| Net asset value, beginning of period | Net investment income (loss) | Net realized and unrealized gain (loss) | Total from investment operations | Distributions from net investment income | Distributions from net realized gains | Total distributions to shareholders | |
| Institutional 3 Class | |||||||
| Year Ended 5/31/2023 | $9.74 | 0.27 | (0.81) | (0.54) | (0.68) | — | (0.68) |
| Year Ended 5/31/2022 | $12.16 | 0.36 | (0.61) | (0.25) | (0.44) | (1.73) | (2.17) |
| Year Ended 5/31/2021 | $10.41 | 0.03 | 1.99 | 2.02 | (0.11) | (0.16) | (0.27) |
| Year Ended 5/31/2020 | $10.59 | 0.11 | 0.52 | 0.63 | (0.29) | (0.52) | (0.81) |
| Year Ended 5/31/2019 | $10.95 | 0.32 | (0.07)(f) | 0.25 | (0.38) | (0.23) | (0.61) |
| Class R | |||||||
| Year Ended 5/31/2023 | $9.56 | 0.22 | (0.80) | (0.58) | (0.63) | — | (0.63) |
| Year Ended 5/31/2022 | $11.97 | 0.30 | (0.60) | (0.30) | (0.40) | (1.71) | (2.11) |
| Year Ended 5/31/2021 | $10.13 | (0.03) | 1.93 | 1.90 | — | (0.06) | (0.06) |
| Year Ended 5/31/2020 | $10.32 | 0.05 | 0.52 | 0.57 | (0.24) | (0.52) | (0.76) |
| Year Ended 5/31/2019 | $10.69 | 0.16 | 0.02 | 0.18 | (0.32) | (0.23) | (0.55) |
| Notes to Financial Highlights | |
| (a) | In addition to the fees and expenses that the Fund bears directly, the Fund indirectly bears a pro rata share of the fees and expenses of any other funds in which it invests. Such indirect expenses are not included in the Fund’s reported expense ratios. |
| (b) | Total net expenses include the impact of certain fee waivers/expense reimbursements made by the Investment Manager and certain of its affiliates, if applicable. |
| (c) | Ratios include interest on collateral expense. For the periods indicated below, if interest on collateral expense had been excluded, expenses would have been lower by: |
| Class | 5/31/2023 | 5/31/2022 | 5/31/2021 | 5/31/2020 |
| Class A | less than 0.01% | 0.01% | less than 0.01% | less than 0.01% |
| Advisor Class | less than 0.01% | 0.01% | less than 0.01% | less than 0.01% |
| Class C | less than 0.01% | 0.01% | less than 0.01% | less than 0.01% |
| Institutional Class | less than 0.01% | 0.01% | less than 0.01% | less than 0.01% |
| Institutional 2 Class | less than 0.01% | 0.01% | less than 0.01% | less than 0.01% |
| Institutional 3 Class | less than 0.01% | 0.01% | less than 0.01% | less than 0.01% |
| Class R | less than 0.01% | 0.01% | less than 0.01% | less than 0.01% |
| (d) | The benefits derived from expense reductions had an impact of less than 0.01%. |
| (e) | Rounds to zero. |
| (f) | Calculation of the net gain (loss) per share (both realized and unrealized) does not correlate to the aggregate realized and unrealized gain (loss) presented in the Statement of Operations due to the timing of subscriptions and redemptions of Fund shares in relation to fluctuations in the market value of the portfolio. |
| 24 | Columbia Adaptive Risk Allocation Fund | Annual Report 2023 |
| Net asset value, end of period | Total return | Total gross expense ratio to average net assets(a) | Total net expense ratio to average net assets(a),(b) | Net investment income (loss) ratio to average net assets | Portfolio turnover | Net assets, end of period (000’s) | |
| Institutional 3 Class | |||||||
| Year Ended 5/31/2023 | $8.52 | (5.47%) | 0.74%(c) | 0.74%(c) | 3.02% | 199% | $19,005 |
| Year Ended 5/31/2022 | $9.74 | (3.40%) | 0.72%(c) | 0.72%(c) | 3.13% | 260% | $19,579 |
| Year Ended 5/31/2021 | $12.16 | 19.53% | 0.71%(c) | 0.71%(c) | 0.23% | 227% | $21,369 |
| Year Ended 5/31/2020 | $10.41 | 5.73% | 0.72%(c) | 0.72%(c) | 1.04% | 314% | $14,168 |
| Year Ended 5/31/2019 | $10.59 | 2.67% | 0.71% | 0.71% | 3.02% | 203% | $13,063 |
| Class R | |||||||
| Year Ended 5/31/2023 | $8.35 | (6.02%) | 1.27%(c) | 1.27%(c),(d) | 2.47% | 199% | $841 |
| Year Ended 5/31/2022 | $9.56 | (3.91%) | 1.25%(c) | 1.25%(c) | 2.69% | 260% | $911 |
| Year Ended 5/31/2021 | $11.97 | 18.82% | 1.25%(c) | 1.25%(c) | (0.31%) | 227% | $528 |
| Year Ended 5/31/2020 | $10.13 | 5.22% | 1.26%(c) | 1.26%(c),(d) | 0.51% | 314% | $363 |
| Year Ended 5/31/2019 | $10.32 | 2.07% | 1.25% | 1.25%(d) | 1.54% | 203% | $424 |
| Columbia Adaptive Risk Allocation Fund | Annual Report 2023 | 25 |
May 31, 2023
| 26 | Columbia Adaptive Risk Allocation Fund | Annual Report 2023 |
May 31, 2023
| Columbia Adaptive Risk Allocation Fund | Annual Report 2023 | 27 |
May 31, 2023
| 28 | Columbia Adaptive Risk Allocation Fund | Annual Report 2023 |
May 31, 2023
| Columbia Adaptive Risk Allocation Fund | Annual Report 2023 | 29 |
May 31, 2023
| 30 | Columbia Adaptive Risk Allocation Fund | Annual Report 2023 |
May 31, 2023
| Asset derivatives | ||
| Risk exposure category | Statement of assets and liabilities location | Fair value ($) |
| Credit risk | Component of total distributable earnings (loss) — unrealized appreciation on swap contracts | 13,244,796* |
| Equity risk | Component of total distributable earnings (loss) — unrealized appreciation on futures contracts | 2,745,914* |
| Foreign exchange risk | Unrealized appreciation on forward foreign currency exchange contracts | 11,639,236 |
| Interest rate risk | Component of total distributable earnings (loss) — unrealized appreciation on futures contracts | 3,085,659* |
| Total | 30,715,605 |
| Liability derivatives | ||
| Risk exposure category | Statement of assets and liabilities location | Fair value ($) |
| Credit risk | Component of total distributable earnings (loss) — unrealized depreciation on swap contracts | 26,291* |
| Equity risk | Component of total distributable earnings (loss) — unrealized depreciation on futures contracts | 22,070,102* |
| Foreign exchange risk | Unrealized depreciation on forward foreign currency exchange contracts | 1,264,544 |
| Interest rate risk | Component of total distributable earnings (loss) — unrealized depreciation on futures contracts | 1,196,481* |
| Total | 24,557,418 |
| * | Includes cumulative appreciation (depreciation) as reported in the tables following the Portfolio of Investments. Only the current day’s variation margin for futures and centrally cleared swaps, if any, is reported in receivables or payables in the Statement of Assets and Liabilities. |
| Columbia Adaptive Risk Allocation Fund | Annual Report 2023 | 31 |
May 31, 2023
| Amount of realized gain (loss) on derivatives recognized in income | ||||
| Risk exposure category | Forward foreign currency exchange contracts ($) | Futures contracts ($) | Swap contracts ($) | Total ($) |
| Credit risk | — | — | (5,568,424) | (5,568,424) |
| Equity risk | — | (52,963,961) | — | (52,963,961) |
| Foreign exchange risk | 71,494,985 | — | — | 71,494,985 |
| Interest rate risk | — | (83,044,724) | — | (83,044,724) |
| Total | 71,494,985 | (136,008,685) | (5,568,424) | (70,082,124) |
| Change in unrealized appreciation (depreciation) on derivatives recognized in income | ||||
| Risk exposure category | Forward foreign currency exchange contracts ($) | Futures contracts ($) | Swap contracts ($) | Total ($) |
| Credit risk | — | — | 17,655,322 | 17,655,322 |
| Equity risk | — | (8,947,867) | — | (8,947,867) |
| Foreign exchange risk | 8,729,637 | — | — | 8,729,637 |
| Interest rate risk | — | 31,231,602 | — | 31,231,602 |
| Total | 8,729,637 | 22,283,735 | 17,655,322 | 48,668,694 |
| Derivative instrument | Average notional amounts ($)* |
| Futures contracts — long | 1,620,147,427 |
| Futures contracts — short | 92,211,319 |
| Credit default swap contracts — sell protection | 720,142,310 |
| Derivative instrument | Average unrealized appreciation ($)* | Average unrealized depreciation ($)* |
| Forward foreign currency exchange contracts | 19,001,223 | (3,269,831) |
| * | Based on the ending quarterly outstanding amounts for the year ended May 31, 2023. |
| 32 | Columbia Adaptive Risk Allocation Fund | Annual Report 2023 |
May 31, 2023
| Columbia Adaptive Risk Allocation Fund | Annual Report 2023 | 33 |
May 31, 2023
| Barclays ($) | Citi ($) | Goldman Sachs International ($) | HSBC ($) | Morgan Stanley ($)(a) | Morgan Stanley ($)(a) | State Street ($) | UBS ($) | Total ($) | |
| Assets | |||||||||
| Centrally cleared credit default swap contracts (b) | — | — | — | — | — | 8,760,921 | — | — | 8,760,921 |
| Forward foreign currency exchange contracts | 38,117 | 8,503,643 | 1,448,873 | 490,511 | 17,965 | — | 20,317 | 1,119,810 | 11,639,236 |
| Total assets | 38,117 | 8,503,643 | 1,448,873 | 490,511 | 17,965 | 8,760,921 | 20,317 | 1,119,810 | 20,400,157 |
| Liabilities | |||||||||
| Centrally cleared credit default swap contracts (b) | — | — | — | — | — | 4,742,821 | — | — | 4,742,821 |
| Forward foreign currency exchange contracts | 2,131 | 58,820 | 100,404 | 1,116 | — | — | 2,186 | 1,099,887 | 1,264,544 |
| Total liabilities | 2,131 | 58,820 | 100,404 | 1,116 | — | 4,742,821 | 2,186 | 1,099,887 | 6,007,365 |
| Total financial and derivative net assets | 35,986 | 8,444,823 | 1,348,469 | 489,395 | 17,965 | 4,018,100 | 18,131 | 19,923 | 14,392,792 |
| Total collateral received (pledged) (c) | — | — | — | — | — | — | — | — | — |
| Net amount (d) | 35,986 | 8,444,823 | 1,348,469 | 489,395 | 17,965 | 4,018,100 | 18,131 | 19,923 | 14,392,792 |
| (a) | Exposure can only be netted across transactions governed under the same master agreement with the same legal entity. |
| (b) | Centrally cleared swaps are included within payable/receivable for variation margin in the Statement of Assets and Liabilities. |
| (c) | In some instances, the actual collateral received and/or pledged may be more than the amount shown due to overcollateralization. |
| (d) | Represents the net amount due from/(to) counterparties in the event of default. |
| 34 | Columbia Adaptive Risk Allocation Fund | Annual Report 2023 |
May 31, 2023
| Columbia Adaptive Risk Allocation Fund | Annual Report 2023 | 35 |
May 31, 2023
| 36 | Columbia Adaptive Risk Allocation Fund | Annual Report 2023 |
May 31, 2023
| Effective rate (%) | |
| Class A | 0.05 |
| Advisor Class | 0.05 |
| Class C | 0.05 |
| Institutional Class | 0.05 |
| Institutional 2 Class | 0.06 |
| Institutional 3 Class | 0.02 |
| Class R | 0.05 |
| Columbia Adaptive Risk Allocation Fund | Annual Report 2023 | 37 |
May 31, 2023
| Front End (%) | CDSC (%) | Amount ($) | |
| Class A | 5.75 | 0.50 - 1.00(a) | 115,373 |
| Class C | — | 1.00(b) | 7,954 |
| (a) | This charge is imposed on certain investments of between $1 million and $50 million redeemed within 18 months after purchase, as follows: 1.00% if redeemed within 12 months after purchase, and 0.50% if redeemed more than 12, but less than 18, months after purchase, with certain limited exceptions. |
| (b) | This charge applies to redemptions within 12 months after purchase, with certain limited exceptions. |
| October 1, 2022 through September 30, 2023 | Prior to October 1, 2022 | |
| Class A | 1.25% | 1.25% |
| Advisor Class | 1.00 | 1.00 |
| Class C | 2.00 | 2.00 |
| Institutional Class | 1.00 | 1.00 |
| Institutional 2 Class | 1.01 | 1.01 |
| Institutional 3 Class | 0.97 | 0.96 |
| Class R | 1.50 | 1.50 |
| 38 | Columbia Adaptive Risk Allocation Fund | Annual Report 2023 |
May 31, 2023
| Excess of distributions over net investment income ($) | Accumulated net realized (loss) ($) | Paid in capital ($) |
| 15,995,858 | (15,980,282) | (15,576) |
| Year Ended May 31, 2023 | Year Ended May 31, 2022 | ||||
| Ordinary income ($) | Long-term capital gains ($) | Total ($) | Ordinary income ($) | Long-term capital gains ($) | Total ($) |
| 279,036,410 | — | 279,036,410 | 455,778,260 | 314,741,876 | 770,520,136 |
| Undistributed ordinary income ($) | Undistributed long-term capital gains ($) | Capital loss carryforwards ($) | Net unrealized (depreciation) ($) |
| — | — | (562,544,401) | (259,253,320) |
| Federal tax cost ($) | Gross unrealized appreciation ($) | Gross unrealized (depreciation) ($) | Net unrealized (depreciation) ($) |
| 4,129,350,539 | 18,673,120 | (277,926,440) | (259,253,320) |
| No expiration short-term ($) | No expiration long-term ($) | Total ($) | Utilized ($) |
| (342,788,432) | (219,755,969) | (562,544,401) | — |
| Late year ordinary losses ($) | Post-October capital losses ($) |
| 88,167,003 | — |
| Columbia Adaptive Risk Allocation Fund | Annual Report 2023 | 39 |
May 31, 2023
| Borrower or lender | Average loan balance ($) | Weighted average interest rate (%) | Number of days with outstanding loans |
| Lender | 12,454,545 | 4.49 | 11 |
| 40 | Columbia Adaptive Risk Allocation Fund | Annual Report 2023 |
May 31, 2023
| Columbia Adaptive Risk Allocation Fund | Annual Report 2023 | 41 |
May 31, 2023
| 42 | Columbia Adaptive Risk Allocation Fund | Annual Report 2023 |
May 31, 2023
| Columbia Adaptive Risk Allocation Fund | Annual Report 2023 | 43 |
| 44 | Columbia Adaptive Risk Allocation Fund | Annual Report 2023 |
| Section 199A dividends | |
| 1.27% |
| Name, address, year of birth | Position held with the Columbia Funds and length of service | Principal occupation(s) during past five years and other relevant professional experience | Number of Funds in the Columbia Funds Complex* overseen | Other directorships held by Trustee during the past five years and other relevant Board experience |
| George S. Batejan c/o Columbia Management Investment Advisers, LLC 290 Congress Street Boston, MA 02210 1954 | Trustee since 2017 | Executive Vice President, Global Head of Technology and Operations, Janus Capital Group, Inc., 2010-2016 | 174 | Former Chairman of the Board, NICSA (National Investment Company Services Association) (Executive Committee, Nominating Committee and Governance Committee), 2014-2016; former Director, Intech Investment Management, 2011-2016; former Board Member, Metro Denver Chamber of Commerce, 2015-2016; former Advisory Board Member, University of Colorado Business School, 2015-2018; former Board Member, Chase Bank International, 1993-1994 |
| Columbia Adaptive Risk Allocation Fund | Annual Report 2023 | 45 |
(Unaudited)
Independent trustees (continued)
| Name, address, year of birth | Position held with the Columbia Funds and length of service | Principal occupation(s) during past five years and other relevant professional experience | Number of Funds in the Columbia Funds Complex* overseen | Other directorships held by Trustee during the past five years and other relevant Board experience |
| Kathleen Blatz c/o Columbia Management Investment Advisers, LLC 290 Congress Street Boston, MA 02210 1954 | Trustee since 2006 | Attorney, specializing in arbitration and mediation; Chief Justice, Minnesota Supreme Court, 1998-2006; Associate Justice, Minnesota Supreme Court, 1996-1998; Fourth Judicial District Court Judge, Hennepin County, 1994-1996; Attorney in private practice and public service, 1984-1993; State Representative, Minnesota House of Representatives, 1979-1993, which included service on the Tax and Financial Institutions and Insurance Committees; Member and Interim Chair, Minnesota Sports Facilities Authority, January-July 2017; Interim President and Chief Executive Officer, Blue Cross and Blue Shield of Minnesota (health care insurance), February-July 2018, April-October 2021 | 174 | Former Trustee, Blue Cross and Blue Shield of Minnesota, 2009-2021 (Chair of the Business Development Committee, 2014-2017; Chair of the Governance Committee, 2017-2019); former Member and Chair of the Board, Minnesota Sports Facilities Authority, January 2017-July 2017; former Director, Robina Foundation, 2009-2020 (Chair, 2014-2020); Director, Richard M. Schulze Family Foundation, since 2021 |
| Pamela G. Carlton c/o Columbia Management Investment Advisers, LLC 290 Congress Street Boston, MA 02210 1954 | Chair since 2023; Trustee since 2007 | President, Springboard — Partners in Cross Cultural Leadership (consulting company), since 2003; Managing Director of US Equity Research, JP Morgan Chase, 1999-2003; Director of US Equity Research, Chase Asset Management, 1996-1999; Co-Director Latin America Research, 1993-1996, COO Global Research, 1992-1996, Co-Director of US Research, 1991-1992, Investment Banker, 1982-1991, Morgan Stanley; Attorney, Cleary Gottlieb Steen & Hamilton LLP, 1980-1982 | 174 | Trustee, New York Presbyterian Hospital Board, since 1996; Director, DR Bank (Audit Committee) since 2017; Director, Evercore Inc. (Audit Committee, Nominating and Governance Committee), since 2019; Director, Apollo Commercial Real Estate Finance, Inc. (Chair, Nominating and Governance Committee) (financial services), since 2021; the Governing Council of the Independent Directors Council (IDC), since 2021 |
| Janet Langford Carrig c/o Columbia Management Investment Advisers, LLC 290 Congress Street Boston, MA 02210 1957 | Trustee since 1996 | Senior Vice President, General Counsel and Corporate Secretary, ConocoPhillips (independent energy company), September 2007-October 2018 | 174 | Director, EQT Corporation (natural gas producer), since 2019; former Director, Whiting Petroleum Corporation (independent oil and gas company), 2020-2022 |
| J. Kevin Connaughton c/o Columbia Management Investment Advisers, LLC 290 Congress Street Boston, MA 02210 1964 | Trustee since 2020 | CEO and President, RhodeWay Financial (non-profit financial planning firm), since December 2022; Member, FINRA National Adjudicatory Council, since January 2020; Adjunct Professor of Finance, Bentley University since January 2018; Consultant to Independent Trustees of CFVIT and CFST I from March 2016 to June 2020 with respect to CFVIT and to December 2020 with respect to CFST I; Managing Director and General Manager of Mutual Fund Products, Columbia Management Investment Advisers, LLC, May 2010-February 2015; President, Columbia Funds, 2008-2015; and senior officer of Columbia Funds and affiliated funds, 2003-2015 | 172 | Former Director, The Autism Project, March 2015-December 2021; former Member of the Investment Committee, St. Michael’s College, November 2015-February 2020; former Trustee, St. Michael’s College, June 2017-September 2019; former Trustee, New Century Portfolios (former mutual fund complex), January 2015-December 2017 |
| 46 | Columbia Adaptive Risk Allocation Fund | Annual Report 2023 |
(Unaudited)
Independent trustees (continued)
| Name, address, year of birth | Position held with the Columbia Funds and length of service | Principal occupation(s) during past five years and other relevant professional experience | Number of Funds in the Columbia Funds Complex* overseen | Other directorships held by Trustee during the past five years and other relevant Board experience |
| Olive M. Darragh c/o Columbia Management Investment Advisers, LLC 290 Congress Street Boston, MA 02210 1962 | Trustee since 2020 | Managing Director of Darragh Inc. (strategy and talent management consulting firm), since 2010; Founder and CEO, Zolio, Inc. (investment management talent identification platform), since 2004; Consultant to Independent Trustees of CFVIT and CFST I from June 2019 to June 2020 with respect to CFVIT and to December 2020 with respect to CFST I; Partner, Tudor Investments, 2004-2010; Senior Partner, McKinsey & Company (consulting), 1990-2004; Touche Ross CPA, 1985-1988 | 172 | Treasurer, Edinburgh University US Trust Board, since January 2023; Member, HBS Community Action Partners Board, since September 2022; former Director, University of Edinburgh Business School (Member of US Board), 2004-2019; former Director, Boston Public Library Foundation, 2008-2017 |
| Patricia M. Flynn c/o Columbia Management Investment Advisers, LLC 290 Congress Street Boston, MA 02210 1950 | Trustee since 2004 | Professor of Economics and Management, Bentley University, since 2002; Dean, McCallum Graduate School of Business, Bentley University, 1992-2002 | 174 | Former Trustee, MA Taxpayers Foundation, 1997-2022; former Director, The MA Business Roundtable, 2003-2019; former Chairperson, Innovation Index Advisory Committee, MA Technology Collaborative, 1997-2020 |
| Brian J. Gallagher c/o Columbia Management Investment Advisers, LLC 290 Congress Street Boston, MA 02210 1954 | Trustee since 2017 | Retired; Partner with Deloitte & Touche LLP and its predecessors, 1977-2016 | 174 | Trustee, Catholic Schools Foundation, since 2004 |
| Douglas A. Hacker c/o Columbia Management Investment Advisers, LLC 290 Congress Street Boston, MA 02210 1955 | Trustee since 1996 | Independent business executive, since May 2006; Executive Vice President – Strategy of United Airlines, December 2002 - May 2006; President of UAL Loyalty Services (airline marketing company), September 2001-December 2002; Executive Vice President and Chief Financial Officer of United Airlines, July 1999-September 2001 | 174 | Director, SpartanNash Company since November 2013 (Chair of the Board, since May 2021) (food distributor); Director, Aircastle Limited (Chair of Audit Committee) (aircraft leasing), since August 2006; former Director, Nash Finch Company (food distributor), 2005-2013; former Director, SeaCube Container Leasing Ltd. (container leasing), 2010-2013; and former Director, Travelport Worldwide Limited (travel information technology), 2014-2019 |
| Nancy T. Lukitsh c/o Columbia Management Investment Advisers, LLC 290 Congress Street Boston, MA 02210 1956 | Trustee since 2011 | Senior Vice President, Partner and Director of Marketing, Wellington Management Company, LLP (investment adviser), 1997-2010; Chair, Wellington Management Portfolios (commingled non-U.S. investment pools), 2007-2010; Director, Wellington Trust Company, NA and other Wellington affiliates, 1997-2010 | 172 | None |
| Columbia Adaptive Risk Allocation Fund | Annual Report 2023 | 47 |
(Unaudited)
Independent trustees (continued)
| Name, address, year of birth | Position held with the Columbia Funds and length of service | Principal occupation(s) during past five years and other relevant professional experience | Number of Funds in the Columbia Funds Complex* overseen | Other directorships held by Trustee during the past five years and other relevant Board experience |
| David M. Moffett c/o Columbia Management Investment Advisers, LLC 290 Congress Street Boston, MA 02210 1952 | Trustee since 2011 | Retired; former Chief Executive Officer of Freddie Mac and Chief Financial Officer of U.S. Bank | 172 | Director, CSX Corporation (transportation suppliers); Director, PayPal Holdings Inc. (payment and data processing services); Trustee, University of Oklahoma Foundation; former Director, eBay Inc. (online trading community), 2007-2015; and former Director, CIT Bank, CIT Group Inc. (commercial and consumer finance), 2010-2016; former Senior Adviser to The Carlyle Group (financial services), March 2008-September 2008; former Governance Consultant to Bridgewater Associates, January 2013-December 2015 |
| Catherine James Paglia c/o Columbia Management Investment Advisers, LLC 290 Congress Street Boston, MA 02210 1952 | Trustee since 2004 | Director, Enterprise Asset Management, Inc. (private real estate and asset management company), since September 1998; Managing Director and Partner, Interlaken Capital, Inc., 1989-1997; Vice President, 1982-1985, Principal, 1985-1987, Managing Director, 1987-1989, Morgan Stanley; Vice President, Investment Banking, 1980-1982, Associate, Investment Banking, 1976-1980, Dean Witter Reynolds, Inc. | 174 | Director, Valmont Industries, Inc. (irrigation systems manufacturer), since 2012; Trustee, Carleton College (on the Investment Committee), since 1987; Trustee, Carnegie Endowment for International Peace (on the Investment Committee), since 2009 |
| Natalie A. Trunow c/o Columbia Management Investment Advisers, LLC 290 Congress Street Boston, MA 02210 1967 | Trustee since 2020 | Chief Executive Officer, Millennial Portfolio Solutions LLC (asset management and consulting services), January 2016-January 2021; Non-executive Member of the Investment Committee and Valuation Committee, Sarona Asset Management Inc. (private equity firm) since September 2019; Advisor, Horizon Investments (asset management and consulting services), August 2018-January 2022; Advisor, Paradigm Asset Management, November 2016-January 2022; Consultant to Independent Trustees of CFVIT and CFST I from September 2016 to June 2020 with respect to CFVIT and to December 2020 with respect to CFST I; Director of Investments/Consultant, Casey Family Programs, April 2016-November 2016; Senior Vice President and Chief Investment Officer, Calvert Investments, August 2008-January 2016; Section Head and Portfolio Manager, General Motors Asset Management, June 1997-August 2008 | 172 | Independent Director, Investment Committee, Health Services for Children with Special Needs, Inc., 2010-2021; Independent Director, (Executive Committee and Chair, Audit Committee), Consumer Credit Counseling Services (formerly Guidewell Financial Solutions), since 2016; Independent Director, (Investment Committee), Sarona Asset Management, since 2019 |
| 48 | Columbia Adaptive Risk Allocation Fund | Annual Report 2023 |
(Unaudited)
Independent trustees (continued)
| Name, address, year of birth | Position held with the Columbia Funds and length of service | Principal occupation(s) during past five years and other relevant professional experience | Number of Funds in the Columbia Funds Complex* overseen | Other directorships held by Trustee during the past five years and other relevant Board experience |
| Sandra L. Yeager c/o Columbia Management Investment Advisers, LLC 290 Congress Street Boston, MA 02210 1964 | Trustee since 2017 | Retired; President and founder, Hanoverian Capital, LLC (SEC registered investment advisor firm), 2008-2016; Managing Director, DuPont Capital, 2006-2008; Managing Director, Morgan Stanley Investment Management, 2004-2006; Senior Vice President, Alliance Bernstein, 1990-2004 | 174 | Former Director, NAPE (National Alliance for Partnerships in Equity) Education Foundation, October 2016-October 2020; Advisory Board, Jennersville YMCA, since 2022 |
| Name, address, year of birth | Position held with the Columbia Funds and length of service | Principal occupation(s) during the past five years and other relevant professional experience | Number of Funds in the Columbia Funds Complex overseen | Other directorships held by Trustee during the past five years and other relevant Board experience |
| Daniel J. Beckman c/o Columbia Management Investment Advisers, LLC 290 Congress Street Boston, MA 02210 1962 | Trustee since November 2021 and President since June 2021 | Vice President – Head of North America Product, Columbia Management Investment Advisers, LLC, since April 2015; President and Principal Executive Officer of the Columbia Funds, since June 2021; officer of Columbia Funds and affiliated funds, 2020-2021 | 174 | Director, Ameriprise Trust Company, since October 2016; Director, Columbia Management Investment Distributors, Inc. since November 2018; Board of Governors, Columbia Wanger Asset Management, LLC since, January 2022; Director, Columbia Threadneedle Canada, Inc., since December 2022 |
| * | The term “Columbia Funds Complex” as used herein includes Columbia Seligman Premium Technology Growth Fund, Tri-Continental Corporation and each series of Columbia Funds Series Trust (CFST), Columbia Funds Series Trust I (CFST I), Columbia Funds Series Trust II (CFST II), Columbia ETF Trust I (CET I), Columbia ETF Trust II (CET II), Columbia Funds Variable Insurance Trust (CFVIT) and Columbia Funds Variable Series Trust II (CFVST II). Messrs. Batejan, Beckman, Gallagher and Hacker and Mses. Blatz, Carlton, Carrig, Flynn, Paglia, and Yeager serve as directors of Columbia Seligman Premium Technology Growth Fund and Tri-Continental Corporation. |
| ** | Interested person (as defined under the 1940 Act) by reason of being an officer, director, security holder and/or employee of the Investment Manager or Ameriprise Financial. |
| Columbia Adaptive Risk Allocation Fund | Annual Report 2023 | 49 |
(Unaudited)
The Board has appointed officers who are responsible for day-to-day business decisions based on policies it has established. The officers serve at the pleasure of the Board. The following table provides basic information about the Officers of the Fund as of the printing of this report, including principal occupations during the past five years, although their specific titles may have varied over the period. In addition to Mr. Beckman, who is President and Principal Executive Officer, the Fund’s other officers are:
| Name, address and year of birth | Position and year first appointed to position for any Fund in the Columbia Funds Complex or a predecessor thereof | Principal occupation(s) during past five years |
| Michael G. Clarke 290 Congress Street Boston, MA 02210 1969 | Chief Financial Officer and Principal Financial Officer (2009) and Senior Vice President (2019) | Senior Vice President and North America Head of Operations & Investor Services, Columbia Management Investment Advisers, LLC, since June 2023 (previously Senior Vice President and Head of Global Operations, March 2022 – June 2023, Vice President, Head of North America Operations, and Co-Head of Global Operations, June 2019 - February 2022 and Vice President – Accounting and Tax, May 2010 - May 2019); senior officer of Columbia Funds and affiliated funds, since 2002. Director, Ameriprise Trust Company, since June 2023. |
| Joseph Beranek 5890 Ameriprise Financial Center Minneapolis, MN 55474 1965 | Treasurer and Chief Accounting Officer (Principal Accounting Officer) (2019) and Principal Financial Officer (2020), CFST, CFST I, CFST II, CFVIT and CFVST II; Assistant Treasurer, CET I and CET II | Vice President – Mutual Fund Accounting and Financial Reporting, Columbia Management Investment Advisers, LLC, since December 2018 and March 2017, respectively. |
| Marybeth Pilat 290 Congress Street Boston, MA 02210 1968 | Treasurer and Chief Accounting Officer (Principal Accounting Officer) and Principal Financial Officer (2020) for CET I and CET II; Assistant Treasurer, CFST, CFST I, CFST II, CFVIT and CFVST II | Vice President – Product Pricing and Administration, Columbia Management Investment Advisers, LLC, since May 2017. |
| William F. Truscott 290 Congress Street Boston, MA 02210 1960 | Senior Vice President (2001) | Formerly, Trustee/Director of Columbia Funds Complex or legacy funds, November 2001 - January 1, 2021; Chief Executive Officer, Global Asset Management, Ameriprise Financial, Inc., since September 2012; Chairman of the Board and President, Columbia Management Investment Advisers, LLC, since July 2004 and February 2012, respectively; Chairman of the Board and Chief Executive Officer, Columbia Management Investment Distributors, Inc., since November 2008 and February 2012, respectively;Chairman of the Board and Director, Threadneedle Asset Management Holdings, Sàrl, since March 2013 and December 2008, respectively; senior executive of various entities affiliated with Columbia Threadneedle. |
| Christopher O. Petersen 5228 Ameriprise Financial Center Minneapolis, MN 55474 1970 | Senior Vice President and Assistant Secretary (2021) | Formerly, Trustee/Director of funds within the Columbia Funds Complex, July 1, 2020 - November 22, 2021; Senior Vice President and Assistant General Counsel, Ameriprise Financial, Inc., since September 2021 (previously Vice President and Lead Chief Counsel, January 2015 - September 2021); formerly, President and Principal Executive Officer of the Columbia Funds, 2015 - 2021; officer of Columbia Funds and affiliated funds, since 2007. |
| Thomas P. McGuire 290 Congress Street Boston, MA 02210 1972 | Senior Vice President and Chief Compliance Officer (2012) | Vice President – Asset Management Compliance, Ameriprise Financial, Inc., since May 2010; Chief Compliance Officer, Columbia Acorn/Wanger Funds, since December 2015; formerly, Chief Compliance Officer, Ameriprise Certificate Company, September 2010 – September 2020. |
| Ryan C. Larrenaga 290 Congress Street Boston, MA 02210 1970 | Senior Vice President (2017), Chief Legal Officer (2017), and Secretary (2015) | Vice President and Chief Counsel, Ameriprise Financial, Inc., since August 2018 (previously Vice President and Group Counsel, August 2011 - August 2018); Chief Legal Officer, Columbia Acorn/Wanger Funds, since September 2020; officer of Columbia Funds and affiliated funds, since 2005. |
| 50 | Columbia Adaptive Risk Allocation Fund | Annual Report 2023 |
(Unaudited)
Fund officers (continued)
| Name, address and year of birth | Position and year first appointed to position for any Fund in the Columbia Funds Complex or a predecessor thereof | Principal occupation(s) during past five years |
| Michael E. DeFao 290 Congress Street Boston, MA 02210 1968 | Vice President (2011) and Assistant Secretary (2010) | Vice President and Chief Counsel, Ameriprise Financial, Inc., since May 2010; Vice President, Chief Legal Officer and Assistant Secretary, Columbia Management Investment Advisers, LLC, since October 2021 (previously Vice President and Assistant Secretary, May 2010 – September 2021). |
| Lyn Kephart-Strong 5903 Ameriprise Financial Center Minneapolis, MN 55474 1960 | Vice President (2015) | Vice President, Global Investment Operations Services, Columbia Management Investment Advisers, LLC, since 2010; Director (since January 2007) and President (since October 2014), Columbia Management Investment Services Corp.; Director (since December 2017) and President (since January 2017), Ameriprise Trust Company. |
| • | the Fund had sufficient liquidity to both meet redemptions and operate effectively on behalf of shareholders; |
| • | there were no material changes to the Program during the period; |
| • | the implementation of the Program was effective to manage the Fund’s liquidity risk; and |
| • | the Program operated adequately during the period. |
| Columbia Adaptive Risk Allocation Fund | Annual Report 2023 | 51 |
columbiathreadneedleus.com/investor/. The Fund is distributed by Columbia Management Investment Distributors, Inc., member FINRA, and managed by Columbia Management Investment Advisers, LLC.

May 31, 2023

| 3 | |
| 5 | |
| 7 | |
| 8 | |
| 12 | |
| 14 | |
| 15 | |
| 18 | |
| 22 | |
| 30 | |
| 31 | |
| 31 | |
| 37 |
(Unaudited)
| Average annual total returns (%) (for the period ended May 31, 2023) | |||||
| Inception | 1 Year | 5 Years | 10 Years | ||
| Class A | Excluding sales charges | 11/25/02 | -1.71 | 9.27 | 10.06 |
| Including sales charges | -7.37 | 7.98 | 9.41 | ||
| Advisor Class | 11/08/12 | -1.46 | 9.54 | 10.33 | |
| Class C | Excluding sales charges | 11/25/02 | -2.42 | 8.45 | 9.23 |
| Including sales charges | -3.37 | 8.45 | 9.23 | ||
| Institutional Class | 03/04/98 | -1.45 | 9.54 | 10.33 | |
| Institutional 2 Class | 11/08/12 | -1.40 | 9.61 | 10.44 | |
| Institutional 3 Class | 11/08/12 | -1.36 | 9.67 | 10.50 | |
| Class R | 03/28/08 | -1.96 | 8.99 | 9.78 | |
| Class V | Excluding sales charges | 03/04/98 | -1.71 | 9.27 | 10.05 |
| Including sales charges | -7.37 | 7.99 | 9.40 | ||
| Russell 1000 Index | 2.45 | 10.61 | 11.76 | ||
| Columbia Dividend Income Fund | Annual Report 2023 | 3 |
(Unaudited)
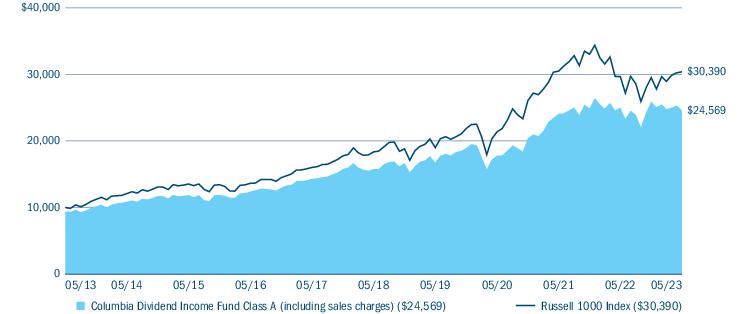
| Portfolio breakdown (%) (at May 31, 2023) | |
| Common Stocks | 98.6 |
| Money Market Funds | 1.4 |
| Total | 100.0 |
| Equity sector breakdown (%) (at May 31, 2023) | |
| Communication Services | 3.6 |
| Consumer Discretionary | 4.3 |
| Consumer Staples | 10.0 |
| Energy | 7.4 |
| Financials | 14.8 |
| Health Care | 15.3 |
| Industrials | 14.9 |
| Information Technology | 19.6 |
| Materials | 3.1 |
| Real Estate | 1.0 |
| Utilities | 6.0 |
| Total | 100.0 |
| 4 | Columbia Dividend Income Fund | Annual Report 2023 |
(Unaudited)
| • | Stock selection was the primary driver of relative underperformance during the 12-month period. Sector allocations were a secondary source of detraction versus the benchmark. |
| • | Selections within the information technology, communication services and financials sector weighed most on relative performance. |
| Columbia Dividend Income Fund | Annual Report 2023 | 5 |
(Unaudited)
| • | An underweight to the strong-performing information technology sector detracted, as did a relative overweight to the utilities sector, which produced negative returns for the benchmark during the period. |
| • | Fund holdings that detracted most relative to the benchmark included an underweight to software company Microsoft Corp. and exposure to financial companies Bank of America Corp., PNC Financial Services Group, Inc., U.S. Bancorp and Northern Trust Corp. |
| • | Not owning NVIDIA, Apple and Meta Platforms also detracted. |
| • | Stock selection within the materials and energy sector contributed to relative performance during the period. |
| • | Underweighted allocations to the consumer discretionary and real estate sectors, relative to the benchmark, also aided performance during the period. |
| • | Individual fund holdings that contributed most to relative performance during the period included semiconductor companies Broadcom, Inc., KLA Corp. and Lam Research Corp., pharmaceutical giant Merck & Co., Inc. and electrical equipment company Eaton Corp. PLC. |
| • | Not owning Tesla and Pfizer during the period also contributed. |
| 6 | Columbia Dividend Income Fund | Annual Report 2023 |
(Unaudited)
| December 1, 2022 — May 31, 2023 | |||||||
| Account value at the beginning of the period ($) | Account value at the end of the period ($) | Expenses paid during the period ($) | Fund’s annualized expense ratio (%) | ||||
| Actual | Hypothetical | Actual | Hypothetical | Actual | Hypothetical | Actual | |
| Class A | 1,000.00 | 1,000.00 | 947.90 | 1,020.39 | 4.42 | 4.58 | 0.91 |
| Advisor Class | 1,000.00 | 1,000.00 | 949.20 | 1,021.64 | 3.21 | 3.33 | 0.66 |
| Class C | 1,000.00 | 1,000.00 | 944.40 | 1,016.65 | 8.05 | 8.35 | 1.66 |
| Institutional Class | 1,000.00 | 1,000.00 | 949.20 | 1,021.64 | 3.21 | 3.33 | 0.66 |
| Institutional 2 Class | 1,000.00 | 1,000.00 | 949.70 | 1,021.94 | 2.92 | 3.02 | 0.60 |
| Institutional 3 Class | 1,000.00 | 1,000.00 | 949.70 | 1,022.19 | 2.67 | 2.77 | 0.55 |
| Class R | 1,000.00 | 1,000.00 | 946.80 | 1,019.15 | 5.63 | 5.84 | 1.16 |
| Class V | 1,000.00 | 1,000.00 | 948.00 | 1,020.39 | 4.42 | 4.58 | 0.91 |
| Columbia Dividend Income Fund | Annual Report 2023 | 7 |
May 31, 2023
| Common Stocks 98.5% | ||
| Issuer | Shares | Value ($) |
| Communication Services 3.6% | ||
| Diversified Telecommunication Services 0.8% | ||
| Verizon Communications, Inc. | 7,628,643 | 271,808,550 |
| Entertainment 0.5% | ||
| Electronic Arts, Inc. | 1,397,800 | 178,918,400 |
| Media 2.3% | ||
| Comcast Corp., Class A | 20,119,034 | 791,683,988 |
| Total Communication Services | 1,242,410,938 | |
| Consumer Discretionary 4.2% | ||
| Hotels, Restaurants & Leisure 1.7% | ||
| McDonald’s Corp. | 2,076,324 | 591,980,736 |
| Specialty Retail 2.1% | ||
| Home Depot, Inc. (The) | 2,653,863 | 752,237,467 |
| Textiles, Apparel & Luxury Goods 0.4% | ||
| NIKE, Inc., Class B | 1,312,291 | 138,131,751 |
| Total Consumer Discretionary | 1,482,349,954 | |
| Consumer Staples 9.8% | ||
| Beverages 2.4% | ||
| Coca-Cola Co. (The) | 8,509,748 | 507,691,566 |
| PepsiCo, Inc. | 1,857,796 | 338,769,100 |
| Total | 846,460,666 | |
| Consumer Staples Distribution & Retail 2.4% | ||
| Target Corp. | 1,735,817 | 227,270,520 |
| Walmart, Inc. | 4,340,519 | 637,492,026 |
| Total | 864,762,546 | |
| Food Products 1.3% | ||
| Mondelez International, Inc., Class A | 6,231,905 | 457,484,146 |
| Household Products 2.3% | ||
| Procter & Gamble Co. (The) | 5,595,652 | 797,380,410 |
| Tobacco 1.4% | ||
| Philip Morris International, Inc. | 5,345,222 | 481,123,432 |
| Total Consumer Staples | 3,447,211,200 | |
| Common Stocks (continued) | ||
| Issuer | Shares | Value ($) |
| Energy 7.3% | ||
| Oil, Gas & Consumable Fuels 7.3% | ||
| Chevron Corp. | 5,376,688 | 809,836,747 |
| ConocoPhillips Co. | 2,030,775 | 201,655,957 |
| EOG Resources, Inc. | 4,281,752 | 459,389,172 |
| Exxon Mobil Corp. | 7,442,242 | 760,448,288 |
| Valero Energy Corp. | 3,004,810 | 321,634,862 |
| Total | 2,552,965,026 | |
| Total Energy | 2,552,965,026 | |
| Financials 14.6% | ||
| Banks 6.2% | ||
| Bank of America Corp. | 13,660,862 | 379,635,355 |
| JPMorgan Chase & Co. | 7,828,819 | 1,062,449,027 |
| PNC Financial Services Group, Inc. (The) | 2,962,122 | 343,102,591 |
| Wells Fargo & Co. | 9,746,453 | 388,006,294 |
| Total | 2,173,193,267 | |
| Capital Markets 3.9% | ||
| BlackRock, Inc. | 565,438 | 371,803,757 |
| Blackstone, Inc. | 1,404,540 | 120,284,806 |
| CME Group, Inc. | 2,242,358 | 400,821,493 |
| Morgan Stanley | 3,813,909 | 311,825,200 |
| Northern Trust Corp. | 2,518,775 | 181,150,298 |
| Total | 1,385,885,554 | |
| Financial Services 1.5% | ||
| Visa, Inc., Class A | 2,389,984 | 528,258,163 |
| Insurance 3.0% | ||
| Chubb Ltd. | 2,319,191 | 430,905,688 |
| Marsh & McLennan Companies, Inc. | 3,502,530 | 606,568,145 |
| Total | 1,037,473,833 | |
| Total Financials | 5,124,810,817 | |
| Health Care 15.1% | ||
| Biotechnology 2.1% | ||
| AbbVie, Inc. | 5,302,743 | 731,566,424 |
| 8 | Columbia Dividend Income Fund | Annual Report 2023 |
May 31, 2023
| Common Stocks (continued) | ||
| Issuer | Shares | Value ($) |
| Health Care Equipment & Supplies 3.7% | ||
| Abbott Laboratories | 3,374,131 | 344,161,362 |
| Becton Dickinson & Co. | 1,926,718 | 465,803,344 |
| Medtronic PLC | 5,951,382 | 492,536,374 |
| Total | 1,302,501,080 | |
| Health Care Providers & Services 3.4% | ||
| Cigna Group (The) | 812,435 | 201,004,544 |
| Elevance Health, Inc. | 979,954 | 438,843,000 |
| UnitedHealth Group, Inc. | 1,123,621 | 547,473,096 |
| Total | 1,187,320,640 | |
| Pharmaceuticals 5.9% | ||
| Bristol-Myers Squibb Co. | 5,693,275 | 366,874,641 |
| Eli Lilly & Co. | 277,369 | 119,118,891 |
| Johnson & Johnson | 5,653,365 | 876,610,777 |
| Merck & Co., Inc. | 6,359,389 | 702,140,139 |
| Total | 2,064,744,448 | |
| Total Health Care | 5,286,132,592 | |
| Industrials 14.7% | ||
| Aerospace & Defense 2.8% | ||
| Lockheed Martin Corp. | 905,309 | 401,966,249 |
| Northrop Grumman Corp. | 1,350,241 | 588,016,453 |
| Total | 989,982,702 | |
| Air Freight & Logistics 1.8% | ||
| United Parcel Service, Inc., Class B | 3,819,787 | 637,904,429 |
| Building Products 0.8% | ||
| Trane Technologies PLC | 1,621,330 | 264,649,696 |
| Commercial Services & Supplies 1.2% | ||
| Waste Management, Inc. | 2,656,671 | 430,168,168 |
| Electrical Equipment 1.3% | ||
| Eaton Corp. PLC | 2,541,137 | 446,985,998 |
| Ground Transportation 1.6% | ||
| Union Pacific Corp. | 2,976,262 | 572,989,960 |
| Industrial Conglomerates 1.7% | ||
| Honeywell International, Inc. | 3,107,313 | 595,361,171 |
| Machinery 2.2% | ||
| Common Stocks (continued) | ||
| Issuer | Shares | Value ($) |
| Cummins, Inc. | 1,333,518 | 272,584,414 |
| Parker-Hannifin Corp. | 1,559,315 | 499,666,899 |
| Total | 772,251,313 | |
| Professional Services 1.3% | ||
| Automatic Data Processing, Inc. | 1,402,869 | 293,185,592 |
| Booz Allen Hamilton Holding Corp. | 1,441,394 | 144,975,409 |
| Total | 438,161,001 | |
| Total Industrials | 5,148,454,438 | |
| Information Technology 19.3% | ||
| Communications Equipment 2.4% | ||
| Cisco Systems, Inc. | 16,811,747 | 835,039,474 |
| IT Services 2.5% | ||
| Accenture PLC, Class A | 1,333,487 | 407,940,343 |
| International Business Machines Corp. | 3,730,934 | 479,760,803 |
| Total | 887,701,146 | |
| Semiconductors & Semiconductor Equipment 10.8% | ||
| Analog Devices, Inc. | 2,951,984 | 524,538,037 |
| Broadcom, Inc. | 1,428,838 | 1,154,443,950 |
| KLA Corp. | 1,445,449 | 640,319,453 |
| Lam Research Corp. | 1,177,384 | 726,092,713 |
| Microchip Technology, Inc. | 5,589,762 | 420,685,488 |
| Texas Instruments, Inc. | 1,898,546 | 330,119,178 |
| Total | 3,796,198,819 | |
| Software 3.6% | ||
| Microsoft Corp. | 3,854,172 | 1,265,671,543 |
| Total Information Technology | 6,784,610,982 | |
| Materials 3.0% | ||
| Chemicals 2.2% | ||
| Linde PLC | 1,190,535 | 421,044,608 |
| PPG Industries, Inc. | 2,605,027 | 342,013,995 |
| Total | 763,058,603 | |
| Containers & Packaging 0.8% | ||
| Avery Dennison Corp. | 1,208,415 | 194,711,909 |
| Packaging Corp. of America | 856,915 | 106,283,167 |
| Total | 300,995,076 | |
| Total Materials | 1,064,053,679 | |
| Columbia Dividend Income Fund | Annual Report 2023 | 9 |
May 31, 2023
| Common Stocks (continued) | ||
| Issuer | Shares | Value ($) |
| Real Estate 1.0% | ||
| Residential REITs 0.5% | ||
| AvalonBay Communities, Inc. | 1,033,929 | 179,882,968 |
| Specialized REITs 0.5% | ||
| Crown Castle, Inc. | 1,392,073 | 157,596,584 |
| Total Real Estate | 337,479,552 | |
| Utilities 5.9% | ||
| Electric Utilities 3.9% | ||
| American Electric Power Co., Inc. | 3,105,506 | 258,129,659 |
| Entergy Corp. | 2,338,143 | 229,605,643 |
| Eversource Energy | 2,194,176 | 151,902,804 |
| NextEra Energy, Inc. | 4,256,268 | 312,665,447 |
| Southern Co. (The) | 2,663,560 | 185,783,310 |
| Xcel Energy, Inc. | 3,254,356 | 212,476,903 |
| Total | 1,350,563,766 | |
| Multi-Utilities 2.0% | ||
| Ameren Corp. | 2,481,290 | 201,158,181 |
| CMS Energy Corp. | 2,726,437 | 158,078,817 |
| DTE Energy Co. | 1,203,762 | 129,524,791 |
| WEC Energy Group, Inc. | 2,545,972 | 222,390,654 |
| Total | 711,152,443 | |
| Total Utilities | 2,061,716,209 | |
| Total Common Stocks (Cost $24,452,144,160) | 34,532,195,387 | |
| Money Market Funds 1.4% | ||
| Shares | Value ($) | |
| Columbia Short-Term Cash Fund, 5.241%(a),(b) | 497,739,490 | 497,490,621 |
| Total Money Market Funds (Cost $497,570,465) | 497,490,621 | |
| Total Investments in Securities (Cost: $24,949,714,625) | 35,029,686,008 | |
| Other Assets & Liabilities, Net | 50,044,225 | |
| Net Assets | 35,079,730,233 | |
| (a) | The rate shown is the seven-day current annualized yield at May 31, 2023. |
| (b) | As defined in the Investment Company Act of 1940, as amended, an affiliated company is one in which the Fund owns 5% or more of the company’s outstanding voting securities, or a company which is under common ownership or control with the Fund. The value of the holdings and transactions in these affiliated companies during the year ended May 31, 2023 are as follows: |
| Affiliated issuers | Beginning of period($) | Purchases($) | Sales($) | Net change in unrealized appreciation (depreciation)($) | End of period($) | Realized gain (loss)($) | Dividends($) | End of period shares |
| Columbia Short-Term Cash Fund, 5.241% | ||||||||
| 862,509,688 | 2,181,531,617 | (2,546,763,174) | 212,490 | 497,490,621 | (246,951) | 24,857,191 | 497,739,490 | |
| 10 | Columbia Dividend Income Fund | Annual Report 2023 |
May 31, 2023
pricing an investment. An investment’s level within the fair value hierarchy is based on the lowest level of any input that is deemed significant to the asset’s or liability’s fair value measurement. The input levels are not necessarily an indication of the risk or liquidity associated with investments at that level. For example, certain U.S. government securities are generally high quality and liquid, however, they are reflected as Level 2 because the inputs used to determine fair value may not always be quoted prices in an active market.
| ■ | Level 1 — Valuations based on quoted prices for investments in active markets that the Fund has the ability to access at the measurement date. Valuation adjustments are not applied to Level 1 investments. |
| ■ | Level 2 — Valuations based on other significant observable inputs (including quoted prices for similar securities, interest rates, prepayment speeds, credit risks, etc.). |
| ■ | Level 3 — Valuations based on significant unobservable inputs (including the Fund’s own assumptions and judgment in determining the fair value of investments). |
| Level 1 ($) | Level 2 ($) | Level 3 ($) | Total ($) | |
| Investments in Securities | ||||
| Common Stocks | ||||
| Communication Services | 1,242,410,938 | — | — | 1,242,410,938 |
| Consumer Discretionary | 1,482,349,954 | — | — | 1,482,349,954 |
| Consumer Staples | 3,447,211,200 | — | — | 3,447,211,200 |
| Energy | 2,552,965,026 | — | — | 2,552,965,026 |
| Financials | 5,124,810,817 | — | — | 5,124,810,817 |
| Health Care | 5,286,132,592 | — | — | 5,286,132,592 |
| Industrials | 5,148,454,438 | — | — | 5,148,454,438 |
| Information Technology | 6,784,610,982 | — | — | 6,784,610,982 |
| Materials | 1,064,053,679 | — | — | 1,064,053,679 |
| Real Estate | 337,479,552 | — | — | 337,479,552 |
| Utilities | 2,061,716,209 | — | — | 2,061,716,209 |
| Total Common Stocks | 34,532,195,387 | — | — | 34,532,195,387 |
| Money Market Funds | 497,490,621 | — | — | 497,490,621 |
| Total Investments in Securities | 35,029,686,008 | — | — | 35,029,686,008 |
| Columbia Dividend Income Fund | Annual Report 2023 | 11 |
May 31, 2023
| Assets | |
| Investments in securities, at value | |
| Unaffiliated issuers (cost $24,452,144,160) | $34,532,195,387 |
| Affiliated issuers (cost $497,570,465) | 497,490,621 |
| Receivable for: | |
| Capital shares sold | 31,128,700 |
| Dividends | 89,954,084 |
| Prepaid expenses | 174,697 |
| Trustees’ deferred compensation plan | 820,883 |
| Total assets | 35,151,764,372 |
| Liabilities | |
| Payable for: | |
| Capital shares purchased | 66,277,943 |
| Management services fees | 512,770 |
| Distribution and/or service fees | 64,579 |
| Transfer agent fees | 3,360,224 |
| Compensation of board members | 427,015 |
| Other expenses | 570,725 |
| Trustees’ deferred compensation plan | 820,883 |
| Total liabilities | 72,034,139 |
| Net assets applicable to outstanding capital stock | $35,079,730,233 |
| Represented by | |
| Paid in capital | 24,081,059,117 |
| Total distributable earnings (loss) | 10,998,671,116 |
| Total - representing net assets applicable to outstanding capital stock | $35,079,730,233 |
| 12 | Columbia Dividend Income Fund | Annual Report 2023 |
May 31, 2023
| Class A | |
| Net assets | $3,967,470,679 |
| Shares outstanding | 140,632,392 |
| Net asset value per share | $28.21 |
| Maximum sales charge | 5.75% |
| Maximum offering price per share (calculated by dividing the net asset value per share by 1.0 minus the maximum sales charge for Class A shares) | $29.93 |
| Advisor Class | |
| Net assets | $3,142,105,019 |
| Shares outstanding | 109,146,977 |
| Net asset value per share | $28.79 |
| Class C | |
| Net assets | $1,231,202,897 |
| Shares outstanding | 45,248,256 |
| Net asset value per share | $27.21 |
| Institutional Class | |
| Net assets | $16,392,770,599 |
| Shares outstanding | 580,337,620 |
| Net asset value per share | $28.25 |
| Institutional 2 Class | |
| Net assets | $2,799,839,127 |
| Shares outstanding | 97,360,350 |
| Net asset value per share | $28.76 |
| Institutional 3 Class | |
| Net assets | $7,272,474,327 |
| Shares outstanding | 252,453,648 |
| Net asset value per share | $28.81 |
| Class R | |
| Net assets | $192,439,450 |
| Shares outstanding | 6,816,939 |
| Net asset value per share | $28.23 |
| Class V | |
| Net assets | $81,428,135 |
| Shares outstanding | 2,884,820 |
| Net asset value per share | $28.23 |
| Maximum sales charge | 5.75% |
| Maximum offering price per share (calculated by dividing the net asset value per share by 1.0 minus the maximum sales charge for Class V shares) | $29.95 |
| Columbia Dividend Income Fund | Annual Report 2023 | 13 |
Year Ended May 31, 2023
| Net investment income | |
| Income: | |
| Dividends — unaffiliated issuers | $960,465,450 |
| Dividends — affiliated issuers | 24,857,191 |
| Interfund lending | 13,359 |
| Total income | 985,336,000 |
| Expenses: | |
| Management services fees | 191,792,232 |
| Distribution and/or service fees | |
| Class A | 10,417,924 |
| Class C | 12,873,885 |
| Class R | 1,057,691 |
| Class V | 211,724 |
| Transfer agent fees | |
| Class A | 4,804,716 |
| Advisor Class | 3,724,046 |
| Class C | 1,484,347 |
| Institutional Class | 19,627,610 |
| Institutional 2 Class | 1,625,711 |
| Institutional 3 Class | 509,883 |
| Class R | 243,841 |
| Class V | 97,646 |
| Compensation of board members | 611,979 |
| Custodian fees | 147,859 |
| Printing and postage fees | 1,415,957 |
| Registration fees | 666,595 |
| Accounting services fees | 30,090 |
| Legal fees | 496,419 |
| Compensation of chief compliance officer | 7,232 |
| Other | 542,146 |
| Total expenses | 252,389,533 |
| Expense reduction | (1,860) |
| Total net expenses | 252,387,673 |
| Net investment income | 732,948,327 |
| Realized and unrealized gain (loss) — net | |
| Net realized gain (loss) on: | |
| Investments — unaffiliated issuers | 1,142,789,493 |
| Investments — affiliated issuers | (246,951) |
| Net realized gain | 1,142,542,542 |
| Net change in unrealized appreciation (depreciation) on: | |
| Investments — unaffiliated issuers | (2,438,213,257) |
| Investments — affiliated issuers | 212,490 |
| Net change in unrealized appreciation (depreciation) | (2,438,000,767) |
| Net realized and unrealized loss | (1,295,458,225) |
| Net decrease in net assets resulting from operations | $(562,509,898) |
| 14 | Columbia Dividend Income Fund | Annual Report 2023 |
| Year Ended May 31, 2023 | Year Ended May 31, 2022 | |
| Operations | ||
| Net investment income | $732,948,327 | $604,521,277 |
| Net realized gain | 1,142,542,542 | 452,076,428 |
| Net change in unrealized appreciation (depreciation) | (2,438,000,767) | 405,905,851 |
| Net increase (decrease) in net assets resulting from operations | (562,509,898) | 1,462,503,556 |
| Distributions to shareholders | ||
| Net investment income and net realized gains | ||
| Class A | (154,151,214) | (124,980,544) |
| Advisor Class | (125,342,783) | (101,221,238) |
| Class C | (39,242,163) | (29,165,217) |
| Institutional Class | (673,349,498) | (540,399,033) |
| Institutional 2 Class | (113,983,696) | (99,465,229) |
| Institutional 3 Class | (292,108,284) | (231,722,717) |
| Class R | (7,283,081) | (6,024,068) |
| Class V | (3,116,021) | (2,666,349) |
| Total distributions to shareholders | (1,408,576,740) | (1,135,644,395) |
| Increase (decrease) in net assets from capital stock activity | (699,230,374) | 2,311,117,128 |
| Total increase (decrease) in net assets | (2,670,317,012) | 2,637,976,289 |
| Net assets at beginning of year | 37,750,047,245 | 35,112,070,956 |
| Net assets at end of year | $35,079,730,233 | $37,750,047,245 |
| Columbia Dividend Income Fund | Annual Report 2023 | 15 |
| Year Ended | Year Ended | |||
| May 31, 2023 | May 31, 2022 | |||
| Shares | Dollars ($) | Shares | Dollars ($) | |
| Capital stock activity | ||||
| Class A | ||||
| Subscriptions | 22,850,983 | 653,720,647 | 29,845,816 | 900,339,496 |
| Distributions reinvested | 4,510,442 | 130,057,930 | 3,486,547 | 105,441,363 |
| Redemptions | (34,283,933) | (978,042,663) | (29,779,035) | (899,331,555) |
| Net increase (decrease) | (6,922,508) | (194,264,086) | 3,553,328 | 106,449,304 |
| Advisor Class | ||||
| Subscriptions | 24,553,496 | 718,386,500 | 38,790,900 | 1,192,233,253 |
| Distributions reinvested | 4,247,838 | 124,704,086 | 3,265,878 | 100,532,706 |
| Redemptions | (29,638,020) | (866,623,980) | (36,553,500) | (1,127,088,618) |
| Net increase (decrease) | (836,686) | (23,533,394) | 5,503,278 | 165,677,341 |
| Class C | ||||
| Subscriptions | 5,996,819 | 166,176,131 | 9,101,820 | 265,699,953 |
| Distributions reinvested | 1,204,095 | 33,818,342 | 854,445 | 25,139,789 |
| Redemptions | (8,938,103) | (246,374,902) | (8,146,924) | (237,516,776) |
| Net increase (decrease) | (1,737,189) | (46,380,429) | 1,809,341 | 53,322,966 |
| Institutional Class | ||||
| Subscriptions | 118,495,412 | 3,391,400,366 | 152,870,803 | 4,612,757,750 |
| Distributions reinvested | 20,599,048 | 593,407,172 | 15,623,440 | 472,403,308 |
| Redemptions | (152,768,478) | (4,373,840,875) | (128,602,883) | (3,888,570,214) |
| Net increase (decrease) | (13,674,018) | (389,033,337) | 39,891,360 | 1,196,590,844 |
| Institutional 2 Class | ||||
| Subscriptions | 26,645,634 | 774,006,652 | 28,189,723 | 863,966,863 |
| Distributions reinvested | 3,818,719 | 111,923,333 | 3,177,985 | 97,637,694 |
| Redemptions | (31,113,728) | (901,900,606) | (36,383,818) | (1,124,641,415) |
| Net decrease | (649,375) | (15,970,621) | (5,016,110) | (163,036,858) |
| Institutional 3 Class | ||||
| Subscriptions | 46,402,567 | 1,351,589,075 | 72,446,071 | 2,228,533,037 |
| Distributions reinvested | 6,726,837 | 197,370,827 | 4,950,475 | 152,421,625 |
| Redemptions | (53,142,236) | (1,549,338,118) | (46,594,347) | (1,434,309,179) |
| Net increase (decrease) | (12,832) | (378,216) | 30,802,199 | 946,645,483 |
| Class R | ||||
| Subscriptions | 724,188 | 20,764,907 | 1,619,319 | 48,845,688 |
| Distributions reinvested | 251,212 | 7,268,313 | 198,217 | 6,012,034 |
| Redemptions | (1,847,553) | (52,957,402) | (1,499,767) | (45,215,627) |
| Net increase (decrease) | (872,153) | (24,924,182) | 317,769 | 9,642,095 |
| Class V | ||||
| Subscriptions | 19,359 | 557,987 | 22,295 | 670,913 |
| Distributions reinvested | 88,468 | 2,552,565 | 71,346 | 2,158,582 |
| Redemptions | (272,715) | (7,856,661) | (231,428) | (7,003,542) |
| Net decrease | (164,888) | (4,746,109) | (137,787) | (4,174,047) |
| Total net increase (decrease) | (24,869,649) | (699,230,374) | 76,723,378 | 2,311,117,128 |
| 16 | Columbia Dividend Income Fund | Annual Report 2023 |
| Net asset value, beginning of period | Net investment income | Net realized and unrealized gain (loss) | Total from investment operations | Distributions from net investment income | Distributions from net realized gains | Total distributions to shareholders | |
| Class A | |||||||
| Year Ended 5/31/2023 | $29.77 | 0.52 | (1.02) | (0.50) | (0.50) | (0.56) | (1.06) |
| Year Ended 5/31/2022 | $29.50 | 0.42 | 0.71 | 1.13 | (0.41) | (0.45) | (0.86) |
| Year Ended 5/31/2021 | $22.13 | 0.38 | 7.37 | 7.75 | (0.38) | — | (0.38) |
| Year Ended 5/31/2020 | $21.45 | 0.41 | 0.93 | 1.34 | (0.40) | (0.26) | (0.66) |
| Year Ended 5/31/2019 | $21.63 | 0.39 | 0.88 | 1.27 | (0.38) | (1.07) | (1.45) |
| Advisor Class | |||||||
| Year Ended 5/31/2023 | $30.36 | 0.60 | (1.03) | (0.43) | (0.58) | (0.56) | (1.14) |
| Year Ended 5/31/2022 | $30.06 | 0.51 | 0.72 | 1.23 | (0.48) | (0.45) | (0.93) |
| Year Ended 5/31/2021 | $22.54 | 0.45 | 7.51 | 7.96 | (0.44) | — | (0.44) |
| Year Ended 5/31/2020 | $21.84 | 0.48 | 0.94 | 1.42 | (0.46) | (0.26) | (0.72) |
| Year Ended 5/31/2019 | $22.00 | 0.45 | 0.89 | 1.34 | (0.43) | (1.07) | (1.50) |
| Class C | |||||||
| Year Ended 5/31/2023 | $28.73 | 0.29 | (0.96) | (0.67) | (0.29) | (0.56) | (0.85) |
| Year Ended 5/31/2022 | $28.49 | 0.19 | 0.68 | 0.87 | (0.18) | (0.45) | (0.63) |
| Year Ended 5/31/2021 | $21.38 | 0.18 | 7.14 | 7.32 | (0.21) | — | (0.21) |
| Year Ended 5/31/2020 | $20.73 | 0.23 | 0.91 | 1.14 | (0.23) | (0.26) | (0.49) |
| Year Ended 5/31/2019 | $20.95 | 0.22 | 0.84 | 1.06 | (0.21) | (1.07) | (1.28) |
| Institutional Class | |||||||
| Year Ended 5/31/2023 | $29.81 | 0.59 | (1.01) | (0.42) | (0.58) | (0.56) | (1.14) |
| Year Ended 5/31/2022 | $29.53 | 0.50 | 0.71 | 1.21 | (0.48) | (0.45) | (0.93) |
| Year Ended 5/31/2021 | $22.15 | 0.44 | 7.38 | 7.82 | (0.44) | — | (0.44) |
| Year Ended 5/31/2020 | $21.48 | 0.47 | 0.92 | 1.39 | (0.46) | (0.26) | (0.72) |
| Year Ended 5/31/2019 | $21.66 | 0.44 | 0.88 | 1.32 | (0.43) | (1.07) | (1.50) |
| Institutional 2 Class | |||||||
| Year Ended 5/31/2023 | $30.33 | 0.62 | (1.04) | (0.42) | (0.59) | (0.56) | (1.15) |
| Year Ended 5/31/2022 | $30.03 | 0.52 | 0.73 | 1.25 | (0.50) | (0.45) | (0.95) |
| Year Ended 5/31/2021 | $22.52 | 0.46 | 7.51 | 7.97 | (0.46) | — | (0.46) |
| Year Ended 5/31/2020 | $21.83 | 0.49 | 0.94 | 1.43 | (0.48) | (0.26) | (0.74) |
| Year Ended 5/31/2019 | $21.99 | 0.47 | 0.89 | 1.36 | (0.45) | (1.07) | (1.52) |
| 18 | Columbia Dividend Income Fund | Annual Report 2023 |
| Net asset value, end of period | Total return | Total gross expense ratio to average net assets(a) | Total net expense ratio to average net assets(a),(b) | Net investment income ratio to average net assets | Portfolio turnover | Net assets, end of period (000’s) | |
| Class A | |||||||
| Year Ended 5/31/2023 | $28.21 | (1.71%) | 0.91% | 0.91%(c) | 1.81% | 17% | $3,967,471 |
| Year Ended 5/31/2022 | $29.77 | 3.80% | 0.90% | 0.90%(c) | 1.38% | 16% | $4,392,792 |
| Year Ended 5/31/2021 | $29.50 | 35.42% | 0.92% | 0.92%(c) | 1.49% | 11% | $4,247,346 |
| Year Ended 5/31/2020 | $22.13 | 6.26% | 0.94% | 0.94%(c) | 1.80% | 14% | $2,689,884 |
| Year Ended 5/31/2019 | $21.45 | 6.10% | 0.96% | 0.96%(c) | 1.77% | 13% | $2,094,539 |
| Advisor Class | |||||||
| Year Ended 5/31/2023 | $28.79 | (1.46%) | 0.66% | 0.66%(c) | 2.06% | 17% | $3,142,105 |
| Year Ended 5/31/2022 | $30.36 | 4.08% | 0.65% | 0.65%(c) | 1.63% | 16% | $3,338,904 |
| Year Ended 5/31/2021 | $30.06 | 35.76% | 0.67% | 0.67%(c) | 1.74% | 11% | $3,140,636 |
| Year Ended 5/31/2020 | $22.54 | 6.53% | 0.69% | 0.69%(c) | 2.07% | 14% | $1,640,078 |
| Year Ended 5/31/2019 | $21.84 | 6.35% | 0.71% | 0.71%(c) | 2.04% | 13% | $815,017 |
| Class C | |||||||
| Year Ended 5/31/2023 | $27.21 | (2.42%) | 1.66% | 1.66%(c) | 1.06% | 17% | $1,231,203 |
| Year Ended 5/31/2022 | $28.73 | 3.01% | 1.65% | 1.65%(c) | 0.63% | 16% | $1,350,125 |
| Year Ended 5/31/2021 | $28.49 | 34.43% | 1.67% | 1.67%(c) | 0.75% | 11% | $1,286,989 |
| Year Ended 5/31/2020 | $21.38 | 5.44% | 1.69% | 1.69%(c) | 1.05% | 14% | $1,037,413 |
| Year Ended 5/31/2019 | $20.73 | 5.29% | 1.71% | 1.71%(c) | 1.02% | 13% | $856,621 |
| Institutional Class | |||||||
| Year Ended 5/31/2023 | $28.25 | (1.45%) | 0.66% | 0.66%(c) | 2.06% | 17% | $16,392,771 |
| Year Ended 5/31/2022 | $29.81 | 4.09% | 0.65% | 0.65%(c) | 1.63% | 16% | $17,707,133 |
| Year Ended 5/31/2021 | $29.53 | 35.76% | 0.67% | 0.67%(c) | 1.74% | 11% | $16,364,361 |
| Year Ended 5/31/2020 | $22.15 | 6.50% | 0.69% | 0.69%(c) | 2.06% | 14% | $9,604,530 |
| Year Ended 5/31/2019 | $21.48 | 6.36% | 0.71% | 0.71%(c) | 2.02% | 13% | $5,966,124 |
| Institutional 2 Class | |||||||
| Year Ended 5/31/2023 | $28.76 | (1.40%) | 0.60% | 0.60% | 2.12% | 17% | $2,799,839 |
| Year Ended 5/31/2022 | $30.33 | 4.16% | 0.59% | 0.59% | 1.69% | 16% | $2,972,324 |
| Year Ended 5/31/2021 | $30.03 | 35.84% | 0.61% | 0.61% | 1.79% | 11% | $3,093,985 |
| Year Ended 5/31/2020 | $22.52 | 6.57% | 0.62% | 0.62% | 2.13% | 14% | $1,385,364 |
| Year Ended 5/31/2019 | $21.83 | 6.44% | 0.63% | 0.63% | 2.11% | 13% | $772,924 |
| Columbia Dividend Income Fund | Annual Report 2023 | 19 |
| Net asset value, beginning of period | Net investment income | Net realized and unrealized gain (loss) | Total from investment operations | Distributions from net investment income | Distributions from net realized gains | Total distributions to shareholders | |
| Institutional 3 Class | |||||||
| Year Ended 5/31/2023 | $30.38 | 0.63 | (1.03) | (0.40) | (0.61) | (0.56) | (1.17) |
| Year Ended 5/31/2022 | $30.08 | 0.54 | 0.73 | 1.27 | (0.52) | (0.45) | (0.97) |
| Year Ended 5/31/2021 | $22.55 | 0.48 | 7.52 | 8.00 | (0.47) | — | (0.47) |
| Year Ended 5/31/2020 | $21.86 | 0.50 | 0.94 | 1.44 | (0.49) | (0.26) | (0.75) |
| Year Ended 5/31/2019 | $22.02 | 0.48 | 0.89 | 1.37 | (0.46) | (1.07) | (1.53) |
| Class R | |||||||
| Year Ended 5/31/2023 | $29.79 | 0.45 | (1.02) | (0.57) | (0.43) | (0.56) | (0.99) |
| Year Ended 5/31/2022 | $29.51 | 0.35 | 0.71 | 1.06 | (0.33) | (0.45) | (0.78) |
| Year Ended 5/31/2021 | $22.14 | 0.31 | 7.38 | 7.69 | (0.32) | — | (0.32) |
| Year Ended 5/31/2020 | $21.46 | 0.35 | 0.94 | 1.29 | (0.35) | (0.26) | (0.61) |
| Year Ended 5/31/2019 | $21.64 | 0.33 | 0.88 | 1.21 | (0.32) | (1.07) | (1.39) |
| Class V | |||||||
| Year Ended 5/31/2023 | $29.79 | 0.52 | (1.02) | (0.50) | (0.50) | (0.56) | (1.06) |
| Year Ended 5/31/2022 | $29.51 | 0.42 | 0.72 | 1.14 | (0.41) | (0.45) | (0.86) |
| Year Ended 5/31/2021 | $22.14 | 0.38 | 7.37 | 7.75 | (0.38) | — | (0.38) |
| Year Ended 5/31/2020 | $21.46 | 0.41 | 0.93 | 1.34 | (0.40) | (0.26) | (0.66) |
| Year Ended 5/31/2019 | $21.64 | 0.39 | 0.88 | 1.27 | (0.38) | (1.07) | (1.45) |
| Notes to Financial Highlights | |
| (a) | In addition to the fees and expenses that the Fund bears directly, the Fund indirectly bears a pro rata share of the fees and expenses of any other funds in which it invests. Such indirect expenses are not included in the Fund’s reported expense ratios. |
| (b) | Total net expenses include the impact of certain fee waivers/expense reimbursements made by the Investment Manager and certain of its affiliates, if applicable. |
| (c) | The benefits derived from expense reductions had an impact of less than 0.01%. |
| 20 | Columbia Dividend Income Fund | Annual Report 2023 |
| Net asset value, end of period | Total return | Total gross expense ratio to average net assets(a) | Total net expense ratio to average net assets(a),(b) | Net investment income ratio to average net assets | Portfolio turnover | Net assets, end of period (000’s) | |
| Institutional 3 Class | |||||||
| Year Ended 5/31/2023 | $28.81 | (1.36%) | 0.55% | 0.55% | 2.17% | 17% | $7,272,474 |
| Year Ended 5/31/2022 | $30.38 | 4.20% | 0.55% | 0.55% | 1.74% | 16% | $7,668,907 |
| Year Ended 5/31/2021 | $30.08 | 35.95% | 0.56% | 0.56% | 1.85% | 11% | $6,667,177 |
| Year Ended 5/31/2020 | $22.55 | 6.62% | 0.57% | 0.57% | 2.17% | 14% | $3,986,971 |
| Year Ended 5/31/2019 | $21.86 | 6.48% | 0.58% | 0.58% | 2.15% | 13% | $2,955,434 |
| Class R | |||||||
| Year Ended 5/31/2023 | $28.23 | (1.96%) | 1.15% | 1.15%(c) | 1.56% | 17% | $192,439 |
| Year Ended 5/31/2022 | $29.79 | 3.56% | 1.15% | 1.15%(c) | 1.13% | 16% | $229,025 |
| Year Ended 5/31/2021 | $29.51 | 35.08% | 1.17% | 1.17%(c) | 1.24% | 11% | $217,516 |
| Year Ended 5/31/2020 | $22.14 | 5.97% | 1.19% | 1.19%(c) | 1.54% | 14% | $137,720 |
| Year Ended 5/31/2019 | $21.46 | 5.83% | 1.21% | 1.21%(c) | 1.52% | 13% | $113,166 |
| Class V | |||||||
| Year Ended 5/31/2023 | $28.23 | (1.71%) | 0.91% | 0.91%(c) | 1.81% | 17% | $81,428 |
| Year Ended 5/31/2022 | $29.79 | 3.83% | 0.90% | 0.90%(c) | 1.38% | 16% | $90,837 |
| Year Ended 5/31/2021 | $29.51 | 35.40% | 0.92% | 0.92%(c) | 1.50% | 11% | $94,062 |
| Year Ended 5/31/2020 | $22.14 | 6.26% | 0.94% | 0.94%(c) | 1.78% | 14% | $74,269 |
| Year Ended 5/31/2019 | $21.46 | 6.10% | 0.96% | 0.96%(c) | 1.76% | 13% | $76,067 |
| Columbia Dividend Income Fund | Annual Report 2023 | 21 |
May 31, 2023
| 22 | Columbia Dividend Income Fund | Annual Report 2023 |
May 31, 2023
| Columbia Dividend Income Fund | Annual Report 2023 | 23 |
May 31, 2023
| 24 | Columbia Dividend Income Fund | Annual Report 2023 |
May 31, 2023
| Effective rate (%) | |
| Class A | 0.12 |
| Advisor Class | 0.12 |
| Class C | 0.12 |
| Institutional Class | 0.12 |
| Institutional 2 Class | 0.06 |
| Institutional 3 Class | 0.01 |
| Class R | 0.12 |
| Class V | 0.12 |
| Columbia Dividend Income Fund | Annual Report 2023 | 25 |
May 31, 2023
| Front End (%) | CDSC (%) | Amount ($) | |
| Class A | 5.75 | 0.50 - 1.00(a) | 4,225,344 |
| Class C | — | 1.00(b) | 98,156 |
| Class V | 5.75 | 0.50 - 1.00(a) | 1,469 |
| (a) | This charge is imposed on certain investments of between $1 million and $50 million redeemed within 18 months after purchase, as follows: 1.00% if redeemed within 12 months after purchase, and 0.50% if redeemed more than 12, but less than 18, months after purchase, with certain limited exceptions. |
| (b) | This charge applies to redemptions within 12 months after purchase, with certain limited exceptions. |
| Fee rate(s) contractual through September 30, 2023 | |
| Class A | 1.10% |
| Advisor Class | 0.85 |
| Class C | 1.85 |
| Institutional Class | 0.85 |
| Institutional 2 Class | 0.79 |
| Institutional 3 Class | 0.74 |
| Class R | 1.35 |
| Class V | 1.10 |
| 26 | Columbia Dividend Income Fund | Annual Report 2023 |
May 31, 2023
| Year Ended May 31, 2023 | Year Ended May 31, 2022 | ||||
| Ordinary income ($) | Long-term capital gains ($) | Total ($) | Ordinary income ($) | Long-term capital gains ($) | Total ($) |
| 705,937,483 | 702,639,257 | 1,408,576,740 | 582,376,416 | 553,267,979 | 1,135,644,395 |
| Undistributed ordinary income ($) | Undistributed long-term capital gains ($) | Capital loss carryforwards ($) | Net unrealized appreciation ($) |
| 100,388,019 | 824,193,370 | — | 10,075,312,587 |
| Federal tax cost ($) | Gross unrealized appreciation ($) | Gross unrealized (depreciation) ($) | Net unrealized appreciation ($) |
| 24,954,373,421 | 10,671,090,924 | (595,778,337) | 10,075,312,587 |
| Columbia Dividend Income Fund | Annual Report 2023 | 27 |
May 31, 2023
| Borrower or lender | Average loan balance ($) | Weighted average interest rate (%) | Number of days with outstanding loans |
| Lender | 5,551,429 | 2.54 | 35 |
| 28 | Columbia Dividend Income Fund | Annual Report 2023 |
May 31, 2023
| Columbia Dividend Income Fund | Annual Report 2023 | 29 |
| 30 | Columbia Dividend Income Fund | Annual Report 2023 |
| Qualified dividend income | Dividends received deduction | Capital gain dividend |
| 100.00% | 100.00% | $1,200,935,964 |
| Name, address, year of birth | Position held with the Columbia Funds and length of service | Principal occupation(s) during past five years and other relevant professional experience | Number of Funds in the Columbia Funds Complex* overseen | Other directorships held by Trustee during the past five years and other relevant Board experience |
| George S. Batejan c/o Columbia Management Investment Advisers, LLC 290 Congress Street Boston, MA 02210 1954 | Trustee since 2017 | Executive Vice President, Global Head of Technology and Operations, Janus Capital Group, Inc., 2010-2016 | 174 | Former Chairman of the Board, NICSA (National Investment Company Services Association) (Executive Committee, Nominating Committee and Governance Committee), 2014-2016; former Director, Intech Investment Management, 2011-2016; former Board Member, Metro Denver Chamber of Commerce, 2015-2016; former Advisory Board Member, University of Colorado Business School, 2015-2018; former Board Member, Chase Bank International, 1993-1994 |
| Columbia Dividend Income Fund | Annual Report 2023 | 31 |
(Unaudited)
Independent trustees (continued)
| Name, address, year of birth | Position held with the Columbia Funds and length of service | Principal occupation(s) during past five years and other relevant professional experience | Number of Funds in the Columbia Funds Complex* overseen | Other directorships held by Trustee during the past five years and other relevant Board experience |
| Kathleen Blatz c/o Columbia Management Investment Advisers, LLC 290 Congress Street Boston, MA 02210 1954 | Trustee since 2006 | Attorney, specializing in arbitration and mediation; Chief Justice, Minnesota Supreme Court, 1998-2006; Associate Justice, Minnesota Supreme Court, 1996-1998; Fourth Judicial District Court Judge, Hennepin County, 1994-1996; Attorney in private practice and public service, 1984-1993; State Representative, Minnesota House of Representatives, 1979-1993, which included service on the Tax and Financial Institutions and Insurance Committees; Member and Interim Chair, Minnesota Sports Facilities Authority, January-July 2017; Interim President and Chief Executive Officer, Blue Cross and Blue Shield of Minnesota (health care insurance), February-July 2018, April-October 2021 | 174 | Former Trustee, Blue Cross and Blue Shield of Minnesota, 2009-2021 (Chair of the Business Development Committee, 2014-2017; Chair of the Governance Committee, 2017-2019); former Member and Chair of the Board, Minnesota Sports Facilities Authority, January 2017-July 2017; former Director, Robina Foundation, 2009-2020 (Chair, 2014-2020); Director, Richard M. Schulze Family Foundation, since 2021 |
| Pamela G. Carlton c/o Columbia Management Investment Advisers, LLC 290 Congress Street Boston, MA 02210 1954 | Chair since 2023; Trustee since 2007 | President, Springboard — Partners in Cross Cultural Leadership (consulting company), since 2003; Managing Director of US Equity Research, JP Morgan Chase, 1999-2003; Director of US Equity Research, Chase Asset Management, 1996-1999; Co-Director Latin America Research, 1993-1996, COO Global Research, 1992-1996, Co-Director of US Research, 1991-1992, Investment Banker, 1982-1991, Morgan Stanley; Attorney, Cleary Gottlieb Steen & Hamilton LLP, 1980-1982 | 174 | Trustee, New York Presbyterian Hospital Board, since 1996; Director, DR Bank (Audit Committee) since 2017; Director, Evercore Inc. (Audit Committee, Nominating and Governance Committee), since 2019; Director, Apollo Commercial Real Estate Finance, Inc. (Chair, Nominating and Governance Committee) (financial services), since 2021; the Governing Council of the Independent Directors Council (IDC), since 2021 |
| Janet Langford Carrig c/o Columbia Management Investment Advisers, LLC 290 Congress Street Boston, MA 02210 1957 | Trustee since 1996 | Senior Vice President, General Counsel and Corporate Secretary, ConocoPhillips (independent energy company), September 2007-October 2018 | 174 | Director, EQT Corporation (natural gas producer), since 2019; former Director, Whiting Petroleum Corporation (independent oil and gas company), 2020-2022 |
| J. Kevin Connaughton c/o Columbia Management Investment Advisers, LLC 290 Congress Street Boston, MA 02210 1964 | Trustee since 2020 | CEO and President, RhodeWay Financial (non-profit financial planning firm), since December 2022; Member, FINRA National Adjudicatory Council, since January 2020; Adjunct Professor of Finance, Bentley University since January 2018; Consultant to Independent Trustees of CFVIT and CFST I from March 2016 to June 2020 with respect to CFVIT and to December 2020 with respect to CFST I; Managing Director and General Manager of Mutual Fund Products, Columbia Management Investment Advisers, LLC, May 2010-February 2015; President, Columbia Funds, 2008-2015; and senior officer of Columbia Funds and affiliated funds, 2003-2015 | 172 | Former Director, The Autism Project, March 2015-December 2021; former Member of the Investment Committee, St. Michael’s College, November 2015-February 2020; former Trustee, St. Michael’s College, June 2017-September 2019; former Trustee, New Century Portfolios (former mutual fund complex), January 2015-December 2017 |
| 32 | Columbia Dividend Income Fund | Annual Report 2023 |
(Unaudited)
Independent trustees (continued)
| Name, address, year of birth | Position held with the Columbia Funds and length of service | Principal occupation(s) during past five years and other relevant professional experience | Number of Funds in the Columbia Funds Complex* overseen | Other directorships held by Trustee during the past five years and other relevant Board experience |
| Olive M. Darragh c/o Columbia Management Investment Advisers, LLC 290 Congress Street Boston, MA 02210 1962 | Trustee since 2020 | Managing Director of Darragh Inc. (strategy and talent management consulting firm), since 2010; Founder and CEO, Zolio, Inc. (investment management talent identification platform), since 2004; Consultant to Independent Trustees of CFVIT and CFST I from June 2019 to June 2020 with respect to CFVIT and to December 2020 with respect to CFST I; Partner, Tudor Investments, 2004-2010; Senior Partner, McKinsey & Company (consulting), 1990-2004; Touche Ross CPA, 1985-1988 | 172 | Treasurer, Edinburgh University US Trust Board, since January 2023; Member, HBS Community Action Partners Board, since September 2022; former Director, University of Edinburgh Business School (Member of US Board), 2004-2019; former Director, Boston Public Library Foundation, 2008-2017 |
| Patricia M. Flynn c/o Columbia Management Investment Advisers, LLC 290 Congress Street Boston, MA 02210 1950 | Trustee since 2004 | Professor of Economics and Management, Bentley University, since 2002; Dean, McCallum Graduate School of Business, Bentley University, 1992-2002 | 174 | Former Trustee, MA Taxpayers Foundation, 1997-2022; former Director, The MA Business Roundtable, 2003-2019; former Chairperson, Innovation Index Advisory Committee, MA Technology Collaborative, 1997-2020 |
| Brian J. Gallagher c/o Columbia Management Investment Advisers, LLC 290 Congress Street Boston, MA 02210 1954 | Trustee since 2017 | Retired; Partner with Deloitte & Touche LLP and its predecessors, 1977-2016 | 174 | Trustee, Catholic Schools Foundation, since 2004 |
| Douglas A. Hacker c/o Columbia Management Investment Advisers, LLC 290 Congress Street Boston, MA 02210 1955 | Trustee since 1996 | Independent business executive, since May 2006; Executive Vice President – Strategy of United Airlines, December 2002 - May 2006; President of UAL Loyalty Services (airline marketing company), September 2001-December 2002; Executive Vice President and Chief Financial Officer of United Airlines, July 1999-September 2001 | 174 | Director, SpartanNash Company since November 2013 (Chair of the Board, since May 2021) (food distributor); Director, Aircastle Limited (Chair of Audit Committee) (aircraft leasing), since August 2006; former Director, Nash Finch Company (food distributor), 2005-2013; former Director, SeaCube Container Leasing Ltd. (container leasing), 2010-2013; and former Director, Travelport Worldwide Limited (travel information technology), 2014-2019 |
| Nancy T. Lukitsh c/o Columbia Management Investment Advisers, LLC 290 Congress Street Boston, MA 02210 1956 | Trustee since 2011 | Senior Vice President, Partner and Director of Marketing, Wellington Management Company, LLP (investment adviser), 1997-2010; Chair, Wellington Management Portfolios (commingled non-U.S. investment pools), 2007-2010; Director, Wellington Trust Company, NA and other Wellington affiliates, 1997-2010 | 172 | None |
| Columbia Dividend Income Fund | Annual Report 2023 | 33 |
(Unaudited)
Independent trustees (continued)
| Name, address, year of birth | Position held with the Columbia Funds and length of service | Principal occupation(s) during past five years and other relevant professional experience | Number of Funds in the Columbia Funds Complex* overseen | Other directorships held by Trustee during the past five years and other relevant Board experience |
| David M. Moffett c/o Columbia Management Investment Advisers, LLC 290 Congress Street Boston, MA 02210 1952 | Trustee since 2011 | Retired; former Chief Executive Officer of Freddie Mac and Chief Financial Officer of U.S. Bank | 172 | Director, CSX Corporation (transportation suppliers); Director, PayPal Holdings Inc. (payment and data processing services); Trustee, University of Oklahoma Foundation; former Director, eBay Inc. (online trading community), 2007-2015; and former Director, CIT Bank, CIT Group Inc. (commercial and consumer finance), 2010-2016; former Senior Adviser to The Carlyle Group (financial services), March 2008-September 2008; former Governance Consultant to Bridgewater Associates, January 2013-December 2015 |
| Catherine James Paglia c/o Columbia Management Investment Advisers, LLC 290 Congress Street Boston, MA 02210 1952 | Trustee since 2004 | Director, Enterprise Asset Management, Inc. (private real estate and asset management company), since September 1998; Managing Director and Partner, Interlaken Capital, Inc., 1989-1997; Vice President, 1982-1985, Principal, 1985-1987, Managing Director, 1987-1989, Morgan Stanley; Vice President, Investment Banking, 1980-1982, Associate, Investment Banking, 1976-1980, Dean Witter Reynolds, Inc. | 174 | Director, Valmont Industries, Inc. (irrigation systems manufacturer), since 2012; Trustee, Carleton College (on the Investment Committee), since 1987; Trustee, Carnegie Endowment for International Peace (on the Investment Committee), since 2009 |
| Natalie A. Trunow c/o Columbia Management Investment Advisers, LLC 290 Congress Street Boston, MA 02210 1967 | Trustee since 2020 | Chief Executive Officer, Millennial Portfolio Solutions LLC (asset management and consulting services), January 2016-January 2021; Non-executive Member of the Investment Committee and Valuation Committee, Sarona Asset Management Inc. (private equity firm) since September 2019; Advisor, Horizon Investments (asset management and consulting services), August 2018-January 2022; Advisor, Paradigm Asset Management, November 2016-January 2022; Consultant to Independent Trustees of CFVIT and CFST I from September 2016 to June 2020 with respect to CFVIT and to December 2020 with respect to CFST I; Director of Investments/Consultant, Casey Family Programs, April 2016-November 2016; Senior Vice President and Chief Investment Officer, Calvert Investments, August 2008-January 2016; Section Head and Portfolio Manager, General Motors Asset Management, June 1997-August 2008 | 172 | Independent Director, Investment Committee, Health Services for Children with Special Needs, Inc., 2010-2021; Independent Director, (Executive Committee and Chair, Audit Committee), Consumer Credit Counseling Services (formerly Guidewell Financial Solutions), since 2016; Independent Director, (Investment Committee), Sarona Asset Management, since 2019 |
| 34 | Columbia Dividend Income Fund | Annual Report 2023 |
(Unaudited)
Independent trustees (continued)
| Name, address, year of birth | Position held with the Columbia Funds and length of service | Principal occupation(s) during past five years and other relevant professional experience | Number of Funds in the Columbia Funds Complex* overseen | Other directorships held by Trustee during the past five years and other relevant Board experience |
| Sandra L. Yeager c/o Columbia Management Investment Advisers, LLC 290 Congress Street Boston, MA 02210 1964 | Trustee since 2017 | Retired; President and founder, Hanoverian Capital, LLC (SEC registered investment advisor firm), 2008-2016; Managing Director, DuPont Capital, 2006-2008; Managing Director, Morgan Stanley Investment Management, 2004-2006; Senior Vice President, Alliance Bernstein, 1990-2004 | 174 | Former Director, NAPE (National Alliance for Partnerships in Equity) Education Foundation, October 2016-October 2020; Advisory Board, Jennersville YMCA, since 2022 |
| Name, address, year of birth | Position held with the Columbia Funds and length of service | Principal occupation(s) during the past five years and other relevant professional experience | Number of Funds in the Columbia Funds Complex overseen | Other directorships held by Trustee during the past five years and other relevant Board experience |
| Daniel J. Beckman c/o Columbia Management Investment Advisers, LLC 290 Congress Street Boston, MA 02210 1962 | Trustee since November 2021 and President since June 2021 | Vice President – Head of North America Product, Columbia Management Investment Advisers, LLC, since April 2015; President and Principal Executive Officer of the Columbia Funds, since June 2021; officer of Columbia Funds and affiliated funds, 2020-2021 | 174 | Director, Ameriprise Trust Company, since October 2016; Director, Columbia Management Investment Distributors, Inc. since November 2018; Board of Governors, Columbia Wanger Asset Management, LLC since, January 2022; Director, Columbia Threadneedle Canada, Inc., since December 2022 |
| * | The term “Columbia Funds Complex” as used herein includes Columbia Seligman Premium Technology Growth Fund, Tri-Continental Corporation and each series of Columbia Funds Series Trust (CFST), Columbia Funds Series Trust I (CFST I), Columbia Funds Series Trust II (CFST II), Columbia ETF Trust I (CET I), Columbia ETF Trust II (CET II), Columbia Funds Variable Insurance Trust (CFVIT) and Columbia Funds Variable Series Trust II (CFVST II). Messrs. Batejan, Beckman, Gallagher and Hacker and Mses. Blatz, Carlton, Carrig, Flynn, Paglia, and Yeager serve as directors of Columbia Seligman Premium Technology Growth Fund and Tri-Continental Corporation. |
| ** | Interested person (as defined under the 1940 Act) by reason of being an officer, director, security holder and/or employee of the Investment Manager or Ameriprise Financial. |
| Columbia Dividend Income Fund | Annual Report 2023 | 35 |
(Unaudited)
The Board has appointed officers who are responsible for day-to-day business decisions based on policies it has established. The officers serve at the pleasure of the Board. The following table provides basic information about the Officers of the Fund as of the printing of this report, including principal occupations during the past five years, although their specific titles may have varied over the period. In addition to Mr. Beckman, who is President and Principal Executive Officer, the Fund’s other officers are:
| Name, address and year of birth | Position and year first appointed to position for any Fund in the Columbia Funds Complex or a predecessor thereof | Principal occupation(s) during past five years |
| Michael G. Clarke 290 Congress Street Boston, MA 02210 1969 | Chief Financial Officer and Principal Financial Officer (2009) and Senior Vice President (2019) | Senior Vice President and North America Head of Operations & Investor Services, Columbia Management Investment Advisers, LLC, since June 2023 (previously Senior Vice President and Head of Global Operations, March 2022 – June 2023, Vice President, Head of North America Operations, and Co-Head of Global Operations, June 2019 - February 2022 and Vice President – Accounting and Tax, May 2010 - May 2019); senior officer of Columbia Funds and affiliated funds, since 2002. Director, Ameriprise Trust Company, since June 2023. |
| Joseph Beranek 5890 Ameriprise Financial Center Minneapolis, MN 55474 1965 | Treasurer and Chief Accounting Officer (Principal Accounting Officer) (2019) and Principal Financial Officer (2020), CFST, CFST I, CFST II, CFVIT and CFVST II; Assistant Treasurer, CET I and CET II | Vice President – Mutual Fund Accounting and Financial Reporting, Columbia Management Investment Advisers, LLC, since December 2018 and March 2017, respectively. |
| Marybeth Pilat 290 Congress Street Boston, MA 02210 1968 | Treasurer and Chief Accounting Officer (Principal Accounting Officer) and Principal Financial Officer (2020) for CET I and CET II; Assistant Treasurer, CFST, CFST I, CFST II, CFVIT and CFVST II | Vice President – Product Pricing and Administration, Columbia Management Investment Advisers, LLC, since May 2017. |
| William F. Truscott 290 Congress Street Boston, MA 02210 1960 | Senior Vice President (2001) | Formerly, Trustee/Director of Columbia Funds Complex or legacy funds, November 2001 - January 1, 2021; Chief Executive Officer, Global Asset Management, Ameriprise Financial, Inc., since September 2012; Chairman of the Board and President, Columbia Management Investment Advisers, LLC, since July 2004 and February 2012, respectively; Chairman of the Board and Chief Executive Officer, Columbia Management Investment Distributors, Inc., since November 2008 and February 2012, respectively;Chairman of the Board and Director, Threadneedle Asset Management Holdings, Sàrl, since March 2013 and December 2008, respectively; senior executive of various entities affiliated with Columbia Threadneedle. |
| Christopher O. Petersen 5228 Ameriprise Financial Center Minneapolis, MN 55474 1970 | Senior Vice President and Assistant Secretary (2021) | Formerly, Trustee/Director of funds within the Columbia Funds Complex, July 1, 2020 - November 22, 2021; Senior Vice President and Assistant General Counsel, Ameriprise Financial, Inc., since September 2021 (previously Vice President and Lead Chief Counsel, January 2015 - September 2021); formerly, President and Principal Executive Officer of the Columbia Funds, 2015 - 2021; officer of Columbia Funds and affiliated funds, since 2007. |
| Thomas P. McGuire 290 Congress Street Boston, MA 02210 1972 | Senior Vice President and Chief Compliance Officer (2012) | Vice President – Asset Management Compliance, Ameriprise Financial, Inc., since May 2010; Chief Compliance Officer, Columbia Acorn/Wanger Funds, since December 2015; formerly, Chief Compliance Officer, Ameriprise Certificate Company, September 2010 – September 2020. |
| Ryan C. Larrenaga 290 Congress Street Boston, MA 02210 1970 | Senior Vice President (2017), Chief Legal Officer (2017), and Secretary (2015) | Vice President and Chief Counsel, Ameriprise Financial, Inc., since August 2018 (previously Vice President and Group Counsel, August 2011 - August 2018); Chief Legal Officer, Columbia Acorn/Wanger Funds, since September 2020; officer of Columbia Funds and affiliated funds, since 2005. |
| 36 | Columbia Dividend Income Fund | Annual Report 2023 |
(Unaudited)
Fund officers (continued)
| Name, address and year of birth | Position and year first appointed to position for any Fund in the Columbia Funds Complex or a predecessor thereof | Principal occupation(s) during past five years |
| Michael E. DeFao 290 Congress Street Boston, MA 02210 1968 | Vice President (2011) and Assistant Secretary (2010) | Vice President and Chief Counsel, Ameriprise Financial, Inc., since May 2010; Vice President, Chief Legal Officer and Assistant Secretary, Columbia Management Investment Advisers, LLC, since October 2021 (previously Vice President and Assistant Secretary, May 2010 – September 2021). |
| Lyn Kephart-Strong 5903 Ameriprise Financial Center Minneapolis, MN 55474 1960 | Vice President (2015) | Vice President, Global Investment Operations Services, Columbia Management Investment Advisers, LLC, since 2010; Director (since January 2007) and President (since October 2014), Columbia Management Investment Services Corp.; Director (since December 2017) and President (since January 2017), Ameriprise Trust Company. |
| • | the Fund had sufficient liquidity to both meet redemptions and operate effectively on behalf of shareholders; |
| • | there were no material changes to the Program during the period; |
| • | the implementation of the Program was effective to manage the Fund’s liquidity risk; and |
| • | the Program operated adequately during the period. |
| Columbia Dividend Income Fund | Annual Report 2023 | 37 |
columbiathreadneedleus.com/investor/. The Fund is distributed by Columbia Management Investment Distributors, Inc., member FINRA, and managed by Columbia Management Investment Advisers, LLC.

May 31, 2023

| 3 | |
| 5 | |
| 7 | |
| 8 | |
| 22 | |
| 23 | |
| 24 | |
| 26 | |
| 30 | |
| 42 | |
| 43 | |
| 43 | |
| 49 |
(Unaudited)
| Average annual total returns (%) (for the period ended May 31, 2023) | |||||
| Inception | 1 Year | 5 Years | 10 Years | ||
| Class A | Excluding sales charges | 07/31/00 | -5.29 | 0.36 | 2.26 |
| Including sales charges | -8.13 | -0.25 | 1.96 | ||
| Advisor Class | 03/19/13 | -5.19 | 0.57 | 2.47 | |
| Class C | Excluding sales charges | 07/15/02 | -5.86 | -0.26 | 1.62 |
| Including sales charges | -6.77 | -0.26 | 1.62 | ||
| Institutional Class | 03/05/84 | -5.20 | 0.56 | 2.47 | |
| Institutional 2 Class | 11/08/12 | -5.19 | 0.60 | 2.52 | |
| Institutional 3 Class* | 03/01/17 | -5.11 | 0.66 | 2.53 | |
| Blended Benchmark | -1.63 | 2.37 | 3.22 | ||
| Bloomberg High Yield Municipal Bond Index | -2.17 | 2.53 | 3.44 | ||
| * | The returns shown for periods prior to the share class inception date (including returns for the Life of the Fund, if shown, which are since Fund inception) include the returns of the Fund’s oldest share class. These returns are adjusted to reflect any higher class-related operating expenses of the newer share classes, as applicable. Please visit columbiathreadneedleus.com/investor/investment-products/mutual-funds/appended-performance for more information. |
| Columbia High Yield Municipal Fund | Annual Report 2023 | 3 |
(Unaudited)
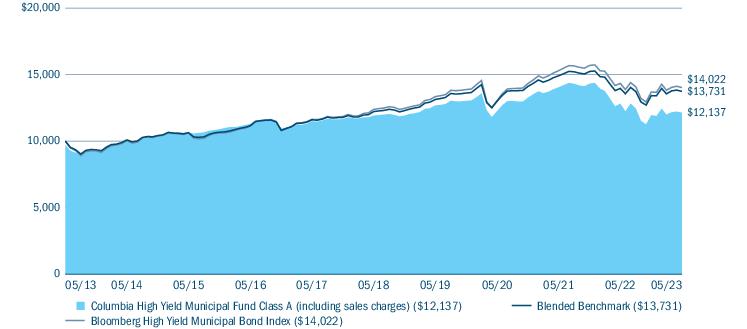
| Quality breakdown (%) (at May 31, 2023) | |
| AAA rating | 1.5 |
| AA rating | 5.5 |
| A rating | 12.7 |
| BBB rating | 13.0 |
| BB rating | 11.9 |
| B rating | 2.1 |
| CCC rating | 0.4 |
| Not rated | 52.9 |
| Total | 100.0 |
| Top Ten States/Territories (%) (at May 31, 2023) | |
| Illinois | 9.9 |
| Colorado | 9.5 |
| Florida | 8.5 |
| New York | 8.3 |
| Texas | 7.5 |
| Puerto Rico | 6.4 |
| California | 4.8 |
| Wisconsin | 4.5 |
| Pennsylvania | 3.9 |
| Iowa | 3.1 |
| 4 | Columbia High Yield Municipal Fund | Annual Report 2023 |
(Unaudited)
| • | The Fund’s above-benchmark duration and emphasis on longer maturity bonds was the primary detractor from performance during the period. (Duration is a measure of interest rate sensitivity.) This aspect of the Fund’s positioning reflected our view that slowing growth would lead to declining yields in the latter half of 2022, but the opposite in fact occurred. The Fund maintained the long duration at the close of the period, given that economic indicators showed increasing odds of a slowdown as the Fed’s extended series of rate hikes began to take effect. In addition, inflation had begun to trend consistently lower. |
| • | An overweight in continuing care retirement communities (CCRCs) also detracted from results. This sector has been a consistent outperformer over time, but more recently it has been negatively impacted by COVID-19. |
| • | Security selection in non-rated, BBB and below B rated bonds detracted, as did selection in the resource recovery, electric revenue, toll road and CCRC sectors. |
| • | Overweights in BBB and A rated bonds, both of which outpaced the high-yield market, contributed to Fund performance. Since yield spreads on below investment-grade bonds remained historically narrow—i.e., “rich”—throughout the period, we viewed mid to lower investment-grade debt as an attractive alternative. |
| ○ | Our preference for higher rated bonds also reflected the fact that the category has typically outperformed lower quality issues when the economy slows or is in a recession. We therefore eliminated positions in areas we identified as being vulnerable to negative economic trends, as well as in issuers with weakening fundamentals. These included healthcare issues — including CCRCs — and holdings in economically sensitive sectors such as corporate-backed, sales tax backed, retail, hotels, and offices. We reinvested the majority of the proceeds in higher quality general obligation and essential service revenue bonds. As a result of these moves, the Fund ended the period significantly underweight in below investment-grade bonds relative to the Blended Benchmark. |
| • | Overweights in the toll road and airline sectors, which continued to benefit from increases in post-COVID-19 travel, also contributed. |
| • | At various times throughout the period, the Fund held small short positions in U.S. Treasury futures as a means of managing interest-rate risk. This strategy was a minor contributor to performance. |
| Columbia High Yield Municipal Fund | Annual Report 2023 | 5 |
(Unaudited)
| 6 | Columbia High Yield Municipal Fund | Annual Report 2023 |
(Unaudited)
| December 1, 2022 — May 31, 2023 | |||||||
| Account value at the beginning of the period ($) | Account value at the end of the period ($) | Expenses paid during the period ($) | Fund’s annualized expense ratio (%) | ||||
| Actual | Hypothetical | Actual | Hypothetical | Actual | Hypothetical | Actual | |
| Class A | 1,000.00 | 1,000.00 | 1,015.40 | 1,020.84 | 4.12 | 4.13 | 0.82 |
| Advisor Class | 1,000.00 | 1,000.00 | 1,016.40 | 1,021.84 | 3.12 | 3.13 | 0.62 |
| Class C | 1,000.00 | 1,000.00 | 1,012.40 | 1,017.85 | 7.12 | 7.14 | 1.42 |
| Institutional Class | 1,000.00 | 1,000.00 | 1,016.40 | 1,021.84 | 3.12 | 3.13 | 0.62 |
| Institutional 2 Class | 1,000.00 | 1,000.00 | 1,016.50 | 1,021.94 | 3.02 | 3.02 | 0.60 |
| Institutional 3 Class | 1,000.00 | 1,000.00 | 1,016.80 | 1,022.19 | 2.77 | 2.77 | 0.55 |
| Columbia High Yield Municipal Fund | Annual Report 2023 | 7 |
May 31, 2023
| Floating Rate Notes 1.2% | ||||
| Issue Description | Yield | Principal Amount ($) | Value ($) | |
| New York 1.0% | ||||
| City of New York(a),(b) | ||||
| Unlimited General Obligation Bonds | ||||
| Fiscal 2015 | ||||
| Subordinated Series 2015 (JPMorgan Chase Bank) | ||||
| 06/01/2044 | 4.100% | 500,000 | 500,000 | |
| New York City Transitional Finance Authority(a),(b) | ||||
| Revenue Bonds | ||||
| Future Tax Secured | ||||
| Subordinated Series 2012C (JPMorgan Chase Bank) | ||||
| 11/01/2036 | 4.100% | 1,500,000 | 1,500,000 | |
| Subordinated Series 2018 (JPMorgan Chase Bank) | ||||
| 08/01/2042 | 4.000% | 1,500,000 | 1,500,000 | |
| New York City Water & Sewer System(a),(b) | ||||
| Revenue Bonds | ||||
| 2nd General Resolution | ||||
| Series 2013 (JPMorgan Chase Bank) | ||||
| 06/15/2050 | 4.100% | 2,000,000 | 2,000,000 | |
| Total | 5,500,000 | |||
| Utah 0.2% | ||||
| City of Murray(a),(b) | ||||
| Revenue Bonds | ||||
| IHC Health Services, Inc. | ||||
| Series 2005B (JPMorgan Chase Bank) | ||||
| 05/15/2037 | 4.000% | 1,000,000 | 1,000,000 | |
| Total Floating Rate Notes (Cost $6,500,000) | 6,500,000 | |||
| Municipal Bonds 98.0% | ||||
| Issue Description | Coupon Rate | Principal Amount ($) | Value ($) | |
| Alabama 0.6% | ||||
| Black Belt Energy Gas District | ||||
| Revenue Bonds | ||||
| Series 2023A (Mandatory Put 10/01/30) | ||||
| 12/31/2053 | 5.250% | 3,000,000 | 3,173,750 | |
| Alaska 0.1% | ||||
| Northern Tobacco Securitization Corp.(c) | ||||
| Refunding Revenue Bonds | ||||
| Series 2021B-2 | ||||
| 06/01/2066 | 0.000% | 5,000,000 | 615,931 | |
| Municipal Bonds (continued) | ||||
| Issue Description | Coupon Rate | Principal Amount ($) | Value ($) | |
| Arizona 2.4% | ||||
| Arizona Industrial Development Authority(d),(e) | ||||
| Revenue Bonds | ||||
| Legacy Cares, Inc. Project | ||||
| Series 2020 | ||||
| 07/01/2050 | 0.000% | 3,000,000 | 1,650,000 | |
| Series 2021A | ||||
| 07/01/2051 | 0.000% | 500,000 | 275,000 | |
| Arizona Industrial Development Authority(d) | ||||
| Revenue Bonds | ||||
| Pinecrest Academy of Northern Nevada Project | ||||
| Series 2022 | ||||
| 07/15/2029 | 4.500% | 2,500,000 | 2,418,041 | |
| Industrial Development Authority of the County of Pima (The)(d) | ||||
| Refunding Revenue Bonds | ||||
| American Leadership Academy | ||||
| Series 2022 | ||||
| 06/15/2057 | 4.000% | 4,000,000 | 2,822,796 | |
| Revenue Bonds | ||||
| La Posada at Pusch Ridge Project | ||||
| Series 2022 | ||||
| 11/15/2057 | 7.000% | 1,000,000 | 1,002,001 | |
| La Paz County Industrial Development Authority | ||||
| Revenue Bonds | ||||
| Charter School Solutions - Harmony Public Schools Project | ||||
| Series 2016 | ||||
| 02/15/2046 | 5.000% | 1,500,000 | 1,447,699 | |
| Series 2018 | ||||
| 02/15/2048 | 5.000% | 230,000 | 220,210 | |
| Maricopa County Industrial Development Authority(d),(f) | ||||
| Revenue Bonds | ||||
| Commercial Metals Co. | ||||
| Series 2022 | ||||
| 10/15/2047 | 4.000% | 3,000,000 | 2,535,035 | |
| Total | 12,370,782 | |||
| Arkansas 0.4% | ||||
| Arkansas Development Finance Authority(f) | ||||
| Revenue Bonds | ||||
| Green Bonds - United States Steel Corp. Project | ||||
| Series 2023 | ||||
| 05/01/2053 | 5.700% | 2,000,000 | 2,006,198 | |
| California 4.8% | ||||
| California County Tobacco Securitization Agency | ||||
| Refunding Revenue Bonds | ||||
| Subordinated Series 2020B-1 | ||||
| 06/01/2049 | 5.000% | 390,000 | 392,093 | |
| 8 | Columbia High Yield Municipal Fund | Annual Report 2023 |
May 31, 2023
| Municipal Bonds (continued) | ||||
| Issue Description | Coupon Rate | Principal Amount ($) | Value ($) | |
| California Municipal Finance Authority(d),(e),(f) | ||||
| Revenue Bonds | ||||
| UTS Renewable Energy-Waste Water Facilities | ||||
| Series 2011 | ||||
| 12/01/2032 | 0.000% | 1,835,000 | 36,700 | |
| California Statewide Communities Development Authority | ||||
| Revenue Bonds | ||||
| Loma Linda University Medical Center | ||||
| Series 2014 | ||||
| 12/01/2054 | 5.500% | 1,000,000 | 992,767 | |
| California Statewide Communities Development Authority(d) | ||||
| Revenue Bonds | ||||
| Loma Linda University Medical Center | ||||
| Series 2018 | ||||
| 12/01/2058 | 5.500% | 1,000,000 | 955,238 | |
| City of Long Beach Marina System | ||||
| Revenue Bonds | ||||
| Series 2015 | ||||
| 05/15/2045 | 5.000% | 500,000 | 505,279 | |
| CMFA Special Finance Agency(d) | ||||
| Revenue Bonds | ||||
| Junior Bonds - Latitude33 | ||||
| Series 2021A | ||||
| 12/01/2045 | 4.000% | 2,000,000 | 1,567,696 | |
| Junior Bonds - Solana at Grand | ||||
| Series 2021A-2 | ||||
| 08/01/2045 | 4.000% | 5,000,000 | 3,942,872 | |
| CSCDA Community Improvement Authority(d) | ||||
| Revenue Bonds | ||||
| Social Bonds - Mezzanine Lien - Westgate Phase 1-Pasadena | ||||
| Series 2021 | ||||
| 06/01/2057 | 4.000% | 2,000,000 | 1,366,449 | |
| Social Bonds - Millennium South Bay-Hawthorne | ||||
| Series 2021 | ||||
| 07/01/2058 | 4.000% | 3,000,000 | 2,076,362 | |
| Golden State Tobacco Securitization Corp.(c) | ||||
| Refunding Revenue Bonds | ||||
| Subordinated Series 2021B-2 | ||||
| 06/01/2066 | 0.000% | 40,000,000 | 4,046,376 | |
| Hastings Campus Housing Finance Authority | ||||
| Revenue Bonds | ||||
| Green Bonds | ||||
| Series 2020A | ||||
| 07/01/2061 | 5.000% | 1,000,000 | 801,062 | |
| Hastings Campus Housing Finance Authority(c),(d) | ||||
| Revenue Bonds | ||||
| Green Bonds | ||||
| Subordinated Series 2020A | ||||
| 07/01/2061 | 0.000% | 3,000,000 | 1,028,155 | |
| Municipal Bonds (continued) | ||||
| Issue Description | Coupon Rate | Principal Amount ($) | Value ($) | |
| M-S-R Energy Authority | ||||
| Revenue Bonds | ||||
| Series 2009B | ||||
| 11/01/2039 | 6.500% | 5,000,000 | 5,804,551 | |
| State of California | ||||
| Unlimited General Obligation Refunding Bonds | ||||
| Series 2023 | ||||
| 10/01/2036 | 5.000% | 500,000 | 582,590 | |
| 10/01/2042 | 5.000% | 625,000 | 705,186 | |
| Total | 24,803,376 | |||
| Colorado 9.5% | ||||
| Aerotropolis Regional Transportation Authority | ||||
| Revenue Bonds | ||||
| Series 2021 | ||||
| 12/01/2052 | 4.375% | 4,000,000 | 2,986,728 | |
| Aurora Crossroads Metropolitan District No. 2 | ||||
| Limited General Obligation Bonds | ||||
| Senior Series 2020A | ||||
| 12/01/2050 | 5.000% | 1,000,000 | 870,576 | |
| City & County of Denver Airport System(f) | ||||
| Revenue Bonds | ||||
| Series 2022A | ||||
| 11/15/2047 | 5.000% | 900,000 | 939,366 | |
| Colorado Bridge Enterprise(f) | ||||
| Revenue Bonds | ||||
| Central 70 Project | ||||
| Series 2017 | ||||
| 06/30/2051 | 4.000% | 6,000,000 | 5,264,167 | |
| Colorado Educational & Cultural Facilities Authority(d) | ||||
| Refunding Revenue Bonds | ||||
| New Summit Charter Academy Project | ||||
| Series 2021 | ||||
| 07/01/2051 | 4.000% | 715,000 | 531,277 | |
| 07/01/2061 | 4.000% | 1,225,000 | 863,749 | |
| Colorado Health Facilities Authority | ||||
| Improvement Refunding Revenue Bonds | ||||
| Christian Living Neighborhoods | ||||
| Series 2021 | ||||
| 01/01/2042 | 4.000% | 1,000,000 | 719,637 | |
| Refunding Revenue Bonds | ||||
| CommonSpirit Health | ||||
| Series 2019A | ||||
| 08/01/2049 | 4.000% | 3,250,000 | 2,923,059 | |
| Revenue Bonds | ||||
| Aberdeen Ridge | ||||
| Series 2021A | ||||
| 05/15/2058 | 5.000% | 3,250,000 | 2,340,622 | |
| NJH-SJH Center for Outpatient Health Project | ||||
| Series 2019 | ||||
| 01/01/2045 | 3.000% | 5,000,000 | 3,806,655 | |
| Columbia High Yield Municipal Fund | Annual Report 2023 | 9 |
May 31, 2023
| Municipal Bonds (continued) | ||||
| Issue Description | Coupon Rate | Principal Amount ($) | Value ($) | |
| Eagle Brook Meadows Metropolitan District No. 3 | ||||
| Limited General Obligation Bonds | ||||
| Series 2021 | ||||
| 12/01/2051 | 5.000% | 1,500,000 | 1,273,855 | |
| Fiddlers Business Improvement District(d) | ||||
| Unlimited General Obligation Refunding Bonds | ||||
| Series 2022 | ||||
| 12/01/2047 | 5.550% | 3,000,000 | 3,008,480 | |
| Jefferson Center Metropolitan District No. 1 | ||||
| Refunding Revenue Bonds | ||||
| Subordinated Series 2020B | ||||
| 12/15/2050 | 5.750% | 4,000,000 | 3,821,904 | |
| Lanterns Metropolitan District No. 2 | ||||
| Limited General Obligation Bonds | ||||
| Series 2021A | ||||
| 12/01/2050 | 4.500% | 2,830,000 | 2,028,287 | |
| Peak Metropolitan District No. 1(d) | ||||
| Limited General Obligation Bonds | ||||
| Series 2021A | ||||
| 12/01/2051 | 5.000% | 1,150,000 | 986,982 | |
| Peak Metropolitan District No. 3(c) | ||||
| Limited General Obligation Bonds | ||||
| Capital Appreciation | ||||
| Series 2022 | ||||
| 12/01/2052 | 0.000% | 2,000,000 | 1,092,199 | |
| Rampart Range Metropolitan District No. 5 | ||||
| Revenue Bonds | ||||
| Series 2021 | ||||
| 12/01/2051 | 4.000% | 2,500,000 | 1,730,598 | |
| RRC Metropolitan District No. 2 | ||||
| Limited General Obligation Bonds | ||||
| Series 2021 | ||||
| 12/01/2051 | 5.250% | 2,500,000 | 2,078,600 | |
| Sagebrush Farm Metropolitan District No. 1 | ||||
| Limited General Obligation Bonds | ||||
| Series 2022A | ||||
| 12/01/2052 | 6.750% | 2,000,000 | 1,954,273 | |
| Senac South Metropolitan District No. 1 | ||||
| Limited General Obligation Bonds | ||||
| Series 2021A | ||||
| 12/01/2051 | 5.250% | 3,000,000 | 2,549,273 | |
| Sky Ranch Community Authority Board | ||||
| Limited General Obligation Bonds | ||||
| Series 2022A | ||||
| 12/01/2052 | 5.750% | 1,250,000 | 1,159,953 | |
| Sterling Ranch Community Authority Board | ||||
| Refunding Revenue Bonds | ||||
| Series 2022A | ||||
| 12/01/2053 | 6.750% | 2,000,000 | 2,015,167 | |
| Municipal Bonds (continued) | ||||
| Issue Description | Coupon Rate | Principal Amount ($) | Value ($) | |
| Waterfront at Foster Lake Metropolitan District No. 2 | ||||
| Revenue Bonds | ||||
| Series 2022 | ||||
| 12/01/2028 | 4.625% | 2,000,000 | 1,839,427 | |
| Windler Public Improvement Authority | ||||
| Revenue Bonds | ||||
| Series 2021A-1 | ||||
| 12/01/2051 | 4.125% | 4,000,000 | 2,413,516 | |
| Total | 49,198,350 | |||
| Connecticut 0.5% | ||||
| Connecticut State Health & Educational Facility Authority(d) | ||||
| Revenue Bonds | ||||
| Church Home of Hartford, Inc. Project | ||||
| Series 2016 | ||||
| 09/01/2053 | 5.000% | 1,750,000 | 1,385,095 | |
| Stamford Housing Authority(d) | ||||
| Revenue Bonds | ||||
| The Dogwoods Project | ||||
| BAN Series 2022 | ||||
| 12/01/2027 | 11.000% | 1,000,000 | 1,036,204 | |
| Total | 2,421,299 | |||
| District of Columbia 1.1% | ||||
| District of Columbia | ||||
| Revenue Bonds | ||||
| KIPP DC Project | ||||
| Series 2019 | ||||
| 07/01/2049 | 4.000% | 680,000 | 567,620 | |
| Metropolitan Washington Airports Authority(f),(g) | ||||
| Refunding Revenue Bonds | ||||
| Series 2023A | ||||
| 10/01/2048 | 5.250% | 1,000,000 | 1,067,627 | |
| Metropolitan Washington Airports Authority Dulles Toll Road | ||||
| Refunding Revenue Bonds | ||||
| Dulles Metrorail | ||||
| Subordinated Series 2019 | ||||
| 10/01/2049 | 4.000% | 4,275,000 | 3,904,034 | |
| Total | 5,539,281 | |||
| Florida 8.4% | ||||
| Capital Trust Agency, Inc.(d) | ||||
| 04/27/2021 | ||||
| 07/01/2056 | 5.000% | 4,000,000 | 3,577,504 | |
| Revenue Bonds | ||||
| WFCS Portfolio Projects | ||||
| Series 2021A | ||||
| 01/01/2031 | 3.300% | 250,000 | 215,008 | |
| 01/01/2056 | 5.000% | 1,000,000 | 735,122 | |
| 10 | Columbia High Yield Municipal Fund | Annual Report 2023 |
May 31, 2023
| Municipal Bonds (continued) | ||||
| Issue Description | Coupon Rate | Principal Amount ($) | Value ($) | |
| Capital Trust Agency, Inc.(d),(e) | ||||
| Revenue Bonds | ||||
| 1st Mortgage - Tapestry Walden Senior Housing Project | ||||
| Series 2017 | ||||
| 07/01/2052 | 0.000% | 3,400,000 | 748,000 | |
| 1st Mortgage Tallahassee Tapestry Senior Housing Project | ||||
| Series 2015 | ||||
| 12/01/2050 | 0.000% | 3,550,000 | 1,162,625 | |
| Capital Trust Agency, Inc.(c),(d) | ||||
| Subordinated | ||||
| 07/01/2061 | 0.000% | 30,000,000 | 1,913,259 | |
| City of Atlantic Beach | ||||
| Revenue Bonds | ||||
| Fleet Landing Project | ||||
| Series 2018A | ||||
| 11/15/2053 | 5.000% | 1,500,000 | 1,235,497 | |
| City of Pompano Beach | ||||
| Revenue Bonds | ||||
| John Knox Village Project | ||||
| Series 2021A | ||||
| 09/01/2056 | 4.000% | 1,835,000 | 1,275,070 | |
| City of Tampa(c) | ||||
| Revenue Bonds | ||||
| Series 2020A | ||||
| 09/01/2053 | 0.000% | 1,800,000 | 376,658 | |
| County of Miami-Dade(c) | ||||
| Revenue Bonds | ||||
| Capital Appreciation | ||||
| Subordinated Series 2009B | ||||
| 10/01/2041 | 0.000% | 10,000,000 | 4,361,307 | |
| County of Osceola Transportation(c) | ||||
| Refunding Revenue Bonds | ||||
| Osceola Parkway Toll Facility | ||||
| Series 2019A-2 | ||||
| 10/01/2049 | 0.000% | 1,700,000 | 398,450 | |
| Series 2020A-2 | ||||
| 10/01/2046 | 0.000% | 3,175,000 | 892,343 | |
| 10/01/2048 | 0.000% | 2,000,000 | 497,559 | |
| Florida Development Finance Corp. | ||||
| Prerefunded 06/15/23 Revenue Bonds | ||||
| Renaissance Charter School | ||||
| Series 2013A | ||||
| 06/15/2044 | 8.500% | 1,500,000 | 1,502,430 | |
| Florida Development Finance Corp.(d) | ||||
| Refunding Revenue Bonds | ||||
| Glenridge on Palmer Ranch Project (The) | ||||
| Series 2021 | ||||
| 06/01/2051 | 5.000% | 2,000,000 | 1,562,307 | |
| Mayflower Retirement Community Project (The) | ||||
| Series 2021 | ||||
| 06/01/2055 | 4.000% | 1,500,000 | 903,921 | |
| Municipal Bonds (continued) | ||||
| Issue Description | Coupon Rate | Principal Amount ($) | Value ($) | |
| Renaissance Charter School | ||||
| Series 2020 | ||||
| 09/15/2050 | 5.000% | 2,200,000 | 1,795,113 | |
| Revenue Bonds | ||||
| Cornerstone Charter Academy Project | ||||
| Series 2022 | ||||
| 10/01/2052 | 5.125% | 1,000,000 | 915,792 | |
| 10/01/2056 | 5.250% | 1,900,000 | 1,743,856 | |
| Discovery High School Project | ||||
| Series 2020 | ||||
| 06/01/2055 | 5.000% | 2,000,000 | 1,709,420 | |
| Renaissance Charter School | ||||
| Series 2015 | ||||
| 06/15/2046 | 6.125% | 4,900,000 | 4,904,013 | |
| Lee County Industrial Development Authority | ||||
| Revenue Bonds | ||||
| Cypress Cove at HealthPark Florida, Inc. Project | ||||
| Series 2022 | ||||
| 10/01/2057 | 5.250% | 3,000,000 | 2,455,562 | |
| Palm Beach County Health Facilities Authority | ||||
| Refunding Revenue Bonds | ||||
| Toby & Leon Cooperman Sinai Residences of Boca Raton | ||||
| Series 2022 | ||||
| 06/01/2056 | 4.250% | 4,000,000 | 2,849,519 | |
| Polk County Industrial Development Authority | ||||
| Refunding Revenue Bonds | ||||
| Carpenter’s Home Estates, Inc. | ||||
| Series 2019 | ||||
| 01/01/2055 | 5.000% | 2,615,000 | 2,169,854 | |
| Seminole County Industrial Development Authority | ||||
| Refunding Revenue Bonds | ||||
| Legacy Pointe at UCF Project | ||||
| Series 2019 | ||||
| 11/15/2054 | 5.750% | 2,525,000 | 1,971,546 | |
| Seminole County Industrial Development Authority(d) | ||||
| Revenue Bonds | ||||
| Galileo Schools for Gifted Learning Project | ||||
| Series 2021 | ||||
| 06/15/2051 | 4.000% | 830,000 | 617,792 | |
| 06/15/2056 | 4.000% | 1,410,000 | 1,012,903 | |
| Westridge Community Development District | ||||
| Special Assessment Bonds | ||||
| Series 2005 | ||||
| 05/01/2037 | 5.800% | 285,000 | 285,064 | |
| Total | 43,787,494 | |||
| Georgia 1.7% | ||||
| Floyd County Development Authority | ||||
| Revenue Bonds | ||||
| Spires Berry College Project | ||||
| Series 2018 | ||||
| 12/01/2048 | 6.250% | 1,500,000 | 1,390,503 | |
| Columbia High Yield Municipal Fund | Annual Report 2023 | 11 |
May 31, 2023
| Municipal Bonds (continued) | ||||
| Issue Description | Coupon Rate | Principal Amount ($) | Value ($) | |
| Georgia State Road & Tollway Authority(d),(h) | ||||
| Prerefunded 06/01/24 Revenue Bonds | ||||
| I-75 S Expressway | ||||
| Series 2014S | ||||
| 06/01/2049 | 0.000% | 4,600,000 | 4,665,317 | |
| Oconee County Industrial Development Authority | ||||
| Revenue Bonds | ||||
| Presbyterian Village Athens Project | ||||
| Series 2018 | ||||
| 12/01/2053 | 6.375% | 3,000,000 | 2,502,057 | |
| Total | 8,557,877 | |||
| Idaho 1.0% | ||||
| Idaho Health Facilities Authority | ||||
| Revenue Bonds | ||||
| Terraces of Boise Project | ||||
| Series 2021 | ||||
| 10/01/2050 | 4.500% | 4,000,000 | 2,811,134 | |
| Spring Valley Community Infrastructure District No. 1(d) | ||||
| Special Assessment Bonds | ||||
| Series 2021 | ||||
| 09/01/2051 | 3.750% | 3,000,000 | 2,217,314 | |
| Total | 5,028,448 | |||
| Illinois 9.8% | ||||
| Chicago Board of Education(d) | ||||
| Unlimited General Obligation Bonds | ||||
| Dedicated | ||||
| Series 2017A | ||||
| 12/01/2046 | 7.000% | 3,000,000 | 3,233,477 | |
| Chicago Board of Education | ||||
| Unlimited General Obligation Bonds | ||||
| Dedicated | ||||
| Series 2017H | ||||
| 12/01/2036 | 5.000% | 1,665,000 | 1,681,662 | |
| Project | ||||
| Series 2015C | ||||
| 12/01/2039 | 5.250% | 2,000,000 | 2,002,273 | |
| Series 2012A | ||||
| 12/01/2042 | 5.000% | 1,000,000 | 959,116 | |
| Series 2016B | ||||
| 12/01/2046 | 6.500% | 1,500,000 | 1,568,720 | |
| Series 2018D | ||||
| 12/01/2046 | 5.000% | 5,000,000 | 4,761,073 | |
| Series 2022A | ||||
| 12/01/2047 | 4.000% | 6,000,000 | 5,126,169 | |
| Unlimited General Obligation Refunding Bonds | ||||
| Series 2018A (AGM) | ||||
| 12/01/2035 | 5.000% | 500,000 | 523,716 | |
| Municipal Bonds (continued) | ||||
| Issue Description | Coupon Rate | Principal Amount ($) | Value ($) | |
| Chicago O’Hare International Airport(f) | ||||
| Revenue Bonds | ||||
| TriPs Obligated Group | ||||
| Series 2018 | ||||
| 07/01/2048 | 5.000% | 800,000 | 783,088 | |
| City of Chicago | ||||
| Unlimited General Obligation Bonds | ||||
| Series 2017A | ||||
| 01/01/2038 | 6.000% | 3,235,000 | 3,428,516 | |
| Unlimited General Obligation Refunding Bonds | ||||
| Series 2007F | ||||
| 01/01/2042 | 5.500% | 1,000,000 | 1,013,071 | |
| Du Page County Special Service Area No. 31 | ||||
| Special Tax Bonds | ||||
| Monarch Landing Project | ||||
| Series 2006 | ||||
| 03/01/2036 | 5.625% | 548,000 | 537,187 | |
| Illinois Finance Authority(d) | ||||
| Refunding Revenue Bonds | ||||
| DePaul College Prep Foundation | ||||
| Series 2023 | ||||
| 08/01/2053 | 5.625% | 1,000,000 | 980,701 | |
| Metropolitan Pier & Exposition Authority | ||||
| Refunding Revenue Bonds | ||||
| McCormick Place Expansion Project | ||||
| Series 2020 | ||||
| 06/15/2050 | 4.000% | 1,200,000 | 1,063,700 | |
| Revenue Bonds | ||||
| McCormick Place Expansion Project | ||||
| Series 2017 | ||||
| 06/15/2057 | 5.000% | 1,000,000 | 994,341 | |
| Metropolitan Pier & Exposition Authority(c) | ||||
| Refunding Revenue Bonds | ||||
| McCormick Place Expansion Project | ||||
| Series 2022 | ||||
| 12/15/2037 | 0.000% | 2,700,000 | 1,374,479 | |
| 06/15/2038 | 0.000% | 3,000,000 | 1,479,040 | |
| State of Illinois | ||||
| Unlimited General Obligation Bonds | ||||
| Series 2017A | ||||
| 12/01/2035 | 5.000% | 1,345,000 | 1,399,106 | |
| 12/01/2038 | 5.000% | 3,000,000 | 3,089,340 | |
| Series 2018A | ||||
| 05/01/2032 | 5.000% | 2,500,000 | 2,657,295 | |
| 05/01/2041 | 5.000% | 3,910,000 | 4,014,229 | |
| 05/01/2043 | 5.000% | 3,000,000 | 3,067,699 | |
| Series 2020 | ||||
| 05/01/2039 | 5.500% | 570,000 | 622,139 | |
| 05/01/2045 | 5.750% | 750,000 | 814,336 | |
| Series 2022A | ||||
| 03/01/2047 | 5.500% | 2,700,000 | 2,919,521 | |
| 12 | Columbia High Yield Municipal Fund | Annual Report 2023 |
May 31, 2023
| Municipal Bonds (continued) | ||||
| Issue Description | Coupon Rate | Principal Amount ($) | Value ($) | |
| Series 2023B | ||||
| 05/01/2047 | 5.500% | 500,000 | 541,139 | |
| Village of Lincolnshire | ||||
| Special Tax Bonds | ||||
| Sedgebrook Project | ||||
| Series 2004 | ||||
| 03/01/2034 | 6.250% | 557,000 | 557,381 | |
| Total | 51,192,514 | |||
| Iowa 3.1% | ||||
| Iowa Finance Authority(h) | ||||
| Prerefunded 11/15/24 Revenue Bonds | ||||
| Deerfield Retirement Community | ||||
| Series 2014 | ||||
| 11/15/2046 | 5.400% | 1,931,669 | 1,975,035 | |
| Iowa Finance Authority | ||||
| Refunding Revenue Bonds | ||||
| Iowa Fertilizer Co. Project | ||||
| Series 2022 | ||||
| 12/01/2050 | 5.000% | 2,700,000 | 2,706,069 | |
| Lifespace Communities, Inc. | ||||
| Series 2021 | ||||
| 05/15/2053 | 4.000% | 4,000,000 | 2,320,304 | |
| Revenue Bonds | ||||
| Lifespace Communities, Inc. | ||||
| Series 2018A | ||||
| 05/15/2043 | 5.000% | 1,740,000 | 1,321,336 | |
| PHS Council Bluffs, Inc. Project | ||||
| Series 2018 | ||||
| 08/01/2055 | 5.250% | 3,200,000 | 2,372,002 | |
| Iowa Tobacco Settlement Authority(c) | ||||
| Refunding Revenue Bonds | ||||
| Series 2021B-2 | ||||
| 06/01/2065 | 0.000% | 50,000,000 | 5,512,230 | |
| Total | 16,206,976 | |||
| Kansas 1.0% | ||||
| City of Overland Park | ||||
| Revenue Bonds | ||||
| Prairiefire-Lionsgate Project | ||||
| Series 2012 | ||||
| 12/15/2032 | 6.000% | 6,000,000 | 2,662,534 | |
| Wyandotte County-Kansas City Unified Government | ||||
| Revenue Bonds | ||||
| Legends Village West Project | ||||
| Series 2006 | ||||
| 10/01/2028 | 4.875% | 2,735,000 | 2,623,824 | |
| Total | 5,286,358 | |||
| Municipal Bonds (continued) | ||||
| Issue Description | Coupon Rate | Principal Amount ($) | Value ($) | |
| Kentucky 0.7% | ||||
| City of Henderson(d),(f) | ||||
| Revenue Bonds | ||||
| Pratt Paper LLC Project | ||||
| Series 2022 | ||||
| 01/01/2052 | 4.700% | 3,000,000 | 2,777,927 | |
| Kentucky Economic Development Finance Authority | ||||
| Refunding Revenue Bonds | ||||
| Owensboro Health | ||||
| Series 2017A | ||||
| 06/01/2045 | 5.000% | 1,000,000 | 972,899 | |
| Total | 3,750,826 | |||
| Louisiana 1.4% | ||||
| Louisiana Public Facilities Authority | ||||
| Prerefunded 05/15/26 Revenue Bonds | ||||
| Ochsner Clinic Foundation Project | ||||
| Series 2016 | ||||
| 05/15/2034 | 5.000% | 25,000 | 26,233 | |
| Louisiana Public Facilities Authority(f) | ||||
| Revenue Bonds | ||||
| Impala Warehousing LLC Project | ||||
| Series 2013 | ||||
| 07/01/2036 | 6.500% | 3,420,000 | 3,423,262 | |
| Parish of St. James(d) | ||||
| Revenue Bonds | ||||
| NuStar Logistics LP Project | ||||
| Series 2020-2 | ||||
| 07/01/2040 | 6.350% | 3,750,000 | 4,034,371 | |
| Total | 7,483,866 | |||
| Maryland 0.8% | ||||
| Maryland Economic Development Corp.(f) | ||||
| Revenue Bonds | ||||
| Green Bonds - Purple Line Light Rail Project | ||||
| Series 2022 | ||||
| 06/30/2055 | 5.250% | 2,000,000 | 2,027,470 | |
| Maryland Economic Development Corp. | ||||
| Tax Allocation Bonds | ||||
| Port Covington Project | ||||
| Series 2020 | ||||
| 09/01/2050 | 4.000% | 2,700,000 | 2,185,971 | |
| Total | 4,213,441 | |||
| Massachusetts 1.0% | ||||
| Massachusetts Development Finance Agency(d) | ||||
| Refunding Revenue Bonds | ||||
| NewBridge on the Charles, Inc. | ||||
| Series 2017 | ||||
| 10/01/2057 | 5.000% | 2,000,000 | 1,749,382 | |
| Columbia High Yield Municipal Fund | Annual Report 2023 | 13 |
May 31, 2023
| Municipal Bonds (continued) | ||||
| Issue Description | Coupon Rate | Principal Amount ($) | Value ($) | |
| Revenue Bonds | ||||
| Linden Ponds, Inc. Facility | ||||
| Series 2018 | ||||
| 11/15/2046 | 5.125% | 2,000,000 | 2,015,126 | |
| Massachusetts Educational Financing Authority(f) | ||||
| Refunding Revenue Bonds | ||||
| Issue K | ||||
| Subordinated Series 2017B | ||||
| 07/01/2046 | 4.250% | 1,500,000 | 1,387,176 | |
| Total | 5,151,684 | |||
| Michigan 0.7% | ||||
| Michigan Finance Authority(c) | ||||
| Refunding Revenue Bonds | ||||
| Senior Series 2020B-2 Class 2 | ||||
| 06/01/2065 | 0.000% | 37,500,000 | 3,671,996 | |
| Minnesota 0.7% | ||||
| City of Crookston | ||||
| Revenue Bonds | ||||
| Riverview Health Project | ||||
| Series 2019 | ||||
| 05/01/2044 | 5.000% | 500,000 | 395,611 | |
| 05/01/2051 | 5.000% | 1,500,000 | 1,134,133 | |
| St. Cloud Housing & Redevelopment Authority(e) | ||||
| Revenue Bonds | ||||
| Sanctuary St. Cloud Project | ||||
| Series 2016A | ||||
| 08/01/2036 | 0.000% | 2,245,000 | 1,908,250 | |
| Total | 3,437,994 | |||
| Missouri 1.0% | ||||
| Kansas City Industrial Development Authority(d) | ||||
| Revenue Bonds | ||||
| Platte Purchase Project | ||||
| Series 2019A | ||||
| 07/01/2040 | 5.000% | 1,800,000 | 1,543,774 | |
| Kirkwood Industrial Development Authority | ||||
| Refunding Revenue Bonds | ||||
| Aberdeen Heights Project | ||||
| Series 2017 | ||||
| 05/15/2050 | 5.250% | 1,500,000 | 1,122,824 | |
| St. Louis County Industrial Development Authority | ||||
| Refunding Revenue Bonds | ||||
| St. Andrews Residence for Seniors | ||||
| Series 2015 | ||||
| 12/01/2045 | 5.125% | 3,000,000 | 2,688,414 | |
| Total | 5,355,012 | |||
| Municipal Bonds (continued) | ||||
| Issue Description | Coupon Rate | Principal Amount ($) | Value ($) | |
| Nevada 1.1% | ||||
| City of Reno(c),(d) | ||||
| Refunding Revenue Bonds | ||||
| Retrac-Reno Transportation Rail Access Corridor Project | ||||
| Series 2018 | ||||
| 07/01/2058 | 0.000% | 16,000,000 | 2,022,181 | |
| State of Nevada Department of Business & Industry(d) | ||||
| Revenue Bonds | ||||
| Somerset Academy | ||||
| Series 2015A | ||||
| 12/15/2045 | 5.125% | 2,515,000 | 2,297,041 | |
| Series 2018A | ||||
| 12/15/2048 | 5.000% | 1,500,000 | 1,321,174 | |
| Total | 5,640,396 | |||
| New Hampshire 0.7% | ||||
| New Hampshire Business Finance Authority(d) | ||||
| Revenue Bonds | ||||
| The Vista Project | ||||
| Series 2019A | ||||
| 07/01/2054 | 5.750% | 3,750,000 | 3,326,509 | |
| New Hampshire Health and Education Facilities Authority Act(e) | ||||
| Revenue Bonds | ||||
| Hillside Village | ||||
| Series 2017A | ||||
| 07/01/2052 | 0.000% | 2,086,967 | 459,133 | |
| Total | 3,785,642 | |||
| New Jersey 1.6% | ||||
| Camden County Improvement Authority (The) | ||||
| Revenue Bonds | ||||
| Social Bonds - Cooper Norcross Academy | ||||
| Series 2022 | ||||
| 06/15/2062 | 6.000% | 1,000,000 | 1,049,405 | |
| City of Newark Mass Transit Access Tax | ||||
| Revenue Bonds | ||||
| Mulberry Pedestrian Bridge Redevelopment Project | ||||
| Series 2022 (AGM) | ||||
| 11/15/2062 | 6.000% | 1,000,000 | 1,146,884 | |
| Middlesex County Improvement Authority(e) | ||||
| Revenue Bonds | ||||
| Heldrich Center Hotel | ||||
| Series 2005C | ||||
| 01/01/2037 | 0.000% | 1,250,000 | 12 | |
| New Jersey Economic Development Authority | ||||
| Prerefunded 06/15/25 Revenue Bonds | ||||
| Series 2015WW | ||||
| 06/15/2040 | 5.250% | 350,000 | 364,570 | |
| 14 | Columbia High Yield Municipal Fund | Annual Report 2023 |
May 31, 2023
| Municipal Bonds (continued) | ||||
| Issue Description | Coupon Rate | Principal Amount ($) | Value ($) | |
| New Jersey Economic Development Authority(f) | ||||
| Revenue Bonds | ||||
| UMM Energy Partners LLC | ||||
| Series 2012A | ||||
| 06/15/2043 | 5.125% | 2,000,000 | 2,000,126 | |
| Passaic County Improvement Authority (The) | ||||
| Revenue Bonds | ||||
| Paterson Arts and Science Charter School Project | ||||
| Series 2023 | ||||
| 07/01/2053 | 5.375% | 1,000,000 | 1,004,254 | |
| 07/01/2058 | 5.500% | 1,000,000 | 1,005,855 | |
| South Jersey Port Corp.(f) | ||||
| Revenue Bonds | ||||
| Marine Terminal | ||||
| Subordinated Series 2017B | ||||
| 01/01/2048 | 5.000% | 600,000 | 602,636 | |
| Tobacco Settlement Financing Corp. | ||||
| Refunding Revenue Bonds | ||||
| Subordinated Series 2018B | ||||
| 06/01/2046 | 5.000% | 1,025,000 | 1,029,493 | |
| Total | 8,203,235 | |||
| New York 7.2% | ||||
| Build NYC Resource Corp. | ||||
| Revenue Bonds | ||||
| International Leadership Charter School | ||||
| Series 2013 | ||||
| 07/01/2043 | 6.000% | 4,330,000 | 4,329,583 | |
| Build NYC Resource Corp.(d) | ||||
| Revenue Bonds | ||||
| International Leadership Charter School | ||||
| Series 2016 | ||||
| 07/01/2046 | 6.250% | 715,000 | 716,140 | |
| Social Bonds - East Harlem Scholars Academy Charter School Project | ||||
| Series 2022 | ||||
| 06/01/2062 | 5.750% | 500,000 | 501,997 | |
| Glen Cove Local Economic Assistance Corp.(h) | ||||
| Revenue Bonds | ||||
| Garvies Point | ||||
| Series 2016 CABS | ||||
| 01/01/2055 | 0.000% | 2,500,000 | 2,156,677 | |
| Huntington Local Development Corp. | ||||
| Revenue Bonds | ||||
| Fountaingate Garden Project | ||||
| Series 2021A | ||||
| 07/01/2056 | 5.250% | 1,500,000 | 1,128,283 | |
| Jefferson County Industrial Development Agency(d),(e),(f) | ||||
| Revenue Bonds | ||||
| ReEnergy Black River LLC P | ||||
| Series 2019 | ||||
| 01/01/2024 | 0.000% | 1,620,000 | 648,000 | |
| Municipal Bonds (continued) | ||||
| Issue Description | Coupon Rate | Principal Amount ($) | Value ($) | |
| Metropolitan Transportation Authority | ||||
| Revenue Bonds | ||||
| Green Bonds | ||||
| Series 2020C-1 | ||||
| 11/15/2055 | 5.250% | 4,000,000 | 4,126,180 | |
| Nassau County Tobacco Settlement Corp.(c) | ||||
| Asset-Backed Revenue Bonds | ||||
| Capital Appreciation | ||||
| Third Series 2006D | ||||
| 06/01/2060 | 0.000% | 25,000,000 | 1,379,425 | |
| New York City Municipal Water Finance Authority | ||||
| Revenue Bonds | ||||
| Series 2022AA-1 | ||||
| 06/15/2052 | 5.250% | 5,000,000 | 5,555,894 | |
| New York State Dormitory Authority(g) | ||||
| Revenue Bonds | ||||
| Financing Program | ||||
| Series 2023 (AGM) | ||||
| 10/01/2035 | 5.000% | 4,350,000 | 4,893,152 | |
| New York State Thruway Authority | ||||
| Refunding Revenue Bonds | ||||
| Personal Income Tax - Bidding Group | ||||
| Series 2022A | ||||
| 03/15/2050 | 4.000% | 3,000,000 | 2,910,377 | |
| New York Transportation Development Corp.(f) | ||||
| Refunding Revenue Bonds | ||||
| John F. Kennedy International Airport Project | ||||
| Series 2020 | ||||
| 08/01/2036 | 5.375% | 1,250,000 | 1,259,876 | |
| Revenue Bonds | ||||
| Delta Air Lines, Inc. LaGuardia | ||||
| Series 2020 | ||||
| 10/01/2040 | 5.000% | 2,500,000 | 2,528,413 | |
| 10/01/2045 | 4.375% | 2,500,000 | 2,361,801 | |
| Westchester County Local Development Corp.(d) | ||||
| Revenue Bonds | ||||
| Purchase Senior Learning Community | ||||
| Series 2021 | ||||
| 07/01/2056 | 5.000% | 4,000,000 | 2,970,236 | |
| Total | 37,466,034 | |||
| North Carolina 0.8% | ||||
| North Carolina Medical Care Commission | ||||
| Refunding Revenue Bonds | ||||
| Sharon Towers | ||||
| Series 2019 | ||||
| 07/01/2049 | 5.000% | 1,000,000 | 841,248 | |
| Revenue Bonds | ||||
| Lutheran Services for the Aging | ||||
| Series 2021 | ||||
| 03/01/2051 | 4.000% | 1,500,000 | 1,026,541 | |
| Columbia High Yield Municipal Fund | Annual Report 2023 | 15 |
May 31, 2023
| Municipal Bonds (continued) | ||||
| Issue Description | Coupon Rate | Principal Amount ($) | Value ($) | |
| North Carolina Turnpike Authority(c) | ||||
| Revenue Bonds | ||||
| Triangle Expressway System Appropriation | ||||
| Series 2019 | ||||
| 01/01/2049 | 0.000% | 2,500,000 | 744,911 | |
| North Carolina Turnpike Authority | ||||
| Revenue Bonds | ||||
| Triangle Expressway System Senior Lien Turnpike | ||||
| Series 2019 | ||||
| 01/01/2055 | 4.000% | 1,400,000 | 1,263,181 | |
| Total | 3,875,881 | |||
| Ohio 3.0% | ||||
| Buckeye Tobacco Settlement Financing Authority | ||||
| Refunding Senior Revenue Bonds | ||||
| Series 2020B-2 | ||||
| 06/01/2055 | 5.000% | 11,370,000 | 10,518,318 | |
| County of Marion | ||||
| Refunding Revenue Bonds | ||||
| United Church Homes, Inc. | ||||
| Series 2019 | ||||
| 12/01/2049 | 5.125% | 1,875,000 | 1,569,789 | |
| Hickory Chase Community Authority(d) | ||||
| Refunding Revenue Bonds | ||||
| Hickory Chase Project | ||||
| Series 2019 | ||||
| 12/01/2040 | 5.000% | 1,360,000 | 1,209,291 | |
| Lake County Port & Economic Development Authority(d),(e) | ||||
| Revenue Bonds | ||||
| 1st Mortgage - Tapestry Wickliffe LLC | ||||
| Series 2017 | ||||
| 12/01/2052 | 0.000% | 5,600,000 | 1,624,000 | |
| Ohio Air Quality Development Authority(f) | ||||
| Revenue Bonds | ||||
| Ohio Valley Electric Crop. | ||||
| Series 2019 (Mandatory Put 10/01/29) | ||||
| 06/01/2041 | 2.600% | 500,000 | 433,914 | |
| Ohio Air Quality Development Authority(d),(f) | ||||
| Revenue Bonds | ||||
| Pratt Paper LLC Project | ||||
| Series 2017 | ||||
| 01/15/2048 | 4.500% | 500,000 | 461,470 | |
| Total | 15,816,782 | |||
| Oregon 0.8% | ||||
| Clackamas County Hospital Facility Authority | ||||
| Revenue Bonds | ||||
| Mary’s Woods at Marylhurst, Inc. | ||||
| Series 2018 | ||||
| 05/15/2052 | 5.000% | 1,000,000 | 808,718 | |
| Municipal Bonds (continued) | ||||
| Issue Description | Coupon Rate | Principal Amount ($) | Value ($) | |
| Hospital Facilities Authority of Multnomah County | ||||
| Refunding Revenue Bonds | ||||
| Mirabella at South Waterfront | ||||
| Series 2014A | ||||
| 10/01/2049 | 5.500% | 3,115,000 | 2,685,987 | |
| State of Oregon Housing & Community Services Department | ||||
| Revenue Bonds | ||||
| Single Family Mortgage Program | ||||
| Series 2018C | ||||
| 07/01/2043 | 3.950% | 775,000 | 749,254 | |
| Total | 4,243,959 | |||
| Pennsylvania 3.8% | ||||
| Allentown Neighborhood Improvement Zone Development Authority(d) | ||||
| Revenue Bonds | ||||
| City Center Project | ||||
| Subordinated Series 2022 | ||||
| 05/01/2042 | 5.250% | 3,000,000 | 2,943,453 | |
| Commonwealth Financing Authority | ||||
| Revenue Bonds | ||||
| Tobacco Master Settlement Payment | ||||
| Series 2018 (AGM) | ||||
| 06/01/2039 | 4.000% | 1,365,000 | 1,312,462 | |
| Commonwealth of Pennsylvania | ||||
| Refunding Certificate of Participation | ||||
| Series 2018A | ||||
| 07/01/2046 | 4.000% | 2,500,000 | 2,306,040 | |
| Dauphin County Industrial Development Authority(f) | ||||
| Revenue Bonds | ||||
| Dauphin Consolidated Water Supply | ||||
| Series 1992A | ||||
| 06/01/2024 | 6.900% | 3,200,000 | 3,296,206 | |
| Franklin County Industrial Development Authority | ||||
| Refunding Revenue Bonds | ||||
| Menno-Haven, Inc. Project | ||||
| Series 2018 | ||||
| 12/01/2053 | 5.000% | 1,900,000 | 1,442,904 | |
| Montgomery County Industrial Development Authority | ||||
| Refunding Revenue Bonds | ||||
| Meadowood Senior Living Project | ||||
| Series 2018 | ||||
| 12/01/2048 | 5.000% | 1,000,000 | 919,060 | |
| Northampton County Industrial Development Authority | ||||
| Refunding Revenue Bonds | ||||
| Morningstar Senior Living, Inc. Project | ||||
| Series 2019 | ||||
| 11/01/2049 | 5.000% | 1,600,000 | 1,323,233 | |
| Pennsylvania Economic Development Financing Authority(d),(e) | ||||
| Refunding Revenue Bonds | ||||
| Tapestry Moon Senior Housing Project | ||||
| Series 2018 | ||||
| 12/01/2053 | 0.000% | 2,750,000 | 1,048,438 | |
| 16 | Columbia High Yield Municipal Fund | Annual Report 2023 |
May 31, 2023
| Municipal Bonds (continued) | ||||
| Issue Description | Coupon Rate | Principal Amount ($) | Value ($) | |
| Pennsylvania Economic Development Financing Authority(f) | ||||
| Revenue Bonds | ||||
| The PennDOT Major Bridges Package One Project | ||||
| Series 2022 | ||||
| 06/30/2061 | 6.000% | 1,500,000 | 1,657,500 | |
| Philadelphia Authority for Industrial Development | ||||
| Revenue Bonds | ||||
| 1st Philadelphia Preparatory Charter School | ||||
| Series 2014 | ||||
| 06/15/2033 | 7.000% | 1,870,000 | 1,925,191 | |
| Scranton School District | ||||
| Limited General Obligation Refunding Bonds | ||||
| Series 2017D (NPFGC) | ||||
| 06/01/2037 | 4.250% | 1,750,000 | 1,759,202 | |
| Total | 19,933,689 | |||
| Puerto Rico 6.3% | ||||
| Commonwealth of Puerto Rico(c),(i) | ||||
| Revenue Notes | ||||
| Series 2022 | ||||
| 11/01/2051 | 0.000% | 3,001,691 | 1,448,316 | |
| Subordinated Series 2022 | ||||
| 11/01/2043 | 0.000% | 2,384,607 | 1,162,496 | |
| Unlimited General Obligation Bonds | ||||
| Series 2021A | ||||
| 07/01/2024 | 0.000% | 168,169 | 160,274 | |
| Commonwealth of Puerto Rico(i) | ||||
| Unlimited General Obligation Bonds | ||||
| Series 2021-A1 | ||||
| 07/01/2033 | 4.000% | 503,640 | 462,246 | |
| 07/01/2035 | 4.000% | 452,705 | 404,409 | |
| 07/01/2037 | 4.000% | 388,540 | 337,102 | |
| 07/01/2041 | 4.000% | 528,266 | 440,861 | |
| 07/01/2046 | 4.000% | 1,719,389 | 1,384,443 | |
| Puerto Rico Commonwealth Aqueduct & Sewer Authority(d),(i) | ||||
| Refunding Revenue Bonds | ||||
| Senior Lien | ||||
| Series 2020A | ||||
| 07/01/2047 | 5.000% | 3,500,000 | 3,357,947 | |
| Puerto Rico Electric Power Authority(e),(i) | ||||
| Revenue Bonds | ||||
| Series 2007TT | ||||
| 07/01/2037 | 0.000% | 2,000,000 | 1,430,000 | |
| Series 2010XX | ||||
| 07/01/2040 | 0.000% | 8,500,000 | 6,077,500 | |
| Puerto Rico Highway & Transportation Authority(c),(i) | ||||
| Revenue Bonds | ||||
| Series 2022B | ||||
| 07/01/2032 | 0.000% | 306,982 | 195,176 | |
| Series 2022C | ||||
| 07/01/2053 | 0.000% | 525,123 | 319,010 | |
| Municipal Bonds (continued) | ||||
| Issue Description | Coupon Rate | Principal Amount ($) | Value ($) | |
| Puerto Rico Sales Tax Financing Corp.(c),(i) | ||||
| Revenue Bonds | ||||
| Series 2018A-1 | ||||
| 07/01/2046 | 0.000% | 44,000,000 | 11,835,947 | |
| Puerto Rico Sales Tax Financing Corp.(i) | ||||
| Revenue Bonds | ||||
| Series 2019A1 | ||||
| 07/01/2058 | 5.000% | 4,000,000 | 3,821,790 | |
| Total | 32,837,517 | |||
| South Carolina 2.2% | ||||
| South Carolina Jobs-Economic Development Authority | ||||
| Prerefunded 11/01/24 Revenue Bonds | ||||
| York Preparatory Academy Project | ||||
| Series 2014A | ||||
| 11/01/2045 | 7.250% | 4,000,000 | 4,192,886 | |
| Revenue Bonds | ||||
| Lutheran Homes of South Carolina, Inc. Obligation Group | ||||
| Series 2013 | ||||
| 05/01/2043 | 5.000% | 750,000 | 602,454 | |
| 05/01/2048 | 5.125% | 1,500,000 | 1,182,262 | |
| South Carolina Public Service Authority | ||||
| Revenue Bonds | ||||
| Series 2022A | ||||
| 12/01/2052 | 4.000% | 6,000,000 | 5,427,211 | |
| Total | 11,404,813 | |||
| Tennessee 0.5% | ||||
| Shelby County Health Educational & Housing Facilities Board | ||||
| Revenue Bonds | ||||
| The Farms at Bailey Station Project | ||||
| Series 2019 | ||||
| 10/01/2059 | 5.750% | 3,750,000 | 2,683,062 | |
| Texas 7.4% | ||||
| Angelina & Neches River Authority(d),(f) | ||||
| Revenue Bonds | ||||
| Jefferson Enterprise Energy LLC Project | ||||
| Series 2021 | ||||
| 12/01/2045 | 7.500% | 2,250,000 | 1,460,647 | |
| Arlington Higher Education Finance Corp. | ||||
| Refunding Revenue Bonds | ||||
| Legacy Traditional Schools | ||||
| Series 2021 | ||||
| 02/15/2056 | 4.500% | 2,330,000 | 1,612,002 | |
| Revenue Bonds | ||||
| Brooks Academies of Texas | ||||
| Series 2021 | ||||
| 01/15/2051 | 5.000% | 2,625,000 | 2,196,451 | |
| Columbia High Yield Municipal Fund | Annual Report 2023 | 17 |
May 31, 2023
| Municipal Bonds (continued) | ||||
| Issue Description | Coupon Rate | Principal Amount ($) | Value ($) | |
| Arlington Higher Education Finance Corp.(d) | ||||
| Revenue Bonds | ||||
| Magellan International School | ||||
| Series 2022 | ||||
| 06/01/2062 | 6.375% | 1,750,000 | 1,767,273 | |
| City of Houston Airport System(f) | ||||
| Refunding Revenue Bonds | ||||
| United Airlines, Inc. Airport Improvement Projects | ||||
| Series 2020 | ||||
| 07/15/2027 | 5.000% | 2,350,000 | 2,368,748 | |
| Revenue Bonds | ||||
| United Airlines, Inc. Terminal Improvement Projects | ||||
| Series 2021 | ||||
| 07/15/2041 | 4.000% | 2,850,000 | 2,478,790 | |
| Clifton Higher Education Finance Corp. | ||||
| Revenue Bonds | ||||
| International Leadership of Texas | ||||
| Series 2015 | ||||
| 08/15/2045 | 5.750% | 3,500,000 | 3,414,002 | |
| New Hope Cultural Education Facilities Finance Corp.(e) | ||||
| Revenue Bonds | ||||
| Bridgemoor Plano Project | ||||
| Series 2018 | ||||
| 12/01/2053 | 0.000% | 3,500,000 | 3,150,000 | |
| Cardinal Bay, Inc. - Village on the Park/Carriage Inn Project | ||||
| Series 2016 | ||||
| 07/01/2046 | 0.000% | 1,630,000 | 815,000 | |
| Series 2016A-1 | ||||
| 07/01/2046 | 0.000% | 950,000 | 650,750 | |
| New Hope Cultural Education Facilities Finance Corp.(d) | ||||
| Revenue Bonds | ||||
| Cumberland Academy Project | ||||
| Series 2020A | ||||
| 08/15/2050 | 5.000% | 1,000,000 | 854,752 | |
| New Hope Cultural Education Facilities Finance Corp. | ||||
| Revenue Bonds | ||||
| NCCD-College Station Properties LLC | ||||
| Series 2015 | ||||
| 07/01/2035 | 5.000% | 1,000,000 | 905,000 | |
| Series 2015A | ||||
| 07/01/2047 | 5.000% | 1,000,000 | 905,000 | |
| Westminster Project | ||||
| Series 2021 | ||||
| 11/01/2055 | 4.000% | 500,000 | 372,034 | |
| Port Beaumont Navigation District(d),(f) | ||||
| Refunding Revenue Bonds | ||||
| Jefferson Gulf Coast Energy Project | ||||
| Series 2020A | ||||
| 01/01/2050 | 4.000% | 2,000,000 | 1,408,173 | |
| Municipal Bonds (continued) | ||||
| Issue Description | Coupon Rate | Principal Amount ($) | Value ($) | |
| Revenue Bonds | ||||
| Jefferson Gulf Coast Energy Project | ||||
| Series 2021 | ||||
| 01/01/2050 | 3.000% | 1,750,000 | 1,008,024 | |
| Pottsboro Higher Education Finance Corp. | ||||
| Revenue Bonds | ||||
| Series 2016A | ||||
| 08/15/2046 | 5.000% | 1,000,000 | 902,120 | |
| Red River Health Facilities Development Corp. | ||||
| Prerefunded 11/15/24 Revenue Bonds | ||||
| MRC Crossings Project | ||||
| Series 2014A | ||||
| 11/15/2049 | 8.000% | 2,000,000 | 2,124,763 | |
| Sanger Industrial Development Corp.(d),(e),(f) | ||||
| Revenue Bonds | ||||
| Texas Pellets Project | ||||
| Series 2012B | ||||
| 07/01/2038 | 0.000% | 4,950,000 | 1,237,500 | |
| Tarrant County Cultural Education Facilities Finance Corp.(e) | ||||
| Revenue Bonds | ||||
| CC Young Memorial Home | ||||
| Series 2009A | ||||
| 02/15/2038 | 0.000% | 3,000,000 | 1,650,000 | |
| Texas Private Activity Bond Surface Transportation Corp.(f) | ||||
| Revenue Bonds | ||||
| Segment 3C Project | ||||
| Series 2019 | ||||
| 06/30/2058 | 5.000% | 2,300,000 | 2,262,515 | |
| Senior Lien - Blueridge Transportation Group LLC | ||||
| Series 2016 | ||||
| 12/31/2040 | 5.000% | 1,250,000 | 1,253,116 | |
| 12/31/2055 | 5.000% | 3,515,000 | 3,394,967 | |
| Texas Transportation Commission | ||||
| Revenue Bonds | ||||
| State Highway 249 System Toll | ||||
| Series 2019 | ||||
| 08/01/2057 | 5.000% | 500,000 | 500,727 | |
| Total | 38,692,354 | |||
| Utah 2.5% | ||||
| Black Desert Public Infrastructure District(d) | ||||
| Limited General Obligation Bonds | ||||
| Senior Bonds | ||||
| Series 2021A | ||||
| 03/01/2051 | 4.000% | 3,000,000 | 2,242,623 | |
| Downtown East Streetcar Sewer Public Infrastructure District(d) | ||||
| Limited General Obligation Bonds | ||||
| Series 2022A | ||||
| 03/01/2053 | 6.000% | 2,000,000 | 1,977,880 | |
| 18 | Columbia High Yield Municipal Fund | Annual Report 2023 |
May 31, 2023
| Municipal Bonds (continued) | ||||
| Issue Description | Coupon Rate | Principal Amount ($) | Value ($) | |
| Mida Golf and Equestrian Center Public Infrastructure District(d) | ||||
| Limited General Obligation Bonds | ||||
| Series 2021 | ||||
| 06/01/2057 | 4.625% | 3,000,000 | 2,249,225 | |
| Red Bridge Public Infrastructure District No. 1(d) | ||||
| Limited General Obligation Bonds | ||||
| Series 2021-1A | ||||
| 02/01/2041 | 4.125% | 500,000 | 386,840 | |
| 02/01/2051 | 4.375% | 1,100,000 | 817,341 | |
| Subordinated Series 2021B | ||||
| 08/15/2051 | 7.375% | 600,000 | 482,636 | |
| UIPA Crossroads Public Infrastructure District(d) | ||||
| Tax Allocation Bonds | ||||
| Series 2021 | ||||
| 06/01/2052 | 4.375% | 3,000,000 | 2,544,646 | |
| Utah Charter School Finance Authority(d) | ||||
| Revenue Bonds | ||||
| Ascent Academies Charter Schools | ||||
| Series 2022 | ||||
| 06/15/2057 | 5.000% | 3,000,000 | 2,345,776 | |
| Total | 13,046,967 | |||
| Virginia 2.6% | ||||
| City of Chesapeake Expressway Toll Road(h) | ||||
| Refunding Revenue Bonds | ||||
| Transportation System | ||||
| Series 2012 | ||||
| 07/15/2040 | 0.000% | 7,530,000 | 7,640,374 | |
| Hanover County Economic Development Authority | ||||
| Refunding Revenue Bonds | ||||
| Covenant Woods | ||||
| Series 2018 | ||||
| 07/01/2051 | 5.000% | 1,200,000 | 1,042,340 | |
| Tobacco Settlement Financing Corp. | ||||
| Revenue Bonds | ||||
| Senior Series 2007B-1 | ||||
| 06/01/2047 | 5.000% | 5,000,000 | 4,643,947 | |
| Total | 13,326,661 | |||
| Washington 2.3% | ||||
| King County Housing Authority | ||||
| Refunding Revenue Bonds | ||||
| Series 2018 | ||||
| 05/01/2038 | 3.750% | 3,295,000 | 3,079,907 | |
| King County Public Hospital District No. 4 | ||||
| Revenue Bonds | ||||
| Series 2015A | ||||
| 12/01/2035 | 6.000% | 1,250,000 | 1,279,904 | |
| 12/01/2045 | 6.250% | 2,500,000 | 2,557,307 | |
| Municipal Bonds (continued) | ||||
| Issue Description | Coupon Rate | Principal Amount ($) | Value ($) | |
| Tacoma Consolidated Local Improvement Districts | ||||
| Special Assessment Bonds | ||||
| No. 65 | ||||
| Series 2013 | ||||
| 04/01/2043 | 5.750% | 1,140,000 | 1,089,529 | |
| Washington State Housing Finance Commission(d) | ||||
| Prerefunded 07/01/25 Revenue Bonds | ||||
| Heron’s Key | ||||
| Series 2015A | ||||
| 07/01/2050 | 7.000% | 3,000,000 | 3,191,993 | |
| Revenue Bonds | ||||
| Transforming Age Projects | ||||
| Series 2019A | ||||
| 01/01/2055 | 5.000% | 1,000,000 | 706,464 | |
| Total | 11,905,104 | |||
| Wisconsin 4.5% | ||||
| Public Finance Authority | ||||
| Refunding Revenue Bonds | ||||
| Friends Homes | ||||
| Series 2019 | ||||
| 09/01/2054 | 5.000% | 2,665,000 | 2,235,066 | |
| WakeMed Hospital | ||||
| Series 2019A | ||||
| 10/01/2049 | 4.000% | 4,310,000 | 3,935,997 | |
| Public Finance Authority(d) | ||||
| Refunding Revenue Bonds | ||||
| Mary’s Woods at Marylhurst, Inc. | ||||
| Series 2017 | ||||
| 05/15/2052 | 5.250% | 2,300,000 | 1,961,340 | |
| Revenue Bonds | ||||
| Wonderful Foundations Charter School Portfolio Projects | ||||
| Series 2020 | ||||
| 01/01/2055 | 5.000% | 2,500,000 | 1,843,303 | |
| Public Finance Authority(f) | ||||
| Revenue Bonds | ||||
| Sky Harbour Capital LLC Aviation Facilities Project | ||||
| Series 2021 | ||||
| 07/01/2054 | 4.250% | 5,000,000 | 3,578,541 | |
| Wisconsin Center District(c) | ||||
| Revenue Bonds | ||||
| Junior Dedicated | ||||
| Series 2020D (AGM) | ||||
| 12/15/2060 | 0.000% | 18,000,000 | 2,670,212 | |
| Wisconsin Health & Educational Facilities Authority | ||||
| Refunding Revenue Bonds | ||||
| Cedar Crest, Inc. Project | ||||
| Series 2022 | ||||
| 04/01/2057 | 5.125% | 3,000,000 | 2,182,006 | |
| St. Camillus Health System, Inc. | ||||
| Series 2019 | ||||
| 11/01/2054 | 5.000% | 3,000,000 | 2,290,372 | |
| Columbia High Yield Municipal Fund | Annual Report 2023 | 19 |
May 31, 2023
| Municipal Bonds (continued) | ||||
| Issue Description | Coupon Rate | Principal Amount ($) | Value ($) | |
| Revenue Bonds | ||||
| PHW Muskego, Inc. Project | ||||
| Series 2021 | ||||
| 10/01/2061 | 4.000% | 4,000,000 | 2,637,867 | |
| Total | 23,334,704 | |||
| Total Municipal Bonds (Cost $603,589,266) | 509,450,253 | |||
| Money Market Funds 0.2% | ||
| Shares | Value ($) | |
| Dreyfus Tax Exempt Cash Management Fund, Institutional Shares, 3.259%(j) | 107,412 | 107,402 |
| JPMorgan Institutional Tax Free Money Market Fund, Institutional Shares, 3.207%(j) | 1,019,818 | 1,019,818 |
| Total Money Market Funds (Cost $1,127,230) | 1,127,220 | |
| Total Investments in Securities (Cost $611,216,496) | 517,077,473 | |
| Other Assets & Liabilities, Net | 2,928,240 | |
| Net Assets | $520,005,713 | |
| (a) | The Fund is entitled to receive principal and interest from the guarantor after a day or a week’s notice or upon maturity. The maturity date disclosed represents the final maturity. |
| (b) | Represents a variable rate security where the coupon rate adjusts on specified dates (generally daily or weekly) using the prevailing money market rate. The interest rate shown was the current rate as of May 31, 2023. |
| (c) | Zero coupon bond. |
| (d) | Represents privately placed and other securities and instruments exempt from Securities and Exchange Commission registration (collectively, private placements), such as Section 4(a)(2) and Rule 144A eligible securities, which are often sold only to qualified institutional buyers. At May 31, 2023, the total value of these securities amounted to $129,156,469, which represents 24.84% of total net assets. |
| (e) | Represents a security in default. |
| (f) | Income from this security may be subject to alternative minimum tax. |
| (g) | Represents a security purchased on a when-issued basis. |
| (h) | Represents a variable rate security with a step coupon where the rate adjusts according to a schedule for a series of periods, typically lower for an initial period and then increasing to a higher coupon rate thereafter. The interest rate shown was the current rate as of May 31, 2023. |
| (i) | Municipal obligations include debt obligations issued by or on behalf of territories, possessions, or sovereign nations within the territorial boundaries of the United States. At May 31, 2023, the total value of these securities amounted to $32,837,517, which represents 6.31% of total net assets. |
| (j) | The rate shown is the seven-day current annualized yield at May 31, 2023. |
| AGM | Assured Guaranty Municipal Corporation |
| BAN | Bond Anticipation Note |
| NPFGC | National Public Finance Guarantee Corporation |
| 20 | Columbia High Yield Municipal Fund | Annual Report 2023 |
May 31, 2023
pricing an investment. An investment’s level within the fair value hierarchy is based on the lowest level of any input that is deemed significant to the asset’s or liability’s fair value measurement. The input levels are not necessarily an indication of the risk or liquidity associated with investments at that level. For example, certain U.S. government securities are generally high quality and liquid, however, they are reflected as Level 2 because the inputs used to determine fair value may not always be quoted prices in an active market.
| ■ | Level 1 — Valuations based on quoted prices for investments in active markets that the Fund has the ability to access at the measurement date. Valuation adjustments are not applied to Level 1 investments. |
| ■ | Level 2 — Valuations based on other significant observable inputs (including quoted prices for similar securities, interest rates, prepayment speeds, credit risks, etc.). |
| ■ | Level 3 — Valuations based on significant unobservable inputs (including the Fund’s own assumptions and judgment in determining the fair value of investments). |
| Level 1 ($) | Level 2 ($) | Level 3 ($) | Total ($) | |
| Investments in Securities | ||||
| Floating Rate Notes | — | 6,500,000 | — | 6,500,000 |
| Municipal Bonds | — | 509,450,253 | — | 509,450,253 |
| Money Market Funds | 1,127,220 | — | — | 1,127,220 |
| Total Investments in Securities | 1,127,220 | 515,950,253 | — | 517,077,473 |
| Columbia High Yield Municipal Fund | Annual Report 2023 | 21 |
May 31, 2023
| Assets | |
| Investments in securities, at value | |
| Unaffiliated issuers (cost $611,216,496) | $517,077,473 |
| Cash | 17,557 |
| Receivable for: | |
| Investments sold | 1,335,195 |
| Capital shares sold | 1,582,128 |
| Dividends | 3,855 |
| Interest | 8,971,272 |
| Expense reimbursement due from Investment Manager | 839 |
| Prepaid expenses | 4,606 |
| Trustees’ deferred compensation plan | 145,740 |
| Total assets | 529,138,665 |
| Liabilities | |
| Payable for: | |
| Investments purchased on a delayed delivery basis | 6,075,396 |
| Capital shares purchased | 875,669 |
| Distributions to shareholders | 1,945,773 |
| Management services fees | 7,650 |
| Distribution and/or service fees | 1,341 |
| Transfer agent fees | 28,438 |
| Compensation of board members | 20,964 |
| Other expenses | 31,981 |
| Trustees’ deferred compensation plan | 145,740 |
| Total liabilities | 9,132,952 |
| Net assets applicable to outstanding capital stock | $520,005,713 |
| Represented by | |
| Paid in capital | 636,744,148 |
| Total distributable earnings (loss) | (116,738,435) |
| Total - representing net assets applicable to outstanding capital stock | $520,005,713 |
| Class A | |
| Net assets | $153,077,390 |
| Shares outstanding | 17,421,592 |
| Net asset value per share | $8.79 |
| Maximum sales charge | 3.00% |
| Maximum offering price per share (calculated by dividing the net asset value per share by 1.0 minus the maximum sales charge for Class A shares) | $9.06 |
| Advisor Class | |
| Net assets | $9,940,145 |
| Shares outstanding | 1,130,024 |
| Net asset value per share | $8.80 |
| Class C | |
| Net assets | $23,140,852 |
| Shares outstanding | 2,633,736 |
| Net asset value per share | $8.79 |
| Institutional Class | |
| Net assets | $213,810,360 |
| Shares outstanding | 24,333,327 |
| Net asset value per share | $8.79 |
| Institutional 2 Class | |
| Net assets | $13,181,139 |
| Shares outstanding | 1,501,204 |
| Net asset value per share | $8.78 |
| Institutional 3 Class | |
| Net assets | $106,855,827 |
| Shares outstanding | 12,129,939 |
| Net asset value per share | $8.81 |
| 22 | Columbia High Yield Municipal Fund | Annual Report 2023 |
Year Ended May 31, 2023
| Net investment income | |
| Income: | |
| Dividends — unaffiliated issuers | $60,751 |
| Interest | 28,462,475 |
| Total income | 28,523,226 |
| Expenses: | |
| Management services fees | 3,031,229 |
| Distribution and/or service fees | |
| Class A | 306,460 |
| Class C | 210,297 |
| Transfer agent fees | |
| Class A | 122,235 |
| Advisor Class | 6,248 |
| Class C | 20,999 |
| Institutional Class | 213,083 |
| Institutional 2 Class | 8,201 |
| Institutional 3 Class | 6,076 |
| Compensation of board members | 24,650 |
| Custodian fees | 13,160 |
| Printing and postage fees | 30,114 |
| Registration fees | 131,475 |
| Accounting services fees | 40,290 |
| Legal fees | 19,881 |
| Interest on interfund lending | 5,255 |
| Compensation of chief compliance officer | 104 |
| Other | 19,162 |
| Total expenses | 4,208,919 |
| Fees waived or expenses reimbursed by Investment Manager and its affiliates | (233,788) |
| Expense reduction | (380) |
| Total net expenses | 3,974,751 |
| Net investment income | 24,548,475 |
| Realized and unrealized gain (loss) — net | |
| Net realized gain (loss) on: | |
| Investments — unaffiliated issuers | (15,919,186) |
| Futures contracts | 770,304 |
| Net realized loss | (15,148,882) |
| Net change in unrealized appreciation (depreciation) on: | |
| Investments — unaffiliated issuers | (46,871,128) |
| Futures contracts | (109,862) |
| Net change in unrealized appreciation (depreciation) | (46,980,990) |
| Net realized and unrealized loss | (62,129,872) |
| Net decrease in net assets resulting from operations | $(37,581,397) |
| Columbia High Yield Municipal Fund | Annual Report 2023 | 23 |
| Year Ended May 31, 2023 | Year Ended May 31, 2022 | |
| Operations | ||
| Net investment income | $24,548,475 | $26,631,909 |
| Net realized gain (loss) | (15,148,882) | 2,829,869 |
| Net change in unrealized appreciation (depreciation) | (46,980,990) | (95,286,627) |
| Net decrease in net assets resulting from operations | (37,581,397) | (65,824,849) |
| Distributions to shareholders | ||
| Net investment income and net realized gains | ||
| Class A | (7,014,650) | (6,545,320) |
| Advisor Class | (381,292) | (419,048) |
| Class C | (1,042,844) | (1,074,895) |
| Institutional Class | (12,239,802) | (18,387,335) |
| Institutional 2 Class | (687,255) | (1,078,421) |
| Institutional 3 Class | (4,940,646) | (116,993) |
| Total distributions to shareholders | (26,306,489) | (27,622,012) |
| Decrease in net assets from capital stock activity | (78,948,564) | (5,620,316) |
| Total decrease in net assets | (142,836,450) | (99,067,177) |
| Net assets at beginning of year | 662,842,163 | 761,909,340 |
| Net assets at end of year | $520,005,713 | $662,842,163 |
| 24 | Columbia High Yield Municipal Fund | Annual Report 2023 |
| Year Ended | Year Ended | |||
| May 31, 2023 | May 31, 2022 | |||
| Shares | Dollars ($) | Shares | Dollars ($) | |
| Capital stock activity | ||||
| Class A | ||||
| Subscriptions | 6,901,356 | 62,359,193 | 6,216,597 | 65,029,652 |
| Distributions reinvested | 706,433 | 6,313,691 | 530,683 | 5,630,466 |
| Redemptions | (7,734,760) | (69,392,489) | (5,688,814) | (58,747,218) |
| Net increase (decrease) | (126,971) | (719,605) | 1,058,466 | 11,912,900 |
| Advisor Class | ||||
| Subscriptions | 821,373 | 7,389,976 | 898,273 | 9,787,737 |
| Distributions reinvested | 42,679 | 381,259 | 38,944 | 419,016 |
| Redemptions | (382,996) | (3,398,709) | (1,413,842) | (15,196,417) |
| Net increase (decrease) | 481,056 | 4,372,526 | (476,625) | (4,989,664) |
| Class C | ||||
| Subscriptions | 569,581 | 5,147,785 | 579,322 | 6,155,222 |
| Distributions reinvested | 110,632 | 989,485 | 97,650 | 1,036,790 |
| Redemptions | (1,267,986) | (11,390,788) | (961,237) | (10,125,881) |
| Net decrease | (587,773) | (5,253,518) | (284,265) | (2,933,869) |
| Institutional Class | ||||
| Subscriptions | 12,240,748 | 111,073,979 | 11,383,196 | 119,964,905 |
| Distributions reinvested | 1,045,705 | 9,353,688 | 880,460 | 9,357,049 |
| Redemptions | (33,723,133) | (312,031,967) | (12,574,266) | (131,029,954) |
| Net decrease | (20,436,680) | (191,604,300) | (310,610) | (1,708,000) |
| Institutional 2 Class | ||||
| Subscriptions | 919,365 | 8,379,478 | 2,156,284 | 23,347,547 |
| Distributions reinvested | 76,900 | 686,953 | 100,582 | 1,077,861 |
| Redemptions | (1,100,176) | (9,846,622) | (3,171,988) | (33,446,833) |
| Net decrease | (103,911) | (780,191) | (915,122) | (9,021,425) |
| Institutional 3 Class | ||||
| Subscriptions | 20,403,975 | 191,717,950 | 215,594 | 2,197,273 |
| Distributions reinvested | 18,566 | 166,319 | 10,868 | 115,100 |
| Redemptions | (8,659,030) | (76,847,745) | (116,383) | (1,192,631) |
| Net increase | 11,763,511 | 115,036,524 | 110,079 | 1,119,742 |
| Total net decrease | (9,010,768) | (78,948,564) | (818,077) | (5,620,316) |
| Columbia High Yield Municipal Fund | Annual Report 2023 | 25 |
| Net asset value, beginning of period | Net investment income | Net realized and unrealized gain (loss) | Total from investment operations | Distributions from net investment income | Total distributions to shareholders | |
| Class A | ||||||
| Year Ended 5/31/2023 | $9.72 | 0.38 | (0.90) | (0.52) | (0.41) | (0.41) |
| Year Ended 5/31/2022 | $11.04 | 0.37 | (1.31) | (0.94) | (0.38) | (0.38) |
| Year Ended 5/31/2021 | $9.96 | 0.36 | 1.08 | 1.44 | (0.36) | (0.36) |
| Year Ended 5/31/2020 | $10.74 | 0.42 | (0.77) | (0.35) | (0.43) | (0.43) |
| Year Ended 5/31/2019 | $10.56 | 0.43 | 0.23 | 0.66 | (0.48) | (0.48) |
| Advisor Class | ||||||
| Year Ended 5/31/2023 | $9.74 | 0.40 | (0.91) | (0.51) | (0.43) | (0.43) |
| Year Ended 5/31/2022 | $11.05 | 0.38 | (1.29) | (0.91) | (0.40) | (0.40) |
| Year Ended 5/31/2021 | $9.97 | 0.38 | 1.08 | 1.46 | (0.38) | (0.38) |
| Year Ended 5/31/2020 | $10.76 | 0.44 | (0.78) | (0.34) | (0.45) | (0.45) |
| Year Ended 5/31/2019 | $10.57 | 0.46 | 0.23 | 0.69 | (0.50) | (0.50) |
| Class C | ||||||
| Year Ended 5/31/2023 | $9.72 | 0.33 | (0.90) | (0.57) | (0.36) | (0.36) |
| Year Ended 5/31/2022 | $11.04 | 0.30 | (1.30) | (1.00) | (0.32) | (0.32) |
| Year Ended 5/31/2021 | $9.96 | 0.30 | 1.07 | 1.37 | (0.29) | (0.29) |
| Year Ended 5/31/2020 | $10.74 | 0.35 | (0.77) | (0.42) | (0.36) | (0.36) |
| Year Ended 5/31/2019 | $10.56 | 0.37 | 0.22 | 0.59 | (0.41) | (0.41) |
| Institutional Class | ||||||
| Year Ended 5/31/2023 | $9.73 | 0.40 | (0.91) | (0.51) | (0.43) | (0.43) |
| Year Ended 5/31/2022 | $11.05 | 0.39 | (1.31) | (0.92) | (0.40) | (0.40) |
| Year Ended 5/31/2021 | $9.96 | 0.38 | 1.09 | 1.47 | (0.38) | (0.38) |
| Year Ended 5/31/2020 | $10.75 | 0.44 | (0.78) | (0.34) | (0.45) | (0.45) |
| Year Ended 5/31/2019 | $10.56 | 0.46 | 0.23 | 0.69 | (0.50) | (0.50) |
| Institutional 2 Class | ||||||
| Year Ended 5/31/2023 | $9.72 | 0.40 | (0.91) | (0.51) | (0.43) | (0.43) |
| Year Ended 5/31/2022 | $11.04 | 0.39 | (1.30) | (0.91) | (0.41) | (0.41) |
| Year Ended 5/31/2021 | $9.95 | 0.39 | 1.08 | 1.47 | (0.38) | (0.38) |
| Year Ended 5/31/2020 | $10.74 | 0.44 | (0.77) | (0.33) | (0.46) | (0.46) |
| Year Ended 5/31/2019 | $10.55 | 0.46 | 0.23 | 0.69 | (0.50) | (0.50) |
| 26 | Columbia High Yield Municipal Fund | Annual Report 2023 |
| Net asset value, end of period | Total return | Total gross expense ratio to average net assets(a) | Total net expense ratio to average net assets(a),(b) | Net investment income ratio to average net assets | Portfolio turnover | Net assets, end of period (000’s) | |
| Class A | |||||||
| Year Ended 5/31/2023 | $8.79 | (5.29%) | 0.87%(c) | 0.83%(c),(d) | 4.25% | 14% | $153,077 |
| Year Ended 5/31/2022 | $9.72 | (8.75%) | 0.86%(c) | 0.85%(c),(d) | 3.39% | 30% | $170,634 |
| Year Ended 5/31/2021 | $11.04 | 14.64% | 0.87%(e) | 0.85%(d),(e) | 3.41% | 22% | $182,125 |
| Year Ended 5/31/2020 | $9.96 | (3.41%) | 0.88%(c),(e) | 0.87%(c),(d),(e) | 3.98% | 46% | $164,388 |
| Year Ended 5/31/2019 | $10.74 | 6.42% | 0.88% | 0.85%(d) | 4.16% | 35% | $172,655 |
| Advisor Class | |||||||
| Year Ended 5/31/2023 | $8.80 | (5.19%) | 0.67%(c) | 0.63%(c),(d) | 4.47% | 14% | $9,940 |
| Year Ended 5/31/2022 | $9.74 | (8.47%) | 0.66%(c) | 0.65%(c),(d) | 3.46% | 30% | $6,318 |
| Year Ended 5/31/2021 | $11.05 | 14.86% | 0.68%(e) | 0.65%(d),(e) | 3.61% | 22% | $12,442 |
| Year Ended 5/31/2020 | $9.97 | (3.30%) | 0.68%(c),(e) | 0.67%(c),(d),(e) | 4.17% | 46% | $5,549 |
| Year Ended 5/31/2019 | $10.76 | 6.73% | 0.68% | 0.65%(d) | 4.35% | 35% | $5,318 |
| Class C | |||||||
| Year Ended 5/31/2023 | $8.79 | (5.86%) | 1.47%(c) | 1.43%(c),(d) | 3.65% | 14% | $23,141 |
| Year Ended 5/31/2022 | $9.72 | (9.30%) | 1.52%(c) | 1.45%(c),(d) | 2.77% | 30% | $31,324 |
| Year Ended 5/31/2021 | $11.04 | 13.94% | 1.62%(e) | 1.47%(d),(e),(f) | 2.80% | 22% | $38,720 |
| Year Ended 5/31/2020 | $9.96 | (4.04%) | 1.63%(c),(e) | 1.52%(c),(d),(e),(f) | 3.34% | 46% | $42,578 |
| Year Ended 5/31/2019 | $10.74 | 5.73% | 1.63% | 1.50%(d),(f) | 3.50% | 35% | $51,214 |
| Institutional Class | |||||||
| Year Ended 5/31/2023 | $8.79 | (5.20%) | 0.67%(c) | 0.63%(c),(d) | 4.41% | 14% | $213,810 |
| Year Ended 5/31/2022 | $9.73 | (8.56%) | 0.66%(c) | 0.65%(c),(d) | 3.58% | 30% | $435,400 |
| Year Ended 5/31/2021 | $11.05 | 14.97% | 0.67%(e) | 0.66%(d),(e) | 3.61% | 22% | $497,969 |
| Year Ended 5/31/2020 | $9.96 | (3.31%) | 0.68%(c),(e) | 0.67%(c),(d),(e) | 4.19% | 46% | $481,793 |
| Year Ended 5/31/2019 | $10.75 | 6.73% | 0.68% | 0.65%(d) | 4.35% | 35% | $548,850 |
| Institutional 2 Class | |||||||
| Year Ended 5/31/2023 | $8.78 | (5.19%) | 0.65%(c) | 0.61%(c) | 4.47% | 14% | $13,181 |
| Year Ended 5/31/2022 | $9.72 | (8.54%) | 0.63%(c) | 0.61%(c) | 3.54% | 30% | $15,596 |
| Year Ended 5/31/2021 | $11.04 | 15.03% | 0.64%(e) | 0.62%(e) | 3.64% | 22% | $27,815 |
| Year Ended 5/31/2020 | $9.95 | (3.28%) | 0.64%(c),(e) | 0.63%(c),(e) | 4.13% | 46% | $15,702 |
| Year Ended 5/31/2019 | $10.74 | 6.78% | 0.63% | 0.60% | 4.40% | 35% | $10,868 |
| Columbia High Yield Municipal Fund | Annual Report 2023 | 27 |
| Net asset value, beginning of period | Net investment income | Net realized and unrealized gain (loss) | Total from investment operations | Distributions from net investment income | Total distributions to shareholders | |
| Institutional 3 Class | ||||||
| Year Ended 5/31/2023 | $9.75 | 0.41 | (0.91) | (0.50) | (0.44) | (0.44) |
| Year Ended 5/31/2022 | $11.07 | 0.40 | (1.31) | (0.91) | (0.41) | (0.41) |
| Year Ended 5/31/2021 | $9.98 | 0.39 | 1.09 | 1.48 | (0.39) | (0.39) |
| Year Ended 5/31/2020 | $10.77 | 0.45 | (0.78) | (0.33) | (0.46) | (0.46) |
| Year Ended 5/31/2019 | $10.58 | 0.47 | 0.23 | 0.70 | (0.51) | (0.51) |
| Notes to Financial Highlights | |
| (a) | In addition to the fees and expenses that the Fund bears directly, the Fund indirectly bears a pro rata share of the fees and expenses of any other funds in which it invests. Such indirect expenses are not included in the Fund’s reported expense ratios. |
| (b) | Total net expenses include the impact of certain fee waivers/expense reimbursements made by the Investment Manager and certain of its affiliates, if applicable. |
| (c) | Ratios include interfund lending expense which is less than 0.01%. |
| (d) | The benefits derived from expense reductions had an impact of less than 0.01%. |
| (e) | Ratios include interest and fee expense related to the participation in certain inverse floater programs. If interest and fee expense related to the participation in certain inverse floater programs had been excluded, expenses would have been lower by 0.01%. Due to an equal increase in interest income from fixed rate municipal bonds held in trust, there is no impact on the Fund’s net assets, net asset value per share, total return or net investment income. |
| (f) | Ratios include the impact of voluntary waivers paid by the Investment Manager. For the periods indicated below, if the Investment Manager had not paid these voluntary waivers, the Fund’s net expense ratio would increase by: |
| 5/31/2021 | 5/31/2020 | 5/31/2019 | |
| Class C | 0.03% | 0.10% | 0.10% |
| 28 | Columbia High Yield Municipal Fund | Annual Report 2023 |
| Net asset value, end of period | Total return | Total gross expense ratio to average net assets(a) | Total net expense ratio to average net assets(a),(b) | Net investment income ratio to average net assets | Portfolio turnover | Net assets, end of period (000’s) | |
| Institutional 3 Class | |||||||
| Year Ended 5/31/2023 | $8.81 | (5.11%) | 0.60%(c) | 0.55%(c) | 4.61% | 14% | $106,856 |
| Year Ended 5/31/2022 | $9.75 | (8.46%) | 0.58%(c) | 0.57%(c) | 3.69% | 30% | $3,572 |
| Year Ended 5/31/2021 | $11.07 | 15.05% | 0.59%(e) | 0.57%(e) | 3.69% | 22% | $2,838 |
| Year Ended 5/31/2020 | $9.98 | (3.21%) | 0.59%(c),(e) | 0.58%(c),(e) | 4.26% | 46% | $2,170 |
| Year Ended 5/31/2019 | $10.77 | 6.83% | 0.59% | 0.56% | 4.45% | 35% | $1,933 |
| Columbia High Yield Municipal Fund | Annual Report 2023 | 29 |
May 31, 2023
| 30 | Columbia High Yield Municipal Fund | Annual Report 2023 |
May 31, 2023
| Columbia High Yield Municipal Fund | Annual Report 2023 | 31 |
May 31, 2023
| 32 | Columbia High Yield Municipal Fund | Annual Report 2023 |
May 31, 2023
| Amount of realized gain (loss) on derivatives recognized in income | |
| Risk exposure category | Futures contracts ($) |
| Interest rate risk | 770,304 |
| Change in unrealized appreciation (depreciation) on derivatives recognized in income | |
| Risk exposure category | Futures contracts ($) |
| Interest rate risk | (109,862) |
| Derivative instrument | Average notional amounts ($)* |
| Futures contracts — short | 11,157,122 |
| * | Based on the ending daily outstanding amounts for the year ended May 31, 2023. |
| Columbia High Yield Municipal Fund | Annual Report 2023 | 33 |
May 31, 2023
| 34 | Columbia High Yield Municipal Fund | Annual Report 2023 |
May 31, 2023
| Purchases ($) | Sales ($) | Net realized gain (loss) ($) |
| 2,398,140 | — | — |
| Effective rate (%) | |
| Class A | 0.08 |
| Advisor Class | 0.08 |
| Class C | 0.08 |
| Institutional Class | 0.08 |
| Institutional 2 Class | 0.06 |
| Institutional 3 Class | 0.01 |
| Columbia High Yield Municipal Fund | Annual Report 2023 | 35 |
May 31, 2023
| Front End (%) | CDSC (%) | Amount ($) | |
| Class A | 3.00 | 0.75(a) | 84,897 |
| Class C | — | 1.00(b) | 1,789 |
| (a) | This charge is imposed on certain investments of $500,000 or more if redeemed within 12 months after purchase. |
| (b) | This charge applies to redemptions within 12 months after purchase, with certain limited exceptions. |
| October 1, 2022 through September 30, 2023 | Prior to October 1, 2022 | |
| Class A | 0.83% | 0.85% |
| Advisor Class | 0.63 | 0.65 |
| Class C | 1.43 | 1.45 |
| Institutional Class | 0.63 | 0.65 |
| Institutional 2 Class | 0.60 | 0.62 |
| Institutional 3 Class | 0.55 | 0.57 |
| 36 | Columbia High Yield Municipal Fund | Annual Report 2023 |
May 31, 2023
| Undistributed net investment income ($) | Accumulated net realized (loss) ($) | Paid in capital ($) |
| 156,939 | (156,939) | — |
| Year Ended May 31, 2023 | Year Ended May 31, 2022 | ||||||
| Ordinary income ($) | Tax-exempt income ($) | Long-term capital gains ($) | Total ($) | Ordinary income ($) | Tax-exempt income ($) | Long-term capital gains ($) | Total ($) |
| 65,268 | 26,241,221 | — | 26,306,489 | 166,117 | 27,455,895 | — | 27,622,012 |
| Undistributed ordinary income ($) | Undistributed tax- exempt income ($) | Undistributed long-term capital gains ($) | Capital loss carryforwards ($) | Net unrealized (depreciation) ($) |
| — | 12,743,479 | — | (22,036,401) | (105,335,275) |
| Federal tax cost ($) | Gross unrealized appreciation ($) | Gross unrealized (depreciation) ($) | Net unrealized (depreciation) ($) |
| 622,412,748 | 8,298,807 | (113,634,082) | (105,335,275) |
| No expiration short-term ($) | No expiration long-term ($) | Total ($) | Utilized ($) |
| (10,912,178) | (11,124,223) | (22,036,401) | — |
| Columbia High Yield Municipal Fund | Annual Report 2023 | 37 |
May 31, 2023
| Borrower or lender | Average loan balance ($) | Weighted average interest rate (%) | Number of days with outstanding loans |
| Borrower | 1,682,143 | 3.90 | 28 |
| 38 | Columbia High Yield Municipal Fund | Annual Report 2023 |
May 31, 2023
| Columbia High Yield Municipal Fund | Annual Report 2023 | 39 |
May 31, 2023
| 40 | Columbia High Yield Municipal Fund | Annual Report 2023 |
May 31, 2023
| Columbia High Yield Municipal Fund | Annual Report 2023 | 41 |
| 42 | Columbia High Yield Municipal Fund | Annual Report 2023 |
| Exempt- interest dividends | |
| 99.75% |
| Name, address, year of birth | Position held with the Columbia Funds and length of service | Principal occupation(s) during past five years and other relevant professional experience | Number of Funds in the Columbia Funds Complex* overseen | Other directorships held by Trustee during the past five years and other relevant Board experience |
| George S. Batejan c/o Columbia Management Investment Advisers, LLC 290 Congress Street Boston, MA 02210 1954 | Trustee since 2017 | Executive Vice President, Global Head of Technology and Operations, Janus Capital Group, Inc., 2010-2016 | 174 | Former Chairman of the Board, NICSA (National Investment Company Services Association) (Executive Committee, Nominating Committee and Governance Committee), 2014-2016; former Director, Intech Investment Management, 2011-2016; former Board Member, Metro Denver Chamber of Commerce, 2015-2016; former Advisory Board Member, University of Colorado Business School, 2015-2018; former Board Member, Chase Bank International, 1993-1994 |
| Columbia High Yield Municipal Fund | Annual Report 2023 | 43 |
(Unaudited)
Independent trustees (continued)
| Name, address, year of birth | Position held with the Columbia Funds and length of service | Principal occupation(s) during past five years and other relevant professional experience | Number of Funds in the Columbia Funds Complex* overseen | Other directorships held by Trustee during the past five years and other relevant Board experience |
| Kathleen Blatz c/o Columbia Management Investment Advisers, LLC 290 Congress Street Boston, MA 02210 1954 | Trustee since 2006 | Attorney, specializing in arbitration and mediation; Chief Justice, Minnesota Supreme Court, 1998-2006; Associate Justice, Minnesota Supreme Court, 1996-1998; Fourth Judicial District Court Judge, Hennepin County, 1994-1996; Attorney in private practice and public service, 1984-1993; State Representative, Minnesota House of Representatives, 1979-1993, which included service on the Tax and Financial Institutions and Insurance Committees; Member and Interim Chair, Minnesota Sports Facilities Authority, January-July 2017; Interim President and Chief Executive Officer, Blue Cross and Blue Shield of Minnesota (health care insurance), February-July 2018, April-October 2021 | 174 | Former Trustee, Blue Cross and Blue Shield of Minnesota, 2009-2021 (Chair of the Business Development Committee, 2014-2017; Chair of the Governance Committee, 2017-2019); former Member and Chair of the Board, Minnesota Sports Facilities Authority, January 2017-July 2017; former Director, Robina Foundation, 2009-2020 (Chair, 2014-2020); Director, Richard M. Schulze Family Foundation, since 2021 |
| Pamela G. Carlton c/o Columbia Management Investment Advisers, LLC 290 Congress Street Boston, MA 02210 1954 | Chair since 2023; Trustee since 2007 | President, Springboard — Partners in Cross Cultural Leadership (consulting company), since 2003; Managing Director of US Equity Research, JP Morgan Chase, 1999-2003; Director of US Equity Research, Chase Asset Management, 1996-1999; Co-Director Latin America Research, 1993-1996, COO Global Research, 1992-1996, Co-Director of US Research, 1991-1992, Investment Banker, 1982-1991, Morgan Stanley; Attorney, Cleary Gottlieb Steen & Hamilton LLP, 1980-1982 | 174 | Trustee, New York Presbyterian Hospital Board, since 1996; Director, DR Bank (Audit Committee) since 2017; Director, Evercore Inc. (Audit Committee, Nominating and Governance Committee), since 2019; Director, Apollo Commercial Real Estate Finance, Inc. (Chair, Nominating and Governance Committee) (financial services), since 2021; the Governing Council of the Independent Directors Council (IDC), since 2021 |
| Janet Langford Carrig c/o Columbia Management Investment Advisers, LLC 290 Congress Street Boston, MA 02210 1957 | Trustee since 1996 | Senior Vice President, General Counsel and Corporate Secretary, ConocoPhillips (independent energy company), September 2007-October 2018 | 174 | Director, EQT Corporation (natural gas producer), since 2019; former Director, Whiting Petroleum Corporation (independent oil and gas company), 2020-2022 |
| J. Kevin Connaughton c/o Columbia Management Investment Advisers, LLC 290 Congress Street Boston, MA 02210 1964 | Trustee since 2020 | CEO and President, RhodeWay Financial (non-profit financial planning firm), since December 2022; Member, FINRA National Adjudicatory Council, since January 2020; Adjunct Professor of Finance, Bentley University since January 2018; Consultant to Independent Trustees of CFVIT and CFST I from March 2016 to June 2020 with respect to CFVIT and to December 2020 with respect to CFST I; Managing Director and General Manager of Mutual Fund Products, Columbia Management Investment Advisers, LLC, May 2010-February 2015; President, Columbia Funds, 2008-2015; and senior officer of Columbia Funds and affiliated funds, 2003-2015 | 172 | Former Director, The Autism Project, March 2015-December 2021; former Member of the Investment Committee, St. Michael’s College, November 2015-February 2020; former Trustee, St. Michael’s College, June 2017-September 2019; former Trustee, New Century Portfolios (former mutual fund complex), January 2015-December 2017 |
| 44 | Columbia High Yield Municipal Fund | Annual Report 2023 |
(Unaudited)
Independent trustees (continued)
| Name, address, year of birth | Position held with the Columbia Funds and length of service | Principal occupation(s) during past five years and other relevant professional experience | Number of Funds in the Columbia Funds Complex* overseen | Other directorships held by Trustee during the past five years and other relevant Board experience |
| Olive M. Darragh c/o Columbia Management Investment Advisers, LLC 290 Congress Street Boston, MA 02210 1962 | Trustee since 2020 | Managing Director of Darragh Inc. (strategy and talent management consulting firm), since 2010; Founder and CEO, Zolio, Inc. (investment management talent identification platform), since 2004; Consultant to Independent Trustees of CFVIT and CFST I from June 2019 to June 2020 with respect to CFVIT and to December 2020 with respect to CFST I; Partner, Tudor Investments, 2004-2010; Senior Partner, McKinsey & Company (consulting), 1990-2004; Touche Ross CPA, 1985-1988 | 172 | Treasurer, Edinburgh University US Trust Board, since January 2023; Member, HBS Community Action Partners Board, since September 2022; former Director, University of Edinburgh Business School (Member of US Board), 2004-2019; former Director, Boston Public Library Foundation, 2008-2017 |
| Patricia M. Flynn c/o Columbia Management Investment Advisers, LLC 290 Congress Street Boston, MA 02210 1950 | Trustee since 2004 | Professor of Economics and Management, Bentley University, since 2002; Dean, McCallum Graduate School of Business, Bentley University, 1992-2002 | 174 | Former Trustee, MA Taxpayers Foundation, 1997-2022; former Director, The MA Business Roundtable, 2003-2019; former Chairperson, Innovation Index Advisory Committee, MA Technology Collaborative, 1997-2020 |
| Brian J. Gallagher c/o Columbia Management Investment Advisers, LLC 290 Congress Street Boston, MA 02210 1954 | Trustee since 2017 | Retired; Partner with Deloitte & Touche LLP and its predecessors, 1977-2016 | 174 | Trustee, Catholic Schools Foundation, since 2004 |
| Douglas A. Hacker c/o Columbia Management Investment Advisers, LLC 290 Congress Street Boston, MA 02210 1955 | Trustee since 1996 | Independent business executive, since May 2006; Executive Vice President – Strategy of United Airlines, December 2002 - May 2006; President of UAL Loyalty Services (airline marketing company), September 2001-December 2002; Executive Vice President and Chief Financial Officer of United Airlines, July 1999-September 2001 | 174 | Director, SpartanNash Company since November 2013 (Chair of the Board, since May 2021) (food distributor); Director, Aircastle Limited (Chair of Audit Committee) (aircraft leasing), since August 2006; former Director, Nash Finch Company (food distributor), 2005-2013; former Director, SeaCube Container Leasing Ltd. (container leasing), 2010-2013; and former Director, Travelport Worldwide Limited (travel information technology), 2014-2019 |
| Nancy T. Lukitsh c/o Columbia Management Investment Advisers, LLC 290 Congress Street Boston, MA 02210 1956 | Trustee since 2011 | Senior Vice President, Partner and Director of Marketing, Wellington Management Company, LLP (investment adviser), 1997-2010; Chair, Wellington Management Portfolios (commingled non-U.S. investment pools), 2007-2010; Director, Wellington Trust Company, NA and other Wellington affiliates, 1997-2010 | 172 | None |
| Columbia High Yield Municipal Fund | Annual Report 2023 | 45 |
(Unaudited)
Independent trustees (continued)
| Name, address, year of birth | Position held with the Columbia Funds and length of service | Principal occupation(s) during past five years and other relevant professional experience | Number of Funds in the Columbia Funds Complex* overseen | Other directorships held by Trustee during the past five years and other relevant Board experience |
| David M. Moffett c/o Columbia Management Investment Advisers, LLC 290 Congress Street Boston, MA 02210 1952 | Trustee since 2011 | Retired; former Chief Executive Officer of Freddie Mac and Chief Financial Officer of U.S. Bank | 172 | Director, CSX Corporation (transportation suppliers); Director, PayPal Holdings Inc. (payment and data processing services); Trustee, University of Oklahoma Foundation; former Director, eBay Inc. (online trading community), 2007-2015; and former Director, CIT Bank, CIT Group Inc. (commercial and consumer finance), 2010-2016; former Senior Adviser to The Carlyle Group (financial services), March 2008-September 2008; former Governance Consultant to Bridgewater Associates, January 2013-December 2015 |
| Catherine James Paglia c/o Columbia Management Investment Advisers, LLC 290 Congress Street Boston, MA 02210 1952 | Trustee since 2004 | Director, Enterprise Asset Management, Inc. (private real estate and asset management company), since September 1998; Managing Director and Partner, Interlaken Capital, Inc., 1989-1997; Vice President, 1982-1985, Principal, 1985-1987, Managing Director, 1987-1989, Morgan Stanley; Vice President, Investment Banking, 1980-1982, Associate, Investment Banking, 1976-1980, Dean Witter Reynolds, Inc. | 174 | Director, Valmont Industries, Inc. (irrigation systems manufacturer), since 2012; Trustee, Carleton College (on the Investment Committee), since 1987; Trustee, Carnegie Endowment for International Peace (on the Investment Committee), since 2009 |
| Natalie A. Trunow c/o Columbia Management Investment Advisers, LLC 290 Congress Street Boston, MA 02210 1967 | Trustee since 2020 | Chief Executive Officer, Millennial Portfolio Solutions LLC (asset management and consulting services), January 2016-January 2021; Non-executive Member of the Investment Committee and Valuation Committee, Sarona Asset Management Inc. (private equity firm) since September 2019; Advisor, Horizon Investments (asset management and consulting services), August 2018-January 2022; Advisor, Paradigm Asset Management, November 2016-January 2022; Consultant to Independent Trustees of CFVIT and CFST I from September 2016 to June 2020 with respect to CFVIT and to December 2020 with respect to CFST I; Director of Investments/Consultant, Casey Family Programs, April 2016-November 2016; Senior Vice President and Chief Investment Officer, Calvert Investments, August 2008-January 2016; Section Head and Portfolio Manager, General Motors Asset Management, June 1997-August 2008 | 172 | Independent Director, Investment Committee, Health Services for Children with Special Needs, Inc., 2010-2021; Independent Director, (Executive Committee and Chair, Audit Committee), Consumer Credit Counseling Services (formerly Guidewell Financial Solutions), since 2016; Independent Director, (Investment Committee), Sarona Asset Management, since 2019 |
| 46 | Columbia High Yield Municipal Fund | Annual Report 2023 |
(Unaudited)
Independent trustees (continued)
| Name, address, year of birth | Position held with the Columbia Funds and length of service | Principal occupation(s) during past five years and other relevant professional experience | Number of Funds in the Columbia Funds Complex* overseen | Other directorships held by Trustee during the past five years and other relevant Board experience |
| Sandra L. Yeager c/o Columbia Management Investment Advisers, LLC 290 Congress Street Boston, MA 02210 1964 | Trustee since 2017 | Retired; President and founder, Hanoverian Capital, LLC (SEC registered investment advisor firm), 2008-2016; Managing Director, DuPont Capital, 2006-2008; Managing Director, Morgan Stanley Investment Management, 2004-2006; Senior Vice President, Alliance Bernstein, 1990-2004 | 174 | Former Director, NAPE (National Alliance for Partnerships in Equity) Education Foundation, October 2016-October 2020; Advisory Board, Jennersville YMCA, since 2022 |
| Name, address, year of birth | Position held with the Columbia Funds and length of service | Principal occupation(s) during the past five years and other relevant professional experience | Number of Funds in the Columbia Funds Complex overseen | Other directorships held by Trustee during the past five years and other relevant Board experience |
| Daniel J. Beckman c/o Columbia Management Investment Advisers, LLC 290 Congress Street Boston, MA 02210 1962 | Trustee since November 2021 and President since June 2021 | Vice President – Head of North America Product, Columbia Management Investment Advisers, LLC, since April 2015; President and Principal Executive Officer of the Columbia Funds, since June 2021; officer of Columbia Funds and affiliated funds, 2020-2021 | 174 | Director, Ameriprise Trust Company, since October 2016; Director, Columbia Management Investment Distributors, Inc. since November 2018; Board of Governors, Columbia Wanger Asset Management, LLC since, January 2022; Director, Columbia Threadneedle Canada, Inc., since December 2022 |
| * | The term “Columbia Funds Complex” as used herein includes Columbia Seligman Premium Technology Growth Fund, Tri-Continental Corporation and each series of Columbia Funds Series Trust (CFST), Columbia Funds Series Trust I (CFST I), Columbia Funds Series Trust II (CFST II), Columbia ETF Trust I (CET I), Columbia ETF Trust II (CET II), Columbia Funds Variable Insurance Trust (CFVIT) and Columbia Funds Variable Series Trust II (CFVST II). Messrs. Batejan, Beckman, Gallagher and Hacker and Mses. Blatz, Carlton, Carrig, Flynn, Paglia, and Yeager serve as directors of Columbia Seligman Premium Technology Growth Fund and Tri-Continental Corporation. |
| ** | Interested person (as defined under the 1940 Act) by reason of being an officer, director, security holder and/or employee of the Investment Manager or Ameriprise Financial. |
| Columbia High Yield Municipal Fund | Annual Report 2023 | 47 |
(Unaudited)
The Board has appointed officers who are responsible for day-to-day business decisions based on policies it has established. The officers serve at the pleasure of the Board. The following table provides basic information about the Officers of the Fund as of the printing of this report, including principal occupations during the past five years, although their specific titles may have varied over the period. In addition to Mr. Beckman, who is President and Principal Executive Officer, the Fund’s other officers are:
| Name, address and year of birth | Position and year first appointed to position for any Fund in the Columbia Funds Complex or a predecessor thereof | Principal occupation(s) during past five years |
| Michael G. Clarke 290 Congress Street Boston, MA 02210 1969 | Chief Financial Officer and Principal Financial Officer (2009) and Senior Vice President (2019) | Senior Vice President and North America Head of Operations & Investor Services, Columbia Management Investment Advisers, LLC, since June 2023 (previously Senior Vice President and Head of Global Operations, March 2022 – June 2023, Vice President, Head of North America Operations, and Co-Head of Global Operations, June 2019 - February 2022 and Vice President – Accounting and Tax, May 2010 - May 2019); senior officer of Columbia Funds and affiliated funds, since 2002. Director, Ameriprise Trust Company, since June 2023. |
| Joseph Beranek 5890 Ameriprise Financial Center Minneapolis, MN 55474 1965 | Treasurer and Chief Accounting Officer (Principal Accounting Officer) (2019) and Principal Financial Officer (2020), CFST, CFST I, CFST II, CFVIT and CFVST II; Assistant Treasurer, CET I and CET II | Vice President – Mutual Fund Accounting and Financial Reporting, Columbia Management Investment Advisers, LLC, since December 2018 and March 2017, respectively. |
| Marybeth Pilat 290 Congress Street Boston, MA 02210 1968 | Treasurer and Chief Accounting Officer (Principal Accounting Officer) and Principal Financial Officer (2020) for CET I and CET II; Assistant Treasurer, CFST, CFST I, CFST II, CFVIT and CFVST II | Vice President – Product Pricing and Administration, Columbia Management Investment Advisers, LLC, since May 2017. |
| William F. Truscott 290 Congress Street Boston, MA 02210 1960 | Senior Vice President (2001) | Formerly, Trustee/Director of Columbia Funds Complex or legacy funds, November 2001 - January 1, 2021; Chief Executive Officer, Global Asset Management, Ameriprise Financial, Inc., since September 2012; Chairman of the Board and President, Columbia Management Investment Advisers, LLC, since July 2004 and February 2012, respectively; Chairman of the Board and Chief Executive Officer, Columbia Management Investment Distributors, Inc., since November 2008 and February 2012, respectively;Chairman of the Board and Director, Threadneedle Asset Management Holdings, Sàrl, since March 2013 and December 2008, respectively; senior executive of various entities affiliated with Columbia Threadneedle. |
| Christopher O. Petersen 5228 Ameriprise Financial Center Minneapolis, MN 55474 1970 | Senior Vice President and Assistant Secretary (2021) | Formerly, Trustee/Director of funds within the Columbia Funds Complex, July 1, 2020 - November 22, 2021; Senior Vice President and Assistant General Counsel, Ameriprise Financial, Inc., since September 2021 (previously Vice President and Lead Chief Counsel, January 2015 - September 2021); formerly, President and Principal Executive Officer of the Columbia Funds, 2015 - 2021; officer of Columbia Funds and affiliated funds, since 2007. |
| Thomas P. McGuire 290 Congress Street Boston, MA 02210 1972 | Senior Vice President and Chief Compliance Officer (2012) | Vice President – Asset Management Compliance, Ameriprise Financial, Inc., since May 2010; Chief Compliance Officer, Columbia Acorn/Wanger Funds, since December 2015; formerly, Chief Compliance Officer, Ameriprise Certificate Company, September 2010 – September 2020. |
| Ryan C. Larrenaga 290 Congress Street Boston, MA 02210 1970 | Senior Vice President (2017), Chief Legal Officer (2017), and Secretary (2015) | Vice President and Chief Counsel, Ameriprise Financial, Inc., since August 2018 (previously Vice President and Group Counsel, August 2011 - August 2018); Chief Legal Officer, Columbia Acorn/Wanger Funds, since September 2020; officer of Columbia Funds and affiliated funds, since 2005. |
| 48 | Columbia High Yield Municipal Fund | Annual Report 2023 |
(Unaudited)
Fund officers (continued)
| Name, address and year of birth | Position and year first appointed to position for any Fund in the Columbia Funds Complex or a predecessor thereof | Principal occupation(s) during past five years |
| Michael E. DeFao 290 Congress Street Boston, MA 02210 1968 | Vice President (2011) and Assistant Secretary (2010) | Vice President and Chief Counsel, Ameriprise Financial, Inc., since May 2010; Vice President, Chief Legal Officer and Assistant Secretary, Columbia Management Investment Advisers, LLC, since October 2021 (previously Vice President and Assistant Secretary, May 2010 – September 2021). |
| Lyn Kephart-Strong 5903 Ameriprise Financial Center Minneapolis, MN 55474 1960 | Vice President (2015) | Vice President, Global Investment Operations Services, Columbia Management Investment Advisers, LLC, since 2010; Director (since January 2007) and President (since October 2014), Columbia Management Investment Services Corp.; Director (since December 2017) and President (since January 2017), Ameriprise Trust Company. |
| • | the Fund had sufficient liquidity to both meet redemptions and operate effectively on behalf of shareholders; |
| • | there were no material changes to the Program during the period; |
| • | the implementation of the Program was effective to manage the Fund’s liquidity risk; and |
| • | the Program operated adequately during the period. |
| Columbia High Yield Municipal Fund | Annual Report 2023 | 49 |
columbiathreadneedleus.com/investor/. The Fund is distributed by Columbia Management Investment Distributors, Inc., member FINRA, and managed by Columbia Management Investment Advisers, LLC.
Item 2. Code of Ethics.
(a) | The registrant has adopted a code of ethics that applies to the registrant’s principal executive officer, principal financial officer, principal accounting officer or controller, or persons performing similar functions, regardless of whether these individuals are employed by the registrant or a third party. |
(b) | During the period covered by this report, there were not any amendments to a provision of the code of ethics that applies to the registrant’s principal executive officer, principal financial officer, principal accounting officer or controller, or persons performing similar functions, regardless of whether these individuals are employed by the registrant or a third party, and that relates to any element of the code of ethics definition enumerated in paragraph (b) of this Item. |
(c) | During the period covered by this report, there were no waivers, including any implicit waivers, from a provision of the code of ethics to the registrant’s principal executive officer, principal financial officer, principal accounting officer or controller, or persons performing similar functions, regardless of whether these individuals are employed by the registrant or a third party that relates to one or more of the items set forth in paragraph (b) of this Item. |
Item 3. Audit Committee Financial Expert.
The registrant’s Board of Trustees has determined that David M. Moffett, Brian J. Gallagher, J. Kevin Connaughton, Sandra L. Yeager, and Douglas A. Hacker, each of whom are members of the registrant’s Board of Trustees and Audit Committee, each qualify as an audit committee financial expert. Mr. Moffett, Mr. Gallagher, Mr. Connaughton, Ms. Yeager, and Mr. Hacker are each independent trustees, as defined in paragraph (a)(2) of this item’s instructions.
Item 4. Principal Accountant Fees and Services.
Fee information below is disclosed for the four series of the registrant whose reports to stockholders are included in this annual filing.
(a) Audit Fees. Aggregate Audit Fees billed by the principal accountant for professional services rendered during the fiscal years ended May 31, 2023 and May 31, 2022 are approximately as follows:
2023 | 2022 |
$171,400 | $168,000 |
Audit Fees include amounts related to the audit of the registrant’s annual financial statements or services that are normally provided by the accountant in connection with statutory and regulatory filings or engagements for those fiscal years.
(b) Audit-Related Fees. Aggregate Audit-Related Fees billed to the registrant by the principal accountant for professional services rendered during the fiscal years ended May 31, 2023 and May 31, 2022 are approximately as follows:
2023 | 2022 |
$0 | $2,800 |
Audit-Related Fees include amounts for assurance and related services by the principal accountant that are reasonably related to the performance of the audit of the registrant’s financial statements and are not reported in Audit Fees above.
During the fiscal years ended May 31, 2023 and May 31, 2022, there were no Audit-Related Fees billed by the registrant’s principal accountant to the registrant’s investment adviser (not including any sub-adviser whose role is primarily portfolio management and is subcontracted with or overseen by another investment adviser) and any entity controlling, controlled by, or under common control with the adviser that provides ongoing services to the registrant for an engagement that related directly to the operations and financial reporting of the registrant.
(c) Tax Fees. Aggregate Tax Fees billed by the principal accountant to the registrant for professional services rendered during the fiscal years ended May 31, 2023 and May 31, 2022 are approximately as follows:
2023 | 2022 |
$50,000 | $20,200 |
Tax Fees include amounts for the review of annual tax returns, the review of required shareholder distribution calculations and typically include amounts for professional services by the principal accountant for tax compliance, tax advice and tax planning.
During the fiscal years ended May 31, 2023 and May 31, 2022, there were no Tax Fees billed by the registrant’s principal accountant to the registrant’s investment adviser (not including any sub-adviser whose role is primarily portfolio management and is subcontracted with or overseen by another investment adviser) and any entity controlling, controlled by, or under common control with the adviser that provides ongoing services to the registrant for an engagement that related directly to the operations and financial reporting of the registrant.
(d) All Other Fees. Aggregate All Other Fees billed by the principal accountant to the registrant for professional services rendered during the fiscal years ended May 31, 2023 and May 31, 2022 are approximately as follows:
2023 | 2022 |
$0 | $0 |
All Other Fees, if any, include amounts for products and services provided by the principal accountant, other than the services reported in paragraphs (a) through (c) above.
Aggregate All Other Fees billed by the registrant’s principal accountant to the registrant’s investment adviser (not including any sub-adviser whose role is primarily portfolio management and is subcontracted with or overseen by another investment adviser) and any entity controlling, controlled by, or under common control with the adviser that provides ongoing services to the registrant for an engagement that related directly to the operations and financial reporting of the registrant during the fiscal years ended May 31, 2023 and May 31, 2022 are approximately as follows:
2023 | 2022 |
$557,000 | $535,000 |
In fiscal years 2023 and 2022, All Other Fees primarily consists of fees billed for internal control examinations of the registrant’s transfer agent and investment adviser.
(e)(1) Audit Committee Pre-Approval Policies and Procedures
The registrant’s Audit Committee is required to pre-approve the engagement of the registrant’s independent auditors to provide audit and non-audit services to the registrant and non-audit services to its investment adviser (excluding any sub-adviser whose role is primarily portfolio management and is sub-contracted or overseen by another investment adviser (the “Adviser”) or any entity controlling, controlled by or under common control with the Adviser that provides ongoing services to the Fund (a “Control Affiliate”) if the engagement relates directly to the operations and financial reporting of the registrant.
The Audit Committee has adopted a Policy for Engagement of Independent Auditors for Audit and Non-Audit Services (the “Policy”). The Policy sets forth the understanding of the Audit Committee regarding the engagement of the registrant’s independent accountants to provide (i) audit and permissible audit-related, tax and other services to the registrant (“Fund Services”); (ii) non-audit services to the registrant’s Adviser and any Control Affiliates, that relates directly to the operations and financial reporting of a Fund (“Fund-related Adviser Services”); and (iii) certain other audit and non-audit services to the registrant’s Adviser and its Control Affiliates. A service will require specific pre-approval by the Audit Committee if it is to be provided by the Fund’s independent auditor; provided, however, that pre-approval of non-audit services to the Fund, the Adviser or Control Affiliates may be waived if certain de minimis requirements set forth in the SEC’s rules are met.
Under the Policy, the Audit Committee may delegate pre-approval authority to any pre-designated member or members who are independent board members. The member(s) to whom such authority is delegated must report, for informational purposes only, any pre-approval decisions to the Audit Committee at its next regular meeting. The Audit Committee's responsibilities with respect to the pre-approval of services performed by the independent auditor may not be delegated to management.
On an annual basis, at a regularly scheduled Audit Committee meeting, the Fund’s Treasurer or other Fund officer shall submit to the Audit Committee a schedule of the types of Fund Services and Fund-related Adviser Services that are subject to specific pre-approval. This schedule will provide a description of each type of service that is subject to specific pre-approval, along with total projected fees for each service. The pre-approval will generally cover a one-year period. The Audit Committee will review and approve the types of services and the projected fees for the next one-year period and may add to, or subtract from, the list of pre-approved services from time to time, based on subsequent determinations. This specific approval acknowledges that the Audit Committee is in agreement with the specific types of services that the independent auditor will be permitted to perform and the projected fees for each service.
The Fund’s Treasurer or other Fund officer shall report to the Audit Committee at each of its regular meetings regarding all Fund Services or Fund-related Adviser Services provided since the last such report was rendered, including a description of the services, by category, with forecasted fees for the annual reporting period, proposed changes requiring specific pre-approval and a description of services provided by the independent auditor, by category, with actual fees during the current reporting period.
*****
(e)(2) None, or 0%, of the Audit-Related Fees, Tax Fees and All Other Fees paid by the Fund or affiliated entities relating directly to the operations and financial reporting of the Registrant disclosed above were approved by the audit committee pursuant to paragraphs (c)(7)(i)(C) of Rule 2-01 of Regulation S-X (which permits audit committee approval after the start of the engagement with respect to services other than audit, review or attest services, if certain conditions are satisfied).
(f) Not applicable.
(g) The aggregate non-audit fees billed by the registrant’s accountant for services rendered to the registrant, and rendered to the registrant’s investment adviser (not including any sub-adviser whose role is primarily portfolio management and is subcontracted with or overseen by another investment adviser), and any entity controlling, controlled by, or under common control with the adviser that provides ongoing services to the registrant for the fiscal years ended May 31, 2023 and May 31, 2022 are approximately as follows:
2023 | 2022 |
$607,000 | $558,000 |
(h) The registrant’s Audit Committee of the Board of Directors has considered whether the provision of non-audit services that were rendered to the registrant’s adviser (not including any sub-adviser whose role is primarily portfolio management and is subcontracted with or overseen by another investment adviser), and any entity controlling, controlled by, or under common control with the investment adviser that provides ongoing services to the registrant that were not pre-approved pursuant to paragraph (c)(7)(ii) of Rule 2-01 of Regulation S-X, is compatible with maintaining the principal accountant’s independence.
Item 5. Audit Committee of Listed Registrants.
Not applicable.
Item 6. Investments
(a) | The registrant’s “Schedule I – Investments in securities of unaffiliated issuers” (as set forth in 17 CFR 210.12-12) is included in Item 1 of this Form N-CSR. |
(b) | Not applicable. |
Item 7. Disclosure of Proxy Voting Policies and Procedures for Closed-End Management Investment Companies.
Not applicable.
Item 8. Portfolio Managers of Closed-End Management Investment Companies.
Not applicable.
Item 9. Purchases of Equity Securities by Closed-End Management Investment Company and Affiliated Purchasers.
Not applicable.
Item 10. Submission of Matters to a Vote of Security Holders.
There were no material changes to the procedures by which shareholders may recommend nominees to the registrant's board of directors.
Item 11. Controls and Procedures.
(a) | The registrant’s principal executive officer and principal financial officer, based on their evaluation of the registrant’s disclosure controls and procedures as of a date within 90 days of the filing of this report, have concluded that such controls and procedures are adequately designed to ensure that information required to be disclosed by the registrant in Form N-CSR is accumulated and communicated to the registrant’s management, including the principal executive officer and principal financial officer, or persons performing similar functions, as appropriate to allow timely decisions regarding required disclosure. |
(b) | There was no change in the registrant's internal control over financial reporting that occurred during the period covered by this report that has materially affected, or is reasonably likely to materially affect, the registrant's internal control over financial reporting. |
Item 12. Disclosure of Securities Lending Activities for Closed-End Management Investment Companies
Not applicable.
Item 13. Exhibits.
SIGNATURES
Pursuant to the requirements of the Securities Exchange Act of 1934 and the Investment Company Act of 1940, the registrant has duly caused this report to be signed on its behalf by the undersigned, thereunto duly authorized.
(registrant) | Columbia Funds Series Trust I |
|
|
By (Signature and Title) | /s/ Daniel J. Beckman |
| Daniel J. Beckman, President and Principal Executive Officer |
|
|
Date | July 21, 2023 |
|
|
|
|
Pursuant to the requirements of the Securities Exchange Act of 1934 and the Investment Company Act of 1940, this report has been signed below by the following persons on behalf of the registrant and in the capacities and on the dates indicated.
By (Signature and Title) | /s/ Daniel J. Beckman |
| Daniel J. Beckman, President and Principal Executive Officer |
|
|
Date | July 21, 2023 |
By (Signature and Title) | /s/ Michael G. Clarke |
| Michael G. Clarke, Chief Financial Officer, |
| Principal Financial Officer and Senior Vice President |
|
|
Date | July 21, 2023 |
By (Signature and Title) | /s/ Joseph Beranek |
| Joseph Beranek, Treasurer, Chief Accounting |
| Officer and Principal Financial Officer |
|
|
Date | July 21, 2023 |