UNITED STATES
SECURITIES AND EXCHANGE COMMISSION
Washington, DC 20549
FORM N-CSR
CERTIFIED SHAREHOLDER REPORT OF REGISTERED MANAGEMENT
INVESTMENT COMPANIES
Investment Company Act file number File No. 811-04415
COLLEGE RETIREMENT EQUITIES FUND
(Exact Name of Registrant as specified in charter)
730 Third Avenue, New York, New York 10017-3206
(Address of Principal Executive Offices) (Zip code)
Rachael M. Zufall, Esq.
College Retirement Equities Fund
8500 Andrew Carnegie Blvd.
Charlotte, North Carolina 28262-8500
(Name and address of agent for service)
Registrant’s telephone number, including area code: 704-595-1000
Date of fiscal year end: December 31
Date of reporting period: December 31, 2021
Item 1. Reports to Stockholders.
Annual Report ■ December 31, 2021
College Retirement
The annual report contains the audited financial statements.
|
| Account name | Class R1 | Class R2 | Class R3 |
| Stock Account | QCSTRX | QCSTPX | QCSTIX |
| Global Equities Account | QCGLRX | QCGLPX | QCGLIX |
| Growth Account | QCGRRX | QCGRPX | QCGRIX |
| Equity Index Account | QCEQRX | QCEQPX | QCEQIX |
| Bond Market Account | QCBMRX | QCBMPX | QCBMIX |
| Inflation-Linked Bond Account | QCILRX | QCILPX | QCILIX |
| Social Choice Account | QCSCRX | QCSCPX | QCSCIX |
| Money Market Account | QCMMRX | QCMMPX | QCMMIX |

As permitted by regulations adopted by the Securities and Exchange Commission (“SEC”), paper copies of the CREF Accounts’ (the “Accounts”) annual and semiannual reports will not be sent to you by mail, unless you specifically request paper copies of the reports. Instead, they will be made available on Teachers Insurance and Annuity Association of America’s (“TIAA”) website, TIAA.org, and you will be notified by mail each time a report is posted and provided with a website link to access the report.
You may elect to receive reports and other communications from the Accounts electronically anytime by either (1) updating your account settings at TIAA.org/eDelivery, if you hold your Account units through a TIAA-affiliated financial intermediary, account or retirement plan (each, a “TIAA Account”), or (2) contacting your financial intermediary (such as a broker-dealer or bank) through which you hold Account units.
If you invest in the Accounts through a TIAA Account, you may elect to receive all future reports in paper free of charge by updating your account settings at TIAA.org/eDelivery or by calling 877-518-9161 during regular business hours. If you invest through another financial intermediary, you can contact your financial intermediary to request that you receive paper copies of your reports. Your election to receive reports in paper will apply to all funds held through your financial intermediary or, if you invest through a TIAA Account, to all funds held with the Accounts and any other investment companies within the same group of related investment companies.
Contents
This annual report contains information about the CREF variable annuity accounts and describes their results for the twelve months ended December 31, 2021. The report contains four main sections:
| • | A letter to participants from Colbert G. Narcisse, President and Chief Executive Officer of CREF. | |
| • | The account performance section compares each account’s investment returns with those of its benchmark index. | |
| • | The summary portfolios of investments list the industries and types of securities in which each account had investments as of December 31, 2021. | |
| • | The financial statements provide detailed information about the operations and financial condition of each account. |
The views and opinions expressed in this report are through the end of the period, as stated on the cover of this report. They are subject to change at any time based on a variety of factors. As such, they are not guarantees of future performance or investment results and should not be taken as investment advice. To see the risks of investing in any account, please read the latest prospectus.
As always, you should carefully consider the investment objectives, risks, charges and expenses of any account before investing. For a prospectus that contains this and other important information, please visit our website at TIAA.org, or call 877-518-9161. We urge you to read the prospectus carefully before investing.
Proposals for action at the 2022 meeting of CREF participants
We anticipate that the next meeting of CREF participants will be held in July 2022; however, the exact date, time and location of such meeting have yet to be determined. Proposals submitted by or on behalf of participants pursuant to Rule 14a-8 under the Securities Exchange Act of 1934 for inclusion in the proxy materials for the 2022 participant meeting must be received by the CREF Corporate Secretary no later than March 18, 2022. The submission of a proposal does not assure its inclusion in CREF’s proxy statement or presentation at the meeting. Unless CREF is notified by April 27, 2022 of other matters that may be properly brought before the 2022 participant meeting by or on behalf of participants, the persons named in the proxy will have the discretion to vote on those matters as they see fit.
| College Retirement Equities Fund ■ 2021 Annual Report | 3 |
Domestic and international developed stock markets produced solid gains in 2021 despite the ongoing global challenge of the COVID-19 pandemic. The U.S. economy grew strongly at the start of the period, but the pace of expansion decelerated in the summer months. Economies in the 19-nation euro area struggled at the beginning of the year but returned to growth as the period progressed. Most central banks around the world left accommodative monetary policies in place but monitored rising inflation. The U.S. Federal Reserve kept the federal funds target rate unchanged at 0.00%–0.25%. The European Central Bank also maintained its near-zero benchmark rates, while the Bank of England increased its benchmark rate from 0.10% to 0.25% in December 2021.
| • | The five CREF accounts with significant exposure to the U.S. stock market all recorded double-digit gains ranging from 12.4% for the Social Choice Account to 25.3% for the Equity Index Account. | |
| • | Fixed-income markets generally declined, and the Bond Market Account returned –1.4%. However, the Inflation-Linked Bond Account gained 5.1% due to the rise in inflation. | |
| • | Two accounts outperformed their benchmarks, while the other six underperformed. All account returns are for Class R1. |
CREF performance review
Six of the eight CREF accounts produced positive results for the period. Overall, stocks outperformed bonds, and U.S. equities outpaced foreign stocks.
The Stock Account—the largest CREF account in terms of net assets—advanced 18.7% but trailed its composite benchmark. The Equity Index Account gained 25.3% but underperformed the Russell 3000® Index, primarily due to expenses. The Growth Account returned 20.2%, trailing the Russell 1000® Growth Index. The Global Equities Account gained 15.4%, lagging the MSCI All Country World Index (ACWI). The Social Choice Account, which excludes certain stocks and bonds due to environmental, social and governance criteria, outpaced its composite benchmark with a return of 12.4%.
Turning to fixed-income accounts, the Bond Market Account returned –1.4%, outperforming the Bloomberg U.S. Aggregate Bond Index. The Inflation-Linked Bond Account gained 5.1% but fell short of the Bloomberg U.S. Treasury Inflation-Protected Securities (TIPS) 1–10 Year Index. The Money Market Account, which returned 0.0%, slightly underperformed the iMoneyNet Money Fund Averages™—All Government. For more information regarding the performance of the CREF accounts, please see the commentaries starting on page 11.
| 4 | 2021 Annual Report ■ College Retirement Equities Fund |
 |
| Colbert G. Narcisse |
Stocks advanced while bonds lost ground
For the twelve-month period, the domestic stock market, as measured by the Russell 3000 Index, rose 25.7%. Foreign equities, as represented by the MSCI EAFE Index, returned 11.3%. U.S. investment-grade fixed-rate bonds, as measured by the Bloomberg U.S. Aggregate Bond Index, returned –1.5%. Yields on all but the shortest maturity U.S. Treasury securities rose, generally sending bond prices lower (bond yields move in the opposite direction of prices).
Keeping long-term goals in mind
As we begin a third year living with the COVID-19 pandemic, it’s clear that we still haven’t reached the point of a full recovery. But the resiliency demonstrated by people and economies in the face of these challenges has been truly remarkable.
The U.S. economy has steadily expanded since the latter half of 2020, and global stock markets have prospered. But there were moments when continued growth appeared far from certain, and investors experienced periods of higher volatility along the way. Certainly, no one can predict the direction of financial markets in the future. But those unknowns, along with the inevitable periods of higher volatility, should not distract investors from their long-term investment goals. We believe a well-balanced and diversified portfolio of different asset classes can be a prudent strategy to help investors manage through the market’s ups and downs. Of course, diversification does not guarantee against market losses, and past performance cannot guarantee future results.
If you have questions or concerns about your investments, we recommend that you speak with your financial advisor or call a TIAA financial consultant. To learn more, visit us at TIAA.org or call 800-842-2252. We would be pleased to assist you.
/s/ Colbert G. Narcisse
Colbert G. Narcisse
President and Chief Executive Officer of CREF
| College Retirement Equities Fund ■ 2021 Annual Report | 5 |
Information for CREF participants
Portfolio holdings
Securities and Exchange Commission (SEC) rules allow investment companies to list the top holdings of each account in their annual and semiannual reports instead of providing complete portfolio listings. CREF also files complete portfolio listings with the SEC, and they are available to the public.
You can obtain a complete list of the CREF accounts’ holdings (Schedules of Investments) as of the most recently completed fiscal quarter in the following ways:
| • | By visiting our website at TIAA.org; or | |
| • | By calling us at 800-842-2252 to request a copy, which will be provided free of charge. |
You can also obtain a complete list of the CREF accounts’ portfolio holdings as of the most recently completed fiscal quarter, and for prior quarter-ends, from our SEC Form N-CSR and Form N-PORT or Form N-MFP (for money market products only) filings. Form N-CSR filings are as of December 31 or June 30; Form N-PORT or Form N-MFP filings are as of March 31 or September 30. Copies of these forms are available:
| • | Through the Electronic Data Gathering and Retrieval System (EDGAR) on the SEC’s website at sec.gov; or | |
| • | From the SEC’s Office of Investor Education and Advocacy. | |
| Call 202-551-8090 for more information. |
Proxy voting
CREF’s ownership of stock gives it the right to vote on proxy issues of companies in which it invests. A description of our proxy voting policies and procedures can be found on our website at TIAA.org or on the SEC’s website at sec.gov. You can also call us at 800-842-2252 to request a free copy. A report of how the accounts voted during the most recently completed twelve-month period ended June 30 can be found on our website or on Form N-PX at sec.gov.
Contacting TIAA
There are three easy ways to contact us: by email, using the Contact Us link under Get Help at the top of our home page; by mail at TIAA, 730 Third Avenue, New York, NY 10017-3206; or by phone at 800-842-2252.
Account management
The CREF Accounts are managed by the portfolio management teams of TIAA-CREF Investment Management, LLC. The members of these teams are responsible for the day-to-day investment management of the accounts.
| 6 | 2021 Annual Report ■ College Retirement Equities Fund |
Information for CREF participants
CREF Rules of the Fund
From time to time, CREF updates its Rules of the Fund with the New York State Department of Financial Services. Current copies of the updated Rules of the Fund can be found on the TIAA.org website at the following location: https://www.tiaa.org/public/about-tiaa/corporate-governance-leadership/document-library.
| College Retirement Equities Fund ■ 2021 Annual Report | 7 |
About the accounts’ benchmarks
CREF Stock Account
The Account’s composite benchmark is a weighted average of two unmanaged indexes: the Russell 3000® Index, which measures the performance of the broad U.S. stock market, and the MSCI All Country World (ACWI) ex USA Investable Market Index (IMI), which measures the performance of small-, mid- and large-cap stocks in 47 developed- and emerging-markets nations throughout the world, excluding the United States.
The Morningstar Aggressive Target Risk Index is a broad-based securities market index for the Stock Account and has a 95% global equity market exposure and a multi-asset class exposure that is similar to the Stock Account.
CREF Global Equities Account
The Account’s benchmark is the MSCI All Country World Index (ACWI), which measures the performance of large- and mid-capitalization stocks in 23 developed-markets countries and 25 emerging-markets countries.
CREF Growth Account
The Account’s benchmark is the Russell 1000® Growth Index, a subset of the Russell 1000 Index, which measures the performance of the stocks of the 1,000 largest companies in the Russell 3000 Index, based on market capitalization. The Russell 1000 Growth Index measures the performance of those stocks of the Russell 1000 Index with higher relative forecasted growth rates and price/book ratios.
CREF Equity Index Account
The Account’s benchmark is the Russell 3000 Index, which measures the performance of the stocks of the 3,000 largest publicly traded U.S. companies, based on market capitalization. The index measures the performance of about 98% of the total market capitalization of the publicly traded U.S. equity market.
CREF Bond Market Account
The Account’s benchmark is the Bloomberg U.S. Aggregate Bond Index, which measures the performance of the domestic investment-grade fixed-rate bond market, including government and corporate securities, agency mortgage pass-through securities, asset-backed securities and commercial mortgage-backed securities.
| 8 | 2021 Annual Report ■ College Retirement Equities Fund |
About the accounts’ benchmarks
CREF Inflation-Linked Bond Account
The Account’s benchmark is the Bloomberg U.S. Treasury Inflation Protected Securities (TIPS) 1–10 Year Index, which measures the performance of fixed-income securities with maturities between 1 and 10 years that are adjusted for inflation, as measured by the Consumer Price Index for All Urban Consumers (CPI-U).
CREF Social Choice Account
The Account’s composite benchmark is a weighted average of three unmanaged indexes: the Russell 3000® Index, which measures the performance of the broad U.S. stock market; the Bloomberg U.S. Aggregate Bond Index, which measures the performance of the domestic investment-grade fixed-rate bond market; and the MSCI EAFE+Canada Index, which measures stock performance in 22 developed-markets nations, excluding the United States.
The Morningstar Moderate Target Risk Index is a broad-based securities market index for the Social Choice Account. The index has a multi-asset class exposure (60% global equity, 40% global fixed income) that is similar to the Social Choice Account.
You cannot invest directly in any index. Index returns do not include a deduction for fees or expenses. For additional details about the benchmark indexes, please read the accounts’ latest prospectus.
London Stock Exchange Group plc and its group undertakings (collectively, the “LSE Group”). © LSE Group 2022. FTSE Russell is a trading name of certain of the LSE Group companies. “FTSE® ,” “Russell® ” and “FTSE Russell® ” are trademarks of the relevant LSE Group companies and are used by any other LSE Group company under license. All rights in the FTSE Russell indexes or data vest in the relevant LSE Group company which owns the index or the data. Neither LSE Group nor its licensors accept any liability for any errors or omissions in the indexes or data and no party may rely on any indexes or data contained in this communication. No further distribution of data from the LSE Group is permitted without the relevant LSE Group company’s express written consent. The LSE Group does not promote, sponsor or endorse the content of this communication. MSCI makes no express or implied warranties or representations and shall have no liability whatsoever with respect to any MSCI data contained herein. This report is not approved, reviewed or produced by MSCI. EAFE stands for Europe, Australasia, Far East.
| College Retirement Equities Fund ■ 2021 Annual Report | 9 |
Important information about expenses
All participants in the CREF Accounts incur ongoing costs, including management fees and other account expenses.
The expense examples that appear in this report are intended to help you understand your ongoing costs only (in U.S. dollars) and do not reflect transactional costs. The examples are designed to help you compare these ongoing costs with the ongoing costs of investing in other variable annuity accounts and mutual funds. Participants in the CREF Accounts do not incur a sales charge for purchases or other distributions.
The examples are based on an investment of $1,000 invested at the beginning of the six-month period and held for the entire period (July 1, 2021–December 31, 2021).
Actual expenses
The first section in each table uses the Account’s actual expenses and its actual rate of return. You may use the information in this section, together with the amount you invested, to estimate the expenses that you paid over the six-month period.
Simply divide your account value by $1,000 (for example, an $8,600 account value divided by $1,000 = 8.6), then multiply the result by the number in the first line under the heading “Expenses paid during period” to estimate the expenses you paid during the six-month period.
Hypothetical example for comparison purposes
The second section in the table shows hypothetical account values and expenses based on the Account’s actual expense ratio for each Class for the six-month period and an assumed 5%-per-year rate of return before expenses. This was not the Account’s actual return.
This hypothetical example cannot be used to estimate the actual expenses you paid for the period, but rather allows you to compare the ongoing costs of investing in the Account with the costs of other accounts. To do so, compare this 5% hypothetical example with the 5% hypothetical examples that appear in the shareholder reports of other variable annuity accounts and mutual funds.
| 10 | 2021 Annual Report ■ College Retirement Equities Fund |
Performance for the twelve months ended December 31, 2021
The CREF Stock Account returned 18.67% for the year, compared with the 19.90% return of its composite benchmark, a weighted average of the Russell 3000® Index and the MSCI All Country World (ACWI) ex USA Investable Market Index (IMI). (All returns for the Account are for Class R1.)
The U.S. economy grew at a solid pace during the period, despite ongoing supply-chain bottlenecks and the impact of new COVID-19 variants. The unemployment rate fell from 6.3% in January 2021 to 3.9% in December. Core inflation, which includes all items except food and energy, rose 5.5% over the twelve months ended December 31, 2021. The Federal Reserve held the federal funds target rate unchanged at 0.00%–0.25%. In November, however, the Fed began reducing the pace of its bond-buying program and indicated it would continue tapering into 2022. Crude oil prices rose sharply over the twelve months.
The broad U.S. stock market, as measured by the Russell 3000 Index, advanced 25.66% for the period. Large-cap stocks surpassed smaller shares, while mid- and small-cap value equities had the best performance overall. (Returns by investment style and capitalization size are based on the Russell indexes.)
Account trailed its composite benchmark
The Account’s management team typically uses a combination of three different investment strategies—active management, quantitative management and indexing—which, in turn, invest in both domestic and foreign stocks.
For the twelve-month period, the Account trailed its composite benchmark. In the United States, the Account’s quantitative small-cap and active large-cap value strategies outperformed but were offset by underperformance from the active large-cap growth and core strategies. Among foreign investments, the Account’s actively managed global strategies made a solid contribution, while emerging markets detracted.
The Account’s returns may sometimes diverge from the returns of its benchmark more than would be expected. This divergence may be the result of the Account’s fair value pricing adjustments or of the timing of foreign currency valuations. Many foreign exchanges close for trading before the Account’s accumulation unit value (AUV) is calculated (see the current CREF prospectus for more details on AUV calculations). In the intervening hours, the values of foreign securities can change, and these changes are not reflected immediately in the returns of the Account’s benchmark. These changes are, however, taken into account to value the Account’s portfolio holdings at the time the Account’s AUV is calculated; these are known as fair value pricing adjustments.
| College Retirement Equities Fund ■ 2021 Annual Report | 11 |
CREF Stock Account
Performance as of December 31, 2021
| Stock Account | Total return | Average annual total return | Estimated annual operating expenses | |||||||||||||||||
| Inception date | 1 year | 5 years | 10 years | * | ||||||||||||||||
| Class R1 | 7/31/1952 | 18.67 | % | 14.50 | % | 12.94 | % | 0.445 | % | |||||||||||
| Class R2 | 4/24/2015 | 18.86 | 14.72 | 13.10 | † | 0.290 | ||||||||||||||
| Class R3 | 4/24/2015 | 18.92 | 14.79 | 13.15 | † | 0.240 | ||||||||||||||
| CREF Stock Account Composite Index§ | — | 19.90 | 15.44 | 13.64 | — | |||||||||||||||
| Broad market index | ||||||||||||||||||||
| Morningstar Aggressive Target Risk Index | — | 17.30 | 13.38 | 11.93 | — | |||||||||||||||
The returns in this report show past performance, which is no guarantee of future results. Returns and the principal value of your investment will fluctuate. Current performance may be higher or lower than that shown, and you may have a gain or a loss when you redeem your accumulation units. For current performance information, including performance to the most recent month-end, please visit TIAA.org.
You cannot invest directly in any index. Index returns do not include a deduction for fees or expenses.
| * | The estimated annual operating expenses are taken from the Account’s current prospectus. Expenses are estimated each year based on projected expense and asset levels. Differences between actual expenses and the estimate are adjusted quarterly and are reflected in current investment results. Refer to the Financial highlights later in this report for the Account’s expense ratios as of the end of the reporting period. | |
| † | The performance shown for Classes R2 and R3 that is prior to their inception date is based on performance of the Account’s Class R1. The performance for these periods has not been restated to reflect the lower expenses of Classes R2 and R3. If those expenses had been reflected, the performance would have been higher. | |
| § | As of the close of business on December 31, 2021, the CREF Stock Account Composite Benchmark consisted of: 65.0% Russell 3000® Index and 35.0% MSCI ACWI ex USA IMI. The Account’s benchmark, the components that make up the composite benchmark and the method of calculating the composite benchmark’s performance may vary over time. |
| 12 | 2021 Annual Report ■ College Retirement Equities Fund |
CREF Stock Account
$10,000 over 10 years (Class R1)
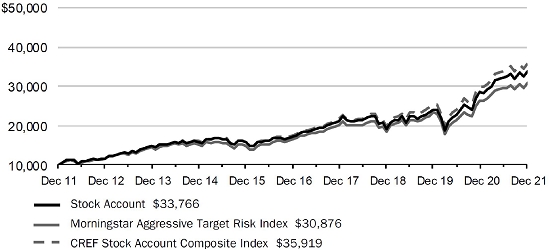
Ending amounts are as of December 31, 2021. For the purpose of comparison, the graph also shows the change in the values of the Account’s composite benchmark and a broad market index during the same period. The performance of other classes varies due to differences in expense charges.
Expense example
Six months ended December 31, 2021
| Stock Account | Beginning account value (7/1/21 | ) | Ending account value (12/31/21 | ) | Expenses paid during period (7/1/21–12/31/21 | * ) | ||||||
| Actual return | ||||||||||||
| Class R1 | $ | 1,000.00 | $ | 1,047.00 | $ | 2.06 | ||||||
| Class R2 | 1,000.00 | 1,047.77 | 1.29 | |||||||||
| Class R3 | 1,000.00 | 1,048.03 | 1.03 | |||||||||
| 5% annual hypothetical return | ||||||||||||
| Class R1 | 1,000.00 | 1,023.19 | 2.04 | |||||||||
| Class R2 | 1,000.00 | 1,023.95 | 1.28 | |||||||||
| Class R3 | 1,000.00 | 1,024.20 | 1.02 | |||||||||
| * | “Expenses paid during period” is based on the Account’s actual expense ratio for the most recent fiscal half-year, multiplied by the average account value over the six-month period, multiplied by 184/365. There were 184 days in the six months ended December 31, 2021. The Account’s annualized six-month expense ratios for that period were 0.40% for Class R1, 0.25% for Class R2 and 0.20% for Class R3. |
For more information about this expense example, please see page 10.
| College Retirement Equities Fund ■ 2021 Annual Report | 13 |
CREF Stock Account
Actual expenses
| Net expense ratio for the one-year period ended 12/31/2021 | |
| Class R1 | 0.43% |
| Class R2 | 0.28% |
| Class R3 | 0.23% |
| Account profile | |
| as of 12/31/2021 | |
| Net assets | $139.17 billion |
| Portfolio turnover rate | 50% |
| Number of holdings | 10,094 |
| Weighted median market capitalization | $86.16 billion |
| Price/earnings ratio (weighted 12-month trailing average)† | 24.0 |
| † | Price/earnings ratio is the price of a stock divided by its earnings per share for the past twelve-month period. |
| Portfolio composition | |
| Sector | % of net assets as of 12/31/2021 |
| Information technology | 23.1 |
| Financials | 13.8 |
| Consumer discretionary | 12.8 |
| Health care | 11.4 |
| Industrials | 10.6 |
| Communication services | 7.8 |
| Consumer staples | 6.1 |
| Materials | 4.8 |
| Energy | 3.2 |
| Real estate | 3.0 |
| Utilities | 2.3 |
| Short-term investments, other assets & liabilities, net | 1.1 |
| Total | 100.0 |
| Holdings by company size | |
| Market capitalization | % of equity investments as of 12/31/2021 |
| More than $50 billion | 60.5 |
| More than $15 billion–$50 billion | 19.4 |
| More than $2 billion–$15 billion | 16.5 |
| $2 billion or less | 3.6 |
| Total | 100.0 |
| Holdings by country | |
| % of portfolio investments as of 12/31/2021 | |
| United States | 63.7 |
| Japan | 4.9 |
| United Kingdom | 3.4 |
| China | 3.1 |
| France | 2.5 |
| Canada | 2.4 |
| Germany | 2.0 |
| Switzerland | 1.8 |
| 73 other nations | 14.4 |
| Short-term investments | 1.8 |
| Total | 100.0 |
| 14 | 2021 Annual Report ■ College Retirement Equities Fund |
Performance for the twelve months ended December 31, 2021
The CREF Global Equities Account returned 15.42% for the year, compared with the 18.54% return of its benchmark, the MSCI All Country World Index (ACWI). (All returns for the Account are for Class R1.)
International developed-markets stocks posted double-digit gains for the period, while emerging-markets equities declined. China’s economy grew at a rapid year-over-year pace in the first quarter, though expansion decelerated as the year progressed. Economies in the 19-nation euro area grew at a moderate pace during the period. Central banks around the world maintained accommodative monetary policies but grew increasingly cautious about rising inflation. The U.S. Federal Reserve maintained the federal funds target rate at 0.00%–0.25% throughout the period, and the European Central Bank left its benchmark rates unchanged at near-zero levels. The Bank of England increased its benchmark interest rate from 0.10% to 0.25% in December 2021.
Thirty-seven of the 48 countries represented in the MSCI ACWI posted gains in U.S.-dollar terms for the twelve-month period. In local-currency terms, the returns of most countries were higher than—or the same as—their U.S.-dollar returns.
Account trailed its benchmark
The account underperformed its benchmark for the twelve-month period. An out-of-benchmark investment in British e-commerce company THG detracted most as the stock declined amid a wave of selling caused by a lack of investor confidence. Next was an overweight position in Chinese internet data services provider GDS Holdings, which was hurt by the bearish trend in Chinese technology stocks, and an underweight in U.S. gaming semiconductor maker NVIDIA, which performed well.
Other positions helped offset these detractors, including overweights in Dutch financial firm ING Groep, which reported strong earnings, as well as U.S. stocks Freeport-McMoRan, a mining company, and Broadcom, a semiconductor manufacturer.
The Account’s returns may sometimes diverge from the returns of its benchmark more than would be expected. This divergence may be the result of the Account’s fair value pricing adjustments or of the timing of foreign currency valuations. Many foreign exchanges close for trading before the Account’s accumulation unit value (AUV) is calculated (see the current CREF prospectus for more details on AUV calculations). In the intervening hours, the values of foreign securities can change, and these changes are not reflected immediately in the returns of the Account’s benchmark. These changes are, however, taken into account to value the Account’s portfolio holdings at the time the Account’s AUV is calculated; these are known as fair value pricing adjustments.
| College Retirement Equities Fund ■ 2021 Annual Report | 15 |
CREF Global Equities Account
Performance as of December 31, 2021
| Global Equities Account | Total return | Average annual total return | Estimated annual operating expenses | |||||||||||||||||
| Inception date | 1 year | 5 years | 10 years | * | ||||||||||||||||
| Class R1 | 5/1/1992 | 15.42 | % | 14.49 | % | 12.39 | % | 0.420 | % | |||||||||||
| Class R2 | 4/24/2015 | 15.59 | 14.71 | 12.55 | † | 0.265 | ||||||||||||||
| Class R3 | 4/24/2015 | 15.65 | 14.78 | 12.60 | † | 0.215 | ||||||||||||||
| MSCI All Country World Index | — | 18.54 | 14.40 | 11.85 | — | |||||||||||||||
The returns in this report show past performance, which is no guarantee of future results. Returns and the principal value of your investment will fluctuate. Current performance may be higher or lower than that shown, and you may have a gain or a loss when you redeem your accumulation units. For current performance information, including performance to the most recent month-end, please visit TIAA.org.
You cannot invest directly in any index. Index returns do not include a deduction for fees or expenses.
| * | The estimated annual operating expenses are taken from the Account’s current prospectus. Expenses are estimated each year based on projected expense and asset levels. Differences between actual expenses and the estimate are adjusted quarterly and are reflected in current investment results. Refer to the Financial highlights later in this report for the Account’s expense ratios as of the end of the reporting period. | |
| † | The performance shown for Classes R2 and R3 that is prior to their inception date is based on performance of the Account’s Class R1. The performance for these periods has not been restated to reflect the lower expenses of Classes R2 and R3. If those expenses had been reflected, the performance would have been higher. |
$10,000 over 10 years (Class R1)
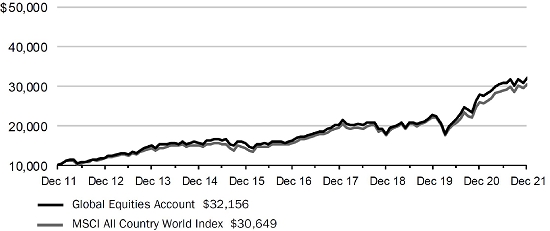
Ending amounts are as of December 31, 2021. For the purpose of comparison, the graph also shows the change in the value of the Account’s benchmark during the same period. The performance of other classes varies due to differences in expense charges.
| 16 | 2021 Annual Report ■ College Retirement Equities Fund |
CREF Global Equities Account
Expense example
Six months ended December 31, 2021
| Global Equities Account | Beginning account value (7/1/21) | Ending account value (12/31/21) | Expenses paid during period (7/1/21–12/31/21 | * ) | ||||||||
| Actual return | ||||||||||||
| Class R1 | $ | 1,000.00 | $ | 1,041.42 | $ | 1.96 | ||||||
| Class R2 | 1,000.00 | 1,042.18 | 1.18 | |||||||||
| Class R3 | 1,000.00 | 1,042.44 | 0.93 | |||||||||
| 5% annual hypothetical return | ||||||||||||
| Class R1 | 1,000.00 | 1,023.29 | 1.94 | |||||||||
| Class R2 | 1,000.00 | 1,024.05 | 1.17 | |||||||||
| Class R3 | 1,000.00 | 1,024.30 | 0.92 | |||||||||
| * | “Expenses paid during period” is based on the Account’s actual expense ratio for the most recent fiscal half-year, multiplied by the average account value over the six-month period, multiplied by 184/365. There were 184 days in the six months ended December 31, 2021. The Account’s annualized six-month expense ratios for that period were 0.38% for Class R1, 0.23% for Class R2 and 0.18% for Class R3. |
For more information about this expense example, please see page 10.
Actual expenses
| Net expense ratio for the one-year period ended 12/31/2021 | |
| Class R1 | 0.41% |
| Class R2 | 0.26% |
| Class R3 | 0.20% |
| College Retirement Equities Fund ■ 2021 Annual Report | 17 |
CREF Global Equities Account
| Account profile | |
| as of 12/31/2021 | |
| Net assets | $28.74 billion |
| Portfolio turnover rate | 46% |
| Number of holdings | 2,568 |
| Weighted median market capitalization | $131.63 billion |
| Price/earnings ratio (weighted 12-month trailing average)† | 23.5 |
| † | Price/earnings ratio is the price of a stock divided by its earnings per share for the past twelve-month period. |
| Portfolio composition | |
| Sector | % of net assets as of 12/31/2021 |
| Information technology | 24.1 |
| Financials | 12.8 |
| Consumer discretionary | 12.4 |
| Health care | 11.2 |
| Industrials | 10.4 |
| Consumer staples | 7.5 |
| Communication services | 7.4 |
| Materials | 5.4 |
| Energy | 3.1 |
| Utilities | 2.1 |
| Real estate | 2.1 |
| Short-term investments, other assets & liabilities, net | 1.5 |
| Total | 100.0 |
| Holdings by company size | |
| Market capitalization | % of equity investments as of 12/31/2021 |
| More than $50 billion | 72.4 |
| More than $15 billion–$50 billion | 18.9 |
| More than $2 billion–$15 billion | 8.2 |
| $2 billion or less | 0.5 |
| Total | 100.0 |
| Holdings by country | |
| % of portfolio investments as of 12/31/2021 | |
| United States | 60.0 |
| Japan | 5.5 |
| United Kingdom | 4.4 |
| China | 3.7 |
| France | 3.5 |
| Netherlands | 2.2 |
| Switzerland | 2.1 |
| Germany | 2.1 |
| 46 other nations | 14.6 |
| Short-term investments | 1.9 |
| Total | 100.0 |
| 18 | 2021 Annual Report ■ College Retirement Equities Fund |
Performance for the twelve months ended December 31, 2021
The CREF Growth Account returned 20.19% for the year, compared with the 27.60% return of its benchmark, the Russell 1000® Growth Index. (All returns for the Account are for Class R1.)
The U.S. economy grew at a solid pace during the period, despite ongoing supply-chain bottlenecks and the impact of new COVID-19 variants. The unemployment rate fell from 6.3% in January 2021 to 3.9% in December. Core inflation, which includes all items except food and energy, rose 5.5% over the twelve months ended December 31, 2021. The Federal Reserve held the federal funds target rate unchanged at 0.00%–0.25%. In November, however, the Fed began reducing the pace of its bond-buying program, which was designed to support the economy and credit markets, and indicated it would continue tapering into 2022. Crude oil prices rose sharply over the twelve months.
The broad U.S. stock market, as measured by the Russell 3000® Index, advanced 25.66% for the period. Large-cap stocks surpassed smaller shares, while mid- and small-cap value equities had the best performance overall. (Returns by investment style and capitalization size are based on the Russell indexes.)
Account posted a double-digit gain but lagged its benchmark
All eleven industry sectors in the Russell 1000 Growth Index generated significant gains for the twelve months. Energy (up 53.9%) was the best-performing sector, driven by the steep increase in oil prices. Information technology (up 33.3%)—the benchmark’s largest sector—contributed more than one-half of the index’s return. The next-largest contributors were communication services (up 31.4%) and consumer discretionary (up 18.4%). Together, these four sectors represented nearly three-quarters of the benchmark’s total market capitalization on December 31, 2021. Utilities (up 13.4%) and industrials (up 16.2%) were the worst-performing sectors.
The Account underperformed its benchmark for the year as certain stock selections did not perform as anticipated. The largest detractors were an underweight position in Apple, which reported strong growth in iPhone and iPad sales, and an overweight position in PayPal Holdings, which issued a lower-than-expected 2022 sales forecast. The next-largest detractor was an overweight position in cloud-communications firm Twilio.
On the positive side, an overweight position in software provider Intuit was the top contributor to relative performance. Intuit benefited from record levels of small business creation in the United States, which fueled demand for its products. The next-largest contributors were overweight positions in retailer Costco Wholesale and semiconductor supplier Marvell Technology.
| College Retirement Equities Fund ■ 2021 Annual Report | 19 |
CREF Growth Account
Performance as of December 31, 2021
| Growth Account | Total return | Average annual total return | Estimated annual | |||||||||||||||||
| Inception date | 1 year | 5 years | 10 years | operating expenses | * | |||||||||||||||
| Class R1 | 4/29/1994 | 20.19 | % | 23.17 | % | 18.56 | % | 0.390 | % | |||||||||||
| Class R2 | 4/24/2015 | 20.37 | 23.40 | 18.73 | † | 0.235 | ||||||||||||||
| Class R3 | 4/24/2015 | 20.43 | 23.47 | 18.78 | † | 0.185 | ||||||||||||||
| Russell 1000® Growth Index | — | 27.60 | 25.32 | 19.79 | — | |||||||||||||||
The returns in this report show past performance, which is no guarantee of future results. Returns and the principal value of your investment will fluctuate. Current performance may be higher or lower than that shown, and you may have a gain or a loss when you redeem your accumulation units. For current performance information, including performance to the most recent month-end, please visit TIAA.org.
You cannot invest directly in any index. Index returns do not include a deduction for fees or expenses.
| * | The estimated annual operating expenses are taken from the Account’s current prospectus. Expenses are estimated each year based on projected expense and asset levels. Differences between actual expenses and the estimate are adjusted quarterly and are reflected in current investment results. Refer to the Financial highlights later in this report for the Account’s expense ratios as of the end of the reporting period. |
| † | The performance shown for Classes R2 and R3 that is prior to their inception date is based on performance of the Account’s Class R1. The performance for these periods has not been restated to reflect the lower expenses of Classes R2 and R3. If those expenses had been reflected, the performance would have been higher. |
$10,000 over 10 years (Class R1)
![]()
Ending amounts are as of December 31, 2021. For the purpose of comparison, the graph also shows the change in the value of the Account’s benchmark during the same period. The performance of other classes varies due to differences in expense charges.
| 20 | 2021 Annual Report ■ College Retirement Equities Fund |
CREF Growth Account
Expense example
Six months ended December 31, 2021
| Growth Account | Beginning account value (7/1/21 | ) | Ending account value (12/31/21 | ) | Expenses paid during period (7/1/21–12/31/21 | * ) | ||||||
| Actual return | ||||||||||||
| Class R1 | $ | 1,000.00 | $ | 1,064.00 | $ | 1.82 | ||||||
| Class R2 | 1,000.00 | 1,064.78 | 1.09 | |||||||||
| Class R3 | 1,000.00 | 1,065.05 | 0.83 | |||||||||
| 5% annual hypothetical return | ||||||||||||
| Class R1 | 1,000.00 | 1,023.44 | 1.79 | |||||||||
| Class R2 | 1,000.00 | 1,024.15 | 1.07 | |||||||||
| Class R3 | 1,000.00 | 1,024.40 | 0.82 | |||||||||
| * | “Expenses paid during period” is based on the Account’s actual expense ratio for the most recent fiscal half-year, multiplied by the average account value over the six-month period, multiplied by 184/365. There were 184 days in the six months ended December 31, 2021. The Account’s annualized six-month expense ratios for that period were 0.35% for Class R1, 0.21% for Class R2 and 0.16% for Class R3. |
For more information about this expense example, please see page 10.
Actual expenses
| Net expense ratio for the one-year period ended 12/31/2021 | ||||
| Class R1 | 0.38 | % | ||
| Class R2 | 0.23 | % | ||
| Class R3 | 0.18 | % | ||
| College Retirement Equities Fund ■ 2021 Annual Report | 21 |
CREF Growth Account
| Account profile | ||
| as of 12/31/2021 | ||
| Net assets | $39.84 billion | |
| Portfolio turnover rate | 67% | |
| Number of holdings | 121 | |
| Weighted median market capitalization | $250.82 billion | |
| Price/earnings ratio (weighted 12-month trailing average)† | 46.5 |
| † | Price/earnings ratio is the price of a stock divided by its earnings per share for the past twelve-month period. |
| Portfolio composition | ||
| Sector | % of net assets as of 12/31/2021 | |
| Information technology | 41.9 | |
| Consumer discretionary | 19.3 | |
| Communication services | 13.6 | |
| Health care | 10.2 | |
| Industrials | 5.5 | |
| Consumer staples | 4.0 | |
| Financials | 3.5 | |
| Materials | 1.2 | |
| Short-term investments, other assets & liabilities, net | 0.8 | |
| Total | 100.0 |
| Holdings by company size | ||
| Market capitalization | % of equity investments as of 12/31/2021 | |
| More than $50 billion | 84.2 | |
| More than $15 billion–$50 billion | 14.5 | |
| More than $2 billion–$15 billion | 1.2 | |
| $2 billion or less | 0.1 | |
| Total | 100.0 |
| 22 | 2021 Annual Report ■ College Retirement Equities Fund |
Performance for the twelve months ended December 31, 2021
The CREF Equity Index Account returned 25.26% for the year, compared with the 25.66% return of its benchmark, the Russell 3000® Index. (All returns for the Account are for Class R1.)
For the twelve-month period, the Account’s return underperformed that of its benchmark index due to the effect of expenses. The Account’s return includes a deduction for expenses, while the benchmark’s does not. The Account had a risk profile similar to that of its benchmark.
The U.S. economy grew at a solid pace during the period, despite ongoing supply-chain bottlenecks and the impact of new COVID-19 variants. The unemployment rate fell from 6.3% in January 2021 to 3.9% in December. Core inflation, which includes all items except food and energy, rose 5.5% over the twelve months ended December 31, 2021. The Federal Reserve held the federal funds target rate unchanged at 0.00%–0.25%. In November, however, the Fed began reducing the pace of its bond-buying program, which was designed to support the economy and credit markets, and indicated it would continue tapering into 2022. Crude oil prices rose sharply over the twelve months.
The broad U.S. stock market, as measured by the Russell 3000 Index, advanced 25.66% for the period. Large-cap stocks surpassed smaller shares, while mid- and small-cap value equities had the best performance overall. (Returns by investment style and capitalization size are based on the Russell indexes.)
All benchmark sectors posted double-digit gains
All eleven industry sectors in the Russell 3000 Index delivered substantial gains for the twelve months. Energy (up 56.1%) produced the strongest return, helped by rising oil prices. Information technology (up 29.9%)—the benchmark’s largest sector—was the top contributor to the index’s return. The next-largest contributors were financials (up 34.8%) and consumer discretionary (up 22.4%). Together, these four sectors represented over one-half of the benchmark’s total market capitalization on December 31, 2021. The worst performer was utilities (up 17.1%), a defensive sector that tends to lag when the economy is strong, followed by communication services (up 17.9%).
For the twelve-month period, four of the five largest stocks in the Russell 3000 Index generated impressive gains that surpassed the overall return of the benchmark. Alphabet (the parent company of Google) performed best amid robust growth in spending on digital advertising. Next came Microsoft, which benefited from strong demand for its cloud-computing services. Electric car maker Tesla and Apple also outperformed, while Amazon.com advanced modestly but trailed the benchmark. Amazon was hurt by rising labor and shipping costs.
| College Retirement Equities Fund ■ 2021 Annual Report | 23 |
CREF Equity Index Account
Performance as of December 31, 2021
| Equity Index Account | Total return | Average annual total return | Estimated annual | |||||||||||||||||
| Inception date | 1 year | 5 years | 10 years | operating expenses | * | |||||||||||||||
| Class R1 | 4/29/1994 | 25.26 | % | 17.45 | % | 15.79 | % | 0.375 | % | |||||||||||
| Class R2 | 4/24/2015 | 25.45 | 17.68 | 15.96 | † | 0.220 | ||||||||||||||
| Class R3 | 4/24/2015 | 25.52 | 17.75 | 16.01 | † | 0.170 | ||||||||||||||
| Russell 3000® Index | — | 25.66 | 17.97 | 16.30 | — | |||||||||||||||
The returns in this report show past performance, which is no guarantee of future results. Returns and the principal value of your investment will fluctuate. Current performance may be higher or lower than that shown, and you may have a gain or a loss when you redeem your accumulation units. For current performance information, including performance to the most recent month-end, please visit TIAA.org.
You cannot invest directly in any index. Index returns do not include a deduction for fees or expenses.
| * | The estimated annual operating expenses are taken from the Account’s current prospectus. Expenses are estimated each year based on projected expense and asset levels. Differences between actual expenses and the estimate are adjusted quarterly and are reflected in current investment results. Refer to the Financial highlights later in this report for the Account’s expense ratios as of the end of the reporting period. |
| † | The performance shown for Classes R2 and R3 that is prior to their inception date is based on performance of the Account’s Class R1. The performance for these periods has not been restated to reflect the lower expenses of Classes R2 and R3. If those expenses had been reflected, the performance would have been higher. |
$10,000 over 10 years (Class R1)

Ending amounts are as of December 31, 2021. For the purpose of comparison, the graph also shows the change in the value of the Account’s benchmark during the same period. The performance of other classes varies due to differences in expense charges.
| 24 | 2021 Annual Report ■ College Retirement Equities Fund |
CREF Equity Index Account
Expense example
Six months ended December 31, 2021
| Equity Index Account | Beginning account value (7/1/21 | ) | Ending account value (12/31/21 | ) | Expenses paid during period (7/1/21–12/31/21 | * ) | ||||||
| Actual return | ||||||||||||
| Class R1 | $ | 1,000.00 | $ | 1,089.97 | $ | 1.79 | ||||||
| Class R2 | 1,000.00 | 1,090.76 | 1.00 | |||||||||
| Class R3 | 1,000.00 | 1,091.04 | 0.74 | |||||||||
| 5% annual hypothetical return | ||||||||||||
| Class R1 | 1,000.00 | 1,023.49 | 1.73 | |||||||||
| Class R2 | 1,000.00 | 1,024.25 | 0.97 | |||||||||
| Class R3 | 1,000.00 | 1,024.50 | 0.71 | |||||||||
| * | “Expenses paid during period” is based on the Account’s actual expense ratio for the most recent fiscal half-year, multiplied by the average account value over the six-month period, multiplied by 184/365. There were 184 days in the six months ended December 31, 2021. The Account’s annualized six-month expense ratios for that period were 0.34% for Class R1, 0.19% for Class R2 and 0.14% for Class R3. |
For more information about this expense example, please see page 10.
Actual expenses
| Net expense ratio for the one-year period ended 12/31/2021 | ||||
| Class R1 | 0.36 | % | ||
| Class R2 | 0.21 | % | ||
| Class R3 | 0.16 | % | ||
| College Retirement Equities Fund ■ 2021 Annual Report | 25 |
CREF Equity Index Account
| Account profile | ||
| as of 12/31/2021 | ||
| Net assets | $25.68 billion | |
| Portfolio turnover rate | 4% | |
| Number of holdings | 2,814 | |
| Weighted median market capitalization | $139.18 billion | |
| Price/earnings ratio (weighted 12-month trailing average)† | 28.5 |
| † | Price/earnings ratio is the price of a stock divided by its earnings per share for the past twelve-month period. |
| Portfolio composition | ||
| Sector | % of net assets as of 12/31/2021 | |
| Information technology | 28.2 | |
| Health care | 13.3 | |
| Consumer discretionary | 12.3 | |
| Financials | 11.2 | |
| Communication services | 9.2 | |
| Industrials | 8.9 | |
| Consumer staples | 5.4 | |
| Real estate | 3.6 | |
| Energy | 2.7 | |
| Utilities | 2.4 | |
| Materials | 2.4 | |
| Short-term investments, other assets & liabilities, net | 0.4 | |
| Total | 100.0 |
Holdings by company size
| Market capitalization | % of equity investments as of 12/31/2021 | |
| More than $50 billion | 68.4 | |
| More than $15 billion–$50 billion | 17.7 | |
| More than $2 billion–$15 billion | 12.0 | |
| $2 billion or less | 1.9 | |
| Total | 100.0 |
| 26 | 2021 Annual Report ■ College Retirement Equities Fund |
Performance for the twelve months ended December 31, 2021
The CREF Bond Market Account returned –1.43% for the year, compared with the –1.54% return of its benchmark, the Bloomberg U.S. Aggregate Bond Index. (All returns for the Account are for Class R1.)
The U.S. economy grew at a solid pace during the period, despite ongoing supply-chain bottlenecks and the impact of new COVID-19 variants. The unemployment rate fell from 6.3% in January 2021 to 3.9% in December. Core inflation, which includes all items except food and energy, rose 5.5% over the twelve months ended December 31, 2021, while crude oil prices increased sharply.
Central banks around the world maintained accommodative monetary policies but grew increasingly cautious about rising inflation. The Federal Reserve maintained the federal funds target rate throughout the period at 0.00%–0.25%, and the European Central Bank left its benchmark rates unchanged at near-zero levels. The Bank of England increased its benchmark rate from 0.10% to 0.25% in December. Yields on U.S. Treasury securities rose for all but one- to three-month maturities, with intermediate-term bond yields having the largest increases (bond yields move in the opposite direction of prices).
Account outperformed its benchmark
Most sectors in the Bloomberg U.S. Aggregate Bond Index declined for the twelve month period due to the general rise in bond yields. The U.S. Treasuries sector, the largest in the index with a weight of 37.8%, returned –2.3%. Mortgage-backed securities (MBS), the second-largest sector accounting for 26.5% of the index’s total market capitalization on December 31, 2021, returned –1.0%. Corporate bonds—the benchmark’s third-largest sector at 26.4%—returned –1.0%, while asset-backed securities and commercial mortgage-backed securities (CMBS) returned –0.3% and –1.2%, respectively.
The Account outperformed its benchmark for the year, with asset allocation as the largest driver of the Account’s returns versus its benchmark. An overweight to corporate bonds (including high-yield and emerging-markets corporates) and underweights to MBS and Treasuries proved beneficial as risk appetites returned during the year. Positions in out-of-index municipal bonds, asset-backed securities and CMBS also aided the Account’s performance. Overall, shorter-than-benchmark duration helped as rates generally rose.
By contrast, these positive effects were offset by positioning along the yield curve, where the Account was underweight the longer-maturity segments of the curve.
| College Retirement Equities Fund ■ 2021 Annual Report | 27 |
CREF Bond Market Account
Performance as of December 31, 2021
| Bond Market Account | Average annual | Estimated | ||||||||||||||||
| Total return | total return | annual | ||||||||||||||||
| Inception | operating | |||||||||||||||||
| date | 1 year | 5 years | 10 years | expenses | * | |||||||||||||
| Class R1 | 3/1/1990 | –1.43 | % | 3.59 | % | 2.98 | % | 0.415 | % | |||||||||
| Class R2 | 4/24/2015 | –1.28 | 3.79 | 3.13 | † | 0.260 | ||||||||||||
| Class R3 | 4/24/2015 | –1.23 | 3.85 | 3.18 | † | 0.210 | ||||||||||||
| Bloomberg U.S. Aggregate Bond Index | — | –1.54 | 3.57 | 2.90 | — | |||||||||||||
The returns in this report show past performance, which is no guarantee of future results. Returns and the principal value of your investment will fluctuate. Current performance may be higher or lower than that shown, and you may have a gain or a loss when you redeem your accumulation units. For current performance and 30-day SEC yield information, including performance to the most recent month-end, please visit TIAA.org.
You cannot invest directly in any index. Index returns do not include a deduction for fees or expenses.
| * | The estimated annual operating expenses are taken from the Account’s current prospectus. Expenses are estimated each year based on projected expense and asset levels. Differences between actual expenses and the estimate are adjusted quarterly and are reflected in current investment results. Refer to the Financial highlights later in this report for the Account’s expense ratios as of the end of the reporting period. |
| † | The performance shown for Classes R2 and R3 that is prior to their inception date is based on performance of the Account’s Class R1. The performance for these periods has not been restated to reflect the lower expenses of Classes R2 and R3. If those expenses had been reflected, the performance would have been higher. |
$10,000 over 10 years (Class R1)

Ending amounts are as of December 31, 2021. For the purpose of comparison, the graph also shows the change in the value of the Account’s benchmark during the same period. The performance of other classes varies due to differences in expense charges.
| 28 | 2021 Annual Report ■ College Retirement Equities Fund |
CREF Bond Market Account
Expense example
Six months ended December 31, 2021
| Bond Market Account | Beginning account value (7/1/21 | ) | Ending account value (12/31/21 | ) | Expenses paid during period (7/1/21-12/31/21 | * ) | ||||||
| Actual return | ||||||||||||
| Class R1 | $ | 1,000.00 | $ | 997.78 | $ | 1.96 | ||||||
| Class R2 | 1,000.00 | 998.51 | 1.21 | |||||||||
| Class R3 | 1,000.00 | 998.76 | 0.96 | |||||||||
| 5% annual hypothetical return | ||||||||||||
| Class R1 | 1,000.00 | 1,023.24 | 1.99 | |||||||||
| Class R2 | 1,000.00 | 1,024.00 | 1.22 | |||||||||
| Class R3 | 1,000.00 | 1,024.25 | 0.97 | |||||||||
| * | “Expenses paid during period” is based on the Account’s actual expense ratio for the most recent fiscal half-year, multiplied by the average account value over the six-month period, multiplied by 184/365. There were 184 days in the six months ended December 31, 2021. The Account’s annualized six-month expense ratios for that period were 0.39% for Class R1, 0.24% for Class R2 and 0.19% for Class R3. |
For more information about this expense example, please see page 10.
Actual expenses
| Net expense ratio for the one-year period ended 12/31/2021 | |||
| Class R1 | 0.41% | ||
| Class R2 | 0.26% | ||
| Class R3 | 0.21% | ||
| College Retirement Equities Fund ■ 2021 Annual Report | 29 |
CREF Bond Market Account
Account profile
| as of 12/31/2021 | ||
| Net assets | $13.62 billion | |
| Portfolio turnover rate | 207% | |
| Portfolio turnover rate, excluding mortgage dollar-roll transactions | 49% | |
| Number of issues | 2,140 | |
| Option-adjusted duration‡ | 6.33 years | |
| Average maturity§ | 8.38 years |
| ‡ | Option-adjusted duration estimates how much the value of a bond portfolio would be affected by a change in prevailing interest rates, taking into account the options embedded in the individual securities. The longer a portfolio’s duration, the more sensitive it is to changes in interest rates. |
| § | Average maturity is a simple average of the maturities of all the bonds in an account’s portfolio. The maturity of a bond is the amount of time until the bond’s principal becomes due or payable. |
Portfolio composition
| Sector | % of net assets as of 12/31/2021 | |
| Corporate bonds | 33.4 | |
| Mortgage-backed securities | 23.5 | |
| Foreign government & corporate bonds denominated in U.S. dollars | 15.8 | |
| U.S. Treasury securities | 7.6 | |
| Commercial mortgage-backed securities | 7.3 | |
| Asset-backed securities | 6.9 | |
| Municipal bonds | 3.0 | |
| Bank loan obligations | 0.7 | |
| U.S. agency securities | 0.4 | |
| Preferred stock | 0.1 | |
| Short-term investments, other assets & liabilities, net | 1.3 | |
| Total | 100.0 |
Holdings by maturity
| % of fixed-income investments (excluding short-term investments) as of 12/31/2021 | ||
| Less than 1 year | 3.6 | |
| 1–3 years | 12.4 | |
| 3–5 years | 20.7 | |
| 5–10 years | 44.0 | |
| Over 10 years | 19.3 | |
| Total | 100.0 |
Holdings by credit quality
| % of fixed-income investments (excluding short-term investments) as of 12/31/2021 | |||
| U.S. Treasury & U.S. agency securities* | 28.3 | ||
| Aaa/AAA | 9.9 | ||
| Aa/AA | 9.1 | ||
| A/A | 18.1 | ||
| Baa/BBB | 29.2 | ||
| Ba/BB | 3.0 | ||
| B/B | 1.2 | ||
| Non-rated | 1.2 | ||
| Total | 100.0 | ||
| * | These securities are guaranteed by the full faith and credit of the U.S. government. |
Credit quality ratings are based on the Bloomberg methodology, which uses the median rating of those compiled by the Moody’s, Standard & Poor’s and Fitch ratings agencies. If ratings are available from only two of these agencies, the lower rating is used. When only one rating is available, that one is used. These ratings are subject to change without notice.
| 30 | 2021 Annual Report ■ College Retirement Equities Fund |
CREF Inflation-Linked Bond Account
Performance for the twelve months ended December 31, 2021
The CREF Inflation-Linked Bond Account returned 5.06% for the year, compared with the 5.69% return of its benchmark, the Bloomberg U.S. Treasury Inflation Protected Securities (TIPS) 1–10 Year Index. (All returns for the Account are for Class R1.)
The U.S. economy grew at a solid pace during the period, despite ongoing supply-chain bottlenecks and the impact of new COVID-19 variants. The unemployment rate fell from 6.3% in January 2021 to 3.9% in December. Core inflation, which includes all items except food and energy, rose 5.5% over the twelve months ended December 31, 2021, while crude oil prices increased sharply.
Central banks around the world maintained accommodative monetary policies but grew increasingly cautious about rising inflation. The Federal Reserve maintained the federal funds target rate throughout the period at 0.00%–0.25%, and the European Central Bank left its benchmark rates unchanged at near-zero levels. The Bank of England increased its benchmark rate from 0.10% to 0.25% in December. Yields on U.S. Treasury securities rose for all but one- to three-month maturities, with intermediate-term bond yields having the largest increases (bond yields move in the opposite direction of prices).
TIPS surpassed the broader U.S. bond market
For the twelve months, the TIPS 1–10 Year Index outperformed the –1.54% return of the broad domestic investment-grade fixed-rate bond market, as measured by the Bloomberg U.S. Aggregate Bond Index.
Yields on intermediate- and longer-maturity high-quality bonds rose during the period as tight labor markets, surging consumer demand and supply-chain bottlenecks led to higher interest rates, a sharp increase in inflation and a shift in Fed monetary policy. As a result, bond performance overall was generally negative. However, these developments were favorable for TIPS, which posted gains for the period.
The Account trailed its benchmark for the period. The Account’s return includes a deduction for expenses, while the benchmark’s return does not. Since the Account’s portfolio resembled the composition of its benchmark, the above discussion of the benchmark’s performance also applies to the Account’s performance.
During the period, the Account’s portfolio managers kept the Account’s duration—a measure of its sensitivity to interest-rate changes—close to that of the TIPS 1–10 Year Index. This strategy helped the Account’s risk and reward characteristics to more closely resemble those of its benchmark.
| College Retirement Equities Fund ■ 2021 Annual Report | 31 |
CREF Inflation-Linked Bond Account
Performance as of December 31, 2021
| Inflation-Linked Bond Account | Average annual | Estimated | ||||||||||||||||
| Total return | total return | annual | ||||||||||||||||
| Inception | operating | |||||||||||||||||
| date | 1 year | 5 years | 10 years | expenses | * | |||||||||||||
| Class R1 | 5/1/1997 | 5.06 | % | 3.93 | % | 2.13 | % | 0.385 | % | |||||||||
| Class R2 | 4/24/2015 | 5.22 | 4.13 | 2.28 | † | 0.230 | ||||||||||||
| Class R3 | 4/24/2015 | 5.28 | 4.19 | 2.33 | † | 0.180 | ||||||||||||
| Bloomberg U.S. Treasury Inflation Protected Securities (TIPS) 1–10 Year Index | — | 5.69 | 4.46 | 2.57 | — | |||||||||||||
The returns in this report show past performance, which is no guarantee of future results. Returns and the principal value of your investment will fluctuate. Current performance may be higher or lower than that shown, and you may have a gain or a loss when you redeem your accumulation units. For current performance and 30-day SEC yield information, including performance to the most recent month-end, please visit TIAA.org.
You cannot invest directly in any index. Index returns do not include a deduction for fees or expenses.
| * | The estimated annual operating expenses are taken from the Account’s current prospectus. Expenses are estimated each year based on projected expense and asset levels. Differences between actual expenses and the estimate are adjusted quarterly and are reflected in current investment results. Refer to the Financial highlights later in this report for the Account’s expense ratios as of the end of the reporting period. |
| † | The performance shown for Classes R2 and R3 that is prior to their inception date is based on performance of the Account’s Class R1. The performance for these periods has not been restated to reflect the lower expenses of Classes R2 and R3. If those expenses had been reflected, the performance would have been higher. |
$10,000 over 10 years (Class R1)

Ending amounts are as of December 31, 2021. For the purpose of comparison, the graph also shows the change in the value of the Account’s benchmark during
| 32 | 2021 Annual Report ■ College Retirement Equities Fund |
CREF Inflation-Linked Bond Account
the same period. The performance of other classes varies due to differences in expense charges.
Expense example
Six months ended December 31, 2021
| Inflation-Linked Bond Account | Beginning account value (7/1/21 | ) | Ending account value (12/31/21 | ) | Expenses paid during period (7/1/21-12/31/21 | * ) | ||||||
| Actual return | ||||||||||||
| Class R1 | $ | 1,000.00 | $ | 1,029.63 | $ | 1.79 | ||||||
| Class R2 | 1,000.00 | 1,030.38 | 1.07 | |||||||||
| Class R3 | 1,000.00 | 1,030.64 | 0.82 | |||||||||
| 5% annual hypothetical return | ||||||||||||
| Class R1 | 1,000.00 | 1,023.44 | 1.79 | |||||||||
| Class R2 | 1,000.00 | 1,024.15 | 1.07 | |||||||||
| Class R3 | 1,000.00 | 1,024.40 | 0.82 | |||||||||
| * | “Expenses paid during period” is based on the Account’s actual expense ratio for the most recent fiscal half-year, multiplied by the average account value over the six-month period, multiplied by 184/365. There were 184 days in the six months ended December 31, 2021. The Account’s annualized six-month expense ratios for that period were 0.35% for Class R1, 0.21% for Class R2 and 0.16% for Class R3. |
For more information about this expense example, please see page 10.
Actual expenses
| Net expense ratio for the one-year period ended 12/31/2021 | |
| Class R1 | 0.37% |
| Class R2 | 0.22% |
| Class R3 | 0.17% |
| College Retirement Equities Fund ■ 2021 Annual Report | 33 |
CREF Inflation-Linked Bond Account
Account profile
| as of 12/31/2021 | |
| Net assets | $7.82 billion |
| Portfolio turnover rate | 24% |
| Number of issues | 128 |
| Option-adjusted duration‡ | 4.40 years |
| Average maturity§ | 4.53 years |
| ‡ | Option-adjusted duration estimates how much the value of a bond portfolio would be affected by a change in prevailing interest rates, taking into account the options embedded in the individual securities. The longer a portfolio’s duration, the more sensitive it is to changes in interest rates. |
| § | Average maturity is a simple average of the maturities of all the bonds in an account’s portfolio. The maturity of a bond is the amount of time until the bond’s principal becomes due or payable. |
Portfolio composition
| Sector | % of net assets as of 12/31/2021 |
| U.S. Treasury securities | 92.7 |
| Mortgage-backed securities | 3.1 |
| Commercial mortgage-backed securities | 1.3 |
| Corporate bonds | 1.0 |
| Foreign government & corporate bonds denominated in U.S. dollars | 0.5 |
| Bank loan obligations | 0.4 |
| Asset-backed securities | 0.4 |
| U.S. agency securities | 0.2 |
| Short-term investments, other assets & liabilities, net | 0.4 |
| Total | 100.0 |
Holdings by maturity
| % of fixed-income investments (excluding short-term investments) as of 12/31/2021 | |
| Less than 1 year | 3.5 |
| 1–3 years | 25.7 |
| 3–5 years | 28.8 |
| 5–10 years | 39.4 |
| Over 10 years | 2.6 |
| Total | 100.0 |
Holdings by credit quality
| % of fixed-income investments (excluding short-term investments) as of 12/31/2021 | ||
| U.S. Treasury & U.S. agency securities* | 93.0 | |
| Aaa/AAA | 2.5 | |
| Aa/AA | 0.2 | |
| A/A | 1.0 | |
| Baa/BBB | 0.9 | |
| Ba/BB | 1.3 | |
| B/B | 0.3 | |
| Non-rated | 0.8 | |
| Total | 100.0 | |
| * | These securities are guaranteed by the full faith and credit of the U.S. government. |
Credit quality ratings are based on the Bloomberg methodology, which uses the median rating of those compiled by the Moody’s, Standard & Poor’s and Fitch ratings agencies. If ratings are available from only two of these agencies, the lower rating is used. When only one rating is available, that one is used. These ratings are subject to change without notice.
| 34 | 2021 Annual Report ■ College Retirement Equities Fund |
Performance for the twelve months ended December 31, 2021
The CREF Social Choice Account returned 12.42% for the year, compared with the 11.97% return of its composite benchmark, a weighted average of the Russell 3000® Index, the MSCI EAFE+Canada Index and the Bloomberg U.S. Aggregate Bond Index. The Account utilizes environmental, social and governance (ESG) criteria, while the benchmark does not. (All returns for the Account are for Class R1.)
Because of its ESG criteria, the Account did not invest in a number of stocks and bonds that were included in the indexes that comprise its composite benchmark. Avoiding these investments produced mixed results, but the net effect was that the Account outperformed its benchmark.
Relative to the Russell 3000 Index, the performance of the Account’s domestic equity component benefited from avoiding Amazon.com, credit card issuer Visa and AT&T. In contrast, the omissions of drug maker Pfizer, Exxon Mobil and Bank of America were detrimental. Relative to the MSCI EAFE+Canada Index, the Account’s international holdings were helped by excluding Japanese conglomerate Softbank Group, Swiss drug maker Novartis and British consumer products giant Unilever. Conversely, avoiding French luxury goods firm LVMH, Toronto-Dominion Bank and British beverage company Diageo was disadvantageous.
Account outperformed its composite benchmark
To compensate for the Account’s exclusion of some stocks, its managers use quantitative (mathematical) modeling and other techniques in an attempt to match the overall investment characteristics of the portfolio with those of its composite benchmark.
Compared to the Russell 3000 Index, the Account’s domestic equity holdings benefited most from overweight positions in semiconductor companies NVIDIA and Applied Materials, as well as software provider Intuit. By contrast, the largest detractors were an underweight position in Apple and overweight positions in PayPal and video game firm Activision Blizzard.
Relative to the MSCI EAFE+Canada Index, the Account’s foreign holdings were helped most by an overweight position in Japanese marine transportation company Nippon Yusen, an underweight position in Hong Kong insurer AIA Group and an overweight position in Canada’s Cenovus Energy. Conversely, overweight positions in French digital services company Atos, Japan’s Chugai Pharmaceutical and Danish wind farm developer Orsted detracted most from relative performance.
The Account’s fixed-income component declined, but its return outperformed the –1.54% result of the Bloomberg U.S. Aggregate Bond Index, mainly due to favorable yield curve positioning in the U.S. Treasuries sector.
| College Retirement Equities Fund ■ 2021 Annual Report | 35 |
CREF Social Choice Account
| Performance as of December 31, 2021 | ||||||||||||||||||||
| Social Choice Account | Average annual | Estimated | ||||||||||||||||||
| Total return | total return | annual | ||||||||||||||||||
| Inception | operating | |||||||||||||||||||
| date | 1 year | 5 years | 10 years | expenses | * | |||||||||||||||
| Class R1 | 3/1/1990 | 12.42 | % | 10.78 | % | 9.34 | % | 0.400 | % | |||||||||||
| Class R2 | 4/24/2015 | 12.59 | 10.99 | 9.49 | † | 0.245 | ||||||||||||||
| Class R3 | 4/24/2015 | 12.64 | 11.06 | 9.54 | † | 0.195 | ||||||||||||||
| CREF Social Choice Account Composite Index§ | — | 11.97 | 10.88 | 9.67 | — | |||||||||||||||
| Broad market index | ||||||||||||||||||||
| Morningstar Moderate Target Risk Index | — | 10.19 | 10.07 | 8.75 | — | |||||||||||||||
The returns in this report show past performance, which is no guarantee of future results. Returns and the principal value of your investment will fluctuate. Current performance may be higher or lower than that shown, and you may have a gain or a loss when you redeem your accumulation units. For current performance information, including performance to the most recent month-end, please visit TIAA.org.
You cannot invest directly in any index. Index returns do not include a deduction for fees or expenses.
| * | The estimated annual operating expenses are taken from the Account’s current prospectus. Expenses are estimated each year based on projected expense and asset levels. Differences between actual expenses and the estimate are adjusted quarterly and are reflected in current investment results. Refer to the Financial highlights later in this report for the Account’s expense ratios as of the end of the reporting period. |
| † | The performance shown for Classes R2 and R3 that is prior to their inception date is based on performance of the Account’s Class R1. The performance for these periods has not been restated to reflect the lower expenses of Classes R2 and R3. If those expenses had been reflected, the performance would have been higher. |
| § | As of the close of business on December 31, 2021, the CREF Social Choice Composite Benchmark consisted of: 42.0% Russell 3000® Index, 40.0% Bloomberg U.S. Aggregate Bond Index and 18.0% MSCI EAFE+ Canada Index. The Account’s benchmark, the components that make up the composite benchmark and the method of calculating the composite benchmark’s performance may vary over time. |
| 36 | 2021 Annual Report ■ College Retirement Equities Fund |
CREF Social Choice Account
$10,000 over 10 years (Class R1)
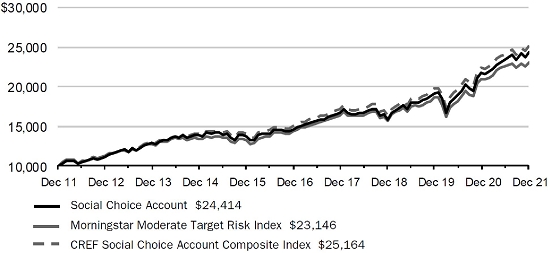
Ending amounts are as of December 31, 2021. For the purpose of comparison, the graph also shows the change in the values of the Account’s composite benchmark and a broad market index during the same period. The performance of other classes varies due to differences in expense charges.
Expense example
Six months ended December 31, 2021
| Beginning | Ending | Expenses paid | ||||||||||
| account value | account value | during period | * | |||||||||
| Social Choice Account | (7/1/21 | ) | (12/31/21 | ) | (7/1/21-12/31/21 | ) | ||||||
| Actual return | ||||||||||||
| Class R1 | $1,000.00 | $ | 1,044.86 | $ | 1.91 | |||||||
| Class R2 | 1,000.00 | 1,045.63 | 1.19 | |||||||||
| Class R3 | 1,000.00 | 1,045.89 | 0.93 | |||||||||
| 5% annual hypothetical return | ||||||||||||
| Class R1 | 1,000.00 | 1,023.34 | 1.89 | |||||||||
| Class R2 | 1,000.00 | 1,024.05 | 1.17 | |||||||||
| Class R3 | 1,000.00 | 1,024.30 | 0.92 | |||||||||
| * | “Expenses paid during period” is based on the Account’s actual expense ratio for the most recent fiscal half-year, multiplied by the average account value over the six-month period, multiplied by 184/365. There were 184 days in the six months ended December 31, 2021. The Account’s annualized six-month expense ratios for that period were 0.37% for Class R1, 0.23% for Class R2 and 0.18% for Class R3. |
For more information about this expense example, please see page 10.
| College Retirement Equities Fund ■ 2021 Annual Report | 37 |
CREF Social Choice Account
Actual expenses
| Net expense ratio for the one-year period ended 12/31/2021 | ||
| Class R1 | 0.40% | |
| Class R2 | 0.24% | |
| Class R3 | 0.19% |
| Account profile | ||
| as of 12/31/2021 | ||
| Net assets | $19.75 billion | |
| Portfolio turnover rate | 118% | |
| Portfolio turnover rate, excluding mortgage dollar-roll transactions | 57% | |
| Equity segment | ||
| Number of holdings | 1,031 | |
| Weighted median market capitalization | $75.74 billion | |
| Price/earnings ratio (weighted 12-month trailing average)† | 24.0 | |
| Fixed-income segment | ||
| Number of issues | 960 | |
| Option-adjusted duration‡ | 6.61 years | |
| Average maturity§ | 9.51 years |
| † | Price/earnings ratio is the price of a stock divided by its earnings per share for the past twelve-month period. |
| ‡ | Option-adjusted duration estimates how much the value of a bond portfolio would be affected by a change in prevailing interest rates, taking into account the options embedded in the individual securities. The longer a portfolio’s duration, the more sensitive it is to changes in interest rates. |
| § | Average maturity is a simple average of the maturities of all the bonds in an account’s portfolio. The maturity of a bond is the amount of time until the bond’s principal becomes due or payable. |
| Portfolio composition | ||
| Sector | % of net assets as of 12/31/2021 | |
| Equities | 60.1 | |
| Fixed-income securities | 38.8 | |
| Short-term investments, other assets & liabilities, net | 1.1 | |
| Total | 100.0 | |
| Holdings by company size | ||
| Market capitalization | % of equity investments as of 12/31/2021 | |
| More than $50 billion | 59.5 | |
| More than $15 billion–$50 billion | 27.8 | |
| More than $2 billion–$15 billion | 11.7 | |
| $2 billion or less | 1.0 | |
| Total | 100.0 | |
| Holdings by maturity | ||
| % of fixed-income investments (excluding short-term investments) as of 12/31/2021 | ||
| Less than 1 year | 2.8 | |
| 1–3 years | 13.2 | |
| 3–5 years | 18.2 | |
| 5–10 years | 41.5 | |
| Over 10 years | 24.3 | |
| Total | 100.0 | |
| 38 | 2021 Annual Report ■ College Retirement Equities Fund |
Performance for the twelve months ended December 31, 2021
The CREF Money Market Account returned 0.00% for the year, compared with the 0.01% return of the iMoneyNet Money Fund Averages™—All Government, a simple average of over 500 money market funds that invest in short-term U.S. government securities. The iMoneyNet average is not an index, and its return reflects the deduction of expenses charged by the funds included in the average. (All returns for the Account are for Class R1.)
The U.S. economy grew at a solid pace during the period, despite ongoing supply-chain bottlenecks and the impact of new COVID-19 variants. The unemployment rate fell from 6.3% in January 2021 to 3.9% in December. Core inflation, which includes all items except food and energy, rose 5.5% over the twelve months ended December 31, 2021, while crude oil prices increased sharply.
Central banks around the world maintained accommodative monetary policies but grew increasingly cautious about rising inflation. The Federal Reserve maintained the federal funds target rate throughout the period at 0.00%–0.25%, and the European Central Bank left its benchmark rates unchanged at near-zero levels. The Bank of England increased its benchmark rate from 0.10% to 0.25% in December. Yields on U.S. Treasury securities rose for all but one- to three-month maturities, with intermediate-term bond yields having the largest increases (bond yields move in the opposite direction of prices).
During the twelve-month period, continued low short-term interest rates kept yields on government money market securities at near-zero levels. The “secured overnight financing rate” (SOFR), which represents dealer transactions in Treasury collateralized overnight repurchase agreements, declined from 0.10% on January 4, 2021, to 0.05% on December 31, 2021. With short-term interest rates at such low levels, money market fund yields followed suit and remained at almost zero as well.
Account slightly trailed the iMoneyNet average
In an environment of historically low money market rates, the Money Market Account’s return was slightly lower than that of the iMoneyNet average for the year. The Account continued to invest in floating-rate government agency securities, which provide a yield enhancement over short-term fixed-rate securities and could produce higher income if market rates rise. As of December 28, 2021, the Account’s weighted average maturity (WAM) was 40 days, versus 35 days for the iMoneyNet average. iMoneyNet releases their data on a weekly basis, and December 28 was the last date of release for the month.
| College Retirement Equities Fund ■ 2021 Annual Report | 39 |
CREF Money Market Account
Net annualized yield for the 7 days ended December 28, 2021§
| Current yield | Effective yield | |||||||
| Money Market Account | ||||||||
| Class R1 | 0.00 | % | 0.00 | % | ||||
| Class R2 | 0.00 | 0.00 | ||||||
| Class R3 | 0.00 | 0.00 | ||||||
| iMoneyNet Money Fund Averages™—All Government‡ | 0.01 | 0.01 | ||||||
The current yield more closely reflects current earnings than does the total return.
| § | Typically, iMoneyNet reports its 7-day yields as of Tuesday of each week. |
Performance as of December 31, 2021
| Money Market Account# | ||||||||||||||||||||
| Average annual | Estimated | |||||||||||||||||||
| Total return | total return | annual | ||||||||||||||||||
| Inception | operating | |||||||||||||||||||
| date | 1 year | 5 years | 10 years | expenses | * | |||||||||||||||
| Class R1 | 4/1/1988 | 0.00 | % | 0.63 | % | 0.31 | % | 0.390 | % | |||||||||||
| Class R2 | 4/24/2015 | 0.00 | 0.81 | 0.41 | † | 0.235 | ||||||||||||||
| Class R3 | 4/24/2015 | 0.00 | 0.87 | 0.45 | † | 0.185 | ||||||||||||||
| iMoneyNet Money Fund Averages™—All Government‡ | — | 0.01 | 0.79 | 0.41 | — | |||||||||||||||
The returns in this report show past performance, which is no guarantee of future results. Returns and the principal value of your investment will fluctuate. Current performance may be higher or lower than that shown, and you may have a gain or a loss when you redeem your accumulation units. For current performance information, including performance to the most recent month-end, please visit TIAA.org.
You could lose money by investing in this Account. Because the accumulation unit value of the Account will fluctuate, the value of your investment may increase or decrease. An investment in the Account is not insured or guaranteed by the Federal Deposit Insurance Corporation (FDIC) or any other government agency. The Account’s sponsor has no legal obligation to provide support to the Account, and you should not expect that the sponsor will provide financial support to the Account at any time. For a detailed discussion of risk, please see the prospectus. The current yield more closely reflects current earnings than does the total return.
Note: Unlike most money market funds, the CREF Money Market Account does not distribute income on a daily basis. Therefore, the Account does not maintain a constant value of $1.00 per accumulation unit.
| # | Between July 16, 2009, and March 7, 2017, TIAA withheld (“waived”) a portion of the 12b–1 distribution and/or administrative expenses for each class of the CREF Money Market Account when a class’ yield was less than zero. Without this waiver, the total returns of the Money Market Account would have been lower. For a period of three years after the date an amount was waived, it was eligible for recoupment by TIAA, under certain conditions. All eligible expenses were recouped by July 2018 for Class R3, September 2018 for Class R2 and June 2019 for Class R1. |
| TIAA has agreed to withhold (“waive”) a portion of the Rule 12b-1 distribution and/or administrative expenses for each class of the CREF Money Market Account (the “Account”) when a class’ yield is less than zero. Without this waiver, the total returns of each class of the Account would be lower, and could be negative. TIAA may, for a period of three years after the date an amount was waived, recover from the Account a portion of the amounts waived at such time as the class’ daily yield would be positive absent the effect of the waiver and, in |
| 40 | 2021 Annual Report ■ College Retirement Equities Fund |
CREF Money Market Account
| such event, the amount of recovery on any day will be approximately 25% of the class’ yield (net of all other expenses) on that day. This limited waiver terminated on December 31, 2021. Upon expiration of the waiver, the total returns of each class of the Account will be lower, and could be negative, particularly if interest rates remain low at the time of the waiver’s expiration. | |
| * | The estimated annual operating expenses are taken from the Account’s current prospectus. Expenses are estimated each year based on projected expense and asset levels. Differences between actual expenses and the estimate are adjusted quarterly and are reflected in current investment results. Refer to the Financial highlights later in this report for the Account’s expense ratios as of the end of the reporting period. |
| † | The performance shown for Classes R2 and R3 that is prior to their inception date is based on performance of the Account’s Class R1. The performance for these periods has not been restated to reflect the lower expenses of Classes R2 and R3. If those expenses had been reflected, the performance would have been higher. |
| ‡ | The iMoneyNet Money Fund Averages—All Government is a simple average of over 500 money market funds that invest in U.S. Treasuries, U.S. agencies, repurchase agreements and government-backed floating-rate notes. You cannot invest directly in it. |
Expense example
Six months ended December 31, 2021
| Beginning | Ending | Expenses paid | ||||||||||
| account value | account value | during period | * | |||||||||
| Money Market Account | (7/1/21 | ) | (12/31/21 | ) | (7/1/21-12/31/21 | ) | ||||||
| Actual return | ||||||||||||
| Class R1 | $1,000.00 | $ | 1,000.00 | $ | 0.30 | |||||||
| Class R2 | 1,000.00 | 1,000.00 | 0.30 | |||||||||
| Class R3 | 1,000.00 | 1,000.00 | 0.30 | |||||||||
| 5% annual hypothetical return | ||||||||||||
| Class R1 | 1,000.00 | 1,024.90 | 0.31 | |||||||||
| Class R2 | 1,000.00 | 1,024.90 | 0.31 | |||||||||
| Class R3 | 1,000.00 | 1,024.90 | 0.31 | |||||||||
| * | “Expenses paid during period” is based on the Account’s actual expense ratio for the most recent fiscal half-year, multiplied by the average account value over the six-month period, multiplied by 184/365. There were 184 days in the six months ended December 31, 2021. The Account’s annualized six-month expense ratios for that period were 0.06% for Class R1, 0.06% for Class R2 and 0.06% for Class R3. The expense charges of the Account reflect a voluntary waiver. Without this waiver, the expenses of the account would have been higher and its performance lower. |
For more information about this expense example, please see page 10.
Actual expenses
| Net expense ratio for the one-year period ended 12/31/2021 | ||
| Class R1 | 0.07% | |
| Class R2 | 0.07% | |
| Class R3 | 0.07% |
| College Retirement Equities Fund ■ 2021 Annual Report | 41 |
CREF Money Market Account
| Account profile | ||
| as of 12/31/2021 | ||
| Net assets | $8.36 billion | |
| Number of issues | 185 |
| Portfolio composition | ||
| % of net assets | ||
| Sector | as of 12/31/2021 | |
| U.S. government agency securities* | 52.5 | |
| U.S. Treasury securities* | 24.2 | |
| Floating-rate securities, government* | 23.7 | |
| Other assets & liabilities, net | –0.4 | |
| Total | 100.0 | |
| * | These securities are guaranteed by the full faith and credit of the U.S. government. |
| 42 | 2021 Annual Report ■ College Retirement Equities Fund |
Summary portfolio of investments
CREF Stock Account ■ December 31, 2021
| Principal | Issuer | Value (000) | % of net assets | ||||||||||||
| BONDS | |||||||||||||||
| CORPORATE BONDS | |||||||||||||||
| FOOD, BEVERAGE & TOBACCO | $ | 62 | 0.0 | % | |||||||||||
| TOTAL CORPORATE BONDS | (Cost $64) | 62 | 0.0 | ||||||||||||
| GOVERNMENT BONDS | |||||||||||||||
| U.S. TREASURY SECURITIES | 302 | 0.0 | |||||||||||||
| TOTAL GOVERNMENT BONDS | (Cost $300) | 302 | 0.0 | ||||||||||||
| TOTAL BONDS | (Cost $364) | 364 | 0.0 | ||||||||||||
| Shares | Company | ||||||||||||||
| COMMON STOCKS | |||||||||||||||
| AUTOMOBILES & COMPONENTS | |||||||||||||||
| 1,299,808 | *,n | Tesla, Inc | 1,373,611 | 1.0 | |||||||||||
| Other | 2,204,413 | 1.6 | |||||||||||||
| 3,578,024 | 2.6 | ||||||||||||||
| BANKS | |||||||||||||||
| 19,484,297 | Bank of America Corp | 866,856 | 0.6 | ||||||||||||
| 5,281,841 | JPMorgan Chase & Co | 836,380 | 0.6 | ||||||||||||
| 13,713,738 | Wells Fargo & Co | 657,985 | 0.5 | ||||||||||||
| Other | 7,130,549 | 5.1 | |||||||||||||
| 9,491,770 | 6.8 | ||||||||||||||
| CAPITAL GOODS | |||||||||||||||
| 2,268,986 | Honeywell International, Inc | 473,106 | 0.4 | ||||||||||||
| 5,335,629 | e | Raytheon Technologies Corp | 459,184 | 0.4 | |||||||||||
| Other | 9,051,271 | 6.4 | |||||||||||||
| 9,983,561 | 7.2 | ||||||||||||||
| COMMERCIAL & PROFESSIONAL SERVICES | 2,018,374 | 1.4 | |||||||||||||
| CONSUMER DURABLES & APPAREL | |||||||||||||||
| 2,413,718 | Nike, Inc (Class B) | 402,294 | 0.3 | ||||||||||||
| Other | 2,983,224 | 2.1 | |||||||||||||
| 3,385,518 | 2.4 | ||||||||||||||
| CONSUMER SERVICES | |||||||||||||||
| 7,209,528 | *,a,e | Arcos Dorados Holdings | 42,032 | 0.0 | |||||||||||
| 2,165,513 | McDonald’s Corp | 580,509 | 0.4 | ||||||||||||
| Other | 2,579,448 | 1.9 | |||||||||||||
| 3,201,989 | 2.3 | ||||||||||||||
| DIVERSIFIED FINANCIALS | |||||||||||||||
| 2,309,859 | * | Berkshire Hathaway, Inc (Class B) | 690,648 | 0.5 | |||||||||||
| 6,314,200 | Morgan Stanley | 619,802 | 0.5 | ||||||||||||
| Other | 5,269,329 | 3.7 | |||||||||||||
| 6,579,779 | 4.7 | ||||||||||||||
| See notes to financial statements | College Retirement Equities Fund ■ 2021 Annual Report | 43 |
| Summary portfolio of investments | continued |
| CREF Stock Account ■ December 31, 2021 |
| Shares | Company | Value (000) | % of net assets | ||||||||||
| ENERGY | |||||||||||||
| 3,891,550 | Chevron Corp | $ | 456,673 | 0.3 | % | ||||||||
| Other | 3,977,071 | 2.9 | |||||||||||
| 4,433,744 | 3.2 | ||||||||||||
| FOOD & STAPLES RETAILING | |||||||||||||
| 947,479 | Costco Wholesale Corp | 537,884 | 0.4 | ||||||||||
| 3,758,539 | Walmart, Inc | 543,823 | 0.4 | ||||||||||
| Other | 950,211 | 0.7 | |||||||||||
| 2,031,918 | 1.5 | ||||||||||||
| FOOD, BEVERAGE & TOBACCO | |||||||||||||
| 4,138,665 | Nestle S.A. | 577,829 | 0.4 | ||||||||||
| 2,396,648 | PepsiCo, Inc | 416,322 | 0.3 | ||||||||||
| Other | 3,517,032 | 2.5 | |||||||||||
| 4,511,183 | 3.2 | ||||||||||||
| HEALTH CARE EQUIPMENT & SERVICES | |||||||||||||
| 3,602,870 | Abbott Laboratories | 507,068 | 0.4 | ||||||||||
| 2,036,876 | UnitedHealth Group, Inc | 1,022,797 | 0.8 | ||||||||||
| Other | 4,868,214 | 3.4 | |||||||||||
| 6,398,079 | 4.6 | ||||||||||||
| HOUSEHOLD & PERSONAL PRODUCTS | |||||||||||||
| 4,247,130 | Procter & Gamble Co | 694,746 | 0.5 | ||||||||||
| Other | 1,287,964 | 0.9 | |||||||||||
| 1,982,710 | 1.4 | ||||||||||||
| INSURANCE | 3,191,975 | 2.3 | |||||||||||
| MATERIALS | 6,626,973 | 4.8 | |||||||||||
| MEDIA & ENTERTAINMENT | |||||||||||||
| 547,955 | *,n | Alphabet, Inc (Class A) | 1,587,448 | 1.2 | |||||||||
| 569,461 | *,n | Alphabet, Inc (Class C) | 1,647,787 | 1.2 | |||||||||
| 11,018,668 | Comcast Corp (Class A) | 554,570 | 0.4 | ||||||||||
| 5,682,338 | *,a,e | iClick Interactive Asia Group Ltd (ADR) | 26,196 | 0.0 | |||||||||
| 4,420,992 | *,a,e | HUYA, Inc (ADR) | 30,682 | 0.0 | |||||||||
| 3,979,559 | * | Meta Platforms, Inc. | 1,338,525 | 1.0 | |||||||||
| 11,028,759 | Tencent Holdings Ltd | 643,540 | 0.5 | ||||||||||
| 3,460,304 | *,n | Walt Disney Co | 535,966 | 0.4 | |||||||||
| Other | 2,811,659 | 1.9 | |||||||||||
| 9,176,373 | 6.6 | ||||||||||||
| PHARMACEUTICALS, BIOTECHNOLOGY & LIFE SCIENCES | |||||||||||||
| 5,672,714 | AbbVie, Inc | 768,085 | 0.6 | ||||||||||
| 4,526,831 | AstraZeneca plc | 528,595 | 0.4 | ||||||||||
| 1,200,730 | Danaher Corp | 395,052 | 0.3 | ||||||||||
| 3,709,292 | Johnson & Johnson | 634,549 | 0.5 | ||||||||||
| 10,646,567 | Pfizer, Inc | 628,680 | 0.5 | ||||||||||
| 1,083,958 | Roche Holding AG. | 449,692 | 0.3 | ||||||||||
| Other | 6,102,037 | 4.2 | |||||||||||
| 9,506,690 | 6.8 | ||||||||||||
| REAL ESTATE | 4,178,004 | 3.0 | |||||||||||
| 44 | 2021 Annual Report ■ College Retirement Equities Fund | See notes to financial statements |
| Summary portfolio of investments | continued |
| CREF Stock Account ■ December 31, 2021 |
| Shares | Company | Value (000) | % of net assets | |||||||||||
| RETAILING | ||||||||||||||
| 860,291 | * | Amazon.com, Inc | $ | 2,868,503 | 2.1 | % | ||||||||
| 1,613,852 | Home Depot, Inc | 669,765 | 0.5 | |||||||||||
| 64,973,036 | a | Lojas Americanas S.A. (Preference) | 68,436 | 0.0 | ||||||||||
| 1,800,527 | n | Lowe’s Companies, Inc | 465,400 | 0.4 | ||||||||||
| 156,345,400 | a | Matahari Department Store Tbk PT* | 45,527 | 0.0 | ||||||||||
| Other | 3,475,934 | 2.5 | ||||||||||||
| 7,593,565 | 5.5 | |||||||||||||
| SEMICONDUCTORS & SEMICONDUCTOR EQUIPMENT | ||||||||||||||
| 2,618,187 | Applied Materials, Inc | 411,998 | 0.3 | |||||||||||
| 932,806 | ASML Holding NV | 747,196 | 0.6 | |||||||||||
| 1,105,294 | Broadcom, Inc | 735,474 | 0.6 | |||||||||||
| 4,476,069 | NVIDIA Corp | 1,316,457 | 1.0 | |||||||||||
| 2,614,846 | QUALCOMM, Inc | 478,177 | 0.4 | |||||||||||
| 42,622,458 | Taiwan Semiconductor Manufacturing Co Ltd | 942,851 | 0.7 | |||||||||||
| Other | 3,789,257 | 2.5 | ||||||||||||
| 8,421,410 | 6.1 | |||||||||||||
| SOFTWARE & SERVICES | ||||||||||||||
| 1,425,486 | Accenture plc | 590,935 | 0.4 | |||||||||||
| 2,273,551 | Mastercard, Inc (Class A) | 816,932 | 0.6 | |||||||||||
| 15,124,645 | n | Microsoft Corp | 5,086,721 | 3.7 | ||||||||||
| 2,494,831 | * | PayPal Holdings, Inc | 470,475 | 0.4 | ||||||||||
| 2,988,728 | * | salesforce.com, Inc | 759,525 | 0.6 | ||||||||||
| 637,628 | * | ServiceNow, Inc | 413,891 | 0.3 | ||||||||||
| 3,139,340 | Visa, Inc (Class A) | 680,326 | 0.5 | |||||||||||
| Other | 6,566,536 | 4.6 | ||||||||||||
| 15,385,341 | 11.1 | |||||||||||||
| TECHNOLOGY HARDWARE & EQUIPMENT | ||||||||||||||
| 25,113,653 | d | Apple, Inc | 4,459,431 | 3.2 | ||||||||||
| 12,199,966 | Cisco Systems, Inc | 773,112 | 0.6 | |||||||||||
| 6,716,634 | Samsung Electronics Co Ltd | 441,114 | 0.3 | |||||||||||
| Other | 2,565,633 | 1.8 | ||||||||||||
| 8,239,290 | 5.9 | |||||||||||||
| TELECOMMUNICATION SERVICES | 1,675,929 | 1.2 | ||||||||||||
| TRANSPORTATION | ||||||||||||||
| 2,602,045 | Union Pacific Corp | 655,533 | 0.5 | |||||||||||
| Other | 2,083,854 | 1.5 | ||||||||||||
| 2,739,387 | 2.0 | |||||||||||||
| UTILITIES | 3,226,210 | 2.3 | ||||||||||||
| TOTAL COMMON STOCKS | (Cost $108,787,929) | 137,557,796 | 98.9 | |||||||||||
| PURCHASED OPTIONS | ||||||||||||||
| MEDIA & ENTERTAINMENT | 19 | 0.0 | ||||||||||||
| TOTAL PURCHASED OPTIONS | (Cost $1,151) | 19 | 0.0 | |||||||||||
| See notes to financial statements | College Retirement Equities Fund ■ 2021 Annual Report | 45 |
| Summary portfolio of investments | continued |
| CREF Stock Account ■ December 31, 2021 |
| Shares | Company | Value (000) | % of net assets | |||||||||
| PREFERRED STOCKS | ||||||||||||
| REAL ESTATE | $ | 17 | 0.0 | % | ||||||||
| TOTAL PREFERRED STOCKS | (Cost $20) | 17 | 0.0 | |||||||||
| RIGHTS / WARRANTS | ||||||||||||
| AUTOMOBILES & COMPONENTS | 103 | 0.0 | ||||||||||
| CAPITAL GOODS | 32 | 0.0 | ||||||||||
| COMMERCIAL & PROFESSIONAL SERVICES | 32 | 0.0 | ||||||||||
| CONSUMER DURABLES & APPAREL | 1,251 | 0.0 | ||||||||||
| CONSUMER SERVICES | 17 | 0.0 | ||||||||||
| DIVERSIFIED FINANCIALS | 8 | 0.0 | ||||||||||
| ENERGY | 4 | 0.0 | ||||||||||
| HEALTH CARE EQUIPMENT & SERVICES | 22 | 0.0 | ||||||||||
| MATERIALS | 12 | 0.0 | ||||||||||
| MEDIA & ENTERTAINMENT | 761 | 0.0 | ||||||||||
| PHARMACEUTICALS, BIOTECHNOLOGY & LIFE SCIENCES | 87 | 0.0 | ||||||||||
| REAL ESTATE | 17 | 0.0 | ||||||||||
| TECHNOLOGY HARDWARE & EQUIPMENT | 5 | 0.0 | ||||||||||
| TRANSPORTATION | 16 | 0.0 | ||||||||||
| TOTAL RIGHTS / WARRANTS | (Cost $609) | 2,367 | 0.0 | |||||||||
| Principal | Issuer | |||||||||||
| SHORT-TERM INVESTMENTS | ||||||||||||
| GOVERNMENT AGENCY DEBT | 1,291,219 | 0.9 | ||||||||||
| REPURCHASE AGREEMENT | 113,560 | 0.1 | ||||||||||
| TREASURY DEBT | 96,836 | 0.0 | ||||||||||
| INVESTMENT OF CASH COLLATERAL FOR SECURITIES LOANED | ||||||||||||
| CERTIFICATE OF DEPOSIT | 52,000 | 0.0 | ||||||||||
| COMMERCIAL PAPER | 61,956 | 0.1 | ||||||||||
| REPURCHASE AGREEMENT | 689,000 | 0.5 | ||||||||||
| TREASURY DEBT | 254,986 | 0.2 | ||||||||||
| TOTAL INVESTMENT OF CASH COLLATERAL FOR SECURITIES LOANED | 1,057,942 | 0.8 | ||||||||||
| TOTAL SHORT-TERM INVESTMENTS | (Cost $2,559,664) | 2,559,557 | 1.8 | |||||||||
| TOTAL PORTFOLIO | (Cost $111,349,737) | 140,120,120 | 100.7 | |||||||||
| OTHER ASSETS & LIABILITIES, NET | (949,978 | ) | (0.7 | ) | ||||||||
| NET ASSETS | $ | 139,170,142 | 100.0 | % | ||||||||
| 46 | 2021 Annual Report ■ College Retirement Equities Fund | See notes to financial statements |
| Summary portfolio of investments | continued |
| CREF Stock Account ■ December 31, 2021 |
| ADR | American Depositary Receipt |
| * | Non-income producing |
| a | Affiliated holding |
| d | All or a portion of these securities have been segregated to cover margin requirements on open futures contracts. |
| e | All or a portion of these securities are out on loan. The aggregate value of securities on loan is $1,746,890,302. See Note 4 in the Notes to financial statements for additional information about securities lending collateral. |
| n | All or a portion of these securities have been segregated by the custodian to cover requirements on open written options contracts. |
“Other” securities represent the aggregate value, by category, of securities that are not among the 50 largest holdings and, in total for any issuer, represent 1% or less of net assets.
At 12/31/21, the aggregate value of securities exempt from registration under Rule 144(A) of the Securities Act of 1933, as amended, amounted to $1,629,222,198 or 1.2% of net assets. Such securities are deemed liquid and may be resold in transactions exempt from registration to qualified institutional buyers.
Cost amounts are in thousands.
For ease of presentation, a number of classification categories have been grouped together in the Summary portfolio of investments. Note that the Account uses more specific categories in following its investment limitations on investment concentrations.
Purchased options outstanding as of December 31, 2021 were as follows (notional amounts and values are in thousands):
| Description/underlying investment | Number of contracts | Notional amount | Exercise price | Expiration date | Value | |||||||||||||
| Sea Ltd, Call | 350 | $1,151 | $360.00 | 03/18/22 | $19 | |||||||||||||
Written options outstanding as of December 31, 2021 were as follows (notional amounts and values are in thousands):
| Description/underlying investment | Number of contracts | Notional amount | Exercise price | Expiration date | Value | ||||||||||||||||
| Advantest Corp, Call | 270 | $ (19 | ) | $ | 11,500.00 | 01/13/22 | $ | (19 | ) | ||||||||||||
| Alphabet, Inc, Call | 5 | (5 | ) | 3,300.00 | 01/21/22 | (0 | )^ | ||||||||||||||
| Baozun, Inc, Call | 2,500 | (123 | ) | 15.00 | 01/21/22 | (88 | ) | ||||||||||||||
| Ciena Corp, Put | 30 | (1 | ) | 60.00 | 01/21/22 | (0 | )^ | ||||||||||||||
| Crocs, Inc, Put | 30 | (3 | ) | 90.00 | 01/21/22 | (1 | ) | ||||||||||||||
| Estee Lauder Cos, Inc, Call | 20 | (3 | ) | 400.00 | 01/21/22 | (1 | ) | ||||||||||||||
| GDS Holdings Ltd, Call | 2,400 | (284 | ) | 55.00 | 01/21/22 | (264 | ) | ||||||||||||||
| Generac Holdings, Inc, Put | 20 | (6 | ) | 310.00 | 01/21/22 | (3 | ) | ||||||||||||||
| Intuitive Surgical, Inc, Put | 213 | (311 | ) | 320.00 | 01/21/22 | (42 | ) | ||||||||||||||
| Kornit Digital Ltd, Call | 50 | (10 | ) | 160.00 | 01/21/22 | (16 | ) | ||||||||||||||
| Lowe’s Cos, Inc, Call | 10 | (1 | ) | 280.00 | 01/21/22 | (0 | )^ | ||||||||||||||
| Lowe’s Cos, Inc, Call | 10 | (1 | ) | 290.00 | 01/21/22 | (0 | )^ | ||||||||||||||
| Microsoft Corp, Put | 20 | (4 | ) | 290.00 | 01/21/22 | (1 | ) | ||||||||||||||
| Nintendo Co Ltd, Put | 30 | (16 | ) | 50,000.00 | 01/13/22 | (14 | ) | ||||||||||||||
| Renesas Electronics Corp, Call | 2,650 | (1 | ) | 1,600.00 | 01/13/22 | (5 | ) | ||||||||||||||
| Sea Ltd, Call | 350 | (409 | ) | 440.00 | 03/18/22 | (9 | ) | ||||||||||||||
| Sea Ltd, Put | 10 | (3 | ) | 160.00 | 01/21/22 | (1 | ) | ||||||||||||||
| Sea Ltd, Put | 20 | (11 | ) | 190.00 | 01/21/22 | (3 | ) | ||||||||||||||
| Sea Ltd, Put | 350 | (690 | ) | 300.00 | 03/18/22 | (2,747 | ) | ||||||||||||||
| SUMCO Corp, Call | 670 | (1 | ) | 2,600.00 | 01/13/22 | (3 | ) | ||||||||||||||
| Tesla, Inc, Call | 129 | (253 | ) | 1,300.00 | 01/21/22 | (92 | ) | ||||||||||||||
| Tesla, Inc, Put | 5 | (10 | ) | 800.00 | 01/21/22 | (1 | ) | ||||||||||||||
| Tesla, Inc, Put | 126 | (477 | ) | 900.00 | 01/21/22 | (127 | ) | ||||||||||||||
| ViacomCBS, Inc, Put | 45 | (27 | ) | 35.00 | 06/17/22 | (30 | ) | ||||||||||||||
| Walt Disney Co, Put | 15 | (4 | ) | 130.00 | 02/18/22 | (1 | ) | ||||||||||||||
| Walt Disney Co, Put | 15 | (5 | ) | 135.00 | 02/18/22 | (1 | ) | ||||||||||||||
| Total | 9,993 | $(2,678 | ) | $ | (3,469 | ) | |||||||||||||||
| ^ | Amount represents less than $1,000. |
| See notes to financial statements | College Retirement Equities Fund ■ 2021 Annual Report | 47 |
| Summary portfolio of investments | concluded |
| CREF Stock Account ■ December 31, 2021 | |
| Futures contracts outstanding as of December 31, 2021 were as follows (dollar amounts are in thousands): |
| Description | Number of long (short contracts | ) | Expiration date | Notional amount | Value | Unrealized appreciation (depreciation | ) | |||||||||||||
| Russell 2000 E Mini Index | 482 | 03/18/22 | $ | 54,638 | $ | 54,052 | $ | (586 | ) | |||||||||||
| S&P 500 E Mini Index | 3,263 | 03/18/22 | 765,059 | 776,349 | 11,290 | |||||||||||||||
| S&P Mid-Cap 400 E Mini Index | 299 | 03/18/22 | 84,100 | 84,847 | 747 | |||||||||||||||
| Total | 4,044 | $ | 903,797 | $ | 915,248 | $ | 11,451 | |||||||||||||
Forward foreign currency contracts outstanding as of December 31, 2021 were as follows (dollar amounts are in thousands):
| Currency to be purchased | Receive | Currency to be sold | Deliver | Counterparty | Settlement date | Unrealized appreciation (depreciation | ) | ||||||||
| $ | 80,315 | CAD | 100,000 | Bank of America | 02/08/22 | $ | 1,265 | ||||||||
| $ | 23,230 | EUR | 20,000 | Bank of America | 02/09/22 | 442 | |||||||||
| $ | 13,495 | GBP | 10,000 | Bank of America | 02/09/22 | (39 | ) | ||||||||
| CAD | 100,000 | $ | 80,389 | Bank of America | 02/08/22 | (1,338 | ) | ||||||||
| EUR | 20,000 | $ | 23,164 | Bank of America | 02/09/22 | (376 | ) | ||||||||
| GBP | 10,000 | $ | 13,569 | Bank of America | 02/09/22 | (36 | ) | ||||||||
| JPY | 2,235,080 | $ | 19,823 | Bank of America | 02/09/22 | (387 | ) | ||||||||
| Total | $ | (469 | ) | ||||||||||||
| $ | 100,000 | CAD | 124,456 | Morgan Stanley | 02/08/22 | $ | 1,616 | ||||||||
| EUR | 4,087 | $ | 4,748 | Morgan Stanley | 02/09/22 | (92 | ) | ||||||||
| Total | $ | 1,524 | |||||||||||||
| $ | 7,402 | AUD | 10,000 | Toronto Dominion Bank | 02/09/22 | $ | 126 | ||||||||
| $ | 14,804 | AUD | 20,000 | Toronto Dominion Bank | 02/09/22 | 252 | |||||||||
| $ | 5,196 | AUD | 7,015 | Toronto Dominion Bank | 02/09/22 | 91 | |||||||||
| $ | 2,598 | AUD | 3,508 | Toronto Dominion Bank | 02/09/22 | 45 | |||||||||
| $ | 16,064 | CAD | 20,000 | Toronto Dominion Bank | 02/08/22 | 254 | |||||||||
| $ | 3,936 | CAD | 4,899 | Toronto Dominion Bank | 02/08/22 | 63 | |||||||||
| $ | 34,749 | EUR | 30,000 | Toronto Dominion Bank | 02/09/22 | 567 | |||||||||
| $ | 67,468 | GBP | 50,000 | Toronto Dominion Bank | 02/09/22 | (201 | ) | ||||||||
| $ | 6,747 | GBP | 5,000 | Toronto Dominion Bank | 02/09/22 | (20 | ) | ||||||||
| EUR | 17,215 | $ | 20,000 | Toronto Dominion Bank | 02/09/22 | (385 | ) | ||||||||
| GBP | 5,000 | $ | 6,787 | Toronto Dominion Bank | 02/09/22 | (20 | ) | ||||||||
| JPY | 20,000 | $ | 177 | Toronto Dominion Bank | 02/09/22 | (3 | ) | ||||||||
| Total | $ | 769 | |||||||||||||
| Total | $ | 1,824 | |||||||||||||
| AUD | Australian Dollar | |
| CAD | Canadian Dollar | |
| EUR | Euro | |
| GBP | Pound Sterling | |
| JPY | Japanese Yen |
| 48 | 2021 Annual Report ■ College Retirement Equities Fund | See notes to financial statements |
Summary portfolio of investments
CREF Global Equities Account ■ December 31, 2021
| Principal | Issuer | Value (000) | % of net assets | |||||||||||
| CORPORATE BONDS | ||||||||||||||
| INDIA | $ | 16 | 0.0 | % | ||||||||||
| TOTAL CORPORATE BONDS | (Cost $16) | 16 | 0.0 | |||||||||||
| Shares | Company | |||||||||||||
| COMMON STOCKS | ||||||||||||||
| ARGENTINA | 13,070 | 0.0 | ||||||||||||
| AUSTRALIA | 333,797 | 1.2 | ||||||||||||
| AUSTRIA | 33,859 | 0.1 | ||||||||||||
| BELGIUM | 28,986 | 0.1 | ||||||||||||
| BERMUDA | 1,759 | 0.0 | ||||||||||||
| BRAZIL | 243,645 | 0.8 | ||||||||||||
| CANADA | 486,638 | 1.7 | ||||||||||||
| CHILE | 5,338 | 0.0 | ||||||||||||
| CHINA | ||||||||||||||
| 5,084,800 | Tencent Holdings Ltd | 296,703 | 1.0 | |||||||||||
| Other | 759,976 | 2.7 | ||||||||||||
| 1,056,679 | 3.7 | |||||||||||||
| COLOMBIA | 2,473 | 0.0 | ||||||||||||
| CZECH REPUBLIC | 1,878 | 0.0 | ||||||||||||
| DENMARK | 133,899 | 0.5 | ||||||||||||
| EGYPT | 743 | 0.0 | ||||||||||||
| FINLAND | 93,100 | 0.3 | ||||||||||||
| FRANCE | ||||||||||||||
| 585,052 | Cap Gemini S.A. | 143,385 | 0.5 | |||||||||||
| Other | 877,493 | 3.1 | ||||||||||||
| 1,020,878 | 3.6 | |||||||||||||
| GERMANY | ||||||||||||||
| 986,460 | Siemens AG. | 170,858 | 0.6 | |||||||||||
| Other | 425,547 | 1.5 | ||||||||||||
| 596,405 | 2.1 | |||||||||||||
| GREECE | 3,571 | 0.0 | ||||||||||||
| HONG KONG | 86,438 | 0.3 | ||||||||||||
| HUNGARY | 9,509 | 0.0 | ||||||||||||
| INDIA | 230,936 | 0.8 | ||||||||||||
| INDONESIA | 41,995 | 0.1 | ||||||||||||
| See notes to financial statements | College Retirement Equities Fund ■ 2021 Annual Report | 49 |
| Summary portfolio of investments | continued |
| CREF Global Equities Account ■ December 31, 2021 |
| Shares | Company | Value (000) | % of net assets | ||||||||||
| IRELAND | $ | 199,272 | 0.7 | % | |||||||||
| ISRAEL | 46,750 | 0.2 | |||||||||||
| ITALY | 246,872 | 0.9 | |||||||||||
| JAPAN | |||||||||||||
| 2,772,600 | Recruit Holdings Co Ltd | 168,728 | 0.6 | ||||||||||
| 2,070,265 | Sony Corp | 261,429 | 0.9 | ||||||||||
| 8,140,410 | * | Toyota Motor Corp | 150,456 | 0.5 | |||||||||
| Other | 993,416 | 3.5 | |||||||||||
| 1,574,029 | 5.5 | ||||||||||||
| KOREA, REPUBLIC OF | |||||||||||||
| 2,815,556 | Samsung Electronics Co Ltd | 184,911 | 0.7 | ||||||||||
| Other | 213,131 | 0.7 | |||||||||||
| 398,042 | 1.4 | ||||||||||||
| KUWAIT | 9,028 | 0.0 | |||||||||||
| LUXEMBOURG | 29,449 | 0.1 | |||||||||||
| MACAU | 1,556 | 0.0 | |||||||||||
| MALAYSIA | 19,496 | 0.1 | |||||||||||
| MEXICO | 35,301 | 0.1 | |||||||||||
| NETHERLANDS | |||||||||||||
| 296,159 | ASML Holding NV | 237,229 | 0.8 | ||||||||||
| 13,642,422 | ING Groep NV | 189,671 | 0.7 | ||||||||||
| Other | 199,494 | 0.7 | |||||||||||
| 626,394 | 2.2 | ||||||||||||
| NEW ZEALAND | 8,685 | 0.0 | |||||||||||
| NORWAY | 175,990 | 0.6 | |||||||||||
| PERU | 3,505 | 0.0 | |||||||||||
| PHILIPPINES | 16,399 | 0.1 | |||||||||||
| POLAND | 14,667 | 0.1 | |||||||||||
| PORTUGAL | 31,742 | 0.1 | |||||||||||
| QATAR | 7,874 | 0.0 | |||||||||||
| ROMANIA | 673 | 0.0 | |||||||||||
| RUSSIA | 179,246 | 0.6 | |||||||||||
| SAUDI ARABIA | 62,888 | 0.2 | |||||||||||
| SINGAPORE | 71,909 | 0.3 | |||||||||||
| SOUTH AFRICA | 64,830 | 0.2 | |||||||||||
| SPAIN | 147,751 | 0.5 | |||||||||||
| SWEDEN | 182,258 | 0.6 | |||||||||||
| 50 | 2021 Annual Report ■ College Retirement Equities Fund | See notes to financial statements |
| Summary portfolio of investments | continued |
| CREF Global Equities Account ■ December 31, 2021 |
| Shares | Company | Value (000) | % of net assets | ||||||||||
| SWITZERLAND | |||||||||||||
| 195,551 | Lonza Group AG. | $ | 162,813 | 0.6 | % | ||||||||
| 486,423 | Roche Holding AG. | 201,798 | 0.7 | ||||||||||
| Other | 240,745 | 0.8 | |||||||||||
| 605,356 | 2.1 | ||||||||||||
| TAIWAN | |||||||||||||
| 15,637,100 | Taiwan Semiconductor Manufacturing Co Ltd | 345,908 | 1.2 | ||||||||||
| Other | 185,295 | 0.7 | |||||||||||
| 531,203 | 1.9 | ||||||||||||
| TANZANIA, UNITED REPUBLIC OF | 1,918 | 0.0 | |||||||||||
| THAILAND | 25,719 | 0.1 | |||||||||||
| TURKEY | 3,360 | 0.0 | |||||||||||
| UNITED ARAB EMIRATES | 17,408 | 0.1 | |||||||||||
| UNITED KINGDOM | |||||||||||||
| 1,464,596 | AstraZeneca plc | 171,020 | 0.6 | ||||||||||
| 2,589,939 | Diageo plc | 141,608 | 0.5 | ||||||||||
| 636,125 | Linde plc (Xetra) | 220,740 | 0.8 | ||||||||||
| Other | 738,000 | 2.5 | |||||||||||
| 1,271,368 | 4.4 | ||||||||||||
| UNITED STATES | |||||||||||||
| 1,287,461 | Abbott Laboratories | 181,197 | 0.6 | ||||||||||
| 1,381,295 | AbbVie, Inc | 187,027 | 0.6 | ||||||||||
| 374,534 | Accenture plc | 155,263 | 0.5 | ||||||||||
| 102,893 | * | Alphabet, Inc (Class A) | 298,085 | 1.0 | |||||||||
| 113,866 | * | Alphabet, Inc (Class C) | 329,482 | 1.1 | |||||||||
| 184,351 | * | Amazon.com, Inc | 614,689 | 2.1 | |||||||||
| 5,747,631 | d | Apple, Inc | 1,020,607 | 3.6 | |||||||||
| 461,094 | Broadcom, Inc | 306,817 | 1.1 | ||||||||||
| 2,910,740 | Cisco Systems, Inc | 184,454 | 0.6 | ||||||||||
| 3,059,525 | Coca-Cola Co | 181,155 | 0.6 | ||||||||||
| 396,867 | Costco Wholesale Corp | 225,301 | 0.8 | ||||||||||
| 2,740,551 | Exxon Mobil Corp | 167,694 | 0.6 | ||||||||||
| 4,161,724 | Freeport-McMoRan, Inc (Class B) | 173,669 | 0.6 | ||||||||||
| 361,853 | Goldman Sachs Group, Inc | 138,427 | 0.5 | ||||||||||
| 695,299 | Home Depot, Inc | 288,556 | 1.0 | ||||||||||
| 763,236 | Honeywell International, Inc | 159,142 | 0.6 | ||||||||||
| 1,601,074 | JPMorgan Chase & Co | 253,530 | 0.9 | ||||||||||
| 386,763 | KLA Corp | 166,351 | 0.6 | ||||||||||
| 692,302 | McDonald’s Corp | 185,585 | 0.6 | ||||||||||
| 3,145,095 | Microsoft Corp | 1,057,758 | 3.7 | ||||||||||
| 2,523,867 | Morgan Stanley | 247,743 | 0.9 | ||||||||||
| 1,061,795 | Nike, Inc (Class B) | 176,969 | 0.6 | ||||||||||
| 614,132 | NVIDIA Corp | 180,622 | 0.6 | ||||||||||
| 860,667 | * | PayPal Holdings, Inc | 162,305 | 0.6 | |||||||||
| 1,515,180 | Procter & Gamble Co | 247,853 | 0.9 | ||||||||||
| 1,096,037 | * | salesforce.com, Inc | 278,536 | 1.0 | |||||||||
| See notes to financial statements | College Retirement Equities Fund ■ 2021 Annual Report | 51 |
| Summary portfolio of investments | continued |
| CREF Global Equities Account ■ December 31, 2021 |
| Shares | Company | Value (000) | % of net assets | ||||||||||||
| UNITED STATES—continued | |||||||||||||||
| 775,008 | Schneider Electric S.A. | $ | 152,363 | 0.5 | % | ||||||||||
| 372,472 | * | ServiceNow, Inc | 241,775 | 0.8 | |||||||||||
| 290,000 | * | Tesla, Inc | 306,466 | 1.1 | |||||||||||
| 920,214 | Union Pacific Corp | 231,830 | 0.8 | ||||||||||||
| 504,888 | UnitedHealth Group, Inc | 253,524 | 0.9 | �� | |||||||||||
| 896,163 | Visa, Inc (Class A) | 194,208 | 0.7 | ||||||||||||
| 1,065,161 | Walmart, Inc | 154,118 | 0.5 | ||||||||||||
| 1,246,105 | * | Walt Disney Co | 193,009 | 0.7 | |||||||||||
| 4,715,729 | Wells Fargo & Co | 226,261 | 0.8 | ||||||||||||
| Other | 7,754,346 | 27.0 | |||||||||||||
| 17,276,717 | 60.1 | ||||||||||||||
| TOTAL COMMON STOCKS | (Cost $21,445,983) | 28,313,251 | 98.5 | ||||||||||||
| RIGHTS / WARRANTS | |||||||||||||||
| AUSTRALIA | 21 | 0.0 | |||||||||||||
| KOREA, REPUBLIC OF | 12 | 0.0 | |||||||||||||
| SWITZERLAND | 213 | 0.0 | |||||||||||||
| TOTAL RIGHTS / WARRANTS | (Cost $10) | 246 | 0.0 | ||||||||||||
| Principal | Issuer | ||||||||||||||
| SHORT-TERM INVESTMENTS | |||||||||||||||
| GOVERNMENT AGENCY DEBT | 396,372 | 1.4 | |||||||||||||
| REPURCHASE AGREEMENTS | 19,280 | 0.1 | |||||||||||||
| TREASURY DEBT | 22,517 | 0.1 | |||||||||||||
| INVESTMENT OF CASH COLLATERAL FOR SECURITIES LOANED | |||||||||||||||
| CERTIFICATE OF DEPOSIT | 8,000 | 0.0 | |||||||||||||
| COMMERCIAL PAPER | 7,994 | 0.0 | |||||||||||||
| REPURCHASE AGREEMENTS | 67,000 | 0.2 | |||||||||||||
| TREASURY DEBT | 26,190 | 0.1 | |||||||||||||
| TOTAL INVESTMENT OF CASH COLLATERAL FOR SECURITIES LOANED | 109,184 | 0.3 | |||||||||||||
| TOTAL SHORT-TERM INVESTMENTS | (Cost $547,367) | 547,353 | 1.9 | ||||||||||||
| TOTAL PORTFOLIO | (Cost $21,993,376) | 28,860,866 | 100.4 | ||||||||||||
| OTHER ASSETS & LIABILITIES, NET | (117,570 | ) | (0.4 | ) | |||||||||||
| NET ASSETS | $ | 28,743,296 | 100.0 | % | |||||||||||
| 52 | 2021 Annual Report ■ College Retirement Equities Fund | See notes to financial statements |
| Summary portfolio of investments | concluded |
| CREF Global Equities Account ■ December 31, 2021 |
| * | Non-income producing |
| d | All or a portion of these securities have been segregated to cover margin requirements on open futures contracts. |
“Other” securities represent the aggregate value, by category, of securities that are not among the 50 largest holdings and, in total for any issuer, represent 1% or less of net assets.
At 12/31/21, the aggregate value of securities on loan is $160,847,614. See Note 4 in the Notes to financial statements for additional information about securities lending collateral.
At 12/31/21, the aggregate value of securities exempt from registration under Rule 144(A) of the Securities Act of 1933, as amended, amounted to $368,748,110 or 1.3% of net assets. Such securities are deemed liquid and may be resold in transactions exempt from registration to qualified institutional buyers.
Cost amounts are in thousands.
For ease of presentation, a number of classification categories have been grouped together in the Summary portfolio of investments. Note that the Account uses more specific categories in following its investment limitations on investment concentrations.
Futures contracts outstanding as of December 31, 2021 were as follows (dollar amounts are in thousands):
| Description | Number of long (short contracts | )
| Expiration date | Notional amount | Value | Unrealized appreciation (depreciation | ) | |||||||||||||
| MSCI EAFE Index | 731 | 03/18/22 | $ | 83,676 | $ | 84,862 | $ | 1,186 | ||||||||||||
| S&P 500 E Mini Index | 896 | 03/18/22 | 210,515 | 213,181 | 2,666 | |||||||||||||||
| Total | 1,627 | $ | 294,191 | $ | 298,043 | $ | 3,852 | |||||||||||||
| See notes to financial statements | College Retirement Equities Fund ■ 2021 Annual Report | 53 |
Summary portfolio of investments
CREF Growth Account ■ December 31, 2021
| Shares | Company | Value (000) | % of net assets | ||||||||||||
| COMMON STOCKS | |||||||||||||||
| AUTOMOBILES & COMPONENTS | |||||||||||||||
| 1,719,575 | * | Aptiv plc | $ | 283,644 | 0.7 | % | |||||||||
| 1,278,423 | *,n | Tesla, Inc | 1,351,012 | 3.4 | |||||||||||
| Other | 143,385 | 0.4 | |||||||||||||
| 1,778,041 | 4.5 | ||||||||||||||
| CAPITAL GOODS | |||||||||||||||
| 8,044,932 | Carrier Global Corp | 436,357 | 1.1 | ||||||||||||
| 470,266 | Roper Technologies Inc | 231,305 | 0.6 | ||||||||||||
| Other | 481,080 | 1.2 | |||||||||||||
| 1,148,742 | 2.9 | ||||||||||||||
| COMMERCIAL & PROFESSIONAL SERVICES | 477,684 | 1.2 | |||||||||||||
| CONSUMER DURABLES & APPAREL | |||||||||||||||
| 3,146,702 | Nike, Inc (Class B) | 524,461 | 1.3 | ||||||||||||
| Other | 249,925 | 0.6 | |||||||||||||
| 774,386 | 1.9 | ||||||||||||||
| CONSUMER SERVICES | |||||||||||||||
| 149,507 | * | Booking Holdings, Inc | 358,702 | 0.9 | |||||||||||
| 168,858 | * | Chipotle Mexican Grill, Inc (Class A) | 295,206 | 0.7 | |||||||||||
| Other | 424,081 | 1.1 | |||||||||||||
| 1,077,989 | 2.7 | ||||||||||||||
| DIVERSIFIED FINANCIALS | |||||||||||||||
| 2,554,131 | Charles Schwab Corp | 214,803 | 0.5 | ||||||||||||
| 1,084,500 | e | iShares Russell 1000 Growth Index Fund | 331,412 | 0.8 | |||||||||||
| 2,497,330 | Morgan Stanley | 245,138 | 0.6 | ||||||||||||
| 625,449 | S&P Global, Inc | 295,168 | 0.8 | ||||||||||||
| Other | 151,367 | 0.4 | |||||||||||||
| 1,237,888 | 3.1 | ||||||||||||||
| FOOD & STAPLES RETAILING | |||||||||||||||
| 1,597,668 | Costco Wholesale Corp | 906,996 | 2.3 | ||||||||||||
| 906,996 | 2.3 | ||||||||||||||
| FOOD, BEVERAGE & TOBACCO | |||||||||||||||
| 3,842,858 | * | Monster Beverage Corp | 369,068 | 0.9 | |||||||||||
| Other | 87,125 | 0.2 | |||||||||||||
| 456,193 | 1.1 | ||||||||||||||
| HEALTH CARE EQUIPMENT & SERVICES | |||||||||||||||
| 738,750 | * | Align Technology, Inc | 485,492 | 1.2 | |||||||||||
| 830,893 | * | DexCom, Inc | 446,148 | 1.1 | |||||||||||
| 1,059,188 | *,n | Intuitive Surgical, Inc | 380,566 | 1.0 | |||||||||||
| Other | 595,624 | 1.5 | |||||||||||||
| 1,907,830 | 4.8 | ||||||||||||||
| 54 | 2021 Annual Report ■ College Retirement Equities Fund | See notes to financial statements |
| Summary portfolio of investments | continued |
| CREF Growth Account ■ December 31, 2021 |
| Shares | Company | Value (000) | % of net assets | ||||||||||||
| HOUSEHOLD & PERSONAL PRODUCTS | |||||||||||||||
| 674,280 | Estee Lauder Cos (Class A) | $ | 249,618 | 0.6 | % | ||||||||||
| 249,618 | 0.6 | ||||||||||||||
| INSURANCE | 145,081 | 0.4 | |||||||||||||
| MATERIALS | |||||||||||||||
| 1,090,071 | Sherwin-Williams Co | 383,879 | 1.0 | ||||||||||||
| Other | 94,783 | 0.2 | |||||||||||||
| 478,662 | 1.2 | ||||||||||||||
| MEDIA & ENTERTAINMENT | |||||||||||||||
| 481,895 | * | Alphabet, Inc (Class A) | 1,396,069 | 3.5 | |||||||||||
| 345,796 | * | Alphabet, Inc (Class C) | 1,000,592 | 2.5 | |||||||||||
| 2,967,078 | * | Match Group, Inc | 392,396 | 1.0 | |||||||||||
| 4,914,784 | * | Meta Platforms, Inc. | 1,653,088 | 4.1 | |||||||||||
| Other | 893,153 | 2.3 | |||||||||||||
| 5,335,298 | 13.4 | ||||||||||||||
| PHARMACEUTICALS, BIOTECHNOLOGY & LIFE SCIENCES | |||||||||||||||
| 10,141,413 | * | Avantor, Inc | 427,359 | 1.1 | |||||||||||
| 3,430,391 | * | Horizon Therapeutics Plc | 369,659 | 0.9 | |||||||||||
| 2,700,081 | Zoetis, Inc | 658,901 | 1.6 | ||||||||||||
| Other | 707,629 | 1.8 | |||||||||||||
| 2,163,548 | 5.4 | ||||||||||||||
| RETAILING | |||||||||||||||
| 794,412 | * | Amazon.com, Inc | 2,648,840 | 6.6 | |||||||||||
| 953,350 | * | Burlington Stores, Inc | 277,911 | 0.7 | |||||||||||
| 1,659,114 | Lowe’s Companies, Inc | 428,848 | 1.1 | ||||||||||||
| 3,591,320 | TJX Companies, Inc | 272,653 | 0.7 | ||||||||||||
| Other | 425,836 | 1.1 | |||||||||||||
| 4,054,088 | 10.2 | ||||||||||||||
| SEMICONDUCTORS & SEMICONDUCTOR EQUIPMENT | |||||||||||||||
| 1,944,324 | Applied Materials, Inc | 305,959 | 0.8 | ||||||||||||
| 911,541 | Broadcom, Inc | 606,548 | 1.5 | ||||||||||||
| 582,941 | Lam Research Corp | 419,222 | 1.0 | ||||||||||||
| 2,533,441 | Marvell Technology, Inc | 221,651 | 0.6 | ||||||||||||
| 429,113 | Monolithic Power Systems, Inc | 211,694 | 0.5 | ||||||||||||
| 4,828,682 | NVIDIA Corp | 1,420,164 | 3.6 | ||||||||||||
| 1,460,856 | QUALCOMM, Inc | 267,147 | 0.7 | ||||||||||||
| Other | 291,398 | 0.7 | |||||||||||||
| 3,743,783 | 9.4 | ||||||||||||||
| See notes to financial statements | College Retirement Equities Fund ■ 2021 Annual Report | 55 |
| Summary portfolio of investments | continued |
| CREF Growth Account ■ December 31, 2021 |
| Shares | Company | Value (000) | % of net assets | |||||||||||||
| SOFTWARE & SERVICES | ||||||||||||||||
| 1,411,004 | * | Block Inc | $ | 227,891 | 0.6 | % | ||||||||||
| 1,194,474 | Intuit, Inc | 768,310 | 1.9 | |||||||||||||
| 2,208,643 | Mastercard, Inc (Class A) | 793,610 | 2.0 | |||||||||||||
| 12,155,604 | Microsoft Corp | 4,088,173 | 10.3 | |||||||||||||
| 436,575 | * | Palo Alto Networks, Inc | 243,067 | 0.6 | ||||||||||||
| 3,722,896 | * | PayPal Holdings, Inc | 702,064 | 1.8 | ||||||||||||
| 3,956,135 | * | salesforce.com, Inc | 1,005,373 | 2.5 | ||||||||||||
| 956,650 | * | ServiceNow, Inc | 620,971 | 1.6 | ||||||||||||
| 700,311 | * | Synopsys, Inc | 258,065 | 0.6 | ||||||||||||
| 1,072,705 | * | Twilio, Inc | 282,486 | 0.7 | ||||||||||||
| 3,535,213 | Visa, Inc (Class A) | 766,116 | 1.9 | |||||||||||||
| Other | 1,216,313 | 3.0 | ||||||||||||||
| 10,972,439 | 27.5 | |||||||||||||||
| TECHNOLOGY HARDWARE & EQUIPMENT | ||||||||||||||||
| 11,233,224 | Apple, Inc | 1,994,684 | 5.0 | |||||||||||||
| 1,994,684 | 5.0 | |||||||||||||||
| TELECOMMUNICATION SERVICES | 68,028 | 0.2 | ||||||||||||||
| TRANSPORTATION | ||||||||||||||||
| 5,133,984 | * | Uber Technologies, Inc | 215,268 | 0.5 | ||||||||||||
| 1,375,743 | Union Pacific Corp | 346,591 | 0.9 | |||||||||||||
| 561,859 | 1.4 | |||||||||||||||
| TOTAL COMMON STOCKS | (Cost $29,912,433) | 39,532,837 | 99.2 | |||||||||||||
| Principal | Issuer | |||||||||||||||
| SHORT-TERM INVESTMENTS | ||||||||||||||||
| GOVERNMENT AGENCY DEBT | 87,000 | 0.2 | ||||||||||||||
| TREASURY DEBT | 8,395 | 0.0 | ||||||||||||||
| Shares | Company | |||||||||||||||
| INVESTMENTS IN REGISTERED INVESTMENT COMPANIES | ||||||||||||||||
| 65,478,995 | c | State Street Navigator Securities Lending Government Money Market Portfolio | 0.030% | 65,479 | 0.2 | |||||||||||
| TOTAL SHORT-TERM INVESTMENTS | (Cost $160,875) | 160,874 | 0.4 | |||||||||||||
| TOTAL PORTFOLIO | (Cost $30,073,308) | 39,693,711 | 99.6 | |||||||||||||
| OTHER ASSETS & LIABILITIES, NET | 150,153 | 0.4 | ||||||||||||||
| NET ASSETS | $ | 39,843,864 | 100.0 | % | ||||||||||||
| * | Non-income producing |
| c | Investments made with cash collateral received from securities on loan. |
| e | All or a portion of these securities are out on loan. The aggregate value of securities on loan is $154,370,834. See Note 4 in the Notes to financial statements for additional information about securities lending collateral. |
| n | All or a portion of these securities have been segregated by the custodian to cover requirements on open written options contracts. |
| 56 | 2021 Annual Report ■ College Retirement Equities Fund | See notes to financial statements |
| Summary portfolio of investments | concluded |
CREF Growth Account ■ December 31, 2021
“Other” securities represent the aggregate value, by category, of securities that are not among the 50 largest holdings and, in total for any issuer, represent 1% or less of net assets.
At 12/31/21, the aggregate value of securities exempt from registration under Rule 144(A) of the Securities Act of 1933, as amended, amounted to $187,969,626 or 0.5% of net assets. Such securities are deemed liquid and may be resold in transactions exempt from registration to qualified institutional buyers.
Cost amounts are in thousands.
For ease of presentation, a number of classification categories have been grouped together in the Summary portfolio of investments. Note that the Account uses more specific categories in following its investment limitations on investment concentrations.
Written options outstanding as of December 31, 2021 were as follows (notional amounts and values are in thousands):
| Description/underlying investment | Number of contracts | Notional amount | Exercise price | Expiration date | Value | |||||||||||||
| Intuitive Surgical, Inc, Put | 615 | $ | (897 | ) | $ | 320.00 | 01/21/22 | $ | (122 | ) | ||||||||
| Tesla, Inc, Call | 477 | (942 | ) | 1,300.00 | 01/21/22 | (339 | ) | |||||||||||
| Tesla, Inc, Put | 477 | (1,807 | ) | 900.00 | 01/21/22 | (481 | ) | |||||||||||
| Total | 1,569 | $ | (3,646 | ) | $ | (942 | ) | |||||||||||
| See notes to financial statements | College Retirement Equities Fund ■ 2021 Annual Report | 57 |
Summary portfolio of investments
CREF Equity Index Account ■ December 31, 2021
| Shares | Company | Value (000) | % of net assets | ||||||||||||
| COMMON STOCKS | |||||||||||||||
| AUTOMOBILES & COMPONENTS | |||||||||||||||
| 432,832 | * | Tesla, Inc | $ | 457,408 | 1.8 | % | |||||||||
| Other | 169,610 | 0.6 | |||||||||||||
| 627,018 | 2.4 | ||||||||||||||
| BANKS | |||||||||||||||
| 3,852,559 | Bank of America Corp | 171,400 | 0.7 | ||||||||||||
| 1,574,258 | JPMorgan Chase & Co | 249,284 | 1.0 | ||||||||||||
| 2,139,804 | Wells Fargo & Co | 102,668 | 0.4 | ||||||||||||
| Other | 562,362 | 2.1 | |||||||||||||
| 1,085,714 | 4.2 | ||||||||||||||
| CAPITAL GOODS | 1,482,525 | 5.8 | |||||||||||||
| COMMERCIAL & PROFESSIONAL SERVICES | 309,463 | 1.2 | |||||||||||||
| CONSUMER DURABLES & APPAREL | |||||||||||||||
| 664,586 | Nike, Inc (Class B) | 110,767 | 0.5 | ||||||||||||
| Other | 253,295 | 0.9 | |||||||||||||
| 364,062 | 1.4 | ||||||||||||||
| CONSUMER SERVICES | |||||||||||||||
| 400,133 | McDonald’s Corp | 107,264 | 0.4 | ||||||||||||
| Other | 444,272 | 1.8 | |||||||||||||
| 551,536 | 2.2 | ||||||||||||||
| DIVERSIFIED FINANCIALS | |||||||||||||||
| 981,264 | * | Berkshire Hathaway, Inc (Class B) | 293,398 | 1.2 | |||||||||||
| Other | 996,865 | 3.8 | |||||||||||||
| 1,290,263 | 5.0 | ||||||||||||||
| ENERGY | |||||||||||||||
| 1,035,140 | Chevron Corp | 121,474 | 0.5 | ||||||||||||
| 2,270,917 | d | Exxon Mobil Corp | 138,957 | 0.5 | |||||||||||
| Other | 422,886 | 1.7 | |||||||||||||
| 683,317 | 2.7 | ||||||||||||||
| FOOD & STAPLES RETAILING | |||||||||||||||
| 236,934 | Costco Wholesale Corp | 134,508 | 0.5 | ||||||||||||
| 766,796 | Walmart, Inc | 110,948 | 0.5 | ||||||||||||
| Other | 89,848 | 0.3 | |||||||||||||
| 335,304 | 1.3 | ||||||||||||||
| FOOD, BEVERAGE & TOBACCO | |||||||||||||||
| 2,077,610 | Coca-Cola Co | 123,015 | 0.5 | ||||||||||||
| 739,576 | PepsiCo, Inc | 128,472 | 0.5 | ||||||||||||
| Other | 435,906 | 1.7 | |||||||||||||
| 687,393 | 2.7 | ||||||||||||||
| 58 | 2021 Annual Report ■ College Retirement Equities Fund | See notes to financial statements |
| Summary portfolio of investments | continued |
| CREF Equity Index Account ■ December 31, 2021 |
| Shares | Company | Value (000) | % of net assets | ||||||||||||
| HEALTH CARE EQUIPMENT & SERVICES | |||||||||||||||
| 929,468 | Abbott Laboratories | $ | 130,813 | 0.5 | % | ||||||||||
| 504,241 | UnitedHealth Group, Inc | 253,200 | 1.0 | ||||||||||||
| Other | 1,094,581 | 4.2 | |||||||||||||
| 1,478,594 | 5.7 | ||||||||||||||
| HOUSEHOLD & PERSONAL PRODUCTS | |||||||||||||||
| 1,290,662 | Procter & Gamble Co | 211,127 | 0.8 | ||||||||||||
| Other | 154,839 | 0.6 | |||||||||||||
| 365,966 | 1.4 | ||||||||||||||
| INSURANCE | 508,828 | 2.0 | |||||||||||||
| MATERIALS | 623,574 | 2.4 | |||||||||||||
| MEDIA & ENTERTAINMENT | |||||||||||||||
| 160,955 | * | Alphabet, Inc (Class A) | 466,293 | 1.8 | |||||||||||
| 150,161 | * | Alphabet, Inc (Class C) | 434,504 | 1.7 | |||||||||||
| 2,441,951 | Comcast Corp (Class A) | 122,903 | 0.5 | ||||||||||||
| 1,264,882 | * | Meta Platforms, Inc. | 425,443 | 1.7 | |||||||||||
| 231,094 | * | Netflix, Inc | 139,220 | 0.6 | |||||||||||
| 971,416 | * | Walt Disney Co | 150,463 | 0.6 | |||||||||||
| Other | 345,237 | 1.2 | |||||||||||||
| 2,084,063 | 8.1 | ||||||||||||||
| PHARMACEUTICALS, BIOTECHNOLOGY & LIFE SCIENCES | |||||||||||||||
| 947,035 | AbbVie, Inc | 128,229 | 0.5 | ||||||||||||
| 339,367 | Danaher Corp | 111,655 | 0.5 | ||||||||||||
| 455,955 | Eli Lilly & Co | 125,944 | 0.5 | ||||||||||||
| 1,412,966 | Johnson & Johnson | 241,716 | 1.0 | ||||||||||||
| 1,356,565 | Merck & Co, Inc | 103,967 | 0.4 | ||||||||||||
| 2,992,253 | Pfizer, Inc | 176,693 | 0.7 | ||||||||||||
| 210,446 | Thermo Fisher Scientific, Inc | 140,418 | 0.6 | ||||||||||||
| Other | 918,721 | 3.4 | |||||||||||||
| 1,947,343 | 7.6 | ||||||||||||||
| REAL ESTATE | 920,613 | 3.6 | |||||||||||||
| RETAILING | |||||||||||||||
| 232,283 | * | Amazon.com, Inc | 774,511 | 3.0 | |||||||||||
| 570,071 | Home Depot, Inc | 236,585 | 0.9 | ||||||||||||
| 370,444 | Lowe’s Companies, Inc | 95,752 | 0.4 | ||||||||||||
| Other | 513,871 | 2.0 | |||||||||||||
| 1,620,719 | 6.3 | ||||||||||||||
| SEMICONDUCTORS & SEMICONDUCTOR EQUIPMENT | |||||||||||||||
| 648,573 | * | Advanced Micro Devices, Inc | 93,330 | 0.4 | |||||||||||
| 213,856 | Broadcom, Inc | 142,302 | 0.6 | ||||||||||||
| 2,161,990 | Intel Corp | 111,342 | 0.4 | ||||||||||||
| 1,280,309 | NVIDIA Corp | 376,552 | 1.5 | ||||||||||||
| 605,166 | QUALCOMM, Inc | 110,667 | 0.4 | ||||||||||||
| 493,708 | Texas Instruments, Inc | 93,049 | 0.4 | ||||||||||||
| Other | 572,172 | 2.1 | |||||||||||||
| 1,499,414 | 5.8 | ||||||||||||||
| See notes to financial statements | College Retirement Equities Fund ■ 2021 Annual Report | 59 |
| Summary portfolio of investments | continued |
| CREF Equity Index Account ■ December 31, 2021 |
| Shares | Company | Value (000) | % of net assets | |||||||||||||
| SOFTWARE & SERVICES | ||||||||||||||||
| 340,499 | Accenture plc | $ | 141,154 | 0.6 | % | |||||||||||
| 255,432 | * | Adobe, Inc | 144,845 | 0.6 | ||||||||||||
| 468,147 | Mastercard, Inc (Class A) | 168,215 | 0.7 | |||||||||||||
| 4,035,012 | Microsoft Corp | 1,357,055 | 5.3 | |||||||||||||
| 631,765 | * | PayPal Holdings, Inc | 119,138 | 0.5 | ||||||||||||
| 500,653 | * | salesforce.com, Inc | 127,231 | 0.5 | ||||||||||||
| 908,191 | Visa, Inc (Class A) | 196,814 | 0.8 | |||||||||||||
| Other | 1,514,626 | 5.7 | ||||||||||||||
| 3,769,078 | 14.7 | |||||||||||||||
| TECHNOLOGY HARDWARE & EQUIPMENT | ||||||||||||||||
| 8,262,656 | Apple, Inc | 1,467,200 | 5.7 | |||||||||||||
| 2,263,452 | Cisco Systems, Inc | 143,435 | 0.6 | |||||||||||||
| Other | 351,371 | 1.4 | ||||||||||||||
| 1,962,006 | 7.7 | |||||||||||||||
| TELECOMMUNICATION SERVICES | ||||||||||||||||
| 3,831,720 | AT&T, Inc | 94,260 | 0.4 | |||||||||||||
| 2,218,488 | Verizon Communications, Inc | 115,273 | 0.5 | |||||||||||||
| Other | 56,205 | 0.2 | ||||||||||||||
| 265,738 | 1.1 | |||||||||||||||
| TRANSPORTATION | 481,762 | 1.9 | ||||||||||||||
| UTILITIES | ||||||||||||||||
| 1,051,619 | NextEra Energy, Inc | 98,179 | 0.4 | |||||||||||||
| Other | 528,618 | 2.0 | ||||||||||||||
| 626,797 | 2.4 | |||||||||||||||
| TOTAL COMMON STOCKS | (Cost $7,885,662) | 25,571,090 | 99.6 | |||||||||||||
| RIGHTS / WARRANTS | ||||||||||||||||
| PHARMACEUTICALS, BIOTECHNOLOGY & LIFE SCIENCES | 2 | 0.0 | ||||||||||||||
| TOTAL RIGHTS / WARRANTS (Cost $1) | 2 | 0.0 | ||||||||||||||
| Principal | Issuer | |||||||||||||||
| SHORT-TERM INVESTMENTS | ||||||||||||||||
| GOVERNMENT AGENCY DEBT | 67,079 | 0.3 | ||||||||||||||
| REPURCHASE AGREEMENT | 32,395 | 0.1 | ||||||||||||||
| Shares | Company | |||||||||||||||
| INVESTMENTS IN REGISTERED INVESTMENT COMPANIES | ||||||||||||||||
| 77,919,775 | c | State Street Navigator Securities Lending Government Money Market Portfolio | 0.030% | 77,920 | 0.3 | |||||||||||
| TOTAL SHORT-TERM INVESTMENTS | (Cost $177,393) | 177,394 | 0.7 | |||||||||||||
| TOTAL PORTFOLIO | (Cost $8,063,056) | 25,748,486 | 100.3 | |||||||||||||
| OTHER ASSETS & LIABILITIES, NET | (68,502 | ) | (0.3 | ) | ||||||||||||
| NET ASSETS | $ | 25,679,984 | 100.0 | % | ||||||||||||
| 60 | 2021 Annual Report ■ College Retirement Equities Fund | See notes to financial statements |
| Summary portfolio of investments | concluded |
CREF Equity Index Account ■ December 31, 2021
| * | Non-income producing |
| c | Investments made with cash collateral received from securities on loan. |
| d | All or a portion of these securities have been segregated to cover margin requirements on open futures contracts. |
“Other” securities represent the aggregate value, by category, of securities that are not among the 50 largest holdings and, in total for any issuer, represent 1% or less of net assets.
At 12/31/21, the aggregate value of securities on loan is $171,025,790. See Note 4 in the Notes to financial statements for additional information about securities lending collateral.
Cost amounts are in thousands.
For ease of presentation, a number of classification categories have been grouped together in the Summary portfolio of investments. Note that the Account uses more specific categories in following its investment limitations on investment concentrations.
Futures contracts outstanding as of December 31, 2021 were as follows (dollar amounts are in thousands):
| Description | Number of long (short contracts | )
| Expiration date | Notional amount | Value | Unrealized appreciation (depreciation | ) | |||||||||||
| S&P 500 E Mini Index | 364 | 03/18/22 | $84,469 | $86,605 | $2,136 | |||||||||||||
| See notes to financial statements | College Retirement Equities Fund ■ 2021 Annual Report | 61 |
Summary portfolio of investments
CREF Bond Market Account ■ December 31, 2021
| Principal | Issuer | Value (000) | % of net assets | ||||||||||||
| BANK LOAN OBLIGATIONS | |||||||||||||||
| AUTOMOBILES & COMPONENTS | $ | 3,666 | 0.0 | % | |||||||||||
| CAPITAL GOODS | 5,785 | 0.0 | |||||||||||||
| COMMERCIAL & PROFESSIONAL SERVICES | 11,097 | 0.1 | |||||||||||||
| CONSUMER DURABLES & APPAREL | 378 | 0.0 | |||||||||||||
| CONSUMER SERVICES | 6,481 | 0.1 | |||||||||||||
| DIVERSIFIED FINANCIALS | 2,600 | 0.0 | |||||||||||||
| ENERGY | 5,040 | 0.0 | |||||||||||||
| FOOD, BEVERAGE & TOBACCO | 1,473 | 0.0 | |||||||||||||
| HEALTH CARE EQUIPMENT & SERVICES | 10,678 | 0.1 | |||||||||||||
| HOUSEHOLD & PERSONAL PRODUCTS | 590 | 0.0 | |||||||||||||
| INSURANCE | 4,509 | 0.0 | |||||||||||||
| MATERIALS | 7,085 | 0.1 | |||||||||||||
| MEDIA & ENTERTAINMENT | 16,856 | 0.1 | |||||||||||||
| PHARMACEUTICALS, BIOTECHNOLOGY & LIFE SCIENCES | 8,778 | 0.1 | |||||||||||||
| REAL ESTATE | 1,348 | 0.0 | |||||||||||||
| RETAILING | 668 | 0.0 | |||||||||||||
| SEMICONDUCTORS & SEMICONDUCTOR EQUIPMENT | 499 | 0.0 | |||||||||||||
| SOFTWARE & SERVICES | 6,594 | 0.1 | |||||||||||||
| TECHNOLOGY HARDWARE & EQUIPMENT | 1,873 | 0.0 | |||||||||||||
| TELECOMMUNICATION SERVICES | 615 | 0.0 | |||||||||||||
| TRANSPORTATION | 1,168 | 0.0 | |||||||||||||
| UTILITIES | 914 | 0.0 | |||||||||||||
| TOTAL BANK LOAN OBLIGATIONS | (Cost $99,527) | 98,695 | 0.7 | ||||||||||||
| BONDS | |||||||||||||||
| CORPORATE BONDS | |||||||||||||||
| AUTOMOBILES & COMPONENTS | 52,449 | 0.4 | |||||||||||||
| BANKS | |||||||||||||||
| $55,925,000 | Bank of America Corp | 2.592%, 04/29/31 | 56,494 | 0.4 | |||||||||||
| 39,000,000 | Bank of America Corp | 1.922%, 10/24/31 | 37,341 | 0.3 | |||||||||||
| 36,375,000 | Citigroup, Inc | 3.200%, 10/21/26 | 38,546 | 0.3 | |||||||||||
| 38,100,000 | Citigroup, Inc | 2.520%, 11/03/32 | 38,055 | 0.3 | |||||||||||
| 35,850,000 | JPMorgan Chase & Co | 2.301%, 10/15/25 | 36,664 | 0.3 | |||||||||||
| Other | 989,006 | 7.3 | |||||||||||||
| 1,196,106 | 8.9 | ||||||||||||||
| 62 | 2021 Annual Report ■ College Retirement Equities Fund | See notes to financial statements |
| Summary portfolio of investments | continued |
| CREF Bond Market Account ■ December 31, 2021 |
| Principal | Issuer | Value (000) | % of net assets | ||||||||||||
| CAPITAL GOODS | $ | 189,145 | 1.4 | % | |||||||||||
| COMMERCIAL & PROFESSIONAL SERVICES | 40,268 | 0.3 | |||||||||||||
| CONSUMER DURABLES & APPAREL | 1,953 | 0.0 | |||||||||||||
| CONSUMER SERVICES | 116,190 | 0.9 | |||||||||||||
| DIVERSIFIED FINANCIALS | 528,758 | 3.9 | |||||||||||||
| ENERGY | 524,327 | 3.9 | |||||||||||||
| FOOD & STAPLES RETAILING | 55,808 | 0.4 | |||||||||||||
| FOOD, BEVERAGE & TOBACCO | 147,402 | 1.1 | |||||||||||||
| HEALTH CARE EQUIPMENT & SERVICES | 281,382 | 2.1 | |||||||||||||
| HOUSEHOLD & PERSONAL PRODUCTS | 7,188 | 0.1 | |||||||||||||
| INSURANCE | 169,554 | 1.2 | |||||||||||||
| MATERIALS | 170,417 | 1.2 | |||||||||||||
| MEDIA & ENTERTAINMENT | 377,115 | 2.8 | |||||||||||||
| PHARMACEUTICALS, BIOTECHNOLOGY & LIFE SCIENCES | 215,992 | 1.6 | |||||||||||||
| REAL ESTATE | |||||||||||||||
| $ 42,100,000 | g | SBA Tower Trust | 1.840%, 04/15/27 | 41,796 | 0.3 | ||||||||||
| Other | 352,538 | 2.6 | |||||||||||||
| 394,334 | 2.9 | ||||||||||||||
| RETAILING | 58,485 | 0.4 | |||||||||||||
| SEMICONDUCTORS & SEMICONDUCTOR EQUIPMENT | 128,091 | 0.9 | |||||||||||||
| SOFTWARE & SERVICES | 143,377 | 1.0 | |||||||||||||
| TECHNOLOGY HARDWARE & EQUIPMENT | 71,984 | 0.5 | |||||||||||||
| TELECOMMUNICATION SERVICES | |||||||||||||||
| 46,893,000 | AT&T, Inc | 2.550%, 12/01/33 | 45,863 | 0.3 | |||||||||||
| 30,220,000 | Verizon Communications, Inc | 4.272%, 01/15/36 | 35,448 | 0.3 | |||||||||||
| Other | 314,560 | 2.3 | |||||||||||||
| 395,871 | 2.9 | ||||||||||||||
| TRANSPORTATION | 77,966 | 0.6 | |||||||||||||
| UTILITIES | 505,650 | 3.7 | |||||||||||||
| TOTAL CORPORATE BONDS | (Cost $5,663,286) | 5,849,812 | 43.1 | ||||||||||||
| GOVERNMENT BONDS | |||||||||||||||
| AGENCY SECURITIES | 53,791 | 0.4 | |||||||||||||
| FOREIGN GOVERNMENT BONDS | 731,607 | 5.4 | |||||||||||||
| MORTGAGE BACKED | |||||||||||||||
| 38,422,177 | Federal Home Loan Mortgage Corp (FHLMC) | 3.000%, 11/01/51 | 41,003 | 0.3 | |||||||||||
| 63,034,000 | Federal National Mortgage Association (FNMA) | 2.500%, 01/25/51 | 64,310 | 0.5 | |||||||||||
| 75,950,000 | FNMA | 2.000%, 01/25/37 | 77,767 | 0.6 | |||||||||||
| See notes to financial statements | College Retirement Equities Fund ■ 2021 Annual Report | 63 |
| Summary portfolio of investments | continued |
| CREF Bond Market Account ■ December 31, 2021 |
| Principal | Issuer | Value (000) | % of net assets | |||||||||||||
| MORTGAGE BACKED—continued | ||||||||||||||||
| $ 72,650,000 | h | FNMA | 2.000%, 02/25/37 | $ | 74,263 | 0.5 | % | |||||||||
| 66,830,000 | FNMA | 2.000%, 01/25/51 | 66,624 | 0.5 | ||||||||||||
| 136,820,000 | FNMA | 3.000%, 01/25/52 | 141,740 | 1.0 | ||||||||||||
| 355,010,000 | h | FNMA | 2.000%, 02/25/52 | 353,126 | 2.6 | |||||||||||
| 401,760,000 | h | FNMA | 2.500%, 02/25/51 | 408,871 | 3.0 | |||||||||||
| 176,180,000 | h | FNMA | 3.000%, 02/25/51 | 182,248 | 1.3 | |||||||||||
| 550,063,368 | FNMA | 2.000%–9.000%, 07/01/24–01/01/52 | 521,990 | 3.8 | ||||||||||||
| 109,225,000 | h | Government National Mortgage Association (GNMA) | 2.000%, 01/20/51 | 110,211 | 0.8 | |||||||||||
| 167,640,000 | GNMA | 2.500%, 01/20/52 | 171,674 | 1.3 | ||||||||||||
| 74,830,000 | GNMA | 3.000%, 01/20/51 | 77,423 | 0.6 | ||||||||||||
| 57,740,000 | h | GNMA | 2.500%, 02/20/52 | 59,001 | 0.4 | |||||||||||
| 77,550,000 | h | GNMA | 3.000%, 02/20/52 | 80,095 | 0.6 | |||||||||||
| Other | 351,027 | 2.6 | ||||||||||||||
| 2,781,373 | 20.4 | |||||||||||||||
| MUNICIPAL BONDS | 405,024 | 3.0 | ||||||||||||||
| U.S. TREASURY SECURITIES | ||||||||||||||||
| 35,680,000 | United States Treasury Bond | 3.000%, 05/15/45 | 42,675 | 0.3 | ||||||||||||
| 41,710,000 | United States Treasury Bond | 2.875%, 08/15/45 | 48,972 | 0.3 | ||||||||||||
| 52,140,000 | United States Treasury Bond | 2.500%, 05/15/46 | 57,625 | 0.4 | ||||||||||||
| 30,710,000 | United States Treasury Bond | 2.750%, 11/15/47 | 35,753 | 0.3 | ||||||||||||
| 51,995,000 | United States Treasury Bond | 3.000%, 08/15/48 | 63,623 | 0.5 | ||||||||||||
| 110,019,000 | United States Treasury Bond | 2.750%–4.750%, 02/15/37–11/15/48 | 143,921 | 1.0 | ||||||||||||
| 33,549,228 | k | United States Treasury Inflation Indexed Bonds | 0.500%, 04/15/24 | 35,760 | 0.3 | |||||||||||
| 39,285,000 | United States Treasury Note | 0.125%, 08/31/22 | 39,251 | 0.3 | ||||||||||||
| 50,000,000 | United States Treasury Note | 1.500%, 09/15/22 | 50,428 | 0.4 | ||||||||||||
| 79,581,000 | United States Treasury Note | 0.250%, 11/15/23 | 78,925 | 0.6 | ||||||||||||
| 68,855,000 | United States Treasury Note | 0.625%, 11/30/27 | 65,947 | 0.5 | ||||||||||||
| 125,979,000 | d | United States Treasury Note | 2.000%, 08/15/51 | 128,420 | 0.9 | |||||||||||
| 80,000,000 | United States Treasury Note | 1.875%, 11/15/51 | 79,363 | 0.6 | ||||||||||||
| 171,190,000 | United States Treasury Note | 0.125%–1.875%, 10/31/22–05/15/50 | 166,019 | 1.2 | ||||||||||||
| 1,036,682 | 7.6 | |||||||||||||||
| TOTAL GOVERNMENT BONDS | (Cost $4,890,435) | 5,008,477 | 36.8 | |||||||||||||
| STRUCTURED ASSETS | ||||||||||||||||
| ASSET BACKED | ||||||||||||||||
| 50,500,000 | Chase Issuance Trust Series – 2020 A1 (Class A1) | 1.530%, 01/15/25 | 50,983 | 0.4 | ||||||||||||
| 37,500,000 | g | DB Master Finance LLC Series – 2021 1A (Class A2I) | 2.045%, 11/20/51 | 36,641 | 0.2 | |||||||||||
| 44,800,000 | Verizon Owner Trust Series – 2020 A (Class A1A) | 1.850%, 07/22/24 | 45,136 | 0.3 | ||||||||||||
| Other | 908,899 | 6.7 | ||||||||||||||
| 1,041,659 | 7.6 | |||||||||||||||
| OTHER MORTGAGE BACKED | 1,423,868 | 10.4 | ||||||||||||||
| TOTAL STRUCTURED ASSETS | (Cost $2,464,965) | 2,465,527 | 18.0 | |||||||||||||
| TOTAL BONDS | (Cost $13,018,686) | 13,323,816 | 97.9 | |||||||||||||
| 64 | 2021 Annual Report ■ College Retirement Equities Fund | See notes to financial statements |
| Summary portfolio of investments | continued |
| CREF Bond Market Account ■ December 31, 2021 |
| Shares | Company | Value (000) | % of net assets | |||||||||||||
| PREFERRED STOCKS | ||||||||||||||||
| BANKS | $ | 19,957 | 0.1 | % | ||||||||||||
| TOTAL PREFERRED STOCKS | (Cost $63,411) | 19,957 | 0.1 | |||||||||||||
| Principal | Issuer | |||||||||||||||
| SHORT-TERM INVESTMENTS | ||||||||||||||||
| GOVERNMENT AGENCY DEBT | ||||||||||||||||
| $ 40,000,000 | Federal Farm Credit Bank (FFCB) | 0.000%, 01/10/22 | 40,000 | 0.3 | ||||||||||||
| 41,785,000 | Federal Home Loan Bank (FHLB) | 0.000%, 01/04/22 | 41,785 | 0.3 | ||||||||||||
| 144,446,000 | FHLB | 0.000%, 01/05/22 | 144,446 | 1.1 | ||||||||||||
| 108,627,000 | FHLB | 0.000%, 01/12/22 | 108,627 | 0.8 | ||||||||||||
| 53,250,000 | FHLB | 0.000%, 01/19/22 | 53,250 | 0.4 | ||||||||||||
| 40,000,000 | FHLB | 0.000%, 01/28/22 | 40,000 | 0.3 | ||||||||||||
| 123,375,000 | FHLB | 0.000%, 02/02/22 | 123,373 | 0.9 | ||||||||||||
| 70,000,000 | FHLB | 0.000%, 02/04/22 | 69,999 | 0.5 | ||||||||||||
| 104,192,000 | FHLB | 0.000%, 02/09/22 | 104,190 | 0.8 | ||||||||||||
| 50,000,000 | FHLB | 0.000%, 02/14/22 | 49,985 | 0.4 | ||||||||||||
| 55,000,000 | FHLB | 0.000%, 02/18/22 | 54,999 | 0.4 | ||||||||||||
| 53,405,000 | FHLB | 0.000%, 04/22/22 | 53,390 | 0.4 | ||||||||||||
| Other | 971,592 | 7.0 | ||||||||||||||
| 1,855,636 | 13.6 | |||||||||||||||
| TREASURY DEBT | ||||||||||||||||
| 40,000,000 | United States Treasury Bill | 0.000%, 08/11/22 | 39,952 | 0.3 | ||||||||||||
| Other | 39,988 | 0.3 | ||||||||||||||
| 79,940 | 0.6 | |||||||||||||||
| Shares | Company | |||||||||||||||
| INVESTMENTS IN REGISTERED INVESTMENT COMPANIES | ||||||||||||||||
| 13,709,003 | c | State Street Navigator Securities Lending Government Money Market Portfolio | 0.030% | 13,709 | 0.1 | |||||||||||
| TOTAL INVESTMENT IN REGISTERED INVESTMENT COMPANIES | 13,709 | 0.1 | ||||||||||||||
| TOTAL SHORT-TERM INVESTMENTS | (Cost $1,949,518) | 1,949,285 | 14.3 | |||||||||||||
| TOTAL PORTFOLIO | (Cost $15,131,142) | 15,391,753 | 113.0 | |||||||||||||
| OTHER ASSETS & LIABILITIES, NET | (1,769,356 | ) | (13.0 | ) | ||||||||||||
| NET ASSETS | $ | 13,622,397 | 100.0 | % | ||||||||||||
| c | Investments made with cash collateral received from securities on loan. |
| d | All or a portion of these securities have been segregated to cover margin requirements on open futures contracts. |
| g | Security is exempt from registration under Rule 144(A) of the Securities Act of 1933, as amended. Such securities are deemed liquid and may be resold in transactions exempt from registration to qualified institutional buyers. At 12/31/21, the aggregate value of these securities, including those in “Other,” is $2,930,966,342 or 21.5% of net assets. |
| h | All or a portion of these securities were purchased on a delayed delivery basis. |
| k | Principal amount for interest accrual purposes is periodically adjusted based on changes in the Consumer Price Index. |
“Other” securities represent the aggregate value, by category, of securities that are not among the 50 largest holdings and, in total for any issuer, represent 1% or less of net assets.
At 12/31/21, the aggregate value of securities on loan is $13,400,892. See Note 4 in the Notes to financial statements for additional information about securities lending collateral.
Cost amounts are in thousands.
| See notes to financial statements | College Retirement Equities Fund ■ 2021 Annual Report | 65 |
| Summary portfolio of investments | continued |
CREF Bond Market Account ■ December 31, 2021
For ease of presentation, a number of classification categories have been grouped together in the Summary portfolio of investments. Note that the Account uses more specific categories in following its investment limitations on investment concentrations.
Futures contracts outstanding as of December 31, 2021 were as follows (dollar amounts are in thousands):
| Description | Number of long (short contracts | )
| Expiration date | Notional amount | Value | Unrealized appreciation (depreciation | ) | ||||||||||
| US 10YR Ultra | (1,943 | ) | 03/22/22 | $(279,909 | ) | $(284,528 | ) | $(4,619 | ) | ||||||||
Forward foreign currency contracts outstanding as of December 31, 2021 were as follows (dollar amounts are in thousands):
| Currency to be purchased | Receive | Currency to be sold | Deliver | Counterparty | Settlement date | Unrealized appreciation (depreciation | ) | ||||||||||||
| $ | 1,194 | NZD | 1,667 | Australia and New Zealand Banking Group | 02/01/22 | $ | 53 | ||||||||||||
| $ | 498 | NZD | 696 | Australia and New Zealand Banking Group | 02/01/22 | 22 | |||||||||||||
| GBP | 69 | $ | 94 | Australia and New Zealand Banking Group | 01/31/22 | (1 | ) | ||||||||||||
| Total | $ | 74 | |||||||||||||||||
| $ | 348 | GBP | 255 | Bank of America | 01/31/22 | $ | 3 | ||||||||||||
| GBP | 991 | $ | 1,340 | Bank of America | 01/31/22 | 2 | |||||||||||||
| Total | $ | 5 | |||||||||||||||||
| $ | 6,339 | KRW | 7,535,195 | Citibank N.A. | 02/04/22 | $ | 9 | ||||||||||||
| Total | $ | 9 | |||||||||||||||||
| $ | 1,397 | CAD | 1,777 | Goldman Sachs | 01/31/22 | $ | (7 | ) | |||||||||||
| $ | 1,473 | ILS | 4,630 | Goldman Sachs | 01/31/22 | (16 | ) | ||||||||||||
| $ | 799 | THB | 26,644 | Goldman Sachs | 01/31/22 | 1 | |||||||||||||
| Total | $ | (22 | ) | ||||||||||||||||
| $ | 7,554 | CAD | 9,325 | Morgan Stanley | 01/31/22 | $ | 182 | ||||||||||||
| $ | 1,099 | CAD | 1,367 | Morgan Stanley | 01/31/22 | 19 | |||||||||||||
| $ | 1,493 | NOK | 12,543 | Morgan Stanley | 01/31/22 | 70 | |||||||||||||
| $ | 708 | PLN | 2,968 | Morgan Stanley | 01/31/22 | (27 | ) | ||||||||||||
| $ | 697 | SEK | 5,971 | Morgan Stanley | 01/31/22 | 36 | |||||||||||||
| CAD | 1,354 | $ | 1,089 | Morgan Stanley | 01/31/22 | (19 | ) | ||||||||||||
| EUR | 509 | $ | 574 | Morgan Stanley | 01/31/22 | 6 | |||||||||||||
| $ | 419 | ZAR | 6,756 | Morgan Stanley | 01/31/22 | (3 | ) | ||||||||||||
| Total | $ | 264 | |||||||||||||||||
| $ | 4,624 | AUD | 6,150 | Toronto Dominion Bank | 01/31/22 | $ | 148 | ||||||||||||
| $ | 19,848 | CNY | 127,559 | Toronto Dominion Bank | 01/28/22 | (169 | ) | ||||||||||||
| $ | 91,508 | EUR | 81,008 | Toronto Dominion Bank | 01/31/22 | (777 | ) | ||||||||||||
| $ | 3,787 | EUR | 3,343 | Toronto Dominion Bank | 03/15/22 | (24 | ) | ||||||||||||
| $ | 24,978 | GBP | 18,188 | Toronto Dominion Bank | 01/31/22 | 362 | |||||||||||||
| $ | 945 | GBP | 700 | Toronto Dominion Bank | 01/31/22 | (2 | ) | ||||||||||||
| $ | 504 | GBP | 378 | Toronto Dominion Bank | 01/31/22 | (8 | ) | ||||||||||||
| $ | 27,269 | JPY | 3,093,974 | Toronto Dominion Bank | 01/31/22 | 365 | |||||||||||||
| Total | $ | (105 | ) | ||||||||||||||||
| Total | $ | 225 | |||||||||||||||||
| 66 | 2021 Annual Report ■ College Retirement Equities Fund | See notes to financial statements |
| Summary portfolio of investments | concluded |
CREF Bond Market Account ■ December 31, 2021
| AUD | Australian Dollar |
| CAD | Canadian Dollar |
| CNY | Chinese Yuan |
| EUR | Euro |
| GBP | Pound Sterling |
| ILS | Israeli Shekel |
| JPY | Japanese Yen |
| KRW | South Korean Won |
| NOK | Norwegian Krone |
| NZD | New Zealand Dollar |
| PLN | Polish Zloty |
| SEK | Swedish Krona |
| THB | Thailand Baht |
| ZAR | South African Rand |
Centrally cleared credit default swap contracts outstanding as of December 31, 2021 were as follows (dollar amounts are in thousands):
PURCHASED
| Reference entity | Terms of payments to be paid | Terms of payments to be received | Counterparty | Frequency of payments | Maturity date | Notional amount | * | Upfront premiums paid (received | ) | Value | Unrealized appreciation (depreciation | ) | |||||||
| CDX-NAIGS37V1-5 Year Index | 1.00% | Credit event as specified in contract | Citigroup Global Markets, Inc | Quarterly | 12/20/26 | $75,000 | $(1,699 | ) | $(1,890 | ) | $(191 | ) |
| * | The maximum potential amount the Account could be required to pay as a seller of credit protection or receive as a buyer of credit protection if a credit event occurs is defined under the terms of that particular swap agreement. This amount may be reduced by any recoverable assets, if applicable. |
SOLD
| Reference entity | Terms of payments to be paid | Terms of payments to be received | Counterparty | Frequency of payments | Maturity date | Notional amount | * | Upfront premiums paid (received | ) | Value | Unrealized appreciation (depreciation | ) | |||||||
| CDX-NAIGS37V1- 5 Year Index | Credit event as specified in contract | 1.00% | Citigroup Global Markets, Inc | Quarterly | 12/20/26 | $37,500 | $758 | $924 | $166 |
| * | The maximum potential amount the Account could be required to pay as a seller of credit protection or receive as a buyer of credit protection if a credit event occurs is defined under the terms of that particular swap agreement. This amount may be reduced by any recoverable assets, if applicable. |
| See notes to financial statements | College Retirement Equities Fund ■ 2021 Annual Report | 67 |
Summary portfolio of investments
CREF Inflation-Linked Bond Account ■ December 31, 2021
| Principal | Issuer | Value (000) | % of net assets | ||||||||||||
| BANK LOAN OBLIGATIONS | |||||||||||||||
| COMMERCIAL & PROFESSIONAL SERVICES | $ | 2,492 | 0.0 | % | |||||||||||
| CONSUMER SERVICES | 5,444 | 0.1 | |||||||||||||
| HEALTH CARE EQUIPMENT & SERVICES | 3,352 | 0.1 | |||||||||||||
| MEDIA & ENTERTAINMENT | 5,644 | 0.1 | |||||||||||||
| PHARMACEUTICALS, BIOTECHNOLOGY & LIFE SCIENCES | 7,497 | 0.1 | |||||||||||||
| RETAILING | 2,999 | 0.0 | |||||||||||||
| SOFTWARE & SERVICES | 2,964 | 0.0 | |||||||||||||
| UTILITIES | 2,482 | 0.0 | |||||||||||||
| TOTAL BANK LOAN OBLIGATIONS | (Cost $32,860) | 32,874 | 0.4 | ||||||||||||
| BONDS | |||||||||||||||
| CORPORATE BONDS | |||||||||||||||
| BANKS | 6,031 | 0.1 | |||||||||||||
| COMMERCIAL & PROFESSIONAL SERVICES | 8,888 | 0.1 | |||||||||||||
| DIVERSIFIED FINANCIALS | 11,021 | 0.1 | |||||||||||||
| ENERGY | 25,852 | 0.4 | |||||||||||||
| HEALTH CARE EQUIPMENT & SERVICES | 6,079 | 0.1 | |||||||||||||
| MATERIALS | 4,975 | 0.1 | |||||||||||||
| MEDIA & ENTERTAINMENT | 9,594 | 0.1 | |||||||||||||
| PHARMACEUTICALS, BIOTECHNOLOGY & LIFE SCIENCES | 5,443 | 0.1 | |||||||||||||
| REAL ESTATE | 10,094 | 0.1 | |||||||||||||
| RETAILING | 4,421 | 0.0 | |||||||||||||
| SOFTWARE & SERVICES | 5,383 | 0.1 | |||||||||||||
| TELECOMMUNICATION SERVICES | 14,219 | 0.2 | |||||||||||||
| TOTAL CORPORATE BONDS | (Cost $111,924) | 112,000 | 1.5 | ||||||||||||
| GOVERNMENT BONDS | |||||||||||||||
| AGENCY SECURITIES | |||||||||||||||
| $ 14,985,000 | Montefiore Medical Center | 2.895%, 04/20/32 | 15,719 | 0.2 | |||||||||||
| Other | 3,036 | 0.0 | |||||||||||||
| 18,755 | 0.2 | ||||||||||||||
| MORTGAGE BACKED | |||||||||||||||
| 10,000,000 | g,i | Freddie Mac STACR REMIC Trust | 1.000%, 12/25/41 | 10,000 | 0.1 | ||||||||||
| 20,055,164 | Government National Mortgage Association (GNMA) | 3.600%, 09/15/31 | 20,853 | 0.3 | |||||||||||
| 9,987,600 | GNMA | 3.650%, 02/15/32 | 10,565 | 0.1 | |||||||||||
| 38,019,181 | GNMA | 1.730%, 07/15/37 | 37,988 | 0.5 | |||||||||||
| 56,603,124 | GNMA | 4.250%, 09/15/38 | 59,730 | 0.8 | |||||||||||
| 24,255,036 | GNMA | 1.650%, 07/15/42 | 23,871 | 0.3 | |||||||||||
| 68 | 2021 Annual Report ■ College Retirement Equities Fund | See notes to financial statements |
| Summary portfolio of investments | continued |
CREF Inflation-Linked Bond Account ■ December 31, 2021
| Principal | Issuer | Value (000) | % of net assets | ||||||||||||
| MORTGAGE BACKED—continued | |||||||||||||||
| $ 26,228,351 | GNMA | 2.750%, 01/15/45 | $ | 27,711 | 0.4 | % | |||||||||
| Other | 11,706 | 0.1 | |||||||||||||
| 202,424 | 2.6 | ||||||||||||||
| U.S. TREASURY SECURITIES | |||||||||||||||
| 262,249,983 | k | United States Treasury Inflation Indexed Bonds | 0.125%, 07/15/22 | 268,719 | 3.4 | ||||||||||
| 364,179,840 | k | United States Treasury Inflation Indexed Bonds | 0.125%, 01/15/23 | 376,101 | 4.8 | ||||||||||
| 263,833,140 | k | United States Treasury Inflation Indexed Bonds | 0.625%, 04/15/23 | 275,798 | 3.5 | ||||||||||
| 266,750,900 | k | United States Treasury Inflation Indexed Bonds | 0.375%, 07/15/23 | 280,459 | 3.6 | ||||||||||
| 189,909,070 | d,k | United States Treasury Inflation Indexed Bonds | 0.625%, 01/15/24 | 202,091 | 2.6 | ||||||||||
| 223,661,520 | k | United States Treasury Inflation Indexed Bonds | 0.500%, 04/15/24 | 238,404 | 3.0 | ||||||||||
| 189,237,750 | k | United States Treasury Inflation Indexed Bonds | 0.125%, 07/15/24 | 201,716 | 2.6 | ||||||||||
| 212,857,600 | k | United States Treasury Inflation Indexed Bonds | 0.125%, 10/15/24 | 227,340 | 2.9 | ||||||||||
| 213,643,350 | k | United States Treasury Inflation Indexed Bonds | 0.250%, 01/15/25 | 228,876 | 2.9 | ||||||||||
| 112,971,286 | k | United States Treasury Inflation Indexed Bonds | 2.375%, 01/15/25 | 128,644 | 1.6 | ||||||||||
| 173,424,240 | k | United States Treasury Inflation Indexed Bonds | 0.125%, 04/15/25 | 185,502 | 2.4 | ||||||||||
| 230,873,940 | k | United States Treasury Inflation Indexed Bonds | 0.375%, 07/15/25 | 250,745 | 3.2 | ||||||||||
| 300,524,580 | k | United States Treasury Inflation Indexed Bonds | 0.125%, 10/15/25 | 323,957 | 4.1 | ||||||||||
| 247,322,882 | k | United States Treasury Inflation Indexed Bonds | 0.625%, 01/15/26 | 271,610 | 3.5 | ||||||||||
| 74,291,324 | k | United States Treasury Inflation Indexed Bonds | 2.000%, 01/15/26 | 85,957 | 1.1 | ||||||||||
| 152,888,000 | k | United States Treasury Inflation Indexed Bonds | 0.125%, 04/15/26 | 164,985 | 2.1 | ||||||||||
| 170,729,840 | k | United States Treasury Inflation Indexed Bonds | 0.125%, 07/15/26 | 185,350 | 2.4 | ||||||||||
| 279,051,107 | k | United States Treasury Inflation Indexed Bonds | 0.125%, 10/15/26 | 303,447 | 3.9 | ||||||||||
| 227,224,935 | k | United States Treasury Inflation Indexed Bonds | 0.375%, 01/15/27 | 249,913 | 3.2 | ||||||||||
| 131,906,554 | k | United States Treasury Inflation Indexed Bonds | 2.375%, 01/15/27 | 159,300 | 2.0 | ||||||||||
| 130,561,200 | k | United States Treasury Inflation Indexed Bonds | 0.375%, 07/15/27 | 144,842 | 1.9 | ||||||||||
| 230,367,555 | k | United States Treasury Inflation Indexed Bonds | 0.500%, 01/15/28 | 257,747 | 3.3 | ||||||||||
| 227,552,484 | k | United States Treasury Inflation Indexed Bonds | 1.750%, 01/15/28 | 272,962 | 3.5 | ||||||||||
| 121,426,471 | k | United States Treasury Inflation Indexed Bonds | 3.625%, 04/15/28 | 161,310 | 2.1 | ||||||||||
| 141,002,240 | k | United States Treasury Inflation Indexed Bonds | 0.750%, 07/15/28 | 161,465 | 2.1 | ||||||||||
| 206,973,900 | k | United States Treasury Inflation Indexed Bonds | 0.875%, 01/15/29 | 239,328 | 3.1 | ||||||||||
| 151,845,768 | k | United States Treasury Inflation Indexed Bonds | 2.500%, 01/15/29 | 194,099 | 2.5 | ||||||||||
| 8,561,584 | k | United States Treasury Inflation Indexed Bonds | 3.875%, 04/15/29 | 11,923 | 0.1 | ||||||||||
| 202,148,870 | k | United States Treasury Inflation Indexed Bonds | 0.250%, 07/15/29 | 226,488 | 2.9 | ||||||||||
| 166,586,250 | k | United States Treasury Inflation Indexed Bonds | 0.125%, 01/15/30 | 184,882 | 2.4 | ||||||||||
| 132,115,025 | k | United States Treasury Inflation Indexed Bonds | 0.125%, 07/15/30 | 147,803 | 1.9 | ||||||||||
| 161,458,960 | k | United States Treasury Inflation Indexed Bonds | 0.125%, 01/15/31 | 180,763 | 2.3 | ||||||||||
| 242,922,759 | k | United States Treasury Inflation Indexed Bonds | 0.125%, 07/15/31 | 273,038 | 3.5 | ||||||||||
| 69,479,218 | k | United States Treasury Inflation Indexed Bonds | 3.375%, 04/15/32 | 103,329 | 1.3 | ||||||||||
| 66,911,670 | k | United States Treasury Inflation Indexed Bonds | 0.125%, 02/15/51 | 79,191 | 1.0 | ||||||||||
| 7,248,084 | 92.7 | ||||||||||||||
| TOTAL GOVERNMENT BONDS | (Cost $6,948,968) | 7,469,263 | 95.5 | ||||||||||||
| STRUCTURED ASSETS | |||||||||||||||
| ASSET BACKED | |||||||||||||||
| 8,000,000 | g | MVW LLC | |||||||||||||
| Series - 2021 2A (Class B) | 1.830%, 05/20/39 | 7,948 | 0.1 | ||||||||||||
| Other | 24,413 | 0.3 | |||||||||||||
| 32,361 | 0.4 | ||||||||||||||
| See notes to financial statements | College Retirement Equities Fund ■ 2021 Annual Report | 69 |
| Summary portfolio of investments | continued |
| CREF Inflation-Linked Bond Account ■ December 31, 2021 |
| Principal | Issuer | Value (000) | % of net assets | |||||||||||||
| OTHER MORTGAGE BACKED | ||||||||||||||||
| $ | 30,250,000 | g,i | BX Commercial Mortgage Trust | |||||||||||||
| Series - 2021 XL2 (Class C), LIBOR 1 M + 1.197% | 1.307%, 10/15/38 | $ | 30,063 | 0.4 | % | |||||||||||
| 9,000,000 | g,i | Connecticut Avenue Securities Trust | ||||||||||||||
| Series - 2021 R03 (Class 1M2) | 1.700%, 12/25/41 | 9,011 | 0.1 | |||||||||||||
| 10,000,000 | g,i | Connecticut Avenue Securities Trust | ||||||||||||||
| Series - 2021 R01 (Class 1M2) | 1.600%, 10/25/41 | 10,012 | 0.1 | |||||||||||||
| 9,850,334 | g,i | Verus Securitization Trust | ||||||||||||||
| Series - 2021 7 (Class A3) | 2.240%, 10/25/66 | 9,826 | 0.1 | |||||||||||||
| Other | 84,841 | 1.1 | ||||||||||||||
| 143,753 | 1.8 | |||||||||||||||
| TOTAL STRUCTURED ASSETS | (Cost $176,412) | 176,114 | 2.2 | |||||||||||||
| TOTAL BONDS | (Cost $7,237,304) | 7,757,377 | 99.2 | |||||||||||||
| SHORT-TERM INVESTMENTS | ||||||||||||||||
| GOVERNMENT AGENCY DEBT | 7,500 | 0.1 | ||||||||||||||
| REPURCHASE AGREEMENT | ||||||||||||||||
| 31,000,000 | r | Fixed Income Clearing Corp (FICC) | 0.020%, 01/03/22 | 31,000 | 0.4 | |||||||||||
| 31,000 | 0.4 | |||||||||||||||
| TREASURY DEBT | ||||||||||||||||
| 10,000,000 | United States Treasury Bill | 0.000%, 06/23/22 | 9,992 | 0.1 | ||||||||||||
| 9,992 | 0.1 | |||||||||||||||
| Shares | Company | |||||||||||||||
| INVESTMENTS IN REGISTERED INVESTMENT COMPANIES | ||||||||||||||||
| 2,033,802 | c | State Street Navigator Securities Lending Government Money Market Portfolio | 0.030% | 2,034 | 0.0 | |||||||||||
| TOTAL INVESTMENT IN REGISTERED INVESTMENT COMPANIES | 2,034 | 0.0 | ||||||||||||||
| TOTAL SHORT-TERM INVESTMENTS | (Cost $50,526) | 50,526 | 0.6 | |||||||||||||
| TOTAL PORTFOLIO | (Cost $7,320,690) | 7,840,777 | 100.2 | |||||||||||||
| OTHER ASSETS & LIABILITIES, NET | (16,512 | ) | (0.2 | ) | ||||||||||||
| NET ASSETS | $ | 7,824,265 | 100.0 | % | ||||||||||||
| LIBOR | London Interbank Offered Rate |
| M | Month |
| c | Investments made with cash collateral received from securities on loan. |
| d | All or a portion of these securities have been segregated to cover margin requirements on open futures contracts. |
| g | Security is exempt from registration under Rule 144(A) of the Securities Act of 1933, as amended. Such securities are deemed liquid and may be resold in transactions exempt from registration to qualified institutional buyers. At 12/31/21, the aggregate value of these securities, including those in “Other,” is $256,745,131 or 3.3% of net assets. |
| i | Floating or variable rate security includes the reference rate and spread, unless the variable rate is based on the underlying asset of the security. Coupon rate reflects the rate at period end. |
| k | Principal amount for interest accrual purposes is periodically adjusted based on changes in the Consumer Price Index. |
| r | Agreement with Fixed Income Clearing Corporation, 0.020% dated 12/31/21 to be repurchased at $31,000,000 on 1/3/22, collateralized by Government Agency Securities, with coupon rate 1.875% and maturity date 2/15/41, valued at $31,620,066. |
| 70 | 2021 Annual Report ■ College Retirement Equities Fund | See notes to financial statements |
| Summary portfolio of investments | concluded |
CREF Inflation-Linked Bond Account ■ December 31, 2021
“Other” securities represent the aggregate value, by category, of securities that are not among the 50 largest holdings and, in total for any issuer, represent 1% or less of net assets.
At 12/31/21, the aggregate value of securities on loan is $1,989,769. See Note 4 in the Notes to financial statements for additional information about securities lending collateral.
Cost amounts are in thousands.
For ease of presentation, a number of classification categories have been grouped together in the Summary portfolio of investments. Note that the Account uses more specific categories in following its investment limitations on investment concentrations.
Futures contracts outstanding as of December 31, 2021 were as follows (dollar amounts are in thousands):
| Description | Number of long (short contracts | )
| Expiration date | Notional amount | Value | Unrealized appreciation (depreciation) | ||||||||||||
| US Long Bond | (20 | ) | 03/22/22 | $ (3,164 | ) | $ (3,209 | ) | $ (45 | ) | |||||||||
| US Ultra Bond | (480 | ) | 03/22/22 | (92,695 | ) | (94,620 | ) | (1,925 | ) | |||||||||
| Total | (500 | ) | $(95,859 | ) | $(97,829 | ) | $(1,970 | ) | ||||||||||
| See notes to financial statements | College Retirement Equities Fund ■ 2021 Annual Report | 71 |
Summary portfolio of investments
CREF Social Choice Account ■ December 31, 2021
| Principal | Issuer | Value (000) | % of net assets | |||||||||||
| BANK LOAN OBLIGATIONS | ||||||||||||||
| COMMERCIAL & PROFESSIONAL SERVICES | $ | 15,830 | 0.1 | % | ||||||||||
| TOTAL BANK LOAN OBLIGATIONS | (Cost $15,800) | 15,830 | 0.1 | |||||||||||
| BONDS | ||||||||||||||
| CORPORATE BONDS | ||||||||||||||
| AUTOMOBILES & COMPONENTS | 37,861 | 0.2 | ||||||||||||
| BANKS | 596,986 | 3.0 | ||||||||||||
| CAPITAL GOODS | 72,614 | 0.4 | ||||||||||||
| COMMERCIAL & PROFESSIONAL SERVICES | 50,117 | 0.3 | ||||||||||||
| CONSUMER DURABLES & APPAREL | 13,197 | 0.1 | ||||||||||||
| CONSUMER SERVICES | 111,524 | 0.6 | ||||||||||||
| DIVERSIFIED FINANCIALS | 419,286 | 2.1 | ||||||||||||
| ENERGY | 144,322 | 0.7 | ||||||||||||
| FOOD & STAPLES RETAILING | 34,373 | 0.2 | ||||||||||||
| FOOD, BEVERAGE & TOBACCO | 29,675 | 0.1 | ||||||||||||
| HEALTH CARE EQUIPMENT & SERVICES | 30,246 | 0.1 | ||||||||||||
| HOUSEHOLD & PERSONAL PRODUCTS | 25,335 | 0.1 | ||||||||||||
| INSURANCE | 156,609 | 0.8 | ||||||||||||
| MATERIALS | 121,154 | 0.6 | ||||||||||||
| MEDIA & ENTERTAINMENT | 44,154 | 0.2 | ||||||||||||
| PHARMACEUTICALS, BIOTECHNOLOGY & LIFE SCIENCES | 158,063 | 0.8 | ||||||||||||
| REAL ESTATE | 149,259 | 0.8 | ||||||||||||
| RETAILING | 29,982 | 0.1 | ||||||||||||
| SEMICONDUCTORS & SEMICONDUCTOR EQUIPMENT | 19,437 | 0.1 | ||||||||||||
| SOFTWARE & SERVICES | 60,093 | 0.3 | ||||||||||||
| TECHNOLOGY HARDWARE & EQUIPMENT | 30,949 | 0.2 | ||||||||||||
| TELECOMMUNICATION SERVICES | 73,738 | 0.4 | ||||||||||||
| TRANSPORTATION | 39,323 | 0.2 | ||||||||||||
| UTILITIES | 888,558 | 4.5 | ||||||||||||
| TOTAL CORPORATE BONDS | (Cost $3,275,631) | 3,336,855 | 16.9 | |||||||||||
| GOVERNMENT BONDS | ||||||||||||||
| AGENCY SECURITIES | 307,331 | 1.6 | ||||||||||||
| FOREIGN GOVERNMENT BONDS | 572,018 | 2.9 | ||||||||||||
| 72 | 2021 Annual Report ■ College Retirement Equities Fund | See notes to financial statements |
| Summary portfolio of investments | continued |
CREF Social Choice Account ■ December 31, 2021
| Principal | Issuer | Value (000) | % of net assets | |||||||||||||
| MORTGAGE BACKED | ||||||||||||||||
| $153,620,000 | h | Federal National Mortgage Association (FNMA) | 2.000%, 02/25/52 | $ | 152,805 | 0.8 | % | |||||||||
| 170,260,000 | h | FNMA | 2.500%, 02/25/51 | 173,274 | 0.9 | |||||||||||
| 68,640,000 | h | FNMA | 3.000%, 02/25/52 | 71,004 | 0.4 | |||||||||||
| 414,978,439 | h | FNMA | 1.250%–8.000%, 07/01/24–01/25/52 | 401,256 | 1.9 | |||||||||||
| 67,535,000 | h | Government National Mortgage | ||||||||||||||
| Association (GNMA) | 2.000%, 01/20/51 | 68,145 | 0.4 | |||||||||||||
| 87,870,000 | h | GNMA | 2.500%, 01/20/52 | 89,984 | 0.5 | |||||||||||
| Other | 339,496 | 1.7 | ||||||||||||||
| 1,295,964 | 6.6 | |||||||||||||||
| MUNICIPAL BONDS | 610,841 | 3.1 | ||||||||||||||
| U.S. TREASURY SECURITIES | ||||||||||||||||
| 178,783,000 | United States Treasury Note | 1.250%, 12/31/26 | 178,587 | 0.9 | ||||||||||||
| 135,057,000 | United States Treasury Note | 2.000%, 08/15/51 | 137,674 | 0.7 | ||||||||||||
| 382,382,000 | United States Treasury Note | 0.125%–2.875%, 05/31/22–11/15/41 | 380,144 | 1.9 | ||||||||||||
| Other | 52,684 | 0.2 | ||||||||||||||
| 749,089 | 3.7 | |||||||||||||||
| TOTAL GOVERNMENT BONDS | (Cost $3,465,319) | 3,535,243 | 17.9 | |||||||||||||
| STRUCTURED ASSETS | ||||||||||||||||
| ASSET BACKED | 272,560 | 1.4 | ||||||||||||||
| OTHER MORTGAGE BACKED | 501,290 | 2.5 | ||||||||||||||
| TOTAL STRUCTURED ASSETS | (Cost $772,284) | 773,850 | 3.9 | |||||||||||||
| TOTAL BONDS | (Cost $7,513,234) | 7,645,948 | 38.7 | |||||||||||||
| Shares | Company | |||||||||||||||
| COMMON STOCKS | ||||||||||||||||
| AUTOMOBILES & COMPONENTS | ||||||||||||||||
| 178,349 | * | Tesla, Inc | 188,476 | 1.0 | ||||||||||||
| Other | 158,184 | 0.8 | ||||||||||||||
| 346,660 | 1.8 | |||||||||||||||
| BANKS | 618,128 | 3.1 | ||||||||||||||
| CAPITAL GOODS | ||||||||||||||||
| 285,113 | Caterpillar, Inc | 58,944 | 0.3 | |||||||||||||
| Other | 739,728 | 3.8 | ||||||||||||||
| 798,672 | 4.1 | |||||||||||||||
| COMMERCIAL & PROFESSIONAL SERVICES | 235,704 | 1.2 | ||||||||||||||
| CONSUMER DURABLES & APPAREL | ||||||||||||||||
| 443,605 | Nike, Inc (Class B) | 73,936 | 0.4 | |||||||||||||
| Other | 175,495 | 0.9 | ||||||||||||||
| 249,431 | 1.3 | |||||||||||||||
| CONSUMER SERVICES | ||||||||||||||||
| 23,897 | * | Booking Holdings, Inc | 57,334 | 0.3 | ||||||||||||
| 540,313 | Starbucks Corp | 63,200 | 0.3 | |||||||||||||
| Other | 143,564 | 0.7 | ||||||||||||||
| 264,098 | 1.3 | |||||||||||||||
| See notes to financial statements | College Retirement Equities Fund ■ 2021 Annual Report | 73 |
| Summary portfolio of investments | continued |
CREF Social Choice Account ■ December 31, 2021
| Shares | Company | Value (000) | % of net assets | |||||||||
| DIVERSIFIED FINANCIALS | ||||||||||||
| 66,998 | BlackRock, Inc | $ | 61,341 | 0.3 | % | |||||||
| 716,294 | Charles Schwab Corp | 60,240 | 0.3 | |||||||||
| 595,136 | Morgan Stanley | 58,418 | 0.3 | |||||||||
| 122,346 | S&P Global, Inc | 57,739 | 0.3 | |||||||||
| Other | 513,397 | 2.6 | ||||||||||
| 751,135 | 3.8 | |||||||||||
| ENERGY | 381,780 | 1.9 | ||||||||||
| FOOD & STAPLES RETAILING | 123,208 | 0.6 | ||||||||||
| FOOD, BEVERAGE & TOBACCO | ||||||||||||
| 1,335,199 | Coca-Cola Co | 79,057 | 0.4 | |||||||||
| 598,750 | Nestle S.A. | 83,596 | 0.4 | |||||||||
| 465,088 | PepsiCo, Inc | 80,790 | 0.4 | |||||||||
| Other | 171,493 | 0.9 | ||||||||||
| 414,936 | 2.1 | |||||||||||
| HEALTH CARE EQUIPMENT & SERVICES | 596,706 | 3.0 | ||||||||||
| HOUSEHOLD & PERSONAL PRODUCTS | ||||||||||||
| 664,450 | Procter & Gamble Co | 108,691 | 0.5 | |||||||||
| Other | 191,633 | 1.0 | ||||||||||
| 300,324 | 1.5 | |||||||||||
| INSURANCE | 399,993 | 2.0 | ||||||||||
| MATERIALS | 490,644 | 2.5 | ||||||||||
| MEDIA��& ENTERTAINMENT | ||||||||||||
| 131,390 | * | Netflix, Inc | 79,155 | 0.4 | ||||||||
| 563,977 | * | Walt Disney Co | 87,354 | 0.5 | ||||||||
| Other | 335,417 | 1.6 | ||||||||||
| 501,926 | 2.5 | |||||||||||
| PHARMACEUTICALS, BIOTECHNOLOGY & LIFE SCIENCES | ||||||||||||
| 229,372 | Danaher Corp | 75,466 | 0.4 | |||||||||
| 294,385 | Eli Lilly & Co | 81,315 | 0.4 | |||||||||
| 151,818 | Roche Holding AG. | 62,983 | 0.3 | |||||||||
| 128,344 | Thermo Fisher Scientific, Inc | 85,636 | 0.4 | |||||||||
| 243,161 | Zoetis, Inc | 59,339 | 0.3 | |||||||||
| Other | 610,917 | 3.1 | ||||||||||
| 975,656 | 4.9 | |||||||||||
| REAL ESTATE | ||||||||||||
| 211,503 | American Tower Corp | 61,865 | 0.3 | |||||||||
| 359,442 | Prologis, Inc | 60,516 | 0.3 | |||||||||
| Other | 261,911 | 1.4 | ||||||||||
| 384,292 | 2.0 | |||||||||||
| RETAILING | ||||||||||||
| 279,281 | Home Depot, Inc | 115,904 | 0.6 | |||||||||
| 229,305 | Lowe’s Companies, Inc | 59,271 | 0.3 | |||||||||
| Other | 280,253 | 1.4 | ||||||||||
| 455,428 | 2.3 | |||||||||||
| 74 | 2021 Annual Report ■ College Retirement Equities Fund | See notes to financial statements |
| Summary portfolio of investments | continued |
CREF Social Choice Account ■ December 31, 2021
| Shares | Company | Value (000) | % of net assets | |||||||||||
| SEMICONDUCTORS & SEMICONDUCTOR EQUIPMENT | ||||||||||||||
| 417,605 | Applied Materials, Inc | $ | 65,714 | 0.3 | % | |||||||||
| 89,481 | ASML Holding NV | 71,676 | 0.4 | |||||||||||
| 1,438,463 | Intel Corp | 74,081 | 0.4 | |||||||||||
| 543,594 | NVIDIA Corp | 159,876 | 0.8 | |||||||||||
| 365,987 | Texas Instruments, Inc | 68,978 | 0.4 | |||||||||||
| Other | 195,836 | 0.9 | ||||||||||||
| 636,161 | 3.2 | |||||||||||||
| SOFTWARE & SERVICES | ||||||||||||||
| 149,083 | * | Adobe, Inc | 84,539 | 0.4 | ||||||||||
| 236,997 | Automatic Data Processing, Inc | 58,439 | 0.3 | |||||||||||
| 458,782 | International Business Machines Corp | 61,321 | 0.3 | |||||||||||
| 106,355 | Intuit, Inc | 68,410 | 0.4 | |||||||||||
| 261,486 | Mastercard, Inc (Class A) | 93,957 | 0.5 | |||||||||||
| 1,412,900 | Microsoft Corp | 475,187 | 2.4 | |||||||||||
| 408,669 | * | PayPal Holdings, Inc | 77,067 | 0.4 | ||||||||||
| 312,159 | * | salesforce.com, Inc | 79,329 | 0.4 | ||||||||||
| 92,812 | * | ServiceNow, Inc | 60,245 | 0.3 | ||||||||||
| Other | 531,409 | 2.7 | ||||||||||||
| 1,589,903 | 8.1 | |||||||||||||
| TECHNOLOGY HARDWARE & EQUIPMENT | ||||||||||||||
| 1,373,303 | Cisco Systems, Inc | 87,026 | 0.5 | |||||||||||
| Other | 352,525 | 1.7 | ||||||||||||
| 439,551 | 2.2 | |||||||||||||
| TELECOMMUNICATION SERVICES | ||||||||||||||
| 1,337,473 | Verizon Communications, Inc | 69,495 | 0.4 | |||||||||||
| Other | 160,556 | 0.8 | ||||||||||||
| 230,051 | 1.2 | |||||||||||||
| TRANSPORTATION | 266,784 | 1.4 | ||||||||||||
| UTILITIES | ||||||||||||||
| 670,641 | NextEra Energy, Inc | 62,611 | 0.3 | |||||||||||
| Other | 286,170 | 1.5 | ||||||||||||
| 348,781 | 1.8 | |||||||||||||
| TOTAL COMMON STOCKS | (Cost $8,007,594) | 11,799,952 | 59.8 | |||||||||||
| PREFERRED STOCKS | ||||||||||||||
| BANKS | 15,574 | 0.1 | ||||||||||||
| INSURANCE | 4,855 | 0.0 | ||||||||||||
| REAL ESTATE | 26,382 | 0.1 | ||||||||||||
| UTILITIES | 20,545 | 0.1 | ||||||||||||
| TOTAL PREFERRED STOCKS | (Cost $88,178) | 67,356 | 0.3 | |||||||||||
| See notes to financial statements | College Retirement Equities Fund ■ 2021 Annual Report | 75 |
| Summary portfolio of investments | concluded |
CREF Social Choice Account ■ December 31, 2021
| Principal | Issuer | Value (000) | % of net assets | |||||||||||
| SHORT-TERM INVESTMENTS | ||||||||||||||
| GOVERNMENT AGENCY DEBT | ||||||||||||||
| $106,655,000 | Federal Home Loan Bank (FHLB) | 0.000%, 02/02/22 | $ | 106,653 | 0.5 | % | ||||||||
| Other | 892,612 | 4.6 | ||||||||||||
| 999,265 | 5.1 | |||||||||||||
| REPURCHASE AGREEMENT | 4,800 | 0.0 | ||||||||||||
| TREASURY DEBT | 20,236 | 0.1 | ||||||||||||
| INVESTMENTS IN REGISTERED INVESTMENT COMPANIES | ||||||||||||||
| 78,705,014 | c | State Street Navigator Securities Lending Government Money Market Portfolio | 0.030% | 78,705 | 0.4 | |||||||||
| 78,705 | 0.4 | |||||||||||||
| TOTAL INVESTMENT IN REGISTERED INVESTMENT COMPANIES | 78,705 | 0.4 | ||||||||||||
| TOTAL SHORT-TERM INVESTMENTS | (Cost $1,103,116) | 1,103,006 | 5.6 | |||||||||||
| TOTAL PORTFOLIO | (Cost $16,727,922) | 20,632,092 | 104.5 | % | ||||||||||
| OTHER ASSETS & LIABILITIES, NET | (880,558 | ) | (4.5 | )% | ||||||||||
| NET ASSETS | $ | 19,751,534 | 100.0 | % | ||||||||||
| * | Non-income producing |
| c | Investments made with cash collateral received from securities on loan. |
| h | All or a portion of these securities were purchased on a delayed delivery basis. |
“Other” securities represent the aggregate value, by category, of securities that are not among the 50 largest holdings and, in total for any issuer, represent 1% or less of net assets.
At 12/31/21, the aggregate value of securities on loan is $123,770,484. See Note 4 in the Notes to financial statements for additional information about securities lending collateral.
At 12/31/21, the aggregate value of securities exempt from registration under Rule 144(A) of the Securities Act of 1933, as amended, amounted to $2,042,381,458 or 10.3% of net assets. Such securities are deemed liquid and may be resold in transactions exempt from registration to qualified institutional buyers.
Cost amounts are in thousands.
For ease of presentation, a number of classification categories have been grouped together in the Summary portfolio of investments. Note that the Account uses more specific categories in following its investment limitations on investment concentrations.
Forward foreign currency contracts outstanding as of December 31, 2021 were as follows (dollar amounts are in thousands):
| Currency to be purchased | Receive | Currency to be sold | Deliver | Counterparty | Settlement date | Unrealized appreciation (depreciation | ) | |||||||||||
| $ | 12,721 | EUR | 10,901 | JPMorgan | 01/31/22 | $303 | ||||||||||||
| EUR | Euro |
| 76 | 2021 Annual Report ■ College Retirement Equities Fund | See notes to financial statements |
Summary portfolio of investments
CREF Money Market Account ■ December 31, 2021
| Principal | Issuer | Value (000) | % of net assets | |||||||||||||
| SHORT-TERM INVESTMENTS | ||||||||||||||||
| GOVERNMENT AGENCY DEBT | ||||||||||||||||
| $242,664,000 | Federal Agricultural Mortgage Corp (FAMC) | 0.000%, 02/02/22–03/02/22 | $ | 242,647 | 2.9 | % | ||||||||||
| 93,509,000 | Federal Farm Credit Bank (FFCB) | 0.000%, 01/13/22 | 93,508 | 1.1 | ||||||||||||
| 447,857,000 | FFCB, SOFR + 0.008% | 0.000%–2.600%, 01/03/22–01/12/23 | 447,918 | 5.4 | ||||||||||||
| 170,443,000 | Federal Home Loan Bank (FHLB) | 0.000%, 01/07/22 | 170,442 | 2.0 | ||||||||||||
| 64,000,000 | FHLB | 0.040%, 01/07/22 | 64,000 | 0.8 | ||||||||||||
| 64,000,000 | FHLB | 0.045%, 01/13/22 | 64,000 | 0.8 | ||||||||||||
| 104,349,000 | FHLB | 0.000%, 01/14/22 | 104,347 | 1.2 | ||||||||||||
| 100,512,000 | FHLB | 0.000%, 01/19/22 | 100,510 | 1.2 | ||||||||||||
| 254,073,000 | FHLB | 0.000%, 01/21/22 | 254,066 | 3.0 | ||||||||||||
| 149,250,000 | FHLB | 0.000%, 01/26/22 | 149,245 | 1.8 | ||||||||||||
| 89,250,000 | FHLB | 0.040%, 01/28/22 | 89,249 | 1.1 | ||||||||||||
| 164,743,000 | FHLB | 0.000%, 01/28/22 | 164,737 | 2.0 | ||||||||||||
| 192,750,000 | FHLB | 0.035%, 02/01/22 | 192,747 | 2.3 | ||||||||||||
| 165,750,000 | FHLB | 0.000%, 02/02/22 | 165,743 | 2.0 | ||||||||||||
| 102,559,000 | FHLB | 0.000%, 02/04/22 | 102,554 | 1.2 | ||||||||||||
| 284,492,000 | FHLB | 0.000%, 02/09/22 | 284,477 | 3.4 | ||||||||||||
| 85,250,000 | FHLB | 0.050%, 02/10/22 | 85,249 | 1.0 | ||||||||||||
| 62,300,000 | FHLB | 0.000%, 02/11/22 | 62,296 | 0.7 | ||||||||||||
| 172,939,000 | FHLB | 0.000%, 02/18/22 | 172,927 | 2.1 | ||||||||||||
| 151,640,000 | FHLB | 0.000%, 02/23/22 | 151,629 | 1.8 | ||||||||||||
| 72,000,000 | FHLB | 0.045%, 03/17/22 | 71,999 | 0.9 | ||||||||||||
| 80,246,000 | FHLB | 0.000%, 03/23/22 | 80,235 | 1.0 | ||||||||||||
| 115,697,000 | FHLB | 0.000%, 04/01/22 | 115,682 | 1.4 | ||||||||||||
| 593,268,000 | FHLB | 0.000%–2.750%, 01/05/22–06/10/22 | 593,666 | 7.0 | ||||||||||||
| 131,820,000 | Federal Home Loan Mortgage Corp (FHLMC) | 2.375%, 01/13/22 | 131,920 | 1.6 | ||||||||||||
| 84,530,000 | Federal National Mortgage Association (FNMA) | 2.000%, 01/05/22 | 84,548 | 1.0 | ||||||||||||
| 147,794,000 | FNMA | 0.000%–2.625%, 01/11/22–04/12/22 | 148,024 | 1.8 | ||||||||||||
| Other | 1,055 | 0.0 | ||||||||||||||
| 4,389,420 | 52.5 | |||||||||||||||
| TREASURY DEBT | ||||||||||||||||
| 120,812,000 | United States Cash Management Bill | 0.000%, 03/08/22 | 120,800 | 1.4 | ||||||||||||
| 85,000,000 | United States Cash Management Bill | 0.000%, 03/29/22 | 84,986 | 1.0 | ||||||||||||
| 77,200,000 | United States Cash Management Bill | 0.000%, 04/05/22 | 77,186 | 0.9 | ||||||||||||
| 63,750,000 | United States Cash Management Bill | 0.000%, 04/12/22 | 63,734 | 0.8 | ||||||||||||
| 112,817,000 | United States Cash Management Bill | 0.000%, 04/26/22 | 112,786 | 1.4 | ||||||||||||
| 100,095,000 | United States Cash Management Bill | 0.000%, 03/15/22–04/19/22 | 100,081 | 1.2 | ||||||||||||
| 118,800,000 | United States Treasury Bill | 0.000%, 02/17/22 | 118,792 | 1.4 | ||||||||||||
| 126,351,000 | United States Treasury Bill | 0.000%, 03/01/22 | 126,340 | 1.5 | ||||||||||||
| 151,214,000 | United States Treasury Bill | 0.000%, 03/24/22 | 151,191 | 1.8 | ||||||||||||
| 275,511,000 | United States Treasury Bill | 0.000%, 01/06/22–04/07/22 | 275,486 | 3.3 | ||||||||||||
| 72,200,000 | United States Treasury Note | 1.375%, 01/31/22 | 72,278 | 0.9 | ||||||||||||
| 114,570,000 | United States Treasury Note | 2.000%, 02/15/22 | 114,840 | 1.4 | ||||||||||||
| 79,200,000 | United States Treasury Note | 1.875%, 02/28/22 | 79,431 | 1.0 | ||||||||||||
| 100,925,000 | United States Treasury Note | 0.375%, 03/31/22 | 100,999 | 1.2 | ||||||||||||
| 72,200,000 | United States Treasury Note | 1.875%, 03/31/22 | 72,519 | 0.9 | ||||||||||||
| 349,958,000 | United States Treasury Note | 0.125%–2.375%, 01/15/22–04/30/22 | 350,775 | 4.1 | ||||||||||||
| 2,022,224 | 24.2 | |||||||||||||||
| See notes to financial statements | College Retirement Equities Fund ■ 2021 Annual Report | 77 |
| Summary portfolio of investments | concluded |
CREF Money Market Account ■ December 31, 2021
| Principal | Issuer | Value (000) | % of net assets | ||||||||||||
| VARIABLE RATE SECURITIES | |||||||||||||||
| $ 64,000,000 | i | Federal Farm Credit Bank (FFCB), SOFR + 0.070% | 0.120%, 02/17/22 | $ | 64,000 | 0.8 | % | ||||||||
| 101,000,000 | i | FFCB, SOFR + 0.040% | 0.090%, 06/01/22 | 101,000 | 1.2 | ||||||||||
| 127,700,000 | i | FFCB, SOFR + 0.005% | 0.055%, 07/12/22 | 127,698 | 1.5 | ||||||||||
| 127,400,000 | i | FFCB, SOFR + 0.045% | 0.095%, 09/08/22 | 127,407 | 1.5 | ||||||||||
| 63,750,000 | i | FFCB, SOFR + 0.005% | 0.055%, 10/05/22 | 63,748 | 0.8 | ||||||||||
| 69,491,000 | i | FFCB, SOFR + 0.010% | 0.060%, 11/16/22 | 69,490 | 0.8 | ||||||||||
| 88,250,000 | i | FFCB, SOFR + 0.018% | 0.068%, 07/13/23 | 88,234 | 1.1 | ||||||||||
| 486,402,000 | i | FFCB, SOFR + 0.170%–SOFR + 0.025% 0.058%–0.240%, | 03/15/22–10/27/23 | 486,439 | 5.8 | ||||||||||
| 84,000,000 | i | Federal Home Loan Bank (FHLB), SOFR + 0.080% | 0.130%, 02/22/22 | 84,000 | 1.0 | ||||||||||
| 64,000,000 | i | FHLB, SOFR + 0.055% | 0.105%, 05/13/22 | 64,000 | 0.8 | ||||||||||
| 63,500,000 | i | FHLB, SOFR + 0.045% | 0.095%, 07/29/22 | 63,500 | 0.8 | ||||||||||
| 63,750,000 | i | FHLB, SOFR + 0.010% | 0.060%, 09/09/22 | 63,750 | 0.8 | ||||||||||
| 64,000,000 | i | FHLB, SOFR + 0.085% | 0.135%, 10/05/22 | 64,000 | 0.8 | ||||||||||
| 121,850,000 | i | FHLB, SOFR + 0.060% | 0.110%, 12/08/22 | 121,873 | 1.4 | ||||||||||
| 203,375,000 | i | FHLB, SOFR + 0.015%–SOFR + 0.030% 0.060%–0.140%, | 04/11/22–08/11/23 | 203,376 | 2.4 | ||||||||||
| 64,750,000 | i | Federal Home Loan Mortgage Corp | |||||||||||||
| (FHLMC), SOFR + 0.095% | 0.145%, 08/19/22 | 64,750 | 0.8 | ||||||||||||
| Other | 121,149 | 1.4 | |||||||||||||
| 1,978,414 | 23.7 | ||||||||||||||
| TOTAL SHORT-TERM INVESTMENTS | (Cost $8,390,058) | 8,390,058 | 100.4 | ||||||||||||
| TOTAL PORTFOLIO | (Cost $8,390,058) | 8,390,058 | 100.4 | ||||||||||||
| OTHER ASSETS & LIABILITIES, NET | (34,802 | ) | (0.4 | ) | |||||||||||
| NET ASSETS | $ | 8,355,256 | 100.0 | % | |||||||||||
| SOFR | Secure Overnight Financing Rate |
| i | Floating or variable rate security includes the reference rate and spread, unless the variable rate is based on the underlying asset of the security. Coupon rate reflects the rate at period end. |
“Other” securities represent the aggregate value, by category, of securities that are not among the 50 largest holdings and, in total for any issuer, represent 1% or less of net assets.
Cost amounts are in thousands.
For ease of presentation, a number of classification categories have been grouped together in the Summary portfolio of investments. Note that the Account uses more specific categories in following its investment limitations on investment concentrations.
| 78 | 2021 Annual Report ■ College Retirement Equities Fund | See notes to financial statements |
[This page intentionally left blank.]
| College Retirement Equities Fund ■ 2021 Annual Report | 79 |
Statements of assets and liabilities
College Retirement Equities Fund ■ December 31, 2021
| (amounts in thousands) | Stock Account | Global Equities Account | Growth Account | Equity Index Account | Bond Market Account | Inflation-Linked Bond Account | Social Choice Account | Money Market Account | ||||||||||||||||||||||||||
| ASSETS | ||||||||||||||||||||||||||||||||||
| Portfolio investments, at value*† | $ | 139,907,247 | $ | 28,860,866 | $ | 39,693,711 | $ | 25,748,486 | $ | 15,391,753 | $ | 7,840,777 | $ | 20,632,092 | $ | 8,390,058 | ||||||||||||||||||
| Affiliated investments, at value‡ | 212,873 | — | — | — | — | — | — | — | ||||||||||||||||||||||||||
| Total portfolio investments, at value | 140,120,120 | 28,860,866 | 39,693,711 | 25,748,486 | 15,391,753 | 7,840,777 | 20,632,092 | 8,390,058 | ||||||||||||||||||||||||||
| Cash#** | 11,396 | 883 | 2 | — | 103,103 | 1,211 | 31,650 | 1 | ||||||||||||||||||||||||||
| Cash – foreign^ | 24,827 | 4,244 | — | — | 7 | — | 1,591 | — | ||||||||||||||||||||||||||
| Dividends and interest receivable | 142,534 | 25,399 | 4,014 | 16,069 | 72,226 | 17,370 | 56,405 | 8,079 | ||||||||||||||||||||||||||
| Receivable from securities transactions | 302,771 | 4,371 | 372,560 | — | 21,814 | — | 245,515 | — | ||||||||||||||||||||||||||
| Receivable for delayed delivery securities | 175,936 | 43,913 | — | 310 | 1,104,624 | — | 529,752 | — | ||||||||||||||||||||||||||
| Due from affiliates | — | — | — | — | — | 2,068 | — | 286 | ||||||||||||||||||||||||||
| Receivable for variation margin on open futures contracts | 11,459 | 3,855 | — | 2,137 | — | — | — | — | ||||||||||||||||||||||||||
| Unrealized appreciation on forward foreign currency contracts | 4,721 | — | — | — | 1,278 | — | 303 | — | ||||||||||||||||||||||||||
| Other | 23,041 | 2,978 | 3,339 | 2,366 | 2,320 | 1,214 | 2,386 | 2,044 | ||||||||||||||||||||||||||
| Total assets | 140,816,805 | 28,946,509 | 40,073,626 | 25,769,368 | 16,697,125 | 7,862,640 | 21,499,694 | 8,400,468 | ||||||||||||||||||||||||||
| LIABILITIES | ||||||||||||||||||||||||||||||||||
| Investment management fees payable | 6,944 | 1,696 | 857 | 556 | 373 | 244 | 717 | 294 | ||||||||||||||||||||||||||
| Service agreement fees payable | 2,444 | 176 | 892 | 502 | — | 55 | — | — | ||||||||||||||||||||||||||
| Payable for collateral for securities loaned | 1,067,306 | 109,672 | 65,479 | 77,920 | 13,709 | 2,034 | 78,705 | — | ||||||||||||||||||||||||||
| Payable for securities transactions | 169,470 | 31,858 | 150,267 | — | 20,098 | — | 239,965 | 42,999 | ||||||||||||||||||||||||||
| Payable for delayed delivery securities | 171,103 | 43,913 | — | — | 3,030,025 | 32,860 | 1,425,613 | — | ||||||||||||||||||||||||||
| Due to affiliates | 140,524 | 3,327 | 8,274 | 5,867 | 2,858 | — | 1,179 | — | ||||||||||||||||||||||||||
| Overdraft payable | 22,360 | 4,621 | — | 2,189 | — | — | — | — | ||||||||||||||||||||||||||
| Written options◊ | 3,469 | — | 942 | — | — | — | — | — | ||||||||||||||||||||||||||
| Payable for variation margin on futures contracts | — | — | — | — | 4,615 | 1,969 | — | — | ||||||||||||||||||||||||||
| Unrealized depreciation on forward foreign currency contracts | 2,897 | — | — | — | 1,053 | — | — | — | ||||||||||||||||||||||||||
| Payable for trustee compensation | 22,104 | 2,888 | 3,046 | 2,346 | 1,985 | 1,213 | 1,978 | 1,919 | ||||||||||||||||||||||||||
| Other | 38,042 | 5,062 | 5 | 4 | 12 | — | 3 | — | ||||||||||||||||||||||||||
| Total liabilities | 1,646,663 | 203,213 | 229,762 | 89,384 | 3,074,728 | 38,375 | 1,748,160 | 45,212 | ||||||||||||||||||||||||||
| NET ASSETS | $ | 139,170,142 | $ | 28,743,296 | $ | 39,843,864 | $ | 25,679,984 | $ | 13,622,397 | $ | 7,824,265 | $ | 19,751,534 | $ | 8,355,256 | ||||||||||||||||||
| CLASS R1 (Accumulation): | Net assets | $ | 16,518,968 | $ | 4,495,057 | $ | 7,207,621 | $ | 4,943,246 | $ | 2,153,810 | $ | 1,303,003 | $ | 2,841,453 | $ | 1,659,523 | |||||||||||||||||
| Units outstanding | 21,354 | 15,816 | 18,154 | 12,217 | 15,400 | 15,862 | 8,282 | 62,996 | ||||||||||||||||||||||||||
| Unit value | $ | 773.56 | $ | 284.21 | $ | 397.02 | $ | 404.63 | $ | 139.86 | $ | 82.15 | $ | 343.10 | $ | 26.34 | ||||||||||||||||||
| CLASS R2 (Accumulation): | Net assets | 41,153,346 | 9,289,757 | 13,218,305 | 8,625,199 | 4,648,844 | 2,356,491 | 6,868,447 | 2,512,546 | |||||||||||||||||||||||||
| Units outstanding | 52,441 | 32,221 | 32,819 | 21,012 | 32,766 | 28,277 | 19,734 | 94,437 | ||||||||||||||||||||||||||
| Unit value | $ | 784.75 | $ | 288.31 | $ | 402.77 | $ | 410.48 | $ | 141.88 | $ | 83.34 | $ | 348.06 | $ | 26.61 | ||||||||||||||||||
| CLASS R3 (Accumulation): | Net assets | 68,461,500 | 14,427,213 | 18,613,860 | 11,485,731 | 6,512,718 | 3,970,270 | 9,541,196 | 4,065,771 | |||||||||||||||||||||||||
| Units outstanding | 86,844 | 49,813 | 46,005 | 27,854 | 45,696 | 47,427 | 27,289 | 152,288 | ||||||||||||||||||||||||||
| Unit value | $ | 788.33 | $ | 289.63 | $ | 404.61 | $ | 412.35 | $ | 142.52 | $ | 83.71 | $ | 349.64 | $ | 26.70 | ||||||||||||||||||
| ANNUITY: | Net assets | $ | 13,036,328 | $ | 531,269 | $ | 804,078 | $ | 625,808 | $ | 307,025 | $ | 194,501 | $ | 500,438 | $ | 117,416 | |||||||||||||||||
| * Includes securities loaned of | $ | 1,746,890 | $ | 160,848 | $ | 154,371 | $ | 171,026 | $ | 13,401 | $ | 1,990 | $ | 123,770 | $ | — | ||||||||||||||||||
| ** Includes cash collateral for securities loaned of | $ | 11,396 | $ | 883 | $ | — | $ | — | $ | — | $ | — | $ | — | $ | — | ||||||||||||||||||
| # Includes cash collateral for mortgage dollar rolls of | $ | — | $ | — | $ | — | $ | — | $ | 99,000 | $ | — | $ | 31,501 | $ | — | ||||||||||||||||||
| † Portfolio investments; unaffiliated issuers cost | $ | 111,020,972 | $ | 21,993,376 | $ | 30,073,308 | $ | 8,063,056 | $ | 15,131,142 | $ | 7,320,690 | $ | 16,727,922 | $ | 8,390,058 | ||||||||||||||||||
| ‡ Portfolio investments, affiliated issuers cost | $ | 328,765 | $ | — | $ | — | $ | — | $ | — | $ | — | $ | — | $ | — | ||||||||||||||||||
| ^ Foreign cash, cost | $ | 24,720 | $ | 4,216 | $ | — | $ | — | $ | 7 | $ | — | $ | 1,578 | $ | — | ||||||||||||||||||
| ◊ Written options premiums | $ | 2,678 | $ | — | $ | 3,646 | $ | — | $ | — | $ | — | $ | — | $ | — | ||||||||||||||||||
| 80 | 2021 Annual Report ■ College Retirement Equities Fund | See notes to financial statements | See notes to financial statements | College Retirement Equities Fund ■ 2021 Annual Report | 81 |
College Retirement Equities Fund ■ For the year ended December 31, 2021
| (amounts in thousands) | Stock Account | Global Equities Account | Growth Account | Equity Index Account | Bond Market Account | Inflation-Linked Bond Account | Social Choice Account | Money Market Account | ||||||||||||||||||||||||
| INVESTMENT INCOME | ||||||||||||||||||||||||||||||||
| Dividends: | ||||||||||||||||||||||||||||||||
| Unaffiliated issuers* | $ | 2,149,477 | $ | 500,897 | $ | 194,275 | $ | 312,987 | $ | 488 | $ | — | $ | 207,092 | $ | — | ||||||||||||||||
| Affiliated issuers* | 3,936 | — | — | — | — | — | — | — | ||||||||||||||||||||||||
| Income from securities lending, net | 28,256 | 7,377 | 3,752 | 1,686 | 85 | 6 | 2,120 | — | ||||||||||||||||||||||||
| Other | 3,969 | 1,379 | — | 21 | 3,442 | 26 | 961 | 62 | ||||||||||||||||||||||||
| Interest* | 863 | 104 | 34 | 6 | 319,261 | 412,622 | 160,355 | 6,576 | ||||||||||||||||||||||||
| Total income | 2,186,501 | 509,757 | 198,061 | 314,700 | 323,276 | 412,654 | 370,528 | 6,638 | ||||||||||||||||||||||||
| EXPENSES | ||||||||||||||||||||||||||||||||
| Investment management fees | 113,686 | 16,234 | 12,022 | 3,274 | 8,957 | 1,981 | 8,873 | 3,333 | ||||||||||||||||||||||||
| Administrative – Class R1 | 41,072 | 10,980 | 17,585 | 11,770 | 5,660 | 3,122 | 6,943 | 4,498 | ||||||||||||||||||||||||
| Administrative – Class R2 | 56,482 | 12,432 | 17,735 | 11,379 | 6,793 | 3,207 | 9,096 | 3,873 | ||||||||||||||||||||||||
| Administrative – Class R3 | 82,281 | 14,483 | 19,141 | 11,667 | 7,332 | 4,098 | 9,706 | 4,814 | ||||||||||||||||||||||||
| Distribution fees – Class R1 | 14,921 | 3,989 | 6,388 | 4,276 | 2,055 | 1,134 | 2,522 | 1,631 | ||||||||||||||||||||||||
| Distribution fees – Class R2 | 20,551 | 4,524 | 6,455 | 4,141 | 2,472 | 1,167 | 3,311 | 1,409 | ||||||||||||||||||||||||
| Distribution fees – Class R3 | 28,961 | 5,101 | 6,738 | 4,108 | 2,577 | 1,442 | 3,417 | 1,689 | ||||||||||||||||||||||||
| Mortality and expense risk charges | 6,812 | 1,362 | 1,908 | 1,204 | 710 | 375 | 932 | 461 | ||||||||||||||||||||||||
| Total expenses | 364,766 | 69,105 | 87,972 | 51,819 | 36,556 | 16,526 | 44,800 | 21,708 | ||||||||||||||||||||||||
| Less: Expenses withheld by TIAA | — | — | — | — | — | — | — | (15,070 | ) | |||||||||||||||||||||||
| Net expenses | 364,766 | 69,105 | 87,972 | 51,819 | 36,556 | 16,526 | 44,800 | 6,638 | ||||||||||||||||||||||||
| Net investment income (loss) | 1,821,735 | 440,652 | 110,089 | 262,881 | 286,720 | 396,128 | 325,728 | — | ||||||||||||||||||||||||
| NET REALIZED AND UNREALIZED GAIN (LOSS) ON TOTAL INVESTMENTS | ||||||||||||||||||||||||||||||||
| Realized gain (loss): | ||||||||||||||||||||||||||||||||
| Portfolio investments: | ||||||||||||||||||||||||||||||||
| Unaffiliated issuers† | 20,681,865 | 2,703,146 | 8,259,936 | 1,477,123 | 136,450 | 144,669 | 1,402,681 | 12 | ||||||||||||||||||||||||
| Affiliated issuers | 67,393 | — | — | — | — | — | — | — | ||||||||||||||||||||||||
| Purchased options | 25,495 | 512 | — | — | — | — | — | — | ||||||||||||||||||||||||
| Written options | (13,888 | ) | 148 | (684 | ) | — | — | — | — | — | ||||||||||||||||||||||
| Futures contracts | 311,175 | 81,227 | — | 18,637 | (7,229 | ) | 623 | — | — | |||||||||||||||||||||||
| Forward foreign currency contracts | (3,890 | ) | 3 | — | — | 9,452 | — | 7 | — | |||||||||||||||||||||||
| Swap contracts | — | — | — | — | (3,376 | ) | — | — | — | |||||||||||||||||||||||
| Foreign currency transactions | (11,618 | ) | (2,463 | ) | 957 | — | (1,921 | ) | — | (572 | ) | — | ||||||||||||||||||||
| Net realized gain (loss) on total investments | 21,056,532 | 2,782,573 | 8,260,209 | 1,495,760 | 133,376 | 145,292 | 1,402,116 | 12 | ||||||||||||||||||||||||
| Change in unrealized appreciation (depreciation) on: | ||||||||||||||||||||||||||||||||
| Portfolio investments: | ||||||||||||||||||||||||||||||||
| Unaffiliated issuers‡ | 534,208 | 648,819 | (1,354,205 | ) | 3,643,004 | (617,166 | ) | (158,482 | ) | 465,803 | — | |||||||||||||||||||||
| Affiliated issuers | (144,803 | ) | — | — | — | — | — | — | — | |||||||||||||||||||||||
| Purchased options | (1,133 | ) | — | — | — | — | — | — | — | |||||||||||||||||||||||
| Written options | (802 | ) | — | 2,703 | — | — | — | — | — | |||||||||||||||||||||||
| Futures contracts | (23,559 | ) | (1,542 | ) | — | 152 | (4,619 | ) | (1,970 | ) | — | — | ||||||||||||||||||||
| Forward foreign currency contracts | 5,096 | — | — | — | 4,461 | — | 1,240 | — | ||||||||||||||||||||||||
| Swap contracts | — | — | — | — | 2,878 | — | — | — | ||||||||||||||||||||||||
| Translation of assets (other than portfolio investments) and liabilities denominated in foreign currencies | (4,529 | ) | (1,199 | ) | (38 | ) | — | (114 | ) | — | (609 | ) | — | |||||||||||||||||||
| Net change in unrealized appreciation (depreciation) on total investments | 364,478 | 646,078 | (1,351,540 | ) | 3,643,156 | (614,560 | ) | (160,452 | ) | 466,434 | — | |||||||||||||||||||||
| Net realized and unrealized gain (loss) on total investments | 21,421,010 | 3,428,651 | 6,908,669 | 5,138,916 | (481,184 | ) | (15,160 | ) | 1,868,550 | 12 | ||||||||||||||||||||||
| Net increase (decrease) in net assets from operations | $ | 23,242,745 | $ | 3,869,303 | $ | 7,018,758 | $ | 5,401,797 | $ | (194,464 | ) | $ | 380,968 | $ | 2,194,278 | $ | 12 | |||||||||||||||
| * Net of foreign withholding taxes of unaffiliated issuers | $ | 98,757 | $ | 30,887 | $ | 1,259 | $ | 70 | $ | 274 | $ | 1 | $ | 9,261 | $ | — | ||||||||||||||||
| † Includes net realized gain (loss) from securities sold to affiliates of | $ | 1,272,571 | $ | 426,903 | $ | 141,177 | $ | 62,452 | $ | — | $ | — | $ | 4,719 | $ | — | ||||||||||||||||
| ‡ Includes net change in unrealized foreign capital gains taxes of | $ | (26,701 | ) | $ | (3,401 | ) | $ | — | $ | — | $ | 34 | $ | — | $ | — | $ | — | ||||||||||||||
| 82 | 2021 Annual Report ■ College Retirement Equities Fund | See notes to financial statements | See notes to financial statements | College Retirement Equities Fund ■ 2021 Annual Report | 83 |
Statements of changes in net assets
College Retirement Equities Fund ■ For the year ended
| Stock Account | Global Equities Account | Growth Account | ||||||||||||||||||||||||
| (amounts in thousands, except accumulation units) | December 31, 2021 | December 31, 2020 | December 31, 2021 | December 31, 2020 | December 31, 2021 | December 31, 2020 | ||||||||||||||||||||
| OPERATIONS | ||||||||||||||||||||||||||
| Net investment income (loss) | $ | 1,821,735 | $ | 1,647,544 | $ | 440,652 | $ | 281,816 | $ | 110,089 | $ | 131,803 | ||||||||||||||
| Net realized gain (loss) on total investments | 21,056,532 | 5,199,417 | 2,782,573 | 877,243 | 8,260,209 | 6,136,719 | ||||||||||||||||||||
| Net change in unrealized appreciation (depreciation)on total investments | 364,478 | 12,005,005 | 646,078 | 3,223,748 | (1,351,540 | ) | 4,259,461 | |||||||||||||||||||
| Net increase (decrease) in net assets from operations | 23,242,745 | 18,851,966 | 3,869,303 | 4,382,807 | 7,018,758 | 10,527,983 | ||||||||||||||||||||
| FROM PARTICIPANT TRANSACTIONS | ||||||||||||||||||||||||||
| Premiums and contributions: | Class R1 | 455,255 | 401,380 | 244,064 | 139,187 | 248,869 | 302,936 | |||||||||||||||||||
| Class R2 | 793,161 | 805,365 | 414,131 | 231,542 | 254,281 | 346,985 | ||||||||||||||||||||
| Class R3 | 1,537,635 | 1,526,195 | 1,395,637 | 633,822 | 474,064 | 659,126 | ||||||||||||||||||||
| Net transfers between CREF Accounts: | Class R1 | (330,829 | ) | (474,595 | ) | 23,444 | (101,456 | ) | (153,956 | ) | (216,714 | ) | ||||||||||||||
| Class R2 | (665,182 | ) | (389,766 | ) | 198,427 | 86,482 | (269,570 | ) | (96,224 | ) | ||||||||||||||||
| Class R3 | 137,623 | (862,544 | ) | 651,125 | 31,169 | 46,203 | (269,931 | ) | ||||||||||||||||||
| Withdrawals and death benefits: | Class R1 | (1,633,223 | ) | (1,499,736 | ) | (419,084 | ) | (423,941 | ) | (710,164 | ) | (668,907 | ) | |||||||||||||
| Class R2 | (3,832,963 | ) | (3,536,605 | ) | (786,675 | ) | (748,176 | ) | (1,128,577 | ) | (1,091,170 | ) | ||||||||||||||
| Class R3 | (5,977,933 | ) | (6,026,060 | ) | (1,164,173 | ) | (1,149,964 | ) | (1,576,674 | ) | (1,655,054 | ) | ||||||||||||||
| Annuity payments | (1,517,323 | ) | (1,169,339 | ) | (49,723 | ) | (35,623 | ) | (70,542 | ) | (48,765 | ) | ||||||||||||||
| Net increase (decrease) from participant transactions | (11,033,779 | ) | (11,225,705 | ) | 507,173 | (1,336,958 | ) | (2,886,066 | ) | (2,737,718 | ) | |||||||||||||||
| Net increase (decrease) in net assets | 12,208,966 | 7,626,261 | 4,376,476 | 3,045,849 | 4,132,692 | 7,790,265 | ||||||||||||||||||||
| NET ASSETS | ||||||||||||||||||||||||||
| Beginning of period | 126,961,176 | 119,334,915 | 24,366,820 | 21,320,971 | 35,711,172 | 27,920,907 | ||||||||||||||||||||
| End of period | $ | 139,170,142 | $ | 126,961,176 | $ | 28,743,296 | $ | 24,366,820 | $ | 39,843,864 | $ | 35,711,172 | ||||||||||||||
| ACCUMULATION UNITS: | ||||||||||||||||||||||||||
| Units purchased: | Class R1 | 626,453 | 750,296 | 905,951 | 690,293 | 684,354 | 1,150,083 | |||||||||||||||||||
| Class R2 | 1,078,729 | 1,497,161 | 1,533,070 | 1,126,257 | 693,135 | 1,309,422 | ||||||||||||||||||||
| Class R3 | 1,771,662 | 2,543,692 | 5,046,926 | 2,876,490 | 1,171,927 | 2,316,680 | ||||||||||||||||||||
| Units sold / transferred: | Class R1 | (2,697,581 | ) | (3,632,558 | ) | (1,462,434 | ) | (2,630,955 | ) | (2,352,050 | ) | (3,367,507 | ) | |||||||||||||
| Class R2 | (6,105,139 | ) | (7,281,293 | ) | (2,149,749 | ) | (3,458,376 | ) | (3,794,135 | ) | (4,637,965 | ) | ||||||||||||||
| Class R3 | (7,873,094 | ) | (12,656,276 | ) | (1,840,929 | ) | (5,717,914 | ) | (4,135,893 | ) | (7,389,191 | ) | ||||||||||||||
| Outstanding: | ||||||||||||||||||||||||||
| Beginning of period | 173,838,288 | 192,617,266 | 95,817,222 | 102,931,427 | 104,710,446 | 115,328,924 | ||||||||||||||||||||
| End of period | 160,639,318 | 173,838,288 | 97,850,057 | 95,817,222 | 96,977,784 | 104,710,446 | ||||||||||||||||||||
| 84 | 2021 Annual Report ■ College Retirement Equities Fund | See notes to financial statements | See notes to financial statements | College Retirement Equities Fund ■ 2021 Annual Report | 85 |
| Statements of changes in net assets | continued |
| College Retirement Equities Fund ■ For the year ended |
| Equity Index Account | Bond Market Account | Inflation-Linked Bond Account | ||||||||||||||||||||||||
| (amounts in thousands, except accumulation units) | December 31, 2021 | December 31, 2020 | December 31, 2021 | December 31, 2020 | December 31, 2021 | December 31, 2020 | ||||||||||||||||||||
| OPERATIONS | ||||||||||||||||||||||||||
| Net investment income (loss) | $ | 262,881 | $ | 279,702 | $ | 286,720 | $ | 350,697 | $ | 396,128 | $ | 96,089 | ||||||||||||||
| Net realized gain (loss) on total investments | 1,495,760 | 1,363,541 | 133,376 | 286,253 | 145,292 | 14,616 | ||||||||||||||||||||
| Net change in unrealized appreciation (depreciation)on total investments | 3,643,156 | 2,028,165 | (614,560 | ) | 459,062 | (160,452 | ) | 415,592 | ||||||||||||||||||
| Net increase (decrease) in net assets from operations | 5,401,797 | 3,671,408 | (194,464 | ) | 1,096,012 | 380,968 | 526,297 | |||||||||||||||||||
| FROM PARTICIPANT TRANSACTIONS | ||||||||||||||||||||||||||
| Premiums and contributions: | Class R1 | 199,677 | 194,078 | 128,344 | 217,407 | 165,913 | 160,764 | |||||||||||||||||||
| Class R2 | 227,332 | 248,717 | 204,538 | 318,567 | 165,980 | 159,218 | ||||||||||||||||||||
| Class R3 | 316,635 | 347,919 | 352,642 | 596,036 | 389,257 | 321,421 | ||||||||||||||||||||
| Net transfers between CREF Accounts: | Class R1 | (61,469 | ) | (170,783 | ) | (5,189 | ) | 83,391 | 57,085 | 44,448 | ||||||||||||||||
| Class R2 | (132,039 | ) | (130,354 | ) | (65,811 | ) | 256,928 | 96,950 | 128,028 | |||||||||||||||||
| Class R3 | 185,799 | (210,828 | ) | 36,925 | 260,450 | 244,821 | 181,520 | |||||||||||||||||||
| Withdrawals and death benefits: | Class R1 | (467,843 | ) | (461,461 | ) | (308,592 | ) | (317,040 | ) | (163,608 | ) | (147,653 | ) | |||||||||||||
| Class R2 | (782,911 | ) | (778,664 | ) | (601,847 | ) | (633,037 | ) | (290,071 | ) | (285,131 | ) | ||||||||||||||
| Class R3 | (974,371 | ) | (1,115,170 | ) | (917,058 | ) | (1,015,615 | ) | (434,425 | ) | (469,097 | ) | ||||||||||||||
| Annuity payments | (57,953 | ) | (42,421 | ) | (32,280 | ) | (30,278 | ) | (20,118 | ) | (18,632 | ) | ||||||||||||||
| Net increase (decrease) from participant transactions | (1,547,143 | ) | (2,118,967 | ) | (1,208,328 | ) | (263,191 | ) | 211,784 | 74,886 | ||||||||||||||||
| Net increase (decrease) in net assets | 3,854,654 | 1,552,441 | (1,402,792 | ) | 832,821 | 592,752 | 601,183 | |||||||||||||||||||
| NET ASSETS | ||||||||||||||||||||||||||
| Beginning of period | 21,825,330 | 20,272,889 | 15,025,189 | 14,192,368 | 7,231,513 | 6,630,330 | ||||||||||||||||||||
| End of period | $ | 25,679,984 | $ | 21,825,330 | $ | 13,622,397 | $ | 15,025,189 | $ | 7,824,265 | $ | 7,231,513 | ||||||||||||||
| ACCUMULATION UNITS: | ||||||||||||||||||||||||||
| Units purchased: | Class R1 | 548,559 | 733,048 | 917,233 | 1,590,164 | 2,071,442 | 2,133,720 | |||||||||||||||||||
| Class R2 | 622,233 | 957,051 | 1,442,226 | 2,298,506 | 2,045,289 | 2,093,085 | ||||||||||||||||||||
| Class R3 | 777,520 | 1,232,194 | 2,309,030 | 4,051,035 | 4,645,656 | 4,028,507 | ||||||||||||||||||||
| Units sold / transferred: | Class R1 | (1,428,232 | ) | (2,366,813 | ) | (2,244,467 | ) | (1,708,690 | ) | (1,330,905 | ) | (1,372,803 | ) | |||||||||||||
| Class R2 | (2,474,012 | ) | (3,475,139 | ) | (4,709,301 | ) | (2,748,719 | ) | (2,392,181 | ) | (2,089,147 | ) | ||||||||||||||
| Class R3 | (2,094,908 | ) | (4,979,337 | ) | (6,177,678 | ) | (5,469,527 | ) | (2,369,983 | ) | (3,819,802 | ) | ||||||||||||||
| Outstanding: | ||||||||||||||||||||||||||
| Beginning of period | 65,132,395 | 73,031,391 | 102,324,697 | 104,311,928 | 88,896,245 | 87,922,685 | ||||||||||||||||||||
| End of period | 61,083,555 | 65,132,395 | 93,861,740 | 102,324,697 | 91,565,563 | 88,896,245 | ||||||||||||||||||||
| 86 | 2021 Annual Report ■ College Retirement Equities Fund | See notes to financial statements | See notes to financial statements | College Retirement Equities Fund ■ 2021 Annual Report | 87 |
| Statements of changes in net assets | concluded |
| College Retirement Equities Fund ■ For the year ended |
| Social Choice Account | Money Market Account | |||||||||||||||||
| (amounts in thousands, except accumulation units) | December 31, 2021 | December 31, 2020 | December 31, 2021 | December 31, 2020 | ||||||||||||||
| OPERATIONS | ||||||||||||||||||
| Net investment income (loss) | $ | 325,728 | $ | 302,263 | $ | — | $ | 37,081 | ||||||||||
| Net realized gain (loss) on total investments | 1,402,116 | 692,667 | 12 | 442 | ||||||||||||||
| Net change in unrealized appreciation (depreciation)on total investments | 466,434 | 1,060,607 | — | — | ||||||||||||||
| Net increase (decrease) in net assets from operations | 2,194,278 | 2,055,537 | 12 | 37,523 | ||||||||||||||
| FROM PARTICIPANT TRANSACTIONS | ||||||||||||||||||
| Premiums and contributions: | Class R1 | 165,207 | 135,067 | 604,893 | 975,472 | |||||||||||||
| Class R2 | 450,311 | 443,899 | 462,476 | 1,276,761 | ||||||||||||||
| Class R3 | 783,231 | 722,944 | 983,239 | 2,718,638 | ||||||||||||||
| Net transfers between CREF Accounts: | Class R1 | 7,611 | (6,274 | ) | (114,678 | ) | 163,240 | |||||||||||
| Class R2 | 121,334 | 211,036 | (139,487 | ) | 537,084 | |||||||||||||
| Class R3 | 353,969 | 257,112 | (223,277 | ) | 688,582 | |||||||||||||
| Withdrawals and death benefits: | Class R1 | (253,417 | ) | (249,570 | ) | (831,769 | ) | (1,078,924 | ) | |||||||||
| Class R2 | (585,245 | ) | (532,111 | ) | (1,018,259 | ) | (1,571,024 | ) | ||||||||||
| Class R3 | (834,999 | ) | (763,007 | ) | (1,951,449 | ) | (3,174,935 | ) | ||||||||||
| Annuity payments | (45,814 | ) | (37,146 | ) | (13,585 | ) | (15,428 | ) | ||||||||||
| Net increase (decrease) from participant transactions | 162,188 | 181,950 | (2,241,896 | ) | 519,466 | |||||||||||||
| Net increase (decrease) in net assets | 2,356,466 | 2,237,487 | (2,241,884 | ) | 556,989 | |||||||||||||
| NET ASSETS | ||||||||||||||||||
| Beginning of period | 17,395,068 | 15,157,581 | 10,597,140 | 10,040,151 | ||||||||||||||
| End of period | $ | 19,751,534 | $ | 17,395,068 | $ | 8,355,256 | $ | 10,597,140 | ||||||||||
| ACCUMULATION UNITS: | ||||||||||||||||||
| Units purchased: | Class R1 | 506,965 | 499,272 | 22,961,824 | 37,043,012 | |||||||||||||
| Class R2 | 1,359,568 | 1,630,433 | 17,382,698 | 48,014,917 | ||||||||||||||
| Class R3 | 2,232,512 | 2,567,063 | 36,366,262 | 101,258,332 | ||||||||||||||
| Units sold / transferred: | Class R1 | (747,385 | ) | (941,610 | ) | (35,927,258 | ) | (34,767,224 | ) | |||||||||
| Class R2 | (1,403,617 | ) | (1,210,391 | ) | (43,515,193 | ) | (38,866,180 | ) | ||||||||||
| Class R3 | (1,475,437 | ) | (1,870,709 | ) | (81,213,221 | ) | (92,751,729 | ) | ||||||||||
| Outstanding: | ||||||||||||||||||
| Beginning of period | 54,831,413 | 54,157,355 | 393,665,336 | 373,734,208 | ||||||||||||||
| End of period | 55,304,019 | 54,831,413 | 309,720,448 | 393,665,336 | ||||||||||||||
| 88 | 2021 Annual Report ■ College Retirement Equities Fund | See notes to financial statements | See notes to financial statements | College Retirement Equities Fund ■ 2021 Annual Report | 89 |
College Retirement Equities Fund
| Selected per accumulation unit data | Ratios and supplemental data | |||||||||||||||||||||||||||||||||||||||||||||||||||||
| Gain (loss) from investment operations | ||||||||||||||||||||||||||||||||||||||||||||||||||||||
| Net realized | Ratios to average net assets | Accumulation | ||||||||||||||||||||||||||||||||||||||||||||||||||||
| For the year ended | Investment income | a | Expenses | a | Net investment income (loss | )a | & unrealized gain (loss on total investments | ) | Net change in accumulation unit value | Accumulation unit value beginning of period | Accumulation unit value end of period | Total return | b | Gross expenses | Net investment income (loss | ) | Portfolio turnover rate | units outstanding end of period (in millions | ) | Accumulation fund net assets (in millions | )i | |||||||||||||||||||||||||||||||||
| STOCK ACCOUNT | ||||||||||||||||||||||||||||||||||||||||||||||||||||||
| Class R1: | 12/31/21 | $11.657 | $3.132 | $8.525 | $113.206 | $121.731 | $651.830 | $773.561 | 18.67 | % | 0.43 | % | 1.17 | % | 50 | % | 21 | $16,519 | ||||||||||||||||||||||||||||||||||||
| 12/31/20 | 9.890 | 2.810 | 7.080 | 90.652 | 97.732 | 554.098 | 651.830 | 17.64 | 0.52 | 1.31 | 69 | 23 | 15,270 | |||||||||||||||||||||||||||||||||||||||||
| 12/31/19 | 11.125 | 2.749 | 8.376 | 109.873 | 118.249 | 435.849 | 554.098 | 27.13 | 0.55 | 1.67 | 60 | 26 | 14,577 | |||||||||||||||||||||||||||||||||||||||||
| 12/31/18 | 10.238 | 2.573 | 7.665 | (55.323 | ) | (47.658 | ) | 483.507 | 435.849 | (9.86 | ) | 0.53 | 1.57 | 55 | 29 | 12,655 | ||||||||||||||||||||||||||||||||||||||
| 12/31/17 | 8.937 | 2.869 | 6.068 | 84.379 | 90.447 | 393.060 | 483.507 | 23.01 | 0.65 | 1.38 | 48 | 33 | 15,853 | |||||||||||||||||||||||||||||||||||||||||
| Class R2: | 12/31/21 | 11.811 | 2.055 | 9.756 | 114.741 | 124.497 | 660.256 | 784.753 | 18.86 | 0.28 | 1.33 | 50 | 52 | 41,153 | ||||||||||||||||||||||||||||||||||||||||
| 12/31/20 | 10.005 | 1.916 | 8.089 | 91.852 | 99.941 | 560.315 | 660.256 | 17.84 | 0.35 | 1.47 | 69 | 57 | 37,943 | |||||||||||||||||||||||||||||||||||||||||
| 12/31/19 | 11.240 | 1.772 | 9.468 | 110.979 | 120.447 | 439.868 | 560.315 | 27.38 | 0.35 | 1.86 | 60 | 63 | 35,441 | |||||||||||||||||||||||||||||||||||||||||
| 12/31/18 | 10.327 | 1.687 | 8.640 | (55.847 | ) | (47.207 | ) | 487.075 | 439.868 | (9.69 | ) | 0.34 | 1.75 | 55 | 70 | 30,866 | ||||||||||||||||||||||||||||||||||||||
| 12/31/17 | 8.990 | 1.736 | 7.254 | 84.893 | 92.147 | 394.928 | 487.075 | 23.33 | 0.39 | 1.64 | 48 | 78 | 38,159 | |||||||||||||||||||||||||||||||||||||||||
| Class R3: | 12/31/21 | 11.872 | 1.688 | 10.184 | 115.218 | 125.402 | 662.928 | 788.330 | 18.92 | 0.23 | 1.38 | 50 | 87 | 68,462 | ||||||||||||||||||||||||||||||||||||||||
| 12/31/20 | 10.044 | 1.598 | 8.446 | 92.234 | 100.680 | 562.248 | 662.928 | 17.91 | 0.29 | 1.53 | 69 | 93 | 61,616 | |||||||||||||||||||||||||||||||||||||||||
| 12/31/19 | 11.279 | 1.507 | 9.772 | 111.324 | 121.096 | 441.152 | 562.248 | 27.45 | 0.30 | 1.92 | 60 | 103 | 57,944 | |||||||||||||||||||||||||||||||||||||||||
| 12/31/18 | 10.352 | 1.485 | 8.867 | (56.010 | ) | (47.143 | ) | 488.295 | 441.152 | (9.65 | ) | 0.30 | 1.79 | 55 | 114 | 50,309 | ||||||||||||||||||||||||||||||||||||||
| 12/31/17 | 9.010 | 1.395 | 7.615 | 85.073 | 92.688 | 395.607 | 488.295 | 23.43 | 0.32 | 1.72 | 48 | 124 | 60,531 | |||||||||||||||||||||||||||||||||||||||||
| GLOBAL EQUITIES ACCOUNT | ||||||||||||||||||||||||||||||||||||||||||||||||||||||
| Class R1: | 12/31/21 | 5.035 | 1.096 | 3.939 | 34.023 | 37.962 | 246.247 | 284.209 | 15.42 | 0.41 | 1.46 | 46 | 16 | 4,495 | ||||||||||||||||||||||||||||||||||||||||
| 12/31/20 | 3.467 | 1.009 | 2.458 | 42.730 | 45.188 | 201.059 | 246.247 | 22.48 | 0.50 | 1.23 | 63 | 16 | 4,032 | |||||||||||||||||||||||||||||||||||||||||
| 12/31/19 | 4.042 | 0.913 | 3.129 | 40.803 | 43.932 | 157.127 | 201.059 | 27.96 | 0.50 | 1.73 | 67 | 18 | 3,682 | |||||||||||||||||||||||||||||||||||||||||
| 12/31/18 | 3.712 | 0.948 | 2.764 | (25.325 | ) | (22.561 | ) | 179.688 | 157.127 | (12.56 | ) | 0.53 | 1.54 | 77 | 20 | 3,154 | ||||||||||||||||||||||||||||||||||||||
| 12/31/17 | 3.346 | 1.117 | 2.229 | 32.997 | 35.226 | 144.462 | 179.688 | 24.38 | 0.69 | 1.38 | 36 | 20 | 3,681 | |||||||||||||||||||||||||||||||||||||||||
| Class R2: | 12/31/21 | 5.099 | 0.697 | 4.402 | 34.488 | 38.890 | 249.424 | 288.314 | 15.59 | 0.26 | 1.61 | 46 | 32 | 9,290 | ||||||||||||||||||||||||||||||||||||||||
| 12/31/20 | 3.505 | 0.678 | 2.827 | 43.288 | 46.115 | 203.309 | 249.424 | 22.68 | 0.33 | 1.39 | 63 | 33 | 8,190 | |||||||||||||||||||||||||||||||||||||||||
| 12/31/19 | 4.081 | 0.560 | 3.521 | 41.217 | 44.738 | 158.571 | 203.309 | 28.21 | 0.31 | 1.92 | 67 | 35 | 7,150 | |||||||||||||||||||||||||||||||||||||||||
| 12/31/18 | 3.746 | 0.624 | 3.122 | (25.558 | ) | (22.436 | ) | 181.007 | 158.571 | (12.40 | ) | 0.35 | 1.73 | 77 | 38 | 6,104 | ||||||||||||||||||||||||||||||||||||||
| 12/31/17 | 3.365 | 0.700 | 2.665 | 33.198 | 35.863 | 145.144 | 181.007 | 24.71 | 0.43 | 1.64 | 36 | 39 | 7,131 | |||||||||||||||||||||||||||||||||||||||||
| Class R3: | 12/31/21 | 5.129 | 0.560 | 4.569 | 34.624 | 39.193 | 250.434 | 289.627 | 15.65 | 0.20 | 1.67 | 46 | 50 | 14,427 | ||||||||||||||||||||||||||||||||||||||||
| 12/31/20 | 3.517 | 0.561 | 2.956 | 43.466 | 46.422 | 204.012 | 250.434 | 22.75 | 0.27 | 1.45 | 63 | 47 | 11,672 | |||||||||||||||||||||||||||||||||||||||||
| 12/31/19 | 4.095 | 0.465 | 3.630 | 41.347 | 44.977 | 159.035 | 204.012 | 28.28 | 0.25 | 1.98 | 67 | 49 | 10,088 | |||||||||||||||||||||||||||||||||||||||||
| 12/31/18 | 3.747 | 0.547 | 3.200 | (25.626 | ) | (22.426 | ) | 181.461 | 159.035 | (12.36 | ) | 0.30 | 1.77 | 77 | 54 | 8,621 | ||||||||||||||||||||||||||||||||||||||
| 12/31/17 | 3.372 | 0.574 | 2.798 | 33.270 | 36.068 | 145.393 | 181.461 | 24.81 | 0.35 | 1.71 | 36 | 53 | 9,558 | |||||||||||||||||||||||||||||||||||||||||
| 90 | 2021 Annual Report ■ College Retirement Equities Fund | See notes to financial statements | See notes to financial statements | College Retirement Equities Fund ■ 2021 Annual Report | 91 |
| Financial highlights | continued |
| College Retirement Equities Fund |
| Selected per accumulation unit data | Ratios and supplemental data | |||||||||||||||||||||||||||||||||||||||||||||||||||||
| Gain (loss) from investment operations | ||||||||||||||||||||||||||||||||||||||||||||||||||||||
| Net realized | Ratios to average net assets | Accumulation | ||||||||||||||||||||||||||||||||||||||||||||||||||||
| For the year ended | Investment income | a | Expenses | a | Net investment income (loss | )a | & unrealized gain (loss on total investments | ) | Net change in accumulation unit value | Accumulation unit value beginning of period | Accumulation unit value end of period | Total return | b | Gross expenses | Net investment income (loss | ) | Portfolio turnover rate | units outstanding end of period (in millions | ) | Accumulation fund net assets (in millions | )i | |||||||||||||||||||||||||||||||||
| GROWTH ACCOUNT | ||||||||||||||||||||||||||||||||||||||||||||||||||||||
| Class R1: | 12/31/21 | $1.902 | $1.389 | $0.513 | $66.175 | $66.688 | $330.336 | $397.024 | 20.19 | % | 0.38 | % | 0.14 | % | 67 | % | 18 | $7,208 | ||||||||||||||||||||||||||||||||||||
| 12/31/20 | 1.972 | 1.242 | 0.730 | 94.391 | 95.121 | 235.215 | 330.336 | 40.44 | 0.47 | 0.27 | 82 | 20 | 6,548 | |||||||||||||||||||||||||||||||||||||||||
| 12/31/19 | 1.988 | 1.026 | 0.962 | 55.151 | 56.113 | 179.102 | 235.215 | 31.33 | 0.48 | 0.45 | 85 | 22 | 5,184 | |||||||||||||||||||||||||||||||||||||||||
| 12/31/18 | 2.166 | 0.914 | 1.252 | (6.193 | ) | (4.941 | ) | 184.043 | 179.102 | (2.69 | ) | 0.46 | 0.63 | 62 | 24 | 4,311 | ||||||||||||||||||||||||||||||||||||||
| 12/31/17 | 1.818 | 0.977 | 0.841 | 43.121 | 43.962 | 140.081 | 184.043 | 31.38 | 0.60 | 0.52 | 48 | 26 | 4,841 | |||||||||||||||||||||||||||||||||||||||||
| Class R2: | 12/31/21 | 1.929 | 0.844 | 1.085 | 67.078 | 68.163 | 334.603 | 402.766 | 20.37 | 0.23 | 0.29 | 67 | 33 | 13,218 | ||||||||||||||||||||||||||||||||||||||||
| 12/31/20 | 1.995 | 0.800 | 1.195 | 95.559 | 96.754 | 237.849 | 334.603 | 40.68 | 0.30 | 0.44 | 82 | 36 | 12,019 | |||||||||||||||||||||||||||||||||||||||||
| 12/31/19 | 2.007 | 0.609 | 1.398 | 55.701 | 57.099 | 180.750 | 237.849 | 31.59 | 0.28 | 0.65 | 85 | 39 | 9,335 | |||||||||||||||||||||||||||||||||||||||||
| 12/31/18 | 2.186 | 0.555 | 1.631 | (6.277 | ) | (4.646 | ) | 185.396 | 180.750 | (2.51 | ) | 0.28 | 0.82 | 62 | 43 | 7,850 | ||||||||||||||||||||||||||||||||||||||
| 12/31/17 | 1.830 | 0.556 | 1.274 | 43.379 | 44.653 | 140.743 | 185.396 | 31.73 | 0.34 | 0.78 | 48 | 47 | 8,788 | |||||||||||||||||||||||||||||||||||||||||
| Class R3: | 12/31/21 | 1.935 | 0.658 | 1.277 | 67.368 | 68.645 | 335.962 | 404.607 | 20.43 | 0.18 | 0.34 | 67 | 46 | 18,614 | ||||||||||||||||||||||||||||||||||||||||
| �� | 12/31/20 | 2.003 | 0.644 | 1.359 | 95.929 | 97.288 | 238.674 | 335.962 | 40.76 | 0.24 | 0.50 | 82 | 49 | 16,452 | ||||||||||||||||||||||||||||||||||||||||
| 12/31/19 | 2.016 | 0.496 | 1.520 | 55.873 | 57.393 | 181.281 | 238.674 | 31.66 | 0.23 | 0.70 | 85 | 54 | 12,898 | |||||||||||||||||||||||||||||||||||||||||
| 12/31/18 | 2.193 | 0.471 | 1.722 | (6.301 | ) | (4.579 | ) | 185.860 | 181.281 | (2.46 | ) | 0.24 | 0.86 | 62 | 59 | 10,665 | ||||||||||||||||||||||||||||||||||||||
| 12/31/17 | 1.834 | 0.429 | 1.405 | 43.471 | 44.876 | 140.984 | 185.860 | 31.83 | 0.26 | 0.86 | 48 | 62 | 11,524 | |||||||||||||||||||||||||||||||||||||||||
| EQUITY INDEX ACCOUNT | ||||||||||||||||||||||||||||||||||||||||||||||||||||||
| Class R1: | 12/31/21 | 4.795 | 1.326 | 3.469 | 78.134 | 81.603 | 323.028 | 404.631 | 25.26 | 0.36 | 0.95 | 4 | 12 | 4,943 | ||||||||||||||||||||||||||||||||||||||||
| 12/31/20 | 4.683 | 1.182 | 3.501 | 51.129 | 54.630 | 268.398 | 323.028 | 20.35 | 0.44 | 1.30 | 3 | 13 | 4,230 | |||||||||||||||||||||||||||||||||||||||||
| 12/31/19 | 4.780 | 1.100 | 3.680 | 58.895 | 62.575 | 205.823 | 268.398 | 30.40 | 0.46 | 1.53 | 2 | 15 | 3,954 | |||||||||||||||||||||||||||||||||||||||||
| 12/31/18 | 4.426 | 0.992 | 3.434 | (15.616 | ) | (12.182 | ) | 218.005 | 205.823 | (5.59 | ) | 0.44 | 1.52 | 3 | 16 | 3,308 | ||||||||||||||||||||||||||||||||||||||
| 12/31/17 | 3.836 | 1.126 | 2.710 | 34.271 | 36.981 | 181.024 | 218.005 | 20.43 | 0.57 | 1.37 | 4 | 18 | 3,912 | |||||||||||||||||||||||||||||||||||||||||
| Class R2: | 12/31/21 | 4.858 | 0.779 | 4.079 | 79.203 | 83.282 | 327.198 | 410.480 | 25.45 | 0.21 | 1.10 | 4 | 21 | 8,625 | ||||||||||||||||||||||||||||||||||||||||
| 12/31/20 | 4.739 | 0.737 | 4.002 | 51.792 | 55.794 | 271.404 | 327.198 | 20.56 | 0.27 | 1.47 | 3 | 23 | 7,481 | |||||||||||||||||||||||||||||||||||||||||
| 12/31/19 | 4.832 | 0.630 | 4.202 | 59.485 | 63.687 | 207.717 | 271.404 | 30.66 | 0.26 | 1.73 | 2 | 25 | 6,889 | |||||||||||||||||||||||||||||||||||||||||
| 12/31/18 | 4.465 | 0.581 | 3.884 | (15.774 | ) | (11.890 | ) | 219.607 | 207.717 | (5.41 | ) | 0.26 | 1.71 | 3 | 28 | 5,728 | ||||||||||||||||||||||||||||||||||||||
| 12/31/17 | 3.859 | 0.612 | 3.247 | 34.480 | 37.727 | 181.880 | 219.607 | 20.74 | 0.31 | 1.63 | 4 | 31 | 6,708 | |||||||||||||||||||||||||||||||||||||||||
| Class R3: | 12/31/21 | 4.885 | 0.592 | 4.293 | 79.534 | 83.827 | 328.522 | 412.349 | 25.52 | 0.16 | 1.15 | 4 | 28 | 11,486 | ||||||||||||||||||||||||||||||||||||||||
| 12/31/20 | 4.757 | 0.578 | 4.179 | 52.002 | 56.181 | 272.341 | 328.522 | 20.63 | 0.21 | 1.53 | 3 | 29 | 9,584 | |||||||||||||||||||||||||||||||||||||||||
| 12/31/19 | 4.851 | 0.502 | 4.349 | 59.668 | 64.017 | 208.324 | 272.341 | 30.73 | 0.21 | 1.78 | 2 | 33 | 8,965 | |||||||||||||||||||||||||||||||||||||||||
| 12/31/18 | 4.479 | 0.486 | 3.993 | (15.823 | ) | (11.830 | ) | 220.154 | 208.324 | (5.37 | ) | 0.21 | 1.75 | 3 | 36 | 7,418 | ||||||||||||||||||||||||||||||||||||||
| 12/31/17 | 3.869 | 0.458 | 3.411 | 34.551 | 37.962 | 182.192 | 220.154 | 20.84 | 0.23 | 1.71 | 4 | 39 | 8,486 | |||||||||||||||||||||||||||||||||||||||||
| 92 | 2021 Annual Report ■ College Retirement Equities Fund | See notes to financial statements | See notes to financial statements | College Retirement Equities Fund ■ 2021 Annual Report | 93 |
| Financial highlights | continued |
| College Retirement Equities Fund |
| Selected per accumulation unit data | Ratios and supplemental data | |||||||||||||||||||||||||||||||||||||||||||||||||||||||||
| Gain (loss) from investment operations | ||||||||||||||||||||||||||||||||||||||||||||||||||||||||||
| Net realized | Ratios to average net assets | Portfolio | Accumulation | |||||||||||||||||||||||||||||||||||||||||||||||||||||||
| For the year ended | Investment income | a | Expenses | a | Net investment income (loss | )a | & unrealized gain (loss on total investments | ) | Net change in accumulation unit value | Accumulation unit value beginning of period | Accumulation unit value end of period | Total return | b | Gross expenses | Net investment income (loss | ) | Portfolio turnover rate | turnover rate excluding mortgage dollar rolls | units outstanding end of period (in millions | ) | Accumulation fund net assets (in millions | )i | ||||||||||||||||||||||||||||||||||||
| BOND MARKET ACCOUNT | ||||||||||||||||||||||||||||||||||||||||||||||||||||||||||
| Class R1: | 12/31/21 | $3.185 | $0.574 | $2.611 | $(4.639 | ) | $(2.028 | ) | $141.886 | $139.858 | (1.43 | )% | 0.41 | % | 1.87 | % | 207 | % | 49 | % | 15 | $2,154 | ||||||||||||||||||||||||||||||||||||
| 12/31/20 | 3.696 | 0.655 | 3.041 | 7.068 | 10.109 | 131.777 | 141.886 | 7.67 | 0.48 | 2.21 | 135 | 84 | 17 | 2,373 | ||||||||||||||||||||||||||||||||||||||||||||
| 12/31/19 | 4.029 | 0.634 | 3.395 | 7.214 | 10.609 | 121.168 | 131.777 | 8.75 | 0.50 | 2.66 | 85 | 79 | 17 | 2,220 | ||||||||||||||||||||||||||||||||||||||||||||
| 12/31/18 | 3.829 | 0.620 | 3.209 | (3.713 | ) | (0.504 | ) | 121.672 | 121.168 | (0.41 | ) | 0.52 | 2.68 | 106 | 91 | 17 | 2,048 | |||||||||||||||||||||||||||||||||||||||||
| 12/31/17 | 3.517 | 0.764 | 2.753 | 1.670 | 4.423 | 117.249 | 121.672 | 3.77 | 0.64 | 2.30 | 140 | 96 | 18 | 2,209 | ||||||||||||||||||||||||||||||||||||||||||||
| Class R2: | 12/31/21 | 3.229 | 0.367 | 2.862 | (4.701 | ) | (1.839 | ) | 143.719 | 141.880 | (1.28 | ) | 0.26 | 2.02 | 207 | 49 | 33 | 4,649 | ||||||||||||||||||||||||||||||||||||||||
| 12/31/20 | 3.741 | 0.427 | 3.314 | 7.152 | 10.466 | 133.253 | 143.719 | 7.85 | 0.31 | 2.38 | 135 | 84 | 36 | 5,179 | ||||||||||||||||||||||||||||||||||||||||||||
| 12/31/19 | 4.070 | 0.385 | 3.685 | 7.286 | 10.971 | 122.282 | 133.253 | 8.97 | 0.30 | 2.86 | 85 | 79 | 36 | 4,862 | ||||||||||||||||||||||||||||||||||||||||||||
| 12/31/18 | 3.861 | 0.402 | 3.459 | (3.741 | ) | (0.282 | ) | 122.564 | 122.282 | (0.23 | ) | 0.33 | 2.87 | 106 | 91 | 37 | 4,567 | |||||||||||||||||||||||||||||||||||||||||
| 12/31/17 | 3.539 | 0.453 | 3.086 | 1.676 | 4.762 | 117.802 | 122.564 | 4.04 | 0.38 | 2.56 | 140 | 96 | 39 | 4,818 | ||||||||||||||||||||||||||||||||||||||||||||
| Class R3: | 12/31/21 | 3.242 | 0.296 | 2.946 | (4.720 | ) | (1.774 | ) | 144.298 | 142.524 | (1.23 | ) | 0.21 | 2.07 | 207 | 49 | 46 | 6,513 | ||||||||||||||||||||||||||||||||||||||||
| 12/31/20 | 3.756 | 0.346 | 3.410 | 7.176 | 10.586 | 133.712 | 144.298 | 7.92 | 0.25 | 2.44 | 135 | 84 | 50 | 7,152 | ||||||||||||||||||||||||||||||||||||||||||||
| 12/31/19 | 4.083 | 0.317 | 3.766 | 7.308 | 11.074 | 122.638 | 133.712 | 9.03 | 0.25 | 2.91 | 85 | 79 | 51 | 6,817 | ||||||||||||||||||||||||||||||||||||||||||||
| 12/31/18 | 3.872 | 0.352 | 3.520 | (3.753 | ) | (0.233 | ) | 122.871 | 122.638 | (0.19 | ) | 0.29 | 2.91 | 106 | 91 | 52 | 6,329 | |||||||||||||||||||||||||||||||||||||||||
| 12/31/17 | 3.546 | 0.360 | 3.186 | 1.681 | 4.867 | 118.004 | 122.871 | 4.12 | 0.30 | 2.63 | 140 | 96 | 53 | 6,527 | ||||||||||||||||||||||||||||||||||||||||||||
| INFLATION-LINKED BOND ACCOUNT | ||||||||||||||||||||||||||||||||||||||||||||||||||||||||||
| Class R1: | 12/31/21 | 4.419 | 0.300 | 4.119 | (0.159 | ) | 3.960 | 78.189 | 82.149 | 5.06 | 0.37 | 5.14 | 24 | 24 | 16 | 1,303 | ||||||||||||||||||||||||||||||||||||||||||
| 12/31/20 | 1.271 | 0.338 | 0.933 | 4.714 | 5.647 | 72.542 | 78.189 | 7.78 | 0.45 | 1.24 | 25 | 25 | 15 | 1,182 | ||||||||||||||||||||||||||||||||||||||||||||
| 12/31/19 | 1.660 | 0.329 | 1.331 | 2.944 | 4.275 | 68.267 | 72.542 | 6.27 | 0.46 | 1.88 | 26 | 26 | 14 | 1,042 | ||||||||||||||||||||||||||||||||||||||||||||
| 12/31/18 | 2.105 | 0.307 | 1.798 | (2.292 | ) | (0.494 | ) | 68.761 | 68.267 | (0.72 | ) | 0.45 | 2.63 | 21 | 21 | 14 | 964 | |||||||||||||||||||||||||||||||||||||||||
| 12/31/17 | 1.731 | 0.395 | 1.336 | (0.315 | ) | 1.021 | 67.740 | 68.761 | 1.51 | 0.58 | 1.95 | 18 | 18 | 15 | 1,041 | |||||||||||||||||||||||||||||||||||||||||||
| Class R2: | 12/31/21 | 4.462 | 0.181 | 4.281 | (0.143 | ) | 4.138 | 79.197 | 83.335 | 5.22 | 0.22 | 5.27 | 24 | 24 | 28 | 2,356 | ||||||||||||||||||||||||||||||||||||||||||
| 12/31/20 | 1.270 | 0.213 | 1.057 | 4.787 | 5.844 | 73.353 | 79.197 | 7.96 | 0.28 | 1.39 | 25 | 25 | 29 | 2,267 | ||||||||||||||||||||||||||||||||||||||||||||
| 12/31/19 | 1.686 | 0.190 | 1.496 | 2.962 | 4.458 | 68.895 | 73.353 | 6.48 | 0.27 | 2.09 | 26 | 26 | 29 | 2,099 | ||||||||||||||||||||||||||||||||||||||||||||
| 12/31/18 | 2.122 | 0.182 | 1.940 | (2.310 | ) | (0.370 | ) | 69.265 | 68.895 | (0.53 | ) | 0.26 | 2.82 | 21 | 21 | 29 | 2,028 | |||||||||||||||||||||||||||||||||||||||||
| 12/31/17 | 1.743 | 0.218 | 1.525 | (0.319 | ) | 1.206 | 68.059 | 69.265 | 1.77 | 0.32 | 2.22 | 18 | 18 | 30 | 2,096 | |||||||||||||||||||||||||||||||||||||||||||
| Class R3: | 12/31/21 | 4.494 | 0.139 | 4.355 | (0.158 | ) | 4.197 | 79.517 | 83.714 | 5.28 | 0.17 | 5.34 | 24 | 24 | 47 | 3,970 | ||||||||||||||||||||||||||||||||||||||||||
| 12/31/20 | 1.274 | 0.168 | 1.106 | 4.805 | 5.911 | 73.606 | 79.517 | 8.03 | 0.22 | 1.44 | 25 | 25 | 45 | 3,590 | ||||||||||||||||||||||||||||||||||||||||||||
| 12/31/19 | 1.694 | 0.153 | 1.541 | 2.970 | 4.511 | 69.095 | 73.606 | 6.53 | 0.21 | 2.14 | 26 | 26 | 45 | 3,308 | ||||||||||||||||||||||||||||||||||||||||||||
| 12/31/18 | 2.125 | 0.154 | 1.971 | (2.313 | ) | (0.342 | ) | 69.437 | 69.095 | (0.49 | ) | 0.22 | 2.86 | 21 | 21 | 46 | 3,171 | |||||||||||||||||||||||||||||||||||||||||
| 12/31/17 | 1.746 | 0.165 | 1.581 | (0.320 | ) | 1.261 | 68.176 | 69.437 | 1.85 | 0.24 | 2.29 | 18 | 18 | 46 | 3,214 | |||||||||||||||||||||||||||||||||||||||||||
| 94 | 2021 Annual Report ■ College Retirement Equities Fund | See notes to financial statements | See notes to financial statements | College Retirement Equities Fund ■ 2021 Annual Report | 95 |
| Financial highlights | continued |
| College Retirement Equities Fund |
| Selected per accumulation unit data | Ratios and supplemental data | |||||||||||||||||||||||||||||||||||||||||||||||||||||||||
| Gain (loss) from investment operations | ||||||||||||||||||||||||||||||||||||||||||||||||||||||||||
| Net realized | Ratios to average net assets | Portfolio | Accumulation | |||||||||||||||||||||||||||||||||||||||||||||||||||||||
| For the year ended | Investment income | a | Expenses | a | Net investment income (loss | )a | & unrealized gain (loss on total investments | ) | Net change in accumulation unit value | Accumulation unit value beginning of period | Accumulation unit value end of period | Total return | b | Gross expenses | Net investment income (loss | ) | Portfolio turnover rate | turnover rate excluding mortgage dollar rolls | units outstanding end of period (in millions | ) | Accumulation fund net assets (in millions | )i | ||||||||||||||||||||||||||||||||||||
| SOCIAL CHOICE ACCOUNT | ||||||||||||||||||||||||||||||||||||||||||||||||||||||||||
| Class R1: | 12/31/21 | $6.484 | $1.289 | $5.195 | $32.701 | $37.896 | $305.205 | $343.101 | 12.42 | % | 0.40 | % | 1.59 | % | 118 | % | 57 | % | 8 | $2,841 | ||||||||||||||||||||||||||||||||||||||
| 12/31/20 | 6.129 | 1.279 | 4.850 | 30.887 | 35.737 | 269.468 | 305.205 | 13.26 | 0.47 | 1.79 | 100 | 73 | 9 | 2,601 | ||||||||||||||||||||||||||||||||||||||||||||
| 12/31/19 | 6.789 | 1.210 | 5.579 | 40.254 | 45.833 | 223.635 | 269.468 | 20.50 | 0.49 | 2.24 | 52 | 51 | 9 | 2,416 | ||||||||||||||||||||||||||||||||||||||||||||
| 12/31/18 | 6.291 | 1.102 | 5.189 | (15.749 | ) | (10.560 | ) | 234.195 | 223.635 | (4.51 | ) | 0.47 | 2.21 | 52 | 47 | 9 | 2,104 | |||||||||||||||||||||||||||||||||||||||||
| 12/31/17 | 5.627 | 1.327 | 4.300 | 24.249 | 28.549 | 205.646 | 234.195 | 13.88 | 0.60 | 1.95 | 53 | 37 | 10 | 2,426 | ||||||||||||||||||||||||||||||||||||||||||||
| Class R2: | 12/31/21 | 6.570 | 0.804 | 5.766 | 33.148 | 38.914 | 309.144 | 348.058 | 12.59 | 0.24 | 1.74 | 118 | 57 | 20 | 6,868 | |||||||||||||||||||||||||||||||||||||||||||
| 12/31/20 | 6.195 | 0.832 | 5.363 | 31.296 | 36.659 | 272.485 | 309.144 | 13.45 | 0.30 | 1.96 | 100 | 73 | 20 | 6,114 | ||||||||||||||||||||||||||||||||||||||||||||
| 12/31/19 | 6.857 | 0.724 | 6.133 | 40.661 | 46.794 | 225.691 | 272.485 | 20.73 | 0.29 | 2.43 | 52 | 51 | 19 | 5,275 | ||||||||||||||||||||||||||||||||||||||||||||
| 12/31/18 | 6.344 | 0.673 | 5.671 | (15.895 | ) | (10.224 | ) | 235.915 | 225.691 | (4.33 | ) | 0.28 | 2.39 | 52 | 47 | 20 | 4,476 | |||||||||||||||||||||||||||||||||||||||||
| 12/31/17 | 5.661 | 0.757 | 4.904 | 24.394 | 29.298 | 206.617 | 235.915 | 14.18 | 0.34 | 2.21 | 53 | 37 | 22 | 5,082 | ||||||||||||||||||||||||||||||||||||||||||||
| Class R3: | 12/31/21 | 6.601 | 0.639 | 5.962 | 33.286 | 39.248 | 310.392 | 349.640 | 12.64 | 0.19 | 1.80 | 118 | 57 | 27 | 9,541 | |||||||||||||||||||||||||||||||||||||||||||
| 12/31/20 | 6.218 | 0.672 | 5.546 | 31.423 | 36.969 | 273.423 | 310.392 | 13.52 | 0.24 | 2.01 | 100 | 73 | 27 | 8,235 | ||||||||||||||||||||||||||||||||||||||||||||
| 12/31/19 | 6.879 | 0.592 | 6.287 | 40.787 | 47.074 | 226.349 | 273.423 | 20.80 | 0.23 | 2.49 | 52 | 51 | 26 | 7,064 | ||||||||||||||||||||||||||||||||||||||||||||
| 12/31/18 | 6.361 | 0.576 | 5.785 | (15.940 | ) | (10.155 | ) | 236.504 | 226.349 | (4.29 | ) | 0.24 | 2.43 | 52 | 47 | 26 | 5,931 | |||||||||||||||||||||||||||||||||||||||||
| 12/31/17 | 5.673 | 0.586 | 5.087 | 24.445 | 29.532 | 206.972 | 236.504 | 14.27 | 0.26 | 2.29 | 53 | 37 | 28 | 6,547 | ||||||||||||||||||||||||||||||||||||||||||||
| 96 | 2021 Annual Report ■ College Retirement Equities Fund | See notes to financial statements | See notes to financial statements | College Retirement Equities Fund ■ 2021 Annual Report | 97 |
| Financial highlights | concluded |
| College Retirement Equities Fund |
| Selected per accumulation unit data | Ratios and supplemental data | |||||||||||||||||||||||||||||||||||||||||||||||||||||
| Gain (loss) from investment operations | ||||||||||||||||||||||||||||||||||||||||||||||||||||||
| Net realized | Ratios to average net assets | Accumulation | ||||||||||||||||||||||||||||||||||||||||||||||||||||
| For the year ended | Investment income | a | Expenses | a | Net investment income (loss | )a | & unrealized gain (loss on total investments | ) | Net change in accumulation unit value | Accumulation unit value beginning of period | Accumulation unit value end of period | Total return | b | Gross expenses | Expenses net of TIAA withholding | Net Investment Income (loss | ) | units outstanding end of period (in millions | ) | Accumulation fund net assets (in millions | )i | |||||||||||||||||||||||||||||||||
| MONEY MARKET ACCOUNT | ||||||||||||||||||||||||||||||||||||||||||||||||||||||
| Class R1: | 12/31/21 | $0.019 | $0.019 | $0.000 | $0.000 | $0.000 | $26.343 | $26.343 | 0.00 | % | 0.38 | % | 0.07 | % | 0.00 | % | 63 | $1,660 | ||||||||||||||||||||||||||||||||||||
| 12/31/20 | 0.143 | 0.075 | 0.068 | 0.006 | 0.074 | 26.269 | 26.343 | 0.28 | 0.45 | 0.28 | 0.26 | 76 | 2,001 | |||||||||||||||||||||||||||||||||||||||||
| 12/31/19 | 0.577 | 0.175 | 0.402 | 0.001 | 0.403 | 25.866 | 26.269 | 1.56 | 0.47 | 0.67 | 1.54 | 74 | 1,936 | |||||||||||||||||||||||||||||||||||||||||
| 12/31/18 | 0.474 | 0.206 | 0.268 | 0.002 | 0.270 | 25.596 | 25.866 | 1.05 | 0.45 | 0.80 | 1.04 | 72 | 1,866 | |||||||||||||||||||||||||||||||||||||||||
| 12/31/17 | 0.227 | 0.165 | 0.062 | 0.000 | 0.062 | 25.534 | 25.596 | 0.25 | 0.57 | 0.64 | 0.32 | 72 | 1,842 | |||||||||||||||||||||||||||||||||||||||||
| Class R2: | 12/31/21 | 0.019 | 0.019 | 0.000 | 0.000 | 0.000 | 26.606 | 26.606 | 0.00 | 0.23 | 0.07 | 0.00 | 94 | 2,513 | ||||||||||||||||||||||||||||||||||||||||
| 12/31/20 | 0.141 | 0.058 | 0.083 | 0.011 | 0.094 | 26.512 | 26.606 | 0.35 | 0.28 | 0.22 | 0.31 | 121 | 3,208 | |||||||||||||||||||||||||||||||||||||||||
| 12/31/19 | 0.582 | 0.071 | 0.511 | 0.001 | 0.512 | 26.000 | 26.512 | 1.97 | 0.27 | 0.27 | 1.94 | 111 | 2,954 | |||||||||||||||||||||||||||||||||||||||||
| 12/31/18 | 0.476 | 0.138 | 0.338 | 0.000 | 0.338 | 25.662 | 26.000 | 1.32 | 0.27 | 0.53 | 1.31 | 114 | 2,970 | |||||||||||||||||||||||||||||||||||||||||
| 12/31/17 | 0.227 | 0.116 | 0.111 | 0.002 | 0.113 | 25.549 | 25.662 | 0.44 | 0.31 | 0.45 | 0.58 | 111 | 2,838 | |||||||||||||||||||||||||||||||||||||||||
| Class R3: | 12/31/21 | 0.019 | 0.019 | 0.000 | 0.000 | 0.000 | 26.698 | 26.698 | 0.00 | 0.18 | 0.07 | 0.00 | 152 | 4,066 | ||||||||||||||||||||||||||||||||||||||||
| 12/31/20 | 0.142 | 0.051 | 0.091 | 0.011 | 0.102 | 26.596 | 26.698 | 0.38 | 0.22 | 0.19 | 0.34 | 197 | 5,263 | |||||||||||||||||||||||||||||||||||||||||
| 12/31/19 | 0.583 | 0.057 | 0.526 | 0.001 | 0.527 | 26.069 | 26.596 | 2.02 | 0.22 | 0.22 | 2.00 | 189 | 5,017 | |||||||||||||||||||||||||||||||||||||||||
| 12/31/18 | 0.477 | 0.103 | 0.374 | 0.000 | 0.374 | 25.695 | 26.069 | 1.46 | 0.23 | 0.40 | 1.45 | 189 | 4,927 | |||||||||||||||||||||||||||||||||||||||||
| 12/31/17 | 0.228 | 0.102 | 0.126 | 0.002 | 0.128 | 25.567 | 25.695 | 0.50 | 0.23 | 0.40 | 0.66 | 177 | 4,539 | |||||||||||||||||||||||||||||||||||||||||
| a | Based on average units outstanding. |
| b | Based on per accumulation unit data. |
| i | Does not include annuity net assets. |
| 98 | 2021 Annual Report ■ College Retirement Equities Fund | See notes to financial statements | See notes to financial statements | College Retirement Equities Fund ■ 2021 Annual Report | 99 |
College Retirement Equities Fund
Note 1—organization
The purpose of the College Retirement Equities Fund (“CREF”), as stated in its charter, is to aid and strengthen non-profit educational and research organizations, governmental entities, and other non-profit institutions by providing their employees with variable retirement benefits. CREF is registered with the U.S. Securities and Exchange Commission (“SEC”) under the Investment Company Act of 1940, as amended (“1940 Act”), as an open-end management investment company. It consists of eight investment portfolios: the Stock, Global Equities, Growth, Equity Index, Bond Market, Inflation-Linked Bond, Social Choice and Money Market Accounts (individually referred to as the “Account” or collectively referred to as the “Accounts”).
Note 2—significant accounting policies
The accompanying financial statements were prepared in accordance with accounting principles generally accepted in the United States of America (“U.S. GAAP”), which may require the use of estimates made by management and the evaluation of subsequent events. Actual results may differ from those estimates. The Accounts are investment companies and follow the accounting guidance in the Financial Accounting Standards Board (“FASB”) Accounting Standards Codification 946, Financial Services—Investment Companies. The accumulation unit value (“AUV”) for financial reporting purposes may differ from the AUV for processing transactions. The AUV for financial reporting purposes includes security and participant transactions through the date of the report. Total return is computed based on the AUV used for processing transactions. The following is a summary of the significant accounting policies consistently followed by the Accounts.
Accumulation and Annuity Funds: The Accumulation Fund represents the net assets attributable to participants in the accumulation phase of their investment. The Annuity Fund represents the net assets attributable to the participants currently receiving annuity payments. The net increase or decrease in net assets from investment operations is apportioned between the funds based upon their relative daily net asset values. Annuitants bear the mortality risk under their contracts. Initial annuity payments are calculated based on the value of a participant’s accumulation on the last valuation day before the annuity start date, the income option chosen, an assumed annual investment return, and expense and mortality assumptions. Annuity payments vary after the initial payment based on investment performance, Account expenses, and mortality experience. Death benefits are paid to beneficiaries if the annuitant dies during the accumulation period, or during the annuity period while payments are still due for the remainder of a guaranteed period.
Investments and investment income: Securities transactions are accounted for as of the trade date for financial reporting purposes. Interest income is recorded on an accrual basis and includes accretion of discounts and amortization of premiums. Dividend income is recorded on the ex-dividend date. Foreign dividend income is recorded on the ex-dividend date or as soon as possible after the Accounts determine the existence of a dividend declaration. Securities lending income is comprised of
| 100 | 2021 Annual Report ■ College Retirement Equities Fund |
fees earned from borrowers and income earned on cash collateral investments. Realized gains and losses on securities transactions are based upon the specific identification method. Distributions received on securities that represent a return of capital or capital gains are recorded as a reduction of cost of investments and/or as a realized gain. The Accounts estimate the components of distributions received that may be considered return of capital distributions or capital gain distributions.
Multiclass operations and allocations: Income, expenses, realized gains and losses and unrealized appreciation and depreciation of an Account are allocated on a pro rata basis to each class, except for administrative service fees and distribution fees, which are unique to each class of each Account. Most expenses of CREF can be directly attributed to an Account or class. Expenses that cannot be directly attributed are allocated based upon the average net assets of each Account or class.
Foreign currency transactions and translation: The books and records of the Accounts are maintained in U.S. dollars. Assets, including investments, and liabilities denominated in foreign currencies are translated into U.S. dollars at the end of each day. Purchases and sales of securities, income, and expenses are translated into U.S. dollars at the prevailing exchange rate on the respective dates of the transactions.
Net realized foreign currency gains and losses resulting from changes in exchange rates associated with (i) foreign currency, (ii) investments and (iii) derivatives include foreign currency gains and losses between trade date and settlement date of the transactions, foreign currency transactions, and the difference between the amounts of interest and dividends recorded on the books of the Accounts and the amounts actually received and are recognized as a component of “Net realized gain (loss) on total investments” on the Statements of operations, when applicable.
The unrealized gains and losses resulting from changes in foreign currency exchange rates and changes in foreign exchange rates associated with (i) investments and (ii) other assets and liabilities are recognized as a component of “Change in net unrealized appreciation (depreciation) of investments and foreign currency” on the Statements of operations, when applicable. The unrealized gains and losses resulting from changes in foreign exchange rates associated with investments in derivatives are recognized as a component of the respective derivative’s related “Change in net unrealized appreciation (depreciation) on total investments” on the Statements of operations, when applicable.
Trustee compensation: The Accounts pay the members of the Board of Trustees (“Board”), all of whom are independent, certain remuneration for their services, plus travel and other expenses. Trustees may elect to participate in a deferred compensation plan and defer all or a portion of their compensation. In addition, trustees participate in a long-term compensation plan. Amounts deferred are retained by the Accounts until paid. Amounts payable to the trustees for compensation are included separately in the accompanying Statements of assets and liabilities. Trustees’ fees, including any deferred and long-term compensation incurred, are reflected in the Statements of operations.
| College Retirement Equities Fund ■ 2021 Annual Report | 101 |
Notes to financial statements
Indemnification: In the normal course of business, each Account enters into contracts that contain a variety of representations and warranties and that provide general indemnities. An Account’s maximum exposure under these arrangements is unknown, as this would involve future claims against the Account that have not yet occurred. Also, under the Accounts’ organizational documents, the trustees and officers of the Accounts are indemnified against certain liabilities that may arise out of their duties to the Accounts. However, based on experience, the Accounts expect the risk of loss due to these warranties and indemnities to be unlikely.
Other matters: The outbreak of the novel coronavirus (“COVID-19”) and subsequent global pandemic began significantly impacting the U.S. and global financial markets and economies during the calendar quarter ended March 31, 2020. The worldwide spread of COVID-19 has created significant uncertainty in the global economy. The duration and extent of COVID-19 over the long term cannot be reasonably estimated at this time. The ultimate impact of COVID-19 and the extent to which COVID-19 impacts the Accounts’ normal course of business, results of operations, investments, and cash flows will depend on future developments, which are highly uncertain and difficult to predict. Management continues to monitor and evaluate this situation.
New accounting pronouncements: In March 2020, FASB issued Accounting Standards Update (“ASU”) 2020-04, Reference Rate Reform: Facilitation of the Effects of Reference Rate Reform on Financial Reporting. The main objective of the new guidance is to provide relief to companies that will be impacted by the expected change in benchmark interest rates, when participating banks will no longer be required to submit London Interbank Offered Rate (LIBOR) quotes by the UK Financial Conduct Authority (FCA). The new guidance allows companies to, provided the only changes to existing contracts are a change to an approved benchmark interest rate, account for modifications as a continuance of the existing contract without additional analysis. For new and existing contracts, the Accounts may elect to apply the amendments as of March 12, 2020 through December 31, 2022. Management has not yet elected to apply the amendments, is continuously evaluating the potential effect a discontinuation of LIBOR could have on the Accounts’ investments and has currently determined that it is unlikely the ASU’s adoption will have a significant impact on the Accounts’ financial statements and various filings.
New rule issuance: In December 2020, the SEC voted to adopt a new rule governing fund valuation practices. New Rule 2a-5 under the 1940 Act establishes requirements for determining fair value in good faith for purposes of the 1940 Act. Rule 2a-5 will permit fund boards to designate certain parties to perform fair value determinations, subject to board oversight and certain other conditions. Rule 2a-5 also defines when market quotations are “readily available” for purposes of Section 2(a)(41) of the 1940 Act, which requires a fund to fair value a security when market quotations are not readily available. The SEC also adopted new Rule 31a-4 under the 1940 Act, which sets forth the recordkeeping requirements associated with fair value determinations. Finally, the SEC is rescinding previously issued guidance on related issues, including the role of a board in determining fair value and the accounting and auditing of fund investments. Rule 2a-5 and Rule 31a-4 became effective on March 8,
| 102 | 2021 Annual Report ■ College Retirement Equities Fund |
continued
2021, with a compliance date of September 8, 2022. The Accounts may voluntarily comply with the rules after the effective date, and in advance of the compliance date, under certain conditions. Management is currently assessing the impact of these provisions on the Accounts’ financial statements.
Note 3—valuation of investments
The Accounts’ investments in securities are recorded at their estimated fair value utilizing valuation methods approved by the Board. Fair value is defined as the price that would be received upon selling an investment or transferring a liability in an orderly transaction to an independent buyer in the principal or most advantageous market for the investment. U.S. GAAP establishes the three-tier hierarchy that is used to maximize the use of observable market data and minimize the use of unobservable inputs and to establish classification of fair value measurements for disclosure purposes. Observable inputs reflect the assumptions market participants would use in pricing the asset or liability. Observable inputs are based on market data obtained from sources independent of the reporting entity. Unobservable inputs reflect management’s assumptions about the assumptions market participants would use in pricing the asset or liability. Unobservable inputs are based on the best information available in the circumstances. The following is a summary of the three-tiered hierarchy of valuation input levels.
| • | Level 1 – Inputs are unadjusted and prices are determined using quoted prices in active markets for identical securities. |
| • | Level 2 – Prices are determined using other significant observable inputs (including quoted prices for similar securities, interest rates, credit spreads, etc.). |
| • | Level 3 – Prices are determined using significant unobservable inputs (including management’s assumptions in determining the fair value of investments). |
A description of the valuation techniques applied to the Accounts’ major classifications of assets and liabilities measured at fair value follows:
Debt securities: Prices of fixed-income securities are provided by an independent pricing service (“pricing service”) approved by the Board. The pricing service establishes a security’s fair value using methods that may include consideration of the following: yields or prices of investments of comparable quality, type of issue, coupon, maturity and rating, market quotes or indications of value from security dealers, evaluations of anticipated cash flows or collateral, general market conditions and other information and analysis, including the obligor’s credit characteristics considered relevant. In pricing certain securities, particularly less liquid and lower quality securities, the pricing service may consider information about a security, its issuer or market activity provided by TIAA-CREF Investment Management, LLC (“TCIM”). These securities are generally classified as Level 2.
Exchange-traded equity securities, common and preferred stock: Equity securities and exchange-traded funds listed or traded on a national market or exchange are valued based on their sale price at the official close of business of such market or
| College Retirement Equities Fund ■ 2021 Annual Report | 103 |
Notes to financial statements
exchange on the valuation date. Foreign equity securities are valued at the last sale price or official closing price reported on the exchange where traded and converted to U.S. dollars at the prevailing rates of exchange on the date of valuation. To the extent these securities are actively traded and that valuation adjustments are not applied, they are categorized as Level 1. If there is no official close of business, then the latest available sale price is utilized. If no sales are reported, then the mean of the latest available bid and asked prices is utilized and the securities are generally classified as Level 2.
For events affecting the value of foreign securities between the time when the exchange on which they are traded closes and the time when the Accounts’ net assets are calculated, such securities will be valued at fair value in accordance with procedures adopted by the Board. These foreign securities are generally classified as Level 2.
The Money Market Account: The Money Market Account’s portfolio securities are valued on an amortized cost basis. Money Market investments are generally classified as Level 2.
Investments in registered investment companies: Investments in investment companies are valued at their respective net asset value on the valuation date and are generally classified as Level 1.
Option contracts: Purchased and written options traded and listed on a national market or exchange are valued at the last sale price as of the close of such exchange or at the mean of the closing bid and asked prices if no sale is reported and are generally classified as Level 1. Over-the-counter (“OTC”) options are marked-to-market daily based upon a price supplied by a pricing service. OTC options are generally classified as Level 2.
Futures contracts: Futures contracts are valued using the closing settlement price and are generally classified as Level 1.
Forward foreign currency contracts: Forward foreign currency contracts are valued using the prevailing forward exchange rate which is derived from quotes provided by the pricing service using the procedures approved by the Board and are classified as Level 2.
Repurchase agreements: Repurchase agreements are valued at contract amount plus accrued interest, which approximates market value. These securities are generally classified as Level 2.
Swap contracts: Swap contracts are marked-to-market daily based upon a price supplied by a pricing service. Swaps are generally classified as Level 2.
Any portfolio security or derivative for which market quotations are not readily available or for which the above valuation procedures are deemed not to reflect fair value are valued at fair value, as determined in good faith using procedures approved by the Board. As a general principle, the fair value of a security would appear to be the amount that the owner might reasonably expect to receive for it in a current sale.
| 104 | 2021 Annual Report ■ College Retirement Equities Fund |
continued
A variety of factors may be considered in determining the fair value of such securities, which may include consideration of the following: yields or prices of investments of comparable quality, type of issue, coupon, maturity and rating, market quotes or indications of value from security dealers, evaluations of anticipated cash flows or collateral, general market conditions and other information and analysis, including the obligor’s credit characteristics considered relevant. To the extent the inputs are observable and timely, the values would be classified as Level 2; otherwise they would be classified as Level 3.
As of December 31, 2021, 100% of the value of investments in the Money Market Account were valued based on Level 2 inputs.
The following table summarizes the market value of the Accounts’ investments as of the end of the reporting period, based on the inputs used to value them (dollar amounts are in thousands):
| Account | Level 1 | Level 2 | Level 3 | Total | ||||||||||||
| Stock | ||||||||||||||||
| Corporate bonds | $ | — | $ | 62 | $ | — | $ | 62 | ||||||||
| Government bonds | — | 302 | — | 302 | ||||||||||||
| Equity investments: | ||||||||||||||||
| Communication services | 8,523,386 | 2,329,658 | 19 | 10,853,063 | ||||||||||||
| Consumer discretionary | 11,926,636 | 5,833,661 | 170 | 17,760,467 | ||||||||||||
| Consumer staples | 5,079,907 | 3,443,123 | 2,781 | 8,525,811 | ||||||||||||
| Energy | 2,999,779 | 1,433,181 | 788 | 4,433,748 | ||||||||||||
| Financials | 12,299,030 | 6,964,235 | 267 | 19,263,532 | ||||||||||||
| Health care | 11,657,666 | 4,247,112 | 100 | 15,904,878 | ||||||||||||
| Industrials | 8,711,706 | 6,029,630 | 66 | 14,741,402 | ||||||||||||
| Information technology | 25,632,278 | 6,413,762 | 6 | 32,046,046 | ||||||||||||
| Materials | 3,344,918 | 3,281,578 | 489 | 6,626,985 | ||||||||||||
| Real estate | 2,802,743 | 1,375,244 | 51 | 4,178,038 | ||||||||||||
| Utilities | 2,143,314 | 1,082,888 | 8 | 3,226,210 | ||||||||||||
| Short-term investments | — | 2,559,557 | — | 2,559,557 | ||||||||||||
| Purchased options** | 19 | — | — | 19 | ||||||||||||
| Written options** | (3,469 | ) | — | — | (3,469 | ) | ||||||||||
| Futures contracts** | 11,451 | — | — | 11,451 | ||||||||||||
| Forward foreign currency contracts** | — | 1,824 | — | 1,824 | ||||||||||||
| Total | $ | 95,129,364 | $ | 44,995,817 | $ | 4,745 | $ | 140,129,926 | ||||||||
| Global Equities | ||||||||||||||||
| Corporate bonds | $ | — | $ | 16 | $ | — | $ | 16 | ||||||||
| Equity investments: | ||||||||||||||||
| Asia | 215,790 | 2,946,120 | 1 | 3,161,911 | ||||||||||||
| Europe | 49,502 | 4,071,113 | — | 4,120,615 | ||||||||||||
| North America | 17,607,361 | 155,994 | — | 17,763,355 | ||||||||||||
| All other equity investments* | 521,781 | 2,745,832 | 3 | 3,267,616 | ||||||||||||
| Short-term investments | — | 547,353 | — | 547,353 | ||||||||||||
| Futures contracts** | 3,852 | — | — | 3,852 | ||||||||||||
| Total | $ | 18,398,286 | $ | 10,466,428 | $ | 4 | $ | 28,864,718 | ||||||||
| College Retirement Equities Fund ■ 2021 Annual Report | 105 |
Notes to financial statements
| Account | Level 1 | Level 2 | Level 3 | Total | ||||||||||||
| Growth | ||||||||||||||||
| Equity investments: | ||||||||||||||||
| Communication services | $ | 5,235,715 | $ | 167,611 | $ | — | $ | 5,403,326 | ||||||||
| Consumer discretionary | 7,226,860 | 457,644 | — | 7,684,504 | ||||||||||||
| Consumer staples | 1,525,683 | 87,124 | — | 1,612,807 | ||||||||||||
| Financials | — | 32,606 | — | 32,606 | ||||||||||||
| Health care | 3,919,812 | 151,566 | — | 4,071,378 | ||||||||||||
| Industrials | 1,916,962 | 271,323 | — | 2,188,285 | ||||||||||||
| Information technology | 16,547,756 | 163,150 | — | 16,710,906 | ||||||||||||
| All other equity investments* | 1,829,025 | — | — | 1,829,025 | ||||||||||||
| Short-term investments | 65,479 | 95,395 | — | 160,874 | ||||||||||||
| Written options** | (942 | ) | — | — | (942 | ) | ||||||||||
| Total | $ | 38,266,350 | $ | 1,426,419 | $ | — | $ | 39,692,769 | ||||||||
| Equity Index | ||||||||||||||||
| Equity investments: | ||||||||||||||||
| Health care | $ | 3,425,907 | $ | — | $ | 32 | $ | 3,425,939 | ||||||||
| Materials | 623,274 | 300 | — | 623,574 | ||||||||||||
| All other equity investments* | 21,521,579 | — | — | 21,521,579 | ||||||||||||
| Short-term investments | 77,920 | 99,474 | — | 177,394 | ||||||||||||
| Futures contracts** | 2,136 | — | — | 2,136 | ||||||||||||
| Total | $ | 25,650,816 | $ | 99,774 | $ | 32 | $ | 25,750,622 | ||||||||
| Bond Market | ||||||||||||||||
| Bank loan obligations | $ | — | $ | 98,695 | $ | — | $ | 98,695 | ||||||||
| Corporate bonds | — | 5,849,290 | 522 | 5,849,812 | ||||||||||||
| Government bonds | — | 5,007,601 | 876 | 5,008,477 | ||||||||||||
| Structured assets | — | 2,456,266 | 9,261 | 2,465,527 | ||||||||||||
| Preferred stocks | 19,957 | — | — | 19,957 | ||||||||||||
| Short-term investments | 13,709 | 1,935,576 | — | 1,949,285 | ||||||||||||
| Futures contracts** | (4,619 | ) | — | — | (4,619 | ) | ||||||||||
| Forward foreign currency contracts** | — | 225 | — | 225 | ||||||||||||
| Credit default swap contracts** | — | (25 | ) | — | (25 | ) | ||||||||||
| Total | $ | 29,047 | $ | 15,347,628 | $ | 10,659 | $ | 15,387,334 | ||||||||
| Inflation-Linked Bond | ||||||||||||||||
| Bank loan obligations | $ | — | $ | 32,874 | $ | — | $ | 32,874 | ||||||||
| Corporate bonds | — | 112,000 | — | 112,000 | ||||||||||||
| Government bonds | — | 7,469,263 | — | 7,469,263 | ||||||||||||
| Structured assets | — | 169,113 | 7,001 | 176,114 | ||||||||||||
| Short-term investments | 2,034 | 48,492 | — | 50,526 | ||||||||||||
| Futures contracts** | (1,970 | ) | — | — | (1,970 | ) | ||||||||||
| Total | $ | 64 | $ | 7,831,742 | $ | 7,001 | $ | 7,838,807 | ||||||||
| 106 | 2021 Annual Report ■ College Retirement Equities Fund |
continued
| Account | Level 1 | Level 2 | Level 3 | Total | ||||||||||||
| Social Choice | ||||||||||||||||
| Bank loan obligations | $ | — | $ | 15,830 | $ | — | $ | 15,830 | ||||||||
| Corporate bonds | — | 3,336,855 | — | 3,336,855 | ||||||||||||
| Government bonds | — | 3,534,240 | 1,003 | 3,535,243 | ||||||||||||
| Structured assets | — | 764,222 | 9,628 | 773,850 | ||||||||||||
| Equity investments: | ||||||||||||||||
| Communication services | 580,830 | 151,147 | — | 731,977 | ||||||||||||
| Consumer discretionary | 920,397 | 395,220 | — | 1,315,617 | ||||||||||||
| Consumer staples | 518,220 | 320,248 | — | 838,468 | ||||||||||||
| Energy | 276,298 | 105,482 | — | 381,780 | ||||||||||||
| Financials | 1,189,202 | 600,483 | — | 1,789,685 | ||||||||||||
| Health care | 1,177,619 | 394,743 | — | 1,572,362 | ||||||||||||
| Industrials | 834,759 | 466,401 | — | 1,301,160 | ||||||||||||
| Information technology | 2,382,541 | 283,074 | — | 2,665,615 | ||||||||||||
| Materials | 240,008 | 250,636 | — | 490,644 | ||||||||||||
| Real estate | 295,843 | 114,831 | — | 410,674 | ||||||||||||
| Utilities | 256,732 | 112,594 | — | 369,326 | ||||||||||||
| Short-term investments | 78,705 | 1,024,301 | — | 1,103,006 | ||||||||||||
| Forward foreign currency contracts** | — | 303 | — | 303 | ||||||||||||
| Total | $ | 8,751,154 | $ | 11,870,610 | $ | 10,631 | $ | 20,632,395 | ||||||||
| * | For detailed categories, see the accompanying Summary portfolio of investments. |
| ** | Derivative instruments, excluding purchased options, are not reflected in the market value of portfolio investments. |
Note 4—investments
Mortgage dollar roll transactions: Some of the Accounts may enter into mortgage dollar rolls in which an Account sells mortgage securities for delivery in the current month, realizing a gain (loss), and simultaneously contracts to repurchase similar securities on a specified future date. During the roll period, an Account forgoes principal and interest paid on the securities. The Account is compensated by the interest earned on the cash proceeds of the initial sale and by the lower repurchase price at the future date. The difference between the sales proceeds and the repurchase price is recorded as a realized gain or loss.
Repurchase agreements: In connection with transactions in repurchase agreements, it is the Account’s policy that its custodian take possession of the underlying collateral securities, the fair value of which exceeds the principal amount of the repurchase transaction, including accrued interest, at all times. If the counterparty defaults, and the fair value of the collateral declines, realization of the collateral may be delayed or limited.
Restricted securities: Restricted securities held by the Accounts, if any, may not be sold except in exempt transactions or in a public offering registered under the Securities Act of 1933, as amended. The risk of investing in such securities is generally greater than the risk of investing in securities that are widely held and publicly traded.
| College Retirement Equities Fund ■ 2021 Annual Report | 107 |
Notes to financial statements
Securities lending: Certain Accounts may lend their securities to qualified institutional borrowers to earn additional income. An Account receives collateral (in the form of cash, Treasury securities or other collateral permitted by applicable law) against the loaned securities and maintains collateral in an amount not less than 100% of the market value of loaned securities during the period of the loan; any additional collateral required due to changes in security values is delivered to the Account the next business day. Cash collateral received by the Account will generally be invested in high-quality short-term instruments or in one or more funds maintained by the securities lending agent (“Agent”) for the purpose of investing cash collateral.
The value of the loaned securities and the liability to return the cash collateral received are reflected in the Statements of assets and liabilities. Non-cash collateral is not disclosed in the Accounts’ Statements of assets and liabilities as it is held by the Agent or by a third-party bank engaged by the Agent as a special “tri-party” custodian on behalf of the Accounts, and the Accounts do not have the ability to sell or re-hypothecate those securities. As of December 31, 2021, securities lending transactions (with the exception of Bond Market Account, Inflation-Linked Bond Account and the Social Choice Account) are for equity securities, and the resulting loans are continuous, can be recalled at any time, and have no set maturity. For the Bond Market Account, all loans from securities lending transactions are continuous, can be recalled at any time, and have no set maturity, with $13,400,892 related to fixed income securities. For the Inflation-Linked Bond Account all loans from securities lending transactions are continuous, can be recalled at any time, and have no set maturity, with $1,989,769 related to fixed income securities. For the Social Choice Account, all loans from securities lending transactions are continuous, can be recalled at any time, and have no set maturity, with $44,800,532 related to fixed income securities and $78,969,952 related to equity securities. Securities lending income recognized by the Accounts consists of earnings on invested collateral and lending fees, net of any rebates to the borrower and compensation to the Agent. Such income is reflected separately in the Statements of operations. In lending its securities, an Account bears the market risk with respect to the investment of collateral and the risk that the Agent may default on its contractual obligations to the Account. The Agent bears the risk that the borrower may default on its obligation to return the loaned securities as the Agent is contractually obligated to indemnify the Account if at the time of a default by a borrower some or all of the loan securities have not been returned.
| 108 | 2021 Annual Report ■ College Retirement Equities Fund |
continued
At December 31, 2021, the total value of securities on loan and the total value of collateral received were as follows (dollar amounts are in thousands):
| Account | Aggregate value of securities on loan | Cash collateral received | * | Non-cash collateral received | Total collateral received | |||||||||||
| Stock | $1,746,890 | $1,067,306 | $771,843 | $1,839,149 | ||||||||||||
| Global Equities | 160,848 | 109,672 | 58,100 | 167,772 | ||||||||||||
| Growth | 154,371 | 65,479 | 95,994 | 161,473 | ||||||||||||
| Equity Index | 171,026 | 77,920 | 102,380 | 180,300 | ||||||||||||
| Bond Market | 13,401 | 13,709 | — | 13,709 | ||||||||||||
| Inflation-Linked Bond | 1,990 | 2,034 | — | 2,034 | ||||||||||||
| Social Choice | 123,770 | 78,705 | 50,516 | 129,221 | ||||||||||||
| * | May include cash and investment of cash collateral. |
Securities purchased on a when-issued or delayed-delivery basis: The Accounts may purchase securities on a when-issued or delayed-delivery basis. Securities purchased or sold on a when-issued or delayed-delivery basis may have extended settlement periods; interest income is not accrued until settlement date. Any securities so purchased are subject to market fluctuation during this period. The Accounts have segregated securities in their portfolios with a current value at least equal to the amount of the when-issued/delayed delivery purchase commitments.
Treasury inflation-protected securities: The Accounts (other than the Money Market Account) may invest in Treasury Inflation-Protected Securities, specially structured bonds in which the principal amount is adjusted periodically to keep pace with inflation, as measured by the U.S. Consumer Price Index. The adjustments for interest income due to inflation or deflation are reflected in interest income in the Statements of operations.
Zero coupon securities: A zero coupon security does not pay a regular interest coupon to its holders during the life of the security. Income to the holder of the security comes from accretion of the difference between the original purchase price of the security at issuance and the par value of the security at maturity and is effectively paid at maturity. The market prices of zero coupon securities generally are more volatile than the market prices of securities that pay interest periodically.
Purchases and sales: Purchases and sales of securities (other than short-term instruments) for all of the Accounts for the year ended December 31, 2021 were as follows (dollar amounts are in thousands):
| Stock Account | Global Equities Account | Growth Account | Equity Index Account | Bond Market Account | Inflation- Linked Bond Account | Social Choice Account | ||||||||||||||||||||||
| Purchases: | ||||||||||||||||||||||||||||
| Non-U.S. Government | $66,364,939 | $13,285,874 | $25,495,606 | $878,257 | $ | 3,419,792 | $ | 293,510 | $ | 5,945,329 | ||||||||||||||||||
| U.S. Government | — | — | — | — | 25,406,500 | 2,169,767 | 16,316,114 | |||||||||||||||||||||
| College Retirement Equities Fund ■ 2021 Annual Report | 109 |
Notes to financial statements
| Stock Account | Global Equities Account | Growth Account | Equity Index Account | Bond Market Account | Inflation- Linked Bond Account | Social Choice Account | ||||||||||||||||||||||
| Sales: | ||||||||||||||||||||||||||||
| Non-U.S. Government | $ | 74,769,481 | $ | 12,240,813 | $ | 28,359,878 | $ | 2,124,839 | $ | 3,000,394 | $ | 29,854 | $ | 5,492,862 | ||||||||||||||
| U.S. Government | — | — | — | — | 25,583,859 | 1,756,283 | 16,118,458 | |||||||||||||||||||||
Note 5—derivative investments
Each Account is authorized to invest in certain derivative instruments. As defined by U.S. GAAP, a derivative is a financial instrument whose value is derived from an underlying security price, foreign exchange rate, interest rate, index of prices or rates, or other variables. The Accounts record derivative instruments at fair value, with changes in fair value recognized on the Statements of operations, when applicable.
At December 31, 2021, the following Accounts have invested in derivative contracts which are reflected in the Statements of assets and liabilities as follows (dollar amounts are in thousands):
| Asset derivatives | Liabilities derivatives | |||||||||||
| Derivative contract | Location | Fair value amount | Location | Fair value amount | ||||||||
| Stock Account | ||||||||||||
| Equity contracts | Futures contracts* | $ | 12,037 | Futures contracts* | $ | (586 | ) | |||||
| Equity contracts | Portfolio investments | 19 | Written options | (3,469 | ) | |||||||
| Foreign-exchange contracts | Forward foreign currency contracts | 4,721 | Forward foreign currency contracts | (2,897 | ) | |||||||
| Global Equities Account | ||||||||||||
| Equity contracts | Futures contracts* | 3,852 | ||||||||||
| Growth Account | ||||||||||||
| Equity contracts | Written options | (942 | ) | |||||||||
| Equity Index Account | ||||||||||||
| Equity contracts | Futures contracts* | 2,136 | ||||||||||
| Bond Market Account | ||||||||||||
| Equity contracts | Futures contracts* | (4,619 | ) | |||||||||
| Credit contracts | Credit default swap contracts* | 166 | Credit default swap contracts* | (191 | ) | |||||||
| Foreign-exchange contracts | Forward foreign currency contracts | 1,278 | Forward foreign currency contracts | (1,053 | ) | |||||||
| Inflation-Linked Bond Account | ||||||||||||
| Equity contracts | Futures contracts* | (1,970 | ) | |||||||||
| Social Choice Account | ||||||||||||
| Foreign-exchange contracts | Forward foreign currency contracts | 303 | ||||||||||
| * | The fair value presented includes cumulative gain (loss) on open futures contracts and centrally cleared swap contracts; however, the value reflected on the accompanying Statements of assets and liabilities is only the receivable or payable for variation margin on open futures contracts and centrally cleared swap contracts. |
| 110 | 2021 Annual Report ■ College Retirement Equities Fund |
continued
For the year ended December 31, 2021, the effect of derivative contracts on the Accounts’ Statements of operations was as follows (dollar amounts are in thousands):
| Derivative contract | Location | Realized gain (loss | ) | Change in unrealized appreciation (depreciation | ) | |||||
| Stock Account | ||||||||||
| Equity contracts | Purchased options | $ | 25,495 | $ | (1,133 | ) | ||||
| Equity contracts | Written options | (13,888 | ) | (802 | ) | |||||
| Equity contracts | Futures contracts | 311,175 | (23,559 | ) | ||||||
| Foreign-exchange contracts | Forward foreign currency contracts | (3,890 | ) | 5,096 | ||||||
| Global Equities Account | ||||||||||
| Equity contracts | Purchased options | 512 | — | |||||||
| Equity contracts | Written options | 148 | — | |||||||
| Equity contracts | Futures contracts | 81,227 | (1,542 | ) | ||||||
| Foreign-exchange contracts | Forward foreign currency contracts | 3 | — | |||||||
| Growth Account | ||||||||||
| Equity contracts | Written options | (684 | ) | 2,703 | ||||||
| Equity Index Account | ||||||||||
| Equity contracts | Futures contracts | 18,637 | 152 | |||||||
| Bond Market Account | ||||||||||
| Interest-rate contracts | Futures contracts | (7,229 | ) | (4,619 | ) | |||||
| Foreign-exchange contracts | Forward foreign currency contracts | 9,452 | 4,461 | |||||||
| Credit contracts | Swap contracts | (3,376 | ) | 2,878 | ||||||
| Inflation-Linked Bond Account | ||||||||||
| Interest-rate contracts | Futures contracts | 623 | (1,970 | ) | ||||||
| Social Choice Account | ||||||||||
| Foreign-exchange contracts | Forward foreign currency contracts | 7 | 1,240 | |||||||
Options: Certain Accounts are subject to equity price risk in the normal course of pursuing their investment objectives. Options can be settled either directly with the counterparty (over the counter) or through a central clearinghouse (exchange traded). To manage the risk, the Accounts may invest in both equity and index options. The Accounts use options contracts for hedging and cash management purposes and to seek to increase total return. Call and put equity options give the holder the right, in return for a premium paid, to purchase or sell, respectively, a security at a specified exercise price at any time during the period of the option. Index options are written or purchased options in which the underlying investment is a specified index. The exercise of an index option will not result in the physical delivery of the underlier, but a cash transfer of the difference between the settlement price of the underlier and the strike price of the option. Purchased options are included in the Summary portfolio of investments, and written options are separately reflected as a liability in
| College Retirement Equities Fund ■ 2021 Annual Report | 111 |
Notes to financial statements
the Statements of assets and liabilities. Premiums on unexercised, expired options are recorded as realized gains or losses; premiums on exercised options are recorded as an adjustment to the proceeds from the sale or cost of the purchase. The difference between the premium and the amount received or paid in a closing transaction is also treated as a realized gain or loss. Risks may arise upon entering into over the counter options from the potential of default by counterparty. Also, risks related to the use of options include possible illiquidity of the options markets, price movements in underlying security values, and losses that may exceed amounts recognized on the Statements of assets and liabilities. During the year ended December 31, 2021, the Stock Account, Global Equities Account and Growth Account had exposure to options, based on underlying notional values, generally between 0% and 1% of net assets. The purchased and written options outstanding as of December 31, 2021 are disclosed in the Summary portfolio of investments and the full Schedules of investments.
Futures contracts: Certain Accounts are subject to equity price risk in the normal course of pursuing their investment objectives. The Accounts use futures contracts to manage exposure to the equity markets and for cash management purposes to remain highly invested in these markets while minimizing transaction costs. Buying futures contracts tends to increase exposure to the underlying instrument/index, while selling futures contracts tends to decrease exposure to the underlying instrument/index or hedge other investments. Initial margin deposits are made upon entering into a futures contract, and variation margin receipts or payments are settled daily reflecting changes in the value of the futures contracts. Daily changes in the value of such contracts are reflected in net unrealized gains and losses. Gains or losses are realized upon the expiration or closing of the futures contracts or if the counterparties do not perform in accordance with contractual provisions. With futures contracts, there is minimal counterparty credit risk to the Accounts since futures contracts are exchange-traded and the exchange’s clearinghouse, as counterparty to all exchange-traded funds, guarantees the futures contracts against default. During the year ended December 31, 2021, the Stock Account, Global Equities Account, Equity Index Account, Bond Market Account, and Inflation-Linked Bond Account had exposure to futures contracts, based on underlying notional values, generally between 0% and 3% of net assets. The futures contracts outstanding as of December 31, 2021 are disclosed in the Summary portfolio of investments and the full Schedules of investments.
Forward foreign currency contracts: Certain Accounts are subject to foreign exchange risk in the normal course of pursuing their investment objectives. The Accounts use forward foreign currency contracts (“forwards”), including non-deliverable forwards (“NDFs”), to, among other things, hedge portfolio currency risk and to facilitate transactions in securities denominated in foreign currencies. Forwards are over-the counter (“OTC”) commitments that involve an obligation to purchase or sell a fixed amount of a specific currency on a future date at a locked exchange rate. NDFs allow hedging of currencies where government regulations restrict foreign access to local currency or the parties want to compensate for risk without a physical exchange of
| 112 | 2021 Annual Report ■ College Retirement Equities Fund |
continued
funds. Forwards are marked-to-market daily at the applicable foreign exchange rate, and any resulting unrealized gains or losses are recorded as appreciation or depreciation in the Statements of assets and liabilities. The Accounts realize gains and losses at the time the forward is closed. Realized and unrealized gains and losses are included in the Statements of operations. Risks may arise upon entering into these contracts from the potential inability of counterparties to meet the terms of their contracts; from unanticipated movements in the value of a foreign currency relative to the U.S. dollar; and that losses may exceed amounts recognized on the Statements of assets and liabilities. During the year ended December 31, 2021, the Stock Account, Bond Market Account, and Social Choice Account had exposure to forwards contracts, based on underlying notional values, generally between 0% and 2% of net assets. The forward contracts outstanding as of December 31, 2021 are disclosed in the Summary portfolio of investments and the full Schedules of Investments.
Credit default swap contracts: Certain Accounts are subject to credit risk in the normal course of pursuing their investment objectives. Credit default swaps can be settled either directly with the counterparty (bilateral) or through a central clearinghouse (centrally cleared). A credit default swap is a contract between a buyer and a seller of protection against pre-defined credit events for the reference entity. As a seller in a credit default swap contract, the Accounts are required to pay an agreed upon amount to the counterparty with the occurrence of a specified credit event, such as certain bankruptcies related to an underlying credit instrument, index, or issuer which would likely result in a loss to the Accounts. The agreed upon amount approximates the notional value of the swap and is estimated to be the maximum potential future payment that the Accounts could be required to make under the contract. In return, the Accounts receive from the counterparty a periodic stream of payments over the term of the contract provided that no credit event has occurred. If no credit event occurs, the Accounts keep the stream of payments with no payment obligations. When the Accounts sell a credit default swap contract it will cover its commitment. This may be achieved by, among other methods, maintaining cash or liquid assets in a segregated account equal to the aggregate notional value of the reference entities for all outstanding credit default swap contracts sold by the Accounts.
Certain Accounts may also buy credit default swap contracts, in which case the Accounts function as the counterparty referenced above. This involves the risk that the contract may expire worthless. Bilateral swaps involve counterparty risk that the seller may fail to satisfy its payment obligations to the Accounts with the occurrence of a credit event. Centrally cleared swaps have minimal counterparty credit risk to the Accounts as they are entered into with a central clearinghouse which guarantees the swap against default.
The value of a bilateral swap included in net assets is the unrealized gain or loss of the contract plus or minus any unamortized premiums paid or received, respectively. Appreciated swaps and premiums paid are reflected as assets, while depreciated swaps and premiums received are reflected as liabilities on the Statements of assets and liabilities. Centrally cleared swaps initial margin deposits are made, and variation margin payments are made or received reflecting daily changes in the value
| College Retirement Equities Fund ■ 2021 Annual Report | 113 |
Notes to financial statements
of the swap contract. The daily fluctuation in fair value is accounted for as a variation margin receivable or payable on the Statements of assets and liabilities.
Under the terms of the credit default swap contracts, the Accounts receive or make quarterly payments based on a payment rate on a fixed notional amount. These payments are recorded as a realized gain or loss in the Statements of operations. Payments received or made as a result of a credit event or termination of the contract are recognized as realized gains or losses. Daily changes in the value of such contracts are reflected in net unrealized gains and losses.
The Accounts (other than the Money Market Account) invest in credit default swaps to hedge or manage the risks associated with assets held in the Accounts and/or to facilitate the implementation of portfolio strategies to seek to increase the total return. During the year ended December 31, 2021, Bond Market Account had exposure to credit default swap contracts, based on underlying notional values, generally between 0% and 1% of net assets. The credit default swap contracts outstanding as of December 31, 2021 are disclosed in the Summary portfolio of investments and the full Schedule of investments.
Note 6—income tax and other tax matters
Income taxes: CREF is taxed as a life insurance company under Subchapter L of the Internal Revenue Code. CREF should incur no federal income tax liability. Under the rules of taxation applicable to life insurance companies, CREF’s Accumulation and Annuity Funds for participants will generally be treated as life insurance reserves; therefore, any increase in such reserves will be deductible. CREF files income tax returns in U.S. federal and applicable state jurisdictions. CREF’s federal income tax return is generally subject to examination for a period of three fiscal years after being filed. State and local tax returns may be subject to examination for an additional period of time depending on the jurisdiction. Management has analyzed the Accounts’ tax positions taken for all open income tax years and has concluded that no provision for income tax is required in the Accounts’ financial statements.
Foreign taxes: The Accounts may be subject to foreign taxes on income, gains on investments or currency repatriation, a portion of which may be recoverable. The Accounts will accrue such taxes and recoveries as applicable, based upon the current interpretation of tax rules and regulations that exist in the markets in which the Accounts invest.
Net unrealized appreciation (depreciation): At December 31, 2021, net unrealized appreciation (depreciation) based on the aggregate cost of all investments for federal income tax purposes, consisting of gross unrealized appreciation and gross unrealized depreciation, was as follows (dollar amounts are in thousands):
| 114 | 2021 Annual Report ■ College Retirement Equities Fund |
continued
| Account | Tax cost | Gross unrealized appreciation | Gross unrealized (depreciation | ) | Net unrealized appreciation (depreciation | ) | ||||||||||
| Stock | $ | 111,360,333 | $ | 32,996,237 | $ | (4,226,644 | ) | $ | 28,769,593 | |||||||
| Global Equities | 21,997,228 | 7,592,799 | (725,309 | ) | 6,867,490 | |||||||||||
| Growth | 30,069,662 | 10,367,171 | (744,064 | ) | 9,623,107 | |||||||||||
| Equity Index | 8,065,192 | 18,219,655 | (534,225 | ) | 17,685,430 | |||||||||||
| Bond Market | 15,126,705 | 400,907 | (140,295 | ) | 260,612 | |||||||||||
| Inflation-Linked Bond | 7,318,720 | 524,460 | (4,373 | ) | 520,087 | |||||||||||
| Social Choice | 16,728,225 | 4,263,695 | (359,525 | ) | 3,904,170 | |||||||||||
For purposes of this disclosure, tax cost generally includes the cost of portfolio investments as well as up-front fees or premiums exchanged on derivatives and any amounts unrealized for income statement reporting but realized in income and/or capital gains for tax reporting.
Note 7—investment adviser and other transactions with affiliates
Investment advisory services for the Accounts are provided by TCIM in accordance with an Investment Management Services Agreement. TCIM is a registered investment adviser and a wholly owned subsidiary of Teachers Insurance and Annuity Association of America (“TIAA”), a companion organization of CREF. Investment management expenses generally include investment management, portfolio accounting and custodial services and are the same across all classes of an Account.
Administrative services are provided to the Accounts by TIAA, pursuant to an Administrative Services Agreement with CREF. Distribution functions are provided to the Accounts by TIAA-CREF Individual & Institutional Services, LLC (“Services”), a wholly owned subsidiary of TIAA, pursuant to a Principal Underwriting and Distribution Services Agreement with CREF and the Rule 12b-1 plan. Participants invested in a particular CREF Account will be subject to different administrative and distribution expenses depending upon the class of the Account they own.
TIAA charges a mortality and expense charge of 0.005% to guarantee that CREF participants transferring Accounts to TIAA for the immediate purchase of lifetime payout annuities will not be charged more than the rate stipulated in the CREF contract. This charge is the same across all Accounts and classes.
The services provided by TCIM, Services, and TIAA are provided to CREF at cost, and CREF also reimburses TCIM, Services, and TIAA for certain third party expenses and trustee fees paid on its behalf. Payments from the CREF Accounts are made on a daily basis according to formulas established each year with the objective of keeping the estimated expenses as close as possible to each Account’s actual expenses. Any differences between actual expenses and the estimated expenses remitted are adjusted.
| College Retirement Equities Fund ■ 2021 Annual Report | 115 |
Notes to financial statements
As of December 31, 2021, the following table represents the effective expense deductions as an annual percentage of average daily net assets to approximate the costs that CREF incurred:
| Investment management fee | Administrative fee | Distribution fee | ||||||||||||||||||||||||||
| Account | All classes | Class R1 | Class R2 | Class R3 | Class R1 | Class R2 | Class R3 | |||||||||||||||||||||
| Stock | 0.083 | % | 0.251 | % | 0.140 | % | 0.103 | % | 0.091 | % | 0.051 | % | 0.036 | % | ||||||||||||||
| Global Equities | 0.060 | 0.251 | 0.140 | 0.104 | 0.091 | 0.051 | 0.036 | |||||||||||||||||||||
| Growth | 0.032 | 0.251 | 0.140 | 0.104 | 0.091 | 0.051 | 0.036 | |||||||||||||||||||||
| Equity Index | 0.014 | 0.251 | 0.140 | 0.104 | 0.091 | 0.051 | 0.036 | |||||||||||||||||||||
| Bond Market | 0.063 | 0.251 | 0.140 | 0.103 | 0.091 | 0.051 | 0.036 | |||||||||||||||||||||
| Inflation-Linked Bond | 0.026 | 0.251 | 0.140 | 0.104 | 0.091 | 0.051 | 0.036 | |||||||||||||||||||||
| Social Choice | 0.048 | 0.251 | 0.140 | 0.104 | 0.091 | 0.051 | 0.036 | |||||||||||||||||||||
| Money Market | 0.036 | 0.251 | 0.140 | 0.103 | 0.091 | 0.051 | 0.036 | |||||||||||||||||||||
From May 12, 2020 to December 31, 2021, TIAA agreed to withhold (“waive”) a portion of the Rule 12b-1 distribution and/or administrative expenses for each class of the Money Market Account when a class’s yield was less than zero, subject to a maximum aggregate limit of $25 million for all amounts waived. TIAA may, for a period of three years after the date an amount was waived, recover from the Account a portion of the amounts waived at such time as the class’s daily yield would be positive and, in such event, the amount of recovery on any day will be approximately 25% of the class’s yield (net of all other expenses) on that day. As of December 31, 2021, the cumulative amount of expenses waived subject to recovery is $9,146,492 for Class R1, $6,641,622 for Class R2 and $6,970,403 for Class R3. The amounts waived and recovered during the current period are disclosed on the Statements of operations.
Amounts owed to Account affiliates for payment of Account expenses, payments for units purchased, and receipt for units sold are disclosed as due to/from affiliates on the Statements of assets and liabilities. Account expenses owed to affiliates are reflected in the Statements of operations.
The Accounts may purchase or sell investment securities in transactions with affiliated entities under procedures adopted by the Board, pursuant to the 1940 Act. These transactions are effected at market rates without incurring broker commissions. For the year ended December 31, 2021, the Accounts engaged in the following security transactions with affiliated entities (dollar amounts are in thousands):
| Account | Purchases | Sales | Realized gain (loss) | |||||||||
| Stock | $ | 2,916,479 | $ | 3,419,516 | $ | 1,272,571 | ||||||
| Global Equities | 2,543,432 | 1,233,669 | 426,903 | |||||||||
| Growth | 328,702 | 540,653 | 141,177 | |||||||||
| Equity Index | 3,957 | 81,010 | 62,452 | |||||||||
| Social Choice | 29,128 | 9,197 | 4,719 | |||||||||
| 116 | 2021 Annual Report ■ College Retirement Equities Fund |
continued
Companies in which an Account holds 5% or more of the outstanding voting shares are considered “affiliated companies” of the Account, pursuant to the 1940 Act. Information regarding transactions with affiliated companies is as follows (dollar amounts are in thousands):
| Issue | Value at 12/31/20 | Purchases cost | Sales proceeds | Realized gain (loss | ) | Spin-off | Change in unrealized appreciation (depreciation) | Dividend income | Shares at 12/31/21 | Value at 12/31/21 | ||||||||||||||||||||||||||
| Stock Account Common Stock Capital Goods | ||||||||||||||||||||||||||||||||||||
| Terex Corp | $ | 147,972 | $ | 37,274 | $ | 196,825 | $ | 82,384 | $ | — | $ | (53,994 | ) | $ | 1,067 | — | § | $ | — | § | ||||||||||||||||
| Consumer Services | ||||||||||||||||||||||||||||||||||||
| Arcos Dorados Holdings, Inc*,e | 44,499 | 918 | 9,366 | (6,722 | ) | — | 12,703 | — | 7,209,528 | 42,032 | ||||||||||||||||||||||||||
| Media & Entertainment | ||||||||||||||||||||||||||||||||||||
| iClick Interactive Asia Group Ltd (ADR)*,e | 2,221 | ‡ | 71,790 | 3,279 | (2,351 | ) | — | (42,185 | ) | — | 5,682,338 | 26,196 | ||||||||||||||||||||||||
| HUYA, Inc (ADR)*,e | 38,473 | ‡ | 66,091 | 7,918 | (6,155 | ) | — | (59,809 | ) | — | 4,420,992 | 30,682 | ||||||||||||||||||||||||
| Real Estate | ||||||||||||||||||||||||||||||||||||
| Hibernia REIT plc | 50,704 | 5,063 | 11,860 | 597 | — | 1,471 | 1,585 | — | § | — | § | |||||||||||||||||||||||||
| Retailing | ||||||||||||||||||||||||||||||||||||
| Lojas Americanas S.A. (Preference) | 55,479 | ‡ | 115,821 | 1,206 | (360 | ) | (67,447 | ) | (33,851 | ) | 357 | 64,973,036 | 68,436 | |||||||||||||||||||||||
| Matahari Department Store Tbk PT | 12,956 | 1,709 | — | — | — | 30,862 | 927 | 156,345,400 | 45,527 | |||||||||||||||||||||||||||
| Total | $ | 352,304 | $ | 298,666 | $ | 230,454 | $ | 67,393 | $ | (67,447 | ) | $ | (144,803 | ) | $ | 3,936 | 238,631,294 | $ | 212,873 | |||||||||||||||||
| * | Non-income producing |
| ‡ | At December 31, 2020, the issuer was not an affiliated company of the Account. |
| § | At December 31, 2021, the issuer was not an affiliated company of the Account. |
| e | Security on loan |
Note 8—inter-fund lending program
Pursuant to an exemptive order issued by the SEC, the Accounts may participate in an inter-fund lending program. This program allows certain Accounts to lend cash to and/or borrow cash from other Accounts or certain other affiliated registered investment companies for temporary purposes, (e.g., to satisfy redemption requests or to cover unanticipated cash shortfalls). The program is subject to a number of conditions, including the requirement that no Account may borrow or lend money under the program unless it receives a more favorable interest rate than is available from a bank or other financial institution for a comparable transaction. In addition, each Account may participate in the program only if its participation is consistent with the Account’s investment policies and limitations and authorized by its portfolio manager(s). During the year ended December 31, 2021, there were no inter-fund borrowing or lending transactions.
| College Retirement Equities Fund ■ 2021 Annual Report | 117 |
| Notes to financial statements | concluded |
Note 9—line of credit
The Accounts (other than the Money Market Account) participate in a $1 billion unsecured revolving credit facility that can be used for temporary purposes, including, without limitation, the funding of participant withdrawals. The current facility was entered into on June 15, 2021 expiring on June 14, 2022, replacing the previous facility, which expired June 2021. Certain affiliated accounts and mutual funds, each of which is managed by TCIM, or an affiliate of TCIM, also participate in this facility. An annual commitment fee for the credit facility is borne by the participating accounts and mutual funds on a pro rata basis. Interest associated with any borrowing under the facility is charged to the borrowing accounts or mutual funds at a specified rate of interest. The Accounts are not liable for borrowings under the facility by other affiliated accounts or mutual funds. For the year ended December 31, 2021, there were no borrowings under this credit facility by the Accounts.
Note 10—subsequent event
The Money Market Account voluntary waiver of the Rule 12b-1 distribution and/or administrative expenses terminated on December 31, 2021. On January 3, 2022, the total returns and yields of each class of the Account became negative, and are expected to remain so until interest rates rise.
| 118 | 2021 Annual Report ■ College Retirement Equities Fund |
Report of Independent Registered
Public Accounting Firm
To the Board of Trustees of College Retirement Equities Fund and Participants of Stock Account, Global Equities Account, Growth Account, Equity Index Account, Bond Market Account, Inflation-Linked Bond Account, Social Choice Account and Money Market Account
Opinions on the Financial Statements
We have audited the accompanying statements of assets and liabilities, including the summary portfolios of investments, of Stock Account, Global Equities Account, Growth Account, Equity Index Account, Bond Market Account, Inflation-Linked Bond Account, Social Choice Account and Money Market Account (constituting College Retirement Equities Fund, hereafter collectively referred to as the “Accounts”) as of December 31, 2021, the related statements of operations for the year ended December 31, 2021, the statements of changes in net assets for each of the two years in the period ended December 31, 2021, including the related notes, and the financial highlights for each of the five years in the period ended December 31, 2021 (collectively referred to as the “financial statements”). In our opinion, the financial statements present fairly, in all material respects, the financial position of each of the Accounts as of December 31, 2021, the results of each of their operations for the year then ended, the changes in each of their net assets for each of the two years in the period ended December 31, 2021 and each of the financial highlights for each of the five years in the period ended December 31, 2021 in conformity with accounting principles generally accepted in the United States of America.
Basis for Opinions
These financial statements are the responsibility of the Accounts’ management. Our responsibility is to express an opinion on the Accounts’ financial statements based on our audits. We are a public accounting firm registered with the Public Company Accounting Oversight Board (United States) (PCAOB) and are required to be independent with respect to the Accounts in accordance with the U.S. federal securities laws and the applicable rules and regulations of the Securities and Exchange Commission and the PCAOB.
We conducted our audits of these financial statements in accordance with the standards of the PCAOB. Those standards require that we plan and perform the audit to obtain reasonable assurance about whether the financial statements are free of material misstatement, whether due to error or fraud.
Our audits included performing procedures to assess the risks of material misstatement of the financial statements, whether due to error or fraud, and performing procedures that respond to those risks. Such procedures included examining, on a test basis, evidence regarding the amounts and disclosures in the financial statements. Our audits also included evaluating the accounting principles used and significant estimates made by management, as well as evaluating the overall presentation of the financial statements. Our procedures included
| College Retirement Equities Fund ■ 2021 Annual Report | 119 |
| Report of Independent Registered Public Accounting Firm | concluded |
confirmation of securities owned as of December 31, 2021 by correspondence with the custodian and brokers; when replies were not received from brokers, we performed other auditing procedures. We believe that our audits provide a reasonable basis for our opinions.
/s/ PricewaterhouseCoopers LLP
Baltimore, Maryland
February 23, 2022
We have served as the auditor of one or more investment companies in TIAA-CREF Funds’ investment company group since 2005.
| 120 | 2021 Annual Report ■ College Retirement Equities Fund |
Trustees and officers (unaudited)
College Retirement Equities Fund ■ February 15, 2022
Trustees
| Name, address and year of birth (“YOB”) | Position(s) held with CREF | Term of office and length of time served | Principal occupation(s) during past 5 years and other relevant experience and qualifications | Number of portfolios in fund complex overseen by Trustee | Other directorship(s) and positions held by Trustee | |||||
| Forrest Berkley c/o Corporate Secretary 730 Third Avenue New York, NY 10017-3206 YOB: 1954 | Trustee | Four-year term. Trustee since 2006. | Retired Partner (since 2006), Partner (1990–2005) and Head of Global Product Management (2003–2005), GMO (formerly, Grantham, Mayo, Van Otterloo & Co.) (investment management); and member of asset allocation portfolio management team, GMO (2003–2005). | 88 | Director, Save the Children Federation, Inc.; Investment Committee Member, Maine Community Foundation. | |||||
| Joseph A. Boateng c/o Corporate Secretary 730 Third Avenue New York, NY 10017-3206 YOB: 1963 | Trustee | Four-year term. Trustee since 2018. | Chief Investment Officer, Casey Family Programs (since 2007). Director of U.S. Pension Plans, Johnson & Johnson (2002–2006). Manager, Financial Services Consultant, KPMG Consulting (2000–2002). | 88 | Board member, Lumina Foundation and Waterside School; Emeritus Board Member, Year-Up Puget Sound, Investment Advisory Committee Chair, Seattle City Employees’ Retirement System; Investment Committee Member, The Seattle Foundation. | |||||
| Janice C. Eberly c/o Corporate Secretary 730 Third Avenue New York, NY 10017-3206 YOB: 1962 | Trustee | Four-year term. Trustee since 2018. | James R. and Helen D. Russell Professor of Finance at the Kellogg School of Management, Northwestern University (2002–2011 and since 2013), Senior Associate Dean for Strategy and Academics (since 2020) and Chair of the Finance Department (2005–2007). Vice President, American Economic Association (2020–2021). Assistant Secretary for Economic Policy, United States Department of the Treasury (2011–2013). | 88 | Member of the Board of the Office of Finance, Federal Home Loan Banks; Director, Avant, LLC. |
| College Retirement Equities Fund ■ 2021 Annual Report | 121 |
Trustees and officers (unaudited)
| College Retirement Equities Fund ■ February 15, 2022 | continued |
Trustees—concluded
| Name, address and year of birth (“YOB”) | Position(s) held with CREF | Term of office and length of time served | Principal occupation(s) during past 5 years and other relevant experience and qualifications | Number of Portfolios in fund complex overseen by Trustee | Other directorship(s) and positions held by Trustee | |||||
| Nancy A. Eckl c/o Corporate Secretary 730 Third Avenue New York, NY 10017-3206 YOB: 1962 | Trustee | Four-year term. Trustee since 2007. | Vice President (1990–2006), American Beacon Advisors, Inc., and of certain funds advised by American Beacon Advisors, Inc. | 88 | Independent Director, The Lazard Funds, Inc., Lazard Retirement Series, Inc., and Lazard Global Total Return and Income Fund, Inc. | |||||
| Michael A. Forrester c/o Corporate Secretary 730 Third Avenue New York, NY 10017-3206 YOB: 1967 | Trustee | Four-year term. Trustee since 2007. | Chief Executive Officer (2014–2021) and Chief Operating Officer (2007–2014), Copper Rock Capital Partners, LLC. Chief Operating Officer, DDJ Capital Management (2003–2006). | 88 | Trustee, Dexter Southfield School; Member, Governing Council of the Independent Directors Council. | |||||
| Howell E. Jackson c/o Corporate Secretary 730 Third Avenue New York, NY 10017-3206 YOB: 1954 | Trustee | Four-year term. Trustee since 2005. | James S. Reid, Jr. Professor of Law (since 2004), Senior Adviser to President and Provost (2010–2012), Acting Dean (2009), Vice Dean for Budget (2003–2006) and on the faculty (since 1989) of Harvard Law School. | 88 | Director, Build Commonwealth (non-profit organization). |
| 122 | 2021 Annual Report ■ College Retirement Equities Fund |
| Thomas J. Kenny c/o Corporate Secretary 730 Third Avenue New York, NY 10017-3206 YOB: 1963 | Chairman of the Board and Trustee | Four-year term Trustee since 2011. Chairman for term ending June 30, 2023. Chairman since September 13, 2017. | Advisory Director (2010–2011), Partner (2004–2010), Managing Director (1999–2004) and Co-Head of Global Cash and Fixed Income Portfolio Management Team (2002–2010), Goldman Sachs Asset Management. | 88 | Director and Chair of the Finance and Investment Committee, Aflac Incorporated; Director and Investment Committee Member, Sansum Clinic; Director, ParentSquare; Member, University of California at Santa Barbara Arts and Lectures Advisory Council. | |||||
| James M. Poterba c/o Corporate Secretary 730 Third Avenue New York, NY 10017-3206 YOB: 1958 | Trustee | Four-year term. Trustee since 2006. | President and Chief Executive Officer (since 2008) and Program Director (1990–2008), National Bureau of Economic Research. Mitsui Professor of Economics, Massachusetts Institute of Technology (“MIT”) (since 1996); Affiliated Faculty Member of the Finance Group, Alfred P. Sloan School of Management (since 2014); Head (2006–2008) and Associate Head (1994–2000 and 2001–2006), Economics Department of MIT. | 88 | Director, National Bureau of Economic Research; Member, Congressional Budget Office Panel of Economic Advisers. | |||||
| Maceo K. Sloan c/o Corporate Secretary 730 Third Avenue New York, NY 10017-3206 YOB: 1949 | Trustee | Four-year term. Trustee since 1991. | Chairman, President and Chief Executive Officer, Sloan Financial Group, Inc. (1991–2018); Chairman and Chief Executive Officer (1991–2016), Chief Investment Officer (1991–2013) and Chief Compliance Officer (2015–2016), NCM Capital Management Group, Inc.; Chairman, Chief Executive Officer (2003–2016), Chief Investment Officer (2003–2013) and Chief Compliance Officer (2015–2016), NCM Capital Advisers, Inc.; and Chairman, President and Principal Executive Officer, NCM Capital Investment Trust (2007–2012). | 88 | Director, TheraTrue Inc. |
| College Retirement Equities Fund ■ 2021 Annual Report | 123 |
Trustees and officers (unaudited)
| College Retirement Equities Fund ■ February 15, 2022 | continued |
Officers
| Name, address and year of birth (“YOB”) | Position(s) held with CREF | Term of office and length of time served | Principal occupation(s) during past 5 years | |||
| Richard S. Biegen TIAA 730 Third Avenue New York, NY 10017-3206 YOB: 1962 | Chief Compliance Officer | One-year term. Chief Compliance Officer since 2008. | Senior Managing Director, TIAA. Chief Compliance Officer of the College Retirement Equities Fund (“CREF”), TIAA Separate Account VA-1, TIAA-CREF Funds and TIAA-CREF Life Funds (collectively, the “TIAA-CREF Fund Complex”). | |||
| Derek B. Dorn TIAA 730 Third Avenue New York, NY 10017-3206 YOB: 1976 | Senior Managing Director and Corporate Secretary | One-year term. Senior Managing Director and Corporate Secretary since 2020. | Senior Managing Director and Corporate Secretary of Teachers Insurance and Annuity Association of America (“TIAA”) and the TIAA-CREF Fund Complex. Formerly, Managing Director, Special Assistant to the CEO, and Managing Director, Regulatory Affairs, TIAA. Prior to joining TIAA, Mr. Dorn served as a partner at Davis & Harman LLP and an adjunct professor of Law at Georgetown University Law Center. | |||
| John L. Douglas TIAA 730 Third Avenue New York, NY 10017-3206 YOB: 1950 | Executive Vice President and Chief Legal, Risk and Compliance Officer | One-year term. Executive Vice President since 2021. | Senior Executive Vice President, Chief Legal, Risk and Compliance Officer of TIAA, Executive Vice President, Chief Legal, Risk and Compliance Officer of the TIAA-CREF Fund Complex. Formerly, Senior Executive Vice President, Senior Advisor to the CEO, and Senior Executive Vice President, Chief Advocacy & Oversight Officer, TIAA. Prior to joining TIAA, Mr. Douglas was a Partner at Davis Polk & Wardwell LLP. | |||
| W. Dave Dowrich TIAA 730 Third Avenue New York, NY 10017-3206 YOB: 1967 | Executive Vice President | One-year term. Executive Vice President since 2022. | Senior Executive Vice President and Chief Financial Officer of TIAA. Executive Vice President of the TIAA-CREF Fund Complex. Prior to joining TIAA, Mr. Dowrich served as Chief Financial Officer, International Businesses at Prudential Financial, Inc. |
| 124 | 2021 Annual Report ■ College Retirement Equities Fund |
| Jose Minaya TIAA 730 Third Avenue New York, NY 10017-3206 YOB: 1971 | Executive Vice President | One-year term. Executive Vice President since 2018. | Chief Executive Officer, Nuveen. Executive Vice President of the TIAA-CREF Fund Complex. Formerly, Executive Vice President, President and Chief investment Officer, Nuveen; Executive Vice President, Chief Investment Officer and President, Nuveen Global Investments; and Senior Managing Director, President, Global Investments, TIAA. | |||
| Colbert Narcisse TIAA 730 Third Avenue New York, NY 10017-3206 YOB: 1965 | President and Chief Executive Officer | One-year term. President and Chief Executive Officer since 2022. | Senior Executive Vice President, Chief Product and Business Development Officer of TIAA. President and Chief Executive Officer of CREF and TIAA Separate Account VA-1. Formerly, Executive Vice President and Head of Advisory and Corporate Solutions, TIAA. Prior to joining TIAA, Mr. Narcisse served as Managing Director and Head of International Wealth Management and Head of Traditional and Alternative Investment Products at Morgan Stanley. | |||
| David G. Nason TIAA 730 Third Avenue New York, NY 10017-3206 YOB: 1970 | Executive Vice President | One-year term. Executive Vice President since 2020. | Senior Executive Vice President, Chief Operating Officer of TIAA. Executive Vice President of the TIAA-CREF Fund Complex. Formerly, Senior Executive Vice President, Chief Legal, Risk and Compliance Officer of TIAA. Executive Vice President, Chief Risk and Compliance Officer, TIAA. Prior to joining TIAA, Mr. Nason served as President and CEO of GE Energy Financial Services. | |||
| Micky Onvural TIAA 730 Third Avenue New York, NY 10017-3206 YOB: 1974 | Executive Vice President | One-year term. Executive Vice President since 2022. | Senior Executive Vice President, Chief Marketing and Communications Officer of TIAA. Executive Vice President of CREF and TIAA Separate Account VA-1. Prior to joining TIAA, Ms. Onvural served as Chief Executive Officer for Bonobos. | |||
| E. Scott Wickerham TIAA 730 Third Avenue New York, NY 10017-3206 YOB: 1973 | Principal Financial Officer, Principal Accounting Officer and Treasurer | One-year term. Principal Financial Officer since 2020, Principal Accounting Officer since 2020 and Treasurer since 2017. | Senior Managing Director, Head, Publics Investment Finance, Nuveen. Principal Financial Officer, Principal Accounting Officer and Treasurer of the TIAA-CREF Fund Complex; and Vice President and Controller of the Nuveen Funds. Formerly, Managing Director, Head, TC Fund Administration, Nuveen. |
| College Retirement Equities Fund ■ 2021 Annual Report | 125 |
Trustees and officers (unaudited)
| College Retirement Equities Fund ■ February 15, 2022 | concluded |
Officers—concluded
| Name, address and year of birth (“YOB”) | Position(s) held with CREF | Term of office and length of time served | Principal occupation(s) during past 5 years | |||
| Sean N. Woodroffe TIAA 730 Third Avenue New York, NY 10017-3206 YOB: 1963 | Executive Vice President | One-year term. Executive Vice President since 2018. | Senior Executive Vice President, Chief People Officer of TIAA, and Executive Vice President of the TIAA-CREF Fund Complex. Prior to joining TIAA, Mr. Woodroffe served as Chief People Officer at National Life Group. |
Please note that the Funds’ Statement of Additional Information (SAI) includes additional information about the Funds’ trustees and is available, without charge, through our website, TIAA.org, or by calling 877-518-9161.
| 126 | 2021 Annual Report ■ College Retirement Equities Fund |
Additional information about index providers (unaudited)
Russell indexes
Source: London Stock Exchange Group plc and its group undertakings (collectively, the “LSE Group”). © LSE Group 2022. FTSE Russell is a trading name of certain of the LSE Group companies. “FTSE®,” “Russell®” and “FTSE Russell®“ are trademarks of the relevant LSE Group companies and are used by any other LSE Group company under license. All rights in the FTSE Russell indexes or data vest in the relevant LSE Group company which owns the index or the data. Neither LSE Group nor its licensors accept any liability for any errors or omissions in the indexes or data and no party may rely on any indexes or data contained in this communication. No further distribution of data from the LSE Group is permitted without the relevant LSE Group company’s express written consent. The LSE Group does not promote, sponsor or endorse the content of this communication.
Bloomberg indexes
Source: Bloomberg Index Services Limited. BLOOMBERG® is a trademark and service mark of Bloomberg Finance L.P. and its affiliates (collectively “Bloomberg”). Bloomberg or Bloomberg’s licensors own all proprietary rights in the Bloomberg Indices. Bloomberg neither approves nor endorses this material, nor guarantees the accuracy or completeness of any information herein, nor makes any warranty, express or implied, as to the results to be obtained therefrom and, to the maximum extent allowed by law, neither shall have any liability or responsibility for injury or damages arising in connection therewith.
During the reporting period, “Bloomberg Barclays” fixed-income indices were rebranded as “Bloomberg” indices. This change affects all Bloomberg fixed-income indices.
MSCI indexes
Source: MSCI. The MSCI information may only be used for your internal use, may not be reproduced or redisseminated in any form and may not be used as a basis for or a component of any financial instruments or products or indices. None of the MSCI information is intended to constitute investment advice or a recommendation to make (or refrain from making) any kind of investment decision and may not be relied on as such. Historical data and analysis should not be taken as an indication or guarantee of any future performance analysis, forecast or prediction. The MSCI information is provided on an “as is” basis and the user of this information assumes the entire risk of any use made of this information. MSCI, each of its affiliates and each other person involved in or related to compiling, computing or creating any MSCI information (collectively, the “MSCI Parties”) expressly disclaims all warranties (including, without limitation, any warranties of originality, accuracy, completeness, timeliness, non-infringement, merchantability and fitness for a particular purpose) with respect to this information. Without limiting any of the foregoing, in no event shall any MSCI Party have any liability for any direct, indirect, special, incidental, punitive, consequential (including, without limitation, lost profits) or any other damages. (www.msci.com)
| College Retirement Equities Fund ■ 2021 Annual Report | 127 |
| Additional information about index providers (unaudited) | concluded |
Morningstar indexes
© 2022 Morningstar. All Rights Reserved. The information contained herein: (1) is proprietary to Morningstar and/or its content providers; (2) may not be copied or distributed; and (3) is not warranted to be accurate, complete or timely. Neither Morningstar nor its content providers are responsible for any damages or losses arising from any use of this information.
| 128 | 2021 Annual Report ■ College Retirement Equities Fund |
[This page intentionally left blank.]
[This page intentionally left blank.]
TIAA website
Account performance, personal account information and transactions, product descriptions, and information about investment choices and income options
TIAA.org
Automated telephone service
Check account performance and accumulation balances, change allocations, transfer funds and verify credited premiums
800-842-2252
24 hours a day, 7 days a week
National Contact Center
Retirement saving and planning, income options and payments, beneficiary services and tax reporting
800-842-2252
8 a.m. to 10 p.m. (ET), Monday–Friday
For the hearing- or speech-impaired
800-842-2755
8 a.m. to 10 p.m. (ET), Monday–Friday
TIAA Brokerage Services
Self-directed brokerage accounts for investing in stocks, bonds and mutual funds
800-927-3059
8 a.m. to 7 p.m. (ET), Monday–Friday
Advisor services
888-842-0318
8 a.m. to 7:30 p.m. (ET), Monday–Friday
You should carefully consider the investment objectives, risks, charges and expenses of any account before investing. For a prospectus that contains this and other information, please visit TIAA.org, or call 877-518-9161. Please read the prospectus carefully before investing. Investment, insurance and annuity products are not Federal Deposit Insurance Corporation (FDIC) insured, are not bank guaranteed, are not bank deposits, are not insured by any federal government agency, are not a condition to any banking service or activity, and may lose value. TIAA Brokerage Services is a division of TIAA-CREF Individual & Institutional Services, LLC. TIAA-CREF Individual & Institutional Services, LLC, member FINRA, distributes securities products. CREF variable annuities are issued by College Retirement Equities Fund, New York, NY. Each of the foregoing is solely responsible for its own financial condition and contractual obligations.
This material is for informational or educational purposes only and does not constitute fiduciary investment advice under ERISA, a securities recommendation under all securities laws, or an insurance product recommendation under state insurance laws or regulations. This material does not take into account any specific objectives or circumstances of any particular investor, or suggest any specific course of action. Investment decisions should be made based on the investor’s own objectives and circumstances.
©2022 Teachers Insurance and Annuity Association of America—College Retirement Equities Fund, 730 Third Avenue, New York, NY 10017-3206
 | 730 Third Avenue New York, NY 10017-3206 | PRESORTED STANDARD U.S. POSTAGE PAID TIAA |

 | Printed on paper containing recycled fiber |
 | We’re fond of paper...in its original form. Switch to eDelivery at TIAA.org/eDelivery |
| 1960361 | A10922 (2/22) |
| 730 Third Avenue New York, NY 10017-3206 |
| Printed on paper containing recycled fiber |
| 1960361 | A10922 (2/22) |
| 730 Third Avenue New York, NY 10017-3206 |
| 1960361 | A10922 (2/22) |
Item 2. Code of Conduct.
2(a) The Board of Trustees of the College Retirement Equities Fund (the “Registrant”) has adopted a code of conduct for senior financial officers, including the Registrant’s principal executive officer, principal financial officer, principal accounting officer, or controller, and persons performing similar functions, in conformity with rules promulgated under the Sarbanes-Oxley Act of 2002.
2(b) No response required.
2(c) During the reporting period, there were no amendments to the code of conduct.
2(d) During the reporting period, there were no implicit or explicit waivers granted by the Registrant from any provision of the code of conduct.
2(e) Not applicable.
2(f) A copy of the current code of conduct is filed as an exhibit to this Form N-CSR.
Item 3. Audit Committee Financial Expert.
3(a)(1) The Registrant’s Board of Trustees has determined that the Registrant has at least one audit committee financial expert serving on its Audit and Compliance Committee.
3(a)(2) Maceo K. Sloan is the Registrant’s audit committee financial expert and is “independent” for purposes of Item 3 of Form N-CSR.
Item 4. Principal Accountant Fees and Services.
PricewaterhouseCoopers LLP (“PwC”) performs independent audits of the Registrant’s financial statements. To maintain auditor independence and avoid the appearance of conflicts of interest, the Registrant, as a policy, does not engage PwC for management advisory or consulting services.
The aggregate fees billed by PwC as disclosed below for the fiscal years ended December 31, 2021 and December 31, 2020 may not align with the figures reported and filed with the Securities and Exchange Commission in Form N-CEN or Form N-CSR for each period, respectively, (SEC File No. 811-04415) because the fees disclosed in this statement reflect fees updated after the date of that Form N-CEN or Form N-CSR for the relevant periods.
4(a) Audit Fees.
For the fiscal years ended December 31, 2021 and December 31, 2020, PwC’s aggregate fees for the audit of the Registrant’s annual financial statements were $798,496 and $798,486, respectively.
4(b) Audit Related Fees.
For the fiscal years ended December 31, 2021 and December 31, 2020, PwC’s aggregate fees for services related to the performance of the audit of the Registrant’s annual financial statements were $0 and $0, respectively.
For the fiscal years ended December 31, 2021 and December 31, 2020, the Audit-Related Fees billed by PwC to Teachers Advisors, LLC (“Advisors”) or to any entity controlling, controlled by or under common control with Advisors that provides ongoing services to the Registrant (collectively, “Fund Service Providers”) were $0 and $0, respectively.
4(c) Tax Fees.
For the fiscal years ended December 31, 2021 and December 31, 2020, PwC’s aggregate fees for tax services billed to the Registrant were $289,647 and $141,330, respectively.
For the fiscal years ended December 31, 2021 and December 31, 2020, the Tax Fees billed by PwC to the Fund Service Providers were $0 and $0, respectively.
4(d) All Other Fees.
For the fiscal years ended December 31, 2021 and December 31, 2020, PwC’s aggregate fees for all other services billed to the Registrant were $0 and $18,582, respectively.
For the fiscal years ended December 31, 2021 and December 31, 2020, PwC’s aggregate fees for all other services billed to the Fund Service Providers were $0 and $0, respectively.
4(e)(1) Preapproval Policy.
The Registrant’s audit and compliance committee (“Audit Committee”) has adopted a Preapproval Policy for External Audit Firm Services (the “Policy”). The Policy describes the types of services that may be provided by the independent auditor to the Registrant and certain of its affiliates without impairing the auditor’s independence. Under the Policy, the Audit Committee is required to preapprove all services to be performed by the Registrant’s independent auditor in order to ensure that such services do not impair the auditor’s independence.
The Policy requires the Audit Committee to: (i) appoint the independent auditor to perform the financial statements audit for the Registrant and certain of its affiliates, including approving the terms of the engagement, and (ii) preapprove the audit, audit-related, tax and other services to be provided by the independent auditor to the Registrant and certain of its affiliates and the fees to be charged for provision of such services from year to year.
4(e)(2) Services provided pursuant to paragraph (c)(7)(i)(C) of Rule 2-01 of Regulation S-X (the “de minimis exception”):
Audit-Related Fees:
There were no amounts that were approved by the Audit Committee pursuant to the de minimis exception for the fiscal years ended December 31, 2021 and December 31, 2020 on behalf of the Registrant.
There were no amounts that were approved by the Audit Committee pursuant to the de minimis exception for the fiscal years ended December 31, 2021 and December 31, 2020 on behalf of the Fund Service Providers that relate directly to the operations and financial reporting of the Registrant.
Tax Fees:
There were no amounts that were approved by the Audit Committee pursuant to the de minimis exception for the fiscal years ended December 31, 2021 and December 31, 2020 on behalf of the Registrant.
There were no amounts that were approved by the Audit Committee pursuant to the de minimis exception for the fiscal years ended December 31, 2021 and December 31, 2020 on behalf of the Fund Service Providers that relate directly to the operations and financial reporting of the Registrant.
All Other Fees:
There were no amounts that were approved by the Audit Committee pursuant to the de minimis exception for the fiscal years ended December 31, 2021 and December 31, 2020 on behalf of the Registrant.
There were no amounts that were approved by the Audit Committee pursuant to the de minimis exception for the fiscal years ended December 31, 2021 and December 31, 2020 on behalf of the Fund Service Providers that relate directly to the operations and financial reporting of the Registrant.
4(f) The percentage of hours expended by PwC’s engagement to audit the Registrant’s financial statements for the most recent fiscal year attributable to work performed by persons other than PwC’s full-time, permanent employees was less than 50%.
4(g) Non-Audit Fees for Related Entities.
For the fiscal years ended December 31, 2021 and December 31, 2020, aggregate non-audit fees billed to the Registrant and to its Fund Service Providers by PwC were $1,058,073 and $1,364,000, respectively.
4(h) The Registrant’s Audit Committee has considered whether the non-audit services that were rendered by PwC to the Registrant’s Fund Service Providers that were not pre-approved pursuant to paragraph (c)(7)(ii) of Rule 2-01 of Regulation S-X are compatible with maintaining PwC’s independence.
Item 5. Audit Committee of Listed Registrants.
Not Applicable.
Item 6. Schedule of Investments.
COLLEGE RETIREMENT EQUITIES FUND - Stock Account
COLLEGE RETIREMENT EQUITIES FUND
STOCK ACCOUNT
SCHEDULE OF INVESTMENTS
December 31, 2021
| MATURITY | VALUE | |||||||||||||||||
| PRINCIPAL | ISSUER | RATE | DATE | (000) | ||||||||||||||
| BONDS - 0.0% | ||||||||||||||||||
| CORPORATE BONDS - 0.0% | ||||||||||||||||||
| FOOD, BEVERAGE & TOBACCO - 0.0% | ||||||||||||||||||
| INR | 4,636,868 | Britannia Industries Ltd | 5.500 | % | 06/03/24 | $ | 62 | |||||||||||
| TOTAL FOOD, BEVERAGE & TOBACCO | 62 | |||||||||||||||||
| TOTAL CORPORATE BONDS | 62 | |||||||||||||||||
| (Cost $64) | ||||||||||||||||||
| GOVERNMENT BONDS - 0.0% | ||||||||||||||||||
| U.S. TREASURY SECURITIES - 0.0% | ||||||||||||||||||
| $ | 300,000 | United States Treasury Note | 1.750 | 05/15/22 | 302 | |||||||||||||
| TOTAL U.S. TREASURY SECURITIES | 302 | |||||||||||||||||
| TOTAL GOVERNMENT BONDS | 302 | |||||||||||||||||
| (Cost $300) | ||||||||||||||||||
| TOTAL BONDS | 364 | |||||||||||||||||
| (Cost $364) | ||||||||||||||||||
| SHARES | COMPANY | |||||||||||||||||
| COMMON STOCKS - 98.9% | ||||||||||||||||||
| AUTOMOBILES & COMPONENTS - 2.6% | ||||||||||||||||||
| 21,879 | e | AB Dynamics plc | 524 | |||||||||||||||
| 58,000 | Actron Technology Corp | 510 | ||||||||||||||||
| 2,153,353 | * | Adient plc | 103,103 | |||||||||||||||
| 212,453 | Aisin Seiki Co Ltd | 8,151 | ||||||||||||||||
| 482,732 | * | American Axle & Manufacturing Holdings, Inc | 4,504 | |||||||||||||||
| 381,614 | Apollo Tyres Ltd | 1,121 | ||||||||||||||||
| 906,445 | * | Aptiv plc | 149,518 | |||||||||||||||
| 92,062 | ARB Corp Ltd | 3,518 | ||||||||||||||||
| 4,714 | * | Arcimoto, Inc | 37 | |||||||||||||||
| 63,900 | Asahi India Glass Ltd | 414 | ||||||||||||||||
| 81,480 | *,g | Aston Martin Lagonda Global Holdings plc | 1,502 | |||||||||||||||
| 66,282,807 | Astra International Tbk PT | 26,530 | ||||||||||||||||
| 29,555 | Autel Intelligent Technology Corp Ltd | 368 | ||||||||||||||||
| 3,451 | *,e | Autoneum Holding AG. | 641 | |||||||||||||||
| 80,309 | Bajaj Holdings and Investment Ltd | 3,500 | ||||||||||||||||
| 1 |
COLLEGE RETIREMENT EQUITIES FUND - Stock Account
| SHARES | COMPANY | VALUE (000) | ||||||||
| 100,414 | Balkrishna Industries Ltd | $ | 3,130 | |||||||
| 384,579 | Bayerische Motoren Werke AG. | 38,474 | ||||||||
| 2,941 | Bayerische Motoren Werke AG. (Preference) | 244 | ||||||||
| 270,854 | Bharat Forge Ltd | 2,532 | ||||||||
| 84,595 | BorgWarner, Inc | 3,813 | ||||||||
| 405,757 | Bridgestone Corp | 17,420 | ||||||||
| 1,248,497 | * | Brilliance China Automotive Holdings Ltd | 601 | |||||||
| 123,643 | BYD Co Ltd | 5,194 | ||||||||
| 923,362 | BYD Co Ltd (H shares) | 31,232 | ||||||||
| 47,341 | *,e | Canoo, Inc | 365 | |||||||
| 24,655 | Ceat Ltd | 402 | ||||||||
| 12,739 | Changzhou Xingyu Automotive Lighting Systems Co Ltd | 408 | ||||||||
| 1,960,885 | Cheng Shin Rubber Industry Co Ltd | 2,555 | ||||||||
| 235,791 | China Motor Corp | 540 | ||||||||
| 263,376 | Chongqing Changan Automobile Co Ltd | 628 | ||||||||
| 59,681 | Cie Automotive S.A. | 1,844 | ||||||||
| 71,587 | Cie Plastic Omnium SA | 1,858 | ||||||||
| 1,012,420 | * | Cofide S.p.A. | 542 | |||||||
| 385,899 | * | Continental AG. | 40,545 | |||||||
| 14,616 | * | Cooper-Standard Holding, Inc | 328 | |||||||
| 66,847 | Cub Elecparts, Inc | 455 | ||||||||
| 753,273 | Daimler AG. (Registered) | 57,553 | ||||||||
| 66,160 | Dana Inc | 1,510 | ||||||||
| 476,206 | Denso Corp | 39,464 | ||||||||
| 388,389 | g | Dometic Group AB | 5,098 | |||||||
| 3,120,517 | Dongfeng Motor Group Co Ltd | 2,594 | ||||||||
| 2,775 | * | Dorman Products, Inc | 314 | |||||||
| 1,045,668 | Drb-Hicom BHD | 359 | ||||||||
| 25,500 | Eagle Industry Co Ltd | 245 | ||||||||
| 157,370 | Eicher Motors Ltd | 5,471 | ||||||||
| 120,062 | * | ElringKlinger AG. | 1,504 | |||||||
| 39,002 | g | Endurance Technologies Ltd | 887 | |||||||
| 36,482 | Exedy Corp | 528 | ||||||||
| 420,037 | Exide Industries Ltd | 949 | ||||||||
| 140,953 | e | Faurecia | 6,706 | |||||||
| 153,628 | FAW Jiefang Group Co Ltd | 248 | ||||||||
| 44,700 | FCC Co Ltd | 582 | ||||||||
| 89,654 | Ferrari NV | 23,077 | ||||||||
| 119,138 | *,e | Fisker, Inc | 1,874 | |||||||
| 4,825,565 | Ford Motor Co | 100,227 | ||||||||
| 76,382 | Ford Otomotiv Sanayi AS | 1,375 | ||||||||
| 105,402 | * | Fox Factory Holding Corp | 17,929 | |||||||
| 2 |
COLLEGE RETIREMENT EQUITIES FUND - Stock Account
| SHARES | COMPANY | VALUE (000) | ||||||||
| 183,176 | e | Freni Brembo SpA | $ | 2,606 | ||||||
| 433,201 | Fuji Heavy Industries Ltd | 7,740 | ||||||||
| 132,363 | Fuyao Glass Industry Group Co Ltd | 978 | ||||||||
| 707,762 | g | Fuyao Glass Industry Group Co Ltd (Hong Kong) | 3,660 | |||||||
| 6,930,302 | Geely Automobile Holdings Ltd | 18,932 | ||||||||
| 3,764,012 | * | General Motors Co | 220,684 | |||||||
| 80,166 | Gentex Corp | 2,794 | ||||||||
| 54,024 | * | Gentherm, Inc | 4,695 | |||||||
| 211,509 | *,g | Gestamp Automocion S.A. | 1,067 | |||||||
| 6,232 | * | Global & Yuasa Battery Co Ltd | 397 | |||||||
| 51,000 | Global PMX Co Ltd | 333 | ||||||||
| 488,193 | * | Goodyear Tire & Rubber Co | 10,408 | |||||||
| 3,626,746 | Great Wall Motor Co Ltd | 12,459 | ||||||||
| 146,159 | Great Wall Motor Co Ltd | 1,112 | ||||||||
| 25,600 | G-Tekt Corp | 318 | ||||||||
| 3,515,042 | Guangzhou Automobile Group Co Ltd (Hong Kong) | 3,469 | ||||||||
| 144,012 | GUD Holdings Ltd | 1,191 | ||||||||
| 7,607 | * | Halla Holdings Corp | 293 | |||||||
| 86,053 | * | Hankook Tire Co Ltd | 2,875 | |||||||
| 26,182 | * | Hankook Tire Worldwide Co Ltd | 346 | |||||||
| 211,743 | Hanon Systems | 2,394 | ||||||||
| 146,910 | Harley-Davidson, Inc | 5,537 | ||||||||
| 208,049 | Hero Honda Motors Ltd | 6,866 | ||||||||
| 1,304,186 | Honda Motor Co Ltd | 37,105 | ||||||||
| 1,467,186 | Hota Industrial Manufacturing Co Ltd | 4,831 | ||||||||
| 230,415 | Huayu Automotive Systems Co Ltd | 1,023 | ||||||||
| 564,000 | e | Huazhong In-Vehicle Holdings Co Ltd | 226 | |||||||
| 30,200 | Huizhou Desay Sv Automotive Co Ltd | 671 | ||||||||
| 78,074 | Hyundai Mobis | 16,689 | ||||||||
| 162,515 | Hyundai Motor Co | 28,526 | ||||||||
| 41,522 | Hyundai Motor Co Ltd (2nd Preference) | 3,522 | ||||||||
| 26,121 | Hyundai Motor Co Ltd (Preference) | 2,161 | ||||||||
| 17,905 | * | Hyundai Wia Corp | 1,201 | |||||||
| 32,500 | Ichikoh Industries Ltd | 154 | ||||||||
| 411,551 | Isuzu Motors Ltd | 5,122 | ||||||||
| 493,342 | Johnson Electric Holdings Ltd | 1,046 | ||||||||
| 257,900 | JTEKT Corp | 2,255 | ||||||||
| 24,596 | Kayaba Industry Co Ltd | 690 | ||||||||
| 572,874 | Kenda Rubber Industrial Co Ltd | 643 | ||||||||
| 347,446 | * | Kia Motors Corp | 23,978 | |||||||
| 769,687 | * | Koito Manufacturing Co Ltd | 40,766 | |||||||
| 152,076 | * | Kuang-Chi Technologies Co Ltd | 574 | |||||||
| 3 |
COLLEGE RETIREMENT EQUITIES FUND - Stock Account
| SHARES | COMPANY | VALUE (000) | ||||||||
| 94,417 | * | Kumho Tire Co, Inc | $ | 366 | ||||||
| 2,657 | LCI Industries, Inc | 414 | ||||||||
| 20,428 | Lear Corp | 3,737 | ||||||||
| 640,622 | * | Li Auto, Inc (ADR) | 20,564 | |||||||
| 55,129 | Linamar Corp | 3,266 | ||||||||
| 123,152 | *,e | Lordstown Motors Corp | 425 | |||||||
| 353,009 | Magna International, Inc | 28,563 | ||||||||
| 1,021,870 | Mahindra & Mahindra Ltd | 11,466 | ||||||||
| 122,812 | * | Mahindra CIE Automotive Ltd | 386 | |||||||
| 40,912 | Mahle-Metal Leve S.A. Industria e Comercio | 225 | ||||||||
| 36,178 | * | Mando Corp | 1,925 | |||||||
| 175,471 | Martinrea International, Inc | 1,595 | ||||||||
| 159,813 | Maruti Suzuki India Ltd | 15,911 | ||||||||
| 758,097 | * | Mazda Motor Corp | 5,817 | |||||||
| 12,267 | MGI Coutier | 304 | ||||||||
| 52,100 | * | Mianyang Fulin Precision Co Ltd | 241 | |||||||
| 208,065 | Michelin (C.G.D.E.) (Class B) | 34,078 | ||||||||
| 78,706 | Minda Industries Ltd | 1,293 | ||||||||
| 887,426 | Minth Group Ltd | 3,909 | ||||||||
| 1,364,500 | * | Mitsubishi Motors Corp | 3,802 | |||||||
| 165,793 | * | Modine Manufacturing Co | 1,673 | |||||||
| 1,439,910 | Motherson Sumi Systems Ltd | 4,305 | ||||||||
| 15,227 | * | Motorcar Parts of America, Inc | 260 | |||||||
| 2,193 | MRF Ltd | 2,160 | ||||||||
| 54,638 | Musashi Seimitsu Industry Co Ltd | 911 | ||||||||
| 23,084 | * | Myoung Shin Industrial Co Ltd | 584 | |||||||
| 404,949 | Nan Kang Rubber Tire Co Ltd | 586 | ||||||||
| 2,134,750 | *,g | Nemak SAB de C.V. | 634 | |||||||
| 36,355 | * | Nexen Tire Corp | 208 | |||||||
| 655,000 | Nexteer Automotive Group Ltd | 813 | ||||||||
| 185,800 | NGK Spark Plug Co Ltd | 3,235 | ||||||||
| 234,215 | NHK Spring Co Ltd | 1,992 | ||||||||
| 98,112 | Nifco, Inc | 3,085 | ||||||||
| 124,011 | Ningbo Joyson Electronic Corp | 428 | ||||||||
| 65,778 | Ningbo Tuopu Group Co Ltd | 547 | ||||||||
| 1,567,272 | * | NIO, Inc (ADR) | 49,651 | |||||||
| 63,253 | Nippon Seiki Co Ltd | 639 | ||||||||
| 2,283,043 | * | Nissan Motor Co Ltd | 10,996 | |||||||
| 88,910 | Nissan Shatai Co Ltd | 545 | ||||||||
| 32,527 | *,e | Niu Technologies (ADR) | 524 | |||||||
| 133,188 | NOK Corp | 1,451 | ||||||||
| 160,479 | Nokian Renkaat Oyj | 6,064 | ||||||||
| 4 |
COLLEGE RETIREMENT EQUITIES FUND - Stock Account
| SHARES | COMPANY | VALUE (000) | ||||||||
| 44,700 | Pacific Industrial Co Ltd | $ | 473 | |||||||
| 37,662 | Patrick Industries, Inc | 3,039 | ||||||||
| 265,326 | Piaggio & C S.p.A. | 868 | ||||||||
| 31,694 | Piolax Inc | 485 | ||||||||
| 426,691 | g | Pirelli & C S.p.A | 2,959 | |||||||
| 319,091 | Porsche AG. | 30,126 | ||||||||
| 193,500 | Prinx Chengshan Cayman Holding Ltd | 180 | ||||||||
| 816,830 | Qingling Motors Co Ltd | 166 | ||||||||
| 88,902 | * | QuantumScape Corp | 1,973 | |||||||
| 53,628 | * | Renault S.A. | 1,860 | |||||||
| 256,353 | * | Rivian Automotive, Inc | 26,581 | |||||||
| 8,866 | S&T Daewoo Co Ltd | 350 | ||||||||
| 111,169 | * | SAF-Holland SE | 1,557 | |||||||
| 526,323 | SAIC Motor Corp Ltd | 1,705 | ||||||||
| 217,700 | Sailun Group Co Ltd | 506 | ||||||||
| 511,920 | Sanyang Industry Co Ltd | 500 | ||||||||
| 143,310 | Schaeffler AG. | 1,185 | ||||||||
| 100,905 | Shandong Linglong Tyre Co Ltd | 579 | ||||||||
| 15,300 | Shenzhen Kedali Industry Co Ltd | 385 | ||||||||
| 29,400 | Shoei Co Ltd | 1,159 | ||||||||
| 15,729 | * | SL Corp | 412 | |||||||
| 962,054 | Sri Trang Agro-Industry PCL (Foreign) | 894 | ||||||||
| 18,572 | Standard Motor Products, Inc | 973 | ||||||||
| 86,149 | Stanley Electric Co Ltd | 2,163 | ||||||||
| 569,483 | Stellantis NV | 10,751 | ||||||||
| 147,987 | * | Stoneridge, Inc | 2,921 | |||||||
| 531,940 | Sumitomo Electric Industries Ltd | 6,942 | ||||||||
| 41,417 | Sumitomo Riko Co Ltd | 214 | ||||||||
| 208,100 | Sumitomo Rubber Industries, Inc | 2,123 | ||||||||
| 5,358 | Sundaram-Clayton Ltd | 273 | ||||||||
| 103,161 | Sundram Fasteners Ltd | 1,263 | ||||||||
| 73,065 | Suprajit Engineering Ltd | 422 | ||||||||
| 261,658 | * | Suzuki Motor Corp | 10,090 | |||||||
| 1,958,985 | * | Tata Motors Ltd | 12,628 | |||||||
| 27,500 | Teikoku Piston Ring Co Ltd | 341 | ||||||||
| 225,919 | * | Tenneco, Inc | 2,553 | |||||||
| 1,299,808 | *,n | Tesla, Inc | 1,373,611 | |||||||
| 91,003 | Thor Industries, Inc | 9,443 | ||||||||
| 271,450 | g | TI Fluid Systems plc | 949 | |||||||
| 739,118 | e | Tianneng Power International Ltd | 782 | |||||||
| 138,842 | Tofas Turk Otomobil Fabrik | 794 | ||||||||
| 64,547 | Tokai Rika Co Ltd | 870 | ||||||||
| 5 |
COLLEGE RETIREMENT EQUITIES FUND - Stock Account
| SHARES | COMPANY | VALUE (000) | ||||||||
| 417,699 | Tong Yang Industry Co Ltd | $ | 500 | |||||||
| 36,368 | Topre Corp | 376 | ||||||||
| 385,325 | e | Toyo Tire & Rubber Co Ltd | 6,015 | |||||||
| 83,000 | Toyoda Gosei Co Ltd | 1,805 | ||||||||
| 79,595 | Toyota Boshoku Corp | 1,562 | ||||||||
| 20,610,055 | * | Toyota Motor Corp | 380,927 | |||||||
| 10,511 | Trigano S.A. | 2,040 | ||||||||
| 107,800 | TS Tech Co Ltd | 1,327 | ||||||||
| 105,185 | Tube Investments of India Ltd | 2,474 | ||||||||
| 69,000 | Tung Thih Electronic Co Ltd | 435 | ||||||||
| 81,683 | Tupy S.A. | 292 | ||||||||
| 207,688 | TVS Motor Co Ltd | 1,745 | ||||||||
| 379,700 | UMW Holdings BHD | 271 | ||||||||
| 2,438,694 | Valeo S.A. | 73,542 | ||||||||
| 20,200 | * | Visteon Corp | 2,245 | |||||||
| 59,424 | * | Vitesco Technologies Group AG. | 2,914 | |||||||
| 34,350 | Volkswagen AG. | 10,042 | ||||||||
| 765,360 | Volkswagen AG. (ADR) | 22,349 | ||||||||
| 328,022 | Volkswagen AG. (Preference) | 65,894 | ||||||||
| 21,700 | Weifu High-Technology Group Co Ltd | 73 | ||||||||
| 61,672 | Winnebago Industries, Inc | 4,620 | ||||||||
| 102,716 | *,e | Workhorse Group, Inc | 448 | |||||||
| 1,140,000 | e | Wuling Motors Holdings Ltd | 246 | |||||||
| 32,937 | *,e | XL Fleet Corp | 109 | |||||||
| 77,877 | * | XPEL, Inc | 5,317 | |||||||
| 425,116 | * | XPeng, Inc (ADR) | 21,396 | |||||||
| 1,383,031 | g | Yadea Group Holdings Ltd | 2,695 | |||||||
| 318,765 | Yamaha Motor Co Ltd | 7,656 | ||||||||
| 144,300 | Yokohama Rubber Co Ltd | 2,314 | ||||||||
| 586,860 | Yulon Motor Co Ltd | 887 | ||||||||
| TOTAL AUTOMOBILES & COMPONENTS | 3,578,024 | |||||||||
| BANKS - 6.8% | ||||||||||
| 14,575 | 1st Source Corp | 723 | ||||||||
| 74,203 | 77 Bank Ltd | 861 | ||||||||
| 72,883 | Aareal Bank AG. | 2,378 | ||||||||
| 38,299 | * | Aavas Financiers Ltd | 1,343 | |||||||
| 132,120 | g | ABN AMRO Group NV | 1,942 | |||||||
| 857,364 | Absa Group Ltd | 8,205 | ||||||||
| 3,540,767 | Abu Dhabi Commercial Bank PJSC | 8,215 | ||||||||
| 957,943 | Abu Dhabi Islamic Bank PJSC | 1,789 | ||||||||
| 19,527,383 | Agricultural Bank of China Ltd | 6,718 | ||||||||
| 3,349,862 | Agricultural Bank of China Ltd (Class A) | 1,545 | ||||||||
| 6 |
COLLEGE RETIREMENT EQUITIES FUND - Stock Account
| SHARES | COMPANY | VALUE (000) | ||||||||
| 17,125,984 | * | AIB Group plc | $ | 41,726 | ||||||
| 2,226,187 | Akbank TAS | 1,202 | ||||||||
| 67,618 | Aktia Bank Oyj | 940 | ||||||||
| 1,469,848 | Al Rajhi Bank | 55,431 | ||||||||
| 708,711 | Alinma Bank | 4,515 | ||||||||
| 101,374 | * | Alior Bank S.A. | 1,372 | |||||||
| 17,512 | Allegiance Bancshares, Inc | 739 | ||||||||
| 975,800 | Alliance Financial Group BHD | 669 | ||||||||
| 2,556,080 | * | Alpha Bank AE | 3,132 | |||||||
| 315,270 | *,† | Amagerbanken AS | 0 | |||||||
| 43,533 | Amalgamated Financial Corp | 730 | ||||||||
| 31,311 | Amerant Bancorp Inc | 1,082 | ||||||||
| 9,191 | American National Bankshares, Inc | 346 | ||||||||
| 256,565 | Ameris Bancorp | 12,746 | ||||||||
| 37,698 | Amlak International for Real Estate Finance Co | 212 | ||||||||
| 1,225,834 | * | AMMB Holdings BHD | 933 | |||||||
| 151,900 | Aozora Bank Ltd | 3,322 | ||||||||
| 426,439 | Arab National Bank | 2,597 | ||||||||
| 12,469 | Arrow Financial Corp | 439 | ||||||||
| 132,331 | Associated Banc-Corp | 2,989 | ||||||||
| 18,272 | * | Atlantic Capital Bancshares, Inc | 526 | |||||||
| 66,746 | Atlantic Union Bankshares Corp | 2,489 | ||||||||
| 85,226 | *,g | AU Small Finance Bank Ltd | 1,185 | |||||||
| 3,905,798 | Australia & New Zealand Banking Group Ltd | 78,238 | ||||||||
| 36,244 | Awa Bank Ltd | 684 | ||||||||
| 2,641,717 | * | Axis Bank Ltd | 24,006 | |||||||
| 110,329 | * | Axos Financial, Inc | 6,168 | |||||||
| 233,445 | Banc of California, Inc | 4,580 | ||||||||
| 384,989 | *,e | Banca Monte dei Paschi di Siena S.p.A | 389 | |||||||
| 714,390 | e | Banca Popolare di Sondrio SCARL | 2,999 | |||||||
| 20,687 | Bancfirst Corp | 1,460 | ||||||||
| 97,965 | Banco ABC Brasil S.A. | 278 | ||||||||
| 22,655,385 | Banco Bilbao Vizcaya Argentaria S.A. | 134,369 | ||||||||
| 1,659,942 | e | Banco BPM S.p.A. | 4,970 | |||||||
| 5,169,542 | Banco Bradesco S.A. | 14,985 | ||||||||
| 9,731,427 | Banco Bradesco S.A. (Preference) | 33,737 | ||||||||
| 40,158,748 | *,e | Banco Comercial Portugues S.A. | 6,427 | |||||||
| 30,225,704 | Banco de Chile | 2,361 | ||||||||
| 38,335 | Banco de Credito e Inversiones | 1,120 | ||||||||
| 6,846,258 | * | Banco de Sabadell S.A. | 4,563 | |||||||
| 792,874 | e,g | Banco del Bajio S.A. | 1,425 | |||||||
| 624,701 | Banco do Brasil S.A. | 3,229 | ||||||||
| 7 |
COLLEGE RETIREMENT EQUITIES FUND - Stock Account
| SHARES | COMPANY | VALUE (000) | ||||||||
| 215,920 | Banco do Estado do Rio Grande do Sul | $ | 374 | |||||||
| 16,063,377 | *,† | Banco Espirito Santo S.A. | 183 | |||||||
| 1,448,075 | Banco Inter S.A. | 7,363 | ||||||||
| 2,255,701 | Banco Pan S.A. | 4,297 | ||||||||
| 292,910 | Banco Santander Brasil S.A. | 1,576 | ||||||||
| 43,196,815 | Banco Santander Chile S.A. | 1,736 | ||||||||
| 7,405,622 | Banco Santander S.A. (AQXE) | 24,595 | ||||||||
| 178,803 | BanColombia S.A. | 1,526 | ||||||||
| 525,299 | BanColombia S.A. (Preference) | 4,134 | ||||||||
| 464,680 | g | Bandhan Bank Ltd | 1,575 | |||||||
| 5,775,300 | * | Bank Aladin Syariah Tbk PT | 929 | |||||||
| 249,568 | * | Bank AlBilad | 3,076 | |||||||
| 302,431 | Bank Al-Jazira | 1,551 | ||||||||
| 2,430,800 | Bank BTPN Syariah Tbk PT | 610 | ||||||||
| 65,678,170 | Bank Central Asia Tbk PT | 33,637 | ||||||||
| 6,049 | e | Bank First Corp | 437 | |||||||
| 57,366 | Bank Handlowy w Warszawie S.A. | 840 | ||||||||
| 737,714 | Bank Hapoalim Ltd | 7,593 | ||||||||
| 8,000,000 | * | Bank Jago Tbk PT | 8,973 | |||||||
| 861,824 | Bank Leumi Le-Israel | 9,244 | ||||||||
| 665,441 | * | Bank Millennium S.A. | 1,349 | |||||||
| 19,484,297 | Bank of America Corp | 866,856 | ||||||||
| 957,562 | Bank of Beijing Co Ltd | 667 | ||||||||
| 418,100 | Bank of Changsha Co Ltd | 512 | ||||||||
| 196,520 | Bank of Chengdu Co Ltd | 370 | ||||||||
| 1,886,244 | Bank of China Ltd | 903 | ||||||||
| 92,668,912 | Bank of China Ltd (Hong Kong) | 33,339 | ||||||||
| 1,858,612 | Bank of Communications Co Ltd | 1,345 | ||||||||
| 6,808,319 | Bank of Communications Co Ltd (Hong Kong) | 4,116 | ||||||||
| 1,711,400 | Bank of East Asia Ltd | 2,459 | ||||||||
| 50,178 | Bank of Georgia Group plc | 1,133 | ||||||||
| 292,795 | Bank of Hangzhou Co Ltd | 589 | ||||||||
| 2,962 | Bank of Hawaii Corp | 248 | ||||||||
| 12,114,481 | * | Bank of Ireland Group plc | 68,610 | |||||||
| 685,418 | Bank of Jiangsu Co Ltd | 627 | ||||||||
| 528,493 | Bank of Kaohsiung | 231 | ||||||||
| 75,700 | Bank of Kyoto Ltd | 3,505 | ||||||||
| 31,128 | Bank of Marin Bancorp | 1,159 | ||||||||
| 1,033,750 | Bank of Montreal | 111,298 | ||||||||
| 548,914 | Bank of Nanjing Co Ltd | 772 | ||||||||
| 284,474 | Bank of Ningbo Co Ltd | 1,708 | ||||||||
| 1,586,971 | Bank of Nova Scotia | 112,347 | ||||||||
| 8 |
COLLEGE RETIREMENT EQUITIES FUND - Stock Account
| SHARES | COMPANY | VALUE (000) | ||||||||
| 114,567 | Bank of NT Butterfield & Son Ltd | $ | 4,366 | |||||||
| 1,377,275 | Bank of Queensland Ltd (ASE) | 8,111 | ||||||||
| 721,099 | Bank of Shanghai Co Ltd | 807 | ||||||||
| 1,291,090 | Bank of the Philippine Islands | 2,333 | ||||||||
| 8,785 | Bank OZK | 409 | ||||||||
| 137,586 | Bank Pekao S.A. | 4,153 | ||||||||
| 2,783,400 | Bank Pembangunan Daerah Jawa Barat Dan Banten Tbk PT | 261 | ||||||||
| 3,599,600 | Bank Pembangunan Daerah Jawa Timur Tbk PT | 189 | ||||||||
| 120,199,068 | Bank Rakyat Indonesia | 34,608 | ||||||||
| 11,224,400 | * | Bank Tabungan Negara Persero Tbk PT | 1,360 | |||||||
| 25,101 | Bank Zachodni WBK S.A. | 2,156 | ||||||||
| 820,076 | Bankinter S.A. | 4,178 | ||||||||
| 189,325 | BankUnited | 8,010 | ||||||||
| 240,360 | Banner Corp | 14,583 | ||||||||
| 43,978 | Banque Cantonale Vaudoise | 3,411 | ||||||||
| 714,925 | Banque Saudi Fransi | 8,982 | ||||||||
| 12,873 | Bar Harbor Bankshares | 372 | ||||||||
| 66,515,199 | Barclays plc | 169,432 | ||||||||
| 1,106,165 | g | BAWAG Group AG. | 67,842 | |||||||
| 3,980,576 | BDO Unibank, Inc | 9,420 | ||||||||
| 900,724 | Bendigo Bank Ltd | 5,967 | ||||||||
| 105,407 | Berkshire Hills Bancorp, Inc | 2,997 | ||||||||
| 693,600 | BIMB Holdings BHD | 499 | ||||||||
| 25,474 | * | Blue Foundry Bancorp | 373 | |||||||
| 15,787 | Blue Ridge Bankshares, Inc | 283 | ||||||||
| 1,792,425 | BNP Paribas S.A. | 123,930 | ||||||||
| 4,328,669 | BOC Hong Kong Holdings Ltd | 14,196 | ||||||||
| 20,730 | BOK Financial Corp | 2,187 | ||||||||
| 708,004 | * | Boubyan Bank KSCP | 1,850 | |||||||
| 3,130,851 | e | BPER Banca | 6,471 | |||||||
| 11,106 | * | BRE Bank S.A. | 1,187 | |||||||
| 15,528 | * | Bridgewater Bancshares, Inc | 275 | |||||||
| 70,353 | Brookline Bancorp, Inc | 1,139 | ||||||||
| 18,231 | Bryn Mawr Bank Corp | 821 | ||||||||
| 303,717 | * | BS Financial Group, Inc | 2,143 | |||||||
| 4,794,523 | Bumiputra-Commerce Holdings BHD | 6,272 | ||||||||
| 1,065,956 | Burgan Bank SAK | 884 | ||||||||
| 16,972 | Business First Bancshares, Inc | 480 | ||||||||
| 152,248 | Byline Bancorp, Inc | 4,164 | ||||||||
| 294,673 | Cadence BanCorp | 8,778 | ||||||||
| 2,901,880 | CaixaBank S.A. | 7,927 | ||||||||
| 5,921 | Cambridge Bancorp | 554 | ||||||||
| 9 |
COLLEGE RETIREMENT EQUITIES FUND - Stock Account
| SHARES | COMPANY | VALUE (000) | ||||||||
| 12,899 | e | Camden National Corp | $ | 621 | ||||||
| 66,016 | Can Fin Homes Ltd | 489 | ||||||||
| 627,196 | Canadian Imperial Bank of Commerce | 73,110 | ||||||||
| 268,476 | Canadian Western Bank | 7,704 | ||||||||
| 399,160 | * | Canara Bank | 1,068 | |||||||
| 7,429 | Capital Bancorp, Inc | 195 | ||||||||
| 13,102 | Capital City Bank Group, Inc | 346 | ||||||||
| 216,228 | Capitec Bank Holdings Ltd | 27,679 | ||||||||
| 295,261 | Capitol Federal Financial | 3,345 | ||||||||
| 29,361 | Capstar Financial Holdings, Inc | 617 | ||||||||
| 22,248 | * | Carter Bankshares, Inc | 342 | |||||||
| 137,517 | Cathay General Bancorp | 5,912 | ||||||||
| 15,528 | CBTX, Inc | 450 | ||||||||
| 258,966 | Central Pacific Financial Corp | 7,295 | ||||||||
| 2,560,615 | Chang Hwa Commercial Bank | 1,573 | ||||||||
| 524,616 | Chiba Bank Ltd | 3,001 | ||||||||
| 2,209,293 | g | China Bohai Bank Co Ltd | 850 | |||||||
| 7,112,490 | China Citic Bank | 3,085 | ||||||||
| 731,107 | China Construction Bank Corp | 672 | ||||||||
| 127,549,546 | China Construction Bank Corp (Hong Kong) | 88,385 | ||||||||
| 1,929,704 | China Everbright Bank Co Ltd | 1,005 | ||||||||
| 2,578,845 | China Everbright Bank Co Ltd (Hong Kong) | 913 | ||||||||
| 4,645,481 | China Merchants Bank Co Ltd | 36,140 | ||||||||
| 5,098,231 | China Merchants Bank Co Ltd (Class A) | 38,974 | ||||||||
| 1,702,248 | China Minsheng Banking Corp Ltd | 1,042 | ||||||||
| 4,321,991 | e | China Minsheng Banking Corp Ltd (Hong Kong) | 1,653 | |||||||
| 746,829 | China Zheshang Bank Co Ltd | 410 | ||||||||
| 34,221,388 | Chinatrust Financial Holding Co | 32,059 | ||||||||
| 1,306,900 | Chongqing Rural Commercial Bank Co Ltd | 790 | ||||||||
| 178,200 | Chugoku Bank Ltd | 1,395 | ||||||||
| 173,204 | CIT Group, Inc | 8,892 | ||||||||
| 3,769,493 | Citigroup, Inc | 227,640 | ||||||||
| 12,147 | Citizens & Northern Corp | 317 | ||||||||
| 941,069 | Citizens Financial Group, Inc | 44,466 | ||||||||
| 13,317 | City Holding Co | 1,089 | ||||||||
| 407,617 | City Union Bank Ltd | 737 | ||||||||
| 13,256 | Civista Bancshares, Inc | 323 | ||||||||
| 183,251 | Close Brothers Group plc | 3,495 | ||||||||
| 13,810 | CNB Financial Corp | 366 | ||||||||
| 2,161 | * | Coastal Financial Corp | 109 | |||||||
| 297,509 | * | Collector AB | 1,248 | |||||||
| 196,406 | Columbia Banking System, Inc | 6,426 | ||||||||
| 10 |
COLLEGE RETIREMENT EQUITIES FUND - Stock Account
| SHARES | COMPANY | VALUE (000) | ||||||||
| 22,993 | * | Columbia Financial, Inc | $ | 480 | ||||||
| 65,806 | Comerica, Inc | 5,725 | ||||||||
| 8,037 | e | Commerce Bancshares, Inc | 552 | |||||||
| 1,404,196 | Commercial Bank of Qatar QSC | 2,602 | ||||||||
| 1,213,763 | * | Commercial International Bank | 4,085 | |||||||
| 4,874,698 | * | Commerzbank AG. | 36,880 | |||||||
| 2,638,845 | Commonwealth Bank of Australia | 193,985 | ||||||||
| 95,552 | Community Bank System, Inc | 7,117 | ||||||||
| 13,433 | Community Trust Bancorp, Inc | 586 | ||||||||
| 981,160 | Concordia Financial Group Ltd | 3,563 | ||||||||
| 109,665 | ConnectOne Bancorp, Inc | 3,587 | ||||||||
| 350,542 | Credicorp Ltd (NY) | 42,791 | ||||||||
| 3,358,714 | Credit Agricole S.A. | 47,886 | ||||||||
| 92,707 | Credito Emiliano S.p.A. | 612 | ||||||||
| 25,211 | * | CrossFirst Bankshares, Inc | 394 | |||||||
| 4,031 | e | Cullen/Frost Bankers, Inc | 508 | |||||||
| 24,473 | * | Customers Bancorp, Inc | 1,600 | |||||||
| 272,941 | CVB Financial Corp | 5,844 | ||||||||
| 5,646,074 | *,† | Cyprus Popular Bank Public Co Ltd | 64 | |||||||
| 692,827 | Dah Sing Banking Group Ltd | 592 | ||||||||
| �� | 237,908 | Dah Sing Financial Holdings Ltd | 721 | |||||||
| 45,986 | Daishi Hokuetsu Financial Group, Inc | 1,015 | ||||||||
| 194,893 | Danske Bank AS | 3,365 | ||||||||
| 2,096,568 | DBS Group Holdings Ltd | 50,777 | ||||||||
| 162,260 | g | Deutsche Pfandbriefbank AG. | 1,944 | |||||||
| 186,263 | DGB Financial Group Co Ltd | 1,468 | ||||||||
| 61,735 | Dime Community Bancshares, Inc | 2,171 | ||||||||
| 431,522 | DNB Bank ASA | 9,871 | ||||||||
| 1,714,537 | Doha Bank QSC | 1,507 | ||||||||
| 2,051,924 | Dubai Islamic Bank PJSC | 2,999 | ||||||||
| 14,076,525 | E.Sun Financial Holding Co Ltd | 14,267 | ||||||||
| 27,667 | Eagle Bancorp, Inc | 1,614 | ||||||||
| 137,441 | e | East West Bancorp, Inc | 10,814 | |||||||
| 204,746 | Eastern Bankshares, Inc | 4,130 | ||||||||
| 1,872,586 | Emirates NBD Bank PJSC | 6,903 | ||||||||
| 12,245 | Enact Holdings, Inc | 253 | ||||||||
| 8,332 | Enterprise Bancorp, Inc | 374 | ||||||||
| 30,930 | Enterprise Financial Services Corp | 1,456 | ||||||||
| 28,595 | Equitable Group, Inc | 1,558 | ||||||||
| 247,445 | *,g | Equitas Small Finance Bank Ltd | 197 | |||||||
| 12,534 | Equity Bancshares, Inc | 425 | ||||||||
| 382,636 | Erste Bank der Oesterreichischen Sparkassen AG. | 17,938 | ||||||||
| 11 |
COLLEGE RETIREMENT EQUITIES FUND - Stock Account
| SHARES | COMPANY | VALUE (000) | ||||||||
| 180,237 | Essent Group Ltd | $ | 8,206 | |||||||
| 2,881,709 | * | Eurobank Ergasias S.A. | 2,919 | |||||||
| 2,169,620 | Far Eastern International Bank | 842 | ||||||||
| 24,549 | Farmers National Banc Corp | 455 | ||||||||
| 26,413 | FB Financial Corp | 1,157 | ||||||||
| 8,374 | Federal Agricultural Mortgage Corp (FAMC) | 1,038 | ||||||||
| 1,924,213 | Federal Bank Ltd | 2,140 | ||||||||
| 20,615 | FIBI Holdings Ltd | 941 | ||||||||
| 3,957 | e | Fidelity D&D Bancorp, Inc | 233 | |||||||
| 5,311,963 | Fifth Third Bancorp | 231,336 | ||||||||
| 28,149 | *,e | Finance Of America Cos, Inc | 112 | |||||||
| 13,614 | Financial Institutions, Inc | 433 | ||||||||
| 1,041,946 | FinecoBank Banca Fineco S.p.A | 18,247 | ||||||||
| 689,699 | First Bancorp | 9,504 | ||||||||
| 26,187 | First Bancorp | 1,197 | ||||||||
| 7,610 | First Bancorp, Inc | 239 | ||||||||
| 18,002 | First Bancshares, Inc | 695 | ||||||||
| 12,106 | e | First Bank | 176 | |||||||
| 43,493 | First Busey Corp | 1,180 | ||||||||
| 466 | e | First Citizens Bancshares, Inc (Class A) | 387 | |||||||
| 81,724 | First Commonwealth Financial Corp | 1,315 | ||||||||
| 16,095 | First Community Bancshares, Inc | 538 | ||||||||
| 153,303 | First Financial Bancorp | 3,738 | ||||||||
| 73,978 | First Financial Bankshares, Inc | 3,761 | ||||||||
| 10,548 | First Financial Corp | 478 | ||||||||
| 7,478,161 | First Financial Holding Co Ltd | 6,615 | ||||||||
| 68,072 | First Foundation, Inc | 1,692 | ||||||||
| 8,017 | First Hawaiian, Inc | 219 | ||||||||
| 39,114 | First Horizon National Corp | 639 | ||||||||
| 73,259 | First International Bank Of Israel Ltd | 3,045 | ||||||||
| 7,835 | First Internet Bancorp | 369 | ||||||||
| 35,789 | e | First Interstate Bancsystem, Inc | 1,456 | |||||||
| 132,594 | First Merchants Corp | 5,554 | ||||||||
| 13,583 | First Mid-Illinois Bancshares, Inc | 581 | ||||||||
| 99,113 | First Midwest Bancorp, Inc | 2,030 | ||||||||
| 21,647 | e | First National Financial Corp | 711 | |||||||
| 21,141 | First of Long Island Corp | 456 | ||||||||
| 303,273 | First Republic Bank | 62,629 | ||||||||
| 10,139 | Five Star Bancorp | 304 | ||||||||
| 68,568 | Flagstar Bancorp, Inc | 3,287 | ||||||||
| 25,914 | Flushing Financial Corp | 630 | ||||||||
| 21,822 | FNB Corp | 265 | ||||||||
| 12 |
COLLEGE RETIREMENT EQUITIES FUND - Stock Account
| SHARES | COMPANY | VALUE (000) | ||||||||
| 7,252 | FS Bancorp, Inc | $ | 244 | |||||||
| 5,200 | *,† | FS Finans A.S. | 0 | |||||||
| 220,900 | Fukuoka Financial Group, Inc | 3,783 | ||||||||
| 138,289 | Fulton Financial Corp | 2,351 | ||||||||
| 599,701 | Genworth Mortgage Insurance Australia Ltd | 1,013 | ||||||||
| 22,508 | German American Bancorp, Inc | 877 | ||||||||
| 187,451 | Glacier Bancorp, Inc | 10,628 | ||||||||
| 9,341 | Great Southern Bancorp, Inc | 553 | ||||||||
| 128,487 | Great Western Bancorp, Inc | 4,363 | ||||||||
| 3,086,761 | Grupo Financiero Banorte S.A. de C.V. | 20,053 | ||||||||
| 1,491,777 | *,e | Grupo Financiero Inbursa S.A. | 1,786 | |||||||
| 12,372 | Guaranty Bancshares, Inc | 465 | ||||||||
| 1,869,225 | Gulf Bank KSCP | 1,724 | ||||||||
| 431,500 | Gunma Bank Ltd | 1,319 | ||||||||
| 435,000 | Hachijuni Bank Ltd | 1,486 | ||||||||
| 355,568 | Hana Financial Group, Inc | 12,562 | ||||||||
| 147,165 | Hancock Whitney Corp | 7,361 | ||||||||
| 903,057 | Hang Seng Bank Ltd | 16,536 | ||||||||
| 137,513 | Hanmi Financial Corp | 3,256 | ||||||||
| 46,215 | HarborOne Northeast Bancorp, Inc | 686 | ||||||||
| 9,907 | HBT Financial, Inc | 186 | ||||||||
| 642,698 | HDFC Bank Ltd | 12,724 | ||||||||
| 181,159 | HDFC Bank Ltd (ADR) | 11,788 | ||||||||
| 96,159 | Heartland Financial USA, Inc | 4,867 | ||||||||
| 53,754 | Heritage Commerce Corp | 642 | ||||||||
| 47,465 | Heritage Financial Corp | 1,160 | ||||||||
| 99,453 | Hilltop Holdings, Inc | 3,495 | ||||||||
| 1,238 | Hingham Institution for Savings | 520 | ||||||||
| 341,102 | Hirogin Holdings, Inc | 2,042 | ||||||||
| 21,200 | * | Hokkoku Financial Holdings, Inc | 470 | |||||||
| 139,960 | Hokuhoku Financial Group, Inc | 1,112 | ||||||||
| 6,163 | Home Bancorp, Inc | 256 | ||||||||
| 811,730 | Home Bancshares, Inc | 19,766 | ||||||||
| 64,542 | * | Home Capital Group, Inc | 1,993 | |||||||
| 28,125 | *,g | Home First Finance Co India Ltd | 293 | |||||||
| 3,010 | e | Home Point Capital, Inc | 14 | |||||||
| 20,004 | HomeStreet, Inc | 1,040 | ||||||||
| 14,116 | HomeTrust Bancshares, Inc | 437 | ||||||||
| 462,512 | Hong Leong Bank BHD | 2,066 | ||||||||
| 125,470 | Hong Leong Credit BHD | 522 | ||||||||
| 310,178 | Hope Bancorp, Inc | 4,563 | ||||||||
| 38,000 | Horizon Bancorp | 792 | ||||||||
| 13 |
COLLEGE RETIREMENT EQUITIES FUND - Stock Account
| SHARES | COMPANY | VALUE (000) | ||||||||
| 1,762,497 | Housing Development Finance Corp | $ | 60,981 | |||||||
| 10,532 | * | Howard Bancorp, Inc | 229 | |||||||
| 16,104,926 | HSBC Holdings plc | 97,262 | ||||||||
| 6,027,004 | Hua Nan Financial Holdings Co Ltd | 4,613 | ||||||||
| 750,786 | Huaxia Bank Co Ltd | 660 | ||||||||
| 4,635,701 | Huntington Bancshares, Inc | 71,482 | ||||||||
| 265,074 | Hyakugo Bank Ltd | 792 | ||||||||
| 7,712,933 | ICICI Bank Ltd | 76,674 | ||||||||
| 1,494,861 | ICICI Bank Ltd (ADR) | 29,583 | ||||||||
| 3,597,540 | * | IDFC Bank Ltd | 2,333 | |||||||
| 118,901 | IIFL Finance Ltd | 446 | ||||||||
| 70,459 | * | Illimity Bank S.p.A | 1,055 | |||||||
| 55,989 | Independent Bank Corp (MA) | 4,565 | ||||||||
| 19,427 | Independent Bank Corp (MI) | 464 | ||||||||
| 65,105 | Independent Bank Group, Inc | 4,697 | ||||||||
| 267,332 | Indiabulls Housing Finance Ltd | 781 | ||||||||
| 2,973,939 | Industrial & Commercial Bank of China Ltd | 2,160 | ||||||||
| 67,567,914 | Industrial & Commercial Bank of China Ltd (Hong Kong) | 38,114 | ||||||||
| 906,705 | Industrial Bank Co Ltd | 2,708 | ||||||||
| 537,385 | Industrial Bank of Korea | 4,649 | ||||||||
| 23,400,985 | ING Groep NV | 325,344 | ||||||||
| 62,004 | e | Intercorp Financial Services, Inc | 1,636 | |||||||
| 128,025 | International Bancshares Corp | 5,427 | ||||||||
| 15,581,258 | Intesa Sanpaolo S.p.A. | 40,245 | ||||||||
| 3,389,821 | Investimentos Itau S.A. - PR | 5,422 | ||||||||
| 135,725 | Investors Bancorp, Inc | 2,056 | ||||||||
| 4,132,826 | iShares Core MSCI EAFE ETF | 308,474 | ||||||||
| 1,316,906 | Israel Discount Bank Ltd | 8,842 | ||||||||
| 1,102,401,072 | * | Itau CorpBanca Chile SA | 2,129 | |||||||
| 7,599,450 | Itau Unibanco Holding S.A. | 28,640 | ||||||||
| 291,154 | Iyo Bank Ltd | 1,457 | ||||||||
| 392,577 | Japan Post Bank Co Ltd | 3,599 | ||||||||
| 235,905 | * | JB Financial Group Co Ltd | 1,654 | |||||||
| 5,281,841 | JPMorgan Chase & Co | 836,380 | ||||||||
| 33,240 | * | Juroku Financial Group, Inc | 627 | |||||||
| 67,504 | * | Jyske Bank | 3,472 | |||||||
| 690,474 | *,e | KakaoBank Corp | 34,270 | |||||||
| 440,241 | Karur Vysya Bank Ltd | 269 | ||||||||
| 990,656 | KB Financial Group, Inc | 45,812 | ||||||||
| 64,541 | KBC Ancora | 3,087 | ||||||||
| 714,165 | KBC Groep NV | 61,362 | ||||||||
| 46,639 | Kearny Financial Corp | 618 | ||||||||
| 14 |
COLLEGE RETIREMENT EQUITIES FUND - Stock Account
| SHARES | COMPANY | VALUE (000) | ||||||||
| 92,248 | Keiyo Bank Ltd | $ | 373 | |||||||
| 60,943 | Keycorp | 1,410 | ||||||||
| 299,932 | Kiatnakin Bank PCL (Foreign) | 535 | ||||||||
| 1,615,000 | King’s Town Bank | 2,364 | ||||||||
| 66,219 | Kiyo Bank Ltd | 812 | ||||||||
| 56,988 | Komercni Banka AS | 2,437 | ||||||||
| 403,316 | Kotak Mahindra Bank Ltd | 9,708 | ||||||||
| 4,991,196 | Krung Thai Bank PCL (Foreign) | 1,968 | ||||||||
| 3,430,723 | Kuwait Finance House | 9,438 | ||||||||
| 644,825 | * | Kuwait International Bank KSCP | 465 | |||||||
| 960,597 | Kuwait Projects Co Holding KSCP | 451 | ||||||||
| 429,200 | Kyushu Financial Group, Inc | 1,559 | ||||||||
| 121,439 | Lakeland Bancorp, Inc | 2,306 | ||||||||
| 19,890 | e | Lakeland Financial Corp | 1,594 | |||||||
| 52,252 | e | Laurentian Bank of Canada | 1,659 | |||||||
| 328,572 | LIC Housing Finance Ltd | 1,627 | ||||||||
| 15,564 | Liechtensteinische Landesbank AG. | 897 | ||||||||
| 3,419 | Live Oak Bancshares, Inc | 298 | ||||||||
| 98,093,848 | Lloyds TSB Group plc | 63,701 | ||||||||
| 14,995 | Luther Burbank Corp | 211 | ||||||||
| 106,412 | M&T Bank Corp | 16,343 | ||||||||
| 23,529 | Macatawa Bank Corp | 208 | ||||||||
| 3,482,893 | Malayan Banking BHD | 6,937 | ||||||||
| 2,285,742 | Malaysia Building Society | 294 | ||||||||
| 2,835,171 | Masraf Al Rayan | 3,612 | ||||||||
| 1,300,700 | Mebuki Financial Group Inc | 2,677 | ||||||||
| 1,178,968 | e | Mediobanca S.p.A. | 13,535 | |||||||
| 13,029,076 | Mega Financial Holding Co Ltd | 16,733 | ||||||||
| 11,980 | Mercantile Bank Corp | 420 | ||||||||
| 7,941 | Merchants Bancorp | 376 | ||||||||
| 115,922 | Meta Financial Group, Inc | 6,916 | ||||||||
| 13,169 | Metrocity Bankshares, Inc | 363 | ||||||||
| 1,336,884 | Metropolitan Bank & Trust | 1,460 | ||||||||
| 38,437 | * | Metropolitan Bank Holding Corp | 4,095 | |||||||
| 312,960 | MGIC Investment Corp | 4,513 | ||||||||
| 12,466 | Mid Penn Bancorp, Inc | 396 | ||||||||
| 19,835 | Midland States Bancorp, Inc | 492 | ||||||||
| 11,216 | MidWestOne Financial Group, Inc | 363 | ||||||||
| 17,109,286 | Mitsubishi UFJ Financial Group, Inc | 93,113 | ||||||||
| 132,651 | Mizrahi Tefahot Bank Ltd | 5,108 | ||||||||
| 2,731,358 | Mizuho Financial Group, Inc | 34,692 | ||||||||
| 275,138 | g | Moneta Money Bank AS | 1,181 | |||||||
| 15 |
COLLEGE RETIREMENT EQUITIES FUND - Stock Account
| SHARES | COMPANY | VALUE (000) | ||||||||
| 54,266 | * | Mr Cooper Group, Inc | $ | 2,258 | ||||||
| 29,768 | Musashino Bank Ltd | 465 | ||||||||
| 8,642 | MVB Financial Corp | 359 | ||||||||
| 28,549 | Nanto Bank Ltd | 482 | ||||||||
| 3,829,949 | National Australia Bank Ltd | 80,418 | ||||||||
| 196,455 | National Bank Holdings Corp | 8,632 | ||||||||
| 5,277,220 | National Bank of Abu Dhabi PJSC | 27,068 | ||||||||
| 482,224 | e | National Bank of Canada | 36,765 | |||||||
| 598,903 | * | National Bank of Greece S.A. | 1,998 | |||||||
| 8,356,874 | National Bank of Kuwait SAKP | 27,553 | ||||||||
| 3,315,903 | National Commercial Bank | 56,878 | ||||||||
| 18,094,091 | Natwest Group plc | 55,410 | ||||||||
| 53,007 | NBT Bancorp, Inc | 2,042 | ||||||||
| 332,287 | Nedbank Group Ltd | 3,650 | ||||||||
| 33,022 | e | New York Community Bancorp, Inc | 403 | |||||||
| 8,454 | * | Nicolet Bankshares, Inc | 725 | |||||||
| 155,464 | Nishi-Nippon Financial Holdings, Inc | 1,004 | ||||||||
| 189,558 | * | NMI Holdings, Inc | 4,142 | |||||||
| 5,496,326 | Nordea Bank Abp | 67,047 | ||||||||
| 9,810,662 | Nordea Bank Abp | 120,201 | ||||||||
| 294,397 | North Pacific Bank Ltd | 640 | ||||||||
| 39,467 | Northfield Bancorp, Inc | 638 | ||||||||
| 8,743 | Northrim BanCorp, Inc | 380 | ||||||||
| 107,250 | Northwest Bancshares, Inc | 1,519 | ||||||||
| 219,289 | Nova Ljubljanska Banka dd (GDR) | 3,747 | ||||||||
| 1,133,812 | O-Bank Co Ltd | 327 | ||||||||
| 110,917 | OceanFirst Financial Corp | 2,462 | ||||||||
| 29,345 | * | Ocwen Financial Corp | 1,173 | |||||||
| 313,724 | OFG Bancorp | 8,332 | ||||||||
| 39,407 | Ogaki Kyoritsu Bank Ltd | 662 | ||||||||
| 29,500 | * | Okinawa Financial Group, Inc | 567 | |||||||
| 403,861 | Old National Bancorp | 7,318 | ||||||||
| 65,181 | Old Second Bancorp, Inc | 821 | ||||||||
| 30,261 | Origin Bancorp, Inc | 1,299 | ||||||||
| 8,088 | Orrstown Financial Services, Inc | 204 | ||||||||
| 1,180,586 | OSB Group plc | 8,876 | ||||||||
| 561,168 | * | OTP Bank | 28,615 | |||||||
| 4,296,371 | Oversea-Chinese Banking Corp | 36,363 | ||||||||
| 150,530 | Pacific Premier Bancorp, Inc | 6,026 | ||||||||
| 371,438 | PacWest Bancorp | 16,778 | ||||||||
| 306,353 | Paragon Group of Cos plc | 2,349 | ||||||||
| 12,396 | Park National Corp | 1,702 | ||||||||
| 16 |
COLLEGE RETIREMENT EQUITIES FUND - Stock Account
| SHARES | COMPANY | VALUE (000) | ||||||||
| 19,765 | PCSB Financial Corp | $ | 376 | |||||||
| 16,416 | Peapack Gladstone Financial Corp | 581 | ||||||||
| 29,014 | PennyMac Financial Services, Inc | 2,025 | ||||||||
| 21,950 | Peoples Bancorp, Inc | 698 | ||||||||
| 6,274 | Peoples Financial Services Corp | 331 | ||||||||
| 37,941 | People’s United Financial, Inc | 676 | ||||||||
| 223,171 | * | Pepper Money Ltd | 350 | |||||||
| 1,741,049 | * | Permanent TSB Group Holdings plc | 3,199 | |||||||
| 1,378,027 | Ping An Bank Co Ltd | 3,563 | ||||||||
| 133,687 | Pinnacle Financial Partners, Inc | 12,767 | ||||||||
| 9,826 | * | Pioneer Bancorp, Inc | 111 | |||||||
| 681,140 | * | Piraeus Financial Holdings S.A. | 999 | |||||||
| 63,764 | *,g | PNB Housing Finance Ltd | 423 | |||||||
| 555,438 | PNC Financial Services Group, Inc | 111,376 | ||||||||
| 83,742 | Popular, Inc | 6,870 | ||||||||
| 1,248,937 | Postal Savings Bank of China Co Ltd | 1,000 | ||||||||
| 10,914,972 | g | Postal Savings Bank of China Co Ltd | 7,665 | |||||||
| 1,088,907 | * | Powszechna Kasa Oszczednosci Bank Polski S.A. | 12,078 | |||||||
| 184,810 | Preferred Bank | 13,268 | ||||||||
| 32,333 | Premier Financial Corp | 999 | ||||||||
| 48,472 | Primis Financial Corp | 729 | ||||||||
| 68,000 | e | Prosperity Bancshares, Inc | 4,916 | |||||||
| 14,279 | Provident Bancorp Inc | 266 | ||||||||
| 66,395 | Provident Financial Services, Inc | 1,608 | ||||||||
| 13,558,885 | PT Bank Mandiri Persero Tbk | 6,695 | ||||||||
| 5,347,953 | PT Bank Negara Indonesia | 2,528 | ||||||||
| 17,115,505 | Public Bank BHD | 17,082 | ||||||||
| 458,874 | Qatar International Islamic Bank QSC | 1,160 | ||||||||
| 780,166 | Qatar Islamic Bank SAQ | 3,927 | ||||||||
| 3,269,453 | Qatar National Bank | 18,126 | ||||||||
| 14,106 | QCR Holdings, Inc | 790 | ||||||||
| 164,441 | Qingdao Rural Commercial Bank Corp | 100 | ||||||||
| 156,238 | Radian Group, Inc | 3,301 | ||||||||
| 52,964 | Raiffeisen International Bank Holding AG. | 1,556 | ||||||||
| 11,822 | RBB Bancorp | 310 | ||||||||
| 6,531,479 | *,g | RBL Bank Ltd | 11,124 | |||||||
| 4,325 | Red River Bancshares Inc | 231 | ||||||||
| 254,477 | e | Regional SAB de C.V. | 1,320 | |||||||
| 62,854 | Regions Financial Corp | 1,370 | ||||||||
| 12,407 | Reliant Bancorp Inc | 440 | ||||||||
| 63,632 | Renasant Corp | 2,415 | ||||||||
| 7,396 | Republic Bancorp, Inc (Class A) | 376 | ||||||||
| 17 |
COLLEGE RETIREMENT EQUITIES FUND - Stock Account
| SHARES | COMPANY | VALUE (000) | ||||||||
| 42,086 | * | Republic First Bancorp, Inc | $ | 157 | ||||||
| 2,161,000 | Resona Holdings, Inc | 8,398 | ||||||||
| 1,303,957 | RHB Capital BHD | 1,680 | ||||||||
| 33,531 | Ringkjoebing Landbobank A.S. | 4,507 | ||||||||
| 1,757,391 | Riyad Bank | 12,685 | ||||||||
| 132,842 | e | Rocket Cos, Inc | 1,860 | |||||||
| 1,946,611 | Royal Bank of Canada | 206,595 | ||||||||
| 34,583 | S&T Bancorp, Inc | 1,090 | ||||||||
| 39,868 | Sandy Spring Bancorp, Inc | 1,917 | ||||||||
| 160,864 | San-In Godo Bank Ltd | 905 | ||||||||
| 978,372 | Saudi British Bank | 8,581 | ||||||||
| 184,113 | g | Sbanken ASA | 1,959 | |||||||
| 4,899,100 | Sberbank of Russia (ADR) | 77,161 | ||||||||
| 63,938 | Seacoast Banking Corp of Florida | 2,263 | ||||||||
| 497,210 | Security Bank Corp | 1,160 | ||||||||
| 11,888 | ServisFirst Bancshares, Inc | 1,010 | ||||||||
| 756,200 | Seven Bank Ltd | 1,563 | ||||||||
| 2,552,978 | Shanghai Commercial & Savings Bank Ltd | 4,355 | ||||||||
| 1,404,334 | Shanghai Pudong Development Bank Co Ltd | 1,880 | ||||||||
| 57,400 | Shiga Bank Ltd | 1,032 | ||||||||
| 519,203 | Shinhan Financial Group Co Ltd | 16,043 | ||||||||
| 91,900 | * | Shinsei Bank Ltd | 1,495 | |||||||
| 381,747 | e | Shizuoka Bank Ltd | 2,725 | |||||||
| 999,761 | Siam Commercial Bank PCL (Foreign) | 3,795 | ||||||||
| 12,097 | Sierra Bancorp | 328 | ||||||||
| 56,897 | Signature Bank | 18,404 | ||||||||
| 23,838 | * | Silvergate Capital Corp | 3,533 | |||||||
| 99,230 | Simmons First National Corp (Class A) | 2,935 | ||||||||
| 7,182,617 | SinoPac Financial Holdings Co Ltd | 4,189 | ||||||||
| 998,414 | Skandinaviska Enskilda Banken AB (Class A) | 13,862 | ||||||||
| 11,032 | SmartFinancial, Inc | 302 | ||||||||
| 229,297 | Societe Generale | 7,881 | ||||||||
| 21,099 | South Plains Financial Inc | 587 | ||||||||
| 61,257 | South State Corp | 4,907 | ||||||||
| 4,936 | * | Southern First Bancshares, Inc | 308 | |||||||
| 6,272 | Southern Missouri Bancorp, Inc | 327 | ||||||||
| 27,310 | Southside Bancshares, Inc | 1,142 | ||||||||
| 110,095 | Spar Nord Bank AS | 1,409 | ||||||||
| 55,770 | Sparebank Oestlandet | 922 | ||||||||
| 218,107 | SpareBank SR-Bank ASA | 3,294 | ||||||||
| 157,650 | Sparebanken Midt-Norge | 2,661 | ||||||||
| 173,000 | Sparebanken Nord-Norge | 2,212 | ||||||||
| 18 |
COLLEGE RETIREMENT EQUITIES FUND - Stock Account
| SHARES | COMPANY | VALUE (000) | ||||||||
| 11,246 | Spirit of Texas Bancshares, Inc | $ | 324 | |||||||
| 3,642 | St Galler Kantonalbank | 1,739 | ||||||||
| 1,521,955 | Standard Bank Group Ltd | 13,371 | ||||||||
| 6,654,397 | Standard Chartered plc | 40,464 | ||||||||
| 3,917,245 | State Bank of India | 24,171 | ||||||||
| 12,180 | e | Sterling Bancorp | 314 | |||||||
| 16,055 | Stock Yards Bancorp, Inc | 1,026 | ||||||||
| 2,834,628 | Sumitomo Mitsui Financial Group, Inc | 96,795 | ||||||||
| 365,963 | Sumitomo Mitsui Trust Holdings, Inc | 12,237 | ||||||||
| 9,376 | Summit Financial Group, Inc | 257 | ||||||||
| 247,864 | Suruga Bank Ltd | 1,095 | ||||||||
| 34,907 | * | SVB Financial Group | 23,675 | |||||||
| 407,162 | Svenska Handelsbanken AB | 4,401 | ||||||||
| 423,400 | Swedbank AB (A Shares) | 8,509 | ||||||||
| 107,760 | Sydbank AS | 3,406 | ||||||||
| 10,292 | e | Synovus Financial Corp | 493 | |||||||
| 3,429,326 | Taichung Commercial Bank | 1,505 | ||||||||
| 7,331,924 | Taishin Financial Holdings Co Ltd | 5,016 | ||||||||
| 6,545,810 | Taiwan Business Bank | 2,340 | ||||||||
| 6,772,844 | Taiwan Cooperative Financial Holding | 6,223 | ||||||||
| 52,611 | TBC Bank Group plc | 1,175 | ||||||||
| 495,275 | TCS Group Holding plc (ADR) | 41,762 | ||||||||
| 73,311 | * | Texas Capital Bancshares, Inc | 4,417 | |||||||
| 34,362 | Texcell-NetCom Co Ltd | 239 | ||||||||
| 3,570 | TFS Financial Corp | 64 | ||||||||
| 454,631 | Thanachart Capital PCL | 513 | ||||||||
| 46,137 | * | The Bancorp, Inc | 1,168 | |||||||
| 2,663 | * | Third Coast Bancshares, Inc | 69 | |||||||
| 142,346 | Timbercreek Financial Corp | 1,081 | ||||||||
| 211,700 | Tisco Bank PCL | 607 | ||||||||
| 158,543 | Toho Bank Ltd | 292 | ||||||||
| 154,564 | Tomony Holdings, Inc | 426 | ||||||||
| 12,555 | Tompkins Financial Corp | 1,049 | ||||||||
| 2,478,925 | Toronto-Dominion Bank | 190,052 | ||||||||
| 57,966 | Towne Bank | 1,831 | ||||||||
| 71,286 | Trico Bancshares | 3,062 | ||||||||
| 92,018 | * | Tristate Capital Holdings, Inc | 2,784 | |||||||
| 24,965 | * | Triumph Bancorp, Inc | 2,973 | |||||||
| 1,221,570 | Truist Financial Corp | 71,523 | ||||||||
| 17,393 | TrustCo Bank Corp NY | 579 | ||||||||
| 53,557 | Trustmark Corp | 1,738 | ||||||||
| 1,678,487 | Turkiye Garanti Bankasi AS | 1,428 | ||||||||
| 19 |
COLLEGE RETIREMENT EQUITIES FUND - Stock Account
| SHARES | COMPANY | VALUE (000) | ||||||||
| 654,971 | * | Turkiye Halk Bankasi AS | $ | 223 | ||||||
| 1,031,569 | Turkiye Is Bankasi (Series C) | 559 | ||||||||
| 891,439 | * | Turkiye Vakiflar Bankasi Tao | 247 | |||||||
| 39,975 | UMB Financial Corp | 4,242 | ||||||||
| 15,701 | Umpqua Holdings Corp | 302 | ||||||||
| 1,698,049 | g | Unicaja Banco S.A. | 1,671 | |||||||
| 879,298 | UniCredit S.p.A. | 13,516 | ||||||||
| 2,650,669 | * | Union Bank Of Taiwan | 1,301 | |||||||
| 110,099 | United Bankshares, Inc | 3,994 | ||||||||
| 244,145 | United Community Banks, Inc | 8,775 | ||||||||
| 1,389,027 | United Overseas Bank Ltd | 27,741 | ||||||||
| 71,527 | Univest Financial Corp | 2,140 | ||||||||
| 4,263,624 | US Bancorp | 239,488 | ||||||||
| 90,668 | e | UWM Holdings Corp | 537 | |||||||
| 19,392 | Valiant Holding | 1,939 | ||||||||
| 358,165 | Valley National Bancorp | 4,925 | ||||||||
| 264,765 | Van Lanschot Kempen NV | 6,632 | ||||||||
| 8,800 | * | Velocity Financial, Inc | 121 | |||||||
| 343,281 | Veritex Holdings, Inc | 13,656 | ||||||||
| 1,577,680 | * | Virgin Money UK plc | 3,827 | |||||||
| 516,950 | VTB Bank PJSC (GDR) Equiduct | 652 | ||||||||
| 959,999 | * | VTB Bank PJSC (GDR) Tradegate | 1,210 | |||||||
| 23,753 | Walker & Dunlop, Inc | 3,584 | ||||||||
| 1,324,671 | * | Warba Bank KSCP | 1,199 | |||||||
| 132,315 | Washington Federal, Inc | 4,417 | ||||||||
| 15,603 | Washington Trust Bancorp, Inc | 880 | ||||||||
| 50,650 | Waterstone Financial, Inc | 1,107 | ||||||||
| 6,309 | Webster Financial Corp | 352 | ||||||||
| 13,713,738 | Wells Fargo & Co | 657,985 | ||||||||
| 54,652 | WesBanco, Inc | 1,912 | ||||||||
| 12,656 | West Bancorporation, Inc | 393 | ||||||||
| 61,719 | Westamerica Bancorporation | 3,563 | ||||||||
| 8,648 | Western Alliance Bancorp | 931 | ||||||||
| 4,272,077 | Westpac Banking Corp | 66,275 | ||||||||
| 165,275 | Wintrust Financial Corp | 15,010 | ||||||||
| 367,153 | Woori Financial Group, Inc | 3,915 | ||||||||
| 100,037 | WSFS Financial Corp | 5,014 | ||||||||
| 442,299 | Yamaguchi Financial Group, Inc | 2,585 | ||||||||
| 3,313,489 | Yapi ve Kredi Bankasi | 847 | ||||||||
| 8,092,568 | * | Yes Bank Ltd | 1,488 | |||||||
| 14,212 | Zions Bancorporation | 898 | ||||||||
| TOTAL BANKS | 9,491,770 | |||||||||
| 20 |
COLLEGE RETIREMENT EQUITIES FUND - Stock Account
| SHARES | COMPANY | VALUE (000) | ||||||||
| CAPITAL GOODS - 7.2% | ||||||||||
| 320,649 | 3M Co | $ | 56,957 | |||||||
| 3,052 | * | 3M India Ltd | 1,039 | |||||||
| 129,058 | A.O. Smith Corp | 11,080 | ||||||||
| 120,984 | Aalberts Industries NV | 8,022 | ||||||||
| 2,081,752 | Aamal Co | 620 | ||||||||
| 4,470 | Aaon, Inc | 355 | ||||||||
| 29,636 | * | AAR Corp | 1,157 | |||||||
| 488,085 | ABB Ltd | 18,602 | ||||||||
| 8,665 | ABB Power Products & Systems India Ltd | 294 | ||||||||
| 2,233,069 | Aboitiz Equity Ventures, Inc | 2,384 | ||||||||
| 406,270 | AcBel Polytech, Inc | 536 | ||||||||
| 28,507 | Ackermans & Van Haaren | 5,469 | ||||||||
| 67,289 | ACS Actividades de Construccion y Servicios S.A. | 1,794 | ||||||||
| 59,771 | Acuity Brands, Inc | 12,655 | ||||||||
| 317,126 | Adani Enterprises Ltd | 7,268 | ||||||||
| 315,914 | AddTech AB | 7,514 | ||||||||
| 24,200 | Advan Co Ltd | 204 | ||||||||
| 85,554 | Advanced Drainage Systems, Inc | 11,646 | ||||||||
| 33,000 | Advanced Energy Solution Holding Co Ltd | 2,176 | ||||||||
| 2,370 | *,e | Advent Technologies Holdings, Inc | 17 | |||||||
| 50,527 | AECC Aero-Engine Control Co Ltd | 240 | ||||||||
| 118,752 | AECC Aviation Power Co Ltd | 1,182 | ||||||||
| 215,575 | * | Aecom Technology Corp | 16,675 | |||||||
| 72,579 | e | Aecon Group, Inc | 969 | |||||||
| 162,232 | * | AerCap Holdings NV | 10,613 | |||||||
| 241,900 | * | Aeris Industria E Comercio De Equipamentos Para Geracao De Energia S.A. | 284 | |||||||
| 47,453 | Aerojet Rocketdyne Holdings, Inc | 2,219 | ||||||||
| 9,068 | * | Aerovironment, Inc | 562 | |||||||
| 5,701 | * | AerSale Corp | 101 | |||||||
| 63,316 | AFG Arbonia-Forster Hldg | 1,428 | ||||||||
| 22,596 | e | AG Growth International Inc | 566 | |||||||
| 43,933 | AGCO Corp | 5,097 | ||||||||
| 32,732 | *,e | AgEagle Aerial Systems, Inc | 51 | |||||||
| 43,887 | AIA Engineering Ltd | 1,103 | ||||||||
| 63,452 | Aica Kogyo Co Ltd | 1,837 | ||||||||
| 37,400 | Aichi Corp | 263 | ||||||||
| 60,241 | Aida Engineering Ltd | 560 | ||||||||
| 101,680 | Air Lease Corp | 4,497 | ||||||||
| 1,362,482 | * | Airbus SE | 174,321 | |||||||
| 35,728 | * | Airbus SE (ADR) | 1,140 | |||||||
| 152,226 | Airtac International Group | 5,590 | ||||||||
| 21 |
COLLEGE RETIREMENT EQUITIES FUND - Stock Account
| SHARES | COMPANY | VALUE (000) | ||||||||
| 1,946 | Alamo Group, Inc | $ | 286 | |||||||
| 21,937 | Albany International Corp (Class A) | 1,940 | ||||||||
| 87,279 | Alfa Laval AB | 3,506 | ||||||||
| 3,322,000 | Alfa S.A. de C.V. (Class A) | 2,437 | ||||||||
| 25,160 | *,g | Alfen Beheer BV | 2,530 | |||||||
| 37,378 | g | Alimak Group AB | 473 | |||||||
| 247,921 | Allegion plc | 32,835 | ||||||||
| 3,107,500 | Alliance Global Group, Inc | 719 | ||||||||
| 2,252 | Allied Motion Technologies, Inc | 82 | ||||||||
| 106,621 | Allison Transmission Holdings, Inc | 3,876 | ||||||||
| 299,615 | e | Alstom RGPT | 10,639 | |||||||
| 14,776 | * | Alta Equipment Group, Inc | 216 | |||||||
| 719,399 | Altra Industrial Motion Corp | 37,099 | ||||||||
| 795,200 | Amada Co Ltd | 7,874 | ||||||||
| 102,726 | Amara Raja Batteries Ltd | 878 | ||||||||
| 2,624 | * | Ameresco, Inc | 214 | |||||||
| 25,695 | * | American Superconductor Corp | 280 | |||||||
| 14,796 | * | American Woodmark Corp | 965 | |||||||
| 14,810 | Ametek, Inc | 2,178 | ||||||||
| 399,901 | Andritz AG. | 20,568 | ||||||||
| 257,500 | * | API Group Corp | 6,636 | |||||||
| 22,014 | Apogee Enterprises, Inc | 1,060 | ||||||||
| 245,656 | Applied Industrial Technologies, Inc | 25,229 | ||||||||
| 3,510 | Arad Investment & Industrial Development Ltd | 520 | ||||||||
| 169,540 | Arcadis NV | 8,168 | ||||||||
| 42,036 | Arcosa, Inc | 2,215 | ||||||||
| 13,078 | Argan, Inc | 506 | ||||||||
| 108,400 | Armac Locacao Logistica E Servicos S.A. | 505 | ||||||||
| 47,949 | Armstrong World Industries, Inc | 5,568 | ||||||||
| 383,454 | * | Array Technologies, Inc | 6,016 | |||||||
| 177,039 | Asahi Glass Co Ltd | 8,458 | ||||||||
| 698,153 | Aselsan Elektronik Sanayi Ve Ticaret AS | 1,102 | ||||||||
| 1,597,298 | Ashok Leyland Ltd | 2,620 | ||||||||
| 1,501,085 | Ashtead Group plc | 121,009 | ||||||||
| 79,807 | Ashtrom Group Ltd | 2,161 | ||||||||
| 1,008,515 | Assa Abloy AB | 30,741 | ||||||||
| 31,812 | Astec Industries, Inc | 2,204 | ||||||||
| 37,791 | Astra Industrial Group | 400 | ||||||||
| 105,458 | Astral Polytechnik Ltd | 3,223 | ||||||||
| 23,544 | * | Astronics Corp | 283 | |||||||
| 241,714 | * | Atkore International Group, Inc | 26,876 | |||||||
| 254,998 | Atlas Copco AB (A Shares) | 17,621 | ||||||||
| 22 |
COLLEGE RETIREMENT EQUITIES FUND - Stock Account
| SHARES | COMPANY | VALUE (000) | ||||||||
| 181,693 | Atlas Copco AB (B Shares) | $ | 10,673 | |||||||
| 88,759 | *,e | ATS Automation Tooling Systems, Inc | 3,525 | |||||||
| 382,817 | Austal Ltd | 543 | ||||||||
| 169,831 | AVIC Electromechanical Systems Co Ltd | 484 | ||||||||
| 2,121,037 | AviChina Industry & Technology Co | 1,467 | ||||||||
| 26,859 | AVICOPTER plc | 338 | ||||||||
| 39,466 | Avon Rubber plc | 599 | ||||||||
| 80,686 | * | Axon Enterprise, Inc | 12,668 | |||||||
| 198,487 | Ayala Corp | 3,236 | ||||||||
| 502,202 | * | AZEK Co, Inc | 23,222 | |||||||
| 50,306 | AZZ, Inc | 2,781 | ||||||||
| 34,973 | * | Babcock & Wilcox Enterprises, Inc | 315 | |||||||
| 317,316 | * | Babcock International Group | 1,374 | |||||||
| 41,762 | e | Badger Infrastructure Solution | 1,050 | |||||||
| 3,241,545 | BAE Systems plc | 24,173 | ||||||||
| 786,021 | Balfour Beatty plc | 2,800 | ||||||||
| 290,181 | *,e | Ballard Power Systems, Inc | 3,645 | |||||||
| 175,037 | Barloworld Ltd | 1,652 | ||||||||
| 91,380 | Barnes Group, Inc | 4,257 | ||||||||
| 18,629 | BayWa AG. | 818 | ||||||||
| 341,342 | * | Beacon Roofing Supply, Inc | 19,576 | |||||||
| 1,408 | *,e | Beam Global | 26 | |||||||
| 72,010 | Beijer Alma AB | 2,182 | ||||||||
| 301,292 | e | Beijer Ref AB | 6,569 | |||||||
| 126,612 | Beijing New Building Materials plc | 713 | ||||||||
| 25,000 | Beijing United Information Technology Co Ltd | 422 | ||||||||
| 11,959 | Belimo Holding AG. | 7,594 | ||||||||
| 20,380 | BEML Ltd | 449 | ||||||||
| 363,151 | * | Bera Holding A.S. | 267 | |||||||
| 1,361,000 | BES Engineering Corp | 446 | ||||||||
| 24,409 | * | BGF Co Ltd | 108 | |||||||
| 1,405,197 | Bharat Electronics Ltd | 3,957 | ||||||||
| 910,507 | * | Bharat Heavy Electricals | 719 | |||||||
| 328,901 | Bidvest Group Ltd | 3,910 | ||||||||
| 15,467 | *,e | Biesse S.p.A. | 429 | |||||||
| 139,213 | Bizlink Holdings Inc | 1,310 | ||||||||
| 3,062 | *,e | Blink Charging Co | 81 | |||||||
| 305,834 | * | Bloom Energy Corp | 6,707 | |||||||
| 8,996 | * | Blue Bird Corp | 141 | |||||||
| 59,984 | Blue Star Ltd | 815 | ||||||||
| 17,806 | * | BlueLinx Holdings, Inc | 1,705 | |||||||
| 9,793 | * | Bobst Group AG. | 889 | |||||||
| 23 |
COLLEGE RETIREMENT EQUITIES FUND - Stock Account
| SHARES | COMPANY | VALUE (000) | ||||||||
| 656,606 | g | BOC Aviation Ltd | $ | 4,811 | ||||||
| 232,693 | Bodycote plc | 2,727 | ||||||||
| 1,282,762 | * | Boeing Co | 258,246 | |||||||
| 107,665 | Boise Cascade Co | 7,666 | ||||||||
| 2,560,700 | * | Bombardier, Inc | 3,401 | |||||||
| 24,551 | Bonheur ASA | 990 | ||||||||
| 95,254 | Boskalis Westminster | 2,777 | ||||||||
| 6,759 | Bossard Holding AG. | 2,431 | ||||||||
| 249,754 | e | Bouygues S.A. | 8,940 | |||||||
| 210,653 | Brenntag AG. | 19,023 | ||||||||
| 436,000 | Brighton-Best International Taiwan, Inc | 604 | ||||||||
| 8,107 | Bucher Industries AG. | 3,995 | ||||||||
| 13,512 | Budimex S.A. | 761 | ||||||||
| 32,337 | Bufab AB | 1,595 | ||||||||
| 356,138 | * | Builders FirstSource, Inc | 30,525 | |||||||
| 67,100 | Bunka Shutter Co Ltd | 627 | ||||||||
| 460,691 | Bunzl plc | 17,997 | ||||||||
| 3,535 | Burckhardt Compression Holding AG. | 1,671 | ||||||||
| 5,318 | Burkhalter Holding AG. | 368 | ||||||||
| 32,916 | BWX Technologies, Inc | 1,576 | ||||||||
| 3,032 | *,e | Byrna Technologies, Inc | 40 | |||||||
| 3,490 | Cadre Holdings, Inc | 89 | ||||||||
| 792,723 | * | CAE, Inc | 19,997 | |||||||
| 104,760 | Caesarstone Sdot-Yam Ltd | 1,188 | ||||||||
| 22,701 | Carbone Lorraine | 956 | ||||||||
| 41,298 | g | Carel Industries S.p.A | 1,249 | |||||||
| 94,993 | Cargotec Corp (B Shares) | 4,741 | ||||||||
| 95,402 | Carlisle Cos, Inc | 23,671 | ||||||||
| 6,325,298 | Carrier Global Corp | 343,084 | ||||||||
| 712,755 | Caterpillar, Inc | 147,355 | ||||||||
| 94,900 | Central Glass Co Ltd | 1,760 | ||||||||
| 5,583 | Cera Sanitaryware Ltd | 361 | ||||||||
| 113,781 | * | Ceres Power Holdings plc | 1,538 | |||||||
| 1,156,744 | CH Karnchang PCL | 792 | ||||||||
| 91,500 | *,e,g | Changsha Broad Homes Industrial Group Co Ltd | 141 | |||||||
| 212,520 | *,e | ChargePoint Holdings, Inc | 4,049 | |||||||
| 18,320 | Chargeurs S.A. | 543 | ||||||||
| 15,272 | * | Chart Industries, Inc | 2,436 | |||||||
| 346,776 | Chemring Group plc | 1,410 | ||||||||
| 148,636 | Chicony Power Technology Co Ltd | 419 | ||||||||
| 282,346 | e | China Aircraft Leasing Group Holdings Ltd | 207 | |||||||
| 193,722 | China Baoan Group Co Ltd | 440 | ||||||||
| 24 |
COLLEGE RETIREMENT EQUITIES FUND - Stock Account
| SHARES | COMPANY | VALUE (000) | ||||||||
| 1,992,000 | China Communications Services Corp Ltd | $ | 971 | |||||||
| 1,227,074 | China Conch Venture Holdings Ltd | 6,002 | ||||||||
| 315,800 | China CSSC Holdings Ltd | 1,230 | ||||||||
| 431,000 | * | China High Speed Transmission Equipment Group Co Ltd | 311 | |||||||
| 847,036 | China Lesso Group Holdings Ltd | 1,218 | ||||||||
| 318,500 | China National Chemical Engineering Co Ltd | 601 | ||||||||
| 979,818 | China Railway Group Ltd | 891 | ||||||||
| 3,257,000 | China Railway Group Ltd (Hong Kong) | 1,723 | ||||||||
| 1,920,700 | China State Construction Engineering Corp Ltd | 1,508 | ||||||||
| 1,570,000 | China State Construction International Holdings Ltd | 1,954 | ||||||||
| 19,037 | China Yuchai International Ltd | 284 | ||||||||
| 204,545 | * | Chiyoda Corp | 625 | |||||||
| 35,800 | Chudenko Corp | 661 | ||||||||
| 415,000 | Chung Hsin Electric & Machinery Manufacturing Corp | 678 | ||||||||
| 9,605 | Cie d’Entreprises CFE | 1,336 | ||||||||
| 778,000 | e | CIMC Enric Holdings Ltd | 1,133 | |||||||
| 94,878 | e | CIMIC Group Ltd | 1,169 | |||||||
| 1,580 | * | CIRCOR International, Inc | 43 | |||||||
| 4,401,517 | Citic Pacific Ltd | 4,355 | ||||||||
| 2,926,000 | * | Citic Resources Holdings Ltd | 180 | |||||||
| 17,504 | * | CJ Corp | 1,227 | |||||||
| 2,972,090 | CK Hutchison Holdings Ltd | 19,136 | ||||||||
| 60,993 | CKD Corp | 1,239 | ||||||||
| 285,537 | CNH Industrial NV | 5,521 | ||||||||
| 706,416 | e | CNH Industrial NV (NYSE) | 13,726 | |||||||
| 37,123 | g | Cochin Shipyard Ltd | 178 | |||||||
| 116,911 | * | Colfax Corp | 5,374 | |||||||
| 25,228 | Columbus McKinnon Corp | 1,167 | ||||||||
| 166,647 | Comfort Systems USA, Inc | 16,488 | ||||||||
| 56,960 | * | Commercial Vehicle Group, Inc | 459 | |||||||
| 3,696,496 | Compagnie de Saint-Gobain | 260,036 | ||||||||
| 136,917 | COMSYS Holdings Corp | 3,050 | ||||||||
| 25,559 | * | Concrete Pumping Holdings Inc | 210 | |||||||
| 21,987 | Construcciones y Auxiliar de Ferrocarriles S.A. | 909 | ||||||||
| 2,842 | * | Construction Partners Inc | 84 | |||||||
| 164,059 | Contemporary Amperex Technology Co Ltd | 15,112 | ||||||||
| 378,450 | Continental Engineering Corp | 344 | ||||||||
| 1,676 | Conzzeta AG. | 2,353 | ||||||||
| 33,615 | * | Core & Main, Inc | 1,020 | |||||||
| 742,696 | * | Cornerstone Building Brands, Inc | 12,953 | |||||||
| 25 |
COLLEGE RETIREMENT EQUITIES FUND - Stock Account
| SHARES | COMPANY | VALUE (000) | ||||||||
| 587,600 | COSCO SHIPPING Development Co Ltd | $ | 301 | |||||||
| 16,247 | Crane Co | 1,653 | ||||||||
| 49,943 | * | Creative & Innovative System | 603 | |||||||
| 766,793 | * | Crompton Greaves Ltd | 1,995 | |||||||
| 27,566 | CS Wind Corp | 1,521 | ||||||||
| 515,402 | * | CSBC Corp Taiwan | 408 | |||||||
| 34,469 | CSW Industrials, Inc | 4,166 | ||||||||
| 613,000 | CTCI Corp | 824 | ||||||||
| 135,493 | Cummins India Ltd | 1,712 | ||||||||
| 84,518 | Cummins, Inc | 18,437 | ||||||||
| 40,638 | Curtiss-Wright Corp | 5,635 | ||||||||
| 155,472 | *,e | Custom Truck One Source, Inc | 1,244 | |||||||
| 14,637 | * | Daelim Industrial Co | 749 | |||||||
| 9,187 | Daetwyler Holding AG. | 4,043 | ||||||||
| 197,411 | * | Daewoo Engineering & Construction Co Ltd | 957 | |||||||
| 52,791 | * | Daewoo International Corp | 995 | |||||||
| 40,969 | * | Daewoo Shipbuilding & Marine Engineering Co Ltd | 792 | |||||||
| 17,038 | Dai-Dan Co Ltd | 340 | ||||||||
| 216,213 | Daifuku Co Ltd | 17,681 | ||||||||
| 23,348 | Daihen Corp | 970 | ||||||||
| 10,589 | e | Daiho Corp | 366 | |||||||
| 16,437 | Daiichi Jitsugyo Co Ltd | 708 | ||||||||
| 397,886 | Daikin Industries Ltd | 90,129 | ||||||||
| 276,983 | * | Daimler Truck Holding AG. | 10,182 | |||||||
| 35,100 | e | Daiwa Industries Ltd | 386 | |||||||
| 17,711 | e | Danieli & Co S.p.A. | 543 | |||||||
| 73,482 | Danieli & Co S.p.A. (RSP) | 1,436 | ||||||||
| 26,774 | Dassault Aviation S.A. | 2,896 | ||||||||
| 27,268 | * | Dawonsys Co Ltd | 673 | |||||||
| 108,769 | DCC plc | 8,904 | ||||||||
| 670,098 | Deere & Co | 229,770 | ||||||||
| 97,067 | *,e | Desktop Metal, Inc | 480 | |||||||
| 156,648 | * | Deutz AG. | 1,168 | |||||||
| 38,924 | g | Dilip Buildcon Ltd | 231 | |||||||
| 228,786 | Diploma plc | 10,489 | ||||||||
| 16,797 | * | DL E&C Co Ltd | 1,679 | |||||||
| 4,232,400 | DMCI Holdings, Inc | 640 | ||||||||
| 1,084,753 | Dogan Sirketler Grubu Holdings | 225 | ||||||||
| 129,584 | Donaldson Co, Inc | 7,679 | ||||||||
| 211,929 | Dongfang Electric Corp Ltd | 713 | ||||||||
| 57,707 | * | Doosan Bobcat, Inc | 1,975 | |||||||
| 7,254 | * | Doosan Corp | 718 | |||||||
| 26 |
COLLEGE RETIREMENT EQUITIES FUND - Stock Account
| SHARES | COMPANY | VALUE (000) | ||||||||
| 46,323 | * | Doosan Fuel Cell Co Ltd | $ | 1,867 | ||||||
| 220,441 | * | Doosan Heavy Industries and Construction Co Ltd | 3,774 | |||||||
| 187,557 | * | Doosan Infracore Co Ltd | 1,117 | |||||||
| 2,555 | Douglas Dynamics, Inc | 100 | ||||||||
| 746,887 | Dover Corp | 135,635 | ||||||||
| 392,953 | *,† | Drake & Scull International PJSC | 1 | |||||||
| 2,275,973 | Dubai Investments PJSC | 1,194 | ||||||||
| 9,535 | * | Ducommun, Inc | 446 | |||||||
| 63,086 | Duerr AG. | 2,867 | ||||||||
| 334,200 | Dufu Technology Corp Bhd | 344 | ||||||||
| 15,348 | * | DXP Enterprises, Inc | 394 | |||||||
| 7,039 | * | Dycom Industries, Inc | 660 | |||||||
| 4,327,600 | Dynasty Ceramic PCL | 368 | ||||||||
| 1,496,851 | Eaton Corp | 258,686 | ||||||||
| 116,000 | Ebara Corp | 6,444 | ||||||||
| 12,457 | Ecopro BM Co Ltd | 5,234 | ||||||||
| 24,000 | *,e | EHang Holdings Ltd (ADR) | 358 | |||||||
| 23,375 | Eiffage S.A. | 2,410 | ||||||||
| 28,917 | Elbit Systems Ltd | 4,998 | ||||||||
| 21,032 | Elco Holdings Ltd | 1,544 | ||||||||
| 2,512 | Electra Israel Ltd | 1,740 | ||||||||
| 1,781,733 | Electrocomponents plc | 29,219 | ||||||||
| 271,576 | * | Electrolux Professional AB | 1,880 | |||||||
| 694,312 | * | ElSewedy Electric Co | 433 | |||||||
| 1,822,788 | * | Embraer S.A. | 8,141 | |||||||
| 139,917 | EMCOR Group, Inc | 17,824 | ||||||||
| 470,946 | Emeco Holdings Ltd | 302 | ||||||||
| 38,622 | Emerson Electric Co | 3,591 | ||||||||
| 80,438 | Encore Wire Corp | 11,511 | ||||||||
| 8,038 | Energiekontor AG. | 650 | ||||||||
| 35,461 | * | Energy Recovery, Inc | 762 | |||||||
| 5,529 | Enerpac Tool Group Corp | 112 | ||||||||
| 34,611 | EnerSys | 2,736 | ||||||||
| 267,768 | Engineers India Ltd | 251 | ||||||||
| 63,732 | EnPro Industries, Inc | 7,015 | ||||||||
| 3,477 | *,e | Eos Energy Enterprises, Inc | 26 | |||||||
| 187,136 | Epiroc AB | 4,732 | ||||||||
| 110,901 | Epiroc AB | 2,345 | ||||||||
| 199,327 | ESCO Technologies, Inc | 17,937 | ||||||||
| 73,635 | Escorts Ltd | 1,884 | ||||||||
| 125,120 | Eve Energy Co Ltd | 2,321 | ||||||||
| 873 | *,e | EVI Industries, Inc | 27 | |||||||
| 27 |
COLLEGE RETIREMENT EQUITIES FUND - Stock Account
| SHARES | COMPANY | VALUE (000) | ||||||||
| 594,437 | * | Evoqua Water Technologies Corp | $ | 27,790 | ||||||
| 146,457 | Fagerhult AB | 987 | ||||||||
| 339,000 | Fangda Carbon New Material Co Ltd | 576 | ||||||||
| 257,184 | * | Fanuc Ltd | 54,668 | |||||||
| 3,581,631 | Far Eastern Textile Co Ltd | 3,788 | ||||||||
| 563,340 | Fastenal Co | 36,088 | ||||||||
| 220,991 | Federal Signal Corp | 9,578 | ||||||||
| 92,098 | Ferguson plc | 16,359 | ||||||||
| 533,207 | Ferrovial S.A. | 16,675 | ||||||||
| 574,478 | *,e | Fincantieri S.p.A | 395 | |||||||
| 345,724 | Finning International, Inc | 8,713 | ||||||||
| 73,737 | Finolex Cables Ltd | 523 | ||||||||
| 390,000 | e | First Tractor Co | 198 | |||||||
| 949,634 | Fletcher Building Ltd | 4,759 | ||||||||
| 43,421 | Flowserve Corp | 1,329 | ||||||||
| 1,445,249 | FLSmidth & Co AS | 54,026 | ||||||||
| 196,769 | Fluidra S.A. | 7,848 | ||||||||
| 125,803 | * | Fluor Corp | 3,116 | |||||||
| 740,091 | Fortive Corp | 56,462 | ||||||||
| 184,591 | Fortune Brands Home & Security, Inc | 19,733 | ||||||||
| 3,328,508 | e | Fosun International | 3,592 | |||||||
| 38,255 | Franklin Electric Co, Inc | 3,617 | ||||||||
| 378,700 | Frencken Group Ltd | 553 | ||||||||
| 2,812 | *,e | FTC Solar, Inc | 21 | |||||||
| 247,341 | *,e | FuelCell Energy, Inc | 1,286 | |||||||
| 439,306 | *,e | Fugro NV | 3,447 | |||||||
| 87,633 | * | Fuji Electric Holdings Co Ltd | 4,787 | |||||||
| 83,245 | Fuji Machine Manufacturing Co Ltd | 1,867 | ||||||||
| 1,031,378 | * | Fujikura Ltd | 5,063 | |||||||
| 77,739 | Fujitec Co Ltd | 1,704 | ||||||||
| 13,939 | * | Fukushima Industries Corp | 579 | |||||||
| 31,656 | Furukawa Co Ltd | 350 | ||||||||
| 203,344 | Furukawa Electric Co Ltd | 4,108 | ||||||||
| 1,873,700 | * | Gamuda BHD | 1,304 | |||||||
| 31,033 | GARO AB | 740 | ||||||||
| 226,701 | * | Gates Industrial Corp plc | 3,607 | |||||||
| 31,111 | GATX Corp | 3,241 | ||||||||
| 43,469 | GEA Group AG. | 2,374 | ||||||||
| 15,904 | Geberit AG. | 12,964 | ||||||||
| 55,559 | * | GEK Group of Cos S.A. | 601 | |||||||
| 198,481 | *,n | Generac Holdings, Inc | 69,849 | |||||||
| 190,512 | General Dynamics Corp | 39,716 | ||||||||
| 28 |
COLLEGE RETIREMENT EQUITIES FUND - Stock Account
| SHARES | COMPANY | VALUE (000) | ||||||||
| 70,438 | General Electric Co | $ | 6,654 | |||||||
| 4,980 | Georg Fischer AG. | 7,535 | ||||||||
| 46,759 | * | Gibraltar Industries, Inc | 3,118 | |||||||
| 20,701 | Giken Seisakusho Co, Inc | 731 | ||||||||
| 16,200 | Ginlong Technologies Co Ltd | 589 | ||||||||
| 3,790 | Global Industrial Co | 155 | ||||||||
| 60,256 | Glory Ltd | 1,148 | ||||||||
| 7,215 | GMM Pfaudler Ltd | 471 | ||||||||
| 117,471 | * | GMS, Inc | 7,061 | |||||||
| 55,073 | * | Godrej Industries Ltd | 464 | |||||||
| 16,964 | Gorman-Rupp Co | 756 | ||||||||
| 95,830 | * | Gotion High-tech Co Ltd | 772 | |||||||
| 115,165 | Graco, Inc | 9,285 | ||||||||
| 230,875 | GrafTech International Ltd | 2,731 | ||||||||
| 276,243 | Grafton Group plc | 4,638 | ||||||||
| 39,993 | Granite Construction, Inc | 1,548 | ||||||||
| 62,773 | Graphite India Ltd | 429 | ||||||||
| 56,573 | * | Great Lakes Dredge & Dock Corp | 889 | |||||||
| 27,836 | Greenbrier Cos, Inc | 1,277 | ||||||||
| 487,000 | g | Greentown Management Holdings Co Ltd | 334 | |||||||
| 40,483 | Griffon Corp | 1,153 | ||||||||
| 48,108 | Grindwell Norton Ltd | 1,235 | ||||||||
| 559,993 | e | Grupo Carso S.A. de C.V. (Series A1) | 1,810 | |||||||
| 217,407 | e | Grupo Rotoplas SAB de C.V. | 298 | |||||||
| 45,260 | * | GS Engineering & Construction Corp | 1,505 | |||||||
| 84,254 | GS Yuasa Corp | 1,875 | ||||||||
| 345,404 | GT Capital Holdings, Inc | 3,658 | ||||||||
| 18,315 | Guangdong Kinlong Hardware Products Co Ltd | 523 | ||||||||
| 115,187 | Gulf Cable & Electrical Industries Co KSCP | 331 | ||||||||
| 292,760 | GWA International Ltd | 586 | ||||||||
| 2,771 | H&E Equipment Services, Inc | 123 | ||||||||
| 808,497 | Haitian International Holdings Ltd | 2,246 | ||||||||
| 307,982 | Hangzhou Steam Turbine Co | 639 | ||||||||
| 27,299 | * | Hanjin Heavy Industries & Construction Co Ltd | 184 | |||||||
| 65,079 | Hanwa Co Ltd | 1,846 | ||||||||
| 64,256 | * | Hanwha Corp | 1,694 | |||||||
| 20,715 | * | Hanwha Corp (3P) | 279 | |||||||
| 49,072 | * | Hanwha Systems Co Ltd | 659 | |||||||
| 677,581 | HAP Seng Consolidated BHD | 1,252 | ||||||||
| 752,000 | Harbin Power Equipment | 340 | ||||||||
| 68,300 | Harmonic Drive Systems, Inc | 2,880 | ||||||||
| 269,951 | Havells India Ltd | 5,064 | ||||||||
| 29 |
COLLEGE RETIREMENT EQUITIES FUND - Stock Account
| SHARES | COMPANY | VALUE (000) | ||||||||
| 219,536 | Hazama Ando Corp | $ | 1,652 | |||||||
| 42,524 | * | HDC Hyundai Development Co-Engineering & Construction | 818 | |||||||
| 54,560 | Hefei Meiya Optoelectronic Technology, Inc | 321 | ||||||||
| 12,590 | HEG Ltd | 302 | ||||||||
| 40,561 | HEICO Corp | 5,850 | ||||||||
| 74,153 | HEICO Corp (Class A) | 9,530 | ||||||||
| 327,839 | * | Heidelberger Druckmaschinen | 984 | |||||||
| 21,857 | Helios Technologies, Inc | 2,299 | ||||||||
| 136,501 | Hensoldt AG. | 1,936 | ||||||||
| 2,118 | Herc Holdings, Inc | 332 | ||||||||
| 124,432 | * | Hexagon Composites ASA | 460 | |||||||
| 64,675 | * | Hexagon Purus Holding AS. | 157 | |||||||
| 36,496 | Hexatronic Group AB | 2,022 | ||||||||
| 79,498 | * | Hexcel Corp | 4,118 | |||||||
| 105,408 | Hillenbrand, Inc | 5,480 | ||||||||
| 194,494 | Hino Motors Ltd | 1,604 | ||||||||
| 11,300 | Hirata Corp | 627 | ||||||||
| 233,259 | * | Hitachi Construction Machinery Co Ltd | 6,740 | |||||||
| 2,195,660 | * | Hitachi Ltd | 118,946 | |||||||
| 693,720 | Hitachi Zosen Corp | 4,810 | ||||||||
| 192,003 | Hiwin Technologies Corp | 2,125 | ||||||||
| 25,668 | Hochtief AG. | 2,067 | ||||||||
| 2,268,986 | Honeywell International, Inc | 473,106 | ||||||||
| 54,075 | Hongfa Technology Co Ltd | 633 | ||||||||
| 52,662 | Hoshizaki Electric Co Ltd | 3,962 | ||||||||
| 14,400 | Hosokawa Micron Corp | 427 | ||||||||
| 981,104 | Howden Joinery Group plc | 12,017 | ||||||||
| 676,765 | Howmet Aerospace, Inc | 21,541 | ||||||||
| 464,564 | Hubbell, Inc | 96,755 | ||||||||
| 19,232 | Huber & Suhner AG. | 1,833 | ||||||||
| 3,637 | Huntington Ingalls | 679 | ||||||||
| 691,542 | Husqvarna AB (B Shares) | 11,057 | ||||||||
| 3,450 | * | Hydrofarm Holdings Group, Inc | 98 | |||||||
| 90,142 | *,e | Hyliion Holdings Corp | 559 | |||||||
| 48,458 | * | Hyosung Corp | 3,853 | |||||||
| 4,837 | * | Hyosung Heavy Industries Corp | 237 | |||||||
| 8,855 | Hyster-Yale Materials Handling, Inc | 364 | ||||||||
| 41,950 | * | Hyundai Construction Equipment Co Ltd | 1,427 | |||||||
| 21,508 | * | Hyundai Electric & Energy System Co Ltd | 359 | |||||||
| 26,567 | * | Hyundai Elevator Co Ltd | 919 | |||||||
| 57,590 | * | Hyundai Engineering & Construction Co Ltd | 2,149 | |||||||
| 27,929 | * | Hyundai Heavy Industries | 2,220 | |||||||
| 30 |
COLLEGE RETIREMENT EQUITIES FUND - Stock Account
| SHARES | COMPANY | VALUE (000) | ||||||||
| 26,185 | * | Hyundai Mipo Dockyard | $ | 1,539 | ||||||
| 38,045 | Hyundai Robotics Co Ltd | 1,717 | ||||||||
| 87,877 | * | Hyundai Rotem Co Ltd | 1,532 | |||||||
| 373,109 | *,e | Ideanomics Inc | 448 | |||||||
| 33,477 | Idec Corp | 810 | ||||||||
| 24,863 | IDEX Corp | 5,876 | ||||||||
| 684 | * | IES Holdings, Inc | 35 | |||||||
| 2,887,100 | IJM Corp BHD | 1,053 | ||||||||
| 7,021 | * | Iljin Diamond Co Ltd | 179 | |||||||
| 235,096 | Illinois Tool Works, Inc | 58,022 | ||||||||
| 502,321 | IMI plc | 11,847 | ||||||||
| 17,002 | *,e | Implenia AG. | 387 | |||||||
| 87,336 | Inaba Denki Sangyo Co Ltd | 2,052 | ||||||||
| 71,498 | Inabata & Co Ltd | 1,044 | ||||||||
| 13,294 | g | IndiaMart InterMesh Ltd | 1,155 | |||||||
| 25,777 | Indus Holding AG. | 960 | ||||||||
| 1,799,650 | Industries Qatar QSC | 7,655 | ||||||||
| 332,070 | Indutrade AB | 10,138 | ||||||||
| 13,836 | *,e | Infrastructure and Energy Alternatives, Inc | 127 | |||||||
| 301,060 | *,e | INFRONEER Holdings, Inc | 2,741 | |||||||
| 952,539 | Ingersoll Rand, Inc | 58,934 | ||||||||
| 125,313 | *,e | INNOVATE Corp | 464 | |||||||
| 2,803,600 | *,† | Inovisi Infracom Tbk PT | 0 | ^ | ||||||
| 274,013 | * | InPost S.A. | 3,306 | |||||||
| 50,505 | e | Instalco AB | 2,422 | |||||||
| 15,583 | Insteel Industries, Inc | 620 | ||||||||
| 86,091 | Interpump Group S.p.A. | 6,306 | ||||||||
| 779 | Interroll Holding AG. | 3,502 | ||||||||
| 251,062 | Investment AB Latour | 10,200 | ||||||||
| 49,823 | INVISIO AB | 901 | ||||||||
| 139,810 | Inwido AB | 2,890 | ||||||||
| 496,724 | Iochpe-Maxion S.A. | 1,363 | ||||||||
| 163,428 | * | IRB Infrastructure Developers Ltd | 498 | |||||||
| 14,233 | * | IS Dongseo Co Ltd | 529 | |||||||
| 26,831 | ISGEC Heavy Engineering Ltd | 219 | ||||||||
| 159,800 | Ishikawajima-Harima Heavy Industries Co Ltd | 3,218 | ||||||||
| 14,862 | Italmobiliare S.p.A | 549 | ||||||||
| 522,299 | *,e | Itm Power plc | 2,804 | |||||||
| 1,338,662 | Itochu Corp | 40,955 | ||||||||
| 465,161 | ITT, Inc | 47,535 | ||||||||
| 25,652 | Jantsa Jant Sanayi Ve Ticaret AS. | 126 | ||||||||
| 12,732 | Japan Pulp & Paper Co Ltd | 456 | ||||||||
| 31 |
COLLEGE RETIREMENT EQUITIES FUND - Stock Account
| SHARES | COMPANY | VALUE (000) | ||||||||
| 72,261 | Japan Steel Works Ltd | $ | 2,425 | |||||||
| 239,068 | Jardine Matheson Holdings Ltd | 13,146 | ||||||||
| 47,400 | JDC Corp | 231 | ||||||||
| 48,495 | * | JELD-WEN Holding, Inc | 1,278 | |||||||
| 3,358,256 | JG Summit Holdings (Series B) | 3,486 | ||||||||
| 417,500 | JGC Corp | 3,488 | ||||||||
| 83,504 | Jiangsu Hengli Hydraulic Co Ltd | 1,071 | ||||||||
| 263,318 | Jiangsu Zhongtian Technology Co Ltd | 701 | ||||||||
| 10,343 | John Bean Technologies Corp | 1,588 | ||||||||
| 215,564 | Johns Lyng Group Ltd | 1,432 | ||||||||
| 700,278 | e | Johnson Controls International plc | 56,940 | |||||||
| 19,808 | g | JOST Werke AG. | 1,116 | |||||||
| 186,600 | *,e | JTOWER, Inc | 15,637 | |||||||
| 6,492 | Judges Scientific plc | 742 | ||||||||
| 58,289 | Jungheinrich AG. | 2,961 | ||||||||
| 3,578 | Kaba Holding AG. | 2,363 | ||||||||
| 1,255 | Kadant, Inc | 289 | ||||||||
| 86,020 | Kajaria Ceramics Ltd | 1,491 | ||||||||
| 311,499 | Kajima Corp | 3,580 | ||||||||
| 71,739 | Kalpataru Power Transmission Ltd | 360 | ||||||||
| 24,963 | Kaman Corp | 1,077 | ||||||||
| 39,100 | Kanamoto Co Ltd | 820 | ||||||||
| 116,401 | Kandenko Co Ltd | 867 | ||||||||
| 99,300 | Kanematsu Corp | 1,106 | ||||||||
| 2,674,417 | KAP Industrial Holdings Ltd | 734 | ||||||||
| 1,375 | * | Karat Packaging, Inc | 28 | |||||||
| 18,524 | Kardex AG. | 6,080 | ||||||||
| 23,800 | e | Katakura Industries Co Ltd | 511 | |||||||
| 247,600 | Kawasaki Heavy Industries Ltd | 4,475 | ||||||||
| 10,211 | KCC Glass Corp | 514 | ||||||||
| 125,641 | KEC International Ltd | 808 | ||||||||
| 57,459 | KEI Industries Ltd | 900 | ||||||||
| 117,300 | Keihan Electric Railway Co Ltd | 2,699 | ||||||||
| 118,910 | Keller Group plc | 1,585 | ||||||||
| 74,754 | Kennametal, Inc | 2,684 | ||||||||
| 14,581 | * | KEPCO Engineering & Construction Co, Inc | 1,041 | |||||||
| 1,615,447 | Keppel Corp Ltd | 6,144 | ||||||||
| 565,113 | *,e | Kier Group plc | 841 | |||||||
| 229,371 | Kinden Corp | 3,449 | ||||||||
| 76,650 | Kingspan Group plc | 9,143 | ||||||||
| 79,704 | KION Group AG. | 8,706 | ||||||||
| 178,000 | Kitz Corp | 1,102 | ||||||||
| 32 |
COLLEGE RETIREMENT EQUITIES FUND - Stock Account
| SHARES | COMPANY | VALUE (000) | ||||||||
| 107,442 | * | Kloeckner & Co AG. | $ | 1,308 | ||||||
| 78,519 | Knorr-Bremse AG. | 7,755 | ||||||||
| 137,687 | KNR Constructions Ltd | 553 | ||||||||
| 861,980 | KOC Holding AS | 1,849 | ||||||||
| 17,329 | * | Koenig & Bauer AG. | 618 | |||||||
| 962,820 | Komatsu Ltd | 22,516 | ||||||||
| 4,460 | * | Komax Holding AG. | 1,236 | |||||||
| 96,462 | Kone Oyj (Class B) | 6,922 | ||||||||
| 72,273 | Konecranes Oyj | 2,895 | ||||||||
| 246,419 | Kongsberg Gruppen ASA | 7,985 | ||||||||
| 339,193 | * | Koninklijke BAM Groep NV | 1,041 | |||||||
| 86,520 | * | Korea Aerospace Industries Ltd | 2,357 | |||||||
| 5,496 | Korea Electric Terminal Co Ltd | 352 | ||||||||
| 379,939 | *,n | Kornit Digital Ltd | 57,846 | |||||||
| 157,239 | * | Kratos Defense & Security Solutions, Inc | 3,050 | |||||||
| 17,040 | Krones AG. | 1,854 | ||||||||
| 1,070,612 | Kubota Corp | 23,806 | ||||||||
| 41,304 | Kumagai Gumi Co Ltd | 1,031 | ||||||||
| 70,997 | Kung Long Batteries Industrial Co Ltd | 355 | ||||||||
| 93,287 | Kurita Water Industries Ltd | 4,423 | ||||||||
| 33,654 | Kyokuto Kaihatsu Kogyo Co Ltd | 447 | ||||||||
| 121,255 | Kyowa Exeo Corp | 2,557 | ||||||||
| 51,522 | Kyudenko Corp | 1,592 | ||||||||
| 6,666 | * | Kyung Dong Navien Co Ltd | 308 | |||||||
| 194,795 | L3Harris Technologies, Inc | 41,538 | ||||||||
| 3,552 | Lakshmi Machine Works Ltd | 409 | ||||||||
| 1,438,446 | Larsen & Toubro Ltd | 36,536 | ||||||||
| 886 | * | Lawson Products, Inc | 49 | |||||||
| 113,518 | Legrand S.A. | 13,295 | ||||||||
| 32,633 | Lennox International, Inc | 10,585 | ||||||||
| 493,530 | * | Leonardo S.p.A. | 3,528 | |||||||
| 100,094 | * | LG Corp | 6,813 | |||||||
| 44,483 | * | LG Hausys Ltd | 2,297 | |||||||
| 149,300 | * | LG International Corp | 3,314 | |||||||
| 219,321 | * | Liberty Media Acquisition Corp | 2,327 | |||||||
| 332,899 | Lifco AB | 9,943 | ||||||||
| 11,569 | * | LIG Nex1 Co Ltd | 666 | |||||||
| 20,927 | Lincoln Electric Holdings, Inc | 2,919 | ||||||||
| 206,538 | Lindab International AB | 7,347 | ||||||||
| 1,778 | Lindsay Corp | 270 | ||||||||
| 56,725 | *,e | Lion Electric Co | 561 | |||||||
| 20,887 | LISI | 674 | ||||||||
| 33 |
COLLEGE RETIREMENT EQUITIES FUND - Stock Account
| SHARES | COMPANY | VALUE (000) | ||||||||
| 292,550 | LIXIL Group Corp | $ | 7,804 | |||||||
| 670,000 | e | LK Technology Holdings Ltd | 1,379 | |||||||
| 229,819 | Lockheed Martin Corp | 81,680 | ||||||||
| 2,067,355 | Lonking Holdings Ltd | 581 | ||||||||
| 142,374 | * | Lotte Corp | 3,578 | |||||||
| 64,426 | * | LS Cable Ltd | 2,929 | |||||||
| 27,771 | * | LS Industrial Systems Co Ltd | 1,300 | |||||||
| 2,228,400 | LT Group, Inc | 433 | ||||||||
| 82,642 | g | Luceco plc | 390 | |||||||
| 266,000 | *,e | Luoyang Glass Co Ltd | 598 | |||||||
| 10,900 | Luoyang Xinqianglian Slewing Bearing Co Ltd | 306 | ||||||||
| 16,398 | Luxfer Holdings plc | 317 | ||||||||
| 44,279 | * | LX Holdings Corp | 372 | |||||||
| 85,741 | Maas Group Holdings Ltd | 331 | ||||||||
| 59,632 | Mabuchi Motor Co Ltd | 1,972 | ||||||||
| 175,267 | e | Maire Tecnimont S.p.A | 828 | |||||||
| 29,339 | Makino Milling Machine Co Ltd | 1,050 | ||||||||
| 244,991 | Makita Corp | 10,400 | ||||||||
| 1,726,200 | Malaysian Resources Corp BHD | 147 | ||||||||
| 11,755 | Manitou BF S.A. | 369 | ||||||||
| 30,984 | * | Manitowoc Co, Inc | 576 | |||||||
| 475,010 | Marcopolo S.A. | 259 | ||||||||
| 1,777,340 | Marubeni Corp | 17,317 | ||||||||
| 936,117 | Masco Corp | 65,734 | ||||||||
| 10,892 | * | Masonite International Corp | 1,285 | |||||||
| 53,262 | * | Mastec, Inc | 4,915 | |||||||
| 24,900 | *,e | Matrix Service Co | 187 | |||||||
| 27,600 | Max Co Ltd | 461 | ||||||||
| 64,136 | Maxar Technologies, Inc | 1,894 | ||||||||
| 7,397 | * | Mayville Engineering Co Inc | 110 | |||||||
| 2,387 | MBB SE | 372 | ||||||||
| 34,727 | McGrath RentCorp | 2,787 | ||||||||
| 24,635 | *,e | McPhy Energy S.A. | 608 | |||||||
| 64,807 | * | MDA Ltd | 487 | |||||||
| 887,000 | e | MECOM Power and Construction Ltd | 410 | |||||||
| 950,881 | * | Meggitt plc | 9,516 | |||||||
| 42,271 | Meidensha Corp | 1,007 | ||||||||
| 1,183,169 | Melrose Industries plc | 2,573 | ||||||||
| 50,801 | * | Mercury Systems, Inc | 2,797 | |||||||
| 79,815 | * | Meritor, Inc | 1,978 | |||||||
| 917,003 | Metallurgical Corp of China Ltd | 552 | ||||||||
| 26,200 | METAWATER Co Ltd | 460 | ||||||||
| 34 |
COLLEGE RETIREMENT EQUITIES FUND - Stock Account
| SHARES | COMPANY | VALUE (000) | ||||||||
| 756,688 | Metso Outotec Oyj | $ | 8,036 | |||||||
| 19,288 | * | Middleby Corp | 3,795 | |||||||
| 85,494 | e | Mie Kotsu Group Holdings, Inc | 359 | |||||||
| 9,355 | Miller Industries, Inc | 312 | ||||||||
| 373,290 | Minebea Co Ltd | 10,607 | ||||||||
| 143,900 | Ming Yang Smart Energy Group Ltd | 590 | ||||||||
| 111,662 | Miraito Holdings Corp | 1,842 | ||||||||
| 359,954 | MISUMI Group, Inc | 14,788 | ||||||||
| 1,482,735 | Mitsubishi Corp | 47,081 | ||||||||
| 1,596,777 | Mitsubishi Electric Corp | 20,268 | ||||||||
| 323,938 | Mitsubishi Heavy Industries Ltd | 7,490 | ||||||||
| 30,000 | Mitsubishi Nichiyu Forklift Co Ltd | 276 | ||||||||
| 25,850 | Mitsuboshi Belting Co Ltd | 485 | ||||||||
| 1,971,669 | Mitsui & Co Ltd | 46,724 | ||||||||
| 178,631 | Miura Co Ltd | 6,149 | ||||||||
| 101,762 | Monadelphous Group Ltd | 715 | ||||||||
| 4,180,890 | MonotaRO Co Ltd | 75,197 | ||||||||
| 201,219 | *,g | Montana Aerospace AG. | 7,475 | |||||||
| 25,122 | Moog, Inc (Class A) | 2,034 | ||||||||
| 344,863 | Morgan Crucible Co plc | 1,673 | ||||||||
| 47,876 | Morgan Sindall plc | 1,643 | ||||||||
| 137,544 | Mori Seiki Co Ltd | 2,366 | ||||||||
| 38,000 | Morita Holdings Corp | 432 | ||||||||
| 401,387 | * | MRC Global, Inc | 2,762 | |||||||
| 43,429 | MSC Industrial Direct Co (Class A) | 3,651 | ||||||||
| 11,141 | MTAR Technologies Ltd | 367 | ||||||||
| 71,977 | MTU Aero Engines Holding AG. | 14,614 | ||||||||
| 108,076 | Mueller Industries, Inc | 6,415 | ||||||||
| 158,798 | Mueller Water Products, Inc (Class A) | 2,287 | ||||||||
| 148,941 | g | Munters Group AB | 1,153 | |||||||
| 34,235 | * | MYR Group, Inc | 3,785 | |||||||
| 158,300 | Nabtesco Corp | 4,690 | ||||||||
| 19,833 | Nachi-Fujikoshi Corp | 711 | ||||||||
| 427,124 | Nagarjuna Construction Co | 402 | ||||||||
| 119,700 | Nagase & Co Ltd | 1,940 | ||||||||
| 380,264 | NARI Technology Co Ltd | 2,391 | ||||||||
| 194,272 | National Central Cooling Co PJSC | 134 | ||||||||
| 1,209,418 | * | National Industries Group Holding SAK | 1,132 | |||||||
| 4,464 | National Presto Industries, Inc | 366 | ||||||||
| 732,783 | NBCC India Ltd | 451 | ||||||||
| 96,996 | NCC AB (B Shares) | 1,798 | ||||||||
| 1,779,564 | *,e | NEL ASA | 3,042 | |||||||
| 35 |
COLLEGE RETIREMENT EQUITIES FUND - Stock Account
| SHARES | COMPANY | VALUE (000) | ||||||||
| 117,429 | Neles Oyj | $ | 1,828 | |||||||
| 29,266 | Nexans S.A. | 2,862 | ||||||||
| 76,876 | e | NFI Group, Inc | 1,231 | |||||||
| 69,804 | NGK Insulators Ltd | 1,181 | ||||||||
| 1,571,487 | Nibe Industrier AB | 23,745 | ||||||||
| 69,940 | Nichias Corp | 1,688 | ||||||||
| 15,700 | Nichiden Corp | 321 | ||||||||
| 54,045 | Nichiha Corp | 1,437 | ||||||||
| 349,352 | Nidec Corp | 41,326 | ||||||||
| 54,067 | Nikkiso Co Ltd | 378 | ||||||||
| 19,454 | *,e | Nikola Corp | 192 | |||||||
| 37,918 | * | Nilfisk Holding A.S. | 1,248 | |||||||
| 10,600 | Nippon Carbon Co Ltd | 385 | ||||||||
| 45,059 | Nippon Densetsu Kogyo Co Ltd | 652 | ||||||||
| 13,325 | Nippon Koei Co Ltd | 370 | ||||||||
| 7,300 | Nippon Road Co Ltd | 523 | ||||||||
| 96,000 | * | Nippon Sheet Glass Co Ltd | 428 | |||||||
| 20,017 | Nippon Steel Trading Co Ltd | 874 | ||||||||
| 41,865 | Nishimatsu Construction Co Ltd | 1,327 | ||||||||
| 102,400 | Nishio Rent All Co Ltd | 2,556 | ||||||||
| 5,595 | Nissei ASB Machine Co Ltd | 154 | ||||||||
| 177,331 | e | Nisshinbo Industries, Inc | 1,350 | |||||||
| 58,000 | Nissin Electric Co Ltd | 794 | ||||||||
| 26,100 | Nitta Corp | 669 | ||||||||
| 349,800 | Nitto Boseki Co Ltd | 8,963 | ||||||||
| 42,135 | Nitto Kogyo Corp | 583 | ||||||||
| 17,635 | Nittoku Engineering Co Ltd | 610 | ||||||||
| 49,088 | * | NKT Holding AS | 2,374 | |||||||
| 41,672 | * | NN, Inc | 171 | |||||||
| 2,400 | *,†,e | Noble Group Ltd | 0 | ^ | ||||||
| 249,331 | Nolato AB | 2,966 | ||||||||
| 126,608 | *,e | Nordex AG. | 1,986 | |||||||
| 76,496 | Nordson Corp | 19,527 | ||||||||
| 9,983 | Noritake Co Ltd | 435 | ||||||||
| 20,651 | Noritsu Koki Co Ltd | 487 | ||||||||
| 31,131 | Noritz Corp | 455 | ||||||||
| 62,543 | NORMA Group | 2,414 | ||||||||
| 113,400 | * | North Industries Group Red Arrow Co Ltd | 475 | |||||||
| 507,111 | Northrop Grumman Corp | 196,287 | ||||||||
| 8,925 | * | Northwest Pipe Co | 284 | |||||||
| 797,486 | * | NOW, Inc | 6,811 | |||||||
| 1,485,713 | NRW Holdings Ltd | 1,909 | ||||||||
| 36 |
COLLEGE RETIREMENT EQUITIES FUND - Stock Account
| SHARES | COMPANY | VALUE (000) | ||||||||
| 554,600 | NSK Ltd | $ | 3,563 | |||||||
| 985,561 | * | NTN Corp | 2,059 | |||||||
| 8,747 | * | NV5 Global Inc | 1,208 | |||||||
| 180,231 | e | nVent Electric plc | 6,849 | |||||||
| 2,030,000 | NWS Holdings Ltd | 1,904 | ||||||||
| 11,446 | Obara Corp | 344 | ||||||||
| 454,109 | Obayashi Corp | 3,515 | ||||||||
| 469,681 | OC Oerlikon Corp AG. | 4,803 | ||||||||
| 5,961 | OHB AG. | 244 | ||||||||
| 23,121 | Oiles Corp | 340 | ||||||||
| 29,567 | Okuma Holdings, Inc | 1,316 | ||||||||
| 41,600 | Okumura Corp | 1,168 | ||||||||
| 34,139 | * | Olectra Greentech Ltd | 363 | |||||||
| 254 | Omega Flex, Inc | 32 | ||||||||
| 345,066 | *,e | Opus Global Rt | 219 | |||||||
| 7,237 | Organo Corp | 544 | ||||||||
| 105,006 | OSG Corp | 1,632 | ||||||||
| 22,951 | Oshkosh Corp | 2,587 | ||||||||
| 9 | * | OSRAM Licht AG. | 1 | |||||||
| 571,107 | Otis Worldwide Corp | 49,726 | ||||||||
| 8,008 | Otokar Otobus Karoseri Sanayi AS | 216 | ||||||||
| 604,057 | Owens Corning, Inc | 54,667 | ||||||||
| 103,530 | * | OX2 AB | 677 | |||||||
| 579,656 | PACCAR, Inc | 51,160 | ||||||||
| 121,215 | * | PAE, Inc | 1,204 | |||||||
| 16,668 | Palfinger AG. | 650 | ||||||||
| 16,903 | Park Aerospace Corp | 223 | ||||||||
| 469,360 | Parker-Hannifin Corp | 149,313 | ||||||||
| 7,739 | Park-Ohio Holdings Corp | 164 | ||||||||
| 22,893 | * | Parsons Corp | 770 | |||||||
| 222,086 | Peab AB (Series B) | 2,799 | ||||||||
| 58,263 | Pentair plc | 4,255 | ||||||||
| 1,608,700 | Pentamaster Corp BHD | 2,136 | ||||||||
| 339,746 | Penta-Ocean Construction Co Ltd | 1,920 | ||||||||
| 19,841 | * | People & Technology, Inc | 729 | |||||||
| 34,522 | PER Aarsleff A.S. | 1,616 | ||||||||
| 4,650 | Pfeiffer Vacuum Technology AG. | 1,143 | ||||||||
| 29,144 | * | PGT Innovations, Inc | 655 | |||||||
| 833,255 | *,e | Plug Power, Inc | 23,523 | |||||||
| 97,131 | PNC Infratech Ltd | 343 | ||||||||
| 44,399 | PNE AG. | 425 | ||||||||
| 40,423 | Polycab India Ltd | 1,337 | ||||||||
| 37 |
COLLEGE RETIREMENT EQUITIES FUND - Stock Account
| SHARES | COMPANY | VALUE (000) | ||||||||
| 301,111 | Polypipe Group plc | $ | 2,406 | |||||||
| 207,805 | Polyplex PCL (Foreign) | 148 | ||||||||
| 20,267 | * | Porr AG. | 317 | |||||||
| 9,210 | Powell Industries, Inc | 272 | ||||||||
| 739,369 | Power Construction Corp of China Ltd | 938 | ||||||||
| 58,990 | *,e | PowerCell Sweden AB | 1,204 | |||||||
| 3,205,588 | * | PP Persero Tbk PT | 222 | |||||||
| 39,507 | * | PPK Group Ltd | 267 | |||||||
| 114,206 | Praj Industries Ltd | 512 | ||||||||
| 2,806 | Preformed Line Products Co | 182 | ||||||||
| 46,806 | Primoris Services Corp | 1,122 | ||||||||
| 28,694 | Prince Pipes & Fittings Ltd | 269 | ||||||||
| 72,736 | * | Proto Labs, Inc | 3,735 | |||||||
| 69,577 | Prysmian S.p.A. | 2,617 | ||||||||
| 183,220 | PSG Group Ltd | 1,026 | ||||||||
| 1,347,020 | QinetiQ plc | 4,849 | ||||||||
| 29,438 | Quanex Building Products Corp | 729 | ||||||||
| 172,532 | Quanta Services, Inc | 19,783 | ||||||||
| 54,000 | Raito Kogyo Co Ltd | 930 | ||||||||
| 186,132 | Randon Participacoes S.A. | 362 | ||||||||
| 521,986 | Ras Al Khaimah Ceramics | 404 | ||||||||
| 5,490 | e | Rational AG. | 5,615 | |||||||
| 5,335,629 | e | Raytheon Technologies Corp | 459,184 | |||||||
| 27,904 | * | RBC Bearings, Inc | 5,636 | |||||||
| 488,000 | *,e | Realord Group Holdings Ltd | 609 | |||||||
| 317,060 | Reece Ltd | 6,235 | ||||||||
| 217,598 | Regal-Beloit Corp | 37,031 | ||||||||
| 959,605 | Reliance Worldwide Corp Ltd | 4,385 | ||||||||
| 41,200 | *,e | ReneSola Ltd (ADR) | 246 | |||||||
| 215,112 | * | Resideo Technologies, Inc | 5,599 | |||||||
| 177,297 | Reunert Ltd | 590 | ||||||||
| 450,561 | REV Group, Inc | 6,375 | ||||||||
| 297,273 | Rexel S.A. | 6,021 | ||||||||
| 139,000 | Rexon Industrial Corp Ltd | 283 | ||||||||
| 90,491 | Rheinmetall AG. | 8,516 | ||||||||
| 64,027 | Richelieu Hardware Ltd | 2,208 | ||||||||
| 7,484 | * | Rieter Holding AG. | 1,449 | |||||||
| 64,400 | Riyue Heavy Industry Co Ltd | 333 | ||||||||
| 103,438 | Rockwell Automation, Inc | 36,084 | ||||||||
| 2,372 | Rockwool International AS (B Shares) | 1,036 | ||||||||
| 9,095,151 | * | Rolls-Royce Group plc | 15,181 | |||||||
| 19,474 | *,e | Romeo Power, Inc | 71 | |||||||
| 38 |
COLLEGE RETIREMENT EQUITIES FUND - Stock Account
| SHARES | COMPANY | VALUE (000) | ||||||||
| 275,552 | Roper Technologies Inc | $ | 135,533 | |||||||
| 1,059,437 | Rotork plc | 5,156 | ||||||||
| 194,056 | Run Long Construction Co Ltd | 388 | ||||||||
| 37,716 | Rush Enterprises, Inc (Class A) | 2,099 | ||||||||
| 5,214 | Rush Enterprises, Inc (Class B) | 281 | ||||||||
| 75,433 | Russel Metals, Inc | 2,005 | ||||||||
| 89,441 | Saab AB (Class B) | 2,272 | ||||||||
| 508,854 | e | Sacyr Vallehermoso S.A. | 1,320 | |||||||
| 610,463 | Safran S.A. | 74,735 | ||||||||
| 20,805 | Salcef S.p.A | 583 | ||||||||
| 24,479 | * | SAM KANG M&T Co Ltd | 439 | |||||||
| 5,226 | * | Samho International Co Ltd | 119 | |||||||
| 98,927 | * | Samsung C&T Corp | 9,885 | |||||||
| 114,033 | * | Samsung Engineering Co Ltd | 2,192 | |||||||
| 429,681 | * | Samsung Heavy Industries Co Ltd | 2,048 | |||||||
| 141,120 | * | Samsung Techwin Co Ltd | 5,689 | |||||||
| 110,623 | San Shing Fastech Corp | 230 | ||||||||
| 3,501,474 | Sandvik AB | 97,598 | ||||||||
| 50,400 | Sanki Engineering Co Ltd | 631 | ||||||||
| 409,641 | Sanwa Shutter Corp | 4,374 | ||||||||
| 1,333,000 | Sany Heavy Equipment International | 1,292 | ||||||||
| 583,957 | Sany Heavy Industry Co Ltd | 2,091 | ||||||||
| 9,200 | Sanyo Denki Co Ltd | 483 | ||||||||
| 41,430 | Saudi Ceramic Co | 607 | ||||||||
| 61,657 | e | Savaria Corp | 934 | |||||||
| 8,559 | Schaeffler India Ltd | 1,011 | ||||||||
| 50,470 | Schindler Holding AG. | 13,548 | ||||||||
| 106,083 | Schindler Holding AG. (Registered) | 28,349 | ||||||||
| 940,717 | Schneider Electric S.A. | 184,941 | ||||||||
| 1,214 | Schweiter Technologies AG. | 1,801 | ||||||||
| 29,295 | Sekisui Jushi Corp | 533 | ||||||||
| 17,108,492 | * | SembCorp Marine Ltd | 1,041 | |||||||
| 11,991 | Semperit AG. Holding | 400 | ||||||||
| 473,942 | * | Senior plc | 943 | |||||||
| 88,815 | * | Sensata Technologies Holding plc | 5,479 | |||||||
| 176,744 | e | Seven Group Holdings Ltd | 2,781 | |||||||
| 19,285 | * | SFA Engineering Corp | 583 | |||||||
| 20,549 | SFS Group AG. | 2,837 | ||||||||
| 79,869 | * | SGL Carbon AG. | 698 | |||||||
| 380,627 | Shanghai Construction Group Co Ltd | 215 | ||||||||
| 435,580 | Shanghai Diesel Engine Co Ltd | 260 | ||||||||
| 857,803 | Shanghai Electric Group Co Ltd | 654 | ||||||||
| 39 |
COLLEGE RETIREMENT EQUITIES FUND - Stock Account
| SHARES | COMPANY | VALUE (000) | ||||||||
| 358,554 | Shanghai Highly Group Co Ltd | $ | 187 | |||||||
| 478,000 | Shanghai Industrial Holdings Ltd | 697 | ||||||||
| 238,700 | Shanghai Mechanical and Electrical Industry Co Ltd | 326 | ||||||||
| 174,605 | Shapir Engineering and Industry Ltd | 1,543 | ||||||||
| 174,140 | Shenzhen Inovance Technology Co Ltd | 1,876 | ||||||||
| 25,136 | Shibaura Machine Co Ltd | 823 | ||||||||
| 19,600 | Shibuya Kogyo Co Ltd | 509 | ||||||||
| 287,694 | * | Shikun & Binui Ltd | 1,840 | |||||||
| 42,600 | Shima Seiki Manufacturing Ltd | 731 | ||||||||
| 380,744 | Shimizu Corp | 2,361 | ||||||||
| 10,904 | Shin Nippon Air Technologies Co Ltd | 228 | ||||||||
| 162,361 | Shin Zu Shing Co Ltd | 566 | ||||||||
| 33,584 | Shinko Plantech Co Ltd | 342 | ||||||||
| 66,600 | Shinmaywa Industries Ltd | 507 | ||||||||
| 42,348 | Shinnihon Corp | 301 | ||||||||
| 97,093 | * | Shoals Technologies Group, Inc | 2,359 | |||||||
| 47,808 | SHO-BOND Holdings Co Ltd | 2,148 | ||||||||
| 1,537,469 | * | Shun TAK Holdings Ltd | 424 | |||||||
| 317,227 | Shyft Group, Inc | 15,585 | ||||||||
| 397,200 | Sichuan Road & Bridge Co Ltd | 750 | ||||||||
| 1,700,982 | Siemens AG. | 294,615 | ||||||||
| 2,137,776 | * | Siemens Energy AG. | 54,544 | |||||||
| 65,410 | * | Siemens Gamesa Renewable Energy | 1,553 | |||||||
| 80,889 | Siemens India Ltd | 2,564 | ||||||||
| 54,000 | Sieyuan Electric Co Ltd | 418 | ||||||||
| 12,782 | e | SIF Holding NV | 178 | |||||||
| 888,978 | * | SIG plc | 572 | |||||||
| 237,803 | g | Signify NV | 11,042 | |||||||
| 3,335,359 | Sime Darby BHD | 1,859 | ||||||||
| 70,634 | Simpson Manufacturing Co, Inc | 9,823 | ||||||||
| 1,032,907 | Singapore Technologies Engineering Ltd | 2,883 | ||||||||
| 19,751 | Sinko Industries Ltd | 345 | ||||||||
| 1,101,296 | Sino Thai Engineering & Construction PCL | 484 | ||||||||
| 1,537,500 | Sinopec Engineering Group Co Ltd | 759 | ||||||||
| 872,467 | Sinotruk Hong Kong Ltd | 1,343 | ||||||||
| 74,644 | * | SiteOne Landscape Supply, Inc | 18,085 | |||||||
| 49,745 | SK Holdings Co Ltd | 10,487 | ||||||||
| 397,129 | * | SK Networks Co Ltd | 1,675 | |||||||
| 92,612 | Skanska AB (B Shares) | 2,393 | ||||||||
| 1,258,857 | SKF AB (B Shares) | 29,772 | ||||||||
| 24,248 | SKF India Ltd | 1,218 | ||||||||
| 179,436 | SM Investments Corp | 3,318 | ||||||||
| 40 |
COLLEGE RETIREMENT EQUITIES FUND - Stock Account
| SHARES | COMPANY | VALUE (000) | ||||||||
| 45,163 | SMC Corp | $ | 30,524 | |||||||
| 1,673,676 | Smiths Group plc | 35,825 | ||||||||
| 52,498 | Snap-On, Inc | 11,307 | ||||||||
| 234,648 | e | SNC-Lavalin Group, Inc | 5,734 | |||||||
| 60,300 | e | Sodick Co Ltd | 429 | |||||||
| 288,502 | Sojitz Holdings Corp | 4,335 | ||||||||
| 6,947 | * | Solar Holdings AS (B Shares) | 846 | |||||||
| 49,581 | * | Soltec Power Holdings S.A. | 349 | |||||||
| 97,875 | Spirax-Sarco Engineering plc | 21,301 | ||||||||
| 615,359 | Spirit Aerosystems Holdings, Inc (Class A) | 26,516 | ||||||||
| 339,868 | * | SPX Corp | 20,283 | |||||||
| 132,907 | SPX FLOW, Inc | 11,494 | ||||||||
| 50,940 | Stabilus S.A. | 3,744 | ||||||||
| 60,888 | e | Stadler Rail AG. | 2,669 | |||||||
| 10,520 | Standex International Corp | 1,164 | ||||||||
| 611,316 | Stanley Black & Decker, Inc | 115,306 | ||||||||
| 42,466 | Star Micronics Co Ltd | 572 | ||||||||
| 6,451 | Steico SE | 826 | ||||||||
| 386,699 | *,e | Stem, Inc | 7,336 | |||||||
| 53,805 | * | Sterling & Wilson Solar Ltd | 276 | |||||||
| 39,020 | * | Sterling Construction Co, Inc | 1,026 | |||||||
| 22,920 | e | Sulzer AG. | 2,252 | |||||||
| 1,383,170 | Sumitomo Corp | 20,470 | ||||||||
| 18,097 | Sumitomo Densetsu Co Ltd | 329 | ||||||||
| 283,300 | Sumitomo Heavy Industries Ltd | 6,876 | ||||||||
| 201,737 | Sumitomo Mitsui Construction Co Ltd | 751 | ||||||||
| 1,170,000 | * | Sun King Power Electronics Group Ltd | 661 | |||||||
| 101,770 | Sungrow Power Supply Co Ltd | 2,329 | ||||||||
| 190,920 | * | Sunrun, Inc | 6,549 | |||||||
| 2,144,600 | Sunway BHD | 885 | ||||||||
| 367,848 | Sunway Construction Group BHD | 138 | ||||||||
| 112,763 | Sunwoda Electronic Co Ltd | 746 | ||||||||
| 69,800 | Suzhou Gold Mantis Construction Decoration Co Ltd | 67 | ||||||||
| 6,500 | Suzhou Maxwell Technologies Co Ltd | 655 | ||||||||
| 5,073,738 | * | Suzlon Energy Ltd | 692 | |||||||
| 242,142 | e | Sweco AB | 4,556 | |||||||
| 115,722 | Tadano Ltd | 1,116 | ||||||||
| 314,176 | * | Taihan Electric Wire Co Ltd | 470 | |||||||
| 14,243 | Taihei Dengyo Kaisha Ltd | 355 | ||||||||
| 52,753 | Taikisha Ltd | 1,437 | ||||||||
| 132,586 | Taisei Corp | 4,032 | ||||||||
| 1,067,670 | Taiwan Glass Industrial Corp | 1,030 | ||||||||
| 41 |
COLLEGE RETIREMENT EQUITIES FUND - Stock Account
| SHARES | COMPANY | VALUE (000) | ||||||||
| 14,639 | Takamatsu Corp | $ | 251 | |||||||
| 31,364 | Takara Standard Co Ltd | 385 | ||||||||
| 84,841 | Takasago Thermal Engineering Co Ltd | 1,400 | ||||||||
| 124,500 | Takeuchi Manufacturing Co Ltd | 2,954 | ||||||||
| 80,100 | Takuma Co Ltd | 992 | ||||||||
| 76,355 | *,e,g | Talgo S.A. | 471 | |||||||
| 1,912,000 | * | Tatung Co Ltd | 2,249 | |||||||
| 292,866 | TBEA Co Ltd | 971 | ||||||||
| 1,493,975 | Techtronic Industries Co | 29,782 | ||||||||
| 1,849,000 | Teco Electric and Machinery Co Ltd | 2,112 | ||||||||
| 25,899 | e | Teikoku Sen-I Co Ltd | 523 | |||||||
| 203,552 | Tekfen Holding AS | 311 | ||||||||
| 9,274 | Tennant Co | 752 | ||||||||
| 382,512 | Terex Corp | 16,811 | ||||||||
| 37,128 | Textainer Group Holdings Ltd | 1,326 | ||||||||
| 766,143 | Textron, Inc | 59,146 | ||||||||
| 180,765 | Thales S.A. | 15,377 | ||||||||
| 45,533 | Thermax Ltd | 1,093 | ||||||||
| 29,798 | * | Thermon Group Holdings | 504 | |||||||
| 174,200 | * | THK Co Ltd | 4,227 | |||||||
| 2,764,200 | Thoresen Thai Agencies PCL | 790 | ||||||||
| 323,400 | Tianshan Aluminum Group Co Ltd | 415 | ||||||||
| 21,162 | Timken Co | 1,466 | ||||||||
| 19,490 | Timken India Ltd | 521 | ||||||||
| 130,132 | * | Titan International, Inc | 1,426 | |||||||
| 78,149 | * | Titan Machinery, Inc | 2,633 | |||||||
| 142,900 | Titan Wind Energy Suzhou Co Ltd | 435 | ||||||||
| 49,524 | TKH Group NV | 3,126 | ||||||||
| 16,800 | e | Toa Corp/Tokyo | 353 | |||||||
| 69,811 | Tocalo Co Ltd | 895 | ||||||||
| 284,156 | Toda Corp | 1,800 | ||||||||
| 9,815 | Toenec Corp | 288 | ||||||||
| 109,500 | Tokai Corp | 828 | ||||||||
| 108,002 | Tokyu Construction Co Ltd | 626 | ||||||||
| 103,536 | Topsec Technologies Group Inc | 311 | ||||||||
| 66,791 | Toro Co | 6,673 | ||||||||
| 182,501 | Toromont Industries Ltd | 16,499 | ||||||||
| 314,292 | Toshiba Corp | 12,933 | ||||||||
| 27,077 | Totetsu Kogyo Co Ltd | 591 | ||||||||
| 129,428 | Toto Ltd | 5,971 | ||||||||
| 79,003 | Toyo Construction Co Ltd | 399 | ||||||||
| 12,700 | e | Toyo Tanso Co Ltd | 354 | |||||||
| 42 |
COLLEGE RETIREMENT EQUITIES FUND - Stock Account
| SHARES | COMPANY | VALUE (000) | ||||||||
| 103,971 | Toyota Industries Corp | $ | 8,317 | |||||||
| 154,858 | Toyota Tsusho Corp | 7,138 | ||||||||
| 4,248 | * | TPI Composites, Inc | 64 | |||||||
| 842,727 | Trane Technologies plc | 170,256 | ||||||||
| 754 | * | Transcat Inc | 70 | |||||||
| 80,220 | * | TransDigm Group, Inc | 51,042 | |||||||
| 273,161 | Travis Perkins plc | 5,767 | ||||||||
| 473,539 | Trelleborg AB (B Shares) | 12,424 | ||||||||
| 115,128 | * | Trex Co, Inc | 15,546 | |||||||
| 68,067 | Trinity Industries, Inc | 2,056 | ||||||||
| 76,164 | Triton International Ltd | 4,587 | ||||||||
| 57,200 | * | Triumph Group, Inc | 1,060 | |||||||
| 65,756 | Troax Group AB | 3,373 | ||||||||
| 54,710 | Trusco Nakayama Corp | 1,300 | ||||||||
| 53,130 | Tsubaki Nakashima Co Ltd | 679 | ||||||||
| 30,790 | Tsubakimoto Chain Co | 846 | ||||||||
| 53,200 | Tsugami Corp | 812 | ||||||||
| 39,100 | Tsukishima Kikai Co Ltd | 386 | ||||||||
| 43,210 | TTK Prestige Ltd | 573 | ||||||||
| 37,434 | Turk Traktor ve Ziraat Makineleri AS | 637 | ||||||||
| 1,499,212 | Turkiye Sise ve Cam Fabrikalari AS | 1,516 | ||||||||
| 35,782 | * | Tutor Perini Corp | 443 | |||||||
| 20,469 | * | TY Holdings Co Ltd | 485 | |||||||
| 248,447 | Tyman plc | 1,343 | ||||||||
| 183,964 | UFP Industries, Inc | 16,927 | ||||||||
| 86,879 | Ultra Electronics Holdings | 3,751 | ||||||||
| 10,100 | Union Tool Co | 349 | ||||||||
| 172,537 | United Integrated Services Co Ltd | 1,131 | ||||||||
| 133,405 | * | United Rentals, Inc | 44,329 | |||||||
| 324,603 | * | Univar Solutions Inc | 9,202 | |||||||
| 66,841 | Uponor Oyj | 1,583 | ||||||||
| 119,700 | Ushio, Inc | 1,989 | ||||||||
| 366,200 | UWC BHD | 545 | ||||||||
| 209,633 | Valmet Corp | 8,988 | ||||||||
| 21,166 | Valmont Industries, Inc | 5,302 | ||||||||
| 22,125 | e | Varta AG. | 2,863 | |||||||
| 34,117 | g | VAT Group AG. | 16,906 | |||||||
| 78,510 | * | Vectrus, Inc | 3,593 | |||||||
| 131,688 | Veidekke ASA | 1,980 | ||||||||
| 12,621 | * | Veritiv Corp | 1,547 | |||||||
| 546,525 | Vertiv Holdings Co | 13,647 | ||||||||
| 527,016 | Vestas Wind Systems A.S. | 16,050 | ||||||||
| 43 |
COLLEGE RETIREMENT EQUITIES FUND - Stock Account
| SHARES | COMPANY | VALUE (000) | ||||||||
| 272,091 | Vesuvius plc | $ | 1,668 | |||||||
| 186,212 | V-Guard Industries Ltd | 554 | ||||||||
| 2,667 | * | Vicor Corp | 339 | |||||||
| 111,802 | *,e | View, Inc | 437 | |||||||
| 957,932 | Vinci S.A. | 101,172 | ||||||||
| 170,360 | * | Virgin Galactic Holdings, Inc | 2,279 | |||||||
| 25,085 | Volati AB | 629 | ||||||||
| 351,340 | Volex plc | 1,649 | ||||||||
| 233,406 | Voltas Ltd | 3,821 | ||||||||
| 70,000 | Voltronic Power Technology Corp | 3,905 | ||||||||
| 232,727 | Volution Group plc | 1,744 | ||||||||
| 56,743 | Volvo AB (A Shares) | 1,331 | ||||||||
| 534,193 | Volvo AB (B Shares) | 12,354 | ||||||||
| 11,856 | Vossloh AG. | 608 | ||||||||
| 324,334 | W.W. Grainger, Inc | 168,083 | ||||||||
| 42,552 | Wabash National Corp | 831 | ||||||||
| 85,531 | Wacker Construction Equipment AG. | 2,447 | ||||||||
| 49,600 | Wakita & Co Ltd | 464 | ||||||||
| 2,600,472 | Walsin Lihwa Corp | 2,484 | ||||||||
| 129,922 | Wartsila Oyj (B Shares) | 1,822 | ||||||||
| 5,042,100 | * | Waskita Karya Persero Tbk PT | 225 | |||||||
| 45,002 | Watsco, Inc | 14,080 | ||||||||
| 18,208 | Watts Water Technologies, Inc (Class A) | 3,535 | ||||||||
| 487,019 | e | Webuild SpA | 1,152 | |||||||
| 1,919,150 | Weg S.A. | 11,304 | ||||||||
| 1,420,709 | Weichai Power Co Ltd | 2,786 | ||||||||
| 328,386 | Weichai Power Co Ltd (Class A) | 921 | ||||||||
| 2,135,040 | Weir Group plc | 49,545 | ||||||||
| 264,532 | * | Welbilt, Inc | 6,288 | |||||||
| 81,887 | * | WESCO International, Inc | 10,776 | |||||||
| 1,004,238 | Westinghouse Air Brake Technologies Corp | 92,500 | ||||||||
| 158,561 | *,e | Westport Innovations, Inc | 377 | |||||||
| 3,263,972 | * | Wijaya Karya Persero Tbk PT | 253 | |||||||
| 1,911 | * | Willis Lease Finance Corp | 72 | |||||||
| 546,839 | * | WillScot Mobile Mini Holdings Corp | 22,333 | |||||||
| 57,990 | Wilson Bayly Holmes-Ovcon Ltd | 412 | ||||||||
| 184,901 | e | Woodward Inc | 20,239 | |||||||
| 143,630 | e | WSP Global, Inc | 20,850 | |||||||
| 19,700 | Wuxi Shangji Automation Co Ltd | 516 | ||||||||
| 656,738 | XCMG Construction Machinery Co Ltd | 617 | ||||||||
| 444,711 | Xiamen C & D, Inc | 633 | ||||||||
| 271,767 | Xinjiang Goldwind Science & Technology Co Ltd | 703 | ||||||||
| 44 |
COLLEGE RETIREMENT EQUITIES FUND - Stock Account
| SHARES | COMPANY | VALUE (000) | ||||||||
| 917,813 | Xinjiang Goldwind Science & Technology Co Ltd (Hong Kong) | $ | 1,792 | |||||||
| 2,004,000 | Xinyi Glass Holdings Co Ltd | 5,020 | ||||||||
| 137,112 | Xxentria Technology Materials Corp | 337 | ||||||||
| 62,702 | Xylem, Inc | 7,519 | ||||||||
| 38,380 | e | YAMABIKO Corp | 416 | |||||||
| 76,470 | Yamazen Corp | 716 | ||||||||
| 2,906,800 | Yangzijiang Shipbuilding | 2,888 | ||||||||
| 25,348 | Yantai Eddie Precision Machinery Co Ltd | 127 | ||||||||
| 67,422 | Yaskawa Electric Corp | 3,308 | ||||||||
| 184,963 | *,g | Yellow Cake plc | 855 | |||||||
| 170,694 | e | YIT Oyj | 839 | |||||||
| 61,279 | Yokogawa Bridge Holdings Corp | 1,171 | ||||||||
| 18,600 | * | Youngy Co Ltd | 380 | |||||||
| 18,652 | Yuasa Trading Co Ltd | 483 | ||||||||
| 121,000 | Yungtay Engineering Co Ltd | 282 | ||||||||
| 40,800 | Yurtec Corp | 238 | ||||||||
| 10,438 | *,† | Yuyang DNU Co Ltd | 0 | |||||||
| 227,727 | Zardoya Otis S.A. | 1,833 | ||||||||
| 12,600 | Zehnder Group AG. | 1,282 | ||||||||
| 366,100 | Zhefu Holding Group Co Ltd | 409 | ||||||||
| 155,463 | Zhejiang Chint Electrics Co Ltd | 1,314 | ||||||||
| 21,192 | Zhejiang Dingli Machinery Co Ltd | 267 | ||||||||
| 27,892 | Zhejiang HangKe Technology, Inc Co | 471 | ||||||||
| 234,612 | Zhejiang Sanhua Intelligent Controls Co Ltd | 931 | ||||||||
| 133,451 | Zhejiang Weixing New Building Materials Co Ltd | 509 | ||||||||
| 260,000 | e | Zhengzhou Coal Mining Machinery Group Co Ltd | 274 | |||||||
| 57,600 | Zhengzhou Yutong Bus Co Ltd | 100 | ||||||||
| 392,400 | Zhuzhou CSR Times Electric Co Ltd | 2,274 | ||||||||
| 209,700 | Zhuzhou Kibing Group Co Ltd | 564 | ||||||||
| 550,139 | Zoomlion Heavy Industry Science and Technology Co Ltd | 619 | ||||||||
| 1,017,138 | Zoomlion Heavy Industry Science and Technology Co Ltd | 641 | ||||||||
| 32,506 | Zumtobel AG. | 285 | ||||||||
| 228,316 | Zurn Water Solutions Corp | 8,311 | ||||||||
| TOTAL CAPITAL GOODS | 9,983,561 | |||||||||
| COMMERCIAL & PROFESSIONAL SERVICES - 1.4% | ||||||||||
| 22,891 | * | 51job, Inc (ADR) | 1,120 | |||||||
| 118,451 | ABM Industries, Inc | 4,839 | ||||||||
| 46,581 | * | Acacia Research (Acacia Technologies) | 239 | |||||||
| 260,570 | ACCO Brands Corp | 2,152 | ||||||||
| 184,221 | Adecco S.A. | 9,387 | ||||||||
| 45 |
COLLEGE RETIREMENT EQUITIES FUND - Stock Account
| SHARES | COMPANY | VALUE (000) | ||||||||
| 135,899 | e | ADT, Inc | $ | 1,143 | ||||||
| 40,320 | Aeon Delight Co Ltd | 1,182 | ||||||||
| 145,959 | AF AB | 4,108 | ||||||||
| 3,024,601 | * | Aker Carbon Capture AS. | 9,402 | |||||||
| 16,553 | * | Akka Technologies S.A. | 907 | |||||||
| 593,492 | ALS Ltd | 5,650 | ||||||||
| 40,530 | e | Altech Corp | 670 | |||||||
| 7,994 | Amadeus Fire AG | 1,649 | ||||||||
| 48,800 | Ambipar Participacoes e Empreendimentos S | 368 | ||||||||
| 29,298 | * | Anaergia, Inc | 468 | |||||||
| 174,707 | Applus Services S.A. | 1,608 | ||||||||
| 10,322 | * | Aris Water Solution, Inc | 134 | |||||||
| 150,498 | * | ASGN Inc | 18,571 | |||||||
| 111,214 | * | Atlas Technical Consultants, Inc | 936 | |||||||
| 6,786 | Barrett Business Services, Inc | 469 | ||||||||
| 46,279 | BayCurrent Consulting, Inc | 17,837 | ||||||||
| 48,664 | g | Befesa S.A. | 3,734 | |||||||
| 388,023 | Beijing Originwater Technology Co Ltd | 438 | ||||||||
| 290,100 | Benefit One, Inc | 12,464 | ||||||||
| 64,947 | BeNEXT Group Inc | 957 | ||||||||
| 7,490 | Bertrandt AG. | 486 | ||||||||
| 371,897 | g | Biffa plc | 1,805 | |||||||
| 34,790 | Bilfinger Berger AG. | 1,177 | ||||||||
| 95,500 | Binjiang Service Group Co Ltd | 268 | ||||||||
| 334,000 | Boa Vista Servicos S.A. | 360 | ||||||||
| 199,279 | Booz Allen Hamilton Holding Co | 16,897 | ||||||||
| 151,898 | Boyd Group Services, Inc | 23,971 | ||||||||
| 148,092 | Brady Corp (Class A) | 7,982 | ||||||||
| 1,604,340 | Brambles Ltd | 12,412 | ||||||||
| 246,947 | g | Bravida Holding AB | 3,469 | |||||||
| 36,905 | * | BrightView Holdings, Inc | 520 | |||||||
| 4,715 | Brink’s Co | 309 | ||||||||
| 95,147 | Brunel International NV | 1,215 | ||||||||
| 422,728 | Bureau Veritas S.A. | 14,034 | ||||||||
| 22,414 | * | CACI International, Inc (Class A) | 6,034 | |||||||
| 33,110 | * | Casella Waste Systems, Inc (Class A) | 2,828 | |||||||
| 131,236 | Caverion Corp | 953 | ||||||||
| 43,697 | * | CBIZ, Inc | 1,709 | |||||||
| 25,473 | * | Ceco Environmental Corp | 159 | |||||||
| 12,692 | Cewe Color Holding AG. | 1,848 | ||||||||
| 2,801,085 | China Everbright International Ltd | 2,250 | ||||||||
| 84,168 | * | Cimpress plc | 6,027 | |||||||
| 46 |
COLLEGE RETIREMENT EQUITIES FUND - Stock Account
| SHARES | COMPANY | VALUE (000) | ||||||||
| 85,532 | Cintas Corp | $ | 37,905 | |||||||
| 1,756,287 | * | Clarivate Analytics plc | 41,308 | |||||||
| 49,757 | * | Clean Harbors, Inc | 4,964 | |||||||
| 83,000 | Cleanaway Co Ltd | 700 | ||||||||
| 4,548,489 | Cleanaway Waste Management Ltd | 10,354 | ||||||||
| 118,569 | Clipper Logistics plc | 1,165 | ||||||||
| 4,978 | e | Compx International, Inc | 112 | |||||||
| 113,985 | g | Coor Service Management Holding AB | 1,041 | |||||||
| 205,245 | * | Copart, Inc | 31,119 | |||||||
| 108,300 | * | CoreCivic, Inc | 1,080 | |||||||
| 375,203 | * | CoStar Group, Inc | 29,652 | |||||||
| 3,474 | CRA International, Inc | 324 | ||||||||
| 1,182,700 | CTOS Digital Bhd | 514 | ||||||||
| 1,968,733 | Dai Nippon Printing Co Ltd | 49,547 | ||||||||
| 53,165 | Daiseki Co Ltd | 2,362 | ||||||||
| 6,177 | Danel Adir Yeoshua Ltd | 1,396 | ||||||||
| 38,020 | Deluxe Corp | 1,221 | ||||||||
| 120,894 | * | Derichebourg | 1,399 | |||||||
| 54,560 | DKSH Holding AG. | 4,497 | ||||||||
| 8,965 | *,e | DO & CO AG. | 754 | |||||||
| 849,079 | Downer EDI Ltd | 3,688 | ||||||||
| 50,092 | * | Driven Brands Holdings, Inc | 1,684 | |||||||
| 152,536 | * | Dun & Bradstreet Holdings, Inc | 3,125 | |||||||
| 47,498 | Duskin Co Ltd | 1,160 | ||||||||
| 418,000 | Dynagreen Environmental Protection Group Co Ltd | 215 | ||||||||
| 11,675 | Ecopro HN Co Ltd | 757 | ||||||||
| 36,000 | ECOVE Environment Corp | 304 | ||||||||
| 392,943 | * | Elis S.A. | 6,808 | |||||||
| 146,820 | en-japan, Inc | 4,149 | ||||||||
| 22,357 | Ennis, Inc | 437 | ||||||||
| 116,672 | Equifax, Inc | 34,160 | ||||||||
| 1,198,365 | Experian Group Ltd | 59,027 | ||||||||
| 18,035 | Exponent, Inc | 2,105 | ||||||||
| 32,474 | Fila S.p.A | 358 | ||||||||
| 161,464 | * | First Advantage Corp | 3,074 | |||||||
| 27,452 | * | Forrester Research, Inc | 1,612 | |||||||
| 33,224 | * | Franklin Covey Co | 1,540 | |||||||
| 2,797,600 | Frontken Corp BHD | 2,678 | ||||||||
| 31,897 | * | FTI Consulting, Inc | 4,894 | |||||||
| 107,865 | Fullcast Co Ltd | 2,308 | ||||||||
| 45,354 | Funai Soken Holdings, Inc | 1,032 | ||||||||
| 16,193 | * | GDI Integrated Facility Services, Inc | 689 | |||||||
| 47 |
COLLEGE RETIREMENT EQUITIES FUND - Stock Account
| SHARES | COMPANY | VALUE (000) | ||||||||
| 193,463 | e | GFL Environmental, Inc | $ | 7,315 | ||||||
| 245,300 | g | GPS Participacoes e Empreendimentos S.A. | 696 | |||||||
| 64,365 | * | Harsco Corp | 1,076 | |||||||
| 2,035,734 | Hays plc | 4,042 | ||||||||
| 108,326 | Healthcare Services Group | 1,927 | ||||||||
| 16,653 | Heidrick & Struggles International, Inc | 728 | ||||||||
| 8,679 | * | Heritage-Crystal Clean, Inc | 278 | |||||||
| 391,603 | Herman Miller, Inc | 15,347 | ||||||||
| 2,028 | e | HireQuest, Inc | 41 | |||||||
| 11,275 | * | HireRight Holdings Corp | 180 | |||||||
| 34,499 | HNI Corp | 1,451 | ||||||||
| 649,712 | HomeServe plc | 7,691 | ||||||||
| 46,527 | * | Huron Consulting Group, Inc | 2,322 | |||||||
| 230,303 | * | IAA, Inc | 11,658 | |||||||
| 169,713 | ICF International, Inc | 17,404 | ||||||||
| 364,286 | IHS Markit Ltd | 48,421 | ||||||||
| 271,450 | Indian Railway Catering & Tourism Corp Ltd | 3,026 | ||||||||
| 27,806 | Insource Co Ltd | 680 | ||||||||
| 11,545 | Insperity, Inc | 1,364 | ||||||||
| 27,118 | * | Insun ENT Co Ltd | 253 | |||||||
| 135,394 | Interface, Inc | 2,160 | ||||||||
| 222,392 | Intertek Group plc | 16,966 | ||||||||
| 114,642 | *,g | Intertrust NV | 2,557 | |||||||
| 776,744 | Intrum Justitia AB | 20,014 | ||||||||
| 273,251 | IPH Ltd | 1,745 | ||||||||
| 142,944 | IR Japan Holdings Ltd | 8,526 | ||||||||
| 191,864 | * | ISS AS | 3,638 | |||||||
| 16,600 | JAC Recruitment Co Ltd | 301 | ||||||||
| 265,295 | Jacobs Engineering Group, Inc | 36,937 | ||||||||
| 1,758,800 | Japan Elevator Service Holdings Co Ltd | 32,854 | ||||||||
| 654,560 | JMT Network Services PCL | 1,342 | ||||||||
| 567,209 | * | Johnson Service Group plc | 1,129 | |||||||
| 111,427 | * | KAR Auction Services, Inc | 1,740 | |||||||
| 98,959 | KBR, Inc | 4,712 | ||||||||
| 64,595 | Kelly Services, Inc (Class A) | 1,083 | ||||||||
| 23,829 | * | KEPCO Plant Service & Engineering Co Ltd | 771 | |||||||
| 169,730 | Kforce, Inc | 12,767 | ||||||||
| 31,970 | Kimball International, Inc (Class B) | 327 | ||||||||
| 100,408 | Kokuyo Co Ltd | 1,498 | ||||||||
| 48,502 | Korn/Ferry International | 3,673 | ||||||||
| 36,557 | g | L&T Technology Services Ltd | 2,746 | |||||||
| 18,956 | *,e | Legalzoom.com, Inc | 305 | |||||||
| 48 |
COLLEGE RETIREMENT EQUITIES FUND - Stock Account
| SHARES | COMPANY | VALUE (000) | ||||||||
| 133,896 | Leidos Holdings, Inc | $ | 11,903 | |||||||
| 82,901 | LifeWorks, Inc | 1,673 | ||||||||
| 27,389 | e | Link And Motivation, Inc | 131 | |||||||
| 91,506 | Loomis AB | 2,437 | ||||||||
| 20,085 | Maharah Human Resources Co | 406 | ||||||||
| 5,600 | *,e | Makuake, Inc | 211 | |||||||
| 85,418 | Manpower, Inc | 8,314 | ||||||||
| 23,953 | Mantech International Corp (Class A) | 1,747 | ||||||||
| 14,262 | Matsuda Sangyo Co Ltd | 302 | ||||||||
| 26,658 | Matthews International Corp (Class A) | 978 | ||||||||
| 79,336 | McMillan Shakespeare Ltd | 698 | ||||||||
| 29,328 | Meitec Corp | 1,726 | ||||||||
| 301,167 | *,e | Meltwater Holding BV | 865 | |||||||
| 399,173 | Michael Page International plc | 3,423 | ||||||||
| 9,000 | * | Midac Holdings Co Ltd | 318 | |||||||
| 18,549 | * | Mistras Group, Inc | 138 | |||||||
| 1,716,902 | Mitie Group | 1,499 | ||||||||
| 51,044 | Mitsubishi Pencil Co Ltd | 538 | ||||||||
| 2,230 | * | Montrose Environmental Group, Inc | 157 | |||||||
| 35,303 | MSA Safety, Inc | 5,329 | ||||||||
| 35,365 | * | NICE Information Service Co Ltd | 535 | |||||||
| 349,213 | Nielsen NV | 7,162 | ||||||||
| 727,270 | Nihon M&A Center, Inc | 17,839 | ||||||||
| 23,100 | Nippon Kanzai Co Ltd | 581 | ||||||||
| 218,111 | Nippon Parking Development Co Ltd | 262 | ||||||||
| 3,010 | e | NL Industries, Inc | 22 | |||||||
| 253,348 | Nomura Co Ltd | 2,099 | ||||||||
| 70,928 | Okamura Corp | 793 | ||||||||
| 1,540,830 | * | Omni Bridgeway Ltd | 4,127 | |||||||
| 137,709 | e | Outsourcing, Inc | 1,858 | |||||||
| 279,700 | Park24 Co Ltd | 3,834 | ||||||||
| 24,300 | Pasona Group, Inc | 697 | ||||||||
| 144,626 | Persol Holdings Co Ltd | 4,205 | ||||||||
| 33,142 | Pilot Corp | 1,269 | ||||||||
| 656,557 | Pitney Bowes, Inc | 4,353 | ||||||||
| 123,827 | Prestige International, Inc | 720 | ||||||||
| 513,742 | e,g | Prosegur Cash S.A. | 362 | |||||||
| 290,742 | Prosegur Cia de Seguridad S.A. | 763 | ||||||||
| 100,932 | *,e | PyroGenesis Canada, Inc | 266 | |||||||
| 167,702 | *,e | Quantafuel ASA | 610 | |||||||
| 69,525 | g | Quess Corp Ltd | 799 | |||||||
| 372,303 | * | Raksul, Inc | 18,392 | |||||||
| 49 |
COLLEGE RETIREMENT EQUITIES FUND - Stock Account
| SHARES | COMPANY | VALUE (000) | ||||||||
| 137,360 | Randstad Holdings NV | $ | 9,370 | |||||||
| 4,677,574 | Recruit Holdings Co Ltd | 284,657 | ||||||||
| 264,818 | RELX plc | 8,599 | ||||||||
| 2,210,124 | RELX plc (London) | 72,154 | ||||||||
| 101,287 | * | Renewi plc | 1,048 | |||||||
| 2,034,609 | Rentokil Initial plc | 16,105 | ||||||||
| 199,531 | Republic Services, Inc | 27,825 | ||||||||
| 28,804 | Resources Connection, Inc | 514 | ||||||||
| 162,036 | Restore plc | 1,075 | ||||||||
| 136,464 | Ritchie Bros Auctioneers, Inc | 8,351 | ||||||||
| 110,132 | Robert Half International, Inc | 12,282 | ||||||||
| 225,629 | Rollins, Inc | 7,719 | ||||||||
| 393,123 | * | RR Donnelley & Sons Co | 4,427 | |||||||
| 355,117 | RWS Holdings plc | 3,124 | ||||||||
| 20,435 | * | S1 Corp (Korea) | 1,272 | |||||||
| 97,352 | Sato Corp | 1,864 | ||||||||
| 44,588 | * | Saudi Airlines Catering Co | 924 | |||||||
| 55,809 | Science Applications International Corp | 4,665 | ||||||||
| 29,154 | * | Sdiptech AB | 1,521 | |||||||
| 260,706 | Secom Co Ltd | 18,115 | ||||||||
| 349,388 | Securitas AB (B Shares) | 4,806 | ||||||||
| 1,821,184 | Serco Group plc | 3,307 | ||||||||
| 122,207 | SG Fleet Group Ltd | 222 | ||||||||
| 6,639 | SGS S.A. | 22,132 | ||||||||
| 65,535 | Shanghai M&G Stationery, Inc | 663 | ||||||||
| 100,500 | *,† | Shanghai Youngsun Investment Co Ltd | 1 | |||||||
| 37,696 | * | SIS Ltd | 233 | |||||||
| 156,753 | Smart Metering Systems plc | 1,784 | ||||||||
| 161,989 | SmartGroup Corp Ltd | 914 | ||||||||
| 360,787 | SMS Co Ltd | 14,188 | ||||||||
| 29,995 | Societe BIC S.A. | 1,616 | ||||||||
| 53,890 | Sohgo Security Services Co Ltd | 2,141 | ||||||||
| 194,100 | *,e | SOS Ltd (ADR) | 160 | |||||||
| 2,010 | * | SP Plus Corp | 57 | |||||||
| 298,019 | SPIE S.A. | 7,720 | ||||||||
| 82,732 | S-Pool, Inc | 874 | ||||||||
| 71,580 | Sporton International, Inc | 561 | ||||||||
| 133,570 | Stantec, Inc | 7,505 | ||||||||
| 77,547 | Steelcase, Inc (Class A) | 909 | ||||||||
| 87,117 | * | Stericycle, Inc | 5,196 | |||||||
| 8,415 | * | Sterling Check Corp | 173 | |||||||
| 333,976 | Sthree plc | 2,098 | ||||||||
| 50 |
COLLEGE RETIREMENT EQUITIES FUND - Stock Account
| SHARES | COMPANY | VALUE (000) | ||||||||
| 69,000 | Sunny Friend Environmental Technology Co Ltd | $ | 497 | |||||||
| 401,660 | Taiwan Secom Co Ltd | 1,509 | ||||||||
| 317,340 | Taiwan-Sogo Shinkong Security Corp | 451 | ||||||||
| 36,975 | Talenom Oyj | 493 | ||||||||
| 11,491 | * | TeamLease Services Ltd | 643 | |||||||
| 565,754 | TechnoPro Holdings, Inc | 17,150 | ||||||||
| 157,912 | Teleperformance | 70,599 | ||||||||
| 11,061 | Tetra Tech, Inc | 1,878 | ||||||||
| 227,296 | Thomson Reuters Corp | 27,181 | ||||||||
| 46,525 | Tinexta S.p.A | 2,017 | ||||||||
| 144,017 | Tomra Systems ASA | 10,298 | ||||||||
| 215,617 | Toppan Printing Co Ltd | 4,046 | ||||||||
| 182,699 | TransUnion | 21,664 | ||||||||
| 50,400 | * | TRE Holdings Corp | 776 | |||||||
| 119,566 | * | TriNet Group, Inc | 11,390 | |||||||
| 30,150 | * | TrueBlue, Inc | 834 | |||||||
| 13,134 | Unifirst Corp | 2,763 | ||||||||
| 223,007 | * | Upwork, Inc | 7,618 | |||||||
| 25,775 | * | US Ecology, Inc | 823 | |||||||
| 30,899 | UT Group Co Ltd | 1,161 | ||||||||
| 168,881 | Verisk Analytics, Inc | 38,628 | ||||||||
| 164,883 | *,e | Vestum AB | 945 | |||||||
| 2,030 | * | Viad Corp | 87 | |||||||
| 14,600 | *,e | Visional, Inc | 1,234 | |||||||
| 9,164 | VSE Corp | 558 | ||||||||
| 278,973 | Waste Connections, Inc | 38,016 | ||||||||
| 1,158,886 | Waste Management, Inc | 193,418 | ||||||||
| 12,100 | WDB Holdings Co Ltd | 326 | ||||||||
| 5,800 | Weathernews, Inc | 485 | ||||||||
| 2,949 | * | Willdan Group, Inc | 104 | |||||||
| 296,058 | Wolters Kluwer NV | 34,846 | ||||||||
| 8,700 | World Holdings Co Ltd | 196 | ||||||||
| 231,000 | *,†,e | Youyuan International Holdings Ltd | 0 | ^ | ||||||
| 82,700 | Zhejiang Weiming Environment Protection Co Ltd | 474 | ||||||||
| TOTAL COMMERCIAL & PROFESSIONAL SERVICES | 2,018,374 | |||||||||
| CONSUMER DURABLES & APPAREL - 2.4% | ||||||||||
| 874,000 | * | 361 Degrees International Ltd | 449 | |||||||
| 31,218 | * | Accell Group | 1,703 | |||||||
| 131,520 | Acushnet Holdings Corp | 6,981 | ||||||||
| 397,191 | Adidas-Salomon AG. | 114,369 | ||||||||
| 51 |
COLLEGE RETIREMENT EQUITIES FUND - Stock Account
| SHARES | COMPANY | VALUE (000) | ||||||||
| 352,898 | * | Aditya Birla Fashion and Retail Ltd | $ | 1,287 | ||||||
| 159,844 | Aksa Akrilik Kimya Sanayii | 414 | ||||||||
| 1,327,683 | * | Alok Industries Ltd | 458 | |||||||
| 175,670 | Alpargatas S.A. | 1,163 | ||||||||
| 17,818 | * | Amber Enterprises India Ltd | 793 | |||||||
| 12,956 | * | American Outdoor Brands, Inc | 258 | |||||||
| 151,373 | *,e | AMMO, Inc | 825 | |||||||
| 73,245 | AMPACS Corp | 189 | ||||||||
| 708,223 | AmTRAN Technology Co Ltd | 449 | ||||||||
| 1,268,955 | Anta Sports Products Ltd | 19,058 | ||||||||
| 59,469 | Arezzo Industria e Comercio S.A. | 818 | ||||||||
| 338,473 | Asics Corp | 7,504 | ||||||||
| 98,630 | * | Azorim-Investment Development & Construction Co Ltd | 590 | |||||||
| 48,301 | * | Bajaj Electricals Ltd | 832 | |||||||
| 165,836 | Bandai Namco Holdings Inc | 12,966 | ||||||||
| 287,986 | Barratt Developments plc | 2,924 | ||||||||
| 7,334 | Bassett Furniture Industries, Inc | 123 | ||||||||
| 56,168 | Bata India Ltd | 1,410 | ||||||||
| 26,412 | * | Beazer Homes USA, Inc | 613 | |||||||
| 4,783 | Beijing Roborock Technology Co Ltd | 610 | ||||||||
| 149,977 | Bellway plc | 6,816 | ||||||||
| 78,154 | * | Beneteau S.A. | 1,268 | |||||||
| 30,639 | Berkeley Group Holdings plc | 1,984 | ||||||||
| 211,060 | Bonava AB | 1,827 | ||||||||
| 537,000 | *,†,e | Boshiwa International Holding Ltd | 1 | |||||||
| 3,706,472 | Bosideng International Holdings Ltd | 2,335 | ||||||||
| 270,313 | Bovis Homes Group plc | 4,324 | ||||||||
| 118,288 | Breville Group Ltd | 2,728 | ||||||||
| 45,384 | BRP, Inc (Toronto) | 3,975 | ||||||||
| 41,433 | * | Brunello Cucinelli S.p.A | 2,848 | |||||||
| 535,491 | Brunswick Corp | 53,940 | ||||||||
| 198,302 | Burberry Group plc | 4,895 | ||||||||
| 9,860,808 | Cairn Homes plc | 12,686 | ||||||||
| 3,907,743 | Cairn Homes plc (London) | 5,035 | ||||||||
| 322,979 | * | Callaway Golf Co | 8,863 | |||||||
| 71,625 | *,e | Canada Goose Holdings, Inc | 2,654 | |||||||
| 610,738 | * | Capri Holdings Ltd | 39,643 | |||||||
| 3,280 | Carter’s, Inc | 332 | ||||||||
| 282,100 | * | Casio Computer Co Ltd | 3,632 | |||||||
| 74,707 | *,e | Casper Sleep, Inc | 499 | |||||||
| 16,406 | * | Cavco Industries, Inc | 5,211 | |||||||
| 39,038 | * | CCC S.A. | 1,019 | |||||||
| 52 |
COLLEGE RETIREMENT EQUITIES FUND - Stock Account
| SHARES | COMPANY | VALUE (000) | ||||||||
| 11,309 | Century Communities, Inc | $ | 925 | |||||||
| 2,817,400 | China Dongxiang Group Co | 246 | ||||||||
| 485,698 | China Lilang Ltd | 272 | ||||||||
| 22,800 | Chofu Seisakusho Co Ltd | 404 | ||||||||
| 531,357 | Chow Sang Sang Holding | 742 | ||||||||
| 761,291 | Cie Financiere Richemont S.A. | 113,763 | ||||||||
| 1,506,000 | * | Citychamp Watch & Jewellery Group Ltd | 295 | |||||||
| 23,261 | Clarus Corp | 645 | ||||||||
| 2,711,368 | Coats Group plc | 2,540 | ||||||||
| 2,602 | e | Columbia Sportswear Co | 254 | |||||||
| 602,532 | *,g | Countryside Properties plc | 3,694 | |||||||
| 63,569 | * | Coway Co Ltd | 3,983 | |||||||
| 24,315 | COWELL FASHION Co Ltd | 172 | ||||||||
| 313,505 | Crest Nicholson Holdings plc | 1,579 | ||||||||
| 154,862 | *,n | Crocs, Inc | 19,856 | |||||||
| 634,557 | Crompton Greaves Consumer Electricals Ltd | 3,724 | ||||||||
| 656,375 | g | Crystal International Group Ltd | 221 | |||||||
| 8,545 | * | Cuckoo Electronics Co Ltd | 138 | |||||||
| 307,917 | Cyrela Brazil Realty S.A. | 869 | ||||||||
| 19,700 | * | Daiwa Seiko, Inc | 541 | |||||||
| 29,351 | * | Deckers Outdoor Corp | 10,752 | |||||||
| 163,422 | De’Longhi S.p.A. | 5,846 | ||||||||
| 11,068 | Delta-Galil Industries Ltd | 761 | ||||||||
| 38,802 | * | Descente Ltd | 1,428 | |||||||
| 1,339 | * | DI Dong Il Corp | 311 | |||||||
| 35,078 | Dixon Technologies India Ltd | 2,594 | ||||||||
| 454,016 | DR Horton, Inc | 49,238 | ||||||||
| 1,792,475 | * | Dr. Martens PLC | 10,384 | |||||||
| 37,463 | * | Duni AB | 484 | |||||||
| 668,869 | Eclat Textile Co Ltd | 15,241 | ||||||||
| 31,300 | Ecovacs Robotics Co Ltd | 741 | ||||||||
| 2,124 | Einhell Germany AG. | 534 | ||||||||
| 13,038 | Electra Consumer Products 1970 Ltd | 753 | ||||||||
| 1,037,312 | e | Electrolux AB | 25,123 | |||||||
| 7,109 | e | Escalade, Inc | 112 | |||||||
| 36,357 | e | ES-Con Japan Ltd | 248 | |||||||
| 1,551,228 | Essilor International S.A. | 330,220 | ||||||||
| 21,042 | Ethan Allen Interiors, Inc | 553 | ||||||||
| 121,098 | Ez Tec Empreendimentos e Participacoes S.A. | 443 | ||||||||
| 3,912 | * | F&F Co Ltd | 3,106 | |||||||
| 1,196,689 | Feng TAY Enterprise Co Ltd | 10,003 | ||||||||
| 24,654 | *,† | FF Group | 0 | ^ | ||||||
| 53 |
COLLEGE RETIREMENT EQUITIES FUND - Stock Account
| SHARES | COMPANY | VALUE (000) | ||||||||
| 73,756 | * | Fila Korea Ltd | $ | 2,223 | ||||||
| 5,973 | Flexsteel Industries, Inc | 160 | ||||||||
| 1,308 | Forbo Holding AG. | 2,680 | ||||||||
| 822,000 | Formosa Taffeta Co Ltd | 865 | ||||||||
| 39,888 | * | Fossil Group, Inc | 410 | |||||||
| 339,999 | *,†,e | Fuguiniao Co Ltd | 0 | ^ | ||||||
| 72,221 | Fujitsu General Ltd | 1,716 | ||||||||
| 142,032 | Fulgent Sun International Holding Co Ltd | 497 | ||||||||
| 90,568 | Fusheng Precision Co Ltd | 634 | ||||||||
| 39,845 | Games Workshop Group plc | 5,372 | ||||||||
| 80,816 | Garmin Ltd | 11,005 | ||||||||
| 9,642 | Garware Technical Fibres Ltd | 412 | ||||||||
| 250,301 | *,e | Genius Brands International, Inc | 263 | |||||||
| 335,856 | Giant Manufacturing Co Ltd | 4,180 | ||||||||
| 38,442 | * | G-III Apparel Group Ltd | 1,063 | |||||||
| 334,545 | Gildan Activewear, Inc | 14,184 | ||||||||
| 1,577,122 | *,g | Glenveagh Properties plc | 2,212 | |||||||
| 3,460,973 | *,g | Glenveagh Properties plc (London) | 4,819 | |||||||
| 28,847 | Goldwin, Inc | 1,669 | ||||||||
| 157,602 | *,e | GoPro, Inc | 1,625 | |||||||
| 20,904 | * | Green Brick Partners, Inc | 634 | |||||||
| 332,631 | Grendene S.A. | 517 | ||||||||
| 457,671 | * | GRUPO DE MODA SOMA S.A. | 1,043 | |||||||
| 21,500 | Guangdong Xinbao Electrical Appliances Holdings Co Ltd | 83 | ||||||||
| 568,410 | Guararapes Confeccoes S.A. | 1,002 | ||||||||
| 16,318 | Gunze Ltd | 573 | ||||||||
| 2,543,201 | Haier Smart Home Co Ltd | 10,756 | ||||||||
| 437,370 | Haier Smart Home Co Ltd | 2,052 | ||||||||
| 5,634 | Hamilton Beach Brands Holding Co | 81 | ||||||||
| 14,672 | * | Handsome Co Ltd | 439 | |||||||
| 32,724 | Hanesbrands, Inc | 547 | ||||||||
| 53,700 | * | Hang Zhou Great Star Industrial Co Ltd | 257 | |||||||
| 84,305 | Hangzhou Robam Appliances Co Ltd | 477 | ||||||||
| 18,781 | Hansae Co Ltd | 346 | ||||||||
| 11,289 | * | Hanssem Co Ltd | 878 | |||||||
| 16,771 | Harvia Oyj | 1,121 | ||||||||
| 122,216 | Hasbro, Inc | 12,439 | ||||||||
| 310,272 | Haseko Corp | 3,849 | ||||||||
| 43,062 | *,e | Hayward Holdings, Inc | 1,130 | |||||||
| 70,889 | Heiwa Corp | 1,167 | ||||||||
| 8,670 | * | Helen of Troy Ltd | 2,120 | |||||||
| 28,261 | Hermes International | 49,383 | ||||||||
| 54 |
COLLEGE RETIREMENT EQUITIES FUND - Stock Account
| SHARES | COMPANY | VALUE (000) | ||||||||
| 7,319 | * | Hitachi Home & Life Solutions India Ltd | $ | 194 | ||||||
| 101,471 | *,e | HLB, Inc | 2,969 | |||||||
| 11,230 | Hooker Furniture Corp | 261 | ||||||||
| 466,000 | *,† | HOSA International Ltd | 1 | |||||||
| 4,545 | * | Hovnanian Enterprises, Inc | 579 | |||||||
| 140,162 | Hugo Boss AG. | 8,485 | ||||||||
| 17,141 | * | Hwaseung Enterprise Co Ltd | 243 | |||||||
| 92,462 | IG Design Group plc | 320 | ||||||||
| 102,550 | Iida Group Holdings Co Ltd | 2,385 | ||||||||
| 81,409 | Indo Count Industries Ltd | 272 | ||||||||
| 12,815 | Installed Building Products, Inc | 1,791 | ||||||||
| 4,438 | * | iRobot Corp | 292 | |||||||
| 64,610 | Japan Wool Textile Co Ltd | 514 | ||||||||
| 46,619 | Jason Furniture Hangzhou Co Ltd | 564 | ||||||||
| 67,482 | JM AB | 3,045 | ||||||||
| 174,994 | JNBY Design Ltd | 278 | ||||||||
| 98,000 | Johnson Health Tech Co Ltd | 199 | ||||||||
| 2,177 | Johnson Outdoors, Inc | 204 | ||||||||
| 19,900 | Joyoung Co Ltd | 72 | ||||||||
| 16,415 | Kaufman & Broad S.A. | 691 | ||||||||
| 57,688 | KB Home | 2,580 | ||||||||
| 1,202,244 | Kinpo Electronics | 700 | ||||||||
| 10,400 | * | Ki-Star Real Estate Co Ltd | 807 | |||||||
| 273,956 | KMC Kuei Meng International In | 1,952 | ||||||||
| 618,700 | Konka Group Co Ltd | 187 | ||||||||
| 162,757 | Kontoor Brands, Inc | 8,341 | ||||||||
| 91,413 | KPR Mill Ltd | 821 | ||||||||
| 13,723 | * | Landsea Homes Corp | 100 | |||||||
| 2,684 | *,e | Latham Group, Inc | 67 | |||||||
| 41,116 | La-Z-Boy, Inc | 1,493 | ||||||||
| 7,095 | * | Legacy Housing Corp | 188 | |||||||
| 128,260 | Leggett & Platt, Inc | 5,279 | ||||||||
| 254,695 | Lennar Corp (Class A) | 29,585 | ||||||||
| 14,613 | Lennar Corp (Class B) | 1,397 | ||||||||
| 717,168 | Levi Strauss & Co | 17,951 | ||||||||
| 17,212 | * | LF Corp | 249 | |||||||
| 77,366 | LG Electronics, Inc | 8,957 | ||||||||
| 1,836 | * | LGI Homes, Inc | 284 | |||||||
| 2,633,121 | Li Ning Co Ltd | 28,885 | ||||||||
| 13,073 | Lifetime Brands, Inc | 209 | ||||||||
| 99,097 | * | Lock & Lock Co Ltd | 966 | |||||||
| 1,307 | * | Lovesac Co | 87 | |||||||
| 55 |
COLLEGE RETIREMENT EQUITIES FUND - Stock Account
| SHARES | COMPANY | VALUE (000) | ||||||||
| 1,245 | LPP S.A. | $ | 5,315 | |||||||
| 182,821 | * | Lululemon Athletica, Inc | 71,565 | |||||||
| 7,802 | LUX Industries Ltd | 386 | ||||||||
| 343,796 | LVMH Moet Hennessy Louis Vuitton S.A. | 284,125 | ||||||||
| 25,022 | * | M/I Homes, Inc | 1,556 | |||||||
| 236,224 | Makalot Industrial Co Ltd | 2,107 | ||||||||
| 14,053 | * | Malibu Boats, Inc | 966 | |||||||
| 2,172,184 | Man Wah Holdings Ltd | 3,368 | ||||||||
| 6,442 | *,† | Mariella Burani S.p.A. | 0 | |||||||
| 7,711 | * | Marimekko Oyj | 738 | |||||||
| 6,984 | Marine Products Corp | 87 | ||||||||
| 1,662 | * | MasterCraft Boat Holdings, Inc | 47 | |||||||
| 1,275,231 | * | Mattel, Inc | 27,494 | |||||||
| 122,354 | g | Mavi Giyim Sanayi Ve Ticaret AS. | 645 | |||||||
| 112,696 | Maytronics Ltd | 2,780 | ||||||||
| 38,141 | MDC Holdings, Inc | 2,129 | ||||||||
| 228,000 | Merida Industry Co Ltd | 2,692 | ||||||||
| 149,391 | * | Meritage Homes Corp | 18,235 | |||||||
| 91,700 | Midea Group Co Ltd | 1,062 | ||||||||
| 155,883 | MIPS AB | 20,397 | ||||||||
| 50,700 | Mizuno Corp | 989 | ||||||||
| 54,579 | * | Mohawk Industries, Inc | 9,943 | |||||||
| 1,066,094 | Moncler S.p.A | 77,045 | ||||||||
| 13,524 | Movado Group, Inc | 566 | ||||||||
| 328,514 | MRV Engenharia e Participacoes S.A. | 707 | ||||||||
| 8,900 | *,e | Nagawa Co Ltd | 882 | |||||||
| 121,434 | *,e | Nautilus, Inc | 744 | |||||||
| 89,567 | * | NavInfo Co Ltd | 224 | |||||||
| 57,779 | g | Neinor Homes S.A. | 693 | |||||||
| 48,460 | New Wave Group AB (B Shares) | 900 | ||||||||
| 3,635,153 | Newell Brands Inc | 79,392 | ||||||||
| 176,448 | Nien Made Enterprise Co Ltd | 2,627 | ||||||||
| 2,413,718 | Nike, Inc (Class B) | 402,294 | ||||||||
| 654,100 | Nikon Corp | 7,046 | ||||||||
| 266,692 | Nobia AB | 1,606 | ||||||||
| 14,301 | * | NVR, Inc | 84,503 | |||||||
| 14,534 | * | On Holding AG. | 550 | |||||||
| 1,101,831 | Onward Kashiyama Co Ltd | 2,867 | ||||||||
| 38,800 | Open House Co Ltd | 2,028 | ||||||||
| 39,132 | Oppein Home Group, Inc | 905 | ||||||||
| 135,922 | Orient Electric Ltd | 684 | ||||||||
| 276,564 | *,g | OVS S.p.A | 801 | |||||||
| 56 |
COLLEGE RETIREMENT EQUITIES FUND - Stock Account
| SHARES | COMPANY | VALUE (000) | ||||||||
| 12,881 | Oxford Industries, Inc | $ | 1,308 | |||||||
| 1,060,778 | Pacific Textile Holdings Ltd | 501 | ||||||||
| 6,491 | Page Industries Ltd | 3,521 | ||||||||
| 1,722,568 | Panasonic Corp | 18,936 | ||||||||
| 53,758 | Pandora AS | 6,687 | ||||||||
| 402,000 | *,† | Peace Mark Holdings Ltd | 0 | |||||||
| 293,408 | * | Peloton Interactive, Inc | 10,492 | |||||||
| 90,545 | Persimmon plc | 3,509 | ||||||||
| 20,656 | PIK Group (GDR) | 305 | ||||||||
| 2,654 | *,e | PLBY Group, Inc | 71 | |||||||
| 56,335 | Polaris Inc | 6,192 | ||||||||
| 2,697,006 | Pou Chen Corp | 3,227 | ||||||||
| 6,035,618 | Prada S.p.A | 38,648 | ||||||||
| 38,123 | Pressance Corp | 695 | ||||||||
| 346,916 | Pulte Homes, Inc | 19,830 | ||||||||
| 75,573 | Puma AG. Rudolf Dassler Sport | 9,229 | ||||||||
| 73,566 | *,e | Purple Innovation, Inc | 976 | |||||||
| 18,750 | PVH Corp | 2,000 | ||||||||
| 440,000 | e | Q Technology Group Co Ltd | 569 | |||||||
| 59,000 | Quang Viet Enterprise Co Ltd | 278 | ||||||||
| 107,639 | Rajesh Exports Ltd | 1,066 | ||||||||
| 4,363 | Ralph Lauren Corp | 519 | ||||||||
| 342,413 | Redrow plc | 3,268 | ||||||||
| 54,477 | Relaxo Footwears Ltd | 962 | ||||||||
| 52,682 | Rinnai Corp | 4,754 | ||||||||
| 6,032 | Rocky Brands, Inc | 240 | ||||||||
| 14,800 | Roland Corp | 505 | ||||||||
| 742,200 | Ruentex Industries Ltd | 2,609 | ||||||||
| 61,492 | *,e | Salvatore Ferragamo Italia S.p.A | 1,577 | |||||||
| 1,177,200 | *,g | Samsonite International | 2,390 | |||||||
| 61,124 | Sangetsu Co Ltd | 863 | ||||||||
| 163,000 | Sankyo Co Ltd | 4,225 | ||||||||
| 14,574 | Sanlorenzo S.p.A | 629 | ||||||||
| 46,564 | SEB S.A. | 7,256 | ||||||||
| 282,900 | Sega Sammy Holdings, Inc | 4,437 | ||||||||
| 27,500 | Seiko Holdings Corp | 537 | ||||||||
| 51,293 | Seiren Co Ltd | 1,124 | ||||||||
| 256,062 | Sekisui Chemical Co Ltd | 4,282 | ||||||||
| 481,545 | Sekisui House Ltd | 10,361 | ||||||||
| 146,093 | Sharp Corp | 1,678 | ||||||||
| 15,942 | * | Sheela Foam Ltd | 693 | |||||||
| 216,945 | * | Shenzhen MTC Co Ltd | 166 | |||||||
| 57 |
COLLEGE RETIREMENT EQUITIES FUND - Stock Account
| SHARES | COMPANY | VALUE (000) | ||||||||
| 972,538 | Shenzhou International Group Holdings Ltd | $ | 18,832 | |||||||
| 95,445 | Shimano, Inc | 25,419 | ||||||||
| 10,355 | * | Skechers U.S.A., Inc (Class A) | 449 | |||||||
| 228,085 | * | Skyline Champion Corp | 18,014 | |||||||
| 1,551,900 | * | Skyworth Digital Holdings Ltd | 1,087 | |||||||
| 138,633 | Smith & Wesson Brands, Inc | 2,468 | ||||||||
| 7,249 | * | Snap One Holdings Corp | 153 | |||||||
| 31,800 | e | Snow Peak, Inc | 878 | |||||||
| 4,779 | *,e | Solo Brands, Inc | 75 | |||||||
| 149,354 | * | Sonos, Inc | 4,451 | |||||||
| 2,838,487 | Sony Corp | 358,439 | ||||||||
| 502,837 | *,g | Spin Master Corp | 19,057 | |||||||
| 19,478 | * | Spinnova Oyj | 298 | |||||||
| 4,445,478 | *,e | Steinhoff International Holdings NV | 1,400 | |||||||
| 692,000 | Stella International Holdings Ltd | 837 | ||||||||
| 670,303 | Steven Madden Ltd | 31,149 | ||||||||
| 2,481 | Sturm Ruger & Co, Inc | 169 | ||||||||
| 172,697 | Sumitomo Forestry Co Ltd | 3,338 | ||||||||
| 11,800 | Suofeiya Home Collection Co Ltd | 41 | ||||||||
| 8,666 | e | Superior Uniform Group, Inc | 190 | |||||||
| 40,300 | Suzhou TA&A Ultra Clean Technology Co Ltd | 513 | ||||||||
| 25,423 | Swatch Group AG. | 7,742 | ||||||||
| 2,182 | Swatch Group AG. (Registered) | 128 | ||||||||
| 16,183 | Symphony Ltd | 216 | ||||||||
| 1,165,602 | Tainan Spinning Co Ltd | 1,074 | ||||||||
| 272,600 | Taiwan Paiho Ltd | 803 | ||||||||
| 20,500 | Tama Home Co Ltd | 412 | ||||||||
| 56,500 | Tamron Co Ltd | 1,402 | ||||||||
| 158,620 | Tapestry, Inc | 6,440 | ||||||||
| 162,584 | * | Taylor Morrison Home Corp | 5,684 | |||||||
| 4,000,166 | Taylor Wimpey plc | 9,537 | ||||||||
| 894,973 | TCL Multimedia Technology Holdings Ltd | 465 | ||||||||
| 960,845 | TCL Technology Group Corp | 931 | ||||||||
| 156,413 | e,g | Technogym S.p.A | 1,503 | |||||||
| 628,132 | Tempur Sealy International, Inc | 29,541 | ||||||||
| 290,500 | Texhong Textile Group Ltd | 384 | ||||||||
| 127,066 | g | Thule Group AB | 7,674 | |||||||
| 414,719 | Titan Industries Ltd | 14,030 | ||||||||
| 13,077 | �� | * | Tod’s S.p.A. | 731 | ||||||
| 8,690 | Token Corp | 714 | ||||||||
| 109,517 | Toll Brothers, Inc | 7,928 | ||||||||
| 84,241 | *,e | TomTom NV | 868 | |||||||
| 58 |
COLLEGE RETIREMENT EQUITIES FUND - Stock Account
| SHARES | COMPANY | VALUE (000) | ||||||||
| 101,301 | Tomy Co Ltd | $ | 968 | |||||||
| 37,894 | * | TopBuild Corp | 10,455 | |||||||
| 69,000 | Topkey Corp | 373 | ||||||||
| 1,037,432 | * | Traeger, Inc | 12,615 | |||||||
| 91,669 | * | TRI Pointe Homes, Inc | 2,557 | |||||||
| 1,057,315 | Trident Ltd | 758 | ||||||||
| 44,547 | * | Tupperware Brands Corp | 681 | |||||||
| 177,253 | * | Under Armour, Inc (Class A) | 3,756 | |||||||
| 2,224,037 | *,e | Under Armour, Inc (Class C) | 40,122 | |||||||
| 13,369 | * | Unifi, Inc | 309 | |||||||
| 12,073 | * | Universal Electronics, Inc | 492 | |||||||
| 27,843 | *,e | Universal Entertainment Corp | 591 | |||||||
| 52,456 | Vaibhav Global Ltd | 413 | ||||||||
| 4,921 | VAN DE Velde | 193 | ||||||||
| 24,880 | Vardhman Textiles Ltd | 773 | ||||||||
| 21,280 | * | Vera Bradley, Inc | 181 | |||||||
| 76,192 | Vestel Elektronik Sanayi | 144 | ||||||||
| 217,000 | e | Vesync Co Ltd | 264 | |||||||
| 257,768 | VF Corp | 18,874 | ||||||||
| 74,229 | * | Victoria plc | 1,206 | |||||||
| 61,339 | * | VIP Industries Ltd | 443 | |||||||
| 82,156 | * | Vista Outdoor, Inc | 3,785 | |||||||
| 100,496 | Vivara Participacoes S.A. | 458 | ||||||||
| 14,256 | * | VOXX International Corp (Class A) | 145 | |||||||
| 22,806 | *,e | Vuzix Corp | 198 | |||||||
| 4,139 | * | V-ZUG Holding AG. | 559 | |||||||
| 139,013 | Wacoal Holdings Corp | 2,583 | ||||||||
| 11,621 | e | Weber, Inc | 150 | |||||||
| 442,636 | Welspun India Ltd | 863 | ||||||||
| 403,797 | Whirlpool Corp | 94,755 | ||||||||
| 34,335 | Whirlpool of India Ltd | 812 | ||||||||
| 203,262 | Wolverine World Wide, Inc | 5,856 | ||||||||
| 56,366 | Xiamen Intretech, Inc | 301 | ||||||||
| 1,430,883 | e | XTEP International Holdings | 2,387 | |||||||
| 95,404 | Yamaha Corp | 4,707 | ||||||||
| 338,045 | * | YETI Holdings, Inc | 28,000 | |||||||
| 65,400 | Yonex Co Ltd | 500 | ||||||||
| 23,516 | Youngone Corp | 863 | ||||||||
| 5,979 | * | Youngone Holdings Co Ltd | 235 | |||||||
| 990,500 | * | Yue Yuen Industrial Holdings | 1,658 | |||||||
| 288,812 | Zhejiang Semir Garment Co Ltd | 350 | ||||||||
| 45,813 | Zhejiang Supor Co Ltd | 448 | ||||||||
| 59 |
COLLEGE RETIREMENT EQUITIES FUND - Stock Account
| SHARES | COMPANY | VALUE (000) | ||||||||
| 9,895 | * | Zinus, Inc | $ | 641 | ||||||
| 36,700 | Zojirushi Corp | 461 | ||||||||
| TOTAL CONSUMER DURABLES & APPAREL | 3,385,518 | |||||||||
| CONSUMER SERVICES - 2.3% | ||||||||||
| 37,503 | * | 2U, Inc | 753 | |||||||
| 1,042,575 | 888 Holdings plc | 4,248 | ||||||||
| 209,923 | g | AcadeMedia AB | 1,289 | |||||||
| 41,134 | * | Accel Entertainment, Inc | 536 | |||||||
| 300,564 | * | Accor S.A. | 9,742 | |||||||
| 43,407 | * | Adtalem Global Education, Inc | 1,283 | |||||||
| 135,531 | *,e | Afya Ltd | 2,129 | |||||||
| 92,754 | * | Airbnb, Inc | 15,443 | |||||||
| 212,500 | *,e | Airtrip Corp | 5,670 | |||||||
| 2,255,538 | *,e | Alsea SAB de C.V. | 4,181 | |||||||
| 16,139 | * | American Public Education, Inc | 359 | |||||||
| 84,389 | * | AmRest Holdings SE | 578 | |||||||
| 314,649 | * | Anima Holding S.A. | 471 | |||||||
| 219,490 | ARAMARK Holdings Corp | 8,088 | ||||||||
| 17,060 | e | ARCLAND SERVICE Co Ltd | 336 | |||||||
| 94,317 | *,e | Arco Platform Ltd | 1,970 | |||||||
| 7,209,528 | *,a,e | Arcos Dorados Holdings, Inc | 42,032 | |||||||
| 724,614 | Aristocrat Leisure Ltd | 22,987 | ||||||||
| 5,157,968 | * | Asset World Corp PCL | 715 | |||||||
| 19,407 | Ataa Educational Co | 299 | ||||||||
| 148,400 | Atom Corp | 994 | ||||||||
| 231,307 | *,e | Autogrill S.p.A. | 1,633 | |||||||
| 84,534 | * | Bally’s Corp | 3,217 | |||||||
| 60,195 | *,e,g | Basic-Fit NV | 2,873 | |||||||
| 84,200 | Benesse Holdings, Inc | 1,653 | ||||||||
| 872,161 | Berjaya Sports Toto BHD | 398 | ||||||||
| 767,350 | * | Betmakers Technology Group Ltd | 447 | |||||||
| 133,223 | Betsson AB | 802 | ||||||||
| 705 | * | Biglari Holdings, Inc (B Shares) | 101 | |||||||
| 3,802 | * | BJ’s Restaurants, Inc | 131 | |||||||
| 2,780,600 | * | BK Brasil Operacao e Assessoria a Restaurantes S.A. | 2,972 | |||||||
| 4,149,600 | * | Bloomberry Resorts Corp | 513 | |||||||
| 368,701 | * | Bloomin’ Brands, Inc | 7,735 | |||||||
| 31,876 | * | Bluegreen Vacations Holding Corp | 1,119 | |||||||
| 112,878 | * | Booking Holdings, Inc | 270,820 | |||||||
| 163,219 | * | Boyd Gaming Corp | 10,702 | |||||||
| 60,224 | * | Bright Horizons Family Solutions | 7,581 | |||||||
| 60 |
COLLEGE RETIREMENT EQUITIES FUND - Stock Account
| SHARES | COMPANY | VALUE (000) | ||||||||
| 17,699 | * | Brinker International, Inc | $ | 648 | ||||||
| 170,113 | * | Burger King India Ltd | 323 | |||||||
| 874,892 | * | Caesars Entertainment, Inc | 81,829 | |||||||
| 430,000 | Cafe de Coral Holdings Ltd | 767 | ||||||||
| 351,849 | Cairo Investment & Real Estate Development Co SAE | 304 | ||||||||
| 2,006,559 | *,e | Carnival Corp | 40,372 | |||||||
| 234,738 | * | Carnival plc | 4,393 | |||||||
| 11,833 | Carriage Services, Inc | 763 | ||||||||
| 32,835 | Carrols Restaurant Group, Inc | 97 | ||||||||
| 412,568 | * | Central Plaza Hotel PCL | 385 | |||||||
| 1,975 | * | Century Casinos, Inc | 24 | |||||||
| 63,247 | * | Chalet Hotels Ltd | 183 | |||||||
| 99,914 | * | Cheesecake Factory | 3,912 | |||||||
| 138,825 | * | Chegg, Inc | 4,262 | |||||||
| 808,000 | g | China East Education Holdings Ltd | 506 | |||||||
| 969,303 | China Education Group Holdings Ltd | 1,575 | ||||||||
| 418,000 | China Kepei Education Group Ltd | 172 | ||||||||
| 1,558,000 | * | China Maple Leaf Educational Systems Ltd | 108 | |||||||
| 919,000 | g | China New Higher Education Group Ltd | 390 | |||||||
| 2,552,000 | * | China Travel International Inv HK | 504 | |||||||
| 1,678,656 | g | China Yuhua Education Corp Ltd | 601 | |||||||
| 78,965 | * | Chipotle Mexican Grill, Inc (Class A) | 138,051 | |||||||
| 34,258 | Choice Hotels International, Inc | 5,344 | ||||||||
| 92,137 | Churchill Downs, Inc | 22,196 | ||||||||
| 9,989 | * | Chuy’s Holdings, Inc | 301 | |||||||
| 29,650 | *,e | Cie des Alpes | 468 | |||||||
| 1,965,900 | * | Cogna Educacao | 862 | |||||||
| 130,544 | Collins Foods Ltd | 1,270 | ||||||||
| 86,400 | e | Colowide Co Ltd | 1,224 | |||||||
| 2,056,591 | * | Compass Group plc | 46,301 | |||||||
| 133,034 | * | Corporate Travel Management Ltd | 2,134 | |||||||
| 63,486 | *,e | Coursera, Inc | 1,552 | |||||||
| 6,947 | Cracker Barrel Old Country Store, Inc | 894 | ||||||||
| 130,200 | *,e | Create Restaurants Holdings, Inc | 818 | |||||||
| 398,253 | * | Crown Resorts Ltd | 3,467 | |||||||
| 173,600 | Cruzeiro do Sul Educacional S.A. | 239 | ||||||||
| 53,900 | Curves Holdings Co Ltd | 372 | ||||||||
| 246,656 | * | CVC Brasil Operadora e Agencia de Viagens S.A. | 592 | |||||||
| 195,429 | Dadi Early-Childhood Education Group Ltd | 1,030 | ||||||||
| 244,408 | * | Dalata Hotel Group plc | 1,035 | |||||||
| 463,264 | Darden Restaurants, Inc | 69,786 | ||||||||
| 22,785 | * | Dave & Buster’s Entertainment, Inc | 875 | |||||||
| 61 |
COLLEGE RETIREMENT EQUITIES FUND - Stock Account
| SHARES | COMPANY | VALUE (000) | ||||||||
| 28,027 | Del Taco Restaurants, Inc | $ | 349 | |||||||
| 66,064 | Delta Corp Ltd | 229 | ||||||||
| 19,892 | * | Denny’s Corp | 318 | |||||||
| 200,273 | *,e | Despegar.com Corp | 1,961 | |||||||
| 253,931 | * | Devyani International Ltd | 560 | |||||||
| 21,380 | *,† | Diamond Resorts International, Inc | 0 | |||||||
| 1,511 | Dine Brands Global Inc. | 115 | ||||||||
| 66,564 | Domino’s Pizza Enterprises Ltd | 5,713 | ||||||||
| 500,772 | Domino’s Pizza Group plc | 3,119 | ||||||||
| 35,102 | Domino’s Pizza, Inc | 19,809 | ||||||||
| 63,426 | * | DoubleUGames Co Ltd | 3,086 | |||||||
| 40,818 | Doutor Nichires Holdings Co Ltd | 569 | ||||||||
| 291,840 | *,e | DraftKings, Inc | 8,017 | |||||||
| 741,030 | * | Drive Shack, Inc | 1,060 | |||||||
| 49,159 | * | Dur Hospitality Co | 407 | |||||||
| 362,000 | EC Healthcare | 517 | ||||||||
| 65,722 | *,e | eDreams ODIGEO S.A. | 726 | |||||||
| 358,000 | Edvantage Group Holdings Ltd | 216 | ||||||||
| 168,894 | * | EIH Ltd | 282 | |||||||
| 17,814 | * | El Pollo Loco Holdings, Inc | 253 | |||||||
| 142,393 | *,g | Elior Participations S.C.A | 1,031 | |||||||
| 79,163 | * | Emerson Pacific, Inc | 701 | |||||||
| 923,037 | * | Entain PLC | 21,098 | |||||||
| 1,920 | *,e | Esports Technologies, Inc | 39 | |||||||
| 126,084 | * | European Wax Center, Inc | 3,827 | |||||||
| 580,520 | * | Everi Holdings, Inc | 12,394 | |||||||
| 264,969 | g | Evolution Gaming Group AB | 37,451 | |||||||
| 416,141 | * | Expedia Group, Inc | 75,205 | |||||||
| 9,738 | * | F45 Training Holdings, Inc | 106 | |||||||
| 16,148 | * | Fattal Holdings 1998 Ltd | 1,627 | |||||||
| 17,435 | * | Fiesta Restaurant Group, Inc | 192 | |||||||
| 3,475 | * | First Watch Restaurant Group, Inc | 58 | |||||||
| 193,239 | *,e | Flight Centre Travel Group Ltd | 2,480 | |||||||
| 366,274 | * | Flutter Entertainment plc | 58,596 | |||||||
| 183,033 | * | Flutter Entertainment plc | 28,977 | |||||||
| 56,990 | Formosa International Hotels Corp | 311 | ||||||||
| 334,200 | *,e,g | Fosun Tourism Group | 449 | |||||||
| 131,554 | * | frontdoor, Inc | 4,821 | |||||||
| 1,270,000 | Fu Shou Yuan International Group Ltd | 998 | ||||||||
| 26,999 | Fuji Kyuko Co Ltd | 957 | ||||||||
| 19,300 | *,e | Fujio Food System Co Ltd | 222 | |||||||
| 65,548 | * | Full House Resorts, Inc | 794 | |||||||
| 62 |
COLLEGE RETIREMENT EQUITIES FUND - Stock Account
| SHARES | COMPANY | VALUE (000) | ||||||||
| 943,826 | * | G8 Education Ltd | $ | 763 | ||||||
| 2,487,622 | * | Galaxy Entertainment Group Ltd | 12,905 | |||||||
| 31,945 | *,e | GAN Ltd | 294 | |||||||
| 2,541,997 | Genting BHD | 2,847 | ||||||||
| 5,764,281 | Genting Malaysia BHD | 3,982 | ||||||||
| 6,580,470 | Genting Singapore Ltd | 3,785 | ||||||||
| 1,939 | * | Golden Entertainment, Inc | 98 | |||||||
| 3,995 | * | Golden Nugget Online Gaming, Inc | 40 | |||||||
| 94,739 | Gourmet Master Co Ltd | 385 | ||||||||
| 3,344 | Graham Holdings Co | 2,106 | ||||||||
| 38,166 | * | Grand Canyon Education, Inc | 3,271 | |||||||
| 33,451 | * | Grand Korea Leisure Co Ltd | 369 | |||||||
| 229,917 | Greggs plc | 10,407 | ||||||||
| 189,588 | *,e | GSX Techedu, Inc (ADR) | 368 | |||||||
| 202,525 | *,g | Gym Group plc | 701 | |||||||
| 333,368 | H&R Block, Inc | 7,854 | ||||||||
| 5,816,000 | *,g | Haichang Holdings Ltd | 2,373 | |||||||
| 1,264,776 | e,g | Haidilao International Holding Ltd | 2,859 | |||||||
| 54,994 | *,e | Hall of Fame Resort & Entertainment Co | 84 | |||||||
| 9,564 | * | Hana Tour Service, Inc | 599 | |||||||
| 24,784 | Herfy Food Services Co | 411 | ||||||||
| 27,137 | e | Hiday Hidaka Corp | 408 | |||||||
| 178,943 | * | Hilton Grand Vacations, Inc | 9,325 | |||||||
| 774,028 | * | Hilton Worldwide Holdings, Inc | 120,741 | |||||||
| 53,628 | *,e | HIS Co Ltd | 872 | |||||||
| 521,500 | * | Hongkong & Shanghai Hotels | 458 | |||||||
| 2,962,000 | e,g | Hope Education Group Co Ltd | 571 | |||||||
| 545,892 | * | Houghton Mifflin Harcourt Co | 8,789 | |||||||
| 317,588 | * | Huangshan Tourism Development Co Ltd | 227 | |||||||
| 210,651 | *,e | Huazhu Group Ltd (ADR) | 7,866 | |||||||
| 99,820 | Humansoft Holding Co KSC | 1,064 | ||||||||
| 47,845 | * | Hyatt Hotels Corp | 4,588 | |||||||
| 18,900 | Ichibanya Co Ltd | 764 | ||||||||
| 1,663,473 | IDP Education Ltd | 41,907 | ||||||||
| 866,851 | Indian Hotels Co Ltd | 2,101 | ||||||||
| 198,410 | * | InterContinental Hotels Group plc | 12,827 | |||||||
| 575,082 | e | International Game Technology plc | 16,626 | |||||||
| 174,462 | e | Invocare Ltd | 1,493 | |||||||
| 17,107 | Jack in the Box, Inc | 1,497 | ||||||||
| 446,000 | e | JH Educational Technology, Inc | 161 | |||||||
| 856,000 | e,g | Jiumaojiu International Holdings Ltd | 1,505 | |||||||
| 1,495,473 | Jollibee Foods Corp | 6,346 | ||||||||
| 63 |
COLLEGE RETIREMENT EQUITIES FUND - Stock Account
| SHARES | COMPANY | VALUE (000) | ||||||||
| 90,348 | Jubilant Foodworks Ltd | $ | 4,347 | |||||||
| 442,434 | e | Jumbo Interactive Ltd | 6,199 | |||||||
| 125,674 | *,e | Kambi Group plc | 3,574 | |||||||
| 108,790 | * | Kangwon Land, Inc | 2,198 | |||||||
| 29,570 | *,e | Kappa Create Co Ltd | 345 | |||||||
| 16,100 | Kentucky Fried Chicken Japan Ltd | 405 | ||||||||
| 338,327 | Kindred Group plc | 4,008 | ||||||||
| 30,200 | e | Kisoji Co Ltd | 577 | |||||||
| 57,700 | KOMEDA Holdings Co Ltd | 1,028 | ||||||||
| 369,500 | *,e,g | Koolearn Technology Holding Ltd | 251 | |||||||
| 47,594 | e | Koshidaka Holdings Co Ltd | 254 | |||||||
| 7,213 | Krispy Kreme, Inc | 136 | ||||||||
| 68,804 | Kura Corp | 2,169 | ||||||||
| 587 | *,e | Kura Sushi USA, Inc | 47 | |||||||
| 36,283 | Kyoritsu Maintenance Co Ltd | 1,273 | ||||||||
| 100,498 | g | La Francaise des Jeux SAEM | 4,454 | |||||||
| 1,302,620 | * | Las Vegas Sands Corp | 49,031 | |||||||
| 86,804 | Laureate Education, Inc | 1,062 | ||||||||
| 22,301 | Leejam Sports Co JSC | 646 | ||||||||
| 467,628 | e,g | LeoVegas AB | 1,808 | |||||||
| 16,020 | * | Life Time Group Holdings, Inc | 276 | |||||||
| 2,966 | * | Lindblad Expeditions Holdings, Inc | 46 | |||||||
| 25,000 | LITALICO, Inc | 876 | ||||||||
| 37,481 | * | Lotte Tour Development Co Ltd | 552 | |||||||
| 157,000 | Lung Yen Life Service Corp | 251 | ||||||||
| 819,007 | Magnum BHD | 373 | ||||||||
| 102,753 | * | MakeMyTrip Ltd | 2,847 | |||||||
| 300,863 | * | Marriott International, Inc (Class A) | 49,715 | |||||||
| 39,547 | Marriott Vacations Worldwide Corp | 6,683 | ||||||||
| 849,519 | * | Marston’s plc | 896 | |||||||
| 10,200 | Matsuya Foods Co Ltd | 321 | ||||||||
| 2,165,513 | McDonald’s Corp | 580,509 | ||||||||
| 55,799 | McDonald’s Holdings Co Japan Ltd | 2,469 | ||||||||
| 30,646 | MegaStudyEdu Co Ltd | 2,123 | ||||||||
| 4,704,076 | * | Melco Crown Entertainment Ltd (ADR) | 47,888 | |||||||
| 9,264,817 | * | Melco International Development | 11,306 | |||||||
| 153,372 | * | Melia Hotels International S.A. | 1,039 | |||||||
| 1,204,000 | *,e | MGM China Holdings Ltd | 731 | |||||||
| 372,463 | MGM Resorts International | 16,716 | ||||||||
| 3,396,300 | * | Minor International PCL (Foreign) | 2,920 | |||||||
| 1,096,000 | g | Minsheng Education Group Co Ltd | 132 | |||||||
| 71,995 | * | Mister Car Wash, Inc | 1,311 | |||||||
| 64 |
COLLEGE RETIREMENT EQUITIES FUND - Stock Account
| SHARES | COMPANY | VALUE (000) | ||||||||
| 309,110 | * | Mitchells & Butlers plc | $ | 1,071 | ||||||
| 332,400 | MK Restaurants Group PCL | 517 | ||||||||
| 3,203 | * | Monarch Casino & Resort, Inc | 237 | |||||||
| 12,134 | e | Monogatari Corp | 712 | |||||||
| 30,400 | MOS Food Services, Inc | 814 | ||||||||
| 142,900 | MPM Corporeos S.A. | 213 | ||||||||
| 23,783 | e | MTY Food Group, Inc | 1,190 | |||||||
| 1,357 | Nathan’s Famous, Inc | 79 | ||||||||
| 17,973 | * | National Co for Learning & Education | 286 | |||||||
| 44,009 | * | NEOGAMES S.A. | 1,223 | |||||||
| 1,829,469 | * | New Oriental Education & Technology Group (ADR) | 3,842 | |||||||
| 829,035 | * | Noodles & Co | 7,519 | |||||||
| 355,116 | *,e | Norwegian Cruise Line Holdings Ltd | 7,365 | |||||||
| 58,900 | * | Offcn Education Technology Co Ltd | 73 | |||||||
| 14,200 | Ohsho Food Service Corp | 754 | ||||||||
| 209,027 | *,g | On the Beach Group plc | 812 | |||||||
| 1,714 | * | ONE Group Hospitality, Inc | 22 | |||||||
| 77,711 | *,†,e | OneSmart International Education Group Ltd (ADR) | 19 | |||||||
| 25,162 | * | OneSpaWorld Holdings Ltd | 252 | |||||||
| 229,454 | OPAP S.A. | 3,250 | ||||||||
| 12,184 | * | Open Door, Inc | 195 | |||||||
| 221,598 | Oriental Land Co Ltd | 37,367 | ||||||||
| 175,075 | Papa John’s International, Inc | 23,367 | ||||||||
| 48,385 | * | Paradise Co Ltd | 607 | |||||||
| 287,060 | Park Lawn Corp | 9,418 | ||||||||
| 38,470 | *,† | Patisserie Holdings plc | 1 | |||||||
| 206,353 | * | Penn National Gaming, Inc | 10,699 | |||||||
| 125,416 | * | Perdoceo Education Corp | 1,475 | |||||||
| 364,000 | Perfect Shape Medical Ltd | 264 | ||||||||
| 98,535 | * | Planet Fitness, Inc | 8,925 | |||||||
| 187,568 | * | PlayAGS, Inc | 1,274 | |||||||
| 372,340 | * | Playtech Ltd | 3,692 | |||||||
| 23,905 | Plenus Co Ltd | 419 | ||||||||
| 2,185,087 | * | PointsBet Holdings Ltd | 11,210 | |||||||
| 11,336 | e | Pollard Banknote Ltd | 357 | |||||||
| 7,568 | *,e | Portillo’s, Inc | 284 | |||||||
| 39,113 | * | PowerSchool Holdings, Inc | 644 | |||||||
| 306,996 | * | Rank Group plc | 648 | |||||||
| 722 | RCI Hospitality Holdings, Inc | 56 | ||||||||
| 20,419 | * | Recipe Unlimited Corp | 286 | |||||||
| 2,595 | * | Red Robin Gourmet Burgers, Inc | 43 | |||||||
| 223,646 | Red Rock Resorts, Inc | 12,303 | ||||||||
| 65 |
COLLEGE RETIREMENT EQUITIES FUND - Stock Account
| SHARES | COMPANY | VALUE (000) | ||||||||
| 103,300 | Resorttrust, Inc | $ | 1,688 | |||||||
| 352,259 | Restaurant Brands International, Inc (Toronto) | 21,359 | ||||||||
| 864,508 | * | Restaurant Group plc | 1,111 | |||||||
| 28,600 | Ringer Hut Co Ltd | 553 | ||||||||
| 120,000 | Riso Kyoiku Co Ltd | 410 | ||||||||
| 74,861 | Round One Corp | 888 | ||||||||
| 251,964 | * | Royal Caribbean Cruises Ltd | 19,376 | |||||||
| 29,800 | *,e | Royal Holdings Co Ltd | 492 | |||||||
| 294,321 | * | Rush Street Interactive, Inc | 4,856 | |||||||
| 3,340 | * | Ruth’s Hospitality Group Inc | 66 | |||||||
| 34,300 | Saizeriya Co Ltd | 896 | ||||||||
| 19,449,092 | * | Sands China Ltd | 45,137 | |||||||
| 198,322 | *,g | Scandic Hotels Group AB | 798 | |||||||
| 112,306 | * | Scientific Games Corp (Class A) | 7,505 | |||||||
| 98,506 | * | SeaWorld Entertainment, Inc | 6,389 | |||||||
| 155,067 | * | Seera Group Holding | 711 | |||||||
| 27,619 | Seobu Truck Terminal Co Ltd | 207 | ||||||||
| 156,052 | Service Corp International | 11,078 | ||||||||
| 3,194 | * | Shake Shack, Inc | 230 | |||||||
| 67,939 | Shanghai Jinjiang International Hotels Development Co Ltd | 626 | ||||||||
| 1,424,000 | Shanghai Jinjiang International Hotels Group Co Ltd | 535 | ||||||||
| 1,358,000 | * | Shangri-La Asia Ltd | 1,134 | |||||||
| 570,972 | Shenzhen Overseas Chinese Town Co Ltd | 631 | ||||||||
| 72,296 | * | Six Flags Entertainment Corp | 3,078 | |||||||
| 8,052,000 | *,e | SJM Holdings Ltd | 5,425 | |||||||
| 51,934 | SkiStar AB | 976 | ||||||||
| 917,339 | Sky City Entertainment Group Ltd | 1,960 | ||||||||
| 276,182 | e | Skylark Co Ltd | 3,629 | |||||||
| 152,300 | * | Smartfit Escola de Ginastica e Danca S.A. | 435 | |||||||
| 96,074 | e | Sodexho Alliance S.A. | 8,423 | |||||||
| 210,414 | Songcheng Performance Development Co Ltd | 473 | ||||||||
| 1,630,569 | * | SSP Group plc | 5,333 | |||||||
| 1,040,542 | * | Star Entertainment Grp Ltd | 2,788 | |||||||
| 1,447,257 | Starbucks Corp | 169,286 | ||||||||
| 35,042 | *,e | StoneMor, Inc | 80 | |||||||
| 21,211 | Strategic Education, Inc | 1,227 | ||||||||
| 33,454 | * | Stride, Inc | 1,115 | |||||||
| 22,828,000 | *,e | Summit Ascent Holdings Ltd | 433 | |||||||
| 133,893 | Sushiro Global Holdings Ltd | 5,056 | ||||||||
| 3,164,196 | Tabcorp Holdings Ltd | 11,560 | ||||||||
| 501,168 | * | TAL Education Group (ADR) | 1,970 | |||||||
| 66 |
COLLEGE RETIREMENT EQUITIES FUND - Stock Account
| SHARES | COMPANY | VALUE (000) | ||||||||
| 4,476 | * | Target Hospitality Corp | $ | 16 | ||||||
| 119,827 | * | Terminix Global Holdings, Inc | 5,420 | |||||||
| 287,682 | Texas Roadhouse, Inc (Class A) | 25,684 | ||||||||
| 1,189,000 | † | Tianli Education International Holdings Ltd | 146 | |||||||
| 106,685 | e | Tokyotokeiba Co Ltd | 3,952 | |||||||
| 1,817,620 | * | Tongcheng-Elong Holdings Ltd | 3,369 | |||||||
| 56,559 | Toridoll.corp | 1,223 | ||||||||
| 13,684 | Tosho Co Ltd | 198 | ||||||||
| 584,858 | *,g | Trainline plc | 2,209 | |||||||
| 103,060 | Travel & Leisure Co | 5,696 | ||||||||
| 375,701 | * | Trip.com Group Ltd (ADR) | 9,250 | |||||||
| 1,382,581 | *,e | TUI AG. (DI) | 4,366 | |||||||
| 10,129 | * | Udemy, Inc | 198 | |||||||
| 41,300 | Vail Resorts, Inc | 13,542 | ||||||||
| 62,721 | * | Vivint Smart Home, Inc | 613 | |||||||
| 450,336 | *,e | Webjet Ltd | 1,696 | |||||||
| 337,958 | e | Wendy’s | 8,060 | |||||||
| 56,630 | * | Westlife Development Ltd | 427 | |||||||
| 114,789 | * | Wetherspoon (J.D.) plc | 1,492 | |||||||
| 221,329 | * | Whitbread plc | 9,003 | |||||||
| 30,221 | Wingstop, Inc | 5,222 | ||||||||
| 712,000 | e | Wisdom Education International Holdings Co Ltd | 63 | |||||||
| 35,152 | * | WW International Inc | 567 | |||||||
| 90,039 | Wyndham Hotels & Resorts, Inc | 8,072 | ||||||||
| 36,927,000 | *,e | Wynn Macau Ltd | 29,987 | |||||||
| 505,653 | * | Wynn Resorts Ltd | 43,001 | |||||||
| 471,500 | g | Xiabuxiabu Catering Management China Holdings Co Ltd | 368 | |||||||
| 1,468 | * | Xponential Fitness, Inc | 30 | |||||||
| 1,185,361 | YDUQS Part | 4,355 | ||||||||
| 78,219 | Yoshinoya D&C Co Ltd | 1,579 | ||||||||
| 38,300 | *,e | Youdao, Inc (ADR) | 478 | |||||||
| 26,949 | Young & Co’s Brewery plc | 569 | ||||||||
| 974,206 | Yum China Holdings, Inc | 48,554 | ||||||||
| 1,207,403 | Yum! Brands, Inc | 167,660 | ||||||||
| 17,113 | Zeal Network SE | 774 | ||||||||
| 112,522 | Zensho Co Ltd | 2,645 | ||||||||
| TOTAL CONSUMER SERVICES | 3,201,989 | |||||||||
| DIVERSIFIED FINANCIALS - 4.7% | ||||||||||
| 104,200 | 360 Finance, Inc (ADR) | 2,389 | ||||||||
| 274,170 | 3i Group plc | 5,375 | ||||||||
| 44,980 | ABC Arbitrage | 366 | ||||||||
| 67 |
COLLEGE RETIREMENT EQUITIES FUND - Stock Account
| SHARES | COMPANY | VALUE (000) | ||||||||
| 123,000 | Acom Co Ltd | $ | 354 | |||||||
| 486,280 | * | Aditya Birla Capital Ltd | 807 | |||||||
| 110,511 | Aeon Credit Service M BHD | 361 | ||||||||
| 128,500 | AEON Financial Service Co Ltd | 1,386 | ||||||||
| 90,400 | Aeon Thana Sinsap Thailand PCL | 509 | ||||||||
| 6,889 | e | AFC Gamma, Inc | 157 | |||||||
| 40,057 | Affiliated Managers Group, Inc | 6,590 | ||||||||
| 2,853,762 | AGNC Investment Corp | 42,921 | ||||||||
| 373,700 | Aiful Corp | 1,156 | ||||||||
| 671,866 | AJ Bell plc | 3,450 | ||||||||
| 40,043 | * | Aju IB Investment Co Ltd | 134 | |||||||
| 31,751 | Aker ASA (A Shares) | 2,961 | ||||||||
| 1,002,201 | Al Waha Capital PJSC | 466 | ||||||||
| 13,257 | Alerus Financial Corp | 388 | ||||||||
| 712,871 | Alexander Forbes Group Holdings Ltd | 201 | ||||||||
| 755,016 | * | Alimtiaz Investment Group KSC | 295 | |||||||
| 1,167,691 | * | Allfunds Group PLC | 22,994 | |||||||
| 325,022 | Ally Financial, Inc | 15,474 | ||||||||
| 33,952 | Alpha FX Group plc | 1,004 | ||||||||
| 75,759 | Altshuler Shaham Provident Funds & Pension Ltd | 409 | ||||||||
| 1,211,254 | * | Amanat Holdings PJSC | 379 | |||||||
| 31,929 | A-Mark Precious Metals, Inc | 1,951 | ||||||||
| 1,043,726 | American Express Co | 170,754 | ||||||||
| 115,686 | Ameriprise Financial, Inc | 34,898 | ||||||||
| 4,221,000 | * | AMP Ltd | 3,103 | |||||||
| 50,569 | g | Amundi S.A. | 4,171 | |||||||
| 6,673 | Angel Oak Mortgage, Inc | 109 | ||||||||
| 21,363 | Angel One Ltd | 339 | ||||||||
| 497,269 | g | Anima Holding S.p.A | 2,539 | |||||||
| 736,388 | Annaly Capital Management, Inc | 5,759 | ||||||||
| 122,726 | Apollo Commercial Real Estate Finance, Inc | 1,615 | ||||||||
| 228,168 | e | Apollo Global Management, Inc | 16,526 | |||||||
| 115,577 | Arbor Realty Trust, Inc | 2,117 | ||||||||
| 35,239 | Ares Commercial Real Estate Corp | 512 | ||||||||
| 139,473 | Ares Management Corp | 11,335 | ||||||||
| 65,411 | e | ARMOUR Residential REIT, Inc | 642 | |||||||
| 107,073 | Artisan Partners Asset Management, Inc | 5,101 | ||||||||
| 560,201 | Ashmore Group plc | 2,213 | ||||||||
| 150,655 | * | Assetmark Financial Holdings, Inc | 3,949 | |||||||
| 2,106 | Associated Capital Group, Inc | 91 | ||||||||
| 814 | * | Atlanticus Holdings Corp | 58 | |||||||
| 35,009 | Aurelius AG. | 1,071 | ||||||||
| 68 |
COLLEGE RETIREMENT EQUITIES FUND - Stock Account
| SHARES | COMPANY | VALUE (000) | ||||||||
| 131,142 | Australian Ethical Investment Ltd | $ | 1,316 | |||||||
| 197,778 | Australian Stock Exchange Ltd | 13,367 | ||||||||
| 150,637 | Avanza Bank Holding AB | 5,518 | ||||||||
| 121,314 | Avic Capital Co Ltd | 76 | ||||||||
| 2,215 | *,† | Ayala Corp Preferred | 0 | |||||||
| 130,347 | Azimut Holding S.p.A. | 3,644 | ||||||||
| 17,682 | B. Riley Financial, Inc | 1,571 | ||||||||
| 4,429,229 | B3 SA-Brasil Bolsa Balcao | 8,820 | ||||||||
| 311,269 | Bajaj Finance Ltd | 29,073 | ||||||||
| 27,576 | Bajaj Finserv Ltd | 6,062 | ||||||||
| 199,905 | g | Banca Farmafactoring S.p.A | 1,607 | |||||||
| 549,917 | * | Banca Generali S.p.A | 24,123 | |||||||
| 64,015 | Banca IFIS S.p.A. | 1,237 | ||||||||
| 267,776 | Banca Mediolanum S.p.A | 2,640 | ||||||||
| 142,300 | Banco BTG Pactual S.A. | 327 | ||||||||
| 813,668 | Banco BTG Pactual S.A. | 756 | ||||||||
| 4,790,404 | Banco BTG Pactual S.A. - Unit | 17,993 | ||||||||
| 28,455 | Banco Latinoamericano de Exportaciones S.A. (Class E) | 472 | ||||||||
| 1,107,552 | Bangkok Commercial Asset Management PCL | 719 | ||||||||
| 3,326,961 | Bank of New York Mellon Corp | 193,230 | ||||||||
| 2,309,859 | * | Berkshire Hathaway, Inc (Class B) | 690,648 | |||||||
| 8,335,000 | BFI Finance Indonesia Tbk PT | 687 | ||||||||
| 295,752 | BGC Partners, Inc (Class A) | 1,375 | ||||||||
| 240,014 | BlackRock, Inc | 219,747 | ||||||||
| 938,823 | Blackstone Group, Inc | 121,474 | ||||||||
| 131,738 | Blackstone Mortgage Trust, Inc | 4,034 | ||||||||
| 30,304 | * | Blucora, Inc | 525 | |||||||
| 100,700 | BOC International China Co Ltd | 213 | ||||||||
| 1,335,012 | e | BOCOM International Holdings Co Ltd | 310 | |||||||
| 628,854 | e | Bolsa Mexicana de Valores S.A. de C.V. | 1,195 | |||||||
| 105,789 | Boursa Kuwait Securities Co KPSC | 707 | ||||||||
| 719,826 | Brewin Dolphin Holdings plc | 3,605 | ||||||||
| 956,610 | * | Bridgepoint Group Ltd | 6,383 | |||||||
| 163,317 | Brightsphere Investment Group, Inc | 4,181 | ||||||||
| 74,820 | BrightSpire Capital, Inc | 768 | ||||||||
| 111,913 | Broadmark Realty Capital, Inc | 1,055 | ||||||||
| 1,726,861 | Brookfield Asset Management, Inc | 104,285 | ||||||||
| 270,393 | Brookfield Asset Management, Inc (New York) | 16,326 | ||||||||
| 34,886 | BSE Ltd | 898 | ||||||||
| 76,613 | Bure Equity AB | 3,704 | ||||||||
| 1,017,502 | Burford Capital Ltd | 10,619 | ||||||||
| 69 |
COLLEGE RETIREMENT EQUITIES FUND - Stock Account
| SHARES | COMPANY | VALUE (000) | ||||||||
| 839,900 | Bursa Malaysia BHD | $ | 1,321 | |||||||
| 183,502 | Caitong Securities Co Ltd | 320 | ||||||||
| 116,567 | Canaccord Financial, Inc | 1,390 | ||||||||
| 156,357 | * | Cannae Holdings, Inc | 5,496 | |||||||
| 980,131 | Capital One Financial Corp | 142,207 | ||||||||
| 1,719,990 | Capital Securities Corp | 1,053 | ||||||||
| 252,178 | Carlyle Group, Inc | 13,845 | ||||||||
| 154,007 | CBOE Global Markets, Inc | 20,083 | ||||||||
| 37,118 | Cembra Money Bank AG. | 2,700 | ||||||||
| 288,862 | Central Depository Services India Ltd | 5,809 | ||||||||
| 44,291 | Cerved Information Solutions S.p.A | 518 | ||||||||
| 1,497,554 | Chailease Holding Co Ltd | 14,244 | ||||||||
| 698,681 | Challenger Financial Services Group Ltd | 3,319 | ||||||||
| 286,164 | Changjiang Securities Co Ltd | 339 | ||||||||
| 4,121,721 | Charles Schwab Corp | 346,637 | ||||||||
| 206,184 | Chimera Investment Corp | 3,109 | ||||||||
| 1,006,000 | China Bills Finance Corp | 625 | ||||||||
| 6,721,574 | China Cinda Asset Management Co Ltd | 1,224 | ||||||||
| 1,006,000 | China Everbright Ltd | 1,202 | ||||||||
| 2,645,459 | China Galaxy Securities Co Ltd | 1,521 | ||||||||
| 172,650 | China Galaxy Securities Co Ltd (Class A) | 303 | ||||||||
| 100,700 | China Great Wall Securities Co Ltd | 205 | ||||||||
| 4,136,279 | *,†,g | China Huarong Asset Management Co Ltd | 5 | |||||||
| 1,036,937 | g | China International Capital Corp Ltd | 2,862 | |||||||
| 60,500 | China International Capital Corp Ltd | 466 | ||||||||
| 357,236 | China Merchants Securities Co Ltd | 989 | ||||||||
| 177,900 | e,g | China Renaissance Holdings Ltd | 337 | |||||||
| 96,627 | Cholamandalam Financial Holdings Ltd | 848 | ||||||||
| 458,034 | Cholamandalam Investment and Finance Co Ltd | 3,195 | ||||||||
| 313,219 | CI Financial Corp | 6,547 | ||||||||
| 1,720,405 | CITIC Securities Co Ltd | 4,493 | ||||||||
| 464,275 | CITIC Securities Co Ltd (Class A) | 1,925 | ||||||||
| 476,376 | e | CMBC Capital Holdings Ltd | 295 | |||||||
| 142,697 | g | CMC Markets plc | 509 | |||||||
| 462,738 | CME Group, Inc | 105,717 | ||||||||
| 128,075 | Coface S.A. | 1,825 | ||||||||
| 72,635 | Cohen & Steers, Inc | 6,719 | ||||||||
| 243,733 | Coronation Fund Managers Ltd | 804 | ||||||||
| 31,497 | Corp Financiera Alba | 1,835 | ||||||||
| 115,564 | * | Corp Financiera Colombiana S.A. | 813 | |||||||
| 22,702 | e | Cowen Group, Inc | 820 | |||||||
| 59,908 | e | Creades AB | 974 | |||||||
| 70 |
COLLEGE RETIREMENT EQUITIES FUND - Stock Account
| SHARES | COMPANY | VALUE (000) | ||||||||
| 7,819 | *,e | Credit Acceptance Corp | $ | 5,377 | ||||||
| 81,924 | Credit Corp Group Ltd | 1,997 | ||||||||
| 179,800 | Credit Saison Co Ltd | 1,891 | ||||||||
| 970,381 | e | Credit Suisse Group | 9,408 | |||||||
| 42,622 | * | CreditAccess Grameen Ltd | 341 | |||||||
| 15,859 | CRISIL Ltd | 615 | ||||||||
| 179,125 | CSC Financial Co Ltd | 822 | ||||||||
| 1,156,000 | CSSC Hong Kong Shipping Co Ltd | 162 | ||||||||
| 3,349 | Curo Group Holdings Corp | 54 | ||||||||
| 94,581 | * | Daishin Securities Co Ltd | 1,482 | |||||||
| 23,043 | * | Daishin Securities Co Ltd PF | 307 | |||||||
| 1,579,993 | Daiwa Securities Group, Inc | 8,916 | ||||||||
| 16,378 | Daou Data Corp | 207 | ||||||||
| 24,062 | * | Daou Technology, Inc | 460 | |||||||
| 584,572 | * | Deutsche Bank AG. (Registered) | 7,281 | |||||||
| 24,409 | Deutsche Beteiligungs AG. | 1,108 | ||||||||
| 107,284 | Deutsche Boerse AG. | 17,914 | ||||||||
| 301,739 | * | Dhani Services Ltd | 670 | |||||||
| 2,799 | Diamond Hill Investment Group, Inc | 544 | ||||||||
| 8,401,600 | e | Differ Group Holding Co Ltd | 2,639 | |||||||
| 1,045,151 | Discover Financial Services | 120,778 | ||||||||
| 70,051 | g | doBank S.p.A | 669 | |||||||
| 123,225 | Dongxing Securities Co Ltd | 225 | ||||||||
| 177,640 | * | Donnelley Financial Solutions, Inc | 8,374 | |||||||
| 148,409 | * | Draper Esprit plc | 2,060 | |||||||
| 1,756,899 | Dubai Financial Market | 1,356 | ||||||||
| 28,034 | e | Dynex Capital, Inc | 468 | |||||||
| 449,191 | East Money Information Co Ltd | 2,619 | ||||||||
| 439,522 | e | ECN Capital Corp | 1,855 | |||||||
| 24,081,345 | Edelweiss Capital Ltd | 23,256 | ||||||||
| 124,747 | EFG International | 949 | ||||||||
| 45,586 | eGuarantee, Inc | 917 | ||||||||
| 717,867 | * | Egyptian Financial Group-Hermes Holding | 675 | |||||||
| 6,375 | * | Electreon Wireless Ltd | 429 | |||||||
| 518,853 | e | Element Financial Corp | 5,283 | |||||||
| 38,343 | Ellington Financial Inc | 655 | ||||||||
| 27,670 | *,e | Encore Capital Group, Inc | 1,719 | |||||||
| 31,046 | * | Enova International, Inc | 1,272 | |||||||
| 427,476 | EQT AB | 23,173 | ||||||||
| 2,519,659 | Equitable Holdings, Inc | 82,620 | ||||||||
| 11,460 | Eurazeo | 1,000 | ||||||||
| 1,055,715 | g | Euronext NV | 109,756 | |||||||
| 71 |
COLLEGE RETIREMENT EQUITIES FUND - Stock Account
| SHARES | COMPANY | VALUE (000) | ||||||||
| 158,406 | Everbright Securities Co Ltd | $ | 371 | |||||||
| 136,147 | Evercore Inc | 18,496 | ||||||||
| 30,800 | EXOR NV | 2,757 | ||||||||
| 85,956 | * | Ezcorp, Inc (Class A) | 633 | |||||||
| 54,043 | Factset Research Systems, Inc | 26,265 | ||||||||
| 762,401 | e | Far East Horizon Ltd | 677 | |||||||
| 83,083 | Federated Investors, Inc (Class B) | 3,122 | ||||||||
| 81,161 | Fiera Capital Corp | 673 | ||||||||
| 69,700 | Financial Products Group Co Ltd | 415 | ||||||||
| 115,153 | e | FinVolution Group (ADR) | 568 | |||||||
| 224,091 | First Capital Securities Co Ltd | 258 | ||||||||
| 32,428 | FirstCash Holdings, Inc | 2,426 | ||||||||
| 5,953,649 | FirstRand Ltd | 22,714 | ||||||||
| 166,579 | * | flatexDEGIRO AG. | 3,816 | |||||||
| 39,863 | g | Flow Traders | 1,461 | |||||||
| 179,025 | * | Focus Financial Partners, Inc | 10,691 | |||||||
| 449,846 | Founder Securities Co Ltd | 554 | ||||||||
| 29,055 | Franklin BSP Realty Trust, Inc | 434 | ||||||||
| 274,938 | Franklin Resources, Inc | 9,208 | ||||||||
| 11,438,363 | Fuhwa Financial Holdings Co Ltd | 10,448 | ||||||||
| 255,635 | *,g | Funding Circle Holdings plc | 388 | |||||||
| 55,000 | *,e | Futu Holdings Ltd (ADR) | 2,381 | |||||||
| 35,484 | Fuyo General Lease Co Ltd | 2,460 | ||||||||
| 810 | GAMCO Investors, Inc (Class A) | 20 | ||||||||
| 222,140 | GCM Grosvenor, Inc | 2,332 | ||||||||
| 5,976,017 | *,e | Gentera SAB de C.V. | 3,847 | |||||||
| 849,236 | GF Securities Co Ltd | 1,619 | ||||||||
| 264,108 | GF Securities Co Ltd (Class A) | 1,019 | ||||||||
| 26,439 | Gimv NV | 1,606 | ||||||||
| 15,128,000 | * | Glory Sun Financial Group Ltd | 388 | |||||||
| 40,301 | * | GMO Financial Holdings, Inc | 296 | |||||||
| 233,452 | e | goeasy Ltd | 33,085 | |||||||
| 647,186 | Goldman Sachs Group, Inc | 247,581 | ||||||||
| 4,397,338 | * | Grab Holdings Ltd. | 17,809 | |||||||
| 49,647 | Granite Point Mortgage Trust, Inc | 581 | ||||||||
| 21,749 | Great Ajax Corp | 286 | ||||||||
| 42,709 | * | Green Dot Corp | 1,548 | |||||||
| 2,536 | Greenhill & Co, Inc | 45 | ||||||||
| 33,895 | GRENKE AG. | 1,178 | ||||||||
| 32,112 | Groupe Bruxelles Lambert S.A. (EN Brussels) | 3,586 | ||||||||
| 158,614 | Grupo de Inversiones Suramericana S.A. | 1,170 | ||||||||
| 31,656 | Gruppo MutuiOnline S.p.A | 1,594 | ||||||||
| 72 |
COLLEGE RETIREMENT EQUITIES FUND - Stock Account
| SHARES | COMPANY | VALUE (000) | ||||||||
| 76,735 | Guangzhou Yuexiu Financial Holdings Group Co Ltd | $ | 105 | |||||||
| 110,104 | Guolian Securities Co Ltd | 242 | ||||||||
| 207,549 | Guosen Securities Co Ltd | 374 | ||||||||
| 3,285,800 | Guotai Junan International Hol | 455 | ||||||||
| 379,316 | Guotai Junan Securities Co Ltd | 1,065 | ||||||||
| 176,654 | Guoyuan Securities Co Ltd | 214 | ||||||||
| 1,828,184 | Haci Omer Sabanci Holding AS | 1,825 | ||||||||
| 2,526,282 | Haitong International Securities Group Ltd | 545 | ||||||||
| 2,009,173 | Haitong Securities Co Ltd | 1,781 | ||||||||
| 489,112 | Haitong Securities Co Ltd (Class A) | 941 | ||||||||
| 1,374,000 | e,g | Haitong UniTrust International Leasing Co Ltd | 181 | |||||||
| 21,427 | Hamilton Lane, Inc | 2,220 | ||||||||
| 63,977 | e | Hannon Armstrong Sustainable Infrastructure Capital, Inc | 3,398 | |||||||
| 111,811 | * | Hanwha Securities Co | 599 | |||||||
| 95,798 | Hargreaves Lansdown plc | 1,760 | ||||||||
| 35,822 | g | HDFC Asset Management Co Ltd | 1,175 | |||||||
| 21,986 | Hithink RoyalFlush Information Network Co Ltd | 499 | ||||||||
| 2,926,466 | Hong Kong Exchanges and Clearing Ltd | 171,151 | ||||||||
| 164,000 | Hotai Finance Co Ltd | 546 | ||||||||
| 10,609 | Houlihan Lokey, Inc | 1,098 | ||||||||
| 1,206,540 | g | Huatai Securities Co Ltd | 2,010 | |||||||
| 153,334 | Huatai Securities Co Ltd (Class A) | 427 | ||||||||
| 161,200 | Huaxi Securities Co Ltd | 249 | ||||||||
| 64,041 | HUB24 Ltd | 1,319 | ||||||||
| 34,345 | * | Hypoport AG. | 19,919 | |||||||
| 122,765 | g | ICICI Securities Ltd | 1,304 | |||||||
| 1,214,827 | * | IDFC Ltd | 1,028 | |||||||
| 159,100 | e | iFAST Corp Ltd | 992 | |||||||
| 3,468,801 | IG Group Holdings plc | 38,342 | ||||||||
| 114,075 | IGM Financial, Inc | 4,114 | ||||||||
| 36,707 | IIFL Wealth Management Ltd | 699 | ||||||||
| 102,760 | Impax Asset Management Group plc | 2,047 | ||||||||
| 459,713 | g | Indian Energy Exchange Ltd | 1,559 | |||||||
| 353,680 | Industrial Securities Co Ltd | 549 | ||||||||
| 148,422 | e | Industrivarden AB | 4,716 | |||||||
| 44,469 | Industrivarden AB | 1,393 | ||||||||
| 339,554 | IntegraFin Holdings plc | 2,582 | ||||||||
| 73,262 | e | Interactive Brokers Group, Inc (Class A) | 5,818 | |||||||
| 617,144 | Intercontinental Exchange Group, Inc | 84,407 | ||||||||
| 494,472 | Intermediate Capital Group plc | 14,726 | ||||||||
| 325,673 | Invesco Ltd | 7,497 | ||||||||
| 73 |
COLLEGE RETIREMENT EQUITIES FUND - Stock Account
| SHARES | COMPANY | VALUE (000) | ||||||||
| 230,516 | e | Invesco Mortgage Capital, Inc | $ | 641 | ||||||
| 297,699 | Investec Ltd | 1,636 | ||||||||
| 845,870 | Investec plc | 4,664 | ||||||||
| 37,994 | Investment AB Oresund | 613 | ||||||||
| 697,550 | Investor AB | 17,504 | ||||||||
| 284,188 | Investor AB | 7,476 | ||||||||
| 751,851 | IOOF Holdings Ltd | 1,981 | ||||||||
| 3,151,195 | IP Group plc | 5,332 | ||||||||
| 130,442 | Is Yatirim Menkul Degerler AS | 229 | ||||||||
| 2,239,649 | iShares Core MSCI Emerging Markets ETF | 134,065 | ||||||||
| 9,390 | iShares Core S&P 500 ETF | 4,479 | ||||||||
| 21,300 | iShares MSCI ACWI ex US ETF | 1,184 | ||||||||
| 918,421 | e | iShares MSCI Canada Index Fund | 35,295 | |||||||
| 40,150 | e | iShares MSCI EAFE Index Fund | 3,159 | |||||||
| 14,184 | e | iShares MSCI EAFE Small-Cap ETF | 1,037 | |||||||
| 19,052 | iShares MSCI Emerging Markets | 931 | ||||||||
| 5,000 | e | iShares MSCI Emerging Markets Small-Cap ETF | 301 | |||||||
| 235,602 | e | iShares MSCI Japan ETF | 15,776 | |||||||
| 8,897 | e | iShares Russell 2000 Index Fund | 1,979 | |||||||
| 85,000 | e | iShares Russell Midcap Growth Index Fund | 9,794 | |||||||
| 244,224 | Isracard Ltd | 1,204 | ||||||||
| 24,025 | Jaccs Co Ltd | 619 | ||||||||
| 9,799 | e | Jackson Financial, Inc | 410 | |||||||
| 49,818 | * | Jafco Co Ltd | 2,866 | |||||||
| 163,564 | Janus Henderson Group plc | 6,860 | ||||||||
| 108,600 | Japan Securities Finance Co Ltd | 907 | ||||||||
| 354,915 | Jefferies Financial Group, Inc | 13,771 | ||||||||
| 1,228,953 | Jih Sun Financial Holdings Co Ltd | 549 | ||||||||
| 462,474 | JM Financial Ltd | 461 | ||||||||
| 92,561 | JSE Ltd | 651 | ||||||||
| 156,033 | g | JTC plc | 1,946 | |||||||
| 106,252 | Julius Baer Group Ltd | 7,105 | ||||||||
| 527,908 | Jupiter Investment Management Group Ltd | 1,831 | ||||||||
| 182,294 | Kelsian Group Ltd | 980 | ||||||||
| 68,487 | * | Kinnevik AB | 2,435 | |||||||
| 17,074 | * | KIWOOM Securities Co Ltd | 1,533 | |||||||
| 805,267 | KKR & Co, Inc | 59,992 | ||||||||
| 84,933 | KKR Real Estate Finance Trust, Inc | 1,769 | ||||||||
| 29,323 | * | Korea Investment Holdings Co Ltd | 1,987 | |||||||
| 18,689 | KRUK S.A. | 1,517 | ||||||||
| 918,128 | Krungthai Card PCL | 1,629 | ||||||||
| 436,035 | * | Kumho Investment Bank | 330 | |||||||
| 74 |
COLLEGE RETIREMENT EQUITIES FUND - Stock Account
| SHARES | COMPANY | VALUE (000) | ||||||||
| 878,029 | * | L&T Finance Holdings Ltd | $ | 915 | ||||||
| 829,599 | Ladder Capital Corp | 9,947 | ||||||||
| 96,236 | Lazard Ltd (Class A) | 4,199 | ||||||||
| 449,298 | * | LendingClub Corp | 10,864 | |||||||
| 1,036 | * | LendingTree, Inc | 127 | |||||||
| 12,285 | Leonteq A.G. | 933 | ||||||||
| 109,800 | *,e | LexinFintech Holdings Ltd (ADR) | 424 | |||||||
| 77,025 | Liontrust Asset Management plc | 2,294 | ||||||||
| 527,325 | London Stock Exchange Group plc | 49,606 | ||||||||
| 417,332 | LPL Financial Holdings, Inc | 66,811 | ||||||||
| 21,566 | Lundbergs AB (B Shares) | 1,208 | ||||||||
| 18,000 | * | M&A Capital Partners Co Ltd | 825 | |||||||
| 2,377,300 | M&G plc | 6,431 | ||||||||
| 96,157 | MA Financial Group Ltd | 626 | ||||||||
| 439,574 | Macquarie Group Ltd | 65,710 | ||||||||
| 158,629 | Magellan Financial Group Ltd | 2,451 | ||||||||
| 158,605 | * | Magma Fincorp Ltd | 465 | |||||||
| 667,082 | Mahindra & Mahindra Financial Services Ltd | 1,332 | ||||||||
| 27,285,140 | Man Group plc | 83,983 | ||||||||
| 551,694 | Manappuram General Finance & Leasing Ltd | 1,217 | ||||||||
| 36,677 | MarketAxess Holdings, Inc | 15,084 | ||||||||
| 8,301 | Marlin Business Services Corp | 193 | ||||||||
| 12,626 | g | MAS Financial Services Ltd | 107 | |||||||
| 149,400 | Matsui Securities Co Ltd | 1,027 | ||||||||
| 43,619 | * | Meritz finance Holdings Co Ltd | 1,616 | |||||||
| 238,525 | * | Meritz Securities Co Ltd | 1,033 | |||||||
| 7,827,380 | Metro Pacific Investments Corp | 599 | ||||||||
| 387,482 | MFA Financial Inc | 1,767 | ||||||||
| 176,761 | * | Mirae Asset Daewoo Co Ltd | 1,284 | |||||||
| 489,570 | Mitsubishi UFJ Lease & Finance Co Ltd | 2,422 | ||||||||
| 32,700 | Mizuho Leasing Co Ltd | 907 | ||||||||
| 82,590 | MLP AG. | 806 | ||||||||
| 139,591 | Moelis & Co | 8,726 | ||||||||
| 185,652 | * | Monex Group, Inc | 1,133 | |||||||
| 170,609 | Moody’s Corp | 66,636 | ||||||||
| 6,314,200 | Morgan Stanley | 619,802 | ||||||||
| 35,013 | Morningstar, Inc | 11,974 | ||||||||
| 39,724 | Motilal Oswal Financial Services Ltd | 488 | ||||||||
| 88,857 | MSCI, Inc (Class A) | 54,442 | ||||||||
| 680,482 | Muangthai Capital PCL | 1,194 | ||||||||
| 39,737 | Multi Commodity Exchange of India Ltd | 844 | ||||||||
| 87,422 | Muthoot Finance Ltd | 1,754 | ||||||||
| 75 |
COLLEGE RETIREMENT EQUITIES FUND - Stock Account
| SHARES | COMPANY | VALUE (000) | ||||||||
| 93,039 | Nanjing Securities Co Ltd | $ | 145 | |||||||
| 110,179 | Nasdaq Inc | 23,139 | ||||||||
| 138,784 | Navient Corp | 2,945 | ||||||||
| 14,777 | Nelnet, Inc (Class A) | 1,443 | ||||||||
| 263,089 | Netwealth Group Ltd | 3,389 | ||||||||
| 423,149 | New Residential Investment Corp | 4,532 | ||||||||
| 332,893 | New York Mortgage Trust, Inc | 1,238 | ||||||||
| 3,422 | *,† | NewStar Financial, Inc | 1 | |||||||
| 1,246,200 | * | Ngern Tid Lor PCL | 1,362 | |||||||
| 19,328 | * | NICE Holdings Co Ltd | 260 | |||||||
| 161,925 | Ninety One Ltd | 574 | ||||||||
| 633,638 | Ninety One plc | 2,377 | ||||||||
| 129,350 | g | Nippon Life India Asset Management Ltd | 611 | |||||||
| 26,543 | * | Noah Holdings Ltd (ADR) | 815 | |||||||
| 3,474,236 | * | Nomura Holdings, Inc | 15,133 | |||||||
| 1,536,715 | e | Nordnet AB publ | 29,482 | |||||||
| 142,300 | Northeast Securities Co Ltd | 196 | ||||||||
| 68,465 | Northern Trust Corp | 8,189 | ||||||||
| 109,152 | Numis Corp plc | 505 | ||||||||
| 164,093 | Okasan Holdings, Inc | 543 | ||||||||
| 197,012 | OneMain Holdings, Inc | 9,858 | ||||||||
| 100,303 | Onex Corp | 7,872 | ||||||||
| 131,025 | * | Open Lending Corp | 2,945 | |||||||
| 18,478 | * | Oportun Financial Corp | 374 | |||||||
| 8,374 | Oppenheimer Holdings, Inc | 388 | ||||||||
| 88,935 | e | Orchid Island Capital, Inc | 400 | |||||||
| 677,100 | Orient Corp | 735 | ||||||||
| 289,937 | Orient Securities Co Ltd | 672 | ||||||||
| 2,499,168 | ORIX Corp | 51,003 | ||||||||
| 327,238 | Osaka Securities Exchange Co Ltd | 7,170 | ||||||||
| 6,647,344 | * | Pacific Strategic Financial Tbk PT | 520 | |||||||
| 11,743 | Partners Group | 19,385 | ||||||||
| 435,965 | Pendal Group Ltd | 1,767 | ||||||||
| 70,523 | PennyMac Mortgage Investment Trust | 1,222 | ||||||||
| 1,561,079 | * | Pensionbee Group plc | 2,825 | |||||||
| 75,493 | Perpetual Trustees Australia Ltd | 1,976 | ||||||||
| 142,484 | Pinnacle Investment Management Group Ltd | 1,617 | ||||||||
| 120,361 | Piper Jaffray Cos | 21,486 | ||||||||
| 2,431,454 | Piramal Healthcare Ltd | 86,225 | ||||||||
| 5,371 | PJT Partners, Inc | 398 | ||||||||
| 518,959 | Platinum Asset Mangement Ltd | 1,019 | ||||||||
| 210,723 | Plus500 Ltd | 3,887 | ||||||||
| 76 |
COLLEGE RETIREMENT EQUITIES FUND - Stock Account
| SHARES | COMPANY | VALUE (000) | ||||||||
| 94,734 | Polar Capital Holdings plc | $ | 1,017 | |||||||
| 40,544 | * | PRA Group, Inc | 2,036 | |||||||
| 762,390 | President Securities Corp | 651 | ||||||||
| 284,968 | * | PROG Holdings, Inc | 12,855 | |||||||
| 294,369 | * | Provident Financial plc | 1,431 | |||||||
| 34,922 | Pzena Investment Management, Inc (Class A) | 331 | ||||||||
| 197,580 | *,e | Qudian, Inc (ADR) | 191 | |||||||
| 2,072,004 | g | Quilter plc | 4,187 | |||||||
| 1,963,527 | Ratchthani Leasing PCL | 257 | ||||||||
| 135,323 | Rathbone Brothers | 3,668 | ||||||||
| 254,980 | Ratos AB (B Shares) | 1,630 | ||||||||
| 176,129 | Raymond James Financial, Inc | 17,683 | ||||||||
| 225,574 | Ready Capital Corp | 3,526 | ||||||||
| 1,062,275 | REC Ltd | 1,908 | ||||||||
| 384,402 | Redwood Trust, Inc | 5,070 | ||||||||
| 149,982 | Regional Management Corp | 8,618 | ||||||||
| 95,200 | Reinet Investments S.C.A | 1,709 | ||||||||
| 601,466 | Remgro Ltd | 4,950 | ||||||||
| 139,212 | g | Resurs Holding AB | 584 | |||||||
| 16,461 | Ricoh Leasing Co Ltd | 552 | ||||||||
| 409,760 | S&P Global, Inc | 193,378 | ||||||||
| 45,305 | * | Samsung Securities Co Ltd | 1,708 | |||||||
| 196,894 | Sanne Group plc | 2,428 | ||||||||
| 59,221 | Santander Consumer USA Holdings, Inc | 2,488 | ||||||||
| 269,184 | * | SBI Cards & Payment Services Ltd | 3,355 | |||||||
| 1,192,338 | * | SBI Holdings, Inc | 32,522 | |||||||
| 97,744 | Schroders plc | 4,718 | ||||||||
| 19,980 | Sculptor Capital Management, Inc | 427 | ||||||||
| 284,563 | SDIC Capital Co Ltd | 367 | ||||||||
| 26,499 | SE Investments Ltd | 258 | ||||||||
| 155,891 | Sealand Securities Co Ltd | 101 | ||||||||
| 104,991 | SEI Investments Co | 6,398 | ||||||||
| 207,969 | Shanxi Securities Co Ltd | 215 | ||||||||
| 448,500 | Sheng Ye Capital Ltd | 446 | ||||||||
| 956,844 | Shenwan Hongyuan Group Co Ltd | 769 | ||||||||
| 2,837 | Shinyoung Securities Co Ltd | 143 | ||||||||
| 24,178 | Shriram City Union Finance Ltd | 572 | ||||||||
| 146,608 | Shriram Transport Finance Co Ltd | 2,386 | ||||||||
| 1,175,878 | SHUAA Capital PSC | 219 | ||||||||
| 592,044 | Singapore Exchange Ltd | 4,087 | ||||||||
| 151,982 | Sinolink Securities Co Ltd | 270 | ||||||||
| 635,852 | * | SK Square Co Ltd | 35,517 | |||||||
| 77 |
COLLEGE RETIREMENT EQUITIES FUND - Stock Account
| SHARES | COMPANY | VALUE (000) | ||||||||
| 281,797 | SLM Corp | $ | 5,543 | |||||||
| 5,964 | Societe Fonciere Financiere et de Participations FFP | 842 | ||||||||
| 16,777 | Sofina S.A. | 8,241 | ||||||||
| 211,935 | SooChow Securities Co Ltd | 295 | ||||||||
| 120,373 | Southwest Securities Co Ltd | 100 | ||||||||
| 18,940 | * | Spandana Sphoorty Financial Ltd | 117 | |||||||
| 94,358 | Sparx Group Co Ltd | 245 | ||||||||
| 8,000 | SPDR S&P 500 ETF Trust | 3,800 | ||||||||
| 32,642 | e | Sprott, Inc | 1,473 | |||||||
| 768,475 | *,†,e | SRH NV | 9 | |||||||
| 753,810 | Srisawad Corp PCL | 1,390 | ||||||||
| 493,232 | St. James’s Place plc | 11,271 | ||||||||
| 2,255,109 | Standard Life Aberdeen plc | 7,347 | ||||||||
| 503,909 | Starwood Property Trust, Inc | 12,245 | ||||||||
| 634,195 | State Street Corp | 58,980 | ||||||||
| 221,214 | e | StepStone Group, Inc | 9,196 | |||||||
| 97,214 | Stifel Financial Corp | 6,846 | ||||||||
| 14,052 | * | StoneX Group, Inc | 861 | |||||||
| 10,324 | Strike Co Ltd | 459 | ||||||||
| 589,735 | Sun Hung Kai & Co Ltd | 315 | ||||||||
| 62,202 | Sundaram Finance Ltd | 1,909 | ||||||||
| 26,676 | Svolder AB | 1,080 | ||||||||
| 11,111 | Swissquote Group Holding S.A. | 2,433 | ||||||||
| 2,019,212 | Synchrony Financial | 93,671 | ||||||||
| 216,678 | T Rowe Price Group, Inc | 42,608 | ||||||||
| 161,128 | Taiwan Acceptance Corp | 1,018 | ||||||||
| 193,668 | Tamburi Investment Partners S.p.A. | 2,177 | ||||||||
| 14,392 | Tata Investment Corp Ltd | 262 | ||||||||
| 1,025,638 | Tel Aviv Stock Exchange Ltd | 5,534 | ||||||||
| 122,437 | Tianfeng Securities Co Ltd | 78 | ||||||||
| 104,740 | TMX Group Ltd | 10,619 | ||||||||
| 251,780 | Tokai Tokyo Securities Co Ltd | 863 | ||||||||
| 28,410 | Tokyo Century Corp | 1,379 | ||||||||
| 81,545 | * | Tong Yang Investment Bank | 275 | |||||||
| 964,472 | TP Icap Group plc | 1,993 | ||||||||
| 52,666 | TPG RE Finance Trust, Inc | 649 | ||||||||
| 97,645 | Tradeweb Markets, Inc | 9,778 | ||||||||
| 873,686 | Transaction Capital Ltd | 2,469 | ||||||||
| 1,214,667 | Turkiye Sinai Kalkinma Bankasi AS | 132 | ||||||||
| 288,447 | e | Two Harbors Investment Corp | 1,664 | |||||||
| 6,428,905 | UBS Group AG | 115,394 | ||||||||
| 95,900 | *,e | Up Fintech Holding Ltd (ADR) | 471 | |||||||
| 78 |
COLLEGE RETIREMENT EQUITIES FUND - Stock Account
| SHARES | COMPANY | VALUE (000) | ||||||||
| 45,010 | * | Upstart Holdings, Inc | $ | 6,810 | ||||||
| 46,443 | UTI Asset Management Co Ltd | 657 | ||||||||
| 23,900 | * | Uzabase, Inc | 305 | |||||||
| 247 | Value Line, Inc | 12 | ||||||||
| 1,273,011 | Value Partners Group Ltd | 636 | ||||||||
| 25,000 | e | Vanguard FTSE Developed Markets ETF | 1,276 | |||||||
| 83,805 | Virtu Financial, Inc | 2,416 | ||||||||
| 678 | Virtus Investment Partners, Inc | 201 | ||||||||
| 97,215 | * | VNV Global AB | 1,125 | |||||||
| 196,375 | Vontobel Holding AG. | 17,172 | ||||||||
| 1,102,219 | Voya Financial, Inc | 73,088 | ||||||||
| 18,471 | VZ Holding AG. | 1,983 | ||||||||
| 61,752 | Warsaw Stock Exchange | �� | 635 | |||||||
| 2,251,167 | Waterland Financial Holdings | 1,305 | ||||||||
| 25,700 | *,e | WealthNavi, Inc | 456 | |||||||
| 29,221 | Wendel | 3,501 | ||||||||
| 271,003 | Western Securities Co Ltd | 343 | ||||||||
| 41,991 | WisdomTree Investments, Inc | 257 | ||||||||
| 116,654 | * | Woori Investment & Securities Co Ltd | 1,225 | |||||||
| 56,403 | *,e | Woori Technology Investment Co Ltd | 432 | |||||||
| 4,050 | * | World Acceptance Corp | 994 | |||||||
| 1 | * | XP, Inc | 0 | ^ | ||||||
| 44,356 | g | X-Trade Brokers Dom Maklerski S.A. | 184 | |||||||
| 1,389,500 | *,g | Yixin Group Ltd | 218 | |||||||
| 120,465 | Zenkoku Hosho Co Ltd | 5,251 | ||||||||
| 231,491 | Zheshang Securities Co Ltd | 479 | ||||||||
| 412,900 | Zhongtai Securities Co Ltd | 647 | ||||||||
| 2,908,434 | *,e | Zip Co Ltd | 9,160 | |||||||
| TOTAL DIVERSIFIED FINANCIALS | 6,579,779 | |||||||||
| ENERGY - 3.2% | ||||||||||
| 179,400 | * | 3R PETROLEUM OLEO E GAS S.A. | 1,079 | |||||||
| 18,885,261 | Adaro Energy Tbk | 2,995 | ||||||||
| 229,619 | *,e | Advantage Energy Ltd | 1,345 | |||||||
| 151,351 | Aegis Logistics Ltd | 449 | ||||||||
| 21,419 | * | Aemetis, Inc | 263 | |||||||
| 809,670 | Aker BP ASA | 24,896 | ||||||||
| 367,933 | * | Aker Solutions ASA | 972 | |||||||
| 39,482 | Aldrees Petroleum and Transport Services Co | 702 | ||||||||
| 62,836 | * | Alto Ingredients, Inc | 302 | |||||||
| 3,012 | Altus Midstream Co | 185 | ||||||||
| 262,961 | Ampol Ltd | 5,678 | ||||||||
| 79 |
COLLEGE RETIREMENT EQUITIES FUND - Stock Account
| SHARES | COMPANY | VALUE (000) | ||||||||
| 305,954 | e | Antero Midstream Corp | $ | 2,962 | ||||||
| 371,481 | * | Antero Resources Corp | 6,501 | |||||||
| 318,684 | APA Corp | 8,569 | ||||||||
| 828,700 | e | ARC Resources Ltd | 7,534 | |||||||
| 41,736 | Arch Resources, Inc | 3,811 | ||||||||
| 118,542 | Archrock, Inc | 887 | ||||||||
| 1,972 | * | Aspen Aerogels, Inc | 98 | |||||||
| 45,280 | Baker Hughes Co | 1,089 | ||||||||
| 1,284,900 | Bangchak Corp PCL | 970 | ||||||||
| 5,675,166 | Banpu PCL (Foreign) | 1,804 | ||||||||
| 1,031,735 | *,e | Baytex Energy Trust | 3,189 | |||||||
| 2,180,586 | Beach Petroleum Ltd | 2,002 | ||||||||
| 59,340 | Berry Petroleum Co LLC | 500 | ||||||||
| 1,054,854 | Bharat Petroleum Corp Ltd | 5,454 | ||||||||
| 321,218 | e | Birchcliff Energy Ltd | 1,640 | |||||||
| 351,154 | Bonanza Creek Energy, Inc | 17,196 | ||||||||
| 20,280,415 | BP plc | 90,869 | ||||||||
| 1,060,508 | BP plc (ADR) | 28,241 | ||||||||
| 93,631 | Brigham Minerals, Inc | 1,975 | ||||||||
| 4,650,000 | *,†,e | Brightoil Petroleum Holdings Ltd | 671 | |||||||
| 19,998 | * | Bristow Group, Inc | 633 | |||||||
| 2,823,000 | * | Bumi Armada BHD | 318 | |||||||
| 68,915 | * | BW Energy Ltd | 156 | |||||||
| 92,864 | g | BW LPG Ltd | 525 | |||||||
| 123,984 | BW Offshore Ltd | 375 | ||||||||
| 1,311,675 | Cabot Oil & Gas Corp | 24,922 | ||||||||
| 47,694 | Cactus, Inc | 1,819 | ||||||||
| 617,191 | Cairn Energy plc | 1,593 | ||||||||
| 72,227 | California Resources Corp | 3,085 | ||||||||
| 8,232 | *,e | Callon Petroleum Co | 389 | |||||||
| 484,896 | Cameco Corp (Toronto) | 10,572 | ||||||||
| 171,842 | e | Canacol Energy Ltd | 436 | |||||||
| 1,552,628 | Canadian Natural Resources Ltd (Canada) | 65,606 | ||||||||
| 1,790,336 | e | Cenovus Energy, Inc (Toronto) | 21,952 | |||||||
| 638,806 | * | Centennial Resource Development, Inc | 3,820 | |||||||
| 8,456 | * | Centrus Energy Corp | 422 | |||||||
| 760,314 | *,e | CGG S.A. | 553 | |||||||
| 2,450,000 | CGN Mining Co Ltd | 245 | ||||||||
| 365,270 | * | ChampionX Corp | 7,382 | |||||||
| 500,980 | Cheniere Energy, Inc | 50,809 | ||||||||
| 185,340 | Chesapeake Energy Corp | 11,958 | ||||||||
| 3,891,550 | Chevron Corp | 456,673 | ||||||||
| 80 |
COLLEGE RETIREMENT EQUITIES FUND - Stock Account
| SHARES | COMPANY | VALUE (000) | ||||||||
| 300,803 | China Aviation Oil Singapore Corp Ltd | $ | 210 | |||||||
| 3,201,000 | e | China Coal Energy Co | 1,851 | |||||||
| 2,711,122 | China Oilfield Services Ltd | 2,378 | ||||||||
| 548,576 | China Shenhua Energy Co Ltd | 1,940 | ||||||||
| 5,383,955 | China Shenhua Energy Co Ltd (Hong Kong) | 12,600 | ||||||||
| 2,210,000 | China Suntien Green Energy Cor | 1,724 | ||||||||
| 127,397 | *,e | Clean Energy Fuels Corp | 781 | |||||||
| 188,806 | * | CNX Resources Corp | 2,596 | |||||||
| 1,962,962 | Coal India Ltd | 3,848 | ||||||||
| 118 | *,†,b | Cobalt International Energy, Inc | 0 | ^ | ||||||
| 84,946 | * | Comstock Resources Inc | 687 | |||||||
| 3,762,546 | ConocoPhillips | 271,581 | ||||||||
| 30,477 | * | CONSOL Energy, Inc | 692 | |||||||
| 15,503 | e | Continental Resources, Inc | 694 | |||||||
| 1,222,304 | Cosan SA Industria e Comercio | 4,802 | ||||||||
| 407,793 | COSCO SHIPPING Energy Transportation Co Ltd | 379 | ||||||||
| 206,458 | Cosmo Energy Holdings Co Ltd | 4,034 | ||||||||
| 2,632 | *,e | Crescent Energy, Inc | 33 | |||||||
| 1,052,068 | Crescent Point Energy Corp | 5,614 | ||||||||
| 30,561 | CropEnergies AG. | 426 | ||||||||
| 26,870 | CVR Energy, Inc | 452 | ||||||||
| 5,673,074 | Dana Gas PJSC | 1,631 | ||||||||
| 10,920 | * | Delek Group Ltd | 895 | |||||||
| 59,704 | * | Delek US Holdings, Inc | 895 | |||||||
| 57,355 | * | Denbury, Inc | 4,393 | |||||||
| 921,048 | *,e | Denison Mines Corp | 1,267 | |||||||
| 1,963,978 | Devon Energy Corp | 86,513 | ||||||||
| 123,988 | DHT Holdings, Inc | 644 | ||||||||
| 4,743,212 | Dialog Group BHD | 2,982 | ||||||||
| 1,367,426 | Diamondback Energy, Inc | 147,477 | ||||||||
| 2,455,738 | Diversified Gas & Oil plc | 3,473 | ||||||||
| 1,746 | * | DMC Global, Inc | 69 | |||||||
| 480,629 | DNO International ASA | 568 | ||||||||
| 23,348 | Dorian LPG Ltd | 296 | ||||||||
| 23,784 | * | Drilling Co of 1972 | 928 | |||||||
| 31,091 | * | Dril-Quip, Inc | 612 | |||||||
| 21,539 | DT Midstream, Inc | 1,033 | ||||||||
| 19,145 | * | Earthstone Energy, Inc | 209 | |||||||
| 7,010,783 | Ecopetrol S.A. | 4,631 | ||||||||
| 457,244 | Empresas COPEC S.A. | 3,535 | ||||||||
| 121,653 | Enauta Participacoes S.A. | 290 | ||||||||
| 2,641,763 | Enbridge, Inc (Toronto) | 103,189 | ||||||||
| 81 |
COLLEGE RETIREMENT EQUITIES FUND - Stock Account
| SHARES | COMPANY | VALUE (000) | ||||||||
| 3,560,568 | ENEOS Holdings, Inc | $ | 13,302 | |||||||
| 107,908 | Enerflex Ltd | 653 | ||||||||
| 140,389 | * | Energean plc | 1,625 | |||||||
| 1,168,600 | *,† | Energy Earth PCL | 0 | ^ | ||||||
| 178,901 | *,e | Energy Fuels, Inc | 1,366 | |||||||
| 157,910 | *,e | Energy Fuels, Inc | 1,205 | |||||||
| 1 | Energy Transfer LP | 0 | ^ | |||||||
| 717,270 | Enerplus Corp | 7,564 | ||||||||
| 3,189,006 | ENI S.p.A. | 44,320 | ||||||||
| 1,761,463 | EOG Resources, Inc | 156,471 | ||||||||
| 68,994 | * | EQT Corp | 1,505 | |||||||
| 3,934,481 | Equinor ASA | 104,182 | ||||||||
| 25,335 | * | Equital Ltd | 971 | |||||||
| 365,640 | Equitrans Midstream Corp | 3,781 | ||||||||
| 1,163,600 | * | Esso Thailand PCL (Foreign) | 256 | |||||||
| 228,273 | Euronav NV | 2,023 | ||||||||
| 295,547 | Exxaro Resources Ltd | 2,835 | ||||||||
| 3,452,773 | Exxon Mobil Corp | 211,275 | ||||||||
| 81,195 | e | Falcon Minerals Corp | 395 | |||||||
| 35,055 | FLEX LNG Ltd | 782 | ||||||||
| 1,381,269 | Formosa Petrochemical Corp | 4,776 | ||||||||
| 34,121 | *,e | Frank’s International NV | 490 | |||||||
| 202,042 | e | Freehold Royalty Trust | 1,861 | |||||||
| 107,272 | *,e | Frontline Ltd | 758 | |||||||
| 115,645 | *,e | Frontline Ltd (Sigmax MTF) | 823 | |||||||
| 9,096 | * | FTS International, Inc | 239 | |||||||
| 137,861 | Galp Energia SGPS S.A. | 1,338 | ||||||||
| 2,717,209 | Gazprom (ADR) | 24,971 | ||||||||
| 4,253,464 | Gazprom OAO (ADR) | 39,277 | ||||||||
| 26,923 | Gaztransport Et Technigaz S.A. | 2,512 | ||||||||
| 174,009 | *,e | Gevo, Inc | 745 | |||||||
| 176,311 | e | Gibson Energy, Inc | 3,125 | |||||||
| 305,295 | * | Golar LNG Ltd | 3,783 | |||||||
| 110,294 | Great Eastern Shipping Co Ltd | 441 | ||||||||
| 41,217 | * | Green Plains Inc | 1,433 | |||||||
| 102,340 | * | Grupa Lotos S.A. | 1,547 | |||||||
| 55,534 | * | GS Holdings Corp | 1,824 | |||||||
| 745,186 | * | Guanghui Energy Co Ltd | 766 | |||||||
| 995,227 | * | Gulf International Services QSC | 468 | |||||||
| 61,790 | * | Hafnia Ltd | 122 | |||||||
| 1,009,139 | Halliburton Co | 23,079 | ||||||||
| 507,236 | * | Harbour Energy plc | 2,448 | |||||||
| 82 |
COLLEGE RETIREMENT EQUITIES FUND - Stock Account
| SHARES | COMPANY | VALUE (000) | ||||||||
| 231,234 | * | Headwater Exploration, Inc | $ | 941 | ||||||
| 123,856 | * | Helix Energy Solutions Group, Inc | 386 | |||||||
| 69,195 | Hellenic Petroleum S.A. | 490 | ||||||||
| 91,100 | Helmerich & Payne, Inc | 2,159 | ||||||||
| 768,539 | Hess Corp | 56,895 | ||||||||
| 14,540 | HighPeak Energy, Inc | 213 | ||||||||
| 809,086 | Hindustan Petroleum Corp Ltd | 3,174 | ||||||||
| 34,796 | HollyFrontier Corp | 1,141 | ||||||||
| 399,696 | Hunting plc | 915 | ||||||||
| 158,949 | Idemitsu Kosan Co Ltd | 4,056 | ||||||||
| 299,061 | Imperial Oil Ltd | 10,786 | ||||||||
| 2,429,749 | Indian Oil Corp Ltd | 3,635 | ||||||||
| 696,500 | Indo Tambangraya Megah Tbk PT | 997 | ||||||||
| 1,148,600 | Inner Mongolia Yitai Coal Co | 1,004 | ||||||||
| 1,187,034 | Inpex Holdings, Inc | 10,322 | ||||||||
| 37,327 | International Seaways, Inc | 548 | ||||||||
| 13,278,386 | IRPC PCL (Foreign) | 1,524 | ||||||||
| 81,050 | Itochu Enex Co Ltd | 702 | ||||||||
| 57,022 | Iwatani International Corp | 2,873 | ||||||||
| 82,677 | Japan Petroleum Exploration Co | 1,800 | ||||||||
| 839,000 | * | John Wood Group plc | 2,180 | |||||||
| 701,436 | * | Karoon Gas Australia Ltd | 860 | |||||||
| 192,971 | *,e | Kelt Exploration Ltd | 735 | |||||||
| 271,705 | e | Keyera Corp | 6,128 | |||||||
| 1,174,538 | Kinder Morgan, Inc | 18,628 | ||||||||
| 100,009 | Koninklijke Vopak NV | 3,507 | ||||||||
| 40,344 | * | Kosmos Energy Ltd | 140 | |||||||
| 8,582 | * | Laredo Petroleum, Inc | 516 | |||||||
| 55,528 | * | Liberty Oilfield Services, Inc | 539 | |||||||
| 489,914 | LUKOIL PJSC (ADR) | 43,994 | ||||||||
| 247,126 | Lundin Petroleum AB | 8,843 | ||||||||
| 14,830 | Magnolia Oil & Gas Corp | 280 | ||||||||
| 1,457,037 | Marathon Oil Corp | 23,925 | ||||||||
| 1,051,234 | Marathon Petroleum Corp | 67,268 | ||||||||
| 98,770 | Matador Resources Co | 3,647 | ||||||||
| 332,178 | * | MEG Energy Corp | 3,072 | |||||||
| 42,600 | Mitsuuroko Co Ltd | 450 | ||||||||
| 17,630 | Modec, Inc | 211 | ||||||||
| 557,273 | MOL Hungarian Oil & Gas plc | 4,325 | ||||||||
| 67,523 | Motor Oil Hellas Corinth Refineries S.A. | 1,058 | ||||||||
| 127,721 | Murphy Oil Corp | 3,335 | ||||||||
| 13,319 | * | Nabors Industries Ltd | 1,080 | |||||||
| 83 |
COLLEGE RETIREMENT EQUITIES FUND - Stock Account
| SHARES | COMPANY | VALUE (000) | ||||||||
| 41,629 | * | Naphtha Israel Petroleum Corp Ltd | $ | 299 | ||||||
| 27,082 | * | National Energy Services Reunited Corp | 256 | |||||||
| 301,722 | Neste Oil Oyj | 14,849 | ||||||||
| 23,136 | e | New Fortress Energy, Inc | 559 | |||||||
| 696,084 | e | New Hope Corp Ltd | 1,130 | |||||||
| 75,384 | * | Newpark Resources, Inc | 222 | |||||||
| 486,963 | * | NexGen Energy Ltd | 2,133 | |||||||
| 837,180 | * | NexTier Oilfield Solutions, Inc | 2,972 | |||||||
| 128,316 | e | Nordic American Tankers Ltd | 217 | |||||||
| 721,793 | Northern Oil and Gas, Inc | 14,855 | ||||||||
| 504,530 | NOV, Inc | 6,836 | ||||||||
| 107,009 | Novatek PJSC (GDR) | 25,062 | ||||||||
| 217,798 | * | NuVista Energy Ltd | 1,198 | |||||||
| 30,955 | Oasis Petroleum, Inc | 3,900 | ||||||||
| 788,115 | Occidental Petroleum Corp | 22,847 | ||||||||
| 265,565 | * | Oceaneering International, Inc | 3,004 | |||||||
| 805,927 | Offshore Oil Engineering Co Ltd | 583 | ||||||||
| 292,814 | Oil India Ltd | 782 | ||||||||
| 5,256,769 | * | Oil Refineries Ltd | 1,505 | |||||||
| 52,946 | * | Oil States International, Inc | 263 | |||||||
| 41,696 | OMV AG. | 2,358 | ||||||||
| 479,771 | ONEOK, Inc | 28,191 | ||||||||
| 477,452 | Ovintiv, Inc | 16,090 | ||||||||
| 2,852,982 | * | Paladin Resources Ltd | 1,837 | |||||||
| 660,075 | * | Pantheon Resources plc | 691 | |||||||
| 10,409 | * | Par Pacific Holdings, Inc | 172 | |||||||
| 89,252 | e | Paramount Resources Ltd (Class A) | 1,735 | |||||||
| 152,579 | Parex Resources, Inc | 2,607 | ||||||||
| 309,612 | Parkland Corp | 8,510 | ||||||||
| 94,980 | Pason Systems, Inc | 867 | ||||||||
| 461,464 | Patterson-UTI Energy, Inc | 3,899 | ||||||||
| 11,626 | * | Paz Oil Co Ltd | 1,446 | |||||||
| 338,128 | * | PBF Energy, Inc | 4,386 | |||||||
| 347,933 | PDC Energy, Inc | 16,972 | ||||||||
| 209,681 | * | Peabody Energy Corp | 2,112 | |||||||
| 677,150 | e | Pembina Pipeline Income Fund | 20,540 | |||||||
| 18,463 | * | Penn Virginia Corp | 497 | |||||||
| 675,405 | * | Petro Rio S.A. | 2,501 | |||||||
| 539,867 | *,e | Petrofac Ltd | 843 | |||||||
| 4,397,195 | Petroleo Brasileiro S.A. | 24,216 | ||||||||
| 5,604,927 | Petroleo Brasileiro S.A. (Preference) | 28,474 | ||||||||
| 384,180 | Petronas Dagangan BHD | 1,898 | ||||||||
| 84 |
COLLEGE RETIREMENT EQUITIES FUND - Stock Account
| SHARES | COMPANY | VALUE (000) | ||||||||
| 959,100 | Petronet LNG Ltd | $ | 2,785 | |||||||
| 199,712 | e | Peyto Exploration & Development Corp | 1,492 | |||||||
| 627,045 | Phillips 66 | 45,436 | ||||||||
| 932,461 | Pioneer Natural Resources Co | 169,596 | ||||||||
| 361,738 | Polski Koncern Naftowy Orlen S.A. | 6,668 | ||||||||
| 2,269,590 | Polskie Gornictwo Naftowe i Gazownictwo S.A. | 3,549 | ||||||||
| 100,100 | *,† | Poseidon Concepts Corp | 1 | |||||||
| 411,402 | e | PrairieSky Royalty Ltd | 4,433 | |||||||
| 1,032,800 | Prima Marine PCL | 187 | ||||||||
| 450,284 | * | ProPetro Holding Corp | 3,647 | |||||||
| 1,947,772 | PT AKR Corporindo Tbk | 561 | ||||||||
| 1,940,600 | * | PT Indika Energy Tbk | 210 | |||||||
| 8,573,992 | * | PT Medco Energi Internasional Tbk | 280 | |||||||
| 4,982,428 | PT Tambang Batubara Bukit Asam Tbk | 948 | ||||||||
| 10,719,006 | PT United Tractors Tbk | 16,642 | ||||||||
| 1,859,448 | PTT Exploration & Production PCL (Foreign) | 6,555 | ||||||||
| 8,922,100 | PTT PCL | 10,125 | ||||||||
| 12,049,609 | PTT PCL (Foreign) | 13,674 | ||||||||
| 614,354 | Qatar Fuel QSC | 3,084 | ||||||||
| 3,031,051 | Qatar Gas Transport Co Ltd | 2,743 | ||||||||
| 290,575 | * | Rabigh Refining & Petrochemical Co | 1,596 | |||||||
| 208,459 | * | Range Resources Corp | 3,717 | |||||||
| 6,847,748 | Reliance Industries Ltd | 217,530 | ||||||||
| 39,823 | * | Renewable Energy Group, Inc | 1,690 | |||||||
| 731,255 | Repsol YPF S.A. | 8,660 | ||||||||
| 4,723 | * | Rex American Resources Corp | 453 | |||||||
| 3,020 | e | Riley Exploration Permian, Inc | 58 | |||||||
| 1,495,575 | * | Rosneft Oil Co PJSC (GDR) | 12,027 | |||||||
| 7,825,754 | Royal Dutch Shell plc (A Shares) | 171,497 | ||||||||
| 6,528,567 | Royal Dutch Shell plc (B Shares) | 143,345 | ||||||||
| 288,661 | *,e | RPC, Inc | 1,311 | |||||||
| 726,238 | *,e | Saipem S.p.A | 1,523 | |||||||
| 60,452 | San-Ai Oil Co Ltd | 702 | ||||||||
| 3,071,254 | Santos Ltd | 14,148 | ||||||||
| 642,251 | *,e | Saras S.p.A. | 402 | |||||||
| 8,014 | Saudi Arabia Refineries Co | 293 | ||||||||
| 4,821,224 | g | Saudi Arabian Oil Co | 45,952 | |||||||
| 183,726 | SBM Offshore NV | 2,739 | ||||||||
| 1,583,256 | Schlumberger Ltd | 47,419 | ||||||||
| 16,157 | * | Schoeller-Bleckmann Oilfield Equipment AG. | 565 | |||||||
| 44,070 | Scorpio Tankers, Inc | 565 | ||||||||
| 85 |
COLLEGE RETIREMENT EQUITIES FUND - Stock Account
| SHARES | COMPANY | VALUE (000) | ||||||||
| 463,536 | Secure Energy Services, Inc | $ | 1,928 | |||||||
| 51,131 | * | Select Energy Services, Inc | 319 | |||||||
| 909,000 | Semirara Mining & Power Corp | 381 | ||||||||
| 1,843,251 | † | Serba Dinamik Holdings BHD | 116 | |||||||
| 196,923 | Serica Energy plc | 642 | ||||||||
| 50 | *,† | Serval Integrated Energy Services | 0 | |||||||
| 454,011 | SFL Corp Ltd | 3,700 | ||||||||
| 776,338 | Shaanxi Coal Industry Co Ltd | 1,489 | ||||||||
| 328,286 | Shanxi Lu’an Environmental Energy Development Co Ltd | 584 | ||||||||
| 368,800 | Shanxi Xishan Coal & Electricity Power Co Ltd | 479 | ||||||||
| 877,072 | Siamgas & Petrochemicals PCL | 322 | ||||||||
| 1,136,000 | Sinopec Kantons Holdings Ltd | 446 | ||||||||
| 11,395 | * | SK Discovery Co Ltd | 445 | |||||||
| 2,916 | * | SK Gas Co Ltd | 312 | |||||||
| 60,131 | * | SK Innovation Co Ltd | 12,040 | |||||||
| 481,524 | SM Energy Co | 14,195 | ||||||||
| 56,004 | S-Oil Corp | 4,025 | ||||||||
| 49,864 | Solaris Oilfield Infrastructure, Inc | 327 | ||||||||
| 92,066 | * | Southwestern Energy Co | 429 | |||||||
| 1,871,120 | * | Star Petroleum Refining PCL | 549 | |||||||
| 666,477 | Subsea 7 S.A. | 4,768 | ||||||||
| 2,058,560 | Suncor Energy, Inc | 51,507 | ||||||||
| 1,743,246 | Surgutneftegaz (ADR) (London) | 9,204 | ||||||||
| 28,251 | * | Talos Energy, Inc | 277 | |||||||
| 488,615 | *,e | Tamarack Valley Energy Ltd | 1,487 | |||||||
| 342,990 | Targa Resources Investments, Inc | 17,918 | ||||||||
| 290,481 | Tatneft PJSC (ADR) | 11,940 | ||||||||
| 1,220,227 | e | TC Energy Corp | 56,750 | |||||||
| 129,900 | *,e | Technip Energies NV | 1,900 | |||||||
| 154,558 | * | TechnipFMC plc | 915 | |||||||
| 35,469 | *,e | Tecnicas Reunidas S.A. | 280 | |||||||
| 58,807 | * | Teekay Corp | 185 | |||||||
| 23,747 | *,e | Teekay Tankers Ltd | 259 | |||||||
| 1,029,120 | *,e | Tellurian, Inc | 3,170 | |||||||
| 1,119,697 | Tenaris S.A. | 11,686 | ||||||||
| 415,275 | * | Tetra Technologies, Inc | 1,179 | |||||||
| 5,777 | Texas Pacific Land Corp | 7,215 | ||||||||
| 144,133 | TGS Nopec Geophysical Co ASA | 1,379 | ||||||||
| 1,487,160 | Thai Oil PCL (Foreign) | 2,201 | ||||||||
| 141,851 | *,e | Thungela Resources Ltd | 753 | |||||||
| 35,929 | * | Tidewater, Inc | 385 | |||||||
| 246,550 | e | Topaz Energy Corp | 3,479 | |||||||
| 86 |
COLLEGE RETIREMENT EQUITIES FUND - Stock Account
| SHARES | COMPANY | VALUE (000) | ||||||||
| 18,015 | *,e | TORM plc | $ | 142 | ||||||
| 3,299,739 | Total S.A. | 167,957 | ||||||||
| 452,961 | Tourmaline Oil Corp | 14,624 | ||||||||
| 269,448 | * | Trican Well Service Ltd | 590 | |||||||
| 1,447,610 | * | Tullow Oil plc | 914 | |||||||
| 161,231 | * | Turkiye Petrol Rafinerileri AS | 1,883 | |||||||
| 859,261 | Ultrapar Participacoes S.A. | 2,278 | ||||||||
| 26,737 | *,e | Uranium Energy Corp | 90 | |||||||
| 28,198 | *,e | Ur-Energy, Inc | 34 | |||||||
| 65,556 | * | US Silica Holdings, Inc | 616 | |||||||
| 1,825,994 | Valero Energy Corp | 137,150 | ||||||||
| 167,479 | * | Vallourec S.A. | 1,675 | |||||||
| 26,698 | Verbio AG. | 1,817 | ||||||||
| 194,930 | *,e | Vermilion Energy, Inc | 2,450 | |||||||
| 1,104,093 | g | Viva Energy Group Ltd | 1,890 | |||||||
| 92,643 | * | W&T Offshore, Inc | 299 | |||||||
| 239,563 | Washington H Soul Pattinson & Co Ltd | 5,163 | ||||||||
| 106,983 | * | Weatherford International Ltd | 2,966 | |||||||
| 753,341 | e | Whitecap Resources, Inc | 4,461 | |||||||
| 1,124,539 | * | Whitehaven Coal Ltd | 2,141 | |||||||
| 34,194 | * | Whiting Petroleum Corp | 2,212 | |||||||
| 1,382,597 | Williams Cos, Inc | 36,003 | ||||||||
| 1,068,111 | Woodside Petroleum Ltd | 17,028 | ||||||||
| 54,518 | World Fuel Services Corp | 1,443 | ||||||||
| 381,385 | Worley Ltd | 2,955 | ||||||||
| 97,333 | Yantai Jereh Oilfield Services Group Co Ltd | 613 | ||||||||
| 1,929,540 | e | Yanzhou Coal Mining Co Ltd | 3,835 | |||||||
| 217,469 | Yanzhou Coal Mining Co Ltd (Class A) | 805 | ||||||||
| 676,800 | Yinson Holdings BHD | 975 | ||||||||
| 66 | * | YPF S.A. (ADR) (Class D) | 0 | ^ | ||||||
| 619,487 | Z Energy Ltd | 1,506 | ||||||||
| TOTAL ENERGY | 4,433,744 | |||||||||
| FOOD & STAPLES RETAILING - 1.5% | ||||||||||
| 29,713 | *,e | 111, Inc (ADR) | 104 | |||||||
| 50,236 | Abdullah Al Othaim Markets Co | 1,448 | ||||||||
| 611,763 | e | Aeon Co Ltd | 14,417 | |||||||
| 20,800 | Aeon Hokkaido Corp | 229 | ||||||||
| 31,683 | Ain Pharmaciez Inc | 1,579 | ||||||||
| 112,278 | Al Meera Consumer Goods Co | 604 | ||||||||
| 784,032 | e | Albertsons Cos, Inc | 23,670 | |||||||
| 1,406,643 | Alimentation Couche-Tard, Inc | 58,937 | ||||||||
| 108,052 | Andersons, Inc | 4,183 | ||||||||
| 87 |
COLLEGE RETIREMENT EQUITIES FUND - Stock Account
| SHARES | COMPANY | VALUE (000) | ||||||||
| 55,279 | Arcs Co Ltd | $ | 1,027 | |||||||
| 606,795 | Atacadao Distribuicao Comercio e Industria Ltd | 1,657 | ||||||||
| 190,923 | *,g | Avenue Supermarts Ltd | 11,976 | |||||||
| 127,126 | Axfood AB | 3,660 | ||||||||
| 19,555 | Axial Retailing, Inc | 574 | ||||||||
| 13,700 | Belc Co Ltd | 671 | ||||||||
| 1,390,812 | Berli Jucker PCL | 1,290 | ||||||||
| 27,179 | * | BGF retail Co Ltd | 3,321 | |||||||
| 391,597 | Bid Corp Ltd | 8,023 | ||||||||
| 504,399 | BIM Birlesik Magazalar AS | 2,337 | ||||||||
| 315,027 | * | BJ’s Wholesale Club Holdings, Inc | 21,097 | |||||||
| 747,734 | e | Carrefour S.A. | 13,709 | |||||||
| 34,692 | Casey’s General Stores, Inc | 6,846 | ||||||||
| 46,431 | *,e | Casino Guichard Perrachon S.A. | 1,225 | |||||||
| 15,151 | Cawachi Ltd | 290 | ||||||||
| 1,679,918 | Cencosud S.A. | 2,810 | ||||||||
| 26,485 | * | Chefs’ Warehouse Holdings, Inc | 882 | |||||||
| 182,603 | Cia Brasileira de Distribuicao | 727 | ||||||||
| 271,034 | Clicks Group Ltd | 5,367 | ||||||||
| 1,439,553 | Coles Group Ltd | 18,783 | ||||||||
| 15,069 | Colruyt S.A. | 639 | ||||||||
| 1,788,863 | Cosco Capital, Inc | 182 | ||||||||
| 21,600 | e | Cosmos Pharmaceutical Corp | 3,175 | |||||||
| 947,479 | Costco Wholesale Corp | 537,884 | ||||||||
| 6,904,516 | CP ALL plc | 12,242 | ||||||||
| 32,700 | Create SD Holdings Co Ltd | 906 | ||||||||
| 5,318 | Daikokutenbussaan Co Ltd | 238 | ||||||||
| 1,206,000 | e | Dairy Farm International Holdings Ltd | 3,449 | |||||||
| 57,396 | DaShenLin Pharmaceutical Group Co Ltd | 379 | ||||||||
| 145,472 | *,g | Dino Polska S.A. | 13,261 | |||||||
| 378,356 | g | Dis-Chem Pharmacies Ltd | 841 | |||||||
| 19,314,023 | * | Distribuidora Internacional de Alimentacion S.A. | 350 | |||||||
| 32,585 | * | Dongsuh Co, Inc | 850 | |||||||
| 42,667 | E-Mart Co Ltd | 5,409 | ||||||||
| 304,972 | Empire Co Ltd | 9,292 | ||||||||
| 1,474,872 | Endeavour Group Ltd | 7,238 | ||||||||
| 90,454 | Eurocash S.A. | 244 | ||||||||
| 17,600 | Fuji Co Ltd | 299 | ||||||||
| 23,800 | G-7 Holdings, Inc | 349 | ||||||||
| 8,600 | Genky DrugStores Co Ltd | 459 | ||||||||
| 104,168 | George Weston Ltd | 12,077 | ||||||||
| 266,546 | GrainCorp Ltd-A | 1,605 | ||||||||
| 88 |
COLLEGE RETIREMENT EQUITIES FUND - Stock Account
| SHARES | COMPANY | VALUE (000) | ||||||||
| 81,667 | * | Grocery Outlet Holding Corp | $ | 2,310 | ||||||
| 682,787 | e | Grupo Comercial Chedraui S.a. DE C.V. | 1,415 | |||||||
| 583,000 | * | Grupo Mateus S.A. | 629 | |||||||
| 43,898 | * | GS Retail Co Ltd | 1,121 | |||||||
| 13,800 | Halows Co Ltd | 339 | ||||||||
| 32,958 | Heiwado Co Ltd | 553 | ||||||||
| 514,842 | * | HelloFresh SE | 39,456 | |||||||
| 30,595 | *,e | HF Foods Group Inc | 259 | |||||||
| 47,234 | * | Hyundai Greenfood Co Ltd | 340 | |||||||
| 24,300 | Inageya Co Ltd | 293 | ||||||||
| 12,313 | Ingles Markets, Inc (Class A) | 1,063 | ||||||||
| 5,570 | Itochu-Shokuhin Co Ltd | 242 | ||||||||
| 491,730 | J Sainsbury plc | 1,838 | ||||||||
| 623,771 | Jeronimo Martins SGPS S.A. | 14,274 | ||||||||
| 12,000 | JM Holdings Co Ltd | 172 | ||||||||
| 29,523 | Kato Sangyo Co Ltd | 861 | ||||||||
| 505,934 | Kesko Oyj (B Shares) | 16,863 | ||||||||
| 36,600 | Kobe Bussan Co Ltd | 1,417 | ||||||||
| 1,001,471 | Koninklijke Ahold Delhaize NV | 34,367 | ||||||||
| 762,897 | Kroger Co | 34,529 | ||||||||
| 19,234 | Kusuri no Aoki Holdings Co Ltd | 1,219 | ||||||||
| 537,881 | e | La Comer SAB de C.V. | 967 | |||||||
| 20,455 | Laobaixing Pharmacy Chain JSC | 159 | ||||||||
| 14,231 | Lawson, Inc | 675 | ||||||||
| 187,418 | * | Lenta PLC (GDR) | 469 | |||||||
| 17,996 | Life Corp | 533 | ||||||||
| 233,867 | Loblaw Cos Ltd | 19,161 | ||||||||
| 5,792 | M Yochananof & Sons Ltd | 439 | ||||||||
| 66,419 | Magnit PJSC (GDR) | 996 | ||||||||
| 355,766 | Magnit PJSC (GDR) | 5,336 | ||||||||
| 66,291 | * | Majestic Wine plc | 584 | |||||||
| 42,620 | MARR S.p.A. | 915 | ||||||||
| 274,058 | * | Massmart Holdings Ltd | 1,044 | |||||||
| 130,056 | Matsumotokiyoshi Holdings Co Ltd | 4,809 | ||||||||
| 11,600 | Maxvalu Tokai Co Ltd | 278 | ||||||||
| 7,980 | *,e | MedAvail Holdings, Inc | 11 | |||||||
| 1,172,159 | Metcash Ltd | 3,834 | ||||||||
| 409,680 | Metro Wholesale & Food Specialist AG. | 4,298 | ||||||||
| 302,628 | Metro, Inc | 16,106 | ||||||||
| 99,064 | * | Migros Ticaret AS | 283 | |||||||
| 10,157 | Natural Grocers by Vitamin C | 145 | ||||||||
| 20,708 | Neighbourly Pharmacy, Inc | 654 | ||||||||
| 89 |
COLLEGE RETIREMENT EQUITIES FUND - Stock Account
| SHARES | COMPANY | VALUE (000) | ||||||||
| 7,300 | Nihon Chouzai Co Ltd | $ | 87 | |||||||
| 58,349 | e | North West Co, Inc | 1,579 | |||||||
| 534,614 | * | Ocado Ltd | 12,163 | |||||||
| 1,104,044 | Olam International Ltd | 1,435 | ||||||||
| 434,184 | * | Performance Food Group Co | 19,925 | |||||||
| 404,666 | Pick’n Pay Stores Ltd | 1,332 | ||||||||
| 667,717 | President Chain Store Corp | 6,593 | ||||||||
| 18,862 | Pricesmart, Inc | 1,380 | ||||||||
| 1,106,100 | Puregold Price Club, Inc | 852 | ||||||||
| 23,600 | Qol Holdings Co Ltd | 287 | ||||||||
| 1,238,335 | Raia Drogasil S.A. | 5,391 | ||||||||
| 11,364 | Rami Levi Chain Stores Hashikma Marketing Ltd | 853 | ||||||||
| 23,712 | Retail Partners Co Ltd | 283 | ||||||||
| 175,916 | *,e | Rite Aid Corp | 2,584 | |||||||
| 944,630 | Robinsons Retail Holdings, Inc | 1,212 | ||||||||
| 19,741 | Ryoshoku Ltd | 475 | ||||||||
| 22,500 | San-A Co Ltd | 817 | ||||||||
| 12,442,930 | Sendas Distribuidora S.A. | 29,024 | ||||||||
| 724,463 | Seven & I Holdings Co Ltd | 31,868 | ||||||||
| 806,110 | e | Sheng Siong Group Ltd | 873 | |||||||
| 11,511 | Shoei Foods Corp | 384 | ||||||||
| 16,512 | *,g | Shop Apotheke Europe NV | 2,125 | |||||||
| 579,232 | Shoprite Holdings Ltd | 7,593 | ||||||||
| 322,159 | Shufersal Ltd | 2,681 | ||||||||
| 28,352 | * | Sligro Food Group NV | 688 | |||||||
| 2,895,544 | SMU S.A. | 291 | ||||||||
| 468,250 | Sok Marketler Ticaret AS. | 450 | ||||||||
| 1,110,082 | Sonae SPGS S.A. | 1,268 | ||||||||
| 227,532 | Spar Group Ltd | 2,386 | ||||||||
| 93,212 | SpartanNash Co | 2,401 | ||||||||
| 61,496 | * | Sprouts Farmers Market, Inc | 1,825 | |||||||
| 42,296 | Sugi Pharmacy Co Ltd | 2,563 | ||||||||
| 2,429,500 | e | Sun Art Retail Group Ltd | 975 | |||||||
| 87,200 | Sundrug Co Ltd | 2,280 | ||||||||
| 499,616 | SYSCO Corp | 39,245 | ||||||||
| 24,145,122 | Tesco plc | 95,061 | ||||||||
| 29,367 | Tsuruha Holdings, Inc | 2,820 | ||||||||
| 147,996 | * | United Natural Foods, Inc | 7,264 | |||||||
| 57,250 | United Super Markets Holdings, Inc | 527 | ||||||||
| 338,095 | * | US Foods Holding Corp | 11,776 | |||||||
| 44,394 | Valor Co Ltd | 829 | ||||||||
| 7,876 | Village Super Market (Class A) | 184 | ||||||||
| 90 |
COLLEGE RETIREMENT EQUITIES FUND - Stock Account
| SHARES | COMPANY | VALUE (000) | ||||||||
| 541,104 | Walgreens Boots Alliance, Inc | $ | 28,224 | |||||||
| 17,479,136 | e | Wal-Mart de Mexico SAB de C.V. | 64,955 | |||||||
| 3,758,539 | Walmart, Inc | 543,823 | ||||||||
| 14,246 | Weis Markets, Inc | 939 | ||||||||
| 97,160 | Welcia Holdings Co Ltd | 3,035 | ||||||||
| 1,410,873 | Woolworths Ltd | 39,002 | ||||||||
| 144,281 | * | X5 Retail Group NV (GDR) | 3,819 | |||||||
| 21,900 | Yaoko Co Ltd | 1,331 | ||||||||
| 49,659 | Yifeng Pharmacy Chain Co Ltd | 429 | ||||||||
| 53,200 | Yokohama Reito Co Ltd | 386 | ||||||||
| 739,853 | Yonghui Superstores Co Ltd | 470 | ||||||||
| 10,899 | *,e | Zur Rose Group AG. | 2,809 | |||||||
| TOTAL FOOD & STAPLES RETAILING | 2,031,918 | |||||||||
| FOOD, BEVERAGE & TOBACCO - 3.2% | ||||||||||
| 13,558 | *,e | 22nd Century Group, Inc | 42 | |||||||
| 1,388,019 | *,e | a2 Milk Co Ltd | 5,620 | |||||||
| 218,438 | AAK AB | 4,710 | ||||||||
| 120,667 | AG. Barr plc | 849 | ||||||||
| 13,236 | Agrana Beteiligungs AG. | 259 | ||||||||
| 348,199 | Agthia Group PJSC | 488 | ||||||||
| 502,863 | Ajinomoto Co, Inc | 15,308 | ||||||||
| 16,214 | Al Jouf Agricultural Development Co | 253 | ||||||||
| 284,916 | Almarai Co JSC | 3,704 | ||||||||
| 1,205,513 | Altria Group, Inc | 57,129 | ||||||||
| 5,533,809 | AMBEV S.A. | 15,485 | ||||||||
| 11,178,197 | Anadolu Efes Biracilik Ve Malt Sanayii AS | 25,028 | ||||||||
| 58,211 | Angel Yeast Co Ltd | 551 | ||||||||
| 1,069,254 | Anheuser-Busch InBev S.A. | 64,465 | ||||||||
| 132,558 | Anhui Gujing Distillery Co Ltd | 1,886 | ||||||||
| 28,114 | Anhui Gujing Distillery Co Ltd (Class A) | 1,076 | ||||||||
| 48,517 | Anhui Kouzi Distillery Co Ltd | 540 | ||||||||
| 49,600 | Anhui Yingjia Distillery Co Ltd | 542 | ||||||||
| 42,635 | Anora Group Oyj | 527 | ||||||||
| 5,881 | *,e | AppHarvest, Inc | 23 | |||||||
| 516,370 | Archer-Daniels-Midland Co | 34,901 | ||||||||
| 22,572 | Ariake Japan Co Ltd | 1,225 | ||||||||
| 2,771,350 | * | Aryzta AG. | 3,455 | |||||||
| 235,886 | Asahi Breweries Ltd | 9,183 | ||||||||
| 66,560 | * | Aseer Trading Tourism & Manufacturing Co | 338 | |||||||
| 606,727 | Associated British Foods plc | 16,609 | ||||||||
| 41,437 | Astral Foods Ltd | 449 | ||||||||
| 96,855 | *,e | Atlantic Sapphire ASA | 461 | |||||||
| 91 |
COLLEGE RETIREMENT EQUITIES FUND - Stock Account
| SHARES | COMPANY | VALUE (000) | ||||||||
| 112,143 | Austevoll Seafood ASA | $ | 1,350 | |||||||
| 342,827 | * | Australian Agricultural Co Ltd | 369 | |||||||
| 58,605 | Avanti Feeds Ltd | 444 | ||||||||
| 345,974 | AVI Ltd | 1,604 | ||||||||
| 55,975 | B&G Foods, Inc (Class A) | 1,720 | ||||||||
| 61,285 | Bakkafrost P | 4,051 | ||||||||
| 165,384 | g | Bakkavor Group plc | 283 | |||||||
| 1,029,510 | Baladna | 408 | ||||||||
| 136,565 | Balrampur Chini Mills Ltd | 672 | ||||||||
| 3,432 | Barry Callebaut AG. | 8,332 | ||||||||
| 519,629 | Becle SAB de C.V. | 1,303 | ||||||||
| 563,328 | Bega Cheese Ltd | 2,326 | ||||||||
| 354,101 | Beijing Dabeinong Technology Group Co Ltd | 583 | ||||||||
| 77,000 | Beijing Shunxin Agriculture Co Ltd | 461 | ||||||||
| 73,400 | Beijing Yanjing Brewery Co Ltd | 98 | ||||||||
| 2,855 | Bell AG. | 913 | ||||||||
| 52,147 | *,e | Beyond Meat, Inc | 3,398 | |||||||
| 5,680 | * | Binggrae Co Ltd | 254 | |||||||
| 18,701 | Bombay Burmah Trading Co | 278 | ||||||||
| 12,699 | Bonduelle S.C.A. | 301 | ||||||||
| 13,523 | * | Boston Beer Co, Inc (Class A) | 6,830 | |||||||
| 768,747 | * | BRF S.A. | 3,116 | |||||||
| 126,962 | Britannia Industries Ltd | 6,145 | ||||||||
| 151,800 | British American Tobacco Malaysia BHD | 509 | ||||||||
| 2,170,502 | British American Tobacco plc | 80,594 | ||||||||
| 628,355 | Britvic plc | 7,825 | ||||||||
| 11,199 | Brown-Forman Corp (Class A) | 759 | ||||||||
| 47,619 | Brown-Forman Corp (Class B) | 3,470 | ||||||||
| 1,876,129 | g | Budweiser Brewing Co APAC Ltd | 4,932 | |||||||
| 1,115,035 | Bunge Ltd | 104,100 | ||||||||
| 463,962 | * | C&C Group plc | 1,458 | |||||||
| 16,378 | Calavo Growers, Inc | 694 | ||||||||
| 105,800 | Calbee, Inc | 2,457 | ||||||||
| 35,420 | Cal-Maine Foods, Inc | 1,310 | ||||||||
| 117,167 | Camil Alimentos S.A. | 239 | ||||||||
| 46,988 | Campbell Soup Co | 2,042 | ||||||||
| 310,700 | Carabao Group PCL | 1,111 | ||||||||
| 174,389 | Carlsberg AS (Class B) | 30,108 | ||||||||
| 165,500 | Carlsberg Brewery-Malay BHD | 798 | ||||||||
| 78,377 | CCL Products India Ltd | 452 | ||||||||
| 86,970 | * | Celsius Holdings, Inc | 6,485 | |||||||
| 1,364,300 | Century Pacific Food, Inc | 783 | ||||||||
| 92 |
COLLEGE RETIREMENT EQUITIES FUND - Stock Account
| SHARES | COMPANY | VALUE (000) | ||||||||
| 40,766 | Chacha Food Co Ltd | $ | 392 | |||||||
| 175,279 | Charoen Pokphand Enterprise | 511 | ||||||||
| 4,346,031 | Charoen Pokphand Foods PCL | 3,321 | ||||||||
| 4,089,021 | g | China Feihe Ltd | 5,486 | |||||||
| 4,375,889 | *,†,e | China Huishan Dairy Holdings Co Ltd | 6 | |||||||
| 370,000 | *,† | China Huiyuan Juice Group Ltd | 0 | ^ | ||||||
| 3,732,227 | China Mengniu Dairy Co Ltd | 21,158 | ||||||||
| 3,114,000 | e | China Modern Dairy Holdings | 524 | |||||||
| 1,733,392 | China Resources Beer Holdings Company Ltd | 14,195 | ||||||||
| 787,000 | *,g | China Youran Dairy Group Ltd | 420 | |||||||
| 32,927 | * | Chongqing Brewery Co Ltd | 782 | |||||||
| 46,404 | Chongqing Fuling Zhacai Group Co Ltd | 276 | ||||||||
| 181,795 | Cia Cervecerias Unidas S.A. | 1,489 | ||||||||
| 9,502 | * | CJ CheilJedang Corp | 3,095 | |||||||
| 656,151 | Cloetta AB | 1,900 | ||||||||
| 4,896,505 | Coca-Cola Co | 289,922 | ||||||||
| 3,890 | Coca-Cola Consolidated Inc | 2,409 | ||||||||
| 253,927 | * | Coca-Cola European Partners plc (Class A) | 14,202 | |||||||
| 618,793 | e | Coca-Cola Femsa SAB de C.V. | 3,376 | |||||||
| 310,098 | Coca-Cola HBC AG. | 10,737 | ||||||||
| 80,240 | Coca-Cola Icecek AS | 538 | ||||||||
| 202,300 | Coca-Cola West Japan Co Ltd | 2,324 | ||||||||
| 1,532,825 | Cofco International Ltd | 601 | ||||||||
| 2,540,000 | e | COFCO Meat Holdings Ltd | 969 | |||||||
| 456,187 | ConAgra Brands, Inc | 15,579 | ||||||||
| 257,683 | Constellation Brands, Inc (Class A) | 64,671 | ||||||||
| 14,604 | Corby Spirit and Wine Ltd | 194 | ||||||||
| 550,759 | Costa Group Holdings Ltd | 1,216 | ||||||||
| 64,034 | Cranswick plc | 3,209 | ||||||||
| 20,197 | * | Daesang Corp | 395 | |||||||
| 2,449,320 | g | Dali Foods Group Co Ltd | 1,282 | |||||||
| 562,348 | Danone | 34,955 | ||||||||
| 155,493 | * | Darling International, Inc | 10,774 | |||||||
| 3,519,589 | Davide Campari-Milano NV | 51,359 | ||||||||
| 4,400,392 | Diageo plc | 240,596 | ||||||||
| 360,016 | * | Distell Group Holdings Ltd | 3,814 | |||||||
| 1,257 | * | Dongwon F&B Co Ltd | 205 | |||||||
| 1,005 | * | Dongwon Industries Co Ltd | 192 | |||||||
| 8,310 | * | Duckhorn Portfolio, Inc | 194 | |||||||
| 10,500 | Dydo Drinco, Inc | 433 | ||||||||
| 1,350,655 | Eastern Tobacco | 922 | ||||||||
| 85,085 | e | Ebro Puleva S.A. | 1,635 | |||||||
| 93 |
COLLEGE RETIREMENT EQUITIES FUND - Stock Account
| SHARES | COMPANY | VALUE (000) | ||||||||
| 411,559 | Embotelladora Andina S.A. | $ | 894 | |||||||
| 519,226 | Embotelladoras Arca SAB de C.V. | 3,310 | ||||||||
| 2,605 | Emmi AG. | 3,070 | ||||||||
| 60,715 | Ezaki Glico Co Ltd | 1,932 | ||||||||
| 1,043,086 | Fevertree Drinks plc | 38,191 | ||||||||
| 3,042,000 | First Pacific Co | 1,120 | ||||||||
| 623,900 | First Resources Ltd | 700 | ||||||||
| 47,229 | Flowers Foods, Inc | 1,297 | ||||||||
| 2,287,283 | Fomento Economico Mexicano S.A. de C.V. | 17,797 | ||||||||
| 1,030,447 | Fomento Economico Mexicano SAB de C.V. (ADR) | 80,076 | ||||||||
| 32,274 | ForFarmers NV | 148 | ||||||||
| 240,060 | Foshan Haitian Flavouring & Food Co Ltd | 3,956 | ||||||||
| 148,793 | Fraser & Neave Holdings BHD | 884 | ||||||||
| 29,377 | Fresh Del Monte Produce, Inc | 811 | ||||||||
| 72,724 | * | Freshpet, Inc | 6,928 | |||||||
| 16,245 | Fu Jian Anjoy Foods Co Ltd | 435 | ||||||||
| 64,227 | Fuji Oil Co Ltd | 1,297 | ||||||||
| 120,200 | Fujian Sunner Development Co Ltd | 455 | ||||||||
| 23,832 | Fujicco Co Ltd | 390 | ||||||||
| 11,782 | e | Fujiya Co Ltd | 232 | |||||||
| 182,267 | Futuris Corp Ltd | 1,628 | ||||||||
| 184,783 | General Mills, Inc | 12,451 | ||||||||
| 291,400 | Genting Plantations BHD | 469 | ||||||||
| 402,000 | GFPT PCL (Foreign) | 154 | ||||||||
| 474,620 | Glanbia plc | 6,631 | ||||||||
| 12,957 | Godfrey Phillips India Ltd | 196 | ||||||||
| 14,005,625 | Golden Agri-Resources Ltd | 2,548 | ||||||||
| 625,900 | Great Wall Enterprise Co | 1,207 | ||||||||
| 629,062 | * | Greencore Group plc | 1,103 | |||||||
| 57,937 | *,e | Grieg Seafood ASA | 546 | |||||||
| 251,581 | Gruma SAB de C.V. | 3,226 | ||||||||
| 1,796,441 | Grupo Bimbo S.A. de C.V. (Series A) | 5,525 | ||||||||
| 186,756 | e | Grupo Herdez SAB de C.V. | 369 | |||||||
| 372,000 | Guan Chong Bhd | 250 | ||||||||
| 118,745 | Guangdong Haid Group Co Ltd | 1,366 | ||||||||
| 163,500 | Guinness Anchor BHD | 818 | ||||||||
| 81,150 | * | Hain Celestial Group, Inc | 3,458 | |||||||
| 13,446 | Halwani Brothers Co | 325 | ||||||||
| 34,479 | * | Harim Holdings Co Ltd | 274 | |||||||
| 259,814 | Health & Happiness H&H International Holdings Ltd | 402 | ||||||||
| 147,747 | Heilongjiang Agriculture Co Ltd | 338 | ||||||||
| 125,640 | Heineken Holding NV | 11,585 | ||||||||
| 94 |
COLLEGE RETIREMENT EQUITIES FUND - Stock Account
| SHARES | COMPANY | VALUE (000) | ||||||||
| 751,982 | e | Heineken NV | $ | 84,628 | ||||||
| 219,948 | Henan Shuanghui Investment & Development Co Ltd | 1,089 | ||||||||
| 370,075 | Hershey Co | 71,598 | ||||||||
| 33,216 | * | Hite Jinro Co Ltd | 841 | |||||||
| 18,900 | Hokuto Corp | 314 | ||||||||
| 68,922 | Hormel Foods Corp | 3,364 | ||||||||
| 408,641 | * | Hostess Brands, Inc | 8,344 | |||||||
| 103,054 | * | Hotel Chocolat Group Ltd | 704 | |||||||
| 73,562 | House Foods Corp | 1,858 | ||||||||
| 392,000 | Ichitan Group PCL | 117 | ||||||||
| 1,164,274 | Imperial Tobacco Group plc | 25,515 | ||||||||
| 2,655,609 | Indofood CBP Sukses Makmur Tbk | 1,622 | ||||||||
| 398,321 | Inghams Group Ltd | 1,017 | ||||||||
| 16,985 | Ingredion, Inc | 1,641 | ||||||||
| 432,553 | Inner Mongolia Yili Industrial Group Co Ltd | 2,815 | ||||||||
| 9,135,000 | *,† | Inti Agri Resources Tbk PT | 0 | ^ | ||||||
| 2,742,906 | IOI Corp BHD | 2,454 | ||||||||
| 3,511,560 | ITC Ltd | 10,274 | ||||||||
| 38,729 | Ito En Ltd | 2,035 | ||||||||
| 174,500 | Itoham Yonekyu Holdings, Inc | 998 | ||||||||
| 1,252 | J&J Snack Foods Corp | 198 | ||||||||
| 25,690 | J.M. Smucker Co | 3,489 | ||||||||
| 546,130 | Japan Tobacco, Inc | 11,027 | ||||||||
| 4,245,512 | Japfa Comfeed Indonesia Tbk PT | 512 | ||||||||
| 471,742 | e | Japfa Ltd | 212 | |||||||
| 1,011,382 | JBS S.A. | 6,901 | ||||||||
| 75,307 | e | JDE Peet’s BV | 2,331 | |||||||
| 78,926 | Jiangsu King’s Luck Brewery JSC Ltd | 674 | ||||||||
| 101,081 | Jiangsu Yanghe Brewery Joint-Stock Co Ltd | 2,616 | ||||||||
| 275,706 | Jiangxi Zhengbang Technology Co Ltd | 418 | ||||||||
| 19,662 | JiuGui Liquor Co Ltd | 656 | ||||||||
| 27,968 | John B. Sanfilippo & Son, Inc | 2,522 | ||||||||
| 22,346 | J-Oil Mills, Inc | 325 | ||||||||
| 51,964 | Jonjee Hi-Tech Industrial And Commercial Holding Co Ltd | 309 | ||||||||
| 45,501 | Juewei Food Co Ltd | 488 | ||||||||
| 433,915 | * | Juhayna Food Industries | 212 | |||||||
| 91,746 | e | Kagome Co Ltd | 2,390 | |||||||
| 16,200 | Kameda Seika Co Ltd | 603 | ||||||||
| 46,242 | Kaveri Seed Co Ltd | 354 | ||||||||
| 164,660 | Kellogg Co | 10,607 | ||||||||
| 256,025 | Kerry Group plc (Class A) | 33,031 | ||||||||
| 2,018,676 | Keurig Dr Pepper, Inc | 74,408 | ||||||||
| 95 |
COLLEGE RETIREMENT EQUITIES FUND - Stock Account
| SHARES | COMPANY | VALUE (000) | ||||||||
| 127,597 | Kewpie Corp | $ | 2,752 | |||||||
| 2,177,400 | * | Khon Kaen Sugar Industry PCL | 236 | |||||||
| 149,175 | e | Kikkoman Corp | 12,562 | |||||||
| 627,953 | Kirin Brewery Co Ltd | 10,114 | ||||||||
| 22,880 | Kotobuki Spirits Co Ltd | 1,095 | ||||||||
| 169,498 | Kraft Heinz Co | 6,085 | ||||||||
| 137,680 | KT&G Corp | 9,147 | ||||||||
| 498,235 | Kuala Lumpur Kepong BHD | 2,605 | ||||||||
| 88,685 | Kweichow Moutai Co Ltd | 28,500 | ||||||||
| 15,525 | KWS Saat AG. | 1,290 | ||||||||
| 13,357 | La Doria S.p.A | 250 | ||||||||
| 3,009 | *,e | Laird Superfood, Inc | 39 | |||||||
| 267,959 | Lamb Weston Holdings, Inc | 16,983 | ||||||||
| 3,513 | Lancaster Colony Corp | 582 | ||||||||
| 27,316 | * | Landec Corp | 303 | |||||||
| 3,827 | e | Lassonde Industries, Inc | 476 | |||||||
| 363,969 | Leroy Seafood Group ASA | 2,844 | ||||||||
| 1,362,205 | Lien Hwa Industrial Corp | 3,046 | ||||||||
| 10,857 | Limoneira Co | 163 | ||||||||
| 1,092 | Lindt & Spruengli AG. | 15,136 | ||||||||
| 95 | Lindt & Spruengli AG. (Registered) | 12,740 | ||||||||
| 6,205 | * | Lotte Chilsung Beverage Co Ltd | 697 | |||||||
| 1,340 | * | Lotte Confectionery Co Ltd | 136 | |||||||
| 777 | Lotus Bakeries NV | 4,945 | ||||||||
| 102,223 | Luzhou Laojiao Co Ltd | 4,074 | ||||||||
| 303,239 | M Dias Branco S.A. | 1,389 | ||||||||
| 3,725 | Maeil Dairies Co Ltd | 215 | ||||||||
| 97,003 | Maple Leaf Foods, Inc | 2,244 | ||||||||
| 412,499 | Marfrig Global Foods S.A. | 1,634 | ||||||||
| 48,400 | Maruha Nichiro Corp | 1,014 | ||||||||
| 60,956 | McCormick & Co, Inc | 5,889 | ||||||||
| 56,087 | Megmilk Snow Brand Co Ltd | 972 | ||||||||
| 113,022 | MEIJI Holdings Co Ltd | 6,747 | ||||||||
| 155,810 | Mezzan Holding Co KSCC | 304 | ||||||||
| 163,204 | e | MGP Ingredients, Inc | 13,871 | |||||||
| 296,928 | Minerva S.A. | 566 | ||||||||
| 30,128 | *,e | Mission Produce, Inc | 473 | |||||||
| 20,000 | Mitsui Sugar Co Ltd | 337 | ||||||||
| 166,716 | Molson Coors Brewing Co (Class B) | 7,727 | ||||||||
| 5,050,000 | *,g | Monde Nissin Corp | 1,604 | |||||||
| 5,039,335 | Mondelez International, Inc | 334,158 | ||||||||
| 2,532,858 | * | Monster Beverage Corp | 243,256 | |||||||
| 96 |
COLLEGE RETIREMENT EQUITIES FUND - Stock Account
| SHARES | COMPANY | VALUE (000) | ||||||||
| 45,779 | Morinaga & Co Ltd | $ | 1,497 | |||||||
| 107,013 | Morinaga Milk Industry Co Ltd | 5,084 | ||||||||
| 471,384 | Mowi ASA | 11,156 | ||||||||
| 365,337 | Muyuan Foodstuff Co Ltd | 3,063 | ||||||||
| 157,000 | Namchow Chemical Industrial Ltd | 285 | ||||||||
| 53,758 | * | National Agriculture Development Co | 435 | |||||||
| 2,100 | e | National Beverage Corp | 95 | |||||||
| 39,835 | Nestle India Ltd | 10,543 | ||||||||
| 81,814 | Nestle Malaysia BHD | 2,635 | ||||||||
| 4,138,665 | Nestle S.A. | 577,829 | ||||||||
| 318,105 | * | New Hope Liuhe Co Ltd | 759 | |||||||
| 74,285 | * | NewAge, Inc | 77 | |||||||
| 287,792 | Nichirei Corp | 6,681 | ||||||||
| 55,097 | Nippon Flour Mills Co Ltd | 794 | ||||||||
| 154,000 | Nippon Meat Packers, Inc | 5,553 | ||||||||
| 357,659 | Nippon Suisan Kaisha Ltd | 1,690 | ||||||||
| 29,222 | Nisshin Oillio Group Ltd | 737 | ||||||||
| 209,378 | Nisshin Seifun Group, Inc | 3,021 | ||||||||
| 56,378 | Nissin Food Products Co Ltd | 4,115 | ||||||||
| 361,568 | e | Nissin Foods Co Ltd | 277 | |||||||
| 3,235 | * | Nong Shim Co Ltd | 868 | |||||||
| 2,114,400 | e,g | Nongfu Spring Co Ltd | 13,966 | |||||||
| 14,854 | Norway Royal Salmon ASA | 275 | ||||||||
| 91,372 | Oceana Group Ltd | 318 | ||||||||
| 158,850 | Origin Enterprises plc | 597 | ||||||||
| 20,416 | * | Orion Corp | 274 | |||||||
| 26,977 | * | Orion Corp/Republic of Korea | 2,348 | |||||||
| 8,314 | Orior AG. | 820 | ||||||||
| 1,131,817 | Orkla ASA | 11,345 | ||||||||
| 984,217 | Osotspa PCL | 1,009 | ||||||||
| 1,565 | * | Ottogi Corp | 600 | |||||||
| 2,396,648 | PepsiCo, Inc | 416,322 | ||||||||
| 388,225 | e | Pernod-Ricard S.A. | 93,398 | |||||||
| 575 | Philip Morris CR | 424 | ||||||||
| 3,019,712 | Philip Morris International, Inc | 286,873 | ||||||||
| 76,812 | * | Pilgrim’s Pride Corp | 2,166 | |||||||
| 15,075 | * | Post Holdings, Inc | 1,699 | |||||||
| 736,941 | PPB Group BHD | 3,025 | ||||||||
| 707,612 | Premier Foods plc | 1,071 | ||||||||
| 47,210 | e | Premium Brands Holdings Corp | 4,719 | |||||||
| 79,738 | Prima Meat Packers Ltd | 1,721 | ||||||||
| 393,198 | Primo Water Corp | 6,932 | ||||||||
| 97 |
COLLEGE RETIREMENT EQUITIES FUND - Stock Account
| SHARES | COMPANY | VALUE (000) | ||||||||
| 184,674 | Primo Water Corp (Toronto) | $ | 3,259 | |||||||
| 499,200 | PT Astra Agro Lestari Tbk | 333 | ||||||||
| 8,517,318 | PT Charoen Pokphand Indonesia Tbk | 3,550 | ||||||||
| 578,784 | PT Gudang Garam Tbk | 1,243 | ||||||||
| 5,156,809 | PT Indofood Sukses Makmur Tbk | 2,290 | ||||||||
| 3,124,400 | PT Perusahaan Perkebunan London Sumatra Indonesia Tbk | 260 | ||||||||
| 3,416,200 | PT Sawit Sumbermas Sarana Tbk | 231 | ||||||||
| 11,351 | * | Pulmuone Co Ltd | 165 | |||||||
| 20,800 | Qianhe Condiment and Food Co Ltd | 79 | ||||||||
| 949,100 | QL Resources BHD | 1,041 | ||||||||
| 501,900 | R&B Food Supply PCL | 337 | ||||||||
| 79,598 | Radico Khaitan Ltd | 1,317 | ||||||||
| 44,624 | e | Remy Cointreau S.A. | 10,847 | |||||||
| 28,100 | Riken Vitamin Co Ltd | 417 | ||||||||
| 729,413 | *,e | RLX Technology, Inc (ADR) | 2,845 | |||||||
| 112,125 | e | Rogers Sugar, Inc | 527 | |||||||
| 38,018 | * | Ros Agro plc (ADR) | 579 | |||||||
| 10,104 | Ros Agro plc (GDR) | 154 | ||||||||
| 104,629 | Royal Unibrew A.S. | 11,769 | ||||||||
| 20,194 | S Foods, Inc | 611 | ||||||||
| 371,930 | Saigon Beer Alcohol Beverage Corp | 2,464 | ||||||||
| 34,855 | Sakata Seed Corp | 996 | ||||||||
| 127,560 | Salmar ASA | 8,798 | ||||||||
| 1,761 | * | Samlip General Foods Co Ltd | 105 | |||||||
| 2,685 | * | Samyang Corp | 142 | |||||||
| 3,547 | * | Samyang Foods Co Ltd | 283 | |||||||
| 3,650 | * | Samyang Holdings Corp | 301 | |||||||
| 84,655 | Sanderson Farms, Inc | 16,176 | ||||||||
| 193,907 | Sao Martinho S.A. | 1,196 | ||||||||
| 76,386 | e | Sapporo Holdings Ltd | 1,453 | |||||||
| 307,974 | Saputo, Inc | 6,939 | ||||||||
| 21,676 | * | Saudi Fisheries Co | 262 | |||||||
| 17,544 | Saudia Dairy & Foodstuff Co | 771 | ||||||||
| 292,407 | Savola Group | 2,489 | ||||||||
| 139,261 | g | Scandinavian Tobacco Group A.S. | 2,925 | |||||||
| 15,569 | Schouw & Co | 1,356 | ||||||||
| 237 | Seaboard Corp | 933 | ||||||||
| 154,227 | Select Harvests Ltd | 697 | ||||||||
| 5,539 | * | Seneca Foods Corp | 266 | |||||||
| 46,031 | Shanghai Bairun Investment Holding Group Co Ltd | 431 | ||||||||
| 83,422 | Shanxi Xinghuacun Fen Wine Factory Co Ltd | 4,131 | ||||||||
| 98 |
COLLEGE RETIREMENT EQUITIES FUND - Stock Account
| SHARES | COMPANY | VALUE (000) | ||||||||
| 19,587 | e | Showa Sangyo Co Ltd | $ | 453 | ||||||
| 548,000 | * | Shree Renuka Sugars Ltd | 220 | |||||||
| 35,701 | Sichuan Swellfun Co Ltd | 674 | ||||||||
| 1,929,378 | Sime Darby Plantation BHD | 1,741 | ||||||||
| 89,259 | * | Simply Good Foods Co | 3,710 | |||||||
| 102,939 | SLC Agricola S.A. | 832 | ||||||||
| 1,837,171 | e,g | Smoore International Holdings Ltd | 9,381 | |||||||
| 13,767 | * | Sovos Brands, Inc | 207 | |||||||
| 444,000 | Standard Foods Corp | 849 | ||||||||
| 102,484 | Strauss Group Ltd | 3,196 | ||||||||
| 86,178 | Suedzucker AG. | 1,299 | ||||||||
| 96,877 | *,e | SunOpta, Inc | 672 | |||||||
| 68,023 | Suntory Beverage & Food Ltd | 2,463 | ||||||||
| 3,855,298 | Swedish Match AB | 30,606 | ||||||||
| 89,081 | *,e | Synlait Milk Ltd | 211 | |||||||
| 192,000 | Taisun Enterprise Co Ltd | 189 | ||||||||
| 563,000 | * | Taiwan TEA Corp | 413 | |||||||
| 175,703 | Takara Holdings, Inc | 1,869 | ||||||||
| 283,291 | Tassal Group Ltd | 719 | ||||||||
| 688,432 | Tata Tea Ltd | 6,868 | ||||||||
| 601,706 | Tate & Lyle plc | 5,413 | ||||||||
| 4,990 | *,e | Tattooed Chef, Inc | 78 | |||||||
| 3,284,803 | Thai Union Group PCL | 1,917 | ||||||||
| 450,669 | Thai Vegetable Oil PCL (Foreign) | 419 | ||||||||
| 847,400 | Thaifoods Group PCL | 123 | ||||||||
| 201,458 | Tiger Brands Ltd | 2,288 | ||||||||
| 2,363,301 | Tingyi Cayman Islands Holding Corp | 4,860 | ||||||||
| 80,085 | Toly Bread Co Ltd | 357 | ||||||||
| 301,639 | Tongwei Co Ltd | 2,127 | ||||||||
| 13,560 | e | Tootsie Roll Industries, Inc | 491 | |||||||
| 141,316 | Toyo Suisan Kaisha Ltd | 5,992 | ||||||||
| 782,324 | Treasury Wine Estates Ltd | 7,054 | ||||||||
| 46,696 | * | TreeHouse Foods, Inc | 1,893 | |||||||
| 126,100 | * | Tres Tentos Agroindustrial S.A. | 219 | |||||||
| 74,475 | Triveni Engineering & Industries Ltd | 221 | ||||||||
| 615,471 | Tsingtao Brewery Co Ltd | 5,759 | ||||||||
| 49,393 | Tsingtao Brewery Co Ltd (Class A) | 768 | ||||||||
| 43,000 | Ttet Union Corp | 247 | ||||||||
| 22,319 | Turning Point Brands, Inc | 843 | ||||||||
| 90,727 | Tyson Foods, Inc (Class A) | 7,908 | ||||||||
| 160,876 | Ulker Biskuvi Sanayi AS | 212 | ||||||||
| 1,581,616 | Uni-President China Holdings Ltd | 1,533 | ||||||||
| 99 |
COLLEGE RETIREMENT EQUITIES FUND - Stock Account
| SHARES | COMPANY | VALUE (000) | ||||||||
| 5,701,384 | Uni-President Enterprises Corp | $ | 14,116 | |||||||
| 353,618 | United Malt Grp Ltd | 1,125 | ||||||||
| 100,800 | United Plantations BHD | 336 | ||||||||
| 337,871 | * | United Spirits Ltd | 4,072 | |||||||
| 21,105 | Universal Corp | 1,159 | ||||||||
| 1,003,840 | Universal Robina | 2,520 | ||||||||
| 83,264 | e | Utz Brands, Inc | 1,328 | |||||||
| 170,946 | Varun Beverages Ltd | 2,040 | ||||||||
| 295,774 | Vector Group Ltd | 3,395 | ||||||||
| 92,661 | *,e | Village Farms International, Inc | 595 | |||||||
| 5,681 | Vilmorin & Cie | 347 | ||||||||
| 489,075 | Vina Concha y Toro S.A. | 752 | ||||||||
| 78,955 | Viscofan S.A. | 5,115 | ||||||||
| 505 | * | Vita Coco Co, Inc | 6 | |||||||
| 163,140 | *,e | Vital Farms, Inc | 2,946 | |||||||
| 920,000 | e | Vitasoy International Holdings Ltd | 1,860 | |||||||
| 5,776,694 | Want Want China Holdings Ltd | 5,302 | ||||||||
| 320,561 | Wei Chuan Food Corp | 258 | ||||||||
| 465,370 | Wens Foodstuffs Group Co Ltd | 1,408 | ||||||||
| 9,643,109 | g | WH Group Ltd | 6,053 | |||||||
| 33,803 | * | Whole Earth Brands, Inc | 363 | |||||||
| 2,646,942 | Wilmar International Ltd | 8,146 | ||||||||
| 274,042 | Wuliangye Yibin Co Ltd | 9,573 | ||||||||
| 133,225 | Yakult Honsha Co Ltd | 6,950 | ||||||||
| 197,600 | e | Yamazaki Baking Co Ltd | 2,627 | |||||||
| 550,407 | e | Yihai International Holding Ltd | 2,545 | |||||||
| 97,800 | Yihai Kerry Arawana Holdings Co Ltd | 967 | ||||||||
| 119,917 | * | Yuan Longping High-tech Agriculture Co Ltd | 438 | |||||||
| 19,100 | Yukiguni Maitake Co Ltd | 199 | ||||||||
| 1,114 | *,e | Zevia PBC | 8 | |||||||
| 911,500 | e,g | Zhou Hei Ya International Holdings Co Ltd | 688 | |||||||
| 14,061 | Zydus Wellness Ltd | 356 | ||||||||
| TOTAL FOOD, BEVERAGE & TOBACCO | 4,511,183 | |||||||||
| HEALTH CARE EQUIPMENT & SERVICES - 4.6% | ||||||||||
| 181,688 | *,e | 1Life Healthcare, Inc | 3,192 | |||||||
| 3,602,870 | Abbott Laboratories | 507,068 | ||||||||
| 13,890 | * | Abiomed, Inc | 4,989 | |||||||
| 332,560 | * | Acadia Healthcare Co, Inc | 20,186 | |||||||
| 154,169 | *,e | Accelerate Diagnostics, Inc | 805 | |||||||
| 19,749 | * | Accolade, Inc | 521 | |||||||
| 214,319 | * | Accuray, Inc | 1,022 | |||||||
| 100 |
COLLEGE RETIREMENT EQUITIES FUND - Stock Account
| SHARES | COMPANY | VALUE (000) | ||||||||
| 6,254 | *,e | Acutus Medical, Inc | $ | 21 | ||||||
| 61,571 | * | AdaptHealth Corp | 1,506 | |||||||
| 12,942 | * | Addus HomeCare Corp | 1,210 | |||||||
| 227,490 | Advanced Medical Solutions Group plc | 1,034 | ||||||||
| 183,377 | * | AGFA-Gevaert NV | 791 | |||||||
| 51,331 | *,e | Agiliti, Inc | 1,189 | |||||||
| 163,368 | *,e | agilon health, Inc | 4,411 | |||||||
| 638,483 | Aier Eye Hospital Group Co Ltd | 4,240 | ||||||||
| 300 | * | AirSculpt Technologies, Inc | 5 | |||||||
| 532,000 | e,g | AK Medical Holdings Ltd | 450 | |||||||
| 68,834 | Al Hammadi Co for Development and Investment | 738 | ||||||||
| 1,371,043 | Alcon, Inc | 120,933 | ||||||||
| 228,700 | Alfresa Holdings Corp | 3,048 | ||||||||
| 2,883,829 | * | Alibaba Health Information Technology Ltd | 2,443 | |||||||
| 293,351 | * | Align Technology, Inc | 192,784 | |||||||
| 144,762 | * | Alignment Healthcare, Inc | 2,035 | |||||||
| 169,980 | * | Allscripts Healthcare Solutions, Inc | 3,136 | |||||||
| 171,285 | * | Alphatec Holdings Inc | 1,958 | |||||||
| 101,118 | g | Ambea AB | 677 | |||||||
| 182,822 | Ambu A.S. | 4,825 | ||||||||
| 25,080 | * | Amedisys, Inc | 4,060 | |||||||
| 162,159 | * | American Well Corp | 979 | |||||||
| 112,124 | AmerisourceBergen Corp | 14,900 | ||||||||
| 58,164 | * | AMN Healthcare Services, Inc | 7,115 | |||||||
| 333,310 | Amplifon S.p.A. | 17,935 | ||||||||
| 20,306 | e | Andlauer Healthcare Group, Inc | 867 | |||||||
| 51,967 | * | Angiodynamics, Inc | 1,433 | |||||||
| 273,034 | Ansell Ltd | 6,244 | ||||||||
| 699,527 | Anthem, Inc | 324,259 | ||||||||
| 162,785 | Apollo Hospitals Enterprise Ltd | 10,957 | ||||||||
| 3,775 | *,e | Apollo Medical Holdings, Inc | 277 | |||||||
| 8,196 | * | Apria, Inc | 267 | |||||||
| 2,360 | * | Apyx Medical Corp | 30 | |||||||
| 500,990 | Arjo AB | 6,130 | ||||||||
| 35,144 | As One Corp | 2,355 | ||||||||
| 757,940 | Asahi Intecc Co Ltd | 16,283 | ||||||||
| 43,689 | * | Ascom Holding AG. | 562 | |||||||
| 393,647 | *,e | Asensus Surgical, Inc | 437 | |||||||
| 12,249 | *,e | Aspira Women’s Health, Inc | 22 | |||||||
| 137,958 | *,g | Aster DM Healthcare Ltd | 322 | |||||||
| 247,501 | * | AtriCure, Inc | 17,209 | |||||||
| 116 | Atrion Corp | 82 | ||||||||
| 101 |
COLLEGE RETIREMENT EQUITIES FUND - Stock Account
| SHARES | COMPANY | VALUE (000) | ||||||||
| 124,900 | *,g | Attendo AB | $ | 531 | ||||||
| 456,634 | Australian Pharmaceutical Industries Ltd | 575 | ||||||||
| 15,368 | Autobio Diagnostics Co Ltd | 133 | ||||||||
| 200,914 | * | Avanos Medical, Inc | 6,966 | |||||||
| 240,469 | * | Aveanna Healthcare Holdings, Inc | 1,779 | |||||||
| 5,805 | * | AxoGen, Inc | 54 | |||||||
| 171,620 | * | Axonics Modulation Technologies, Inc | 9,611 | |||||||
| 18,869 | *,e | Bactiguard Holding AB | 345 | |||||||
| 1,439,956 | Bangkok Chain Hospital PCL | 866 | ||||||||
| 6,647,671 | Bangkok Dusit Medical Services PCL (Foreign) | 4,577 | ||||||||
| 920,265 | Baxter International, Inc | 78,996 | ||||||||
| 103,020 | Becton Dickinson & Co | 25,907 | ||||||||
| 96,000 | *,e | Beijing Chunlizhengda Medical Instruments Co Ltd | 187 | |||||||
| 5,065 | *,e | Biodesix, Inc | 27 | |||||||
| 200,502 | * | BioLife Solutions Inc | 7,473 | |||||||
| 56,204 | BioMerieux | 7,992 | ||||||||
| 27,476 | *,e | Bioventus, Inc | 398 | |||||||
| 27,045 | BML, Inc | 841 | ||||||||
| 2,607,876 | * | Boston Scientific Corp | 110,783 | |||||||
| 167,238 | * | Brookdale Senior Living, Inc | 863 | |||||||
| 339,738 | Bumrungrad Hospital PCL (Foreign) | 1,430 | ||||||||
| 175,944 | *,e | Butterfly Network, Inc | 1,177 | |||||||
| 224,477 | Cardinal Health, Inc | 11,558 | ||||||||
| 3,590 | * | Cardiovascular Systems, Inc | 67 | |||||||
| 487,700 | e | Carenet, Inc | 4,539 | |||||||
| 38,504 | Carl Zeiss Meditec AG. | 8,077 | ||||||||
| 9,812 | * | Castle Biosciences, Inc | 421 | |||||||
| 223,175 | * | Castlight Health, Inc | 344 | |||||||
| 18,182 | Cellavision AB | 653 | ||||||||
| 61,583 | e | Celltrion Healthcare Co Ltd | 4,149 | |||||||
| 1,089,648 | * | Centene Corp | 89,787 | |||||||
| 228,581 | Cerner Corp | 21,228 | ||||||||
| 101,178 | * | Certara, Inc | 2,875 | |||||||
| 65,112 | * | Cerus Corp | 443 | |||||||
| 46,102 | * | Chabiotech Co Ltd | 772 | |||||||
| 196,581 | * | Change Healthcare, Inc | 4,203 | |||||||
| 11,704 | Chemed Corp | 6,192 | ||||||||
| 29,592 | China National Medicines Corp Ltd | 146 | ||||||||
| 937,500 | China Resources Phoenix Healthcare Holdings Co Ltd | 558 | ||||||||
| 5,144,074 | Chularat Hospital PCL | 564 | ||||||||
| 1,236,565 | Cigna Corp | 283,952 | ||||||||
| 102 |
COLLEGE RETIREMENT EQUITIES FUND - Stock Account
| SHARES | COMPANY | VALUE (000) | ||||||||
| 3,479 | * | ClearPoint Neuro, Inc | $ | 39 | ||||||
| 1,032,034 | * | Cleopatra Hospital | 323 | |||||||
| 102,500 | CM Hospitalar S.A. | 347 | ||||||||
| 596,000 | e | C-Mer Eye Care Holdings Ltd | 527 | |||||||
| 196,207 | Cochlear Ltd | 30,795 | ||||||||
| 86,774 | Coloplast AS | 15,279 | ||||||||
| 6,384 | Coltene Holding AG. | 788 | ||||||||
| 459,298 | * | Community Health Systems, Inc | 6,113 | |||||||
| 32,326 | CompuGroup Medical SE & Co KgaA | 2,606 | ||||||||
| 12,936 | * | Computer Programs & Systems, Inc | 379 | |||||||
| 16,841 | Conmed Corp | 2,387 | ||||||||
| 1,959,531 | g | ConvaTec Group plc | 5,119 | |||||||
| 1,425 | * | Convey Holding Parent, Inc | 12 | |||||||
| 24,231 | Cooper Cos, Inc | 10,151 | ||||||||
| 879 | * | Corvel Corp | 183 | |||||||
| 200,306 | * | Covetrus, Inc | 4,000 | |||||||
| 48,306 | Craneware plc | 1,586 | ||||||||
| 143,491 | * | Cross Country Healthcare, Inc | 3,983 | |||||||
| 27,500 | * | CryoLife, Inc | 560 | |||||||
| 40,877 | *,e | CryoPort, Inc | 2,419 | |||||||
| 4,866 | *,e | Cue Health, Inc | 65 | |||||||
| 125,151 | * | Cutera, Inc | 5,171 | |||||||
| 907 | * | CVRx, Inc | 11 | |||||||
| 238,108 | CVS Group plc | 7,236 | ||||||||
| 1,428,142 | CVS Health Corp | 147,327 | ||||||||
| 122,331 | *,e | CYBERDYNE, Inc | 377 | |||||||
| 5,788 | * | CytoSorbents Corp | 24 | |||||||
| 35,352 | Dallah Healthcare Co | 705 | ||||||||
| 13,854 | *,e | DarioHealth Corp | 180 | |||||||
| 52,441 | * | DaVita, Inc | 5,966 | |||||||
| 10,139 | * | Definitive Healthcare Corp | 277 | |||||||
| 29,492 | * | Demant A.S. | 1,510 | |||||||
| 503,718 | *,e | dentalcorp Holdings Ltd | 6,479 | |||||||
| 7,184 | * | Dentium Co Ltd | 421 | |||||||
| 68,838 | Dentsply Sirona, Inc | 3,840 | ||||||||
| 459,667 | * | DexCom, Inc | 246,818 | |||||||
| 42,484 | DiaSorin S.p.A. | 8,082 | ||||||||
| 11,648 | * | DIO Corp | 365 | |||||||
| 36,174 | g | Dr Lal PathLabs Ltd | 1,854 | |||||||
| 165,838 | Dr Sulaiman Al Habib Medical Services Group Co | 7,121 | ||||||||
| 11,012 | Draegerwerk AG. | 690 | ||||||||
| 4,081 | Draegerwerk AG. & Co KGaA | 250 | ||||||||
| 103 |
COLLEGE RETIREMENT EQUITIES FUND - Stock Account
| SHARES | COMPANY | VALUE (000) | ||||||||
| 18,029 | Eckert & Ziegler Strahlen- und Medizintechnik AG. | $ | 1,927 | |||||||
| 1,038,345 | * | Edwards Lifesciences Corp | 134,518 | |||||||
| 34,800 | Eiken Chemical Co Ltd | 584 | ||||||||
| 50,445 | El.En. S.p.A | 892 | ||||||||
| 40,138 | e | Elan Corp | 388 | |||||||
| 448,206 | e | Elekta AB (B Shares) | 5,667 | |||||||
| 56,500 | EM Systems Co Ltd | 371 | ||||||||
| 69,569 | EMIS Group plc | 1,279 | ||||||||
| 136,339 | Encompass Health Corp | 8,897 | ||||||||
| 22,135 | Ensign Group, Inc | 1,858 | ||||||||
| 695,234 | * | Envista Holdings Corp | 31,327 | |||||||
| 7,776 | * | Eoflow Co Ltd | 320 | |||||||
| 130,661 | * | Establishment Labs Holdings, Inc | 8,831 | |||||||
| 405,653 | * | Evolent Health, Inc | 11,224 | |||||||
| 96,991 | e | Extendicare, Inc | 560 | |||||||
| 82,844 | Fagron NV | 1,397 | ||||||||
| 94,727 | *,e | Figs, Inc | 2,611 | |||||||
| 722,246 | Fisher & Paykel Healthcare Corp | 16,181 | ||||||||
| 202,506 | Fleury S.A. | 652 | ||||||||
| 3,784 | *,e | Forian, Inc | 34 | |||||||
| 495,852 | * | Fortis Healthcare Ltd | 1,975 | |||||||
| 263,216 | Fresenius Medical Care AG. | 17,064 | ||||||||
| 116,964 | Fresenius SE | 4,701 | ||||||||
| 16,117 | *,e | Fulgent Genetics, Inc | 1,621 | |||||||
| 60,721 | g | Galenica AG. | 4,560 | |||||||
| 996,675 | g | Genertec Universal Medical Group Company Limited | 720 | |||||||
| 128,785 | Getinge AB (B Shares) | 5,613 | ||||||||
| 69,150 | Ginko International Co Ltd | 670 | ||||||||
| 3,878 | * | Glaukos Corp | 172 | |||||||
| 87,145 | * | Globus Medical, Inc | 6,292 | |||||||
| 130,981 | GN Store Nord | 8,219 | ||||||||
| 19,538 | Guangzhou Kingmed Diagnostics Group Co Ltd | 341 | ||||||||
| 506,606 | * | Guardant Health, Inc | 50,671 | |||||||
| 6,455 | Guerbet | 274 | ||||||||
| 88,177 | g | GVS S.p.A | 1,058 | |||||||
| 17,520 | * | Haemonetics Corp | 929 | |||||||
| 3,242 | * | Hanger Inc | 59 | |||||||
| 710,166 | g | Hapvida Participacoes e Investimentos S.A. | 1,318 | |||||||
| 7,612,482 | Hartalega Holdings BHD | 10,470 | ||||||||
| 522,162 | HCA Healthcare, Inc | 134,154 | ||||||||
| 603,744 | Healius Ltd | 2,313 | ||||||||
| 104 |
COLLEGE RETIREMENT EQUITIES FUND - Stock Account
| SHARES | COMPANY | VALUE (000) | ||||||||
| 5,307 | * | Health Catalyst, Inc | $ | 210 | ||||||
| 251,082 | * | HealthEquity, Inc | 11,108 | |||||||
| 32,917 | * | HealthStream, Inc | 868 | |||||||
| 108,199 | * | Henry Schein, Inc | 8,389 | |||||||
| 870 | * | Heska Corp | 159 | |||||||
| 87,175 | * | HLB Life Science CO Ltd | 912 | |||||||
| 25,298 | e | HLS Therapeutics, Inc | 300 | |||||||
| 29,200 | Hogy Medical Co Ltd | 827 | ||||||||
| 197,565 | * | Hologic, Inc | 15,126 | |||||||
| 90,600 | * | Hospital Mater Dei S.A. | 219 | |||||||
| 635,473 | * | Hoya Corp | 94,299 | |||||||
| 68,278 | Huadong Medicine Co Ltd | 431 | ||||||||
| 280,059 | Humana, Inc | 129,908 | ||||||||
| 409,600 | e,g | Hygeia Healthcare Holdings Co Ltd | 2,565 | |||||||
| 3,883 | * | iCAD, Inc | 28 | |||||||
| 5,745 | * | ICU Medical, Inc | 1,364 | |||||||
| 139,858 | * | IDEXX Laboratories, Inc | 92,091 | |||||||
| 1,867,989 | IHH Healthcare BHD | 3,291 | ||||||||
| 23,312 | *,e | Implantica AG. | 168 | |||||||
| 69,807 | * | Inari Medical, Inc | 6,371 | |||||||
| 38,047 | * | InfuSystem Holdings, Inc | 648 | |||||||
| 89,179 | * | Inmode Ltd | 6,294 | |||||||
| 1,489 | * | Innovage Holding Corp | 7 | |||||||
| 1,835 | * | Inogen, Inc | 62 | |||||||
| 12,585 | * | Inspire Medical Systems, Inc | 2,895 | |||||||
| 58,283 | Instituto Hermes Pardini S.A. | 201 | ||||||||
| 71,856 | * | Insulet Corp | 19,119 | |||||||
| 26,584 | Intco Medical Technology Co Ltd | 241 | ||||||||
| 41,969 | * | Integer Holding Corp | 3,592 | |||||||
| 20,357 | * | Integra LifeSciences Holdings Corp | 1,364 | |||||||
| 198,692 | Integral Diagnostics Ltd | 715 | ||||||||
| 87,785 | * | Intersect ENT, Inc | 2,397 | |||||||
| 555,176 | *,n | Intuitive Surgical, Inc | 199,475 | |||||||
| 33,349 | * | Invacare Corp | 91 | |||||||
| 24,363 | Ion Beam Applications | 423 | ||||||||
| 9,214 | * | iRadimed Corp | 426 | |||||||
| 11,410 | * | iRhythm Technologies, Inc | 1,343 | |||||||
| 867,000 | IVD Medical Holding Ltd | 359 | ||||||||
| 43,944 | Jafron Biomedical Co Ltd | 368 | ||||||||
| 75,000 | Japan Lifeline Co Ltd | 716 | ||||||||
| 16,200 | Japan Medical Dynamic Marketing, Inc | 264 | ||||||||
| 44,488 | Jeol Ltd | 3,549 | ||||||||
| 105 |
COLLEGE RETIREMENT EQUITIES FUND - Stock Account
| SHARES | COMPANY | VALUE (000) | ||||||||
| 43,350 | Jiangsu Yuyue Medical Equipment & Supply Co Ltd | $ | 257 | |||||||
| 949,109 | *,e,g | Jinxin Fertility Group Ltd | 1,061 | |||||||
| 30,700 | * | JMDC, Inc | 2,286 | |||||||
| 18,624 | * | Joint Corp | 1,223 | |||||||
| 76,968 | Jointown Pharmaceutical Group Co Ltd | 178 | ||||||||
| 348,000 | e | Kangji Medical Holdings Ltd | 355 | |||||||
| 1,290,996 | Koninklijke Philips Electronics NV | 47,782 | ||||||||
| 90,034 | Korian-Medica | 2,852 | ||||||||
| 1,311,700 | Kossan Rubber Industries | 605 | ||||||||
| 2,223,028 | KPJ Healthcare BHD | 592 | ||||||||
| 16,126 | *,g | Krishna Institute of Medical Sciences Ltd | 309 | |||||||
| 96,637 | * | Laboratory Corp of America Holdings | 30,364 | |||||||
| 408,623 | * | Lantheus Holdings, Inc | 11,805 | |||||||
| 5,499 | Le Noble Age | 315 | ||||||||
| 2,085 | LeMaitre Vascular, Inc | 105 | ||||||||
| 23,113 | Lepu Medical Technology Beijing Co Ltd | 82 | ||||||||
| 13,914 | * | LHC Group, Inc | 1,909 | |||||||
| 15,410,716 | Life Healthcare Group Holdings Pte Ltd | 23,239 | ||||||||
| 17,912 | *,e | LifeStance Health Group, Inc | 171 | |||||||
| 4,032,000 | * | Lifetech Scientific Corp | 1,894 | |||||||
| 59,310 | * | LivaNova plc | 5,185 | |||||||
| 241 | * | Lucid Diagnostics, Inc | 1 | |||||||
| 389,416 | M3, Inc | 19,635 | ||||||||
| 13,342 | * | Magellan Health Services, Inc | 1,267 | |||||||
| 97,863 | Mani, Inc | 1,358 | ||||||||
| 34,880 | * | Masimo Corp | 10,212 | |||||||
| 318,072 | * | Max Healthcare Institute Ltd | 1,891 | |||||||
| 169,339 | McKesson Corp | 42,093 | ||||||||
| 9,004 | *,g | Medacta Group S.A. | 1,403 | |||||||
| 4,861 | *,g | Medartis Holding AG. | 695 | |||||||
| 37,500 | e | Medical Data Vision Co Ltd | 405 | |||||||
| 147,954 | Medicare Group | 345 | ||||||||
| 121,432 | Mediceo Paltac Holdings Co Ltd | 2,276 | ||||||||
| 492,235 | * | Mediclinic International plc | 2,131 | |||||||
| 13,780 | * | Medios AG. | 610 | |||||||
| 23,400 | * | Medley, Inc | 482 | |||||||
| 29,513 | *,g | Medmix AG. | 1,458 | |||||||
| 35,333 | * | MEDNAX, Inc | 961 | |||||||
| 103,100 | * | MedPeer, Inc | 3,210 | |||||||
| 2,933,353 | Medtronic plc | 303,455 | ||||||||
| 179,508 | * | Meinian Onehealth Healthcare Holdings Co Ltd | 221 | |||||||
| 69,484 | Menicon Co Ltd | 2,055 | ||||||||
| 106 |
COLLEGE RETIREMENT EQUITIES FUND - Stock Account
| SHARES | COMPANY | VALUE (000) | ||||||||
| 137,952 | * | Meridian Bioscience, Inc | $ | 2,814 | ||||||
| 40,403 | * | Merit Medical Systems, Inc | 2,517 | |||||||
| 4,437 | Mesa Laboratories, Inc | 1,456 | ||||||||
| 217 | Metall Zug AG.(B Shares) | 491 | ||||||||
| 12,592,000 | * | Metro Healthcare Indonesia TBK PT | 455 | |||||||
| 28,001 | g | Metropolis Healthcare Ltd | 1,295 | |||||||
| 977,895 | Microport Scientific Corp | 3,564 | ||||||||
| 41,589 | * | Middle East Healthcare Co | 350 | |||||||
| 62,700 | Miraca Holdings, Inc | 1,591 | ||||||||
| 93,852 | *,g | MLP Saglik Hizmetleri AS. | 212 | |||||||
| 22,801 | * | ModivCare, Inc | 3,381 | |||||||
| 79,763 | * | Molina Healthcare, Inc | 25,371 | |||||||
| 119,432 | Mouwasat Medical Services Co | 5,518 | ||||||||
| 434,007 | *,e | Multiplan Corp | 1,923 | |||||||
| 22,836 | Nagaileben Co Ltd | 450 | ||||||||
| 86,322 | Nakanishi, Inc | 1,590 | ||||||||
| 1,011,808 | *,e | Nanosonics Ltd | 4,647 | |||||||
| 42,574 | *,e | Nano-X Imaging Ltd | 619 | |||||||
| 65,457 | *,e | NantHealth, Inc | 69 | |||||||
| 75,723 | * | Narayana Hrudayalaya Ltd | 650 | |||||||
| 10,885 | National Healthcare Corp | 740 | ||||||||
| 25,901 | National Medical Care Co | 431 | ||||||||
| 1,218 | National Research Corp | 51 | ||||||||
| 67,626 | * | Natus Medical, Inc | 1,605 | |||||||
| 499,239 | * | Neogen Corp | 22,670 | |||||||
| 1,189,113 | * | Network Healthcare Holdings Ltd | 1,185 | |||||||
| 2,230 | Neuca S.A. | 465 | ||||||||
| 6,355 | *,e | Neuronetics, Inc | 28 | |||||||
| 1,368 | *,e | NeuroPace, Inc | 14 | |||||||
| 3,757 | * | Nevro Corp | 305 | |||||||
| 89,500 | *,e,g | New Horizon Health Ltd | 254 | |||||||
| 120,692 | * | NextGen Healthcare, Inc | 2,147 | |||||||
| 198,677 | Nihon Kohden Corp | 5,447 | ||||||||
| 163,252 | Nipro Corp | 1,546 | ||||||||
| 159,379 | *,† | NMC Health plc | 2 | |||||||
| 14,098 | g | NNIT A.S. | 248 | |||||||
| 358,650 | Notre Dame Intermedica Participacoes S.A. | 3,872 | ||||||||
| 98,928 | * | Novocure Ltd | 7,428 | |||||||
| 57,916 | * | NuVasive, Inc | 3,039 | |||||||
| 370,185 | *,e | Oak Street Health, Inc | 12,268 | |||||||
| 1,123,836 | Oceania Healthcare Ltd | 1,031 | ||||||||
| 288,175 | Odontoprev S.A. | 651 | ||||||||
| 107 |
COLLEGE RETIREMENT EQUITIES FUND - Stock Account
| SHARES | COMPANY | VALUE (000) | ||||||||
| 1,317,738 | Olympus Corp | $ | 30,344 | |||||||
| 106,117 | * | Omnicell, Inc | 19,148 | |||||||
| 152,000 | * | Oncoclinicas do Brasil Servicos Medicos S.A. | 306 | |||||||
| 3,449 | *,e | Ontrak, Inc | 22 | |||||||
| 9,268 | * | OptimizeRx Corp | 576 | |||||||
| 981,787 | * | Option Care Health, Inc | 27,922 | |||||||
| 65,151 | * | OraSure Technologies, Inc | 566 | |||||||
| 130,251 | Oriola-KD Oyj (B Shares) | 298 | ||||||||
| 103,621 | e | Orpea | 10,392 | |||||||
| 627,802 | * | Ortho Clinical Diagnostics Holdings plc | 13,429 | |||||||
| 62,981 | * | Orthofix Medical Inc | 1,958 | |||||||
| 1,538 | * | OrthoPediatrics Corp | 92 | |||||||
| 23,976 | * | Osstem Implant Co Ltd | 2,871 | |||||||
| 18,693 | * | Outset Medical, Inc | 862 | |||||||
| 24,066 | Ovctek China, Inc | 217 | ||||||||
| 145,295 | Owens & Minor, Inc | 6,320 | ||||||||
| 414 | * | Paragon 28, Inc | 7 | |||||||
| 49,244 | Paramount Bed Holdings Co Ltd | 835 | ||||||||
| 346,911 | Patterson Cos, Inc | 10,182 | ||||||||
| 161,115 | *,e | PAVmed, Inc | 396 | |||||||
| 30,000 | Pegavision Corp | 461 | ||||||||
| 487,000 | *,g | Peijia Medical Ltd | 831 | |||||||
| 2,229 | * | Pennant Group, Inc | 51 | |||||||
| 30,032 | * | Penumbra, Inc | 8,629 | |||||||
| 29,889 | *,e | PetIQ, Inc | 679 | |||||||
| 5,168 | Pharmagest Inter@ctive | 553 | ||||||||
| 66,102 | * | Phreesia, Inc | 2,754 | |||||||
| 79,000 | *,† | Pihsiang Machinery Manufacturing Co Ltd | 0 | ^ | ||||||
| 343,659 | *,e,g | Ping An Healthcare and Technology Co Ltd | 1,253 | |||||||
| 25,458 | Poly Medicure Ltd | 328 | ||||||||
| 745,225 | *,e | PolyNovo Ltd | 826 | |||||||
| 93,915 | Premier, Inc | 3,866 | ||||||||
| 171,307 | * | Privia Health Group, Inc | 4,432 | |||||||
| 161,112 | Pro Medicus Ltd | 7,312 | ||||||||
| 514 | * | PROCEPT BioRobotics Corp | 13 | |||||||
| 22,869 | * | Progyny, Inc | 1,151 | |||||||
| 497,600 | PT Siloam International Hospitals Tbk | 299 | ||||||||
| 20,601 | *,e | Pulmonx Corp | 661 | |||||||
| 2,330 | *,e | Pulse Biosciences, Inc | 35 | |||||||
| 252,763 | Qualicorp S.A. | 765 | ||||||||
| 131,977 | Quest Diagnostics, Inc | 22,833 | ||||||||
| 11,618 | * | Quidel Corp | 1,568 | |||||||
| 108 |
COLLEGE RETIREMENT EQUITIES FUND - Stock Account
| SHARES | COMPANY | VALUE (000) | ||||||||
| 15,907 | *,e | Quotient Ltd | $ | 41 | ||||||
| 572,257 | * | R1 RCM, Inc | 14,587 | |||||||
| 32,932 | * | RadNet, Inc | 992 | |||||||
| 1,609,499 | Raffles Medical Group Ltd | 1,636 | ||||||||
| 391,771 | Ramsay Health Care Ltd | 20,360 | ||||||||
| 270,100 | g | Rede D’Or Sao Luiz S.A. | 2,169 | |||||||
| 63,984 | * | Renalytix AI plc | 537 | |||||||
| 47,633 | Resmed, Inc | 12,407 | ||||||||
| 2,612 | *,e | Retractable Technologies, Inc | 18 | |||||||
| 28,746 | Revenio Group Oyj | 1,818 | ||||||||
| 515,600 | Riverstone Holdings Ltd | 268 | ||||||||
| 922 | * | RxSight, Inc | 10 | |||||||
| 372,637 | Ryman Healthcare Ltd | 3,125 | ||||||||
| 34,297 | Sartorius AG. | 23,196 | ||||||||
| 44,743 | Saudi Chemical Co | 404 | ||||||||
| 46,411 | * | Schrodinger, Inc | 1,617 | |||||||
| 39,809 | * | SD Biosensor, Inc | 1,872 | |||||||
| 15,976 | * | SeaSpine Holdings Corp | 218 | |||||||
| 163,629 | e | Sectra AB | 3,625 | |||||||
| 72,838 | *,e | Sedana Medical AB | 788 | |||||||
| 557,795 | Select Medical Holdings Corp | 16,399 | ||||||||
| 631,923 | *,e | Senseonics Holdings, Inc | 1,687 | |||||||
| 1,747,082 | Shandong Weigao Group Medical Polymer Co Ltd | 2,178 | ||||||||
| 130,032 | Shanghai Pharmaceuticals Holding Co Ltd | 406 | ||||||||
| 640,927 | Shanghai Pharmaceuticals Holding Co Ltd (Hong Kong) | 1,216 | ||||||||
| 2,708 | * | Sharps Compliance Corp | 19 | |||||||
| 53,322 | Shenzhen Mindray Bio-Medical Electronics Co Ltd | 3,187 | ||||||||
| 263,636 | Ship Healthcare Holdings, Inc | 6,143 | ||||||||
| 38,284 | * | Shockwave Medical Inc | 6,827 | |||||||
| 60,104 | * | SI-BONE, Inc | 1,335 | |||||||
| 476,603 | g | Siemens Healthineers AG. | 35,535 | |||||||
| 80,666 | e | Sienna Senior Living, Inc | 958 | |||||||
| 160,555 | * | Sientra, Inc | 589 | |||||||
| 3,334 | *,e | Sight Sciences, Inc | 59 | |||||||
| 1,016,691 | Sigma Healthcare Ltd | 355 | ||||||||
| 58,210 | *,e | Signify Health, Inc | 828 | |||||||
| 2,970 | * | Silk Road Medical Inc | 127 | |||||||
| 1,436 | e | Simulations Plus, Inc | 68 | |||||||
| 985,387 | Sinopharm Group Co | 2,145 | ||||||||
| 177,200 | g | Sisram Medical Ltd | 216 | |||||||
| 1,589,496 | Smith & Nephew plc | 27,740 | ||||||||
| 109 |
COLLEGE RETIREMENT EQUITIES FUND - Stock Account
| SHARES | COMPANY | VALUE (000) | ||||||||
| 27,519 | *,e | SOC Telemed, Inc | $ | 35 | ||||||
| 71,100 | Solasto Corp | 764 | ||||||||
| 1,080,219 | Sonic Healthcare Ltd | 36,637 | ||||||||
| 69,210 | Sonova Holdings AG | 27,047 | ||||||||
| 341,480 | *,g | Spire Healthcare Group plc | 1,156 | |||||||
| 499,100 | Sri Trang Gloves Thailand PCL | 452 | ||||||||
| 51,000 | St. Shine Optical Co Ltd | 578 | ||||||||
| 36,897 | * | Staar Surgical Co | 3,369 | |||||||
| 8,262 | * | Stereotaxis, Inc | 51 | |||||||
| 123,448 | STERIS plc | 30,048 | ||||||||
| 9,539 | STRATEC Biomedical AG. | 1,496 | ||||||||
| 17,224 | Straumann Holding AG. | 36,422 | ||||||||
| 296,964 | Stryker Corp | 79,414 | ||||||||
| 6,009 | * | Suheung Capsule Co Ltd | 223 | |||||||
| 300,869 | Summerset Group Holdings Ltd | 2,816 | ||||||||
| 1,679,269 | Supermax Corp BHD | 593 | ||||||||
| 187,259 | * | Surgery Partners, Inc | 10,002 | |||||||
| 41,808 | * | Surgical Science Sweden AB | 1,302 | |||||||
| 1,305 | * | SurModics, Inc | 63 | |||||||
| 81,800 | Suzuken Co Ltd | 2,361 | ||||||||
| 56,298 | * | Synlab AG. | 1,510 | |||||||
| 655,213 | Sysmex Corp | 88,442 | ||||||||
| 2,144 | * | Tabula Rasa HealthCare, Inc | 32 | |||||||
| 202,319 | * | Tactile Systems Technology, Inc | 3,850 | |||||||
| 60,000 | TaiDoc Technology Corp | 394 | ||||||||
| 17,533 | *,e | Talis Biomedical Corp | 70 | |||||||
| 143,323 | * | Tandem Diabetes Care, Inc | 21,573 | |||||||
| 110,768 | * | Teladoc, Inc | 10,171 | |||||||
| 15,418 | Teleflex, Inc | 5,065 | ||||||||
| 310,142 | * | Tenet Healthcare Corp | 25,336 | |||||||
| 1,116,456 | Terumo Corp | 47,160 | ||||||||
| 399,311 | Thonburi Healthcare Group PCL | 445 | ||||||||
| 20,606 | g | Thyrocare Technologies Ltd | 307 | |||||||
| 17,946 | * | Tivity Health, Inc | 475 | |||||||
| 158,230 | Toho Pharmaceutical Co Ltd | 2,415 | ||||||||
| 27,209 | Tokai Corp (GIFU) | 467 | ||||||||
| 3,684,086 | Top Glove Corp BHD | 2,290 | ||||||||
| 12,080 | * | Topchoice Medical Corp | 377 | |||||||
| 42,852 | * | Transmedics Group, Inc | 821 | |||||||
| 18,289 | * | Treace Medical Concepts, Inc | 341 | |||||||
| 20,480 | * | Triple-S Management Corp (Class B) | 731 | |||||||
| 282,025 | Uniphar plc | 1,605 | ||||||||
| 110 |
COLLEGE RETIREMENT EQUITIES FUND - Stock Account
| SHARES | COMPANY | VALUE (000) | ||||||||
| 2,036,876 | UnitedHealth Group, Inc | $ | 1,022,797 | |||||||
| 54,064 | Universal Health Services, Inc (Class B) | 7,010 | ||||||||
| 41,000 | Universal Vision Biotechnology Co Ltd | 419 | ||||||||
| 1,254 | US Physical Therapy, Inc | 120 | ||||||||
| 2,644 | Utah Medical Products, Inc | 264 | ||||||||
| 8,415 | Value Added Technologies Co Ltd | 250 | ||||||||
| 2,452 | *,e | Vapotherm, Inc | 51 | |||||||
| 52,744 | * | Varex Imaging Corp | 1,664 | |||||||
| 252,191 | * | Veeva Systems, Inc | 64,430 | |||||||
| 157,500 | *,e,g | Venus MedTech Hangzhou, Inc | 600 | |||||||
| 30,345 | *,e | Viemed Healthcare, Inc | 158 | |||||||
| 465,579 | * | ViewRay, Inc | 2,565 | |||||||
| 145,982 | *,e | Vimian Group AB | 1,282 | |||||||
| 3,633 | * | Vocera Communications, Inc | 236 | |||||||
| 210,019 | *,e | Well Health Technologies Corp | 815 | |||||||
| 107,572 | Winning Health Technology Group Co Ltd | 283 | ||||||||
| 177,693 | * | Xvivo Perfusion AB | 5,469 | |||||||
| 4,217 | e | Ypsomed Holding AG. | 861 | |||||||
| 1,219,737 | Zimmer Biomet Holdings, Inc | 154,955 | ||||||||
| 3,206 | *,e | Zynex Inc | 32 | |||||||
| TOTAL HEALTH CARE EQUIPMENT & SERVICES | 6,398,079 | |||||||||
| HOUSEHOLD & PERSONAL PRODUCTS - 1.4% | ||||||||||
| 10,976 | * | Aekyung Industrial Co Ltd | 175 | |||||||
| 278,442 | *,e | Amorepacific Corp | 39,075 | |||||||
| 104,908 | Bajaj Corp Ltd | 279 | ||||||||
| 118,865 | *,e | Beauty Health Co | 2,872 | |||||||
| 302,457 | Beiersdorf AG. | 31,003 | ||||||||
| 248,969 | *,e | BellRing Brands, Inc | 7,103 | |||||||
| 5,499,000 | *,†,e | Best World International Ltd | 2,775 | |||||||
| 17,894 | Blackmores Ltd | 1,190 | ||||||||
| 371,062 | BWX Ltd | 1,176 | ||||||||
| 119,197 | By-health Co Ltd | 504 | ||||||||
| 74,040 | C&S Paper Co Ltd | 194 | ||||||||
| 5,996 | * | Central Garden & Pet Co | 316 | |||||||
| 105,600 | * | Central Garden and Pet Co (Class A) | 5,053 | |||||||
| 52,000 | Chlitina Holding Ltd | 427 | ||||||||
| 60,265 | Church & Dwight Co, Inc | 6,177 | ||||||||
| 42,014 | Clorox Co | 7,326 | ||||||||
| 886,908 | Colgate-Palmolive Co | 75,689 | ||||||||
| 140,775 | Colgate-Palmolive India Ltd | 2,801 | ||||||||
| 9,152 | * | Cosmax, Inc | 671 | |||||||
| 111 |
COLLEGE RETIREMENT EQUITIES FUND - Stock Account
| SHARES | COMPANY | VALUE (000) | ||||||||
| 83,260 | *,e | Coty, Inc | $ | 874 | ||||||
| 718,318 | Dabur India Ltd | 5,597 | ||||||||
| 19,430 | Earth Chemical Co Ltd | 1,037 | ||||||||
| 46,968 | Edgewell Personal Care Co | 2,147 | ||||||||
| 901,534 | * | elf Beauty, Inc | 29,940 | |||||||
| 228,799 | Emami Ltd | 1,592 | ||||||||
| 73,979 | Energizer Holdings, Inc | 2,967 | ||||||||
| 346,516 | Essity AB | 11,305 | ||||||||
| 713,889 | n | Estee Lauder Cos (Class A) | 264,282 | |||||||
| 127,400 | *,e | Euglena Co Ltd | 785 | |||||||
| 165,984 | Fancl Corp | 4,947 | ||||||||
| 6,444 | Gillette India Ltd | 456 | ||||||||
| 406,321 | * | Godrej Consumer Products Ltd | 5,283 | |||||||
| 120,000 | Grape King Industrial Co | 694 | ||||||||
| 761,136 | Hengan International Group Co Ltd | 3,921 | ||||||||
| 124,687 | Henkel KGaA | 9,719 | ||||||||
| 193,082 | Henkel KGaA (Preference) | 15,580 | ||||||||
| 26,573 | * | Herbalife Nutrition Ltd | 1,088 | |||||||
| 967,901 | Hindustan Lever Ltd | 30,639 | ||||||||
| 72,265 | *,e | Honest Co, Inc | 585 | |||||||
| 34,917 | * | Hyundai Bioscience Co Ltd | 742 | |||||||
| 8,344,769 | Industri Jamu Dan Farmasi Sido Muncul Tbk PT | 506 | ||||||||
| 28,630 | Inter Parfums S.A. | 2,398 | ||||||||
| 1,650 | Inter Parfums, Inc | 176 | ||||||||
| 48,322 | e,g | Jamieson Wellness, Inc | 1,533 | |||||||
| 155,100 | Jyothy Laboratories Ltd | 288 | ||||||||
| 560,969 | Kao Corp | 29,380 | ||||||||
| 225,904 | Kimberly-Clark Corp | 32,286 | ||||||||
| 1,687,218 | e | Kimberly-Clark de Mexico S.A. de C.V. (Class A) | 2,555 | |||||||
| 66,890 | Kitanotatsujin Corp | 195 | ||||||||
| 15,960 | Kobayashi Pharmaceutical Co Ltd | 1,255 | ||||||||
| 12,712 | * | Kolmar BNH Co Ltd | 331 | |||||||
| 14,473 | * | Kolmar Korea Co Ltd | 489 | |||||||
| 29,668 | Kose Corp | 3,366 | ||||||||
| 28,184 | * | LG Household & Health Care Ltd | 26,013 | |||||||
| 2,504 | * | LG Household & Health Care Ltd (Preference) | 1,297 | |||||||
| 185,550 | Lion Corp | 2,480 | ||||||||
| 412,770 | L’Oreal S.A. | 196,814 | ||||||||
| 41,072 | Mandom Corp | 506 | ||||||||
| 616,260 | Marico Ltd | 4,243 | ||||||||
| 30,336 | Medifast, Inc | 6,353 | ||||||||
| 112 |
COLLEGE RETIREMENT EQUITIES FUND - Stock Account
| SHARES | COMPANY | VALUE (000) | ||||||||
| 330,532 | * | Microbio Co Ltd | $ | 829 | ||||||
| 45,098 | Milbon Co Ltd | 2,237 | ||||||||
| 1,008,564 | * | Natura & Co Holding S.A. | 4,651 | |||||||
| 10,174 | Nature’s Sunshine Products, Inc | 188 | ||||||||
| 19,500 | Noevir Holdings Co Ltd | 914 | ||||||||
| 61,861 | Nu Skin Enterprises, Inc (Class A) | 3,139 | ||||||||
| 4,721 | Oil-Dri Corp of America | 155 | ||||||||
| 74,017 | * | Olaplex Holdings, Inc | 2,156 | |||||||
| 76,573 | *,e | Ontex Group NV | 611 | |||||||
| 126,523 | * | Pacific Corp | 4,714 | |||||||
| 4,893 | Pharmanutra S.p.A | 419 | ||||||||
| 217,201 | e | Pigeon Corp | 4,157 | |||||||
| 78,265 | Pola Orbis Holdings, Inc | 1,304 | ||||||||
| 4,000 | *,e | Premier Anti-Aging Co Ltd | 322 | |||||||
| 4,247,130 | Procter & Gamble Co | 694,746 | ||||||||
| 9,398 | Proya Cosmetics Co Ltd | 307 | ||||||||
| 9,015,210 | PT Unilever Indonesia Tbk | 2,600 | ||||||||
| 492,499 | PZ Cussons plc | 1,382 | ||||||||
| 1,100,750 | Reckitt Benckiser Group plc | 94,757 | ||||||||
| 104,279 | *,e | Revlon, Inc (Class A) | 1,183 | |||||||
| 47,094 | Reynolds Consumer Products, Inc | 1,479 | ||||||||
| 114,745 | Rohto Pharmaceutical Co Ltd | 3,469 | ||||||||
| 44,074 | Sarantis S.A. | 447 | ||||||||
| 53,153 | Shanghai Jahwa United Co Ltd | 337 | ||||||||
| 818,326 | Shiseido Co Ltd | 45,651 | ||||||||
| 188,568 | Spectrum Brands Holdings, Inc | 19,181 | ||||||||
| 108,128 | TCI Co Ltd | 815 | ||||||||
| 308 | * | Thorne HealthTech, Inc | 2 | |||||||
| 622,799 | Uni-Charm Corp | 27,096 | ||||||||
| 57,792 | Unilever plc | 3,098 | ||||||||
| 3,009,126 | Unilever plc | 161,429 | ||||||||
| 31,209 | * | USANA Health Sciences, Inc | 3,158 | |||||||
| 416,403 | * | Veru, Inc | 2,453 | |||||||
| 434,536 | e | Vinda International Holdings Ltd | 1,059 | |||||||
| 1,392 | WD-40 Co | 341 | ||||||||
| 33,500 | YA-MAN Ltd | 280 | ||||||||
| 90,200 | *,e | Yatsen Holding Ltd (ADR) | 194 | |||||||
| TOTAL HOUSEHOLD & PERSONAL PRODUCTS | 1,982,710 | |||||||||
| INSURANCE - 2.3% | ||||||||||
| 55,091 | Admiral Group plc | 2,358 | ||||||||
| 489,716 | Aegon NV | 2,435 | ||||||||
| 113 |
COLLEGE RETIREMENT EQUITIES FUND - Stock Account
| SHARES | COMPANY | VALUE (000) | ||||||||
| 703,553 | Aflac, Inc | $ | 41,080 | |||||||
| 49,647 | Ageas | 2,571 | ||||||||
| 15,758,322 | AIA Group Ltd | 159,046 | ||||||||
| 19,326 | * | Al Rajhi Co for Co-operative Insurance | 400 | |||||||
| 13,995 | * | Alleghany Corp | 9,343 | |||||||
| 361,976 | Allianz AG. | 85,375 | ||||||||
| 293,166 | Allstate Corp | 34,491 | ||||||||
| 1,054,033 | Alm Brand AS | 2,048 | ||||||||
| 82,243 | * | AMBAC Financial Group, Inc | 1,320 | |||||||
| 164,265 | American Equity Investment Life Holding Co | 6,393 | ||||||||
| 98,755 | American Financial Group, Inc | 13,561 | ||||||||
| 3,677,886 | American International Group, Inc | 209,125 | ||||||||
| 6,681 | American National Group, Inc | 1,262 | ||||||||
| 16,783 | Amerisafe, Inc | 903 | ||||||||
| 255,631 | Anadolu Sigorta | 127 | ||||||||
| 90,800 | * | Anicom Holdings, Inc | 654 | |||||||
| 234,498 | Aon plc | 70,481 | ||||||||
| 351,359 | * | Arch Capital Group Ltd | 15,618 | |||||||
| 27,723 | Argo Group International Holdings Ltd | 1,611 | ||||||||
| 193,888 | Arthur J. Gallagher & Co | 32,897 | ||||||||
| 167,191 | ASR Nederland NV | 7,700 | ||||||||
| 809,392 | e | Assicurazioni Generali S.p.A. | 17,106 | |||||||
| 55,076 | Assurant, Inc | 8,584 | ||||||||
| 67,541 | Assured Guaranty Ltd | 3,391 | ||||||||
| 253,012 | * | Athene Holding Ltd | 21,083 | |||||||
| 86,089 | AUB Group Ltd | 1,615 | ||||||||
| 5,277,306 | Aviva plc | 29,417 | ||||||||
| 2,250,852 | AXA S.A. | 66,993 | ||||||||
| 153,709 | Axis Capital Holdings Ltd | 8,373 | ||||||||
| 12,929 | Baloise Holding AG. | 2,110 | ||||||||
| 660,900 | Bangkok Life Assurance PCL | 733 | ||||||||
| 7,421,046 | BB Seguridade Participacoes S.A. | 27,470 | ||||||||
| 3,234,322 | * | Beazley plc | 20,452 | |||||||
| 487,682 | *,e | Bright Health Group, Inc | 1,678 | |||||||
| 76,053 | * | Brighthouse Financial, Inc | 3,940 | |||||||
| 10,773 | Brookfield Asset Management Reinsurance Partners Ltd | 677 | ||||||||
| 311,693 | Brown & Brown, Inc | 21,906 | ||||||||
| 164,046 | * | BRP Group, Inc | 5,924 | |||||||
| 65,608 | Bupa Arabia for Cooperative Insurance Co | 2,296 | ||||||||
| 9,315,807 | Cathay Financial Holding Co Ltd | 20,987 | ||||||||
| 19,772,180 | China Development Financial Holding Corp | 12,488 | ||||||||
| 1,697,757 | * | China Development Financial Holding Corp | 588 | |||||||
| 114 |
COLLEGE RETIREMENT EQUITIES FUND - Stock Account
| SHARES | COMPANY | VALUE (000) | ||||||||
| 2,146,332 | China Insurance International Holdings Co Ltd | $ | 2,947 | |||||||
| 8,896,790 | China Life Insurance Co Ltd | 14,748 | ||||||||
| 194,975 | China Life Insurance Co Ltd (Class A) | 920 | ||||||||
| 510,000 | China Pacific Insurance Group Co Ltd | 2,170 | ||||||||
| 3,185,809 | China Pacific Insurance Group Co Ltd (Hong Kong) | 8,655 | ||||||||
| 1,340,017 | Chubb Ltd | 259,039 | ||||||||
| 142,334 | Cincinnati Financial Corp | 16,216 | ||||||||
| 44,608 | *,e | Citizens, Inc (Class A) | 237 | |||||||
| 74,028 | * | Clal Insurance | 1,895 | |||||||
| 26,907 | CNA Financial Corp | 1,186 | ||||||||
| 49,861 | CNP Assurances | 1,233 | ||||||||
| 69,128 | Co for Cooperative Insurance | 1,423 | ||||||||
| 110,403 | Conseco, Inc | 2,632 | ||||||||
| 3,630,000 | *,† | Convoy Global Holdings Ltd | 5 | |||||||
| 22,896 | Crawford & Co | 171 | ||||||||
| 983,362 | Dai-ichi Mutual Life Insurance Co | 19,834 | ||||||||
| 417,900 | * | Dhipaya Group Holdings PCL | 963 | |||||||
| 1,941,495 | Direct Line Insurance Group plc | 7,336 | ||||||||
| 479,264 | * | Discovery Holdings Ltd | 4,318 | |||||||
| 12,603 | Donegal Group, Inc (Class A) | 180 | ||||||||
| 55,895 | * | Dongbu Insurance Co Ltd | 2,538 | |||||||
| 16,150 | * | eHealth, Inc | 412 | |||||||
| 24,938 | Employers Holdings, Inc | 1,032 | ||||||||
| 10,874 | * | Enstar Group Ltd | 2,692 | |||||||
| 24,825 | Erie Indemnity Co (Class A) | 4,783 | ||||||||
| 187,699 | Everest Re Group Ltd | 51,415 | ||||||||
| 33,036 | Fairfax Financial Holdings Ltd | 16,251 | ||||||||
| 43,626 | e | Fanhua, Inc (ADR) | 318 | |||||||
| 256,154 | Fidelity National Financial Inc | 13,366 | ||||||||
| 140,285 | First American Financial Corp | 10,974 | ||||||||
| 71,518 | * | Fubon Financial Holding Co Ltd | 155 | |||||||
| 9,063,124 | Fubon Financial Holding Co Ltd | 24,946 | ||||||||
| 443,230 | * | Genworth Financial, Inc (Class A) | 1,795 | |||||||
| 252,909 | Gjensidige Forsikring BA | 6,136 | ||||||||
| 98,416 | Globe Life, Inc | 9,224 | ||||||||
| 58,797 | * | GoHealth, Inc | 223 | |||||||
| 13,393 | Goosehead Insurance, Inc | 1,742 | ||||||||
| 362,851 | Great-West Lifeco, Inc | 10,889 | ||||||||
| 28,042 | * | Greenlight Capital Re Ltd (Class A) | 220 | |||||||
| 51,226 | Grupo Catalana Occidente S.A. | 1,750 | ||||||||
| 17,051 | Hannover Rueckversicherung AG. | 3,233 | ||||||||
| 34,260 | Hanover Insurance Group, Inc | 4,490 | ||||||||
| 115 |
COLLEGE RETIREMENT EQUITIES FUND - Stock Account
| SHARES | COMPANY | VALUE (000) | ||||||||
| 1,508,477 | *,e | Hanwha Life Insurance Co Ltd | $ | 3,718 | ||||||
| 238,805 | Harel Insurance Investments & Finances Ltd | 2,711 | ||||||||
| 906,915 | Hartford Financial Services Group, Inc | 62,613 | ||||||||
| 5,202 | HCI Group, Inc | 435 | ||||||||
| 1,030,494 | g | HDFC Life Insurance Co Ltd | 8,982 | |||||||
| 45,067 | Helvetia Holding AG. | 5,294 | ||||||||
| 301,170 | Heritage Insurance Holdings, Inc | 1,771 | ||||||||
| 421,159 | Hiscox Ltd | 4,946 | ||||||||
| 37,536 | Horace Mann Educators Corp | 1,453 | ||||||||
| 63,205 | * | Hyundai Marine & Fire Insurance Co Ltd | 1,218 | |||||||
| 140,130 | iA Financial Corp, Inc | 8,018 | ||||||||
| 252,863 | g | ICICI Lombard General Insurance Co Ltd | 4,756 | |||||||
| 402,608 | g | ICICI Prudential Life Insurance Co Ltd | 3,031 | |||||||
| 10,220 | IDI Insurance Co Ltd | 372 | ||||||||
| 3,735 | Independence Holding Co | 212 | ||||||||
| 2,863,918 | Insurance Australia Group Ltd | 8,875 | ||||||||
| 227,795 | Intact Financial Corp | 29,609 | ||||||||
| 926 | Investors Title Co | 183 | ||||||||
| 1,039,200 | * | IRB Brasil Resseguros S | 748 | |||||||
| 27,291 | James River Group Holdings Ltd | 786 | ||||||||
| 2,110,200 | Japan Post Holdings Co Ltd | 16,439 | ||||||||
| 247,400 | Japan Post Insurance Co Ltd | 3,974 | ||||||||
| 1,266,861 | * | Just Retirement Group plc | 1,434 | |||||||
| 57,947 | Kemper Corp | 3,407 | ||||||||
| 26,563 | Kinsale Capital Group, Inc | 6,319 | ||||||||
| 78,153 | * | Korean Reinsurance Co | 607 | |||||||
| 287,278 | Lancashire Holdings Ltd | 2,061 | ||||||||
| 5,561,041 | Legal & General Group plc | 22,457 | ||||||||
| 36,115 | *,e | Lemonade, Inc | 1,521 | |||||||
| 137,907 | * | Liberty Holdings Ltd | 818 | |||||||
| 66,100 | * | Lifenet Insurance Co | 526 | |||||||
| 513,121 | Lincoln National Corp | 35,026 | ||||||||
| 769,758 | e | Linea Directa Aseguradora S.A. Cia de Seguros y Reaseguros | 1,399 | |||||||
| 205,597 | Loews Corp | 11,875 | ||||||||
| 66,518 | *,e | Maiden Holdings Ltd | 204 | |||||||
| 2,536,201 | Manulife Financial Corp (Toronto) | 48,340 | ||||||||
| 1,308,990 | e | Mapfre S.A. | 2,676 | |||||||
| 12,635 | * | Markel Corp | 15,592 | |||||||
| 1,525,930 | Marsh & McLennan Cos, Inc | 265,237 | ||||||||
| 226,320 | * | Max Financial Services Ltd | 2,978 | |||||||
| 44,295 | * | MBIA, Inc | 699 | |||||||
| 4,174,444 | Medibank Pvt Ltd | 10,167 | ||||||||
| 116 |
COLLEGE RETIREMENT EQUITIES FUND - Stock Account
| SHARES | COMPANY | VALUE (000) | ||||||||
| 30,509 | Menorah Mivtachim Holdings Ltd | $ | 721 | |||||||
| 362,518 | Mercuries & Associates Holding Ltd | 297 | ||||||||
| 3,449,599 | * | Mercuries Life Insurance Co Lt | 1,150 | |||||||
| 26,649 | Mercury General Corp | 1,414 | ||||||||
| 52,669 | * | Meritz Fire & Marine Insurance Co Ltd | 1,483 | |||||||
| 1,341,066 | Metlife, Inc | 83,803 | ||||||||
| 41,456 | * | MetroMile, Inc | 91 | |||||||
| 418,088 | Migdal Insurance Holdings Ltd | 688 | ||||||||
| 57,613 | * | Mirae Asset Life Insurance Co Ltd | 194 | |||||||
| 1,155,861 | Momentum Metropolitan Holdings | 1,375 | ||||||||
| 400,026 | MS&AD Insurance Group Holdings Inc | 12,318 | ||||||||
| 39,751 | Muenchener Rueckver AG. | 11,735 | ||||||||
| 2,274 | National Western Life Group, Inc | 488 | ||||||||
| 164,165 | New China Life Insurance Co Ltd | 1,002 | ||||||||
| 1,195,365 | New China Life insurance Co Ltd (Hong Kong) | 3,198 | ||||||||
| 10,117 | * | NI Holdings, Inc | 191 | |||||||
| 556,364 | nib holdings Ltd | 2,835 | ||||||||
| 328,954 | NN Group NV | 17,790 | ||||||||
| 5,635,609 | Old Mutual Ltd | 4,633 | ||||||||
| 271,792 | Old Republic International Corp | 6,681 | ||||||||
| 2,149 | * | Palomar Holdings, Inc | 139 | |||||||
| 11,305,388 | People’s Insurance Co Group of China Ltd | 3,424 | ||||||||
| 632,715 | People’s Insurance Co Group of China Ltd (Class A) | 467 | ||||||||
| 709,155 | Phoenix Group Holdings plc | 6,277 | ||||||||
| 184,379 | Phoenix Holdings Ltd | 2,382 | ||||||||
| 8,523,556 | PICC Property & Casualty Co Ltd | 6,967 | ||||||||
| 10,875,476 | Ping An Insurance Group Co of China Ltd | 78,370 | ||||||||
| 3,954,792 | Ping An Insurance Group Co of China Ltd (Class A) | 31,294 | ||||||||
| 490,699 | g | Poste Italiane S.p.A | 6,428 | |||||||
| 730,693 | e | Power Corp Of Canada | 24,146 | |||||||
| 696,043 | Powszechny Zaklad Ubezpieczen S.A. | 6,078 | ||||||||
| 37,095 | Primerica, Inc | 5,686 | ||||||||
| 251,670 | Principal Financial Group | 18,203 | ||||||||
| 47,241 | ProAssurance Corp | 1,195 | ||||||||
| 635,578 | Progressive Corp | 65,242 | ||||||||
| 74,915 | Protector Forsikring ASA | 919 | ||||||||
| 902,632 | Prudential Financial, Inc | 97,701 | ||||||||
| 2,135,352 | Prudential plc | 36,926 | ||||||||
| 10,234,300 | * | PT Panin Life Tbk | 124 | |||||||
| 1,752,164 | * | Qatar Insurance Co SAQ | 1,323 | |||||||
| 1,728,459 | QBE Insurance Group Ltd | 14,273 | ||||||||
| 117 |
COLLEGE RETIREMENT EQUITIES FUND - Stock Account
| SHARES | COMPANY | VALUE (000) | ||||||||
| 177,665 | e | Qualitas Controladora SAB de C.V. | $ | 901 | ||||||
| 484,477 | Rand Merchant Investment Holdings Ltd | 1,376 | ||||||||
| 64,839 | Reinsurance Group of America, Inc (Class A) | 7,099 | ||||||||
| 68,903 | RenaissanceRe Holdings Ltd | 11,667 | ||||||||
| 6,528 | RLI Corp | 732 | ||||||||
| 195,320 | * | Ryan Specialty Group Holdings, Inc | 7,881 | |||||||
| 314,657 | g | Sabre Insurance Group plc | 784 | |||||||
| 12,470 | Safety Insurance Group, Inc | 1,060 | ||||||||
| 137,711 | * | Saga plc | 533 | |||||||
| 340,529 | Sampo Oyj (A Shares) | 17,043 | ||||||||
| 36,317 | * | Samsung Fire & Marine Insurance Co Ltd | 6,169 | |||||||
| 79,657 | * | Samsung Life Insurance Co Ltd | 4,289 | |||||||
| 2,126,839 | Sanlam Ltd | 7,923 | ||||||||
| 43,142 | Santam Ltd | 728 | ||||||||
| 517,473 | g | SBI Life Insurance Co Ltd | 8,298 | |||||||
| 230,654 | SCOR SE | 7,201 | ||||||||
| 76,655 | Selective Insurance Group, Inc | 6,281 | ||||||||
| 184,340 | * | Selectquote, Inc | 1,670 | |||||||
| 14,243,866 | Shin Kong Financial Holding Co Ltd | 5,676 | ||||||||
| 191,564 | Shinkong Insurance Co Ltd | 329 | ||||||||
| 75,960 | * | SiriusPoint Ltd | 618 | |||||||
| 59,142 | * | Societa Cattolica di Assicurazioni SCRL | 390 | |||||||
| 16,807 | * | Solid Forsakring AB | 109 | |||||||
| 727,520 | Sompo Holdings, Inc | 30,682 | ||||||||
| 14,747 | State Auto Financial Corp | 762 | ||||||||
| 1,547,670 | Steadfast Group Ltd | 5,907 | ||||||||
| 23,075 | Stewart Information Services Corp | 1,840 | ||||||||
| 568,151 | Storebrand ASA | 5,693 | ||||||||
| 324,900 | Sul America S.A. | 1,598 | ||||||||
| 765,663 | e | Sun Life Financial, Inc | 42,619 | |||||||
| 1,503,184 | Suncorp-Metway Ltd | 12,102 | ||||||||
| 23,745 | Swiss Life Holding | 14,508 | ||||||||
| 88,297 | Swiss Re Ltd | 8,716 | ||||||||
| 272,125 | Syarikat Takaful Malaysia BHD | 242 | ||||||||
| 636,065 | T&D Holdings, Inc | 8,126 | ||||||||
| 36,221 | Tiptree Inc | 501 | ||||||||
| 677,399 | Tokio Marine Holdings, Inc | 37,711 | ||||||||
| 44,881 | * | Tongyang Life Insurance Co Ltd | 249 | |||||||
| 60,492 | Topdanmark AS | 3,393 | ||||||||
| 338,624 | TQM Corp PCL | 985 | ||||||||
| 233,625 | Travelers Cos, Inc | 36,546 | ||||||||
| 17,114 | * | Trean Insurance Group, Inc | 152 | |||||||
| 118 |
COLLEGE RETIREMENT EQUITIES FUND - Stock Account
| SHARES | COMPANY | VALUE (000) | ||||||||
| 44,611 | * | Trisura Group Ltd | $ | 1,682 | ||||||
| 3,245 | * | Trupanion, Inc | 428 | |||||||
| 102,294 | Tryg A.S. | 2,524 | ||||||||
| 478,579 | Unipol Gruppo Finanziario S.p.A | 2,592 | ||||||||
| 147,082 | Uniqa Versicherungen AG. | 1,347 | ||||||||
| 19,192 | United Fire Group Inc | 445 | ||||||||
| 18,676 | United Insurance Holdings Corp | 81 | ||||||||
| 23,604 | Universal Insurance Holdings, Inc | 401 | ||||||||
| 192,349 | Unum Group | 4,726 | ||||||||
| 47,107 | Vienna Insurance Group AG Wiener Versicherung Gruppe | 1,337 | ||||||||
| 212,084 | W.R. Berkley Corp | 17,474 | ||||||||
| 6,018 | White Mountains Insurance Group Ltd | 6,102 | ||||||||
| 295,382 | Willis Towers Watson plc | 70,150 | ||||||||
| 29,089 | Wuestenrot & Wuerttembergische AG. | 585 | ||||||||
| 354,005 | *,e,g | ZhongAn Online P&C Insurance Co Ltd | 1,233 | |||||||
| 258,719 | Zurich Insurance Group AG | 113,339 | ||||||||
| TOTAL INSURANCE | 3,191,975 | |||||||||
| MATERIALS - 4.8% | ||||||||||
| 335,049 | * | 29Metals Ltd | 749 | |||||||
| 216,740 | Aarti Industries | 2,919 | ||||||||
| 435,335 | Acerinox S.A. | 5,602 | ||||||||
| 57,474 | *,e | Aclara Resources, Inc | 65 | |||||||
| 98,738 | ADEKA Corp | 2,205 | ||||||||
| 411,263 | Adelaide Brighton Ltd | 845 | ||||||||
| 48,473 | Advanced Enzyme Technologies Ltd | 212 | ||||||||
| 123,214 | Advanced Petrochemical Co | 2,308 | ||||||||
| 23,797 | AdvanSix, Inc | 1,124 | ||||||||
| 118,771 | Aeci Ltd | 835 | ||||||||
| 122,339 | African Rainbow Minerals Ltd | 1,775 | ||||||||
| 313,348 | Agnico-Eagle Mines Ltd | 16,644 | ||||||||
| 11,800 | Aichi Steel Corp | 256 | ||||||||
| 631,330 | Air Liquide | 110,107 | ||||||||
| 249,925 | Air Products & Chemicals, Inc | 76,042 | ||||||||
| 223,400 | Air Water, Inc | 3,453 | ||||||||
| 14,570 | e | AirBoss of America Corp | 532 | |||||||
| 8,133 | Akzo Nobel India Ltd | 224 | ||||||||
| 206,494 | Akzo Nobel NV | 22,686 | ||||||||
| 472,573 | Alamos Gold, Inc | 3,635 | ||||||||
| 145,239 | Albemarle Corp | 33,953 | ||||||||
| 378,925 | Alcoa Corp | 22,576 | ||||||||
| 447,307 | * | Alkane Resources Ltd | 299 | |||||||
| 119 |
COLLEGE RETIREMENT EQUITIES FUND - Stock Account
| SHARES | COMPANY | VALUE (000) | ||||||||
| 13,932 | Alkyl Amines Chemicals | $ | 664 | |||||||
| 53,201 | * | Allegheny Technologies, Inc | 847 | |||||||
| 697,463 | * | Allkem Ltd | 5,291 | |||||||
| 47,444 | Altius Minerals Corp | 653 | ||||||||
| 78,384 | Altri SGPS S.A. | 500 | ||||||||
| 35,779 | Alujain Corp | 514 | ||||||||
| 3,001,343 | Alumina Ltd | 4,083 | ||||||||
| 4,711,964 | * | Aluminum Corp of China Ltd | 2,596 | |||||||
| 929,287 | * | Aluminum Corp of China Ltd (Class A) | 893 | |||||||
| 794,746 | Ambuja Cements Ltd | 4,023 | ||||||||
| 1,457,021 | Amcor plc | 17,499 | ||||||||
| 87,450 | American Vanguard Corp | 1,433 | ||||||||
| 40,442 | e | AMG Advanced Metallurgical Group NV | 1,299 | |||||||
| 224,015 | *,e | Amyris, Inc | 1,212 | |||||||
| 60,611 | Anglo American Platinum Ltd | 6,913 | ||||||||
| 1,493,075 | Anglo American plc (London) | 61,413 | ||||||||
| 477,888 | AngloGold Ashanti Ltd | 10,062 | ||||||||
| 2,189,232 | e | AngloGold Ashanti Ltd (ADR) | 45,930 | |||||||
| 931,565 | Anhui Conch Cement Co Ltd | 4,659 | ||||||||
| 176,145 | Anhui Conch Cement Co Ltd (Class A) | 1,115 | ||||||||
| 22,900 | Anhui Honglu Steel Construction Group Co Ltd | 192 | ||||||||
| 430,865 | Antofagasta plc | 7,836 | ||||||||
| 144,651 | e | APERAM | 7,874 | |||||||
| 122,425 | * | APL Apollo Tubes Ltd | 1,639 | |||||||
| 62,297 | Aptargroup, Inc | 7,630 | ||||||||
| 51,979 | Arabian Cement Co | 523 | ||||||||
| 1,040,438 | ArcelorMittal | 33,376 | ||||||||
| 109,162 | * | Arconic Corp | 3,603 | |||||||
| 21,277 | e | Ardagh Group S.A. | 480 | |||||||
| 130,240 | * | Ardagh Metal Packaging S.A. | 1,176 | |||||||
| 373,786 | * | Argonaut Gold, Inc | 709 | |||||||
| 67,240 | Arkema | 9,491 | ||||||||
| 91,834 | Asahi Holdings, Inc | 1,640 | ||||||||
| 972,540 | Asahi Kasei Corp | 9,162 | ||||||||
| 53,425 | Ashland Global Holdings, Inc | 5,752 | ||||||||
| 492,125 | Asia Cement China Holdings Corp | 315 | ||||||||
| 1,549,044 | Asia Cement Corp | 2,477 | ||||||||
| 374,000 | Asia Polymer | 494 | ||||||||
| 451,224 | Asian Paints Ltd | 20,503 | ||||||||
| 88,465 | Associated Cement Co Ltd | 2,631 | ||||||||
| 96,270 | Atalaya Mining plc | 536 | ||||||||
| 16,096 | Atul Ltd | 1,954 | ||||||||
| 120 |
COLLEGE RETIREMENT EQUITIES FUND - Stock Account
| SHARES | COMPANY | VALUE (000) | ||||||||
| 38,215 | Aurubis AG. | $ | 3,820 | |||||||
| 99,273 | * | Australian Strategic Materials Ltd | 770 | |||||||
| 139,409 | Avery Dennison Corp | 30,192 | ||||||||
| 343,463 | Avient Corp | 19,217 | ||||||||
| 3,056,195 | *,e | AVZ Minerals Ltd | 1,722 | |||||||
| 328,270 | * | Axalta Coating Systems Ltd | 10,872 | |||||||
| 87,606 | * | Aya Gold & Silver, Inc | 661 | |||||||
| 1,513,275 | B2Gold Corp | 5,958 | ||||||||
| 10,423 | Balaji Amines Ltd | 477 | ||||||||
| 40,739 | Balchem Corp | 6,869 | ||||||||
| 701,054 | Ball Corp | 67,490 | ||||||||
| 1,639,985 | Baoshan Iron & Steel Co Ltd | 1,849 | ||||||||
| 2,325,225 | Barrick Gold Corp (Canada) | 44,209 | ||||||||
| 11,780 | BASF India Ltd | 479 | ||||||||
| 1,008,613 | BASF SE | 70,790 | ||||||||
| 14,772 | Bayer CropScience Ltd | 985 | ||||||||
| 759,600 | BBMG Corp | 339 | ||||||||
| 31,700 | Beijing Easpring Material Technology Co Ltd | 432 | ||||||||
| 44,184 | Bekaert S.A. | 1,964 | ||||||||
| 1,061,769 | * | Bellevue Gold Ltd | 655 | |||||||
| 278,732 | Berger Paints India Ltd | 2,889 | ||||||||
| 2,332,300 | * | Berkah Beton Sadaya Tbk PT | 973 | |||||||
| 129,678 | * | Berry Global Group, Inc | 9,568 | |||||||
| 4,362,520 | e | BHP Billiton Ltd | 131,712 | |||||||
| 2,560,298 | BHP Group plc | 76,181 | ||||||||
| 370,375 | Billerud AB | 6,970 | ||||||||
| 4,000 | *,†,e | Bio On S.p.A. | 0 | ^ | ||||||
| 28,728 | Birla Corp Ltd | 548 | ||||||||
| 764,994 | BlueScope Steel Ltd | 11,679 | ||||||||
| 303,169 | e | Boliden AB | 11,690 | |||||||
| 1,238,136 | * | Boral Ltd | 5,496 | |||||||
| 116,009 | Borregaard ASA | 2,919 | ||||||||
| 403,870 | Boubyan Petrochemicals Co KSCP | 1,138 | ||||||||
| 178,791 | Bradespar S.A. | 798 | ||||||||
| 221,800 | Braskem S.A. | 2,344 | ||||||||
| 1,850,064 | Breedon Group plc | 2,379 | ||||||||
| 91,944 | Brickworks Ltd | 1,617 | ||||||||
| 249,221 | Buzzi Unicem S.p.A. | 5,370 | ||||||||
| 5,870 | Cabot Corp | 330 | ||||||||
| 265,278 | * | Calibre Mining Corp | 281 | |||||||
| 120,089 | * | Canfor Corp | 3,044 | |||||||
| 71,310 | CAP S.A. | 695 | ||||||||
| 121 |
COLLEGE RETIREMENT EQUITIES FUND - Stock Account
| SHARES | COMPANY | VALUE (000) | ||||||||
| 350,184 | * | Capricorn Metals Ltd | $ | 867 | ||||||
| 371,675 | *,e | Capstone Mining Corp | 1,640 | |||||||
| 113,022 | Carborundum Universal Ltd | 1,490 | ||||||||
| 42,245 | Carpenter Technology Corp | 1,233 | ||||||||
| 104,623 | Cascades, Inc | 1,155 | ||||||||
| 404,265 | Castrol India Ltd | 666 | ||||||||
| 186,447 | CCL Industries | 9,998 | ||||||||
| 133,348 | Celanese Corp (Series A) | 22,410 | ||||||||
| 55,461 | Cementir Holding NV | 529 | ||||||||
| 640,681 | Cementos Argos S.A. | 963 | ||||||||
| 17,404,130 | *,e | Cemex S.A. de C.V. | 11,891 | |||||||
| 1,410,483 | Centamin plc | 1,708 | ||||||||
| 267,826 | Centerra Gold, Inc | 2,064 | ||||||||
| 210,342 | Central Asia Metals plc | 737 | ||||||||
| 43,272 | * | Century Aluminum Co | 717 | |||||||
| 158,000 | Century Iron & Steel Industrial Co Ltd | 631 | ||||||||
| 60,268 | Century Plyboards India Ltd | 482 | ||||||||
| 87,195 | Century Textile & Industries Ltd | 1,072 | ||||||||
| 847,752 | CF Industries Holdings, Inc | 60,004 | ||||||||
| 386,493 | * | Chalice Gold Mines Ltd | 2,705 | |||||||
| 193,946 | Chambal Fertilizers & Chemicals Ltd | 1,026 | ||||||||
| 429,976 | * | Champion Iron Ltd | 1,706 | |||||||
| 5,178 | Chase Corp | 516 | ||||||||
| 296,743 | Chemours Co | 9,959 | ||||||||
| 41,554 | * | Chemplast Sanmar Ltd | 309 | |||||||
| 860,006 | Cheng Loong Corp | 1,096 | ||||||||
| 196,900 | Chengtun Mining Group Co Ltd | 333 | ||||||||
| 59,100 | * | Chengxin Lithium Group Co Ltd | 538 | |||||||
| 412,000 | Chia Hsin Cement Corp | 309 | ||||||||
| 137,562 | * | Chifeng Jilong Gold Mining Co Ltd | 322 | |||||||
| 7,436,695 | China BlueChemical Ltd | 2,070 | ||||||||
| 366,183 | China General Plastics Corp | 459 | ||||||||
| 2,750,105 | China Hongqiao Group Ltd | 2,907 | ||||||||
| 203,029 | China Jushi Co Ltd | 580 | ||||||||
| 1,206,361 | China Manmade Fibers Corp | 442 | ||||||||
| 297,112 | China Metal Products | 354 | ||||||||
| 70,000 | China Minmetals Rare Earth Co Ltd | 429 | ||||||||
| 3,853,614 | China Molybdenum Co Ltd | 2,036 | ||||||||
| 1,179,144 | China Molybdenum Co Ltd (Class A) | 1,035 | ||||||||
| 3,086,276 | China National Building Material Co Ltd | 3,789 | ||||||||
| 262,529 | China Northern Rare Earth Group High-Tech Co Ltd | 1,887 | ||||||||
| 1,246,000 | China Oriental Group Co Ltd | 376 | ||||||||
| 122 |
COLLEGE RETIREMENT EQUITIES FUND - Stock Account
| SHARES | COMPANY | VALUE (000) | ||||||||
| 4,173,856 | * | China Petrochemical Development Corp | $ | 1,980 | ||||||
| 1,874,248 | China Resources Cement Holdings Ltd | 1,418 | ||||||||
| 164,000 | China Steel Chemical Corp | 713 | ||||||||
| 13,725,181 | China Steel Corp | 17,514 | ||||||||
| 2,371,000 | China XLX Fertiliser Ltd | 1,623 | ||||||||
| 4,462,240 | *,†,e | China Zhongwang Holdings Ltd | 481 | |||||||
| 115,522 | Chr Hansen Holding A/S | 9,109 | ||||||||
| 46,678 | Chugoku Marine Paints Ltd | 385 | ||||||||
| 412,000 | Chun Yuan Steel | 363 | ||||||||
| 4,374 | Chunbo Co Ltd | 1,280 | ||||||||
| 939,000 | Chung Hung Steel Corp | 1,391 | ||||||||
| 394,540 | * | Chung Hwa Pulp Corp | 353 | |||||||
| 154,900 | * | Cia Brasileira de Aluminio | 379 | |||||||
| 264,122 | *,e | Cia de Minas Buenaventura S.A. (ADR) (Series B) | 1,933 | |||||||
| 41,998 | Cia Ferro Ligas da Bahia - FERBASA | 368 | ||||||||
| 761,650 | Cia Siderurgica Nacional S.A. | 3,411 | ||||||||
| 52,552 | Ciech S.A. | 548 | ||||||||
| 73,399 | City Cement Co | 440 | ||||||||
| 385,057 | Clariant AG. | 7,999 | ||||||||
| 22,009 | * | Clean Science & Technology Ltd | 735 | |||||||
| 13,972 | * | Clearwater Paper Corp | 512 | |||||||
| 624,259 | *,e | Cleveland-Cliffs, Inc | 13,590 | |||||||
| 148,400 | CNNC Hua Yuan Titanium Dioxide Co Ltd | 294 | ||||||||
| 89,539 | * | Coeur Mining, Inc | 451 | |||||||
| 342,939 | Commercial Metals Co | 12,445 | ||||||||
| 86,132 | * | Companhia Vale do Rio Doce | 7 | |||||||
| 3,049 | Compass Minerals International, Inc | 156 | ||||||||
| 341,417 | * | Constellium SE | 6,115 | |||||||
| 72,215 | Corbion NV | 3,410 | ||||||||
| 127,336 | Coromandel International Ltd | 1,293 | ||||||||
| 2,718,366 | *,g | Coronado Global Resources, Inc | 2,455 | |||||||
| 1,461,222 | Corteva, Inc | 69,087 | ||||||||
| 53,786 | Corticeira Amorim SGPS S.A. | 689 | ||||||||
| 241,726 | g | Covestro AG. | 14,878 | |||||||
| 459,000 | CPMC Holdings Ltd | 257 | ||||||||
| 1,338,617 | CRH plc | 70,866 | ||||||||
| 153,442 | Croda International plc | 21,017 | ||||||||
| 1,693,685 | Crown Holdings, Inc | 187,355 | ||||||||
| 588,407 | CSR Ltd | 2,519 | ||||||||
| 2,370,700 | D&L Industries Inc | 439 | ||||||||
| 313,400 | Daicel Chemical Industries Ltd | 2,169 | ||||||||
| 32,431 | Daido Steel Co Ltd | 1,178 | ||||||||
| 123 |
COLLEGE RETIREMENT EQUITIES FUND - Stock Account
| SHARES | COMPANY | VALUE (000) | ||||||||
| 23,900 | Daiken Corp | $ | 451 | |||||||
| 33,100 | * | Daiki Aluminium Industry Co Ltd | 461 | |||||||
| 162,499 | Daio Paper Corp | 2,699 | ||||||||
| 94,685 | Dalmia Bharat Ltd | 2,347 | ||||||||
| 8,614 | *,e | Danimer Scientific, Inc | 73 | |||||||
| 1,300,149 | *,e | De Grey Mining Ltd | 1,155 | |||||||
| 56,589 | Deepak Fertilizers & Petrochemicals Corp Ltd | 283 | ||||||||
| 87,757 | Deepak Nitrite Ltd | 2,932 | ||||||||
| 96,349 | Denki Kagaku Kogyo KK | 3,153 | ||||||||
| 514,142 | Deterra Royalties Ltd | 1,610 | ||||||||
| 607,438 | Dexco S.A. | 1,624 | ||||||||
| 92,601 | DIC Corp | 2,334 | ||||||||
| 70,511 | * | Diversey Holdings Ltd | 939 | |||||||
| 58,300 | Do-Fluoride New Materials Co Ltd | 411 | ||||||||
| 21,641 | Dongbu Steel Co Ltd | 193 | ||||||||
| 36,429 | Dongjin Semichem Co Ltd | 1,561 | ||||||||
| 65,446 | * | Dongkuk Steel Mill Co Ltd | 874 | |||||||
| 5,338 | * | Dongwha Enterprise Co Ltd | 443 | |||||||
| 5,699 | * | Dongwon Systems Corp | 245 | |||||||
| 1,695,000 | Dongyue Group | 2,648 | ||||||||
| 868,970 | Dow, Inc | 49,288 | ||||||||
| 60,179 | Dowa Holdings Co Ltd | 2,533 | ||||||||
| 441,014 | DRDGOLD Ltd | 369 | ||||||||
| 1,668,897 | DS Smith plc | 8,691 | ||||||||
| 192,350 | DSM NV | 43,318 | ||||||||
| 231,612 | Dundee Precious Metals, Inc | 1,432 | ||||||||
| 3,147,051 | DuPont de Nemours, Inc | 254,219 | ||||||||
| 13,523 | Eagle Materials, Inc | 2,251 | ||||||||
| 1,034,200 | Eastern Polymer Group PCL | 346 | ||||||||
| 44,754 | Eastern Province Cement Co | 524 | ||||||||
| 176,368 | Eastman Chemical Co | 21,325 | ||||||||
| 628,325 | Ecolab, Inc | 147,399 | ||||||||
| 19,956 | Ecopro Co Ltd | 1,967 | ||||||||
| 77,110 | EID Parry India Ltd | 467 | ||||||||
| 219,711 | * | Eldorado Gold Corp | 2,060 | |||||||
| 325,158 | Element Solutions, Inc | 7,895 | ||||||||
| 709,971 | * | Elementis plc | 1,265 | |||||||
| 270,136 | g | Elkem ASA | 910 | |||||||
| 155,594 | * | Elopak ASA | 472 | |||||||
| 1,292,005 | Empresas CMPC S.A. | 2,165 | ||||||||
| 7,764 | e | EMS-Chemie Holding AG. | 8,677 | |||||||
| 206,539 | * | Ence Energia y Celulosa S.A. | 530 | |||||||
| 124 |
COLLEGE RETIREMENT EQUITIES FUND - Stock Account
| SHARES | COMPANY | VALUE (000) | ||||||||
| 204,918 | *,e | Endeavour Silver Corp | $ | 867 | ||||||
| 307,294 | *,e | Equinox Gold Corp | 2,079 | |||||||
| 39,440 | * | Eramet | 3,239 | |||||||
| 1,579,088 | Eregli Demir ve Celik Fabrikalari TAS | 3,361 | ||||||||
| 79,777 | * | ERO Copper Corp | 1,217 | |||||||
| 131,641 | Essel Propack Ltd | 366 | ||||||||
| 368,677 | Essentra plc | 1,727 | ||||||||
| 938,574 | Eternal Chemical Co Ltd | 1,369 | ||||||||
| 2,311,057 | *,e | Eurasia Mining plc | 766 | |||||||
| 429,128 | Everlight Chemical Industrial Corp | 422 | ||||||||
| 2,002,854 | Evolution Mining Ltd | 5,942 | ||||||||
| 230,211 | Evonik Industries AG. | 7,437 | ||||||||
| 132,742 | Evraz plc | 1,085 | ||||||||
| 135,996 | * | Falcon Metals Ltd | 57 | |||||||
| 475,050 | Feng Hsin Iron & Steel Co | 1,433 | ||||||||
| 359,479 | Ferrexpo plc | 1,463 | ||||||||
| 102,482 | * | Ferro Corp | 2,237 | |||||||
| 202,348 | *,† | Ferroglobe plc | 0 | |||||||
| 7,874 | Fine Organic Industries Ltd | 393 | ||||||||
| 266,341 | Finolex Industries Ltd | 739 | ||||||||
| 134,000 | First Copper Technology Co Ltd | 213 | ||||||||
| 277,755 | e | First Majestic Silver Corp | 3,089 | |||||||
| 725,416 | First Quantum Minerals Ltd | 17,359 | ||||||||
| 130,503 | FMC Corp | 14,341 | ||||||||
| 55,641 | * | Foosung Co Ltd | 1,079 | |||||||
| 4,141,139 | Formosa Chemicals & Fibre Corp | 12,078 | ||||||||
| 4,485,019 | Formosa Plastics Corp | 16,833 | ||||||||
| 265,919 | g | Forterra plc | 993 | |||||||
| 2,411 | * | Forterra, Inc | 57 | |||||||
| 1,855,852 | Fortescue Metals Group Ltd | 26,087 | ||||||||
| 333,131 | *,e | Fortuna Silver Mines, Inc | 1,301 | |||||||
| 56,720 | FP Corp | 1,935 | ||||||||
| 236,221 | Franco-Nevada Corp | 32,669 | ||||||||
| 1,861,590 | Freeport-McMoRan, Inc (Class B) | 77,684 | ||||||||
| 75,451 | FUCHS PETROLUB SE | 3,410 | ||||||||
| 1,615,483 | Fufeng Group Ltd | 557 | ||||||||
| 49,877 | Fuji Seal International, Inc | 918 | ||||||||
| 21,675 | Fujimi, Inc | 1,459 | ||||||||
| 18,230 | Fujimori Kogyo Co Ltd | 652 | ||||||||
| 6,938,296 | Fushan International Energy Group Ltd | 2,351 | ||||||||
| 23,900 | Fuso Chemical Co Ltd | 1,008 | ||||||||
| 258,747 | FutureFuel Corp | 1,977 | ||||||||
| 125 |
COLLEGE RETIREMENT EQUITIES FUND - Stock Account
| SHARES | COMPANY | VALUE (000) | ||||||||
| 11,949 | Galaxy Surfactants Ltd | $ | 505 | |||||||
| 301,400 | g | Ganfeng Lithium Co Ltd | 4,746 | |||||||
| 75,143 | Ganfeng Lithium Co Ltd | 1,688 | ||||||||
| 9,762 | * | Gatos Silver, Inc | 101 | |||||||
| 104,036 | * | GCP Applied Technologies, Inc | 3,294 | |||||||
| 348,979 | GEM Co Ltd | 568 | ||||||||
| 1,309,310 | Gerdau S.A. (Preference) | 6,436 | ||||||||
| 12,458 | Givaudan S.A. | 65,362 | ||||||||
| 38,100 | Glatfelter Corp | 655 | ||||||||
| 12,866,054 | Glencore Xstrata plc | 65,556 | ||||||||
| 317,610 | * | GoGold Resources, Inc | 761 | |||||||
| 1,020,111 | Gold Fields Ltd | 11,287 | ||||||||
| 1,044,038 | Gold Road Resources Ltd | 1,197 | ||||||||
| 952,484 | Goldsun Development & Construction Co Ltd | 1,003 | ||||||||
| 931,000 | Grand Pacific Petrochemical | 964 | ||||||||
| 129,537 | Granges AB | 1,514 | ||||||||
| 307,302 | Graphic Packaging Holding Co | 5,992 | ||||||||
| 305,549 | Grasim Industries Ltd | 6,645 | ||||||||
| 605,755 | *,† | Great Basin Gold Ltd | 5 | |||||||
| 4,586,353 | * | Greatland Gold plc | 993 | |||||||
| 874,000 | Greatview Aseptic Packaging Co | 319 | ||||||||
| 19,673 | Greif, Inc (Class A) | 1,188 | ||||||||
| 4,499 | Greif, Inc (Class B) | 269 | ||||||||
| 8,450 | Groupe Guillin | 261 | ||||||||
| 99,352 | * | Grupa Azoty S.A. | 833 | |||||||
| 323,407 | Grupo Argos S.A. | 1,078 | ||||||||
| 220,593 | e | Grupo Cementos de Chihuahua SAB de C.V. | 1,707 | |||||||
| 3,571,138 | Grupo Mexico S.A. de C.V. (Series B) | 15,573 | ||||||||
| 65,362 | Guangzhou Tinci Materials Technology Co Ltd | 1,176 | ||||||||
| 52,582 | * | Gubre Fabrikalari TAS | 305 | |||||||
| 23,816 | * | Gujarat Fluorochemicals Ltd | 774 | |||||||
| 82,549 | Gujarat Narmada Valley Fertilizers Co Ltd | 487 | ||||||||
| 182,323 | Gujarat State Fertilisers & Chemicals Ltd | 297 | ||||||||
| 358 | e | Gurit Holding AG. | 609 | |||||||
| 203,439 | H.B. Fuller Co | 16,479 | ||||||||
| 43,500 | Hangzhou Oxygen Plant Group Co Ltd | 205 | ||||||||
| 22,605 | Hanil Cement Co Ltd | 399 | ||||||||
| 9,910 | * | Hansol Chemical Co Ltd | 2,546 | |||||||
| 140,629 | * | Hanwha Chemical Corp | 4,194 | |||||||
| 2,255,971 | Harmony Gold Mining Co Ltd | 9,462 | ||||||||
| 7,341 | Hawkins, Inc | 290 | ||||||||
| 11,506 | Haynes International, Inc | 464 | ||||||||
| 126 |
COLLEGE RETIREMENT EQUITIES FUND - Stock Account
| SHARES | COMPANY | VALUE (000) | ||||||||
| 1,044,557 | Hecla Mining Co | $ | 5,453 | |||||||
| 1,159,596 | HeidelbergCement AG. | 78,478 | ||||||||
| 72,386 | HeidelbergCement India Ltd | 220 | ||||||||
| 420,906 | * | Hektas Ticaret TAS | 473 | |||||||
| 404,769 | Hengli Petrochemical Co Ltd | 1,460 | ||||||||
| 334,194 | Hengyi Petrochemical Co Ltd | 557 | ||||||||
| 1,370,916 | Hesteel Co Ltd | 530 | ||||||||
| 339,942 | e | Hexpol AB | 4,546 | |||||||
| 96,719 | Hill & Smith Holdings plc | 2,355 | ||||||||
| 1,828,574 | Hindalco Industries Ltd | 11,628 | ||||||||
| 245,390 | * | Hitachi Metals Ltd | 4,547 | |||||||
| 418,303 | Hochschild Mining plc | 740 | ||||||||
| 158,329 | Hokuetsu Paper Mills Ltd | 990 | ||||||||
| 149,038 | Holcim Ltd | 7,580 | ||||||||
| 113,919 | Holmen AB | 5,456 | ||||||||
| 19,806 | * | Honam Petrochemical Corp | 3,613 | |||||||
| 32,200 | Hoshine Silicon Industry Co Ltd | 667 | ||||||||
| 248,000 | Hsin Kuang Steel Co Ltd | 521 | ||||||||
| 1,082,000 | e | Huabao International Holdings Ltd | 2,000 | |||||||
| 321,600 | Huafon Chemical Co Ltd | 527 | ||||||||
| 90,101 | Huaxin Cement Co Ltd | 273 | ||||||||
| 82,700 | Hubei Xingfa Chemicals Group Co Ltd | 492 | ||||||||
| 19,571 | * | Huchems Fine Chemical Corp | 380 | |||||||
| 267,475 | e | HudBay Minerals, Inc | 1,937 | |||||||
| 117,966 | Huhtamaki Oyj | 5,218 | ||||||||
| 177,267 | *,e | Humble Group AB | 545 | |||||||
| 587,811 | Hunan Valin Steel Co Ltd | 472 | ||||||||
| 363,914 | Huntsman Corp | 12,693 | ||||||||
| 2,924 | * | Hyosung Advanced Materials Corp | 1,464 | |||||||
| 2,050 | * | Hyosung Chemical Corp | 522 | |||||||
| 2,826 | * | Hyosung TNC Co Ltd | 1,236 | |||||||
| 25,157 | * | Hyundai Development Co | 221 | |||||||
| 98,019 | * | Hyundai Steel Co | 3,376 | |||||||
| 573,319 | *,e | IAMGOLD Corp | 1,786 | |||||||
| 499,876 | g | Ibstock plc | 1,386 | |||||||
| 514,122 | Iluka Resources Ltd | 3,790 | ||||||||
| 48,899 | IMCD Group NV | 10,807 | ||||||||
| 501,935 | Imdex Ltd | 1,077 | ||||||||
| 41,110 | Imerys S.A. | 1,708 | ||||||||
| 947,517 | Impala Platinum Holdings Ltd | 13,366 | ||||||||
| 2,361,661 | Incitec Pivot Ltd | 5,582 | ||||||||
| 828,648 | Independence Group NL | 6,940 | ||||||||
| 127 |
COLLEGE RETIREMENT EQUITIES FUND - Stock Account
| SHARES | COMPANY | VALUE (000) | ||||||||
| 147,673 | India Cements Ltd | $ | 381 | |||||||
| 10,546 | * | Indigo Paints Ltd | 302 | |||||||
| 1,838,204 | Indorama Ventures PCL (Foreign) | 2,377 | ||||||||
| 156,811 | e | Industrias Penoles S.A. de C.V. | 1,804 | |||||||
| 57,659 | * | Ingevity Corp | 4,134 | |||||||
| 3,142,018 | * | Inner Mongolia BaoTou Steel Union Co Ltd | 1,378 | |||||||
| 583,988 | Inner Mongolia Junzheng Energy & Chemical Industry Group Co Ltd | 479 | ||||||||
| 343,900 | * | Inner Mongolia Yuan Xing Energy Co Ltd | 395 | |||||||
| 79,256 | Innospec, Inc | 7,160 | ||||||||
| 130,199 | Interfor Corp | 4,170 | ||||||||
| 735,912 | International CSRC Investment Holdings Co | 749 | ||||||||
| 933,805 | International Flavors & Fragrances, Inc | 140,678 | ||||||||
| 388,646 | International Paper Co | 18,259 | ||||||||
| 121,066 | Intertape Polymer Group, Inc | 2,519 | ||||||||
| 8,474 | * | Intrepid Potash, Inc | 362 | |||||||
| 1,808,731 | * | ioneer Ltd | 1,053 | |||||||
| 1,114,439 | Israel Chemicals Ltd | 10,734 | ||||||||
| 4,542 | * | Israel Corp Ltd | 1,959 | |||||||
| 747,928 | * | Ivanhoe Mines Ltd | 6,102 | |||||||
| 562,181 | James Hardie Industries NV | 22,629 | ||||||||
| 55,678 | * | Jastrzebska Spolka Weglowa S.A. | 480 | |||||||
| 22,900 | JCU Corp | 1,089 | ||||||||
| 451,520 | JFE Holdings, Inc | 5,760 | ||||||||
| 13,300 | Jiangsu Yangnong Chemical Co Ltd | 274 | ||||||||
| 32,600 | Jiangsu Yoke Technology Co Ltd | 415 | ||||||||
| 1,372,115 | Jiangxi Copper Co Ltd | 2,204 | ||||||||
| 179,709 | Jiangxi Copper Co Ltd (Class A) | 633 | ||||||||
| 3,447,000 | e | Jinchuan Group International Resources Co Ltd | 601 | |||||||
| 99,113 | * | Jindal Stainless Hisar Ltd | 463 | |||||||
| 911,083 | * | Jindal Steel & Power Ltd | 4,597 | |||||||
| 37,800 | JK Cement Ltd | 1,724 | ||||||||
| 63,085 | JK Lakshmi Cement Ltd | 490 | ||||||||
| 209,453 | Johnson Matthey plc | 5,820 | ||||||||
| 185,090 | * | JSL Ltd | 492 | |||||||
| 14,007 | JSP Corp | 199 | ||||||||
| 237,464 | JSR Corp | 9,024 | ||||||||
| 965,141 | JSW Steel Ltd | 8,481 | ||||||||
| 66,094 | Jubilant Ingrevia Ltd | 509 | ||||||||
| 384,146 | * | K&S AG. | 6,608 | |||||||
| 267,076 | * | K92 Mining, Inc | 1,518 | |||||||
| 12,106 | Kaiser Aluminum Corp | 1,137 | ||||||||
| 59,915 | Kaneka Corp | 1,967 | ||||||||
| 128 |
COLLEGE RETIREMENT EQUITIES FUND - Stock Account
| SHARES | COMPANY | VALUE (000) | ||||||||
| 146,069 | Kansai Nerolac Paints Ltd | $ | 1,160 | |||||||
| 135,594 | Kansai Paint Co Ltd | 2,949 | ||||||||
| 117,100 | Kanto Denka Kogyo Co Ltd | 1,154 | ||||||||
| 818,182 | * | Kardemir Karabuk Demir Celik Sanayi ve Ticaret AS (Class D) | 570 | |||||||
| 4,677 | KCC Corp | 1,238 | ||||||||
| 18,100 | KeePer Technical Laboratory Co Ltd | 350 | ||||||||
| 130,719 | Kemira Oyj | 1,981 | ||||||||
| 154,514 | KGHM Polska Miedz S.A. | 5,363 | ||||||||
| 41,700 | KH Neochem Co Ltd | 1,153 | ||||||||
| 198,125 | Kingfa Sci & Tech Co Ltd | 391 | ||||||||
| 1,547,874 | Kinross Gold Corp | 8,982 | ||||||||
| 329,460 | Kirkland Lake Gold Ltd | 13,807 | ||||||||
| 784,138 | Klabin S.A. | 3,606 | ||||||||
| 677,100 | Kobe Steel Ltd | 3,395 | ||||||||
| 30,153 | Kolon Industries, Inc | 1,796 | ||||||||
| 32,058 | Konishi Co Ltd | 483 | ||||||||
| 17,522 | * | Koppers Holdings, Inc | 548 | |||||||
| 13,344 | * | Korea Kumho Petrochemical | 1,860 | |||||||
| 3,920 | * | Korea Petrochemical Ind Co Ltd | 603 | |||||||
| 9,674 | * | Korea Zinc Co Ltd | 4,162 | |||||||
| 41,825 | * | Koza Altin Isletmeleri AS | 365 | |||||||
| 207,266 | * | Koza Anadolu Metal Madencilik Isletmeleri AS | 282 | |||||||
| 27,570 | * | Kraton Corp | 1,277 | |||||||
| 152,038 | Kronos Worldwide, Inc | 2,282 | ||||||||
| 91,093 | * | Kuk-il Paper Manufacturing Co Ltd | 311 | |||||||
| 69,691 | Kumba Iron Ore Ltd | 2,010 | ||||||||
| 98,848 | Kumiai Chemical Industry Co Ltd | 680 | ||||||||
| 367,100 | e | Kuraray Co Ltd | 3,193 | |||||||
| 20,100 | Kureha CORP | 1,436 | ||||||||
| 22,716 | Kyoei Steel Ltd | 280 | ||||||||
| 69,309 | e | Labrador Iron Ore Royalty Corp | 2,056 | |||||||
| 1,072,414 | Lanxess AG. | 66,317 | ||||||||
| 42,805 | * | Largo, Inc | 397 | |||||||
| 54,730 | Laxmi Organic Industries Ltd | 316 | ||||||||
| 1,556,927 | Lee & Man Paper Manufacturing Ltd | 1,083 | ||||||||
| 16,296 | e | Lenzing AG. | 2,246 | |||||||
| 84,412 | * | LG Chem Ltd | 43,638 | |||||||
| 8,829 | * | LG Chem Ltd (Preference) | 2,130 | |||||||
| 22,725 | Linde India Ltd | 759 | ||||||||
| 567,942 | Linde plc | 196,752 | ||||||||
| 450,141 | Linde plc (Xetra) | 156,202 | ||||||||
| 51,600 | Lintec Corp | 1,184 | ||||||||
| 129 |
COLLEGE RETIREMENT EQUITIES FUND - Stock Account
| SHARES | COMPANY | VALUE (000) | ||||||||
| 1,993,782 | * | Liontown Resources Ltd | $ | 2,409 | ||||||
| 115,441 | *,e | Lithium Americas Corp | 3,360 | |||||||
| 13,766 | * | Livent Corp | 336 | |||||||
| 173,154 | Lomon Billions Group Co Ltd | 777 | ||||||||
| 664,704 | Long Chen Paper Co Ltd | 585 | ||||||||
| 1,663,535 | g | Lotte Chemical Titan Holding BHD | 958 | |||||||
| 223,076 | Louisiana-Pacific Corp | 17,478 | ||||||||
| 84,004 | * | Lundin Gold, Inc | 692 | |||||||
| 810,553 | Lundin Mining Corp | 6,331 | ||||||||
| 163,500 | Luxi Chemical Group Co Ltd | 392 | ||||||||
| 1,094,857 | * | Lynas Corp Ltd | 8,125 | |||||||
| 251,534 | LyondellBasell Industries NV | 23,199 | ||||||||
| 140,611 | Madras Cements Ltd | 1,894 | ||||||||
| 23,533 | e | Maeda Kosen Co Ltd | 803 | |||||||
| 102,837 | *,e | MAG. Silver Corp | 1,612 | |||||||
| 21,765 | * | Marrone Bio Innovations, Inc | 16 | |||||||
| 239,442 | Marshalls plc | 2,256 | ||||||||
| 20,380 | Martin Marietta Materials, Inc | 8,978 | ||||||||
| 66,700 | Maruichi Steel Tube Ltd | 1,478 | ||||||||
| 130,448 | Materion Corp | 11,993 | ||||||||
| 86,211 | e | Maverix Metals, Inc | 376 | |||||||
| 12,500,477 | * | Merdeka Copper Gold Tbk PT | 3,422 | |||||||
| 4,967,125 | Mesaieed Petrochemical Holding Co | 2,848 | ||||||||
| 798,944 | Metalurgica Gerdau S.A. | 1,632 | ||||||||
| 77,945 | Methanex Corp | 3,083 | ||||||||
| 264,802 | Mineral Resources Ltd | 10,816 | ||||||||
| 29,020 | Minerals Technologies, Inc | 2,123 | ||||||||
| 18,295 | Miquel y Costas & Miquel S.A. | 273 | ||||||||
| 50,816 | Misr Fertilizers Production Co SAE | 314 | ||||||||
| 11,800 | Mitani Sekisan Co Ltd | 785 | ||||||||
| 1,363,205 | Mitsubishi Chemical Holdings Corp | 10,111 | ||||||||
| 125,090 | Mitsubishi Gas Chemical Co, Inc | 2,120 | ||||||||
| 259,400 | Mitsubishi Materials Corp | 4,458 | ||||||||
| 246,062 | Mitsui Chemicals, Inc | 6,614 | ||||||||
| 111,064 | Mitsui Mining & Smelting Co Ltd | 3,026 | ||||||||
| 1,604 | Miwon Commercial Co Ltd | 275 | ||||||||
| 741,715 | MMC Norilsk Nickel PJSC (ADR) | 22,748 | ||||||||
| 3,296,000 | * | MMG Ltd | 1,060 | |||||||
| 614,853 | Mondi plc | 15,251 | ||||||||
| 12,981 | *,† | Mongolian Metals Corporation | 0 | |||||||
| 397,380 | Mosaic Co | 15,613 | ||||||||
| 8,079 | *,e | MP Materials Corp | 367 | |||||||
| 130 |
COLLEGE RETIREMENT EQUITIES FUND - Stock Account
| SHARES | COMPANY | VALUE (000) | ||||||||
| 216,269 | M-real Oyj (B Shares) | $ | 2,119 | |||||||
| 114,389 | Myers Industries, Inc | 2,289 | ||||||||
| 109,614 | Mytilineos Holdings S.A. | 1,888 | ||||||||
| 87,171 | Najran Cement Co | 419 | ||||||||
| 25,564 | * | Namhae Chemical Corp | 225 | |||||||
| 54,000 | Nan Pao Resins Chemical Co Ltd | 277 | ||||||||
| 6,038,887 | Nan Ya Plastics Corp | 18,604 | ||||||||
| 302,000 | Nanofilm Technologies International Ltd | 856 | ||||||||
| 133,071 | *,e | NanoXplore, Inc | 687 | |||||||
| 294,557 | Nantex Industry Co Ltd | 906 | ||||||||
| 1,078,716 | National Aluminium Co Ltd | 1,458 | ||||||||
| 381,020 | * | National Industrialization Co | 2,017 | |||||||
| 132,986 | National Petrochemical Co | 1,413 | ||||||||
| 35,127 | Navin Fluorine International Ltd | 1,974 | ||||||||
| 14,772 | Neenah Inc | 684 | ||||||||
| 778,230 | * | New Gold, Inc | 1,163 | |||||||
| 102,218 | * | New Pacific Metals Corp | 302 | |||||||
| 905,979 | Newcrest Mining Ltd | 16,226 | ||||||||
| 6,273 | NewMarket Corp | 2,150 | ||||||||
| 2,145,084 | Newmont Goldcorp Corp | 133,038 | ||||||||
| 41,352 | * | Next Science Co Ltd | 755 | |||||||
| 1,271,208 | Nickel Mines Ltd | 1,325 | ||||||||
| 104,381 | Nihon Parkerizing Co Ltd | 1,022 | ||||||||
| 2,044,151 | Nine Dragons Paper Holdings Ltd | 2,195 | ||||||||
| 456,406 | Ningxia Baofeng Energy Group Co Ltd | 1,243 | ||||||||
| 159,366 | Nippon Kayaku Co Ltd | 1,642 | ||||||||
| 75,003 | Nippon Light Metal Holdings Co Ltd | 1,126 | ||||||||
| 699,990 | Nippon Paint Co Ltd | 7,644 | ||||||||
| 117,280 | Nippon Paper Industries Co Ltd | 1,108 | ||||||||
| 35,228 | Nippon Shokubai Co Ltd | 1,631 | ||||||||
| 27,484 | Nippon Soda Co Ltd | 791 | ||||||||
| 987,250 | Nippon Steel Corp | 16,128 | ||||||||
| 141,231 | Nissan Chemical Industries Ltd | 8,214 | ||||||||
| 5,707 | Nittetsu Mining Co Ltd | 328 | ||||||||
| 154,725 | Nitto Denko Corp | 11,953 | ||||||||
| 103,941 | NOCIL Ltd | 324 | ||||||||
| 136,982 | NOF Corp | 6,926 | ||||||||
| 2,237,916 | Norsk Hydro ASA | 17,609 | ||||||||
| 397,686 | * | Northam Platinum Holdings Ltd | 5,228 | |||||||
| 97,261 | Northern Region Cement Co | 347 | ||||||||
| 1,211,201 | Northern Star Resources Ltd | 8,330 | ||||||||
| 21,009 | * | Novagold Resources Inc | 144 | |||||||
| 131 |
COLLEGE RETIREMENT EQUITIES FUND - Stock Account
| SHARES | COMPANY | VALUE (000) | ||||||||
| 279,347 | * | Novagold Resources, Inc | $ | 1,915 | ||||||
| 174,382 | Novolipetsk Steel PJSC (GDR) | 5,148 | ||||||||
| 225,855 | Novozymes AS | 18,545 | ||||||||
| 303,910 | Nucor Corp | 34,691 | ||||||||
| 1,085,970 | Nufarm Ltd | 3,837 | ||||||||
| 65,963 | Nuh Cimento Sanayi AS. | 253 | ||||||||
| 294,965 | e | Nutrien Ltd | 22,181 | |||||||
| 909,756 | Nutrien Ltd (Toronto) | 68,382 | ||||||||
| 117,750 | * | Nuvoco Vistas Corp Ltd | 791 | |||||||
| 847,093 | *,e | OceanaGold Corp | 1,473 | |||||||
| 26,652 | *,e | OCI Co Ltd | 2,328 | |||||||
| 268,282 | * | OCI NV | 7,003 | |||||||
| 79,693 | * | O-I Glass, Inc | 959 | |||||||
| 613,778 | OJI Paper Co Ltd | 2,974 | ||||||||
| 10,800 | Okamoto Industries, Inc | 397 | ||||||||
| 230,781 | e | Olin Corp | 13,275 | |||||||
| 8,840 | e | Olympic Steel, Inc | 208 | |||||||
| 304,931 | * | Omega Energia S.A. | 693 | |||||||
| 1,226,648 | e | Orbia Advance Corp SAB de C.V. | 3,131 | |||||||
| 445,607 | Orica Ltd | 4,444 | ||||||||
| 551,000 | * | Oriental Union Chemical Corp | 446 | |||||||
| 458,001 | * | Orion Engineered Carbons SA | 8,409 | |||||||
| 178,490 | *,e | Orla Mining Ltd | 682 | |||||||
| 1,260,248 | Orora Ltd | 3,216 | ||||||||
| 15,800 | e | Osaka Organic Chemical Industry Ltd | 456 | |||||||
| 13,700 | Osaka Soda Co Ltd | 362 | ||||||||
| 171,274 | Osisko Gold Royalties Ltd | 2,096 | ||||||||
| 366,549 | * | Osisko Mining, Inc | 1,104 | |||||||
| 932,921 | *,e | Outokumpu Oyj | 5,850 | |||||||
| 404,562 | Oxiana Ltd | 8,341 | ||||||||
| 249,076 | * | Oyak Cimento Fabrikalari AS | 149 | |||||||
| 15,400 | e | Pack Corp | 361 | |||||||
| 243,105 | Packaging Corp of America | 33,099 | ||||||||
| 305,650 | Pact Group Holdings Ltd | 564 | ||||||||
| 37,676 | Pactiv Evergreen, Inc | 478 | ||||||||
| 257,777 | e | Pan American Silver Corp (Toronto) | 6,431 | |||||||
| 564,266 | * | Pangang Group Vanadium Titanium & Resources Co Ltd | 345 | |||||||
| 744,227 | Perenti Global Ltd | 501 | ||||||||
| 6,350 | * | Perpetua Resources Corp | 30 | |||||||
| 1,495,331 | Perseus Mining Ltd | 1,770 | ||||||||
| 2,749,257 | *,e | Peter Hambro Mining plc | 722 | |||||||
| 1,348,517 | * | Petkim Petrokimya Holding | 798 | |||||||
| 132 |
COLLEGE RETIREMENT EQUITIES FUND - Stock Account
| SHARES | COMPANY | VALUE (000) | ||||||||
| 2,886,015 | Petronas Chemicals Group BHD | $ | 6,179 | |||||||
| 171,525 | PhosAgro PJSC (GDR) | 3,702 | ||||||||
| 16,061 | PI Advanced Materials Co Ltd | 743 | ||||||||
| 95,413 | PI Industries Ltd | 3,886 | ||||||||
| 173,190 | Pidilite Industries Ltd | 5,727 | ||||||||
| 5,223,367 | * | Pilbara Minerals Ltd | 12,184 | |||||||
| 23,486 | * | PolyMet Mining Corp | 59 | |||||||
| 416,869 | Polymetal International plc | 7,423 | ||||||||
| 12,989 | Polyplex Corp Ltd | 326 | ||||||||
| 65,324 | e | Polyus PJSC (GDR) | 5,770 | |||||||
| 13,456 | Polyus PJSC (GDR) | 1,187 | ||||||||
| 19,457 | * | Poongsan Corp | 509 | |||||||
| 235,641 | Portucel Empresa Produtora de Pasta e Papel S.A. | 898 | ||||||||
| 99,325 | POSCO | 23,032 | ||||||||
| 34,160 | * | POSCO Refractories & Environment Co Ltd | 4,128 | |||||||
| 855,918 | PPG Industries, Inc | 147,594 | ||||||||
| 107,229 | PQ Group Holdings, Inc | 1,098 | ||||||||
| 3,459,068 | Press Metal BHD | 4,799 | ||||||||
| 226,093 | * | Pretium Resources, Inc | 3,185 | |||||||
| 136,359 | * | Prism Cement Ltd | 237 | |||||||
| 9,226,100 | PT Aneka Tambang Tbk | 1,460 | ||||||||
| 30,115,697 | PT Barito Pacific Tbk | 1,804 | ||||||||
| 2,948,597 | PT Indah Kiat Pulp and Paper Corp Tbk | 1,620 | ||||||||
| 1,795,952 | PT Indocement Tunggal Prakarsa Tbk | 1,525 | ||||||||
| 1,448,600 | PT Pabrik Kertas Tjiwi Kimia Tbk | 766 | ||||||||
| 3,278,689 | PT Semen Gresik Persero Tbk | 1,667 | ||||||||
| 2,821,500 | * | PT Timah Tbk | 288 | |||||||
| 2,710,809 | PTT Global Chemical PCL (Foreign) | 4,765 | ||||||||
| 185,987 | *,e | PureCycle Technologies, Inc | 1,780 | |||||||
| 47,946 | Qassim Cement Co | 967 | ||||||||
| 2,990,279 | Qatar Aluminum Manufacturing Co | 1,479 | ||||||||
| 366,361 | Qatar National Cement Co | 513 | ||||||||
| 397,939 | Qatari Investors Group | 243 | ||||||||
| 1,452 | Quaker Chemical Corp | 335 | ||||||||
| 636,098 | Qurain Petrochemical Industries Co | 730 | ||||||||
| 180,527 | Rain Commodities Ltd | 579 | ||||||||
| 75,664 | Rallis India Ltd | 278 | ||||||||
| 932,390 | Ramelius Resources Ltd | 1,069 | ||||||||
| 62,965 | * | Ranpak Holdings Corp | 2,366 | |||||||
| 17,007 | Ratnamani Metals & Tubes Ltd | 444 | ||||||||
| 52,601 | * | Rayonier Advanced Materials, Inc | 300 | |||||||
| 21,203 | *,e | Re:NewCell AB | 515 | |||||||
| 133 |
COLLEGE RETIREMENT EQUITIES FUND - Stock Account
| SHARES | COMPANY | VALUE (000) | ||||||||
| 48,985 | Recticel S.A. | $ | 978 | |||||||
| 926,865 | Regis Resources Ltd | 1,319 | ||||||||
| 382,898 | Reliance Steel & Aluminum Co | 62,114 | ||||||||
| 547,283 | Rengo Co Ltd | 4,140 | ||||||||
| 35,424 | Rhi Magnesita NV | 1,581 | ||||||||
| 453,097 | Rio Tinto Ltd | 33,063 | ||||||||
| 1,776,662 | Rio Tinto plc | 117,164 | ||||||||
| 66,600 | Riyadh Cement Co | 584 | ||||||||
| 676,224 | Rongsheng Petro Chemical Co Ltd | 1,929 | ||||||||
| 13,767 | Rossari Biotech Ltd | 238 | ||||||||
| 189,904 | Royal Bafokeng Platinum Ltd | 1,869 | ||||||||
| 64,025 | Royal Gold, Inc | 6,736 | ||||||||
| 134,963 | RPM International, Inc | 13,631 | ||||||||
| 5,480 | Ryerson Holding Corp | 143 | ||||||||
| 107,815 | Sa des Ciments Vicat | 4,417 | ||||||||
| 253,908 | SABIC Agri-Nutrients Co | 11,920 | ||||||||
| 376,938 | * | Sabina Gold & Silver Corp | 432 | |||||||
| 412,235 | Sahara International Petrochemical Co | 4,594 | ||||||||
| 45,800 | e | Sakata INX Corp | 396 | |||||||
| 43,837 | * | Salzgitter AG. | 1,566 | |||||||
| 19,638 | * | Samsung Fine Chemicals Co Ltd | 1,237 | |||||||
| 468,282 | Sandfire Resources NL | 2,250 | ||||||||
| 234,506 | * | Sandstorm Gold Ltd | 1,455 | |||||||
| 13,711 | Sanyo Chemical Industries Ltd | 636 | ||||||||
| 84,106 | Sanyo Special Steel Co Ltd | 1,491 | ||||||||
| 619,357 | * | Sappi Ltd | 1,773 | |||||||
| 661,101 | * | Sasol Ltd | 10,824 | |||||||
| 485,746 | * | Saudi Arabian Mining Co | 10,137 | |||||||
| 1,052,248 | Saudi Basic Industries Corp | 32,451 | ||||||||
| 83,526 | Saudi Cement Co | 1,218 | ||||||||
| 250,054 | Saudi Industrial Investment Group | 2,071 | ||||||||
| 840,112 | * | Saudi Kayan Petrochemical Co | 3,795 | |||||||
| 6,673,058 | * | Sayona Mining Ltd | 633 | |||||||
| 1,443,900 | SCG Packaging PCL | 2,991 | ||||||||
| 912,380 | * | Schmolz + Bickenbach AG. | 344 | |||||||
| 20,870 | Schnitzer Steel Industries, Inc (Class A) | 1,084 | ||||||||
| 28,067 | Schweitzer-Mauduit International, Inc | 839 | ||||||||
| 765,800 | Scientex BHD | 881 | ||||||||
| 56,792 | Scotts Miracle-Gro Co (Class A) | 9,144 | ||||||||
| 78,810 | *,e | Seabridge Gold, Inc | 1,302 | |||||||
| 124,171 | * | Seah Besteel Corp | 2,076 | |||||||
| 740,899 | Sealed Air Corp | 49,988 | ||||||||
| 134 |
COLLEGE RETIREMENT EQUITIES FUND - Stock Account
| SHARES | COMPANY | VALUE (000) | ||||||||
| 8,218,300 | *,† | Sekawan Intipratama Tbk PT | $ | 0 | ^ | |||||
| 20,193 | Semapa-Sociedade de Investimento e Gestao | 269 | ||||||||
| 72,019 | Sensient Technologies Corp | 7,206 | ||||||||
| 1,328,064 | Sesa Sterlite Ltd | 6,074 | ||||||||
| 241,066 | Severstal (GDR) | 5,193 | ||||||||
| 274,968 | Shandong Gold Mining Co Ltd | 813 | ||||||||
| 817,505 | e,g | Shandong Gold Mining Co Ltd | 1,403 | |||||||
| 167,007 | Shandong Hualu Hengsheng Chemical Co Ltd | 820 | ||||||||
| 888,366 | Shandong Nanshan Aluminum Co Ltd | 659 | ||||||||
| 221,911 | Shandong Sun Paper Industry JSC Ltd | 400 | ||||||||
| 480,600 | Shanghai Chlor-Alkali Chemical Co Ltd | 325 | ||||||||
| 48,832 | Shanghai Putailai New Energy Technology Co Ltd | 1,231 | ||||||||
| 326,629 | * | Shanxi Meijin Energy Co Ltd | 832 | |||||||
| 443,763 | Shanxi Taigang Stainless Steel Co Ltd | 492 | ||||||||
| 132,600 | Shenghe Resources Holding Co Ltd | 408 | ||||||||
| 26,138 | Shenzhen Capchem Technology Co Ltd | 463 | ||||||||
| 54,700 | Shenzhen Senior Technology Material Co Ltd | 316 | ||||||||
| 557,410 | Sherwin-Williams Co | 196,298 | ||||||||
| 148,000 | * | Shihlin Paper Corp | 347 | |||||||
| 38,800 | Shikoku Chemicals Corp | 476 | ||||||||
| 400,325 | Shin-Etsu Chemical Co Ltd | 69,487 | ||||||||
| 48,003 | Shin-Etsu Polymer Co Ltd | 462 | ||||||||
| 1,206,661 | Shinkong Synthetic Fibers Corp | 880 | ||||||||
| 86,666 | Shiny Chemical Industrial Co Ltd | 549 | ||||||||
| 213,500 | Showa Denko KK | 4,489 | ||||||||
| 12,293 | Shree Cement Ltd | 4,450 | ||||||||
| 924,683 | Siam Cement PCL (Foreign) | 10,690 | ||||||||
| 93,400 | Siam City Cement PCL | 438 | ||||||||
| 3,160,647 | Sibanye Stillwater Ltd | 9,827 | ||||||||
| 786,100 | * | Sichuan Hebang Biotechnology Co Ltd | 421 | |||||||
| 92,800 | * | Sichuan New Energy Power Co Ltd | 386 | |||||||
| 80,600 | Sichuan Yahua Industrial Group Co Ltd | 363 | ||||||||
| 389,801 | e | SIG Combibloc Group AG. | 10,858 | |||||||
| 40,313 | e | Sika AG. | 16,755 | |||||||
| 152,471 | Silgan Holdings, Inc | 6,532 | ||||||||
| 1,017,946 | * | Silver Lake Resources Ltd | 1,320 | |||||||
| 212,202 | e | Silvercorp Metals, Inc | 793 | |||||||
| 165,594 | *,e | SilverCrest Metals, Inc | 1,309 | |||||||
| 206,958 | Sims Ltd | 2,423 | ||||||||
| 1,650,000 | Sinofert Holdings Ltd | 248 | ||||||||
| 134,000 | Sinoma Science & Technology Co Ltd | 715 | ||||||||
| 135 |
COLLEGE RETIREMENT EQUITIES FUND - Stock Account
| SHARES | COMPANY | VALUE (000) | ||||||||
| 730,967 | Sinopec Shanghai Petrochemical Co Ltd (Class A) | $ | 479 | |||||||
| 12,902 | * | SK Chemicals Co Ltd | 1,615 | |||||||
| 19,838 | *,g | SK IE Technology Co Ltd | 2,801 | |||||||
| 23,479 | * | SKC Co Ltd | 3,432 | |||||||
| 24,006 | Skshu Paint Co Ltd | 524 | ||||||||
| 497,633 | Smurfit Kappa Group plc | 27,428 | ||||||||
| 392,570 | Sociedad Quimica y Minera de Chile S.A. (ADR) | 19,797 | ||||||||
| 160,363 | Sociedad Quimica y Minera de Chile S.A. (Class B) | 8,187 | ||||||||
| 40,747 | SOL S.p.A. | 979 | ||||||||
| 433,720 | Solar Applied Materials Technology Co | 799 | ||||||||
| 29,518 | Solar Industries India Ltd | 959 | ||||||||
| 155,374 | * | Solaris Resources, Inc | 2,081 | |||||||
| 866,663 | * | SolGold plc | 343 | |||||||
| 81,075 | Solvay S.A. | 9,425 | ||||||||
| 94,776 | Sonoco Products Co | 5,487 | ||||||||
| 4,690 | * | Soulbrain Co Ltd | 1,097 | |||||||
| 5,963 | * | Soulbrain Holdings Co Ltd | 173 | |||||||
| 6,463,777 | South32 Ltd | 18,904 | ||||||||
| 182,577 | Southern Copper Corp | 11,267 | ||||||||
| 73,462 | Southern Province Cement Co | 1,372 | ||||||||
| 169,572 | SRF Ltd | 5,509 | ||||||||
| 307,272 | * | Ssab Svenskt Stal AB (Series A) | 1,776 | |||||||
| 705,229 | * | Ssab Svenskt Stal AB (Series B) | 3,543 | |||||||
| 260,266 | SSR Mining, Inc | 4,607 | ||||||||
| 3,894,790 | St Barbara Ltd | 4,164 | ||||||||
| 267,233 | Steel Dynamics, Inc | 16,587 | ||||||||
| 37,212 | e | Stelco Holdings, Inc | 1,213 | |||||||
| 70,505 | Stella-Jones, Inc | 2,230 | ||||||||
| 34,748 | Stepan Co | 4,319 | ||||||||
| 2,926 | STO AG. | 736 | ||||||||
| 671,211 | Stora Enso Oyj (R Shares) | 12,319 | ||||||||
| 70,712 | Sumitomo Bakelite Co Ltd | 3,589 | ||||||||
| 1,530,715 | Sumitomo Chemical Co Ltd | 7,219 | ||||||||
| 107,097 | Sumitomo Chemical India Ltd | 554 | ||||||||
| 287,300 | Sumitomo Metal Mining Co Ltd | 10,881 | ||||||||
| 44,121 | Sumitomo Osaka Cement Co Ltd | 1,357 | ||||||||
| 1,309,091 | * | Summit Materials, Inc | 52,547 | |||||||
| 74,990 | SunCoke Energy, Inc | 494 | ||||||||
| 2,444,500 | *,†,e | Superb Summit International Group Ltd | 3 | |||||||
| 68,815 | Supreme Industries Ltd | 2,057 | ||||||||
| 34,713 | Supreme Petrochem Ltd | 328 | ||||||||
| 136 |
COLLEGE RETIREMENT EQUITIES FUND - Stock Account
| SHARES | COMPANY | VALUE (000) | ||||||||
| 846,017 | * | Suzano SA | $ | 9,138 | ||||||
| 671,604 | Svenska Cellulosa AB (B Shares) | 11,917 | ||||||||
| 32,866 | * | Sylvamo Corp | 917 | |||||||
| 158,542 | Symrise AG. | 23,448 | ||||||||
| 40,400 | T Hasegawa Co Ltd | 950 | ||||||||
| 1,566,317 | TA Chen Stainless Pipe | 2,612 | ||||||||
| 293 | * | Taekwang Industrial Co Ltd | 257 | |||||||
| 271,100 | Taiheiyo Cement Corp | 5,354 | ||||||||
| 236,200 | Taita Chemical Co Ltd | 295 | ||||||||
| 3,714,482 | Taiwan Cement Corp | 6,438 | ||||||||
| 798,000 | Taiwan Fertilizer Co Ltd | 2,015 | ||||||||
| 344,725 | Taiwan Hon Chuan Enterprise Co Ltd | 892 | ||||||||
| 41,200 | Taiyo Ink Manufacturing Co Ltd | 1,246 | ||||||||
| 113,104 | Taiyo Nippon Sanso Corp | 2,474 | ||||||||
| 13,755 | Takasago International Corp | 346 | ||||||||
| 5,300 | e | Taki Chemical Co Ltd | 267 | |||||||
| 61,014 | Takiron Co Ltd | 298 | ||||||||
| 208,492 | Tata Chemicals Ltd | 2,499 | ||||||||
| 844,446 | Tata Steel Ltd | 12,557 | ||||||||
| 682,728 | Teck Cominco Ltd | 19,662 | ||||||||
| 222,600 | Teijin Ltd | 2,740 | ||||||||
| 16,600 | Tenma Corp | 381 | ||||||||
| 20,278 | * | Tessenderlo Chemie NV | 769 | |||||||
| 8,944,619 | * | ThyssenKrupp AG. | 97,994 | |||||||
| 1,232,000 | e | Tiangong International Co Ltd | 755 | |||||||
| 74,500 | Tibet Summit Resources Co Ltd | 441 | ||||||||
| 40,181 | * | TimkenSteel Corp | 663 | |||||||
| 729,959 | Tipco Asphalt PCL | 396 | ||||||||
| 40,543 | Titan Cement International S.A. | 617 | ||||||||
| 614,000 | TOA Paint Thailand PCL | 589 | ||||||||
| 120,903 | Toagosei Co Ltd | 1,216 | ||||||||
| 46,024 | Toho Titanium Co Ltd | 378 | ||||||||
| 240,529 | e | Tokai Carbon Co Ltd | 2,528 | |||||||
| 11,200 | Tokushu Tokai Holdings Co Ltd | 401 | ||||||||
| 132,241 | Tokuyama Corp | 2,103 | ||||||||
| 38,314 | Tokyo Ohka Kogyo Co Ltd | 2,262 | ||||||||
| 100,704 | Tokyo Steel Manufacturing Co Ltd | 1,208 | ||||||||
| 670,750 | Ton Yi Industrial Corp | 352 | ||||||||
| 174,878 | Tongkun Group Co Ltd | 582 | ||||||||
| 544,100 | Tongling Nonferrous Metals Group Co Ltd | 298 | ||||||||
| 1,475,637 | Toray Industries, Inc | 8,743 | ||||||||
| 233,207 | * | Torex Gold Resources, Inc | 2,424 | |||||||
| 137 |
COLLEGE RETIREMENT EQUITIES FUND - Stock Account
| SHARES | COMPANY | VALUE (000) | ||||||||
| 424,073 | Tosoh Corp | $ | 6,300 | |||||||
| 6,200 | Toyo Gosei Co Ltd | 842 | ||||||||
| 43,200 | Toyo Ink Manufacturing Co Ltd | 724 | ||||||||
| 168,900 | Toyo Seikan Kaisha Ltd | 2,017 | ||||||||
| 98,448 | Toyobo Co Ltd | 1,076 | ||||||||
| 5,689,900 | TPI Polene PCL | 293 | ||||||||
| 87,973 | Transcontinental, Inc | 1,412 | ||||||||
| 290,910 | Transfar Zhilian Co Ltd | 397 | ||||||||
| 8,556 | Tredegar Corp | 101 | ||||||||
| 37,658 | Trimas Corp | 1,393 | ||||||||
| 3,308 | Trinseo plc | 174 | ||||||||
| 120,294 | Tronox Holdings plc | 2,891 | ||||||||
| 569,000 | TSRC Corp | 830 | ||||||||
| 625,163 | Tung Ho Steel Enterprise Corp | 1,516 | ||||||||
| 121,068 | * | Turquoise Hill Resources Ltd | 1,991 | |||||||
| 39,043 | * | UACJ Corp | 904 | |||||||
| 264,826 | UBE Industries Ltd | 4,602 | ||||||||
| 9,022 | * | UFP Technologies, Inc | 634 | |||||||
| 117,011 | Ultra Tech Cement Ltd | 11,919 | ||||||||
| 213,294 | e | Umicore S.A. | 8,701 | |||||||
| 47,219 | Uniao de Industrias Petroquimicas S.A. | 875 | ||||||||
| 11,875 | Unid Co Ltd | 1,002 | ||||||||
| 1,639 | United States Lime & Minerals, Inc | 211 | ||||||||
| 312,428 | United States Steel Corp | 7,439 | ||||||||
| 416,000 | Universal Cement Corp | 325 | ||||||||
| 763,650 | UPC Technology Corp | 595 | ||||||||
| 593,551 | UPL Ltd | 5,942 | ||||||||
| 635,514 | UPM-Kymmene Oyj | 24,180 | ||||||||
| 769,973 | USI Corp | 877 | ||||||||
| 5,933,983 | Vale S.A. | 82,680 | ||||||||
| 709 | Valhi, Inc | 20 | ||||||||
| 284,012 | Valvoline, Inc | 10,591 | ||||||||
| 89,380 | g | Verallia S.A. | 3,149 | |||||||
| 23,482 | Verso Corp | 634 | ||||||||
| 31,503 | Vetropack Holding AG. | 1,991 | ||||||||
| 48,944 | * | Victoria Gold Corp | 551 | |||||||
| 106,000 | Victrex plc | 3,532 | ||||||||
| 28,026 | Vinati Organics Ltd | 747 | ||||||||
| 241,720 | Vinythai PCL (Foreign) | 279 | ||||||||
| 132,799 | Voestalpine AG. | 4,818 | ||||||||
| 95,147 | * | Vulcan Energy Resources Ltd | 721 | |||||||
| 63,954 | Vulcan Materials Co | 13,276 | ||||||||
| 138 |
COLLEGE RETIREMENT EQUITIES FUND - Stock Account
| SHARES | COMPANY | VALUE (000) | ||||||||
| 19,011 | Wacker Chemie AG. | $ | 2,826 | |||||||
| 736,118 | *,e | Wallbridge Mining Co Ltd | 233 | |||||||
| 218,196 | Wanhua Chemical Group Co Ltd | 3,456 | ||||||||
| 123,750 | Warrior Met Coal, Inc | 3,182 | ||||||||
| 30,389 | Weihai Guangwei Composites Co Ltd | 403 | ||||||||
| 168,535 | * | Wesdome Gold Mines Ltd | 1,534 | |||||||
| 1,183,979 | * | West African Resources Ltd | 1,142 | |||||||
| 2,378,491 | West China Cement Ltd | 424 | ||||||||
| 152,130 | West Fraser Timber Co Ltd | 14,514 | ||||||||
| 388,501 | * | Western Areas NL | 971 | |||||||
| 30,654 | Western Superconducting Technologies Co Ltd | 467 | ||||||||
| 472,186 | Westgold Resources Ltd | 703 | ||||||||
| 93,561 | Westlake Chemical Corp | 9,088 | ||||||||
| 261,786 | WestRock Co | 11,613 | ||||||||
| 556,630 | Wheaton Precious Metals Corp | 23,885 | ||||||||
| 3,388,139 | Wienerberger AG. | 124,424 | ||||||||
| 39,106 | e | Winpak Ltd | 1,149 | |||||||
| 29,542 | Worthington Industries, Inc | 1,615 | ||||||||
| 125,115 | Xiamen Tungsten Co Ltd | 445 | ||||||||
| 241,100 | Xinjiang Zhongtai Chemical Co Ltd | 361 | ||||||||
| 104,356 | * | Yamama Cement Co | 722 | |||||||
| 1,383,162 | Yamana Gold, Inc | 5,817 | ||||||||
| 48,705 | Yamato Kogyo Co Ltd | 1,579 | ||||||||
| 83,230 | Yanbu Cement Co | 801 | ||||||||
| 298,832 | Yanbu National Petrochemical Co | 5,456 | ||||||||
| 246,694 | Yara International ASA | 12,438 | ||||||||
| 405,974 | Yeun Chyang Industrial Co Ltd | 472 | ||||||||
| 928,220 | * | Yieh Phui Enterprise | 847 | |||||||
| 234,323 | Yintai Gold Co Ltd | 323 | ||||||||
| 24,655 | Yodogawa Steel Works Ltd | 546 | ||||||||
| 29,300 | YongXing Special Materials Technology Co Ltd | 681 | ||||||||
| 9,533 | * | Youlchon Chemical Co Ltd | 218 | |||||||
| 423 | * | Young Poong Corp | 233 | |||||||
| 1,258,849 | Yuen Foong Yu Paper Manufacturing Co Ltd | 1,617 | ||||||||
| 414,088 | Yule Catto & Co plc | 2,236 | ||||||||
| 267,200 | * | Yunnan Aluminium Co Ltd | 471 | |||||||
| 59,341 | Yunnan Energy New Material Co Ltd | 2,329 | ||||||||
| 124,300 | * | Yunnan Tin Co Ltd | 383 | |||||||
| 877,216 | Zeon Corp | 10,139 | ||||||||
| 1,292,500 | e | Zhaojin Mining Industry Co Ltd | 1,106 | |||||||
| 86,653 | Zhejiang Huayou Cobalt Co Ltd | 1,501 | ||||||||
| 206,636 | Zhejiang Juhua Co Ltd | 419 | ||||||||
| 139 |
COLLEGE RETIREMENT EQUITIES FUND - Stock Account
| SHARES | COMPANY | VALUE (000) | ||||||||
| 287,318 | Zhejiang Longsheng Group Co Ltd | $ | 570 | |||||||
| 118,420 | Zhejiang Satellite Petrochemical Co Ltd | 745 | ||||||||
| 66,400 | * | Zhejiang Yongtai Technology Co Ltd | 534 | |||||||
| 217,400 | Zibo Qixiang Tengda Chemical Co Ltd | 359 | ||||||||
| 26,138 | Zignago Vetro S.p.A. | 514 | ||||||||
| 6,797,232 | Zijin Mining Group Co Ltd | 8,118 | ||||||||
| 1,418,316 | Zijin Mining Group Co Ltd (Class A) | 2,165 | ||||||||
| 59,908 | *,e | Zymergen, Inc | 401 | |||||||
| TOTAL MATERIALS | 6,626,973 | |||||||||
| MEDIA & ENTERTAINMENT - 6.6% | ||||||||||
| 731,805 | Activision Blizzard, Inc | 48,687 | ||||||||
| 289,079 | * | Adevinta ASA | 3,840 | |||||||
| 1,212,191 | *,e | Advantage Solutions, Inc | 9,722 | |||||||
| 65,572 | * | Affle India Ltd | 993 | |||||||
| 8,784 | * | AfreecaTV Co Ltd | 1,492 | |||||||
| 14,251,173 | *,e | Alibaba Pictures Group Ltd | 1,298 | |||||||
| 547,955 | *,n | Alphabet, Inc (Class A) | 1,587,448 | |||||||
| 569,461 | *,n | Alphabet, Inc (Class C) | 1,647,787 | |||||||
| 2,455,093 | * | Altice USA, Inc | 39,723 | |||||||
| 485,732 | *,e | AMC Entertainment Holdings, Inc | 13,212 | |||||||
| 14,947 | * | AMC Networks, Inc | 515 | |||||||
| 1,712 | * | APG SGA S.A. | 374 | |||||||
| 173,000 | e,g | Archosaur Games, Inc | 179 | |||||||
| 147,636 | * | Arnoldo Mondadori Editore S.p.A. | 342 | |||||||
| 533,338 | * | Ascential plc | 2,933 | |||||||
| 865,300 | Astro Malaysia Holdings BHD | 197 | ||||||||
| 106,410 | Atresmedia Corp de Medios de Comunicacion S.A. | 406 | ||||||||
| 2,831,013 | g | Auto Trader Group plc | 28,352 | |||||||
| 53,923 | Autohome, Inc (ADR) | 1,590 | ||||||||
| 38,459 | Avex Group Holdings, Inc | 482 | ||||||||
| 1,241,851 | * | Baidu, Inc (ADR) | 184,775 | |||||||
| 1,125,500 | * | BEC World PCL (Foreign) | 475 | |||||||
| 156,557 | Beijing Enlight Media Co Ltd | 316 | ||||||||
| 39,187 | Beijing Kunlun Tech Co Ltd | 143 | ||||||||
| 24,297 | * | Believe S.A. | 467 | |||||||
| 8,700 | *,e | Bengo4.com, Inc | 461 | |||||||
| 34,910 | * | Better Collective A.S. | 756 | |||||||
| 470,667 | *,e | Bilibili, Inc (ADR) | 21,839 | |||||||
| 979,589 | Bollore | 5,479 | ||||||||
| 408,588 | * | Borussia Dortmund GmbH & Co KGaA | 2,014 | |||||||
| 15,942 | * | Boston Omaha Corp | 458 | |||||||
| 140 |
COLLEGE RETIREMENT EQUITIES FUND - Stock Account
| SHARES | COMPANY | VALUE (000) | ||||||||
| 536,353 | Brightcom Group Ltd | $ | 1,293 | |||||||
| 11,500 | *,e | Bushiroad, Inc | 188 | |||||||
| 5,233 | Cable One, Inc | 9,228 | ||||||||
| 123,700 | Capcom Co Ltd | 2,913 | ||||||||
| 2,756 | *,e | Cardlytics, Inc | 182 | |||||||
| 169,941 | * | Cargurus, Inc | 5,717 | |||||||
| 52,981 | * | Cars.com, Inc | 852 | |||||||
| 781,788 | carsales.com Ltd | 14,285 | ||||||||
| 416,000 | g | Cathay Media And Education Group, Inc | 106 | |||||||
| 47,110 | CD Projekt Red S.A. | 2,241 | ||||||||
| 187,436 | * | Charter Communications, Inc | 122,203 | |||||||
| 74,196 | * | Cheil Communications, Inc | 1,424 | |||||||
| 161,865 | *,† | Chennai Super Kings Cricket Ltd | 15 | |||||||
| 7,820 | * | Chicken Soup For The Soul Entertainment, Inc | 108 | |||||||
| 779,358 | *,e,g | China Literature Ltd | 4,904 | |||||||
| 46,700 | China South Publishing & Media Group Co Ltd | 70 | ||||||||
| 24,767 | *,e | Cinemark Holdings, Inc | 399 | |||||||
| 136,000 | *,e | Cineplex Galaxy Income Fund | 1,463 | |||||||
| 1,175,312 | *,e | Cineworld Group plc | 513 | |||||||
| 24,422 | * | CJ CGV Co Ltd | 513 | |||||||
| 296,354 | * | Clear Channel | 981 | |||||||
| 1,006,000 | e | CMGE Technology Group Ltd | 400 | |||||||
| 18,861 | Cogeco Communications, Inc | 1,502 | ||||||||
| 6,411 | Cogeco, Inc | 412 | ||||||||
| 147,918 | * | COLOPL, Inc | 845 | |||||||
| 9,108 | Com2uSCorp | 1,210 | ||||||||
| 11,018,668 | Comcast Corp (Class A) | 554,570 | ||||||||
| 126,963 | * | comScore, Inc | 424 | |||||||
| 760,078 | e | Corus Entertainment, Inc | 2,860 | |||||||
| 344,572 | * | CTS Eventim AG. | 25,186 | |||||||
| 22,136 | *,e | CuriosityStream, Inc | 131 | |||||||
| 344,140 | CyberAgent, Inc | 5,737 | ||||||||
| 291,914 | Cyfrowy Polsat S.A. | 2,515 | ||||||||
| 43,831 | Daiichikosho Co Ltd | 1,327 | ||||||||
| 1,095 | * | Daily Journal Corp | 391 | |||||||
| 279,111 | * | Dena Co Ltd | 4,298 | |||||||
| 310,883 | Dentsu, Inc | 11,065 | ||||||||
| 4,756 | * | Devsisters Co Ltd | 421 | |||||||
| 6,320 | e | Digital Bros S.p.A | 215 | |||||||
| 1,966 | * | Digital Media Solutions, Inc | 9 | |||||||
| 43,864 | Dip Corp | 1,493 | ||||||||
| 18,200 | e | Direct Marketing MiX, Inc | 264 | |||||||
| 141 |
COLLEGE RETIREMENT EQUITIES FUND - Stock Account
| SHARES | COMPANY | VALUE (000) | ||||||||
| 155,488 | *,e | Discovery, Inc (Class A) | $ | 3,660 | ||||||
| 297,947 | * | Discovery, Inc (Class C) | 6,823 | |||||||
| 279,930 | * | DISH Network Corp (Class A) | 9,081 | |||||||
| 695,522 | Domain Holdings Australia Ltd | 2,857 | ||||||||
| 1,265,124 | *,e | DouYu International Holdings Ltd (ADR) | 3,340 | |||||||
| 15,981 | Echo Marketing, Inc | 224 | ||||||||
| 447,300 | Electronic Arts, Inc | 58,999 | ||||||||
| 857,725 | *,e | Embracer Group AB | 9,100 | |||||||
| 21,735 | * | Emerald Holding, Inc | 86 | |||||||
| 186,463 | * | Entercom Communications Corp | 479 | |||||||
| 387,639 | * | Enthusiast Gaming Holdings, Inc | 1,140 | |||||||
| 488,130 | Entravision Communications Corp (Class A) | 3,309 | ||||||||
| 251,682 | *,e | Eros STX Global Corp | 60 | |||||||
| 139,878 | Euromoney Institutional Investor plc | 1,764 | ||||||||
| 210,788 | e | Eutelsat Communications | 2,573 | |||||||
| 122,848 | * | EVENT Hospitality and Entertainment Ltd | 1,323 | |||||||
| 498,903 | * | Eventbrite Inc | 8,701 | |||||||
| 62,901 | * | EverQuote Inc | 985 | |||||||
| 51,542 | * | EW Scripps Co (Class A) | 997 | |||||||
| 2,190,000 | Fire Rock Holdings Ltd | 304 | ||||||||
| 39,746 | * | Fluent, Inc | 79 | |||||||
| 1,050,307 | Focus Media Information Technology Co Ltd | 1,352 | ||||||||
| 306,390 | Fox Corp (Class A) | 11,306 | ||||||||
| 146,290 | Fox Corp (Class B) | 5,013 | ||||||||
| 26,553 | * | Frontier Developments plc | 640 | |||||||
| 404,027 | *,e | fuboTV, Inc | 6,270 | |||||||
| 61,800 | Fuji Television Network, Inc | 595 | ||||||||
| 373,273 | Future plc | 19,325 | ||||||||
| 39,648 | Gakken Co Ltd | 361 | ||||||||
| 714,942 | * | Gannett Co, Inc | 3,811 | |||||||
| 4,270 | G-bits Network Technology Xiamen Co Ltd | 283 | ||||||||
| 108,365 | Giant Network Group Co Ltd | 204 | ||||||||
| 7,858 | * | Giantstep, Inc | 461 | |||||||
| 10,400 | *,e | giftee, Inc | 177 | |||||||
| 1,520,364 | * | Glory Sun Land Group Ltd | 20 | |||||||
| 3,937 | * | Golfzon co Ltd | 578 | |||||||
| 75,862 | Gray Television, Inc | 1,529 | ||||||||
| 131,650 | e | Gree, Inc | 968 | |||||||
| 2,726,329 | e | Grupo Televisa S.A. | 5,133 | |||||||
| 4,138,079 | Grupo Televisa SAB (ADR) | 38,774 | ||||||||
| 122,043 | * | GungHo Online Entertainment Inc | 2,743 | |||||||
| 142 |
COLLEGE RETIREMENT EQUITIES FUND - Stock Account
| SHARES | COMPANY | VALUE (000) | ||||||||
| 363,437 | Hakuhodo DY Holdings, Inc | $ | 6,048 | |||||||
| 110,515 | Hello Group, Inc (ADR) | 992 | ||||||||
| 13,953 | * | Hemisphere Media Group, Inc | 101 | |||||||
| 54,728 | * | Hemnet Group AB | 1,013 | |||||||
| 2,564,600 | * | Hong Seng Consolidated Bhd | 1,656 | |||||||
| 1,710,000 | * | Huanxi Media Group Ltd | 309 | |||||||
| 42,630 | *,g | HUUUGE, Inc | 266 | |||||||
| 4,420,992 | *,a,e | HUYA, Inc (ADR) | 30,682 | |||||||
| 18,891 | * | HYBE Co Ltd | 5,533 | |||||||
| 46,110 | * | Hyundai Hy Communications & Network Co | 163 | |||||||
| 250,520 | * | IAC | 32,745 | |||||||
| 5,682,338 | *,a,e | iClick Interactive Asia Group Ltd (ADR) | 26,196 | |||||||
| 581,200 | *,e,g | iDreamSky Technology Holdings Ltd | 466 | |||||||
| 1,114,000 | IGG, Inc | 991 | ||||||||
| 614,105 | * | iHeartMedia, Inc | 12,921 | |||||||
| 130,700 | e,g | IMAX China Holding, Inc | 194 | |||||||
| 41,363 | * | Imax Corp | 738 | |||||||
| 89,673 | Info Edge India Ltd | 6,711 | ||||||||
| 1,739,931 | * | Informa plc | 12,182 | |||||||
| 103,000 | * | Infracommerce CXAAS S.A. | 322 | |||||||
| 9,794 | Innocean Worldwide, Inc | 456 | ||||||||
| 68,147 | * | Inox Leisure Ltd | 324 | |||||||
| 59,282 | * | Integral Ad Science Holding Corp | 1,317 | |||||||
| 64,854 | International Games System Co Ltd | 1,855 | ||||||||
| 462,994 | Interpublic Group of Cos, Inc | 17,339 | ||||||||
| 48,787 | IPSOS | 2,285 | ||||||||
| 209,048 | *,e | IQIYI, Inc (ADR) | 953 | |||||||
| 4,404,033 | * | ITV plc | 6,622 | |||||||
| 77,416 | * | JC Decaux S.A. | 1,938 | |||||||
| 5,533 | * | Jcontentree Corp | 254 | |||||||
| 37,415 | John Wiley & Sons, Inc (Class A) | 2,143 | ||||||||
| 625,000 | *,e | Joy Spreader Interactive Technology Ltd | 209 | |||||||
| 40,216 | JOYY, Inc (ADR) | 1,827 | ||||||||
| 31,657 | * | Just Dial Ltd | 347 | |||||||
| 1,467,630 | *,e | Juventus Football Club S.p.A. | 573 | |||||||
| 30,977 | * | JYP Entertainment Corp | 1,318 | |||||||
| 111,924 | Kadokawa Dwango Corp | 2,920 | ||||||||
| 778,202 | *,e | Kahoot! AS. | 4,071 | |||||||
| 108,914 | Kakaku.com, Inc | 2,912 | ||||||||
| 225,234 | Kakao Corp | 21,269 | ||||||||
| 33,434 | * | Kakao Games Corp | 2,555 | |||||||
| 82,800 | * | Kanzhun Ltd (ADR) | 2,888 | |||||||
| 143 |
COLLEGE RETIREMENT EQUITIES FUND - Stock Account
| SHARES | COMPANY | VALUE (000) | ||||||||
| 16,895 | *,e | Kinepolis Group NV | $ | 1,053 | ||||||
| 692,910 | Kingsoft Corp Ltd | 3,048 | ||||||||
| 40,790 | e | Koei Tecmo Holdings Co Ltd | 1,602 | |||||||
| 72,857 | Konami Corp | 3,497 | ||||||||
| 55,417 | *,e,g | Krafton, Inc | 21,418 | |||||||
| 24,441 | * | KT Skylife Co Ltd | 188 | |||||||
| 467,300 | *,g | Kuaishou Technology | 4,333 | |||||||
| 43,076 | * | Lagardere S.C.A. | 1,191 | |||||||
| 1,529 | * | Liberty Braves Group (Class A) | 44 | |||||||
| 11,032 | * | Liberty Braves Group (Class C) | 310 | |||||||
| 23,199 | * | Liberty Broadband Corp (Class A) | 3,733 | |||||||
| 132,204 | * | Liberty Broadband Corp (Class C) | 21,298 | |||||||
| 23,869 | * | Liberty Media Group (Class A) | 1,416 | |||||||
| 239,623 | * | Liberty Media Group (Class C) | 15,154 | |||||||
| 86,369 | * | Liberty SiriusXM Group (Class A) | 4,392 | |||||||
| 150,335 | * | Liberty SiriusXM Group (Class C) | 7,645 | |||||||
| 24,444 | * | Liberty TripAdvisor Holdings, Inc | 53 | |||||||
| 423,098 | *,e | Lions Gate Entertainment Corp (Class A) | 7,040 | |||||||
| 427,434 | * | Lions Gate Entertainment Corp (Class B) | 6,578 | |||||||
| 132,928 | * | Live Nation, Inc | 15,910 | |||||||
| 587,114 | * | LiveOne, Inc | 751 | |||||||
| 18,899 | * | Loyalty Ventures, Inc | 568 | |||||||
| 34,172 | M6-Metropole Television | 669 | ||||||||
| 17,456 | * | Madison Square Garden Co | 3,033 | |||||||
| 21,901 | * | Madison Square Garden Entertainment Corp | 1,540 | |||||||
| 758,461 | *,e | Magnite, Inc | 13,273 | |||||||
| 1,578,075 | * | Mail.Ru Group Ltd (GDR) | 18,290 | |||||||
| 535,100 | Major Cineplex Group PCL (Foreign) | 320 | ||||||||
| 115,922 | Mango Excellent Media Co Ltd | 1,041 | ||||||||
| 21,039 | *,e | Marcus Corp | 376 | |||||||
| 1,585,187 | * | Match Group, Inc | 209,641 | |||||||
| 100,783 | *,e | Media and Games Invest plc | 494 | |||||||
| 7,414,798 | Media Nusantara Citra Tbk PT | 468 | ||||||||
| 3,068 | * | MediaAlpha, Inc | 47 | |||||||
| 203,549 | * | Mediaset Espana Comunicacion SA | 956 | |||||||
| 358,799 | e | Megacable Holdings SAB de C.V. | 1,222 | |||||||
| 2,399,500 | *,g | Meitu, Inc | 477 | |||||||
| 533,500 | Meliuz S.A. | 310 | ||||||||
| 3,979,559 | * | Meta Platforms, Inc. | 1,338,525 | |||||||
| 386,789 | *,e | MFE-MediaForEurope NV | 394 | |||||||
| 386,789 | e | MFE-MediaForEurope NV | 547 | |||||||
| 53,890 | Mixi Inc | 944 | ||||||||
| 19,519,300 | * | MNC Vision Networks Tbk PT | 230 | |||||||
| 144 |
COLLEGE RETIREMENT EQUITIES FUND - Stock Account
| SHARES | COMPANY | VALUE (000) | ||||||||
| 506,697 | *,e,g | Mobvista, Inc | $ | 448 | ||||||
| 121,791 | * | Modern Times Group AB (B Shares) | 1,240 | |||||||
| 419,641 | MultiChoice Group Ltd | 3,217 | ||||||||
| 63,900 | NanJi E-Commerce Co Ltd | 69 | ||||||||
| 57,631 | National CineMedia, Inc | 162 | ||||||||
| 117,513 | * | Naver Corp | 37,301 | |||||||
| 7,816 | * | Nazara Technologies Ltd | 240 | |||||||
| 11,963 | * | NCsoft | 6,462 | |||||||
| 14,392 | * | Neowiz | 436 | |||||||
| 11,950 | * | Neptune Co | 281 | |||||||
| 263,634 | NetDragon Websoft, Inc | 620 | ||||||||
| 2,915,530 | NetEase, Inc | 58,948 | ||||||||
| 580,224 | * | Netflix, Inc | 349,550 | |||||||
| 15,045 | *,g | Netmarble Corp | 1,580 | |||||||
| 4,311 | New Work SE | 1,067 | ||||||||
| 157,130 | e | New York Times Co (Class A) | 7,589 | |||||||
| 517,057 | News Corp (Class A) | 11,536 | ||||||||
| 116,010 | News Corp (Class B) | 2,610 | ||||||||
| 749,378 | Nexon Co Ltd | 14,490 | ||||||||
| 37,868 | Nexstar Media Group Inc | 5,717 | ||||||||
| 20,640 | * | NHN Corp | 781 | |||||||
| 1,762,916 | Nine Entertainment Co Holdings Ltd | 3,726 | ||||||||
| 178,630 | n | Nintendo Co Ltd | 83,573 | |||||||
| 69,000 | Nippon Television Network Corp | 700 | ||||||||
| 89,449 | * | Nordic Entertainment Group AB | 4,635 | |||||||
| 202,523 | Omnicom Group, Inc | 14,839 | ||||||||
| 786,193 | * | oOh!media Ltd | 969 | |||||||
| 4,289 | * | Outbrain, Inc | 60 | |||||||
| 53,670 | e | Paradox Interactive AB | 1,060 | |||||||
| 20,619 | * | Pearl Abyss Corp | 2,396 | |||||||
| 828,942 | Pearson plc | 6,877 | ||||||||
| 115,534 | Perfect World Co Ltd | 368 | ||||||||
| 47,815 | * | Perion Network Ltd | 1,160 | |||||||
| 602,055 | * | Pinterest, Inc | 21,885 | |||||||
| 2,265,777 | * | Plan B Media PCL | 519 | |||||||
| 100,201 | * | Playtika Holding Corp | 1,732 | |||||||
| 1,128 | PlayWay S.A. | 117 | ||||||||
| 120,000 | *,e | PR Times, Inc | 3,174 | |||||||
| 203,425 | ProSiebenSat. Media AG. | 3,232 | ||||||||
| 61,008 | Proto Corp | 729 | ||||||||
| 299,042 | Publicis Groupe S.A. | 20,148 | ||||||||
| 48,718 | * | PVR Ltd | 849 | |||||||
| 145 |
COLLEGE RETIREMENT EQUITIES FUND - Stock Account
| SHARES | COMPANY | VALUE (000) | ||||||||
| 202,594 | Quebecor, Inc | $ | 4,573 | |||||||
| 105,452 | * | QuinStreet, Inc | 1,918 | |||||||
| 106,710 | g | RAI Way S.p.A | 632 | |||||||
| 55,981 | REA Group Ltd | 6,826 | ||||||||
| 11,064 | e | Remedy Entertainment Oyj | 500 | |||||||
| 1,232,870 | Rightmove plc | 13,304 | ||||||||
| 192,804 | * | ROBLOX Corp | 19,890 | |||||||
| 174,913 | * | Roku, Inc | 39,915 | |||||||
| 48,649 | e,g | Rovio Entertainment Oyj | 364 | |||||||
| 520,500 | * | RS PCL | 338 | |||||||
| 336,214 | * | S4 Capital plc | 2,902 | |||||||
| 101,132 | Sanoma-WSOY Oyj | 1,561 | ||||||||
| 6,995 | Saregama India Ltd | 492 | ||||||||
| 39,146 | * | Saudi Research & Marketing Group | 2,041 | |||||||
| 80,016 | Schibsted ASA | 3,085 | ||||||||
| 108,202 | Schibsted ASA (B Shares) | 3,649 | ||||||||
| 23,043 | Scholastic Corp | 921 | ||||||||
| 313,300 | g | Scout24 AG. | 21,877 | |||||||
| 174,073 | *,n | Sea Ltd (ADR) | 38,942 | |||||||
| 366,825 | Seek Ltd | 8,745 | ||||||||
| 2,258,400 | Septeni Holdings Co Ltd | 9,548 | ||||||||
| 706,862 | SES S.A. | 5,602 | ||||||||
| 558,936 | Shaw Communications, Inc (B Shares) | 16,963 | ||||||||
| 11,301 | * | Shochiku Co Ltd | 1,180 | |||||||
| 36,001 | e | Sinclair Broadcast Group, Inc (Class A) | 951 | |||||||
| 1,958,200 | e | Singapore Press Holdings Ltd | 3,381 | |||||||
| 827,056 | e | Sirius XM Holdings, Inc | 5,252 | |||||||
| 293,093 | *,e | Skillz, Inc | 2,181 | |||||||
| 786,900 | Sky Perfect Jsat Corp | 2,873 | ||||||||
| 20,675 | * | SM Entertainment Co | 1,289 | |||||||
| 617,600 | *,†,e | SMI Holdings Group Ltd | 1 | |||||||
| 295,952 | * | Snap, Inc | 13,919 | |||||||
| 58,705 | Societe Television Francaise 1 | 583 | ||||||||
| 67,540 | Soft-World International Corp | 240 | ||||||||
| 31,241 | *,e | Sohu.com Ltd (ADR) | 509 | |||||||
| 318,354 | Southern Cross Media Group | 449 | ||||||||
| 169,728 | * | Spotify Technology S.A. | 39,721 | |||||||
| 59,500 | Square Enix Co Ltd | 3,052 | ||||||||
| 98,480 | * | Stagwell, Inc | 854 | |||||||
| 370,152 | *,e | Stillfront Group AB | 1,975 | |||||||
| 171,494 | *,e | Storytel AB | 3,120 | |||||||
| 34,464 | Stroer Out-of-Home Media AG. | 2,719 | ||||||||
| 146 |
COLLEGE RETIREMENT EQUITIES FUND - Stock Account
| SHARES | COMPANY | VALUE (000) | ||||||||
| 133,235 | * | Sumo Group plc | $ | 925 | ||||||
| 83,089 | Sun TV Network Ltd | 558 | ||||||||
| 19,585,000 | * | Surya Citra Media Tbk PT | 449 | |||||||
| 131,922 | * | Taboola.com Ltd | 1,026 | |||||||
| 589,610 | * | Take-Two Interactive Software, Inc | 104,785 | |||||||
| 3,630 | * | Tamedia AG. | 623 | |||||||
| 160,211 | * | Team17 Group plc | 1,691 | |||||||
| 233,545 | * | Technicolor S.A. | 748 | |||||||
| 50,864 | *,e | TechTarget, Inc | 4,866 | |||||||
| 194,397 | TEGNA, Inc | 3,608 | ||||||||
| 54,510 | Telenet Group Holding NV | 1,989 | ||||||||
| 3,918 | TEN Square Games S.A. | 338 | ||||||||
| 11,028,759 | Tencent Holdings Ltd | 643,540 | ||||||||
| 471,697 | * | Tencent Music Entertainment (ADR) | 3,231 | |||||||
| 24,336 | *,e | Thinkific Labs, Inc | 171 | |||||||
| 23,594 | * | Thryv Holdings, Inc | 970 | |||||||
| 7,484 | Toei Co Ltd | 1,143 | ||||||||
| 90,645 | Toho Co Ltd | 3,879 | ||||||||
| 44,300 | Tokyo Broadcasting System, Inc | 642 | ||||||||
| 257,400 | * | Tongdao Liepin Group | 625 | |||||||
| 134,905 | * | Tremor International Ltd | 1,012 | |||||||
| 345,309 | Trinity Mirror plc | 1,320 | ||||||||
| 93,553 | * | TripAdvisor, Inc | 2,550 | |||||||
| 97,484 | * | TrueCar, Inc | 331 | |||||||
| 1,080,361 | *,e,g | Trustpilot Group plc | 4,784 | |||||||
| 24,551 | TV Asahi Corp | 306 | ||||||||
| 473,038 | * | TV18 Broadcast Ltd | 285 | |||||||
| 1,749,867 | * | Twitter, Inc | 75,629 | |||||||
| 100,669 | * | Ubisoft Entertainment | 4,911 | |||||||
| 1,553,844 | e | Universal Music Group NV | 43,837 | |||||||
| 20,758 | ValueCommerce Co Ltd | 808 | ||||||||
| 32,335 | * | Vector, Inc | 330 | |||||||
| 3,623,500 | VGI PCL | 716 | ||||||||
| 9,602 | n | ViacomCBS, Inc (Class A) | 320 | |||||||
| 586,715 | n | ViacomCBS, Inc (Class B) | 17,707 | |||||||
| 447,405 | * | Vimeo, Inc | 8,035 | |||||||
| 5,840,000 | e | Viva China Holdings Ltd | 1,153 | |||||||
| 1,617,119 | Vivendi Universal S.A. | 21,875 | ||||||||
| 3,460,304 | *,n | Walt Disney Co | 535,966 | |||||||
| 15,043 | * | Webzen, Inc | 365 | |||||||
| 46,326 | *,e | Weibo Corp (ADR) | 1,435 | |||||||
| 20,096 | WeMade Entertainment Co Ltd | 2,999 | ||||||||
| 147 |
COLLEGE RETIREMENT EQUITIES FUND - Stock Account
| SHARES | COMPANY | VALUE (000) | ||||||||
| 159,618 | * | WideOpenWest, Inc | $ | 3,435 | ||||||
| 42,929 | e | World Wrestling Entertainment, Inc (Class A) | 2,118 | |||||||
| 1,613,444 | WPP plc | 24,569 | ||||||||
| 139,523 | Wuhu Shunrong Sanqi Interactive Entertainment Network Technology Co Ltd | 592 | ||||||||
| 25,559 | * | Wysiwyg Studios Co Ltd | 852 | |||||||
| 208,800 | *,e | XD, Inc | 1,060 | |||||||
| 717,570 | * | Yandex NV | 43,413 | |||||||
| 230,829 | * | Yelp, Inc | 8,365 | |||||||
| 11,567 | * | YG Entertainment, Inc | 540 | |||||||
| 514,679 | YouGov plc | 11,064 | ||||||||
| 2,860,239 | Z Holdings Corp | 16,504 | ||||||||
| 940,285 | ZEE Telefilms Ltd | 4,043 | ||||||||
| 36,550 | Zenrin Co Ltd | 316 | ||||||||
| 613,213 | * | Zhejiang Century Huatong Group Co Ltd | 809 | |||||||
| 72,548 | * | Ziff Davis Inc | 8,043 | |||||||
| 594,798 | * | ZoomInfo Technologies, Inc | 38,186 | |||||||
| 996,310 | * | Zynga, Inc | 6,376 | |||||||
| TOTAL MEDIA & ENTERTAINMENT | 9,176,373 | |||||||||
| PHARMACEUTICALS, BIOTECHNOLOGY & LIFE SCIENCES - 6.8% | ||||||||||
| 44,013 | * | 10X Genomics, Inc | 6,556 | |||||||
| 20,375 | * | 2seventy bio, Inc | 522 | |||||||
| 1,030,151 | *,g | 3SBio, Inc | 858 | |||||||
| 34,092 | * | 4D Molecular Therapeutics, Inc | 748 | |||||||
| 28,478 | *,e | 89bio, Inc | 372 | |||||||
| 1,517,720 | *,e | 9 Meters Biopharma, Inc | 1,485 | |||||||
| 36,099 | * | Aarti Drugs Ltd | 264 | |||||||
| 32,169 | *,e | AB Science S.A. | 440 | |||||||
| 5,672,714 | AbbVie, Inc | 768,085 | ||||||||
| 262,032 | * | Abcam plc | 6,146 | |||||||
| 30,048 | * | ABLBio, Inc | 558 | |||||||
| 6,298 | *,e | Absci Corp | 52 | |||||||
| 130,853 | * | Acadia Pharmaceuticals, Inc | 3,054 | |||||||
| 118,961 | *,e | Aclaris Therapeutics, Inc | 1,730 | |||||||
| 4,587 | * | Acumen Pharmaceuticals, Inc | 31 | |||||||
| 9,334 | * | Adagio Therapeutics, Inc | 68 | |||||||
| 105,789 | * | Adaptive Biotechnologies Corp | 2,968 | |||||||
| 89,934 | Adcock Ingram Holdings Ltd | 285 | ||||||||
| 19,082 | *,e | Adicet Bio, Inc | 334 | |||||||
| 319,000 | Adimmune Corp | 515 | ||||||||
| 87,552 | * | Adverum Biotechnologies, Inc | 154 | |||||||
| 40,672 | * | Aeglea BioTherapeutics, Inc | 193 | |||||||
| 148 |
COLLEGE RETIREMENT EQUITIES FUND - Stock Account
| SHARES | COMPANY | VALUE (000) | ||||||||
| 51,544 | *,e | Aerie Pharmaceuticals, Inc | $ | 362 | ||||||
| 4,767 | *,e | Aerovate Therapeutics, Inc | 56 | |||||||
| 169,979 | * | Affimed NV | 938 | |||||||
| 663,192 | * | Agenus, Inc | 2,135 | |||||||
| 124,938 | Agilent Technologies, Inc | 19,946 | ||||||||
| 69,567 | * | Agios Pharmaceuticals, Inc | 2,287 | |||||||
| 28,182 | Ajanta Pharma Ltd | 847 | ||||||||
| 91,603 | * | Akebia Therapeutics, Inc | 207 | |||||||
| 7,803 | * | Akero Therapeutics, Inc | 165 | |||||||
| 283,000 | *,e,g | Akeso, Inc | 1,234 | |||||||
| 24,532 | *,e | Akouos, Inc | 209 | |||||||
| 2,892 | * | Akoya Biosciences, Inc | 44 | |||||||
| 4,729 | * | Albireo Pharma, Inc | 110 | |||||||
| 75,281 | *,†,e | Alder Biopharmaceuticals Inc | 66 | |||||||
| 95,376 | *,e | Aldeyra Therapeutics, Inc | 382 | |||||||
| 126,132 | * | Alector, Inc | 2,605 | |||||||
| 63,140 | Alembic Pharmaceuticals Ltd | 680 | ||||||||
| 3,039 | * | Aligos Therapeutics, Inc | 36 | |||||||
| 8,005 | * | ALK-Abello AS | 4,203 | |||||||
| 455,457 | * | Alkermes plc | 10,594 | |||||||
| 3,750 | * | Allakos, Inc | 37 | |||||||
| 1,284,421 | Alliance Pharma plc | 1,904 | ||||||||
| 78,370 | * | Allogene Therapeutics, Inc | 1,169 | |||||||
| 2,947 | * | Allovir, Inc | 38 | |||||||
| 90,097 | Almirall S.A. | 1,151 | ||||||||
| 301,849 | * | Alnylam Pharmaceuticals, Inc | 51,188 | |||||||
| 17,561 | * | Alpha Teknova, Inc | 360 | |||||||
| 410,000 | *,e,g | Alphamab Oncology | 716 | |||||||
| 2,057 | *,e | Alpine Immune Sciences, Inc | 28 | |||||||
| 19,375 | * | Alteogen, Inc | 1,232 | |||||||
| 1,290,611 | *,e | Altimmune, Inc | 11,822 | |||||||
| 2,014 | * | ALX Oncology Holdings, Inc | 43 | |||||||
| 153,673 | Amgen, Inc | 34,572 | ||||||||
| 45,062 | * | Amicogen, Inc | 1,201 | |||||||
| 563,843 | * | Amicus Therapeutics, Inc | 6,512 | |||||||
| 1,125,903 | * | Amneal Pharmaceuticals, Inc | 5,393 | |||||||
| 121,313 | * | Amphastar Pharmaceuticals, Inc | 2,825 | |||||||
| 31,584 | *,e | Ampio Pharmaceuticals, Inc | 18 | |||||||
| 103,999 | * | AnaptysBio, Inc | 3,614 | |||||||
| 5,598 | *,e | Anavex Life Sciences Corp | 97 | |||||||
| 158,172 | *,e | AnGes MG, Inc | 529 | |||||||
| 3,494 | * | Angion Biomedica Corp | 10 | |||||||
| 149 |
COLLEGE RETIREMENT EQUITIES FUND - Stock Account
| SHARES | COMPANY | VALUE (000) | ||||||||
| 9,070 | * | ANI Pharmaceuticals, Inc | $ | 418 | ||||||
| 13,175 | * | Anika Therapeutics, Inc | 472 | |||||||
| 27,725 | *,e | Annexon, Inc | 319 | |||||||
| 769,434 | * | Antares Pharma, Inc | 2,747 | |||||||
| 214,000 | *,g | Antengene Corp Ltd | 269 | |||||||
| 8,216 | * | Anterogen Co Ltd | 443 | |||||||
| 1,287,120 | *,† | Anxin-China Holdings Ltd | 2 | |||||||
| 59,495 | * | Apellis Pharmaceuticals, Inc | 2,813 | |||||||
| 62,971 | Apeloa Pharmaceutical Co Ltd | 347 | ||||||||
| 2,337 | * | Applied Molecular Transport, Inc | 33 | |||||||
| 6,867 | * | Applied Therapeutics, Inc | 61 | |||||||
| 16,350 | * | AptaBio Therapeutics, Inc | 510 | |||||||
| 38,465 | *,e | AquaBounty Technologies, Inc | 81 | |||||||
| 329,368 | *,e | Arbutus Biopharma Corp | 1,281 | |||||||
| 25,287 | *,e | Arcturus Therapeutics Holdings, Inc | 936 | |||||||
| 39,884 | * | Arcus Biosciences, Inc | 1,614 | |||||||
| 67,876 | * | Arcutis Biotherapeutics, Inc | 1,408 | |||||||
| 31,095 | * | Ardelyx, Inc | 34 | |||||||
| 288,793 | * | Arena Pharmaceuticals, Inc | 26,840 | |||||||
| 69,894 | * | Argenx SE | 24,855 | |||||||
| 17,020 | * | Argenx SE | 6,110 | |||||||
| 125,318 | * | Arrowhead Pharmaceuticals Inc | 8,309 | |||||||
| 104,684 | * | Arvinas, Inc | 8,599 | |||||||
| 158,400 | *,e,g | Ascentage Pharma Group International | 573 | |||||||
| 423,160 | Aspen Pharmacare Holdings Ltd | 5,960 | ||||||||
| 2,185,884 | Astellas Pharma, Inc | 35,576 | ||||||||
| 5,829 | AstraZeneca Pharma India Ltd | 243 | ||||||||
| 4,526,831 | AstraZeneca plc | 528,595 | ||||||||
| 2,190,288 | e | AstraZeneca plc (ADR) | 127,584 | |||||||
| 16,716 | Asymchem Laboratories Tianjin Co Ltd | 1,141 | ||||||||
| 306,200 | * | Atara Biotherapeutics, Inc | 4,826 | |||||||
| 53,140 | * | Atea Pharmaceuticals, Inc | 475 | |||||||
| 122,607 | *,e | Athenex, Inc | 167 | |||||||
| 63,367 | *,e | Athersys, Inc | 57 | |||||||
| 29,485 | *,e | Athira Pharma, Inc | 384 | |||||||
| 106,003 | *,e | Atossa Therapeutics, Inc | 170 | |||||||
| 58,530 | *,e | Atreca, Inc | 177 | |||||||
| 2,047 | * | Aura Biosciences, Inc | 35 | |||||||
| 210,516 | Aurobindo Pharma Ltd | 2,075 | ||||||||
| 238,270 | *,e | Aurora Cannabis, Inc | 1,290 | |||||||
| 293,590 | *,e | Avacta Group plc | 502 | |||||||
| 431,817 | * | Avalo Therapeutics, Inc | 734 | |||||||
| 150 |
COLLEGE RETIREMENT EQUITIES FUND - Stock Account
| SHARES | COMPANY | VALUE (000) | ||||||||
| 4,400,239 | * | Avantor, Inc | $ | 185,426 | ||||||
| 250,573 | * | Avid Bioservices, Inc | 7,312 | |||||||
| 24,247 | * | Avidity Biosciences, Inc | 576 | |||||||
| 3,710 | *,e | Avita Medical, Inc | 44 | |||||||
| 36,308 | * | Avrobio, Inc | 140 | |||||||
| 203,951 | *,e | Axsome Therapeutics, Inc | 7,705 | |||||||
| 8,345 | Bachem Holding AG. | 6,535 | ||||||||
| 14,592 | *,e | Basilea Pharmaceutica | 654 | |||||||
| 376,362 | * | Bausch Health Cos, Inc | 10,396 | |||||||
| 77,664 | * | Bavarian Nordic AS | 3,190 | |||||||
| 871,053 | Bayer AG. | 46,518 | ||||||||
| 41,330 | * | Beam Therapeutics, Inc | 3,294 | |||||||
| 33,758 | * | BeiGene Ltd (ADR) | 9,146 | |||||||
| 35,391 | Beijing Tiantan Biological Products Corp Ltd | 161 | ||||||||
| 275,000 | e | Beijing Tong Ren Tang Chinese Medicine Co Ltd | 473 | |||||||
| 27,500 | Beijing Wantai Biological Pharmacy Enterprise Co Ltd | 957 | ||||||||
| 78,974 | * | Berkeley Lights, Inc | 1,436 | |||||||
| 15,861 | Betta Pharmaceuticals Co Ltd | 199 | ||||||||
| 134,694 | *,e | Beyondspring Inc | 610 | |||||||
| 18,220 | BGI Genomics Co Ltd | 251 | ||||||||
| 27,168 | * | Binex Co Ltd | 347 | |||||||
| 64,000 | *,g | BioArctic AB | 844 | |||||||
| 1,513 | * | BioAtla, Inc | 30 | |||||||
| 477,426 | * | Biocon Ltd | 2,337 | |||||||
| 435,474 | *,e | BioCryst Pharmaceuticals, Inc | 6,031 | |||||||
| 442,933 | * | BioDelivery Sciences International, Inc | 1,373 | |||||||
| 20,705 | e | Biogaia AB (B Shares) | 1,185 | |||||||
| 137,755 | * | Biogen, Inc | 33,050 | |||||||
| 43,559 | * | Biohaven Pharmaceutical Holding Co Ltd | 6,003 | |||||||
| 276,683 | * | BioMarin Pharmaceutical, Inc | 24,445 | |||||||
| 2,707 | *,e | Biomea Fusion, Inc | 20 | |||||||
| 25,524 | *,e | Bionano Genomics, Inc | 76 | |||||||
| 22,486 | * | Bioneer Corp | 919 | |||||||
| 3,642 | * | BioNTech SE (ADR) | 939 | |||||||
| 14,533 | * | Bio-Rad Laboratories, Inc (Class A) | 10,981 | |||||||
| 107,171 | Biotage AB | 3,101 | ||||||||
| 17,631 | Bio-Techne Corp | 9,121 | ||||||||
| 1,566 | *,e | Bioxcel Therapeutics Inc | 32 | |||||||
| 22,766 | * | Black Diamond Therapeutics, Inc | 121 | |||||||
| 36,300 | Blau Farmaceutica S.A. | 237 | ||||||||
| 61,152 | * | Bluebird Bio, Inc | 611 | |||||||
| 135,216 | * | Blueprint Medicines Corp | 14,483 | |||||||
| 151 |
COLLEGE RETIREMENT EQUITIES FUND - Stock Account
| SHARES | COMPANY | VALUE (000) | ||||||||
| 5,035 | Boiron S.A. | $ | 205 | |||||||
| 22,648 | *,e | Bolt Biotherapeutics, Inc | 111 | |||||||
| 28,184 | * | Boryung Pharmaceutical Co Ltd | 345 | |||||||
| 37,126 | *,e | Bridgebio Pharma, Inc | 619 | |||||||
| 4,039,712 | Bristol-Myers Squibb Co | 251,876 | ||||||||
| 7,191 | *,e | Brooklyn ImmunoTherapeutics, Inc | 30 | |||||||
| 87,213 | Bruker BioSciences Corp | 7,318 | ||||||||
| 46,134 | Bukwang Pharmaceutical Co Ltd | 500 | ||||||||
| 47,800 | * | Burning Rock Biotech Ltd (ADR) | 456 | |||||||
| 35,473 | * | C4 Therapeutics, Inc | 1,142 | |||||||
| 32,559 | *,e | Calliditas Therapeutics AB | 406 | |||||||
| 39,809 | *,e | Camurus AB | 664 | |||||||
| 289,477 | *,e | Canopy Growth Corp (Toronto) | 2,526 | |||||||
| 56,275 | *,e,g | CanSino Biologics, Inc | 1,301 | |||||||
| 5,990 | * | CanSino Biologics, Inc | 282 | |||||||
| 19,610 | Caplin Point Laboratories Ltd | 226 | ||||||||
| 133,349 | * | Cara Therapeutics, Inc | 1,624 | |||||||
| 137,452 | *,e | Cardiff Oncology, Inc | 826 | |||||||
| 130,141 | * | CareDx, Inc | 5,919 | |||||||
| 3,495 | Caregen Co Ltd | 195 | ||||||||
| 9,320 | * | Caribou Biosciences, Inc | 141 | |||||||
| 51,150 | *,e | Cassava Sciences, Inc | 2,235 | |||||||
| 274,800 | * | Catalent, Inc | 35,183 | |||||||
| 191,414 | * | Catalyst Pharmaceuticals, Inc | 1,296 | |||||||
| 1,838 | * | Celcuity, Inc | 24 | |||||||
| 11,115 | * | Celldex Therapeutics, Inc | 429 | |||||||
| 37,016 | *,e | Cellectis S.A. | 306 | |||||||
| 6,797 | * | Cellid Co Ltd | 280 | |||||||
| 39,881 | * | CELLINK AB | 1,219 | |||||||
| 18,248 | * | Cellivery Therapeutics, Inc | 670 | |||||||
| 6,000 | *,e | CellSource Co Ltd | 283 | |||||||
| 11,543 | * | Celltrion Pharm Inc | 1,207 | |||||||
| 113,663 | e | Celltrion, Inc | 18,921 | |||||||
| 26,517 | Celon Pharma S.A. | 218 | ||||||||
| 8,498 | *,e | CEL-SCI Corp | 60 | |||||||
| 385,263 | Center Laboratories, Inc | 841 | ||||||||
| 5,678 | *,e | Century Therapeutics, Inc | 90 | |||||||
| 4,723 | * | Cerevel Therapeutics Holdings, Inc | 153 | |||||||
| 15,114 | Changchun High & New Technology Industry Group, Inc | 644 | ||||||||
| 97,349 | * | Charles River Laboratories International, Inc | 36,679 | |||||||
| 190,511 | * | ChemoCentryx, Inc | 6,937 | |||||||
| 37,595 | Chemometec A.S. | 4,761 | ||||||||
| 152 |
COLLEGE RETIREMENT EQUITIES FUND - Stock Account
| SHARES | COMPANY | VALUE (000) | ||||||||
| 120,061 | * | Chimerix, Inc | $ | 772 | ||||||
| 1,163,500 | e | China Grand Pharmaceutical and Healthcare Holdings Ltd | 964 | |||||||
| 1,021,660 | China Medical System Holdings Ltd | 1,708 | ||||||||
| 65,820 | China Resources Sanjiu Medical & Pharmaceutical Co Ltd | 354 | ||||||||
| 462,560 | China Shineway Pharmaceutical Group Ltd | 410 | ||||||||
| 58,764 | * | Chinook Therapeutics, Inc | 958 | |||||||
| 7,404 | * | Chong Kun Dang Pharmaceutical Corp | 690 | |||||||
| 62,980 | Chongqing Zhifei Biological Products Co Ltd | 1,231 | ||||||||
| 13,819 | * | Choongwae Pharma Corp | 265 | |||||||
| 312,686 | *,e | ChromaDex Corp | 1,169 | |||||||
| 343,406 | Chugai Pharmaceutical Co Ltd | 11,194 | ||||||||
| 446,509 | Cipla Ltd | 5,664 | ||||||||
| 111,463 | *,e | Citius Pharmaceuticals, Inc | 172 | |||||||
| 3,094,000 | e | CK Life Sciences International Holdings, Inc | 294 | |||||||
| 9,123 | *,e | Clene, Inc | 37 | |||||||
| 153,927 | e | Clinigen Group plc | 1,907 | |||||||
| 50,612 | Clinuvel Pharmaceuticals Ltd | 1,000 | ||||||||
| 8,980 | *,e | Clovis Oncology, Inc | 24 | |||||||
| 108,238 | * | CMG Pharmaceutical Co Ltd | 349 | |||||||
| 1,397 | *,e | Codex DNA, Inc | 15 | |||||||
| 123,861 | * | Codexis, Inc | 3,873 | |||||||
| 2,825 | *,e | Codiak Biosciences, Inc | 31 | |||||||
| 28,586 | *,e | Cogent Biosciences, Inc | 245 | |||||||
| 115,317 | * | Coherus Biosciences, Inc | 1,840 | |||||||
| 3,209 | * | Collegium Pharmaceutical, Inc | 60 | |||||||
| 272,235 | * | Columbia Care, Inc | 775 | |||||||
| 110,525 | *,e | Compugen Ltd | 475 | |||||||
| 8,212 | * | Corcept Therapeutics, Inc | 163 | |||||||
| 86,638 | *,e | CorMedix Inc | 394 | |||||||
| 1,576 | *,e | Cortexyme Inc | 20 | |||||||
| 10,218 | *,e | COSMO Pharmaceuticals NV | 734 | |||||||
| 9,170 | * | Crinetics Pharmaceuticals, Inc | 261 | |||||||
| 246,061 | *,e | Cronos Group, Inc | 969 | |||||||
| 530,464 | CSL Ltd | 112,193 | ||||||||
| 6,660,054 | CSPC Pharmaceutical Group Ltd | 7,252 | ||||||||
| 799,500 | *,g | CStone Pharmaceuticals | 848 | |||||||
| 2,315 | * | Cue Biopharma, Inc | 26 | |||||||
| 41,943 | *,e | Cullinan Oncology, Inc | 647 | |||||||
| 13,876 | *,e | CureVac NV | 476 | |||||||
| 18,014 | * | Curis, Inc | 86 | |||||||
| 69,704 | *,e | Cymabay Therapeutics, Inc | 236 | |||||||
| 3,661 | * | Cyteir Therapeutics, Inc | 42 | |||||||
| 153 |
COLLEGE RETIREMENT EQUITIES FUND - Stock Account
| SHARES | COMPANY | VALUE (000) | ||||||||
| 34,017 | *,e | Cytek Biosciences, Inc | $ | 555 | ||||||
| 36,502 | * | Cytokinetics, Inc | 1,664 | |||||||
| 14,994 | * | CytomX Therapeutics, Inc | 65 | |||||||
| 83,371 | Da An Gene Co Ltd of Sun Yat-Sen University | 262 | ||||||||
| 94,972 | * | Daewoong Co Ltd | 2,478 | |||||||
| 9,678 | * | Daewoong Pharmaceutical Co Ltd | 1,202 | |||||||
| 3,556,701 | Daiichi Sankyo Co Ltd | 90,523 | ||||||||
| 1,200,730 | Danaher Corp | 395,052 | ||||||||
| 5,158 | *,e | Day One Biopharmaceuticals, Inc | 87 | |||||||
| 693,138 | Dechra Pharmaceuticals plc | 50,096 | ||||||||
| 9,932 | * | Deciphera Pharmaceuticals, Inc | 97 | |||||||
| 75,939 | * | Denali Therapeutics, Inc | 3,387 | |||||||
| 68,694 | Dermapharm Holding SE | 6,975 | ||||||||
| 1,982 | *,e | DermTech, Inc | 31 | |||||||
| 8,109 | * | Design Therapeutics, Inc | 174 | |||||||
| 5,832 | * | DICE Therapeutics, Inc | 148 | |||||||
| 274,521 | Divi S Laboratories Ltd | 17,252 | ||||||||
| 3,701 | Dong-A Pharmaceutical Co Ltd | 357 | ||||||||
| 4,841 | * | Dong-A ST Co Ltd | 291 | |||||||
| 43,371 | Dong-E-E-Jiao Co Ltd | 332 | ||||||||
| 24,894 | * | DongKook Pharmaceutical Co Ltd | 456 | |||||||
| 18,490 | * | Dongwha Pharm Co Ltd | 227 | |||||||
| 249,583 | Dr Reddy’s Laboratories Ltd | 16,446 | ||||||||
| 105,242 | Dr Reddys Laboratories Ltd (ADR) | 6,884 | ||||||||
| 396,000 | Duopharma Biotech Bhd | 160 | ||||||||
| 198,444 | *,e | Durect Corp | 196 | |||||||
| 498,566 | *,e | Dynavax Technologies Corp | 7,015 | |||||||
| 27,074 | *,e | Dyne Therapeutics, Inc | 322 | |||||||
| 6,198 | * | Eagle Pharmaceuticals, Inc | 316 | |||||||
| 4,585 | * | Edgewise Therapeutics, Inc | 70 | |||||||
| 130,931 | * | Editas Medicine, Inc | 3,476 | |||||||
| 32,944 | * | Eiger BioPharmaceuticals, Inc | 171 | |||||||
| 164,000 | * | EirGenix, Inc | 661 | |||||||
| 341,018 | Eisai Co Ltd | 19,359 | ||||||||
| 458,837 | * | Elanco Animal Health, Inc | 13,022 | |||||||
| 1,233,294 | Eli Lilly & Co | 340,660 | ||||||||
| 3,590 | *,e | Eliem Therapeutics, Inc | 38 | |||||||
| 58,580 | * | Emergent Biosolutions, Inc | 2,546 | |||||||
| 15,380 | * | Enanta Pharmaceuticals, Inc | 1,150 | |||||||
| 106,995 | * | Endo International plc | 402 | |||||||
| 3,315 | * | Entrada Therapeutics, Inc | 57 | |||||||
| 11,580 | * | Enzychem Lifesciences Corp | 535 | |||||||
| 154 |
COLLEGE RETIREMENT EQUITIES FUND - Stock Account
| SHARES | COMPANY | VALUE (000) | ||||||||
| 14,642 | * | Epizyme, Inc | $ | 37 | ||||||
| 9,872 | *,e | Erasca, Inc | 154 | |||||||
| 69,417 | * | Ergomed plc | 1,409 | |||||||
| 37,497 | g | Eris Lifesciences Ltd | 383 | |||||||
| 4,127 | *,e | Esperion Thereapeutics, Inc | 21 | |||||||
| 294,000 | Essex Bio-technology Ltd | 187 | ||||||||
| 64,132 | * | Eubiologics Co Ltd | 1,891 | |||||||
| 192,351 | Eurofins Scientific SE | 23,831 | ||||||||
| 4,562 | *,e | Evelo Biosciences, Inc | 28 | |||||||
| 29,000 | * | Ever Supreme Bio Technology Co Ltd | 220 | |||||||
| 163,000 | *,g | Everest Medicines Ltd | 729 | |||||||
| 250,248 | *,e | Evolus, Inc | 1,629 | |||||||
| 160,074 | * | Evotec AG. | 7,727 | |||||||
| 131,162 | * | Exact Sciences Corp | 10,208 | |||||||
| 7,924 | * | Exagen, Inc | 92 | |||||||
| 350,235 | *,e | Exelixis, Inc | 6,402 | |||||||
| 20,498 | * | EyePoint Pharmaceuticals, Inc | 251 | |||||||
| 587,241 | Faes Farma S.A. (Sigma) | 2,330 | ||||||||
| 172,336 | * | Fate Therapeutics, Inc | 10,083 | |||||||
| 53,635 | * | FDC Ltd | 219 | |||||||
| 14,157 | * | FibroGen, Inc | 200 | |||||||
| 6,860 | * | Finch Therapeutics Group, Inc | 68 | |||||||
| 675,335 | *,e | Fluidigm Corp | 2,647 | |||||||
| 15,447 | *,e | Foghorn Therapeutics, Inc | 353 | |||||||
| 29,293 | * | Forma Therapeutics Holdings, Inc | 417 | |||||||
| 7,481 | *,e | Forte Biosciences, Inc | 16 | |||||||
| 12,298 | * | Fortress Biotech, Inc | 31 | |||||||
| 32,514 | *,e | Frequency Therapeutics, Inc | 167 | |||||||
| 52,849 | *,e | Fulcrum Therapeutics, Inc | 935 | |||||||
| 103,108 | *,e | G1 Therapeutics, Inc | 1,053 | |||||||
| 1,962 | *,e | Galapagos NV | 109 | |||||||
| 53,998 | * | Galapagos NV | 3,026 | |||||||
| 25,368 | *,e | Gemini Therapeutics, Inc | 74 | |||||||
| 74,755 | * | GeneOne Life Science, Inc | 1,019 | |||||||
| 6,749 | * | Generation Bio Co | 48 | |||||||
| 18,800 | *,e | Genetron Holdings Ltd (ADR) | 115 | |||||||
| 20,339 | * | Genexine Co Ltd | 995 | |||||||
| 337,039 | * | Genmab A.S. (ADR) | 13,333 | |||||||
| 156,341 | * | Genmab AS | 62,404 | |||||||
| 871,456 | e | Genomma Lab Internacional S.A. de C.V. | 914 | |||||||
| 173,500 | *,e,g | Genor Biopharma Holdings Ltd | 158 | |||||||
| 1,359,386 | * | Genscript Biotech Corp | 6,015 | |||||||
| 155 |
COLLEGE RETIREMENT EQUITIES FUND - Stock Account
| SHARES | COMPANY | VALUE (000) | ||||||||
| 79,943 | Genus plc | $ | 5,362 | |||||||
| 272,954 | *,e | Geron Corp | 333 | |||||||
| 71,559 | Gerresheimer AG. | 6,880 | ||||||||
| 3,307,735 | Gilead Sciences, Inc | 240,175 | ||||||||
| 36,902 | GlaxoSmithKline Pharmaceuticals Ltd | 871 | ||||||||
| 2,388,577 | GlaxoSmithKline plc | 52,006 | ||||||||
| 203,848 | Glenmark Pharmaceuticals Ltd | 1,448 | ||||||||
| 59,738 | * | Global Blood Therapeutics, Inc | 1,749 | |||||||
| 45,601 | *,e | GNI Group Ltd | 588 | |||||||
| 57,238 | * | Gossamer Bio, Inc | 647 | |||||||
| 143,299 | Granules India Ltd | 646 | ||||||||
| 7,827 | * | Graphite Bio, Inc | 97 | |||||||
| 3,770 | * | Green Cross Corp | 690 | |||||||
| 22,595 | * | Green Cross Holdings Corp | 515 | |||||||
| 10,178 | * | Green Cross LabCell Corp | 869 | |||||||
| 663 | * | Greenwich Lifesciences, Inc | 16 | |||||||
| 80,693 | e | Grifols S.A. | 1,553 | |||||||
| 177,145 | * | Gritstone Oncology, Inc | 2,278 | |||||||
| 3,195 | *,e | GT Biopharma, Inc | 10 | |||||||
| 87,812 | Guangzhou Baiyunshan Pharmaceutical Holdings Co Ltd | 471 | ||||||||
| 84,597 | H Lundbeck AS | 2,178 | ||||||||
| 414,658 | * | Halozyme Therapeutics, Inc | 16,673 | |||||||
| 33,628 | * | Hanall Biopharma Co Ltd | 594 | |||||||
| 10,721 | Hangzhou Tigermed Consulting Co Ltd | 215 | ||||||||
| 88,053 | g | Hangzhou Tigermed Consulting Co Ltd (Hong Kong) | 1,117 | |||||||
| 4,361 | * | Hanmi Pharm Co Ltd | 1,012 | |||||||
| 48,076 | * | Hansa Biopharma AB | 471 | |||||||
| 879,839 | g | Hansoh Pharmaceutical Group Co Ltd | 2,148 | |||||||
| 183,523 | *,e | Harmony Biosciences Holdings, Inc | 7,825 | |||||||
| 3,112 | * | Harpoon Therapeutics, Inc | 23 | |||||||
| 9,376 | * | Harvard Bioscience, Inc | 66 | |||||||
| 160,500 | Haw Par Corp Ltd | 1,353 | ||||||||
| 19,900 | * | HEALIOS KK | 222 | |||||||
| 38,958 | * | Helixmith Co Ltd | 743 | |||||||
| 307,442 | *,e | Heron Therapeutics, Inc | 2,807 | |||||||
| 573,245 | *,e | HEXO Corp | 399 | |||||||
| 38,665 | Hikal Ltd | 273 | ||||||||
| 47,701 | Hikma Pharmaceuticals plc | 1,433 | ||||||||
| 76,500 | Hisamitsu Pharmaceutical Co, Inc | 2,643 | ||||||||
| 7,532 | * | HK inno N Corp | 333 | |||||||
| 41,920 | * | Homology Medicines, Inc | 153 | |||||||
| 120,577 | * | Hookipa Pharma, Inc | 281 | |||||||
| 156 |
COLLEGE RETIREMENT EQUITIES FUND - Stock Account
| SHARES | COMPANY | VALUE (000) | ||||||||
| 1,613,521 | * | Horizon Therapeutics Plc | $ | 173,873 | ||||||
| 2,548,684 | *,†,e | Hua Han Health Industry Holdings Ltd | 20 | |||||||
| 704,500 | *,g | Hua Medicine | 343 | |||||||
| 77,920 | Hualan Biological Engineering, Inc | 356 | ||||||||
| 7,293 | * | Hugel, Inc | 941 | |||||||
| 3,604 | *,e | Humanigen, Inc | 13 | |||||||
| 74,354 | Humanwell Healthcare Group Co Ltd | 263 | ||||||||
| 7,337 | Huons Co Ltd | 294 | ||||||||
| 6,421 | Huons Global Co Ltd | 207 | ||||||||
| 59,780 | * | Hutchison China MediTech Ltd (ADR) | 2,097 | |||||||
| 261,344 | Hypermarcas S.A. | 1,323 | ||||||||
| 229,322 | *,e | iBio, Inc | 126 | |||||||
| 56,734 | * | ICON plc | 17,571 | |||||||
| 6,410 | * | Icosavax, Inc | 147 | |||||||
| 29,180 | * | Ideaya Biosciences, Inc | 690 | |||||||
| 133,053 | *,e | Idorsia Ltd | 2,711 | |||||||
| 854 | *,e | IGM Biosciences, Inc | 25 | |||||||
| 22,433 | * | Ikena Oncology, Inc | 281 | |||||||
| 300,808 | * | Illumina, Inc | 114,439 | |||||||
| 42,944 | * | Ilyang Pharmaceutical Co Ltd | 1,011 | |||||||
| 27,300 | * | I-Mab (ADR) | 1,294 | |||||||
| 4,754 | * | Imago Biosciences, Inc | 113 | |||||||
| 14,900 | Imeik Technology Development Co Ltd | 1,253 | ||||||||
| 3,900 | * | Immuneering Corp | 63 | |||||||
| 38,520 | * | Immunic, Inc | 369 | |||||||
| 67,420 | *,e | ImmunityBio, Inc | 410 | |||||||
| 223,471 | * | Immunogen, Inc | 1,658 | |||||||
| 110,000 | *,e | Immunotech Biopharm Ltd | 238 | |||||||
| 96,368 | *,e | Immunovant, Inc | 821 | |||||||
| 1,889 | *,e | Impel Neuropharma, Inc | 16 | |||||||
| 6,074,528 | * | Imugene Ltd | 1,767 | |||||||
| 146,004 | * | Incyte Corp | 10,717 | |||||||
| 887,314 | * | Indivior plc | 3,087 | |||||||
| 13,956 | *,e | Infinity Pharmaceuticals, Inc | 31 | |||||||
| 2,444 | * | Inhibrx, Inc | 107 | |||||||
| 564,000 | *,g | InnoCare Pharma Ltd | 1,107 | |||||||
| 1,167,073 | *,g | Innovent Biologics, Inc | 7,227 | |||||||
| 346,254 | * | Innoviva, Inc | 5,973 | |||||||
| 68,197 | *,e | Inotiv, Inc | 2,869 | |||||||
| 186,657 | *,e | Inovio Pharmaceuticals, Inc | 931 | |||||||
| 13,924 | * | Inozyme Pharma, Inc | 95 | |||||||
| 112,892 | * | Insmed, Inc | 3,075 | |||||||
| 157 |
COLLEGE RETIREMENT EQUITIES FUND - Stock Account
| SHARES | COMPANY | VALUE (000) | ||||||||
| 27,361 | *,e | Instil Bio, Inc | $ | 468 | ||||||
| 123,749 | * | Intellia Therapeutics, Inc | 14,632 | |||||||
| 2,287 | *,e | Intercept Pharmaceuticals, Inc | 37 | |||||||
| 6,780 | * | Intra-Cellular Therapies, Inc | 355 | |||||||
| 27,449 | * | iNtRON Biotechnology, Inc | 485 | |||||||
| 297,925 | *,e | Invitae Corp | 4,549 | |||||||
| 26,008 | IOL Chemicals and Pharmaceuticals Ltd | 168 | ||||||||
| 81,235 | * | Ionis Pharmaceuticals, Inc | 2,472 | |||||||
| 306,259 | * | Iovance Biotherapeutics, Inc | 5,846 | |||||||
| 245,898 | Ipca Laboratories Ltd | 7,156 | ||||||||
| 10,259 | �� | Ipsen | 939 | |||||||
| 435,713 | * | IQVIA Holdings, Inc | 122,932 | |||||||
| 907,523 | * | Ironwood Pharmaceuticals, Inc | 10,582 | |||||||
| 381 | *,e | IsoPlexis Corp | 4 | |||||||
| 41,577 | * | iTeos Therapeutics, Inc | 1,936 | |||||||
| 143,498 | * | IVERIC bio, Inc | 2,399 | |||||||
| 6,314 | *,e | Janux Therapeutics, Inc | 125 | |||||||
| 83,235 | * | Jazz Pharmaceuticals plc | 10,604 | |||||||
| 37,962 | JB Chemicals & Pharmaceuticals Ltd | 907 | ||||||||
| 79,044 | JCR Pharmaceuticals Co Ltd | 1,531 | ||||||||
| 6,413 | * | Jeil Pharmaceutical Co Ltd | 182 | |||||||
| 288,511 | Jiangsu Hengrui Medicine Co Ltd | 2,299 | ||||||||
| 3,709,292 | Johnson & Johnson | 634,549 | ||||||||
| 134,758 | Joincare Pharmaceutical Group Industry Co Ltd | 272 | ||||||||
| 13,080 | Joinn Laboratories China Co Ltd | 237 | ||||||||
| 78,373 | * | Jounce Therapeutics, Inc | 654 | |||||||
| 68,170 | Jubilant Organosys Ltd | 537 | ||||||||
| 168,500 | *,e,g | JW Cayman Therapeutics Co Ltd | 291 | |||||||
| 43,879 | Kaken Pharmaceutical Co Ltd | 1,607 | ||||||||
| 30,705 | *,e | Kala Pharmaceuticals, Inc | 37 | |||||||
| 23,518,206 | Kalbe Farma Tbk PT | 2,665 | ||||||||
| 4,800 | *,e | Kaleido Biosciences Inc | 11 | |||||||
| 3,608 | * | KalVista Pharmaceuticals Inc | 48 | |||||||
| 71,304 | * | Karo Pharma AB | 473 | |||||||
| 2,341 | * | Karuna Therapeutics, Inc | 307 | |||||||
| 92,766 | *,e | Karyopharm Therapeutics, Inc | 596 | |||||||
| 16,934 | *,e | KemPharm, Inc | 147 | |||||||
| 18,039 | *,e | Keros Therapeutics, Inc | 1,055 | |||||||
| 73,224 | * | Kezar Life Sciences, Inc | 1,224 | |||||||
| 15,893 | * | Kiniksa Pharmaceuticals Ltd | 187 | |||||||
| 22,169 | *,e | Kinnate Biopharma, Inc | 393 | |||||||
| 34,800 | Kissei Pharmaceutical Co Ltd | 683 | ||||||||
| 158 |
COLLEGE RETIREMENT EQUITIES FUND - Stock Account
| SHARES | COMPANY | VALUE (000) | ||||||||
| 128,528 | * | Knight Therapeutics, Inc | $ | 539 | ||||||
| 3,359 | * | Kodiak Sciences, Inc | 285 | |||||||
| 41,908 | * | Komipharm International Co Ltd | 302 | |||||||
| 9,411 | * | Korea United Pharm Inc | 374 | |||||||
| 53,234 | *,e | Kronos Bio, Inc | 723 | |||||||
| 10,935 | * | Krystal Biotech Inc | 765 | |||||||
| 17,946 | Kukjeon Pharmaceutical Co Ltd | 165 | ||||||||
| 56,670 | * | Kura Oncology, Inc | 793 | |||||||
| 16,426 | * | Kymera Therapeutics, Inc | 1,043 | |||||||
| 49,781 | Kyorin Co Ltd | 799 | ||||||||
| 493,215 | Kyowa Hakko Kogyo Co Ltd | 13,448 | ||||||||
| 14,881 | L&C Bio Co Ltd | 457 | ||||||||
| 34,645 | Laboratorios Farmaceuticos Rovi S.A | 2,911 | ||||||||
| 1,563 | * | Landos Biopharma, Inc | 8 | |||||||
| 364,222 | g | Laurus Labs Ltd | 2,635 | |||||||
| 52,640 | *,e | Legend Biotech Corp (ADR) | 2,454 | |||||||
| 21,599 | * | LegoChem Biosciences, Inc | 1,011 | |||||||
| 46,027 | * | Lexicon Pharmaceuticals, Inc | 181 | |||||||
| 12,056 | * | Ligand Pharmaceuticals, Inc (Class B) | 1,862 | |||||||
| 119,731 | *,e | Lineage Cell Therapeutics, Inc | 293 | |||||||
| 46,617 | Livzon Pharmaceutical Group, Inc | 294 | ||||||||
| 281,024 | Lonza Group AG. | 233,977 | ||||||||
| 100,000 | Lotus Pharmaceutical Co Ltd | 352 | ||||||||
| 163,894 | Lupin Ltd | 2,091 | ||||||||
| 1,943,000 | *,e,g | Luye Pharma Group Ltd | 886 | |||||||
| 11,347 | * | Lyell Immunopharma, Inc | 88 | |||||||
| 68,188 | * | MacroGenics, Inc | 1,094 | |||||||
| 23,717 | * | Madrigal Pharmaceuticals, Inc | 2,010 | |||||||
| 8,167 | * | Magenta Therapeutics, Inc | 36 | |||||||
| 1,385,183 | *,e | MannKind Corp | 6,053 | |||||||
| 160,632 | * | Maravai LifeSciences Holdings, Inc | 6,730 | |||||||
| 2,983 | *,e | Marinus Pharmaceuticals, Inc | 35 | |||||||
| 79,776 | *,e | MaxCyte, Inc | 813 | |||||||
| 1,702,337 | * | Mayne Pharma Group Ltd | 366 | |||||||
| 162,000 | * | Medigen Vaccine Biologics Corp | 1,751 | |||||||
| 47,684 | * | Medpace Holdings, Inc | 10,378 | |||||||
| 14,546 | * | MedPacto, Inc | 715 | |||||||
| 5,340 | * | Medy-Tox, Inc | 645 | |||||||
| 273,130 | Mega Lifesciences PCL | 413 | ||||||||
| 15,288 | * | MEI Pharma, Inc | 41 | |||||||
| 25,638 | * | MeiraGTx Holdings plc | 609 | |||||||
| 2,951,280 | Merck & Co, Inc | 226,186 | ||||||||
| 159 |
COLLEGE RETIREMENT EQUITIES FUND - Stock Account
| SHARES | COMPANY | VALUE (000) | ||||||||
| 593,981 | Merck KGaA | $ | 152,806 | |||||||
| 7,825 | Merck Ltd | 562 | ||||||||
| 47,316 | * | Mersana Therapeutics, Inc | 294 | |||||||
| 705,560 | *,e | Mesoblast Ltd | 716 | |||||||
| 26,961 | * | Mettler-Toledo International, Inc | 45,758 | |||||||
| 7,269 | * | Mezzion Pharma Co Ltd | 1,327 | |||||||
| 41,188 | *,e | MiMedx Group, Inc | 249 | |||||||
| 664,772 | *,e | Mind Medicine MindMed, Inc | 917 | |||||||
| 420,716 | *,e | Mind Medicine MindMed, Inc | 575 | |||||||
| 41,527 | * | Mirati Therapeutics, Inc | 6,092 | |||||||
| 3,533 | * | Mirum Pharmaceuticals, Inc | 56 | |||||||
| 27,091 | *,e | Mithra Pharmaceuticals S.A. | 615 | |||||||
| 29,075 | Mochida Pharmaceutical Co Ltd | 880 | ||||||||
| 296,703 | * | Moderna, Inc | 75,357 | |||||||
| 17,929 | *,e | Molecular Partners AG. | 351 | |||||||
| 6,378 | *,e | Molecular Templates, Inc | 25 | |||||||
| 5,569 | *,e | Monte Rosa Therapeutics, Inc | 114 | |||||||
| 10,872 | * | Morphic Holding, Inc | 515 | |||||||
| 91,387 | * | Morphosys AG. | 3,461 | |||||||
| 258,819 | *,e | Mustang Bio, Inc | 430 | |||||||
| 67,779 | * | Myriad Genetics, Inc | 1,871 | |||||||
| 42,487 | Nanjing King-Friend Biochemical Pharmaceutical Co Ltd | 280 | ||||||||
| 78,795 | * | NanoString Technologies, Inc | 3,328 | |||||||
| 99,580 | Natco Pharma Ltd | 1,210 | ||||||||
| 164,078 | * | Natera, Inc | 15,323 | |||||||
| 51,808 | * | Naturecell Co Ltd | 774 | |||||||
| 134,857 | * | Nektar Therapeutics | 1,822 | |||||||
| 63,259 | * | NeoGenomics, Inc | 2,158 | |||||||
| 27,996 | * | Neoleukin Therapeutics, Inc | 135 | |||||||
| 74,906 | * | Neurocrine Biosciences, Inc | 6,380 | |||||||
| 9,179 | * | NexImmune, Inc | 42 | |||||||
| 159,913 | * | NGM Biopharmaceuticals Inc | 2,832 | |||||||
| 42,062 | * | NH Special Purpose Acquisition 11 Co Ltd | 989 | |||||||
| 50,002 | Nichi-iko Pharmaceutical Co Ltd | 307 | ||||||||
| 32,500 | Nippon Shinyaku Co Ltd | 2,263 | ||||||||
| 13,650 | * | Nkarta, Inc | 210 | |||||||
| 31,356 | * | NKMax Co Ltd | 590 | |||||||
| 1,589,460 | Novartis AG. | 139,669 | ||||||||
| 75,526 | *,e | Novavax, Inc | 10,806 | |||||||
| 2,066,588 | Novo Nordisk AS | 232,131 | ||||||||
| 5,966 | * | Nurix Therapeutics, Inc | 173 | |||||||
| 5,439 | * | Nuvalent, Inc | 104 | |||||||
| 160 |
COLLEGE RETIREMENT EQUITIES FUND - Stock Account
| SHARES | COMPANY | VALUE (000) | ||||||||
| 173,583 | *,e | Nuvation Bio, Inc | $ | 1,475 | ||||||
| 137,963 | * | OBI Pharma, Inc | 568 | |||||||
| 277,589 | *,e | Ocugen, Inc | 1,263 | |||||||
| 169,838 | * | Ocular Therapeutix, Inc | 1,184 | |||||||
| 175,500 | *,e,g | Ocumension Therapeutics | 394 | |||||||
| 88,426 | *,e | Olema Pharmaceuticals, Inc | 828 | |||||||
| 10,068 | * | OliX Pharmaceuticals, Inc | 346 | |||||||
| 3,377 | * | Omega Therapeutics, Inc | 38 | |||||||
| 5,254 | *,e | Omeros Corp | 34 | |||||||
| 184,309 | * | Oncocyte Corp | 400 | |||||||
| 44,895 | *,e | Oncorus, Inc | 237 | |||||||
| 120,589 | * | Oncternal Therapeutics, Inc | 274 | |||||||
| 162,679 | * | Oneness Biotech Co Ltd | 1,690 | |||||||
| 104,488 | Ono Pharmaceutical Co Ltd | 2,597 | ||||||||
| 1,110,252 | *,e | Opko Health, Inc | 5,340 | |||||||
| 3,157 | * | Oramed Pharmaceuticals, Inc | 45 | |||||||
| 305,448 | *,e | Organigram Holdings, Inc | 536 | |||||||
| 460,695 | *,e | Organogenesis Holdings Inc | 4,257 | |||||||
| 195,117 | Organon & Co | 5,941 | ||||||||
| 23,650 | *,e | ORIC Pharmaceuticals, Inc | 348 | |||||||
| 25,342 | Orion Oyj (Class B) | 1,053 | ||||||||
| 23,374 | * | Oscotec, Inc | 718 | |||||||
| 110,680 | Otsuka Holdings KK | 4,027 | ||||||||
| 14,802 | *,e | Outlook Therapeutics, Inc | 20 | |||||||
| 75,152 | * | Oxford Biomedica plc | 1,251 | |||||||
| 85,000 | * | Oxford Nanopore Technologies plc | 803 | |||||||
| 30,459 | *,e | Oyster Point Pharma, Inc | 556 | |||||||
| 337,603 | * | Pacific Biosciences of California, Inc | 6,907 | |||||||
| 181,397 | * | Pacira BioSciences Inc | 10,915 | |||||||
| 398,795 | * | Paion AG. | 545 | |||||||
| 9,666 | *,e | Paratek Pharmaceuticals, Inc | 43 | |||||||
| 118,594 | * | Passage Bio, Inc | 753 | |||||||
| 373,700 | * | PeptiDream, Inc | 8,298 | |||||||
| 157,369 | PerkinElmer, Inc | 31,641 | ||||||||
| 90,921 | Perrigo Co plc | 3,537 | ||||||||
| 40,335 | * | Personalis, Inc | 576 | |||||||
| 10,646,567 | Pfizer, Inc | 628,680 | ||||||||
| 24,000 | e | Pharma Foods International Co Ltd | 442 | |||||||
| 16,981 | e | Pharma Mar S.A. | 1,101 | |||||||
| 5,834 | PHARMA RESEARCH PRODUCTS Co Ltd | 402 | ||||||||
| 12,400 | PharmaBlock Sciences Nanjing, Inc | 276 | ||||||||
| 69,951 | *,† | Pharmally International Holding Co Ltd | 0 | ^ | ||||||
| 161 |
COLLEGE RETIREMENT EQUITIES FUND - Stock Account
| SHARES | COMPANY | VALUE (000) | ||||||||
| 27,300 | Pharmaron Beijing Co Ltd | $ | 605 | |||||||
| 97,082 | g | Pharmaron Beijing Co Ltd | 1,499 | |||||||
| 61,530 | * | Pharmicell Co Ltd | 674 | |||||||
| 681,469 | *,e | Pharming Group NV | 603 | |||||||
| 1,666 | * | Phathom Pharmaceuticals, Inc | 33 | |||||||
| 127,761 | Phibro Animal Health Corp | 2,609 | ||||||||
| 5,089 | *,e | Pliant Therapeutics, Inc | 69 | |||||||
| 13,095 | * | PMV Pharmaceuticals, Inc | 302 | |||||||
| 13,810 | *,g | PolyPeptide Group AG. | 2,068 | |||||||
| 4,258 | * | Portage Biotech, Inc | 46 | |||||||
| 28,361 | *,e | Poseida Therapeutics, Inc | 193 | |||||||
| 21,277 | * | Praxis Precision Medicines, Inc | 419 | |||||||
| 446,515 | *,e | Precigen, Inc | 1,657 | |||||||
| 5,352 | * | Precision BioSciences Inc | 40 | |||||||
| 1,770 | *,e | Prelude Therapeutics, Inc | 22 | |||||||
| 77,112 | * | Prestige Consumer Healthcare, Inc. | 4,677 | |||||||
| 83,715 | *,† | Progenics Pharmaceuticals, Inc | 0 | |||||||
| 23,090 | * | Prometheus Biosciences, Inc | 913 | |||||||
| 27,149 | * | Protagonist Therapeutics, Inc | 928 | |||||||
| 158,500 | * | Prothena Corp plc | 7,830 | |||||||
| 50,533 | *,e | Provention Bio, Inc | 284 | |||||||
| 7,662 | * | PTC Therapeutics, Inc | 305 | |||||||
| 6,288 | * | Puma Biotechnology, Inc | 19 | |||||||
| 4,382 | * | Pyxis Oncology, Inc | 48 | |||||||
| 159,164 | * | QIAGEN NV | 8,846 | |||||||
| 224,801 | * | QIAGEN NV (Turquoise) | 12,465 | |||||||
| 24,077 | * | Quanterix Corp | 1,021 | |||||||
| 282,531 | * | Radius Health, Inc | 1,955 | |||||||
| 4,334 | * | Rain Therapeutics, Inc | 56 | |||||||
| 814 | * | Rallybio Corp | 8 | |||||||
| 4,040 | * | Rapid Micro Biosystems, Inc | 43 | |||||||
| 1,992 | * | RAPT Therapeutics, Inc | 73 | |||||||
| 5,868 | * | Reata Pharmaceuticals, Inc | 155 | |||||||
| 28,759 | Recordati S.p.A. | 1,847 | ||||||||
| 43,966 | *,e | Recursion Pharmaceuticals, Inc | 753 | |||||||
| 97,191 | * | Regeneron Pharmaceuticals, Inc | 61,378 | |||||||
| 18,890 | * | REGENXBIO, Inc | 618 | |||||||
| 27,413 | * | Relay Therapeutics, Inc | 842 | |||||||
| 1,938,327 | *,e | Relief Therapeutics Holding AG. | 132 | |||||||
| 2,341 | * | Relmada Therapeutics, Inc | 53 | |||||||
| 1,890 | *,e | Reneo Pharmaceuticals, Inc | 16 | |||||||
| 54,209 | * | Repligen Corp | 14,357 | |||||||
| 162 |
COLLEGE RETIREMENT EQUITIES FUND - Stock Account
| SHARES | COMPANY | VALUE (000) | ||||||||
| 10,045 | * | Replimune Group, Inc | $ | 272 | ||||||
| 6,302 | * | Revance Therapeutics, Inc | 103 | |||||||
| 45,606 | * | REVOLUTION Medicines, Inc | 1,148 | |||||||
| 7,465 | * | Reyon Pharmaceutical Co Ltd | 223 | |||||||
| 39,241 | * | Rhythm Pharmaceuticals, Inc | 392 | |||||||
| 197,537 | Richter Gedeon Rt | 5,312 | ||||||||
| 72,953 | * | Rigel Pharmaceuticals, Inc | 193 | |||||||
| 1,083,958 | Roche Holding AG. | 449,692 | ||||||||
| 9,372 | e | Roche Holding AG. | 4,195 | |||||||
| 3,804 | * | Rocket Pharmaceuticals, Inc | 83 | |||||||
| 309,482 | Royalty Pharma plc | 12,333 | ||||||||
| 4,211 | *,e | Rubius Therapeutics, Inc | 41 | |||||||
| 91,235 | * | Sage Therapeutics, Inc | 3,881 | |||||||
| 14,090 | * | Sam Chun Dang Pharm Co Ltd | 512 | |||||||
| 26,497 | *,g | Samsung Biologics Co Ltd | 20,119 | |||||||
| 8,215 | *,e | Sana Biotechnology, Inc | 127 | |||||||
| 25,824 | *,e | SanBio Co Ltd | 226 | |||||||
| 206,529 | * | Sangamo Therapeutics Inc | 1,549 | |||||||
| 8,580 | Sanofi India Ltd | 909 | ||||||||
| 1,501,550 | Sanofi-Aventis | 150,671 | ||||||||
| 387,583 | Santen Pharmaceutical Co Ltd | 4,732 | ||||||||
| 175,103 | * | Sarepta Therapeutics, Inc | 15,768 | |||||||
| 40,795 | Sartorius Stedim Biotech | 22,405 | ||||||||
| 62,804 | Saudi Pharmaceutical Industries & Medical Appliances Corp | 657 | ||||||||
| 49,417 | Sawai Group Holdings Co Ltd | 1,889 | ||||||||
| 6,294 | *,e | Scholar Rock Holding Corp | 156 | |||||||
| 220,960 | Scinopharm Taiwan Ltd | 197 | ||||||||
| 675,572 | * | Seagen, Inc | 104,443 | |||||||
| 26,119 | e | Seegene, Inc | 1,340 | |||||||
| 16,720 | *,e | Seelos Therapeutics, Inc | 27 | |||||||
| 41,333 | *,e | Seer, Inc | 943 | |||||||
| 37,100 | Seikagaku Corp | 304 | ||||||||
| 464,920 | * | Selecta Biosciences, Inc | 1,516 | |||||||
| 21,520 | * | Sensei Biotherapeutics, Inc | 125 | |||||||
| 1,175 | * | Sera Prognostics, Inc | 8 | |||||||
| 38,149 | * | Seres Therapeutics, Inc | 318 | |||||||
| 28,465 | *,e | Sesen Bio, Inc | 23 | |||||||
| 92,013 | Shandong Buchang Pharmaceuticals Co Ltd | 304 | ||||||||
| 132,788 | Shanghai Fosun Pharmaceutical Group Co Ltd | 1,019 | ||||||||
| 367,429 | e | Shanghai Fosun Pharmaceutical Group Co Ltd (Hong Kong) | 1,618 | |||||||
| 270,000 | Shanghai Fudan-Zhangjiang Bio-Pharmaceutical Co Ltd | 133 | ||||||||
| 163 |
COLLEGE RETIREMENT EQUITIES FUND - Stock Account
| SHARES | COMPANY | VALUE (000) | ||||||||
| 554,000 | Shanghai Haixin Group Co | $ | 198 | |||||||
| 85,100 | *,e,g | Shanghai Henlius Biotech, Inc | 241 | |||||||
| 55,543 | * | Shanghai Junshi Biosciences Co Ltd | 584 | |||||||
| 4,213 | Shanghai Medicilon, Inc | 321 | ||||||||
| 416,337 | Shanghai RAAS Blood Products Co Ltd | 446 | ||||||||
| 8,404 | * | Shattuck Labs, Inc | 72 | |||||||
| 27,230 | Shenzhen Kangtai Biological Products Co Ltd | 421 | ||||||||
| 45,400 | Shenzhen New Industries Biomedical Engineering Co Ltd | 314 | ||||||||
| 64,425 | * | Shenzhen Salubris Pharmaceuticals Co Ltd | 276 | |||||||
| 87,107 | Shijiazhuang Yiling Pharmaceutical Co Ltd | 268 | ||||||||
| 35,847 | Shilpa Medicare Ltd | 258 | ||||||||
| 22,508 | * | Shin Poong Pharmaceutical Co Ltd | 603 | |||||||
| 311,322 | Shionogi & Co Ltd | 21,900 | ||||||||
| 110,255 | Sichuan Kelun Pharmaceutical Co Ltd | 327 | ||||||||
| 4,809 | Siegfried Holding AG. | 4,678 | ||||||||
| 4,188 | * | SIGA Technologies, Inc | 31 | |||||||
| 10,125 | * | Sigilon Therapeutics, Inc | 28 | |||||||
| 4,116,000 | e | Sihuan Pharmaceutical Holdings | 782 | |||||||
| 13,434 | *,†,e | SillaJen, Inc | 0 | |||||||
| 14,121 | * | Silverback Therapeutics, Inc | 94 | |||||||
| 5,424 | * | Singular Genomics Systems, Inc | 63 | |||||||
| 8,705,236 | Sino Biopharmaceutical | 6,109 | ||||||||
| 17,426 | * | SK Biopharmaceuticals Co Ltd | 1,423 | |||||||
| 26,319 | * | SK Bioscience Co Ltd | 4,982 | |||||||
| 14,441 | Solara Active Pharma Sciences Ltd | 198 | ||||||||
| 63,287 | * | Solid Biosciences, Inc | 111 | |||||||
| 163,576 | *,e | Sorrento Therapeutics, Inc | 761 | |||||||
| 89,208 | *,e | Sosei Group | 1,478 | |||||||
| 97,085 | * | Sotera Health Co | 2,286 | |||||||
| 27,283 | * | Spectrum Pharmaceuticals, Inc | 35 | |||||||
| 4,258 | * | Spero Therapeutics, Inc | 68 | |||||||
| 26,020 | * | SpringWorks Therapeutics, Inc | 1,613 | |||||||
| 8,720 | *,e | Spruce Biosciences, Inc | 39 | |||||||
| 22,455 | *,e | SQZ Biotechnologies Co | 201 | |||||||
| 1,416,000 | e | SSY Group Ltd | 731 | |||||||
| 10,144 | * | ST Pharm Co Ltd | 1,186 | |||||||
| 1,705 | * | Stoke Therapeutics, Inc | 41 | |||||||
| 62,188 | Strides Arcolab Ltd | 372 | ||||||||
| 721,475 | Sumitomo Dainippon Pharma Co Ltd | 8,324 | ||||||||
| 30,455 | *,e | Summit Therapeutics, Inc | 82 | |||||||
| 74,874 | * | Sun Pharma Advanced Research Company Ltd | 288 | |||||||
| 164 |
COLLEGE RETIREMENT EQUITIES FUND - Stock Account
| SHARES | COMPANY | VALUE (000) | ||||||||
| 1,320,720 | Sun Pharmaceutical Industries Ltd | $ | 15,006 | |||||||
| 274,525 | * | Supernus Pharmaceuticals, Inc | 8,005 | |||||||
| 33,293 | * | Surface Oncology, Inc | 159 | |||||||
| 37,589 | * | Sutro Biopharma, Inc | 559 | |||||||
| 96,278 | Suven Pharmaceuticals Ltd | 637 | ||||||||
| 107,209 | SwedenCare AB | 1,827 | ||||||||
| 32,698 | * | Syndax Pharmaceuticals, Inc | 716 | |||||||
| 137,241 | * | Syneos Health, Inc | 14,092 | |||||||
| 131,044 | *,g | Syngene International Ltd | 1,089 | |||||||
| 35,100 | *,e | Syros Pharmaceuticals, Inc | 114 | |||||||
| 357,799 | * | Taigen Biopharmaceuticals Holdings Ltd | 199 | |||||||
| 191,000 | * | TaiMed Biologics, Inc | 488 | |||||||
| 9,878 | Taisho Pharmaceutical Holdings Co Ltd | 456 | ||||||||
| 184,233 | Takara Bio, Inc | 4,228 | ||||||||
| 449,094 | Takeda Pharmaceutical Co Ltd | 12,264 | ||||||||
| 5,370 | *,e | Talaris Therapeutics, Inc | 82 | |||||||
| 150,073 | * | Tanvex BioPharma, Inc | 315 | |||||||
| 28,903 | *,e | Taro Pharmaceutical Industries Ltd | 1,448 | |||||||
| 3,050 | * | Tarsus Pharmaceuticals, Inc | 69 | |||||||
| 18,735 | *,e | Taysha Gene Therapies, Inc | 218 | |||||||
| 29,824 | * | TCR2 Therapeutics Inc | 139 | |||||||
| 23,434 | Tecan Group AG. | 14,233 | ||||||||
| 223,199 | * | Telix Pharmaceuticals Ltd | 1,259 | |||||||
| 6,885 | * | Tenaya Therapeutics, Inc | 130 | |||||||
| 6,485 | * | Terns Pharmaceuticals, Inc | 46 | |||||||
| 311,593 | * | Teva Pharmaceutical Industries Ltd (ADR) | 2,496 | |||||||
| 94,721 | * | TG Therapeutics, Inc | 1,800 | |||||||
| 71,517 | *,e | TherapeuticsMD, Inc | 25 | |||||||
| 10,153 | * | Theravance Biopharma, Inc | 112 | |||||||
| 418,910 | Thermo Fisher Scientific, Inc | 279,514 | ||||||||
| 3,827 | * | Theseus Pharmaceuticals, Inc | 49 | |||||||
| 224,400 | e | Tianjin ZhongXin Pharmaceutical Group Corp Ltd | 258 | |||||||
| 656,000 | Tong Ren Tang Technologies Co Ltd | 704 | ||||||||
| 691,089 | *,e | Tonix Pharmaceuticals Holding Corp | 247 | |||||||
| 14,465 | e | Torii Pharmaceutical Co Ltd | 362 | |||||||
| 59,451 | Torrent Pharmaceuticals Ltd | 2,622 | ||||||||
| 32,013 | Towa Pharmaceutical Co Ltd | 798 | ||||||||
| 83,722 | * | Travere Therapeutics, Inc | 2,599 | |||||||
| 126,310 | *,e | Trevena, Inc | 74 | |||||||
| 70,000 | Tsumura & Co | 1,994 | ||||||||
| 223,917 | TTY Biopharm Co Ltd | 556 | ||||||||
| 113,267 | * | Turning Point Therapeutics Inc | 5,403 | |||||||
| 165 |
COLLEGE RETIREMENT EQUITIES FUND - Stock Account
| SHARES | COMPANY | VALUE (000) | ||||||||
| 45,869 | * | Twist Bioscience Corp | $ | 3,550 | ||||||
| 5,142 | * | Tyra Biosciences, Inc | 72 | |||||||
| 85,441 | UCB S.A. | 9,751 | ||||||||
| 63,408 | * | Ultragenyx Pharmaceutical, Inc | 5,332 | |||||||
| 1,397,562 | United Laboratories Ltd | 780 | ||||||||
| 178,128 | * | United Therapeutics Corp | 38,490 | |||||||
| 34,550 | *,e | UroGen Pharma Ltd | 329 | |||||||
| 175,153 | * | Vaccibody AS. | 1,605 | |||||||
| 85,131 | *,e | Valneva SE | 2,372 | |||||||
| 48,087 | * | Vanda Pharmaceuticals, Inc | 754 | |||||||
| 21,838 | *,e | Vaxart Inc | 137 | |||||||
| 9,939 | * | Vaxcell-Bio Therapeutics Co Ltd | 362 | |||||||
| 26,478 | *,e | Vaxcyte, Inc | 630 | |||||||
| 212,985 | *,e | VBI Vaccines, Inc | 498 | |||||||
| 4,177 | * | Ventyx Biosciences, Inc | 83 | |||||||
| 3,859 | * | Vera Therapeutics, Inc | 103 | |||||||
| 80,362 | * | Veracyte, Inc | 3,311 | |||||||
| 16,020 | * | Verastem, Inc | 33 | |||||||
| 66,490 | * | Vericel Corp | 2,613 | |||||||
| 2,499 | *,e | Verrica Pharmaceuticals, Inc | 23 | |||||||
| 270,935 | * | Vertex Pharmaceuticals, Inc | 59,497 | |||||||
| 11,452 | *,e | Verve Therapeutics, Inc | 422 | |||||||
| 903,988 | Viatris, Inc | 12,231 | ||||||||
| 13,464 | Vifor Pharma AG. | 2,392 | ||||||||
| 257,942 | *,e | Viking Therapeutics, Inc | 1,187 | |||||||
| 52,602 | * | Vincerx Pharma, Inc | 536 | |||||||
| 167,262 | * | Vir Biotechnology, Inc | 7,003 | |||||||
| 28,273 | * | Viracta Therapeutics, Inc | 103 | |||||||
| 5,141 | Virbac S.A. | 2,482 | ||||||||
| 43,489 | *,e | VistaGen Therapeutics, Inc | 85 | |||||||
| 79,107 | Vitrolife AB | 4,881 | ||||||||
| 694,500 | e,g | Viva Biotech Holdings | 420 | |||||||
| 11,301 | *,e | Vor BioPharma, Inc | 131 | |||||||
| 268,028 | Walvax Biotechnology Co Ltd | 2,357 | ||||||||
| 115,378 | * | Waters Corp | 42,990 | |||||||
| 5,696 | * | WaVe Life Sciences Ltd | 18 | |||||||
| 5,105 | *,e | Werewolf Therapeutics, Inc | 61 | |||||||
| 244,495 | West Pharmaceutical Services, Inc | 114,671 | ||||||||
| 3,786,404 | Winteam Pharmaceutical Group Ltd | 2,509 | ||||||||
| 45,484 | * | Wockhardt Ltd | 252 | |||||||
| 161,558 | WuXi AppTec Co Ltd | 3,007 | ||||||||
| 357,937 | g | WuXi AppTec Co Ltd (Hong Kong) | 6,185 | |||||||
| 166 |
COLLEGE RETIREMENT EQUITIES FUND - Stock Account
| SHARES | COMPANY | VALUE (000) | ||||||||
| 9,571,650 | *,g | Wuxi Biologics Cayman, Inc | $ | 113,318 | ||||||
| 13,842 | XBiotech, Inc | 154 | ||||||||
| 5,470 | * | Xencor, Inc | 219 | |||||||
| 337 | *,e | Xilio Therapeutics, Inc | 5 | |||||||
| 12,486 | *,e | XOMA Corp | 260 | |||||||
| 3,562 | * | Y-mAbs Therapeutics, Inc | 58 | |||||||
| 35,530 | * | Yuhan Corp | 1,856 | |||||||
| 94,379 | * | Yungjin Pharmaceutical Co Ltd | 419 | |||||||
| 217,707 | YungShin Global Holding Corp | 338 | ||||||||
| 57,148 | Yunnan Baiyao Group Co Ltd | 939 | ||||||||
| 92,317 | * | Zai Lab Ltd (ADR) | 5,802 | |||||||
| 44,237 | * | Zealand Pharma AS | 976 | |||||||
| 20,140 | *,e | Zentalis Pharmaceuticals, Inc | 1,693 | |||||||
| 25,500 | Zeria Pharmaceutical Co Ltd | 436 | ||||||||
| 34,501 | Zhangzhou Pientzehuang Pharmaceutical Co Ltd | 2,370 | ||||||||
| 93,758 | Zhejiang Huahai Pharmaceutical Co Ltd | 319 | ||||||||
| 37,100 | Zhejiang Jiuzhou Pharmaceutical Co Ltd | 328 | ||||||||
| 109,416 | Zhejiang NHU Co Ltd | 534 | ||||||||
| 11,467 | Zhejiang Wolwo Bio-Pharmaceutical Co Ltd | 103 | ||||||||
| 285,067 | *,e | ZIOPHARM Oncology, Inc | 311 | |||||||
| 1,100,639 | Zoetis, Inc | 268,589 | ||||||||
| 50,783 | * | Zogenix, Inc | 825 | |||||||
| TOTAL PHARMACEUTICALS, BIOTECHNOLOGY & LIFE SCIENCES | 9,506,690 | |||||||||
| REAL ESTATE - 3.0% | ||||||||||
| 924,611 | Abacus Property Group | 2,549 | ||||||||
| 239,083 | Acadia Realty Trust | 5,219 | ||||||||
| 902 | Activia Properties Inc | 3,261 | ||||||||
| 1,600 | Advance Residence Investment Corp | 5,286 | ||||||||
| 70,209 | e | Aedifica S.A. | 9,165 | |||||||
| 130,000 | Aeon Mall Co Ltd | 1,855 | ||||||||
| 1,855 | AEON REIT Investment Corp | 2,599 | ||||||||
| 13,901 | AFI Properties Ltd | 921 | ||||||||
| 1,398,302 | e | Agile Property Holdings Ltd | 759 | |||||||
| 69,287 | Agree Realty Corp | 4,944 | ||||||||
| 652,100 | AIMS AMP Capital Industrial REIT | 702 | ||||||||
| 83,500 | * | Airport City Ltd | 1,870 | |||||||
| 4,485,214 | Aldar Properties PJSC | 4,870 | ||||||||
| 137,785 | e,g | ALDER Group S.A. | 1,713 | |||||||
| 171,203 | Alexander & Baldwin, Inc | 4,295 | ||||||||
| 179 | Alexander’s, Inc | 47 | ||||||||
| 171,177 | Alexandria Real Estate Equities, Inc | 38,166 | ||||||||
| 167 |
COLLEGE RETIREMENT EQUITIES FUND - Stock Account
| SHARES | COMPANY | VALUE (000) | ||||||||
| 153,922 | Aliansce Sonae Shopping Centers sa | $ | 597 | |||||||
| 654,776 | g | A-Living Services Co Ltd | 1,119 | |||||||
| 75,032 | Allied Properties Real Estate Investment Trust | 2,607 | ||||||||
| 17,436 | Allreal Holding AG. | 3,860 | ||||||||
| 179,669 | Alony Hetz Properties & Investments Ltd | 3,344 | ||||||||
| 194,603 | Alstria Office REIT-AG. | 4,327 | ||||||||
| 5,381 | e | Altarea SCA | 1,028 | |||||||
| 50,314 | Altus Group Ltd | 2,823 | ||||||||
| 903,098 | Amata Corp PCL (Foreign) | 567 | ||||||||
| 42,961 | American Assets Trust, Inc | 1,612 | ||||||||
| 60,930 | American Campus Communities, Inc | 3,491 | ||||||||
| 97,436 | American Finance Trust, Inc | 890 | ||||||||
| 1,093,407 | American Homes 4 Rent | 47,683 | ||||||||
| 541,914 | American Tower Corp | 158,510 | ||||||||
| 282,488 | Americold Realty Trust | 9,263 | ||||||||
| 251,010 | Amot Investments Ltd | 2,039 | ||||||||
| 122,021 | Apartment Income REIT Corp | 6,671 | ||||||||
| 128,648 | * | Apartment Investment and Management Co | 993 | |||||||
| 191,628 | Apple Hospitality REIT, Inc | 3,095 | ||||||||
| 1,640,041 | ARA LOGOS Logistics Trust | 1,096 | ||||||||
| 482,900 | AREIT, Inc | 460 | ||||||||
| 402,600 | Arena REIT | 1,444 | ||||||||
| 979,179 | Argosy Property Ltd | 1,072 | ||||||||
| 76,371 | Armada Hoffler Properties, Inc | 1,162 | ||||||||
| 461,527 | Aroundtown S.A. | 2,784 | ||||||||
| 93,314 | Arriyadh Development Co | 630 | ||||||||
| 76,474 | Artis Real Estate Investment Trust | 722 | ||||||||
| 1,071,400 | Ascendas India Trust | 1,128 | ||||||||
| 3,853,763 | Ascendas REIT | 8,444 | ||||||||
| 2,275,304 | Ascott Trust | 1,738 | ||||||||
| 11,752 | *,e | Ashford Hospitality Trust, Inc | 113 | |||||||
| 3,011,032 | Asian Property Development PCL (Foreign) | 861 | ||||||||
| 3,357,832 | Assura Group Ltd | 3,172 | ||||||||
| 53,062 | Atrium Ljungberg AB | 1,173 | ||||||||
| 339,054 | AvalonBay Communities, Inc | 85,642 | ||||||||
| 416,084 | Aventus Retail Property Fund Ltd | 1,090 | ||||||||
| 1,327,500 | Axis Real Estate Investment Trust | 618 | ||||||||
| 9,360,708 | Ayala Land, Inc | 6,737 | ||||||||
| 4,761,352 | *,† | AZ BGP Holdings | 14 | |||||||
| 12,042 | Azrieli Group | 1,149 | ||||||||
| 11,396,700 | Bangkok Land PCL | 364 | ||||||||
| 2,526,547 | Barwa Real Estate Co | 2,123 | ||||||||
| 168 |
COLLEGE RETIREMENT EQUITIES FUND - Stock Account
| SHARES | COMPANY | VALUE (000) | ||||||||
| 169,889 | Bayside Land Corp | $ | 2,098 | |||||||
| 42,308 | Befimmo SCA Sicafi | 1,626 | ||||||||
| 12,870 | Big Shopping Centers Ltd | 2,098 | ||||||||
| 395,349 | Big Yellow Group plc | 9,135 | ||||||||
| 6,591 | Blue Square Real Estate Ltd | 596 | ||||||||
| 1,035,423 | BMO Commercial Property Trust Ltd | 1,475 | ||||||||
| 27,460 | Boardwalk REIT | 1,190 | ||||||||
| 133,342 | Boston Properties, Inc | 15,358 | ||||||||
| 2,082,240 | * | BR Malls Participacoes S.A. | 3,098 | |||||||
| 1,010,196 | BR Properties S.A. | 1,325 | ||||||||
| 44,952 | *,e | BraeMar Hotels & Resorts, Inc | 229 | |||||||
| 871,551 | Brandywine Realty Trust | 11,696 | ||||||||
| 112,538 | Brigade Enterprises Ltd | 739 | ||||||||
| 332,659 | British Land Co plc | 2,402 | ||||||||
| 22,176 | Brixmor Property Group, Inc | 563 | ||||||||
| 163,962 | Broadstone Net Lease, Inc | 4,070 | ||||||||
| 112,022 | g | Brookfield India Real Estate Trust | 447 | |||||||
| 9,547 | Brt Realty Trust | 229 | ||||||||
| 29,199 | BSR Real Estate Investment Trust | 517 | ||||||||
| 7,767,900 | * | Bumi Serpong Damai Tbk PT | 550 | |||||||
| 581,515 | Bunnings Warehouse Property Trust | 1,756 | ||||||||
| 421,417 | C&D International Investment Group Ltd | 889 | ||||||||
| 473,000 | * | C&D Property Management Group Co Ltd | 270 | |||||||
| 57,186 | e | CA Immobilien Anlagen AG. | 2,134 | |||||||
| 3,492,134 | e | Cambridge Industrial Trust | 1,245 | |||||||
| 6,780 | Camden Property Trust | 1,211 | ||||||||
| 175,164 | Canadian Apartment Properties REIT | 8,303 | ||||||||
| 868,564 | Capital & Counties Properties | 1,984 | ||||||||
| 3,084,188 | * | Capitaland Investment Ltd | 7,798 | |||||||
| 5,371,411 | CapitaMall Trust | 8,127 | ||||||||
| 1,349,287 | CapitaRetail China Trust | 1,192 | ||||||||
| 83,658 | CareTrust REIT, Inc | 1,910 | ||||||||
| 78,702 | Carmila S.A. | 1,246 | ||||||||
| 317,315 | e | Castellum AB | 8,533 | |||||||
| 48,093 | CatchMark Timber Trust, Inc | 419 | ||||||||
| 34,987 | Catena AB | 2,180 | ||||||||
| 542,900 | Cathay Real Estate Development Co Ltd | 378 | ||||||||
| 334,658 | * | CBRE Group, Inc | 36,314 | |||||||
| 888,020 | e | CDL Hospitality Trusts | 771 | |||||||
| 527,937 | Cencosud Shopping S.A. | 626 | ||||||||
| 11,910 | Centerspace | 1,321 | ||||||||
| 169 |
COLLEGE RETIREMENT EQUITIES FUND - Stock Account
| SHARES | COMPANY | VALUE (000) | ||||||||
| 2,090,968 | Central China Management Co Ltd | $ | 424 | |||||||
| 300,000 | e | Central China New Life Ltd | 193 | |||||||
| 931,968 | e | Central China Real Estate Ltd | 112 | |||||||
| 2,194,082 | Central Pattana PCL (Foreign) | 3,710 | ||||||||
| 714,646 | Centuria Capital Group | 1,819 | ||||||||
| 687,674 | Centuria Industrial REIT | 2,097 | ||||||||
| 717,495 | Centuria Office REIT | 1,222 | ||||||||
| 2,564,806 | Champion Real Estate Investment Trust | 1,312 | ||||||||
| 798,220 | Charter Hall Education Trust | 2,399 | ||||||||
| 566,156 | Charter Hall Group | 8,470 | ||||||||
| 1,584,331 | Charter Hall Long Wale REIT | 5,822 | ||||||||
| 80,801 | * | Chatham Lodging Trust | 1,109 | |||||||
| 1,843,000 | China Aoyuan Group Ltd | 334 | ||||||||
| 101,900 | * | China Fortune Land Development Co Ltd | 58 | |||||||
| 4,709,156 | China Jinmao Holdings Group Ltd | 1,456 | ||||||||
| 763,000 | *,e,g | China Logistics Property Holdings Co Ltd | 421 | |||||||
| 1,334,000 | China Merchants Land Ltd | 127 | ||||||||
| 584,527 | China Merchants Shekou Industrial Zone Holdings Co Ltd | 1,225 | ||||||||
| 1,261,794 | China Overseas Grand Oceans Group Ltd | 641 | ||||||||
| 3,558,786 | China Overseas Land & Investment Ltd | 8,430 | ||||||||
| 1,080,119 | China Overseas Property Holdings Ltd | 1,146 | ||||||||
| 3,804,602 | China Resources Land Ltd | 16,031 | ||||||||
| 683,800 | g | China Resources Mixc Lifestyle Services Ltd | 3,191 | |||||||
| 1,799,452 | China SCE Group Holdings Ltd | 437 | ||||||||
| 5,066,000 | e | China South City Holdings Ltd | 474 | |||||||
| 2,040,038 | China Vanke Co Ltd | 4,750 | ||||||||
| 703,315 | China Vanke Co Ltd (Class A) | 2,182 | ||||||||
| 547,000 | Chinese Estates Holdings Ltd | 201 | ||||||||
| 193,014 | Choice Properties REIT | 2,318 | ||||||||
| 191,088 | Chong Hong Construction Co | 504 | ||||||||
| 44,308 | Cibus Nordic Real Estate AB | 1,425 | ||||||||
| 4,205,107 | CIFI Holdings Group Co Ltd | 2,529 | ||||||||
| 434,953 | City Developments Ltd | 2,201 | ||||||||
| 37,768 | City Office REIT, Inc | 745 | ||||||||
| 75,744 | e | Citycon Oyj | 604 | |||||||
| 781,807 | Civitas Social Housing plc | 1,025 | ||||||||
| 2,209,301 | CK Asset Holdings Ltd | 13,936 | ||||||||
| 923 | Clipper Realty, Inc | 9 | ||||||||
| 218,844 | CLS Holdings plc | 648 | ||||||||
| 34,645 | Cofinimmo | 5,534 | ||||||||
| 41,064 | Colliers International Group, Inc | 6,115 | ||||||||
| 407,000 | e | Colour Life Services Group | 49 | |||||||
| 170 |
COLLEGE RETIREMENT EQUITIES FUND - Stock Account
| SHARES | COMPANY | VALUE (000) | ||||||||
| 759 | Comforia Residential REIT, Inc | $ | 2,253 | |||||||
| 107,574 | Cominar Real Estate Investment Trust | 994 | ||||||||
| 38,546 | Community Healthcare Trust, Inc | 1,822 | ||||||||
| 322,830 | Concentradora Fibra Danhos S.A. de C.V. | 364 | ||||||||
| 825,766 | e | Corem Property Group AB | 2,980 | |||||||
| 111,935 | * | CorePoint Lodging, Inc | 1,757 | |||||||
| 19,967 | *,e | Corestate Capital Holding S.A. | 255 | |||||||
| 786,756 | e | Corp Inmobiliaria Vesta SAB de C.V. | 1,584 | |||||||
| 99,995 | Corporate Office Properties Trust | 2,797 | ||||||||
| 2,128,000 | *,e | Cosmopolitan International Holdings Ltd | 465 | |||||||
| 9,201,898 | Country Garden Holdings Co Ltd | 8,172 | ||||||||
| 1,955,400 | Country Garden Services Holdings Co Ltd | 11,740 | ||||||||
| 142,220 | Cousins Properties, Inc | 5,729 | ||||||||
| 5,047 | CRE Logistics REIT, Inc | 9,925 | ||||||||
| 57,259 | Crombie Real Estate Investment Trust | 843 | ||||||||
| 368,000 | Cromwell European Real Estate Investment Trust | 1,060 | ||||||||
| 1,678,221 | Cromwell Group | 1,062 | ||||||||
| 872,066 | Crown Castle International Corp | 182,035 | ||||||||
| 62,335 | CT Real Estate Investment Trust | 854 | ||||||||
| 4,996 | CTO Realty Growth, Inc | 307 | ||||||||
| 193,684 | CubeSmart | 11,023 | ||||||||
| 414,987 | * | Cushman & Wakefield plc | 9,229 | |||||||
| 452,505 | Custodian Reit plc | 649 | ||||||||
| 198,133 | CyrusOne, Inc | 17,776 | ||||||||
| 426,000 | e | DaFa Properties Group Ltd | 251 | |||||||
| 56,210 | Daibiru Corp | 1,083 | ||||||||
| 50,022 | Daito Trust Construction Co Ltd | 5,739 | ||||||||
| 585,781 | Daiwa House Industry Co Ltd | 16,835 | ||||||||
| 2,346 | Daiwa House REIT Investment Corp | 7,107 | ||||||||
| 386 | Daiwa Office Investment Corp | 2,348 | ||||||||
| 2,206 | Daiwa Securities Living Investments Corp | 2,271 | ||||||||
| 425,523 | * | Dar Al Arkan Real Estate Development Co | 1,139 | |||||||
| 374,000 | e | Datang Group Holdings Ltd | 196 | |||||||
| 207,860 | Derwent London plc | 9,670 | ||||||||
| 204,500 | Deutsche Annington Immobilien SE | 11,268 | ||||||||
| 64,850 | Deutsche Euroshop AG. | 1,081 | ||||||||
| 917,000 | e | Dexin China Holdings Co Ltd | 314 | |||||||
| 257,119 | Dexus Industria REIT | 657 | ||||||||
| 728,591 | Dexus Property Group | 5,891 | ||||||||
| 183,231 | * | DiamondRock Hospitality Co | 1,761 | |||||||
| 90,819 | DIC Asset AG. | 1,587 | ||||||||
| 209,045 | Digital Realty Trust, Inc | 36,974 | ||||||||
| 171 |
COLLEGE RETIREMENT EQUITIES FUND - Stock Account
| SHARES | COMPANY | VALUE (000) | ||||||||
| 430,192 | * | DigitalBridge Group, Inc | $ | 3,583 | ||||||
| 109,326 | Dios Fastigheter AB | 1,436 | ||||||||
| 685,994 | Diversified Healthcare Trust | 2,120 | ||||||||
| 716,211 | DLF Ltd | 3,743 | ||||||||
| 58,001 | * | Dongwon Development Co Ltd | 260 | |||||||
| 147,887 | * | Douglas Elliman, Inc | 1,701 | |||||||
| 12,388 | Douglas Emmett, Inc | 415 | ||||||||
| 123,708 | Dream Industrial Real Estate Investment Trust | 1,684 | ||||||||
| 29,878 | Dream Office Real Estate Investment Trust | 582 | ||||||||
| 54,752 | DREAM Unlimited Corp | 1,681 | ||||||||
| 620,712 | Duke Realty Corp | 40,744 | ||||||||
| 437,000 | *,† | Eagle Hospitality Trust | 4 | |||||||
| 73,951 | Easterly Government Properties, Inc | 1,695 | ||||||||
| 73,498 | EastGroup Properties, Inc | 16,747 | ||||||||
| 28,762 | Electra Real Estate Ltd | 573 | ||||||||
| 1,088,885 | * | Emaar Development PJSC | 1,292 | |||||||
| 292,501 | * | Emaar Economic City | 930 | |||||||
| 4,972,098 | Emaar Properties PJSC | 6,607 | ||||||||
| 465,347 | Embassy Office Parks REIT | 2,123 | ||||||||
| 2,215,615 | Emlak Konut Gayrimenkul Yatiri | 358 | ||||||||
| 129,192 | Empire State Realty Trust, Inc | 1,150 | ||||||||
| 1,190,436 | Empiric Student Property plc | 1,386 | ||||||||
| 203,896 | EPR Properties | 9,683 | ||||||||
| 102,915 | Equinix, Inc | 87,050 | ||||||||
| 675,896 | Equites Property Fund Ltd | 975 | ||||||||
| 103,503 | * | Equity Commonwealth | 2,681 | |||||||
| 1,263,671 | Equity Lifestyle Properties, Inc | 110,773 | ||||||||
| 417,700 | Equity Residential | 37,802 | ||||||||
| 4,144,800 | *,g | ESR Cayman Ltd | 14,020 | |||||||
| 151,016 | ESR Kendall Square REIT Co Ltd | 804 | ||||||||
| 273,157 | Essential Properties Realty Trust, Inc | 7,875 | ||||||||
| 53,409 | Essex Property Trust, Inc | 18,812 | ||||||||
| 50,509 | Eurocommercial Properties NV | 1,098 | ||||||||
| 923,000 | Ever Sunshine Lifestyle Services Group Ltd | 1,433 | ||||||||
| 335,000 | Excellence Commercial Property & Facilities Management Group Ltd | 199 | ||||||||
| 5,336 | e | eXp World Holdings Inc | 180 | |||||||
| 380,794 | Extra Space Storage, Inc | 86,337 | ||||||||
| 321,312 | Fabege AB | 5,378 | ||||||||
| 1,372,269 | Far East Consortium | 500 | ||||||||
| 889,405 | Far East Hospitality Trust | 389 | ||||||||
| 253,812 | Farglory Land Development Co Ltd | 567 | ||||||||
| 23,893 | Farmland Partners, Inc | 286 | ||||||||
| 172 |
COLLEGE RETIREMENT EQUITIES FUND - Stock Account
| SHARES | COMPANY | VALUE (000) | ||||||||
| 136,081 | * | Fastighets AB Balder | $ | 9,793 | ||||||
| 884 | *,e | Fathom Holdings, Inc | 18 | |||||||
| 112,050 | Federal Realty Investment Trust | 15,275 | ||||||||
| 3,632,897 | Fibra Uno Administracion S.A. de C.V. | 3,840 | ||||||||
| 8,881,000 | Filinvest Land, Inc | 192 | ||||||||
| 2,180,800 | Filinvest REIT Corp | 316 | ||||||||
| 77,800 | Financial Street Holdings Co Ltd | 69 | ||||||||
| 136,998 | First Capital Real Estate Investment Trust | 2,043 | ||||||||
| 205,576 | First Industrial Realty Trust, Inc | 13,609 | ||||||||
| 48,896 | FirstService Corp | 9,610 | ||||||||
| 14,018 | Fonciere Des Regions | 1,151 | ||||||||
| 88,463 | * | Forestar Group, Inc | 1,924 | |||||||
| 1,244,814 | Fortress REIT Ltd (Class A) | 976 | ||||||||
| 1,821,000 | Fortune Real Estate Investment Trust | 1,871 | ||||||||
| 66,817 | Four Corners Property Trust, Inc | 1,965 | ||||||||
| 94,242 | Franklin Street Properties Corp | 561 | ||||||||
| 1,249,477 | Frasers Centrepoint Trust | 2,143 | ||||||||
| 875,600 | Frasers Hospitality Trust | 302 | ||||||||
| 7,109,745 | Frasers Logistics & Industrial Trust | 8,019 | ||||||||
| 592 | e | Frontier Real Estate Investment Corp | 2,559 | |||||||
| 6,262 | * | FRP Holdings, Inc | 362 | |||||||
| 742 | Fukuoka REIT Corp | 1,076 | ||||||||
| 358,227 | Gaming and Leisure Properties, Inc | 17,431 | ||||||||
| 548,000 | e | Ganglong China Property Group Ltd | 321 | |||||||
| 146,592 | Gazit Globe Ltd | 1,158 | ||||||||
| 548,653 | GDI Property Group | 441 | ||||||||
| 14,796 | Gecina S.A. | 2,070 | ||||||||
| 336,764 | Gemdale Corp | 685 | ||||||||
| 11,842,937 | Gemdale Properties and Investment Corp Ltd | 1,261 | ||||||||
| 112,470 | e | Geo Group, Inc | 872 | |||||||
| 62,383 | Getty Realty Corp | 2,002 | ||||||||
| 23,901 | Gladstone Commercial Corp | 616 | ||||||||
| 30,901 | e | Gladstone Land Corp | 1,043 | |||||||
| 51,385 | Global Medical REIT, Inc | 912 | ||||||||
| 85,974 | Global Net Lease, Inc | 1,314 | ||||||||
| 1,175 | Global One Real Estate Investment Corp | 1,229 | ||||||||
| 1,146 | GLP J-Reit | 1,981 | ||||||||
| 142,329 | * | Godrej Properties Ltd | 3,577 | |||||||
| 101,280 | Goldcrest Co Ltd | 1,425 | ||||||||
| 1,825,146 | Goodman Group | 35,183 | ||||||||
| 1,359,667 | Goodman Property Trust | 2,401 | ||||||||
| 2,110,156 | GPT Group | 8,321 | ||||||||
| 173 |
COLLEGE RETIREMENT EQUITIES FUND - Stock Account
| SHARES | COMPANY | VALUE (000) | ||||||||
| 817,278 | Grainger plc | $ | 3,515 | |||||||
| 127,739 | Grand City Properties S.A. | 3,034 | ||||||||
| 91,126 | Granite REIT | 7,593 | ||||||||
| 1,452,715 | Great Portland Estates plc | 14,380 | ||||||||
| 447,504 | Greenland Holdings Corp Ltd | 305 | ||||||||
| 845,000 | Greenland Hong Kong Holdings Ltd | 163 | ||||||||
| 1,006,322 | e | Greentown China Holdings Ltd | 1,622 | |||||||
| 1,668,379 | Greentown Service Group Co Ltd | 1,541 | ||||||||
| 376,935 | Growthpoint Properties Australia Ltd | 1,195 | ||||||||
| 4,019,008 | Growthpoint Properties Ltd | 3,877 | ||||||||
| 2,077,392 | e | Guangzhou R&F Properties Co Ltd | 773 | |||||||
| 349,981 | H&R Real Estate Investment Trust | 4,496 | ||||||||
| 81,832 | Hamborner REIT AG. | 933 | ||||||||
| 4,020,653 | e | Hammerson plc | 1,797 | |||||||
| 1,573,442 | Hang Lung Group Ltd | 3,364 | ||||||||
| 2,426,995 | Hang Lung Properties Ltd | 4,992 | ||||||||
| 745 | Hankyu Reit, Inc | 1,027 | ||||||||
| 291,385 | Healthcare Realty Trust, Inc | 9,219 | ||||||||
| 299,023 | Healthcare Trust of America, Inc | 9,984 | ||||||||
| 706,942 | Healthpeak Properties Inc | 25,514 | ||||||||
| 37,122 | Heiwa Real Estate Co Ltd | 1,251 | ||||||||
| 1,129 | e | Heiwa Real Estate REIT, Inc | 1,535 | |||||||
| 147,231 | Helical Bar plc | 905 | ||||||||
| 454,895 | Heliopolis Housing | 194 | ||||||||
| 1,694,518 | Henderson Land Development Co Ltd | 7,228 | ||||||||
| 29,989 | * | Hersha Hospitality Trust | 275 | |||||||
| 31,063,316 | Hibernia REIT plc | 45,975 | ||||||||
| 854,000 | Highwealth Construction Corp | 1,427 | ||||||||
| 7,609 | Highwoods Properties, Inc | 339 | ||||||||
| 111,346 | Home Consortium | 645 | ||||||||
| 686,883 | e | Home Reit plc | 1,213 | |||||||
| 930,402 | e | HomeCo Daily Needs REIT | 1,080 | |||||||
| 1,440,262 | Hongkong Land Holdings Ltd | 7,489 | ||||||||
| 893,379 | e | Hopson Development Holdings Ltd | 1,861 | |||||||
| 261 | Hoshino Resorts REIT, Inc | 1,482 | ||||||||
| 979,340 | * | Host Hotels and Resorts, Inc | 17,031 | |||||||
| 40,227 | * | Howard Hughes Corp | 4,094 | |||||||
| 310,393 | Huaku Development Co Ltd | 1,025 | ||||||||
| 124,861 | Hudson Pacific Properties | 3,085 | ||||||||
| 135,319 | Hufvudstaden AB (Series A) | 2,022 | ||||||||
| 910,000 | e | Huijing Holdings Co Ltd | 228 | |||||||
| 316,483 | Hulic Co Ltd | 3,010 | ||||||||
| 174 |
COLLEGE RETIREMENT EQUITIES FUND - Stock Account
| SHARES | COMPANY | VALUE (000) | ||||||||
| 1,727 | Hulic Reit, Inc | $ | 2,598 | |||||||
| 336,186 | Hyprop Investments Ltd | 786 | ||||||||
| 765,696 | Hysan Development Co Ltd | 2,367 | ||||||||
| 40,156 | Icade | 2,889 | ||||||||
| 313,725 | Ichigo Holdings Co Ltd | 764 | ||||||||
| 1,479 | Ichigo Real Estate Investment Corp | 1,066 | ||||||||
| 1,740,500 | IGB Real Estate Investment Trust | 689 | ||||||||
| 411,270 | Iguatemi S.A. | 201 | ||||||||
| 136,600 | * | Iguatemi S.A. | 443 | |||||||
| 3,978 | Immobel S.A. | 330 | ||||||||
| 61,748 | *,e | Immobiliare Grande Distribuzione SIIQ S.p.A | 271 | |||||||
| 98,084 | e | IMMOFINANZ AG. | 2,519 | |||||||
| 201,775 | Independence Realty Trust, Inc | 5,212 | ||||||||
| 191,924 | * | Indiabulls Real Estate Ltd | 405 | |||||||
| 2,818 | Indus Realty Trust, Inc | 228 | ||||||||
| 2,267 | Industrial & Infrastructure Fund Investment Corp | 4,371 | ||||||||
| 729,936 | Industrial Buildings Corp | 3,138 | ||||||||
| 449,174 | Industrial Logistics Properties Trust | 11,252 | ||||||||
| 2,354,319 | Ingenia Communities Group | 10,651 | ||||||||
| 355,287 | Inmobiliaria Colonial S.A. | 3,324 | ||||||||
| 33,248 | e | Innovative Industrial Properties, Inc | 8,741 | |||||||
| 60,916 | g | Instone Real Estate Group AG. | 1,148 | |||||||
| 82,149 | InterRent Real Estate Investment Trust | 1,124 | ||||||||
| 1,487 | Intershop Holding AG. | 999 | ||||||||
| 27,639 | Intervest Offices | 887 | ||||||||
| 650,667 | Investec Property Fund Ltd | 506 | ||||||||
| 19,858 | Invincible Investment Corp | 6,277 | ||||||||
| 860,924 | Invitation Homes, Inc | 39,034 | ||||||||
| 1,484,000 | IOI Properties Group BHD | 392 | ||||||||
| 975,492 | Irish Residential Properties REIT plc | 1,861 | ||||||||
| 287,306 | Iron Mountain, Inc | 15,035 | ||||||||
| 609,305 | e | Irongate Group | 767 | |||||||
| 135,032 | Israel Canada T.R Ltd | 868 | ||||||||
| 2,300 | Isras Investment Co Ltd | 609 | ||||||||
| 59,482 | e | iStar Inc | 1,536 | |||||||
| 707 | ITOCHU Advance Logistics Investment Corp | 1,124 | ||||||||
| 918,635 | * | IWG plc | 3,621 | |||||||
| 86,339 | Jadwa REIT Saudi Fund | 344 | ||||||||
| 1,483 | Japan Excellent, Inc | 1,719 | ||||||||
| 13,913 | Japan Hotel REIT Investment Corp | 6,797 | ||||||||
| 992 | Japan Logistics Fund Inc | 3,072 | ||||||||
| 175 |
COLLEGE RETIREMENT EQUITIES FUND - Stock Account
| SHARES | COMPANY | VALUE (000) | ||||||||
| 991 | Japan Prime Realty Investment Corp | $ | 3,437 | |||||||
| 1,052 | Japan Real Estate Investment Corp | 5,972 | ||||||||
| 4,912 | Japan Retail Fund Investment Corp | 4,232 | ||||||||
| 142,032 | JBG SMITH Properties | 4,078 | ||||||||
| 341,190 | JHSF Participacoes S.A. | 341 | ||||||||
| 1,596,750 | *,† | Jiangsu Future Land Co Ltd | 16 | |||||||
| 1,594,000 | e | Jiayuan International Group Ltd | 538 | |||||||
| 519,269 | Jingrui Holdings Ltd | 115 | ||||||||
| 321,105 | Jinke Properties Group Co Ltd | 226 | ||||||||
| 40,226 | * | Jones Lang LaSalle, Inc | 10,834 | |||||||
| 112,540 | JR Reit XXVII | 504 | ||||||||
| 571,000 | JY Grandmark Holdings Ltd | 167 | ||||||||
| 2,443,329 | K Wah International Holdings Ltd | 943 | ||||||||
| 2,928,000 | e | Kaisa Group Holdings Ltd | 293 | |||||||
| 664,552 | Katitas Co Ltd | 25,578 | ||||||||
| 263,411 | * | KE Holdings, Inc (ADR) | 5,300 | |||||||
| 33,000 | Keihanshin Building Co Ltd | 448 | ||||||||
| 545 | Kenedix Realty Investment Corp | 3,368 | ||||||||
| 1,151 | Kenedix Residential Investment Corp | 2,224 | ||||||||
| 700 | Kenedix Retail REIT Corp | 1,722 | ||||||||
| 271,517 | Kennedy-Wilson Holdings, Inc | 6,484 | ||||||||
| 1,673,617 | Keppel DC REIT | 3,067 | ||||||||
| 2,365,391 | Keppel REIT | 1,985 | ||||||||
| 1,050,914 | Keppel-KBS US REIT | 841 | ||||||||
| 748,000 | Kerry Properties Ltd | 1,948 | ||||||||
| 66,116 | *,e | K-fast Holding AB | 636 | |||||||
| 145,875 | Killam Apartment Real Estate Investment Trust | 2,720 | ||||||||
| 130,773 | Kilroy Realty Corp | 8,691 | ||||||||
| 109,726 | Kimco Realty Corp | 2,705 | ||||||||
| 398,174 | Kindom Construction Co | 543 | ||||||||
| 194,190 | Kite Realty Group Trust | 4,229 | ||||||||
| 2,059,142 | Kiwi Property Group Ltd | 1,685 | ||||||||
| 55,792 | Klepierre | 1,320 | ||||||||
| 150,134 | Kojamo Oyj | 3,630 | ||||||||
| 156,278 | * | Korea Real Estate Investment Trust Co | 342 | |||||||
| 1,458,406 | KWG Group Holdings Ltd | 955 | ||||||||
| 3,367,800 | KWG Living Group Holdings Ltd | 1,385 | ||||||||
| 85,456 | Lamar Advertising Co | 10,366 | ||||||||
| 75,380 | * | Lamda Development S.A. | 591 | |||||||
| 9,660,077 | Land and Houses PCL Co Reg | 2,540 | ||||||||
| 261,508 | Land Securities Group plc | 2,760 | ||||||||
| 62,342 | Lar Espana Real Estate Socimi S.A. | 368 | ||||||||
| 176 |
COLLEGE RETIREMENT EQUITIES FUND - Stock Account
| SHARES | COMPANY | VALUE (000) | ||||||||
| 2,171 | LaSalle Logiport REIT | $ | 3,824 | |||||||
| 307,000 | *,e | Leading Holdings Group Ltd | 177 | |||||||
| 24,806 | LEG Immobilien AG. | 3,459 | ||||||||
| 757,089 | Lend Lease Corp Ltd | 5,895 | ||||||||
| 1,122,826 | Lendlease Global Commercial REIT | 746 | ||||||||
| 164,443 | * | Leopalace21 Corp | 263 | |||||||
| 245,194 | e | Lexington Realty Trust | 3,830 | |||||||
| 49,934 | Life Storage, Inc | 7,649 | ||||||||
| 113,885 | Lifestyle Communities Ltd | 1,721 | ||||||||
| 2,733,126 | Link REIT | 24,077 | ||||||||
| 23,323,540 | * | Lippo Karawaci Tbk PT | 231 | |||||||
| 286,605 | LOG Commercial Properties e Participacoes S.A. | 1,299 | ||||||||
| 1,751,528 | Logan Property Holdings Co Ltd | 1,339 | ||||||||
| 2,291,787 | LondonMetric Property plc | 8,808 | ||||||||
| 2,156,593 | g | Longfor Properties Co Ltd | 10,172 | |||||||
| 132,211 | LOTTE Reit Co Ltd | 617 | ||||||||
| 34,046 | LTC Properties, Inc | 1,162 | ||||||||
| 1,166,000 | * | LVGEM China Real Estate Investment Co Ltd | 205 | |||||||
| 1,557,914 | LXI REIT plc | 3,072 | ||||||||
| 674,581 | Mabanee Co KPSC | 1,769 | ||||||||
| 186,241 | e | Macerich Co | 3,218 | |||||||
| 169,704 | * | Mack-Cali Realty Corp | 3,119 | |||||||
| 798,671 | Macquarie CountryWide Trust | 2,476 | ||||||||
| 1,235,942 | g | Macquarie Mexico Real Estate Management SA de CV | 1,583 | |||||||
| 1,205,134 | Mah Sing Group BHD | 200 | ||||||||
| 1,801,550 | Manulife US Real Estate Investment Trust | 1,207 | ||||||||
| 35,779 | *,†,e | Mapeley Ltd | 0 | ^ | ||||||
| 2,349,384 | Mapletree Commercial Trust | 3,514 | ||||||||
| 2,431,047 | Mapletree Industrial Trust | 4,889 | ||||||||
| 3,568,687 | Mapletree Logistics Trust | 5,033 | ||||||||
| 2,883,800 | Mapletree North Asia Commercial Trust | 2,386 | ||||||||
| 180,690 | * | Marcus & Millichap, Inc | 9,298 | |||||||
| 483,356 | Matrix Concepts Holdings BHD | 255 | ||||||||
| 899,000 | * | MBK PCL | 361 | |||||||
| 180,629 | Medical Properties Trust, Inc | 4,268 | ||||||||
| 28,865 | Mega Or Holdings Ltd | 1,323 | ||||||||
| 11,889,000 | Megaworld Corp | 734 | ||||||||
| 25,617 | * | Melisron Ltd | 2,388 | |||||||
| 84,087 | Mercialys S.A | 821 | ||||||||
| 449,717 | Merlin Properties Socimi S.A. | 4,872 | ||||||||
| 33,880 | g | Metrovacesa S.A. | 273 | |||||||
| 177 |
COLLEGE RETIREMENT EQUITIES FUND - Stock Account
| SHARES | COMPANY | VALUE (000) | ||||||||
| 161,604 | MGM Growth Properties LLC | $ | 6,602 | |||||||
| 14,640 | Mid-America Apartment Communities, Inc | 3,359 | ||||||||
| 324,600 | g | Midea Real Estate Holding Ltd | 505 | |||||||
| 161,600 | g | Mindspace Business Parks REIT | 711 | |||||||
| 21,388 | g | Minto Apartment Real Estate REIT NPV | 370 | |||||||
| 2,257 | Mirai Corp | 971 | ||||||||
| 4,326,531 | Mirvac Group | 9,158 | ||||||||
| 1,270,944 | Mitsubishi Estate Co Ltd | 17,631 | ||||||||
| 444 | Mitsubishi Estate Logistics REIT Investment Corp | 2,023 | ||||||||
| 1,008,285 | Mitsui Fudosan Co Ltd | 19,985 | ||||||||
| 993 | Mitsui Fudosan Logistics Park, Inc | 5,568 | ||||||||
| 8,065 | Mobimo Holding AG. | 2,704 | ||||||||
| 72,851 | Monmouth Real Estate Investment Corp (Class A) | 1,531 | ||||||||
| 18,943 | Montea C.V.A | 2,851 | ||||||||
| 10,353 | Morguard Corp | 1,117 | ||||||||
| 33,914 | Morguard North American Resid | 475 | ||||||||
| 3,308 | Mori Hills REIT Investment Corp | 4,489 | ||||||||
| 378 | Mori Trust Hotel Reit, Inc | 408 | ||||||||
| 1,208 | Mori Trust Sogo Reit, Inc | 1,521 | ||||||||
| 308,600 | Multiplan Empreendimentos Imobiliarios S.A. | 1,034 | ||||||||
| 18,581 | *,e | Nam Tai Property, Inc | 187 | |||||||
| 37,874 | National Health Investors, Inc | 2,177 | ||||||||
| 854,439 | * | National Real Estate Co KPSC | 624 | |||||||
| 120,720 | National Retail Properties, Inc | 5,803 | ||||||||
| 483,777 | National Storage Affiliates Trust | 33,477 | ||||||||
| 1,362,753 | National Storage REIT | 2,636 | ||||||||
| 2,126,000 | Neo-China Land Group Holdings Ltd | 207 | ||||||||
| 502,733 | NEPI Rockcastle plc | 3,344 | ||||||||
| 23,250 | NESCO Ltd | 182 | ||||||||
| 70,284 | NETSTREIT Corp | 1,610 | ||||||||
| 1,775,193 | New World Development Co Ltd | 7,028 | ||||||||
| 327,347 | Newmark Group, Inc | 6,121 | ||||||||
| 47,914 | Nexity | 2,256 | ||||||||
| 61,187 | NexPoint Residential Trust, Inc | 5,129 | ||||||||
| 551 | Nippon Accommodations Fund, Inc | 3,176 | ||||||||
| 1,536 | Nippon Building Fund, Inc | 8,947 | ||||||||
| 2,192 | Nippon ProLogis REIT, Inc | 7,748 | ||||||||
| 538 | NIPPON REIT Investment Corp | 1,918 | ||||||||
| 83,325 | Nomura Real Estate Holdings, Inc | 1,920 | ||||||||
| 4,662 | Nomura Real Estate Master Fund, Inc | 6,561 | ||||||||
| 128,199 | NorthWest Healthcare Properties Real Estate Investment Trust | 1,400 | ||||||||
| 178 |
COLLEGE RETIREMENT EQUITIES FUND - Stock Account
| SHARES | COMPANY | VALUE (000) | ||||||||
| 23,979 | NSI NV | $ | 956 | |||||||
| 220,205 | e | Nyfosa AB | 3,790 | |||||||
| 138,195 | * | Oberoi Realty Ltd | 1,597 | |||||||
| 51,109 | Office Properties Income Trust | 1,270 | ||||||||
| 91,131 | Omega Healthcare Investors, Inc | 2,697 | ||||||||
| 14,575 | e | One Liberty Properties, Inc | 514 | |||||||
| 284 | One REIT, Inc | 746 | ||||||||
| 436,535 | * | Opendoor Technologies, Inc | 6,378 | |||||||
| 784,067 | Origin Property PCL | 265 | ||||||||
| 63,505 | *,e | Orion Office REIT, Inc | 1,186 | |||||||
| 1,961 | Orix JREIT, Inc | 3,066 | ||||||||
| 2,461,674 | OUE Commercial Real Estate Investment Trust | 804 | ||||||||
| 408,825 | Outfront Media, Inc | 10,965 | ||||||||
| 726,822 | Overseas Union Enterprise Ltd | 733 | ||||||||
| 17,634,300 | * | Pakuwon Jati Tbk PT | 573 | |||||||
| 1,610,307 | Palm Hills Developments SAE | 204 | ||||||||
| 111,798 | * | Pandox AB | 1,801 | |||||||
| 409,413 | Paramount Group, Inc | 3,415 | ||||||||
| 230,700 | * | Park Hotels & Resorts, Inc | 4,356 | |||||||
| 482,824 | Parkway Life Real Estate Investment Trust | 1,838 | ||||||||
| 507,760 | * | Parque Arauco S.A. | 560 | |||||||
| 79,622 | Patrizia Immobilien AG. | 1,858 | ||||||||
| 9,712 | Peach Property Group AG. | 675 | ||||||||
| 113,439 | Pebblebrook Hotel Trust | 2,538 | ||||||||
| 113,495 | * | PEXA Group Ltd | 1,649 | |||||||
| 156,959 | Phillips Edison & Co, Inc | 5,186 | ||||||||
| 103,005 | Phoenix Mills Ltd | 1,361 | ||||||||
| 192,326 | Physicians Realty Trust | 3,621 | ||||||||
| 644,491 | Picton Property Income Ltd | 890 | ||||||||
| 244,197 | Piedmont Office Realty Trust, Inc | 4,488 | ||||||||
| 870,056 | PLA Administradora Industrial S de RL de C.V. | 1,218 | ||||||||
| 73,146 | Platzer Fastigheter Holding AB | 1,096 | ||||||||
| 405,264 | Plaza S.A. | 447 | ||||||||
| 87,413 | Plymouth Industrial REIT, Inc | 2,797 | ||||||||
| 2,143,817 | Poly Hong Kong Investment Ltd | 564 | ||||||||
| 824,162 | Poly Real Estate Group Co Ltd | 2,021 | ||||||||
| 12,125 | e | Postal Realty Trust, Inc | 240 | |||||||
| 85,163 | PotlatchDeltic Corp | 5,129 | ||||||||
| 173,500 | Powerlong Commercial Management Holdings Ltd | 323 | ||||||||
| 1,791,000 | Powerlong Real Estate Holdings Ltd | 938 | ||||||||
| 6,926 | Prashkovsky Investments and Construction Ltd | 285 | ||||||||
| 179 |
COLLEGE RETIREMENT EQUITIES FUND - Stock Account
| SHARES | COMPANY | VALUE (000) | ||||||||
| 1,538,376 | Precinct Properties New Zealand Ltd | $ | 1,759 | |||||||
| 409,785 | Preferred Apartment Communities, Inc | 7,401 | ||||||||
| 1,504 | Premier Investment Co | 2,031 | ||||||||
| 147,394 | Prestige Estates Projects Ltd | 938 | ||||||||
| 1,614,439 | Primary Health Properties plc | 3,316 | ||||||||
| 542,800 | Prime US REIT | 453 | ||||||||
| 1,016,826 | Prince Housing & Development Corp | 492 | ||||||||
| 519,553 | ProLogis Property Mexico S.A. de C.V. | 1,442 | ||||||||
| 2,048,817 | Prologis, Inc | 344,939 | ||||||||
| 3,451 | * | Property & Building Corp | 495 | |||||||
| 1,444,000 | Prosperity REIT | 570 | ||||||||
| 769,800 | Pruksa Holding PCL | 300 | ||||||||
| 9,918 | PS Business Parks, Inc | 1,827 | ||||||||
| 87,713 | PSP Swiss Property AG. | 10,930 | ||||||||
| 9,694,740 | PT Ciputra Development Tbk | 660 | ||||||||
| 16,315,400 | *,† | PT Hanson International Tbk | 0 | ^ | ||||||
| 165,730 | Public Storage, Inc | 62,076 | ||||||||
| 23,633,258 | Puradelta Lestari Tbk PT | 317 | ||||||||
| 10,020,722 | Quality House PCL | 678 | ||||||||
| 963,000 | e | Radiance Holdings Group Co Ltd | 513 | |||||||
| 136,458 | Rayonier, Inc | 5,507 | ||||||||
| 108,946 | Re/Max Holdings, Inc | 3,322 | ||||||||
| 93,890 | *,e | Real Matters, Inc | 616 | |||||||
| 101,059 | * | Realogy Holdings Corp | 1,699 | |||||||
| 177,865 | Realty Income Corp | 12,733 | ||||||||
| 1,166,000 | e,g | Redco Properties Group Ltd | 390 | |||||||
| 5,989,786 | Redefine Properties Ltd | 1,650 | ||||||||
| 8,776 | *,e | Redfin Corp | 337 | |||||||
| 1,124,000 | e | Redsun Properties Group Ltd | 316 | |||||||
| 493,391 | Regency Centers Corp | 37,177 | ||||||||
| 487,471 | g | Regional REIT Ltd | 620 | |||||||
| 216,748 | Reit Ltd | 1,548 | ||||||||
| 138,928 | Relo Holdings, Inc | 2,507 | ||||||||
| 328,078 | Resilient REIT Ltd | 1,230 | ||||||||
| 12,144 | Retail Estates NV | 985 | ||||||||
| 106,275 | Retail Opportunities Investment Corp | 2,083 | ||||||||
| 17,982 | Retail Value, Inc | 115 | ||||||||
| 1,277,484 | Rexford Industrial Realty, Inc | 103,617 | ||||||||
| 229,637 | RioCan Real Estate Investment Trust | 4,164 | ||||||||
| 522,363 | RiseSun Real Estate Development Co Ltd | 357 | ||||||||
| 148,000 | RLJ Lodging Trust | 2,062 | ||||||||
| 72,476 | RMR Group, Inc | 2,513 | ||||||||
| 180 |
COLLEGE RETIREMENT EQUITIES FUND - Stock Account
| SHARES | COMPANY | VALUE (000) | ||||||||
| 259,277 | Road King Infrastructure | $ | 237 | |||||||
| 2,201,800 | Robinsons Land Corp | 829 | ||||||||
| 616,405 | e | Ronshine China Holdings Ltd | 237 | |||||||
| 70,898 | RPT Realty | 949 | ||||||||
| 1,337,708 | Ruentex Development Co Ltd | 3,078 | ||||||||
| 415,921 | Rural Funds Group | 959 | ||||||||
| 17,819 | * | Ryman Hospitality Properties | 1,639 | |||||||
| 487,086 | Sabra Healthcare REIT, Inc | 6,595 | ||||||||
| 6,661 | Safehold, Inc | 532 | ||||||||
| 810,865 | Safestore Holdings plc | 15,464 | ||||||||
| 141,446 | Sagax AB | 4,758 | ||||||||
| 444,872 | e | Samhallsbyggnadsbolaget i - D | 1,582 | |||||||
| 1,799,553 | e | Samhallsbyggnadsbolaget i Norden AB | 13,196 | |||||||
| 41,130 | SAMTY Co Ltd | 785 | ||||||||
| 467 | Samty Residential Investment Corp | 523 | ||||||||
| 12,433,282 | Sansiri PCL | 457 | ||||||||
| 972,900 | Sasseur Real Estate Investment Trust | 609 | ||||||||
| 103,269 | * | Saudi Real Estate Co | 558 | |||||||
| 1,838 | Saul Centers, Inc | 97 | ||||||||
| 173,588 | Savills plc | 3,307 | ||||||||
| 123,116 | SBA Communications Corp | 47,895 | ||||||||
| 2,810,846 | SC Asset Corp PCL | 283 | ||||||||
| 583,000 | *,e | SCE Intelligent Commercial Management Holdings Ltd | 271 | |||||||
| 5,718,286 | Scentre Group | 13,154 | ||||||||
| 1,731,461 | Seazen Group Ltd | 1,171 | ||||||||
| 170,298 | * | Seazen Holdings Co Ltd | 779 | |||||||
| 335,012 | Secure Income REIT plc | 1,927 | ||||||||
| 419,194 | Segro plc | 8,158 | ||||||||
| 4,958 | Sekisui House Reit, Inc | 3,695 | ||||||||
| 47,834 | Selvaag Bolig ASA | 277 | ||||||||
| 33,595 | *,e | Seritage Growth Properties | 446 | |||||||
| 424,788 | Service Properties Trust | 3,734 | ||||||||
| 232,115 | Shaftesbury plc | 1,937 | ||||||||
| 313,000 | Shanghai Jinqiao Export Processing Zone Development Co Ltd | 284 | ||||||||
| 35,637 | Shanghai Lingang Holdings Corp Ltd | 83 | ||||||||
| 1,763,492 | Shanghai Lujiazui Finance & Trade Zone Development Co Ltd | 1,607 | ||||||||
| 146,649 | Shanghai Zhangjiang High-Tech Park Development Co Ltd | 347 | ||||||||
| 3,934,000 | Shenzhen Investment Ltd | 848 | ||||||||
| 1,483,078 | e | Shimao Property Holdings Ltd | 971 | |||||||
| 818,000 | e,g | Shimao Services Holdings Ltd | 569 | |||||||
| 819,000 | e | Shinsun Holdings Group Co Ltd | 92 | |||||||
| 181 |
COLLEGE RETIREMENT EQUITIES FUND - Stock Account
| SHARES | COMPANY | VALUE (000) | ||||||||
| 1,308,258 | Shopping Centres Australasia Property Group | $ | 2,827 | |||||||
| 2,301,200 | Shoucheng Holdings Ltd | 458 | ||||||||
| 8,457,500 | Shui On Land Ltd | 1,138 | ||||||||
| 31,899 | Shurgard Self Storage Europe Sarl | 2,088 | ||||||||
| 2,585,600 | Sime Darby Property BHD | 369 | ||||||||
| 1,166,954 | Simon Property Group, Inc | 186,444 | ||||||||
| 2,422,000 | * | Singha Estate PCL | 146 | |||||||
| 3,620,648 | Sino Land Co | 4,508 | ||||||||
| 3,214,000 | Sino-Ocean Land Holdings Ltd | 751 | ||||||||
| 231,692 | Sinyi Realty Co | 293 | ||||||||
| 1,193,466 | Sirius Real Estate Ltd | 2,284 | ||||||||
| 570,290 | SITE Centers Corp | 9,028 | ||||||||
| 10,278 | * | SK D&D Co Ltd | 274 | |||||||
| 2,922,000 | Skyfame Realty Holdings Ltd | 322 | ||||||||
| 71,065 | SL Green Realty Corp | 5,095 | ||||||||
| 70,300 | Slate Grocery REIT | 802 | ||||||||
| 11,713,488 | SM Prime Holdings | 7,786 | ||||||||
| 87,008 | SmartCentres Real Estate Investment Trust | 2,214 | ||||||||
| 41,340 | Sobha Ltd | 496 | ||||||||
| 2,170,500 | *,e | Soho China Ltd | 479 | |||||||
| 749 | SOSiLA Logistics REIT, Inc | 1,146 | ||||||||
| 1,731,500 | * | SP Setia BHD | 536 | |||||||
| 54,307 | Sparkassen Immobilien AG. | 1,345 | ||||||||
| 1,239,400 | e | SPH REIT | 920 | |||||||
| 314,631 | Spirit Realty Capital, Inc | 15,162 | ||||||||
| 7,100 | * | SRE Holdings Corp | 447 | |||||||
| 48,902 | St. Joe Co | 2,545 | ||||||||
| 677,283 | STAG Industrial, Inc | 32,482 | ||||||||
| 2,986 | Star Asia Investment Corp | 1,642 | ||||||||
| 1,658,029 | Starhill Global REIT | 806 | ||||||||
| 71,700 | Starts Corp, Inc | 1,567 | ||||||||
| 279 | Starts Proceed Investment Corp | 578 | ||||||||
| 1,618,225 | Stockland Trust Group | 4,992 | ||||||||
| 1,223,000 | StorageVault Canada, Inc | 6,971 | ||||||||
| 414,710 | STORE Capital Corp | 14,266 | ||||||||
| 266,406 | Sumitomo Realty & Development Co Ltd | 7,854 | ||||||||
| 10,224,709 | * | Summarecon Agung Tbk PT | 599 | |||||||
| 989,860 | * | Summit Hotel Properties, Inc | 9,661 | |||||||
| 99,574 | Summit Industrial Income REIT | 1,850 | ||||||||
| 44,998 | * | Summit Real Estate Holdings Ltd | 947 | |||||||
| 234,404 | Sun Communities, Inc | 49,218 | ||||||||
| 92,580 | Sun Frontier Fudousan Co Ltd | 806 | ||||||||
| 182 |
COLLEGE RETIREMENT EQUITIES FUND - Stock Account
| SHARES | COMPANY | VALUE (000) | ||||||||
| 1,529,123 | Sun Hung Kai Properties Ltd | $ | 18,555 | |||||||
| 3,424,197 | Sunac China Holdings Ltd | 5,180 | ||||||||
| 1,274,000 | g | Sunac Services Holdings Ltd | 1,300 | |||||||
| 844,000 | e | Sunkwan Properties Group Ltd | 233 | |||||||
| 1,138,000 | Sunlight Real Estate Investment Trust | 633 | ||||||||
| 193,622 | * | Sunstone Hotel Investors, Inc | 2,271 | |||||||
| 2,438,900 | Suntec Real Estate Investment Trust | 2,732 | ||||||||
| 53,674 | Sunteck Realty Ltd | 353 | ||||||||
| 2,057,500 | Sunway Real Estate Investment | 696 | ||||||||
| 2,286,101 | Supalai PCL | 1,552 | ||||||||
| 542,128 | Swire Pacific Ltd (Class A) | 3,084 | ||||||||
| 1,415,371 | Swire Properties Ltd | 3,548 | ||||||||
| 86,513 | Swiss Prime Site AG. | 8,493 | ||||||||
| 322,334 | TAG Tegernsee Immobilien und Beteiligungs AG. | 9,004 | ||||||||
| 640 | Takara Leben Real Estate Investment Corp | 646 | ||||||||
| 973,483 | Talaat Moustafa Group | 560 | ||||||||
| 67,241 | e | Tanger Factory Outlet Centers, Inc | 1,296 | |||||||
| 707,912 | Target Healthcare REIT plc | 1,131 | ||||||||
| 18,304 | * | Tejon Ranch Co | 349 | |||||||
| 127,544 | Terreno Realty Corp | 10,878 | ||||||||
| 522,000 | Times Neighborhood Holdings Ltd | 194 | ||||||||
| 16,571 | *,e | TKP Corp | 199 | |||||||
| 41,480 | TOC Co Ltd | 240 | ||||||||
| 307,793 | Tokyo Tatemono Co Ltd | 4,501 | ||||||||
| 742,300 | Tokyu Fudosan Holdings Corp | 4,159 | ||||||||
| 1,012 | Tokyu REIT, Inc | 1,742 | ||||||||
| 166,443 | Tosei Corp | 1,461 | ||||||||
| 305,178 | Tricon Capital Group, Inc | 4,671 | ||||||||
| 8,901,563 | Tritax Big Box REIT plc | 30,030 | ||||||||
| 17,891,554 | g | Tritax EuroBox plc | 28,334 | |||||||
| 18,409 | UDR, Inc | 1,104 | ||||||||
| 956,299 | UK Commercial Property REIT Ltd | 969 | ||||||||
| 77,199 | UMH Properties, Inc | 2,110 | ||||||||
| 24,240 | * | Unibail-Rodamco-Westfield | 1,701 | |||||||
| 10,941 | * | Unibail-Rodamco-Westfield | 766 | |||||||
| 977,770 | Unite Group plc | 14,706 | ||||||||
| 1,904,641 | United Development Co PSC | 804 | ||||||||
| 5,511 | United Urban Investment Corp | 6,477 | ||||||||
| 174,028 | Uniti Group, Inc | 2,438 | ||||||||
| 2,202 | Universal Health Realty Income Trust | 131 | ||||||||
| 510,133 | UOL Group Ltd | 2,685 | ||||||||
| 100,070 | Urban Edge Properties | 1,901 | ||||||||
| 183 |
COLLEGE RETIREMENT EQUITIES FUND - Stock Account
| SHARES | COMPANY | VALUE (000) | ||||||||
| 552,496 | Urban Logistics REIT plc | $ | 1,403 | |||||||
| 25,640 | Urstadt Biddle Properties, Inc (Class A) | 546 | ||||||||
| 17,479 | Vastned Retail NV | 478 | ||||||||
| 558,864 | Ventas, Inc | 28,569 | ||||||||
| 8,773 | e | VGP NV | 2,560 | |||||||
| 834,789 | e | VICI Properties, Inc | 25,135 | |||||||
| 4,216,424 | Vicinity Centres | 5,186 | ||||||||
| 3,362,000 | Vista Land & Lifescapes, Inc | 233 | ||||||||
| 14,888 | Vornado Realty Trust | 623 | ||||||||
| 798,784 | Vukile Property Fund Ltd | 620 | ||||||||
| 197,298 | Wallenstam AB | 3,663 | ||||||||
| 811,674 | Warehouse REIT plc | 1,942 | ||||||||
| 352,590 | Warehouses De Pauw CVA | 16,922 | ||||||||
| 74,201 | �� | Washington REIT | 1,918 | |||||||
| 397,053 | Watkin Jones plc | 1,405 | ||||||||
| 1,366,291 | Waypoint REIT | 2,813 | ||||||||
| 424,539 | Welltower, Inc | 36,413 | ||||||||
| 39,458 | e | Wereldhave NV | 575 | |||||||
| 757,655 | Weyerhaeuser Co | 31,200 | ||||||||
| 8,518,909 | WHA Corp PCL | 896 | ||||||||
| 1,613,606 | Wharf Holdings Ltd | 4,957 | ||||||||
| 1,919,897 | Wharf Real Estate Investment Co Ltd | 9,755 | ||||||||
| 38,626 | Whitestone REIT | 391 | ||||||||
| 220,836 | Wihlborgs Fastigheter AB | 5,005 | ||||||||
| 162,314 | e | Workspace Group plc | 1,776 | |||||||
| 8,514 | WP Carey, Inc | 699 | ||||||||
| 98,207 | * | Xenia Hotels & Resorts, Inc | 1,779 | |||||||
| 25,780 | e | Xior Student Housing NV | 1,440 | |||||||
| 664,342 | Yanlord Land Group Ltd | 547 | ||||||||
| 9,050 | YH Dimri Construction & Development Ltd | 879 | ||||||||
| 434,000 | e | Yincheng International Holding Co Ltd | 136 | |||||||
| 120,500 | Youngor Group Co Ltd | 130 | ||||||||
| 511,600 | YTL Hospitality REIT | 113 | ||||||||
| 1,666,426 | Yuexiu Property Co Ltd | 1,470 | ||||||||
| 1,912,000 | Yuexiu Real Estate Investment Trust | 792 | ||||||||
| 2,250,238 | e | Yuzhou Group Holdings Co Ltd | 185 | |||||||
| 570,000 | e | Zensun Enterprises Ltd | 282 | |||||||
| 135,300 | Zhejiang China Commodities City Group Co Ltd | 103 | ||||||||
| 1,924,000 | e | Zhenro Properties Group Ltd | 915 | |||||||
| 753,000 | *,e | Zhongliang Holdings Group Co Ltd | 353 | |||||||
| 1,906,000 | e | Zhuguang Holdings Group Co Ltd | 396 | |||||||
| 57,345 | * | Zillow Group, Inc (Class A) | 3,568 | |||||||
| 184 |
COLLEGE RETIREMENT EQUITIES FUND - Stock Account
| SHARES | COMPANY | VALUE (000) | ||||||||
| 163,606 | *,e | Zillow Group, Inc (Class C) | $ | 10,446 | ||||||
| TOTAL REAL ESTATE | 4,178,004 | |||||||||
| RETAILING - 5.5% | ||||||||||
| 142,457 | *,e | 1-800-FLOWERS.COM, Inc (Class A) | 3,329 | |||||||
| 760 | * | 1stdibs.com, Inc | 10 | |||||||
| 99,157 | Aaron’s Co, Inc | 2,444 | ||||||||
| 49,500 | ABC-Mart, Inc | 2,119 | ||||||||
| 48,314 | * | Abercrombie & Fitch Co (Class A) | 1,683 | |||||||
| 52,580 | * | About You Holding SE | 1,225 | |||||||
| 2,962,959 | Abu Dhabi National Oil Co for Distribution PJSC | 3,445 | ||||||||
| 274,460 | * | Academy Sports & Outdoors, Inc | 12,049 | |||||||
| 777,330 | Accent Group Ltd | 1,387 | ||||||||
| 7,360,000 | Ace Hardware Indonesia Tbk PT | 660 | ||||||||
| 27,330 | Adastria Holdings Co Ltd | 385 | ||||||||
| 60,130 | Advance Auto Parts, Inc | 14,424 | ||||||||
| 431 | * | aka Brands Holding Corp | 4 | |||||||
| 24,493,944 | * | Alibaba Group Holding Ltd | 359,953 | |||||||
| 549,502 | *,g | Allegro.eu S.A. | 5,290 | |||||||
| 1,353,400 | AllHome Corp | 223 | ||||||||
| 15,990 | e | Alpen Co Ltd | 297 | |||||||
| 860,291 | * | Amazon.com, Inc | 2,868,503 | |||||||
| 16,063 | e | American Eagle Outfitters, Inc | 407 | |||||||
| 13,765,009 | * | Americanas S.A. | 77,566 | |||||||
| 1,412 | * | America’s Car-Mart, Inc | 145 | |||||||
| 379,531 | *,e | AO World plc | 568 | |||||||
| 34,600 | e | AOKI Holdings, Inc | 186 | |||||||
| 183,988 | AP Eagers Ltd | 1,801 | ||||||||
| 4,060,000 | *,e | Apollo Future Mobility Group Ltd | 234 | |||||||
| 26,203 | *,e,g | Aramis Group SAS | 419 | |||||||
| 23,222 | Arata Corp | 890 | ||||||||
| 30,576 | Arc Land Sakamoto Co Ltd | 436 | ||||||||
| 106,084 | * | Aritzia, Inc | 4,390 | |||||||
| 11,609 | * | Arko Corp | 102 | |||||||
| 25,245 | * | Asbury Automotive Group, Inc | 4,361 | |||||||
| 250,628 | ASKUL Corp | 3,344 | ||||||||
| 337,991 | * | ASOS plc | 10,939 | |||||||
| 520,535 | * | Auction Technology Group plc | 10,681 | |||||||
| 28,568 | *,g | Auto1 Group SE | 631 | |||||||
| 83,788 | Autobacs Seven Co Ltd | 1,022 | ||||||||
| 29,737 | *,e | AutoCanada, Inc | 1,004 | |||||||
| 185 |
COLLEGE RETIREMENT EQUITIES FUND - Stock Account
| SHARES | COMPANY | VALUE (000) | ||||||||
| 86,596 | * | Autonation, Inc | $ | 10,119 | ||||||
| 20,665 | * | AutoZone, Inc | 43,322 | |||||||
| 3,510,399 | B&M European Value Retail S.A. | 30,237 | ||||||||
| 32,887 | g | B&S Group Sarl | 268 | |||||||
| 1,405,386 | *,e,n | Baozun, Inc (ADR) | 19,535 | |||||||
| 424,139 | Bapcor Ltd | 2,162 | ||||||||
| 36,764 | * | Barnes & Noble Education, Inc | 250 | |||||||
| 64,393 | Bath & Body Works, Inc | 4,494 | ||||||||
| 270,014 | *,e | Bed Bath & Beyond, Inc | 3,937 | |||||||
| 56,805 | Belluna Co Ltd | 350 | ||||||||
| 922,773 | Berjaya Auto BHD | 350 | ||||||||
| 243,319 | Best Buy Co, Inc | 24,721 | ||||||||
| 248,954 | * | BHG Group AB | 2,616 | |||||||
| 112,900 | BIC CAMERA, Inc | 945 | ||||||||
| 18,252 | e | Big 5 Sporting Goods Corp | 347 | |||||||
| 31,030 | Big Lots, Inc | 1,398 | ||||||||
| 25,154 | * | Bike24 Holding AG. | 441 | |||||||
| 87,441 | Bilia AB | 1,545 | ||||||||
| 2,862,978 | * | boohoo.com plc | 4,801 | |||||||
| 2,482 | * | Boot Barn Holdings, Inc | 305 | |||||||
| 68,474 | *,e,g | Boozt AB | 1,390 | |||||||
| 50,734 | Buckle, Inc | 2,147 | ||||||||
| 390,713 | * | Burlington Stores, Inc | 113,897 | |||||||
| 132,424 | * | C&A Modas Ltd | 146 | |||||||
| 3,494 | Caleres, Inc | 79 | ||||||||
| 201,321 | e | Camping World Holdings, Inc | 8,133 | |||||||
| 90,174 | Canadian Tire Corp Ltd | 12,934 | ||||||||
| 42,100 | e | Cango, Inc (ADR) | 132 | |||||||
| 45,985 | *,e | CarLotz, Inc | 104 | |||||||
| 394,873 | * | CarMax, Inc | 51,424 | |||||||
| 200,792 | * | CarParts.com, Inc | 2,249 | |||||||
| 19,462 | * | Cartrade Tech Ltd | 222 | |||||||
| 75,568 | * | Carvana Co | 17,516 | |||||||
| 17,903 | Cato Corp (Class A) | 307 | ||||||||
| 196,670 | * | Ceconomy AG | 846 | |||||||
| 1,850,965 | Central Retail Corp PCL | 1,771 | ||||||||
| 168,883 | * | Cettire Ltd | 438 | |||||||
| 393,012 | * | Chico’s FAS, Inc | 2,114 | |||||||
| 249,387 | * | Children’s Place, Inc | 19,774 | |||||||
| 848,500 | China Harmony New Energy Auto Holding Ltd | 536 | ||||||||
| 135,301 | China International Travel Service Corp Ltd | 4,664 | ||||||||
| 652,629 | China Meidong Auto Holdings Ltd | 3,364 | ||||||||
| 186 |
COLLEGE RETIREMENT EQUITIES FUND - Stock Account
| SHARES | COMPANY | VALUE (000) | ||||||||
| 220,000 | China Tobacco International HK Co Ltd | $ | 443 | |||||||
| 2,182,800 | Chow Tai Fook Jewellery Group Ltd | 3,933 | ||||||||
| 782 | * | Citi Trends, Inc | 74 | |||||||
| 234,568 | * | City Chic Collective Ltd | 938 | |||||||
| 25,123 | * | CJ O Shopping Co Ltd | 2,929 | |||||||
| 114,823 | e | Clas Ohlson AB (B Shares) | 1,742 | |||||||
| 471,279 | Com7 PCL (Foreign) | 1,152 | ||||||||
| 15,658 | * | Conn’s, Inc | 368 | |||||||
| 28,046 | * | Container Store Group, Inc | 280 | |||||||
| 475,438 | *,e | Coupang, Inc | 13,968 | |||||||
| 7,262 | * | Cuckoo Homesys Co Ltd | 239 | |||||||
| 48,100 | * | Dada Nexus Ltd (ADR) | 633 | |||||||
| 181,946 | DCM Holdings Co Ltd | 1,684 | ||||||||
| 60,223 | Delek Automotive Systems Ltd | 853 | ||||||||
| 845,577 | *,g | Deliveroo plc | 2,414 | |||||||
| 176,899 | *,g | Delivery Hero AG. | 19,581 | |||||||
| 60,600 | *,e | Demae-Can Co Ltd | 483 | |||||||
| 44,726 | *,e | Desenio Group AB | 120 | |||||||
| 535,336 | * | Designer Brands, Inc | 7,607 | |||||||
| 4,704 | e | Dick’s Sporting Goods, Inc | 541 | |||||||
| 51,035 | Dieteren S.A. | 9,949 | ||||||||
| 5,337 | e | Dillard’s, Inc (Class A) | 1,308 | |||||||
| 1,697,808 | Dixons Carphone plc | 2,640 | ||||||||
| 631,712 | Dohome PCL | 440 | ||||||||
| 253,354 | Dollar General Corp | 59,748 | ||||||||
| 255,852 | * | Dollar Tree, Inc | 35,952 | |||||||
| 617,316 | Dollarama, Inc | 30,896 | ||||||||
| 443,832 | Don Quijote Co Ltd | 6,118 | ||||||||
| 141,061 | * | DoorDash, Inc | 21,004 | |||||||
| 24,400 | Doshisha Co Ltd | 332 | ||||||||
| 157,179 | * | Dufry Group | 7,748 | |||||||
| 2,245 | * | Duluth Holdings, Inc | 34 | |||||||
| 147,829 | Dunelm Group plc | 2,763 | ||||||||
| 83,290 | g | Dustin Group AB | 978 | |||||||
| 976,953 | eBay, Inc | 64,967 | ||||||||
| 99,478 | EDION Corp | 929 | ||||||||
| 141,083 | * | Etsy, Inc | 30,889 | |||||||
| 193,586 | g | Europris ASA | 1,546 | |||||||
| 914,000 | Far Eastern Department Stores Co Ltd | 708 | ||||||||
| 29,185 | * | Farfetch Ltd | 976 | |||||||
| 46,262 | Fast Retailing Co Ltd | 26,297 | ||||||||
| 80,711 | * | Fawaz Abdulaziz Al Hokair & Co | 334 | |||||||
| 187 |
COLLEGE RETIREMENT EQUITIES FUND - Stock Account
| SHARES | COMPANY | VALUE (000) | ||||||||
| 31,887 | Fielmann AG. | $ | 2,141 | |||||||
| 88,773 | * | Five Below, Inc | 18,366 | |||||||
| 24,978 | * | Fiverr International Ltd | 2,840 | |||||||
| 389,710 | g | Fix Price Group Ltd (GDR) | 2,942 | |||||||
| 101,063 | * | Floor & Decor Holdings, Inc | 13,139 | |||||||
| 21,243 | Fnac Darty SA | 1,390 | ||||||||
| 36,090 | Foot Locker, Inc | 1,575 | ||||||||
| 359,839 | * | Foschini Ltd | 2,798 | |||||||
| 9,285 | Fox Wizel Ltd | 1,667 | ||||||||
| 21,640 | Franchise Group, Inc | 1,129 | ||||||||
| 467,313 | * | Frasers Group plc | 4,903 | |||||||
| 300,613 | * | Funko, Inc | 5,652 | |||||||
| 218,116 | * | Future Enterprises Ltd | 150 | |||||||
| 68,942 | *,e | GameStop Corp (Class A) | 10,230 | |||||||
| 508,383 | Gap, Inc | 8,973 | ||||||||
| 12,470 | * | Genesco, Inc | 800 | |||||||
| 45,949 | Genuine Parts Co | 6,442 | ||||||||
| 29,300 | Geo Holdings Corp | 316 | ||||||||
| 412,461 | *,e | Global Fashion Group S.A. | 2,077 | |||||||
| 12,774,885 | *,e | GOME Electrical Appliances Holdings Ltd | 1,082 | |||||||
| 9,170 | *,e | Greenlane Holdings Inc | 9 | |||||||
| 15,715 | Group 1 Automotive, Inc | 3,068 | ||||||||
| 26,351 | *,e | Groupon, Inc | 610 | |||||||
| 24,632 | *,e | GrowGeneration Corp | 321 | |||||||
| 99,053 | * | Grupo SBF S.A. | 399 | |||||||
| 84,996 | Guess?, Inc | 2,013 | ||||||||
| 76,700 | Gulliver International Co Ltd | 482 | ||||||||
| 501,775 | Halfords Group plc | 2,346 | ||||||||
| 93,625 | Hankyu Department Stores, Inc | 660 | ||||||||
| 679,694 | Harvey Norman Holdings Ltd | 2,443 | ||||||||
| 9,512 | Haverty Furniture Cos, Inc | 291 | ||||||||
| 3,116,000 | *,e | HengTen Networks Group Ltd | 1,181 | |||||||
| 1,052,584 | e | Hennes & Mauritz AB (B Shares) | 20,654 | |||||||
| 15,416 | Hibbett Sports, Inc | 1,109 | ||||||||
| 19,822 | Hikari Tsushin, Inc | 3,053 | ||||||||
| 1,613,852 | Home Depot, Inc | 669,765 | ||||||||
| 6,430,867 | Home Product Center PCL (Foreign) | 2,790 | ||||||||
| 25,994 | * | Home24 SE | 343 | |||||||
| 3,904,000 | e | Hong Kong Television Network Ltd | 4,257 | |||||||
| 9,079 | Hornbach Baumarkt AG. | 493 | ||||||||
| 11,668 | Hornbach Holding AG. & Co KGaA | 1,752 | ||||||||
| 343,482 | Hotai Motor Co Ltd | 7,611 | ||||||||
| 188 |
COLLEGE RETIREMENT EQUITIES FUND - Stock Account
| SHARES | COMPANY | VALUE (000) | ||||||||
| 35,529 | *,e | Hotel Shilla Co Ltd | $ | 2,329 | ||||||
| 2,285,000 | *,† | Hsin Chong Group Holdings Ltd | 3 | |||||||
| 14,850 | * | Hyundai Department Store Co Ltd | 937 | |||||||
| 5,445 | * | Hyundai Home Shopping Network Corp | 290 | |||||||
| 475,635 | Inchcape plc | 5,855 | ||||||||
| 1,126,231 | Industria De Diseno Textil S.A. | 36,321 | ||||||||
| 409,500 | Isetan Mitsukoshi Holdings Ltd | 3,026 | ||||||||
| 39,800 | Izumi Co Ltd | 1,116 | ||||||||
| 304,900 | J Front Retailing Co Ltd | 2,776 | ||||||||
| 101,342 | Jarir Marketing Co | 5,303 | ||||||||
| 145,668 | JB Hi-Fi Ltd | 5,122 | ||||||||
| 1,528,950 | *,e,g | JD Health International, Inc | 12,061 | |||||||
| 3,350,001 | * | JD Sports Fashion plc | 9,877 | |||||||
| 4,302,368 | *,h | JD.com, Inc | 148,227 | |||||||
| 16,142 | JINS Holdings, Inc | 984 | ||||||||
| 72,715 | e | JOANN, Inc | 755 | |||||||
| 28,620 | Joshin Denki Co Ltd | 533 | ||||||||
| 62,374 | Joyful Honda Co Ltd | 799 | ||||||||
| 118,297 | JUMBO S.A. | 1,697 | ||||||||
| 300,589 | *,g | Just Eat Takeaway.com NV | 16,331 | |||||||
| 129,949 | *,e | Just Eat Takeaway.com NV (ADR) | 1,398 | |||||||
| 36,842 | e | Kamux Corp | 481 | |||||||
| 36,387 | Keiyo Co Ltd | 268 | ||||||||
| 300,817 | Kering | 241,361 | ||||||||
| 598,836 | Kingfisher plc | 2,754 | ||||||||
| 10,300 | * | Kintetsu Department Store Co Ltd | 234 | |||||||
| 2,254 | *,e | Kirkland’s, Inc | 34 | |||||||
| 114,767 | e | Kogan.com Ltd | 736 | |||||||
| 84,948 | Kohl’s Corp | 4,196 | ||||||||
| 74,305 | Kohnan Shoji Co Ltd | 2,187 | ||||||||
| 132,152 | Komeri Co Ltd | 2,942 | ||||||||
| 30,096 | * | Koreacenter Co Ltd | 168 | |||||||
| 516,128 | K’s Holdings Corp | 5,015 | ||||||||
| 13,245 | * | Lands’ End, Inc | 260 | |||||||
| 6,243 | * | Lazydays Holdings, Inc | 134 | |||||||
| 129,475 | * | Leslie’s, Inc | 3,063 | |||||||
| 39,800 | Liaoning Cheng Da Co Ltd | 122 | ||||||||
| 514,000 | * | Lifestyle International Holdings Ltd | 283 | |||||||
| 2,403 | * | Liquidity Services, Inc | 53 | |||||||
| 28,274 | Lithia Motors, Inc (Class A) | 8,396 | ||||||||
| 89,483 | LKQ Corp | 5,372 | ||||||||
| 17,372,800 | Lojas Americanas S.A. | 18,335 | ||||||||
| 189 |
COLLEGE RETIREMENT EQUITIES FUND - Stock Account
| SHARES | COMPANY | VALUE (000) | ||||||||
| 64,973,036 | a | Lojas Americanas S.A. (Preference) | $ | 68,436 | ||||||
| 783,100 | Lojas Quero Quero S | 1,567 | ||||||||
| 1,086,980 | Lojas Renner S.A. | 4,704 | ||||||||
| 10,638 | * | LOTTE Himart Co Ltd | 225 | |||||||
| 13,969 | * | Lotte Shopping Co Ltd | 1,024 | |||||||
| 62,358 | Lovisa Holdings Ltd | 912 | ||||||||
| 1,800,527 | n | Lowe’s Companies, Inc | 465,400 | |||||||
| 430,561 | Luk Fook Holdings International Ltd | 1,160 | ||||||||
| 265 | * | Lulu’s Fashion Lounge Holdings, Inc | 3 | |||||||
| 25,421 | * | Lumber Liquidators, Inc | 434 | |||||||
| 552,479 | Macy’s, Inc | 14,464 | ||||||||
| 6,225,525 | Magazine Luiza S.A. | 8,025 | ||||||||
| 42,205 | e,g | Maisons du Monde S.A. | 977 | |||||||
| 430,126 | *,e,g | Maoyan Entertainment | 504 | |||||||
| 19,753 | * | MarineMax, Inc | 1,166 | |||||||
| 2,380,298 | * | Marks & Spencer Group plc | 7,488 | |||||||
| 230,800 | Marui Co Ltd | 4,346 | ||||||||
| 156,345,400 | a | Matahari Department Store Tbk PT | 45,527 | |||||||
| 48,411 | Matas A.S. | 923 | ||||||||
| 28,516 | * | Matsuya Co Ltd | 205 | |||||||
| 10,571 | e | Media Do Holdings Co Ltd | 377 | |||||||
| 5,013,635 | *,g | Meituan Dianping (Class B) | 144,982 | |||||||
| 57,846 | * | Mekonomen AB | 1,003 | |||||||
| 9,012 | * | MercadoLibre, Inc | 12,152 | |||||||
| 258,800 | * | Mercari, Inc | 13,167 | |||||||
| 261,070 | * | Mister Spex SE | 3,347 | |||||||
| 8,884,479 | * | Mitra Adiperkasa Tbk PT | 443 | |||||||
| 55,540 | Mobilezone Holding AG. | 828 | ||||||||
| 52,000 | momo.com, Inc | 3,044 | ||||||||
| 681,170 | Moneysupermarket.com Group plc | 1,992 | ||||||||
| 23,278 | Monro Muffler, Inc | 1,356 | ||||||||
| 201,141 | * | Moonpig Group plc | 1,022 | |||||||
| 163,799 | Motus Holdings Ltd | 1,132 | ||||||||
| 296,726 | Mr Price Group Ltd | 3,721 | ||||||||
| 263,500 | *,e,g | Mulsanne Group Holding Ltd | 174 | |||||||
| 6,186 | Murphy USA, Inc | 1,233 | ||||||||
| 37,355 | e | Musti Group Oyj | 1,322 | |||||||
| 14,900 | e | Nafco Co Ltd | 227 | |||||||
| 359,595 | Naspers Ltd (N Shares) | 55,813 | ||||||||
| 58,567 | * | National Vision Holdings, Inc | 2,811 | |||||||
| 81,892 | Next plc | 9,058 | ||||||||
| 56,920 | Nextage Co Ltd | 1,174 | ||||||||
| 190 |
COLLEGE RETIREMENT EQUITIES FUND - Stock Account
| SHARES | COMPANY | VALUE (000) | ||||||||
| 80,031 | Nick Scali Ltd | $ | 894 | |||||||
| 50,635 | e | Nishimatsuya Chain Co Ltd | 607 | |||||||
| 80,617 | Nitori Co Ltd | 12,058 | ||||||||
| 35,962 | Nojima Corp | 753 | ||||||||
| 9,512 | *,e | Nordstrom, Inc | 215 | |||||||
| 125,119 | * | ODP Corp | 4,915 | |||||||
| 27,500 | * | Oisix ra daichi, Inc | 739 | |||||||
| 62,886 | * | Ollie’s Bargain Outlet Holdings, Inc | 3,219 | |||||||
| 8,068 | OneWater Marine, Inc | 492 | ||||||||
| 65,584 | * | O’Reilly Automotive, Inc | 46,317 | |||||||
| 4,566 | * | Overstock.com, Inc | 269 | |||||||
| 60,280 | *,e | Ozon Holdings plc (ADR) | 1,785 | |||||||
| 327,987 | Padini Holdings BHD | 220 | ||||||||
| 23,528 | * | Pal Co Ltd | 351 | |||||||
| 383,215 | Paltac Corp | 15,792 | ||||||||
| 53,210 | * | Party City Holdco, Inc | 296 | |||||||
| 103,780 | PChome Online Inc | 480 | ||||||||
| 31,691 | Penske Auto Group, Inc | 3,398 | ||||||||
| 886,325 | *,g | Pepkor Holdings Ltd | 1,218 | |||||||
| 327,800 | Pet Center Comercio e Participacoes S.A. | 960 | ||||||||
| 33,688 | Pet Valu Holdings Ltd | 961 | ||||||||
| 276,273 | *,e | Petco Health & Wellness Co, Inc | 5,467 | |||||||
| 4,229 | e | PetMed Express, Inc | 107 | |||||||
| 607,699 | Pets at Home Group plc | 3,825 | ||||||||
| 979,378 | * | Pinduoduo, Inc (ADR) | 57,098 | |||||||
| 54,636 | Pool Corp | 30,924 | ||||||||
| 7,779 | * | Porch Group, Inc | 121 | |||||||
| 2,399,129 | * | Pou Sheng International Holdings Ltd | 351 | |||||||
| 60,252 | Poya Co Ltd | 923 | ||||||||
| 241,243 | Premier Investments Ltd | 5,323 | ||||||||
| 1,668,520 | Prosus NV | 138,195 | ||||||||
| 857,768 | PTG Energy PCL (Foreign) | 387 | ||||||||
| 3,188,900 | PTT Oil & Retail Business PCL | 2,574 | ||||||||
| 53,717 | *,e | Puuilo Oyj | 572 | |||||||
| 10,005 | * | Quotient Technology, Inc | 74 | |||||||
| 355,813 | Qurate Retail Group, Inc QVC Group | 2,704 | ||||||||
| 441,065 | * | Rakuten, Inc | 4,425 | |||||||
| 108,788 | * | RealReal, Inc | 1,263 | |||||||
| 216,780 | *,e | Redbubble Ltd | 515 | |||||||
| 6,075 | * | Rent the Runway, Inc | 50 | |||||||
| 105,612 | Rent-A-Center, Inc | 5,074 | ||||||||
| 15,329 | * | Retailors Ltd | 518 | |||||||
| 191 |
COLLEGE RETIREMENT EQUITIES FUND - Stock Account
| SHARES | COMPANY | VALUE (000) | ||||||||
| 45,137 | * | Revolve Group, Inc | $ | 2,529 | ||||||
| 25,072 | * | RH | 13,437 | |||||||
| 295,286 | Ross Stores, Inc | 33,745 | ||||||||
| 50,053 | Rvrc Holding AB | 580 | ||||||||
| 167,640 | Ryohin Keikaku Co Ltd | 2,556 | ||||||||
| 1,233,831 | *,e | SA SA International Holdings Ltd | 264 | |||||||
| 1,780,567 | SACI Falabella | 5,808 | ||||||||
| 9,786 | * | Sally Beauty Holdings, Inc | 181 | |||||||
| 63,200 | Sanrio Co Ltd | 1,372 | ||||||||
| 187,079 | Saudi Co For Hardware CJSC | 2,426 | ||||||||
| 70,781 | Seria Co Ltd | 2,050 | ||||||||
| 270,404 | Shanghai Yuyuan Tourist Mart Group Co Ltd | 437 | ||||||||
| 251,256 | *,e | Shift Technologies, Inc | 857 | |||||||
| 36,200 | Shimamura Co Ltd | 3,038 | ||||||||
| 23,414 | Shinsegae Co Ltd | 4,997 | ||||||||
| 3,055 | Shinsegae International Co Ltd | 373 | ||||||||
| 2,850 | Shoe Carnival, Inc | 111 | ||||||||
| 23,799 | Shutterstock, Inc | 2,639 | ||||||||
| 23,139 | Signet Jewelers Ltd | 2,014 | ||||||||
| 389,552 | Singer Thailand PCL | 617 | ||||||||
| 44,309 | g | Sleep Country Canada Holdings, Inc | 1,315 | |||||||
| 12,090 | * | Sleep Number Corp | 926 | |||||||
| 36,589 | *,g | SMCP S.A. | 303 | |||||||
| 68,802 | Sonic Automotive, Inc (Class A) | 3,402 | ||||||||
| 4,395 | * | Sportsman’s Warehouse Holdings, Inc | 52 | |||||||
| 8,069 | * | Stitch Fix Inc | 153 | |||||||
| 519,024 | * | Suning.com Co Ltd | 336 | |||||||
| 430,597 | Super Group Ltd | 920 | ||||||||
| 189,139 | Super Retail Group Ltd | 1,714 | ||||||||
| 4,043 | Tadiran Holdings Ltd | 564 | ||||||||
| 184,251 | Takashimaya Co Ltd | 1,717 | ||||||||
| 38,794 | Takkt AG. | 678 | ||||||||
| 726,494 | Target Corp | 168,140 | ||||||||
| 20,369 | Telepark Corp | 294 | ||||||||
| 100,146 | *,e | Temple & Webster Group Ltd | 784 | |||||||
| 3,263,776 | * | THG Holdings Ltd | 10,125 | |||||||
| 20,954 | Tilly’s, Inc | 338 | ||||||||
| 3,318,161 | TJX Companies, Inc | 251,915 | ||||||||
| 205,494 | Tokmanni Group Corp | 4,600 | ||||||||
| 1,864,489 | g | Topsports International Holdings Ltd | 1,888 | |||||||
| 196,558 | * | Torrid Holdings, Inc | 1,942 | |||||||
| 111,892 | Tractor Supply Co | 26,697 | ||||||||
| 192 |
COLLEGE RETIREMENT EQUITIES FUND - Stock Account
| SHARES | COMPANY | VALUE (000) | ||||||||
| 1,014 | * | TravelCenters of America, Inc | $ | 52 | ||||||
| 200,917 | Trent Ltd | 2,869 | ||||||||
| 449,569 | Truworths International Ltd | 1,474 | ||||||||
| 80,013 | * | Ulta Beauty, Inc | 32,993 | |||||||
| 198,099 | United Arrows Ltd | 3,154 | ||||||||
| 30,876 | United Electronics Co | 1,112 | ||||||||
| 341,869 | * | Urban Outfitters, Inc | 10,037 | |||||||
| 379,473 | USS Co Ltd | 5,929 | ||||||||
| 258,200 | *,e | Uxin Ltd (ADR) | 408 | |||||||
| 4,600 | * | Valora Holding AG. | 785 | |||||||
| 1,390,667 | * | Via S | 1,305 | |||||||
| 1,358,272 | Vibra Energia S.A. | 5,208 | ||||||||
| 497,329 | * | Victorian Plumbing PLC | 798 | |||||||
| 18,307 | * | Victoria’s Secret & Co | 1,017 | |||||||
| 4,878,940 | * | Vipshop Holdings Ltd (ADR) | 40,983 | |||||||
| 561,169 | g | Vivo Energy plc | 1,001 | |||||||
| 10,050 | * | V-Mart Retail Ltd | 504 | |||||||
| 110,113 | *,e | Vroom, Inc | 1,188 | |||||||
| 71,988 | VT Holdings Co Ltd | 292 | ||||||||
| 20,200 | Wangfujing Group Co Ltd | 86 | ||||||||
| 72,598 | *,e | Wayfair, Inc | 13,791 | |||||||
| 1,298,858 | Wesfarmers Ltd | 56,041 | ||||||||
| 11,798 | * | Westwing Group AG. | 295 | |||||||
| 158,843 | * | WH Smith plc | 3,193 | |||||||
| 311,201 | Wickes Group plc | 998 | ||||||||
| 1,560,700 | Wilcon Depot, Inc | 934 | ||||||||
| 107,338 | Williams-Sonoma, Inc | 18,154 | ||||||||
| 2,064 | Winmark Corp | 512 | ||||||||
| 1,131,917 | Woolworths Holdings Ltd | 3,684 | ||||||||
| 142,000 | e | Workman Co Ltd | 6,790 | |||||||
| 420,983 | Wuchan Zhongda Group Co Ltd | 392 | ||||||||
| 21,142 | Xebio Co Ltd | 170 | ||||||||
| 508,000 | Xinhua Winshare Publishing and Media Co Ltd | 385 | ||||||||
| 2,122 | * | Xometry, Inc | 109 | |||||||
| 154,801 | e,g | XXL ASA | 247 | |||||||
| 1,271,100 | Yamada Denki Co Ltd | 4,346 | ||||||||
| 41,633 | Yellow Hat Ltd | 599 | ||||||||
| 272,081 | *,g | Zalando SE | 21,918 | |||||||
| 667,572 | Zhongsheng Group Holdings Ltd | 5,209 | ||||||||
| 4,202,791 | * | Zomato Ltd | 7,768 | |||||||
| 140,830 | ZOZO Inc | 4,391 | ||||||||
| 193 |
COLLEGE RETIREMENT EQUITIES FUND - Stock Account
| SHARES | COMPANY | VALUE (000) | ||||||||
| 72,780 | * | Zumiez, Inc | $ | 3,493 | ||||||
| TOTAL RETAILING | 7,593,565 | |||||||||
| SEMICONDUCTORS & SEMICONDUCTOR EQUIPMENT - 6.1% | ||||||||||
| 235,615 | A-DATA Technology Co Ltd | 785 | ||||||||
| 2,169,979 | *,e | Advanced Micro Devices, Inc | 312,260 | |||||||
| 44,821 | * | Advanced Micro-Fabrication Equipment, Inc China | 891 | |||||||
| 148,483 | Advanced Wireless Semiconductor Co | 760 | ||||||||
| 186,600 | n | Advantest Corp | 17,671 | |||||||
| 322,100 | AEM Holdings Ltd | 1,257 | ||||||||
| 270,779 | Aixtron AG. | 5,485 | ||||||||
| 77,000 | Alchip Technologies Ltd | 2,832 | ||||||||
| 39,567 | * | Allegro MicroSystems, Inc | 1,432 | |||||||
| 142,509 | * | Alpha & Omega Semiconductor Ltd | 8,630 | |||||||
| 336,654 | * | Alphawave IP Group plc | 910 | |||||||
| 80,000 | Amazing Microelectronic Corp | 707 | ||||||||
| 115,783 | * | Ambarella, Inc | 23,491 | |||||||
| 388,094 | Amkor Technology, Inc | 9,621 | ||||||||
| 333,716 | *,e | ams AG. | 6,039 | |||||||
| 980,574 | Analog Devices, Inc | 172,355 | ||||||||
| 37,000 | Andes Technology Corp | 713 | ||||||||
| 89,000 | AP Memory Technology Corp | 1,600 | ||||||||
| 2,618,187 | Applied Materials, Inc | 411,998 | ||||||||
| 443,738 | Ardentec Corp | 888 | ||||||||
| 7,220,925 | ASE Technology Holding Co Ltd | 27,903 | ||||||||
| 70,399 | ASM International NV | 31,075 | ||||||||
| 1,911,800 | ASM Pacific Technology | 20,660 | ||||||||
| 30,231 | ASMedia Technology, Inc | 1,982 | ||||||||
| 23,589 | ASML Holding NV | 18,780 | ||||||||
| 932,806 | ASML Holding NV | 747,196 | ||||||||
| 26,000 | ASPEED Technology, Inc | 3,353 | ||||||||
| 1,829 | *,e | Atomera, Inc | 37 | |||||||
| 25,451 | * | Axcelis Technologies, Inc | 1,898 | |||||||
| 36,699 | * | AXT, Inc | 323 | |||||||
| 118,614 | BE Semiconductor Industries NV | 10,084 | ||||||||
| 308,000 | e | BOE Varitronix Ltd | 396 | |||||||
| 47,106 | * | Borosil Renewables Ltd | 394 | |||||||
| 1,105,294 | Broadcom, Inc | 735,474 | ||||||||
| 149,842 | Brooks Automation, Inc | 15,450 | ||||||||
| 36,499 | * | Camtek Ltd | 1,683 | |||||||
| 2,381 | * | Ceva, Inc | 103 | |||||||
| 206,000 | Chang Wah Technology Co Ltd | 776 | ||||||||
| 194 |
COLLEGE RETIREMENT EQUITIES FUND - Stock Account
| SHARES | COMPANY | VALUE (000) | ||||||||
| 11,538 | *,† | China Energy Savings Technology, Inc | $ | 0 | ||||||
| 1,697,000 | Chipbond Technology Corp | 4,087 | ||||||||
| 2,534,436 | ChipMOS Technologies, Inc | 4,439 | ||||||||
| 98,375 | * | Cirrus Logic, Inc | 9,052 | |||||||
| 7,208 | CMC Materials, Inc | 1,382 | ||||||||
| 26,331 | * | Cohu, Inc | 1,003 | |||||||
| 456,000 | D&O Green Technologies Bhd | 644 | ||||||||
| 393,151 | * | Daqo New Energy Corp (ADR) | 15,852 | |||||||
| 20,329 | * | Diodes, Inc | 2,232 | |||||||
| 33,280 | Disco Corp | 10,172 | ||||||||
| 59,674 | * | Dongbu HiTek Co Ltd | 3,637 | |||||||
| 11,125 | * | Duk San Neolux Co Ltd | 526 | |||||||
| 313,400 | Elan Microelectronics Corp | 1,921 | ||||||||
| 278,000 | Elite Semiconductor Memory Technology, Inc | 1,650 | ||||||||
| 10,279 | Elmos Semiconductor AG. | 682 | ||||||||
| 125,000 | eMemory Technology, Inc | 9,866 | ||||||||
| 774,000 | * | ENNOSTAR, Inc | 2,140 | |||||||
| 141,697 | * | Enphase Energy, Inc | 25,922 | |||||||
| 133,528 | Entegris, Inc | 18,504 | ||||||||
| 9,395 | * | Eo Technics Co Ltd | 943 | |||||||
| 256,000 | * | Episil Holdings, Inc | 1,318 | |||||||
| 106,000 | Episil-Precision, Inc | 510 | ||||||||
| 15,455 | Eugene Technology Co Ltd | 671 | ||||||||
| 499,000 | Everlight Electronics Co Ltd | 948 | ||||||||
| 884,060 | Faraday Technology Corp | 7,616 | ||||||||
| 49,933 | Ferrotec | 1,830 | ||||||||
| 14,453 | * | Fine Semitech Corp | 307 | |||||||
| 101,384 | * | First Solar, Inc | 8,837 | |||||||
| 111,859 | Fitipower Integrated Technology, Inc | 1,137 | ||||||||
| 97,500 | Flat Glass Group Co Ltd | 885 | ||||||||
| 472,000 | e | Flat Glass Group Co Ltd | 2,403 | |||||||
| 97,532 | * | Formfactor, Inc | 4,459 | |||||||
| 162,000 | Formosa Advanced Technologies Co Ltd | 229 | ||||||||
| 610,200 | Formosa Sumco Technology Corp | 6,376 | ||||||||
| 76,376 | Foxsemicon Integrated Technology, Inc | 702 | ||||||||
| 14,263,000 | *,e | GCL Poly Energy Holdings Ltd | 5,173 | |||||||
| 337,706 | * | GCL System Integration Technology Co Ltd | 202 | |||||||
| 34,813 | * | GemVax & Kael Co Ltd | 511 | |||||||
| 46,306 | Gigadevice Semiconductor Beijing, Inc | 1,278 | ||||||||
| 74,000 | Global Mixed Mode Technology, Inc | 708 | ||||||||
| 95,000 | Global Unichip Corp | 2,006 | ||||||||
| 48,628 | * | GLOBALFOUNDRIES, Inc | 3,159 | |||||||
| 195 |
COLLEGE RETIREMENT EQUITIES FUND - Stock Account
| SHARES | COMPANY | VALUE (000) | ||||||||
| 1,069,088 | Globalwafers Co Ltd | $ | 34,249 | |||||||
| 567,000 | * | Greatech Technology Bhd | 913 | |||||||
| 310,000 | Greatek Electronics, Inc | 874 | ||||||||
| 54,000 | Gudeng Precision Industrial Co Ltd | 631 | ||||||||
| 18,884 | * | HAESUNG DS Co Ltd | 774 | |||||||
| 9,306 | Hana Materials, Inc | 490 | ||||||||
| 64,143 | Hangzhou First Applied Material Co Ltd | 1,312 | ||||||||
| 91,944 | Hangzhou Silan Microelectronics Co Ltd | 782 | ||||||||
| 22,903 | * | Hanmi Semiconductor Co Ltd | 727 | |||||||
| 190,000 | Holtek Semiconductor, Inc | 770 | ||||||||
| 365,531 | *,g | Hua Hong Semiconductor Ltd | 2,019 | |||||||
| 1,244,665 | Hynix Semiconductor, Inc | 136,705 | ||||||||
| 186,829 | * | Ichor Holdings Ltd | 8,600 | |||||||
| 44,028 | *,e | Impinj, Inc | 3,905 | |||||||
| 2,399,397 | Infineon Technologies AG. | 110,465 | ||||||||
| 34,056 | Ingenic Semiconductor Co Ltd | 717 | ||||||||
| 13,038 | Innox Advanced Materials Co Ltd | 505 | ||||||||
| 2,784,808 | Intel Corp | 143,418 | ||||||||
| 764,233 | *,e | IQE plc | 359 | |||||||
| 156,000 | ITE Technology, Inc | 610 | ||||||||
| 7,236 | ITM Semiconductor Co Ltd | 259 | ||||||||
| 108,703 | JA Solar Technology Co Ltd | 1,579 | ||||||||
| 74,513 | Japan Material Co Ltd | 1,227 | ||||||||
| 73,000 | Jentech Precision Industrial Co Ltd | 1,074 | ||||||||
| 41,712 | *,e | JinkoSolar Holding Co Ltd (ADR) | 1,917 | |||||||
| 39,373 | * | Jusung Engineering Co Ltd | 693 | |||||||
| 2,083,000 | King Yuan Electronics Co Ltd | 3,364 | ||||||||
| 319,000 | Kinsus Interconnect Technology Corp | 2,674 | ||||||||
| 335,333 | KLA Corp | 144,230 | ||||||||
| 58,791 | * | Koh Young Technology, Inc | 1,171 | |||||||
| 6,242 | * | KoMiCo Ltd | 352 | |||||||
| 373,148 | *,e | Kopin Corp | 1,526 | |||||||
| 38,801 | Kulicke & Soffa Industries, Inc | 2,349 | ||||||||
| 387,302 | Lam Research Corp | 278,528 | ||||||||
| 87,800 | Land Mark Optoelectronics Corp | 623 | ||||||||
| 77,948 | Lasertec Corp | 23,876 | ||||||||
| 477,151 | * | Lattice Semiconductor Corp | 36,769 | |||||||
| 28,902 | * | LB Semicon, Inc | 324 | |||||||
| 10,770 | * | LEENO Industrial Inc | 1,794 | |||||||
| 373,563 | LONGi Green Energy Technology Co Ltd | 5,054 | ||||||||
| 309,437 | * | MACOM Technology Solutions Holdings, Inc | 24,229 | |||||||
| 2,011,000 | Macronix International | 3,060 | ||||||||
| 196 |
COLLEGE RETIREMENT EQUITIES FUND - Stock Account
| SHARES | COMPANY | VALUE (000) | ||||||||
| 227,200 | Malaysian Pacific Industries BHD | $ | 2,686 | |||||||
| 777,000 | Marketech International Corp | 5,100 | ||||||||
| 2,300,145 | Marvell Technology, Inc | 201,240 | ||||||||
| 15,141 | * | Maxeon Solar Technologies Ltd | 210 | |||||||
| 48,608 | * | MaxLinear, Inc | 3,665 | |||||||
| 5,061,065 | MediaTek, Inc | 217,168 | ||||||||
| 19,389 | * | Megachips Corp | 868 | |||||||
| 40,179 | Melexis NV | 4,788 | ||||||||
| 24,071 | *,e | Meta Materials, Inc | 59 | |||||||
| 3,043,834 | *,e | Meyer Burger Technology AG. | 1,354 | |||||||
| 359,200 | Mi Technovation Bhd | 291 | ||||||||
| 305,794 | Microchip Technology, Inc | 26,622 | ||||||||
| 2,145,311 | Micron Technology, Inc | 199,836 | ||||||||
| 33,000 | Micronics Japan Co Ltd | 531 | ||||||||
| 17,991 | Mimasu Semiconductor Industry Co Ltd | 415 | ||||||||
| 24,006 | Mitsui High-Tec, Inc | 2,355 | ||||||||
| 32,082 | MKS Instruments, Inc | 5,588 | ||||||||
| 221,893 | Monolithic Power Systems, Inc | 109,466 | ||||||||
| 51,306 | Montage Technology Co Ltd | 675 | ||||||||
| 31,220 | * | Nanometrics, Inc | 3,160 | |||||||
| 917,075 | Nanya Technology Corp | 2,583 | ||||||||
| 142,810 | * | National Silicon Industry Group Co Ltd | 579 | |||||||
| 36,014 | NAURA Technology Group Co Ltd | 1,963 | ||||||||
| 44,015 | * | NeoPhotonics Corp Ltd | 677 | |||||||
| 18,402 | * | NEPES Corp | 591 | |||||||
| 4,392 | * | NEXTIN, Inc | 222 | |||||||
| 275,958 | * | Nordic Semiconductor ASA | 9,255 | |||||||
| 34,559 | * | Nova Measuring Instruments Ltd | 4,946 | |||||||
| 421,758 | Novatek Microelectronics Corp Ltd | 8,190 | ||||||||
| 169,657 | Nuvoton Technology Corp | 861 | ||||||||
| 377 | NVE Corp | 26 | ||||||||
| 4,476,069 | NVIDIA Corp | 1,316,457 | ||||||||
| 929,138 | NXP Semiconductors NV | 211,639 | ||||||||
| 428,323 | * | ON Semiconductor Corp | 29,092 | |||||||
| 35,852 | Optorun Co Ltd | 740 | ||||||||
| 176,000 | Orise Technology Co Ltd | 1,087 | ||||||||
| 332,100 | Pan Jit International, Inc | 1,280 | ||||||||
| 115,000 | Parade Technologies Ltd | 8,749 | ||||||||
| 25,821 | * | PDF Solutions, Inc | 821 | |||||||
| 170,000 | Phison Electronics Corp | 3,138 | ||||||||
| 112,593 | * | Photronics, Inc | 2,122 | |||||||
| 143,613 | Pixart Imaging, Inc | 788 | ||||||||
| 197 |
COLLEGE RETIREMENT EQUITIES FUND - Stock Account
| SHARES | COMPANY | VALUE (000) | ||||||||
| 6,118 | Power Integrations, Inc | $ | 568 | |||||||
| 807,000 | Powertech Technology, Inc | 2,844 | ||||||||
| 10,317 | * | PSK, Inc | 457 | |||||||
| 24,790 | * | PVA TePla AG. | 1,178 | |||||||
| 59,739 | * | Qorvo, Inc | 9,343 | |||||||
| 2,614,846 | QUALCOMM, Inc | 478,177 | ||||||||
| 476,983 | Radiant Opto-Electronics Corp | 1,739 | ||||||||
| 94,340 | * | Rambus, Inc | 2,773 | |||||||
| 55,000 | * | RDC Semiconductor Co Ltd | 942 | |||||||
| 474,261 | Realtek Semiconductor Corp | 9,909 | ||||||||
| 320,397 | *,e | REC Silicon ASA | 649 | |||||||
| 1,304,715 | *,n | Renesas Electronics Corp | 16,205 | |||||||
| 18,266 | * | RFHIC Corp | 547 | |||||||
| 88,800 | RichWave Technology Corp | 874 | ||||||||
| 106,441 | Rohm Co Ltd | 9,683 | ||||||||
| 12,807 | Rorze Corp | 1,379 | ||||||||
| 8,400 | RS Technologies Co Ltd | 497 | ||||||||
| 16,113 | S&S Tech Corp | 498 | ||||||||
| 28,613 | Sanken Electric Co Ltd | 1,568 | ||||||||
| 46,269 | e | SCREEN Holdings Co Ltd | 4,972 | |||||||
| 134,000 | SDI Corp | 847 | ||||||||
| 184,767 | * | Semtech Corp | 16,431 | |||||||
| 42,171 | * | Seoul Semiconductor Co Ltd | 545 | |||||||
| 13,641 | * | Seoul Viosys Co Ltd | 152 | |||||||
| 14,956 | SG Micro Corp | 726 | ||||||||
| 30,185 | Shenzhen Goodix Technology Co Ltd | 511 | ||||||||
| 21,721 | Shenzhen SC New Energy Technology Corp | 390 | ||||||||
| 238,700 | Shinko Electric Industries | 11,372 | ||||||||
| 783,116 | Sigurd Microelectronics Corp | 1,660 | ||||||||
| 201,578 | Silergy Corp | 36,485 | ||||||||
| 104,862 | * | Silicon Laboratories, Inc | 21,646 | |||||||
| 12,027 | * | Silicon Works Co Ltd | 1,689 | |||||||
| 16,374 | Siltronic AG. | 2,619 | ||||||||
| 3,827 | Siltronic AG. | 616 | ||||||||
| 20,939 | SIMMTECH Co Ltd | 802 | ||||||||
| 1,167,838 | Sino-American Silicon Products, Inc | 9,946 | ||||||||
| 9,535 | * | SiTime Corp | 2,789 | |||||||
| 123,567 | Sitronix Technology Corp | 1,424 | ||||||||
| 1,445 | *,e | SkyWater Technology, Inc | 23 | |||||||
| 90,699 | Skyworks Solutions, Inc | 14,071 | ||||||||
| 11,553 | SMA Solar Technology AG. | 488 | ||||||||
| 60,560 | * | SMART Global Holdings, Inc | 4,299 | |||||||
| 198 |
COLLEGE RETIREMENT EQUITIES FUND - Stock Account
| SHARES | COMPANY | VALUE (000) | ||||||||
| 26,571 | *,e | SOITEC | $ | 6,510 | ||||||
| 799 | * | SolarEdge Technologies, Inc | 224 | |||||||
| 153,000 | Sonix Technology Co Ltd | 508 | ||||||||
| 11,500 | StarPower Semiconductor Ltd | 686 | ||||||||
| 1,138,189 | STMicroelectronics NV | 55,970 | ||||||||
| 78,516 | * | STS Semiconductor & Telecommunications | 506 | |||||||
| 231,183 | e,n | Sumco Corp | 4,708 | |||||||
| 515,000 | Sunplus Technology Co Ltd | 720 | ||||||||
| 167,790 | *,e | SunPower Corp | 3,502 | |||||||
| 35,099 | * | Synaptics, Inc | 10,162 | |||||||
| 200,000 | Taiwan Mask Corp | 778 | ||||||||
| 230,000 | Taiwan Semiconductor Co Ltd | 652 | ||||||||
| 42,622,458 | Taiwan Semiconductor Manufacturing Co Ltd | 942,851 | ||||||||
| 813,876 | Taiwan Semiconductor Manufacturing Co Ltd (ADR) | 97,917 | ||||||||
| 270,847 | Taiwan Surface Mounting Technology Co Ltd | 1,206 | ||||||||
| 159,699 | Teradyne, Inc | 26,116 | ||||||||
| 14,210 | TES Co Ltd | 354 | ||||||||
| 10,512 | * | Tesna Co Ltd | 441 | |||||||
| 716,105 | Texas Instruments, Inc | 134,964 | ||||||||
| 226,525 | Tianjin Zhonghuan Semiconductor Co Ltd | 1,483 | ||||||||
| 170,261 | Tianshui Huatian Technology Co Ltd | 340 | ||||||||
| 5,612 | Tokai Carbon Korea Co Ltd | 700 | ||||||||
| 147,905 | Tokyo Electron Ltd | 85,130 | ||||||||
| 63,200 | Tokyo Seimitsu Co Ltd | 2,799 | ||||||||
| 71,248 | TongFu Microelectronics Co Ltd | 217 | ||||||||
| 354,330 | Topco Scientific Co Ltd | 2,020 | ||||||||
| 109,532 | * | Tower Semiconductor Ltd | 4,346 | |||||||
| 221,447 | * | Tower Semiconductor Ltd (Tel Aviv) | 8,758 | |||||||
| 32,600 | Tri Chemical Laboratories, Inc | 1,033 | ||||||||
| 1,746,000 | *,† | Trony Solar Holdings Co Ltd. | 2 | |||||||
| 4,176 | TSE Co Ltd | 259 | ||||||||
| 397,000 | * | TSEC Corp | 609 | |||||||
| 7,614 | * | U-Blox AG. | 587 | |||||||
| 248,843 | * | Ultra Clean Holdings | 14,274 | |||||||
| 54,044 | Ulvac, Inc | 3,381 | ||||||||
| 46,706 | Unigroup Guoxin Microelectronics Co Ltd | 1,649 | ||||||||
| 422,800 | Unisem M BHD | 413 | ||||||||
| 8,747,071 | United Microelectronics Corp | 20,492 | ||||||||
| 2,415,396 | * | United Renewable Energy Co Ltd/Taiwan | 1,908 | |||||||
| 18,071 | * | UniTest, Inc | 450 | |||||||
| 37,154 | Universal Display Corp | 6,132 | ||||||||
| 199 |
COLLEGE RETIREMENT EQUITIES FUND - Stock Account
| SHARES | COMPANY | VALUE (000) | ||||||||
| 639,744 | Vanguard International Semiconductor Corp | $ | 3,644 | |||||||
| 43,578 | * | Veeco Instruments, Inc | 1,241 | |||||||
| 204,000 | Via Technologies, Inc | 632 | ||||||||
| 160,068 | Visual Photonics Epitaxy Co Ltd | 830 | ||||||||
| 282,600 | ViTrox Corp BHD | 1,348 | ||||||||
| 548,935 | Wafer Works Corp | 1,691 | ||||||||
| 58,011 | Will Semiconductor Ltd | 2,828 | ||||||||
| 501,000 | Win Semiconductors Corp | 6,760 | ||||||||
| 2,054,389 | Winbond Electronics Corp | 2,516 | ||||||||
| 549,410 | * | Wolfspeed Inc | 61,408 | |||||||
| 31,590 | * | WONIK IPS Co Ltd | 1,121 | |||||||
| 16,642 | * | Wonik QnC Corp | 399 | |||||||
| 62,425 | *,g | X-Fab Silicon Foundries SE | 646 | |||||||
| 3,466 | *,g | X-Fab Silicon Foundries SE | 36 | |||||||
| 303,422 | Xilinx, Inc | 64,335 | ||||||||
| 177,000 | XinTec, Inc | 914 | ||||||||
| 5,183,214 | Xinyi Solar Holdings Ltd | 8,800 | ||||||||
| 89,906 | Zhejiang Jingsheng Mechanical & Electrical Co Ltd | 980 | ||||||||
| TOTAL SEMICONDUCTORS & SEMICONDUCTOR EQUIPMENT | 8,421,410 | |||||||||
| SOFTWARE & SERVICES - 11.1% | ||||||||||
| 117,200 | * | 21Vianet Group, Inc (ADR) | 1,058 | |||||||
| 291,287 | * | 360 Security Technology, Inc | 581 | |||||||
| 79,691 | * | 8x8, Inc | 1,336 | |||||||
| 31,000 | * | 91APP, Inc | 296 | |||||||
| 95,132 | A10 Networks, Inc | 1,577 | ||||||||
| 146,984 | e | Absolute Software Corp | 1,378 | |||||||
| 1,425,486 | Accenture plc | 590,935 | ||||||||
| 210,498 | * | ACI Worldwide, Inc | 7,304 | |||||||
| 3,677 | Adesso SE | 875 | ||||||||
| 3,173 | e | Admicom Oyj | 305 | |||||||
| 496,039 | * | Adobe, Inc | 281,284 | |||||||
| 51,659 | *,g | Adyen NV | 135,605 | |||||||
| 588,938 | * | Afterpay Touch Group Ltd | 35,553 | |||||||
| 3,080 | * | Agilysys, Inc | 137 | |||||||
| 32,700 | * | Agora, Inc (ADR) | 530 | |||||||
| 6,480 | * | Ahnlab, Inc | 539 | |||||||
| 153,175 | * | Akamai Technologies, Inc | 17,928 | |||||||
| 13,154 | Al Moammar Information Systems Co | 530 | ||||||||
| 24,621 | * | Alarm.com Holdings, Inc | 2,088 | |||||||
| 34,606 | *,e | Alkami Technology, Inc | 694 | |||||||
| 58,681 | Alliance Data Systems Corp | 3,906 | ||||||||
| 200 |
COLLEGE RETIREMENT EQUITIES FUND - Stock Account
| SHARES | COMPANY | VALUE (000) | ||||||||
| 7,100 | Alpha Systems, Inc | $ | 250 | |||||||
| 4,583 | *,e | Altair Engineering, Inc | 354 | |||||||
| 35,483 | Alten | 6,402 | ||||||||
| 57,734 | * | Alteryx, Inc | 3,493 | |||||||
| 143,714 | Altium Ltd | 4,719 | ||||||||
| 662,597 | * | Amadeus IT Holding S.A. | 44,834 | |||||||
| 187,687 | Amdocs Ltd | 14,046 | ||||||||
| 9,370 | American Software, Inc (Class A) | 245 | ||||||||
| 288,392 | * | Anaplan, Inc | 13,223 | |||||||
| 38,075 | * | Ansys, Inc | 15,273 | |||||||
| 299,383 | Appen Ltd | 2,427 | ||||||||
| 1,777 | * | Appfolio, Inc | 215 | |||||||
| 19,207 | *,e | Appian Corp | 1,252 | |||||||
| 534,548 | * | Argo Blockchain plc | 716 | |||||||
| 22,300 | Argo Graphics, Inc | 624 | ||||||||
| 1,730 | * | Arteris, Inc | 37 | |||||||
| 217,877 | * | Asana, Inc | 16,243 | |||||||
| 205,600 | g | AsiaInfo Technologies Ltd | 336 | |||||||
| 66,151 | * | Aspen Technology, Inc | 10,068 | |||||||
| 98,413 | Asseco Poland S.A. | 2,112 | ||||||||
| 101,558 | Atea ASA | 1,890 | ||||||||
| 134,696 | * | Atlassian Corp plc | 51,358 | |||||||
| 143,841 | e | Atos Origin S.A. | 6,093 | |||||||
| 5,032 | Atoss Software AG. | 1,241 | ||||||||
| 8,244 | Aubay | 587 | ||||||||
| 205,170 | * | Autodesk, Inc | 57,692 | |||||||
| 416,866 | Automatic Data Processing, Inc | 102,791 | ||||||||
| 91,381 | * | Avalara, Inc | 11,798 | |||||||
| 816,900 | g | Avast plc | 6,714 | |||||||
| 7,313 | * | Avaya Holdings Corp | 145 | |||||||
| 132,203 | Aveva Group plc | 6,100 | ||||||||
| 5,314 | *,e | AvidXchange Holdings, Inc | 80 | |||||||
| 1,506,900 | *,e | BASE, Inc | 8,085 | |||||||
| 13,460 | * | BasWare Oyj | 458 | |||||||
| 370,934 | Bechtle AG. | 26,396 | ||||||||
| 40,237 | Beijing E-Hualu Information Technology Co Ltd | 223 | ||||||||
| 24,676 | Beijing Kingsoft Office Software, Inc | 1,027 | ||||||||
| 53,540 | Beijing Shiji Information Technology Co Ltd | 241 | ||||||||
| 59,318 | Beijing Sinnet Technology Co Ltd | 138 | ||||||||
| 38,400 | Bell System24 Holdings, Inc | 418 | ||||||||
| 61,772 | * | Benefitfocus, Inc | 658 | |||||||
| 136,717 | Bentley Systems, Inc | 6,608 | ||||||||
| 201 |
COLLEGE RETIREMENT EQUITIES FUND - Stock Account
| SHARES | COMPANY | VALUE (000) | ||||||||
| 231,274 | * | BigCommerce Holdings, Inc | $ | 8,180 | ||||||
| 90,755 | * | Bill.Com Holdings, Inc | 22,612 | |||||||
| 151,709 | Birlasoft Ltd | 1,109 | ||||||||
| 67,458 | *,e | Bit Digital, Inc | 410 | |||||||
| 40,200 | *,e | BIT Mining Ltd (ADR) | 247 | |||||||
| 221,017 | * | Black Knight, Inc | 18,320 | |||||||
| 26,217 | * | Blackbaud, Inc | 2,071 | |||||||
| 659,384 | *,e | Blackberry Ltd (New) | 6,161 | |||||||
| 55,047 | *,e | Blackline, Inc | 5,700 | |||||||
| 739,474 | * | Block Inc | 119,432 | |||||||
| 98,897 | * | Blue Prism Group plc | 1,691 | |||||||
| 33,393 | * | Bottomline Technologies, Inc | 1,886 | |||||||
| 384,650 | * | Box, Inc | 10,074 | |||||||
| 1,696,923 | *,e | BrainChip Holdings Ltd | 838 | |||||||
| 316,730 | Bravura Solutions Ltd | 568 | ||||||||
| 166,315 | * | Brightcove, Inc | 1,700 | |||||||
| 92,800 | e | Broadleaf Co Ltd | 352 | |||||||
| 113,417 | Broadridge Financial Solutions, Inc | 20,735 | ||||||||
| 287,305 | * | BTRS Holdings, Inc | 2,247 | |||||||
| 259,511 | Bytes Technology Group plc | 1,993 | ||||||||
| 57,247 | *,e | C3.ai, Inc | 1,789 | |||||||
| 244,267 | * | Cadence Design Systems, Inc | 45,519 | |||||||
| 80,647 | * | Cafe24 Corp | 1,854 | |||||||
| 46,848 | Cancom SE | 3,141 | ||||||||
| 5,324 | * | Cantaloupe, Inc | 47 | |||||||
| 788,179 | Cap Gemini S.A. | 193,167 | ||||||||
| 2,035,176 | * | Capita Group plc | 1,005 | |||||||
| 10,987 | Cass Information Systems, Inc | 432 | ||||||||
| 10,963 | cBrain A.S. | 473 | ||||||||
| 116,509 | CDK Global, Inc | 4,863 | ||||||||
| 47,414 | *,e | Cellebrite DI Ltd | 380 | |||||||
| 3,215 | *,e | Cerence Inc | 246 | |||||||
| 125,719 | * | Ceridian HCM Holding, Inc | 13,133 | |||||||
| 267,238 | * | CGI, Inc | 23,630 | |||||||
| 37,100 | *,e | Change, Inc | 611 | |||||||
| 103,604 | * | ChannelAdvisor Corp | 2,557 | |||||||
| 400,000 | *,e | Chatwork Co Ltd | 3,300 | |||||||
| 148,953 | * | Check Point Software Technologies | 17,362 | |||||||
| 93,274 | China TransInfo Technology Co Ltd | 219 | ||||||||
| 9,266,321 | * | China Youzan Ltd | 643 | |||||||
| 3,018,000 | Chinasoft International Ltd | 3,936 | ||||||||
| 132,400 | * | Chindata Group Holdings Ltd (ADR) | 873 | |||||||
| 1,231,200 | Cielo S.A. | 494 | ||||||||
| 202 |
COLLEGE RETIREMENT EQUITIES FUND - Stock Account
| SHARES | COMPANY | VALUE (000) | ||||||||
| 133,176 | * | Cint Group AB | $ | 2,113 | ||||||
| 119,164 | Citrix Systems, Inc | 11,272 | ||||||||
| 29,129 | *,e | Cleanspark, Inc | 277 | |||||||
| 59,400 | * | Clear Sale S.A. | 94 | |||||||
| 56,000 | *,e | Cloopen Group Holding Ltd (ADR) | 162 | |||||||
| 249,176 | * | Cloudflare, Inc | 32,767 | |||||||
| 14,146 | *,e | CM.com NV | 448 | |||||||
| 26,355 | Coforge Ltd | 2,082 | ||||||||
| 498,976 | Cognizant Technology Solutions Corp (Class A) | 44,269 | ||||||||
| 78,481 | * | Cognyte Software Ltd | 1,230 | |||||||
| 233,242 | * | Commvault Systems, Inc | 16,075 | |||||||
| 134,336 | Computacenter plc | 5,336 | ||||||||
| 41,123 | Computer Age Management Services Ltd | 1,472 | ||||||||
| 366,275 | Computershare Ltd | 5,332 | ||||||||
| 27,488 | Comture Corp | 861 | ||||||||
| 71,299 | Concentrix Corp | 12,735 | ||||||||
| 631,130 | * | Conduent, Inc | 3,370 | |||||||
| 6,913 | *,e | Consensus Cloud Solutions, Inc | 400 | |||||||
| 34,282 | Constellation Software, Inc | 63,606 | ||||||||
| 239,377 | *,e | Converge Technology Solutions Corp | 2,057 | |||||||
| 3,692 | * | Couchbase, Inc | 92 | |||||||
| 70,873 | * | Coupa Software, Inc | 11,201 | |||||||
| 69,761 | *,g | Crayon Group Holding ASA | 1,450 | |||||||
| 316,885 | * | Crowdstrike Holdings, Inc | 64,882 | |||||||
| 6,481 | * | CS Disco, Inc | 232 | |||||||
| 16,285 | CSG Systems International, Inc | 938 | ||||||||
| 111,956 | * | CyberArk Software Ltd | 19,400 | |||||||
| 32,200 | e | Cybozu, Inc | 512 | |||||||
| 89,579 | Cyient Ltd | 1,231 | ||||||||
| 2,336,989 | * | Darktrace plc | 13,292 | |||||||
| 1,373,228 | Dassault Systemes SE | 81,495 | ||||||||
| 190,368 | Data#3 Ltd | 814 | ||||||||
| 268,026 | * | Datadog, Inc | 47,738 | |||||||
| 4,713 | * | Datagroup SE | 519 | |||||||
| 17,763 | *,e | Datto Holding Corp | 468 | |||||||
| 382,825 | * | Descartes Systems Group, Inc | 31,662 | |||||||
| 88,577 | DHC Software Co Ltd | 108 | ||||||||
| 1,203 | *,e | Digimarc Corp | 47 | |||||||
| 14,300 | Digital Arts, Inc | 1,045 | ||||||||
| 1,717,831 | Digital China Holdings Ltd | 1,091 | ||||||||
| 40,213 | Digital Garage, Inc | 1,709 | ||||||||
| 2,782,900 | * | Digital Mediatama Maxima Tbk PT | 531 | |||||||
| 203 |
COLLEGE RETIREMENT EQUITIES FUND - Stock Account
| SHARES | COMPANY | VALUE (000) | ||||||||
| 122,165 | * | Digital Turbine, Inc | $ | 7,451 | ||||||
| 4,119 | * | Digital Value S.p.A | 534 | |||||||
| 121,485 | *,e | DigitalOcean Holdings, Inc | 9,759 | |||||||
| 17,719 | *,e | Docebo, Inc | 1,189 | |||||||
| 341,794 | * | DocuSign, Inc | 52,059 | |||||||
| 34,299 | Dolby Laboratories, Inc (Class A) | 3,266 | ||||||||
| 167,429 | * | Domo, Inc | 8,304 | |||||||
| 339,666 | dotdigital group plc | 909 | ||||||||
| 49,120 | * | DoubleVerify Holdings, Inc | 1,635 | |||||||
| 301,325 | * | Dropbox, Inc | 7,395 | |||||||
| 46,900 | DTS Corp | 1,030 | ||||||||
| 339,059 | * | Dubber Corp Ltd | 674 | |||||||
| 66,846 | * | Duck Creek Technologies, Inc | 2,013 | |||||||
| 21,131 | * | DuzonBIzon Co Ltd | 1,296 | |||||||
| 243,455 | * | DXC Technology Co | 7,837 | |||||||
| 359,589 | e | Dye & Durham Ltd | 12,758 | |||||||
| 293,803 | * | Dynatrace, Inc | 17,731 | |||||||
| 472,391 | *,e | E2open Parent Holdings, Inc | 5,319 | |||||||
| 22,805 | Ebix, Inc | 693 | ||||||||
| 16,258 | eClerx Services Ltd | 571 | ||||||||
| 169,969 | e | Econocom Group S.A. | 710 | |||||||
| 271,375 | Edenred | 12,532 | ||||||||
| 12,934 | * | eGain Corp | 129 | |||||||
| 104,647 | * | Elastic NV | 12,881 | |||||||
| 381,916 | * | EML Payments Ltd | 897 | |||||||
| 6,015 | * | Enfusion, Inc | 126 | |||||||
| 4,299 | * | EngageSmart, Inc | 104 | |||||||
| 50,085 | Enghouse Systems Ltd | 1,918 | ||||||||
| 16,535 | * | Envestnet, Inc | 1,312 | |||||||
| 130,368 | * | EPAM Systems, Inc | 87,144 | |||||||
| 6,380 | Esker S.A. | 2,627 | ||||||||
| 49,554 | * | Euronet Worldwide, Inc | 5,905 | |||||||
| 37,575 | * | Everbridge, Inc | 2,530 | |||||||
| 16,217 | *,e | EverCommerce, Inc | 255 | |||||||
| 96,854 | EVERTEC, Inc | 4,841 | ||||||||
| 5,464 | * | Evo Payments, Inc | 140 | |||||||
| 200,000 | * | Exasol AG. | 1,740 | |||||||
| 72,933 | * | ExlService Holdings, Inc | 10,559 | |||||||
| 33,384 | * | Fair Isaac Corp | 14,478 | |||||||
| 100,500 | *,e | Fastly, Inc | 3,563 | |||||||
| 552,252 | * | Fawry for Banking & Payment Technology Services SAE | 451 | |||||||
| 1,322,277 | Fidelity National Information Services, Inc | 144,327 | ||||||||
| 204 |
COLLEGE RETIREMENT EQUITIES FUND - Stock Account
| SHARES | COMPANY | VALUE (000) | ||||||||
| 108,403 | *,†,g | Finablr plc | $ | 1 | ||||||
| 224,200 | * | FireEye, Inc | 3,932 | |||||||
| 115,704 | * | First Derivatives plc | 3,148 | |||||||
| 291,474 | Firstsource Solutions Ltd | 715 | ||||||||
| 1,346,695 | * | Fiserv, Inc | 139,773 | |||||||
| 92,741 | * | Five9, Inc | 12,735 | |||||||
| 76,431 | * | FleetCor Technologies, Inc | 17,108 | |||||||
| 13,210 | * | Flywire Corp | 503 | |||||||
| 12,395 | Formula Systems 1985 Ltd | 1,511 | ||||||||
| 193,888 | * | Fortinet, Inc | 69,683 | |||||||
| 59,342 | Fortnox AB | 3,821 | ||||||||
| 84,100 | * | Freee KK | 4,624 | |||||||
| 120,433 | F-Secure Oyj | 681 | ||||||||
| 28,084 | FUJI SOFT, Inc | 1,355 | ||||||||
| 132,369 | Fujitsu Ltd | 22,744 | ||||||||
| 9,327 | Fukui Computer Holdings, Inc | 280 | ||||||||
| 56,200 | Future Architect, Inc | 855 | ||||||||
| 90,843 | * | Gartner, Inc | 30,371 | |||||||
| 453,265 | GB Group plc | 4,514 | ||||||||
| 618,700 | *,n | GDS Holdings Ltd | 3,584 | |||||||
| 739,540 | *,n | GDS Holdings Ltd (ADR) | 34,877 | |||||||
| 279,324 | Genpact Ltd | 14,827 | ||||||||
| 21,657 | GFT Technologies AG. | 1,134 | ||||||||
| 122,456 | g | Global Dominion Access S.A. | 646 | |||||||
| 281,316 | Global Payments, Inc | 38,028 | ||||||||
| 51,762 | * | Globant S.A. | 16,258 | |||||||
| 1,400 | GMO Financial Gate, Inc | 340 | ||||||||
| 5,000 | e | GMO GlobalSign Holdings KK | 182 | |||||||
| 81,770 | * | GMO internet, Inc | 1,927 | |||||||
| 131,577 | GMO Payment Gateway, Inc | 16,385 | ||||||||
| 155,789 | * | GoDaddy, Inc | 13,220 | |||||||
| 3,094 | *,e | GreenBox POS | 13 | |||||||
| 41,085 | * | GreenSky, Inc | 467 | |||||||
| 171,657 | * | Grid Dynamics Holdings, Inc | 6,518 | |||||||
| 31,850 | * | GTY Technology Holdings Inc | 213 | |||||||
| 6,172 | * | Guidewire Software, Inc | 701 | |||||||
| 55,849 | Hackett Group, Inc | 1,147 | ||||||||
| 201,784 | Hansen Technologies Ltd | 785 | ||||||||
| 63,646 | Happiest Minds Technologies Ltd | 1,108 | ||||||||
| 792,271 | HCL Technologies Ltd | 14,015 | ||||||||
| 121,400 | *,e | Hennge KK | 2,035 | |||||||
| 2,000,501 | * | Hi Sun Technology China Ltd | 265 | |||||||
| 205 |
COLLEGE RETIREMENT EQUITIES FUND - Stock Account
| SHARES | COMPANY | VALUE (000) | ||||||||
| 17,411 | Hilan Ltd | $ | 1,164 | |||||||
| 47,632 | * | HubSpot, Inc | 31,397 | |||||||
| 59,502 | Hundsun Technologies, Inc | 581 | ||||||||
| 263,507 | *,e | Hut 8 Mining Corp | 2,069 | |||||||
| 7,471 | * | Hyundai Autoever Corp | 864 | |||||||
| 8,815 | * | I3 Verticals, Inc | 201 | |||||||
| 24,999 | *,e | IBEX Ltd | 322 | |||||||
| 338,294 | Ideagen plc | 1,259 | ||||||||
| 107,683 | Iflytek Co Ltd | 887 | ||||||||
| 158,949 | * | Indra Sistemas S.A. | 1,717 | |||||||
| 348,849 | Infibeam Incorporation Ltd | 188 | ||||||||
| 31,353 | Infocom Corp | 594 | ||||||||
| 4,475,900 | Infomart Corp | 36,394 | ||||||||
| 32,031 | * | Informatica, Inc | 1,185 | |||||||
| 26,248 | Information Services International-Dentsu Ltd | 884 | ||||||||
| 4,399,055 | Infosys Technologies Ltd | 111,409 | ||||||||
| 9,874 | * | Instructure Holdings, Inc | 237 | |||||||
| 3,960 | * | Intapp, Inc | 100 | |||||||
| 87,588 | * | Intellect Design Arena Ltd | 870 | |||||||
| 669 | *,e | Intelligent Systems Corp | 26 | |||||||
| 17,395 | InterDigital, Inc | 1,246 | ||||||||
| 848,412 | International Business Machines Corp | 113,399 | ||||||||
| 2,692 | *,e | International Money Express Inc | 43 | |||||||
| 548,997 | Intuit, Inc | 353,126 | ||||||||
| 230,476 | Iress Market Technology Ltd | 2,097 | ||||||||
| 2,134,859 | * | ironSource Ltd | 16,524 | |||||||
| 805,413 | *,e | ironSource Ltd | 6,234 | |||||||
| 63,400 | Itochu Techno-Science Corp | 2,039 | ||||||||
| 71,941 | Jack Henry & Associates, Inc | 12,013 | ||||||||
| 290,831 | *,e | Jamf Holding Corp | 11,054 | |||||||
| 4,967 | * | JFrog Ltd | 148 | |||||||
| 4,400 | *,e | JIG-SAW, Inc | 242 | |||||||
| 39,157 | Justsystems Corp | 1,828 | ||||||||
| 275,338 | Kainos Group plc | 7,144 | ||||||||
| 9,607 | *,e | Kaltura, Inc | 32 | |||||||
| 12,186 | Kanematsu Electronics Ltd | 421 | ||||||||
| 287,900 | *,e | Kaonavi, Inc | 7,428 | |||||||
| 130,067 | * | Kape Technologies plc | 801 | |||||||
| 508,544 | Keywords Studios plc | 20,251 | ||||||||
| 21,491 | Kginicis Co Ltd | 343 | ||||||||
| 227,087 | * | Kinaxis, Inc | 31,835 | |||||||
| 1,865,495 | * | Kingdee International Software Group Co Ltd | 5,742 | |||||||
| 206 |
COLLEGE RETIREMENT EQUITIES FUND - Stock Account
| SHARES | COMPANY | VALUE (000) | ||||||||
| 41,692 | *,e | Kingsoft Cloud Holdings Ltd (ADR) | $ | 657 | ||||||
| 27,409 | e | KNOW IT AB | 1,139 | |||||||
| 235,253 | KPIT Engineering Ltd | 1,927 | ||||||||
| 205,788 | * | Kyndryl Holdings, Inc | 3,725 | |||||||
| 74,105 | Lakala Payment Co Ltd | 338 | ||||||||
| 59,646 | g | Larsen & Toubro Infotech Ltd | 5,866 | |||||||
| 3,984,719 | Learning Technologies Group plc | 9,590 | ||||||||
| 680,835 | * | Lightspeed Commerce, Inc | 27,493 | |||||||
| 12,220 | e | Lime Technologies AB | 465 | |||||||
| 112,088 | *,e | Limelight Networks, Inc | 384 | |||||||
| 541,956 | Link Administration Holdings Ltd | 2,196 | ||||||||
| 316,258 | *,e | LINK Mobility Group Holding ASA | 688 | |||||||
| 19,347 | LiveChat Software S.A. | 561 | ||||||||
| 45,611 | * | Liveperson, Inc | 1,629 | |||||||
| 145,187 | * | LiveRamp Holdings, Inc | 6,962 | |||||||
| 987,428 | *,g | Locaweb Servicos de Internet S.A. | 2,291 | |||||||
| 4,869 | * | Lotte Data Communication Co | 148 | |||||||
| 447,000 | * | M Cash Integrasi PT | 299 | |||||||
| 33,562 | Magic Software Enterprises Ltd | 712 | ||||||||
| 11,682 | * | Magnet Forensics, Inc | 304 | |||||||
| 11,908 | Malam-Team Ltd | 435 | ||||||||
| 90,178 | * | Manhattan Associates, Inc | 14,022 | |||||||
| 199,634 | *,e | Marathon Digital Holdings, Inc | 6,560 | |||||||
| 13,158 | Mastek Ltd | 533 | ||||||||
| 2,273,551 | Mastercard, Inc (Class A) | 816,932 | ||||||||
| 42,218 | Matrix IT Ltd | 1,282 | ||||||||
| 5,949 | MAXIMUS, Inc | 474 | ||||||||
| 80,166 | McAfee Corp | 2,067 | ||||||||
| 398,064 | * | Megaport Ltd | 5,364 | |||||||
| 4,633 | * | MeridianLink, Inc | 100 | |||||||
| 397,311 | Micro Focus International plc | 2,250 | ||||||||
| 15,124,645 | n | Microsoft Corp | 5,086,721 | |||||||
| 719 | *,e | MicroStrategy, Inc (Class A) | 391 | |||||||
| 152,332 | * | Mimecast Ltd | 12,121 | |||||||
| 247,927 | MindTree Ltd | 15,907 | ||||||||
| 639,000 | e | Ming Yuan Cloud Group Holdings Ltd | 1,457 | |||||||
| 20,300 | Miroku Jyoho Service Co Ltd | 244 | ||||||||
| 83,253 | * | Mitek Systems, Inc | 1,478 | |||||||
| 20,267 | Mitsubishi Research Institute, Inc | 711 | ||||||||
| 62,160 | * | Model N, Inc | 1,867 | |||||||
| 51,588 | * | Money Forward, Inc | 3,087 | |||||||
| 71,249 | * | MoneyGram International, Inc | 562 | |||||||
| 207 |
COLLEGE RETIREMENT EQUITIES FUND - Stock Account
| SHARES | COMPANY | VALUE (000) | ||||||||
| 62,767 | * | MongoDB, Inc | $ | 33,226 | ||||||
| 42,237 | Moshi Moshi Hotline, Inc | 358 | ||||||||
| 111,821 | Mphasis Ltd | 5,098 | ||||||||
| 5,598,400 | My EG Services BHD | 1,435 | ||||||||
| 27,310 | * | N-Able, Inc | 303 | |||||||
| 10,526 | * | Nagarro SE | 2,410 | |||||||
| 852,000 | *,†,e | National Agricultural Holdings Ltd | 1 | |||||||
| 374,309 | NCC Group plc | 1,183 | ||||||||
| 54,746 | *,e | nCino, Inc | 3,003 | |||||||
| 122,799 | * | NCR Corp | 4,937 | |||||||
| 4,082,943 | *,e | nearmap Ltd | 4,590 | |||||||
| 612,181 | NEC Corp | 28,307 | ||||||||
| 81,643 | NEC Networks & System Integration Corp | 1,281 | ||||||||
| 62,431 | Nemetschek AG. | 7,983 | ||||||||
| 104,506 | NET One Systems Co Ltd | 2,812 | ||||||||
| 100,772 | g | Netcompany Group A.S. | 10,805 | |||||||
| 564,756 | *,g | Network International Holdings plc | 2,234 | |||||||
| 51,143 | * | New Relic, Inc | 5,624 | |||||||
| 372,000 | * | Newborn Town, Inc | 177 | |||||||
| 449,080 | *,g | Nexi S.p.A | 7,116 | |||||||
| 6,173,939 | * | NEXTDC Ltd | 57,329 | |||||||
| 23,628 | * | NHN KCP Corp | 602 | |||||||
| 69,306 | * | Nice Systems Ltd | 21,017 | |||||||
| 265,138 | Nihon Unisys Ltd | 7,441 | ||||||||
| 76,174 | NIIT Ltd | 461 | ||||||||
| 84,000 | Nippon System Development Co Ltd | 1,526 | ||||||||
| 1,631,579 | *,e | Nitro Software Ltd | 2,927 | |||||||
| 220,790 | Nomura Research Institute Ltd | 9,439 | ||||||||
| 6,192 | *,e | Northern Data AG. | 543 | |||||||
| 1,726,787 | NortonLifelock, Inc | 44,862 | ||||||||
| 37,892 | NS Solutions Corp | 1,168 | ||||||||
| 431,245 | NTT Data Corp | 9,251 | ||||||||
| 387,160 | * | Nuance Communications, Inc | 21,418 | |||||||
| 187,138 | * | Nuix Ltd | 299 | |||||||
| 361,432 | * | Nutanix, Inc | 11,515 | |||||||
| 115,481 | *,g | Nuvei Corp | 7,504 | |||||||
| 152,778 | * | Nuvei Corp | 9,904 | |||||||
| 40,500 | OBIC Business Consultants Ltd | 1,703 | ||||||||
| 27,210 | Obic Co Ltd | 5,092 | ||||||||
| 26,485 | Objective Corp Ltd | 383 | ||||||||
| 121,833 | * | Okta, Inc | 27,311 | |||||||
| 4,939 | * | ON24, Inc | 86 | |||||||
| 208 |
COLLEGE RETIREMENT EQUITIES FUND - Stock Account
| SHARES | COMPANY | VALUE (000) | ||||||||
| 47,071 | One Software Technologies Ltd | $ | 936 | |||||||
| 122,300 | * | OneConnect Financial Technology Co Ltd (ADR) | 302 | |||||||
| 3,473 | * | OneSpan, Inc | 59 | |||||||
| 163,744 | Open Text Corp | 7,775 | ||||||||
| 335,041 | Open Text Corp (Toronto) | 15,902 | ||||||||
| 19,000 | *,e | Optim Corp | 217 | |||||||
| 2,735,245 | Oracle Corp | 238,541 | ||||||||
| 14,142 | * | Oracle Corp Japan | 1,074 | |||||||
| 23,422 | Oracle Financial Services Software Ltd | 1,244 | ||||||||
| 10,138 | e | Oro Co Ltd | 256 | |||||||
| 31,760 | Otsuka Corp | 1,514 | ||||||||
| 78,484 | *,e | Pagerduty, Inc | 2,727 | |||||||
| 434,707 | * | Pagseguro Digital Ltd | 11,398 | |||||||
| 1,608,001 | * | Palantir Technologies, Inc | 29,282 | |||||||
| 282,471 | * | Palo Alto Networks, Inc | 157,269 | |||||||
| 215,404 | * | Paya Holdings, Inc | 1,366 | |||||||
| 315,223 | Paychex, Inc | 43,028 | ||||||||
| 49,821 | * | Paycom Software, Inc | 20,685 | |||||||
| 31,265 | *,e | Paycor HCM, Inc | 901 | |||||||
| 61,926 | * | Paylocity Holding Corp | 14,624 | |||||||
| 2,494,831 | * | PayPal Holdings, Inc | 470,475 | |||||||
| 640,626 | *,e | Paysafe Ltd | 2,505 | |||||||
| 68,136 | Pegasystems, Inc | 7,619 | ||||||||
| 9,815 | * | Perficient, Inc | 1,269 | |||||||
| 57,158 | Persistent Systems Ltd | 3,755 | ||||||||
| 93,202 | *,e | Pexip Holding ASA | 433 | |||||||
| 40,622 | * | Ping Identity Holding Corp | 929 | |||||||
| 16,000 | *,e | PKSHA Technology, Inc | 349 | |||||||
| 14,600 | *,e | Plaid, Inc | 270 | |||||||
| 13,700 | * | Plus Alpha Consulting Co Ltd | 378 | |||||||
| 58,073 | * | Posco ICT Co Ltd | 320 | |||||||
| 3,092 | * | Priority Technology Holdings Inc | 22 | |||||||
| 57,484 | *,e | Procore Technologies, Inc | 4,597 | |||||||
| 169,264 | Progress Software Corp | 8,170 | ||||||||
| 3,428 | * | PROS Holdings, Inc | 118 | |||||||
| 106,661 | * | PTC, Inc | 12,922 | |||||||
| 1,275,290 | * | Pushpay Holdings Ltd | 1,151 | |||||||
| 20,455 | * | Q2 Holdings, Inc | 1,625 | |||||||
| 53,700 | e | QIWI plc (ADR) | 429 | |||||||
| 21,365 | * | QT Group Oyj | 3,236 | |||||||
| 754,418 | * | Qualtrics International, Inc | 26,706 | |||||||
| 3,563 | * | Qualys, Inc | 489 | |||||||
| 209 |
COLLEGE RETIREMENT EQUITIES FUND - Stock Account
| SHARES | COMPANY | VALUE (000) | ||||||||
| 17,676 | *,e | Rackspace Technology, Inc | $ | 238 | ||||||
| 88,200 | Rakus Co Ltd | 2,367 | ||||||||
| 16,385 | * | Rapid7, Inc | 1,928 | |||||||
| 12,906 | *,e | Rekor Systems, Inc | 85 | |||||||
| 2,632 | * | Remitly Global, Inc | 54 | |||||||
| 139,720 | * | Repay Holdings Corp | 2,553 | |||||||
| 35,117 | Reply S.p.A | 7,133 | ||||||||
| 7,804 | * | Rimini Street, Inc | 47 | |||||||
| 78,443 | * | RingCentral, Inc | 14,696 | |||||||
| 125,306 | *,e | Riot Blockchain, Inc | 2,798 | |||||||
| 24,488 | * | Riskified Ltd | 192 | |||||||
| 21,892 | Route Mobile Ltd | 524 | ||||||||
| 60,918 | e | S&T AG. | 1,012 | |||||||
| 306,698 | * | Sabre Corp | 2,635 | |||||||
| 1,160,651 | Sage Group plc | 13,430 | ||||||||
| 99,619 | * | SailPoint Technologies Holding, Inc | 4,816 | |||||||
| 53,592 | Saipens International Corp NV | 1,861 | ||||||||
| 2,988,728 | * | salesforce.com, Inc | 759,525 | |||||||
| 25,413 | * | Samsung SDS Co Ltd | 3,338 | |||||||
| 27,325 | Sangfor Technologies, Inc | 819 | ||||||||
| 75,000 | * | Sansan, Inc | 1,622 | |||||||
| 1,178,966 | SAP AG. | 165,927 | ||||||||
| 26,697 | Sapiens International Corp NV | 920 | ||||||||
| 1,673 | Secunet Security Networks AG. | 784 | ||||||||
| 9,509 | * | SecureWorks Corp | 152 | |||||||
| 60,000 | * | SentinelOne, Inc | 3,029 | |||||||
| 637,628 | * | ServiceNow, Inc | 413,891 | |||||||
| 900,000 | * | Sezzle, Inc | 1,979 | |||||||
| 45,489 | Shanghai Baosight Software Co Ltd | 434 | ||||||||
| 478,900 | Shanghai Baosight Software Co Ltd | 2,311 | ||||||||
| 233,972 | * | SHIFT, Inc | 48,257 | |||||||
| 42,371 | *,e | Shift4 Payments, Inc | 2,455 | |||||||
| 172,931 | * | Shopify, Inc (Class A) (Toronto) | 238,106 | |||||||
| 1,362 | * | ShotSpotter, Inc | 40 | |||||||
| 929,741 | Silverlake Axis Ltd | 190 | ||||||||
| 49,253 | SimCorp AS | 5,368 | ||||||||
| 567,166 | *,g | Sinch AB | 7,157 | |||||||
| 395,257 | * | SiteMinder Ltd | 1,944 | |||||||
| 195,270 | * | Smartsheet, Inc | 15,124 | |||||||
| 144,140 | * | Smith Micro Software, Inc | 709 | |||||||
| 191,783 | * | Snowflake, Inc | 64,966 | |||||||
| 13,400 | Softbank Technology Corp | 300 | ||||||||
| 210 |
COLLEGE RETIREMENT EQUITIES FUND - Stock Account
| SHARES | COMPANY | VALUE (000) | ||||||||
| 145,172 | Softcat plc | $ | 3,545 | |||||||
| 63,046 | e | Software AG. | 2,512 | |||||||
| 27,352 | SolarWinds Corp | 388 | ||||||||
| 127,269 | *,e | Solutions 30 SE | 1,028 | |||||||
| 70,229 | Sonata Software Ltd | 825 | ||||||||
| 42,880 | Sopra Group S.A. | 7,695 | ||||||||
| 162,801 | * | Splunk, Inc | 18,839 | |||||||
| 81,630 | * | Sprout Social, Inc | 7,403 | |||||||
| 134,677 | * | SPS Commerce, Inc | 19,171 | |||||||
| 209,379 | SS&C Technologies Holdings, Inc | 17,165 | ||||||||
| 19,945 | * | StarTek, Inc | 104 | |||||||
| 2,674,027 | * | StoneCo Ltd | 45,084 | |||||||
| 336 | * | Stronghold Digital Mining, Inc | 4 | |||||||
| 43,300 | Sumisho Computer Systems Corp | 862 | ||||||||
| 36,160 | * | Sumo Logic, Inc | 490 | |||||||
| 891,224 | SUNeVision Holdings Ltd | 845 | ||||||||
| 496,154 | * | SVMK, Inc | 10,494 | |||||||
| 108,757 | Switch, Inc | 3,115 | ||||||||
| 632,972 | * | Synopsys, Inc | 233,250 | |||||||
| 322,112 | Systena Corp | 1,202 | ||||||||
| 391,851 | Systex Corp | 1,200 | ||||||||
| 93,811 | Tanla Platforms Ltd | 2,369 | ||||||||
| 976,842 | Tata Consultancy Services Ltd | 48,994 | ||||||||
| 58,769 | Tata Elxsi Ltd | 4,633 | ||||||||
| 234,296 | *,g | TeamViewer AG. | 3,144 | |||||||
| 462,286 | Tech Mahindra Ltd | 11,092 | ||||||||
| 51,400 | TechMatrix Corp | 849 | ||||||||
| 332,142 | Technology One Ltd | 3,082 | ||||||||
| 13,963 | e | TECSYS, Inc | 581 | |||||||
| 3,757 | * | Telos Corp | 58 | |||||||
| 73,864 | Temenos Group AG. | 10,182 | ||||||||
| 596,614 | * | Tenable Holdings, Inc | 32,856 | |||||||
| 107,110 | *,e | Teradata Corp | 4,549 | |||||||
| 28,261 | Thunder Software Technology Co Ltd | 613 | ||||||||
| 108,273 | Tietoenator Oyj | 3,382 | ||||||||
| 210,900 | TIS, Inc | 6,271 | ||||||||
| 35,940 | TKC | 1,080 | ||||||||
| 555,452 | Totvus S.A. | 2,823 | ||||||||
| 419,495 | * | Trade Desk, Inc | 38,443 | |||||||
| 43,261 | * | Trans Cosmos, Inc/Japan | 1,234 | |||||||
| 686,219 | Travelsky Technology Ltd | 1,155 | ||||||||
| 211 |
COLLEGE RETIREMENT EQUITIES FUND - Stock Account
| SHARES | COMPANY | VALUE (000) | ||||||||
| 60,552 | * | Trend Micro, Inc | $ | 3,362 | ||||||
| 11,227 | *,e | Trifork Holding AG. | 522 | |||||||
| 41,867 | TTEC Holdings, Inc | 3,791 | ||||||||
| 807 | *,e | Tucows, Inc | 68 | |||||||
| 40,060 | * | Turing Holding Corp | 1,074 | |||||||
| 444,709 | * | Twilio, Inc | 117,110 | |||||||
| 39,374 | * | Tyler Technologies, Inc | 21,181 | |||||||
| 423,873 | *,e | Tyro Payments Ltd | 883 | |||||||
| 20,300 | Uchida Yoko Co Ltd | 930 | ||||||||
| 285,093 | * | Unifiedpost Group S.A. | 4,849 | |||||||
| 17,646 | * | Unisys Corp | 363 | |||||||
| 146,133 | * | Unity Software, Inc | 20,896 | |||||||
| 39,673 | * | Upland Software, Inc | 712 | |||||||
| 784,858 | Vakrangee Ltd | 464 | ||||||||
| 11,487 | * | Varonis Systems, Inc | 560 | |||||||
| 56,932 | * | Verint Systems, Inc | 2,989 | |||||||
| 98,095 | * | VeriSign, Inc | 24,898 | |||||||
| 2,985 | *,e | Veritone, Inc | 67 | |||||||
| 984,686 | * | Verra Mobility Corp | 15,194 | |||||||
| 1,673 | * | Viant Technology, Inc | 16 | |||||||
| 62,028 | *,e | VirnetX Holding Corp | 161 | |||||||
| 3,139,340 | Visa, Inc (Class A) | 680,326 | ||||||||
| 34,328 | e | Vitec Software Group AB | 2,116 | |||||||
| 210,657 | VMware, Inc (Class A) | 24,411 | ||||||||
| 1,529,000 | *,e | Vobile Group Ltd | 1,213 | |||||||
| 49,936 | *,e | Volue ASA | 331 | |||||||
| 644,573 | * | Vonage Holdings Corp | 13,401 | |||||||
| 214 | * | Weave Communications, Inc | 3 | |||||||
| 2,179,000 | *,e,g | Weimob, Inc | 2,207 | |||||||
| 547,466 | Western Union Co | 9,767 | ||||||||
| 43,561 | *,e | WEX, Inc | 6,116 | |||||||
| 11,464 | Wiit S.p.A | 468 | ||||||||
| 1,001,688 | Wipro Ltd | 9,599 | ||||||||
| 99,293 | Wisetech Global Ltd | 4,211 | ||||||||
| 112,880 | * | Wix.com Ltd | 17,811 | |||||||
| 301,395 | * | Workday, Inc | 82,335 | |||||||
| 118,610 | * | Workiva, Inc | 15,477 | |||||||
| 66,065 | *,g | Worldline S.A. | 3,677 | |||||||
| 147,857 | * | Xero Ltd | 15,135 | |||||||
| 131,294 | Xperi Holding Corp | 2,483 | ||||||||
| 221,600 | *,e | Yeahka Ltd | 735 | |||||||
| 10,039 | * | Yext, Inc | 100 | |||||||
| 212 |
COLLEGE RETIREMENT EQUITIES FUND - Stock Account
| SHARES | COMPANY | VALUE (000) | ||||||||
| 128,387 | Yonyou Network Technology Co Ltd | $ | 723 | |||||||
| 173,814 | * | Zendesk, Inc | 18,127 | |||||||
| 103,796 | Zensar Technologies Ltd | 725 | ||||||||
| 210,287 | * | Zoom Video Communications, Inc | 38,674 | |||||||
| 251,012 | * | Zscaler, Inc | 80,658 | |||||||
| 18,800 | Zuken, Inc | 604 | ||||||||
| 674,437 | * | Zuora Inc | 12,598 | |||||||
| TOTAL SOFTWARE & SERVICES | 15,385,341 | |||||||||
| TECHNOLOGY HARDWARE & EQUIPMENT - 5.9% | ||||||||||
| 164,396 | * | 3D Systems Corp | 3,541 | |||||||
| 1,545 | * | 908 Devices, Inc | 40 | |||||||
| 9,292,444 | AAC Technologies Holdings, Inc | 36,623 | ||||||||
| 569,402 | Accton Technology Corp | 5,335 | ||||||||
| 31,641 | * | ACE Technologies Corp | 401 | |||||||
| 2,001,532 | Acer, Inc | 2,198 | ||||||||
| 69,311 | Addsino Co Ltd | 182 | ||||||||
| 96,000 | Adlink Technology, Inc | 224 | ||||||||
| 39,415 | Adtran, Inc | 900 | ||||||||
| 57,172 | * | ADVA AG. Optical Networking | 914 | |||||||
| 48,000 | Advanced Ceramic X Corp | 609 | ||||||||
| 137,795 | Advanced Energy Industries, Inc | 12,548 | ||||||||
| 272,331 | Advantech Co Ltd | 3,893 | ||||||||
| 416,540 | *,e | Aeva Technologies, Inc | 3,149 | |||||||
| 41,506 | Ai Holdings Corp | 695 | ||||||||
| 7,286 | *,e | Akoustis Technologies, Inc | 49 | |||||||
| 204,000 | Alpha Networks, Inc | 247 | ||||||||
| 477,900 | Alps Electric Co Ltd | 4,508 | ||||||||
| 7,825 | ALSO Holding AG. | 2,566 | ||||||||
| 64,750 | Amano Corp | 1,491 | ||||||||
| 325,326 | Amphenol Corp (Class A) | 28,453 | ||||||||
| 1,610,193 | e | Anritsu Corp | 24,868 | |||||||
| 150,000 | Apex International Co Ltd | 705 | ||||||||
| 25,113,653 | d | Apple, Inc | 4,459,431 | |||||||
| 145,409 | Arcadyan Technology Corp | 669 | ||||||||
| 328,251 | * | Arista Networks, Inc | 47,186 | |||||||
| 256,595 | * | Arlo Technologies, Inc | 2,692 | |||||||
| 81,403 | * | Arrow Electronics, Inc | 10,930 | |||||||
| 244,000 | Asia Optical Co, Inc | 826 | ||||||||
| 298,000 | Asia Vital Components Co Ltd | 947 | ||||||||
| 46,000 | ASROCK, Inc | 467 | ||||||||
| 521,026 | Asustek Computer, Inc | 7,073 | ||||||||
| 415,700 | ATA IMS BHD | 61 | ||||||||
| 213 |
COLLEGE RETIREMENT EQUITIES FUND - Stock Account
| SHARES | COMPANY | VALUE (000) | ||||||||
| 5,804,534 | AU Optronics Corp | $ | 4,798 | |||||||
| 42,085 | Audiocodes Ltd | 1,462 | ||||||||
| 71,000 | AURAS Technology Co Ltd | 517 | ||||||||
| 53,598 | Aurora Corp | 174 | ||||||||
| 29,703 | Austria Technologie & Systemtechnik AG. | 1,457 | ||||||||
| 103,100 | Avary Holding Shenzhen Co Ltd | 687 | ||||||||
| 8,942 | *,e | Aviat Networks, Inc | 287 | |||||||
| 116,027 | * | Avid Technology, Inc | 3,779 | |||||||
| 170,443 | e | Avnet, Inc | 7,027 | |||||||
| 88,000 | Azbil Corp | 4,014 | ||||||||
| 8,090 | Badger Meter, Inc | 862 | ||||||||
| 83,128 | e | Barco NV | 1,811 | |||||||
| 4,245 | Basler AG. | 765 | ||||||||
| 22,543 | * | Beijing BDStar Navigation Co Ltd | 139 | |||||||
| 15,300 | Beijing Yuanliu Hongyuan Electronic Technology Co Ltd | 430 | ||||||||
| 67,715 | Belden CDT, Inc | 4,451 | ||||||||
| 64,755 | Benchmark Electronics, Inc | 1,755 | ||||||||
| 1,696,798 | Benq Corp | 1,865 | ||||||||
| 25,495 | BH Co Ltd | 497 | ||||||||
| 1,643,937 | BOE Technology Group Co Ltd | 1,303 | ||||||||
| 231,030 | Brother Industries Ltd | 4,453 | ||||||||
| 499,939 | e | BYD Electronic International Co Ltd | 1,830 | |||||||
| 29,628 | * | CalAmp Corp | 209 | |||||||
| 408,010 | * | Calix, Inc | 32,629 | |||||||
| 38,088 | * | Cambium Networks Corp | 976 | |||||||
| 97,600 | *,e | Canaan, Inc (ADR) | 503 | |||||||
| 20,700 | * | Canon Electronics, Inc | 285 | |||||||
| 54,990 | Canon Marketing Japan, Inc | 1,096 | ||||||||
| 452,859 | e | Canon, Inc | 11,047 | |||||||
| 443,996 | Career Technology Co Ltd | 423 | ||||||||
| 57,612 | * | Casa Systems, Inc | 327 | |||||||
| 487,947 | Catcher Technology Co Ltd | 2,758 | ||||||||
| 389,532 | CDW Corp | 79,768 | ||||||||
| 280,151 | * | Celestica, Inc | 3,123 | |||||||
| 363,000 | Chang Wah Electromaterials, Inc | 509 | ||||||||
| 124,945 | Chaozhou Three-Circle Group Co Ltd | 875 | ||||||||
| 533,481 | Cheng Uei Precision Industry Co Ltd | 762 | ||||||||
| 651,000 | Chicony Electronics Co Ltd | 1,935 | ||||||||
| 489,600 | *,† | China Fiber Optic Network System Group Ltd | 1 | |||||||
| 120,957 | China Greatwall Technology Group Co Ltd | 269 | ||||||||
| 389,963 | China Railway Signal & Communication Corp Ltd | 305 | ||||||||
| 214 |
COLLEGE RETIREMENT EQUITIES FUND - Stock Account
| SHARES | COMPANY | VALUE (000) | ||||||||
| 33,500 | China Zhenhua Group Science & Technology Co Ltd | $ | 654 | |||||||
| 389,000 | Chin-Poon Industrial Co | 515 | ||||||||
| 390,840 | Chroma ATE, Inc | 2,819 | ||||||||
| 21,000 | Chunghwa Precision Test Tech Co Ltd | 539 | ||||||||
| 1,054,903 | *,n | Ciena Corp | 81,196 | |||||||
| 12,199,966 | Cisco Systems, Inc | 773,112 | ||||||||
| 1,028,300 | Citizen Watch Co Ltd | 4,451 | ||||||||
| 976 | * | Clearfield, Inc | 82 | |||||||
| 358,393 | Clevo Co | 427 | ||||||||
| 189,101 | Codan Ltd | 1,283 | ||||||||
| 584,134 | Cognex Corp | 45,422 | ||||||||
| 13,984 | * | Coherent, Inc | 3,727 | |||||||
| 2,276,312 | *,e | Comba Telecom Systems Holdings Ltd | 526 | |||||||
| 8,505 | Comet Holding AG. | 3,128 | ||||||||
| 119,652 | * | CommScope Holding Co, Inc | 1,321 | |||||||
| 3,026,524 | Compal Electronics, Inc | 2,646 | ||||||||
| 1,099,000 | Compeq Manufacturing Co | 1,736 | ||||||||
| 23,733 | Comtech Telecommunications Corp | 562 | ||||||||
| 24,000 | CONEXIO Corp | 308 | ||||||||
| 4,540,000 | * | Coolpad Group Ltd | 224 | |||||||
| 363,600 | Coretronic Corp | 1,211 | ||||||||
| 418,451 | Corning, Inc | 15,579 | ||||||||
| 2,403 | *,e | Corsair Gaming, Inc | 50 | |||||||
| 22,986 | * | CosmoAM&T Co Ltd | 890 | |||||||
| 215,000 | Co-Tech Development Corp | 598 | ||||||||
| 348,000 | *,e | Cowell e Holdings, Inc | 587 | |||||||
| 72,316 | CTS Corp | 2,655 | ||||||||
| 37,714 | Daeduck Electronics Co Ltd | 788 | ||||||||
| 11,803 | * | Daejoo Electronic Materials Co Ltd | 1,055 | |||||||
| 105,170 | Daiwabo Co Ltd | 1,682 | ||||||||
| 37,772 | * | Daktronics, Inc | 191 | |||||||
| 202,421 | Darfon Electronics Corp | 371 | ||||||||
| 16,600 | Datalogic S.p.A. | 288 | ||||||||
| 319,603 | DataTec Ltd | 772 | ||||||||
| 256,483 | * | Dell Technologies, Inc | 14,407 | |||||||
| 223,457 | Delta Electronics Thai PCL | 2,756 | ||||||||
| 1,404,673 | Delta Electronics, Inc | 13,937 | ||||||||
| 66,501 | Dexerials Corp | 2,400 | ||||||||
| 70,756 | e | Dicker Data Ltd | 764 | |||||||
| 6,418 | * | Diebold, Inc | 58 | |||||||
| 27,687 | * | Digi International, Inc | 680 | |||||||
| 31,844 | * | Digital Power Communications Co Ltd | 394 | |||||||
| 215 |
COLLEGE RETIREMENT EQUITIES FUND - Stock Account
| SHARES | COMPANY | VALUE (000) | ||||||||
| 24,217 | * | Dreamtech Co Ltd | $ | 246 | ||||||
| 144,000 | Dynapack International Technology Corp | 533 | ||||||||
| 9,790 | * | DZS, Inc | 159 | |||||||
| 453,300 | Eastern Communications Co Ltd | 212 | ||||||||
| 10,584 | *,e | Eastman Kodak Co | 50 | |||||||
| 19,924 | Eizo Nanao Corp | 700 | ||||||||
| 59,496 | Elecom Co Ltd | 783 | ||||||||
| 307,270 | Elite Material Co Ltd | 3,079 | ||||||||
| 332,000 | Elitegroup Computer Systems Co Ltd | 270 | ||||||||
| 121,052 | * | EMCORE Corp | 845 | |||||||
| 71,383 | h | Ennoconn Corp | 609 | |||||||
| 23,290 | * | ePlus, Inc | 1,255 | |||||||
| 48,057,100 | Erajaya Swasembada Tbk PT | 2,022 | ||||||||
| 3,208,443 | Ericsson (LM) (B Shares) | 35,303 | ||||||||
| 18,601 | ESPEC Corp | 361 | ||||||||
| 40,061 | e | Esprinet S.p.A. | 587 | |||||||
| 32,127 | Evertz Technologies Ltd | 334 | ||||||||
| 610,013 | * | Extreme Networks, Inc | 9,577 | |||||||
| 33,710 | * | F5 Networks, Inc | 8,249 | |||||||
| 50,155 | * | Fabrinet | 5,942 | |||||||
| 23,882 | * | FARO Technologies, Inc | 1,672 | |||||||
| 100,848 | Fiberhome Telecommunication Technologies Co Ltd | 285 | ||||||||
| 3,347,000 | *,e | FIH Mobile Ltd | 584 | |||||||
| 328,262 | *,e | Fingerprint Cards AB | 750 | |||||||
| 364,392 | FLEXium Interconnect, Inc | 1,373 | ||||||||
| 18,513,957 | Foxconn Industrial Internet Co Ltd | 34,629 | ||||||||
| 1,589,193 | Foxconn Technology Co Ltd | 3,722 | ||||||||
| 987,863 | Fujifilm Holdings Corp | 73,234 | ||||||||
| 249,000 | General Interface Solution Holding Ltd | 916 | ||||||||
| 85,378 | Genius Electronic Optical Co Ltd | 1,627 | ||||||||
| 404,271 | Getac Technology Corp | 812 | ||||||||
| 553,123 | Gigabyte Technology Co Ltd | 3,104 | ||||||||
| 43,610 | Gilat Satellite Networks Ltd | 311 | ||||||||
| 263,120 | Global Brands Manufacture Ltd | 366 | ||||||||
| 137,422 | GoerTek, Inc | 1,168 | ||||||||
| 416,000 | Gold Circuit Electronics Ltd | 1,139 | ||||||||
| 195,436 | GRG Banking Equipment Co Ltd | 366 | ||||||||
| 140,497 | Guangzhou Haige Communications Group, Inc Co | 241 | ||||||||
| 40,418 | Guangzhou Shiyuan Electronic Technology Co Ltd | 517 | ||||||||
| 908,524 | Halma plc | 39,393 | ||||||||
| 81,884 | Hamamatsu Photonics KK | 5,230 | ||||||||
| 216 |
COLLEGE RETIREMENT EQUITIES FUND - Stock Account
| SHARES | COMPANY | VALUE (000) | ||||||||
| 634,000 | Hana Microelectronics PCL (Foreign) | $ | 1,679 | |||||||
| 315,493 | Hannstar Board Corp | 517 | ||||||||
| 2,455,330 | HannStar Display Corp | 1,602 | ||||||||
| 69,581 | * | Harmonic, Inc | 818 | |||||||
| 224,600 | Hengtong Optic-electric Co Ltd | 533 | ||||||||
| 1,237,211 | Hewlett Packard Enterprise Co | 19,511 | ||||||||
| 1,422,686 | e | Hexagon AB | 22,536 | |||||||
| 757,000 | * | High Tech Computer Corp | 2,311 | |||||||
| 11,900 | Hioki EE Corp | 911 | ||||||||
| 13,444 | Hirose Electric Co Ltd | 2,259 | ||||||||
| 58,580 | Hiwin Mikrosystem Corp | 239 | ||||||||
| 31,387 | HMS Networks AB | 1,938 | ||||||||
| 144,470 | Holystone Enterprise Co Ltd | 623 | ||||||||
| 9,088,640 | Hon Hai Precision Industry Co, Ltd | 34,084 | ||||||||
| 42,799 | Horiba Ltd | 2,517 | ||||||||
| 57,200 | Hosiden Corp | 573 | ||||||||
| 1,107,520 | HP, Inc | 41,720 | ||||||||
| 62,000 | Huagong Tech Co Ltd | 271 | ||||||||
| 883,000 | Ibiden Co Ltd | 52,437 | ||||||||
| 1,867 | * | Identiv, Inc | 53 | |||||||
| 61,061 | * | II-VI, Inc | 4,172 | |||||||
| 25,787 | * | Iljin Materials Co Ltd | 2,920 | |||||||
| 3,264,000 | Inari Amertron BHD | 3,127 | ||||||||
| 2,088 | Inficon Holding AG. | 3,053 | ||||||||
| 16,049 | *,e | Infinera Corp | 154 | |||||||
| 76,200 | Innodisk Corp | 561 | ||||||||
| 6,919,321 | InnoLux Display Corp | 4,890 | ||||||||
| 216,024 | *,e | Inseego Corp | 1,259 | |||||||
| 47,085 | * | Insight Enterprises, Inc | 5,019 | |||||||
| 65,500 | Inspur Electronic Information Industry Co Ltd | 369 | ||||||||
| 83,900 | Intelbras S.A. Industria de Telecomunicacao Eletronica Brasileira | 420 | ||||||||
| 1,926,172 | Inventec Co Ltd | 1,735 | ||||||||
| 20,297 | * | IPG Photonics Corp | 3,494 | |||||||
| 24,300 | Iriso Electronics Co Ltd | 916 | ||||||||
| 268,820 | ITEQ Corp | 1,374 | ||||||||
| 77,929 | * | Iteris, Inc | 312 | |||||||
| 10,823 | * | Itron, Inc | 742 | |||||||
| 27,755 | Ituran Location and Control Ltd | 740 | ||||||||
| 143,171 | Jabil Inc | 10,072 | ||||||||
| 57,542 | Japan Aviation Electronics Industry Ltd | 997 | ||||||||
| 992,594 | *,e | Japan Display, Inc | 311 | |||||||
| 516,300 | Jaymart PCL | 887 | ||||||||
| 217 |
COLLEGE RETIREMENT EQUITIES FUND - Stock Account
| SHARES | COMPANY | VALUE (000) | ||||||||
| 62,687 | Jenoptik AG. | $ | 2,645 | |||||||
| 1,338,955 | Juniper Networks, Inc | 47,814 | ||||||||
| 17,800 | Kaga Electronics Co Ltd | 506 | ||||||||
| 860,900 | KCE Electronics PCL | 2,268 | ||||||||
| 523,038 | Keyence Corp | 328,864 | ||||||||
| 101,547 | * | Keysight Technologies, Inc | 20,970 | |||||||
| 20,740 | * | Kimball Electronics, Inc | 451 | |||||||
| 63,000 | King Slide Works Co Ltd | 1,176 | ||||||||
| 499,705 | Kingboard Chemical Holdings Ltd | 2,435 | ||||||||
| 1,148,246 | Kingboard Laminates Holdings Ltd | 1,953 | ||||||||
| 27,683 | *,e | KMW Co Ltd | 956 | |||||||
| 195,395 | * | Knowles Corp | 4,562 | |||||||
| 38,300 | Koa Corp | 536 | ||||||||
| 30,468 | * | KONA I Co Ltd | 827 | |||||||
| 1,053,900 | Konica Minolta Holdings, Inc | 4,809 | ||||||||
| 14,064 | * | KVH Industries, Inc | 129 | |||||||
| 91,193 | Kyocera Corp | 5,702 | ||||||||
| 25,208 | L&F Co Ltd | 4,691 | ||||||||
| 26,206 | Landis&Gyr Group AG. | 1,769 | ||||||||
| 73,625 | Largan Precision Co Ltd | 6,550 | ||||||||
| 783 | LEM Holding S.A. | 2,183 | ||||||||
| 29,938,399 | Lenovo Group Ltd | 34,408 | ||||||||
| 316,023 | Lens Technology Co Ltd | 1,140 | ||||||||
| 267,661 | Leyard Optoelectronic Co Ltd | 431 | ||||||||
| 168,009 | *,e | LG Display Co Ltd | 3,464 | |||||||
| 9,855 | * | LG Innotek Co Ltd | 3,013 | |||||||
| 466,184 | * | Lingyi iTech Guangdong Co | 539 | |||||||
| 1,542,277 | Lite-On Technology Corp | 3,551 | ||||||||
| 9,134 | Littelfuse, Inc | 2,874 | ||||||||
| 188,898 | e | Logitech International S.A. | 15,846 | |||||||
| 86,270 | Lotes Co Ltd | 2,370 | ||||||||
| 31,755 | LPKF Laser & Electronics AG. | 698 | ||||||||
| 69,783 | * | Lumentum Holdings, Inc | 7,381 | |||||||
| 5,240 | * | Luna Innovations, Inc | 44 | |||||||
| 459,724 | Luxshare Precision Industry Co Ltd | 3,551 | ||||||||
| 57,207 | Macnica Fuji Electronics Holdings, Inc | 1,369 | ||||||||
| 10,400 | Maruwa Co Ltd | 1,472 | ||||||||
| 168,100 | Maxell Holdings Ltd | 2,001 | ||||||||
| 21,384 | Maxscend Microelectronics Co Ltd | 1,098 | ||||||||
| 87,891 | Mcj Co Ltd | 827 | ||||||||
| 12,821 | Mcnex Co Ltd | 619 | ||||||||
| 25,900 | Meiko Electronics Co | 1,071 | ||||||||
| 218 |
COLLEGE RETIREMENT EQUITIES FUND - Stock Account
| SHARES | COMPANY | VALUE (000) | ||||||||
| 7,065 | Melco Holdings, Inc | $ | 250 | |||||||
| 631,887 | Merry Electronics Co Ltd | 2,154 | ||||||||
| 32,892 | Methode Electronics, Inc | 1,617 | ||||||||
| 198,000 | *,†,e | MH Development Ltd | 0 | ^ | ||||||
| 89,647 | e | Micronic AB | 2,091 | |||||||
| 483,200 | Micro-Star International Co Ltd | 2,799 | ||||||||
| 13,705 | *,e | Microvision, Inc | 69 | |||||||
| 985,893 | Mitac Holdings Corp | 1,252 | ||||||||
| 253,686 | Motorola Solutions, Inc | 68,926 | ||||||||
| 212,500 | * | Multilaser Industrial S.A. | 318 | |||||||
| 301,127 | Murata Manufacturing Co Ltd | 24,019 | ||||||||
| 158,000 | Nan Ya Printed Circuit Board Corp | 3,255 | ||||||||
| 312,600 | *,e | Nano Dimension Ltd (ADR) | 1,188 | |||||||
| 1,359 | * | Napco Security Technologies, Inc | 68 | |||||||
| 240,018 | e | National Instruments Corp | 10,482 | |||||||
| 103,464 | * | Nayax Ltd | 373 | |||||||
| 39,213 | Neopost S.A. | 854 | ||||||||
| 217,454 | NetApp, Inc | 20,004 | ||||||||
| 26,335 | * | Netgear, Inc | 769 | |||||||
| 61,112 | * | Netscout Systems, Inc | 2,022 | |||||||
| 65,550 | Nichicon Corp | 720 | ||||||||
| 86,915 | Ninestar Corp | 652 | ||||||||
| 25,600 | Nippon Ceramic Co Ltd | 626 | ||||||||
| 265,776 | Nippon Electric Glass Co Ltd | 6,814 | ||||||||
| 46,256 | Nippon Signal Co Ltd | 368 | ||||||||
| 47,860 | e | Nissha Printing Co Ltd | 695 | |||||||
| 55,894 | * | nLight, Inc | 1,339 | |||||||
| 26,172 | Nohmi Bosai Ltd | 512 | ||||||||
| 1 | * | Nokia Corp (ADR) | 0 | ^ | ||||||
| 6,347,611 | * | Nokia Oyj (Turquoise) | 40,204 | |||||||
| 18,934 | * | Novanta, Inc | 3,339 | |||||||
| 322,980 | *,e | Novonix Ltd | 2,159 | |||||||
| 2,560,510 | * | OFILM Group Co Ltd | 3,899 | |||||||
| 102,936 | Oki Electric Industry Co Ltd | 810 | ||||||||
| 97,268 | Omron Corp | 9,692 | ||||||||
| 40,879 | e | Optex Co Ltd | 584 | |||||||
| 55,113 | * | OSI Systems, Inc | 5,137 | |||||||
| 16,419 | *,e | Ouster, Inc | 85 | |||||||
| 415,224 | Pan-International Industrial | 590 | ||||||||
| 2,258 | *,e | PAR Technology Corp | 119 | |||||||
| 4,532 | * | Park Systems Corp | 582 | |||||||
| 41,688 | Partron Co Ltd | 465 | ||||||||
| 219 |
COLLEGE RETIREMENT EQUITIES FUND - Stock Account
| SHARES | COMPANY | VALUE (000) | ||||||||
| 906,000 | PAX Global Technology Ltd | $ | 641 | |||||||
| 9,589 | PC Connection, Inc | 414 | ||||||||
| 1,451,915 | Pegatron Technology Corp | 3,623 | ||||||||
| 19,641 | * | Plantronics, Inc | 576 | |||||||
| 12,095 | * | Plexus Corp | 1,160 | |||||||
| 433,414 | Primax Electronics Ltd | 886 | ||||||||
| 6,329,000 | Prime View International Co Ltd | 34,466 | ||||||||
| 454,678 | * | Pure Storage, Inc | 14,800 | |||||||
| 1,963,390 | Quanta Computer, Inc | 6,705 | ||||||||
| 48,310 | * | Quantum Corp | 267 | |||||||
| 51,307 | * | Radware Ltd | 2,136 | |||||||
| 26,318 | Raytron Technology Co Ltd | 325 | ||||||||
| 2,487,000 | *,e,g | Razer, Inc | 772 | |||||||
| 551,123 | Redington India Ltd | 1,071 | ||||||||
| 44,371 | Renishaw plc | 2,875 | ||||||||
| 20,747 | Restar Holdings Corp | 364 | ||||||||
| 60,955 | * | Ribbon Communications, Inc | 369 | |||||||
| 360,885 | Ricoh Co Ltd | 3,364 | ||||||||
| 17,826 | Riken Keiki Co Ltd | 910 | ||||||||
| 19,798 | Riso Kagaku Corp | 369 | ||||||||
| 12,494 | * | Rogers Corp | 3,411 | |||||||
| 23,233 | Ryosan Co Ltd | 460 | ||||||||
| 14,700 | e | Ryoyo Electro Corp | 306 | |||||||
| 39,950 | * | Samsung Electro-Mechanics Co Ltd | 6,626 | |||||||
| 6,716,634 | Samsung Electronics Co Ltd | 441,114 | ||||||||
| 598,656 | Samsung Electronics Co Ltd (Preference) | 35,791 | ||||||||
| 39,858 | Samsung SDI Co Ltd | 21,921 | ||||||||
| 8,397 | * | Samwha Capacitor Co Ltd | 424 | |||||||
| 8,879 | Sang-A Frontec Co Ltd | 390 | ||||||||
| 106,283 | * | Sanmina Corp | 4,406 | |||||||
| 21,855 | * | Scansource, Inc | 767 | |||||||
| 3,116 | Seagate Technology Holdings plc | 352 | ||||||||
| 40,776 | *,e | Seco S.p.A | 415 | |||||||
| 293,260 | Seiko Epson Corp | 5,282 | ||||||||
| 11,052 | *,g | Sensirion Holding AG. | 1,612 | |||||||
| 24,000 | Sensortek Technology Corp | 448 | ||||||||
| 14,027 | * | Seojin System Co Ltd | 509 | |||||||
| 244,419 | Sercomm Corp | 668 | ||||||||
| 22,947 | Sesa S.p.A | 4,522 | ||||||||
| 5,984 | *,e | SES-imagotag S.A. | 515 | |||||||
| 4,067 | Shanghai Friendess Electronic Technology Corp Ltd | 246 | ||||||||
| 156,284 | Shengyi Technology Co Ltd | 577 | ||||||||
| 220 |
COLLEGE RETIREMENT EQUITIES FUND - Stock Account
| SHARES | COMPANY | VALUE (000) | ||||||||
| 22,205 | Shennan Circuits Co Ltd | $ | 424 | |||||||
| 63,621 | Shenzhen Kaifa Technology Co Ltd | 158 | ||||||||
| 45,000 | Shenzhen Sunlord Electronics Co Ltd | 270 | ||||||||
| 82,402 | Shenzhen Sunway Communication Co Ltd | 328 | ||||||||
| 44,385 | Shenzhen Transsion Holdings Co Ltd | 1,095 | ||||||||
| 200,917 | Shimadzu Corp | 8,486 | ||||||||
| 44,752 | *,e | Sierra Wireless, Inc | 789 | |||||||
| 32,100 | e | Siix Corp | 395 | |||||||
| 255,907 | Simplo Technology Co Ltd | 3,035 | ||||||||
| 229,123 | Sinbon Electronics Co Ltd | 2,347 | ||||||||
| 987,202 | SKP Resources Bhd | 411 | ||||||||
| 28,587 | e | Softchoice Corp | 483 | |||||||
| 846,983 | Softwareone Holding AG. | 18,294 | ||||||||
| 32,373 | * | SOLUM Co Ltd | 610 | |||||||
| 11,723 | * | Solus Advanced Materials Co Ltd | 879 | |||||||
| 222,268 | Spectris plc | 11,064 | ||||||||
| 104,000 | Speed Tech Corp | 309 | ||||||||
| 1,430,536 | Spirent Communications plc | 5,397 | ||||||||
| 170,414 | Sterlite Technologies Ltd | 657 | ||||||||
| 415,314 | * | Stratasys Ltd | 10,171 | |||||||
| 263,615 | e | Strix Group plc | 1,083 | |||||||
| 16,800 | Sun Corp | 377 | ||||||||
| 519,949 | Sunny Optical Technology Group Co Ltd | 16,469 | ||||||||
| 121,603 | * | Super Micro Computer, Inc | 5,344 | |||||||
| 437,623 | Supreme Electronics Co Ltd | 798 | ||||||||
| 120,841 | Suzhou Dongshan Precision Manufacturing Co Ltd | 514 | ||||||||
| 79,267 | SYNNEX Corp | 9,065 | ||||||||
| 980,621 | Synnex Technology International Corp | 2,343 | ||||||||
| 283,400 | Synnex Thailand PCL | 310 | ||||||||
| 291,600 | Synnex Thailand PCL | 319 | ||||||||
| 260,000 | Taiwan Union Technology Corp | 957 | ||||||||
| 142,440 | Taiyo Yuden Co Ltd | 8,192 | ||||||||
| 81,300 | e | Tamura Corp | 473 | |||||||
| 110,537 | TDK Corp | 4,314 | ||||||||
| 1,247,178 | TE Connectivity Ltd | 201,220 | ||||||||
| 59,360 | *,g | Tejas Networks Ltd | 333 | |||||||
| 115,019 | * | Teledyne Technologies, Inc | 50,251 | |||||||
| 161,495 | Test Research, Inc | 341 | ||||||||
| 76,000 | Thinking Electronic Industrial Co Ltd | 431 | ||||||||
| 47,904 | Tianjin 712 Communication & Broadcasting Co Ltd | 326 | ||||||||
| 80,630 | Tianma Microelectronics Co Ltd | 165 | ||||||||
| 93,474 | *,e | Tobii AB | 378 | |||||||
| 221 |
COLLEGE RETIREMENT EQUITIES FUND - Stock Account
| SHARES | COMPANY | VALUE (000) | ||||||||
| 3,773 | *,e | Tobii Dynavox AB | $ | 13 | ||||||
| 166,220 | Tong Hsing Electronic Industries Ltd | 1,780 | ||||||||
| 128,256 | Topcon Corp | 1,852 | ||||||||
| 32,385 | Toshiba TEC Corp | 1,327 | ||||||||
| 1,784,000 | TPK Holding Co Ltd | 2,799 | ||||||||
| 207,000 | Transcend Information, Inc | 546 | ||||||||
| 133,560 | * | Trimble Inc | 11,645 | |||||||
| 460,574 | Tripod Technology Corp | 2,069 | ||||||||
| 1,876,000 | Truly International Holdings | 768 | ||||||||
| 899,045 | * | TTM Technologies, Inc | 13,396 | |||||||
| 126,372 | * | Turtle Beach Corp | 2,813 | |||||||
| 318,039 | TXC Corp | 1,210 | ||||||||
| 6,411 | Ubiquiti, Inc | 1,966 | ||||||||
| 869,011 | Unimicron Technology Corp | 7,232 | ||||||||
| 196,611 | Unisplendour Corp Ltd | 706 | ||||||||
| 65,398 | Universal Scientific Industrial Shanghai Co Ltd | 165 | ||||||||
| 7,583 | *,e | Velodyne Lidar, Inc | 35 | |||||||
| 181,900 | Venture Corp Ltd | 2,472 | ||||||||
| 25,000 | VIA Labs, Inc | 452 | ||||||||
| 65,146 | * | Viasat, Inc | 2,902 | |||||||
| 133,392 | * | Viavi Solutions, Inc | 2,350 | |||||||
| 39,839 | * | Vidente Co Ltd | 808 | |||||||
| 197,438 | Vishay Intertechnology, Inc | 4,318 | ||||||||
| 59,794 | * | Vishay Precision Group, Inc | 2,220 | |||||||
| 929,523 | Vontier Corp | 28,564 | ||||||||
| 3,126,628 | VS Industry BHD | 1,026 | ||||||||
| 1,239,042 | VST Holdings Ltd | 1,163 | ||||||||
| 201,785 | Vtech Holdings Ltd | 1,580 | ||||||||
| 178,500 | Wacom Co Ltd | 1,420 | ||||||||
| 178,018 | Wah Lee Industrial Corp | 688 | ||||||||
| 342,000 | Walsin Technology Corp | 2,059 | ||||||||
| 166,487 | * | Western Digital Corp | 10,857 | |||||||
| 82,384 | Wingtech Technology Co Ltd | 1,671 | ||||||||
| 190,500 | *,†,b | Wintek Corp | 0 | ^ | ||||||
| 2,045,323 | Wistron Corp | 2,152 | ||||||||
| 327,372 | Wistron NeWeb Corp | 922 | ||||||||
| 87,049 | Wiwynn Corp | 3,501 | ||||||||
| 1,189,519 | WPG Holdings Co Ltd | 2,260 | ||||||||
| 424,783 | WT Microelectronics Co Ltd | 1,128 | ||||||||
| 110,415 | Wuhan Guide Infrared Co Ltd | 419 | ||||||||
| 247,874 | Wuhu Token Science Co Ltd | 517 | ||||||||
| 139,152 | WUS Printed Circuit Kunshan Co Ltd | 362 | ||||||||
| 222 |
COLLEGE RETIREMENT EQUITIES FUND - Stock Account
| SHARES | COMPANY | VALUE (000) | ||||||||
| 50,213 | Wuxi Lead Intelligent Equipment Co Ltd | $ | 586 | |||||||
| 134,957 | Xerox Holdings Corp | 3,055 | ||||||||
| 15,500 | Xiamen Faratronic Co Ltd | 566 | ||||||||
| 10,405,800 | *,g | Xiaomi Corp | 25,224 | |||||||
| 15,750 | *,† | Ya Hsin Industrial Co Ltd | 0 | |||||||
| 313,979 | Yageo Corp | 5,429 | ||||||||
| 51,147 | Yealink Network Technology Corp Ltd | 654 | ||||||||
| 65,119 | Yokogawa Electric Corp | 1,175 | ||||||||
| 18,784 | Yokowo Co Ltd | 483 | ||||||||
| 52,329 | * | Zebra Technologies Corp (Class A) | 31,146 | |||||||
| 34,627 | *,e | Zepp Health Corp (ADR) | 175 | |||||||
| 222,518 | Zhejiang Dahua Technology Co Ltd | 820 | ||||||||
| 464,558 | Zhen Ding Technology Holding Ltd | 1,683 | ||||||||
| 35,223 | Zhongji Innolight Co Ltd | 235 | ||||||||
| 24,300 | Zhuzhou Hongda Electronics Corp Ltd | 381 | ||||||||
| 285,703 | ZTE Corp | 1,502 | ||||||||
| 559,599 | ZTE Corp (Class H) | 1,533 | ||||||||
| TOTAL TECHNOLOGY HARDWARE & EQUIPMENT | 8,239,290 | |||||||||
| TELECOMMUNICATION SERVICES - 1.2% | ||||||||||
| 890,071 | Advanced Info Service PCL (Foreign) | 6,123 | ||||||||
| 1,113,589 | g | Airtel Africa plc | 2,006 | |||||||
| 1,094,482 | * | AL Yah Satellite Communications Co-Pjsc-Yah Sat | 817 | |||||||
| 39,981,732 | e | America Movil S.A.B. de C.V. | 42,353 | |||||||
| 69,667 | * | Anterix, Inc | 4,094 | |||||||
| 30,100 | ARTERIA Networks Corp | 404 | ||||||||
| 2,013,929 | * | Asia Pacific Telecom Co Ltd | 597 | |||||||
| 9,610,114 | AT&T, Inc | 236,409 | ||||||||
| 9,955 | ATN International, Inc | 398 | ||||||||
| 120,435 | * | Aussie Broadband Ltd | 416 | |||||||
| 2,018,106 | Axiata Group Bhd | 2,015 | ||||||||
| 980,820 | *,e | Axtel SAB de C.V. | 185 | |||||||
| 149,207 | * | Bandwidth Inc | 10,707 | |||||||
| 90,738 | BCE, Inc | 4,721 | ||||||||
| 2,525,043 | * | Bezeq Israeli Telecommunication Corp Ltd | 4,171 | |||||||
| 2,877,151 | * | Bharti Airtel Ltd | 26,426 | |||||||
| 9,751,596 | BT Group plc | 22,434 | ||||||||
| 104,485 | * | Cellcom Israel Ltd | 586 | |||||||
| 1,016,545 | g | Cellnex Telecom SAU | 58,886 | |||||||
| 27,000 | Chief Telecom, Inc | 273 | ||||||||
| 17,537,912 | g | China Tower Corp Ltd | 1,935 | |||||||
| 548,045 | Chorus Ltd | 2,692 | ||||||||
| 223 |
COLLEGE RETIREMENT EQUITIES FUND - Stock Account
| SHARES | COMPANY | VALUE (000) | ||||||||
| 2,797,653 | Chunghwa Telecom Co Ltd | $ | 11,777 | |||||||
| 3,770,641 | Citic 1616 Holdings Ltd | 1,272 | ||||||||
| 96,612 | Cogent Communications Group, Inc | 7,070 | ||||||||
| 108,465 | * | Consolidated Communications Holdings, Inc | 811 | |||||||
| 3,899,027 | Deutsche Telekom AG. | 72,044 | ||||||||
| 2,229,844 | Digi.Com BHD | 2,334 | ||||||||
| 53,084 | Drillisch AG. | 1,449 | ||||||||
| 244,162 | * | EchoStar Corp (Class A) | 6,434 | |||||||
| 155,245 | Elisa Oyj (Series A) | 9,559 | ||||||||
| 4,129,091 | Emirates Telecommunications Group Co PJSC | 35,677 | ||||||||
| 203,002 | Empresa Nacional de Telecomunicaciones S.A. | 686 | ||||||||
| 462,540 | Etihad Etisalat Co | 3,837 | ||||||||
| 1,233,282 | Far EasTone Telecommunications Co Ltd | 2,877 | ||||||||
| 155,520 | Freenet AG. | 4,110 | ||||||||
| 99,598 | Gamma Communications plc | 2,224 | ||||||||
| 4,247,957 | *,e | Globalstar, Inc | 4,928 | |||||||
| 19,207 | Globe Telecom, Inc | 1,252 | ||||||||
| 158,654 | *,e | Gogo, Inc | 2,147 | |||||||
| 870,944 | * | Helios Towers plc | 2,028 | |||||||
| 264,590 | Hellenic Telecommunications Organization S.A. | 4,888 | ||||||||
| 598,907 | Himachal Futuristic Communications | 632 | ||||||||
| 2,016,120 | HKBN Ltd | 2,474 | ||||||||
| 4,164,739 | HKT Trust and HKT Ltd | 5,596 | ||||||||
| 1,665,607 | Hutchison Telecommunications Hong Kong Holdings Ltd | 267 | ||||||||
| 5,036 | * | IDT Corp (Class B) | 222 | |||||||
| 2,387,780 | Indosat Tbk PT | 1,041 | ||||||||
| 786,435 | Indus Towers Ltd | 2,622 | ||||||||
| 360,006 | g | Infrastrutture Wireless Italiane S.p.A | 4,365 | |||||||
| 62,524 | Internet Initiative Japan, Inc | 2,582 | ||||||||
| 1,268,400 | Intouch Holdings PCL (Class F) | 3,046 | ||||||||
| 70,741 | * | Iridium Communications, Inc | 2,921 | |||||||
| 4,368,885 | * | Jasmine International PCL | 457 | |||||||
| 1,661,887 | KDDI Corp | 48,600 | ||||||||
| 3,879,218 | Koninklijke KPN NV | 12,057 | ||||||||
| 222,725 | *,†,e | Let’s GOWEX S.A. | 3 | |||||||
| 165,441 | LG Telecom Ltd | 1,888 | ||||||||
| 37,901 | * | Liberty Global plc (Class A) | 1,051 | |||||||
| 189,192 | * | Liberty Latin America Ltd (Class A) | 2,206 | |||||||
| 244,348 | * | Liberty Latin America Ltd (Class C) | 2,786 | |||||||
| 1,118,429 | Link Net Tbk PT | 314 | ||||||||
| 224 |
COLLEGE RETIREMENT EQUITIES FUND - Stock Account
| SHARES | COMPANY | VALUE (000) | ||||||||
| 971,526 | Lumen Technologies, Inc | $ | 12,193 | |||||||
| 490,303 | Magyar Telekom | 623 | ||||||||
| 1,670,983 | Maxis BHD | 1,945 | ||||||||
| 123,763 | *,e | Millicom International Cellular S.A. | 3,518 | |||||||
| 2,657,756 | Mobile Telecommunications Co KSC | 5,234 | ||||||||
| 527,235 | * | Mobile Telecommunications Co Saudi Arabia | 1,688 | |||||||
| 549,593 | Mobile TeleSystems (ADR) | 4,369 | ||||||||
| 15,712 | Mobistar S.A. | 356 | ||||||||
| 1,973,376 | * | MTN Group Ltd | 21,153 | |||||||
| 3,814,366 | NetLink NBN Trust | 2,830 | ||||||||
| 1,193,710 | Nippon Telegraph & Telephone Corp | 32,646 | ||||||||
| 245,558 | e | NOS SGPS S.A. | 953 | |||||||
| 15,100 | Okinawa Cellular Telephone Co | 672 | ||||||||
| 220,523 | * | Ooma, Inc | 4,507 | |||||||
| 1,055,660 | Ooredoo QSC | 2,035 | ||||||||
| 2,310,355 | Orange S. A. | 24,680 | ||||||||
| 164,937 | * | Partner Communications | 1,340 | |||||||
| 5,238,000 | PCCW Ltd | 2,654 | ||||||||
| 54,737 | PLDT, Inc | 1,945 | ||||||||
| 157,158 | Proximus plc | 3,069 | ||||||||
| 51,322 | * | Radius Global Infrastructure, Inc | 826 | |||||||
| 435,857 | Rogers Communications, Inc (Class B) | 20,753 | ||||||||
| 121,080 | Rostelecom (ADR) | 835 | ||||||||
| 74,132 | Rostelecom (ADR) (OTC US) | 491 | ||||||||
| 27,153,533 | Sarana Menara Nusantara Tbk PT | 2,141 | ||||||||
| 704,116 | Saudi Telecom Co | 21,061 | ||||||||
| 28,986 | Shenandoah Telecom Co | 739 | ||||||||
| 9,362,196 | Singapore Telecommunications Ltd | 16,117 | ||||||||
| 76,836 | Sistema PJSFC (GDR) | 476 | ||||||||
| 211,771 | Sistema PJSFC (GDR) (London) | 1,311 | ||||||||
| 197,314 | SK Telecom Co Ltd | 9,589 | ||||||||
| 405,933 | SK Telecom Co Ltd (ADR) | 10,826 | ||||||||
| 95,568,200 | * | Smartfren Telecom Tbk PT | 584 | |||||||
| 390,141 | SmarTone Telecommunications Holding Ltd | 208 | ||||||||
| 2,274,640 | Softbank Corp | 28,730 | ||||||||
| 1,300,148 | Softbank Group Corp | 62,329 | ||||||||
| 661,514 | StarHub Ltd | 668 | ||||||||
| 28,504 | Swisscom AG. | 16,080 | ||||||||
| 1,211,506 | Taiwan Mobile Co Ltd | 4,375 | ||||||||
| 124,140 | Tata Communications Ltd | 2,440 | ||||||||
| 552,689 | Tele2 AB (B Shares) | 7,884 | ||||||||
| 2,060,015 | Telecom Corp of New Zealand Ltd | 6,371 | ||||||||
| 225 |
COLLEGE RETIREMENT EQUITIES FUND - Stock Account
| SHARES | COMPANY | VALUE (000) | ||||||||
| 495,647 | Telecom Egypt | $ | 529 | |||||||
| 10,984,818 | Telecom Italia S.p.A. | 5,404 | ||||||||
| 610,985 | Telefonica Brasil S.A. | 5,304 | ||||||||
| 1,134,973 | Telefonica Deutschland Holding AG. | 3,148 | ||||||||
| 6,144,752 | e | Telefonica S.A. | 26,645 | |||||||
| 275,769 | Telekom Austria AG. | 2,392 | ||||||||
| 885,484 | Telekom Malaysia BHD | 1,168 | ||||||||
| 797,540 | * | Telekomunikacja Polska S.A. | 1,673 | |||||||
| 767,243 | Telenor ASA | 12,060 | ||||||||
| 88,591 | Telephone & Data Systems, Inc | 1,785 | ||||||||
| 1,186 | *,e | Telesat Corp | 34 | |||||||
| 1,155,900 | e | Telesites SAB de C.V. | 1,183 | |||||||
| 2,935,373 | TeliaSonera AB | 11,480 | ||||||||
| 89,043,501 | Telkom Indonesia Persero Tbk PT | 25,413 | ||||||||
| 334,993 | * | Telkom S.A. Ltd | 1,137 | |||||||
| 4,811,760 | Telstra Corp Ltd | 14,624 | ||||||||
| 549,494 | TELUS Corp | 12,941 | ||||||||
| 1,031,649 | TIM S.A. | 2,444 | ||||||||
| 1,195,481 | Time dotCom BHD | 1,320 | ||||||||
| 1,823,883 | * | T-Mobile US, Inc | 211,534 | |||||||
| 8,894,100 | Tower Bersama Infrastructure | 1,843 | ||||||||
| 152,056 | e | TPG Telecom Ltd | 652 | |||||||
| 7,494,562 | True Corp PCL (Foreign) | 1,095 | ||||||||
| 1,403,898 | Turkcell Iletisim Hizmet AS | 1,959 | ||||||||
| 105,229 | United Internet AG. | 4,172 | ||||||||
| 666,984 | * | Uniti Group Ltd | 2,158 | |||||||
| 13,836 | * | US Cellular Corp | 436 | |||||||
| 19,200 | Usen-Next Holdings Co Ltd | 503 | ||||||||
| 3,720,188 | Verizon Communications, Inc | 193,301 | ||||||||
| 2,452,642 | *,e | Vision, Inc | 24,732 | |||||||
| 747,679 | Vodacom Group Pty Ltd | 6,311 | ||||||||
| 27,893,765 | Vodafone Group plc | 42,015 | ||||||||
| 436,500 | e | Vodafone Group plc (ADR) | 6,517 | |||||||
| 9,765,146 | * | Vodafone Idea Ltd | 2,008 | |||||||
| 1,796,377 | Vodafone Qatar | 822 | ||||||||
| 3,417,500 | XL Axiata Tbk PT | 761 | ||||||||
| TOTAL TELECOMMUNICATION SERVICES | 1,675,929 | |||||||||
| TRANSPORTATION - 2.0% | ||||||||||
| 9,182 | †,e | Abertis Infraestructuras S.A. (Continuous) | 31 | |||||||
| 604,050 | Adani Ports & Special Economic Zone Ltd | 5,910 | ||||||||
| 1,114,800 | * | Adi Sarana Armada Tbk PT | 260 | |||||||
| 226 |
COLLEGE RETIREMENT EQUITIES FUND - Stock Account
| SHARES | COMPANY | VALUE (000) | ||||||||
| 36,841 | * | Aegean Airlines S.A. | $ | 201 | ||||||
| 81,789 | *,g | Aena S.A. | 12,880 | |||||||
| 264,249 | *,g | Aeroflot PJSC (GDR) | 1,107 | |||||||
| 31,797 | *,e | Aeroports de Paris | 4,102 | |||||||
| 1,422,637 | Agility Public Warehousing Co KSC | 4,441 | ||||||||
| 2,417,715 | * | Air Arabia PJSC | 952 | |||||||
| 211,587 | *,e | Air Canada | 3,534 | |||||||
| 346,229 | * | Air China Ltd | 497 | |||||||
| 1,297,910 | * | Air China Ltd (H shares) | 906 | |||||||
| 352,385 | *,e | Air France-KLM | 1,556 | |||||||
| 637,655 | *,e | Air New Zealand Ltd | 659 | |||||||
| 51,547 | * | Air Transport Services Group, Inc | 1,514 | |||||||
| 1,766,900 | * | AirAsia BHD | 335 | |||||||
| 4,661,188 | Airports of Thailand PCL (Foreign) | 8,488 | ||||||||
| 175,066 | * | Alaska Air Group, Inc | 9,121 | |||||||
| 161,613 | g | ALD S.A. | 2,378 | |||||||
| 139,575 | *,e | All Nippon Airways Co Ltd | 2,918 | |||||||
| 76,109 | Allcargo Logistics Ltd | 398 | ||||||||
| 1,523 | * | Allegiant Travel Co | 285 | |||||||
| 8,728 | Amerco, Inc | 6,339 | ||||||||
| 631,141 | *,e | American Airlines Group, Inc | 11,335 | |||||||
| 634,771 | *,† | AMR Corporation | 6 | |||||||
| 448,000 | Anhui Expressway Co | 362 | ||||||||
| 4,534 | AP Moller - Maersk AS (Class A) | 15,042 | ||||||||
| 7,641 | AP Moller - Maersk AS (Class B) | 27,273 | ||||||||
| 807,056 | Aramex PJSC | 901 | ||||||||
| 21,666 | ArcBest Corp | 2,597 | ||||||||
| 3,923,700 | * | Asia Aviation PCL | 297 | |||||||
| 39,053 | * | Asiana Airlines | 655 | |||||||
| 24,920 | * | Atlas Air Worldwide Holdings, Inc | 2,345 | |||||||
| 1,166,044 | Atlas Arteria Ltd | 5,868 | ||||||||
| 326,345 | e | Atlas Corp | 4,628 | |||||||
| 852,789 | * | Auckland International Airport Ltd | 4,489 | |||||||
| 2,020,609 | Aurizon Holdings Ltd | 5,134 | ||||||||
| 540,741 | * | Autostrade S.p.A. | 10,729 | |||||||
| 38,841 | * | Avis Budget Group, Inc | 8,054 | |||||||
| 607,925 | * | Azul S.A. | 2,660 | |||||||
| 697,600 | * | Bangkok Airways Co Ltd | 203 | |||||||
| 155,800 | * | Bangkok Aviation Fuel Services PCL | 119 | |||||||
| 7,603,762 | Bangkok Expressway & Metro PCL | 1,924 | ||||||||
| 2,346,810 | * | Beijing Capital International Airport Co Ltd | 1,438 | |||||||
| 1,825,679 | Beijing-Shanghai High Speed Railway Co Ltd | 1,383 | ||||||||
| 227 |
COLLEGE RETIREMENT EQUITIES FUND - Stock Account
| SHARES | COMPANY | VALUE (000) | ||||||||
| 204,800 | *,e | BEST, Inc (ADR) | $ | 174 | ||||||
| 5,193 | Blue Dart Express Ltd | 441 | ||||||||
| 116,298 | * | bpost S.A. | 1,015 | |||||||
| 8,029,037 | BTS Group Holdings PCL | 2,244 | ||||||||
| 1,053,578 | Canadian National Railway Co | 129,416 | ||||||||
| 1,254 | Canadian Pacific Railway Ltd | 90 | ||||||||
| 1,085,503 | Canadian Pacific Railway Ltd (Toronto) | 78,073 | ||||||||
| 10,214 | e | Cargojet, Inc | 1,345 | |||||||
| 64,960 | *,e | Cathay Pacific Airways Ltd | 53 | |||||||
| 200,360 | * | Cebu Air, Inc | 166 | |||||||
| 180,389 | Central Japan Railway Co | 24,005 | ||||||||
| 125,653 | CH Robinson Worldwide, Inc | 13,524 | ||||||||
| 2,808,000 | * | China Airlines | 2,791 | |||||||
| 195,400 | * | China Eastern Airlines Corp Ltd | 158 | |||||||
| 1,122,667 | China Merchants Holdings International Co Ltd | 2,049 | ||||||||
| 1,172,447 | *,e | China Southern Airlines Co Ltd | 702 | |||||||
| 406,859 | * | China Southern Airlines Co Ltd (Class A) | 435 | |||||||
| 104,744 | *,e | Chorus Aviation, Inc | 275 | |||||||
| 1,355,572 | Cia de Concessoes Rodoviarias | 2,814 | ||||||||
| 97,556 | Cia de Distribucion Integral Logista Holdings SAU | 1,947 | ||||||||
| 360,087 | Cia de Locacao das Americas | 1,514 | ||||||||
| 34,185 | Clarkson plc | 1,795 | ||||||||
| 2,648,100 | ComfortDelgro Corp Ltd | 2,750 | ||||||||
| 279,344 | Container Corp Of India Ltd | 2,303 | ||||||||
| 931,775 | *,e | Controladora Vuela Cia de Aviacion SAB de C.V. | 1,672 | |||||||
| 28,295 | * | Copa Holdings S.A. (Class A) | 2,339 | |||||||
| 1,299,600 | * | Cosco Corp Singapore Ltd | 247 | |||||||
| 663,120 | Cosco International Holdings Ltd | 202 | ||||||||
| 1,375,536 | COSCO Pacific Ltd | 1,196 | ||||||||
| 2,512,809 | *,e | COSCO SHIPPING Holdings Co Ltd | 4,872 | |||||||
| 903,415 | * | COSCO SHIPPING Holdings Co Ltd | 2,660 | |||||||
| 456,260 | Costamare, Inc | 5,772 | ||||||||
| 10,729 | * | Covenant Transportation Group, Inc | 284 | |||||||
| 3,212,056 | CSX Corp | 120,773 | ||||||||
| 148,290 | CTT-Correios de Portugal S.A. | 769 | ||||||||
| 33,820 | D/S Norden | 859 | ||||||||
| 3,545 | *,e | Daseke, Inc | 36 | |||||||
| 1,374,613 | * | Delta Air Lines, Inc | 53,720 | |||||||
| 647,229 | * | Deutsche Lufthansa AG. | 4,532 | |||||||
| 1,641,227 | Deutsche Post AG. | 105,565 | ||||||||
| 42,022 | * | Dfds A.S. | 2,246 | |||||||
| 228 |
COLLEGE RETIREMENT EQUITIES FUND - Stock Account
| SHARES | COMPANY | VALUE (000) | ||||||||
| 367,476 | *,e | DiDi Global, Inc (ADR) | $ | 1,830 | ||||||
| 581,828 | DSV AS | 135,582 | ||||||||
| 6,960 | e | Eagle Bulk Shipping, Inc | 317 | |||||||
| 374,638 | East Japan Railway Co | 23,031 | ||||||||
| 368,746 | * | easyJet plc | 2,801 | |||||||
| 362,335 | * | EcoRodovias Infraestrutura e Logistica S.A. | 475 | |||||||
| 327,373 | *,g | Enav S.p.A | 1,465 | |||||||
| 3,809,435 | *,g | Europcar Groupe S.A. | 2,195 | |||||||
| 2,600,000 | * | Eva Airways Corp | 2,622 | |||||||
| 3,041,000 | Evergreen International Storage & Transport Corp | 3,206 | ||||||||
| 2,276,532 | Evergreen Marine Corp Tawain Ltd | 11,662 | ||||||||
| 22,403 | e | Exchange Income Corp | 746 | |||||||
| 164,201 | Expeditors International of Washington, Inc | 22,051 | ||||||||
| 247,812 | FedEx Corp | 64,094 | ||||||||
| 803,131 | *,e | Finnair Oyj | 544 | |||||||
| 907,101 | * | Firstgroup plc | 1,255 | |||||||
| 24,241 | * | Flughafen Zuerich AG. | 4,353 | |||||||
| 56,686 | Forward Air Corp | 6,864 | ||||||||
| 44,915 | * | Fraport AG. Frankfurt Airport Services Worldwide | 3,007 | |||||||
| 3,066 | * | Frontier Group Holdings, Inc | 42 | |||||||
| 35,160 | Fukuyama Transporting Co Ltd | 1,201 | ||||||||
| 28,639 | Genco Shipping & Trading Ltd | 458 | ||||||||
| 478,096 | Getlink S.E. | 7,918 | ||||||||
| 134,484 | Globaltrans Investment plc (GDR) | 1,146 | ||||||||
| 1,945,892 | * | GMR Infrastructure Ltd | 1,193 | |||||||
| 59,071 | * | Go-Ahead Group plc | 533 | |||||||
| 215,253 | * | Gol Linhas Aereas Inteligentes S.A. | 649 | |||||||
| 156,702 | Golden Ocean Group Ltd | 1,410 | ||||||||
| 318,520 | e | Grupo Aeroportuario del Centro Norte Sab de C.V. | 2,139 | |||||||
| 421,149 | e | Grupo Aeroportuario del Pacifico S.A. de C.V. (B Shares) | 5,804 | |||||||
| 234,238 | Grupo Aeroportuario del Sureste S.A. de C.V. (Class B) | 4,836 | ||||||||
| 296,900 | *,e,g | Grupo Traxion SAB de C.V. | 519 | |||||||
| 286,888 | Gujarat Pipavav Port Ltd | 384 | ||||||||
| 339,702 | Gulf Warehousing Co | 423 | ||||||||
| 121,318 | * | GXO Logistics, Inc | 11,019 | |||||||
| 206,000 | * | Hainan Meilan International Airport Co Ltd | 635 | |||||||
| 17,000 | Hamakyorex Co Ltd | 429 | ||||||||
| 41,194 | Hamburger Hafen und Logistik AG. | 964 | ||||||||
| 8,644 | * | Hanjin Transportation Co Ltd | 218 | |||||||
| 219,511 | Hankyu Hanshin Holdings, Inc | 6,238 | ||||||||
| 229 |
COLLEGE RETIREMENT EQUITIES FUND - Stock Account
| SHARES | COMPANY | VALUE (000) | ||||||||
| 46,400 | * | Hawaiian Holdings, Inc | $ | 852 | ||||||
| 201,541 | Heartland Express, Inc | 3,390 | ||||||||
| 423,100 | * | Hidrovias do Brasil S.A. | 262 | |||||||
| 37,325 | Hitachi Transport System Ltd | 1,755 | ||||||||
| 262,584 | * | Hub Group, Inc (Class A) | 22,120 | |||||||
| 10,804,551 | Hutchison Port Holdings Trust | 2,427 | ||||||||
| 2,326 | * | HyreCar, Inc | 11 | |||||||
| 21,322 | * | Hyundai Glovis Co Ltd | 3,007 | |||||||
| 249,907 | *,e | Hyundai Merchant Marine Co Ltd | 5,653 | |||||||
| 3,064 | * | ID Logistics Group | 1,279 | |||||||
| 87,338 | Iino Kaiun Kaisha Ltd | 415 | ||||||||
| 190,135 | Imperial Holdings Ltd | 764 | ||||||||
| 105,766 | *,g | InterGlobe Aviation Ltd | 2,867 | |||||||
| 1,176,309 | International Container Term Services, Inc | 4,614 | ||||||||
| 127,337 | * | Japan Airlines Co Ltd | 2,417 | |||||||
| 73,600 | * | Japan Airport Terminal Co Ltd | 3,070 | |||||||
| 2,305,200 | * | Jasa Marga Tbk PT | 628 | |||||||
| 17,515 | JB Hunt Transport Services, Inc | 3,580 | ||||||||
| 19,615 | * | Jeju Air Co Ltd | 290 | |||||||
| 195,800 | * | JET2 plc | 2,972 | |||||||
| 293,999 | * | JetBlue Airways Corp | 4,187 | |||||||
| 908,915 | Jiangsu Express | 931 | ||||||||
| 22,668 | * | Jin Air Co Ltd | 318 | |||||||
| 125,400 | Kamigumi Co Ltd | 2,375 | ||||||||
| 57,088 | * | Kawasaki Kisen Kaisha Ltd | 3,447 | |||||||
| 268,300 | Keihin Electric Express Railway Co Ltd | 2,684 | ||||||||
| 95,093 | Keio Corp | 4,196 | ||||||||
| 111,302 | Keisei Electric Railway Co Ltd | 3,011 | ||||||||
| 428,009 | Kerry Logistics Network Ltd | 1,047 | ||||||||
| 179,925 | * | Kintetsu Corp | 5,030 | |||||||
| 96,000 | Kintetsu World Express, Inc | 2,491 | ||||||||
| 56,424 | * | Kirby Corp | 3,353 | |||||||
| 466,415 | Knight-Swift Transportation Holdings, Inc | 28,423 | ||||||||
| 26,268 | Konoike Transport Co Ltd | 281 | ||||||||
| 9,892 | * | Korea Express Co Ltd | 1,048 | |||||||
| 167,176 | * | Korea Line Corp | 371 | |||||||
| 116,831 | * | Korean Air Lines Co Ltd | 2,877 | |||||||
| 72,637 | Kuehne & Nagel International AG. | 23,393 | ||||||||
| 162,400 | Kyushu Railway Co | 3,377 | ||||||||
| 3,822 | Landstar System, Inc | 684 | ||||||||
| 685,017 | Localiza Rent A Car | 6,499 | ||||||||
| 15,327 | * | Lotte Rental Co Ltd | 490 | |||||||
| 230 |
COLLEGE RETIREMENT EQUITIES FUND - Stock Account
| SHARES | COMPANY | VALUE (000) | ||||||||
| 345,361 | * | Lyft, Inc (Class A) | $ | 14,757 | ||||||
| 422,650 | g | Mahindra Logistics Ltd | 3,870 | |||||||
| 1,246,154 | * | Malaysia Airports Holdings BHD | 1,789 | |||||||
| 200,541 | Marten Transport Ltd | 3,441 | ||||||||
| 41,650 | Maruwa Unyu Kikan Co Ltd | 528 | ||||||||
| 30,630 | Maruzen Showa Unyu Co Ltd | 853 | ||||||||
| 37,650 | Matson, Inc | 3,390 | ||||||||
| 31,739 | * | Mesa Air Group, Inc | 178 | |||||||
| 1,802,740 | MISC BHD | 3,048 | ||||||||
| 63,928 | Mitsubishi Logistics Corp | 1,606 | ||||||||
| 132,000 | Mitsui OSK Lines Ltd | 9,811 | ||||||||
| 47,114 | Mitsui-Soko Co Ltd | 1,018 | ||||||||
| 729,352 | Movida Participacoes S.A. | 2,059 | ||||||||
| 1,080,175 | * | MPC Container Ships AS. | 2,998 | |||||||
| 1,709,363 | MTR Corp | 9,176 | ||||||||
| 109,975 | Mullen Group Ltd | 1,011 | ||||||||
| 227,300 | * | Nagoya Railroad Co Ltd | 3,460 | |||||||
| 128,527 | Nankai Electric Railway Co Ltd | 2,432 | ||||||||
| 662,510 | * | National Express Group plc | 2,316 | |||||||
| 78,526 | Nippon Express Co Ltd | 4,699 | ||||||||
| 108,849 | Nippon Konpo Unyu Soko Co Ltd | 2,051 | ||||||||
| 119,066 | Nippon Yusen Kabushiki Kaisha | 9,079 | ||||||||
| 71,900 | Nishi-Nippon Railroad Co Ltd | 1,631 | ||||||||
| 105,550 | g | Nobina AB | 1,250 | |||||||
| 15,631 | Norfolk Southern Corp | 4,653 | ||||||||
| 657,437 | * | Norwegian Air Shuttle AS | 800 | |||||||
| 8,946 | * | NTG Nordic Transport Group A.S. | 729 | |||||||
| 276,194 | Odakyu Electric Railway Co Ltd | 5,135 | ||||||||
| 41,478 | e | Oesterreichische Post AG. | 1,775 | |||||||
| 100,482 | Old Dominion Freight Line | 36,011 | ||||||||
| 6,055,290 | Pacific Basin Shipping Ltd | 2,226 | ||||||||
| 668 | * | PAM Transportation Services, Inc | 47 | |||||||
| 198,020 | * | Pan Ocean Co Ltd | 901 | |||||||
| 33,244 | * | Pegasus Hava Tasimaciligi AS. | 214 | |||||||
| 808,800 | Precious Shipping PCL | 401 | ||||||||
| 260,197 | e | Promotora y Operadora de Infraestructura SAB de C.V. | 2,033 | |||||||
| 1,063,777 | * | Qantas Airways Ltd | 3,881 | |||||||
| 613,658 | Qatar Navigation QSC | 1,287 | ||||||||
| 3,712,048 | Qube Logistics Holdings Ltd | 8,569 | ||||||||
| 192,240 | * | Radiant Logistics, Inc | 1,401 | |||||||
| 282,687 | Redde Northgate plc | 1,670 | ||||||||
| 340,300 | Regional Container Lines PCL | 501 | ||||||||
| 231 |
COLLEGE RETIREMENT EQUITIES FUND - Stock Account
| SHARES | COMPANY | VALUE (000) | ||||||||
| 972,368 | Royal Mail plc | $ | 6,667 | |||||||
| 1,431,946 | * | Rumo S.A. | 4,558 | |||||||
| 29,705 | e | Ryder System, Inc | 2,449 | |||||||
| 52,304 | * | Safe Bulkers, Inc | 197 | |||||||
| 89,497 | Sagami Railway Co Ltd | 1,639 | ||||||||
| 67,613 | * | Saia, Inc | 22,788 | |||||||
| 96 | *,† | SAir Group | 0 | |||||||
| 11,570 | Sakai Moving Service Co Ltd | 436 | ||||||||
| 147,650 | Sankyu, Inc | 6,127 | ||||||||
| 486,704 | Santos Brasil Participacoes S.A. | 559 | ||||||||
| 4,490,273 | *,e | SAS AB | 633 | |||||||
| 101,399 | * | Saudi Ground Services Co | 798 | |||||||
| 43,519 | Saudi Industrial Services Co | 356 | ||||||||
| 66,991 | * | Saudi Public Transport Co | 359 | |||||||
| 61,204 | SBS Holdings, Inc | 1,736 | ||||||||
| 177,666 | Schneider National, Inc | 4,781 | ||||||||
| 285,800 | * | Seibu Holdings, Inc | 2,672 | |||||||
| 151,806 | Seino Holdings Corp | 1,538 | ||||||||
| 130,196 | Senko Co Ltd | 1,049 | ||||||||
| 68,900 | * | Sequoia Logistica e Transportes S.A. | 174 | |||||||
| 548,339 | SF Holding Co Ltd | 5,936 | ||||||||
| 276,690 | SG Holdings Co Ltd | 6,488 | ||||||||
| 78,196 | * | Shanghai International Airport Co Ltd | 572 | |||||||
| 530,760 | Shanghai International Port Group Co Ltd | 457 | ||||||||
| 1,120,902 | Shenzhen International Holdings Ltd | 1,164 | ||||||||
| 4,827 | Shenzhen Investment Holdings Bay Area Development Co Ltd | 2 | ||||||||
| 20,500 | Shinwa Kaiun Kaisha Ltd | 624 | ||||||||
| 117,768 | Shipping Corp of India Ltd | 213 | ||||||||
| 333,300 | * | SIA Engineering Co Ltd | 539 | |||||||
| 1,032,000 | Sichuan Expressway Co Ltd | 275 | ||||||||
| 298,088 | SIMPAR S.A. | 621 | ||||||||
| 307,720 | Sincere Navigation | 324 | ||||||||
| 1,466,350 | *,e | Singapore Airlines Ltd | 5,437 | |||||||
| 824,200 | * | Singapore Airport Terminal Services Ltd | 2,378 | |||||||
| 1,892,819 | Singapore Post Ltd | 912 | ||||||||
| 108,347 | Sinotrans Ltd (Class A) | 76 | ||||||||
| 2,387,000 | SITC International Co Ltd | 8,633 | ||||||||
| 16,570 | * | Sixt AG. | 2,923 | |||||||
| 20,096 | Sixt AG. (Preference) | 1,980 | ||||||||
| 44,715 | * | Skywest, Inc | 1,757 | |||||||
| 562,117 | * | Southwest Airlines Co | 24,081 | |||||||
| 254,564 | * | SpiceJet Ltd | 232 | |||||||
| 232 |
COLLEGE RETIREMENT EQUITIES FUND - Stock Account
| SHARES | COMPANY | VALUE (000) | ||||||||
| 88,133 | *,e | Spirit Airlines, Inc | $ | 1,926 | ||||||
| 571,573 | * | Stagecoach Group plc | 694 | |||||||
| 32,880 | Stolt-Nielsen S.A. | 506 | ||||||||
| 63,083 | Sumitomo Warehouse Co Ltd | 1,067 | ||||||||
| 440,746 | * | Sun Country Airlines Holdings, Inc | 12,010 | |||||||
| 1,343,304 | * | Sydney Airport | �� | 8,481 | ||||||
| 199,000 | T.Join Transportation Co | 323 | ||||||||
| 97,000 | T3EX Global Holdings Corp | 477 | ||||||||
| 2,210,501 | Taiwan High Speed Rail Corp | 2,362 | ||||||||
| 196,373 | * | TAV Havalimanlari Holding AS | 488 | |||||||
| 13,938 | TCI Express Ltd | 414 | ||||||||
| 84,483 | TFI International, Inc | 9,475 | ||||||||
| 2,082,000 | Tianjin Port Development Holdings Ltd | 166 | ||||||||
| 587,041 | TNT NV | 2,553 | ||||||||
| 168,043 | Tobu Railway Co Ltd | 3,835 | ||||||||
| 476,918 | Tokyu Corp | 6,340 | ||||||||
| 5,648,600 | *,† | Trada Alam Minera Tbk PT | 0 | ^ | ||||||
| 8,207 | Trancom Co Ltd | 638 | ||||||||
| 1,069,000 | * | Transcoal Pacific Tbk PT | 754 | |||||||
| 3,325,821 | Transurban Group | 33,406 | ||||||||
| 578,342 | * | Turk Hava Yollari | 875 | |||||||
| 65,351 | *,e | TuSimple Holdings, Inc | 2,343 | |||||||
| 2,730,162 | * | Uber Technologies, Inc | 114,476 | |||||||
| 456,000 | U-Ming Marine Transport Corp | 991 | ||||||||
| 2,602,045 | Union Pacific Corp | 655,533 | ||||||||
| 304,411 | * | United Airlines Holdings Inc | 13,327 | |||||||
| 435,304 | United International Transportation Co | 5,394 | ||||||||
| 1,124,366 | United Parcel Service, Inc (Class B) | 240,997 | ||||||||
| 1,140 | Universal Logistics Holdings Inc | 21 | ||||||||
| 24,163 | * | US Xpress Enterprises, Inc | 142 | |||||||
| 2,428,652 | Vamos Locacao de Caminhoes Maquinas e Equipamentos S.A. | 5,185 | ||||||||
| 67,336 | *,† | Virgin Australia Int Holdings | 0 | |||||||
| 125,777 | * | Wallenius Wilhelmsen ASA | 723 | |||||||
| 434,000 | Wan Hai Lines Ltd | 3,095 | ||||||||
| 68,766 | Werner Enterprises, Inc | 3,277 | ||||||||
| 200,923 | West Japan Railway Co | 8,403 | ||||||||
| 1,076,494 | Westports Holdings BHD | 1,047 | ||||||||
| 49,476 | e | Westshore Terminals Investment Corp | 1,049 | |||||||
| 444,042 | Wisdom Marine Lines Co Ltd | 1,303 | ||||||||
| 167,351 | * | XPO Logistics, Inc | 12,958 | |||||||
| 324,221 | Yamato Transport Co Ltd | 7,616 | ||||||||
| 1,267,000 | * | Yang Ming Marine Transport | 5,511 | |||||||
| 233 |
COLLEGE RETIREMENT EQUITIES FUND - Stock Account
| SHARES | COMPANY | VALUE (000) | ||||||||
| 42,178 | * | Yellow Corp | $ | 531 | ||||||
| 150,459 | YTO Express Group Co Ltd | 394 | ||||||||
| 1,098,000 | Yuexiu Transport Infrastructure Ltd | 651 | ||||||||
| 152,615 | Yunda Holding Co Ltd | 490 | ||||||||
| 1,078,968 | Zhejiang Expressway Co Ltd | 962 | ||||||||
| 48,632 | ZIM Integrated Shipping Services Ltd | 2,862 | ||||||||
| 930,892 | ZTO Express Cayman, Inc (ADR) | 26,270 | ||||||||
| TOTAL TRANSPORTATION | 2,739,387 | |||||||||
| UTILITIES - 2.3% | ||||||||||
| 1,900,201 | A2A S.p.A. | 3,703 | ||||||||
| 1,735,400 | Absolute Clean Energy PCL | 182 | ||||||||
| 9,983,800 | AC Energy Corp | 2,154 | ||||||||
| 29,969 | Acciona S.A. | 5,704 | ||||||||
| 54,940 | ACEA S.p.A. | 1,174 | ||||||||
| 140,448 | e | Actelios S.p.A. | 1,382 | |||||||
| 314,944 | Adani Gas Ltd | 7,295 | ||||||||
| 445,897 | * | Adani Green Energy Ltd | 7,959 | |||||||
| 1,088,166 | * | Adani Power Ltd | 1,456 | |||||||
| 314,506 | * | Adani Transmissions Ltd | 7,368 | |||||||
| 3,691,964 | AES Andes S.A. | 579 | ||||||||
| 263,076 | AES Brasil Energia S.A. | 522 | ||||||||
| 421,335 | AES Corp | 10,238 | ||||||||
| 348,364 | *,† | AET&D Holdings No 1 Ptd Ltd | 0 | |||||||
| 946,860 | AGL Energy Ltd | 4,230 | ||||||||
| 3,149,904 | Aguas Andinas S.A. | 574 | ||||||||
| 155,355 | *,e | Aker Horizons Holding ASA | 579 | |||||||
| 328,210 | * | Aksa Enerji Uretim AS | 249 | |||||||
| 827,700 | e | Algonquin Power & Utilities Corp | 11,955 | |||||||
| 9,340 | AlKhorayef Water & Power Technologies Co | 255 | ||||||||
| 116,752 | Allete, Inc | 7,747 | ||||||||
| 2,119,141 | Alliant Energy Corp | 130,264 | ||||||||
| 343,428 | e | AltaGas Ltd | 7,415 | |||||||
| 154,897 | Alupar Investimento S.A. | 670 | ||||||||
| 1,986,395 | Ameren Corp | 176,809 | ||||||||
| 2,482,174 | American Electric Power Co, Inc | 220,839 | ||||||||
| 20,217 | American States Water Co | 2,091 | ||||||||
| 43,695 | American Water Works Co, Inc | 8,252 | ||||||||
| 1,364,848 | APA Group | 9,985 | ||||||||
| 7,374 | Artesian Resources Corp | 342 | ||||||||
| 104,204 | Ascopiave S.p.A. | 411 | ||||||||
| 107,223 | Atco Ltd | 3,619 | ||||||||
| 45,760 | Athens Water Supply & Sewage Co S.A. | 407 | ||||||||
| 234 |
COLLEGE RETIREMENT EQUITIES FUND - Stock Account
| SHARES | COMPANY | VALUE (000) | ||||||||
| 30,772 | Atmos Energy Corp | $ | 3,224 | |||||||
| 2,086,970 | AusNet Services | 3,904 | ||||||||
| 11,746 | e | Avangrid, Inc | 586 | |||||||
| 62,285 | Avista Corp | 2,647 | ||||||||
| 178,208 | *,e | Azure Power Global Ltd | 3,235 | |||||||
| 750,230 | B Grimm Power PCL | 911 | ||||||||
| 763,900 | Banpu Power PCL | 393 | ||||||||
| 832,300 | BCPG PCL | 299 | ||||||||
| 10,738,000 | * | Beijing Energy International Holding Co Ltd | 406 | |||||||
| 446,179 | Beijing Enterprises Holdings Ltd | 1,539 | ||||||||
| 3,358,586 | Beijing Enterprises Water Group Ltd | 1,305 | ||||||||
| 4,776,000 | *,† | Beijing Gas Blue Sky Holdings Ltd | 6 | |||||||
| 1,538,000 | Beijing Jingneng Clean Energy Co Ltd | 499 | ||||||||
| 25,632 | BKW S.A. | 3,328 | ||||||||
| 339,764 | Black Hills Corp | 23,977 | ||||||||
| 104,957 | e | Boralex, Inc | 2,878 | |||||||
| 45,973 | e | Brookfield Infrastructure Corp | 3,138 | |||||||
| 36,277 | e | Brookfield Infrastructure Corp | 2,476 | |||||||
| 158,451 | e | Brookfield Renewable Corp | 5,831 | |||||||
| 605,705 | Brookfield Renewable Corp | 22,308 | ||||||||
| 148,262 | *,e | Cadiz, Inc | 572 | |||||||
| 46,121 | California Water Service Group | 3,314 | ||||||||
| 160,842 | Canadian Utilities Ltd | 4,665 | ||||||||
| 559,000 | Canvest Environment Protection Group Co Ltd | 296 | ||||||||
| 261,875 | Capital Power Corp | 8,169 | ||||||||
| 121,974 | Capital Stage AG. | 2,151 | ||||||||
| 268,300 | CECEP Solar Energy Co Ltd | 472 | ||||||||
| 435,700 | CECEP Wind-Power Corp | 445 | ||||||||
| 4,821,118 | Centerpoint Energy, Inc | 134,557 | ||||||||
| 390,749 | Centrais Eletricas Brasileiras S.A. | 2,382 | ||||||||
| 297,839 | Centrais Eletricas Brasileiras S.A. (Preference) | 1,760 | ||||||||
| 10,492,931 | * | Centrica plc | 10,175 | |||||||
| 646,072 | CESC Ltd | 759 | ||||||||
| 195,309 | CEZ AS | 7,392 | ||||||||
| 1,008,000 | e | CGN New Energy Holdings Co Ltd | 1,055 | |||||||
| 3,613,000 | g | CGN Power Co Ltd | 1,098 | |||||||
| 15,583 | Chesapeake Utilities Corp | 2,272 | ||||||||
| 2,458,631 | China Datang Corp Renewable Power Co Ltd | 1,133 | ||||||||
| 602,000 | e,g | China Everbright Greentech Ltd | 226 | |||||||
| 1,011,313 | e | China Everbright Water Ltd | 236 | |||||||
| 2,294,165 | China Gas Holdings Ltd | 4,772 | ||||||||
| 2,418,044 | China Longyuan Power Group Corp | 5,648 | ||||||||
| 235 |
COLLEGE RETIREMENT EQUITIES FUND - Stock Account
| SHARES | COMPANY | VALUE (000) | ||||||||
| 562,900 | * | China National Nuclear Power Co Ltd | $ | 733 | ||||||
| 3,903,847 | e | China Power International Development Ltd | 2,629 | |||||||
| 685,312 | China Resources Gas Group Ltd | 3,872 | ||||||||
| 1,458,373 | China Resources Power Holdings Co | 4,878 | ||||||||
| 354,000 | China Tian Lun Gas Holdings Ltd | 382 | ||||||||
| 900,254 | China Water Affairs Group Ltd | 1,291 | ||||||||
| 536,101 | China Yangtze Power Co Ltd | 1,909 | ||||||||
| 647,046 | Chubu Electric Power Co, Inc | 6,834 | ||||||||
| 353,300 | Chugoku Electric Power Co, Inc | 2,865 | ||||||||
| 396,201 | Cia de Saneamento Basico do Estado de Sao Paulo | 2,893 | ||||||||
| 1,179,500 | Cia de Saneamento de Minas Gerais-COPASA | 2,687 | ||||||||
| 154,449 | Cia de Saneamento do Parana | 531 | ||||||||
| 415,991 | Cia de Saneamento do Parana (Preference) | 289 | ||||||||
| 1,267,120 | Cia Energetica de Minas Gerais | 3,024 | ||||||||
| 243,421 | Cia Energetica de Sao Paulo (Class B) | 939 | ||||||||
| 15,756 | Cia Energetica do Ceara | 164 | ||||||||
| 64,300 | Cia Paranaense de Energia | 369 | ||||||||
| 893,700 | Cia Paranaense de Energia | 1,029 | ||||||||
| 758,723 | CK Infrastructure Holdings Ltd | 4,834 | ||||||||
| 2,072,680 | CK Power PCL | 309 | ||||||||
| 279,991 | Clearway Energy, Inc (Class A) | 9,374 | ||||||||
| 288,110 | Clearway Energy, Inc (Class C) | 10,381 | ||||||||
| 1,930,317 | CLP Holdings Ltd | 19,505 | ||||||||
| 237,142 | CMS Energy Corp | 15,426 | ||||||||
| 8,090,467 | Colbun S.A. | 658 | ||||||||
| 6,020,000 | Concord New Energy Group Ltd | 633 | ||||||||
| 84,266 | Consolidated Edison, Inc | 7,190 | ||||||||
| 944,686 | Contact Energy Ltd | 5,236 | ||||||||
| 316,489 | g | ContourGlobal plc | 825 | |||||||
| 1,320,000 | *,†,e | CT Environmental Group Ltd | 2 | |||||||
| 1,391,365 | Dominion Energy, Inc | 109,306 | ||||||||
| 74,509 | * | Doral Group Renewable Energy Resources Ltd | 329 | |||||||
| 484,479 | Drax Group plc | 3,985 | ||||||||
| 46,119 | DTE Energy Co | 5,513 | ||||||||
| 331,110 | Duke Energy Corp | 34,733 | ||||||||
| 2,294,538 | E.ON AG. | 31,888 | ||||||||
| 527,000 | Eastern Water Resources Development and Management PCL | 147 | ||||||||
| 156,970 | Edison International | 10,713 | ||||||||
| 330,645 | EDP - Energias do Brasil S.A. | 1,243 | ||||||||
| 315,736 | EDP Renovaveis S.A. | 7,852 | ||||||||
| 177,700 | Electric Power Development Co | 2,362 | ||||||||
| 236 |
COLLEGE RETIREMENT EQUITIES FUND - Stock Account
| SHARES | COMPANY | VALUE (000) | ||||||||
| 623,041 | Electricite de France | $ | 7,328 | |||||||
| 348,417 | Electricity Generating PCL | 1,829 | ||||||||
| 33,541 | e | Elia System Operator S.A. | 4,421 | |||||||
| 314,626 | Emera, Inc | 15,724 | ||||||||
| 67,767 | Enagas | 1,574 | ||||||||
| 209,284 | e | Endesa S.A. | 4,818 | |||||||
| 575,276 | * | Enea S.A. | 1,216 | |||||||
| 33,561,601 | Enel Chile S.A. | 1,176 | ||||||||
| 13,200,903 | Enel S.p.A. | 105,555 | ||||||||
| 5,100,899 | Energias de Portugal S.A. | 28,021 | ||||||||
| 213,833 | Energisa S.A. | 1,700 | ||||||||
| 282,596 | Energix-Renewable Energies Ltd | 1,197 | ||||||||
| 1,678,944 | Energy Absolute PCL (Foreign) | 4,819 | ||||||||
| 263,002 | g | Enerjisa Enerji AS. | 256 | |||||||
| 25,239,138 | Enersis S.A. | 2,758 | ||||||||
| 764,944 | * | Eneva S.A. | 1,937 | |||||||
| 238,848 | Engie Brasil Energia S.A. | 1,646 | ||||||||
| 533,816 | Engie Energia Chile S.A. | 315 | ||||||||
| 2,112,597 | Engie S.A. | 31,278 | ||||||||
| 1,118,499 | * | Enlight Renewable Energy Ltd | 2,739 | |||||||
| 582,435 | ENN Energy Holdings Ltd | 10,980 | ||||||||
| 157,900 | ENN Natural Gas Co Ltd | 455 | ||||||||
| 106,643 | Entergy Corp | 12,013 | ||||||||
| 1,043,253 | Equatorial Energia S.A. | 4,230 | ||||||||
| 30,443 | eRex Co Ltd | 541 | ||||||||
| 72,308 | ERG S.p.A. | 2,335 | ||||||||
| 126,123 | Essential Utilities Inc | 6,772 | ||||||||
| 524,460 | Evergy, Inc | 35,983 | ||||||||
| 85,563 | Eversource Energy | 7,785 | ||||||||
| 59,538 | EVN AG. | 1,796 | ||||||||
| 1,148,007 | Exelon Corp | 66,309 | ||||||||
| 5,629 | *,e | Fastned BV | 316 | |||||||
| 551,384 | Federal Grid Co Unified Energy System PJSC (GDR) | 772 | ||||||||
| 107,352 | e | Fersa Energias Renovables S.A. | 154 | |||||||
| 615,470 | First Gen Corp | 336 | ||||||||
| 2,219,135 | FirstEnergy Corp | 92,294 | ||||||||
| 186,670 | g | Fjordkraft Holding ASA | 1,008 | |||||||
| 32,401 | * | Fluence Energy, Inc | 1,152 | |||||||
| 581,753 | Fortis, Inc | 28,068 | ||||||||
| 347,894 | Fortum Oyj | 10,670 | ||||||||
| 6,048,038 | GAIL India Ltd | 10,472 | ||||||||
| 24,762,000 | *,e | GCL New Energy Holdings Ltd | 756 | |||||||
| 237 |
COLLEGE RETIREMENT EQUITIES FUND - Stock Account
| SHARES | COMPANY | VALUE (000) | ||||||||
| 1,091,700 | GD Power Development Co Ltd | $ | 543 | |||||||
| 640,033 | Genesis Energy Ltd | 1,254 | ||||||||
| 779,257 | Global Power Synergy Co Ltd (Foreign) | 2,072 | ||||||||
| 1,965 | Global Water Resources, Inc | 34 | ||||||||
| 14,109 | *,e | Grenergy Renovables S.A. | 466 | |||||||
| 2,261,210 | Guangdong Investments Ltd | 2,874 | ||||||||
| 187,902 | Gujarat Gas Ltd | 1,600 | ||||||||
| 304,752 | Gujarat State Petronet Ltd | 1,206 | ||||||||
| 3,234,627 | Gulf Energy Development PCL | 4,430 | ||||||||
| 4,170,319 | Gunkul Engineering PCL | 698 | ||||||||
| 26,194 | e | Hawaiian Electric Industries, Inc | 1,087 | |||||||
| 1,064,386 | Hera S.p.A. | 4,424 | ||||||||
| 2,959,000 | HK Electric Investments & HK Electric Investments Ltd | 2,903 | ||||||||
| 199,193 | Hokkaido Electric Power Co, Inc | 891 | ||||||||
| 208,877 | Hokuriku Electric Power Co | 1,064 | ||||||||
| 124,909 | Holding CO ADMIE IPTO S.A. | 343 | ||||||||
| 13,091,979 | Hong Kong & China Gas Ltd | 20,420 | ||||||||
| 1,627,438 | Hong Kong Electric Holdings Ltd | 10,144 | ||||||||
| 425,919 | Huadian Power International Corp Ltd (Class A) | 358 | ||||||||
| 406,266 | Huaneng Power International, Inc | 619 | ||||||||
| 2,934,751 | Huaneng Power International, Inc (Hong Kong) | 1,960 | ||||||||
| 407,226 | e,g | Hydro One Ltd | 10,595 | |||||||
| 7,968,025 | Iberdrola S.A. | 94,341 | ||||||||
| 12,550 | Idacorp, Inc | 1,422 | ||||||||
| 326,372 | Indraprastha Gas Ltd | 2,059 | ||||||||
| 880,845 | Infratil Ltd | 4,825 | ||||||||
| 151,476 | e | Innergex Renewable Energy, Inc | 2,227 | |||||||
| 1,027,900 | *,† | Inter Far East Energy Corp | 0 | ^ | ||||||
| 522,342 | Interconexion Electrica S.A. | 2,874 | ||||||||
| 425,898 | Inversiones Aguas Metropolitanas S.A. | 194 | ||||||||
| 790,066 | Iride S.p.A. | 2,378 | ||||||||
| 589,282 | Italgas S.p.A | 4,051 | ||||||||
| 241,800 | Jiangsu Eastern Shenghong Co Ltd | 736 | ||||||||
| 852,728 | Kansai Electric Power Co, Inc | 7,970 | ||||||||
| 29,058 | Kenon Holdings Ltd | 1,473 | ||||||||
| 4,328,793 | Keppel Infrastructure Trust | 1,751 | ||||||||
| 190,628 | Korea Electric Power Corp | 3,540 | ||||||||
| 990,700 | Kyushu Electric Power Co, Inc | 7,397 | ||||||||
| 375,300 | Light S.A. | 789 | ||||||||
| 7 | Macquarie Infrastructure Co LLC | 0 | ^ | |||||||
| 59,329 | Mahanagar Gas Ltd | 688 | ||||||||
| 238 |
COLLEGE RETIREMENT EQUITIES FUND - Stock Account
| SHARES | COMPANY | VALUE (000) | ||||||||
| 1,808,400 | Malakoff Corp BHD | $ | 312 | |||||||
| 272,742 | Manila Electric Co | 1,578 | ||||||||
| 1,089,400 | Manila Water Co, Inc | 529 | ||||||||
| 334,529 | e | MDU Resources Group, Inc | 10,317 | |||||||
| 594,500 | Mega First Corp BHD | 499 | ||||||||
| 747,974 | Mercury NZ Ltd | 3,134 | ||||||||
| 1,401,606 | Meridian Energy Ltd | 4,652 | ||||||||
| 33,311 | MGE Energy, Inc | 2,740 | ||||||||
| 10,499 | Middlesex Water Co | 1,263 | ||||||||
| 331,756 | Mosenergo PJSC (ADR) | 458 | ||||||||
| 20,446 | National Fuel Gas Co | 1,307 | ||||||||
| 41,721 | National Gas & Industrialization Co | 603 | ||||||||
| 3,728,449 | National Grid plc | 53,762 | ||||||||
| 258,857 | e | Naturgy Energy Group S.A. | 8,419 | |||||||
| 45,521 | *,e,g | Neoen S.A. | 1,976 | |||||||
| 88,245 | New Jersey Resources Corp | 3,623 | ||||||||
| 3,457,389 | NextEra Energy, Inc | 322,782 | ||||||||
| 128,787 | Nippon Gas Co Ltd | 1,707 | ||||||||
| 103,346 | NiSource, Inc | 2,853 | ||||||||
| 284,830 | NLC India Ltd | 237 | ||||||||
| 275,941 | Northland Power Income Fund | 8,279 | ||||||||
| 63,300 | Northwest Natural Holding Co | 3,088 | ||||||||
| 49,681 | NorthWestern Corp | 2,840 | ||||||||
| 202,558 | NRG Energy, Inc | 8,726 | ||||||||
| 5,814,761 | NTPC Ltd | 9,702 | ||||||||
| 207,664 | e | OGE Energy Corp | 7,970 | |||||||
| 52,401 | Okinawa Electric Power Co, Inc | 664 | ||||||||
| 81,305 | ONE Gas, Inc | 6,308 | ||||||||
| 115,857 | * | OPC Energy Ltd | 1,297 | |||||||
| 1,929,891 | Origin Energy Ltd | 7,365 | ||||||||
| 41,106 | e | Ormat Technologies, Inc | 3,260 | |||||||
| 222,838 | g | Orsted AS | 28,538 | |||||||
| 344,234 | Osaka Gas Co Ltd | 5,693 | ||||||||
| 108,900 | Otter Tail Corp | 7,778 | ||||||||
| 362,069 | Pennon Group plc | 5,732 | ||||||||
| 1,071,678 | Petronas Gas BHD | 4,628 | ||||||||
| 1,515,444 | * | PG&E Corp | 18,398 | |||||||
| 985,319 | * | PGE Polska Grupa Energetyczna S.A. | 1,966 | |||||||
| 29,556 | Pinnacle West Capital Corp | 2,086 | ||||||||
| 76,618 | PNM Resources, Inc | 3,495 | ||||||||
| 85,757 | Portland General Electric Co | 4,538 | ||||||||
| 239 |
COLLEGE RETIREMENT EQUITIES FUND - Stock Account
| SHARES | COMPANY | VALUE (000) | ||||||||
| 3,753,625 | Power Grid Corp of India Ltd | $ | 10,301 | |||||||
| 182,071 | PPL Corp | 5,473 | ||||||||
| 40,706,900 | * | PT Perusahaan Gas Negara Persero Tbk | 3,930 | |||||||
| 348,876 | * | Public Power Corp | 3,743 | |||||||
| 121,087 | Public Service Enterprise Group, Inc | 8,080 | ||||||||
| 29,780 | * | Pure Cycle Corp | 435 | |||||||
| 565,723 | Qatar Electricity & Water Co | 2,579 | ||||||||
| 598,027 | Ratch Group PCL | 806 | ||||||||
| 143,832 | e | Red Electrica Corp S.A. | 3,110 | |||||||
| 484,894 | Redes Energeticas Nacionais S.A. | 1,405 | ||||||||
| 3,207,925 | * | Reliance Power Ltd | 582 | |||||||
| 42,800 | * | RENOVA, Inc | 775 | |||||||
| 114,284 | Rubis S.C.A | 3,417 | ||||||||
| 2,594,679 | RWE AG. | 105,127 | ||||||||
| 25,000 | Saibu Gas Co Ltd | 462 | ||||||||
| 7,204 | * | Sam Kwang Glass Ind Co Ltd | 286 | |||||||
| 986,030 | Saudi Electricity Co | 6,289 | ||||||||
| 144,065 | g | Scatec Solar ASA | 2,487 | |||||||
| 1,100,455 | Scottish & Southern Energy plc | 24,601 | ||||||||
| 382,212 | SDIC Power Holdings Co Ltd | 688 | ||||||||
| 36,738 | Sechilienne-Sidec | 1,434 | ||||||||
| 1,201,078 | SembCorp Industries Ltd | 1,783 | ||||||||
| 327,911 | Sempra Energy | 43,376 | ||||||||
| 68,468 | Severn Trent plc | 2,734 | ||||||||
| 620,394 | Shamal Az-Zour Al-Oula for the First Phase of Az-Zour Power Plant KSC | 468 | ||||||||
| 184,088 | Shenzhen Energy Group Co Ltd | 234 | ||||||||
| 275,342 | Shikoku Electric Power Co, Inc | 1,946 | ||||||||
| 60,010 | Shizuoka Gas Co Ltd | 514 | ||||||||
| 196,400 | Sichuan Chuantou Energy Co Ltd | 385 | ||||||||
| 24,748 | SJW Corp | 1,812 | ||||||||
| 567,793 | e | Snam Rete Gas S.p.A. | 3,420 | |||||||
| 89,473 | *,e | Solaria Energia y Medio Ambiente S.A. | 1,729 | |||||||
| 128,000 | *,† | Sound Global Ltd | 0 | ^ | ||||||
| 268,500 | e | South Jersey Industries, Inc | 7,013 | |||||||
| 252,706 | Southern Co | 17,331 | ||||||||
| 53,524 | Southwest Gas Holdings Inc | 3,749 | ||||||||
| 482,600 | SPCG PCL | 266 | ||||||||
| 236,377 | Spire, Inc | 15,417 | ||||||||
| 531,717 | Suez Environnement S.A. | 11,992 | ||||||||
| 267,091 | * | Sunnova Energy International, Inc | 7,457 | |||||||
| 17,303,156 | Super Energy Corp PCL (Foreign) | 493 | ||||||||
| 220,210 | e | Superior Plus Corp | 2,263 | |||||||
| 240 |
COLLEGE RETIREMENT EQUITIES FUND - Stock Account
| SHARES | COMPANY | VALUE (000) | ||||||||
| 406,450 | Taiwan Cogeneration Corp | $ | 557 | |||||||
| 2,680,772 | Tata Power Co Ltd | 7,940 | ||||||||
| 1,113,548 | * | Tauron Polska Energia S.A. | 732 | |||||||
| 79,914 | Telecom Plus plc | 1,716 | ||||||||
| 2,772,204 | Tenaga Nasional BHD | 6,214 | ||||||||
| 50,597 | Terna Energy S.A. | 782 | ||||||||
| 1,480,350 | Terna Rete Elettrica Nazionale S.p.A. | 11,976 | ||||||||
| 106,300 | Toho Gas Co Ltd | 2,708 | ||||||||
| 643,300 | Tohoku Electric Power Co, Inc | 4,573 | ||||||||
| 1,416,793 | * | Tokyo Electric Power Co, Inc | 3,663 | |||||||
| 419,842 | Tokyo Gas Co Ltd | 7,536 | ||||||||
| 197,693 | Torrent Power Ltd | 1,469 | ||||||||
| 1,176,000 | Towngas China Co Ltd | 1,023 | ||||||||
| 2,473,639 | TPI Polene Power PCL | 308 | ||||||||
| 320,543 | TransAlta Corp | 3,560 | ||||||||
| 128,444 | e | TransAlta Renewables, Inc | 1,904 | |||||||
| 223,506 | Transmissora Alianca de Energia Eletrica S.A. | 1,461 | ||||||||
| 1,431,078 | TTW PCL | 488 | ||||||||
| 51,608 | UGI Corp | 2,369 | ||||||||
| 176,335 | Uniper SE | 8,372 | ||||||||
| 186,970 | United Utilities Group plc | 2,759 | ||||||||
| 25,347 | Unitil Corp | 1,166 | ||||||||
| 960,079 | Veolia Environnement | 35,258 | ||||||||
| 79,389 | Verbund AG. | 8,922 | ||||||||
| 16,795 | e | Via Renewables, Inc | 192 | |||||||
| 502,184 | Vistra Energy Corp | 11,435 | ||||||||
| 28,711 | * | Voltalia S.A. | 641 | |||||||
| 1,000,342 | WEC Energy Group, Inc | 97,103 | ||||||||
| 27,730 | West Holdings Corp | 1,379 | ||||||||
| 892,500 | WHA Utilities and Power PCL | 109 | ||||||||
| 2,427,537 | Xcel Energy, Inc | 164,344 | ||||||||
| 5,470 | York Water Co | 272 | ||||||||
| 4,530,900 | YTL Corp BHD | 631 | ||||||||
| 2,300,200 | YTL Power International BHD | 340 | ||||||||
| 1 | * | Zorlu Enerji Elektrik Uretim AS | 0 | |||||||
| TOTAL UTILITIES | 3,226,210 | |||||||||
| TOTAL COMMON STOCKS | 137,557,796 | |||||||||
| (Cost $108,787,929) | ||||||||||
| 241 |
COLLEGE RETIREMENT EQUITIES FUND - Stock Account
| SHARES | COMPANY | EXPIRATION DATE | VALUE (000) | |||||||||
| PREFERRED STOCKS - 0.0% | ||||||||||||
| REAL ESTATE - 0.0% | ||||||||||||
| 8,497,223 | *,† | Ayala Land, Inc | $ | 17 | ||||||||
| TOTAL REAL ESTATE | 17 | |||||||||||
| TOTAL PREFERRED STOCKS | 17 | |||||||||||
| (Cost $20) | ||||||||||||
| PURCHASED OPTIONS - 0.0% | ||||||||||||
| MEDIA & ENTERTAINMENT - 0.0% | ||||||||||||
| 35,000 | Sea Ltd | 19 | ||||||||||
| TOTAL MEDIA & ENTERTAINMENT | 19 | |||||||||||
| TOTAL PURCHASED OPTIONS | 19 | |||||||||||
| (Cost $1,151) | ||||||||||||
| RIGHTS/WARRANTS - 0.0% | ||||||||||||
| AUTOMOBILES & COMPONENTS - 0.0% | ||||||||||||
| 28,044 | Doosan Heavy Industries & Construction Co Ltd | 02/08/22 | 103 | |||||||||
| TOTAL AUTOMOBILES & COMPONENTS | 103 | |||||||||||
| CAPITAL GOODS - 0.0% | ||||||||||||
| 82,450 | Seazen Group Ltd | 0 | ||||||||||
| 7,167,367 | Waskita Karya Persero Tbk PT | 02/15/22 | 6 | |||||||||
| 26,206 | †,e | Webuild S.p.A | 08/02/30 | 26 | ||||||||
| TOTAL CAPITAL GOODS | 32 | |||||||||||
| COMMERCIAL & PROFESSIONAL SERVICES - 0.0% | ||||||||||||
| 233,500 | Frontken Corp Bhd | 05/03/26 | 32 | |||||||||
| TOTAL COMMERCIAL & PROFESSIONAL SERVICES | 32 | |||||||||||
| CONSUMER DURABLES & APPAREL - 0.0% | ||||||||||||
| 1,140,087 | e | Cie Financiere Richemont S.A. | 11/27/23 | 1,251 | ||||||||
| TOTAL CONSUMER DURABLES & APPAREL | 1,251 | |||||||||||
| CONSUMER SERVICES - 0.0% | ||||||||||||
| 69,576 | e | PointsBet Holdings Pty Ltd | 09/30/22 | 17 | ||||||||
| TOTAL CONSUMER SERVICES | 17 | |||||||||||
| DIVERSIFIED FINANCIALS - 0.0% | ||||||||||||
| 26,653 | Srisawad Corp PCL | 08/29/25 | 8 | |||||||||
| TOTAL DIVERSIFIED FINANCIALS | 8 | |||||||||||
| ENERGY - 0.0% | ||||||||||||
| 8,715 | e | Weatherford International plc | 12/13/23 | 4 | ||||||||
| TOTAL ENERGY | 4 | |||||||||||
| 242 |
COLLEGE RETIREMENT EQUITIES FUND - Stock Account
| SHARES | COMPANY | EXPIRATION DATE | VALUE (000) | |||||||||||||
| HEALTH CARE EQUIPMENT & SERVICES - 0.0% | ||||||||||||||||
| 72,360 | h | Comfort Glove Bhd | 06/26/26 | $ | 4 | |||||||||||
| 2,016 | Eoflow Co Ltd | 12/16/21 | 18 | |||||||||||||
| TOTAL HEALTH CARE EQUIPMENT & SERVICES | 22 | |||||||||||||||
| MATERIALS - 0.0% | ||||||||||||||||
| 37,560 | Scientex BHD | 01/14/26 | 12 | |||||||||||||
| TOTAL MATERIALS | 12 | |||||||||||||||
| MEDIA & ENTERTAINMENT - 0.0% | ||||||||||||||||
| 307,952 | Advantage Solutions, Inc | 12/31/26 | 761 | |||||||||||||
| 230,631 | † | Media General, Inc | 0 | |||||||||||||
| TOTAL MEDIA & ENTERTAINMENT | 761 | |||||||||||||||
| PHARMACEUTICALS, BIOTECHNOLOGY & LIFE SCIENCES - 0.0% | ||||||||||||||||
| 12,599 | † | Chinook Therapeutics, Inc | 0 | |||||||||||||
| 156,143 | † | Elanco Animal Health, Inc CVR | 9 | |||||||||||||
| 4,387 | Enzychem Lifesciences Corp | 02/15/22 | 0 | |||||||||||||
| 369,289 | Faes Farma S.A. | 01/04/22 | 77 | |||||||||||||
| 20,027 | †,e | Tobira Therapeutics, Inc | 1 | |||||||||||||
| TOTAL PHARMACEUTICALS, BIOTECHNOLOGY & LIFE SCIENCES | 87 | |||||||||||||||
| REAL ESTATE - 0.0% | ||||||||||||||||
| 28,048 | MBK PCL | 12/31/24 | 9 | |||||||||||||
| 28,048 | MBK PCL | 11/15/24 | 8 | |||||||||||||
| TOTAL REAL ESTATE | 17 | |||||||||||||||
| TECHNOLOGY HARDWARE & EQUIPMENT - 0.0% | ||||||||||||||||
| 113,648 | SKP Resources Bhd | 04/25/26 | 5 | |||||||||||||
| 125 | VS Industry Bhd | 06/14/24 | 0 | ^ | ||||||||||||
| TOTAL TECHNOLOGY HARDWARE & EQUIPMENT | 5 | |||||||||||||||
| TRANSPORTATION - 0.0% | ||||||||||||||||
| 680,902 | Asia Aviation PCL | 16 | ||||||||||||||
| TOTAL TRANSPORTATION | 16 | |||||||||||||||
| TOTAL RIGHTS/WARRANTS | 2,367 | |||||||||||||||
| (Cost $609) | ||||||||||||||||
| PRINCIPAL | ISSUER | RATE | MATURITY DATE | |||||||||||||
| SHORT-TERM INVESTMENTS - 1.8% | ||||||||||||||||
| �� | ||||||||||||||||
| GOVERNMENT AGENCY DEBT - 0.9% | ||||||||||||||||
| $ | 23,333,000 | Federal Agricultural Mortgage Corp (FAMC) | 0.000 | % | 03/02/22 | 23,331 | ||||||||||
| 43,120,000 | Federal Farm Credit Bank (FFCB) | 0.000 | 01/05/22 | 43,120 | ||||||||||||
| 6,000,000 | FFCB | 0.000 | 01/10/22 | 6,000 | ||||||||||||
| 20,000,000 | FFCB | 0.000 | 01/19/22 | 20,000 | ||||||||||||
| 10,000,000 | FFCB | 0.000 | 01/26/22 | 10,000 | ||||||||||||
| 20,000,000 | FFCB | 0.000 | 01/28/22 | 20,000 | ||||||||||||
| 40,000,000 | FFCB | 0.000 | 02/02/22 | 39,999 | ||||||||||||
| 42,333,000 | FFCB | 0.000 | 02/15/22 | 42,332 | ||||||||||||
| 10,000,000 | FFCB | 0.000 | 02/25/22 | 10,000 | ||||||||||||
| 24,916,000 | FFCB | 0.000 | 02/28/22 | 24,915 | ||||||||||||
| 12,500,000 | FFCB | 0.000 | 03/01/22 | 12,499 | ||||||||||||
| 12,500,000 | FFCB | 0.000 | 03/02/22 | 12,499 | ||||||||||||
| 243 |
COLLEGE RETIREMENT EQUITIES FUND - Stock Account
| PRINCIPAL | ISSUER | RATE | MATURITY DATE | VALUE (000) | ||||||||||||
| $ | 10,000,000 | FFCB | 0.000 | % | 03/17/22 | $ | 9,999 | |||||||||
| 25,000,000 | FFCB | 0.000 | 06/10/22 | 24,979 | ||||||||||||
| 7,000,000 | FFCB | 0.000 | 06/16/22 | 6,994 | ||||||||||||
| 12,214,000 | FFCB | 0.000 | 07/20/22 | 12,199 | ||||||||||||
| 10,305,000 | FFCB | 0.000 | 07/22/22 | 10,293 | ||||||||||||
| 10,000,000 | FFCB | 0.000 | 09/13/22 | 9,981 | ||||||||||||
| 45,000,000 | Federal Home Loan Bank (FHLB) | 0.000 | 01/04/22 | 45,000 | ||||||||||||
| 3,000,000 | FHLB | 0.000 | 01/05/22 | 3,000 | ||||||||||||
| 13,055,000 | FHLB | 0.000 | 01/06/22 | 13,055 | ||||||||||||
| 4,400,000 | FHLB | 0.000 | 01/11/22 | 4,400 | ||||||||||||
| 145,062,000 | FHLB | 0.000 | 01/12/22 | 145,062 | ||||||||||||
| 50,600,000 | FHLB | 0.000 | 01/13/22 | 50,600 | ||||||||||||
| 28,250,000 | FHLB | 0.000 | 01/19/22 | 28,250 | ||||||||||||
| 116,890,000 | FHLB | 0.000 | 01/21/22 | 116,890 | ||||||||||||
| 31,000,000 | FHLB | 0.000 | 01/26/22 | 31,000 | ||||||||||||
| 32,000,000 | FHLB | 0.040 | 01/28/22 | 31,994 | ||||||||||||
| 14,600,000 | FHLB | 0.000 | 01/31/22 | 14,600 | ||||||||||||
| 45,010,000 | FHLB | 0.000 | 02/02/22 | 45,009 | ||||||||||||
| 85,014,000 | FHLB | 0.000 | 02/09/22 | 85,012 | ||||||||||||
| 48,000,000 | FHLB | 0.000 | 02/11/22 | 47,999 | ||||||||||||
| 3,060,000 | FHLB | 0.000 | 02/16/22 | 3,060 | ||||||||||||
| 2,400,000 | FHLB | 0.000 | 02/17/22 | 2,400 | ||||||||||||
| 42,577,000 | FHLB | 0.000 | 02/18/22 | 42,576 | ||||||||||||
| 25,000,000 | FHLB | 0.000 | 02/22/22 | 24,999 | ||||||||||||
| 5,729,000 | FHLB | 0.000 | 02/23/22 | 5,729 | ||||||||||||
| 10,000,000 | FHLB | 0.000 | 03/07/22 | 9,999 | ||||||||||||
| 11,000,000 | FHLB | 0.000 | 04/11/22 | 10,997 | ||||||||||||
| 23,815,000 | FHLB | 0.000 | 04/20/22 | 23,809 | ||||||||||||
| 21,000,000 | FHLB | 0.000 | 04/22/22 | 20,994 | ||||||||||||
| 26,612,000 | FHLB | 0.000 | 05/05/22 | 26,599 | ||||||||||||
| 54,783,000 | FHLB | 0.000 | 05/13/22 | 54,755 | ||||||||||||
| 6,100,000 | FHLB | 0.000 | 05/25/22 | 6,097 | ||||||||||||
| 6,000,000 | FHLB | 0.000 | 06/08/22 | 5,995 | ||||||||||||
| 20,000,000 | FHLB | 0.000 | 08/04/22 | 19,972 | ||||||||||||
| 8,000,000 | FHLB | 0.000 | 08/05/22 | 7,989 | ||||||||||||
| 11,140,000 | Federal Home Loan Mortgage Corp (FHLMC) | 2.375 | 01/13/22 | 11,147 | ||||||||||||
| 9,483,000 | Federal National Mortgage Association (FNMA) | 2.000 | 01/05/22 | 9,484 | ||||||||||||
| 3,605,000 | FNMA | 2.625 | 01/11/22 | 3,607 | ||||||||||||
| TOTAL GOVERNMENT AGENCY DEBT | 1,291,219 | |||||||||||||||
| REPURCHASE AGREEMENT - 0.1% | ||||||||||||||||
| 113,560,000 | r | Fixed Income Clearing Corp (FICC) | 0.020 | 01/03/22 | 113,560 | |||||||||||
| TOTAL REPURCHASE AGREEMENT | 113,560 | |||||||||||||||
| TREASURY DEBT - 0.0% | ||||||||||||||||
| 36,845,000 | United States Treasury Bill | 0.000 | 01/13/22 | 36,845 | ||||||||||||
| 10,000,000 | United States Treasury Bill | 0.000 | 06/23/22 | 9,992 | ||||||||||||
| 25,000,000 | United States Treasury Bill | 0.000 | 08/11/22 | 24,970 | ||||||||||||
| 24,880,000 | United States Treasury Note | 2.250 | 04/15/22 | 25,029 | ||||||||||||
| TOTAL TREASURY DEBT | 96,836 | |||||||||||||||
| 244 |
COLLEGE RETIREMENT EQUITIES FUND - Stock Account
| PRINCIPAL | ISSUER | RATE | MATURITY DATE | VALUE (000) | ||||||||||||
| INVESTMENT OF CASH COLLATERAL FOR SECURITIES LOANED - 0.8% | ||||||||||||||||
| CERTIFICATE OF DEPOSIT - 0.0% | ||||||||||||||||
| $ | 52,000,000 | Mizuho Bank Ltd | 0.250 | % | 05/09/22 | $ | 52,000 | |||||||||
| TOTAL CERTIFICATE OF DEPOSIT | 52,000 | |||||||||||||||
| COMMERCIAL PAPER - 0.1% | ||||||||||||||||
| 62,000,000 | Skandin Ens Banken | 0.000 | 05/02/22 | 61,956 | ||||||||||||
| TOTAL COMMERCIAL PAPER | 61,956 | |||||||||||||||
| REPURCHASE AGREEMENT - 0.5% | ||||||||||||||||
| 25,000,000 | s | Calyon | 0.050 | 01/03/22 | 25,000 | |||||||||||
| 62,000,000 | t | Citigroup | 0.060 | 01/03/22 | 62,000 | |||||||||||
| 60,000,000 | u | Deutsche Bank | 0.050 | 01/03/22 | 60,000 | |||||||||||
| 55,000,000 | v | Goldman Sachs | 0.050 | 01/03/22 | 55,000 | |||||||||||
| 50,000,000 | w | HSBC | 0.050 | 01/03/22 | 50,000 | |||||||||||
| 1,000,000 | x | HSBC | 0.050 | 01/03/22 | 1,000 | |||||||||||
| 3,000,000 | y | HSBC | 0.051 | 01/05/22 | 3,000 | |||||||||||
| 85,000,000 | z | JP Morgan | 0.050 | 01/03/22 | 85,000 | |||||||||||
| 26,000,000 | aa | Merrill Lynch | 0.050 | 01/03/22 | 26,000 | |||||||||||
| 50,000,000 | ab | Merrill Lynch | 0.050 | 01/03/22 | 50,000 | |||||||||||
| 2,000,000 | ac | Merrill Lynch | 0.050 | 01/03/22 | 2,000 | |||||||||||
| 50,000,000 | ad | Morgan Stanley | 0.050 | 01/03/22 | 50,000 | |||||||||||
| 95,000,000 | ae | Nomura | 0.050 | 01/03/22 | 95,000 | |||||||||||
| 125,000,000 | af | Royal Bank of Scotland | 0.050 | 01/03/22 | 125,000 | |||||||||||
| TOTAL REPURCHASE AGREEMENT | 689,000 | |||||||||||||||
| TREASURY DEBT - 0.2% | ||||||||||||||||
| 55,000,000 | United States Treasury Bill | 0.000 | 01/13/22 | 54,999 | ||||||||||||
| 16,390,000 | United States Treasury Bill | 0.000 | 01/18/22 | 16,390 | ||||||||||||
| 85,200,000 | United States Treasury Bill | 0.000 | 01/18/22 | 85,199 | ||||||||||||
| 82,000,000 | United States Treasury Bill | 0.000 | 01/18/22 | 81,998 | ||||||||||||
| 16,400,000 | United States Treasury Bill | 0.000 | 01/18/22 | 16,400 | ||||||||||||
| 254,986 | ||||||||||||||||
| TOTAL INVESTMENT OF CASH COLLATERAL FOR SECURITIES LOANED | 1,057,942 | |||||||||||||||
| TOTAL SHORT-TERM INVESTMENTS | 2,559,557 | |||||||||||||||
| (Cost $2,559,664) | ||||||||||||||||
| TOTAL INVESTMENTS - 100.7% | 140,120,120 | |||||||||||||||
| (Cost $111,349,737) | ||||||||||||||||
| OTHER ASSETS & LIABILITIES, NET - (0.7)% | (949,978 | ) | ||||||||||||||
| NET ASSETS - 100.0% | $ | 139,170,142 | ||||||||||||||
| ADR | American Depositary Receipt | ||
| CVR | Contingent Value Right | ||
| ETF | Exchange Traded Fund | ||
| GDR | Global Depositary Receipt | ||
| HDC | Housing Development Corporation | ||
| INR | Indian Rupee | ||
| IRB | Interest Rate Reduction Bond | ||
| OTC | Over The Counter | ||
| REIT | Real Estate Investment Trust | ||
| SPDR | Standard & Poor’s Depositary Receipts | ||
| 245 |
COLLEGE RETIREMENT EQUITIES FUND - Stock Account
| ^ | Amount represents less than $1,000. | ||
| * | Non-income producing | ||
| † | Security is categorized as Level 3 in the fair value hierarchy. | ||
| a | Affiliated holding | ||
| b | In bankruptcy | ||
| d | All or a portion of these securities have been segregated to cover margin requirements on open futures contracts. | ||
| e | All or a portion of these securities are out on loan. The aggregate value of securities on loan is $1,746,890,302. | ||
| g | Security is exempt from registration under Rule 144(A) of the Securities Act of 1933, as amended. Such securities are deemed liquid and may be resold in transactions exempt from registration to qualified institutional buyers. At 12/31/21, the aggregate value of these securities is $1,629,222,198 or 1.2% of net assets. | ||
| h | All or a portion of these securities were purchased on a delayed delivery basis. | ||
| n | All or a portion of these securities have been segregated by the custodian to cover requirements on open written options contracts. | ||
| r | Agreement with Fixed Income Clearing Corp (FICC), 0.020% dated 12/31/21 to be repurchased at $113,560,000 on 1/3/22, collateralized by Government Agency Securities, with coupon rate 1.875% and maturity date 2/15/41, valued at $115,831,273. | ||
| s | Agreement with Calyon, 0.050% dated 12/31/21 to be repurchased at $25,000,000 on 1/3/22, collateralized by Government Agency Securities, with coupon rate 2.000% and maturity date 1/20/51, valued at $25,500,001. | ||
| t | Agreement with Citigroup, 0.060% dated 12/31/21 to be repurchased at $62,000,000 on 1/3/22, collateralized by Government Agency Securities, with coupon rates 0.125%–1.625% and maturity dates 5/31/22–7/31/23, valued at $63,240,056. | ||
| u | Agreement with Deutsche Bank, 0.050% dated 12/31/21 to be repurchased at $60,000,000 on 1/3/22, collateralized by Government Agency Securities, with coupon rate 0.000% and maturity dates 5/15/24–5/15/29, valued at $61,200,000. | ||
| v | Agreement with Goldman Sachs, 0.050% dated 12/31/21 to be repurchased at $55,000,000 on 1/3/22, collateralized by Government Agency Securities, with coupon rates 0.375%–3.750% and maturity dates 1/31/23–5/15/48, valued at $56,100,073. | ||
| w | Agreement with HSBC, 0.050% dated 12/31/21 to be repurchased at $50,000,000 on 1/3/22, collateralized by Government Agency Securities, with coupon rates 0.000%–4.375% and maturity dates 11/15/24–5/15/40, valued at $51,000,001. | ||
| x | Agreement with HSBC, 0.050% dated 12/31/21 to be repurchased at $1,000,000 on 1/3/22, collateralized by Government Agency Securities, with coupon rate 0.000% and maturity date 11/15/27, valued at $1,020,000. | ||
| y | Agreement with HSBC, 0.051% dated 12/29/21 to be repurchased at $3,000,000 on 1/5/22, collateralized by Government Agency Securities, with coupon rates 0.000%–1.250% and maturity dates 2/24/22–11/15/27, valued at $3,060,002. | ||
| z | Agreement with JP Morgan, 0.050% dated 12/31/21 to be repurchased at $85,000,000 on 1/3/22, collateralized by Government Agency Securities, with coupon rates 2.000%–6.000% and maturity dates 2/1/25–1/1/52, valued at $86,700,000. | ||
| aa | Agreement with Merrill Lynch, 0.050% dated 12/31/21 to be repurchased at $26,000,000 on 1/3/22, collateralized by Government Agency Securities, with coupon rate 1.250% and maturity date 8/15/31, valued at $26,520,043. | ||
| ab | Agreement with Merrill Lynch, 0.050% dated 12/31/21 to be repurchased at $50,000,000 on 1/3/22, collateralized by Government Agency Securities, with coupon rate 3.250% and maturity date 11/16/28, valued at $51,004,186. | ||
| ac | Agreement with Merrill Lynch, 0.050% dated 12/31/21 to be repurchased at $2,000,000 on 1/3/22, collateralized by Government Agency Securities, with coupon rate 2.625% and maturity date 2/15/29, valued at $2,040,080. | ||
| ad | Agreement with Morgan Stanley, 0.050% dated 12/31/21 to be repurchased at $50,000,000 on 1/3/22, collateralized by Government Agency Securities, with coupon rates 1.500%–8.000% and maturity dates 8/1/23–1/1/52, valued at $51,000,094. | ||
| ae | Agreement with Nomura, 0.050% dated 12/31/21 to be repurchased at $95,000,000 on 1/3/22, collateralized by Government Agency Securities, with coupon rates 0.000%–2.500% and maturity dates 1/11/22–10/15/26, valued at $96,900,000. | ||
| af | Agreement with Royal Bank of Scotland, 0.050% dated 12/31/21 to be repurchased at $125,000,000 on 1/3/22, collateralized by Government Agency Securities, with coupon rate 0.750% and maturity date 12/31/23, valued at $127,500,070. | ||
| Cost amounts are in thousands. | |||
Principal denominated in U.S. Dollars, unless otherwise noted.
| 246 |
COLLEGE RETIREMENT EQUITIES FUND - Stock Account
Purchased options outstanding as of December 31, 2021 were as follows (notional amounts and values are in thousands):
| Description/underlying investment | Number of contracts | Notional amount | Exercise price | Expiration date | Value | |||||||||||||
| Sea Ltd, Call | 350 | $ | 1,151 | $ | 360.00 | 03/18/22 | $ | 19 | ||||||||||
Written options outstanding as of December 31, 2021 were as follows (notional amounts and values are in thousands):
| Description/underlying investment | Number of contracts | Notional amount | Exercise price | Expiration date | Value | |||||||||||||
| Advantest Corp, Call | 270 | $ | (19 | ) | $ | 11,500.00 | 01/13/22 | $ | (19 | ) | ||||||||
| Alphabet, Inc, Call | 5 | (5 | ) | 3,300.00 | 01/21/22 | (0 | )^ | |||||||||||
| Baozun, Inc, Call | 2,500 | (123 | ) | 15.00 | 01/21/22 | (88 | ) | |||||||||||
| Ciena Corp, Put | 30 | (1 | ) | 60.00 | 01/21/22 | (0 | )^ | |||||||||||
| Crocs, Inc, Put | 30 | (3 | ) | 90.00 | 01/21/22 | (1 | ) | |||||||||||
| Estee Lauder Cos, Inc, Call | 20 | (3 | ) | 400.00 | 01/21/22 | (1 | ) | |||||||||||
| GDS Holdings Ltd, Call | 2,400 | (284 | ) | 55.00 | 01/21/22 | (264 | ) | |||||||||||
| Generac Holdings, Inc, Put | 20 | (6 | ) | 310.00 | 01/21/22 | (3 | ) | |||||||||||
| Intuitive Surgical, Inc, Put | 213 | (311 | ) | 320.00 | 01/21/22 | (42 | ) | |||||||||||
| Kornit Digital Ltd, Call | 50 | (10 | ) | 160.00 | 01/21/22 | (16 | ) | |||||||||||
| Lowe’s Cos, Inc, Call | 10 | (1 | ) | 280.00 | 01/21/22 | (0 | )^ | |||||||||||
| Lowe’s Cos, Inc, Call | 10 | (1 | ) | 290.00 | 01/21/22 | (0 | )^ | |||||||||||
| Microsoft Corp, Put | 20 | (4 | ) | 290.00 | 01/21/22 | (1 | ) | |||||||||||
| Nintendo Co Ltd, Put | 30 | (16 | ) | 50,000.00 | 01/13/22 | (14 | ) | |||||||||||
| Renesas Electronics Corp, Call | 2,650 | (1 | ) | 1,600.00 | 01/13/22 | (5 | ) | |||||||||||
| Sea Ltd, Call | 350 | (409 | ) | 440.00 | 03/18/22 | (9 | ) | |||||||||||
| Sea Ltd, Put | 10 | (3 | ) | 160.00 | 01/21/22 | (1 | ) | |||||||||||
| Sea Ltd, Put | 20 | (11 | ) | 190.00 | 01/21/22 | (3 | ) | |||||||||||
| Sea Ltd, Put | 350 | (690 | ) | 300.00 | 03/18/22 | (2,747 | ) | |||||||||||
| SUMCO Corp, Call | 670 | (1 | ) | 2,600.00 | 01/13/22 | (3 | ) | |||||||||||
| Tesla, Inc, Call | 129 | (253 | ) | 1,300.00 | 01/21/22 | (92 | ) | |||||||||||
| Tesla, Inc, Put | 5 | (10 | ) | 800.00 | 01/21/22 | (1 | ) | |||||||||||
| Tesla, Inc, Put | 126 | (477 | ) | 900.00 | 01/21/22 | (127 | ) | |||||||||||
| ViacomCBS, Inc, Put | 45 | (27 | ) | 35.00 | 06/17/22 | (30 | ) | |||||||||||
| Walt Disney Co, Put | 15 | (4 | ) | 130.00 | 02/18/22 | (1 | ) | |||||||||||
| Walt Disney Co, Put | 15 | (5 | ) | 135.00 | 02/18/22 | (1 | ) | |||||||||||
| Total | 9,993 | $ | (2,678 | ) | $ | (3,469 | ) | |||||||||||
| ^ | Amount represents less than $1,000. |
| 247 |
COLLEGE RETIREMENT EQUITIES FUND - Stock Account
Futures contracts outstanding as of December 31, 2021 were as follows (dollar amounts are in thousands):
| Description | Number of long (short) contracts | Expiration date | Notional amount | Value | Unrealized appreciation (depreciation) | |||||||||||||
| Russell 2000 E Mini Index | 482 | 03/18/22 | $ | 54,638 | $ | 54,052 | $ | (586 | ) | |||||||||
| S&P 500 E Mini Index | 3,263 | 03/18/22 | 765,059 | 776,349 | 11,290 | |||||||||||||
| S&P Mid-Cap 400 E Mini Index | 299 | 03/18/22 | 84,100 | 84,847 | 747 | |||||||||||||
| Total | 4,044 | $ | 903,797 | $ | 915,248 | $ | 11,451 | |||||||||||
Forward foreign currency contracts outstanding as of December 31, 2021 were as follows (dollar amounts are in thousands):
| Currency to be purchased | Receive | Currency to be sold | Deliver | Counterparty | Settlement date | Unrealized appreciation (depreciation) | ||||||||
| $ | 80,315 | CAD | 100,000 | Bank of America | 02/08/22 | $ | 1,265 | |||||||
| $ | 23,230 | EUR | 20,000 | Bank of America | 02/09/22 | 442 | ||||||||
| $ | 13,495 | GBP | 10,000 | Bank of America | 02/09/22 | (39 | ) | |||||||
| CAD | 100,000 | $ | 80,389 | Bank of America | 02/08/22 | (1,338 | ) | |||||||
| EUR | 20,000 | $ | 23,164 | Bank of America | 02/09/22 | (376 | ) | |||||||
| GBP | 10,000 | $ | 13,569 | Bank of America | 02/09/22 | (36 | ) | |||||||
| JPY | 2,235,080 | $ | 19,823 | Bank of America | 02/09/22 | (387 | ) | |||||||
| Total | $ | (469 | ) | |||||||||||
| $ | 100,000 | CAD | 124,456 | Morgan Stanley | 02/08/22 | $ | 1,616 | |||||||
| EUR | 4,087 | $ | 4,748 | Morgan Stanley | 02/09/22 | (92 | ) | |||||||
| Total | $ | 1,524 | ||||||||||||
| $ | 7,402 | AUD | 10,000 | Toronto Dominion Bank | 02/09/22 | $ | 126 | |||||||
| $ | 14,804 | AUD | 20,000 | Toronto Dominion Bank | 02/09/22 | 252 | ||||||||
| $ | 5,196 | AUD | 7,015 | Toronto Dominion Bank | 02/09/22 | 91 | ||||||||
| $ | 2,598 | AUD | 3,508 | Toronto Dominion Bank | 02/09/22 | 45 | ||||||||
| $ | 16,064 | CAD | 20,000 | Toronto Dominion Bank | 02/08/22 | 254 | ||||||||
| $ | 3,936 | CAD | 4,899 | Toronto Dominion Bank | 02/08/22 | 63 | ||||||||
| $ | 34,749 | EUR | 30,000 | Toronto Dominion Bank | 02/09/22 | 567 | ||||||||
| $ | 67,468 | GBP | 50,000 | Toronto Dominion Bank | 02/09/22 | (201 | ) | |||||||
| $ | 6,747 | GBP | 5,000 | Toronto Dominion Bank | 02/09/22 | (20 | ) | |||||||
| EUR | 17,215 | $ | 20,000 | Toronto Dominion Bank | 02/09/22 | (385 | ) | |||||||
| GBP | 5,000 | $ | 6,787 | Toronto Dominion Bank | 02/09/22 | (20 | ) | |||||||
| JPY | 20,000 | $ | 177 | Toronto Dominion Bank | 02/09/22 | (3 | ) | |||||||
| Total | $ | 769 | ||||||||||||
| Total | $ | 1,824 |
| AUD | Australian Dollar | ||
| CAD | Canadian Dollar | ||
| EUR | Euro | ||
| GBP | Pound Sterling | ||
| JPY | Japanese Yen | ||
| 248 |
COLLEGE RETIREMENT EQUITIES FUND - Global Equities Account
COLLEGE RETIREMENT EQUITIES FUND
GLOBAL EQUITIES ACCOUNT
SCHEDULE OF INVESTMENTS
December 31, 2021
| PRINCIPAL | ISSUER | RATE | MATURITY DATE | VALUE (000) | ||||||||||||
| BONDS - 0.0% | ||||||||||||||||
| CORPORATE BONDS - 0.0% | ||||||||||||||||
| INDIA - 0.0% | �� | |||||||||||||||
| INR | 1,191,204 | Britannia Industries Ltd | 5.500 | % | 06/03/24 | $ | 16 | |||||||||
| TOTAL INDIA | 16 | |||||||||||||||
| TOTAL CORPORATE BONDS | 16 | |||||||||||||||
| (Cost $16) | ||||||||||||||||
| TOTAL BONDS | 16 | |||||||||||||||
| (Cost $16) | ||||||||||||||||
| SHARES | COMPANY | |||||||||||||||
| COMMON STOCKS - 98.5% | ||||||||||||||||
| ARGENTINA - 0.0% | ||||||||||||||||
| 9,693 | * | MercadoLibre, Inc | 13,070 | |||||||||||||
| TOTAL ARGENTINA | 13,070 | |||||||||||||||
| AUSTRALIA - 1.2% | ||||||||||||||||
| 239,723 | * | Afterpay Touch Group Ltd | 14,471 | |||||||||||||
| 752,010 | * | AMP Ltd | 553 | |||||||||||||
| 224,663 | APA Group | 1,644 | ||||||||||||||
| 1,749,498 | Australia & New Zealand Banking Group Ltd | 35,045 | ||||||||||||||
| 42,361 | Australian Stock Exchange Ltd | 2,863 | ||||||||||||||
| 681,005 | *,† | AZ BGP Holdings | 2 | |||||||||||||
| 753,372 | BHP Group plc | 22,416 | ||||||||||||||
| 41,007 | Cochlear Ltd | 6,436 | ||||||||||||||
| 387,370 | Commonwealth Bank of Australia | 28,476 | ||||||||||||||
| 61,015 | CSL Ltd | 12,905 | ||||||||||||||
| 164,056 | Endeavour Group Ltd | 805 | ||||||||||||||
| 5,394,609 | Glencore Xstrata plc | 27,487 | ||||||||||||||
| 1,035,437 | IDP Education Ltd | 26,085 | ||||||||||||||
| 3,866,637 | Ingenia Communities Group | 17,493 | ||||||||||||||
| 505,712 | Insurance Australia Group Ltd | 1,567 | ||||||||||||||
| 75,277 | Macquarie Group Ltd | 11,253 | ||||||||||||||
| 28,720 | e | Magellan Financial Group Ltd | 444 | |||||||||||||
| 602,642 | Medibank Pvt Ltd | 1,468 | ||||||||||||||
| 254,298 | * | Megaport Ltd | 3,426 | |||||||||||||
| 699,409 | National Australia Bank Ltd | 14,685 | ||||||||||||||
| 249 |
COLLEGE RETIREMENT EQUITIES FUND - Global Equities Account
| SHARES | COMPANY | VALUE (000) | ||||||||||||||
| 1,496,503 | * | NEXTDC Ltd | $ | 13,896 | ||||||||||||
| 2,457,346 | *,e | PointsBet Holdings Ltd | 12,607 | |||||||||||||
| 218,446 | * | Qantas Airways Ltd | 797 | |||||||||||||
| 321,499 | QBE Insurance Group Ltd | 2,655 | ||||||||||||||
| 104,498 | Ramsay Health Care Ltd | 5,431 | ||||||||||||||
| 286,614 | Rio Tinto plc | 18,901 | ||||||||||||||
| 388,194 | Sonic Healthcare Ltd | 13,166 | ||||||||||||||
| 275,926 | Suncorp-Metway Ltd | 2,221 | ||||||||||||||
| 863,346 | Telstra Corp Ltd | 2,624 | ||||||||||||||
| 93,595 | Wesfarmers Ltd | 4,038 | ||||||||||||||
| 802,681 | Westpac Banking Corp | 12,452 | ||||||||||||||
| 164,056 | Woolworths Ltd | 4,535 | ||||||||||||||
| 3,476,767 | *,e | Zip Co Ltd | 10,950 | |||||||||||||
| TOTAL AUSTRALIA | 333,797 | |||||||||||||||
| AUSTRIA - 0.1% | ||||||||||||||||
| 301,530 | g | BAWAG Group AG. | 18,493 | |||||||||||||
| 162,638 | Erste Bank der Oesterreichischen Sparkassen AG. | 7,625 | ||||||||||||||
| 253,163 | Mondi plc | 6,279 | ||||||||||||||
| 13,007 | Verbund AG. | 1,462 | ||||||||||||||
| TOTAL AUSTRIA | 33,859 | |||||||||||||||
| BELGIUM - 0.1% | ||||||||||||||||
| 98,478 | Anheuser-Busch InBev S.A. | 5,937 | ||||||||||||||
| 268,260 | KBC Groep NV | 23,049 | ||||||||||||||
| TOTAL BELGIUM | 28,986 | |||||||||||||||
| BERMUDA - 0.0% | ||||||||||||||||
| 10,387 | RenaissanceRe Holdings Ltd | 1,759 | ||||||||||||||
| TOTAL BERMUDA | 1,759 | |||||||||||||||
| BRAZIL - 0.8% | ||||||||||||||||
| 35,400 | Alpargatas S.A. | 234 | ||||||||||||||
| 1,049,200 | AMBEV S.A. | 2,936 | ||||||||||||||
| 5,050,728 | * | Americanas S.A. | 28,461 | |||||||||||||
| 110,400 | Atacadao Distribuicao Comercio e Industria Ltd | 301 | ||||||||||||||
| 512,900 | B3 SA-Brasil Bolsa Balcao | 1,021 | ||||||||||||||
| 1,481,062 | Banco Bradesco S.A. | 4,293 | ||||||||||||||
| 15,821,244 | Banco Bradesco S.A. (Preference) | 54,849 | ||||||||||||||
| 52,524 | Banco BTG Pactual S.A. | 121 | ||||||||||||||
| 5,200 | Banco BTG Pactual S.A. | 5 | ||||||||||||||
| 3,915,060 | Banco BTG Pactual S.A. - Unit | 14,705 | ||||||||||||||
| 70,932 | Banco do Brasil S.A. | 367 | ||||||||||||||
| 1,627,603 | Banco Inter S.A. | 8,276 | ||||||||||||||
| 30,500 | Banco Santander Brasil S.A. | 164 | ||||||||||||||
| 250 |
COLLEGE RETIREMENT EQUITIES FUND - Global Equities Account
| SHARES | COMPANY | VALUE (000) | ||||||||||||||
| 151,500 | BB Seguridade Participacoes S.A. | $ | 561 | |||||||||||||
| 42,800 | Braskem S.A. | 452 | ||||||||||||||
| 143,900 | * | BRF S.A. | 583 | |||||||||||||
| 73,155 | Centrais Eletricas Brasileiras S.A. | 446 | ||||||||||||||
| 59,600 | Centrais Eletricas Brasileiras S.A. (Preference) | 352 | ||||||||||||||
| 256,800 | Cia de Concessoes Rodoviarias | 533 | ||||||||||||||
| 77,800 | Cia de Saneamento Basico do Estado de Sao Paulo | 568 | ||||||||||||||
| 222,750 | Cia Energetica de Minas Gerais | 532 | ||||||||||||||
| 139,700 | Cia Siderurgica Nacional S.A. | 626 | ||||||||||||||
| 221,568 | Cosan SA Industria e Comercio | 871 | ||||||||||||||
| 39,100 | Energisa S.A. | 311 | ||||||||||||||
| 44,350 | Engie Brasil Energia S.A. | 306 | ||||||||||||||
| 198,000 | Equatorial Energia S.A. | 803 | ||||||||||||||
| 250,300 | Gerdau S.A. (Preference) | 1,230 | ||||||||||||||
| 87,700 | g | Hapvida Participacoes e Investimentos S.A. | 163 | |||||||||||||
| 31,200 | Hypermarcas S.A. | 158 | ||||||||||||||
| 398,937 | Investimentos Itau S.A. - PR | 638 | ||||||||||||||
| 4,589,519 | Itau Unibanco Holding S.A. | 17,296 | ||||||||||||||
| 150,200 | Klabin S.A. | 691 | ||||||||||||||
| 127,995 | Localiza Rent A Car | 1,214 | ||||||||||||||
| 207,992 | Lojas Renner S.A. | 900 | ||||||||||||||
| 5,127,800 | Magazine Luiza S.A. | 6,610 | ||||||||||||||
| 190,895 | * | Natura & Co Holding S.A. | 880 | |||||||||||||
| 41,584 | Notre Dame Intermedica Participacoes S.A. | 449 | ||||||||||||||
| 382,583 | * | Pagseguro Digital Ltd | 10,031 | |||||||||||||
| 846,600 | Petroleo Brasileiro S.A. | 4,662 | ||||||||||||||
| 1,085,038 | Petroleo Brasileiro S.A. (Preference) | 5,512 | ||||||||||||||
| 246,100 | Raia Drogasil S.A. | 1,071 | ||||||||||||||
| 77,700 | g | Rede D’Or Sao Luiz S.A. | 624 | |||||||||||||
| 278,300 | * | Rumo S.A. | 886 | |||||||||||||
| 9,045,500 | Sendas Distribuidora S.A. | 21,099 | ||||||||||||||
| 586,180 | * | StoneCo Ltd | 9,883 | |||||||||||||
| 163,122 | * | Suzano SA | 1,762 | |||||||||||||
| 117,500 | Telefonica Brasil S.A. | 1,020 | ||||||||||||||
| 194,500 | TIM S.A. | 461 | ||||||||||||||
| 105,000 | Totvus S.A. | 534 | ||||||||||||||
| 159,400 | Ultrapar Participacoes S.A. | 423 | ||||||||||||||
| 2,110,664 | Vale S.A. | 29,409 | ||||||||||||||
| 248,000 | * | Via S | 233 | |||||||||||||
| 260,000 | Vibra Energia S.A. | 997 | ||||||||||||||
| 361,920 | Weg S.A. | 2,132 | ||||||||||||||
| 251 |
COLLEGE RETIREMENT EQUITIES FUND - Global Equities Account
| SHARES | COMPANY | VALUE (000) | ||||||||||||||
| 1 | * | XP, Inc | $ | 0 | ^ | |||||||||||
| TOTAL BRAZIL | 243,645 | |||||||||||||||
| CANADA - 1.7% | ||||||||||||||||
| 41,799 | Agnico-Eagle Mines Ltd | 2,220 | ||||||||||||||
| 956,001 | Alimentation Couche-Tard, Inc | 40,055 | ||||||||||||||
| 398,479 | Bank of Montreal | 42,902 | ||||||||||||||
| 265,466 | Bank of Nova Scotia | 18,793 | ||||||||||||||
| 342,494 | Barrick Gold Corp | 6,512 | ||||||||||||||
| 387 | Brookfield Asset Management Reinsurance Partners Ltd | 24 | ||||||||||||||
| 54,907 | Brookfield Asset Management, Inc | 3,316 | ||||||||||||||
| 97,406 | Canadian Imperial Bank of Commerce | 11,354 | ||||||||||||||
| 224,207 | e | Canadian National Railway Co | 27,540 | |||||||||||||
| 233,371 | Canadian Natural Resources Ltd | 9,861 | ||||||||||||||
| 951,839 | Canadian Pacific Railway Ltd | 68,460 | ||||||||||||||
| 45,733 | CI Financial Corp | 956 | ||||||||||||||
| 490,196 | Dollarama, Inc | 24,534 | ||||||||||||||
| 299,836 | Enbridge, Inc | 11,712 | ||||||||||||||
| 5,852 | Fairfax Financial Holdings Ltd | 2,879 | ||||||||||||||
| 23,410 | First Capital Real Estate Investment Trust | 349 | ||||||||||||||
| 60,896 | Great-West Lifeco, Inc | 1,827 | ||||||||||||||
| 23,399 | iA Financial Corp, Inc | 1,339 | ||||||||||||||
| 18,129 | IGM Financial, Inc | 654 | ||||||||||||||
| 31,293 | Intact Financial Corp | 4,068 | ||||||||||||||
| 392,965 | * | Lightspeed Commerce, Inc | 15,868 | |||||||||||||
| 424,400 | Manulife Financial Corp | 8,089 | ||||||||||||||
| 73,492 | National Bank of Canada | 5,603 | ||||||||||||||
| 478,785 | Nutrien Ltd | 35,988 | ||||||||||||||
| 18,207 | Onex Corp | 1,429 | ||||||||||||||
| 121,680 | e | Power Corp Of Canada | 4,021 | |||||||||||||
| 109,817 | RioCan Real Estate Investment Trust | 1,992 | ||||||||||||||
| 311,465 | Royal Bank of Canada | 33,056 | ||||||||||||||
| 24,730 | * | Shopify, Inc (Class A) | 34,050 | |||||||||||||
| 127,928 | e | Sun Life Financial, Inc | 7,121 | |||||||||||||
| 314,921 | Teck Cominco Ltd | 9,070 | ||||||||||||||
| 37,967 | Thomson Reuters Corp | 4,540 | ||||||||||||||
| 12,331 | TMX Group Ltd | 1,250 | ||||||||||||||
| 395,891 | Toronto-Dominion Bank | 30,352 | ||||||||||||||
| �� | 155,692 | West Fraser Timber Co Ltd | 14,854 | |||||||||||||
| TOTAL CANADA | 486,638 | |||||||||||||||
| CHILE - 0.0% | ||||||||||||||||
| 3,678,651 | Banco de Chile | 287 | ||||||||||||||
| 4,215 | Banco de Credito e Inversiones | 123 | ||||||||||||||
| 252 |
COLLEGE RETIREMENT EQUITIES FUND - Global Equities Account
| SHARES | COMPANY | VALUE (000) | ||||||||||||||
| 5,276,304 | Banco Santander Chile S.A. | $ | 212 | |||||||||||||
| 317,313 | Cencosud S.A. | 531 | ||||||||||||||
| 33,645 | Cia Cervecerias Unidas S.A. | 276 | ||||||||||||||
| 249,086 | Empresas CMPC S.A. | 418 | ||||||||||||||
| 85,415 | Empresas COPEC S.A. | 660 | ||||||||||||||
| 6,315,205 | Enel Chile S.A. | 221 | ||||||||||||||
| 4,917,211 | Enersis S.A. | 538 | ||||||||||||||
| 168,104 | SACI Falabella | 548 | ||||||||||||||
| 29,858 | Sociedad Quimica y Minera de Chile S.A. (Class B) | 1,524 | ||||||||||||||
| TOTAL CHILE | 5,338 | |||||||||||||||
| CHINA - 3.7% | ||||||||||||||||
| 21,200 | * | 21Vianet Group, Inc (ADR) | 191 | |||||||||||||
| 19,300 | 360 Finance, Inc (ADR) | 443 | ||||||||||||||
| 34,200 | * | 360 Security Technology, Inc | 68 | |||||||||||||
| 114,500 | *,g | 3SBio, Inc | 95 | |||||||||||||
| 2,800 | * | 51job, Inc (ADR) | 137 | |||||||||||||
| 586,600 | AAC Technologies Holdings, Inc | 2,312 | ||||||||||||||
| 13,700 | Addsino Co Ltd | 36 | ||||||||||||||
| 8,577 | * | Advanced Micro-Fabrication Equipment, Inc China | 170 | |||||||||||||
| 12,600 | AECC Aero-Engine Control Co Ltd | 60 | ||||||||||||||
| 24,700 | AECC Aviation Power Co Ltd | 246 | ||||||||||||||
| 268,000 | e | Agile Property Holdings Ltd | 145 | |||||||||||||
| 4,400 | *,e | Agora, Inc (ADR) | 71 | |||||||||||||
| 2,555,000 | Agricultural Bank of China Ltd | 879 | ||||||||||||||
| 418,900 | Agricultural Bank of China Ltd (Class A) | 193 | ||||||||||||||
| 121,664 | Aier Eye Hospital Group Co Ltd | 808 | ||||||||||||||
| 22,200 | * | Air China Ltd | 32 | |||||||||||||
| 178,000 | * | Air China Ltd (H shares) | 124 | |||||||||||||
| 30,207 | Airtac International Group | 1,109 | ||||||||||||||
| 24,000 | *,g | Akeso, Inc | 105 | |||||||||||||
| 2,875,772 | * | Alibaba Group Holding Ltd | 42,261 | |||||||||||||
| 316,000 | * | Alibaba Health Information Technology Ltd | 268 | |||||||||||||
| 124,250 | g | A-Living Services Co Ltd | 212 | |||||||||||||
| 908,000 | * | Aluminum Corp of China Ltd | 500 | |||||||||||||
| 177,800 | * | Aluminum Corp of China Ltd (Class A) | 171 | |||||||||||||
| 10,300 | Angel Yeast Co Ltd | 98 | ||||||||||||||
| 110,500 | Anhui Conch Cement Co Ltd | 553 | ||||||||||||||
| 20,600 | Anhui Conch Cement Co Ltd (Class A) | 130 | ||||||||||||||
| 27,500 | Anhui Gujing Distillery Co Ltd | 391 | ||||||||||||||
| 4,800 | Anhui Gujing Distillery Co Ltd (Class A) | 184 | ||||||||||||||
| 4,000 | Anhui Honglu Steel Construction Group Co Ltd | 34 | ||||||||||||||
| 253 |
COLLEGE RETIREMENT EQUITIES FUND - Global Equities Account
| SHARES | COMPANY | VALUE (000) | ||||||||||||||
| 8,800 | Anhui Kouzi Distillery Co Ltd | $ | 98 | |||||||||||||
| 9,900 | Anhui Yingjia Distillery Co Ltd | 108 | ||||||||||||||
| 239,400 | Anta Sports Products Ltd | 3,595 | ||||||||||||||
| 4,500 | Apeloa Pharmaceutical Co Ltd | 25 | ||||||||||||||
| 1,100 | Asymchem Laboratories Tianjin Co Ltd | 75 | ||||||||||||||
| 5,244 | Autel Intelligent Technology Corp Ltd | 65 | ||||||||||||||
| 2,300 | Autobio Diagnostics Co Ltd | 20 | ||||||||||||||
| 6,300 | Autohome, Inc (ADR) | 186 | ||||||||||||||
| 19,300 | Avary Holding Shenzhen Co Ltd | 129 | ||||||||||||||
| 6,200 | Avic Capital Co Ltd | 4 | ||||||||||||||
| 29,300 | AVIC Electromechanical Systems Co Ltd | 84 | ||||||||||||||
| 427,000 | e | AviChina Industry & Technology Co | 295 | |||||||||||||
| 5,600 | AVICOPTER plc | 71 | ||||||||||||||
| 118,677 | * | Baidu, Inc (ADR) | 17,658 | |||||||||||||
| 139,000 | Bank of Beijing Co Ltd | 97 | ||||||||||||||
| 90,900 | Bank of Changsha Co Ltd | 111 | ||||||||||||||
| 19,300 | Bank of Chengdu Co Ltd | 36 | ||||||||||||||
| 212,800 | Bank of China Ltd | 102 | ||||||||||||||
| 18,555,000 | Bank of China Ltd (Hong Kong) | 6,675 | ||||||||||||||
| 245,700 | Bank of Communications Co Ltd | 178 | ||||||||||||||
| 818,000 | Bank of Communications Co Ltd (Hong Kong) | 494 | ||||||||||||||
| 30,200 | Bank of Hangzhou Co Ltd | 61 | ||||||||||||||
| 89,180 | Bank of Jiangsu Co Ltd | 82 | ||||||||||||||
| 57,400 | Bank of Nanjing Co Ltd | 81 | ||||||||||||||
| 33,000 | Bank of Ningbo Co Ltd | 198 | ||||||||||||||
| 81,122 | Bank of Shanghai Co Ltd | 91 | ||||||||||||||
| 341,000 | Baoshan Iron & Steel Co Ltd | 384 | ||||||||||||||
| 82,300 | BBMG Corp | 37 | ||||||||||||||
| 3,800 | * | BeiGene Ltd (ADR) | 1,030 | |||||||||||||
| 6,600 | * | Beijing BDStar Navigation Co Ltd | 41 | |||||||||||||
| 472,000 | * | Beijing Capital International Airport Co Ltd | 289 | |||||||||||||
| 54,600 | Beijing Dabeinong Technology Group Co Ltd | 90 | ||||||||||||||
| 6,100 | Beijing Easpring Material Technology Co Ltd | 83 | ||||||||||||||
| 5,040 | Beijing E-Hualu Information Technology Co Ltd | 28 | ||||||||||||||
| 42,500 | Beijing Enlight Media Co Ltd | 86 | ||||||||||||||
| 53,500 | Beijing Enterprises Holdings Ltd | 185 | ||||||||||||||
| 454,000 | Beijing Enterprises Water Group Ltd | 176 | ||||||||||||||
| 4,772 | Beijing Kingsoft Office Software, Inc | 199 | ||||||||||||||
| 9,500 | Beijing Kunlun Tech Co Ltd | 35 | ||||||||||||||
| 20,900 | Beijing New Building Materials plc | 118 | ||||||||||||||
| 49,900 | Beijing Originwater Technology Co Ltd | 56 | ||||||||||||||
| 717 | Beijing Roborock Technology Co Ltd | 91 | ||||||||||||||
| 254 |
COLLEGE RETIREMENT EQUITIES FUND - Global Equities Account
| SHARES | COMPANY | VALUE (000) | ||||||||||||||
| 8,160 | Beijing Shiji Information Technology Co Ltd | $ | 37 | |||||||||||||
| 9,800 | Beijing Shunxin Agriculture Co Ltd | 59 | ||||||||||||||
| 19,800 | Beijing Sinnet Technology Co Ltd | 46 | ||||||||||||||
| 6,340 | Beijing Tiantan Biological Products Corp Ltd | 29 | ||||||||||||||
| 4,100 | Beijing United Information Technology Co Ltd | 69 | ||||||||||||||
| 5,400 | Beijing Wantai Biological Pharmacy Enterprise Co Ltd | 188 | ||||||||||||||
| 23,000 | Beijing Yanjing Brewery Co Ltd | 31 | ||||||||||||||
| 3,300 | Beijing Yuanliu Hongyuan Electronic Technology Co Ltd | 93 | ||||||||||||||
| 205,000 | Beijing-Shanghai High Speed Railway Co Ltd | 155 | ||||||||||||||
| 1,900 | Betta Pharmaceuticals Co Ltd | 24 | ||||||||||||||
| 2,200 | BGI Genomics Co Ltd | 30 | ||||||||||||||
| 122,058 | *,e | Bilibili, Inc (ADR) | 5,663 | |||||||||||||
| 809,000 | BOC Hong Kong Holdings Ltd | 2,653 | ||||||||||||||
| 5,700 | BOC International China Co Ltd | 12 | ||||||||||||||
| 195,000 | BOE Technology Group Co Ltd | 155 | ||||||||||||||
| 704,000 | Bosideng International Holdings Ltd | 444 | ||||||||||||||
| 136,000 | * | Brilliance China Automotive Holdings Ltd | 65 | |||||||||||||
| 23,700 | BYD Co Ltd | 996 | ||||||||||||||
| 175,000 | BYD Co Ltd (H shares) | 5,919 | ||||||||||||||
| 52,000 | e | BYD Electronic International Co Ltd | 190 | |||||||||||||
| 20,900 | By-health Co Ltd | 88 | ||||||||||||||
| 18,000 | C&S Paper Co Ltd | 47 | ||||||||||||||
| 13,100 | Caitong Securities Co Ltd | 23 | ||||||||||||||
| 325 | * | CanSino Biologics, Inc | 15 | |||||||||||||
| 6,000 | *,e,g | CanSino Biologics, Inc | 139 | |||||||||||||
| 49,600 | CECEP Solar Energy Co Ltd | 87 | ||||||||||||||
| 106,200 | CECEP Wind-Power Corp | 108 | ||||||||||||||
| 339,000 | g | CGN Power Co Ltd | 103 | |||||||||||||
| 5,100 | Chacha Food Co Ltd | 49 | ||||||||||||||
| 2,600 | Changchun High & New Technology Industry Group, Inc | 111 | ||||||||||||||
| 24,000 | Changjiang Securities Co Ltd | 28 | ||||||||||||||
| 3,500 | Changzhou Xingyu Automotive Lighting Systems Co Ltd | 112 | ||||||||||||||
| 24,800 | Chaozhou Three-Circle Group Co Ltd | 174 | ||||||||||||||
| 34,200 | Chengtun Mining Group Co Ltd | 58 | ||||||||||||||
| 11,700 | * | Chengxin Lithium Group Co Ltd | 107 | |||||||||||||
| 22,900 | * | Chifeng Jilong Gold Mining Co Ltd | 54 | |||||||||||||
| 165,000 | China Aoyuan Group Ltd | 30 | ||||||||||||||
| 35,600 | China Baoan Group Co Ltd | 81 | ||||||||||||||
| 265,500 | g | China Bohai Bank Co Ltd | 102 | |||||||||||||
| 926,000 | China Cinda Asset Management Co Ltd | 169 | ||||||||||||||
| 255 |
COLLEGE RETIREMENT EQUITIES FUND - Global Equities Account
| SHARES | COMPANY | VALUE (000) | ||||||||||||||
| 884,000 | China Citic Bank | $ | 383 | |||||||||||||
| 656,000 | e | China Coal Energy Co | 379 | |||||||||||||
| 250,000 | China Communications Services Corp Ltd | 122 | ||||||||||||||
| 138,000 | China Conch Venture Holdings Ltd | 675 | ||||||||||||||
| 130,500 | China Construction Bank Corp | 120 | ||||||||||||||
| 22,683,000 | China Construction Bank Corp (Hong Kong) | 15,718 | ||||||||||||||
| 65,400 | China CSSC Holdings Ltd | 255 | ||||||||||||||
| 74,500 | g | China East Education Holdings Ltd | 47 | |||||||||||||
| 36,600 | * | China Eastern Airlines Corp Ltd | 30 | |||||||||||||
| 173,000 | China Education Group Holdings Ltd | 281 | ||||||||||||||
| 225,400 | China Everbright Bank Co Ltd | 117 | ||||||||||||||
| 337,000 | China Everbright Bank Co Ltd (Hong Kong) | 119 | ||||||||||||||
| 308,555 | China Everbright International Ltd | 248 | ||||||||||||||
| 780,000 | g | China Feihe Ltd | 1,047 | |||||||||||||
| 31,900 | * | China Fortune Land Development Co Ltd | 18 | |||||||||||||
| 291,000 | China Galaxy Securities Co Ltd | 167 | ||||||||||||||
| 10,900 | China Galaxy Securities Co Ltd (Class A) | 19 | ||||||||||||||
| 263,200 | China Gas Holdings Ltd | 547 | ||||||||||||||
| 9,700 | China Great Wall Securities Co Ltd | 20 | ||||||||||||||
| 27,400 | China Greatwall Technology Group Co Ltd | 61 | ||||||||||||||
| 536,500 | China Hongqiao Group Ltd | 567 | ||||||||||||||
| 437,000 | *,†,g | China Huarong Asset Management Co Ltd | 1 | |||||||||||||
| 424,200 | China Insurance International Holdings Co Ltd | 583 | ||||||||||||||
| 4,600 | China International Capital Corp Ltd | 35 | ||||||||||||||
| 121,200 | g | China International Capital Corp Ltd | 335 | |||||||||||||
| 26,015 | China International Travel Service Corp Ltd | 897 | ||||||||||||||
| 974,000 | China Jinmao Holdings Group Ltd | 301 | ||||||||||||||
| 19,929 | China Jushi Co Ltd | 57 | ||||||||||||||
| 90,000 | China Lesso Group Holdings Ltd | 129 | ||||||||||||||
| 1,705,000 | China Life Insurance Co Ltd | 2,826 | ||||||||||||||
| 30,600 | China Life Insurance Co Ltd (Class A) | 144 | ||||||||||||||
| 181,800 | *,e,g | China Literature Ltd | 1,144 | |||||||||||||
| 290,000 | China Longyuan Power Group Corp | 677 | ||||||||||||||
| 118,000 | China Medical System Holdings Ltd | 197 | ||||||||||||||
| 124,000 | China Meidong Auto Holdings Ltd | 639 | ||||||||||||||
| 709,000 | China Mengniu Dairy Co Ltd | 4,019 | ||||||||||||||
| 930,000 | China Merchants Bank Co Ltd | 7,235 | ||||||||||||||
| 947,787 | China Merchants Bank Co Ltd (Class A) | 7,245 | ||||||||||||||
| 141,426 | China Merchants Holdings International Co Ltd | 258 | ||||||||||||||
| 37,020 | China Merchants Securities Co Ltd | 103 | ||||||||||||||
| 110,700 | China Merchants Shekou Industrial Zone Holdings Co Ltd | 232 | ||||||||||||||
| 13,700 | China Minmetals Rare Earth Co Ltd | 84 | ||||||||||||||
| 256 |
COLLEGE RETIREMENT EQUITIES FUND - Global Equities Account
| SHARES | COMPANY | VALUE (000) | ||||||||||||||
| 199,900 | China Minsheng Banking Corp Ltd | $ | 122 | |||||||||||||
| 554,300 | e | China Minsheng Banking Corp Ltd (Hong Kong) | 212 | |||||||||||||
| 774,000 | China Molybdenum Co Ltd | 409 | ||||||||||||||
| 233,400 | China Molybdenum Co Ltd (Class A) | 205 | ||||||||||||||
| 346,000 | China National Building Material Co Ltd | 425 | ||||||||||||||
| 33,800 | China National Chemical Engineering Co Ltd | 64 | ||||||||||||||
| 3,600 | China National Medicines Corp Ltd | 18 | ||||||||||||||
| 97,100 | * | China National Nuclear Power Co Ltd | 126 | |||||||||||||
| 49,600 | China Northern Rare Earth Group High-Tech Co Ltd | 357 | ||||||||||||||
| 572,000 | China Oilfield Services Ltd | 502 | ||||||||||||||
| 661,435 | China Overseas Land & Investment Ltd | 1,567 | ||||||||||||||
| 220,000 | China Overseas Property Holdings Ltd | 233 | ||||||||||||||
| 98,000 | China Pacific Insurance Group Co Ltd | 417 | ||||||||||||||
| 605,200 | China Pacific Insurance Group Co Ltd (Hong Kong) | 1,644 | ||||||||||||||
| 479,000 | e | China Power International Development Ltd | 323 | |||||||||||||
| 126,300 | China Railway Group Ltd | 115 | ||||||||||||||
| 371,000 | China Railway Group Ltd (Hong Kong) | 196 | ||||||||||||||
| 83,084 | China Railway Signal & Communication Corp Ltd | 65 | ||||||||||||||
| 326,000 | China Resources Beer Holdings Company Ltd | 2,670 | ||||||||||||||
| 193,999 | China Resources Cement Holdings Ltd | 147 | ||||||||||||||
| 84,000 | China Resources Gas Group Ltd | 475 | ||||||||||||||
| 725,836 | China Resources Land Ltd | 3,058 | ||||||||||||||
| 131,800 | g | China Resources Mixc Lifestyle Services Ltd | 615 | |||||||||||||
| 172,000 | China Resources Power Holdings Co | 575 | ||||||||||||||
| 6,800 | China Resources Sanjiu Medical & Pharmaceutical Co Ltd | 37 | ||||||||||||||
| 118,000 | China Shenhua Energy Co Ltd | 417 | ||||||||||||||
| 835,500 | China Shenhua Energy Co Ltd (Hong Kong) | 1,955 | ||||||||||||||
| 14,600 | China South Publishing & Media Group Co Ltd | 22 | ||||||||||||||
| 134,000 | *,e | China Southern Airlines Co Ltd | 80 | |||||||||||||
| 34,000 | * | China Southern Airlines Co Ltd (Class A) | 36 | |||||||||||||
| 239,500 | China State Construction Engineering Corp Ltd | 188 | ||||||||||||||
| 178,000 | China State Construction International Holdings Ltd | 222 | ||||||||||||||
| 445,000 | China Suntien Green Energy Cor | 347 | ||||||||||||||
| 1,670,000 | g | China Tower Corp Ltd | 184 | |||||||||||||
| 16,400 | China TransInfo Technology Co Ltd | 38 | ||||||||||||||
| 404,900 | China Vanke Co Ltd | 943 | ||||||||||||||
| 144,258 | China Vanke Co Ltd (Class A) | 448 | ||||||||||||||
| 46,200 | China Yangtze Power Co Ltd | 164 | ||||||||||||||
| 358,000 | g | China Yuhua Education Corp Ltd | 128 | |||||||||||||
| 257 |
COLLEGE RETIREMENT EQUITIES FUND - Global Equities Account
| SHARES | COMPANY | VALUE (000) | ||||||||||||||
| 6,800 | China Zhenhua Group Science & Technology Co Ltd | $ | 133 | |||||||||||||
| 106,200 | China Zheshang Bank Co Ltd | 58 | ||||||||||||||
| 580,000 | Chinasoft International Ltd | 756 | ||||||||||||||
| 25,700 | * | Chindata Group Holdings Ltd (ADR) | 169 | |||||||||||||
| 5,900 | * | Chongqing Brewery Co Ltd | 140 | |||||||||||||
| 64,480 | Chongqing Changan Automobile Co Ltd | 154 | ||||||||||||||
| 12,300 | Chongqing Fuling Zhacai Group Co Ltd | 73 | ||||||||||||||
| 284,100 | Chongqing Rural Commercial Bank Co Ltd | 172 | ||||||||||||||
| 8,500 | Chongqing Zhifei Biological Products Co Ltd | 166 | ||||||||||||||
| 815,661 | CIFI Holdings Group Co Ltd | 491 | ||||||||||||||
| 507,000 | Citic Pacific Ltd | 502 | ||||||||||||||
| 208,500 | CITIC Securities Co Ltd | 545 | ||||||||||||||
| 61,800 | CITIC Securities Co Ltd (Class A) | 256 | ||||||||||||||
| 29,400 | CNNC Hua Yuan Titanium Dioxide Co Ltd | 58 | ||||||||||||||
| 30,900 | Contemporary Amperex Technology Co Ltd | 2,846 | ||||||||||||||
| 184,445 | COSCO Pacific Ltd | 160 | ||||||||||||||
| 118,800 | COSCO SHIPPING Development Co Ltd | 61 | ||||||||||||||
| 124,300 | COSCO SHIPPING Energy Transportation Co Ltd | 115 | ||||||||||||||
| 272,650 | *,e | COSCO SHIPPING Holdings Co Ltd | 529 | |||||||||||||
| 170,460 | * | COSCO SHIPPING Holdings Co Ltd | 502 | |||||||||||||
| 1,766,000 | Country Garden Holdings Co Ltd | 1,568 | ||||||||||||||
| 351,000 | Country Garden Services Holdings Co Ltd | 2,107 | ||||||||||||||
| 19,300 | CSC Financial Co Ltd | 89 | ||||||||||||||
| 766,880 | CSPC Pharmaceutical Group Ltd | 835 | ||||||||||||||
| 3,984 | Da An Gene Co Ltd of Sun Yat-Sen University | 13 | ||||||||||||||
| 5,200 | * | Dada Nexus Ltd (ADR) | 68 | |||||||||||||
| 469,000 | g | Dali Foods Group Co Ltd | 245 | |||||||||||||
| 73,392 | * | Daqo New Energy Corp (ADR) | 2,959 | |||||||||||||
| 9,260 | DaShenLin Pharmaceutical Group Co Ltd | 61 | ||||||||||||||
| 10,400 | DHC Software Co Ltd | 13 | ||||||||||||||
| 67,605 | *,e | DiDi Global, Inc (ADR) | 337 | |||||||||||||
| 11,500 | Do-Fluoride New Materials Co Ltd | 81 | ||||||||||||||
| 1,500 | Dong-E-E-Jiao Co Ltd | 11 | ||||||||||||||
| 38,900 | Dongfang Electric Corp Ltd | 131 | ||||||||||||||
| 608,000 | Dongfeng Motor Group Co Ltd | 505 | ||||||||||||||
| 11,300 | Dongxing Securities Co Ltd | 21 | ||||||||||||||
| 333,000 | Dongyue Group | 520 | ||||||||||||||
| 52,352 | East Money Information Co Ltd | 305 | ||||||||||||||
| 6,100 | Ecovacs Robotics Co Ltd | 144 | ||||||||||||||
| 66,900 | ENN Energy Holdings Ltd | 1,261 | ||||||||||||||
| 31,500 | ENN Natural Gas Co Ltd | 91 | ||||||||||||||
| 24,970 | Eve Energy Co Ltd | 463 | ||||||||||||||
| 258 |
COLLEGE RETIREMENT EQUITIES FUND - Global Equities Account
| SHARES | COMPANY | VALUE (000) | ||||||||||||||
| 172,000 | Ever Sunshine Lifestyle Services Group Ltd | $ | 267 | |||||||||||||
| 11,600 | Everbright Securities Co Ltd | 27 | ||||||||||||||
| 56,343 | Fangda Carbon New Material Co Ltd | 96 | ||||||||||||||
| 74,000 | e | Far East Horizon Ltd | 66 | |||||||||||||
| 33,800 | FAW Jiefang Group Co Ltd | 55 | ||||||||||||||
| 18,900 | Fiberhome Telecommunication Technologies Co Ltd | 53 | ||||||||||||||
| 24,300 | Financial Street Holdings Co Ltd | 22 | ||||||||||||||
| 25,300 | First Capital Securities Co Ltd | 29 | ||||||||||||||
| 17,300 | Flat Glass Group Co Ltd | 157 | ||||||||||||||
| 91,000 | e | Flat Glass Group Co Ltd | 463 | |||||||||||||
| 203,000 | Focus Media Information Technology Co Ltd | 261 | ||||||||||||||
| 45,098 | Foshan Haitian Flavouring & Food Co Ltd | 743 | ||||||||||||||
| 645,500 | Fosun International | 697 | ||||||||||||||
| 32,700 | Founder Securities Co Ltd | 40 | ||||||||||||||
| 1,104,387 | Foxconn Industrial Internet Co Ltd | 2,066 | ||||||||||||||
| 2,694 | Fu Jian Anjoy Foods Co Ltd | 72 | ||||||||||||||
| 13,400 | Fujian Sunner Development Co Ltd | 51 | ||||||||||||||
| 24,800 | Fuyao Glass Industry Group Co Ltd | 183 | ||||||||||||||
| 132,800 | g | Fuyao Glass Industry Group Co Ltd (Hong Kong) | 687 | |||||||||||||
| 58,600 | g | Ganfeng Lithium Co Ltd | 923 | |||||||||||||
| 14,900 | Ganfeng Lithium Co Ltd | 334 | ||||||||||||||
| 700 | G-bits Network Technology Xiamen Co Ltd | 46 | ||||||||||||||
| 100,500 | * | GCL System Integration Technology Co Ltd | 60 | |||||||||||||
| 130,800 | GD Power Development Co Ltd | 65 | ||||||||||||||
| 960,196 | * | GDS Holdings Ltd (ADR) | 45,283 | |||||||||||||
| 1,308,000 | Geely Automobile Holdings Ltd | 3,573 | ||||||||||||||
| 76,300 | GEM Co Ltd | 124 | ||||||||||||||
| 68,300 | Gemdale Corp | 139 | ||||||||||||||
| 426,000 | * | Genscript Biotech Corp | 1,885 | |||||||||||||
| 100,200 | GF Securities Co Ltd | 191 | ||||||||||||||
| 31,900 | GF Securities Co Ltd (Class A) | 123 | ||||||||||||||
| 11,200 | Giant Network Group Co Ltd | 21 | ||||||||||||||
| 9,072 | Gigadevice Semiconductor Beijing, Inc | 250 | ||||||||||||||
| 3,200 | Ginlong Technologies Co Ltd | 116 | ||||||||||||||
| 17,000 | GoerTek, Inc | 145 | ||||||||||||||
| 2,573,000 | *,e | GOME Electrical Appliances Holdings Ltd | 218 | |||||||||||||
| 17,200 | * | Gotion High-tech Co Ltd | 138 | |||||||||||||
| 28,100 | Great Wall Motor Co Ltd | 214 | ||||||||||||||
| 684,000 | Great Wall Motor Co Ltd | 2,350 | ||||||||||||||
| 136,940 | Greenland Holdings Corp Ltd | 93 | ||||||||||||||
| 188,000 | e | Greentown China Holdings Ltd | 303 | |||||||||||||
| 338,000 | Greentown Service Group Co Ltd | 312 | ||||||||||||||
| 259 |
COLLEGE RETIREMENT EQUITIES FUND - Global Equities Account
| SHARES | COMPANY | VALUE (000) | ||||||||||||||
| 33,100 | GRG Banking Equipment Co Ltd | $ | 62 | |||||||||||||
| 16,729 | *,e | GSX Techedu, Inc (ADR) | 32 | |||||||||||||
| 23,600 | Guangdong Haid Group Co Ltd | 271 | ||||||||||||||
| 284,000 | Guangdong Investments Ltd | 361 | ||||||||||||||
| 3,300 | Guangdong Kinlong Hardware Products Co Ltd | 94 | ||||||||||||||
| 6,700 | Guangdong Xinbao Electrical Appliances Holdings Co Ltd | 26 | ||||||||||||||
| 140,600 | * | Guanghui Energy Co Ltd | 145 | |||||||||||||
| 652,000 | Guangzhou Automobile Group Co Ltd (Hong Kong) | 643 | ||||||||||||||
| 4,900 | Guangzhou Baiyunshan Pharmaceutical Holdings Co Ltd | 26 | ||||||||||||||
| 36,400 | Guangzhou Haige Communications Group, Inc Co | 62 | ||||||||||||||
| 4,300 | Guangzhou Kingmed Diagnostics Group Co Ltd | 75 | ||||||||||||||
| 407,200 | e | Guangzhou R&F Properties Co Ltd | 152 | |||||||||||||
| 7,395 | Guangzhou Shiyuan Electronic Technology Co Ltd | 95 | ||||||||||||||
| 12,400 | Guangzhou Tinci Materials Technology Co Ltd | 223 | ||||||||||||||
| 9,990 | Guangzhou Yuexiu Financial Holdings Group Co Ltd | 14 | ||||||||||||||
| 12,200 | Guolian Securities Co Ltd | 27 | ||||||||||||||
| 29,100 | Guosen Securities Co Ltd | 52 | ||||||||||||||
| 42,200 | Guotai Junan Securities Co Ltd | 119 | ||||||||||||||
| 25,790 | Guoyuan Securities Co Ltd | 31 | ||||||||||||||
| 232,000 | e,g | Haidilao International Holding Ltd | 524 | |||||||||||||
| 82,600 | Haier Smart Home Co Ltd | 388 | ||||||||||||||
| 464,000 | Haier Smart Home Co Ltd | 1,962 | ||||||||||||||
| 150,000 | Haitian International Holdings Ltd | 417 | ||||||||||||||
| 278,000 | Haitong Securities Co Ltd | 246 | ||||||||||||||
| 54,600 | Haitong Securities Co Ltd (Class A) | 105 | ||||||||||||||
| 14,300 | * | Hang Zhou Great Star Industrial Co Ltd | 68 | |||||||||||||
| 13,740 | Hangzhou First Applied Material Co Ltd | 281 | ||||||||||||||
| 11,100 | Hangzhou Oxygen Plant Group Co Ltd | 52 | ||||||||||||||
| 13,830 | Hangzhou Robam Appliances Co Ltd | 78 | ||||||||||||||
| 18,800 | Hangzhou Silan Microelectronics Co Ltd | 160 | ||||||||||||||
| 1,800 | Hangzhou Tigermed Consulting Co Ltd | 36 | ||||||||||||||
| 10,900 | g | Hangzhou Tigermed Consulting Co Ltd (Hong Kong) | 138 | |||||||||||||
| 108,000 | g | Hansoh Pharmaceutical Group Co Ltd | 264 | |||||||||||||
| 8,200 | Hefei Meiya Optoelectronic Technology, Inc | 48 | ||||||||||||||
| 23,700 | Heilongjiang Agriculture Co Ltd | 54 | ||||||||||||||
| 13,200 | Hello Group, Inc (ADR) | 119 | ||||||||||||||
| 40,700 | Henan Shuanghui Investment & Development Co Ltd | 201 | ||||||||||||||
| 147,000 | Hengan International Group Co Ltd | 757 | ||||||||||||||
| 76,380 | Hengli Petrochemical Co Ltd | 275 | ||||||||||||||
| 260 |
COLLEGE RETIREMENT EQUITIES FUND - Global Equities Account
| SHARES | COMPANY | VALUE (000) | ||||||||||||||
| 624,000 | *,e | HengTen Networks Group Ltd | $ | 237 | ||||||||||||
| 53,200 | Hengtong Optic-electric Co Ltd | 126 | ||||||||||||||
| 44,630 | Hengyi Petrochemical Co Ltd | 74 | ||||||||||||||
| 316,900 | Hesteel Co Ltd | 122 | ||||||||||||||
| 2,800 | Hithink RoyalFlush Information Network Co Ltd | 64 | ||||||||||||||
| 10,900 | Hongfa Technology Co Ltd | 128 | ||||||||||||||
| 165,880 | e | Hopson Development Holdings Ltd | 346 | |||||||||||||
| 6,200 | Hoshine Silicon Industry Co Ltd | 128 | ||||||||||||||
| 42,000 | *,g | Hua Hong Semiconductor Ltd | 232 | |||||||||||||
| 56,600 | Huadian Power International Corp Ltd (Class A) | 48 | ||||||||||||||
| 9,440 | Huadong Medicine Co Ltd | 60 | ||||||||||||||
| 51,600 | Huafon Chemical Co Ltd | 85 | ||||||||||||||
| 17,800 | Huagong Tech Co Ltd | 78 | ||||||||||||||
| 10,260 | Hualan Biological Engineering, Inc | 47 | ||||||||||||||
| 45,600 | Huaneng Power International, Inc | 69 | ||||||||||||||
| 344,000 | Huaneng Power International, Inc (Hong Kong) | 230 | ||||||||||||||
| 151,000 | g | Huatai Securities Co Ltd | 252 | |||||||||||||
| 15,500 | Huatai Securities Co Ltd (Class A) | 43 | ||||||||||||||
| 14,200 | Huaxi Securities Co Ltd | 22 | ||||||||||||||
| 88,500 | Huaxia Bank Co Ltd | 78 | ||||||||||||||
| 3,500 | Huaxin Cement Co Ltd | 11 | ||||||||||||||
| 41,400 | Huayu Automotive Systems Co Ltd | 184 | ||||||||||||||
| 39,637 | * | Huazhu Group Ltd (ADR) | 1,480 | |||||||||||||
| 16,400 | Hubei Xingfa Chemicals Group Co Ltd | 98 | ||||||||||||||
| 5,800 | Huizhou Desay Sv Automotive Co Ltd | 129 | ||||||||||||||
| 4,700 | Humanwell Healthcare Group Co Ltd | 17 | ||||||||||||||
| 74,300 | Hunan Valin Steel Co Ltd | 60 | ||||||||||||||
| 6,948 | Hundsun Technologies, Inc | 68 | ||||||||||||||
| 6,671 | * | Hutchison China MediTech Ltd (ADR) | 234 | |||||||||||||
| 173,198 | * | HUYA, Inc (ADR) | 1,202 | |||||||||||||
| 77,200 | e,g | Hygeia Healthcare Holdings Co Ltd | 484 | |||||||||||||
| 251,311 | * | iClick Interactive Asia Group Ltd (ADR) | 1,159 | |||||||||||||
| 13,200 | Iflytek Co Ltd | 109 | ||||||||||||||
| 17,800 | * | I-Mab (ADR) | 844 | |||||||||||||
| 2,900 | Imeik Technology Development Co Ltd | 244 | ||||||||||||||
| 337,500 | Industrial & Commercial Bank of China Ltd | 245 | ||||||||||||||
| 13,751,000 | Industrial & Commercial Bank of China Ltd (Hong Kong) | 7,757 | ||||||||||||||
| 104,900 | Industrial Bank Co Ltd | 313 | ||||||||||||||
| 32,300 | Industrial Securities Co Ltd | 50 | ||||||||||||||
| 6,300 | Ingenic Semiconductor Co Ltd | 133 | ||||||||||||||
| 634,000 | * | Inner Mongolia BaoTou Steel Union Co Ltd | 278 | |||||||||||||
| 261 |
COLLEGE RETIREMENT EQUITIES FUND - Global Equities Account
| SHARES | COMPANY | VALUE (000) | ||||||||||||||
| 115,800 | Inner Mongolia Junzheng Energy & Chemical Industry Group Co Ltd | $ | 95 | |||||||||||||
| 84,300 | Inner Mongolia Yili Industrial Group Co Ltd | 549 | ||||||||||||||
| 62,600 | * | Inner Mongolia Yuan Xing Energy Co Ltd | 72 | |||||||||||||
| 340,000 | *,g | Innovent Biologics, Inc | 2,105 | |||||||||||||
| 5,000 | Inspur Electronic Information Industry Co Ltd | 28 | ||||||||||||||
| 2,500 | Intco Medical Technology Co Ltd | 23 | ||||||||||||||
| 25,453 | *,e | IQIYI, Inc (ADR) | 116 | |||||||||||||
| 21,500 | JA Solar Technology Co Ltd | 312 | ||||||||||||||
| 3,760 | Jafron Biomedical Co Ltd | 32 | ||||||||||||||
| 6,800 | Jason Furniture Hangzhou Co Ltd | 82 | ||||||||||||||
| 29,350 | *,e,g | JD Health International, Inc | 232 | |||||||||||||
| 1,206,328 | *,h | JD.com, Inc | 41,561 | |||||||||||||
| 42,200 | Jiangsu Eastern Shenghong Co Ltd | 128 | ||||||||||||||
| 148,000 | Jiangsu Express | 152 | ||||||||||||||
| 15,804 | Jiangsu Hengli Hydraulic Co Ltd | 203 | ||||||||||||||
| 31,982 | Jiangsu Hengrui Medicine Co Ltd | 255 | ||||||||||||||
| 16,100 | Jiangsu King’s Luck Brewery JSC Ltd | 137 | ||||||||||||||
| 19,800 | Jiangsu Yanghe Brewery Joint-Stock Co Ltd | 513 | ||||||||||||||
| 3,000 | Jiangsu Yangnong Chemical Co Ltd | 62 | ||||||||||||||
| 4,700 | Jiangsu Yoke Technology Co Ltd | 60 | ||||||||||||||
| 5,200 | Jiangsu Yuyue Medical Equipment & Supply Co Ltd | 31 | ||||||||||||||
| 46,700 | Jiangsu Zhongtian Technology Co Ltd | 124 | ||||||||||||||
| 277,000 | Jiangxi Copper Co Ltd | 445 | ||||||||||||||
| 28,958 | Jiangxi Copper Co Ltd (Class A) | 102 | ||||||||||||||
| 38,500 | Jiangxi Zhengbang Technology Co Ltd | 58 | ||||||||||||||
| 61,200 | Jinke Properties Group Co Ltd | 43 | ||||||||||||||
| 100,000 | *,e,g | Jinxin Fertility Group Ltd | 112 | |||||||||||||
| 4,500 | JiuGui Liquor Co Ltd | 150 | ||||||||||||||
| 174,000 | e,g | Jiumaojiu International Holdings Ltd | 306 | |||||||||||||
| 8,900 | Joincare Pharmaceutical Group Industry Co Ltd | 18 | ||||||||||||||
| 1,540 | Joinn Laboratories China Co Ltd | 28 | ||||||||||||||
| 17,200 | Jointown Pharmaceutical Group Co Ltd | 40 | ||||||||||||||
| 11,700 | Jonjee Hi-Tech Industrial And Commercial Holding Co Ltd | 70 | ||||||||||||||
| 6,200 | Joyoung Co Ltd | 23 | ||||||||||||||
| 5,000 | JOYY, Inc (ADR) | 227 | ||||||||||||||
| 6,900 | Juewei Food Co Ltd | 74 | ||||||||||||||
| 15,600 | * | Kanzhun Ltd (ADR) | 544 | |||||||||||||
| 30,800 | * | KE Holdings, Inc (ADR) | 620 | |||||||||||||
| 56,500 | Kingboard Chemical Holdings Ltd | 275 | ||||||||||||||
| 215,000 | * | Kingdee International Software Group Co Ltd | 662 | |||||||||||||
| 262 |
COLLEGE RETIREMENT EQUITIES FUND - Global Equities Account
| SHARES | COMPANY | VALUE (000) | ||||||||||||||
| 26,600 | Kingfa Sci & Tech Co Ltd | $ | 53 | |||||||||||||
| 4,700 | *,e | Kingsoft Cloud Holdings Ltd (ADR) | 74 | |||||||||||||
| 80,000 | Kingsoft Corp Ltd | 352 | ||||||||||||||
| 73,900 | *,g | Kuaishou Technology | 685 | |||||||||||||
| 26,300 | * | Kuang-Chi Technologies Co Ltd | 99 | |||||||||||||
| 16,797 | Kweichow Moutai Co Ltd | 5,398 | ||||||||||||||
| 296,064 | KWG Group Holdings Ltd | 194 | ||||||||||||||
| 8,600 | Lakala Payment Co Ltd | 39 | ||||||||||||||
| 4,360 | Laobaixing Pharmacy Chain JSC | 34 | ||||||||||||||
| 326,000 | Lee & Man Paper Manufacturing Ltd | 227 | ||||||||||||||
| 3,232,000 | Lenovo Group Ltd | 3,714 | ||||||||||||||
| 62,800 | Lens Technology Co Ltd | 227 | ||||||||||||||
| 1,300 | Lepu Medical Technology Beijing Co Ltd | 5 | ||||||||||||||
| 42,800 | Leyard Optoelectronic Co Ltd | 69 | ||||||||||||||
| 121,991 | * | Li Auto, Inc (ADR) | 3,916 | |||||||||||||
| 499,500 | Li Ning Co Ltd | 5,480 | ||||||||||||||
| 12,400 | Liaoning Cheng Da Co Ltd | 38 | ||||||||||||||
| 70,100 | * | Lingyi iTech Guangdong Co | 81 | |||||||||||||
| 2,100 | Livzon Pharmaceutical Group, Inc | 13 | ||||||||||||||
| 326,000 | Logan Property Holdings Co Ltd | 249 | ||||||||||||||
| 32,600 | Lomon Billions Group Co Ltd | 146 | ||||||||||||||
| 409,000 | g | Longfor Properties Co Ltd | 1,929 | |||||||||||||
| 71,764 | LONGi Green Energy Technology Co Ltd | 971 | ||||||||||||||
| 2,100 | Luoyang Xinqianglian Slewing Bearing Co Ltd | 59 | ||||||||||||||
| 32,700 | Luxi Chemical Group Co Ltd | 78 | ||||||||||||||
| 90,309 | Luxshare Precision Industry Co Ltd | 698 | ||||||||||||||
| 19,400 | Luzhou Laojiao Co Ltd | 773 | ||||||||||||||
| 24,690 | Mango Excellent Media Co Ltd | 222 | ||||||||||||||
| 4,580 | Maxscend Microelectronics Co Ltd | 235 | ||||||||||||||
| 18,800 | * | Meinian Onehealth Healthcare Holdings Co Ltd | 23 | |||||||||||||
| 868,600 | *,g | Meituan Dianping (Class B) | 25,118 | |||||||||||||
| 88,200 | Metallurgical Corp of China Ltd | 53 | ||||||||||||||
| 10,400 | * | Mianyang Fulin Precision Co Ltd | 48 | |||||||||||||
| 51,900 | Microport Scientific Corp | 189 | ||||||||||||||
| 28,700 | Midea Group Co Ltd | 332 | ||||||||||||||
| 27,700 | Ming Yang Smart Energy Group Ltd | 114 | ||||||||||||||
| 108,000 | e | Ming Yuan Cloud Group Holdings Ltd | 246 | |||||||||||||
| 168,000 | Minth Group Ltd | 740 | ||||||||||||||
| 696,000 | * | MMG Ltd | 224 | |||||||||||||
| 11,165 | Montage Technology Co Ltd | 147 | ||||||||||||||
| 67,844 | Muyuan Foodstuff Co Ltd | 569 | ||||||||||||||
| 20,000 | NanJi E-Commerce Co Ltd | 22 | ||||||||||||||
| 263 |
COLLEGE RETIREMENT EQUITIES FUND - Global Equities Account
| SHARES | COMPANY | VALUE (000) | ||||||||||||||
| 5,589 | Nanjing King-Friend Biochemical Pharmaceutical Co Ltd | $ | 37 | |||||||||||||
| 14,400 | Nanjing Securities Co Ltd | 22 | ||||||||||||||
| 75,800 | NARI Technology Co Ltd | 477 | ||||||||||||||
| 25,590 | * | National Silicon Industry Group Co Ltd | 104 | |||||||||||||
| 7,100 | NAURA Technology Group Co Ltd | 387 | ||||||||||||||
| 22,100 | * | NavInfo Co Ltd | 55 | |||||||||||||
| 514,395 | NetEase, Inc | 10,400 | ||||||||||||||
| 29,900 | New China Life Insurance Co Ltd | 182 | ||||||||||||||
| 230,100 | New China Life insurance Co Ltd (Hong Kong) | 616 | ||||||||||||||
| 52,400 | * | New Hope Liuhe Co Ltd | 125 | |||||||||||||
| 344,408 | * | New Oriental Education & Technology Group (ADR) | 723 | |||||||||||||
| 16,300 | Ninestar Corp | 122 | ||||||||||||||
| 14,600 | Ningbo Joyson Electronic Corp | 50 | ||||||||||||||
| 12,400 | Ningbo Tuopu Group Co Ltd | 103 | ||||||||||||||
| 84,400 | Ningxia Baofeng Energy Group Co Ltd | 230 | ||||||||||||||
| 294,030 | * | NIO, Inc (ADR) | 9,315 | |||||||||||||
| 3,400 | * | Noah Holdings Ltd (ADR) | 104 | |||||||||||||
| 396,400 | e,g | Nongfu Spring Co Ltd | 2,618 | |||||||||||||
| 27,100 | * | North Industries Group Red Arrow Co Ltd | 113 | |||||||||||||
| 5,300 | Northeast Securities Co Ltd | 7 | ||||||||||||||
| 247,363 | NXP Semiconductors NV | 56,344 | ||||||||||||||
| 18,400 | * | Offcn Education Technology Co Ltd | 23 | |||||||||||||
| 179,600 | Offshore Oil Engineering Co Ltd | 130 | ||||||||||||||
| 10,800 | * | OFILM Group Co Ltd | 16 | |||||||||||||
| 6,740 | Oppein Home Group, Inc | 156 | ||||||||||||||
| 37,600 | Orient Securities Co Ltd | 87 | ||||||||||||||
| 3,809 | Ovctek China, Inc | 34 | ||||||||||||||
| 134,600 | * | Pangang Group Vanadium Titanium & Resources Co Ltd | 82 | |||||||||||||
| 2,199,000 | People’s Insurance Co Group of China Ltd | 666 | ||||||||||||||
| 142,300 | People’s Insurance Co Group of China Ltd (Class A) | 105 | ||||||||||||||
| 11,200 | Perfect World Co Ltd | 36 | ||||||||||||||
| 2,400 | PharmaBlock Sciences Nanjing, Inc | 54 | ||||||||||||||
| 3,100 | Pharmaron Beijing Co Ltd | 69 | ||||||||||||||
| 11,000 | g | Pharmaron Beijing Co Ltd | 170 | |||||||||||||
| 1,660,000 | PICC Property & Casualty Co Ltd | 1,357 | ||||||||||||||
| 218,337 | * | Pinduoduo, Inc (ADR) | 12,729 | |||||||||||||
| 272,700 | Ping An Bank Co Ltd | 705 | ||||||||||||||
| 39,600 | *,e,g | Ping An Healthcare and Technology Co Ltd | 144 | |||||||||||||
| 5,454,703 | Ping An Insurance Group Co of China Ltd | 39,307 | ||||||||||||||
| 150,600 | Ping An Insurance Group Co of China Ltd (Class A) | 1,192 | ||||||||||||||
| 264 |
COLLEGE RETIREMENT EQUITIES FUND - Global Equities Account
| SHARES | COMPANY | VALUE (000) | ||||||||||||||
| 170,400 | Poly Real Estate Group Co Ltd | $ | 418 | |||||||||||||
| 153,300 | Postal Savings Bank of China Co Ltd | 123 | ||||||||||||||
| 2,441,000 | g | Postal Savings Bank of China Co Ltd | 1,714 | |||||||||||||
| 90,300 | Power Construction Corp of China Ltd | 115 | ||||||||||||||
| 390,000 | Powerlong Real Estate Holdings Ltd | 204 | ||||||||||||||
| 3,000 | Proya Cosmetics Co Ltd | 98 | ||||||||||||||
| 6,500 | Qianhe Condiment and Food Co Ltd | 25 | ||||||||||||||
| 38,600 | Qingdao Rural Commercial Bank Corp | 23 | ||||||||||||||
| 5,313 | Raytron Technology Co Ltd | 66 | ||||||||||||||
| 82,200 | RiseSun Real Estate Development Co Ltd | 56 | ||||||||||||||
| 12,000 | Riyue Heavy Industry Co Ltd | 62 | ||||||||||||||
| 136,730 | *,e | RLX Technology, Inc (ADR) | 533 | |||||||||||||
| 123,450 | Rongsheng Petro Chemical Co Ltd | 352 | ||||||||||||||
| 103,700 | SAIC Motor Corp Ltd | 336 | ||||||||||||||
| 35,700 | Sailun Group Co Ltd | 83 | ||||||||||||||
| 5,700 | Sangfor Technologies, Inc | 171 | ||||||||||||||
| 265,000 | Sany Heavy Equipment International | 257 | ||||||||||||||
| 112,300 | Sany Heavy Industry Co Ltd | 402 | ||||||||||||||
| 32,896 | SDIC Capital Co Ltd | 42 | ||||||||||||||
| 43,400 | SDIC Power Holdings Co Ltd | 78 | ||||||||||||||
| 48,700 | Sealand Securities Co Ltd | 31 | ||||||||||||||
| 186,000 | Seazen Group Ltd | 126 | ||||||||||||||
| 30,900 | * | Seazen Holdings Co Ltd | 141 | |||||||||||||
| 127,710 | SF Holding Co Ltd | 1,382 | ||||||||||||||
| 3,200 | SG Micro Corp | 155 | ||||||||||||||
| 150,500 | Shaanxi Coal Industry Co Ltd | 289 | ||||||||||||||
| 7,670 | Shandong Buchang Pharmaceuticals Co Ltd | 25 | ||||||||||||||
| 58,620 | Shandong Gold Mining Co Ltd | 174 | ||||||||||||||
| 164,500 | e,g | Shandong Gold Mining Co Ltd | 282 | |||||||||||||
| 27,550 | Shandong Hualu Hengsheng Chemical Co Ltd | 135 | ||||||||||||||
| 15,600 | Shandong Linglong Tyre Co Ltd | 90 | ||||||||||||||
| 162,400 | Shandong Nanshan Aluminum Co Ltd | 121 | ||||||||||||||
| 25,400 | Shandong Sun Paper Industry JSC Ltd | 46 | ||||||||||||||
| 205,600 | Shandong Weigao Group Medical Polymer Co Ltd | 256 | ||||||||||||||
| 8,480 | Shanghai Bairun Investment Holding Group Co Ltd | 79 | ||||||||||||||
| 4,510 | Shanghai Baosight Software Co Ltd | 43 | ||||||||||||||
| 95,100 | Shanghai Baosight Software Co Ltd | 459 | ||||||||||||||
| 51,300 | Shanghai Construction Group Co Ltd | 29 | ||||||||||||||
| 202,000 | Shanghai Electric Group Co Ltd | 154 | ||||||||||||||
| 8,700 | Shanghai Fosun Pharmaceutical Group Co Ltd | 67 | ||||||||||||||
| 210,500 | e | Shanghai Fosun Pharmaceutical Group Co Ltd (Hong Kong) | 927 | |||||||||||||
| 265 |
COLLEGE RETIREMENT EQUITIES FUND - Global Equities Account
| SHARES | COMPANY | VALUE (000) | ||||||||||||||
| 845 | Shanghai Friendess Electronic Technology Corp Ltd | $ | 51 | |||||||||||||
| 13,800 | * | Shanghai International Airport Co Ltd | 101 | |||||||||||||
| 60,700 | Shanghai International Port Group Co Ltd | 52 | ||||||||||||||
| 8,100 | Shanghai Jahwa United Co Ltd | 51 | ||||||||||||||
| 11,800 | Shanghai Jinjiang International Hotels Development Co Ltd | 109 | ||||||||||||||
| 7,376 | * | Shanghai Junshi Biosciences Co Ltd | 78 | |||||||||||||
| 10,360 | Shanghai Lingang Holdings Corp Ltd | 24 | ||||||||||||||
| 362,369 | Shanghai Lujiazui Finance & Trade Zone Development Co Ltd | 330 | ||||||||||||||
| 10,900 | Shanghai M&G Stationery, Inc | 110 | ||||||||||||||
| 825 | Shanghai Medicilon, Inc | 63 | ||||||||||||||
| 16,700 | Shanghai Pharmaceuticals Holding Co Ltd | 52 | ||||||||||||||
| 66,100 | Shanghai Pharmaceuticals Holding Co Ltd (Hong Kong) | 125 | ||||||||||||||
| 160,800 | Shanghai Pudong Development Bank Co Ltd | 215 | ||||||||||||||
| 9,840 | Shanghai Putailai New Energy Technology Co Ltd | 248 | ||||||||||||||
| 43,200 | Shanghai RAAS Blood Products Co Ltd | 46 | ||||||||||||||
| 33,200 | Shanghai Yuyuan Tourist Mart Group Co Ltd | 54 | ||||||||||||||
| 19,000 | Shanghai Zhangjiang High-Tech Park Development Co Ltd | 45 | ||||||||||||||
| 67,279 | Shanxi Lu’an Environmental Energy Development Co Ltd | 120 | ||||||||||||||
| 64,000 | * | Shanxi Meijin Energy Co Ltd | 163 | |||||||||||||
| 19,330 | Shanxi Securities Co Ltd | 20 | ||||||||||||||
| 85,500 | Shanxi Taigang Stainless Steel Co Ltd | 95 | ||||||||||||||
| 15,720 | Shanxi Xinghuacun Fen Wine Factory Co Ltd | 778 | ||||||||||||||
| 76,570 | Shanxi Xishan Coal & Electricity Power Co Ltd | 100 | ||||||||||||||
| 25,000 | Shenghe Resources Holding Co Ltd | 77 | ||||||||||||||
| 29,100 | Shengyi Technology Co Ltd | 107 | ||||||||||||||
| 4,680 | Shennan Circuits Co Ltd | 89 | ||||||||||||||
| 119,600 | Shenwan Hongyuan Group Co Ltd | 96 | ||||||||||||||
| 5,600 | Shenzhen Capchem Technology Co Ltd | 99 | ||||||||||||||
| 40,900 | Shenzhen Energy Group Co Ltd | 52 | ||||||||||||||
| 6,600 | Shenzhen Goodix Technology Co Ltd | 112 | ||||||||||||||
| 34,100 | Shenzhen Inovance Technology Co Ltd | 367 | ||||||||||||||
| 127,485 | Shenzhen International Holdings Ltd | 132 | ||||||||||||||
| 11,260 | Shenzhen Investment Holdings Bay Area Development Co Ltd | 4 | ||||||||||||||
| 362,000 | Shenzhen Investment Ltd | 78 | ||||||||||||||
| 12,300 | Shenzhen Kaifa Technology Co Ltd | 31 | ||||||||||||||
| 2,900 | Shenzhen Kangtai Biological Products Co Ltd | 45 | ||||||||||||||
| 3,100 | Shenzhen Kedali Industry Co Ltd | 78 | ||||||||||||||
| 6,500 | Shenzhen Mindray Bio-Medical Electronics Co Ltd | 388 | ||||||||||||||
| 266 |
COLLEGE RETIREMENT EQUITIES FUND - Global Equities Account
| SHARES | COMPANY | VALUE (000) | ||||||||||||||
| 46,000 | * | Shenzhen MTC Co Ltd | $ | 35 | ||||||||||||
| 8,300 | Shenzhen New Industries Biomedical Engineering Co Ltd | 57 | ||||||||||||||
| 96,000 | Shenzhen Overseas Chinese Town Co Ltd | 106 | ||||||||||||||
| 4,400 | * | Shenzhen Salubris Pharmaceuticals Co Ltd | 19 | |||||||||||||
| 4,100 | Shenzhen SC New Energy Technology Corp | 74 | ||||||||||||||
| 10,600 | Shenzhen Senior Technology Material Co Ltd | 61 | ||||||||||||||
| 9,700 | Shenzhen Sunlord Electronics Co Ltd | 58 | ||||||||||||||
| 12,400 | Shenzhen Sunway Communication Co Ltd | 49 | ||||||||||||||
| 8,665 | Shenzhen Transsion Holdings Co Ltd | 214 | ||||||||||||||
| 185,100 | Shenzhou International Group Holdings Ltd | 3,584 | ||||||||||||||
| 8,580 | Shijiazhuang Yiling Pharmaceutical Co Ltd | 26 | ||||||||||||||
| 294,500 | e | Shimao Property Holdings Ltd | 193 | |||||||||||||
| 135,000 | e,g | Shimao Services Holdings Ltd | 94 | |||||||||||||
| 28,900 | Sichuan Chuantou Energy Co Ltd | 57 | ||||||||||||||
| 154,500 | * | Sichuan Hebang Biotechnology Co Ltd | 83 | |||||||||||||
| 3,700 | Sichuan Kelun Pharmaceutical Co Ltd | 11 | ||||||||||||||
| 18,700 | * | Sichuan New Energy Power Co Ltd | 78 | |||||||||||||
| 70,100 | Sichuan Road & Bridge Co Ltd | 132 | ||||||||||||||
| 6,300 | Sichuan Swellfun Co Ltd | 119 | ||||||||||||||
| 15,300 | Sichuan Yahua Industrial Group Co Ltd | 69 | ||||||||||||||
| 10,600 | Sieyuan Electric Co Ltd | 82 | ||||||||||||||
| 174,400 | Silergy Corp | 31,566 | ||||||||||||||
| 13,900 | Sinolink Securities Co Ltd | 25 | ||||||||||||||
| 21,400 | Sinoma Science & Technology Co Ltd | 114 | ||||||||||||||
| 128,100 | Sinopec Shanghai Petrochemical Co Ltd (Class A) | 84 | ||||||||||||||
| 117,600 | Sinopharm Group Co | 256 | ||||||||||||||
| 8,100 | Sinotrans Ltd (Class A) | 6 | ||||||||||||||
| 176,500 | Sinotruk Hong Kong Ltd | 272 | ||||||||||||||
| 4,200 | Skshu Paint Co Ltd | 92 | ||||||||||||||
| 312,000 | e,g | Smoore International Holdings Ltd | 1,593 | |||||||||||||
| 40,200 | Songcheng Performance Development Co Ltd | 90 | ||||||||||||||
| 28,262 | SooChow Securities Co Ltd | 39 | ||||||||||||||
| 29,700 | Southwest Securities Co Ltd | 25 | ||||||||||||||
| 2,300 | StarPower Semiconductor Ltd | 137 | ||||||||||||||
| 445,000 | e | Sun Art Retail Group Ltd | 179 | |||||||||||||
| 642,000 | Sunac China Holdings Ltd | 971 | ||||||||||||||
| 251,000 | g | Sunac Services Holdings Ltd | 256 | |||||||||||||
| 19,600 | Sungrow Power Supply Co Ltd | 449 | ||||||||||||||
| 125,800 | * | Suning.com Co Ltd | 81 | |||||||||||||
| 60,000 | Sunny Optical Technology Group Co Ltd | 1,900 | ||||||||||||||
| 21,700 | Sunwoda Electronic Co Ltd | 144 | ||||||||||||||
| 267 |
COLLEGE RETIREMENT EQUITIES FUND - Global Equities Account
| SHARES | COMPANY | VALUE (000) | ||||||||||||||
| 3,700 | Suofeiya Home Collection Co Ltd | $ | 13 | |||||||||||||
| 21,400 | Suzhou Dongshan Precision Manufacturing Co Ltd | 91 | ||||||||||||||
| 21,900 | Suzhou Gold Mantis Construction Decoration Co Ltd | 21 | ||||||||||||||
| 1,200 | Suzhou Maxwell Technologies Co Ltd | 121 | ||||||||||||||
| 7,900 | Suzhou TA&A Ultra Clean Technology Co Ltd | 101 | ||||||||||||||
| 93,277 | * | TAL Education Group (ADR) | 367 | |||||||||||||
| 55,000 | TBEA Co Ltd | 182 | ||||||||||||||
| 182,800 | TCL Technology Group Corp | 177 | ||||||||||||||
| 5,084,800 | Tencent Holdings Ltd | 296,703 | ||||||||||||||
| 54,900 | * | Tencent Music Entertainment (ADR) | 376 | |||||||||||||
| 4,800 | Thunder Software Technology Co Ltd | 104 | ||||||||||||||
| 29,300 | Tianfeng Securities Co Ltd | 19 | ||||||||||||||
| 6,500 | Tianjin 712 Communication & Broadcasting Co Ltd | 44 | ||||||||||||||
| 43,300 | Tianjin Zhonghuan Semiconductor Co Ltd | 283 | ||||||||||||||
| 19,200 | Tianma Microelectronics Co Ltd | 39 | ||||||||||||||
| 58,000 | Tianshan Aluminum Group Co Ltd | 74 | ||||||||||||||
| 35,700 | Tianshui Huatian Technology Co Ltd | 71 | ||||||||||||||
| 13,400 | Tibet Summit Resources Co Ltd | 79 | ||||||||||||||
| 436,000 | Tingyi Cayman Islands Holding Corp | 897 | ||||||||||||||
| 28,100 | Titan Wind Energy Suzhou Co Ltd | 86 | ||||||||||||||
| 11,240 | Toly Bread Co Ltd | 50 | ||||||||||||||
| 84,000 | * | Tongcheng-Elong Holdings Ltd | 156 | |||||||||||||
| 18,200 | TongFu Microelectronics Co Ltd | 56 | ||||||||||||||
| 28,500 | Tongkun Group Co Ltd | 95 | ||||||||||||||
| 165,800 | Tongling Nonferrous Metals Group Co Ltd | 91 | ||||||||||||||
| 59,200 | Tongwei Co Ltd | 418 | ||||||||||||||
| 1,500 | * | Topchoice Medical Corp | 47 | |||||||||||||
| 18,700 | Topsec Technologies Group Inc | 56 | ||||||||||||||
| 338,000 | g | Topsports International Holdings Ltd | 342 | |||||||||||||
| 43,300 | Transfar Zhilian Co Ltd | 59 | ||||||||||||||
| 79,000 | Travelsky Technology Ltd | 133 | ||||||||||||||
| 43,478 | * | Trip.com Group Ltd (ADR) | 1,070 | |||||||||||||
| 122,000 | Tsingtao Brewery Co Ltd | 1,142 | ||||||||||||||
| 9,600 | Tsingtao Brewery Co Ltd (Class A) | 149 | ||||||||||||||
| 8,600 | Unigroup Guoxin Microelectronics Co Ltd | 304 | ||||||||||||||
| 299,000 | Uni-President China Holdings Ltd | 290 | ||||||||||||||
| 40,500 | Unisplendour Corp Ltd | 145 | ||||||||||||||
| 14,900 | Universal Scientific Industrial Shanghai Co Ltd | 38 | ||||||||||||||
| 18,000 | *,e,g | Venus MedTech Hangzhou, Inc | 69 | |||||||||||||
| 373,067 | * | Vipshop Holdings Ltd (ADR) | 3,134 | |||||||||||||
| 113,900 | Walvax Biotechnology Co Ltd | 1,002 | ||||||||||||||
| 268 |
COLLEGE RETIREMENT EQUITIES FUND - Global Equities Account
| SHARES | COMPANY | VALUE (000) | ||||||||||||||
| 6,300 | Wangfujing Group Co Ltd | $ | 27 | |||||||||||||
| 42,300 | Wanhua Chemical Group Co Ltd | 670 | ||||||||||||||
| 1,084,000 | Want Want China Holdings Ltd | 995 | ||||||||||||||
| 5,300 | *,e | Weibo Corp (ADR) | 164 | |||||||||||||
| 161,000 | Weichai Power Co Ltd | 316 | ||||||||||||||
| 34,600 | Weichai Power Co Ltd (Class A) | 97 | ||||||||||||||
| 6,800 | Weifu High-Technology Group Co Ltd | 23 | ||||||||||||||
| 7,500 | Weihai Guangwei Composites Co Ltd | 99 | ||||||||||||||
| 393,000 | *,e,g | Weimob, Inc | 398 | |||||||||||||
| 91,640 | Wens Foodstuffs Group Co Ltd | 277 | ||||||||||||||
| 26,400 | Western Securities Co Ltd | 33 | ||||||||||||||
| 6,509 | Western Superconducting Technologies Co Ltd | 99 | ||||||||||||||
| 305,000 | Wharf Holdings Ltd | 937 | ||||||||||||||
| 11,300 | Will Semiconductor Ltd | 551 | ||||||||||||||
| 16,100 | Wingtech Technology Co Ltd | 327 | ||||||||||||||
| 17,050 | Winning Health Technology Group Co Ltd | 45 | ||||||||||||||
| 768,000 | Winteam Pharmaceutical Group Ltd | 509 | ||||||||||||||
| 74,600 | Wuchan Zhongda Group Co Ltd | 69 | ||||||||||||||
| 24,928 | Wuhan Guide Infrared Co Ltd | 95 | ||||||||||||||
| 27,900 | Wuhu Shunrong Sanqi Interactive Entertainment Network Technology Co Ltd | 118 | ||||||||||||||
| 30,300 | Wuhu Token Science Co Ltd | 63 | ||||||||||||||
| 51,835 | Wuliangye Yibin Co Ltd | 1,811 | ||||||||||||||
| 17,650 | WUS Printed Circuit Kunshan Co Ltd | 46 | ||||||||||||||
| 13,216 | WuXi AppTec Co Ltd | 246 | ||||||||||||||
| 29,185 | g | WuXi AppTec Co Ltd (Hong Kong) | 504 | |||||||||||||
| 9,379,850 | *,g | Wuxi Biologics Cayman, Inc | 111,047 | |||||||||||||
| 10,700 | Wuxi Lead Intelligent Equipment Co Ltd | 125 | ||||||||||||||
| 3,600 | Wuxi Shangji Automation Co Ltd | 94 | ||||||||||||||
| 102,300 | XCMG Construction Machinery Co Ltd | 96 | ||||||||||||||
| 81,100 | Xiamen C & D, Inc | 115 | ||||||||||||||
| 3,700 | Xiamen Faratronic Co Ltd | 135 | ||||||||||||||
| 8,500 | Xiamen Intretech, Inc | 45 | ||||||||||||||
| 20,600 | Xiamen Tungsten Co Ltd | 73 | ||||||||||||||
| 1,196,600 | *,g | Xiaomi Corp | 2,901 | |||||||||||||
| 53,800 | Xinjiang Goldwind Science & Technology Co Ltd | 139 | ||||||||||||||
| 184,600 | Xinjiang Goldwind Science & Technology Co Ltd (Hong Kong) | 360 | ||||||||||||||
| 43,800 | Xinjiang Zhongtai Chemical Co Ltd | 66 | ||||||||||||||
| 916,863 | Xinyi Solar Holdings Ltd | 1,557 | ||||||||||||||
| 77,389 | * | XPeng, Inc (ADR) | 3,895 | |||||||||||||
| 250,000 | g | Yadea Group Holdings Ltd | 487 | |||||||||||||
| 5,760 | Yantai Eddie Precision Machinery Co Ltd | 29 | ||||||||||||||
| 269 |
COLLEGE RETIREMENT EQUITIES FUND - Global Equities Account
| SHARES | COMPANY | VALUE (000) | ||||||||||||||
| 18,400 | Yantai Jereh Oilfield Services Group Co Ltd | $ | 116 | |||||||||||||
| 374,000 | e | Yanzhou Coal Mining Co Ltd | 743 | |||||||||||||
| 40,700 | Yanzhou Coal Mining Co Ltd (Class A) | 151 | ||||||||||||||
| 11,150 | Yealink Network Technology Corp Ltd | 143 | ||||||||||||||
| 8,282 | Yifeng Pharmacy Chain Co Ltd | 72 | ||||||||||||||
| 104,000 | e | Yihai International Holding Ltd | 481 | |||||||||||||
| 18,900 | Yihai Kerry Arawana Holdings Co Ltd | 187 | ||||||||||||||
| 29,420 | Yintai Gold Co Ltd | 41 | ||||||||||||||
| 141,000 | Yonghui Superstores Co Ltd | 90 | ||||||||||||||
| 5,700 | YongXing Special Materials Technology Co Ltd | 133 | ||||||||||||||
| 14,559 | Yonyou Network Technology Co Ltd | 82 | ||||||||||||||
| 37,700 | Youngor Group Co Ltd | 41 | ||||||||||||||
| 3,700 | * | Youngy Co Ltd | 76 | |||||||||||||
| 17,300 | YTO Express Group Co Ltd | 45 | ||||||||||||||
| 18,700 | * | Yuan Longping High-tech Agriculture Co Ltd | 68 | |||||||||||||
| 342,200 | Yuexiu Property Co Ltd | 302 | ||||||||||||||
| 334,948 | Yum China Holdings, Inc | 16,694 | ||||||||||||||
| 15,080 | Yunda Holding Co Ltd | 48 | ||||||||||||||
| 35,000 | * | Yunnan Aluminium Co Ltd | 62 | |||||||||||||
| 6,500 | Yunnan Baiyao Group Co Ltd | 107 | ||||||||||||||
| 11,708 | Yunnan Energy New Material Co Ltd | 459 | ||||||||||||||
| 22,600 | * | Yunnan Tin Co Ltd | 70 | |||||||||||||
| 22,478 | * | Zai Lab Ltd (ADR) | 1,413 | |||||||||||||
| 3,000 | Zhangzhou Pientzehuang Pharmaceutical Co Ltd | 206 | ||||||||||||||
| 72,900 | Zhefu Holding Group Co Ltd | 81 | ||||||||||||||
| 101,320 | * | Zhejiang Century Huatong Group Co Ltd | 134 | |||||||||||||
| 19,500 | Zhejiang China Commodities City Group Co Ltd | 15 | ||||||||||||||
| 31,100 | Zhejiang Chint Electrics Co Ltd | 263 | ||||||||||||||
| 40,000 | Zhejiang Dahua Technology Co Ltd | 147 | ||||||||||||||
| 6,060 | Zhejiang Dingli Machinery Co Ltd | 76 | ||||||||||||||
| 152,000 | Zhejiang Expressway Co Ltd | 135 | ||||||||||||||
| 4,766 | Zhejiang HangKe Technology, Inc Co | 80 | ||||||||||||||
| 6,150 | Zhejiang Huahai Pharmaceutical Co Ltd | 21 | ||||||||||||||
| 15,610 | Zhejiang Huayou Cobalt Co Ltd | 270 | ||||||||||||||
| 16,800 | Zhejiang Jingsheng Mechanical & Electrical Co Ltd | 183 | ||||||||||||||
| 5,000 | Zhejiang Jiuzhou Pharmaceutical Co Ltd | 44 | ||||||||||||||
| 47,900 | Zhejiang Juhua Co Ltd | 97 | ||||||||||||||
| 47,000 | Zhejiang Longsheng Group Co Ltd | 93 | ||||||||||||||
| 13,920 | Zhejiang NHU Co Ltd | 68 | ||||||||||||||
| 47,290 | Zhejiang Sanhua Intelligent Controls Co Ltd | 188 | ||||||||||||||
| 19,800 | Zhejiang Satellite Petrochemical Co Ltd | 125 | ||||||||||||||
| 270 |
COLLEGE RETIREMENT EQUITIES FUND - Global Equities Account
| SHARES | COMPANY | VALUE (000) | ||||||||||||||
| 24,300 | Zhejiang Semir Garment Co Ltd | $ | 29 | |||||||||||||
| 7,500 | Zhejiang Supor Co Ltd | 73 | ||||||||||||||
| 16,500 | Zhejiang Weiming Environment Protection Co Ltd | 95 | ||||||||||||||
| 21,100 | Zhejiang Weixing New Building Materials Co Ltd | 81 | ||||||||||||||
| 4,300 | Zhejiang Wolwo Bio-Pharmaceutical Co Ltd | 39 | ||||||||||||||
| 12,500 | * | Zhejiang Yongtai Technology Co Ltd | 100 | |||||||||||||
| 18,000 | Zhengzhou Yutong Bus Co Ltd | 31 | ||||||||||||||
| 16,000 | Zheshang Securities Co Ltd | 33 | ||||||||||||||
| 38,300 | *,e,g | ZhongAn Online P&C Insurance Co Ltd | 133 | |||||||||||||
| 6,800 | Zhongji Innolight Co Ltd | 45 | ||||||||||||||
| 126,500 | Zhongsheng Group Holdings Ltd | 987 | ||||||||||||||
| 67,400 | Zhongtai Securities Co Ltd | 106 | ||||||||||||||
| 48,300 | Zhuzhou CSR Times Electric Co Ltd | 280 | ||||||||||||||
| 4,900 | Zhuzhou Hongda Electronics Corp Ltd | 77 | ||||||||||||||
| 32,500 | Zhuzhou Kibing Group Co Ltd | 87 | ||||||||||||||
| 42,400 | Zibo Qixiang Tengda Chemical Co Ltd | 70 | ||||||||||||||
| 1,292,000 | Zijin Mining Group Co Ltd | 1,543 | ||||||||||||||
| 281,500 | Zijin Mining Group Co Ltd (Class A) | 430 | ||||||||||||||
| 122,400 | Zoomlion Heavy Industry Science and Technology Co Ltd | 77 | ||||||||||||||
| 91,600 | Zoomlion Heavy Industry Science and Technology Co Ltd | 103 | ||||||||||||||
| 56,300 | ZTE Corp | 296 | ||||||||||||||
| 65,400 | ZTE Corp (Class H) | 179 | ||||||||||||||
| 231,167 | ZTO Express Cayman, Inc (ADR) | 6,524 | ||||||||||||||
| TOTAL CHINA | 1,056,679 | |||||||||||||||
| COLOMBIA - 0.0% | ||||||||||||||||
| 17,048 | BanColombia S.A. | 146 | ||||||||||||||
| 95,223 | BanColombia S.A. (Preference) | 749 | ||||||||||||||
| 1,423,265 | Ecopetrol S.A. | 940 | ||||||||||||||
| 17,248 | Grupo de Inversiones Suramericana S.A. | 127 | ||||||||||||||
| 92,792 | Interconexion Electrica S.A. | 511 | ||||||||||||||
| TOTAL COLOMBIA | 2,473 | |||||||||||||||
| CZECH REPUBLIC - 0.0% | ||||||||||||||||
| 38,502 | CEZ AS | 1,457 | ||||||||||||||
| 6,808 | Komercni Banka AS | 291 | ||||||||||||||
| 30,196 | g | Moneta Money Bank AS | 130 | |||||||||||||
| TOTAL CZECH REPUBLIC | 1,878 | |||||||||||||||
| DENMARK - 0.5% | ||||||||||||||||
| 102,764 | Carlsberg AS (Class B) | 17,742 | ||||||||||||||
| 72,932 | Coloplast AS | 12,841 | ||||||||||||||
| 33,212 | * | Genmab AS | 13,257 | |||||||||||||
| 709,535 | Novo Nordisk AS | 79,699 | ||||||||||||||
| 271 |
COLLEGE RETIREMENT EQUITIES FUND - Global Equities Account
| SHARES | COMPANY | VALUE (000) | ||||||||||||||
| 80,896 | g | Orsted AS | $ | 10,360 | ||||||||||||
| TOTAL DENMARK | 133,899 | |||||||||||||||
| EGYPT - 0.0% | ||||||||||||||||
| 139,717 | * | Commercial International Bank | 470 | |||||||||||||
| 262,432 | Eastern Tobacco | 179 | ||||||||||||||
| 114,322 | * | Fawry for Banking & Payment Technology Services SAE | 94 | |||||||||||||
| TOTAL EGYPT | 743 | |||||||||||||||
| FINLAND - 0.3% | ||||||||||||||||
| 91,213 | Cargotec Corp (B Shares) | 4,552 | ||||||||||||||
| 93,174 | Neste Oil Oyj | 4,586 | ||||||||||||||
| 3,799,179 | Nordea Bank Abp | 46,548 | ||||||||||||||
| 878,674 | Nordea Bank Abp | 10,718 | ||||||||||||||
| 390,270 | Sampo Oyj (A Shares) | 19,532 | ||||||||||||||
| 90,800 | Stora Enso Oyj (R Shares) | 1,667 | ||||||||||||||
| 144,479 | UPM-Kymmene Oyj | 5,497 | ||||||||||||||
| TOTAL FINLAND | 93,100 | |||||||||||||||
| FRANCE - 3.6% | ||||||||||||||||
| 363,497 | * | Accor S.A. | 11,782 | |||||||||||||
| 52,140 | Air Liquide | 9,093 | ||||||||||||||
| 1,009,414 | * | Airbus SE | 129,148 | |||||||||||||
| 1,129,963 | BNP Paribas S.A. | 78,127 | ||||||||||||||
| 585,052 | Cap Gemini S.A. | 143,385 | ||||||||||||||
| 572,716 | Compagnie de Saint-Gobain | 40,289 | ||||||||||||||
| 724,254 | Credit Agricole S.A. | 10,326 | ||||||||||||||
| 304,998 | Danone | 18,958 | ||||||||||||||
| 1,456,600 | Dassault Systemes SE | 86,442 | ||||||||||||||
| 116,535 | Electricite de France | 1,371 | ||||||||||||||
| 375,424 | Engie S.A. | 5,558 | ||||||||||||||
| 256,336 | Essilor International S.A. | 54,568 | ||||||||||||||
| 7,318 | Gecina S.A. | 1,024 | ||||||||||||||
| 9,870 | Icade | 710 | ||||||||||||||
| 135,672 | Kering | 108,857 | ||||||||||||||
| 174,895 | L’Oreal S.A. | 83,392 | ||||||||||||||
| 58,031 | LVMH Moet Hennessy Louis Vuitton S.A. | 47,959 | ||||||||||||||
| 115,676 | e | Michelin (C.G.D.E.) (Class B) | 18,946 | |||||||||||||
| 378,319 | Orange S. A. | 4,041 | ||||||||||||||
| 9,880 | e | Pernod-Ricard S.A. | 2,377 | |||||||||||||
| 176,475 | Sanofi-Aventis | 17,708 | ||||||||||||||
| 16,993 | Sartorius Stedim Biotech | 9,333 | ||||||||||||||
| 78,332 | Suez Environnement S.A. | 1,767 | ||||||||||||||
| 139,246 | Teleperformance | 62,254 | ||||||||||||||
| 264,076 | Total S.A. | 13,441 | ||||||||||||||
| 272 |
COLLEGE RETIREMENT EQUITIES FUND - Global Equities Account
| SHARES | COMPANY | VALUE (000) | ||||||||||||||
| 1,029,583 | Valeo S.A. | $ | 31,048 | |||||||||||||
| 126,853 | Veolia Environnement | 4,659 | ||||||||||||||
| 1,797,523 | Vivendi Universal S.A. | 24,315 | ||||||||||||||
| TOTAL FRANCE | 1,020,878 | |||||||||||||||
| GERMANY - 2.1% | ||||||||||||||||
| 68,831 | Adidas-Salomon AG. | 19,820 | ||||||||||||||
| 47,729 | Allianz AG. | 11,257 | ||||||||||||||
| 549,091 | Aroundtown S.A. | 3,312 | ||||||||||||||
| 229,928 | Bayer AG. | 12,279 | ||||||||||||||
| 243,715 | Beiersdorf AG. | 24,982 | ||||||||||||||
| 744,520 | * | Borussia Dortmund GmbH & Co KGaA | 3,669 | |||||||||||||
| 123,542 | Deutsche Annington Immobilien SE | 6,808 | ||||||||||||||
| 98,494 | Deutsche Boerse AG. | 16,446 | ||||||||||||||
| 727,369 | Deutsche Telekom AG. | 13,440 | ||||||||||||||
| 463,889 | E.ON AG. | 6,447 | ||||||||||||||
| 651,747 | HeidelbergCement AG. | 44,108 | ||||||||||||||
| 231,991 | * | HelloFresh SE | 17,779 | |||||||||||||
| 41,272 | Henkel KGaA | 3,217 | ||||||||||||||
| 2,508,232 | Infineon Technologies AG. | 115,475 | ||||||||||||||
| 12,809 | LEG Immobilien AG. | 1,786 | ||||||||||||||
| 51,864 | Merck KGaA | 13,342 | ||||||||||||||
| 1,100 | * | OSRAM Licht AG. | 71 | |||||||||||||
| 745,419 | * | Paion AG. | 1,019 | |||||||||||||
| 2,177,646 | RWE AG. | 88,231 | ||||||||||||||
| 986,460 | Siemens AG. | 170,858 | ||||||||||||||
| 295,856 | g | Siemens Healthineers AG. | 22,059 | |||||||||||||
| TOTAL GERMANY | 596,405 | |||||||||||||||
| GREECE - 0.0% | ||||||||||||||||
| 504,716 | * | Alpha Bank AE | 618 | |||||||||||||
| 575,754 | * | Eurobank Ergasias S.A. | 583 | |||||||||||||
| 5,760 | *,† | FF Group | 0 | ^ | ||||||||||||
| 50,909 | Hellenic Telecommunications Organization S.A. | 940 | ||||||||||||||
| 23,251 | JUMBO S.A. | 334 | ||||||||||||||
| 43,625 | OPAP S.A. | 618 | ||||||||||||||
| 44,505 | * | Public Power Corp | 478 | |||||||||||||
| TOTAL GREECE | 3,571 | |||||||||||||||
| HONG KONG - 0.3% | ||||||||||||||||
| 2,645,100 | AIA Group Ltd | 26,697 | ||||||||||||||
| 2,710,000 | * | Alibaba Pictures Group Ltd | 247 | |||||||||||||
| 287,000 | Bank of East Asia Ltd | 412 | ||||||||||||||
| 229,000 | *,e | Cathay Pacific Airways Ltd | 188 | |||||||||||||
| 1,088,000 | * | China Youzan Ltd | 75 | |||||||||||||
| 273 |
COLLEGE RETIREMENT EQUITIES FUND - Global Equities Account
| SHARES | COMPANY | VALUE (000) | ||||||||||||||
| 113,730 | CK Infrastructure Holdings Ltd | $ | 725 | |||||||||||||
| 354,500 | CLP Holdings Ltd | 3,582 | ||||||||||||||
| 731,000 | Hang Lung Properties Ltd | 1,504 | ||||||||||||||
| 167,300 | Hang Seng Bank Ltd | 3,064 | ||||||||||||||
| 274,000 | Henderson Land Development Co Ltd | 1,169 | ||||||||||||||
| 2,259,806 | Hong Kong & China Gas Ltd | 3,525 | ||||||||||||||
| 262,212 | Hong Kong Electric Holdings Ltd | 1,634 | ||||||||||||||
| 263,582 | Hong Kong Exchanges and Clearing Ltd | 15,415 | ||||||||||||||
| 457,500 | Hongkong Land Holdings Ltd | 2,379 | ||||||||||||||
| 204,000 | e | Huabao International Holdings Ltd | 377 | |||||||||||||
| 223,000 | Kingboard Laminates Holdings Ltd | 379 | ||||||||||||||
| 274,500 | Link REIT | 2,418 | ||||||||||||||
| 1,536,546 | * | Melco Crown Entertainment Ltd (ADR) | 15,642 | |||||||||||||
| 320,000 | New World Development Co Ltd | 1,267 | ||||||||||||||
| 395,000 | Nine Dragons Paper Holdings Ltd | 424 | ||||||||||||||
| 863,250 | Sino Biopharmaceutical | 606 | ||||||||||||||
| 277,000 | e | Sun Hung Kai Properties Ltd | 3,361 | |||||||||||||
| 80,000 | e | Vinda International Holdings Ltd | 195 | |||||||||||||
| 227,000 | Wharf Real Estate Investment Co Ltd | 1,153 | ||||||||||||||
| TOTAL HONG KONG | 86,438 | |||||||||||||||
| HUNGARY - 0.0% | ||||||||||||||||
| 107,799 | MOL Hungarian Oil & Gas plc | 836 | ||||||||||||||
| 143,061 | * | OTP Bank | 7,295 | |||||||||||||
| 51,242 | Richter Gedeon Rt | 1,378 | ||||||||||||||
| TOTAL HUNGARY | �� | 9,509 | ||||||||||||||
| INDIA - 0.8% | ||||||||||||||||
| 59,643 | Adani Enterprises Ltd | 1,367 | ||||||||||||||
| 60,604 | Adani Gas Ltd | 1,404 | ||||||||||||||
| 84,492 | * | Adani Green Energy Ltd | 1,508 | |||||||||||||
| 114,776 | Adani Ports & Special Economic Zone Ltd | 1,123 | ||||||||||||||
| 60,401 | * | Adani Transmissions Ltd | 1,415 | |||||||||||||
| 153,648 | Ambuja Cements Ltd | 778 | ||||||||||||||
| 32,327 | Apollo Hospitals Enterprise Ltd | 2,176 | ||||||||||||||
| 85,042 | Asian Paints Ltd | 3,864 | ||||||||||||||
| 16,895 | Associated Cement Co Ltd | 502 | ||||||||||||||
| 22,434 | Aurobindo Pharma Ltd | 221 | ||||||||||||||
| 35,801 | *,g | Avenue Supermarts Ltd | 2,246 | |||||||||||||
| 522,752 | * | Axis Bank Ltd | 4,750 | |||||||||||||
| 61,350 | Bajaj Finance Ltd | 5,730 | ||||||||||||||
| 3,153 | Bajaj Finserv Ltd | 693 | ||||||||||||||
| 15,337 | Bajaj Holdings and Investment Ltd | 668 | ||||||||||||||
| 18,900 | Balkrishna Industries Ltd | 589 | ||||||||||||||
| 274 |
COLLEGE RETIREMENT EQUITIES FUND - Global Equities Account
| SHARES | COMPANY | VALUE (000) | ||||||||||||||
| 52,624 | g | Bandhan Bank Ltd | $ | 178 | ||||||||||||
| 52,067 | Berger Paints India Ltd | 540 | ||||||||||||||
| 278,855 | Bharat Electronics Ltd | 785 | ||||||||||||||
| 49,712 | Bharat Forge Ltd | 465 | ||||||||||||||
| 204,651 | Bharat Petroleum Corp Ltd | 1,058 | ||||||||||||||
| 543,852 | * | Bharti Airtel Ltd | 4,995 | |||||||||||||
| 91,015 | * | Biocon Ltd | 445 | |||||||||||||
| 24,156 | Britannia Industries Ltd | 1,169 | ||||||||||||||
| 85,694 | Cholamandalam Investment and Finance Co Ltd | 598 | ||||||||||||||
| 40,371 | Cipla Ltd | 512 | ||||||||||||||
| 388,585 | Coal India Ltd | 762 | ||||||||||||||
| 27,629 | Colgate-Palmolive India Ltd | 550 | ||||||||||||||
| 53,948 | Container Corp Of India Ltd | 445 | ||||||||||||||
| 135,758 | Dabur India Ltd | 1,058 | ||||||||||||||
| 60,070 | Divi S Laboratories Ltd | 3,775 | ||||||||||||||
| 135,248 | DLF Ltd | 707 | ||||||||||||||
| 29,023 | Dr Reddy’s Laboratories Ltd | 1,912 | ||||||||||||||
| 30,359 | Eicher Motors Ltd | 1,055 | ||||||||||||||
| 366,037 | GAIL India Ltd | 634 | ||||||||||||||
| 78,468 | * | Godrej Consumer Products Ltd | 1,020 | |||||||||||||
| 26,871 | * | Godrej Properties Ltd | 675 | |||||||||||||
| 58,316 | Grasim Industries Ltd | 1,268 | ||||||||||||||
| 51,319 | Havells India Ltd | 963 | ||||||||||||||
| 91,454 | HCL Technologies Ltd | 1,618 | ||||||||||||||
| 4,711 | g | HDFC Asset Management Co Ltd | 155 | |||||||||||||
| 197,476 | g | HDFC Life Insurance Co Ltd | 1,721 | |||||||||||||
| 26,714 | Hero Honda Motors Ltd | 882 | ||||||||||||||
| 347,474 | Hindalco Industries Ltd | 2,210 | ||||||||||||||
| 182,848 | Hindustan Lever Ltd | 5,788 | ||||||||||||||
| 161,084 | Hindustan Petroleum Corp Ltd | 632 | ||||||||||||||
| 310,444 | Housing Development Finance Corp | 10,741 | ||||||||||||||
| 1,758,699 | ICICI Bank Ltd | 17,483 | ||||||||||||||
| 48,154 | g | ICICI Lombard General Insurance Co Ltd | 906 | |||||||||||||
| 78,150 | g | ICICI Prudential Life Insurance Co Ltd | 588 | |||||||||||||
| 492,727 | Indian Oil Corp Ltd | 737 | ||||||||||||||
| 52,579 | Indian Railway Catering & Tourism Corp Ltd | 586 | ||||||||||||||
| 64,073 | Indraprastha Gas Ltd | 404 | ||||||||||||||
| 147,022 | Indus Towers Ltd | 490 | ||||||||||||||
| 17,060 | Info Edge India Ltd | 1,277 | ||||||||||||||
| 896,658 | Infosys Technologies Ltd | 22,709 | ||||||||||||||
| 19,953 | *,g | InterGlobe Aviation Ltd | 541 | |||||||||||||
| 49,543 | Ipca Laboratories Ltd | 1,442 | ||||||||||||||
| 275 |
COLLEGE RETIREMENT EQUITIES FUND - Global Equities Account
| SHARES | COMPANY | VALUE (000) | ||||||||||||||
| 667,738 | ITC Ltd | $ | 1,954 | |||||||||||||
| 183,917 | JSW Steel Ltd | 1,616 | ||||||||||||||
| 17,472 | Jubilant Foodworks Ltd | 841 | ||||||||||||||
| 46,385 | Kotak Mahindra Bank Ltd | 1,117 | ||||||||||||||
| 11,590 | g | Larsen & Toubro Infotech Ltd | 1,140 | |||||||||||||
| 153,068 | Larsen & Toubro Ltd | 3,888 | ||||||||||||||
| 19,041 | Lupin Ltd | 243 | ||||||||||||||
| 192,929 | Mahindra & Mahindra Ltd | 2,165 | ||||||||||||||
| 114,688 | Marico Ltd | 790 | ||||||||||||||
| 30,398 | Maruti Suzuki India Ltd | 3,026 | ||||||||||||||
| 204,243 | MindTree Ltd | 13,104 | ||||||||||||||
| 277,038 | Motherson Sumi Systems Ltd | 828 | ||||||||||||||
| 19,021 | Mphasis Ltd | 867 | ||||||||||||||
| 429 | MRF Ltd | 423 | ||||||||||||||
| 9,618 | Muthoot Finance Ltd | 193 | ||||||||||||||
| 7,467 | Nestle India Ltd | 1,976 | ||||||||||||||
| 1,102,908 | NTPC Ltd | 1,840 | ||||||||||||||
| 1,272 | Page Industries Ltd | 690 | ||||||||||||||
| 186,459 | Petronet LNG Ltd | 541 | ||||||||||||||
| 18,522 | PI Industries Ltd | 754 | ||||||||||||||
| 33,259 | Pidilite Industries Ltd | 1,100 | ||||||||||||||
| 59,276 | Piramal Healthcare Ltd | 2,102 | ||||||||||||||
| 711,902 | Power Grid Corp of India Ltd | 1,954 | ||||||||||||||
| 628,614 | Reliance Industries Ltd | 19,969 | ||||||||||||||
| 51,804 | * | SBI Cards & Payment Services Ltd | 646 | |||||||||||||
| 99,120 | g | SBI Life Insurance Co Ltd | 1,589 | |||||||||||||
| 261,768 | Sesa Sterlite Ltd | 1,197 | ||||||||||||||
| 2,362 | Shree Cement Ltd | 855 | ||||||||||||||
| 17,608 | Shriram Transport Finance Co Ltd | 287 | ||||||||||||||
| 15,373 | Siemens India Ltd | 487 | ||||||||||||||
| 32,058 | SRF Ltd | 1,042 | ||||||||||||||
| 1,015,292 | State Bank of India | 6,265 | ||||||||||||||
| 271,363 | Sun Pharmaceutical Industries Ltd | 3,083 | ||||||||||||||
| 174,222 | Tata Consultancy Services Ltd | 8,738 | ||||||||||||||
| 372,367 | * | Tata Motors Ltd | 2,400 | |||||||||||||
| 327,370 | Tata Power Co Ltd | 970 | ||||||||||||||
| 159,742 | Tata Steel Ltd | 2,375 | ||||||||||||||
| 130,531 | Tata Tea Ltd | 1,302 | ||||||||||||||
| 53,870 | Tech Mahindra Ltd | 1,293 | ||||||||||||||
| 78,520 | Titan Industries Ltd | 2,656 | ||||||||||||||
| 11,417 | Torrent Pharmaceuticals Ltd | 504 | ||||||||||||||
| 38,396 | Trent Ltd | 548 | ||||||||||||||
| 22,217 | Ultra Tech Cement Ltd | 2,263 | ||||||||||||||
| 276 |
COLLEGE RETIREMENT EQUITIES FUND - Global Equities Account
| SHARES | COMPANY | VALUE (000) | ||||||||||||||
| 65,372 | * | United Spirits Ltd | $ | 788 | ||||||||||||
| 108,962 | UPL Ltd | 1,091 | ||||||||||||||
| 115,148 | Wipro Ltd | 1,103 | ||||||||||||||
| 911,639 | * | Yes Bank Ltd | 168 | |||||||||||||
| 352,766 | * | Zomato Ltd | 652 | |||||||||||||
| TOTAL INDIA | 230,936 | |||||||||||||||
| INDONESIA - 0.1% | ||||||||||||||||
| 3,608,000 | Adaro Energy Tbk | 572 | ||||||||||||||
| 4,470,800 | Astra International Tbk PT | 1,789 | ||||||||||||||
| 13,091,000 | Bank Central Asia Tbk PT | 6,705 | ||||||||||||||
| 2,700,000 | * | Bank Jago Tbk PT | 3,028 | |||||||||||||
| 74,257,193 | Bank Rakyat Indonesia | 21,381 | ||||||||||||||
| 501,700 | Indofood CBP Sukses Makmur Tbk | 306 | ||||||||||||||
| 4,569,000 | Kalbe Farma Tbk PT | 518 | ||||||||||||||
| 2,420,400 | * | Merdeka Copper Gold Tbk PT | 663 | |||||||||||||
| 1,803,600 | PT Aneka Tambang Tbk | 285 | ||||||||||||||
| 1,532,347 | PT Bank Mandiri Persero Tbk | 757 | ||||||||||||||
| 612,400 | PT Bank Negara Indonesia | 289 | ||||||||||||||
| 5,820,800 | PT Barito Pacific Tbk | 349 | ||||||||||||||
| 1,617,800 | PT Charoen Pokphand Indonesia Tbk | 674 | ||||||||||||||
| 106,900 | PT Gudang Garam Tbk | 230 | ||||||||||||||
| 593,300 | PT Indah Kiat Pulp and Paper Corp Tbk | 326 | ||||||||||||||
| 342,400 | PT Indocement Tunggal Prakarsa Tbk | 291 | ||||||||||||||
| 956,000 | PT Indofood Sukses Makmur Tbk | 425 | ||||||||||||||
| 657,100 | PT Semen Gresik Persero Tbk | 334 | ||||||||||||||
| 1,676,000 | PT Unilever Indonesia Tbk | 483 | ||||||||||||||
| 382,100 | PT United Tractors Tbk | 593 | ||||||||||||||
| 5,326,200 | Sarana Menara Nusantara Tbk PT | 420 | ||||||||||||||
| 4,240,700 | Telkom Indonesia Persero Tbk PT | 1,210 | ||||||||||||||
| 1,773,300 | Tower Bersama Infrastructure | 367 | ||||||||||||||
| TOTAL INDONESIA | 41,995 | |||||||||||||||
| IRELAND - 0.7% | ||||||||||||||||
| 6,354,092 | * | AIB Group plc | 15,481 | |||||||||||||
| 3,139,804 | * | Bank of Ireland Group plc | 17,782 | |||||||||||||
| 1,395,374 | CRH plc | 73,871 | ||||||||||||||
| 175,852 | * | Flutter Entertainment plc | 28,133 | |||||||||||||
| 9,945,620 | Hibernia REIT plc | 14,720 | ||||||||||||||
| 16,242 | Kerry Group plc (Class A) | 2,095 | ||||||||||||||
| 509,386 | Keywords Studios plc | 20,285 | ||||||||||||||
| 28,918 | * | Prothena Corp plc | 1,429 | |||||||||||||
| 462,226 | Smurfit Kappa Group plc | 25,476 | ||||||||||||||
| TOTAL IRELAND | 199,272 | |||||||||||||||
| 277 |
COLLEGE RETIREMENT EQUITIES FUND - Global Equities Account
| SHARES | COMPANY | VALUE (000) | ||||||||||||||
| ISRAEL - 0.2% | ||||||||||||||||
| 248,458 | Bank Hapoalim Ltd | $ | 2,557 | |||||||||||||
| 317,906 | Bank Leumi Le-Israel | 3,410 | ||||||||||||||
| 254,695 | Israel Discount Bank Ltd | 1,710 | ||||||||||||||
| 248,879 | * | Kornit Digital Ltd | 37,892 | |||||||||||||
| 30,678 | Mizrahi Tefahot Bank Ltd | 1,181 | ||||||||||||||
| TOTAL ISRAEL | 46,750 | |||||||||||||||
| ITALY - 0.9% | ||||||||||||||||
| 394,415 | Amplifon S.p.A. | 21,223 | ||||||||||||||
| 3,422,452 | Davide Campari-Milano NV | 49,941 | ||||||||||||||
| 43,066 | DiaSorin S.p.A. | 8,193 | ||||||||||||||
| 8,587,776 | Enel S.p.A. | 68,669 | ||||||||||||||
| 121,505 | Ferrari NV | 31,276 | ||||||||||||||
| 2,884,497 | Intesa Sanpaolo S.p.A. | 7,451 | ||||||||||||||
| 653,294 | Moncler S.p.A | 47,212 | ||||||||||||||
| 2,015,681 | Prada S.p.A | 12,907 | ||||||||||||||
| TOTAL ITALY | 246,872 | |||||||||||||||
| JAPAN - 5.5% | ||||||||||||||||
| 87,300 | Acom Co Ltd | 251 | ||||||||||||||
| 316 | Activia Properties Inc | 1,142 | ||||||||||||||
| 300 | Aeon Mall Co Ltd | 4 | ||||||||||||||
| 343,600 | Aisin Seiki Co Ltd | 13,183 | ||||||||||||||
| 10,508 | * | All Nippon Airways Co Ltd | 220 | |||||||||||||
| 25,800 | e | Aozora Bank Ltd | 564 | |||||||||||||
| 205,100 | Asahi Intecc Co Ltd | 4,406 | ||||||||||||||
| 241,979 | Asahi Kasei Corp | 2,280 | ||||||||||||||
| 463,100 | Astellas Pharma, Inc | 7,537 | ||||||||||||||
| 12,500 | Bank of Kyoto Ltd | 579 | ||||||||||||||
| 39,000 | BayCurrent Consulting, Inc | 15,032 | ||||||||||||||
| 416,700 | Benefit One, Inc | 17,903 | ||||||||||||||
| 71,437 | Central Japan Railway Co | 9,506 | ||||||||||||||
| 115,900 | Chiba Bank Ltd | 663 | ||||||||||||||
| 162,800 | Chubu Electric Power Co, Inc | 1,720 | ||||||||||||||
| 224,900 | Concordia Financial Group Ltd | 817 | ||||||||||||||
| 76,500 | Daifuku Co Ltd | 6,256 | ||||||||||||||
| 235,900 | Dai-ichi Mutual Life Insurance Co | 4,758 | ||||||||||||||
| 2,027,291 | Daiichi Sankyo Co Ltd | 51,597 | ||||||||||||||
| 83,331 | Daikin Industries Ltd | 18,876 | ||||||||||||||
| 6,800 | Daito Trust Construction Co Ltd | 780 | ||||||||||||||
| 313 | Daiwa House REIT Investment Corp | 948 | ||||||||||||||
| 316,000 | Daiwa Securities Group, Inc | 1,783 | ||||||||||||||
| 149,386 | East Japan Railway Co | 9,184 | ||||||||||||||
| 582,900 | ENEOS Holdings, Inc | 2,178 | ||||||||||||||
| 278 |
COLLEGE RETIREMENT EQUITIES FUND - Global Equities Account
| SHARES | COMPANY | VALUE (000) | ||||||||||||||
| 272,200 | * | Fanuc Ltd | $ | 57,859 | ||||||||||||
| 6,900 | Fast Retailing Co Ltd | 3,922 | ||||||||||||||
| 37,600 | Fukuoka Financial Group, Inc | 644 | ||||||||||||||
| 147,099 | GMO Payment Gateway, Inc | 18,318 | ||||||||||||||
| 271,600 | * | Hitachi Construction Machinery Co Ltd | 7,848 | |||||||||||||
| 1,986,164 | * | Hitachi Ltd | 107,597 | |||||||||||||
| 38,585 | * | Hitachi Metals Ltd | 715 | |||||||||||||
| 150,700 | Hulic Co Ltd | 1,433 | ||||||||||||||
| 729 | Hulic Reit, Inc | 1,097 | ||||||||||||||
| 40,537 | Idemitsu Kosan Co Ltd | 1,034 | ||||||||||||||
| 6,386,100 | Infomart Corp | 51,926 | ||||||||||||||
| 179,174 | Inpex Holdings, Inc | 1,558 | ||||||||||||||
| 8 | Invincible Investment Corp | 3 | ||||||||||||||
| 142,200 | IR Japan Holdings Ltd | 8,482 | ||||||||||||||
| 715,800 | Japan Elevator Service Holdings Co Ltd | 13,371 | ||||||||||||||
| 88,500 | Japan Post Bank Co Ltd | 811 | ||||||||||||||
| 344,700 | Japan Post Holdings Co Ltd | 2,685 | ||||||||||||||
| 49,200 | Japan Post Insurance Co Ltd | 790 | ||||||||||||||
| 4 | Japan Retail Fund Investment Corp | 3 | ||||||||||||||
| 220,440 | Japan Tobacco, Inc | 4,451 | ||||||||||||||
| 98,309 | JFE Holdings, Inc | 1,254 | ||||||||||||||
| 471,600 | JGC Corp | 3,940 | ||||||||||||||
| 37,273 | JSR Corp | 1,417 | ||||||||||||||
| 314,700 | Kansai Electric Power Co, Inc | 2,942 | ||||||||||||||
| 39,101 | Kansai Paint Co Ltd | 850 | ||||||||||||||
| 107,200 | Kao Corp | 5,615 | ||||||||||||||
| 343,200 | KDDI Corp | 10,036 | ||||||||||||||
| 64 | Kenedix Realty Investment Corp | 396 | ||||||||||||||
| 159,900 | Keyence Corp | 100,538 | ||||||||||||||
| 202,900 | Mebuki Financial Group Inc | 418 | ||||||||||||||
| 269,101 | Mitsubishi Chemical Holdings Corp | 1,996 | ||||||||||||||
| 355,673 | Mitsubishi Estate Co Ltd | 4,934 | ||||||||||||||
| 34,400 | Mitsubishi Gas Chemical Co, Inc | 583 | ||||||||||||||
| 2,674,700 | Mitsubishi UFJ Financial Group, Inc | 14,556 | ||||||||||||||
| 88,100 | Mitsubishi UFJ Lease & Finance Co Ltd | 436 | ||||||||||||||
| 864,000 | Mitsui & Co Ltd | 20,475 | ||||||||||||||
| 35,201 | Mitsui Chemicals, Inc | 946 | ||||||||||||||
| 6,750 | Mitsui Fudosan Co Ltd | 134 | ||||||||||||||
| 1,173 | Mitsui Fudosan Logistics Park, Inc | 6,577 | ||||||||||||||
| 527,800 | Mizuho Financial Group, Inc | 6,704 | ||||||||||||||
| 1,211,550 | MonotaRO Co Ltd | 21,791 | ||||||||||||||
| 276 | Mori Hills REIT Investment Corp | 375 | ||||||||||||||
| 97,300 | MS&AD Insurance Group Holdings Inc | 2,996 | ||||||||||||||
| 279 |
COLLEGE RETIREMENT EQUITIES FUND - Global Equities Account
| SHARES | COMPANY | VALUE (000) | ||||||||||||||
| 176,061 | Nintendo Co Ltd | $ | 82,371 | |||||||||||||
| 151,600 | Nippon Paint Co Ltd | 1,656 | ||||||||||||||
| 144,901 | Nippon Steel Corp | 2,367 | ||||||||||||||
| 267,800 | Nippon Telegraph & Telephone Corp | 7,324 | ||||||||||||||
| 23,039 | Nissan Chemical Industries Ltd | 1,340 | ||||||||||||||
| 31,000 | Nitto Denko Corp | 2,395 | ||||||||||||||
| 688,000 | * | Nomura Holdings, Inc | 2,997 | |||||||||||||
| 750 | Nomura Real Estate Master Fund, Inc | 1,056 | ||||||||||||||
| 153,695 | OJI Paper Co Ltd | 745 | ||||||||||||||
| 137,511 | Omron Corp | 13,703 | ||||||||||||||
| 35,500 | Oriental Land Co Ltd | 5,986 | ||||||||||||||
| 287,400 | ORIX Corp | 5,865 | ||||||||||||||
| 507 | Orix JREIT, Inc | 793 | ||||||||||||||
| 111,400 | Osaka Securities Exchange Co Ltd | 2,441 | ||||||||||||||
| 331,400 | Paltac Corp | 13,657 | ||||||||||||||
| 479,600 | Panasonic Corp | 5,272 | ||||||||||||||
| 2,772,600 | Recruit Holdings Co Ltd | 168,728 | ||||||||||||||
| 457,600 | Resona Holdings, Inc | 1,778 | ||||||||||||||
| 51,600 | * | SBI Holdings, Inc | 1,407 | |||||||||||||
| 134,200 | Sekisui House Ltd | 2,887 | ||||||||||||||
| 108,700 | Seven & I Holdings Co Ltd | 4,781 | ||||||||||||||
| 129,000 | Seven Bank Ltd | 267 | ||||||||||||||
| 99,498 | * | SHIFT, Inc | 20,521 | |||||||||||||
| 33,900 | * | Shinsei Bank Ltd | 551 | |||||||||||||
| 23,100 | Shiseido Co Ltd | 1,289 | ||||||||||||||
| 91,100 | e | Shizuoka Bank Ltd | 650 | |||||||||||||
| 454,300 | SMS Co Ltd | 17,866 | ||||||||||||||
| 73,400 | Sompo Holdings, Inc | 3,096 | ||||||||||||||
| 2,070,265 | Sony Corp | 261,429 | ||||||||||||||
| 3,200 | Star Asia Investment Corp | 1,759 | ||||||||||||||
| 302,200 | Sumitomo Chemical Co Ltd | 1,425 | ||||||||||||||
| 82,901 | Sumitomo Heavy Industries Ltd | 2,012 | ||||||||||||||
| 46,900 | Sumitomo Metal Mining Co Ltd | 1,776 | ||||||||||||||
| 1,570,501 | Sumitomo Mitsui Financial Group, Inc | 53,628 | ||||||||||||||
| 73,900 | Sumitomo Mitsui Trust Holdings, Inc | 2,471 | ||||||||||||||
| 20 | Sumitomo Realty & Development Co Ltd | 1 | ||||||||||||||
| 80,800 | Sysmex Corp | 10,907 | ||||||||||||||
| 117,600 | T&D Holdings, Inc | 1,502 | ||||||||||||||
| 22,582 | Taiyo Nippon Sanso Corp | 494 | ||||||||||||||
| 605,397 | TechnoPro Holdings, Inc | 18,352 | ||||||||||||||
| 207,800 | Terumo Corp | 8,778 | ||||||||||||||
| 138,100 | Tokio Marine Holdings, Inc | 7,688 | ||||||||||||||
| 9,300 | Tokyo Century Corp | 451 | ||||||||||||||
| 280 |
COLLEGE RETIREMENT EQUITIES FUND - Global Equities Account
| SHARES | COMPANY | VALUE (000) | ||||||||||||||
| 323,700 | * | Tokyo Electric Power Co, Inc | $ | 837 | ||||||||||||
| 170,700 | Tokyo Gas Co Ltd | 3,064 | ||||||||||||||
| 244,500 | Tokyo Tatemono Co Ltd | 3,576 | ||||||||||||||
| 276,901 | Toray Industries, Inc | 1,641 | ||||||||||||||
| 55,421 | Tosoh Corp | 823 | ||||||||||||||
| 8,140,410 | * | Toyota Motor Corp | 150,456 | |||||||||||||
| 465 | United Urban Investment Corp | 547 | ||||||||||||||
| TOTAL JAPAN | 1,574,029 | |||||||||||||||
| KOREA, REPUBLIC OF - 1.4% | ||||||||||||||||
| 2,126 | * | Alteogen, Inc | 135 | |||||||||||||
| 7,115 | * | Amorepacific Corp | 999 | |||||||||||||
| 1,871 | * | BGF retail Co Ltd | 229 | |||||||||||||
| 7,362 | Celltrion Healthcare Co Ltd | 496 | ||||||||||||||
| 1,229 | * | Celltrion Pharm Inc | 128 | |||||||||||||
| 21,751 | Celltrion, Inc | 3,621 | ||||||||||||||
| 14,910 | * | Cheil Communications, Inc | 286 | |||||||||||||
| 1,784 | * | CJ CheilJedang Corp | 581 | |||||||||||||
| 3,252 | * | CJ Corp | 228 | |||||||||||||
| 2,443 | * | CJ O Shopping Co Ltd | 285 | |||||||||||||
| 11,859 | * | Coway Co Ltd | 743 | |||||||||||||
| 10,445 | * | Dongbu Insurance Co Ltd | 474 | |||||||||||||
| 10,713 | * | Doosan Bobcat, Inc | 367 | |||||||||||||
| 25,437 | * | Doosan Heavy Industries and Construction Co Ltd | 436 | |||||||||||||
| 3,790 | * | DuzonBIzon Co Ltd | 232 | |||||||||||||
| 2,400 | Ecopro BM Co Ltd | 1,008 | ||||||||||||||
| 4,376 | E-Mart Co Ltd | 555 | ||||||||||||||
| 765 | * | F&F Co Ltd | 607 | |||||||||||||
| 6,611 | * | Fila Korea Ltd | 199 | |||||||||||||
| 1,231 | * | Green Cross Corp | 225 | |||||||||||||
| 4,921 | * | GS Engineering & Construction Corp | 164 | |||||||||||||
| 10,591 | * | GS Holdings Corp | 348 | |||||||||||||
| 70,187 | Hana Financial Group, Inc | 2,480 | ||||||||||||||
| 15,896 | * | Hankook Tire Co Ltd | 531 | |||||||||||||
| 614 | * | Hanmi Pharm Co Ltd | 142 | |||||||||||||
| 40,358 | Hanon Systems | 456 | ||||||||||||||
| 26,443 | * | Hanwha Chemical Corp | 789 | |||||||||||||
| 19,420 | * | HLB, Inc | 568 | |||||||||||||
| 3,845 | * | Honam Petrochemical Corp | 701 | |||||||||||||
| 6,831 | * | Hotel Shilla Co Ltd | 448 | |||||||||||||
| 3,548 | * | HYBE Co Ltd | 1,039 | |||||||||||||
| 290,832 | Hynix Semiconductor, Inc | 31,943 | ||||||||||||||
| 6,931 | * | Hyundai Engineering & Construction Co Ltd | 259 | |||||||||||||
| 281 |
COLLEGE RETIREMENT EQUITIES FUND - Global Equities Account
| SHARES | COMPANY | VALUE (000) | ||||||||||||||
| 4,080 | * | Hyundai Glovis Co Ltd | $ | 575 | ||||||||||||
| 3,313 | * | Hyundai Heavy Industries | 263 | |||||||||||||
| 20,937 | * | Hyundai Merchant Marine Co Ltd | 474 | |||||||||||||
| 14,787 | Hyundai Mobis | 3,161 | ||||||||||||||
| 30,855 | Hyundai Motor Co | 5,416 | ||||||||||||||
| 7,933 | Hyundai Motor Co Ltd (2nd Preference) | 673 | ||||||||||||||
| 5,033 | Hyundai Motor Co Ltd (Preference) | 416 | ||||||||||||||
| 4,407 | Hyundai Robotics Co Ltd | 199 | ||||||||||||||
| 19,159 | * | Hyundai Steel Co | 660 | |||||||||||||
| 5,007 | * | Iljin Materials Co Ltd | 567 | |||||||||||||
| 20,853 | Industrial Bank of Korea | 180 | ||||||||||||||
| 25,890 | Kakao Corp | 2,445 | ||||||||||||||
| 6,495 | * | Kakao Games Corp | 496 | |||||||||||||
| 308,496 | *,e | KakaoBank Corp | 15,311 | |||||||||||||
| 20,925 | * | Kangwon Land, Inc | 423 | |||||||||||||
| 199,654 | KB Financial Group, Inc | 9,233 | ||||||||||||||
| 58,220 | * | Kia Motors Corp | 4,018 | |||||||||||||
| 19,063 | * | Korea Aerospace Industries Ltd | 519 | |||||||||||||
| 23,725 | Korea Electric Power Corp | 441 | ||||||||||||||
| 1,977 | * | Korea Express Co Ltd | 209 | |||||||||||||
| 3,222 | * | Korea Investment Holdings Co Ltd | 218 | |||||||||||||
| 1,467 | * | Korea Kumho Petrochemical | 205 | |||||||||||||
| 1,842 | * | Korea Zinc Co Ltd | 793 | |||||||||||||
| 14,125 | * | Korean Air Lines Co Ltd | 348 | |||||||||||||
| 4,807 | *,e,g | Krafton, Inc | 1,858 | |||||||||||||
| 25,849 | KT&G Corp | 1,717 | ||||||||||||||
| 4,913 | L&F Co Ltd | 914 | ||||||||||||||
| 115,700 | * | LG Chem Ltd | 59,812 | |||||||||||||
| 1,702 | * | LG Chem Ltd (Preference) | 411 | |||||||||||||
| 18,790 | * | LG Corp | 1,279 | |||||||||||||
| 19,684 | * | LG Display Co Ltd | 406 | |||||||||||||
| 8,880 | LG Electronics, Inc | 1,028 | ||||||||||||||
| 2,063 | * | LG Household & Health Care Ltd | 1,904 | |||||||||||||
| 469 | * | LG Household & Health Care Ltd (Preference) | 243 | |||||||||||||
| 1,162 | * | LG Innotek Co Ltd | 355 | |||||||||||||
| 18,972 | LG Telecom Ltd | 216 | ||||||||||||||
| 2,730 | * | Lotte Shopping Co Ltd | 200 | |||||||||||||
| 24,310 | * | Meritz Securities Co Ltd | 105 | |||||||||||||
| 21,098 | * | Mirae Asset Daewoo Co Ltd | 153 | |||||||||||||
| 19,239 | * | Naver Corp | 6,107 | |||||||||||||
| 1,368 | * | NCsoft | 739 | |||||||||||||
| 1,828 | *,g | Netmarble Corp | 192 | |||||||||||||
| 282 |
COLLEGE RETIREMENT EQUITIES FUND - Global Equities Account
| SHARES | COMPANY | VALUE (000) | ||||||||||||||
| 5,000 | * | Orion Corp/Republic of Korea | $ | 435 | ||||||||||||
| 6,444 | * | Pacific Corp | 240 | |||||||||||||
| 21,826 | * | Pan Ocean Co Ltd | 99 | |||||||||||||
| 2,544 | * | Pearl Abyss Corp | 296 | |||||||||||||
| 16,694 | POSCO | 3,871 | ||||||||||||||
| 6,641 | * | POSCO Refractories & Environment Co Ltd | 803 | |||||||||||||
| 3,947 | * | S1 Corp (Korea) | 246 | |||||||||||||
| 5,439 | *,g | Samsung Biologics Co Ltd | 4,130 | |||||||||||||
| 18,589 | * | Samsung C&T Corp | 1,857 | |||||||||||||
| 4,596 | * | Samsung Electro-Mechanics Co Ltd | 762 | |||||||||||||
| 2,815,556 | Samsung Electronics Co Ltd | 184,911 | ||||||||||||||
| 68,697 | Samsung Electronics Co Ltd (Preference) | 4,107 | ||||||||||||||
| 12,291 | * | Samsung Engineering Co Ltd | 236 | |||||||||||||
| 6,854 | * | Samsung Fire & Marine Insurance Co Ltd | 1,164 | |||||||||||||
| 51,579 | * | Samsung Heavy Industries Co Ltd | 246 | |||||||||||||
| 15,337 | Samsung Life Insurance Co Ltd | 826 | ||||||||||||||
| 4,594 | Samsung SDI Co Ltd | 2,527 | ||||||||||||||
| 2,864 | * | Samsung SDS Co Ltd | 376 | |||||||||||||
| 4,996 | * | Samsung Securities Co Ltd | 188 | |||||||||||||
| 7,815 | * | SD Biosensor, Inc | 368 | |||||||||||||
| 25,929 | Seegene, Inc | 1,331 | ||||||||||||||
| 2,617 | * | Shin Poong Pharmaceutical Co Ltd | 70 | |||||||||||||
| 102,286 | Shinhan Financial Group Co Ltd | 3,161 | ||||||||||||||
| 1,004 | Shinsegae Co Ltd | 214 | ||||||||||||||
| 4,422 | * | SK Biopharmaceuticals Co Ltd | 361 | |||||||||||||
| 5,086 | * | SK Bioscience Co Ltd | 963 | |||||||||||||
| 2,419 | * | SK Chemicals Co Ltd | 303 | |||||||||||||
| 9,580 | SK Holdings Co Ltd | 2,020 | ||||||||||||||
| 3,845 | *,g | SK IE Technology Co Ltd | 543 | |||||||||||||
| 11,318 | * | SK Innovation Co Ltd | 2,266 | |||||||||||||
| 3,714 | * | SK Square Co Ltd | 207 | |||||||||||||
| 2,153 | SK Telecom Co Ltd | 105 | ||||||||||||||
| 4,447 | * | SKC Co Ltd | 650 | |||||||||||||
| 10,853 | S-Oil Corp | 780 | ||||||||||||||
| 42,684 | Woori Financial Group, Inc | 455 | ||||||||||||||
| 11,674 | * | Woori Investment & Securities Co Ltd | 123 | |||||||||||||
| 4,163 | * | Yuhan Corp | 218 | |||||||||||||
| TOTAL KOREA, REPUBLIC OF | 398,042 | |||||||||||||||
| KUWAIT - 0.0% | ||||||||||||||||
| 274,011 | Agility Public Warehousing Co KSC | 855 | ||||||||||||||
| 86,004 | * | Boubyan Bank KSCP | 225 | |||||||||||||
| 384,090 | Kuwait Finance House | 1,057 | ||||||||||||||
| 283 |
COLLEGE RETIREMENT EQUITIES FUND - Global Equities Account
| SHARES | COMPANY | VALUE (000) | ||||||||||||||
| 126,346 | Mabanee Co KPSC | $ | 331 | |||||||||||||
| 526,153 | Mobile Telecommunications Co KSC | 1,036 | ||||||||||||||
| 1,675,411 | National Bank of Kuwait SAKP | 5,524 | ||||||||||||||
| TOTAL KUWAIT | 9,028 | |||||||||||||||
| LUXEMBOURG - 0.1% | ||||||||||||||||
| 911,880 | ArcelorMittal | 29,252 | ||||||||||||||
| 10,958 | Reinet Investments S.C.A | 197 | ||||||||||||||
| TOTAL LUXEMBOURG | 29,449 | |||||||||||||||
| MACAU - 0.0% | ||||||||||||||||
| 300,000 | * | Galaxy Entertainment Group Ltd | 1,556 | |||||||||||||
| TOTAL MACAU | 1,556 | |||||||||||||||
| MALAYSIA - 0.1% | ||||||||||||||||
| 155,700 | * | AMMB Holdings BHD | 119 | |||||||||||||
| 223,343 | Axiata Group Bhd | 223 | ||||||||||||||
| 543,767 | Bumiputra-Commerce Holdings BHD | 711 | ||||||||||||||
| 927,000 | Dialog Group BHD | 583 | ||||||||||||||
| 259,800 | Digi.Com BHD | 272 | ||||||||||||||
| 23,500 | Fraser & Neave Holdings BHD | 140 | ||||||||||||||
| 474,800 | Genting BHD | 532 | ||||||||||||||
| 659,300 | Genting Malaysia BHD | 455 | ||||||||||||||
| 118,500 | HAP Seng Consolidated BHD | 219 | ||||||||||||||
| 135,600 | Hartalega Holdings BHD | 187 | ||||||||||||||
| 51,300 | Hong Leong Bank BHD | 229 | ||||||||||||||
| 15,000 | Hong Leong Credit BHD | 62 | ||||||||||||||
| 854,300 | IHH Healthcare BHD | 1,505 | ||||||||||||||
| 631,900 | Inari Amertron BHD | 605 | ||||||||||||||
| 537,800 | IOI Corp BHD | 481 | ||||||||||||||
| 93,630 | Kuala Lumpur Kepong BHD | 490 | ||||||||||||||
| 395,078 | Malayan Banking BHD | 787 | ||||||||||||||
| 233,100 | * | Malaysia Airports Holdings BHD | 335 | |||||||||||||
| 186,000 | Maxis BHD | 217 | ||||||||||||||
| 352,200 | MISC BHD | 595 | ||||||||||||||
| 17,300 | Nestle Malaysia BHD | 557 | ||||||||||||||
| 535,100 | Petronas Chemicals Group BHD | 1,146 | ||||||||||||||
| 73,100 | Petronas Dagangan BHD | 361 | ||||||||||||||
| 225,400 | Petronas Gas BHD | 974 | ||||||||||||||
| 138,380 | PPB Group BHD | 568 | ||||||||||||||
| 669,000 | Press Metal BHD | 928 | ||||||||||||||
| 3,370,200 | Public Bank BHD | 3,364 | ||||||||||||||
| 168,050 | QL Resources BHD | 184 | ||||||||||||||
| 149,362 | RHB Capital BHD | 192 | ||||||||||||||
| 627,400 | Sime Darby BHD | 350 | ||||||||||||||
| 284 |
COLLEGE RETIREMENT EQUITIES FUND - Global Equities Account
| SHARES | COMPANY | VALUE (000) | ||||||||||||||
| 375,800 | Sime Darby Plantation BHD | $ | 339 | |||||||||||||
| 1,153 | * | SP Setia BHD | 0 | ^ | ||||||||||||
| 98,700 | Telekom Malaysia BHD | 130 | ||||||||||||||
| 536,300 | Tenaga Nasional BHD | 1,202 | ||||||||||||||
| 423,200 | Top Glove Corp BHD | 263 | ||||||||||||||
| 196,100 | Westports Holdings BHD | 191 | ||||||||||||||
| TOTAL MALAYSIA | 19,496 | |||||||||||||||
| MEXICO - 0.1% | ||||||||||||||||
| 651,700 | Alfa S.A. de C.V. (Class A) | 478 | ||||||||||||||
| 7,549,600 | America Movil S.A.B. de C.V. | 7,997 | ||||||||||||||
| 93,500 | Becle SAB de C.V. | 235 | ||||||||||||||
| 3,332,394 | * | Cemex S.A. de C.V. | 2,277 | |||||||||||||
| 122,755 | Coca-Cola Femsa SAB de C.V. | 670 | ||||||||||||||
| 101,400 | Embotelladoras Arca SAB de C.V. | 646 | ||||||||||||||
| 708,700 | Fibra Uno Administracion S.A. de C.V. | 749 | ||||||||||||||
| 431,300 | Fomento Economico Mexicano S.A. de C.V. | 3,356 | ||||||||||||||
| 47,200 | Gruma SAB de C.V. | 605 | ||||||||||||||
| 80,600 | Grupo Aeroportuario del Pacifico S.A. de C.V. (B Shares) | 1,111 | ||||||||||||||
| 45,865 | Grupo Aeroportuario del Sureste S.A. de C.V. (Class B) | 947 | ||||||||||||||
| 336,700 | Grupo Bimbo S.A. de C.V. (Series A) | 1,036 | ||||||||||||||
| 108,000 | Grupo Carso S.A. de C.V. (Series A1) | 349 | ||||||||||||||
| 622,300 | Grupo Financiero Banorte S.A. de C.V. | 4,043 | ||||||||||||||
| 178,927 | * | Grupo Financiero Inbursa S.A. | 214 | |||||||||||||
| 673,400 | Grupo Mexico S.A. de C.V. (Series B) | 2,937 | ||||||||||||||
| 522,100 | Grupo Televisa S.A. | 983 | ||||||||||||||
| 31,295 | Industrias Penoles S.A. de C.V. | 360 | ||||||||||||||
| 359,500 | Kimberly-Clark de Mexico S.A. de C.V. (Class A) | 544 | ||||||||||||||
| 73,400 | Megacable Holdings SAB de C.V. | 250 | ||||||||||||||
| 225,800 | Orbia Advance Corp SAB de C.V. | 576 | ||||||||||||||
| 48,670 | Promotora y Operadora de Infraestructura SAB de C.V. | 380 | ||||||||||||||
| 238,400 | e | Telesites SAB de C.V. | 244 | |||||||||||||
| 1,160,800 | Wal-Mart de Mexico SAB de C.V. | 4,314 | ||||||||||||||
| TOTAL MEXICO | 35,301 | |||||||||||||||
| NETHERLANDS - 2.2% | ||||||||||||||||
| 31,802 | *,g | Adyen NV | 83,480 | |||||||||||||
| 3,451 | * | Argenx SE | 1,239 | |||||||||||||
| 23,304 | * | Argenx SE | 8,287 | |||||||||||||
| 296,159 | ASML Holding NV | 237,229 | ||||||||||||||
| 121,345 | g | Euronext NV | 12,615 | |||||||||||||
| 62,367 | Heineken NV | 7,019 | ||||||||||||||
| 13,642,422 | ING Groep NV | 189,671 | ||||||||||||||
| 285 |
COLLEGE RETIREMENT EQUITIES FUND - Global Equities Account
| SHARES | COMPANY | VALUE (000) | ||||||||||||||
| 272,224 | Koninklijke Ahold Delhaize NV | $ | 9,342 | |||||||||||||
| 667,227 | Koninklijke KPN NV | 2,074 | ||||||||||||||
| 911,290 | Royal Dutch Shell plc (A Shares) | 19,970 | ||||||||||||||
| 216,607 | Royal Dutch Shell plc (B Shares) | 4,756 | ||||||||||||||
| 1,797,523 | Universal Music Group NV | 50,712 | ||||||||||||||
| TOTAL NETHERLANDS | 626,394 | |||||||||||||||
| NEW ZEALAND - 0.0% | ||||||||||||||||
| 387,651 | Fisher & Paykel Healthcare Corp | 8,685 | ||||||||||||||
| TOTAL NEW ZEALAND | 8,685 | |||||||||||||||
| NORWAY - 0.6% | ||||||||||||||||
| 1,178,178 | e | Aker BP ASA | 36,227 | |||||||||||||
| 674,182 | *,e | Aker Carbon Capture AS. | 2,096 | |||||||||||||
| 4,317,509 | Equinor ASA | 114,324 | ||||||||||||||
| 193,118 | Gjensidige Forsikring BA | 4,685 | ||||||||||||||
| 2,371,153 | Norsk Hydro ASA | 18,658 | ||||||||||||||
| TOTAL NORWAY | 175,990 | |||||||||||||||
| PERU - 0.0% | ||||||||||||||||
| 51,600 | *,e | Cia de Minas Buenaventura S.A. (ADR) (Series B) | 378 | |||||||||||||
| 16,000 | Credicorp Ltd | 1,953 | ||||||||||||||
| 19,021 | Southern Copper Corp | 1,174 | ||||||||||||||
| TOTAL PERU | 3,505 | |||||||||||||||
| PHILIPPINES - 0.1% | ||||||||||||||||
| 433,780 | Aboitiz Equity Ventures, Inc | 463 | ||||||||||||||
| 1,975,600 | AC Energy Corp | 426 | ||||||||||||||
| 22,920 | Ayala Corp | 374 | ||||||||||||||
| 1,749,870 | Ayala Land, Inc | 1,259 | ||||||||||||||
| 149,880 | Bank of the Philippine Islands | 271 | ||||||||||||||
| 162,040 | BDO Unibank, Inc | 383 | ||||||||||||||
| 2,505 | Globe Telecom, Inc | 163 | ||||||||||||||
| 21,224 | GT Capital Holdings, Inc | 225 | ||||||||||||||
| 226,290 | International Container Term Services, Inc | 888 | ||||||||||||||
| 628,205 | JG Summit Holdings (Series B) | 652 | ||||||||||||||
| 95,060 | Jollibee Foods Corp | 403 | ||||||||||||||
| 54,560 | Manila Electric Co | 316 | ||||||||||||||
| 914,900 | Metro Pacific Investments Corp | 70 | ||||||||||||||
| 156,263 | Metropolitan Bank & Trust | 171 | ||||||||||||||
| 996,200 | *,g | Monde Nissin Corp | 317 | |||||||||||||
| 6,430 | PLDT, Inc | 229 | ||||||||||||||
| 5,826,950 | Robinsons Retail Holdings, Inc | 7,473 | ||||||||||||||
| 19,520 | SM Investments Corp | 361 | ||||||||||||||
| 2,215,100 | SM Prime Holdings | 1,472 | ||||||||||||||
| 286 |
COLLEGE RETIREMENT EQUITIES FUND - Global Equities Account
| SHARES | COMPANY | VALUE (000) | ||||||||||||||
| 192,580 | Universal Robina | $ | 483 | |||||||||||||
| TOTAL PHILIPPINES | 16,399 | |||||||||||||||
| POLAND - 0.1% | ||||||||||||||||
| 338,829 | *,g | Allegro.eu S.A. | 3,262 | |||||||||||||
| 15,706 | Bank Pekao S.A. | 474 | ||||||||||||||
| 3,045 | Bank Zachodni WBK S.A. | 261 | ||||||||||||||
| 1,210 | * | BRE Bank S.A. | 129 | |||||||||||||
| 5,670 | CD Projekt Red S.A. | 270 | ||||||||||||||
| 53,825 | Cyfrowy Polsat S.A. | 464 | ||||||||||||||
| 10,540 | *,g | Dino Polska S.A. | 961 | |||||||||||||
| 187,188 | * | InPost S.A. | 2,259 | |||||||||||||
| 28,114 | KGHM Polska Miedz S.A. | 976 | ||||||||||||||
| 239 | LPP S.A. | 1,020 | ||||||||||||||
| 189,198 | * | PGE Polska Grupa Energetyczna S.A. | 377 | |||||||||||||
| 71,608 | Polski Koncern Naftowy Orlen S.A. | 1,320 | ||||||||||||||
| 435,097 | Polskie Gornictwo Naftowe i Gazownictwo S.A. | 680 | ||||||||||||||
| 70,409 | * | Powszechna Kasa Oszczednosci Bank Polski S.A. | 781 | |||||||||||||
| 130,400 | Powszechny Zaklad Ubezpieczen S.A. | 1,139 | ||||||||||||||
| 140,211 | * | Telekomunikacja Polska S.A. | 294 | |||||||||||||
| TOTAL POLAND | 14,667 | |||||||||||||||
| PORTUGAL - 0.1% | ||||||||||||||||
| 2,268,672 | Energias de Portugal S.A. | 12,462 | ||||||||||||||
| 842,501 | Jeronimo Martins SGPS S.A. | 19,280 | ||||||||||||||
| TOTAL PORTUGAL | 31,742 | |||||||||||||||
| QATAR - 0.0% | ||||||||||||||||
| 470,652 | Barwa Real Estate Co | 395 | ||||||||||||||
| 160,505 | Commercial Bank of Qatar QSC | 297 | ||||||||||||||
| 334,601 | Industries Qatar QSC | 1,423 | ||||||||||||||
| 389,182 | Masraf Al Rayan | 496 | ||||||||||||||
| 960,766 | Mesaieed Petrochemical Holding Co | 551 | ||||||||||||||
| 213,770 | Ooredoo QSC | 412 | ||||||||||||||
| 108,770 | Qatar Electricity & Water Co | 496 | ||||||||||||||
| 118,581 | Qatar Fuel QSC | 595 | ||||||||||||||
| 593,199 | Qatar Gas Transport Co Ltd | 537 | ||||||||||||||
| 56,911 | Qatar International Islamic Bank QSC | 144 | ||||||||||||||
| 92,301 | Qatar Islamic Bank SAQ | 465 | ||||||||||||||
| 372,061 | Qatar National Bank | 2,063 | ||||||||||||||
| TOTAL QATAR | 7,874 | |||||||||||||||
| ROMANIA - 0.0% | ||||||||||||||||
| 101,163 | NEPI Rockcastle plc | 673 | ||||||||||||||
| TOTAL ROMANIA | 673 | |||||||||||||||
| 287 |
COLLEGE RETIREMENT EQUITIES FUND - Global Equities Account
| SHARES | COMPANY | VALUE (000) | ||||||||||||||
| RUSSIA - 0.6% | ||||||||||||||||
| 579,439 | Gazprom (ADR) | $ | 5,325 | |||||||||||||
| 758,416 | Gazprom OAO (ADR) | 7,003 | ||||||||||||||
| 94,318 | LUKOIL PJSC (ADR) | 8,470 | ||||||||||||||
| 80,143 | Magnit PJSC (GDR) | 1,202 | ||||||||||||||
| 24,079 | * | Mail.Ru Group Ltd (GDR) | 279 | |||||||||||||
| 139,558 | MMC Norilsk Nickel PJSC (ADR) | 4,280 | ||||||||||||||
| 109,200 | Mobile TeleSystems (ADR) | 868 | ||||||||||||||
| 21,018 | Novatek PJSC (GDR) | 4,922 | ||||||||||||||
| 33,468 | Novolipetsk Steel PJSC (GDR) | 988 | ||||||||||||||
| 11,600 | *,e | Ozon Holdings plc (ADR) | 344 | |||||||||||||
| 32,501 | PhosAgro PJSC (GDR) | 701 | ||||||||||||||
| 80,279 | Polymetal International plc | 1,430 | ||||||||||||||
| 12,630 | Polyus PJSC (GDR) | 1,116 | ||||||||||||||
| 2,528 | Polyus PJSC (GDR) | 223 | ||||||||||||||
| 285,936 | * | Rosneft Oil Co PJSC (GDR) | 2,300 | |||||||||||||
| 3,140,845 | Sberbank of Russia (ADR) | 49,468 | ||||||||||||||
| 46,814 | Severstal (GDR) | 1,008 | ||||||||||||||
| 345,774 | Surgutneftegaz (ADR) (London) | 1,826 | ||||||||||||||
| 57,841 | Tatneft PJSC (ADR) | 2,378 | ||||||||||||||
| 26,375 | TCS Group Holding plc (ADR) | 2,224 | ||||||||||||||
| 211,169 | * | VTB Bank PJSC (GDR) Tradegate | 266 | |||||||||||||
| 28,945 | * | X5 Retail Group NV (GDR) | 766 | |||||||||||||
| 1,353,041 | *,e | Yandex NV | 81,859 | |||||||||||||
| TOTAL RUSSIA | 179,246 | |||||||||||||||
| SAUDI ARABIA - 0.2% | ||||||||||||||||
| 9,711 | Abdullah Al Othaim Markets Co | 280 | ||||||||||||||
| 24,543 | Advanced Petrochemical Co | 460 | ||||||||||||||
| 297,694 | Al Rajhi Bank | 11,227 | ||||||||||||||
| 81,696 | Alinma Bank | 520 | ||||||||||||||
| 56,192 | Almarai Co JSC | 730 | ||||||||||||||
| 47,085 | Arab National Bank | 287 | ||||||||||||||
| 29,842 | * | Bank AlBilad | 368 | |||||||||||||
| 31,292 | Bank Al-Jazira | 160 | ||||||||||||||
| 128,131 | Banque Saudi Fransi | 1,610 | ||||||||||||||
| 12,912 | Bupa Arabia for Cooperative Insurance Co | 452 | ||||||||||||||
| 12,554 | Co for Cooperative Insurance | 258 | ||||||||||||||
| 66,761 | * | Dar Al Arkan Real Estate Development Co | 179 | |||||||||||||
| 38,728 | Dr Sulaiman Al Habib Medical Services Group Co | 1,663 | ||||||||||||||
| 33,529 | * | Emaar Economic City | 107 | |||||||||||||
| 87,064 | Etihad Etisalat Co | 722 | ||||||||||||||
| 13,070 | Jarir Marketing Co | 684 | ||||||||||||||
| 288 |
COLLEGE RETIREMENT EQUITIES FUND - Global Equities Account
| SHARES | COMPANY | VALUE (000) | ||||||||||||||
| 99,093 | * | Mobile Telecommunications Co Saudi Arabia | $ | 317 | ||||||||||||
| 10,681 | Mouwasat Medical Services Co | 493 | ||||||||||||||
| 758,559 | National Commercial Bank | 13,012 | ||||||||||||||
| 73,002 | * | National Industrialization Co | 386 | |||||||||||||
| 23,454 | National Petrochemical Co | 249 | ||||||||||||||
| 48,062 | * | Rabigh Refining & Petrochemical Co | 264 | |||||||||||||
| 375,385 | Riyad Bank | 2,710 | ||||||||||||||
| 48,006 | SABIC Agri-Nutrients Co | 2,254 | ||||||||||||||
| 79,701 | Sahara International Petrochemical Co | 888 | ||||||||||||||
| 92,300 | * | Saudi Arabian Mining Co | 1,926 | |||||||||||||
| 496,969 | g | Saudi Arabian Oil Co | 4,737 | |||||||||||||
| 200,029 | Saudi Basic Industries Corp | 6,169 | ||||||||||||||
| 196,353 | Saudi British Bank | 1,722 | ||||||||||||||
| 15,160 | Saudi Cement Co | 221 | ||||||||||||||
| 188,335 | Saudi Electricity Co | 1,201 | ||||||||||||||
| 47,543 | Saudi Industrial Investment Group | 394 | ||||||||||||||
| 158,715 | * | Saudi Kayan Petrochemical Co | 717 | |||||||||||||
| 133,976 | Saudi Telecom Co | 4,007 | ||||||||||||||
| 56,925 | Savola Group | 485 | ||||||||||||||
| 56,361 | Yanbu National Petrochemical Co | 1,029 | ||||||||||||||
| TOTAL SAUDI ARABIA | 62,888 | |||||||||||||||
| SINGAPORE - 0.3% | ||||||||||||||||
| 545,200 | e | Ascendas REIT | 1,195 | |||||||||||||
| 17,900 | g | BOC Aviation Ltd | 131 | |||||||||||||
| 435,142 | *,e | Capitaland Investment Ltd | 1,100 | |||||||||||||
| 67,304 | CapitaMall Trust | 102 | ||||||||||||||
| 392,600 | DBS Group Holdings Ltd | 9,509 | ||||||||||||||
| 723,361 | Oversea-Chinese Banking Corp | 6,122 | ||||||||||||||
| 175,900 | e | Singapore Exchange Ltd | 1,214 | |||||||||||||
| 1,677,100 | e | Singapore Telecommunications Ltd | 2,887 | |||||||||||||
| 905,140 | STMicroelectronics NV | 44,510 | ||||||||||||||
| 257,316 | United Overseas Bank Ltd | 5,139 | ||||||||||||||
| TOTAL SINGAPORE | 71,909 | |||||||||||||||
| SOUTH AFRICA - 0.2% | ||||||||||||||||
| 167,335 | Absa Group Ltd | 1,602 | ||||||||||||||
| 21,000 | African Rainbow Minerals Ltd | 305 | ||||||||||||||
| 12,095 | Anglo American Platinum Ltd | 1,380 | ||||||||||||||
| 229,175 | Anglo American plc | 9,426 | ||||||||||||||
| 31,861 | Aspen Pharmacare Holdings Ltd | 449 | ||||||||||||||
| 73,565 | Bid Corp Ltd | 1,507 | ||||||||||||||
| 62,391 | Bidvest Group Ltd | 742 | ||||||||||||||
| 59,497 | Capitec Bank Holdings Ltd | 7,616 | ||||||||||||||
| 289 |
COLLEGE RETIREMENT EQUITIES FUND - Global Equities Account
| SHARES | COMPANY | VALUE (000) | ||||||||||||||
| 52,536 | Clicks Group Ltd | $ | 1,040 | |||||||||||||
| 88,991 | * | Discovery Holdings Ltd | 802 | |||||||||||||
| 56,596 | Exxaro Resources Ltd | 543 | ||||||||||||||
| 1,151,654 | FirstRand Ltd | 4,394 | ||||||||||||||
| 193,273 | Gold Fields Ltd | 2,138 | ||||||||||||||
| 784,485 | Growthpoint Properties Ltd | 757 | ||||||||||||||
| 113,882 | Harmony Gold Mining Co Ltd | 478 | ||||||||||||||
| 181,777 | Impala Platinum Holdings Ltd | 2,564 | ||||||||||||||
| 13,042 | Kumba Iron Ore Ltd | 376 | ||||||||||||||
| 55,060 | Mr Price Group Ltd | 691 | ||||||||||||||
| 374,429 | * | MTN Group Ltd | 4,013 | |||||||||||||
| 81,399 | MultiChoice Group Ltd | 624 | ||||||||||||||
| 47,651 | Naspers Ltd (N Shares) | 7,396 | ||||||||||||||
| 39,150 | Nedbank Group Ltd | 430 | ||||||||||||||
| 78,787 | * | Northam Platinum Holdings Ltd | 1,036 | |||||||||||||
| 1,073,392 | Old Mutual Ltd | 882 | ||||||||||||||
| 106,411 | *,g | Pepkor Holdings Ltd | 146 | |||||||||||||
| 64,202 | Rand Merchant Investment Holdings Ltd | 182 | ||||||||||||||
| 120,806 | Remgro Ltd | 994 | ||||||||||||||
| 406,106 | Sanlam Ltd | 1,513 | ||||||||||||||
| 125,655 | * | Sasol Ltd | 2,057 | |||||||||||||
| 110,423 | Shoprite Holdings Ltd | 1,447 | ||||||||||||||
| 618,946 | Sibanye Stillwater Ltd | 1,925 | ||||||||||||||
| 41,589 | Spar Group Ltd | 436 | ||||||||||||||
| 298,913 | Standard Bank Group Ltd | 2,626 | ||||||||||||||
| 36,253 | Tiger Brands Ltd | 412 | ||||||||||||||
| 142,334 | Vodacom Group Pty Ltd | 1,201 | ||||||||||||||
| 215,106 | Woolworths Holdings Ltd | 700 | ||||||||||||||
| TOTAL SOUTH AFRICA | 64,830 | |||||||||||||||
| SPAIN - 0.5% | ||||||||||||||||
| 268,723 | * | Amadeus IT Holding S.A. | 18,183 | |||||||||||||
| 14,762,232 | Banco Bilbao Vizcaya Argentaria S.A. | 87,555 | ||||||||||||||
| 2,003,718 | Iberdrola S.A. | 23,724 | ||||||||||||||
| 297,893 | Industria De Diseno Textil S.A. | 9,607 | ||||||||||||||
| 108,528 | *,†,e | Let’s GOWEX S.A. | 1 | |||||||||||||
| 13,603 | Merlin Properties Socimi S.A. | 147 | ||||||||||||||
| 64,249 | e | Naturgy Energy Group S.A. | 2,090 | |||||||||||||
| 79,628 | e | Red Electrica Corp S.A. | 1,722 | |||||||||||||
| 1,089,074 | e | Telefonica S.A. | 4,722 | |||||||||||||
| TOTAL SPAIN | 147,751 | |||||||||||||||
| SWEDEN - 0.6% | ||||||||||||||||
| 1,162,528 | Assa Abloy AB | 35,435 | ||||||||||||||
| 290 |
COLLEGE RETIREMENT EQUITIES FUND - Global Equities Account
| SHARES | COMPANY | VALUE (000) | ||||||||||||||
| 108,999 | g | Evolution Gaming Group AB | $ | 15,406 | ||||||||||||
| 58,567 | * | Fastighets AB Balder | �� | 4,215 | ||||||||||||
| 1,829,415 | Hexagon AB | 28,979 | ||||||||||||||
| 498,177 | Intrum Justitia AB | 12,836 | ||||||||||||||
| 53,153 | Lundin Petroleum AB | 1,902 | ||||||||||||||
| 1,548,013 | Sandvik AB | 43,149 | ||||||||||||||
| 26,406 | *,e | SAS AB | 4 | |||||||||||||
| 5,080,479 | Swedish Match AB | 40,332 | ||||||||||||||
| TOTAL SWEDEN | 182,258 | |||||||||||||||
| SWITZERLAND - 2.1% | ||||||||||||||||
| 242,882 | Alcon, Inc | 21,424 | ||||||||||||||
| 112,416 | Cie Financiere Richemont S.A. | 16,799 | ||||||||||||||
| 566,342 | Credit Suisse Group | 5,491 | ||||||||||||||
| 4,339 | Givaudan S.A. | 22,765 | ||||||||||||||
| 195,551 | Lonza Group AG. | 162,813 | ||||||||||||||
| 645,150 | Nestle S.A. | 90,074 | ||||||||||||||
| 188,623 | Novartis AG. | 16,575 | ||||||||||||||
| 9,150 | PSP Swiss Property AG. | 1,140 | ||||||||||||||
| 486,423 | Roche Holding AG. | 201,798 | ||||||||||||||
| 9,738 | Sonova Holdings AG | 3,806 | ||||||||||||||
| 7,522 | Straumann Holding AG. | 15,906 | ||||||||||||||
| 9,150 | Swiss Prime Site AG. | 898 | ||||||||||||||
| 813,579 | UBS Group AG | 14,603 | ||||||||||||||
| 71,367 | Zurich Insurance Group AG | 31,264 | ||||||||||||||
| TOTAL SWITZERLAND | 605,356 | |||||||||||||||
| TAIWAN - 1.9% | ||||||||||||||||
| 109,000 | Accton Technology Corp | 1,021 | ||||||||||||||
| 220,000 | Acer, Inc | 242 | ||||||||||||||
| 31,391 | Advantech Co Ltd | 449 | ||||||||||||||
| 276,000 | ASE Technology Holding Co Ltd | 1,067 | ||||||||||||||
| 193,000 | Asia Cement Corp | 309 | ||||||||||||||
| 6,000 | ASMedia Technology, Inc | 393 | ||||||||||||||
| 59,000 | Asustek Computer, Inc | 801 | ||||||||||||||
| 685,000 | AU Optronics Corp | 566 | ||||||||||||||
| 58,189 | Catcher Technology Co Ltd | 329 | ||||||||||||||
| 1,760,412 | Cathay Financial Holding Co Ltd | 3,966 | ||||||||||||||
| 283,592 | Chailease Holding Co Ltd | 2,697 | ||||||||||||||
| 322,293 | Chang Hwa Commercial Bank | 198 | ||||||||||||||
| 383,000 | Cheng Shin Rubber Industry Co Ltd | 499 | ||||||||||||||
| 320,212 | * | China Development Financial Holding Corp | 111 | |||||||||||||
| 3,842,918 | China Development Financial Holding Corp | 2,427 | ||||||||||||||
| 2,601,000 | China Steel Corp | 3,319 | ||||||||||||||
| 291 |
COLLEGE RETIREMENT EQUITIES FUND - Global Equities Account
| SHARES | COMPANY | VALUE (000) | ||||||||||||||
| 8,105,000 | Chinatrust Financial Holding Co | $ | 7,593 | |||||||||||||
| 329,000 | Chunghwa Telecom Co Ltd | 1,385 | ||||||||||||||
| 361,000 | Compal Electronics, Inc | 316 | ||||||||||||||
| 929,727 | Dadi Early-Childhood Education Group Ltd | 4,901 | ||||||||||||||
| 161,000 | Delta Electronics, Inc | 1,597 | ||||||||||||||
| 2,800,033 | E.Sun Financial Holding Co Ltd | 2,838 | ||||||||||||||
| 639,000 | Eclat Textile Co Ltd | 14,560 | ||||||||||||||
| 14,000 | eMemory Technology, Inc | 1,105 | ||||||||||||||
| 210,731 | Evergreen Marine Corp Tawain Ltd | 1,080 | ||||||||||||||
| 699,000 | Far Eastern Textile Co Ltd | 739 | ||||||||||||||
| 143,000 | Far EasTone Telecommunications Co Ltd | 334 | ||||||||||||||
| 93,040 | Feng TAY Enterprise Co Ltd | 778 | ||||||||||||||
| 848,165 | First Financial Holding Co Ltd | 750 | ||||||||||||||
| 775,000 | Formosa Chemicals & Fibre Corp | 2,260 | ||||||||||||||
| 264,000 | Formosa Petrochemical Corp | 913 | ||||||||||||||
| 850,000 | Formosa Plastics Corp | 3,190 | ||||||||||||||
| 81,000 | Foxconn Technology Co Ltd | 190 | ||||||||||||||
| 23,860 | * | Fubon Financial Holding Co Ltd | 52 | |||||||||||||
| 1,796,822 | Fubon Financial Holding Co Ltd | 4,946 | ||||||||||||||
| 2,269,600 | Fuhwa Financial Holdings Co Ltd | 2,073 | ||||||||||||||
| 65,000 | Giant Manufacturing Co Ltd | 809 | ||||||||||||||
| 274,900 | Globalwafers Co Ltd | 8,807 | ||||||||||||||
| 22,680 | Hiwin Technologies Corp | 251 | ||||||||||||||
| 1,054,000 | Hon Hai Precision Industry Co, Ltd | 3,953 | ||||||||||||||
| 1,934,278 | Hota Industrial Manufacturing Co Ltd | 6,369 | ||||||||||||||
| 65,000 | Hotai Motor Co Ltd | 1,440 | ||||||||||||||
| 687,984 | Hua Nan Financial Holdings Co Ltd | 527 | ||||||||||||||
| 805,000 | InnoLux Display Corp | 569 | ||||||||||||||
| 234,000 | Inventec Co Ltd | 211 | ||||||||||||||
| 8,604 | Largan Precision Co Ltd | 765 | ||||||||||||||
| 177,000 | Lite-On Technology Corp | 408 | ||||||||||||||
| 788,242 | MediaTek, Inc | 33,823 | ||||||||||||||
| 2,595,000 | Mega Financial Holding Co Ltd | 3,333 | ||||||||||||||
| 56,000 | Micro-Star International Co Ltd | 324 | ||||||||||||||
| 10,000 | momo.com, Inc | 585 | ||||||||||||||
| 1,135,000 | Nan Ya Plastics Corp | 3,497 | ||||||||||||||
| 19,000 | Nan Ya Printed Circuit Board Corp | 391 | ||||||||||||||
| 109,000 | Nanya Technology Corp | 307 | ||||||||||||||
| 34,000 | Nien Made Enterprise Co Ltd | 506 | ||||||||||||||
| 48,000 | Novatek Microelectronics Corp Ltd | 932 | ||||||||||||||
| 18,000 | * | Oneness Biotech Co Ltd | 187 | |||||||||||||
| 168,000 | Pegatron Technology Corp | 419 | ||||||||||||||
| 524,000 | Pou Chen Corp | 627 | ||||||||||||||
| 292 |
COLLEGE RETIREMENT EQUITIES FUND - Global Equities Account
| SHARES | COMPANY | VALUE (000) | ||||||||||||||
| 126,000 | President Chain Store Corp | $ | 1,244 | |||||||||||||
| 1,717,000 | Prime View International Co Ltd | 9,350 | ||||||||||||||
| 223,000 | Quanta Computer, Inc | 762 | ||||||||||||||
| 37,000 | Realtek Semiconductor Corp | 773 | ||||||||||||||
| 252,540 | Ruentex Development Co Ltd | 581 | ||||||||||||||
| 289,999 | Shanghai Commercial & Savings Bank Ltd | 495 | ||||||||||||||
| 2,709,684 | Shin Kong Financial Holding Co Ltd | 1,080 | ||||||||||||||
| 845,300 | SinoPac Financial Holdings Co Ltd | 493 | ||||||||||||||
| 112,000 | Synnex Technology International Corp | 268 | ||||||||||||||
| 858,350 | Taishin Financial Holdings Co Ltd | 587 | ||||||||||||||
| 432,192 | Taiwan Cement Corp | 749 | ||||||||||||||
| 771,024 | Taiwan Cooperative Financial Holding | 708 | ||||||||||||||
| 413,000 | Taiwan High Speed Rail Corp | 441 | ||||||||||||||
| 143,000 | Taiwan Mobile Co Ltd | 516 | ||||||||||||||
| 15,637,100 | Taiwan Semiconductor Manufacturing Co Ltd | 345,908 | ||||||||||||||
| 146,645 | Taiwan Semiconductor Manufacturing Co Ltd (ADR) | 17,643 | ||||||||||||||
| 102,000 | Unimicron Technology Corp | 849 | ||||||||||||||
| 1,067,000 | Uni-President Enterprises Corp | 2,642 | ||||||||||||||
| 988,000 | United Microelectronics Corp | 2,315 | ||||||||||||||
| 73,000 | Vanguard International Semiconductor Corp | 416 | ||||||||||||||
| 13,000 | Voltronic Power Technology Corp | 725 | ||||||||||||||
| 52,400 | Wan Hai Lines Ltd | 374 | ||||||||||||||
| 28,000 | Win Semiconductors Corp | 378 | ||||||||||||||
| 247,000 | Winbond Electronics Corp | 302 | ||||||||||||||
| 218,690 | Wistron Corp | 230 | ||||||||||||||
| 16,000 | Wiwynn Corp | 644 | ||||||||||||||
| 133,640 | WPG Holdings Co Ltd | 254 | ||||||||||||||
| 36,339 | Yageo Corp | 628 | ||||||||||||||
| 144,000 | * | Yang Ming Marine Transport | 626 | |||||||||||||
| 52,000 | Zhen Ding Technology Holding Ltd | 188 | ||||||||||||||
| TOTAL TAIWAN | 531,203 | |||||||||||||||
| TANZANIA, UNITED REPUBLIC OF - 0.0% | ||||||||||||||||
| 91,086 | AngloGold Ashanti Ltd | 1,918 | ||||||||||||||
| TOTAL TANZANIA, UNITED REPUBLIC OF | 1,918 | |||||||||||||||
| THAILAND - 0.1% | ||||||||||||||||
| 100,900 | Advanced Info Service PCL | 694 | ||||||||||||||
| 926,600 | Airports of Thailand PCL | 1,687 | ||||||||||||||
| 1,215,500 | * | Asset World Corp PCL | 168 | |||||||||||||
| 147,500 | B Grimm Power PCL | 179 | ||||||||||||||
| 137,400 | Bangkok Commercial Asset Management PCL | 89 | ||||||||||||||
| 794,600 | Bangkok Dusit Medical Services PCL | 547 | ||||||||||||||
| 293 |
COLLEGE RETIREMENT EQUITIES FUND - Global Equities Account
| SHARES | COMPANY | VALUE (000) | ||||||||||||||
| 1,505,500 | Bangkok Expressway & Metro PCL | $ | 381 | |||||||||||||
| 276,400 | Berli Jucker PCL | 256 | ||||||||||||||
| 1,568,090 | BTS Group Holdings PCL | 438 | ||||||||||||||
| 40,400 | Bumrungrad Hospital PCL | 170 | ||||||||||||||
| 60,800 | Carabao Group PCL | 217 | ||||||||||||||
| 431,100 | Central Pattana PCL | 729 | ||||||||||||||
| 380,775 | Central Retail Corp PCL | 364 | ||||||||||||||
| 841,600 | Charoen Pokphand Foods PCL | 643 | ||||||||||||||
| 1,278,200 | CP ALL plc | 2,266 | ||||||||||||||
| 26,300 | Delta Electronics Thai PCL | 324 | ||||||||||||||
| 68,400 | Electricity Generating PCL | 359 | ||||||||||||||
| 326,300 | Energy Absolute PCL | 937 | ||||||||||||||
| 150,000 | Global Power Synergy Co Ltd | 399 | ||||||||||||||
| 626,030 | Gulf Energy Development PCL | 858 | ||||||||||||||
| 1,268,200 | Home Product Center PCL | 550 | ||||||||||||||
| 362,900 | Indorama Ventures PCL | 469 | ||||||||||||||
| 250,900 | Intouch Holdings PCL (Class F) | 603 | ||||||||||||||
| 923,900 | Krung Thai Bank PCL | 364 | ||||||||||||||
| 180,400 | Krungthai Card PCL | 320 | ||||||||||||||
| 1,869,900 | Land and Houses PCL Co Reg | 492 | ||||||||||||||
| 674,100 | * | Minor International PCL | 580 | |||||||||||||
| 120,600 | Muangthai Capital PCL | 212 | ||||||||||||||
| 241,100 | Osotspa PCL | 247 | ||||||||||||||
| 369,500 | PTT Exploration & Production PCL | 1,303 | ||||||||||||||
| 510,800 | PTT Global Chemical PCL | 898 | ||||||||||||||
| 638,800 | PTT Oil & Retail Business PCL | 516 | ||||||||||||||
| 2,390,400 | PTT PCL | 2,713 | ||||||||||||||
| 71,700 | Ratch Group PCL | 97 | ||||||||||||||
| 282,500 | SCG Packaging PCL | 585 | ||||||||||||||
| 173,600 | Siam Cement PCL | 2,007 | ||||||||||||||
| 197,200 | Siam Commercial Bank PCL | 749 | ||||||||||||||
| 80,800 | Sri Trang Gloves Thailand PCL | 73 | ||||||||||||||
| 144,300 | Srisawad Corp PCL | 266 | ||||||||||||||
| 309,500 | Thai Oil PCL | 458 | ||||||||||||||
| 636,000 | Thai Union Group PCL | 371 | ||||||||||||||
| 966,900 | True Corp PCL | 141 | ||||||||||||||
| TOTAL THAILAND | 25,719 | |||||||||||||||
| TURKEY - 0.0% | ||||||||||||||||
| 291,316 | Akbank TAS | 157 | ||||||||||||||
| 127,694 | Aselsan Elektronik Sanayi Ve Ticaret AS | 202 | ||||||||||||||
| 102,280 | BIM Birlesik Magazalar AS | 474 | ||||||||||||||
| 302,690 | Eregli Demir ve Celik Fabrikalari TAS | 644 | ||||||||||||||
| 294 |
COLLEGE RETIREMENT EQUITIES FUND - Global Equities Account
| SHARES | COMPANY | VALUE (000) | ||||||||||||||
| 13,978 | Ford Otomotiv Sanayi AS | $ | 252 | |||||||||||||
| 160,280 | KOC Holding AS | 344 | ||||||||||||||
| 271,872 | Turkcell Iletisim Hizmet AS | 379 | ||||||||||||||
| 196,155 | Turkiye Garanti Bankasi AS | 167 | ||||||||||||||
| 117,143 | Turkiye Is Bankasi (Series C) | 64 | ||||||||||||||
| 32,287 | * | Turkiye Petrol Rafinerileri AS | 377 | |||||||||||||
| 296,826 | Turkiye Sise ve Cam Fabrikalari AS | 300 | ||||||||||||||
| TOTAL TURKEY | 3,360 | |||||||||||||||
| UNITED ARAB EMIRATES - 0.1% | ||||||||||||||||
| 621,448 | Abu Dhabi Commercial Bank PJSC | 1,442 | ||||||||||||||
| 114,112 | Abu Dhabi Islamic Bank PJSC | 213 | ||||||||||||||
| 579,807 | Abu Dhabi National Oil Co for Distribution PJSC | 674 | ||||||||||||||
| 875,041 | Aldar Properties PJSC | 950 | ||||||||||||||
| 231,115 | Dubai Islamic Bank PJSC | 338 | ||||||||||||||
| 913,900 | Emaar Properties PJSC | 1,214 | ||||||||||||||
| 206,351 | Emirates NBD Bank PJSC | 761 | ||||||||||||||
| 770,325 | Emirates Telecommunications Group Co PJSC | 6,656 | ||||||||||||||
| 1,005,963 | National Bank of Abu Dhabi PJSC | 5,160 | ||||||||||||||
| 5,358 | *,† | NMC Health plc | 0 | ^ | ||||||||||||
| TOTAL UNITED ARAB EMIRATES | 17,408 | |||||||||||||||
| UNITED KINGDOM - 4.4% | ||||||||||||||||
| 1,006,399 | * | Allfunds Group PLC | 19,817 | |||||||||||||
| 1,250,890 | Ashtead Group plc | 100,840 | ||||||||||||||
| 147,799 | Associated British Foods plc | 4,046 | ||||||||||||||
| 1,464,596 | AstraZeneca plc | 171,020 | ||||||||||||||
| 11,427,016 | Barclays plc | 29,108 | ||||||||||||||
| 1,866,804 | * | Beazley plc | 11,805 | |||||||||||||
| 118,969 | Big Yellow Group plc | 2,749 | ||||||||||||||
| 1,809,231 | BP plc | 8,106 | ||||||||||||||
| 692,852 | British American Tobacco plc | 25,727 | ||||||||||||||
| 274,545 | British Land Co plc | 1,983 | ||||||||||||||
| 102,835 | * | Coca-Cola European Partners plc (Class A) | 5,752 | |||||||||||||
| 308,712 | * | Compass Group plc | 6,950 | |||||||||||||
| 1,865,555 | * | Darktrace plc | 10,611 | |||||||||||||
| 289,255 | Dechra Pharmaceuticals plc | 20,906 | ||||||||||||||
| 36,604 | Derwent London plc | 1,703 | ||||||||||||||
| 2,589,939 | Diageo plc | 141,608 | ||||||||||||||
| 1,804,801 | Electrocomponents plc | 29,597 | ||||||||||||||
| 866,668 | Fevertree Drinks plc | 31,732 | ||||||||||||||
| 341,798 | GlaxoSmithKline plc | 7,442 | ||||||||||||||
| 183,029 | Great Portland Estates plc | 1,812 | ||||||||||||||
| 328,233 | * | Informa plc | 2,298 | |||||||||||||
| 295 |
COLLEGE RETIREMENT EQUITIES FUND - Global Equities Account
| SHARES | COMPANY | VALUE (000) | ||||||||||||||
| 199,076 | *,g | Just Eat Takeaway.com NV | $ | 10,816 | ||||||||||||
| 201,332 | e | Land Securities Group plc | 2,125 | |||||||||||||
| 116,186 | * | Liberty Global plc (Class A) | 3,223 | |||||||||||||
| 24,891 | * | Liberty Global plc (Class C) | 699 | |||||||||||||
| 113,721 | Linde plc | 39,396 | ||||||||||||||
| 636,125 | Linde plc (Xetra) | 220,740 | ||||||||||||||
| 114,637,069 | Lloyds TSB Group plc | 74,444 | ||||||||||||||
| 142,326 | London Stock Exchange Group plc | 13,389 | ||||||||||||||
| 6,134,848 | Man Group plc | 18,883 | ||||||||||||||
| 2,115,370 | Natwest Group plc | 6,478 | ||||||||||||||
| 34,920 | Next plc | 3,862 | ||||||||||||||
| 1,147,795 | Prudential plc | 19,849 | ||||||||||||||
| 153,337 | Reckitt Benckiser Group plc | 13,200 | ||||||||||||||
| 822,279 | RELX plc | 26,699 | ||||||||||||||
| 263,439 | RELX plc | 8,600 | ||||||||||||||
| 146,422 | Safestore Holdings plc | 2,792 | ||||||||||||||
| 216,512 | Scottish & Southern Energy plc | 4,840 | ||||||||||||||
| 235,995 | Segro plc | 4,593 | ||||||||||||||
| 145,498 | Smith & Nephew plc | 2,539 | ||||||||||||||
| 1,888,082 | Standard Chartered plc | 11,481 | ||||||||||||||
| 72,886 | * | TechnipFMC plc | 431 | |||||||||||||
| 20,444,132 | Tesco plc | 80,490 | ||||||||||||||
| 1,531,899 | * | THG Holdings Ltd | 4,752 | |||||||||||||
| 5,028,907 | Tritax Big Box REIT plc | 16,965 | ||||||||||||||
| 5,062,441 | g | Tritax EuroBox plc | 8,017 | |||||||||||||
| 444,216 | Unilever plc | 23,831 | ||||||||||||||
| 5,598,326 | Vodafone Group plc | 8,432 | ||||||||||||||
| 275,134 | WPP plc | 4,190 | ||||||||||||||
| TOTAL UNITED KINGDOM | 1,271,368 | |||||||||||||||
| UNITED STATES - 60.1% | ||||||||||||||||
| 362 | * | 10X Genomics, Inc | 54 | |||||||||||||
| 65,531 | 3M Co | 11,640 | ||||||||||||||
| 580 | A.O. Smith Corp | 50 | ||||||||||||||
| 1,287,461 | Abbott Laboratories | 181,197 | ||||||||||||||
| 1,381,295 | AbbVie, Inc | 187,027 | ||||||||||||||
| 31,645 | * | Abiomed, Inc | 11,366 | |||||||||||||
| 374,534 | Accenture plc | 155,263 | ||||||||||||||
| 3,473 | Activision Blizzard, Inc | 231 | ||||||||||||||
| 230,653 | * | Adient plc | 11,044 | |||||||||||||
| 15,277 | * | Adobe, Inc | 8,663 | |||||||||||||
| 282 | Advance Auto Parts, Inc | 68 | ||||||||||||||
| 564,302 | * | Advanced Micro Devices, Inc | 81,203 | |||||||||||||
| 296 |
COLLEGE RETIREMENT EQUITIES FUND - Global Equities Account
| SHARES | COMPANY | VALUE (000) | ||||||||||||||
| 2,982 | AES Corp | $ | 72 | |||||||||||||
| 370 | * | Affirm Holdings, Inc | 37 | |||||||||||||
| 41,800 | Aflac, Inc | 2,441 | ||||||||||||||
| 39,416 | Agilent Technologies, Inc | 6,293 | ||||||||||||||
| 2,058 | AGNC Investment Corp | 31 | ||||||||||||||
| 27,453 | Agree Realty Corp | 1,959 | ||||||||||||||
| 85,852 | Air Products & Chemicals, Inc | 26,121 | ||||||||||||||
| 1,053 | * | Airbnb, Inc | 175 | |||||||||||||
| 727 | * | Akamai Technologies, Inc | 85 | |||||||||||||
| 52,896 | Albemarle Corp | 12,365 | ||||||||||||||
| 40,000 | * | Alector, Inc | 826 | |||||||||||||
| 58,671 | Alexandria Real Estate Equities, Inc | 13,081 | ||||||||||||||
| 20,205 | * | Align Technology, Inc | 13,278 | |||||||||||||
| 3,242 | * | Alleghany Corp | 2,164 | |||||||||||||
| 393 | Allegion plc | 52 | ||||||||||||||
| 462,913 | Alliant Energy Corp | 28,455 | ||||||||||||||
| 15,167 | Allstate Corp | 1,784 | ||||||||||||||
| 1,620 | Ally Financial, Inc | 77 | ||||||||||||||
| 68,745 | * | Alnylam Pharmaceuticals, Inc | 11,658 | |||||||||||||
| 102,893 | * | Alphabet, Inc (Class A) | 298,085 | |||||||||||||
| 113,866 | * | Alphabet, Inc (Class C) | 329,482 | |||||||||||||
| 162,643 | * | Altice USA, Inc | 2,632 | |||||||||||||
| 901,455 | * | Altimmune, Inc | 8,257 | |||||||||||||
| 349,941 | Altria Group, Inc | 16,584 | ||||||||||||||
| 184,351 | * | Amazon.com, Inc | 614,689 | |||||||||||||
| 2,312 | *,e | AMC Entertainment Holdings, Inc | 63 | |||||||||||||
| 6,892 | Amcor plc | 83 | ||||||||||||||
| 40 | Amerco, Inc | 29 | ||||||||||||||
| 329,295 | Ameren Corp | 29,311 | ||||||||||||||
| 388,223 | American Electric Power Co, Inc | 34,540 | ||||||||||||||
| 3,015 | American Express Co | 493 | ||||||||||||||
| 350 | American Financial Group, Inc | 48 | ||||||||||||||
| 249,723 | American Homes 4 Rent | 10,890 | ||||||||||||||
| 486,166 | American International Group, Inc | 27,643 | ||||||||||||||
| 93,543 | American Tower Corp | 27,361 | ||||||||||||||
| 810 | American Water Works Co, Inc | 153 | ||||||||||||||
| 82,923 | Americold Realty Trust | 2,719 | ||||||||||||||
| 7,388 | Ameriprise Financial, Inc | 2,229 | ||||||||||||||
| 697 | AmerisourceBergen Corp | 93 | ||||||||||||||
| 1,031 | Ametek, Inc | 152 | ||||||||||||||
| 28,766 | Amgen, Inc | 6,471 | ||||||||||||||
| 2,670 | Amphenol Corp (Class A) | 234 | ||||||||||||||
| 356,907 | Analog Devices, Inc | 62,734 | ||||||||||||||
| 297 |
COLLEGE RETIREMENT EQUITIES FUND - Global Equities Account
| SHARES | COMPANY | VALUE (000) | ||||||||||||||
| 6,143 | Annaly Capital Management, Inc | $ | 48 | |||||||||||||
| 389 | * | Ansys, Inc | 156 | |||||||||||||
| 44,995 | Anthem, Inc | 20,857 | ||||||||||||||
| 42,303 | Aon plc | 12,715 | ||||||||||||||
| 870 | e | Apollo Global Management, Inc | 63 | |||||||||||||
| 5,747,631 | d | Apple, Inc | 1,020,607 | |||||||||||||
| 101,626 | Applied Materials, Inc | 15,992 | ||||||||||||||
| 154,947 | * | Aptiv plc | 25,558 | |||||||||||||
| 891 | ARAMARK Holdings Corp | 33 | ||||||||||||||
| 1,767 | * | Arch Capital Group Ltd | 79 | |||||||||||||
| 102,502 | Archer-Daniels-Midland Co | 6,928 | ||||||||||||||
| 1,028 | * | Arista Networks, Inc | 148 | |||||||||||||
| 321 | * | Arrow Electronics, Inc | 43 | |||||||||||||
| 923 | Arthur J. Gallagher & Co | 157 | ||||||||||||||
| 251 | * | Asana, Inc | 19 | |||||||||||||
| 248 | Assurant, Inc | 39 | ||||||||||||||
| 1,906,274 | AT&T, Inc | 46,894 | ||||||||||||||
| 227,926 | * | Athene Holding Ltd | 18,993 | |||||||||||||
| 583 | Atmos Energy Corp | 61 | ||||||||||||||
| 982 | * | Autodesk, Inc | 276 | |||||||||||||
| 1,889 | Automatic Data Processing, Inc | 466 | ||||||||||||||
| 1,987 | * | AutoZone, Inc | 4,166 | |||||||||||||
| 380 | * | Avalara, Inc | 49 | |||||||||||||
| 34,620 | AvalonBay Communities, Inc | 8,745 | ||||||||||||||
| 19,964 | * | Avantor, Inc | 841 | |||||||||||||
| 36,782 | Avery Dennison Corp | 7,966 | ||||||||||||||
| 3,701 | Baker Hughes Co | 89 | ||||||||||||||
| 61,840 | Ball Corp | 5,953 | ||||||||||||||
| 1,779,497 | Bank of America Corp | 79,170 | ||||||||||||||
| 744,191 | Bank of New York Mellon Corp | 43,223 | ||||||||||||||
| 1,188 | Bath & Body Works, Inc | 83 | ||||||||||||||
| 44,577 | Baxter International, Inc | 3,826 | ||||||||||||||
| 35,780 | Becton Dickinson & Co | 8,998 | ||||||||||||||
| 815 | Bentley Systems, Inc | 39 | ||||||||||||||
| 286,833 | * | Berkshire Hathaway, Inc (Class B) | 85,763 | |||||||||||||
| 27,829 | Best Buy Co, Inc | 2,827 | ||||||||||||||
| 334 | * | Bill.Com Holdings, Inc | 83 | |||||||||||||
| 666 | * | Biogen, Inc | 160 | |||||||||||||
| 820 | * | BioMarin Pharmaceutical, Inc | 72 | |||||||||||||
| 13,458 | * | Bio-Rad Laboratories, Inc (Class A) | 10,168 | |||||||||||||
| 174 | Bio-Techne Corp | 90 | ||||||||||||||
| 695 | * | Black Knight, Inc | 58 | |||||||||||||
| 38,961 | BlackRock, Inc | 35,671 | ||||||||||||||
| 298 |
COLLEGE RETIREMENT EQUITIES FUND - Global Equities Account
| SHARES | COMPANY | VALUE (000) | ||||||||||||||
| 142,523 | Blackstone Group, Inc | $ | 18,441 | |||||||||||||
| 1,775 | * | Block Inc | 287 | |||||||||||||
| 354,184 | * | Boeing Co | 71,304 | |||||||||||||
| 6,728 | * | Booking Holdings, Inc | 16,142 | |||||||||||||
| 591 | Booz Allen Hamilton Holding Co | 50 | ||||||||||||||
| 1,027 | BorgWarner, Inc | 46 | ||||||||||||||
| 21,713 | Boston Properties, Inc | 2,501 | ||||||||||||||
| 1,532,053 | * | Boston Scientific Corp | 65,082 | |||||||||||||
| 592,748 | Bristol-Myers Squibb Co | 36,958 | ||||||||||||||
| 461,094 | Broadcom, Inc | 306,817 | ||||||||||||||
| 519 | Broadridge Financial Solutions, Inc | 95 | ||||||||||||||
| 1,069 | Brown & Brown, Inc | 75 | ||||||||||||||
| 1,382 | Brown-Forman Corp (Class B) | 101 | ||||||||||||||
| 182,526 | Bunge Ltd | 17,041 | ||||||||||||||
| 60,941 | * | Burlington Stores, Inc | 17,765 | |||||||||||||
| 22 | Cable One, Inc | 39 | ||||||||||||||
| 3,462 | Cabot Oil & Gas Corp | 66 | ||||||||||||||
| 1,236 | * | Cadence Design Systems, Inc | 230 | |||||||||||||
| 960 | * | Caesars Entertainment, Inc | 90 | |||||||||||||
| 449 | Camden Property Trust | 80 | ||||||||||||||
| 922 | Campbell Soup Co | 40 | ||||||||||||||
| 266,071 | Capital One Financial Corp | 38,604 | ||||||||||||||
| 1,304 | Cardinal Health, Inc | 67 | ||||||||||||||
| 711 | Carlyle Group, Inc | 39 | ||||||||||||||
| 728 | * | CarMax, Inc | 95 | |||||||||||||
| 80,318 | * | Carnival Corp | 1,616 | |||||||||||||
| 1,554,527 | Carrier Global Corp | 84,318 | ||||||||||||||
| 341 | * | Carvana Co | 79 | |||||||||||||
| 761 | * | Catalent, Inc | 97 | |||||||||||||
| 402,746 | Caterpillar, Inc | 83,264 | ||||||||||||||
| 476 | CBOE Global Markets, Inc | 62 | ||||||||||||||
| 1,499 | * | CBRE Group, Inc | 163 | |||||||||||||
| 391,361 | CDW Corp | 80,143 | ||||||||||||||
| 72,294 | Celanese Corp (Series A) | 12,150 | ||||||||||||||
| 211,199 | * | Centene Corp | 17,403 | |||||||||||||
| 1,113,398 | Centerpoint Energy, Inc | 31,075 | ||||||||||||||
| 603 | * | Ceridian HCM Holding, Inc | 63 | |||||||||||||
| 48,046 | Cerner Corp | 4,462 | ||||||||||||||
| 105,818 | CF Industries Holdings, Inc | 7,490 | ||||||||||||||
| 588 | CH Robinson Worldwide, Inc | 63 | ||||||||||||||
| 29,569 | * | Charles River Laboratories International, Inc | 11,141 | |||||||||||||
| 518,272 | Charles Schwab Corp | 43,587 | ||||||||||||||
| 36,225 | * | Charter Communications, Inc | 23,618 | |||||||||||||
| 299 |
COLLEGE RETIREMENT EQUITIES FUND - Global Equities Account
| SHARES | COMPANY | VALUE (000) | ||||||||||||||
| 59,727 | Cheniere Energy, Inc | $ | 6,058 | |||||||||||||
| 571,035 | Chevron Corp | 67,011 | ||||||||||||||
| 441 | *,e | Chewy, Inc | 26 | |||||||||||||
| 4,070 | * | Chipotle Mexican Grill, Inc (Class A) | 7,115 | |||||||||||||
| 334,775 | Chubb Ltd | 64,715 | ||||||||||||||
| 1,096 | Church & Dwight Co, Inc | 112 | ||||||||||||||
| 119,766 | Cigna Corp | 27,502 | ||||||||||||||
| 685 | Cincinnati Financial Corp | 78 | ||||||||||||||
| 414 | Cintas Corp | 183 | ||||||||||||||
| 2,910,740 | Cisco Systems, Inc | 184,454 | ||||||||||||||
| 326,369 | Citigroup, Inc | 19,709 | ||||||||||||||
| 378,775 | Citizens Financial Group, Inc | 17,897 | ||||||||||||||
| 603 | Citrix Systems, Inc | 57 | ||||||||||||||
| 1,649 | * | Clarivate Analytics plc | 39 | |||||||||||||
| 27,288 | Clorox Co | 4,758 | ||||||||||||||
| 1,059 | * | Cloudflare, Inc | 139 | |||||||||||||
| 75,672 | CME Group, Inc | 17,288 | ||||||||||||||
| 339,938 | CMS Energy Corp | 22,113 | ||||||||||||||
| 3,059,525 | Coca-Cola Co | 181,155 | ||||||||||||||
| 790 | Cognex Corp | 61 | ||||||||||||||
| 2,346 | Cognizant Technology Solutions Corp (Class A) | 208 | ||||||||||||||
| 160 | * | Coinbase Global, Inc | 40 | |||||||||||||
| 213,549 | Colgate-Palmolive Co | 18,224 | ||||||||||||||
| 2,185,866 | Comcast Corp (Class A) | 110,015 | ||||||||||||||
| 258,989 | ConAgra Brands, Inc | 8,844 | ||||||||||||||
| 733,461 | ConocoPhillips | 52,941 | ||||||||||||||
| 1,579 | Consolidated Edison, Inc | 135 | ||||||||||||||
| 62,400 | Constellation Brands, Inc (Class A) | 15,661 | ||||||||||||||
| 219 | Cooper Cos, Inc | 92 | ||||||||||||||
| 950 | * | Copart, Inc | 144 | |||||||||||||
| 3,623 | Corning, Inc | 135 | ||||||||||||||
| 229,062 | Corteva, Inc | 10,830 | ||||||||||||||
| 1,764 | * | CoStar Group, Inc | 139 | |||||||||||||
| 396,867 | Costco Wholesale Corp | 225,301 | ||||||||||||||
| 9,683 | * | Coty, Inc | 102 | |||||||||||||
| 363 | * | Coupa Software, Inc | 57 | |||||||||||||
| 845 | * | Crowdstrike Holdings, Inc | 173 | |||||||||||||
| 193,331 | Crown Castle International Corp | 40,356 | ||||||||||||||
| 603,121 | Crown Holdings, Inc | 66,717 | ||||||||||||||
| 476,975 | CSX Corp | 17,934 | ||||||||||||||
| 13,606 | Cummins, Inc | 2,968 | ||||||||||||||
| 581,879 | CVS Health Corp | 60,027 | ||||||||||||||
| 300 |
COLLEGE RETIREMENT EQUITIES FUND - Global Equities Account
| SHARES | COMPANY | VALUE (000) | ||||||||||||||
| 37,325 | CyrusOne, Inc | $ | 3,349 | |||||||||||||
| 239,399 | Danaher Corp | 78,765 | ||||||||||||||
| 32,149 | Darden Restaurants, Inc | 4,843 | ||||||||||||||
| 856 | * | Datadog, Inc | 152 | |||||||||||||
| 305 | * | DaVita, Inc | 35 | |||||||||||||
| 169,890 | Deere & Co | 58,254 | ||||||||||||||
| 1,239 | * | Dell Technologies, Inc | 70 | |||||||||||||
| 223,327 | * | Delta Air Lines, Inc | 8,728 | |||||||||||||
| 948 | Dentsply Sirona, Inc | 53 | ||||||||||||||
| 1,067,125 | Devon Energy Corp | 47,007 | ||||||||||||||
| 49,360 | * | DexCom, Inc | 26,504 | |||||||||||||
| 630,644 | Diamondback Energy, Inc | 68,015 | ||||||||||||||
| 38,587 | Digital Realty Trust, Inc | 6,825 | ||||||||||||||
| 369,325 | Discover Financial Services | 42,679 | ||||||||||||||
| 554 | *,e | Discovery, Inc (Class A) | 13 | |||||||||||||
| 1,172 | * | Discovery, Inc (Class C) | 27 | |||||||||||||
| 59,356 | * | DISH Network Corp (Class A) | 1,926 | |||||||||||||
| 870 | * | DocuSign, Inc | 133 | |||||||||||||
| 45,337 | Dollar General Corp | 10,692 | ||||||||||||||
| 72,541 | * | Dollar Tree, Inc | 10,193 | |||||||||||||
| 304,561 | Dominion Energy, Inc | 23,926 | ||||||||||||||
| 164 | Domino’s Pizza, Inc | 93 | ||||||||||||||
| 479 | * | DoorDash, Inc | 71 | |||||||||||||
| 643 | Dover Corp | 117 | ||||||||||||||
| 1,087,538 | Dow, Inc | 61,685 | ||||||||||||||
| 1,519 | DR Horton, Inc | 165 | ||||||||||||||
| 1,373 | *,e | DraftKings, Inc | 38 | |||||||||||||
| 1,482 | * | Dropbox, Inc | 36 | |||||||||||||
| 866 | DTE Energy Co | 104 | ||||||||||||||
| 201,156 | Duke Energy Corp | 21,101 | ||||||||||||||
| 48,886 | Duke Realty Corp | 3,209 | ||||||||||||||
| 745,587 | DuPont de Nemours, Inc | 60,229 | ||||||||||||||
| 909 | * | Dynatrace, Inc | 55 | |||||||||||||
| 76,642 | Eastman Chemical Co | 9,267 | ||||||||||||||
| 443,062 | Eaton Corp | 76,570 | ||||||||||||||
| 193,757 | eBay, Inc | 12,885 | ||||||||||||||
| 50,559 | Ecolab, Inc | 11,861 | ||||||||||||||
| 100,312 | Edison International | 6,846 | ||||||||||||||
| 112,508 | * | Edwards Lifesciences Corp | 14,575 | |||||||||||||
| 200,017 | * | Elanco Animal Health, Inc | 5,676 | |||||||||||||
| 1,271 | Electronic Arts, Inc | 168 | ||||||||||||||
| 204,936 | Eli Lilly & Co | 56,607 | ||||||||||||||
| 2,669 | Emerson Electric Co | 248 | ||||||||||||||
| 301 |
COLLEGE RETIREMENT EQUITIES FUND - Global Equities Account
| SHARES | COMPANY | VALUE (000) | ||||||||||||||
| 571 | * | Enphase Energy, Inc | $ | 104 | ||||||||||||
| 606 | Entegris, Inc | 84 | ||||||||||||||
| 94,419 | Entergy Corp | 10,636 | ||||||||||||||
| 220,748 | EOG Resources, Inc | 19,609 | ||||||||||||||
| 253 | * | EPAM Systems, Inc | 169 | |||||||||||||
| 544 | Equifax, Inc | 159 | ||||||||||||||
| 9,659 | Equinix, Inc | 8,170 | ||||||||||||||
| 1,285,747 | Equitable Holdings, Inc | 42,160 | ||||||||||||||
| 141,113 | Equity Lifestyle Properties, Inc | 12,370 | ||||||||||||||
| 76,240 | Equity Residential | 6,900 | ||||||||||||||
| 93 | Erie Indemnity Co (Class A) | 18 | ||||||||||||||
| 1,028 | Essential Utilities Inc | 55 | ||||||||||||||
| 9,440 | Essex Property Trust, Inc | 3,325 | ||||||||||||||
| 87,079 | Estee Lauder Cos (Class A) | 32,237 | ||||||||||||||
| 8,456 | * | Etsy, Inc | 1,851 | |||||||||||||
| 171 | Everest Re Group Ltd | 47 | ||||||||||||||
| 1,027 | Evergy, Inc | 70 | ||||||||||||||
| 1,533 | Eversource Energy | 139 | ||||||||||||||
| 772 | * | Exact Sciences Corp | 60 | |||||||||||||
| 347,582 | Exelon Corp | 20,076 | ||||||||||||||
| 30,946 | * | Expedia Group, Inc | 5,593 | |||||||||||||
| 759 | Expeditors International of Washington, Inc | 102 | ||||||||||||||
| 28,050 | Extra Space Storage, Inc | 6,360 | ||||||||||||||
| 2,740,551 | Exxon Mobil Corp | 167,694 | ||||||||||||||
| 269 | * | F5 Networks, Inc | 66 | |||||||||||||
| 168 | Factset Research Systems, Inc | 82 | ||||||||||||||
| 127 | * | Fair Isaac Corp | 55 | |||||||||||||
| 2,565 | Fastenal Co | 164 | ||||||||||||||
| 4,477 | FedEx Corp | 1,158 | ||||||||||||||
| 1,214 | Fidelity National Financial Inc | 63 | ||||||||||||||
| 2,758 | Fidelity National Information Services, Inc | 301 | ||||||||||||||
| 877,774 | Fifth Third Bancorp | 38,227 | ||||||||||||||
| 112,960 | First Republic Bank | 23,327 | ||||||||||||||
| 583,300 | FirstEnergy Corp | 24,259 | ||||||||||||||
| 2,662 | * | Fiserv, Inc | 276 | |||||||||||||
| 388 | * | FleetCor Technologies, Inc | 87 | |||||||||||||
| 577 | FMC Corp | 63 | ||||||||||||||
| 17,529 | Ford Motor Co | 364 | ||||||||||||||
| 620 | * | Fortinet, Inc | 223 | |||||||||||||
| 312,954 | Fortive Corp | 23,875 | ||||||||||||||
| 617 | Fortune Brands Home & Security, Inc | 66 | ||||||||||||||
| 1,597 | Fox Corp (Class A) | 59 | ||||||||||||||
| 302 |
COLLEGE RETIREMENT EQUITIES FUND - Global Equities Account
| SHARES | COMPANY | VALUE (000) | ||||||||||||||
| 845 | Fox Corp (Class B) | $ | 29 | |||||||||||||
| 1,469 | Franklin Resources, Inc | 49 | ||||||||||||||
| 4,161,724 | Freeport-McMoRan, Inc (Class B) | 173,669 | ||||||||||||||
| 83,871 | Gaming and Leisure Properties, Inc | 4,081 | ||||||||||||||
| 687 | Garmin Ltd | 94 | ||||||||||||||
| 373 | * | Gartner, Inc | 125 | |||||||||||||
| 282 | * | Generac Holdings, Inc | 99 | |||||||||||||
| 1,061 | General Dynamics Corp | 221 | ||||||||||||||
| 4,904 | General Electric Co | 463 | ||||||||||||||
| 71,357 | General Mills, Inc | 4,808 | ||||||||||||||
| 1,391,379 | * | General Motors Co | 81,577 | |||||||||||||
| 640 | Genuine Parts Co | 90 | ||||||||||||||
| 380,100 | Gilead Sciences, Inc | 27,599 | ||||||||||||||
| 1,312 | Global Payments, Inc | 177 | ||||||||||||||
| 393 | Globe Life, Inc | 37 | ||||||||||||||
| 828 | * | GoDaddy, Inc | 70 | |||||||||||||
| 361,853 | Goldman Sachs Group, Inc | 138,427 | ||||||||||||||
| 784,010 | * | Grab Holdings Ltd. | 3,175 | |||||||||||||
| 63,297 | * | Guardant Health, Inc | 6,331 | |||||||||||||
| 325 | * | Guidewire Software, Inc | 37 | |||||||||||||
| 603,547 | Halliburton Co | 13,803 | ||||||||||||||
| 195,781 | Hartford Financial Services Group, Inc | 13,517 | ||||||||||||||
| 581 | Hasbro, Inc | 59 | ||||||||||||||
| 155,375 | HCA Healthcare, Inc | 39,919 | ||||||||||||||
| 47,198 | Healthcare Trust of America, Inc | 1,576 | ||||||||||||||
| 144,789 | Healthpeak Properties Inc | 5,225 | ||||||||||||||
| 240 | HEICO Corp | 35 | ||||||||||||||
| 348 | HEICO Corp (Class A) | 45 | ||||||||||||||
| 599 | * | Henry Schein, Inc | 46 | |||||||||||||
| 650 | Hershey Co | 126 | ||||||||||||||
| 306,217 | Hess Corp | 22,669 | ||||||||||||||
| 6,450 | Hewlett Packard Enterprise Co | 102 | ||||||||||||||
| 1,246 | * | Hilton Worldwide Holdings, Inc | 194 | |||||||||||||
| 187,196 | * | Hologic, Inc | 14,332 | |||||||||||||
| 695,299 | Home Depot, Inc | 288,556 | ||||||||||||||
| 763,236 | Honeywell International, Inc | 159,142 | ||||||||||||||
| 105,832 | * | Horizon Therapeutics Plc | 11,404 | |||||||||||||
| 1,332 | Hormel Foods Corp | 65 | ||||||||||||||
| 149,540 | * | Host Hotels and Resorts, Inc | 2,600 | |||||||||||||
| 1,702 | Howmet Aerospace, Inc | 54 | ||||||||||||||
| 5,364 | HP, Inc | 202 | ||||||||||||||
| 193,555 | Hubbell, Inc | 40,312 | ||||||||||||||
| 199 | * | HubSpot, Inc | 131 | |||||||||||||
| 303 |
COLLEGE RETIREMENT EQUITIES FUND - Global Equities Account
| SHARES | COMPANY | VALUE (000) | ||||||||||||||
| 23,766 | Humana, Inc | $ | 11,024 | |||||||||||||
| 6,593 | Huntington Bancshares, Inc | 102 | ||||||||||||||
| 149 | Huntington Ingalls | 28 | ||||||||||||||
| 385 | * | IAC | 50 | |||||||||||||
| 339 | IDEX Corp | 80 | ||||||||||||||
| 32,465 | * | IDEXX Laboratories, Inc | 21,377 | |||||||||||||
| 30,492 | IHS Markit Ltd | 4,053 | ||||||||||||||
| 35,981 | Illinois Tool Works, Inc | 8,880 | ||||||||||||||
| 68,860 | * | Illumina, Inc | 26,197 | |||||||||||||
| 927 | * | Incyte Corp | 68 | |||||||||||||
| 811,086 | Ingersoll Rand, Inc | 50,182 | ||||||||||||||
| 7,748 | * | Insulet Corp | 2,062 | |||||||||||||
| 2,641,095 | Intel Corp | 136,016 | ||||||||||||||
| 91,641 | Intercontinental Exchange Group, Inc | 12,534 | ||||||||||||||
| 4,003 | International Business Machines Corp | 535 | ||||||||||||||
| 742,926 | International Flavors & Fragrances, Inc | 111,922 | ||||||||||||||
| 69,264 | International Paper Co | 3,254 | ||||||||||||||
| 211,860 | Interpublic Group of Cos, Inc | 7,934 | ||||||||||||||
| 1,220 | Intuit, Inc | 785 | ||||||||||||||
| 125,646 | * | Intuitive Surgical, Inc | 45,145 | |||||||||||||
| 1,434 | Invesco Ltd | 33 | ||||||||||||||
| 184,824 | Invitation Homes, Inc | 8,380 | ||||||||||||||
| 185 | * | IPG Photonics Corp | 32 | |||||||||||||
| 102,818 | * | IQVIA Holdings, Inc | 29,009 | |||||||||||||
| 1,299 | Iron Mountain, Inc | 68 | ||||||||||||||
| 260,712 | e | iShares MSCI Canada Index Fund | 10,019 | |||||||||||||
| 63,579 | *,e | iShares MSCI South Korea Index Fund | 4,951 | |||||||||||||
| 483 | J.M. Smucker Co | 66 | ||||||||||||||
| 328 | Jack Henry & Associates, Inc | 55 | ||||||||||||||
| 27,809 | e | Jackson Financial, Inc | 1,163 | |||||||||||||
| 582 | Jacobs Engineering Group, Inc | 81 | ||||||||||||||
| 228 | * | Jazz Pharmaceuticals plc | 29 | |||||||||||||
| 4,741 | JB Hunt Transport Services, Inc | 969 | ||||||||||||||
| 193,500 | JBS S.A. | 1,320 | ||||||||||||||
| 678,123 | Johnson & Johnson | 116,006 | ||||||||||||||
| 3,180 | Johnson Controls International plc | 259 | ||||||||||||||
| 1,601,074 | JPMorgan Chase & Co | 253,530 | ||||||||||||||
| 1,800,083 | Juniper Networks, Inc | 64,281 | ||||||||||||||
| 1,142 | Kellogg Co | 74 | ||||||||||||||
| 1,476,104 | Keurig Dr Pepper, Inc | 54,409 | ||||||||||||||
| 4,274 | Keycorp | 99 | ||||||||||||||
| 822 | * | Keysight Technologies, Inc | 170 | |||||||||||||
| 18,301 | Kilroy Realty Corp | 1,216 | ||||||||||||||
| 304 |
COLLEGE RETIREMENT EQUITIES FUND - Global Equities Account
| SHARES | COMPANY | VALUE (000) | ||||||||||||||
| 91,565 | Kimberly-Clark Corp | $ | 13,086 | |||||||||||||
| 9,110 | Kinder Morgan, Inc | 144 | ||||||||||||||
| 30,911 | KKR & Co, Inc | 2,303 | ||||||||||||||
| 386,763 | KLA Corp | 166,351 | ||||||||||||||
| 749 | Knight-Swift Transportation Holdings, Inc | 46 | ||||||||||||||
| 3,007 | Kraft Heinz Co | 108 | ||||||||||||||
| 216,912 | Kroger Co | 9,817 | ||||||||||||||
| 898 | L3Harris Technologies, Inc | 191 | ||||||||||||||
| 28,697 | * | Laboratory Corp of America Holdings | 9,017 | |||||||||||||
| 634 | Lam Research Corp | 456 | ||||||||||||||
| 160,490 | * | Las Vegas Sands Corp | 6,041 | |||||||||||||
| 267 | Lear Corp | 49 | ||||||||||||||
| 9,971 | *,e | Legend Biotech Corp (ADR) | 465 | |||||||||||||
| 591 | Leidos Holdings, Inc | 53 | ||||||||||||||
| 1,226 | Lennar Corp (Class A) | 142 | ||||||||||||||
| 145 | Lennox International, Inc | 47 | ||||||||||||||
| 124 | * | Liberty Broadband Corp (Class A) | 20 | |||||||||||||
| 650 | * | Liberty Broadband Corp (Class C) | 105 | |||||||||||||
| 852 | * | Liberty Media Group (Class C) | 54 | |||||||||||||
| 463 | * | Liberty SiriusXM Group (Class A) | 24 | |||||||||||||
| 757 | * | Liberty SiriusXM Group (Class C) | 38 | |||||||||||||
| 786 | Lincoln National Corp | 54 | ||||||||||||||
| 735 | * | Live Nation, Inc | 88 | |||||||||||||
| 1,250 | LKQ Corp | 75 | ||||||||||||||
| 1,113 | Lockheed Martin Corp | 396 | ||||||||||||||
| 970 | Loews Corp | 56 | ||||||||||||||
| 277,672 | Lowe’s Companies, Inc | 71,773 | ||||||||||||||
| 1,810 | *,e | Lucid Group, Inc | 69 | |||||||||||||
| 125,981 | * | Lululemon Athletica, Inc | 49,315 | |||||||||||||
| 4,148 | Lumen Technologies, Inc | 52 | ||||||||||||||
| 1,101 | * | Lyft, Inc (Class A) | 47 | |||||||||||||
| 1,195 | LyondellBasell Industries NV | 110 | ||||||||||||||
| 578 | M&T Bank Corp | 89 | ||||||||||||||
| 222,206 | Marathon Petroleum Corp | 14,219 | ||||||||||||||
| 61 | * | Markel Corp | 75 | |||||||||||||
| 170 | MarketAxess Holdings, Inc | 70 | ||||||||||||||
| 17,019 | * | Marriott International, Inc (Class A) | 2,812 | |||||||||||||
| 113,669 | Marsh & McLennan Cos, Inc | 19,758 | ||||||||||||||
| 279 | Martin Marietta Materials, Inc | 123 | ||||||||||||||
| 3,678 | Marvell Technology, Inc | 322 | ||||||||||||||
| 1,102 | Masco Corp | 77 | ||||||||||||||
| 34,144 | * | Masimo Corp | 9,997 | |||||||||||||
| 298,130 | Mastercard, Inc (Class A) | 107,124 | ||||||||||||||
| 305 |
COLLEGE RETIREMENT EQUITIES FUND - Global Equities Account
| SHARES | COMPANY | VALUE (000) | ||||||||||||||
| 477,678 | * | Match Group, Inc | $ | 63,173 | ||||||||||||
| 1,113 | McCormick & Co, Inc | 108 | ||||||||||||||
| 692,302 | McDonald’s Corp | 185,585 | ||||||||||||||
| 66,784 | McKesson Corp | 16,600 | ||||||||||||||
| 2,657 | Medical Properties Trust, Inc | 63 | ||||||||||||||
| 1,125,215 | Medtronic plc | 116,403 | ||||||||||||||
| 524,506 | Merck & Co, Inc | 40,198 | ||||||||||||||
| 377,103 | * | Meta Platforms, Inc. | 126,839 | |||||||||||||
| 45,076 | Metlife, Inc | 2,817 | ||||||||||||||
| 5,454 | * | Mettler-Toledo International, Inc | 9,257 | |||||||||||||
| 61,089 | MGM Growth Properties LLC | 2,495 | ||||||||||||||
| 1,733 | MGM Resorts International | 78 | ||||||||||||||
| 2,448 | Microchip Technology, Inc | 213 | ||||||||||||||
| 5,028 | Micron Technology, Inc | 468 | ||||||||||||||
| 3,145,095 | Microsoft Corp | 1,057,758 | ||||||||||||||
| 22,478 | Mid-America Apartment Communities, Inc | 5,157 | ||||||||||||||
| 46,681 | * | Moderna, Inc | 11,856 | |||||||||||||
| 250 | * | Mohawk Industries, Inc | 46 | |||||||||||||
| 260 | * | Molina Healthcare, Inc | 83 | |||||||||||||
| 762 | Molson Coors Brewing Co (Class B) | 35 | ||||||||||||||
| 706,938 | Mondelez International, Inc | 46,877 | ||||||||||||||
| 260 | * | MongoDB, Inc | 138 | |||||||||||||
| 194 | Monolithic Power Systems, Inc | 96 | ||||||||||||||
| 980,628 | * | Monster Beverage Corp | 94,180 | |||||||||||||
| 5,942 | Moody’s Corp | 2,321 | ||||||||||||||
| 2,523,867 | Morgan Stanley | 247,743 | ||||||||||||||
| 116,315 | Mosaic Co | 4,570 | ||||||||||||||
| 756 | Motorola Solutions, Inc | 205 | ||||||||||||||
| 2,964 | MSCI, Inc (Class A) | 1,816 | ||||||||||||||
| 522 | Nasdaq Inc | 110 | ||||||||||||||
| 52,173 | National Storage Affiliates Trust | 3,610 | ||||||||||||||
| 1,002 | NetApp, Inc | 92 | ||||||||||||||
| 101,303 | * | Netflix, Inc | 61,029 | |||||||||||||
| 367 | * | Neurocrine Biosciences, Inc | 31 | |||||||||||||
| 1,519 | Newell Brands Inc | 33 | ||||||||||||||
| 346,036 | Newmont Goldcorp Corp | 21,461 | ||||||||||||||
| 1,752 | News Corp (Class A) | 39 | ||||||||||||||
| 557,839 | NextEra Energy, Inc | 52,080 | ||||||||||||||
| 1,061,795 | Nike, Inc (Class B) | 176,969 | ||||||||||||||
| 1,897 | NiSource, Inc | 52 | ||||||||||||||
| 233 | Nordson Corp | 59 | ||||||||||||||
| 1,103 | Norfolk Southern Corp | 328 | ||||||||||||||
| 883 | Northern Trust Corp | 106 | ||||||||||||||
| 169,922 | Northrop Grumman Corp | 65,772 | ||||||||||||||
| 306 |
COLLEGE RETIREMENT EQUITIES FUND - Global Equities Account
| SHARES | COMPANY | VALUE (000) | ||||||||||||||
| 2,604 | NortonLifelock, Inc | $ | 68 | |||||||||||||
| 31,874 | *,e | Novavax, Inc | 4,560 | |||||||||||||
| 367 | * | Novocure Ltd | 28 | |||||||||||||
| 68,565 | NRG Energy, Inc | 2,954 | ||||||||||||||
| 1,337 | * | Nuance Communications, Inc | 74 | |||||||||||||
| 17,265 | Nucor Corp | 1,971 | ||||||||||||||
| 614,132 | NVIDIA Corp | 180,622 | ||||||||||||||
| 15 | * | NVR, Inc | 89 | |||||||||||||
| 251 | *,e | Oak Street Health, Inc | 8 | |||||||||||||
| 29,748 | Occidental Petroleum Corp | 862 | ||||||||||||||
| 559 | * | Okta, Inc | 125 | |||||||||||||
| 439 | Old Dominion Freight Line | 157 | ||||||||||||||
| 962 | Omnicom Group, Inc | 70 | ||||||||||||||
| 1,923 | * | ON Semiconductor Corp | 131 | |||||||||||||
| 114,239 | ONEOK, Inc | 6,713 | ||||||||||||||
| 1,240,251 | Oracle Corp | 108,162 | ||||||||||||||
| 5,315 | * | O’Reilly Automotive, Inc | 3,754 | |||||||||||||
| 5,016 | * | Orion Office REIT, Inc | 94 | |||||||||||||
| 91,975 | Otis Worldwide Corp | 8,008 | ||||||||||||||
| 165,461 | Owens Corning, Inc | 14,974 | ||||||||||||||
| 1,550 | PACCAR, Inc | 137 | ||||||||||||||
| 11,697 | Packaging Corp of America | 1,593 | ||||||||||||||
| 7,083 | * | Palantir Technologies, Inc | 129 | |||||||||||||
| 132,147 | * | Palo Alto Networks, Inc | 73,574 | |||||||||||||
| 6,000 | Parade Technologies Ltd | 456 | ||||||||||||||
| 158,086 | Parker-Hannifin Corp | 50,290 | ||||||||||||||
| 1,445 | Paychex, Inc | 197 | ||||||||||||||
| 228 | * | Paycom Software, Inc | 95 | |||||||||||||
| 860,667 | * | PayPal Holdings, Inc | 162,305 | |||||||||||||
| 13,091 | * | Peloton Interactive, Inc | 468 | |||||||||||||
| 730 | Pentair plc | 53 | ||||||||||||||
| 350,663 | PepsiCo, Inc | 60,914 | ||||||||||||||
| 59,183 | * | Performance Food Group Co | 2,716 | |||||||||||||
| 29,976 | PerkinElmer, Inc | 6,027 | ||||||||||||||
| 203,973 | *,e | Petco Health & Wellness Co, Inc | 4,037 | |||||||||||||
| 1,420,177 | Pfizer, Inc | 83,861 | ||||||||||||||
| 405,157 | * | PG&E Corp | 4,919 | |||||||||||||
| 302,355 | Philip Morris International, Inc | 28,724 | ||||||||||||||
| 23,253 | Phillips 66 | 1,685 | ||||||||||||||
| 30,108 | * | Pinterest, Inc | 1,094 | |||||||||||||
| 166,428 | Pioneer Natural Resources Co | 30,270 | ||||||||||||||
| 2,325 | *,e | Plug Power, Inc | 66 | |||||||||||||
| 1,898 | PNC Financial Services Group, Inc | 381 | ||||||||||||||
| 307 |
COLLEGE RETIREMENT EQUITIES FUND - Global Equities Account
| SHARES | COMPANY | VALUE (000) | ||||||||||||||
| 179 | Pool Corp | $ | 101 | |||||||||||||
| 48,571 | PPG Industries, Inc | 8,376 | ||||||||||||||
| 3,439 | PPL Corp | 103 | ||||||||||||||
| 1,326 | Principal Financial Group | 96 | ||||||||||||||
| 1,515,180 | Procter & Gamble Co | 247,853 | ||||||||||||||
| 112,318 | Progressive Corp | 11,529 | ||||||||||||||
| 240,992 | Prologis, Inc | 40,573 | ||||||||||||||
| 237,768 | * | ProPetro Holding Corp | 1,926 | |||||||||||||
| 110,746 | Prudential Financial, Inc | 11,987 | ||||||||||||||
| 498 | * | PTC, Inc | 60 | |||||||||||||
| 2,257 | Public Service Enterprise Group, Inc | 151 | ||||||||||||||
| 32,822 | Public Storage, Inc | 12,294 | ||||||||||||||
| 1,164 | Pulte Homes, Inc | 67 | ||||||||||||||
| 495 | * | Qorvo, Inc | 77 | |||||||||||||
| 669,998 | QUALCOMM, Inc | 122,523 | ||||||||||||||
| 88,810 | Quest Diagnostics, Inc | 15,365 | ||||||||||||||
| 827 | Raymond James Financial, Inc | 83 | ||||||||||||||
| 745,276 | Raytheon Technologies Corp | 64,138 | ||||||||||||||
| 49,660 | Realty Income Corp | 3,555 | ||||||||||||||
| 125,356 | Regency Centers Corp | 9,446 | ||||||||||||||
| 35,655 | * | Regeneron Pharmaceuticals, Inc | 22,517 | |||||||||||||
| 4,286 | Regions Financial Corp | 93 | ||||||||||||||
| 994 | Republic Services, Inc | 139 | ||||||||||||||
| 8,318 | Resmed, Inc | 2,167 | ||||||||||||||
| 345,847 | Rexford Industrial Realty, Inc | 28,052 | ||||||||||||||
| 346 | * | RingCentral, Inc | 65 | |||||||||||||
| 770 | * | Rivian Automotive, Inc | 80 | |||||||||||||
| 495 | Robert Half International, Inc | 55 | ||||||||||||||
| 566 | *,e | Robinhood Markets, Inc | 10 | |||||||||||||
| 11,605 | Rockwell Automation, Inc | 4,048 | ||||||||||||||
| 8,411 | * | Roku, Inc | 1,919 | |||||||||||||
| 1,028 | Rollins, Inc | 35 | ||||||||||||||
| 69,516 | Roper Technologies Inc | 34,192 | ||||||||||||||
| 39,800 | Ross Stores, Inc | 4,548 | ||||||||||||||
| 38,872 | * | Royal Caribbean Cruises Ltd | 2,989 | |||||||||||||
| 1,528 | Royalty Pharma plc | 61 | ||||||||||||||
| 29,830 | RPM International, Inc | 3,013 | ||||||||||||||
| 65,475 | S&P Global, Inc | 30,900 | ||||||||||||||
| 110,849 | Sabra Healthcare REIT, Inc | 1,501 | ||||||||||||||
| 1,096,037 | * | salesforce.com, Inc | 278,536 | |||||||||||||
| 19,218 | SBA Communications Corp | 7,476 | ||||||||||||||
| 51,578 | Schlumberger Ltd | 1,545 | ||||||||||||||
| 775,008 | Schneider Electric S.A. | 152,363 | ||||||||||||||
| 308 |
COLLEGE RETIREMENT EQUITIES FUND - Global Equities Account
| SHARES | COMPANY | VALUE (000) | ||||||||||||||
| 915 | Seagate Technology Holdings plc | $ | 103 | |||||||||||||
| 448,289 | * | Seagen, Inc | 69,305 | |||||||||||||
| 636 | Sealed Air Corp | 43 | ||||||||||||||
| 558 | SEI Investments Co | 34 | ||||||||||||||
| 77,137 | Sempra Energy | 10,204 | ||||||||||||||
| 710 | * | Sensata Technologies Holding plc | 44 | |||||||||||||
| 372,472 | * | ServiceNow, Inc | 241,775 | |||||||||||||
| 48,054 | Sherwin-Williams Co | 16,923 | ||||||||||||||
| 271 | Signature Bank | 88 | ||||||||||||||
| 542,687 | Simon Property Group, Inc | 86,705 | ||||||||||||||
| 5,001 | e | Sirius XM Holdings, Inc | 32 | |||||||||||||
| 737 | Skyworks Solutions, Inc | 114 | ||||||||||||||
| 4,007 | SL Green Realty Corp | 287 | ||||||||||||||
| 4,737 | * | Snap, Inc | 223 | |||||||||||||
| 237 | Snap-On, Inc | 51 | ||||||||||||||
| 941 | * | Snowflake, Inc | 319 | |||||||||||||
| 2,134 | *,e | SoFi Technologies, Inc | 34 | |||||||||||||
| 234 | * | SolarEdge Technologies, Inc | 66 | |||||||||||||
| 4,726 | Southern Co | 324 | ||||||||||||||
| 662 | * | Southwest Airlines Co | 28 | |||||||||||||
| 732 | * | Splunk, Inc | 85 | |||||||||||||
| 1,027 | SS&C Technologies Holdings, Inc | 84 | ||||||||||||||
| 17,668 | Stanley Black & Decker, Inc | 3,333 | ||||||||||||||
| 266,408 | Starbucks Corp | 31,162 | ||||||||||||||
| 22,299 | State Street Corp | 2,074 | ||||||||||||||
| 228,475 | Steel Dynamics, Inc | 14,181 | ||||||||||||||
| 445 | STERIS plc | 108 | ||||||||||||||
| 130,120 | Stryker Corp | 34,797 | ||||||||||||||
| 69,467 | Sun Communities, Inc | 14,586 | ||||||||||||||
| 645 | * | Sunrun, Inc | 22 | |||||||||||||
| 262 | * | SVB Financial Group | 178 | |||||||||||||
| 436,214 | Synchrony Financial | 20,236 | ||||||||||||||
| 202,585 | * | Synopsys, Inc | 74,653 | |||||||||||||
| 62,738 | SYSCO Corp | 4,928 | ||||||||||||||
| 1,013 | T Rowe Price Group, Inc | 199 | ||||||||||||||
| 414,163 | * | Take-Two Interactive Software, Inc | 73,605 | |||||||||||||
| 558,392 | Target Corp | 129,234 | ||||||||||||||
| 248,169 | TE Connectivity Ltd | 40,040 | ||||||||||||||
| 640 | * | Teladoc, Inc | 59 | |||||||||||||
| 208 | * | Teledyne Technologies, Inc | 91 | |||||||||||||
| 210 | Teleflex, Inc | 69 | ||||||||||||||
| 737 | Teradyne, Inc | 121 | ||||||||||||||
| 309 |
COLLEGE RETIREMENT EQUITIES FUND - Global Equities Account
| SHARES | COMPANY | VALUE (000) | ||||||||||||||
| 47,198 | Terreno Realty Corp | $ | 4,026 | |||||||||||||
| 290,000 | * | Tesla, Inc | 306,466 | |||||||||||||
| 4,122 | Texas Instruments, Inc | 777 | ||||||||||||||
| 209,203 | Textron, Inc | 16,150 | ||||||||||||||
| 102,700 | Thermo Fisher Scientific, Inc | 68,526 | ||||||||||||||
| 296,846 | TJX Companies, Inc | 22,537 | ||||||||||||||
| 351,857 | * | T-Mobile US, Inc | 40,808 | |||||||||||||
| 510 | Tractor Supply Co | 122 | ||||||||||||||
| 1,939 | * | Trade Desk, Inc | 178 | |||||||||||||
| 441 | Tradeweb Markets, Inc | 44 | ||||||||||||||
| 252,298 | * | Traeger, Inc | 3,068 | |||||||||||||
| 420,372 | Trane Technologies plc | 84,928 | ||||||||||||||
| 234 | * | TransDigm Group, Inc | 149 | |||||||||||||
| 855 | TransUnion | 101 | ||||||||||||||
| 1,114 | Travelers Cos, Inc | 174 | ||||||||||||||
| 1,123 | * | Trimble Inc | 98 | |||||||||||||
| 5,960 | Truist Financial Corp | 349 | ||||||||||||||
| 745 | * | Twilio, Inc | 196 | |||||||||||||
| 3,564 | * | Twitter, Inc | 154 | |||||||||||||
| 182 | * | Tyler Technologies, Inc | 98 | |||||||||||||
| 30,627 | Tyson Foods, Inc (Class A) | 2,669 | ||||||||||||||
| 5,471 | * | Uber Technologies, Inc | 229 | |||||||||||||
| 1,324 | UDR, Inc | 79 | ||||||||||||||
| 857 | UGI Corp | 39 | ||||||||||||||
| 21,060 | * | Ulta Beauty, Inc | 8,684 | |||||||||||||
| 920,214 | Union Pacific Corp | 231,830 | ||||||||||||||
| 112,789 | United Parcel Service, Inc (Class B) | 24,175 | ||||||||||||||
| 138,652 | * | United Rentals, Inc | 46,073 | |||||||||||||
| 504,888 | UnitedHealth Group, Inc | 253,524 | ||||||||||||||
| 262 | * | Unity Software, Inc | 37 | |||||||||||||
| 325 | Universal Health Services, Inc (Class B) | 42 | ||||||||||||||
| 54 | * | Upstart Holdings, Inc | 8 | |||||||||||||
| 805,464 | US Bancorp | 45,243 | ||||||||||||||
| 6,123 | Vail Resorts, Inc | 2,008 | ||||||||||||||
| 434,895 | Valero Energy Corp | 32,665 | ||||||||||||||
| 675,868 | e | Vanguard Emerging Markets ETF | 33,428 | |||||||||||||
| 50,000 | e | Vanguard FTSE Developed Markets ETF | 2,553 | |||||||||||||
| 47,395 | * | Veeva Systems, Inc | 12,108 | |||||||||||||
| 117,521 | Ventas, Inc | 6,008 | ||||||||||||||
| 449 | * | VeriSign, Inc | 114 | |||||||||||||
| 685 | Verisk Analytics, Inc | 157 | ||||||||||||||
| 866,132 | Verizon Communications, Inc | 45,004 | ||||||||||||||
| 37,371 | * | Vertex Pharmaceuticals, Inc | 8,207 | |||||||||||||
| 310 |
COLLEGE RETIREMENT EQUITIES FUND - Global Equities Account
| SHARES | COMPANY | VALUE (000) | ||||||||||||||
| 35,018 | VF Corp | $ | 2,564 | |||||||||||||
| 105,874 | ViacomCBS, Inc (Class B) | 3,195 | ||||||||||||||
| 5,440 | Viatris, Inc | 74 | ||||||||||||||
| 139,251 | e | VICI Properties, Inc | 4,193 | |||||||||||||
| 896,163 | Visa, Inc (Class A) | 194,208 | ||||||||||||||
| 92,990 | Vistra Energy Corp | 2,117 | ||||||||||||||
| 935 | VMware, Inc (Class A) | 108 | ||||||||||||||
| 727 | Vornado Realty Trust | 30 | ||||||||||||||
| 539,784 | Voya Financial, Inc | 35,793 | ||||||||||||||
| 8,965 | Vulcan Materials Co | 1,861 | ||||||||||||||
| 697 | W.R. Berkley Corp | 57 | ||||||||||||||
| 109,608 | W.W. Grainger, Inc | 56,803 | ||||||||||||||
| 3,284 | Walgreens Boots Alliance, Inc | 171 | ||||||||||||||
| 1,065,161 | Walmart, Inc | 154,118 | ||||||||||||||
| 1,246,105 | * | Walt Disney Co | 193,009 | |||||||||||||
| 1,162 | Waste Connections, Inc | 158 | ||||||||||||||
| 1,880 | Waste Management, Inc | 314 | ||||||||||||||
| 274 | * | Waters Corp | 102 | |||||||||||||
| 329 | *,e | Wayfair, Inc | 62 | |||||||||||||
| 53,479 | * | Weatherford International Ltd | 1,482 | |||||||||||||
| 1,407 | WEC Energy Group, Inc | 137 | ||||||||||||||
| 4,715,729 | Wells Fargo & Co | 226,261 | ||||||||||||||
| 67,387 | Welltower, Inc | 5,780 | ||||||||||||||
| 60,712 | West Pharmaceutical Services, Inc | 28,475 | ||||||||||||||
| 1,387 | * | Western Digital Corp | 90 | |||||||||||||
| 1,487 | Western Union Co | 27 | ||||||||||||||
| 155,916 | Westinghouse Air Brake Technologies Corp | 14,361 | ||||||||||||||
| 5,556 | Westlake Chemical Corp | 540 | ||||||||||||||
| 40,063 | WestRock Co | 1,777 | ||||||||||||||
| 146,489 | Weyerhaeuser Co | 6,032 | ||||||||||||||
| 41,615 | Whirlpool Corp | 9,765 | ||||||||||||||
| 326,305 | Williams Cos, Inc | 8,497 | ||||||||||||||
| 9,484 | Willis Towers Watson plc | 2,252 | ||||||||||||||
| 853 | * | Workday, Inc | 233 | |||||||||||||
| 825 | WP Carey, Inc | 68 | ||||||||||||||
| 13,187 | * | Wynn Resorts Ltd | 1,121 | |||||||||||||
| 73,870 | Xcel Energy, Inc | 5,001 | ||||||||||||||
| 1,105 | Xilinx, Inc | 234 | ||||||||||||||
| 804 | Xylem, Inc | 96 | ||||||||||||||
| 339,463 | * | YETI Holdings, Inc | 28,118 | |||||||||||||
| 116,078 | Yum! Brands, Inc | 16,119 | ||||||||||||||
| 238 | * | Zebra Technologies Corp (Class A) | 142 | |||||||||||||
| 536 | * | Zendesk, Inc | 56 | |||||||||||||
| 311 |
COLLEGE RETIREMENT EQUITIES FUND - Global Equities Account
| SHARES | COMPANY | MATURITY DATE | VALUE (000) | |||||||||||||
| 237 | * | Zillow Group, Inc (Class A) | $ | 15 | ||||||||||||
| 668 | *,e | Zillow Group, Inc (Class C) | 43 | |||||||||||||
| 933 | Zimmer Biomet Holdings, Inc | 119 | ||||||||||||||
| 137,210 | Zoetis, Inc | 33,483 | ||||||||||||||
| 968 | * | Zoom Video Communications, Inc | 178 | |||||||||||||
| 1,005 | * | ZoomInfo Technologies, Inc | 65 | |||||||||||||
| 367 | * | Zscaler, Inc | 118 | |||||||||||||
| TOTAL UNITED STATES | 17,276,717 | |||||||||||||||
| TOTAL COMMON STOCKS | 28,313,251 | |||||||||||||||
| (Cost $21,445,983) | ||||||||||||||||
| RIGHTS/WARRANTS - 0.0% | ||||||||||||||||
| AUSTRALIA - 0.0% | ||||||||||||||||
| 89,428 | e | PointsBet Holdings Pty Ltd | 09/30/22 | 21 | ||||||||||||
| TOTAL AUSTRALIA | 21 | |||||||||||||||
| CHINA - 0.0% | ||||||||||||||||
| 8,857 | Seazen Group Ltd | 0 | ||||||||||||||
| TOTAL CHINA | 0 | |||||||||||||||
| KOREA, REPUBLIC OF - 0.0% | ||||||||||||||||
| 3,236 | Doosan Heavy Industries & Construction Co Ltd | 02/08/22 | 12 | |||||||||||||
| TOTAL KOREA, REPUBLIC OF | 12 | |||||||||||||||
| SWITZERLAND - 0.0% | ||||||||||||||||
| 193,679 | e | Cie Financiere Richemont S.A. | 11/27/23 | 213 | ||||||||||||
| TOTAL SWITZERLAND | 213 | |||||||||||||||
| TOTAL RIGHTS/WARRANTS | 246 | |||||||||||||||
| (Cost $10) | ||||||||||||||||
| PRINCIPAL | ISSUER | RATE | ||||||||||||||
| SHORT-TERM INVESTMENTS - 1.9% | ||||||||||||||||
| GOVERNMENT AGENCY DEBT - 1.4% | ||||||||||||||||
| $ | 11,460,000 | Federal Farm Credit Bank (FFCB) | 0.000 | % | 01/05/22 | 11,460 | ||||||||||
| 8,294,000 | FFCB | 0.000 | 01/13/22 | 8,294 | ||||||||||||
| 10,000,000 | FFCB | 0.000 | 01/26/22 | 10,000 | ||||||||||||
| 10,000,000 | FFCB | 0.000 | 02/25/22 | 10,000 | ||||||||||||
| 8,000,000 | FFCB | 0.000 | 02/28/22 | 8,000 | ||||||||||||
| 12,500,000 | FFCB | 0.000 | 03/01/22 | 12,499 | ||||||||||||
| 10,000,000 | FFCB | 0.000 | 03/17/22 | 9,999 | ||||||||||||
| 11,000,000 | FFCB | 0.000 | 07/25/22 | 10,986 | ||||||||||||
| 9,000,000 | FFCB | 0.000 | 09/23/22 | 8,982 | ||||||||||||
| 312 |
COLLEGE RETIREMENT EQUITIES FUND - Global Equities Account
| PRINCIPAL | ISSUER | RATE | MATURITY DATE | VALUE (000) | ||||||||||||
| $ | 18,335,000 | Federal Home Loan Bank (FHLB) | 0.000 | % | 01/04/22 | $ | 18,335 | |||||||||
| 38,622,000 | FHLB | 0.000 | 01/05/22 | 38,622 | ||||||||||||
| 15,617,000 | FHLB | 0.000 | 01/06/22 | 15,617 | ||||||||||||
| 27,835,000 | FHLB | 0.000 | 01/12/22 | 27,835 | ||||||||||||
| 20,000,000 | FHLB | 0.000 | 01/18/22 | 20,000 | ||||||||||||
| 25,000,000 | FHLB | 0.000 | 01/21/22 | 25,000 | ||||||||||||
| 10,000,000 | FHLB | 0.000 | 01/26/22 | 10,000 | ||||||||||||
| 25,000,000 | FHLB | 0.000 | 02/03/22 | 25,000 | ||||||||||||
| 25,000,000 | FHLB | 0.000 | 02/04/22 | 24,999 | ||||||||||||
| 12,672,000 | FHLB | 0.000 | 02/16/22 | 12,672 | ||||||||||||
| 25,000,000 | FHLB | 0.000 | 02/18/22 | 24,999 | ||||||||||||
| 25,000,000 | FHLB | 0.000 | 02/22/22 | 24,999 | ||||||||||||
| 10,000,000 | FHLB | 0.000 | 02/23/22 | 10,000 | ||||||||||||
| 21,400,000 | FHLB | 0.000 | 03/16/22 | 21,398 | ||||||||||||
| 6,680,000 | FHLB | 0.000 | 05/25/22 | 6,676 | ||||||||||||
| TOTAL GOVERNMENT AGENCY DEBT | 396,372 | |||||||||||||||
| REPURCHASE AGREEMENT - 0.1% | ||||||||||||||||
| 19,280,000 | r | Fixed Income Clearing Corp (FICC) | 0.010 | 01/03/22 | 19,280 | |||||||||||
| TOTAL REPURCHASE AGREEMENT | 19,280 | |||||||||||||||
| TREASURY DEBT - 0.1% | ||||||||||||||||
| 12,525,000 | United States Treasury Bill | 0.000 | 01/13/22 | 12,525 | ||||||||||||
| 10,000,000 | United States Treasury Bill | 0.000 | 06/23/22 | 9,992 | ||||||||||||
| TOTAL TREASURY DEBT | 22,517 | |||||||||||||||
| INVESTMENT OF CASH COLLATERAL FOR SECURITIES LOANED – 0.3% | ||||||||||||||||
| CERTIFICATE OF DEPOSIT - 0.0% | ||||||||||||||||
| 8,000,000 | Mizuho Bank | 0.250 | 05/09/22 | 8,000 | ||||||||||||
| TOTAL CERTIFICATE OF DEPOSIT | 8,000 | |||||||||||||||
| COMMERCIAL PAPER - 0.0% | ||||||||||||||||
| 8,000,000 | Skandin Ens Banken AG | 0.000 | 05/02/22 | 7,994 | ||||||||||||
| TOTAL COMMERCIAL PAPER | 7,994 | |||||||||||||||
| REPURCHASE AGREEMENT - 0.2% | ||||||||||||||||
| 10,000,000 | s | Calyon | 0.050 | 01/03/22 | 10,000 | |||||||||||
| 5,000,000 | t | Deutsche Bank | 0.050 | 01/03/22 | 5,000 | |||||||||||
| 5,000,000 | u | Goldman Sachs | 0.050 | 01/03/22 | 5,000 | |||||||||||
| 5,000,000 | v | HSBC | 0.050 | 01/03/22 | 5,000 | |||||||||||
| 1,000,000 | w | HSBC | 0.050 | 01/03/22 | 1,000 | |||||||||||
| 313 |
COLLEGE RETIREMENT EQUITIES FUND - Global Equities Account
| PRINCIPAL | ISSUER | RATE | MATURITY DATE | VALUE (000) | ||||||||||||
| $ | 1,000,000 | x | HSBC | 0.051 | % | 01/05/22 | $ | 1,000 | ||||||||
| 5,000,000 | y | JP Morgan | 0.050 | 01/03/22 | 5,000 | |||||||||||
| 14,000,000 | z | Merrill Lynch | 0.050 | 01/03/22 | 14,000 | |||||||||||
| 5,000,000 | aa | Merrill Lynch | 0.050 | 01/03/22 | 5,000 | |||||||||||
| 1,000,000 | ab | Merrill Lynch | 0.050 | 01/03/22 | 1,000 | |||||||||||
| 5,000,000 | ac | Morgan Stanley | 0.050 | 01/03/22 | 5,000 | |||||||||||
| 5,000,000 | ad | Nomura | 0.050 | 01/03/22 | 5,000 | |||||||||||
| 5,000,000 | ae | Royal Bank of Scotland | 0.050 | 01/03/22 | 5,000 | |||||||||||
| TOTAL REPURCHASE AGREEMENT | 67,000 | |||||||||||||||
| TREASURY DEBT - 0.1% | ||||||||||||||||
| 8,200,000 | United States Treasury Bill | 0.000 | 01/18/22 | 8,200 | ||||||||||||
| 1,640,000 | United States Treasury Bill | 0.000 | 01/18/22 | 1,640 | ||||||||||||
| 8,500,000 | United States Treasury Bill | 0.000 | 01/18/22 | 8,500 | ||||||||||||
| 1,600,000 | United States Treasury Bill | 0.000 | 01/18/22 | 1,600 | ||||||||||||
| 6,250,000 | United States Treasury Bill | 0.000 | 01/13/22 | 6,250 | ||||||||||||
| 26,190 | ||||||||||||||||
| TOTAL INVESTMENT OF CASH COLLATERAL FOR SECURITIES LOANED | 109,184 | |||||||||||||||
| TOTAL SHORT-TERM INVESTMENTS | 547,353 | |||||||||||||||
| (Cost $547,367) | ||||||||||||||||
| TOTAL INVESTMENTS - 100.4% | 28,860,866 | |||||||||||||||
| (Cost $21,993,376) | ||||||||||||||||
| OTHER ASSETS & LIABILITIES, NET - (0.4)% | (117,570 | ) | ||||||||||||||
| NET ASSETS - 100.0% | $ | 28,743,296 | ||||||||||||||
| ADR | American Depositary Receipt | |||||||||||||||
| ETF | Exchange Traded Fund | |||||||||||||||
| GDR | Global Depositary Receipt | |||||||||||||||
| INR | Indian Rupee | |||||||||||||||
| REIT | Real Estate Investment Trust | |||||||||||||||
| ^ | Amount represents less than $1,000. | |||||||||||||||
| * | Non-income producing | |||||||||||||||
| † | Security is categorized as Level 3 in the fair value hierarchy. | |||||||||||||||
| d | All or a portion of these securities have been segregated to cover margin requirements on open futures contracts. | |||||||||||||||
| e | All or a portion of these securities are out on loan. The aggregate value of securities on loan is $160,847,614. | |||||||||||||||
| g | Security is exempt from registration under Rule 144(A) of the Securities Act of 1933, as amended. Such securities are deemed liquid and may be resold in transactions exempt from registration to qualified institutional buyers. At 12/31/21, the aggregate value of these securities is $368,748,110 or 1.3% of net assets. | |||||||||||||||
| h | All or a portion of these securities were purchased on a delayed delivery basis. | |||||||||||||||
| r | Agreement with Fixed Income Clearing Corp (FICC), 0.010% dated 12/31/21 to be repurchased at $19,280,000 on 1/3/22, collateralized by Government Agency Securities, with coupon rate 1.875% and maturity date 2/15/41, valued at $19,665,655. | |||||||||||||||
| s | Agreement with Calyon, 0.050% dated 12/31/21 to be repurchased at $10,000,000 on 1/3/22, collateralized by Government Agency Securities, with coupon rate 2.000% and maturity date 1/20/51, valued at $10,200,000. | |||||||||||||||
| t | Agreement with Deutsche Bank, 0.050% dated 12/31/21 to be repurchased at $5,000,000 on 1/3/22, collateralized by Government Agency Securities, with coupon rate 0.750% and maturity date 7/15/28, valued at $5,100,041. | |||||||||||||||
| u | Agreement with Goldman Sachs, 0.050% dated 12/31/21 to be repurchased at $5,000,000 on 1/3/22, collateralized by Government Agency Securities, with coupon rates 0.000%–7.625% and maturity dates 6/16/22–5/15/49, valued at $5,100,000. | |||||||||||||||
| v | Agreement with HSBC, 0.050% dated 12/31/21 to be repurchased at $5,000,000 on 1/3/22, collateralized by Government Agency Securities, with coupon rates 0.000%–2.625% and maturity dates 2/28/23–5/15/30, valued at $5,100,015. | |||||||||||||||
| 314 |
COLLEGE RETIREMENT EQUITIES FUND - Global Equities Account
| w | Agreement with HSBC, 0.050% dated 12/31/21 to be repurchased at $1,000,000 on 1/3/22, collateralized by Government Agency Securities, with coupon rates 0.000%–6.625% and maturity dates 1/27/22–8/15/51, valued at $1,020,000. | ||
| x | Agreement with HSBC, 0.051% dated 12/29/21 to be repurchased at $1,000,000 on 1/5/22, collateralized by Government Agency Securities, with coupon rate 0.000% and maturity dates 8/15/25–8/15/31, valued at $1,020,024. | ||
| y | Agreement with JP Morgan, 0.050% dated 12/31/21 to be repurchased at $5,000,000 on 1/3/22, collateralized by Government Agency Securities, with coupon rates 2.278%–6.000% and maturity dates 3/1/26–10/1/51, valued at $5,100,000. | ||
| z | Agreement with Merrill Lynch, 0.050% dated 12/31/21 to be repurchased at $14,000,000 on 1/3/22, collateralized by Government Agency Securities, with coupon rate 1.250% and maturity date 6/30/28, valued at $14,280,056. | ||
| aa | Agreement with Merrill Lynch, 0.050% dated 12/31/21 to be repurchased at $5,000,000 on 1/3/22, collateralized by Government Agency Securities, with coupon rate 2.625% and maturity date 2/15/29, valued at $5,100,036. | ||
| ab | Agreement with Merrill Lynch, 0.050% dated 12/31/21 to be repurchased at $1,000,000 on 1/3/22, collateralized by Government Agency Securities, with coupon rate 2.625% and maturity date 2/28/23, valued at $1,020,048. | ||
| ac | Agreement with Morgan Stanley, 0.050% dated 12/31/21 to be repurchased at $5,000,000 on 1/3/22, collateralized by Government Agency Securities, with coupon rates 2.000%–7.000% and maturity dates 8/1/22–12/1/51, valued at $5,100,000. | ||
| ad | Agreement with Nomura, 0.050% dated 12/31/21 to be repurchased at $5,000,000 on 1/3/22, collateralized by Government Agency Securities, with coupon rates 0.000%–6.750% and maturity dates 6/30/22–8/15/41, valued at $5,100,000. | ||
| ae | Agreement with Royal Bank of Scotland, 0.050% dated 12/31/21 to be repurchased at $5,000,000 on 1/3/22, collateralized by Government Agency Securities, with coupon rate 2.000% and maturity date 2/15/50, valued at $5,100,095. | ||
| Cost amounts are in thousands. | |||
Futures contracts outstanding as of December 31, 2021 were as follows (dollar amounts are in thousands):
| Description | Number of long (short) contracts | Expiration date | Notional amount | Value | Unrealized appreciation (depreciation) | |||||||||||||
| MSCI EAFE Index | 731 | 03/18/22 | $ | 83,676 | $ | 84,862 | $ | 1,186 | ||||||||||
| S&P 500 E Mini Index | 896 | 03/18/22 | 210,515 | 213,181 | 2,666 | |||||||||||||
| Total | 1,627 | $ | 294,191 | $ | 298,043 | $ | 3,852 | |||||||||||
| 315 |
COLLEGE RETIREMENT EQUITIES FUND - Growth Account
COLLEGE RETIREMENT EQUITIES FUND
GROWTH ACCOUNT
SCHEDULE OF INVESTMENTS
December 31, 2021
| SHARES | COMPANY | VALUE (000) | ||||||||
| COMMON STOCKS - 99.2% | ||||||||||
| AUTOMOBILES & COMPONENTS - 4.5% | ||||||||||
| 1,719,575 | * | Aptiv plc | $ | 283,644 | ||||||
| 1,539,198 | * | General Motors Co | 90,243 | |||||||
| 512,504 | * | Rivian Automotive, Inc | 53,142 | |||||||
| 1,278,423 | *,n | Tesla, Inc | 1,351,012 | |||||||
| TOTAL AUTOMOBILES & COMPONENTS | 1,778,041 | |||||||||
| CAPITAL GOODS - 2.9% | ||||||||||
| 452,569 | * | Boeing Co | 91,111 | |||||||
| 8,044,932 | Carrier Global Corp | 436,357 | ||||||||
| 283,855 | Deere & Co | 97,331 | ||||||||
| 434,521 | * | Generac Holdings, Inc | 152,917 | |||||||
| 948,338 | * | Liberty Media Acquisition Corp | 10,062 | |||||||
| 470,266 | Roper Technologies Inc | 231,305 | ||||||||
| 1,059,107 | Safran S.A. | 129,659 | ||||||||
| TOTAL CAPITAL GOODS | 1,148,742 | |||||||||
| COMMERCIAL & PROFESSIONAL SERVICES - 1.2% | ||||||||||
| 368,351 | * | Cimpress plc | 26,378 | |||||||
| 5,942,815 | * | Clarivate Analytics plc | 139,775 | |||||||
| 2,876,071 | Experian Group Ltd | 141,663 | ||||||||
| 1,246,556 | Waste Connections, Inc | 169,868 | ||||||||
| TOTAL COMMERCIAL & PROFESSIONAL SERVICES | 477,684 | |||||||||
| CONSUMER DURABLES & APPAREL - 1.9% | ||||||||||
| 860,637 | Essilor International S.A. | 183,209 | ||||||||
| 3,146,702 | Nike, Inc (Class B) | 524,461 | ||||||||
| 10,419,000 | Prada S.p.A | 66,716 | ||||||||
| TOTAL CONSUMER DURABLES & APPAREL | 774,386 | |||||||||
| CONSUMER SERVICES - 2.7% | ||||||||||
| 149,507 | * | Booking Holdings, Inc | 358,702 | |||||||
| 1,937,866 | * | Caesars Entertainment, Inc | 181,249 | |||||||
| 5,246,177 | *,e | Carnival Corp | 105,553 | |||||||
| 168,858 | * | Chipotle Mexican Grill, Inc (Class A) | 295,206 | |||||||
| 486,275 | * | Flutter Entertainment plc | 77,794 | |||||||
| 316 |
COLLEGE RETIREMENT EQUITIES FUND - Growth Account
| SHARES | COMPANY | VALUE (000) | ||||||||
| 508,551 | Starbucks Corp | $ | 59,485 | |||||||
| TOTAL CONSUMER SERVICES | 1,077,989 | |||||||||
| DIVERSIFIED FINANCIALS - 3.1% | ||||||||||
| 736,902 | Capital One Financial Corp | 106,917 | ||||||||
| 2,554,131 | Charles Schwab Corp | 214,803 | ||||||||
| 8,050,962 | * | Grab Holdings Ltd. | 32,606 | |||||||
| 1,084,500 | e | iShares Russell 1000 Growth Index Fund | 331,412 | |||||||
| 2,497,330 | Morgan Stanley | 245,138 | ||||||||
| 1,191,512 | * | Ribbit LEAP Ltd | 11,844 | |||||||
| 625,449 | S&P Global, Inc | 295,168 | ||||||||
| TOTAL DIVERSIFIED FINANCIALS | 1,237,888 | |||||||||
| FOOD & STAPLES RETAILING - 2.3% | ||||||||||
| 1,597,668 | Costco Wholesale Corp | 906,996 | ||||||||
| TOTAL FOOD & STAPLES RETAILING | 906,996 | |||||||||
| FOOD, BEVERAGE & TOBACCO - 1.1% | ||||||||||
| 5,970,591 | Davide Campari-Milano NV | 87,125 | ||||||||
| 3,842,858 | * | Monster Beverage Corp | 369,068 | |||||||
| TOTAL FOOD, BEVERAGE & TOBACCO | 456,193 | |||||||||
| HEALTH CARE EQUIPMENT & SERVICES - 4.8% | ||||||||||
| 1,068,111 | Alcon, Inc | 94,213 | ||||||||
| 738,750 | * | Align Technology, Inc | 485,492 | |||||||
| 622,596 | Cigna Corp | 142,967 | ||||||||
| 48,681 | Cooper Cos, Inc | 20,394 | ||||||||
| 830,893 | * | DexCom, Inc | 446,148 | |||||||
| 939,399 | * | Edwards Lifesciences Corp | 121,699 | |||||||
| 733,621 | * | Guardant Health, Inc | 73,377 | |||||||
| 1,059,188 | *,n | Intuitive Surgical, Inc | 380,566 | |||||||
| 1,159,728 | *,e | Oak Street Health, Inc | 38,433 | |||||||
| 409,194 | * | Veeva Systems, Inc | 104,541 | |||||||
| TOTAL HEALTH CARE EQUIPMENT & SERVICES | 1,907,830 | |||||||||
| HOUSEHOLD & PERSONAL PRODUCTS - 0.6% | ||||||||||
| 674,280 | Estee Lauder Cos (Class A) | 249,618 | ||||||||
| TOTAL HOUSEHOLD & PERSONAL PRODUCTS | 249,618 | |||||||||
| INSURANCE - 0.4% | ||||||||||
| 2,551,549 | American International Group, Inc | 145,081 | ||||||||
| TOTAL INSURANCE | 145,081 | |||||||||
| MATERIALS - 1.2% | ||||||||||
| 273,598 | Linde plc | 94,783 | ||||||||
| 317 |
COLLEGE RETIREMENT EQUITIES FUND - Growth Account
| SHARES | COMPANY | VALUE (000) | ||||||||
| 1,090,071 | Sherwin-Williams Co | $ | 383,879 | |||||||
| TOTAL MATERIALS | 478,662 | |||||||||
| MEDIA & ENTERTAINMENT - 13.4% | ||||||||||
| 481,895 | * | Alphabet, Inc (Class A) | 1,396,069 | |||||||
| 345,796 | * | Alphabet, Inc (Class C) | 1,000,592 | |||||||
| 2,251,182 | Comcast Corp (Class A) | 113,302 | ||||||||
| 797,239 | Electronic Arts, Inc | 105,156 | ||||||||
| 799,318 | * | IAC | 104,479 | |||||||
| 2,967,078 | * | Match Group, Inc | 392,396 | |||||||
| 4,914,784 | * | Meta Platforms, Inc. | 1,653,088 | |||||||
| 861,524 | * | ROBLOX Corp | 88,875 | |||||||
| 182,749 | * | Roku, Inc | 41,703 | |||||||
| 1,706,614 | Tencent Holdings Ltd | 99,583 | ||||||||
| 2,123,797 | * | Twitter, Inc | 91,790 | |||||||
| 1,297,699 | * | Vimeo, Inc | 23,307 | |||||||
| 759,270 | * | Walt Disney Co | 117,603 | |||||||
| 1,672,196 | * | ZoomInfo Technologies, Inc | 107,355 | |||||||
| TOTAL MEDIA & ENTERTAINMENT | 5,335,298 | |||||||||
| PHARMACEUTICALS, BIOTECHNOLOGY & LIFE SCIENCES - 5.4% | ||||||||||
| 1,098,870 | AbbVie, Inc | 148,787 | ||||||||
| 491,165 | AstraZeneca plc | 57,353 | ||||||||
| 3,275,605 | AstraZeneca plc (ADR) | 190,804 | ||||||||
| 10,141,413 | * | Avantor, Inc | 427,359 | |||||||
| 447,880 | Eli Lilly & Co | 123,713 | ||||||||
| 3,430,391 | * | Horizon Therapeutics Plc | 369,659 | |||||||
| 491,463 | * | Illumina, Inc | 186,972 | |||||||
| 2,700,081 | Zoetis, Inc | 658,901 | ||||||||
| TOTAL PHARMACEUTICALS, BIOTECHNOLOGY & LIFE SCIENCES | 2,163,548 | |||||||||
| RETAILING - 10.2% | ||||||||||
| 794,412 | * | Amazon.com, Inc | 2,648,840 | |||||||
| 637,057 | * | ASOS plc | 20,617 | |||||||
| 953,350 | * | Burlington Stores, Inc | 277,911 | |||||||
| 1,068,474 | * | CarMax, Inc | 139,147 | |||||||
| 2,117,072 | * | Coupang, Inc | 62,200 | |||||||
| 1,170,008 | eBay, Inc | 77,806 | ||||||||
| 25,713 | Home Depot, Inc | 10,671 | ||||||||
| 565,825 | *,e | Just Eat Takeaway.com NV (ADR) | 6,088 | |||||||
| 136,233 | Kering | 109,307 | ||||||||
| 1,659,114 | Lowe’s Companies, Inc | 428,848 | ||||||||
| 3,591,320 | TJX Companies, Inc | 272,653 | ||||||||
| TOTAL RETAILING | 4,054,088 | |||||||||
| 318 |
COLLEGE RETIREMENT EQUITIES FUND - Growth Account
| SHARES | COMPANY | VALUE (000) | ||||||||
| SEMICONDUCTORS & SEMICONDUCTOR EQUIPMENT - 9.4% | ||||||||||
| 1,944,324 | Applied Materials, Inc | $ | 305,959 | |||||||
| 911,541 | Broadcom, Inc | 606,548 | ||||||||
| 582,941 | Lam Research Corp | 419,222 | ||||||||
| 2,533,441 | Marvell Technology, Inc | 221,651 | ||||||||
| 429,113 | Monolithic Power Systems, Inc | 211,694 | ||||||||
| 4,828,682 | NVIDIA Corp | 1,420,164 | ||||||||
| 666,337 | NXP Semiconductors NV | 151,778 | ||||||||
| 1,460,856 | QUALCOMM, Inc | 267,147 | ||||||||
| 1,160,505 | Taiwan Semiconductor Manufacturing Co Ltd (ADR) | 139,620 | ||||||||
| TOTAL SEMICONDUCTORS & SEMICONDUCTOR EQUIPMENT | 3,743,783 | |||||||||
| SOFTWARE & SERVICES - 27.5% | ||||||||||
| 446,535 | Accenture plc | 185,111 | ||||||||
| 45,692 | *,g | Adyen NV | 119,941 | |||||||
| 1,411,004 | * | Block Inc | 227,891 | |||||||
| 468,046 | * | Crowdstrike Holdings, Inc | 95,832 | |||||||
| 630,574 | * | DocuSign, Inc | 96,043 | |||||||
| 292,469 | * | EPAM Systems, Inc | 195,501 | |||||||
| 1,194,474 | Intuit, Inc | 768,310 | ||||||||
| 2,011,595 | * | ironSource Ltd | 15,570 | |||||||
| 5,582,500 | * | ironSource Ltd | 43,208 | |||||||
| 2,208,643 | Mastercard, Inc (Class A) | 793,610 | ||||||||
| 12,155,604 | Microsoft Corp | 4,088,173 | ||||||||
| 436,575 | * | Palo Alto Networks, Inc | 243,067 | |||||||
| 3,722,896 | * | PayPal Holdings, Inc | 702,064 | |||||||
| 3,372,712 | * | Qualtrics International, Inc | 119,394 | |||||||
| 3,956,135 | * | salesforce.com, Inc | 1,005,373 | |||||||
| 956,650 | * | ServiceNow, Inc | 620,971 | |||||||
| 700,311 | * | Synopsys, Inc | 258,065 | |||||||
| 1,072,705 | * | Twilio, Inc | 282,486 | |||||||
| 3,535,213 | Visa, Inc (Class A) | 766,116 | ||||||||
| 525,754 | * | Workday, Inc | 143,625 | |||||||
| 628,910 | * | Zscaler, Inc | 202,088 | |||||||
| TOTAL SOFTWARE & SERVICES | 10,972,439 | |||||||||
| TECHNOLOGY HARDWARE & EQUIPMENT - 5.0% | ||||||||||
| 11,233,224 | Apple, Inc | 1,994,684 | ||||||||
| TOTAL TECHNOLOGY HARDWARE & EQUIPMENT | 1,994,684 | |||||||||
| TELECOMMUNICATION SERVICES - 0.2% | ||||||||||
| 1,174,365 | g | Cellnex Telecom SAU | 68,028 | |||||||
| TOTAL TELECOMMUNICATION SERVICES | 68,028 | |||||||||
| 319 |
COLLEGE RETIREMENT EQUITIES FUND - Growth Account
| SHARES | COMPANY | VALUE (000) | ||||||||||||||
| TRANSPORTATION - 1.4% | ||||||||||||||||
| 5,133,984 | * | Uber Technologies, Inc | $ | 215,268 | ||||||||||||
| 1,375,743 | Union Pacific Corp | 346,591 | ||||||||||||||
| TOTAL TRANSPORTATION | 561,859 | |||||||||||||||
| TOTAL COMMON STOCKS | 39,532,837 | |||||||||||||||
| (Cost $29,912,433) | ||||||||||||||||
| PRINCIPAL | ISSUER | RATE | MATURITY DATE | |||||||||||||
| SHORT-TERM INVESTMENTS - 0.4% | ||||||||||||||||
| GOVERNMENT AGENCY DEBT - 0.2% | ||||||||||||||||
| $ | 4,470,000 | Federal Farm Credit Bank (FFCB) | 0.000 | % | 01/05/22 | 4,470 | ||||||||||
| 33,970,000 | Federal Home Loan Bank (FHLB) | 0.000 | 01/21/22 | 33,970 | ||||||||||||
| 10,000,000 | FHLB | 0.000 | 02/18/22 | 9,999 | ||||||||||||
| 38,561,000 | Tennessee Valley Authority (TVA) | 0.000 | 01/12/22 | 38,561 | ||||||||||||
| TOTAL GOVERNMENT AGENCY DEBT | 87,000 | |||||||||||||||
| TREASURY DEBT - 0.0% | ||||||||||||||||
| 8,345,000 | United States Treasury Note | 2.250 | 04/15/22 | 8,395 | ||||||||||||
| TOTAL TREASURY DEBT | 8,395 | |||||||||||||||
| SHARES | COMPANY | |||||||||||||||
| INVESTMENT IN REGISTERED INVESTMENT COMPANIES - 0.2% | ||||||||||||||||
| 65,478,995 | c | State Street Navigator Securities Lending Government Money Market Portfolio | 0.030 | 65,479 | ||||||||||||
| TOTAL INVESTMENTS IN REGISTERED INVESTMENT COMPANIES | 65,479 | |||||||||||||||
| TOTAL SHORT-TERM INVESTMENTS | 160,874 | |||||||||||||||
| (Cost $160,875) | ||||||||||||||||
| TOTAL INVESTMENTS - 99.6% | 39,693,711 | |||||||||||||||
| (Cost $30,073,308) | ||||||||||||||||
| OTHER ASSETS & LIABILITIES, NET - 0.4% | 150,153 | |||||||||||||||
| NET ASSETS - 100.0% | $ | 39,843,864 | ||||||||||||||
| ADR | American Depositary Receipt | ||
| * | Non-income producing | ||
| c | Investments made with cash collateral received from securities on loan. | ||
| e | All or a portion of these securities are out on loan. The aggregate value of securities on loan is $154,370,834. | ||
| g | Security is exempt from registration under Rule 144(A) of the Securities Act of 1933, as amended. Such securities are deemed liquid and may be resold in transactions exempt from registration to qualified institutional buyers. At 12/31/21, the aggregate value of these securities is $187,969,626 or 0.5% of net assets. | ||
| n | All or a portion of these securities have been segregated by the custodian to cover requirements on open written options contracts. | ||
| Cost amounts are in thousands. | |||
| 320 |
COLLEGE RETIREMENT EQUITIES FUND - Growth Account
Written options outstanding as of December 31, 2021 were as follows (notional amounts and values are in thousands):
| Description/underlying investment | Number of contracts | Notional amount | Exercise price | Expiration date | Value | |||||||||||||
| Intuitive Surgical, Inc, Put | 615 | $ | (897 | ) | $ | 320.00 | 01/21/22 | $ | (122 | ) | ||||||||
| Tesla, Inc, Call | 477 | (942 | ) | 1,300.00 | 01/21/22 | (339 | ) | |||||||||||
| Tesla, Inc, Put | 477 | (1,807 | ) | 900.00 | 01/21/22 | (481 | ) | |||||||||||
| Total | 1,569 | (3,646 | ) | $ | (942 | ) | ||||||||||||
| 321 |
COLLEGE RETIREMENT EQUITIES FUND - Equity Index Account
COLLEGE RETIREMENT EQUITIES FUND
EQUITY INDEX ACCOUNT
SCHEDULE OF INVESTMENTS
December 31, 2021
| SHARES | COMPANY | VALUE (000) | ||||||||
| COMMON STOCKS - 99.6% | ||||||||||
| AUTOMOBILES & COMPONENTS - 2.4% | ||||||||||
| 49,971 | * | Adient plc | $ | 2,393 | ||||||
| 60,325 | * | American Axle & Manufacturing Holdings, Inc | 563 | |||||||
| 142,468 | * | Aptiv plc | 23,500 | |||||||
| 14,947 | * | Arcimoto, Inc | 116 | |||||||
| 131,607 | BorgWarner, Inc | 5,932 | ||||||||
| 43,545 | *,e | Canoo, Inc | 336 | |||||||
| 12,534 | * | Cooper-Standard Holding, Inc | 281 | |||||||
| 76,541 | Dana Inc | 1,747 | ||||||||
| 12,642 | * | Dorman Products, Inc | 1,429 | |||||||
| 86,619 | *,e | Fisker, Inc | 1,363 | |||||||
| 2,113,987 | Ford Motor Co | 43,908 | ||||||||
| 23,054 | * | Fox Factory Holding Corp | 3,921 | |||||||
| 734,131 | * | General Motors Co | 43,042 | |||||||
| 119,427 | Gentex Corp | 4,162 | ||||||||
| 18,149 | * | Gentherm, Inc | 1,577 | |||||||
| 150,840 | * | Goodyear Tire & Rubber Co | 3,216 | |||||||
| 87,213 | Harley-Davidson, Inc | 3,287 | ||||||||
| 12,667 | LCI Industries, Inc | 1,974 | ||||||||
| 32,974 | Lear Corp | 6,033 | ||||||||
| 61,192 | * | Lordstown Motors Corp | 211 | |||||||
| 36,302 | * | Modine Manufacturing Co | 366 | |||||||
| 13,147 | * | Motorcar Parts of America, Inc | 224 | |||||||
| 12,396 | Patrick Industries, Inc | 1,000 | ||||||||
| 111,576 | * | QuantumScape Corp | 2,476 | |||||||
| 76,576 | * | Rivian Automotive, Inc | 7,940 | |||||||
| 11,405 | Standard Motor Products, Inc | 597 | ||||||||
| 20,247 | * | Stoneridge, Inc | 400 | |||||||
| 38,574 | * | Tenneco, Inc | 436 | |||||||
| 432,832 | * | Tesla, Inc | 457,408 | |||||||
| 29,413 | Thor Industries, Inc | 3,052 | ||||||||
| 16,494 | * | Visteon Corp | 1,833 | |||||||
| 17,654 | Winnebago Industries, Inc | 1,323 | ||||||||
| 67,449 | *,e | Workhorse Group, Inc | 294 | |||||||
| 9,934 | * | XPEL, Inc | 678 | |||||||
| TOTAL AUTOMOBILES & COMPONENTS | 627,018 | |||||||||
| BANKS - 4.2% | ||||||||||
| 12,408 | 1st Source Corp | 615 | ||||||||
| 7,958 | Allegiance Bancshares, Inc | 336 | ||||||||
| 12,491 | Amerant Bancorp Inc | 432 | ||||||||
| 5,882 | American National Bankshares, Inc | 222 | ||||||||
| 38,500 | Ameris Bancorp | 1,913 | ||||||||
| 8,940 | Arrow Financial Corp | 315 | ||||||||
| 85,309 | Associated Banc-Corp | 1,927 | ||||||||
| 14,762 | * | Atlantic Capital Bancshares, Inc | 425 | |||||||
| 42,326 | Atlantic Union Bankshares Corp | 1,578 | ||||||||
| 322 |
COLLEGE RETIREMENT EQUITIES FUND - Equity Index Account
| SHARES | COMPANY | VALUE (000) | ||||||||
| 31,941 | * | Axos Financial, Inc | $ | 1,786 | ||||||
| 31,112 | Banc of California, Inc | 610 | ||||||||
| 11,574 | Bancfirst Corp | 817 | ||||||||
| 3,732 | e | Bank First Corp | 270 | |||||||
| 3,852,559 | Bank of America Corp | 171,400 | ||||||||
| 23,380 | Bank of Hawaii Corp | 1,958 | ||||||||
| 7,728 | Bank of Marin Bancorp | 288 | ||||||||
| 27,371 | Bank of NT Butterfield & Son Ltd | 1,043 | ||||||||
| 68,657 | Bank OZK | 3,195 | ||||||||
| 50,841 | BankUnited | 2,151 | ||||||||
| 18,925 | Banner Corp | 1,148 | ||||||||
| 11,016 | Bar Harbor Bankshares | 319 | ||||||||
| 26,834 | Berkshire Hills Bancorp, Inc | 763 | ||||||||
| 15,941 | BOK Financial Corp | 1,682 | ||||||||
| 54,590 | Brookline Bancorp, Inc | 884 | ||||||||
| 12,987 | Bryn Mawr Bank Corp | 585 | ||||||||
| 6,436 | Business First Bancshares, Inc | 182 | ||||||||
| 5,576 | Byline Bancorp, Inc | 153 | ||||||||
| 107,871 | Cadence BanCorp | 3,213 | ||||||||
| 2,502 | Cambridge Bancorp | 234 | ||||||||
| 11,436 | Camden National Corp | 551 | ||||||||
| 9,158 | Capital City Bank Group, Inc | 242 | ||||||||
| 33,828 | Capitol Federal Financial | 383 | ||||||||
| 5,956 | Capstar Financial Holdings, Inc | 125 | ||||||||
| 14,623 | * | Carter Bankshares, Inc | 225 | |||||||
| 40,414 | Cathay General Bancorp | 1,737 | ||||||||
| 12,633 | CBTX, Inc | 366 | ||||||||
| 21,511 | Central Pacific Financial Corp | 606 | ||||||||
| 54,177 | CIT Group, Inc | 2,781 | ||||||||
| 1,057,973 | Citigroup, Inc | 63,891 | ||||||||
| 9,568 | Citizens & Northern Corp | 250 | ||||||||
| 233,465 | Citizens Financial Group, Inc | 11,031 | ||||||||
| 10,955 | City Holding Co | 896 | ||||||||
| 7,262 | Civista Bancshares, Inc | 177 | ||||||||
| 9,772 | CNB Financial Corp | 259 | ||||||||
| 39,274 | Columbia Banking System, Inc | 1,285 | ||||||||
| 33,673 | * | Columbia Financial, Inc | 702 | |||||||
| 76,653 | Comerica, Inc | 6,669 | ||||||||
| 58,578 | Commerce Bancshares, Inc | 4,027 | ||||||||
| 29,222 | Community Bank System, Inc | 2,176 | ||||||||
| 1,585 | Community Trust Bancorp, Inc | 69 | ||||||||
| 21,722 | ConnectOne Bancorp, Inc | 711 | ||||||||
| 29,153 | * | CrossFirst Bankshares, Inc | 455 | |||||||
| 31,366 | Cullen/Frost Bankers, Inc | 3,954 | ||||||||
| 19,196 | * | Customers Bancorp, Inc | 1,255 | |||||||
| 75,634 | CVB Financial Corp | 1,619 | ||||||||
| 19,153 | Dime Community Bancshares, Inc | 673 | ||||||||
| 17,266 | Eagle Bancorp, Inc | 1,007 | ||||||||
| 77,531 | East West Bancorp, Inc | 6,100 | ||||||||
| 94,260 | Eastern Bankshares, Inc | 1,901 | ||||||||
| 6,481 | Enterprise Bancorp, Inc | 291 | ||||||||
| 16,077 | Enterprise Financial Services Corp | 757 | ||||||||
| 7,477 | Equity Bancshares, Inc | 254 | ||||||||
| 53,471 | Essent Group Ltd | 2,435 | ||||||||
| 323 |
COLLEGE RETIREMENT EQUITIES FUND - Equity Index Account
| SHARES | COMPANY | VALUE (000) | ||||||||
| 18,150 | Farmers National Banc Corp | $ | 337 | |||||||
| 13,107 | FB Financial Corp | 574 | ||||||||
| 1,343 | Federal Agricultural Mortgage Corp (FAMC) | 166 | ||||||||
| 373,551 | Fifth Third Bancorp | 16,268 | ||||||||
| 10,211 | Financial Institutions, Inc | 325 | ||||||||
| 114,850 | First Bancorp | 1,583 | ||||||||
| 15,371 | First Bancorp | 703 | ||||||||
| 6,485 | First Bancorp, Inc | 204 | ||||||||
| 6,018 | First Bancshares, Inc | 232 | ||||||||
| 26,747 | First Busey Corp | 725 | ||||||||
| 3,317 | e | First Citizens Bancshares, Inc (Class A) | 2,753 | |||||||
| 52,091 | First Commonwealth Financial Corp | 838 | ||||||||
| 12,139 | First Community Bancshares, Inc | 406 | ||||||||
| 52,485 | First Financial Bancorp | 1,280 | ||||||||
| 70,877 | First Financial Bankshares, Inc | 3,603 | ||||||||
| 8,330 | First Financial Corp | 377 | ||||||||
| 19,660 | First Foundation, Inc | 489 | ||||||||
| 71,845 | First Hawaiian, Inc | 1,964 | ||||||||
| 308,284 | First Horizon National Corp | 5,034 | ||||||||
| 4,089 | First Internet Bancorp | 192 | ||||||||
| 18,329 | First Interstate Bancsystem, Inc | 745 | ||||||||
| 29,933 | First Merchants Corp | 1,254 | ||||||||
| 7,120 | First Mid-Illinois Bancshares, Inc | 305 | ||||||||
| 63,811 | First Midwest Bancorp, Inc | 1,307 | ||||||||
| 15,462 | First of Long Island Corp | 334 | ||||||||
| 92,712 | First Republic Bank | 19,146 | ||||||||
| 17,270 | Flagstar Bancorp, Inc | 828 | ||||||||
| 20,105 | Flushing Financial Corp | 489 | ||||||||
| 181,165 | FNB Corp | 2,198 | ||||||||
| 84,379 | Fulton Financial Corp | 1,434 | ||||||||
| 14,703 | German American Bancorp, Inc | 573 | ||||||||
| 63,141 | Glacier Bancorp, Inc | 3,580 | ||||||||
| 7,809 | Great Southern Bancorp, Inc | 463 | ||||||||
| 30,231 | Great Western Bancorp, Inc | 1,027 | ||||||||
| 1,346 | Guaranty Bancshares, Inc | 51 | ||||||||
| 47,878 | Hancock Whitney Corp | 2,395 | ||||||||
| 23,963 | Hanmi Financial Corp | 567 | ||||||||
| 16,668 | HarborOne Northeast Bancorp, Inc | 247 | ||||||||
| 13,408 | Heartland Financial USA, Inc | 679 | ||||||||
| 25,661 | Heritage Commerce Corp | 306 | ||||||||
| 22,188 | Heritage Financial Corp | 542 | ||||||||
| 35,248 | Hilltop Holdings, Inc | 1,239 | ||||||||
| 997 | Hingham Institution for Savings | 419 | ||||||||
| 4,264 | Home Bancorp, Inc | 177 | ||||||||
| 81,882 | Home Bancshares, Inc | 1,994 | ||||||||
| 15,022 | HomeStreet, Inc | 781 | ||||||||
| 13,541 | HomeTrust Bancshares, Inc | 420 | ||||||||
| 64,875 | Hope Bancorp, Inc | 954 | ||||||||
| 23,268 | Horizon Bancorp | 485 | ||||||||
| 6,001 | * | Howard Bancorp, Inc | 131 | |||||||
| 768,669 | Huntington Bancshares, Inc | 11,853 | ||||||||
| 25,003 | Independent Bank Corp (MA) | 2,039 | ||||||||
| 17,558 | Independent Bank Corp (MI) | 419 | ||||||||
| 20,253 | Independent Bank Group, Inc | 1,461 | ||||||||
| 324 |
COLLEGE RETIREMENT EQUITIES FUND - Equity Index Account
| SHARES | COMPANY | VALUE (000) | ||||||||
| 29,344 | International Bancshares Corp | $ | 1,244 | |||||||
| 129,084 | Investors Bancorp, Inc | 1,956 | ||||||||
| 1,574,258 | JPMorgan Chase & Co | 249,284 | ||||||||
| 39,857 | Kearny Financial Corp | 528 | ||||||||
| 490,546 | Keycorp | 11,346 | ||||||||
| 32,502 | Lakeland Bancorp, Inc | 617 | ||||||||
| 13,317 | Lakeland Financial Corp | 1,067 | ||||||||
| 14,926 | Live Oak Bancshares, Inc | 1,303 | ||||||||
| 70,925 | M&T Bank Corp | 10,893 | ||||||||
| 19,210 | Macatawa Bank Corp | 169 | ||||||||
| 12,428 | Mercantile Bank Corp | 435 | ||||||||
| 5,375 | Merchants Bancorp | 254 | ||||||||
| 20,574 | Meta Financial Group, Inc | 1,227 | ||||||||
| 10,190 | Metrocity Bankshares, Inc | 281 | ||||||||
| 4,420 | * | Metropolitan Bank Holding Corp | 471 | |||||||
| 136,986 | MGIC Investment Corp | 1,975 | ||||||||
| 10,800 | Midland States Bancorp, Inc | 268 | ||||||||
| 7,821 | MidWestOne Financial Group, Inc | 253 | ||||||||
| 21,883 | * | Mr Cooper Group, Inc | 911 | |||||||
| 5,369 | MVB Financial Corp | 223 | ||||||||
| 19,324 | National Bank Holdings Corp | 849 | ||||||||
| 23,025 | NBT Bancorp, Inc | 887 | ||||||||
| 189,764 | New York Community Bancorp, Inc | 2,317 | ||||||||
| 6,480 | * | Nicolet Bankshares, Inc | 556 | |||||||
| 38,864 | * | NMI Holdings, Inc | 849 | |||||||
| 33,024 | Northfield Bancorp, Inc | 534 | ||||||||
| 5,019 | Northrim BanCorp, Inc | 218 | ||||||||
| 31,953 | Northwest Bancshares, Inc | 452 | ||||||||
| 30,487 | OceanFirst Financial Corp | 677 | ||||||||
| 33,903 | OFG Bancorp | 900 | ||||||||
| 60,802 | Old National Bancorp | 1,102 | ||||||||
| 21,667 | Old Second Bancorp, Inc | 273 | ||||||||
| 11,057 | Origin Bancorp, Inc | 475 | ||||||||
| 5,318 | Orrstown Financial Services, Inc | 134 | ||||||||
| 51,153 | Pacific Premier Bancorp, Inc | 2,048 | ||||||||
| 66,007 | PacWest Bancorp | 2,982 | ||||||||
| 7,855 | Park National Corp | 1,079 | ||||||||
| 13,465 | PCSB Financial Corp | 256 | ||||||||
| 11,582 | Peapack Gladstone Financial Corp | 410 | ||||||||
| 9,684 | PennyMac Financial Services, Inc | 676 | ||||||||
| 17,527 | Peoples Bancorp, Inc | 558 | ||||||||
| 5,712 | Peoples Financial Services Corp | 301 | ||||||||
| 233,553 | People’s United Financial, Inc | 4,162 | ||||||||
| 41,191 | Pinnacle Financial Partners, Inc | 3,934 | ||||||||
| 226,179 | PNC Financial Services Group, Inc | 45,353 | ||||||||
| 38,321 | Popular, Inc | 3,144 | ||||||||
| 8,859 | Preferred Bank | 636 | ||||||||
| 20,188 | Premier Financial Corp | 624 | ||||||||
| 8,140 | Primis Financial Corp | 122 | ||||||||
| 41,648 | Prosperity Bancshares, Inc | 3,011 | ||||||||
| 6,589 | Provident Bancorp Inc | 123 | ||||||||
| 41,409 | Provident Financial Services, Inc | 1,003 | ||||||||
| 8,729 | QCR Holdings, Inc | 489 | ||||||||
| 73,149 | Radian Group, Inc | 1,546 | ||||||||
| 325 |
COLLEGE RETIREMENT EQUITIES FUND - Equity Index Account
| SHARES | COMPANY | VALUE (000) | ||||||||
| 9,265 | RBB Bancorp | $ | 243 | |||||||
| 507,710 | Regions Financial Corp | 11,068 | ||||||||
| 4,712 | Reliant Bancorp Inc | 167 | ||||||||
| 30,881 | Renasant Corp | 1,172 | ||||||||
| 6,104 | Republic Bancorp, Inc (Class A) | 310 | ||||||||
| 34,776 | * | Republic First Bancorp, Inc | 129 | |||||||
| 74,318 | e | Rocket Cos, Inc | 1,040 | |||||||
| 25,676 | S&T Bancorp, Inc | 809 | ||||||||
| 22,606 | Sandy Spring Bancorp, Inc | 1,087 | ||||||||
| 28,631 | Seacoast Banking Corp of Florida | 1,013 | ||||||||
| 24,631 | ServisFirst Bancshares, Inc | 2,092 | ||||||||
| 8,919 | Sierra Bancorp | 242 | ||||||||
| 31,566 | Signature Bank | 10,211 | ||||||||
| 12,494 | * | Silvergate Capital Corp | 1,852 | |||||||
| 55,218 | Simmons First National Corp (Class A) | 1,633 | ||||||||
| 5,382 | SmartFinancial, Inc | 147 | ||||||||
| 38,679 | South State Corp | 3,099 | ||||||||
| 4,079 | * | Southern First Bancshares, Inc | 255 | |||||||
| 4,139 | Southern Missouri Bancorp, Inc | 216 | ||||||||
| 20,042 | Southside Bancshares, Inc | 838 | ||||||||
| 104,925 | Sterling Bancorp | 2,706 | ||||||||
| 11,262 | Stock Yards Bancorp, Inc | 719 | ||||||||
| 6,101 | Summit Financial Group, Inc | 167 | ||||||||
| 30,063 | * | SVB Financial Group | 20,390 | |||||||
| 85,330 | Synovus Financial Corp | 4,085 | ||||||||
| 27,678 | * | Texas Capital Bancshares, Inc | 1,668 | |||||||
| 34,383 | TFS Financial Corp | 614 | ||||||||
| 35,393 | * | The Bancorp, Inc | 896 | |||||||
| 7,797 | Tompkins Financial Corp | 652 | ||||||||
| 36,656 | Towne Bank | 1,158 | ||||||||
| 19,212 | Trico Bancshares | 825 | ||||||||
| 16,178 | * | Tristate Capital Holdings, Inc | 490 | |||||||
| 10,668 | * | Triumph Bancorp, Inc | 1,270 | |||||||
| 717,597 | Truist Financial Corp | 42,015 | ||||||||
| 14,208 | TrustCo Bank Corp NY | 473 | ||||||||
| 34,442 | Trustmark Corp | 1,118 | ||||||||
| 23,900 | UMB Financial Corp | 2,536 | ||||||||
| 117,477 | Umpqua Holdings Corp | 2,260 | ||||||||
| 68,198 | United Bankshares, Inc | 2,474 | ||||||||
| 43,715 | United Community Banks, Inc | 1,571 | ||||||||
| 19,117 | Univest Financial Corp | 572 | ||||||||
| 717,419 | US Bancorp | 40,297 | ||||||||
| 23,393 | e | UWM Holdings Corp | 138 | |||||||
| 218,557 | Valley National Bancorp | 3,005 | ||||||||
| 22,054 | Veritex Holdings, Inc | 877 | ||||||||
| 15,960 | Walker & Dunlop, Inc | 2,408 | ||||||||
| 39,374 | Washington Federal, Inc | 1,314 | ||||||||
| 10,818 | Washington Trust Bancorp, Inc | 610 | ||||||||
| 19,189 | Waterstone Financial, Inc | 419 | ||||||||
| 51,153 | Webster Financial Corp | 2,856 | ||||||||
| 2,139,804 | Wells Fargo & Co | 102,668 | ||||||||
| 35,637 | WesBanco, Inc | 1,247 | ||||||||
| 11,970 | West Bancorporation, Inc | 372 | ||||||||
| 14,217 | Westamerica Bancorporation | 821 | ||||||||
| 326 |
COLLEGE RETIREMENT EQUITIES FUND - Equity Index Account
| SHARES | COMPANY | VALUE (000) | ||||||||
| 55,378 | Western Alliance Bancorp | $ | 5,961 | |||||||
| 31,127 | Wintrust Financial Corp | 2,827 | ||||||||
| 25,658 | WSFS Financial Corp | 1,286 | ||||||||
| 90,905 | Zions Bancorporation | 5,742 | ||||||||
| TOTAL BANKS | 1,085,714 | |||||||||
| CAPITAL GOODS - 5.8% | ||||||||||
| 310,277 | 3M Co | 55,115 | ||||||||
| 72,697 | A.O. Smith Corp | 6,241 | ||||||||
| 21,498 | Aaon, Inc | 1,708 | ||||||||
| 23,226 | * | AAR Corp | 907 | |||||||
| 19,422 | Acuity Brands, Inc | 4,112 | ||||||||
| 31,531 | Advanced Drainage Systems, Inc | 4,292 | ||||||||
| 76,752 | * | Aecom Technology Corp | 5,937 | |||||||
| 39,078 | Aerojet Rocketdyne Holdings, Inc | 1,827 | ||||||||
| 12,268 | * | Aerovironment, Inc | 761 | |||||||
| 34,274 | AGCO Corp | 3,976 | ||||||||
| 56,080 | Air Lease Corp | 2,480 | ||||||||
| 5,427 | Alamo Group, Inc | 799 | ||||||||
| 16,794 | Albany International Corp (Class A) | 1,485 | ||||||||
| 49,318 | Allegion plc | 6,532 | ||||||||
| 6,739 | Allied Motion Technologies, Inc | 246 | ||||||||
| 39,511 | Allison Transmission Holdings, Inc | 1,436 | ||||||||
| 35,359 | Altra Industrial Motion Corp | 1,823 | ||||||||
| 13,776 | * | Ameresco, Inc | 1,122 | |||||||
| 15,290 | * | American Superconductor Corp | 166 | |||||||
| 10,171 | * | American Woodmark Corp | 663 | |||||||
| 122,153 | Ametek, Inc | 17,961 | ||||||||
| 98,441 | * | API Group Corp | 2,537 | |||||||
| 13,802 | Apogee Enterprises, Inc | 665 | ||||||||
| 21,181 | Applied Industrial Technologies, Inc | 2,175 | ||||||||
| 26,444 | Arcosa, Inc | 1,394 | ||||||||
| 10,471 | Argan, Inc | 405 | ||||||||
| 26,334 | Armstrong World Industries, Inc | 3,058 | ||||||||
| 69,116 | * | Array Technologies, Inc | 1,084 | |||||||
| 15,250 | Astec Industries, Inc | 1,056 | ||||||||
| 15,755 | * | Astronics Corp | 189 | |||||||
| 23,836 | * | Atkore International Group, Inc | 2,650 | |||||||
| 35,579 | * | Axon Enterprise, Inc | 5,586 | |||||||
| 60,195 | * | AZEK Co, Inc | 2,783 | |||||||
| 13,571 | AZZ, Inc | 750 | ||||||||
| 30,289 | * | Babcock & Wilcox Enterprises, Inc | 273 | |||||||
| 25,595 | Barnes Group, Inc | 1,193 | ||||||||
| 30,067 | * | Beacon Roofing Supply, Inc | 1,724 | |||||||
| 19,926 | *,e | Blink Charging Co | 528 | |||||||
| 75,992 | * | Bloom Energy Corp | 1,667 | |||||||
| 3,946 | * | Blue Bird Corp | 62 | |||||||
| 4,896 | * | BlueLinx Holdings, Inc | 469 | |||||||
| 288,542 | * | Boeing Co | 58,089 | |||||||
| 21,496 | Boise Cascade Co | 1,531 | ||||||||
| 95,274 | * | Builders FirstSource, Inc | 8,166 | |||||||
| 52,184 | BWX Technologies, Inc | 2,499 | ||||||||
| 14,163 | Caesarstone Sdot-Yam Ltd | 161 | ||||||||
| 25,553 | Carlisle Cos, Inc | 6,340 | ||||||||
| 327 |
COLLEGE RETIREMENT EQUITIES FUND - Equity Index Account
| SHARES | COMPANY | VALUE (000) | ||||||||
| 459,824 | Carrier Global Corp | $ | 24,941 | |||||||
| 290,870 | Caterpillar, Inc | 60,134 | ||||||||
| 120,169 | *,e | ChargePoint Holdings, Inc | 2,289 | |||||||
| 19,930 | * | Chart Industries, Inc | 3,179 | |||||||
| 12,045 | * | CIRCOR International, Inc | 327 | |||||||
| 64,286 | * | Colfax Corp | 2,955 | |||||||
| 14,727 | Columbus McKinnon Corp | 681 | ||||||||
| 19,457 | Comfort Systems USA, Inc | 1,925 | ||||||||
| 11,212 | * | Construction Partners Inc | 330 | |||||||
| 18,969 | * | Core & Main, Inc | 576 | |||||||
| 29,151 | * | Cornerstone Building Brands, Inc | 508 | |||||||
| 27,810 | Crane Co | 2,829 | ||||||||
| 7,468 | CSW Industrials, Inc | 903 | ||||||||
| 76,393 | Cummins, Inc | 16,664 | ||||||||
| 22,308 | Curtiss-Wright Corp | 3,093 | ||||||||
| 149,043 | Deere & Co | 51,105 | ||||||||
| 62,846 | *,e | Desktop Metal, Inc | 311 | |||||||
| 63,656 | Donaldson Co, Inc | 3,772 | ||||||||
| 16,771 | Douglas Dynamics, Inc | 655 | ||||||||
| 75,978 | Dover Corp | 13,798 | ||||||||
| 8,048 | * | Ducommun, Inc | 376 | |||||||
| 11,117 | * | DXP Enterprises, Inc | 285 | |||||||
| 16,954 | * | Dycom Industries, Inc | 1,590 | |||||||
| 211,074 | Eaton Corp | 36,478 | ||||||||
| 28,208 | EMCOR Group, Inc | 3,593 | ||||||||
| 323,910 | Emerson Electric Co | 30,114 | ||||||||
| 10,981 | Encore Wire Corp | 1,571 | ||||||||
| 24,905 | * | Energy Recovery, Inc | 535 | |||||||
| 32,971 | Enerpac Tool Group Corp | 669 | ||||||||
| 25,301 | EnerSys | 2,000 | ||||||||
| 11,263 | EnPro Industries, Inc | 1,240 | ||||||||
| 23,158 | *,e | Eos Energy Enterprises, Inc | 174 | |||||||
| 13,003 | ESCO Technologies, Inc | 1,170 | ||||||||
| 2,576 | *,e | EVI Industries, Inc | 80 | |||||||
| 63,155 | * | Evoqua Water Technologies Corp | 2,953 | |||||||
| 306,228 | Fastenal Co | 19,617 | ||||||||
| 32,884 | Federal Signal Corp | 1,425 | ||||||||
| 71,435 | Flowserve Corp | 2,186 | ||||||||
| 77,505 | * | Fluor Corp | 1,920 | |||||||
| 174,063 | Fortive Corp | 13,279 | ||||||||
| 75,096 | Fortune Brands Home & Security, Inc | 8,028 | ||||||||
| 25,145 | Franklin Electric Co, Inc | 2,378 | ||||||||
| 176,294 | *,e | FuelCell Energy, Inc | 917 | |||||||
| 30,738 | * | Gates Industrial Corp plc | 489 | |||||||
| 19,270 | GATX Corp | 2,008 | ||||||||
| 33,699 | * | Generac Holdings, Inc | 11,859 | |||||||
| 131,218 | General Dynamics Corp | 27,355 | ||||||||
| 588,679 | General Electric Co | 55,613 | ||||||||
| 17,907 | * | Gibraltar Industries, Inc | 1,194 | |||||||
| 9,938 | Global Industrial Co | 406 | ||||||||
| 23,326 | * | GMS, Inc | 1,402 | |||||||
| 12,385 | e | Gorman-Rupp Co | 552 | |||||||
| 85,810 | Graco, Inc | 6,918 | ||||||||
| 95,580 | GrafTech International Ltd | 1,131 | ||||||||
| 328 |
COLLEGE RETIREMENT EQUITIES FUND - Equity Index Account
| SHARES | COMPANY | VALUE (000) | ||||||||
| 24,972 | Granite Construction, Inc | $ | 966 | |||||||
| 44,924 | * | Great Lakes Dredge & Dock Corp | 706 | |||||||
| 19,838 | Greenbrier Cos, Inc | 910 | ||||||||
| 20,793 | Griffon Corp | 592 | ||||||||
| 17,554 | H&E Equipment Services, Inc | 777 | ||||||||
| 24,611 | HEICO Corp | 3,549 | ||||||||
| 43,210 | HEICO Corp (Class A) | 5,553 | ||||||||
| 16,194 | Helios Technologies, Inc | 1,703 | ||||||||
| 13,619 | Herc Holdings, Inc | 2,132 | ||||||||
| 48,986 | * | Hexcel Corp | 2,538 | |||||||
| 41,016 | Hillenbrand, Inc | 2,132 | ||||||||
| 372,087 | Honeywell International, Inc | 77,584 | ||||||||
| 215,275 | Howmet Aerospace, Inc | 6,852 | ||||||||
| 30,217 | Hubbell, Inc | 6,293 | ||||||||
| 17,907 | Huntington Ingalls | 3,344 | ||||||||
| 20,974 | * | Hydrofarm Holdings Group, Inc | 593 | |||||||
| 63,978 | *,e | Hyliion Holdings Corp | 397 | |||||||
| 7,224 | Hyster-Yale Materials Handling, Inc | 297 | ||||||||
| 223,148 | *,e | Ideanomics Inc | 268 | |||||||
| 39,537 | IDEX Corp | 9,343 | ||||||||
| 5,334 | * | IES Holdings, Inc | 270 | |||||||
| 167,345 | Illinois Tool Works, Inc | 41,301 | ||||||||
| 219,998 | Ingersoll Rand, Inc | 13,611 | ||||||||
| 13,472 | Insteel Industries, Inc | 536 | ||||||||
| 46,862 | ITT, Inc | 4,789 | ||||||||
| 45,832 | * | JELD-WEN Holding, Inc | 1,208 | |||||||
| 16,888 | John Bean Technologies Corp | 2,593 | ||||||||
| 380,121 | Johnson Controls International plc | 30,908 | ||||||||
| 5,348 | Kadant, Inc | 1,233 | ||||||||
| 15,070 | Kaman Corp | 650 | ||||||||
| 45,625 | Kennametal, Inc | 1,638 | ||||||||
| 66,946 | * | Kratos Defense & Security Solutions, Inc | 1,299 | |||||||
| 104,833 | L3Harris Technologies, Inc | 22,355 | ||||||||
| 4,456 | * | Lawson Products, Inc | 244 | |||||||
| 18,711 | Lennox International, Inc | 6,069 | ||||||||
| 28,514 | Lincoln Electric Holdings, Inc | 3,977 | ||||||||
| 5,950 | Lindsay Corp | 904 | ||||||||
| 132,233 | Lockheed Martin Corp | 46,997 | ||||||||
| 17,575 | Luxfer Holdings plc | 339 | ||||||||
| 22,630 | * | Manitowoc Co, Inc | 421 | |||||||
| 126,078 | Masco Corp | 8,853 | ||||||||
| 13,395 | * | Masonite International Corp | 1,580 | |||||||
| 31,664 | * | Mastec, Inc | 2,922 | |||||||
| 19,934 | * | Matrix Service Co | 150 | |||||||
| 38,365 | Maxar Technologies, Inc | 1,133 | ||||||||
| 13,177 | McGrath RentCorp | 1,058 | ||||||||
| 30,340 | * | Mercury Systems, Inc | 1,671 | |||||||
| 34,734 | * | Meritor, Inc | 861 | |||||||
| 30,281 | * | Middleby Corp | 5,958 | |||||||
| 7,280 | Miller Industries, Inc | 243 | ||||||||
| 15,909 | Moog, Inc (Class A) | 1,288 | ||||||||
| 43,932 | * | MRC Global, Inc | 302 | |||||||
| 25,456 | MSC Industrial Direct Co (Class A) | 2,140 | ||||||||
| 21,110 | Mueller Industries, Inc | 1,253 | ||||||||
| 329 |
COLLEGE RETIREMENT EQUITIES FUND - Equity Index Account
| SHARES | COMPANY | VALUE (000) | ||||||||
| 85,916 | Mueller Water Products, Inc (Class A) | $ | 1,237 | |||||||
| 10,993 | * | MYR Group, Inc | 1,215 | |||||||
| 3,534 | National Presto Industries, Inc | 290 | ||||||||
| 109,431 | *,e | Nikola Corp | 1,080 | |||||||
| 19,066 | * | NN, Inc | 78 | |||||||
| 30,222 | Nordson Corp | 7,715 | ||||||||
| 78,907 | Northrop Grumman Corp | 30,543 | ||||||||
| 6,891 | * | Northwest Pipe Co | 219 | |||||||
| 78,206 | * | NOW, Inc | 668 | |||||||
| 5,211 | * | NV5 Global Inc | 720 | |||||||
| 87,536 | nVent Electric plc | 3,326 | ||||||||
| 2,354 | e | Omega Flex, Inc | 299 | |||||||
| 38,204 | Oshkosh Corp | 4,306 | ||||||||
| 230,670 | Otis Worldwide Corp | 20,084 | ||||||||
| 52,288 | Owens Corning, Inc | 4,732 | ||||||||
| 182,332 | PACCAR, Inc | 16,093 | ||||||||
| 35,158 | * | PAE, Inc | 349 | |||||||
| 14,228 | Park Aerospace Corp | 188 | ||||||||
| 68,108 | Parker-Hannifin Corp | 21,667 | ||||||||
| 6,136 | Park-Ohio Holdings Corp | 130 | ||||||||
| 12,058 | * | Parsons Corp | 406 | |||||||
| 88,369 | Pentair plc | 6,454 | ||||||||
| 36,380 | * | PGT Innovations, Inc | 818 | |||||||
| 274,975 | * | Plug Power, Inc | 7,763 | |||||||
| 7,077 | Powell Industries, Inc | 209 | ||||||||
| 1,801 | Preformed Line Products Co | 117 | ||||||||
| 28,783 | Primoris Services Corp | 690 | ||||||||
| 15,505 | * | Proto Labs, Inc | 796 | |||||||
| 25,291 | Quanex Building Products Corp | 627 | ||||||||
| 75,730 | Quanta Services, Inc | 8,683 | ||||||||
| 798,644 | Raytheon Technologies Corp | 68,731 | ||||||||
| 13,498 | * | RBC Bearings, Inc | 2,726 | |||||||
| 36,333 | Regal-Beloit Corp | 6,183 | ||||||||
| 82,950 | * | Resideo Technologies, Inc | 2,159 | |||||||
| 8,757 | REV Group, Inc | 124 | ||||||||
| 61,336 | Rockwell Automation, Inc | 21,397 | ||||||||
| 67,835 | *,e | Romeo Power, Inc | 248 | |||||||
| 55,116 | Roper Technologies Inc | 27,109 | ||||||||
| 22,440 | Rush Enterprises, Inc (Class A) | 1,249 | ||||||||
| 6,895 | Rush Enterprises, Inc (Class B) | 372 | ||||||||
| 88,808 | * | Sensata Technologies Holding plc | 5,479 | |||||||
| 50,036 | * | Shoals Technologies Group, Inc | 1,216 | |||||||
| 18,886 | Shyft Group, Inc | 928 | ||||||||
| 23,778 | Simpson Manufacturing Co, Inc | 3,307 | ||||||||
| 24,415 | * | SiteOne Landscape Supply, Inc | 5,915 | |||||||
| 28,698 | Snap-On, Inc | 6,181 | ||||||||
| 59,911 | Spirit Aerosystems Holdings, Inc (Class A) | 2,582 | ||||||||
| 23,935 | * | SPX Corp | 1,428 | |||||||
| 23,001 | SPX FLOW, Inc | 1,989 | ||||||||
| 8,333 | Standex International Corp | 922 | ||||||||
| 86,148 | Stanley Black & Decker, Inc | 16,249 | ||||||||
| 34,176 | *,e | Stem, Inc | 648 | |||||||
| 18,886 | * | Sterling Construction Co, Inc | 497 | |||||||
| 109,516 | * | Sunrun, Inc | 3,756 | |||||||
| 330 |
COLLEGE RETIREMENT EQUITIES FUND - Equity Index Account
| SHARES | COMPANY | VALUE (000) | ||||||||
| 10,075 | Tennant Co | $ | 817 | |||||||
| 35,787 | Terex Corp | 1,573 | ||||||||
| 26,155 | Textainer Group Holdings Ltd | 934 | ||||||||
| 117,431 | Textron, Inc | 9,066 | ||||||||
| 24,419 | * | Thermon Group Holdings | 413 | |||||||
| 35,263 | Timken Co | 2,443 | ||||||||
| 27,553 | * | Titan International, Inc | 302 | |||||||
| 11,613 | * | Titan Machinery, Inc | 391 | |||||||
| 54,608 | Toro Co | 5,456 | ||||||||
| 19,490 | * | TPI Composites, Inc | 292 | |||||||
| 126,114 | Trane Technologies plc | 25,479 | ||||||||
| 3,856 | * | Transcat Inc | 356 | |||||||
| 28,405 | * | TransDigm Group, Inc | 18,074 | |||||||
| 63,333 | * | Trex Co, Inc | 8,552 | |||||||
| 47,350 | Trinity Industries, Inc | 1,430 | ||||||||
| 28,650 | Triton International Ltd | 1,726 | ||||||||
| 32,779 | * | Triumph Group, Inc | 607 | |||||||
| 27,269 | * | Tutor Perini Corp | 337 | |||||||
| 31,994 | UFP Industries, Inc | 2,944 | ||||||||
| 38,527 | * | United Rentals, Inc | 12,802 | |||||||
| 91,890 | * | Univar Solutions Inc | 2,605 | |||||||
| 10,628 | Valmont Industries, Inc | 2,662 | ||||||||
| 7,860 | * | Vectrus, Inc | 360 | |||||||
| 7,828 | * | Veritiv Corp | 960 | |||||||
| 154,466 | Vertiv Holdings Co | 3,857 | ||||||||
| 12,845 | * | Vicor Corp | 1,631 | |||||||
| 46,216 | *,e | View, Inc | 181 | |||||||
| 96,965 | * | Virgin Galactic Holdings, Inc | 1,297 | |||||||
| 24,542 | W.W. Grainger, Inc | 12,719 | ||||||||
| 28,077 | Wabash National Corp | 548 | ||||||||
| 17,942 | Watsco, Inc | 5,614 | ||||||||
| 12,667 | Watts Water Technologies, Inc (Class A) | 2,460 | ||||||||
| 50,259 | * | Welbilt, Inc | 1,195 | |||||||
| 24,302 | * | WESCO International, Inc | 3,198 | |||||||
| 94,532 | Westinghouse Air Brake Technologies Corp | 8,707 | ||||||||
| 3,392 | * | Willis Lease Finance Corp | 128 | |||||||
| 98,203 | * | WillScot Mobile Mini Holdings Corp | 4,011 | |||||||
| 30,482 | Woodward Inc | 3,337 | ||||||||
| 95,020 | Xylem, Inc | 11,395 | ||||||||
| 65,462 | Zurn Water Solutions Corp | 2,383 | ||||||||
| TOTAL CAPITAL GOODS | 1,482,525 | |||||||||
| COMMERCIAL & PROFESSIONAL SERVICES - 1.2% | ||||||||||
| 40,285 | ABM Industries, Inc | 1,646 | ||||||||
| 37,820 | * | Acacia Research (Acacia Technologies) | 194 | |||||||
| 5,587 | ACCO Brands Corp | 46 | ||||||||
| 86,801 | ADT, Inc | 730 | ||||||||
| 27,574 | * | ASGN Inc | 3,403 | |||||||
| 5,145 | Barrett Business Services, Inc | 355 | ||||||||
| 73,456 | Booz Allen Hamilton Holding Co | 6,228 | ||||||||
| 22,496 | Brady Corp (Class A) | 1,213 | ||||||||
| 16,522 | * | BrightView Holdings, Inc | 233 | |||||||
| 26,557 | e | Brink’s Co | 1,741 | |||||||
| 12,641 | * | CACI International, Inc (Class A) | 3,403 | |||||||
| 331 |
COLLEGE RETIREMENT EQUITIES FUND - Equity Index Account
| SHARES | COMPANY | VALUE (000) | ||||||||
| 26,846 | * | Casella Waste Systems, Inc (Class A) | $ | 2,293 | ||||||
| 27,294 | * | CBIZ, Inc | 1,068 | |||||||
| 18,496 | * | Ceco Environmental Corp | 115 | |||||||
| 8,021 | * | Cimpress plc | 574 | |||||||
| 45,866 | Cintas Corp | 20,326 | ||||||||
| 226,376 | * | Clarivate Analytics plc | 5,324 | |||||||
| 27,814 | * | Clean Harbors, Inc | 2,775 | |||||||
| 111,447 | * | Copart, Inc | 16,898 | |||||||
| 49,610 | * | CoreCivic, Inc | 495 | |||||||
| 209,279 | * | CoStar Group, Inc | 16,539 | |||||||
| 3,881 | CRA International, Inc | 362 | ||||||||
| 22,984 | Deluxe Corp | 738 | ||||||||
| 20,676 | * | Driven Brands Holdings, Inc | 695 | |||||||
| 87,944 | * | Dun & Bradstreet Holdings, Inc | 1,802 | |||||||
| 20,052 | Ennis, Inc | 392 | ||||||||
| 64,659 | Equifax, Inc | 18,932 | ||||||||
| 28,338 | Exponent, Inc | 3,308 | ||||||||
| 15,944 | * | First Advantage Corp | 304 | |||||||
| 7,582 | * | Forrester Research, Inc | 445 | |||||||
| 7,620 | * | Franklin Covey Co | 353 | |||||||
| 18,215 | * | FTI Consulting, Inc | 2,795 | |||||||
| 42,732 | * | Harsco Corp | 714 | |||||||
| 40,910 | Healthcare Services Group | 728 | ||||||||
| 14,300 | Heidrick & Struggles International, Inc | 625 | ||||||||
| 8,893 | * | Heritage-Crystal Clean, Inc | 285 | |||||||
| 37,280 | Herman Miller, Inc | 1,461 | ||||||||
| 23,758 | HNI Corp | 999 | ||||||||
| 15,850 | * | Huron Consulting Group, Inc | 791 | |||||||
| 74,086 | * | IAA, Inc | 3,750 | |||||||
| 10,095 | ICF International, Inc | 1,035 | ||||||||
| 197,078 | IHS Markit Ltd | 26,196 | ||||||||
| 19,828 | Insperity, Inc | 2,342 | ||||||||
| 44,581 | Interface, Inc | 711 | ||||||||
| 67,582 | Jacobs Engineering Group, Inc | 9,409 | ||||||||
| 67,918 | * | KAR Auction Services, Inc | 1,061 | |||||||
| 77,169 | KBR, Inc | 3,675 | ||||||||
| 20,372 | Kelly Services, Inc (Class A) | 342 | ||||||||
| 11,207 | Kforce, Inc | 843 | ||||||||
| 25,171 | Kimball International, Inc (Class B) | 258 | ||||||||
| 29,134 | Korn/Ferry International | 2,206 | ||||||||
| 10,217 | *,e | Legalzoom.com, Inc | 164 | |||||||
| 77,553 | Leidos Holdings, Inc | 6,895 | ||||||||
| 31,415 | Manpower, Inc | 3,058 | ||||||||
| 14,965 | Mantech International Corp (Class A) | 1,091 | ||||||||
| 16,885 | Matthews International Corp (Class A) | 619 | ||||||||
| 13,300 | * | Mistras Group, Inc | 99 | |||||||
| 12,017 | * | Montrose Environmental Group, Inc | 847 | |||||||
| 19,573 | MSA Safety, Inc | 2,955 | ||||||||
| 196,358 | Nielsen NV | 4,027 | ||||||||
| 4,961 | NL Industries, Inc | 37 | ||||||||
| 95,984 | Pitney Bowes, Inc | 636 | ||||||||
| 111,211 | Republic Services, Inc | 15,508 | ||||||||
| 20,546 | Resources Connection, Inc | 367 | ||||||||
| 57,365 | Robert Half International, Inc | 6,397 | ||||||||
| 332 |
COLLEGE RETIREMENT EQUITIES FUND - Equity Index Account
| SHARES | COMPANY | VALUE (000) | ||||||||
| 127,813 | Rollins, Inc | $ | 4,373 | |||||||
| 38,672 | * | RR Donnelley & Sons Co | 436 | |||||||
| 32,160 | Science Applications International Corp | 2,688 | ||||||||
| 12,140 | * | SP Plus Corp | 343 | |||||||
| 61,807 | Steelcase, Inc (Class A) | 724 | ||||||||
| 49,051 | * | Stericycle, Inc | 2,925 | |||||||
| 29,513 | Tetra Tech, Inc | 5,011 | ||||||||
| 100,803 | TransUnion | 11,953 | ||||||||
| 22,121 | * | TriNet Group, Inc | 2,107 | |||||||
| 19,072 | * | TrueBlue, Inc | 528 | |||||||
| 8,983 | Unifirst Corp | 1,890 | ||||||||
| 63,645 | * | Upwork, Inc | 2,174 | |||||||
| 16,280 | * | US Ecology, Inc | 520 | |||||||
| 84,768 | Verisk Analytics, Inc | 19,389 | ||||||||
| 15,178 | * | Viad Corp | 650 | |||||||
| 5,586 | VSE Corp | 340 | ||||||||
| 223,885 | Waste Management, Inc | 37,366 | ||||||||
| 5,398 | * | Willdan Group, Inc | 190 | |||||||
| TOTAL COMMERCIAL & PROFESSIONAL SERVICES | 309,463 | |||||||||
| CONSUMER DURABLES & APPAREL - 1.4% | ||||||||||
| 15,286 | Acushnet Holdings Corp | 811 | ||||||||
| 9,880 | * | American Outdoor Brands, Inc | 197 | |||||||
| 35,953 | *,e | AMMO, Inc | 196 | |||||||
| 21,459 | * | Beazer Homes USA, Inc | 498 | |||||||
| 38,863 | Brunswick Corp | 3,915 | ||||||||
| 63,158 | * | Callaway Golf Co | 1,733 | |||||||
| 80,799 | * | Capri Holdings Ltd | 5,245 | |||||||
| 23,650 | Carter’s, Inc | 2,394 | ||||||||
| 5,040 | * | Cavco Industries, Inc | 1,601 | |||||||
| 13,611 | Century Communities, Inc | 1,113 | ||||||||
| 14,289 | Clarus Corp | 396 | ||||||||
| 21,656 | Columbia Sportswear Co | 2,110 | ||||||||
| 31,668 | * | Crocs, Inc | 4,060 | |||||||
| 14,122 | * | Deckers Outdoor Corp | 5,173 | |||||||
| 174,121 | DR Horton, Inc | 18,883 | ||||||||
| 7,865 | Escalade, Inc | 124 | ||||||||
| 18,783 | Ethan Allen Interiors, Inc | 494 | ||||||||
| 31,215 | * | Fossil Group, Inc | 321 | |||||||
| 79,850 | Garmin Ltd | 10,873 | ||||||||
| 154,338 | *,e | Genius Brands International, Inc | 162 | |||||||
| 24,084 | * | G-III Apparel Group Ltd | 666 | |||||||
| 74,136 | * | GoPro, Inc | 764 | |||||||
| 16,535 | * | Green Brick Partners, Inc | 502 | |||||||
| 6,360 | e | Hamilton Beach Brands Holding Co | 91 | |||||||
| 156,073 | Hanesbrands, Inc | 2,610 | ||||||||
| 67,084 | Hasbro, Inc | 6,828 | ||||||||
| 21,061 | *,e | Hayward Holdings, Inc | 552 | |||||||
| 13,347 | * | Helen of Troy Ltd | 3,263 | |||||||
| 7,913 | Hooker Furniture Corp | 184 | ||||||||
| 2,792 | * | Hovnanian Enterprises, Inc | 355 | |||||||
| 13,822 | Installed Building Products, Inc | 1,931 | ||||||||
| 15,263 | * | iRobot Corp | 1,006 | |||||||
| 3,583 | Johnson Outdoors, Inc | 336 | ||||||||
| 333 |
COLLEGE RETIREMENT EQUITIES FUND - Equity Index Account
| SHARES | COMPANY | VALUE (000) | ||||||||
| 36,885 | KB Home | $ | 1,650 | |||||||
| 30,075 | Kontoor Brands, Inc | 1,541 | ||||||||
| 12,660 | *,e | Latham Group, Inc | 317 | |||||||
| 25,091 | La-Z-Boy, Inc | 911 | ||||||||
| 73,033 | Leggett & Platt, Inc | 3,006 | ||||||||
| 149,149 | Lennar Corp (Class A) | 17,325 | ||||||||
| 2,824 | Lennar Corp (Class B) | 270 | ||||||||
| 12,635 | * | LGI Homes, Inc | 1,952 | |||||||
| 7,210 | Lifetime Brands, Inc | 115 | ||||||||
| 5,568 | * | Lovesac Co | 369 | |||||||
| 60,026 | * | Lululemon Athletica, Inc | 23,497 | |||||||
| 15,593 | * | M/I Homes, Inc | 970 | |||||||
| 13,092 | * | Malibu Boats, Inc | 900 | |||||||
| 8,407 | Marine Products Corp | 105 | ||||||||
| 13,690 | * | MasterCraft Boat Holdings, Inc | 388 | |||||||
| 167,123 | * | Mattel, Inc | 3,603 | |||||||
| 23,210 | MDC Holdings, Inc | 1,296 | ||||||||
| 17,632 | * | Meritage Homes Corp | 2,152 | |||||||
| 28,443 | * | Mohawk Industries, Inc | 5,182 | |||||||
| 11,320 | Movado Group, Inc | 474 | ||||||||
| 17,631 | *,e | Nautilus, Inc | 108 | |||||||
| 207,669 | Newell Brands Inc | 4,535 | ||||||||
| 664,586 | Nike, Inc (Class B) | 110,767 | ||||||||
| 1,755 | * | NVR, Inc | 10,370 | |||||||
| 8,770 | Oxford Industries, Inc | 890 | ||||||||
| 145,284 | * | Peloton Interactive, Inc | 5,195 | |||||||
| 5,912 | *,e | PLBY Group, Inc | 158 | |||||||
| 32,179 | Polaris Inc | 3,537 | ||||||||
| 134,770 | Pulte Homes, Inc | 7,703 | ||||||||
| 27,406 | * | Purple Innovation, Inc | 364 | |||||||
| 40,092 | PVH Corp | 4,276 | ||||||||
| 25,991 | Ralph Lauren Corp | 3,089 | ||||||||
| 3,738 | Rocky Brands, Inc | 149 | ||||||||
| 72,360 | * | Skechers U.S.A., Inc (Class A) | 3,140 | |||||||
| 28,672 | * | Skyline Champion Corp | 2,265 | |||||||
| 29,016 | Smith & Wesson Brands, Inc | 516 | ||||||||
| 67,337 | * | Sonos, Inc | 2,007 | |||||||
| 44,766 | Steven Madden Ltd | 2,080 | ||||||||
| 9,374 | Sturm Ruger & Co, Inc | 638 | ||||||||
| 5,163 | Superior Uniform Group, Inc | 113 | ||||||||
| 153,327 | Tapestry, Inc | 6,225 | ||||||||
| 52,524 | * | Taylor Morrison Home Corp | 1,836 | |||||||
| 99,972 | Tempur Sealy International, Inc | 4,702 | ||||||||
| 61,714 | Toll Brothers, Inc | 4,467 | ||||||||
| 18,124 | * | TopBuild Corp | 5,001 | |||||||
| 12,158 | * | Traeger, Inc | 148 | |||||||
| 47,835 | * | TRI Pointe Homes, Inc | 1,334 | |||||||
| 28,980 | * | Tupperware Brands Corp | 443 | |||||||
| 110,698 | * | Under Armour, Inc (Class A) | 2,346 | |||||||
| 110,542 | * | Under Armour, Inc (Class C) | 1,994 | |||||||
| 10,905 | * | Unifi, Inc | 252 | |||||||
| 10,485 | * | Universal Electronics, Inc | 427 | |||||||
| 16,444 | * | Vera Bradley, Inc | 140 | |||||||
| 177,722 | VF Corp | 13,013 | ||||||||
| 334 |
COLLEGE RETIREMENT EQUITIES FUND - Equity Index Account
| SHARES | COMPANY | VALUE (000) | ||||||||
| 29,556 | * | Vista Outdoor, Inc | $ | 1,362 | ||||||
| 11,097 | * | VOXX International Corp (Class A) | 113 | |||||||
| 32,024 | *,e | Vuzix Corp | 278 | |||||||
| 31,427 | Whirlpool Corp | 7,375 | ||||||||
| 48,726 | Wolverine World Wide, Inc | 1,404 | ||||||||
| 46,993 | * | YETI Holdings, Inc | 3,892 | |||||||
| TOTAL CONSUMER DURABLES & APPAREL | 364,062 | |||||||||
| CONSUMER SERVICES - 2.2% | ||||||||||
| 36,774 | * | 2U, Inc | 738 | |||||||
| 25,118 | * | Accel Entertainment, Inc | 327 | |||||||
| 29,568 | * | Adtalem Global Education, Inc | 874 | |||||||
| 12,233 | * | American Public Education, Inc | 272 | |||||||
| 125,887 | ARAMARK Holdings Corp | 4,639 | ||||||||
| 17,816 | * | Bally’s Corp | 678 | |||||||
| 769 | * | Biglari Holdings, Inc (B Shares) | 110 | |||||||
| 15,173 | * | BJ’s Restaurants, Inc | 524 | |||||||
| 44,145 | * | Bloomin’ Brands, Inc | 926 | |||||||
| 8,897 | * | Bluegreen Vacations Holding Corp | 312 | |||||||
| 22,027 | * | Booking Holdings, Inc | 52,848 | |||||||
| 43,510 | * | Boyd Gaming Corp | 2,853 | |||||||
| 33,375 | * | Bright Horizons Family Solutions | 4,201 | |||||||
| 25,489 | * | Brinker International, Inc | 933 | |||||||
| 109,557 | * | Caesars Entertainment, Inc | 10,247 | |||||||
| 468,051 | *,e | Carnival Corp | 9,417 | |||||||
| 11,838 | Carriage Services, Inc | 763 | ||||||||
| 27,792 | Carrols Restaurant Group, Inc | 82 | ||||||||
| 16,727 | * | Century Casinos, Inc | 204 | |||||||
| 23,639 | * | Cheesecake Factory | 925 | |||||||
| 76,982 | * | Chegg, Inc | 2,363 | |||||||
| 14,793 | * | Chipotle Mexican Grill, Inc (Class A) | 25,862 | |||||||
| 19,126 | Choice Hotels International, Inc | 2,983 | ||||||||
| 20,586 | Churchill Downs, Inc | 4,959 | ||||||||
| 12,474 | * | Chuy’s Holdings, Inc | 376 | |||||||
| 31,100 | * | Coursera, Inc | 760 | |||||||
| 12,944 | Cracker Barrel Old Country Store, Inc | 1,665 | ||||||||
| 71,457 | Darden Restaurants, Inc | 10,764 | ||||||||
| 23,587 | * | Dave & Buster’s Entertainment, Inc | 906 | |||||||
| 23,487 | Del Taco Restaurants, Inc | 292 | ||||||||
| 41,277 | * | Denny’s Corp | 660 | |||||||
| 8,713 | Dine Brands Global Inc. | 661 | ||||||||
| 18,765 | Domino’s Pizza, Inc | 10,590 | ||||||||
| 166,848 | *,e | DraftKings, Inc | 4,583 | |||||||
| 14,501 | * | El Pollo Loco Holdings, Inc | 206 | |||||||
| 45,885 | * | Everi Holdings, Inc | 980 | |||||||
| 78,395 | * | Expedia Group, Inc | 14,168 | |||||||
| 20,469 | * | Fiesta Restaurant Group, Inc | 225 | |||||||
| 45,952 | * | frontdoor, Inc | 1,684 | |||||||
| 13,690 | * | GAN Ltd | 126 | |||||||
| 7,389 | * | Golden Entertainment, Inc | 373 | |||||||
| 17,420 | * | Golden Nugget Online Gaming, Inc | 173 | |||||||
| 2,114 | Graham Holdings Co | 1,331 | ||||||||
| 20,931 | * | Grand Canyon Education, Inc | 1,794 | |||||||
| 70,397 | H&R Block, Inc | 1,659 | ||||||||
| 335 |
COLLEGE RETIREMENT EQUITIES FUND - Equity Index Account
| SHARES | COMPANY | VALUE (000) | ||||||||
| 49,665 | * | Hilton Grand Vacations, Inc | $ | 2,588 | ||||||
| 147,072 | * | Hilton Worldwide Holdings, Inc | 22,942 | |||||||
| 76,812 | * | Houghton Mifflin Harcourt Co | 1,237 | |||||||
| 24,452 | * | Hyatt Hotels Corp | 2,345 | |||||||
| 54,564 | International Game Technology plc | 1,577 | ||||||||
| 12,544 | Jack in the Box, Inc | 1,097 | ||||||||
| 181,736 | * | Las Vegas Sands Corp | 6,841 | |||||||
| 62,559 | Laureate Education, Inc | 766 | ||||||||
| 20,784 | * | Life Time Group Holdings, Inc | 358 | |||||||
| 10,890 | * | Lindblad Expeditions Holdings, Inc | 170 | |||||||
| 144,772 | * | Marriott International, Inc (Class A) | 23,922 | |||||||
| 22,871 | Marriott Vacations Worldwide Corp | 3,865 | ||||||||
| 400,133 | McDonald’s Corp | 107,264 | ||||||||
| 212,155 | MGM Resorts International | 9,522 | ||||||||
| 22,276 | * | Mister Car Wash, Inc | 406 | |||||||
| 7,140 | * | Monarch Casino & Resort, Inc | 528 | |||||||
| 2,378 | Nathan’s Famous, Inc | 139 | ||||||||
| 3,043 | * | NEOGAMES S.A. | 85 | |||||||
| 8,091 | * | Noodles & Co | 73 | |||||||
| 204,209 | *,e | Norwegian Cruise Line Holdings Ltd | 4,235 | |||||||
| 29,338 | * | OneSpaWorld Holdings Ltd | 294 | |||||||
| 18,811 | Papa John’s International, Inc | 2,511 | ||||||||
| 85,767 | * | Penn National Gaming, Inc | 4,447 | |||||||
| 46,334 | * | Perdoceo Education Corp | 545 | |||||||
| 45,756 | * | Planet Fitness, Inc | 4,145 | |||||||
| 10,854 | * | PlayAGS, Inc | 74 | |||||||
| 12,559 | * | Portillo’s, Inc | 471 | |||||||
| 23,203 | * | PowerSchool Holdings, Inc | 382 | |||||||
| 6,547 | RCI Hospitality Holdings, Inc | 510 | ||||||||
| 9,211 | * | Red Robin Gourmet Burgers, Inc | 152 | |||||||
| 37,399 | Red Rock Resorts, Inc | 2,057 | ||||||||
| 120,421 | * | Royal Caribbean Cruises Ltd | 9,260 | |||||||
| 28,549 | * | Rush Street Interactive, Inc | 471 | |||||||
| 21,790 | * | Ruth’s Hospitality Group Inc | 434 | |||||||
| 52,481 | * | Scientific Games Corp (Class A) | 3,507 | |||||||
| 30,308 | * | SeaWorld Entertainment, Inc | 1,966 | |||||||
| 77,028 | Service Corp International | 5,468 | ||||||||
| 20,425 | * | Shake Shack, Inc | 1,474 | |||||||
| 42,367 | * | Six Flags Entertainment Corp | 1,804 | |||||||
| 628,674 | Starbucks Corp | 73,536 | ||||||||
| 11,328 | Strategic Education, Inc | 655 | ||||||||
| 26,055 | * | Stride, Inc | 868 | |||||||
| 21,327 | * | Target Hospitality Corp | 76 | |||||||
| 70,662 | * | Terminix Global Holdings, Inc | 3,196 | |||||||
| 40,109 | Texas Roadhouse, Inc (Class A) | 3,581 | ||||||||
| 46,546 | Travel & Leisure Co | 2,573 | ||||||||
| 21,929 | Vail Resorts, Inc | 7,191 | ||||||||
| 41,530 | *,e | Vivint Smart Home, Inc | 406 | |||||||
| 97,887 | Wendy’s | 2,335 | ||||||||
| 16,288 | Wingstop, Inc | 2,815 | ||||||||
| 26,120 | * | WW International Inc | 421 | |||||||
| 45,815 | Wyndham Hotels & Resorts, Inc | 4,107 | ||||||||
| 58,587 | * | Wynn Resorts Ltd | 4,982 | |||||||
| 223,229 | Yum China Holdings, Inc | 11,126 | ||||||||
| 336 |
COLLEGE RETIREMENT EQUITIES FUND - Equity Index Account
| SHARES | COMPANY | VALUE (000) | ||||||||
| 156,418 | Yum! Brands, Inc | $ | 21,720 | |||||||
| TOTAL CONSUMER SERVICES | 551,536 | |||||||||
| DIVERSIFIED FINANCIALS - 5.0% | ||||||||||
| 22,801 | Affiliated Managers Group, Inc | 3,751 | ||||||||
| 280,518 | AGNC Investment Corp | 4,219 | ||||||||
| 8,948 | Alerus Financial Corp | 262 | ||||||||
| 195,459 | Ally Financial, Inc | 9,306 | ||||||||
| 4,761 | A-Mark Precious Metals, Inc | 291 | ||||||||
| 337,806 | American Express Co | 55,265 | ||||||||
| 59,091 | Ameriprise Financial, Inc | 17,825 | ||||||||
| 673,859 | Annaly Capital Management, Inc | 5,270 | ||||||||
| 68,911 | Apollo Commercial Real Estate Finance, Inc | 907 | ||||||||
| 126,796 | e | Apollo Global Management, Inc | 9,184 | |||||||
| 61,262 | e | Arbor Realty Trust, Inc | 1,122 | |||||||
| 22,112 | Ares Commercial Real Estate Corp | 321 | ||||||||
| 70,488 | Ares Management Corp | 5,729 | ||||||||
| 26,163 | e | ARMOUR Residential REIT, Inc | 257 | |||||||
| 32,135 | Artisan Partners Asset Management, Inc | 1,531 | ||||||||
| 8,796 | * | Assetmark Financial Holdings, Inc | 230 | |||||||
| 4,316 | Associated Capital Group, Inc | 186 | ||||||||
| 10,240 | B. Riley Financial, Inc | 910 | ||||||||
| 21,466 | Banco Latinoamericano de Exportaciones S.A. (Class E) | 356 | ||||||||
| 406,366 | Bank of New York Mellon Corp | 23,602 | ||||||||
| 981,264 | * | Berkshire Hathaway, Inc (Class B) | 293,398 | |||||||
| 166,153 | BGC Partners, Inc (Class A) | 773 | ||||||||
| 76,647 | BlackRock, Inc | 70,175 | ||||||||
| 364,136 | Blackstone Group, Inc | 47,116 | ||||||||
| 73,790 | Blackstone Mortgage Trust, Inc | 2,259 | ||||||||
| 30,473 | * | Blucora, Inc | 528 | |||||||
| 23,450 | Brightsphere Investment Group, Inc | 600 | ||||||||
| 46,061 | BrightSpire Capital, Inc | 473 | ||||||||
| 37,551 | Broadmark Realty Capital, Inc | 354 | ||||||||
| 48,331 | * | Cannae Holdings, Inc | 1,699 | |||||||
| 227,065 | Capital One Financial Corp | 32,945 | ||||||||
| 81,300 | Carlyle Group, Inc | 4,463 | ||||||||
| 58,426 | CBOE Global Markets, Inc | 7,619 | ||||||||
| 803,791 | Charles Schwab Corp | 67,599 | ||||||||
| 79,272 | Chimera Investment Corp | 1,195 | ||||||||
| 192,449 | CME Group, Inc | 43,967 | ||||||||
| 15,440 | Cohen & Steers, Inc | 1,428 | ||||||||
| 18,127 | Cowen Group, Inc | 654 | ||||||||
| 4,330 | *,e | Credit Acceptance Corp | 2,978 | |||||||
| 7,834 | Curo Group Holdings Corp | 125 | ||||||||
| 2,179 | Diamond Hill Investment Group, Inc | 423 | ||||||||
| 159,233 | Discover Financial Services | 18,401 | ||||||||
| 19,156 | * | Donnelley Financial Solutions, Inc | 903 | |||||||
| 11,107 | e | Dynex Capital, Inc | 186 | |||||||
| 17,423 | Ellington Financial Inc | 298 | ||||||||
| 16,248 | *,e | Encore Capital Group, Inc | 1,009 | |||||||
| 23,911 | * | Enova International, Inc | 979 | |||||||
| 197,378 | Equitable Holdings, Inc | 6,472 | ||||||||
| 21,958 | Evercore Inc | 2,983 | ||||||||
| 38,445 | * | Ezcorp, Inc (Class A) | 283 | |||||||
| 337 |
COLLEGE RETIREMENT EQUITIES FUND - Equity Index Account
| SHARES | COMPANY | VALUE (000) | ||||||||
| 19,752 | Factset Research Systems, Inc | $ | 9,600 | |||||||
| 51,663 | Federated Investors, Inc (Class B) | 1,941 | ||||||||
| 24,222 | FirstCash Holdings, Inc | 1,812 | ||||||||
| 32,102 | * | Focus Financial Partners, Inc | 1,917 | |||||||
| 23,368 | Franklin BSP Realty Trust, Inc | 349 | ||||||||
| 158,845 | Franklin Resources, Inc | 5,320 | ||||||||
| 2,827 | GAMCO Investors, Inc (Class A) | 71 | ||||||||
| 23,172 | GCM Grosvenor, Inc | 243 | ||||||||
| 175,517 | Goldman Sachs Group, Inc | 67,144 | ||||||||
| 31,227 | Granite Point Mortgage Trust, Inc | 366 | ||||||||
| 9,250 | Great Ajax Corp | 122 | ||||||||
| 33,057 | * | Green Dot Corp | 1,198 | |||||||
| 19,893 | Greenhill & Co, Inc | 357 | ||||||||
| 18,233 | Hamilton Lane, Inc | 1,889 | ||||||||
| 41,845 | Hannon Armstrong Sustainable Infrastructure Capital, Inc | 2,223 | ||||||||
| 25,893 | Houlihan Lokey, Inc | 2,680 | ||||||||
| 44,099 | Interactive Brokers Group, Inc (Class A) | 3,502 | ||||||||
| 295,705 | Intercontinental Exchange Group, Inc | 40,444 | ||||||||
| 183,237 | Invesco Ltd | 4,218 | ||||||||
| 100,745 | Invesco Mortgage Capital, Inc | 280 | ||||||||
| 84,445 | Janus Henderson Group plc | 3,542 | ||||||||
| 110,637 | Jefferies Financial Group, Inc | 4,293 | ||||||||
| 289,960 | KKR & Co, Inc | 21,602 | ||||||||
| 17,625 | KKR Real Estate Finance Trust, Inc | 367 | ||||||||
| 49,932 | Ladder Capital Corp | 599 | ||||||||
| 55,948 | Lazard Ltd (Class A) | 2,441 | ||||||||
| 42,896 | * | LendingClub Corp | 1,037 | |||||||
| 6,343 | * | LendingTree, Inc | 778 | |||||||
| 43,732 | LPL Financial Holdings, Inc | 7,001 | ||||||||
| 20,525 | MarketAxess Holdings, Inc | 8,441 | ||||||||
| 6,533 | Marlin Business Services Corp | 152 | ||||||||
| 184,073 | MFA Financial Inc | 839 | ||||||||
| 33,380 | Moelis & Co | 2,087 | ||||||||
| 86,644 | Moody’s Corp | 33,841 | ||||||||
| 719,743 | Morgan Stanley | 70,650 | ||||||||
| 12,847 | Morningstar, Inc | 4,393 | ||||||||
| 43,299 | MSCI, Inc (Class A) | 26,529 | ||||||||
| 59,335 | Nasdaq Inc | 12,461 | ||||||||
| 72,107 | Navient Corp | 1,530 | ||||||||
| 3,424 | Nelnet, Inc (Class A) | 334 | ||||||||
| 231,837 | New Residential Investment Corp | 2,483 | ||||||||
| 73,139 | New York Mortgage Trust, Inc | 272 | ||||||||
| 112,805 | Northern Trust Corp | 13,493 | ||||||||
| 60,203 | OneMain Holdings, Inc | 3,013 | ||||||||
| 56,898 | * | Open Lending Corp | 1,279 | |||||||
| 11,565 | * | Oportun Financial Corp | 234 | |||||||
| 7,363 | Oppenheimer Holdings, Inc | 341 | ||||||||
| 23,694 | e | Orchid Island Capital, Inc | 107 | |||||||
| 47,765 | PennyMac Mortgage Investment Trust | 828 | ||||||||
| 10,272 | Piper Jaffray Cos | 1,834 | ||||||||
| 13,025 | PJT Partners, Inc | 965 | ||||||||
| 24,781 | * | PRA Group, Inc | 1,244 | |||||||
| 36,804 | * | PROG Holdings, Inc | 1,660 | |||||||
| 9,591 | Pzena Investment Management, Inc (Class A) | 91 | ||||||||
| 338 |
COLLEGE RETIREMENT EQUITIES FUND - Equity Index Account
| SHARES | COMPANY | VALUE (000) | ||||||||
| 94,609 | Raymond James Financial, Inc | $ | 9,499 | |||||||
| 22,908 | Ready Capital Corp | 358 | ||||||||
| 49,700 | Redwood Trust, Inc | 655 | ||||||||
| 8,577 | Regional Management Corp | 493 | ||||||||
| 128,666 | S&P Global, Inc | 60,721 | ||||||||
| 25,339 | Santander Consumer USA Holdings, Inc | 1,065 | ||||||||
| 10,879 | Sculptor Capital Management, Inc | 232 | ||||||||
| 58,985 | SEI Investments Co | 3,595 | ||||||||
| 176,795 | SLM Corp | 3,478 | ||||||||
| 137,605 | Starwood Property Trust, Inc | 3,344 | ||||||||
| 190,999 | State Street Corp | 17,763 | ||||||||
| 20,369 | StepStone Group, Inc | 847 | ||||||||
| 56,036 | Stifel Financial Corp | 3,946 | ||||||||
| 11,369 | * | StoneX Group, Inc | 696 | |||||||
| 296,064 | Synchrony Financial | 13,734 | ||||||||
| 118,281 | T Rowe Price Group, Inc | 23,259 | ||||||||
| 32,761 | TPG RE Finance Trust, Inc | 404 | ||||||||
| 52,338 | Tradeweb Markets, Inc | 5,241 | ||||||||
| 149,469 | e | Two Harbors Investment Corp | 862 | |||||||
| 24,235 | * | Upstart Holdings, Inc | 3,667 | |||||||
| 51,259 | Virtu Financial, Inc | 1,478 | ||||||||
| 2,751 | Virtus Investment Partners, Inc | 817 | ||||||||
| 56,679 | Voya Financial, Inc | 3,758 | ||||||||
| 84,317 | WisdomTree Investments, Inc | 516 | ||||||||
| 2,399 | * | World Acceptance Corp | 589 | |||||||
| TOTAL DIVERSIFIED FINANCIALS | 1,290,263 | |||||||||
| ENERGY - 2.7% | ||||||||||
| 39,034 | * | Alto Ingredients, Inc | 188 | |||||||
| 183,627 | Antero Midstream Corp | 1,777 | ||||||||
| 156,157 | * | Antero Resources Corp | 2,733 | |||||||
| 194,060 | APA Corp | 5,218 | ||||||||
| 9,586 | Arch Resources, Inc | 875 | ||||||||
| 6,877 | Archrock, Inc | 51 | ||||||||
| 11,564 | * | Aspen Aerogels, Inc | 576 | |||||||
| 405,017 | Baker Hughes Co | 9,745 | ||||||||
| 36,376 | Berry Petroleum Co LLC | 306 | ||||||||
| 24,693 | Bonanza Creek Energy, Inc | 1,209 | ||||||||
| 23,816 | Brigham Minerals, Inc | 502 | ||||||||
| 4,788 | * | Bristow Group, Inc | 152 | |||||||
| 434,664 | Cabot Oil & Gas Corp | 8,259 | ||||||||
| 29,784 | Cactus, Inc | 1,136 | ||||||||
| 28,404 | California Resources Corp | 1,213 | ||||||||
| 21,769 | *,e | Callon Petroleum Co | 1,029 | |||||||
| 98,820 | * | Centennial Resource Development, Inc | 591 | |||||||
| 5,171 | * | Centrus Energy Corp | 258 | |||||||
| 110,556 | * | ChampionX Corp | 2,234 | |||||||
| 128,714 | Cheniere Energy, Inc | 13,054 | ||||||||
| 53,916 | Chesapeake Energy Corp | 3,479 | ||||||||
| 1,035,140 | Chevron Corp | 121,474 | ||||||||
| 75,896 | *,e | Clean Energy Fuels Corp | 465 | |||||||
| 119,401 | * | CNX Resources Corp | 1,642 | |||||||
| 49,969 | * | Comstock Resources Inc | 404 | |||||||
| 702,109 | ConocoPhillips | 50,678 | ||||||||
| 339 |
COLLEGE RETIREMENT EQUITIES FUND - Equity Index Account
| SHARES | COMPANY | VALUE (000) | ||||||||
| 20,666 | * | CONSOL Energy, Inc | $ | 469 | ||||||
| 32,957 | e | Continental Resources, Inc | 1,475 | |||||||
| 10,678 | *,e | Crescent Energy, Inc | 135 | |||||||
| 11,149 | CVR Energy, Inc | 187 | ||||||||
| 27,497 | * | Delek US Holdings, Inc | 412 | |||||||
| 27,534 | * | Denbury, Inc | 2,109 | |||||||
| 370,820 | Devon Energy Corp | 16,335 | ||||||||
| 55,111 | DHT Holdings, Inc | 286 | ||||||||
| 99,242 | Diamondback Energy, Inc | 10,703 | ||||||||
| 9,586 | * | DMC Global, Inc | 380 | |||||||
| 19,179 | Dorian LPG Ltd | 243 | ||||||||
| 19,159 | * | Dril-Quip, Inc | 377 | |||||||
| 52,968 | DT Midstream, Inc | 2,541 | ||||||||
| 7,121 | * | Earthstone Energy, Inc | 78 | |||||||
| 56,201 | *,e | Energy Fuels, Inc | 429 | |||||||
| 314,833 | EOG Resources, Inc | 27,967 | ||||||||
| 153,612 | * | EQT Corp | 3,350 | |||||||
| 223,182 | Equitrans Midstream Corp | 2,308 | ||||||||
| 2,270,917 | d | Exxon Mobil Corp | 138,957 | |||||||
| 24,885 | Falcon Minerals Corp | 121 | ||||||||
| 6,110 | * | Frank’s International NV | 88 | |||||||
| 70,150 | *,e | Frontline Ltd | 496 | |||||||
| 106,507 | *,e | Gevo, Inc | 456 | |||||||
| 69,477 | * | Golar LNG Ltd | 861 | |||||||
| 26,945 | * | Green Plains Inc | 937 | |||||||
| 486,964 | Halliburton Co | 11,137 | ||||||||
| 100,808 | * | Helix Energy Solutions Group, Inc | 314 | |||||||
| 52,744 | Helmerich & Payne, Inc | 1,250 | ||||||||
| 152,403 | Hess Corp | 11,282 | ||||||||
| 82,202 | HollyFrontier Corp | 2,695 | ||||||||
| 28,719 | International Seaways, Inc | 422 | ||||||||
| 1,030,068 | Kinder Morgan, Inc | 16,337 | ||||||||
| 234,852 | * | Kosmos Energy Ltd | 813 | |||||||
| 6,863 | * | Laredo Petroleum, Inc | 413 | |||||||
| 47,450 | * | Liberty Oilfield Services, Inc | 460 | |||||||
| 65,268 | Magnolia Oil & Gas Corp | 1,232 | ||||||||
| 430,752 | Marathon Oil Corp | 7,073 | ||||||||
| 330,202 | Marathon Petroleum Corp | 21,130 | ||||||||
| 61,756 | Matador Resources Co | 2,280 | ||||||||
| 86,947 | Murphy Oil Corp | 2,270 | ||||||||
| 4,194 | * | Nabors Industries Ltd | 340 | |||||||
| 16,237 | * | National Energy Services Reunited Corp | 153 | |||||||
| 14,551 | e | New Fortress Energy, Inc | 351 | |||||||
| 63,344 | * | Newpark Resources, Inc | 186 | |||||||
| 76,759 | * | NexTier Oilfield Solutions, Inc | 272 | |||||||
| 68,002 | e | Nordic American Tankers Ltd | 115 | |||||||
| 26,098 | Northern Oil and Gas, Inc | 537 | ||||||||
| 214,007 | NOV, Inc | 2,900 | ||||||||
| 11,011 | Oasis Petroleum, Inc | 1,387 | ||||||||
| 468,293 | Occidental Petroleum Corp | 13,576 | ||||||||
| 54,360 | * | Oceaneering International, Inc | 615 | |||||||
| 38,178 | * | Oil States International, Inc | 190 | |||||||
| 235,907 | ONEOK, Inc | 13,862 | ||||||||
| 143,049 | Ovintiv, Inc | 4,821 | ||||||||
| 340 |
COLLEGE RETIREMENT EQUITIES FUND - Equity Index Account
| SHARES | COMPANY | VALUE (000) | ||||||||
| 23,180 | * | Par Pacific Holdings, Inc | $ | 382 | ||||||
| 101,807 | Patterson-UTI Energy, Inc | 860 | ||||||||
| 52,566 | * | PBF Energy, Inc | 682 | |||||||
| 54,256 | PDC Energy, Inc | 2,647 | ||||||||
| 37,795 | * | Peabody Energy Corp | 381 | |||||||
| 10,090 | * | Penn Virginia Corp | 272 | |||||||
| 240,662 | Phillips 66 | 17,438 | ||||||||
| 115,241 | Pioneer Natural Resources Co | 20,960 | ||||||||
| 48,018 | * | ProPetro Holding Corp | 389 | |||||||
| 107,893 | * | Range Resources Corp | 1,924 | |||||||
| 21,719 | * | Renewable Energy Group, Inc | 922 | |||||||
| 4,186 | * | Rex American Resources Corp | 402 | |||||||
| 4,815 | e | Riley Exploration Permian, Inc | 93 | |||||||
| 42,512 | * | RPC, Inc | 193 | |||||||
| 751,249 | Schlumberger Ltd | 22,500 | ||||||||
| 26,610 | Scorpio Tankers, Inc | 341 | ||||||||
| 6,869 | * | Select Energy Services, Inc | 43 | |||||||
| 45,041 | SFL Corp Ltd | 367 | ||||||||
| 63,633 | SM Energy Co | 1,876 | ||||||||
| 6,855 | Solaris Oilfield Infrastructure, Inc | 45 | ||||||||
| 541,965 | * | Southwestern Energy Co | 2,525 | |||||||
| 13,911 | * | Talos Energy, Inc | 136 | |||||||
| 123,793 | Targa Resources Investments, Inc | 6,467 | ||||||||
| 172,980 | *,e | Tellurian, Inc | 533 | |||||||
| 66,939 | * | Tetra Technologies, Inc | 190 | |||||||
| 3,232 | Texas Pacific Land Corp | 4,036 | ||||||||
| 16,234 | * | Tidewater, Inc | 174 | |||||||
| 95,169 | *,e | Uranium Energy Corp | 319 | |||||||
| 40,076 | * | US Silica Holdings, Inc | 377 | |||||||
| 224,402 | Valero Energy Corp | 16,855 | ||||||||
| 14,396 | * | W&T Offshore, Inc | 46 | |||||||
| 21,493 | * | Whiting Petroleum Corp | 1,390 | |||||||
| 668,134 | Williams Cos, Inc | 17,398 | ||||||||
| 29,960 | World Fuel Services Corp | 793 | ||||||||
| TOTAL ENERGY | 683,317 | |||||||||
| FOOD & STAPLES RETAILING - 1.3% | ||||||||||
| 87,310 | e | Albertsons Cos, Inc | 2,636 | |||||||
| 19,849 | Andersons, Inc | 768 | ||||||||
| 74,804 | * | BJ’s Wholesale Club Holdings, Inc | 5,010 | |||||||
| 20,249 | Casey’s General Stores, Inc | 3,996 | ||||||||
| 14,374 | * | Chefs’ Warehouse Holdings, Inc | 479 | |||||||
| 236,934 | Costco Wholesale Corp | 134,508 | ||||||||
| 47,990 | * | Grocery Outlet Holding Corp | 1,357 | |||||||
| 21,180 | *,e | HF Foods Group Inc | 179 | |||||||
| 7,660 | Ingles Markets, Inc (Class A) | 661 | ||||||||
| 410,935 | Kroger Co | 18,599 | ||||||||
| 6,410 | Natural Grocers by Vitamin C | 91 | ||||||||
| 81,687 | * | Performance Food Group Co | 3,749 | |||||||
| 14,866 | Pricesmart, Inc | 1,088 | ||||||||
| 38,176 | *,e | Rite Aid Corp | 561 | |||||||
| 27,344 | SpartanNash Co | 704 | ||||||||
| 64,788 | * | Sprouts Farmers Market, Inc | 1,923 | |||||||
| 274,628 | SYSCO Corp | 21,572 | ||||||||
| 341 |
COLLEGE RETIREMENT EQUITIES FUND - Equity Index Account
| SHARES | COMPANY | VALUE (000) | ||||||||
| 30,449 | * | United Natural Foods, Inc | $ | 1,495 | ||||||
| 121,342 | * | US Foods Holding Corp | 4,226 | |||||||
| 4,843 | Village Super Market (Class A) | 113 | ||||||||
| 384,399 | Walgreens Boots Alliance, Inc | 20,050 | ||||||||
| 766,796 | Walmart, Inc | 110,948 | ||||||||
| 8,974 | Weis Markets, Inc | 591 | ||||||||
| TOTAL FOOD & STAPLES RETAILING | 335,304 | |||||||||
| FOOD, BEVERAGE & TOBACCO - 2.7% | ||||||||||
| 82,392 | *,e | 22nd Century Group, Inc | 255 | |||||||
| 988,678 | Altria Group, Inc | 46,853 | ||||||||
| 26,157 | *,e | AppHarvest, Inc | 102 | |||||||
| 297,146 | Archer-Daniels-Midland Co | 20,084 | ||||||||
| 34,958 | B&G Foods, Inc (Class A) | 1,074 | ||||||||
| 31,483 | *,e | Beyond Meat, Inc | 2,051 | |||||||
| 5,121 | * | Boston Beer Co, Inc (Class A) | 2,587 | |||||||
| 25,010 | Brown-Forman Corp (Class A) | 1,695 | ||||||||
| 99,618 | Brown-Forman Corp (Class B) | 7,258 | ||||||||
| 70,268 | Bunge Ltd | 6,560 | ||||||||
| 11,455 | Calavo Growers, Inc | 486 | ||||||||
| 22,629 | Cal-Maine Foods, Inc | 837 | ||||||||
| 107,192 | Campbell Soup Co | 4,659 | ||||||||
| 29,057 | * | Celsius Holdings, Inc | 2,167 | |||||||
| 2,077,610 | Coca-Cola Co | 123,015 | ||||||||
| 2,566 | Coca-Cola Consolidated Inc | 1,589 | ||||||||
| 238,268 | ConAgra Brands, Inc | 8,137 | ||||||||
| 82,247 | Constellation Brands, Inc (Class A) | 20,641 | ||||||||
| 89,070 | * | Darling International, Inc | 6,172 | |||||||
| 11,007 | * | Duckhorn Portfolio, Inc | 257 | |||||||
| 103,413 | Flowers Foods, Inc | 2,841 | ||||||||
| 20,613 | Fresh Del Monte Produce, Inc | 569 | ||||||||
| 23,047 | * | Freshpet, Inc | 2,196 | |||||||
| 320,492 | General Mills, Inc | 21,595 | ||||||||
| 46,022 | * | Hain Celestial Group, Inc | 1,961 | |||||||
| 77,606 | Hershey Co | 15,014 | ||||||||
| 143,109 | Hormel Foods Corp | 6,985 | ||||||||
| 71,472 | * | Hostess Brands, Inc | 1,459 | |||||||
| 36,826 | Ingredion, Inc | 3,559 | ||||||||
| 8,046 | J&J Snack Foods Corp | 1,271 | ||||||||
| 58,293 | J.M. Smucker Co | 7,917 | ||||||||
| 5,780 | John B. Sanfilippo & Son, Inc | 521 | ||||||||
| 130,457 | Kellogg Co | 8,404 | ||||||||
| 368,701 | Keurig Dr Pepper, Inc | 13,590 | ||||||||
| 372,917 | Kraft Heinz Co | 13,388 | ||||||||
| 80,196 | Lamb Weston Holdings, Inc | 5,083 | ||||||||
| 10,268 | Lancaster Colony Corp | 1,700 | ||||||||
| 19,323 | * | Landec Corp | 214 | |||||||
| 8,386 | Limoneira Co | 126 | ||||||||
| 131,394 | McCormick & Co, Inc | 12,694 | ||||||||
| 9,193 | MGP Ingredients, Inc | 781 | ||||||||
| 20,226 | *,e | Mission Produce, Inc | 318 | |||||||
| 100,662 | Molson Coors Brewing Co (Class B) | 4,666 | ||||||||
| 744,515 | Mondelez International, Inc | 49,369 | ||||||||
| 195,472 | * | Monster Beverage Corp | 18,773 | |||||||
| 342 |
COLLEGE RETIREMENT EQUITIES FUND - Equity Index Account
| SHARES | COMPANY | VALUE (000) | ||||||||
| 12,819 | National Beverage Corp | $ | 581 | |||||||
| 46,743 | * | NewAge, Inc | 48 | |||||||
| 739,576 | PepsiCo, Inc | 128,472 | ||||||||
| 833,883 | Philip Morris International, Inc | 79,219 | ||||||||
| 11,378 | * | Pilgrim’s Pride Corp | 321 | |||||||
| 32,395 | * | Post Holdings, Inc | 3,652 | |||||||
| 92,946 | Primo Water Corp | 1,639 | ||||||||
| 9,000 | Sanderson Farms, Inc | 1,720 | ||||||||
| 138 | Seaboard Corp | 543 | ||||||||
| 5,451 | * | Seneca Foods Corp | 261 | |||||||
| 46,457 | * | Simply Good Foods Co | 1,931 | |||||||
| 25,510 | *,e | Tattooed Chef, Inc | 396 | |||||||
| 11,994 | e | Tootsie Roll Industries, Inc | 435 | |||||||
| 29,630 | * | TreeHouse Foods, Inc | 1,201 | |||||||
| 4,760 | Turning Point Brands, Inc | 180 | ||||||||
| 151,449 | Tyson Foods, Inc (Class A) | 13,200 | ||||||||
| 4,499 | Universal Corp | 247 | ||||||||
| 32,173 | Utz Brands, Inc | 513 | ||||||||
| 78,380 | Vector Group Ltd | 900 | ||||||||
| 13,394 | *,e | Vital Farms, Inc | 242 | |||||||
| 20,392 | * | Whole Earth Brands, Inc | 219 | |||||||
| TOTAL FOOD, BEVERAGE & TOBACCO | 687,393 | |||||||||
| HEALTH CARE EQUIPMENT & SERVICES - 5.7% | ||||||||||
| 63,623 | * | 1Life Healthcare, Inc | 1,118 | |||||||
| 929,468 | Abbott Laboratories | 130,813 | ||||||||
| 24,348 | * | Abiomed, Inc | 8,745 | |||||||
| 48,576 | * | Acadia Healthcare Co, Inc | 2,949 | |||||||
| 18,841 | *,e | Accelerate Diagnostics, Inc | 98 | |||||||
| 27,471 | * | Accolade, Inc | 724 | |||||||
| 58,290 | * | Accuray, Inc | 278 | |||||||
| 5,674 | *,e | Acutus Medical, Inc | 19 | |||||||
| 42,027 | * | AdaptHealth Corp | 1,028 | |||||||
| 8,397 | * | Addus HomeCare Corp | 785 | |||||||
| 12,333 | *,e | Agiliti, Inc | 286 | |||||||
| 89,660 | * | agilon health, Inc | 2,421 | |||||||
| 41,729 | * | Align Technology, Inc | 27,424 | |||||||
| 14,356 | * | Alignment Healthcare, Inc | 202 | |||||||
| 76,369 | * | Allscripts Healthcare Solutions, Inc | 1,409 | |||||||
| 31,277 | * | Alphatec Holdings Inc | 358 | |||||||
| 17,538 | * | Amedisys, Inc | 2,839 | |||||||
| 106,234 | * | American Well Corp | 642 | |||||||
| 76,774 | AmerisourceBergen Corp | 10,203 | ||||||||
| 25,726 | * | AMN Healthcare Services, Inc | 3,147 | |||||||
| 26,107 | * | Angiodynamics, Inc | 720 | |||||||
| 131,576 | Anthem, Inc | 60,991 | ||||||||
| 16,786 | *,e | Apollo Medical Holdings, Inc | 1,233 | |||||||
| 8,132 | * | Apria, Inc | 265 | |||||||
| 127,698 | *,e | Asensus Surgical, Inc | 142 | |||||||
| 45,045 | *,e | Aspira Women’s Health, Inc | 80 | |||||||
| 22,609 | * | AtriCure, Inc | 1,572 | |||||||
| 1,019 | Atrion Corp | 718 | ||||||||
| 26,266 | * | Avanos Medical, Inc | 911 | |||||||
| 21,058 | * | Aveanna Healthcare Holdings, Inc | 156 | |||||||
| 343 |
COLLEGE RETIREMENT EQUITIES FUND - Equity Index Account
| SHARES | COMPANY | VALUE (000) | ||||||||
| 18,090 | * | AxoGen, Inc | $ | 170 | ||||||
| 22,714 | * | Axonics Modulation Technologies, Inc | 1,272 | |||||||
| 269,147 | Baxter International, Inc | 23,104 | ||||||||
| 152,919 | Becton Dickinson & Co | 38,456 | ||||||||
| 13,317 | * | BioLife Solutions Inc | 496 | |||||||
| 758,130 | * | Boston Scientific Corp | 32,205 | |||||||
| 100,981 | * | Brookdale Senior Living, Inc | 521 | |||||||
| 98,379 | *,e | Butterfly Network, Inc | 658 | |||||||
| 144,641 | Cardinal Health, Inc | 7,448 | ||||||||
| 23,626 | * | Cardiovascular Systems, Inc | 444 | |||||||
| 11,625 | * | Castle Biosciences, Inc | 498 | |||||||
| 306,383 | * | Centene Corp | 25,246 | |||||||
| 155,282 | Cerner Corp | 14,421 | ||||||||
| 44,636 | * | Certara, Inc | 1,269 | |||||||
| 71,510 | * | Cerus Corp | 487 | |||||||
| 111,702 | * | Change Healthcare, Inc | 2,388 | |||||||
| 8,564 | Chemed Corp | 4,531 | ||||||||
| 172,612 | Cigna Corp | 39,637 | ||||||||
| 67,798 | * | Community Health Systems, Inc | 902 | |||||||
| 8,700 | * | Computer Programs & Systems, Inc | 255 | |||||||
| 15,846 | Conmed Corp | 2,246 | ||||||||
| 25,736 | Cooper Cos, Inc | 10,782 | ||||||||
| 4,814 | * | Corvel Corp | 1,001 | |||||||
| 56,477 | * | Covetrus, Inc | 1,128 | |||||||
| 25,224 | * | Cross Country Healthcare, Inc | 700 | |||||||
| 23,064 | * | CryoLife, Inc | 469 | |||||||
| 22,130 | * | CryoPort, Inc | 1,309 | |||||||
| 10,004 | * | Cutera, Inc | 413 | |||||||
| 704,480 | CVS Health Corp | 72,674 | ||||||||
| 19,235 | * | CytoSorbents Corp | 81 | |||||||
| 38,496 | * | DaVita, Inc | 4,379 | |||||||
| 119,396 | Dentsply Sirona, Inc | 6,661 | ||||||||
| 51,640 | * | DexCom, Inc | 27,728 | |||||||
| 335,599 | * | Edwards Lifesciences Corp | 43,477 | |||||||
| 54,203 | Encompass Health Corp | 3,537 | ||||||||
| 28,674 | Ensign Group, Inc | 2,408 | ||||||||
| 90,976 | * | Envista Holdings Corp | 4,099 | |||||||
| 45,708 | * | Evolent Health, Inc | 1,265 | |||||||
| 53,050 | *,e | Figs, Inc | 1,462 | |||||||
| 11,072 | *,e | Fulgent Genetics, Inc | 1,114 | |||||||
| 24,523 | * | Glaukos Corp | 1,090 | |||||||
| 42,442 | * | Globus Medical, Inc | 3,064 | |||||||
| 49,332 | * | Guardant Health, Inc | 4,934 | |||||||
| 27,531 | * | Haemonetics Corp | 1,460 | |||||||
| 23,398 | * | Hanger Inc | 424 | |||||||
| 129,512 | HCA Healthcare, Inc | 33,274 | ||||||||
| 24,393 | * | Health Catalyst, Inc | 967 | |||||||
| 44,640 | * | HealthEquity, Inc | 1,975 | |||||||
| 18,780 | * | HealthStream, Inc | 495 | |||||||
| 77,378 | * | Henry Schein, Inc | 5,999 | |||||||
| 4,605 | * | Heska Corp | 840 | |||||||
| 129,076 | * | Hologic, Inc | 9,882 | |||||||
| 68,230 | Humana, Inc | 31,649 | ||||||||
| 11,947 | * | iCAD, Inc | 86 | |||||||
| 344 |
COLLEGE RETIREMENT EQUITIES FUND - Equity Index Account
| SHARES | COMPANY | VALUE (000) | ||||||||
| 10,885 | * | ICU Medical, Inc | $ | 2,583 | ||||||
| 46,053 | * | IDEXX Laboratories, Inc | 30,324 | |||||||
| 18,547 | * | Inari Medical, Inc | 1,693 | |||||||
| 10,000 | *,e | Innovage Holding Corp | 50 | |||||||
| 12,244 | * | Inogen, Inc | 416 | |||||||
| 15,579 | * | Inspire Medical Systems, Inc | 3,584 | |||||||
| 36,326 | * | Insulet Corp | 9,665 | |||||||
| 17,928 | * | Integer Holding Corp | 1,535 | |||||||
| 39,699 | * | Integra LifeSciences Holdings Corp | 2,659 | |||||||
| 18,642 | * | Intersect ENT, Inc | 509 | |||||||
| 189,245 | * | Intuitive Surgical, Inc | 67,996 | |||||||
| 23,110 | * | Invacare Corp | 63 | |||||||
| 16,105 | * | iRhythm Technologies, Inc | 1,895 | |||||||
| 7,427 | * | Joint Corp | 488 | |||||||
| 49,658 | * | Laboratory Corp of America Holdings | 15,603 | |||||||
| 34,223 | * | Lantheus Holdings, Inc | 989 | |||||||
| 9,523 | LeMaitre Vascular, Inc | 478 | ||||||||
| 17,004 | * | LHC Group, Inc | 2,334 | |||||||
| 25,006 | *,e | LifeStance Health Group, Inc | 238 | |||||||
| 26,810 | * | LivaNova plc | 2,344 | |||||||
| 11,624 | * | Magellan Health Services, Inc | 1,104 | |||||||
| 27,485 | * | Masimo Corp | 8,047 | |||||||
| 81,898 | McKesson Corp | 20,357 | ||||||||
| 43,753 | * | MEDNAX, Inc | 1,191 | |||||||
| 720,946 | Medtronic plc | 74,582 | ||||||||
| 31,965 | * | Meridian Bioscience, Inc | 652 | |||||||
| 28,011 | * | Merit Medical Systems, Inc | 1,745 | |||||||
| 2,255 | Mesa Laboratories, Inc | 740 | ||||||||
| 6,780 | * | ModivCare, Inc | 1,005 | |||||||
| 31,866 | * | Molina Healthcare, Inc | 10,136 | |||||||
| 122,337 | *,e | Multiplan Corp | 542 | |||||||
| 7,753 | National Healthcare Corp | 527 | ||||||||
| 5,598 | National Research Corp | 232 | ||||||||
| 24,197 | * | Natus Medical, Inc | 574 | |||||||
| 55,746 | * | Neogen Corp | 2,531 | |||||||
| 13,631 | *,e | Neuronetics, Inc | 61 | |||||||
| 19,942 | * | Nevro Corp | 1,617 | |||||||
| 37,773 | * | NextGen Healthcare, Inc | 672 | |||||||
| 56,233 | * | Novocure Ltd | 4,222 | |||||||
| 28,270 | * | NuVasive, Inc | 1,484 | |||||||
| 56,949 | *,e | Oak Street Health, Inc | 1,887 | |||||||
| 23,061 | * | Omnicell, Inc | 4,161 | |||||||
| 4,594 | *,e | Ontrak, Inc | 29 | |||||||
| 8,440 | * | OptimizeRx Corp | 524 | |||||||
| 80,646 | * | Option Care Health, Inc | 2,294 | |||||||
| 40,487 | * | OraSure Technologies, Inc | 352 | |||||||
| 49,394 | * | Ortho Clinical Diagnostics Holdings plc | 1,057 | |||||||
| 12,159 | * | Orthofix Medical Inc | 378 | |||||||
| 5,177 | * | OrthoPediatrics Corp | 310 | |||||||
| 24,964 | * | Outset Medical, Inc | 1,151 | |||||||
| 43,714 | Owens & Minor, Inc | 1,902 | ||||||||
| 46,765 | Patterson Cos, Inc | 1,373 | ||||||||
| 39,207 | *,e | PAVmed, Inc | 96 | |||||||
| 17,723 | * | Pennant Group, Inc | 409 | |||||||
| 345 |
COLLEGE RETIREMENT EQUITIES FUND - Equity Index Account
| SHARES | COMPANY | VALUE (000) | ||||||||
| 17,918 | * | Penumbra, Inc | $ | 5,148 | ||||||
| 14,406 | *,e | PetIQ, Inc | 327 | |||||||
| 20,801 | * | Phreesia, Inc | 867 | |||||||
| 69,502 | Premier, Inc | 2,861 | ||||||||
| 10,696 | * | Privia Health Group, Inc | 277 | |||||||
| 34,423 | * | Progyny, Inc | 1,733 | |||||||
| 13,858 | *,e | Pulmonx Corp | 444 | |||||||
| 1,569 | *,e | Pulse Biosciences, Inc | 23 | |||||||
| 65,473 | Quest Diagnostics, Inc | 11,328 | ||||||||
| 20,943 | * | Quidel Corp | 2,827 | |||||||
| 36,034 | *,e | Quotient Ltd | 93 | |||||||
| 72,154 | * | R1 RCM, Inc | 1,839 | |||||||
| 25,914 | * | RadNet, Inc | 780 | |||||||
| 76,233 | Resmed, Inc | 19,857 | ||||||||
| 24,729 | * | Schrodinger, Inc | 861 | |||||||
| 15,644 | * | SeaSpine Holdings Corp | 213 | |||||||
| 60,301 | Select Medical Holdings Corp | 1,773 | ||||||||
| 226,696 | *,e | Senseonics Holdings, Inc | 605 | |||||||
| 18,412 | * | Shockwave Medical Inc | 3,283 | |||||||
| 17,531 | * | SI-BONE, Inc | 389 | |||||||
| 10,185 | * | Sientra, Inc | 37 | |||||||
| 34,185 | *,e | Signify Health, Inc | 486 | |||||||
| 18,916 | * | Silk Road Medical Inc | 806 | |||||||
| 7,680 | e | Simulations Plus, Inc | 363 | |||||||
| 26,141 | * | Staar Surgical Co | 2,387 | |||||||
| 27,076 | * | Stereotaxis, Inc | 168 | |||||||
| 46,289 | STERIS plc | 11,267 | ||||||||
| 185,160 | Stryker Corp | 49,516 | ||||||||
| 17,295 | * | Surgery Partners, Inc | 924 | |||||||
| 10,275 | * | SurModics, Inc | 495 | |||||||
| 12,258 | * | Tabula Rasa HealthCare, Inc | 184 | |||||||
| 10,460 | * | Tactile Systems Technology, Inc | 199 | |||||||
| 35,006 | * | Tandem Diabetes Care, Inc | 5,269 | |||||||
| 80,556 | * | Teladoc, Inc | 7,397 | |||||||
| 25,464 | Teleflex, Inc | 8,364 | ||||||||
| 59,665 | * | Tenet Healthcare Corp | 4,874 | |||||||
| 30,967 | * | Tivity Health, Inc | 819 | |||||||
| 11,786 | * | Transmedics Group, Inc | 226 | |||||||
| 5,968 | * | Treace Medical Concepts, Inc | 111 | |||||||
| 4,956 | * | Triple-S Management Corp (Class B) | 177 | |||||||
| 504,241 | UnitedHealth Group, Inc | 253,200 | ||||||||
| 41,647 | Universal Health Services, Inc (Class B) | 5,400 | ||||||||
| 6,975 | e | US Physical Therapy, Inc | 667 | |||||||
| 2,349 | Utah Medical Products, Inc | 235 | ||||||||
| 7,211 | *,e | Vapotherm, Inc | 149 | |||||||
| 27,229 | * | Varex Imaging Corp | 859 | |||||||
| 73,780 | * | Veeva Systems, Inc | 18,849 | |||||||
| 20,450 | *,e | Viemed Healthcare, Inc | 107 | |||||||
| 74,317 | * | ViewRay, Inc | 410 | |||||||
| 20,093 | * | Vocera Communications, Inc | 1,303 | |||||||
| 114,723 | Zimmer Biomet Holdings, Inc | 14,574 | ||||||||
| 9,856 | *,e | Zynex Inc | 98 | |||||||
| TOTAL HEALTH CARE EQUIPMENT & SERVICES | 1,478,594 | |||||||||
| 346 |
COLLEGE RETIREMENT EQUITIES FUND - Equity Index Account
| SHARES | COMPANY | VALUE (000) | ||||||||
| HOUSEHOLD & PERSONAL PRODUCTS - 1.4% | ||||||||||
| 46,991 | *,e | Beauty Health Co | $ | 1,135 | ||||||
| 25,021 | *,e | BellRing Brands, Inc | 714 | |||||||
| 7,431 | * | Central Garden & Pet Co | 391 | |||||||
| 22,079 | * | Central Garden and Pet Co (Class A) | 1,056 | |||||||
| 125,208 | Church & Dwight Co, Inc | 12,834 | ||||||||
| 65,460 | Clorox Co | 11,414 | ||||||||
| 443,194 | Colgate-Palmolive Co | 37,822 | ||||||||
| 159,439 | * | Coty, Inc | 1,674 | |||||||
| 29,639 | Edgewell Personal Care Co | 1,355 | ||||||||
| 24,917 | * | elf Beauty, Inc | 828 | |||||||
| 37,105 | Energizer Holdings, Inc | 1,488 | ||||||||
| 122,207 | Estee Lauder Cos (Class A) | 45,241 | ||||||||
| 58,982 | * | Herbalife Nutrition Ltd | 2,414 | |||||||
| 13,542 | *,e | Honest Co, Inc | 110 | |||||||
| 12,258 | Inter Parfums, Inc | 1,310 | ||||||||
| 177,781 | Kimberly-Clark Corp | 25,408 | ||||||||
| 6,191 | Medifast, Inc | 1,297 | ||||||||
| 5,868 | Nature’s Sunshine Products, Inc | 109 | ||||||||
| 27,121 | Nu Skin Enterprises, Inc (Class A) | 1,376 | ||||||||
| 3,981 | Oil-Dri Corp of America | 130 | ||||||||
| 43,357 | * | Olaplex Holdings, Inc | 1,263 | |||||||
| 1,290,662 | Procter & Gamble Co | 211,127 | ||||||||
| 8,319 | * | Revlon, Inc (Class A) | 94 | |||||||
| 12,941 | Reynolds Consumer Products, Inc | 406 | ||||||||
| 21,541 | Spectrum Brands Holdings, Inc | 2,191 | ||||||||
| 8,349 | * | USANA Health Sciences, Inc | 845 | |||||||
| 30,185 | *,e | Veru, Inc | 178 | |||||||
| 7,178 | WD-40 Co | 1,756 | ||||||||
| TOTAL HOUSEHOLD & PERSONAL PRODUCTS | 365,966 | |||||||||
| INSURANCE - 2.0% | ||||||||||
| 344,156 | Aflac, Inc | 20,095 | ||||||||
| 6,777 | * | Alleghany Corp | 4,524 | |||||||
| 152,869 | Allstate Corp | 17,985 | ||||||||
| 32,424 | * | AMBAC Financial Group, Inc | 520 | |||||||
| 46,586 | American Equity Investment Life Holding Co | 1,813 | ||||||||
| 37,245 | American Financial Group, Inc | 5,114 | ||||||||
| 446,140 | American International Group, Inc | 25,368 | ||||||||
| 256 | American National Group, Inc | 48 | ||||||||
| 13,468 | Amerisafe, Inc | 725 | ||||||||
| 115,949 | Aon plc | 34,850 | ||||||||
| 192,749 | * | Arch Capital Group Ltd | 8,568 | |||||||
| 17,301 | Argo Group International Holdings Ltd | 1,005 | ||||||||
| 108,126 | Arthur J. Gallagher & Co | 18,346 | ||||||||
| 33,181 | Assurant, Inc | 5,172 | ||||||||
| 36,683 | Assured Guaranty Ltd | 1,841 | ||||||||
| 61,967 | * | Athene Holding Ltd | 5,164 | |||||||
| 32,921 | Axis Capital Holdings Ltd | 1,793 | ||||||||
| 28,604 | *,e | Bright Health Group, Inc | 98 | |||||||
| 38,430 | * | Brighthouse Financial, Inc | 1,991 | |||||||
| 122,529 | Brown & Brown, Inc | 8,611 | ||||||||
| 25,189 | * | BRP Group, Inc | 910 | |||||||
| 229,123 | Chubb Ltd | 44,292 | ||||||||
| 347 |
COLLEGE RETIREMENT EQUITIES FUND - Equity Index Account
| SHARES | COMPANY | VALUE (000) | ||||||||
| 83,756 | Cincinnati Financial Corp | $ | 9,542 | |||||||
| 32,879 | *,e | Citizens, Inc (Class A) | 175 | |||||||
| 3,923 | CNA Financial Corp | 173 | ||||||||
| 66,761 | Conseco, Inc | 1,592 | ||||||||
| 7,812 | Donegal Group, Inc (Class A) | 112 | ||||||||
| 15,165 | * | eHealth, Inc | 387 | |||||||
| 15,546 | Employers Holdings, Inc | 643 | ||||||||
| 7,506 | * | Enstar Group Ltd | 1,858 | |||||||
| 13,782 | Erie Indemnity Co (Class A) | 2,655 | ||||||||
| 20,303 | Everest Re Group Ltd | 5,561 | ||||||||
| 143,159 | Fidelity National Financial Inc | 7,470 | ||||||||
| 52,851 | First American Financial Corp | 4,135 | ||||||||
| 311,286 | * | Genworth Financial, Inc (Class A) | 1,261 | |||||||
| 55,726 | Globe Life, Inc | 5,223 | ||||||||
| 24,045 | * | GoHealth, Inc | 91 | |||||||
| 9,663 | Goosehead Insurance, Inc | 1,257 | ||||||||
| 20,683 | * | Greenlight Capital Re Ltd (Class A) | 162 | |||||||
| 19,607 | Hanover Insurance Group, Inc | 2,570 | ||||||||
| 180,659 | Hartford Financial Services Group, Inc | 12,473 | ||||||||
| 3,092 | HCI Group, Inc | 258 | ||||||||
| 18,411 | Heritage Insurance Holdings, Inc | 108 | ||||||||
| 22,775 | Horace Mann Educators Corp | 881 | ||||||||
| 5,237 | Independence Holding Co | 297 | ||||||||
| 1,119 | Investors Title Co | 221 | ||||||||
| 19,526 | James River Group Holdings Ltd | 563 | ||||||||
| 33,482 | Kemper Corp | 1,968 | ||||||||
| 10,502 | Kinsale Capital Group, Inc | 2,498 | ||||||||
| 20,988 | *,e | Lemonade, Inc | 884 | |||||||
| 95,447 | Lincoln National Corp | 6,515 | ||||||||
| 112,892 | Loews Corp | 6,521 | ||||||||
| 6,948 | * | Markel Corp | 8,574 | |||||||
| 271,306 | Marsh & McLennan Cos, Inc | 47,158 | ||||||||
| 26,174 | * | MBIA, Inc | 413 | |||||||
| 12,675 | Mercury General Corp | 673 | ||||||||
| 380,912 | Metlife, Inc | 23,803 | ||||||||
| 1,551 | National Western Life Group, Inc | 333 | ||||||||
| 7,308 | * | NI Holdings, Inc | 138 | |||||||
| 151,820 | Old Republic International Corp | 3,732 | ||||||||
| 13,408 | * | Palomar Holdings, Inc | 868 | |||||||
| 21,522 | Primerica, Inc | 3,299 | ||||||||
| 141,558 | Principal Financial Group | 10,239 | ||||||||
| 37,307 | ProAssurance Corp | 944 | ||||||||
| 313,343 | Progressive Corp | 32,165 | ||||||||
| 202,763 | Prudential Financial, Inc | 21,947 | ||||||||
| 37,637 | Reinsurance Group of America, Inc (Class A) | 4,121 | ||||||||
| 25,282 | RenaissanceRe Holdings Ltd | 4,281 | ||||||||
| 23,570 | RLI Corp | 2,642 | ||||||||
| 7,901 | Safety Insurance Group, Inc | 672 | ||||||||
| 32,431 | Selective Insurance Group, Inc | 2,657 | ||||||||
| 73,128 | * | Selectquote, Inc | 663 | |||||||
| 8,398 | * | SiriusPoint Ltd | 68 | |||||||
| 11,039 | State Auto Financial Corp | 571 | ||||||||
| 15,315 | Stewart Information Services Corp | 1,221 | ||||||||
| 22,143 | Tiptree Inc | 306 | ||||||||
| 348 |
COLLEGE RETIREMENT EQUITIES FUND - Equity Index Account
| SHARES | COMPANY | VALUE (000) | ||||||||
| 131,467 | Travelers Cos, Inc | $ | 20,565 | |||||||
| 20,838 | * | Trupanion, Inc | 2,751 | |||||||
| 16,104 | United Fire Group Inc | 373 | ||||||||
| 12,682 | United Insurance Holdings Corp | 55 | ||||||||
| 22,402 | Universal Insurance Holdings, Inc | 381 | ||||||||
| 99,041 | Unum Group | 2,433 | ||||||||
| 77,055 | W.R. Berkley Corp | 6,349 | ||||||||
| 1,751 | White Mountains Insurance Group Ltd | 1,775 | ||||||||
| 66,407 | Willis Towers Watson plc | 15,771 | ||||||||
| TOTAL INSURANCE | 508,828 | |||||||||
| MATERIALS - 2.4% | ||||||||||
| 14,906 | AdvanSix, Inc | 704 | ||||||||
| 116,991 | Air Products & Chemicals, Inc | 35,596 | ||||||||
| 63,872 | Albemarle Corp | 14,931 | ||||||||
| 99,055 | Alcoa Corp | 5,902 | ||||||||
| 78,013 | * | Allegheny Technologies, Inc | 1,243 | |||||||
| 814,849 | Amcor plc | 9,786 | ||||||||
| 20,501 | American Vanguard Corp | 336 | ||||||||
| 91,243 | *,e | Amyris, Inc | 494 | |||||||
| 36,073 | Aptargroup, Inc | 4,418 | ||||||||
| 57,334 | * | Arconic Corp | 1,893 | |||||||
| 13,288 | Ardagh Group S.A. | 300 | ||||||||
| 74,922 | * | Ardagh Metal Packaging S.A. | 677 | |||||||
| 30,177 | Ashland Global Holdings, Inc | 3,249 | ||||||||
| 45,238 | Avery Dennison Corp | 9,797 | ||||||||
| 49,682 | Avient Corp | 2,780 | ||||||||
| 113,646 | * | Axalta Coating Systems Ltd | 3,764 | |||||||
| 19,086 | Balchem Corp | 3,218 | ||||||||
| 169,762 | Ball Corp | 16,343 | ||||||||
| 72,467 | * | Berry Global Group, Inc | 5,347 | |||||||
| 31,457 | Cabot Corp | 1,768 | ||||||||
| 25,997 | Carpenter Technology Corp | 759 | ||||||||
| 55,597 | Celanese Corp (Series A) | 9,344 | ||||||||
| 36,798 | * | Century Aluminum Co | 609 | |||||||
| 110,041 | CF Industries Holdings, Inc | 7,789 | ||||||||
| 5,158 | Chase Corp | 514 | ||||||||
| 90,404 | Chemours Co | 3,034 | ||||||||
| 11,678 | * | Clearwater Paper Corp | 428 | |||||||
| 250,263 | *,e | Cleveland-Cliffs, Inc | 5,448 | |||||||
| 119,550 | * | Coeur Mining, Inc | 603 | |||||||
| 53,154 | Commercial Metals Co | 1,929 | ||||||||
| 20,319 | Compass Minerals International, Inc | 1,038 | ||||||||
| 66,991 | * | Constellium SE | 1,200 | |||||||
| 393,963 | Corteva, Inc | 18,627 | ||||||||
| 67,521 | Crown Holdings, Inc | 7,469 | ||||||||
| 37,520 | *,e | Danimer Scientific, Inc | 320 | |||||||
| 28,159 | * | Diversey Holdings Ltd | 375 | |||||||
| 403,048 | Dow, Inc | 22,861 | ||||||||
| 284,266 | DuPont de Nemours, Inc | 22,963 | ||||||||
| 22,586 | Eagle Materials, Inc | 3,760 | ||||||||
| 73,320 | Eastman Chemical Co | 8,865 | ||||||||
| 133,116 | Ecolab, Inc | 31,228 | ||||||||
| 127,079 | Element Solutions, Inc | 3,085 | ||||||||
| 349 |
COLLEGE RETIREMENT EQUITIES FUND - Equity Index Account
| SHARES | COMPANY | VALUE (000) | ||||||||
| 21,673 | * | Ferro Corp | $ | 473 | ||||||
| 47,286 | *,† | Ferroglobe plc | 0 | |||||||
| 67,073 | FMC Corp | 7,371 | ||||||||
| 16,526 | * | Forterra, Inc | 393 | |||||||
| 777,614 | Freeport-McMoRan, Inc (Class B) | 32,450 | ||||||||
| 17,819 | FutureFuel Corp | 136 | ||||||||
| 18,881 | * | Gatos Silver, Inc | 196 | |||||||
| 23,656 | * | GCP Applied Technologies, Inc | 749 | |||||||
| 32,454 | Glatfelter Corp | 558 | ||||||||
| 145,764 | Graphic Packaging Holding Co | 2,842 | ||||||||
| 14,075 | Greif, Inc (Class A) | 850 | ||||||||
| 3,993 | Greif, Inc (Class B) | 239 | ||||||||
| 28,458 | H.B. Fuller Co | 2,305 | ||||||||
| 15,846 | Hawkins, Inc | 625 | ||||||||
| 9,402 | Haynes International, Inc | 379 | ||||||||
| 290,099 | Hecla Mining Co | 1,514 | ||||||||
| 104,824 | Huntsman Corp | 3,656 | ||||||||
| 21,966 | * | Ingevity Corp | 1,575 | |||||||
| 11,273 | Innospec, Inc | 1,018 | ||||||||
| 133,564 | International Flavors & Fragrances, Inc | 20,121 | ||||||||
| 207,582 | International Paper Co | 9,752 | ||||||||
| 6,735 | * | Intrepid Potash, Inc | 288 | |||||||
| 8,625 | Kaiser Aluminum Corp | 810 | ||||||||
| 15,231 | * | Koppers Holdings, Inc | 477 | |||||||
| 21,628 | * | Kraton Corp | 1,002 | |||||||
| 14,288 | Kronos Worldwide, Inc | 214 | ||||||||
| 80,227 | * | Livent Corp | 1,956 | |||||||
| 40,741 | Louisiana-Pacific Corp | 3,192 | ||||||||
| 140,098 | LyondellBasell Industries NV | 12,921 | ||||||||
| 33,027 | Martin Marietta Materials, Inc | 14,549 | ||||||||
| 11,119 | Materion Corp | 1,022 | ||||||||
| 12,674 | Minerals Technologies, Inc | 927 | ||||||||
| 186,754 | Mosaic Co | 7,338 | ||||||||
| 39,809 | *,e | MP Materials Corp | 1,808 | |||||||
| 18,118 | Myers Industries, Inc | 363 | ||||||||
| 10,909 | Neenah Inc | 505 | ||||||||
| 3,677 | NewMarket Corp | 1,260 | ||||||||
| 432,175 | Newmont Goldcorp Corp | 26,803 | ||||||||
| 149,512 | * | Novagold Resources Inc | 1,026 | |||||||
| 152,457 | Nucor Corp | 17,403 | ||||||||
| 90,414 | * | O-I Glass, Inc | 1,088 | |||||||
| 75,066 | Olin Corp | 4,318 | ||||||||
| 6,559 | Olympic Steel, Inc | 154 | ||||||||
| 38,461 | * | Orion Engineered Carbons SA | 706 | |||||||
| 51,497 | Packaging Corp of America | 7,011 | ||||||||
| 22,477 | Pactiv Evergreen, Inc | 285 | ||||||||
| 126,925 | PPG Industries, Inc | 21,887 | ||||||||
| 20,162 | PQ Group Holdings, Inc | 206 | ||||||||
| 17,967 | *,e | PureCycle Technologies, Inc | 172 | |||||||
| 7,360 | Quaker Chemical Corp | 1,699 | ||||||||
| 16,208 | * | Ranpak Holdings Corp | 609 | |||||||
| 31,957 | * | Rayonier Advanced Materials, Inc | 182 | |||||||
| 29,353 | Reliance Steel & Aluminum Co | 4,762 | ||||||||
| 36,601 | Royal Gold, Inc | 3,851 | ||||||||
| 350 |
COLLEGE RETIREMENT EQUITIES FUND - Equity Index Account
| SHARES | COMPANY | VALUE (000) | ||||||||
| 68,580 | RPM International, Inc | $ | 6,927 | |||||||
| 8,418 | Ryerson Holding Corp | 219 | ||||||||
| 14,147 | Schnitzer Steel Industries, Inc (Class A) | 735 | ||||||||
| 20,766 | Schweitzer-Mauduit International, Inc | 621 | ||||||||
| 22,512 | Scotts Miracle-Gro Co (Class A) | 3,624 | ||||||||
| 76,393 | Sealed Air Corp | 5,154 | ||||||||
| 23,291 | Sensient Technologies Corp | 2,330 | ||||||||
| 128,420 | Sherwin-Williams Co | 45,224 | ||||||||
| 33,361 | Silgan Holdings, Inc | 1,429 | ||||||||
| 55,117 | Sonoco Products Co | 3,191 | ||||||||
| 46,247 | Southern Copper Corp | 2,854 | ||||||||
| 104,286 | Steel Dynamics, Inc | 6,473 | ||||||||
| 11,764 | Stepan Co | 1,462 | ||||||||
| 64,023 | * | Summit Materials, Inc | 2,570 | |||||||
| 48,451 | SunCoke Energy, Inc | 319 | ||||||||
| 18,871 | * | Sylvamo Corp | 526 | |||||||
| 29,755 | * | TimkenSteel Corp | 491 | |||||||
| 19,671 | Tredegar Corp | 232 | ||||||||
| 23,586 | Trimas Corp | 873 | ||||||||
| 23,427 | Trinseo plc | 1,229 | ||||||||
| 62,538 | Tronox Holdings plc | 1,503 | ||||||||
| 4,630 | * | UFP Technologies, Inc | 325 | |||||||
| 1,357 | United States Lime & Minerals, Inc | 175 | ||||||||
| 123,966 | United States Steel Corp | 2,952 | ||||||||
| 99,474 | Valvoline, Inc | 3,709 | ||||||||
| 22,885 | Verso Corp | 618 | ||||||||
| 72,657 | Vulcan Materials Co | 15,082 | ||||||||
| 28,082 | Warrior Met Coal, Inc | 722 | ||||||||
| 18,212 | Westlake Chemical Corp | 1,769 | ||||||||
| 143,029 | WestRock Co | 6,345 | ||||||||
| 18,895 | Worthington Industries, Inc | 1,033 | ||||||||
| 10,209 | *,e | Zymergen, Inc | 68 | |||||||
| TOTAL MATERIALS | 623,574 | |||||||||
| MEDIA & ENTERTAINMENT - 8.1% | ||||||||||
| 420,631 | Activision Blizzard, Inc | 27,985 | ||||||||
| 41,683 | * | Advantage Solutions, Inc | 334 | |||||||
| 160,955 | * | Alphabet, Inc (Class A) | 466,293 | |||||||
| 150,161 | * | Alphabet, Inc (Class C) | 434,504 | |||||||
| 112,426 | * | Altice USA, Inc | 1,819 | |||||||
| 278,123 | *,e | AMC Entertainment Holdings, Inc | 7,565 | |||||||
| 16,067 | * | AMC Networks, Inc | 553 | |||||||
| 7,354 | * | Boston Omaha Corp | 211 | |||||||
| 3,042 | Cable One, Inc | 5,364 | ||||||||
| 17,446 | * | Cardlytics, Inc | 1,153 | |||||||
| 51,402 | * | Cargurus, Inc | 1,729 | |||||||
| 37,344 | * | Cars.com, Inc | 601 | |||||||
| 67,158 | * | Charter Communications, Inc | 43,785 | |||||||
| 6,276 | * | Chicken Soup For The Soul Entertainment, Inc | 87 | |||||||
| 58,982 | * | Cinemark Holdings, Inc | 951 | |||||||
| 198,206 | * | Clear Channel | 656 | |||||||
| 2,441,951 | Comcast Corp (Class A) | 122,903 | ||||||||
| 31,610 | * | comScore, Inc | 106 | |||||||
| 772 | * | Daily Journal Corp | 275 | |||||||
| 351 |
COLLEGE RETIREMENT EQUITIES FUND - Equity Index Account
| SHARES | COMPANY | VALUE (000) | ||||||||
| 89,117 | *,e | Discovery, Inc (Class A) | $ | 2,098 | ||||||
| 173,268 | * | Discovery, Inc (Class C) | 3,968 | |||||||
| 136,485 | * | DISH Network Corp (Class A) | 4,428 | |||||||
| 149,844 | Electronic Arts, Inc | 19,764 | ||||||||
| 11,002 | * | Emerald Holding, Inc | 44 | |||||||
| 88,350 | * | Entercom Communications Corp | 227 | |||||||
| 50,932 | Entravision Communications Corp (Class A) | 345 | ||||||||
| 40,961 | * | Eventbrite Inc | 714 | |||||||
| 8,345 | * | EverQuote Inc | 131 | |||||||
| 31,270 | * | EW Scripps Co (Class A) | 605 | |||||||
| 10,504 | * | Fluent, Inc | 21 | |||||||
| 177,109 | Fox Corp (Class A) | 6,535 | ||||||||
| 87,909 | Fox Corp (Class B) | 3,013 | ||||||||
| 71,756 | *,e | fuboTV, Inc | 1,114 | |||||||
| 74,491 | * | Gannett Co, Inc | 397 | |||||||
| 46,930 | Gray Television, Inc | 946 | ||||||||
| 11,523 | * | Hemisphere Media Group, Inc | 84 | |||||||
| 42,355 | * | IAC | 5,536 | |||||||
| 61,117 | * | iHeartMedia, Inc | 1,286 | |||||||
| 27,196 | * | Imax Corp | 485 | |||||||
| 201,354 | Interpublic Group of Cos, Inc | 7,541 | ||||||||
| 23,547 | John Wiley & Sons, Inc (Class A) | 1,349 | ||||||||
| 7,655 | * | Liberty Braves Group (Class A) | 220 | |||||||
| 25,374 | * | Liberty Braves Group (Class C) | 713 | |||||||
| 12,929 | * | Liberty Broadband Corp (Class A) | 2,080 | |||||||
| 74,361 | * | Liberty Broadband Corp (Class C) | 11,980 | |||||||
| 15,619 | * | Liberty Media Group (Class A) | 927 | |||||||
| 108,895 | * | Liberty Media Group (Class C) | 6,887 | |||||||
| 34,936 | * | Liberty SiriusXM Group (Class A) | 1,776 | |||||||
| 80,096 | * | Liberty SiriusXM Group (Class C) | 4,073 | |||||||
| 53,282 | * | Liberty TripAdvisor Holdings, Inc | 116 | |||||||
| 37,150 | * | Lions Gate Entertainment Corp (Class A) | 618 | |||||||
| 71,817 | * | Lions Gate Entertainment Corp (Class B) | 1,105 | |||||||
| 73,828 | * | Live Nation, Inc | 8,836 | |||||||
| 10,931 | * | Loyalty Ventures, Inc | 329 | |||||||
| 10,365 | * | Madison Square Garden Co | 1,801 | |||||||
| 13,156 | * | Madison Square Garden Entertainment Corp | 925 | |||||||
| 61,168 | * | Magnite, Inc | 1,070 | |||||||
| 14,211 | *,e | Marcus Corp | 254 | |||||||
| 148,269 | * | Match Group, Inc | 19,609 | |||||||
| 11,302 | * | MediaAlpha, Inc | 174 | |||||||
| 1,264,882 | * | Meta Platforms, Inc. | 425,443 | |||||||
| 46,358 | National CineMedia, Inc | 130 | ||||||||
| 231,094 | * | Netflix, Inc | 139,220 | |||||||
| 89,935 | New York Times Co (Class A) | 4,344 | ||||||||
| 213,357 | News Corp (Class A) | 4,760 | ||||||||
| 66,535 | News Corp (Class B) | 1,497 | ||||||||
| 22,603 | Nexstar Media Group Inc | 3,413 | ||||||||
| 117,073 | Omnicom Group, Inc | 8,578 | ||||||||
| 300,393 | * | Pinterest, Inc | 10,919 | |||||||
| 42,908 | * | Playtika Holding Corp | 742 | |||||||
| 20,643 | * | QuinStreet, Inc | 375 | |||||||
| 63,324 | * | Roku, Inc | 14,451 | |||||||
| 19,984 | Scholastic Corp | 799 | ||||||||
| 352 |
COLLEGE RETIREMENT EQUITIES FUND - Equity Index Account
| SHARES | COMPANY | VALUE (000) | ||||||||
| 25,063 | Sinclair Broadcast Group, Inc (Class A) | $ | 662 | |||||||
| 495,104 | e | Sirius XM Holdings, Inc | 3,144 | |||||||
| 161,762 | *,e | Skillz, Inc | 1,204 | |||||||
| 75,096 | * | Spotify Technology S.A. | 17,575 | |||||||
| 33,238 | * | Stagwell, Inc | 288 | |||||||
| 62,733 | * | Take-Two Interactive Software, Inc | 11,149 | |||||||
| 12,153 | * | TechTarget, Inc | 1,163 | |||||||
| 119,764 | TEGNA, Inc | 2,223 | ||||||||
| 56,597 | * | TripAdvisor, Inc | 1,543 | |||||||
| 44,667 | * | TrueCar, Inc | 152 | |||||||
| 421,075 | * | Twitter, Inc | 18,199 | |||||||
| 4,594 | ViacomCBS, Inc (Class A) | 153 | ||||||||
| 320,378 | ViacomCBS, Inc (Class B) | 9,669 | ||||||||
| 68,763 | * | Vimeo, Inc | 1,235 | |||||||
| 971,416 | * | Walt Disney Co | 150,463 | |||||||
| 28,599 | * | WideOpenWest, Inc | 615 | |||||||
| 27,047 | e | World Wrestling Entertainment, Inc (Class A) | 1,334 | |||||||
| 41,665 | * | Yelp, Inc | 1,510 | |||||||
| 23,417 | * | Ziff Davis Inc | 2,596 | |||||||
| 549,506 | * | Zynga, Inc | 3,517 | |||||||
| TOTAL MEDIA & ENTERTAINMENT | 2,084,063 | |||||||||
| PHARMACEUTICALS, BIOTECHNOLOGY & LIFE SCIENCES - 7.6% | ||||||||||
| 45,940 | * | 10X Genomics, Inc | 6,843 | |||||||
| 11,229 | * | 2seventy bio, Inc | 288 | |||||||
| 11,292 | * | 4D Molecular Therapeutics, Inc | 248 | |||||||
| 947,035 | AbbVie, Inc | 128,229 | ||||||||
| 70,913 | * | Acadia Pharmaceuticals, Inc | 1,655 | |||||||
| 23,691 | *,e | Aclaris Therapeutics, Inc | 344 | |||||||
| 11,379 | * | Adagio Therapeutics, Inc | 83 | |||||||
| 59,774 | * | Adaptive Biotechnologies Corp | 1,677 | |||||||
| 36,900 | * | Adverum Biotechnologies, Inc | 65 | |||||||
| 25,056 | * | Aeglea BioTherapeutics, Inc | 119 | |||||||
| 21,807 | * | Aerie Pharmaceuticals, Inc | 153 | |||||||
| 43,765 | * | Affimed NV | 242 | |||||||
| 107,560 | * | Agenus, Inc | 346 | |||||||
| 162,760 | Agilent Technologies, Inc | 25,985 | ||||||||
| 34,493 | * | Agios Pharmaceuticals, Inc | 1,134 | |||||||
| 62,063 | * | Akebia Therapeutics, Inc | 140 | |||||||
| 14,029 | * | Akero Therapeutics, Inc | 297 | |||||||
| 8,375 | *,e | Akouos, Inc | 71 | |||||||
| 6,175 | * | Albireo Pharma, Inc | 144 | |||||||
| 34,164 | *,† | Alder Biopharmaceuticals Inc | 30 | |||||||
| 26,477 | *,e | Aldeyra Therapeutics, Inc | 106 | |||||||
| 31,429 | * | Alector, Inc | 649 | |||||||
| 10,235 | * | Aligos Therapeutics, Inc | 121 | |||||||
| 87,531 | * | Alkermes plc | 2,036 | |||||||
| 19,068 | * | Allakos, Inc | 187 | |||||||
| 28,864 | * | Allogene Therapeutics, Inc | 431 | |||||||
| 10,335 | * | Allovir, Inc | 134 | |||||||
| 64,441 | * | Alnylam Pharmaceuticals, Inc | 10,928 | |||||||
| 17,738 | * | Altimmune, Inc | 162 | |||||||
| 9,675 | * | ALX Oncology Holdings, Inc | 208 | |||||||
| 305,508 | Amgen, Inc | 68,730 | ||||||||
| 353 |
COLLEGE RETIREMENT EQUITIES FUND - Equity Index Account
| SHARES | COMPANY | VALUE (000) | ||||||||
| 151,298 | * | Amicus Therapeutics, Inc | $ | 1,747 | ||||||
| 53,162 | * | Amneal Pharmaceuticals, Inc | 255 | |||||||
| 25,774 | * | Amphastar Pharmaceuticals, Inc | 600 | |||||||
| 12,566 | * | AnaptysBio, Inc | 437 | |||||||
| 30,524 | *,e | Anavex Life Sciences Corp | 529 | |||||||
| 5,767 | * | ANI Pharmaceuticals, Inc | 266 | |||||||
| 10,943 | * | Anika Therapeutics, Inc | 392 | |||||||
| 8,875 | * | Annexon, Inc | 102 | |||||||
| 104,354 | * | Antares Pharma, Inc | 373 | |||||||
| 34,684 | * | Apellis Pharmaceuticals, Inc | 1,640 | |||||||
| 13,418 | * | Applied Molecular Transport, Inc | 188 | |||||||
| 2,776 | * | Applied Therapeutics, Inc | 25 | |||||||
| 7,756 | *,e | Arcturus Therapeutics Holdings, Inc | 287 | |||||||
| 20,717 | * | Arcus Biosciences, Inc | 838 | |||||||
| 15,151 | * | Arcutis Biotherapeutics, Inc | 314 | |||||||
| 22,973 | * | Ardelyx, Inc | 25 | |||||||
| 33,642 | * | Arena Pharmaceuticals, Inc | 3,127 | |||||||
| 55,310 | * | Arrowhead Pharmaceuticals Inc | 3,667 | |||||||
| 23,815 | * | Arvinas, Inc | 1,956 | |||||||
| 34,194 | * | Atara Biotherapeutics, Inc | 539 | |||||||
| 35,244 | * | Atea Pharmaceuticals, Inc | 315 | |||||||
| 28,525 | *,e | Athenex, Inc | 39 | |||||||
| 52,762 | *,e | Athersys, Inc | 48 | |||||||
| 7,303 | * | Athira Pharma, Inc | 95 | |||||||
| 92,322 | *,e | Atossa Therapeutics, Inc | 148 | |||||||
| 12,676 | *,e | Atreca, Inc | 38 | |||||||
| 318,550 | * | Avantor, Inc | 13,424 | |||||||
| 33,858 | * | Avid Bioservices, Inc | 988 | |||||||
| 9,645 | * | Avidity Biosciences, Inc | 229 | |||||||
| 13,026 | *,e | Avita Medical, Inc | 156 | |||||||
| 13,157 | * | Avrobio, Inc | 51 | |||||||
| 15,727 | *,e | Axsome Therapeutics, Inc | 594 | |||||||
| 25,636 | * | Beam Therapeutics, Inc | 2,043 | |||||||
| 26,163 | * | Berkeley Lights, Inc | 476 | |||||||
| 12,065 | *,e | Beyondspring Inc | 55 | |||||||
| 6,481 | * | BioAtla, Inc | 127 | |||||||
| 97,016 | *,e | BioCryst Pharmaceuticals, Inc | 1,344 | |||||||
| 52,671 | * | BioDelivery Sciences International, Inc | 163 | |||||||
| 80,536 | * | Biogen, Inc | 19,322 | |||||||
| 28,080 | * | Biohaven Pharmaceutical Holding Co Ltd | 3,870 | |||||||
| 100,218 | * | BioMarin Pharmaceutical, Inc | 8,854 | |||||||
| 153,496 | *,e | Bionano Genomics, Inc | 459 | |||||||
| 11,654 | * | Bio-Rad Laboratories, Inc (Class A) | 8,805 | |||||||
| 21,267 | Bio-Techne Corp | 11,002 | ||||||||
| 6,302 | *,e | Bioxcel Therapeutics Inc | 128 | |||||||
| 7,321 | *,e | Black Diamond Therapeutics, Inc | 39 | |||||||
| 33,689 | * | Bluebird Bio, Inc | 337 | |||||||
| 31,927 | * | Blueprint Medicines Corp | 3,420 | |||||||
| 7,102 | *,e | Bolt Biotherapeutics, Inc | 35 | |||||||
| 58,721 | *,e | Bridgebio Pharma, Inc | 979 | |||||||
| 1,198,218 | Bristol-Myers Squibb Co | 74,709 | ||||||||
| 25,182 | * | Brooklyn ImmunoTherapeutics, Inc | 105 | |||||||
| 56,206 | Bruker BioSciences Corp | 4,716 | ||||||||
| 18,793 | * | C4 Therapeutics, Inc | 605 | |||||||
| 354 |
COLLEGE RETIREMENT EQUITIES FUND - Equity Index Account
| SHARES | COMPANY | VALUE (000) | ||||||||
| 19,366 | * | Cara Therapeutics, Inc | $ | 236 | ||||||
| 129,048 | * | Cardiff Oncology, Inc | 776 | |||||||
| 27,306 | * | CareDx, Inc | 1,242 | |||||||
| 10,333 | * | Caribou Biosciences, Inc | 156 | |||||||
| 20,876 | *,e | Cassava Sciences, Inc | 912 | |||||||
| 90,837 | * | Catalent, Inc | 11,630 | |||||||
| 50,782 | * | Catalyst Pharmaceuticals, Inc | 344 | |||||||
| 21,395 | * | Celldex Therapeutics, Inc | 827 | |||||||
| 20,222 | *,e | CEL-SCI Corp | 144 | |||||||
| 19,234 | * | Cerevel Therapeutics Holdings, Inc | 624 | |||||||
| 27,377 | * | Charles River Laboratories International, Inc | 10,315 | |||||||
| 26,464 | * | ChemoCentryx, Inc | 964 | |||||||
| 30,594 | * | Chimerix, Inc | 197 | |||||||
| 7,917 | * | Chinook Therapeutics, Inc | 129 | |||||||
| 23,081 | *,e | ChromaDex Corp | 86 | |||||||
| 61,931 | *,e | Citius Pharmaceuticals, Inc | 95 | |||||||
| 67,474 | *,e | Clovis Oncology, Inc | 183 | |||||||
| 23,538 | * | Codexis, Inc | 736 | |||||||
| 27,864 | * | Coherus Biosciences, Inc | 445 | |||||||
| 16,286 | * | Collegium Pharmaceutical, Inc | 304 | |||||||
| 52,750 | * | Corcept Therapeutics, Inc | 1,044 | |||||||
| 10,884 | *,e | Cortexyme Inc | 137 | |||||||
| 16,128 | * | Crinetics Pharmaceuticals, Inc | 458 | |||||||
| 11,975 | * | Cue Biopharma, Inc | 135 | |||||||
| 7,345 | *,e | Cullinan Oncology, Inc | 113 | |||||||
| 29,183 | *,e | CureVac NV | 1,001 | |||||||
| 47,252 | * | Curis, Inc | 225 | |||||||
| 39,943 | * | Cymabay Therapeutics, Inc | 135 | |||||||
| 42,716 | *,e | Cytokinetics, Inc | 1,947 | |||||||
| 21,311 | * | CytomX Therapeutics, Inc | 92 | |||||||
| 339,367 | Danaher Corp | 111,655 | ||||||||
| 22,263 | * | Deciphera Pharmaceuticals, Inc | 218 | |||||||
| 49,642 | * | Denali Therapeutics, Inc | 2,214 | |||||||
| 12,956 | *,e | DermTech, Inc | 205 | |||||||
| 14,200 | *,e | Design Therapeutics, Inc | 304 | |||||||
| 117,742 | * | Durect Corp | 116 | |||||||
| 58,823 | *,e | Dynavax Technologies Corp | 828 | |||||||
| 16,387 | *,e | Dyne Therapeutics, Inc | 195 | |||||||
| 6,368 | * | Eagle Pharmaceuticals, Inc | 324 | |||||||
| 20,664 | * | Edgewise Therapeutics, Inc | 316 | |||||||
| 35,681 | * | Editas Medicine, Inc | 947 | |||||||
| 14,062 | * | Eiger BioPharmaceuticals, Inc | 73 | |||||||
| 242,401 | * | Elanco Animal Health, Inc | 6,879 | |||||||
| 455,955 | Eli Lilly & Co | 125,944 | ||||||||
| 24,015 | * | Emergent Biosolutions, Inc | 1,044 | |||||||
| 11,786 | * | Enanta Pharmaceuticals, Inc | 881 | |||||||
| 56,660 | * | Epizyme, Inc | 142 | |||||||
| 9,694 | *,e | Esperion Thereapeutics, Inc | 48 | |||||||
| 16,577 | *,e | Evelo Biosciences, Inc | 101 | |||||||
| 17,590 | *,e | Evolus, Inc | 115 | |||||||
| 93,800 | * | Exact Sciences Corp | 7,300 | |||||||
| 170,031 | * | Exelixis, Inc | 3,108 | |||||||
| 42,216 | * | Fate Therapeutics, Inc | 2,470 | |||||||
| 50,667 | * | FibroGen, Inc | 714 | |||||||
| 355 |
COLLEGE RETIREMENT EQUITIES FUND - Equity Index Account
| SHARES | COMPANY | VALUE (000) | ||||||||
| 20,851 | *,e | Fluidigm Corp | $ | 82 | ||||||
| 17,542 | * | Forma Therapeutics Holdings, Inc | 249 | |||||||
| 6,156 | *,e | Forte Biosciences, Inc | 13 | |||||||
| 16,778 | *,e | Frequency Therapeutics, Inc | 86 | |||||||
| 14,355 | *,e | Fulcrum Therapeutics, Inc | 254 | |||||||
| 20,311 | *,e | G1 Therapeutics, Inc | 207 | |||||||
| 23,909 | * | Generation Bio Co | 169 | |||||||
| 114,325 | *,e | Geron Corp | 139 | |||||||
| 673,322 | Gilead Sciences, Inc | 48,890 | ||||||||
| 36,433 | * | Global Blood Therapeutics, Inc | 1,066 | |||||||
| 12,922 | * | Gossamer Bio, Inc | 146 | |||||||
| 22,037 | * | Gritstone Oncology, Inc | 283 | |||||||
| 13,013 | *,e | GT Biopharma, Inc | 40 | |||||||
| 79,065 | * | Halozyme Therapeutics, Inc | 3,179 | |||||||
| 12,195 | * | Harmony Biosciences Holdings, Inc | 520 | |||||||
| 52,161 | *,e | Heron Therapeutics, Inc | 476 | |||||||
| 11,341 | * | Homology Medicines, Inc | 41 | |||||||
| 119,937 | * | Horizon Therapeutics Plc | 12,924 | |||||||
| 28,958 | * | Humanigen, Inc | 108 | |||||||
| 132,891 | *,e | iBio, Inc | 73 | |||||||
| 7,208 | * | Icosavax, Inc | 165 | |||||||
| 15,316 | * | Ideaya Biosciences, Inc | 362 | |||||||
| 2,211 | * | IGM Biosciences, Inc | 65 | |||||||
| 79,203 | * | Illumina, Inc | 30,132 | |||||||
| 36,493 | *,e | ImmunityBio, Inc | 222 | |||||||
| 106,612 | * | Immunogen, Inc | 791 | |||||||
| 11,380 | * | Immunovant, Inc | 97 | |||||||
| 101,497 | * | Incyte Corp | 7,450 | |||||||
| 303,016 | * | Infinity Pharmaceuticals, Inc | 682 | |||||||
| 15,231 | * | Inhibrx, Inc | 665 | |||||||
| 34,523 | * | Innoviva, Inc | 596 | |||||||
| 7,067 | * | Inotiv, Inc | 297 | |||||||
| 112,816 | *,e | Inovio Pharmaceuticals, Inc | 563 | |||||||
| 60,247 | * | Insmed, Inc | 1,641 | |||||||
| 28,852 | *,e | Instil Bio, Inc | 494 | |||||||
| 34,856 | * | Intellia Therapeutics, Inc | 4,121 | |||||||
| 12,921 | *,e | Intercept Pharmaceuticals, Inc | 210 | |||||||
| 38,562 | * | Intra-Cellular Therapies, Inc | 2,018 | |||||||
| 109,344 | *,e | Invitae Corp | 1,670 | |||||||
| 79,163 | * | Ionis Pharmaceuticals, Inc | 2,409 | |||||||
| 74,052 | * | Iovance Biotherapeutics, Inc | 1,414 | |||||||
| 104,821 | * | IQVIA Holdings, Inc | 29,574 | |||||||
| 95,014 | * | Ironwood Pharmaceuticals, Inc | 1,108 | |||||||
| 11,046 | * | iTeos Therapeutics, Inc | 514 | |||||||
| 56,231 | * | IVERIC bio, Inc | 940 | |||||||
| 32,370 | * | Jazz Pharmaceuticals plc | 4,124 | |||||||
| 1,412,966 | Johnson & Johnson | 241,716 | ||||||||
| 4,482 | * | Jounce Therapeutics, Inc | 37 | |||||||
| 5,857 | *,e | Kala Pharmaceuticals, Inc | 7 | |||||||
| 10,666 | * | KalVista Pharmaceuticals Inc | 141 | |||||||
| 12,114 | * | Karuna Therapeutics, Inc | 1,587 | |||||||
| 46,110 | *,e | Karyopharm Therapeutics, Inc | 296 | |||||||
| 15,593 | *,e | KemPharm, Inc | 136 | |||||||
| 8,516 | * | Keros Therapeutics, Inc | 498 | |||||||
| 356 |
COLLEGE RETIREMENT EQUITIES FUND - Equity Index Account
| SHARES | COMPANY | VALUE (000) | ||||||||
| 18,676 | * | Kezar Life Sciences, Inc | $ | 312 | ||||||
| 11,321 | * | Kiniksa Pharmaceuticals Ltd | 133 | |||||||
| 7,565 | *,e | Kinnate Biopharma, Inc | 134 | |||||||
| 18,276 | * | Kodiak Sciences, Inc | 1,549 | |||||||
| 21,178 | *,e | Kronos Bio, Inc | 288 | |||||||
| 9,785 | * | Krystal Biotech Inc | 684 | |||||||
| 31,598 | * | Kura Oncology, Inc | 442 | |||||||
| 15,771 | * | Kymera Therapeutics, Inc | 1,001 | |||||||
| 30,110 | * | Lexicon Pharmaceuticals, Inc | 119 | |||||||
| 8,586 | * | Ligand Pharmaceuticals, Inc (Class B) | 1,326 | |||||||
| 32,187 | * | MacroGenics, Inc | 517 | |||||||
| 6,193 | * | Madrigal Pharmaceuticals, Inc | 525 | |||||||
| 94,899 | *,e | MannKind Corp | 415 | |||||||
| 54,984 | * | Maravai LifeSciences Holdings, Inc | 2,304 | |||||||
| 20,153 | *,e | Marinus Pharmaceuticals, Inc | 239 | |||||||
| 51,230 | * | MaxCyte, Inc | 522 | |||||||
| 15,823 | * | Medpace Holdings, Inc | 3,444 | |||||||
| 61,495 | * | MEI Pharma, Inc | 164 | |||||||
| 10,086 | * | MeiraGTx Holdings plc | 239 | |||||||
| 1,356,565 | Merck & Co, Inc | 103,967 | ||||||||
| 27,294 | * | Mersana Therapeutics, Inc | 170 | |||||||
| 12,288 | * | Mettler-Toledo International, Inc | 20,855 | |||||||
| 60,615 | *,e | MiMedx Group, Inc | 366 | |||||||
| 175,751 | *,e | Mind Medicine MindMed, Inc | 243 | |||||||
| 21,876 | * | Mirati Therapeutics, Inc | 3,209 | |||||||
| 181,845 | * | Moderna, Inc | 46,185 | |||||||
| 33,966 | * | Molecular Templates, Inc | 133 | |||||||
| 8,159 | * | Morphic Holding, Inc | 387 | |||||||
| 46,607 | * | Myriad Genetics, Inc | 1,286 | |||||||
| 22,499 | * | NanoString Technologies, Inc | 950 | |||||||
| 42,988 | * | Natera, Inc | 4,015 | |||||||
| 106,507 | * | Nektar Therapeutics | 1,439 | |||||||
| 58,635 | * | NeoGenomics, Inc | 2,001 | |||||||
| 17,673 | * | Neoleukin Therapeutics, Inc | 85 | |||||||
| 51,383 | * | Neurocrine Biosciences, Inc | 4,376 | |||||||
| 15,360 | * | NGM Biopharmaceuticals Inc | 272 | |||||||
| 9,374 | * | Nkarta, Inc | 144 | |||||||
| 40,572 | *,e | Novavax, Inc | 5,805 | |||||||
| 17,085 | * | Nurix Therapeutics, Inc | 495 | |||||||
| 35,946 | *,e | Nuvation Bio, Inc | 306 | |||||||
| 100,765 | *,e | Ocugen, Inc | 458 | |||||||
| 41,830 | * | Ocular Therapeutix, Inc | 292 | |||||||
| 6,792 | * | Olema Pharmaceuticals, Inc | 64 | |||||||
| 29,642 | *,e | Omeros Corp | 191 | |||||||
| 38,675 | * | Oncocyte Corp | 84 | |||||||
| 238,337 | *,e | Opko Health, Inc | 1,146 | |||||||
| 14,566 | * | Oramed Pharmaceuticals, Inc | 208 | |||||||
| 13,691 | * | Organogenesis Holdings Inc | 127 | |||||||
| 142,546 | Organon & Co | 4,341 | ||||||||
| 16,096 | * | ORIC Pharmaceuticals, Inc | 237 | |||||||
| 100,456 | * | Pacific Biosciences of California, Inc | 2,055 | |||||||
| 23,821 | * | Pacira BioSciences Inc | 1,433 | |||||||
| 17,330 | *,e | Paratek Pharmaceuticals, Inc | 78 | |||||||
| 8,093 | * | Passage Bio, Inc | 51 | |||||||
| 357 |
COLLEGE RETIREMENT EQUITIES FUND - Equity Index Account
| SHARES | COMPANY | VALUE (000) | ||||||||
| 67,725 | PerkinElmer, Inc | $ | 13,617 | |||||||
| 73,370 | Perrigo Co plc | 2,854 | ||||||||
| 19,507 | * | Personalis, Inc | 278 | |||||||
| 2,992,253 | Pfizer, Inc | 176,693 | ||||||||
| 6,396 | *,e | Phathom Pharmaceuticals, Inc | 126 | |||||||
| 12,927 | Phibro Animal Health Corp | 264 | ||||||||
| 13,444 | *,e | Pliant Therapeutics, Inc | 181 | |||||||
| 14,315 | * | PMV Pharmaceuticals, Inc | 331 | |||||||
| 48,133 | * | Praxis Precision Medicines, Inc | 948 | |||||||
| 39,456 | *,e | Precigen, Inc | 146 | |||||||
| 22,592 | * | Precision BioSciences Inc | 167 | |||||||
| 5,217 | *,e | Prelude Therapeutics, Inc | 65 | |||||||
| 27,333 | * | Prestige Consumer Healthcare, Inc. | 1,658 | |||||||
| 51,583 | *,† | Progenics Pharmaceuticals, Inc | 0 | |||||||
| 15,994 | * | Prometheus Biosciences, Inc | 632 | |||||||
| 22,557 | * | Protagonist Therapeutics, Inc | 771 | |||||||
| 18,603 | * | Prothena Corp plc | 919 | |||||||
| 25,243 | *,e | Provention Bio, Inc | 142 | |||||||
| 37,990 | * | PTC Therapeutics, Inc | 1,513 | |||||||
| 20,506 | * | Puma Biotechnology, Inc | 62 | |||||||
| 125,141 | * | QIAGEN NV | 6,955 | |||||||
| 16,838 | * | Quanterix Corp | 714 | |||||||
| 27,010 | * | Radius Health, Inc | 187 | |||||||
| 6,533 | * | RAPT Therapeutics, Inc | 240 | |||||||
| 14,987 | * | Reata Pharmaceuticals, Inc | 395 | |||||||
| 61,485 | *,e | Recursion Pharmaceuticals, Inc | 1,053 | |||||||
| 53,592 | * | Regeneron Pharmaceuticals, Inc | 33,844 | |||||||
| 19,715 | * | REGENXBIO, Inc | 645 | |||||||
| 31,945 | * | Relay Therapeutics, Inc | 981 | |||||||
| 8,368 | * | Relmada Therapeutics, Inc | 189 | |||||||
| 30,248 | * | Repligen Corp | 8,011 | |||||||
| 10,254 | * | Replimune Group, Inc | 278 | |||||||
| 33,815 | * | Revance Therapeutics, Inc | 552 | |||||||
| 32,407 | * | REVOLUTION Medicines, Inc | 816 | |||||||
| 24,038 | * | Rhythm Pharmaceuticals, Inc | 240 | |||||||
| 86,450 | * | Rigel Pharmaceuticals, Inc | 229 | |||||||
| 20,281 | * | Rocket Pharmaceuticals, Inc | 443 | |||||||
| 180,548 | Royalty Pharma plc | 7,195 | ||||||||
| 22,395 | *,e | Rubius Therapeutics, Inc | 217 | |||||||
| 28,225 | * | Sage Therapeutics, Inc | 1,201 | |||||||
| 46,510 | * | Sana Biotechnology, Inc | 720 | |||||||
| 52,234 | * | Sangamo Therapeutics Inc | 392 | |||||||
| 41,917 | * | Sarepta Therapeutics, Inc | 3,775 | |||||||
| 13,353 | *,e | Scholar Rock Holding Corp | 332 | |||||||
| 72,859 | * | Seagen, Inc | 11,264 | |||||||
| 22,417 | *,e | Seer, Inc | 511 | |||||||
| 48,754 | * | Selecta Biosciences, Inc | 159 | |||||||
| 37,976 | * | Seres Therapeutics, Inc | 316 | |||||||
| 93,280 | *,e | Sesen Bio, Inc | 76 | |||||||
| 14,514 | * | Shattuck Labs, Inc | 124 | |||||||
| 35,191 | * | SIGA Technologies, Inc | 265 | |||||||
| 7,098 | * | Silverback Therapeutics, Inc | 47 | |||||||
| 6,168 | * | Solid Biosciences, Inc | 11 | |||||||
| 127,563 | *,e | Sorrento Therapeutics, Inc | 593 | |||||||
| 358 |
COLLEGE RETIREMENT EQUITIES FUND - Equity Index Account
| SHARES | COMPANY | VALUE (000) | ||||||||
| 43,033 | * | Sotera Health Co | $ | 1,013 | ||||||
| 56,104 | * | Spectrum Pharmaceuticals, Inc | 71 | |||||||
| 15,930 | * | SpringWorks Therapeutics, Inc | 987 | |||||||
| 10,464 | * | Stoke Therapeutics, Inc | 251 | |||||||
| 26,807 | * | Supernus Pharmaceuticals, Inc | 782 | |||||||
| 15,843 | * | Sutro Biopharma, Inc | 236 | |||||||
| 24,529 | * | Syndax Pharmaceuticals, Inc | 537 | |||||||
| 55,220 | * | Syneos Health, Inc | 5,670 | |||||||
| 9,466 | * | Syros Pharmaceuticals, Inc | 31 | |||||||
| 12,149 | *,e | Taysha Gene Therapies, Inc | 142 | |||||||
| 9,709 | * | TCR2 Therapeutics Inc | 45 | |||||||
| 69,942 | * | TG Therapeutics, Inc | 1,329 | |||||||
| 114,084 | *,e | TherapeuticsMD, Inc | 41 | |||||||
| 29,259 | * | Theravance Biopharma, Inc | 323 | |||||||
| 210,446 | Thermo Fisher Scientific, Inc | 140,418 | ||||||||
| 180,181 | * | Tonix Pharmaceuticals Holding Corp | 64 | |||||||
| 25,726 | * | Travere Therapeutics, Inc | 799 | |||||||
| 25,134 | * | Turning Point Therapeutics Inc | 1,199 | |||||||
| 26,284 | * | Twist Bioscience Corp | 2,034 | |||||||
| 33,751 | * | Ultragenyx Pharmaceutical, Inc | 2,838 | |||||||
| 25,272 | * | United Therapeutics Corp | 5,461 | |||||||
| 12,098 | *,e | UroGen Pharma Ltd | 115 | |||||||
| 31,395 | * | Vanda Pharmaceuticals, Inc | 493 | |||||||
| 65,175 | *,e | Vaxart Inc | 409 | |||||||
| 21,774 | *,e | Vaxcyte, Inc | 518 | |||||||
| 102,172 | *,e | VBI Vaccines, Inc | 239 | |||||||
| 36,815 | * | Veracyte, Inc | 1,517 | |||||||
| 97,480 | * | Verastem, Inc | 200 | |||||||
| 24,994 | * | Vericel Corp | 982 | |||||||
| 136,771 | * | Vertex Pharmaceuticals, Inc | 30,035 | |||||||
| 8,512 | *,e | Verve Therapeutics, Inc | 314 | |||||||
| 629,110 | Viatris, Inc | 8,512 | ||||||||
| 29,514 | * | Viking Therapeutics, Inc | 136 | |||||||
| 32,800 | * | Vir Biotechnology, Inc | 1,373 | |||||||
| 19,787 | * | Viracta Therapeutics, Inc | 72 | |||||||
| 104,364 | *,e | VistaGen Therapeutics, Inc | 204 | |||||||
| 6,387 | *,e | Vor BioPharma, Inc | 74 | |||||||
| 33,594 | * | Waters Corp | 12,517 | |||||||
| 39,150 | * | WaVe Life Sciences Ltd | 123 | |||||||
| 39,169 | West Pharmaceutical Services, Inc | 18,371 | ||||||||
| 11,934 | XBiotech, Inc | 133 | ||||||||
| 27,098 | * | Xencor, Inc | 1,087 | |||||||
| 19,065 | * | Y-mAbs Therapeutics, Inc | 309 | |||||||
| 18,143 | * | Zentalis Pharmaceuticals, Inc | 1,525 | |||||||
| 710,503 | *,e | ZIOPHARM Oncology, Inc | 774 | |||||||
| 254,413 | Zoetis, Inc | 62,084 | ||||||||
| 33,098 | * | Zogenix, Inc | 538 | |||||||
| TOTAL PHARMACEUTICALS, BIOTECHNOLOGY & LIFE SCIENCES | 1,947,343 | |||||||||
| REAL ESTATE - 3.6% | ||||||||||
| 46,252 | Acadia Realty Trust | 1,010 | ||||||||
| 36,654 | Agree Realty Corp | 2,616 | ||||||||
| 47,563 | Alexander & Baldwin, Inc | 1,193 | ||||||||
| 1,329 | Alexander’s, Inc | 346 | ||||||||
| 359 |
COLLEGE RETIREMENT EQUITIES FUND - Equity Index Account
| SHARES | COMPANY | VALUE (000) | ||||||||
| 79,908 | Alexandria Real Estate Equities, Inc | $ | 17,816 | |||||||
| 28,646 | American Assets Trust, Inc | 1,075 | ||||||||
| 75,200 | American Campus Communities, Inc | 4,308 | ||||||||
| 68,972 | American Finance Trust, Inc | 630 | ||||||||
| 152,675 | American Homes 4 Rent | 6,658 | ||||||||
| 242,067 | American Tower Corp | 70,805 | ||||||||
| 133,721 | Americold Realty Trust | 4,385 | ||||||||
| 85,829 | Apartment Income REIT Corp | 4,692 | ||||||||
| 79,626 | * | Apartment Investment and Management Co | 615 | |||||||
| 113,878 | Apple Hospitality REIT, Inc | 1,839 | ||||||||
| 31,681 | Armada Hoffler Properties, Inc | 482 | ||||||||
| 5,980 | *,e | Ashford Hospitality Trust, Inc | 57 | |||||||
| 74,556 | AvalonBay Communities, Inc | 18,832 | ||||||||
| 86,787 | Boston Properties, Inc | 9,996 | ||||||||
| 92,621 | Brandywine Realty Trust | 1,243 | ||||||||
| 162,598 | Brixmor Property Group, Inc | 4,132 | ||||||||
| 77,650 | Broadstone Net Lease, Inc | 1,927 | ||||||||
| 52,715 | Camden Property Trust | 9,419 | ||||||||
| 50,740 | CareTrust REIT, Inc | 1,158 | ||||||||
| 29,192 | CatchMark Timber Trust, Inc | 254 | ||||||||
| 178,216 | * | CBRE Group, Inc | 19,338 | |||||||
| 9,060 | Centerspace | 1,005 | ||||||||
| 28,285 | * | Chatham Lodging Trust | 388 | |||||||
| 21,833 | City Office REIT, Inc | 431 | ||||||||
| 10,462 | Clipper Realty, Inc | 104 | ||||||||
| 9,586 | Community Healthcare Trust, Inc | 453 | ||||||||
| 7,951 | * | CorePoint Lodging, Inc | 125 | |||||||
| 61,652 | Corporate Office Properties Trust | 1,724 | ||||||||
| 84,914 | Cousins Properties, Inc | 3,420 | ||||||||
| 234,344 | Crown Castle International Corp | 48,917 | ||||||||
| 3,998 | CTO Realty Growth, Inc | 246 | ||||||||
| 110,271 | CubeSmart | 6,276 | ||||||||
| 66,192 | * | Cushman & Wakefield plc | 1,472 | |||||||
| 65,743 | CyrusOne, Inc | 5,898 | ||||||||
| 114,160 | * | DiamondRock Hospitality Co | 1,097 | |||||||
| 149,930 | Digital Realty Trust, Inc | 26,518 | ||||||||
| 279,022 | * | DigitalBridge Group, Inc | 2,324 | |||||||
| 136,618 | Diversified Healthcare Trust | 422 | ||||||||
| 39,190 | * | Douglas Elliman, Inc | 451 | |||||||
| 91,371 | Douglas Emmett, Inc | 3,061 | ||||||||
| 196,555 | Duke Realty Corp | 12,902 | ||||||||
| 45,431 | Easterly Government Properties, Inc | 1,041 | ||||||||
| 21,698 | EastGroup Properties, Inc | 4,944 | ||||||||
| 82,308 | Empire State Realty Trust, Inc | 733 | ||||||||
| 40,647 | EPR Properties | 1,930 | ||||||||
| 47,763 | Equinix, Inc | 40,400 | ||||||||
| 62,602 | * | Equity Commonwealth | 1,621 | |||||||
| 96,734 | Equity Lifestyle Properties, Inc | 8,480 | ||||||||
| 196,834 | Equity Residential | 17,814 | ||||||||
| 63,885 | Essential Properties Realty Trust, Inc | 1,842 | ||||||||
| 35,607 | Essex Property Trust, Inc | 12,542 | ||||||||
| 28,436 | eXp World Holdings Inc | 958 | ||||||||
| 69,414 | Extra Space Storage, Inc | 15,738 | ||||||||
| 19,962 | Farmland Partners, Inc | 239 | ||||||||
| 360 |
COLLEGE RETIREMENT EQUITIES FUND - Equity Index Account
| SHARES | COMPANY | VALUE (000) | ||||||||
| 43,819 | Federal Realty Investment Trust | $ | 5,973 | |||||||
| 67,202 | First Industrial Realty Trust, Inc | 4,449 | ||||||||
| 425 | * | Forestar Group, Inc | 9 | |||||||
| 44,705 | Four Corners Property Trust, Inc | 1,315 | ||||||||
| 72,511 | Franklin Street Properties Corp | 431 | ||||||||
| 4,942 | * | FRP Holdings, Inc | 286 | |||||||
| 109,186 | Gaming and Leisure Properties, Inc | 5,313 | ||||||||
| 42,598 | e | Geo Group, Inc | 330 | |||||||
| 18,198 | Getty Realty Corp | 584 | ||||||||
| 17,811 | Gladstone Commercial Corp | 459 | ||||||||
| 11,325 | Gladstone Land Corp | 382 | ||||||||
| 30,930 | Global Medical REIT, Inc | 549 | ||||||||
| 44,961 | Global Net Lease, Inc | 687 | ||||||||
| 82,789 | Healthcare Realty Trust, Inc | 2,619 | ||||||||
| 119,524 | Healthcare Trust of America, Inc | 3,991 | ||||||||
| 296,211 | Healthpeak Properties Inc | 10,690 | ||||||||
| 27,708 | * | Hersha Hospitality Trust | 254 | |||||||
| 59,455 | Highwoods Properties, Inc | 2,651 | ||||||||
| 393,682 | * | Host Hotels and Resorts, Inc | 6,846 | |||||||
| 22,285 | * | Howard Hughes Corp | 2,268 | |||||||
| 80,595 | Hudson Pacific Properties | 1,992 | ||||||||
| 48,914 | Independence Realty Trust, Inc | 1,263 | ||||||||
| 34,891 | Industrial Logistics Properties Trust | 874 | ||||||||
| 12,344 | e | Innovative Industrial Properties, Inc | 3,245 | |||||||
| 320,459 | Invitation Homes, Inc | 14,530 | ||||||||
| 157,392 | Iron Mountain, Inc | 8,236 | ||||||||
| 38,621 | e | iStar Inc | 998 | |||||||
| 64,898 | JBG SMITH Properties | 1,863 | ||||||||
| 26,164 | * | Jones Lang LaSalle, Inc | 7,047 | |||||||
| 44,610 | Kennedy-Wilson Holdings, Inc | 1,065 | ||||||||
| 63,758 | Kilroy Realty Corp | 4,237 | ||||||||
| 321,428 | Kimco Realty Corp | 7,923 | ||||||||
| 118,460 | Kite Realty Group Trust | 2,580 | ||||||||
| 47,334 | Lamar Advertising Co | 5,742 | ||||||||
| 144,484 | Lexington Realty Trust | 2,257 | ||||||||
| 42,193 | Life Storage, Inc | 6,463 | ||||||||
| 21,247 | LTC Properties, Inc | 725 | ||||||||
| 107,859 | Macerich Co | 1,864 | ||||||||
| 47,939 | * | Mack-Cali Realty Corp | 881 | |||||||
| 11,498 | * | Marcus & Millichap, Inc | 592 | |||||||
| 283,531 | Medical Properties Trust, Inc | 6,700 | ||||||||
| 61,102 | Mid-America Apartment Communities, Inc | 14,019 | ||||||||
| 50,307 | Monmouth Real Estate Investment Corp (Class A) | 1,057 | ||||||||
| 23,875 | National Health Investors, Inc | 1,372 | ||||||||
| 97,026 | National Retail Properties, Inc | 4,664 | ||||||||
| 38,309 | National Storage Affiliates Trust | 2,651 | ||||||||
| 21,654 | NETSTREIT Corp | 496 | ||||||||
| 81,428 | Newmark Group, Inc | 1,523 | ||||||||
| 12,730 | NexPoint Residential Trust, Inc | 1,067 | ||||||||
| 23,677 | Office Properties Income Trust | 588 | ||||||||
| 129,929 | Omega Healthcare Investors, Inc | 3,845 | ||||||||
| 9,166 | e | One Liberty Properties, Inc | 323 | |||||||
| 228,590 | * | Opendoor Technologies, Inc | 3,340 | |||||||
| 29,999 | * | Orion Office REIT, Inc | 560 | |||||||
| 361 |
COLLEGE RETIREMENT EQUITIES FUND - Equity Index Account
| SHARES | COMPANY | VALUE (000) | ||||||||
| 76,197 | Outfront Media, Inc | $ | 2,044 | |||||||
| 101,864 | Paramount Group, Inc | 850 | ||||||||
| 132,332 | * | Park Hotels & Resorts, Inc | 2,498 | |||||||
| 71,223 | Pebblebrook Hotel Trust | 1,593 | ||||||||
| 10,100 | Phillips Edison & Co, Inc | 334 | ||||||||
| 107,460 | Physicians Realty Trust | 2,023 | ||||||||
| 71,716 | Piedmont Office Realty Trust, Inc | 1,318 | ||||||||
| 13,733 | Plymouth Industrial REIT, Inc | 439 | ||||||||
| 34,013 | PotlatchDeltic Corp | 2,048 | ||||||||
| 21,687 | Preferred Apartment Communities, Inc | 392 | ||||||||
| 395,121 | Prologis, Inc | 66,523 | ||||||||
| 10,961 | PS Business Parks, Inc | 2,019 | ||||||||
| 81,523 | Public Storage, Inc | 30,535 | ||||||||
| 75,814 | Rayonier, Inc | 3,060 | ||||||||
| 13,117 | Re/Max Holdings, Inc | 400 | ||||||||
| 62,854 | * | Realogy Holdings Corp | 1,057 | |||||||
| 303,733 | Realty Income Corp | 21,744 | ||||||||
| 57,095 | *,e | Redfin Corp | 2,192 | |||||||
| 92,769 | Regency Centers Corp | 6,990 | ||||||||
| 63,462 | Retail Opportunities Investment Corp | 1,244 | ||||||||
| 11,764 | Retail Value, Inc | 76 | ||||||||
| 73,707 | Rexford Industrial Realty, Inc | 5,978 | ||||||||
| 92,471 | RLJ Lodging Trust | 1,288 | ||||||||
| 5,123 | RMR Group, Inc | 178 | ||||||||
| 57,913 | RPT Realty | 775 | ||||||||
| 29,351 | * | Ryman Hospitality Properties | 2,699 | |||||||
| 116,469 | Sabra Healthcare REIT, Inc | 1,577 | ||||||||
| 7,521 | Safehold, Inc | 601 | ||||||||
| 6,451 | Saul Centers, Inc | 342 | ||||||||
| 57,350 | SBA Communications Corp | 22,310 | ||||||||
| 18,501 | *,e | Seritage Growth Properties | 246 | |||||||
| 93,168 | Service Properties Trust | 819 | ||||||||
| 175,765 | Simon Property Group, Inc | 28,082 | ||||||||
| 103,764 | SITE Centers Corp | 1,643 | ||||||||
| 38,244 | SL Green Realty Corp | 2,742 | ||||||||
| 62,949 | Spirit Realty Capital, Inc | 3,034 | ||||||||
| 18,561 | St. Joe Co | 966 | ||||||||
| 84,224 | STAG Industrial, Inc | 4,039 | ||||||||
| 134,185 | STORE Capital Corp | 4,616 | ||||||||
| 73,018 | * | Summit Hotel Properties, Inc | 713 | |||||||
| 60,721 | Sun Communities, Inc | 12,750 | ||||||||
| 117,301 | * | Sunstone Hotel Investors, Inc | 1,376 | |||||||
| 54,135 | e | Tanger Factory Outlet Centers, Inc | 1,044 | |||||||
| 12,164 | * | Tejon Ranch Co | 232 | |||||||
| 35,329 | Terreno Realty Corp | 3,013 | ||||||||
| 162,250 | UDR, Inc | 9,733 | ||||||||
| 20,169 | UMH Properties, Inc | 551 | ||||||||
| 81,711 | Uniti Group, Inc | 1,145 | ||||||||
| 9,264 | Universal Health Realty Income Trust | 551 | ||||||||
| 70,770 | Urban Edge Properties | 1,345 | ||||||||
| 20,808 | Urstadt Biddle Properties, Inc (Class A) | 443 | ||||||||
| 214,672 | Ventas, Inc | 10,974 | ||||||||
| 337,627 | e | VICI Properties, Inc | 10,166 | |||||||
| 96,380 | Vornado Realty Trust | 4,034 | ||||||||
| 362 |
COLLEGE RETIREMENT EQUITIES FUND - Equity Index Account
| SHARES | COMPANY | VALUE (000) | ||||||||
| 46,196 | Washington REIT | $ | 1,194 | |||||||
| 229,555 | Welltower, Inc | 19,689 | ||||||||
| 397,195 | Weyerhaeuser Co | 16,357 | ||||||||
| 25,132 | Whitestone REIT | 255 | ||||||||
| 95,264 | WP Carey, Inc | 7,816 | ||||||||
| 62,184 | * | Xenia Hotels & Resorts, Inc | 1,126 | |||||||
| 32,630 | * | Zillow Group, Inc (Class A) | 2,030 | |||||||
| 90,080 | * | Zillow Group, Inc (Class C) | 5,752 | |||||||
| TOTAL REAL ESTATE | 920,613 | |||||||||
| RETAILING - 6.3% | ||||||||||
| 18,290 | * | 1-800-FLOWERS.COM, Inc (Class A) | 427 | |||||||
| 18,402 | Aaron’s Co, Inc | 454 | ||||||||
| 36,579 | * | Abercrombie & Fitch Co (Class A) | 1,274 | |||||||
| 36,738 | * | Academy Sports & Outdoors, Inc | 1,613 | |||||||
| 33,209 | Advance Auto Parts, Inc | 7,966 | ||||||||
| 232,283 | * | Amazon.com, Inc | 774,511 | |||||||
| 85,497 | e | American Eagle Outfitters, Inc | 2,165 | |||||||
| 3,312 | * | America’s Car-Mart, Inc | 339 | |||||||
| 65,041 | * | Arko Corp | 570 | |||||||
| 10,565 | * | Asbury Automotive Group, Inc | 1,825 | |||||||
| 24,494 | * | Autonation, Inc | 2,862 | |||||||
| 11,218 | * | AutoZone, Inc | 23,517 | |||||||
| 20,976 | * | Barnes & Noble Education, Inc | 143 | |||||||
| 132,327 | Bath & Body Works, Inc | 9,235 | ||||||||
| 59,900 | *,e | Bed Bath & Beyond, Inc | 873 | |||||||
| 131,568 | Best Buy Co, Inc | 13,367 | ||||||||
| 11,361 | e | Big 5 Sporting Goods Corp | 216 | |||||||
| 20,052 | Big Lots, Inc | 903 | ||||||||
| 15,681 | * | Boot Barn Holdings, Inc | 1,930 | |||||||
| 14,004 | Buckle, Inc | 593 | ||||||||
| 36,184 | * | Burlington Stores, Inc | 10,548 | |||||||
| 20,111 | Caleres, Inc | 456 | ||||||||
| 22,123 | e | Camping World Holdings, Inc | 894 | |||||||
| 85,911 | * | CarMax, Inc | 11,188 | |||||||
| 19,398 | * | CarParts.com, Inc | 217 | |||||||
| 42,371 | * | Carvana Co | 9,821 | |||||||
| 12,003 | Cato Corp (Class A) | 206 | ||||||||
| 66,517 | * | Chico’s FAS, Inc | 358 | |||||||
| 7,673 | * | Children’s Place, Inc | 608 | |||||||
| 6,121 | * | Citi Trends, Inc | 580 | |||||||
| 13,169 | *,e | Conn’s, Inc | 310 | |||||||
| 11,400 | * | Container Store Group, Inc | 114 | |||||||
| 32,814 | * | Designer Brands, Inc | 466 | |||||||
| 28,635 | e | Dick’s Sporting Goods, Inc | 3,293 | |||||||
| 3,340 | e | Dillard’s, Inc (Class A) | 818 | |||||||
| 123,132 | Dollar General Corp | 29,038 | ||||||||
| 118,105 | * | Dollar Tree, Inc | 16,596 | |||||||
| 78,210 | * | DoorDash, Inc | 11,645 | |||||||
| 7,236 | * | Duluth Holdings, Inc | 110 | |||||||
| 334,780 | eBay, Inc | 22,263 | ||||||||
| 66,094 | * | Etsy, Inc | 14,471 | |||||||
| 30,809 | * | Five Below, Inc | 6,374 | |||||||
| 55,907 | * | Floor & Decor Holdings, Inc | 7,269 | |||||||
| 363 |
COLLEGE RETIREMENT EQUITIES FUND - Equity Index Account
| SHARES | COMPANY | VALUE (000) | ||||||||
| 33,391 | Foot Locker, Inc | $ | 1,457 | |||||||
| 11,421 | Franchise Group, Inc | 596 | ||||||||
| 10,965 | * | Funko, Inc | 206 | |||||||
| 34,832 | *,e | GameStop Corp (Class A) | 5,169 | |||||||
| 110,566 | Gap, Inc | 1,952 | ||||||||
| 7,998 | * | Genesco, Inc | 513 | |||||||
| 74,387 | Genuine Parts Co | 10,429 | ||||||||
| 9,591 | Group 1 Automotive, Inc | 1,872 | ||||||||
| 12,244 | *,e | Groupon, Inc | 284 | |||||||
| 29,518 | * | GrowGeneration Corp | 385 | |||||||
| 21,962 | Guess?, Inc | 520 | ||||||||
| 9,098 | Haverty Furniture Cos, Inc | 278 | ||||||||
| 9,181 | Hibbett Sports, Inc | 660 | ||||||||
| 570,071 | Home Depot, Inc | 236,585 | ||||||||
| 86,005 | Kohl’s Corp | 4,248 | ||||||||
| 9,431 | * | Lands’ End, Inc | 185 | |||||||
| 59,869 | * | Leslie’s, Inc | 1,417 | |||||||
| 19,090 | * | Liquidity Services, Inc | 422 | |||||||
| 15,893 | Lithia Motors, Inc (Class A) | 4,719 | ||||||||
| 133,711 | LKQ Corp | 8,027 | ||||||||
| 370,444 | Lowe’s Companies, Inc | 95,752 | ||||||||
| 19,294 | * | Lumber Liquidators, Inc | 329 | |||||||
| 172,372 | Macy’s, Inc | 4,513 | ||||||||
| 11,739 | * | MarineMax, Inc | 693 | |||||||
| 18,107 | Monro Muffler, Inc | 1,055 | ||||||||
| 13,744 | Murphy USA, Inc | 2,738 | ||||||||
| 47,869 | * | National Vision Holdings, Inc | 2,297 | |||||||
| 60,699 | *,e | Nordstrom, Inc | 1,373 | |||||||
| 29,720 | * | ODP Corp | 1,167 | |||||||
| 35,834 | * | Ollie’s Bargain Outlet Holdings, Inc | 1,834 | |||||||
| 5,690 | OneWater Marine, Inc | 347 | ||||||||
| 35,662 | * | O’Reilly Automotive, Inc | 25,186 | |||||||
| 24,586 | * | Overstock.com, Inc | 1,451 | |||||||
| 60,315 | * | Party City Holdco, Inc | 336 | |||||||
| 13,329 | Penske Auto Group, Inc | 1,429 | ||||||||
| 40,988 | * | Petco Health & Wellness Co, Inc | 811 | |||||||
| 14,105 | e | PetMed Express, Inc | 356 | |||||||
| 20,231 | Pool Corp | 11,451 | ||||||||
| 41,549 | * | Porch Group, Inc | 648 | |||||||
| 53,361 | * | Quotient Technology, Inc | 396 | |||||||
| 130,909 | Qurate Retail Group, Inc QVC Group | 995 | ||||||||
| 42,901 | * | RealReal, Inc | 498 | |||||||
| 35,975 | Rent-A-Center, Inc | 1,728 | ||||||||
| 19,596 | * | Revolve Group, Inc | 1,098 | |||||||
| 9,426 | * | RH | 5,052 | |||||||
| 189,042 | Ross Stores, Inc | �� | 21,604 | |||||||
| 66,571 | * | Sally Beauty Holdings, Inc | 1,229 | |||||||
| 33,875 | *,e | Shift Technologies, Inc | 116 | |||||||
| 4,712 | Shoe Carnival, Inc | 184 | ||||||||
| 13,499 | Shutterstock, Inc | 1,497 | ||||||||
| 29,200 | Signet Jewelers Ltd | 2,541 | ||||||||
| 13,058 | * | Sleep Number Corp | 1,000 | |||||||
| 11,945 | e | Sonic Automotive, Inc (Class A) | 591 | |||||||
| 19,952 | * | Sportsman’s Warehouse Holdings, Inc | 235 | |||||||
| 364 |
COLLEGE RETIREMENT EQUITIES FUND - Equity Index Account
| SHARES | COMPANY | VALUE (000) | ||||||||
| 32,244 | * | Stitch Fix Inc | $ | 610 | ||||||
| 259,834 | Target Corp | 60,136 | ||||||||
| 6,790 | Tilly’s, Inc | 109 | ||||||||
| 643,051 | TJX Companies, Inc | 48,820 | ||||||||
| 59,954 | Tractor Supply Co | 14,305 | ||||||||
| 28,388 | * | Ulta Beauty, Inc | 11,706 | |||||||
| 37,439 | * | Urban Outfitters, Inc | 1,099 | |||||||
| 41,105 | * | Victoria’s Secret & Co | 2,283 | |||||||
| 63,231 | *,e | Vroom, Inc | 682 | |||||||
| 41,399 | *,e | Wayfair, Inc | 7,865 | |||||||
| 41,140 | Williams-Sonoma, Inc | 6,958 | ||||||||
| 1,945 | Winmark Corp | 483 | ||||||||
| 4,344 | * | Xometry, Inc | 223 | |||||||
| 11,661 | * | Zumiez, Inc | 560 | |||||||
| TOTAL RETAILING | 1,620,719 | |||||||||
| SEMICONDUCTORS & SEMICONDUCTOR EQUIPMENT - 5.8% | ||||||||||
| 648,573 | * | Advanced Micro Devices, Inc | 93,330 | |||||||
| 26,133 | * | Allegro MicroSystems, Inc | 945 | |||||||
| 15,539 | * | Alpha & Omega Semiconductor Ltd | 941 | |||||||
| 19,074 | * | Ambarella, Inc | 3,870 | |||||||
| 55,705 | Amkor Technology, Inc | 1,381 | ||||||||
| 286,799 | Analog Devices, Inc | 50,411 | ||||||||
| 480,794 | Applied Materials, Inc | 75,658 | ||||||||
| 10,142 | *,e | Atomera, Inc | 204 | |||||||
| 20,849 | * | Axcelis Technologies, Inc | 1,554 | |||||||
| 26,991 | * | AXT, Inc | 238 | |||||||
| 213,856 | Broadcom, Inc | 142,302 | ||||||||
| 39,365 | Brooks Automation, Inc | 4,059 | ||||||||
| 15,710 | * | Ceva, Inc | 679 | |||||||
| 31,760 | * | Cirrus Logic, Inc | 2,923 | |||||||
| 15,115 | CMC Materials, Inc | 2,897 | ||||||||
| 26,675 | * | Cohu, Inc | 1,016 | |||||||
| 23,788 | * | Diodes, Inc | 2,612 | |||||||
| 70,419 | * | Enphase Energy, Inc | 12,882 | |||||||
| 66,933 | Entegris, Inc | 9,276 | ||||||||
| 58,223 | * | First Solar, Inc | 5,075 | |||||||
| 42,439 | * | Formfactor, Inc | 1,940 | |||||||
| 28,123 | * | GLOBALFOUNDRIES, Inc | 1,827 | |||||||
| 15,133 | * | Ichor Holdings Ltd | 697 | |||||||
| 13,074 | * | Impinj, Inc | 1,160 | |||||||
| 2,161,990 | Intel Corp | 111,342 | ||||||||
| 81,230 | KLA Corp | 34,938 | ||||||||
| 42,347 | *,e | Kopin Corp | 173 | |||||||
| 33,411 | Kulicke & Soffa Industries, Inc | 2,023 | ||||||||
| 75,362 | Lam Research Corp | 54,197 | ||||||||
| 75,431 | * | Lattice Semiconductor Corp | 5,813 | |||||||
| 29,103 | * | MACOM Technology Solutions Holdings, Inc | 2,279 | |||||||
| 436,855 | Marvell Technology, Inc | 38,220 | ||||||||
| 38,172 | * | MaxLinear, Inc | 2,878 | |||||||
| 118,061 | *,e | Meta Materials, Inc | 290 | |||||||
| 292,034 | Microchip Technology, Inc | 25,424 | ||||||||
| 599,065 | Micron Technology, Inc | 55,803 | ||||||||
| 26,862 | MKS Instruments, Inc | 4,679 | ||||||||
| 365 |
COLLEGE RETIREMENT EQUITIES FUND - Equity Index Account
| SHARES | COMPANY | VALUE (000) | ||||||||
| 23,066 | Monolithic Power Systems, Inc | $ | 11,379 | |||||||
| 26,573 | * | Nanometrics, Inc | 2,690 | |||||||
| 21,168 | * | NeoPhotonics Corp Ltd | 325 | |||||||
| 3,184 | NVE Corp | 217 | ||||||||
| 1,280,309 | NVIDIA Corp | 376,552 | ||||||||
| 140,051 | NXP Semiconductors NV | 31,901 | ||||||||
| 229,199 | * | ON Semiconductor Corp | 15,567 | |||||||
| 20,605 | * | PDF Solutions, Inc | 655 | |||||||
| 46,544 | * | Photronics, Inc | 877 | |||||||
| 33,225 | Power Integrations, Inc | 3,086 | ||||||||
| 59,412 | * | Qorvo, Inc | 9,291 | |||||||
| 605,166 | QUALCOMM, Inc | 110,667 | ||||||||
| 61,164 | * | Rambus, Inc | 1,798 | |||||||
| 35,296 | * | Semtech Corp | 3,139 | |||||||
| 21,183 | * | Silicon Laboratories, Inc | 4,373 | |||||||
| 7,023 | * | SiTime Corp | 2,054 | |||||||
| 87,959 | Skyworks Solutions, Inc | 13,646 | ||||||||
| 7,747 | * | SMART Global Holdings, Inc | 550 | |||||||
| 42,585 | * | SunPower Corp | 889 | |||||||
| 19,257 | * | Synaptics, Inc | 5,575 | |||||||
| 85,656 | Teradyne, Inc | 14,007 | ||||||||
| 493,708 | Texas Instruments, Inc | 93,049 | ||||||||
| 23,500 | * | Ultra Clean Holdings | 1,348 | |||||||
| 24,314 | Universal Display Corp | 4,013 | ||||||||
| 34,384 | * | Veeco Instruments, Inc | 979 | |||||||
| 62,345 | * | Wolfspeed Inc | 6,968 | |||||||
| 131,505 | Xilinx, Inc | 27,883 | ||||||||
| TOTAL SEMICONDUCTORS & SEMICONDUCTOR EQUIPMENT | 1,499,414 | |||||||||
| SOFTWARE & SERVICES - 14.7% | ||||||||||
| 65,506 | * | 8x8, Inc | 1,098 | |||||||
| 32,215 | A10 Networks, Inc | 534 | ||||||||
| 340,499 | Accenture plc | 141,154 | ||||||||
| 68,208 | * | ACI Worldwide, Inc | 2,367 | |||||||
| 255,432 | * | Adobe, Inc | 144,845 | |||||||
| 11,056 | * | Agilysys, Inc | 492 | |||||||
| 82,582 | * | Akamai Technologies, Inc | 9,665 | |||||||
| 26,945 | * | Alarm.com Holdings, Inc | 2,285 | |||||||
| 15,192 | *,e | Alkami Technology, Inc | 305 | |||||||
| 27,328 | Alliance Data Systems Corp | 1,819 | ||||||||
| 24,769 | *,e | Altair Engineering, Inc | 1,915 | |||||||
| 32,290 | * | Alteryx, Inc | 1,954 | |||||||
| 63,407 | Amdocs Ltd | 4,745 | ||||||||
| 15,720 | American Software, Inc (Class A) | 411 | ||||||||
| 78,020 | * | Anaplan, Inc | 3,577 | |||||||
| 45,731 | * | Ansys, Inc | 18,344 | |||||||
| 9,509 | * | Appfolio, Inc | 1,151 | |||||||
| 20,140 | *,e | Appian Corp | 1,313 | |||||||
| 40,356 | * | Asana, Inc | 3,009 | |||||||
| 37,307 | * | Aspen Technology, Inc | 5,678 | |||||||
| 72,802 | * | Atlassian Corp plc | 27,759 | |||||||
| 117,180 | * | Autodesk, Inc | 32,950 | |||||||
| 227,993 | Automatic Data Processing, Inc | 56,219 | ||||||||
| 46,044 | * | Avalara, Inc | 5,945 | |||||||
| 366 |
COLLEGE RETIREMENT EQUITIES FUND - Equity Index Account
| SHARES | COMPANY | VALUE (000) | ||||||||
| 45,036 | * | Avaya Holdings Corp | $ | 892 | ||||||
| 11,374 | * | Benefitfocus, Inc | 121 | |||||||
| 74,063 | Bentley Systems, Inc | 3,579 | ||||||||
| 24,476 | * | BigCommerce Holdings, Inc | 866 | |||||||
| 49,304 | * | Bill.Com Holdings, Inc | 12,284 | |||||||
| 82,754 | * | Black Knight, Inc | 6,859 | |||||||
| 26,411 | * | Blackbaud, Inc | 2,086 | |||||||
| 29,853 | * | Blackline, Inc | 3,091 | |||||||
| 212,702 | * | Block Inc | 34,354 | |||||||
| 24,159 | * | Bottomline Technologies, Inc | 1,364 | |||||||
| 86,219 | * | Box, Inc | 2,258 | |||||||
| 20,694 | * | Brightcove, Inc | 211 | |||||||
| 61,037 | Broadridge Financial Solutions, Inc | 11,159 | ||||||||
| 25,858 | * | BTRS Holdings, Inc | 202 | |||||||
| 42,696 | *,e | C3.ai, Inc | 1,334 | |||||||
| 147,641 | * | Cadence Design Systems, Inc | 27,513 | |||||||
| 31,787 | * | Cantaloupe, Inc | 282 | |||||||
| 10,596 | Cass Information Systems, Inc | 417 | ||||||||
| 66,103 | CDK Global, Inc | 2,759 | ||||||||
| 22,039 | * | Cerence Inc | 1,689 | |||||||
| 66,788 | * | Ceridian HCM Holding, Inc | 6,977 | |||||||
| 15,814 | * | ChannelAdvisor Corp | 390 | |||||||
| 68,044 | Citrix Systems, Inc | 6,436 | ||||||||
| 17,869 | *,e | Cleanspark, Inc | 170 | |||||||
| 140,170 | * | Cloudflare, Inc | 18,432 | |||||||
| 277,107 | Cognizant Technology Solutions Corp (Class A) | 24,585 | ||||||||
| 20,876 | * | Commvault Systems, Inc | 1,439 | |||||||
| 23,676 | Concentrix Corp | 4,229 | ||||||||
| 91,431 | * | Conduent, Inc | 488 | |||||||
| 7,805 | * | Consensus Cloud Solutions, Inc | 452 | |||||||
| 40,201 | * | Coupa Software, Inc | 6,354 | |||||||
| 106,940 | * | Crowdstrike Holdings, Inc | 21,896 | |||||||
| 6,968 | * | CS Disco, Inc | 249 | |||||||
| 17,763 | CSG Systems International, Inc | 1,024 | ||||||||
| 136,604 | * | Datadog, Inc | 24,331 | |||||||
| 13,627 | *,e | Datto Holding Corp | 359 | |||||||
| 7,264 | *,e | Digimarc Corp | 287 | |||||||
| 46,104 | * | Digital Turbine, Inc | 2,812 | |||||||
| 26,690 | * | DigitalOcean Holdings, Inc | 2,144 | |||||||
| 103,146 | * | DocuSign, Inc | 15,710 | |||||||
| 35,265 | Dolby Laboratories, Inc (Class A) | 3,358 | ||||||||
| 15,039 | * | Domo, Inc | 746 | |||||||
| 8,370 | * | DoubleVerify Holdings, Inc | 279 | |||||||
| 165,340 | * | Dropbox, Inc | 4,057 | |||||||
| 40,815 | * | Duck Creek Technologies, Inc | 1,229 | |||||||
| 139,396 | * | DXC Technology Co | 4,487 | |||||||
| 106,722 | * | Dynatrace, Inc | 6,441 | |||||||
| 87,429 | * | E2open Parent Holdings, Inc | 984 | |||||||
| 17,480 | e | Ebix, Inc | 531 | |||||||
| 37,517 | * | Elastic NV | 4,618 | |||||||
| 30,234 | * | Envestnet, Inc | 2,399 | |||||||
| 28,803 | * | EPAM Systems, Inc | 19,253 | |||||||
| 27,813 | * | Euronet Worldwide, Inc | 3,314 | |||||||
| 21,053 | * | Everbridge, Inc | 1,418 | |||||||
| 31,074 | EVERTEC, Inc | 1,553 | ||||||||
| 367 |
COLLEGE RETIREMENT EQUITIES FUND - Equity Index Account
| SHARES | COMPANY | VALUE (000) | ||||||||
| 25,590 | * | Evo Payments, Inc | $ | 655 | ||||||
| 17,218 | * | ExlService Holdings, Inc | 2,493 | |||||||
| 14,532 | * | Fair Isaac Corp | 6,302 | |||||||
| 58,075 | *,e | Fastly, Inc | 2,059 | |||||||
| 326,984 | Fidelity National Information Services, Inc | 35,690 | ||||||||
| 127,712 | * | FireEye, Inc | 2,240 | |||||||
| 317,979 | * | Fiserv, Inc | 33,003 | |||||||
| 37,675 | * | Five9, Inc | 5,174 | |||||||
| 42,717 | * | FleetCor Technologies, Inc | 9,562 | |||||||
| 33,603 | * | Flywire Corp | 1,279 | |||||||
| 71,759 | * | Fortinet, Inc | 25,790 | |||||||
| 42,619 | * | Gartner, Inc | 14,248 | |||||||
| 94,449 | Genpact Ltd | 5,013 | ||||||||
| 154,882 | Global Payments, Inc | 20,937 | ||||||||
| 21,651 | * | Globant S.A. | 6,800 | |||||||
| 93,198 | * | GoDaddy, Inc | 7,909 | |||||||
| 37,008 | * | GreenSky, Inc | 420 | |||||||
| 15,258 | * | Grid Dynamics Holdings, Inc | 579 | |||||||
| 46,084 | * | Guidewire Software, Inc | 5,232 | |||||||
| 17,956 | Hackett Group, Inc | 369 | ||||||||
| 24,272 | * | HubSpot, Inc | 15,999 | |||||||
| 9,245 | * | I3 Verticals, Inc | 211 | |||||||
| 17,943 | * | Informatica, Inc | 664 | |||||||
| 4,355 | *,e | Intelligent Systems Corp | 169 | |||||||
| 18,324 | InterDigital, Inc | 1,313 | ||||||||
| 479,337 | International Business Machines Corp | 64,068 | ||||||||
| 13,645 | * | International Money Express Inc | 218 | |||||||
| 141,883 | Intuit, Inc | 91,262 | ||||||||
| 40,567 | Jack Henry & Associates, Inc | 6,774 | ||||||||
| 29,050 | *,e | Jamf Holding Corp | 1,104 | |||||||
| 28,159 | * | JFrog Ltd | 836 | |||||||
| 95,867 | * | Kyndryl Holdings, Inc | 1,735 | |||||||
| 50,961 | *,e | Limelight Networks, Inc | 175 | |||||||
| 34,967 | * | Liveperson, Inc | 1,249 | |||||||
| 35,615 | * | LiveRamp Holdings, Inc | 1,708 | |||||||
| 32,654 | * | Manhattan Associates, Inc | 5,077 | |||||||
| 52,095 | *,e | Marathon Digital Holdings, Inc | 1,712 | |||||||
| 468,147 | Mastercard, Inc (Class A) | 168,215 | ||||||||
| 31,583 | MAXIMUS, Inc | 2,516 | ||||||||
| 21,219 | McAfee Corp | 547 | ||||||||
| 4,035,012 | Microsoft Corp | 1,357,055 | ||||||||
| 4,156 | *,e | MicroStrategy, Inc (Class A) | 2,263 | |||||||
| 33,586 | * | Mimecast Ltd | 2,672 | |||||||
| 22,456 | * | Mitek Systems, Inc | 399 | |||||||
| 14,483 | * | Model N, Inc | 435 | |||||||
| 35,218 | * | MoneyGram International, Inc | 278 | |||||||
| 33,619 | * | MongoDB, Inc | 17,796 | |||||||
| 19,169 | * | N-Able, Inc | 213 | |||||||
| 25,933 | * | nCino, Inc | 1,423 | |||||||
| 68,992 | * | NCR Corp | 2,773 | |||||||
| 30,028 | * | New Relic, Inc | 3,302 | |||||||
| 283,454 | NortonLifelock, Inc | 7,364 | ||||||||
| 147,476 | * | Nuance Communications, Inc | 8,158 | |||||||
| 105,783 | * | Nutanix, Inc | 3,370 | |||||||
| 368 |
COLLEGE RETIREMENT EQUITIES FUND - Equity Index Account
| SHARES | COMPANY | VALUE (000) | ||||||||
| 68,248 | * | Okta, Inc | $ | 15,299 | ||||||
| 4,837 | * | ON24, Inc | 84 | |||||||
| 21,489 | * | OneSpan, Inc | 364 | |||||||
| 887,190 | Oracle Corp | 77,372 | ||||||||
| 41,005 | * | Pagerduty, Inc | 1,425 | |||||||
| 862,353 | * | Palantir Technologies, Inc | 15,703 | |||||||
| 50,772 | * | Palo Alto Networks, Inc | 28,268 | |||||||
| 44,842 | * | Paya Holdings, Inc | 284 | |||||||
| 172,244 | Paychex, Inc | 23,511 | ||||||||
| 26,642 | * | Paycom Software, Inc | 11,061 | |||||||
| 11,105 | *,e | Paycor HCM, Inc | 320 | |||||||
| 20,584 | * | Paylocity Holding Corp | 4,861 | |||||||
| 631,765 | * | PayPal Holdings, Inc | 119,138 | |||||||
| 225,806 | *,e | Paysafe Ltd | 883 | |||||||
| 22,404 | Pegasystems, Inc | 2,505 | ||||||||
| 17,663 | * | Perficient, Inc | 2,284 | |||||||
| 23,740 | * | Ping Identity Holding Corp | 543 | |||||||
| 31,944 | * | Procore Technologies, Inc | 2,555 | |||||||
| 23,997 | Progress Software Corp | 1,158 | ||||||||
| 19,034 | * | PROS Holdings, Inc | 656 | |||||||
| 57,208 | * | PTC, Inc | 6,931 | |||||||
| 29,530 | * | Q2 Holdings, Inc | 2,346 | |||||||
| 18,605 | * | Qualys, Inc | 2,553 | |||||||
| 19,217 | *,e | Rackspace Technology, Inc | 259 | |||||||
| 31,056 | * | Rapid7, Inc | 3,655 | |||||||
| 42,004 | * | Repay Holdings Corp | 767 | |||||||
| 44,149 | * | RingCentral, Inc | 8,271 | |||||||
| 47,739 | *,e | Riot Blockchain, Inc | 1,066 | |||||||
| 186,641 | * | Sabre Corp | 1,603 | |||||||
| 52,403 | * | SailPoint Technologies Holding, Inc | 2,533 | |||||||
| 500,653 | * | salesforce.com, Inc | 127,231 | |||||||
| 15,268 | Sapiens International Corp NV | 526 | ||||||||
| 4,599 | * | SecureWorks Corp | 73 | |||||||
| 105,474 | * | ServiceNow, Inc | 68,464 | |||||||
| 23,585 | * | Shift4 Payments, Inc | 1,366 | |||||||
| 4,906 | * | ShotSpotter, Inc | 145 | |||||||
| 66,115 | * | Smartsheet, Inc | 5,121 | |||||||
| 104,932 | * | Snowflake, Inc | 35,546 | |||||||
| 19,169 | SolarWinds Corp | 272 | ||||||||
| 90,017 | * | Splunk, Inc | 10,417 | |||||||
| 24,107 | * | Sprout Social, Inc | 2,186 | |||||||
| 19,690 | * | SPS Commerce, Inc | 2,803 | |||||||
| 111,085 | SS&C Technologies Holdings, Inc | 9,107 | ||||||||
| 120,616 | * | StoneCo Ltd | 2,034 | |||||||
| 44,512 | * | Sumo Logic, Inc | 604 | |||||||
| 70,963 | * | SVMK, Inc | 1,501 | |||||||
| 62,944 | Switch, Inc | 1,803 | ||||||||
| 80,377 | * | Synopsys, Inc | 29,619 | |||||||
| 21,512 | * | Telos Corp | 332 | |||||||
| 49,510 | * | Tenable Holdings, Inc | 2,727 | |||||||
| 63,587 | * | Teradata Corp | 2,701 | |||||||
| 234,140 | * | Trade Desk, Inc | 21,457 | |||||||
| 10,054 | TTEC Holdings, Inc | 910 | ||||||||
| 369 |
COLLEGE RETIREMENT EQUITIES FUND - Equity Index Account
| SHARES | COMPANY | VALUE (000) | ||||||||
| 6,516 | *,e | Tucows, Inc | $ | 546 | ||||||
| 22,872 | * | Turing Holding Corp | 613 | |||||||
| 90,362 | * | Twilio, Inc | 23,796 | |||||||
| 21,091 | * | Tyler Technologies, Inc | 11,346 | |||||||
| 38,674 | * | Unisys Corp | 796 | |||||||
| 80,847 | * | Unity Software, Inc | 11,560 | |||||||
| 15,606 | * | Upland Software, Inc | 280 | |||||||
| 56,469 | * | Varonis Systems, Inc | 2,755 | |||||||
| 35,164 | * | Verint Systems, Inc | 1,846 | |||||||
| 51,900 | * | VeriSign, Inc | 13,173 | |||||||
| 13,662 | *,e | Veritone, Inc | 307 | |||||||
| 63,620 | * | Verra Mobility Corp | 982 | |||||||
| 6,012 | * | Viant Technology, Inc | 58 | |||||||
| 32,131 | *,e | VirnetX Holding Corp | 84 | |||||||
| 908,191 | Visa, Inc (Class A) | 196,814 | ||||||||
| 119,630 | VMware, Inc (Class A) | 13,863 | ||||||||
| 143,849 | * | Vonage Holdings Corp | 2,991 | |||||||
| 229,572 | Western Union Co | 4,096 | ||||||||
| 24,535 | * | WEX, Inc | 3,444 | |||||||
| 29,289 | * | Wix.com Ltd | 4,622 | |||||||
| 101,979 | * | Workday, Inc | 27,859 | |||||||
| 22,930 | * | Workiva, Inc | 2,992 | |||||||
| 57,275 | Xperi Holding Corp | 1,083 | ||||||||
| 55,032 | * | Yext, Inc | 546 | |||||||
| 65,282 | * | Zendesk, Inc | 6,808 | |||||||
| 115,895 | * | Zoom Video Communications, Inc | 21,314 | |||||||
| 41,021 | * | Zscaler, Inc | 13,181 | |||||||
| 55,037 | * | Zuora Inc | 1,028 | |||||||
| TOTAL SOFTWARE & SERVICES | 3,769,078 | |||||||||
| TECHNOLOGY HARDWARE & EQUIPMENT - 7.7% | ||||||||||
| 66,252 | * | 3D Systems Corp | 1,427 | |||||||
| 6,963 | * | 908 Devices, Inc | 180 | |||||||
| 35,649 | Adtran, Inc | 814 | ||||||||
| 20,999 | Advanced Energy Industries, Inc | 1,912 | ||||||||
| 41,314 | *,e | Aeva Technologies, Inc | 312 | |||||||
| 18,515 | *,e | Akoustis Technologies, Inc | 124 | |||||||
| 307,977 | Amphenol Corp (Class A) | 26,936 | ||||||||
| 8,262,656 | Apple, Inc | 1,467,200 | ||||||||
| 126,832 | * | Arista Networks, Inc | 18,232 | |||||||
| 47,303 | * | Arlo Technologies, Inc | 496 | |||||||
| 36,241 | * | Arrow Electronics, Inc | 4,866 | |||||||
| 24,161 | * | Avid Technology, Inc | 787 | |||||||
| 54,480 | Avnet, Inc | 2,246 | ||||||||
| 15,939 | Badger Meter, Inc | 1,698 | ||||||||
| 24,142 | Belden CDT, Inc | 1,587 | ||||||||
| 19,531 | Benchmark Electronics, Inc | 529 | ||||||||
| 26,799 | * | CalAmp Corp | 189 | |||||||
| 28,887 | * | Calix, Inc | 2,310 | |||||||
| 4,889 | * | Cambium Networks Corp | 125 | |||||||
| 9,824 | * | Casa Systems, Inc | 56 | |||||||
| 72,490 | CDW Corp | 14,845 | ||||||||
| 79,273 | * | Ciena Corp | 6,102 | |||||||
| 2,263,452 | Cisco Systems, Inc | 143,435 | ||||||||
| 370 |
COLLEGE RETIREMENT EQUITIES FUND - Equity Index Account
| SHARES | COMPANY | VALUE (000) | ||||||||
| 8,964 | * | Clearfield, Inc | $ | 757 | ||||||
| 93,925 | Cognex Corp | 7,304 | ||||||||
| 13,422 | * | Coherent, Inc | 3,578 | |||||||
| 115,638 | * | CommScope Holding Co, Inc | 1,277 | |||||||
| 16,237 | Comtech Telecommunications Corp | 385 | ||||||||
| 415,791 | Corning, Inc | 15,480 | ||||||||
| 8,680 | *,e | Corsair Gaming, Inc | 182 | |||||||
| 17,421 | CTS Corp | 640 | ||||||||
| 27,847 | * | Daktronics, Inc | 141 | |||||||
| 136,382 | * | Dell Technologies, Inc | 7,661 | |||||||
| 53,560 | * | Diebold, Inc | 485 | |||||||
| 18,652 | * | Digi International, Inc | 458 | |||||||
| 9,167 | * | DZS, Inc | 149 | |||||||
| 24,605 | *,e | Eastman Kodak Co | 115 | |||||||
| 20,159 | * | EMCORE Corp | 141 | |||||||
| 18,556 | * | ePlus, Inc | 1,000 | |||||||
| 79,396 | * | Extreme Networks, Inc | 1,247 | |||||||
| 30,171 | * | F5 Networks, Inc | 7,383 | |||||||
| 20,485 | * | Fabrinet | 2,427 | |||||||
| 9,925 | * | FARO Technologies, Inc | 695 | |||||||
| 58,321 | * | Harmonic, Inc | 686 | |||||||
| 707,951 | Hewlett Packard Enterprise Co | 11,164 | ||||||||
| 607,114 | HP, Inc | 22,870 | ||||||||
| 11,473 | * | Identiv, Inc | 323 | |||||||
| 57,079 | * | II-VI, Inc | 3,900 | |||||||
| 103,799 | * | Infinera Corp | 995 | |||||||
| 40,550 | *,e | Inseego Corp | 236 | |||||||
| 19,073 | * | Insight Enterprises, Inc | 2,033 | |||||||
| 19,271 | * | IPG Photonics Corp | 3,317 | |||||||
| 18,293 | * | Iteris, Inc | 73 | |||||||
| 24,355 | * | Itron, Inc | 1,669 | |||||||
| 71,253 | Jabil Inc | 5,013 | ||||||||
| 178,205 | Juniper Networks, Inc | 6,364 | ||||||||
| 99,085 | * | Keysight Technologies, Inc | 20,462 | |||||||
| 21,162 | * | Kimball Electronics, Inc | 461 | |||||||
| 48,573 | * | Knowles Corp | 1,134 | |||||||
| 10,929 | * | KVH Industries, Inc | 100 | |||||||
| 13,151 | Littelfuse, Inc | 4,138 | ||||||||
| 41,562 | * | Lumentum Holdings, Inc | 4,396 | |||||||
| 20,833 | Methode Electronics, Inc | 1,024 | ||||||||
| 86,400 | *,e | Microvision, Inc | 433 | |||||||
| 89,099 | Motorola Solutions, Inc | 24,208 | ||||||||
| 7,937 | * | Napco Security Technologies, Inc | 397 | |||||||
| 72,088 | National Instruments Corp | 3,148 | ||||||||
| 118,594 | NetApp, Inc | 10,909 | ||||||||
| 16,454 | * | Netgear, Inc | 481 | |||||||
| 43,446 | * | Netscout Systems, Inc | 1,437 | |||||||
| 20,535 | * | nLight, Inc | 492 | |||||||
| 18,332 | * | Novanta, Inc | 3,232 | |||||||
| 9,244 | * | OSI Systems, Inc | 862 | |||||||
| 15,844 | *,e | Ouster, Inc | 82 | |||||||
| 12,941 | *,e | PAR Technology Corp | 683 | |||||||
| 8,216 | PC Connection, Inc | 354 | ||||||||
| 18,613 | * | Plantronics, Inc | 546 | |||||||
| 371 |
COLLEGE RETIREMENT EQUITIES FUND - Equity Index Account
| SHARES | COMPANY | VALUE (000) | ||||||||
| 17,083 | * | Plexus Corp | $ | 1,638 | ||||||
| 148,433 | * | Pure Storage, Inc | 4,832 | |||||||
| 30,487 | * | Quantum Corp | 168 | |||||||
| 37,508 | * | Ribbon Communications, Inc | 227 | |||||||
| 10,213 | * | Rogers Corp | 2,788 | |||||||
| 36,299 | * | Sanmina Corp | 1,505 | |||||||
| 17,777 | * | Scansource, Inc | 624 | |||||||
| 26,460 | * | Super Micro Computer, Inc | 1,163 | |||||||
| 22,861 | SYNNEX Corp | 2,614 | ||||||||
| 24,117 | * | Teledyne Technologies, Inc | 10,536 | |||||||
| 129,908 | * | Trimble Inc | 11,327 | |||||||
| 20,652 | * | TTM Technologies, Inc | 308 | |||||||
| 8,166 | * | Turtle Beach Corp | 182 | |||||||
| 3,604 | Ubiquiti, Inc | 1,105 | ||||||||
| 38,579 | *,e | Velodyne Lidar, Inc | 179 | |||||||
| 34,027 | * | Viasat, Inc | 1,516 | |||||||
| 136,006 | * | Viavi Solutions, Inc | 2,396 | |||||||
| 72,768 | Vishay Intertechnology, Inc | 1,591 | ||||||||
| 9,508 | * | Vishay Precision Group, Inc | 353 | |||||||
| 92,880 | Vontier Corp | 2,854 | ||||||||
| 155,579 | * | Western Digital Corp | 10,145 | |||||||
| 84,117 | Xerox Holdings Corp | 1,904 | ||||||||
| 27,748 | * | Zebra Technologies Corp (Class A) | 16,516 | |||||||
| TOTAL TECHNOLOGY HARDWARE & EQUIPMENT | 1,962,006 | |||||||||
| TELECOMMUNICATION SERVICES - 1.1% | ||||||||||
| 7,472 | * | Anterix, Inc | 439 | |||||||
| 3,831,720 | AT&T, Inc | 94,260 | ||||||||
| 7,918 | ATN International, Inc | 316 | ||||||||
| 12,460 | * | Bandwidth Inc | 894 | |||||||
| 25,280 | Cogent Communications Group, Inc | 1,850 | ||||||||
| 48,355 | * | Consolidated Communications Holdings, Inc | 362 | |||||||
| 22,558 | * | EchoStar Corp (Class A) | 594 | |||||||
| 331,269 | *,e | Globalstar, Inc | 384 | |||||||
| 42,541 | *,e | Gogo, Inc | 576 | |||||||
| 11,096 | * | IDT Corp (Class B) | 490 | |||||||
| 60,764 | * | Iridium Communications, Inc | 2,509 | |||||||
| 29,453 | * | Liberty Latin America Ltd (Class A) | 343 | |||||||
| 84,348 | * | Liberty Latin America Ltd (Class C) | 962 | |||||||
| 554,638 | Lumen Technologies, Inc | 6,961 | ||||||||
| 13,047 | * | Ooma, Inc | 267 | |||||||
| 23,995 | * | Radius Global Infrastructure, Inc | 386 | |||||||
| 26,373 | Shenandoah Telecom Co | 673 | ||||||||
| 55,138 | Telephone & Data Systems, Inc | 1,111 | ||||||||
| 9,932 | *,e | Telesat Corp | 285 | |||||||
| 314,734 | * | T-Mobile US, Inc | 36,503 | |||||||
| 9,529 | * | US Cellular Corp | 300 | |||||||
| 2,218,488 | Verizon Communications, Inc | 115,273 | ||||||||
| TOTAL TELECOMMUNICATION SERVICES | 265,738 | |||||||||
| TRANSPORTATION - 1.9% | ||||||||||
| 37,928 | * | Air Transport Services Group, Inc | 1,114 | |||||||
| 69,726 | * | Alaska Air Group, Inc | 3,633 | |||||||
| 8,270 | * | Allegiant Travel Co | 1,547 | |||||||
| 372 |
COLLEGE RETIREMENT EQUITIES FUND - Equity Index Account
| SHARES | COMPANY | VALUE (000) | ||||||||
| 4,307 | Amerco, Inc | $ | 3,128 | |||||||
| 347,869 | *,e | American Airlines Group, Inc | 6,248 | |||||||
| 13,812 | ArcBest Corp | 1,655 | ||||||||
| 15,514 | * | Atlas Air Worldwide Holdings, Inc | 1,460 | |||||||
| 22,038 | * | Avis Budget Group, Inc | 4,570 | |||||||
| 67,597 | CH Robinson Worldwide, Inc | 7,275 | ||||||||
| 17,311 | * | Copa Holdings S.A. (Class A) | 1,431 | |||||||
| 23,634 | Costamare, Inc | 299 | ||||||||
| 8,672 | * | Covenant Transportation Group, Inc | 229 | |||||||
| 1,185,229 | CSX Corp | 44,565 | ||||||||
| 14,173 | * | Daseke, Inc | 142 | |||||||
| 351,191 | * | Delta Air Lines, Inc | 13,725 | |||||||
| 4,116 | e | Eagle Bulk Shipping, Inc | 187 | |||||||
| 85,367 | Expeditors International of Washington, Inc | 11,464 | ||||||||
| 129,759 | FedEx Corp | 33,561 | ||||||||
| 14,836 | Forward Air Corp | 1,796 | ||||||||
| 18,987 | * | Frontier Group Holdings, Inc | 258 | |||||||
| 17,525 | Genco Shipping & Trading Ltd | 280 | ||||||||
| 50,638 | * | GXO Logistics, Inc | 4,599 | |||||||
| 27,588 | * | Hawaiian Holdings, Inc | 507 | |||||||
| 26,012 | Heartland Express, Inc | 437 | ||||||||
| 18,067 | * | Hub Group, Inc (Class A) | 1,522 | |||||||
| 9,562 | * | HyreCar, Inc | 45 | |||||||
| 43,796 | JB Hunt Transport Services, Inc | 8,952 | ||||||||
| 173,855 | * | JetBlue Airways Corp | 2,476 | |||||||
| 32,726 | * | Kirby Corp | 1,945 | |||||||
| 88,315 | Knight-Swift Transportation Holdings, Inc | 5,382 | ||||||||
| 20,412 | Landstar System, Inc | 3,654 | ||||||||
| 154,071 | * | Lyft, Inc (Class A) | 6,583 | |||||||
| 34,852 | Marten Transport Ltd | 598 | ||||||||
| 23,449 | Matson, Inc | 2,111 | ||||||||
| 19,117 | * | Mesa Air Group, Inc | 107 | |||||||
| 129,243 | Norfolk Southern Corp | 38,477 | ||||||||
| 54,303 | Old Dominion Freight Line | 19,461 | ||||||||
| 29,335 | * | Radiant Logistics, Inc | 214 | |||||||
| 25,040 | Ryder System, Inc | 2,064 | ||||||||
| 33,371 | * | Safe Bulkers, Inc | 126 | |||||||
| 13,620 | * | Saia, Inc | 4,590 | |||||||
| 22,723 | Schneider National, Inc | 611 | ||||||||
| 28,022 | * | Skywest, Inc | 1,101 | |||||||
| 314,707 | * | Southwest Airlines Co | 13,482 | |||||||
| 50,261 | * | Spirit Airlines, Inc | 1,098 | |||||||
| 9,455 | * | Sun Country Airlines Holdings, Inc | 258 | |||||||
| 71,175 | *,e | TuSimple Holdings, Inc | 2,552 | |||||||
| 876,189 | * | Uber Technologies, Inc | 36,739 | |||||||
| 343,517 | Union Pacific Corp | 86,542 | ||||||||
| 177,925 | * | United Airlines Holdings Inc | 7,790 | |||||||
| 386,486 | United Parcel Service, Inc (Class B) | 82,839 | ||||||||
| 6,297 | Universal Logistics Holdings Inc | 119 | ||||||||
| 14,010 | * | US Xpress Enterprises, Inc | 82 | |||||||
| 36,247 | Werner Enterprises, Inc | 1,728 | ||||||||
| 52,508 | * | XPO Logistics, Inc | 4,066 | |||||||
| 26,820 | * | Yellow Corp | 338 | |||||||
| TOTAL TRANSPORTATION | 481,762 | |||||||||
| 373 |
COLLEGE RETIREMENT EQUITIES FUND - Equity Index Account
| SHARES | COMPANY | VALUE (000) | ||||||||
| UTILITIES - 2.4% | ||||||||||
| 362,922 | AES Corp | $ | 8,819 | |||||||
| 28,646 | Allete, Inc | 1,901 | ||||||||
| 137,659 | Alliant Energy Corp | 8,462 | ||||||||
| 139,860 | Ameren Corp | 12,449 | ||||||||
| 269,655 | American Electric Power Co, Inc | 23,991 | ||||||||
| 20,132 | American States Water Co | 2,082 | ||||||||
| 98,521 | American Water Works Co, Inc | 18,607 | ||||||||
| 4,909 | Artesian Resources Corp | 227 | ||||||||
| 69,836 | Atmos Energy Corp | 7,317 | ||||||||
| 27,653 | Avangrid, Inc | 1,379 | ||||||||
| 33,562 | Avista Corp | 1,426 | ||||||||
| 34,402 | Black Hills Corp | 2,428 | ||||||||
| 28,904 | e | Brookfield Infrastructure Corp | 1,973 | |||||||
| 72,027 | Brookfield Renewable Corp | 2,653 | ||||||||
| 15,011 | * | Cadiz, Inc | 58 | |||||||
| 27,726 | California Water Service Group | 1,992 | ||||||||
| 319,280 | Centerpoint Energy, Inc | 8,911 | ||||||||
| 9,405 | Chesapeake Utilities Corp | 1,371 | ||||||||
| 10,556 | Clearway Energy, Inc (Class A) | 353 | ||||||||
| 47,061 | Clearway Energy, Inc (Class C) | 1,696 | ||||||||
| 161,672 | CMS Energy Corp | 10,517 | ||||||||
| 182,270 | Consolidated Edison, Inc | 15,551 | ||||||||
| 426,782 | Dominion Energy, Inc | 33,528 | ||||||||
| 101,817 | DTE Energy Co | 12,171 | ||||||||
| 409,511 | Duke Energy Corp | 42,958 | ||||||||
| 195,908 | Edison International | 13,371 | ||||||||
| 106,399 | Entergy Corp | 11,986 | ||||||||
| 120,688 | Essential Utilities Inc | 6,480 | ||||||||
| 119,824 | Evergy, Inc | 8,221 | ||||||||
| 188,645 | Eversource Energy | 17,163 | ||||||||
| 517,839 | Exelon Corp | 29,910 | ||||||||
| 288,831 | FirstEnergy Corp | 12,012 | ||||||||
| 18,242 | * | Fluence Energy, Inc | 649 | |||||||
| 6,410 | Global Water Resources, Inc | 110 | ||||||||
| 57,902 | Hawaiian Electric Industries, Inc | 2,403 | ||||||||
| 27,642 | Idacorp, Inc | 3,132 | ||||||||
| 96,446 | MDU Resources Group, Inc | 2,974 | ||||||||
| 19,874 | MGE Energy, Inc | 1,635 | ||||||||
| 11,759 | Middlesex Water Co | 1,415 | ||||||||
| 44,613 | National Fuel Gas Co | 2,853 | ||||||||
| 52,723 | New Jersey Resources Corp | 2,165 | ||||||||
| 1,051,619 | NextEra Energy, Inc | 98,179 | ||||||||
| 211,543 | NiSource, Inc | 5,841 | ||||||||
| 14,483 | Northwest Natural Holding Co | 706 | ||||||||
| 27,636 | NorthWestern Corp | 1,580 | ||||||||
| 135,219 | NRG Energy, Inc | 5,825 | ||||||||
| 109,645 | OGE Energy Corp | 4,208 | ||||||||
| 29,641 | ONE Gas, Inc | 2,300 | ||||||||
| 24,734 | e | Ormat Technologies, Inc | 1,961 | |||||||
| 22,455 | Otter Tail Corp | 1,604 | ||||||||
| 829,869 | * | PG&E Corp | 10,075 | |||||||
| 62,725 | Pinnacle West Capital Corp | 4,428 | ||||||||
| 374 |
COLLEGE RETIREMENT EQUITIES FUND - Equity Index Account
| SHARES | COMPANY | VALUE (000) | ||||||||||||||
| 31,702 | PNM Resources, Inc | $ | 1,446 | |||||||||||||
| 50,460 | Portland General Electric Co | 2,670 | ||||||||||||||
| 390,063 | PPL Corp | 11,725 | ||||||||||||||
| 263,097 | Public Service Enterprise Group, Inc | 17,556 | ||||||||||||||
| 11,616 | * | Pure Cycle Corp | 170 | |||||||||||||
| 167,821 | Sempra Energy | 22,199 | ||||||||||||||
| 12,005 | SJW Corp | 879 | ||||||||||||||
| 58,642 | e | South Jersey Industries, Inc | 1,532 | |||||||||||||
| 562,303 | Southern Co | 38,563 | ||||||||||||||
| 31,668 | Southwest Gas Holdings Inc | 2,218 | ||||||||||||||
| 26,256 | Spire, Inc | 1,712 | ||||||||||||||
| 46,961 | * | Sunnova Energy International, Inc | 1,311 | |||||||||||||
| 105,006 | UGI Corp | 4,821 | ||||||||||||||
| 10,272 | Unitil Corp | 472 | ||||||||||||||
| 7,544 | e | Via Renewables, Inc | 86 | |||||||||||||
| 268,521 | Vistra Energy Corp | 6,114 | ||||||||||||||
| 173,437 | WEC Energy Group, Inc | 16,836 | ||||||||||||||
| 295,903 | Xcel Energy, Inc | 20,033 | ||||||||||||||
| 9,006 | York Water Co | 448 | ||||||||||||||
| TOTAL UTILITIES | 626,797 | |||||||||||||||
| TOTAL COMMON STOCKS | 25,571,090 | |||||||||||||||
| (Cost $7,885,662) | ||||||||||||||||
| RIGHTS / WARRANTS - 0.0% | ||||||||||||||||
| MEDIA & ENTERTAINMENT - 0.0% | ||||||||||||||||
| 80,085 | † | Media General, Inc | 0 | |||||||||||||
| TOTAL MEDIA & ENTERTAINMENT | 0 | |||||||||||||||
| PHARMACEUTICALS, BIOTECHNOLOGY & LIFE SCIENCES - 0.0% | ||||||||||||||||
| 7,917 | † | Chinook Therapeutics, Inc | 0 | |||||||||||||
| 29,050 | † | Elanco Animal Health, Inc CVR | 2 | |||||||||||||
| 6,981 | † | Tobira Therapeutics, Inc | 0 | ^ | ||||||||||||
| TOTAL PHARMACEUTICALS, BIOTECHNOLOGY & LIFE SCIENCES | 2 | |||||||||||||||
| TOTAL RIGHTS / WARRANTS | 2 | |||||||||||||||
| (Cost $1) | ||||||||||||||||
| PRINCIPAL | ISSUER | RATE | MATURITY DATE | |||||||||||||
| SHORT-TERM INVESTMENTS - 0.7% | ||||||||||||||||
| GOVERNMENT AGENCY DEBT - 0.3% | ||||||||||||||||
| $ | 22,130,000 | Federal Farm Credit Bank (FFCB) | 0.000 | % | 01/05/22 | 22,130 | ||||||||||
| 27,640,000 | Federal Home Loan Bank (FHLB) | 0.000 | 01/21/22 | 27,640 | ||||||||||||
| 7,310,000 | FHLB | 0.000 | 01/24/22 | 7,310 | ||||||||||||
| 10,000,000 | FHLB | 0.000 | 02/18/22 | 9,999 | ||||||||||||
| TOTAL GOVERNMENT AGENCY DEBT | 67,079 | |||||||||||||||
| REPURCHASE AGREEMENT - 0.1% | ||||||||||||||||
| 32,395,000 | r | Fixed Income Clearing Corp (FICC) | 0.020 | 01/03/22 | 32,395 | |||||||||||
| TOTAL REPURCHASE AGREEMENT | 32,395 | |||||||||||||||
| 375 |
COLLEGE RETIREMENT EQUITIES FUND - Equity Index Account
| SHARES | COMPANY | RATE | VALUE (000) | |||||||||||||
| INVESTMENTS IN REGISTERED INVESTMENT COMPANIES - 0.3% | ||||||||||||||||
| 77,919,775 | c | State Street Navigator Securities Lending Government Money Market Portfolio | 0.030 | % | $ | 77,920 | ||||||||||
| TOTAL INVESTMENTS IN REGISTERED INVESTMENT COMPANIES | 77,920 | |||||||||||||||
| TOTAL SHORT-TERM INVESTMENTS | 177,394 | |||||||||||||||
| (Cost $177,393) | ||||||||||||||||
| TOTAL INVESTMENTS - 100.3% | 25,748,486 | |||||||||||||||
| (Cost $8,063,056) | ||||||||||||||||
| OTHER ASSETS & LIABILITIES, NET - (0.3)% | (68,502 | ) | ||||||||||||||
| NET ASSETS - 100.0% | $ | 25,679,984 | ||||||||||||||
| REIT | Real Estate Investment Trust | ||
| CVR | Contingent Value Right | ||
| * | Non-income producing | ||
| ^ | Amount represents less than $1,000. | ||
| † | Security is categorized as Level 3 in the fair value hierarchy. | ||
| c | Investments made with cash collateral received from securities on loan. | ||
| d | All or a portion of these securities have been segregated to cover margin requirements on open futures contracts. | ||
| e | All or a portion of these securities are out on loan. The aggregate value of securities on loan is $171,025,790. | ||
| h | These securities were purchased on a delayed delivery basis. | ||
| r | Agreement with Fixed Income Clearing Corporation, 0.020% dated 12/31/21 to be repurchased at $32,395,000 on 01/03/22, collateralized by Government Agency Securities, with coupon rate 1.875% and maturity date 02/15/2041, valued at $33,042,997. | ||
| Cost amounts are in thousands. | |||
Futures contracts outstanding as of December 31, 2021 were as follows (dollar amounts are in thousands):
| Description | Number of long (short) contracts | Expiration date | Notional amount | Value | Unrealized appreciation (depreciation) | |||||||||||||
| S&P 500 E Mini Index | 364 | 03/18/22 | $ | 84,469 | $ | 86,605 | $ | 2,136 | ||||||||||
| 376 |
COLLEGE RETIREMENT EQUITIES FUND - Bond Market Account
COLLEGE RETIREMENT EQUITIES FUND
BOND MARKET ACCOUNT
SCHEDULE OF INVESTMENTS
December 31, 2021
| PRINCIPAL | ISSUER | REFERENCE RATE & SPREAD | RATE | MATURITY DATE | VALUE (000) | ||||||||||||
| BANK LOAN OBLIGATIONS - 0.7% | |||||||||||||||||
| AUTOMOBILES & COMPONENTS - 0.0% | |||||||||||||||||
| $ | 817,226 | i | Adient US LLC | LIBOR 1 M + 3.500% | 3.604 | % | 04/10/28 | $ | 816 | ||||||||
| 847,326 | i | Clarios Global LP | LIBOR 1 M + 3.250% | 3.354 | 04/30/26 | 842 | |||||||||||
| 2,013,554 | i | Gates Global LLC | LIBOR 1 M + 2.500% | 3.250 | 03/31/27 | 2,008 | |||||||||||
| TOTAL AUTOMOBILES & COMPONENTS | 3,666 | ||||||||||||||||
| CAPITAL GOODS - 0.0% | |||||||||||||||||
| 500,000 | h,i | APi Group DE, Inc | LIBOR 3 M + 2.750% | 2.882 | 12/18/28 | 499 | |||||||||||
| 174,057 | i | Avolon TLB Borrower US LLC | LIBOR 1 M + 1.750% | 2.500 | 01/15/25 | 174 | |||||||||||
| 221,625 | i | Avolon TLB Borrower US LLC | LIBOR 1 M + 1.500% | 2.250 | 02/12/27 | 220 | |||||||||||
| 807,601 | i | Beacon Roofing Supply, Inc | LIBOR 1 M + 2.250% | 2.354 | 05/19/28 | 802 | |||||||||||
| 842,749 | i | Cornerstone Building Brands, Inc | LIBOR 1 M + 3.250% | 3.750 | 04/12/28 | 840 | |||||||||||
| 476,365 | i | Prometric Holdings Inc | LIBOR 1 M + 3.000% | 4.000 | 01/29/25 | 470 | |||||||||||
| 1,351,317 | i | TransDigm, Inc | LIBOR 1 M + 2.250% | 2.354 | 08/22/24 | 1,335 | |||||||||||
| 1,466,269 | i | TransDigm, Inc | LIBOR 1 M + 2.250% | 2.354 | 05/30/25 | 1,445 | |||||||||||
| TOTAL CAPITAL GOODS | 5,785 | ||||||||||||||||
| COMMERCIAL & PROFESSIONAL SERVICES - 0.1% | |||||||||||||||||
| 648,375 | i | AECOM | LIBOR 1 M + 1.750% | 1.852 | 04/13/28 | 648 | |||||||||||
| 1,599,099 | i | GFL Environmental, Inc | 3.500 | 05/31/25 | 1,602 | ||||||||||||
| 669,938 | i | PAE Holding Corp | LIBOR 1 M + 4.500% | 5.250 | 10/14/27 | 670 | |||||||||||
| 2,518,323 | i | Prime Security Services Borrower LLC | LIBOR 3 M + 2.750% | 3.500 | 09/23/26 | 2,515 | |||||||||||
| 766,150 | i | Spin Holdco, Inc | LIBOR 3 M + 4.000% | 4.750 | 03/01/28 | 768 | |||||||||||
| 4,910,000 | i | Trans Union LLC | LIBOR 1 M + 2.250% | 2.750 | 12/01/28 | 4,894 | |||||||||||
| TOTAL COMMERCIAL & PROFESSIONAL SERVICES | 11,097 | ||||||||||||||||
| CONSUMER DURABLES & APPAREL - 0.0% | |||||||||||||||||
| 389,590 | i | Samsonite IP Holdings Sarl | LIBOR 1 M + 1.750% | 1.854 | 04/25/25 | 378 | |||||||||||
| TOTAL CONSUMER DURABLES & APPAREL | 378 | ||||||||||||||||
| CONSUMER SERVICES - 0.1% | |||||||||||||||||
| 438,068 | i | 1011778 BC ULC | LIBOR 1 M + 1.750% | 1.854 | 11/19/26 | 431 | |||||||||||
| 315,935 | i | Boyd Gaming Corp | LIBOR 1 M + 2.250% | 2.354 | 09/15/23 | 316 | |||||||||||
| 1,195,000 | i | Carnival Corp | LIBOR 3 M + 3.250% | 4.000 | 10/18/28 | 1,183 | |||||||||||
| 495,000 | i | IRB Holding Corp | LIBOR 3 M + 3.250% | 4.250 | 12/15/27 | 495 | |||||||||||
| 1,310,144 | i | KFC Holding Co | LIBOR 1 M + 1.750% | 1.854 | 03/09/28 | 1,305 | |||||||||||
| 762,411 | i | Scientific Games International, Inc | LIBOR 1 M + 2.750% | 2.854 | 08/14/24 | 759 | |||||||||||
| 2,000,000 | i | Stars Group Holdings BV | LIBOR 3 M + 2.250% | 2.382 | 07/21/26 | 1,992 | |||||||||||
| TOTAL CONSUMER SERVICES | 6,481 | ||||||||||||||||
| DIVERSIFIED FINANCIALS - 0.0% | |||||||||||||||||
| 862,389 | i | Lions Gate Capital Holdings LLC | LIBOR 1 M + 2.250% | 2.354 | 03/24/25 | 854 | |||||||||||
| 1,757,250 | i | Reynolds Group Holdings, Inc | LIBOR 1 M + 3.250% | 3.354 | 02/05/26 | 1,746 | |||||||||||
| TOTAL DIVERSIFIED FINANCIALS | 2,600 | ||||||||||||||||
| ENERGY - 0.0% | |||||||||||||||||
| 1,965,150 | i | Buckeye Partners LP | LIBOR 1 M + 2.250% | 2.354 | 11/01/26 | 1,956 | |||||||||||
| 539,063 | i | ChampionX Holding, Inc | LIBOR 3 M + 5.000% | 6.000 | 06/03/27 | 545 | |||||||||||
| 1,954,514 | i | Delek US Holdings, Inc | LIBOR 1 M + 2.250% | 2.354 | 03/31/25 | 1,896 | |||||||||||
| 641,775 | i | DT Midstream, Inc | LIBOR 6 M + 2.000% | 2.500 | 06/26/28 | 643 | |||||||||||
| TOTAL ENERGY | 5,040 | ||||||||||||||||
| 377 |
COLLEGE RETIREMENT EQUITIES FUND - Bond Market Account
| PRINCIPAL | ISSUER | REFERENCE RATE & SPREAD | RATE | MATURITY DATE | VALUE (000) | ||||||||||||
| FOOD, BEVERAGE & TOBACCO - 0.0% | |||||||||||||||||
| $ | 594,000 | i | Chobani LLC | LIBOR 1 M + 3.500% | 4.500 | % | 10/20/27 | $ | 595 | ||||||||
| 881,955 | i | Hostess Brands LLC | LIBOR 1 M + 2.250% | 3.000 | 08/01/25 | 878 | |||||||||||
| TOTAL FOOD, BEVERAGE & TOBACCO | 1,473 | ||||||||||||||||
| HEALTH CARE EQUIPMENT & SERVICES - 0.1% | |||||||||||||||||
| 492,010 | i | Change Healthcare Holdings LLC | LIBOR 1 M + 2.500% | 3.500 | 03/01/24 | 491 | |||||||||||
| 2,192,180 | i | Da Vinci Purchaser Corp | LIBOR 1 M + 4.000% | 5.000 | 01/08/27 | 2,192 | |||||||||||
| 977,550 | i | DaVita, Inc | LIBOR 1 M + 1.750% | 1.854 | 08/12/26 | 972 | |||||||||||
| 411,449 | i | Grifols Worldwide Operations USA, Inc | LIBOR 1 M + 2.000% | 2.104 | 11/15/27 | 405 | |||||||||||
| 375,000 | h,i | II-VI, Inc | LIBOR 3 M + 2.750% | 3.250 | 12/07/28 | 374 | |||||||||||
| 2,012,842 | i | RegionalCare Hospital Partners Holdings, Inc | LIBOR 1 M + 3.750% | 3.852 | 11/16/25 | 2,009 | |||||||||||
| 2,920,100 | i | Select Medical Corp | LIBOR 1 M + 2.250% | 2.360 | 03/06/25 | 2,898 | |||||||||||
| 1,402,150 | i | Team Health Holdings, Inc | LIBOR 1 M + 2.750% | 3.750 | 02/06/24 | 1,337 | |||||||||||
| TOTAL HEALTH CARE EQUIPMENT & SERVICES | 10,678 | ||||||||||||||||
| HOUSEHOLD & PERSONAL PRODUCTS - 0.0% | |||||||||||||||||
| 590,092 | i | Weber-Stephen Products LLC | LIBOR 1 M + 3.250% | 4.000 | 10/29/27 | 590 | |||||||||||
| TOTAL HOUSEHOLD & PERSONAL PRODUCTS | 590 | ||||||||||||||||
| INSURANCE - 0.0% | |||||||||||||||||
| 150,000 | i | Alliant Holdings Intermediate LLC | LIBOR 1 M + 3.500% | 4.000 | 11/12/27 | 150 | |||||||||||
| 1,965,000 | i | NFP Corp | LIBOR 1 M + 3.250% | 3.354 | 02/15/27 | 1,931 | |||||||||||
| 2,448,849 | i | USI, Inc | LIBOR 3 M + 3.000% | 3.224 | 05/16/24 | 2,428 | |||||||||||
| TOTAL INSURANCE | 4,509 | ||||||||||||||||
| MATERIALS - 0.1% | |||||||||||||||||
| 1,728,125 | i | Asplundh Tree Expert LLC | LIBOR 1 M + 1.750% | 1.854 | 09/02/27 | 1,720 | |||||||||||
| 1,288,578 | i | Berry Global, Inc | LIBOR 2 M + 1.750% | 1.864 | 07/01/26 | 1,279 | |||||||||||
| 479,980 | i | Ineos US Finance LLC | LIBOR 1 M + 2.000% | 2.104 | 03/31/24 | 477 | |||||||||||
| 297,463 | i | Messer Industries USA, Inc | LIBOR 3 M + 2.500% | 2.724 | 03/01/26 | 295 | |||||||||||
| 1,361,612 | i | PolyOne Corp | LIBOR 1 M + 0.104% | 0.209 | 01/30/26 | 1,362 | |||||||||||
| 301,451 | i | Reynolds Consumer Products LLC | LIBOR 1 M + 1.750% | 1.854 | 02/04/27 | 299 | |||||||||||
| 336,267 | i | Starfruit US Holdco LLC | LIBOR 1 M + 3.000% | 3.102 | 10/01/25 | 335 | |||||||||||
| 1,180,937 | i | Tamko Building Products, Inc | LIBOR 2 M + 3.000% | 3.141 | 05/29/26 | 1,173 | |||||||||||
| 145,000 | i | WR Grace Holdings LLC | LIBOR 3 M + 3.750% | 4.250 | 09/22/28 | 145 | |||||||||||
| TOTAL MATERIALS | 7,085 | ||||||||||||||||
| MEDIA & ENTERTAINMENT - 0.1% | |||||||||||||||||
| 1,640,304 | i | Alliance Laundry Systems LLC | LIBOR 3 M + 3.500% | 4.250 | 10/08/27 | 1,640 | |||||||||||
| 346,500 | i | Arterra Wines Canada, Inc | LIBOR 3 M + 3.500% | 4.250 | 11/19/27 | 346 | |||||||||||
| 420,750 | i | Cablevision Lightpath LLC | LIBOR 1 M + 3.250% | 3.750 | 11/30/27 | 420 | |||||||||||
| 1,955,000 | i | Charter Communications Operating LLC | LIBOR 1 M + 1.750% | 1.860 | 02/01/27 | 1,935 | |||||||||||
| 970,125 | i | CNT Holdings I Corp | LIBOR 3 M + 3.500% | 4.250 | 11/08/27 | 970 | |||||||||||
| 710,532 | i | CSC Holdings LLC | LIBOR 1 M + 2.500% | 2.610 | 04/15/27 | 701 | |||||||||||
| 500,000 | h,i | Delta 2 Lux Sarl | LIBOR 1 M + 2.500% | 3.500 | 02/01/24 | 499 | |||||||||||
| 977,500 | i | Diamond Sports Group LLC | LIBOR 1 M + 3.250% | 3.360 | 08/24/26 | 450 | |||||||||||
| 1,368,500 | i | DIRECTV Financing LLC | LIBOR 3 M + 5.000% | 5.750 | 08/02/27 | 1,369 | |||||||||||
| 800,000 | i | Mozart Borrower LP | LIBOR 1 M + 3.250% | 3.750 | 10/23/28 | 800 | |||||||||||
| 319,651 | i | Nielsen Finance LLC | LIBOR 1 M + 2.000% | 2.102 | 10/04/23 | 319 | |||||||||||
| 500,000 | i | Phoenix Newco, Inc | LIBOR 1 M + 3.500% | 4.000 | 11/15/28 | 500 | |||||||||||
| 497,500 | i | Rackspace Technology Global, Inc | LIBOR 3 M + 2.750% | 3.500 | 02/03/28 | 493 | |||||||||||
| 1,580,000 | i | Radiate Holdco LLC | LIBOR 1 M + 3.250% | 4.000 | 09/25/26 | 1,574 | |||||||||||
| 800,000 | i | SkyMiles IP Ltd | LIBOR 3 M + 3.750% | 4.750 | 10/20/27 | 845 | |||||||||||
| 1,767,125 | i | TK Elevator US Newco, Inc | LIBOR 6 M + 3.500% | 4.000 | 07/30/27 | 1,767 | |||||||||||
| 2,250,000 | i | Virgin Media Bristol LLC | LIBOR 1 M + 2.500% | 2.610 | 01/31/28 | 2,228 | |||||||||||
| TOTAL MEDIA & ENTERTAINMENT | 16,856 | ||||||||||||||||
| 378 |
COLLEGE RETIREMENT EQUITIES FUND - Bond Market Account
| PRINCIPAL | ISSUER | REFERENCE RATE & SPREAD | RATE | MATURITY DATE | VALUE (000) | ||||||||||||
| PHARMACEUTICALS, BIOTECHNOLOGY & LIFE SCIENCES - 0.1% | |||||||||||||||||
| $ | 942,887 | i | Avantor, Inc | LIBOR 1 M + 2.250% | 2.750 | % | 11/08/27 | $ | 942 | ||||||||
| 1,485,867 | i | Bausch Health Americas, Inc | LIBOR 1 M + 3.000% | 3.104 | 06/02/25 | 1,478 | |||||||||||
| 1,511,749 | i | Bausch Health Americas, Inc | LIBOR 1 M + 2.750% | 2.854 | 11/27/25 | 1,502 | |||||||||||
| 2,468,655 | i | Catalent Pharma Solutions, Inc | LIBOR 1 M + 2.000% | 2.500 | 02/22/28 | 2,469 | |||||||||||
| 2,459,406 | i | Endo Luxembourg Finance Co I Sarl | LIBOR 3 M + 5.000% | 5.750 | 03/27/28 | 2,387 | |||||||||||
| TOTAL PHARMACEUTICALS, BIOTECHNOLOGY & LIFE SCIENCES | 8,778 | ||||||||||||||||
| REAL ESTATE - 0.0% | |||||||||||||||||
| 1,358,306 | i | Cushman & Wakefield plc | LIBOR 1 M + 2.750% | 2.854 | 08/21/25 | 1,348 | |||||||||||
| TOTAL REAL ESTATE | 1,348 | ||||||||||||||||
| RETAILING - 0.0% | |||||||||||||||||
| 669,938 | i | LS GROUP OPCO ACQUISITIO | LIBOR 3 M + 3.250% | 4.000 | 11/02/27 | 668 | |||||||||||
| TOTAL RETAILING | 668 | ||||||||||||||||
| SEMICONDUCTORS & SEMICONDUCTOR EQUIPMENT - 0.0% | |||||||||||||||||
| 500,000 | h,i | MKS Instruments, Inc | LIBOR 3 M + 2.250% | 2.750 | 10/20/28 | 499 | |||||||||||
| TOTAL SEMICONDUCTORS & SEMICONDUCTOR EQUIPMENT | 499 | ||||||||||||||||
| SOFTWARE & SERVICES - 0.1% | |||||||||||||||||
| 318,500 | i | Camelot Finance S.A. | LIBOR 1 M + 3.000% | 3.104 | 10/30/26 | 316 | |||||||||||
| 990,000 | i | Camelot US Acquisition | LIBOR 1 M + 3.000% | 4.000 | 10/31/26 | 989 | |||||||||||
| 666,390 | i | Hyland Software, Inc | LIBOR 1 M + 3.500% | 4.250 | 07/01/24 | 668 | |||||||||||
| 1,954,315 | i | Open Text Corp | LIBOR 1 M + 1.750% | 1.854 | 05/30/25 | 1,956 | |||||||||||
| 979,849 | i | Rocket Software, Inc | LIBOR 1 M + 4.250% | 4.354 | 11/28/25 | 973 | |||||||||||
| 95,042 | i | Sabre GLBL, Inc | LIBOR 1 M + 2.000% | 2.104 | 02/22/24 | 93 | |||||||||||
| 1,608,780 | i | UKG, Inc | LIBOR 1 M + 3.250% | 3.750 | 05/04/26 | 1,599 | |||||||||||
| TOTAL SOFTWARE & SERVICES | 6,594 | ||||||||||||||||
| TECHNOLOGY HARDWARE & EQUIPMENT - 0.0% | |||||||||||||||||
| 1,146,492 | i | Plantronics, Inc | LIBOR 1 M + 2.500% | 2.604 | 07/02/25 | 1,119 | |||||||||||
| 755,472 | i | TTM Technologies, Inc | LIBOR 1 M + 2.500% | 2.599 | 09/28/24 | 754 | |||||||||||
| TOTAL TECHNOLOGY HARDWARE & EQUIPMENT | 1,873 | ||||||||||||||||
| TELECOMMUNICATION SERVICES - 0.0% | |||||||||||||||||
| 623,553 | i | Zayo Group Holdings, Inc | LIBOR 1 M + 3.000% | 3.104 | 03/09/27 | 615 | |||||||||||
| TOTAL TELECOMMUNICATION SERVICES | 615 | ||||||||||||||||
| TRANSPORTATION - 0.0% | |||||||||||||||||
| 555,000 | i | Air Canada | LIBOR 3 M + 3.500% | 4.250 | 08/09/28 | 553 | |||||||||||
| 629,616 | i | American Airlines, Inc | LIBOR 1 M + 2.000% | 2.110 | 12/14/23 | 615 | |||||||||||
| TOTAL TRANSPORTATION | 1,168 | ||||||||||||||||
| UTILITIES - 0.0% | |||||||||||||||||
| 979,229 | i | Gopher Resource LLC | LIBOR 1 M + 3.250% | 4.250 | 03/06/25 | 914 | |||||||||||
| TOTAL UTILITIES | 914 | ||||||||||||||||
| TOTAL BANK LOAN OBLIGATIONS | 98,695 | ||||||||||||||||
| (Cost $99,527) | |||||||||||||||||
| 379 |
COLLEGE RETIREMENT EQUITIES FUND - Bond Market Account
| PRINCIPAL | ISSUER | RATE | MATURITY DATE | VALUE (000) | |||||||||||||
| BONDS - 97.9% | |||||||||||||||||
| CORPORATE BONDS - 43.1% | |||||||||||||||||
| AUTOMOBILES & COMPONENTS - 0.4% | |||||||||||||||||
| EUR | 950,000 | g | Adient Global Holdings Ltd | 3.500 | % | 08/15/24 | $ | 1,095 | |||||||||
| $ | 350,000 | g | Adient US LLC | 9.000 | 04/15/25 | 372 | |||||||||||
| EUR | 500,000 | Aptiv plc | 1.500 | 03/10/25 | 590 | ||||||||||||
| 500,000 | g | Dana Financing Luxembourg Sarl | 3.000 | 07/15/29 | 575 | ||||||||||||
| $ | 225,000 | Dana, Inc | 5.375 | 11/15/27 | 236 | ||||||||||||
| 350,000 | Dana, Inc | 5.625 | 06/15/28 | 372 | |||||||||||||
| 11,000,000 | General Motors Co | 6.125 | 10/01/25 | 12,636 | |||||||||||||
| 5,600,000 | General Motors Co | 5.000 | 10/01/28 | 6,422 | |||||||||||||
| 6,950,000 | General Motors Co | 6.600 | 04/01/36 | 9,400 | |||||||||||||
| 6,500,000 | General Motors Co | 5.200 | 04/01/45 | 8,042 | |||||||||||||
| 1,925,000 | General Motors Co | 6.750 | 04/01/46 | 2,751 | |||||||||||||
| EUR | 400,000 | g,o | IHO Verwaltungs GmbH | 3.750 | 09/15/26 | 462 | |||||||||||
| $ | 8,675,000 | Magna International, Inc | 3.625 | 06/15/24 | 9,124 | ||||||||||||
| EUR | 300,000 | Volkswagen Bank GmbH | 2.500 | 07/31/26 | 372 | ||||||||||||
| TOTAL AUTOMOBILES & COMPONENTS | 52,449 | ||||||||||||||||
| BANKS - 8.9% | |||||||||||||||||
| $ | 2,000,000 | g | Akbank TAS | 6.800 | 06/22/31 | 1,818 | |||||||||||
| 8,250,000 | g | Australia & New Zealand Banking Group Ltd | 2.950 | 07/22/30 | 8,455 | ||||||||||||
| 1,975,000 | g | Banco de Credito del Peru | 3.250 | 09/30/31 | 1,950 | ||||||||||||
| 8,225,000 | g | Banco de Credito e Inversiones S.A. | 2.875 | 10/14/31 | 8,102 | ||||||||||||
| 3,000,000 | g | Banco del Estado de Chile | 2.704 | 01/09/25 | 3,060 | ||||||||||||
| 300,000 | g | Banco General S.A. | 4.125 | 08/07/27 | 321 | ||||||||||||
| 3,800,000 | g | Banco Internacional del Peru SAA Interbank | 3.375 | 01/18/23 | 3,852 | ||||||||||||
| 3,225,000 | g | Banco Santander Mexico S.A. Institucion de Banca Multiple Grupo Financiero Santand | 5.375 | 04/17/25 | 3,519 | ||||||||||||
| 10,000,000 | Banco Santander S.A. | 1.722 | 09/14/27 | 9,818 | |||||||||||||
| 3,800,000 | Banco Santander S.A. | 3.800 | 02/23/28 | 4,119 | |||||||||||||
| 2,400,000 | Banco Santander S.A. | 3.225 | 11/22/32 | 2,402 | |||||||||||||
| 600,000 | Banco Santander S.A. | 7.500 | N/A‡ | 645 | |||||||||||||
| 4,350,000 | Bancolombia S.A. | 3.000 | 01/29/25 | 4,366 | |||||||||||||
| 2,650,000 | Bancolombia S.A. | 4.625 | 12/18/29 | 2,650 | |||||||||||||
| 3,010,000 | g | Bangkok Bank PCL | 3.466 | 09/23/36 | 3,011 | ||||||||||||
| 2,750,000 | g | Banistmo S.A. | 4.250 | 07/31/27 | 2,798 | ||||||||||||
| 8,100,000 | g | Bank Hapoalim BM | 3.255 | 01/21/32 | 8,035 | ||||||||||||
| 6,300,000 | g | Bank Leumi Le-Israel BM | 3.275 | 01/29/31 | 6,300 | ||||||||||||
| 5,700,000 | Bank of America Corp | 3.004 | 12/20/23 | 5,818 | |||||||||||||
| EUR | 400,000 | Bank of America Corp | 1.375 | 03/26/25 | 474 | ||||||||||||
| $ | 10,200,000 | Bank of America Corp | 3.875 | 08/01/25 | 11,056 | ||||||||||||
| 7,100,000 | Bank of America Corp | 1.319 | 06/19/26 | 7,024 | |||||||||||||
| EUR | 300,000 | Bank of America Corp | 1.776 | 05/04/27 | 361 | ||||||||||||
| $ | 17,250,000 | Bank of America Corp | 3.824 | 01/20/28 | 18,680 | ||||||||||||
| 380 |
COLLEGE RETIREMENT EQUITIES FUND - Bond Market Account
| PRINCIPAL | ISSUER | RATE | MATURITY DATE | VALUE (000) | |||||||||||
| $ | 23,400,000 | Bank of America Corp | 2.496 | % | 02/13/31 | $ | 23,460 | ||||||||
| 55,925,000 | Bank of America Corp | 2.592 | 04/29/31 | 56,494 | |||||||||||
| 39,000,000 | Bank of America Corp | 1.922 | 10/24/31 | 37,341 | |||||||||||
| 16,250,000 | Bank of America Corp | 2.299 | 07/21/32 | 15,977 | |||||||||||
| 5,975,000 | Bank of America Corp | 2.676 | 06/19/41 | 5,751 | |||||||||||
| 18,000,000 | Bank of America Corp | 4.083 | 03/20/51 | 21,651 | |||||||||||
| 5,000,000 | Bank of America Corp | 6.250 | N/A‡ | 5,381 | |||||||||||
| 3,000,000 | Bank of America Corp | 6.100 | N/A‡ | 3,251 | |||||||||||
| 5,350,000 | Bank of Montreal | 3.803 | 12/15/32 | 5,738 | |||||||||||
| EUR | 400,000 | Barclays plc | 0.625 | 11/14/23 | 458 | ||||||||||
| $ | 5,900,000 | Barclays plc | 4.338 | 05/16/24 | 6,142 | ||||||||||
| 10,000,000 | Barclays plc | 3.932 | 05/07/25 | 10,517 | |||||||||||
| 6,075,000 | Barclays plc | 3.330 | 11/24/42 | 6,182 | |||||||||||
| 11,000,000 | g | BNP Paribas S.A. | 2.819 | 11/19/25 | 11,320 | ||||||||||
| 1,850,000 | g | BNP Paribas S.A. | 2.219 | 06/09/26 | 1,867 | ||||||||||
| 7,000,000 | g | BNP Paribas S.A. | 1.904 | 09/30/28 | 6,833 | ||||||||||
| 5,000,000 | g | BNP Paribas S.A. | 2.159 | 09/15/29 | 4,902 | ||||||||||
| 5,700,000 | g | BNP Paribas S.A. | 2.588 | 08/12/35 | 5,461 | ||||||||||
| 2,950,000 | Citigroup, Inc | 2.700 | 10/27/22 | 2,996 | |||||||||||
| 8,500,000 | Citigroup, Inc | 3.875 | 03/26/25 | 9,071 | |||||||||||
| 36,375,000 | Citigroup, Inc | 3.200 | 10/21/26 | 38,546 | |||||||||||
| 6,575,000 | Citigroup, Inc | 4.300 | 11/20/26 | 7,275 | |||||||||||
| 13,835,000 | Citigroup, Inc | 4.450 | 09/29/27 | 15,426 | |||||||||||
| 7,000,000 | Citigroup, Inc | 4.125 | 07/25/28 | 7,682 | |||||||||||
| 16,750,000 | Citigroup, Inc | 2.666 | 01/29/31 | 17,004 | |||||||||||
| 7,125,000 | Citigroup, Inc | 2.572 | 06/03/31 | 7,187 | |||||||||||
| 38,100,000 | Citigroup, Inc | 2.520 | 11/03/32 | 38,055 | |||||||||||
| 5,000,000 | Citigroup, Inc | 5.000 | N/A‡ | 5,150 | |||||||||||
| 4,000,000 | Citigroup, Inc | 6.300 | N/A‡ | 4,193 | |||||||||||
| 4,500,000 | g | Cooperatieve Rabobank UA | 2.625 | 07/22/24 | 4,646 | ||||||||||
| 2,800,000 | g | Cooperatieve Rabobank UA | 1.339 | 06/24/26 | 2,760 | ||||||||||
| 13,125,000 | Cooperatieve Rabobank UA | 3.750 | 07/21/26 | 14,135 | |||||||||||
| EUR | 200,000 | Cooperatieve Rabobank UA | 3.250 | N/A‡ | 233 | ||||||||||
| $ | 4,125,000 | g | Credicorp Ltd | 2.750 | 06/17/25 | 4,165 | |||||||||
| 11,050,000 | g | Credit Agricole S.A. | 3.250 | 10/04/24 | 11,559 | ||||||||||
| 10,350,000 | g | Credit Agricole S.A. | 1.247 | 01/26/27 | 10,071 | ||||||||||
| 2,450,000 | g | DBS Group Holdings Ltd | 4.520 | 12/11/28 | 2,580 | ||||||||||
| 2,975,000 | g | Development Bank of Kazakhstan JSC | 2.950 | 05/06/31 | 2,950 | ||||||||||
| 8,200,000 | Discover Bank | 2.450 | 09/12/24 | 8,393 | |||||||||||
| 8,455,000 | Discover Bank | 3.450 | 07/27/26 | 8,944 | |||||||||||
| 4,575,000 | Discover Bank | 2.700 | 02/06/30 | 4,633 | |||||||||||
| 3,325,000 | g | Grupo Aval Ltd | 4.375 | 02/04/30 | 3,188 | ||||||||||
| 2,880,000 | e,g | Hana Bank | 3.500 | N/A‡ | 2,945 | ||||||||||
| 6,075,000 | HSBC Holdings plc | 3.900 | 05/25/26 | 6,552 | |||||||||||
| 15,275,000 | HSBC Holdings plc | 4.292 | 09/12/26 | 16,491 | |||||||||||
| 1,250,000 | HSBC Holdings plc | 4.375 | 11/23/26 | 1,371 | |||||||||||
| 26,250,000 | HSBC Holdings plc | 2.251 | 11/22/27 | 26,305 | |||||||||||
| 6,200,000 | HSBC Holdings plc | 2.013 | 09/22/28 | 6,069 | |||||||||||
| 20,675,000 | HSBC Holdings plc | 2.206 | 08/17/29 | 20,274 | |||||||||||
| 8,950,000 | HSBC Holdings plc | 3.973 | 05/22/30 | 9,709 | |||||||||||
| 7,000,000 | Huntington Bancshares, Inc | 5.625 | N/A‡ | 7,989 | |||||||||||
| 4,350,000 | g | ING Groep NV | 4.625 | 01/06/26 | 4,834 | ||||||||||
| 15,200,000 | g | ING Groep NV | 1.400 | 07/01/26 | 15,039 | ||||||||||
| 2,125,000 | g | Intercorp Financial Services, Inc | 4.125 | 10/19/27 | 2,121 | ||||||||||
| 200,000 | g | Intesa Sanpaolo S.p.A | 4.198 | 06/01/32 | 202 | ||||||||||
| 4,850,000 | JPMorgan Chase & Co | 2.700 | 05/18/23 | 4,960 | |||||||||||
| 381 |
COLLEGE RETIREMENT EQUITIES FUND - Bond Market Account
| PRINCIPAL | ISSUER | RATE | MATURITY DATE | VALUE (000) | |||||||||||
| $ | 35,850,000 | JPMorgan Chase & Co | 2.301 | % | 10/15/25 | $ | 36,664 | ||||||||
| 20,000,000 | JPMorgan Chase & Co | 2.005 | 03/13/26 | 20,236 | |||||||||||
| 14,900,000 | JPMorgan Chase & Co | 3.200 | 06/15/26 | 15,800 | |||||||||||
| EUR | 600,000 | JPMorgan Chase & Co | 1.638 | 05/18/28 | 723 | ||||||||||
| $ | 12,000,000 | JPMorgan Chase & Co | 4.203 | 07/23/29 | 13,424 | ||||||||||
| 23,700,000 | JPMorgan Chase & Co | 3.702 | 05/06/30 | 25,901 | |||||||||||
| 23,000,000 | JPMorgan Chase & Co | 4.493 | 03/24/31 | 26,616 | |||||||||||
| 12,600,000 | JPMorgan Chase & Co | 2.522 | 04/22/31 | 12,735 | |||||||||||
| 4,575,000 | JPMorgan Chase & Co | 2.956 | 05/13/31 | 4,737 | |||||||||||
| 25,075,000 | JPMorgan Chase & Co | 1.953 | 02/04/32 | 24,151 | |||||||||||
| 27,075,000 | JPMorgan Chase & Co | 3.157 | 04/22/42 | 28,263 | |||||||||||
| 5,700,000 | JPMorgan Chase & Co | 3.328 | 04/22/52 | 6,099 | |||||||||||
| 5,500,000 | JPMorgan Chase & Co | 5.000 | N/A‡ | 5,651 | |||||||||||
| 11,100,000 | JPMorgan Chase & Co | 6.100 | N/A‡ | 11,711 | |||||||||||
| 6,250,000 | JPMorgan Chase & Co | 3.650 | N/A‡ | 6,234 | |||||||||||
| GBP | 500,000 | Lloyds Banking Group plc | 1.985 | 12/15/31 | 666 | ||||||||||
| $ | 5,950,000 | M&T Bank Corp | 3.500 | N/A‡ | 5,830 | ||||||||||
| 9,000,000 | Mitsubishi UFJ Financial Group, Inc | 2.193 | 02/25/25 | 9,178 | |||||||||||
| 4,675,000 | g | Mizrahi Tefahot Bank Ltd | 3.077 | 04/07/31 | 4,640 | ||||||||||
| 8,850,000 | Natwest Group plc | 3.032 | 11/28/35 | 8,732 | |||||||||||
| 10,225,000 | g | NBK SPC Ltd | 1.625 | 09/15/27 | 9,964 | ||||||||||
| 3,100,000 | g | Oversea-Chinese Banking Corp Ltd | 1.832 | 09/10/30 | 3,073 | ||||||||||
| 4,000,000 | PNC Bank NA | 2.700 | 10/22/29 | 4,132 | |||||||||||
| 6,000,000 | PNC Financial Services Group, Inc | 3.900 | 04/29/24 | 6,357 | |||||||||||
| 7,465,000 | PNC Financial Services Group, Inc | 3.400 | N/A‡ | 7,347 | |||||||||||
| CNY | 6,420,000 | QNB Finance Ltd | 3.150 | 02/04/26 | 991 | ||||||||||
| $ | 11,800,000 | Royal Bank of Canada | 2.550 | 07/16/24 | 12,191 | ||||||||||
| 6,325,000 | Royal Bank of Scotland Group plc | 3.073 | 05/22/28 | 6,579 | |||||||||||
| 9,350,000 | Santander Holdings USA, Inc | 3.400 | 01/18/23 | 9,556 | |||||||||||
| 3,675,000 | Sumitomo Mitsui Financial Group, Inc | 2.778 | 10/18/22 | 3,738 | |||||||||||
| 11,050,000 | Sumitomo Mitsui Financial Group, Inc | 2.696 | 07/16/24 | 11,411 | |||||||||||
| 5,385,000 | SVB Financial Group | 4.100 | N/A‡ | 5,326 | |||||||||||
| 11,000,000 | Toronto-Dominion Bank | 1.150 | 06/12/25 | 10,908 | |||||||||||
| 2,350,000 | Toronto-Dominion Bank | 3.625 | 09/15/31 | 2,524 | |||||||||||
| 4,575,000 | Truist Bank | 1.500 | 03/10/25 | 4,601 | |||||||||||
| 5,000,000 | Truist Financial Corp | 4.000 | 05/01/25 | 5,395 | |||||||||||
| 9,000,000 | Truist Financial Corp | 4.800 | N/A‡ | 9,383 | |||||||||||
| 5,000,000 | Truist Financial Corp | �� | 4.950 | N/A‡ | 5,364 | ||||||||||
| 3,050,000 | g | Turkiye Vakiflar Bankasi TAO | 5.500 | 10/01/26 | 2,715 | ||||||||||
| 7,025,000 | g | UBS Group AG. | 1.494 | 08/10/27 | 6,853 | ||||||||||
| 450,000 | g | UniCredit S.p.A | 2.569 | 09/22/26 | 449 | ||||||||||
| 3,000,000 | g | United Overseas Bank Ltd | 1.250 | 04/14/26 | 2,957 | ||||||||||
| 2,350,000 | g | United Overseas Bank Ltd | 3.750 | 04/15/29 | 2,460 | ||||||||||
| 3,500,000 | g | United Overseas Bank Ltd | 2.000 | 10/14/31 | 3,475 | ||||||||||
| GBP | 500,000 | Virgin Money UK plc | 3.375 | 04/24/26 | 699 | ||||||||||
| $ | 8,400,000 | Wells Fargo & Co | 3.750 | 01/24/24 | 8,820 | ||||||||||
| 5,300,000 | Wells Fargo & Co | 3.550 | 09/29/25 | 5,648 | |||||||||||
| 382 |
COLLEGE RETIREMENT EQUITIES FUND - Bond Market Account
| PRINCIPAL | ISSUER | RATE | MATURITY DATE | VALUE (000) | |||||||||||
| $ | 5,600,000 | Wells Fargo & Co | 3.000 | % | 10/23/26 | $ | 5,883 | ||||||||
| 21,575,000 | Wells Fargo & Co | 2.393 | 06/02/28 | 21,927 | |||||||||||
| 11,950,000 | Wells Fargo & Co | 2.879 | 10/30/30 | 12,423 | |||||||||||
| 10,000,000 | Wells Fargo & Co | 3.900 | N/A‡ | 10,275 | |||||||||||
| 8,500,000 | Wells Fargo & Co | 5.875 | N/A‡ | 9,286 | |||||||||||
| 6,000,000 | Wells Fargo & Co | 5.900 | N/A‡ | 6,331 | |||||||||||
| 6,171,000 | Westpac Banking Corp | 2.668 | 11/15/35 | 6,011 | |||||||||||
| TOTAL BANKS | 1,196,106 | ||||||||||||||
| CAPITAL GOODS - 1.4% | |||||||||||||||
| 5,000,000 | Air Lease Corp | 3.125 | 12/01/30 | 5,102 | |||||||||||
| EUR | 400,000 | Airbus SE | 2.375 | 06/09/40 | 508 | ||||||||||
| GBP | 500,000 | BAE Systems plc | 4.125 | 06/08/22 | 686 | ||||||||||
| $ | 6,600,000 | g | BAE Systems plc | 1.900 | 02/15/31 | 6,262 | |||||||||
| 31,650,000 | Boeing Co | 2.196 | 02/04/26 | 31,642 | |||||||||||
| 13,350,000 | Boeing Co | 2.950 | 02/01/30 | 13,601 | |||||||||||
| 3,352,000 | Boeing Co | 3.250 | 02/01/35 | 3,378 | |||||||||||
| 15,000,000 | Boeing Co | 5.805 | 05/01/50 | 20,312 | |||||||||||
| 875,000 | g | DAE Funding LLC | 1.550 | 08/01/24 | 868 | ||||||||||
| 200,000 | g | DAE Funding LLC | 3.375 | 03/20/28 | 202 | ||||||||||
| 3,000,000 | g | Embraer Netherlands Finance BV | 6.950 | 01/17/28 | 3,312 | ||||||||||
| 3,075,000 | g | H&E Equipment Services, Inc | 3.875 | 12/15/28 | 3,052 | ||||||||||
| EUR | 500,000 | Honeywell International, Inc | 0.000 | 03/10/24 | 571 | ||||||||||
| $ | 1,000,000 | Ingersoll-Rand Global Holding Co Ltd | 3.750 | 08/21/28 | 1,092 | ||||||||||
| 7,500,000 | Ingersoll-Rand Luxembourg Finance S.A. | 3.800 | 03/21/29 | 8,192 | |||||||||||
| 3,000,000 | g | Korea East-West Power Co Ltd | 1.750 | 05/06/25 | 3,023 | ||||||||||
| 3,150,000 | L3Harris Technologies, Inc | 3.850 | 06/15/23 | 3,272 | |||||||||||
| 1,700,000 | e | Lockheed Martin Corp | 1.850 | 06/15/30 | 1,670 | ||||||||||
| 300,000 | National Central Cooling Co PJSC | 2.500 | 10/21/27 | 295 | |||||||||||
| 8,925,000 | Northrop Grumman Corp | 3.250 | 01/15/28 | 9,552 | |||||||||||
| 13,775,000 | Parker-Hannifin Corp | 3.250 | 06/14/29 | 14,599 | |||||||||||
| 361,000 | Raytheon Technologies Corp | 3.650 | 08/16/23 | 375 | |||||||||||
| 16,850,000 | Raytheon Technologies Corp | 4.125 | 11/16/28 | 18,848 | |||||||||||
| 6,600,000 | Raytheon Technologies Corp | 2.250 | 07/01/30 | 6,581 | |||||||||||
| 6,665,000 | Raytheon Technologies Corp | 4.500 | 06/01/42 | 8,239 | |||||||||||
| 325,000 | g | Rolls-Royce plc | 5.750 | 10/15/27 | 359 | ||||||||||
| 5,475,000 | Roper Technologies, Inc | 1.400 | 09/15/27 | 5,312 | |||||||||||
| 2,650,000 | Roper Technologies, Inc | 2.950 | 09/15/29 | 2,741 | |||||||||||
| 10,900,000 | Roper Technologies, Inc | 2.000 | 06/30/30 | 10,479 | |||||||||||
| EUR | 800,000 | Thermo Fisher Scientific Finance I BV | 0.800 | 10/18/30 | 915 | ||||||||||
| $ | 4,000,000 | g | TSMC Global Ltd | 1.000 | 09/28/27 | 3,776 | |||||||||
| 300,000 | g | WESCO Distribution, Inc | 7.250 | 06/15/28 | 329 | ||||||||||
| TOTAL CAPITAL GOODS | 189,145 | ||||||||||||||
| COMMERCIAL & PROFESSIONAL SERVICES - 0.3% | |||||||||||||||
| EUR | 250,000 | g | Allied Universal Holdco LLC | 3.625 | 06/01/28 | 278 | |||||||||
| $ | 325,000 | g | ASGN, Inc | 4.625 | 05/15/28 | 337 | |||||||||
| 925,000 | g | Booz Allen Hamilton, Inc | 3.875 | 09/01/28 | 941 | ||||||||||
| 750,000 | g | GFL Environmental, Inc | 4.250 | 06/01/25 | 772 | ||||||||||
| 1,000,000 | g | GFL Environmental, Inc | 3.750 | 08/01/25 | 1,010 | ||||||||||
| 1,950,000 | IHS Markit Ltd | 4.125 | 08/01/23 | 2,038 | |||||||||||
| 3,175,000 | IHS Markit Ltd | 4.250 | 05/01/29 | 3,611 | |||||||||||
| 383 |
COLLEGE RETIREMENT EQUITIES FUND - Bond Market Account
| PRINCIPAL | ISSUER | RATE | MATURITY DATE | VALUE (000) | |||||||||||
| $ | 2,350,000 | g | Prime Security Services Borrower LLC | 5.250 | % | 04/15/24 | $ | 2,501 | |||||||
| 2,000,000 | g | Prime Security Services Borrower LLC | 5.750 | 04/15/26 | 2,147 | ||||||||||
| 1,325,000 | g | Prime Security Services Borrower LLC | 3.375 | 08/31/27 | 1,279 | ||||||||||
| 725,000 | g | Prime Security Services Borrower LLC | 6.250 | 01/15/28 | 756 | ||||||||||
| EUR | 500,000 | RELX Capital, Inc | 1.300 | 05/12/25 | 590 | ||||||||||
| $ | 7,971,000 | Republic Services, Inc | 2.900 | 07/01/26 | 8,332 | ||||||||||
| 1,250,000 | Verisk Analytics, Inc | 4.125 | 03/15/29 | 1,393 | |||||||||||
| 1,050,000 | Verisk Analytics, Inc | 3.625 | 05/15/50 | 1,142 | |||||||||||
| 9,650,000 | Waste Management, Inc | 2.900 | 09/15/22 | 9,764 | |||||||||||
| 3,550,000 | Waste Management, Inc | 2.500 | 11/15/50 | 3,377 | |||||||||||
| TOTAL COMMERCIAL & PROFESSIONAL SERVICES | 40,268 | ||||||||||||||
| CONSUMER DURABLES & APPAREL - 0.0% | |||||||||||||||
| 1,600,000 | Leggett & Platt, Inc | 4.400 | 03/15/29 | 1,791 | |||||||||||
| 149,000 | Newell Brands, Inc | 4.875 | 06/01/25 | 162 | |||||||||||
| TOTAL CONSUMER DURABLES & APPAREL | 1,953 | ||||||||||||||
| CONSUMER SERVICES - 0.9% | |||||||||||||||
| 9,820,000 | Amherst College | 4.100 | 11/01/45 | 12,144 | |||||||||||
| 29,085,000 | Anheuser-Busch Cos LLC | 3.650 | 02/01/26 | 31,227 | |||||||||||
| 9,500,000 | Anheuser-Busch Cos LLC | 4.900 | 02/01/46 | 12,008 | |||||||||||
| 1,825,000 | g | Cedar Fair LP | 5.500 | 05/01/25 | 1,889 | ||||||||||
| 3,800,000 | g | ENA Master Trust | 4.000 | 05/19/48 | 3,809 | ||||||||||
| 125,000 | g | Hilton Domestic Operating Co, Inc | 5.750 | 05/01/28 | 134 | ||||||||||
| 2,975,000 | Hyatt Hotels Corp | 1.300 | 10/01/23 | 2,975 | |||||||||||
| 1,610,000 | g | International Game Technology plc | 6.500 | 02/15/25 | 1,747 | ||||||||||
| EUR | 500,000 | g | International Game Technology plc | 3.500 | 06/15/26 | 580 | |||||||||
| $ | 8,000,000 | President and Fellows of Harvard College | 3.529 | 10/01/31 | 9,064 | ||||||||||
| 14,250,000 | President and Fellows of Harvard College | 3.619 | 10/01/37 | 16,642 | |||||||||||
| 1,000,000 | g | Sands China Ltd | 2.300 | 03/08/27 | 941 | ||||||||||
| 2,100,000 | Sands China Ltd | 5.400 | 08/08/28 | 2,261 | |||||||||||
| EUR | 500,000 | g | Scientific Games International, Inc | 3.375 | 02/15/26 | 574 | |||||||||
| $ | 15,000,000 | Smith College | 4.620 | 07/01/45 | 19,138 | ||||||||||
| 1,125,000 | g | Wynn Macau Ltd | 5.500 | 01/15/26 | 1,057 | ||||||||||
| TOTAL CONSUMER SERVICES | 116,190 | ||||||||||||||
| DIVERSIFIED FINANCIALS - 3.9% | |||||||||||||||
| 8,975,000 | AerCap Ireland Capital DAC | 1.750 | 01/30/26 | 8,803 | |||||||||||
| 13,300,000 | AerCap Ireland Capital DAC | 2.450 | 10/29/26 | 13,409 | |||||||||||
| 3,500,000 | AerCap Ireland Capital DAC | 3.650 | 07/21/27 | 3,688 | |||||||||||
| 7,000,000 | AerCap Ireland Capital DAC | 4.625 | 10/15/27 | 7,743 | |||||||||||
| 3,650,000 | AerCap Ireland Capital DAC | 3.300 | 01/30/32 | 3,719 | |||||||||||
| 2,250,000 | AerCap Ireland Capital DAC | 3.850 | 10/29/41 | 2,344 | |||||||||||
| 5,525,000 | American Express Co | 2.500 | 08/01/22 | 5,582 | |||||||||||
| 4,000,000 | American Express Co | 3.700 | 08/03/23 | 4,171 | |||||||||||
| 2,775,000 | g | American Express Co | 3.300 | 05/03/27 | 2,975 | ||||||||||
| 7,500,000 | American Express Co | 3.550 | N/A‡ | 7,513 | |||||||||||
| EUR | 425,000 | American Honda Finance Corp | 1.950 | 10/18/24 | 510 | ||||||||||
| $ | 3,975,000 | Ameriprise Financial, Inc | 3.000 | 03/22/22 | 3,998 | ||||||||||
| 2,900,000 | g | B3 S.A.-Brasil Bolsa Balcao | 4.125 | 09/20/31 | 2,795 | ||||||||||
| 6,000,000 | g | Banco BTG Pactual S.A. | 2.750 | 01/11/26 | 5,692 | ||||||||||
| 384 |
COLLEGE RETIREMENT EQUITIES FUND - Bond Market Account
| PRINCIPAL | ISSUER | RATE | MATURITY DATE | VALUE (000) | |||||||||||
| $ | 3,125,000 | g | Banco de Chile | 2.990 | % | 12/09/31 | $ | 3,080 | |||||||
| 10,000,000 | Bank of New York Mellon Corp | 4.700 | N/A‡ | 10,667 | |||||||||||
| 300,000 | g | BBVA Bancomer S.A. | 5.350 | 11/12/29 | 312 | ||||||||||
| 1,500,000 | g | BBVA Bancomer S.A. | 5.125 | 01/18/33 | 1,539 | ||||||||||
| 7,674,000 | g | BPCE S.A. | 4.625 | 07/11/24 | 8,202 | ||||||||||
| 20,775,000 | Capital One Bank USA NA | 3.375 | 02/15/23 | 21,350 | |||||||||||
| EUR | 150,000 | Capital One Financial Corp | 0.800 | 06/12/24 | 174 | ||||||||||
| $ | 6,635,000 | Capital One Financial Corp | 3.950 | N/A‡ | 6,668 | ||||||||||
| EUR | 100,000 | Celanese US Holdings LLC | 0.625 | 09/10/28 | 112 | ||||||||||
| $ | 4,000,000 | Charles Schwab Corp | 4.000 | N/A‡ | 4,080 | ||||||||||
| 7,000,000 | Charles Schwab Corp | 5.375 | N/A‡ | 7,630 | |||||||||||
| 6,250,000 | Community Preservation Corp | 2.867 | 02/01/30 | 6,458 | |||||||||||
| 9,800,000 | g | Credit Suisse Group AG. | 2.997 | 12/14/23 | 9,958 | ||||||||||
| 8,475,000 | g | Credit Suisse Group AG. | 2.193 | 06/05/26 | 8,522 | ||||||||||
| 10,275,000 | g | Credit Suisse Group AG. | 1.305 | 02/02/27 | 9,926 | ||||||||||
| GBP | 300,000 | Credit Suisse Group AG. | 2.250 | 06/09/28 | 406 | ||||||||||
| $ | 1,850,000 | g | Credit Suisse Group AG. | 3.091 | 05/14/32 | 1,883 | |||||||||
| 7,700,000 | Credit Suisse Group Funding Guernsey Ltd | 3.800 | 06/09/23 | 7,978 | |||||||||||
| 10,250,000 | Credit Suisse Group Funding Guernsey Ltd | 3.750 | 03/26/25 | 10,876 | |||||||||||
| GBP | 300,000 | Danske Bank A.S. | 2.250 | 01/14/28 | 408 | ||||||||||
| $ | 6,850,000 | Deutsche Bank AG. | 2.311 | 11/16/27 | 6,847 | ||||||||||
| 5,700,000 | Deutsche Bank AG. | 3.035 | 05/28/32 | 5,743 | |||||||||||
| 3,543,000 | Equitable Holdings, Inc | 4.950 | N/A‡ | 3,711 | |||||||||||
| 4,000,000 | Ford Motor Credit Co LLC | 3.096 | 05/04/23 | 4,075 | |||||||||||
| 19,281,000 | GE Capital International Funding Co | 4.418 | 11/15/35 | 23,009 | |||||||||||
| 20,000,000 | General Motors Financial Co, Inc | 2.750 | 06/20/25 | 20,637 | |||||||||||
| EUR | 500,000 | General Motors Financial Co, Inc | 0.600 | 05/20/27 | 564 | ||||||||||
| $ | 5,475,000 | General Motors Financial Co, Inc | 5.650 | 01/17/29 | 6,492 | ||||||||||
| 11,000,000 | General Motors Financial Co, Inc | 2.700 | 06/10/31 | 10,961 | |||||||||||
| 5,450,000 | General Motors Financial Co, Inc | 5.700 | N/A‡ | 6,213 | |||||||||||
| 6,650,000 | Goldman Sachs Group, Inc | 3.500 | 01/23/25 | 7,011 | |||||||||||
| 6,925,000 | Goldman Sachs Group, Inc | 3.500 | 04/01/25 | 7,323 | |||||||||||
| EUR | 825,000 | Goldman Sachs Group, Inc | 1.625 | 07/27/26 | 991 | ||||||||||
| $ | 6,900,000 | Goldman Sachs Group, Inc | 1.431 | 03/09/27 | 6,759 | ||||||||||
| 26,625,000 | Goldman Sachs Group, Inc | 3.691 | 06/05/28 | 28,671 | |||||||||||
| 6,875,000 | Goldman Sachs Group, Inc | 1.992 | 01/27/32 | 6,592 | |||||||||||
| 13,425,000 | Goldman Sachs Group, Inc | 2.615 | 04/22/32 | 13,521 | |||||||||||
| 3,500,000 | Goldman Sachs Group, Inc | 2.650 | 10/21/32 | 3,522 | |||||||||||
| 6,075,000 | Goldman Sachs Group, Inc | 4.017 | 10/31/38 | 6,948 | |||||||||||
| 7,675,000 | Goldman Sachs Group, Inc | 4.800 | 07/08/44 | 9,802 | |||||||||||
| 1,500,000 | Goldman Sachs Group, Inc | 4.125 | N/A‡ | 1,525 | |||||||||||
| 1,500,000 | Goldman Sachs Group, Inc | 3.800 | N/A‡ | 1,492 | |||||||||||
| 200,000 | g | Indian Railway Finance Corp Ltd | 3.249 | 02/13/30 | 203 | ||||||||||
| 3,600,000 | g | Indian Railway Finance Corp Ltd | 2.800 | 02/10/31 | 3,509 | ||||||||||
| 5,000,000 | International Lease Finance Corp | 5.875 | 08/15/22 | 5,154 | |||||||||||
| 1,305,000 | Legg Mason, Inc | 3.950 | 07/15/24 | 1,387 | |||||||||||
| 3,000,000 | g | Minejesa Capital BV | 4.625 | 08/10/30 | 3,077 | ||||||||||
| 19,000,000 | Morgan Stanley | 2.188 | 04/28/26 | 19,373 | |||||||||||
| 31,425,000 | Morgan Stanley | 3.125 | 07/27/26 | 33,289 | |||||||||||
| EUR | 700,000 | Morgan Stanley | 1.342 | 10/23/26 | 827 | ||||||||||
| $ | 6,200,000 | Morgan Stanley | 1.512 | 07/20/27 | 6,102 | ||||||||||
| 16,600,000 | Morgan Stanley | 2.699 | 01/22/31 | 16,983 | |||||||||||
| 385 |
COLLEGE RETIREMENT EQUITIES FUND - Bond Market Account
| PRINCIPAL | ISSUER | RATE | MATURITY DATE | VALUE (000) | |||||||||||
| $ | 4,900,000 | Morgan Stanley | 1.794 | % | 02/13/32 | $ | 4,638 | ||||||||
| 4,600,000 | Morgan Stanley | 1.928 | 04/28/32 | 4,395 | |||||||||||
| 5,450,000 | Morgan Stanley | 2.239 | 07/21/32 | 5,331 | |||||||||||
| 4,440,000 | Northern Trust Corp | 4.600 | N/A‡ | 4,777 | |||||||||||
| 3,350,000 | g | Power Finance Corp Ltd | 3.950 | 04/23/30 | 3,462 | ||||||||||
| 3,800,000 | g | Societe Generale S.A. | 2.889 | 06/09/32 | 3,791 | ||||||||||
| 550,000 | Springleaf Finance Corp | 5.375 | 11/15/29 | 598 | |||||||||||
| 5,600,000 | g | Swiss Re Finance Luxembourg SA | 5.000 | 04/02/49 | 6,265 | ||||||||||
| 3,750,000 | Synchrony Financial | 4.375 | 03/19/24 | 3,957 | |||||||||||
| 5,519,000 | Synchrony Financial | 4.250 | 08/15/24 | 5,845 | |||||||||||
| 10,157,000 | g | UBS Group AG | 2.859 | 08/15/23 | 10,279 | ||||||||||
| 1,000,000 | Voya Financial, Inc | 5.700 | 07/15/43 | 1,361 | |||||||||||
| 8,295,000 | Voya Financial, Inc | 5.650 | 05/15/53 | 8,575 | |||||||||||
| TOTAL DIVERSIFIED FINANCIALS | 528,758 | ||||||||||||||
| ENERGY - 3.9% | |||||||||||||||
| 1,050,000 | AmeriGas Partners LP | 5.875 | 08/20/26 | 1,174 | |||||||||||
| 6,750,000 | Cenovus Energy, Inc | 4.250 | 04/15/27 | 7,357 | |||||||||||
| 1,625,000 | Cenovus Energy, Inc | 2.650 | 01/15/32 | 1,590 | |||||||||||
| 11,000,000 | Chevron Corp | 1.554 | 05/11/25 | 11,093 | |||||||||||
| 11,200,000 | g | ConocoPhillips | 2.400 | 02/15/31 | 11,236 | ||||||||||
| 10,000,000 | Diamondback Energy, Inc | 2.875 | 12/01/24 | 10,374 | |||||||||||
| 6,700,000 | Diamondback Energy, Inc | 3.125 | 03/24/31 | 6,905 | |||||||||||
| 5,250,000 | Ecopetrol S.A. | 5.375 | 06/26/26 | 5,532 | |||||||||||
| 2,075,000 | Ecopetrol S.A. | 6.875 | 04/29/30 | 2,316 | |||||||||||
| 2,125,000 | Ecopetrol S.A. | 4.625 | 11/02/31 | 2,066 | |||||||||||
| 3,000,000 | g | Empresa Nacional del Petroleo | 5.250 | 11/06/29 | 3,232 | ||||||||||
| 2,975,000 | g | Empresa Nacional del Petroleo | 3.450 | 09/16/31 | 2,834 | ||||||||||
| 21,068,000 | Enbridge, Inc | 3.125 | 11/15/29 | 22,062 | |||||||||||
| 3,650,000 | Enbridge, Inc | 3.400 | 08/01/51 | 3,700 | |||||||||||
| 2,624,000 | g | Energean Israel Finance Ltd | 4.500 | 03/30/24 | 2,642 | ||||||||||
| 6,421,000 | Energy Transfer Operating LP | 3.600 | 02/01/23 | 6,546 | |||||||||||
| 5,930,000 | Energy Transfer Operating LP | 4.200 | 09/15/23 | 6,193 | |||||||||||
| 4,575,000 | Energy Transfer Operating LP | 2.900 | 05/15/25 | 4,726 | |||||||||||
| 4,725,000 | Energy Transfer Operating LP | 4.750 | 01/15/26 | 5,169 | |||||||||||
| 2,950,000 | Energy Transfer Operating LP | 5.500 | 06/01/27 | 3,365 | |||||||||||
| 7,850,000 | Energy Transfer Operating LP | 4.950 | 06/15/28 | 8,830 | |||||||||||
| 4,225,000 | Energy Transfer Operating LP | 5.250 | 04/15/29 | 4,839 | |||||||||||
| 8,700,000 | Energy Transfer Operating LP | 6.250 | 04/15/49 | 11,364 | |||||||||||
| 9,125,000 | Energy Transfer Operating LP | 5.000 | 05/15/50 | 10,500 | |||||||||||
| 5,125,000 | Enterprise Products Operating LLC | 3.700 | 02/15/26 | 5,497 | |||||||||||
| 6,275,000 | Enterprise Products Operating LLC | 3.125 | 07/31/29 | 6,663 | |||||||||||
| 700,000 | Enterprise Products Operating LLC | 2.800 | 01/31/30 | 730 | |||||||||||
| 4,025,000 | Enterprise Products Operating LLC | 4.250 | 02/15/48 | 4,556 | |||||||||||
| 6,200,000 | Enterprise Products Operating LLC | 4.200 | 01/31/50 | 6,950 | |||||||||||
| 10,600,000 | Enterprise Products Operating LLC | 3.700 | 01/31/51 | 11,121 | |||||||||||
| 11,000,000 | Enterprise Products Operating LLC | 3.300 | 02/15/53 | 10,941 | |||||||||||
| 1,225,000 | g | EQM Midstream Partners LP | 6.000 | 07/01/25 | 1,332 | ||||||||||
| 3,334,000 | g | Galaxy Pipeline Assets Bidco Ltd | 2.160 | 03/31/34 | 3,268 | ||||||||||
| 386 |
COLLEGE RETIREMENT EQUITIES FUND - Bond Market Account
| PRINCIPAL | ISSUER | RATE | MATURITY DATE | VALUE (000) | |||||||||||
| $ | 3,300,000 | g | Galaxy Pipeline Assets Bidco Ltd | 2.625 | % | 03/31/36 | $ | 3,223 | |||||||
| EUR | 300,000 | g | Gazprom PJSC via Gaz Finance plc | 1.850 | 11/17/28 | 336 | |||||||||
| $ | 3,475,000 | g | KazTransGas JSC | 4.375 | 09/26/27 | 3,782 | |||||||||
| 4,850,000 | Kinder Morgan Energy Partners LP | 5.400 | 09/01/44 | 5,898 | |||||||||||
| 2,065,000 | Kinder Morgan, Inc | 5.300 | 12/01/34 | 2,485 | |||||||||||
| 10,675,000 | Magellan Midstream Partners LP | 3.250 | 06/01/30 | 11,211 | |||||||||||
| 9,075,000 | Marathon Petroleum Corp | 3.800 | 04/01/28 | 9,726 | |||||||||||
| 6,235,000 | Marathon Petroleum Corp | 4.750 | 09/15/44 | 7,337 | |||||||||||
| 5,500,000 | Marathon Petroleum Corp | 5.000 | 09/15/54 | 6,517 | |||||||||||
| 725,000 | g | MEG Energy Corp | 5.875 | 02/01/29 | 759 | ||||||||||
| 8,950,000 | MPLX LP | 1.750 | 03/01/26 | 8,860 | |||||||||||
| 25,450,000 | MPLX LP | 2.650 | 08/15/30 | 25,334 | |||||||||||
| 6,150,000 | MPLX LP | 4.700 | 04/15/48 | 7,095 | |||||||||||
| 275,000 | Murphy Oil Corp | 5.875 | 12/01/27 | 284 | |||||||||||
| 1,000,000 | NAK Naftogaz Ukraine via Kondor Finance plc | 7.375 | 07/19/22 | 978 | |||||||||||
| 1,400,000 | NuStar Logistics LP | 5.750 | 10/01/25 | 1,507 | |||||||||||
| 2,200,000 | Occidental Petroleum Corp | 5.550 | 03/15/26 | 2,449 | |||||||||||
| 3,900,000 | Occidental Petroleum Corp | 4.300 | 08/15/39 | 3,890 | |||||||||||
| 1,350,000 | g | Oleoducto Central S.A. | 4.000 | 07/14/27 | 1,343 | ||||||||||
| 1,775,000 | ONEOK, Inc | 4.000 | 07/13/27 | 1,919 | |||||||||||
| 11,642,000 | ONEOK, Inc | 4.550 | 07/15/28 | 12,853 | |||||||||||
| 12,150,000 | ONEOK, Inc | 4.350 | 03/15/29 | 13,242 | |||||||||||
| 5,500,000 | ONEOK, Inc | 4.500 | 03/15/50 | 6,091 | |||||||||||
| 315,000 | g | Parkland Corp | 4.625 | 05/01/30 | 313 | ||||||||||
| 500,000 | g | Parkland Fuel Corp | 5.875 | 07/15/27 | 528 | ||||||||||
| 3,000,000 | g | Pertamina Persero PT | 4.300 | 05/20/23 | 3,117 | ||||||||||
| 2,800,000 | g | Pertamina Persero PT | 1.400 | 02/09/26 | 2,717 | ||||||||||
| 1,425,000 | g | Pertamina Persero PT | 3.650 | 07/30/29 | 1,513 | ||||||||||
| 1,200,000 | Petrobras Global Finance BV | 5.999 | 01/27/28 | 1,308 | |||||||||||
| 1,100,000 | Petrobras Global Finance BV | 5.093 | 01/15/30 | 1,144 | |||||||||||
| 4,000,000 | Petrobras Global Finance BV | 5.600 | 01/03/31 | 4,236 | |||||||||||
| 560,000 | Petrobras Global Finance BV | 7.250 | 03/17/44 | 620 | |||||||||||
| 350,000 | e | Petrobras Global Finance BV | 5.500 | 06/10/51 | 325 | ||||||||||
| EUR | 375,000 | Petroleos Mexicanos | 1.875 | 04/21/22 | 428 | ||||||||||
| $ | 2,000,000 | Petroleos Mexicanos | 1.950 | 12/20/22 | 2,015 | ||||||||||
| 1,070,000 | Petroleos Mexicanos | 2.000 | 12/20/22 | 1,079 | |||||||||||
| 1,600,000 | Petroleos Mexicanos | 7.000 | 01/23/30 | 1,655 | |||||||||||
| 5,300,000 | Petroleos Mexicanos | 5.950 | 01/28/31 | 5,150 | |||||||||||
| 5,481,000 | g | Petroleos Mexicanos | 6.700 | 02/16/32 | 5,536 | ||||||||||
| 1,950,000 | g | Petronas Capital Ltd | 3.500 | 04/21/30 | 2,108 | ||||||||||
| 4,375,000 | g | Petronas Energy Canada Ltd | 2.112 | 03/23/28 | 4,376 | ||||||||||
| 9,400,000 | Phillips 66 | 2.150 | 12/15/30 | 9,047 | |||||||||||
| 4,300,000 | Phillips 66 | 3.300 | 03/15/52 | 4,295 | |||||||||||
| 3,250,000 | Phillips 66 Partners LP | 3.150 | 12/15/29 | 3,369 | |||||||||||
| 3,275,000 | Phillips 66 Partners LP | 4.680 | 02/15/45 | 3,840 | |||||||||||
| 475,000 | Plains All American Pipeline LP | 3.800 | 09/15/30 | 496 | |||||||||||
| 387 |
COLLEGE RETIREMENT EQUITIES FUND - Bond Market Account
| PRINCIPAL | ISSUER | RATE | MATURITY DATE | VALUE (000) | |||||||||||
| $ | 1,900,000 | g | PTTEP Treasury Center Co Ltd | 2.587 | % | 06/10/27 | $ | 1,935 | |||||||
| 1,200,000 | Regency Energy Partners LP | 4.500 | 11/01/23 | 1,257 | |||||||||||
| 2,458,670 | g | Rio Oil Finance Trust | 8.200 | 04/06/28 | 2,781 | ||||||||||
| 1,700,000 | g | S.A. Global Sukuk Ltd | 0.946 | 06/17/24 | 1,674 | ||||||||||
| 9,875,000 | Sabine Pass Liquefaction LLC | 4.200 | 03/15/28 | 10,817 | |||||||||||
| 10,200,000 | Sabine Pass Liquefaction LLC | 4.500 | 05/15/30 | 11,506 | |||||||||||
| 4,075,000 | g | Santos Finance Ltd | 3.649 | 04/29/31 | 4,149 | ||||||||||
| 4,000,000 | g | Saudi Arabian Oil Co | 2.250 | 11/24/30 | 3,890 | ||||||||||
| 3,000,000 | g | Saudi Arabian Oil Co | 3.250 | 11/24/50 | 2,919 | ||||||||||
| 4,875,000 | Shell International Finance BV | 2.875 | 05/10/26 | 5,171 | |||||||||||
| 6,900,000 | Shell International Finance BV | 3.125 | 11/07/49 | 7,100 | |||||||||||
| 6,500,000 | Sunoco Logistics Partners Operations LP | 4.000 | 10/01/27 | 6,979 | |||||||||||
| 1,925,000 | Sunoco Logistics Partners Operations LP | 5.400 | 10/01/47 | 2,259 | |||||||||||
| 425,000 | Targa Resources Partners LP | 6.500 | 07/15/27 | 456 | |||||||||||
| 4,300,000 | g | Thaioil Treasury Center Co Ltd | 2.500 | 06/18/30 | 4,017 | ||||||||||
| 11,000,000 | Total Capital International S.A. | 3.127 | 05/29/50 | 11,275 | |||||||||||
| 19,150,000 | TransCanada PipeLines Ltd | 4.250 | 05/15/28 | 21,355 | |||||||||||
| 1,400,000 | Vale Overseas Ltd | 6.250 | 08/10/26 | 1,621 | |||||||||||
| 14,750,000 | Williams Cos, Inc | 2.600 | 03/15/31 | 14,650 | |||||||||||
| 5,075,000 | Williams Partners LP | 3.750 | 06/15/27 | 5,479 | |||||||||||
| TOTAL ENERGY | 524,327 | ||||||||||||||
| FOOD & STAPLES RETAILING - 0.4% | |||||||||||||||
| 5,225,000 | Costco Wholesale Corp | 1.375 | 06/20/27 | 5,185 | |||||||||||
| 7,850,000 | Costco Wholesale Corp | 1.600 | 04/20/30 | 7,605 | |||||||||||
| 2,450,000 | Costco Wholesale Corp | 1.750 | 04/20/32 | 2,380 | |||||||||||
| 5,575,000 | Kroger Co | 3.700 | 08/01/27 | 6,085 | |||||||||||
| 3,140,000 | Kroger Co | 3.875 | 10/15/46 | 3,494 | |||||||||||
| EUR | 1,000,000 | SYSCO Corp | 1.250 | 06/23/23 | 1,157 | ||||||||||
| $ | 6,700,000 | SYSCO Corp | 3.150 | 12/14/51 | 6,595 | ||||||||||
| 770,000 | Walmart, Inc | 2.375 | 09/24/29 | 803 | |||||||||||
| 15,450,000 | Walmart, Inc | 1.800 | 09/22/31 | 15,295 | |||||||||||
| 7,150,000 | Walmart, Inc | 2.500 | 09/22/41 | 7,209 | |||||||||||
| TOTAL FOOD & STAPLES RETAILING | 55,808 | ||||||||||||||
| FOOD, BEVERAGE & TOBACCO - 1.1% | |||||||||||||||
| 2,050,000 | Altria Group, Inc | 3.400 | 05/06/30 | 2,121 | |||||||||||
| 2,225,000 | Altria Group, Inc | 2.450 | 02/04/32 | 2,112 | |||||||||||
| 5,800,000 | Altria Group, Inc | 5.950 | 02/14/49 | 7,238 | |||||||||||
| 2,600,000 | g | Anadolu Efes Biracilik Ve Malt Sanayii AS. | 3.375 | 06/29/28 | 2,522 | ||||||||||
| 18,600,000 | Anheuser-Busch InBev Worldwide, Inc | 4.750 | 01/23/29 | 21,649 | |||||||||||
| 5,045,000 | Anheuser-Busch InBev Worldwide, Inc | 4.439 | 10/06/48 | 6,030 | |||||||||||
| 6,275,000 | BAT Capital Corp | 2.259 | 03/25/28 | 6,115 | |||||||||||
| 16,425,000 | BAT Capital Corp | 4.906 | 04/02/30 | 18,436 | |||||||||||
| 12,850,000 | BAT Capital Corp | 2.726 | 03/25/31 | 12,470 | |||||||||||
| 6,900,000 | BAT Capital Corp | 3.984 | 09/25/50 | 6,633 | |||||||||||
| GBP | 200,000 | BAT International Finance plc | 4.000 | 09/04/26 | 290 | ||||||||||
| $ | 1,000,000 | e,g | BRF S.A. | 5.750 | 09/21/50 | 995 | |||||||||
| 1,700,000 | Constellation Brands, Inc | 4.400 | 11/15/25 | 1,863 | |||||||||||
| 2,675,000 | Constellation Brands, Inc | 3.700 | 12/06/26 | 2,890 | |||||||||||
| 3,225,000 | Constellation Brands, Inc | 3.150 | 08/01/29 | 3,401 | |||||||||||
| 388 |
COLLEGE RETIREMENT EQUITIES FUND - Bond Market Account
| PRINCIPAL | ISSUER | RATE | MATURITY DATE | VALUE (000) | |||||||||||
| $ | 6,900,000 | Constellation Brands, Inc | 2.875 | % | 05/01/30 | $ | 7,081 | ||||||||
| 5,675,000 | Constellation Brands, Inc | 2.250 | 08/01/31 | 5,547 | |||||||||||
| 2,250,000 | g | Corp Lindley S.A. | 4.625 | 04/12/23 | 2,292 | ||||||||||
| 4,500,000 | Diageo Capital plc | 1.375 | 09/29/25 | 4,475 | |||||||||||
| 8,050,000 | Diageo Capital plc | 2.375 | 10/24/29 | 8,221 | |||||||||||
| 3,900,000 | Diageo Capital plc | 2.000 | 04/29/30 | 3,859 | |||||||||||
| 425,000 | g | Embotelladora Andina S.A. | 3.950 | 01/21/50 | 439 | ||||||||||
| 1,550,000 | General Mills, Inc | 2.875 | 04/15/30 | 1,617 | |||||||||||
| 3,500,000 | g | Grupo Bimbo SAB de C.V. | 4.700 | 11/10/47 | 4,153 | ||||||||||
| 2,400,000 | e,g | Grupo Bimbo SAB de C.V. | 5.950 | N/A‡ | 2,484 | ||||||||||
| 4,575,000 | J M Smucker Co | 2.125 | 03/15/32 | 4,425 | |||||||||||
| 1,600,000 | Philip Morris International, Inc | 6.375 | 05/16/38 | 2,245 | |||||||||||
| 2,050,000 | g | Post Holdings, Inc | 4.625 | 04/15/30 | 2,088 | ||||||||||
| 3,500,000 | g | Sigma Alimentos S.A. de C.V. | 4.125 | 05/02/26 | 3,711 | ||||||||||
| TOTAL FOOD, BEVERAGE & TOBACCO | 147,402 | ||||||||||||||
| HEALTH CARE EQUIPMENT & SERVICES - 2.1% | |||||||||||||||
| 9,700,000 | Abbott Laboratories | 1.150 | 01/30/28 | 9,428 | |||||||||||
| 2,250,000 | Abbott Laboratories | 5.300 | 05/27/40 | 3,107 | |||||||||||
| 9,000,000 | Anthem, Inc | 2.250 | 05/15/30 | 8,968 | |||||||||||
| 4,500,000 | Anthem, Inc | 2.550 | 03/15/31 | 4,594 | |||||||||||
| EUR | 670,000 | Becton Dickinson & Co | 1.900 | 12/15/26 | 815 | ||||||||||
| $ | 8,450,000 | Becton Dickinson & Co | 2.823 | 05/20/30 | 8,747 | ||||||||||
| EUR | 430,000 | Becton Dickinson and Co | 1.401 | 05/24/23 | 499 | ||||||||||
| $ | 4,850,000 | Boston Scientific Corp | 2.650 | 06/01/30 | 4,944 | ||||||||||
| 3,650,000 | Centene Corp | 4.250 | 12/15/27 | 3,805 | |||||||||||
| 3,285,000 | Centene Corp | 2.450 | 07/15/28 | 3,236 | |||||||||||
| 2,910,000 | Centene Corp | 3.000 | 10/15/30 | 2,958 | |||||||||||
| 19,230,000 | Children’s Hospital Medic | 4.268 | 05/15/44 | 24,288 | |||||||||||
| 5,350,000 | Cigna Corp | 2.400 | 03/15/30 | 5,397 | |||||||||||
| 5,075,000 | Cigna Corp | 3.200 | 03/15/40 | 5,257 | |||||||||||
| 13,400,000 | CVS Health Corp | 3.625 | 04/01/27 | 14,540 | |||||||||||
| 26,450,000 | CVS Health Corp | 3.750 | 04/01/30 | 28,999 | |||||||||||
| 33,500,000 | CVS Health Corp | 1.750 | 08/21/30 | 31,924 | |||||||||||
| 10,300,000 | CVS Health Corp | 4.780 | 03/25/38 | 12,538 | |||||||||||
| 4,675,000 | CVS Health Corp | 2.700 | 08/21/40 | 4,503 | |||||||||||
| 8,350,000 | CVS Health Corp | 5.050 | 03/25/48 | 10,917 | |||||||||||
| 3,750,000 | CVS Health Corp | 4.250 | 04/01/50 | 4,532 | |||||||||||
| 4,105,000 | Dartmouth-Hitchcock Health | 4.178 | 08/01/48 | 4,863 | |||||||||||
| 1,250,000 | g | DaVita, Inc | 4.625 | 06/01/30 | 1,280 | ||||||||||
| 4,325,000 | g | DaVita, Inc | 3.750 | 02/15/31 | 4,214 | ||||||||||
| 4,225,000 | HCA, Inc | 5.625 | 09/01/28 | 4,937 | |||||||||||
| 5,000,000 | HCA, Inc | 5.500 | 06/15/47 | 6,543 | |||||||||||
| 3,500,000 | g | Hologic, Inc | 3.250 | 02/15/29 | 3,500 | ||||||||||
| 6,250,000 | Humana, Inc | 3.950 | 03/15/27 | 6,831 | |||||||||||
| 8,975,000 | Humana, Inc | 2.150 | 02/03/32 | 8,678 | |||||||||||
| GBP | 500,000 | McKesson Corp | 3.125 | 02/17/29 | 723 | ||||||||||
| $ | 12,500,000 | Mercy Health | 3.382 | 11/01/25 | 13,162 | ||||||||||
| 5,000,000 | New York and Presbyterian Hospital | 3.563 | 08/01/36 | 5,537 | |||||||||||
| EUR | 450,000 | Stryker Corp | 2.625 | 11/30/30 | 589 | ||||||||||
| 389 |
COLLEGE RETIREMENT EQUITIES FUND - Bond Market Account
| PRINCIPAL | ISSUER | RATE | MATURITY DATE | VALUE (000) | |||||||||||
| $ | 375,000 | g | Tenet Healthcare Corp | 4.625 | % | 06/15/28 | $ | 385 | |||||||
| 5,775,000 | UnitedHealth Group, Inc | 2.950 | 10/15/27 | 6,159 | |||||||||||
| 14,425,000 | UnitedHealth Group, Inc | 2.300 | 05/15/31 | 14,676 | |||||||||||
| 4,625,000 | UnitedHealth Group, Inc | 3.750 | 10/15/47 | 5,309 | |||||||||||
| TOTAL HEALTH CARE EQUIPMENT & SERVICES | 281,382 | ||||||||||||||
| HOUSEHOLD & PERSONAL PRODUCTS - 0.1% | |||||||||||||||
| 2,600,000 | Church & Dwight Co, Inc | 2.300 | 12/15/31 | 2,622 | |||||||||||
| EUR | 750,000 | g | Coty, Inc | 3.875 | 04/15/26 | 871 | |||||||||
| $ | 2,525,000 | g | Natura Cosmeticos S.A. | 4.125 | 05/03/28 | 2,478 | |||||||||
| EUR | 600,000 | The Procter & Gamble Company | 0.625 | 10/30/24 | 697 | ||||||||||
| 400,000 | The Procter & Gamble Company | 1.875 | 10/30/38 | 520 | |||||||||||
| TOTAL HOUSEHOLD & PERSONAL PRODUCTS | 7,188 | ||||||||||||||
| INSURANCE - 1.2% | |||||||||||||||
| $ | 1,925,000 | Aetna, Inc | 6.625 | 06/15/36 | 2,729 | ||||||||||
| 825,000 | g | Alliant Holdings Intermediate LLC | 4.250 | 10/15/27 | 825 | ||||||||||
| 2,700,000 | American Financial Group, Inc | 3.500 | 08/15/26 | 2,888 | |||||||||||
| 6,350,000 | Aon Corp | 2.800 | 05/15/30 | 6,544 | |||||||||||
| 9,631,000 | Aon plc | 3.500 | 06/14/24 | 10,122 | |||||||||||
| 5,250,000 | AXIS Specialty Finance LLC | 4.900 | 01/15/40 | 5,486 | |||||||||||
| 2,275,000 | Berkshire Hathaway Finance Corp | 1.850 | 03/12/30 | 2,253 | |||||||||||
| 2,400,000 | Berkshire Hathaway Finance Corp | 4.250 | 01/15/49 | 2,947 | |||||||||||
| 16,000,000 | Berkshire Hathaway Finance Corp | 2.850 | 10/15/50 | 15,765 | |||||||||||
| EUR | 500,000 | Chubb INA Holdings, Inc | 1.550 | 03/15/28 | 602 | ||||||||||
| 450,000 | Chubb INA Holdings, Inc | 1.400 | 06/15/31 | 537 | |||||||||||
| $ | 3,525,000 | CNA Financial Corp | 3.950 | 05/15/24 | 3,719 | ||||||||||
| 3,775,000 | CNA Financial Corp | 2.050 | 08/15/30 | 3,655 | |||||||||||
| 1,825,000 | g | Equitable Financial Life Global Funding | 1.400 | 07/07/25 | 1,808 | ||||||||||
| EUR | 250,000 | g | Fairfax Financial Holdings Ltd | 2.750 | 03/29/28 | 308 | |||||||||
| $ | 5,575,000 | g | Five Corners Funding Trust | 4.419 | 11/15/23 | 5,909 | |||||||||
| 7,325,000 | g | Five Corners Funding Trust II | 2.850 | 05/15/30 | 7,590 | ||||||||||
| 26,158,000 | Hartford Financial Services Group, Inc | 2.800 | 08/19/29 | 27,126 | |||||||||||
| 1,350,000 | Hartford Financial Services Group, Inc | 4.300 | 04/15/43 | 1,590 | |||||||||||
| 2,500,000 | Hartford Financial Services Group, Inc | 2.900 | 09/15/51 | 2,463 | |||||||||||
| EUR | 750,000 | Liberty Mutual Group, Inc | 2.750 | 05/04/26 | 933 | ||||||||||
| $ | 4,100,000 | g | Liberty Mutual Group, Inc | 3.951 | 10/15/50 | 4,538 | |||||||||
| 1,600,000 | Marsh & McLennan Cos, Inc | 3.500 | 06/03/24 | 1,687 | |||||||||||
| 1,365,000 | Marsh & McLennan Cos, Inc | 3.500 | 03/10/25 | 1,445 | |||||||||||
| 4,325,000 | MetLife, Inc | 3.600 | 11/13/25 | 4,664 | |||||||||||
| 11,820,000 | MetLife, Inc | 3.850 | N/A‡ | 12,056 | |||||||||||
| 3,025,000 | g | Metropolitan Life Global Funding I | 2.950 | 04/09/30 | 3,190 | ||||||||||
| 11,875,000 | PartnerRe Finance B LLC | 4.500 | 10/01/50 | 12,495 | |||||||||||
| 6,000,000 | Principal Financial Group, Inc | 2.125 | 06/15/30 | 5,932 | |||||||||||
| 2,500,000 | Prudential Financial, Inc | 3.905 | 12/07/47 | 2,903 | |||||||||||
| 6,960,000 | Prudential Financial, Inc | 3.700 | 10/01/50 | 7,041 | |||||||||||
| 3,000,000 | g | Prudential Funding LLC | 6.750 | 09/15/23 | 3,266 | ||||||||||
| 4,150,000 | Reinsurance Group of America, Inc | 3.900 | 05/15/29 | 4,538 | |||||||||||
| TOTAL INSURANCE | 169,554 | ||||||||||||||
| 390 |
COLLEGE RETIREMENT EQUITIES FUND - Bond Market Account
| PRINCIPAL | ISSUER | RATE | MATURITY DATE | VALUE (000) | |||||||||||
| MATERIALS - 1.2% | |||||||||||||||
| $ | 1,925,000 | g | Alpek SAB de C.V. | 4.250 | % | 09/18/29 | $ | 2,048 | |||||||
| 2,600,000 | g | Alpek SAB de C.V. | 3.250 | 02/25/31 | 2,593 | ||||||||||
| 7,550,000 | Amcor Flexibles North America, Inc | 2.690 | 05/25/31 | 7,652 | |||||||||||
| 4,550,000 | g | Anglo American Capital plc | 2.625 | 09/10/30 | 4,462 | ||||||||||
| 4,300,000 | AngloGold Ashanti Holdings plc | 3.375 | 11/01/28 | 4,257 | |||||||||||
| 11,325,000 | AngloGold Ashanti Holdings plc | 3.750 | 10/01/30 | 11,404 | |||||||||||
| EUR | 500,000 | g | Ardagh Metal Packaging Finance USA LLC | 2.000 | 09/01/28 | 562 | |||||||||
| 500,000 | g | Ardagh Metal Packaging Finance USA LLC | 3.000 | 09/01/29 | 557 | ||||||||||
| 200,000 | g | Ashland Services BV | 2.000 | 01/30/28 | 231 | ||||||||||
| 250,000 | Ball Corp | 4.375 | 12/15/23 | 306 | |||||||||||
| 425,000 | Ball Corp | 0.875 | 03/15/24 | 486 | |||||||||||
| $ | 1,875,000 | Ball Corp | 2.875 | 08/15/30 | 1,819 | ||||||||||
| 852,000 | Bemis Co, Inc | 3.100 | 09/15/26 | 884 | |||||||||||
| 2,600,000 | Bemis Co, Inc | 2.630 | 06/19/30 | 2,609 | |||||||||||
| 14,250,000 | Berry Global, Inc | 1.570 | 01/15/26 | 13,944 | |||||||||||
| 200,000 | Celulosa Arauco y Constitucion S.A. | 3.875 | 11/02/27 | 213 | |||||||||||
| 3,000,000 | g | Celulosa Arauco y Constitucion S.A. | 4.250 | 04/30/29 | 3,195 | ||||||||||
| 1,650,000 | g | Celulosa Arauco y Constitucion S.A. | 4.200 | 01/29/30 | 1,761 | ||||||||||
| 2,000,000 | g | Cemex SAB de C.V. | 7.375 | 06/05/27 | 2,202 | ||||||||||
| 2,500,000 | g | Cemex SAB de C.V. | 5.450 | 11/19/29 | 2,678 | ||||||||||
| 2,925,000 | g | Cemex SAB de C.V. | 3.875 | 07/11/31 | 2,914 | ||||||||||
| 1,600,000 | g | Cemex SAB de C.V. | 5.125 | N/A‡ | 1,656 | ||||||||||
| 7,425,000 | g | Corp Nacional del Cobre de Chile | 3.625 | 08/01/27 | 7,922 | ||||||||||
| EUR | 500,000 | Dow Chemical Co | 0.500 | 03/15/27 | 567 | ||||||||||
| $ | 4,000,000 | DowDuPont, Inc | 4.725 | 11/15/28 | 4,633 | ||||||||||
| 3,000,000 | Freeport-McMoRan, Inc | 5.450 | 03/15/43 | 3,771 | |||||||||||
| 2,400,000 | g | Fresnillo plc | 4.250 | 10/02/50 | 2,514 | ||||||||||
| 1,850,000 | g | Gold Fields Orogen Holdings BVI Ltd | 6.125 | 05/15/29 | 2,123 | ||||||||||
| 1,994,000 | International Paper Co | 4.350 | 08/15/48 | 2,442 | |||||||||||
| 3,000,000 | g | Inversiones CMPC S.A. | 4.375 | 04/04/27 | 3,308 | ||||||||||
| 3,600,000 | g | Inversiones CMPC S.A. | 3.000 | 04/06/31 | 3,528 | ||||||||||
| 1,300,000 | g | Klabin Finance S.A. | 4.875 | 09/19/27 | 1,381 | ||||||||||
| 5,800,000 | g | Midwest Connector Capital Co LLC | 3.900 | 04/01/24 | 6,011 | ||||||||||
| 5,800,000 | g | Midwest Connector Capital Co LLC | 4.625 | 04/01/29 | 6,243 | ||||||||||
| 1,725,000 | Mosaic Co | 4.875 | 11/15/41 | 2,010 | |||||||||||
| 4,000,000 | Newmont Corp | 2.250 | 10/01/30 | 3,944 | |||||||||||
| 6,775,000 | Newmont Corp | 2.600 | 07/15/32 | 6,789 | |||||||||||
| 7,500,000 | Nutrien Ltd | 2.950 | 05/13/30 | 7,892 | |||||||||||
| 1,920,000 | g | OCI NV | 4.625 | 10/15/25 | 1,992 | ||||||||||
| 875,000 | g | OCP S.A. | 3.750 | 06/23/31 | 850 | ||||||||||
| EUR | 250,000 | g | OI European Group BV | 3.125 | 11/15/24 | 292 | |||||||||
| 250,000 | g | Olympus Water US Holding Corp | 3.875 | 10/01/28 | 285 | ||||||||||
| $ | 3,800,000 | g | Orbia Advance Corp SAB de C.V. | 1.875 | 05/11/26 | 3,744 | |||||||||
| 375,000 | g | PolyOne Corp | 5.750 | 05/15/25 | 391 | ||||||||||
| 250,000 | g | SABIC Capital II BV | 4.000 | 10/10/23 | 262 | ||||||||||
| 1,850,000 | Sasol Financing USA LLC | 5.875 | 03/27/24 | 1,931 | |||||||||||
| 2,575,000 | Sasol Financing USA LLC | 4.375 | 09/18/26 | 2,591 | |||||||||||
| EUR | 400,000 | Silgan Holdings, Inc | 3.250 | 03/15/25 | 457 | ||||||||||
| $ | 4,525,000 | g | Sociedad Quimica y Minera de Chile S.A. | 3.500 | 09/10/51 | 4,384 | |||||||||
| 1,925,000 | Suzano Austria GmbH | 6.000 | 01/15/29 | 2,228 | |||||||||||
| 391 |
COLLEGE RETIREMENT EQUITIES FUND - Bond Market Account
| PRINCIPAL | ISSUER | RATE | MATURITY DATE | VALUE (000) | |||||||||||
| $ | 4,300,000 | Suzano Austria GmbH | 3.125 | % | 01/15/32 | $ | 4,161 | ||||||||
| 200,000 | g | UltraTech Cement Ltd | 2.800 | 02/16/31 | 193 | ||||||||||
| 11,300,000 | WRKCo, Inc | 4.900 | 03/15/29 | 13,145 | |||||||||||
| TOTAL MATERIALS | 170,417 | ||||||||||||||
| MEDIA & ENTERTAINMENT - 2.8% | |||||||||||||||
| 4,350,000 | Activision Blizzard, Inc | 3.400 | 09/15/26 | 4,654 | |||||||||||
| 3,700,000 | Activision Blizzard, Inc | 1.350 | 09/15/30 | 3,413 | |||||||||||
| 1,950,000 | g | Adani Electricity Mumbai Ltd | 3.867 | 07/22/31 | 1,897 | ||||||||||
| 6,200,000 | Agree LP | 2.000 | 06/15/28 | 6,074 | |||||||||||
| EUR | 1,000,000 | g | Albion Financing SARL | 5.250 | 10/15/26 | 1,148 | |||||||||
| $ | 4,000,000 | g | Alfa Desarrollo S.p.A | 4.550 | 09/27/51 | 3,948 | |||||||||
| 300,000 | g | Arabian Centres Sukuk II Ltd | 5.625 | 10/07/26 | 296 | ||||||||||
| 11,900,000 | e | AstraZeneca Finance LLC | 2.250 | 05/28/31 | 11,983 | ||||||||||
| 2,800,000 | Baidu, Inc | 2.875 | 07/06/22 | 2,824 | |||||||||||
| 1,725,000 | Baidu, Inc | 4.375 | 05/14/24 | 1,834 | |||||||||||
| 1,550,000 | Baidu, Inc | 1.625 | 02/23/27 | 1,509 | |||||||||||
| 3,000,000 | g | Banco Nacional de Panama | 2.500 | 08/11/30 | 2,813 | ||||||||||
| EUR | 400,000 | g | Blackstone Private Credit Fund | 1.750 | 11/30/26 | 450 | |||||||||
| $ | 4,000,000 | g | BOC Aviation USA Corp | 1.625 | 04/29/24 | 3,994 | |||||||||
| 1,775,000 | g | Cable Onda S.A. | 4.500 | 01/30/30 | 1,823 | ||||||||||
| 5,000,000 | g | CCO Holdings LLC | 4.250 | 02/01/31 | 5,044 | ||||||||||
| 8,625,000 | Charter Communications Operating LLC | 2.250 | 01/15/29 | 8,415 | |||||||||||
| 7,200,000 | Charter Communications Operating LLC | 2.800 | 04/01/31 | 7,124 | |||||||||||
| 10,000,000 | Charter Communications Operating LLC | 3.500 | 03/01/42 | 9,699 | |||||||||||
| 6,150,000 | Charter Communications Operating LLC | 5.125 | 07/01/49 | 7,134 | |||||||||||
| 21,620,000 | Charter Communications Operating LLC | 4.800 | 03/01/50 | 24,207 | |||||||||||
| 11,800,000 | Comcast Corp | 3.950 | 10/15/25 | 12,882 | |||||||||||
| 17,300,000 | Comcast Corp | 2.350 | 01/15/27 | 17,917 | |||||||||||
| EUR | 450,000 | Comcast Corp | 0.250 | 05/20/27 | 508 | ||||||||||
| $ | 28,750,000 | Comcast Corp | 4.150 | 10/15/28 | 32,638 | ||||||||||
| 25,675,000 | Comcast Corp | 1.500 | 02/15/31 | 24,234 | |||||||||||
| 5,000,000 | Comcast Corp | 4.400 | 08/15/35 | 5,992 | |||||||||||
| 18,200,000 | Comcast Corp | 3.200 | 07/15/36 | 19,410 | |||||||||||
| 3,000,000 | Comcast Corp | 3.900 | 03/01/38 | 3,395 | |||||||||||
| 20,850,000 | Comcast Corp | 2.800 | 01/15/51 | 20,087 | |||||||||||
| 4,500,000 | g | Comcast Corp | 2.887 | 11/01/51 | 4,356 | ||||||||||
| 3,395,000 | g | Comcast Corp | 2.937 | 11/01/56 | 3,234 | ||||||||||
| 5,000,000 | g | CSC Holdings LLC | 3.375 | 02/15/31 | 4,681 | ||||||||||
| EUR | 500,000 | g | Diebold Nixdorf Dutch Holding BV | 9.000 | 07/15/25 | 606 | |||||||||
| $ | 2,099,000 | Discovery Communications LLC | 2.950 | 03/20/23 | 2,147 | ||||||||||
| GBP | 300,000 | Discovery Communications LLC | 2.500 | 09/20/24 | 416 | ||||||||||
| $ | 6,375,000 | Discovery Communications LLC | 3.625 | 05/15/30 | 6,815 | ||||||||||
| 6,400,000 | Discovery Communications LLC | 5.200 | 09/20/47 | 7,933 | |||||||||||
| 1,550,000 | e,g | Empresa de los Ferrocarriles del Estado | 3.068 | 08/18/50 | 1,329 | ||||||||||
| 200,000 | g | ENN Clean Energy International Investment Ltd | 3.375 | 05/12/26 | 199 | ||||||||||
| 4,300,000 | g | Genm Capital Labuan Ltd | 3.882 | 04/19/31 | 4,192 | ||||||||||
| EUR | 205,000 | g | Goodyear Europe BV | 2.750 | 08/15/28 | 237 | |||||||||
| $ | 1,895,000 | Grupo Televisa SAB | 6.625 | 01/15/40 | 2,570 | ||||||||||
| 2,000,000 | g | Interchile S.A. | 4.500 | 06/30/56 | 2,125 | ||||||||||
| 650,000 | Lamar Media Corp | 3.750 | 02/15/28 | 652 | |||||||||||
| 392 |
COLLEGE RETIREMENT EQUITIES FUND - Bond Market Account
| PRINCIPAL | ISSUER | RATE | MATURITY DATE | VALUE (000) | |||||||||||
| $ | 1,000,000 | Lamar Media Corp | 4.000 | % | 02/15/30 | $ | 1,014 | ||||||||
| 4,600,000 | g | LUKOIL Capital DAC | 2.800 | 04/26/27 | 4,531 | ||||||||||
| 5,100,000 | g | LUKOIL Securities BV | 3.875 | 05/06/30 | 5,193 | ||||||||||
| 3,260,000 | g | Mexico Remittances Funding Fiduciary Estate Management Sarl | 4.875 | 01/15/28 | 3,040 | ||||||||||
| 5,400,000 | Omnicom Group, Inc | 2.600 | 08/01/31 | 5,472 | |||||||||||
| 2,675,000 | g | Sirius XM Radio, Inc | 4.125 | 07/01/30 | 2,675 | ||||||||||
| 975,000 | g | TEGNA, Inc | 4.750 | 03/15/26 | 1,014 | ||||||||||
| 675,000 | TEGNA, Inc | 4.625 | 03/15/28 | 682 | |||||||||||
| 5,675,000 | Time Warner Cable LLC | 5.875 | 11/15/40 | 7,082 | |||||||||||
| 4,075,000 | Time Warner Cable LLC | 4.500 | 09/15/42 | 4,443 | |||||||||||
| 1,775,000 | TSMC Arizona Corp | 1.750 | 10/25/26 | 1,776 | |||||||||||
| 125,000 | g | Univision Communications, Inc | 4.500 | 05/01/29 | 126 | ||||||||||
| 4,200,000 | ViacomCBS, Inc | 2.900 | 01/15/27 | 4,373 | |||||||||||
| 2,500,000 | ViacomCBS, Inc | 3.375 | 02/15/28 | 2,661 | |||||||||||
| 2,250,000 | ViacomCBS, Inc | 4.375 | 03/15/43 | 2,560 | |||||||||||
| 1,150,000 | ViacomCBS, Inc | 5.850 | 09/01/43 | 1,549 | |||||||||||
| 4,200,000 | Viatris, Inc | 2.700 | 06/22/30 | 4,215 | |||||||||||
| 2,425,000 | Viatris, Inc | 3.850 | 06/22/40 | 2,568 | |||||||||||
| 2,105,000 | Walt Disney Co | 7.625 | 11/30/28 | 2,853 | |||||||||||
| 12,750,000 | Walt Disney Co | 2.000 | 09/01/29 | 12,683 | |||||||||||
| 1,578,000 | Walt Disney Co | 6.550 | 03/15/33 | 2,204 | |||||||||||
| 10,900,000 | Walt Disney Co | 3.600 | 01/13/51 | 12,326 | |||||||||||
| 2,700,000 | Weibo Corp | 3.375 | 07/08/30 | 2,673 | |||||||||||
| EUR | 500,000 | Whirlpool EMEA Finance Sarl | 0.500 | 02/20/28 | 564 | ||||||||||
| TOTAL MEDIA & ENTERTAINMENT | 377,115 | ||||||||||||||
| PHARMACEUTICALS, BIOTECHNOLOGY & LIFE SCIENCES - 1.6% | |||||||||||||||
| EUR | 400,000 | Abbott Ireland Financing DAC | 1.500 | 09/27/26 | 483 | ||||||||||
| $ | 3,500,000 | AbbVie, Inc | 2.850 | 05/14/23 | 3,577 | ||||||||||
| EUR | 550,000 | AbbVie, Inc | 1.250 | 06/01/24 | 644 | ||||||||||
| $ | 8,700,000 | AbbVie, Inc | 3.800 | 03/15/25 | 9,261 | ||||||||||
| 26,000,000 | AbbVie, Inc | 2.950 | 11/21/26 | 27,401 | |||||||||||
| 23,800,000 | AbbVie, Inc | 4.050 | 11/21/39 | 27,306 | |||||||||||
| 6,700,000 | AbbVie, Inc | 4.400 | 11/06/42 | 7,994 | |||||||||||
| 2,680,000 | AbbVie, Inc | 4.450 | 05/14/46 | 3,241 | |||||||||||
| 9,525,000 | AbbVie, Inc | 4.250 | 11/21/49 | 11,451 | |||||||||||
| 4,200,000 | Amgen, Inc | 2.000 | 01/15/32 | 4,067 | |||||||||||
| 5,650,000 | AstraZeneca plc | 3.125 | 06/12/27 | 6,055 | |||||||||||
| EUR | 750,000 | g | Avantor Funding, Inc | 3.875 | 07/15/28 | 888 | |||||||||
| $ | 1,500,000 | g | Avantor Funding, Inc | 4.625 | 07/15/28 | 1,564 | |||||||||
| 1,366,000 | Bristol-Myers Squibb Co | 3.875 | 08/15/25 | 1,478 | |||||||||||
| 13,600,000 | Bristol-Myers Squibb Co | 3.450 | 11/15/27 | 14,842 | |||||||||||
| 6,575,000 | Bristol-Myers Squibb Co | 3.400 | 07/26/29 | 7,199 | |||||||||||
| 10,100,000 | Bristol-Myers Squibb Co | 1.450 | 11/13/30 | 9,622 | |||||||||||
| 6,100,000 | Bristol-Myers Squibb Co | 2.350 | 11/13/40 | 5,785 | |||||||||||
| 2,650,000 | Bristol-Myers Squibb Co | 2.550 | 11/13/50 | 2,507 | |||||||||||
| 4,725,000 | Danaher Corp | 2.800 | 12/10/51 | 4,659 | |||||||||||
| 3,725,000 | Gilead Sciences, Inc | 1.200 | 10/01/27 | 3,600 | |||||||||||
| 1,775,000 | Gilead Sciences, Inc | 4.000 | 09/01/36 | 2,042 | |||||||||||
| 13,100,000 | Gilead Sciences, Inc | 2.800 | 10/01/50 | 12,700 | |||||||||||
| 3,750,000 | Johnson & Johnson | 3.400 | 01/15/38 | 4,223 | |||||||||||
| 4,025,000 | Merck & Co, Inc | 2.750 | 12/10/51 | 3,983 | |||||||||||
| 393 |
COLLEGE RETIREMENT EQUITIES FUND - Bond Market Account
| PRINCIPAL | ISSUER | RATE | MATURITY DATE | VALUE (000) | |||||||||||
| $ | 5,750,000 | Mylan, Inc | 4.550 | % | 04/15/28 | $ | 6,436 | ||||||||
| EUR | 600,000 | g | Organon Finance LLC | 2.875 | 04/30/28 | 687 | |||||||||
| $ | 750,000 | g | Organon Finance LLC | 5.125 | 04/30/31 | 784 | |||||||||
| 4,900,000 | Royalty Pharma plc | 2.150 | 09/02/31 | 4,629 | |||||||||||
| 21,850,000 | Takeda Pharmaceutical Co Ltd | 2.050 | 03/31/30 | 21,396 | |||||||||||
| EUR | 400,000 | Takeda Pharmaceutical Co Ltd | 1.375 | 07/09/32 | 472 | ||||||||||
| $ | 1,975,000 | Takeda Pharmaceutical Co Ltd | 3.025 | 07/09/40 | 2,010 | ||||||||||
| 1,045,000 | Teva Pharmaceutical Finance Netherlands III BV | 4.750 | 05/09/27 | 1,035 | |||||||||||
| 2,000,000 | Thermo Fisher Scientific, Inc | 2.000 | 10/15/31 | 1,971 | |||||||||||
| TOTAL PHARMACEUTICALS, BIOTECHNOLOGY & LIFE SCIENCES | 215,992 | ||||||||||||||
| REAL ESTATE - 2.9% | |||||||||||||||
| 1,675,000 | Alexandria Real Estate Equities, Inc | 3.950 | 01/15/27 | 1,831 | |||||||||||
| 2,300,000 | Alexandria Real Estate Equities, Inc | 3.950 | 01/15/28 | 2,539 | |||||||||||
| 5,500,000 | Alexandria Real Estate Equities, Inc | 4.900 | 12/15/30 | 6,607 | |||||||||||
| 3,725,000 | Alexandria Real Estate Equities, Inc | 1.875 | 02/01/33 | 3,500 | |||||||||||
| 5,950,000 | American Tower Corp | 3.000 | 06/15/23 | 6,118 | |||||||||||
| 5,775,000 | American Tower Corp | 2.950 | 01/15/25 | 5,997 | |||||||||||
| 2,418,000 | American Tower Corp | 3.375 | 10/15/26 | 2,569 | |||||||||||
| EUR | 650,000 | American Tower Corp | 0.450 | 01/15/27 | 730 | ||||||||||
| $ | 10,000,000 | American Tower Corp | 2.750 | 01/15/27 | 10,307 | ||||||||||
| 1,600,000 | American Tower Corp | 3.600 | 01/15/28 | 1,724 | |||||||||||
| 8,850,000 | American Tower Corp | 3.800 | 08/15/29 | 9,628 | |||||||||||
| 13,700,000 | American Tower Corp | 2.900 | 01/15/30 | 14,040 | |||||||||||
| 2,750,000 | American Tower Corp | 2.100 | 06/15/30 | 2,648 | |||||||||||
| 7,175,000 | American Tower Corp | 1.875 | 10/15/30 | 6,780 | |||||||||||
| 5,575,000 | Brandywine Operating Partnership LP | 4.100 | 10/01/24 | 5,888 | |||||||||||
| 5,825,000 | Brixmor Operating Partnership LP | 3.850 | 02/01/25 | 6,159 | |||||||||||
| 1,075,000 | Brixmor Operating Partnership LP | 2.250 | 04/01/28 | 1,069 | |||||||||||
| 1,300,000 | Brixmor Operating Partnership LP | 2.500 | 08/16/31 | 1,272 | |||||||||||
| 1,950,000 | Camden Property Trust | 3.150 | 07/01/29 | 2,074 | |||||||||||
| 2,150,000 | Camden Property Trust | 2.800 | 05/15/30 | 2,236 | |||||||||||
| 2,800,000 | Corporate Office Properties LP | 2.750 | 04/15/31 | 2,784 | |||||||||||
| 1,700,000 | Crown Castle International Corp | 3.650 | 09/01/27 | 1,826 | |||||||||||
| 15,425,000 | Crown Castle International Corp | 2.250 | 01/15/31 | 15,028 | |||||||||||
| 10,630,000 | Crown Castle International Corp | 2.100 | 04/01/31 | 10,172 | |||||||||||
| 5,300,000 | CubeSmart LP | 2.250 | 12/15/28 | 5,301 | |||||||||||
| 2,425,000 | Digital Realty Trust LP | 3.600 | 07/01/29 | 2,625 | |||||||||||
| GBP | 400,000 | Digital Stout Holding LLC | 3.750 | 10/17/30 | 605 | ||||||||||
| $ | 1,600,000 | Duke Realty LP | 3.250 | 06/30/26 | 1,698 | ||||||||||
| 2,525,000 | Duke Realty LP | 2.875 | 11/15/29 | 2,624 | |||||||||||
| 3,125,000 | Duke Realty LP | 1.750 | 07/01/30 | 2,969 | |||||||||||
| 3,825,000 | Equinix, Inc | 2.150 | 07/15/30 | 3,718 | |||||||||||
| 9,100,000 | Essex Portfolio LP | 3.000 | 01/15/30 | 9,537 | |||||||||||
| 3,050,000 | Federal Realty Investment Trust | 1.250 | 02/15/26 | 2,987 | |||||||||||
| 6,600,000 | Healthcare Realty Trust, Inc | 3.875 | 05/01/25 | 6,999 | |||||||||||
| 3,000,000 | Healthcare Realty Trust, Inc | 3.625 | 01/15/28 | 3,229 | |||||||||||
| 1,750,000 | Healthcare Realty Trust, Inc | 2.400 | 03/15/30 | 1,741 | |||||||||||
| 1,850,000 | Healthcare Realty Trust, Inc | 2.050 | 03/15/31 | 1,768 | |||||||||||
| 6,250,000 | Healthcare Trust of America Holdings LP | 3.500 | 08/01/26 | 6,662 | |||||||||||
| 11,400,000 | Healthcare Trust of America Holdings LP | 3.100 | 02/15/30 | 11,768 | |||||||||||
| 7,950,000 | Highwoods Realty LP | 3.875 | 03/01/27 | 8,668 | |||||||||||
| 2,900,000 | Highwoods Realty LP | 4.125 | 03/15/28 | 3,195 | |||||||||||
| 2,875,000 | Highwoods Realty LP | 4.200 | 04/15/29 | 3,173 | |||||||||||
| 6,000,000 | Highwoods Realty LP | 3.050 | 02/15/30 | 6,164 | |||||||||||
| 394 |
COLLEGE RETIREMENT EQUITIES FUND - Bond Market Account
| PRINCIPAL | ISSUER | RATE | MATURITY DATE | VALUE (000) | |||||||||||
| $ | 3,250,000 | Highwoods Realty LP | 2.600 | % | 02/01/31 | $ | 3,215 | ||||||||
| 1,833,000 | Hudson Pacific Properties LP | 3.950 | 11/01/27 | 1,964 | |||||||||||
| 3,000,000 | Hudson Pacific Properties LP | 3.250 | 01/15/30 | 3,112 | |||||||||||
| 800,000 | iStar, Inc | 4.750 | 10/01/24 | 830 | |||||||||||
| 5,600,000 | Life Storage LP | 2.400 | 10/15/31 | 5,504 | |||||||||||
| 5,224,000 | Mid-America Apartments LP | 4.300 | 10/15/23 | 5,466 | |||||||||||
| 5,525,000 | Mid-America Apartments LP | 3.750 | 06/15/24 | 5,816 | |||||||||||
| 4,300,000 | Mid-America Apartments LP | 4.000 | 11/15/25 | 4,646 | |||||||||||
| 11,100,000 | Mid-America Apartments LP | 2.750 | 03/15/30 | 11,495 | |||||||||||
| 5,400,000 | Mid-America Apartments LP | 1.700 | 02/15/31 | 5,156 | |||||||||||
| 3,050,000 | Mid-America Apartments LP | 2.875 | 09/15/51 | 3,003 | |||||||||||
| 2,575,000 | National Retail Properties, Inc | 4.000 | 11/15/25 | 2,789 | |||||||||||
| 3,000,000 | National Retail Properties, Inc | 3.600 | 12/15/26 | 3,193 | |||||||||||
| EUR | 360,000 | ProLogis Euro Finance LLC | 0.375 | 02/06/28 | 407 | ||||||||||
| $ | 7,225,000 | Regency Centers LP | 3.900 | 11/01/25 | 7,734 | ||||||||||
| 2,250,000 | Regency Centers LP | 3.600 | 02/01/27 | 2,425 | |||||||||||
| 5,500,000 | Regency Centers LP | 2.950 | 09/15/29 | 5,707 | |||||||||||
| 5,700,000 | Retail Properties of America, Inc | 4.750 | 09/15/30 | 6,305 | |||||||||||
| 10,150,000 | g | SBA Tower Trust | 2.836 | 01/15/25 | 10,413 | ||||||||||
| 11,046,000 | g | SBA Tower Trust | 1.884 | 01/15/26 | 11,030 | ||||||||||
| 25,000,000 | g | SBA Tower Trust | 1.631 | 11/15/26 | 24,597 | ||||||||||
| 42,100,000 | g | SBA Tower Trust | 1.840 | 04/15/27 | 41,796 | ||||||||||
| 2,968,000 | SITE Centers Corp | 3.625 | 02/01/25 | 3,107 | |||||||||||
| 350,000 | SITE Centers Corp | 4.700 | 06/01/27 | 387 | |||||||||||
| EUR | 400,000 | Vonovia SE | 0.625 | 12/14/29 | 447 | ||||||||||
| $ | 1,170,000 | Weingarten Realty Investors | 3.375 | 10/15/22 | 1,185 | ||||||||||
| 4,800,000 | Weingarten Realty Investors | 3.500 | 04/15/23 | 4,924 | |||||||||||
| 3,025,000 | Weingarten Realty Investors | 4.450 | 01/15/24 | 3,183 | |||||||||||
| 3,950,000 | Weingarten Realty Investors | 3.850 | 06/01/25 | 4,174 | |||||||||||
| 1,300,000 | Weingarten Realty Investors | 3.250 | 08/15/26 | 1,367 | |||||||||||
| TOTAL REAL ESTATE | 394,334 | ||||||||||||||
| RETAILING - 0.4% | |||||||||||||||
| 2,950,000 | AutoNation, Inc | 3.800 | 11/15/27 | 3,141 | |||||||||||
| 2,650,000 | AutoNation, Inc | 2.400 | 08/01/31 | 2,556 | |||||||||||
| 6,525,000 | AutoZone, Inc | 1.650 | 01/15/31 | 6,140 | |||||||||||
| 900,000 | Chevron USA, Inc | 3.900 | 11/15/24 | 963 | |||||||||||
| 550,000 | g | Group 1 Automotive, Inc | 4.000 | 08/15/28 | 548 | ||||||||||
| 350,000 | JD.com, Inc | 3.375 | 01/14/30 | 365 | |||||||||||
| 925,000 | g | L Brands, Inc | 6.625 | 10/01/30 | 1,048 | ||||||||||
| 875,000 | g | Lithia Motors, Inc | 4.625 | 12/15/27 | 920 | ||||||||||
| 5,100,000 | O’Reilly Automotive, Inc | 3.550 | 03/15/26 | 5,470 | |||||||||||
| 6,875,000 | O’Reilly Automotive, Inc | 3.600 | 09/01/27 | 7,431 | |||||||||||
| 4,075,000 | O’Reilly Automotive, Inc | 4.200 | 04/01/30 | 4,589 | |||||||||||
| 7,400,000 | O’Reilly Automotive, Inc | 1.750 | 03/15/31 | 7,001 | |||||||||||
| 6,000,000 | g | Prosus NV | 3.832 | 02/08/51 | 5,596 | ||||||||||
| 3,000,000 | g | Staples, Inc | 7.500 | 04/15/26 | 3,083 | ||||||||||
| 9,375,000 | Target Corp | 2.350 | 02/15/30 | 9,634 | |||||||||||
| TOTAL RETAILING | 58,485 | ||||||||||||||
| 395 |
COLLEGE RETIREMENT EQUITIES FUND - Bond Market Account
| PRINCIPAL | ISSUER | RATE | MATURITY DATE | VALUE (000) | |||||||||||
| SEMICONDUCTORS & SEMICONDUCTOR EQUIPMENT - 0.9% | |||||||||||||||
| $ | 11,406,000 | Broadcom, Inc | 4.150 | % | 11/15/30 | $ | 12,650 | ||||||||
| 13,650,000 | g | Broadcom, Inc | 2.450 | 02/15/31 | 13,384 | ||||||||||
| 10,530,000 | g | Broadcom, Inc | 3.469 | 04/15/34 | 11,021 | ||||||||||
| 619,000 | g | Broadcom, Inc | 3.187 | 11/15/36 | 618 | ||||||||||
| 15,640,000 | Intel Corp | 2.875 | 05/11/24 | 16,283 | |||||||||||
| 7,325,000 | Intel Corp | 3.750 | 03/25/27 | 8,055 | |||||||||||
| 2,400,000 | Intel Corp | 2.000 | 08/12/31 | 2,384 | |||||||||||
| 2,500,000 | Intel Corp | 3.734 | 12/08/47 | 2,847 | |||||||||||
| 2,875,000 | Lam Research Corp | 3.750 | 03/15/26 | 3,129 | |||||||||||
| 3,275,000 | Lam Research Corp | 4.000 | 03/15/29 | 3,667 | |||||||||||
| 1,100,000 | Lam Research Corp | 1.900 | 06/15/30 | 1,082 | |||||||||||
| 8,075,000 | Lam Research Corp | 2.875 | 06/15/50 | 8,046 | |||||||||||
| 13,200,000 | NVIDIA Corp | 2.000 | 06/15/31 | 13,131 | |||||||||||
| 3,850,000 | g | NXP BV | 2.700 | 05/01/25 | 3,977 | ||||||||||
| 5,725,000 | g | NXP BV | 3.875 | 06/18/26 | 6,179 | ||||||||||
| 2,450,000 | g | NXP BV | 3.400 | 05/01/30 | 2,611 | ||||||||||
| 4,750,000 | g | NXP BV | 3.125 | 02/15/42 | 4,779 | ||||||||||
| 4,800,000 | g | SK Hynix, Inc | 1.500 | 01/19/26 | 4,695 | ||||||||||
| 2,100,000 | Skyworks Solutions, Inc | 1.800 | 06/01/26 | 2,078 | |||||||||||
| 3,475,000 | Texas Instruments, Inc | 2.625 | 05/15/24 | 3,607 | |||||||||||
| 3,100,000 | Texas Instruments, Inc | 4.150 | 05/15/48 | 3,868 | |||||||||||
| TOTAL SEMICONDUCTORS & SEMICONDUCTOR EQUIPMENT | 128,091 | ||||||||||||||
| SOFTWARE & SERVICES - 1.0% | |||||||||||||||
| 10,050,000 | Adobe, Inc | 2.300 | 02/01/30 | 10,272 | |||||||||||
| 200,000 | g | CA Magnum Holdings | 5.375 | 10/31/26 | 207 | ||||||||||
| 100,000 | g | Camelot Finance S.A. | 4.500 | 11/01/26 | 103 | ||||||||||
| EUR | 375,000 | Fidelity National Information Services, Inc | 1.100 | 07/15/24 | 436 | ||||||||||
| $ | 4,325,000 | Fidelity National Information Services, Inc | 2.250 | 03/01/31 | 4,230 | ||||||||||
| 14,800,000 | Fiserv, Inc | 2.750 | 07/01/24 | 15,308 | |||||||||||
| 23,750,000 | Fiserv, Inc | 3.500 | 07/01/29 | 25,542 | |||||||||||
| GBP | 200,000 | Fiserv, Inc | 3.000 | 07/01/31 | 290 | ||||||||||
| $ | 900,000 | g | Gartner, Inc | 3.750 | 10/01/30 | 920 | |||||||||
| 4,725,000 | Global Payments, Inc | 2.650 | 02/15/25 | 4,856 | |||||||||||
| 10,275,000 | Global Payments, Inc | 3.200 | 08/15/29 | 10,702 | |||||||||||
| 4,700,000 | g | HCL America, Inc | 1.375 | 03/10/26 | 4,574 | ||||||||||
| EUR | 400,000 | International Business Machines Corp | 0.650 | 02/11/32 | 450 | ||||||||||
| 500,000 | g | IQVIA, Inc | 1.750 | 03/15/26 | 573 | ||||||||||
| $ | 1,413,000 | g | j2 Global, Inc | 4.625 | 10/15/30 | 1,449 | |||||||||
| 26,300,000 | Microsoft Corp | 2.400 | 08/08/26 | 27,523 | |||||||||||
| 7,245,000 | Microsoft Corp | 2.525 | 06/01/50 | 7,065 | |||||||||||
| 1,705,000 | Microsoft Corp | 2.921 | 03/17/52 | 1,810 | |||||||||||
| 2,425,000 | g | NCR Corp | 5.000 | 10/01/28 | 2,498 | ||||||||||
| 550,000 | g | Open Text Holdings, Inc | 4.125 | 02/15/30 | 566 | ||||||||||
| 2,425,000 | salesforce.com, Inc | 3.700 | 04/11/28 | 2,691 | |||||||||||
| 6,600,000 | salesforce.com, Inc | 1.950 | 07/15/31 | 6,538 | |||||||||||
| 5,775,000 | salesforce.com, Inc | 2.700 | 07/15/41 | 5,768 | |||||||||||
| 7,075,000 | Visa, Inc | 2.050 | 04/15/30 | 7,166 | |||||||||||
| 1,800,000 | Visa, Inc | 2.700 | 04/15/40 | 1,840 | |||||||||||
| TOTAL SOFTWARE & SERVICES | 143,377 | ||||||||||||||
| 396 |
COLLEGE RETIREMENT EQUITIES FUND - Bond Market Account
| PRINCIPAL | ISSUER | RATE | MATURITY DATE | VALUE (000) | |||||||||||
| TECHNOLOGY HARDWARE & EQUIPMENT - 0.5% | |||||||||||||||
| $ | 7,025,000 | Amphenol Corp | 2.800 | % | 02/15/30 | $ | 7,239 | ||||||||
| 8,075,000 | Apple, Inc | 2.450 | 08/04/26 | 8,433 | |||||||||||
| 26,100,000 | Apple, Inc | 2.050 | 09/11/26 | 26,812 | |||||||||||
| 4,525,000 | Apple, Inc | 4.650 | 02/23/46 | 5,935 | |||||||||||
| 5,900,000 | Apple, Inc | 2.650 | 02/08/51 | 5,801 | |||||||||||
| 2,075,000 | Corning, Inc | 4.375 | 11/15/57 | 2,467 | |||||||||||
| 7,050,000 | Dell International LLC | 5.300 | 10/01/29 | 8,264 | |||||||||||
| 2,175,000 | Tyco Electronics Group S.A. | 3.700 | 02/15/26 | 2,341 | |||||||||||
| 4,800,000 | g | Wipro IT Services LLC | 1.500 | 06/23/26 | 4,692 | ||||||||||
| TOTAL TECHNOLOGY HARDWARE & EQUIPMENT | 71,984 | ||||||||||||||
| TELECOMMUNICATION SERVICES - 2.9% | |||||||||||||||
| EUR | 400,000 | g | Altice France S.A. | 3.375 | 01/15/28 | 442 | |||||||||
| 500,000 | AT&T, Inc | 2.350 | 09/05/29 | 632 | |||||||||||
| $ | 25,850,000 | AT&T, Inc | 2.250 | 02/01/32 | 24,979 | ||||||||||
| 46,893,000 | AT&T, Inc | 2.550 | 12/01/33 | 45,863 | |||||||||||
| 9,000,000 | AT&T, Inc | 4.500 | 05/15/35 | 10,397 | |||||||||||
| 15,575,000 | AT&T, Inc | 3.300 | 02/01/52 | 15,253 | |||||||||||
| 27,320,000 | AT&T, Inc | 3.550 | 09/15/55 | 27,419 | |||||||||||
| 17,978,000 | AT&T, Inc | 3.800 | 12/01/57 | 18,716 | |||||||||||
| 5,127,000 | AT&T, Inc | 3.650 | 09/15/59 | 5,178 | |||||||||||
| 2,875,000 | g | Avaya, Inc | 6.125 | 09/15/28 | 3,047 | ||||||||||
| 2,000,000 | g | Bharti Airtel International Netherlands BV | 5.350 | 05/20/24 | 2,150 | ||||||||||
| 7,225,000 | g | Bharti Airtel Ltd | 3.250 | 06/03/31 | 7,305 | ||||||||||
| 3,000,000 | g | C&W Senior Financing Designated Activity Co | 6.875 | 09/15/27 | 3,120 | ||||||||||
| 4,000,000 | Deutsche Telekom International Finance BV | 8.750 | 06/15/30 | 5,814 | |||||||||||
| EUR | 915,000 | g | Iliad Holding SAS | 5.125 | 10/15/26 | 1,087 | |||||||||
| $ | 1,175,000 | g | Millicom International Cellular S.A. | 4.500 | 04/27/31 | 1,184 | |||||||||
| 4,000,000 | g | MTN Mauritius Investment Ltd | 6.500 | 10/13/26 | 4,462 | ||||||||||
| 2,350,000 | g | Ooredoo International Finance Ltd | 2.625 | 04/08/31 | 2,359 | ||||||||||
| 3,950,000 | Orange S.A. | 5.375 | 01/13/42 | 5,199 | |||||||||||
| 2,125,000 | Telefonica Emisiones SAU | 4.103 | 03/08/27 | 2,339 | |||||||||||
| 3,800,000 | Telefonica Emisiones SAU | 4.895 | 03/06/48 | 4,571 | |||||||||||
| 3,000,000 | g | Telefonica Moviles Chile S.A. | 3.537 | 11/18/31 | 2,987 | ||||||||||
| 32,175,000 | T-Mobile USA, Inc | 3.875 | 04/15/30 | 35,192 | |||||||||||
| 21,500,000 | T-Mobile USA, Inc | 2.550 | 02/15/31 | 21,392 | |||||||||||
| 2,525,000 | T-Mobile USA, Inc | 3.000 | 02/15/41 | 2,465 | |||||||||||
| 2,350,000 | T-Mobile USA, Inc | 4.500 | 04/15/50 | 2,750 | |||||||||||
| 7,800,000 | T-Mobile USA, Inc | 3.300 | 02/15/51 | 7,618 | |||||||||||
| 6,600,000 | Verizon Communications, Inc | 4.329 | 09/21/28 | 7,497 | |||||||||||
| EUR | 400,000 | Verizon Communications, Inc | 1.875 | 10/26/29 | 497 | ||||||||||
| $ | 24,589,000 | Verizon Communications, Inc | 3.150 | 03/22/30 | 26,014 | ||||||||||
| 2,325,000 | Verizon Communications, Inc | 1.680 | 10/30/30 | 2,209 | |||||||||||
| 7,525,000 | Verizon Communications, Inc | 1.750 | 01/20/31 | 7,122 | |||||||||||
| 5,000,000 | Verizon Communications, Inc | 2.550 | 03/21/31 | 5,045 | |||||||||||
| 9,126,000 | g | Verizon Communications, Inc | 2.355 | 03/15/32 | 8,992 | ||||||||||
| 30,220,000 | Verizon Communications, Inc | 4.272 | 01/15/36 | 35,448 | |||||||||||
| EUR | 300,000 | Verizon Communications, Inc | 2.875 | 01/15/38 | 408 | ||||||||||
| $ | 7,625,000 | Verizon Communications, Inc | 3.400 | 03/22/41 | 7,983 | ||||||||||
| 397 |
COLLEGE RETIREMENT EQUITIES FUND - Bond Market Account
| PRINCIPAL | ISSUER | RATE | MATURITY DATE | VALUE (000) | |||||||||||
| $ | 11,300,000 | Verizon Communications, Inc | 2.875 | % | 11/20/50 | $ | 10,722 | ||||||||
| GBP | 1,895,000 | g | Vmed O2 UK Financing I plc | 4.500 | 07/15/31 | 2,556 | |||||||||
| $ | 7,975,000 | Vodafone Group plc | 4.375 | 02/19/43 | 9,350 | ||||||||||
| 7,000,000 | Vodafone Group plc | 4.250 | 09/17/50 | 8,108 | |||||||||||
| TOTAL TELECOMMUNICATION SERVICES | 395,871 | ||||||||||||||
| TRANSPORTATION - 0.6% | |||||||||||||||
| 1,850,000 | g | Adani Ports & Special Economic Zone Ltd | 4.000 | 07/30/27 | 1,907 | ||||||||||
| 2,000,000 | g | Adani Ports & Special Economic Zone Ltd | 4.200 | 08/04/27 | 2,075 | ||||||||||
| 2,700,000 | g | Adani Ports & Special Economic Zone Ltd | 3.100 | 02/02/31 | 2,570 | ||||||||||
| 5,175,000 | Burlington Northern Santa Fe LLC | 3.050 | 02/15/51 | 5,355 | |||||||||||
| 3,700,000 | Canadian Pacific Railway Co | 2.050 | 03/05/30 | 3,647 | |||||||||||
| 5,600,000 | e | Canadian Pacific Railway Co | 3.100 | 12/02/51 | 5,758 | ||||||||||
| 2,040,000 | CSX Corp | 2.600 | 11/01/26 | 2,126 | |||||||||||
| 7,125,000 | CSX Corp | 3.250 | 06/01/27 | 7,640 | |||||||||||
| 3,500,000 | CSX Corp | 3.800 | 03/01/28 | 3,846 | |||||||||||
| 23,495,000 | CSX Corp | 4.250 | 03/15/29 | 26,415 | |||||||||||
| 1,257,000 | g | Delta Air Lines, Inc | 7.000 | 05/01/25 | 1,437 | ||||||||||
| 1,250,000 | g | DP World Ltd | 5.625 | 09/25/48 | 1,534 | ||||||||||
| 6,150,000 | Union Pacific Corp | 2.891 | 04/06/36 | 6,445 | |||||||||||
| 6,125,000 | Union Pacific Corp | 3.839 | 03/20/60 | 7,211 | |||||||||||
| TOTAL TRANSPORTATION | 77,966 | ||||||||||||||
| UTILITIES - 3.7% | |||||||||||||||
| 3,425,000 | g | Abu Dhabi National Energy Co PJSC | 2.000 | 04/29/28 | 3,386 | ||||||||||
| 1,650,000 | AEP Transmission Co LLC | 3.100 | 12/01/26 | 1,740 | |||||||||||
| 1,650,000 | AEP Transmission Co LLC | 4.000 | 12/01/46 | 1,902 | |||||||||||
| 5,775,000 | AEP Transmission Co LLC | 2.750 | 08/15/51 | 5,494 | |||||||||||
| 1,650,000 | g | Aeropuerto Internacional de Tocumen S.A. | 4.000 | 08/11/41 | 1,682 | ||||||||||
| 200,000 | g | Aeropuerto Internacional de Tocumen S.A. | 5.125 | 08/11/61 | 209 | ||||||||||
| 3,475,000 | Alabama Power Co | 4.150 | 08/15/44 | 4,061 | |||||||||||
| 7,000,000 | Alabama Power Co | 3.450 | 10/01/49 | 7,417 | |||||||||||
| 2,500,000 | Ameren Corp | 3.500 | 01/15/31 | 2,697 | |||||||||||
| 2,750,000 | American Water Capital Corp | 3.000 | 12/01/26 | 2,908 | |||||||||||
| 8,425,000 | American Water Capital Corp | 2.800 | 05/01/30 | 8,731 | |||||||||||
| 10,000,000 | American Water Capital Corp | 2.300 | 06/01/31 | 10,000 | |||||||||||
| 2,375,000 | American Water Capital Corp | 4.000 | 12/01/46 | 2,720 | |||||||||||
| 4,500,000 | American Water Capital Corp | 3.750 | 09/01/47 | 5,018 | |||||||||||
| 1,325,000 | American Water Capital Corp | 3.450 | 05/01/50 | 1,409 | |||||||||||
| 6,038,000 | Appalachian Power Co | 4.450 | 06/01/45 | 7,045 | |||||||||||
| 10,375,000 | Atmos Energy Corp | 1.500 | 01/15/31 | 9,735 | |||||||||||
| 1,175,000 | Atmos Energy Corp | 4.125 | 10/15/44 | 1,367 | |||||||||||
| 6,500,000 | Baltimore Gas & Electric Co | 3.750 | 08/15/47 | 7,333 | |||||||||||
| 4,700,000 | g | Becle SAB de C.V. | 2.500 | 10/14/31 | 4,625 | ||||||||||
| 5,925,000 | Berkshire Hathaway Energy Co | 3.250 | 04/15/28 | 6,342 | |||||||||||
| 6,225,000 | Black Hills Corp | 4.250 | 11/30/23 | 6,537 | |||||||||||
| 1,575,000 | Black Hills Corp | 3.150 | 01/15/27 | 1,638 | |||||||||||
| 3,550,000 | CenterPoint Energy Resources Corp | 6.250 | 02/01/37 | 4,720 | |||||||||||
| EUR | 350,000 | CEZ AS. | 0.875 | 12/02/26 | 406 | ||||||||||
| $ | 4,675,000 | CMS Energy Corp | 3.600 | 11/15/25 | 4,981 | ||||||||||
| 3,025,000 | g | Colbun S.A. | 3.150 | 01/19/32 | 2,993 | ||||||||||
| 398 |
COLLEGE RETIREMENT EQUITIES FUND - Bond Market Account
| PRINCIPAL | ISSUER | RATE | MATURITY DATE | VALUE (000) | |||||||||||
| $ | 4,200,000 | Commonwealth Edison Co | 5.900 | % | 03/15/36 | $ | 5,757 | ||||||||
| 8,250,000 | Commonwealth Edison Co | 3.000 | 03/01/50 | 8,370 | |||||||||||
| 5,500,000 | Commonwealth Edison Co | 2.750 | 09/01/51 | 5,317 | |||||||||||
| 5,050,000 | Consumers Energy Co | 2.650 | 08/15/52 | 4,912 | |||||||||||
| 3,325,000 | Consumers Energy Co | 2.500 | 05/01/60 | 2,931 | |||||||||||
| 4,000,000 | Dominion Energy, Inc | 2.250 | 08/15/31 | 3,906 | |||||||||||
| 4,600,000 | Dominion Energy, Inc | 3.300 | 04/15/41 | 4,778 | |||||||||||
| 2,800,000 | Duke Energy Carolinas LLC | 2.550 | 04/15/31 | 2,874 | |||||||||||
| 8,675,000 | Duke Energy Corp | 2.650 | 09/01/26 | 8,981 | |||||||||||
| 5,000,000 | Duke Energy Florida LLC | 3.400 | 10/01/46 | 5,275 | |||||||||||
| 695,511 | Duke Energy Florida Project Finance LLC | 1.731 | 09/01/22 | 697 | |||||||||||
| 11,425,000 | Duke Energy Indiana LLC | 2.750 | 04/01/50 | 11,112 | |||||||||||
| 1,450,000 | Duke Energy Ohio, Inc | 3.800 | 09/01/23 | 1,507 | |||||||||||
| 6,100,000 | Duke Energy Progress LLC | 2.500 | 08/15/50 | 5,634 | |||||||||||
| 4,125,000 | Eastern Energy Gas Holdings LLC | 2.500 | 11/15/24 | 4,247 | |||||||||||
| EUR | 300,000 | Electricite de France S.A. | 2.000 | 10/02/30 | 377 | ||||||||||
| $ | 3,445,000 | g | Empresas Publicas de Medellin ESP | 4.250 | 07/18/29 | 3,268 | |||||||||
| 3,000,000 | Enel Chile S.A. | 4.875 | 06/12/28 | 3,308 | |||||||||||
| 4,000,000 | g | EnfraGen Energia Sur S.A. | 5.375 | 12/30/30 | 3,650 | ||||||||||
| 4,300,000 | g | ENN Energy Holdings Ltd | 2.625 | 09/17/30 | 4,271 | ||||||||||
| 6,900,000 | Entergy Corp | 0.900 | 09/15/25 | 6,683 | |||||||||||
| 2,800,000 | g | Equate Petrochemical BV | 2.625 | 04/28/28 | 2,804 | ||||||||||
| 2,050,000 | Eversource Energy | 0.800 | 08/15/25 | 1,995 | |||||||||||
| 6,250,000 | Eversource Energy | 1.650 | 08/15/30 | 5,844 | |||||||||||
| 7,000,000 | Eversource Energy | 3.450 | 01/15/50 | 7,366 | |||||||||||
| 2,475,000 | Exelon Corp | 4.050 | 04/15/30 | 2,750 | |||||||||||
| 9,450,000 | Exelon Generation Co LLC | 3.400 | 03/15/22 | 9,479 | |||||||||||
| 5,775,000 | Florida Power & Light Co | 3.990 | 03/01/49 | 7,042 | |||||||||||
| UGX | 2,000,000,000 | †,g | ICBC Standard Bank plc | 14.250 | 06/26/34 | 522 | |||||||||
| $ | 3,600,000 | Indiana Michigan Power Co | 3.750 | 07/01/47 | 3,970 | ||||||||||
| 8,525,000 | g | Israel Electric Corp Ltd | 4.250 | 08/14/28 | 9,361 | ||||||||||
| 2,850,000 | g | Kallpa Generacion SA | 4.125 | 08/16/27 | 2,950 | ||||||||||
| 3,675,000 | g | Korea Hydro & Nuclear Power Co Ltd | 3.750 | 07/25/23 | 3,818 | ||||||||||
| 3,200,000 | g | Korea Southern Power Co Ltd | 0.750 | 01/27/26 | 3,086 | ||||||||||
| 6,975,000 | MidAmerican Energy Co | 3.650 | 04/15/29 | 7,686 | |||||||||||
| 6,150,000 | MidAmerican Energy Co | 3.650 | 08/01/48 | 6,912 | |||||||||||
| EUR | 300,000 | g | Mondelez International Holdings Netherlands BV | 1.250 | 09/09/41 | 328 | |||||||||
| $ | 7,350,000 | Nevada Power Co | 2.400 | 05/01/30 | 7,386 | ||||||||||
| 3,335,000 | Nevada Power Co | 5.450 | 05/15/41 | 4,345 | |||||||||||
| 17,000,000 | NextEra Energy Capital Holdings, Inc | 2.250 | 06/01/30 | 16,898 | |||||||||||
| 29,085,000 | NiSource, Inc | 1.700 | 02/15/31 | 27,154 | |||||||||||
| 8,250,000 | g | NRG Energy, Inc | 2.450 | 12/02/27 | 8,175 | ||||||||||
| 1,675,000 | NSTAR Electric Co | 3.950 | 04/01/30 | 1,881 | |||||||||||
| 3,600,000 | Ohio Power Co | 2.600 | 04/01/30 | 3,689 | |||||||||||
| 6,150,000 | Ohio Power Co | 4.150 | 04/01/48 | 7,213 | |||||||||||
| 6,150,000 | Ohio Power Co | 4.000 | 06/01/49 | 7,065 | |||||||||||
| 1,280,000 | Oncor Electric Delivery Co LLC | 5.250 | 09/30/40 | 1,697 | |||||||||||
| 3,500,000 | ONE Gas, Inc | 3.610 | 02/01/24 | 3,649 | |||||||||||
| 600,000 | g | Pattern Energy Operations LP | 4.500 | 08/15/28 | 623 | ||||||||||
| 2,775,000 | PECO Energy Co | 3.000 | 09/15/49 | 2,801 | |||||||||||
| 3,700,000 | PECO Energy Co | 2.800 | 06/15/50 | 3,619 | |||||||||||
| 399 |
COLLEGE RETIREMENT EQUITIES FUND - Bond Market Account
| PRINCIPAL | ISSUER | RATE | MATURITY DATE | VALUE (000) | |||||||||||
| $ | 1,500,000 | g | Perusahaan Gas Negara Persero Tbk PT | 5.125 | % | 05/16/24 | $ | 1,623 | |||||||
| 3,000,000 | g | Perusahaan Listrik Negara PT | 4.125 | 05/15/27 | 3,201 | ||||||||||
| 650,000 | g | Perusahaan Listrik Negara PT | 3.875 | 07/17/29 | 688 | ||||||||||
| 3,000,000 | g | Perusahaan Listrik Negara PT | 3.375 | 02/05/30 | 3,064 | ||||||||||
| 200,000 | g | Perusahaan Listrik Negara PT | 4.875 | 07/17/49 | 214 | ||||||||||
| 5,000,000 | g | Perusahaan Perseroan Persero PT Perusahaan Listrik Negara | 4.000 | 06/30/50 | 4,853 | ||||||||||
| 3,175,000 | g | Phosagro OAO Via Phosagro Bond Funding DAC | 2.600 | 09/16/28 | 3,085 | ||||||||||
| 750,000 | Potomac Electric Power Co | 7.900 | 12/15/38 | 1,181 | |||||||||||
| 3,300,000 | g | Promigas S.A. ESP | 3.750 | 10/16/29 | 3,239 | ||||||||||
| 8,425,000 | Public Service Co of Colorado | 1.875 | 06/15/31 | 8,190 | |||||||||||
| 3,000,000 | Public Service Co of Colorado | 4.050 | 09/15/49 | 3,556 | |||||||||||
| 4,450,000 | Public Service Co of Colorado | 3.200 | 03/01/50 | 4,639 | |||||||||||
| 7,970,000 | Public Service Electric & Gas Co | 3.150 | 01/01/50 | 8,331 | |||||||||||
| 3,500,000 | g | Saka Energi Indonesia PT | 4.450 | 05/05/24 | 3,397 | ||||||||||
| 20,000,000 | Southern Co | 4.000 | 01/15/51 | 20,450 | |||||||||||
| EUR | 300,000 | Southern Co | 1.875 | 09/15/81 | 332 | ||||||||||
| $ | 8,475,000 | Southern Co Gas Capital Corp | 3.875 | 11/15/25 | 9,105 | ||||||||||
| 2,125,000 | Southern Co Gas Capital Corp | 4.400 | 06/01/43 | 2,421 | |||||||||||
| 2,000,000 | Southern Co Gas Capital Corp | 3.950 | 10/01/46 | 2,195 | |||||||||||
| 2,440,000 | Southwestern Public Service Co | 3.400 | 08/15/46 | 2,645 | |||||||||||
| 350,000 | g | Tengizchevroil Finance Co International Ltd | 2.625 | 08/15/25 | 350 | ||||||||||
| 3,250,000 | Virginia Electric & Power Co | 2.950 | 11/15/26 | 3,417 | |||||||||||
| 3,250,000 | Virginia Electric & Power Co | 3.500 | 03/15/27 | 3,501 | |||||||||||
| 12,379,000 | Virginia Electric & Power Co | 3.800 | 04/01/28 | 13,548 | |||||||||||
| 4,125,000 | Wisconsin Power & Light Co | 4.100 | 10/15/44 | 4,701 | |||||||||||
| 2,975,000 | Xcel Energy, Inc | 3.350 | 12/01/26 | 3,159 | |||||||||||
| 2,890,000 | Xcel Energy, Inc | 4.800 | 09/15/41 | 3,506 | |||||||||||
| TOTAL UTILITIES | 505,650 | ||||||||||||||
| TOTAL CORPORATE BONDS | 5,849,812 | ||||||||||||||
| (Cost $5,663,286) | |||||||||||||||
| GOVERNMENT BONDS - 36.8% | |||||||||||||||
| AGENCY SECURITIES - 0.4% | |||||||||||||||
| 2,500,000 | Amber Circle Funding Ltd | 3.250 | 12/04/22 | 2,551 | |||||||||||
| 3,153,000 | Canal Barge Co, Inc | 4.500 | 11/12/34 | 3,602 | |||||||||||
| 313 | Export-Import Bank of the United States | 1.822 | 05/03/25 | 0 | ^ | ||||||||||
| 9,855,000 | Lutheran Medical Center | 1.982 | 02/20/30 | 9,962 | |||||||||||
| 25,747,000 | Private Export Funding Corp (PEFCO) | 2.050 | 11/15/22 | 26,098 | |||||||||||
| 8,225,000 | PEFCO | 1.750 | 11/15/24 | 8,375 | |||||||||||
| 3,000,000 | g | Reliance Industries Ltd | 3.667 | 11/30/27 | 3,203 | ||||||||||
| TOTAL AGENCY SECURITIES | 53,791 | ||||||||||||||
| FOREIGN GOVERNMENT BONDS - 5.4% | |||||||||||||||
| 4,000,000 | g | Abu Dhabi Government International Bond | 3.125 | 05/03/26 | 4,254 | ||||||||||
| 2,000,000 | g | Abu Dhabi Government International Bond | 2.500 | 09/30/29 | 2,074 | ||||||||||
| 2,250,000 | g | Abu Dhabi Government International Bond | 3.125 | 09/30/49 | 2,299 | ||||||||||
| 400 |
COLLEGE RETIREMENT EQUITIES FUND - Bond Market Account
| PRINCIPAL | ISSUER | RATE | MATURITY DATE | VALUE (000) | |||||||||||
| $ | 750,000 | g | Africa Finance Corp | 2.875 | % | 04/28/28 | $ | 744 | |||||||
| 2,325,000 | g | African Export-Import Bank | 2.634 | 05/17/26 | 2,333 | ||||||||||
| 4,350,000 | g | Airport Authority | 1.625 | 02/04/31 | 4,192 | ||||||||||
| 3,325,000 | g | Arab Petroleum Investments Corp | 4.125 | 09/18/23 | 3,508 | ||||||||||
| AUD | 400,000 | Australia Government Bond | 2.250 | 05/21/28 | 305 | ||||||||||
| 860,000 | Australia Government Bond | 1.750 | 06/21/51 | 542 | |||||||||||
| $ | 3,000,000 | g | Bahrain Government International Bond | 5.450 | 09/16/32 | 2,910 | |||||||||
| 1,500,000 | g | Banque Ouest Africaine de Developpement | 5.000 | 07/27/27 | 1,654 | ||||||||||
| 8,500,000 | g | Banque Ouest Africaine de Developpement | 4.700 | 10/22/31 | 9,251 | ||||||||||
| EUR | 3,650,000 | g | Banque Ouest Africaine de Developpement | 2.750 | 01/22/33 | 4,360 | |||||||||
| 850,000 | g | Benin Government International Bond | 4.950 | 01/22/35 | 922 | ||||||||||
| $ | 2,600,000 | g | Bermuda Government International Bond | 3.717 | 01/25/27 | 2,782 | |||||||||
| 200,000 | g | Bermuda Government International Bond | 4.750 | 02/15/29 | 230 | ||||||||||
| 12,400,000 | g | BNG Bank NV | 3.000 | 09/20/23 | 12,877 | ||||||||||
| 8,000,000 | g | BNG Bank NV | 0.875 | 05/18/26 | 7,856 | ||||||||||
| 2,730,000 | g | Brazil Minas SPE via State of Minas Gerais | 5.333 | 02/15/28 | 2,839 | ||||||||||
| 2,900,000 | Brazilian Government International Bond | 4.625 | 01/13/28 | 3,027 | |||||||||||
| 2,975,000 | Brazilian Government International Bond | 3.875 | 06/12/30 | 2,886 | |||||||||||
| 2,850,000 | Brazilian Government International Bond | 5.625 | 02/21/47 | 2,821 | |||||||||||
| EUR | 1,000,000 | Bundesrepublik Deutschland Bundesanleihe | 0.000 | 02/15/31 | 1,160 | ||||||||||
| $ | 7,000,000 | g | Caisse d’Amortissement de la Dette Sociale | 1.125 | 11/29/24 | 7,001 | |||||||||
| CAD | 1,400,000 | g | Canada Housing Trust No | 1.100 | 12/15/26 | 1,083 | |||||||||
| 1,475,000 | Canadian Government Bond | 2.000 | 06/01/28 | 1,218 | |||||||||||
| 950,000 | Canadian Government Bond | 2.000 | 12/01/51 | 808 | |||||||||||
| 875,000 | Canadian Government International Bond | 2.000 | 09/01/23 | 704 | |||||||||||
| 1,000,000 | Canadian Government International Bond | 5.000 | 06/01/37 | 1,154 | |||||||||||
| $ | 3,050,000 | Chile Government International Bond | 2.550 | 01/27/32 | 3,043 | ||||||||||
| EUR | 475,000 | Chile Government International Bond | 1.250 | 01/22/51 | 485 | ||||||||||
| CNY | 3,200,000 | China Government Bond | 2.570 | 05/20/23 | 504 | ||||||||||
| 24,000,000 | China Government Bond | 2.880 | 11/05/23 | 3,800 | |||||||||||
| 17,000,000 | China Government Bond | 1.990 | 04/09/25 | 2,621 | |||||||||||
| 11,250,000 | China Government Bond | 3.270 | 11/19/30 | 1,825 | |||||||||||
| 4,700,000 | China Government Bond | 3.810 | 09/14/50 | 789 | |||||||||||
| 9,400,000 | China Government Bond | 3.720 | 04/12/51 | 1,562 | |||||||||||
| 26,500,000 | China Government International Bond | 2.360 | 07/02/23 | 4,158 | |||||||||||
| 9,700,000 | China Government International Bond | 2.940 | 10/17/24 | 1,540 | |||||||||||
| 47,400,000 | China Government International Bond | 3.120 | 12/05/26 | 7,601 | |||||||||||
| $ | 4,000,000 | g | China Government International Bond | 1.200 | 10/21/30 | 3,850 | |||||||||
| CNY | 18,900,000 | China Government International Bond | 3.860 | 07/22/49 | 3,188 | ||||||||||
| 10,000,000 | China Government International Bond | 3.390 | 03/16/50 | 1,555 | |||||||||||
| $ | 2,000,000 | g | China Government International Bond | 2.250 | 10/21/50 | 1,914 | |||||||||
| NOK | 7,000,000 | City of Oslo Norway | 2.050 | 10/31/24 | 797 | ||||||||||
| $ | 12,650,000 | Colombia Government International Bond | 3.000 | 01/30/30 | 11,562 | ||||||||||
| 6,675,000 | Colombia Government International Bond | 3.250 | 04/22/32 | 5,999 | |||||||||||
| 1,700,000 | Colombia Government International Bond | 5.000 | 06/15/45 | 1,535 | |||||||||||
| 4,100,000 | g | Costa Rica Government International Bond | 5.625 | 04/30/43 | 3,506 | ||||||||||
| 20,200,000 | g | CPPIB Capital, Inc | 2.250 | 01/25/22 | 20,224 | ||||||||||
| 5,000,000 | g | Development Bank of Japan, Inc | 0.500 | 03/04/24 | 4,950 | ||||||||||
| DOP | 8,000,000 | g | Dominican Republic Government International Bond | 9.750 | 06/05/26 | 155 | |||||||||
| $ | 3,500,000 | g | Dominican Republic Government International Bond | 4.875 | 09/23/32 | 3,557 | |||||||||
| 2,950,000 | g | Dominican Republic Government International Bond | 6.500 | 02/15/48 | 3,127 | ||||||||||
| 401 |
COLLEGE RETIREMENT EQUITIES FUND - Bond Market Account
| PRINCIPAL | ISSUER | RATE | MATURITY DATE | VALUE (000) | |||||||||||
| $ | 24,960 | g | Ecuador Government International Bond | 0.000 | % | 07/31/30 | $ | 14 | |||||||
| 141,600 | g | Ecuador Government International Bond (Step Bond) | 5.000 | 07/31/30 | 117 | ||||||||||
| 99,120 | g | Ecuador Government International Bond (Step Bond) | 1.000 | 07/31/35 | 65 | ||||||||||
| 425,000 | g | Egypt Government International Bond | 5.750 | 05/29/24 | 442 | ||||||||||
| EGP | 19,025,000 | Egypt Government International Bond | 15.900 | 07/02/24 | 1,245 | ||||||||||
| $ | 1,500,000 | g | Egypt Government International Bond | 5.800 | 09/30/27 | 1,441 | |||||||||
| 725,000 | g | Egypt Government International Bond | 7.600 | 03/01/29 | 718 | ||||||||||
| EUR | 1,100,000 | g | Egypt Government International Bond | 5.625 | 04/16/30 | 1,129 | |||||||||
| 700,000 | g | Egypt Government International Bond | 6.375 | 04/11/31 | 734 | ||||||||||
| $ | 1,100,000 | g | Egypt Government International Bond | 7.053 | 01/15/32 | 1,014 | |||||||||
| 2,700,000 | g | Egypt Government International Bond | 8.500 | 01/31/47 | 2,389 | ||||||||||
| 650,000 | g | El Salvador Government International Bond | 6.375 | 01/18/27 | 393 | ||||||||||
| 1,445,000 | g | El Salvador Government International Bond | 7.125 | 01/20/50 | 791 | ||||||||||
| 2,000,000 | Emirate of Dubai Government International Bonds | 3.900 | 09/09/50 | 1,913 | |||||||||||
| 800,000 | † | European Bank for Reconstruction & Development | 10.000 | 02/28/23 | 692 | ||||||||||
| 3,500,000 | European Investment Bank | 4.875 | 02/15/36 | 4,816 | |||||||||||
| 4,000,000 | g | Export-Import Bank of India | 3.875 | 02/01/28 | 4,275 | ||||||||||
| 3,975,000 | g | Export-Import Bank of India | 2.250 | 01/13/31 | 3,740 | ||||||||||
| 2,800,000 | Export-Import Bank of Korea | 0.750 | 09/21/25 | 2,739 | |||||||||||
| 3,350,000 | Export-Import Bank of Korea | 1.250 | 09/21/30 | 3,187 | |||||||||||
| EUR | 3,000,000 | French Republic Government Bond OAT | 0.500 | 05/25/25 | 3,526 | ||||||||||
| 1,325,000 | French Republic Government Bond OAT | 0.750 | 11/25/28 | 1,599 | |||||||||||
| 1,175,000 | g | French Republic Government Bond OAT | 0.500 | 05/25/40 | 1,304 | ||||||||||
| 860,000 | g | French Republic Government Bond OAT | 0.750 | 05/25/52 | 936 | ||||||||||
| $ | 2,325,000 | g | Ghana Government International Bond | 8.125 | 03/26/32 | 1,897 | |||||||||
| 1,000,000 | g | Ghana Government International Bond | 8.627 | 06/16/49 | 791 | ||||||||||
| 1,800,000 | g | Guatemala Government International Bond | 4.500 | 05/03/26 | 1,894 | ||||||||||
| 450,000 | g | Guatemala Government International Bond | 4.375 | 06/05/27 | 472 | ||||||||||
| 600,000 | g | Guatemala Government International Bond | 6.125 | 06/01/50 | 687 | ||||||||||
| EUR | 725,000 | g | Hellenic Republic Government Bond | 0.750 | 06/18/31 | 782 | |||||||||
| 1,250,000 | g | Hellenic Republic Government International Bond | 1.500 | 06/18/30 | 1,449 | ||||||||||
| $ | 1,775,000 | g | Honduras Government International Bond | 6.250 | 01/19/27 | 1,917 | |||||||||
| 350,000 | g | Honduras Government International Bond | 5.625 | 06/24/30 | 363 | ||||||||||
| 1,150,000 | g | Hungary Government International Bond | 2.125 | 09/22/31 | 1,130 | ||||||||||
| CAD | 1,475,000 | Hydro-Quebec | 5.000 | 02/15/45 | 1,686 | ||||||||||
| $ | 11,675,000 | g | Indonesia Government International Bond | 4.625 | 04/15/43 | 13,672 | |||||||||
| IDR | 7,750,000,000 | Indonesia Treasury Bond | 8.125 | 05/15/24 | 592 | ||||||||||
| 28,000,000,000 | Indonesia Treasury Bond | 7.000 | 09/15/30 | 2,035 | |||||||||||
| 10,000,000,000 | Indonesia Treasury Bond | 6.375 | 04/15/32 | 707 | |||||||||||
| AUD | 500,000 | Inter-American Development Bank | 4.750 | 08/27/24 | 397 | ||||||||||
| 900,000 | Inter-American Development Bank | 2.750 | 10/30/25 | 685 | |||||||||||
| NZD | 941,000 | International Bank for Reconstruction & Development | 3.375 | 01/25/22 | 645 | ||||||||||
| CAD | 1,300,000 | International Bank for Reconstruction & Development | 1.900 | 01/16/25 | 1,044 | ||||||||||
| GBP | 500,000 | International Finance Corp | 0.250 | 12/15/25 | 655 | ||||||||||
| $ | 1,665,625 | g | Iraq Government International Bond | 5.800 | 01/15/28 | 1,591 | |||||||||
| 6,200,000 | Israel Government International Bond | 3.250 | 01/17/28 | 6,718 | |||||||||||
| ILS | 3,100,000 | Israel Government International Bond | 5.500 | 01/31/42 | 1,586 | ||||||||||
| 3,200,000 | Israel Government International Bond | 3.750 | 03/31/47 | 1,327 | |||||||||||
| 402 |
COLLEGE RETIREMENT EQUITIES FUND - Bond Market Account
| PRINCIPAL | ISSUER | RATE | MATURITY DATE | VALUE (000) | |||||||||||
| $ | 1,875,000 | Israel Government International Bond | 4.125 | % | 01/17/48 | $ | 2,295 | ||||||||
| EUR | 3,500,000 | Italy Buoni Poliennali Del Tesoro | 2.450 | 10/01/23 | 4,170 | ||||||||||
| 3,345,000 | Italy Buoni Poliennali Del Tesoro | 1.250 | 12/01/26 | 3,963 | |||||||||||
| 2,075,000 | Italy Buoni Poliennali Del Tesoro | 0.950 | 09/15/27 | 2,409 | |||||||||||
| 1,350,000 | g | Italy Buoni Poliennali Del Tesoro | 0.950 | 03/01/37 | 1,411 | ||||||||||
| 475,000 | g | Italy Buoni Poliennali Del Tesoro | 3.850 | 09/01/49 | 760 | ||||||||||
| 425,000 | g | Italy Buoni Poliennali Del Tesoro | 1.700 | 09/01/51 | 452 | ||||||||||
| 1,000,000 | g | Ivory Coast Government International Bond | 5.875 | 10/17/31 | 1,167 | ||||||||||
| 100,000 | g | Ivory Coast Government International Bond | 4.875 | 01/30/32 | 109 | ||||||||||
| $ | 1,510,973 | g | Ivory Coast Government International Bond (Step Bond) | 5.750 | 12/31/32 | 1,515 | |||||||||
| 2,850,000 | Jamaica Government International Bond | 7.875 | 07/28/45 | 3,944 | |||||||||||
| 6,000,000 | Japan Bank for International Cooperation | 2.375 | 04/20/26 | 6,231 | |||||||||||
| 6,650,000 | g | Japan Finance Organization for Municipalities | 3.375 | 09/27/23 | 6,932 | ||||||||||
| 2,500,000 | g | Japan Finance Organization for Municipalities | 1.000 | 05/21/25 | 2,476 | ||||||||||
| JPY | 140,000,000 | Japan Finance Organization for Municipalities | 0.020 | 03/13/26 | 1,217 | ||||||||||
| 498,000,000 | Japan Government Five Year Bond | 0.005 | 09/20/26 | 4,347 | |||||||||||
| 327,000,000 | Japan Government Ten Year Bond | 0.100 | 09/20/26 | 2,866 | |||||||||||
| 162,000,000 | Japan Government Ten Year Bond | 0.100 | 12/20/29 | 1,423 | |||||||||||
| 175,000,000 | Japan Government Thirty Year Bond | 2.400 | 11/20/31 | 1,867 | |||||||||||
| 350,000,000 | Japan Government Thirty Year Bond | 2.300 | 05/20/32 | 3,729 | |||||||||||
| 418,000,000 | Japan Government Thirty Year Bond | 2.500 | 09/20/34 | 4,674 | |||||||||||
| 225,000,000 | Japan Government Thirty Year Bond | 0.500 | 09/20/46 | 1,919 | |||||||||||
| 105,000,000 | Japan Government Thirty Year Bond | 0.600 | 09/20/50 | 894 | |||||||||||
| 259,500,000 | Japan Government Thirty Year Bond | 0.700 | 09/20/51 | 2,259 | |||||||||||
| 93,000,000 | Japan Government Twenty Year Bond | 0.600 | 12/20/36 | 843 | |||||||||||
| 219,000,000 | Japan Government Twenty Year Bond | 0.500 | 12/20/38 | 1,939 | |||||||||||
| 153,000,000 | Japan Government Twenty Year Bond | 0.300 | 06/20/39 | 1,307 | |||||||||||
| $ | 2,500,000 | g | Jordan Government International Bond | 4.950 | 07/07/25 | 2,578 | |||||||||
| 1,025,000 | g | Jordan Government International Bond | 5.850 | 07/07/30 | 1,036 | ||||||||||
| 3,000,000 | g | Kazakhstan Government International Bond | 4.875 | 10/14/44 | 3,683 | ||||||||||
| 1,525,000 | g | Kenya Government International Bond | 6.875 | 06/24/24 | 1,611 | ||||||||||
| 2,350,000 | g | Kenya Government International Bond | 7.000 | 05/22/27 | 2,478 | ||||||||||
| EUR | 1,875,000 | g | Kingdom of Belgium Government International Bond | 0.000 | 10/22/27 | 2,166 | |||||||||
| $ | 5,000,000 | g | Kommunalbanken AS. | 2.250 | 01/25/22 | 5,005 | |||||||||
| 2,600,000 | g | Kommunalbanken AS. | 2.750 | 02/05/24 | 2,703 | ||||||||||
| 3,000,000 | g | Kommunalbanken AS. | 1.125 | 06/14/30 | 2,885 | ||||||||||
| 2,833,000 | e,g | Kommuninvest I Sverige AB | 2.625 | 09/15/22 | 2,876 | ||||||||||
| 2,000,000 | g | Kommuninvest I Sverige AB | 0.500 | 07/05/23 | 1,994 | ||||||||||
| 6,975,000 | g | Korea Electric Power Corp | 1.125 | 06/15/25 | 6,886 | ||||||||||
| 5,775,000 | g | Korea Housing Finance Corp | 3.000 | 10/31/22 | 5,867 | ||||||||||
| 2,500,000 | g | Korea Hydro & Nuclear Power Co Ltd | 1.250 | 04/27/26 | 2,455 | ||||||||||
| KRW | 1,200,000,000 | Korea Treasury Bond | 1.125 | 06/10/24 | 994 | ||||||||||
| 1,270,000,000 | Korea Treasury Bond | 1.500 | 03/10/25 | 1,057 | |||||||||||
| 1,800,000,000 | Korea Treasury Bond | 1.500 | 12/10/26 | 1,474 | |||||||||||
| 2,400,000,000 | Korea Treasury Bond | 2.000 | 06/10/31 | 1,971 | |||||||||||
| 2,380,000,000 | Korea Treasury Bond | 2.375 | 09/10/38 | 2,008 | |||||||||||
| $ | 18,750,000 | Kreditanstalt fuer Wiederaufbau | 2.625 | 01/25/22 | 18,775 | ||||||||||
| 5,750,000 | g | Kuwait Government International Bond | 2.750 | 03/20/22 | 5,779 | ||||||||||
| 403 |
COLLEGE RETIREMENT EQUITIES FUND - Bond Market Account
| PRINCIPAL | ISSUER | RATE | MATURITY DATE | VALUE (000) | |||||||||||
| $ | 1,750,000 | †,q | Lebanon Government International Bond | 6.750 | % | 11/29/27 | $ | 184 | |||||||
| 5,250,000 | g | Lithuania Government International Bond | 6.625 | 02/01/22 | 5,273 | ||||||||||
| MYR | 2,160,000 | Malaysia Government Bond | 3.757 | 05/22/40 | 495 | ||||||||||
| 3,100,000 | Malaysia Government International Bond | 4.893 | 06/08/38 | 818 | |||||||||||
| MXN | 23,500,000 | Mexican Bonos | 5.750 | 03/05/26 | 1,082 | ||||||||||
| 13,700,000 | Mexican Bonos | 8.500 | 11/18/38 | 704 | |||||||||||
| $ | 3,000,000 | Mexico Government International Bond | 4.150 | 03/28/27 | 3,315 | ||||||||||
| 13,175,000 | Mexico Government International Bond | 3.250 | 04/16/30 | 13,490 | |||||||||||
| 6,051,000 | Mexico Government International Bond | 6.050 | 01/11/40 | 7,518 | |||||||||||
| 6,650,000 | Mexico Government International Bond | 4.280 | 08/14/41 | 6,891 | |||||||||||
| 3,500,000 | Mexico Government International Bond | 4.600 | 02/10/48 | 3,728 | |||||||||||
| 825,000 | g | Mongolia Government International Bond | 4.450 | 07/07/31 | 781 | ||||||||||
| EUR | 900,000 | g | Morocco Government International Bond | 1.500 | 11/27/31 | 940 | |||||||||
| $ | 5,750,000 | g | Morocco Government International Bond | 5.500 | 12/11/42 | 6,340 | |||||||||
| 1,675,000 | g | Namibia Government International Bond | 5.250 | 10/29/25 | 1,756 | ||||||||||
| 5,000,000 | g | Nederlandse Waterschapsbank NV | 1.875 | 04/14/22 | 5,022 | ||||||||||
| EUR | 400,000 | g | Netherlands Government International Bond | 2.750 | 01/15/47 | 739 | |||||||||
| AUD | 500,000 | New South Wales Treasury Corp | 4.000 | 05/20/26 | 403 | ||||||||||
| 2,690,000 | New South Wales Treasury Corp | 3.000 | 04/20/29 | 2,117 | |||||||||||
| NZD | 1,465,000 | New Zealand Government Bond | 2.000 | 05/15/32 | 967 | ||||||||||
| $ | 2,600,000 | g | Nigeria Government International Bond | 6.500 | 11/28/27 | 2,589 | |||||||||
| EUR | 850,000 | g | North Macedonia Government International Bond | 3.675 | 06/03/26 | 1,023 | |||||||||
| NOK | 17,250,000 | g | Norway Government International Bond | 2.000 | 04/26/28 | 1,995 | |||||||||
| $ | 525,000 | g | Oman Government International Bond | 6.750 | 10/28/27 | 588 | |||||||||
| 1,500,000 | g | Oman Government International Bond | 6.000 | 08/01/29 | 1,614 | ||||||||||
| 3,000,000 | g | Oman Government International Bond | 6.250 | 01/25/31 | 3,276 | ||||||||||
| 500,000 | e,g | Oman Sovereign Sukuk Co | 4.875 | 06/15/30 | 531 | ||||||||||
| 21,300,000 | g | OMERS Finance Trust | 2.500 | 05/02/24 | 22,048 | ||||||||||
| 15,000,000 | g | Ontario Teachers’ Finance Trust | 1.625 | 09/12/24 | 15,208 | ||||||||||
| 500,000 | g | Pakistan Government International Bond | 6.000 | 04/08/26 | 499 | ||||||||||
| 6,000,000 | Panama Bonos del Tesoro | 3.362 | 06/30/31 | 6,030 | |||||||||||
| 3,600,000 | Panama Government International Bond | 3.160 | 01/23/30 | 3,726 | |||||||||||
| 4,000,000 | Panama Government International Bond | 4.300 | 04/29/53 | 4,294 | |||||||||||
| 10,955,000 | Panama Notas del Tesoro | 3.750 | 04/17/26 | 11,624 | |||||||||||
| 925,000 | g | Paraguay Government International Bond | 5.400 | 03/30/50 | 1,056 | ||||||||||
| 11,900,000 | g | Perusahaan Penerbit SBSN Indonesia III | 4.400 | 03/01/28 | 13,424 | ||||||||||
| 3,000,000 | Peruvian Government International Bond | 1.862 | 12/01/32 | 2,738 | |||||||||||
| 1,970,000 | Peruvian Government International Bond | 3.000 | 01/15/34 | 1,962 | |||||||||||
| 17,708 | g | Petroamazonas EP | 4.625 | 12/06/21 | 18 | ||||||||||
| PHP | 17,000,000 | Philippine Government International Bond | 6.250 | 01/14/36 | 370 | ||||||||||
| CAD | 875,000 | Province of Ontario Canada | 2.150 | 06/02/31 | 699 | ||||||||||
| 650,000 | Province of Quebec Canada | 2.750 | 09/01/27 | 544 | |||||||||||
| $ | 6,000,000 | Province of Quebec Canada | 7.500 | 09/15/29 | 8,378 | ||||||||||
| 2,000,000 | g | Provincia de Mendoza Argentina (Step Bond) | 4.250 | 03/19/29 | 1,330 | ||||||||||
| 925,000 | g | Qatar Government International Bond | 3.400 | 04/16/25 | 981 | ||||||||||
| 2,050,000 | g | Qatar Government International Bond | 3.750 | 04/16/30 | 2,299 | ||||||||||
| 5,900,000 | g | Qatar Government International Bond | 4.400 | 04/16/50 | 7,325 | ||||||||||
| EUR | 425,000 | g | Republic of Cameroon International Bond | 5.950 | 07/07/32 | 452 | |||||||||
| $ | 500,000 | g | Republic of Guatemala | 4.650 | 10/07/41 | 499 | |||||||||
| 7,000,000 | Republic of Italy Government International Bond | 4.000 | 10/17/49 | 7,693 | |||||||||||
| 404 |
COLLEGE RETIREMENT EQUITIES FUND - Bond Market Account
| PRINCIPAL | ISSUER | RATE | MATURITY DATE | VALUE (000) | |||||||||||
| $ | 2,000,000 | g | Republic of Paraguay | 6.100 | % | 08/11/44 | $ | 2,458 | |||||||
| PLN | 6,225,000 | Republic of Poland Government International Bond | 2.750 | 10/25/29 | 1,444 | ||||||||||
| ZAR | 14,725,000 | Republic of South Africa Government Bond | 8.875 | 02/28/35 | 829 | ||||||||||
| $ | 3,225,000 | g | Republic of Uzbekistan Bond | 4.750 | 02/20/24 | 3,353 | |||||||||
| 1,400,000 | g | Republic of Uzbekistan Bond | 3.700 | 11/25/30 | 1,341 | ||||||||||
| UZS | 5,708,925,000 | g | Republic of Uzbekistan International Bond | 14.000 | 07/19/24 | 532 | |||||||||
| RON | 7,075,000 | Romania Government Bond | 4.150 | 01/26/28 | 1,558 | ||||||||||
| $ | 3,000,000 | e,g | Romanian Government International Bond | 3.000 | 02/14/31 | 3,038 | |||||||||
| EUR | 600,000 | g | Romanian Government International Bond | 2.000 | 01/28/32 | 633 | |||||||||
| 500,000 | g | Romanian Government International Bond | 2.000 | 04/14/33 | 517 | ||||||||||
| $ | 4,600,000 | g | Romanian Government International Bond | 4.000 | 02/14/51 | 4,593 | |||||||||
| RUB | 72,000,000 | Russian Federal Bond-OFZ | 4.500 | 07/16/25 | 852 | ||||||||||
| $ | 5,000,000 | g | Russian Foreign Bond - Eurobond | 4.375 | 03/21/29 | 5,496 | |||||||||
| 3,200,000 | g | Russian Foreign Bond - Eurobond | 5.100 | 03/28/35 | 3,774 | ||||||||||
| 4,850,000 | g | Rwanda International Government Bond | 5.500 | 08/09/31 | 4,883 | ||||||||||
| 4,500,000 | g | Saudi Government International Bond | 3.250 | 10/26/26 | 4,793 | ||||||||||
| 6,775,000 | g | Saudi Government International Bond | 4.500 | 04/17/30 | 7,893 | ||||||||||
| 6,150,000 | g | Saudi Government International Bond | 3.750 | 01/21/55 | 6,590 | ||||||||||
| EUR | 1,000,000 | g | Senegal Government International Bond | 4.750 | 03/13/28 | 1,154 | |||||||||
| 425,000 | g | Senegal Government International Bond | 5.375 | 06/08/37 | 457 | ||||||||||
| $ | 1,000,000 | g | Senegal Government International Bond | 6.750 | 03/13/48 | 979 | |||||||||
| EUR | 1,250,000 | g | Serbia Government International Bond | 1.500 | 06/26/29 | 1,371 | |||||||||
| $ | 5,450,000 | g | Serbia International Bond | 2.125 | 12/01/30 | 5,095 | |||||||||
| EUR | 575,000 | g | Serbia International Bond | 2.050 | 09/23/36 | 597 | |||||||||
| RSD | 96,000,000 | Serbia Treasury Bonds | 5.875 | 02/08/28 | 1,024 | ||||||||||
| 31,700,000 | Serbia Treasury Bonds | 4.500 | 08/20/32 | 313 | |||||||||||
| SGD | 2,030,000 | Singapore Government Bond | 1.625 | 07/01/31 | 1,499 | ||||||||||
| $ | 4,000,000 | South Africa Government International Bond | 5.875 | 09/16/25 | 4,420 | ||||||||||
| ZAR | 15,100,000 | South Africa Government International Bond | 8.750 | 01/31/44 | 788 | ||||||||||
| $ | 2,800,000 | South Africa Government International Bond | 5.375 | 07/24/44 | 2,674 | ||||||||||
| 1,000,000 | g | Southern Gas Corridor CJSC | 6.875 | 03/24/26 | 1,149 | ||||||||||
| EUR | 2,950,000 | g | Spain Government Bond | 0.500 | 10/31/31 | 3,334 | |||||||||
| 2,550,000 | g | Spain Government International Bond | 2.750 | 10/31/24 | 3,169 | ||||||||||
| 845,000 | g | Spain Government International Bond | 1.400 | 07/30/28 | 1,042 | ||||||||||
| 1,475,000 | g | Spain Government International Bond | 0.600 | 10/31/29 | 1,720 | ||||||||||
| 625,000 | g | Spain Government International Bond | 0.100 | 04/30/31 | 686 | ||||||||||
| 2,350,000 | g | Spain Government International Bond | 1.200 | 10/31/40 | 2,697 | ||||||||||
| 3,100,000 | State of Israel | 3.375 | 01/15/50 | 3,348 | |||||||||||
| 6,590,000 | Svensk Exportkredit AB | 1.750 | 12/12/23 | 6,698 | |||||||||||
| SEK | 6,500,000 | Sweden Government Bond | 0.500 | 11/24/45 | 687 | ||||||||||
| THB | 48,800,000 | Thailand Government International Bond | 3.300 | 06/17/38 | 1,607 | ||||||||||
| $ | 2,500,000 | g | Turkiye Ihracat Kredi Bankasi AS. | 5.750 | 07/06/26 | 2,293 | |||||||||
| UAH | 25,000,000 | Ukraine Government International Bond | 17.000 | 05/11/22 | 933 | ||||||||||
| EUR | 1,000,000 | g | Ukraine Government International Bond | 6.750 | 06/20/26 | 1,081 | |||||||||
| 4,050,000 | g | Ukraine Government International Bond | 4.375 | 01/27/30 | 3,701 | ||||||||||
| GBP | 2,850,000 | United Kingdom Gilt | 1.625 | 10/22/28 | 4,068 | ||||||||||
| 2,400,000 | United Kingdom Gilt | 0.875 | 07/31/33 | 3,187 | |||||||||||
| 405 |
COLLEGE RETIREMENT EQUITIES FUND - Bond Market Account
| PRINCIPAL | ISSUER | REFERENCE RATE & SPREAD | RATE | MATURITY DATE | VALUE (000) | ||||||||||||
| GBP | 2,450,000 | United Kingdom Gilt | 1.750 | % | 09/07/37 | $ | 3,590 | ||||||||||
| 500,000 | United Kingdom Gilt | 1.250 | 10/22/41 | 683 | |||||||||||||
| 1,375,000 | United Kingdom Gilt | 0.625 | 10/22/50 | 1,635 | |||||||||||||
| UYU | 21,800,000 | g | Uruguay Government International Bond | 8.500 | 03/15/28 | 484 | |||||||||||
| $ | 8,007,410 | Uruguay Government International Bond | 4.375 | 01/23/31 | 9,218 | ||||||||||||
| UYU | 20,300,000 | Uruguay Government International Bond | 8.250 | 05/21/31 | 437 | ||||||||||||
| $ | 850,000 | Uruguay Government International Bond | 4.125 | 11/20/45 | 1,006 | ||||||||||||
| 1,400,000 | Uruguay Government International Bond | 5.100 | 06/18/50 | 1,849 | |||||||||||||
| TOTAL FOREIGN GOVERNMENT BONDS | 731,607 | ||||||||||||||||
| MORTGAGE BACKED - 20.4% | |||||||||||||||||
| 5,176,000 | g,i | Angel Oak Mortgage Trust | 2.837 | 11/25/66 | 5,180 | ||||||||||||
| 7,732,106 | Federal Home Loan Mortgage Corp (FHLMC) | 3.000 | 10/15/33 | 8,148 | |||||||||||||
| 5,293,317 | i | FHLMC | LIBOR 1 M + 5.920% | 5.810 | 03/15/44 | 911 | |||||||||||
| 17,563,134 | FHLMC | 4.000 | 10/01/47 | 19,192 | |||||||||||||
| 14,192,501 | FHLMC | 4.000 | 06/01/48 | 15,408 | |||||||||||||
| 10,692,397 | i | FHLMC | LIBOR 1 M + 9.920% | 9.744 | 06/15/48 | 12,193 | |||||||||||
| 9,197,685 | FHLMC | 4.000 | 07/01/48 | 10,035 | |||||||||||||
| 8,132,823 | i | FHLMC | LIBOR 1 M + 9.840% | 9.664 | 10/15/48 | 9,578 | |||||||||||
| 23,183,931 | FHLMC | 3.000 | 11/01/49 | 24,396 | |||||||||||||
| 19,246,833 | FHLMC | 2.000 | 09/25/50 | 2,213 | |||||||||||||
| 30,379,891 | FHLMC | 2.500 | 11/25/50 | 4,999 | |||||||||||||
| 40,275,306 | FHLMC | 2.500 | 02/25/51 | 6,759 | |||||||||||||
| 38,422,177 | FHLMC | 3.000 | 11/01/51 | 41,003 | |||||||||||||
| 5,590,608 | FHLMC | 3.000 | 11/01/51 | 5,884 | |||||||||||||
| 3,499,189 | FHLMC | 3.000 | 11/01/51 | 3,748 | |||||||||||||
| 4,823,589 | FHLMC | 3.000 | 11/01/51 | 5,151 | |||||||||||||
| 1,041 | Federal Home Loan Mortgage Corp Gold (FGLMC) | 7.000 | 05/01/23 | 1 | |||||||||||||
| 10,798 | FGLMC | 8.000 | 01/01/31 | 11 | |||||||||||||
| 4,503 | FGLMC | 7.000 | 01/01/32 | 4 | |||||||||||||
| 298,684 | FGLMC | 4.500 | 07/01/33 | 329 | |||||||||||||
| 2,148,572 | FGLMC | 7.000 | 12/01/33 | 2,438 | |||||||||||||
| 574,896 | FGLMC | 4.500 | 10/01/34 | 630 | |||||||||||||
| 374,285 | FGLMC | 4.500 | 04/01/35 | 412 | |||||||||||||
| 618,737 | FGLMC | 7.000 | 05/01/35 | 695 | |||||||||||||
| 1,672,689 | FGLMC | 5.000 | 06/01/36 | 1,891 | |||||||||||||
| 572,016 | FGLMC | 5.000 | 07/01/39 | 649 | |||||||||||||
| 76,607 | FGLMC | 4.500 | 12/01/43 | 85 | |||||||||||||
| 47,032 | FGLMC | 4.500 | 02/01/44 | 52 | |||||||||||||
| 1,751,489 | FGLMC | 4.500 | 10/01/44 | 1,916 | |||||||||||||
| 942,349 | FGLMC | 4.500 | 11/01/44 | 1,041 | |||||||||||||
| 1,308,541 | FGLMC | 4.500 | 11/01/44 | 1,444 | |||||||||||||
| 705,137 | FGLMC | 4.500 | 12/01/44 | 766 | |||||||||||||
| 929,431 | FGLMC | 4.500 | 12/01/44 | 1,026 | |||||||||||||
| 3,854,841 | FGLMC | 3.500 | 04/01/45 | 4,165 | |||||||||||||
| 791,899 | FGLMC | 4.500 | 05/01/45 | 840 | |||||||||||||
| 18,103,736 | FGLMC | 3.500 | 08/01/45 | 19,618 | |||||||||||||
| 16,249,139 | FGLMC | 4.000 | 12/01/45 | 17,884 | |||||||||||||
| 30,219,663 | FGLMC | 3.500 | 08/01/46 | 32,549 | |||||||||||||
| 1,823,880 | FGLMC | 4.500 | 06/01/47 | 2,011 | |||||||||||||
| 3,635,190 | FGLMC | 4.000 | 09/01/47 | 3,984 | |||||||||||||
| 406 |
COLLEGE RETIREMENT EQUITIES FUND - Bond Market Account
| PRINCIPAL | ISSUER | REFERENCE RATE & SPREAD | RATE | MATURITY DATE | VALUE (000) | ||||||||||||
| $ | 3,169,958 | FGLMC | 3.500 | % | 12/01/47 | $ | 3,411 | ||||||||||
| 8,012,121 | FGLMC | 4.000 | 07/01/48 | 8,745 | |||||||||||||
| 12,258,563 | FGLMC | 4.500 | 08/01/48 | 13,473 | |||||||||||||
| 5,631,548 | FGLMC | 4.500 | 10/01/48 | 6,189 | |||||||||||||
| 8,508,616 | FGLMC | 3.500 | 11/01/48 | 9,160 | |||||||||||||
| 14,180 | Federal National Mortgage Association (FNMA) | 8.000 | 07/01/24 | 15 | |||||||||||||
| 4,497 | FNMA | 9.000 | 11/01/25 | 5 | |||||||||||||
| 2,937,986 | FNMA | 3.500 | 05/01/32 | 3,115 | |||||||||||||
| 17,877,864 | FNMA | 3.000 | �� | 10/01/32 | 18,786 | ||||||||||||
| 296,220 | FNMA | 4.500 | 10/01/33 | 326 | |||||||||||||
| 518,139 | FNMA | 4.500 | 05/01/35 | 568 | |||||||||||||
| 3,313,770 | FNMA | 5.000 | 05/01/35 | 3,739 | |||||||||||||
| 1,537,861 | FNMA | 5.000 | 10/01/35 | 1,738 | |||||||||||||
| 1,284,643 | FNMA | 5.000 | 02/01/36 | 1,452 | |||||||||||||
| 16,000,000 | h | FNMA | 1.500 | 01/25/37 | 16,043 | ||||||||||||
| 75,950,000 | h | FNMA | 2.000 | 01/25/37 | 77,767 | ||||||||||||
| 32,665,000 | h | FNMA | 2.500 | 01/25/37 | 33,763 | ||||||||||||
| 72,650,000 | h | FNMA | 2.000 | 02/25/37 | 74,263 | ||||||||||||
| 3,508,859 | FNMA | 5.500 | 11/01/38 | 4,020 | |||||||||||||
| 1,265,973 | FNMA | 3.000 | 10/01/39 | 1,315 | |||||||||||||
| 15,742,528 | FNMA | 3.000 | 05/01/40 | 16,443 | |||||||||||||
| 2,274,297 | FNMA | 5.000 | 09/01/40 | 2,562 | |||||||||||||
| 4,210,861 | FNMA | 5.000 | 05/01/41 | 4,771 | |||||||||||||
| 12,331,594 | FNMA | 4.000 | 09/01/42 | 13,397 | |||||||||||||
| 8,713,937 | FNMA | 3.500 | 04/01/43 | 9,411 | |||||||||||||
| 7,652,483 | FNMA | 3.500 | 09/01/43 | 8,276 | |||||||||||||
| 6,851,387 | i | FNMA | LIBOR 1 M + 5.950% | 5.848 | 09/25/43 | 1,233 | |||||||||||
| 3,614,263 | FNMA | 4.000 | 01/01/44 | 3,968 | |||||||||||||
| 7,780,016 | FNMA | 4.500 | 03/01/44 | 8,655 | |||||||||||||
| 3,704,845 | FNMA | 4.500 | 06/01/44 | 4,068 | |||||||||||||
| 3,886,947 | FNMA | 4.500 | 10/01/44 | 4,288 | |||||||||||||
| 6,876,852 | FNMA | 4.500 | 11/01/44 | 7,585 | |||||||||||||
| 2,043,901 | FNMA | 5.000 | 11/01/44 | 2,314 | |||||||||||||
| 2,271,303 | FNMA | 4.500 | 12/01/44 | 2,487 | |||||||||||||
| 2,451,587 | FNMA | 4.000 | 01/01/45 | 2,664 | |||||||||||||
| 732,286 | FNMA | 4.500 | 03/01/45 | 804 | |||||||||||||
| 337,971 | FNMA | 4.500 | 04/01/45 | 373 | |||||||||||||
| 8,079,501 | FNMA | 3.500 | 05/01/45 | 8,752 | |||||||||||||
| 3,943,584 | FNMA | 4.000 | 06/01/45 | 4,323 | |||||||||||||
| 6,545,070 | FNMA | 4.000 | 12/01/45 | 7,180 | |||||||||||||
| 10,596,581 | FNMA | 3.500 | 01/01/46 | 11,409 | |||||||||||||
| 18,282,482 | FNMA | 4.000 | 01/01/46 | 20,010 | |||||||||||||
| 502,208 | FNMA | 4.000 | 03/01/46 | 551 | |||||||||||||
| 1,264,396 | FNMA | 4.000 | 04/01/46 | 1,379 | |||||||||||||
| 8,850,819 | FNMA | 3.500 | 06/01/46 | 9,529 | |||||||||||||
| 10,361,591 | FNMA | 3.500 | 07/01/46 | 11,156 | |||||||||||||
| 19,239,019 | FNMA | 3.500 | 07/01/46 | 20,767 | |||||||||||||
| 1,873,306 | FNMA | 3.000 | 10/01/46 | 1,918 | |||||||||||||
| 10,844,948 | FNMA | 3.500 | 10/01/46 | 11,676 | |||||||||||||
| 11,844,141 | FNMA | 3.000 | 11/01/46 | 12,367 | |||||||||||||
| 21,123,152 | FNMA | 3.500 | 01/01/47 | 22,470 | |||||||||||||
| 4,366,258 | FNMA | 4.500 | 05/01/47 | 4,820 | |||||||||||||
| 3,997,749 | FNMA | 4.000 | 09/01/47 | 4,287 | |||||||||||||
| 232,030 | FNMA | 4.000 | 09/01/47 | 248 | |||||||||||||
| 459,967 | FNMA | 3.000 | 11/01/47 | 471 | |||||||||||||
| 1,577,982 | FNMA | 3.000 | 11/01/47 | 1,612 | |||||||||||||
| 407 |
COLLEGE RETIREMENT EQUITIES FUND - Bond Market Account
| PRINCIPAL | ISSUER | RATE | MATURITY DATE | VALUE (000) | |||||||||||
| $ | 8,091,173 | FNMA | 3.500 | % | 11/01/47 | $ | 8,723 | ||||||||
| 25,201,751 | FNMA | 4.000 | 12/01/47 | 27,560 | |||||||||||
| 5,121,459 | FNMA | 4.000 | 12/01/47 | 5,484 | |||||||||||
| 17,435,904 | FNMA | 3.500 | 01/01/48 | 18,752 | |||||||||||
| 7,209,667 | FNMA | 4.500 | 01/01/48 | 7,921 | |||||||||||
| 6,708,792 | FNMA | 4.500 | 02/01/48 | 7,381 | |||||||||||
| 6,495,886 | FNMA | 4.000 | 03/01/48 | 7,110 | |||||||||||
| 26,814,726 | FNMA | 4.500 | 03/01/48 | 29,495 | |||||||||||
| 15,346,477 | FNMA | 4.000 | 04/01/48 | 16,308 | |||||||||||
| 5,033,010 | FNMA | 4.500 | 05/01/48 | 5,537 | |||||||||||
| 3,896,354 | FNMA | 4.500 | 05/01/48 | 4,286 | |||||||||||
| 10,201,001 | FNMA | 5.000 | 08/01/48 | 11,371 | |||||||||||
| 736,075 | FNMA | 3.000 | 06/01/49 | 747 | |||||||||||
| 22,643,888 | FNMA | 3.000 | 07/01/50 | 23,877 | |||||||||||
| 13,856,612 | FNMA | 2.000 | 08/25/50 | 1,579 | |||||||||||
| 37,178,411 | FNMA | 2.500 | 11/25/50 | 5,157 | |||||||||||
| 66,830,000 | h | FNMA | 2.000 | 01/25/51 | 66,624 | ||||||||||
| 63,034,000 | h | FNMA | 2.500 | 01/25/51 | 64,310 | ||||||||||
| 401,760,000 | h | FNMA | 2.500 | 02/25/51 | 408,871 | ||||||||||
| 176,180,000 | h | FNMA | 3.000 | 02/25/51 | 182,248 | ||||||||||
| 4,619,239 | FNMA | 3.000 | 02/25/51 | 733 | |||||||||||
| 13,267,096 | FNMA | 3.000 | 09/01/51 | 14,062 | |||||||||||
| 12,739,011 | FNMA | 2.500 | 11/25/51 | 1,790 | |||||||||||
| 6,780,000 | h | FNMA | 3.000 | 01/01/52 | 7,051 | ||||||||||
| 136,820,000 | h | FNMA | 3.000 | 01/25/52 | 141,740 | ||||||||||
| 355,010,000 | h | FNMA | 2.000 | 02/25/52 | 353,126 | ||||||||||
| 4,725,000 | g,i | Freddie Mac STACR REMIC Trust | 3.450 | 10/25/41 | 4,755 | ||||||||||
| 7,600,000 | g,i | Freddie Mac Structured Agency Credit Risk Debt Notes | 3.700 | 11/25/41 | 7,718 | ||||||||||
| 11,778,420 | Government National Mortgage Association (GNMA) | 3.700 | 10/15/33 | 12,376 | |||||||||||
| 220,872 | GNMA | 5.000 | 04/15/38 | 250 | |||||||||||
| 273,953 | GNMA | 6.500 | 11/20/38 | 317 | |||||||||||
| 974,979 | GNMA | 5.000 | 06/15/39 | 1,126 | |||||||||||
| 540,015 | GNMA | 5.000 | 06/15/39 | 622 | |||||||||||
| 10,242,944 | GNMA | 3.700 | 08/15/40 | 10,712 | |||||||||||
| 5,043,792 | GNMA | 4.500 | 12/20/45 | 5,636 | |||||||||||
| 5,613,898 | GNMA | 4.000 | 06/20/46 | 662 | |||||||||||
| 10,794,557 | GNMA | 3.500 | 01/20/49 | 11,539 | |||||||||||
| 109,225,000 | h | GNMA | 2.000 | 01/20/51 | 110,211 | ||||||||||
| 74,830,000 | h | GNMA | 3.000 | 01/20/51 | 77,423 | ||||||||||
| 167,640,000 | h | GNMA | 2.500 | 01/20/52 | 171,674 | ||||||||||
| 57,740,000 | h | GNMA | 2.500 | 02/20/52 | 59,001 | ||||||||||
| 77,550,000 | h | GNMA | 3.000 | 02/20/52 | 80,095 | ||||||||||
| 7,631,765 | g,i | GS Mortgage-Backed Securities Trust | 2.500 | 03/25/52 | 7,569 | ||||||||||
| 2,462,348 | g,i | GS Mortgage-Backed Securities Trust | 2.500 | 03/25/52 | 2,488 | ||||||||||
| TOTAL MORTGAGE BACKED | 2,781,373 | ||||||||||||||
| MUNICIPAL BONDS - 3.0% | |||||||||||||||
| 2,975,000 | Chicago Housing Authority | 3.682 | 01/01/25 | 3,160 | |||||||||||
| 245,000 | City & County of San Francisco CA Community Facilities District | 3.264 | 09/01/25 | 261 | |||||||||||
| 1,000,000 | City & County of San Francisco CA Community Facilities District | 4.038 | 09/01/34 | 1,100 | |||||||||||
| 845,000 | City & County of San Francisco CA Community Facilities District | 3.750 | 09/01/37 | 917 | |||||||||||
| 2,000,000 | City & County of San Francisco CA Community Facilities District | 4.000 | 09/01/48 | 2,150 | |||||||||||
| 3,995,000 | City of Los Angeles CA Wastewater System Revenue | 4.029 | 06/01/39 | 4,377 | |||||||||||
| 4,940,000 | City of New York NY | 3.200 | 12/01/26 | 5,322 | |||||||||||
| 1,575,000 | City of San Antonio TX Customer Facility Charge Revenue | 4.353 | 07/01/25 | 1,686 | |||||||||||
| 4,055,000 | Commonwealth Financing Authority | 3.864 | 06/01/38 | 4,593 | |||||||||||
| 408 |
COLLEGE RETIREMENT EQUITIES FUND - Bond Market Account
| PRINCIPAL | ISSUER | RATE | MATURITY DATE | VALUE (000) | |||||||||||
| $ | 19,355,000 | Commonwealth Financing Authority | 3.807 | % | 06/01/41 | $ | 22,207 | ||||||||
| 1,505,000 | County of Miami-Dade FL Aviation Revenue | 2.218 | 10/01/22 | 1,522 | |||||||||||
| 1,500,000 | County of Miami-Dade FL Aviation Revenue | 2.368 | 10/01/23 | 1,535 | |||||||||||
| 2,500,000 | County of Miami-Dade FL Aviation Revenue | 3.285 | 10/01/23 | 2,598 | |||||||||||
| 3,500,000 | County of Miami-Dade FL Aviation Revenue | 2.504 | 10/01/24 | 3,611 | |||||||||||
| 2,250,000 | County of Miami-Dade FL Aviation Revenue | 3.405 | 10/01/24 | 2,376 | |||||||||||
| 4,365,000 | County of Miami-Dade FL Aviation Revenue | 2.604 | 10/01/25 | 4,531 | |||||||||||
| 2,375,000 | County of Miami-Dade FL Aviation Revenue | 3.505 | 10/01/25 | 2,543 | |||||||||||
| 2,500,000 | County of Miami-Dade FL Aviation Revenue | 2.704 | 10/01/26 | 2,602 | |||||||||||
| 3,940,000 | County of Miami-Dade FL Aviation Revenue | 3.049 | 10/01/26 | 4,163 | |||||||||||
| 3,750,000 | County of Miami-Dade FL Aviation Revenue | 3.612 | 10/01/26 | 4,058 | |||||||||||
| 4,700,000 | County of Miami-Dade FL Aviation Revenue | 2.529 | 10/01/30 | 4,756 | |||||||||||
| 3,730,000 | County of Miami-Dade FL Aviation Revenue | 3.732 | 10/01/37 | 3,973 | |||||||||||
| 3,900,000 | County of Miami-Dade FL Aviation Revenue | 3.982 | 10/01/41 | 4,175 | |||||||||||
| 9,160,000 | County of Miami-Dade FL Aviation Revenue | 4.280 | 10/01/41 | 10,046 | |||||||||||
| 2,000,000 | Duke University | 3.199 | 10/01/38 | 2,160 | |||||||||||
| 5,080,000 | Illinois Finance Authority | 3.944 | 08/15/47 | 5,807 | |||||||||||
| 4,805,000 | Los Angeles County Redevelopment Refunding Authority Redev Agency Successor Agy | 3.375 | 09/01/35 | 5,213 | |||||||||||
| 1,110,000 | New Jersey Economic Development Authority | 3.800 | 07/01/22 | 1,124 | |||||||||||
| 870,000 | New York City Housing Development Corp | 3.403 | 05/01/22 | 879 | |||||||||||
| 750,000 | New York City Housing Development Corp | 3.453 | 11/01/22 | 768 | |||||||||||
| 1,360,000 | New York City Housing Development Corp | 3.523 | 05/01/23 | 1,409 | |||||||||||
| 1,815,000 | New York City Housing Development Corp | 3.573 | 11/01/23 | 1,901 | |||||||||||
| 1,000,000 | New York City Housing Development Corp | 3.650 | 05/01/24 | 1,056 | |||||||||||
| 5,680,000 | New York State Dormitory Authority | 3.998 | 07/01/39 | 6,168 | |||||||||||
| 10,605,000 | New York State Dormitory Authority | 4.294 | 07/01/44 | 11,812 | |||||||||||
| 6,000,000 | New York State Dormitory Authority | 3.879 | 07/01/46 | 6,399 | |||||||||||
| 5,000,000 | New York State Thruway Authority | 2.256 | 01/01/25 | 5,116 | |||||||||||
| 6,460,000 | New York State Thruway Authority | 2.406 | 01/01/26 | 6,653 | |||||||||||
| 4,750,000 | New York State Thruway Authority | 2.500 | 01/01/27 | 4,906 | |||||||||||
| 2,000,000 | Port of Corpus Christi Authority of Nueces County | 3.138 | 12/01/22 | 2,045 | |||||||||||
| 3,400,000 | Port of Corpus Christi Authority of Nueces County | 3.287 | 12/01/23 | 3,547 | |||||||||||
| 1,500,000 | Port of Corpus Christi Authority of Nueces County | 3.387 | 12/01/24 | 1,590 | |||||||||||
| 1,000,000 | Port of Corpus Christi Authority of Nueces County | 3.487 | 12/01/25 | 1,077 | |||||||||||
| 1,910,000 | Public Finance Authority | 4.269 | 07/01/40 | 2,224 | |||||||||||
| 6,000,000 | San Francisco City & County Airport Comm-San Francisco International Airport | 3.046 | 05/01/22 | 6,054 | |||||||||||
| 6,360,000 | San Jose Redevelopment Agency | 3.375 | 08/01/34 | 6,678 | |||||||||||
| 13,060,000 | State of California | 4.600 | 04/01/38 | 15,034 | |||||||||||
| 10,500,000 | State of Illinois | 3.150 | 06/15/26 | 11,061 | |||||||||||
| 12,500,000 | State of Illinois | 3.250 | 06/15/27 | 13,231 | |||||||||||
| 27,150,000 | State of Illinois | 5.100 | 06/01/33 | 31,382 | |||||||||||
| 9,700,000 | State of Oregon Department of Administrative Services | 4.103 | 05/01/39 | 10,808 | |||||||||||
| 9,900,000 | State of Wisconsin | 3.154 | 05/01/27 | 10,637 | |||||||||||
| 25,860,000 | University of California | 3.063 | 07/01/25 | 27,496 | |||||||||||
| 10,230,000 | University of California | 4.601 | 05/15/31 | 11,910 | |||||||||||
| 17,045,000 | University of California | 3.931 | 05/15/45 | 19,632 | |||||||||||
| 21,000,000 | University of Chicago | 4.151 | 10/01/45 | 21,957 | |||||||||||
| 7,620,000 | University of Massachusetts Building Authority | 3.097 | 11/01/35 | 7,992 | |||||||||||
| 13,000,000 | University of Massachusetts Building Authority | 3.434 | 11/01/40 | 13,707 | |||||||||||
| 20,000,000 | University of New Mexico | 3.532 | 06/20/32 | 21,235 | |||||||||||
| 1,750,000 | Utah Municipal Power Agency | 2.262 | 07/01/22 | 1,761 | |||||||||||
| 1,500,000 | Utah Municipal Power Agency | 2.512 | 07/01/23 | 1,526 | |||||||||||
| 2,160,000 | Virginia Port Authority | 4.228 | 07/01/36 | 2,376 | |||||||||||
| 390,000 | Washington Convention & Sports Authority | 3.969 | 10/01/30 | 431 | |||||||||||
| TOTAL MUNICIPAL BONDS | 405,024 | ||||||||||||||
| 409 |
COLLEGE RETIREMENT EQUITIES FUND - Bond Market Account
| PRINCIPAL | ISSUER | REFERENCE RATE & SPREAD | RATE | MATURITY DATE | VALUE (000) | ||||||||||||
| U.S. TREASURY SECURITIES - 7.6% | |||||||||||||||||
| $ | 4,500,000 | United States Treasury Bond | 4.750 | % | 02/15/37 | $ | 6,383 | ||||||||||
| 22,750,000 | United States Treasury Bond | 3.500 | 02/15/39 | 28,541 | |||||||||||||
| 12,050,000 | United States Treasury Bond | 3.875 | 08/15/40 | 15,882 | |||||||||||||
| 20,935,000 | United States Treasury Bond | 4.375 | 05/15/41 | 29,491 | |||||||||||||
| 16,434,000 | United States Treasury Bond | 3.750 | 08/15/41 | 21,464 | |||||||||||||
| 6,000,000 | United States Treasury Bond | 2.750 | 11/15/42 | 6,838 | |||||||||||||
| 35,680,000 | United States Treasury Bond | 3.000 | 05/15/45 | 42,675 | |||||||||||||
| 41,710,000 | United States Treasury Bond | 2.875 | 08/15/45 | 48,972 | |||||||||||||
| 52,140,000 | United States Treasury Bond | 2.500 | 05/15/46 | 57,625 | |||||||||||||
| 1,075,000 | United States Treasury Bond | 3.000 | 05/15/47 | 1,305 | |||||||||||||
| 30,710,000 | United States Treasury Bond | 2.750 | 11/15/47 | 35,753 | |||||||||||||
| 6,155,000 | United States Treasury Bond | 3.125 | 05/15/48 | 7,692 | |||||||||||||
| 51,995,000 | United States Treasury Bond | �� | 3.000 | 08/15/48 | 63,623 | ||||||||||||
| 20,120,000 | United States Treasury Bond | 3.375 | 11/15/48 | 26,325 | |||||||||||||
| 33,549,228 | k | United States Treasury Inflation Indexed Bonds | 0.500 | 04/15/24 | 35,760 | ||||||||||||
| 39,285,000 | United States Treasury Note | 0.125 | 08/31/22 | 39,251 | |||||||||||||
| 50,000,000 | United States Treasury Note | 1.500 | 09/15/22 | 50,428 | |||||||||||||
| 27,305,000 | United States Treasury Note | 0.125 | 10/31/22 | 27,259 | |||||||||||||
| 14,575,000 | United States Treasury Note | 0.125 | 01/31/23 | 14,525 | |||||||||||||
| 4,475,000 | United States Treasury Note | 0.125 | 03/31/23 | 4,454 | |||||||||||||
| 9,875,000 | United States Treasury Note | 0.125 | 05/31/23 | 9,814 | |||||||||||||
| 5,145,000 | United States Treasury Note | 0.125 | 08/31/23 | 5,100 | |||||||||||||
| 79,581,000 | United States Treasury Note | 0.250 | 11/15/23 | 78,925 | |||||||||||||
| 2,205,000 | United States Treasury Note | 0.250 | 10/31/25 | 2,131 | |||||||||||||
| 20,105,000 | United States Treasury Note | 1.250 | 12/31/26 | 20,096 | |||||||||||||
| 29,925,000 | United States Treasury Note | 0.500 | 10/31/27 | 28,478 | |||||||||||||
| 68,855,000 | United States Treasury Note | 0.625 | 11/30/27 | 65,947 | |||||||||||||
| 100,000 | United States Treasury Note | 0.625 | 12/31/27 | 96 | |||||||||||||
| 1,250,000 | United States Treasury Note | 1.250 | 09/30/28 | 1,235 | |||||||||||||
| 24,400,000 | United States Treasury Note | 1.375 | 11/15/31 | 24,091 | |||||||||||||
| 10,000,000 | United States Treasury Note | 1.125 | 08/15/40 | 8,731 | |||||||||||||
| 1,950,000 | United States Treasury Note | 1.875 | 02/15/41 | 1,930 | |||||||||||||
| 9,950,000 | United States Treasury Note | 1.750 | 08/15/41 | 9,647 | |||||||||||||
| 9,930,000 | United States Treasury Note | 1.250 | 05/15/50 | 8,432 | |||||||||||||
| 125,979,000 | d | United States Treasury Note | 2.000 | 08/15/51 | 128,420 | ||||||||||||
| 80,000,000 | United States Treasury Note | 1.875 | 11/15/51 | 79,363 | |||||||||||||
| TOTAL U.S. TREASURY SECURITIES | 1,036,682 | ||||||||||||||||
| TOTAL GOVERNMENT BONDS | 5,008,477 | ||||||||||||||||
| (Cost $4,890,435) | |||||||||||||||||
| STRUCTURED ASSETS - 18.0% | |||||||||||||||||
| ASSET BACKED - 7.6% | |||||||||||||||||
| 7,100,000 | g,i | AIMCO CLO 16 Ltd | LIBOR 3 M + 1.650% | 0.000 | 01/17/35 | 7,095 | |||||||||||
| Series - 2021 16A (Class B) | |||||||||||||||||
| 8,000,000 | g,i | AIMCO CLO Ltd | LIBOR 3 M + 1.550% | 1.672 | 01/17/32 | 8,000 | |||||||||||
| Series - 2020 12A (Class B) | |||||||||||||||||
| 7,500,000 | g,i | AIMCO CLO Series | LIBOR 3 M + 1.500% | 1.632 | 04/20/34 | 7,363 | |||||||||||
| Series - 2017 AA (Class BR) | |||||||||||||||||
| 2,000,000 | g,i | Allegany Park CLO Ltd | LIBOR 3 M + 1.330% | 1.462 | 01/20/33 | 2,000 | |||||||||||
| Series - 2019 1A (Class A) | |||||||||||||||||
| 4,120,000 | AmeriCredit Automobile Receivables Trust | 2.130 | 03/18/26 | 4,171 | |||||||||||||
| Series - 2020 2 (Class D) | |||||||||||||||||
| 6,190,000 | AmeriCredit Automobile Receivables Trust | 1.490 | 09/18/26 | 6,202 | |||||||||||||
| Series - 2020 3 (Class D) | |||||||||||||||||
| 410 |
COLLEGE RETIREMENT EQUITIES FUND - Bond Market Account
| PRINCIPAL | ISSUER | REFERENCE RATE & SPREAD | RATE | MATURITY DATE | VALUE (000) | ||||||||||||
| $ | 2,121,964 | g | AMSR Trust | 1.819 | % | 04/17/37 | $ | 2,121 | |||||||||
| Series - 2020 SFR1 (Class A) | |||||||||||||||||
| 3,499,000 | g | AMSR Trust | 3.148 | 01/19/39 | 3,597 | ||||||||||||
| Series - 2019 SFR1 (Class C) | |||||||||||||||||
| 3,347,000 | g | AMSR Trust | 3.247 | 01/19/39 | 3,420 | ||||||||||||
| Series - 2019 SFR1 (Class D) | |||||||||||||||||
| 74,236 | †,g | Asset Backed Funding Corp NIM Trust | 5.900 | 07/26/35 | 0 | ^ | |||||||||||
| Series - 2005 WMC1 (Class N1) | |||||||||||||||||
| 4,000,000 | g | Avis Budget Rental Car Funding AESOP LLC | 3.450 | 03/20/23 | 4,016 | ||||||||||||
| Series - 2019 1A (Class A) | |||||||||||||||||
| 12,000,000 | g | Avis Budget Rental Car Funding AESOP LLC | 3.070 | 09/20/23 | 12,152 | ||||||||||||
| Series - 2017 1A (Class A) | |||||||||||||||||
| 32,000,000 | g | Avis Budget Rental Car Funding AESOP LLC | 2.970 | 03/20/24 | 32,649 | ||||||||||||
| Series - 2017 2A (Class A) | |||||||||||||||||
| 9,500,000 | g | Avis Budget Rental Car Funding AESOP LLC | 1.380 | 08/20/27 | 9,329 | ||||||||||||
| Series - 2021 1A (Class A) | |||||||||||||||||
| 2,310,191 | i | Bear Stearns Asset Backed Securities Trust | LIBOR 1 M + 1.005% | 1.107 | 04/25/36 | 2,308 | |||||||||||
| Series - 2006 SD1 (Class M1) | |||||||||||||||||
| 4,400,000 | g | BHG Securitization Trust | 1.670 | 10/17/34 | 4,327 | ||||||||||||
| Series - 2021 B (Class B) | |||||||||||||||||
| 2,760,650 | g | BRE Grand Islander Timeshare Issuer LLC | 3.280 | 09/26/33 | 2,840 | ||||||||||||
| Series - 2019 A (Class A) | |||||||||||||||||
| 6,331,345 | g | Capital Automotive REIT | 3.870 | 04/15/47 | 6,332 | ||||||||||||
| Series - 2017 1A (Class A1) | |||||||||||||||||
| 12,315,482 | g | Capital Automotive REIT | 2.690 | 02/15/50 | 12,467 | ||||||||||||
| Series - 2020 1A (Class A1) | |||||||||||||||||
| 5,947,859 | g | Capital Automotive REIT | 1.440 | 08/15/51 | 5,782 | ||||||||||||
| Series - 2021 1A (Class A1) | |||||||||||||||||
| 4,230,000 | g | Capital Automotive REIT | 1.920 | 08/15/51 | 4,163 | ||||||||||||
| Series - 2021 1A (Class A3) | |||||||||||||||||
| 6,946,922 | CarMax Auto Owner Trust | 1.890 | 12/16/24 | 7,009 | |||||||||||||
| Series - 2020 1 (Class A3) | |||||||||||||||||
| 9,900,000 | g | Cars Net Lease Mortgage Notes Series | 2.010 | 12/15/50 | 9,694 | ||||||||||||
| Series - 2020 1A (Class A1) | |||||||||||||||||
| 5,000,000 | Carvana Auto Receivables Trust | 0.970 | 03/10/28 | 4,944 | |||||||||||||
| Series - 2021 N2 (Class A2) | |||||||||||||||||
| 1,000,000 | Carvana Auto Receivables Trust | 1.270 | 03/10/28 | 991 | |||||||||||||
| Series - 2021 N2 (Class D) | |||||||||||||||||
| 4,150,000 | g,i | Cayuga Park CLO Ltd | LIBOR 3 M + 1.650% | 1.000 | 07/17/34 | 4,135 | |||||||||||
| Series - 2020 1A (Class B1R) | |||||||||||||||||
| 864,047 | i | C-BASS Trust | LIBOR 1 M + 0.160% | 0.262 | 07/25/36 | 845 | |||||||||||
| Series - 2006 CB6 (Class A1) | |||||||||||||||||
| 17,581,617 | g | CF Hippolyta LLC | 1.690 | 07/15/60 | 17,440 | ||||||||||||
| Series - 2020 1 (Class A1) | |||||||||||||||||
| 5,218,047 | g | CF Hippolyta LLC | 1.990 | 07/15/60 | 5,125 | ||||||||||||
| Series - 2020 1 (Class A2) | |||||||||||||||||
| 3,010,046 | g | CF Hippolyta LLC | 2.280 | 07/15/60 | 3,007 | ||||||||||||
| Series - 2020 1 (Class B1) | |||||||||||||||||
| 19,290,107 | g | CF Hippolyta LLC | 1.530 | 03/15/61 | 18,928 | ||||||||||||
| Series - 2021 1A (Class A1) | |||||||||||||||||
| 4,581,400 | g | CF Hippolyta LLC | 1.980 | 03/15/61 | 4,513 | ||||||||||||
| Series - 2021 1A (Class B1) | |||||||||||||||||
| 428,194 | i | Chase Funding Mortgage Loan Asset-Backed Certificates | 5.700 | 02/26/35 | 462 | ||||||||||||
| Series - 2004 2 (Class 1M2) | |||||||||||||||||
| 50,500,000 | Chase Issuance Trust | 1.530 | 01/15/25 | 50,983 | |||||||||||||
| Series - 2020 A1 (Class A1) | |||||||||||||||||
| 411 |
COLLEGE RETIREMENT EQUITIES FUND - Bond Market Account
| PRINCIPAL | ISSUER | REFERENCE RATE & SPREAD | RATE | MATURITY DATE | VALUE (000) | ||||||||||||
| $ | 1,500,000 | g,i | CIFC Funding Ltd | LIBOR 3 M + 1.220% | 1.352 | % | 07/20/30 | $ | 1,500 | ||||||||
| Series - 2017 3A (Class A1) | |||||||||||||||||
| 2,000,000 | g,i | CIFC Funding Ltd | LIBOR 3 M + 1.600% | 1.722 | 11/16/30 | 2,000 | |||||||||||
| Series - 2017 5A (Class A2) | |||||||||||||||||
| 123,846 | CIT Group Home Equity Loan Trust (Step Bond) | 6.200 | 02/25/30 | 126 | |||||||||||||
| Series - 2002 1 (Class AF6) | |||||||||||||||||
| 8,143,748 | g | Corevest American Finance Trust | 1.832 | 03/15/50 | 8,130 | ||||||||||||
| Series - 2020 1 (Class A1) | |||||||||||||||||
| 8,123,025 | g | DB Master Finance LLC | 4.021 | 05/20/49 | 8,408 | ||||||||||||
| Series - 2019 1A (Class A2II) | |||||||||||||||||
| 37,500,000 | g | DB Master Finance LLC | 2.045 | 11/20/51 | 36,641 | ||||||||||||
| Series - 2021 1A (Class A2I) | |||||||||||||||||
| 29,600,000 | g | DB Master Finance LLC | 2.493 | 11/20/51 | 29,468 | ||||||||||||
| Series - 2021 1A (Class A2II) | |||||||||||||||||
| 1,995,769 | g | Diamond Resorts Owner Trust | 3.700 | 01/21/31 | 2,032 | ||||||||||||
| Series - 2018 1 (Class A) | |||||||||||||||||
| 4,895,303 | g | Diamond Resorts Owner Trust | 2.890 | 02/20/32 | 4,973 | ||||||||||||
| Series - 2019 1A (Class A) | |||||||||||||||||
| 700,513 | g | Diamond Resorts Owner Trust | 2.700 | 11/21/33 | 697 | ||||||||||||
| Series - 2021 1A (Class C) | |||||||||||||||||
| 28,432,125 | g | Domino’s Pizza Master Issuer LLC | 2.662 | 04/25/51 | 28,552 | ||||||||||||
| Series - 2021 1A (Class A2I) | |||||||||||||||||
| 3,800,000 | g,i | Dryden 49 Senior Loan Fund | LIBOR 3 M + 1.600% | 1.722 | 07/18/30 | 3,800 | |||||||||||
| Series - 2017 49A (Class BR) | |||||||||||||||||
| 4,000,000 | g | DT Auto Owner Trust | 0.840 | 10/15/26 | 3,966 | ||||||||||||
| Series - 2021 1A (Class C) | |||||||||||||||||
| 1,656,514 | g,i | Ellington Loan Acquisition Trust | LIBOR 1 M + 1.100% | 1.202 | 05/25/37 | 1,657 | |||||||||||
| Series - 2007 2 (Class A2C) | |||||||||||||||||
| 10,240,156 | g | FCI Funding LLC | 1.130 | 04/15/33 | 10,185 | ||||||||||||
| Series - 2021 1A (Class A) | |||||||||||||||||
| 9,008,511 | †,g | FNA VI LLC | 1.350 | 01/10/32 | 8,912 | ||||||||||||
| Series - 2021 1A (Class A) | |||||||||||||||||
| 17,050,000 | g | Ford Credit Auto Owner Trust | 2.360 | 03/15/29 | 17,266 | ||||||||||||
| Series - 2017 2 (Class A) | |||||||||||||||||
| 12,000,000 | Ford Credit Floorplan Master Owner Trust | 2.230 | 09/15/24 | 12,143 | |||||||||||||
| Series - 2019 3 (Class A1) | |||||||||||||||||
| 1,563,379 | GM Financial Automobile Leasing Trust | 1.670 | 12/20/22 | 1,567 | |||||||||||||
| Series - 2020 1 (Class A3) | |||||||||||||||||
| 6,471,487 | GM Financial Consumer Automobile Receivables Trust | 1.840 | 09/16/24 | 6,525 | |||||||||||||
| Series - 2020 1 (Class A3) | |||||||||||||||||
| 2,000,000 | g,i | GoldenTree Loan Opportunities IX Ltd | LIBOR 3 M + 1.110% | 1.239 | 10/29/29 | 2,001 | |||||||||||
| Series - 2014 9A (Class AR2) | |||||||||||||||||
| 4,000,000 | g | GSCG Trust | 2.936 | 09/06/34 | 4,096 | ||||||||||||
| Series - 2019 600C (Class A) | |||||||||||||||||
| 335,760 | g | HERO Funding Trust | 3.280 | 09/20/48 | 344 | ||||||||||||
| Series - 2017 2A (Class A1) | |||||||||||||||||
| 671,520 | g | HERO Funding Trust | 4.070 | 09/20/48 | 696 | ||||||||||||
| Series - 2017 2A (Class A2) | |||||||||||||||||
| 24,000,000 | g | Hertz Vehicle Financing LLC | 1.210 | 12/26/25 | 23,763 | ||||||||||||
| Series - 2021 1A (Class A) | |||||||||||||||||
| 2,406,511 | g | Hilton Grand Vacations Trust | 2.660 | 12/26/28 | 2,439 | ||||||||||||
| Series - 2017 AA (Class A) | |||||||||||||||||
| 2,075,616 | g | Hilton Grand Vacations Trust | 2.960 | 12/26/28 | 2,101 | ||||||||||||
| Series - 2017 AA (Class B) | |||||||||||||||||
| 5,026,430 | g | Hilton Grand Vacations Trust | 2.340 | 07/25/33 | 5,091 | ||||||||||||
| Series - 2019 AA (Class A) | |||||||||||||||||
| 412 |
COLLEGE RETIREMENT EQUITIES FUND - Bond Market Account
| PRINCIPAL | ISSUER | REFERENCE RATE & SPREAD | RATE | MATURITY DATE | VALUE (000) | ||||||||||||
| $ | 514,619 | i | Home Equity Asset Trust | LIBOR 1 M + 1.500% | 3.986 | % | 06/25/33 | $ | 518 | ||||||||
| Series - 2003 1 (Class M1) | |||||||||||||||||
| 1,499,931 | g,i | Invitation Homes Trust | LIBOR 1 M + 1.250% | 1.359 | 01/17/38 | 1,500 | |||||||||||
| Series - 2018 SFR4 (Class B) | |||||||||||||||||
| 4,442,950 | g | JG Wentworth XXII LLC | 3.820 | 12/15/48 | 4,589 | ||||||||||||
| Series - 2010 3A (Class A) | |||||||||||||||||
| 4,625,085 | i | JP Morgan Mortgage Acquisition Trust | LIBOR 1 M + 0.320% | 0.422 | 03/25/37 | 4,613 | |||||||||||
| Series - 2007 CH3 (Class A1B) | |||||||||||||||||
| 11,253,035 | i | JP Morgan Mortgage Acquisition Trust | LIBOR 1 M + 0.160% | 0.262 | 06/25/37 | 11,122 | |||||||||||
| Series - 2007 CH5 (Class A1) | |||||||||||||||||
| 5,000,000 | g,i | KKR Clo 32 Ltd | LIBOR 3 M + 1.750% | 1.874 | 01/15/32 | 5,000 | |||||||||||
| Series - 2020 32A (Class B) | |||||||||||||||||
| 12,500,000 | g,i | Madison Park Funding X Ltd | LIBOR 3 M + 1.600% | 1.732 | 01/20/29 | 12,500 | |||||||||||
| Series - 2012 10A (Class BR3) | |||||||||||||||||
| 5,500,000 | g,i | Madison Park Funding XXI Ltd | LIBOR 3 M + 1.650% | 0.000 | 10/15/32 | 5,500 | |||||||||||
| Series - 2016 21A (Class A2RR) | |||||||||||||||||
| 530,000 | g,i | Magnetite XVIII Ltd | LIBOR 3 M + 1.500% | 1.656 | 11/15/28 | 530 | |||||||||||
| Series - 2016 18A (Class BR) | |||||||||||||||||
| 3,500,000 | g,i | Massachusetts St | LIBOR 3 M + 1.650% | 0.000 | 01/15/35 | 3,487 | |||||||||||
| Series - 2021 3A (Class B) | |||||||||||||||||
| 6,385,526 | g | MVW LLC | 1.140 | 01/22/41 | 6,262 | ||||||||||||
| Series - 2021 1WA (Class A) | |||||||||||||||||
| 1,991,085 | g | MVW Owner Trust | 2.420 | 12/20/34 | 2,012 | ||||||||||||
| Series - 2017 1A (Class A) | |||||||||||||||||
| 2,238,335 | g | MVW Owner Trust | 3.450 | 01/21/36 | 2,301 | ||||||||||||
| Series - 2018 1A (Class A) | |||||||||||||||||
| 2,385,331 | g | MVW Owner Trust | 2.890 | 11/20/36 | 2,418 | ||||||||||||
| Series - 2019 1A (Class A) | |||||||||||||||||
| 7,852,973 | g | MVW Owner Trust | 2.220 | 10/20/38 | 7,937 | ||||||||||||
| Series - 2019 2A (Class A) | |||||||||||||||||
| 4,694,691 | g | Navient Private Education Refi Loan Trust | 1.310 | 01/15/69 | 4,676 | ||||||||||||
| Series - 2020 HA (Class A) | |||||||||||||||||
| 7,577,963 | g | Navient Private Education Refi Loan Trust | 0.840 | 05/15/69 | 7,482 | ||||||||||||
| Series - 2021 A (Class A) | |||||||||||||||||
| 3,507,906 | g | Navient Student Loan Trust | 3.390 | 12/15/59 | 3,614 | ||||||||||||
| Series - 2019 BA (Class A2A) | |||||||||||||||||
| 8,600,000 | g,i | Neuberger Berman Loan Advisers CLO 31 Ltd | LIBOR 3 M + 1.550% | 1.682 | 04/20/31 | 8,601 | |||||||||||
| Series - 2019 31A (Class BR) | |||||||||||||||||
| 6,650,000 | g,i | OHA Credit Funding 10 Ltd | LIBOR 3 M + 1.650% | 0.000 | 01/18/36 | 6,634 | |||||||||||
| Series - 2021 10A (Class B) | |||||||||||||||||
| 9,500,000 | g,i | OHA Credit Funding 7 Ltd | LIBOR 3 M + 1.250% | 1.374 | 10/19/32 | 9,501 | |||||||||||
| Series - 2020 7A (Class A) | |||||||||||||||||
| 17,005,000 | g | OneMain Financial Issuance Trust | 3.840 | 05/14/32 | 17,389 | ||||||||||||
| Series - 2020 1A (Class A) | |||||||||||||||||
| 17,350,000 | g | OneMain Financial Issuance Trust | 1.750 | 09/14/35 | 17,237 | ||||||||||||
| Series - 2020 2A (Class A) | |||||||||||||||||
| 5,000,000 | g | Oportun Funding XIV LLC | 1.210 | 03/08/28 | 4,989 | ||||||||||||
| Series - 2021 A (Class A) | |||||||||||||||||
| 682,172 | g | Orange Lake Timeshare Trust | 3.100 | 11/08/30 | 695 | ||||||||||||
| Series - 2018 A (Class A) | |||||||||||||||||
| 20,500,000 | g | PFS Financing Corp | 1.270 | 06/15/25 | 20,583 | ||||||||||||
| Series - 2020 A (Class A) | |||||||||||||||||
| 9,000,000 | g | PFS Financing Corp | 1.000 | 10/15/25 | 8,968 | ||||||||||||
| Series - 2020 E (Class A) | |||||||||||||||||
| 9,861,000 | g | PFS Financing Corp | 0.970 | 02/15/26 | 9,805 | ||||||||||||
| Series - 2020 G (Class A) | |||||||||||||||||
| 413 |
COLLEGE RETIREMENT EQUITIES FUND - Bond Market Account
| PRINCIPAL | ISSUER | REFERENCE RATE & SPREAD | RATE | MATURITY DATE | VALUE (000) | ||||||||||||
| $ | 2,809,000 | g | Progress Residential Trust | 2.937 | % | 10/17/36 | $ | 2,837 | |||||||||
| Series - 2019 SFR4 (Class B) | |||||||||||||||||
| 5,385,000 | g | Progress Residential Trust | 2.082 | 10/17/38 | 5,265 | ||||||||||||
| Series - 2021 SFR8 (Class D) | |||||||||||||||||
| 1,450,000 | g | Progress Residential Trust | 2.711 | 11/17/40 | 1,414 | ||||||||||||
| Series - 2021 SFR9 (Class D) | |||||||||||||||||
| 1,000,000 | g | Purchasing Power Funding LLC | 4.370 | 10/15/25 | 1,001 | ||||||||||||
| Series - 2021 A (Class D) | |||||||||||||||||
| 1,347,256 | i | RASC Trust | LIBOR 1 M + 0.590% | 3.080 | 08/25/35 | 1,347 | |||||||||||
| Series - 2005 KS8 (Class M4) | |||||||||||||||||
| 12,653 | i | Renaissance Home Equity Loan Trust | LIBOR 1 M + 0.880% | 0.972 | 08/25/33 | 13 | |||||||||||
| Series - 2003 2 (Class A) | |||||||||||||||||
| 15,420,000 | Santander Drive Auto Receivables Trust | 2.220 | 09/15/26 | 15,644 | |||||||||||||
| Series - 2020 2 (Class D) | |||||||||||||||||
| 3,690,000 | Santander Drive Auto Receivables Trust | 1.480 | 01/15/27 | 3,701 | |||||||||||||
| Series - 2020 4 (Class D) | |||||||||||||||||
| 34,000,000 | Santander Drive Auto Receivables Trust | 1.670 | 10/15/27 | 33,771 | |||||||||||||
| Series - 2021 4 (Class D) | |||||||||||||||||
| 24,875,000 | g | SERVPRO Master Issuer LLC | 2.394 | 04/25/51 | 24,443 | ||||||||||||
| Series - 2021 1A (Class A2) | |||||||||||||||||
| 3,858,833 | g | Sierra Timeshare Receivables Funding LLC | 2.910 | 03/20/34 | 3,861 | ||||||||||||
| Series - 2017 1A (Class A) | |||||||||||||||||
| 1,778,887 | g | Sierra Timeshare Receivables Funding LLC | 3.200 | 03/20/34 | 1,780 | ||||||||||||
| Series - 2017 1A (Class B) | |||||||||||||||||
| 2,023,868 | g | Sierra Timeshare Receivables Funding LLC | 3.500 | 06/20/35 | 2,070 | ||||||||||||
| Series - 2018 2A (Class A) | |||||||||||||||||
| 2,315,104 | g | Sierra Timeshare Receivables Funding LLC | 3.200 | 01/20/36 | 2,367 | ||||||||||||
| Series - 2019 1A (Class A) | |||||||||||||||||
| 3,484,963 | g | Sierra Timeshare Receivables Funding LLC | 2.590 | 05/20/36 | 3,524 | ||||||||||||
| Series - 2019 2A (Class A) | |||||||||||||||||
| 2,129,679 | g | Sierra Timeshare Receivables Funding LLC | 2.340 | 08/20/36 | 2,142 | ||||||||||||
| Series - 2019 3A (Class A) | |||||||||||||||||
| 2,848,778 | g | Sierra Timeshare Receivables Funding LLC | 0.990 | 11/20/37 | 2,824 | ||||||||||||
| Series - 2021 1A (Class A) | |||||||||||||||||
| 3,088,843 | g | Sierra Timeshare Receivables Funding LLC | 1.340 | 11/20/37 | 3,042 | ||||||||||||
| Series - 2021 1A (Class B) | |||||||||||||||||
| 1,712,468 | g | Sierra Timeshare Receivables Funding LLC | 1.790 | 11/20/37 | 1,691 | ||||||||||||
| Series - 2021 1A (Class C) | |||||||||||||||||
| 64,074 | g | SMB Private Education Loan Trust | 2.490 | 06/15/27 | 64 | ||||||||||||
| Series - 2015 A (Class A2A) | |||||||||||||||||
| 463,256 | g | SMB Private Education Loan Trust | 2.750 | 07/15/27 | 464 | ||||||||||||
| Series - 2015 C (Class A2A) | |||||||||||||||||
| 4,923,360 | g | SMB Private Education Loan Trust | 2.430 | 02/17/32 | 4,987 | ||||||||||||
| Series - 2016 B (Class A2A) | |||||||||||||||||
| 7,432,092 | g | SMB Private Education Loan Trust | 2.880 | 09/15/34 | 7,545 | ||||||||||||
| Series - 2017 A (Class A2A) | |||||||||||||||||
| 7,876,350 | g | SMB Private Education Loan Trust | 2.820 | 10/15/35 | 8,025 | ||||||||||||
| Series - 2017 B (Class A2A) | |||||||||||||||||
| 3,464,402 | g | SMB Private Education Loan Trust | 3.500 | 02/15/36 | 3,589 | ||||||||||||
| Series - 2018 A (Class A2A) | |||||||||||||||||
| 2,675,750 | g | SoFi Professional Loan Program LLC | 2.340 | 04/25/33 | 2,704 | ||||||||||||
| Series - 2016 D (Class A2B) | |||||||||||||||||
| 813,067 | g | SoFi Professional Loan Program LLC | 2.490 | 01/25/36 | 817 | ||||||||||||
| Series - 2016 E (Class A2B) | |||||||||||||||||
| 595,475 | g | SoFi Professional Loan Program LLC | 2.760 | 12/26/36 | 598 | ||||||||||||
| Series - 2016 A (Class A2) | |||||||||||||||||
| 414 |
COLLEGE RETIREMENT EQUITIES FUND - Bond Market Account
| PRINCIPAL | ISSUER | REFERENCE RATE & SPREAD | RATE | MATURITY DATE | VALUE (000) | ||||||||||||
| $ | 780,954 | g | SoFi Professional Loan Program LLC | 2.400 | % | 03/26/40 | $ | 787 | |||||||||
| Series - 2017 A (Class A2B) | |||||||||||||||||
| 2,236,994 | g | SoFi Professional Loan Program LLC | 2.740 | 05/25/40 | 2,259 | ||||||||||||
| Series - 2017 B (Class A2FX) | |||||||||||||||||
| 841,352 | g | SoFi Professional Loan Program LLC | 2.630 | 07/25/40 | 849 | ||||||||||||
| Series - 2017 C (Class A2B) | |||||||||||||||||
| 3,009,586 | g | SoFi Professional Loan Program LLC | 2.720 | 11/26/40 | 3,041 | ||||||||||||
| Series - 2017 E (Class A2B) | |||||||||||||||||
| 4,894,959 | g | SoFi Professional Loan Program LLC | 2.840 | 01/25/41 | 4,979 | ||||||||||||
| Series - 2017 F (Class A2FX) | |||||||||||||||||
| 9,073,392 | g | SoFi Professional Loan Program LLC | 2.950 | 02/25/42 | 9,197 | ||||||||||||
| Series - 2018 A (Class A2B) | |||||||||||||||||
| 3,144,100 | g | SoFi Professional Loan Program LLC | 3.690 | 06/15/48 | 3,221 | ||||||||||||
| Series - 2019 A (Class A2FX) | |||||||||||||||||
| 6,394,069 | g | SpringCastle America Funding LLC | 1.970 | 09/25/37 | 6,362 | ||||||||||||
| Series - 2020 AA (Class A) | |||||||||||||||||
| 9,021,000 | g | SpringCastle America Funding LLC | 2.660 | 09/25/37 | 9,078 | ||||||||||||
| Series - 2020 AA (Class B) | |||||||||||||||||
| 9,000,000 | g | Stack Infrastructure Issuer LLC | 1.893 | 08/25/45 | 8,844 | ||||||||||||
| Series - 2020 1A (Class A2) | |||||||||||||||||
| 5,875,000 | g | Stack Infrastructure Issuer LLC | 1.877 | 03/26/46 | 5,776 | ||||||||||||
| Series - 2021 1A (Class A2) | |||||||||||||||||
| 150,851 | i | Structured Asset Investment Loan Trust | LIBOR 1 M + 0.900% | 1.002 | 09/25/34 | 150 | |||||||||||
| Series - 2004 8 (Class M1) | |||||||||||||||||
| 653,857 | i | Structured Asset Investment Loan Trust | LIBOR 1 M + 1.000% | 1.102 | 09/25/34 | 658 | |||||||||||
| Series - 2004 8 (Class A9) | |||||||||||||||||
| 3,500,000 | Synchrony Credit Card Master Note Trust | 2.620 | 10/15/25 | 3,559 | |||||||||||||
| Series - 2017 2 (Class A) | |||||||||||||||||
| 1,814,500 | g | Taco Bell Funding LLC | 4.970 | 05/25/46 | 1,893 | ||||||||||||
| Series - 2016 1A (Class A23) | |||||||||||||||||
| 26,870,000 | g | Taco Bell Funding LLC | 1.946 | 08/25/51 | 26,340 | ||||||||||||
| Series - 2021 1A (Class A2I) | |||||||||||||||||
| 16,410,000 | g | Taco Bell Funding LLC | 2.294 | 08/25/51 | 16,221 | ||||||||||||
| Series - 2021 1A (Class A2II) | |||||||||||||||||
| 9,756,680 | g | Tesla Auto Lease Trust | 2.160 | 10/20/22 | 9,796 | ||||||||||||
| Series - 2019 A (Class A3) | |||||||||||||||||
| 7,800,000 | g | Tesla Auto Lease Trust | 0.680 | 12/20/23 | 7,802 | ||||||||||||
| Series - 2020 A (Class A3) | |||||||||||||||||
| 2,300,000 | g | Tesla Auto Lease Trust | 0.780 | 12/20/23 | 2,301 | ||||||||||||
| Series - 2020 A (Class A4) | |||||||||||||||||
| 7,000,000 | g,i | TICP CLO VIII Ltd | LIBOR 3 M + 1.700% | 0.000 | 10/20/34 | 6,985 | |||||||||||
| Series - 2017 8A (Class A2R) | |||||||||||||||||
| 3,822,277 | g | Tricon American Homes Trust | 2.928 | 01/17/36 | 3,843 | ||||||||||||
| Series - 2017 SFR2 (Class A) | |||||||||||||||||
| 1,050,000 | g | Tricon American Homes Trust | 3.275 | 01/17/36 | 1,056 | ||||||||||||
| Series - 2017 SFR2 (Class B) | |||||||||||||||||
| 1,275,000 | g | Tricon American Homes Trust | 2.049 | 07/17/38 | 1,253 | ||||||||||||
| Series - 2020 SFR1 (Class B) | |||||||||||||||||
| 44,800,000 | Verizon Owner Trust | 1.850 | 07/22/24 | 45,136 | |||||||||||||
| Series - 2020 A (Class A1A) | |||||||||||||||||
| 440,000 | Verizon Owner Trust | 0.770 | 04/21/25 | 436 | |||||||||||||
| Series - 2020 C (Class C) | |||||||||||||||||
| 7,750,000 | g,i | Vitality Re IX Ltd Series - 2020 A (Class ) | U.S. Treasury Bill 3 M + 1.600% | 1.628 | 01/10/22 | 7,748 | |||||||||||
| 415 |
COLLEGE RETIREMENT EQUITIES FUND - Bond Market Account
| PRINCIPAL | ISSUER | REFERENCE RATE & SPREAD | RATE | MATURITY DATE | VALUE (000) | ||||||||||||
| $ | 3,500,000 | g,i | Vitality Re X Ltd | U.S. Treasury Bill 3 M + 1.750% | 1.778 | % | 01/10/23 | $ | 3,429 | ||||||||
| Series - 2020 A (Class ) | |||||||||||||||||
| 19,631,350 | g | Wendy’s Funding LLC | 2.370 | 06/15/51 | 19,178 | ||||||||||||
| Series - 2021 1A (Class A2I) | |||||||||||||||||
| TOTAL ASSET BACKED | 1,041,659 | ||||||||||||||||
| OTHER MORTGAGE BACKED - 10.4% | |||||||||||||||||
| 3,000,000 | g,i | 20 Times Square Trust | 3.100 | 05/15/35 | 2,989 | ||||||||||||
| Series - 2018 20TS (Class B) | |||||||||||||||||
| 12,000,000 | g,i | 20 TSQ GROUNDCO LLC | 3.100 | 05/15/35 | 11,553 | ||||||||||||
| Series - 2018 20TS (Class E) | |||||||||||||||||
| 2,919,630 | g,i | ACRE Commercial Mortgage Ltd | LIBOR 1 M + 0.830% | 0.934 | 12/18/37 | 2,906 | |||||||||||
| Series - 2021 FL4 (Class A) | |||||||||||||||||
| 1,409,003 | g,i | Agate Bay Mortgage Trust | 3.500 | 09/25/45 | 1,408 | ||||||||||||
| Series - 2015 6 (Class A9) | |||||||||||||||||
| 5,000,000 | g,i | Alen Mortgage Trust | LIBOR 1 M + 2.250% | 2.360 | 04/15/34 | 4,991 | |||||||||||
| Series - 2021 ACEN (Class C) | |||||||||||||||||
| 482,058 | i | Alternative Loan Trust | LIBOR 1 M + 0.750% | 0.852 | 06/25/34 | 494 | |||||||||||
| Series - 2004 8CB (Class M1) | |||||||||||||||||
| 534,916 | g,i | Atom Mortgage Securities DAC | SONIA Interest Rate Benchmark + 1.900% | 0.000 | 07/22/31 | 722 | |||||||||||
| Series - 2021 1A (Class D) | |||||||||||||||||
| 667,340 | i | BANK | 3.925 | 11/15/50 | 712 | ||||||||||||
| Series - 2017 BNK8 (Class B) | |||||||||||||||||
| 2,500,000 | i | BANK | 4.069 | 11/15/50 | 2,608 | ||||||||||||
| Series - 2017 BNK8 (Class C) | |||||||||||||||||
| 3,800,000 | BANK | 3.203 | 12/15/52 | 4,008 | |||||||||||||
| Series - 2019 BN23 (Class AS) | |||||||||||||||||
| 1,000,000 | i | BANK | 3.851 | 07/15/60 | 1,038 | ||||||||||||
| Series - 2017 BNK6 (Class C) | |||||||||||||||||
| 2,000,000 | BANK | 2.758 | 09/15/62 | 2,065 | |||||||||||||
| Series - 2019 BN20 (Class A2) | |||||||||||||||||
| 8,000,000 | i | BANK | 3.283 | 11/15/62 | 8,505 | ||||||||||||
| Series - 2019 BN24 (Class AS) | |||||||||||||||||
| 772,000 | i | BANK | 3.517 | 11/15/62 | 793 | ||||||||||||
| Series - 2019 BN24 (Class C) | |||||||||||||||||
| 7,381,376 | g,i | Bayview MSR Opportunity Master Fund Trust | 3.000 | 10/25/51 | 7,492 | ||||||||||||
| Series - 2021 6 (Class A19) | |||||||||||||||||
| 1,250,000 | g,i | BBCMS Mortgage Trust | 4.267 | 08/05/38 | 1,096 | ||||||||||||
| Series - 2018 CHRS (Class E) | |||||||||||||||||
| 5,000,000 | BBCMS Mortgage Trust | 3.488 | 02/15/50 | 5,259 | |||||||||||||
| Series - 2017 C1 (Class ASB) | |||||||||||||||||
| 452,658 | i | Bear Stearns Commercial Mortgage Securities Trust | 5.214 | 02/11/41 | 450 | ||||||||||||
| Series - 2005 PWR7 (Class B) | |||||||||||||||||
| 4,600,000 | g,i | Benchmark Mortgage Trust | 2.791 | 09/15/48 | 4,691 | ||||||||||||
| Series - 2020 IG2 (Class AM) | |||||||||||||||||
| 2,740,000 | g,i | Benchmark Mortgage Trust | 3.131 | 09/15/48 | 2,820 | ||||||||||||
| Series - 2020 IG3 (Class AS) | |||||||||||||||||
| 2,500,000 | g,i | Benchmark Mortgage Trust | 3.536 | 09/15/48 | 2,565 | ||||||||||||
| Series - 2020 IG3 (Class BXA) | |||||||||||||||||
| 1,445,000 | Benchmark Mortgage Trust | 4.232 | 01/15/52 | 1,635 | |||||||||||||
| Series - 2018 B8 (Class A5) | |||||||||||||||||
| 416 |
COLLEGE RETIREMENT EQUITIES FUND - Bond Market Account
| PRINCIPAL | ISSUER | REFERENCE RATE & SPREAD | RATE | MATURITY DATE | VALUE (000) | ||||||||||||
| $ | 3,452,143 | Benchmark Mortgage Trust | 4.016 | % | 03/15/52 | $ | 3,875 | ||||||||||
| Series - 2019 B9 (Class A5) | |||||||||||||||||
| 1,500,000 | Benchmark Mortgage Trust | 3.419 | 08/15/52 | 1,607 | |||||||||||||
| Series - 2019 B12 (Class AS) | |||||||||||||||||
| 830,000 | Benchmark Mortgage Trust | 4.241 | 05/15/53 | 923 | |||||||||||||
| Series - 2018 B7 (Class A3) | |||||||||||||||||
| 5,921,744 | i | Benchmark Mortgage Trust | 4.510 | 05/15/53 | 6,802 | ||||||||||||
| Series - 2018 B7 (Class A4) | |||||||||||||||||
| 1,000,000 | Benchmark Mortgage Trust | 2.355 | 07/15/54 | 968 | |||||||||||||
| Series - 2021 B27 (Class B) | |||||||||||||||||
| 10,000,000 | i | Benchmark Mortgage Trust | 2.244 | 08/15/54 | 9,564 | ||||||||||||
| Series - 2021 B28 (Class B) | |||||||||||||||||
| 10,000,000 | Benchmark Mortgage Trust | 2.429 | 08/15/54 | 9,979 | |||||||||||||
| Series - 2021 B28 (Class AS) | |||||||||||||||||
| 3,000,000 | i | BENCHMARK Mortgage Trust | 4.197 | 02/15/51 | 3,186 | ||||||||||||
| Series - 2018 B2 (Class C) | |||||||||||||||||
| 9,500,000 | BMARK A5 | 2.612 | 09/15/54 | 9,611 | |||||||||||||
| Series - 2021 B29 (Class AS) | |||||||||||||||||
| 5,000,000 | g,i | BX Commercial Mortgage Trust | LIBOR 1 M + 0.921% | 1.021 | 12/15/28 | 4,998 | |||||||||||
| Series - 2021 CIP (Class A) | |||||||||||||||||
| 7,500,000 | g,i | BX Commercial Mortgage Trust | LIBOR 1 M + 1.271% | 1.371 | 12/15/28 | 7,498 | |||||||||||
| Series - 2021 CIP (Class B) | |||||||||||||||||
| 1,668,475 | g,i | BX Commercial Mortgage Trust | LIBOR 1 M + 0.920% | 1.030 | 10/15/36 | 1,669 | |||||||||||
| Series - 2019 XL (Class A) | |||||||||||||||||
| 1,325,000 | g | BXP Trust | 3.459 | 08/13/37 | 1,412 | ||||||||||||
| Series - 2017 CC (Class A) | |||||||||||||||||
| 5,000,000 | g | BXP Trust | 2.618 | 01/15/44 | 5,089 | ||||||||||||
| Series - 2021 601L (Class A) | |||||||||||||||||
| 15,000,000 | g,i | BXP Trust | 2.775 | 01/15/44 | 14,430 | ||||||||||||
| Series - 2021 601L (Class C) | |||||||||||||||||
| 8,000,000 | g,i | BXP Trust | 2.775 | 01/15/44 | 7,374 | ||||||||||||
| Series - 2021 601L (Class D) | |||||||||||||||||
| 4,835,643 | CD Mortgage Trust | 2.622 | 08/10/49 | 4,958 | |||||||||||||
| Series - 2016 CD1 (Class ASB) | |||||||||||||||||
| 9,000,000 | CD Mortgage Trust | 2.926 | 08/10/49 | 9,250 | |||||||||||||
| Series - 2016 CD1 (Class AM) | |||||||||||||||||
| 5,750,000 | i | CD Mortgage Trust | 3.879 | 11/10/49 | 5,955 | ||||||||||||
| Series - 2016 CD2 (Class B) | |||||||||||||||||
| 1,000,000 | i | CD Mortgage Trust | 3.983 | 11/10/49 | 1,007 | ||||||||||||
| Series - 2016 CD2 (Class C) | |||||||||||||||||
| 999,983 | CD Mortgage Trust | 3.453 | 02/10/50 | 1,047 | |||||||||||||
| Series - 2017 CD3 (Class AAB) | |||||||||||||||||
| 500,000 | i | CD Mortgage Trust | 4.555 | 02/10/50 | 506 | ||||||||||||
| Series - 2017 CD3 (Class C) | |||||||||||||||||
| 5,000,000 | CD Mortgage Trust | 3.220 | 08/15/50 | 5,229 | |||||||||||||
| Series - 2017 CD5 (Class AAB) | |||||||||||||||||
| 3,457,000 | CD Mortgage Trust | 2.812 | 08/15/57 | 3,603 | |||||||||||||
| Series - 2019 CD8 (Class ASB) | |||||||||||||||||
| 914,076 | CFCRE Commercial Mortgage Trust | 3.121 | 05/10/58 | 934 | |||||||||||||
| Series - 2016 C4 (Class AHR) | |||||||||||||||||
| 517,339 | i | CHL Mortgage Pass-Through Trust | 2.510 | 02/20/35 | 522 | ||||||||||||
| Series - 2004 HYB9 (Class 1A1) | |||||||||||||||||
| 2,500,000 | g,i | Citigroup Commercial Mortgage Trust | 3.518 | 05/10/35 | 2,544 | ||||||||||||
| Series - 2013 375P (Class B) | |||||||||||||||||
| 5,750,000 | g | Citigroup Commercial Mortgage Trust | 3.341 | 05/10/36 | 5,961 | ||||||||||||
| Series - 2019 PRM (Class A) | |||||||||||||||||
| 417 |
COLLEGE RETIREMENT EQUITIES FUND - Bond Market Account
| PRINCIPAL | ISSUER | REFERENCE RATE & SPREAD | RATE | MATURITY DATE | VALUE (000) | ||||||||||||
| $ | 1,054,000 | i | Citigroup Commercial Mortgage Trust | 3.732 | % | 04/10/46 | $ | 1,074 | |||||||||
| Series - 2013 GC11 (Class B) | |||||||||||||||||
| 2,400,000 | Citigroup Commercial Mortgage Trust | 4.023 | 03/10/47 | 2,521 | |||||||||||||
| Series - 2014 GC19 (Class A4) | |||||||||||||||||
| 1,700,000 | i | Citigroup Commercial Mortgage Trust | 3.758 | 04/10/48 | 1,776 | ||||||||||||
| Series - 2015 GC29 (Class B) | |||||||||||||||||
| 3,000,000 | i | Citigroup Commercial Mortgage Trust | 4.142 | 04/10/48 | 3,108 | ||||||||||||
| Series - 2015 GC29 (Class C) | |||||||||||||||||
| 5,300,000 | Citigroup Commercial Mortgage Trust | 3.243 | 08/15/50 | 5,559 | |||||||||||||
| Series - 2017 B1 (Class AAB) | |||||||||||||||||
| 6,765,000 | Citigroup Commercial Mortgage Trust | 3.764 | 10/12/50 | 7,232 | |||||||||||||
| Series - 2017 C4 (Class AS) | |||||||||||||||||
| 2,000,000 | Citigroup Commercial Mortgage Trust | 3.778 | 09/10/58 | 2,142 | |||||||||||||
| Series - 2015 GC33 (Class A4) | |||||||||||||||||
| 406,726 | i | Citigroup Mortgage Loan Trust | LIBOR 1 M + 0.750% | 0.852 | 01/25/36 | 407 | |||||||||||
| Series - 2006 WFH1 (Class M4) | |||||||||||||||||
| 5,000,000 | g | COMM Mortgage Trust | 3.244 | 10/10/29 | 5,097 | ||||||||||||
| Series - 2017 PANW (Class A) | |||||||||||||||||
| 2,000,000 | i | COMM Mortgage Trust | 4.255 | 07/10/45 | 2,075 | ||||||||||||
| Series - 2013 CR9 (Class A4) | |||||||||||||||||
| 3,727,236 | COMM Mortgage Trust | 2.853 | 10/15/45 | 3,767 | |||||||||||||
| Series - 2012 CR4 (Class A3) | |||||||||||||||||
| 1,185,000 | g | COMM Mortgage Trust | 3.147 | 03/10/46 | 1,206 | ||||||||||||
| Series - 2013 CR6 (Class AM) | |||||||||||||||||
| 3,359,721 | g,i | COMM Mortgage Trust | 3.929 | 06/10/46 | 3,457 | ||||||||||||
| Series - 2013 CR8 (Class B) | |||||||||||||||||
| 2,000,000 | g,i | COMM Mortgage Trust | 4.900 | 08/10/46 | 2,089 | ||||||||||||
| Series - 2013 CR10 (Class B) | |||||||||||||||||
| 5,000,000 | g,i | COMM Mortgage Trust | 4.900 | 08/10/46 | 5,181 | ||||||||||||
| Series - 2013 CR10 (Class C) | |||||||||||||||||
| 3,000,000 | COMM Mortgage Trust | 4.199 | 03/10/47 | 3,137 | |||||||||||||
| Series - 2014 UBS2 (Class AM) | |||||||||||||||||
| 750,000 | COMM Mortgage Trust | 4.174 | 05/10/47 | 787 | |||||||||||||
| Series - 2014 CR17 (Class AM) | |||||||||||||||||
| 2,500,000 | g,i | COMM Mortgage Trust | 4.767 | 06/10/47 | 2,433 | ||||||||||||
| Series - 2014 UBS3 (Class D) | |||||||||||||||||
| 5,240,000 | COMM Mortgage Trust | 3.917 | 10/10/47 | 5,562 | |||||||||||||
| Series - 2014 LC17 (Class A5) | |||||||||||||||||
| 5,000,000 | i | COMM Mortgage Trust | 4.188 | 10/10/47 | 5,288 | ||||||||||||
| Series - 2014 LC17 (Class AM) | |||||||||||||||||
| 2,288,546 | i | COMM Mortgage Trust | 4.490 | 10/10/47 | 2,398 | ||||||||||||
| Series - 2014 LC17 (Class B) | |||||||||||||||||
| 800,979 | i | COMM Mortgage Trust | 3.829 | 02/10/48 | 834 | ||||||||||||
| Series - 2015 LC19 (Class B) | |||||||||||||||||
| 1,000,000 | g | COMM Mortgage Trust | 3.000 | 03/10/48 | 889 | ||||||||||||
| Series - 2015 CR22 (Class E) | |||||||||||||||||
| 1,445,000 | COMM Mortgage Trust | 3.309 | 03/10/48 | 1,519 | |||||||||||||
| Series - 2015 CR22 (Class A5) | |||||||||||||||||
| 3,382,775 | i | COMM Mortgage Trust | 3.603 | 03/10/48 | 3,556 | ||||||||||||
| Series - 2015 CR22 (Class AM) | |||||||||||||||||
| 2,175,000 | i | COMM Mortgage Trust | 4.106 | 03/10/48 | 2,256 | ||||||||||||
| Series - 2015 CR22 (Class C) | |||||||||||||||||
| 7,150,000 | COMM Mortgage Trust | 3.801 | 05/10/48 | 7,573 | |||||||||||||
| Series - 2015 CR23 (Class AM) | |||||||||||||||||
| 4,500,000 | i | COMM Mortgage Trust | 4.183 | 05/10/48 | 4,705 | ||||||||||||
| Series - 2015 CR23 (Class B) | |||||||||||||||||
| 418 |
COLLEGE RETIREMENT EQUITIES FUND - Bond Market Account
| PRINCIPAL | ISSUER | REFERENCE RATE & SPREAD | RATE | MATURITY DATE | VALUE (000) | ||||||||||||
| $ | 2,549,000 | i | COMM Mortgage Trust | 4.286 | % | 05/10/48 | $ | 2,659 | |||||||||
| Series - 2015 CR23 (Class C) | |||||||||||||||||
| 3,401,846 | COMM Mortgage Trust | 3.421 | 07/10/48 | 3,515 | |||||||||||||
| Series - 2015 LC21 (Class ASB) | |||||||||||||||||
| 4,000,000 | i | COMM Mortgage Trust | 3.463 | 08/10/48 | 3,694 | ||||||||||||
| Series - 2015 CR24 (Class D) | |||||||||||||||||
| 2,550,000 | COMM Mortgage Trust | 3.696 | 08/10/48 | 2,711 | |||||||||||||
| Series - 2015 CR24 (Class A5) | |||||||||||||||||
| 5,000,000 | i | COMM Mortgage Trust | 4.028 | 08/10/48 | 5,320 | ||||||||||||
| Series - 2015 CR24 (Class AM) | |||||||||||||||||
| 2,000,000 | i | COMM Mortgage Trust | 4.379 | 08/10/48 | 2,127 | ||||||||||||
| Series - 2015 CR24 (Class B) | |||||||||||||||||
| 1,467,000 | i | COMM Mortgage Trust | 4.379 | 08/10/48 | 1,513 | ||||||||||||
| Series - 2015 CR24 (Class C) | |||||||||||||||||
| 1,352,000 | COMM Mortgage Trust | 3.612 | 10/10/48 | 1,441 | |||||||||||||
| Series - 2015 CR27 (Class A4) | |||||||||||||||||
| 3,212,210 | COMM Mortgage Trust | 3.630 | 10/10/48 | 3,423 | |||||||||||||
| Series - 2015 CR26 (Class A4) | |||||||||||||||||
| 1,575,000 | COMM Mortgage Trust | 3.774 | 10/10/48 | 1,689 | |||||||||||||
| Series - 2015 LC23 (Class A4) | |||||||||||||||||
| 1,875,000 | i | COMM Mortgage Trust | 4.478 | 10/10/48 | 2,005 | ||||||||||||
| Series - 2015 CR26 (Class B) | |||||||||||||||||
| 1,005,000 | i | COMM Mortgage Trust | 4.609 | 10/10/48 | 1,055 | ||||||||||||
| Series - 2015 LC23 (Class C) | |||||||||||||||||
| 1,023,765 | COMM Mortgage Trust | 3.651 | 02/10/49 | 1,067 | |||||||||||||
| Series - 2016 CR28 (Class AHR) | |||||||||||||||||
| 4,650,000 | i | COMM Mortgage Trust | 4.638 | 02/10/49 | 5,025 | ||||||||||||
| Series - 2016 CR28 (Class B) | |||||||||||||||||
| 6,500,000 | COMM Mortgage Trust | 3.263 | 08/15/57 | 6,860 | |||||||||||||
| Series - 2019 GC44 (Class AM) | |||||||||||||||||
| 2,000,000 | i | COMM Mortgage Trust | 3.526 | 08/15/57 | 2,031 | ||||||||||||
| Series - 2019 GC44 (Class C) | |||||||||||||||||
| 11,705,644 | i | Connecticut Avenue Securities | LIBOR 1 M + 2.600% | 2.703 | 05/25/24 | 11,924 | |||||||||||
| Series - 2014 C02 (Class 1M2) | |||||||||||||||||
| 8,148,869 | i | Connecticut Avenue Securities | LIBOR 1 M + 3.000% | 3.103 | 07/25/24 | 8,274 | |||||||||||
| Series - 2014 C03 (Class 1M2) | |||||||||||||||||
| 1,870,000 | g,i | Connecticut Avenue Securities | 3.350 | 11/25/41 | 1,884 | ||||||||||||
| Series - 2021 R02 (Class 2B1) | |||||||||||||||||
| 2,105,000 | g,i | Connecticut Avenue Securities Trust | 1.600 | 10/25/41 | 2,107 | ||||||||||||
| Series - 2021 R01 (Class 1M2) | |||||||||||||||||
| 3,070,000 | g,i | Connecticut Avenue Securities Trust | 2.800 | 12/25/41 | 3,070 | ||||||||||||
| Series - 2021 R03 (Class 1B1) | |||||||||||||||||
| 2,000,000 | g,i | CPT Mortgage Trust | 2.997 | 11/13/39 | 1,904 | ||||||||||||
| Series - 2019 CPT (Class E) | |||||||||||||||||
| 7,400,000 | g,i | Credit Suisse Commercial Mortgage Trust | 3.728 | 11/10/32 | 7,599 | ||||||||||||
| Series - 2017 CALI (Class B) | |||||||||||||||||
| 5,189,839 | g,i | Credit Suisse Commercial Mortgage Trust | 3.500 | 02/25/48 | 5,234 | ||||||||||||
| Series - 2018 J1 (Class A11) | |||||||||||||||||
| 1,910,000 | g,i | Credit Suisse Mortgage Capital Certificates | LIBOR 1 M + 1.600% | 1.710 | 05/15/36 | 1,903 | |||||||||||
| Series - 2019 ICE4 (Class D) | |||||||||||||||||
| 10,000,000 | g,i | Credit Suisse Mortgage Capital Certificates | 2.405 | 10/25/66 | 9,991 | ||||||||||||
| Series - 2021 NQM8 (Class A3) | |||||||||||||||||
| 4,270,400 | g,i | CSMC Series | 3.388 | 10/25/59 | 4,321 | ||||||||||||
| Series - 2019 NQM1 (Class M1) | |||||||||||||||||
| 419 |
COLLEGE RETIREMENT EQUITIES FUND - Bond Market Account
| PRINCIPAL | ISSUER | REFERENCE RATE & SPREAD | RATE | MATURITY DATE | VALUE (000) | ||||||||||||
| $ | 9,250,000 | DBGS Mortgage Trust | 4.466 | % | 10/15/51 | $ | 10,569 | ||||||||||
| Series - 2018 C1 (Class A4) | |||||||||||||||||
| 10,275,090 | DBJPM Mortgage Trust | 2.756 | 08/10/49 | 10,527 | |||||||||||||
| Series - 2016 C3 (Class ASB) | |||||||||||||||||
| 10,000,000 | DBJPM Mortgage Trust | 3.121 | 06/10/50 | 10,449 | |||||||||||||
| Series - 2017 C6 (Class ASB) | |||||||||||||||||
| 5,300,000 | DBJPM Mortgage Trust | 2.340 | 08/15/53 | 5,256 | |||||||||||||
| Series - 2020 C9 (Class AM) | |||||||||||||||||
| 17,410,000 | g | DBUBS Mortgage Trust | 3.452 | 10/10/34 | 18,100 | ||||||||||||
| Series - 2017 BRBK (Class A) | |||||||||||||||||
| 15,500,000 | g,i | DBUBS Mortgage Trust | 3.530 | 10/10/34 | 16,021 | ||||||||||||
| Series - 2017 BRBK (Class B) | |||||||||||||||||
| 5,000,000 | g,i | ELP Commercial Mortgage Trust | LIBOR 1 M + 1.120% | 1.230 | 11/15/38 | 4,970 | |||||||||||
| Series - 2021 ELP (Class B) | |||||||||||||||||
| 7,000,000 | g,i | ELP Commercial Mortgage Trust | LIBOR 1 M + 1.320% | 1.430 | 11/15/38 | 6,959 | |||||||||||
| Series - 2021 ELP (Class C) | |||||||||||||||||
| 7,520,000 | g,i | ELP Commercial Mortgage Trust | LIBOR 1 M + 2.118% | 2.228 | 11/15/38 | 7,475 | |||||||||||
| Series - 2021 ELP (Class E) | |||||||||||||||||
| 500,000 | g,i | ELP Commercial Mortgage Trust | LIBOR 1 M + 2.667% | 2.777 | 11/15/38 | 497 | |||||||||||
| Series - 2021 ELP (Class F) | |||||||||||||||||
| 5,000,000 | g,i | EQUS Mortgage Trust | LIBOR 1 M + 0.755% | 0.865 | 10/15/38 | 4,976 | |||||||||||
| Series - 2021 EQAZ (Class A) | |||||||||||||||||
| 4,730,000 | g,i | EQUS Mortgage Trust | LIBOR 1 M + 2.300% | 2.410 | 10/15/38 | 4,708 | |||||||||||
| Series - 2021 EQAZ (Class E) | |||||||||||||||||
| 1,333,871 | i | Fieldstone Mortgage Investment Trust | LIBOR 1 M + 0.735% | 0.837 | 12/25/35 | 1,331 | |||||||||||
| Series - 2005 2 (Class M2) | |||||||||||||||||
| 517,834 | g,i | FirstKey Mortgage Trust | 3.500 | 11/25/44 | 524 | ||||||||||||
| Series - 2014 1 (Class A8) | |||||||||||||||||
| 2,493,086 | g,i | Flagstar Mortgage Trust | 4.080 | 10/25/47 | 2,520 | ||||||||||||
| Series - 2017 2 (Class B3) | |||||||||||||||||
| 286,852 | g,i | Flagstar Mortgage Trust | 4.000 | 09/25/48 | 288 | ||||||||||||
| Series - 2018 5 (Class A11) | |||||||||||||||||
| 3,540,750 | g,i | Flagstar Mortgage Trust | 2.500 | 04/25/51 | 3,509 | ||||||||||||
| Series - 2021 2 (Class A4) | |||||||||||||||||
| 10,133,012 | g,i | Flagstar Mortgage Trust | 2.500 | 06/01/51 | 10,063 | ||||||||||||
| Series - 2021 4 (Class A21) | |||||||||||||||||
| 31,260,311 | g,i | Flagstar Mortgage Trust | 3.000 | 10/25/51 | 31,710 | ||||||||||||
| Series - 2021 10IN (Class A1) | |||||||||||||||||
| 5,725,000 | g,i | Freddie Mac STACR REMIC Trust | 2.100 | 12/25/33 | 5,736 | ||||||||||||
| Series - 2021 HQA2 (Class M2) | |||||||||||||||||
| 12,292,000 | g,i | Freddie Mac STACR REMIC Trust | 1.700 | 01/25/34 | 12,344 | ||||||||||||
| Series - 2021 DNA5 (Class M2) | |||||||||||||||||
| 750,000 | g,i | FREMF Mortgage Trust | 4.021 | 03/25/49 | 805 | ||||||||||||
| Series - 2016 K53 (Class B) | |||||||||||||||||
| 700,000 | g,i | Frost CMBS DAC | SONIA Interest Rate Benchmark + 2.900% | 0.000 | 11/22/26 | 948 | |||||||||||
| Series - 2021 1A (Class GBD) | |||||||||||||||||
| 1,074,173 | g,i | GS Mortage-Backed Securities Trust | 3.687 | 05/25/50 | 1,090 | ||||||||||||
| Series - 2020 PJ1 (Class B2) | |||||||||||||||||
| 5,943,000 | g | GS Mortgage Securities Corp II | 3.551 | 04/10/34 | 5,943 | ||||||||||||
| Series - 2012 ALOH (Class A) | |||||||||||||||||
| 4,430,000 | g | GS Mortgage Securities Corp II | 2.954 | 11/05/34 | 4,473 | ||||||||||||
| Series - 2012 BWTR (Class A) | |||||||||||||||||
| 5,000,000 | g,i | GS Mortgage Securities Corp II | LIBOR 1 M + 1.250% | 1.360 | 11/15/36 | 4,947 | |||||||||||
| Series - 2021 ARDN (Class A) | |||||||||||||||||
| 420 |
COLLEGE RETIREMENT EQUITIES FUND - Bond Market Account
| PRINCIPAL | ISSUER | REFERENCE RATE & SPREAD | RATE | MATURITY DATE | VALUE (000) | ||||||||||||
| $ | 2,600,000 | g,i | GS Mortgage Securities Corp II | LIBOR 1 M + 3.350% | 3.460 | % | 11/15/36 | $ | 2,594 | ||||||||
| Series - 2021 ARDN (Class E) | |||||||||||||||||
| 2,500,000 | g,i | GS Mortgage Securities Corp II | 3.483 | 09/10/37 | 2,609 | ||||||||||||
| Series - 2017 375H (Class B) | |||||||||||||||||
| 1,350,000 | i | GS Mortgage Securities Corp II | 3.777 | 05/10/50 | 1,417 | ||||||||||||
| Series - 2015 GC30 (Class AS) | |||||||||||||||||
| 3,500,000 | i | GS Mortgage Securities Corp II | 4.155 | 07/10/51 | 3,939 | ||||||||||||
| Series - 2018 GS10 (Class A5) | |||||||||||||||||
| 5,235,000 | g,i | GS Mortgage Securities Corp Trust | LIBOR 1 M + 1.600% | 1.710 | 07/15/31 | 5,050 | |||||||||||
| Series - 2018 TWR (Class D) | |||||||||||||||||
| 2,000,000 | g,i | GS Mortgage Securities Trust | LIBOR 1 M + 1.450% | 1.560 | 07/15/31 | 1,950 | |||||||||||
| Series - 2018 TWR (Class C) | |||||||||||||||||
| 1,100,000 | GS Mortgage Securities Trust | 4.740 | 05/10/45 | 1,110 | |||||||||||||
| Series - 2012 GCJ7 (Class B) | |||||||||||||||||
| 951,166 | GS Mortgage Securities Trust | 3.206 | 02/10/48 | 978 | |||||||||||||
| Series - 2015 GC28 (Class AAB) | |||||||||||||||||
| 2,816,500 | GS Mortgage Securities Trust | 3.396 | 02/10/48 | 2,952 | |||||||||||||
| Series - 2015 GC28 (Class A5) | |||||||||||||||||
| 2,000,000 | i | GS Mortgage Securities Trust | 4.018 | 07/10/48 | 2,130 | ||||||||||||
| Series - 2015 GC32 (Class AS) | |||||||||||||||||
| 2,821,194 | GS Mortgage Securities Trust | 3.278 | 10/10/48 | 2,920 | |||||||||||||
| Series - 2015 GC34 (Class AAB) | |||||||||||||||||
| 2,000,000 | GS Mortgage Securities Trust | 3.143 | 10/10/49 | 2,079 | |||||||||||||
| Series - 2016 GS3 (Class AS) | |||||||||||||||||
| 2,000,000 | GS Mortgage Securities Trust | 3.674 | 03/10/50 | 2,165 | |||||||||||||
| Series - 2017 GS5 (Class A4) | |||||||||||||||||
| 4,150,000 | i | GS Mortgage Securities Trust | 3.826 | 03/10/50 | 4,436 | ||||||||||||
| Series - 2017 GS5 (Class AS) | |||||||||||||||||
| 12,000,000 | GS Mortgage Securities Trust | 3.230 | 05/10/50 | 12,554 | |||||||||||||
| Series - 2017 GS6 (Class AAB) | |||||||||||||||||
| 6,000,000 | GS Mortgage Securities Trust | 3.433 | 05/10/50 | 6,416 | |||||||||||||
| Series - 2017 GS6 (Class A3) | |||||||||||||||||
| 1,691,000 | i | GS Mortgage Securities Trust | 4.029 | 05/10/50 | 1,780 | ||||||||||||
| Series - 2015 GC30 (Class B) | |||||||||||||||||
| 4,061,000 | i | GS Mortgage Securities Trust | 4.073 | 05/10/50 | 4,202 | ||||||||||||
| Series - 2015 GC30 (Class C) | |||||||||||||||||
| 3,000,000 | GS Mortgage Securities Trust | 3.837 | 11/10/50 | 3,255 | |||||||||||||
| Series - 2017 GS8 (Class ABP) | |||||||||||||||||
| 4,844,000 | i | GS Mortgage Securities Trust | 4.335 | 11/10/50 | 5,133 | ||||||||||||
| Series - 2017 GS8 (Class C) | |||||||||||||||||
| 3,050,000 | i | GS Mortgage Securities Trust | 4.158 | 02/10/52 | 3,373 | ||||||||||||
| Series - 2019 GC38 (Class AS) | |||||||||||||||||
| 2,000,000 | g,i | GS Mortgage Securities Trust | 3.550 | 07/10/52 | 2,018 | ||||||||||||
| Series - 2019 GC40 (Class DBC) | |||||||||||||||||
| 2,500,000 | i | GS Mortgage Securities Trust | 3.173 | 02/13/53 | 2,646 | ||||||||||||
| Series - 2020 GC45 (Class AS) | |||||||||||||||||
| 357,759 | g,i | GS Mortgage-Backed Securities Corp Trust | 4.000 | 11/25/49 | 358 | ||||||||||||
| Series - 2019 PJ2 (Class A1) | |||||||||||||||||
| 934,538 | g,i | GS Mortgage-Backed Securities Corp Trust | 4.000 | 11/25/49 | 935 | ||||||||||||
| Series - 2019 PJ2 (Class A4) | |||||||||||||||||
| 1,298,695 | g,i | GS Mortgage-Backed Securities Corp Trust | 3.500 | 07/25/50 | 1,307 | ||||||||||||
| Series - 2020 PJ2 (Class A4) | |||||||||||||||||
| 1,189,452 | g,i | GS Mortgage-Backed Securities Corp Trust | 3.000 | 01/25/51 | 1,200 | ||||||||||||
| Series - 2020 PJ4 (Class A4) | |||||||||||||||||
| 421 |
COLLEGE RETIREMENT EQUITIES FUND - Bond Market Account
| PRINCIPAL | ISSUER | REFERENCE RATE & SPREAD | RATE | MATURITY DATE | VALUE (000) | ||||||||||||
| $ | 900,865 | i | GS Mortgage-Backed Securities Corp Trust | 3.000 | % | 03/27/51 | $ | 910 | |||||||||
| Series - 2020 PJ5 (Class A4) | |||||||||||||||||
| 2,178,554 | g,i | GS Mortgage-Backed Securities Corp Trust | 2.500 | 05/25/51 | 2,157 | ||||||||||||
| Series - 2020 PJ6 (Class A4) | |||||||||||||||||
| 6,855,111 | g,i | GS Mortgage-Backed Securities Corp Trust | 2.500 | 10/25/51 | 6,795 | ||||||||||||
| Series - 2021 PJ5 (Class A4) | |||||||||||||||||
| 2,674,486 | g,i | GS Mortgage-Backed Securities Trust | 2.500 | 07/25/51 | 2,644 | ||||||||||||
| Series - 2021 PJ2 (Class A4) | |||||||||||||||||
| 24,349,330 | g,i | GS Mortgage-Backed Securities Trust | 2.500 | 01/25/52 | 24,157 | ||||||||||||
| Series - 2021 PJ7 (Class A4) | |||||||||||||||||
| 11,286,528 | g,i | GS Mortgage-Backed Securities Trust | 2.500 | 01/25/52 | 11,191 | ||||||||||||
| Series - 2021 PJ8 (Class A4) | |||||||||||||||||
| 19,907,777 | g,i | GS MortSecurities Trust | 2.500 | 11/25/51 | 19,745 | ||||||||||||
| Series - 2021 PJ6 (Class A4) | |||||||||||||||||
| 2,200,930 | i | HarborView Mortgage Loan Trust | LIBOR 1 M + 0.620% | 0.724 | 08/19/45 | 2,218 | |||||||||||
| Series - 2005 11 (Class 2A1A) | |||||||||||||||||
| 6,000,000 | g | Hudson Yards Mortgage Trust | 2.835 | 08/10/38 | 6,222 | ||||||||||||
| Series - 2016 10HY (Class A) | |||||||||||||||||
| 2,500,000 | g,i | Hudson Yards Mortgage Trust | 2.977 | 08/10/38 | 2,580 | ||||||||||||
| Series - 2016 10HY (Class B) | |||||||||||||||||
| 7,250,000 | g,i | Hudson Yards Mortgage Trust | 2.977 | 08/10/38 | 7,379 | ||||||||||||
| Series - 2016 10HY (Class C) | |||||||||||||||||
| 5,500,000 | g,i | Hudson Yards Mortgage Trust | 2.943 | 12/10/41 | 5,397 | ||||||||||||
| Series - 2019 55HY (Class D) | |||||||||||||||||
| 2,750,000 | g,i | Hudson Yards Mortgage Trust | 2.943 | 12/10/41 | 2,643 | ||||||||||||
| Series - 2019 55HY (Class E) | |||||||||||||||||
| 363,150 | i | Impac CMB Trust | LIBOR 1 M + 0.660% | 0.762 | 03/25/35 | 372 | |||||||||||
| Series - 2004 11 (Class 2A1) | |||||||||||||||||
| 4,838,603 | g,i | Imperial Fund Mortgage Trust | 2.051 | 10/25/55 | 4,843 | ||||||||||||
| Series - 2020 NQM1 (Class A3) | |||||||||||||||||
| 1,043,500 | g,i | Imperial Fund Mortgage Trust | 3.531 | 10/25/55 | 1,059 | ||||||||||||
| Series - 2020 NQM1 (Class M1) | |||||||||||||||||
| 1,000,000 | g,i | JP Morgan Chase Commercial Mortgage Securities Corp | 4.613 | 07/05/31 | 1,027 | ||||||||||||
| Series - 2018 AON (Class D) | |||||||||||||||||
| 7,715,000 | g,i | JP Morgan Chase Commercial Mortgage Securities Corp | 5.360 | 02/15/46 | 7,621 | ||||||||||||
| Series - 2011 C3 (Class C) | |||||||||||||||||
| 3,585,288 | g,i | JP Morgan Chase Commercial Mortgage Securities Corp | 5.389 | 07/15/46 | 3,705 | ||||||||||||
| Series - 2011 C4 (Class C) | |||||||||||||||||
| 2,800,000 | JP Morgan Chase Commercial Mortgage Securities Corp | 3.372 | 12/15/47 | 2,856 | |||||||||||||
| Series - 2013 C10 (Class AS) | |||||||||||||||||
| 1,780,000 | JP Morgan Chase Commercial Mortgage Securities Corp | 3.914 | 01/15/49 | 1,920 | |||||||||||||
| Series - 2015 JP1 (Class A5) | |||||||||||||||||
| 750,000 | i | JP Morgan Chase Commercial Mortgage Securities Corp | 4.119 | 01/15/49 | 802 | ||||||||||||
| Series - 2015 JP1 (Class AS) | |||||||||||||||||
| 6,251,595 | JP Morgan Chase Commercial Mortgage Securities Corp | 2.713 | 08/15/49 | 6,412 | |||||||||||||
| Series - 2016 JP2 (Class ASB) | |||||||||||||||||
| 4,500,000 | JP Morgan Chase Commercial Mortgage Securities Corp | 3.379 | 09/15/50 | 4,636 | |||||||||||||
| Series - 2017 JP7 (Class A3) | |||||||||||||||||
| 422 |
COLLEGE RETIREMENT EQUITIES FUND - Bond Market Account
| PRINCIPAL | ISSUER | REFERENCE RATE & SPREAD | RATE | MATURITY DATE | VALUE (000) | ||||||||||||
| $ | 3,155,000 | g | JP Morgan Chase Commercial Mortgage Securities Trust | 3.065 | % | 01/16/37 | $ | 3,184 | |||||||||
| Series - 2020 NNN (Class BFX) | |||||||||||||||||
| 260,000 | i | JP Morgan Chase Commercial Mortgage Securities Trust | 4.077 | 01/15/46 | 270 | ||||||||||||
| Series - 2013 C13 (Class AS) | |||||||||||||||||
| 5,569,478 | g,i | JP Morgan Mortgage Trust | LIBOR 1 M - 0.000% | 2.116 | 12/25/44 | 5,673 | |||||||||||
| Series - 2015 1 (Class B1) | |||||||||||||||||
| 319,846 | g,i | JP Morgan Mortgage Trust | 3.500 | 05/25/45 | 323 | ||||||||||||
| Series - 2015 3 (Class A19) | |||||||||||||||||
| 2,773,967 | g,i | JP Morgan Mortgage Trust | 3.500 | 10/25/45 | 2,765 | ||||||||||||
| Series - 2015 6 (Class A13) | |||||||||||||||||
| 595,738 | g,i | JP Morgan Mortgage Trust | 3.500 | 05/25/46 | 603 | ||||||||||||
| Series - 2016 1 (Class A13) | |||||||||||||||||
| 1,455,152 | g,i | JP Morgan Mortgage Trust | 3.500 | 05/25/47 | 1,465 | ||||||||||||
| Series - 2017 2 (Class A13) | |||||||||||||||||
| 1,889,670 | g,i | JP Morgan Mortgage Trust | 3.500 | 09/25/48 | 1,883 | ||||||||||||
| Series - 2018 3 (Class A13) | |||||||||||||||||
| 753,098 | g,i | JP Morgan Mortgage Trust | 3.500 | 10/25/48 | 757 | ||||||||||||
| Series - 2018 4 (Class A13) | |||||||||||||||||
| 3,235,030 | g,i | JP Morgan Mortgage Trust | 3.500 | 10/25/48 | 3,263 | ||||||||||||
| Series - 2018 5 (Class A13) | |||||||||||||||||
| 2,111,458 | g,i | JP Morgan Mortgage Trust | 3.063 | 10/26/48 | 2,175 | ||||||||||||
| Series - 2017 5 (Class A2) | |||||||||||||||||
| 473,234 | g,i | JP Morgan Mortgage Trust | 4.000 | 01/25/49 | 476 | ||||||||||||
| Series - 2018 8 (Class A13) | |||||||||||||||||
| 1,126,416 | g,i | JP Morgan Mortgage Trust | 4.000 | 02/25/49 | 1,134 | ||||||||||||
| Series - 2018 9 (Class A13) | |||||||||||||||||
| 643,944 | g,i | JP Morgan Mortgage Trust | 4.000 | 05/25/49 | 647 | ||||||||||||
| Series - 2019 1 (Class A3) | |||||||||||||||||
| 1,181,917 | g,i | JP Morgan Mortgage Trust | 4.000 | 05/25/49 | 1,187 | ||||||||||||
| Series - 2019 1 (Class A15) | |||||||||||||||||
| 1,510,649 | g,i | JP Morgan Mortgage Trust | 4.681 | 09/25/49 | 1,505 | ||||||||||||
| Series - 2019 3 (Class B1) | |||||||||||||||||
| 2,142,336 | g,i | JP Morgan Mortgage Trust | LIBOR 1 M + 0.950% | 1.052 | 10/25/49 | 2,151 | |||||||||||
| Series - 2019 INV1 (Class A11) | |||||||||||||||||
| 6,871,253 | g,i | JP Morgan Mortgage Trust | 3.871 | 06/25/50 | 7,111 | ||||||||||||
| Series - 2020 1 (Class B2) | |||||||||||||||||
| 11,138,227 | g,i | JP Morgan Mortgage Trust | 2.500 | 10/25/51 | 11,040 | ||||||||||||
| Series - 2021 6 (Class A15) | |||||||||||||||||
| 5,912,692 | g,i | JP Morgan Mortgage Trust | 2.500 | 11/25/51 | 5,842 | ||||||||||||
| Series - 2021 7 (Class A15) | |||||||||||||||||
| 7,255,115 | g,i | JP Morgan Mortgage Trust | 2.500 | 12/25/51 | 7,214 | ||||||||||||
| Series - 2021 8 (Class A15) | |||||||||||||||||
| 9,979,704 | g,i | JP Morgan Mortgage Trust | 2.500 | 01/25/52 | 9,892 | ||||||||||||
| Series - 2021 11 (Class A15) | |||||||||||||||||
| 9,239,930 | g,i | JP Morgan Mortgage Trust | 3.364 | 04/25/52 | 9,709 | ||||||||||||
| Series - 2021 INV6 (Class B1) | |||||||||||||||||
| 5,912,559 | g,i | JP Morgan Mortgage Trust | 3.364 | 04/25/52 | 6,140 | ||||||||||||
| Series - 2021 INV6 (Class B2) | |||||||||||||||||
| 12,723,000 | g,i | JP Morgan Mortgage Trust | 2.500 | 06/25/52 | 12,579 | ||||||||||||
| Series - 2021 15 (Class A15) | |||||||||||||||||
| 753,794 | i | JPMBB Commercial Mortgage Securities Trust | 4.133 | 08/15/46 | 776 | ||||||||||||
| Series - 2013 C14 (Class A4) | |||||||||||||||||
| 5,000,000 | JPMBB Commercial Mortgage Securities Trust | 3.997 | 08/15/47 | 5,238 | |||||||||||||
| Series - 2014 C21 (Class AS) | |||||||||||||||||
| 423 |
COLLEGE RETIREMENT EQUITIES FUND - Bond Market Account
| PRINCIPAL | ISSUER | REFERENCE RATE & SPREAD | RATE | MATURITY DATE | VALUE (000) | ||||||||||||
| $ | 2,000,000 | i | JPMBB Commercial Mortgage Securities Trust | 4.484 | % | 09/15/47 | $ | 2,089 | |||||||||
| Series - 2014 C23 (Class B) | |||||||||||||||||
| 3,000,000 | JPMBB Commercial Mortgage Securities Trust | 3.898 | 02/15/48 | 3,084 | |||||||||||||
| Series - 2015 C27 (Class B) | |||||||||||||||||
| 2,556,000 | JPMBB Commercial Mortgage Securities Trust | 3.611 | 05/15/48 | 2,702 | |||||||||||||
| Series - 2015 C29 (Class A4) | |||||||||||||||||
| 2,500,000 | i | JPMBB Commercial Mortgage Securities Trust | 3.917 | 05/15/48 | 2,633 | ||||||||||||
| Series - 2015 C29 (Class AS) | |||||||||||||||||
| 2,350,000 | i | JPMBB Commercial Mortgage Securities Trust | 4.118 | 05/15/48 | 2,396 | ||||||||||||
| Series - 2015 C29 (Class B) | |||||||||||||||||
| 3,500,000 | JPMBB Commercial Mortgage Securities Trust | 4.106 | 08/15/48 | 3,730 | |||||||||||||
| Series - 2015 C31 (Class AS) | |||||||||||||||||
| 9,952,000 | i | JPMBB Commercial Mortgage Securities Trust | 4.621 | 08/15/48 | 10,610 | ||||||||||||
| Series - 2015 C31 (Class B) | |||||||||||||||||
| 4,610,000 | JPMBB Commercial Mortgage Securities Trust | 3.576 | 03/15/49 | 4,903 | |||||||||||||
| Series - 2016 C1 (Class A5) | |||||||||||||||||
| 1,820,000 | i | JPMBB Commercial Mortgage Securities Trust | 4.732 | 03/15/49 | 1,926 | ||||||||||||
| Series - 2016 C1 (Class C) | |||||||||||||||||
| 4,750,000 | JPMCC Commercial Mortgage Securities Trust | 3.457 | 03/15/50 | 4,991 | |||||||||||||
| Series - 2017 JP5 (Class A4) | |||||||||||||||||
| 1,220,000 | JPMCC Commercial Mortgage Securities Trust | 3.549 | 03/15/50 | 1,277 | |||||||||||||
| Series - 2017 JP5 (Class ASB) | |||||||||||||||||
| 1,000,000 | i | JPMDB Commercial Mortgage Securities Trust | 3.071 | 12/15/49 | 990 | ||||||||||||
| Series - 2016 C4 (Class C) | |||||||||||||||||
| 3,000,000 | JPMDB Commercial Mortgage Securities Trust | 3.694 | 03/15/50 | 3,236 | |||||||||||||
| Series - 2017 C5 (Class A5) | |||||||||||||||||
| 9,000,000 | JPMDB Commercial Mortgage Securities Trust | 2.536 | 05/13/53 | 9,009 | |||||||||||||
| Series - 2020 COR7 (Class AS) | |||||||||||||||||
| 3,178,850 | g | Ladder Capital Commercial Mortgage Securities | 3.575 | 02/15/36 | 3,323 | ||||||||||||
| Series - 2013 GCP (Class A1) | |||||||||||||||||
| 5,000,000 | g | Ladder Capital Commercial Mortgage Securities | 3.357 | 07/12/50 | 5,228 | ||||||||||||
| Series - 2017 LC26 (Class ASB) | |||||||||||||||||
| 597,323 | g,i | Last Mile Logistics Pan Euro Finance DAC | EURIBOR 3 M + 2.700% | 1.000 | 08/17/33 | 681 | |||||||||||
| Series - 2021 1A (Class E) | |||||||||||||||||
| 7,250,000 | g | Liberty Street Trust | 3.597 | 02/10/36 | 7,660 | ||||||||||||
| Series - 2016 225L (Class A) | |||||||||||||||||
| 4,000,000 | g,i | MAD Mortgage Trust | 3.188 | 08/15/34 | 4,047 | ||||||||||||
| Series - 2017 330M (Class A) | |||||||||||||||||
| 1,500,000 | g,i | Manhattan West | 2.335 | 09/10/39 | 1,493 | ||||||||||||
| Series - 2020 1MW (Class B) | |||||||||||||||||
| 3,000,000 | g,i | Manhattan West | 2.335 | 09/10/39 | 2,956 | ||||||||||||
| Series - 2020 1MW (Class C) | |||||||||||||||||
| 680,112 | i | Merrill Lynch Mortgage Investors Trust | LIBOR 1 M + 0.520% | 2.278 | 01/25/37 | 664 | |||||||||||
| Series - 2006 WMC1 (Class A1B) | |||||||||||||||||
| 627,094 | Morgan Stanley Bank of America Merrill Lynch Trust | 2.469 | 02/15/46 | 632 | |||||||||||||
| Series - 2013 C7 (Class AAB) | |||||||||||||||||
| 2,807,347 | g | Morgan Stanley Bank of America Merrill Lynch Trust | 3.989 | 12/15/46 | 2,931 | ||||||||||||
| Series - 2014 C19 (Class LNC1) | |||||||||||||||||
| 924,991 | g | Morgan Stanley Bank of America Merrill Lynch Trust | 4.384 | 12/15/46 | 965 | ||||||||||||
| Series - 2014 C19 (Class LNC2) | |||||||||||||||||
| 4,650,000 | Morgan Stanley Bank of America Merrill Lynch Trust | 3.832 | 12/15/47 | 4,875 | |||||||||||||
| Series - 2014 C19 (Class AS) | |||||||||||||||||
| 424 |
COLLEGE RETIREMENT EQUITIES FUND - Bond Market Account
| PRINCIPAL | ISSUER | REFERENCE RATE & SPREAD | RATE | MATURITY DATE | VALUE (000) | ||||||||||||
| $ | 1,600,000 | Morgan Stanley Bank of America Merrill Lynch Trust | 3.605 | % | 02/15/48 | $ | 1,667 | ||||||||||
| Series - 2015 C20 (Class AS) | |||||||||||||||||
| 1,250,000 | i | Morgan Stanley Bank of America Merrill Lynch Trust | 4.452 | 02/15/48 | 1,279 | ||||||||||||
| Series - 2015 C20 (Class C) | |||||||||||||||||
| 2,500,000 | Morgan Stanley Bank of America Merrill Lynch Trust | 3.338 | 03/15/48 | 2,611 | |||||||||||||
| Series - 2015 C21 (Class A4) | |||||||||||||||||
| 6,500,000 | Morgan Stanley Bank of America Merrill Lynch Trust | 3.652 | 03/15/48 | 6,719 | |||||||||||||
| Series - 2015 C21 (Class AS) | |||||||||||||||||
| 3,000,000 | Morgan Stanley Bank of America Merrill Lynch Trust | 3.561 | 04/15/48 | 3,096 | |||||||||||||
| Series - 2015 C22 (Class AS) | |||||||||||||||||
| 3,380,820 | g,i | Morgan Stanley Capital I Inc | LIBOR 1 M + 1.377% | 1.487 | 11/15/23 | 3,365 | |||||||||||
| Series - 2021 ILP (Class C) | |||||||||||||||||
| 502,270 | i | Morgan Stanley Capital I Trust | LIBOR 1 M + 0.825% | 0.927 | 08/25/34 | 498 | |||||||||||
| Series - 2004 HE6 (Class M1) | |||||||||||||||||
| 2,795,000 | i | Morgan Stanley Capital I Trust | 3.779 | 05/15/48 | 2,972 | ||||||||||||
| Series - 2015 MS1 (Class A4) | |||||||||||||||||
| 388,737 | †,i | Morgan Stanley Capital I Trust | 6.261 | 12/12/49 | 207 | ||||||||||||
| Series - 2007 IQ16 (Class AJ) | |||||||||||||||||
| 265,169 | †,i | Morgan Stanley Capital I Trust | 6.261 | 12/12/49 | 141 | ||||||||||||
| Series - 2007 IQ16 (Class AJFX) | |||||||||||||||||
| 6,000,000 | Morgan Stanley Capital I Trust | 3.304 | 06/15/50 | 6,263 | |||||||||||||
| Series - 2017 H1 (Class ASB) | |||||||||||||||||
| 1,458,000 | Morgan Stanley Capital I Trust | 3.587 | 12/15/50 | 1,582 | |||||||||||||
| Series - 2017 HR2 (Class A4) | |||||||||||||||||
| 8,750,000 | Morgan Stanley Capital I Trust | 4.177 | 07/15/51 | 9,810 | |||||||||||||
| Series - 2018 H3 (Class A5) | |||||||||||||||||
| 2,840,000 | i | Morgan Stanley Capital I Trust | 4.429 | 07/15/51 | 3,195 | ||||||||||||
| Series - 2018 H3 (Class AS) | |||||||||||||||||
| 5,027,114 | Morgan Stanley Capital I Trust | 4.310 | 12/15/51 | 5,718 | |||||||||||||
| Series - 2018 H4 (Class A4) | |||||||||||||||||
| 772,862 | g,i | Morgan Stanley Residential Mortgage Loan Trust | 2.500 | 07/25/51 | 779 | ||||||||||||
| Series - 2021 4 (Class A4) | |||||||||||||||||
| 9,310,558 | g,i | Morgan Stanley Residential Mortgage Loan Trust | 2.500 | 08/25/51 | 9,229 | ||||||||||||
| Series - 2021 5 (Class A9) | |||||||||||||||||
| 2,402,437 | g,i | Morgan Stanley Residential Mortgage Loan Trust | 2.500 | 09/25/51 | 2,420 | ||||||||||||
| Series - 2021 6 (Class A4) | |||||||||||||||||
| 6,239,278 | g,i | Morgan Stanley Residential Mortgage Loan Trust | 2.500 | 09/25/51 | 6,184 | ||||||||||||
| Series - 2021 6 (Class A9) | |||||||||||||||||
| 3,000,000 | g,i | MSDB Trust | 3.316 | 07/11/39 | 3,137 | ||||||||||||
| Series - 2017 712F (Class A) | |||||||||||||||||
| 1,200,000 | g,i | Natixis Commercial Mortgage Securities Trust | 3.790 | 11/15/32 | 1,218 | ||||||||||||
| Series - 2018 285M (Class A) | |||||||||||||||||
| 15,010,000 | g,i | Natixis Commercial Mortgage Securities Trust | LIBOR 1 M + 1.500% | 1.610 | 07/15/36 | 15,010 | |||||||||||
| Series - 2019 MILE (Class A) | |||||||||||||||||
| 5,000,000 | g,i | Natixis Commercial Mortgage Securities Trust | LIBOR 1 M + 1.800% | 1.910 | 07/15/36 | 4,995 | |||||||||||
| Series - 2019 MILE (Class B) | |||||||||||||||||
| 2,900,000 | g,i | Natixis Commercial Mortgage Securities Trust | LIBOR 1 M + 2.200% | 2.310 | 07/15/36 | 2,896 | |||||||||||
| Series - 2019 MILE (Class C) | |||||||||||||||||
| 5,000,000 | g,i | Natixis Commercial Mortgage Securities Trust | LIBOR 1 M + 2.750% | 2.860 | 07/15/36 | 4,993 | |||||||||||
| Series - 2019 MILE (Class D) | |||||||||||||||||
| 5,000,000 | g | Natixis Commercial Mortgage Securities Trust | 2.507 | 10/15/36 | 4,996 | ||||||||||||
| Series - 2019 1776 (Class A) | |||||||||||||||||
| 425 |
COLLEGE RETIREMENT EQUITIES FUND - Bond Market Account
| PRINCIPAL | ISSUER | REFERENCE RATE & SPREAD | RATE | MATURITY DATE | VALUE (000) | ||||||||||||
| $ | 2,000,000 | g | Natixis Commercial Mortgage Securities Trust | 2.966 | % | 12/15/38 | $ | 2,048 | |||||||||
| Series - 2020 2PAC (Class A) | |||||||||||||||||
| 288,872 | g,i | New Residential Mortgage Loan Trust | 3.750 | 05/28/52 | 299 | ||||||||||||
| Series - 2015 1A (Class A3) | |||||||||||||||||
| 81,630 | g,i | New Residential Mortgage Loan Trust | 4.000 | 08/27/57 | 86 | ||||||||||||
| Series - 2017 6A (Class A1) | |||||||||||||||||
| 1,841,206 | g,i | New Residential Mortgage Loan Trust | 2.797 | 09/25/59 | 1,841 | ||||||||||||
| Series - 2019 NQM4 (Class A3) | |||||||||||||||||
| 980,000 | g,i | New Residential Mortgage Loan Trust | 2.986 | 09/25/59 | 978 | ||||||||||||
| Series - 2019 NQM4 (Class M1) | |||||||||||||||||
| 485,733 | i | New York Mortgage Trust | LIBOR 1 M + 0.480% | 0.582 | 02/25/36 | 489 | |||||||||||
| Series - 2005 3 (Class A1) | |||||||||||||||||
| 1,825,000 | g,i | NLT Trust | 2.569 | 08/25/56 | 1,788 | ||||||||||||
| Series - 2021 INV2 (Class M1) | |||||||||||||||||
| 12,253,423 | g,i | OBX Trust | 2.500 | 07/25/51 | 12,101 | ||||||||||||
| Series - 2021 J2 (Class A19) | |||||||||||||||||
| 1,283,779 | g,i | OBX Trust | LIBOR 1 M + 0.650% | 0.752 | 06/25/57 | 1,285 | |||||||||||
| Series - 2018 1 (Class A2) | |||||||||||||||||
| 3,877,136 | g,i | Oceanview Mortgage Trust | 2.500 | 05/25/51 | 3,842 | ||||||||||||
| Series - 2021 1 (Class A19) | |||||||||||||||||
| 5,120,000 | g | One Bryant Park Trust | 2.516 | 09/15/54 | 5,181 | ||||||||||||
| Series - 2019 OBP (Class A) | |||||||||||||||||
| 69,429 | g | Prima Capital CRE Securitization Ltd | 2.550 | 08/24/49 | 69 | ||||||||||||
| Series - 2015 4A (Class MR-A) | |||||||||||||||||
| 2,000,000 | g | RBS Commercial Funding, Inc Trust | 3.511 | 03/11/31 | 2,002 | ||||||||||||
| Series - 2013 SMV (Class B) | |||||||||||||||||
| 865,915 | g,i | Sequoia Mortgage Trust | 3.500 | 05/25/45 | 872 | ||||||||||||
| Series - 2015 2 (Class A1) | |||||||||||||||||
| 722,598 | g,i | Sequoia Mortgage Trust | 3.500 | 06/25/46 | 728 | ||||||||||||
| Series - 2016 1 (Class A19) | |||||||||||||||||
| 47,353 | g,i | Sequoia Mortgage Trust | 3.500 | 11/25/46 | 47 | ||||||||||||
| Series - 2016 3 (Class A10) | |||||||||||||||||
| 196,834 | g,i | Sequoia Mortgage Trust | 3.500 | 02/25/47 | 198 | ||||||||||||
| Series - 2017 2 (Class A19) | |||||||||||||||||
| 59,415 | g,i | Sequoia Mortgage Trust | 3.500 | 04/25/47 | 60 | ||||||||||||
| Series - 2017 3 (Class A19) | |||||||||||||||||
| 2,213,188 | g,i | Sequoia Mortgage Trust | 3.760 | 09/25/47 | 2,238 | ||||||||||||
| Series - 2017 6 (Class B1) | |||||||||||||||||
| 424,510 | g,i | Sequoia Mortgage Trust | 3.500 | 02/25/48 | 428 | ||||||||||||
| Series - 2018 2 (Class A1) | |||||||||||||||||
| 80,096 | g,i | Sequoia Mortgage Trust | 3.500 | 02/25/48 | 81 | ||||||||||||
| Series - 2018 2 (Class A19) | |||||||||||||||||
| 1,491,561 | g,i | Sequoia Mortgage Trust | 3.500 | 03/25/48 | 1,502 | ||||||||||||
| Series - 2018 3 (Class A1) | |||||||||||||||||
| 183,454 | g,i | Sequoia Mortgage Trust | 4.000 | 09/25/48 | 185 | ||||||||||||
| Series - 2018 7 (Class A19) | |||||||||||||||||
| 185,495 | g,i | Sequoia Mortgage Trust | 4.000 | 11/25/48 | 186 | ||||||||||||
| Series - 2018 8 (Class A19) | |||||||||||||||||
| 1,452,388 | g,i | Sequoia Mortgage Trust | 4.000 | 06/25/49 | 1,465 | ||||||||||||
| Series - 2019 2 (Class A1) | |||||||||||||||||
| 456,964 | g,i | Sequoia Mortgage Trust | 4.000 | 06/25/49 | 461 | ||||||||||||
| Series - 2019 2 (Class A19) | |||||||||||||||||
| 2,439,986 | g,i | Sequoia Mortgage Trust | 3.500 | 11/25/49 | 2,431 | ||||||||||||
| Series - 2019 4 (Class A1) | |||||||||||||||||
| 3,410,158 | g,i | Sequoia Mortgage Trust | 3.500 | 12/25/49 | 3,465 | ||||||||||||
| Series - 2019 5 (Class A1) | |||||||||||||||||
| 426 |
COLLEGE RETIREMENT EQUITIES FUND - Bond Market Account
| PRINCIPAL | ISSUER | REFERENCE RATE & SPREAD | RATE | MATURITY DATE | VALUE (000) | ||||||||||||
| $ | 1,969,074 | g,i | Sequoia Mortgage Trust | 3.500 | % | 12/25/49 | $ | 1,996 | |||||||||
| Series - 2019 5 (Class A19) | |||||||||||||||||
| 3,312,294 | g,i | Sequoia Mortgage Trust | 3.500 | 03/25/50 | 3,350 | ||||||||||||
| Series - 2020 2 (Class A1) | |||||||||||||||||
| 7,587,147 | g,i | Sequoia Mortgage Trust | 3.000 | 04/25/50 | 7,674 | ||||||||||||
| Series - 2020 3 (Class A19) | |||||||||||||||||
| 6,382,271 | g,i | Sequoia Mortgage Trust | 2.500 | 06/25/51 | 6,318 | ||||||||||||
| Series - 2021 4 (Class A19) | |||||||||||||||||
| 603,029 | g,i | Shellpoint Co-Originator Trust | 3.500 | 04/25/47 | 604 | ||||||||||||
| Series - 2017 1 (Class A19) | |||||||||||||||||
| 15,750,000 | g | SLG Office Trust | 2.585 | 07/15/41 | 16,117 | ||||||||||||
| Series - 2021 OVA (Class A) | |||||||||||||||||
| 26,865,000 | g | SLG Office Trust | 2.851 | 07/15/41 | 26,104 | ||||||||||||
| Series - 2021 OVA (Class D) | |||||||||||||||||
| 10,000,000 | g,i | SREIT Trust | LIBOR 1 M + 0.822% | 0.922 | 11/15/36 | 9,950 | |||||||||||
| Series - 2021 MFP2 (Class A) | |||||||||||||||||
| 6,930,000 | g,i | SREIT Trust | LIBOR 1 M + 1.171% | 1.271 | 11/15/36 | 6,895 | |||||||||||
| Series - 2021 MFP2 (Class B) | |||||||||||||||||
| 539,758 | i | Structured Agency Credit Risk Debt Note (STACR) | LIBOR 1 M + 1.200% | 1.303 | 10/25/29 | 540 | |||||||||||
| Series - 2017 DNA2 (Class M1) | |||||||||||||||||
| 3,410,000 | g,i | STACR | 2.300 | 08/25/33 | 3,433 | ||||||||||||
| Series - 2021 HQA1 (Class M2) | |||||||||||||||||
| 7,302,000 | g,i | STACR | 2.150 | 10/25/33 | 7,432 | ||||||||||||
| Series - 2021 DNA3 (Class M2) | |||||||||||||||||
| 180,627 | g,i | STACR | 3.730 | 02/25/48 | 180 | ||||||||||||
| Series - 2018 SPI1 (Class M2) | |||||||||||||||||
| 2,100,000 | g,i | STACR | LIBOR 1 M + 2.500% | 2.603 | 02/25/50 | 2,104 | |||||||||||
| Series - 2020 DNA2 (Class B1) | |||||||||||||||||
| 2,640,000 | g,i | STACR | 4.050 | 11/25/50 | 2,757 | ||||||||||||
| Series - 2020 HQA5 (Class B1) | |||||||||||||||||
| 347,448 | g,i | Taurus UK DAC Series - 2021 UK1A (Class B) | SONIA Interest Rate Benchmark + 1.300% | 1.350 | 05/17/31 | 470 | |||||||||||
| 506,281 | g,i | Taurus UK DAC Series - 2021 UK1A (Class C) | SONIA Interest Rate Benchmark + 1.650% | 1.700 | 05/17/31 | 684 | |||||||||||
| 12,548,000 | UBS Commercial Mortgage Trust | 3.256 | 06/15/50 | 13,084 | |||||||||||||
| Series - 2017 C1 (Class ASB) | |||||||||||||||||
| 2,000,000 | UBS Commercial Mortgage Trust | 3.366 | 10/15/50 | 2,100 | |||||||||||||
| Series - 2017 C4 (Class ASB) | |||||||||||||||||
| 4,000,000 | UBS-Barclays Commercial Mortgage Trust | 2.850 | 12/10/45 | 4,029 | |||||||||||||
| Series - 2012 C4 (Class A5) | |||||||||||||||||
| 500,761 | g | Verus Securitization Trust | 2.938 | 07/25/59 | 503 | ||||||||||||
| Series - 2019 3 (Class A2) | |||||||||||||||||
| 2,725,000 | g,i | Verus Securitization Trust | 3.139 | 07/25/59 | 2,733 | ||||||||||||
| Series - 2019 3 (Class M1) | |||||||||||||||||
| 2,070,000 | g,i | Verus Securitization Trust | 3.207 | 11/25/59 | 2,091 | ||||||||||||
| Series - 2019 4 (Class M1) | |||||||||||||||||
| 2,100,207 | g | Verus Securitization Trust | 1.733 | 05/25/65 | 2,093 | ||||||||||||
| Series - 2020 5 (Class A3) | |||||||||||||||||
| 2,334,529 | g,i | Verus Securitization Trust | 2.240 | 10/25/66 | 2,329 | ||||||||||||
| Series - 2021 7 (Class A3) | |||||||||||||||||
| 734,964 | g | VSE VOI Mortgage LLC | 2.540 | 07/20/33 | 734 | ||||||||||||
| Series - 2016 A (Class A) | |||||||||||||||||
| 563,348 | g | VSE VOI Mortgage LLC | 2.740 | 07/20/33 | 563 | ||||||||||||
| Series - 2016 A (Class B) | |||||||||||||||||
| 427 |
COLLEGE RETIREMENT EQUITIES FUND - Bond Market Account
| PRINCIPAL | ISSUER | RATE | MATURITY DATE | VALUE (000) | |||||||||||
| $ | 2,337,931 | g | VSE VOI Mortgage LLC | 2.330 | % | 03/20/35 | $ | 2,360 | |||||||
| Series - 2017 A (Class A) | |||||||||||||||
| 8,200,000 | Wells Fargo Commercial Mortgage Trust | 3.539 | 10/15/45 | 8,305 | |||||||||||
| Series - 2012 LC5 (Class AS) | |||||||||||||||
| 1,740,030 | Wells Fargo Commercial Mortgage Trust | 3.405 | 12/15/47 | 1,828 | |||||||||||
| Series - 2014 LC18 (Class A5) | |||||||||||||||
| 990,000 | Wells Fargo Commercial Mortgage Trust | 3.406 | 05/15/48 | 1,033 | |||||||||||
| Series - 2015 NXS1 (Class AS) | |||||||||||||||
| 2,000,000 | i | Wells Fargo Commercial Mortgage Trust | 3.658 | 05/15/48 | 2,083 | ||||||||||
| Series - 2015 NXS1 (Class B) | |||||||||||||||
| 2,279,000 | i | Wells Fargo Commercial Mortgage Trust | 4.145 | 05/15/48 | 2,291 | ||||||||||
| Series - 2015 NXS1 (Class D) | |||||||||||||||
| 8,986,991 | Wells Fargo Commercial Mortgage Trust | 2.788 | 07/15/48 | 9,234 | |||||||||||
| Series - 2016 C35 (Class ASB) | |||||||||||||||
| 13,910,107 | Wells Fargo Commercial Mortgage Trust | 2.514 | 08/15/49 | 14,219 | |||||||||||
| Series - 2016 BNK1 (Class ASB) | |||||||||||||||
| 13,714,487 | Wells Fargo Commercial Mortgage Trust | 2.825 | 10/15/49 | 14,097 | |||||||||||
| Series - 2016 LC24 (Class ASB) | |||||||||||||||
| 872,111 | Wells Fargo Commercial Mortgage Trust | 3.635 | 03/15/50 | 945 | |||||||||||
| Series - 2017 RB1 (Class A5) | |||||||||||||||
| 2,000,000 | Wells Fargo Commercial Mortgage Trust | 3.757 | 03/15/50 | 2,144 | |||||||||||
| Series - 2017 RB1 (Class AS) | |||||||||||||||
| 1,825,000 | Wells Fargo Commercial Mortgage Trust | 3.184 | 04/15/50 | 1,910 | |||||||||||
| Series - 2015 LC20 (Class A5) | |||||||||||||||
| 15,000,000 | Wells Fargo Commercial Mortgage Trust | 3.261 | 07/15/50 | 15,642 | |||||||||||
| Series - 2017 C38 (Class ASB) | |||||||||||||||
| 2,197,255 | i | Wells Fargo Commercial Mortgage Trust | 3.903 | 07/15/50 | 2,294 | ||||||||||
| Series - 2017 C38 (Class C) | |||||||||||||||
| 10,000,000 | Wells Fargo Commercial Mortgage Trust | 3.212 | 09/15/50 | 10,458 | |||||||||||
| Series - 2017 C39 (Class ASB) | |||||||||||||||
| 4,710,000 | Wells Fargo Commercial Mortgage Trust | 4.302 | 01/15/52 | 5,344 | |||||||||||
| Series - 2018 C48 (Class A5) | |||||||||||||||
| 4,000,000 | i | Wells Fargo Commercial Mortgage Trust | 3.767 | 07/15/58 | 4,268 | ||||||||||
| Series - 2015 NXS2 (Class A5) | |||||||||||||||
| 1,000,000 | i | Wells Fargo Commercial Mortgage Trust | 4.290 | 07/15/58 | 1,064 | ||||||||||
| Series - 2015 NXS2 (Class B) | |||||||||||||||
| 3,800,000 | Wells Fargo Commercial Mortgage Trust | 3.560 | 01/15/59 | 4,058 | |||||||||||
| Series - 2016 C32 (Class A4) | |||||||||||||||
| 6,000,000 | Wells Fargo Commercial Mortgage Trust | 3.749 | 03/15/59 | 6,351 | |||||||||||
| Series - 2016 C33 (Class AS) | |||||||||||||||
| 418,877 | g,i | Wells Fargo Mortgage Backed Securities Trust | 4.000 | 04/25/49 | 418 | ||||||||||
| Series - 2019 2 (Class A17) | |||||||||||||||
| 3,606,585 | g,i | Wells Fargo Mortgage Backed Securities Trust | 3.500 | 09/25/49 | 3,651 | ||||||||||
| Series - 2019 4 (Class A1) | |||||||||||||||
| 827,936 | g,i | Wells Fargo Mortgage Backed Securities Trust | 3.000 | 07/25/50 | 834 | ||||||||||
| Series - 2020 4 (Class A17) | |||||||||||||||
| 12,715,495 | g,i | Wells Fargo Mortgage Backed Securities Trust | 2.500 | 06/25/51 | 12,596 | ||||||||||
| Series - 2021 2 (Class A17) | |||||||||||||||
| 5,468,635 | g,i | Wells Fargo Mortgage Backed Securities Trust | 3.000 | 08/25/51 | 5,537 | ||||||||||
| Series - 2021 INV1 (Class A17) | |||||||||||||||
| 5,564,035 | g,i | Wells Fargo Mortgage Backed Securities Trust | 3.335 | 08/25/51 | 5,792 | ||||||||||
| Series - 2021 INV1 (Class B1) | |||||||||||||||
| 1,770,000 | WFRBS Commercial Mortgage Trust | 3.345 | 05/15/45 | 1,808 | |||||||||||
| Series - 2013 C13 (Class AS) | |||||||||||||||
| 4,073,170 | i | WFRBS Commercial Mortgage Trust | 4.079 | 03/15/46 | 4,248 | ||||||||||
| Series - 2013 UBS1 (Class A4) | |||||||||||||||
| 428 |
COLLEGE RETIREMENT EQUITIES FUND - Bond Market Account
| PRINCIPAL | ISSUER | RATE | MATURITY DATE | VALUE (000) | |||||||||||
| $ | 1,050,000 | i | WFRBS Commercial Mortgage Trust | 4.162 | % | 12/15/46 | $ | 1,101 | |||||||
| Series - 2013 C18 (Class A5) | |||||||||||||||
| 2,185,281 | WFRBS Commercial Mortgage Trust | 3.995 | 05/15/47 | 2,289 | |||||||||||
| Series - 2014 C20 (Class A5) | |||||||||||||||
| 3,865,000 | WFRBS Commercial Mortgage Trust | 3.607 | 11/15/47 | 4,063 | |||||||||||
| Series - 2014 C24 (Class A5) | |||||||||||||||
| 8,000,000 | WFRBS Commercial Mortgage Trust | 3.560 | 03/15/48 | 8,182 | |||||||||||
| Series - 2013 C12 (Class AS) | |||||||||||||||
| 374,888 | g,i | WinWater Mortgage Loan Trust | 3.906 | 06/20/44 | 375 | ||||||||||
| Series - 2014 1 (Class B4) | |||||||||||||||
| TOTAL OTHER MORTGAGE BACKED | 1,423,868 | ||||||||||||||
| TOTAL STRUCTURED ASSETS | 2,465,527 | ||||||||||||||
| (Cost $2,464,965) | |||||||||||||||
| TOTAL BONDS | 13,323,816 | ||||||||||||||
| (Cost $13,018,686) | |||||||||||||||
| SHARES | COMPANY | ||||||||||||||
| PREFERRED STOCKS - 0.1% | |||||||||||||||
| BANKS - 0.1% | |||||||||||||||
| 328,800 | Bank of America Corp | 8,411 | |||||||||||||
| 470,597 | * | Federal Home Loan Mortgage Corp (FHLMC) | 1,351 | ||||||||||||
| 1,527,061 | * | Federal National Mortgage Association (FNMA) | 4,764 | ||||||||||||
| 208,000 | JPMorgan Chase & Co | 5,431 | |||||||||||||
| TOTAL BANKS | 19,957 | ||||||||||||||
| TOTAL PREFERRED STOCKS | 19,957 | ||||||||||||||
| (Cost $63,411) | |||||||||||||||
| PRINCIPAL | ISSUER | ||||||||||||||
| SHORT-TERM INVESTMENTS - 14.3% | |||||||||||||||
| GOVERNMENT AGENCY DEBT - 13.6% | |||||||||||||||
| $ | 12,500,000 | Federal Agricultural Mortgage Corp (FAMC) | 0.000 | 01/25/22 | 12,500 | ||||||||||
| 20,000,000 | FAMC | 0.000 | 02/14/22 | 19,999 | |||||||||||
| 12,500,000 | FAMC | 0.000 | 02/28/22 | 12,500 | |||||||||||
| 23,333,000 | FAMC | 0.000 | 03/02/22 | 23,331 | |||||||||||
| 7,000,000 | FAMC | 0.000 | 08/26/22 | 6,989 | |||||||||||
| 690,000 | Federal Farm Credit Bank (FFCB) | 0.000 | 01/03/22 | 690 | |||||||||||
| 15,000,000 | FFCB | 0.000 | 01/05/22 | 15,000 | |||||||||||
| 40,000,000 | FFCB | 0.000 | 01/10/22 | 40,000 | |||||||||||
| 4,000,000 | FFCB | 0.000 | 01/13/22 | 4,000 | |||||||||||
| 6,000,000 | FFCB | 0.000 | 01/24/22 | 6,000 | |||||||||||
| 24,000,000 | FFCB | 0.000 | 01/25/22 | 24,000 | |||||||||||
| 10,000,000 | FFCB | 0.000 | 01/26/22 | 10,000 | |||||||||||
| 8,000,000 | FFCB | 0.000 | 02/07/22 | 8,000 | |||||||||||
| 10,000,000 | FFCB | 0.000 | 02/10/22 | 10,000 | |||||||||||
| 10,000,000 | FFCB | 0.000 | 02/11/22 | 10,000 | |||||||||||
| 33,334,000 | FFCB | 0.000 | 02/15/22 | 33,333 | |||||||||||
| 12,500,000 | FFCB | 0.000 | 03/01/22 | 12,499 | |||||||||||
| 12,500,000 | FFCB | 0.000 | 03/02/22 | 12,499 | |||||||||||
| 20,000,000 | FFCB | 0.000 | 03/11/22 | 19,998 | |||||||||||
| 429 |
COLLEGE RETIREMENT EQUITIES FUND - Bond Market Account
| PRINCIPAL | ISSUER | RATE | MATURITY DATE | VALUE (000) | |||||||||||
| $ | 11,627,000 | FFCB | 0.000 | % | 03/17/22 | $ | 11,626 | ||||||||
| 20,000,000 | FFCB | 0.000 | 03/23/22 | 19,998 | |||||||||||
| 9,000,000 | FFCB | 0.000 | 04/11/22 | 8,998 | |||||||||||
| 5,000,000 | FFCB | 0.000 | 04/29/22 | 4,998 | |||||||||||
| 20,000,000 | FFCB | 0.000 | 05/11/22 | 19,990 | |||||||||||
| 13,750,000 | FFCB | 0.000 | 05/27/22 | 13,742 | |||||||||||
| 5,395,000 | FFCB | 0.000 | 06/08/22 | 5,391 | |||||||||||
| 17,580,000 | FFCB | 0.000 | 06/16/22 | 17,565 | |||||||||||
| 11,760,000 | FFCB | 0.000 | 06/29/22 | 11,749 | |||||||||||
| 10,000,000 | FFCB | 0.000 | 07/06/22 | 9,989 | |||||||||||
| 16,197,000 | FFCB | 0.000 | 07/22/22 | 16,177 | |||||||||||
| 11,000,000 | FFCB | 0.000 | 07/25/22 | 10,986 | |||||||||||
| 5,461,000 | FFCB | 0.000 | 08/18/22 | 5,453 | |||||||||||
| 15,000,000 | FFCB | 0.000 | 09/13/22 | 14,972 | |||||||||||
| 22,000,000 | FFCB | 0.000 | 11/08/22 | 21,940 | |||||||||||
| 20,317,000 | Federal Home Loan Bank (FHLB) | 0.000 | 01/03/22 | 20,317 | |||||||||||
| 41,785,000 | FHLB | 0.000 | 01/04/22 | 41,785 | |||||||||||
| 144,446,000 | FHLB | 0.000 | 01/05/22 | 144,446 | |||||||||||
| 10,000,000 | FHLB | 0.000 | 01/07/22 | 10,000 | |||||||||||
| 26,548,000 | FHLB | 0.000 | 01/10/22 | 26,548 | |||||||||||
| 108,627,000 | FHLB | 0.000 | 01/12/22 | 108,627 | |||||||||||
| 20,000,000 | FHLB | 0.000 | 01/18/22 | 20,000 | |||||||||||
| 53,250,000 | FHLB | 0.000 | 01/19/22 | 53,250 | |||||||||||
| 30,000,000 | FHLB | 0.000 | 01/20/22 | 30,000 | |||||||||||
| 25,571,000 | FHLB | 0.000 | 01/21/22 | 25,571 | |||||||||||
| 10,000,000 | FHLB | 0.000 | 01/24/22 | 10,000 | |||||||||||
| 28,100,000 | FHLB | 0.000 | 01/26/22 | 28,100 | |||||||||||
| 40,000,000 | FHLB | 0.000 | 01/28/22 | 40,000 | |||||||||||
| 31,000,000 | FHLB | 0.040 | 01/28/22 | 30,994 | |||||||||||
| 5,000,000 | FHLB | 0.000 | 01/31/22 | 5,000 | |||||||||||
| 123,375,000 | FHLB | 0.000 | 02/02/22 | 123,373 | |||||||||||
| 70,000,000 | FHLB | 0.000 | 02/04/22 | 69,999 | |||||||||||
| 25,000,000 | FHLB | 0.000 | 02/07/22 | 24,999 | |||||||||||
| 104,192,000 | FHLB | 0.000 | 02/09/22 | 104,190 | |||||||||||
| 27,443,000 | FHLB | 0.000 | 02/11/22 | 27,442 | |||||||||||
| 50,000,000 | FHLB | 0.045 | 02/14/22 | 49,985 | |||||||||||
| 55,000,000 | FHLB | 0.000 | 02/18/22 | 54,999 | |||||||||||
| 25,000,000 | FHLB | 0.000 | 02/22/22 | 24,999 | |||||||||||
| 13,000,000 | FHLB | 0.000 | 03/11/22 | 12,999 | |||||||||||
| 2,593,000 | FHLB | 0.000 | 03/25/22 | 2,593 | |||||||||||
| 12,500,000 | FHLB | 0.000 | 04/06/22 | 12,497 | |||||||||||
| 5,000,000 | FHLB | 0.000 | 04/20/22 | 4,999 | |||||||||||
| 53,405,000 | FHLB | 0.000 | 04/22/22 | 53,390 | |||||||||||
| 16,500,000 | FHLB | 0.000 | 04/29/22 | 16,495 | |||||||||||
| 27,562,000 | FHLB | 0.000 | 05/05/22 | 27,549 | |||||||||||
| 6,680,000 | FHLB | 0.000 | 05/25/22 | 6,676 | |||||||||||
| 7,500,000 | FHLB | 0.000 | 06/08/22 | 7,494 | |||||||||||
| 25,000,000 | FHLB | 0.000 | 07/15/22 | 24,971 | |||||||||||
| 30,000,000 | FHLB | 0.000 | 08/01/22 | 29,958 | |||||||||||
| 15,000,000 | FHLB | 0.000 | 08/02/22 | 14,979 | |||||||||||
| 8,000,000 | FHLB | 0.000 | 08/05/22 | 7,989 | |||||||||||
| 18,000,000 | FHLB | 0.000 | 09/16/22 | 17,966 | |||||||||||
| 15,550,000 | Federal National Mortgage Association (FNMA) | 0.000 | 02/02/22 | 15,550 | |||||||||||
| 22,500,000 | FNMA | 0.000 | 03/02/22 | 22,498 | |||||||||||
| 27,500,000 | FNMA | 0.000 | 03/16/22 | 27,497 | |||||||||||
| TOTAL GOVERNMENT AGENCY DEBT | 1,855,636 | ||||||||||||||
| 430 |
COLLEGE RETIREMENT EQUITIES FUND - Bond Market Account
| PRINCIPAL | ISSUER | RATE | MATURITY DATE | VALUE (000) | |||||||||||
| TREASURY DEBT - 0.6% | |||||||||||||||
| EGP | 29,100,000 | Egypt Treasury Bill | 0.000 | % | 03/15/22 | $ | 1,813 | ||||||||
| 51,700,000 | Egypt Treasury Bill | 0.000 | 05/17/22 | 3,156 | |||||||||||
| $ | 40,000,000 | United States Treasury Bill | 0.000 | 08/11/22 | 39,952 | ||||||||||
| 10,000,000 | United States Treasury Bill | 0.000 | 10/06/22 | 9,980 | |||||||||||
| 24,890,000 | United States Treasury Note | 2.250 | 04/15/22 | 25,039 | |||||||||||
| TOTAL TREASURY DEBT | 79,940 | ||||||||||||||
| SHARES | COMPANY | ||||||||||||||
| INVESTMENT OF CASH COLLATERAL FOR SECURITIES LOANED - 0.1% | |||||||||||||||
| 13,709,003 | c | State Street Navigator Securities Lending Government Money Market Portfolio | 0.030 | 13,709 | |||||||||||
| TOTAL INVESTMENT OF CASH COLLATERAL FOR SECURITIES LOANED | 13,709 | ||||||||||||||
| TOTAL SHORT-TERM INVESTMENTS | 1,949,285 | ||||||||||||||
| (Cost $1,949,518) | |||||||||||||||
| TOTAL INVESTMENTS - 113.0% | 15,391,753 | ||||||||||||||
| (Cost $15,131,142) | |||||||||||||||
| OTHER ASSETS & LIABILITIES, NET - (13.0)% | (1,769,356 | ) | |||||||||||||
| NET ASSETS - 100.0% | $ | 13,622,397 | |||||||||||||
| AUD | Australian Dollar | ||
| CAD | Canadian Dollar | ||
| CNY | Chinese Yuan | ||
| DOP | Dominican Republic Peso | ||
| EGP | Egyptian Pound | ||
| EUR | Euro | ||
| EURIBOR | EURO Interbank Offer Rate | ||
| GBP | Pound Sterling | ||
| IDR | Indonesian Rupiah | ||
| ILS | Israeli New Shekel | ||
| JPY | Japanese Yen | ||
| KRW | South Korean Won | ||
| LIBOR | London Interbank Offered Rate | ||
| M | Month | ||
| MXN | Mexican Peso | ||
| MYR | Malaysian Ringgit | ||
| NOK | Norwegian Krone | ||
| NZD | New Zealand Dollar | ||
| PHP | Philippines Peso | ||
| PLN | Polish Zloty | ||
| REIT | Real Estate Investment Trust | ||
| RON | Romanian Leu | ||
| RSD | Serbian Dinar | ||
| RUB | Russian Ruble | ||
| SEK | Swedish Krona | ||
| SGD | Singapore Dollar | ||
| SONIA | Sterling Overnight Interbank Average Rate | ||
| THB | Thai Baht | ||
| 431 |
COLLEGE RETIREMENT EQUITIES FUND - Bond Market Account
| UAH | Ukrainian Hryvnia | ||
| UGX | Ugandan Shilling | ||
| UYU | Uruguayan Peso | ||
| UZS | Uzbekistani Som | ||
| ZAR | South African Rand | ||
| ^ | Amount represents less than $1,000. | ||
| * | Non-income producing | ||
| † | Security is categorized as Level 3 in the fair value hierarchy. | ||
| ‡ | Perpetual security | ||
| c | Investments made with cash collateral received from securities on loan. | ||
| d | All or a portion of these securities have been segregated to cover margin requirements on open futures contracts. | ||
| e | All or a portion of these securities are out on loan. The aggregate value of securities on loan is $13,400,892. | ||
| g | Security is exempt from registration under Rule 144(A) of the Securities Act of 1933, as amended. Such securities are deemed liquid and may be resold in transactions exempt from registration to qualified institutional buyers. At 12/31/21, the aggregate value of these securities is $2,930,966,342 or 21.5% of net assets. | ||
| h | All or a portion of these securities were purchased on a delayed delivery basis. | ||
| i | Floating or variable rate security includes the reference rate and spread, unless the variable rate is based on the underlying asset of the security. Coupon rate reflects the rate at period end. | ||
| k | Principal amount for interest accrual purposes is periodically adjusted based on changes in the Consumer Price Index. | ||
| o | Payment in Kind Bond | ||
| q | In default | ||
| Cost amounts are in thousands. | |||
Futures contracts outstanding as of December 31, 2021 were as follows (dollar amounts are in thousands):
| Description | Number of long (short) contracts | Expiration date | Notional amount | Value | Unrealized appreciation (depreciation) | |||||||||||||
| US 10YR Ultra | (1,943 | ) | 03/22/22 | $ | (279,909 | ) | $ | (284,528 | ) | $ | (4,619 | ) | ||||||
| 432 |
COLLEGE RETIREMENT EQUITIES FUND - Bond Market Account
Forward foreign currency contracts outstanding as of December 31, 2021 were as follows (dollar amounts are in thousands):
| Currency to be purchased | Receive | Currency to be sold | Deliver | Counterparty | Settlement date | Unrealized appreciation (depreciation) | ||||||||
| $ | 1,194 | NZD | 1,667 | Australia and New Zealand Banking Group | 02/01/22 | $ | 53 | |||||||
| $ | 498 | NZD | 696 | Australia and New Zealand Banking Group | 02/01/22 | 22 | ||||||||
| GBP | 69 | $ | 94 | Australia and New Zealand Banking Group | 01/31/22 | (1 | ) | |||||||
| Total | $ | 74 | ||||||||||||
| $ | 348 | GBP | 255 | Bank of America | 01/31/22 | $ | 3 | |||||||
| GBP | 991 | $ | 1,340 | Bank of America | 01/31/22 | 2 | ||||||||
| Total | $ | 5 | ||||||||||||
| $ | 6,339 | KRW | 7,535,195 | Citibank N.A. | 02/04/22 | $ | 9 | |||||||
| Total | $ | 9 | ||||||||||||
| $ | 1,397 | CAD | 1,777 | Goldman Sachs | 01/31/22 | $ | (7 | ) | ||||||
| $ | 1,473 | ILS | 4,630 | Goldman Sachs | 01/31/22 | (16 | ) | |||||||
| $ | 799 | THB | 26,644 | Goldman Sachs | 01/31/22 | 1 | ||||||||
| Total | $ | (22 | ) | |||||||||||
| $ | 7,554 | CAD | 9,325 | Morgan Stanley Capital Services | 01/31/22 | $ | 182 | |||||||
| $ | 1,099 | CAD | 1,367 | Morgan Stanley Capital Services | 01/31/22 | 19 | ||||||||
| $ | 1,493 | NOK | 12,543 | Morgan Stanley Capital Services | 01/31/22 | 70 | ||||||||
| $ | 708 | PLN | 2,968 | Morgan Stanley Capital Services | 01/31/22 | (27 | ) | |||||||
| $ | 697 | SEK | 5,971 | Morgan Stanley Capital Services | 01/31/22 | 36 | ||||||||
| CAD | 1,354 | $ | 1,089 | Morgan Stanley Capital Services | 01/31/22 | (19 | ) | |||||||
| EUR | 509 | $ | 574 | Morgan Stanley Capital Services | 01/31/22 | 6 | ||||||||
| $ | 419 | ZAR | 6,756 | Morgan Stanley Capital Services | 01/31/22 | (3 | ) | |||||||
| Total | $ | 264 | ||||||||||||
| $ | 4,624 | AUD | 6,150 | Toronto Dominion Bank | 01/31/22 | $ | 148 | |||||||
| $ | 19,848 | CNY | 127,559 | Toronto Dominion Bank | 01/28/22 | (169 | ) | |||||||
| $ | 91,508 | EUR | 81,008 | Toronto Dominion Bank | 01/31/22 | (777 | ) | |||||||
| $ | 3,787 | EUR | 3,343 | Toronto Dominion Bank | 03/15/22 | (24 | ) | |||||||
| $ | 24,978 | GBP | 18,188 | Toronto Dominion Bank | 01/31/22 | 362 | ||||||||
| $ | 945 | GBP | 700 | Toronto Dominion Bank | 01/31/22 | (2 | ) | |||||||
| $ | 504 | GBP | 378 | Toronto Dominion Bank | 01/31/22 | (8 | ) | |||||||
| $ | 27,269 | JPY | 3,093,974 | Toronto Dominion Bank | 01/31/22 | 365 | ||||||||
| Total | $ | (105 | ) | |||||||||||
| Total | $ | 225 | ||||||||||||
| AUD | Australian Dollar | ||
| CAD | Canadian Dollar | ||
| CNY | Chinese Yuan | ||
| EUR | Euro | ||
| GBP | Pound Sterling | ||
| ILS | Israeli New Shekel | ||
| JPY | Japanese Yen | ||
| KRW | South Korean Won | ||
| NOK | Norwegian Krone | ||
| NZD | New Zealand Dollar | ||
| PLN | Polish Zloty | ||
| SEK | Swedish Krona | ||
| THB | Thai Baht | ||
| ZAR | South African Rand | ||
| 433 |
COLLEGE RETIREMENT EQUITIES FUND - Bond Market Account
Centrally cleared credit default swap contracts outstanding as of December 31, 2021 were as follows (dollar amounts are in thousands):
PURCHASED
| Reference entity | Terms of payments to be paid | Terms of payments to be received | Counterparty | Frequency of payments | Maturity date | Notional amount* | Upfront premiums paid (received) | Value | Unrealized appreciation (depreciation) | |||||||||||||||||
| CDX-NAIGS37V1-5 Year Index | 1.00% | Credit event as specified in contract | Citigroup Global Markets, Inc | Quarterly | 12/20/2026 | $ | 75,000 | $ | (1,699 | ) | $ | (1,890 | ) | $ | (191 | ) | ||||||||||
| * | The maximum potential amount the Account could be required to pay as a seller of credit protection or receive as a buyer of credit protection if a credit event occurs is defined under the terms of that particular swap agreement. This amount may be reduced by any recoverable assets, if applicable. |
SOLD
| Reference entity | Terms of payments to be paid | Terms of payments to be received | Counterparty | Frequency of payments | Maturity date | Notional amount* | Upfront premiums paid (received) | Value | Unrealized appreciation (depreciation) | ||||||||||||||||||
| CDX-NAIGS37V1-5 Year Index | Credit event as specified in contract | 1.00 | % | Citigroup Global Markets, Inc | Quarterly | 12/20/2026 | $ | 37,500 | $ | 758 | $ | 924 | $ | 166 | |||||||||||||
| * | The maximum potential amount the Account could be required to pay as a seller of credit protection or receive as a buyer of credit protection if a credit event occurs is defined under the terms of that particular swap agreement. This amount may be reduced by any recoverable assets, if applicable. |
| 434 |
COLLEGE RETIREMENT EQUITIES FUND - Inflation-Linked Bond Account
COLLEGE RETIREMENT EQUITIES FUND
INFLATION-LINKED BOND ACCOUNT
SCHEDULE OF INVESTMENTS
December 31, 2021
| PRINCIPAL | ISSUER | REFERENCE RATE & SPREAD | RATE | MATURITY DATE | VALUE (000) | ||||||||||||
| BANK LOAN OBLIGATIONS - 0.4% | |||||||||||||||||
| COMMERCIAL & PROFESSIONAL SERVICES - 0.0% | |||||||||||||||||
| $ | 2,500,000 | i,h | Trans Union LLC | LIBOR 1 M + 2.250% | 2.750 | % | 12/01/28 | $ | 2,492 | ||||||||
| TOTAL COMMERCIAL & PROFESSIONAL SERVICES | 2,492 | ||||||||||||||||
| CONSUMER SERVICES - 0.1% | |||||||||||||||||
| 3,000,000 | i,h | 1011778 BC ULC | LIBOR 1 M + 1.750% | 1.854 | 11/19/26 | 2,955 | |||||||||||
| 2,500,000 | i,h | Stars Group Holdings BV | LIBOR 3 M + 2.250% | 2.382 | 07/21/26 | 2,489 | |||||||||||
| TOTAL CONSUMER SERVICES | 5,444 | ||||||||||||||||
| HEALTH CARE EQUIPMENT & SERVICES - 0.1% | |||||||||||||||||
| 375,000 | i,h | II-VI, Inc | LIBOR 3 M + 2.750% | 3.250 | 12/07/28 | 374 | |||||||||||
| 3,000,000 | i,h | Select Medical Corp | LIBOR 1 M + 2.250% | 2.360 | 03/06/25 | 2,978 | |||||||||||
| TOTAL HEALTH CARE EQUIPMENT & SERVICES | 3,352 | ||||||||||||||||
| MEDIA & ENTERTAINMENT - 0.1% | |||||||||||||||||
| 3,150,646 | i,h | Nascar Holdings, Inc | LIBOR 3 M + 2.750% | 2.604 | 10/19/26 | 3,143 | |||||||||||
| 2,500,000 | i,h | Organon & Co | LIBOR 3 M + 3.000% | 3.500 | 06/02/28 | 2,501 | |||||||||||
| TOTAL MEDIA & ENTERTAINMENT | 5,644 | ||||||||||||||||
| PHARMACEUTICALS, BIOTECHNOLOGY & LIFE SCIENCES - 0.1% | |||||||||||||||||
| 2,500,000 | i,h | Jazz Financing Lux Sarl | LIBOR 1 M + 3.500% | 4.000 | 05/05/28 | 2,508 | |||||||||||
| 5,000,000 | i,h | PPD, Inc | LIBOR 1 M + 2.250% | 2.500 | 01/13/28 | 4,989 | |||||||||||
| TOTAL PHARMACEUTICALS, BIOTECHNOLOGY & LIFE SCIENCES | 7,497 | ||||||||||||||||
| RETAILING - 0.0% | |||||||||||||||||
| 3,000,000 | i,h | Rexnord LLC | LIBOR 1 M + 2.250% | 2.750 | 10/04/28 | 2,999 | |||||||||||
| TOTAL RETAILING | 2,999 | ||||||||||||||||
| SOFTWARE & SERVICES - 0.0% | |||||||||||||||||
| 1,655,838 | i,h | SS&C Technologies, Inc | LIBOR 1 M + 1.750% | 1.854 | 04/16/25 | 1,636 | |||||||||||
| 1,344,162 | i,h | SS&C Technologies, Inc | LIBOR 1 M + 1.750% | 1.854 | 04/16/25 | 1,328 | |||||||||||
| TOTAL SOFTWARE & SERVICES | 2,964 | ||||||||||||||||
| UTILITIES - 0.0% | |||||||||||||||||
| 2,500,000 | i,h | Core & Main LP | LIBOR 1 M + 2.500% | 2.601 | 07/27/28 | 2,482 | |||||||||||
| TOTAL UTILITIES | 2,482 | ||||||||||||||||
| TOTAL BANK LOAN OBLIGATIONS | 32,874 | ||||||||||||||||
| (Cost $32,860) | |||||||||||||||||
| BONDS - 99.2% | |||||||||||||||||
| CORPORATE BONDS - 1.5% | |||||||||||||||||
| BANKS - 0.1% | |||||||||||||||||
| 3,000,000 | Bank of America Corp | 2.572 | 10/20/32 | 3,014 | |||||||||||||
| 3,000,000 | JPMorgan Chase & Co | 2.545 | 11/08/32 | 3,017 | |||||||||||||
| TOTAL BANKS | 6,031 | ||||||||||||||||
| 435 |
COLLEGE RETIREMENT EQUITIES FUND - Inflation-Linked Bond Account
| PRINCIPAL | ISSUER | RATE | MATURITY DATE | VALUE (000) | |||||||||||||
| COMMERCIAL & PROFESSIONAL SERVICES - 0.1% | |||||||||||||||||
| $ | 3,485,000 | g | Albion Financing SARL | 6.125 | % | 10/15/26 | $ | 3,520 | |||||||||
| 5,000,000 | g | Prime Security Services Borrower LLC | 5.750 | 04/15/26 | 5,368 | ||||||||||||
| TOTAL COMMERCIAL & PROFESSIONAL SERVICES | 8,888 | ||||||||||||||||
| DIVERSIFIED FINANCIALS - 0.1% | |||||||||||||||||
| 3,125,000 | g | Banco de Chile | 2.990 | 12/09/31 | 3,080 | ||||||||||||
| 3,000,000 | Morgan Stanley | 2.511 | 10/20/32 | 2,997 | |||||||||||||
| 5,000,000 | OneMain Finance Corp | 3.500 | 01/15/27 | 4,944 | |||||||||||||
| TOTAL DIVERSIFIED FINANCIALS | 11,021 | ||||||||||||||||
| ENERGY - 0.4% | |||||||||||||||||
| 2,275,000 | Ecopetrol S.A. | 4.625 | 11/02/31 | 2,212 | |||||||||||||
| 5,000,000 | g | Hess Midstream Operations LP | 5.625 | 02/15/26 | 5,150 | ||||||||||||
| 2,500,000 | g | MEG Energy Corp | 7.125 | 02/01/27 | 2,662 | ||||||||||||
| 5,000,000 | Murphy Oil Corp | 5.875 | 12/01/27 | 5,162 | |||||||||||||
| 5,000,000 | Occidental Petroleum Corp | 3.500 | 08/15/29 | 5,137 | |||||||||||||
| 3,150,000 | g | Parkland Corp | 4.625 | 05/01/30 | 3,130 | ||||||||||||
| 2,375,000 | e,g | Petroleos Mexicanos | 6.700 | 02/16/32 | 2,399 | ||||||||||||
| TOTAL ENERGY | 25,852 | ||||||||||||||||
| HEALTH CARE EQUIPMENT & SERVICES - 0.1% | |||||||||||||||||
| 6,000,000 | g | Tenet Healthcare Corp | 4.375 | 01/15/30 | 6,079 | ||||||||||||
| TOTAL HEALTH CARE EQUIPMENT & SERVICES | 6,079 | ||||||||||||||||
| MATERIALS - 0.1% | |||||||||||||||||
| 5,000,000 | g | SunCoke Energy, Inc | 4.875 | 06/30/29 | 4,975 | ||||||||||||
| TOTAL MATERIALS | 4,975 | ||||||||||||||||
| MEDIA & ENTERTAINMENT - 0.1% | |||||||||||||||||
| 2,970,000 | g | DISH DBS Corp | 5.250 | 12/01/26 | 3,017 | ||||||||||||
| 5,000,000 | g | Sirius XM Radio, Inc | 3.125 | 09/01/26 | 5,001 | ||||||||||||
| 1,575,000 | TSMC Arizona Corp | 1.750 | 10/25/26 | 1,576 | |||||||||||||
| TOTAL MEDIA & ENTERTAINMENT | 9,594 | ||||||||||||||||
| PHARMACEUTICALS, BIOTECHNOLOGY & LIFE SCIENCES - 0.1% | |||||||||||||||||
| 3,400,000 | g | Avantor Funding, Inc | 3.875 | 11/01/29 | 3,437 | ||||||||||||
| 1,045,000 | Teva Pharmaceutical Finance Netherlands III BV | 4.750 | 05/09/27 | 1,035 | |||||||||||||
| 990,000 | Teva Pharmaceutical Finance Netherlands III BV | 5.125 | 05/09/29 | 971 | |||||||||||||
| TOTAL PHARMACEUTICALS, BIOTECHNOLOGY & LIFE SCIENCES | 5,443 | ||||||||||||||||
| REAL ESTATE - 0.1% | |||||||||||||||||
| 5,000,000 | g | Howard Hughes Corp | 4.125 | 02/01/29 | 5,067 | ||||||||||||
| 5,000,000 | g | RLJ Lodging Trust LP | 3.750 | 07/01/26 | 5,027 | ||||||||||||
| TOTAL REAL ESTATE | 10,094 | ||||||||||||||||
| RETAILING - 0.0% | |||||||||||||||||
| 4,340,000 | g | Asbury Automotive Group, Inc | 4.625 | 11/15/29 | 4,421 | ||||||||||||
| TOTAL RETAILING | 4,421 | ||||||||||||||||
| 436 |
COLLEGE RETIREMENT EQUITIES FUND - Inflation-Linked Bond Account
| PRINCIPAL | ISSUER | RATE | MATURITY DATE | VALUE (000) | |||||||||||||
| SOFTWARE & SERVICES - 0.1% | |||||||||||||||||
| $ | 2,435,000 | g | CA Magnum Holdings | 5.375 | % | 10/31/26 | $ | 2,517 | |||||||||
| 2,830,000 | g | Open Text Corp | 3.875 | 12/01/29 | 2,866 | ||||||||||||
| TOTAL SOFTWARE & SERVICES | 5,383 | ||||||||||||||||
| TELECOMMUNICATION SERVICES - 0.2% | |||||||||||||||||
| 3,000,000 | AT&T, Inc | 3.100 | 02/01/43 | 2,916 | |||||||||||||
| 4,925,000 | g | Iliad Holding SASU | 6.500 | 10/15/26 | 5,175 | ||||||||||||
| 3,000,000 | g | Telefonica Moviles Chile S.A. | 3.537 | 11/18/31 | 2,987 | ||||||||||||
| 3,000,000 | Verizon Communications, Inc | 3.400 | 03/22/41 | 3,141 | |||||||||||||
| TOTAL TELECOMMUNICATION SERVICES | 14,219 | ||||||||||||||||
| TOTAL CORPORATE BONDS | 112,000 | ||||||||||||||||
| (Cost $111,924) | |||||||||||||||||
| GOVERNMENT BONDS - 95.5% | |||||||||||||||||
| AGENCY SECURITIES - 0.2% | |||||||||||||||||
| 14,985,000 | Montefiore Medical Center | 2.895 | 04/20/32 | 15,719 | |||||||||||||
| 2,960,526 | Reliance Industries Ltd | 2.444 | 01/15/26 | 3,036 | |||||||||||||
| TOTAL AGENCY SECURITIES | 18,755 | ||||||||||||||||
| MORTGAGE BACKED - 2.6% | |||||||||||||||||
| 6,225,000 | g,i | Federal Home Loan STACR REMIC Trust | 2.300 | 08/25/33 | 6,291 | ||||||||||||
| 10,000,000 | g,i | Federal Home Loan STACR REMIC Trust | 1.000 | 12/25/41 | 10,000 | ||||||||||||
| 20,055,164 | Government National Mortgage Association (GNMA) | 3.600 | 09/15/31 | 20,853 | |||||||||||||
| 9,987,600 | GNMA | 3.650 | 02/15/32 | 10,565 | |||||||||||||
| 2,243,084 | GNMA | 3.380 | 07/15/35 | 2,331 | |||||||||||||
| 2,921,424 | GNMA | 3.870 | 10/15/36 | 3,084 | |||||||||||||
| 38,019,181 | GNMA | 1.730 | 07/15/37 | 37,988 | |||||||||||||
| 56,603,124 | GNMA | 4.250 | 09/15/38 | 59,730 | |||||||||||||
| 24,255,036 | GNMA | 1.650 | 07/15/42 | 23,871 | |||||||||||||
| 26,228,351 | GNMA | 2.750 | 01/15/45 | 27,711 | |||||||||||||
| TOTAL MORTGAGE BACKED | 202,424 | ||||||||||||||||
| U.S. TREASURY SECURITIES - 92.7% | |||||||||||||||||
| 262,249,983 | k | United States Treasury Inflation Indexed Bonds | 0.125 | 07/15/22 | 268,719 | ||||||||||||
| 364,179,840 | k | United States Treasury Inflation Indexed Bonds | 0.125 | 01/15/23 | 376,101 | ||||||||||||
| 263,833,140 | k | United States Treasury Inflation Indexed Bonds | 0.625 | 04/15/23 | 275,798 | ||||||||||||
| 266,750,900 | k | United States Treasury Inflation Indexed Bonds | 0.375 | 07/15/23 | 280,459 | ||||||||||||
| 189,909,070 | d,k | United States Treasury Inflation Indexed Bonds | 0.625 | 01/15/24 | �� | 202,091 | |||||||||||
| 223,661,520 | k | United States Treasury Inflation Indexed Bonds | 0.500 | 04/15/24 | 238,404 | ||||||||||||
| 189,237,750 | k | United States Treasury Inflation Indexed Bonds | 0.125 | 07/15/24 | 201,716 | ||||||||||||
| 212,857,600 | k | United States Treasury Inflation Indexed Bonds | 0.125 | 10/15/24 | 227,340 | ||||||||||||
| 213,643,350 | k | United States Treasury Inflation Indexed Bonds | 0.250 | 01/15/25 | 228,876 | ||||||||||||
| 112,971,286 | k | United States Treasury Inflation Indexed Bonds | 2.375 | 01/15/25 | 128,644 | ||||||||||||
| 173,424,240 | k | United States Treasury Inflation Indexed Bonds | 0.125 | 04/15/25 | 185,502 | ||||||||||||
| 230,873,940 | k | United States Treasury Inflation Indexed Bonds | 0.375 | 07/15/25 | 250,745 | ||||||||||||
| 300,524,580 | k | United States Treasury Inflation Indexed Bonds | 0.125 | 10/15/25 | 323,957 | ||||||||||||
| 247,322,882 | k | United States Treasury Inflation Indexed Bonds | 0.625 | 01/15/26 | 271,610 | ||||||||||||
| 74,291,324 | k | United States Treasury Inflation Indexed Bonds | 2.000 | 01/15/26 | 85,957 | ||||||||||||
| 152,888,000 | k | United States Treasury Inflation Indexed Bonds | 0.125 | 04/15/26 | 164,985 | ||||||||||||
| 170,729,840 | k | United States Treasury Inflation Indexed Bonds | 0.125 | 07/15/26 | 185,350 | ||||||||||||
| 279,051,107 | k | United States Treasury Inflation Indexed Bonds | 0.125 | 10/15/26 | 303,447 | ||||||||||||
| 437 |
COLLEGE RETIREMENT EQUITIES FUND - Inflation-Linked Bond Account
| PRINCIPAL | ISSUER | REFERENCE RATE & SPREAD | RATE | MATURITY DATE | VALUE (000) | ||||||||||||
| $ | 227,224,935 | k | United States Treasury Inflation Indexed Bonds | 0.375 | % | 01/15/27 | $ | 249,913 | |||||||||
| 131,906,554 | k | United States Treasury Inflation Indexed Bonds | 2.375 | 01/15/27 | 159,300 | ||||||||||||
| 130,561,200 | k | United States Treasury Inflation Indexed Bonds | 0.375 | 07/15/27 | 144,842 | ||||||||||||
| 230,367,555 | k | United States Treasury Inflation Indexed Bonds | 0.500 | 01/15/28 | 257,747 | ||||||||||||
| 227,552,484 | k | United States Treasury Inflation Indexed Bonds | 1.750 | 01/15/28 | 272,962 | ||||||||||||
| 121,426,471 | k | United States Treasury Inflation Indexed Bonds | 3.625 | 04/15/28 | 161,310 | ||||||||||||
| 141,002,240 | k | United States Treasury Inflation Indexed Bonds | 0.750 | 07/15/28 | 161,465 | ||||||||||||
| 206,973,900 | k | United States Treasury Inflation Indexed Bonds | 0.875 | 01/15/29 | 239,328 | ||||||||||||
| 151,845,768 | k | United States Treasury Inflation Indexed Bonds | 2.500 | 01/15/29 | 194,099 | ||||||||||||
| 8,561,584 | k | United States Treasury Inflation Indexed Bonds | 3.875 | 04/15/29 | 11,923 | ||||||||||||
| 202,148,870 | k | United States Treasury Inflation Indexed Bonds | 0.250 | 07/15/29 | 226,488 | ||||||||||||
| 166,586,250 | k | United States Treasury Inflation Indexed Bonds | 0.125 | 01/15/30 | 184,882 | ||||||||||||
| 132,115,025 | k | United States Treasury Inflation Indexed Bonds | 0.125 | 07/15/30 | 147,803 | ||||||||||||
| 161,458,960 | k | United States Treasury Inflation Indexed Bonds | 0.125 | 01/15/31 | 180,763 | ||||||||||||
| 242,922,759 | k | United States Treasury Inflation Indexed Bonds | 0.125 | 07/15/31 | 273,038 | ||||||||||||
| 69,479,218 | k | United States Treasury Inflation Indexed Bonds | 3.375 | 04/15/32 | 103,329 | ||||||||||||
| 66,911,670 | k | United States Treasury Inflation Indexed Bonds | 0.125 | 02/15/51 | 79,191 | ||||||||||||
| TOTAL U.S. TREASURY SECURITIES | 7,248,084 | ||||||||||||||||
| TOTAL GOVERNMENT BONDS | 7,469,263 | ||||||||||||||||
| (Cost $6,948,968) | |||||||||||||||||
| STRUCTURED ASSETS - 2.2% | |||||||||||||||||
| �� | |||||||||||||||||
| ASSET BACKED - 0.4% | |||||||||||||||||
| 4,214,000 | i | Bayview Financial Mortgage Pass-Through Trust | LIBOR 1 M + 1.125% | 1.227 | 02/28/41 | 4,218 | |||||||||||
| Series - 2006 A (Class M4) | |||||||||||||||||
| 3,000,000 | g | DB Master Finance LLC | 2.045 | 11/20/51 | 2,931 | ||||||||||||
| Series - 2021 1A (Class A2I) | |||||||||||||||||
| 5,900,000 | g | DB Master Finance LLC | 2.493 | 11/20/51 | 5,874 | ||||||||||||
| Series - 2021 1A (Class A2II) | |||||||||||||||||
| 4,400,000 | g | DB Master Finance LLC | 2.791 | 11/20/51 | 4,389 | ||||||||||||
| Series - 2021 1A (Class A23) | |||||||||||||||||
| 8,000,000 | g | MVW LLC | 1.830 | 05/20/39 | 7,948 | ||||||||||||
| Series - 2021 2A (Class B) | |||||||||||||||||
| 6,990,008 | †,g | Oak Street Investment Grade Net Lease Fund Series | 2.380 | 11/20/51 | 7,001 | ||||||||||||
| Series - 2021 2A (Class A1) | |||||||||||||||||
| TOTAL ASSET BACKED | 32,361 | ||||||||||||||||
| OTHER MORTGAGE BACKED - 1.8% | |||||||||||||||||
| 2,000,000 | i | BENCHMARK Mortgage Trust | 4.197 | 02/15/51 | 2,124 | ||||||||||||
| Series - 2018 B2 (Class C) | |||||||||||||||||
| 5,000,000 | g,i | BX Commercial Mortgage Trust | LIBOR 1 M + 0.921% | 1.021 | 12/15/28 | 4,998 | |||||||||||
| Series - 2021 CIP (Class A) | |||||||||||||||||
| 6,000,000 | g,i | BX Commercial Mortgage Trust | LIBOR 1 M + 1.271% | 1.371 | 12/15/28 | 5,998 | |||||||||||
| Series - 2021 CIP (Class B) | |||||||||||||||||
| 3,675,000 | g,i | BX Commercial Mortgage Trust | LIBOR 1 M + 1.800% | 1.910 | 11/15/35 | 3,673 | |||||||||||
| Series - 2018 IND (Class F) | |||||||||||||||||
| 30,250,000 | g,i | BX Commercial Mortgage Trust | LIBOR 1 M + 1.197% | 1.307 | 10/15/38 | 30,063 | |||||||||||
| Series - 2021 XL2 (Class C) | |||||||||||||||||
| 1,500,000 | g,i | BX Commercial Mortgage Trust | LIBOR 1 M + 1.846% | 1.956 | 10/15/38 | 1,491 | |||||||||||
| Series - 2021 XL2 (Class E) | |||||||||||||||||
| 438 |
COLLEGE RETIREMENT EQUITIES FUND - Inflation-Linked Bond Account
| PRINCIPAL | ISSUER | REFERENCE RATE & SPREAD | RATE | MATURITY DATE | VALUE (000) | ||||||||||||
| $ | 5,650,000 | g,i | Citigroup Commercial Mortgage Trust | LIBOR 1 M + 1.900% | 2.010 | % | 10/15/36 | $ | 5,637 | ||||||||
| Series - 2021 PRM2 (Class D) | |||||||||||||||||
| 7,000,000 | g,i | Citigroup Commercial Mortgage Trust | LIBOR 1 M + 2.400% | 2.510 | 10/15/36 | 6,984 | |||||||||||
| Series - 2021 PRM2 (Class E) | |||||||||||||||||
| 2,000,000 | g | COMM Mortgage Trust | 3.397 | 03/10/46 | 2,025 | ||||||||||||
| Series - 2013 CR6 (Class B) | |||||||||||||||||
| 1,000,000 | i | COMM Mortgage Trust | 4.558 | 10/10/47 | 1,046 | ||||||||||||
| Series - 2014 LC17 (Class C) | |||||||||||||||||
| 2,500,000 | i | COMM Mortgage Trust | 4.478 | 10/10/48 | 2,673 | ||||||||||||
| Series - 2015 CR26 (Class B) | |||||||||||||||||
| 7,049,704 | g,i | Connecticut Avenue Securities | 0.950 | 11/25/41 | 7,054 | ||||||||||||
| Series - 2021 R02 (Class 2M1) | |||||||||||||||||
| 10,000,000 | g,i | Connecticut Avenue Securities Trust | 1.600 | 10/25/41 | 10,012 | ||||||||||||
| Series - 2021 R01 (Class 1M2) | |||||||||||||||||
| 9,000,000 | g,i | Connecticut Avenue Securities Trust | 1.700 | 12/25/41 | 9,011 | ||||||||||||
| Series - 2021 R03 (Class 1M2) | |||||||||||||||||
| 6,000,000 | g,i | ELP Commercial Mortgage Trust | LIBOR 1 M + 1.320% | 1.430 | 11/15/38 | 5,965 | |||||||||||
| Series - 2021 ELP (Class C) | |||||||||||||||||
| 7,000,000 | g,i | ELP Commercial Mortgage Trust | LIBOR 1 M + 2.118% | 2.228 | 11/15/38 | 6,959 | |||||||||||
| Series - 2021 ELP (Class E) | |||||||||||||||||
| 5,000,000 | g,i | EQUS Mortgage Trust | LIBOR 1 M + 2.300% | 2.410 | 10/15/38 | 4,976 | |||||||||||
| Series - 2021 EQAZ (Class E) | |||||||||||||||||
| 2,485,000 | g,i | Freddie Mac STACR REMIC Trust | 1.700 | 01/25/34 | 2,496 | ||||||||||||
| Series - 2021 DNA5 (Class M2) | |||||||||||||||||
| 4,000,000 | g,i | GS Mortgage Securities Corp II | LIBOR 1 M + 3.350% | 3.460 | 11/15/36 | 3,991 | |||||||||||
| Series - 2021 ARDN (Class E) | |||||||||||||||||
| 2,000,000 | g | JP Morgan Chase Commercial Mortgage Securities Trust | 3.620 | 01/16/37 | 1,984 | ||||||||||||
| Series - 2020 NNN (Class DFX) | |||||||||||||||||
| 3,986,816 | g,i | Morgan Stanley Capital I Inc | LIBOR 1 M + 1.377% | 1.487 | 11/15/23 | 3,968 | |||||||||||
| Series - 2021 ILP (Class C) | |||||||||||||||||
| 1,500,000 | g | MRCD Mortgage Trust | 2.718 | 12/15/36 | 1,462 | ||||||||||||
| Series - 2019 PARK (Class E) | |||||||||||||||||
| 2,500,000 | g,i | Natixis Commercial Mortgage Securities Trust | LIBOR 1 M + 2.200% | 2.310 | 07/15/36 | 2,497 | |||||||||||
| Series - 2019 MILE (Class C) | |||||||||||||||||
| 2,000,000 | g,i | SREIT Trust | LIBOR 1 M + 1.171% | 1.271 | 11/15/36 | 1,990 | |||||||||||
| Series - 2021 MFP2 (Class B) | |||||||||||||||||
| 3,342,805 | g | Verus Securitization Trust | 3.000 | 11/25/59 | 3,373 | ||||||||||||
| Series - 2019 4 (Class A3) | |||||||||||||||||
| 9,850,334 | g,i | Verus Securitization Trust | 2.240 | 10/25/66 | 9,826 | ||||||||||||
| Series - 2021 7 (Class A3) | |||||||||||||||||
| 1,451,000 | i | WFRBS Commercial Mortgage Trust | 4.183 | 03/15/45 | 1,477 | ||||||||||||
| Series - 2013 C11 (Class C) | |||||||||||||||||
| TOTAL OTHER MORTGAGE BACKED | 143,753 | ||||||||||||||||
| TOTAL STRUCTURED ASSETS | 176,114 | ||||||||||||||||
| (Cost $176,412) | |||||||||||||||||
| TOTAL BONDS | 7,757,377 | ||||||||||||||||
| (Cost $7,237,304) | |||||||||||||||||
| SHORT-TERM INVESTMENTS - 0.6% | |||||||||||||||||
| GOVERNMENT AGENCY DEBT - 0.1% | |||||||||||||||||
| 7,500,000 | Federal Home Loan Bank (FHLB) | 0.000 | 01/14/22 | 7,500 | |||||||||||||
| TOTAL GOVERNMENT AGENCY DEBT | 7,500 | ||||||||||||||||
| 439 |
COLLEGE RETIREMENT EQUITIES FUND - Inflation-Linked Bond Account
| PRINCIPAL | ISSUER | RATE | MATURITY DATE | VALUE (000) | ||||||||||||||
| REPURCHASE AGREEMENT - 0.4% | ||||||||||||||||||
| $ | 31,000,000 | r | Fixed Income Clearing Corp (FICC) | 0.020 | % | 01/03/22 | $ | 31,000 | ||||||||||
| TOTAL REPURCHASE AGREEMENT | 31,000 | |||||||||||||||||
| TREASURY DEBT - 0.1% | ||||||||||||||||||
| 10,000,000 | United States Treasury Bill | 0.000 | 06/23/22 | 9,992 | ||||||||||||||
| TOTAL TREASURY DEBT | 9,992 | |||||||||||||||||
| SHARES | COMPANY | |||||||||||||||||
| INVESTMENTS IN REGISTERED INVESTMENT COMPANIES - 0.0% | ||||||||||||||||||
| 2,033,802 | c | State Street Navigator Securities Lending Government Money Market Portfolio | 0.030 | 2,034 | ||||||||||||||
| TOTAL INVESTMENTS IN REGISTERED INVESTMENT COMPANIES | 2,034 | |||||||||||||||||
| TOTAL SHORT-TERM INVESTMENTS | 50,526 | |||||||||||||||||
| (Cost $50,526) | ||||||||||||||||||
| TOTAL INVESTMENTS - 100.2% | 7,840,777 | |||||||||||||||||
| (Cost $7,320,690) | ||||||||||||||||||
| OTHER ASSETS & LIABILITIES, NET - (0.2)% | (16,512 | ) | ||||||||||||||||
| NET ASSETS - 100.0% | $ | 7,824,265 | ||||||||||||||||
| LIBOR | London Interbank Offered Rate | |||||||||||||||||
| M | Month | |||||||||||||||||
| REIT | Real Estate Investment Trust | |||||||||||||||||
| REMIC | Real Estate Mortgage Investment Conduit | |||||||||||||||||
| † | Security is categorized as Level 3 in the fair value hierarchy. | |||||
| c | Investments made with cash collateral received from securities on loan. | |||||
| d | All or a portion of these securities have been segregated to cover margin requirements on open futures contracts. | |||||
| e | All or a portion of these securities are out on loan. The aggregate value of securities on loan is $1,989,769. | |||||
| g | Security is exempt from registration under Rule 144(A) of the Securities Act of 1933, as amended. Such securities are deemed liquid and may be resold in transactions exempt from registration to qualified institutional buyers. At 12/31/21, the aggregate value of these securities is $256,745,131 or 3.3% of net assets. | |||||
| h | All or a portion of these securities were purchased on a delayed delivery basis. | |||||
| i | Floating or variable rate security includes the reference rate and spread, unless the variable rate is based on the underlying asset of the security. Coupon rate reflects the rate at period end. | |||||
| k | Principal amount for interest accrual purposes is periodically adjusted based on changes in the Consumer Price Index. | |||||
| r | Agreement with Fixed Income Clearing Corporation, 0.020% dated 12/31/21 to be repurchased at $31,000,000 on 01/03/22, collateralized by Government Agency Securities, with coupon rate 1.875% and maturity date 02/15/2041, valued at $31,620,066. | |||||
| Cost amounts are in thousands. | ||||||
Futures contracts outstanding as of December 31, 2021 were as follows (dollar amounts are in thousands):
| Description | Number of long (short) contracts | Expiration date | Notional amount | Value | Unrealized appreciation (depreciation) | |||||||||||||
| US Long Bond | (20 | ) | 03/22/22 | $ | (3,164 | ) | $ | (3,209 | ) | $ | (45 | ) | ||||||
| US Ultra Bond | (480 | ) | 03/22/22 | (92,695 | ) | (94,620 | ) | (1,925 | ) | |||||||||
| Total | (500 | ) | $ | (95,859 | ) | $ | (97,829 | ) | $ | (1,970 | ) | |||||||
| 440 |
COLLEGE RETIREMENT EQUITIES FUND - Social Choice Account
COLLEGE RETIREMENT EQUITIES FUND
SOCIAL CHOICE ACCOUNT
SCHEDULE OF INVESTMENTS
December 31, 2021
| PRINCIPAL | ISSUER | REFERENCE RATE & SPREAD | RATE | MATURITY DATE | VALUE (000) | ||||||||||||
| BANK LOAN OBLIGATIONS - 0.1% | |||||||||||||||||
| COMMERCIAL & PROFESSIONAL SERVICES - 0.1% | |||||||||||||||||
| $ | 15,960,000 | i | LTR Intermediate Holdings, Inc | LIBOR 3 M + 4.500% | 5.500 | % | 05/05/28 | $ | 15,830 | ||||||||
| TOTAL COMMERCIAL & PROFESSIONAL SERVICES | 15,830 | ||||||||||||||||
| TOTAL BANK LOAN OBLIGATIONS | 15,830 | ||||||||||||||||
| (Cost $15,800) | |||||||||||||||||
| BONDS - 38.7% | |||||||||||||||||
| CORPORATE BONDS - 16.9% | |||||||||||||||||
| AUTOMOBILES & COMPONENTS - 0.2% | |||||||||||||||||
| 6,250,000 | Aptiv plc | 3.100 | 12/01/51 | 5,953 | |||||||||||||
| 5,000,000 | Dana, Inc | 4.250 | 09/01/30 | 5,069 | |||||||||||||
| 4,425,000 | g | Denso Corp | 1.239 | 09/16/26 | 4,334 | ||||||||||||
| 9,665,000 | e | Ford Motor Co | 3.250 | 02/12/32 | 9,897 | ||||||||||||
| 12,925,000 | g | Hyundai Capital Services, Inc | 1.250 | 02/08/26 | 12,608 | ||||||||||||
| TOTAL AUTOMOBILES & COMPONENTS | 37,861 | ||||||||||||||||
| BANKS - 3.0% | |||||||||||||||||
| 12,500,000 | g | ABN AMRO Bank NV | 1.542 | 06/16/27 | 12,253 | ||||||||||||
| 13,800,000 | g | ABN AMRO Bank NV | 2.470 | 12/13/29 | 13,800 | ||||||||||||
| 13,400,000 | g | ABN AMRO Bank NV | 3.324 | 03/13/37 | 13,389 | ||||||||||||
| 6,925,000 | g | Banco Nacional de Comercio Exterior SNC | 2.720 | 08/11/31 | 6,838 | ||||||||||||
| 12,575,000 | g | Bank Hapoalim BM | 3.255 | 01/21/32 | 12,474 | ||||||||||||
| 13,750,000 | Bank of America Corp | 0.981 | 09/25/25 | 13,583 | |||||||||||||
| 14,025,000 | Bank of America Corp | 2.456 | 10/22/25 | 14,405 | |||||||||||||
| 15,000,000 | i | Bank of America Corp | SOFR + 0.970% | 1.020 | 07/22/27 | 15,251 | |||||||||||
| 12,500,000 | Bank of America Corp | 2.087 | 06/14/29 | 12,412 | |||||||||||||
| 15,750,000 | Bank of America Corp | 2.687 | 04/22/32 | 15,984 | |||||||||||||
| 10,000,000 | Bank of Montreal | 3.803 | 12/15/32 | 10,726 | |||||||||||||
| 2,250,000 | Barclays plc | 3.811 | 03/10/42 | 2,399 | |||||||||||||
| 6,225,000 | Barclays plc | 4.375 | N/A‡ | 6,097 | |||||||||||||
| 4,350,000 | g | BNP Paribas S.A. | 1.904 | 09/30/28 | 4,246 | ||||||||||||
| 15,300,000 | g | BNP Paribas S.A. | 2.871 | 04/19/32 | 15,513 | ||||||||||||
| 6,925,000 | g | BNP Paribas S.A. | 2.588 | 08/12/35 | 6,634 | ||||||||||||
| 10,000,000 | Citigroup, Inc | 1.678 | 05/15/24 | 10,111 | |||||||||||||
| 14,125,000 | Citigroup, Inc | 0.776 | 10/30/24 | 14,041 | |||||||||||||
| 12,600,000 | Citigroup, Inc | 1.281 | 11/03/25 | 12,566 | |||||||||||||
| 4,345,000 | Citigroup, Inc | 5.000 | N/A‡ | 4,475 | |||||||||||||
| 2,900,000 | Citigroup, Inc | 5.950 | N/A‡ | 3,103 | |||||||||||||
| 5,475,000 | Citizens Bank NA | 2.250 | 04/28/25 | 5,603 | |||||||||||||
| 3,800,000 | Citizens Bank NA | 3.750 | 02/18/26 | 4,094 | |||||||||||||
| 1,625,000 | g | Credit Agricole S.A. | 3.375 | 01/10/22 | 1,626 | ||||||||||||
| 13,750,000 | HSBC Holdings plc | 2.206 | 08/17/29 | 13,484 | |||||||||||||
| 1,670,000 | i | ING Groep NV | LIBOR 3 M + 1.150% | 1.370 | 03/29/22 | 1,674 | |||||||||||
| 12,500,000 | i | ING Groep NV | SOFR + 1.010% | 1.060 | 04/01/27 | 12,611 | |||||||||||
| 10,000,000 | ING Groep NV | 2.727 | 04/01/32 | 10,209 | |||||||||||||
| 2,714,000 | g | Intesa Sanpaolo S.p.A | 3.375 | 01/12/23 | 2,773 | ||||||||||||
| 1,825,000 | g | Intesa Sanpaolo S.p.A | 5.017 | 06/26/24 | 1,955 | ||||||||||||
| 441 |
COLLEGE RETIREMENT EQUITIES FUND - Social Choice Account
| PRINCIPAL | ISSUER | REFERENCE RATE & SPREAD | RATE | MATURITY DATE | VALUE (000) | ||||||||||||
| $ | 9,750,000 | g | Intesa Sanpaolo S.p.A | 3.250 | % | 09/23/24 | $ | 10,150 | |||||||||
| 6,000,000 | g | Intesa Sanpaolo S.p.A | 4.950 | 06/01/42 | 6,164 | ||||||||||||
| 10,000,000 | e,g | Itau Unibanco Holding S.A. | 3.875 | 04/15/31 | 9,600 | ||||||||||||
| 9,150,000 | JPMorgan Chase & Co | 0.563 | 02/16/25 | 9,017 | |||||||||||||
| 15,000,000 | JPMorgan Chase & Co | 1.040 | 02/04/27 | 14,518 | |||||||||||||
| 13,065,000 | JPMorgan Chase & Co | 3.650 | N/A‡ | 13,032 | |||||||||||||
| 9,570,000 | g | Kookmin Bank | 2.500 | 11/04/30 | 9,385 | ||||||||||||
| 4,000,000 | Lloyds Banking Group plc | 4.500 | 11/04/24 | 4,309 | |||||||||||||
| 9,494,000 | Lloyds Banking Group plc | 3.870 | 07/09/25 | 10,029 | |||||||||||||
| 7,725,000 | Massachusetts Higher Education Assistance Corp | 2.673 | 07/01/31 | 7,858 | |||||||||||||
| 5,925,000 | i | Mizuho Financial Group, Inc | LIBOR 3 M + 0.630% | 0.810 | 03/01/28 | 5,951 | |||||||||||
| 11,125,000 | g | National Australia Bank Ltd | 2.332 | 08/21/30 | 10,658 | ||||||||||||
| 10,000,000 | g | National Australia Bank Ltd | 2.990 | 05/21/31 | 10,029 | ||||||||||||
| 12,638,000 | National Bank of Canada | 0.550 | 11/15/24 | 12,491 | |||||||||||||
| 7,500,000 | Natwest Group plc | 1.642 | 06/14/27 | 7,397 | |||||||||||||
| 2,790,000 | NatWest Group plc | 2.359 | 05/22/24 | 2,835 | |||||||||||||
| 10,000,000 | People’s United Bank NA | 4.000 | 07/15/24 | 10,498 | |||||||||||||
| 7,150,000 | g | Standard Chartered plc | 0.991 | 01/12/25 | 7,069 | ||||||||||||
| 10,000,000 | g | Standard Chartered plc | 1.456 | 01/14/27 | 9,691 | ||||||||||||
| 7,275,000 | Sumitomo Mitsui Financial Group, Inc | 1.474 | 07/08/25 | 7,237 | |||||||||||||
| 11,500,000 | SVB Financial Group | 2.100 | 05/15/28 | 11,503 | |||||||||||||
| 1,925,000 | SVB Financial Group | 3.125 | 06/05/30 | 2,020 | |||||||||||||
| 12,775,000 | SVB Financial Group | 1.800 | 02/02/31 | 12,103 | |||||||||||||
| 14,135,000 | SVB Financial Group | 4.100 | N/A‡ | 13,980 | |||||||||||||
| 10,000,000 | SVB Financial Group | 4.000 | N/A‡ | 10,050 | |||||||||||||
| 14,350,000 | Truist Financial Corp | 1.267 | 03/02/27 | 14,079 | |||||||||||||
| 14,200,000 | g,i | UBS AG. | SOFR + 0.450% | 0.500 | 08/09/24 | 14,223 | |||||||||||
| 11,675,000 | g | UBS Group AG. | 1.494 | 08/10/27 | 11,389 | ||||||||||||
| 3,241,000 | g,i | UniCredit S.p.A | LIBOR 3 M + 3.900% | 4.027 | 01/14/22 | 3,244 | |||||||||||
| 7,500,000 | g | UniCredit S.p.A | 6.572 | 01/14/22 | 7,511 | ||||||||||||
| 15,000,000 | g | UniCredit S.p.A | 2.569 | 09/22/26 | 14,971 | ||||||||||||
| 3,600,000 | g | UniCredit S.p.A | 5.459 | 06/30/35 | 3,922 | ||||||||||||
| 10,000,000 | g | United Overseas Bank Ltd | 2.000 | 10/14/31 | 9,929 | ||||||||||||
| 3,835,000 | g | USAA Capital Corp | 2.125 | 05/01/30 | 3,834 | ||||||||||||
| 12,125,000 | Westpac Banking Corp | 3.020 | 11/18/36 | 11,981 | |||||||||||||
| TOTAL BANKS | 596,986 | ||||||||||||||||
| CAPITAL GOODS - 0.4% | |||||||||||||||||
| 10,450,000 | Carrier Global Corp | 2.700 | 02/15/31 | 10,614 | |||||||||||||
| 4,150,000 | Johnson Controls International plc | 1.750 | 09/15/30 | 3,972 | |||||||||||||
| 4,400,000 | Masco Corp | 1.500 | 02/15/28 | 4,259 | |||||||||||||
| 5,000,000 | Otis Worldwide Corp | 3.112 | 02/15/40 | 5,129 | |||||||||||||
| 4,975,000 | Parker-Hannifin Corp | 4.200 | 11/21/34 | 5,667 | |||||||||||||
| 3,400,000 | e | Roper Technologies, Inc | 1.400 | 09/15/27 | 3,299 | ||||||||||||
| 12,500,000 | g | Siemens Financieringsmaatschappij NV | 1.200 | 03/11/26 | 12,296 | ||||||||||||
| 10,500,000 | g | Triton Container International Ltd | 1.150 | 06/07/24 | 10,350 | ||||||||||||
| 7,000,000 | g | Triton Container International Ltd | 3.150 | 06/15/31 | 7,059 | ||||||||||||
| 6,500,000 | Xylem, Inc | 1.950 | 01/30/28 | 6,426 | |||||||||||||
| 3,575,000 | Xylem, Inc | 2.250 | 01/30/31 | 3,543 | |||||||||||||
| TOTAL CAPITAL GOODS | 72,614 | ||||||||||||||||
| COMMERCIAL & PROFESSIONAL SERVICES - 0.3% | |||||||||||||||||
| 9,540,000 | IHS Markit Ltd | 4.125 | 08/01/23 | 9,969 | |||||||||||||
| 7,500,000 | Mather Foundation | 2.675 | 10/01/31 | 7,498 | |||||||||||||
| 15,810,000 | Rockefeller Foundation | 2.492 | 10/01/50 | 15,548 | |||||||||||||
| 10,000,000 | Waste Connections, Inc | 2.200 | 01/15/32 | 9,793 | |||||||||||||
| 442 |
COLLEGE RETIREMENT EQUITIES FUND - Social Choice Account
| PRINCIPAL | ISSUER | REFERENCE RATE & SPREAD | RATE | MATURITY DATE | VALUE (000) | ||||||||||||
| $ | 7,425,000 | Waste Connections, Inc | 2.950 | % | 01/15/52 | $ | 7,309 | ||||||||||
| TOTAL COMMERCIAL & PROFESSIONAL SERVICES | 50,117 | ||||||||||||||||
| CONSUMER DURABLES & APPAREL - 0.1% | |||||||||||||||||
| 6,450,000 | Tapestry, Inc | 3.050 | 03/15/32 | 6,488 | |||||||||||||
| 6,700,000 | e | Whirlpool Corp | 2.400 | 05/15/31 | 6,709 | ||||||||||||
| TOTAL CONSUMER DURABLES & APPAREL | 13,197 | ||||||||||||||||
| CONSUMER SERVICES - 0.6% | |||||||||||||||||
| 2,900,000 | Bush Foundation | 2.754 | 10/01/50 | 2,929 | |||||||||||||
| 3,125,000 | Conservation Fund | 3.474 | 12/15/29 | 3,298 | |||||||||||||
| 10,000,000 | Henry J Kaiser Family Foundation | 3.356 | 12/01/25 | 10,226 | |||||||||||||
| 5,145,000 | Low Income Investment Fund | 3.711 | 07/01/29 | 5,471 | |||||||||||||
| 3,440,000 | i | Nature Conservancy | LIBOR 3 M + 1.080% | 1.212 | 02/01/24 | 3,435 | |||||||||||
| 17,500,000 | New York Public Library Astor Lenox & Tilden Foundations | 4.305 | 07/01/45 | 21,898 | |||||||||||||
| 3,475,000 | Salvation Army | 5.637 | 09/01/26 | 4,064 | |||||||||||||
| 20,000,000 | Salvation Army | 4.528 | 09/01/48 | 22,057 | |||||||||||||
| 12,300,000 | Starbucks Corp | 2.450 | 06/15/26 | 12,725 | |||||||||||||
| 11,440,000 | Wisconsin Alumni Research Foundation | 3.564 | 10/01/49 | 12,502 | |||||||||||||
| 11,065,000 | YMCA of Greater New York | 5.151 | 08/01/48 | 12,919 | |||||||||||||
| TOTAL CONSUMER SERVICES | 111,524 | ||||||||||||||||
| DIVERSIFIED FINANCIALS - 2.1% | |||||||||||||||||
| 9,400,000 | i | AerCap Ireland Capital DAC | SOFR + 0.680% | 0.730 | 09/29/23 | 9,402 | |||||||||||
| 10,800,000 | AerCap Ireland Capital DAC | 1.750 | 01/30/26 | 10,593 | |||||||||||||
| 10,500,000 | AerCap Ireland Capital DAC | 3.000 | 10/29/28 | 10,648 | |||||||||||||
| 8,900,000 | AerCap Ireland Capital DAC | 3.300 | 01/30/32 | 9,067 | |||||||||||||
| 10,200,000 | Ally Financial, Inc | 4.700 | N/A‡ | 10,582 | |||||||||||||
| 3,000,000 | g | Banco BTG Pactual S.A. | 2.750 | 01/11/26 | 2,846 | ||||||||||||
| 3,300,000 | Bank of New York Mellon Corp | 4.700 | N/A‡ | 3,520 | |||||||||||||
| 11,875,000 | g | BPCE S.A. | 1.652 | 10/06/26 | 11,716 | ||||||||||||
| 20,525,000 | g | BPCE S.A. | 2.045 | 10/19/27 | 20,349 | ||||||||||||
| 7,350,000 | g | BPCE S.A. | 3.116 | 10/19/32 | 7,373 | ||||||||||||
| 8,500,000 | g | BPCE S.A. | 3.582 | 10/19/42 | 8,684 | ||||||||||||
| 8,725,000 | Charles Schwab Corp | 4.000 | N/A‡ | 8,812 | |||||||||||||
| 11,645,000 | Community Preservation Corp | 2.867 | 02/01/30 | 12,032 | |||||||||||||
| 16,425,000 | g | Credit Suisse Group AG. | 1.305 | 02/02/27 | 15,867 | ||||||||||||
| 10,050,000 | g | Credit Suisse Group AG. | 3.091 | 05/14/32 | 10,226 | ||||||||||||
| 4,750,000 | Enterprise Community Loan Fund, Inc | 4.152 | 11/01/28 | 4,834 | |||||||||||||
| 15,000,000 | Ford Foundation | 2.815 | 06/01/70 | 15,464 | |||||||||||||
| 13,300,000 | Goldman Sachs Group, Inc | 0.855 | 02/12/26 | 13,039 | |||||||||||||
| 2,300,000 | Legg Mason, Inc | 3.950 | 07/15/24 | 2,445 | |||||||||||||
| 10,000,000 | Morgan Stanley | 0.791 | 01/22/25 | 9,899 | |||||||||||||
| 11,950,000 | Morgan Stanley | 0.985 | 12/10/26 | 11,591 | |||||||||||||
| 12,450,000 | Morgan Stanley | 1.512 | 07/20/27 | 12,254 | |||||||||||||
| 10,000,000 | Morgan Stanley | 2.239 | 07/21/32 | 9,781 | |||||||||||||
| 14,150,000 | Morgan Stanley | 2.484 | 09/16/36 | 13,626 | |||||||||||||
| 11,400,000 | g,i | NatWest Markets plc | SOFR + 0.530% | 0.580 | 08/12/24 | 11,401 | |||||||||||
| 16,500,000 | g | NatWest Markets plc | 1.600 | 09/29/26 | 16,230 | ||||||||||||
| 10,000,000 | g | NongHyup Bank | 1.250 | 07/20/25 | 9,895 | ||||||||||||
| 680,000 | Reinvestment Fund, Inc | 3.377 | 02/15/22 | 681 | |||||||||||||
| 1,295,000 | Reinvestment Fund, Inc | 3.166 | 11/01/23 | 1,319 | |||||||||||||
| 3,000,000 | Reinvestment Fund, Inc | 3.600 | 02/15/24 | 3,087 | |||||||||||||
| 10,250,000 | Reinvestment Fund, Inc | 3.366 | 11/01/24 | 10,580 | |||||||||||||
| 2,570,000 | Reinvestment Fund, Inc | 3.513 | 11/01/25 | 2,695 | |||||||||||||
| 15,240,000 | Reinvestment Fund, Inc | 3.880 | 02/15/27 | 16,410 | |||||||||||||
| 7,435,000 | Reinvestment Fund, Inc | 3.930 | 02/15/28 | 8,227 | |||||||||||||
| 443 |
COLLEGE RETIREMENT EQUITIES FUND - Social Choice Account
| PRINCIPAL | ISSUER | REFERENCE RATE & SPREAD | RATE | MATURITY DATE | VALUE (000) | ||||||||||||
| $ | 11,150,000 | g | Societe Generale S.A. | 2.889 | % | 06/09/32 | $ | 11,122 | |||||||||
| 4,475,000 | g | Starwood Property Trust, Inc | 5.500 | 11/01/23 | 4,632 | ||||||||||||
| 7,900,000 | g | Swiss Re Finance Luxembourg SA | 5.000 | 04/02/49 | 8,838 | ||||||||||||
| 4,875,000 | Toyota Motor Credit Corp | 2.150 | 02/13/30 | 4,885 | |||||||||||||
| 4,825,000 | g | UBS Group AG | 1.008 | 07/30/24 | 4,810 | ||||||||||||
| 14,700,000 | g | UBS Group AG | 1.364 | 01/30/27 | 14,368 | ||||||||||||
| 11,075,000 | e | Unilever Capital Corp | 2.000 | 07/28/26 | 11,324 | ||||||||||||
| 5,523,000 | Unilever Capital Corp | 2.125 | 09/06/29 | 5,567 | |||||||||||||
| 6,125,000 | Unilever Capital Corp | 1.375 | 09/14/30 | 5,807 | |||||||||||||
| 8,475,000 | Unilever Capital Corp | 1.750 | 08/12/31 | 8,229 | |||||||||||||
| 9,425,000 | Unilever Capital Corp | 2.625 | 08/12/51 | 9,318 | |||||||||||||
| 3,450,000 | g | WLB Asset II B Pte Ltd | 3.950 | 12/10/24 | 3,302 | ||||||||||||
| 1,925,000 | g | WLB Asset II Pte Ltd | 4.000 | 01/14/24 | 1,909 | ||||||||||||
| TOTAL DIVERSIFIED FINANCIALS | 419,286 | ||||||||||||||||
| ENERGY - 0.7% | |||||||||||||||||
| 8,000,000 | g | Aker BP ASA | 2.875 | 01/15/26 | 8,292 | ||||||||||||
| 10,000,000 | g | Aker BP ASA | 4.000 | 01/15/31 | 10,813 | ||||||||||||
| 2,650,000 | Cenovus Energy, Inc | 2.650 | 01/15/32 | 2,593 | |||||||||||||
| 6,550,000 | Cenovus Energy, Inc | 3.750 | 02/15/52 | 6,566 | |||||||||||||
| 7,500,000 | i | Enbridge, Inc | SOFR + 0.400% | 0.450 | 02/17/23 | 7,500 | |||||||||||
| 9,625,000 | e | Enbridge, Inc | 2.500 | 01/15/25 | 9,891 | ||||||||||||
| 8,175,000 | Enbridge, Inc | 3.400 | 08/01/51 | 8,286 | |||||||||||||
| 5,830,000 | Enbridge, Inc | 5.750 | 07/15/80 | 6,471 | |||||||||||||
| 8,125,000 | Equinor ASA | 2.375 | 05/22/30 | 8,254 | |||||||||||||
| 5,932,000 | Equinor ASA | 3.950 | 05/15/43 | 6,896 | |||||||||||||
| 12,450,000 | Equinor ASA | 3.250 | 11/18/49 | 13,187 | |||||||||||||
| 3,875,000 | ONEOK, Inc | 4.000 | 07/13/27 | 4,189 | |||||||||||||
| 6,200,000 | ONEOK, Inc | 4.950 | 07/13/47 | 7,163 | |||||||||||||
| 11,700,000 | g | Santos Finance Ltd | 3.649 | 04/29/31 | 11,913 | ||||||||||||
| 7,540,000 | g | Sunnova Energy Corp | 5.875 | 09/01/26 | 7,691 | ||||||||||||
| 12,850,000 | Total Capital International S.A. | 2.986 | 06/29/41 | 13,018 | |||||||||||||
| 11,316,000 | Total Capital International S.A. | 3.127 | 05/29/50 | 11,599 | |||||||||||||
| TOTAL ENERGY | 144,322 | ||||||||||||||||
| FOOD & STAPLES RETAILING - 0.2% | |||||||||||||||||
| 15,563,000 | SYSCO Corp | 2.400 | 02/15/30 | 15,609 | |||||||||||||
| 18,954,000 | Walmart, Inc | 1.800 | 09/22/31 | 18,764 | |||||||||||||
| TOTAL FOOD & STAPLES RETAILING | 34,373 | ||||||||||||||||
| FOOD, BEVERAGE & TOBACCO - 0.1% | |||||||||||||||||
| 6,150,000 | g | Coca-Cola European Partners plc | 1.500 | 01/15/27 | 6,025 | ||||||||||||
| 10,000,000 | g | NBM US Holdings, Inc | 6.625 | 08/06/29 | 10,938 | ||||||||||||
| 12,124,000 | PepsiCo, Inc | 2.875 | 10/15/49 | 12,712 | |||||||||||||
| TOTAL FOOD, BEVERAGE & TOBACCO | 29,675 | ||||||||||||||||
| HEALTH CARE EQUIPMENT & SERVICES - 0.1% | |||||||||||||||||
| 6,900,000 | Cigna Corp | 0.613 | 03/15/24 | 6,842 | |||||||||||||
| 10,125,000 | Cigna Corp | 2.375 | 03/15/31 | 10,177 | |||||||||||||
| 2,250,000 | Mary Free Bed Rehabilitation Hospital | 3.786 | 04/01/51 | 2,431 | |||||||||||||
| 10,385,000 | Stanford Health Care | 3.027 | 08/15/51 | 10,796 | |||||||||||||
| TOTAL HEALTH CARE EQUIPMENT & SERVICES | 30,246 | ||||||||||||||||
| HOUSEHOLD & PERSONAL PRODUCTS - 0.1% | |||||||||||||||||
| 7,125,000 | Kimberly-Clark Corp | 2.875 | 02/07/50 | 7,304 | |||||||||||||
| 5,300,000 | Procter & Gamble Co | 3.000 | 03/25/30 | 5,760 | |||||||||||||
| 444 |
COLLEGE RETIREMENT EQUITIES FUND - Social Choice Account
| PRINCIPAL | ISSUER | RATE | MATURITY DATE | VALUE (000) | |||||||||||||
| $ | 12,975,000 | Procter & Gamble Co | 1.200 | % | 10/29/30 | $ | 12,271 | ||||||||||
| TOTAL HOUSEHOLD & PERSONAL PRODUCTS | 25,335 | ||||||||||||||||
| INSURANCE - 0.8% | |||||||||||||||||
| 6,850,000 | g | AIA Group Ltd | 3.600 | 04/09/29 | 7,475 | ||||||||||||
| 11,450,000 | g | AIA Group Ltd | 3.375 | 04/07/30 | 12,372 | ||||||||||||
| 2,400,000 | Chubb INA Holdings, Inc | 1.375 | 09/15/30 | 2,261 | |||||||||||||
| 6,275,000 | Chubb INA Holdings, Inc | 2.850 | 12/15/51 | 6,294 | |||||||||||||
| 11,400,000 | g | Empower Finance 2020 LP | 1.357 | 09/17/27 | 11,054 | ||||||||||||
| 4,000,000 | g | Empower Finance 2020 LP | 1.776 | 03/17/31 | 3,862 | ||||||||||||
| 10,178,000 | First American Financial Corp | 2.400 | 08/15/31 | 9,958 | |||||||||||||
| 3,975,000 | g | Five Corners Funding Trust | 4.419 | 11/15/23 | 4,213 | ||||||||||||
| 15,675,000 | g | Five Corners Funding Trust II | 2.850 | 05/15/30 | 16,242 | ||||||||||||
| 4,700,000 | g | Great-West Lifeco US Finance 2020 LP | 0.904 | 08/12/25 | 4,566 | ||||||||||||
| 10,000,000 | Principal Financial Group, Inc | 2.125 | 06/15/30 | 9,886 | |||||||||||||
| 6,504,000 | Prudential Financial, Inc | 1.500 | 03/10/26 | 6,507 | |||||||||||||
| 10,250,000 | Prudential Financial, Inc | 5.200 | 03/15/44 | 10,674 | |||||||||||||
| 4,265,000 | Prudential Financial, Inc | 3.700 | 10/01/50 | 4,314 | |||||||||||||
| 4,475,000 | Reinsurance Group of America, Inc | 3.900 | 05/15/29 | 4,893 | |||||||||||||
| 6,100,000 | Reinsurance Group of America, Inc | 3.150 | 06/15/30 | 6,354 | |||||||||||||
| 18,222,000 | g | Swiss Re Treasury US Corp | 2.875 | 12/06/22 | 18,503 | ||||||||||||
| 14,024,000 | g | Swiss Re Treasury US Corp | 4.250 | 12/06/42 | 17,181 | ||||||||||||
| TOTAL INSURANCE | 156,609 | ||||||||||||||||
| MATERIALS - 0.6% | |||||||||||||||||
| 7,250,000 | e,g | Celulosa Arauco y Constitucion S.A. | 4.200 | 01/29/30 | 7,739 | ||||||||||||
| 10,000,000 | g | Celulosa Arauco y Constitucion S.A. | 5.150 | 01/29/50 | 11,385 | ||||||||||||
| 10,500,000 | Fibria Overseas Finance Ltd | 5.500 | 01/17/27 | 11,773 | |||||||||||||
| 5,650,000 | g | International Flavors & Fragrances, Inc | 2.300 | 11/01/30 | 5,540 | ||||||||||||
| 3,409,000 | International Paper Co | 4.800 | 06/15/44 | 4,309 | |||||||||||||
| 17,000,000 | e,g | Inversiones CMPC S.A. | 4.375 | 04/04/27 | 18,743 | ||||||||||||
| 10,000,000 | g | Klabin Austria GmbH | 7.000 | 04/03/49 | 11,513 | ||||||||||||
| 7,775,000 | g | Klabin Finance S.A. | 4.875 | 09/19/27 | 8,261 | ||||||||||||
| EUR | 2,500,000 | g | LG Chem Ltd | 0.500 | 04/15/23 | 2,862 | |||||||||||
| $ | 3,250,000 | e,g | LG Chem Ltd | 3.625 | 04/15/29 | 3,545 | |||||||||||
| 6,925,000 | LYB International Finance III LLC | 3.375 | 10/01/40 | 7,212 | |||||||||||||
| 5,000,000 | Newmont Corp | 2.250 | 10/01/30 | 4,930 | |||||||||||||
| 9,875,000 | PPG Industries, Inc | 1.200 | 03/15/26 | 9,659 | |||||||||||||
| 12,736,000 | e | Teck Resources Ltd | 3.900 | 07/15/30 | 13,683 | ||||||||||||
| TOTAL MATERIALS | 121,154 | ||||||||||||||||
| MEDIA & ENTERTAINMENT - 0.2% | |||||||||||||||||
| 10,000,000 | Alphabet, Inc | 1.100 | 08/15/30 | 9,453 | |||||||||||||
| 10,000,000 | g | NTT Finance Corp | 1.162 | 04/03/26 | 9,810 | ||||||||||||
| 7,500,000 | g | NTT Finance Corp | 2.065 | 04/03/31 | 7,493 | ||||||||||||
| 9,550,000 | g | RGA Global Funding | 2.000 | 11/30/26 | 9,582 | ||||||||||||
| 2,320,000 | Smithsonian Institution | 2.645 | 09/01/39 | 2,344 | |||||||||||||
| 5,500,000 | g | WLB Asset II C Pte Ltd | 3.900 | 12/23/25 | 5,472 | ||||||||||||
| TOTAL MEDIA & ENTERTAINMENT | 44,154 | ||||||||||||||||
| PHARMACEUTICALS, BIOTECHNOLOGY & LIFE SCIENCES - 0.8% | |||||||||||||||||
| 10,000,000 | Amgen, Inc | 2.000 | 01/15/32 | 9,683 | |||||||||||||
| 10,875,000 | Amgen, Inc | 3.000 | 01/15/52 | 10,552 | |||||||||||||
| 4,800,000 | Bristol-Myers Squibb Co | 2.350 | 11/13/40 | 4,552 | |||||||||||||
| 7,700,000 | Bristol-Myers Squibb Co | 2.550 | 11/13/50 | 7,284 | |||||||||||||
| 11,475,000 | Danaher Corp | 2.800 | 12/10/51 | 11,316 | |||||||||||||
| 6,275,000 | Gilead Sciences, Inc | 1.200 | 10/01/27 | 6,065 | |||||||||||||
| 445 |
COLLEGE RETIREMENT EQUITIES FUND - Social Choice Account
| PRINCIPAL | ISSUER | RATE | MATURITY DATE | VALUE (000) | |||||||||||||
| $ | 5,625,000 | Gilead Sciences, Inc | 2.600 | % | 10/01/40 | $ | 5,419 | ||||||||||
| 15,400,000 | Gilead Sciences, Inc | 2.800 | 10/01/50 | 14,929 | |||||||||||||
| 12,550,000 | Merck & Co, Inc | 2.150 | 12/10/31 | 12,585 | |||||||||||||
| 6,300,000 | Merck & Co, Inc | 2.750 | 12/10/51 | 6,234 | |||||||||||||
| 7,000,000 | PerkinElmer, Inc | 2.250 | 09/15/31 | 6,806 | |||||||||||||
| 10,000,000 | Pfizer, Inc | 1.750 | 08/18/31 | 9,765 | |||||||||||||
| 10,375,000 | g | Roche Holdings, Inc | 1.930 | 12/13/28 | 10,438 | ||||||||||||
| 15,750,000 | g | Roche Holdings, Inc | 2.076 | 12/13/31 | 15,703 | ||||||||||||
| 14,675,000 | Takeda Pharmaceutical Co Ltd | 2.050 | 03/31/30 | 14,371 | |||||||||||||
| 8,500,000 | Takeda Pharmaceutical Co Ltd | 3.175 | 07/09/50 | 8,568 | |||||||||||||
| 3,850,000 | Thermo Fisher Scientific, Inc | 2.000 | 10/15/31 | 3,793 | |||||||||||||
| TOTAL PHARMACEUTICALS, BIOTECHNOLOGY & LIFE SCIENCES | 158,063 | ||||||||||||||||
| REAL ESTATE - 0.8% | |||||||||||||||||
| 13,400,000 | American Tower Corp | 1.500 | 01/31/28 | 12,820 | |||||||||||||
| 1,975,000 | Brandywine Operating Partnership LP | 3.950 | 02/15/23 | 2,022 | |||||||||||||
| 6,225,000 | Brandywine Operating Partnership LP | 3.950 | 11/15/27 | 6,691 | |||||||||||||
| 9,095,000 | Brixmor Operating Partnership LP | 3.900 | 03/15/27 | 9,821 | |||||||||||||
| 6,600,000 | Brixmor Operating Partnership LP | 2.250 | 04/01/28 | 6,565 | |||||||||||||
| 4,175,000 | Brixmor Operating Partnership LP | 2.500 | 08/16/31 | 4,086 | |||||||||||||
| 5,975,000 | Corporate Office Properties LP | 2.750 | 04/15/31 | 5,941 | |||||||||||||
| 2,600,000 | Duke Realty LP | 2.875 | 11/15/29 | 2,701 | |||||||||||||
| 3,500,000 | Federal Realty Investment Trust | 2.750 | 06/01/23 | 3,569 | |||||||||||||
| 6,900,000 | Federal Realty Investment Trust | 1.250 | 02/15/26 | 6,758 | |||||||||||||
| 1,975,000 | g | HAT Holdings I LLC | 6.000 | 04/15/25 | 2,054 | ||||||||||||
| 10,970,000 | g | HAT Holdings I LLC | 3.375 | 06/15/26 | 11,080 | ||||||||||||
| 10,000,000 | g | HAT Holdings I LLC | 3.750 | 09/15/30 | 9,975 | ||||||||||||
| 5,125,000 | e | Healthpeak Properties, Inc | 2.125 | 12/01/28 | 5,132 | ||||||||||||
| 2,100,000 | Host Hotels & Resorts LP | 2.900 | 12/15/31 | 2,026 | |||||||||||||
| 11,075,000 | Kilroy Realty LP | 3.450 | 12/15/24 | 11,598 | |||||||||||||
| 14,360,000 | Kilroy Realty LP | 2.500 | 11/15/32 | 13,888 | |||||||||||||
| 16,822,000 | Regency Centers LP | 3.750 | 06/15/24 | 17,714 | |||||||||||||
| 8,245,000 | g | Scentre Group Trust 2 | 5.125 | 09/24/80 | 8,832 | ||||||||||||
| 3,150,000 | Vornado Realty LP | 2.150 | 06/01/26 | 3,148 | |||||||||||||
| 2,775,000 | Vornado Realty LP | 3.400 | 06/01/31 | 2,838 | |||||||||||||
| TOTAL REAL ESTATE | 149,259 | ||||||||||||||||
| RETAILING - 0.1% | |||||||||||||||||
| 4,100,000 | Advance Auto Parts, Inc | 1.750 | 10/01/27 | 3,979 | |||||||||||||
| 8,000,000 | Amazon.com, Inc | 0.250 | 05/12/23 | 7,959 | |||||||||||||
| 5,200,000 | AutoNation, Inc | 2.400 | 08/01/31 | 5,015 | |||||||||||||
| 7,500,000 | e | Kohl’s Corp | 3.375 | 05/01/31 | 7,638 | ||||||||||||
| 5,525,000 | Lowe’s Cos, Inc | 2.800 | 09/15/41 | 5,391 | |||||||||||||
| TOTAL RETAILING | 29,982 | ||||||||||||||||
| SEMICONDUCTORS & SEMICONDUCTOR EQUIPMENT - 0.1% | |||||||||||||||||
| 9,208,000 | g | NXP BV | 3.400 | 05/01/30 | 9,813 | ||||||||||||
| 10,000,000 | g | SK Hynix, Inc | 2.375 | 01/19/31 | 9,624 | ||||||||||||
| TOTAL SEMICONDUCTORS & SEMICONDUCTOR EQUIPMENT | 19,437 | ||||||||||||||||
| SOFTWARE & SERVICES - 0.3% | |||||||||||||||||
| 10,000,000 | e | Autodesk, Inc | 2.400 | 12/15/31 | 9,971 | ||||||||||||
| 9,500,000 | Automatic Data Processing, Inc | 1.700 | 05/15/28 | 9,466 | |||||||||||||
| 10,000,000 | Automatic Data Processing, Inc | 1.250 | 09/01/30 | 9,411 | |||||||||||||
| 7,725,000 | e | Mastercard, Inc | 1.900 | 03/15/31 | 7,767 | ||||||||||||
| 446 |
COLLEGE RETIREMENT EQUITIES FUND - Social Choice Account
| PRINCIPAL | ISSUER | REFERENCE RATE & SPREAD | RATE | MATURITY DATE | VALUE (000) | ||||||||||||
| $ | 7,500,000 | Visa, Inc | 1.900 | % | 04/15/27 | $ | 7,607 | ||||||||||
| 17,000,000 | Visa, Inc | 1.100 | 02/15/31 | 15,871 | |||||||||||||
| TOTAL SOFTWARE & SERVICES | 60,093 | ||||||||||||||||
| TECHNOLOGY HARDWARE & EQUIPMENT - 0.2% | |||||||||||||||||
| 14,250,000 | Apple, Inc | 3.000 | 06/20/27 | 15,267 | |||||||||||||
| 4,750,000 | g | HP, Inc | 2.650 | 06/17/31 | 4,683 | ||||||||||||
| 11,250,000 | g | New York State Electric & Gas Corp | 2.150 | 10/01/31 | 10,999 | ||||||||||||
| TOTAL TECHNOLOGY HARDWARE & EQUIPMENT | 30,949 | ||||||||||||||||
| TELECOMMUNICATION SERVICES - 0.4% | |||||||||||||||||
| 9,000,000 | i | Verizon Communications, Inc | SOFR + 0.790% | 0.840 | 03/20/26 | 9,123 | |||||||||||
| 14,225,000 | Verizon Communications, Inc | 2.550 | 03/21/31 | 14,352 | |||||||||||||
| 9,825,000 | Verizon Communications, Inc | 3.400 | 03/22/41 | 10,286 | |||||||||||||
| 18,825,000 | Verizon Communications, Inc | 3.550 | 03/22/51 | 20,272 | |||||||||||||
| 10,000,000 | Vodafone Group plc | 3.250 | 06/04/81 | 9,805 | |||||||||||||
| 10,000,000 | Vodafone Group plc | 4.125 | 06/04/81 | 9,900 | |||||||||||||
| TOTAL TELECOMMUNICATION SERVICES | 73,738 | ||||||||||||||||
| TRANSPORTATION - 0.2% | |||||||||||||||||
| 10,000,000 | Canadian Pacific Railway Co | 1.350 | 12/02/24 | 10,012 | |||||||||||||
| 6,950,000 | Canadian Pacific Railway Co | 2.450 | 12/02/31 | 7,086 | |||||||||||||
| 5,650,000 | e | Canadian Pacific Railway Co | 3.000 | 12/02/41 | 5,778 | ||||||||||||
| 8,785,000 | Delta Air Lines, Inc | 2.900 | 10/28/24 | 8,957 | |||||||||||||
| 3,652,000 | g | Delta Air Lines, Inc | 7.000 | 05/01/25 | 4,176 | ||||||||||||
| 2,815,000 | e | Delta Air Lines, Inc | 7.375 | 01/15/26 | 3,314 | ||||||||||||
| TOTAL TRANSPORTATION | 39,323 | ||||||||||||||||
| UTILITIES - 4.5% | |||||||||||||||||
| 3,827,000 | AES Corp | 1.375 | 01/15/26 | 3,714 | |||||||||||||
| 10,875,000 | AES Corp | 2.450 | 01/15/31 | 10,596 | |||||||||||||
| 14,500,000 | g | AES Gener S.A. | 6.350 | 10/07/79 | 14,761 | ||||||||||||
| 12,325,000 | Ameren Illinois Co | 2.900 | 06/15/51 | 12,495 | |||||||||||||
| 4,375,000 | Arizona Public Service Co | 3.750 | 05/15/46 | 4,769 | |||||||||||||
| 4,500,000 | Atlantic City Electric Co | 2.300 | 03/15/31 | 4,519 | |||||||||||||
| 14,950,000 | Avangrid, Inc | 3.200 | 04/15/25 | 15,711 | |||||||||||||
| 13,200,000 | Avangrid, Inc | 3.800 | 06/01/29 | 14,351 | |||||||||||||
| 10,275,000 | Avista Corp | 4.350 | 06/01/48 | 12,688 | |||||||||||||
| 5,900,000 | g | Azure Power Solar Energy Pvt Ltd | 5.650 | 12/24/24 | 6,195 | ||||||||||||
| 9,750,000 | g | Brooklyn Union Gas Co | 4.273 | 03/15/48 | 11,144 | ||||||||||||
| 13,500,000 | g | Brooklyn Union Gas Co | 4.487 | 03/04/49 | 15,860 | ||||||||||||
| 9,875,000 | CenterPoint Energy Houston Electric LLC | 2.350 | 04/01/31 | 10,025 | |||||||||||||
| 12,350,000 | CenterPoint Energy Houston Electric LLC | 3.350 | 04/01/51 | 13,574 | |||||||||||||
| 19,400,000 | i | CenterPoint Energy Resources Corp | LIBOR 3 M + 0.500% | 0.673 | 03/02/23 | 19,355 | |||||||||||
| 13,675,000 | g | Clearway Energy Operating LLC | 3.750 | 02/15/31 | 13,641 | ||||||||||||
| 3,550,000 | CMS Energy Corp | 4.750 | 06/01/50 | 3,861 | |||||||||||||
| 3,100,000 | CMS Energy Corp | 3.750 | 12/01/50 | 3,046 | |||||||||||||
| 13,100,000 | g | Colbun S.A. | 3.150 | 01/19/32 | 12,962 | ||||||||||||
| 17,500,000 | Commonwealth Edison Co | 2.750 | 09/01/51 | 16,918 | |||||||||||||
| 7,525,000 | g | Consorcio Transmantaro SA | 4.700 | 04/16/34 | 8,268 | ||||||||||||
| 13,876,000 | Consumers Energy Co | 2.500 | 05/01/60 | 12,233 | |||||||||||||
| 5,928,844 | g | Continental Wind LLC | 6.000 | 02/28/33 | 6,702 | ||||||||||||
| 4,997,238 | g | Continuum Energy Levanter Pte Ltd | 4.500 | 02/09/27 | 5,110 | ||||||||||||
| 7,110,000 | Dominion Energy, Inc | 3.600 | 03/15/27 | 7,654 | |||||||||||||
| 8,525,000 | Dominion Energy, Inc | 2.250 | 08/15/31 | 8,326 | |||||||||||||
| 8,325,000 | Dominion Energy, Inc | 4.350 | N/A‡ | 8,596 | |||||||||||||
| 447 |
COLLEGE RETIREMENT EQUITIES FUND - Social Choice Account
| PRINCIPAL | ISSUER | RATE | MATURITY DATE | VALUE (000) | |||||||||||||
| $ | 4,000,000 | Dominion Energy, Inc (Step Bond) | 3.071 | % | 08/15/24 | $ | 4,140 | ||||||||||
| 11,725,000 | DTE Electric Co | 1.900 | 04/01/28 | 11,608 | |||||||||||||
| 9,025,000 | DTE Electric Co | 3.250 | 04/01/51 | 9,704 | |||||||||||||
| 10,000,000 | Duke Energy Florida LLC | 2.500 | 12/01/29 | 10,276 | |||||||||||||
| 3,350,000 | g | East Ohio Gas Co | 1.300 | 06/15/25 | 3,304 | ||||||||||||
| 8,850,000 | Eastern Energy Gas Holdings LLC | 2.500 | 11/15/24 | 9,113 | |||||||||||||
| 11,625,000 | g | EDP Finance BV | 3.625 | 07/15/24 | 12,201 | ||||||||||||
| 22,750,000 | g | Electricite de France S.A. | 3.625 | 10/13/25 | 24,272 | ||||||||||||
| 11,735,000 | Essential Utilities, Inc | 2.704 | 04/15/30 | 11,919 | |||||||||||||
| 9,375,000 | Essential Utilities, Inc | 3.351 | 04/15/50 | 9,703 | |||||||||||||
| 12,025,000 | Evergy, Inc | 2.550 | 07/01/26 | 12,465 | |||||||||||||
| 2,800,000 | Eversource Energy | 0.800 | 08/15/25 | 2,725 | |||||||||||||
| 9,885,000 | Georgia Power Co | 3.250 | 04/01/26 | 10,435 | |||||||||||||
| 8,550,000 | g | India Cleantech Energy | 4.700 | 08/10/26 | 8,682 | ||||||||||||
| 9,700,000 | Interstate Power & Light Co | 3.500 | 09/30/49 | 10,395 | |||||||||||||
| 24,325,000 | g | Korea Hydro & Nuclear Power Co Ltd | 3.750 | 07/25/23 | 25,272 | ||||||||||||
| 16,441,000 | g | Liberty Utilities Finance GP | 2.050 | 09/15/30 | 15,674 | ||||||||||||
| 5,875,000 | MidAmerican Energy Co | 3.100 | 05/01/27 | 6,237 | |||||||||||||
| 1,000,000 | MidAmerican Energy Co | 3.950 | 08/01/47 | 1,174 | |||||||||||||
| 3,596,000 | MidAmerican Energy Co | 3.150 | 04/15/50 | 3,764 | |||||||||||||
| 4,300,000 | g | Narragansett Electric Co | 3.919 | 08/01/28 | 4,696 | ||||||||||||
| 12,350,000 | National Fuel Gas Co | 5.500 | 01/15/26 | 13,799 | |||||||||||||
| 2,250,000 | National Fuel Gas Co | 3.950 | 09/15/27 | 2,387 | |||||||||||||
| 3,400,000 | National Fuel Gas Co | 4.750 | 09/01/28 | 3,751 | |||||||||||||
| 11,250,000 | National Fuel Gas Co | 2.950 | 03/01/31 | 11,305 | |||||||||||||
| 3,225,000 | g | NextEra Energy Operating Partners LP | 4.250 | 07/15/24 | 3,350 | ||||||||||||
| 13,559,000 | g | Niagara Mohawk Power Corp | 1.960 | 06/27/30 | 12,955 | ||||||||||||
| 9,732,000 | g | Niagara Mohawk Power Corp | 4.278 | 10/01/34 | 10,936 | ||||||||||||
| 9,750,000 | g | Niagara Mohawk Power Corp | 4.119 | 11/28/42 | 10,988 | ||||||||||||
| 5,250,000 | Northwest Natural Gas Co | 3.078 | 12/01/51 | 5,195 | |||||||||||||
| 3,000,000 | NorthWestern Corp | 4.176 | 11/15/44 | 3,518 | |||||||||||||
| 6,975,000 | OGE Energy Corp | 0.703 | 05/26/23 | 6,943 | |||||||||||||
| 16,250,000 | PacifiCorp | 2.900 | 06/15/52 | 15,946 | |||||||||||||
| 1,925,000 | g | Pattern Energy Operations LP | 4.500 | 08/15/28 | 1,997 | ||||||||||||
| 7,113,000 | Piedmont Natural Gas Co, Inc | 3.350 | 06/01/50 | 7,293 | |||||||||||||
| 630,000 | Public Service Co of Colorado | 4.750 | 08/15/41 | 778 | |||||||||||||
| 5,000,000 | Public Service Co of Colorado | 3.200 | 03/01/50 | 5,213 | |||||||||||||
| 2,975,000 | Public Service Co of New Hampshire | 3.600 | 07/01/49 | 3,332 | |||||||||||||
| 6,134,000 | Public Service Electric & Gas Co | 3.200 | 08/01/49 | 6,437 | |||||||||||||
| 19,475,000 | Public Service Enterprise Group, Inc | 0.800 | 08/15/25 | 18,960 | |||||||||||||
| 10,000,000 | Public Service Enterprise Group, Inc | 1.600 | 08/15/30 | 9,269 | |||||||||||||
| 13,550,000 | San Diego Gas & Electric Co | 2.950 | 08/15/51 | 13,636 | |||||||||||||
| 6,900,000 | Sempra Energy | 4.875 | N/A‡ | 7,388 | |||||||||||||
| 21,440,724 | g | Solar Star Funding LLC | 3.950 | 06/30/35 | 22,676 | ||||||||||||
| 20,203,794 | g | Solar Star Funding LLC | 5.375 | 06/30/35 | 23,286 | ||||||||||||
| 10,000,000 | Southern Power Co | 4.150 | 12/01/25 | 10,875 | |||||||||||||
| 14,825,000 | Southwestern Electric Power Co | 3.250 | 11/01/51 | 14,701 | |||||||||||||
| 5,613,000 | Southwestern Public Service Co | 3.750 | 06/15/49 | 6,389 | |||||||||||||
| 18,650,000 | Southwestern Public Service Co | 3.150 | 05/01/50 | 19,449 | |||||||||||||
| 26,083,570 | g | Star Energy Geothermal Wayang Windu Ltd | 6.750 | 04/24/33 | 28,561 | ||||||||||||
| 18,000,000 | g | TerraForm Power Operating LLC | 5.000 | 01/31/28 | 19,066 | ||||||||||||
| 18,465,704 | g | Topaz Solar Farms LLC | 4.875 | 09/30/39 | 20,822 | ||||||||||||
| 10,337,502 | g | Topaz Solar Farms LLC | 5.750 | 09/30/39 | 12,285 | ||||||||||||
| 9,750,000 | Tucson Electric Power Co | 1.500 | 08/01/30 | 9,107 | |||||||||||||
| 8,421,585 | g | UEP Penonome II S.A. | 6.500 | 10/01/38 | 8,811 | ||||||||||||
| 448 |
COLLEGE RETIREMENT EQUITIES FUND - Social Choice Account
| PRINCIPAL | ISSUER | REFERENCE RATE & SPREAD | RATE | MATURITY DATE | VALUE (000) | ||||||||||||
| $ | 15,000,000 | Union Electric Co | 2.150 | % | 03/15/32 | $ | 14,722 | ||||||||||
| 16,400,000 | Union Electric Co | 2.625 | 03/15/51 | 15,722 | |||||||||||||
| 1,850,000 | g | Vistra Corp | 7.000 | N/A‡ | 1,877 | ||||||||||||
| TOTAL UTILITIES | 888,558 | ||||||||||||||||
| TOTAL CORPORATE BONDS | 3,336,855 | ||||||||||||||||
| (Cost $3,275,631) | |||||||||||||||||
| GOVERNMENT BONDS - 17.9% | |||||||||||||||||
| AGENCY SECURITIES - 1.6% | |||||||||||||||||
| 3,939,000 | Canal Barge Co, Inc | 4.500 | 11/12/34 | 4,499 | |||||||||||||
| 1,005,641 | DY7 Leasing LLC | 2.578 | 12/10/25 | 1,035 | |||||||||||||
| 6,018,042 | Ethiopian Leasing LLC | 2.566 | 08/14/26 | 6,237 | |||||||||||||
| 23,000,000 | Federal Home Loan Mortgage Corp (FHLMC) | 0.375 | 05/05/23 | 22,948 | |||||||||||||
| 18,700,000 | FHLMC | 0.250 | 08/24/23 | 18,579 | |||||||||||||
| 13,650,000 | FHLMC | 0.250 | 09/08/23 | 13,557 | |||||||||||||
| 23,636,000 | FHLMC | 0.250 | 12/04/23 | 23,412 | |||||||||||||
| 20,000,000 | Federal National Mortgage Association (FNMA) | 0.250 | 07/10/23 | 19,891 | |||||||||||||
| 8,000,000 | FNMA | 0.625 | 04/22/25 | 7,890 | |||||||||||||
| 18,880,000 | FNMA | 0.875 | 08/05/30 | 17,791 | |||||||||||||
| 5,950,000 | Hashemite Kingdom of Jordan Government AID Bond | 3.000 | 06/30/25 | 6,291 | |||||||||||||
| 4,125,000 | i | India Government AID Bond | LIBOR 3 M + 0.100% | 0.417 | 02/01/27 | 4,072 | |||||||||||
| 1,825,000 | Iraq Government AID Bond | 2.149 | 01/18/22 | 1,826 | |||||||||||||
| 3,280,000 | Lutheran Medical Center | 1.982 | 02/20/30 | 3,316 | |||||||||||||
| 15,885,000 | Montefiore Medical Center | 2.895 | 04/20/32 | 16,664 | |||||||||||||
| 12,505,000 | New York Society for the Relief of the Ruptured & Crippled | 2.881 | 12/20/31 | 12,750 | |||||||||||||
| 805,804 | Overseas Private Investment Corp (OPIC) | 2.040 | 12/15/26 | 817 | |||||||||||||
| 11,958,252 | OPIC | 3.220 | 09/15/29 | 12,801 | |||||||||||||
| 5,362,237 | OPIC | 1.790 | 10/15/29 | 5,429 | |||||||||||||
| 16,756,991 | OPIC | 2.360 | 10/15/29 | 17,354 | |||||||||||||
| 1,968,903 | OPIC | 2.610 | 04/15/30 | 2,059 | |||||||||||||
| 2,736,000 | OPIC | 2.930 | 05/15/30 | 2,904 | |||||||||||||
| 4,521,600 | OPIC | 3.040 | 05/15/30 | 4,823 | |||||||||||||
| 967,818 | OPIC | 2.810 | 07/31/33 | 1,027 | |||||||||||||
| 1,548,509 | OPIC | 2.940 | 07/31/33 | 1,656 | |||||||||||||
| 5,382,323 | OPIC | 2.450 | 07/15/38 | 5,555 | |||||||||||||
| 27,342,000 | Private Export Funding Corp (PEFCO) | 2.050 | 11/15/22 | 27,715 | |||||||||||||
| 4,000,000 | PEFCO | 3.550 | 01/15/24 | 4,205 | |||||||||||||
| 8,000,000 | PEFCO | 3.250 | 06/15/25 | 8,470 | |||||||||||||
| 64,468 | Tayarra Ltd | 3.628 | 02/15/22 | 65 | |||||||||||||
| 13,041,067 | Thirax LLC | 0.968 | 01/14/33 | 12,560 | |||||||||||||
| 1,775,000 | United States International Development Finance Corp | 1.440 | 04/15/28 | 1,753 | |||||||||||||
| 1,000,000 | United States International Development Finance Corp | 1.650 | 04/15/28 | 999 | |||||||||||||
| 8,721,357 | United States International Development Finance Corp | 1.630 | 07/15/38 | 8,444 | |||||||||||||
| 2,386,000 | US Department of Housing and Urban Development (HUD) | 2.910 | 08/01/23 | 2,390 | |||||||||||||
| 5,000,000 | HUD | 3.535 | 08/01/36 | 5,547 | |||||||||||||
| TOTAL AGENCY SECURITIES | 307,331 | ||||||||||||||||
| FOREIGN GOVERNMENT BONDS - 2.9% | |||||||||||||||||
| 12,750,000 | e | African Development Bank | 0.750 | 04/03/23 | 12,773 | ||||||||||||
| 449 |
COLLEGE RETIREMENT EQUITIES FUND - Social Choice Account
| PRINCIPAL | ISSUER | REFERENCE RATE & SPREAD | RATE | MATURITY DATE | VALUE (000) | ||||||||||||
| $ | 11,850,000 | g | Arab Petroleum Investments Corp | 1.483 | % | 10/06/26 | $ | 11,701 | |||||||||
| 4,882,000 | Asian Development Bank | 1.875 | 08/10/22 | 4,925 | |||||||||||||
| 9,500,000 | Asian Development Bank | 2.125 | 03/19/25 | 9,807 | |||||||||||||
| 6,500,000 | Asian Development Bank | 1.750 | 08/14/26 | 6,631 | |||||||||||||
| 16,489,000 | e | Asian Development Bank | 3.125 | 09/26/28 | 18,431 | ||||||||||||
| 12,500,000 | Asian Development Bank | 1.500 | 03/04/31 | 12,437 | |||||||||||||
| EUR | 7,925,000 | g | Banque Ouest Africaine de Developpement | 2.750 | 01/22/33 | 9,468 | |||||||||||
| $ | 12,400,000 | g | BNG Bank NV | 2.625 | 02/27/24 | 12,858 | |||||||||||
| CLP | 9,475,000,000 | g | Bonos de la Tesoreria de la Republica en pesos | 2.300 | 10/01/28 | 9,177 | |||||||||||
| $ | 1,900,000 | g | Caisse d’Amortissement de la Dette Sociale | 0.625 | 02/18/26 | 1,847 | |||||||||||
| 4,750,000 | g | Caisse d’Amortissement de la Dette Sociale | 1.375 | 01/20/31 | 4,603 | ||||||||||||
| 7,000,000 | e,g | CDP Financial, Inc | 1.000 | 05/26/26 | 6,888 | ||||||||||||
| 10,075,000 | e | Chile Government International Bond | 3.100 | 05/07/41 | 9,858 | ||||||||||||
| 9,500,000 | Chile Government International Bond | 3.500 | 01/25/50 | 9,831 | |||||||||||||
| 15,000,000 | g | Development Bank of Japan, Inc | 0.500 | 03/04/24 | 14,849 | ||||||||||||
| 9,925,000 | g | Egypt Government International Bond | 5.250 | 10/06/25 | 10,001 | ||||||||||||
| 19,500,000 | European Bank for Reconstruction & Development | 1.625 | 09/27/24 | 19,832 | |||||||||||||
| 3,750,000 | e | European Investment Bank | 2.375 | 05/24/27 | 3,934 | ||||||||||||
| 3,725,000 | e | European Investment Bank | 0.625 | 10/21/27 | 3,544 | ||||||||||||
| 11,600,000 | e | European Investment Bank | 1.625 | 10/09/29 | 11,640 | ||||||||||||
| 7,500,000 | European Investment Bank | 0.750 | 09/23/30 | 7,010 | |||||||||||||
| 2,000,000 | European Investment Bank | 4.875 | 02/15/36 | 2,752 | |||||||||||||
| 1,925,000 | g | Guatemala Government International Bond | 5.375 | 04/24/32 | 2,146 | ||||||||||||
| 6,082,000 | Hydro Quebec | 8.400 | 01/15/22 | 6,097 | |||||||||||||
| 20,000,000 | i | Inter-American Development Bank | LIBOR 3 M + 0.010% | 0.134 | 01/15/22 | 20,001 | |||||||||||
| 11,000,000 | International Bank for Reconstruction & Development | 0.625 | 04/22/25 | 10,816 | |||||||||||||
| 14,750,000 | International Bank for Reconstruction & Development | 3.125 | 11/20/25 | 15,788 | |||||||||||||
| 27,150,000 | g | International Development Association | 2.750 | 04/24/23 | 27,890 | ||||||||||||
| 1,000,000 | International Finance Corp | 2.000 | 10/24/22 | 1,013 | |||||||||||||
| 7,375,000 | International Finance Corp | 0.500 | 03/20/23 | 7,368 | |||||||||||||
| 33,500,000 | e | International Finance Corp | 2.125 | 04/07/26 | 34,726 | ||||||||||||
| 8,750,000 | Japan International Cooperation Agency | 1.750 | 04/28/31 | 8,731 | |||||||||||||
| 12,500,000 | g | Kommunalbanken AS. | 2.125 | 02/11/25 | 12,896 | ||||||||||||
| 8,750,000 | i | Korea Development Bank International Bond | LIBOR 3 M + 0.725% | 0.852 | 07/06/22 | 8,775 | |||||||||||
| 10,100,000 | g | Korea Electric Power Corp | 1.125 | 06/15/25 | 9,971 | ||||||||||||
| 9,200,000 | i | Kreditanstalt fuer Wiederaufbau | SOFR + 1.000% | 1.050 | 02/12/24 | 9,375 | |||||||||||
| 11,250,000 | Kreditanstalt fuer Wiederaufbau | 0.250 | 03/08/24 | 11,107 | |||||||||||||
| 9,537,000 | Kreditanstalt fuer Wiederaufbau | 1.000 | 10/01/26 | 9,402 | |||||||||||||
| 13,000,000 | Landwirtschaftliche Rentenbank | 0.875 | 09/03/30 | 12,236 | |||||||||||||
| 18,250,000 | e,g | Nederlandse Waterschapsbank NV | 1.750 | 01/15/25 | 18,613 | ||||||||||||
| 19,000,000 | g | Nederlandse Waterschapsbank NV | 2.375 | 03/24/26 | 19,859 | ||||||||||||
| 22,800,000 | g | Perusahaan Penerbit SBSN Indonesia III | 3.750 | 03/01/23 | 23,551 | ||||||||||||
| 10,500,000 | g | Perusahaan Penerbit SBSN Indonesia III | 3.900 | 08/20/24 | 11,240 | ||||||||||||
| 10,690,000 | Peruvian Government International Bond | 3.000 | 01/15/34 | 10,647 | |||||||||||||
| 12,700,000 | e | Province of Manitoba Canada | 3.050 | 05/14/24 | 13,302 | ||||||||||||
| 10,000,000 | e | Province of Quebec Canada | 2.750 | 04/12/27 | 10,612 | ||||||||||||
| 5,000,000 | Province of Quebec Canada | 7.500 | 09/15/29 | 6,982 | |||||||||||||
| 15,250,000 | Province of Quebec Canada | 1.900 | 04/21/31 | 15,344 | |||||||||||||
| 10,000,000 | Republic of Italy Government International Bond | 2.875 | 10/17/29 | 10,216 | |||||||||||||
| 7,750,000 | Republic of Italy Government International Bond | 4.000 | 10/17/49 | 8,517 | |||||||||||||
| TOTAL FOREIGN GOVERNMENT BONDS | 572,018 | ||||||||||||||||
| 450 |
COLLEGE RETIREMENT EQUITIES FUND - Social Choice Account
| PRINCIPAL | ISSUER | REFERENCE RATE & SPREAD | RATE | MATURITY DATE | VALUE (000) | ||||||||||||
| MORTGAGE BACKED - 6.6% | |||||||||||||||||
| $ | 2,115,000 | g,i | Angel Oak Mortgage Trust | 2.837 | % | 11/25/66 | $ | 2,116 | |||||||||
| 2,600,000 | Federal Home Loan Mortgage Corp (FHLMC) | 3.000 | 10/15/33 | 2,740 | |||||||||||||
| 118,530 | FHLMC | 4.000 | 06/01/42 | 129 | |||||||||||||
| 1,255,994 | i | FHLMC | LIBOR 1 M + 5.920% | 5.810 | 03/15/44 | 216 | |||||||||||
| 3,846,866 | FHLMC | 4.000 | 10/01/47 | 4,204 | |||||||||||||
| 2,289,222 | FHLMC | 4.000 | 06/01/48 | 2,485 | |||||||||||||
| 4,073,818 | i | FHLMC | LIBOR 1 M + 9.920% | 9.744 | 06/15/48 | 4,646 | |||||||||||
| 3,824,401 | FHLMC | 4.000 | 07/01/48 | 4,173 | |||||||||||||
| 2,827,124 | i | FHLMC | LIBOR 1 M + 9.840% | 9.664 | 10/15/48 | 3,330 | |||||||||||
| 10,700,276 | FHLMC | 3.000 | 11/01/49 | 11,260 | |||||||||||||
| 10,333,870 | FHLMC | 2.000 | 09/25/50 | 1,188 | |||||||||||||
| 13,937,401 | FHLMC | 2.500 | 11/25/50 | 2,293 | |||||||||||||
| 18,803,940 | FHLMC | 2.500 | 02/25/51 | 3,155 | |||||||||||||
| 13,448,839 | FHLMC | 3.000 | 11/01/51 | 14,352 | |||||||||||||
| 1,601,023 | FHLMC | 3.000 | 11/01/51 | 1,685 | |||||||||||||
| 1,435,261 | FHLMC | 3.000 | 11/01/51 | 1,537 | |||||||||||||
| 1,888,564 | FHLMC | 3.000 | 11/01/51 | 2,017 | |||||||||||||
| 416 | Federal Home Loan Mortgage Corp Gold (FGLMC) | 7.000 | 05/01/23 | 0 | ^ | ||||||||||||
| 6,419 | FGLMC | 8.000 | 01/01/31 | 7 | |||||||||||||
| 131,087 | FGLMC | 4.500 | 07/01/33 | 144 | |||||||||||||
| 944,082 | FGLMC | 7.000 | 12/01/33 | 1,071 | |||||||||||||
| 271,759 | FGLMC | 7.000 | 05/01/35 | 305 | |||||||||||||
| 619,720 | FGLMC | 5.000 | 06/01/36 | 701 | |||||||||||||
| 178,617 | FGLMC | 5.000 | 07/01/39 | 203 | |||||||||||||
| 291,915 | FGLMC | 4.500 | 10/01/44 | 319 | |||||||||||||
| 418,822 | FGLMC | 4.500 | 11/01/44 | 463 | |||||||||||||
| 581,574 | FGLMC | 4.500 | 11/01/44 | 642 | |||||||||||||
| 313,394 | FGLMC | 4.500 | 12/01/44 | 340 | |||||||||||||
| 413,080 | FGLMC | 4.500 | 12/01/44 | 456 | |||||||||||||
| 1,275,221 | FGLMC | 3.500 | 04/01/45 | 1,378 | |||||||||||||
| 5,265,544 | FGLMC | 3.500 | 10/01/45 | 5,672 | |||||||||||||
| 4,866,021 | FGLMC | 4.000 | 12/01/45 | 5,355 | |||||||||||||
| 16,750,433 | FGLMC | 3.500 | 08/01/46 | 18,042 | |||||||||||||
| 657,226 | FGLMC | 4.500 | 06/01/47 | 725 | |||||||||||||
| 1,554,311 | FGLMC | 4.000 | 09/01/47 | 1,703 | |||||||||||||
| 995,367 | FGLMC | 3.500 | 12/01/47 | 1,071 | |||||||||||||
| 1,418,853 | FGLMC | 4.000 | 07/01/48 | 1,549 | |||||||||||||
| 4,394,507 | FGLMC | 4.500 | 08/01/48 | 4,830 | |||||||||||||
| 3,923 | Federal National Mortgage Association (FNMA) | 8.000 | 07/01/24 | 4 | |||||||||||||
| 17,438,558 | i | FNMA | 2.784 | 02/25/27 | 18,426 | ||||||||||||
| 3,500,000 | i | FNMA | 3.325 | 06/25/28 | 3,830 | ||||||||||||
| 15,250,000 | i | FNMA | 1.510 | 11/25/30 | 14,867 | ||||||||||||
| 15,500,000 | i | FNMA | 1.250 | 01/25/31 | 14,776 | ||||||||||||
| 1,424,608 | FNMA | 3.500 | 05/01/32 | 1,510 | |||||||||||||
| 1,631,531 | FNMA | 3.000 | 10/01/32 | 1,714 | |||||||||||||
| 1,546,426 | FNMA | 5.000 | 05/01/35 | 1,745 | |||||||||||||
| 1,025,240 | FNMA | 5.000 | 10/01/35 | 1,159 | |||||||||||||
| 767,910 | FNMA | 5.000 | 02/01/36 | 868 | |||||||||||||
| 14,200,000 | h | FNMA | 1.500 | 01/25/37 | 14,238 | ||||||||||||
| 38,150,000 | h | FNMA | 2.000 | 01/25/37 | 39,063 | ||||||||||||
| 18,655,000 | h | FNMA | 2.500 | 01/25/37 | 19,282 | ||||||||||||
| 36,450,000 | h | FNMA | 2.000 | 02/25/37 | 37,259 | ||||||||||||
| 451 |
COLLEGE RETIREMENT EQUITIES FUND - Social Choice Account
| PRINCIPAL | ISSUER | REFERENCE RATE & SPREAD | RATE | MATURITY DATE | VALUE (000) | ||||||||||||
| $ | 1,403,544 | FNMA | 5.500 | % | 11/01/38 | $ | 1,608 | ||||||||||
| 194,512 | FNMA | 3.000 | 05/01/40 | 203 | |||||||||||||
| 633,855 | FNMA | 5.000 | 09/01/40 | 714 | |||||||||||||
| 1,329,745 | FNMA | 5.000 | 05/01/41 | 1,507 | |||||||||||||
| 984,625 | FNMA | 4.000 | 09/01/42 | 1,070 | |||||||||||||
| 1,995,316 | i | FNMA | LIBOR 1 M + 5.950% | 5.848 | 09/25/43 | 359 | |||||||||||
| 450,018 | FNMA | 4.000 | 01/01/44 | 494 | |||||||||||||
| 1,473,721 | FNMA | 4.500 | 03/01/44 | 1,640 | |||||||||||||
| 332,002 | FNMA | 4.500 | 06/01/44 | 365 | |||||||||||||
| 4,701,564 | FNMA | 4.500 | 06/01/44 | 5,162 | |||||||||||||
| 1,068,033 | FNMA | 4.500 | 08/01/44 | 1,174 | |||||||||||||
| 2,720,114 | FNMA | 4.500 | 10/01/44 | 3,001 | |||||||||||||
| 5,156,824 | FNMA | 4.500 | 11/01/44 | 5,688 | |||||||||||||
| 897,637 | FNMA | 5.000 | 11/01/44 | 1,016 | |||||||||||||
| 1,265,829 | FNMA | 4.500 | 12/01/44 | 1,386 | |||||||||||||
| 517,537 | FNMA | 4.000 | 01/01/45 | 562 | |||||||||||||
| 244,095 | FNMA | 4.500 | 03/01/45 | 268 | |||||||||||||
| 337,970 | FNMA | 4.500 | 04/01/45 | 373 | |||||||||||||
| 2,573,089 | FNMA | 3.500 | 05/01/45 | 2,787 | |||||||||||||
| 1,327,704 | FNMA | 4.000 | 12/01/45 | 1,457 | |||||||||||||
| 3,784,493 | FNMA | 3.500 | 01/01/46 | 4,075 | |||||||||||||
| 4,490,434 | FNMA | 4.000 | 01/01/46 | 4,915 | |||||||||||||
| 763,388 | FNMA | 4.000 | 04/01/46 | 832 | |||||||||||||
| 4,425,410 | FNMA | 3.500 | 06/01/46 | 4,765 | |||||||||||||
| 2,696,363 | FNMA | 3.500 | 07/01/46 | 2,903 | |||||||||||||
| 4,659,874 | FNMA | 3.500 | 07/01/46 | 5,030 | |||||||||||||
| 1,244,797 | FNMA | 3.500 | 08/01/46 | 1,340 | |||||||||||||
| 390,272 | FNMA | 3.000 | 10/01/46 | 400 | |||||||||||||
| 3,521,376 | FNMA | 3.500 | 10/01/46 | 3,791 | |||||||||||||
| 4,486,886 | FNMA | 3.000 | 11/01/46 | 4,685 | |||||||||||||
| 6,682,523 | FNMA | 3.500 | 01/01/47 | 7,109 | |||||||||||||
| 1,479,869 | FNMA | 4.500 | 05/01/47 | 1,634 | |||||||||||||
| 3,031,626 | FNMA | 4.000 | 09/01/47 | 3,251 | |||||||||||||
| 1,007,913 | FNMA | 4.000 | 09/01/47 | 1,079 | |||||||||||||
| 2,523,500 | FNMA | 4.000 | 10/01/47 | 2,697 | |||||||||||||
| 388,055 | FNMA | 3.000 | 11/01/47 | 396 | |||||||||||||
| 297,072 | FNMA | 3.500 | 11/01/47 | 320 | |||||||||||||
| 391,214 | FNMA | 4.500 | 11/01/47 | 430 | |||||||||||||
| 3,147,251 | FNMA | 4.000 | 12/01/47 | 3,442 | |||||||||||||
| 8,184,007 | FNMA | 4.000 | 12/01/47 | 8,764 | |||||||||||||
| 3,999,533 | FNMA | 3.500 | 01/01/48 | 4,235 | |||||||||||||
| 2,583,088 | FNMA | 4.500 | 01/01/48 | 2,838 | |||||||||||||
| 2,224,132 | FNMA | 4.500 | 02/01/48 | 2,447 | |||||||||||||
| 6,432,129 | FNMA | 3.500 | 03/01/48 | 6,805 | |||||||||||||
| 2,477,132 | FNMA | 4.000 | 03/01/48 | 2,711 | |||||||||||||
| 8,893,358 | FNMA | 4.500 | 03/01/48 | 9,782 | |||||||||||||
| 2,471,101 | FNMA | 4.000 | 04/01/48 | 2,626 | |||||||||||||
| 1,810,964 | FNMA | 4.500 | 05/01/48 | 1,992 | |||||||||||||
| 1,390,668 | FNMA | 4.500 | 05/01/48 | 1,530 | |||||||||||||
| 3,346,812 | FNMA | 5.000 | 08/01/48 | 3,731 | |||||||||||||
| 15,268,223 | FNMA | 3.000 | 07/01/50 | 16,099 | |||||||||||||
| 6,410,162 | FNMA | 2.000 | 08/25/50 | 730 | |||||||||||||
| 16,464,725 | FNMA | 2.500 | 11/25/50 | 2,284 | |||||||||||||
| 31,100,000 | h | FNMA | 2.000 | 01/25/51 | 31,004 | ||||||||||||
| 32,750,000 | h | FNMA | 2.500 | 01/25/51 | 33,413 | ||||||||||||
| 170,260,000 | h | FNMA | 2.500 | 02/25/51 | 173,274 | ||||||||||||
| 452 |
COLLEGE RETIREMENT EQUITIES FUND - Social Choice Account
| PRINCIPAL | ISSUER | RATE | MATURITY DATE | VALUE (000) | |||||||||||||
| $ | 4,703,226 | FNMA | 3.000 | % | 02/25/51 | $ | 747 | ||||||||||
| 5,091,454 | FNMA | 3.000 | 09/01/51 | 5,397 | |||||||||||||
| 5,464,476 | FNMA | 2.500 | 11/25/51 | 768 | |||||||||||||
| 2,630,000 | h | FNMA | 3.000 | 01/01/52 | 2,735 | ||||||||||||
| 53,670,000 | h | FNMA | 3.000 | 01/25/52 | 55,600 | ||||||||||||
| 68,640,000 | h | FNMA | 3.000 | 02/25/52 | 71,004 | ||||||||||||
| 153,620,000 | h | FNMA | 2.000 | 02/25/52 | 152,805 | ||||||||||||
| 2,075,000 | g,i | Federal Home Loan STACR REMIC Trust | 3.450 | 10/25/41 | 2,088 | ||||||||||||
| 3,530,000 | g,i | Federal Home Loan Structured Agency Credit Risk Debt Notes (STACR) | 3.450 | 11/25/41 | 3,585 | ||||||||||||
| 2,794,626 | Government National Mortgage Association (GNMA) | 2.580 | 08/15/25 | 2,847 | |||||||||||||
| 8,871,213 | GNMA | 2.690 | 06/15/33 | 9,020 | |||||||||||||
| 7,322,556 | GNMA | 3.700 | 10/15/33 | 7,694 | |||||||||||||
| 67,210 | GNMA | 5.000 | 04/15/38 | 76 | |||||||||||||
| 136,976 | GNMA | 6.500 | 11/20/38 | 159 | |||||||||||||
| 7,376,417 | GNMA | 3.700 | 08/15/40 | 7,714 | |||||||||||||
| 11,836,405 | GNMA | 2.750 | 01/15/45 | 12,506 | |||||||||||||
| 1,859,217 | GNMA | 4.500 | 12/20/45 | 2,077 | |||||||||||||
| 1,881,918 | GNMA | 4.000 | 06/20/46 | 222 | |||||||||||||
| 5,785,008 | GNMA | 3.500 | 12/20/46 | 6,091 | |||||||||||||
| 3,979,464 | GNMA | 3.500 | 01/20/47 | 4,187 | |||||||||||||
| 3,874,355 | GNMA | 3.500 | 01/20/49 | 4,141 | |||||||||||||
| 2,176,333 | GNMA | 3.500 | 10/20/50 | 2,341 | |||||||||||||
| 67,535,000 | h | GNMA | 2.000 | 01/20/51 | 68,145 | ||||||||||||
| 36,115,000 | h | GNMA | 3.000 | 01/20/51 | 37,367 | ||||||||||||
| 6,387,271 | GNMA | 3.000 | 07/20/51 | 6,815 | |||||||||||||
| 87,870,000 | h | GNMA | 2.500 | 01/20/52 | 89,984 | ||||||||||||
| 30,270,000 | h | GNMA | 2.500 | 02/20/52 | 30,931 | ||||||||||||
| 37,350,000 | h | GNMA | 3.000 | 02/20/52 | 38,576 | ||||||||||||
| 3,430,117 | g,i | GS Mortgage-Backed Securities Trust | 2.500 | 03/25/52 | 3,402 | ||||||||||||
| 3,468,784 | g,i | GS Mortgage-Backed Securities Trust | 2.500 | 03/25/52 | 3,504 | ||||||||||||
| TOTAL MORTGAGE BACKED | 1,295,964 | ||||||||||||||||
| MUNICIPAL BONDS - 3.1% | |||||||||||||||||
| 4,500,000 | g | Basin Electric Power Coop | 6.127 | 06/01/41 | 6,075 | ||||||||||||
| 1,170,000 | Brunswick & Glynn County Development Authority | 3.060 | 04/01/25 | 1,228 | |||||||||||||
| 3,000,000 | California Earthquake Authority | 1.477 | 07/01/23 | 3,027 | |||||||||||||
| 675,000 | g | California Municipal Finance Authority | 4.250 | 11/01/23 | 681 | ||||||||||||
| 455,000 | California Municipal Finance Authority | 2.138 | 08/15/27 | 453 | |||||||||||||
| 350,000 | California Municipal Finance Authority | 2.288 | 08/15/28 | 348 | |||||||||||||
| 500,000 | California Municipal Finance Authority | 3.694 | 08/15/56 | 484 | |||||||||||||
| 16,250,000 | Chicago Housing Authority | 4.361 | 01/01/38 | 19,273 | |||||||||||||
| 11,645,000 | Chicago Metropolitan Water Reclamation District-Greater Chicago | 5.720 | 12/01/38 | 16,039 | |||||||||||||
| 3,035,000 | City & County of Honolulu HI | 2.668 | 10/01/27 | 3,187 | |||||||||||||
| 5,645,000 | City & County of Honolulu HI | 3.974 | 09/01/35 | 6,359 | |||||||||||||
| 1,615,000 | City & County of Honolulu HI | 4.004 | 09/01/36 | 1,817 | |||||||||||||
| 7,085,000 | City & County of San Francisco CA | 4.000 | 04/01/47 | 7,576 | |||||||||||||
| 5,500,000 | City & County of San Francisco CA Community Facilities District | 4.000 | 09/01/48 | 5,914 | |||||||||||||
| 350,000 | City & County of San Francisco CA Community Facilities District No 2014- | 3.091 | 09/01/36 | 358 | |||||||||||||
| 5,465,000 | City & County of San Francisco CA Community Facilities District No 2014- | 3.482 | 09/01/50 | 5,569 | |||||||||||||
| 453 |
COLLEGE RETIREMENT EQUITIES FUND - Social Choice Account
| PRINCIPAL | ISSUER | REFERENCE RATE & SPREAD | RATE | MATURITY DATE | VALUE (000) | ||||||||||||
| $ | 5,395,000 | City of Chicago IL | 7.750 | % | 01/01/42 | $ | 6,446 | ||||||||||
| 1,105,000 | City of Chicago IL | 7.750 | 01/01/42 | 1,258 | |||||||||||||
| 1,250,000 | City of Florence SC | 4.250 | 12/01/34 | 1,323 | |||||||||||||
| 1,000,000 | City of Houston TX Combined Utility System Revenue | 3.375 | 11/15/24 | 1,066 | |||||||||||||
| 1,275,000 | City of Houston TX Combined Utility System Revenue | 4.172 | 11/15/38 | 1,426 | |||||||||||||
| 7,500,000 | City of Los Angeles CA | 3.880 | 09/01/38 | 8,290 | |||||||||||||
| 1,780,000 | g | City of Miami FL | 4.808 | 01/01/39 | 2,006 | ||||||||||||
| 3,665,000 | City of Norfolk VA | 3.050 | 10/01/36 | 3,986 | |||||||||||||
| 4,835,000 | City of Oakland CA | 2.070 | 01/15/29 | 4,912 | |||||||||||||
| 3,345,000 | City of San Francisco CA Public Utilities Commission Water Revenue | 3.000 | 11/01/26 | 3,570 | |||||||||||||
| 3,725,000 | City of San Francisco CA Public Utilities Commission Water Revenue | 3.950 | 11/01/36 | 4,083 | |||||||||||||
| 8,615,000 | City of San Francisco CA Public Utilities Commission Water Revenue | 3.303 | 11/01/39 | 8,907 | |||||||||||||
| 18,050,000 | City of San Francisco CA Public Utilities Commission Water Revenue | 2.825 | 11/01/41 | 17,673 | |||||||||||||
| 18,500,000 | City of San Francisco CA Public Utilities Commission Water Revenue | 4.185 | 11/01/46 | 20,349 | |||||||||||||
| 1,000,000 | City of San Juan Capistrano CA | 3.700 | 08/01/31 | 1,085 | |||||||||||||
| 5,255,000 | City of Seattle WA Local Improvement District No 6751 | 2.999 | 11/01/43 | 5,347 | |||||||||||||
| 5,235,000 | City of Seattle WA Local Improvement District No 6751 | 3.079 | 11/01/43 | 5,332 | |||||||||||||
| 2,730,000 | Commonwealth Financing Authority | 3.864 | 06/01/38 | 3,092 | |||||||||||||
| 11,650,000 | i | Connecticut Housing Finance Authority | SOFR + 0.650% | 0.700 | 05/15/49 | 11,653 | |||||||||||
| 7,650,000 | County of Alameda CA | 3.820 | 08/01/38 | 8,421 | |||||||||||||
| 1,500,000 | County of Miami-Dade FL Aviation Revenue | 2.218 | 10/01/22 | 1,517 | |||||||||||||
| 12,015,000 | County of Miami-Dade FL Water & Sewer System Revenue | 3.490 | 10/01/42 | 12,651 | |||||||||||||
| 235,000 | County of Saline AR | 3.550 | 06/01/42 | 241 | |||||||||||||
| 3,500,000 | District of Columbia | 3.432 | 04/01/42 | 3,653 | |||||||||||||
| 15,000,000 | District of Columbia Water & Sewer Authority | 4.814 | 10/01/14 | 22,539 | |||||||||||||
| 1,000,000 | Grant County Public Utility District No 2 | 5.470 | 01/01/34 | 1,069 | |||||||||||||
| 1,250,000 | Grant County Public Utility District No 2 | 4.164 | 01/01/35 | 1,452 | |||||||||||||
| 22,445,000 | Grant County Public Utility District No 2 | 2.918 | 01/01/40 | 22,739 | |||||||||||||
| 9,255,000 | Grant County Public Utility District No 2 | 3.210 | 01/01/40 | 9,569 | |||||||||||||
| 3,230,000 | Great Lakes Water Authority Sewage Disposal System Revenue | 3.056 | 07/01/39 | 3,408 | |||||||||||||
| 16,915,000 | Great Lakes Water Authority Water Supply System Revenue | 3.473 | 07/01/41 | 17,898 | |||||||||||||
| 1,100,000 | Guadalupe Valley Electric Coop, Inc | 5.671 | 10/01/32 | 1,310 | |||||||||||||
| 410,000 | Guadalupe-Blanco River Authority Industrial Development Corp | 3.287 | 04/15/23 | 419 | |||||||||||||
| 640,000 | Henry County Water Authority | 3.000 | 01/01/43 | 631 | |||||||||||||
| 850,000 | Henry County Water Authority | 3.200 | 01/01/49 | 850 | |||||||||||||
| 1,000,000 | Honolulu City & County Board of Water Supply | 2.327 | 07/01/32 | 1,022 | |||||||||||||
| 2,000,000 | Kern County Water Agency Improvement District No 4 | 4.276 | 05/01/36 | 2,350 | |||||||||||||
| 6,430,000 | Lavaca-Navidad River Authority | 4.430 | 08/01/35 | 6,709 | |||||||||||||
| 8,655,000 | Los Angeles Community College District | 2.106 | 08/01/32 | 8,481 | |||||||||||||
| 2,800,000 | Maryland Community Development Administration Housing Revenue | 3.797 | 03/01/39 | 2,915 | |||||||||||||
| 3,000,000 | Massachusetts Clean Energy Cooperative Corp | 2.020 | 07/01/28 | 2,998 | |||||||||||||
| 3,000,000 | Massachusetts Clean Energy Cooperative Corp | 2.485 | 07/01/32 | 3,019 | |||||||||||||
| 454 |
COLLEGE RETIREMENT EQUITIES FUND - Social Choice Account
| PRINCIPAL | ISSUER | RATE | MATURITY DATE | VALUE (000) | |||||||||||||
| $ | 4,595,000 | Massachusetts St. Water Pollution Abatement | 5.192 | % | 08/01/40 | $ | 5,357 | ||||||||||
| 10,735,000 | Metropolitan Transportation Authority | 5.175 | 11/15/49 | 14,695 | |||||||||||||
| 2,000,000 | Michigan Finance Authority | 5.000 | 07/01/31 | 2,218 | |||||||||||||
| 7,400,000 | New Jersey Economic Development Authority | 5.706 | 06/15/30 | 9,137 | |||||||||||||
| 3,000,000 | New Jersey Economic Development Authority | 5.756 | 06/15/31 | 3,749 | |||||||||||||
| 3,375,000 | New Mexico Finance Authority | 4.090 | 06/15/38 | 3,720 | |||||||||||||
| 4,065,000 | New York City Housing Development Corp | 3.119 | 08/01/38 | 4,201 | |||||||||||||
| 2,500,000 | New York City Housing Development Corp | 3.720 | 11/01/39 | 2,658 | |||||||||||||
| 1,225,000 | New York State Environmental Facilities Corp | 3.195 | 06/15/25 | 1,300 | |||||||||||||
| 2,120,000 | New York State Environmental Facilities Corp | 3.520 | 07/15/27 | 2,334 | |||||||||||||
| 17,500,000 | New York Transportation Development Corp | 5.000 | 01/01/26 | 20,325 | |||||||||||||
| 11,245,000 | Ohio State Water Development Authority | 4.879 | 12/01/34 | 13,268 | |||||||||||||
| 13,250,000 | †,g,q | Oregon State Business Development Commission | 6.500 | 04/01/31 | 795 | ||||||||||||
| 3,470,000 | †,g | Oregon State Business Development Commission | 0.000 | 04/01/37 | 208 | ||||||||||||
| 2,500,000 | Palm Beach County Solid Waste Authority | 2.636 | 10/01/24 | 2,613 | |||||||||||||
| 4,615,000 | Papio-Missouri River Natural Resource District | 2.088 | 12/15/24 | 4,733 | |||||||||||||
| 4,500,000 | Pend Oreille County Public Utility District No Box Canyon | 5.000 | 01/01/30 | 4,561 | |||||||||||||
| 7,250,000 | g | Pennsylvania Economic Development Financing Authority | 10.000 | 12/01/29 | 7,376 | ||||||||||||
| 1,735,000 | g | Public Finance Authority | 9.000 | 06/01/29 | 1,734 | ||||||||||||
| 1,250,000 | Redevelopment Authority of the City of Philadelphia | 1.927 | 09/01/27 | 1,239 | |||||||||||||
| 1,710,000 | Redevelopment Authority of the City of Philadelphia | 3.172 | 09/01/41 | 1,719 | |||||||||||||
| 2,000,000 | San Francisco City & County Redevelopment Agency | 4.375 | 08/01/44 | 2,166 | |||||||||||||
| 36,330,000 | State of California | 3.750 | 10/01/37 | 38,978 | |||||||||||||
| 11,565,000 | State of California | 4.600 | 04/01/38 | 13,313 | |||||||||||||
| 10,050,000 | State of California | 4.988 | 04/01/39 | 10,604 | |||||||||||||
| 8,000,000 | State of Illinois | 5.000 | 02/01/22 | 8,029 | |||||||||||||
| 9,000,000 | State of Illinois | 5.520 | 04/01/38 | 10,892 | |||||||||||||
| 4,405,000 | State of Michigan | 3.590 | 12/01/26 | 4,523 | |||||||||||||
| 2,500,000 | State of Ohio | 5.412 | 09/01/28 | 3,090 | |||||||||||||
| 3,370,000 | State of Texas | 3.726 | 08/01/43 | 3,520 | |||||||||||||
| 3,000 | State of Wisconsin | 5.700 | 05/01/26 | 3 | |||||||||||||
| 1,650,000 | g | Syracuse Industrial Development Agency | 5.000 | 01/01/36 | 1,441 | ||||||||||||
| 2,280,000 | Tampa Bay Water | 2.612 | 10/01/25 | 2,403 | |||||||||||||
| 3,225,000 | Tampa Bay Water | 2.782 | 10/01/26 | 3,406 | |||||||||||||
| 3,000,000 | Tampa Bay Water | 2.952 | 10/01/27 | 3,187 | |||||||||||||
| 1,255,000 | Texas Water Development Board | 4.248 | 10/15/35 | 1,367 | |||||||||||||
| 5,880,000 | Texas Water Development Board | 4.340 | 10/15/48 | 6,586 | |||||||||||||
| 4,170,000 | Texas Water Development Board | 4.648 | 04/15/50 | 4,514 | |||||||||||||
| 5,000,000 | Tuolumne Wind Project Authority | 6.918 | 01/01/34 | 6,697 | |||||||||||||
| 3,035,000 | University of California | 3.809 | 05/15/28 | 3,392 | |||||||||||||
| 11,400,000 | University of California | 4.009 | 05/15/30 | 13,125 | |||||||||||||
| 1,000,000 | University of Cincinnati | 3.250 | 06/01/29 | 1,060 | |||||||||||||
| 1,560,000 | University of Cincinnati | 3.650 | 06/01/34 | 1,663 | |||||||||||||
| 1,615,000 | University of Cincinnati | 3.700 | 06/01/35 | 1,724 | |||||||||||||
| 18,000,000 | University of New Mexico | 3.532 | 06/20/32 | 19,111 | |||||||||||||
| 500,000 | Upper Allegheny Joint Sanitary Authority | 3.550 | 09/01/39 | 536 | |||||||||||||
| 1,500,000 | Upper Allegheny Joint Sanitary Authority | 3.800 | 09/01/49 | 1,587 | |||||||||||||
| 455 |
COLLEGE RETIREMENT EQUITIES FUND - Social Choice Account
| PRINCIPAL | ISSUER | REFERENCE RATE & SPREAD | RATE | MATURITY DATE | VALUE (000) | ||||||||||||
| $ | 5,000,000 | Vermont Educational & Health Buildings Financing Agency | 4.000 | % | 12/01/42 | $ | 5,518 | ||||||||||
| 3,000,000 | Vermont Educational & Health Buildings Financing Agency | 4.000 | 12/01/46 | 3,303 | |||||||||||||
| 1,000,000 | Washington County Clean Water Services | 5.078 | 10/01/24 | 1,110 | |||||||||||||
| TOTAL MUNICIPAL BONDS | 610,841 | ||||||||||||||||
| U.S. TREASURY SECURITIES - 3.7% | |||||||||||||||||
| 6,000,000 | United States Treasury Bond | 3.125 | 02/15/43 | 7,232 | |||||||||||||
| 35,830,000 | United States Treasury Bond | 2.875 | 11/15/46 | 42,379 | |||||||||||||
| 2,500,000 | United States Treasury Bond | 3.000 | 02/15/49 | 3,073 | |||||||||||||
| 9,350,000 | United States Treasury Note | 0.125 | 05/31/22 | 9,349 | |||||||||||||
| 4,150,000 | United States Treasury Note | 2.000 | 07/31/22 | 4,193 | |||||||||||||
| 4,500,000 | United States Treasury Note | 1.750 | 09/30/22 | 4,548 | |||||||||||||
| 21,821,000 | United States Treasury Note | 0.125 | 10/31/22 | 21,784 | |||||||||||||
| 10,350,000 | United States Treasury Note | 0.125 | 12/31/22 | 10,318 | |||||||||||||
| 19,250,000 | United States Treasury Note | 0.125 | 03/31/23 | 19,161 | |||||||||||||
| 3,780,000 | United States Treasury Note | 0.250 | 09/30/23 | 3,753 | |||||||||||||
| 31,765,000 | United States Treasury Note | 2.875 | 09/30/23 | 32,976 | |||||||||||||
| 2,500,000 | United States Treasury Note | 0.750 | 12/31/23 | 2,501 | |||||||||||||
| 6,100,000 | United States Treasury Note | 2.625 | 12/31/23 | 6,327 | |||||||||||||
| 1,525,000 | United States Treasury Note | 2.250 | 10/31/24 | 1,581 | |||||||||||||
| 26,938,000 | United States Treasury Note | 0.875 | 12/15/24 | 26,968 | |||||||||||||
| 18,842,000 | United States Treasury Note | 2.500 | 02/28/26 | 19,833 | |||||||||||||
| 178,783,000 | United States Treasury Note | 1.250 | 12/31/26 | 178,587 | |||||||||||||
| 15,031,000 | United States Treasury Note | 0.500 | 10/31/27 | 14,304 | |||||||||||||
| 35,275,000 | United States Treasury Note | 0.625 | 11/30/27 | 33,785 | |||||||||||||
| 28,250,000 | United States Treasury Note | 1.125 | 08/31/28 | 27,703 | |||||||||||||
| 37,265,000 | United States Treasury Note | 1.375 | 12/31/28 | 37,131 | |||||||||||||
| 29,957,000 | United States Treasury Note | 1.375 | 11/15/31 | 29,578 | |||||||||||||
| 14,508,000 | United States Treasury Note | 1.875 | 02/15/41 | 14,360 | |||||||||||||
| 4,700,000 | United States Treasury Note | 2.250 | 05/15/41 | 4,937 | |||||||||||||
| 50,525,000 | United States Treasury Note | 1.750 | 08/15/41 | 48,986 | |||||||||||||
| 6,000,000 | United States Treasury Note | 2.000 | 11/15/41 | 6,068 | |||||||||||||
| 135,057,000 | United States Treasury Note | 2.000 | 08/15/51 | 137,674 | |||||||||||||
| TOTAL U.S. TREASURY SECURITIES | 749,089 | ||||||||||||||||
| TOTAL GOVERNMENT BONDS | 3,535,243 | ||||||||||||||||
| (Cost $3,465,319) | |||||||||||||||||
| STRUCTURED ASSETS - 3.9% | |||||||||||||||||
| ASSET BACKED - 1.4% | |||||||||||||||||
| 99,904 | g | AMSR Trust | 1.819 | 04/17/37 | 100 | ||||||||||||
| Series - 2020 SFR1 (Class A) | |||||||||||||||||
| 900,000 | g | AMSR Trust | 3.148 | 01/19/39 | 925 | ||||||||||||
| Series - 2019 SFR1 (Class C) | |||||||||||||||||
| 800,000 | g | AMSR Trust | 3.247 | 01/19/39 | 817 | ||||||||||||
| Series - 2019 SFR1 (Class D) | |||||||||||||||||
| 2,093,060 | g,i | AREIT Trust | LIBOR 1 M + 1.134% | 1.184 | 09/14/36 | 2,092 | |||||||||||
| Series - 2019 CRE3 (Class A) | |||||||||||||||||
| 35,340 | i | Bear Stearns Asset Backed Securities Trust | LIBOR 1 M + 1.005% | 1.107 | 04/25/36 | 35 | |||||||||||
| Series - 2006 SD1 (Class M1) | |||||||||||||||||
| 4,500,000 | g,i | BFLD Trust | LIBOR 1 M + 2.100% | 2.210 | 10/15/35 | 4,496 | |||||||||||
| Series - 2020 EYP (Class C) | |||||||||||||||||
| 456 |
COLLEGE RETIREMENT EQUITIES FUND - Social Choice Account
| PRINCIPAL | ISSUER | REFERENCE RATE & SPREAD | RATE | MATURITY DATE | VALUE (000) | ||||||||||||
| $ | 3,617,912 | g | Capital Automotive REIT | 3.870 | % | 04/15/47 | $ | 3,618 | |||||||||
| Series - 2017 1A (Class A1) | |||||||||||||||||
| 309,983 | i | C-BASS Trust | LIBOR 1 M + 0.160% | 0.262 | 07/25/36 | 303 | |||||||||||
| Series - 2006 CB6 (Class A1) | |||||||||||||||||
| 3,278,974 | i | Chase Funding Loan Acquisition Trust | LIBOR 1 M + 0.855% | 0.957 | 06/25/34 | 3,226 | |||||||||||
| Series - 2004 OPT1 (Class M1) | |||||||||||||||||
| 179,162 | g | Corevest American Finance Trust | 1.832 | 03/15/50 | 179 | ||||||||||||
| Series - 2020 1 (Class A1) | |||||||||||||||||
| 1,497,394 | Delta Air Lines Pass Through Trust | 4.250 | 07/30/23 | 1,547 | |||||||||||||
| Series - 2015 1 (Class B) | |||||||||||||||||
| 7,150,000 | Delta Air Lines Pass Through Trust | 3.204 | 04/25/24 | 7,392 | |||||||||||||
| Series - 2019 1 (Class AA) | |||||||||||||||||
| 4,551,546 | Delta Air Lines Pass Through Trust | 2.000 | 06/10/28 | 4,450 | |||||||||||||
| Series - 2020 1 (Class AA) | |||||||||||||||||
| 11,929,571 | Delta Air Lines Pass Through Trust | 2.500 | 06/10/28 | 11,878 | |||||||||||||
| Series - 2020 1 (Class A) | |||||||||||||||||
| 172,062 | g,i | Ellington Loan Acquisition Trust | LIBOR 1 M + 1.100% | 1.202 | 05/25/37 | 172 | |||||||||||
| Series - 2007 2 (Class A2C) | |||||||||||||||||
| 3,896,248 | g | GoodLeap Sustainable Home Solutions Trust | 2.100 | 05/20/48 | 3,829 | ||||||||||||
| Series - 2021 3CS (Class A) | |||||||||||||||||
| 4,237,617 | g | GoodLeap Sustainable Home Solutions Trust | 1.930 | 07/20/48 | 4,144 | ||||||||||||
| Series - 2021 4GS (Class A) | |||||||||||||||||
| 15,750,000 | g | GoodLeap Sustainable Home Solutions Trust | 2.310 | 10/20/48 | 15,702 | ||||||||||||
| Series - 2021 5CS (Class A) | |||||||||||||||||
| 3,160,654 | g | HERO Funding Trust | 3.840 | 09/21/40 | 3,273 | ||||||||||||
| Series - 2015 1A (Class A) | |||||||||||||||||
| 920,799 | g | HERO Funding Trust | 3.990 | 09/21/40 | 962 | ||||||||||||
| Series - 2014 2A (Class A) | |||||||||||||||||
| 1,560,449 | g | HERO Funding Trust | 3.750 | 09/20/41 | 1,613 | ||||||||||||
| Series - 2016 2A (Class A) | |||||||||||||||||
| 1,473,072 | g | HERO Funding Trust | 4.050 | 09/20/41 | 1,536 | ||||||||||||
| Series - 2016 1A (Class A) | |||||||||||||||||
| 568,314 | g | HERO Funding Trust | 3.080 | 09/20/42 | 582 | ||||||||||||
| Series - 2016 3A (Class A1) | |||||||||||||||||
| 4,249,794 | g | HERO Funding Trust | 3.710 | 09/20/47 | 4,392 | ||||||||||||
| Series - 2017 1A (Class A1) | |||||||||||||||||
| 4,267,557 | g | HERO Funding Trust | 3.190 | 09/20/48 | 4,367 | ||||||||||||
| Series - 2017 3A (Class A1) | |||||||||||||||||
| 1,007,279 | g | HERO Funding Trust | 3.280 | 09/20/48 | 1,032 | ||||||||||||
| Series - 2017 2A (Class A1) | |||||||||||||||||
| 4,597,158 | g | HERO Funding Trust | 4.670 | 09/20/48 | 4,827 | ||||||||||||
| Series - 2018 1A (Class A2) | |||||||||||||||||
| 3,539,513 | g | HERO Funding Trust | 2.240 | 09/20/51 | 3,481 | ||||||||||||
| Series - 2021 1A (Class A) | |||||||||||||||||
| 19,736 | i | Home Equity Asset Trust | LIBOR 1 M + 1.500% | 1.608 | 06/25/33 | 20 | |||||||||||
| Series - 2003 1 (Class M1) | |||||||||||||||||
| 599,972 | g,i | Invitation Homes Trust | LIBOR 1 M + 1.250% | 1.359 | 01/17/38 | 600 | |||||||||||
| Series - 2018 SFR4 (Class B) | |||||||||||||||||
| 480,371 | i | JP Morgan Mortgage Acquisition Trust | LIBOR 1 M + 0.320% | 0.422 | 03/25/37 | 479 | |||||||||||
| Series - 2007 CH3 (Class A1B) | |||||||||||||||||
| 4,466,677 | i | JP Morgan Mortgage Acquisition Trust | LIBOR 1 M + 0.160% | 0.262 | 06/25/37 | 4,415 | |||||||||||
| Series - 2007 CH5 (Class A1) | |||||||||||||||||
| 3,986,255 | g | Loanpal Solar Loan Ltd | 2.290 | 01/20/48 | 3,985 | ||||||||||||
| Series - 2021 1GS (Class A) | |||||||||||||||||
| 6,584,359 | g | Loanpal Solar Loan Ltd | 2.220 | 03/20/48 | 6,529 | ||||||||||||
| Series - 2021 2GS (Class A) | |||||||||||||||||
| 457 |
COLLEGE RETIREMENT EQUITIES FUND - Social Choice Account
| PRINCIPAL | ISSUER | REFERENCE RATE & SPREAD | RATE | MATURITY DATE | VALUE (000) | ||||||||||||
| $ | 2,418,632 | †,g | Mosaic Solar Loan Trust | 0.000 | % | 04/20/46 | $ | 2,128 | |||||||||
| Series - 2020 1A (Class R) | |||||||||||||||||
| 1,783,929 | g | Mosaic Solar Loan Trust | 2.100 | 04/20/46 | 1,789 | ||||||||||||
| Series - 2020 1A (Class A) | |||||||||||||||||
| 2,468,831 | g | Mosaic Solar Loan Trust | 3.100 | 04/20/46 | 2,546 | ||||||||||||
| Series - 2020 1A (Class B) | |||||||||||||||||
| 2,802,060 | g | Mosaic Solar Loan Trust | 2.050 | 12/20/46 | 2,768 | ||||||||||||
| Series - 2021 1A (Class B) | |||||||||||||||||
| 4,093,308 | g | Mosaic Solar Loan Trust | 1.440 | 06/20/52 | 3,961 | ||||||||||||
| Series - 2021 3A (Class A) | |||||||||||||||||
| 3,941,766 | g | Mosaic Solar Loans LLC | 3.820 | 06/22/43 | 4,099 | ||||||||||||
| Series - 2017 2A (Class A) | |||||||||||||||||
| 4,390,172 | g | Mosaic Solar Loans LLC | 1.640 | 04/22/47 | 4,263 | ||||||||||||
| Series - 2021 2A (Class A) | |||||||||||||||||
| 2,500,000 | g | Progress Residential Trust | 2.082 | 10/17/38 | 2,444 | ||||||||||||
| Series - 2021 SFR8 (Class D) | |||||||||||||||||
| 750,000 | g | Progress Residential Trust | 2.711 | 11/17/40 | 731 | ||||||||||||
| Series - 2021 SFR9 (Class D) | |||||||||||||||||
| 313,877 | i | RASC Trust | LIBOR 1 M + 0.590% | 3.080 | 08/25/35 | 314 | |||||||||||
| Series - 2005 KS8 (Class M4) | |||||||||||||||||
| 2,567,077 | g | Renew | 3.670 | 09/20/52 | 2,643 | ||||||||||||
| Series - 2017 1A (Class A) | |||||||||||||||||
| 5,605,696 | g | Renew | 3.950 | 09/20/53 | 5,828 | ||||||||||||
| Series - 2018 1 (Class A) | |||||||||||||||||
| 4,927,858 | g | Renew | 2.060 | 11/20/56 | 4,856 | ||||||||||||
| Series - 2021 1 (Class A) | |||||||||||||||||
| 6,193,630 | SCE Recovery Funding LLC | 0.861 | 11/15/31 | 5,903 | |||||||||||||
| 11,583 | i | Structured Asset Investment Loan Trust | LIBOR 1 M + 0.900% | 1.002 | 09/25/34 | 12 | |||||||||||
| Series - 2004 8 (Class M1) | |||||||||||||||||
| 48,488 | i | Structured Asset Investment Loan Trust | LIBOR 1 M + 1.000% | 1.102 | 09/25/34 | 49 | |||||||||||
| Series - 2004 8 (Class A9) | |||||||||||||||||
| 1,202,529 | i | Structured Asset Securities Corp Mortgage Loan Trust | LIBOR 1 M + 1.500% | 1.599 | 04/25/35 | 1,213 | |||||||||||
| Series - 2005 7XS (Class 2A1A) | |||||||||||||||||
| 7,333,657 | g | Sunnova Helios VII Issuer LLC | 2.030 | 10/20/48 | 7,255 | ||||||||||||
| Series - 2021 C (Class A) | |||||||||||||||||
| 2,794,385 | g | Sunrun Athena Issuer LLC | 5.310 | 04/30/49 | 3,056 | ||||||||||||
| Series - 2018 1 (Class A) | |||||||||||||||||
| 9,229,035 | g | Sunrun Atlas Issuer LLC | 3.610 | 02/01/55 | 9,657 | ||||||||||||
| Series - 2019 2 (Class A) | |||||||||||||||||
| 6,080,000 | g | Sunrun Callisto Issuer LLC | 2.270 | 01/30/57 | 6,037 | ||||||||||||
| Series - 2021 2A (Class A) | |||||||||||||||||
| 11,362,346 | g | TES LLC | 4.330 | 10/20/47 | 11,867 | ||||||||||||
| Series - 2017 1A (Class A) | |||||||||||||||||
| 2,500,000 | g | TES LLC | 7.740 | 10/20/47 | 2,395 | ||||||||||||
| Series - 2017 1A (Class B) | |||||||||||||||||
| 6,930,236 | g | TES LLC | 4.120 | 02/20/48 | 7,220 | ||||||||||||
| Series - 2017 2A (Class A) | |||||||||||||||||
| 4,125,000 | g | Tesla Auto Lease Trust | 2.200 | 11/21/22 | 4,158 | ||||||||||||
| Series - 2019 A (Class A4) | |||||||||||||||||
| 5,400,000 | g | Tesla Auto Lease Trust | 0.560 | 03/20/25 | 5,367 | ||||||||||||
| Series - 2021 A (Class A3) | |||||||||||||||||
| 6,650,000 | g | Tesla Auto Lease Trust | 0.660 | 03/20/25 | 6,598 | ||||||||||||
| Series - 2021 A (Class A4) | |||||||||||||||||
| 458 |
COLLEGE RETIREMENT EQUITIES FUND - Social Choice Account
| PRINCIPAL | ISSUER | REFERENCE RATE & SPREAD | RATE | MATURITY DATE | VALUE (000) | ||||||||||||
| $ | 6,250,000 | g | Tesla Auto Lease Trust | 1.180 | % | 03/20/25 | $ | 6,207 | |||||||||
| Series - 2021 A (Class C) | |||||||||||||||||
| 4,500,000 | g | Tesla Auto Lease Trust | 0.600 | 09/22/25 | 4,445 | ||||||||||||
| Series - 2021 B (Class A3) | |||||||||||||||||
| 5,000,000 | g | Tesla Auto Lease Trust | 0.630 | 09/22/25 | 4,932 | ||||||||||||
| Series - 2021 B (Class A4) | |||||||||||||||||
| 9,500,000 | Toyota Auto Receivables Owner Trust | 0.260 | 11/17/25 | 9,408 | |||||||||||||
| Series - 2021 B (Class A3) | |||||||||||||||||
| 9,900,000 | Toyota Auto Receivables Owner Trust | 0.530 | 10/15/26 | 9,696 | |||||||||||||
| Series - 2021 B (Class A4) | |||||||||||||||||
| 1,066,367 | g | Tricon American Homes Trust | 2.928 | 01/17/36 | 1,072 | ||||||||||||
| Series - 2017 SFR2 (Class A) | |||||||||||||||||
| 200,000 | g | Tricon American Homes Trust | 3.275 | 01/17/36 | 201 | ||||||||||||
| Series - 2017 SFR2 (Class B) | |||||||||||||||||
| 475,000 | g | Tricon American Homes Trust | 2.049 | 07/17/38 | 467 | ||||||||||||
| Series - 2020 SFR1 (Class B) | |||||||||||||||||
| 14,127,839 | g | Vivint Colar Financing V LLC | 4.730 | 04/30/48 | 15,038 | ||||||||||||
| Series - 2018 1A (Class A) | |||||||||||||||||
| 5,044,787 | g | Vivint Solar Financing VII LLC | 2.210 | 07/31/51 | 4,939 | ||||||||||||
| Series - 2020 1A (Class A) | |||||||||||||||||
| TOTAL ASSET BACKED | 272,560 | ||||||||||||||||
| OTHER MORTGAGE BACKED - 2.5% | |||||||||||||||||
| 100,643 | g,i | Agate Bay Mortgage Trust | 3.500 | 09/25/45 | 101 | ||||||||||||
| Series - 2015 6 (Class A9) | |||||||||||||||||
| 4,075,000 | g,i | Alen Mortgage Trust | LIBOR 1 M + 2.250% | 2.360 | 04/15/34 | 4,067 | |||||||||||
| Series - 2021 ACEN (Class C) | |||||||||||||||||
| 123,233 | i | Alternative Loan Trust | LIBOR 1 M + 0.750% | 0.852 | 06/25/34 | 126 | |||||||||||
| Series - 2004 8CB (Class M1) | |||||||||||||||||
| 5,000,000 | g | BANK | 2.500 | 10/17/52 | 4,388 | ||||||||||||
| Series - 2019 BN21 (Class D) | |||||||||||||||||
| 6,500,000 | i | BANK | 3.517 | 10/17/52 | 6,563 | ||||||||||||
| Series - 2019 BN21 (Class C) | |||||||||||||||||
| 8,000,000 | i | BANK | 3.461 | 11/15/62 | 8,305 | ||||||||||||
| Series - 2019 BN22 (Class C) | |||||||||||||||||
| 4,940,000 | g,i | BBCMS Mortgage Trust | 4.267 | 08/05/38 | 4,332 | ||||||||||||
| Series - 2018 CHRS (Class E) | |||||||||||||||||
| 12,500,000 | g | BBCMS Trust | 3.593 | 09/15/32 | 12,559 | ||||||||||||
| Series - 2015 MSQ (Class A) | |||||||||||||||||
| 3,600,000 | g | BBCMS Trust | 3.894 | 09/15/32 | 3,616 | ||||||||||||
| Series - 2015 MSQ (Class B) | |||||||||||||||||
| 3,000,000 | g,i | BBCMS Trust | 3.688 | 02/15/53 | 3,090 | ||||||||||||
| Series - 2020 C6 (Class F5TA) | |||||||||||||||||
| 1,000,000 | Benchmark Mortgage Trust | 3.419 | 08/15/52 | 1,071 | |||||||||||||
| Series - 2019 B12 (Class AS) | |||||||||||||||||
| 8,870,000 | g,i | Benchmark Mortgage Trust | 3.899 | 03/15/62 | 9,270 | ||||||||||||
| Series - 2019 B10 (Class 3CCA) | |||||||||||||||||
| 11,225,000 | g,i | BX Commercial Mortgage Trust | LIBOR 1 M + 1.197% | 1.307 | 10/15/38 | 11,155 | |||||||||||
| Series - 2021 XL2 (Class C) | |||||||||||||||||
| 2,000,000 | i | CD Mortgage Trust | 3.879 | 11/10/49 | 2,071 | ||||||||||||
| Series - 2016 CD2 (Class B) | |||||||||||||||||
| 459 |
COLLEGE RETIREMENT EQUITIES FUND - Social Choice Account
| PRINCIPAL | ISSUER | REFERENCE RATE & SPREAD | RATE | MATURITY DATE | VALUE (000) | ||||||||||||
| $ | 2,000,000 | i | Citigroup Commercial Mortgage Trust | 4.142 | % | 04/10/48 | $ | 2,072 | |||||||||
| Series - 2015 GC29 (Class C) | |||||||||||||||||
| 4,000,000 | Citigroup Commercial Mortgage Trust | 3.300 | 11/10/52 | 4,259 | |||||||||||||
| Series - 2019 GC43 (Class AS) | |||||||||||||||||
| 3,115,000 | Citigroup Commercial Mortgage Trust | 3.018 | 08/10/56 | 3,249 | |||||||||||||
| Series - 2019 GC41 (Class AS) | |||||||||||||||||
| 203,363 | i | Citigroup Mortgage Loan Trust | LIBOR 1 M + 0.750% | 0.852 | 01/25/36 | 203 | |||||||||||
| Series - 2006 WFH1 (Class M4) | |||||||||||||||||
| 3,000,000 | g,i | Cityline Commercial Mortgage Trust | 2.778 | 11/10/31 | 3,051 | ||||||||||||
| Series - 2016 CLNE (Class A) | |||||||||||||||||
| 3,740,000 | g,i | COMM Mortgage Trust | 3.413 | 10/10/29 | 3,803 | ||||||||||||
| Series - 2017 PANW (Class B) | |||||||||||||||||
| 3,000,000 | g,i | COMM Mortgage Trust | 3.538 | 10/10/29 | 3,041 | ||||||||||||
| Series - 2017 PANW (Class C) | |||||||||||||||||
| 5,120,000 | g | COMM Mortgage Trust | 4.353 | 08/10/30 | 5,308 | ||||||||||||
| Series - 2013 300P (Class A1) | |||||||||||||||||
| 3,500,000 | g,i | COMM Mortgage Trust | 4.106 | 03/10/48 | 3,473 | ||||||||||||
| Series - 2015 CR22 (Class D) | |||||||||||||||||
| 1,100,000 | i | COMM Mortgage Trust | 4.286 | 05/10/48 | 1,147 | ||||||||||||
| Series - 2015 CR23 (Class C) | |||||||||||||||||
| 1,000,000 | i | COMM Mortgage Trust | 4.286 | 05/10/48 | 991 | ||||||||||||
| Series - 2015 CR23 (Class D) | |||||||||||||||||
| 2,500,000 | i | COMM Mortgage Trust | 3.463 | 08/10/48 | 2,308 | ||||||||||||
| Series - 2015 CR24 (Class D) | |||||||||||||||||
| 1,000,000 | COMM Mortgage Trust | 3.263 | 08/15/57 | 1,055 | |||||||||||||
| Series - 2019 GC44 (Class AM) | |||||||||||||||||
| 1,472,373 | i | Connecticut Avenue Securities | LIBOR 1 M + 2.600% | 2.703 | 05/25/24 | 1,500 | |||||||||||
| Series - 2014 C02 (Class 1M2) | |||||||||||||||||
| 3,995,233 | i | Connecticut Avenue Securities | LIBOR 1 M + 3.000% | 3.103 | 07/25/24 | 4,057 | |||||||||||
| Series - 2014 C03 (Class 1M2) | |||||||||||||||||
| 2,800,000 | g,i | Connecticut Avenue Securities | 3.350 | 11/25/41 | 2,821 | ||||||||||||
| Series - 2021 R02 (Class 2B1) | |||||||||||||||||
| 1,155,000 | g,i | Connecticut Avenue Securities Trust | 1.600 | 10/25/41 | 1,156 | ||||||||||||
| Series - 2021 R01 (Class 1M2) | |||||||||||||||||
| 250,000 | g,i | Connecticut Avenue Securities Trust | 1.700 | 12/25/41 | 250 | ||||||||||||
| Series - 2021 R03 (Class 1M2) | |||||||||||||||||
| 1,685,000 | g,i | Connecticut Avenue Securities Trust | 2.800 | 12/25/41 | 1,685 | ||||||||||||
| Series - 2021 R03 (Class 1B1) | |||||||||||||||||
| 15,000,000 | g | CPT Mortgage Trust | 2.865 | 11/13/39 | 15,605 | ||||||||||||
| Series - 2019 CPT (Class A) | |||||||||||||||||
| 2,000,000 | g,i | CPT Mortgage Trust | 2.997 | 11/13/39 | 1,904 | ||||||||||||
| Series - 2019 CPT (Class E) | |||||||||||||||||
| 5,000,000 | g,i | Credit Suisse Commercial Mortgage Trust | 3.728 | 11/10/32 | 5,134 | ||||||||||||
| Series - 2017 CALI (Class B) | |||||||||||||||||
| 1,631,295 | g,i | Credit Suisse Commercial Mortgage Trust | 3.500 | 02/25/48 | 1,645 | ||||||||||||
| Series - 2018 J1 (Class A11) | |||||||||||||||||
| 3,922,000 | g,i | Credit Suisse Mortgage Capital Certificates | 2.405 | 10/25/66 | 3,919 | ||||||||||||
| Series - 2021 NQM8 (Class A3) | |||||||||||||||||
| 6,650,000 | g,i | CSAIL Commercial Mortgage Trust | 3.677 | 06/15/37 | 6,740 | ||||||||||||
| Series - 2017 C8 (Class 85BA) | |||||||||||||||||
| 6,100,000 | g,i | CSAIL Commercial Mortgage Trust | 3.677 | 06/15/37 | 5,905 | ||||||||||||
| Series - 2017 C8 (Class 85BB) | |||||||||||||||||
| 460 |
COLLEGE RETIREMENT EQUITIES FUND - Social Choice Account
| PRINCIPAL | ISSUER | REFERENCE RATE & SPREAD | RATE | MATURITY DATE | VALUE (000) | ||||||||||||
| $ | 2,000,000 | g,i | CSMC Series | 3.388 | % | 10/25/59 | $ | 2,024 | |||||||||
| Series - 2019 NQM1 (Class M1) | |||||||||||||||||
| 2,340,454 | g,i | CSMC Trust | 3.500 | 02/25/48 | 2,376 | ||||||||||||
| Series - 2018 J1 (Class A2) | |||||||||||||||||
| 102,725,000 | g,i | DOLP Trust | 0.665 | 05/10/41 | 5,030 | ||||||||||||
| Series - 2021 NYC (Class X) | |||||||||||||||||
| 12,500,000 | g,i | ELP Commercial Mortgage Trust | LIBOR 1 M + 1.320% | 1.430 | 11/15/38 | 12,426 | |||||||||||
| Series - 2021 ELP (Class C) | |||||||||||||||||
| 7,500,000 | g,i | ELP Commercial Mortgage Trust | LIBOR 1 M + 2.118% | 2.228 | 11/15/38 | 7,456 | |||||||||||
| Series - 2021 ELP (Class E) | |||||||||||||||||
| 405,880 | i | Fieldstone Mortgage Investment Trust | LIBOR 1 M + 0.735% | 0.837 | 12/25/35 | 405 | |||||||||||
| Series - 2005 2 (Class M2) | |||||||||||||||||
| 644,195 | g,i | FirstKey Mortgage Trust | 3.500 | 11/25/44 | 651 | ||||||||||||
| Series - 2014 1 (Class A8) | |||||||||||||||||
| 545,732 | g,i | Flagstar Mortgage Trust | 4.080 | 10/25/47 | 552 | ||||||||||||
| Series - 2017 2 (Class B3) | |||||||||||||||||
| 100,415 | g,i | Flagstar Mortgage Trust | 4.000 | 09/25/48 | 101 | ||||||||||||
| Series - 2018 5 (Class A11) | |||||||||||||||||
| 1,551,982 | g,i | Flagstar Mortgage Trust | 2.500 | 04/25/51 | 1,538 | ||||||||||||
| Series - 2021 2 (Class A4) | |||||||||||||||||
| 4,787,968 | g,i | Flagstar Mortgage Trust | 2.500 | 06/01/51 | 4,755 | ||||||||||||
| Series - 2021 4 (Class A21) | |||||||||||||||||
| 13,187,944 | g,i | Flagstar Mortgage Trust | 3.000 | 10/25/51 | 13,378 | ||||||||||||
| Series - 2021 10IN (Class A1) | |||||||||||||||||
| 10,260,000 | Freddie Mac Multiclass Certificates Series | 1.878 | 01/25/31 | 10,412 | |||||||||||||
| Series - 2021 P009 (Class A2) | |||||||||||||||||
| 6,794,994 | Freddie Mac Multifamily ML Certificates | 1.877 | 07/25/37 | 6,742 | |||||||||||||
| Series - 2021 ML08 (Class ) | |||||||||||||||||
| 40,267,322 | †,i | Freddie Mac Multifamily ML Certificates | 1.768 | 11/25/37 | 6,467 | ||||||||||||
| Series - 2021 ML08 (Class XCA) | |||||||||||||||||
| 3,218,850 | Freddie Mac Multifamily ML Certificates | 1.896 | 11/25/37 | 3,202 | |||||||||||||
| Series - 2021 ML08 (Class ) | |||||||||||||||||
| 16,738,084 | Freddie Mac Multifamily ML Certificates | 2.340 | 07/25/41 | 17,449 | |||||||||||||
| Series - 2021 ML12 (Class AUS) | |||||||||||||||||
| 4,829,758 | Freddie Mac Multifamily Structured Pass Through Certificates | 1.555 | 01/25/36 | 4,716 | |||||||||||||
| Series - 2020 Q014 (Class A1) | |||||||||||||||||
| 6,140,000 | Freddie Mac Multifamily Variable Rate Certificate | 1.761 | 09/15/38 | 6,357 | |||||||||||||
| Series - 2020 M061 (Class A) | |||||||||||||||||
| 1,520,000 | g,i | Freddie Mac STACR REMIC Trust | 2.100 | 12/25/33 | 1,523 | ||||||||||||
| Series - 2021 HQA2 (Class M2) | |||||||||||||||||
| 2,860,000 | g,i | Freddie Mac STACR REMIC Trust | 1.700 | 01/25/34 | 2,872 | ||||||||||||
| Series - 2021 DNA5 (Class M2) | |||||||||||||||||
| 429,669 | g,i | GS Mortage-Backed Securities Trust | 3.687 | 05/25/50 | 436 | ||||||||||||
| Series - 2020 PJ1 (Class B2) | |||||||||||||||||
| 2,000,000 | g,i | GS Mortgage Securities Trust | LIBOR 1 M + 1.090% | 1.200 | 10/15/31 | 1,999 | |||||||||||
| Series - 2018 HART (Class A) | |||||||||||||||||
| 3,000,000 | GS Mortgage Securities Trust | 3.143 | 10/10/49 | 3,118 | |||||||||||||
| �� | Series - 2016 GS3 (Class AS) | ||||||||||||||||
| 830,000 | i | GS Mortgage Securities Trust | 3.961 | 11/10/49 | 812 | ||||||||||||
| Series - 2016 GS4 (Class C) | |||||||||||||||||
| 1,183,478 | g,i | GS Mortgage-Backed Securities Corp Trust | 3.500 | 07/25/50 | 1,191 | ||||||||||||
| Series - 2020 PJ2 (Class A4) | |||||||||||||||||
| 471,679 | g,i | GS Mortgage-Backed Securities Corp Trust | 3.000 | 01/25/51 | 476 | ||||||||||||
| Series - 2020 PJ4 (Class A4) | |||||||||||||||||
| 461 |
COLLEGE RETIREMENT EQUITIES FUND - Social Choice Account
| PRINCIPAL | ISSUER | REFERENCE RATE & SPREAD | RATE | MATURITY DATE | VALUE (000) | ||||||||||||
| $ | 369,355 | i | GS Mortgage-Backed Securities Corp Trust | 3.000 | % | 03/27/51 | $ | 373 | |||||||||
| Series - 2020 PJ5 (Class A4) | |||||||||||||||||
| 1,128,743 | g,i | GS Mortgage-Backed Securities Corp Trust | 2.500 | 05/25/51 | 1,117 | ||||||||||||
| Series - 2020 PJ6 (Class A4) | |||||||||||||||||
| 3,036,492 | g,i | GS Mortgage-Backed Securities Corp Trust | 2.500 | 10/25/51 | 3,010 | ||||||||||||
| Series - 2021 PJ5 (Class A4) | |||||||||||||||||
| 1,235,708 | g,i | GS Mortgage-Backed Securities Trust | 2.500 | 07/25/51 | 1,222 | ||||||||||||
| Series - 2021 PJ2 (Class A4) | |||||||||||||||||
| 11,672,370 | g,i | GS Mortgage-Backed Securities Trust | 2.500 | 01/25/52 | 11,580 | ||||||||||||
| Series - 2021 PJ7 (Class A4) | |||||||||||||||||
| 5,248,476 | g,i | GS Mortgage-Backed Securities Trust | 2.500 | 01/25/52 | 5,204 | ||||||||||||
| Series - 2021 PJ8 (Class A4) | |||||||||||||||||
| 9,095,307 | g,i | GS MortSecurities Trust | 2.500 | 11/25/51 | 9,021 | ||||||||||||
| Series - 2021 PJ6 (Class A4) | |||||||||||||||||
| 790,417 | i | HarborView Mortgage Loan Trust | LIBOR 1 M + 0.620% | 0.724 | 08/19/45 | 797 | |||||||||||
| Series - 2005 11 (Class 2A1A) | |||||||||||||||||
| 6,000,000 | g | Hudson Yards Mortgage Trust | 2.835 | 08/10/38 | 6,222 | ||||||||||||
| Series - 2016 10HY (Class A) | |||||||||||||||||
| 5,000,000 | g,i | Hudson Yards Mortgage Trust | 2.977 | 08/10/38 | 5,159 | ||||||||||||
| Series - 2016 10HY (Class B) | |||||||||||||||||
| 5,000,000 | g,i | Hudson Yards Mortgage Trust | 2.977 | 08/10/38 | 5,089 | ||||||||||||
| Series - 2016 10HY (Class C) | |||||||||||||||||
| 7,000,000 | g | Hudson Yards Mortgage Trust | 3.228 | 07/10/39 | 7,461 | ||||||||||||
| Series - 2019 30HY (Class A) | |||||||||||||||||
| 1,000,000 | g,i | Hudson Yards Mortgage Trust | 2.943 | 12/10/41 | 981 | ||||||||||||
| Series - 2019 55HY (Class D) | |||||||||||||||||
| 7,000,000 | g,i | Hudson Yards Mortgage Trust | 2.943 | 12/10/41 | 6,727 | ||||||||||||
| Series - 2019 55HY (Class E) | |||||||||||||||||
| 2,500,000 | g,i | Hudson Yards Mortgage Trust | 2.943 | 12/10/41 | 2,313 | ||||||||||||
| Series - 2019 55HY (Class F) | |||||||||||||||||
| 174,807 | i | Impac CMB Trust | LIBOR 1 M + 0.660% | 0.762 | 03/25/35 | 179 | |||||||||||
| Series - 2004 11 (Class 2A1) | |||||||||||||||||
| 480,000 | g,i | Imperial Fund Mortgage Trust | 3.531 | 10/25/55 | 487 | ||||||||||||
| Series - 2020 NQM1 (Class M1) | |||||||||||||||||
| 2,800,000 | JP Morgan Chase Commercial Mortgage Securities Corp | 3.372 | 12/15/47 | 2,856 | |||||||||||||
| Series - 2013 C10 (Class AS) | |||||||||||||||||
| 2,504,262 | g,i | JP Morgan Mortgage Trust | LIBOR 1 M - 0.000% | 2.116 | 12/25/44 | 2,551 | |||||||||||
| Series - 2015 1 (Class B1) | |||||||||||||||||
| 122,262 | g,i | JP Morgan Mortgage Trust | 3.500 | 05/25/45 | 123 | ||||||||||||
| Series - 2015 3 (Class A19) | |||||||||||||||||
| 557,227 | g,i | JP Morgan Mortgage Trust | 3.500 | 10/25/45 | 555 | ||||||||||||
| Series - 2015 6 (Class A13) | |||||||||||||||||
| 293,990 | g,i | JP Morgan Mortgage Trust | 3.500 | 05/25/46 | 297 | ||||||||||||
| Series - 2016 1 (Class A13) | |||||||||||||||||
| 287,937 | g,i | JP Morgan Mortgage Trust | 3.500 | 05/25/47 | 290 | ||||||||||||
| Series - 2017 2 (Class A13) | |||||||||||||||||
| 254,794 | g,i | JP Morgan Mortgage Trust | 3.500 | 09/25/48 | 254 | ||||||||||||
| Series - 2018 3 (Class A13) | |||||||||||||||||
| 171,642 | g,i | JP Morgan Mortgage Trust | 3.500 | 10/25/48 | 172 | ||||||||||||
| Series - 2018 4 (Class A13) | |||||||||||||||||
| 881,046 | g,i | JP Morgan Mortgage Trust | 3.500 | 10/25/48 | 889 | ||||||||||||
| Series - 2018 5 (Class A13) | |||||||||||||||||
| 883,755 | g,i | JP Morgan Mortgage Trust | 3.063 | 10/26/48 | 910 | ||||||||||||
| Series - 2017 5 (Class A2) | |||||||||||||||||
| 184,809 | g,i | JP Morgan Mortgage Trust | 4.000 | 01/25/49 | 186 | ||||||||||||
| Series - 2018 8 (Class A13) | |||||||||||||||||
| 462 |
COLLEGE RETIREMENT EQUITIES FUND - Social Choice Account
| PRINCIPAL | ISSUER | REFERENCE RATE & SPREAD | RATE | MATURITY DATE | VALUE (000) | ||||||||||||
| $ | 319,564 | g,i | JP Morgan Mortgage Trust | 4.000 | % | 02/25/49 | $ | 322 | |||||||||
| Series - 2018 9 (Class A13) | |||||||||||||||||
| 58,013 | g,i | JP Morgan Mortgage Trust | 4.000 | 05/25/49 | 58 | ||||||||||||
| Series - 2019 1 (Class A3) | |||||||||||||||||
| 376,388 | g,i | JP Morgan Mortgage Trust | 4.000 | 05/25/49 | 378 | ||||||||||||
| Series - 2019 1 (Class A15) | |||||||||||||||||
| 137,937 | g,i | JP Morgan Mortgage Trust | 4.681 | 09/25/49 | 137 | ||||||||||||
| Series - 2019 3 (Class B1) | |||||||||||||||||
| 754,670 | g,i | JP Morgan Mortgage Trust | LIBOR 1 M + 0.950% | 1.052 | 10/25/49 | 758 | |||||||||||
| Series - 2019 INV1 (Class A11) | |||||||||||||||||
| 1,619,083 | g,i | JP Morgan Mortgage Trust | 3.871 | 06/25/50 | 1,676 | ||||||||||||
| Series - 2020 1 (Class B2) | |||||||||||||||||
| 4,838,738 | g,i | JP Morgan Mortgage Trust | 2.500 | 10/25/51 | 4,796 | ||||||||||||
| Series - 2021 6 (Class A15) | |||||||||||||||||
| 2,504,199 | g,i | JP Morgan Mortgage Trust | 2.500 | 11/25/51 | 2,474 | ||||||||||||
| Series - 2021 7 (Class A15) | |||||||||||||||||
| 3,190,390 | g,i | JP Morgan Mortgage Trust | 2.500 | 12/25/51 | 3,172 | ||||||||||||
| Series - 2021 8 (Class A15) | |||||||||||||||||
| 4,592,396 | g,i | JP Morgan Mortgage Trust | 2.500 | 01/25/52 | 4,552 | ||||||||||||
| Series - 2021 11 (Class A15) | |||||||||||||||||
| 6,610,000 | g,i | JP Morgan Mortgage Trust | 2.500 | 06/25/52 | 6,535 | ||||||||||||
| Series - 2021 15 (Class A15) | |||||||||||||||||
| 10,000,000 | g | Liberty Street Trust | 3.597 | 02/10/36 | 10,565 | ||||||||||||
| Series - 2016 225L (Class A) | |||||||||||||||||
| 4,000,000 | g,i | MAD Mortgage Trust | 3.188 | 08/15/34 | 4,047 | ||||||||||||
| Series - 2017 330M (Class A) | |||||||||||||||||
| 4,000,000 | g,i | MAD Mortgage Trust | 3.366 | 08/15/34 | 4,042 | ||||||||||||
| Series - 2017 330M (Class B) | |||||||||||||||||
| 3,000,000 | g,i | Manhattan West | 2.335 | 09/10/39 | 2,955 | ||||||||||||
| Series - 2020 1MW (Class C) | |||||||||||||||||
| 298,285 | i | Morgan Stanley Capital I Trust | LIBOR 1 M + 0.825% | 0.927 | 08/25/34 | 296 | |||||||||||
| Series - 2004 HE6 (Class M1) | |||||||||||||||||
| 132,584 | †,i | Morgan Stanley Capital I Trust | 6.261 | 12/12/49 | 71 | ||||||||||||
| Series - 2007 IQ16 (Class AJFX) | |||||||||||||||||
| 1,089,687 | g,i | Morgan Stanley Residential Mortgage Loan Trust | 2.500 | 07/25/51 | 1,098 | ||||||||||||
| Series - 2021 4 (Class A4) | |||||||||||||||||
| 4,336,685 | g,i | Morgan Stanley Residential Mortgage Loan Trust | 2.500 | 08/25/51 | 4,299 | ||||||||||||
| Series - 2021 5 (Class A9) | |||||||||||||||||
| 3,382,440 | g,i | Morgan Stanley Residential Mortgage Loan Trust | 2.500 | 09/25/51 | 3,407 | ||||||||||||
| Series - 2021 6 (Class A4) | |||||||||||||||||
| 2,800,207 | g,i | Morgan Stanley Residential Mortgage Loan Trust | 2.500 | 09/25/51 | 2,776 | ||||||||||||
| Series - 2021 6 (Class A9) | |||||||||||||||||
| 3,000,000 | g,i | MSDB Trust | 3.316 | 07/11/39 | 3,137 | ||||||||||||
| Series - 2017 712F (Class A) | |||||||||||||||||
| 5,750,000 | g,i | Natixis Commercial Mortgage Securities Trust | LIBOR 1 M + 1.500% | 1.610 | 07/15/36 | 5,750 | |||||||||||
| Series - 2019 MILE (Class A) | |||||||||||||||||
| 9,000,000 | g,i | Natixis Commercial Mortgage Securities Trust | LIBOR 1 M + 3.500% | 3.610 | 07/15/36 | 8,980 | |||||||||||
| Series - 2019 MILE (Class E) | |||||||||||||||||
| 1,500,000 | g,i | Natixis Commercial Mortgage Securities Trust | LIBOR 1 M + 4.250% | 4.360 | 07/15/36 | 1,490 | |||||||||||
| Series - 2019 MILE (Class F) | |||||||||||||||||
| 784,217 | g,i | New Residential Mortgage Loan Trust | 2.797 | 09/25/59 | 784 | ||||||||||||
| Series - 2019 NQM4 (Class A3) | |||||||||||||||||
| 463 |
COLLEGE RETIREMENT EQUITIES FUND - Social Choice Account
| PRINCIPAL | ISSUER | REFERENCE RATE & SPREAD | RATE | MATURITY DATE | VALUE (000) | ||||||||||||
| $ | 470,000 | g,i | New Residential Mortgage Loan Trust | 2.986 | % | 09/25/59 | $ | 469 | |||||||||
| Series - 2019 NQM4 (Class M1) | |||||||||||||||||
| 70,573 | i | New York Mortgage Trust | LIBOR 1 M + 0.480% | 0.582 | 02/25/36 | 71 | |||||||||||
| Series - 2005 3 (Class A1) | |||||||||||||||||
| 5,629,444 | g,i | OBX Trust | 2.500 | 07/25/51 | 5,560 | ||||||||||||
| Series - 2021 J2 (Class A19) | |||||||||||||||||
| 483,193 | g,i | OBX Trust | LIBOR 1 M + 0.650% | 0.752 | 06/25/57 | 484 | |||||||||||
| Series - 2018 1 (Class A2) | |||||||||||||||||
| 1,756,467 | g,i | Oceanview Mortgage Trust | 2.500 | 05/25/51 | 1,740 | ||||||||||||
| Series - 2021 1 (Class A19) | |||||||||||||||||
| 11,800,000 | g | One Bryant Park Trust | 2.516 | 09/15/54 | 11,941 | ||||||||||||
| Series - 2019 OBP (Class A) | |||||||||||||||||
| 3,900,000 | g | One Market Plaza Trust | 3.614 | 02/10/32 | 3,910 | ||||||||||||
| Series - 2017 1MKT (Class A) | |||||||||||||||||
| 588,176 | g,i | Sequoia Mortgage Trust | 3.500 | 05/25/45 | 593 | ||||||||||||
| Series - 2015 2 (Class A1) | |||||||||||||||||
| 240,865 | g,i | Sequoia Mortgage Trust | 3.500 | 06/25/46 | 243 | ||||||||||||
| Series - 2016 1 (Class A19) | |||||||||||||||||
| 8,851 | g,i | Sequoia Mortgage Trust | 3.500 | 11/25/46 | 9 | ||||||||||||
| Series - 2016 3 (Class A10) | |||||||||||||||||
| 560,195 | g,i | Sequoia Mortgage Trust | 3.500 | 04/25/47 | 564 | ||||||||||||
| Series - 2017 3 (Class A19) | |||||||||||||||||
| 693,406 | g,i | Sequoia Mortgage Trust | 3.760 | 09/25/47 | 701 | ||||||||||||
| Series - 2017 6 (Class B1) | |||||||||||||||||
| 160,193 | g,i | Sequoia Mortgage Trust | 3.500 | 02/25/48 | 162 | ||||||||||||
| Series - 2018 2 (Class A1) | |||||||||||||||||
| 128,154 | g,i | Sequoia Mortgage Trust | 3.500 | 02/25/48 | 129 | ||||||||||||
| Series - 2018 2 (Class A19) | |||||||||||||||||
| 24,461 | g,i | Sequoia Mortgage Trust | 4.000 | 09/25/48 | 25 | ||||||||||||
| Series - 2018 7 (Class A19) | |||||||||||||||||
| 5,824 | g,i | Sequoia Mortgage Trust | 4.000 | 11/25/48 | 6 | ||||||||||||
| Series - 2018 8 (Class A19) | |||||||||||||||||
| 465,725 | g,i | Sequoia Mortgage Trust | 4.000 | 06/25/49 | 470 | ||||||||||||
| Series - 2019 2 (Class A1) | |||||||||||||||||
| 110,205 | g,i | Sequoia Mortgage Trust | 4.000 | 06/25/49 | 111 | ||||||||||||
| Series - 2019 2 (Class A19) | |||||||||||||||||
| 375,455 | g,i | Sequoia Mortgage Trust | 3.500 | 11/25/49 | 374 | ||||||||||||
| Series - 2019 4 (Class A1) | |||||||||||||||||
| 462,671 | g,i | Sequoia Mortgage Trust | 3.500 | 12/25/49 | 470 | ||||||||||||
| Series - 2019 5 (Class A1) | |||||||||||||||||
| 258,551 | g,i | Sequoia Mortgage Trust | 3.500 | 12/25/49 | 262 | ||||||||||||
| Series - 2019 5 (Class A19) | |||||||||||||||||
| 1,388,009 | g,i | Sequoia Mortgage Trust | 3.500 | 03/25/50 | 1,404 | ||||||||||||
| Series - 2020 2 (Class A1) | |||||||||||||||||
| 1,172,689 | g,i | Sequoia Mortgage Trust | 3.000 | 04/25/50 | 1,186 | ||||||||||||
| Series - 2020 3 (Class A19) | |||||||||||||||||
| 2,804,331 | g,i | Sequoia Mortgage Trust | 2.500 | 06/25/51 | 2,776 | ||||||||||||
| Series - 2021 4 (Class A19) | |||||||||||||||||
| 488,606 | g,i | Shellpoint Co-Originator Trust | 3.500 | 10/25/47 | 491 | ||||||||||||
| Series - 2017 2 (Class A1) | |||||||||||||||||
| 14,390,000 | g | SLG Office Trust | 2.585 | 07/15/41 | 14,725 | ||||||||||||
| Series - 2021 OVA (Class A) | |||||||||||||||||
| 154,364 | i | Structured Agency Credit Risk Debt Note (STACR) | LIBOR 1 M + 1.200% | 1.303 | 10/25/29 | 154 | |||||||||||
| Series - 2017 DNA2 (Class M1) | |||||||||||||||||
| 2,213,636 | i | STACR | LIBOR 1 M + 2.300% | 2.472 | 08/25/30 | 2,239 | |||||||||||
| Series - 2018 HQA1 (Class M2) | |||||||||||||||||
| 464 |
COLLEGE RETIREMENT EQUITIES FUND - Social Choice Account
| PRINCIPAL | ISSUER | RATE | MATURITY DATE | VALUE (000) | |||||||||||||
| $ | 85,000 | g,i | STACR | 2.300 | % | 08/25/33 | $ | 86 | |||||||||
| Series - 2021 HQA1 (Class M2) | |||||||||||||||||
| 5,350,000 | g,i | STACR | 2.150 | 10/25/33 | 5,446 | ||||||||||||
| Series - 2021 DNA3 (Class M2) | |||||||||||||||||
| 75,568 | g,i | STACR | 3.730 | 02/25/48 | 75 | ||||||||||||
| Series - 2018 SPI1 (Class M2) | |||||||||||||||||
| 136,273 | g,i | STACR | 3.808 | 05/25/48 | 136 | ||||||||||||
| Series - 2018 SPI2 (Class M2) | |||||||||||||||||
| 65,000 | g,i | STACR | 4.050 | 11/25/50 | 68 | ||||||||||||
| Series - 2020 HQA5 (Class B1) | |||||||||||||||||
| 1,600,000 | g,i | Verus Securitization Trust | 3.139 | 07/25/59 | 1,605 | ||||||||||||
| Series - 2019 3 (Class M1) | |||||||||||||||||
| 982,000 | g,i | Verus Securitization Trust | 3.207 | 11/25/59 | 992 | ||||||||||||
| Series - 2019 4 (Class M1) | |||||||||||||||||
| 807,772 | g | Verus Securitization Trust | 1.733 | 05/25/65 | 805 | ||||||||||||
| Series - 2020 5 (Class A3) | |||||||||||||||||
| 3,275,236 | g,i | Verus Securitization Trust | 2.240 | 10/25/66 | 3,267 | ||||||||||||
| Series - 2021 7 (Class A3) | |||||||||||||||||
| 1,030,000 | Wells Fargo Commercial Mortgage Trust | 3.539 | 10/15/45 | 1,043 | |||||||||||||
| Series - 2012 LC5 (Class AS) | |||||||||||||||||
| 110,697 | g,i | Wells Fargo Mortgage Backed Securities Trust | 4.000 | 04/25/49 | 110 | ||||||||||||
| Series - 2019 2 (Class A17) | |||||||||||||||||
| 331,175 | g,i | Wells Fargo Mortgage Backed Securities Trust | 3.000 | 07/25/50 | 334 | ||||||||||||
| Series - 2020 4 (Class A17) | |||||||||||||||||
| 5,848,645 | g,i | Wells Fargo Mortgage Backed Securities Trust | 2.500 | 06/25/51 | 5,794 | ||||||||||||
| Series - 2021 2 (Class A17) | |||||||||||||||||
| 221,204 | g,i | WinWater Mortgage Loan Trust | 3.906 | 06/20/44 | 221 | ||||||||||||
| Series - 2014 1 (Class B4) | |||||||||||||||||
| TOTAL OTHER MORTGAGE BACKED | 501,290 | ||||||||||||||||
| TOTAL STRUCTURED ASSETS | 773,850 | ||||||||||||||||
| (Cost $772,284) | |||||||||||||||||
| TOTAL BONDS | 7,645,948 | ||||||||||||||||
| (Cost $7,513,234) | |||||||||||||||||
| SHARES | COMPANY | ||||||||||||||||
| COMMON STOCKS - 59.8% | |||||||||||||||||
| AUTOMOBILES & COMPONENTS - 1.8% | |||||||||||||||||
| 211,252 | * | American Axle & Manufacturing Holdings, Inc | 1,971 | ||||||||||||||
| 119,198 | * | Aptiv plc | 19,662 | ||||||||||||||
| 157,863 | Bayerische Motoren Werke AG. | 15,793 | |||||||||||||||
| 61,010 | Bayerische Motoren Werke AG. (Preference) | 5,059 | |||||||||||||||
| 14,525 | BorgWarner, Inc | 655 | |||||||||||||||
| 187,486 | Daimler AG. (Registered) | 14,325 | |||||||||||||||
| 207,582 | Denso Corp | 17,202 | |||||||||||||||
| 146,222 | *,e | Lordstown Motors Corp | 504 | ||||||||||||||
| 169,939 | Magna International, Inc | 13,750 | |||||||||||||||
| 78,081 | Michelin (C.G.D.E.) (Class B) | 12,788 | |||||||||||||||
| 142,100 | Stanley Electric Co Ltd | 3,568 | |||||||||||||||
| 178,349 | * | Tesla, Inc | 188,476 | ||||||||||||||
| 2,417,500 | * | Toyota Motor Corp | 44,682 | ||||||||||||||
| 243,482 | Valeo S.A. | 7,343 | |||||||||||||||
| 202,382 | *,e | Workhorse Group, Inc | 882 | ||||||||||||||
| TOTAL AUTOMOBILES & COMPONENTS | 346,660 | ||||||||||||||||
| 465 |
COLLEGE RETIREMENT EQUITIES FUND - Social Choice Account
| SHARES | COMPANY | VALUE (000) | ||||||||
| BANKS - 3.1% | ||||||||||
| 2,364 | Ameris Bancorp | $ | 117 | |||||||
| 27,986 | Associated Banc-Corp | 632 | ||||||||
| 1,009,452 | Australia & New Zealand Banking Group Ltd | 20,221 | ||||||||
| 2,600,974 | Banco Bilbao Vizcaya Argentaria S.A. | 15,426 | ||||||||
| 1,249,895 | Bank Hapoalim Ltd | 12,864 | ||||||||
| 206,061 | Bank of Montreal | 22,185 | ||||||||
| 378,879 | Bank of Nova Scotia | 26,822 | ||||||||
| 50,471 | Bank OZK | 2,348 | ||||||||
| 2,405 | Banner Corp | 146 | ||||||||
| 50,885 | Berkshire Hills Bancorp, Inc | 1,447 | ||||||||
| 362,625 | BNP Paribas S.A. | 25,072 | ||||||||
| 3,966,000 | BOC Hong Kong Holdings Ltd | 13,007 | ||||||||
| 8,511 | Brookline Bancorp, Inc | 138 | ||||||||
| 10,169 | Bryn Mawr Bank Corp | 458 | ||||||||
| 1,840 | Cadence BanCorp | 55 | ||||||||
| 3,827,772 | CaixaBank S.A. | 10,456 | ||||||||
| 6,038 | Camden National Corp | 291 | ||||||||
| 162,922 | Canadian Imperial Bank of Commerce | 18,991 | ||||||||
| 892,785 | Citigroup, Inc | 53,915 | ||||||||
| 498,982 | Citizens Financial Group, Inc | 23,577 | ||||||||
| 2,120 | Columbia Banking System, Inc | 69 | ||||||||
| 113,045 | Comerica, Inc | 9,835 | ||||||||
| 784 | Commerce Bancshares, Inc | 54 | ||||||||
| 434,454 | Commonwealth Bank of Australia | 31,937 | ||||||||
| 889 | Community Trust Bancorp, Inc | 39 | ||||||||
| 3,881 | Cullen/Frost Bankers, Inc | 489 | ||||||||
| 49,821 | * | Customers Bancorp, Inc | 3,257 | |||||||
| 747,493 | DBS Group Holdings Ltd | 18,104 | ||||||||
| 84,052 | Erste Bank der Oesterreichischen Sparkassen AG. | 3,940 | ||||||||
| 7,467 | Federal Agricultural Mortgage Corp (FAMC) | 925 | ||||||||
| 7,030 | First Busey Corp | 191 | ||||||||
| 47,521 | First Republic Bank | 9,814 | ||||||||
| 1,019 | Glacier Bancorp, Inc | 58 | ||||||||
| 56,928 | Great Western Bancorp, Inc | 1,933 | ||||||||
| 1,984 | Hancock Whitney Corp | 99 | ||||||||
| 680,700 | Hang Seng Bank Ltd | 12,465 | ||||||||
| 10,817 | Heartland Financial USA, Inc | 548 | ||||||||
| 4,964 | Heritage Financial Corp | 121 | ||||||||
| 22,048 | HomeStreet, Inc | 1,147 | ||||||||
| 4,199,909 | HSBC Holdings plc | 25,364 | ||||||||
| 303,495 | Huntington Bancshares, Inc | 4,680 | ||||||||
| 466 |
COLLEGE RETIREMENT EQUITIES FUND - Social Choice Account
| SHARES | COMPANY | VALUE (000) | ||||||||
| 7,236,339 | Intesa Sanpaolo S.p.A. | $ | 18,691 | |||||||
| 122,862 | KBC Groep NV | 10,557 | ||||||||
| 229,018 | Keycorp | 5,297 | ||||||||
| 25,729 | Live Oak Bancshares, Inc | 2,246 | ||||||||
| 291,686 | MGIC Investment Corp | 4,206 | ||||||||
| 17,431 | * | Mr Cooper Group, Inc | 725 | |||||||
| 27,409 | National Bank Holdings Corp | 1,204 | ||||||||
| 28,534 | National Bank of Canada | 2,175 | ||||||||
| 938 | NBT Bancorp, Inc | 36 | ||||||||
| 9,051 | Old National Bancorp | 164 | ||||||||
| 1,100 | Oversea-Chinese Banking Corp | 9 | ||||||||
| 179,441 | People’s United Financial, Inc | 3,198 | ||||||||
| 56,233 | Pinnacle Financial Partners, Inc | 5,370 | ||||||||
| 258,107 | PNC Financial Services Group, Inc | 51,756 | ||||||||
| 714,787 | Regions Financial Corp | 15,582 | ||||||||
| 2,027,100 | Resona Holdings, Inc | 7,878 | ||||||||
| 926,229 | Skandinaviska Enskilda Banken AB (Class A) | 12,859 | ||||||||
| 447,897 | Societe Generale | 15,394 | ||||||||
| 2,041,856 | Standard Chartered plc | 12,416 | ||||||||
| 301,200 | Sumitomo Mitsui Trust Holdings, Inc | 10,072 | ||||||||
| 20,449 | * | SVB Financial Group | 13,869 | |||||||
| 1,113,834 | Svenska Handelsbanken AB | 12,038 | ||||||||
| 2,226 | * | Texas Capital Bancshares, Inc | 134 | |||||||
| 6,965 | TFS Financial Corp | 125 | ||||||||
| 20,196 | * | The Bancorp, Inc | 511 | |||||||
| 4,787 | Trico Bancshares | 206 | ||||||||
| 33,943 | * | Tristate Capital Holdings, Inc | 1,027 | |||||||
| 548,557 | Truist Financial Corp | 32,118 | ||||||||
| 1,700 | Trustmark Corp | 55 | ||||||||
| 2,114 | UMB Financial Corp | 224 | ||||||||
| 2,050 | Umpqua Holdings Corp | 39 | ||||||||
| 18,027 | Univest Financial Corp | 539 | ||||||||
| 3,957 | Webster Financial Corp | 221 | ||||||||
| 2,021 | Westamerica Bancorporation | 117 | ||||||||
| 1,110 | Wintrust Financial Corp | 101 | ||||||||
| 1,706 | WSFS Financial Corp | 86 | ||||||||
| 57,728 | Zions Bancorporation | 3,646 | ||||||||
| TOTAL BANKS | 618,128 | |||||||||
| CAPITAL GOODS - 4.1% | ||||||||||
| 227,489 | 3M Co | 40,409 | ||||||||
| 353,727 | ABB Ltd | 13,482 | ||||||||
| 467 |
COLLEGE RETIREMENT EQUITIES FUND - Social Choice Account
| SHARES | COMPANY | VALUE (000) | ||||||||
| 790 | Acuity Brands, Inc | $ | 167 | |||||||
| 247 | Allegion plc | 33 | ||||||||
| 186,861 | Ashtead Group plc | 15,064 | ||||||||
| 167,866 | Assa Abloy AB | 5,117 | ||||||||
| 214,258 | Atlas Copco AB (A Shares) | 14,805 | ||||||||
| 202,746 | Atlas Copco AB (B Shares) | 11,909 | ||||||||
| 90,628 | * | Axon Enterprise, Inc | 14,229 | |||||||
| 250,209 | *,e | Ballard Power Systems, Inc | 3,143 | |||||||
| 688 | * | Beacon Roofing Supply, Inc | 40 | |||||||
| 243,450 | * | Bloom Energy Corp | 5,339 | |||||||
| 237,076 | Bouygues S.A. | 8,486 | ||||||||
| 38,706 | Brenntag AG. | 3,495 | ||||||||
| 353,323 | * | CAE, Inc | 8,913 | |||||||
| 18,395 | Carlisle Cos, Inc | 4,564 | ||||||||
| 258,917 | Carrier Global Corp | 14,044 | ||||||||
| 285,113 | Caterpillar, Inc | 58,944 | ||||||||
| 731,123 | CNH Industrial NV | 14,136 | ||||||||
| 38,004 | Cummins, Inc | 8,290 | ||||||||
| 77,587 | Curtiss-Wright Corp | 10,759 | ||||||||
| 38,900 | Daifuku Co Ltd | 3,181 | ||||||||
| 84,700 | Daikin Industries Ltd | 19,186 | ||||||||
| 93,743 | * | Daimler Truck Holding AG. | 3,446 | |||||||
| 92,545 | DCC plc | 7,576 | ||||||||
| 159,524 | Deere & Co | 54,699 | ||||||||
| 396 | Dover Corp | 72 | ||||||||
| 191,855 | Eaton Corp | 33,156 | ||||||||
| 28,212 | Eiffage S.A. | 2,909 | ||||||||
| 1,733 | EMCOR Group, Inc | 221 | ||||||||
| 53,308 | Emerson Electric Co | 4,956 | ||||||||
| 126,277 | Fastenal Co | 8,089 | ||||||||
| 99,134 | Ferguson plc | 17,609 | ||||||||
| 106,189 | Fortive Corp | 8,101 | ||||||||
| 1,653 | Fortune Brands Home & Security, Inc | 177 | ||||||||
| 422 | * | Generac Holdings, Inc | 149 | |||||||
| 12,219 | Herc Holdings, Inc | 1,913 | ||||||||
| 149,572 | * | Hexcel Corp | 7,748 | |||||||
| 58,000 | * | Hitachi Construction Machinery Co Ltd | 1,676 | |||||||
| 1,811 | IDEX Corp | 428 | ||||||||
| 171,542 | Illinois Tool Works, Inc | 42,337 | ||||||||
| 342,973 | Johnson Controls International plc | 27,887 | ||||||||
| 303,500 | Kajima Corp | 3,488 | ||||||||
| 1,335,270 | Keppel Corp Ltd | 5,078 | ||||||||
| 468 |
COLLEGE RETIREMENT EQUITIES FUND - Social Choice Account
| SHARES | COMPANY | VALUE (000) | ||||||||
| 417,800 | Komatsu Ltd | $ | 9,771 | |||||||
| 573,800 | Kubota Corp | 12,759 | ||||||||
| 14,151 | Legrand S.A. | 1,657 | ||||||||
| 86 | Lennox International, Inc | 28 | ||||||||
| 181,419 | Masco Corp | 12,739 | ||||||||
| 103,077 | * | Mercury Systems, Inc | 5,675 | |||||||
| 532,200 | Mitsubishi Corp | 16,899 | ||||||||
| 24,647 | Moog, Inc (Class A) | 1,996 | ||||||||
| 59,826 | MTU Aero Engines Holding AG. | 12,147 | ||||||||
| 4,501 | * | MYR Group, Inc | 498 | |||||||
| 333,800 | Obayashi Corp | 2,583 | ||||||||
| 7,069 | Owens Corning, Inc | 640 | ||||||||
| 66,313 | PACCAR, Inc | 5,853 | ||||||||
| 43,564 | * | PAE, Inc | 433 | |||||||
| 50,923 | Parker-Hannifin Corp | 16,200 | ||||||||
| 41,431 | Rockwell Automation, Inc | 14,453 | ||||||||
| 39,756 | Roper Technologies Inc | 19,554 | ||||||||
| 4,744 | Rush Enterprises, Inc (Class A) | 264 | ||||||||
| 297,860 | Sandvik AB | 8,302 | ||||||||
| 156,517 | Schneider Electric S.A. | 30,771 | ||||||||
| 355,600 | Shimizu Corp | 2,205 | ||||||||
| 201,991 | Siemens AG. | 34,985 | ||||||||
| 829,300 | Singapore Technologies Engineering Ltd | 2,314 | ||||||||
| 10,969 | Skanska AB (B Shares) | 283 | ||||||||
| 29,742 | SKF AB (B Shares) | 703 | ||||||||
| 10,254 | Snap-On, Inc | 2,209 | ||||||||
| 73,935 | Trane Technologies plc | 14,937 | ||||||||
| 32,283 | * | United Rentals, Inc | 10,727 | |||||||
| 20,908 | * | Vectrus, Inc | 957 | |||||||
| 232,500 | Vestas Wind Systems A.S. | 7,081 | ||||||||
| 697,434 | Volvo AB (B Shares) | 16,129 | ||||||||
| 14,019 | W.W. Grainger, Inc | 7,265 | ||||||||
| 1,964 | Wabash National Corp | 38 | ||||||||
| 350,496 | Wartsila Oyj (B Shares) | 4,916 | ||||||||
| 3,684 | * | WESCO International, Inc | 485 | |||||||
| 38,384 | Woodward Inc | 4,202 | ||||||||
| 12,800 | WSP Global, Inc | 1,858 | ||||||||
| 39,243 | Xylem, Inc | 4,706 | ||||||||
| TOTAL CAPITAL GOODS | 798,672 | |||||||||
| COMMERCIAL & PROFESSIONAL SERVICES - 1.2% | ||||||||||
| 834 | ABM Industries, Inc | 34 | ||||||||
| 11,940 | ACCO Brands Corp | 99 | ||||||||
| 469 |
COLLEGE RETIREMENT EQUITIES FUND - Social Choice Account
| SHARES | COMPANY | VALUE (000) | ||||||||
| 134,701 | Adecco S.A. | $ | 6,864 | |||||||
| 295,491 | ADT, Inc | 2,485 | ||||||||
| 1,000 | * | ASGN Inc | 123 | |||||||
| 372 | Booz Allen Hamilton Holding Co | 32 | ||||||||
| 3,969 | Brambles Ltd | 31 | ||||||||
| 16,903 | Cintas Corp | 7,491 | ||||||||
| 299,733 | * | Copart, Inc | 45,445 | |||||||
| 12,844 | * | FTI Consulting, Inc | 1,971 | |||||||
| 5,059 | Heidrick & Struggles International, Inc | 221 | ||||||||
| 309,428 | IHS Markit Ltd | 41,129 | ||||||||
| 125,772 | Intertek Group plc | 9,595 | ||||||||
| 219,671 | * | KAR Auction Services, Inc | 3,431 | |||||||
| 45,168 | Kelly Services, Inc (Class A) | 757 | ||||||||
| 37,666 | Randstad Holdings NV | 2,569 | ||||||||
| 319,000 | Recruit Holdings Co Ltd | 19,413 | ||||||||
| 674,477 | RELX plc (London) | 22,020 | ||||||||
| 304 | Ritchie Bros Auctioneers, Inc | 19 | ||||||||
| 55,353 | Robert Half International, Inc | 6,173 | ||||||||
| 1,100 | Secom Co Ltd | 76 | ||||||||
| 3,476 | SGS S.A. | 11,588 | ||||||||
| 13,606 | Teleperformance | 6,083 | ||||||||
| 126,568 | TransUnion | 15,008 | ||||||||
| 2,948 | * | TriNet Group, Inc | 281 | |||||||
| 15,743 | Verisk Analytics, Inc | 3,601 | ||||||||
| 153,725 | Waste Management, Inc | 25,657 | ||||||||
| 29,805 | Wolters Kluwer NV | 3,508 | ||||||||
| TOTAL COMMERCIAL & PROFESSIONAL SERVICES | 235,704 | |||||||||
| CONSUMER DURABLES & APPAREL - 1.3% | ||||||||||
| 63,624 | Adidas-Salomon AG. | 18,320 | ||||||||
| 540,582 | Barratt Developments plc | 5,489 | ||||||||
| 67,810 | Berkeley Group Holdings plc | 4,391 | ||||||||
| 92,878 | Burberry Group plc | 2,292 | ||||||||
| 15,787 | * | Callaway Golf Co | 433 | |||||||
| 51,782 | DR Horton, Inc | 5,616 | ||||||||
| 104,411 | Essilor International S.A. | 22,227 | ||||||||
| 46,726 | Ethan Allen Interiors, Inc | 1,228 | ||||||||
| 58,468 | * | GoPro, Inc | 603 | |||||||
| 9,916 | * | Green Brick Partners, Inc | 301 | |||||||
| 804 | Hasbro, Inc | 82 | ||||||||
| 6,871 | Hermes International | 12,006 | ||||||||
| 25,198 | * | iRobot Corp | 1,660 | |||||||
| 470 |
COLLEGE RETIREMENT EQUITIES FUND - Social Choice Account
| SHARES | COMPANY | VALUE (000) | ||||||||
| 18,915 | * | Lovesac Co | $ | 1,253 | ||||||
| 28,998 | * | Lululemon Athletica, Inc | 11,351 | |||||||
| 10,439 | Newell Brands Inc | 228 | ||||||||
| 443,605 | Nike, Inc (Class B) | 73,936 | ||||||||
| 1,991 | * | NVR, Inc | 11,765 | |||||||
| 990,000 | Panasonic Corp | 10,883 | ||||||||
| 23,595 | Pandora AS | 2,935 | ||||||||
| 38,776 | Persimmon plc | 1,503 | ||||||||
| 714 | Pulte Homes, Inc | 41 | ||||||||
| 9,035 | Puma AG. Rudolf Dassler Sport | 1,103 | ||||||||
| 1,667 | PVH Corp | 178 | ||||||||
| 6,447 | SEB S.A. | 1,005 | ||||||||
| 296,900 | Sekisui House Ltd | 6,388 | ||||||||
| 141,735 | * | Sonos, Inc | 4,224 | |||||||
| 311,100 | Sony Corp | 39,285 | ||||||||
| 1,162,041 | Taylor Wimpey plc | 2,770 | ||||||||
| 80,777 | * | Tupperware Brands Corp | 1,235 | |||||||
| 64,187 | VF Corp | 4,700 | ||||||||
| TOTAL CONSUMER DURABLES & APPAREL | 249,431 | |||||||||
| CONSUMER SERVICES - 1.3% | ||||||||||
| 138,079 | * | Accor S.A. | 4,476 | |||||||
| 30,274 | * | American Public Education, Inc | 674 | |||||||
| 23,897 | * | Booking Holdings, Inc | 57,334 | |||||||
| 35,108 | * | Bright Horizons Family Solutions | 4,419 | |||||||
| 29,278 | Carriage Services, Inc | 1,887 | ||||||||
| 781,741 | * | Compass Group plc | 17,600 | |||||||
| 46,354 | Darden Restaurants, Inc | 6,983 | ||||||||
| 85,084 | * | Dave & Buster’s Entertainment, Inc | 3,267 | |||||||
| 25,226 | Domino’s Pizza, Inc | 14,236 | ||||||||
| 40,919 | * | El Pollo Loco Holdings, Inc | 581 | |||||||
| 4,469 | Graham Holdings Co | 2,815 | ||||||||
| 251,538 | * | Hilton Worldwide Holdings, Inc | 39,237 | |||||||
| 168 | IDP Education Ltd | 4 | ||||||||
| 177,301 | * | InterContinental Hotels Group plc | 11,462 | |||||||
| 65,700 | Oriental Land Co Ltd | 11,079 | ||||||||
| 30,085 | * | Planet Fitness, Inc | 2,725 | |||||||
| 3,541 | * | Shake Shack, Inc | 256 | |||||||
| 78,908 | * | Six Flags Entertainment Corp | 3,360 | |||||||
| 540,313 | Starbucks Corp | 63,200 | ||||||||
| 92,092 | * | Terminix Global Holdings, Inc | 4,165 | |||||||
| 20,491 | Vail Resorts, Inc | 6,719 | ||||||||
| 471 |
COLLEGE RETIREMENT EQUITIES FUND - Social Choice Account
| SHARES | COMPANY | VALUE (000) | ||||||||
| 81,211 | e | Wendy’s | $ | 1,937 | ||||||
| 129,335 | * | Whitbread plc | 5,261 | |||||||
| 26,116 | * | WW International Inc | 421 | |||||||
| TOTAL CONSUMER SERVICES | 264,098 | |||||||||
| DIVERSIFIED FINANCIALS - 3.8% | ||||||||||
| 725,995 | 3i Group plc | 14,232 | ||||||||
| 189,176 | Ally Financial, Inc | 9,007 | ||||||||
| 350,364 | American Express Co | 57,319 | ||||||||
| 65,740 | Ameriprise Financial, Inc | 19,831 | ||||||||
| 63,534 | g | Amundi S.A. | 5,241 | |||||||
| 24,514 | Annaly Capital Management, Inc | 192 | ||||||||
| 538,689 | Bank of New York Mellon Corp | 31,287 | ||||||||
| 66,998 | BlackRock, Inc | 61,341 | ||||||||
| 392,269 | Brookfield Asset Management, Inc | 23,689 | ||||||||
| 716,294 | Charles Schwab Corp | 60,240 | ||||||||
| 136,040 | CME Group, Inc | 31,080 | ||||||||
| 47,319 | Deutsche Boerse AG. | 7,901 | ||||||||
| 333,909 | Discover Financial Services | 38,586 | ||||||||
| 39,964 | Eurazeo | 3,487 | ||||||||
| 9,442 | Factset Research Systems, Inc | 4,589 | ||||||||
| 103,844 | Franklin Resources, Inc | 3,478 | ||||||||
| 39,027 | Goldman Sachs Group, Inc | 14,930 | ||||||||
| 10,629 | * | Green Dot Corp | 385 | |||||||
| 390,146 | Hong Kong Exchanges and Clearing Ltd | 22,817 | ||||||||
| 379,244 | Intercontinental Exchange Group, Inc | 51,869 | ||||||||
| 43,051 | Invesco Ltd | 991 | ||||||||
| 231,196 | * | Kinnevik AB | 8,220 | |||||||
| 157,367 | London Stock Exchange Group plc | 14,803 | ||||||||
| 127,179 | Macquarie Group Ltd | 19,011 | ||||||||
| 19,831 | MarketAxess Holdings, Inc | 8,156 | ||||||||
| 83,317 | Moody’s Corp | 32,542 | ||||||||
| 595,136 | Morgan Stanley | 58,418 | ||||||||
| 24,409 | Nasdaq Inc | 5,126 | ||||||||
| 281,900 | * | Nomura Holdings, Inc | 1,228 | |||||||
| 126,073 | Northern Trust Corp | 15,080 | ||||||||
| 5,978 | * | PRA Group, Inc | 300 | |||||||
| 2,150 | * | PROG Holdings, Inc | 97 | |||||||
| 122,346 | S&P Global, Inc | 57,739 | ||||||||
| 126,498 | Schroders plc | 6,106 | ||||||||
| 2,200 | Singapore Exchange Ltd | 15 | ||||||||
| 2,304,641 | Standard Life Aberdeen plc | 7,508 | ||||||||
| 131,993 | State Street Corp | 12,275 | ||||||||
| 472 |
COLLEGE RETIREMENT EQUITIES FUND - Social Choice Account
| SHARES | COMPANY | VALUE (000) | ||||||||
| 68,699 | T Rowe Price Group, Inc | $ | 13,509 | |||||||
| 32,500 | Tokyo Century Corp | 1,578 | ||||||||
| 1,219,136 | UBS Group AG | 21,883 | ||||||||
| 27,954 | Voya Financial, Inc | 1,854 | ||||||||
| 26,666 | Wendel | 3,195 | ||||||||
| TOTAL DIVERSIFIED FINANCIALS | 751,135 | |||||||||
| ENERGY - 1.9% | ||||||||||
| 380,386 | Antero Midstream Corp | 3,682 | ||||||||
| 174,861 | APA Corp | 4,702 | ||||||||
| 277,322 | Baker Hughes Co | 6,672 | ||||||||
| 1,028,738 | Cenovus Energy, Inc | 12,614 | ||||||||
| 3,725 | * | ChampionX Corp | 75 | |||||||
| 140,902 | Cheniere Energy, Inc | 14,290 | ||||||||
| 773,232 | ConocoPhillips | 55,812 | ||||||||
| 2,773 | * | Delek US Holdings, Inc | 42 | |||||||
| 174 | Devon Energy Corp | 8 | ||||||||
| 622,360 | Enbridge, Inc | 24,310 | ||||||||
| 20,400 | ENEOS Holdings, Inc | 76 | ||||||||
| 1,229,412 | ENI S.p.A. | 17,086 | ||||||||
| 137,130 | EOG Resources, Inc | 12,181 | ||||||||
| 219,457 | * | EQT Corp | 4,786 | |||||||
| 544,048 | Equinor ASA | 14,406 | ||||||||
| 547,391 | Galp Energia SGPS S.A. | 5,311 | ||||||||
| 588 | Halliburton Co | 13 | ||||||||
| 102,038 | Hess Corp | 7,554 | ||||||||
| 100,631 | Imperial Oil Ltd | 3,629 | ||||||||
| 11,900 | Inpex Holdings, Inc | 104 | ||||||||
| 5,808 | e | Keyera Corp | 131 | |||||||
| 1,005,414 | Kinder Morgan, Inc | 15,946 | ||||||||
| 725,888 | * | Kosmos Energy Ltd | 2,512 | |||||||
| 1,472,099 | Marathon Oil Corp | 24,172 | ||||||||
| 1,757 | Marathon Petroleum Corp | 112 | ||||||||
| 273,168 | Neste Oil Oyj | 13,444 | ||||||||
| 730,958 | NOV, Inc | 9,905 | ||||||||
| 2,570 | Occidental Petroleum Corp | 75 | ||||||||
| 5,830 | * | Oceaneering International, Inc | 66 | |||||||
| 151,704 | OMV AG. | 8,579 | ||||||||
| 25,563 | ONEOK, Inc | 1,502 | ||||||||
| 65,921 | Parkland Corp | 1,812 | ||||||||
| 638 | Pioneer Natural Resources Co | 116 | ||||||||
| 1,037,413 | Repsol YPF S.A. | 12,286 | ||||||||
| 1,086,320 | Schlumberger Ltd | 32,535 | ||||||||
| 473 |
COLLEGE RETIREMENT EQUITIES FUND - Social Choice Account
| SHARES | COMPANY | VALUE (000) | ||||||||
| 774,216 | * | Southwestern Energy Co | $ | 3,608 | ||||||
| 697,888 | Suncor Energy, Inc | 17,462 | ||||||||
| 1,300 | Tenaris S.A. | 14 | ||||||||
| 670,596 | e | Total S.A. | 34,134 | |||||||
| 212,679 | Valero Energy Corp | 15,974 | ||||||||
| 2,653 | Woodside Petroleum Ltd | 42 | ||||||||
| TOTAL ENERGY | 381,780 | |||||||||
| FOOD & STAPLES RETAILING - 0.6% | ||||||||||
| 293,800 | Aeon Co Ltd | 6,924 | ||||||||
| 354,454 | Alimentation Couche-Tard, Inc | 14,851 | ||||||||
| 203,289 | * | BJ’s Wholesale Club Holdings, Inc | 13,614 | |||||||
| 253,286 | Coles Group Ltd | 3,305 | ||||||||
| 77,367 | George Weston Ltd | 8,970 | ||||||||
| 1,743,514 | J Sainsbury plc | 6,517 | ||||||||
| 1,474 | Jeronimo Martins SGPS S.A. | 34 | ||||||||
| 98,864 | Kesko Oyj (B Shares) | 3,295 | ||||||||
| 800 | Lawson, Inc | 38 | ||||||||
| 138,558 | Loblaw Cos Ltd | 11,352 | ||||||||
| 37,655 | Metro, Inc | 2,004 | ||||||||
| 51,050 | * | Performance Food Group Co | 2,343 | |||||||
| 38,843 | Pricesmart, Inc | 2,842 | ||||||||
| 63,935 | SpartanNash Co | 1,647 | ||||||||
| 209,998 | * | Sprouts Farmers Market, Inc | 6,233 | |||||||
| 4,087,739 | Tesco plc | 16,094 | ||||||||
| 95,857 | * | United Natural Foods, Inc | 4,705 | |||||||
| 259,850 | * | US Foods Holding Corp | 9,050 | |||||||
| 339,683 | Woolworths Ltd | 9,390 | ||||||||
| TOTAL FOOD & STAPLES RETAILING | 123,208 | |||||||||
| FOOD, BEVERAGE & TOBACCO - 2.1% | ||||||||||
| 282,500 | Ajinomoto Co, Inc | 8,600 | ||||||||
| 78,364 | Archer-Daniels-Midland Co | 5,297 | ||||||||
| 383,095 | Associated British Foods plc | 10,487 | ||||||||
| 3,904 | Barry Callebaut AG. | 9,477 | ||||||||
| 50,699 | *,e | Beyond Meat, Inc | 3,303 | |||||||
| 1,758 | Bunge Ltd | 164 | ||||||||
| 54,454 | Campbell Soup Co | 2,367 | ||||||||
| 1,335,199 | Coca-Cola Co | 79,057 | ||||||||
| 201,458 | * | Coca-Cola European Partners plc (Class A) | 11,267 | |||||||
| 211,279 | Coca-Cola HBC AG. | 7,316 | ||||||||
| 295,366 | Danone | 18,360 | ||||||||
| 14,883 | * | Darling International, Inc | 1,031 | |||||||
| 474 |
COLLEGE RETIREMENT EQUITIES FUND - Social Choice Account
| SHARES | COMPANY | VALUE (000) | ||||||||
| 56,665 | Fresh Del Monte Produce, Inc | $ | 1,564 | |||||||
| 393,303 | General Mills, Inc | 26,501 | ||||||||
| 2,360 | * | Hain Celestial Group, Inc | 101 | |||||||
| 221,467 | Hormel Foods Corp | 10,810 | ||||||||
| 141,266 | Kellogg Co | 9,100 | ||||||||
| 103,681 | Kerry Group plc (Class A) | 13,376 | ||||||||
| 136,700 | Kikkoman Corp | 11,512 | ||||||||
| 78,501 | McCormick & Co, Inc | 7,584 | ||||||||
| 113,527 | Mowi ASA | 2,687 | ||||||||
| 598,750 | Nestle S.A. | 83,596 | ||||||||
| 29,600 | Nissin Food Products Co Ltd | 2,160 | ||||||||
| 304,982 | Orkla ASA | 3,057 | ||||||||
| 465,088 | PepsiCo, Inc | 80,790 | ||||||||
| 141,100 | Suntory Beverage & Food Ltd | 5,110 | ||||||||
| 6,454 | * | TreeHouse Foods, Inc | 262 | |||||||
| TOTAL FOOD, BEVERAGE & TOBACCO | 414,936 | |||||||||
| HEALTH CARE EQUIPMENT & SERVICES - 3.0% | ||||||||||
| 38,759 | * | Abiomed, Inc | 13,921 | |||||||
| 40,357 | *,e | Accelerate Diagnostics, Inc | 211 | |||||||
| 44,978 | * | Align Technology, Inc | 29,559 | |||||||
| 175,429 | * | Allscripts Healthcare Solutions, Inc | 3,237 | |||||||
| 41,162 | Ambu A.S. | 1,086 | ||||||||
| 99,959 | Amplifon S.p.A. | 5,379 | ||||||||
| 64,063 | * | Angiodynamics, Inc | 1,767 | |||||||
| 35,194 | Anthem, Inc | 16,314 | ||||||||
| 8,730 | * | AtriCure, Inc | 607 | |||||||
| 1,253 | * | Axonics Modulation Technologies, Inc | 70 | |||||||
| 1,376 | Baxter International, Inc | 118 | ||||||||
| 34,133 | BioMerieux | 4,854 | ||||||||
| 4,607 | Cardinal Health, Inc | 237 | ||||||||
| 9,667 | Carl Zeiss Meditec AG. | 2,028 | ||||||||
| 302,142 | Cerner Corp | 28,060 | ||||||||
| 249,927 | * | Cerus Corp | 1,702 | |||||||
| 196,527 | Cigna Corp | 45,128 | ||||||||
| 17,639 | Cochlear Ltd | 2,768 | ||||||||
| 50,637 | Coloplast AS | 8,916 | ||||||||
| 22,324 | * | Computer Programs & Systems, Inc | 654 | |||||||
| 36,863 | Cooper Cos, Inc | 15,443 | ||||||||
| 91,950 | * | Covetrus, Inc | 1,836 | |||||||
| 188 | * | DaVita, Inc | 21 | |||||||
| 185,909 | Dentsply Sirona, Inc | 10,372 | ||||||||
| 50,676 | * | DexCom, Inc | 27,210 | |||||||
| 475 |
COLLEGE RETIREMENT EQUITIES FUND - Social Choice Account
| SHARES | COMPANY | VALUE (000) | ||||||||
| 377,910 | * | Edwards Lifesciences Corp | $ | 48,958 | ||||||
| 147,158 | * | Envista Holdings Corp | 6,631 | |||||||
| 376,593 | Fisher & Paykel Healthcare Corp | 8,437 | ||||||||
| 14,264 | * | Glaukos Corp | 634 | |||||||
| 13,596 | * | Globus Medical, Inc | 982 | |||||||
| 82,796 | GN Store Nord | 5,195 | ||||||||
| 10,855 | * | Guardant Health, Inc | 1,086 | |||||||
| 113,502 | HCA Healthcare, Inc | 29,161 | ||||||||
| 59,326 | * | Health Catalyst, Inc | 2,351 | |||||||
| 26,027 | * | Henry Schein, Inc | 2,018 | |||||||
| 5,801 | * | Heska Corp | 1,059 | |||||||
| 99,838 | * | Hologic, Inc | 7,644 | |||||||
| 93,311 | Humana, Inc | 43,283 | ||||||||
| 53,162 | * | IDEXX Laboratories, Inc | 35,005 | |||||||
| 8,609 | * | Inogen, Inc | 293 | |||||||
| 527 | * | Insulet Corp | 140 | |||||||
| 19,717 | * | Integer Holding Corp | 1,688 | |||||||
| 20,890 | * | Intersect ENT, Inc | 571 | |||||||
| 155,926 | * | Intuitive Surgical, Inc | 56,024 | |||||||
| 40,745 | * | Laboratory Corp of America Holdings | 12,802 | |||||||
| 27,738 | LeMaitre Vascular, Inc | 1,393 | ||||||||
| 8,932 | * | LivaNova plc | 781 | |||||||
| 1,600 | * | Magellan Health Services, Inc | 152 | |||||||
| 14,728 | * | Meridian Bioscience, Inc | 300 | |||||||
| 39,504 | * | Merit Medical Systems, Inc | 2,461 | |||||||
| 98,516 | * | NextGen Healthcare, Inc | 1,753 | |||||||
| 257 | * | Novocure Ltd | 19 | |||||||
| 38,104 | * | Omnicell, Inc | 6,875 | |||||||
| 57,111 | * | OraSure Technologies, Inc | 496 | |||||||
| 32,369 | * | Orthofix Medical Inc | 1,006 | |||||||
| 13,628 | * | Penumbra, Inc | 3,916 | |||||||
| 2,830 | Premier, Inc | 117 | ||||||||
| 25,841 | Quest Diagnostics, Inc | 4,471 | ||||||||
| 62,644 | * | Quidel Corp | 8,456 | |||||||
| 143,876 | Ramsay Health Care Ltd | 7,477 | ||||||||
| 74,315 | Resmed, Inc | 19,358 | ||||||||
| 282,183 | Ryman Healthcare Ltd | 2,366 | ||||||||
| 34,038 | Sonova Holdings AG | 13,302 | ||||||||
| 42,938 | * | Staar Surgical Co | 3,920 | |||||||
| 29,676 | STERIS plc | 7,223 | ||||||||
| 78,900 | Sysmex Corp | 10,650 | ||||||||
| 29,138 | * | Tactile Systems Technology, Inc | 555 | |||||||
| 476 |
COLLEGE RETIREMENT EQUITIES FUND - Social Choice Account
| SHARES | COMPANY | VALUE (000) | ||||||||
| 15,158 | * | Tandem Diabetes Care, Inc | $ | 2,282 | ||||||
| 90,696 | * | Teladoc, Inc | 8,328 | |||||||
| 16,267 | * | Triple-S Management Corp (Class B) | 580 | |||||||
| 46,410 | * | Vocera Communications, Inc | 3,009 | |||||||
| TOTAL HEALTH CARE EQUIPMENT & SERVICES | 596,706 | |||||||||
| HOUSEHOLD & PERSONAL PRODUCTS - 1.5% | ||||||||||
| 33,243 | Beiersdorf AG. | 3,408 | ||||||||
| 34,657 | Clorox Co | 6,043 | ||||||||
| 275,933 | Colgate-Palmolive Co | 23,548 | ||||||||
| 367,053 | Essity AB | 11,975 | ||||||||
| 146,847 | Estee Lauder Cos (Class A) | 54,363 | ||||||||
| 113,463 | Henkel KGaA | 8,844 | ||||||||
| 148,576 | Henkel KGaA (Preference) | 11,989 | ||||||||
| 172,700 | Kao Corp | 9,045 | ||||||||
| 59,574 | Kimberly-Clark Corp | 8,514 | ||||||||
| 68,995 | L’Oreal S.A. | 32,898 | ||||||||
| 664,450 | Procter & Gamble Co | 108,691 | ||||||||
| 189,400 | Shiseido Co Ltd | 10,566 | ||||||||
| 234,200 | Uni-Charm Corp | 10,189 | ||||||||
| 42,698 | * | Veru, Inc | 251 | |||||||
| TOTAL HOUSEHOLD & PERSONAL PRODUCTS | 300,324 | |||||||||
| INSURANCE - 2.0% | ||||||||||
| 1,841,148 | Aegon NV | 9,153 | ||||||||
| 287,827 | Aflac, Inc | 16,806 | ||||||||
| 1,267,400 | AIA Group Ltd | 12,792 | ||||||||
| 118,453 | Allianz AG. | 27,938 | ||||||||
| 101,926 | Allstate Corp | 11,992 | ||||||||
| 11,186 | Arthur J. Gallagher & Co | 1,898 | ||||||||
| 519,493 | Assicurazioni Generali S.p.A. | 10,979 | ||||||||
| 2,426,453 | Aviva plc | 13,526 | ||||||||
| 574,060 | AXA S.A. | 17,086 | ||||||||
| 210,391 | Chubb Ltd | 40,671 | ||||||||
| 179,712 | CNP Assurances | 4,445 | ||||||||
| 37,622 | * | eHealth, Inc | 959 | |||||||
| 970,098 | * | Genworth Financial, Inc (Class A) | 3,929 | |||||||
| 1,068 | Insurance Australia Group Ltd | 3 | ||||||||
| 485 | Intact Financial Corp | 63 | ||||||||
| 3,659,787 | Legal & General Group plc | 14,779 | ||||||||
| 77,179 | Lincoln National Corp | 5,268 | ||||||||
| 186,877 | Loews Corp | 10,794 | ||||||||
| 477 |
COLLEGE RETIREMENT EQUITIES FUND - Social Choice Account
| SHARES | COMPANY | VALUE (000) | ||||||||
| 249,748 | Marsh & McLennan Cos, Inc | $ | 43,411 | |||||||
| 38,449 | Metlife, Inc | 2,403 | ||||||||
| 82,300 | MS&AD Insurance Group Holdings Inc | 2,534 | ||||||||
| 31,684 | Muenchener Rueckver AG. | 9,353 | ||||||||
| 49,367 | NN Group NV | 2,670 | ||||||||
| 642 | Principal Financial Group | 46 | ||||||||
| 263,499 | Progressive Corp | 27,048 | ||||||||
| 286,747 | Prudential Financial, Inc | 31,038 | ||||||||
| 304,703 | QBE Insurance Group Ltd | 2,516 | ||||||||
| 232,800 | Sompo Holdings, Inc | 9,818 | ||||||||
| 75,475 | Sun Life Financial, Inc | 4,201 | ||||||||
| 4,443 | Swiss Life Holding | 2,715 | ||||||||
| 127,451 | Swiss Re Ltd | 12,581 | ||||||||
| 137,678 | Travelers Cos, Inc | 21,537 | ||||||||
| 14,487 | Willis Towers Watson plc | 3,441 | ||||||||
| 49,305 | Zurich Insurance Group AG | 21,600 | ||||||||
| TOTAL INSURANCE | 399,993 | |||||||||
| MATERIALS - 2.5% | ||||||||||
| 117,018 | Agnico-Eagle Mines Ltd | 6,216 | ||||||||
| 63 | Akzo Nobel NV | 7 | ||||||||
| 19,088 | Amcor plc | 229 | ||||||||
| 422,169 | Antofagasta plc | 7,678 | ||||||||
| 10,825 | Aptargroup, Inc | 1,326 | ||||||||
| 480,800 | Asahi Kasei Corp | 4,529 | ||||||||
| 255,812 | Ball Corp | 24,627 | ||||||||
| 175,954 | BASF SE | 12,349 | ||||||||
| 210,005 | BlueScope Steel Ltd | 3,206 | ||||||||
| 301,096 | Boliden AB | 11,610 | ||||||||
| 83,968 | * | Century Aluminum Co | 1,391 | |||||||
| 290 | Chr Hansen Holding A/S | 23 | ||||||||
| 91,048 | * | Cleveland-Cliffs, Inc | 1,982 | |||||||
| 19,088 | * | Coeur Mining, Inc | 96 | |||||||
| 1,679 | Compass Minerals International, Inc | 86 | ||||||||
| 322,410 | CRH plc | 17,068 | ||||||||
| 64,645 | Croda International plc | 8,855 | ||||||||
| 45,685 | DSM NV | 10,289 | ||||||||
| 397,826 | DuPont de Nemours, Inc | 32,136 | ||||||||
| 205,304 | Ecolab, Inc | 48,162 | ||||||||
| 496,318 | Evolution Mining Ltd | 1,472 | ||||||||
| 1,070,804 | Fortescue Metals Group Ltd | 15,052 | ||||||||
| 65,998 | Franco-Nevada Corp | 9,127 | ||||||||
| 3,439 | Givaudan S.A. | 18,043 | ||||||||
| 478 |
COLLEGE RETIREMENT EQUITIES FUND - Social Choice Account
| SHARES | COMPANY | VALUE (000) | ||||||||
| 102,204 | HeidelbergCement AG. | $ | 6,917 | |||||||
| 204,900 | * | Hitachi Metals Ltd | 3,797 | |||||||
| 61,177 | International Flavors & Fragrances, Inc | 9,216 | ||||||||
| 1,576 | International Paper Co | 74 | ||||||||
| 11,455 | Johnson Matthey plc | 318 | ||||||||
| 26,338 | * | Koppers Holdings, Inc | 824 | |||||||
| 2,995 | Linde plc | 1,038 | ||||||||
| 16,162 | Martin Marietta Materials, Inc | 7,120 | ||||||||
| 302,800 | Mitsubishi Chemical Holdings Corp | 2,246 | ||||||||
| 61,692 | Mitsui Chemicals, Inc | 1,658 | ||||||||
| 279,116 | Mondi plc | 6,923 | ||||||||
| 134,533 | Mosaic Co | 5,286 | ||||||||
| 431,268 | Newcrest Mining Ltd | 7,724 | ||||||||
| 440,842 | Newmont Goldcorp Corp | 27,341 | ||||||||
| 301,600 | Nippon Paint Co Ltd | 3,294 | ||||||||
| 600,800 | Nippon Steel Corp | 9,815 | ||||||||
| 89,700 | Nitto Denko Corp | 6,930 | ||||||||
| 1,384,725 | Norsk Hydro ASA | 10,896 | ||||||||
| 375,868 | Northern Star Resources Ltd | 2,585 | ||||||||
| 137,837 | Nucor Corp | 15,734 | ||||||||
| 242,924 | Nutrien Ltd | 18,259 | ||||||||
| 1,122 | Orica Ltd | 11 | ||||||||
| 20,642 | PPG Industries, Inc | 3,559 | ||||||||
| 2,785 | Reliance Steel & Aluminum Co | 452 | ||||||||
| 5,386 | Schnitzer Steel Industries, Inc (Class A) | 280 | ||||||||
| 116,800 | Shin-Etsu Chemical Co Ltd | 20,274 | ||||||||
| 48,119 | Sika AG. | 19,999 | ||||||||
| 152,065 | Stora Enso Oyj (R Shares) | 2,791 | ||||||||
| 1,341,900 | Sumitomo Chemical Co Ltd | 6,328 | ||||||||
| 241,100 | Sumitomo Metal Mining Co Ltd | 9,132 | ||||||||
| 151,235 | * | Summit Materials, Inc | 6,071 | |||||||
| 369,939 | Svenska Cellulosa AB (B Shares) | 6,564 | ||||||||
| 422,529 | Teck Cominco Ltd | 12,169 | ||||||||
| 9,000 | Toray Industries, Inc | 53 | ||||||||
| 20,355 | Trimas Corp | 753 | ||||||||
| 24,182 | Trinseo plc | 1,269 | ||||||||
| 174,527 | Umicore S.A. | 7,120 | ||||||||
| 25,842 | UPM-Kymmene Oyj | 983 | ||||||||
| 112,930 | Voestalpine AG. | 4,097 | ||||||||
| 120,838 | Wheaton Precious Metals Corp | 5,185 | ||||||||
| TOTAL MATERIALS | 490,644 | |||||||||
| 479 |
COLLEGE RETIREMENT EQUITIES FUND - Social Choice Account
| SHARES | COMPANY | VALUE (000) | ||||||||
| MEDIA & ENTERTAINMENT - 2.5% | ||||||||||
| 1,413 | *,e | AMC Entertainment Holdings, Inc | $ | 38 | ||||||
| 78 | Cable One, Inc | 138 | ||||||||
| 23,422 | * | Cardlytics, Inc | 1,548 | |||||||
| 195,835 | *,e | Cinemark Holdings, Inc | 3,157 | |||||||
| 1,125,296 | Comcast Corp (Class A) | 56,636 | ||||||||
| 465 | *,e | Discovery, Inc (Class A) | 11 | |||||||
| 304,868 | * | Discovery, Inc (Class C) | 6,981 | |||||||
| 166,563 | Electronic Arts, Inc | 21,970 | ||||||||
| 162,479 | Gray Television, Inc | 3,276 | ||||||||
| 109,942 | * | iHeartMedia, Inc | 2,313 | |||||||
| 90,725 | * | Imax Corp | 1,619 | |||||||
| 1,140,341 | * | Informa plc | 7,984 | |||||||
| 110,370 | Interpublic Group of Cos, Inc | 4,133 | ||||||||
| 16,923 | John Wiley & Sons, Inc (Class A) | 969 | ||||||||
| 20,610 | * | Liberty Broadband Corp (Class A) | 3,316 | |||||||
| 181,878 | * | Liberty Broadband Corp (Class C) | 29,301 | |||||||
| 236,170 | * | Live Nation, Inc | 28,267 | |||||||
| 131,390 | * | Netflix, Inc | 79,155 | |||||||
| 62,705 | New York Times Co (Class A) | 3,029 | ||||||||
| 42,800 | Nintendo Co Ltd | 20,024 | ||||||||
| 311,355 | Omnicom Group, Inc | 22,813 | ||||||||
| 2,083 | Pearson plc | 17 | ||||||||
| 52,277 | Publicis Groupe S.A. | 3,522 | ||||||||
| 5,556 | * | Roku, Inc | 1,268 | |||||||
| 31,159 | Scholastic Corp | 1,245 | ||||||||
| 10,426 | Seek Ltd | 249 | ||||||||
| 84,576 | Sinclair Broadcast Group, Inc (Class A) | 2,235 | ||||||||
| 1,707,477 | e | Sirius XM Holdings, Inc | 10,843 | |||||||
| 9,104 | * | Snap, Inc | 428 | |||||||
| 84,307 | * | Take-Two Interactive Software, Inc | 14,983 | |||||||
| 9,574 | TEGNA, Inc | 178 | ||||||||
| 187,136 | * | TripAdvisor, Inc | 5,101 | |||||||
| 989,715 | * | Twitter, Inc | 42,776 | |||||||
| 1,668 | ViacomCBS, Inc (Class B) | 50 | ||||||||
| 121,660 | * | Vimeo, Inc | 2,185 | |||||||
| 319,074 | Vivendi Universal S.A. | 4,316 | ||||||||
| 563,977 | * | Walt Disney Co | 87,354 | |||||||
| 6,997 | World Wrestling Entertainment, Inc (Class A) | 345 | ||||||||
| 766,310 | WPP plc | 11,669 | ||||||||
| 1,073,300 | Z Holdings Corp | 6,193 | ||||||||
| 619 | * | ZoomInfo Technologies, Inc | 40 | |||||||
| 480 |
COLLEGE RETIREMENT EQUITIES FUND - Social Choice Account
| SHARES | COMPANY | VALUE (000) | ||||||||
| 1,601,731 | * | Zynga, Inc | $ | 10,251 | ||||||
| TOTAL MEDIA & ENTERTAINMENT | 501,926 | |||||||||
| PHARMACEUTICALS, BIOTECHNOLOGY & LIFE SCIENCES - 4.9% | ||||||||||
| 56,930 | * | Acadia Pharmaceuticals, Inc | 1,329 | |||||||
| 77,531 | *,e | Aerie Pharmaceuticals, Inc | 544 | |||||||
| 238,517 | Agilent Technologies, Inc | 38,079 | ||||||||
| 49,927 | * | Agios Pharmaceuticals, Inc | 1,641 | |||||||
| 191,735 | Amgen, Inc | 43,135 | ||||||||
| 22,172 | * | AnaptysBio, Inc | 770 | |||||||
| 224,873 | * | Antares Pharma, Inc | 803 | |||||||
| 789,014 | Astellas Pharma, Inc | 12,842 | ||||||||
| 323,275 | AstraZeneca plc | 37,749 | ||||||||
| 12,920 | AstraZeneca plc (ADR) | 753 | ||||||||
| 73,556 | * | Atara Biotherapeutics, Inc | 1,159 | |||||||
| 2,859 | *,e | Axsome Therapeutics, Inc | 108 | |||||||
| 107,053 | * | Bausch Health Cos, Inc | 2,957 | |||||||
| 263,424 | * | BioCryst Pharmaceuticals, Inc | 3,648 | |||||||
| 63,315 | * | Biogen, Inc | 15,191 | |||||||
| 50,127 | * | BioMarin Pharmaceutical, Inc | 4,429 | |||||||
| 56,307 | * | Bluebird Bio, Inc | 562 | |||||||
| 769,849 | Bristol-Myers Squibb Co | 48,000 | ||||||||
| 257,619 | *,e | Canopy Growth Corp | 2,248 | |||||||
| 469 | * | Catalent, Inc | 60 | |||||||
| 36,414 | * | Chimerix, Inc | 234 | |||||||
| 321,891 | Chugai Pharmaceutical Co Ltd | 10,492 | ||||||||
| 58,062 | * | Collegium Pharmaceutical, Inc | 1,085 | |||||||
| 121,183 | CSL Ltd | 25,630 | ||||||||
| 85,752 | * | Curis, Inc | 408 | |||||||
| 431,800 | Daiichi Sankyo Co Ltd | 10,990 | ||||||||
| 229,372 | Danaher Corp | 75,466 | ||||||||
| 92,800 | Eisai Co Ltd | 5,268 | ||||||||
| 294,385 | Eli Lilly & Co | 81,315 | ||||||||
| 2,088 | * | Exact Sciences Corp | 162 | |||||||
| 9,127 | * | Genmab AS | 3,643 | |||||||
| 395,328 | Gilead Sciences, Inc | 28,705 | ||||||||
| 1,401,058 | GlaxoSmithKline plc | 30,505 | ||||||||
| 35,779 | * | Halozyme Therapeutics, Inc | 1,439 | |||||||
| 72,695 | * | Humanigen, Inc | 270 | |||||||
| 17,383 | * | Illumina, Inc | 6,613 | |||||||
| 35,026 | * | Insmed, Inc | 954 | |||||||
| 94,825 | * | Intra-Cellular Therapies, Inc | 4,963 | |||||||
| 70,399 | * | IQVIA Holdings, Inc | 19,862 | |||||||
| 481 |
COLLEGE RETIREMENT EQUITIES FUND - Social Choice Account
| SHARES | COMPANY | VALUE (000) | ||||||||
| 29,343 | * | Jazz Pharmaceuticals plc | $ | 3,738 | ||||||
| 106,403 | *,e | Karyopharm Therapeutics, Inc | 684 | |||||||
| 26,790 | Lonza Group AG. | 22,305 | ||||||||
| 34,997 | * | MacroGenics, Inc | 562 | |||||||
| 293,962 | Merck & Co, Inc | 22,529 | ||||||||
| 65,542 | Merck KGaA | 16,861 | ||||||||
| 6,278 | * | Mettler-Toledo International, Inc | 10,655 | |||||||
| 3,119 | * | Mirati Therapeutics, Inc | 458 | |||||||
| 396,180 | Novo Nordisk AS | 44,501 | ||||||||
| 341,800 | Ono Pharmaceutical Co Ltd | 8,496 | ||||||||
| 387,642 | *,e | Opko Health, Inc | 1,865 | |||||||
| 96,567 | Orion Oyj (Class B) | 4,011 | ||||||||
| 45,551 | Perrigo Co plc | 1,772 | ||||||||
| 70,172 | * | Prothena Corp plc | 3,466 | |||||||
| 99,790 | *,e | Provention Bio, Inc | 561 | |||||||
| 10,834 | * | Regeneron Pharmaceuticals, Inc | 6,842 | |||||||
| 15,548 | * | Repligen Corp | 4,118 | |||||||
| 80,012 | * | Revance Therapeutics, Inc | 1,306 | |||||||
| 151,818 | Roche Holding AG. | 62,983 | ||||||||
| 6,648 | * | Sage Therapeutics, Inc | 283 | |||||||
| 94,032 | * | Sangamo Therapeutics Inc | 705 | |||||||
| 18,000 | Santen Pharmaceutical Co Ltd | 220 | ||||||||
| 125,300 | Shionogi & Co Ltd | 8,814 | ||||||||
| 181,200 | Sumitomo Dainippon Pharma Co Ltd | 2,091 | ||||||||
| 128,344 | Thermo Fisher Scientific, Inc | 85,636 | ||||||||
| 103,681 | UCB S.A. | 11,833 | ||||||||
| 30,351 | * | Ultragenyx Pharmaceutical, Inc | 2,552 | |||||||
| 147,780 | * | Vertex Pharmaceuticals, Inc | 32,452 | |||||||
| 17,175 | Vifor Pharma AG. | 3,051 | ||||||||
| 19,812 | * | Waters Corp | 7,382 | |||||||
| 40,638 | West Pharmaceutical Services, Inc | 19,060 | ||||||||
| 235,487 | *,e | ZIOPHARM Oncology, Inc | 257 | |||||||
| 243,161 | Zoetis, Inc | 59,339 | ||||||||
| 15,799 | * | Zogenix, Inc | 257 | |||||||
| TOTAL PHARMACEUTICALS, BIOTECHNOLOGY & LIFE SCIENCES | 975,656 | |||||||||
| REAL ESTATE - 2.0% | ||||||||||
| 52,631 | Alexandria Real Estate Equities, Inc | 11,735 | ||||||||
| 211,503 | American Tower Corp | 61,865 | ||||||||
| 76,706 | Boston Properties, Inc | 8,835 | ||||||||
| 768,947 | British Land Co plc | 5,553 | ||||||||
| 60,579 | Brixmor Property Group, Inc | 1,539 | ||||||||
| 482 |
COLLEGE RETIREMENT EQUITIES FUND - Social Choice Account
| SHARES | COMPANY | VALUE (000) | ||||||||
| 2,693,773 | *,e | Capitaland Investment Ltd | $ | 6,811 | ||||||
| 416,653 | CapitaMall Trust | 630 | ||||||||
| 32,768 | CatchMark Timber Trust, Inc | 285 | ||||||||
| 89,742 | * | CBRE Group, Inc | 9,738 | |||||||
| 177,700 | e | City Developments Ltd | 899 | |||||||
| 49,700 | Crown Castle International Corp | 10,374 | ||||||||
| 33,379 | CyrusOne, Inc | 2,995 | ||||||||
| 301,100 | Daiwa House Industry Co Ltd | 8,653 | ||||||||
| 333,288 | * | DiamondRock Hospitality Co | 3,203 | |||||||
| 6,866 | Douglas Emmett, Inc | 230 | ||||||||
| 38,725 | Equinix, Inc | 32,755 | ||||||||
| 35,008 | First Industrial Realty Trust, Inc | 2,318 | ||||||||
| 5,328 | FirstService Corp | 1,047 | ||||||||
| 28,310 | Fonciere Des Regions | 2,324 | ||||||||
| 55,983 | Franklin Street Properties Corp | 333 | ||||||||
| 665 | Gecina S.A. | 93 | ||||||||
| 715,023 | Goodman Group | 13,783 | ||||||||
| 683,337 | GPT Group | 2,695 | ||||||||
| 216,041 | Healthpeak Properties Inc | 7,797 | ||||||||
| 34,542 | * | Howard Hughes Corp | 3,516 | |||||||
| 274,300 | Hulic Co Ltd | 2,608 | ||||||||
| 945 | Iron Mountain, Inc | 49 | ||||||||
| 30,104 | e | iStar Inc | 778 | |||||||
| 6,486 | * | Jones Lang LaSalle, Inc | 1,747 | |||||||
| 4,380 | Kilroy Realty Corp | 291 | ||||||||
| 95,863 | Kimco Realty Corp | 2,363 | ||||||||
| 104,398 | Klepierre | 2,470 | ||||||||
| 1,939 | Land Securities Group plc | 21 | ||||||||
| 6,470 | LEG Immobilien AG. | 902 | ||||||||
| 459,925 | Lend Lease Corp Ltd | 3,581 | ||||||||
| 1,513,600 | Link REIT | 13,334 | ||||||||
| 253,105 | Macerich Co | 4,374 | ||||||||
| 1,039,835 | Mirvac Group | 2,201 | ||||||||
| 559,000 | Mitsubishi Estate Co Ltd | 7,755 | ||||||||
| 357,710 | Mitsui Fudosan Co Ltd | 7,090 | ||||||||
| 97,100 | Nomura Real Estate Holdings, Inc | 2,237 | ||||||||
| 429,657 | * | Park Hotels & Resorts, Inc | 8,112 | |||||||
| 1,743 | Piedmont Office Realty Trust, Inc | 32 | ||||||||
| 359,442 | Prologis, Inc | 60,516 | ||||||||
| 66,712 | * | Realogy Holdings Corp | 1,121 | |||||||
| 2,740 | RMR Group, Inc | 95 | ||||||||
| 672,078 | Segro plc | 13,080 | ||||||||
| 483 |
COLLEGE RETIREMENT EQUITIES FUND - Social Choice Account
| SHARES | COMPANY | VALUE (000) | ||||||||
| 888,670 | Stockland Trust Group | $ | 2,742 | |||||||
| 541,500 | Swire Pacific Ltd (Class A) | 3,080 | ||||||||
| 1,269,400 | Swire Properties Ltd | 3,182 | ||||||||
| 126,814 | * | Unibail-Rodamco-Westfield | 8,874 | |||||||
| 1,300 | UOL Group Ltd | 7 | ||||||||
| 70,270 | Ventas, Inc | 3,592 | ||||||||
| 182,973 | Vicinity Centres | 225 | ||||||||
| 190,371 | Welltower, Inc | 16,328 | ||||||||
| 251,449 | Weyerhaeuser Co | 10,355 | ||||||||
| 63,158 | * | Xenia Hotels & Resorts, Inc | 1,144 | |||||||
| TOTAL REAL ESTATE | 384,292 | |||||||||
| RETAILING - 2.3% | ||||||||||
| 45,506 | * | 1-800-FLOWERS.COM, Inc (Class A) | 1,063 | |||||||
| 17,171 | Advance Auto Parts, Inc | 4,119 | ||||||||
| 621 | Best Buy Co, Inc | 63 | ||||||||
| 184 | * | Burlington Stores, Inc | 54 | |||||||
| 158 | Canadian Tire Corp Ltd | 23 | ||||||||
| 2,874 | * | CarMax, Inc | 374 | |||||||
| 101,392 | *,g | Delivery Hero AG. | 11,223 | |||||||
| 116,465 | * | Designer Brands, Inc | 1,655 | |||||||
| 699,740 | eBay, Inc | 46,533 | ||||||||
| 13,700 | Fast Retailing Co Ltd | 7,788 | ||||||||
| 7,052 | * | Five Below, Inc | 1,459 | |||||||
| 23,876 | Gap, Inc | 421 | ||||||||
| 25,942 | * | Genesco, Inc | 1,665 | |||||||
| 679 | Genuine Parts Co | 95 | ||||||||
| 289,675 | e | Hennes & Mauritz AB (B Shares) | 5,684 | |||||||
| 31,149 | Hibbett Sports, Inc | 2,241 | ||||||||
| 279,281 | Home Depot, Inc | 115,904 | ||||||||
| 266,617 | Industria De Diseno Textil S.A. | 8,598 | ||||||||
| 1,425,770 | * | JD Sports Fashion plc | 4,204 | |||||||
| 24,243 | Kering | 19,451 | ||||||||
| 585,495 | Kingfisher plc | 2,693 | ||||||||
| 27,150 | * | Lands’ End, Inc | 533 | |||||||
| 83,685 | LKQ Corp | 5,024 | ||||||||
| 229,305 | Lowe’s Companies, Inc | 59,271 | ||||||||
| 441,333 | Macy’s, Inc | 11,554 | ||||||||
| 38,743 | * | MarineMax, Inc | 2,287 | |||||||
| 370 | * | MercadoLibre, Inc | 499 | |||||||
| 40,823 | Next plc | 4,515 | ||||||||
| 569 | Pool Corp | 322 | ||||||||
| 284,110 | Prosus NV | 23,531 | ||||||||
| 484 |
COLLEGE RETIREMENT EQUITIES FUND - Social Choice Account
| SHARES | COMPANY | VALUE (000) | ||||||||
| 157,019 | * | Quotient Technology, Inc | $ | 1,165 | ||||||
| 144,672 | * | RealReal, Inc | 1,680 | |||||||
| 47,226 | Ross Stores, Inc | 5,397 | ||||||||
| 1,746 | * | Sally Beauty Holdings, Inc | 32 | |||||||
| 34,896 | Shoe Carnival, Inc | 1,364 | ||||||||
| 231,411 | Target Corp | 53,558 | ||||||||
| 495,395 | TJX Companies, Inc | 37,610 | ||||||||
| 17,873 | Tractor Supply Co | 4,265 | ||||||||
| 62,274 | Wesfarmers Ltd | 2,687 | ||||||||
| 874 | Winmark Corp | 217 | ||||||||
| 44,752 | *,g | Zalando SE | 3,605 | |||||||
| 20,869 | * | Zumiez, Inc | 1,002 | |||||||
| TOTAL RETAILING | 455,428 | |||||||||
| SEMICONDUCTORS & SEMICONDUCTOR EQUIPMENT - 3.2% | ||||||||||
| 417,605 | Applied Materials, Inc | 65,714 | ||||||||
| 89,481 | ASML Holding NV | 71,676 | ||||||||
| 23,227 | * | Cirrus Logic, Inc | 2,137 | |||||||
| 78,288 | * | First Solar, Inc | 6,824 | |||||||
| 1,438,463 | Intel Corp | 74,081 | ||||||||
| 79,109 | Lam Research Corp | 56,891 | ||||||||
| 543,594 | NVIDIA Corp | 159,876 | ||||||||
| 212,159 | NXP Semiconductors NV | 48,326 | ||||||||
| 670,895 | * | ON Semiconductor Corp | 45,567 | |||||||
| 19,466 | * | Silicon Laboratories, Inc | 4,018 | |||||||
| 365,987 | Texas Instruments, Inc | 68,978 | ||||||||
| 46,000 | Tokyo Electron Ltd | 26,476 | ||||||||
| 14,129 | Universal Display Corp | 2,332 | ||||||||
| 29,210 | * | Wolfspeed Inc | 3,265 | |||||||
| TOTAL SEMICONDUCTORS & SEMICONDUCTOR EQUIPMENT | 636,161 | |||||||||
| SOFTWARE & SERVICES - 8.1% | ||||||||||
| 149,083 | * | Adobe, Inc | 84,539 | |||||||
| 9,303 | * | Anaplan, Inc | 427 | |||||||
| 9,776 | * | Ansys, Inc | 3,921 | |||||||
| 23,321 | * | Aspen Technology, Inc | 3,549 | |||||||
| 174,913 | * | Autodesk, Inc | 49,184 | |||||||
| 236,997 | Automatic Data Processing, Inc | 58,439 | ||||||||
| 157,497 | * | Avaya Holdings Corp | 3,118 | |||||||
| 59,147 | * | Benefitfocus, Inc | 630 | |||||||
| 90,107 | * | Blackline, Inc | 9,330 | |||||||
| 144,088 | * | Cadence Design Systems, Inc | 26,851 | |||||||
| 485 |
COLLEGE RETIREMENT EQUITIES FUND - Social Choice Account
| SHARES | COMPANY | VALUE (000) | ||||||||
| 75,268 | Cap Gemini S.A. | $ | 18,447 | |||||||
| 54,183 | * | ChannelAdvisor Corp | 1,337 | |||||||
| 342 | Citrix Systems, Inc | 32 | ||||||||
| 73,408 | Computershare Ltd | 1,069 | ||||||||
| 28,256 | Concentrix Corp | 5,047 | ||||||||
| 59,654 | CSG Systems International, Inc | 3,437 | ||||||||
| 118,450 | Dolby Laboratories, Inc (Class A) | 11,279 | ||||||||
| 463,295 | * | DXC Technology Co | 14,913 | |||||||
| 40,306 | * | Elastic NV | 4,961 | |||||||
| 59,442 | * | ExlService Holdings, Inc | 8,605 | |||||||
| 113,443 | * | Five9, Inc | 15,578 | |||||||
| 96,100 | Fujitsu Ltd | 16,513 | ||||||||
| 24,921 | * | HubSpot, Inc | 16,427 | |||||||
| 458,782 | International Business Machines Corp | 61,321 | ||||||||
| 106,355 | Intuit, Inc | 68,410 | ||||||||
| 261,486 | Mastercard, Inc (Class A) | 93,957 | ||||||||
| 1,412,900 | Microsoft Corp | 475,187 | ||||||||
| 270,081 | NEC Corp | 12,488 | ||||||||
| 91,100 | * | New Relic, Inc | 10,017 | |||||||
| 211,300 | Nomura Research Institute Ltd | 9,033 | ||||||||
| 1,601 | NortonLifelock, Inc | 42 | ||||||||
| 128,391 | * | Nutanix, Inc | 4,091 | |||||||
| 194,094 | * | Okta, Inc | 43,510 | |||||||
| 6,151 | * | OneSpan, Inc | 104 | |||||||
| 38,600 | Otsuka Corp | 1,841 | ||||||||
| 28,957 | * | Paylocity Holding Corp | 6,838 | |||||||
| 408,669 | * | PayPal Holdings, Inc | 77,067 | |||||||
| 57,183 | * | Perficient, Inc | 7,393 | |||||||
| 29,937 | * | Rapid7, Inc | 3,523 | |||||||
| 312,159 | * | salesforce.com, Inc | 79,329 | |||||||
| 270,041 | SAP AG. | 38,005 | ||||||||
| 92,812 | * | ServiceNow, Inc | 60,245 | |||||||
| 27,795 | * | Shopify, Inc (Class A) | 38,270 | |||||||
| 37,192 | * | Smartsheet, Inc | 2,881 | |||||||
| 451 | * | Splunk, Inc | 52 | |||||||
| 63,735 | * | SPS Commerce, Inc | 9,073 | |||||||
| 73,600 | Sumisho Computer Systems Corp | 1,465 | ||||||||
| 119,055 | * | SVMK, Inc | 2,518 | |||||||
| 60,958 | * | Teradata Corp | 2,589 | |||||||
| 31,388 | TTEC Holdings, Inc | 2,842 | ||||||||
| 356,926 | VMware, Inc (Class A) | 41,361 | ||||||||
| 1,119 | Western Union Co | 20 | ||||||||
| 486 |
COLLEGE RETIREMENT EQUITIES FUND - Social Choice Account
| SHARES | COMPANY | VALUE (000) | ||||||||
| 83,115 | * | WEX, Inc | $ | 11,669 | ||||||
| 163,815 | Wisetech Global Ltd | 6,948 | ||||||||
| 169,834 | * | Workday, Inc | 46,395 | |||||||
| 9,773 | * | Workiva, Inc | 1,275 | |||||||
| 122,223 | * | Xero Ltd | 12,511 | |||||||
| TOTAL SOFTWARE & SERVICES | 1,589,903 | |||||||||
| TECHNOLOGY HARDWARE & EQUIPMENT - 2.2% | ||||||||||
| 76,602 | Avnet, Inc | 3,158 | ||||||||
| 3,200 | Azbil Corp | 146 | ||||||||
| 64,337 | Benchmark Electronics, Inc | 1,744 | ||||||||
| 137,743 | * | Ciena Corp | 10,602 | |||||||
| 1,373,303 | Cisco Systems, Inc | 87,026 | ||||||||
| 206,775 | Cognex Corp | 16,079 | ||||||||
| 48,700 | CTS Corp | 1,788 | ||||||||
| 12,042 | * | ePlus, Inc | 649 | |||||||
| 53,745 | * | Fabrinet | 6,367 | |||||||
| 5,198 | * | FARO Technologies, Inc | 364 | |||||||
| 40,800 | Fujifilm Holdings Corp | 3,025 | ||||||||
| 1,617,450 | Hewlett Packard Enterprise Co | 25,507 | ||||||||
| 1,262,119 | HP, Inc | 47,544 | ||||||||
| 16,400 | Ibiden Co Ltd | 974 | ||||||||
| 41,421 | * | Insight Enterprises, Inc | 4,415 | |||||||
| 4,037 | * | Itron, Inc | 277 | |||||||
| 50,374 | Keyence Corp | 31,673 | ||||||||
| 167,669 | * | Keysight Technologies, Inc | 34,625 | |||||||
| 39,615 | * | Kimball Electronics, Inc | 862 | |||||||
| 134,929 | * | Knowles Corp | 3,151 | |||||||
| 15,513 | * | Lumentum Holdings, Inc | 1,641 | |||||||
| 8,736 | Methode Electronics, Inc | 430 | ||||||||
| 4,828 | Motorola Solutions, Inc | 1,312 | ||||||||
| 236,500 | Murata Manufacturing Co Ltd | 18,864 | ||||||||
| 56,510 | National Instruments Corp | 2,468 | ||||||||
| 3,862 | * | Novanta, Inc | 681 | |||||||
| 57,800 | Omron Corp | 5,760 | ||||||||
| 732 | * | OSI Systems, Inc | 68 | |||||||
| 44,932 | *,e | PAR Technology Corp | 2,371 | |||||||
| 64,222 | * | Ribbon Communications, Inc | 389 | |||||||
| 32,265 | * | Rogers Corp | 8,808 | |||||||
| 5,900 | Shimadzu Corp | 249 | ||||||||
| 32,734 | SYNNEX Corp | 3,743 | ||||||||
| 151,500 | TDK Corp | 5,912 | ||||||||
| 472,344 | * | Trimble Inc | 41,184 | |||||||
| 487 |
COLLEGE RETIREMENT EQUITIES FUND - Social Choice Account
| SHARES | COMPANY | VALUE (000) | ||||||||
| 191,199 | * | TTM Technologies, Inc | $ | 2,849 | ||||||
| 76,602 | Vishay Intertechnology, Inc | 1,675 | ||||||||
| 18,093 | * | Vishay Precision Group, Inc | 672 | |||||||
| 288,088 | Vontier Corp | 8,853 | ||||||||
| 264,233 | Xerox Holdings Corp | 5,982 | ||||||||
| 76,721 | * | Zebra Technologies Corp (Class A) | 45,664 | |||||||
| TOTAL TECHNOLOGY HARDWARE & EQUIPMENT | 439,551 | |||||||||
| TELECOMMUNICATION SERVICES - 1.2% | ||||||||||
| 5,021,923 | BT Group plc | 11,553 | ||||||||
| 10,000 | HKT Trust and HKT Ltd | 13 | ||||||||
| 174,314 | * | Iridium Communications, Inc | 7,197 | |||||||
| 562,532 | KDDI Corp | 16,451 | ||||||||
| 108,559 | Koninklijke KPN NV | 337 | ||||||||
| 2,960 | * | Liberty Global plc (Class A) | 82 | |||||||
| 7,192 | * | Liberty Global plc (Class C) | 202 | |||||||
| 2,586 | Lumen Technologies, Inc | 32 | ||||||||
| 285,900 | Nippon Telegraph & Telephone Corp | 7,819 | ||||||||
| 1,232,129 | Orange S. A. | 13,162 | ||||||||
| 185,118 | Rogers Communications, Inc (Class B) | 8,814 | ||||||||
| 3,175,800 | Singapore Telecommunications Ltd | 5,467 | ||||||||
| 1,198,900 | Softbank Corp | 15,143 | ||||||||
| 6,454 | Swisscom AG. | 3,641 | ||||||||
| 8,252 | Tele2 AB (B Shares) | 118 | ||||||||
| 394,386 | Telefonica Deutschland Holding AG. | 1,094 | ||||||||
| 230,397 | Telenor ASA | 3,622 | ||||||||
| 322,622 | TeliaSonera AB | 1,262 | ||||||||
| 14,204 | TELUS Corp | 334 | ||||||||
| 402,842 | * | T-Mobile US, Inc | 46,722 | |||||||
| 1,337,473 | Verizon Communications, Inc | 69,495 | ||||||||
| 11,612,517 | Vodafone Group plc | 17,491 | ||||||||
| TOTAL TELECOMMUNICATION SERVICES | 230,051 | |||||||||
| TRANSPORTATION - 1.4% | ||||||||||
| 115,400 | *,e | All Nippon Airways Co Ltd | 2,412 | |||||||
| 45,355 | ArcBest Corp | 5,436 | ||||||||
| 147,420 | * | Auckland International Airport Ltd | 776 | |||||||
| 5,067 | Aurizon Holdings Ltd | 13 | ||||||||
| 27,696 | * | Avis Budget Group, Inc | 5,743 | |||||||
| 211,486 | Canadian National Railway Co | 25,978 | ||||||||
| 47,700 | Central Japan Railway Co | 6,348 | ||||||||
| 58,063 | CH Robinson Worldwide, Inc | 6,249 | ||||||||
| 488 |
COLLEGE RETIREMENT EQUITIES FUND - Social Choice Account
| SHARES | COMPANY | VALUE (000) | ||||||||
| 1,337,820 | CSX Corp | $ | 50,302 | |||||||
| 831,893 | * | Delta Air Lines, Inc | 32,510 | |||||||
| 134,300 | East Japan Railway Co | 8,256 | ||||||||
| 106,713 | Expeditors International of Washington, Inc | 14,330 | ||||||||
| 100 | Keio Corp | 4 | ||||||||
| 200 | * | Kintetsu Corp | 6 | |||||||
| 29,378 | Kuehne & Nagel International AG. | 9,461 | ||||||||
| 459 | Landstar System, Inc | 82 | ||||||||
| 1,680,864 | MTR Corp | 9,023 | ||||||||
| 25,400 | Nippon Express Co Ltd | 1,520 | ||||||||
| 111,478 | Nippon Yusen Kabushiki Kaisha | 8,501 | ||||||||
| 120,768 | Norfolk Southern Corp | 35,954 | ||||||||
| 54,955 | Old Dominion Freight Line | 19,695 | ||||||||
| 85,700 | SG Holdings Co Ltd | 2,010 | ||||||||
| 676,449 | *,e | Singapore Airlines Ltd | 2,508 | |||||||
| 485,581 | * | Sydney Airport | 3,066 | |||||||
| 1,606,942 | Transurban Group | 16,141 | ||||||||
| 11,000 | West Japan Railway Co | 460 | ||||||||
| TOTAL TRANSPORTATION | 266,784 | |||||||||
| UTILITIES - 1.8% | ||||||||||
| 478,619 | e | Algonquin Power & Utilities Corp | 6,913 | |||||||
| 689 | Alliant Energy Corp | 42 | ||||||||
| 295,772 | American Electric Power Co, Inc | 26,315 | ||||||||
| 500,415 | APA Group | 3,661 | ||||||||
| 1,300,000 | CLP Holdings Ltd | 13,136 | ||||||||
| 11,970 | CMS Energy Corp | 779 | ||||||||
| 197,499 | Consolidated Edison, Inc | 16,851 | ||||||||
| 21,990 | DTE Energy Co | 2,629 | ||||||||
| 2,829,342 | Enel S.p.A. | 22,624 | ||||||||
| 911,108 | Energias de Portugal S.A. | 5,005 | ||||||||
| 142,997 | Eversource Energy | 13,010 | ||||||||
| 118,617 | Fortis, Inc | 5,723 | ||||||||
| 1,987,529 | Iberdrola S.A. | 23,532 | ||||||||
| 1,875 | Mercury NZ Ltd | 8 | ||||||||
| 520,402 | Meridian Energy Ltd | 1,727 | ||||||||
| 285,175 | National Grid plc | 4,112 | ||||||||
| 202,403 | e | Naturgy Energy Group S.A. | 6,583 | |||||||
| 670,641 | NextEra Energy, Inc | 62,611 | ||||||||
| 4,849 | Origin Energy Ltd | 19 | ||||||||
| 98,908 | g | Orsted AS | 12,667 | |||||||
| 145,500 | Osaka Gas Co Ltd | 2,406 | ||||||||
| 219,128 | Public Service Enterprise Group, Inc | 14,622 | ||||||||
| 489 |
COLLEGE RETIREMENT EQUITIES FUND - Social Choice Account
| SHARES | COMPANY | VALUE (000) | ||||||||
| 620,099 | Scottish & Southern Energy plc | $ | 13,862 | |||||||
| 172,317 | Sempra Energy | 22,794 | ||||||||
| 7,999 | e | South Jersey Industries, Inc | 209 | |||||||
| 536,816 | Southern Co | 36,815 | ||||||||
| 20,822 | * | Sunnova Energy International, Inc | 581 | |||||||
| 181,100 | Tokyo Gas Co Ltd | 3,251 | ||||||||
| 34,209 | UGI Corp | 1,571 | ||||||||
| 119,845 | WEC Energy Group, Inc | 11,633 | ||||||||
| 193,358 | Xcel Energy, Inc | 13,090 | ||||||||
| TOTAL UTILITIES | 348,781 | |||||||||
| TOTAL COMMON STOCKS | 11,799,952 | |||||||||
| (Cost $8,007,594) | ||||||||||
| PREFERRED STOCKS - 0.3% | ||||||||||
| BANKS - 0.1% | ||||||||||
| 233,115 | *,e | Federal Home Loan Mortgage Corp (FHLMC) | 669 | |||||||
| 740,991 | *,e | Federal National Mortgage Association (FNMA) | 2,312 | |||||||
| 490,000 | e | First Republic Bank | 12,593 | |||||||
| TOTAL BANKS | 15,574 | |||||||||
| INSURANCE - 0.0% | ||||||||||
| 180,000 | e | Assurant, Inc | 4,855 | |||||||
| TOTAL INSURANCE | 4,855 | |||||||||
| REAL ESTATE - 0.1% | ||||||||||
| 390,000 | e | Brookfield Property Partners LP | 10,008 | |||||||
| 695,000 | Brookfield Property Partners LP | 16,374 | ||||||||
| TOTAL REAL ESTATE | 26,382 | |||||||||
| UTILITIES - 0.1% | ||||||||||
| 490,000 | e | Brookfield Infrastructure Partners LP | 12,402 | |||||||
| 308,000 | e | Brookfield Renewable Partners LP | 8,143 | |||||||
| TOTAL UTILITIES | 20,545 | |||||||||
| TOTAL PREFERRED STOCKS | 67,356 | |||||||||
| (Cost $88,178) | ||||||||||
| 490 |
COLLEGE RETIREMENT EQUITIES FUND - Social Choice Account
| SHARES | COMPANY | VALUE (000) | ||||||||||
| RIGHTS/WARRANTS - 0.0% | ||||||||||||
| MEDIA & ENTERTAINMENT - 0.0% | ||||||||||||
| 38,808 | † | Media General, Inc | $ | 0 | ||||||||
| TOTAL MEDIA & ENTERTAINMENT | 0 | |||||||||||
| TOTAL RIGHTS/WARRANTS | 0 | |||||||||||
| (Cost $0) | ||||||||||||
| PRINCIPAL | ISSUER | RATE | MATURITY DATE | |||||||||||||
| SHORT-TERM INVESTMENTS - 5.6% | ||||||||||||||||
| GOVERNMENT AGENCY DEBT - 5.1% | ||||||||||||||||
| $ | 25,000,000 | Federal Agricultural Mortgage Corp (FAMC) | 0.000 | % | 01/04/22 | 25,000 | ||||||||||
| 12,500,000 | FAMC | 0.000 | 02/28/22 | 12,500 | ||||||||||||
| 15,000,000 | Federal Farm Credit Bank (FFCB) | 0.000 | 01/05/22 | 15,000 | ||||||||||||
| 9,209,000 | FFCB | 0.000 | 01/13/22 | 9,209 | ||||||||||||
| 5,000,000 | FFCB | 0.000 | 02/10/22 | 5,000 | ||||||||||||
| 20,000,000 | FFCB | 0.000 | 02/15/22 | 19,999 | ||||||||||||
| 6,980,000 | FFCB | 0.000 | 02/25/22 | 6,980 | ||||||||||||
| 25,000,000 | FFCB | 0.000 | 02/28/22 | 24,999 | ||||||||||||
| 12,500,000 | FFCB | 0.000 | 03/01/22 | 12,499 | ||||||||||||
| 12,500,000 | FFCB | 0.000 | 03/02/22 | 12,499 | ||||||||||||
| 8,000,000 | FFCB | 0.000 | 04/11/22 | 7,998 | ||||||||||||
| 13,750,000 | FFCB | 0.000 | 05/27/22 | 13,742 | ||||||||||||
| 29,205,000 | FFCB | 0.000 | 06/08/22 | 29,181 | ||||||||||||
| 17,427,000 | FFCB | 0.000 | 06/16/22 | 17,412 | ||||||||||||
| 10,000,000 | FFCB | 0.000 | 07/06/22 | 9,989 | ||||||||||||
| 19,231,000 | FFCB | 0.000 | 09/01/22 | 19,197 | ||||||||||||
| 15,000,000 | FFCB | 0.000 | 09/13/22 | 14,972 | ||||||||||||
| 25,000,000 | Federal Home Loan Bank (FHLB) | 0.000 | 01/03/22 | 25,000 | ||||||||||||
| 57,198,000 | FHLB | 0.000 | 01/05/22 | 57,198 | ||||||||||||
| 25,430,000 | FHLB | 0.000 | 01/12/22 | 25,430 | ||||||||||||
| 20,000,000 | FHLB | 0.000 | 01/18/22 | 20,000 | ||||||||||||
| 25,000,000 | FHLB | 0.000 | 01/20/22 | 25,000 | ||||||||||||
| 34,290,000 | FHLB | 0.000 | 01/21/22 | 34,290 | ||||||||||||
| 10,000,000 | FHLB | 0.000 | 01/24/22 | 10,000 | ||||||||||||
| 25,000,000 | FHLB | 0.000 | 01/26/22 | 25,000 | ||||||||||||
| 43,340,000 | FHLB | 0.000 | 01/28/22 | 43,340 | ||||||||||||
| 106,655,000 | FHLB | 0.000 | 02/02/22 | 106,653 | ||||||||||||
| 36,656,000 | FHLB | 0.000 | 02/04/22 | 36,655 | ||||||||||||
| 25,000,000 | FHLB | 0.000 | 02/07/22 | 25,000 | ||||||||||||
| 34,985,000 | FHLB | 0.000 | 02/09/22 | 34,984 | ||||||||||||
| 25,000,000 | FHLB | 0.000 | 02/18/22 | 24,999 | ||||||||||||
| 25,000,000 | FHLB | 0.000 | 02/22/22 | 24,999 | ||||||||||||
| 24,450,000 | FHLB | 0.000 | 02/23/22 | 24,449 | ||||||||||||
| 9,700,000 | FHLB | 0.000 | 03/21/22 | 9,699 | ||||||||||||
| 53,885,000 | FHLB | 0.000 | 03/23/22 | 53,879 | ||||||||||||
| 10,681,000 | FHLB | 0.000 | 04/06/22 | 10,679 | ||||||||||||
| 18,695,000 | FHLB | 0.000 | 04/20/22 | 18,690 | ||||||||||||
| 12,500,000 | FHLB | 0.000 | 04/22/22 | 12,497 | ||||||||||||
| 20,543,000 | FHLB | 0.000 | 05/05/22 | 20,533 | ||||||||||||
| 29,188,000 | FHLB | 0.000 | 05/25/22 | 29,172 | ||||||||||||
| 15,000,000 | FHLB | 0.000 | 07/15/22 | 14,982 | ||||||||||||
| 20,000,000 | FHLB | 0.000 | 08/04/22 | 19,972 | ||||||||||||
| 8,000,000 | FHLB | 0.000 | 08/05/22 | 7,989 | ||||||||||||
| 491 |
COLLEGE RETIREMENT EQUITIES FUND - Social Choice Account
| PRINCIPAL | ISSUER | RATE | MATURITY DATE | VALUE (000) | |||||||||||||
| $ | 2,000,000 | Federal National Mortgage Association (FNMA) | 0.000 | % | 02/02/22 | $ | 2,000 | ||||||||||
| TOTAL GOVERNMENT AGENCY DEBT | 999,265 | ||||||||||||||||
| REPURCHASE AGREEMENT - 0.0% | |||||||||||||||||
| 4,800,000 | r | Fixed Income Clearing Corp (FICC) | 0.010 | 01/03/22 | 4,800 | ||||||||||||
| TOTAL REPURCHASE AGREEMENT | 4,800 | ||||||||||||||||
| TREASURY DEBT - 0.1% | |||||||||||||||||
| 10,000,000 | United States Treasury Bill | 0.000 | 10/06/22 | 9,980 | |||||||||||||
| 10,195,000 | United States Treasury Note | 2.250 | 04/15/22 | 10,256 | |||||||||||||
| TOTAL TREASURY DEBT | 20,236 | ||||||||||||||||
| SHARES | COMPANY | ||||||||||||||||
| INVESTMENT OF CASH COLLATERAL FOR SECURITIES LOANED - 0.4% | |||||||||||||||||
| 78,705,014 | c | State Street Navigator Securities Lending Government Money Market Portfolio | 0.030 | 78,705 | |||||||||||||
| TOTAL INVESTMENT OF CASH COLLATERAL FOR SECURITIES LOANED | 78,705 | ||||||||||||||||
| TOTAL SHORT-TERM INVESTMENTS | 1,103,006 | ||||||||||||||||
| (Cost $1,103,116) | |||||||||||||||||
| TOTAL INVESTMENTS - 104.5% | 20,632,092 | ||||||||||||||||
| (Cost $16,727,922) | |||||||||||||||||
| OTHER ASSETS & LIABILITIES, NET - (4.5)% | (880,558 | ) | |||||||||||||||
| NET ASSETS - 100.0% | $ | 19,751,534 | |||||||||||||||
| ADR | American Depositary Receipt | |||
| CLP | Chilean Peso | |||
| EUR | Euro | |||
| LIBOR | London Interbank Offered Rate | |||
| M | Month | |||
| REIT | Real Estate Investment Trust | |||
| SOFR | Secure Overnight Financing Rate | |||
| REMIC | Real Estate Mortgage Investment Conduit | |||
| ^ | Amount represents less than $1,000. | |||
| † | Security is categorized as Level 3 in the fair value hierarchy. | |||
| ‡ | Perpetual security | |||
| c | Investments made with cash collateral received from securities on loan. | |||
| e | All or a portion of these securities are out on loan. The aggregate value of securities on loan is $123,770,484. | |||
| g | Security is exempt from registration under Rule 144(A) of the Securities Act of 1933, as amended. Such securities are deemed liquid and may be resold in transactions exempt from registration to qualified institutional buyers. At 12/31/21, the aggregate value of these securities is $2,042,381,458 or 10.3% of net assets. | |||
| h | All or a portion of these securities were purchased on a delayed delivery basis. | |||
| i | Floating or variable rate security includes the reference rate and spread, unless the variable rate is based on the underlying asset of the security. Coupon rate reflects the rate at period end. | |||
| q | In default | |||
| r | Agreement with Fixed Income Clearing Corporation, 0.010% dated 12/31/21 to be repurchased at $4,800,000 on 1/3/22, collateralized by Government Agency Securities, with coupon rate 1.875% and maturity date 2/15/41, valued at $4,896,076. | |||
| Cost amounts are in thousands. | ||||
| 492 |
COLLEGE RETIREMENT EQUITIES FUND - Social Choice Account
Forward foreign currency contracts outstanding as of December 31, 2021 were as follows (dollar amounts are in thousands):
| Currency to be purchased | Receive | Currency to be sold | Deliver | Counterparty | Settlement date | Unrealized appreciation (depreciation) | ||||||||||
| $ | 12,721 | EUR | 10,901 | JPMorgan | 01/31/22 | $ | 303 | |||||||||
| EUR | Euro | ||
| 493 |
COLLEGE RETIREMENT EQUITIES FUND - Money Market Account
COLLEGE RETIREMENT EQUITIES FUND
MONEY MARKET ACCOUNT
SCHEDULE OF INVESTMENTS
December 31, 2021
| PRINCIPAL | ISSUER | REFERENCE RATE & SPREAD | RATE | MATURITY DATE | VALUE (000) | ||||||||||||
| SHORT-TERM INVESTMENTS - 100.4% | |||||||||||||||||
| GOVERNMENT AGENCY DEBT - 52.5% | |||||||||||||||||
| $ | 42,580,000 | Federal Agricultural Mortgage Corp (FAMC) | 0.000 | % | 02/02/22 | $ | 42,578 | ||||||||||
| 12,750,000 | FAMC | 0.000 | 02/14/22 | 12,749 | |||||||||||||
| 57,284,000 | FAMC | 0.000 | 02/16/22 | 57,281 | |||||||||||||
| 12,750,000 | FAMC | 0.000 | 02/24/22 | 12,749 | |||||||||||||
| 51,000,000 | FAMC | 0.000 | 02/28/22 | 50,996 | |||||||||||||
| 25,800,000 | FAMC | 0.000 | 03/01/22 | 25,798 | |||||||||||||
| 40,500,000 | FAMC | 0.000 | 03/02/22 | 40,496 | |||||||||||||
| 164,000 | Federal Farm Credit Bank (FFCB) | 0.000 | 01/03/22 | 164 | |||||||||||||
| 50,256,000 | FFCB | 0.000 | 01/10/22 | 50,255 | |||||||||||||
| 93,509,000 | FFCB | 0.000 | 01/13/22 | 93,508 | |||||||||||||
| 8,900,000 | FFCB | 0.000 | 01/18/22 | 8,900 | |||||||||||||
| 16,016,000 | FFCB | 0.530 | 01/18/22 | 16,020 | |||||||||||||
| 2,180,000 | FFCB | 2.600 | 01/18/22 | 2,182 | |||||||||||||
| 10,084,000 | FFCB | 1.600 | 01/21/22 | 10,092 | |||||||||||||
| 25,000,000 | FFCB | 0.000 | 01/27/22 | 24,998 | |||||||||||||
| 9,329,000 | FFCB | 1.550 | 01/28/22 | 9,339 | |||||||||||||
| 12,800,000 | FFCB | 0.000 | 01/31/22 | 12,799 | |||||||||||||
| 21,300,000 | FFCB | 0.000 | 02/03/22 | 21,299 | |||||||||||||
| 33,750,000 | FFCB | 0.000 | 02/11/22 | 33,748 | |||||||||||||
| 1,250,000 | FFCB | 2.530 | 02/14/22 | 1,254 | |||||||||||||
| 40,000,000 | FFCB | 0.000 | 02/17/22 | 39,997 | |||||||||||||
| 17,650,000 | FFCB | 0.000 | 02/23/22 | 17,649 | |||||||||||||
| 6,550,000 | FFCB | 0.150 | 02/24/22 | 6,551 | |||||||||||||
| 2,500,000 | FFCB | 1.450 | 02/24/22 | 2,505 | |||||||||||||
| 9,000,000 | FFCB | 0.000 | 02/28/22 | 8,999 | |||||||||||||
| 103,000 | FFCB | 0.000 | 03/01/22 | 103 | |||||||||||||
| 1,200,000 | FFCB | 2.550 | 03/01/22 | 1,205 | |||||||||||||
| 1,845,000 | FFCB | 0.700 | 03/11/22 | 1,847 | |||||||||||||
| 11,650,000 | FFCB | 0.625 | 03/18/22 | 11,664 | |||||||||||||
| 2,215,000 | FFCB | 0.070 | 03/29/22 | 2,215 | |||||||||||||
| 25,000,000 | FFCB | 0.000 | 04/01/22 | 24,996 | |||||||||||||
| 7,125,000 | FFCB | 0.140 | 04/01/22 | 7,126 | |||||||||||||
| 2,610,000 | FFCB | 2.000 | 04/04/22 | 2,623 | |||||||||||||
| 13,500,000 | FFCB | 0.250 | 04/06/22 | 13,506 | |||||||||||||
| 26,790,000 | FFCB | 0.375 | 04/08/22 | 26,811 | |||||||||||||
| 4,960,000 | FFCB | 0.250 | 05/06/22 | 4,963 | |||||||||||||
| 17,200,000 | FFCB | 0.000 | 05/12/22 | 17,196 | |||||||||||||
| 19,775,000 | FFCB | 0.000 | 05/16/22 | 19,770 | |||||||||||||
| 430,000 | FFCB | 0.160 | 05/18/22 | 430 | |||||||||||||
| 25,750,000 | FFCB | 0.000 | 05/20/22 | 25,743 | |||||||||||||
| 17,775,000 | FFCB | 0.000 | 05/25/22 | 17,770 | |||||||||||||
| 3,200,000 | i | FFCB | SOFR + 0.008% | 0.058 | 01/12/23 | 3,199 | |||||||||||
| 2,400,000 | Federal Home Loan Bank (FHLB) | 0.000 | 01/05/22 | 2,400 | |||||||||||||
| 170,443,000 | FHLB | 0.000 | 01/07/22 | 170,442 | |||||||||||||
| 64,000,000 | FHLB | 0.040 | 01/07/22 | 64,000 | |||||||||||||
| 400,000 | FHLB | 0.000 | 01/10/22 | 400 | |||||||||||||
| 494 |
COLLEGE RETIREMENT EQUITIES FUND - Money Market Account
| PRINCIPAL | ISSUER | RATE | MATURITY DATE | VALUE (000) | ||||||||||||
| $ | 3,000,000 | FHLB | 0.000 | % | 01/11/22 | $ | 3,000 | |||||||||
| 36,000,000 | FHLB | 0.000 | 01/12/22 | 35,999 | ||||||||||||
| 41,397,000 | FHLB | 0.000 | 01/13/22 | 41,396 | ||||||||||||
| 64,000,000 | FHLB | 0.045 | 01/13/22 | 64,000 | ||||||||||||
| 104,349,000 | FHLB | 0.000 | 01/14/22 | 104,347 | ||||||||||||
| 100,512,000 | FHLB | 0.000 | 01/19/22 | 100,510 | ||||||||||||
| 254,073,000 | FHLB | 0.000 | 01/21/22 | 254,066 | ||||||||||||
| 149,250,000 | FHLB | 0.000 | 01/26/22 | 149,245 | ||||||||||||
| 164,743,000 | FHLB | 0.000 | 01/28/22 | 164,737 | ||||||||||||
| 89,250,000 | FHLB | 0.040 | 01/28/22 | 89,249 | ||||||||||||
| 192,750,000 | FHLB | 0.035 | 02/01/22 | 192,747 | ||||||||||||
| 165,750,000 | FHLB | 0.000 | 02/02/22 | 165,743 | ||||||||||||
| 52,000,000 | FHLB | 0.000 | 02/03/22 | 51,998 | ||||||||||||
| 102,559,000 | FHLB | 0.000 | 02/04/22 | 102,554 | ||||||||||||
| 19,465,000 | FHLB | 0.050 | 02/07/22 | 19,465 | ||||||||||||
| 284,492,000 | FHLB | 0.000 | 02/09/22 | 284,477 | ||||||||||||
| 85,250,000 | FHLB | 0.050 | 02/10/22 | 85,249 | ||||||||||||
| 62,300,000 | FHLB | 0.000 | 02/11/22 | 62,296 | ||||||||||||
| 10,400,000 | FHLB | 0.000 | 02/15/22 | 10,399 | ||||||||||||
| 172,939,000 | FHLB | 0.000 | 02/18/22 | 172,927 | ||||||||||||
| 151,640,000 | FHLB | 0.000 | 02/23/22 | 151,629 | ||||||||||||
| 42,500,000 | FHLB | 0.050 | 02/23/22 | 42,500 | ||||||||||||
| 1,050,000 | FHLB | 0.000 | 02/25/22 | 1,050 | ||||||||||||
| 4,200,000 | FHLB | 0.000 | 02/28/22 | 4,200 | ||||||||||||
| 13,125,000 | FHLB | 2.430 | 02/28/22 | 13,173 | ||||||||||||
| 900,000 | FHLB | 0.000 | 03/01/22 | 900 | ||||||||||||
| 42,500,000 | FHLB | 0.050 | 03/01/22 | 42,500 | ||||||||||||
| 9,300,000 | FHLB | 0.000 | 03/02/22 | 9,299 | ||||||||||||
| 2,500,000 | FHLB | 0.080 | 03/03/22 | 2,500 | ||||||||||||
| 15,785,000 | FHLB | 2.250 | 03/11/22 | 15,851 | ||||||||||||
| 12,965,000 | FHLB | 2.500 | 03/11/22 | 13,025 | ||||||||||||
| 750,000 | FHLB | 2.750 | 03/11/22 | 754 | ||||||||||||
| 4,330,000 | FHLB | 0.050 | 03/14/22 | 4,330 | ||||||||||||
| 40,245,000 | FHLB | 0.000 | 03/16/22 | 40,241 | ||||||||||||
| 72,000,000 | FHLB | 0.045 | 03/17/22 | 71,999 | ||||||||||||
| 29,498,000 | FHLB | 0.000 | 03/18/22 | 29,495 | ||||||||||||
| 80,246,000 | FHLB | 0.000 | 03/23/22 | 80,235 | ||||||||||||
| 52,000,000 | FHLB | 0.000 | 03/25/22 | 51,992 | ||||||||||||
| 4,300,000 | FHLB | 0.055 | 03/30/22 | 4,300 | ||||||||||||
| 115,697,000 | FHLB | 0.000 | 04/01/22 | 115,682 | ||||||||||||
| 23,383,000 | FHLB | 0.000 | 04/22/22 | 23,379 | ||||||||||||
| 21,000,000 | FHLB | 0.000 | 04/27/22 | 20,996 | ||||||||||||
| 43,000,000 | FHLB | 0.080 | 04/28/22 | 42,999 | ||||||||||||
| 28,550,000 | FHLB | 0.000 | 05/25/22 | 28,540 | ||||||||||||
| 7,650,000 | FHLB | 0.250 | 06/03/22 | 7,654 | ||||||||||||
| 28,675,000 | FHLB | 2.125 | 06/10/22 | 28,931 | ||||||||||||
| 131,820,000 | Federal Home Loan Mortgage Corp (FHLMC) | 2.375 | 01/13/22 | 131,920 | ||||||||||||
| 1,055,000 | FHLMC | 0.250 | 06/08/22 | 1,055 | ||||||||||||
| 84,530,000 | Federal National Mortgage Association (FNMA) | 2.000 | 01/05/22 | 84,548 | ||||||||||||
| 33,707,000 | FNMA | 2.625 | 01/11/22 | 33,730 | ||||||||||||
| 21,250,000 | FNMA | 0.000 | 01/19/22 | 21,250 | ||||||||||||
| 25,000,000 | FNMA | 0.000 | 02/02/22 | 24,999 | ||||||||||||
| 2,000,000 | FNMA | 2.070 | 02/28/22 | 2,006 | ||||||||||||
| 24,750,000 | FNMA | 0.000 | 03/16/22 | 24,747 | ||||||||||||
| 495 |
COLLEGE RETIREMENT EQUITIES FUND - Money Market Account
| PRINCIPAL | ISSUER | REFERENCE RATE & SPREAD | RATE | MATURITY DATE | VALUE (000) | ||||||||||||
| $ | 31,639,000 | FNMA | 1.875 | % | 04/05/22 | $ | 31,787 | ||||||||||
| 9,448,000 | FNMA | 2.250 | 04/12/22 | 9,505 | |||||||||||||
| TOTAL GOVERNMENT AGENCY DEBT | 4,389,420 | ||||||||||||||||
| TREASURY DEBT - 24.2% | |||||||||||||||||
| 120,812,000 | United States Cash Management Bill | 0.000 | 03/08/22 | 120,800 | |||||||||||||
| 29,881,000 | United States Cash Management Bill | 0.000 | 03/15/22 | 29,878 | |||||||||||||
| 28,565,000 | United States Cash Management Bill | 0.000 | 03/22/22 | 28,562 | |||||||||||||
| 85,000,000 | United States Cash Management Bill | 0.000 | 03/29/22 | 84,986 | |||||||||||||
| 77,200,000 | United States Cash Management Bill | 0.000 | 04/05/22 | 77,186 | |||||||||||||
| 63,750,000 | United States Cash Management Bill | 0.000 | 04/12/22 | 63,734 | |||||||||||||
| 41,649,000 | United States Cash Management Bill | 0.000 | 04/19/22 | 41,641 | |||||||||||||
| 112,817,000 | United States Cash Management Bill | 0.000 | 04/26/22 | 112,786 | |||||||||||||
| 16,389,000 | United States Treasury Bill | 0.000 | 01/06/22 | 16,389 | |||||||||||||
| 49,980,000 | United States Treasury Bill | 0.000 | 02/10/22 | 49,977 | |||||||||||||
| 118,800,000 | United States Treasury Bill | 0.000 | 02/17/22 | 118,792 | |||||||||||||
| 55,611,000 | United States Treasury Bill | 0.000 | 02/24/22 | 55,607 | |||||||||||||
| 126,351,000 | United States Treasury Bill | 0.000 | 03/01/22 | 126,340 | |||||||||||||
| 51,000,000 | United States Treasury Bill | 0.000 | 03/03/22 | 50,994 | |||||||||||||
| 49,878,000 | United States Treasury Bill | 0.000 | 03/10/22 | 49,873 | |||||||||||||
| 151,214,000 | United States Treasury Bill | 0.000 | 03/24/22 | 151,191 | |||||||||||||
| 25,000,000 | United States Treasury Bill | 0.000 | 03/31/22 | 24,997 | |||||||||||||
| 27,653,000 | United States Treasury Bill | 0.000 | 04/07/22 | 27,649 | |||||||||||||
| 44,935,000 | United States Treasury Note | 2.500 | 01/15/22 | 44,977 | |||||||||||||
| 72,200,000 | United States Treasury Note | 1.375 | 01/31/22 | 72,278 | |||||||||||||
| 42,700,000 | United States Treasury Note | 1.875 | 01/31/22 | 42,763 | |||||||||||||
| 114,570,000 | United States Treasury Note | 2.000 | 02/15/22 | 114,840 | |||||||||||||
| 32,267,000 | United States Treasury Note | 2.500 | 02/15/22 | 32,363 | |||||||||||||
| 50,000,000 | United States Treasury Note | 1.125 | 02/28/22 | 50,085 | |||||||||||||
| 35,000,000 | United States Treasury Note | 1.750 | 02/28/22 | 35,095 | |||||||||||||
| 79,200,000 | United States Treasury Note | 1.875 | 02/28/22 | 79,431 | |||||||||||||
| 21,500,000 | United States Treasury Note | 2.375 | 03/15/22 | 21,599 | |||||||||||||
| 100,925,000 | United States Treasury Note | 0.375 | 03/31/22 | 100,999 | |||||||||||||
| 51,000,000 | United States Treasury Note | 1.750 | 03/31/22 | 51,209 | |||||||||||||
| 72,200,000 | United States Treasury Note | 1.875 | 03/31/22 | 72,519 | |||||||||||||
| 19,700,000 | United States Treasury Note | 2.250 | 04/15/22 | 19,822 | |||||||||||||
| 52,856,000 | United States Treasury Note | 0.125 | 04/30/22 | 52,862 | |||||||||||||
| TOTAL TREASURY DEBT | 2,022,224 | ||||||||||||||||
| VARIABLE RATE SECURITIES - 23.7% | |||||||||||||||||
| 22,150,000 | i | Federal Agricultural Mortgage Corp (FAMC) | SOFR + 0.020% | 0.070 | 10/24/22 | 22,150 | |||||||||||
| 64,000,000 | i | Federal Farm Credit Bank (FFCB) | SOFR + 0.070% | 0.120 | 02/17/22 | 64,000 | |||||||||||
| 50,700,000 | i | FFCB | SOFR + 0.170% | 0.220 | 03/15/22 | 50,700 | |||||||||||
| 101,000,000 | i | FFCB | SOFR + 0.040% | 0.090 | 06/01/22 | 101,000 | |||||||||||
| 127,700,000 | i | FFCB | SOFR + 0.005% | 0.055 | 07/12/22 | 127,698 | |||||||||||
| 34,750,000 | i | FFCB | SOFR + 0.190% | 0.240 | 07/14/22 | 34,751 | |||||||||||
| 22,465,000 | i | FFCB | SOFR + 0.145% | 0.195 | 07/28/22 | 22,467 | |||||||||||
| 15,250,000 | i | FFCB | SOFR + 0.070% | 0.120 | 08/11/22 | 15,250 | |||||||||||
| 19,750,000 | i | FFCB | SOFR + 0.050% | 0.100 | 08/12/22 | 19,754 | |||||||||||
| 127,400,000 | i | FFCB | SOFR + 0.045% | 0.095 | 09/08/22 | 127,407 | |||||||||||
| 63,750,000 | i | FFCB | SOFR + 0.005% | 0.055 | 10/05/22 | 63,748 | |||||||||||
| 28,200,000 | i | FFCB | SOFR + 0.060% | 0.110 | 10/21/22 | 28,202 | |||||||||||
| 69,491,000 | i | FFCB | SOFR + 0.010% | 0.060 | 11/16/22 | 69,490 | |||||||||||
| 51,000,000 | i | FFCB | SOFR + 0.008% | 0.058 | 11/22/22 | 50,999 | |||||||||||
| 496 |
COLLEGE RETIREMENT EQUITIES FUND - Money Market Account
| PRINCIPAL | ISSUER | REFERENCE RATE & SPREAD | RATE | MATURITY DATE | VALUE (000) | ||||||||||||
| $ | 8,000,000 | i | FFCB | SOFR + 0.060% | 0.110 | % | 12/01/22 | $ | 8,000 | ||||||||
| 50,000,000 | i | FFCB | SOFR + 0.025% | 0.075 | 12/06/22 | 50,000 | |||||||||||
| 43,195,000 | i | FFCB | SOFR + 0.060% | 0.110 | 12/28/22 | 43,214 | |||||||||||
| 14,155,000 | i | FFCB | SOFR + 0.060% | 0.110 | 01/13/23 | 14,159 | |||||||||||
| 12,000,000 | i | FFCB | SOFR + 0.060% | 0.110 | 01/20/23 | 12,001 | |||||||||||
| 8,415,000 | i | FFCB | SOFR + 0.055% | 0.105 | 02/09/23 | 8,417 | |||||||||||
| 11,172,000 | i | FFCB | SOFR + 0.050% | 0.100 | 02/17/23 | 11,174 | |||||||||||
| 4,350,000 | i | FFCB | SOFR + 0.040% | 0.090 | 03/10/23 | 4,351 | |||||||||||
| 30,500,000 | i | FFCB | SOFR + 0.035% | 0.085 | 05/04/23 | 30,500 | |||||||||||
| 30,500,000 | i | FFCB | SOFR + 0.035% | 0.085 | 05/12/23 | 30,500 | |||||||||||
| 88,250,000 | i | FFCB | SOFR + 0.018% | 0.068 | 07/13/23 | 88,234 | |||||||||||
| 25,450,000 | i | FFCB | SOFR + 0.050% | 0.100 | 09/15/23 | 25,450 | |||||||||||
| 12,850,000 | i | FFCB | SOFR + 0.025% | 0.075 | 09/27/23 | 12,850 | |||||||||||
| 13,700,000 | i | FFCB | SOFR + 0.025% | 0.075 | 10/27/23 | 13,700 | |||||||||||
| 84,000,000 | i | Federal Home Loan Bank (FHLB) | SOFR + 0.080% | 0.130 | 02/22/22 | 84,000 | |||||||||||
| 2,900,000 | i | FHLB | SOFR + 0.015% | 0.065 | 04/11/22 | 2,900 | |||||||||||
| 64,000,000 | i | FHLB | SOFR + 0.055% | 0.105 | 05/13/22 | 64,000 | |||||||||||
| 38,500,000 | i | FHLB | SOFR + 0.090% | 0.140 | 05/26/22 | 38,500 | |||||||||||
| 51,400,000 | i | FHLB | SOFR + 0.010% | 0.060 | 06/23/22 | 51,400 | |||||||||||
| 63,500,000 | i | FHLB | SOFR + 0.045% | 0.095 | 07/29/22 | 63,500 | |||||||||||
| 51,625,000 | i | FHLB | SOFR + 0.010% | 0.060 | 08/10/22 | 51,625 | |||||||||||
| 1,700,000 | i | FHLB | SOFR + 0.090% | 0.140 | 09/08/22 | 1,701 | |||||||||||
| 63,750,000 | i | FHLB | SOFR + 0.010% | 0.060 | 09/09/22 | 63,750 | |||||||||||
| 64,000,000 | i | FHLB | SOFR + 0.085% | 0.135 | 10/05/22 | 64,000 | |||||||||||
| 121,850,000 | i | FHLB | SOFR + 0.060% | 0.110 | 12/08/22 | 121,873 | |||||||||||
| 14,750,000 | i | FHLB | SOFR + 0.035% | 0.085 | 05/19/23 | 14,750 | |||||||||||
| 42,500,000 | i | FHLB | SOFR + 0.030% | 0.080 | 08/11/23 | 42,500 | |||||||||||
| 3,175,000 | i | Federal Home Loan Mortgage Corp (FHLMC) | SOFR + 0.150% | 0.200 | 03/04/22 | 3,176 | |||||||||||
| 9,600,000 | i | FHLMC | SOFR + 0.190% | 0.240 | 06/02/22 | 9,607 | |||||||||||
| 840,000 | i | FHLMC | SOFR + 0.130% | 0.180 | 08/05/22 | 841 | |||||||||||
| 64,750,000 | i | FHLMC | SOFR + 0.095% | 0.145 | 08/19/22 | 64,750 | |||||||||||
| 600,000 | i | Federal National Mortgage Association (FNMA) | SOFR + 0.300% | 0.350 | 01/07/22 | 600 | |||||||||||
| 5,400,000 | i | FNMA | SOFR + 0.110% | 0.160 | 03/04/22 | 5,401 | |||||||||||
| 16,300,000 | i | FNMA | SOFR + 0.190% | 0.240 | 05/27/22 | 16,312 | |||||||||||
| 2,350,000 | i | FNMA | SOFR + 0.180% | 0.230 | 07/08/22 | 2,352 | |||||||||||
| 43,450,000 | i | FNMA | SOFR + 0.120% | 0.170 | 07/29/22 | 43,464 | |||||||||||
| 17,246,000 | i | United States Treasury Note | US Treasury Bill 3 M + 0.034% | 0.119 | 04/30/23 | 17,246 | |||||||||||
| TOTAL VARIABLE RATE SECURITIES | 1,978,414 | ||||||||||||||||
| TOTAL SHORT-TERM INVESTMENTS | 8,390,058 | ||||||||||||||||
| (Cost $8,390,058) | |||||||||||||||||
| TOTAL INVESTMENTS - 100.4% | 8,390,058 | ||||||||||||||||
| (Cost $8,390,058) | |||||||||||||||||
| OTHER ASSETS & LIABILITIES, NET - (0.4)% | (34,802 | ) | |||||||||||||||
| NET ASSETS - 100.0% | $ | 8,355,256 | |||||||||||||||
| M | Month | ||
| SOFR | Secure Overnight Financing Rate | ||
| i | Floating or variable rate security includes the reference rate and spread, unless the variable rate is based on the underlying asset of the security. Coupon rate reflects the rate at period end. | ||
| Cost amounts are in thousands. | |||
| 497 |
Report of Independent Registered Public Accounting Firm
To the Board of Trustees of College Retirement Equities Fund and Participants of Stock Account, Global Equities Account, Growth Account, Equity Index Account, Bond Market Account, Inflation-Linked Bond Account, Social Choice Account and Money Market Account
Opinions on the Financial Statements
We have audited the accompanying statements of assets and liabilities, including the summary portfolios of investments, of Stock Account, Global Equities Account, Growth Account, Equity Index Account, Bond Market Account, Inflation-Linked Bond Account, Social Choice Account and Money Market Account (constituting College Retirement Equities Fund, hereafter collectively referred to as the “Accounts”) as of December 31, 2021, the related statements of operations for the year ended December 31, 2021, the statements of changes in net assets for each of the two years in the period ended December 31, 2021, including the related notes, and the financial highlights for each of the five years in the period ended December 31, 2021 (included in Item 1 of this Form N-CSR) and the schedules of investments (included in Item 6 of this Form N-CSR) as of December 31, 2021 (collectively referred to as the “financial statements”). In our opinion, the financial statements present fairly, in all material respects, the financial position of each of the Accounts as of December 31, 2021, the results of each of their operations for the year then ended, the changes in each of their net assets for each of the two years in the period ended December 31, 2021 and each of the financial highlights for each of the five years in the period ended December 31, 2021 in conformity with accounting principles generally accepted in the United States of America.
Basis for Opinions
These financial statements are the responsibility of the Accounts’ management. Our responsibility is to express an opinion on the Accounts’ financial statements based on our audits. We are a public accounting firm registered with the Public Company Accounting Oversight Board (United States) (PCAOB) and are required to be independent with respect to the Accounts in accordance with the U.S. federal securities laws and the applicable rules and regulations of the Securities and Exchange Commission and the PCAOB.
We conducted our audits of these financial statements in accordance with the standards of the PCAOB. Those standards require that we plan and perform the audit to obtain reasonable assurance about whether the financial statements are free of material misstatement, whether due to error or fraud.
Our audits included performing procedures to assess the risks of material misstatement of the financial statements, whether due to error or fraud, and performing procedures that respond to those risks. Such procedures included examining, on a test basis, evidence regarding the amounts and disclosures in the financial statements. Our audits also included evaluating the accounting principles used and significant estimates made by management, as well as evaluating the overall presentation of the financial statements. Our procedures included confirmation of securities owned as of December 31, 2021 by correspondence with the custodian and brokers; when replies were not received from brokers, we performed other auditing procedures. We believe that our audits provide a reasonable basis for our opinions.
/s/ PricewaterhouseCoopers LLP
Baltimore, Maryland
February 23, 2022
We have served as the auditor of one or more investment companies in TIAA-CREF Funds’ investment company group since 2005.
(A10944-A 2/22)
| 498 |
Item 7. Disclosure of Proxy Voting Policies and Procedures for Closed-End Management Investment Companies.
Not Applicable.
Item 8. Portfolio Managers of Closed-End Management Investment Companies.
Not Applicable.
Item 9. Purchases of Equity Securities by Closed-End Management Investment Company and Affiliated Purchasers.
Not Applicable.
Item 10. Submission of Matters to a Vote of Security Holders.
There were no material changes to the procedures by which shareholders may recommend nominees to the Registrant’s Board of Trustees.
Item 11. Controls and Procedures.
(a) An evaluation was performed within 90 days of the filing date of the report under the supervision of the Registrant’s management, including the principal executive officer and principal financial officer, of the effectiveness of the design and operation of the Registrant’s disclosure controls and procedures. Based on that evaluation, the Registrant’s management, including the principal executive officer and principal financial officer, concluded that the Registrant’s disclosure controls and procedures were effective for this annual reporting period.
(b) There were no changes in the Registrant’s internal control over financial reporting that occurred during the Registrant’s annual period covered by this report that materially affected, or are reasonably likely to materially affect, the Registrant’s internal control over financial reporting.
Item 12. Disclosure of Securities Lending Activities for Closed-End Management Investment Companies.
Not Applicable.
Item 13. Exhibits.
13(a)(1) Copy of current SOX code of conduct for Senior Financial Officers
13(a)(2)(i) Section 302 certification of the principal executive officer
13(a)(2)(ii) Section 302 certification of the principal financial officer
13(b) Section 906 certification of principal executive officer and principal financial officer
SIGNATURES
Pursuant to the requirements of the Securities Exchange Act of 1934 and the Investment Company Act of 1940, the Registrant has duly caused this report to be signed on its behalf by the undersigned, thereunto duly authorized.
| COLLEGE RETIREMENT EQUITIES FUND | ||
| Dated: February 23, 2022 | By: | /s/ Colbert Narcisse |
| Colbert Narcisse Principal Executive Officer and President and Chief Executive Officer | ||
Pursuant to the requirements of the Securities Exchange Act of 1934 and the Investment Company Act of 1940, this report has been signed below by the following persons on behalf of the Registrant and in the capacities and on the dates indicated.
| Dated: February 23, 2022 | By: | /s/ Colbert Narcisse |
| Colbert Narcisse Principal Executive Officer and President and Chief Executive Officer (principal executive officer) | ||
| Dated: February 23, 2022 | By: | /s/ E. Scott Wickerham |
| E. Scott Wickerham Principal Financial Officer, Principal Accounting Officer and Treasurer (principal financial officer) |