UNITED STATES SECURITIES AND EXCHANGE COMMISSION
Washington, D.C. 20549
FORM N-CSR
CERTIFIED SHAREHOLDER REPORT OF REGISTERED MANAGEMENT
INVESTMENT COMPANIES
| Investment Company Act file number: | 811-04413 | |
| Exact name of registrant as specified in charter: | Delaware Group®Equity Funds IV | |
| Address of principal executive offices: | 2005 Market Street | |
| Philadelphia, PA 19103 | ||
| Name and address of agent for service: | David F. Connor, Esq. | |
| 2005 Market Street | ||
| Philadelphia, PA 19103 | ||
| Registrant’s telephone number, including area code: | (800) 523-1918 | |
| Date of fiscal year end: | March 31 | |
| Date of reporting period: | March 31, 2020 |
Item 1. Reports to Stockholders
Table of Contents
Delaware Funds* by MACQUARIE |  |
Annual report
Alternative / specialty mutual fund
Delaware Healthcare Fund
March 31, 2020
Beginning on or about June 1, 2021, as permitted by regulations adopted by the Securities and Exchange Commission, paper copies of your Fund’s shareholder reports will no longer be sent to you by mail, unless you specifically request them from the Fund or from your financial intermediary, such as a broker/dealer, bank, or insurance company. Instead, you will be notified by mail each time a report is posted on the website and provided with a link to access the report.
If you already elected to receive shareholder reports electronically, you will not be affected by this change and you do not need to take any action. You may elect to receive shareholder reports and other communications from the Fund electronically by signing up at delawarefunds.com/edelivery. If you own these shares through a financial intermediary, you may contact your financial intermediary.
You may elect to receive paper copies of all future shareholder reports free of charge. You can inform the Fund that you wish to continue receiving paper copies of your shareholder reports by contacting us at 800523-1918. If you own these shares through a financial intermediary, you may contact your financial intermediary to elect to continue to receive paper copies of your shareholder reports. Your election to receive reports in paper will apply to all funds held with the Delaware Funds® by Macquarie or your financial intermediary.
Carefully consider the Fund’s investment objectives, risk factors, charges, and expenses before investing. This and other information can be found in the Fund’s prospectus and its summary prospectus, which may be obtained by visiting delawarefunds.com/literature or calling 800523-1918. Investors should read the prospectus and the summary prospectus carefully before investing.
You can obtain shareholder reports and prospectuses online instead of in the mail.
Visit delawarefunds.com/edelivery.
Table of Contents
Experience Delaware Funds®by Macquarie
Macquarie Investment Management (MIM) is a global asset manager with offices in the United States, Europe, Asia, and Australia. As active managers, we prioritize autonomy and accountability at the investment team level in pursuit of opportunities that matter for clients. Delaware Funds is one of the longest-standing mutual fund families, with more than 80 years in existence.
If you are interested in learning more about creating an investment plan, contact your financial advisor.
You can learn more about Delaware Funds or obtain a prospectus for Delaware Healthcare Fund at delawarefunds.com/literature.
Manage your account online
| ● | Check your account balance and transactions |
| ● | View statements and tax forms |
| ● | Make purchases and redemptions |
Visit delawarefunds.com/account-access.
Macquarie Asset Management (MAM) offers a diverse range of products including securities investment management, infrastructure and real asset management, and fund and equity-based structured products. MIM is the marketing name for certain companies comprising the asset management division of Macquarie Group. This includes the following investment advisers: Macquarie Investment Management Business Trust (MIMBT), Macquarie Funds Management Hong Kong Limited, Macquarie Investment Management Austria Kapitalanlage AG, Macquarie Investment Management Global Limited, Macquarie Investment Management Europe Limited, Macquarie Capital Investment Management LLC, and Macquarie Investment Management Europe S.A.
The Fund is distributed byDelaware Distributors, L.P. (DDLP), an affiliate of MIMBT and Macquarie Group Limited.
Other than Macquarie Bank Limited (MBL), none of the entities noted are authorized deposit-taking institutions for the purposes of the Banking Act 1959 (Commonwealth of Australia). The obligations of these entities do not represent deposits or other liabilities of MBL. MBL does not guarantee or otherwise provide assurance in respect of the obligations of these entities, unless noted otherwise. The Fund is governed by US laws and regulations.
| 1 | ||||
| 4 | ||||
| 8 | ||||
Security type / sector allocation and top 10 equity holdings | 10 | |||
| 12 | ||||
| 16 | ||||
| 18 | ||||
| 20 | ||||
| 22 | ||||
| 30 | ||||
| 43 | ||||
| 44 | ||||
| 46 | ||||
| 56 | ||||
Unless otherwise noted, views expressed herein are current as of March 31, 2020, and subject to change for events occurring after such date.
The Fund is not FDIC insured and is not guaranteed. It is possible to lose the principal amount invested.
Advisory services provided by Delaware Management Company, a series of MIMBT, a US registered investment advisor.
All third-party marks cited are the property of their respective owners.
© 2020 Macquarie Management Holdings, Inc.
Table of Contents
| Delaware Healthcare Fund | April 7, 2020 (Unaudited) |
Performance preview (for the year ended March 31, 2020) | ||||||||
Delaware Healthcare Fund (Institutional Class shares) | 1-year return | -0.01 | % | |||||
Delaware Healthcare Fund (Class A shares)* | 1-year return | -0.23 | % | |||||
Russell 3000®Healthcare Index (benchmark) | 1-year return | -2.11 | % |
Past performance does not guarantee future results.
For complete, annualized performance for Delaware Healthcare Fund, please see the table on page 4. Institutional Class shares are not subject to a sales charge and are offered for sale exclusively to certain eligible investors. In addition, Institutional Class shares pay no distribution and service fee.
The performance of Class A shares excludes the applicable sales charge. Both Institutional Class shares and Class A shares reflect the reinvestment of all distributions.
Please see page 6 for a description of the index. Index performance returns do not reflect any management fees, transaction costs, or expenses. Indices are unmanaged and one cannot invest directly in an index.
*Total return for the report period presented in the table differs from the return in “Financial highlights.” The total return presented in the above table is calculated based on the net asset value (NAV) at which shareholder transactions were processed. The total return presented in “Financial highlights” is calculated in the same manner but also takes into account certain adjustments that are necessary under US generally accepted accounting principles (US GAAP) required in the annual report.
Investment objective
The Fund seeks maximum long-term capital growth through capital appreciation.
Market review
The healthcare sector continued to experience significant challenges during the fiscal year ended March 31, 2020. Amplified discussions concerning drug-pricing reform and a single-payer medical insurance system in the United States once again made headlines and weighed on healthcare stocks as the 2020 presidential race progressed. Meanwhile, the sector saw continued drug innovation, easing regulatory concern, and a flurry of mergers and acquisitions that helped drive positive performance. Most recently, markets have been volatile as investors worry about the economic impact ofCOVID-19.
Within the Fund
For the fiscal period ended March 31, 2020, Delaware Healthcare Fund declined, although it outperformed its benchmark, the Russell 3000 Healthcare Index. The Fund’s Institutional Class shares declined-0.01%. The Fund’s Class A shares fell-0.23% at net asset value and declined
We continue putting a premium on disciplined, intensive research when analyzing investment opportunities for the Fund. We favor companies that, in our opinion, exhibit traits such as:
● proven competitiveness
● seasoned management teams
● stock valuations that are discounted meaningfully from our estimates of intrinsic value.
These characteristics are part of our daily considerations as we follow ourstock-by-stock approach to portfolio management.
|
1
Table of Contents
Portfolio management review
Delaware Healthcare Fund
-5.96% at maximum offer price. These figures reflect all distributions reinvested. During the same period, the benchmark fell-2.11%. For complete, annualized performance of Delaware Healthcare Fund, please see the table on page 4.
Among sectors, the Fund’s holdings in the blue-chip medical products sector contributed the most to relative performance due to favorable stock selection. The Fund’s overweight position in Chugai Pharmaceutical Co. Ltd. outperformed as shares rebounded following positive earnings results in July. Chugai Pharmaceutical is among the strongest franchises in Japan and is also partnered with Roche Holding AG, which allows Chugai to benefit from both companies’ pipelines. The Fund’s overweight position in Roche also performed well. Shares of Roche rebounded after becoming oversold due to concern about biosimilars entering the market. The Fund’s underweight in Pfizer Inc. was positive in terms of asset allocation. In contrast, the Fund’s underweight position in Bristol-Myers Squibb Co. detracted from relative performance.
The biotechnology sector also contributed to relative performance due to favorable stock selection. The Fund’s large overweight position inArray BioPharma Inc.outperformed after Pfizer acquired the company in an $11.4 billion deal. Shares ofRegeneron Pharmaceuticals Inc.performed well as it is one of the most creativelarge-cap biotech firms in the sector. Current product sales continue to grow while Regeneron makes continued progress in its pipeline.MorphoSys AGalso contributed to relative performance in the sector. Shares of the company outperformed following positive quarterly results and continued progress in its pipeline. MorphoSys remains one of the few antibody technology platforms that has not been acquired by a large pharmaceutical company and has consistently demonstrated progress on its own proprietary cancer pipeline. The Fund’s position inArQule Inc.outperformed after Merck announced
in December that it planned to acquire ArQule. This outperformance was somewhat mitigated by the Fund’s overweight positions inAlkermes PLCanduniQure NV. In sympathy with other biotech companies in the sector, uniQure underperformed. Despite this near-term underperformance, uniQure remains the market leader in gene therapy, and recent clinical trials indicate promise for success in its gene therapy platform. Shares of Alkermes declined in sympathy with a broader selloff of biotech companies due to a lack of exciting clinical data. We continue to believe that both companies are undervalued and trade at a discount to their intrinsic values.
In the healthcare services sector, the Fund’s underweight stance was slightly favorable in terms of asset allocation, while stock selection was the main driver of performance. Shares ofCVS Health Corp.outperformed after it announced positive earnings results in August. CVS remains a dominant franchise in the sector and we continue to hold a positive long-term view of the company.
The Fund’s holdings in the small- andmid-cap medical-products sector detracted the most from relative performance due to unfavorable stock selection. The Fund’s overweight position inMylan NVwas the main detractor from performance in the sector. The company reported lackluster financial results and continues to face significant headwinds in the US generic market. There is also ongoing fallout following issues the US Food and Drug Administration (FDA) identified at one of Mylan’s manufacturing facilities. Despite these short-term setbacks, Mylan remains among the strongest franchises for generic pharmaceuticals in the industry and we believe the company is well-positioned for growth as demand for generics increases.
For global healthcare investors, there are risks that short-term legislative and judicial action could overshadow the positive long-term fundamentals of the sector and of specific companies. The
2
Table of Contents
severe effects ofCOVID-19 on the economy and the healthcare sector remains to be seen; however, we continue to see strong long-term opportunities in the global healthcare asset class. The baby-boom generation in the US is aging, implying expanding demand for healthcare products and services for decades to come. At the same time, middle classes in countries with emerging economies (notably India and China) are growing rapidly, creating significant demand for Western-style medicine. We remain positive on the sector and its growth opportunities.
We believe that healthcare remains one of the few growth sectors in the economy. We continue to see many attractive opportunities in the healthcare sector, particularly in the biotechnology sector, where we see potential for continued innovation in cancer treatments and gene-therapy technology. We remain overweight in the biotechnology sector, particularly in small- tomid-cap companies, where we see potential for technological breakthroughs.
Despite some increased volatility last year due to investors’ uncertainty surrounding plans for a repeal and replace measure for the Affordable Care Act (ACA), we believe that healthcare has
remained one of the economy’s few growth sectors. We continue to see many attractive opportunities in the healthcare sector, particularly in the biotechnology sector, where we see potential for continued innovation in cancer treatments and gene therapy technology. The Fund remains overweight in the biotechnology sector, particularly in small- tomid-cap companies, where we see potential for technological breakthroughs.
We continue putting a premium on disciplined, intensive research when analyzing potential investment opportunities for the Fund and favor companies that, in our opinion, exhibit traits such as:
| ● | proven competitiveness |
| ● | seasoned management teams |
| ● | stock valuations that are discounted meaningfully from our estimates of intrinsic value. |
These characteristics are part of our daily considerations as we follow ourstock-by-stock approach to portfolio management.
3
Table of Contents
| Performance summary | ||
| Delaware Healthcare Fund | March 31, 2020 (Unaudited) |
The performance quoted represents past performance and does not guarantee future results. Investment return and principal value of an investment will fluctuate so that shares, when redeemed, may be worth more or less than their original cost. Current performance may be lower or higher than the performance quoted. Performance data current to the most recent month end may be obtained by calling 800523-1918 or visiting delawarefunds.com/performance.
| Fund and benchmark performance1,2 | Average annual total returns through March 31, 2020 | |||||||||||||||
| 1 year | 5 year | 10 year | Lifetime | |||||||||||||
Class A (Est. Sept. 28, 2007) | ||||||||||||||||
Excluding sales charge | -0.23%* | +8.02% | +13.77% | +14.87% | ||||||||||||
Including sales charge | -5.96% | +6.75% | +13.10% | +14.33% | ||||||||||||
Class C (Est. Jan. 28, 2010) | ||||||||||||||||
Excluding sales charge | -0.98%* | +7.22% | +12.93% | +13.44% | ||||||||||||
Including sales charge | -1.90% | +7.22% | +12.93% | +13.44% | ||||||||||||
Class R (Est. Jan. 28, 2010) | ||||||||||||||||
Excluding sales charge | -0.52% | +7.74% | +13.48% | +14.00% | ||||||||||||
Including sales charge | -0.52% | +7.74% | +13.48% | +14.00% | ||||||||||||
Institutional Class (Est. Sept. 28, 2007) | ||||||||||||||||
Excluding sales charge | -0.01% | +8.28% | +14.06% | +15.10% | ||||||||||||
Including sales charge | -0.01% | +8.28% | +14.06% | +15.10% | ||||||||||||
Russell 3000 Healthcare Index | -2.11% | +5.86% | +13.13% | +10.19%** | ||||||||||||
*Total return for the report period presented in the table differs from the return in “Financial highlights.” The total return presented in the above table is calculated based on the net asset value (NAV) at which shareholder transactions were processed. The total return presented in “Financial highlights” is calculated in the same manner but also takes into account certain adjustments that are necessary under US generally accepted accounting principles (US GAAP) required in the annual report.
**The benchmark lifetime return is for Institutional Class share comparison only and is calculated using the last business day in the month of the Fund’s Institutional Class inception date.
1Returns reflect the reinvestment of all distributions and are presented both with and without the applicable sales charges described below. Returns do not reflect the deduction of taxes the shareholder would pay on Fund distributions or redemptions of Fund shares.
Expense limitations were in effect for certain classes during some or all of the periods shown in the “Fund and benchmark performance” table. Expenses for each class are listed on the “Fund expense ratios” table on page 5. Performance would have been lower had expense limitations not been in effect.
Institutional Class shares are not subject to a sales charge and are offered for sale exclusively to certain eligible investors. In addition, Institutional Class shares pay no distribution and service(12b-1) fee.
Class A shares are sold with a maximumfront-end sales charge of 5.75%, and have an annual12b-1 fee of 0.25% of average daily net assets. Performance for Class A shares, excluding sales charges, assumes that nofront-end sales charge applied.
Class C shares are sold with a contingent deferred sales charge of 1.00% if redeemed during the first 12 months. They are also subject to an annual
4
Table of Contents
12b-1 fee of 1.00% of average daily net assets. Performance for Class C shares, excluding sales charges, assumes either that contingent deferred sales charges did not apply or that the investment was not redeemed.
Class R shares are available only for certain retirement plan products. They are sold without a sales charge and have an annual12b-1 fee of 0.50% of average daily net assets.
Narrowly focused investments may exhibit higher volatility than investments in multiple industry sectors.
Healthcare companies are subject to extensive government regulation and their profitability can be affected by restrictions on government reimbursement for medical expenses, rising costs of medical products and services, pricing pressure, and malpractice or other litigation.
International investments entail risks not ordinarily associated with US investments including
fluctuation in currency values, differences in accounting principles, or economic or political instability in other nations. Investing in emerging markets can be riskier than investing in established foreign markets due to increased volatility and lower trading volume.
Investments in small and/ormedium-sized companies typically exhibit greater risk and higher volatility than larger, more established companies.
“Non-diversified” funds may allocate more of their net assets to investments in single securities than “diversified” funds. Resulting adverse effects may subject these funds to greater risks and volatility.
The disruptions caused by natural disasters, pandemics, or similar events could prevent the Fund from executing advantageous investment decisions in a timely manner and could negatively impact the Fund’s ability to achieve its investment objective and the value of the Fund’s investments.
2The Fund’s expense ratios, as described in the most recent prospectus, are disclosed in the following “Fund expense ratios” table. Please see the “Financial highlights” section in this report for the most recent expense ratios.
| Fund expense ratios | Class A | Class C | Class R | Institutional Class | ||||
Total annual operating expenses (without fee waivers) | 1.28% | 2.03% | 1.53% | 1.03% | ||||
Net expenses (including fee waivers, if any) | 1.28% | 2.03% | 1.53% | 1.03% | ||||
| Type of waiver | n/a | n/a | n/a | n/a |
5
Table of Contents
Performance summary
Delaware Healthcare Fund
Performance of a $10,000 Investment1
Average annual total returns from March 31, 2010 through March 31, 2020
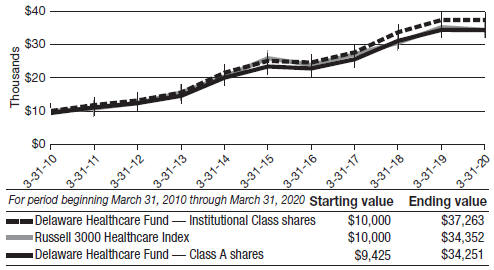
1The “Performance of a $10,000 investment” graph assumes $10,000 invested in Institutional Class and Class A shares of the Fund on March 31, 2010, and includes the effect of a 5.75%front-end sales charge (for Class A shares) and the reinvestment of all distributions. The graph does not reflect the deduction of taxes the shareholders would pay on Fund distributions or redemptions of Fund shares. Expense limitations were in effect for some or all of the periods shown. Performance would have been lower had expense limitations not been in effect. Expenses are listed in the “Fund expense ratios” table on page 5. Please note additional details on pages 4 through 7.
The graph also assumes $10,000 invested in the Russell 3000 Healthcare Index as of March 31, 2010. The Russell 3000 Healthcare Index measures the performance of all healthcare holdings included in the Russell 3000 Index, which represents the 3,000 largest US companies based on total market capitalization.
Frank Russell Company is the source and owner of the trademarks, service marks, and copyrights related to the Russell Indexes. Russell® is a trademark of Frank Russell Company.
Index performance returns do not reflect any management fees, transaction costs, or expenses. Indices are unmanaged and one cannot invest directly in an index.Past performance is not a guarantee of future results.
Performance of other Fund classes will vary due to different charges and expenses.
6
Table of Contents
Nasdaq symbols | CUSIPs | |||
Class A | DLHAX | 24610E101 | ||
Class C | DLHCX | 24610E200 | ||
Class R | DLRHX | 24610E309 | ||
Institutional Class | DLHIX
| 24610E408
|
7
Table of Contents
For thesix-month period from October 1, 2019 to March 31, 2020 (Unaudited)
As a shareholder of the Fund, you incur two types of costs: (1) transaction costs, including sales charges (loads) on purchase payments, reinvested dividends, or other distributions; redemption fees; and exchange fees; and (2) ongoing costs, including management fees; distribution and service(12b-1) fees; and other Fund expenses. This example is intended to help you understand your ongoing costs (in dollars) of investing in the Fund and to compare these costs with the ongoing costs of investing in other mutual funds.
The example is based on an investment of $1,000 invested at the beginning of the period and held for the entiresix-month period from Oct. 1, 2019 to March 31, 2020.
Actual expenses
The first section of the table shown, “Actual Fund return,” provides information about actual account values and actual expenses. You may use the information in this section of the table, together with the amount you invested, to estimate the expenses that you paid over the period. Simply divide your account value by $1,000 (for example, an $8,600 account value divided by $1,000 = 8.6), then multiply the result by the number in the first section under the heading entitled “Expenses Paid During Period” to estimate the expenses you paid on your account during this period.
Hypothetical example for comparison purposes
The second section of the table shown, “Hypothetical 5% return,” provides information about hypothetical account values and hypothetical expenses based on the Fund’s actual expense ratio and an assumed rate of return of 5% per year before expenses, which is not the Fund’s actual return. The hypothetical account values and expenses may not be used to estimate the actual ending account balance or expenses you paid for the period. You may use this information to compare the ongoing costs of investing in the Fund and other funds. To do so, compare this 5% hypothetical example with the 5% hypothetical examples that appear in the shareholder reports of the other funds.
Please note that the expenses shown in the table are meant to highlight your ongoing costs only and do not reflect any transactional costs, such as sales charges (loads), redemption fees, or exchange fees. Therefore, the second section of the table is useful in comparing ongoing costs only, and will not help you determine the relative total costs of owning different funds. In addition, if these transactional costs were included, your costs would have been higher. The Fund’s expenses shown in the table reflect fee waivers in effect and assume reinvestment of all dividends and distributions.
8
Table of Contents
Delaware Healthcare Fund
Expense analysis of an investment of $1,000
| Beginning Account Value 10/1/19 | Ending Account Value 3/31/20 | Annualized Expense Ratio | Expenses Paid During Period 10/1/19 to 3/31/20* | |||||||||||||||||
Actual Fund return† | ||||||||||||||||||||
Class A | $1,000.00 | $1,033.00 | 1.26 | % | $6.40 | |||||||||||||||
Class C | 1,000.00 | 1,029.20 | 2.01 | % | 10.20 | |||||||||||||||
Class R | 1,000.00 | 1,031.60 | 1.51 | % | 7.67 | |||||||||||||||
Institutional Class | 1,000.00 | 1,034.20 | 1.01 | % | 5.14 | |||||||||||||||
Hypothetical 5% Return(5% return before expenses) |
| |||||||||||||||||||
Class A | $1,000.00 | $1,018.70 | 1.26 | % | $6.36 | |||||||||||||||
Class C | 1,000.00 | 1,014.95 | 2.01 | % | 10.13 | |||||||||||||||
Class R | 1,000.00 | 1,017.45 | 1.51 | % | 7.62 | |||||||||||||||
| Institutional Class | 1,000.00 | 1,019.95 | 1.01 | % | 5.10 | |||||||||||||||
*“Expenses Paid During Period” are equal to the Fund’s annualized expense ratio, multiplied by the average account value over the period, multiplied by 183/366 (to reflect theone-half year period).
†Because actual returns reflect only the most recentsix-month period, the returns shown may differ significantly from fiscal year returns.
In addition to the Fund’s expenses reflected above, the Fund also indirectly bears its portion of the fees and expenses of the investment companies (Underlying Funds) in which it invests. The table above does not reflect the expenses of the Underlying Funds.
9
Table of Contents
Security type / sector allocation and top 10 equity holdings
| ||
| Delaware Healthcare Fund | As of March 31, 2020 (Unaudited) | |
Sector designations may be different than the sector designations presented in other Fund materials. The sector designations may represent the investment manager’s internal sector classifications.
| Security type / sector | Percentage of net assets | ||||
Common Stock² | 99.16% | ||||
Biotechnology | 31.90% | ||||
Blue Chip Medical Products | 45.69% | ||||
Healthcare Services | 8.54% | ||||
Other | 6.60% | ||||
Small- /Mid-Cap Medical Products | 6.43% | ||||
Rights | 0.03% | ||||
Short-Term Investments | 0.02% | ||||
Total Value of Securities | 99.21% | ||||
Receivables and Other Assets Net of Liabilities | 0.79% | ||||
Total Net Assets | 100.00% | ||||
| ² | Narrow industries are utilized for compliance purposes for diversification whereas broad sectors are used for financial reporting. |
To monitor compliance with the Fund’s concentration guidelines as described in the Fund’s prospectus and Statement of Additional Information, the Biotechnology and Blue Chip Medical Products sector (as disclosed herein for financial reporting purposes) are subdivided into a variety of “industries” (in accordance with the requirements of the Investment Company Act of 1940, as amended). The Biotechnology sector consisted of biotechnology and pharmaceuticals. As of March 31, 2020, such amounts, as a percentage of total net assets, were 24.41% and 7.49% respectively. The Blue Chip Medical Products sector consisted of biotechnology, healthcare-products and pharmaceuticals. As of March 31, 2020 such amounts, as a percentage of total net assets, were 9.10%, 2.57%, and 34.02% respectively. The percentage in any such single industry will comply with the Fund’s concentration policy even if the percentages in the Biotechnology and Blue Chip Medical Products sectors for financial reporting purposes may exceed 25%.
10
Table of Contents
Holdings are for informational purposes only and are subject to change at any time. They are not a recommendation to buy, sell, or hold any security.
| Top 10 equity holdings | Percentage of net assets | |||
Sanofi ADR | 6.59% | |||
Roche Holding | 6.47% | |||
Amgen | 5.59% | |||
Regeneron Pharmaceuticals | 4.36% | |||
uniQure | 3.69% | |||
Sanofi | 3.67% | |||
MorphoSys | 3.65% | |||
Chugai Pharmaceutical | 3.62% | |||
UnitedHealth Group | 3.34% | |||
Eli Lilly & Co. | 2.81% | |||
11
Table of Contents
| Delaware Healthcare Fund | March 31, 2020 |
| Number of shares | Value (US $) | |||||||
| ||||||||
Common Stock – 99.16%² | ||||||||
| ||||||||
Biotechnology – 31.90% | ||||||||
ACADIA Pharmaceuticals † | 194,776 | $ | 8,229,286 | |||||
Alder Biopharmaceuticals =† | 75,000 | 66,000 | ||||||
Alexion Pharmaceuticals † | 20,000 | 1,795,800 | ||||||
Alkermes † | 370,000 | 5,335,400 | ||||||
Allogene Therapeutics † | 146,779 | 2,853,384 | ||||||
Alnylam Pharmaceuticals † | 41,000 | 4,462,850 | ||||||
Arena Pharmaceuticals † | 525,000 | 22,050,000 | ||||||
Axovant Gene Therapies † | 64,171 | 156,577 | ||||||
BioMarin Pharmaceutical † | 112,000 | 9,464,000 | ||||||
Cellectis ADR † | 219,675 | 2,021,010 | ||||||
Clovis Oncology † | 100,200 | 637,272 | ||||||
Coherus Biosciences † | 430,000 | 6,974,600 | ||||||
Dynavax Technologies † | 760,000 | 2,682,800 | ||||||
Epizyme † | 203,200 | 3,151,632 | ||||||
Exact Sciences † | 17,116 | 992,728 | ||||||
Five Prime Therapeutics † | 100,000 | 227,000 | ||||||
Fortress Biotech † | 100,000 | 189,000 | ||||||
Galmed Pharmaceuticals † | 306,010 | 1,058,795 | ||||||
Immunomedics † | 147,862 | 1,993,180 | ||||||
Incyte † | 60,000 | 4,393,800 | ||||||
Intercept Pharmaceuticals † | 27,000 | 1,699,920 | ||||||
Karyopharm Therapeutics † | 380,000 | 7,299,800 | ||||||
Lexicon Pharmaceuticals † | 11,697 | 22,809 | ||||||
MacroGenics † | 275,000 | 1,600,500 | ||||||
Madrigal Pharmaceuticals † | 28,500 | 1,902,660 | ||||||
MEI Pharma † | 600,000 | 966,000 | ||||||
Mirati Therapeutics † | 165,000 | 12,683,550 | ||||||
Momenta Pharmaceuticals † | 141,501 | 3,848,827 | ||||||
MorphoSys † | 339,685 | 32,706,687 | ||||||
Mustang Bio † | 120,000 | 321,600 | ||||||
Myriad Genetics † | 135,000 | 1,931,850 | ||||||
Nektar Therapeutics † | 256,385 | 4,576,472 | ||||||
Neurocrine Biosciences † | 110,000 | 9,520,500 | ||||||
NextCure † | 100,000 | 3,707,000 | ||||||
Portola Pharmaceuticals † | 160,000 | 1,140,800 | ||||||
Proteostasis Therapeutics † | 750,000 | 855,000 | ||||||
Provention Bio † | 70,000 | 644,000 | ||||||
Puma Biotechnology † | 61,255 | 516,992 | ||||||
Regeneron Pharmaceuticals † | 80,000 | 39,063,200 | ||||||
REGENXBIO † | 149,000 | 4,824,620 | ||||||
Rigel Pharmaceuticals † | 1,600,000 | 2,496,000 | ||||||
12
Table of Contents
| Number of shares | Value (US $) | |||||||
| ||||||||
Common Stock² (continued) | ||||||||
| ||||||||
Biotechnology (continued) | ||||||||
Rocket Pharmaceuticals † | 58,000 | $ | 809,100 | |||||
Sangamo Therapeutics † | 400,000 | 2,548,000 | ||||||
Sarepta Therapeutics † | 23,000 | 2,249,860 | ||||||
Seattle Genetics † | 95,000 | 10,961,100 | ||||||
Syndax Pharmaceuticals † | 180,000 | 1,974,600 | ||||||
Ultragenyx Pharmaceutical † | 70,000 | 3,110,100 | ||||||
uniQure † | 696,000 | 33,025,200 | ||||||
United Therapeutics † | 86,800 | 8,230,810 | ||||||
Vascular Biogenics † | 200,000 | 270,000 | ||||||
Vertex Pharmaceuticals † | 25,000 | 5,948,750 | ||||||
Viking Therapeutics † | 330,100 | 1,544,868 | ||||||
Voyager Therapeutics † | 5,700 | 52,155 | ||||||
Xencor † | 129,191 | 3,860,227 | ||||||
XOMA † | 3,466 | 70,533 | ||||||
|
| |||||||
| 285,719,204 | ||||||||
|
| |||||||
Blue Chip Medical Products – 45.69% | ||||||||
AbbVie | 130,000 | 9,904,700 | ||||||
Amgen | 246,964 | 50,067,012 | ||||||
AstraZeneca | 110,000 | 9,800,877 | ||||||
AstraZeneca ADR | 60,000 | 2,679,600 | ||||||
Biogen † | 45,000 | 14,237,100 | ||||||
Boston Scientific † | 380,000 | 12,399,400 | ||||||
Bristol-Myers Squibb | 200,000 | 11,148,000 | ||||||
Chugai Pharmaceutical | 280,000 | 32,394,819 | ||||||
Eli Lilly & Co. | 181,446 | 25,170,189 | ||||||
Gilead Sciences | 230,000 | 17,194,800 | ||||||
GlaxoSmithKline ADR | 280,000 | 10,609,200 | ||||||
Johnson & Johnson | 100,000 | 13,113,000 | ||||||
Merck & Co. | 180,000 | 13,849,200 | ||||||
Pfizer | 500,000 | 16,320,000 | ||||||
Roche Holding | 180,000 | 57,913,564 | ||||||
Sanofi | 380,000 | 32,898,469 | ||||||
Sanofi ADR | 1,350,000 | 59,022,000 | ||||||
Stryker | 15,000 | 2,497,350 | ||||||
Teva Pharmaceutical Industries ADR † | 530,000 | 4,759,400 | ||||||
UCB | 60,000 | 5,133,733 | ||||||
Zimmer Biomet Holdings | 80,000 | 8,086,400 | ||||||
|
| |||||||
| 409,198,813 | ||||||||
|
| |||||||
Healthcare Services – 8.54% | ||||||||
Anthem | 50,000 | 11,352,000 | ||||||
Change Healthcare † | 25,532 | 255,065 | ||||||
Cigna | 75,000 | 13,288,500 | ||||||
13
Table of Contents
Schedule of investments
Delaware Healthcare Fund
| Number of shares | Value (US $) | |||||||
| ||||||||
Common Stock² (continued) | ||||||||
| ||||||||
Healthcare Services (continued) | ||||||||
CVS Health | 250,000 | $ | 14,832,500 | |||||
McKesson | 12,862 | 1,739,714 | ||||||
Quest Diagnostics | 48,000 | 3,854,400 | ||||||
UnitedHealth Group | 120,000 | 29,925,600 | ||||||
Walgreens Boots Alliance | 26,900 | 1,230,675 | ||||||
|
| |||||||
| 76,478,454 | ||||||||
|
| |||||||
Other – 6.60% | ||||||||
China Mobile ADR | 250,000 | 9,417,500 | ||||||
Cia de Minas Buenaventura ADR | 115,300 | 840,537 | ||||||
Compugen † | 150,000 | 1,089,000 | ||||||
Dell Technologies Class C † | 102,600 | 4,057,830 | ||||||
Fannie Mae † | 1,300,000 | 2,067,000 | ||||||
Federal Home Loan Mortgage † | 1,050,000 | 1,467,638 | ||||||
Micron Technology † | 580,000 | 24,394,800 | ||||||
Opera ADR † | 184,700 | 991,839 | ||||||
QUALCOMM | 50,000 | 3,382,500 | ||||||
SINA † | 60,000 | 1,910,400 | ||||||
SK Telecom ADR | 435,805 | 7,090,547 | ||||||
Sohu.com ADR † | 390,722 | 2,434,198 | ||||||
|
| |||||||
| 59,143,789 | ||||||||
|
| |||||||
Small- /Mid-Cap Medical Products – 6.43% | ||||||||
ABIOMED † | 10,000 | 1,451,600 | ||||||
Aerie Pharmaceuticals † | 5,100 | 68,850 | ||||||
Akorn † | 501,000 | 281,161 | ||||||
Allergan | 111,500 | 19,746,650 | ||||||
Halozyme Therapeutics † | 230,000 | 4,137,700 | ||||||
InnoCare Pharma 144A #† | 17,000 | 24,954 | ||||||
Inspire Medical Systems † | 30,000 | 1,808,400 | ||||||
Intra-Cellular Therapies † | 235,000 | 3,611,950 | ||||||
Mylan † | 1,095,000 | 16,326,450 | ||||||
Perrigo | 210,000 | 10,098,900 | ||||||
|
| |||||||
| 57,556,615 | ||||||||
|
| |||||||
Total Common Stock(cost $803,149,589) | 888,096,875 | |||||||
|
| |||||||
| ||||||||
Rights – 0.03% | ||||||||
| ||||||||
Ambit Bioscience =† | 76,500 | 0 | ||||||
Bristol-Myers Squibb † | 80,000 | 304,000 | ||||||
|
| |||||||
Total Rights(cost $0) | 304,000 | |||||||
14
Table of Contents
| Number of shares | Value (US $) | |||||||
| ||||||||
Short-Term Investments – 0.02% | ||||||||
| ||||||||
Money Market Mutual Funds – 0.02% | ||||||||
BlackRock FedFund – Institutional Shares(seven-day effective yield 0.33%) | 27,355 | $ | 27,355 | |||||
Fidelity Investments Money Market Government Portfolio – Class I(seven-day effective yield 0.30%) | 27,355 | 27,355 | ||||||
GS Financial Square Government Fund – Institutional Shares(seven-day effective yield 0.34%) | 27,355 | 27,355 | ||||||
Morgan Stanley Government Portfolio – Institutional Share Class(seven-day effective yield 0.22%) | 27,355 | 27,355 | ||||||
State Street Institutional US Government Money Market Fund – Investor Class(seven-day effective yield 0.24%) | 27,355 | 27,355 | ||||||
|
| |||||||
| 136,775 | ||||||||
|
| |||||||
Total Short-Term Investments(cost $136,775) | 136,775 | |||||||
|
| |||||||
Total Value of Securities – 99.21% | $ | 888,537,650 | ||||||
|
| |||||||
| # | Security exempt from registration under Rule 144A of the Securities Act of 1933, as amended. At March 31, 2020, the aggregate value of Rule 144A securities was $24,954, which represents less than 0.01% of the Fund’s net assets. See Note 10 in “Notes to financial statements.” |
| ² | Narrow industries are utilized for compliance purposes for diversification whereas broad sectors are used for financial reporting. |
| = | The value of this security was determined using significant unobservable inputs and is reported as a Level 3 security in the disclosure table located in Note 3 in “Notes to financial statements.” |
| † | Non-income producing security. |
Summary of abbreviations:
ADR – American Depositary Receipt
GS – Goldman Sachs
See accompanying notes, which are an integral part of the financial statements.
15
Table of Contents
Statement of assets and liabilities
| Delaware Healthcare Fund | March 31, 2020 |
Assets: | ||||
Investments, at value1 | $ | 888,537,650 | ||
Receivable for fund shares sold | 8,247,889 | |||
Foreign tax reclaims receivable | 952,065 | |||
Dividends and interest receivable | 314,643 | |||
Receivable for securities sold | 116,837 | |||
|
| |||
Total assets | 898,169,084 | |||
|
| |||
Liabilities: | ||||
Cash due to custodian | 1,734 | |||
Payable for fund shares redeemed | 1,371,123 | |||
Investment management fees payable to affiliates | 617,472 | |||
Dividend disbursing and transfer agent fees and expenses payable tonon-affiliates | 235,668 | |||
Distribution fees payable to affiliates | 144,845 | |||
Other accrued expenses | 124,185 | |||
Dividend disbursing and transfer agent fees and expenses payable to affiliates | 7,391 | |||
Trustees’ fees and expenses payable to affiliates | 6,332 | |||
Audit and tax fees payable | 5,500 | |||
Accounting and administration expenses payable to affiliates | 2,964 | |||
Legal fees payable to affiliates | 1,691 | |||
Reports and statements to shareholders expenses payable to affiliates | 1,128 | |||
|
| |||
Total liabilities | 2,520,033 | |||
|
| |||
Total Net Assets | $ | 895,649,051 | ||
|
| |||
Net Assets Consist of: | ||||
Paid-in capital | $ | 790,298,470 | ||
Total distributable earnings (loss) | 105,350,581 | |||
|
| |||
Total Net Assets | $ | 895,649,051 | ||
|
| |||
16
Table of Contents
Net Asset Value | ||||
Class A: | ||||
Net assets | $ | 272,910,802 | ||
Shares of beneficial interest outstanding, unlimited authorization, no par | 11,997,846 | |||
Net asset value per share | $ | 22.75 | ||
Sales charge | 5.75 | % | ||
Offering price per share, equal to net asset value per share / (1 – sales charge) | $ | 24.14 | ||
Class C: | ||||
Net assets | $ | 99,376,492 | ||
Shares of beneficial interest outstanding, unlimited authorization, no par | 4,640,280 | |||
Net asset value per share | $ | 21.42 | ||
Class R: | ||||
Net assets | $ | 5,268,556 | ||
Shares of beneficial interest outstanding, unlimited authorization, no par | 235,181 | |||
Net asset value per share | $ | 22.40 | ||
Institutional Class: | ||||
Net assets | $ | 518,093,201 | ||
Shares of beneficial interest outstanding, unlimited authorization, no par | 22,616,123 | |||
Net asset value per share | $ | 22.91 | ||
1Investments, at cost | $ | 803,286,364 | ||
See accompanying notes, which are an integral part of the financial statements.
17
Table of Contents
| Delaware Healthcare Fund | Year ended March 31, 2020 |
Investment Income: | ||||
Dividends | $ | 14,675,578 | ||
Foreign tax withheld | (877,206 | ) | ||
|
| |||
| 13,798,372 | ||||
|
| |||
Expenses: | ||||
Management fees | 8,120,036 | |||
Distribution expenses – Class A | 757,966 | |||
Distribution expenses – Class C | 1,116,112 | |||
Distribution expenses – Class R | 31,219 | |||
Dividend disbursing and transfer agent fees and expenses | 1,024,153 | |||
Custodian fees | 293,979 | |||
Accounting and administration expenses | 205,680 | |||
Reports and statements to shareholders expenses | 144,638 | |||
Registration fees | 99,854 | |||
Trustees’ fees and expenses | 55,844 | |||
Legal fees | 49,420 | |||
Audit and tax fees | 38,437 | |||
Other | 35,962 | |||
|
| |||
| 11,973,300 | ||||
Less expenses paid indirectly | (1,203 | ) | ||
|
| |||
Total operating expenses | 11,972,097 | |||
|
| |||
Net Investment Income | 1,826,275 | |||
|
| |||
Net Realized and Unrealized Gain (Loss): | ||||
Net realized gain (loss) on: | ||||
Investments | 79,899,306 | |||
Foreign currencies | (197,911 | ) | ||
Foreign currency exchange contracts | (15,809 | ) | ||
|
| |||
Net realized gain | 79,685,586 | |||
|
| |||
Net change in unrealized appreciation (depreciation) of: | ||||
Investments | (79,439,987 | ) | ||
Foreign currencies | 11,119 | |||
|
| |||
Net change in unrealized appreciation (depreciation) | (79,428,868 | ) | ||
|
| |||
Net Realized and Unrealized Gain | 256,718 | |||
|
| |||
Net Increase in Net Assets Resulting from Operations | $ | 2,082,993 | ||
|
| |||
See accompanying notes, which are an integral part of the financial statements.
18
Table of Contents
This page intentionally left blank.
Table of Contents
Statements of changes in net assets
Delaware Healthcare Fund
| Year ended | ||||||||
| 3/31/20 | 3/31/19 | |||||||
Increase (Decrease) in Net Assets from Operations: | ||||||||
Net investment income (loss) | $ | 1,826,275 | $ | (520,868 | ) | |||
Net realized gain | 79,685,586 | 36,353,785 | ||||||
Net change in unrealized appreciation (depreciation) | (79,428,868 | ) | 30,134,188 | |||||
|
|
|
| |||||
Net increase in net assets resulting from operations | 2,082,993 | 65,967,105 | ||||||
|
|
|
| |||||
Dividends and Distributions to Shareholders from: | ||||||||
Distributable earnings: | ||||||||
Class A | (23,247,550 | ) | (5,059,623 | ) | ||||
Class C | (8,927,434 | ) | (1,268,684 | ) | ||||
Class R | (442,120 | ) | (97,124 | ) | ||||
Institutional Class | (43,754,405 | ) | (9,811,391 | ) | ||||
|
|
|
| |||||
| (76,371,509 | ) | (16,236,822 | ) | |||||
|
|
|
| |||||
Capital Share Transactions: | ||||||||
Proceeds from shares sold: | ||||||||
Class A | 51,114,758 | 155,136,237 | ||||||
Class C | 17,068,454 | 52,100,874 | ||||||
Class R | 2,037,618 | 2,685,459 | ||||||
Institutional Class | 248,681,594 | 402,627,766 | ||||||
Net asset value of shares issued upon reinvestment of dividends and distributions: | ||||||||
Class A | 22,461,260 | 4,904,232 | ||||||
Class C | 8,722,235 | 1,248,508 | ||||||
Class R | 439,981 | 97,000 | ||||||
Institutional Class | 39,559,439 | 9,061,635 | ||||||
|
|
|
| |||||
| 390,085,339 | 627,861,711 | |||||||
|
|
|
| |||||
20
Table of Contents
| Year ended | ||||||||
| 3/31/20 | 3/31/19 | |||||||
Capital Share Transactions (continued): | ||||||||
Cost of shares redeemed: | ||||||||
Class A | $ | (97,367,467 | ) | $ | (71,524,105 | ) | ||
Class C | (32,342,093 | ) | (19,881,047 | ) | ||||
Class R | (3,818,176 | ) | (1,947,049 | ) | ||||
Institutional Class | (315,447,503 | ) | (132,551,152 | ) | ||||
|
|
|
| |||||
| (448,975,239 | ) | (225,903,353 | ) | |||||
|
|
|
| |||||
Increase (decrease) in net assets derived from capital share transactions | (58,889,900 | ) | 401,958,358 | |||||
|
|
|
| |||||
Net Increase (Decrease) in Net Assets | (133,178,416 | ) | 451,688,641 | |||||
Net Assets: | ||||||||
Beginning of year | 1,028,827,467 | 577,138,826 | ||||||
|
|
|
| |||||
End of year | $ | 895,649,051 | $ | 1,028,827,467 | ||||
|
|
|
| |||||
See accompanying notes, which are an integral part of the financial statements.
21
Table of Contents
Delaware Healthcare Fund Class A
Selected data for each share of the Fund outstanding throughout each period were as follows:
Net asset value, beginning of period |
Income (loss) from investment operations: |
Net investment income (loss)1 |
Net realized and unrealized gain (loss) |
Total from investment operations |
Less dividends and distributions from: |
Net investment income |
Net realized gain |
Total dividends and distributions |
Net asset value, end of period |
Total return2 |
Ratios and supplemental data: |
Net assets, end of period (000 omitted) |
Ratio of expenses to average net assets |
Ratio of net investment income (loss) to average net assets |
Portfolio turnover |
| 1 | The average shares outstanding method has been applied for per share information. |
| 2 | Total return is based on the change in net asset value of a share during the period and assumes reinvestment of dividends and distributions at net asset value and does not reflect the impact of a sales charge. |
See accompanying notes, which are an integral part of the financial statements.
22
Table of Contents
| Year ended | ||||||||||||||||||||
|
| |||||||||||||||||||
| 3/31/20 | 3/31/19 | 3/31/18 | 3/31/17 | 3/31/16 | ||||||||||||||||
| ||||||||||||||||||||
| $ | 24.63 | $ | 22.63 | $ | 19.19 | $ | 18.46 | $ | 20.36 | |||||||||||
| ||||||||||||||||||||
| 0.03 | (0.03 | ) | 0.04 | 0.16 | 0.05 | |||||||||||||||
| 0.11 | 2.44 | 4.08 | 1.97 | (0.44 | ) | |||||||||||||||
|
|
|
|
|
|
|
|
|
| |||||||||||
| 0.14 | 2.41 | 4.12 | 2.13 | (0.39 | ) | |||||||||||||||
|
|
|
|
|
|
|
|
|
| |||||||||||
| — | (0.15 | ) | (0.68 | ) | (0.18 | ) | (0.17 | ) | ||||||||||||
| (2.02 | ) | (0.26 | ) | — | (1.22 | ) | (1.34 | ) | ||||||||||||
|
|
|
|
|
|
|
|
|
| |||||||||||
| (2.02 | ) | (0.41 | ) | (0.68 | ) | (1.40 | ) | (1.51 | ) | |||||||||||
|
|
|
|
|
|
|
|
|
| |||||||||||
| $ | 22.75 | $ | 24.63 | $ | 22.63 | $ | 19.19 | $ | 18.46 | |||||||||||
|
|
|
|
|
|
|
|
|
| |||||||||||
| (0.27% | ) | 10.74% | 21.56% | 12.30% | (2.45% | ) | ||||||||||||||
| $ | 272,911 | $ | 319,993 | $ | 212,838 | $ | 154,687 | $ | 197,138 | |||||||||||
| 1.27% | 1.28% | 1.31% | 1.38% | 1.37% | ||||||||||||||||
| 0.13% | (0.10% | ) | 0.18% | 0.84% | 0.25% | |||||||||||||||
| 24% | 33% | 28% | 29% | 46% | ||||||||||||||||
23
Table of Contents
Financial highlights
Delaware Healthcare Fund Class C
Selected data for each share of the Fund outstanding throughout each period were as follows:
|
Net asset value, beginning of period |
Income (loss) from investment operations: |
Net investment income (loss)1 |
Net realized and unrealized gain (loss) |
Total from investment operations |
Less dividends and distributions from: |
Net investment income |
Net realized gain |
Total dividends and distributions |
Net asset value, end of period |
Total return2 |
Ratios and supplemental data: |
Net assets, end of period (000 omitted) |
Ratio of expenses to average net assets |
Ratio of net investment income (loss) to average net assets |
Portfolio turnover |
|
| 1 | The average shares outstanding method has been applied for per share information. |
| 2 | Total return is based on the change in net asset value of a share during the period and assumes reinvestment of dividends and distributions at net asset value and does not reflect the impact of a sales charge. |
See accompanying notes, which are an integral part of the financial statements.
24
Table of Contents
| Year ended | ||||||||||||||||||||
|
| |||||||||||||||||||
| 3/31/20 | 3/31/19 | 3/31/18 | 3/31/17 | 3/31/16 | ||||||||||||||||
| ||||||||||||||||||||
| $ | 23.47 | $ | 21.61 | $ | 18.36 | $ | 17.72 | $ | 19.60 | |||||||||||
| ||||||||||||||||||||
| (0.15 | ) | (0.20 | ) | (0.12 | ) | 0.02 | (0.10 | ) | ||||||||||||
| 0.12 | 2.33 | 3.90 | 1.88 | (0.42 | ) | |||||||||||||||
|
|
|
|
|
|
|
|
|
| |||||||||||
| (0.03 | ) | 2.13 | 3.78 | 1.90 | (0.52 | ) | ||||||||||||||
|
|
|
|
|
|
|
|
|
| |||||||||||
| — | (0.01 | ) | (0.53 | ) | (0.04 | ) | (0.02 | ) | ||||||||||||
| (2.02 | ) | (0.26 | ) | — | (1.22 | ) | (1.34 | ) | ||||||||||||
|
|
|
|
|
|
|
|
|
| |||||||||||
| (2.02 | ) | (0.27 | ) | (0.53 | ) | (1.26 | ) | (1.36 | ) | |||||||||||
|
|
|
|
|
|
|
|
|
| |||||||||||
| $ | 21.42 | $ | 23.47 | $ | 21.61 | $ | 18.36 | $ | 17.72 | |||||||||||
|
|
|
|
|
|
|
|
|
| |||||||||||
| (1.02% | ) | 9.91% | 20.67% | 11.45% | (3.17% | ) | ||||||||||||||
| $ | 99,376 | $ | 115,843 | $ | 76,033 | $ | 57,814 | $ | 73,715 | |||||||||||
| 2.02% | 2.03% | 2.06% | 2.13% | 2.12% | ||||||||||||||||
| (0.62% | ) | (0.85% | ) | (0.57% | ) | 0.09% | (0.50% | ) | ||||||||||||
| 24% | 33% | 28% | 29% | 46% | ||||||||||||||||
| ||||||||||||||||||||
25
Table of Contents
Financial highlights
Delaware Healthcare Fund Class R
Selected data for each share of the Fund outstanding throughout each period were as follows:
|
Net asset value, beginning of period |
Income (loss) from investment operations: |
Net investment income (loss)1 |
Net realized and unrealized gain (loss) |
Total from investment operations |
Less dividends and distributions from: |
Net investment income |
Net realized gain |
Total dividends and distributions |
Net asset value, end of period |
Total return3 |
Ratios and supplemental data: |
Net assets, end of period (000 omitted) |
Ratio of expenses to average net assets |
Ratio of net investment income (loss) to average net assets |
Portfolio turnover |
|
| 1 | The average shares outstanding method has been applied for per share information. |
| 2 | Amount is less than $0.005 per share. |
| 3 | Total return is based on the change in net asset value of a share during the period and assumes reinvestment of dividends and distributions at net asset value. |
See accompanying notes, which are an integral part of the financial statements.
26
Table of Contents
| Year ended | ||||||||||||||||||||
|
| |||||||||||||||||||
| 3/31/20 | 3/31/19 | 3/31/18 | 3/31/17 | 3/31/16 | ||||||||||||||||
| ||||||||||||||||||||
| $ | 24.34 | $ | 22.37 | $ | 18.98 | $ | 18.27 | $ | 20.17 | |||||||||||
| ||||||||||||||||||||
| (0.03 | ) | (0.08 | ) | (0.02 | ) | 0.11 | — | 2 | ||||||||||||
| 0.11 | 2.40 | 4.04 | 1.95 | (0.44 | ) | |||||||||||||||
|
|
|
|
|
|
|
|
|
| |||||||||||
| 0.08 | 2.32 | 4.02 | 2.06 | (0.44 | ) | |||||||||||||||
|
|
|
|
|
|
|
|
|
| |||||||||||
| — | (0.09 | ) | (0.63 | ) | (0.13 | ) | (0.12 | ) | ||||||||||||
| (2.02 | ) | (0.26 | ) | — | (1.22 | ) | (1.34 | ) | ||||||||||||
|
|
|
|
|
|
|
|
|
| |||||||||||
| (2.02 | ) | (0.35 | ) | (0.63 | ) | (1.35 | ) | (1.46 | ) | |||||||||||
|
|
|
|
|
|
|
|
|
| |||||||||||
| $ | 22.40 | $ | 24.34 | $ | 22.37 | $ | 18.98 | $ | 18.27 | |||||||||||
|
|
|
|
|
|
|
|
|
| |||||||||||
| (0.52% | ) | 10.44% | 21.26% | 12.03% | (2.71% | ) | ||||||||||||||
| $ | 5,269 | $ | 7,080 | $ | 5,683 | $ | 5,169 | $ | 5,878 | |||||||||||
| 1.52% | 1.53% | 1.56% | 1.63% | 1.62% | ||||||||||||||||
| (0.12% | ) | (0.35% | ) | (0.07% | ) | 0.59% | 0.00% | |||||||||||||
| 24% | 33% | 28% | 29% | 46% | ||||||||||||||||
| ||||||||||||||||||||
27
Table of Contents
Financial highlights
Delaware Healthcare Fund Institutional Class
Selected data for each share of the Fund outstanding throughout each period were as follows:
|
Net asset value, beginning of period |
Income (loss) from investment operations: |
Net investment income1 |
Net realized and unrealized gain (loss) |
Total from investment operations |
Less dividends and distributions from: |
Net investment income |
Net realized gain |
Total dividends and distributions |
Net asset value, end of period |
Total return2 |
Ratios and supplemental data: |
Net assets, end of period (000 omitted) |
Ratio of expenses to average net assets |
Ratio of net investment income to average net assets |
Portfolio turnover |
|
| 1 | The average shares outstanding method has been applied for per share information. |
| 2 | Total return is based on the change in net asset value of a share during the period and assumes reinvestment of dividends and distributions at net asset value. |
See accompanying notes, which are an integral part of the financial statements.
28
Table of Contents
| Year ended | ||||||||||||||||||||
|
| |||||||||||||||||||
| 3/31/20 | 3/31/19 | 3/31/18 | 3/31/17 | 3/31/16 | ||||||||||||||||
| ||||||||||||||||||||
| $ | 24.75 | $ | 22.74 | $ | 19.28 | $ | 18.53 | $ | 20.44 | |||||||||||
| ||||||||||||||||||||
| 0.09 | 0.04 | 0.09 | 0.21 | 0.10 | ||||||||||||||||
| 0.12 | 2.43 | 4.10 | 1.98 | (0.45 | ) | |||||||||||||||
|
|
|
|
|
|
|
|
|
| |||||||||||
| 0.21 | 2.47 | 4.19 | 2.19 | (0.35 | ) | |||||||||||||||
|
|
|
|
|
|
|
|
|
| |||||||||||
| (0.03 | ) | (0.20 | ) | (0.73 | ) | (0.22 | ) | (0.22 | ) | |||||||||||
| (2.02 | ) | (0.26 | ) | — | (1.22 | ) | (1.34 | ) | ||||||||||||
|
|
|
|
|
|
|
|
|
| |||||||||||
| (2.05 | ) | (0.46 | ) | (0.73 | ) | (1.44 | ) | (1.56 | ) | |||||||||||
|
|
|
|
|
|
|
|
|
| |||||||||||
| $ | 22.91 | $ | 24.75 | $ | 22.74 | $ | 19.28 | $ | 18.53 | |||||||||||
|
|
|
|
|
|
|
|
|
| |||||||||||
| (0.01% | ) | 10.98% | 21.84% | 12.53% | (2.20% | ) | ||||||||||||||
| $ | 518,093 | $ | 585,911 | $ | 282,585 | $ | 137,621 | $ | 156,600 | |||||||||||
| 1.02% | 1.03% | 1.06% | 1.13% | 1.12% | ||||||||||||||||
| 0.38% | 0.14% | 0.43% | 1.09% | 0.50% | ||||||||||||||||
| 24% | 33% | 28% | 29% | 46% | ||||||||||||||||
| ||||||||||||||||||||
29
Table of Contents
Delaware Healthcare Fund
Delaware Group® Equity Funds IV (Trust) is organized as a Delaware statutory trust and offers 21 series. These financial statements and the related notes pertain to Delaware Healthcare Fund (Fund). The Fund is anopen-end investment company. The Fund is considerednon-diversified under the Investment Company Act of 1940, as amended, and offers Class A, Class C, Class R, and Institutional Class shares. Class A shares are sold with a maximumfront-end sales charge of 5.75%. Class A share purchases of $1,000,000 or more will incur a contingent deferred sales charge (CDSC) instead of afront-end sales charge of 1.00%, if redeemed during the first year, and 0.50% during the second year, provided that Delaware Distributors, L.P. (DDLP) paid a financial advisor a commission on the purchase of those shares. Class C shares are sold with a CDSC of 1.00%, if redeemed during the first 12 months. Class R and Institutional Class shares are not subject to a sales charge and are offered for sale exclusively to certain eligible investors.
1. Significant Accounting Policies
The Fund follows accounting and reporting guidance under Financial Accounting Standards Board (FASB) Accounting Standards Codification Topic 946, Financial Services – Investment Companies. The following accounting policies are in accordance with US generally accepted accounting principles (US GAAP) and are consistently followed by the Fund.
Security Valuation— Equity securities, except those traded on the Nasdaq Stock Market LLC (Nasdaq), are valued at the last quoted sales price as of the time of the regular close of the New York Stock Exchange on the valuation date. Equity securities traded on the Nasdaq are valued in accordance with the Nasdaq Official Closing Price, which may not be the last sales price. If, on a particular day, an equity security does not trade, the mean between the bid and ask prices will be used, which approximates fair value. Equity securities listed on a foreign exchange are normally valued at the last quoted sales price on the valuation date. US government and agency securities are valued at the mean between the bid and ask prices, which approximates fair value.Open-end investment companies are valued at their published net asset value. Foreign currency exchange contracts are valued at the mean between the bid and ask prices, which approximates fair value. Interpolated values are derived when the settlement date of the contract is an interim date for which quotations are not available. Generally, other securities and assets for which market quotations are not readily available are valued at fair value as determined in good faith under the direction of the Trust’s Board of Trustees (Board). In determining whether market quotations are readily available or fair valuation will be used, various factors will be taken into consideration, such as market closures or suspension of trading in a security. The Fund may use fair value pricing more frequently for securities traded primarily innon-US markets because, among other things, most foreign markets close well before the Fund values its securities, generally as of 4:00pm Eastern time. The earlier close of these foreign markets gives rise to the possibility that significant events, including broad market moves, government actions or pronouncements, aftermarket trading, or news events may have occurred in the interim. Whenever such a significant event occurs, the Fund may value foreign securities using fair value prices based on third-party vendor modeling tools (international fair value pricing). Restricted securities are valued at fair value using methods approved by the Board.
Federal and Foreign Income Taxes— No provision for federal income taxes has been made as the Fund intends to continue to qualify for federal income tax purposes as a regulated investment company under Subchapter M of the Internal Revenue Code of 1986, as amended, and make the
30
Table of Contents
requisite distributions to shareholders. The Fund evaluates tax positions taken or expected to be taken in the course of preparing the Fund’s tax returns to determine whether the tax positions are“more-likely-than-not” of being sustained by the applicable tax authority. Tax positions not deemed to meet the“more-likely-than-not” threshold are recorded as a tax benefit or expense in the current year. Management has analyzed the Fund’s tax positions taken or expected to be taken on the Fund’s federal income tax returns through the year ended March 31, 2020 and for all open tax years (years ended March 31, 2017–March 31, 2019), and has concluded that no provision for federal income tax is required in the Fund’s financial statements. If applicable, the Fund recognizes interest accrued on unrecognized tax benefits in interest expense and penalties in “Other” on the “Statement of operations.” During the year ended March 31, 2020, the Fund did not incur any interest or tax penalties. In regard to foreign taxes only, the Fund has open tax years in certain foreign countries in which it invests that may date back to the inception of the Fund.
Class Accounting— Investment income, common expenses, and realized and unrealized gain (loss) on investments are allocated to the various classes of the Fund on the basis of daily net assets of each class. Distribution expenses relating to a specific class are charged directly to that class.
Foreign Currency Transactions— Transactions denominated in foreign currencies are recorded at the prevailing exchange rates on the valuation date in accordance with the Fund’s prospectus. The value of all assets and liabilities denominated in foreign currencies is translated daily into US dollars at the exchange rate of such currencies against the US dollar. Transaction gains or losses resulting from changes in exchange rates during the reporting period or upon settlement of the foreign currency transaction are reported in operations for the current period. The Fund generally does not bifurcate that portion of realized gains and losses on investments which is due to changes in foreign exchange rates from that which is due to changes in market prices. These gains and losses are included on the “Statement of operations” under “Net realized gain (loss) on investments.” The Fund reports certain foreign currency related transactions as components of realized gains (losses) for financial reporting purposes, whereas such components are treated as ordinary income (loss) for federal income tax purposes.
Use of Estimates— The preparation of financial statements in conformity with US GAAP requires management to make estimates and assumptions that affect the fair value of investments, the reported amounts of assets and liabilities and disclosure of contingent assets and liabilities at the date of the financial statements, and the reported amounts of revenues and expenses during the reporting period. Actual results could differ from those estimates and the differences could be material.
Other— Expenses directly attributable to the Fund are charged directly to the Fund. Other expenses common to various funds within the Delaware Funds® by Macquarie (Delaware Funds) are generally allocated among such funds on the basis of average net assets. Management fees and certain other expenses are paid monthly. Security transactions are recorded on the date the securities are purchased or sold (trade date) for financial reporting purposes. Costs used in calculating realized gains and losses on the sale of investment securities are those of the specific securities sold. Dividend income is recorded on theex-dividend date and interest income is recorded on the accrual basis. Discounts and premiums on debt securities are accreted or amortized to interest income, respectively, over the lives of the respective securities using the effective interest method. Foreign dividends are also recorded on the
31
Table of Contents
Notes to financial statements
Delaware Healthcare Fund
1. Significant Accounting Policies (continued)
ex-dividend date or as soon after theex-dividend date that the Fund is aware of such dividends, net of all tax withholdings, a portion of which may be reclaimable. Withholding taxes and reclaims on foreign dividends have been recorded in accordance with the Fund’s understanding of the applicable country’s tax rules and rates. The Fund declares and pays dividends from net investment income and distributions from net realized gain on investments, if any, annually. The Fund may distribute more frequently, if necessary for tax purposes. Dividends and distributions, if any, are recorded on theex-dividend date.
The Fund receives earnings credits from its custodian when positive cash balances are maintained, which may be used to offset custody fees. The expenses paid under this arrangement are included on the “Statement of operations” under “Custodian fees” with the corresponding expenses offset included under “Less expenses paid indirectly.” For the year ended March 31, 2020, the Fund earned $83 under this arrangement.
The Fund receives earnings credits from its transfer agent when positive cash balances are maintained, which may be used to offset transfer agent fees. If the amount earned is greater than $1, the expenses paid under this arrangement are included on the “Statement of operations” under “Dividend disbursing and transfer agent fees and expenses” with the corresponding expenses offset included under “Less expenses paid indirectly.” For the year ended March 31, 2020, the Fund earned $1,120 under this arrangement.
2. Investment Management, Administration Agreements, and Other Transactions with Affiliates
In accordance with the terms of its investment management agreement, the Fund pays Delaware Management Company (DMC), a series of Macquarie Investment Management Business Trust and the investment manager, an annual fee which is calculated daily and paid monthly at the rates of 0.85% on the first $500 million of the average daily net assets of the Fund, 0.80% on the next $500 million, 0.75% on the next $1.5 billion, and 0.70% on average daily net assets in excess of $2.5 billion.
Effective May 30, 2019, DMC may permit its affiliates, Macquarie Investment Management Global Limited (MIMGL) and Macquarie Funds Management Hong Kong Limited (together, the “AffiliatedSub-Advisors”), to execute Fund equity security trades on behalf of the Manager. The Manager may also seek quantitative support from MIMGL. Although the AffiliatedSub-Advisors serve assub-advisors, DMC has ultimate responsibility for all investment advisory services. For these services, DMC, not the Fund, may pay each AffiliatedSub-Advisor a portion of its investment management fee.
Delaware Investments Fund Services Company (DIFSC), an affiliate of DMC, provides fund accounting and financial administrative oversight services to the Fund. For these services, DIFSC’s fees are calculated daily and paid monthly based on the aggregate daily net assets of all funds within the Delaware Funds at the following annual rates: 0.00475% of the first $35 billion; 0.0040% of the next $10 billion; and 0.0025% of aggregate average daily net assets in excess of $45 billion (Total Fee). Each fund in the Delaware Funds pays a minimum of $4,000, which, in aggregate, is subtracted from the Total Fee. Each fund then pays its portion of the remainder of the remainder of the Total Fee on a relative NAV basis. This amount is included on the “Statement of operations” under “Accounting and administration expenses.” For the year ended March 31, 2020, the Fund was charged $39,108 for these services.
32
Table of Contents
DIFSC is also the transfer agent and dividend disbursing agent of the Fund. For these services, DIFSC’s fees are calculated daily and paid monthly based on the aggregate daily net assets of the retail funds within the Delaware Funds at the following annual rates: 0.014% of the first $20 billion; 0.011% of the next $5 billion; 0.007% of the next $5 billion; 0.005% of the next $20 billion; and 0.0025% of average daily net assets in excess of $50 billion. The fees payable to DIFSC under the shareholder services agreement described above are allocated among all retail funds in the Delaware Funds on a relative NAV basis. This amount is included on the “Statement of operations” under “Dividend disbursing and transfer agent fees and expenses.” For the year ended March 31, 2020, the Fund was charged $91,981 for these services. Pursuant to asub-transfer agency agreement between DIFSC and BNY Mellon Investment Servicing (US) Inc. (BNYMIS), BNYMIS provides certainsub-transfer agency services to the Fund.Sub-transfer agency fees are paid by the Fund and are also included on the “Statement of operations” under “Dividend disbursing and transfer agent fees and expenses.” The fees that are calculated daily and paid as invoices are received on a monthly or quarterly basis.
Pursuant to a distribution agreement and distribution plan, the Fund pays DDLP, the distributor and an affiliate of DMC, annual12b-1 fees of 0.25%, 1.00%, and 0.50% of the average daily net assets of the Class A, Class C, and Class R shares, respectively. The fees are calculated daily and paid monthly. Institutional class shares do not pay12b-1 fees.
As provided in the investment management agreement, the Fund bears a portion of the cost of certain resources shared with DMC, including the cost of internal personnel of DMC and/or its affiliates that provide legal, tax, and regulatory reporting services to the Fund. For the year ended March 31, 2020, the Fund was charged $25,498 for internal legal, tax, and regulatory reporting services provided by DMC and/or its affiliates’ employees. This amount is included on the “Statement of operations” under “Legal fees.”
For the year ended March 31, 2020, DDLP earned $193,507 for commissions on sales of the Fund’s Class A shares. For the year ended March 31, 2020, DDLP received gross CDSC commissions of $6,406 and $24,911 on redemptions of the Fund’s Class A and Class C shares, respectively, and these commissions were entirely used to offset upfront commissions previously paid by DDLP to broker/dealers on sales of those shares.
Trustees’ fees include expenses accrued by the Fund for each Trustee’s retainer and meeting fees. Certain officers of DMC, DIFSC, and DDLP are officers and/or Trustees of the Trust. These officers and Trustees are paid no compensation by the Fund.
In addition to the management fees and other expenses of the Fund, the Fund indirectly bears the investment management fees and other expenses of the investment companies (Underlying Funds) in which it invests. The amount of these fees and expenses incurred indirectly by the Fund will vary based upon the expense and fee levels of the Underlying Funds and the number of shares that are owned of the Underlying Funds at different times.
33
Table of Contents
Notes to financial statements
Delaware Healthcare Fund
3. Investments
For the year ended March 31, 2020, the Fund made purchases and sales of investment securities other than short-term investments as follows:
Purchases | $ | 232,102,781 | ||
Sales | 339,738,043 |
The tax cost of investments includes adjustments to net unrealized appreciation (depreciation) which may not necessarily be final tax cost basis adjustments, but approximate the tax basis unrealized gains and losses that may be realized and distributed to shareholders. At March 31, 2020, the cost and unrealized appreciation (depreciation) of investments for the Fund were as follows:
Cost of investments | $ | 815,754,179 | ||
|
| |||
Aggregate unrealized appreciation of investments | $ | 213,695,150 | ||
Aggregate unrealized depreciation of investments | (140,911,679 | ) | ||
|
| |||
Net unrealized appreciation of investments | $ | 72,783,471 | ||
|
|
US GAAP defines fair value as the price that the Fund would receive to sell an asset or pay to transfer a liability in an orderly transaction between market participants at the measurement date under current market conditions. A three-level hierarchy for fair value measurements has been established based upon the transparency of inputs to the valuation of an asset or liability. Inputs may be observable or unobservable and refer broadly to the assumptions that market participants would use in pricing the asset or liability. Observable inputs reflect the assumptions market participants would use in pricing the asset or liability based on market data obtained from sources independent of the reporting entity. Unobservable inputs reflect the reporting entity’s own assumptions about the assumptions that market participants would use in pricing the asset or liability based on the best information available under the circumstances. The Fund’s investment in its entirety is assigned a level based upon the observability of the inputs which are significant to the overall valuation. The three-level hierarchy of inputs is summarized below.
| Level 1 – | Inputs are quoted prices in active markets for identical investments. (Examples: equity securities,open-end investment companies, futures contracts, and exchange-traded options contracts) | |
| Level 2 – | Other observable inputs, including, but not limited to: quoted prices for similar assets or liabilities in markets that are active, quoted prices for identical or similar assets or liabilities in markets that are not active, inputs other than quoted prices that are observable for the assets or liabilities (such as interest rates, yield curves, volatilities, prepayment speeds, loss severities, credit risks, and default rates) or other market-corroborated inputs. (Examples: debt securities, government securities, swap contracts, foreign currency exchange contracts, foreign securities utilizing international fair value pricing, broker-quoted securities, and fair valued securities) | |
| Level 3 – | Significant unobservable inputs, including the Fund’s own assumptions used to determine the fair value of investments. (Examples: broker-quoted securities and fair valued securities) | |
Level 3 investments are valued using significant unobservable inputs. The Fund may also use an income-based valuation approach in which the anticipated future cash flows of the investment are discounted to calculate fair value. Discounts may also be applied due to the nature or duration of any
34
Table of Contents
restrictions on the disposition of the investments. Valuations may also be based upon current market prices of securities that are comparable in coupon, rating, maturity, and industry. The derived value of a Level 3 investment may not represent the value which is received upon disposition and this could impact the results of operations.
The following table summarizes the valuation of the Fund’s investments by fair value hierarchy levels as of March 31, 2020:
Level 1 | Level 2 | Level 3 | Total | |||||||||||||
Securities | ||||||||||||||||
Assets: | ||||||||||||||||
Common Stock | $ | 717,182,726 | $ | 170,848,149 | $ | 66,000 | $ | 888,096,875 | ||||||||
Rights | 304,000 | — | — | 304,000 | ||||||||||||
Short-Term Investments | 136,775 | — | — | 136,775 | ||||||||||||
|
|
|
|
|
|
|
| |||||||||
Total Value of Securities | $ | 717,623,501 | $ | 170,848,149 | $ | 66,000 | $ | 888,537,650 | ||||||||
|
|
|
|
|
|
|
| |||||||||
The securities that have been valued at zero on the “Schedule of investments” are considered to be Level 3 investments in the above table.
During the year ended March 31, 2020, there were no transfers between Level 1 investments, Level 2 investments, or Level 3 investments that had a significant impact to the Fund. This does not include transfers between Level 1 investments and Level 2 investments due to the Fund utilizing international fair value pricing during the period. In accordance with the fair valuation procedures described in Note 1, international fair value pricing of securities in the Fund occurs when market volatility exceeds an established rolling threshold. If the threshold is exceeded on a given date, then prices of international securities (those that traded on exchanges that close at a different time than the time that the Fund’s NAV is determined) are established using a separate pricing feed from a third-party vendor designed to establish a price for each such security as of the time that the Fund’s NAV is determined. Further, international fair value pricing uses other observable market-based inputs in place of the closing exchange price due to the events occurring after the close of the exchange or market on which the investment is principally traded, causing a change in classification between levels. International fair value pricing was not utilized at March 31, 2020. The Fund’s policy is to recognize transfers between levels based on fair value at the beginning of the reporting period.
A reconciliation of Level 3 investments is presented when the Fund has a significant amount of Level 3 investments at the beginning, interim, or end of the period in relation to the Fund’s net assets. Management has determined not to provide a reconciliation of Level 3 investments as the Level 3 investments were not considered significant to the Fund’s net assets at the beginning, interim, or end of the period. Management has determined not to provide additional disclosure on Level 3 inputs since the Level 3 investments are not considered significant to the Fund’s net assets at the end of the year.
35
Table of Contents
Notes to financial statements
Delaware Healthcare Fund
4. Dividend and Distribution Information
Income and long-term capital gain distributions are determined in accordance with federal income tax regulations, which may differ from US GAAP. Additionally, distributions from net gains on foreign currency transactions and net short-term gains on sales of investment securities are treated as ordinary income for federal income tax purposes. The tax character of dividends and distributions paid during the years ended March 31, 2020 and 2019 was as follows:
| Year ended | ||||||||
| 3/31/20 | 3/31/19 | |||||||
Ordinary income | $ | 8,985,354 | $ | 6,112,369 | ||||
Long-term capital gains | 67,386,155 | 10,124,453 | ||||||
|
|
|
| |||||
Total | $ | 76,371,509 | $ | 16,236,822 | ||||
|
|
|
| |||||
5. Components of Net Assets on a Tax Basis
As of March 31, 2020, the components of net assets on a tax basis were as follows:
Shares of beneficial interest | $ | 790,298,470 | ||
Undistributed ordinary income | 13,896,207 | |||
Undistributed long-term capital gains | 18,670,903 | |||
Net unrealized appreciation on investments and foreign currencies | 72,783,471 | |||
|
| |||
Net assets | $ | 895,649,051 | ||
|
|
The differences between book basis and tax basis components of net assets are primarily attributable to tax deferral of losses on wash sales and tax treatment of securities no longer considered passive foreign investment companies.
36
Table of Contents
6. Capital Shares
Transactions in capital shares were as follows:
| Year ended | ||||||||
| 3/31/20 | 3/31/19 | |||||||
Shares sold: | ||||||||
Class A | 2,088,179 | 6,349,141 | ||||||
Class C | 732,473 | 2,229,329 | ||||||
Class R | 83,857 | 113,033 | ||||||
Institutional Class | 10,187,681 | 16,412,656 | ||||||
Shares issued upon reinvestment of dividends and distributions: | ||||||||
Class A | 888,851 | 208,868 | ||||||
Class C | 365,712 | 55,663 | ||||||
Class R | 17,663 | 4,175 | ||||||
Institutional Class | 1,555,621 | 384,293 | ||||||
|
|
|
| |||||
| 15,920,037 | 25,757,158 | |||||||
|
|
|
| |||||
Shares redeemed: | ||||||||
Class A | (3,972,133 | ) | (2,970,638 | ) | ||||
Class C | (1,394,743 | ) | (867,334 | ) | ||||
Class R | (157,203 | ) | (80,419 | ) | ||||
Institutional Class | (12,797,263 | ) | (5,556,358 | ) | ||||
|
|
|
| |||||
| (18,321,342 | ) | (9,474,749 | ) | |||||
|
|
|
| |||||
Net increase (decrease) | (2,401,305 | ) | 16,282,409 | |||||
|
|
|
| |||||
37
Table of Contents
Notes to financial statements
Delaware Healthcare Fund
6. Capital Shares (continued)
Certain shareholders may exchange shares of one class for shares of another class in the same Fund. These exchange transactions are included as subscriptions and redemptions in the table on the previous page and on the “Statements of changes in net assets.” For the years ended March 31, 2020 and 2019, the Fund had the following exchange transactions:
Exchange Redemptions | Exchange Subscriptions | |||||||||||||||||||
| Institutional | ||||||||||||||||||||
| Class A | Class C | Class A | Class | |||||||||||||||||
Year ended | Shares | Shares | Shares | Shares | Value | |||||||||||||||
| 3/31/20 | 236,831 | 13,382 | 4,240 | 243,920 | $ | 5,977,911 | ||||||||||||||
| 3/31/19 | 66,065 | 37,808 | 8,488 | 93,145 | 2,487,154 | |||||||||||||||
7. Line of Credit
The Fund, along with certain other funds in the Delaware Funds (Participants), was a participant in a $220,000,000 revolving line of credit intended to be used for temporary or emergency purposes as an additional source of liquidity to fund redemptions of investor shares. Under the agreement, the Participants were charged an annual commitment fee of 0.15%, which was allocated across the Participants based on a weighted average of the respective net assets of each Participant. The Participants were permitted to borrow up to a maximum ofone-third of their net assets under the agreement. Each Participant was individually, and not jointly, liable for its particular advances, if any, under the line of credit. The line of credit available under the agreement expired on Nov. 4, 2019.
On Nov. 4, 2019, the Participants entered into an amendment to the agreement for a $250,000,000 revolving line of credit. The revolving line of credit is to be used as described above and operates in substantially the same manner as the original agreement. The line of credit available under the agreement expires on Nov. 2, 2020.
The Fund had no amounts outstanding as of March 31, 2020, or at any time during the year then ended.
8. Derivatives
US GAAP requires disclosures that enable investors to understand: (1) how and why an entity uses derivatives; (2) how they are accounted for; and (3) how they affect an entity’s results of operations and financial position.
Foreign Currency Exchange Contracts— The Fund may enter into foreign currency exchange contracts as a way of managing foreign exchange rate risk. The Fund may enter into these contracts to fix the US dollar value of a security that it has agreed to buy or sell for the period between the date the trade was entered into and the date the security is delivered and paid for. The Fund may also enter into these contracts to hedge the US dollar value of securities it already owns that are denominated in foreign currencies. In addition, the Fund may enter into these contracts to facilitate or expedite the settlement of portfolio transactions. The change in value is recorded as an unrealized gain or loss. When the contract is closed, a realized gain or loss is recorded equal to the difference between the value of the contract at the time it was opened and the value at the time it was closed.
38
Table of Contents
The use of foreign currency exchange contracts does not eliminate fluctuations in the underlying prices of the securities, but does establish a rate of exchange that can be achieved in the future. Although foreign currency exchange contracts limit the risk of loss due to an unfavorable change in the value of the hedged currency, they also limit any potential gain that might result should the value of the currency change favorably. In addition, the Fund could be exposed to risks if the counterparties to the contracts are unable to meet the terms of their contracts. The Fund’s maximum risk of loss from counterparty credit risk is the value of its currency exchanged with the counterparty. The risk is generally mitigated by having a netting arrangement between the Fund and the counterparty and by the posting of collateral by the counterparty to the Fund to cover the Fund’s exposure to the counterparty. No foreign currency exchange contracts were outstanding at March 31, 2020.
During the year ended March 31, 2020, the Fund entered into foreign currency exchange contracts to facilitate or expedite the settlement of portfolio transactions.
During the year ended March 31, 2020, the Fund experienced net realized gains or losses attributable to foreign currency holdings, which is disclosed on the “Statement of operations.”
Derivatives Generally.The table below summarizes the average balance of derivative holdings by the Fund during the year ended March 31, 2020.
| Long Derivative | Short Derivative | |||
| Volume | Volume | |||
Foreign currency exchange contracts | $127,825 | $263,770 |
9. Securities Lending
The Fund, along with other funds in the Delaware Funds, may lend its securities pursuant to a security lending agreement (Lending Agreement) with The Bank of New York Mellon (BNY Mellon). At the time a security is loaned, the borrower must post collateral equal to the required percentage of the market value of the loaned security, including any accrued interest. The required percentage is: (1) 102% with respect to US securities and foreign securities that are denominated and payable in US dollars; and (2) 105% with respect to foreign securities. With respect to each loan, if on any business day, the aggregate market value of securities collateral plus cash collateral held is less than the aggregate market value of the securities which are the subject of such loan, the borrower will be notified to provide additional collateral by the end of the following business day, which, together with the collateral already held, will be not less than the applicable initial collateral requirements for such security loan. If the aggregate market value of securities collateral and cash collateral held with respect to a security loan exceeds the applicable initial collateral requirement, upon request of the borrower, BNY Mellon must return enough collateral to the borrower by the end of the following business day to reduce the value of the remaining collateral to the applicable initial collateral requirement for such security loan. As a result of the foregoing, the value of the collateral held with respect to a loaned security on any particular day, may be more or less than the value of the security on loan. The collateral percentage with respect to the market value of the loaned security is determined by the security lending agent.
Cash collateral received by each fund of the Trust is generally invested in a series of individual separate accounts, each corresponding to a fund. The investment guidelines permit each separate account to hold certain securities that would be considered eligible securities for a money market fund. Cash
39
Table of Contents
Notes to financial statements
Delaware Healthcare Fund
9. Securities Lending (continued)
collateral received is generally invested in government securities; certain obligations issued by government sponsored enterprises; repurchase agreements collateralized by US Treasury securities; obligations issued by the central government of any Organization for Economic Cooperation and Development (OECD) country or its agencies, instrumentalities or establishments; obligations of supranational organizations; commercial paper, notes, bonds, and other debt obligations; certificates of deposit, time deposits, and other bank obligations; and asset-backed securities. The Fund can also accept US government securities and letters of credit(non-cash collateral) in connection with securities loans.
In the event of default or bankruptcy by the lending agent, realization and/or retention of the collateral may be subject to legal proceedings. In the event the borrower fails to return loaned securities and the collateral received is insufficient to cover the value of the loaned securities and provided such collateral shortfall is not the result of investment losses, the lending agent has agreed to pay the amount of the shortfall to the Fund or, at the discretion of the lending agent, replace the loaned securities. The Fund continues to record dividends or interest, as applicable, on the securities loaned and is subject to changes in value of the securities loaned that may occur during the term of the loan. The Fund has the right under the Lending Agreement to recover the securities from the borrower on demand. With respect to security loans collateralized bynon-cash collateral, the Fund receives loan premiums paid by the borrower. With respect to security loans collateralized by cash collateral, the earnings from the collateral investments are shared among the Fund, the security lending agent, and the borrower. The Fund records security lending income net of allocations to the security lending agent and the borrower.
The Fund may incur investment losses as a result of investing securities lending collateral. This could occur if an investment in the collateral investment account defaulted or became impaired. Under those circumstances, the value of the Fund’s cash collateral account may be less than the amount the Fund would be required to return to the borrowers of the securities and the Fund would be required to make up for this shortfall.
During the year ended March 31, 2020, the Fund had no securities out on loan.
10. Credit and Market Risk
The Fund invests a significant portion of its assets in small companies and may be subject to certain risks associated with ownership of securities of such companies. Investments insmall-sized companies may be more volatile than investments in larger companies for a number of reasons, which include limited financial resources or a dependence on narrow product lines.
Some countries in which the Fund may invest require governmental approval for the repatriation of investment income, capital, or the proceeds of sales of securities by foreign investors. In addition, if there is deterioration in a country’s balance of payments or for other reasons, a country may impose temporary restrictions on foreign capital remittances abroad.
The securities exchanges of certain foreign markets are substantially smaller, less liquid, and more volatile than the major securities markets in the US. Consequently, acquisition and disposition of securities by the Fund may be inhibited. In addition, a significant portion of the aggregate market value
40
Table of Contents
of equity securities listed on the major securities exchanges in emerging markets is held by a smaller number of investors. This may limit the number of shares available for acquisition or disposition by the Fund.
The Fund is a nondiversified fund that concentrates its investments in the healthcare industry and is subject to the risks associated with that industry. The value of the Fund’s shares will be affected by factors particular to the healthcare and related sectors (such as government regulation) and may fluctuate more widely than that of a fund that invests in a broad range of industries.
The Fund may invest up to 15% of its net assets in illiquid securities, which may include securities with contractual restrictions on resale, securities exempt from registration under Rule 144A promulgated under the Securities Act of 1933, as amended, and other securities which may not be readily marketable. The relative illiquidity of these securities may impair the Fund from disposing of them in a timely manner and at a fair price when it is necessary or desirable to do so. While maintaining oversight, the Fund’s Board has delegated to DMC, theday-to-day functions of determining whether individual securities are liquid for purposes of the Fund’s limitation on investments in illiquid securities. Securities eligible for resale pursuant to Rule 144A, which are determined to be liquid, are not subject to the Fund’s 15% limit on investments in illiquid securities. As of March 31, 2020, there were no Rule 144A securities held by the Fund.
11. Contractual Obligations
The Fund enters into contracts in the normal course of business that contain a variety of indemnifications. The Fund’s maximum exposure under these arrangements is unknown. However, the Fund has not had prior claims or losses pursuant to these contracts. Management has reviewed the Fund’s existing contracts and expects the risk of loss to be remote.
12. Recent Accounting Pronouncements
In August 2018, the FASB issued an Accounting Standards Update (ASU), ASU2018-13, which changes certain fair value measurement disclosure requirements. ASU2018-13, in addition to other modifications and additions, removes the requirement to disclose the amount and reasons for transfers between Level 1 and Level 2 of the fair value hierarchy, the policy for the timing of transfers between levels and the valuation process for Level 3 fair value measurements. ASU2018-13 is effective for fiscal years, and interim periods within those fiscal years, beginning after Dec. 15, 2019. At this time, Management is evaluating the implications of these changes on the financial statements.
41
Table of Contents
Notes to financial statements
Delaware Healthcare Fund
13. Subsequent Events
On Nov. 4, 2019, the Fund, along with certain other funds in the Delaware Funds (Participants), entered into an amendment to the agreement for a $250,000,000 revolving line of credit. The revolving line of credit available was increased to $275,000,000 on May 6, 2020. The revolving line of credit is to be used as described above and operates in substantially the same manner as the original agreement.
Beginning in January 2020, global financial markets have experienced and may continue to experience significant volatility resulting from the spread of a novel coronavirus known asCOVID-19. The outbreak ofCOVID-19 has resulted in travel and border restrictions, quarantines, supply chain disruptions, lower consumer demand and general market uncertainty. The effects ofCOVID-19 have and may continue to adversely affect the global economy, the economies of certain nations and individual issuers, all of which may negatively impact the Fund’s performance.
Management has determined that no other material events or transactions occurred subsequent to March 31, 2020, that would require recognition or disclosure in the Fund’s financial statements.
42
Table of Contents
registered public accounting firm
To the Board of Trustees of Delaware Group® Equity Funds IV and Shareholders of Delaware Healthcare Fund
Opinion on the Financial Statements
We have audited the accompanying statement of assets and liabilities, including the schedule of investments, of Delaware Healthcare Fund (one of the funds constituting the Delaware Group® Equity Funds IV, referred to hereafter as the “Fund”) as of March 31, 2020, the related statement of operations for the year ended March 31, 2020, the statements of changes in net assets for each of the two years in the period ended March 31, 2020, including the related notes, and the financial highlights for each of the five years in the period ended March 31, 2020 (collectively referred to as the “financial statements”). In our opinion, the financial statements present fairly, in all material respects, the financial position of the Fund as of March 31, 2020, the results of its operations for the year then ended, the changes in its net assets for each of the two years in the period ended March 31, 2020 and the financial highlights for each of the five years in the period ended March 31, 2020 in conformity with accounting principles generally accepted in the United States of America.
Basis for Opinion
These financial statements are the responsibility of the Fund’s management. Our responsibility is to express an opinion on the Fund’s financial statements based on our audits. We are a public accounting firm registered with the Public Company Accounting Oversight Board (United States) (PCAOB) and are required to be independent with respect to the Fund in accordance with the U.S. federal securities laws and the applicable rules and regulations of the Securities and Exchange Commission and the PCAOB.
We conducted our audits of these financial statements in accordance with the standards of the PCAOB. Those standards require that we plan and perform the audit to obtain reasonable assurance about whether the financial statements are free of material misstatement, whether due to error or fraud.
Our audits included performing procedures to assess the risks of material misstatement of the financial statements, whether due to error or fraud, and performing procedures that respond to those risks. Such procedures included examining, on a test basis, evidence regarding the amounts and disclosures in the financial statements. Our audits also included evaluating the accounting principles used and significant estimates made by management, as well as evaluating the overall presentation of the financial statements. Our procedures included confirmation of securities owned as of March 31, 2020 by correspondence with the custodian and transfer agents. We believe that our audits provide a reasonable basis for our opinion.
/s/PricewaterhouseCoopers LLP
Philadelphia, Pennsylvania
May 26, 2020
We have served as the auditor of one or more investment companies in Delaware Funds® by Macquarie since 2010.
43
Table of Contents
Other Fund information (Unaudited)
Delaware Healthcare Fund
Tax Information
The information set forth below is for the Fund’s fiscal year as required by federal income tax laws. Shareholders, however, must report distributions on a calendar year basis for income tax purposes, which may include distributions for portions of two fiscal years of the Fund. Accordingly, the information needed by shareholders for income tax purposes will be sent to them in January of each year. Please consult your tax advisor for proper treatment of this information.
All disclosures are based on financial information available as of the date of this annual report and, accordingly are subject to change. For any and all items requiring reporting, it is the intention of the Fund to report the maximum amount permitted under the Internal Revenue Code and the regulations thereunder.
For the fiscal year ended March 31, 2020, the Fund reports distributions paid during the year as follows:
(A) Long-Term Capital Gain Distributions (Tax Basis) | 88.23 | % | ||
(B) Ordinary Income Distributions (Tax Basis)* | 11.77 | % | ||
Total Distributions (Tax Basis) | 100.00 | % | ||
(C) Qualifying Dividends1 | 78.30 | % |
(A) and (B) are based on a percentage of the Fund’s total distributions.
(C) is based on the Fund’s ordinary income distributions.
* For the fiscal year ended March 31, 2020, certain dividends paid by the Fund may be subject to a maximum tax rate of 20%. The percentage of dividends paid by the Fund from ordinary income reported as qualified dividend income is 100.00%. Complete information will be compiled and reported in conjunction with your 2020 Form1099-DIV.
1Qualifying dividends represent dividends which qualify for the corporate dividends received deduction.
For the fiscal year ended March 31, 2020, certain distributions paid by the Fund, determined to be from Qualified Short-Term Capital Gains, may be subject to relief from U.S. tax withholding for foreign shareholders, as provided by the American Jobs Creation Act of 2004; the Tax Relief Unemployment Insurance Reauthorization, and Job Creations Act of 2010; and as extended by the American Taxpayer Relief Act of 2012. For the fiscal year ended March 31, 2020, the Fund has reported maximum distributions of Qualified Short-Term Capital Gains of $19,767,641.
44
Table of Contents
This page intentionally left blank.
Table of Contents
Board of trustees / directors and officers addendum
Delaware Funds®by Macquarie
A mutual fund is governed by a Board of Trustees/Directors (“Trustees”), which has oversight responsibility for the management of a fund’s business affairs. Trustees establish procedures and oversee and review the performance of the investment manager, the distributor, and others who perform services for the fund. The independent fund trustees, in particular, are advocates
Name, Address, and Birth Date | Position(s) Held with Fund(s) |
Length of Time Served | ||
Interested Trustee
| ||||
Shawn K. Lytle1 | President, | President and | ||
2005 Market Street | Chief Executive Officer, | Chief Executive Officer | ||
Philadelphia, PA 19103 | and Trustee | since August 2015 | ||
February 1970 | ||||
| Trustee since | ||||
| September 2015 | ||||
Independent Trustees
| ||||
Thomas L. Bennett | Chair and Trustee | Trustee since | ||
2005 Market Street | March 2005 | |||
Philadelphia, PA 19103 | ||||
October 1947 | Chair since | |||
| March 2015 | ||||
Jerome D. Abernathy | Trustee | Since January 2019 | ||
2005 Market Street | ||||
Philadelphia, PA 19103 | ||||
July 1959 | ||||
Ann D. Borowiec | Trustee | Since March 2015 | ||
2005 Market Street | ||||
Philadelphia, PA 19103 | ||||
November 1958 | ||||
| 1 | Shawn K. Lytle is considered to be an “Interested Trustee” because he is an executive officer of the Fund’s(s’) investment advisor. |
46
Table of Contents
for shareholder interests. Each trustee has served in that capacity since he or she was elected to or appointed to the Board of Trustees, and will continue to serve until his or her retirement or the election of a new trustee in his or her place. The following is a list of the Trustees and Officers with certain background and related information.
Principal Occupation(s) During the Past Five Years | Number of Portfolios in Fund Complex Overseen by Trustee or Officer | Other Directorships Held by Trustee or Officer | ||
| President — Macquarie | 95 | Trustee — UBS | ||
Investment Management2 | Relationship Funds, | |||
(June 2015–Present) | SMA Relationship | |||
| Trust, and UBS Funds | ||||
Regional Head of | (May 2010–April 2015) | |||
Americas — UBS Global | ||||
Asset Management | ||||
(April 2010–May 2015) | ||||
| Private Investor | 95 | None | ||
(March 2004–Present) | ||||
| Managing Member, | 95 | None | ||
Stonebrook Capital | ||||
Management, LLC (financial | ||||
technology: macro factors | ||||
and databases) | ||||
(January 1993–Present) | ||||
Chief Executive Officer, |
95 |
Director — | ||
Private Wealth Management | Banco Santander International | |||
(2011–2013) and | (October 2016– | |||
Market Manager, | December 2019) | |||
New Jersey Private | ||||
Bank (2005–2011) — | Director — | |||
J.P. Morgan Chase & Co. | Santander Bank, N.A. | |||
| (December 2016– | ||||
| December 2019) | ||||
| 2 | Macquarie Investment Management is the marketing name for Macquarie Management Holdings, Inc. and its subsidiaries, including the Fund’s(s’) investment advisor, principal underwriter, and its transfer agent. |
47
Table of Contents
Board of trustees / directors and officers addendum
Delaware Funds®by Macquarie
Name, Address, and Birth Date | Position(s) Held with Fund(s) |
Length of Time Served | ||
Independent Trustees (continued)
| ||||
Joseph W. Chow |
Trustee |
Since January 2013 | ||
2005 Market Street | ||||
Philadelphia, PA 19103 | ||||
January 1953
| ||||
John A. Fry |
Trustee |
Since January 2001 | ||
2005 Market Street | ||||
Philadelphia, PA 19103 | ||||
May 1960
| ||||
| Lucinda S. Landreth | Trustee | Since March 2005 | ||
2005 Market Street | ||||
Philadelphia, PA 19103 | ||||
June 1947 | ||||
48
Table of Contents
Principal Occupation(s) During the Past Five Years | Number of Portfolios in Fund Complex Overseen by Trustee or Officer | Other Directorships Held by Trustee or Officer | ||
Private Investor |
95 |
Director and Audit Committee | ||
(April 2011–Present) | Member — Hercules | |||
| Technology Growth | ||||
| Capital, Inc. | ||||
| (July 2004–July 2014) | ||||
President — |
95 |
Director; Compensation | ||
Drexel University | Committee and | |||
(August 2010–Present) | Governance Committee | |||
| Member — Community | ||||
| President — | Health Systems | |||
| Franklin & Marshall College | (May 2004–Present) | |||
| (July 2002–June 2010) | ||||
| Director — Drexel | ||||
| Morgan & Co. | ||||
| (2015–2019) | ||||
| Director and Audit Committee | ||||
| Member — vTv | ||||
| Therapeutics Inc. | ||||
| (2017–Present) | ||||
| Director and Audit Committee | ||||
| Member — FS Credit Real | ||||
| Estate Income Trust, Inc. | ||||
| (2018–Present) | ||||
| Director — Federal Reserve | ||||
| Bank of Philadelphia | ||||
| (January 2020–Present) | ||||
Private Investor |
95 |
None | ||
(2004–Present) | ||||
49
Table of Contents
Board of trustees / directors and officers addendum
Delaware Funds® by Macquarie
Name, Address, and Birth Date | Position(s) Held with Fund(s) |
Length of Time Served | ||
Independent Trustees (continued)
| ||||
| Frances A. Sevilla-Sacasa | Trustee | Since September 2011 | ||
2005 Market Street | ||||
Philadelphia, PA 19103 | ||||
January 1956
| ||||
Thomas K. Whitford |
Trustee |
Since January 2013 | ||
2005 Market Street | ||||
Philadelphia, PA 19103 | ||||
March 1956 | ||||
50
Table of Contents
Principal Occupation(s) During the Past Five Years | Number of Portfolios in Fund Complex Overseen by Trustee or Officer | Other Directorships Held by Trustee or Officer | ||
Private Investor |
95 |
Trust Manager and | ||
(January 2017–Present) | Audit Committee | |||
| Chair — Camden | ||||
Chief Executive Officer — | Property Trust | |||
Banco Itaú | (August 2011–Present) | |||
International | ||||
(April 2012–December 2016) | Director; Strategic | |||
| Planning and Reserves | ||||
Executive Advisor to Dean | Committee and Nominating | |||
(August 2011–March 2012) | and Governance | |||
and Interim Dean | Committee Member — | |||
(January 2011–July 2011) — | Callon Petroleum Company | |||
University of Miami School of | (December 2019–Present) | |||
Business Administration | ||||
| Director; Audit | ||||
President — U.S. Trust, | Committee Member — | |||
Bank of America Private | Carrizo Oil & Gas, Inc. | |||
Wealth Management | (March 2018–December 2019) | |||
(Private Banking) | ||||
(July 2007–December 2008) | ||||
Vice Chairman |
95 |
Director — HSBC North | ||
(2010–April 2013) — | America Holdings Inc. | |||
PNC Financial Services Group | (December 2013–Present) | |||
| Director — HSBC USA Inc. | ||||
| (July 2014–Present) | ||||
| Director — | ||||
| HSBC Bank USA, | ||||
| National Association | ||||
| (July 2014–March 2017) | ||||
| Director — HSBC | ||||
| Finance Corporation | ||||
(December 2013–April 2018)
| ||||
51
Table of Contents
Board of trustees / directors and officers addendum
Delaware Funds®by Macquarie
Name, Address, and Birth Date | Position(s) Held with Fund(s) | Length of Time Served | ||
Independent Trustees (continued)
| ||||
Christianna Wood |
Trustee |
Since January 2019 | ||
2005 Market Street | ||||
Philadelphia, PA 19103 | ||||
August 1959
| ||||
52
Table of Contents
Principal Occupation(s) During the Past Five Years | Number of Portfolios in Fund Complex Overseen by Trustee or Officer | Other Directorships Held by Trustee or Officer | ||
Chief Executive Officer |
95 |
Director; Finance Committee | ||
and President — | and Audit Committee | |||
Gore Creek | Member — H&R | |||
Capital, Ltd. | Block Corporation | |||
(August 2009–Present) | (July 2008–Present) | |||
| Director; Investments | ||||
| Committee, Capital | ||||
| and Finance | ||||
| Committee, and Audit | ||||
| Committee Member — | ||||
| Grange Insurance | ||||
| (2013–Present) | ||||
| Trustee; Chair of | ||||
| Nominating and Governance | ||||
| Committee and Audit | ||||
| Committee Member — | ||||
| The Merger Fund | ||||
| (2013–Present), | ||||
| The Merger Fund VL | ||||
| (2013-Present), | ||||
| WCM Alternatives: | ||||
| Event-Driven Fund | ||||
| (2013–Present), | ||||
| and WCM Alternatives: | ||||
| Credit Event Fund | ||||
| (December 2017–Present) | ||||
| Director; Chair of | ||||
| Governance Committee | ||||
| and Audit Committee | ||||
| Member — International | ||||
| Securities Exchange | ||||
(2010–2016)
| ||||
53
Table of Contents
Board of trustees / directors and officers addendum
Delaware Funds®by Macquarie
Name, Address, and Birth Date | Position(s) Held with Fund(s) | Length of Time Served | ||
Independent Trustees (continued)
| ||||
| Janet L. Yeomans | Trustee | Since April 1999 | ||
2005 Market Street | ||||
Philadelphia, PA 19103 | ||||
July 1948 | ||||
Officers
| ||||
| David F. Connor | Senior Vice President, | Senior Vice President since | ||
2005 Market Street | General Counsel, | May 2013; General | ||
Philadelphia, PA 19103 | and Secretary | Counsel since May 2015; | ||
December 1963 | Secretary since | |||
October 2005
| ||||
Daniel V. Geatens |
Vice President |
Vice President and | ||
2005 Market Street | and Treasurer | Treasurer since October 2007 | ||
Philadelphia, PA 19103 | ||||
October 1972
| ||||
Richard Salus |
Senior Vice President |
Senior Vice President and | ||
2005 Market Street | and Chief Financial Officer | Chief Financial Officer | ||
Philadelphia, PA 19103 | since November 2006 | |||
October 1963 | ||||
The Statement of Additional Information for the Fund(s) includes additional information about the Trustees and Officers and is available, without charge, upon request by calling 800523-1918.
54
Table of Contents
Principal Occupation(s) During the Past Five Years | Number of Portfolios in Fund Complex Overseen by Trustee or Officer | Other Directorships Held by Trustee or Officer | ||
Vice President and Treasurer |
95 |
Director; Personnel and | ||
(January 2006–July 2012), | Compensation Committee | |||
Vice President — | Chair; Member of Nominating, | |||
Mergers & Acquisitions | Investments, and Audit | |||
(January 2003–January 2006), | Committees for various | |||
| and Vice President | periods throughout | |||
| and Treasurer | directorship — | |||
| (July 1995–January 2003) — | Okabena Company | |||
| 3M Company | (2009–2017) | |||
David F. Connor has served |
95 |
None3 | ||
in various capacities at | ||||
different times at | ||||
Macquarie Investment | ||||
Management.
| ||||
| Daniel V. Geatens has served | 95 | None3 | ||
in various capacities at | ||||
different times at | ||||
Macquarie Investment | ||||
Management.
| ||||
| Richard Salus has served | 95 | None | ||
in various capacities | ||||
at different times at | ||||
Macquarie Investment | ||||
Management. | ||||
| 3 | David F. Connor and Daniel V. Geatens serve in similar capacities for the six portfolios of the Optimum Fund Trust, which have the same investment advisor, principal underwriter, and transfer agent as the registrant. Mr. Geatens also serves as the Chief Financial Officer of the Optimum Fund Trust, and he is the Chief Financial Officer and Treasurer for Macquarie Global Infrastructure Total Return Fund Inc. |
55
Table of Contents
Board of trustees
Shawn K. Lytle President and Chief Executive Officer Delaware Funds® by Macquarie Philadelphia, PA
Thomas L. Bennett Chairman of the Board Delaware Funds by Macquarie Private Investor Rosemont, PA
Jerome D. Abernathy Managing Member Stonebrook Capital Management, LLC Jersey City, NJ | Ann D. Borowiec Former Chief Executive Officer Private Wealth Management J.P. Morgan Chase & Co. New York, NY
Joseph W. Chow Former Executive Vice President State Street Corporation Boston, MA
John A. Fry President Drexel University Philadelphia, PA | Lucinda S. Landreth Former Chief Investment Officer Assurant, Inc. New York, NY
Frances A. Sevilla-Sacasa Former Chief Executive Officer Banco Itaú International Miami, FL | Thomas K. Whitford Former Vice Chairman PNC Financial Services Group Pittsburgh, PA
Christianna Wood Chief Executive Officer and President Gore Creek Capital, Ltd. Golden, CO
Janet L. Yeomans Former Vice President and Treasurer 3M Company St. Paul, MN | |||
| Affiliated officers | ||||||
| David F. Connor | Daniel V. Geatens | Richard Salus | ||||
Senior Vice President, | Vice President and | Senior Vice President and | ||||
General Counsel, | Treasurer | Chief Financial Officer | ||||
and Secretary | Delaware Funds | Delaware Funds | ||||
Delaware Funds | by Macquarie | by Macquarie | ||||
by Macquarie | Philadelphia, PA | Philadelphia, PA | ||||
Philadelphia, PA | ||||||
This annual report is for the information of Delaware Healthcare Fund shareholders, but it may be used with prospective investors when preceded or accompanied by the Delaware Fund fact sheet for the most recently completed calendar quarter. These documents are available at delawarefunds.com/literature.
The Fund files its complete schedule of portfolio holdings with the Securities and Exchange Commission (SEC) for the first and third quarters of each fiscal year on FormN-PORT. The Fund’s FormsN-PORT, as well as a description of the policies and procedures that the Fund uses to determine how to vote proxies (if any) relating to portfolio securities, are available without charge (i) upon request, by calling 800523-1918; and (ii) on the SEC’s website at sec.gov. In addition, a description of the policies and procedures that the Fund uses to determine how to vote proxies (if any) relating to portfolio securities and the Schedule of Investments included in the Fund’s most recent FormN-PORT are available without charge on the Fund’s website at delawarefunds.com/literature. The Fund’s FormsN-PORT may be reviewed and copied at the SEC’s Public Reference Room in Washington, D.C.; information on the operation of the Public Reference Room may be obtained by calling 800SEC-0330.
Information (if any) regarding how the Fund voted proxies relating to portfolio securities during the most recently disclosed12-month period ended June 30 is available without charge (i) through the Fund’s website at delawarefunds.com/proxy; and (ii) on the SEC’s website at sec.gov.
56
Table of Contents
 |  |
Annual report
US equity mutual fund
Delaware Small Cap Growth Fund
March 31, 2020
Beginning on or about June 1, 2021, as permitted by regulations adopted by the Securities and Exchange Commission, paper copies of your Fund’s shareholder reports will no longer be sent to you by mail, unless you specifically request them from the Fund or from your financial intermediary, such as a broker/dealer, bank, or insurance company. Instead, you will be notified by mail each time a report is posted on the website and provided with a link to access the report.
If you already elected to receive shareholder reports electronically, you will not be affected by this change and you do not need to take any action. You may elect to receive shareholder reports and other communications from the Fund electronically by signing up at delawarefunds.com/edelivery. If you own these shares through a financial intermediary, you may contact your financial intermediary.
You may elect to receive paper copies of all future shareholder reports free of charge. You can inform the Fund that you wish to continue receiving paper copies of your shareholder reports by contacting us at 800 523-1918. If you own these shares through a financial intermediary, you may contact your financial intermediary to elect to continue to receive paper copies of your shareholder reports. Your election to receive reports in paper will apply to all funds held with the Delaware Funds® by Macquarie or your financial intermediary.
Carefully consider the Fund’s investment objectives, risk factors, charges, and expenses before investing. This and other information can be found in the Fund’s prospectus and its summary prospectus, which may be obtained by visiting delawarefunds.com/literature or calling 800 523-1918. Investors should read the prospectus and the summary prospectus carefully before investing.
You can obtain shareholder reports and prospectuses online instead of in the mail.
Visit delawarefunds.com/edelivery.
Table of Contents
Experience Delaware Funds®by Macquarie
Macquarie Investment Management (MIM) is a global asset manager with offices in the United States, Europe, Asia, and Australia. As active managers, we prioritize autonomy and accountability at the investment team level in pursuit of opportunities that matter for clients. Delaware Funds is one of the longest-standing mutual fund families, with more than 80 years in existence.
If you are interested in learning more about creating an investment plan, contact your financial advisor.
You can learn more about Delaware Funds or obtain a prospectus for Delaware Small Cap Growth Fund at delawarefunds.com/literature.
Manage your account online
| ● | Check your account balance and transactions |
| ● | View statements and tax forms |
| ● | Make purchases and redemptions |
Visit delawarefunds.com/account-access.
Macquarie Asset Management (MAM) offers a diverse range of products including securities investment management, infrastructure and real asset management, and fund and equity-based structured products. MIM is the marketing name for certain companies comprising the asset management division of Macquarie Group. This includes the following investment advisers: Macquarie Investment Management Business Trust (MIMBT), Macquarie Funds Management Hong Kong Limited, Macquarie Investment Management Austria Kapitalanlage AG, Macquarie Investment Management Global Limited, Macquarie Investment Management Europe Limited, Macquarie Capital Investment Management LLC, and Macquarie Investment Management Europe S.A.
The Fund is distributed byDelaware Distributors, L.P. (DDLP), an affiliate of MIMBT and Macquarie Group Limited.
Other than Macquarie Bank Limited (MBL), none of the entities noted are authorized deposit-taking institutions for the purposes of the Banking Act 1959 (Commonwealth of Australia). The obligations of these entities do not represent deposits or other liabilities of MBL. MBL does not guarantee or otherwise provide assurance in respect of the obligations of these entities, unless noted otherwise. The Fund is governed by US laws and regulations.
| 1 | ||||
| 5 | ||||
| 9 | ||||
Security type / sector allocation and top 10 equity holdings | 11 | |||
| 13 | ||||
| 15 | ||||
| 17 | ||||
| 18 | ||||
| 20 | ||||
| 28 | ||||
| 38 | ||||
| 39 | ||||
| 40 | ||||
| 50 | ||||
Unless otherwise noted, views expressed herein are current as of March 31, 2020, and subject to change for events occurring after such date.
The Fund is not FDIC insured and is not guaranteed. It is possible to lose the principal amount invested.
Advisory services provided by Delaware Management Company, a series of MIMBT, a US registered investment advisor.
All third-party marks cited are the property of their respective owners.
© 2020 Macquarie Management Holdings, Inc.
Table of Contents
| Portfolio management review | ||
| Delaware Small Cap Growth Fund | April 7, 2020 (Unaudited) |
Performance preview (for the year ended March 31, 2020) | ||||||
Delaware Small Cap Growth Fund (Institutional Class shares)* | 1-year return | -9.65% | ||||
Delaware Small Cap Growth Fund (Class A shares)* | 1-year return | -9.74% | ||||
Russell 2000® Growth Index (benchmark) | 1-year return | -18.58% |
Past performance does not guarantee future results.
For complete, annualized performance for Delaware Small Cap Growth Fund, please see the table on page 5.
Institutional Class shares are not subject to a sales charge and are offered for sale exclusively to certain eligible investors. In addition, Institutional Class shares pay no distribution and service fee.
The performance of Class A shares excludes the applicable sales charge. Both Institutional Class shares and Class A shares reflect the reinvestment of all distributions.
Please see page 7 for a description of the index. Index performance returns do not reflect any management fees, transaction costs, or expenses. Indices are unmanaged and one cannot invest directly in an index.
*Total return for the report period presented in the table differs from the return in “Financial highlights.” The total return presented in the above table is calculated based on the net asset value (NAV) at which shareholder transactions were processed. The total return presented in “Financial highlights” is calculated in the same manner but also takes into account certain adjustments that are necessary under US generally accepted accounting principles (US GAAP) required in the annual report.
Investment objective
The Fund seeks long-term capital appreciation.
Market review
Both the economy and the markets enjoyed sustained growth through the first 10 months of the Fund’s fiscal year ended March 31, 2020, as major market indices achieved new highs through mid-January. Lower interest rates and the apparent resolution of the US-China trade war were largely responsible.
When the fiscal year began, the US Federal Reserve was setting the stage for lower interest rates, an acknowledgement that its last increase, in December 2018, might have been overdone. In July 2019, the Fed implemented the first of three 0.25% cuts that brought its target rate down to 1.50%-1.75% by the end of October. In January 2020, the signing of a Phase 1 trade agreement brought some clarity to the often-acrimonious trade dispute with China.
Investors were not the only winners, however. Consumers, who account for 70% of gross domestic product (GDP), had achieved generational highs for savings rates while reaping
At the end of the fiscal year, we’ve taken a two-pronged approach to positioning the Fund by focusing on those companies that we think can either maintain business or recover quickly:
| ● | First, as we recover from the pandemic, we believe there are certain industries and companies, such as streaming media, telecommunications software, and consumer staples, that should do well throughout. |
| ● | Second, there are other areas, such as digital currency, online dating, and fast-casual restaurants, that we think should do well once social-distancing measures are relaxed and people have the opportunity to get back out and meet with friends, family, and new people again. The businesses that have the potential to meet the pent-up demand for normalcy look attractive to us. |
1
Table of Contents
Portfolio management review
Delaware Small Cap Growth Fund
the benefit of a cyclical high for wage growth. And thanks to a highly regulated banking system that was not extending credit easily, consumer credit scores were also at all-time highs.
Then the pandemic took hold. From its late 2019 start in China’s Wuhan province, the virus spread in January throughout Asia, Australia, Europe, and the United States. In February, markets reacted suddenly and swiftly, sinking more than 30% in just a few weeks.
Following in the footsteps of other countries, governments in the US, both at the state and municipal level, took action to slow the spread of the disease. The social-distancing measures, which included banning large groups and closing non essential businesses, had an immediate impact on the economy. Global economies that had enjoyed a sustained period of moderate growth swiftly plunged into recessions, with GDPs likely cut nearly in half. In the last week of the 12-month period, initial jobless claims jumped to 3.3 million, more than 10 times the previous week and more than four times the previous record set in 1982.
The Fed responded to the crisis by reducing interest rates twice in March, taking the target range down to 0.0%-0.25%. Additionally, the Fed renewed its asset-purchasing program, this time including commercial paper, to shore up distressed credit markets. On the fiscal side, Congress enacted three relief bills in March, the last of which provides $2 trillion to be used for direct payments to individuals, enhanced unemployment benefits, aid to small business, and relief for certain large industries.
For the entire fiscal year, the broad equity market, represented by the Russell 3000® Index, declined 9.13%. Small-cap stocks performed significantly weaker, with the Russell 2000® Index and the Russell 2000 Growth Index dropping 23.99% and 18.58%, respectively. All the losses resulted from the pandemic as the Russell 3000 Index lost 20.90%, the Russell 2000 Index lost 30.61%,
and the Russell 2000 Growth Index lost 25.76% in the first quarter of 2020. In contrast, those same indices posted positive returns of 14.76%, 6.03%, and 8.47%, respectively, from the beginning of the fiscal period on April 1, 2019, through Jan. 31, 2020.
Within the Fund
For the fiscal year ended March 31, 2020, Delaware Small Cap Growth Fund declined, although it outperformed its benchmark, the Russell 2000 Growth Index. The Fund’s Institutional Class shares declined 9.65%. The Fund’s Class A shares fell 9.74% at net asset value and declined 14.90% at maximum offer price (both returns reflect all distributions reinvested). For the same period, the benchmark fell 18.58%. Complete annualized performance for Delaware Small Cap Growth Fund is shown in the table on page 5.
While we focus mainly on individual stock selection, advantageous stock selection on a sector level contributed to strong relative performance in the industrials, consumer staples, and financials sectors. The consumer discretionary sector detracted the most from performance, also due to stock selection. The Fund did not have any positions in energy, materials, real estate, or utilities, the absence of which contributed to performance relative to the benchmark.
The Fund pursues a pure growth strategy, which has benefited performance given that growth stocks have outperformed value stocks over the past decade. We believe that as technological adoption rates accelerate, disruption is caused throughout major industries and enables new secular growth patterns to take hold.
Virtual healthcare is a notable example of disruptive technology. Even before the pandemic, virtual healthcare had increased as people realized this was a better, cheaper, and faster way to get a diagnosis and treatment plan for many routine
2
Table of Contents
health issues. Until the pandemic, the biggest impediment to this industry was getting people to try virtual care for the first time. Once they did, however, there was no turning back.
The pandemic changed that dramatically. Now, no one wants to go to a doctor’s office and sit in a waiting room surrounded by other patients. Virtual care is now growing rapidly and one of the biggest beneficiaries of this isTeladoc Health Inc., which has experienced a large upturn in its business with the onset of the coronavirus. Teladoc was the Fund’s leading contributor to performance for the 12-month period. It has teamed up with both large employers and insurers to make its services available. Teladoc now has more than 35 million members and operates in more than 175 countries.
Financial services has been home to some of the disruptive technology that has greatly impacted our lives. Digital currency and payment systems, for example, have largely replaced cash; indeed, ours may be the last generation that uses paper money. Another example iseHealth Inc., a provider of an online marketplace for comparison and enrollment in health insurance plans and a strong contributor to Fund performance. The company benefited from consumers’ increasing acceptance of the online environment as more Americans become eligible for Medicare at age 65 (estimated to be approximately 10,000 people every day). With more baby boomers applying, the average age of Medicare beneficiaries declines with a consequent increase in the online proficiency of Medicare recipients. We think this trend represents a strong tailwind for eHealth’s preferred method of acquisition.
Yet another disruptive trend that has played a large role in the Fund’s stock selection is the development of software as a service (SaaS). Software solutions built around a SaaS model offer significant advantages to both the developer and the customer. Rather than sell a software package that each customer must install on its
own system, SaaS products are hosted, maintained, and upgraded by the developer and accessed through the cloud. Instead of paying a large fee upfront and maintenance fees thereafter, customers buy a subscription that is often tied to how many users are accessing the software. This reduces customer costs while it provides developers with a steady income stream. A wide variety of applications are available via SaaS, including customer relationship management, human resources, and communications. The onset of the pandemic focused attention on a few SaaS-based opportunities, including the need for remote-working and enhanced network capabilities.
One such company isEverbridge Inc., a developer of SaaS-based systems to manage critical events and notifications and another contributor to the Fund’s performance. The company received several new contracts at the end of the period as states and municipalities signed on to distribute information about the coronavirus and their countermeasures to the public and other large groups.
Not all SaaS companies did well, however.Pluralsight Inc.provides online education and development primarily aimed at the information technology (IT) community. The goal is to keep IT people up to date and prepared for new projects. Although we think it is a good idea, one that has the added benefit of helping to retain employees in a field notorious for fleeting employment, Pluralsight has not been able to execute well and its growth prospects have diminished. Pluralsight detracted from Fund performance during the period and we exited position.
The stay-at-home restrictions imposed to curb the spread of the virus severely affected the retail business. One of the Fund’s holdings, AtHome Group Inc., was no exception. Even before the pandemic struck, the operator of big-ticket, big-box, home-décor stores had experienced a slowdown in traffic across its chains as it opened
3
Table of Contents
Portfolio management review
Delaware Small Cap Growth Fund
in more locations. Business was down and growth prospects diminished. Although this happens occasionally when a small successful chain begins to expand and growth slows, we realized our losses and sold the position in At Home Group.
One financial services firm that underperformed wasLendingTree Inc., an online marketplace that matches lenders with borrowers seeking a variety of loans, including mortgages and home-equity, personal, and business loans. LendingTree was attractive to us because it was an innovative financial services firm that was also positioned to take advantage of the home-building trend. In the last quarter of the fiscal year, as stocks sold off and credit markets went into disarray, the volume of mortgages written at LendingTree plummeted. Given that it will take the economy some time to recover, and that there will likely be less home building during that time, we think the home-building trend has gone away. We exited the position.
At the end of the fiscal year, we’ve taken a two-pronged approach to positioning the Fund by focusing on those companies that we think can either maintain business or recover quickly. First, as we recover from the pandemic, we believe there are certain industries and companies, such as streaming media, telecommunications software, and consumer staples, that should do well throughout.
Second, there are other areas, such as digital currency, online dating, and fast-casual restaurants, that we think should do well once social-distancing measures are relaxed and people have the opportunity to get back out and meet with friends, family, and new people again. The businesses that have the potential to meet the pent-up demand for normalcy look attractive to us.
4
Table of Contents
| Performance summary | ||
| Delaware Small Cap Growth Fund | March 31, 2020 (Unaudited) |
The performance quoted represents past performance and does not guarantee future results. Investment return and principal value of an investment will fluctuate so that shares, when redeemed, may be worth more or less than their original cost. Current performance may be lower or higher than the performance quoted. Performance data current to the most recent month end may be obtained by calling 800 523-1918 or visiting delawarefunds.com/performance.
| Fund and benchmark performance1,2 | Average annual total returns through March 31, 2020 |
| 1 year | 3 year | Lifetime | ||||||||||||||||||||||
Class A (Est. June 30, 2016) | ||||||||||||||||||||||||
Excluding sales charge | -9.74%* | +14.13% | +14.75% | |||||||||||||||||||||
Including sales charge | -14.90%* | +11.91% | +12.95% | |||||||||||||||||||||
Class C (Est. June 30, 2016) | ||||||||||||||||||||||||
Excluding sales charge | -10.53%* | +13.21% | +13.85% | |||||||||||||||||||||
Including sales charge | -11.41%* | +13.21% | +13.85% | |||||||||||||||||||||
Class R (Est. June 30, 2016) | ||||||||||||||||||||||||
Excluding sales charge | -10.04%* | +13.76% | +14.42% | |||||||||||||||||||||
Including sales charge | -10.04%* | +13.76% | +14.42% | |||||||||||||||||||||
Institutional Class (Est. June 30, 2016) | ||||||||||||||||||||||||
Excluding sales charge | -9.65%* | +14.34% | +14.98% | |||||||||||||||||||||
Including sales charge | -9.65%* | +14.34% | +14.98% | |||||||||||||||||||||
Russell 2000 Growth Index | -18.58% | +0.10% | +4.87%** |
*Total return for the report period presented in the table differs from the return in “Financial highlights.” The total return presented in the above table is calculated based on the net asset value (NAV) at which shareholder transactions were processed. The total return presented in “Financial highlights” is calculated in the same manner but also takes into account certain adjustments that are necessary under US generally accepted accounting principles (US GAAP) required in the annual report.
**The benchmark lifetime return is for Class A share comparison only and is calculated using the last business day in the month of the Fund’s Class A inception date.
1Returns reflect the reinvestment of all distributions and are presented both with and without the applicable sales charges described below. Returns do not reflect the deduction of taxes the shareholder would pay on Fund distributions or redemptions of Fund shares.
Expense limitations were in effect for certain classes during some or all of the periods shown in the “Fund and benchmark performance” table. Expenses for each class are listed on the “Fund expense ratios” table on page 6. Performance would have been lower had expense limitations not been in effect.
Institutional Class shares are not subject to a sales charge and are offered for sale exclusively to certain eligible investors. In addition, Institutional Class shares pay no distribution and service (12b-1) fee.
Class A shares are sold with a maximum front-end sales charge of 5.75%, and have an annual 12b-1 fee of 0.25% of average daily net assets. Performance for Class A shares, excluding sales charges, assumes that no front-end sales charge applied.
Class C shares are sold with a contingent deferred sales charge of 1.00% if redeemed during the first 12 months. They are also subject to an annual
5
Table of Contents
Performance summary
Delaware Small Cap Growth Fund
12b-1 fee of 1.00% of average daily net assets. Performance for Class C shares, excluding sales charges, assumes either that contingent deferred sales charges did not apply or that the investment was not redeemed.
Class R shares are available only for certain retirement plan products. They are sold without a sales charge and have an annual 12b-1 fee of 0.50% of average daily net assets.
Investments in small and/or medium-sized companies typically exhibit greater risk and higher volatility than larger, more established companies.
Risk is increased in a concentrated portfolio since it holds a limited number of securities with each investment having a greater effect on the overall performance.
The disruptions caused by natural disasters, pandemics, or similar events could prevent the Fund from executing advantageous investment decisions in a timely manner and could negatively impact the Fund’s ability to achieve its investment objective and the value of the Fund’s investments.
2The Fund’s expense ratios, as described in the most recent prospectus, are disclosed in the following “Fund expense ratios” table. Delaware Management Company has agreed to reimburse certain expenses and/or waive certain fees in order to prevent total annual fund operating expenses (excluding any 12b-1 fees, acquired fund fees and expenses, taxes, interest, short sale and dividend and interest expenses, brokerage fees, certain insurance costs, and nonroutine expenses or costs, including, but not limited to, those relating to reorganizations, litigation, conducting shareholder meetings, and liquidations (collectively, nonroutine expenses)) from exceeding 1.05% of the Fund’s average daily net assets from April 1, 2019 to March 31, 2020.* Please see the most recent prospectus and any applicable supplement(s) for additional information on these fee waivers and/or reimbursements. Please see the “Financial highlights” section in this report for the most recent expense ratios.
| Fund expense ratios | Class A | Class C | Class R | Institutional Class | ||||
Total annual operating expenses (without fee waivers) | 2.68% | 3.43% | 2.93% | 2.43% | ||||
Net expenses (including fee waivers, if any) | 1.30% | 2.05% | 1.55% | 1.05% | ||||
Type of waiver | Contractual | Contractual | Contractual | Contractual |
*The aggregate contractual waiver period covering this report is from July 30, 2018 through July 29, 2020.
6
Table of Contents
Performance of a $10,000 Investment1
Average annual total returns from June 30, 2016 (Fund’s inception)
through March 31, 2020

For period beginning June 30, 2016 (Fund’s inception) through March 31, 2020 | Starting value | Ending value | ||||||||||
| $10,000 | $16,879 | ||||||||||
| $9,425 | $15,787 | ||||||||||
| $10,000 | $11,955 | ||||||||||
 Delaware Small Cap Growth Fund — Institutional Class shares
 Delaware Small Cap Growth Fund — Class A shares
 Russell 2000 Growth Index
1The “Performance of a $10,000 investment” graph assumes $10,000 invested in Institutional Class and Class A shares of the Fund on June 30, 2016, and includes the effect of a 5.75% front-end sales charge (for Class A shares) and the reinvestment of all distributions. The graph does not reflect the deduction of taxes the shareholders would pay on Fund distributions or redemptions of Fund shares. Expense limitations were in effect for some or all of the periods shown. Performance would have been lower had expense limitations not been in effect. Expenses are listed in the “Fund expense ratios” table on page 6. Please note additional details on pages 5 through 8.
The graph also assumes $10,000 invested in the Russell 2000 Growth Index as of June 30, 2016. The Russell 2000 Growth Index measures the performance of the small-cap growth segment of the US equity universe. It includes those Russell
2000 companies with higher price-to-book ratios and higher forecasted growth values.
The Russell 3000 Index, mentioned on page 2, measures the performance of the largest 3,000 US companies, representing approximately 98% of the investable US equity market.
The Russell 2000 Index, mentioned on page 2, measures the performance of the small-cap segment of the US equity universe.
Gross domestic product, mentioned on page 2, is a measure of all goods and services produced by a nation in a year.
Frank Russell Company is the source and owner of the trademarks, service marks and copyrights related to the Russell Indexes. Russell® is a trademark of Frank Russell Company.
Index performance returns do not reflect any management fees, transaction costs, or expenses. Indices are unmanaged and one cannot invest
7
Table of Contents
Performance summary
Delaware Small Cap Growth Fund
directly in an index.Past performance is not a guarantee of future results.
Performance of other Fund classes will vary due to different charges and expenses.
| Nasdaq symbols | CUSIPs | |||||||
Class A | DSGDX | 24610A604 | ||||||
Class C | DSGEX | 24610A703 | ||||||
Class R | DSGFX | 24610A885 | ||||||
Institutional Class | DSGGX | 24610A802 | ||||||
8
Table of Contents
For the six-month period from October 1, 2019 to March 31, 2020 (Unaudited)
As a shareholder of the Fund, you incur two types of costs: (1) transaction costs, including sales charges (loads) on purchase payments, reinvested dividends, or other distributions; redemption fees; and exchange fees; and (2) ongoing costs, including management fees; distribution and service (12b-1) fees; and other Fund expenses. This example is intended to help you understand your ongoing costs (in dollars) of investing in the Fund and to compare these costs with the ongoing costs of investing in other mutual funds.
The example is based on an investment of $1,000 invested at the beginning of the period and held for the entire six-month period from Oct. 1, 2019 to March 31, 2020.
Actual expenses
The first section of the table shown, “Actual Fund return,” provides information about actual account values and actual expenses. You may use the information in this section of the table, together with the amount you invested, to estimate the expenses that you paid over the period. Simply divide your account value by $1,000 (for example, an $8,600 account value divided by $1,000 = 8.6), then multiply the result by the number in the first section under the heading entitled “Expenses Paid During Period” to estimate the expenses you paid on your account during this period.
Hypothetical example for comparison purposes
The second section of the table shown, “Hypothetical 5% return,” provides information about hypothetical account values and hypothetical expenses based on the Fund’s actual expense ratio and an assumed rate of return of 5% per year before expenses, which is not the Fund’s actual return. The hypothetical account values and expenses may not be used to estimate the actual ending account balance or expenses you paid for the period. You may use this information to compare the ongoing costs of investing in the Fund and other funds. To do so, compare this 5% hypothetical example with the 5% hypothetical examples that appear in the shareholder reports of the other funds.
Please note that the expenses shown in the table are meant to highlight your ongoing costs only and do not reflect any transactional costs, such as sales charges (loads), redemption fees, or exchange fees. Therefore, the second section of the table is useful in comparing ongoing costs only, and will not help you determine the relative total costs of owning different funds. In addition, if these transactional costs were included, your costs would have been higher. The Fund’s expenses shown in the table reflect fee waivers in effect and assume reinvestment of all dividends and distributions.
9
Table of Contents
Disclosure of Fund expenses
For the six-month period from October 1, 2019 to March 31, 2020 (Unaudited)
Delaware Small Cap Growth Fund
Expense analysis of an investment of $1,000
| Beginning | Ending | Expenses | ||||||||||||||
| Account Value | Account Value | Annualized | Paid During Period | |||||||||||||
| 10/1/19 | 3/31/20 | Expense Ratio | 10/1/19 to 3/31/20* | |||||||||||||
Actual Fund return† | ||||||||||||||||
Class A | $1,000.00 | $937.70 | 1.30% | $6.30 | ||||||||||||
Class C | 1,000.00 | 933.40 | 2.05% | 9.91 | ||||||||||||
Class R | 1,000.00 | 935.90 | 1.55% | 7.50 | ||||||||||||
Institutional Class | 1,000.00 | 939.20 | 1.05% | 5.09 | ||||||||||||
Hypothetical 5% return(5% return before expenses) | ||||||||||||||||
Class A | $1,000.00 | $1,018.50 | 1.30% | $6.56 | ||||||||||||
Class C | 1,000.00 | 1,014.75 | 2.05% | 10.33 | ||||||||||||
Class R | 1,000.00 | 1,017.25 | 1.55% | 7.82 | ||||||||||||
Institutional Class | 1,000.00 | 1,019.75 | 1.05% | 5.30 | ||||||||||||
*“Expenses Paid During Period” are equal to the Fund’s annualized expense ratio, multiplied by the average account value over the period, multiplied by 183/366 (to reflect the one-half year period).
†Because actual returns reflect only the most recent six-month period, the returns shown may differ significantly from fiscal year returns.
In addition to the Fund’s expenses reflected above, the Fund also indirectly bears its portion of the fees and expenses of the investment companies (Underlying Funds) in which it invests. The table above does not reflect the expenses of the Underlying Funds.
10
Table of Contents
Security type / sector allocation and top 10
equity holdings
| Delaware Small Cap Growth Fund | As of March 31, 2020 (Unaudited) |
Sector designations may be different than the sector designations presented in other Fund materials. The sector designations may represent the investment manager’s internal sector classifications.
| Security type / sector | Percentage of net assets | ||||
Common Stock² | 100.17 | % | |||
Communication Services | 8.40 | % | |||
Consumer Discretionary | 7.03 | % | |||
Consumer Staples | 16.84 | % | |||
Financials | 6.67 | % | |||
Healthcare | 27.66 | % | |||
Industrials | 8.64 | % | |||
Information Technology | 24.93 | % | |||
Total Value of Securities | 100.17 | % | |||
Liabilities Net of Receivables and Other Assets | (0.17 | %) | |||
Total Net Assets | 100.00 | % | |||
| ² | Narrow industries are utilized for compliance purposes for diversification whereas broad sectors are used for financial reporting. |
To monitor compliance with the Fund’s concentration guidelines as described in the Fund’s prospectus and statement of additional information, the Healthcare sector (as disclosed herein for financial reporting purposes) is subdivided into a variety of “industries” (in accordance with the requirements of the Investment Company Act of 1940, as amended). The Healthcare sector consisted of biotechnology, commercial services, healthcare products, healthcare services, pharmaceuticals, retail and software. As of March 31, 2020, such amounts, as percentage of total net assets, were 0.45%, 4.40%, 12.63%, 4.68%, 3.61%, 0.35%, and 1.54% respectively. The percentage in any such single industry will comply with the Fund’s concentration policy even if the percentages in the Healthcare sector for financial reporting purposes may exceed 25%.
11
Table of Contents
Security type / sector allocation and top 10
equity holdings
Delaware Small Cap Growth Fund
Holdings are for informational purposes only and are subject to change at any time. They are not a recommendation to buy, sell, or hold any security.
| Top 10 equity holdings | Percentage of net assets | |
eHealth | 5.15% | |
Boston Beer Class A | 5.01% | |
Simply Good Foods | 4.70% | |
Novocure | 4.56% | |
Progyny | 4.40% | |
Trex | 4.36% | |
Bandwidth Class A | 4.32% | |
iRhythm Technologies | 4.28% | |
SiteOne Landscape Supply | 4.28% | |
Everbridge | 4.03% |
12
Table of Contents
| Schedule of investments | ||
| Delaware Small Cap Growth Fund | March 31, 2020 |
| Number of shares | Value (US $) | |||||||
Common Stock – 100.17%² | ||||||||
Communication Services – 8.40% | ||||||||
Bandwidth Class A † | 40,325 | $ | 2,713,469 | |||||
EverQuote Class A † | 30,835 | 809,419 | ||||||
Live Nation Entertainment † | 38,695 | 1,759,075 | ||||||
|
| |||||||
| 5,281,963 | ||||||||
|
| |||||||
Consumer Discretionary – 7.03% | ||||||||
Etsy † | 16,380 | 629,647 | ||||||
Shake Shack Class A † | 13,089 | 493,979 | ||||||
TopBuild † | 4,640 | 332,410 | ||||||
Wingstop | 7,840 | 624,848 | ||||||
YETI Holdings † | 119,748 | 2,337,481 | ||||||
|
| |||||||
| 4,418,365 | ||||||||
Consumer Staples – 16.84% | ||||||||
Boston Beer Class A † | 8,571 | 3,150,357 | ||||||
Freshpet † | 38,630 | 2,467,298 | ||||||
Performance Food Group † | 81,495 | 2,014,556 | ||||||
Simply Good Foods † | 153,475 | 2,955,929 | ||||||
|
| |||||||
| 10,588,140 | ||||||||
|
| |||||||
Financials – 6.67% | ||||||||
eHealth † | 22,976 | 3,235,480 | ||||||
LendingTree † | 5,203 | 954,178 | ||||||
|
| |||||||
| 4,189,658 | ||||||||
|
| |||||||
Healthcare – 27.66% | ||||||||
1Life Healthcare † | 53,170 | 965,036 | ||||||
Blueprint Medicines † | 4,803 | 280,879 | ||||||
Invitae † | 57,651 | 788,089 | ||||||
iRhythm Technologies † | 33,086 | 2,691,546 | ||||||
Novocure † | 42,536 | 2,864,374 | ||||||
Pacira BioSciences † | 67,734 | 2,271,121 | ||||||
PetIQ † | 9,405 | 218,478 | ||||||
Progyny † | 130,635 | 2,768,156 | ||||||
Quanterix † | 77,311 | 1,420,203 | ||||||
Repligen † | 10,020 | 967,331 | ||||||
Teladoc Health † | 13,906 | 2,155,569 | ||||||
|
| |||||||
| 17,390,782 | ||||||||
|
| |||||||
Industrials – 8.64% | ||||||||
SiteOne Landscape Supply † | 36,545 | 2,690,443 | ||||||
Trex † | 34,179 | 2,739,105 | ||||||
|
| |||||||
| 5,429,548 | ||||||||
|
| |||||||
Information Technology – 24.93% | ||||||||
Avalara † | 33,575 | 2,504,695 | ||||||
Bill.Com Holdings † | 56,405 | 1,929,051 | ||||||
Everbridge † | 23,809 | 2,532,325 | ||||||
13
Table of Contents
Schedule of investments
Delaware Small Cap Growth Fund
| Number of shares | Value (US $) | |||||||
Common Stock²(continued) | ||||||||
Information Technology (continued) | ||||||||
Lattice Semiconductor † | 105,730 | $ | 1,884,109 | |||||
Medallia † | 73,380 | 1,470,535 | ||||||
Monolithic Power Systems | 6,900 | 1,155,474 | ||||||
Rapid7 † | 50,031 | 2,167,843 | ||||||
Silicon Laboratories † | 23,773 | 2,030,452 | ||||||
|
| |||||||
| 15,674,484 | ||||||||
|
| |||||||
Total Common Stock(cost $66,539,570) | 62,972,940 | |||||||
Total Value of Securities – 100.17% (cost $66,539,570) | $ | 62,972,940 | ||||||
|
| |||||||
| ² | Narrow industries are utilized for compliance purposes for diversification whereas broad sectors are used for financial reporting. |
| † | Non-income producing security. |
See accompanying notes, which are an integral part of financial statements.
14
Table of Contents
Statement of assets and liabilities
| Delaware Small Cap Growth Fund | March 31, 2020 |
Assets: | ||||
Investments, at value1 | $ | 62,972,940 | ||
Receivable for fund shares sold | 5,886,926 | |||
Receivable for securities sold | 306,462 | |||
Dividends Receivable | 3,654 | |||
|
| |||
Total assets | 69,169,982 | |||
|
| |||
Liabilities: | ||||
Due to custodian | 223,364 | |||
Payable for securities purchased | 5,873,153 | |||
Payable for fund shares redeemed | 125,462 | |||
Investment management fees payable to affiliates | 15,309 | |||
Other accrued expenses | 60,767 | |||
Distribution fees payable to affiliates | 1,582 | |||
Accounting and administration expenses payable to affiliates | 518 | |||
Dividend disbursing and transfer agent fees and expenses payable to affiliates | 506 | |||
Trustees’ fees and expenses payable to affiliates | 478 | |||
Legal fees payable to affiliates | 128 | |||
Reports and statements to shareholders expenses payable to affiliates | 80 | |||
|
| |||
Total liabilities | 6,301,347 | |||
|
| |||
Total Net Assets | $ | 62,868,635 | ||
|
| |||
Net Assets Consist of: | ||||
Paid-in capital | $ | 67,881,348 | ||
Total distributable earnings (loss) | (5,012,713 | ) | ||
|
| |||
Total Net Assets | $ | 62,868,635 | ||
|
| |||
15
Table of Contents
Statement of assets and liabilities
Delaware Small Cap Growth Fund
Net Asset Value | ||||
Class A: | ||||
Net assets | $ | 2,052,952 | ||
Shares of beneficial interest outstanding, unlimited authorization, no par | 222,405 | |||
Net asset value per share | $ | 9.23 | ||
Sales charge | 5.75 | % | ||
Offering price per share, equal to net asset value per share / (1 – sales charge) | $ | 9.79 | ||
Class C: | ||||
Net assets | $ | 772,613 | ||
Shares of beneficial interest outstanding, unlimited authorization, no par | 86,968 | |||
Net asset value per share | $ | 8.88 | ||
Class R: | ||||
Net assets | $ | 1,120,176 | ||
Shares of beneficial interest outstanding, unlimited authorization, no par | 123,075 | |||
Net asset value per share | $ | 9.10 | ||
Institutional Class: | ||||
Net assets | $ | 58,922,894 | ||
Shares of beneficial interest outstanding, unlimited authorization, no par | 6,317,866 | |||
Net asset value per share | $ | 9.33 | ||
1Investments, at cost | $ | 66,539,570 | ||
See accompanying notes, which are an integral part of the financial statements.
16
Table of Contents
| Statement of operations | ||
| Delaware Small Cap Growth Fund | Year ended March 31, 2020 |
Investment Income: | ||||
Dividends | $ | 12,738 | ||
|
| |||
| 12,738 | ||||
|
| |||
Expenses: | ||||
Management fees | 270,394 | |||
Distribution expenses — Class A | 6,361 | |||
Distribution expenses — Class C | 6,997 | |||
Distribution expenses — Class R | 7,164 | |||
Registration fees | 77,319 | |||
Accounting and administration expenses | 44,930 | |||
Dividend disbursing and transfer agent fees and expenses | 39,200 | |||
Audit and tax fees | 32,030 | |||
Reports and statements to shareholders expenses | 25,258 | |||
Custodian fees | 2,344 | |||
Trustees’ fees and expenses | 1,738 | |||
Legal fees | 1,325 | |||
Other | 11,294 | |||
|
| |||
| 526,354 | ||||
Less expenses waived | (126,880 | ) | ||
Less expenses paid indirectly | (18 | ) | ||
|
| |||
Total operating expenses | 399,456 | |||
|
| |||
Net Investment Loss | (386,718 | ) | ||
|
| |||
Net Realized and Unrealized Loss: | ||||
Net realized gain (loss) on investments | (289,780 | ) | ||
Net change in unrealized appreciation (depreciation) of investments | (5,156,079 | ) | ||
|
| |||
Net Realized and Unrealized Loss | (5,445,859 | ) | ||
|
| |||
Net Decrease in Net Assets Resulting from Operations | $ | (5,832,577 | ) | |
|
| |||
See accompanying notes, which are an integral part of the financial statements.
17
Table of Contents
Statements of changes in net assets
Delaware Small Cap Growth Fund
| Year ended | ||||||||
| 3/31/20 | 3/31/19 | |||||||
Increase (Decrease) in Net Assets from Operations: | ||||||||
Net investment loss | $ | (386,718 | ) | $ | (112,923 | ) | ||
Net realized gain (loss) | (289,780 | ) | 2,169,041 | |||||
Net change in unrealized appreciation (depreciation) | (5,156,079 | ) | 171,156 | |||||
|
|
|
| |||||
Net increase (decrease) in net assets resulting from operations | (5,832,577 | ) | 2,227,274 | |||||
|
|
|
| |||||
Dividends and Distributions to Shareholders from: | ||||||||
Distributable earnings: | ||||||||
Class A | (35,531 | ) | (404,794 | ) | ||||
Class C | (10,143 | ) | (78,290 | ) | ||||
Class R | (17,951 | ) | (400,639 | ) | ||||
Institutional Class | (962,541 | ) | (1,752,445 | ) | ||||
|
|
|
| |||||
| (1,026,166 | ) | (2,636,168 | ) | |||||
|
|
|
| |||||
Capital Share Transactions: | ||||||||
Proceeds from shares sold: | ||||||||
Class A | 838,980 | 2,960,480 | ||||||
Class C | 816,398 | 579,958 | ||||||
Class R | 19,603 | 1,426,311 | ||||||
Institutional Class | 71,586,170 | 3,190,208 | ||||||
Net asset value of shares issued upon reinvestment of dividends and distributions: | ||||||||
Class A | 35,531 | 390,911 | ||||||
Class C | 10,143 | 78,286 | ||||||
Class R | 17,951 | 400,635 | ||||||
Institutional Class | 961,677 | 1,752,442 | ||||||
|
|
|
| |||||
| 74,286,453 | 10,779,231 | |||||||
|
|
|
| |||||
18
Table of Contents
| Year ended | ||||||||||
| 3/31/20 | 3/31/19 | |||||||||
Capital Share Transactions (continued): | ||||||||||
Cost of shares redeemed: | ||||||||||
Class A | $ | (883,963 | ) | $ | (1,340,062 | ) | ||||
Class C | (405,501 | ) | (184,332 | ) | ||||||
Class R | (337,498 | ) | (199,831 | ) | ||||||
Institutional Class | (16,247,738 | ) | (3,436,582 | ) | ||||||
|
|
|
| |||||||
| (17,874,700 | ) | (5,160,807 | ) | |||||||
|
|
|
| |||||||
Increase in net assets derived from capital share transactions | 56,411,753 | 5,618,424 | ||||||||
|
|
|
| |||||||
Net Increase in Net Assets | 49,553,010 | 5,209,530 | ||||||||
|
|
|
| |||||||
Net Assets: | ||||||||||
Beginning of year | 13,315,625 | 8,106,095 | ||||||||
|
|
|
| |||||||
End of year | $ | 62,868,635 | $ | 13,315,625 | ||||||
|
|
|
| |||||||
See accompanying notes, which are an integral part of the financial statements.
19
Table of Contents
Delaware Small Cap Growth Fund Class A
Selected data for each share of the Fund outstanding throughout each period were as follows:
|
Net asset value, beginning of period |
Income (loss) from investment operations: |
Net investment loss2 |
Net realized and unrealized gain (loss) |
Total from investment operations |
Less dividends and distributions from: |
Net realized gain |
Total dividends and distributions |
Net asset value, end of period |
Total return3 |
Ratios and supplemental data: |
Net assets, end of period (000 omitted) |
Ratio of expenses to average net assets |
Ratio of expenses to average net assets prior to fees waived |
Ratio of net investment loss to average net assets. |
Ratio of net investment loss to average net assets prior to fees waived |
Portfolio turnover |
|
| 1 | Date of commencement of operations; ratios have been annualized and total return and portfolio turnover have not been annualized. |
| 2 | The average shares outstanding method has been applied for per share information. |
| 3 | Total return is based on the change in net asset value of a share during the period and assumes reinvestment of dividends and distributions at net asset value and does not reflect the impact of a sales charge. Total return during all of the periods shown reflects a waiver by the manager. Performance would have been lower had the waiver not been in effect. |
See accompanying notes, which are an integral part of the financial statements.
20
Table of Contents
| 6/30/161 | ||||||||||||||||||||||
| Year ended | to | |||||||||||||||||||||
| ||||||||||||||||||||||
| 3/31/20 | 3/31/19 | 3/31/18 | 3/31/17 | |||||||||||||||||||
| ||||||||||||||||||||||
| $ | 10.39 | $ | 11.59 | $ | 9.22 | $ | 8.50 | |||||||||||||||
| (0.13 | ) | (0.14 | ) | (0.13 | ) | (0.05 | ) | |||||||||||||||
| (0.88 | ) | 2.33 | 3.22 | 1.12 | ||||||||||||||||||
|
|
|
|
|
|
|
| |||||||||||||||
| (1.01 | ) | 2.19 | 3.09 | 1.07 | ||||||||||||||||||
|
|
|
|
|
|
|
| |||||||||||||||
| (0.15 | ) | (3.39 | ) | (0.72 | ) | (0.35 | ) | |||||||||||||||
|
|
|
|
|
|
|
| |||||||||||||||
| (0.15 | ) | (3.39 | ) | (0.72 | ) | (0.35 | ) | |||||||||||||||
|
|
|
|
|
|
|
| |||||||||||||||
| $ | 9.23 | $ | 10.39 | $ | 11.59 | $ | 9.22 | |||||||||||||||
|
|
|
|
|
|
|
| |||||||||||||||
| (9.93% | ) | 22.47% | 34.47% | 12.69% | ||||||||||||||||||
| $ | 2,053 | $ | 2,330 | $ | 432 | $ | 184 | |||||||||||||||
| 1.30% | 1.30% | 1.30% | 1.30% | |||||||||||||||||||
| 1.65% | 2.68% | 3.33% | 4.87% | |||||||||||||||||||
| (1.26% | ) | (1.19% | ) | (1.20% | ) | (0.77% | ) | |||||||||||||||
| (1.61% | ) | (2.57% | ) | (3.23% | ) | (4.34% | ) | |||||||||||||||
| 139% | 158% | 151% | 145% | |||||||||||||||||||
| ||||||||||||||||||||||
21
Table of Contents
Financial highlights
Delaware Small Cap Growth Fund Class C
Selected data for each share of the Fund outstanding throughout each period were as follows:
|
Net asset value, beginning of period |
Income (loss) from investment operations: |
Net investment loss2 |
Net realized and unrealized gain (loss) |
Total from investment operations |
Less dividends and distributions from: |
Net realized gain |
Total dividends and distributions |
Net asset value, end of period |
Total return3 |
Ratios and supplemental data: |
Net assets, end of period (000 omitted) |
Ratio of expenses to average net assets |
Ratio of expenses to average net assets prior to fees waived |
Ratio of net investment loss to average net assets. |
Ratio of net investment loss to average net assets prior to fees waived |
Portfolio turnover |
|
| 1 | Date of commencement of operations; ratios have been annualized and total return and portfolio turnover have not been annualized. |
| 2 | The average shares outstanding method has been applied for per share information. |
| 3 | Total return is based on the change in net asset value of a share during the period and assumes reinvestment of dividends and distributions at net asset value and does not reflect the impact of a sales charge. Total return during all of the periods shown reflects a waiver by the manager. Performance would have been lower had the waiver not been in effect. |
See accompanying notes, which are an integral part of the financial statements.
22
Table of Contents
| 6/30/161 | ||||||||||||||||||||||
| Year ended | to | |||||||||||||||||||||
| ||||||||||||||||||||||
| 3/31/20 | 3/31/19 | 3/31/18 | 3/31/17 | |||||||||||||||||||
| ||||||||||||||||||||||
| $ | 10.08 | $ | 11.43 | $ | 9.17 | $ | 8.50 | |||||||||||||||
| (0.20 | ) | (0.21 | ) | (0.20 | ) | (0.11 | ) | |||||||||||||||
| (0.85 | ) | 2.25 | 3.18 | 1.13 | ||||||||||||||||||
|
|
|
|
|
|
|
| |||||||||||||||
| (1.05 | ) | 2.04 | 2.98 | 1.02 | ||||||||||||||||||
|
|
|
|
|
|
|
| |||||||||||||||
| (0.15 | ) | (3.39 | ) | (0.72 | ) | (0.35 | ) | |||||||||||||||
|
|
|
|
|
|
|
| |||||||||||||||
| (0.15 | ) | (3.39 | ) | (0.72 | ) | (0.35 | ) | |||||||||||||||
|
|
|
|
|
|
|
| |||||||||||||||
| $ | 8.88 | $ | 10.08 | $ | 11.43 | $ | 9.17 | |||||||||||||||
|
|
|
|
|
|
|
| |||||||||||||||
| (10.64% | ) | 21.42% | 33.44% | 12.09% | ||||||||||||||||||
| ||||||||||||||||||||||
| $ | 773 | $ | 478 | $ | 61 | $ | 31 | |||||||||||||||
| 2.05% | 2.05% | 2.05% | 2.05% | |||||||||||||||||||
| 2.40% | 3.43% | 4.08% | 5.62% | |||||||||||||||||||
| (2.01% | ) | (1.94% | ) | (1.95% | ) | (1.52% | ) | |||||||||||||||
| (2.36% | ) | (3.32% | ) | (3.98% | ) | (5.09% | ) | |||||||||||||||
| 139% | 158% | 151% | 145% | |||||||||||||||||||
| ||||||||||||||||||||||
23
Table of Contents
Financial highlights
Delaware Small Cap Growth Fund Class R
Selected data for each share of the Fund outstanding throughout each period were as follows:
|
Net asset value, beginning of period |
Income (loss) from investment operations: |
Net investment loss2 |
Net realized and unrealized gain (loss) |
Total from investment operations |
Less dividends and distributions from: |
Net realized gain |
Total dividends and distributions |
Net asset value, end of period |
Total return3 |
Ratios and supplemental data: |
Net assets, end of period (000 omitted) |
Ratio of expenses to average net assets |
Ratio of expenses to average net assets prior to fees waived |
Ratio of net investment loss to average net assets |
Ratio of net investment loss to average net assets prior to fees waived |
Portfolio turnover |
|
| 1 | Date of commencement of operations; ratios have been annualized and total return and portfolio turnover have not been annualized. |
| 2 | The average shares outstanding method has been applied for per share information. |
| 3 | Total return is based on the change in net asset value of a share during the period and assumes reinvestment of dividends and distributions at net asset value. Total return during all of the periods shown reflects a waiver by the manager. Performance would have been lower had the waiver not been in effect. |
See accompanying notes, which are an integral part of the financial statements.
24
Table of Contents
| 6/30/161 | ||||||||||||||||||||||
| Year ended | to | |||||||||||||||||||||
| ||||||||||||||||||||||
| 3/31/20 | 3/31/19 | 3/31/18 | 3/31/17 | |||||||||||||||||||
| ||||||||||||||||||||||
| $ | 10.27 | $ | 11.53 | $ | 9.20 | $ | 8.50 | |||||||||||||||
| (0.16 | ) | (0.17 | ) | (0.15 | ) | (0.07 | ) | |||||||||||||||
| (0.86 | ) | 2.30 | 3.20 | 1.12 | ||||||||||||||||||
|
|
|
|
|
|
|
| |||||||||||||||
| (1.02 | ) | 2.13 | 3.05 | 1.05 | ||||||||||||||||||
|
|
|
|
|
|
|
| |||||||||||||||
| (0.15 | ) | (3.39 | ) | (0.72 | ) | (0.35 | ) | |||||||||||||||
|
|
|
|
|
|
|
| |||||||||||||||
| (0.15 | ) | (3.39 | ) | (0.72 | ) | (0.35 | ) | |||||||||||||||
|
|
|
|
|
|
|
| |||||||||||||||
| $ | 9.10 | $ | 10.27 | $ | 11.53 | $ | 9.20 | |||||||||||||||
|
|
|
|
|
|
|
| |||||||||||||||
| (10.15% | ) | 22.05% | 34.10% | 12.57% | ||||||||||||||||||
| ||||||||||||||||||||||
| $ | 1,120 | $ | 1,577 | $ | 8 | $ | 6 | |||||||||||||||
| 1.55% | 1.55% | 1.55% | 1.55% | |||||||||||||||||||
| 1.90% | 2.93% | 3.58% | 5.12% | |||||||||||||||||||
| (1.51% | ) | (1.44% | ) | (1.45% | ) | (1.02% | ) | |||||||||||||||
| (1.86% | ) | (2.82% | ) | (3.48% | ) | (4.59% | ) | |||||||||||||||
| 139% | 158% | 151% | 145% | |||||||||||||||||||
| ||||||||||||||||||||||
25
Table of Contents
Financial highlights
Delaware Small Cap Growth Fund Institutional Class
Selected data for each share of the Fund outstanding throughout each period were as follows:
|
Net asset value, beginning of period |
Income (loss) from investment operations: |
Net investment loss2 |
Net realized and unrealized gain (loss) |
Total from investment operations |
Less dividends and distributions from: |
Net realized gain |
Total dividends and distributions |
Net asset value, end of period |
Total return3 |
Ratios and supplemental data: |
Net assets, end of period (000 omitted) |
Ratio of expenses to average net assets |
Ratio of expenses to average net assets prior to fees waived |
Ratio of net investment loss to average net assets. |
Ratio of net investment loss to average net assets prior to fees waived . |
Portfolio turnover |
|
| 1 | Date of commencement of operations; ratios have been annualized and total return and portfolio turnover have not been annualized. |
| 2 | The average shares outstanding method has been applied for per share information. |
| 3 | Total return is based on the change in net asset value of a share during the period and assumes reinvestment of dividends and distributions at net asset value. Total return during all of the periods shown reflects a waiver by the manager. Performance would have been lower had the waiver not been in effect. |
See accompanying notes, which are an integral part of the financial statements.
26
Table of Contents
| 6/30/161 | ||||||||||||||||||||||
| Year ended | to | |||||||||||||||||||||
| ||||||||||||||||||||||
| 3/31/20 | 3/31/19 | 3/31/18 | 3/31/17 | |||||||||||||||||||
| ||||||||||||||||||||||
| $ | 10.47 | $ | 11.64 | $ | 9.24 | $ | 8.50 | |||||||||||||||
| (0.11 | ) | (0.11 | ) | (0.10 | ) | (0.04 | ) | |||||||||||||||
| (0.88 | ) | 2.33 | 3.22 | 1.13 | ||||||||||||||||||
|
|
|
|
|
|
|
| |||||||||||||||
| (0.99 | ) | 2.22 | 3.12 | 1.09 | ||||||||||||||||||
|
|
|
|
|
|
|
| |||||||||||||||
| (0.15 | ) | (3.39 | ) | (0.72 | ) | (0.35 | ) | |||||||||||||||
|
|
|
|
|
|
|
| |||||||||||||||
| (0.15 | ) | (3.39 | ) | (0.72 | ) | (0.35 | ) | |||||||||||||||
|
|
|
|
|
|
|
| |||||||||||||||
| $ | 9.33 | $ | 10.47 | $ | 11.64 | $ | 9.24 | |||||||||||||||
|
|
|
|
|
|
|
| |||||||||||||||
| (9.66% | ) | 22.68% | 34.73% | 12.93% | ||||||||||||||||||
| $ | 58,923 | $ | 8,931 | $ | 7,605 | $ | 5,621 | |||||||||||||||
| ||||||||||||||||||||||
| 1.05% | 1.05% | 1.05% | 1.05% | |||||||||||||||||||
| 1.40% | 2.43% | 3.08% | 4.62% | |||||||||||||||||||
| (1.01% | ) | (0.94% | ) | (0.95% | ) | (0.52% | ) | |||||||||||||||
| (1.36% | ) | (2.32% | ) | (2.98% | ) | (4.09% | ) | |||||||||||||||
| 139% | 158% | 151% | 145% | |||||||||||||||||||
| ||||||||||||||||||||||
27
Table of Contents
| Notes to financial statements | ||
| Delaware Small Cap Growth Fund | March 31, 2020 |
Delaware Group® Equity Funds IV (Trust) is organized as a Delaware statutory trust and offers 21 series. These financial statements and the related notes pertain to Delaware Small Cap Growth Fund (Fund). The Fund is an open-end investment company. The Fund is considered diversified under the Investment Company Act of 1940, as amended (1940 Act), and offers Class A, Class C, Class R, and Institutional Class shares. Class A shares are sold with a maximum front-end sales charge of 5.75%. Class A share purchases of $1,000,000 or more will incur a contingent deferred sales charge (CDSC) instead of a front-end sales charge of 1.00%, if redeemed during the first year, and 0.50% during the second year, provided that Delaware Distributors, L.P. (DDLP) paid a financial advisor a commission on the purchase of those shares. Class C shares are sold with a CDSC of 1.00%, if redeemed during the first 12 months. Class R and Institutional Class shares are not subject to a sales charge and are offered for sale exclusively to certain eligible investors.
1. Significant Accounting Policies
The Fund follows accounting and reporting guidance under Financial Accounting Standards Board (FASB) Accounting Standards Codification Topic 946, Financial Services – Investment Companies. The following accounting policies are in accordance with US generally accepted accounting principles (US GAAP) and are consistently followed by the Fund.
Security Valuation— Equity securities, except those traded on the Nasdaq Stock Market LLC (Nasdaq), are valued at the last quoted sales price as of the time of the regular close of the New York Stock Exchange on the valuation date. Equity securities traded on the Nasdaq are valued in accordance with the Nasdaq Official Closing Price, which may not be the last sales price. If, on a particular day, an equity security does not trade, the mean between the bid and ask prices will be used, which approximates fair value. US government and agency securities are valued at the mean between the bid and ask prices, which approximates fair value. Open-end investment companies are valued at their published net asset value (NAV). Generally, other securities and assets for which market quotations are not readily available are valued at fair value as determined in good faith under the direction of the Trust’s Board of Trustees (Board). In determining whether market quotations are readily available or fair valuation will be used, various factors will be taken into consideration, such as market closures or suspension of trading in a security. Restricted securities are valued at fair value using methods approved by the Board.
Federal Income Taxes— No provision for federal income taxes has been made as the Fund intends to continue to qualify for federal income tax purposes as a regulated investment company under Subchapter M of the Internal Revenue Code of 1986, as amended, and make the requisite distributions to shareholders. The Fund evaluates tax positions taken or expected to be taken in the course of preparing the Fund’s tax returns to determine whether the tax positions are “more-likely-than-not” of being sustained by the applicable tax authority. Tax positions not deemed to meet the “more-likely-than-not” threshold are recorded as a tax benefit or expense in the current year. Management has analyzed the Fund’s tax positions taken or expected to be taken on the Fund’s federal income tax returns through the year ended March 31, 2020 and for all open tax years (years ended March 31, 2017–March 31, 2019), and has concluded that no provision for federal income tax is required in the Fund’s financial statements. If applicable, the Fund recognizes interest accrued on unrecognized tax benefits in
28
Table of Contents
interest expense and penalties in “Other” on the “Statement of operations.” During the year ended March 31, 2020, the Fund did not incur any interest or tax penalties.
Class Accounting— Investment income, common expenses, and realized and unrealized gain (loss) on investments are allocated to the various classes of the Fund on the basis of daily net assets of each class. Distribution expenses relating to a specific class are charged directly to that class.
Use of Estimates— The preparation of financial statements in conformity with US GAAP requires management to make estimates and assumptions that affect the fair value of investments, the reported amounts of assets and liabilities and disclosure of contingent assets and liabilities at the date of the financial statements, and the reported amounts of revenues and expenses during the reporting period. Actual results could differ from those estimates and the differences could be material.
Other— Expenses directly attributable to the Fund are charged directly to the Fund. Other expenses common to various funds within the Delaware Funds® by Macquarie (Delaware Funds) are generally allocated among such funds on the basis of average net assets. Management fees and certain other expenses are paid monthly. Security transactions are recorded on the date the securities are purchased or sold (trade date) for financial reporting purposes. Costs used in calculating realized gains and losses on the sale of investment securities are those of the specific securities sold. Dividend income is recorded on the ex-dividend date and interest income is recorded on the accrual basis. Discounts and premiums on debt securities are accreted or amortized to interest income, respectively, over the lives of the respective securities using the effective interest method. Distributions received from investments in real estate investment trusts (REITs) are recorded as dividend income on the ex-dividend date, subject to reclassification upon notice of the character of such distributions by the issuer. The Fund declares and pays dividends from net investment income and distributions from net realized gain on investments, if any, annually. The Fund may distribute more frequently, if necessary for tax purposes. Dividends and distributions, if any, are recorded on the ex-dividend date.
The Fund receives earnings credits from its custodian when positive cash balances are maintained, which may be used to offset custody fees. There were no such earnings credits for the year ended March 31, 2020.
The Fund receives earnings credits from its transfer agent when positive cash balances are maintained, which may be used to offset transfer agent fees. If the amount earned is greater than $1, the expenses paid under this arrangement are included on the “Statement of operations” under “Dividend disbursing and transfer agent fees and expenses” with the corresponding expenses offset included under “Less expenses paid indirectly.” For the year ended March 31, 2020, the Fund earned $18 under this arrangement.
29
Table of Contents
Notes to financial statements
Delaware Small Cap Growth Fund
2. Investment Management, Administration Agreements, and Other Transactions with Affiliates
In accordance with the terms of its investment management agreement, the Fund pays Delaware Management Company (DMC), a series of Macquarie Investment Management Business Trust and the investment manager, an annual fee which is calculated daily and paid monthly at the rates of 0.75% on the first $500 million of average daily net assets of the Fund, 0.70% on the next $500 million, 0.65% on the next $1.5 billion, and 0.60% on average daily net assets in excess of $2.5 billion.
DMC has contractually agreed to waive all or a portion, if any, of its management fee and/or pay/reimburse the Fund to the extent necessary to ensure total annual operating expenses (excluding any distribution and service (12b-1) fees, acquired fund fees and expenses, taxes, interest, short sale dividend and interest expenses, brokerage fees, certain insurance costs, and nonroutine expenses or costs, including, but not limited to, those relating to reorganizations, litigation, conducting shareholder meetings, and liquidations), in order to prevent total annual fund operating expenses from exceeding 1.05% of the Fund’s average daily net assets. This waiver was in effect from April 1, 2019 through March 31, 2020.* This waiver and reimbursement may only be terminated by agreement of DMC and the Fund. The waiver and reimbursement are accrued daily and received monthly.
Delaware Investments Fund Services Company (DIFSC), an affiliate of DMC, provides fund accounting and financial administration oversight services to the Fund. For these services, DIFSC’s fees are calculated daily and paid monthly based on the aggregate daily net assets of all funds within the Delaware Funds at the following annual rates: 0.00475% of the first $35 billion; 0.0040% of the next $10 billion; and 0.0025% of aggregate average daily net assets in excess of $45 billion (Total Fee). Each fund in the Delaware Funds pays a minimum of $4,000, which, in aggregate, is subtracted from the Total Fee. Each fund then pays its portion of the remainder of the Total Fee on a relative NAV basis. This amount is included on the “Statement of operations” under “Accounting and administration expenses.” For the year ended March 31, 2020, the Fund was charged $5,246 for these services.
Effective May 30, 2019, DMC may permit its affiliates, Macquarie Investment Management Global Limited (MIMGL) and Macquarie Funds Management Hong Kong Limited (together, the “Affiliated Sub-Advisors”), to execute Fund equity security trades on behalf of the Manager. The Manager may also seek quantitative support from MIMGL. Although the Affiliated Sub-Advisors serve as sub-advisors, DMC has ultimate responsibility for all investment advisory services. For these services, DMC, not the Fund, may pay each Affiliated Sub-Advisor a portion of its investment management fee.
DIFSC is also the transfer agent and dividend disbursing agent of the Fund. For these services, DIFSC’s fees are calculated daily and paid monthly based on the aggregate daily net assets of the retail funds within the Delaware Funds at the following annual rates: 0.014% of the first $20 billion; 0.011% of the next $5 billion; 0.007% of the next $5 billion; 0.005% of the next $20 billion; and 0.0025% of average daily net assets in excess of $50 billion. The fees payable to DIFSC under the shareholder services agreement described above are allocated among all retail funds in the Delaware Funds on a relative NAV basis. This amount is included on the “Statement of operations” under “Dividend disbursing and transfer agent fees and expenses.” For the year ended March 31, 2020, the Fund was charged $3,254 for these services. Pursuant to a sub-transfer agency agreement between DIFSC and BNY Mellon Investment Servicing (US) Inc. (BNYMIS), BNYMIS provides certain sub-transfer agency services to the Fund. Sub-transfer agency fees are paid by the Fund and are also included on the “Statement of operations”
30
Table of Contents
under “Dividend disbursing and transfer agent fees and expenses.” The fees that are calculated daily and paid as invoices are received on a monthly or quarterly basis.
Pursuant to a distribution agreement and distribution plan, the Fund pays DDLP, the distributor and an affiliate of DMC, annual 12b-1 fees of 0.25%, 1.00%, and 0.50% of the average daily net assets of the Class A, Class C, and Class R shares, respectively. These fees are calculated daily and paid monthly. Institutional Class shares do not pay 12b-1 fees.
As provided in the investment management agreement, the Fund bears a portion of the cost of certain resources shared with DMC, including the cost of internal personnel of DMC and/or its affiliates that provide legal, tax, and regulatory reporting services to the Fund. For the year ended March 31, 2020, the Fund was charged $897 for internal legal, tax, and regulatory reporting services provided by DMC and/or its affiliates’ employees. This amount is included on the “Statement of operations” under “Legal fees.”
For the year ended March 31, 2020, DDLP earned $1,448 for commissions on sales of the Fund’s Class A shares.
Trustees’ fees include expenses accrued by the Fund for each Trustee’s retainer and meeting fees. Certain officers of DMC, DIFSC, and DDLP are officers and/or Trustees of the Trust. These officers and Trustees are paid no compensation by the Fund.
In addition to the management fees and other expenses of the Fund, the Fund indirectly bears the investment management fees and other expenses of the investment companies (Underlying Funds) in which it invests. The amount of these fees and expenses incurred indirectly by the Fund will vary based upon the expense and fee levels of the Underlying Funds and the number of shares that are owned of the Underlying Funds at different times.
Cross trades for the year ended March 31, 2020, were executed by the Fund pursuant to procedures adopted by the Board designed to ensure compliance with Rule 17a-7 under the 1940 Act. Cross trading is the buying or selling of portfolio securities between funds of investment companies, or between a fund of an investment company and another entity, that are or could be considered affiliates by virtue of having a common investment advisor (or affiliated investment advisors), common directors/trustees and/or common officers. At its regularly scheduled meetings, the Board reviews such transactions for compliance with the procedures adopted by the Board. Pursuant to these procedures, for the year ended March 31, 2020, the Fund engaged in securities purchases of $45,341,781.
*The aggregate contractual waiver period covering this report is from July 30, 2018 through July 29, 2020.
3. Investments
For the year ended March 31, 2020, the Fund made purchases and sales of investment securities other than short-term investments as follows:
Purchases | $104,959,665 | |||
Sales | 49,768,046 |
31
Table of Contents
Notes to financial statements
Delaware Small Cap Growth Fund
3. Investments (continued)
The tax cost of investments includes adjustments to net unrealized appreciation (depreciation) which may not necessarily be the final tax cost basis adjustments, but approximate the tax basis unrealized gains and losses that may be realized and distributed to shareholders. At March 31, 2020, the cost and unrealized appreciation (depreciation) of investments for federal income tax purposes for the Fund were as follows:
Cost of investments | $ | 67,346,382 | ||
|
| |||
Aggregate unrealized appreciation of investments | $ | 4,562,909 | ||
Aggregate unrealized depreciation of investments | (8,936,351 | ) | ||
|
| |||
Net unrealized depreciation of investments | $ | (4,373,442 | ) | |
|
|
US GAAP defines fair value as the price that the Fund would receive to sell an asset or pay to transfer a liability in an orderly transaction between market participants at the measurement date under current market conditions. A three-level hierarchy for fair value measurements has been established based upon the transparency of inputs to the valuation of an asset or liability. Inputs may be observable or unobservable and refer broadly to the assumptions that market participants would use in pricing the asset or liability. Observable inputs reflect the assumptions market participants would use in pricing the asset or liability based on market data obtained from sources independent of the reporting entity. Unobservable inputs reflect the reporting entity’s own assumptions about the assumptions that market participants would use in pricing the asset or liability based on the best information available under the circumstances. The Fund’s investment in its entirety is assigned a level based upon the observability of the inputs which are significant to the overall valuation. The three-level hierarchy of inputs is summarized below.
| Level 1 | – | Inputs are quoted prices in active markets for identical investments. (Examples: equity securities, open-end investment companies, futures contracts, and exchange-traded options contracts) | ||
| Level 2 | – | Other observable inputs, including, but not limited to: quoted prices for similar assets or liabilities in markets that are active, quoted prices for identical or similar assets or liabilities in markets that are not active, inputs other than quoted prices that are observable for the assets or liabilities (such as interest rates, yield curves, volatilities, prepayment speeds, loss severities, credit risks, and default rates) or other market-corroborated inputs. (Examples: debt securities, government securities, swap contracts, foreign currency exchange contracts, foreign securities utilizing international fair value pricing, broker-quoted securities, and fair valued securities) | ||
| Level 3 | – | Significant unobservable inputs, including the Fund’s own assumptions used to determine the fair value of investments. (Examples: broker-quoted securities and fair valued securities) | ||
Level 3 investments are valued using significant unobservable inputs. The Fund may also use an income-based valuation approach in which the anticipated future cash flows of the investment are discounted to calculate fair value. Discounts may also be applied due to the nature or duration of any restrictions on the disposition of the investments. Valuations may also be based upon current market prices of securities that are comparable in coupon, rating, maturity, and industry. The derived value of a
32
Table of Contents
Level 3 investment may not represent the value which is received upon disposition and this could impact the results of operations.
The following table summarizes the valuation of the Fund’s investments by fair value hierarchy levels as of March 31, 2020:
| Level 1 | ||||
Securities | ||||
Assets: | ||||
Common Stock | $62,972,940 | |||
During the year ended March 31, 2020, there were no transfers between Level 1 investments, Level 2 investments, or Level 3 investments that had a significant impact to the Fund. The Fund’s policy is to recognize transfers between levels based on fair value at the beginning of the reporting period.
A reconciliation of Level 3 investments is presented when the Fund has a significant amount of Level 3 investments at the beginning, interim, or end of the period in relation to the Fund’s net assets. During the year ended March 31, 2020, there were no Level 3 investments.
4. Dividend and Distribution Information
Income and long-term capital gain distributions are determined in accordance with federal income tax regulations, which may differ from US GAAP. Additionally, distributions from net short-term gains on sales of investment securities are treated as ordinary income for federal income tax purposes. The tax character of dividends and distributions paid during the years ended March 31, 2020 and 2019 were as follows:
| Year ended | ||||||||||||
| 3/31/20 | 3/31/19 | |||||||||||
Ordinary income | $ | — | $ | 1,733,592 | ||||||||
Long-term capital gains | 1,026,166 | 902,576 | ||||||||||
|
|
|
| |||||||||
Total | $ | 1,026,166 | $ | 2,636,168 | ||||||||
|
|
|
| |||||||||
5. Components of Net Assets on a Tax Basis
As of March 31, 2020, the components of net assets on a tax basis were as follows:
Shares of beneficial interest | $ | 67,881,348 | ||
Qualified late year loss deferrals | (639,271 | ) | ||
Net unrealized depreciation on investments, foreign currencies, and derivatives | (4,373,442 | ) | ||
|
| |||
Net assets | $ | 62,868,635 | ||
|
|
The differences between book basis and tax basis components of net assets are primarily attributable to tax deferral of losses on wash sales.
Qualified late year losses represent ordinary losses realized from Jan. 1, 2020 through March 31, 2020 and capital losses realized from Nov. 1, 2019 through March 31, 2020, that in accordance with federal income tax regulations, the Fund has elected to defer and treat as having arisen in the following fiscal year.
33
Table of Contents
Notes to financial statements
Delaware Small Cap Growth Fund
5. Components of Net Assets on a Tax Basis (continued)
For financial reporting purposes, capital accounts are adjusted to reflect the tax character of permanent book/tax differences. Reclassifications are primarily due to tax treatment of net operating losses. Results of operations and net assets were not affected by these reclassifications. For the year ended March 31, 2020, the Funds recorded the following reclassifications:
Total distributable earnings (loss) | $ | 236,113 | ||
Total paid in capital | $ | (236,113 | ) |
6. Capital Shares
Transactions in capital shares were as follows:
| Year ended | ||||||||||||
| 3/31/20 | 3/31/19 | |||||||||||
Shares sold: | ||||||||||||
Class A | 79,439 | 248,349 | ||||||||||
Class C | 81,725 | 49,195 | ||||||||||
Class R | 1,871 | 126,784 | ||||||||||
Institutional Class | 6,930,241 | 270,993 | ||||||||||
Shares issued upon reinvestment of dividends and distributions: | ||||||||||||
Class A | 3,377 | 42,215 | ||||||||||
Class C | 999 | 8,698 | ||||||||||
Class R | 1,729 | 43,737 | ||||||||||
Institutional Class | 90,553 | 188,030 | ||||||||||
|
|
|
| |||||||||
| 7,189,934 | 978,001 | |||||||||||
|
|
|
| |||||||||
Shares redeemed: | ||||||||||||
Class A | (84,596 | ) | (103,629 | ) | ||||||||
Class C | (43,101 | ) | (15,923 | ) | ||||||||
Class R | (34,051 | ) | (17,642 | ) | ||||||||
Institutional Class | (1,555,682 | ) | (259,423 | ) | ||||||||
|
|
|
| |||||||||
| (1,717,430 | ) | (396,617 | ) | |||||||||
|
|
|
| |||||||||
Net increase | 5,472,504 | 581,384 | ||||||||||
|
|
|
| |||||||||
34
Table of Contents
Certain shareholders may exchange shares of one class for shares of another class in the same Fund. These exchange transactions are included as subscriptions and redemptions in the table above and on the “Statements of changes in net assets.” For the years ended March 31, 2020 and 2019, the Fund had the following exchange transactions:
| Exchange Redemptions | Exchange Subscriptions | |||||
| Class C | Class A | |||||
| Year ended | Shares | Shares | Value | |||
3/31/20 | 89 | 86 | $918 | |||
3/31/19 | 69 | 67 | 752 |
7. Line of Credit
The Fund, along with certain other funds in the Delaware Funds (Participants), was a participant in a $220,000,000 revolving line of credit intended to be used for temporary or emergency purposes as an additional source of liquidity to fund redemptions of investor shares. Under the agreement, the Participants were charged an annual commitment fee of 0.15%, which was allocated across the Participants based on a weighted average of the respective net assets of each Participant. The Participants were permitted to borrow up to a maximum of one-third of their net assets under the agreement. Each Participant was individually, and not jointly, liable for its particular advances, if any, under the line of credit. The line of credit available under the agreement expired on Nov. 4, 2019.
On Nov. 4, 2019, the Participants entered into an amendment to the agreement for a $250,000,000 revolving line of credit. The revolving line of credit is to be used as described above and operates in substantially the same manner as the original agreement. The line of credit available under the agreement expires on Nov. 2, 2020.
The Fund had no amounts outstanding as of March 31, 2020, or at any time during the year then ended.
8. Securities Lending
The Fund, along with other funds in the Delaware Funds, may lend its securities pursuant to a security lending agreement (Lending Agreement) with The Bank of New York Mellon (BNY Mellon). At the time a security is loaned, the borrower must post collateral equal to the required percentage of the market value of the loaned security, including any accrued interest. The required percentage is: (1) 102% with respect to US securities and foreign securities that are denominated and payable in US dollars; and (2) 105% with respect to foreign securities. With respect to each loan, if on any business day, the aggregate market value of securities collateral plus cash collateral held is less than the aggregate market value of the securities which are the subject of such loan, the borrower will be notified to provide additional collateral by the end of the following business day, which, together with the collateral already held, will be not less than the applicable initial collateral requirements for such security loan. If the aggregate market value of securities collateral and cash collateral held with respect to a security loan exceeds the applicable initial collateral requirement, upon request of the borrower, BNY Mellon must return enough collateral to the borrower by the end of the following business day to reduce the value of the remaining collateral to the applicable initial collateral requirement for such security loan. As a result of the foregoing, the value of the collateral held with respect to a loaned security on any particular day, may be
35
Table of Contents
Notes to financial statements
Delaware Small Cap Growth Fund
8. Securities Lending (continued)
more or less than the value of the security on loan. The collateral percentage with respect to the market value of the loaned security is determined by the security lending agent.
Cash collateral received by each fund of the Trust is generally invested in a series of individual separate accounts, each corresponding to a fund. The investment guidelines permit each separate account to hold certain securities that would be considered eligible securities for a money market fund. Cash collateral received is generally invested in government securities; certain obligations issued by government sponsored enterprises; repurchase agreements collateralized by US Treasury securities; obligations issued by the central government of any Organization for Economic Cooperation and Development (OECD) country or its agencies, instrumentalities, or establishments; obligations of supranational organizations; commercial paper, notes, bonds, and other debt obligations; certificates of deposit, time deposits, and other bank obligations; and asset-backed securities. The Fund can also accept US government securities and letters of credit (non-cash collateral) in connection with securities loans.
In the event of default or bankruptcy by the lending agent, realization and/or retention of the collateral may be subject to legal proceedings. In the event the borrower fails to return loaned securities and the collateral received is insufficient to cover the value of the loaned securities and provided such collateral shortfall is not the result of investment losses, the lending agent has agreed to pay the amount of the shortfall to the Fund or, at the discretion of the lending agent, replace the loaned securities. The Fund continues to record dividends or interest, as applicable, on the securities loaned and is subject to changes in value of the securities loaned that may occur during the term of the loan. The Fund has the right under the Lending Agreement to recover the securities from the borrower on demand. With respect to security loans collateralized by non-cash collateral, the Fund receives loan premiums paid by the borrower. With respect to security loans collateralized by cash collateral, the earnings from the collateral investments are shared among the Fund, the security lending agent, and the borrower. The Fund records security lending income net of allocations to the security lending agent and the borrower.
The Fund may incur investment losses as a result of investing securities lending collateral. This could occur if an investment in the collateral investment account defaulted or became impaired. Under those circumstances, the value of the Fund’s cash collateral account may be less than the amount the Fund would be required to return to the borrowers of the securities and the Fund would be required to make up for this shortfall.
During the year ended March 31, 2020, the Fund had no securities out on loan.
9. Credit and Market Risk
The Fund invests in growth stocks (such as those in the technology sector), which reflect projections of future earnings and revenue. These prices may rise or fall dramatically depending on whether those projections are met. These companies’ stock prices may be more volatile, particularly over the short-term.
The Fund invests a significant portion of its assets in small companies and may be subject to certain risks associated with ownership of securities of such companies. Investments in small-sized companies
36
Table of Contents
may be more volatile than investments in larger companies for a number of reasons, which include limited financial resources or a dependence on narrow product lines.
The Fund may invest up to 15% of its net assets in illiquid securities, which may include securities with contractual restrictions on resale, securities exempt from registration under Rule 144A, promulgated under the Securities Act of 1933, as amended, and other securities which may not be readily marketable. The relative illiquidity of these securities may impair the Fund from disposing of them in a timely manner and at a fair price when it is necessary or desirable to do so. While maintaining oversight, the Board has delegated to DMC, the day-to-day functions of determining whether individual securities are liquid for purposes of the Fund’s limitation on investments in illiquid securities. Securities eligible for resale pursuant to Rule 144A, which are determined to be liquid, are not subject to the Fund’s 15% limit on investments in illiquid securities. As of March 31, 2020, there were no Rule 144A securities held by the Fund.
10. Contractual Obligations
The Fund enters into contracts in the normal course of business that contain a variety of indemnifications. The Fund’s maximum exposure under these arrangements is unknown. However, the Fund has not had prior claims or losses pursuant to these contracts. Management has reviewed the Fund’s existing contracts and expects the risk of loss to be remote.
11. Recent Accounting Pronouncements
In August 2018, the FASB issued an Accounting Standards Update (ASU), ASU 2018-13, which changes certain fair value measurement disclosure requirements. ASU 2018-13, in addition to other modifications and additions, removes the requirement to disclose the amount and reasons for transfers between Level 1 and Level 2 of the fair value hierarchy, the policy for the timing of transfers between levels and the valuation process for Level 3 fair value measurements. ASU 2018-13 is effective for fiscal years, and interim periods within those fiscal years, beginning after Dec. 15, 2019. At this time, Management is evaluating the implications of these changes on the financial statements.
12. Subsequent Events
On Nov. 4, 2019, the Fund, along with certain other funds in the Delaware Funds (Participants), entered into an amendment to the agreement for a $250,000,000 revolving line of credit. The revolving line of credit available was increased to $275,000,000 on May 6, 2020. The revolving line of credit is to be used as described above and operates in substantially the same manner as the original agreement.
Beginning in January 2020, global financial markets have experienced and may continue to experience significant volatility resulting from the spread of a novel coronavirus known as COVID-19. The outbreak of COVID-19 has resulted in travel and border restrictions, quarantines, supply chain disruptions, lower consumer demand and general market uncertainty. The effects of COVID-19 have and may continue to adversely affect the global economy, the economies of certain nations and individual issuers, all of which may negatively impact the Fund’s performance.
Management has determined that no other material events or transactions occurred subsequent to March 31, 2020, that would require recognition or disclosure in the Fund’s financial statements.
37
Table of Contents
registered public accounting firm
To the Board of Trustees of Delaware Group® Equity Funds IV and Shareholders of Delaware Small Cap Growth Fund
Opinion on the Financial Statements
We have audited the accompanying statement of assets and liabilities, including the schedule of investments, of Delaware Small Cap Growth Fund (one of the funds constituting the Delaware Group® Equity Funds IV, referred to hereafter as the “Fund”) as of March 31, 2020, the related statement of operations for the year ended March 31, 2020, the statements of changes in net assets for each of the two years in the period ended March 31, 2020, including the related notes, and the financial highlights for each of the periods indicated therein (collectively referred to as the “financial statements”). In our opinion, the financial statements present fairly, in all material respects, the financial position of the Fund as of March 31, 2020, the results of its operations for the year then ended, the changes in its net assets for each of the two years in the period ended March 31, 2020 and the financial highlights for each of the periods indicated therein in conformity with accounting principles generally accepted in the United States of America.
Basis for Opinion
These financial statements are the responsibility of the Fund’s management. Our responsibility is to express an opinion on the Fund’s financial statements based on our audits. We are a public accounting firm registered with the Public Company Accounting Oversight Board (United States) (PCAOB) and are required to be independent with respect to the Fund in accordance with the U.S. federal securities laws and the applicable rules and regulations of the Securities and Exchange Commission and the PCAOB.
We conducted our audits of these financial statements in accordance with the standards of the PCAOB. Those standards require that we plan and perform the audit to obtain reasonable assurance about whether the financial statements are free of material misstatement, whether due to error or fraud.
Our audits included performing procedures to assess the risks of material misstatement of the financial statements, whether due to error or fraud, and performing procedures that respond to those risks. Such procedures included examining, on a test basis, evidence regarding the amounts and disclosures in the financial statements. Our audits also included evaluating the accounting principles used and significant estimates made by management, as well as evaluating the overall presentation of the financial statements. Our procedures included confirmation of securities owned as of March 31, 2020 by correspondence with the custodian and brokers; when replies were not received from brokers, we performed other auditing procedures. We believe that our audits provide a reasonable basis for our opinion.
/s/PricewaterhouseCoopers LLP
Philadelphia, Pennsylvania
May 26, 2020
We have served as the auditor of one or more investment companies in Delaware Funds® by Macquarie since 2010.
38
Table of Contents
Other Fund information (Unaudited)
Delaware Small Cap Growth Fund
Tax Information
The information set forth below is for the Fund’s fiscal year as required by federal income tax laws. Shareholders, however, must report distributions on a calendar year basis for income tax purposes, which may include distributions for portions of two fiscal years of the Fund. Accordingly, the information needed by shareholders for income tax purposes will be sent to them in January of each year. Please consult your tax advisor for proper treatment of this information.
All disclosures are based on financial information available as of the date of this annual report and, accordingly are subject to change. For any and all items requiring reporting, it is the intention of the Fund to report the maximum amount permitted under the Internal Revenue Code and the regulations thereunder.
For the fiscal year ended March 31, 2020, the Fund reports distributions paid during the year as follows:
(A) Long-Term Capital Gain Distributions (Tax Basis) | 100.00 | % | ||
(A) is based on a percentage of the Fund’s total distributions. | ||||
39
Table of Contents
Board of trustees / directors and officers addendum
Delaware Funds®by Macquarie
A mutual fund is governed by a Board of Trustees/Directors (“Trustees”), which has oversight responsibility for the management of a fund’s business affairs. Trustees establish procedures and oversee and review the performance of the investment manager, the distributor, and others who perform services for the fund. The independent fund trustees, in particular, are advocates
Name, Address, and Birth Date | Position(s) Held with Fund(s) | Length of Time Served | ||
Interested Trustee
| ||||
| Shawn K. Lytle1 | President, | President and | ||
| 2005 Market Street | Chief Executive Officer, | Chief Executive Officer | ||
| Philadelphia, PA 19103 | and Trustee | since August 2015 | ||
| February 1970 | ||||
| Trustee since | ||||
| September 2015 | ||||
Independent Trustees
| ||||
| Thomas L. Bennett | Chair and Trustee | Trustee since | ||
| 2005 Market Street | March 2005 | |||
| Philadelphia, PA 19103 | ||||
| October 1947 | Chair since | |||
March 2015
| ||||
| Jerome D. Abernathy | Trustee | Since January 2019 | ||
| 2005 Market Street | ||||
| Philadelphia, PA 19103 | ||||
| July 1959 | ||||
| Ann D. Borowiec | Trustee | Since March 2015 | ||
| 2005 Market Street | ||||
| Philadelphia, PA 19103 | ||||
| November 1958 | ||||
| 1 | Shawn K. Lytle is considered to be an “Interested Trustee“ because he is an executive officer of the Fund’s(s’) investment advisor. |
40
Table of Contents
for shareholder interests. Each trustee has served in that capacity since he or she was elected to or appointed to the Board of Trustees, and will continue to serve until his or her retirement or the election of a new trustee in his or her place. The following is a list of the Trustees and Officers with certain background and related information.
Principal Occupation(s) During the Past Five Years | Number of Portfolios in Fund Complex Overseen by Trustee or Officer | Other Directorships Held by Trustee or Officer | ||
| ||||
| President — Macquarie | 95 | Trustee — UBS | ||
| Investment Management2 | Relationship Funds, | |||
| (June 2015–Present) | SMA Relationship | |||
| Trust, and UBS Funds | ||||
| Regional Head of | (May 2010–April 2015) | |||
| Americas —UBS Global | ||||
| Asset Management | ||||
| (April 2010–May 2015) | ||||
| ||||
| Private Investor | 95 | None | ||
| (March 2004–Present) | ||||
| Managing Member, | 95 | None | ||
| Stonebrook Capital | ||||
Management, LLC (financial technology: macro factors and databases) | ||||
| (January 1993–Present) | ||||
| Chief Executive Officer, | 95 | Director — | ||
| Private Wealth Management | Banco Santander International | |||
| (2011–2013) and | (October 2016– | |||
| Market Manager, | December 2019) | |||
| New Jersey Private | ||||
| Bank (2005–2011) — | Director — | |||
| J.P. Morgan Chase & Co. | Santander Bank, N.A. | |||
| (December 2016– | ||||
| December 2019) | ||||
| 2 | Macquarie Investment Management is the marketing name for Macquarie Management Holdings, Inc. and its subsidiaries, including the Fund’s(s’) investment advisor, principal underwriter, and its transfer agent. |
41
Table of Contents
Board of trustees / directors and officers addendum
Delaware Funds®by Macquarie
Name, Address, and Birth Date | Position(s) Held with Fund(s) | Length of Time Served | ||
Independent Trustees (continued)
| ||||
| Joseph W. Chow | Trustee | Since January 2013 | ||
| 2005 Market Street | ||||
| Philadelphia, PA 19103 | ||||
| January 1953 | ||||
| John A. Fry | Trustee | Since January 2001 | ||
| 2005 Market Street | ||||
| Philadelphia, PA 19103 | ||||
| May 1960 | ||||
| Lucinda S. Landreth | Trustee | Since March 2005 | ||
| 2005 Market Street | ||||
| Philadelphia, PA 19103 | ||||
| June 1947 | ||||
42
Table of Contents
Principal Occupation(s) During the Past Five Years | Number of Portfolios in Fund Complex Overseen by Trustee or Officer | Other Directorships Held by Trustee or Officer | ||
| ||||
| Private Investor | 95 | Director and Audit Committee | ||
| (April 2011–Present) | Member — Hercules | |||
| Technology Growth | ||||
| Capital, Inc. | ||||
(July 2004–July 2014)
| ||||
| President — | 95 |
Director; Compensation | ||
| Drexel University | Committee and | |||
| (August 2010–Present) | Governance Committee | |||
| Member — Community | ||||
| President — | Health Systems | |||
| Franklin & Marshall College | (May 2004–Present) | |||
| (July 2002–June 2010) | ||||
| Director — Drexel | ||||
| Morgan & Co. | ||||
| (2015–2019) | ||||
| Director and Audit Committee | ||||
| Member — vTv | ||||
| Therapeutics Inc. | ||||
| (2017–Present) | ||||
| Director and Audit Committee | ||||
| Member — FS Credit Real | ||||
| Estate Income Trust, Inc. | ||||
| (2018–Present) | ||||
| Director — Federal Reserve | ||||
| Bank of Philadelphia | ||||
| (January 2020–Present) | ||||
| Private Investor | 95 | None | ||
(2004–Present)
| ||||
43
Table of Contents
Board of trustees / directors and officers addendum
Delaware Funds®by Macquarie
Name, Address, and Birth Date | Position(s) Held with Fund(s) | Length of Time Served | ||
Independent Trustees (continued)
| ||||
| Frances A. Sevilla-Sacasa | Trustee | Since September 2011 | ||
| 2005 Market Street | ||||
| Philadelphia, PA 19103 | ||||
| January 1956 | ||||
| Thomas K. Whitford | Trustee | Since January 2013 | ||
| 2005 Market Street | ||||
| Philadelphia, PA 19103 | ||||
| March 1956 | ||||
44
Table of Contents
Principal Occupation(s) During the Past Five Years | Number of Portfolios in Fund Complex Overseen by Trustee or Officer | Other Directorships Held by Trustee or Officer | ||
| ||||
| Private Investor | 95 | Trust Manager and | ||
| (January 2017–Present) | Audit Committee | |||
| Chair — Camden | ||||
| Chief Executive Officer — | Property Trust | |||
| Banco Itaú | (August 2011–Present) | |||
| International | ||||
| (April 2012–December 2016) | Director; Strategic | |||
| Planning and Reserves | ||||
| Executive Advisor to Dean | Committee and Nominating | |||
| (August 2011–March 2012) | and Governance | |||
| and Interim Dean | Committee Member — | |||
| (January 2011–July 2011) — | Callon Petroleum Company | |||
| University of Miami School of | (December 2019–Present) | |||
| Business Administration | ||||
| Director; Audit | ||||
| President — U.S. Trust, | Committee Member — | |||
| Bank of America Private | Carrizo Oil & Gas, Inc. | |||
| Wealth Management | (March 2018–December 2019) | |||
| (Private Banking) | ||||
| (July 2007–December 2008) | ||||
| Vice Chairman | 95 | Director — HSBC North | ||
| (2010–April 2013) — | America Holdings Inc. | |||
| PNC Financial | (December 2013–Present) | |||
| Services Group | ||||
| Director — HSBC USA Inc. | ||||
| (July 2014–Present) | ||||
| Director — | ||||
| HSBC Bank USA, | ||||
| National Association | ||||
| (July 2014–March 2017) | ||||
| Director — HSBC | ||||
| Finance Corporation | ||||
(December 2013–April 2018)
| ||||
45
Table of Contents
Board of trustees / directors and officers addendum
Delaware Funds®by Macquarie
Name, Address, and Birth Date | Position(s) Held with Fund(s) | Length of Time Served | ||
Independent Trustees (continued)
| ||||
| Christianna Wood | Trustee | Since January 2019 | ||
| 2005 Market Street | ||||
| Philadelphia, PA 19103 | ||||
| August 1959 | ||||
46
Table of Contents
Principal Occupation(s) During the Past Five Years | Number of Portfolios in Fund Complex Overseen by Trustee or Officer | Other Directorships Held by Trustee or Officer | ||
| ||||
| Chief Executive Officer | 95 | Director; Finance Committee | ||
| and President — | and Audit Committee | |||
| Gore Creek | Member — H&R | |||
| Capital, Ltd. | Block Corporation | |||
| (August 2009–Present) | (July 2008–Present) | |||
| Director; Investments | ||||
| Committee, Capital | ||||
| and Finance | ||||
| Committee, and Audit | ||||
| Committee Member — | ||||
| Grange Insurance | ||||
| (2013–Present) | ||||
| Trustee; Chair of | ||||
| Nominating and Governance | ||||
| Committee and Audit | ||||
| Committee Member — | ||||
| The Merger Fund | ||||
| (2013–Present), | ||||
| The Merger Fund VL | ||||
| (2013-Present), | ||||
| WCM Alternatives: | ||||
| Event-Driven Fund | ||||
| (2013–Present), | ||||
| and WCM Alternatives: | ||||
| Credit Event Fund | ||||
| (December 2017–Present) | ||||
| Director; Chair of | ||||
| Governance Committee | ||||
| and Audit Committee | ||||
| Member — International | ||||
| Securities Exchange | ||||
| (2010–2016) | ||||
47
Table of Contents
Board of trustees / directors and officers addendum
Delaware Funds®by Macquarie
Name, Address, and Birth Date | Position(s) Held with Fund(s) | Length of Time Served | ||
Independent Trustees (continued)
| ||||
| Janet L. Yeomans | Trustee | Since April 1999 | ||
| 2005 Market Street | ||||
| Philadelphia, PA 19103 | ||||
| July 1948 | ||||
Officers
| ||||
| David F. Connor | Senior Vice President, | Senior Vice President since | ||
| 2005 Market Street | General Counsel, | May 2013; General | ||
| Philadelphia, PA 19103 | and Secretary | Counsel since May 2015; | ||
| December 1963 | Secretary since | |||
| October 2005 | ||||
| Daniel V. Geatens | Vice President | Vice President and | ||
| 2005 Market Street | and Treasurer | Treasurer since October 2007 | ||
| Philadelphia, PA 19103 | ||||
| October 1972 | ||||
| Richard Salus | Senior Vice President | Senior Vice President and | ||
| 2005 Market Street | and Chief Financial Officer | Chief Financial Officer | ||
| Philadelphia, PA 19103 | since November 2006 | |||
| October 1963 | ||||
The Statement of Additional Information for the Fund(s) includes additional information about the Trustees and Officers and is available, without charge, upon request by calling 800 523-1918.
48
Table of Contents
Principal Occupation(s) During the Past Five Years | Number of Portfolios in Fund Complex Overseen by Trustee or Officer | Other Directorships Held by Trustee or Officer | ||
| ||||
| Vice President and Treasurer | 95 | Director; Personnel and | ||
| (January 2006–July 2012), | Compensation Committee | |||
| Vice President — | Chair; Member of Nominating, | |||
| Mergers & Acquisitions | Investments, and Audit | |||
| (January 2003–January 2006), | Committees for various | |||
| and Vice President | periods throughout | |||
| and Treasurer | directorship — | |||
| (July 1995–January 2003) — | Okabena Company | |||
| 3M Company | (2009–2017) | |||
| ||||
| David F. Connor has served | 95 | None3 | ||
in various capacities at different times at | ||||
| Macquarie Investment | ||||
| Management. | ||||
| Daniel V. Geatens has served | 95 | None3 | ||
in various capacities at different times at | ||||
| Macquarie Investment | ||||
| Management. | ||||
| Richard Salus has served | 95 | None | ||
in various capacities at different times at | ||||
| Macquarie Investment | ||||
| Management. |
3 David F. Connor and Daniel V. Geatens serve in similar capacities for the six portfolios of the Optimum Fund Trust, which have the same investment advisor, principal underwriter, and transfer agent as the registrant. Mr. Geatens also serves as the Chief Financial Officer of the Optimum Fund Trust, and he is the Chief Financial Officer and Treasurer for Macquarie Global Infrastructure Total Return Fund Inc.
49
Table of Contents
| Board of trustees | ||||||
Shawn K. Lytle President and Chief Executive Officer Delaware Funds® by Macquarie Philadelphia, PA
Thomas L. Bennett Chairman of the Board Delaware Funds by Macquarie Private Investor Rosemont, PA
Jerome D. Abernathy Managing Member Stonebrook Capital Management, LLC Jersey City, NJ | Ann D. Borowiec Former Chief Executive Officer Private Wealth Management J.P. Morgan Chase & Co. New York, NY
Joseph W. Chow Former Executive Vice President State Street Corporation Boston, MA
John A. Fry President Drexel University Philadelphia, PA
| Lucinda S. Landreth Former Chief Investment Officer Assurant, Inc. New York, NY
Frances A. Sevilla-Sacasa Former Chief Executive Officer Banco Itaú International Miami, FL | Thomas K. Whitford Former Vice Chairman PNC Financial Services Group Pittsburgh, PA
Christianna Wood Chief Executive Officer and President Gore Creek Capital, Ltd. Golden, CO
Janet L. Yeomans Former Vice President and Treasurer 3M Company St. Paul, MN | |||
| Affiliated officers | ||||||
| David F. Connor | Daniel V. Geatens | Richard Salus | ||||
Senior Vice President, General Counsel, and Secretary Delaware Funds by Macquarie Philadelphia, PA | Vice President and Treasurer Delaware Funds by Macquarie Philadelphia, PA | Senior Vice President and Chief Financial Officer Delaware Funds by Macquarie Philadelphia, PA | ||||
This annual report is for the information of Delaware Small Cap Growth Fund shareholders, but it may be used with prospective investors when preceded or accompanied by the Delaware Fund fact sheet for the most recently completed calendar quarter. These documents are available at delawarefunds.com/literature.
The Fund files its complete schedule of portfolio holdings with the Securities and Exchange Commission (SEC) for the first and third quarters of each fiscal year on Form N-PORT. The Fund’s Forms N-PORT, as well as a description of the policies and procedures that the Fund uses to determine how to vote proxies (if any) relating to portfolio securities, are available without charge (i) upon request, by calling 800 523-1918; and (ii) on the SEC’s website at sec.gov. In addition, a description of the policies and procedures that the Fund uses to determine how to vote proxies (if any) relating to portfolio securities and the Schedule of Investments included in the Fund’s most recent Form N-PORT are available without charge on the Fund’s website at delawarefunds.com/literature. The Fund’s Forms N-PORT may be reviewed and copied at the SEC’s Public Reference Room in Washington, D.C.; information on the operation of the Public Reference Room may be obtained by calling 800 SEC-0330.
Information (if any) regarding how the Fund voted proxies relating to portfolio securities during the most recently disclosed 12-month period ended June 30 is available without charge (i) through the Fund’s website at delawarefunds.com/proxy; and (ii) on the SEC’s website at sec.gov.
50
Table of Contents
 |  |
Annual report
US equity mutual fund
Delaware Smid Cap Growth Fund
March 31, 2020
Beginning on or about June 1, 2021, as permitted by regulations adopted by the Securities and Exchange Commission, paper copies of your Fund’s shareholder reports will no longer be sent to you by mail, unless you specifically request them from the Fund or from your financial intermediary, such as a broker/dealer, bank, or insurance company. Instead, you will be notified by mail each time a report is posted on the website and provided with a link to access the report.
If you already elected to receive shareholder reports electronically, you will not be affected by this change and you do not need to take any action. You may elect to receive shareholder reports and other communications from the Fund electronically by signing up at delawarefunds.com/edelivery. If you own these shares through a financial intermediary, you may contact your financial intermediary.
You may elect to receive paper copies of all future shareholder reports free of charge. You can inform the Fund that you wish to continue receiving paper copies of your shareholder reports by contacting us at 800 523-1918. If you own these shares through a financial intermediary, you may contact your financial intermediary to elect to continue to receive paper copies of your shareholder reports. Your election to receive reports in paper will apply to all funds held with the Delaware Funds® by Macquarie or your financial intermediary.
|
Carefully consider the Fund’s investment objectives, risk factors, charges, and expenses before investing. This and other information can be found in the Fund’s prospectus and its summary prospectus, which may be obtained by visiting delawarefunds.com/literature or calling 800 523-1918. Investors should read the prospectus and the summary prospectus carefully before investing.
You can obtain shareholder reports and prospectuses online instead of in the mail. Visit delawarefunds.com/edelivery.
Table of Contents
Experience Delaware Funds®by Macquarie
Macquarie Investment Management (MIM) is a global asset manager with offices in the United States, Europe, Asia, and Australia. As active managers, we prioritize autonomy and accountability at the investment team level in pursuit of opportunities that matter for clients. Delaware Funds is one of the longest-standing mutual fund families, with more than 80 years in existence.
If you are interested in learning more about creating an investment plan, contact your financial advisor.
You can learn more about Delaware Funds or obtain a prospectus for Delaware Smid Cap Growth Fund at delawarefunds.com/literature.
Manage your account online
| ● | Check your account balance and transactions |
| ● | View statements and tax forms |
| ● | Make purchases and redemptions |
Visit delawarefunds.com/account-access.
Macquarie Asset Management (MAM) offers a diverse range of products including securities investment management, infrastructure and real asset management, and fund and equity-based structured products. MIM is the marketing name for certain companies comprising the asset management division of Macquarie Group. This includes the following investment advisers: Macquarie Investment Management Business Trust (MIMBT), Macquarie Funds Management Hong Kong Limited, Macquarie Investment Management Austria Kapitalanlage AG, Macquarie Investment Management Global Limited, Macquarie Investment Management Europe Limited, Macquarie Capital Investment Management LLC, and Macquarie Investment Management Europe S.A.
The Fund is distributed byDelaware Distributors, L.P. (DDLP), an affiliate of MIMBT and Macquarie Group Limited.
Other than Macquarie Bank Limited (MBL), none of the entities noted are authorized deposit-taking institutions for the purposes of the Banking Act 1959 (Commonwealth of Australia). The obligations of these entities do not represent deposits or other liabilities of MBL. MBL does not guarantee or otherwise provide assurance in respect of the obligations of these entities, unless noted otherwise. The Fund is governed by US laws and regulations.
| Table of contents | ||||
| 1 | ||||
| 5 | ||||
| 9 | ||||
Security type / sector allocation and top 10 equity holdings | 11 | |||
| 13 | ||||
| 15 | ||||
| 17 | ||||
| 18 | ||||
| 20 | ||||
| 30 | ||||
| 42 | ||||
| 43 | ||||
| 44 | ||||
| 54 | ||||
Unless otherwise noted, views expressed herein are current as of March 31, 2020, and subject to change for events occurring after such date.
The Fund is not FDIC insured and is not guaranteed. It is possible to lose the principal amount invested.
Advisory services are provided by Delaware Management Company, a series of MIMBT, a US registered investment advisor.
All third-party marks cited are the property of their respective owners.
© 2020 Macquarie Management Holdings, Inc.
Table of Contents
| Delaware Smid Cap Growth Fund | April 7, 2020 (Unaudited) |
Performance preview (for the year ended March 31, 2020) | ||||||||
Delaware Smid Cap Growth Fund (Institutional Class shares)* | 1-year return | -3.72% | ||||||
Delaware Smid Cap Growth Fund (Class A shares) | 1-year return | -3.96% | ||||||
Russell 2500™ Growth Index (benchmark) | 1-year return | -14.40% | ||||||
Past performance does not guarantee future results.
For complete, annualized performance for Delaware Smid Cap Growth Fund, please see the table on page 5. Institutional Class shares are not subject to a sales charge and are offered for sale exclusively to certain eligible investors. In addition, Institutional Class shares pay no distribution and service fee.
The performance of Class A shares excludes the applicable sales charge. Both Institutional Class shares and Class A shares reflect the reinvestment of all distributions.
Please see page 7 for a description of the index. Index performance returns do not reflect any management fees, transaction costs, or expenses. Indices are unmanaged and one cannot invest directly in an index.
*Total return for the report period presented in the table differs from the return in “Financial highlights.” The total return presented in the above table is calculated based on the net asset value (NAV) at which shareholder transactions were processed. The total return presented in “Financial highlights” is calculated in the same manner but also takes into account certain adjustments that are necessary under US generally accepted accounting principles (US GAAP) required in the annual report.
Investment objective
The Fund seeks long-term capital appreciation.
Market review
Both the economy and the markets enjoyed sustained growth through the first 10 months of the Fund’s fiscal year ended March 31, 2020, as major market indices achieved new highs through mid-January. Lower interest rates and the apparent resolution of the US-China trade war were largely responsible.
When the fiscal year began, the US Federal Reserve was setting the stage for lower interest rates, an acknowledgement that its last increase, in December 2018, might have been overdone. In July 2019, the Fed implemented the first of three 0.25-percentage-point cuts that brought its target rate down to 1.50%-1.75% by the end of October. In January 2020, the signing of a Phase 1 trade agreement brought some clarity to the often-acrimonious trade dispute with China.
Investors were not the only winners, however. Consumers, who account for 70% of gross domestic product (GDP), had achieved generational highs for savings rates while reaping
At the end of the fiscal year, we’ve taken a two-pronged approach to positioning the Fund by focusing on those companies that we think can either maintain business or recover quickly: • First, as we recover from the pandemic, we believe there are certain industries and companies, such as streaming media, telecommunications software, and consumer staples, that should do well throughout. • Second, there are other areas, such as digital currency, online dating, and fast-casual restaurants, that we think should do well once social-distancing measures are relaxed and people have the opportunity to get back out and meet with friends, family, and new people again. The businesses that have the potential to meet the pent-up demand for normalcy look attractive to us.
|
1
Table of Contents
Portfolio management review
Delaware Smid Cap Growth Fund
the benefit of a cyclical high for wage growth. And thanks to a highly regulated banking system that was not extending credit easily, consumer credit scores were also at all-time highs.
Then the pandemic took hold. From its late 2019 start in China’s Wuhan province, the virus spread in January throughout Asia, Australia, Europe, and the United States. In February, markets reacted suddenly and swiftly, sinking more than 30% in just a few weeks.
Following in the footsteps of other countries, governments in the US, both at the state and municipal level, took action to slow the spread of the disease. The social-distancing measures, which included banning large groups and closing nonessential businesses, had an immediate impact on the economy. Global economies that had enjoyed a sustained period of moderate growth swiftly plunged into recessions, with GDPs likely cut nearly in half. In the last week of the 12-month period, initial jobless claims jumped to 3.3 million, more than 10 times the previous week and more than four times the previous record set in 1982.
The Fed responded to the crisis by reducing interest rates twice in March, taking the target range down to 0.0%-0.25%. Additionally, the Fed renewed its asset-purchasing program, this time including commercial paper, to shore up distressed credit markets. On the fiscal side, Congress enacted three relief bills in March, the last of which provides $2 trillion to be used for direct payments to individuals, enhanced unemployment benefits, aid to small business, and relief for certain large industries.
For the entire fiscal year, the broad equity market, represented by the Russell 3000® Index, declined 9.13%. Small and mid-cap stocks performed significantly more poorly, with the Russell 2500™ Index and the Russell 2500 Growth Index losing 22.47% and 14.40%, respectively. All the losses resulted from the pandemic as the Russell 3000 Index lost 20.90%, the Russell 2500 Index lost
29.72%, and the Russell 2500 Growth Index lost 23.22% in the first quarter of 2020. In contrast, those same indices posted positive returns of 14.76%, 8.08%, and 11.61%, respectively, from the beginning of the fiscal period on April 1, 2019, through Jan. 31, 2020.
Within the Fund
For the fiscal year ended March 31, 2020, Delaware Smid Cap Growth Fund declined, although it outperformed its benchmark, the Russell 2500 Growth Index. The Fund’s Institutional Class shares declined 3.72%. The Fund’s Class A shares fell 3.96% at net asset value and declined 9.50% at maximum offer price (both returns reflect all distributions reinvested). For the same period, the Fund’s benchmark fell 14.40%. Complete annualized performance for Delaware Smid Cap Growth Fund is shown in the table on page 5.
While we focus mainly on individual stock selection, advantageous stock selection on a sector level contributed to strong relative performance in the information technology, industrials, and consumer staples sectors. The consumer discretionary sector detracted the most from performance, also due to stock selection. The Fund did not have any positions in energy, materials, real estate, or utilities, the absence of which contributed to performance relative to the benchmark.
The Fund pursues a pure growth strategy, which has benefited performance given that growth stocks have outperformed value stocks over the past decade. We believe that as technological adoption rates accelerate, disruption is caused throughout major industries and enables new secular growth patterns to take hold.
Virtual healthcare is a notable example of disruptive technology. Even before the pandemic, virtual healthcare had increased as people realized this was a better, cheaper, and faster way to get a diagnosis and treatment plan for many routine
2
Table of Contents
health issues. Until the pandemic, the biggest impediment to this industry was getting people to try virtual care for the first time. Once they did, however, there was no turning back.
The pandemic changed that dramatically. Now, no one wants to go to a doctor’s office and sit in a waiting room surrounded by other patients. Virtual care is now growing rapidly and one of the biggest beneficiaries of this isTeladoc Health Inc., which has experienced a large upturn in its business with the onset of the coronavirus. Teladoc was the Fund’s leading contributor to performance for the 12-month period. It has teamed up with both large employers and insurers to make its services available. Teladoc now has more than 35 million members and operates in more than 175 countries.
Financial services has been home to some of the disruptive technology that has greatly impacted our lives. Digital currency and payment systems, for example, have largely replaced cash; indeed, ours may be the last generation that uses paper money. Another example iseHealth Inc., a provider of an online marketplace for comparison and enrollment in health insurance plans and a strong contributor to Fund performance. The company benefited from consumers’ increasing acceptance of the online environment as more Americans become eligible for Medicare at age 65 (estimated to be approximately 10,000 people every day). With more baby boomers applying, the average age of Medicare beneficiaries declines with a consequent increase in the online proficiency of Medicare recipients. We think this trend represents a strong tailwind for eHealth’s preferred method of acquisition.
Yet another disruptive trend that has played a large role in the Fund’s stock selection is the development of software as a service (SaaS). Software solutions built around a SaaS model offer significant advantages to both the developer and the customer. Rather than sell a software package that each customer must install
on its own system, SaaS products are hosted, maintained, and upgraded by the developer and accessed through the cloud. Instead of paying a large fee upfront and maintenance fees thereafter, customers buy a subscription that is often tied to how many users are accessing the software. This reduces customer costs while it provides developers with a steady income stream. A wide variety of applications are available via SaaS, including customer relationship management, human resources, and communications. The onset of the pandemic focused attention on a few SaaS-based opportunities, including the need for remote-working and enhanced network capabilities.
One such company isRingCentral, Inc., a developer of SaaS-based unified communications systems and another contributor to the Fund’s performance. The company provides a broad array of telecommunications features and options, including detailed reporting on both incoming and outgoing calls. RingCentral benefited from the sudden surge in remote working the pandemic caused.
Not all technology companies performed strongly, however.Arista Networks Inc.provides cloud networking solutions that use software solutions to address the needs of data centers and cloud-service providers. Midway through the fiscal year, Arista’s shares dropped sharply when a major cloud customer significantly reduced orders, severely curtailing Arista’s growth prospects. We exited the Fund’s position.
The stay-at-home restrictions imposed to curb the spread of the virus severely affected the retail business. One of the Fund’s holdings,At Home Group Inc., was no exception. Even before the pandemic struck, the operator of big-ticket, big-box, home-décor stores had experienced a slowdown in traffic across its chains as it opened in more locations. Business was down and growth prospects diminished.
3
Table of Contents
| Portfolio management review | ||
| Delaware Smid Cap Growth Fund | ||
Although this happens occasionally when a small successful chain begins to expand and growth slows, we realized our losses and sold the position in At Home Group.
One financial services firm that underperformed wasLendingTree Inc., an online marketplace that matches lenders with borrowers seeking a variety of loans, including mortgages and home-equity, personal, and business loans. LendingTree was attractive to us because it was an innovative financial services firm that was also positioned to take advantage of the home-building trend. In the last quarter of the fiscal year, as stocks sold off and credit markets went into disarray, the volume of mortgages written at LendingTree plummeted. Given that it will take the economy some time to recover, and that there will likely be less home building during that time, we think the home-building trend has gone away. We exited the position.
At the end of the fiscal year, we’ve taken a two-pronged approach to positioning the Fund by focusing on those companies that we think can either maintain business or recover quickly. First, as we recover from the pandemic, we believe there are certain industries and companies, such as streaming media, telecommunications software, and consumer staples, that should do well throughout.
Second, there are other areas, such as digital currency, online dating, and fast-casual restaurants, that we think should do well once social-distancing measures are relaxed and people have the opportunity to get back out and meet with friends, family, and new people again. The businesses that have the potential to meet the pent-up demand for normalcy look attractive to us.
4
Table of Contents
| Performance summary | ||
| Delaware Smid Cap Growth Fund | March 31, 2020 (Unaudited) | |
The performance quoted represents past performance and does not guarantee future results. Investment return and principal value of an investment will fluctuate so that shares, when redeemed, may be worth more or less than their original cost. Current performance may be lower or higher than the performance quoted. Performance data current to the most recent month end may be obtained by calling 800 523-1918 or visiting delawarefunds.com/performance.
| Fund and benchmark performance1,2 | Average annual total returns through March 31, 2020 | |||||||||||||||
| 1 year | 5 year | 10 year | Lifetime | |||||||||||||
Class A (Est. March 27, 1986) | ||||||||||||||||
Excluding sales charge | -3.96% | +9.38% | +13.94% | +13.11% | ||||||||||||
Including sales charge | -9.50% | +8.09% | +13.27% | +12.92% | ||||||||||||
Class C (Est. Nov. 29, 1995) | ||||||||||||||||
Excluding sales charge | -4.63% | +8.57% | +13.10% | +8.88% | ||||||||||||
Including sales charge | -5.48% | +8.57% | +13.10% | +8.88% | ||||||||||||
Class R (Est. June 2, 2003) | ||||||||||||||||
Excluding sales charge | -4.18% | +9.11% | +13.66% | +10.68% | ||||||||||||
Including sales charge | -4.18% | +9.11% | +13.66% | +10.68% | ||||||||||||
Institutional Class (Est. Nov. 9, 1992) | ||||||||||||||||
Excluding sales charge | -3.72%* | +9.65% | +14.23% | +10.38% | ||||||||||||
Including sales charge | -3.72%* | +9.65% | +14.23% | +10.38% | ||||||||||||
Class R6 (Est. May 2, 2016) | ||||||||||||||||
Excluding sales charge | -3.63% | — | — | +11.71% | ||||||||||||
Including sales charge | -3.63% | — | — | +11.71% | ||||||||||||
Russell 2500 Growth Index | -14.40% | +3.64% | +10.10% | +8.38%** | ||||||||||||
*Total return for the report period presented in the table differs from the return in “Financial highlights.” The total return presented in the above table is calculated based on the net asset value (NAV) at which shareholder transactions were processed. The total return presented in “Financial highlights” is calculated in the same manner but also takes into account certain adjustments that are necessary under US generally accepted accounting principles (US GAAP) required in the annual report.
**The benchmark lifetime return is for Institutional Class share comparison only and is calculated using the last business day in the month of the Fund’s Institutional Class inception date.
1Returns reflect the reinvestment of all distributions and are presented both with and without the applicable sales charges described below. Returns do not reflect the deduction of taxes the shareholder would pay on Fund distributions or redemptions of Fund shares.
Expense limitations were in effect for certain classes during some or all of the periods shown in the “Fund and benchmark performance” table. Expenses for each class are listed on the “Fund expense ratios” table on page 6. Performance
would have been lower had expense limitations not been in effect.
Institutional Class shares are not subject to a sales charge and are offered for sale exclusively to certain eligible investors. In addition, Institutional Class shares pay no distribution and service (12b-1) fee.
Class A shares are sold with a maximum front-end sales charge of 5.75%, and have an annual 12b-1 fee of 0.25% of average daily net assets. The Board has adopted a formula for calculating 12b-1
5
Table of Contents
Performance summary
Delaware Smid Cap Growth Fund
plan fees for the Fund’s Class A shares. The Fund’s Class A shares are currently subject to a blended 12b-1 fee equal to the sum of: (i) 0.10% of average daily net assets representing shares acquired prior to June 1, 1992, and (ii) 0.25% of average daily net assets representing shares acquired on or after June 1, 1992. All Class A shares currently bear 12b-1 fees at the same rate, the blended rate, currently 0.25% of average daily net assets, based on the formula described above. This method of calculating Class A 12b-1 fees may be discontinued at the sole discretion of the Board. Performance for Class A shares, excluding sales charges, assumes that no front-end sales charge applied.
Class C shares are sold with a contingent deferred sales charge of 1.00% if redeemed during the first 12 months. They are also subject to an annual 12b-1 fee of 1.00% of average daily net assets. Performance for Class C shares, excluding sales charges, assumes either that contingent deferred sales charges did not apply or that the investment was not redeemed.
Class R shares are available only for certain retirement plan products. They are sold without a sales charge and have an annual 12b-1 fee of 0.50% of average daily net assets.
Class R6 shares are available only to certain investors. In addition, Class R6 shares do not pay any service fees, sub-accounting fees, and/or sub-transfer agency fees to any brokers, dealers, or other financial intermediaries. Class R6 shares pay no 12b-1 fee.
Investments in small and/or medium-sized companies typically exhibit greater risk and higher volatility than larger, more established companies.
Risk is increased in a concentrated portfolio since it holds a limited number of securities with each investment having a greater effect on the overall performance.
Real estate investment trust (REIT) investments are subject to many of the risks associated with direct real estate ownership, including changes in economic conditions, credit risk, and interest rate fluctuations.
The disruptions caused by natural disasters, pandemics, or similar events could prevent the Fund from executing advantageous investment decisions in a timely manner and could negatively impact the Fund’s ability to achieve its investment objective and the value of the Fund’s investments.
2The Fund’s expense ratios, as described in the most recent prospectus, are disclosed in the following “Fund expense ratios” table. Please see the “Financial highlights” section in this report for the most recent expense ratios.
| Institutional | ||||||||||
| Fund expense ratios | Class A | Class C | Class R | Class | Class R6 | |||||
Total annual operating expenses (without fee waivers) | 1.12% | 1.87% | 1.37% | 0.87% | 0.80% | |||||
Net expenses (including fee waivers, if any) | 1.12% | 1.87% | 1.37% | 0.87% | 0.80% | |||||
Type of waiver | n/a | n/a | n/a | n/a | n/a |
6
Table of Contents
Performance of a $10,000 Investment1
Average annual total returns from March 31, 2010 through March 31, 2020
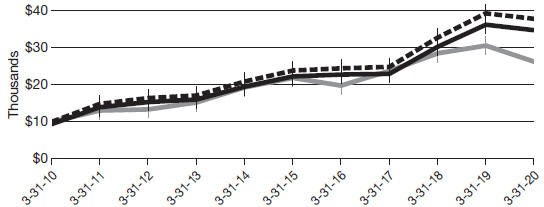
| For period beginning March 31, 2010 through March 31, 2020 | Starting value | Ending value | ||||||||
| $10,000 | $37,816 | ||||||||
| $9,425 | $34,762 | ||||||||
| $10,000 | $26,184 | ||||||||
 Delaware Smid Cap Growth Fund — Institutional Class shares
 Delaware Smid Cap Growth Fund — Class A shares
 Russell 2500 Growth Index
1The “Performance of a $10,000 investment” graph assumes $10,000 invested in Institutional Class and Class A shares of the Fund on March 31, 2010, and includes the effect of a 5.75% front-end sales charge (for Class A shares) and the reinvestment of all distributions. The graph does not reflect the deduction of taxes the shareholders would pay on Fund distributions or redemptions of Fund shares. Expense limitations were in effect for some or all of the periods shown. Performance would have been lower had expense limitations not been in effect. Expenses are listed in the “Fund expense ratios” table on page 6. Please note additional details on pages 5 through 8.
The graph also assumes $10,000 invested in the Russell 2500 Growth Index as of March 31, 2010. The Russell 2500 Growth Index measures the performance of the small- to mid-cap growth segment of the US equity universe. It includes those Russell 2500 companies with higher
price-to-book ratios and higher forecasted growth values.
The Russell 3000 Index, mentioned on page 2, measures the performance of the largest 3,000 US companies, representing approximately 98% of the investable US equity market.
The Russell 2500 Index, mentioned on page 2, measures the performance of the small- to mid-cap segment of the US equity universe. The Russell 2500 Index is a subset of the Russell 3000 Index, representing approximately 2,500 of the smallest securities based on a combination of their market cap and current index membership.
Gross domestic product is a measure of all goods and services produced by a nation in a year.
Frank Russell Company is the source and owner of the trademarks, service marks and copyrights related to the Russell Indexes. Russell® is a trademark of Frank Russell Company.
Index performance returns do not reflect any management fees, transaction costs, or expenses.
7
Table of Contents
Performance summary
Delaware Smid Cap Growth Fund
| Indices are unmanaged and one cannot invest directly in an index.Past performance is not a guarantee of future results. | Performance of other Fund classes will vary due to different charges and expenses. |
| Nasdaq symbols | CUSIPs | |||||||||||
Class A | DFCIX | 245906102 | ||||||||||
Class C | DEEVX | 245906409 | ||||||||||
Class R | DFRIX | 245906508 | ||||||||||
Institutional Class | DFDIX | 245906201 | ||||||||||
Class R6 | DFZRX | 24610A505 | ||||||||||
8
Table of Contents
For the six-month period from October 1, 2019 to March 31, 2020 (Unaudited)
As a shareholder of the Fund, you incur two types of costs: (1) transaction costs, including sales charges (loads) on purchase payments, reinvested dividends, or other distributions; redemption fees; and exchange fees; and (2) ongoing costs, including management fees; distribution and service (12b-1) fees; and other Fund expenses. This example is intended to help you understand your ongoing costs (in dollars) of investing in the Fund and to compare these costs with the ongoing costs of investing in other mutual funds.
The example is based on an investment of $1,000 invested at the beginning of the period and held for the entire six-month period from Oct. 1, 2019 to March 31, 2020.
Actual expenses
The first section of the table shown, “Actual Fund return,” provides information about actual account values and actual expenses. You may use the information in this section of the table, together with the amount you invested, to estimate the expenses that you paid over the period. Simply divide your account value by $1,000 (for example, an $8,600 account value divided by $1,000 = 8.6), then multiply the result by the number in the first section under the heading entitled “Expenses Paid During Period” to estimate the expenses you paid on your account during this period.
Hypothetical example for comparison purposes
The second section of the table shown, “Hypothetical 5% return,” provides information about hypothetical account values and hypothetical expenses based on the Fund’s actual expense ratio and an assumed rate of return of 5% per year before expenses, which is not the Fund’s actual return. The hypothetical account values and expenses may not be used to estimate the actual ending account balance or expenses you paid for the period. You may use this information to compare the ongoing costs of investing in the Fund and other funds. To do so, compare this 5% hypothetical example with the 5% hypothetical examples that appear in the shareholder reports of the other funds.
Please note that the expenses shown in the table are meant to highlight your ongoing costs only and do not reflect any transactional costs, such as sales charges (loads), redemption fees, or exchange fees. Therefore, the second section of the table is useful in comparing ongoing costs only, and will not help you determine the relative total costs of owning different funds. In addition, if these transactional costs were included, your costs would have been higher. The Fund’s expenses shown in the table assume reinvestment of all dividends and distributions.
9
Table of Contents
Disclosure of Fund expenses
For the six-month period from October 1, 2019 to March 31, 2020 (Unaudited)
Delaware Smid Cap Growth Fund
Expense analysis of an investment of $1,000
Beginning
Account Value
10/1/19 | Ending
Account Value
3/31/20 | Annualized
Expense Ratio | Expenses
Paid During Period
10/1/19 to 3/31/20* | |||||||||||||||||
Actual Fund return† | ||||||||||||||||||||
Class A | $1,000.00 | $955.60 | 1.10% | $5.38 | ||||||||||||||||
Class C | 1,000.00 | 952.80 | 1.85% | 9.03 | ||||||||||||||||
Class R | 1,000.00 | 954.70 | 1.35% | 6.60 | ||||||||||||||||
Institutional Class | 1,000.00 | 956.70 | 0.85% | 4.16 | ||||||||||||||||
Class R6 | 1,000.00 | 957.10 | 0.76% | 3.72 | ||||||||||||||||
Hypothetical 5% return(5% return before expenses) |
| |||||||||||||||||||
Class A | $1,000.00 | $1,019.50 | 1.10% | $5.55 | ||||||||||||||||
Class C | 1,000.00 | 1,015.75 | 1.85% | 9.32 | ||||||||||||||||
Class R | 1,000.00 | 1,018.25 | 1.35% | 6.81 | ||||||||||||||||
Institutional Class | 1,000.00 | 1,020.75 | 0.85% | 4.29 | ||||||||||||||||
Class R6 | 1,000.00 | 1,021.20 | 0.76% | 3.84 | ||||||||||||||||
*“Expenses Paid During Period” are equal to the Fund’s annualized expense ratio, multiplied by the average account value over the period, multiplied by 183/366 (to reflect the one-half year period).
†Because actual returns reflect only the most recent six-month period, the returns shown may differ significantly from fiscal year returns.
In addition to the Fund’s expenses reflected above, the Fund also indirectly bears its portion of the fees and expenses of the investment companies (Underlying Funds) in which it invests. The table above does not reflect the expenses of the Underlying Funds.
10
Table of Contents
Security type / sector allocation and top 10 equity holdings
| Delaware Smid Cap Growth Fund | As of March 31, 2020 (Unaudited) |
Sector designations may be different than the sector designations presented in other Fund materials. The sector designations may represent the investment manager’s internal sector classifications.
| Security type / sector | Percentage of net assets | |||||||
Common Stock² | 99.95 | % | ||||||
Communication Services | 6.53 | % | ||||||
Consumer Discretionary | 11.16 | % | ||||||
Consumer Staples | 8.29 | % | ||||||
Financials | 6.63 | % | ||||||
Healthcare | 27.03 | % | ||||||
Industrials | 8.40 | % | ||||||
Technology | 31.91 | % | ||||||
Total Value of Securities | 99.95 | % | ||||||
Receivables and Other Assets Net of Liabilities | 0.05 | % | ||||||
Total Net Assets | 100.00 | % | ||||||
| ² | Narrow industries are utilized for compliance purposes for diversification whereas broad sectors are used for financial reporting. |
To monitor compliance with the Fund’s concentration guidelines as described in the Fund’s prospectus and Statement of Additional Information, the Healthcare and Technology sector (as disclosed herein for financial reporting purposes) are subdivided into a variety of “industries” (in accordance with the requirements of the Investment Company Act of 1940, as amended). The Healthcare sector consisted of biotechnology, commercial services, healthcare-products, healthcare-services, and pharmaceuticals. As of March 31, 2020, such amounts, as a percentage of total net assets, were 2.75%, 3.60%, 11.28%, 5.56%, and 3.84% respectively. The Technology sector consisted of advertising, commercial services, computers, Internet, semiconductors, and software. As of March 31, 2020 such amounts, as a percentage of total net assets, were 3.38%, 2.66%, 3.10%, 5.55%, 6.15%, and 11.07% respectively. The percentage in any such single industry will comply with the Fund’s concentration policy even if the percentages in the Healthcare and Technology sectors for financial reporting purposes may exceed 25%.
11
Table of Contents
Security type / sector allocation and top 10 equity holdings
Delaware Smid Cap Growth Fund
Holdings are for informational purposes only and are subject to change at any time. They are not a recommendation to buy, sell, or hold any security.
| Top 10 equity holdings | Percentage of net assets | |||||||
RingCentral Class A | 5.30 | % | ||||||
Boston Beer Class A | 5.29 | % | ||||||
eHealth | 5.21 | % | ||||||
Novocure | 5.16 | % | ||||||
iRhythm Technologies | 4.63 | % | ||||||
Okta | 4.47 | % | ||||||
SiteOne Landscape Supply | 4.43 | % | ||||||
YETI Holdings | 4.05 | % | ||||||
Everbridge | 4.05 | % | ||||||
Teladoc Health
|
| 4.03
| %
| |||||
12
Table of Contents
| Schedule of investments | ||
| Delaware Smid Cap Growth Fund | March 31, 2020 |
| Number of shares | Value (US $) | |||||||
Common Stock – 99.95%² | ||||||||
Communication Services – 6.53% | ||||||||
Live Nation Entertainment † | 679,090 | $ | 30,871,431 | |||||
Match Group † | 963,411 | 63,623,662 | ||||||
Take-Two Interactive Software † | 84,775 | 10,055,163 | ||||||
|
| |||||||
| 104,550,256 | ||||||||
|
| |||||||
Consumer Discretionary – 11.16% | ||||||||
Chewy Class A † | 887,625 | 33,277,061 | ||||||
Chipotle Mexican Grill † | 69,105 | 45,222,312 | ||||||
Lululemon Athletica † | 79,900 | 15,145,045 | ||||||
Pool | 102,138 | 20,097,694 | ||||||
Shake Shack Class A † | 4,291 | 161,942 | ||||||
YETI Holdings † | 3,321,739 | 64,840,345 | ||||||
|
| |||||||
| 178,744,399 | ||||||||
|
| |||||||
Consumer Staples – 8.29% | ||||||||
Boston Beer Class A † | 230,681 | 84,789,108 | ||||||
Simply Good Foods † | 2,496,520 | 48,082,975 | ||||||
|
| |||||||
| 132,872,083 | ||||||||
|
| |||||||
Financials – 6.63% | ||||||||
eHealth † | 593,107 | 83,521,328 | ||||||
LendingTree † | 123,294 | 22,610,887 | ||||||
|
| |||||||
| 106,132,215 | ||||||||
|
| |||||||
Healthcare – 27.03% | ||||||||
DexCom † | 42,465 | 11,434,551 | ||||||
Exact Sciences † | 759,273 | 44,037,834 | ||||||
Invitae † | 1,788,852 | 24,453,607 | ||||||
iRhythm Technologies † | 911,185 | 74,124,900 | ||||||
Novocure † | 1,228,008 | 82,694,059 | ||||||
Pacira BioSciences † | 1,494,165 | 50,099,353 | ||||||
Progyny † | 2,722,801 | 57,696,153 | ||||||
Quanterix † | 1,302,095 | 23,919,485 | ||||||
Teladoc Health † | 416,394 | 64,545,234 | ||||||
|
| |||||||
| 433,005,176 | ||||||||
|
| |||||||
Industrials – 8.40% | ||||||||
SiteOne Landscape Supply † | 963,839 | 70,957,827 | ||||||
Trex † | 793,199 | 63,566,968 | ||||||
|
| |||||||
| 134,524,795 | ||||||||
|
| |||||||
Technology – 31.91% | ||||||||
Avalara † | 570,915 | 42,590,259 | ||||||
EPAM Systems † | 267,803 | 49,720,305 | ||||||
Everbridge † | 609,621 | 64,839,290 | ||||||
Marvell Technology Group | 2,456,804 | 55,597,475 | ||||||
Monolithic Power Systems | 172,840 | 28,943,786 | ||||||
Okta † | 586,144 | 71,661,966 | ||||||
13
Table of Contents
Schedule of investments
Delaware Smid Cap Growth Fund
| Number of shares | Value (US $) | |||||||
Common Stock²(continued) | ||||||||
Technology(continued) | ||||||||
Proofpoint † | 167,360 | $ | 17,169,462 | |||||
RingCentral Class A † | 400,512 | 84,872,498 | ||||||
Silicon Laboratories † | 164,581 | 14,056,863 | ||||||
Splunk † | 218,369 | 27,564,719 | ||||||
Trade Desk Class A † | 280,457 | 54,128,201 | ||||||
|
| |||||||
| 511,144,824 | ||||||||
|
| |||||||
Total Common Stock(cost $1,364,522,473) | 1,600,973,748 | |||||||
|
| |||||||
Total Value of Securities – 99.95% | $ | 1,600,973,748 | ||||||
|
| |||||||
| ² | Narrow industries are utilized for compliance purposes for diversification whereas broad sectors are used for financial reporting. |
| † | Non-income producing security. |
See accompanying notes, which are an integral part of the financial statements.
14
Table of Contents
| Statement of assets and liabilities | ||
| Delaware Smid Cap Growth Fund | March 31, 2020 |
Assets: | ||||
Investments, at value1 | $ | 1,600,973,748 | ||
Receivable for securities sold | 11,165,828 | |||
Receivable for fund shares sold | 10,652,455 | |||
Dividends and interest receivable | 143,378 | |||
|
| |||
Total assets | 1,622,935,409 | |||
|
| |||
Liabilities: | ||||
Due to custodian | 1,093,339 | |||
Payable for securities purchased | 16,444,275 | |||
Payable for fund shares redeemed | 1,785,042 | |||
Investment management fees payable to affiliates | 940,246 | |||
Other accrued expenses | 618,883 | |||
Distribution fees payable to affiliates | 230,552 | |||
Dividend disbursing and transfer agent fees and expenses payable to affiliates | 13,374 | |||
Trustees’ fees and expenses payable to affiliates | 12,327 | |||
Accounting and administration expenses payable to affiliates | 5,089 | |||
Legal fees payable to affiliates | 3,295 | |||
Reports and statements to shareholders expenses payable to affiliates | 2,076 | |||
|
| |||
Total liabilities | 21,148,498 | |||
|
| |||
Total Net Assets | $ | 1,601,786,911 | ||
|
| |||
Net Assets Consist of: | ||||
Paid-in capital | $ | 1,368,871,851 | ||
Total distributable earnings (loss) | 232,915,060 | |||
|
| |||
Total Net Assets | $ | 1,601,786,911 | ||
|
| |||
15
Table of Contents
Statement of assets and liabilities
Delaware Smid Cap Growth Fund
Net Asset Value | ||||
Class A: | ||||
Net assets | $ | 805,989,247 | ||
Shares of beneficial interest outstanding, unlimited authorization, no par | 36,746,715 | |||
Net asset value per share | $ | 21.93 | ||
Sales charge | 5.75 | % | ||
Offering price per share, equal to net asset value per share / (1 – sales charge) | $ | 23.27 | ||
Class C: | ||||
Net assets | $ | 63,090,345 | ||
Shares of beneficial interest outstanding, unlimited authorization, no par | 7,164,845 | |||
Net asset value per share | $ | 8.81 | ||
Class R: | ||||
Net assets | $ | 8,476,816 | ||
Shares of beneficial interest outstanding, unlimited authorization, no par | 429,500 | |||
Net asset value per share | $ | 19.74 | ||
Institutional Class: | ||||
Net assets | $ | 706,784,517 | ||
Shares of beneficial interest outstanding, unlimited authorization, no par | 22,696,939 | |||
Net asset value per share | $ | 31.14 | ||
Class R6: | ||||
Net assets | $ | 17,445,986 | ||
Shares of beneficial interest outstanding, unlimited authorization, no par | 559,001 | |||
Net asset value per share | $ | 31.21 | ||
___________________ | ||||
1Investments, at cost | $ | 1,364,522,473 | ||
See accompanying notes, which are an integral part of the financial statements.
16
Table of Contents
| Statement of operations | ||
| Delaware Smid Cap Growth Fund | Year ended March 31, 2020 |
Investment Income: | ||||
Dividends | $ | 1,038,582 | ||
|
| |||
Expenses: | ||||
Management fees | 11,993,987 | |||
Distribution expenses — Class A | 2,332,591 | |||
Distribution expenses — Class C | 665,158 | |||
Distribution expenses — Class R | 60,997 | |||
Dividend disbursing and transfer agent fees and expenses | 1,691,205 | |||
Accounting and administration expenses | 330,975 | |||
Reports and statements to shareholders expenses | 154,041 | |||
Registration fees | 147,580 | |||
Trustees’ fees and expenses | 98,931 | |||
Legal fees | 85,261 | |||
Custodian fees | 76,371 | |||
Audit and tax fees | 37,765 | |||
Other | 50,935 | |||
|
| |||
| 17,725,797 | ||||
Less expenses paid indirectly | (2,464 | ) | ||
|
| |||
Total operating expenses | 17,723,333 | |||
|
| |||
Net Investment Loss | (16,684,751 | ) | ||
|
| |||
Net Realized and Unrealized Gain (Loss): | ||||
Net realized gain on Investment | 79,007,296 | |||
Net change in unrealized appreciation (depreciation) of: | ||||
Investments | (144,543,340 | ) | ||
Foreign currencies | 11,274 | |||
|
| |||
Net change in unrealized appreciation (depreciation) | (144,532,066 | ) | ||
|
| |||
Net Realized and Unrealized Loss | (65,524,770 | ) | ||
|
| |||
Net Decrease in Net Assets Resulting from Operations | $ | (82,209,521 | ) | |
|
| |||
See accompanying notes, which are an integral part of the financial statements.
17
Table of Contents
Statements of changes in net assets
Delaware Smid Cap Growth Fund
| Year ended | ||||||||
| 3/31/20 | 3/31/19 | |||||||
Increase (Decrease) in Net Assets from Operations: | ||||||||
Net investment loss | $ | (16,684,751 | ) | $ | (10,468,090 | ) | ||
Net realized gain | 79,007,296 | 80,895,784 | ||||||
Net change in unrealized appreciation (depreciation) | (144,532,066 | ) | 143,155,032 | |||||
|
|
|
| |||||
Net increase (decrease) in net assets resulting from operations | (82,209,521 | ) | 213,582,726 | |||||
|
|
|
| |||||
Dividends and Distributions to Shareholders from: | ||||||||
Distributable earnings: | ||||||||
Class A | (40,069,400 | ) | (108,630,804 | ) | ||||
Class C | (6,825,843 | ) | (11,614,109 | ) | ||||
Class R | (558,548 | ) | (1,937,879 | ) | ||||
Institutional Class | (21,276,178 | ) | (41,863,624 | ) | ||||
Class R6 | (572,224 | ) | (584,121 | ) | ||||
|
|
|
| |||||
| (69,302,193 | ) | (164,630,537 | ) | |||||
|
|
|
| |||||
Capital Share Transactions: | ||||||||
Proceeds from shares sold: | ||||||||
Class A | 97,149,147 | 164,834,821 | ||||||
Class C | 30,055,854 | 38,915,055 | ||||||
Class R | 3,238,198 | 5,209,500 | ||||||
Institutional Class | 557,241,244 | 503,937,429 | ||||||
Class R6 | 17,242,856 | 9,378,770 | ||||||
Net asset value of shares issued upon reinvestment of dividends and distributions: | ||||||||
Class A | 38,911,458 | 105,728,675 | ||||||
Class C | 6,717,827 | 11,502,275 | ||||||
Class R | 557,364 | 1,936,635 | ||||||
Institutional Class | 19,348,530 | 40,785,405 | ||||||
Class R6 | 513,058 | 354,219 | ||||||
|
|
|
| |||||
| 770,975,536 | 882,582,784 | |||||||
|
|
|
| |||||
18
Table of Contents
| Year ended | ||||||||
| 3/31/20 | 3/31/19 | |||||||
Capital Share Transactions (continued): | ||||||||
Cost of shares redeemed: | ||||||||
Class A | $ | (160,158,725 | ) | $ | (178,190,370 | ) | ||
Class C | (19,287,809 | ) | (38,318,977 | ) | ||||
Class R | (8,753,630 | ) | (6,540,676 | ) | ||||
Institutional Class | (387,679,303 | ) | (209,906,097 | ) | ||||
Class R6 | (7,525,632 | ) | (1,733,427 | ) | ||||
|
|
|
| |||||
| (583,405,099 | ) | (434,689,547 | ) | |||||
|
|
|
| |||||
Increase in net assets derived from capital share transactions | 187,570,437 | 447,893,237 | ||||||
|
|
|
| |||||
Net Increase in Net Assets | 36,058,723 | 496,845,426 | ||||||
|
|
|
| |||||
Net Assets: | ||||||||
Beginning of year | 1,565,728,188 | 1,068,882,762 | ||||||
|
|
|
| |||||
End of year | $ | 1,601,786,911 | $ | 1,565,728,188 | ||||
|
|
|
| |||||
See accompanying notes, which are an integral part of the financial statements.
19
Table of Contents
Delaware Smid Cap Growth Fund Class A
Selected data for each share of the Fund outstanding throughout each period were as follows:
|
Net asset value, beginning of period |
Income (loss) from investment operations: |
Net investment loss1 |
Net realized and unrealized gain (loss) |
Total from investment operations |
Less dividends and distributions from: |
Net realized gain |
Total dividends and distributions |
Net asset value, end of period |
Total return2 |
Ratios and supplemental data: |
Net assets, end of period (000 omitted) |
Ratio of expenses to average net assets |
Ratio of net investment loss to average net assets |
Portfolio turnover |
|
| 1 | The average shares outstanding method has been applied for per share information. |
| 2 | Total return is based on the change in net asset value of a share during the period and assumes reinvestment of dividends and distributions at net asset value and does not reflect the impact of a sales charge. |
See accompanying notes, which are an integral part of the financial statements.
20
Table of Contents
| Year ended | ||||||||||||||||||||||||||||
|
| |||||||||||||||||||||||||||
| 3/31/20 | 3/31/19 | 3/31/18 | 3/31/17 | 3/31/16 | ||||||||||||||||||||||||
| ||||||||||||||||||||||||||||
| $ | 23.85 | $ | 22.83 | $ | 17.59 | $ | 27.04 | $ | 29.41 | |||||||||||||||||||
| (0.26 | ) | (0.20 | ) | (0.20 | ) | (0.14 | ) | (0.01 | ) | |||||||||||||||||||
| (0.58 | ) | 4.35 | 5.74 | (0.08 | ) | 0.65 | ||||||||||||||||||||||
|
|
|
|
|
|
|
|
|
| |||||||||||||||||||
| (0.84 | ) | 4.15 | 5.54 | (0.22 | ) | 0.64 | ||||||||||||||||||||||
|
|
|
|
|
|
|
|
|
| |||||||||||||||||||
| (1.08 | ) | (3.13 | ) | (0.30 | ) | (9.23 | ) | (3.01 | ) | |||||||||||||||||||
|
|
|
|
|
|
|
|
|
| |||||||||||||||||||
| (1.08 | ) | (3.13 | ) | (0.30 | ) | (9.23 | ) | (3.01 | ) | |||||||||||||||||||
|
|
|
|
|
|
|
|
|
| |||||||||||||||||||
| $ | 21.93 | $ | 23.85 | $ | 22.83 | $ | 17.59 | $ | 27.04 | |||||||||||||||||||
|
|
|
|
|
|
|
|
|
| |||||||||||||||||||
| (3.96% | ) | 19.68% | 31.68% | 1.13% | 2.26% | |||||||||||||||||||||||
| $ | 805,989 | $ | 901,171 | $ | 776,647 | $ | 653,453 | $ | 787,583 | |||||||||||||||||||
| 1.10% | 1.12% | 1.17% | 1.21% | 1.20% | ||||||||||||||||||||||||
| (1.04% | ) | (0.82% | ) | (1.00% | ) | (0.60% | ) | (0.03% | ) | |||||||||||||||||||
| 113% | 96% | 101% | 159% | 24% | ||||||||||||||||||||||||
| ||||||||||||||||||||||||||||
21
Table of Contents
Financial highlights
Delaware Smid Cap Growth Fund Class C
Selected data for each share of the Fund outstanding throughout each period were as follows:
|
Net asset value, beginning of period |
Income (loss) from investment operations: |
Net investment loss1 |
Net realized and unrealized gain (loss) |
Total from investment operations |
Less dividends and distributions from: |
Net realized gain |
Total dividends and distributions |
Net asset value, end of period |
Total return2 |
Ratios and supplemental data: |
Net assets, end of period (000 omitted) |
Ratio of expenses to average net assets |
Ratio of net investment loss to average net assets |
Portfolio turnover |
|
| 1 | The average shares outstanding method has been applied for per share information. |
| 2 | Total return is based on the change in net asset value of a share during the period and assumes reinvestment of dividends and distributions at net asset value and does not reflect the impact of a sales charge. |
See accompanying notes, which are an integral part of the financial statements.
22
Table of Contents
| Year ended | ||||||||||||||||||||||||||||
|
| |||||||||||||||||||||||||||
| 3/31/20 | 3/31/19 | 3/31/18 | 3/31/17 | 3/31/16 | ||||||||||||||||||||||||
| ||||||||||||||||||||||||||||
| $ | 10.26 | $ | 11.55 | $ | 9.09 | $ | 18.76 | $ | 21.46 | |||||||||||||||||||
| (0.19 | ) | (0.18 | ) | (0.18 | ) | (0.20 | ) | (0.16 | ) | |||||||||||||||||||
| (0.18 | ) | 2.02 | 2.94 | (0.24 | ) | 0.47 | ||||||||||||||||||||||
|
|
|
|
|
|
|
|
|
| |||||||||||||||||||
| (0.37 | ) | 1.84 | 2.76 | (0.44 | ) | 0.31 | ||||||||||||||||||||||
|
|
|
|
|
|
|
|
|
| |||||||||||||||||||
| (1.08 | ) | (3.13 | ) | (0.30 | ) | (9.23 | ) | (3.01 | ) | |||||||||||||||||||
|
|
|
|
|
|
|
|
|
| |||||||||||||||||||
| (1.08 | ) | (3.13 | ) | (0.30 | ) | (9.23 | ) | (3.01 | ) | |||||||||||||||||||
|
|
|
|
|
|
|
|
|
| |||||||||||||||||||
| $ | 8.81 | $ | 10.26 | $ | 11.55 | $ | 9.09 | $ | 18.76 | |||||||||||||||||||
|
|
|
|
|
|
|
|
|
| |||||||||||||||||||
| (4.63% | ) | 18.83% | 30.71% | 0.30% | 1.53% | |||||||||||||||||||||||
| $ | 63,090 | $ | 56,065 | $ | 46,508 | $ | 49,266 | $ | 67,633 | |||||||||||||||||||
| 1.85% | 1.87% | 1.92% | 1.96% | 1.95% | ||||||||||||||||||||||||
| (1.79% | ) | (1.57% | ) | (1.75% | ) | (1.35% | ) | (0.78% | ) | |||||||||||||||||||
| 113% | 96% | 101% | 159% | 24% | ||||||||||||||||||||||||
| ||||||||||||||||||||||||||||
23
Table of Contents
Financial highlights
Delaware Smid Cap Growth Fund Class R
Selected data for each share of the Fund outstanding throughout each period were as follows:
|
| Net asset value, beginning of period |
| Income (loss) from investment operations: |
| Net investment loss1 |
| Net realized and unrealized gain (loss) |
| Total from investment operations |
| Less dividends and distributions from: |
| Net realized gain |
| Total dividends and distributions |
| Net asset value, end of period |
| Total return2 |
| Ratios and supplemental data: |
| Net assets, end of period (000 omitted) |
| Ratio of expenses to average net assets |
| Ratio of net investment loss to average net assets |
| Portfolio turnover |
|
| 1 | The average shares outstanding method has been applied for per share information. |
| 2 | Total return is based on the change in net asset value of a share during the period and assumes reinvestment of dividends and distributions at net asset value. |
See accompanying notes, which are an integral part of the financial statements.
24
Table of Contents
| Year ended | ||||||||||||||||||||||||||||
|
| |||||||||||||||||||||||||||
| 3/31/20 | 3/31/19 | 3/31/18 | 3/31/17 | 3/31/16 | ||||||||||||||||||||||||
| ||||||||||||||||||||||||||||
| $ | 21.62 | $ | 21.01 | $ | 16.25 | $ | 25.77 | $ | 28.24 | |||||||||||||||||||
| (0.29 | ) | (0.24 | ) | (0.23 | ) | (0.19 | ) | (0.08 | ) | |||||||||||||||||||
| (0.51 | ) | 3.98 | 5.29 | (0.10 | ) | 0.62 | ||||||||||||||||||||||
|
|
|
|
|
|
|
|
|
| |||||||||||||||||||
| (0.80 | ) | 3.74 | 5.06 | (0.29 | ) | 0.54 | ||||||||||||||||||||||
|
|
|
|
|
|
|
|
|
| |||||||||||||||||||
| (1.08 | ) | (3.13 | ) | (0.30 | ) | (9.23 | ) | (3.01 | ) | |||||||||||||||||||
|
|
|
|
|
|
|
|
|
| |||||||||||||||||||
| (1.08 | ) | (3.13 | ) | (0.30 | ) | (9.23 | ) | (3.01 | ) | |||||||||||||||||||
|
|
|
|
|
|
|
|
|
| |||||||||||||||||||
| $ | 19.74 | $ | 21.62 | $ | 21.01 | $ | 16.25 | $ | 25.77 | |||||||||||||||||||
|
|
|
|
|
|
|
|
|
| |||||||||||||||||||
| (4.18% | ) | 19.42% | 31.34% | 0.87% | 1.99% | |||||||||||||||||||||||
| $ | 8,477 | $ | 14,143 | $ | 13,068 | $ | 16,731 | $ | 18,768 | |||||||||||||||||||
| 1.35% | 1.37% | 1.42% | 1.46% | 1.45% | ||||||||||||||||||||||||
| (1.29% | ) | (1.07% | ) | (1.25% | ) | (0.85% | ) | (0.28% | ) | |||||||||||||||||||
| 113% | 96% | 101% | 159% | 24% | ||||||||||||||||||||||||
| ||||||||||||||||||||||||||||
25
Table of Contents
Financial highlights
Delaware Smid Cap Growth Fund Institutional Class
Selected data for each share of the Fund outstanding throughout each period were as follows:
|
| Net asset value, beginning of period |
| Income (loss) from investment operations: |
| Net investment income (loss)1 |
| Net realized and unrealized gain (loss) |
| Total from investment operations |
| Less dividends and distributions from: |
| Net investment income |
| Net realized gain |
| Total dividends and distributions |
| Net asset value, end of period |
| Total return2 |
| Ratios and supplemental data: |
| Net assets, end of period (000 omitted) |
| Ratio of expenses to average net assets |
| Ratio of net investment income (loss) to average net assets |
| Portfolio turnover |
|
| 1 | The average shares outstanding method has been applied for per share information. |
| 2 | Total return is based on the change in net asset value of a share during the period and assumes reinvestment of dividends and distributions at net asset value. |
See accompanying notes, which are an integral part of the financial statements.
26
Table of Contents
| Year ended | ||||||||||||||||||||||||||||
|
| |||||||||||||||||||||||||||
| 3/31/20 | 3/31/19 | 3/31/18 | 3/31/17 | 3/31/16 | ||||||||||||||||||||||||
| ||||||||||||||||||||||||||||
| $ | 33.35 | $ | 30.69 | $ | 23.50 | $ | 32.83 | $ | 34.98 | |||||||||||||||||||
| (0.28 | ) | (0.19 | ) | (0.20 | ) | (0.11 | ) | 0.08 | ||||||||||||||||||||
| (0.85 | ) | 5.98 | 7.69 | 0.02 | 0.78 | |||||||||||||||||||||||
|
|
|
|
|
|
|
|
|
| |||||||||||||||||||
| (1.13 | ) | 5.79 | 7.49 | (0.09 | ) | 0.86 | ||||||||||||||||||||||
|
|
|
|
|
|
|
|
|
| |||||||||||||||||||
| — | — | — | (0.01 | ) | — | |||||||||||||||||||||||
| (1.08 | ) | (3.13 | ) | (0.30 | ) | (9.23 | ) | (3.01 | ) | |||||||||||||||||||
|
|
|
|
|
|
|
|
|
| |||||||||||||||||||
| (1.08 | ) | (3.13 | ) | (0.30 | ) | (9.24 | ) | (3.01 | ) | |||||||||||||||||||
|
|
|
|
|
|
|
|
|
| |||||||||||||||||||
| $ | 31.14 | $ | 33.35 | $ | 30.69 | $ | 23.50 | $ | 32.83 | |||||||||||||||||||
|
|
|
|
|
|
|
|
|
| |||||||||||||||||||
| (3.70% | ) | 19.99% | 32.01% | 1.33% | 2.54% | |||||||||||||||||||||||
| $ | 706,785 | $ | 585,344 | $ | 231,474 | $ | 226,724 | $ | 432,915 | |||||||||||||||||||
| 0.85% | 0.87% | 0.92% | 0.96% | 0.95% | ||||||||||||||||||||||||
| (0.79% | ) | (0.57% | ) | (0.75% | ) | (0.35% | ) | 0.22% | ||||||||||||||||||||
| 113% | 96% | 101% | 159% | 24% | ||||||||||||||||||||||||
| ||||||||||||||||||||||||||||
27
Table of Contents
Financial highlights
Delaware Smid Cap Growth Fund Class R6
Selected data for each share of the Fund outstanding throughout each period were as follows:
|
Net asset value, beginning of period |
Income (loss) from investment operations: |
Net investment loss2 |
Net realized and unrealized gain (loss) |
Total from investment operations |
Less dividends and distributions from: |
Net investment income |
Net realized gain |
Total dividends and distributions |
Net asset value, end of period |
Total return3 |
Ratios and supplemental data: |
Net assets, end of period (000 omitted) |
Ratio of expenses to average net assets |
Ratio of net investment loss to average net assets |
Portfolio turnover |
|
| 1 | Date of commencement of operations; ratios have been annualized and total return and portfolio turnover have not been annualized. |
| 2 | The average shares outstanding method has been applied for per share information. |
| 3 | Total return is based on the change in net asset value of a share during the period and assumes reinvestment of dividends and distributions at net asset value. |
| 4 | Portfolio turnover is representative of the Fund for the year ended March 31, 2017. |
See accompanying notes, which are an integral part of the financial statements.
28
Table of Contents
| 5/2/161 | ||||||||||||||||||||||||
Year ended | to | |||||||||||||||||||||||
|
| |||||||||||||||||||||||
| 3/31/20 | 3/31/19 | 3/31/18 | 3/31/17 | |||||||||||||||||||||
| ||||||||||||||||||||||||
| $ | 33.40 | $ | 30.71 | $ | 23.50 | $ | 33.01 | ||||||||||||||||
| ||||||||||||||||||||||||
| (0.25 | ) | (0.16 | ) | (0.19 | ) | (0.05 | ) | |||||||||||||||||
| (0.86 | ) | 5.98 | 7.70 | (0.19 | ) | |||||||||||||||||||
|
|
|
|
|
|
|
| |||||||||||||||||
| (1.11 | ) | 5.82 | 7.51 | (0.24 | ) | |||||||||||||||||||
|
|
|
|
|
|
|
| |||||||||||||||||
| ||||||||||||||||||||||||
| — | — | — | (0.04 | ) | ||||||||||||||||||||
| (1.08 | ) | (3.13 | ) | (0.30 | ) | (9.23 | ) | |||||||||||||||||
|
|
|
|
|
|
|
| |||||||||||||||||
| (1.08 | ) | (3.13 | ) | (0.30 | ) | (9.27 | ) | |||||||||||||||||
|
|
|
|
|
|
|
| |||||||||||||||||
| $ | 31.21 | $ | 33.40 | $ | 30.71 | 23.50 | ||||||||||||||||||
|
|
|
|
|
|
|
| |||||||||||||||||
| (3.63% | ) | 20.08% | 32.10% | 0.88% | ||||||||||||||||||||
| ||||||||||||||||||||||||
| $ | 17,446 | $ | 9,005 | $ | 1,186 | $ | 2 | |||||||||||||||||
| 0.77% | 0.80% | 0.84% | 0.84% | |||||||||||||||||||||
| (0.71% | ) | (0.50% | ) | (0.67% | ) | (0.21% | ) | |||||||||||||||||
| 113% | 96% | 101% | 159% | 4 | ||||||||||||||||||||
| ||||||||||||||||||||||||
29
Table of Contents
| Notes to financial statements | ||
| Delaware Smid Cap Growth Fund | March 31, 2020 | |
Delaware Group® Equity Funds IV (Trust) is organized as a Delaware statutory trust and offers 21 series. These financial statements and the related notes pertain to Delaware Smid Cap Growth Fund (Fund). The Fund is anopen-end investment company. The Fund is considered diversified under the Investment Company Act of 1940, as amended (1940 Act), and offers Class A, Class C, Class R, Institutional Class, and Class R6 shares. Class A shares are sold with a maximumfront-end sales charge of 5.75%. Class A share purchases of $1,000,000 or more will incur a contingent deferred sales charge (CDSC) instead of afront-end sales charge of 1.00%, if redeemed during the first year and 0.50% during the second year, provided that Delaware Distributors, L.P. (DDLP) paid a financial advisor a commission on the purchase of those shares. Class C shares are sold with a CDSC of 1.00%, if redeemed during the first 12 months. Class R, Institutional Class, and Class R6 shares are not subject to a sales charge and are offered for sale exclusively to certain eligible investors. In addition, Class R6 shares do not pay any service fees,sub-accounting fees, and/orsub-transfer agency fees to any brokers, dealers, or other financial intermediaries.
1. Significant Accounting Policies
The Fund follows accounting and reporting guidance under Financial Accounting Standards Board (FASB) Accounting Standards Codification Topic 946, Financial Services – Investment Companies. The following accounting policies are in accordance with US generally accepted accounting principles (US GAAP) and are consistently followed by the Fund.
Security Valuation— Equity securities, except those traded on the Nasdaq Stock Market LLC (Nasdaq), are valued at the last quoted sales price as of the time of the regular close of the New York Stock Exchange on the valuation date. Equity securities traded on the Nasdaq are valued in accordance with the Nasdaq Official Closing Price, which may not be the last sales price. If, on a particular day, an equity security does not trade, the mean between the bid and ask prices will be used, which approximates fair value. Equity securities listed on a foreign exchange are normally valued at the last quoted sales price on the valuation date. US government and agency securities are valued at the mean between the bid and ask prices, which approximates fair value.Open-end investment companies are valued at their published net asset value (NAV). Generally, other securities and assets for which market quotations are not readily available are valued at fair value as determined in good faith under the direction of the Trust’s Board of Trustees (Board). In determining whether market quotations are readily available or fair valuation will be used, various factors will be taken into consideration, such as market closures or suspension of trading in a security. The Fund may use fair value pricing more frequently for securities traded primarily innon-US markets because, among other things, most foreign markets close well before the Fund values its securities, generally as of 4:00pm Eastern time. The earlier close of these foreign markets gives rise to the possibility that significant events, including broad market moves, government actions or pronouncements, aftermarket trading, or news events may have occurred in the interim. Whenever such a significant event occurs, the Fund may value foreign securities using fair value prices based on third-party vendor modeling tools (international fair value pricing). Restricted securities are valued at fair value using methods approved by the Board.
Federal and Foreign Income Taxes— No provision for federal income taxes has been made as the Fund intends to continue to qualify for federal income tax purposes as a regulated investment company under Subchapter M of the Internal Revenue Code of 1986, as amended, and make the requisite
30
Table of Contents
distributions to shareholders. The Fund evaluates tax positions taken or expected to be taken in the course of preparing the Fund’s tax returns to determine whether the tax positions are“more-likely-than-not” of being sustained by the applicable tax authority. Tax positions not deemed to meet the“more-likely-than-not” threshold are recorded as a tax benefit or expense in the current year. Management has analyzed the Fund’s tax positions taken or expected to be taken on the Fund’s federal income tax returns through the year ended March 31, 2020 and for all open tax years (years ended March 31, 2017–March 31, 2019), and has concluded that no provision for federal income tax is required in the Fund’s financial statements. If applicable, the Fund recognizes interest accrued on unrecognized tax benefits in interest expense and penalties in “Other” on the “Statement of operations.” In regard to foreign taxes only, the Fund has open tax years in certain foreign countries in which it invests that may date back to the inception of the Fund. During the year ended March 31, 2020, the Fund did not incur any interest or tax penalties.
Class Accounting— Investment income, common expenses, and realized and unrealized gain (loss) on investments are allocated to the various classes of the Fund on the basis of daily net assets of each class. Distribution expenses relating to a specific class are charged directly to that class. Class R6 shares will not be allocated any expenses related to service fees,sub-accounting fees, and/orsub-transfer agency fees paid to brokers, dealers, or other financial intermediaries.
Foreign Currency Transactions— Transactions denominated in foreign currencies are recorded at the prevailing exchange rates on the valuation date in accordance with the Fund’s prospectus. The value of all assets and liabilities denominated in foreign currencies is translated daily into US dollars at the exchange rate of such currencies against the US dollar. Transaction gains or losses resulting from changes in exchange rates during the reporting period or upon settlement of the foreign currency transaction are reported in operations for the current period. The Fund generally does not bifurcate that portion of realized gains and losses on investments which is due to changes in foreign exchange rates from that which is due to changes in market prices. These gains and losses are included on the “Statement of operations” under “Net realized gain (loss) on investments.” The Fund reports certain foreign currency related transactions as components of realized gains (losses) for financial reporting purposes, whereas such components are treated as ordinary income (loss) for federal income tax purposes.
Use of Estimates— The preparation of financial statements in conformity with US GAAP requires management to make estimates and assumptions that affect the fair value of investments, the reported amounts of assets and liabilities and disclosure of contingent assets and liabilities at the date of the financial statements, and the reported amounts of revenues and expenses during the reporting period. Actual results could differ from those estimates and the differences could be material.
Other— Expenses directly attributable to the Fund are charged directly to the Fund. Other expenses common to various funds within the Delaware Funds® by Macquarie (Delaware Funds) are generally allocated among such funds on the basis of average net assets. Management fees and certain other expenses are paid monthly. Security transactions are recorded on the date the securities are purchased or sold (trade date) for financial reporting purposes. Costs used in calculating realized gains and losses on the sale of investment securities are those of the specific securities sold. Dividend income is recorded on theex-dividend date and interest income is recorded on the accrual basis. Taxablenon-cash
31
Table of Contents
Notes to financial statements
Delaware Smid Cap Growth Fund
1. Significant Accounting Policies (continued)
dividends are recorded as dividend income. Distributions received from investments in real estate investment trusts (REITs) are recorded as dividend income on theex-dividend date, subject to reclassification upon notice of the character of such distributions by the issuer. Foreign dividends are also recorded on theex-dividend date or as soon after theex-dividend date that the Fund is aware of such dividends, net of all tax withholdings, a portion of which may be reclaimable. Withholding taxes and reclaims on foreign dividends have been recorded in accordance with the Fund’s understanding of the applicable country’s tax rules and rates. The Fund declares and pays dividends from net investment income and distributions from net realized gain on investments, if any, annually. The Fund may distribute more frequently, if necessary for tax purposes. Dividends and distributions, if any, are recorded on theex-dividend date.
The Fund receives earnings credits from its custodian when positive cash balances are maintained, which may be used to offset custody fees. The expenses paid under this arrangement are included on the “Statement of operations” under “Custodian fees” with the corresponding expenses offset included under “Less expenses paid indirectly.” For the year ended March 31, 2020, the Fund earned $533 under this arrangement.
The Fund receives earnings credits from its transfer agent when positive cash balances are maintained, which may be used to offset transfer agent fees. If the amount earned is greater than $1, the expenses paid under this arrangement are included on the “Statement of operations” under “Dividend disbursing and transfer agent fees and expenses” with the corresponding expenses offset included under “Less expenses paid indirectly.” For the year ended March 31, 2020, the Fund earned $1,931 under this arrangement.
2. Investment Management, Administration Agreements and Other Transactions with Affiliates
In accordance with the terms of its investment management agreement, the Fund pays Delaware Management Company (DMC), a series of Macquarie Investment Management Business Trust and the investment manager, an annual fee which is calculated daily and paid monthly at the rate of 0.75% on the first $500 million of the average daily net assets of the Fund; 0.70% on the next $500 million; 0.65% on the next $1.5 billion; and 0.60% on average daily net assets in excess of $2.5 billion.
Effective May 30, 2019, DMC may permit its affiliates, Macquarie Investment Management Global Limited (MIMGL) and Macquarie Funds Management Hong Kong Limited (together, the “AffiliatedSub-Advisors”), to execute Fund security trades on behalf of the Manager. The Manager may also seek quantitative support from MIMGL. Although the AffiliatedSub-Advisors serve assub-advisors, DMC has ultimate responsibility for all investment advisory services. For these services, DMC, not the Fund, may pay each AffiliatedSub-Advisor a portion of its investment management fee.
Delaware Investments Fund Services Company (DIFSC), an affiliate of DMC, provides fund accounting and financial administration oversight services to the Fund. For these services, DIFSC’s fees are calculated daily and paid monthly based on the aggregate daily net assets of all funds within the Delaware Funds at the following annual rate: 0.00475% of the first $35 billion; 0.0040% of the next $10 billion; and 0.0025% of aggregate average daily net assets in excess of $45 billion (Total Fee). Each fund in the Delaware Funds pays a minimum of $4,000, which, in aggregate, is subtracted from the Total
32
Table of Contents
Fee. Each fund then pays its portion of the remainder of the Total Fee on a relative NAV basis. This amount is included on the “Statement of operations” under “Accounting and administration expenses.” For the year ended March 31, 2020, the Fund was charged $65,623 for these services.
DIFSC is also the transfer agent and dividend disbursing agent of the Fund. For these services, DIFSC’s fees are calculated daily and paid monthly based on the aggregate daily net assets of the retail funds within the Delaware Funds at the following annual rates: 0.014% of the first $20 billion; 0.011% of the next $5 billion; 0.007% of the next $5 billion; 0.005% of the next $20 billion; and 0.0025% of average daily net assets in excess of $50 billion. The fees payable to DIFSC under the shareholder services agreement described above are allocated among all retail funds in the Delaware Funds on a relative NAV basis. This amount is included on the “Statement of operations” under “Dividend disbursing and transfer agent fees and expenses.” For the year ended March 31, 2020, the Fund was charged $161,504 for these services. Pursuant to asub-transfer agency agreement between DIFSC and BNY Mellon Investment Servicing (US) Inc. (BNYMIS), BNYMIS provides certainsub-transfer agency services to the Fund.Sub-transfer agency fees are paid by the Fund and are also included on the “Statement of operations” under “Dividend disbursing and transfer agent fees and expenses.” The fees are calculated daily and paid as invoices are received on a monthly or quarterly basis.
Pursuant to a distribution agreement and distribution plan, the Fund pays DDLP, the distributor and an affiliate of DMC, annual12b-1 fee of 0.25% of the average daily net assets of the Class A shares, 1.00% of the average daily net assets of the Class C shares, and 0.50% of the average daily net assets of Class R shares. The Board has adopted a formula for calculating12b-1 fees for the Fund’s Class A shares that went into effect on Oct. 11, 2010. The total12b-1 fees to be paid by Class A shareholders of the Fund will be the sum of: (i) 0.10% of the average daily net assets representing shares that were acquired prior to June 1, 1992, and (ii) 0.25% of the average daily net assets representing shares that were acquired on or after June 1, 1992. All Class A shareholders currently bear12b-1 fees at the same rate, the blended rate based on the formula described above. This method of calculating Class A12b-1 fees may be discontinued at the sole discretion of the Board. The fees that are calculated daily and paid monthly. Institutional Class and Class R6 shares do not pay12b-1 fees.
As provided in the investment management agreement, the Fund bears a portion of the cost of certain resources shared with DMC, including the cost of internal personnel of DMC and/or its affiliates that provide legal, tax, and regulatory reporting services to the Fund. For the year ended March 31, 2020, the Fund was charged $45,079 for internal legal, tax, and regulatory reporting services provided by DMC and/or its affiliates’ employees. This amount is included on the “Statement of operations” under “Legal fees.”
For the year ended March 31, 2020, DDLP earned $180,706 for commissions on sales of the Fund’s Class A shares. For the year ended March 31, 2020, DDLP received gross CDSC commissions of $9,554 and $12,456 on redemptions of the Fund’s Class A and Class C shares, respectively, and these commissions were entirely used to offset upfront commissions previously paid by DDLP to broker/dealers on sales of those shares.
Trustees’ fees include expenses accrued by the Fund for each Trustee’s retainer and meeting fees. Certain officers of DMC, DIFSC, and DDLP are officers and/or Trustees of the Trust. These officers and Trustees are paid no compensation by the Fund.
33
Table of Contents
Notes to financial statements
Delaware Smid Cap Growth Fund
2. Investment Management, Administration Agreements and Other Transactions with Affiliates (continued)
In addition to the management fees and other expenses of the Fund, the Fund indirectly bears the investment management fees and other expenses of the investment companies (Underlying Funds) in which it invests. The amount of these fees and expenses incurred indirectly by the Fund will vary based upon the expense and fee levels of the Underlying Funds and the number of shares that are owned of the Underlying Funds at different times.
Cross trades for the year ended March 31, 2020 were executed by the Fund pursuant to procedures adopted by the Board designed to ensure compliance with Rule17a-7 under the 1940 Act. Cross trading is the buying or selling of portfolio securities between funds of investment companies, or between a fund of an investment company and another entity, that are or could be considered affiliates by virtue of having a common investment advisor (or affiliated investment advisors), common directors/trustees and/or common officers. At its regularly scheduled meetings, the Board reviews such transactions for compliance with the procedures adopted by the Board. Pursuant to these procedures, for the year ended March 31, 2020, the Fund engaged in securities sales of $45,341,781 which resulted in net realized loss of $(1,785,398).
3. Investments
For the year ended March 31, 2020, the Fund made purchases and sales of investment securities other than short-term investments as follows:
Purchases | $ | 2,047,268,001 | ||
Sales | 1,946,444,158 |
The tax cost of investments includes adjustments to net unrealized appreciation (depreciation) which may not necessarily be final tax cost basis adjustments, but approximate the tax basis unrealized gains and losses that may be realized and distributed to shareholder. At March 31, 2020, the cost and unrealized appreciation (depreciation) of investments for federal income tax purposes for the Fund were as follows:
Cost of investments | $ | 1,419,363,152 | ||
|
| |||
Aggregate unrealized appreciation of investments | $ | 353,275,019 | ||
Aggregate unrealized depreciation of investments | (171,664,423 | ) | ||
|
| |||
Net unrealized appreciation of investments | $ | 181,610,596 | ||
|
|
US GAAP defines fair value as the price that the Fund would receive to sell an asset or pay to transfer a liability in an orderly transaction between market participants at the measurement date under current market conditions. A three-level hierarchy for fair value measurements has been established based upon the transparency of inputs to the valuation of an asset or liability. Inputs may be observable or unobservable and refer broadly to the assumptions that market participants would use in pricing the asset or liability. Observable inputs reflect the assumptions market participants would use in pricing the asset or liability based on market data obtained from sources independent of the reporting entity. Unobservable inputs reflect the reporting entity’s own assumptions about the assumptions that market participants would use in pricing the asset or liability based on the best information available under the circumstances. The Fund’s investment in its entirety is assigned a level based upon the observability
34
Table of Contents
of the inputs which are significant to the overall valuation. The three-level hierarchy of inputs is summarized below.
| Level 1 – | Inputs are quoted prices in active markets for identical investments. (Examples: equity securities,open-end investment companies, futures contracts, and exchange-traded options contracts) | |
| Level 2 – | Other observable inputs, including, but not limited to: quoted prices for similar assets or liabilities in markets that are active, quoted prices for identical or similar assets or liabilities in markets that are not active, inputs other than quoted prices that are observable for the assets or liabilities (such as interest rates, yield curves, volatilities, prepayment speeds, loss severities, credit risks, and default rates) or other market-corroborated inputs. (Examples: debt securities, government securities, swap contracts, foreign currency exchange contracts, foreign securities utilizing international fair value pricing, broker-quoted securities, and fair valued securities) | |
| Level 3 – | Significant unobservable inputs, including the Fund’s own assumptions used to determine the fair value of investments. (Examples: broker-quoted securities and fair valued securities) | |
Level 3 investments are valued using significant unobservable inputs. The Fund may also use an income-based valuation approach in which the anticipated future cash flows of the investment are discounted to calculate fair value. Discounts may also be applied due to the nature or duration of any restrictions on the disposition of the investments. Valuations may also be based upon current market prices of securities that are comparable in coupon, rating, maturity, and industry. The derived value of a Level 3 investment may not represent the value which is received upon disposition and this could impact the results of operations.
The following table summarizes the valuation of the Fund’s investments by fair value hierarchy levels as of March 31, 2020:
Level 1 | ||||
Securities | ||||
Assets: | ||||
Common Stock | $ | 1,600,973,748 | ||
During the year ended March 31, 2020, there were no transfers between Level 1 investments, Level 2 investments, or Level 3 investments that had a significant impact to the Fund. This does not include transfers between Level 1 investments and Level 2 investments due to the Fund utilizing international fair value pricing during the year. In accordance with the fair valuation procedures described in Note 1, international fair value pricing of securities in the Fund occurs when market volatility exceeds an established rolling threshold. If the threshold is exceeded on a given date, then prices of international securities (those that traded on exchanges that close at a different time than the time that the Fund’s NAV is determined) are established using a separate pricing feed from a third-party vendor designed to establish a price for each such security as of the time that the Fund’s NAV is determined. Further, international fair value pricing uses other observable market-based inputs in place of the closing exchange price due to the events occurring after the close of the exchange or market on which the investment is principally traded, causing a change in classification between levels. International fair value
35
Table of Contents
Notes to financial statements
Delaware Smid Cap Growth Fund
3. Investments (continued)
pricing was not utilized at March 31, 2020. The Fund’s policy is to recognize transfers between levels based on fair value at the beginning of the reporting period.
A reconciliation of Level 3 investments is presented when the Fund has a significant amount of Level 3 investments at the beginning, interim, or end of the period in relation to net assets. During the year ended March 31, 2020, there were no Level 3 investments.
4. Dividend and Distribution Information
Income and long-term capital gain distributions are determined in accordance with federal income tax regulations, which may differ from US GAAP. Additionally, distributions from net gains on foreign currency transactions and net short-term gains on sales of investment securities are treated as ordinary income for federal income tax purposes. The tax character of dividends and distributions paid during the years ended March 31, 2020 and 2019 were as follows:
| Year ended | ||||||||
| 3/31/20 | 3/31/19 | |||||||
Ordinary income | $ | — | $ | 23,954,875 | ||||
Long-term capital gains | 69,302,193 | 140,675,662 | ||||||
|
|
|
| |||||
Total | $ | 69,302,193 | $ | 164,630,537 | ||||
|
|
|
| |||||
5. Components of Net Assets on a Tax Basis
As of March 31, 2020, the components of net assets on a tax basis were as follows:
Shares of beneficial interest | $ | 1,368,871,851 | ||
Undistributed long-term capital gains | 55,612,259 | |||
Qualified late year loss deferrals | (4,307,795 | ) | ||
Net unrealized appreciation on investments and foreign currencies | 181,610,596 | |||
|
| |||
Net assets | $ | 1,601,786,911 | ||
|
|
The differences between book basis and tax basis components of net assets are primarily attributable to tax deferral of losses on wash sales.
Qualified late year losses represent ordinary losses realized from Jan. 1, 2020 through March 31, 2020 and capital losses realized from Nov. 1, 2019 through March 31, 2020, that in accordance with federal income tax regulations, the Fund has elected to defer and treat as having arisen in the following fiscal year.
36
Table of Contents
For financial reporting purposes, capital accounts are adjusted to reflect the tax character of permanent book/tax differences. Reclassifications are primarily due to tax treatment of net operating losses. Results of operations and net assets were not affected by these reclassifications. For the year ended March 31, 2020, the Fund recorded the following reclassifications:
Total distributable earnings (loss) | $ | 15,819,234 | ||
Paid-in capital | (15,819,234 | ) |
6. Capital Shares
Transactions in capital shares were as follows:
| Year ended | ||||||||
| 3/31/20 | 3/31/19 | |||||||
Shares sold: | ||||||||
Class A | 3,916,893 | 6,510,875 | ||||||
Class C | 2,914,364 | 3,368,899 | ||||||
Class R | 145,012 | 230,536 | ||||||
Institutional Class | 16,060,080 | 15,286,247 | ||||||
Class R6 | 494,340 | 272,887 | ||||||
Shares issued upon reinvestment of dividends and distributions: | ||||||||
Class A | 1,598,663 | 4,924,461 | ||||||
Class C | 686,193 | 1,242,146 | ||||||
Class R | 25,427 | 99,416 | ||||||
Institutional Class | 560,340 | 1,359,045 | ||||||
Class R6 | 14,833 | 11,792 | ||||||
|
|
|
| |||||
| 26,416,145 | 33,306,304 | |||||||
|
|
|
| |||||
Shares redeemed: | ||||||||
Class A | (6,550,747 | ) | (7,675,690 | ) | ||||
Class C | (1,900,558 | ) | (3,172,584 | ) | ||||
Class R | (395,179 | ) | (297,634 | ) | ||||
Institutional Class | (11,472,483 | ) | (6,638,042 | ) | ||||
Class R6 | (219,767 | ) | (53,693 | ) | ||||
|
|
|
| |||||
| (20,538,734 | ) | (17,837,643 | ) | |||||
|
|
|
| |||||
Net Increase | 5,877,411 | 15,468,661 | ||||||
|
|
|
| |||||
37
Table of Contents
Notes to financial statements
Delaware Smid Cap Growth Fund
6. Capital Shares (continued)
Certain shareholders may exchange shares of one class for shares of another class in the same Fund. These exchange transactions are included as subscriptions and redemptions in the table on the previous page and the “Statements of changes in net assets.” For the years ended March 31, 2020 and 2019, the Fund had the following exchange transactions:
Exchange Redemptions | Exchange Subscriptions | |||||||||
| Institutional | ||||||||||
| Class A | Class C | Class A | Class | |||||||
| Shares | Shares | Shares | Shares | Value | ||||||
Year ended 3/31/20 | 32,353 | 58,675 | 11,691 | 32,019 | 1,418,403 | |||||
Year ended 3/31/19 | 68,887 | 394,464 | 192,914 | 54,666 | 7,079,422 | |||||
7. Line of Credit
The Fund, along with certain other funds in the Delaware Funds (Participants), was a participant in a $220,000,000 revolving line of credit intended to be used for temporary or emergency purposes as an additional source of liquidity to fund redemptions of investor shares. Under the agreement, the Participants were charged an annual commitment fee of 0.15%, which was allocated across the Participants based on a weighted average of the respective net assets of each Participant. The Participants were permitted to borrow up to a maximum ofone-third of their net assets under the agreement. Each Participant was individually, and not jointly, liable for its particular advances, if any, under the line of credit. The line of credit available under the agreement expired on Nov. 4, 2019.
On Nov. 4, 2019, the Participants entered into an amendment to the agreement for a $250,000,000 revolving line of credit. The revolving line of credit is to be used as described above and operates in substantially the same manner as the original agreement. The line of credit available under the agreement expires on Nov. 2, 2020.
The Fund had no amounts outstanding as of March 31, 2020, or at any time during the year then ended.
8. Securities Lending
The Fund, along with other funds in the Delaware Funds, may lend its securities pursuant to a security lending agreement (Lending Agreement) with The Bank of New York Mellon (BNY Mellon). At the time a security is loaned, the borrower must post collateral equal to the required percentage of the market value of the loaned security, including any accrued interest. The required percentage is: (1) 102% with respect to US securities and foreign securities that are denominated and payable in US dollars; and (2) 105% with respect to foreign securities. With respect to each loan, if on any business day, the aggregate market value of securities collateral plus cash collateral held is less than the aggregate market value of the securities which are the subject of such loan, the borrower will be notified to provide additional collateral by the end of the following business day, which, together with the collateral already held, will be not less than the applicable initial collateral requirements for such security loan. If the aggregate market value of securities collateral and cash collateral held with respect to a security loan exceeds the applicable initial collateral requirement, upon the request of the borrower, BNY Mellon must return
38
Table of Contents
enough collateral to the borrower by the end of the following business day to reduce the value of the remaining collateral to the applicable initial collateral requirement for such security loan. As a result of the foregoing, the value of the collateral held with respect to a loaned security on any particular day, may be more or less than the value of the security on loan. The collateral percentage with respect to the market value of the loaned security is determined by the security lending agent.
Cash collateral received by each fund of the Trust is generally invested in a series of individual separate accounts, each corresponding to a fund. The investment guidelines permit each separate account to hold certain securities that would be considered eligible securities for a money market fund. Cash collateral received is generally invested in government securities; certain obligations issued by government sponsored enterprises; repurchase agreements collateralized by US Treasury securities; obligations issued by the central government of any Organization for Economic Cooperation and Development (OECD) country or its agencies, instrumentalities or establishments; obligations of supranational organizations; commercial paper, notes, bonds, and other debt obligations; certificates of deposit, time deposits, and other bank obligations; and asset-backed securities. The Fund can also accept US government securities and letters of credit(non-cash collateral) in connection with securities loans.
In the event of default or bankruptcy by the lending agent, realization and/or retention of the collateral may be subject to legal proceedings. In the event the borrower fails to return loaned securities and the collateral received is insufficient to cover the value of the loaned securities and provided such collateral shortfall is not the result of investment losses, the lending agent has agreed to pay the amount of the shortfall to the Fund or, at the discretion of the lending agent, replace the loaned securities. The Fund continues to record dividends or interest, as applicable, on the securities loaned and is subject to changes in value of the securities loaned that may occur during the term of the loan. The Fund has the right under the Lending Agreement to recover the securities from the borrower on demand. With respect to security loans collateralized bynon-cash collateral, the Fund receives loan premiums paid by the borrower. With respect to security loans collateralized by cash collateral, the earnings from the collateral investments are shared among the Fund, the security lending agent, and the borrower. The Fund records security lending income net of allocations to the security lending agent and the borrower.
The Fund may incur investment losses as a result of investing securities lending collateral. This could occur if an investment in the collateral investment account defaulted or became impaired. Under those circumstances, the value of the Fund’s cash collateral account may be less than the amount the Fund would be required to return to the borrowers of the securities and the Fund would be required to make up for this shortfall.
During the year ended March 31, 2020, the Fund had no securities out on loan.
9. Credit and Market Risk
The Fund invested in growth stocks (such as those in the technology sector), which reflect projections of future earnings and revenue. These prices may rise or fall dramatically depending on whether those projections are met. These companies’ stock prices may be more volatile, particularly over the short-term.
39
Table of Contents
Notes to financial statements
Delaware Smid Cap Growth Fund
9. Credit and Market Risk (continued)
The Fund invests a significant portion of its assets in small- andmid-sized companies and may be subject to certain risks associated with ownership of securities of such companies. Investments in small- ormid-sized companies may be more volatile than investments in larger companies for a number of reasons, which include limited financial resources or a dependence on narrow product lines.
The Fund invests in REITs and is subject to the risks associated with that industry. If the Fund holds real estate directly or receives rental income directly from real estate holdings, its tax status as a regulated investment company may be jeopardized. There were no direct real estate holdings during the year ended March 31, 2020. The Fund’s REIT holdings are also affected by interest rate changes, particularly if the REITs it holds use floating rate debt to finance their ongoing operations.
The Fund may invest up to 15% of its net assets in illiquid securities, which may include securities with contractual restrictions on resale, securities exempt from registration under Rule 144A promulgated under the Securities Act of 1933, as amended, and other securities which may not be readily marketable. The relative illiquidity of these securities may impair the Fund from disposing of them in a timely manner and at a fair price when it is necessary or desirable to do so. While maintaining oversight, the Board has delegated to DMC, theday-to-day functions of determining whether individual securities are liquid for purposes of the Fund’s limitation on investments in illiquid securities. Securities eligible for resale pursuant to Rule 144A, which are determined to be liquid, are not subject to the Fund’s 15% limit on investments in illiquid securities. As of March 31, 2020, there were no Rule 144A securities held by the Fund.
10. Contractual Obligations
The Fund enters into contracts in the normal course of business that contain a variety of indemnifications. The Fund’s maximum exposure under these arrangements is unknown. However, the Fund has not had prior claims or losses pursuant to these contracts. Management has reviewed the Fund’s existing contracts and expects the risk of loss to be remote.
11. Recent Accounting Pronouncements
In August 2018, the FASB issued an Accounting Standards Update (ASU), ASU2018-13, which changes certain fair value measurement disclosure requirements. ASU2018-13, in addition to other modifications and additions, removes the requirement to disclose the amount and reasons for transfers between Level 1 and Level 2 of the fair value hierarchy, the policy for the timing of transfers between levels and the valuation process for Level 3 fair value measurements. ASU2018-13 is effective for fiscal years, and interim periods within those fiscal years, beginning after Dec. 15, 2019. At this time, Management is evaluating the implications of these changes on the financial statements.
12. Subsequent Events
On Nov. 4, 2019, the Fund, along with certain other funds in the Delaware Funds (Participants), entered into an amendment to the agreement for a $250,000,000 revolving line of credit. The revolving line of credit available was increased to $275,000,000 on May 6, 2020. The revolving line of credit is to be used as described above and operates in substantially the same manner as the original agreement.
40
Table of Contents
Beginning in January 2020, global financial markets have experienced and may continue to experience significant volatility resulting from the spread of a novel coronavirus known asCOVID-19. The outbreak ofCOVID-19 has resulted in travel and border restrictions, quarantines, supply chain disruptions, lower consumer demand and general market uncertainty. The effects ofCOVID-19 have and may continue to adversely affect the global economy, the economies of certain nations and individual issuers, all of which may negatively impact the Fund’s performance.
Management has determined that no other material events or transactions occurred subsequent to March 31, 2020, that would require recognition or disclosure in the Fund’s financial statements.
41
Table of Contents
registered public accounting firm
To the Board of Trustees of Delaware Group® Equity Funds IV and Shareholders of Delaware Smid Cap Growth Fund
Opinion on the Financial Statements
We have audited the accompanying statement of assets and liabilities, including the schedule of investments, of Delaware Smid Cap Growth Fund (one of the funds constituting the Delaware Group® Equity Funds IV, referred to hereafter as the “Fund”) as of March 31, 2020, the related statement of operations for the year ended March 31, 2020, the statements of changes in net assets for each of the two years in the period ended March 31, 2020, including the related notes, and the financial highlights for each of the periods indicated therein (collectively referred to as the “financial statements”). In our opinion, the financial statements present fairly, in all material respects, the financial position of the Fund as of March 31, 2020, the results of its operations for the year then ended, the changes in its net assets for each of the two years in the period ended March 31, 2020 and the financial highlights for each of the periods indicated therein in conformity with accounting principles generally accepted in the United States of America.
Basis for Opinion
These financial statements are the responsibility of the Fund’s management. Our responsibility is to express an opinion on the Fund’s financial statements based on our audits. We are a public accounting firm registered with the Public Company Accounting Oversight Board (United States) (PCAOB) and are required to be independent with respect to the Fund in accordance with the U.S. federal securities laws and the applicable rules and regulations of the Securities and Exchange Commission and the PCAOB.
We conducted our audits of these financial statements in accordance with the standards of the PCAOB. Those standards require that we plan and perform the audit to obtain reasonable assurance about whether the financial statements are free of material misstatement, whether due to error or fraud.
Our audits included performing procedures to assess the risks of material misstatement of the financial statements, whether due to error or fraud, and performing procedures that respond to those risks. Such procedures included examining, on a test basis, evidence regarding the amounts and disclosures in the financial statements. Our audits also included evaluating the accounting principles used and significant estimates made by management, as well as evaluating the overall presentation of the financial statements. Our procedures included confirmation of securities owned as of March 31, 2020 by correspondence with the custodian and brokers; when replies were not received from brokers, we performed other auditing procedures. We believe that our audits provide a reasonable basis for our opinion.
/s/PricewaterhouseCoopers LLP
Philadelphia, Pennsylvania
May 26, 2020
We have served as the auditor of one or more investment companies in Delaware Funds® by Macquarie since 2010.
42
Table of Contents
Other Fund information (Unaudited)
Delaware Smid Cap Growth Fund
Tax Information
The information set forth below is for the Fund’s fiscal year as required by federal income tax laws. Shareholders, however, must report distributions on a calendar year basis for income tax purposes, which may include distributions for portions of two fiscal years of a fund. Accordingly, the information needed by shareholders for income tax purposes will be sent to them in January of each year. Please consult your tax advisor for proper treatment of this information.
All disclosures are based on financial information available as of the date of this annual report and, accordingly are subject to change. For any and all items requiring reporting, it is the intention of the Fund to report the maximum amount permitted under the Internal Revenue Code and the regulations thereunder.
For the fiscal year ended March 31, 2020, the Fund reports distributions paid during the period as follows:
(A) Long-Term Capital Gain Distributions (Tax Basis) | 100.00 | % |
(A) is based on a percentage of the Fund’s total distributions.
43
Table of Contents
Board of trustees / directors and officers addendum
Delaware Funds®by Macquarie
A mutual fund is governed by a Board of Trustees/Directors (“Trustees”), which has oversight responsibility for the management of a fund’s business affairs. Trustees establish procedures and oversee and review the performance of the investment manager, the distributor, and others who perform services for the fund. The independent fund trustees, in particular, are advocates
Name, Address, and Birth Date | Position(s) Held with Fund(s) | Length of Time Served | ||
Interested Trustee
| ||||
| Shawn K. Lytle1 | President, | President and | ||
| 2005 Market Street | Chief Executive Officer, | Chief Executive Officer | ||
| Philadelphia, PA 19103 | and Trustee | since August 2015 | ||
| February 1970 | ||||
| Trustee since | ||||
| September 2015 | ||||
Independent Trustees
| ||||
| Thomas L. Bennett | Chair and Trustee | Trustee since | ||
| 2005 Market Street | March 2005 | |||
| Philadelphia, PA 19103 | ||||
| October 1947 | Chair since | |||
| March 2015 | ||||
| Jerome D. Abernathy | Trustee | Since January 2019 | ||
| 2005 Market Street | ||||
| Philadelphia, PA 19103 | ||||
| July 1959 | ||||
| Ann D. Borowiec | Trustee | Since March 2015 | ||
| 2005 Market Street | ||||
| Philadelphia, PA 19103 | ||||
| November 1958 | ||||
| 1 | Shawn K. Lytle is considered to be an “Interested Trustee” because he is an executive officer of the Fund’s(s’) investment advisor. |
44
Table of Contents
for shareholder interests. Each trustee has served in that capacity since he or she was elected to or appointed to the Board of Trustees, and will continue to serve until his or her retirement or the election of a new trustee in his or her place. The following is a list of the Trustees and Officers with certain background and related information.
Principal Occupation(s) During the Past Five Years | Number of Portfolios in Fund Complex Overseen by Trustee or Officer | Other Directorships Held by Trustee or Officer | ||
| ||||
| President — Macquarie | 95 | Trustee — UBS | ||
| Investment Management2 | Relationship Funds, | |||
| (June 2015–Present) | SMA Relationship | |||
| Trust, and UBS Funds | ||||
| Regional Head of | (May 2010–April 2015) | |||
| Americas — UBS Global | ||||
| Asset Management | ||||
| (April 2010–May 2015) | ||||
| ||||
| Private Investor | 95 | None | ||
| (March 2004–Present) | ||||
| Managing Member, | 95 | None | ||
| Stonebrook Capital | ||||
| Management, LLC (financial | ||||
| technology: macro factors | ||||
| and databases) | ||||
(January 1993–Present)
| ||||
| Chief Executive Officer, | 95 | Director — | ||
| Private Wealth Management | Banco Santander International | |||
| (2011–2013) and | (October 2016– | |||
| Market Manager, | December 2019) | |||
| New Jersey Private | ||||
| Bank (2005–2011) — | Director — | |||
| J.P. Morgan Chase & Co. | Santander Bank, N.A. | |||
| (December 2016– | ||||
December 2019)
|
| 2 | Macquarie Investment Management is the marketing name for Macquarie Management Holdings, Inc. and its subsidiaries, including the Fund’s(s’) investment advisor, principal underwriter, and its transfer agent. |
45
Table of Contents
Board of trustees / directors and officers addendum
Delaware Funds®by Macquarie
Name, Address, and Birth Date | Position(s) Held with Fund(s) | Length of Time Served | ||
Independent Trustees (continued)
| ||||
| Joseph W. Chow | Trustee | Since January 2013 | ||
| 2005 Market Street | ||||
| Philadelphia, PA 19103 | ||||
| January 1953 | ||||
| John A. Fry | Trustee | Since January 2001 | ||
| 2005 Market Street | ||||
| Philadelphia, PA 19103 | ||||
| May 1960 | ||||
| Lucinda S. Landreth | Trustee | Since March 2005 | ||
| 2005 Market Street | ||||
| Philadelphia, PA 19103 | ||||
June 1947
| ||||
46
Table of Contents
Principal Occupation(s) During the Past Five Years | Number of Portfolios in Fund Complex Overseen by Trustee or Officer | Other Directorships Held by Trustee or Officer | ||
| ||||
| Private Investor | 95 | Director and Audit Committee | ||
| (April 2011–Present) | Member — Hercules | |||
| Technology Growth | ||||
| Capital, Inc. | ||||
(July 2004–July 2014)
| ||||
| President — | 95 | Director; Compensation | ||
| Drexel University | Committee and | |||
| (August 2010–Present) | Governance Committee | |||
| Member — Community | ||||
| President — | Health Systems | |||
| Franklin & Marshall College | (May 2004–Present) | |||
| (July 2002–June 2010) | ||||
| Director — Drexel | ||||
| Morgan & Co. | ||||
| (2015–2019) | ||||
| Director and Audit Committee | ||||
| Member — vTv | ||||
| Therapeutics Inc. | ||||
| (2017–Present) | ||||
| Director and Audit Committee | ||||
| Member — FS Credit Real | ||||
| Estate Income Trust, Inc. | ||||
| (2018–Present) | ||||
| Director — Federal Reserve | ||||
| Bank of Philadelphia | ||||
(January 2020–Present)
| ||||
| Private Investor | 95 | None | ||
| (2004–Present) | ||||
|
47
Table of Contents
Board of trustees / directors and officers addendum
Delaware Funds®by Macquarie
Name, Address, and Birth Date | Position(s) Held with Fund(s) | Length of Time Served | ||
Independent Trustees (continued)
| ||||
| Frances A. Sevilla-Sacasa | Trustee | Since September 2011 | ||
| 2005 Market Street | ||||
| Philadelphia, PA 19103 | ||||
| January 1956 | ||||
| Thomas K. Whitford | Trustee | Since January 2013 | ||
| 2005 Market Street | ||||
| Philadelphia, PA 19103 | ||||
| March 1956 | ||||
48
Table of Contents
Principal Occupation(s) During the Past Five Years | Number of Portfolios in Fund Complex Overseen by Trustee or Officer | Other Directorships Held by Trustee or Officer | ||
| ||||
| Private Investor | 95 | Trust Manager and | ||
| (January 2017–Present) | Audit Committee | |||
| Chair — Camden | ||||
| Chief Executive Officer — | Property Trust | |||
| Banco Itaú | (August 2011–Present) | |||
| International | ||||
| (April 2012–December 2016) | Director; Strategic | |||
| Planning and Reserves | ||||
| Executive Advisor to Dean | Committee and Nominating | |||
| (August 2011–March 2012) | and Governance | |||
| and Interim Dean | Committee Member — | |||
| (January 2011–July 2011) — | Callon Petroleum Company | |||
| University of Miami School of | (December 2019–Present) | |||
| Business Administration | ||||
| Director; Audit | ||||
| President — U.S. Trust, | Committee Member — | |||
| Bank of America Private | Carrizo Oil & Gas, Inc. | |||
| Wealth Management | (March 2018–December 2019) | |||
| (Private Banking) | ||||
(July 2007–December 2008)
| ||||
| Vice Chairman | 95 | Director — HSBC North | ||
| (2010–April 2013) — | America Holdings Inc. | |||
| PNC Financial | (December 2013–Present) | |||
| Services Group | ||||
| Director — HSBC USA Inc. | ||||
| (July 2014–Present) | ||||
| Director — | ||||
| HSBC Bank USA, | ||||
| National Association | ||||
| (July 2014–March 2017) | ||||
| Director — HSBC | ||||
| Finance Corporation | ||||
(December 2013–April 2018)
|
49
Table of Contents
Board of trustees / directors and officers addendum
Delaware Funds®by Macquarie
Name, Address, and Birth Date | Position(s) Held with Fund(s) | Length of Time Served | ||
Independent Trustees (continued)
| ||||
| Christianna Wood | Trustee | Since January 2019 | ||
| 2005 Market Street | ||||
| Philadelphia, PA 19103 | ||||
| August 1959 | ||||
50
Table of Contents
Principal Occupation(s) During the Past Five Years | Number of Portfolios in Fund Complex Overseen by Trustee or Officer | Other Directorships Held by Trustee or Officer | ||||
| ||||||
| Chief Executive Officer | 95 | Director; Finance Committee | ||||
| and President — | and Audit Committee | |||||
| Gore Creek | Member — H&R | |||||
| Capital, Ltd. | Block Corporation | |||||
| (August 2009–Present) | (July 2008–Present) | |||||
| Director; Investments | ||||||
| Committee, Capital | ||||||
| and Finance | ||||||
| Committee, and Audit | ||||||
| Committee Member — | ||||||
| Grange Insurance | ||||||
| (2013–Present) | ||||||
| Trustee; Chair of | ||||||
| Nominating and Governance | ||||||
| Committee and Audit | ||||||
| Committee Member — | ||||||
| The Merger Fund | ||||||
| (2013–Present), | ||||||
| The Merger Fund VL | ||||||
| (2013-Present), | ||||||
| WCM Alternatives: | ||||||
| Event-Driven Fund | ||||||
| (2013–Present), | ||||||
| and WCM Alternatives: | ||||||
| Credit Event Fund | ||||||
| (December 2017–Present) | ||||||
| Director; Chair of | ||||||
| Governance Committee | ||||||
| and Audit Committee | ||||||
| Member — International | ||||||
| Securities Exchange | ||||||
| (2010–2016) | ||||||
51
Table of Contents
Board of trustees / directors and officers addendum
Delaware Funds®by Macquarie
Name, Address, and Birth Date | Position(s) Held with Fund(s) | Length of Time Served | ||
Independent Trustees (continued)
| ||||
| Janet L. Yeomans | Trustee | Since April 1999 | ||
| 2005 Market Street | ||||
| Philadelphia, PA 19103 | ||||
| July 1948 | ||||
Officers
| ||||
| David F. Connor | Senior Vice President, | Senior Vice President since | ||
| 2005 Market Street | General Counsel, | May 2013; General | ||
| Philadelphia, PA 19103 | and Secretary | Counsel since May 2015; | ||
| December 1963 | Secretary since | |||
| October 2005 | ||||
| Daniel V. Geatens | Vice President | Vice President and | ||
| 2005 Market Street | and Treasurer | Treasurer since October 2007 | ||
| Philadelphia, PA 19103 | ||||
| October 1972 | ||||
| Richard Salus | Senior Vice President | Senior Vice President and | ||
| 2005 Market Street | and Chief Financial Officer | Chief Financial Officer | ||
| Philadelphia, PA 19103 | since November 2006 | |||
| October 1963 | ||||
The Statement of Additional Information for the Fund(s) includes additional information about the Trustees and Officers and is available, without charge, upon request by calling 800523-1918.
52
Table of Contents
Principal Occupation(s) During the Past Five Years | Number of Portfolios in Fund Complex Overseen by Trustee or Officer | Other Directorships Held by Trustee or Officer | ||
| ||||
| Vice President and Treasurer | 95 | Director; Personnel and | ||
| (January 2006–July 2012), | Compensation Committee | |||
| Vice President — | Chair; Member of Nominating, | |||
| Mergers & Acquisitions | Investments, and Audit | |||
| (January 2003–January 2006), | Committees for various | |||
| and Vice President | periods throughout | |||
| and Treasurer | directorship — | |||
| (July 1995–January 2003) — | Okabena Company | |||
| 3M Company | (2009–2017) | |||
| ||||
| David F. Connor has served | 95 | None3 | ||
| in various capacities at | ||||
| different times at | ||||
| Macquarie Investment | ||||
| Management. | ||||
| Daniel V. Geatens has served | 95 | None3 | ||
| in various capacities at | ||||
| different times at | ||||
| Macquarie Investment | ||||
| Management. | ||||
| Richard Salus has served | 95 | None | ||
| in various capacities | ||||
| at different times at | ||||
| Macquarie Investment | ||||
| Management. | ||||
| 3 | David F. Connor and Daniel V. Geatens serve in similar capacities for the six portfolios of the Optimum Fund Trust, which have the same investment advisor, principal underwriter, and transfer agent as the registrant. Mr. Geatens also serves as the Chief Financial Officer of the Optimum Fund Trust, and he is the Chief Financial Officer and Treasurer for Macquarie Global Infrastructure Total Return Fund Inc. |
53
Table of Contents
| Board of trustees | ||||||
Shawn K. Lytle President and Chief Executive Officer Delaware Funds® by Macquarie Philadelphia, PA
Thomas L. Bennett Chairman of the Board Delaware Funds by Macquarie Private Investor Rosemont, PA
Jerome D. Abernathy Managing Member Stonebrook Capital Management, LLC Jersey City, NJ | Ann D. Borowiec Former Chief Executive Officer Private Wealth Management J.P. Morgan Chase & Co. New York, NY
Joseph W. Chow Former Executive Vice President State Street Corporation Boston, MA
John A. Fry President Drexel University Philadelphia, PA | Lucinda S. Landreth Former Chief Investment Officer Assurant, Inc. New York, NY
Frances A. Sevilla-Sacasa Former Chief Executive Officer Banco Itaú International Miami, FL | Thomas K. Whitford Former Vice Chairman PNC Financial Services Group Pittsburgh, PA
Christianna Wood Chief Executive Officer and President Gore Creek Capital, Ltd. Golden, CO
Janet L. Yeomans Former Vice President and Treasurer 3M Company St. Paul, MN | |||
| Affiliated officers | ||||||
| David F. Connor | Daniel V. Geatens | Richard Salus | ||||
Senior Vice President, General Counsel, and Secretary Delaware Funds by Macquarie Philadelphia, PA | Vice President and Treasurer Delaware Funds by Macquarie Philadelphia, PA | Senior Vice President and Chief Financial Officer Delaware Funds by Macquarie Philadelphia, PA | ||||
This annual report is for the information of Delaware Smid Cap Growth Fund shareholders, but it may be used with prospective investors when preceded or accompanied by the Delaware Fund fact sheet for the most recently completed calendar quarter. These documents are available at delawarefunds.com/literature.
The Fund files its complete schedule of portfolio holdings with the Securities and Exchange Commission (SEC) for the first and third quarters of each fiscal year on FormN-PORT. The Fund’s FormsN-PORT, as well as a description of the policies and procedures that the Fund uses to determine how to vote proxies (if any) relating to portfolio securities, are available without charge (i) upon request, by calling 800523-1918; and (ii) on the SEC’s website at sec.gov. In addition, a description of the policies and procedures that the Fund uses to determine how to vote proxies (if any) relating to portfolio securities and the Schedule of Investments included in the Fund’s most recent FormN-PORT are available without charge on the Fund’s website at delawarefunds.com/literature. The Fund’s FormsN-PORT may be reviewed and copied at the SEC’s Public Reference Room in Washington, D.C.; information on the operation of the Public Reference Room may be obtained by calling 800SEC-0330.
Information (if any) regarding how the Fund voted proxies relating to portfolio securities during the most recently disclosed12-month period ended June 30 is available without charge (i) through the Fund’s website at delawarefunds.com/proxy; and (ii) on the SEC’s website at sec.gov.
54
Item 2. Code of Ethics
The registrant has adopted a code of ethics that applies to the registrant’s principal executive officer, principal financial officer, principal accounting officer or controller, or persons performing similar functions, regardless of whether these individuals are employed by the registrant or a third party. A copy of the registrant’s Code of Business Ethics has been posted on the Delaware Funds® by Macquarie Internet Web site atwww.delawarefunds.com. Any amendments to the Code of Business Ethics, and information on any waiver from its provisions granted by the registrant, will also be posted on this Web site within five business days of such amendment or waiver and will remain on the Web site for at least 12 months.
Item 3. Audit Committee Financial Expert
The registrant’s Board of Trustees has determined that certain members of the registrant’s Audit Committee are audit committee financial experts, as defined below. For purposes of this item, an “audit committee financial expert” is a person who has the following attributes:
a. An understanding of generally accepted accounting principles and financial statements;
b. The ability to assess the general application of such principles in connection with the accounting for estimates, accruals, and reserves;
c. Experience preparing, auditing, analyzing, or evaluating financial statements that present a breadth and level of complexity of accounting issues that are generally comparable to the breadth and complexity of issues that can reasonably be expected to be raised by the registrant’s financial statements, or experience actively supervising one or more persons engaged in such activities;
d. An understanding of internal controls and procedures for financial reporting; and
e. An understanding of audit committee functions.
An “audit committee financial expert” shall have acquired such attributes through:
a. Education and experience as a principal financial officer, principal accounting officer, controller, public accountant, or auditor or experience in one or more positions that involve the performance of similar functions;
b. Experience actively supervising a principal financial officer, principal accounting officer, controller, public accountant, auditor, or person performing similar functions;
c. Experience overseeing or assessing the performance of companies or public accountants with respect to the preparation, auditing, or evaluation of financial statements; or
d. Other relevant experience.
The registrant’s Board of Trustees has also determined that each member of the registrant’s Audit Committee is independent. In order to be “independent” for purposes of this item, the Audit Committee member may not: (i) other than in his or her capacity as a member of the Board of Trustees or any committee thereof, accept directly or indirectly any consulting, advisory or other compensatory fee from the issuer; or (ii) be an “interested person” of the registrant as defined in Section 2(a)(19) of the Investment Company Act of 1940.
The names of the audit committee financial experts on the registrant’s Audit Committee are set forth below:
| Jerome D. Abernathy | |
| John A. Fry | |
| Thomas K. Whitford, Chair | |
| Christianna Wood |
Item 4. Principal Accountant Fees and Services
(a)Audit fees.
The aggregate fees billed for services provided to the registrant by its independent auditors for the audit of the registrant’s annual financial statements and for services normally provided by the independent auditors in connection with statutory and regulatory filings or engagements were $90,050 for the fiscal year ended March 31, 2020.
The aggregate fees billed for services provided to the registrant by its independent auditors for the audit of the registrant’s annual financial statements and for services normally provided by the independent auditors in connection with statutory and regulatory filings or engagements were $88,280 for the fiscal year ended March 31, 2019.
(b)Audit-related fees.
The aggregate fees billed by the registrant’s independent auditors for services relating to the performance of the audit of the registrant’s financial statements and not reported under paragraph (a) of this Item were $0 for the fiscal year ended March 31, 2020.
The aggregate fees billed by the registrant’s independent auditors for services relating to the performance of the audit of the financial statements of the registrant’s investment adviser and other service providers under common control with the adviser and that relate directly to the operations or financial reporting of the registrant were $909,000 for the registrant’s fiscal year ended March 31, 2020. The percentage of these fees relating to services approved by the registrant’s Audit Committee pursuant to thedeminimis exception from the pre-approval requirement in Rule 2-01(c)(7)(i)(C) of Regulation S-X was 0%. These audit-related services were as follows: year-end audit procedures; group reporting and subsidiary statutory audits.
The aggregate fees billed by the registrant’s independent auditors for services relating to the performance of the audit of the registrant’s financial statements and not reported under paragraph (a) of this Item were $0 for the fiscal year ended March 31, 2019.
The aggregate fees billed by the registrant’s independent auditors for services relating to the performance of the audit of the financial statements of the registrant’s investment adviser and other service providers under common control with the adviser and that relate directly to the operations or financial reporting of the registrant were $640,000 for the registrant’s fiscal year ended March 31, 2019. The percentage of these fees relating to services approved by the registrant’s Audit Committee pursuant to thedeminimis exception from the pre-approval requirement in Rule 2-01(c)(7)(i)(C) of Regulation S-X was 0%. These audit-related services were as follows: year-end audit procedures; group reporting and subsidiary statutory audits.
(c)Tax fees.
The aggregate fees billed by the registrant’s independent auditors for tax-related services provided to the registrant were $16,500 for the fiscal year ended March 31, 2020. The percentage of these fees relating to services approved by the registrant’s Audit Committee pursuant to thedeminimis exception from the pre-approval requirement in Rule 2-01(c)(7)(i)(C) of Regulation S-X was 0%. These tax-related services were as follows: review of income tax returns and review of annual excise distribution calculations.
The aggregate fees billed by the registrant’s independent auditors for tax-related services provided to the registrant’s investment adviser and other service providers under common control with the adviser and that relate directly to the operations or financial reporting of the registrant were $0 for the registrant’s fiscal year ended March 31, 2020.
The aggregate fees billed by the registrant’s independent auditors for tax-related services provided to the registrant were $15,975 for the fiscal year ended March 31, 2019. The percentage of these fees relating to services approved by the registrant’s Audit Committee pursuant to thedeminimis exception from the pre-approval requirement in Rule 2-01(c)(7)(i)(C) of Regulation S-X was 0%. These tax-related services were as follows: review of income tax returns and review of annual excise distribution calculations.
The aggregate fees billed by the registrant’s independent auditors for tax-related services provided to the registrant’s investment adviser and other service providers under common control with the adviser and that relate directly to the operations or financial reporting of the registrant were $0 for the registrant’s fiscal year ended March 31, 2019.
(d)All other fees.
The aggregate fees billed for all services provided by the independent auditors to the registrant other than those set forth in paragraphs (a), (b) and (c) of this Item were $0 for the fiscal year ended March 31, 2020.
The aggregate fees billed for all services other than those set forth in paragraphs (b) and (c) of this Item provided by the registrant’s independent auditors to the registrant’s adviser and other service providers under common control with the adviser and that relate directly to the operations or financial reporting of the registrant were $0 for the registrant’s fiscal year ended March 31, 2020. The percentage of these fees relating to services approved by the registrant’s Audit Committee pursuant to thedeminimis exception from the pre-approval requirement in Rule 2-01(c)(7)(i)(C) of Regulation S-X was 0%.
The aggregate fees billed for all services provided by the independent auditors to the registrant other than those set forth in paragraphs (a), (b) and (c) of this Item were $0 for the fiscal year ended March 31, 2019.
The aggregate fees billed for all services other than those set forth in paragraphs (b) and (c) of this Item provided by the registrant’s independent auditors to the registrant’s adviser and other service providers under common control with the adviser and that relate directly to the operations or financial reporting of the registrant were $0 for the registrant’s fiscal year ended March 31, 2019. The percentage of these fees relating to services approved by the registrant’s Audit Committee pursuant to thedeminimis exception from the pre-approval requirement in Rule 2-01(c)(7)(i)(C) of Regulation S-X was 0%.
(e) The registrant’s Audit Committee has established pre-approval policies and procedures as permitted by Rule 2-01(c)(7)(i)(B) of Regulation S-X (the “Pre-Approval Policy”) with respect to services provided by the registrant’s independent auditors. Pursuant to the Pre-Approval Policy, the Audit Committee has pre-approved the services set forth in the table below with respect to the registrant up to the specified fee limits. Certain fee limits are based on aggregate fees to the registrant and other registrants within the Delaware Funds® by Macquarie.
| Service | Range of Fees |
| Audit Services | |
Statutory audits or financial audits for new Funds | up to $40,000 per Fund |
Services associated with SEC registration statements (e.g., Form N-1A, Form N-14, etc.), periodic reports and other documents filed with the SEC or other documents issued in connection with securities offerings (e.g., comfort letters for closed-end Fund offerings, consents), and assistance in responding to SEC comment letters | up to $10,000 per Fund |
Consultations by Fund management as to the accounting or disclosure treatment of transactions or events and/or the actual or potential impact of final or proposed rules, standards or interpretations by the SEC, FASB, or other regulatory or standard-setting bodies (Note: Under SEC rules, some consultations may be considered “audit-related services” rather than “audit services”) | up to $25,000 in the aggregate |
Audit-Related Services | |
Consultations by Fund management as to the accounting or disclosure treatment of transactions or events and /or the actual or potential impact of final or proposed rules, standards or interpretations by the SEC, FASB, or other regulatory or standard-setting bodies (Note: Under SEC rules, some consultations may be considered “audit services” rather than “audit-related services”) | up to $25,000 in the aggregate |
Tax Services | |
U.S. federal, state and local and international tax planning and advice (e.g., consulting on statutory, regulatory or administrative developments, evaluation of Funds’ tax compliance function, etc.) | up to $25,000 in the aggregate |
U.S. federal, state and local tax compliance (e.g., excise distribution reviews, etc.) | up to $5,000 per Fund |
Review of federal, state, local and international income, franchise and other tax returns | up to $5,000 per Fund |
Under the Pre-Approval Policy, the Audit Committee has also pre-approved the services set forth in the table below with respect to the registrant’s investment adviser and other entities controlling, controlled by or under common control with the investment adviser that provide ongoing services to the registrant (the “Control Affiliates”) up to the specified fee limit. This fee limit is based on aggregate fees to the investment adviser and its Control Affiliates.
| Service | Range of Fees |
| Non-Audit Services | |
| Services associated with periodic reports and other documents filed with the SEC and assistance in responding to SEC comment letters | up to $10,000 in the aggregate |
The Pre-Approval Policy requires the registrant’s independent auditors to report to the Audit Committee at each of its regular meetings regarding all services initiated since the last such report was rendered, including those services authorized by the Pre-Approval Policy.
(f) Not applicable.
(g) The aggregate non-audit fees billed by the registrant’s independent auditors for services rendered to the registrant and to its investment adviser and other service providers under common control with the adviser were $4,687,000 and $11,748,000 for the registrant’s fiscal years ended March 31, 2020 and March 31, 2019, respectively.
(h) In connection with its selection of the independent auditors, the registrant’s Audit Committee has considered the independent auditors’ provision of non-audit services to the registrant’s investment adviser and other service providers under common control with the adviser that were not required to be pre-approved pursuant to Rule 2-01(c)(7)(ii) of Regulation S-X. The Audit Committee has determined that the independent auditors’ provision of these services is compatible with maintaining the auditors’ independence.
Item 5. Audit Committee of Listed Registrants
Not applicable.
Item 6. Investments
(a) Included as part of report to shareholders filed under Item 1 of this Form N-CSR.
(b) Divestment of securities in accordance with Section 13(c) of the Investment Company Act of 1940.
Not applicable.
Item 7. Disclosure of Proxy Voting Policies and Procedures for Closed-End Management Investment Companies
Not applicable.
Item 8. Portfolio Managers of Closed-End Management Investment Companies
Not applicable.
Item 9. Purchases of Equity Securities by Closed-End Management Investment Company and Affiliated Purchasers
Not applicable.
Item 10. Submission of Matters to a Vote of Security Holders
Not applicable.
Item 11. Controls and Procedures
The registrant’s principal executive officer and principal financial officer have evaluated the registrant’s disclosure controls and procedures within 90 days of the filing of this report and have concluded that they are effective in providing reasonable assurance that the information required to be disclosed by the registrant in its reports or statements filed under the Securities Exchange Act of 1934 is recorded, processed, summarized and reported within the time periods specified in the rules and forms of the Securities and Exchange Commission.
There were no significant changes in the registrant’s internal control over financial reporting that occurred during the period covered by the report to stockholders included herein (i.e., the registrant’s fourth fiscal quarter) that have materially affected, or are reasonably likely to materially affect, the registrant’s internal control over financial reporting.
Item 12. Disclosure of Securities Lending Activities for Closed-End Management Investment Companies
Not applicable.
Item 13. Exhibits
(a) (1) Code of Ethics
Not applicable.
(3) Written solicitations to purchase securities pursuant to Rule 23c-1 under the Securities Exchange Act of 1934.
Not applicable.
SIGNATURES
Pursuant to the requirements of the Securities Exchange Act of 1934 and the Investment Company Act of 1940, the registrant has duly caused this report to be signed on its behalf, by the undersigned, thereunto duly authorized.
DELAWARE GROUP® EQUITY FUNDS IV
| SHAWN K. LYTLE | |
| By: | Shawn K. Lytle |
| Title: | President and Chief Executive Officer |
| Date: | June 4, 2020 |
Pursuant to the requirements of the Securities Exchange Act of 1934 and the Investment Company Act of 1940, this report has been signed below by the following persons on behalf of the registrant and in the capacities and on the dates indicated.
| SHAWN K. LYTLE | |
| By: | Shawn K. Lytle |
| Title: | President and Chief Executive Officer |
| Date: | June 4, 2020 |
| RICHARD SALUS | |
| By: | Richard Salus |
| Title: | Chief Financial Officer |
| Date: | June 4, 2020 |