Exhibit 99.1

3rd Quarter
INTERIM REPORT TO SHAREHOLDERS
for the three and nine months ended July 31, 2012
 |
The Role of Central Fund
To serve investors as "The Sound Monetary Fund".
To hold gold and silver bullion on a secure basis for the
convenience of investors in the shares of Central Fund.
Investment Policies & Restrictions | The investment policy set by the Board of Directors requires Central Fund to maintain a minimum of 90% of its net assets in gold and silver bullion of which at least 85% must be in physical form. On July 31, 2012, 98.9% of Central Fund's net assets were held in gold and silver bullion. Of this bullion, 99.6% was in physical form and 0.4% was in certificate form.
Central Fund's physical gold and silver bullion holdings may not be loaned, subjected to options or otherwise encumbered in any way. | |
| Safeguards | Central Fund’s bullion is stored on an allocated and fully segregated basis in the underground vaults of the Canadian Imperial Bank of Commerce (the “Bank”), one of the major Canadian banks.
The Bank may only release any portion of Central Fund’s physical bullion holdings upon receipt of an authorizing resolution of Central Fund's Board of Directors.
Bullion holdings and Bank vault security are inspected twice annually by Directors and/or Officers of Central Fund. On every occasion, inspections are required to be performed in the presence of both Central Fund's external auditors and Bank personnel.
Central Fund is subject to the extensive regulations and reporting requirements of the United States Securities and Exchange Commission, two stock exchanges and various Canadian provincial securities regulatory authorities. | |
| Conveniences | Central Fund's Class A shares are listed on the NYSE MKT (CEF), and on the Toronto Stock Exchange (CEF.A in Canadian dollars and CEF.U in U.S. dollars). Making a gold and silver bullion investment through Central Fund is as easy as calling one's stockbroker or investment dealer.
The stock exchange listings provide liquid markets for the Class A shares of Central Fund. The bid/ask spread is considerably less than the buying and selling prices of outright bullion purchases, especially for small transactions.
Unlike most other forms of gold and silver bullion investment, there are no ownership costs such as handling, storage and insurance paid directly by the investor. As well, there are no bullion assay charges to a shareholder upon the sale or redemption of Class A shares of Central Fund. |
| 1 |
|
Third Quarter Report
Central Fund currently holds98.9% of its net assets in gold and silver bullion. At July 31, 2012, Central Fund’s gold holdings consisted of 1,686,218 fine ounces of physical bullion and 8,427 fine ounces of gold bullion certificates for a total of 1,694,645 fine ounces. Silver holdings consisted of 76,708,551 ounces of physical bullion and 255,551 ounces of silver bullion certificates for a total of 76,964,102 ounces. Central Fund continues to fulfill its mandate as “The Sound Monetary Fund”.
| Respectfully submitted, | |
| On behalf of the Board of Directors: | |
| J.C. Stefan Spicer, President & CEO |
August 22, 2012
Management’s Discussion and Analysis (“MD&A”)
The following discussion is based on the financial statements of Central Fund of Canada Limited (“Central Fund” or the “Company”) which are prepared and reported in U.S. dollars in accordance with Canadian generally accepted accounting principles, otherwise known as Canadian GAAP, including the Canadian Institute of Chartered Accountants Accounting Guideline 18, Investment Companies (“AcG-18”). These principles are substantially the same as United States’ generally accepted accounting principles. Notes to the financial statements on pages 7 to 11 inclusive should be referred to as supplementary information to this discussion and analysis.
This analysis should be read in conjunction with Central Fund’s audited October 31, 2011 annual financial statements prepared in accordance with Canadian GAAP and included in its 2011 Annual Report and the accompanying MD&A.
Certain statements in this report may constitute forward-looking information under applicable securities laws. Forward-looking information may relate to the Company’s future outlook and anticipated events and may relate to matters that are not historical facts. In particular, statements regarding the Company’s objectives and strategies are forward-looking statements. These statements are based on certain factors and assumptions which are considered reasonable as of the current date but may prove to be incorrect. Forward-looking information is also subject to certain factors, including risks and uncertainties (described in “Risk Factors” of the Company’s 2011 annual MD&A), that could cause future events and results to differ materially from what the Company currently foresees.
Disclosure Controls and Procedures
Senior Executive Officers have ensured that there are disclosure controls and procedures in place that provide reasonable assurance that material information relating to the Company is disclosed on a timely basis. They believe these disclosure controls and procedures have been effective during the nine months ended July 31, 2012.
| 2 |
|
Outstanding Shares
There were 254,432,713 Class A retractable shares and 40,000 Common shares issued and outstanding at July 31, 2012 and October 31, 2011.
Financial Results – Change in Net Assets
Net assets decreased by $284.2 million or 5.4% during the three months ended July 31, 2012 primarily as a result of decreases in the prices of gold and silver during the period of 1.8% and 9.6% respectively.
Net assets decreased by $646.3 million or 11.5% during the nine months ended July 31, 2012, primarily as a result of decreases in the prices of gold and silver during the period of 5.8% and 17.6% respectively.
The following table summarizes selected quarterly financial information (amounts in millions except where stated on a per share basis):
| Quarter ended | ||||||||||||||||
| (in U.S.$) | ||||||||||||||||
| July 31, 2012 | Apr. 30, 2012 | Jan. 31, 2012 | Oct. 31, 2011 | |||||||||||||
| Change in unrealized appreciation of holdings | $ | (280.5 | ) | $ | (341.9 | ) | $ | (12.0 | ) | $ | (256.4 | ) | ||||
| Net income (loss) inclusive of the change in unrealized appreciation of holdings | $ | (284.2 | ) | $ | (346.1 | ) | $ | (16.0 | ) | $ | (260.7 | ) | ||||
| Net income (loss) per Class A share inclusive of the change in unrealized appreciation of holdings | $ | (1.12 | ) | $ | (1.36 | ) | $ | (0.06 | ) | $ | (1.02 | ) | ||||
| Total net assets | $ | 4,974.5 | $ | 5,258.7 | $ | 5,604.9 | $ | 5,620.9 | ||||||||
| July 31, 2011 | Apr. 30, 2011 | Jan. 31, 2011 | Oct. 31, 2010 | |||||||||||||
| Change in unrealized appreciation of holdings | $ | (509.6 | ) | $ | 1,897.7 | $ | 255.3 | $ | 741.2 | |||||||
| Net income (loss) inclusive of the change in unrealized appreciation of holdings | $ | (513.7 | ) | $ | 1,893.7 | $ | 252.1 | $ | 738.5 | |||||||
| Net income (loss) per Class A share inclusive of the change in unrealized appreciation of holdings | $ | (2.02 | ) | $ | 7.80 | $ | 1.06 | $ | 3.10 | |||||||
| Total net assets | $ | 5,884.1 | $ | 6,397.6 | $ | 4,158.8 | $ | 3,906.8 | ||||||||
Financial Results – Net Income
Central Fund’s earned income objective is secondary to its objective of holding almost all of its net assets in gold and silver bullion. Generally, Central Fund seeks only to maintain adequate cash reserves to enable it to pay expenses and Class A share dividends. Because gold and silver bullion are not loaned to generate income, Central Fund’s realized income is a nominal percentage of its net assets.
| 3 |
|
AcG-18 requires Central Fund to record changes in unrealized appreciation of holdings in income. Net loss, inclusive of the change in unrealized appreciation of holdings, for the three months ended July 31, 2012 was $284.2 million compared to $513.7 million for the comparative period in 2011. For the nine months ended July 31, 2012, the net loss, inclusive of the change in unrealized appreciation of holdings, was $646.3 million compared to net income of $1.6 billion for the same period in 2011. Virtually all of the net loss for both the three and nine month periods ended July 31, 2012 represents the change in the unrealized appreciation of gold and silver holdings. Certain expenses, such as administration fees, which are scaled, and safekeeping fees, have varied in proportion to net asset levels. Administration fees, which are calculated monthly based on the net assets at each month-end, increased by $166,442 during the nine month period ended July 31, 2012 as compared to the same period in 2011. This increase in administration fees was a result of the increase in net assets generated by the April 2011 public offering as discussed in Note 4 to the financial statements. Similarly, safekeeping fees increased by $259,871 for the nine month period ended July 31, 2012.
Expenses as a percentage of average month-end net assets (the “expense ratio”) were 0.08% for the three months ended July 31, 2012 compared to 0.07% for the same period in 2011. The expense ratio for the nine month periods ended July 31, 2012 and 2011 remained unchanged at 0.23%. For the twelve month period ended July 31, 2012, the expense ratio was 0.31% compared to 0.30% for the same twelve month period ended July 31, 2011. Those expense ratios that have slightly increased did so primarily due to a reduction in net assets that occurred in the relevant periods.
Liquidity and Capital Resources
All of Central Fund’s assets are liquid. The Company’s liquidity objective is to hold cash and short-term deposits in a safe and conservative manner to generate income primarily to be applied towards expenses and Class A share dividends. The ability of Central Fund to have sufficient cash for expenses and dividend payments, and to meet demands for redemption (if any), is primarily dependent upon its ability to realize cash flow from its cash equivalents. Should Central Fund not have sufficient cash to meet its needs, portions of Central Fund's bullion holdings may be sold to fund dividend payments, provide working capital and pay for redemptions (if any) of Class A shares.
For the nine months ended July 31, 2012, Central Fund’s cash and short-term deposits decreased by $14.9 million to $57.7 million. This decrease was a result of the amounts used to pay expenses and the year-end Class A share dividend. The Administrator and Senior Executive Officers monitor Central Fund’s cash position with an emphasis on maintaining its mandate to hold maximum amounts of gold and silver bullion at all times.
Administrator and Other Related Party Information
Please refer to Note 5 commencing on page 8 of this interim report.
Future Accounting Policy
Please refer to Note 10 on page 11 of this interim report.
Additional Information
This MD&A is dated August 22, 2012. Additional information relating to the Company, including its Annual Information Form and 2011 Annual Report, is available on the SEDAR website at www.sedar.com.
| 4 |
|
Statements of Net Assets
(expressed in U.S. dollars, unaudited)
| July 31 | October 31 | |||||||
| 2012 | 2011 | |||||||
| Net assets: | ||||||||
| Gold bullion at market (cost $1,355,145,634) (Note 2) | $ | 2,748,713,145 | 2,918,177,581 | |||||
| Silver bullion at market (cost $964,091,381) (Note 2) | 2,170,387,707 | 2,635,250,890 | ||||||
| Cash and short-term deposits (Note 3) | 57,743,179 | 72,623,606 | ||||||
| Interest receivable and other | 176,144 | 71,131 | ||||||
| Prepaid bullion insurance | - | 62,500 | ||||||
| 4,977,020,175 | 5,626,185,708 | |||||||
| Accrued liabilities (Note 5) | (2,470,278 | ) | (2,765,500 | ) | ||||
| Dividends payable | - | (2,544,327 | ) | |||||
| Net assets representing shareholders’ equity | $ | 4,974,549,897 | 5,620,875,881 | |||||
| Represented by: | ||||||||
| Capital stock (Note 4) Class A shares issued: 254,432,713 | $ | 2,419,583,150 | 2,419,583,150 | |||||
| Common shares issued: 40,000 | 19,458 | 19,458 | ||||||
| 2,419,602,608 | 2,419,602,608 | |||||||
| Retained earnings inclusive of unrealized appreciation of holdings | 2,554,947,289 | 3,201,273,273 | ||||||
| $ | 4,974,549,897 | 5,620,875,881 | ||||||
| Net asset value per share: | ||||||||
| Class A shares | $ | 19.55 | 22.09 | |||||
| Common shares | $ | 16.55 | 19.09 | |||||
| Exchange rate: U.S. $1.00 = Cdn. | $ | 1.0014 | 0.9935 | |||||
| Net asset value per share expressed in Canadian dollars: | ||||||||
| Class A shares | $ | 19.58 | 21.95 | |||||
| Common shares | $ | 16.57 | 18.96 | |||||
See accompanying notes to the financial statements.
On behalf of the Board:
| “Bruce D. Heagle” | “Philip M. Spicer” |
| Director | Director |
| 5 |
|
Statements of Income (Loss)
(expressed in U.S. dollars, unaudited)
| Nine months ended July 31 | Three months ended July 31 | |||||||||||||||
| 2012 | 2011 | 2012 | 2011 | |||||||||||||
| Income: | ||||||||||||||||
| Interest | $ | 123,758 | 150,162 | $ | 40,159 | 50,013 | ||||||||||
| Change in unrealized appreciation of holdings | (634,331,213 | ) | 1,643,493,593 | (280,460,633 | ) | (509,592,531 | ) | |||||||||
| Total income (loss) | (634,207,455 | ) | 1,643,643,755 | (280,420,474 | ) | (509,542,518 | ) | |||||||||
| Expenses: | ||||||||||||||||
| Administration fees (Note 5) | 6,902,342 | 6,735,900 | 2,163,704 | 2,449,327 | ||||||||||||
| Safekeeping, insurance and bank charges | 4,451,493 | 4,191,622 | 1,398,161 | 1,507,962 | ||||||||||||
| Shareholder information | 223,512 | 168,649 | 38,174 | 24,975 | ||||||||||||
| Directors’ fees and expenses | 155,269 | 119,923 | 50,046 | 38,088 | ||||||||||||
| Accounting fees | 116,730 | 111,486 | 55,032 | 39,586 | ||||||||||||
| Stock exchange fees | 114,438 | 114,068 | 37,955 | 38,301 | ||||||||||||
| Legal fees (Note 5) | 83,129 | 88,070 | 10,448 | 20,702 | ||||||||||||
| Registrar and transfer agent fees | 71,750 | 65,738 | 19,057 | 14,997 | ||||||||||||
| Miscellaneous | (134 | ) | 825 | (393 | ) | (101 | ) | |||||||||
| Total expenses | 12,118,529 | 11,596,281 | 3,772,184 | 4,133,837 | ||||||||||||
| Net income (loss) inclusive of the change in unrealized appreciation of holdings | $ | (646,325,984 | ) | 1,632,047,474 | $ | (284,192,658 | ) | (513,676,355 | ) | |||||||
| Net income (loss) per share: | ||||||||||||||||
| Class A shares | $ | (2.54 | ) | 6.66 | $ | (1.12 | ) | (2.02 | ) | |||||||
| Common shares | $ | (2.54 | ) | 6.66 | $ | (1.12 | ) | (2.02 | ) | |||||||
Seeaccompanying notes to the financial statements.
Statements of Changes in Net Assets
(expressed in U.S. dollars, unaudited)
| Nine months ended July 31 | Three months ended July 31 | |||||||||||||||
| 2012 | 2011 | 2012 | 2011 | |||||||||||||
| Net assets at beginning of period | $ | 5,620,875,881 | 3,906,765,691 | $ | 5,258,742,555 | 6,397,628,720 | ||||||||||
| Add (deduct): | ||||||||||||||||
| Net income (loss) inclusive of the change in unrealized appreciation of holdings | (646,325,984 | ) | 1,632,047,474 | (284,192,658 | ) | (513,676,355 | ) | |||||||||
| Increase in Class A capital | - | 345,256,620 | - | 117,420 | ||||||||||||
| Increase (decrease) in net assets during the period | $ | (646,325,984 | ) | 1,977,304,094 | (284,192,658 | ) | (513,558,935 | ) | ||||||||
| Net assets at end of period | $ | 4,974,549,897 | 5,884,069,785 | $ | 4,974,549,897 | 5,884,069,785 | ||||||||||
Seeaccompanying notes to the financial statements.
| 6 |
|
Statements of Retained Earnings
(expressed in U.S. dollars, unaudited)
| Nine months ended July 31 | Three months ended July 31 | |||||||||||||||
| 2012 | 2011 | 2012 | 2011 | |||||||||||||
| Retained earnings: | ||||||||||||||||
| Balance at beginning of period | $ | 3,201,273,273 | 1,832,419,703 | $ | 2,839,139,947 | 3,978,143,532 | ||||||||||
| Net income (loss) inclusive of the change in unrealized appreciation of holdings | (646,325,984 | ) | 1,632,047,474 | (284,192,658 | ) | (513,676,355 | ) | |||||||||
| Balance at end of period | $ | 2,554,947,289 | 3,464,467,177 | $ | 2,554,947,289 | 3,464,467,177 | ||||||||||
See accompanying notes to the financial statements.
Notes to Financial Statements
For the nine months ended July 31, 2012
(amounts expressed in U.S. dollars unless otherwise stated)
| 1. | Summary of significant accounting policies: |
The accounting policies applied in the preparation of these unaudited interim financial statements conform with those presented in Central Fund of Canada Limited’s (“Central Fund” or the “Company”) October 31, 2011 audited annual financial statements. These interim financial statements do not include all of the disclosures included in the annual financial statements and, accordingly, should be read in conjunction with the annual financial statements.
| 2. | Gold and Silver Bullion: |
Details of gold and silver bullion holdings are as follows:
| July 31, 2012 | October 31, 2011 | |||||||||
| Gold bullion: | ||||||||||
| Fine ounces | - 400 oz. bars | 1,673,329 | 1,673,329 | |||||||
| - 100 oz. bars | 12,889 | 12,889 | ||||||||
| - bank certificates | 8,427 | 8,427 | ||||||||
| Total fine ounces | 1,694,645 | 1,694,645 | ||||||||
| Average Cost | - per fine ounce | $ | 799.66 | 799.66 | ||||||
| Market | - per fine ounce | $ | 1,622.00 | 1,722.00 | ||||||
| Silver bullion: | ||||||||||
| Ounces | - 1,000 oz. bars | 76,708,551 | 76,708,551 | |||||||
| - bank certificates | 255,551 | 255,551 | ||||||||
| Total ounces | 76,964,102 | 76,964,102 | ||||||||
| Average Cost | - per ounce | $ | 12.53 | 12.53 | ||||||
| Market | - per ounce | $ | 28.20 | 34.24 | ||||||
| 7 |
|
| 3. | Cash and short-term deposits: |
As at July 31, 2012, the Company held one Canadian dollar flexible GIC deposit with a Schedule 1 Canadian bank in the amount of $399,440 (Cdn. $400,000) bearing interest at a rate of 1.15% per annum with a maturity date of May 16, 2013. Cash deposits of $57,343,739 were held with a Schedule 1 Canadian bank at a variable interest rate of 0.25% per annum.
As at October 31, 2011, the Company held one Canadian dollar flexible GIC deposit with a Schedule 1 Canadian bank in the amount of $201,300 (Cdn. $200,000) bearing interest at a rate of 0.75% per annum with a maturity date of January 30, 2012. Cash deposits of $72,422,306 were held in a Schedule 1 Canadian bank at a variable interest rate of 0.25% per annum.
| 4. | Capital stock: |
The authorized share capital consists of an unlimited number of Class A non-voting shares without nominal or par value and 50,000 Common shares without nominal or par value. There were 254,432,713 Class A shares, which are retractable, and 40,000 Common shares issued and outstanding at July 31, 2012. Class A shares are entitled to U.S. $3.00 per share on liquidation, before any remaining net assets are attributed equally to each Class A share and Common share then outstanding.
Since October 1989, holders of the Company’s Class A shares have had the option to require the Company to redeem their Class A shares on the last day of each fiscal quarter of the Company (each a “Retraction Date”) for 80% of the Company’s net asset value per Class A share on the Retraction Date. Class A shareholders who wish to exercise this retraction right must submit their written redemption request at least 90 days prior to the desired Retraction Date. Since adoption of this redemption feature, no shareholders have submitted redemption requests.
On April 6, 2011, the Company, through a public offering, issued 16,150,000 Class A shares for proceeds of $345,739,200 net of underwriting fees of $14,405,800. Costs relating to this public offering were approximately$600,000 and net proceeds were approximately $345,139,200. The Company used the net proceeds from this public offering to purchase 190,400 fine ounces of gold at a cost of $272,304,500 and 1,755,000 ounces of silver at a cost of $66,213,500, all in physical bar form. The balance of $6,621,200 was retained by the Company in interest-bearing cash deposits for working capital purposes.
| 5. | Related party transactions and fees: |
Central Fund has no employees. It is party to an Administrative and Consulting Agreement with The Central Group Alberta Ltd., which is related to the Company through four of its officers and directors. The Central Group Alberta Ltd., which acts as Administrator, has operating offices with employees, advisors and consultants who provide administrative and consulting services to the Company. For such services, the Company pays an administrative and consulting fee, payable monthly, until at least October 31, 2015, at an annual rate of: 0.30% on the first $400 million of total net assets; 0.20% on the next $600 million of total net assets; and 0.15% on total net assets exceeding one billion dollars.
Included in accrued liabilities at July 31, 2012 is $731,660 (October 31, 2011: $816,490) which relates to that month’s administration fee payable to the Administrator.
| 8 |
|
For the nine months ended July 31, 2012, the Company incurred fees totaling $69,464 (2011: $72,139) to legal firms of which two of the Company’s officers or directors are partners or counsel, and $6,902,342 (2011: $6,735,900) to the Administrator. The Board of Directors is of the opinion that these services were undertaken under the same terms and conditions as services with unrelated parties.
| 6. | Management of financial risks: |
The Company has risk management policies and procedures in place to identify risks related to financial instruments and physical assets. The objectives of these policies and procedures are to identify and mitigate risk. The Company’s compliance with these policies and procedures is monitored by the Senior Officers, the Audit Committee and the Board of Directors of the Company. Market fluctuations are unpredictable and outside the control of the Company. New risk factors may emerge from time to time and it is not possible for the Company to predict all such risk factors.
Price risk
Price risk is the risk that the price of a security or physical asset may decline. It is possible to determine the impact that changes in the market prices of gold and silver will have on the Company’s net asset value per Class A share both in U.S. dollars and Cdn. dollars. Assuming as a constant exchange rate, the rate which existed on July 31, 2012 of Cdn. $1.0014 for each U.S. dollar together with the holdings of gold and silver bullion which existed on that date, a 10% change in the price of gold would increase or decrease the net asset value per Class A share by approximately U.S. $1.08 per share or Cdn. $1.08 per share. A 10% change in the price of silver would increase or decrease the net asset value per Class A share by approximately U.S. $0.85 per share or Cdn. $0.85 per share. If both gold and silver prices were to change by 10% simultaneously in the same direction, the net asset value per Class A share would increase or decrease by approximately U.S. $1.93 per share or Cdn. $1.94 per share.
Currency risk
Currency risk is the risk that the value of an asset or liability will fluctuate due to changes in foreign currency exchange rates.
When expressed in U.S. dollars, Central Fund’s net asset value per Class A share is largely unaffected by changes in the U.S./Cdn. dollar exchange rate due to the fact that nearly all of Central Fund’s net assets are priced in U.S. dollars. For this same reason, an increase or decrease in the value of the U.S dollar relative to the Cdn. dollar would change the net asset value per Class A share as expressed in Cdn. dollars in the same direction by approximately the same percentage change in the value of the U.S. dollar.
Due to the limited value of transactions initiated in Cdn. dollars throughout the period, a strengthening or weakening of the Cdn. dollar relative to the U.S. dollar applied to balances outstanding at July 31, 2012 would not have had any material impact on the net income for the nine months ended July 31, 2012, assuming that all other variables, in particular interest rates, remained constant.
Credit risk
Credit risk on financial instruments is the risk of loss occurring as a result of the default of an issuer on its obligation to Central Fund. Credit risk is monitored on an ongoing basis and is managed by the Company dealing only with issuers that are believed to be creditworthy.
| 9 |
|
Liquidity risk
Liquidity risk is the risk that the Company will not be able to generate adequate cash resources to fulfill its payment obligations. The Administrator regards all of Central Fund’s assets as liquid. Central Fund traditionally has maintained sufficient cash reserves to enable it to pay expenses and dividends on its Class A shares. Furthermore, 98.9% of its net assets are in the form of gold and silver bullion which are readily marketable.
| 7. | Financial highlights: |
| Nine months ended July 31 | Three months ended July 31 | |||||||||||||||
| 2012 | 2011 | 2012 | 2011 | |||||||||||||
| Class A per share performance: | ||||||||||||||||
| Net asset value per share at beginning of period | $ | 22.09 | 16.39 | $ | 20.67 | 25.14 | ||||||||||
| Increase (decrease): | ||||||||||||||||
| Net loss before the change in unrealized appreciation of holdings | (0.05 | ) | (0.04 | ) | (0.02 | ) | (0.02 | ) | ||||||||
| Change in unrealized appreciation of holdings - gold | (0.66 | ) | 1.88 | (0.19 | ) | 0.44 | ||||||||||
| - silver | (1.83 | ) | 4.82 | (0.91 | ) | (2.44 | ) | |||||||||
| Total increase (decrease)(1) | (2.54 | ) | 6.66 | (1.12 | ) | (2.02 | ) | |||||||||
| Net asset value per share at end of period | $ | 19.55 | 23.12 | $ | 19.55 | 23.12 | ||||||||||
| Total return for period | (11.5 | )% | 41.1 | % | (5.4 | )% | (8.0 | )% | ||||||||
| Percentages and supplemental data: | ||||||||||||||||
| Ratio as a percentage of average net assets: | ||||||||||||||||
| Expenses(2) | 0.23 | % | 0.23 | % | 0.08 | % | 0.07 | % | ||||||||
| Net loss before the change in unrealized appreciation of holdings (2) | 0.23 | % | 0.22 | % | 0.08 | % | 0.07 | % | ||||||||
The increase (decrease) per share is based on the weighted average number of shares outstanding during the period. The net asset values per share are based on the actual number of shares outstanding at the relevant times.
(1)This table is not meant to be a reconciliation of beginning to end of period net asset values per share.
(2)Ratios not annualized.
| 8. | Capital stewardship: |
The capital of the Company is represented by the issued and outstanding Class A and Common shares and the retained earnings, which comprises the net asset value attributable to participating shareholders. The Board of Directors direct the Administrator to administer the capital of the Company in accordance with the Company’s stated objectives and restrictions, as stipulated in the Articles of Incorporation as amended, while maintaining sufficient cash to pay the expenses of maintaining the Company and to meet demands for redemption (if any). The Company does not have any externally imposed capital requirements.
| 9. | Canadian and United States generally accepted accounting principles: |
The accounting policies followed in these financial statements, which are in accordance with Canadian generally accepted accounting principles (“GAAP”), are consistent with those that would apply under U.S. GAAP except for the following classification difference in the Statements of Net Assets. This U.S. GAAP classification difference has no effect on the reported net asset value per Class A share.
| 10 |
|
Subject to the terms and conditions described in Note 4 to these financial statements, the Class A shares are redeemable at the option of the shareholder. This redemption feature is the basis for the U.S. GAAP classification difference. The likelihood or probability of such redemption is not considered, nor is the fact that the Class A shares participate fully and proportionately with the Common shares in changes in the value of the equity ownership of the Company. Since adoption of this redemption feature in 1989, no holders of Class A shares have tendered their shares to the Company for redemption.
Under Canadian GAAP, the Class A shares are considered to be permanent equity and are classified in shareholders’ equity in the Statements of Net Assets. Under U.S. GAAP, the redemption value of these shares is calculated in accordance with the provisions of the redemption feature and classified outside of shareholders’ equity as mezzanine equity for each reporting period, with changes in the redemption value from the beginning of each reporting period to the end of that reporting period being charged (or credited) to retained earnings.
| 10. | Future accounting policy: |
On December 12, 2011, the Accounting Standards Board of Canada decided to further extend the deferral of International Financial Reporting Standards (“IFRS”) adoption for investment companies for an additional year. Investment companies will now be required to mandatorily adopt IFRS for interim and annual financial statements for fiscal periods beginning on or after January 1, 2014.
The Company is reviewing the key elements within IFRS that may result in a change in accounting policies that will impact its financial statements and accompanying note disclosures. The assessment plan being implemented by the Company includes a position paper which highlights the material standards that need to be addressed under IFRS and preparation of an opening balance sheet and financial statements that incorporate IFRS accounting standards and policies. The major areas of focus identified by the assessment include: first year implementation decisions; statement of cash flows; classification of redeemable Class A shares; income taxes; increased note disclosure; and accounting for changes in unrealized appreciation of holdings. The assessment is addressing the impact on the Company’s accounting system and internal controls required to report under IFRS beginning on the implementation date. The Company will continue with the assessment and implementation in preparation for its initial filing under IFRS expected for the fiscal year beginning November 1, 2014.
| 11 |
|
Corporate Information
Directors Brian E. Felske (A)(C)(I) Bruce D. Heagle (A)(C)(I) Ian M.T. McAvity (C)(I)(L) Michael A. Parente CMA, CFP (A)(I) Dale R. Spackman, Q.C. J.C. Stefan Spicer Philip M. Spicer | Officers Philip M. Spicer, Chairman Dale R. Spackman, Q.C., Vice-Chairman J.C. Stefan Spicer, President & CEO Catherine A. Spackman CMA, Treasurer & CFO Teresa E. Poper CB, Assistant Treasurer John S. Elder, Q.C., Secretary
Consultants Douglas E. Heagle, Retired Director Malcolm A. Taschereau, Retired Director |
| (A) | - | Member of Audit Committee |
| (C) | - | Member of Corporate Governance Committee |
| (I) | - | May be regarded as an independent director under Canadian securities administrators’ guidelines. |
| (L) | - | Lead Director |
Administrator The Central Group Alberta Ltd. Calgary, Alberta | Auditors Ernst & Young LLP Canada |
Banker Canadian Imperial Bank of Commerce | Custodian Canadian Imperial Bank of Commerce |
Legal Counsel Dorsey & Whitney LLP, Seattle Fraser Milner Casgrain LLP, Toronto Parlee McLaws LLP, Calgary
| Registrars and Transfer Agents CIBC Mellon Trust Company, Canada, the Administrative Agent for which is Canadian Stock Transfer Company Inc. Computershare, New Jersey, U.S.A. (formerly Mellon Investor Services LLC) |
Head Office Hallmark Estates Suite 805, 1323-15th Avenue S.W. Calgary, Alberta T3C 0X8 Telephone (403) 228-5861 Fax (403) 228-2222 | Shareholder and Investor Inquiries Administrator, P.O. Box 10050 Ancaster, Ontario L9K 1P2 Telephone (905) 648-7878 Fax (905) 648-4196 |
Website: www.centralfund.com
E-mail: info@centralfund.com

Net Asset Summary at July 31, 2012 | 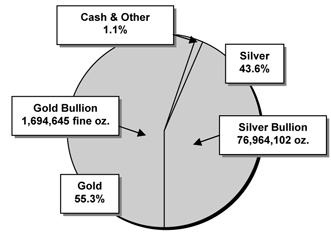 |
Class A Shares Stock Exchange Listings
Electronic Ticker Symbol | Newspaper Quote Symbol | |||
| NYSE MKT | CEF | CFCda | ||
| The Toronto Stock Exchange | CEF.A in CDN $ | CFund A | ||
| CEF.U in US $ | ||||
| Cusip number 153501101 |
Net Asset Value Information
The net asset value per Class A share is calculated daily and is available at www.centralfund.com; or by calling the Administrator’s Investor Inquiries Office at (905) 648-7878; or by sending an email to info@centralfund.com. The Thursday net asset value is published on a regular basis in several financial newspapers including the following:
In the United States (figures published in U.S. $):
nBarrons
nNew York Times
nWall Street Journal
In Canada (figures published in Canadian $):
nNational Post: Financial Post Section
nThe Globe and Mail: Report on Business