UNITED STATES
SECURITIES AND EXCHANGE COMMISSION
Washington, D.C. 20549
FORM N-CSR
CERTIFIED SHAREHOLDER REPORT
OF
REGISTERED MANAGEMENT INVESTMENT COMPANIES
| Investment Company Act file number: 811-4681 | ||
Name of Registrant: Vanguard Bond Index Funds | ||
Address of Registrant: | P.O. Box 2600 | |
| Valley Forge, PA 19482 | ||
Name and address of agent for service: | Heidi Stam, Esquire | |
| P.O. Box 876 | ||
| Valley Forge, PA 19482 | ||
Registrant’s telephone number, including area code: (610) 669-1000 | ||
Date of fiscal year end: December 31 | ||
Date of reporting period: January 1, 2011 – December 31, 2011 | ||
Item 1: Reports to Shareholders | ||
Vanguard Bond Index Funds
Vanguard Total Bond Market Index Fund
Vanguard Short-Term Bond Index Fund
Vanguard Intermediate-Term Bond Index Fund
Vanguard Long-Term Bond Index Fund
> All sectors of the broad investment-grade U.S. bond market posted positive
returns for the fiscal year ended December 31, 2011, with longer-term bonds
performing strongly.
> The returns of all four Vanguard Bond Index Funds were roughly in line with
those of their target indexes. Results for Investor Shares ranged from 2.96% for
the Short-Term Bond Index Fund to 22.06% for the Long-Term Bond Index Fund.
> While U.S. Treasuries outperformed corporate bonds for the year ended
December 31, corporates finished a few steps ahead of Treasuries over the past
decade.
| Contents | |
| Your Fund’s Total Returns. | 1 |
| Chairman’s Letter. | 4 |
| Total Bond Market Index Fund. | 11 |
| Short-Term Bond Index Fund. | 33 |
| Intermediate-Term Bond Index Fund. | 55 |
| Long-Term Bond Index Fund. | 77 |
| About Your Fund’s Expenses. | 97 |
| Glossary. | 100 |
Please note: The opinions expressed in this report are just that—informed opinions. They should not be considered promises or advice.
Also, please keep in mind that the information and opinions cover the period through the date on the front of this report. Of course, the
risks of investing in your fund are spelled out in the prospectus.
See the Glossary for definitions of investment terms used in this report.
About the cover: Vanguard was named for the HMS Vanguard, flagship of British Admiral Horatio Nelson. A ship—whose
performance and safety depend on the work of all hands—has served as a fitting metaphor for the Vanguard crew as we
strive to help clients reach their financial goals.
Your Fund’s Total Returns
| Fiscal Year Ended December 31, 2011 | ||||
| 30-Day SEC | Income | Capital | Total | |
| Yields | Returns | Returns | Returns | |
| Vanguard Total Bond Market Index Fund | ||||
| Investor Shares | 2.17% | 3.30% | 4.26% | 7.56% |
| Admiral™ Shares | 2.33 | 3.43 | 4.26 | 7.69 |
| Signal® Shares | 2.33 | 3.43 | 4.26 | 7.69 |
| Institutional Shares | 2.32 | 3.46 | 4.26 | 7.72 |
| Institutional Plus Shares | 2.34 | 3.48 | 4.26 | 7.74 |
| ETF Shares | 2.32 | |||
| Market Price | 7.86 | |||
| Net Asset Value | 7.71 | |||
| Barclays Capital U.S. Aggregate Float Adjusted | ||||
| Index | 7.92 | |||
| Spliced Intermediate Investment-Grade Debt | ||||
| Funds Average | 6.09 | |||
| Spliced Intermediate Investment-Grade Debt Funds Average: Based on average returns for Intermediate U.S. Government Funds through | ||||
| December 31, 2001, and average returns for Intermediate Investment-Grade Debt Funds thereafter. Derived from data provided by Lipper Inc. | ||||
| Vanguard Short-Term Bond Index Fund | ||||
| Investor Shares | 0.75% | 1.85% | 1.11% | 2.96% |
| Admiral Shares | 0.86 | 1.97 | 1.11 | 3.08 |
| Signal Shares | 0.86 | 1.97 | 1.11 | 3.08 |
| Institutional Shares (Inception: 9/27/2011) | 0.90 | 0.48 | -0.01 | 0.47 |
| Institutional Plus Shares (Inception: 9/29/2011) | 0.92 | 0.48 | -0.01 | 0.47 |
| ETF Shares | 0.86 | |||
| Market Price | 2.97 | |||
| Net Asset Value | 3.04 | |||
| Barclays Capital U.S. 1–5 Year Government/Credit | ||||
| Float Adjusted Index | 3.13 | |||
| Spliced 1–5 Year Investment-Grade Debt Funds | ||||
| Average | 2.22 | |||
Spliced 1–5 Year Investment-Grade Debt Funds Average: Based on average returns for 1–5 Year U.S. Government Funds through December
31, 2001, and average returns for 1–5 Year Investment-Grade Debt Funds thereafter. Derived from data provided by Lipper Inc.
Admiral Shares carry lower expenses and are available to investors who meet certain account-balance requirements. Signal Shares,
Institutional Shares, and Institutional Plus Shares are available to certain institutional investors who meet specific administrative, service,
and account-size criteria. The Vanguard ETF® Shares shown are traded on the NYSE Arca exchange and are available only through brokers.
The table provides ETF returns based on both the NYSE Arca market price and the net asset value for a share. U.S. Pat. No. 6,879,964 B2;
7,337,138; 7,720,749; 7,925,573.
1
Your Fund’s Total Returns
| Fiscal Year Ended December 31, 2011 | ||||
| 30-Day SEC | Income | Capital | Total | |
| Yields | Returns | Returns | Returns | |
| Vanguard Intermediate-Term Bond Index Fund | ||||
| Investor Shares | 2.35% | 4.01% | 6.61% | 10.62% |
| Admiral Shares | 2.46 | 4.13 | 6.61 | 10.74 |
| Signal Shares | 2.46 | 4.13 | 6.61 | 10.74 |
| Institutional Shares | 2.50 | 4.17 | 6.61 | 10.78 |
| Institutional Plus Shares (Inception: | 0.32 | 1.52 | 1.84 | |
| 11/30/2011) | 2.52 | |||
| ETF Shares | 2.46 | |||
| Market Price | 11.09 | |||
| Net Asset Value | 10.62 | |||
| Barclays Capital U.S. 5–10 Year | ||||
| Government/Credit Float Adjusted Index | 10.79 | |||
| Spliced Intermediate Investment-Grade Debt | ||||
| Funds Average | 6.09 | |||
Spliced Intermediate Investment-Grade Debt Funds Average: Based on average returns for Intermediate U.S. Government Funds through
December 31, 2001, and average returns for Intermediate Investment-Grade Debt Funds thereafter. Derived from data provided by Lipper Inc.
Admiral Shares carry lower expenses and are available to investors who meet certain account-balance requirements. Signal Shares,
Institutional Shares, and Institutional Plus Shares are available to certain institutional investors who meet specific administrative, service,
and account-size criteria. The Vanguard ETF® Shares shown are traded on the NYSE Arca exchange and are available only through brokers.
The table provides ETF returns based on both the NYSE Arca market price and the net asset value for a share. U.S. Pat. No. 6,879,964 B2;
7,337,138; 7,720,749; 7,925,573.
2
Your Fund’s Total Returns
| Fiscal Year Ended December 31, 2011 | ||||
| 30-Day SEC | Income | Capital | Total | |
| Yields | Returns | Returns | Returns | |
| Vanguard Long-Term Bond Index Fund | ||||
| Investor Shares | 3.81% | 5.51% | 16.55% | 22.06% |
| Institutional Shares | 3.96 | 5.69 | 16.55 | 22.24 |
| Institutional Plus Shares (Inception: 10/6/2011) | 3.98 | 1.14 | 2.50 | 3.64 |
| ETF Shares | 3.92 | |||
| Market Price | 22.45 | |||
| Net Asset Value | 22.18 | |||
| Barclays Capital U.S. Long Government/Credit | ||||
| Float Adjusted Index | 22.49 | |||
| Spliced Corporate A-Rated Debt Funds Average | 6.71 | |||
Spliced Corporate A-Rated Debt Funds Average: Based on average returns for General Government Funds through December 31, 2001, and
average returns for Corporate A-Rated Debt Funds thereafter. Derived from data provided by Lipper Inc.
Admiral Shares carry lower expenses and are available to investors who meet certain account-balance requirements. Signal Shares,
Institutional Shares, and Institutional Plus Shares are available to certain institutional investors who meet specific administrative, service,
and account-size criteria. The Vanguard ETF® Shares shown are traded on the NYSE Arca exchange and are available only through brokers.
The table provides ETF returns based on both the NYSE Arca market price and the net asset value for a share. U.S. Pat. No. 6,879,964 B2;
7,337,138; 7,720,749; 7,925,573.
For the ETF Shares, the market price is determined by the midpoint of the bid-offer spread as of the closing time of the New York Stock
Exchange (generally 4 p.m., Eastern time). The net asset value is also determined as of the NYSE closing time. For more information about
how the ETF Shares' market prices have compared with their net asset value, visit vanguard.com, select your ETF, and then select the Price
and Performance tab. The ETF premium/discount analysis there shows the percentages of days on which the ETF Shares' market price was
above or below the NAV.
3

Chairman’s Letter
Dear Shareholder,
Safety and a search for higher yields were key themes for the bond market in 2011. Periods of heightened volatility in stocks during the year benefited the fixed income market in general and U.S. Treasuries in particular, given their “risk-free” status. Within the fixed income arena, the Federal Reserve’s efforts to stimulate the economy by keeping short-term interest rates near zero encouraged investors seeking higher yields to turn toward bonds with longer maturities.
In this environment, the four Vanguard Bond Index Funds did well, as they are primarily invested in Treasuries, U.S. government agency bonds, and investment-grade corporate bonds. The Long-Term Bond Index Fund returned an impressive 22.06%, with the Intermediate-Term Bond Index Fund returning 10.62% and the Short-Term Bond Index Fund returning 2.96%. (Returns are for Investor Shares.) The Total Bond Market Index Fund returned 7.56%. A large part of the outperformance among longer maturities came from capital returns.
While the returns of all four Vanguard Bond Index Funds were roughly in line with those of their target indexes, small deviations—whether positive or negative—may occur because of the funds’ sampling approach to track the indexes as well as temporary pricing differences between the funds and their indexes.
4
With demand driving bond prices higher during the year, the yields of the funds fell (bond prices move inversely to yields). The 30-day SEC yield for Investor Shares of the Total Bond Market Index Fund, for example, declined to 2.17% from 2.68% a year earlier.
In the second half of the year, Vanguard introduced a number of new share classes as part of our ongoing efforts to reduce the cost of investing. The Short-Term Bond Index Fund launched lower-cost Institutional and Institutional Plus Shares with expense ratios of 0.07% and 0.05%, respectively. The Intermediate- and Long-Term Bond Index Funds introduced Institutional Plus Shares with an expense ratio of 0.05%.
As yields fell, bonds delivered unexpectedly strong returns
Bond returns were a surprise in 2011, mainly because so little was expected of them. At the end of 2010, bond yields hovered near historical lows, suggesting that the scope for further declines—and rallies in bond prices—was limited. During 2011, however, rates moved lower still as investors sought shelter from stock market turmoil. The broad U.S. bond market returned 7.84%. Municipal bonds, which were battered at the end of 2010, produced even stronger returns than taxable bonds in 2011.
| Market Barometer | |||
| Average Annual Total Returns | |||
| Periods Ended December 31, 2011 | |||
| One | Three | Five | |
| Year | Years | Years | |
| Bonds | |||
| Barclays Capital U.S. Aggregate Bond Index (Broad | |||
| taxable market) | 7.84% | 6.77% | 6.50% |
| Barclays Capital Municipal Bond Index (Broad tax-exempt | |||
| market) | 10.70 | 8.57 | 5.22 |
| Citigroup Three-Month U.S. Treasury Bill Index | 0.08 | 0.11 | 1.36 |
| Stocks | |||
| Russell 1000 Index (Large-caps) | 1.50% | 14.81% | -0.02% |
| Russell 2000 Index (Small-caps) | -4.18 | 15.63 | 0.15 |
| Dow Jones U.S. Total Stock Market Index | 0.52 | 15.24 | 0.28 |
| MSCI All Country World Index ex USA (International) | -13.71 | 10.70 | -2.92 |
| CPI | |||
| Consumer Price Index | 2.96% | 2.39% | 2.26% |
| 5 |
The returns of the 3-month U.S. Treasury bill and other money market instruments approached 0%, which was consistent with the Federal Reserve Board’s interest rate policy but nevertheless a disappointment for savers.
Big dramas and small numbers in the U.S. stock market
The broad U.S. stock market finished the year with a modestly positive return, a result that seems surprisingly low-key in light of the economic and political dramas that monopolized investors’ attention for much of the year.
Stock prices rallied and retreated as early optimism about the global economic outlook traded places with anxiety about Europe’s debt crisis and the contentious negotiations in Washington over raising the U.S. debt ceiling to avoid default. The policymaking strife prompted Standard & Poor’s to downgrade the U.S. credit rating. (Vanguard’s confidence in the full faith and credit of the U.S. Treasury remains unshaken.) By year-end, stock prices were again on the rise, with investors refocused on signs of economic improvement.
| Expense Ratios | |||||||
| Your Fund Compared With Its Peer Group | |||||||
| Peer | |||||||
| Investor | Admiral | Signal | Institutional | Institutional | ETF | Group | |
| Shares | Shares | Shares | Shares | Plus Shares | Shares | Average | |
| Total Bond Market Index Fund | 0.22% | 0.11% | 0.11% | 0.07% | 0.05% | 0.11% | 0.91% |
| Short-Term Bond Index Fund | 0.22 | 0.11 | 0.11 | 0.07 | 0.05 | 0.11 | 0.87 |
| Intermediate-Term Bond Index | |||||||
| Fund | 0.22 | 0.11 | 0.11 | 0.07 | 0.05 | 0.11 | 0.91 |
| Long-Term Bond Index Fund | 0.22 | — | — | 0.07 | 0.05 | 0.11 | 1.06 |
The fund expense ratios shown are from the prospectuses dated April 26, 2011 (for Investor, Admiral, Signal, and ETF Shares), and September
27, 2011 (for Institutional and Institutional Plus Shares). They represent estimated costs for the current fiscal year. For the fiscal year ended
December 31, 2011, the funds’ expense ratios were: for the Total Bond Market Index Fund, 0.22% for Investor Shares, 0.10% for Admiral
Shares, 0.10% for Signal Shares, 0.07% for Institutional Shares, 0.05% for Institutional Plus Shares, and 0.10% for ETF Shares; for the
Short-Term Bond Index Fund, 0.22% for Investor Shares, 0.11% for Admiral Shares, 0.11% for Signal Shares, 0.07% for Institutional Shares
(annualized since inception), 0.05% for Institutional Plus Shares (annualized since inception), and 0.11% for ETF Shares; for the
Intermediate-Term Bond Index Fund, 0.22% for Investor Shares, 0.11% for Admiral Shares, 0.11% for Signal Shares, 0.07% for Institutional
Shares, 0.05% for Institutional Plus Shares (annualized since inception), and 0.11% for ETF Shares; and for the Long-Term Bond Index Fund,
0.22% for Investor Shares, 0.07% for Institutional Shares, 0.05% for Institutional Plus Shares (annualized since inception), and 0.11% for ETF
Shares. Peer-group expense ratios are derived from data provided by Lipper Inc. and capture information through year-end 2010.
Peer groups: For the Total Bond Market Index Fund, Intermediate-Term Investment-Grade Debt Funds; for the Short-Term Bond Index Fund,
1–5 Year Investment-Grade Debt Funds; for the Intermediate-Term Bond Index Fund, Intermediate-Term Investment-Grade Debt Funds; for the
Long-Term Bond Index Fund, Corporate A-Rated Debt Funds.
6
| Total Returns | |
| Ten Years Ended December 31, 2011 | |
| Average | |
| Annual Return | |
| Total Bond Market Index Fund Investor Shares | 5.49% |
| Spliced Barclays Capital U.S. Aggregate Float Adjusted Index | 5.79 |
| Spliced Intermediate Investment-Grade Debt Funds Average | 4.74 |
Spliced Barclays Capital U.S. Aggregate Float Adjusted Index: Barclays Capital U.S. Aggregate Bond Index through December 31, 2009;
Barclays Capital U.S. Aggregate Float Adjusted Index thereafter.
Spliced Intermediate Investment-Grade Debt Funds Average: Based on average returns for Intermediate U.S. Government Funds through
December 31, 2001, and average returns for Intermediate Investment-Grade Debt Funds thereafter. Derived from data provided by Lipper Inc.
| Short-Term Bond Index Fund Investor Shares | 4.02% |
| Spliced Barclays Capital U.S. 1–5 Year Government/Credit Float Adjusted Index | 4.30 |
| Spliced 1–5 Year Investment-Grade Debt Funds Average | 3.04 |
Spliced Barclays Capital U.S. 1–5 Year Government/Credit Float Adjusted Index: Barclays Capital U.S. 1–5 Year Government/Credit Bond
Index through December 31, 2009; Barclays Capital U.S. 1–5 Year Government/Credit Float Adjusted Index thereafter.
Spliced 1–5 Year Investment-Grade Debt Funds Average: Based on average returns for 1–5 Year U.S. Government Funds through December
31, 2001, and average returns for 1–5 Year Investment-Grade Debt Funds thereafter. Derived from data provided by Lipper Inc.
| Intermediate-Term Bond Index Fund Investor Shares | 6.63% |
| Spliced Barclays Capital U.S. 5–10 Year Government/Credit Float Adjusted Index | 6.88 |
| Spliced Intermediate Investment-Grade Debt Funds Average | 4.74 |
Spliced Barclays Capital U.S. 5–10 Year Government/Credit Float Adjusted Index: Barclays Capital U.S. 5–10 Year Government/Credit Bond
Index through December 31, 2009; Barclays Capital U.S. 5–10 Year Government/Credit Float Adjusted Index thereafter.
Spliced Intermediate Investment-Grade Debt Funds Average: Based on average returns for Intermediate U.S. Government Funds through
December 31, 2001, and average returns for Intermediate Investment-Grade Debt Funds thereafter. Derived from data provided by Lipper Inc.
| Long-Term Bond Index Fund Investor Shares | 8.41% |
| Spliced Barclays Capital U.S. Long Government/Credit Float Adjusted Index | 8.54 |
| Spliced Corporate A-Rated Debt Funds Average | 4.95 |
Spliced Barclays Capital U.S. Long Government/Credit Float Adjusted Index: Barclays Capital U.S. Long Government/Credit Bond Index through
December 31, 2009; Barclays Capital U.S. Long Government/Credit Float Adjusted Index thereafter.
Spliced Corporate A-Rated Debt Funds Average: Based on average returns for General Government Funds through December 31, 2001, and
average returns for Corporate A-Rated Debt Funds thereafter. Derived from data provided by Lipper Inc.
The figures shown represent past performance, which is not a guarantee of future results. (Current performance may be
lower or higher than the performance data cited. For performance data current to the most recent month-end, visit our
website at vanguard.com/performance.) Note, too, that both investment returns and principal value can fluctuate widely, so
an investor’s shares, when sold, could be worth more or less than their original cost.
7
International stock prices finished the year with a double-digit decline. The weaker performance of stocks outside the United States reflected the greater economic and financial challenges in Europe, Japan’s struggles with natural and nuclear disaster, and skittishness about emerging markets.
The sweet spot in 2011: Long-term Treasuries and top-rated corporates
In 2011, the widening and deepening of the debt crisis in Europe coupled with political gridlock in the United States over the deficit, taxes, and spending led anxious investors to turn to U.S. Treasuries for safety. Demand surged, driving prices up and yields down, even as the rating of U.S. long-term government debt was downgraded to AA+ in August by Standard & Poor’s.
The shortest end of the Treasury yield curve had little room to move, given that rates were already near zero, but the yield of the 10-year benchmark fell by more than a full percentage point to 1.88%, and yields at the long end fell by an even greater amount to 2.89%. For the year as a whole, Treasuries returned almost 10%. This was a major contributor to the performances of all four Vanguard Bond Index Funds because, like their benchmarks, they each had a sizable stake in U.S. government bonds—from about 45% in the Long-Term Fund to about 70% in the Short-Term Fund.
Corporate bonds weren’t far behind, returning a little over 8% in 2011. The difference between their yields and those
of comparable Treasuries decreased in the first four months of the year as the economic recovery in the United States seemed to be gaining traction (a narrowing spread indicates that investors are becoming more comfortable with this grade of bonds). However, the political and economic impasses I’ve already mentioned led to the spread ending the year significantly wider than where it began. Here, too, however, investors were willing to pay for quality, with bonds rated A or higher outperforming their lower-rated counterparts.
In terms of maturity, the significant flattening of the yield curve put the performance of longer-term bonds well out in front. Long-term Treasury returns were almost 30%, while their corporate counterparts came in at more than 17%.
A solid track record over the past decade
The pattern seen in 2011 of securities with longer maturities generating the highest returns was also true for the ten years ended December 31, although the differences were less extreme. Investor Shares of the Short-Term Bond Index Fund returned 4.02% for the period, whereas their intermediate-term and long-term counterparts returned 6.63% and 8.41%, respectively. The Total Bond Market Index Fund’s Investor Shares returned 5.49%. All of the funds performed roughly in line with their benchmarks and were well ahead of their peer funds. Low costs are a big help in bond investing.
8
Stick to a diversified strategy in good markets and in bad
While bond performances have been very strong of late, especially for Treasuries, it’s important to note that the decline in yields to such low levels means that the opportunity for similarly strong returns is limited in the short term. That said, we continue to believe that bonds are a crucial component of a well-balanced portfolio, and that they will continue to play their role as a diversifier for the riskier assets in your portfolio, such as stocks, even once interest rates begin to rise.
Thank you for entrusting your assets to Vanguard.
Sincerely,
F. William McNabb III
Chairman and Chief Executive Officer
January 17, 2012
Your Fund’s Performance at a Glance
December 31, 2010 , Through December 31, 2011
| Distributions Per Share | ||||
| Starting | Ending | Income | Capital | |
| Share Price | Share Price | Dividends | Gains | |
| Vanguard Total Bond Market Index Fund | ||||
| Investor Shares | $10.60 | $11.00 | $0.337 | $0.051 |
| Admiral Shares | 10.60 | 11.00 | 0.350 | 0.051 |
| Signal Shares | 10.60 | 11.00 | 0.350 | 0.051 |
| Institutional Shares | 10.60 | 11.00 | 0.353 | 0.051 |
| Institutional Plus Shares | 10.60 | 11.00 | 0.355 | 0.051 |
| ETF Shares | 80.21 | 83.31 | 2.598 | 0.387 |
| Vanguard Short-Term Bond Index Fund | ||||
| Investor Shares | $10.55 | $10.61 | $0.193 | $0.057 |
| Admiral Shares | 10.55 | 10.61 | 0.205 | 0.057 |
| Signal Shares | 10.55 | 10.61 | 0.205 | 0.057 |
| Institutional Shares (Inception: 9/27/2011) | 10.66 | 10.61 | 0.050 | 0.049 |
| Institutional Plus Shares | 10.66 | 10.61 | 0.051 | 0.049 |
| (Inception: 9/29/2011) | ||||
| ETF Shares | 80.35 | 80.80 | 1.538 | 0.435 |
| Vanguard Intermediate-Term Bond Index Fund | ||||
| Investor Shares | $11.21 | $11.77 | $0.425 | $0.178 |
| Admiral Shares | 11.21 | 11.77 | 0.437 | 0.178 |
| Signal Shares | 11.21 | 11.77 | 0.437 | 0.178 |
| Institutional Shares | 11.21 | 11.77 | 0.442 | 0.178 |
| Institutional Plus Shares | 11.73 | 11.77 | 0.072 | 0.138 |
| (Inception: 11/30/2011) | ||||
| ETF Shares | 82.56 | 86.63 | 3.183 | 1.313 |
| Vanguard Long-Term Bond Index Fund | ||||
| Investor Shares | $12.04 | $13.91 | $0.587 | $0.121 |
| Institutional Shares | 12.04 | 13.91 | 0.606 | 0.121 |
| Institutional Plus Shares | 13.69 | 13.91 | 0.152 | 0.121 |
| (Inception: 10/6/2011) | ||||
| ETF Shares | 79.07 | 91.40 | 3.904 | 0.797 |
10
Total Bond Market Index Fund
Fund Profile
As of December 31, 2011
| Share-Class Characteristics | ||||||
| Investor | Admiral | Signal | Institutional | Institutional | ||
| Shares | Shares | Shares | Shares | Plus Shares | ETF Shares | |
| Ticker Symbol | VBMFX | VBTLX | VBTSX | VBTIX | VBMPX | BND |
| Expense Ratio1 | 0.22% | 0.11% | 0.11% | 0.07% | 0.05% | 0.11% |
| 30-Day SEC Yield | 2.17% | 2.33% | 2.33% | 2.32% | 2.34% | 2.32% |
| Financial Attributes | ||
| Barclays | ||
| Aggregate | ||
| Float Adj | ||
| Fund | Index | |
| Number of Bonds | 5,075 | 7,854 |
| Yield to Maturity | ||
| (before expenses) | 2.2% | 2.2% |
| Average Coupon | 4.2% | 4.0% |
| Average Duration | 5.0 years | 5.1 years |
| Average Effective | ||
| Maturity | 7.2 years | 7.3 years |
| Short-Term | ||
| Reserves | 4.1% | — |
| Sector Diversification (% of portfolio) | |
| Asset-Backed | 0.2% |
| Commercial Mortgage-Backed | 2.3 |
| Finance | 7.1 |
| Foreign | 4.5 |
| Government Mortgage-Backed | 26.4 |
| Industrial | 11.7 |
| Treasury/Agency | 43.1 |
| Utilities | 2.4 |
| Other | 2.3 |
The agency and mortgage-backed securities sectors may include issues from government-sponsored enterprises; such issues are not
backed by the full faith and credit of the U.S. government.
| Volatility Measures | |
| Spliced | |
| Barclays | |
| Aggregate | |
| FA Index | |
| R-Squared | 0.99 |
| Beta | 1.02 |
These measures show the degree and timing of the fund’s fluctuations compared with the index over 36 months.
| Distribution by Maturity (% of portfolio) | |
| Under 1 Year | 3.4% |
| 1 - 3 Years | 24.6 |
| 3 - 5 Years | 26.3 |
| 5 - 10 Years | 31.4 |
| 10 - 20 Years | 4.1 |
| 20 - 30 Years | 10.0 |
| Over 30 Years | 0.2 |
| Distribution by Credit Quality (% of portfolio) | |
| U.S. Government | 69.3% |
| Aaa | 4.4 |
| Aa | 5.2 |
| A | 11.2 |
| Baa | 9.8 |
| Less Than Baa | 0.1 |
| For information about these ratings, see the Glossary entry for Credit Quality. | |
1 The fund expense ratios shown are from the prospectuses dated April 26, 2011 (for Investor, Admiral, Signal, and ETF Shares), and
September 27, 2011 (for Institutional and Institutional Plus Shares). They represent estimated costs for the current fiscal year. For the fiscal
year ended December 31, 2011, the expense ratios were 0.22% for Investor Shares, 0.10% for Admiral Shares, 0.10% for Signal Shares,
0.07% for Institutional Shares, 0.05% for Institutional Plus Shares, and 0.10% for ETF Shares.
11
Total Bond Market Index Fund
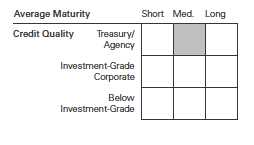
Investment Focus
12
Total Bond Market Index Fund
Performance Summary
All of the returns in this report represent past performance, which is not a guarantee of future results that may be achieved by the fund. (Current performance may be lower or higher than the performance data cited. For performance data current to the most recent month-end, visit our website at vanguard.com/performance.) Note, too, that both investment returns and principal value can fluctuate widely, so an investor’s shares, when sold, could be worth more or less than their original cost. The returns shown do not reflect taxes that a shareholder would pay on fund distributions or on the sale of fund shares.
Cumulative Performance: December 31, 2001, Through December 31, 2011
Initial Investment of $10,000

| Average Annual Total Returns | |||||
| Periods Ended December 31, 2011 | |||||
| Final Value | |||||
| One | Five | Ten | of a $10,000 | ||
| Year | Years | Years | Investment | ||
| Total Bond Market Index Fund | |||||
| Investor Shares | 7.56% | 6.37% | 5.49% | $17,062 | |
| – – – – | Spliced Barclays Capital U.S. | ||||
| Aggregate Float Adjusted Index | 7.92 | 6.52 | 5.79 | 17,555 | |
| Spliced Intermediate | |||||
| Investment-Grade Debt Funds | |||||
| Average | 6.09 | 5.07 | 4.74 | 15,896 | |
Spliced Barclays Capital U.S. Aggregate Float Adjusted Index: Barclays Capital U.S. Aggregate Bond Index through December 31, 2009;
Barclays Capital U.S. Aggregate Float Adjusted Index thereafter.
Spliced Intermediate Investment-Grade Debt Funds Average: Based on average returns for Intermediate U.S. Government Funds through
December 31, 2001, and average returns for Intermediate Investment-Grade Debt Funds thereafter. Derived from data provided by Lipper Inc.
| Final Value | ||||
| One | Five | Ten | of a $10,000 | |
| Year | Years | Years | Investment | |
| Total Bond Market Index Fund Admiral | ||||
| Shares | 7.69% | 6.48% | 5.58% | $17,216 |
| Spliced Barclays Capital U.S. Aggregate Float | ||||
| Adjusted Index | 7.92 | 6.52 | 5.79 | 17,555 |
See Financial Highlights for dividend and capital gains information.
13
Total Bond Market Index Fund
| Average Annual Total Returns | ||||
| Periods Ended December 31, 2011 | ||||
| Since | Final Value | |||
| One | Five | Inception | of a $10,000 | |
| Year | Years | (9/1/2006) | Investment | |
| Total Bond Market Index Fund Signal Shares | 7.69% | 6.48% | 6.50% | $13,987 |
| Spliced Barclays Capital U.S. Aggregate Float | ||||
| Adjusted Index | 7.92 | 6.52 | 6.51 | 13,999 |
"Since Inception" performance is calculated from the Signal Shares’ inception date for both the fund and its comparative standard.
| Final Value | ||||
| One | Five | Ten | of a $5,000,000 | |
| Year | Years | Years | Investment | |
| Total Bond Market Index Fund Institutional | ||||
| Shares | 7.72% | 6.52% | 5.63% | $8,643,890 |
| Spliced Barclays Capital U.S. Aggregate Float | ||||
| Adjusted Index | 7.92 | 6.52 | 5.79 | 8,777,393 |
| Final Value | ||||
| One | Five | Ten | of a $100,000,000 | |
| Year | Years | Years | Investment | |
| Total Bond Market Index Fund Institutional | ||||
| Plus Shares | 7.74% | 6.53% | 5.63% | $172,943,041 |
| Spliced Barclays Capital U.S. Aggregate Float | ||||
| Adjusted Index | 7.92 | 6.52 | 5.79 | 175,547,854 |
The creation of the Institutional Plus Shares occurred on February 5, 2010, when Vanguard Total Bond Market Index Fund acquired the net
assets of Vanguard Institutional Total Bond Market Index Fund. For the period ended December 31, 2011, the returns and other data shown in
the table above reflect a blend of historical performance of the fund’s Institutional Shares prior to February 5, 2010, and of the Institutional
Plus Shares from then on.
| Since | Final Value | ||
| One | Inception | of a $10,000 | |
| Year | (4/3/2007) | Investment | |
| Total Bond Market Index Fund | |||
| ETF Shares Net Asset Value | 7.71% | 6.51% | $13,492 |
| Spliced Barclays Capital U.S. Aggregate Float | |||
| Adjusted Index | 7.92 | 6.55 | 13,515 |
"Since Inception" performance is calculated from the ETF Shares’ inception date for both the fund and its comparative standard.
14
Total Bond Market Index Fund
Cumulative Returns of ETF Shares:April 3, 2007 , Through December 31, 2011
| Since | ||
| One | Inception | |
| Year | (4/3/2007) | |
| Total Bond Market Index Fund | ||
| ETF Shares Market Price | 7.86% | 35.09% |
| Total Bond Market Index Fund | ||
| ETF Shares Net Asset Value | 7.71 | 34.92 |
| Spliced Barclays Capital U.S. Aggregate Float | ||
| Adjusted Index | 7.92 | 35.15 |
"Since Inception" performance is calculated from the ETF Shares’ inception date for both the fund and its comparative standard.
| Fiscal-Year Total Returns (%): December 31, 2001, Through December 31, 2011 | ||||
| Spliced | ||||
| Barclays | ||||
| Aggregate | ||||
| Investor Shares | FA Index | |||
| Fiscal Year | Income Returns | Capital Returns | Total Returns | Total Returns |
| 2002 | 5.88% | 2.38% | 8.26% | 10.26% |
| 2003 | 4.64 | -0.67 | 3.97 | 4.10 |
| 2004 | 4.43 | -0.19 | 4.24 | 4.34 |
| 2005 | 4.43 | -2.03 | 2.40 | 2.43 |
| 2006 | 4.97 | -0.70 | 4.27 | 4.33 |
| 2007 | 5.22 | 1.70 | 6.92 | 6.97 |
| 2008 | 4.85 | 0.20 | 5.05 | 5.24 |
| 2009 | 4.26 | 1.67 | 5.93 | 5.93 |
| 2010 | 3.55 | 2.87 | 6.42 | 6.58 |
| 2011 | 3.30 | 4.26 | 7.56 | 7.92 |
| Spliced Barclays Capital U.S. Aggregate Float Adjusted Index: Barclays Capital U.S. Aggregate Bond Index through December 31, 2009; | ||||
| Barclays Capital U.S. Aggregate Float Adjusted Index thereafter. | ||||
15
Total Bond Market Index Fund
Financial Statements
Statement of Net Assets—Investments Summary
As of December 31, 2011
This Statement summarizes the fund’s holdings by asset type. Details are reported for each of the fund’s 50 largest individual holdings and for investments that, in total for any issuer, represent more than 1% of the fund’s net assets. The total value of smaller holdings is reported as a single amount within each category.
The fund reports a complete list of its holdings in regulatory filings four times in each fiscal year, at the quarter-ends. For the second and fourth fiscal quarters, the complete listing of the fund’s holdings is available electronically on vanguard.com and on the Securities and Exchange Commission’s website (sec.gov), or you can have it mailed to you without charge by calling 800-662-7447. For the first and third fiscal quarters, the fund files the lists with the SEC on Form N-Q. Shareholders can look up the fund’s Forms N-Q on the SEC’s website. Forms N-Q may also be reviewed and copied at the SEC’s Public Reference Room (see the back cover of this report for further information).
| Face | Market | Percentage | |||
| Maturity | Amount | Value | of Net | ||
| Coupon | Date | ($000) | ($000) | Assets | |
| U.S. Government and Agency Obligations | |||||
| U.S. Government Securities | |||||
| United States Treasury Note/Bond | 0.625% | 4/30/13 | 1,313,825 | 1,321,222 | 1.3% |
| United States Treasury Note/Bond | 6.250% | 8/15/23 | 687,360 | 983,358 | 1.0% |
| United States Treasury Note/Bond | 1.375% | 1/15/13 | 826,465 | 836,664 | 0.8% |
| United States Treasury Note/Bond | 1.875% | 2/28/14 | 764,335 | 790,368 | 0.8% |
| United States Treasury Note/Bond | 1.000% | 5/15/14 | 726,945 | 738,874 | 0.7% |
| United States Treasury Note/Bond | 1.875% | 4/30/14 | 638,550 | 661,800 | 0.7% |
| United States Treasury Note/Bond | 4.500% | 8/15/39 | 455,749 | 601,730 | 0.6% |
| United States Treasury Note/Bond | 2.750% | 10/31/13 | 548,723 | 573,673 | 0.6% |
| United States Treasury Note/Bond | 1.375% | 10/15/12 | 560,980 | 566,416 | 0.6% |
| United States Treasury Note/Bond | 1.125% | 12/15/12 | 552,250 | 557,342 | 0.5% |
| United States Treasury Note/Bond | 2.125% | 8/15/21 | 538,613 | 552,078 | 0.5% |
| United States Treasury Note/Bond | 2.125% | 11/30/14 | 514,964 | 540,954 | 0.5% |
| United States Treasury Note/Bond | 3.375% | 11/15/19 | 471,533 | 537,472 | 0.5% |
| United States Treasury Note/Bond | 3.500% | 5/15/20 | 452,328 | 520,250 | 0.5% |
| United States Treasury Note/Bond | 4.625% | 2/15/40 | 377,451 | 508,204 | 0.5% |
| United States Treasury Note/Bond | 4.750% | 8/15/17 | 420,505 | 506,381 | 0.5% |
| United States Treasury Note/Bond | 3.000% | 9/30/16 | 457,850 | 504,853 | 0.5% |
| United States Treasury Note/Bond | 2.500% | 6/30/17 | 462,350 | 500,133 | 0.5% |
| United States Treasury Note/Bond | 0.500% | 8/15/14 | 462,000 | 464,236 | 0.5% |
| United States Treasury Note/Bond | 0.125% | 9/30/13 | 464,530 | 463,661 | 0.5% |
| United States Treasury Note/Bond | 1.750% | 3/31/14 | 442,185 | 456,693 | 0.5% |
| United States Treasury Note/Bond | 0.250% | 12/15/14 | 450,700 | 449,294 | 0.4% |
| United States Treasury Note/Bond | 4.750% | 5/15/14 | 399,828 | 441,622 | 0.4% |
| United States Treasury Note/Bond | 3.875% | 5/15/18 | 376,346 | 439,030 | 0.4% |
| United States Treasury Note/Bond | 2.375% | 5/31/18 | 407,565 | 437,179 | 0.4% |
| United States Treasury Note/Bond | 4.375% | 11/15/39 | 334,296 | 433,278 | 0.4% |
| United States Treasury Note/Bond | 0.625% | 1/31/13 | 427,470 | 429,539 | 0.4% |
| United States Treasury Note/Bond | 4.250% | 5/15/39 | 327,664 | 416,185 | 0.4% |
| United States Treasury Note/Bond | 2.000% | 11/15/21 | 407,274 | 411,729 | 0.4% |
| United States Treasury Note/Bond | 3.500% | 2/15/39 | 366,586 | 411,606 | 0.4% |
| United States Treasury Note/Bond | 4.750% | 2/15/41 | 298,325 | 410,430 | 0.4% |
16
Total Bond Market Index Fund
| Face | Market | Percentage | |||||
| Maturity | Amount | Value | of Net | ||||
| Coupon | Date | ($000) | ($000) | Assets | |||
| United States Treasury Note/Bond | 3.625% | 2/15/21 | 340,705 | 395,484 | 0.4% | ||
| United States Treasury Note/Bond | 3.625% | 2/15/20 | 337,909 | 391,816 | 0.4% | ||
| United States Treasury Note/Bond | 8.750% | 8/15/20 | 244,040 | 384,822 | 0.4% | ||
| United States Treasury Note/Bond | 4.750% | 2/15/37 | 272,660 | 370,092 | 0.4% | ||
| United States Treasury Note/Bond | 3.000% | 8/31/16 | 331,480 | 365,198 | 0.4% | ||
| United States Treasury Note/Bond | 3.250% | 6/30/16 | 327,340 | 363,655 | 0.4% | ||
| United States Treasury Note/Bond | 9.875% | 11/15/15 | 262,900 | 356,516 | 0.4% | ||
| United States Treasury Note/Bond | 2.750% | 5/31/17 | 323,780 | 354,387 | 0.4% | ||
| United States Treasury Note/Bond | 8.750% | 5/15/17 | 250,815 | 353,571 | 0.3% | ||
| United States Treasury Note/Bond | 3.125% | 1/31/17 | 310,060 | 344,750 | 0.3% | ||
| United States Treasury Note/Bond | 4.375% | 5/15/40 | 261,865 | 339,607 | 0.3% | ||
| United States Treasury Note/Bond | 2.375% | 2/28/15 | 319,107 | 338,652 | 0.3% | ||
| United States Treasury Note/Bond | 0.875% | 11/30/16 | 334,001 | 335,097 | 0.3% | ||
| United States Treasury Note/Bond | 0.375% | 11/15/14 | 332,120 | 332,379 | 0.3% | ||
| United States Treasury Note/Bond | 4.375% | 5/15/41 | 252,820 | 328,825 | 0.3% | ||
| United States Treasury | |||||||
| Note/Bond | 0.125%–11.250% | 9/30/12–8/15/41 | 14,355,694 | 16,197,898 | 15.9% | ||
| 39,019,003 | 38.3% | ||||||
| Agency Bonds and Notes | |||||||
| 1 | Federal Home Loan | ||||||
| Bank of Chicago | 5.625% | 6/13/16 | 3,705 | 4,175 | 0.0% | ||
| 1 | Federal Home Loan Banks | 0.375%–5.625% | 12/14/12–7/15/36 | 974,040 | 1,060,585 | 1.1% | |
| 2 | Federal Home Loan | ||||||
| Mortgage Corp. | 0.000%–6.750% | 12/28/12–7/15/32 | 1,477,023 | 1,604,439 | 1.6% | ||
| 2 | Federal National | ||||||
| Mortgage Assn. | 0.000%–8.200% | 12/28/12–7/15/37 | 1,608,781 | 1,747,108 | 1.7% | ||
| Agency Bonds and Notes—Other † | 549,987 | 0.5% | |||||
| 4,966,294 | 4.9% | ||||||
| Conventional Mortgage-Backed Securities | |||||||
| 2,3,4 Fannie Mae Pool | 3.500% | 1/1/27 | 339,005 | 354,474 | 0.3% | ||
| 2,3,4 Fannie Mae Pool | 3.000%–11.000% | 1/1/12–1/1/42 | 10,861,922 | 11,693,959 | 11.5% | ||
| 2,4 | Federal Home Loan | ||||||
| Mortgage Corp. | 3.500% | 9/1/26 | 33,450 | 34,896 | 0.0% | ||
| 2,3,4 Freddie Mac Gold Pool | 3.000%–10.000% | 1/1/12–1/1/42 | 7,377,011 | 7,904,804 | 7.8% | ||
| 2,4 | Freddie Mac Non | ||||||
| Gold Pool | 8.000%–9.500% | 2/1/17–3/1/20 | 46 | 54 | 0.0% | ||
| 3,4 | Ginnie Mae I Pool | 4.000% | 1/1/42 | 306,670 | 328,904 | 0.3% | |
| 3,4 | Ginnie Mae I Pool | 3.500%–11.500% | 6/15/12–1/1/42 | 2,763,603 | 3,051,077 | 3.0% | |
| 3,4 | Ginnie Mae II Pool | 4.500% | 1/1/42 | 610,185 | 664,528 | 0.7% | |
| 3,4 | Ginnie Mae II Pool | 4.000% | 1/1/42 | 472,975 | 505,937 | 0.5% | |
| 3,4 | Ginnie Mae II Pool | 3.500%–8.500% | 4/20/18–1/1/42 | 2,199,515 | 2,424,271 | 2.4% | |
| 26,962,904 | 26.5% | ||||||
| Nonconventional Mortgage-Backed Securities | |||||||
| 2,4 | Fannie Mae Pool | 2.246%–6.304% | 11/1/32–4/1/41 | 455,667 | 478,154 | 0.5% | |
| 2,4 | Freddie Mac Non | ||||||
| Gold Pool | 2.085%–6.394% | 4/1/33–3/1/41 | 369,762 | 389,906 | 0.4% | ||
| 4 | Ginnie Mae II Pool | 2.375%–5.000% | 6/20/29–11/20/41 | 127,109 | 132,989 | 0.1% | |
| 1,001,049 | 1.0% | ||||||
| Total U.S. Government and Agency Obligations (Cost $67,673,045) | 71,949,250 | 70.7% | |||||
| 5Asset-Backed/Commercial Mortgage-Backed Securities (Cost $2,418,241) † | 2,676,843 | 2.6% | |||||
17
Total Bond Market Index Fund
| Market | Percentage | ||||
| Value | of Net | ||||
| ($000) | Assets | ||||
| Corporate Bonds | |||||
| Finance | |||||
| 5 | Banking † | 4,563,797 | 4.5% | ||
| 5 | Brokerage † | 144,391 | 0.1% | ||
| 5 | Finance Companies † | 704,838 | 0.7% | ||
| 5 | Insurance † | 1,204,329 | 1.2% | ||
| Other Finance † | 47,475 | 0.0% | |||
| Real Estate Investment Trusts † | 391,855 | 0.4% | |||
| 7,056,685 | 6.9% | ||||
| Industrial | |||||
| 5 | Basic Industry † | 1,152,472 | 1.1% | ||
| 5 | Capital Goods † | 1,117,215 | 1.1% | ||
| 5 | Communication † | 2,246,395 | 2.2% | ||
| 5 | Consumer Cyclical † | 1,272,875 | 1.3% | ||
| 5 | Consumer Noncyclical † | 2,948,212 | 2.9% | ||
| 5 | Energy † | 1,513,179 | 1.5% | ||
| Other Industrial † | 39,328 | 0.1% | |||
| Technology † | 929,504 | 0.9% | |||
| 5 | Transportation † | 441,449 | 0.4% | ||
| 11,660,629 | 11.5% | ||||
| Utilities | |||||
| Electric † | 1,616,441 | 1.6% | |||
| 5 | Natural Gas † | 730,351 | 0.7% | ||
| Other Utility † | 33,738 | 0.0% | |||
| 2,380,530 | 2.3% | ||||
| Total Corporate Bonds (Cost $19,648,204) | 21,097,844 | 20.7% | |||
| 5Sovereign Bonds (U.S. Dollar-Denominated) (Cost $4,210,807) † | 4,468,114 | 4.4% | |||
| Taxable Municipal Bonds (Cost $815,148) † | 936,564 | 0.9% | |||
| Coupon | Shares | ||||
| Temporary Cash Investment | |||||
| Money Market Fund | |||||
| 6 | Vanguard Market Liquidity | ||||
| Fund (Cost $4,345,508) | 0.110% | 4,345,507,937 | 4,345,508 | 4.3% | |
| Total Investments (Cost $99,110,953) | 105,474,123 | 103.6% | |||
| Other Assets and Liabilities | |||||
| Other Assets | 1,306,299 | 1.3% | |||
| Liabilities | (4,997,606) | (4.9%) | |||
| (3,691,307) | (3.6%) | ||||
| Net Assets | 101,782,816 | 100.0% | |||
| At December 31, 2011, net assets consisted of: | |||||
| Amount | |||||
| ($000) | |||||
| Paid-in Capital | 95,325,912 | ||||
| Undistributed Net Investment Income | — | ||||
| Accumulated Net Realized Gains | 93,734 | ||||
| Unrealized Appreciation (Depreciation) | 6,363,170 | ||||
| Net Assets | 101,782,816 | ||||
18
Total Bond Market Index Fund
| Amount | |
| ($000) | |
| Investor Shares—Net Assets | |
| Applicable to 1,143,446,350 outstanding $.001 par value shares of | |
| beneficial interest (unlimited authorization) | 12,583,563 |
| Net Asset Value Per Share—Investor Shares | $11.00 |
| Admiral Shares—Net Assets | |
| Applicable to 2,850,212,985 outstanding $.001 par value shares of | |
| beneficial interest (unlimited authorization) | 31,366,462 |
| Net Asset Value Per Share—Admiral Shares | $11.00 |
| Signal Shares—Net Assets | |
| Applicable to 993,960,570 outstanding $.001 par value shares of | |
| beneficial interest (unlimited authorization) | 10,938,493 |
| Net Asset Value Per Share—Signal Shares | $11.00 |
| Institutional Shares—Net Assets | |
| Applicable to 2,072,917,906 outstanding $.001 par value shares of | |
| beneficial interest (unlimited authorization) | 22,812,368 |
| Net Asset Value Per Share—Institutional Shares | $11.00 |
| Institutional Plus Shares—Net Assets | |
| Applicable to 861,996,181 outstanding $.001 par value shares of | |
| beneficial interest (unlimited authorization) | 9,486,231 |
| Net Asset Value Per Share—Institutional Plus Shares | $11.00 |
| ETF Shares—Net Assets | |
| Applicable to 175,200,000 outstanding $.001 par value shares of | |
| beneficial interest (unlimited authorization) | 14,595,699 |
| Net Asset Value Per Share—ETF Shares | $83.31 |
See Note A in Notes to Financial Statements.
† Represents the aggregate value, by category, of securities that are not among the 50 largest holdings and, in total for any issuer, represent
1% or less of net assets.
1 The issuer operates under a congressional charter; its securities are generally neither guaranteed by the U.S. Treasury nor backed by the full
faith and credit of the U.S. government.
2 The issuer was placed under federal conservatorship in September 2008; since that time, its daily operations have been managed by the
Federal Housing Finance Agency and it receives capital from the U.S. Treasury in exchange for senior preferred stock.
3 Includes securities purchased on a when-issued or delayed-delivery basis for which the fund has not taken delivery as of December 31, 2011.
4 The average or expected maturity is shorter than the final maturity shown because of the possibility of interim principal payments and
prepayments or the possibility of the issue being called.
5 Certain of the fund’s securities are exempt from registration under Rule 144A of the Securities Act of 1933. Such securities may be sold in
transactions exempt from registration, normally to qualified institutional buyers. At December 31, 2011, the aggregate value of these
securities was $213,175,000, representing 0.2% of net assets.
6 Affiliated money market fund available only to Vanguard funds and certain trusts and accounts managed by Vanguard. Rate shown is
the 7-day yield.
See accompanying Notes, which are an integral part of the Financial Statements.
19
| Total Bond Market Index Fund | |
| Statement of Operations | |
| Year Ended | |
| December 31, 2011 | |
| ($000) | |
| Investment Income | |
| Income | |
| Interest1 | 3,063,764 |
| Security Lending | 788 |
| Total Income | 3,064,552 |
| Expenses | |
| The Vanguard Group—Note B | |
| Investment Advisory Services | 5,233 |
| Management and Administrative—Investor Shares | 23,217 |
| Management and Administrative—Admiral Shares | 21,567 |
| Management and Administrative—Signal Shares | 6,261 |
| Management and Administrative—Institutional Shares | 6,951 |
| Management and Administrative—Institutional Plus Shares | 1,366 |
| Management and Administrative—ETF Shares | 6,849 |
| Marketing and Distribution—Investor Shares | 4,222 |
| Marketing and Distribution—Admiral Shares | 4,953 |
| Marketing and Distribution—Signal Shares | 2,740 |
| Marketing and Distribution—Institutional Shares | 6,126 |
| Marketing and Distribution—Institutional Plus Shares | 2,165 |
| Marketing and Distribution—ETF Shares | 2,880 |
| Custodian Fees | 962 |
| Auditing Fees | 44 |
| Shareholders’ Reports—Investor Shares | 279 |
| Shareholders’ Reports—Admiral Shares | 192 |
| Shareholders’ Reports—Signal Shares | 112 |
| Shareholders’ Reports—Institutional Shares | 264 |
| Shareholders’ Reports—Institutional Plus Shares | 45 |
| Shareholders’ Reports—ETF Shares | 302 |
| Trustees’ Fees and Expenses | 90 |
| Total Expenses | 96,820 |
| Net Investment Income | 2,967,732 |
| Realized Net Gain (Loss) on Investment Securities Sold | 650,673 |
| Change in Unrealized Appreciation (Depreciation) of Investment Securities | 3,252,735 |
| Net Increase (Decrease) in Net Assets Resulting from Operations | 6,871,140 |
| 1 Interest income from an affiliated company of the fund was $5,325,000. | |
See accompanying Notes, which are an integral part of the Financial Statements.
20
| Total Bond Market Index Fund | ||
| Statement of Changes in Net Assets | ||
| Year Ended December 31, | ||
| 2011 | 2010 | |
| ($000) | ($000) | |
| Increase (Decrease) in Net Assets | ||
| Operations | ||
| Net Investment Income | 2,967,732 | 2,844,259 |
| Realized Net Gain (Loss) | 650,673 | 510,477 |
| Change in Unrealized Appreciation (Depreciation) | 3,252,735 | 1,501,294 |
| Net Increase (Decrease) in Net Assets Resulting from Operations | 6,871,140 | 4,856,030 |
| Distributions | ||
| Net Investment Income | ||
| Investor Shares | (408,508) | (688,791) |
| Admiral Shares | (931,697) | (742,912) |
| Signal Shares | (317,543) | (300,220) |
| Institutional Shares | (692,073) | (663,596) |
| Institutional Plus Shares | (270,011) | (169,547) |
| ETF Shares | (347,900) | (279,193) |
| Realized Capital Gain1 | ||
| Investor Shares | (58,470) | (67,415) |
| Admiral Shares | (144,136) | (120,242) |
| Signal Shares | (50,153) | (36,929) |
| Institutional Shares | (103,357) | (91,189) |
| Institutional Plus Shares | (43,336) | (27,393) |
| ETF Shares | (67,338) | (40,157) |
| Total Distributions | (3,434,522) | (3,227,584) |
| Capital Share Transactions | ||
| Investor Shares | (2,327,093) | (5,708,328) |
| Admiral Shares | 3,086,562 | 8,963,563 |
| Signal Shares | 1,749,392 | 159,700 |
| Institutional Shares | 1,602,681 | 4,361,442 |
| Institutional Plus Shares | 2,797,315 | 6,329,913 |
| ETF Shares | 5,162,669 | 2,668,702 |
| Net Increase (Decrease) from Capital Share Transactions | 12,071,526 | 16,774,992 |
| Total Increase (Decrease) | 15,508,144 | 18,403,438 |
| Net Assets | ||
| Beginning of Period | 86,274,672 | 67,871,234 |
| End of Period | 101,782,816 | 86,274,672 |
1 Includes fiscal 2011 and 2010 short-term gain distributions totaling $183,055,000 and $130,494,000, respectively. Short-term gain distributions are treated as ordinary income dividends for tax purposes.
See accompanying Notes, which are an integral part of the Financial Statements.
21
Total Bond Market Index Fund
Financial Highlights
| Investor Shares | |||||
| For a Share Outstanding | Year Ended December 31, | ||||
| Throughout Each Period | 2011 | 2010 | 2009 | 2008 | 2007 |
| Net Asset Value, Beginning of Period | $10.60 | $10.35 | $10.18 | $10.16 | $9.99 |
| Investment Operations | |||||
| Net Investment Income | .337 | .362 | .421 | .477 | .501 |
| Net Realized and Unrealized Gain (Loss) | |||||
| on Investments | .451 | .297 | .170 | .020 | .170 |
| Total from Investment Operations | .788 | .659 | .591 | .497 | .671 |
| Distributions | |||||
| Dividends from Net Investment Income | (.337) | (.362) | (.421) | (.477) | (.501) |
| Distributions from Realized Capital Gains | (.051) | (.047) | — | — | — |
| Total Distributions | (.388) | (.409) | (.421) | (.477) | (.501) |
| Net Asset Value, End of Period | $11.00 | $10.60 | $10.35 | $10.18 | $10.16 |
| Total Return1 | 7.56% | 6.42% | 5.93% | 5.05% | 6.92% |
| Ratios/Supplemental Data | |||||
| Net Assets, End of Period (Millions) | $12,584 | $14,437 | $19,555 | $29,687 | $29,532 |
| Ratio of Total Expenses to | |||||
| Average Net Assets | 0.22% | 0.22% | 0.22% | 0.20% | 0.19% |
| Ratio of Net Investment Income to | |||||
| Average Net Assets | 3.12% | 3.38% | 4.09% | 4.73% | 5.02% |
| Portfolio Turnover Rate2 | 73%3 | 75%3 | 80% | 61% | 54% |
| 1 Total returns do not include account service fees that may have applied in the periods shown. Fund prospectuses provide information about | |||||
| any applicable account service fees. | |||||
| 2 Excludes the value of portfolio securities received or delivered as a result of in-kind purchases or redemptions of the fund’s capital shares, | |||||
| including ETF Creation Units. | |||||
| 3 Includes 34% and 28% attributable to mortgage-dollar-roll activity. | |||||
See accompanying Notes, which are an integral part of the Financial Statements.
22
Total Bond Market Index Fund
Financial Highlights
| Admiral Shares | |||||
| For a Share Outstanding | Year Ended December 31, | ||||
| Throughout Each Period | 2011 | 2010 | 2009 | 2008 | 2007 |
| Net Asset Value, Beginning of Period | $10.60 | $10.35 | $10.18 | $10.16 | $9.99 |
| Investment Operations | |||||
| Net Investment Income | .350 | .374 | .432 | .486 | .510 |
| Net Realized and Unrealized Gain (Loss) | |||||
| on Investments | .451 | .297 | .170 | .020 | .170 |
| Total from Investment Operations | .801 | .671 | .602 | .506 | .680 |
| Distributions | |||||
| Dividends from Net Investment Income | (.350) | (.374) | (.432) | (.486) | (.510) |
| Distributions from Realized Capital Gains | (.051) | (.047) | — | — | — |
| Total Distributions | (.401) | (.421) | (.432) | (.486) | (.510) |
| Net Asset Value, End of Period | $11.00 | $10.60 | $10.35 | $10.18 | $10.16 |
| Total Return | 7.69% | 6.54% | 6.04% | 5.15% | 7.02% |
| Ratios/Supplemental Data | |||||
| Net Assets, End of Period (Millions) | $31,366 | $27,200 | $17,932 | $12,978 | $10,232 |
| Ratio of Total Expenses to | |||||
| Average Net Assets | 0.10% | 0.11% | 0.12% | 0.11% | 0.10% |
| Ratio of Net Investment Income to | |||||
| Average Net Assets | 3.24% | 3.49% | 4.19% | 4.82% | 5.11% |
| Portfolio Turnover Rate1 | 73%2 | 75%2 | 80% | 61% | 54% |
1 Excludes the value of portfolio securities received or delivered as a result of in-kind purchases or redemptions of the fund’s capital shares,
including ETF Creation Units.
2 Includes 34% and 28% attributable to mortgage-dollar-roll activity.
See accompanying Notes, which are an integral part of the Financial Statements.
23
Total Bond Market Index Fund
Financial Highlights
| Signal Shares | |||||
| For a Share Outstanding | Year Ended December 31, | ||||
| Throughout Each Period | 2011 | 2010 | 2009 | 2008 | 2007 |
| Net Asset Value, Beginning of Period | $10.60 | $10.35 | $10.18 | $10.16 | $9.99 |
| Investment Operations | |||||
| Net Investment Income | .350 | .374 | .432 | .486 | .510 |
| Net Realized and Unrealized Gain (Loss) | |||||
| on Investments | .451 | .297 | .170 | .020 | .170 |
| Total from Investment Operations | .801 | .671 | .602 | .506 | .680 |
| Distributions | |||||
| Dividends from Net Investment Income | (.350) | (.374) | (.432) | (.486) | (.510) |
| Distributions from Realized Capital Gains | (.051) | (.047) | — | — | — |
| Total Distributions | (.401) | (.421) | (.432) | (.486) | (.510) |
| Net Asset Value, End of Period | $11.00 | $10.60 | $10.35 | $10.18 | $10.16 |
| Total Return | 7.69% | 6.54% | 6.04% | 5.15% | 7.02% |
| Ratios/Supplemental Data | |||||
| Net Assets, End of Period (Millions) | $10,938 | $8,813 | $8,450 | $7,372 | $5,414 |
| Ratio of Total Expenses to | |||||
| Average Net Assets | 0.10% | 0.11% | 0.12% | 0.11% | 0.10% |
| Ratio of Net Investment Income to | |||||
| Average Net Assets | 3.24% | 3.49% | 4.19% | 4.82% | 5.11% |
| Portfolio Turnover Rate1 | 73%2 | 75%2 | 80% | 61% | 54% |
1 Excludes the value of portfolio securities received or delivered as a result of in-kind purchases or redemptions of the fund’s capital shares,
including ETF Creation Units.
2 Includes 34% and 28% attributable to mortgage-dollar-roll activity.
See accompanying Notes, which are an integral part of the Financial Statements.
24
Total Bond Market Index Fund
Financial Highlights
| Institutional Shares | |||||
| For a Share Outstanding | Year Ended December 31, | ||||
| Throughout Each Period | 2011 | 2010 | 2009 | 2008 | 2007 |
| Net Asset Value, Beginning of Period | $10.60 | $10.35 | $10.18 | $10.16 | $9.99 |
| Investment Operations | |||||
| Net Investment Income | .353 | .378 | .437 | .490 | .513 |
| Net Realized and Unrealized Gain (Loss) | |||||
| on Investments | .451 | .297 | .170 | .020 | .170 |
| Total from Investment Operations | .804 | .675 | .607 | .510 | .683 |
| Distributions | |||||
| Dividends from Net Investment Income | (.353) | (.378) | (.437) | (.490) | (.513) |
| Distributions from Realized Capital Gains | (.051) | (.047) | — | — | — |
| Total Distributions | (.404) | (.425) | (.437) | (.490) | (.513) |
| Net Asset Value, End of Period | $11.00 | $10.60 | $10.35 | $10.18 | $10.16 |
| Total Return | 7.72% | 6.58% | 6.09% | 5.19% | 7.05% |
| Ratios/Supplemental Data | |||||
| Net Assets, End of Period (Millions) | $22,812 | $20,419 | $15,692 | $12,431 | $9,492 |
| Ratio of Total Expenses to | |||||
| Average Net Assets | 0.07% | 0.07% | 0.07% | 0.07% | 0.07% |
| Ratio of Net Investment Income to | |||||
| Average Net Assets | 3.27% | 3.53% | 4.24% | 4.86% | 5.14% |
| Portfolio Turnover Rate1 | 73%2 | 75%2 | 80% | 61% | 54% |
| 1 Excludes the value of portfolio securities received or delivered as a result of in-kind purchases or redemptions of the fund’s capital shares, | |||||
| including ETF Creation Units. | |||||
| 2 Includes 34% and 28% attributable to mortgage-dollar-roll activity. | |||||
See accompanying Notes, which are an integral part of the Financial Statements.
25
Total Bond Market Index Fund
Financial Highlights
| Institutional Plus Shares | ||
| Year | Feb. 5, | |
| Ended | 20101 to | |
| Dec. 31, | Dec. 31, | |
| For a Share Outstanding Throughout Each Period | 2011 | 2010 |
| Net Asset Value, Beginning of Period | $10.60 | $10.50 |
| Investment Operations | ||
| Net Investment Income | .355 | .343 |
| Net Realized and Unrealized Gain (Loss) on Investments | .451 | .147 |
| Total from Investment Operations | .806 | .490 |
| Distributions | ||
| Dividends from Net Investment Income | (.355) | (.343) |
| Distributions from Realized Capital Gains | (.051) | (.047) |
| Total Distributions | (.406) | (.390) |
| Net Asset Value, End of Period | $11.00 | $10.60 |
| Total Return | 7.74% | 4.68% |
| Ratios/Supplemental Data | ||
| Net Assets, End of Period (Millions) | $9,486 | $6,358 |
| Ratio of Total Expenses to Average Net Assets | 0.05% | 0.05%2 |
| Ratio of Net Investment Income to Average Net Assets | 3.29% | 3.55%2 |
| Portfolio Turnover Rate3 | 73%4 | 75%4 |
| 1 Inception. See Note G in Notes to Financial Statements. | ||
| 2 Annualized. | ||
| 3 Excludes the value of portfolio securities received or delivered as a result of in-kind purchases or redemptions of the fund’s capital shares, | ||
| including ETF Creation Units. | ||
| 4 Includes 34% and 28% attributable to mortgage-dollar-roll activity. | ||
See accompanying Notes, which are an integral part of the Financial Statements.
26
Total Bond Market Index Fund
Financial Highlights
| ETF Shares | |||||
| April 3, | |||||
| 20071 to | |||||
| For a Share Outstanding | Year Ended December 31, | Dec. 31, | |||
| Throughout Each Period | 2011 | 2010 | 2009 | 2008 | 2007 |
| Net Asset Value, Beginning of Period | $80.21 | $78.31 | $76.93 | $76.61 | $74.95 |
| Investment Operations | |||||
| Net Investment Income | 2.598 | 2.793 | 3.163 | 3.525 | 2.351 |
| Net Realized and Unrealized Gain (Loss) | |||||
| on Investments | 3.487 | 2.256 | 1.380 | .320 | 1.660 |
| Total from Investment Operations | 6.085 | 5.049 | 4.543 | 3.845 | 4.011 |
| Distributions | |||||
| Dividends from Net Investment Income | (2.598) | (2.793) | (3.163) | (3.525) | (2.351) |
| Distributions from Realized Capital Gains | (.387) | (.356) | — | — | — |
| Total Distributions | (2.985) | (3.149) | (3.163) | (3.525) | (2.351) |
| Net Asset Value, End of Period | $83.31 | $80.21 | $78.31 | $76.93 | $76.61 |
| Total Return | 7.71% | 6.51% | 6.03% | 5.18% | 5.45% |
| Ratios/Supplemental Data | |||||
| Net Assets, End of Period (Millions) | $14,596 | $9,048 | $6,242 | $2,946 | $1,095 |
| Ratio of Total Expenses to | |||||
| Average Net Assets | 0.10% | 0.11% | 0.12% | 0.10% | 0.11%2 |
| Ratio of Net Investment Income to | |||||
| Average Net Assets | 3.24% | 3.49% | 4.19% | 4.83% | 5.10%2 |
| Portfolio Turnover Rate3 | 73%4 | 75%4 | 80% | 61% | 54% |
1 Inception.
2 Annualized.
3 Excludes the value of portfolio securities received or delivered as a result of in-kind purchases or redemptions of the fund’s capital shares,
including ETF Creation Units.
4 Includes 34% and 28% attributable to mortgage-dollar-roll activity.
See accompanying Notes, which are an integral part of the Financial Statements.
27
Total Bond Market Index Fund
Notes to Financial Statements
Vanguard Total Bond Market Index Fund is registered under the Investment Company Act of 1940 as an open-end investment company, or mutual fund. Certain of the fund’s investments are in corporate debt instruments; the issuers’ abilities to meet their obligations may be affected by economic developments in their respective industries. The fund offers six classes of shares: Investor Shares, Admiral Shares, Signal Shares, Institutional Shares, Institutional Plus Shares, and ETF Shares. Investor Shares are available to any investor who meets the fund’s minimum purchase requirements. Admiral Shares, Signal Shares, Institutional Shares, and Institutional Plus Shares are designed for investors who meet certain administrative, service, and account-size criteria. ETF Shares are listed for trading on the NYSE Arca, Inc.; they can be purchased and sold through a broker.
A. The following significant accounting policies conform to generally accepted accounting principles for U.S. mutual funds. The fund consistently follows such policies in preparing its financial statements.
1. Security Valuation: Bonds, and temporary cash investments acquired over 60 days to maturity, are valued using the latest bid prices or using valuations based on a matrix system (which considers such factors as security prices, yields, maturities, and ratings), both as furnished by independent pricing services. Investments in Vanguard Market Liquidity Fund are valued at that fund’s net asset value. Other temporary cash investments are valued at amortized cost, which approximates market value. Securities for which market quotations are not readily available, or whose values have been affected by events occurring before the fund’s pricing time but after the close of the securities’ primary markets, are valued by methods deemed by the board of trustees to represent fair value.
2. To Be Announced (TBA) Transactions: A TBA transaction is an agreement to buy or sell mortgage-backed securities with agreed-upon characteristics (face amount, coupon, maturity) for settlement at a future date. The fund may enter into TBA sells to reduce its exposure to the mortgage-backed securities market or in order to dispose of mortgage-backed securities it owns under delayed-delivery arrangements. For TBA purchases, the fund maintains cash or short-term investments until settlement date in an amount sufficient to meet the purchase price.
3. Mortgage Dollar Rolls: The fund enters into mortgage-dollar-roll transactions, in which the fund sells mortgage-backed securities to a dealer and simultaneously agrees to purchase similar securities in the future at a predetermined price. The proceeds of the securities sold in mortgage-dollar-roll transactions are typically invested in high-quality short-term fixed income securities. The fund forgoes principal and interest paid on the securities sold, and is compensated by interest earned on the proceeds of the sale and by a lower price on the securities to be repurchased. The fund has also entered into mortgage-dollar-roll transactions in which the fund buys mortgage-backed securities from a dealer pursuant to a TBA transaction and simultaneously agrees to sell similar securities in the future at a predetermined price. The securities bought in mortgage-dollar-roll transactions are used to cover an open TBA sell position. The fund continues to earn interest on mortgage-backed security pools already held and receives a lower price on the securities to be sold in the future. The fund accounts for mortgage-dollar-roll transactions as purchases and sales; as such, these transactions may increase the fund’s portfolio turnover rate. Amounts to be received or paid in connection with open mortgage dollar rolls are included in Receivables for Investment Securities Sold or Payables for Investment Securities Purchased in the Statement of Assets and Liabilities. The primary risk associated with mortgage dollar rolls is that a counterparty will default on its obligations. This risk is mitigated by entering into mortgage dollar rolls only with highly rated counterparties, allocating transactions among numerous counterparties, and monitoring exposure to each counterparty.
28
Total Bond Market Index Fund
In April 2011, the Financial Accounting Standards Board adopted Accounting Standards Update (ASU) 2011-03, “Transfers and Servicing (Topic 860)—Reconsideration of Effective Control for Repurchase Agreements.” The ASU takes effect for periods beginning after December 15, 2011. Under the ASU, certain mortgage-dollar-roll transactions that previously would have been accounted for as purchases and sales may be accounted for as financing transactions. Treating these transactions as financing would have no impact on total return, but certain transactions that previously resulted in realized gains and losses would instead be reflected in net income and unrealized gains and losses. Management has concluded that treating the mortgage-dollar-roll arrangements entered into by the fund as purchases and sales continues to be appropriate.
4. Federal Income Taxes: The fund intends to continue to qualify as a regulated investment company and distribute all of its taxable income. Management has analyzed the fund’s tax positions taken for all open federal income tax years (December 31, 2008–2011), and has concluded that no provision for federal income tax is required in the fund’s financial statements.
5. Distributions: Distributions from net investment income are declared daily by all share classes except ETF Shares, and paid on the first business day of the following month. Monthly income dividends from ETF Shares, and annual distributions from realized capital gains, if any, are recorded on the ex-dividend date.
6. Security Lending: The fund has lent its securities to qualified institutional borrowers to earn additional income. Security loans are required to be secured at all times by collateral at least equal to the market value of securities loaned. The fund invests cash collateral received in Vanguard Market Liquidity Fund, and records a liability for the return of the collateral, during the period the securities are on loan. Security lending income represents fees charged to borrowers plus income earned on investing cash collateral, less expenses associated with the loan. Effective in August 2011, the fund is no longer permitted to lend its securities.
7. Other: Interest income includes income distributions received from Vanguard Market Liquidity Fund and is accrued daily. Premiums and discounts on debt securities purchased are amortized and accreted, respectively, to interest income over the lives of the respective securities. Security transactions are accounted for on the date securities are bought or sold. Costs used to determine realized gains (losses) on the sale of investment securities are those of the specific securities sold.
Each class of shares has equal rights as to assets and earnings, except that each class separately bears certain class-specific expenses related to maintenance of shareholder accounts (included in Management and Administrative expenses) and shareholder reporting. Marketing and distribution expenses are allocated to each class of shares based on a method approved by the board of trustees. Income, other non-class-specific expenses, and gains and losses on investments are allocated to each class of shares based on its relative net assets.
B. The Vanguard Group furnishes at cost investment advisory, corporate management, administrative, marketing, and distribution services. The costs of such services are allocated to the fund under methods approved by the board of trustees. The fund has committed to provide up to 0.40% of its net assets in capital contributions to Vanguard. At December 31, 2011, the fund had contributed capital of $16,107,000 to Vanguard (included in Other Assets), representing 0.02% of the fund’s net assets and 6.44% of Vanguard’s capitalization. The fund’s trustees and officers are also directors and officers of Vanguard.
29
Total Bond Market Index Fund
C. Various inputs may be used to determine the value of the fund’s investments. These inputs are summarized in three broad levels for financial statement purposes. The inputs or methodologies used to value securities are not necessarily an indication of the risk associated with investing in those securities.
Level 1—Quoted prices in active markets for identical securities.
Level 2—Other significant observable inputs (including quoted prices for similar securities, interest
rates, prepayment speeds, credit risk, etc.).
Level 3—Significant unobservable inputs (including the fund’s own assumptions used to determine
the fair value of investments).
The following table summarizes the market value of the fund’s investments as of December 31, 2011, based on the inputs used to value them:
| Level 1 | Level 2 | Level 3 | |
| Investments | ($000) | ($000) | ($000) |
| U.S. Government and Agency Obligations | — | 71,949,250 | — |
| Asset-Backed/Commercial Mortgage-Backed Securities | — | 2,676,843 | — |
| Corporate Bonds | — | 21,097,841 | 3 |
| Sovereign Bonds | — | 4,468,114 | — |
| Taxable Municipal Bonds | — | 936,564 | — |
| Temporary Cash Investments | 4,345,508 | — | — |
| Total | 4,345,508 | 101,128,612 | 3 |
The following table summarizes changes in investments valued based on Level 3 inputs during the year ended December 31, 2011.
| Investments in | |
| Corporate Bonds | |
| Amount Valued Based on Level 3 Inputs | ($000) |
| Balance as of December 31, 2010 | 29 |
| Change in Unrealized Appreciation (Depreciation) | (26) |
| Balance as of December 31, 2011 | 3 |
D. Capital gain distributions are determined on a tax basis and may differ from realized capital gains for financial reporting purposes. Differences may be permanent or temporary. Permanent differences are reclassified among capital accounts in the financial statements to reflect their tax character. Temporary differences arise when gains or losses are recognized in different periods for financial statement and tax purposes; these differences will reverse at some time in the future.
During the year ended December 31, 2011, the fund realized $7,291,000 of net capital gains resulting from in-kind redemptions—in which shareholders exchanged fund shares for securities held by the fund rather than for cash. Because such gains are not taxable to the fund, and are not distributed to shareholders, they have been reclassified from accumulated net realized gains to paid-in capital.
The fund used a tax accounting practice to treat a portion of the price of capital shares redeemed during the year as distributions from realized capital gains. Accordingly, the fund has reclassified $60,717,000 from accumulated net realized gains to paid-in capital.
30
Total Bond Market Index Fund
For tax purposes, at December 31, 2011, the fund had short-term and long-term capital gains of $52,572,000 and $44,815,000, respectively, available for distribution. Short-term gain distributions are treated as ordinary income dividends for tax purposes.
At December 31, 2011, the cost of investment securities for tax purposes was $99,114,606,000. Net unrealized appreciation of investment securities for tax purposes was $6,359,517,000, consisting of unrealized gains of $6,536,391,000 on securities that had risen in value since their purchase and $176,874,000 in unrealized losses on securities that had fallen in value since their purchase.
E. During the year ended December 31, 2011, the fund purchased $7,514,587,000 of investment securities and sold $4,435,595,000 of investment securities, other than U.S. government securities and temporary cash investments. Purchases and sales of U.S. government securities were $70,408,794,000 and $61,747,471,000, respectively.
F. Capital share transactions for each class of shares were:
| Year Ended December 31, | ||||
| 2011 | 2010 | |||
| Amount | Shares | Amount | Shares | |
| ($000) | (000) | ($000) | (000) | |
| Investor Shares | ||||
| Issued | 3,663,259 | 339,216 | 6,696,013 | 630,298 |
| Issued in Lieu of Cash Distributions | 446,483 | 41,317 | 711,525 | 66,797 |
| Redeemed | (6,436,835) | (599,204) | (13,115,866) | (1,223,913) |
| Net Increase (Decrease)—Investor Shares | (2,327,093) | (218,671) | (5,708,328) | (526,818) |
| Admiral Shares | ||||
| Issued | 6,336,314 | 587,559 | 11,942,039 | 1,114,390 |
| Issued in Lieu of Cash Distributions | 983,763 | 90,914 | 782,810 | 73,488 |
| Redeemed | (4,233,515) | (394,468) | (3,761,286) | (353,873) |
| Net Increase (Decrease)—Admiral Shares | 3,086,562 | 284,005 | 8,963,563 | 834,005 |
| Signal Shares | ||||
| Issued | 5,082,723 | 471,252 | 3,777,846 | 355,374 |
| Issued in Lieu of Cash Distributions | 325,731 | 30,093 | 295,468 | 27,753 |
| Redeemed | (3,659,062) | (338,831) | (3,913,614) | (367,943) |
| Net Increase (Decrease)—Signal Shares | 1,749,392 | 162,514 | 159,700 | 15,184 |
| Institutional Shares | ||||
| Issued | 8,191,392 | 758,447 | 9,066,632 | 852,560 |
| Issued in Lieu of Cash Distributions | 751,170 | 69,442 | 707,590 | 66,393 |
| Redeemed | (7,339,881) | (681,446) | (5,412,780) | (508,354) |
| Net Increase (Decrease)—Institutional Shares | 1,602,681 | 146,443 | 4,361,442 | 410,599 |
| 31 |
Total Bond Market Index Fund
| Year Ended December 31, | ||||
| 2011 | 2010 | |||
| Amount | Shares | Amount | Shares | |
| ($000) | (000) | ($000) | (000) | |
| Institutional Plus Shares | ||||
| Issued | 4,901,805 | 455,377 | 3,762,449 | 352,823 |
| Issued in Connection with Acquisition of | ||||
| Institutional Total Bond Market Index Fund | — | — | 4,235,240 | 403,613 |
| Issued in Lieu of Cash Distributions | 289,337 | 26,719 | 174,330 | 16,321 |
| Redeemed | (2,393,827) | (219,954) | (1,842,106) | (172,903) |
| Net Increase (Decrease)—Institutional Plus Shares | 2,797,315 | 262,142 | 6,329,913 | 599,854 |
| ETF Shares | ||||
| Issued | 5,340,473 | 64,600 | 2,861,499 | 35,500 |
| Issued in Lieu of Cash Distributions | — | — | — | — |
| Redeemed | (177,804) | (2,200) | (192,797) | (2,400) |
| Net Increase (Decrease)—ETF Shares | 5,162,669 | 62,400 | 2,668,702 | 33,100 |
G. As of the close of business on February 5, 2010, the fund acquired all the net assets of Vanguard Institutional Total Bond Market Index Fund pursuant to a plan of reorganization approved by the funds’ board of trustees. The acquisition was accomplished by a tax-free exchange of 403,613,000 shares of the fund for 80,272,000 shares of Institutional Total Bond Market Index Fund outstanding as of the close of business on February 5, 2010. Shares of Institutional Total Bond Market Index Fund were exchanged for new Institutional Plus Shares of the fund. The Institutional Total Bond Market Index Fund’s net assets as of the close of business on February 5, 2010, of $4,235,240,000, including $134,921,000 of unrealized appreciation, were combined with the fund’s net assets. The net assets of the fund immediately before the acquisition were $70,363,886,000. The net assets of the fund immediately following the acquisition were $74,599,126,000.
H. In preparing the financial statements as of December 31, 2011, management considered the impact of subsequent events for potential recognition or disclosure in these financial statements.
32
Short-Term Bond Index Fund
Fund Profile
As of December 31, 2011
| Share-Class Characteristics | ||||||
| Investor | Admiral | Signal | Institutional | Institutional | ||
| Shares | Shares | Shares | Shares | Plus Shares | ETF Shares | |
| Ticker Symbol | VBISX | VBIRX | VBSSX | VBITX | VBIPX | BSV |
| Expense Ratio1 | 0.22% | 0.11% | 0.11% | 0.07% | 0.05% | 0.11% |
| 30-Day SEC Yield | 0.75% | 0.86% | 0.86% | 0.90% | 0.92% | 0.86% |
| Financial Attributes | |||
| Barclays | |||
| 1–5 Year | |||
| Gov/ | Spliced | ||
| Credit | Barclays | ||
| Float Adj | Aggregate | ||
| Fund | Index | FA Index | |
| Number of Bonds | 1,339 | 2,424 | 7,854 |
| Yield to Maturity | |||
| (before expenses) | 0.9% | 1.0% | 2.2% |
| Average Coupon | 2.4% | 2.6% | 4.0% |
| Average Duration | 2.7 years | 2.7 years | 5.1 years |
| Average Effective | |||
| Maturity | 2.8 years | 2.8 years | 7.3 years |
| Short-Term | |||
| Reserves | 0.4% | — | — |
| Sector Diversification (% of portfolio) | |
| Finance | 9.3% |
| Foreign | 7.5 |
| Government Mortgage-Backed | 0.1 |
| Industrial | 10.6 |
| Treasury/Agency | 70.1 |
| Utilities | 1.4 |
| Other | 1.0 |
The agency and mortgage-backed securities sectors may include issues from government-sponsored enterprises; such issues are not
backed by the full faith and credit of the U.S. government.
| Volatility Measures | ||
| Spliced | ||
| Barclays | Spliced | |
| 1–5 Year | Barclays | |
| Gov/Credit | Aggregate | |
| FA Index | FA Index | |
| R-Squared | 0.98 | 0.74 |
| Beta | 1.03 | 0.52 |
These measures show the degree and timing of the fund’s fluctuations compared with the indexes over 36 months.
| Distribution by Maturity (% of portfolio) | |
| Under 1 Year | 2.0% |
| 1 - 3 Years | 58.6 |
| 3 - 5 Years | 39.4 |
| Distribution by Credit Quality (% of portfolio) | |
| U.S. Government | 70.1% |
| Aaa | 3.1 |
| Aa | 7.8 |
| A | 12.0 |
| Baa | 7.0 |
| For information about these ratings, see the Glossary entry for Credit Quality. | |
1 The fund expense ratios shown are from the prospectuses dated April 26, 2011 (for Investor, Admiral, Signal, and ETF Shares), and September 27, 2011 (for Institutional and Institutional Plus Shares). They represent estimated costs for the current fiscal year. For the fiscal year ended December 31, 2011, the expense ratios were 0.22% for Investor Shares, 0.11% for Admiral Shares, 0.11% for Signal Shares, 0.07% for Institutional Shares (annualized since inception), 0.05% for Institutional Plus Shares (annualized since inception), and 0.11% for ETF Shares.
33
Short-Term Bond Index Fund
Investment Focus

34
Short-Term Bond Index Fund
Performance Summary
All of the returns in this report represent past performance, which is not a guarantee of future results that may be achieved by the fund. (Current performance may be lower or higher than the performance data cited. For performance data current to the most recent month-end, visit our website at vanguard.com/performance.) Note, too, that both investment returns and principal value can fluctuate widely, so an investor’s shares, when sold, could be worth more or less than their original cost. The returns shown do not reflect taxes that a shareholder would pay on fund distributions or on the sale of fund shares.
Cumulative Performance: December 31, 2001, Through December 31, 2011
Initial Investment of $10,000

| Average Annual Total Returns | |||||
| Periods Ended December 31, 2011 | |||||
| Final Value | |||||
| One | Five | Ten | of a $10,000 | ||
| Year | Years | Years | Investment | ||
| Short-Term Bond Index Fund Investor | |||||
| Shares | 2.96% | 4.75% | 4.02% | $14,834 | |
| •••••••• | Spliced Barclays Capital U.S. | ||||
| Aggregate Float Adjusted Index | 7.92 | 6.52 | 5.79 | 17,555 | |
| – – – – | Spliced Barclays Capital U.S. 1–5 | ||||
| Year Government/Credit Float | |||||
| Adjusted Index | 3.13 | 4.84 | 4.30 | 15,237 | |
| Spliced 1–5 Year Investment-Grade | |||||
| Debt Funds Average | 2.22 | 3.02 | 3.04 | 13,489 | |
Spliced Barclays Capital U.S. 1–5 Year Government/Credit Float Adjusted Index: Barclays Capital U.S. 1–5 Year Government/Credit Bond
Index through December 31, 2009; Barclays Capital U.S. 1–5 Year Government/Credit Float Adjusted Index thereafter.
Spliced 1–5 Year Investment-Grade Debt Funds Average: Based on average returns for 1–5 Year U.S. Government Funds through December
31, 2001, and average returns for 1–5 Year Investment-Grade Debt Funds thereafter. Derived from data provided by Lipper Inc.
See Financial Highlights for dividend and capital gains information.
35
Short-Term Bond Index Fund
| Average Annual Total Returns | ||||
| Periods Ended December 31, 2011 | ||||
| Final Value | ||||
| One | Five | Ten | of a $10,000 | |
| Year | Years | Years | Investment | |
| Short-Term Bond Index Fund Admiral Shares | 3.08% | 4.85% | 4.10% | $14,952 |
| Spliced Barclays Capital U.S. Aggregate Float | ||||
| Adjusted Index | 7.92 | 6.52 | 5.79 | 17,555 |
| Spliced Barclays Capital U.S. 1–5 Year | ||||
| Government/Credit Float Adjusted Index | 3.13 | 4.84 | 4.30 | 15,237 |
| Since | Final Value | ||
| One | Inception | of a $10,000 | |
| Year | (3/30/2007) | Investment | |
| Short-Term Bond Index Fund Signal Shares | 3.08% | 4.77% | $12,479 |
| Spliced Barclays Capital U.S. Aggregate Float | |||
| Adjusted Index | 7.92 | 6.53 | 13,513 |
| Spliced Barclays Capital U.S. 1–5 Year | |||
| Government/Credit Float Adjusted Index | 3.13 | 4.75 | 12,470 |
| "Since Inception" performance is calculated from the Signal Shares’ inception date for both the fund and its comparative standards. | |||
| Total Returns | ||
| Period Ended December 31, 2011 | ||
| Since | Final Value | |
| Inception | of a $5,000,000 | |
| (9/27/2011) | Investment | |
| Short-Term Bond Index Fund Institutional | ||
| Shares | 0.47% | $5,023,256 |
| Spliced Barclays Capital U.S. Aggregate Float | ||
| Adjusted Index | 1.55 | 5,077,294 |
| Barclays Capital U.S. 1–5 Year | ||
| Government/Credit Float Adjusted Index | 0.40 | 5,020,171 |
| "Since Inception" performance is calculated from the Institutional Shares’ inception date for both the fund and its comparative standards. | ||
| Since | Final Value | |
| Inception | of a $100,000,000 | |
| (9/29/2011) | Investment | |
| Short-Term Bond Index Fund Institutional Plus | ||
| Shares | 0.47% | $100,470,605 |
| Spliced Barclays Capital U.S. Aggregate Float | ||
| Adjusted Index | 1.27 | 101,273,185 |
| Barclays Capital U.S. 1–5 Year | ||
| Government/Credit Float Adjusted Index | 0.40 | 100,395,888 |
| "Since Inception" performance is calculated from the Institutional Plus Shares’ inception date for both the fund and its comparative standards. | ||
36
Short-Term Bond Index Fund
| Average Annual Total Returns | |||
| Periods Ended December 31, 2011 | |||
| Since | Final Value | ||
| One | Inception | of a $10,000 | |
| Year | (4/3/2007) | Investment | |
| Short-Term Bond Index Fund | |||
| ETF Shares Net Asset Value | 3.04% | 4.77% | $12,475 |
| Spliced Barclays Capital U.S. Aggregate Float | |||
| Adjusted Index | 7.92 | 6.55 | 13,515 |
| Spliced Barclays Capital U.S. 1–5 Year | |||
| Government/Credit Float Adjusted Index | 3.13 | 4.77 | 12,474 |
| "Since Inception" performance is calculated from the ETF Shares’ inception date for both the fund and its comparative standards. | |||
| Cumulative Returns of ETF Shares:April 3, 2007 , Through December 31, 2011 | ||
| Since | ||
| One | Inception | |
| Year | (4/3/2007) | |
| Short-Term Bond Index Fund | ||
| ETF Shares Market Price | 2.97% | 24.78% |
| Short-Term Bond Index Fund | ||
| ETF Shares Net Asset Value | 3.04 | 24.75 |
| Spliced Barclays Capital U.S. 1–5 Year | ||
| Government/Credit Float Adjusted Index | 3.13 | 24.74 |
| "Since Inception" performance is calculated from the ETF Shares’ inception date for both the fund and its comparative standards. | ||
37
Short-Term Bond Index Fund
Fiscal-Year Total Returns (%): December 31, 2001, Through December 31, 2011
| Spliced | ||||
| Barclays | ||||
| 1–5 Year | ||||
| Gov/Credit | ||||
| Investor Shares | FA Index | |||
| Fiscal Year | Income Returns | Capital Returns | Total Returns | Total Returns |
| 2002 | 4.60% | 1.50% | 6.10% | 8.12% |
| 2003 | 3.22 | 0.15 | 3.37 | 3.35 |
| 2004 | 2.98 | -1.28 | 1.70 | 1.85 |
| 2005 | 3.48 | -2.17 | 1.31 | 1.44 |
| 2006 | 4.39 | -0.30 | 4.09 | 4.22 |
| 2007 | 4.79 | 2.43 | 7.22 | 7.27 |
| 2008 | 3.95 | 1.48 | 5.43 | 5.12 |
| 2009 | 2.91 | 1.37 | 4.28 | 4.62 |
| 2010 | 2.22 | 1.70 | 3.92 | 4.08 |
| 2011 | 1.85 | 1.11 | 2.96 | 3.13 |
Spliced Barclays Capital U.S. 1–5 Year Government/Credit Float Adjusted Index: Barclays Capital U.S. 1–5 Year Government/Credit Bond
Index through December 31, 2009; Barclays Capital U.S. 1–5 Year Government/Credit Float Adjusted Index thereafter.
38
Short-Term Bond Index Fund
Financial Statements
Statement of Net Assets—Investments Summary
As of December 31, 2011
This Statement summarizes the fund’s holdings by asset type. Details are reported for each of the fund’s 50 largest individual holdings and for investments that, in total for any issuer, represent more than 1% of the fund’s net assets. The total value of smaller holdings is reported as a single amount within each category.
The fund reports a complete list of its holdings in regulatory filings four times in each fiscal year, at the quarter-ends. For the second and fourth fiscal quarters, the complete listing of the fund’s holdings is available electronically on vanguard.com and on the Securities and Exchange Commission’s website (sec.gov), or you can have it mailed to you without charge by calling 800-662-7447. For the first and third fiscal quarters, the fund files the lists with the SEC on Form N-Q. Shareholders can look up the fund’s Forms N-Q on the SEC’s website. Forms N-Q may also be reviewed and copied at the SEC’s Public Reference Room (see the back cover of this report for further information).
| Face | Market | Percentage | |||
| Maturity | Amount | Value | of Net | ||
| Coupon | Date | ($000) | ($000) | Assets | |
| U.S. Government and Agency Obligations | |||||
| U.S. Government Securities | |||||
| United States Treasury Note/Bond | 0.375% | 7/31/13 | 466,885 | 467,978 | 2.0% |
| United States Treasury Note/Bond | 2.500% | 3/31/15 | 393,068 | 419,172 | 1.8% |
| United States Treasury Note/Bond | 2.625% | 7/31/14 | 393,725 | 416,919 | 1.8% |
| United States Treasury Note/Bond | 0.875% | 12/31/16 | 400,000 | 400,812 | 1.7% |
| United States Treasury Note/Bond | 1.750% | 5/31/16 | 370,725 | 387,756 | 1.6% |
| United States Treasury Note/Bond | 0.625% | 4/30/13 | 369,825 | 371,907 | 1.6% |
| United States Treasury Note/Bond | 2.375% | 10/31/14 | 351,860 | 371,708 | 1.6% |
| United States Treasury Note/Bond | 0.875% | 11/30/16 | 365,500 | 366,699 | 1.6% |
| United States Treasury Note/Bond | 0.250% | 10/31/13 | 327,095 | 327,147 | 1.4% |
| United States Treasury Note/Bond | 1.875% | 4/30/14 | 276,005 | 286,054 | 1.2% |
| United States Treasury Note/Bond | 1.250% | 10/31/15 | 274,925 | 281,971 | 1.2% |
| United States Treasury Note/Bond | 0.625% | 2/28/13 | 279,505 | 280,947 | 1.2% |
| United States Treasury Note/Bond | 1.000% | 9/30/16 | 277,030 | 279,975 | 1.2% |
| United States Treasury Note/Bond | 1.000% | 10/31/16 | 273,285 | 275,974 | 1.2% |
| United States Treasury Note/Bond | 1.875% | 2/28/14 | 262,020 | 270,944 | 1.1% |
| United States Treasury Note/Bond | 2.250% | 5/31/14 | 253,755 | 265,451 | 1.1% |
| United States Treasury Note/Bond | 2.125% | 11/30/14 | 250,135 | 262,759 | 1.1% |
| United States Treasury Note/Bond | 2.625% | 6/30/14 | 242,870 | 256,684 | 1.1% |
| United States Treasury Note/Bond | 0.750% | 3/31/13 | 254,693 | 256,445 | 1.1% |
| United States Treasury Note/Bond | 2.375% | 3/31/16 | 235,947 | 252,720 | 1.1% |
| United States Treasury Note/Bond | 1.750% | 3/31/14 | 241,500 | 249,424 | 1.1% |
| United States Treasury Note/Bond | 3.625% | 5/15/13 | 237,100 | 248,066 | 1.0% |
| United States Treasury Note/Bond | 1.375% | 2/15/13 | 241,618 | 244,827 | 1.0% |
| United States Treasury Note/Bond | 1.375% | 11/30/15 | 233,650 | 240,769 | 1.0% |
| United States Treasury Note/Bond | 1.500% | 6/30/16 | 226,120 | 233,858 | 1.0% |
| United States Treasury Note/Bond | 0.500% | 5/31/13 | 232,625 | 233,569 | 1.0% |
| United States Treasury Note/Bond | 1.875% | 6/30/15 | 215,453 | 225,788 | 1.0% |
| United States Treasury Note/Bond | 2.000% | 4/30/16 | 213,180 | 225,137 | 1.0% |
| United States Treasury Note/Bond | 2.375% | 2/28/15 | 210,482 | 223,374 | 0.9% |
| United States Treasury Note/Bond | 0.375% | 6/30/13 | 201,670 | 202,142 | 0.9% |
39
Short-Term Bond Index Fund
| Face | Market | Percentage | ||||
| Maturity | Amount | Value | of Net | |||
| Coupon | Date | ($000) | ($000) | Assets | ||
| United States Treasury Note/Bond | 0.125% | 8/31/13 | 200,110 | 199,798 | 0.8% | |
| United States Treasury Note/Bond | 1.125% | 6/15/13 | 193,978 | 196,494 | 0.8% | |
| United States Treasury Note/Bond | 0.125% | 12/31/13 | 189,085 | 188,643 | 0.8% | |
| United States Treasury Note/Bond | 2.125% | 2/29/16 | 173,480 | 184,133 | 0.8% | |
| United States Treasury Note/Bond | 2.125% | 12/31/15 | 171,800 | 182,242 | 0.8% | |
| United States Treasury Note/Bond | 1.375% | 3/15/13 | 178,228 | 180,762 | 0.8% | |
| United States Treasury Note/Bond | 1.750% | 4/15/13 | 177,045 | 180,558 | 0.8% | |
| United States Treasury Note/Bond | 1.500% | 7/31/16 | 165,825 | 171,448 | 0.7% | |
| United States Treasury Note/Bond | 0.250% | 11/30/13 | 165,270 | 165,321 | 0.7% | |
| United States Treasury Note/Bond | 1.000% | 8/31/16 | 154,320 | 156,031 | 0.7% | |
| United States Treasury Note/Bond | 1.750% | 7/31/15 | 144,035 | 150,360 | 0.6% | |
| United States Treasury Note/Bond | 0.625% | 7/15/14 | 142,115 | 143,204 | 0.6% | |
| United States Treasury Note/Bond | 2.375% | 9/30/14 | 135,155 | 142,630 | 0.6% | |
| United States Treasury Note/Bond | 2.750% | 10/31/13 | 132,705 | 138,739 | 0.6% | |
| United States Treasury Note/Bond | 4.500% | 2/15/16 | 119,158 | 137,796 | 0.6% | |
| United States Treasury Note/Bond | 0.750% | 6/15/14 | 134,035 | 135,480 | 0.6% | |
| United States Treasury Note/Bond | 3.125% | 9/30/13 | 127,345 | 133,733 | 0.6% | |
| United States Treasury Note/Bond | 0.500% | 10/15/14 | 130,355 | 130,905 | 0.5% | |
| United States Treasury Note/Bond | 4.250% | 8/15/13 | 110,525 | 117,691 | 0.5% | |
| United States Treasury | ||||||
| Note/Bond | 0.250%–11.250% | 2/15/13–11/15/16 | 1,892,806 | 1,991,074 | 8.5% | |
| 13,854,018 | 59.0% | |||||
| Agency Bonds and Notes | ||||||
| 1 Federal Home Loan | ||||||
| Bank of Chicago | 5.625% | 6/13/16 | 4,325 | 4,874 | 0.0% | |
| 1 Federal Home Loan Banks | 0.375%–5.500% | 12/14/12–12/16/16 | 608,980 | 630,409 | 2.7% | |
| 2 Federal Home Loan | ||||||
| Mortgage Corp. | 4.500% | 7/15/13 | 116,495 | 124,043 | 0.5% | |
| 2 Federal Home Loan | ||||||
| Mortgage Corp. | 0.375%–5.500% | 12/28/12–8/25/16 | 753,025 | 783,431 | 3.3% | |
| 2 Federal National | ||||||
| Mortgage Assn. | 0.375%–5.250% | 12/28/12–11/15/16 | 1,001,228 | 1,045,217 | 4.5% | |
| Agency Bonds and Notes—Other † | 182,589 | 0.8% | ||||
| 2,770,563 | 11.8% | |||||
| Total U.S. Government and Agency Obligations (Cost $16,257,432) | 16,624,581 | 70.8% | ||||
| 3Asset-Backed/Commercial Mortgage-Backed Securities (Cost $16,149) † | 16,538 | 0.1% | ||||
| Corporate Bonds | ||||||
| Finance | ||||||
| 3 Banking † | 1,571,457 | 6.7% | ||||
| Brokerage † | 43,453 | 0.2% | ||||
| Finance Companies † | 203,227 | 0.8% | ||||
| Insurance † | 250,285 | 1.1% | ||||
| Other Finance † | 14,862 | 0.1% | ||||
| Real Estate Investment Trusts † | 75,663 | 0.3% | ||||
| 2,158,947 | 9.2% | |||||
| Industrial | ||||||
| 3 Basic Industry † | 222,329 | 0.9% | ||||
| Capital Goods † | 243,005 | 1.0% | ||||
| Communication † | 469,052 | 2.0% | ||||
| 3 Consumer Cyclical † | 251,461 | 1.1% | ||||
| Consumer Noncyclical † | 680,058 | 2.9% | ||||
| Energy † | 254,454 | 1.1% | ||||
| Other Industrial † | 1,935 | 0.0% | ||||
40
Short-Term Bond Index Fund
| Face | Market | Percentage | |||
| Maturity | Amount | Value | of Net | ||
| Coupon | Date | ($000) | ($000) | Assets | |
| Technology † | 301,734 | 1.3% | |||
| Transportation † | 48,937 | 0.2% | |||
| 2,472,965 | 10.5% | ||||
| Utilities | |||||
| Electric † | 226,934 | 1.0% | |||
| Natural Gas † | 102,776 | 0.4% | |||
| 329,710 | 1.4% | ||||
| Total Corporate Bonds (Cost $4,865,799) | 4,961,622 | 21.1% | |||
| Sovereign Bonds (U.S. Dollar-Denominated) | |||||
| European Investment Bank | 0.875%–5.125% | 3/15/13–10/14/16 | 362,375 | 367,110 | 1.6% |
| 4 Kreditanstalt fuer | |||||
| Wiederaufbau | 1.250%–5.125% | 1/14/13–10/5/16 | 265,975 | 273,834 | 1.2% |
| 4 Landwirtschaftliche | |||||
| Rentenbank | 2.125%–4.125% | 3/15/13–7/15/16 | 35,475 | 37,028 | 0.1% |
| Sovereign Bonds (U.S. Dollar-Denominated)—Other † | 1,045,439 | 4.4% | |||
| Total Sovereign Bonds (Cost $1,691,152) | 1,723,411 | 7.3% | |||
| Taxable Municipal Bonds (Cost $28,672) † | 29,540 | 0.1% | |||
| Shares | |||||
| Temporary Cash Investment | |||||
| Money Market Fund | |||||
| 5 Vanguard Market Liquidity | |||||
| Fund (Cost $82,183) | 0.110% | 82,182,802 | 82,183 | 0.3% | |
| Total Investments (Cost $22,941,387) | 23,437,875 | 99.7% | |||
| Other Assets and Liabilities | |||||
| Other Assets | 759,675 | 3.2% | |||
| Liabilities | (694,524) | (2.9%) | |||
| 65,151 | 0.3% | ||||
| Net Assets | 23,503,026 | 100.0% | |||
| At December 31, 2011, net assets consisted of: | |||||
| Amount | |||||
| ($000) | |||||
| Paid-in Capital | 22,997,410 | ||||
| Undistributed Net Investment Income | — | ||||
| Accumulated Net Realized Gains | 9,128 | ||||
| Unrealized Appreciation (Depreciation) | 496,488 | ||||
| Net Assets | 23,503,026 | ||||
41
Short-Term Bond Index Fund
| Amount | |
| ($000) | |
| Investor Shares—Net Assets | |
| Applicable to 358,390,753 outstanding $.001 par value shares of | |
| beneficial interest (unlimited authorization) | 3,802,307 |
| Net Asset Value Per Share—Investor Shares | $10.61 |
| Admiral Shares—Net Assets | |
| Applicable to 385,908,282 outstanding $.001 par value shares of | |
| beneficial interest (unlimited authorization) | 4,094,253 |
| Net Asset Value Per Share—Admiral Shares | $10.61 |
| Signal Shares—Net Assets | |
| Applicable to 619,369,532 outstanding $.001 par value shares of | |
| beneficial interest (unlimited authorization) | 6,571,129 |
| Net Asset Value Per Share—Signal Shares | $10.61 |
| Institutional Shares—Net Assets | |
| Applicable to 79,412,468 outstanding $.001 par value shares of | |
| beneficial interest (unlimited authorization) | 842,517 |
| Net Asset Value Per Share—Institutional Shares | $10.61 |
| Institutional Plus Shares—Net Assets | |
| Applicable to 67,023,638 outstanding $.001 par value shares of | |
| beneficial interest (unlimited authorization) | 711,080 |
| Net Asset Value Per Share—Institutional Plus Shares | $10.61 |
| ETF Shares—Net Assets | |
| Applicable to 92,600,000 outstanding $.001 par value shares of beneficial | |
| interest (unlimited authorization) | 7,481,740 |
| Net Asset Value Per Share—ETF Shares | $80.80 |
See Note A in Notes to Financial Statements.
† Represents the aggregate value, by category, of securities that are not among the 50 largest holdings and, in total for any issuer, represent
1% or less of net assets.
1 The issuer operates under a congressional charter; its securities are generally neither guaranteed by the U.S. Treasury nor backed by the
full faith and credit of the U.S. government.
2 The issuer was placed under federal conservatorship in September 2008; since that time, its daily operations have been managed by the
Federal Housing Finance Agency and it receives capital from the U.S. Treasury in exchange for senior preferred stock.
3 Certain of the fund’s securities are exempt from registration under Rule 144A of the Securities Act of 1933. Such securities may be sold
in transactions exempt from registration, normally to qualified institutional buyers. At December 31, 2011, the aggregate value of these
securities was $25,222,000, representing 0.1% of net assets.
4 Guaranteed by the Federal Republic of Germany.
5 Affiliated money market fund available only to Vanguard funds and certain trusts and accounts managed by Vanguard. Rate shown is
the 7-day yield.
See accompanying Notes, which are an integral part of the Financial Statements.
42
Short-Term Bond Index Fund
Statement of Operations
| Year Ended | |
| December 31, 2011 | |
| ($000) | |
| Investment Income | |
| Income | |
| Interest1 | 447,947 |
| Security Lending | 244 |
| Total Income | 448,191 |
| Expenses | |
| The Vanguard Group—Note B | |
| Investment Advisory Services | 1,266 |
| Management and Administrative—Investor Shares | 7,026 |
| Management and Administrative—Admiral Shares | 3,162 |
| Management and Administrative—Signal Shares | 5,504 |
| Management and Administrative—Institutional Shares | 93 |
| Management and Administrative—Institutional Plus Shares | 49 |
| Management and Administrative—ETF Shares | 4,797 |
| Marketing and Distribution—Investor Shares | 1,235 |
| Marketing and Distribution—Admiral Shares | 830 |
| Marketing and Distribution—Signal Shares | 2,153 |
| Marketing and Distribution—Institutional Shares | 4 |
| Marketing and Distribution—Institutional Plus Shares | 3 |
| Marketing and Distribution—ETF Shares | 1,813 |
| Custodian Fees | 76 |
| Auditing Fees | 37 |
| Shareholders’ Reports—Investor Shares | 103 |
| Shareholders’ Reports—Admiral Shares | 41 |
| Shareholders’ Reports—Signal Shares | 54 |
| Shareholders’ Reports—Institutional Shares | — |
| Shareholders’ Reports—Institutional Plus Shares | — |
| Shareholders’ Reports—ETF Shares | 172 |
| Trustees’ Fees and Expenses | 20 |
| Total Expenses | 28,438 |
| Net Investment Income | 419,753 |
| Realized Net Gain (Loss) on Investment Securities Sold | 161,181 |
| Change in Unrealized Appreciation (Depreciation) of Investment Securities | 67,599 |
| Net Increase (Decrease) in Net Assets Resulting from Operations | 648,533 |
| 1 Interest income from an affiliated company of the fund was $237,000. | |
See accompanying Notes, which are an integral part of the Financial Statements.
43
Short-Term Bond Index Fund
Statement of Changes in Net Assets
| Year Ended December 31, | ||
| 2011 | 2010 | |
| ($000) | ($000) | |
| Increase (Decrease) in Net Assets | ||
| Operations | ||
| Net Investment Income | 419,753 | 427,732 |
| Realized Net Gain (Loss) | 161,181 | 116,222 |
| Change in Unrealized Appreciation (Depreciation) | 67,599 | 166,484 |
| Net Increase (Decrease) in Net Assets Resulting from Operations | 648,533 | 710,438 |
| Distributions | ||
| Net Investment Income | ||
| Investor Shares | (71,522) | (119,470) |
| Admiral Shares | (74,819) | (58,205) |
| Signal Shares | (143,354) | (137,808) |
| Institutional Shares | (2,653) | — |
| Institutional Plus Shares | (2,159) | — |
| ETF Shares | (125,246) | (112,249) |
| Realized Capital Gain1 | ||
| Investor Shares | (20,538) | (19,717) |
| Admiral Shares | (21,641) | (15,638) |
| Signal Shares | (37,231) | (29,901) |
| Institutional Shares | (3,797) | — |
| Institutional Plus Shares | (1,997) | — |
| ETF Shares | (38,969) | (24,356) |
| Total Distributions | (543,926) | (517,344) |
| Capital Share Transactions | ||
| Investor Shares | (445,325) | (1,143,391) |
| Admiral Shares | 309,186 | 1,798,801 |
| Signal Shares | (457,452) | 1,851,176 |
| Institutional Shares | 845,491 | — |
| Institutional Plus Shares | 711,890 | — |
| ETF Shares | 1,815,285 | 1,914,097 |
| Net Increase (Decrease) from Capital Share Transactions | 2,779,075 | 4,420,683 |
| Total Increase (Decrease) | 2,883,682 | 4,613,777 |
| Net Assets | ||
| Beginning of Period | 20,619,344 | 16,005,567 |
| End of Period | 23,503,026 | 20,619,344 |
1 Includes fiscal 2011 and 2010 short-term gain distributions totaling $19,656,000 and $32,306,000, respectively. Short-term gain distributions
are treated as ordinary income dividends for tax purposes.
See accompanying Notes, which are an integral part of the Financial Statements.
44
Short-Term Bond Index Fund
Financial Highlights
| Investor Shares | |||||
| For a Share Outstanding | Year Ended December 31, | ||||
| Throughout Each Period | 2011 | 2010 | 2009 | 2008 | 2007 |
| Net Asset Value, Beginning of Period | $10.55 | $10.42 | $10.28 | $10.13 | $9.89 |
| Investment Operations | |||||
| Net Investment Income | .193 | .229 | .293 | .389 | .456 |
| Net Realized and Unrealized Gain (Loss) | |||||
| on Investments | .117 | .177 | .141 | .150 | .240 |
| Total from Investment Operations | .310 | .406 | .434 | .539 | .696 |
| Distributions | |||||
| Dividends from Net Investment Income | (.193) | (.229) | (.293) | (.389) | (.456) |
| Distributions from Realized Capital Gains | (.057) | (.047) | (.001) | — | — |
| Total Distributions | (.250) | (.276) | (.294) | (.389) | (.456) |
| Net Asset Value, End of Period | $10.61 | $10.55 | $10.42 | $10.28 | $10.13 |
| Total Return1 | 2.96% | 3.92% | 4.28% | 5.43% | 7.22% |
| Ratios/Supplemental Data | |||||
| Net Assets, End of Period (Millions) | $3,802 | $4,226 | $5,283 | $3,680 | $2,773 |
| Ratio of Total Expenses to | |||||
| Average Net Assets | 0.22% | 0.22% | 0.22% | 0.19% | 0.18% |
| Ratio of Net Investment Income to | |||||
| Average Net Assets | 1.81% | 2.15% | 2.78% | 3.79% | 4.58% |
| Portfolio Turnover Rate2 | 67% | 58% | 77% | 101% | 79% |
1 Total returns do not include account service fees that may have applied in the periods shown. Fund prospectuses provide information about
any applicable account service fees.
2 Excludes the value of portfolio securities received or delivered as a result of in-kind purchases or redemptions of the fund’s capital shares,
including ETF Creation Units.
See accompanying Notes, which are an integral part of the Financial Statements.
45
Short-Term Bond Index Fund
Financial Highlights
| Admiral Shares | |||||
| For a Share Outstanding | Year Ended December 31, | ||||
| Throughout Each Period | 2011 | 2010 | 2009 | 2008 | 2007 |
| Net Asset Value, Beginning of Period | $10.55 | $10.42 | $10.28 | $10.13 | $9.89 |
| Investment Operations | |||||
| Net Investment Income | .205 | .240 | .303 | .397 | .464 |
| Net Realized and Unrealized Gain (Loss) | |||||
| on Investments | .117 | .177 | .141 | .150 | .240 |
| Total from Investment Operations | .322 | .417 | .444 | .547 | .704 |
| Distributions | |||||
| Dividends from Net Investment Income | (.205) | (.240) | (.303) | (.397) | (.464) |
| Distributions from Realized Capital Gains | (.057) | (.047) | (.001) | — | — |
| Total Distributions | (.262) | (.287) | (.304) | (.397) | (.464) |
| Net Asset Value, End of Period | $10.61 | $10.55 | $10.42 | $10.28 | $10.13 |
| Total Return | 3.08% | 4.03% | 4.38% | 5.51% | 7.31% |
| Ratios/Supplemental Data | |||||
| Net Assets, End of Period (Millions) | $4,094 | $3,766 | $1,961 | $1,632 | $1,502 |
| Ratio of Total Expenses to | |||||
| Average Net Assets | 0.11% | 0.11% | 0.12% | 0.11% | 0.10% |
| Ratio of Net Investment Income to | |||||
| Average Net Assets | 1.92% | 2.26% | 2.88% | 3.87% | 4.66% |
| Portfolio Turnover Rate1 | 67% | 58% | 77% | 101% | 79% |
1 Excludes the value of portfolio securities received or delivered as a result of in-kind purchases or redemptions of the fund’s capital shares,
including ETF Creation Units.
See accompanying Notes, which are an integral part of the Financial Statements.
46
Short-Term Bond Index Fund
Financial Highlights
| Signal Shares | |||||
| Mar. 30, | |||||
| 20071 to | |||||
| For a Share Outstanding | Year Ended December 31, | Dec. 31, | |||
| Throughout Each Period | 2011 | 2010 | 2009 | 2008 | 2007 |
| Net Asset Value, Beginning of Period | $10.55 | $10.42 | $10.28 | $10.13 | $9.93 |
| Investment Operations | |||||
| Net Investment Income | .205 | .240 | .303 | .397 | .352 |
| Net Realized and Unrealized Gain (Loss) | |||||
| on Investments | .117 | .177 | .141 | .150 | .200 |
| Total from Investment Operations | .322 | .417 | .444 | .547 | .552 |
| Distributions | |||||
| Dividends from Net Investment Income | (.205) | (.240) | (.303) | (.397) | (.352) |
| Distributions from Realized Capital Gains | (.057) | (.047) | (.001) | — | — |
| Total Distributions | (.262) | (.287) | (.304) | (.397) | (.352) |
| Net Asset Value, End of Period | $10.61 | $10.55 | $10.42 | $10.28 | $10.13 |
| Total Return | 3.08% | 4.03% | 4.38% | 5.51% | 5.67% |
| Ratios/Supplemental Data | |||||
| Net Assets, End of Period (Millions) | $6,571 | $6,987 | $5,080 | $3,212 | $1,851 |
| Ratio of Total Expenses to | |||||
| Average Net Assets | 0.11% | 0.11% | 0.12% | 0.11% | 0.10%2 |
| Ratio of Net Investment Income to | |||||
| Average Net Assets | 1.92% | 2.26% | 2.88% | 3.87% | 4.66%2 |
| Portfolio Turnover Rate3 | 67% | 58% | 77% | 101% | 79% |
1 Inception.
2 Annualized.
3 Excludes the value of portfolio securities received or delivered as a result of in-kind purchases or redemptions of the fund’s capital shares,
including ETF Creation Units.
See accompanying Notes, which are an integral part of the Financial Statements.
47
Short-Term Bond Index Fund
Financial Highlights
| Institutional Shares | |
| September 27, 20111 to | |
| For a Share Outstanding Throughout the Period | December 31, 2011 |
| Net Asset Value, Beginning of Period | $10.66 |
| Investment Operations | |
| Net Investment Income | .050 |
| Net Realized and Unrealized Gain (Loss) on Investments | (.001) |
| Total from Investment Operations | .049 |
| Distributions | |
| Dividends from Net Investment Income | (.050) |
| Distributions from Realized Capital Gains | (.049) |
| Total Distributions | (.099) |
| Net Asset Value, End of Period | $10.61 |
| Total Return | 0.47% |
| Ratios/Supplemental Data | |
| Net Assets, End of Period (Millions) | $843 |
| Ratio of Total Expenses to Average Net Assets | 0.07%2 |
| Ratio of Net Investment Income to Average Net Assets | 1.96%2 |
| Portfolio Turnover Rate3 | 67% |
1 Inception.
2 Annualized.
3 Excludes the value of portfolio securities received or delivered as a result of in-kind purchases or redemptions of the fund’s capital shares,
including ETF Creation Units.
See accompanying Notes, which are an integral part of the Financial Statements.
48
Short-Term Bond Index Fund
Financial Highlights
| Institutional Plus Shares | |
| September 29, 20111 to | |
| For a Share Outstanding Throughout the Period | December 31, 2011 |
| Net Asset Value, Beginning of Period | $10.66 |
| Investment Operations | |
| Net Investment Income | .051 |
| Net Realized and Unrealized Gain (Loss) on Investments | (.001) |
| Total from Investment Operations | .050 |
| Distributions | |
| Dividends from Net Investment Income | (.051) |
| Distributions from Realized Capital Gains | (.049) |
| Total Distributions | (.100) |
| Net Asset Value, End of Period | $10.61 |
| Total Return | 0.47% |
| Ratios/Supplemental Data | |
| Net Assets, End of Period (Millions) | $711 |
| Ratio of Total Expenses to Average Net Assets | 0.05%2 |
| Ratio of Net Investment Income to Average Net Assets | 1.98%2 |
| Portfolio Turnover Rate3 | 67% |
1 Inception.
2 Annualized.
3 Excludes the value of portfolio securities received or delivered as a result of in-kind purchases or redemptions of the fund’s capital shares,
including ETF Creation Units.
See accompanying Notes, which are an integral part of the Financial Statements.
49
Short-Term Bond Index Fund
Financial Highlights
| ETF Shares | |||||
| April 3, | |||||
| 20071 to | |||||
| For a Share Outstanding | Year Ended December 31, | Dec. 31, | |||
| Throughout Each Period | 2011 | 2010 | 2009 | 2008 | 2007 |
| Net Asset Value, Beginning of Period | $80.35 | $79.35 | $78.13 | $76.88 | $74.95 |
| Investment Operations | |||||
| Net Investment Income | 1.538 | 1.796 | 2.196 | 2.886 | 2.249 |
| Net Realized and Unrealized Gain (Loss) | |||||
| on Investments | .885 | 1.359 | 1.228 | 1.250 | 1.930 |
| Total from Investment Operations | 2.423 | 3.155 | 3.424 | 4.136 | 4.179 |
| Distributions | |||||
| Dividends from Net Investment Income | (1.538) | (1.796) | (2.196) | (2.886) | (2.249) |
| Distributions from Realized Capital Gains | (.435) | (.359) | (.008) | — | — |
| Total Distributions | (1.973) | (2.155) | (2.204) | (2.886) | (2.249) |
| Net Asset Value, End of Period | $80.80 | $80.35 | $79.35 | $78.13 | $76.88 |
| Total Return | 3.04% | 4.00% | 4.44% | 5.48% | 5.67% |
| Ratios/Supplemental Data | |||||
| Net Assets, End of Period (Millions) | $7,482 | $5,640 | $3,682 | $1,149 | $407 |
| Ratio of Total Expenses to | |||||
| Average Net Assets | 0.11% | 0.11% | 0.12% | 0.10% | 0.11%2 |
| Ratio of Net Investment Income to | |||||
| Average Net Assets | 1.92% | 2.26% | 2.88% | 3.88% | 4.65%2 |
| Portfolio Turnover Rate3 | 67% | 58% | 77% | 101% | 79% |
1 Inception.
2 Annualized.
3 Excludes the value of portfolio securities received or delivered as a result of in-kind purchases or redemptions of the fund’s capital shares,
including ETF Creation Units.
See accompanying Notes, which are an integral part of the Financial Statements.
50
Short-Term Bond Index Fund
Notes to Financial Statements
Vanguard Short-Term Bond Index Fund is registered under the Investment Company Act of 1940 as an open-end investment company, or mutual fund. Certain of the fund’s investments are in corporate debt instruments; the issuers’ abilities to meet their obligations may be affected by economic developments in their respective industries. The fund offers six classes of shares: Investor Shares, Admiral Shares, Signal Shares, Institutional Shares, Institutional Plus Shares, and ETF Shares. Investor Shares are available to any investor who meets the fund’s minimum purchase requirements. Admiral Shares, Signal Shares, Institutional Shares, and Institutional Plus Shares are designed for investors who meet certain administrative, service, and account-size criteria. Institutional Shares were first issued on September 27, 2011. Institutional Plus Shares were first issued on September 29, 2011. ETF Shares are listed for trading on the NYSE Arca, Inc.; they can be purchased and sold through a broker.
A. The following significant accounting policies conform to generally accepted accounting principles for U.S. mutual funds. The fund consistently follows such policies in preparing its financial statements.
1. Security Valuation: Bonds, and temporary cash investments acquired over 60 days to maturity, are valued using the latest bid prices or using valuations based on a matrix system (which considers such factors as security prices, yields, maturities, and ratings), both as furnished by independent pricing services. Investments in Vanguard Market Liquidity Fund are valued at that fund’s net asset value. Other temporary cash investments are valued at amortized cost, which approximates market value. Securities for which market quotations are not readily available, or whose values have been affected by events occurring before the fund’s pricing time but after the close of the securities’ primary markets, are valued by methods deemed by the board of trustees to represent fair value.
2. Federal Income Taxes: The fund intends to continue to qualify as a regulated investment company and distribute all of its taxable income. Management has analyzed the fund’s tax positions taken for all open federal income tax years (December 31, 2008–2011), and has concluded that no provision for federal income tax is required in the fund’s financial statements.
3. Distributions: Distributions from net investment income are declared daily by all share classes except ETF Shares, and paid on the first business day of the following month. Monthly income dividends from ETF Shares, and annual distributions from realized capital gains, if any, are recorded on the ex-dividend date.
4. Security Lending: The fund has lent its securities to qualified institutional borrowers to earn additional income. Security loans are required to be secured at all times by collateral at least equal to the market value of securities loaned. The fund invests cash collateral received in Vanguard Market Liquidity Fund, and records a liability for the return of the collateral, during the period the securities are on loan. Security lending income represents fees charged to borrowers plus income earned on investing cash collateral, less expenses associated with the loan. Effective in August 2011, the fund is no longer permitted to lend its securities.
5. Other: Interest income includes income distributions received from Vanguard Market Liquidity Fund and is accrued daily. Premiums and discounts on debt securities purchased are amortized and accreted, respectively, to interest income over the lives of the respective securities. Security transactions are accounted for on the date securities are bought or sold. Costs used to determine realized gains (losses) on the sale of investment securities are those of the specific securities sold.
Each class of shares has equal rights as to assets and earnings, except that each class separately bears certain class-specific expenses related to maintenance of shareholder accounts (included in Management and Administrative expenses) and shareholder reporting. Marketing and distribution
51
Short-Term Bond Index Fund
expenses are allocated to each class of shares based on a method approved by the board of trustees. Income, other non-class-specific expenses, and gains and losses on investments are allocated to each class of shares based on its relative net assets.
B. The Vanguard Group furnishes at cost investment advisory, corporate management, administrative, marketing, and distribution services. The costs of such services are allocated to the fund under methods approved by the board of trustees. The fund has committed to provide up to 0.40% of its net assets in capital contributions to Vanguard. At December 31, 2011, the fund had contributed capital of $3,803,000 to Vanguard (included in Other Assets), representing 0.02% of the fund’s net assets and 1.52% of Vanguard’s capitalization. The fund’s trustees and officers are also directors and officers of Vanguard.
C. Various inputs may be used to determine the value of the fund’s investments. These inputs are summarized in three broad levels for financial statement purposes. The inputs or methodologies used to value securities are not necessarily an indication of the risk associated with investing in those securities.
Level 1—Quoted prices in active markets for identical securities.
Level 2—Other significant observable inputs (including quoted prices for similar securities, interest rates, prepayment speeds, credit risk, etc.).
Level 3—Significant unobservable inputs (including the fund’s own assumptions used to determine the fair value of investments).
The following table summarizes the market value of the fund’s investments as of December 31, 2011, based on the inputs used to value them:
| Level 1 | Level 2 | Level 3 | |
| Investments | ($000) | ($000) | ($000) |
| U.S. Government and Agency Obligations | — | 16,624,581 | — |
| Asset-Backed/Commercial Mortgage-Backed Securities | — | 16,538 | — |
| Corporate Bonds | — | 4,961,622 | — |
| Sovereign Bonds | — | 1,723,411 | — |
| Taxable Municipal Bonds | — | 29,540 | — |
| Temporary Cash Investments | 82,183 | — | — |
| Total | 82,183 | 23,355,692 | — |
The following table summarizes changes in investments valued based on Level 3 inputs during the year ended December 31, 2011. Transfers into or out of Level 3 are recognized based on values as of the date of transfer.
| Investments in | |
| Corporate Bonds | |
| Amount Valued Based on Level 3 Inputs | ($000) |
| Balance as of December 31, 2010 | 5 |
| Change in Unrealized Appreciation (Depreciation) | (5) |
| Balance as of December 31, 2011 | — |
52
Short-Term Bond Index Fund
D. Capital gain distributions are determined on a tax basis and may differ from realized capital gains for financial reporting purposes. Differences may be permanent or temporary. Permanent differences are reclassified among capital accounts in the financial statements to reflect their tax character. Temporary differences arise when gains or losses are recognized in different periods for financial statement and tax purposes; these differences will reverse at some time in the future.
During the year ended December 31, 2011, the fund realized $22,637,000 of net capital gains resulting from in-kind redemptions—in which shareholders exchanged fund shares for securities held by the fund rather than for cash. Because such gains are not taxable to the fund, and are not distributed to shareholders, they have been reclassified from accumulated net realized gains to paid-in capital.
The fund used a tax accounting practice to treat a portion of the price of capital shares redeemed during the year as distributions from realized capital gains. Accordingly, the fund has reclassified $20,307,000 from accumulated net realized gains to paid-in capital.
For tax purposes, at December 31, 2011, the fund had short-term and long-term capital gains of $2,265,000 and $6,927,000, respectively, available for distribution. Short-term gain distributions are treated as ordinary income dividends for tax purposes.
At December 31, 2011, the cost of investment securities for tax purposes was $22,941,451,000. Net unrealized appreciation of investment securities for tax purposes was $496,424,000, consisting of unrealized gains of $535,058,000 on securities that had risen in value since their purchase and $38,634,000 in unrealized losses on securities that had fallen in value since their purchase.
E. During the year ended December 31, 2011, the fund purchased $3,006,013,000 of investment securities and sold $1,920,680,000 of investment securities, other than U.S. government securities and temporary cash investments. Purchases and sales of U.S. government securities were $15,137,925,000 and $13,512,092,000, respectively.
F. Capital share transactions for each class of shares were:
| Year Ended December 31, | ||||
| 2011 | 2010 | |||
| Amount | Shares | Amount | Shares | |
| ($000) | (000) | ($000) | (000) | |
| Investor Shares | ||||
| Issued | 1,416,207 | 133,421 | 2,903,055 | 274,675 |
| Issued in Lieu of Cash Distributions | 81,818 | 7,715 | 121,607 | 11,490 |
| Redeemed | (1,943,350) | (183,284) | (4,168,053) | (392,385) |
| Net Increase (Decrease)—Investor Shares | (445,325) | (42,148) | (1,143,391) | (106,220) |
| Admiral Shares | ||||
| Issued | 1,551,618 | 146,202 | 2,942,691 | 276,853 |
| Issued in Lieu of Cash Distributions | 86,468 | 8,151 | 65,123 | 6,152 |
| Redeemed | (1,328,900) | (125,317) | (1,209,013) | (114,221) |
| Net Increase (Decrease)—Admiral Shares | 309,186 | 29,036 | 1,798,801 | 168,784 |
53
Short-Term Bond Index Fund
| Year Ended December 31, | ||||
| 2011 | 2010 | |||
| Amount | Shares | Amount | Shares | |
| ($000) | (000) | ($000) | (000) | |
| Signal Shares | ||||
| Issued | 3,351,705 | 315,782 | 3,628,853 | 342,506 |
| Issued in Lieu of Cash Distributions | 148,504 | 13,999 | 144,523 | 13,653 |
| Redeemed | (3,957,661) | (372,534) | (1,922,200) | (181,335) |
| Net Increase (Decrease)—Signal Shares | (457,452) | (42,753) | 1,851,176 | 174,824 |
| Institutional Shares1 | ||||
| Issued | 890,174 | 83,613 | — | — |
| Issued in Lieu of Cash Distributions | 5,988 | 564 | — | — |
| Redeemed | (50,671) | (4,765) | — | — |
| Net Increase (Decrease)—Institutional Shares | 845,491 | 79,412 | — | — |
| Institutional Plus Shares1 | ||||
| Issued | 773,615 | 72,819 | — | — |
| Issued in Lieu of Cash Distributions | 3,568 | 336 | — | — |
| Redeemed | (65,293) | (6,131) | — | — |
| Net Increase (Decrease)—Institutional Plus Shares | 711,890 | 67,024 | — | — |
| ETF Shares | ||||
| Issued | 2,584,132 | 31,900 | 2,155,920 | 26,800 |
| Issued in Lieu of Cash Distributions | — | — | — | — |
| Redeemed | (768,847) | (9,500) | (241,823) | (3,000) |
| Net Increase (Decrease)—ETF Shares | 1,815,285 | 22,400 | 1,914,097 | 23,800 |
| 1 Inception was September 27, 2011, for Institutional Shares and September 29, 2011, for Institutional Plus Shares. | ||||
G. In preparing the financial statements as of December 31, 2011, management considered the impact of subsequent events for potential recognition or disclosure in these financial statements.
54
Intermediate-Term Bond Index Fund
Fund Profile
As of December 31, 2011
| Share-Class Characteristics | ||||||
| Investor | Admiral | Signal | Institutional | Institutional | ||
| Shares | Shares | Shares | Shares | Plus Shares | ETF Shares | |
| Ticker Symbol | VBIIX | VBILX | VIBSX | VBIMX | VBIUX | BIV |
| Expense Ratio1 | 0.22% | 0.11% | 0.11% | 0.07% | 0.05% | 0.11% |
| 30-Day SEC Yield | 2.35% | 2.46% | 2.46% | 2.50% | 2.52% | 2.46% |
| Financial Attributes | |||
| Barclays | |||
| 5–10 Year | |||
| Gov/ | Spliced | ||
| Credit | Barclays | ||
| Float Adj | Aggregate | ||
| Fund | Index | FA Index | |
| Number of Bonds | 1,213 | 1,660 | 7,854 |
| Yield to Maturity | |||
| (before expenses) | 2.5% | 2.5% | 2.2% |
| Average Coupon | 4.5% | 4.3% | 4.0% |
| Average Duration | 6.4 years | 6.4 years | 5.1 years |
| Average Effective | |||
| Maturity | 7.3 years | 7.3 years | 7.3 years |
| Short-Term | |||
| Reserves | 0.0% | — | — |
| Sector Diversification (% of portfolio) | |
| Finance | 13.0% |
| Foreign | 6.1 |
| Government Mortgage-Backed | 0.1 |
| Industrial | 21.4 |
| Treasury/Agency | 55.0 |
| Utilities | 4.4 |
The agency and mortgage-backed securities sectors may include issues from government-sponsored enterprises; such issues are not
backed by the full faith and credit of the U.S. government.
| Volatility Measures | ||
| Spliced | ||
| Barclays | Spliced | |
| 5–10 Year | Barclays | |
| Gov/Credit | Aggregate | |
| FA Index | FA Index | |
| R-Squared | 0.99 | 0.96 |
| Beta | 1.02 | 1.62 |
These measures show the degree and timing of the fund’s fluctuations compared with the indexes over 36 months.
| Distribution by Maturity (% of portfolio) | |
| Under 1 Year | 0.1% |
| 1 - 3 Years | 0.2 |
| 3 - 5 Years | 2.6 |
| 5 - 10 Years | 97.1 |
| Distribution by Credit Quality (% of portfolio) | |
| U.S. Government | 55.2% |
| Aaa | 1.4 |
| Aa | 5.7 |
| A | 18.4 |
| Baa | 19.3 |
For information about these ratings, see the Glossary entry for Credit Quality.
1 The fund expense ratios shown are from the prospectuses dated April 26, 2011 (for Investor, Admiral, Signal, and ETF Shares), and
September 27, 2011 (for Institutional and Institutional Plus Shares). They represent estimated costs for the current fiscal year. For the fiscal
year ended December 31, 2011, the expense ratios were 0.22% for Investor Shares, 0.11% for Admiral Shares, 0.11% for Signal Shares,
0.07% for Institutional Shares, 0.05% for Institutional Plus Shares (annualized since inception), and 0.11% for ETF Shares.
55
Intermediate-Term Bond Index Fund
Investment Focus

56
Intermediate-Term Bond Index Fund
Performance Summary
All of the returns in this report represent past performance, which is not a guarantee of future results that may be achieved by the fund. (Current performance may be lower or higher than the performance data cited. For performance data current to the most recent month-end, visit our website at vanguard.com/performance.) Note, too, that both investment returns and principal value can fluctuate widely, so an investor’s shares, when sold, could be worth more or less than their original cost. The returns shown do not reflect taxes that a shareholder would pay on fund distributions or on the sale of fund shares.
Cumulative Performance: December 31, 2001, Through December 31, 2011
Initial Investment of $10,000
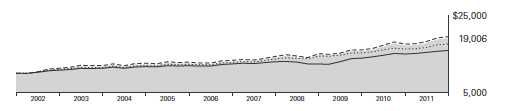
| Average Annual Total Returns | |||||
| Periods Ended December 31, 2011 | |||||
| Final Value | |||||
| One | Five | Ten | of a $10,000 | ||
| Year | Years | Years | Investment | ||
| Intermediate-Term Bond Index Fund | |||||
| Investor Shares | 10.62% | 7.84% | 6.63% | $19,006 | |
| •••••••• | Spliced Barclays Capital U.S. | ||||
| Aggregate Float Adjusted Index | 7.92 | 6.52 | 5.79 | 17,555 | |
| – – – – | Spliced Barclays Capital U.S. 5–10 | ||||
| Year Government/Credit Float | |||||
| Adjusted Index | 10.79 | 7.85 | 6.88 | 19,454 | |
| Spliced Intermediate | |||||
| Investment-Grade Debt Funds | |||||
| Average | 6.09 | 5.07 | 4.74 | 15,896 | |
Spliced Barclays Capital U.S. 5–10 Year Government/Credit Float Adjusted Index: Barclays Capital U.S. 5–10 Year Government/Credit Bond
Index through December 31, 2009; Barclays Capital U.S. 5–10 Year Government/Credit Float Adjusted Index thereafter.
Spliced Intermediate Investment-Grade Debt Funds Average: Based on average returns for Intermediate U.S. Government Funds through
December 31, 2001, and average returns for Intermediate Investment-Grade Debt Funds thereafter. Derived from data provided by Lipper Inc.
See Financial Highlights for dividend and capital gains information.
57
Intermediate-Term Bond Index Fund
| Average Annual Total Returns | ||||
| Periods Ended December 31, 2011 | ||||
| Final Value | ||||
| One | Five | Ten | of a $10,000 | |
| Year | Years | Years | Investment | |
| Intermediate-Term Bond Index Fund Admiral | ||||
| Shares | 10.74% | 7.95% | 6.72% | $19,157 |
| Spliced Barclays Capital U.S. Aggregate Float | ||||
| Adjusted Index | 7.92 | 6.52 | 5.79 | 17,555 |
| Spliced Barclays Capital U.S. 5–10 Year | ||||
| Government/Credit Float Adjusted Index | 10.79 | 7.85 | 6.88 | 19,454 |
| Since | Final Value | ||
| One | Inception | of a $10,000 | |
| Year | (6/4/2007) | Investment | |
| Intermediate-Term Bond Index Fund Signal | |||
| Shares | 10.74% | 8.51% | $14,533 |
| Spliced Barclays Capital U.S. Aggregate Float | |||
| Adjusted Index | 7.92 | 6.88 | 13,560 |
| Spliced Barclays Capital U.S. 5–10 Year | |||
| Government/Credit Float Adjusted Index | 10.79 | 8.41 | 14,467 |
| "Since Inception" performance is calculated from the Signal Shares’ inception date for both the fund and its comparative standards. | |||
| Since | Final Value | |||
| One | Five | Inception | of a $25,000,000 | |
| Year | Years | (1/26/2006) | Investment | |
| Intermediate-Term Bond Index Fund | ||||
| Institutional Shares | 10.78% | 7.99% | 7.47% | $38,315,213 |
| Spliced Barclays Capital U.S. Aggregate Float | ||||
| Adjusted Index | 7.92 | 6.52 | 6.24 | 35,798,554 |
| Spliced Barclays Capital U.S. 5–10 Year | ||||
| Government/Credit Float Adjusted Index | 10.79 | 7.85 | 7.31 | 37,984,658 |
| "Since Inception" performance is calculated from the Institutional Shares’ inception date for both the fund and its comparative standards. | ||||
| Total Returns | ||
| Period Ended December 31, 2011 | ||
| Since | Final Value | |
| Inception | of a $100,000,000 | |
| (11/30/2011) | Investment | |
| Intermediate-Term Bond Index Fund | ||
| Institutional Plus Shares | 1.84% | $101,836,151 |
| Spliced Barclays Capital U.S. Aggregate Float | ||
| Adjusted Index | 1.13 | 101,126,146 |
| Barclays Capital U.S. 5–10 Year | ||
| Government/Credit Float Adjusted Index | 1.71 | 101,706,926 |
| "Since Inception" performance is calculated from the Institutional Plus Shares’ inception date for both the fund and its comparative standards. | ||
58
Intermediate-Term Bond Index Fund
| Average Annual Total Returns | |||
| Periods Ended December 31, 2011 | |||
| Since | Final Value | ||
| One | Inception | of a $10,000 | |
| Year | (4/3/2007) | Investment | |
| Intermediate-Term Bond Index Fund | |||
| ETF Shares Net Asset Value | 10.62% | 8.03% | $14,426 |
| Spliced Barclays Capital U.S. Aggregate Float | |||
| Adjusted Index | 7.92 | 6.55 | 13,515 |
| Spliced Barclays Capital U.S. 5–10 Year | |||
| Government/Credit Float Adjusted Index | 10.79 | 7.93 | 14,366 |
| "Since Inception" performance is calculated from the ETF Shares’ inception date for both the fund and its comparative standards. | |||
| Cumulative Returns of ETF Shares:April 3, 2007 , Through December 31, 2011 | ||
| Since | ||
| One | Inception | |
| Year | (4/3/2007) | |
| Intermediate-Term Bond Index Fund | ||
| ETF Shares Market Price | 11.09% | 44.66% |
| Intermediate-Term Bond Index Fund | ||
| ETF Shares Net Asset Value | 10.62 | 44.26 |
| Spliced Barclays Capital U.S. 5–10 Year | ||
| Government/Credit Float Adjusted Index | 10.79 | 43.66 |
| "Since Inception" performance is calculated from the ETF Shares’ inception date for both the fund and its comparative standards. | ||
59
Intermediate-Term Bond Index Fund
Fiscal-Year Total Returns (%): December 31, 2001, Through December 31, 2011
| Spliced | ||||
| Barclays | ||||
| 5–10 Year | ||||
| Gov/Credit | ||||
| Investor Shares | FA Index | |||
| Fiscal Year | Income Returns | Capital Returns | Total Returns | Total Returns |
| 2002 | 6.19% | 4.66% | 10.85% | 13.03% |
| 2003 | 5.05 | 0.60 | 5.65 | 5.97 |
| 2004 | 4.87 | 0.35 | 5.22 | 5.30 |
| 2005 | 4.64 | -2.89 | 1.75 | 1.83 |
| 2006 | 4.97 | -1.06 | 3.91 | 3.81 |
| 2007 | 5.17 | 2.44 | 7.61 | 7.55 |
| 2008 | 4.93 | 0.00 | 4.93 | 5.06 |
| 2009 | 4.69 | 2.10 | 6.79 | 6.50 |
| 2010 | 4.26 | 5.11 | 9.37 | 9.44 |
| 2011 | 4.01 | 6.61 | 10.62 | 10.79 |
Spliced Barclays Capital U.S. 5–10 Year Government/Credit Float Adjusted Index: Barclays Capital U.S. 5–10 Year Government/Credit Bond
Index through December 31, 2009; Barclays Capital U.S. 5–10 Year Government/Credit Float Adjusted Index thereafter.
60
Intermediate-Term Bond Index Fund
Financial Statements
Statement of Net Assets—Investments Summary
As of December 31, 2011
This Statement summarizes the fund’s holdings by asset type. Details are reported for each of the fund’s 50 largest individual holdings and for investments that, in total for any issuer, represent more than 1% of the fund’s net assets. The total value of smaller holdings is reported as a single amount within each category.
The fund reports a complete list of its holdings in regulatory filings four times in each fiscal year, at the quarter-ends. For the second and fourth fiscal quarters, the complete listing of the fund’s holdings is available electronically on vanguard.com and on the Securities and Exchange Commission’s website (sec.gov), or you can have it mailed to you without charge by calling 800-662-7447. For the first and third fiscal quarters, the fund files the lists with the SEC on Form N-Q. Shareholders can look up the fund’s Forms N-Q on the SEC’s website. Forms N-Q may also be reviewed and copied at the SEC’s Public Reference Room (see the back cover of this report for further information).
| Face | Market | Percentage | |||
| Maturity | Amount | Value | of Net | ||
| Coupon | Date | ($000) | ($000) | Assets | |
| U.S. Government and Agency Obligations | |||||
| U.S. Government Securities | |||||
| United States Treasury Note/Bond | 3.625% | 2/15/20 | 418,952 | 485,787 | 3.5% |
| United States Treasury Note/Bond | 3.375% | 11/15/19 | 405,489 | 462,193 | 3.4% |
| United States Treasury Note/Bond | 3.625% | 8/15/19 | 390,915 | 452,668 | 3.3% |
| United States Treasury Note/Bond | 3.125% | 5/15/19 | 394,410 | 442,169 | 3.2% |
| United States Treasury Note/Bond | 3.500% | 5/15/20 | 368,735 | 424,104 | 3.1% |
| United States Treasury Note/Bond | 2.000% | 11/15/21 | 367,880 | 371,905 | 2.7% |
| United States Treasury Note/Bond | 2.125% | 8/15/21 | 359,333 | 368,316 | 2.7% |
| United States Treasury Note/Bond | 3.750% | 11/15/18 | 288,580 | 335,699 | 2.4% |
| United States Treasury Note/Bond | 2.625% | 8/15/20 | 267,160 | 288,116 | 2.1% |
| United States Treasury Note/Bond | 3.625% | 2/15/21 | 246,010 | 285,563 | 2.1% |
| United States Treasury Note/Bond | 4.000% | 8/15/18 | 236,985 | 279,088 | 2.0% |
| United States Treasury Note/Bond | 3.125% | 5/15/21 | 245,788 | 274,361 | 2.0% |
| United States Treasury Note/Bond | 2.750% | 2/15/19 | 188,060 | 205,984 | 1.5% |
| United States Treasury Note/Bond | 4.750% | 8/15/17 | 167,660 | 201,900 | 1.5% |
| United States Treasury Note/Bond | 3.250% | 12/31/16 | 175,905 | 196,437 | 1.4% |
| United States Treasury Note/Bond | 3.500% | 2/15/18 | 164,640 | 187,767 | 1.4% |
| United States Treasury Note/Bond | 3.875% | 5/15/18 | 152,280 | 177,644 | 1.3% |
| United States Treasury Note/Bond | 4.500% | 5/15/17 | 130,410 | 154,678 | 1.1% |
| United States Treasury Note/Bond | 3.125% | 1/31/17 | 134,845 | 149,931 | 1.1% |
| United States Treasury Note/Bond | 8.750% | 5/15/17 | 83,070 | 117,103 | 0.8% |
| United States Treasury Note/Bond | 2.625% | 11/15/20 | 106,362 | 114,489 | 0.8% |
| United States Treasury Note/Bond | 3.250% | 3/31/17 | 95,065 | 106,458 | 0.8% |
| United States Treasury Note/Bond | 4.625% | 2/15/17 | 88,640 | 105,191 | 0.8% |
| United States Treasury Note/Bond | 3.000% | 2/28/17 | 94,460 | 104,481 | 0.8% |
| United States Treasury Note/Bond | 8.875% | 8/15/17 | 71,285 | 102,060 | 0.7% |
| United States Treasury Note/Bond | 8.875% | 2/15/19 | 51,850 | 78,618 | 0.6% |
| United States Treasury Note/Bond | 7.500% | 11/15/16 | 51,995 | 68,577 | 0.5% |
| United States Treasury Note/Bond | 2.750% | 11/30/16 | 60,000 | 65,513 | 0.5% |
| United States Treasury Note/Bond | 1.875% | 10/31/17 | 60,400 | 63,165 | 0.5% |
| United States Treasury Note/Bond | 2.750% | 5/31/17 | 50,595 | 55,378 | 0.4% |
| United States Treasury Note/Bond | 1.875% | 9/30/17 | 49,335 | 51,594 | 0.4% |
61
Intermediate-Term Bond Index Fund
| Face | Market | Percentage | ||||
| Maturity | Amount | Value | of Net | |||
| Coupon | Date | ($000) | ($000) | Assets | ||
| United States Treasury Note/Bond | 8.750% | 5/15/20 | 31,875 | 49,904 | 0.4% | |
| United States Treasury Note/Bond | 2.500% | 6/30/17 | 43,475 | 47,028 | 0.3% | |
| United States Treasury Note/Bond | 8.125% | 5/15/21 | 30,000 | 46,664 | 0.3% | |
| United States Treasury Note/Bond | 8.000% | 11/15/21 | 24,375 | 38,086 | 0.3% | |
| United States Treasury Note/Bond | 1.750% | 10/31/18 | 34,320 | 35,323 | 0.3% | |
| United States Treasury Note/Bond | 3.125% | 4/30/17 | 26,060 | 29,028 | 0.2% | |
| United States Treasury | ||||||
| Note/Bond | 0.875%–8.750% | 11/30/16–8/15/20 | 84,950 | 97,916 | 0.7% | |
| 7,120,886 | 51.9% | |||||
| Agency Bonds and Notes | ||||||
| 1 Federal Home Loan Banks | 4.875% | 5/17/17 | 26,265 | 31,267 | 0.2% | |
| 2 Federal Home Loan Mortgage Corp. | 3.750% | 3/27/19 | 53,010 | 60,543 | 0.4% | |
| 2 Federal National Mortgage Assn. | 5.000% | 2/13/17 | 45,625 | 54,062 | 0.4% | |
| Agency Bonds and Notes—Other † | 230,933 | 1.7% | ||||
| 376,805 | 2.7% | |||||
| Total U.S. Government and Agency Obligations (Cost $6,793,477) | 7,497,691 | 54.6% | ||||
| 3Asset-Backed/Commercial Mortgage-Backed Securities (Cost $7,461) † | 7,890 | 0.1% | ||||
| Corporate Bonds | ||||||
| Finance | ||||||
| Banking | ||||||
| Bank of America Corp. | 5.650% | 5/1/18 | 27,795 | 26,407 | 0.2% | |
| Bank of America Corp. | 5.420%–7.625% | 3/15/17–1/5/21 | 61,720 | 58,434 | 0.4% | |
| Bank of America NA | 5.300%–6.100% | 3/15/17–6/15/17 | 15,550 | 14,171 | 0.1% | |
| Bear Stearns Cos. LLC | 5.550%–7.250% | 1/22/17–2/1/18 | 32,375 | 35,584 | 0.3% | |
| JPMorgan Chase & Co. | 6.000% | 1/15/18 | 25,625 | 28,713 | 0.2% | |
| JPMorgan Chase & Co. | 4.250%–6.300% | 6/27/17–8/15/21 | 82,048 | 85,425 | 0.6% | |
| JPMorgan Chase Bank NA | 6.000% | 10/1/17 | 6,525 | 6,972 | 0.1% | |
| Merrill Lynch & Co. Inc. | 6.875% | 4/25/18 | 31,850 | 31,395 | 0.2% | |
| Merrill Lynch & Co. Inc. | 5.700%–6.500% | 5/2/17–7/15/18 | 21,450 | 20,386 | 0.2% | |
| 3 Banking—Other † | 813,853 | 5.9% | ||||
| Brokerage † | 50,756 | 0.4% | ||||
| Finance Companies | ||||||
| 4 GE Capital Trust I | 6.375% | 11/15/67 | 425 | 419 | 0.0% | |
| General Electric | ||||||
| Capital Corp. | 5.625% | 5/1/18 | 43,775 | 48,934 | 0.4% | |
| 4 General Electric | ||||||
| Capital Corp. | 4.375%–6.375% | 2/15/17–11/15/67 | 70,950 | 75,294 | 0.5% | |
| Finance Companies—Other † | 37,951 | 0.3% | ||||
| Insurance † | 290,199 | 2.1% | ||||
| Other Finance † | 4,535 | 0.0% | ||||
| Real Estate Investment Trusts † | 145,715 | 1.0% | ||||
| 1,775,143 | 12.9% | |||||
| Industrial | ||||||
| 3 Basic Industry † | 329,310 | 2.4% | ||||
| Capital Goods | ||||||
| General Electric Co. | 5.250% | 12/6/17 | 18,925 | 21,764 | 0.2% | |
| Capital Goods—Other † | 281,350 | 2.0% | ||||
| 3 Communication † | 472,939 | 3.5% | ||||
| Consumer Cyclical † | 262,791 | 1.9% | ||||
| Consumer Noncyclical | ||||||
| Altria Group Inc. | 9.700% | 11/10/18 | 22,400 | 30,159 | 0.2% | |
| Pfizer Inc. | 6.200% | 3/15/19 | 21,000 | 25,965 | 0.2% | |
| 3 Consumer Noncyclical—Other † | 711,461 | 5.2% | ||||
62
Intermediate-Term Bond Index Fund
| Face | Market | Percentage | ||||
| Maturity | Amount | Value | of Net | |||
| Coupon | Date | ($000) | ($000) | Assets | ||
| 3 | Energy † | 360,648 | 2.6% | |||
| Other Industrial † | 5,508 | 0.1% | ||||
| Technology | ||||||
| International Business | ||||||
| Machines Corp. | 5.700% | 9/14/17 | 25,725 | 31,165 | 0.2% | |
| Technology—Other † | 228,734 | 1.7% | ||||
| Transportation † | 112,139 | 0.8% | ||||
| 2,873,933 | 21.0% | |||||
| Utilities | ||||||
| Electric † | 359,866 | 2.6% | ||||
| 3 | Natural Gas † | 225,090 | 1.6% | |||
| Other Utility † | 8,508 | 0.1% | ||||
| 593,464 | 4.3% | |||||
| Total Corporate Bonds (Cost $4,849,691) | 5,242,540 | 38.2% | ||||
| Sovereign Bonds (U.S. Dollar-Denominated) | ||||||
| Brazilian Government | ||||||
| International Bond | 6.000% | 1/17/17 | 33,125 | 38,789 | 0.3% | |
| 5 | Kreditanstalt fuer Wiederaufbau | 2.750% | 9/8/20 | 26,175 | 26,934 | 0.2% |
| 5 | Kreditanstalt fuer Wiederaufbau | 4.375% | 3/15/18 | 22,200 | 25,609 | 0.2% |
| Sovereign Bonds (U.S. Dollar-Denominated)—Other † | 715,985 | 5.2% | ||||
| Total Sovereign Bonds (Cost $745,746) | 807,317 | 5.9% | ||||
| Taxable Municipal Bonds (Cost $38,766) † | 42,288 | 0.3% | ||||
| Shares | ||||||
| Temporary Cash Investment | ||||||
| Money Market Fund | ||||||
| 6 | Vanguard Market Liquidity | |||||
| Fund (Cost $516) | 0.110% | 516,000 | 516 | 0.0% | ||
| Total Investments (Cost $12,435,657) | 13,598,242 | 99.1% | ||||
| Other Assets and Liabilities | ||||||
| Other Assets | 388,261 | 2.9% | ||||
| Liabilities | (270,889) | (2.0%) | ||||
| 117,372 | 0.9% | |||||
| Net Assets | 13,715,614 | 100.0% | ||||
| At December 31, 2011, net assets consisted of: | ||||||
| Amount | ||||||
| ($000) | ||||||
| Paid-in Capital | 12,510,552 | |||||
| Undistributed Net Investment Income | — | |||||
| Accumulated Net Realized Gains | 42,477 | |||||
| Unrealized Appreciation (Depreciation) | 1,162,585 | |||||
| Net Assets | 13,715,614 | |||||
| 63 |
Intermediate-Term Bond Index Fund
| Amount | |
| ($000) | |
| Investor Shares—Net Assets | |
| Applicable to 180,938,283 outstanding $.001 par value shares of | |
| beneficial interest (unlimited authorization) | 2,128,947 |
| Net Asset Value Per Share—Investor Shares | $11.77 |
| Admiral Shares—Net Assets | |
| Applicable to 452,122,246 outstanding $.001 par value shares of | |
| beneficial interest (unlimited authorization) | 5,319,739 |
| Net Asset Value Per Share—Admiral Shares | $11.77 |
| Signal Shares—Net Assets | |
| Applicable to 228,662,728 outstanding $.001 par value shares of | |
| beneficial interest (unlimited authorization) | 2,690,479 |
| Net Asset Value Per Share—Signal Shares | $11.77 |
| Institutional Shares—Net Assets | |
| Applicable to 58,527,117 outstanding $.001 par value shares of | |
| beneficial interest (unlimited authorization) | 688,639 |
| Net Asset Value Per Share—Institutional Shares | $11.77 |
| Institutional Plus Shares—Net Assets | |
| Applicable to 9,090,362 outstanding $.001 par value shares of | |
| beneficial interest (unlimited authorization) | 106,959 |
| Net Asset Value Per Share—Institutional Plus Shares | $11.77 |
| ETF Shares—Net Assets | |
| Applicable to 32,100,000 outstanding $.001 par value shares of | |
| beneficial interest (unlimited authorization) | 2,780,851 |
| Net Asset Value Per Share—ETF Shares | $86.63 |
See Note A in Notes to Financial Statements.
† Represents the aggregate value, by category, of securities that are not among the 50 largest holdings and, in total for any issuer, represent
1% or less of net assets.
1 The issuer operates under a congressional charter; its securities are generally neither guaranteed by the U.S. Treasury nor backed by the full
faith and credit of the U.S. government.
2 The issuer was placed under federal conservatorship in September 2008; since that time, its daily operations have been managed by the
Federal Housing Finance Agency and it receives capital from the U.S. Treasury in exchange for senior preferred stock.
3 Certain of the fund’s securities are exempt from registration under Rule 144A of the Securities Act of 1933. Such securities may be sold in
transactions exempt from registration, normally to qualified institutional buyers. At December 31, 2011, the aggregate value of these
securities was $31,089,000, representing 0.2% of net assets.
4 The average or expected maturity is shorter than the final maturity shown because of the possibility of interim principal payments and
prepayments or the possibility of the issue being called.
5 Guaranteed by the Federal Republic of Germany.
6 Affiliated money market fund available only to Vanguard funds and certain trusts and accounts managed by Vanguard. Rate shown is
the 7-day yield.
See accompanying Notes, which are an integral part of the Financial Statements.
64
Intermediate-Term Bond Index Fund
Statement of Operations
| Year Ended | |
| December 31, 2011 | |
| ($000) | |
| Investment Income | |
| Income | |
| Interest1 | 481,974 |
| Security Lending | 10 |
| Total Income | 481,984 |
| Expenses | |
| The Vanguard Group—Note B | |
| Investment Advisory Services | 706 |
| Management and Administrative—Investor Shares | 3,717 |
| Management and Administrative—Admiral Shares | 4,074 |
| Management and Administrative—Signal Shares | 1,885 |
| Management and Administrative—Institutional Shares | 248 |
| Management and Administrative—Institutional Plus Shares | 4 |
| Management and Administrative—ETF Shares | 1,583 |
| Marketing and Distribution—Investor Shares | 693 |
| Marketing and Distribution—Admiral Shares | 828 |
| Marketing and Distribution—Signal Shares | 719 |
| Marketing and Distribution—Institutional Shares | 209 |
| Marketing and Distribution—Institutional Plus Shares | — |
| Marketing and Distribution—ETF Shares | 608 |
| Custodian Fees | 53 |
| Auditing Fees | 49 |
| Shareholders’ Reports—Investor Shares | 51 |
| Shareholders’ Reports—Admiral Shares | 49 |
| Shareholders’ Reports—Signal Shares | 14 |
| Shareholders’ Reports—Institutional Shares | 1 |
| Shareholders’ Reports—Institutional Plus Shares | — |
| Shareholders’ Reports—ETF Shares | 88 |
| Trustees’ Fees and Expenses | 12 |
| Total Expenses | 15,591 |
| Net Investment Income | 466,393 |
| Realized Net Gain (Loss) on Investment Securities Sold | 238,153 |
| Change in Unrealized Appreciation (Depreciation) of Investment Securities | 535,808 |
| Net Increase (Decrease) in Net Assets Resulting from Operations | 1,240,354 |
| 1 Interest income from an affiliated company of the fund was $72,000. | |
See accompanying Notes, which are an integral part of the Financial Statements.
65
Intermediate-Term Bond Index Fund
Statement of Changes in Net Assets
| Year Ended December 31, | ||
| 2011 | 2010 | |
| ($000) | ($000) | |
| Increase (Decrease) in Net Assets | ||
| Operations | ||
| Net Investment Income | 466,393 | 464,081 |
| Realized Net Gain (Loss) | 238,153 | 186,892 |
| Change in Unrealized Appreciation (Depreciation) | 535,808 | 332,922 |
| Net Increase (Decrease) in Net Assets Resulting from Operations | 1,240,354 | 983,895 |
| Distributions | ||
| Net Investment Income | ||
| Investor Shares | (77,381) | (147,036) |
| Admiral Shares | (181,606) | (127,762) |
| Signal Shares | (96,157) | (87,883) |
| Institutional Shares | (27,725) | (29,471) |
| Institutional Plus Shares | (316) | — |
| ETF Shares | (83,208) | (71,929) |
| Realized Capital Gain1 | ||
| Investor Shares | (31,849) | (12,061) |
| Admiral Shares | (77,555) | (23,457) |
| Signal Shares | (40,161) | (11,415) |
| Institutional Shares | (10,036) | (2,760) |
| Institutional Plus Shares | (1,204) | — |
| ETF Shares | (39,173) | (9,936) |
| Total Distributions | (666,371) | (523,710) |
| Capital Share Transactions | ||
| Investor Shares | (344,657) | (1,327,513) |
| Admiral Shares | 474,019 | 2,063,519 |
| Signal Shares | 313,577 | 252,608 |
| Institutional Shares | 69,153 | 27,623 |
| Institutional Plus Shares | 107,021 | — |
| ETF Shares | 752,115 | 637,745 |
| Net Increase (Decrease) from Capital Share Transactions | 1,371,228 | 1,653,982 |
| Total Increase (Decrease) | 1,945,211 | 2,114,167 |
| Net Assets | ||
| Beginning of Period | 11,770,403 | 9,656,236 |
| End of Period | 13,715,614 | 11,770,403 |
| 1 Includes fiscal 2011 and 2010 short-term gain distributions totaling $15,745,000 and $0, respectively. Short-term gain distributions are | ||
| treated as ordinary income dividends for tax purposes. | ||
See accompanying Notes, which are an integral part of the Financial Statements.
66
Intermediate-Term Bond Index Fund
Financial Highlights
| Investor Shares | |||||
| For a Share Outstanding | Year Ended December 31, | ||||
| Throughout Each Period | 2011 | 2010 | 2009 | 2008 | 2007 |
| Net Asset Value, Beginning of Period | $11.21 | $10.72 | $10.50 | $10.50 | $10.25 |
| Investment Operations | |||||
| Net Investment Income | .425 | .448 | .474 | .498 | .507 |
| Net Realized and Unrealized Gain (Loss) | |||||
| on Investments | .738 | .547 | .220 | — | .250 |
| Total from Investment Operations | 1.163 | .995 | .694 | .498 | .757 |
| Distributions | |||||
| Dividends from Net Investment Income | (.425) | (.448) | (.474) | (.498) | (.507) |
| Distributions from Realized Capital Gains | (.178) | (.057) | — | — | — |
| Total Distributions | (.603) | (.505) | (.474) | (.498) | (.507) |
| Net Asset Value, End of Period | $11.77 | $11.21 | $10.72 | $10.50 | $10.50 |
| Total Return1 | 10.62% | 9.37% | 6.79% | 4.93% | 7.61% |
| Ratios/Supplemental Data | |||||
| Net Assets, End of Period (Millions) | $2,129 | $2,378 | $3,479 | $3,318 | $3,020 |
| Ratio of Total Expenses to | |||||
| Average Net Assets | 0.22% | 0.22% | 0.22% | 0.19% | 0.18% |
| Ratio of Net Investment Income to | |||||
| Average Net Assets | 3.65% | 3.97% | 4.50% | 4.81% | 4.74% |
| Portfolio Turnover Rate2 | 61% | 46% | 72% | 89% | 72% |
| 1 Total returns do not include account service fees that may have applied in the periods shown. Fund prospectuses provide information about | |||||
| any applicable account service fees. | |||||
| 2 Excludes the value of portfolio securities received or delivered as a result of in-kind purchases or redemptions of the fund’s capital shares, | |||||
| including ETF Creation Units. | |||||
See accompanying Notes, which are an integral part of the Financial Statements.
67
Intermediate-Term Bond Index Fund
Financial Highlights
| Admiral Shares | |||||
| For a Share Outstanding | Year Ended December 31, | ||||
| Throughout Each Period | 2011 | 2010 | 2009 | 2008 | 2007 |
| Net Asset Value, Beginning of Period | $11.21 | $10.72 | $10.50 | $10.50 | $10.25 |
| Investment Operations | |||||
| Net Investment Income | .437 | .461 | .485 | .506 | .515 |
| Net Realized and Unrealized Gain (Loss) | |||||
| on Investments | .738 | .547 | .220 | — | .250 |
| Total from Investment Operations | 1.175 | 1.008 | .705 | .506 | .765 |
| Distributions | |||||
| Dividends from Net Investment Income | (.437) | (.461) | (.485) | (.506) | (.515) |
| Distributions from Realized Capital Gains | (.178) | (.057) | — | — | — |
| Total Distributions | (.615) | (.518) | (.485) | (.506) | (.515) |
| Net Asset Value, End of Period | $11.77 | $11.21 | $10.72 | $10.50 | $10.50 |
| Total Return | 10.74% | 9.49% | 6.89% | 5.01% | 7.70% |
| Ratios/Supplemental Data | |||||
| Net Assets, End of Period (Millions) | $5,320 | $4,623 | $2,508 | $2,458 | $2,308 |
| Ratio of Total Expenses to | |||||
| Average Net Assets | 0.11% | 0.11% | 0.12% | 0.11% | 0.10% |
| Ratio of Net Investment Income to | |||||
| Average Net Assets | 3.76% | 4.08% | 4.60% | 4.89% | 4.82% |
| Portfolio Turnover Rate1 | 61% | 46% | 72% | 89% | 72% |
| 1 Excludes the value of portfolio securities received or delivered as a result of in-kind purchases or redemptions of the fund’s capital shares, | |||||
| including ETF Creation Units. | |||||
See accompanying Notes, which are an integral part of the Financial Statements.
68
Intermediate-Term Bond Index Fund
Financial Highlights
| Signal Shares | |||||
| June 4, | |||||
| 20071 to | |||||
| For a Share Outstanding | Year Ended December 31, | Dec. 31, | |||
| Throughout Each Period | 2011 | 2010 | 2009 | 2008 | 2007 |
| Net Asset Value, Beginning of Period | $11.21 | $10.72 | $10.50 | $10.50 | $10.12 |
| Investment Operations | |||||
| Net Investment Income | .437 | .461 | .485 | .506 | .297 |
| Net Realized and Unrealized Gain (Loss) | |||||
| on Investments | .738 | .547 | .220 | — | .380 |
| Total from Investment Operations | 1.175 | 1.008 | .705 | .506 | .677 |
| Distributions | |||||
| Dividends from Net Investment Income | (.437) | (.461) | (.485) | (.506) | (.297) |
| Distributions from Realized Capital Gains | (.178) | (.057) | — | — | — |
| Total Distributions | (.615) | (.518) | (.485) | (.506) | (.297) |
| Net Asset Value, End of Period | $11.77 | $11.21 | $10.72 | $10.50 | $10.50 |
| Total Return | 10.74% | 9.49% | 6.89% | 5.01% | 6.77% |
| Ratios/Supplemental Data | |||||
| Net Assets, End of Period (Millions) | $2,690 | $2,255 | $1,918 | $1,720 | $1,443 |
| Ratio of Total Expenses to | |||||
| Average Net Assets | 0.11% | 0.11% | 0.12% | 0.11% | 0.10%2 |
| Ratio of Net Investment Income to | |||||
| Average Net Assets | 3.76% | 4.08% | 4.60% | 4.89% | 4.82%2 |
| Portfolio Turnover Rate3 | 61% | 46% | 72% | 89% | 72% |
| 1 Inception. | |||||
| 2 Annualized. | |||||
| 3 Excludes the value of portfolio securities received or delivered as a result of in-kind purchases or redemptions of the fund’s capital shares, | |||||
| including ETF Creation Units. | |||||
See accompanying Notes, which are an integral part of the Financial Statements.
69
Intermediate-Term Bond Index Fund
Financial Highlights
| Institutional Shares | |||||
| For a Share Outstanding | Year Ended December 31, | ||||
| Throughout Each Period | 2011 | 2010 | 2009 | 2008 | 2007 |
| Net Asset Value, Beginning of Period | $11.21 | $10.72 | $10.50 | $10.50 | $10.25 |
| Investment Operations | |||||
| Net Investment Income | .442 | .465 | .490 | .510 | .518 |
| Net Realized and Unrealized Gain (Loss) | |||||
| on Investments | .738 | .547 | .220 | — | .250 |
| Total from Investment Operations | 1.180 | 1.012 | .710 | .510 | .768 |
| Distributions | |||||
| Dividends from Net Investment Income | (.442) | (.465) | (.490) | (.510) | (.518) |
| Distributions from Realized Capital Gains | (.178) | (.057) | — | — | — |
| Total Distributions | (.620) | (.522) | (.490) | (.510) | (.518) |
| Net Asset Value, End of Period | $11.77 | $11.21 | $10.72 | $10.50 | $10.50 |
| Total Return | 10.78% | 9.53% | 6.95% | 5.05% | 7.73% |
| Ratios/Supplemental Data | |||||
| Net Assets, End of Period (Millions) | $689 | $582 | $522 | $508 | $271 |
| Ratio of Total Expenses to | |||||
| Average Net Assets | 0.07% | 0.07% | 0.07% | 0.07% | 0.07% |
| Ratio of Net Investment Income to | |||||
| Average Net Assets | 3.80% | 4.12% | 4.65% | 4.93% | 4.85% |
| Portfolio Turnover Rate1 | 61% | 46% | 72% | 89% | 72% |
| 1 Excludes the value of portfolio securities received or delivered as a result of in-kind purchases or redemptions of the fund’s capital shares, | |||||
| including ETF Creation Units. | |||||
See accompanying Notes, which are an integral part of the Financial Statements.
70
Intermediate-Term Bond Index Fund
Financial Highlights
| Institutional Plus Shares | |
| November 30, 20111 to | |
| For a Share Outstanding Throughout the Period | December 31, 2011 |
| Net Asset Value, Beginning of Period | $11.73 |
| Investment Operations | |
| Net Investment Income | .072 |
| Net Realized and Unrealized Gain (Loss) on Investments | .178 |
| Total from Investment Operations | .250 |
| Distributions | |
| Dividends from Net Investment Income | (.072) |
| Distributions from Realized Capital Gains | (.138) |
| Total Distributions | (.210) |
| Net Asset Value, End of Period | $11.77 |
| Total Return | 1.84% |
| Ratios/Supplemental Data | |
| Net Assets, End of Period (Millions) | $107 |
| Ratio of Total Expenses to Average Net Assets | 0.05%2 |
| Ratio of Net Investment Income to Average Net Assets | 3.82%2 |
| Portfolio Turnover Rate3 | 61% |
| 1 Inception. | |
| 2 Annualized. | |
| 3 Excludes the value of portfolio securities received or delivered as a result of in-kind purchases or redemptions of the fund’s capital shares, | |
| including ETF Creation Units. | |
See accompanying Notes, which are an integral part of the Financial Statements.
71
Intermediate-Term Bond Index Fund
Financial Highlights
| ETF Shares | |||||
| April 3, | |||||
| 20071 to | |||||
| Year Ended December 31, | |||||
| For a Share Outstanding | Dec. 31, | ||||
| Throughout Each Period | 2011 | 2010 | 2009 | 2008 | 2007 |
| Net Asset Value, Beginning of Period | $82.56 | $78.85 | $77.19 | $76.96 | $74.90 |
| Investment Operations | |||||
| Net Investment Income | 3.183 | 3.326 | 3.474 | 3.537 | 2.389 |
| Net Realized and Unrealized Gain (Loss) | |||||
| on Investments | 5.383 | 4.131 | 1.660 | .230 | 2.060 |
| Total from Investment Operations | 8.566 | 7.457 | 5.134 | 3.767 | 4.449 |
| Distributions | |||||
| Dividends from Net Investment Income | (3.183) | (3.326) | (3.474) | (3.537) | (2.389) |
| Distributions from Realized Capital Gains | (1.313) | (.421) | — | — | — |
| Total Distributions | (4.496) | (3.747) | (3.474) | (3.537) | (2.389) |
| Net Asset Value, End of Period | $86.63 | $82.56 | $78.85 | $77.19 | $76.96 |
| Total Return | 10.62% | 9.55% | 6.82% | 5.07% | 6.06% |
| Ratios/Supplemental Data | |||||
| Net Assets, End of Period (Millions) | $2,781 | $1,932 | $1,230 | $617 | $169 |
| Ratio of Total Expenses to | |||||
| Average Net Assets | 0.11% | 0.11% | 0.12% | 0.10% | 0.11%2 |
| Ratio of Net Investment Income to | |||||
| Average Net Assets | 3.76% | 4.08% | 4.60% | 4.90% | 4.81%2 |
| Portfolio Turnover Rate3 | 61% | 46% | 72% | 89% | 72% |
| 1 Inception. | |||||
| 2 Annualized. | |||||
| 3 Excludes the value of portfolio securities received or delivered as a result of in-kind purchases or redemptions of the fund’s capital shares, | |||||
| including ETF Creation Units. | |||||
See accompanying Notes, which are an integral part of the Financial Statements.
72
Intermediate-Term Bond Index Fund
Notes to Financial Statements
Vanguard Intermediate-Term Bond Index Fund is registered under the Investment Company Act of 1940 as an open-end investment company, or mutual fund. Certain of the fund’s investments are in corporate debt instruments; the issuers’ abilities to meet their obligations may be affected by economic developments in their respective industries. The fund offers six classes of shares: Investor Shares, Admiral Shares, Signal Shares, Institutional Shares, Institutional Plus Shares, and ETF Shares. Investor Shares are available to any investor who meets the fund’s minimum purchase requirements. Admiral Shares, Signal Shares, Institutional Shares, and Institutional Plus Shares are designed for investors who meet certain administrative, service, and account-size criteria. Institutional Plus Shares were first issued on November 30, 2011. ETF Shares are listed for trading on the NYSE Arca, Inc.; they can be purchased and sold through a broker.
A. The following significant accounting policies conform to generally accepted accounting principles for U.S. mutual funds. The fund consistently follows such policies in preparing its financial statements.
1. Security Valuation: Bonds, and temporary cash investments acquired over 60 days to maturity, are valued using the latest bid prices or using valuations based on a matrix system (which considers such factors as security prices, yields, maturities, and ratings), both as furnished by independent pricing services. Investments in Vanguard Market Liquidity Fund are valued at that fund’s net asset value. Other temporary cash investments are valued at amortized cost, which approximates market value. Securities for which market quotations are not readily available, or whose values have been affected by events occurring before the fund’s pricing time but after the close of the securities’ primary markets, are valued by methods deemed by the board of trustees to represent fair value.
2. Federal Income Taxes: The fund intends to continue to qualify as a regulated investment company and distribute all of its taxable income. Management has analyzed the fund’s tax positions taken for all open federal income tax years (December 31, 2008–2011), and has concluded that no provision for federal income tax is required in the fund’s financial statements.
3. Distributions: Distributions from net investment income are declared daily by all share classes except ETF Shares, and paid on the first business day of the following month. Monthly income dividends from ETF Shares, and annual distributions from realized capital gains, if any, are recorded on the ex-dividend date.
4. Security Lending: The fund has lent its securities to qualified institutional borrowers to earn additional income. Security loans are required to be secured at all times by collateral at least equal to the market value of securities loaned. The fund invests cash collateral received in Vanguard Market Liquidity Fund, and records a liability for the return of the collateral, during the period the securities are on loan. Security lending income represents fees charged to borrowers plus income earned on investing cash collateral, less expenses associated with the loan. Effective in August 2011, the fund is no longer permitted to lend its securities.
5. Other: Interest income includes income distributions received from Vanguard Market Liquidity Fund and is accrued daily. Premiums and discounts on debt securities purchased are amortized and accreted, respectively, to interest income over the lives of the respective securities. Security transactions are accounted for on the date securities are bought or sold. Costs used to determine realized gains (losses) on the sale of investment securities are those of the specific securities sold.
Each class of shares has equal rights as to assets and earnings, except that each class separately bears certain class-specific expenses related to maintenance of shareholder accounts (included in Management and Administrative expenses) and shareholder reporting. Marketing and distribution
73
Intermediate-Term Bond Index Fund
expenses are allocated to each class of shares based on a method approved by the board of trustees. Income, other non-class-specific expenses, and gains and losses on investments are allocated to each class of shares based on its relative net assets.
B. The Vanguard Group furnishes at cost investment advisory, corporate management, administrative, marketing, and distribution services. The costs of such services are allocated to the fund under methods approved by the board of trustees. The fund has committed to provide up to 0.40% of its net assets in capital contributions to Vanguard. At December 31, 2011, the fund had contributed capital of $2,186,000 to Vanguard (included in Other Assets), representing 0.02% of the fund’s net assets and 0.87% of Vanguard’s capitalization. The fund’s trustees and officers are also directors and officers of Vanguard.
C. Various inputs may be used to determine the value of the fund’s investments. These inputs are summarized in three broad levels for financial statement purposes. The inputs or methodologies used to value securities are not necessarily an indication of the risk associated with investing in those securities.
Level 1—Quoted prices in active markets for identical securities.
Level 2—Other significant observable inputs (including quoted prices for similar securities, interest rates, prepayment speeds, credit risk, etc.).
Level 3—Significant unobservable inputs (including the fund’s own assumptions used to determine the fair value of investments).
The following table summarizes the market value of the fund’s investments as of December 31, 2011, based on the inputs used to value them:
| Level 1 | Level 2 | Level 3 | |
| Investments | ($000) | ($000) | ($000) |
| U.S. Government and Agency Obligations | — | 7,497,691 | — |
| Asset-Backed/Commercial Mortgage-Backed Securities | — | 7,890 | — |
| Corporate Bonds | — | 5,242,540 | — |
| Sovereign Bonds | — | 807,317 | — |
| Taxable Municipal Bonds | — | 42,288 | — |
| Temporary Cash Investments | 516 | — | — |
| Total | 516 | 13,597,726 | — |
D. Capital gain distributions are determined on a tax basis and may differ from realized capital gains for financial reporting purposes. Differences may be permanent or temporary. Permanent differences are reclassified among capital accounts in the financial statements to reflect their tax character. Temporary differences arise when gains or losses are recognized in different periods for financial statement and tax purposes; these differences will reverse at some time in the future.
During the year ended December 31, 2011, the fund realized $5,932,000 of net capital gains resulting from in-kind redemptions—in which shareholders exchanged fund shares for securities held by the fund rather than for cash. Because such gains are not taxable to the fund, and are not distributed to shareholders, they have been reclassified from accumulated net realized gains to paid-in capital.
The fund used a tax accounting practice to treat a portion of the price of capital shares redeemed during the year as distributions from realized capital gains. Accordingly, the fund has reclassified $23,215,000 from accumulated net realized gains to paid-in capital.
74
Intermediate-Term Bond Index Fund
For tax purposes, at December 31, 2011, the fund had short-term and long-term capital gains of $3,522,000 and $40,362,000, respectively, available for distribution. Short-term gain distributions are treated as ordinary income dividends for tax purposes.
At December 31, 2011, the cost of investment securities for tax purposes was $12,437,064,000. Net unrealized appreciation of investment securities for tax purposes was $1,161,178,000, consisting of unrealized gains of $1,193,268,000 on securities that had risen in value since their purchase and $32,090,000 in unrealized losses on securities that had fallen in value since their purchase.
E. During the year ended December 31, 2011, the fund purchased $2,432,997,000 of investment securities and sold $1,442,206,000 of investment securities, other than U.S. government securities and temporary cash investments. Purchases and sales of U.S. government securities were $6,326,053,000 and $6,136,328,000, respectively.
F. Capital share transactions for each class of shares were:
| Year Ended December 31, | ||||
| 2011 | 2010 | |||
| Amount | Shares | Amount | Shares | |
| ($000) | (000) | ($000) | (000) | |
| Investor Shares | ||||
| Issued | 739,902 | 64,106 | 1,550,630 | 138,036 |
| Issued in Lieu of Cash Distributions | 98,081 | 8,511 | 140,493 | 12,482 |
| Redeemed | (1,182,640) | (103,745) | (3,018,636) | (263,051) |
| Net Increase (Decrease)—Investor Shares | (344,657) | (31,128) | (1,327,513) | (112,533) |
| Admiral Shares | ||||
| Issued | 1,207,076 | 104,397 | 2,830,131 | 246,233 |
| Issued in Lieu of Cash Distributions | 225,793 | 19,571 | 128,040 | 11,366 |
| Redeemed | (958,850) | (84,074) | (894,652) | (79,420) |
| Net Increase (Decrease)—Admiral Shares | 474,019 | 39,894 | 2,063,519 | 178,179 |
| Signal Shares | ||||
| Issued | 1,307,048 | 114,078 | 760,453 | 67,537 |
| Issued in Lieu of Cash Distributions | 110,096 | 9,543 | 75,419 | 6,698 |
| Redeemed | (1,103,567) | (96,071) | (583,264) | (52,041) |
| Net Increase (Decrease)—Signal Shares | 313,577 | 27,550 | 252,608 | 22,194 |
| Institutional Shares | ||||
| Issued | 421,011 | 36,793 | 389,116 | 35,259 |
| Issued in Lieu of Cash Distributions | 32,795 | 2,844 | 27,385 | 2,425 |
| Redeemed | (384,653) | (32,997) | (388,878) | (34,465) |
| Net Increase (Decrease)—Institutional Shares | 69,153 | 6,640 | 27,623 | 3,219 |
75
Intermediate-Term Bond Index Fund
| Year Ended December 31, | ||||
| 2011 | 2010 | |||
| Amount | Shares | Amount | Shares | |
| ($000) | (000) | ($000) | (000) | |
| Institutional Plus Shares1 | ||||
| Issued | 105,733 | 8,980 | — | — |
| Issued in Lieu of Cash Distributions | 1,520 | 130 | — | — |
| Redeemed | (232) | (20) | — | — |
| Net Increase (Decrease)—Institutional Plus Shares | 107,021 | 9,090 | — | — |
| ETF Shares | ||||
| Issued | 843,294 | 9,800 | 838,464 | 10,200 |
| Issued in Lieu of Cash Distributions | — | — | — | — |
| Redeemed | (91,179) | (1,100) | (200,719) | (2,400) |
| Net Increase (Decrease)—ETF Shares | 752,115 | 8,700 | 637,745 | 7,800 |
| 1 Inception was November 30, 2011, for Institutional Plus Shares. | ||||
G. In preparing the financial statements as of December 31, 2011, management considered the impact
of subsequent events for potential recognition or disclosure in these financial statements.
76
Long-Term Bond Index Fund
Fund Profile
As of December 31, 2011
| Share-Class Characteristics | ||||
| Investor | Institutional | Institutional | ||
| Shares | Shares | Plus Shares | ETF Shares | |
| Ticker Symbol | VBLTX | VBLLX | VBLIX | BLV |
| Expense Ratio1 | 0.22% | 0.07% | 0.05% | 0.11% |
| 30-Day SEC Yield | 3.81% | 3.96% | 3.98% | 3.92% |
| Financial Attributes | |||
| Barclays | |||
| Long | |||
| Gov/ | Spliced | ||
| Credit | Barclays | ||
| Float Adj | Aggregate | ||
| Fund | Index | FA Index | |
| Number of Bonds | 1,212 | 1,530 | 7,854 |
| Yield to Maturity | |||
| (before expenses) | 3.9% | 4.0% | 2.2% |
| Average Coupon | 5.8% | 5.7% | 4.0% |
| Average Duration | 14.4 years | 14.4 years | 5.1 years |
| Average Effective | |||
| Maturity | 24.2 years | 24.4 years | 7.3 years |
| Short-Term | |||
| Reserves | 0.3% | — | — |
| Sector Diversification (% of portfolio) | |
| Asset-Backed | 0.1% |
| Finance | 8.2 |
| Foreign | 5.3 |
| Industrial | 26.6 |
| Treasury/Agency | 46.4 |
| Utilities | 7.2 |
| Other | 6.2 |
The agency and mortgage-backed securities sectors may include issues from government-sponsored enterprises; such issues are not
backed by the full faith and credit of the U.S. government.
| Volatility Measures | ||
| Spliced | ||
| Barclays | Spliced | |
| Long | Barclays | |
| Gov/Credit | Aggregate | |
| FA Index | FA Index | |
| R-Squared | 0.99 | 0.69 |
| Beta | 1.04 | 2.77 |
These measures show the degree and timing of the fund’s fluctuations compared with the indexes over 36 months.
| Distribution by Maturity (% of portfolio) | |
| Under 1 Year | 0.1% |
| 3 - 5 Years | 0.3 |
| 5 - 10 Years | 0.9 |
| 10 - 20 Years | 26.1 |
| 20 - 30 Years | 70.9 |
| Over 30 Years | 1.7 |
| Distribution by Credit Quality (% of portfolio) | |
| U.S. Government | 46.5% |
| Aaa | 1.5 |
| Aa | 8.1 |
| A | 21.5 |
| Baa | 22.4 |
For information about these ratings, see the Glossary entry for Credit Quality.
1 The fund expense ratios shown are from the prospectuses dated April 26, 2011 (for Investor and ETF Shares), and September 27, 2011 (for Institutional and Institutional Plus Shares). They represent estimated costs for the current fiscal year. For the fiscal year ended December 31, 2011, the expense ratios were 0.22% for Investor Shares, 0.07% for Institutional Shares, 0.05% for Institutional Plus Shares (annualized since inception), and 0.11% for ETF Shares.
77
Long-Term Bond Index Fund
Investment Focus

78
Long-Term Bond Index Fund
Performance Summary
All of the returns in this report represent past performance, which is not a guarantee of future results that may be achieved by the fund. (Current performance may be lower or higher than the performance data cited. For performance data current to the most recent month-end, visit our website at vanguard.com/performance.) Note, too, that both investment returns and principal value can fluctuate widely, so an investor’s shares, when sold, could be worth more or less than their original cost. The returns shown do not reflect taxes that a shareholder would pay on fund distributions or on the sale of fund shares.
Cumulative Performance: December 31, 2001, Through December 31, 2011
Initial Investment of $10,000
| Average Annual Total Returns | |||||
| Periods Ended December 31, 2011 | |||||
| Final Value | |||||
| One | Five | Ten | of a $10,000 | ||
| Year | Years | Years | Investment | ||
| Long-Term Bond Index Fund Investor | |||||
| Shares | 22.06% | 9.66% | 8.41% | $22,429 | |
| •••••••• | Spliced Barclays Capital U.S. | ||||
| Aggregate Float Adjusted Index | 7.92 | 6.52 | 5.79 | 17,555 | |
| – – – – | Spliced Barclays Capital U.S. Long | ||||
| Government/Credit Float Adjusted | |||||
| Index | 22.49 | 9.71 | 8.54 | 22,695 | |
| Spliced Corporate A-Rated Debt | |||||
| Funds Average | 6.71 | 5.27 | 4.95 | 16,212 | |
Spliced Barclays Capital U.S. Long Government/Credit Float Adjusted Index: Barclays Capital U.S. Long Government/Credit Bond Index through December 31, 2009; Barclays Capital U.S. Long Government/Credit Float Adjusted Index thereafter.
Spliced Corporate A-Rated Debt Funds Average: Based on average returns for General Government Funds through December 31, 2001, and average returns for Corporate A-Rated Debt Funds thereafter. Derived from data provided by Lipper Inc.
See Financial Highlights for dividend and capital gains information.
79
Long-Term Bond Index Fund
| Average Annual Total Returns | ||||
| Periods Ended December 31, 2011 | ||||
| Since | Final Value | |||
| One | Five | Inception | of a $25,000,000 | |
| Year | Years | (2/2/2006) | Investment | |
| Long-Term Bond Index Fund Institutional | ||||
| Shares | 22.24% | 9.81% | 8.94% | $41,460,710 |
| Spliced Barclays Capital U.S. Aggregate Float | ||||
| Adjusted Index | 7.92 | 6.52 | 6.28 | 35,828,398 |
| Spliced Barclays Capital U.S. Long | ||||
| Government/Credit Float Adjusted Index | 22.49 | 9.71 | 8.83 | 41,210,220 |
| "Since Inception" performance is calculated from the Institutional Shares’ inception date for both the fund and its comparative standards. | ||||
| Total Returns | ||
| Period Ended December 31, 2011 | ||
| Since | Final Value | |
| Inception | of a $100,000,000 | |
| (10/6/2011) | Investment | |
| Long-Term Bond Index Fund Institutional Plus | ||
| Shares | 3.64% | $103,639,511 |
| Spliced Barclays Capital U.S. Aggregate Float | ||
| Adjusted Index | 1.51 | 101,509,057 |
| Barclays Capital U.S. Long | ||
| Government/Credit Float Adjusted Index | 3.37 | 103,366,979 |
| "Since Inception" performance is calculated from the Institutional Plus Shares’ inception date for both the fund and its comparative standards. | ||
| Average Annual Total Returns | |||
| Periods Ended December 31, 2011 | |||
| Since | Final Value | ||
| One | Inception | of a $10,000 | |
| Year | (4/3/2007) | Investment | |
| Long-Term Bond Index Fund | |||
| ETF Shares Net Asset Value | 22.18% | 10.09% | $15,782 |
| Spliced Barclays Capital U.S. Aggregate Float | |||
| Adjusted Index | 7.92 | 6.55 | 13,515 |
| Spliced Barclays Capital U.S. Long | |||
| Government/Credit Float Adjusted Index | 22.49 | 10.05 | 15,750 |
| "Since Inception" performance is calculated from the ETF Shares’ inception date for both the fund and its comparative standards. | |||
80
Long-Term Bond Index Fund
Cumulative Returns of ETF Shares:April 3, 2007 , Through December 31, 2011
| Since | ||
| One | Inception | |
| Year | (4/3/2007) | |
| Long-Term Bond Index Fund | ||
| ETF Shares Market Price | 22.45% | 58.61% |
| Long-Term Bond Index Fund | ||
| ETF Shares Net Asset Value | 22.18 | 57.82 |
| Spliced Barclays Capital U.S. Long | ||
| Government/Credit Float Adjusted Index | 22.49 | 57.50 |
| "Since Inception" performance is calculated from the ETF Shares’ inception date for both the fund and its comparative standards. | ||
| Fiscal-Year Total Returns (%): December 31, 2001, Through December 31, 2011 | ||||
| Spliced | ||||
| Barclays | ||||
| Long | ||||
| Gov/Credit | ||||
| Investor Shares | FA Index | |||
| Fiscal Year | Income Returns | Capital Returns | Total Returns | Total Returns |
| 2002 | 6.59% | 7.76% | 14.35% | 14.81% |
| 2003 | 5.47 | 0.03 | 5.50 | 5.87 |
| 2004 | 5.62 | 2.78 | 8.40 | 8.56 |
| 2005 | 5.15 | 0.17 | 5.32 | 5.34 |
| 2006 | 5.29 | -2.62 | 2.67 | 2.71 |
| 2007 | 5.55 | 1.04 | 6.59 | 6.60 |
| 2008 | 5.81 | 2.83 | 8.64 | 8.44 |
| 2009 | 5.27 | -3.51 | 1.76 | 1.92 |
| 2010 | 5.21 | 5.06 | 10.27 | 10.16 |
| 2011 | 5.51 | 16.55 | 22.06 | 22.49 |
Spliced Barclays Capital U.S. Long Government/Credit Float Adjusted Index: Barclays Capital U.S. Long Government/Credit Bond Index through
December 31, 2009; Barclays Capital U.S. Long Government/Credit Float Adjusted Index thereafter.
81
Long-Term Bond Index Fund
Financial Statements
Statement of Net Assets—Investments Summary
As of December 31, 2011
This Statement summarizes the fund’s holdings by asset type. Details are reported for each of the fund’s 50 largest individual holdings and for investments that, in total for any issuer, represent more than 1% of the fund’s net assets. The total value of smaller holdings is reported as a single amount within each category.
The fund reports a complete list of its holdings in regulatory filings four times in each fiscal year, at the quarter-ends. For the second and fourth fiscal quarters, the complete listing of the fund’s holdings is available electronically on vanguard.com and on the Securities and Exchange Commission’s website (sec.gov), or you can have it mailed to you without charge by calling 800-662-7447. For the first and third fiscal quarters, the fund files the lists with the SEC on Form N-Q. Shareholders can look up the fund’s Forms N-Q on the SEC’s website. Forms N-Q may also be reviewed and copied at the SEC’s Public Reference Room (see the back cover of this report for further information).
| Face | Market | Percentage | ||||
| Maturity | Amount | Value | of Net | |||
| Coupon | Date | ($000) | ($000) | Assets | ||
| U.S. Government and Agency Obligations | ||||||
| U.S. Government Securities | ||||||
| United States Treasury Note/Bond | 4.375% | 11/15/39 | 152,745 | 197,971 | 4.1% | |
| United States Treasury Note/Bond | 4.250% | 11/15/40 | 133,165 | 169,536 | 3.5% | |
| United States Treasury Note/Bond | 4.500% | 8/15/39 | 127,336 | 168,123 | 3.5% | |
| United States Treasury Note/Bond | 4.625% | 2/15/40 | 104,851 | 141,172 | 2.9% | |
| United States Treasury Note/Bond | 4.250% | 5/15/39 | 111,028 | 141,023 | 2.9% | |
| United States Treasury Note/Bond | 4.750% | 2/15/41 | 98,360 | 135,322 | 2.8% | |
| United States Treasury Note/Bond | 4.375% | 5/15/40 | 81,283 | 105,414 | 2.2% | |
| United States Treasury Note/Bond | 4.375% | 5/15/41 | 80,140 | 104,233 | 2.2% | |
| United States Treasury Note/Bond | 6.250% | 8/15/23 | 68,250 | 97,641 | 2.0% | |
| United States Treasury Note/Bond | 7.125% | 2/15/23 | 57,715 | 87,258 | 1.8% | |
| United States Treasury Note/Bond | 4.500% | 5/15/38 | 66,020 | 86,919 | 1.8% | |
| United States Treasury Note/Bond | 6.875% | 8/15/25 | 51,975 | 80,017 | 1.7% | |
| United States Treasury Note/Bond | 5.250% | 11/15/28 | 58,005 | 79,938 | 1.6% | |
| United States Treasury Note/Bond | 3.875% | 8/15/40 | 61,790 | 73,945 | 1.5% | |
| United States Treasury Note/Bond | 3.750% | 8/15/41 | 56,947 | 66,851 | 1.4% | |
| United States Treasury Note/Bond | 6.125% | 8/15/29 | 42,665 | 64,624 | 1.3% | |
| United States Treasury Note/Bond | 4.375% | 2/15/38 | 47,573 | 61,428 | 1.3% | |
| United States Treasury Note/Bond | 3.500% | 2/15/39 | 35,750 | 40,140 | 0.8% | |
| United States Treasury Note/Bond | 7.500% | 11/15/24 | 22,090 | 35,244 | 0.7% | |
| United States Treasury Note/Bond | 6.750% | 8/15/26 | 21,555 | 33,279 | 0.7% | |
| United States Treasury Note/Bond | 6.250% | 5/15/30 | 16,180 | 25,013 | 0.5% | |
| United States Treasury Note/Bond | 6.000% | 2/15/26 | 13,975 | 20,135 | 0.4% | |
| United States Treasury Note/Bond | 5.375% | 2/15/31 | 13,120 | 18,694 | 0.4% | |
| United States Treasury Note/Bond | 5.250% | 2/15/29 | 10,160 | 14,032 | 0.3% | |
| United States Treasury Note/Bond | 5.000% | 5/15/37 | 7,390 | 10,392 | 0.2% | |
| United States Treasury Note/Bond | 5.500% | 8/15/28 | 7,205 | 10,167 | 0.2% | |
| United States Treasury Note/Bond | 6.125% | 11/15/27 | 6,497 | 9,653 | 0.2% | |
| United States Treasury | ||||||
| Note/Bond | 0.625%–9.875% | 12/31/12–11/15/41 | 18,545 | 21,489 | 0.4% | |
| 2,099,653 | 43.3% | |||||
82
Long-Term Bond Index Fund
| Face | Market | Percentage | |||
| Maturity | Amount | Value | of Net | ||
| Coupon | Date | ($000) | ($000) | Assets | |
| Agency Bonds and Notes | |||||
| 1 Federal Home | |||||
| Loan Banks | 5.500% | 7/15/36 | 8,550 | 11,090 | 0.2% |
| 2 Federal Home Loan | |||||
| Mortgage Corp. | 6.750% | 3/15/31 | 10,420 | 15,645 | 0.3% |
| 2 Federal Home Loan | |||||
| Mortgage Corp. | 6.750% | 9/15/29 | 7,700 | 11,391 | 0.2% |
| 2 Federal National | |||||
| Mortgage Assn. | 7.125% | 1/15/30 | 9,075 | 13,934 | 0.3% |
| 2 Federal National | |||||
| Mortgage Assn. | 6.250% | 5/15/29 | 9,850 | 13,852 | 0.3% |
| 2 Federal National | |||||
| Mortgage Assn. | 7.250% | 5/15/30 | 6,635 | 10,350 | 0.2% |
| 2 Federal National | |||||
| Mortgage Assn. | 5.625%–6.625% | 11/15/30–8/6/38 | 8,875 | 12,558 | 0.3% |
| Agency Bonds and Notes—Other † | 58,360 | 1.2% | |||
| 147,180 | 3.0% | ||||
| Total U.S. Government and Agency Obligations (Cost $1,847,341) | 2,246,833 | 46.3% | |||
| Asset-Backed/Commercial Mortgage-Backed Securities (Cost $2,500) † | 2,984 | 0.1% | |||
| Corporate Bonds | |||||
| Finance | |||||
| Banking | |||||
| Goldman Sachs Group Inc. | 6.750% | 10/1/37 | 12,600 | 11,780 | 0.2% |
| 3 Banking—Other † | 202,300 | 4.2% | |||
| Brokerage † | 2,684 | 0.1% | |||
| Finance Companies | |||||
| General Electric Capital Corp. | 6.750% | 3/15/32 | 18,975 | 22,141 | 0.4% |
| General Electric Capital Corp. | 5.875% | 1/14/38 | 12,425 | 13,112 | 0.3% |
| Finance Companies—Other † | 14,860 | 0.3% | |||
| 3 Insurance † | 120,703 | 2.5% | |||
| Real Estate Investment Trusts † | 5,499 | 0.1% | |||
| 393,079 | 8.1% | ||||
| Industrial | |||||
| 3 Basic Industry † | 106,956 | 2.2% | |||
| 3 Capital Goods † | 86,927 | 1.8% | |||
| Communication | |||||
| Ameritech Capital | |||||
| Funding Corp. | 6.550% | 1/15/28 | 1,000 | 1,116 | 0.0% |
| AT&T Corp. | 8.000% | 11/15/31 | 3,105 | 4,381 | 0.1% |
| AT&T Inc. | 6.300% | 1/15/38 | 9,725 | 11,957 | 0.3% |
| AT&T Inc. | 5.350%–6.550% | 6/15/34–8/15/41 | 32,480 | 38,753 | 0.8% |
| AT&T Mobility LLC | 7.125% | 12/15/31 | 2,425 | 3,146 | 0.1% |
| Bellsouth Capital | |||||
| Funding Corp. | 7.875% | 2/15/30 | 4,250 | 5,692 | 0.1% |
| BellSouth Corp. | 6.000%–6.875% | 10/15/31–11/15/34 | 4,230 | 4,992 | 0.1% |
| BellSouth | |||||
| Telecommunications Inc. | 6.375% | 6/1/28 | 1,640 | 1,920 | 0.0% |
| British | |||||
| Telecommunications plc | 9.625% | 12/15/30 | 6,900 | 9,734 | 0.2% |
| Deutsche Telekom | |||||
| International Finance BV | 8.750% | 6/15/30 | 8,425 | 11,727 | 0.2% |
| New Cingular Wireless | |||||
| Services Inc. | 8.750% | 3/1/31 | 2,075 | 3,049 | 0.1% |
| Pacific Bell Telephone Co. | 7.125% | 3/15/26 | 550 | 693 | 0.0% |
83
Long-Term Bond Index Fund
| Face | Market | Percentage | ||||
| Maturity | Amount | Value | of Net | |||
| Coupon | Date | ($000) | ($000) | Assets | ||
| Verizon Global Funding Corp. | 7.750% | 12/1/30 | 7,550 | 10,503 | 0.2% | |
| Communication—Other † | 209,533 | 4.3% | ||||
| Consumer Cyclical † | 162,322 | 3.4% | ||||
| Consumer Noncyclical | ||||||
| Kraft Foods Inc. | 6.500% | 2/9/40 | 7,900 | 10,143 | 0.2% | |
| 3 Consumer Noncyclical—Other † | 249,527 | 5.2% | ||||
| Energy | ||||||
| Tosco Corp. | 8.125% | 2/15/30 | 7,500 | 11,018 | 0.2% | |
| Energy—Other † | 182,059 | 3.8% | ||||
| Other Industrial † | 5,109 | 0.1% | ||||
| Technology † | 69,768 | 1.4% | ||||
| 3 Transportation † | 62,985 | 1.3% | ||||
| 1,264,010 | 26.1% | |||||
| Utilities | ||||||
| Electric | ||||||
| Midamerican Energy Holdings Co. | 6.125% | 4/1/36 | 8,525 | 10,196 | 0.2% | |
| Pacific Gas & Electric Co. | 6.050% | 3/1/34 | 9,125 | 11,355 | 0.2% | |
| Electric—Other † | 227,573 | 4.7% | ||||
| Natural Gas † | 89,243 | 1.8% | ||||
| Other Utility † | 3,478 | 0.1% | ||||
| 341,845 | 7.0% | |||||
| Total Corporate Bonds (Cost $1,747,020) | 1,998,934 | 41.2% | ||||
| Sovereign Bonds (U.S. Dollar-Denominated) | ||||||
| Brazilian Government | ||||||
| International Bond | 10.125% | 5/15/27 | 6,700 | 11,055 | 0.2% | |
| Brazilian Government | ||||||
| International Bond | 5.625% | 1/7/41 | 8,950 | 10,382 | 0.2% | |
| Brazilian Government | ||||||
| International Bond | 8.750% | 2/4/25 | 6,700 | 10,016 | 0.2% | |
| Brazilian Government | ||||||
| International Bond | 7.125%–11.000% | 4/15/24–8/17/40 | 21,325 | 30,301 | 0.6% | |
| Mexico Government | ||||||
| International Bond | 6.750% | 9/27/34 | 12,800 | 16,713 | 0.3% | |
| Mexico Government | ||||||
| International Bond | 6.050% | 1/11/40 | 12,025 | 14,670 | 0.3% | |
| Mexico Government | ||||||
| International Bond | 5.750%–8.300% | 8/15/31–10/12/2110 | 7,275 | 8,617 | 0.2% | |
| Pemex Project Funding | ||||||
| Master Trust | 6.625% | 6/15/35–6/15/38 | 7,725 | 8,750 | 0.2% | |
| 3 Petroleos Mexicanos | 6.500% | 6/2/41 | 4,575 | 5,149 | 0.1% | |
| Sovereign Bonds (U.S. Dollar-Denominated)—Other † | 138,110 | 2.9% | ||||
| Total Sovereign Bonds (Cost $224,102) | 253,763 | 5.2% | ||||
| Taxable Municipal Bonds | ||||||
| Illinois GO | 5.100% | 6/1/33 | 17,475 | 15,949 | 0.3% | |
| Taxable Municipal Bonds—Other † | 281,399 | 5.8% | ||||
| Total Taxable Municipal Bonds (Cost $254,627) | 297,348 | 6.1% | ||||
| Shares | ||||||
| Temporary Cash Investment | ||||||
| Money Market Fund | ||||||
| 4 Vanguard Market Liquidity Fund (Cost $12,481) | 0.110% | 12,481,109 | 12,481 | 0.3% | ||
| Total Investments (Cost $4,088,071) | 4,812,343 | 99.2% | ||||
84
Long-Term Bond Index Fund
| Market | Percentage | |
| Value | of Net | |
| ($000) | Assets | |
| Other Assets and Liabilities | ||
| Other Assets | 80,215 | 1.6% |
| Liabilities | (40,281) | (0.8%) |
| 39,934 | 0.8% | |
| Net Assets | 4,852,277 | 100.0% |
| At December 31, 2011, net assets consisted of: | |
| Amount | |
| ($000) | |
| Paid-in Capital | 4,122,207 |
| Undistributed Net Investment Income | — |
| Accumulated Net Realized Gains | 5,798 |
| Unrealized Appreciation (Depreciation) | 724,272 |
| Net Assets | 4,852,277 |
| Investor Shares—Net Assets | |
| Applicable to 195,983,937 outstanding $.001 par value shares of | |
| beneficial interest (unlimited authorization) | 2,726,653 |
| Net Asset Value Per Share—Investor Shares | $13.91 |
| Institutional Shares—Net Assets | |
| Applicable to 84,396,701 outstanding $.001 par value shares of | |
| beneficial interest (unlimited authorization) | 1,174,181 |
| Net Asset Value Per Share—Institutional Shares | $13.91 |
| Institutional Plus Shares—Net Assets | |
| Applicable to 31,598,676 outstanding $.001 par value shares of | |
| beneficial interest (unlimited authorization) | 439,621 |
| Net Asset Value Per Share—Institutional Plus Shares | $13.91 |
| ETF Shares—Net Assets | |
| Applicable to 5,600,000 outstanding $.001 par value shares of | |
| beneficial interest (unlimited authorization) | 511,822 |
| Net Asset Value Per Share—ETF Shares | $91.40 |
See Note A in Notes to Financial Statements.
† Represents the aggregate value, by category, of securities that are not among the 50 largest holdings and, in total for any issuer, represent
1% or less of net assets.
1 The issuer operates under a congressional charter; its securities are generally neither guaranteed by the U.S. Treasury nor backed by the full
faith and credit of the U.S. government.
2 The issuer was placed under federal conservatorship in September 2008; since that time, its daily operations have been managed by the
Federal Housing Finance Agency and it receives capital from the U.S. Treasury in exchange for senior preferred stock.
3 Certain of the fund’s securities are exempt from registration under Rule 144A of the Securities Act of 1933. Such securities may be sold in
transactions exempt from registration, normally to qualified institutional buyers. At December 31, 2011, the aggregate value of these
securities was $14,493,000, representing 0.3% of net assets.
4 Affiliated money market fund available only to Vanguard funds and certain trusts and accounts managed by Vanguard. Rate shown is the
7-day yield.
GO—General Obligation Bond.
See accompanying Notes, which are an integral part of the Financial Statements.
85
Long-Term Bond Index Fund
Statement of Operations
| Year Ended | |
| December 31, 2011 | |
| ($000) | |
| Investment Income | |
| Income | |
| Interest1 | 205,012 |
| Total Income | 205,012 |
| Expenses | |
| The Vanguard Group—Note B | |
| Investment Advisory Services | 239 |
| Management and Administrative—Investor Shares | 4,315 |
| Management and Administrative—Institutional Shares | 478 |
| Management and Administrative—Institutional Plus Shares | 40 |
| Management and Administrative—ETF Shares | 282 |
| Marketing and Distribution—Investor Shares | 617 |
| Marketing and Distribution—Institutional Shares | 402 |
| Marketing and Distribution—Institutional Plus Shares | 2 |
| Marketing and Distribution—ETF Shares | 107 |
| Custodian Fees | 22 |
| Auditing Fees | 25 |
| Shareholders’ Reports—Investor Shares | 64 |
| Shareholders’ Reports—Institutional Shares | — |
| Shareholders’ Reports—Institutional Plus Shares | — |
| Shareholders’ Reports—ETF Shares | 23 |
| Trustees’ Fees and Expenses | 4 |
| Total Expenses | 6,620 |
| Net Investment Income | 198,392 |
| Realized Net Gain (Loss) on Investment Securities Sold | 57,511 |
| Change in Unrealized Appreciation (Depreciation) of Investment Securities | 622,450 |
| Net Increase (Decrease) in Net Assets Resulting from Operations | 878,353 |
| 1 Interest income from an affiliated company of the fund was $36,000. | |
See accompanying Notes, which are an integral part of the Financial Statements.
86
Long-Term Bond Index Fund
Statement of Changes in Net Assets
| Year Ended December 31, | ||
| 2011 | 2010 | |
| ($000) | ($000) | |
| Increase (Decrease) in Net Assets | ||
| Operations | ||
| Net Investment Income | 198,392 | 168,688 |
| Realized Net Gain (Loss) | 57,511 | 48,861 |
| Change in Unrealized Appreciation (Depreciation) | 622,450 | 86,095 |
| Net Increase (Decrease) in Net Assets Resulting from Operations | 878,353 | 303,644 |
| Distributions | ||
| Net Investment Income | ||
| Investor Shares | (108,320) | (109,674) |
| Institutional Shares | (67,081) | (41,079) |
| Institutional Plus Shares | (4,263) | — |
| ETF Shares | (18,728) | (17,935) |
| Realized Capital Gain1 | ||
| Investor Shares | (23,351) | (19,191) |
| Institutional Shares | (9,970) | (10,102) |
| Institutional Plus Shares | (3,776) | — |
| ETF Shares | (4,463) | (2,772) |
| Total Distributions | (239,952) | (200,753) |
| Capital Share Transactions | ||
| Investor Shares | 134,556 | 121,368 |
| Institutional Shares | (282,666) | 711,646 |
| Institutional Plus Shares | 431,045 | — |
| ETF Shares | 128,036 | (2,778) |
| Net Increase (Decrease) from Capital Share Transactions | 410,971 | 830,236 |
| Total Increase (Decrease) | 1,049,372 | 933,127 |
| Net Assets | ||
| Beginning of Period | 3,802,905 | 2,869,778 |
| End of Period | 4,852,277 | 3,802,905 |
| 1 Includes fiscal 2011 and 2010 short-term gain distributions totaling $2,061,000 and $7,783,000, respectively. Short-term gain distributions | ||
| are treated as ordinary income dividends for tax purposes. | ||
See accompanying Notes, which are an integral part of the Financial Statements.
87
Long-Term Bond Index Fund
Financial Highlights
| Investor Shares | |||||
| For a Share Outstanding | Year Ended December 31, | ||||
| Throughout Each Period | 2011 | 2010 | 2009 | 2008 | 2007 |
| Net Asset Value, Beginning of Period | $12.04 | $11.56 | $11.98 | $11.65 | $11.53 |
| Investment Operations | |||||
| Net Investment Income | .587 | .595 | .608 | .618 | .613 |
| Net Realized and Unrealized Gain (Loss) | |||||
| on Investments | 1.991 | .583 | (.420) | .330 | .120 |
| Total from Investment Operations | 2.578 | 1.178 | .188 | .948 | .733 |
| Distributions | |||||
| Dividends from Net Investment Income | (.587) | (.595) | (.608) | (.618) | (.613) |
| Distributions from Realized Capital Gains | (.121) | (.103) | — | — | — |
| Total Distributions | (.708) | (.698) | (.608) | (.618) | (.613) |
| Net Asset Value, End of Period | $13.91 | $12.04 | $11.56 | $11.98 | $11.65 |
| Total Return1 | 22.06% | 10.27% | 1.76% | 8.64% | 6.59% |
| Ratios/Supplemental Data | |||||
| Net Assets, End of Period (Millions) | $2,727 | $2,250 | $2,049 | $2,518 | $2,277 |
| Ratio of Total Expenses to | |||||
| Average Net Assets | 0.22% | 0.22% | 0.22% | 0.19% | 0.18% |
| Ratio of Net Investment Income to | |||||
| Average Net Assets | 4.62% | 4.87% | 5.33% | 5.49% | 5.34% |
| Portfolio Turnover Rate2 | 45% | 54% | 69% | 67% | 62% |
1 Total returns do not include account service fees that may have applied in the periods shown. Fund prospectuses provide information about
any applicable account service fees.
2 Excludes the value of portfolio securities received or delivered as a result of in-kind purchases or redemptions of the fund’s capital shares,
including ETF Creation Units.
See accompanying Notes, which are an integral part of the Financial Statements.
88
Long-Term Bond Index Fund
Financial Highlights
| Institutional Shares | |||||
| For a Share Outstanding | Year Ended December 31, | ||||
| Throughout Each Period | 2011 | 2010 | 2009 | 2008 | 2007 |
| Net Asset Value, Beginning of Period | $12.04 | $11.56 | $11.98 | $11.65 | $11.53 |
| Investment Operations | |||||
| Net Investment Income | .606 | .613 | .625 | .632 | .626 |
| Net Realized and Unrealized Gain (Loss) | |||||
| on Investments | 1.991 | .583 | (.420) | .330 | .120 |
| Total from Investment Operations | 2.597 | 1.196 | .205 | .962 | .746 |
| Distributions | |||||
| Dividends from Net Investment Income | (.606) | (.613) | (.625) | (.632) | (.626) |
| Distributions from Realized Capital Gains | (.121) | (.103) | — | — | — |
| Total Distributions | (.727) | (.716) | (.625) | (.632) | (.626) |
| Net Asset Value, End of Period | $13.91 | $12.04 | $11.56 | $11.98 | $11.65 |
| Total Return | 22.24% | 10.44% | 1.91% | 8.77% | 6.71% |
| Ratios/Supplemental Data | |||||
| Net Assets, End of Period (Millions) | $1,174 | $1,229 | $509 | $388 | $415 |
| Ratio of Total Expenses to | |||||
| Average Net Assets | 0.07% | 0.07% | 0.07% | 0.07% | 0.07% |
| Ratio of Net Investment Income to | |||||
| Average Net Assets | 4.77% | 5.02% | 5.48% | 5.61% | 5.45% |
| Portfolio Turnover Rate1 | 45% | 54% | 69% | 67% | 62% |
1 Excludes the value of portfolio securities received or delivered as a result of in-kind purchases or redemptions of the fund’s capital shares,
including ETF Creation Units.
See accompanying Notes, which are an integral part of the Financial Statements.
89
Long-Term Bond Index Fund
Financial Highlights
| Institutional Plus Shares | |
| October 6, 20111 to | |
| For a Share Outstanding Throughout the Period | December 31, 2011 |
| Net Asset Value, Beginning of Period | $13.69 |
| Investment Operations | |
| Net Investment Income | .152 |
| Net Realized and Unrealized Gain (Loss) on Investments | .341 |
| Total from Investment Operations | .493 |
| Distributions | |
| Dividends from Net Investment Income | (.152) |
| Distributions from Realized Capital Gains | (.121) |
| Total Distributions | (.273) |
| Net Asset Value, End of Period | $13.91 |
| Total Return | 3.64% |
| Ratios/Supplemental Data | |
| Net Assets, End of Period (Millions) | $440 |
| Ratio of Total Expenses to Average Net Assets | 0.05%2 |
| Ratio of Net Investment Income to Average Net Assets | 4.79%2 |
| Portfolio Turnover Rate3 | 45% |
1 Inception.
2 Annualized.
3 Excludes the value of portfolio securities received or delivered as a result of in-kind purchases or redemptions of the fund’s capital shares,
including ETF Creation Units.
See accompanying Notes, which are an integral part of the Financial Statements.
90
Long-Term Bond Index Fund
Financial Highlights
| ETF Shares | |||||
| April 3, | |||||
| 20071 to | |||||
| For a Share Outstanding | Year Ended December 31, | Dec. 31, | |||
| Throughout Each Period | 2011 | 2010 | 2009 | 2008 | 2007 |
| Net Asset Value, Beginning of Period | $79.07 | $75.91 | $78.66 | $76.38 | $74.90 |
| Investment Operations | |||||
| Net Investment Income | 3.904 | 3.954 | 4.005 | 4.004 | 2.740 |
| Net Realized and Unrealized Gain (Loss) | |||||
| on Investments | 13.127 | 3.836 | (2.750) | 2.280 | 1.480 |
| Total from Investment Operations | 17.031 | 7.790 | 1.255 | 6.284 | 4.220 |
| Distributions | |||||
| Dividends from Net Investment Income | (3.904) | (3.954) | (4.005) | (4.004) | (2.740) |
| Distributions from Realized Capital Gains | (.797) | (.676) | — | — | — |
| Total Distributions | (4.701) | (4.630) | (4.005) | (4.004) | (2.740) |
| Net Asset Value, End of Period | $91.40 | $79.07 | $75.91 | $78.66 | $76.38 |
| Total Return | 22.18% | 10.36% | 1.79% | 8.70% | 5.77% |
| Ratios/Supplemental Data | |||||
| Net Assets, End of Period (Millions) | $512 | $324 | $311 | $149 | $84 |
| Ratio of Total Expenses to | |||||
| Average Net Assets | 0.11% | 0.11% | 0.12% | 0.10% | 0.11%2 |
| Ratio of Net Investment Income to | |||||
| Average Net Assets | 4.73% | 4.98% | 5.43% | 5.58% | 5.41%2 |
| Portfolio Turnover Rate3 | 45% | 54% | 69% | 67% | 62% |
1 Inception.
2 Annualized.
3 Excludes the value of portfolio securities received or delivered as a result of in-kind purchases or redemptions of the fund’s capital shares,
including ETF Creation Units.
See accompanying Notes, which are an integral part of the Financial Statements.
91
Long-Term Bond Index Fund
Notes to Financial Statements
Vanguard Long-Term Bond Index Fund is registered under the Investment Company Act of 1940 as an open-end investment company, or mutual fund. Certain of the fund’s investments are in corporate debt instruments; the issuers’ abilities to meet their obligations may be affected by economic developments in their respective industries. The fund offers four classes of shares: Investor Shares, Institutional Shares, Institutional Plus Shares, and ETF Shares. Investor Shares are available to any investor who meets the fund’s minimum purchase requirements. Institutional Shares and Institutional Plus Shares are designed for investors who meet certain administrative, service, and account-size criteria. Institutional Plus Shares were first issued on October 6, 2011. ETF Shares are listed for trading on the NYSE Arca, Inc.; they can be purchased and sold through a broker.
A. The following significant accounting policies conform to generally accepted accounting principles for U.S. mutual funds. The fund consistently follows such policies in preparing its financial statements.
1. Security Valuation: Bonds, and temporary cash investments acquired over 60 days to maturity, are valued using the latest bid prices or using valuations based on a matrix system (which considers such factors as security prices, yields, maturities, and ratings), both as furnished by independent pricing services. Investments in Vanguard Market Liquidity Fund are valued at that fund’s net asset value. Other temporary cash investments are valued at amortized cost, which approximates market value. Securities for which market quotations are not readily available, or whose values have been affected by events occurring before the fund’s pricing time but after the close of the securities’ primary markets, are valued by methods deemed by the board of trustees to represent fair value.
2. Federal Income Taxes: The fund intends to continue to qualify as a regulated investment company and distribute all of its taxable income. Management has analyzed the fund’s tax positions taken for all open federal income tax years (December 31, 2008–2011), and has concluded that no provision for federal income tax is required in the fund’s financial statements.
3. Distributions: Distributions from net investment income are declared daily by all share classes except ETF Shares, and paid on the first business day of the following month. Monthly income dividends from ETF Shares, and annual distributions from realized capital gains, if any, are recorded on the ex-dividend date.
4. Other: Interest income includes income distributions received from Vanguard Market Liquidity Fund and is accrued daily. Premiums and discounts on debt securities purchased are amortized and accreted, respectively, to interest income over the lives of the respective securities. Security transactions are accounted for on the date securities are bought or sold. Costs used to determine realized gains (losses) on the sale of investment securities are those of the specific securities sold.
Each class of shares has equal rights as to assets and earnings, except that each class separately bears certain class-specific expenses related to maintenance of shareholder accounts (included in Management and Administrative expenses) and shareholder reporting. Marketing and distribution expenses are allocated to each class of shares based on a method approved by the board of trustees. Income, other non-class-specific expenses, and gains and losses on investments are allocated to each class of shares based on its relative net assets.
B. The Vanguard Group furnishes at cost investment advisory, corporate management, administrative, marketing, and distribution services. The costs of such services are allocated to the fund under methods approved by the board of trustees. The fund has committed to provide up to 0.40% of its net assets in capital contributions to Vanguard. At December 31, 2011, the fund had contributed capital of $760,000 to Vanguard (included in Other Assets), representing 0.02% of the fund’s net assets and 0.30% of Vanguard’s capitalization. The fund’s trustees and officers are also directors and officers of Vanguard.
92
Long-Term Bond Index Fund
C. Various inputs may be used to determine the value of the fund’s investments. These inputs are summarized in three broad levels for financial statement purposes. The inputs or methodologies used to value securities are not necessarily an indication of the risk associated with investing in those securities.
Level 1—Quoted prices in active markets for identical securities.
Level 2—Other significant observable inputs (including quoted prices for similar securities, interest rates, prepayment speeds, credit risk, etc.).
Level 3—Significant unobservable inputs (including the fund’s own assumptions used to determine the fair value of investments).
The following table summarizes the market value of the fund’s investments as of December 31, 2011, based on the inputs used to value them:
| Level 1 | Level 2 | Level 3 | |
| Investments | ($000) | ($000) | ($000) |
| U.S. Government and Agency Obligations | — | 2,246,833 | — |
| Asset-Backed/Commercial Mortgage-Backed Securities | — | 2,984 | — |
| Corporate Bonds | — | 1,998,934 | — |
| Sovereign Bonds | — | 253,763 | — |
| Taxable Municipal Bonds | — | 297,348 | — |
| Temporary Cash Investments | 12,481 | — | — |
| Total | 12,481 | 4,799,862 | — |
D. Capital gain distributions are determined on a tax basis and may differ from realized capital gains for financial reporting purposes. Differences may be permanent or temporary. Permanent differences are reclassified among capital accounts in the financial statements to reflect their tax character. Temporary differences arise when gains or losses are recognized in different periods for financial statement and tax purposes; these differences will reverse at some time in the future.
During the year ended December 31, 2011, the fund realized $1,702,000 of net capital gains resulting from in-kind redemptions—in which shareholders exchanged fund shares for securities held by the fund rather than for cash. Because such gains are not taxable to the fund, and are not distributed to shareholders, they have been reclassified from accumulated net realized gains to paid-in capital.
The fund used a tax accounting practice to treat a portion of the price of capital shares redeemed during the year as distributions from realized capital gains. Accordingly, the fund has reclassified $2,965,000 from accumulated net realized gains to paid-in capital.
For tax purposes, at December 31, 2011, the fund had short-term and long-term capital gains of $2,561,000 and $4,727,000, respectively, available for distribution. Short-term gain distributions are treated as ordinary income dividends for tax purposes.
At December 31, 2011, the cost of investment securities for tax purposes was $4,089,561,000. Net unrealized appreciation of investment securities for tax purposes was $722,782,000, consisting of unrealized gains of $743,840,000 on securities that had risen in value since their purchase and $21,058,000 in unrealized losses on securities that had fallen in value since their purchase.
93
Long-Term Bond Index Fund
E. During the year ended December 31, 2011, the fund purchased $564,836,000 of investment securities and sold $360,169,000 of investment securities, other than U.S. government securities and temporary cash investments. Purchases and sales of U.S. government securities were $1,688,295,000 and $1,509,715,000, respectively.
F. Capital share transactions for each class of shares were:
| Year Ended December 31, | ||||
| 2011 | 2010 | |||
| Amount | Shares | Amount | Shares | |
| ($000) | (000) | ($000) | (000) | |
| Investor Shares | ||||
| Issued | 692,900 | 53,609 | 854,441 | 70,009 |
| Issued in Lieu of Cash Distributions | 113,411 | 8,801 | 110,575 | 9,066 |
| Redeemed | (671,755) | (53,309) | (843,648) | (69,507) |
| Net Increase (Decrease)—Investor Shares | 134,556 | 9,101 | 121,368 | 9,568 |
| Institutional Shares | ||||
| Issued | 493,160 | 40,093 | 823,123 | 66,619 |
| Issued in Lieu of Cash Distributions | 70,030 | 5,489 | 44,502 | 3,644 |
| Redeemed | (845,856) | (63,298) | (155,979) | (12,231) |
| Net Increase (Decrease)—Institutional Shares | (282,666) | (17,716) | 711,646 | 58,032 |
| Institutional Plus Shares1 | ||||
| Issued | 423,082 | 31,021 | — | — |
| Issued in Lieu of Cash Distributions | 8,039 | 584 | — | — |
| Redeemed | (76) | (6) | — | — |
| Net Increase (Decrease)—Institutional Plus Shares | 431,045 | 31,599 | — | — |
| ETF Shares | ||||
| Issued | 144,489 | 1,700 | 136,803 | 1,700 |
| Issued in Lieu of Cash Distributions | — | — | — | — |
| Redeemed | (16,453) | (200) | (139,581) | (1,700) |
| Net Increase (Decrease)—ETF Shares | 128,036 | 1,500 | (2,778) | — |
| 1 Inception was October 6, 2011, for Institutional Plus Shares. | ||||
G. In preparing the financial statements as of December 31, 2011, management considered the impact of subsequent events for potential recognition or disclosure in these financial statements.
94
Report of Independent Registered
Public Accounting Firm
To the Trustees of Vanguard Bond Index Funds and the Shareholders of Vanguard Total Bond Market Index Fund, Vanguard Short-Term Bond Index Fund, Vanguard Intermediate-Term Bond Index Fund and Vanguard Long-Term Bond Index Fund:
In our opinion, the accompanying statements of net assets—investments summary, and the related statements of operations and of changes in net assets and the financial highlights present fairly, in all material respects, the financial position of Vanguard Total Bond Market Index Fund, Vanguard Short-Term Bond Index Fund, Vanguard Intermediate-Term Bond Index Fund and Vanguard Long-Term Bond Index Fund (constituting separate portfolios of Vanguard Bond Index Funds, hereafter referred to as the “Funds”) at December 31, 2011, the results of each of their operations for the year then ended, the changes in each of their net assets for each of the two years for the period then ended and the financial highlights for each of the periods indicated, in conformity with accounting principles generally accepted in the United States of America. These financial statements and financial highlights (hereafter referred to as “financial statements”) are the responsibility of the Funds’ management; our responsibility is to express an opinion on these financial statements based on our audits. We conducted our audits of these financial statements in accordance with the standards of the Public Company Accounting Oversight Board (United States). Those standards require that we plan and perform the audit to obtain reasonable assurance about whether the financial statements are free of material misstatement. An audit includes examining, on a test basis, evidence supporting the amounts and disclosures in the financial statements, assessing the accounting principles used and significant estimates made by management, and evaluating the overall financial statement presentation. We believe that our audits, which included confirmation of securities at December 31, 2011 by correspondence with the custodian and brokers and by agreement to the underlying ownership records of Vanguard Market Liquidity Fund, provide a reasonable basis for our opinion.
PricewaterhouseCoopers LLP
Philadelphia, Pennsylvania
February 15, 2012
95

This information for the fiscal year ended December 31, 2011, is included pursuant to provisions of the Internal Revenue Code.
The fund distributed $319,094,000 as capital gain dividends (from net long-term capital gains) to shareholders during the fiscal year.
For nonresident alien shareholders, 100% of short-term capital gain dividends distributed by the fund are qualified short-term capital gains.
For nonresident alien shareholders, 88.1% of income dividends are interest-related dividends.

This information for the fiscal year ended December 31, 2011, is included pursuant to provisions of the Internal Revenue Code.
The fund distributed $121,540,000 as capital gain dividends (from net long-term capital gains) to shareholders during the fiscal year.
For nonresident alien shareholders, 100% of short-term capital gain dividends distributed by the fund are qualified short-term capital gains.
For nonresident alien shareholders, 83.0% of income dividends are interest-related dividends.

This information for the fiscal year ended December 31, 2011, is included pursuant to provisions of the Internal Revenue Code.
The fund distributed $205,924,000 as capital gain dividends (from net long-term capital gains) to shareholders during the fiscal year.
For nonresident alien shareholders, 100% of short-term capital gain dividends distributed by the fund are qualified short-term capital gains.
For nonresident alien shareholders, 85.4% of income dividends are interest-related dividends.

This information for the fiscal year ended December 31, 2011, is included pursuant to provisions of the Internal Revenue Code.
The fund distributed $42,183,000 as capital gain dividends (from net long-term capital gains) to shareholders during the fiscal year.
For nonresident alien shareholders, 100% of short-term capital gain dividends distributed by the fund are qualified short-term capital gains.
For nonresident alien shareholders, 78.4% of income dividends are interest-related dividends.
96
About Your Fund’s Expenses
As a shareholder of the fund, you incur ongoing costs, which include costs for portfolio management, administrative services, and shareholder reports (like this one), among others. Operating expenses, which are deducted from a fund’s gross income, directly reduce the investment return of the fund.
A fund’s expenses are expressed as a percentage of its average net assets. This figure is known as the expense ratio. The following examples are intended to help you understand the ongoing costs (in dollars) of investing in your fund and to compare these costs with those of other mutual funds. The examples are based on an investment of $1,000 made at the beginning of the period shown and held for the entire period.
The accompanying table illustrates your fund’s costs in two ways:
• Based on actual fund return. This section helps you to estimate the actual expenses that you paid over the period. The ”Ending Account Value“ shown is derived from the fund‘s actual return, and the third column shows the dollar amount that would have been paid by an investor who started with $1,000 in the fund. You may use the information here, together with the amount you invested, to estimate the expenses that you paid over the period.
To do so, simply divide your account value by $1,000 (for example, an $8,600 account value divided by $1,000 = 8.6), then multiply the result by the number given for your fund under the heading ”Expenses Paid During Period.“
• Based on hypothetical 5% yearly return. This section is intended to help you compare your fund‘s costs with those of other mutual funds. It assumes that the fund had a yearly return of 5% before expenses, but that the expense ratio is unchanged. In this case—because the return used is not the fund’s actual return—the results do not apply to your investment. The example is useful in making comparisons because the Securities and Exchange Commission requires all mutual funds to calculate expenses based on a 5% return. You can assess your fund’s costs by comparing this hypothetical example with the hypothetical examples that appear in shareholder reports of other funds.
Note that the expenses shown in the table are meant to highlight and help you compare ongoing costs only and do not reflect transaction costs incurred by the fund for buying and selling securities. Further, the expenses do not include any purchase, redemption, or account service fees described in the fund prospectus. If such fees were applied to your account, your costs would be higher. Your fund does not carry a “sales load.”
The calculations assume no shares were bought or sold during the period. Your actual costs may have been higher or lower, depending on the amount of your investment and the timing of any purchases or redemptions.
You can find more information about the fund’s expenses, including annual expense ratios, in the Financial Statements section of this report. For additional information on operating expenses and other shareholder costs, please refer to your fund’s current prospectus.
97
| Six Months Ended December 31, 2011 | |||
| Beginning | Ending | Expenses | |
| Account Value | Account Value | Paid During | |
| 6/30/2011 | 12/31/2011 | Period | |
| Based on Actual Fund Return | |||
| Total Bond Market Index Fund | |||
| Investor Shares | $1,000.00 | $1,049.49 | $1.14 |
| Admiral Shares | 1,000.00 | 1,050.17 | 0.47 |
| Signal Shares | 1,000.00 | 1,050.17 | 0.47 |
| Institutional Shares | 1,000.00 | 1,050.28 | 0.36 |
| Institutional Plus Shares | 1,000.00 | 1,050.38 | 0.26 |
| ETF Shares | 1,000.00 | 1,050.61 | 0.47 |
| Short-Term Bond Index Fund | |||
| Investor Shares | $1,000.00 | $1,013.30 | $1.12 |
| Admiral Shares | 1,000.00 | 1,013.86 | 0.56 |
| Signal Shares | 1,000.00 | 1,013.86 | 0.56 |
| ETF Shares | 1,000.00 | 1,013.73 | 0.56 |
| Intermediate-Term Bond Index Fund | |||
| Investor Shares | $1,000.00 | $1,068.06 | $1.15 |
| Admiral Shares | 1,000.00 | 1,068.65 | 0.57 |
| Signal Shares | 1,000.00 | 1,068.65 | 0.57 |
| Institutional Shares | 1,000.00 | 1,068.87 | 0.37 |
| ETF Shares | 1,000.00 | 1,068.55 | 0.57 |
| Long-Term Bond Index Fund | |||
| Investor Shares | $1,000.00 | $1,185.31 | $1.21 |
| Institutional Shares | 1,000.00 | 1,186.19 | 0.39 |
| ETF Shares | 1,000.00 | 1,185.46 | 0.61 |
98
| Six Months Ended December 31, 2011 | |||
| Beginning | Ending | Expenses | |
| Account Value | Account Value | Paid During | |
| 6/30/2011 | 12/31/2011 | Period | |
| Based on Hypothetical 5% Yearly Return | |||
| Total Bond Market Index Fund | |||
| Investor Shares | $1,000.00 | $1,024.10 | $1.12 |
| Admiral Shares | 1,000.00 | 1,024.75 | 0.46 |
| Signal Shares | 1,000.00 | 1,024.75 | 0.46 |
| Institutional Shares | 1,000.00 | 1,024.85 | 0.36 |
| Institutional Plus Shares | 1,000.00 | 1,024.95 | 0.26 |
| ETF Shares | 1,000.00 | 1,024.75 | 0.46 |
| Short-Term Bond Index Fund | |||
| Investor Shares | $1,000.00 | $1,024.10 | $1.12 |
| Admiral Shares | 1,000.00 | 1,024.65 | 0.56 |
| Signal Shares | 1,000.00 | 1,024.65 | 0.56 |
| ETF Shares | 1,000.00 | 1,024.65 | 0.56 |
| Intermediate-Term Bond Index Fund | |||
| Investor Shares | $1,000.00 | $1,024.10 | $1.12 |
| Admiral Shares | 1,000.00 | 1,024.65 | 0.56 |
| Signal Shares | 1,000.00 | 1,024.65 | 0.56 |
| Institutional Shares | 1,000.00 | 1,024.85 | 0.36 |
| ETF Shares | 1,000.00 | 1,024.65 | 0.56 |
| Long-Term Bond Index Fund | |||
| Investor Shares | $1,000.00 | $1,024.10 | $1.12 |
| Institutional Shares | 1,000.00 | 1,024.85 | 0.36 |
| ETF Shares | 1,000.00 | 1,024.65 | 0.56 |
The calculations are based on expenses incurred in the most recent six-month period. The funds’ annualized six-month expense ratios for that
period are: for the Total Bond Market Index Fund, 0.22% for Investor Shares, 0.09% for Admiral Shares, 0.09% for Signal Shares, 0.07% for
Institutional Shares, 0.05% for Institutional Plus Shares, and 0.09% for ETF Shares; for the Short-Term Bond Index Fund, 0.22% for Investor
Shares, 0.11% for Admiral Shares, 0.11% for Signal Shares, and 0.11% for ETF Shares; for the Intermediate-Term Bond Index Fund, 0.22% for
Investor Shares, 0.11% for Admiral Shares, 0.11% for Signal Shares, 0.07% for Institutional Shares, and 0.11% for ETF Shares; and for the
Long-Term Bond Index Fund, 0.22% for Investor Shares, 0.07% for Institutional Shares, and 0.11% for ETF Shares. The dollar amounts shown
as “Expenses Paid” are equal to the annualized expense ratio multiplied by the average account value over the period, multiplied by the
number of days in the most recent six-month period, then divided by the number of days in the most recent 12-month period. The table does
not include data for share classes with less than six months of history.
99
Glossary
30-Day SEC Yield. A fund’s 30-day SEC yield is derived using a formula specified by the U.S. Securities and Exchange Commission. Under the formula, data related to the fund’s security holdings in the previous 30 days are used to calculate the fund’s hypothetical net income for that period, which is then annualized and divided by the fund’s estimated average net assets over the calculation period. For the purposes of this calculation, a security’s income is based on its current market yield to maturity (for bonds), its actual income (for asset-backed securities), or its projected dividend yield (for stocks). Because the SEC yield represents hypothetical annualized income, it will differ—at times significantly—from the fund’s actual experience. As a result, the fund’s income distributions may be higher or lower than implied by the SEC yield.
Average Coupon. The average interest rate paid on the fixed income securities held by a fund. It is expressed as a percentage of face value.
Average Duration. An estimate of how much the value of the bonds held by a fund will fluctuate in response to a change in interest rates. To see how the value could change, multiply the average duration by the change in rates. If interest rates rise by 1 percentage point, the value of the bonds in a fund with an average duration of five years would decline by about 5%. If rates decrease by a percentage point, the value would rise by 5%.
Average Effective Maturity. The average length of time until fixed income securities held by a fund reach maturity and are repaid, taking into consideration the possibility that the issuer may call the bond before its maturity date. The figure reflects the proportion of fund assets represented by each security; it also reflects any futures contracts held. In general, the longer the average effective maturity, the more a fund’s share price will fluctuate in response to changes in market interest rates.
Beta. A measure of the magnitude of a fund’s past share-price fluctuations in relation to the ups and downs of a given market index. The index is assigned a beta of 1.00. Compared with a given index, a fund with a beta of 1.20 typically would have seen its share price rise or fall by 12% when the index rose or fell by 10%. For this report, beta is based on returns over the past 36 months for both the fund and the index. Note that a fund’s beta should be reviewed in conjunction with its R-squared (see definition). The lower the R-squared, the less correlation there is between the fund and the index, and the less reliable beta is as an indicator of volatility.
Credit Quality. Credit-quality ratings are measured on a scale that generally ranges from AAA (highest) to D (lowest). “Not Rated” is used to classify securities for which a rating is not available. U.S. Treasury, U.S. Agency, and U.S. Agency mortgage-backed securities appear under “U.S. Government.” Credit-quality ratings are obtained from Barclays Capital using ratings generally derived from Moody’s, Fitch, and S&P. When ratings from all three agencies are used, the median rating is shown. When ratings from two of the agencies are used, the lower rating is shown.
Expense Ratio. A fund’s total annual operating expenses expressed as a percentage of the fund’s average net assets. The expense ratio includes management and administrative expenses, but does not include the transaction costs of buying and selling portfolio securities.
Inception Date. The date on which the assets of a fund (or one of its share classes) are first invested in accordance with the fund’s investment objective. For funds with a subscription period, the inception date is the day after that period ends. Investment performance is measured from the inception date.
100
R-Squared. A measure of how much of a fund’s past returns can be explained by the returns from the market in general, as measured by a given index. If a fund’s total returns were precisely synchronized with an index’s returns, its R-squared would be 1.00. If the fund’s returns bore no relationship to the index’s returns, its R-squared would be 0. For this report, R-squared is based on returns over the past 36 months for both the fund and the index.
Short-Term Reserves. The percentage of a fund invested in highly liquid, short-term securities that can be readily converted to cash.
Yield to Maturity. The rate of return an investor would receive if the fixed income securities held by a fund were held to their maturity dates.
101
This page intentionally left blank.
This page intentionally left blank.
The People Who Govern Your Fund
The trustees of your mutual fund are there to see that the fund is operated and managed in your best interests since, as a shareholder, you are a part owner of the fund. Your fund’s trustees also serve on the board of directors of The Vanguard Group, Inc., which is owned by the Vanguard funds and provides services to them on an at-cost basis.
A majority of Vanguard’s board members are independent, meaning that they have no affiliation with Vanguard or the funds they oversee, apart from the sizable personal investments they have made as private individuals. The independent board members have distinguished backgrounds in business, academia, and public service. Each of the trustees and executive officers oversees 180 Vanguard funds.
The following table provides information for each trustee and executive officer of the fund. More information about the trustees is in the Statement of Additional Information, which can be obtained, without charge, by contacting Vanguard at 800-662-7447, or online at vanguard.com.
| Interested Trustee1 | and President (2006–2008) of Rohm and Haas Co. |
| (chemicals); Director of Tyco International, Ltd. | |
| F. William McNabb III | (diversified manufacturing and services) and Hewlett- |
| Born 1957. Trustee Since July 2009. Chairman of the | Packard Co. (electronic computer manufacturing); |
| Board. Principal Occupation(s) During the Past Five | Senior Advisor at New Mountain Capital; Trustee |
| Years: Chairman of the Board of The Vanguard Group, | of The Conference Board; Member of the Board of |
| Inc., and of each of the investment companies served | Managers of Delphi Automotive LLP (automotive |
| by The Vanguard Group, since January 2010; Director | components). |
| of The Vanguard Group since 2008; Chief Executive | |
| Officer and President of The Vanguard Group and of | Amy Gutmann |
| each of the investment companies served by The | Born 1949. Trustee Since June 2006. Principal |
| Vanguard Group since 2008; Director of Vanguard | Occupation(s) During the Past Five Years: President |
| Marketing Corporation; Managing Director of The | of the University of Pennsylvania; Christopher H. |
| Vanguard Group (1995–2008). | Browne Distinguished Professor of Political Science |
| in the School of Arts and Sciences with secondary | |
| appointments at the Annenberg School for Commu- | |
| Independent Trustees | nication and the Graduate School of Education |
| of the University of Pennsylvania; Director of | |
| Emerson U. Fullwood | Carnegie Corporation of New York, Schuylkill River |
| Born 1948. Trustee Since January 2008. Principal | Development Corporation, and Greater Philadelphia |
| Occupation(s) During the Past Five Years: Executive | Chamber of Commerce; Trustee of the National |
| Chief Staff and Marketing Officer for North America | Constitution Center; Chair of the Presidential |
| and Corporate Vice President (retired 2008) of Xerox | Commission for the Study of Bioethical Issues. |
| Corporation (document management products and | |
| services); Executive in Residence and 2010 | JoAnn Heffernan Heisen |
| Distinguished Minett Professor at the Rochester | Born 1950. Trustee Since July 1998. Principal |
| Institute of Technology; Director of SPX Corporation | Occupation(s) During the Past Five Years: Corporate |
| (multi-industry manufacturing), the United Way of | Vice President and Chief Global Diversity Officer |
| Rochester, Amerigroup Corporation (managed health | (retired 2008) and Member of the Executive |
| care), the University of Rochester Medical Center, | Committee (1997–2008) of Johnson & Johnson |
| Monroe Community College Foundation, and North | (pharmaceuticals/consumer products); Director of |
| Carolina A&T University. | Skytop Lodge Corporation (hotels), the University |
| Medical Center at Princeton, the Robert Wood | |
| Rajiv L. Gupta | Johnson Foundation, and the Center for Work Life |
| Born 1945. Trustee Since December 2001.2 | Policy; Member of the Advisory Board of the |
| Principal Occupation(s) During the Past Five Years: | Maxwell School of Citizenship and Public Affairs |
| Chairman and Chief Executive Officer (retired 2009) | at Syracuse University. |
| F. Joseph Loughrey | Thomas J. Higgins | |
| Born 1949. Trustee Since October 2009. Principal | Born 1957. Chief Financial Officer Since September | |
| Occupation(s) During the Past Five Years: President | 2008. Principal Occupation(s) During the Past Five | |
| and Chief Operating Officer (retired 2009) and Vice | Years: Principal of The Vanguard Group, Inc.; Chief | |
| Chairman of the Board (2008–2009) of Cummins Inc. | Financial Officer of each of the investment companies | |
| (industrial machinery); Director of SKF AB (industrial | served by The Vanguard Group since 2008; Treasurer | |
| machinery), Hillenbrand, Inc. (specialized consumer | of each of the investment companies served by The | |
| services), the Lumina Foundation for Education, and | Vanguard Group (1998–2008). | |
| Oxfam America; Chairman of the Advisory Council | ||
| for the College of Arts and Letters and Member | Kathryn J. Hyatt | |
| of the Advisory Board to the Kellogg Institute for | Born 1955. Treasurer Since November 2008. Principal | |
| International Studies at the University of Notre Dame. | Occupation(s) During the Past Five Years: Principal | |
| of The Vanguard Group, Inc.; Treasurer of each of | ||
| André F. Perold | the investment companies served by The Vanguard | |
| Born 1952. Trustee Since December 2004. Principal | Group since 2008; Assistant Treasurer of each of the | |
| Occupation(s) During the Past Five Years: George | investment companies served by The Vanguard Group | |
| Gund Professor of Finance and Banking at the Harvard | (1988–2008). | |
| Business School (retired July 2011); Chief Investment | ||
| Officer and co-Managing Partner of HighVista | Heidi Stam | |
| Strategies LLC (private investment firm); Director of | Born 1956. Secretary Since July 2005. Principal | |
| Rand Merchant Bank; Overseer of the Museum of | Occupation(s) During the Past Five Years: Managing | |
| Fine Arts Boston. | Director of The Vanguard Group, Inc., since 2006; | |
| General Counsel of The Vanguard Group since 2005; | ||
| Alfred M. Rankin, Jr. | Secretary of The Vanguard Group and of each of the | |
| Born 1941. Trustee Since January 1993. Principal | investment companies served by The Vanguard Group | |
| Occupation(s) During the Past Five Years: Chairman, | since 2005; Director and Senior Vice President of | |
| President, and Chief Executive Officer of NACCO | Vanguard Marketing Corporation since 2005; | |
| Industries, Inc. (forklift trucks/housewares/lignite); | Principal of The Vanguard Group (1997–2006). | |
| Director of Goodrich Corporation (industrial products/ | ||
| aircraft systems and services) and the National | ||
| Association of Manufacturers; Chairman of the | Vanguard Senior Management Team | |
| Federal Reserve Bank of Cleveland; Vice Chairman | ||
| of University Hospitals of Cleveland; President of | R. Gregory Barton | Chris D. McIsaac |
| the Board of The Cleveland Museum of Art. | Mortimer J. Buckley | Michael S. Miller |
| Kathleen C. Gubanich | James M. Norris | |
| Peter F. Volanakis | Paul A. Heller | Glenn W. Reed |
| Born 1955. Trustee Since July 2009. Principal | Martha G. King | George U. Sauter |
| Occupation(s) During the Past Five Years: President | ||
| and Chief Operating Officer (retired 2010) of Corning | ||
| Incorporated (communications equipment); Director of | Chairman Emeritus and Senior Advisor | |
| Corning Incorporated (2000–2010) and Dow Corning | ||
| (2001–2010); Overseer of the Amos Tuck School of | John J. Brennan | |
| Business Administration at Dartmouth College. | Chairman, 1996–2009 | |
| Chief Executive Officer and President, 1996–2008 | ||
| Executive Officers | ||
| Founder | ||
| Glenn Booraem | ||
| Born 1967. Controller Since July 2010. Principal | John C. Bogle | |
| Occupation(s) During the Past Five Years: Principal | Chairman and Chief Executive Officer, 1974–1996 | |
| of The Vanguard Group, Inc.; Controller of each of | ||
| the investment companies served by The Vanguard | ||
| Group since 2010; Assistant Controller of each of | ||
| the investment companies served by The Vanguard | ||
| Group (2001–2010). | ||
1 Mr. McNabb is considered an “interested person,” as defined in the Investment Company Act of 1940, because he is an officer of the
Vanguard funds.
2 December 2002 for Vanguard Equity Income Fund, Vanguard Growth Equity Fund, the Vanguard Municipal Bond Funds, and the Vanguard
State Tax-Exempt Funds.

| P.O. Box 2600 | |
| Valley Forge, PA 19482-2600 | |
| Connect with Vanguard® > vanguard.com | |
| Fund Information > 800-662-7447 | Vanguard ETFs are not sponsored, endorsed, sold, or |
| Direct Investor Account Services > 800-662-2739 | promoted by Barclays Capital. Barclays Capital makes |
| no representation or warranty, express or implied, to | |
| Institutional Investor Services > 800-523-1036 | the owners of Vanguard ETFs or any member of the |
| Text Telephone for People | public regarding the advisability of investing in |
| With Hearing Impairment > 800-749-7273 | securities generally or in Vanguard ETFs particularly or |
| the ability of the Barclays Capital Index to track general | |
| This material may be used in conjunction | bond market performance. Barclays Capital hereby |
| with the offering of shares of any Vanguard | expressly disclaims all warranties of merchantability |
| fund only if preceded or accompanied by | and fitness for a particular purpose with respect to the |
| Barclays Capital Index and any data included therein. | |
| the fund’s current prospectus. | Barclays Capital’s only relationship to Vanguard and |
| All comparative mutual fund data are from Lipper Inc. or | Vanguard ETFs is the licensing of the Barclays Capital |
| Morningstar, Inc., unless otherwise noted. | Index which is determined, composed, and calculated |
| by Barclays Capital without regard to Vanguard or the | |
| You can obtain a free copy of Vanguard’s proxy voting | Vanguard ETFs. Barclays Capital is not responsible for, |
| guidelines by visiting vanguard.com/proxyreporting or by | and has not participated in, the determination of the |
| calling Vanguard at 800-662-2739. The guidelines are | timing of, prices of, or quantities of Vanguard ETFs to |
| also available from the SEC’s website, sec.gov. In | be issued. Source of index data: Barclays Capital Global |
| addition, you may obtain a free report on how your fund | Family of Indices. Copyright 2011, Barclays Capital. All |
| voted the proxies for securities it owned during the 12 | rights reserved. |
| months ended June 30. To get the report, visit either | |
| vanguard.com/proxyreporting or sec.gov. | |
| You can review and copy information about your fund at | |
| the SEC’s Public Reference Room in Washington, D.C. To | |
| find out more about this public service, call the SEC at | |
| 202-551-8090. Information about your fund is also | |
| available on the SEC’s website, and you can receive | |
| copies of this information, for a fee, by sending a | |
| request in either of two ways: via e-mail addressed to | |
| publicinfo@sec.gov or via regular mail addressed to the | |
| Public Reference Section, Securities and Exchange | |
| Commission, Washington, DC 20549-1520. | |
| © 2012 The Vanguard Group, Inc. | |
| All rights reserved. | |
| Vanguard Marketing Corporation, Distributor. | |
| Q840 022012 | |
Vanguard® Total Bond Market Index Fund
Schedule of Investments
December 31, 2011
| Face | Market | |||
| Maturity | Amount | Value | ||
| Coupon | Date | ($000) | ($000) | |
| U.S. Government and Agency Obligations (70.7%) | ||||
| U.S. Government Securities (38.3%) | ||||
| United States Treasury Note/Bond | 0.375% | 9/30/12 | 35,470 | 35,537 |
| United States Treasury Note/Bond | 1.375% | 10/15/12 | 560,980 | 566,416 |
| United States Treasury Note/Bond | 3.875% | 10/31/12 | 65,760 | 67,784 |
| United States Treasury Note/Bond | 4.000% | 11/15/12 | 37,210 | 38,448 |
| United States Treasury Note/Bond | 0.500% | 11/30/12 | 27,935 | 28,027 |
| United States Treasury Note/Bond | 3.375% | 11/30/12 | 19,010 | 19,565 |
| United States Treasury Note/Bond | 1.125% | 12/15/12 | 552,250 | 557,342 |
| United States Treasury Note/Bond | 0.625% | 12/31/12 | 5,375 | 5,399 |
| United States Treasury Note/Bond | 3.625% | 12/31/12 | 4,810 | 4,975 |
| United States Treasury Note/Bond | 1.375% | 1/15/13 | 826,465 | 836,664 |
| United States Treasury Note/Bond | 0.625% | 1/31/13 | 427,470 | 429,539 |
| United States Treasury Note/Bond | 1.375% | 2/15/13 | 140,750 | 142,619 |
| United States Treasury Note/Bond | 3.875% | 2/15/13 | 49,855 | 51,904 |
| United States Treasury Note/Bond | 0.625% | 2/28/13 | 72,555 | 72,929 |
| United States Treasury Note/Bond | 2.750% | 2/28/13 | 41,755 | 42,988 |
| United States Treasury Note/Bond | 1.375% | 3/15/13 | 268,515 | 272,333 |
| United States Treasury Note/Bond | 0.750% | 3/31/13 | 34,620 | 34,858 |
| United States Treasury Note/Bond | 1.750% | 4/15/13 | 21,355 | 21,779 |
| United States Treasury Note/Bond | 0.625% | 4/30/13 | 1,313,825 | 1,321,222 |
| United States Treasury Note/Bond | 3.625% | 5/15/13 | 12,056 | 12,614 |
| United States Treasury Note/Bond | 0.500% | 5/31/13 | 159,025 | 159,671 |
| United States Treasury Note/Bond | 3.500% | 5/31/13 | 4,070 | 4,257 |
| United States Treasury Note/Bond | 3.375% | 6/30/13 | 40,360 | 42,246 |
| United States Treasury Note/Bond | 1.000% | 7/15/13 | 6,550 | 6,627 |
| United States Treasury Note/Bond | 3.375% | 7/31/13 | 15,255 | 16,006 |
| United States Treasury Note/Bond | 0.750% | 8/15/13 | 605 | 610 |
| United States Treasury Note/Bond | 4.250% | 8/15/13 | 15,055 | 16,031 |
| United States Treasury Note/Bond | 0.125% | 8/31/13 | 8,940 | 8,926 |
| United States Treasury Note/Bond | 3.125% | 8/31/13 | 22,705 | 23,791 |
| United States Treasury Note/Bond | 0.750% | 9/15/13 | 1,975 | 1,992 |
| United States Treasury Note/Bond | 0.125% | 9/30/13 | 464,530 | 463,661 |
| United States Treasury Note/Bond | 3.125% | 9/30/13 | 303,180 | 318,387 |
| United States Treasury Note/Bond | 0.500% | 10/15/13 | 2,825 | 2,838 |
| United States Treasury Note/Bond | 0.250% | 10/31/13 | 2,825 | 2,825 |
| United States Treasury Note/Bond | 2.750% | 10/31/13 | 548,723 | 573,673 |
| United States Treasury Note/Bond | 0.500% | 11/15/13 | 300 | 301 |
| United States Treasury Note/Bond | 4.250% | 11/15/13 | 60,110 | 64,571 |
| United States Treasury Note/Bond | 0.250% | 11/30/13 | 1,900 | 1,901 |
| United States Treasury Note/Bond | 2.000% | 11/30/13 | 57,785 | 59,699 |
| United States Treasury Note/Bond | 0.750% | 12/15/13 | 6,495 | 6,559 |
| United States Treasury Note/Bond | 0.125% | 12/31/13 | 2,740 | 2,734 |
| United States Treasury Note/Bond | 1.500% | 12/31/13 | 239,735 | 245,690 |
| United States Treasury Note/Bond | 1.750% | 1/31/14 | 234,655 | 241,842 |
| United States Treasury Note/Bond | 4.000% | 2/15/14 | 121,020 | 130,531 |
| United States Treasury Note/Bond | 1.875% | 2/28/14 | 764,335 | 790,368 |
| United States Treasury Note/Bond | 1.250% | 3/15/14 | 43,960 | 44,894 |
| United States Treasury Note/Bond | 1.750% | 3/31/14 | 442,185 | 456,693 |
| United States Treasury Note/Bond | 1.250% | 4/15/14 | 81,325 | 83,104 |
| United States Treasury Note/Bond | 1.875% | 4/30/14 | 638,550 | 661,800 |
| United States Treasury Note/Bond | 1.000% | 5/15/14 | 726,945 | 738,874 |
| United States Treasury Note/Bond | 4.750% | 5/15/14 | 399,828 | 441,622 |
| United States Treasury Note/Bond | 2.250% | 5/31/14 | 260,890 | 272,914 |
| United States Treasury Note/Bond | 0.750% | 6/15/14 | 5,925 | 5,989 |
| United States Treasury Note/Bond | 2.625% | 6/30/14 | 282,890 | 298,981 |
| United States Treasury Note/Bond | 0.625% | 7/15/14 | 282,825 | 284,991 |
| United States Treasury Note/Bond | 2.625% | 7/31/14 | 173,985 | 184,234 |
| United States Treasury Note/Bond | 0.500% | 8/15/14 | 462,000 | 464,236 |
| United States Treasury Note/Bond | 4.250% | 8/15/14 | 189,880 | 209,225 |
| United States Treasury Note/Bond | 2.375% | 8/31/14 | 143,710 | 151,411 |
| United States Treasury Note/Bond | 0.250% | 9/15/14 | 46,380 | 46,278 |
| United States Treasury Note/Bond | 2.375% | 9/30/14 | 182,315 | 192,399 |
1
Vanguard® Total Bond Market Index Fund
Schedule of Investments
December 31, 2011
| Face | Market | |||
| Maturity | Amount | Value | ||
| Coupon | Date | ($000) | ($000) | |
| United States Treasury Note/Bond | 0.500% | 10/15/14 | 245,445 | 246,481 |
| United States Treasury Note/Bond | 2.375% | 10/31/14 | 282,985 | 298,948 |
| United States Treasury Note/Bond | 0.375% | 11/15/14 | 332,120 | 332,379 |
| United States Treasury Note/Bond | 2.125% | 11/30/14 | 514,964 | 540,954 |
| United States Treasury Note/Bond | 0.250% | 12/15/14 | 450,700 | 449,294 |
| United States Treasury Note/Bond | 2.625% | 12/31/14 | 141,070 | 150,460 |
| United States Treasury Note/Bond | 2.250% | 1/31/15 | 62,005 | 65,503 |
| United States Treasury Note/Bond | 4.000% | 2/15/15 | 163,137 | 181,185 |
| United States Treasury Note/Bond | 11.250% | 2/15/15 | 49,325 | 65,826 |
| United States Treasury Note/Bond | 2.375% | 2/28/15 | 319,107 | 338,652 |
| United States Treasury Note/Bond | 2.500% | 3/31/15 | 137,550 | 146,685 |
| United States Treasury Note/Bond | 2.500% | 4/30/15 | 182,305 | 194,554 |
| United States Treasury Note/Bond | 4.125% | 5/15/15 | 248,255 | 278,473 |
| United States Treasury Note/Bond | 2.125% | 5/31/15 | 96,610 | 101,999 |
| United States Treasury Note/Bond | 1.875% | 6/30/15 | 100,865 | 105,703 |
| United States Treasury Note/Bond | 1.750% | 7/31/15 | 249,118 | 260,057 |
| United States Treasury Note/Bond | 4.250% | 8/15/15 | 15,200 | 17,226 |
| United States Treasury Note/Bond | 10.625% | 8/15/15 | 5,935 | 8,085 |
| United States Treasury Note/Bond | 1.250% | 8/31/15 | 91,580 | 94,027 |
| United States Treasury Note/Bond | 1.250% | 9/30/15 | 197,450 | 202,601 |
| United States Treasury Note/Bond | 1.250% | 10/31/15 | 53,365 | 54,733 |
| United States Treasury Note/Bond | 4.500% | 11/15/15 | 126,725 | 145,713 |
| United States Treasury Note/Bond | 9.875% | 11/15/15 | 262,900 | 356,516 |
| United States Treasury Note/Bond | 1.375% | 11/30/15 | 252,290 | 259,977 |
| United States Treasury Note/Bond | 2.125% | 12/31/15 | 248,055 | 263,132 |
| United States Treasury Note/Bond | 2.000% | 1/31/16 | 63,600 | 67,118 |
| United States Treasury Note/Bond | 4.500% | 2/15/16 | 168,355 | 194,687 |
| United States Treasury Note/Bond | 9.250% | 2/15/16 | 2,210 | 2,984 |
| United States Treasury Note/Bond | 2.125% | 2/29/16 | 69,650 | 73,927 |
| United States Treasury Note/Bond | 2.625% | 2/29/16 | 152,950 | 165,353 |
| United States Treasury Note/Bond | 2.375% | 3/31/16 | 70,525 | 75,539 |
| United States Treasury Note/Bond | 2.000% | 4/30/16 | 78,075 | 82,454 |
| United States Treasury Note/Bond | 2.625% | 4/30/16 | 245,360 | 265,487 |
| United States Treasury Note/Bond | 5.125% | 5/15/16 | 247,030 | 294,042 |
| United States Treasury Note/Bond | 7.250% | 5/15/16 | 48,085 | 61,684 |
| United States Treasury Note/Bond | 1.750% | 5/31/16 | 7,435 | 7,777 |
| United States Treasury Note/Bond | 1.500% | 6/30/16 | 216,140 | 223,536 |
| United States Treasury Note/Bond | 3.250% | 6/30/16 | 327,340 | 363,655 |
| United States Treasury Note/Bond | 1.500% | 7/31/16 | 12,310 | 12,727 |
| United States Treasury Note/Bond | 1.000% | 8/31/16 | 7,150 | 7,229 |
| United States Treasury Note/Bond | 3.000% | 8/31/16 | 331,480 | 365,198 |
| United States Treasury Note/Bond | 1.000% | 9/30/16 | 241,210 | 243,774 |
| United States Treasury Note/Bond | 3.000% | 9/30/16 | 457,850 | 504,853 |
| United States Treasury Note/Bond | 1.000% | 10/31/16 | 89,910 | 90,795 |
| United States Treasury Note/Bond | 3.125% | 10/31/16 | 213,860 | 237,218 |
| United States Treasury Note/Bond | 4.625% | 11/15/16 | 106,641 | 125,953 |
| United States Treasury Note/Bond | 7.500% | 11/15/16 | 84,277 | 111,154 |
| United States Treasury Note/Bond | 0.875% | 11/30/16 | 334,001 | 335,097 |
| United States Treasury Note/Bond | 2.750% | 11/30/16 | 240,022 | 262,075 |
| United States Treasury Note/Bond | 3.250% | 12/31/16 | 65,675 | 73,341 |
| United States Treasury Note/Bond | 3.125% | 1/31/17 | 310,060 | 344,750 |
| United States Treasury Note/Bond | 4.625% | 2/15/17 | 36,825 | 43,701 |
| United States Treasury Note/Bond | 3.000% | 2/28/17 | 40,275 | 44,548 |
| United States Treasury Note/Bond | 3.250% | 3/31/17 | 8,570 | 9,597 |
| United States Treasury Note/Bond | 3.125% | 4/30/17 | 11,200 | 12,476 |
| United States Treasury Note/Bond | 4.500% | 5/15/17 | 163,120 | 193,475 |
| United States Treasury Note/Bond | 8.750% | 5/15/17 | 250,815 | 353,571 |
| United States Treasury Note/Bond | 2.750% | 5/31/17 | 323,780 | 354,387 |
| United States Treasury Note/Bond | 2.500% | 6/30/17 | 462,350 | 500,133 |
| United States Treasury Note/Bond | 2.375% | 7/31/17 | 54,375 | 58,462 |
| United States Treasury Note/Bond | 4.750% | 8/15/17 | 420,505 | 506,381 |
| United States Treasury Note/Bond | 8.875% | 8/15/17 | 43,390 | 62,122 |
| United States Treasury Note/Bond | 1.875% | 8/31/17 | 35,650 | 37,327 |
| United States Treasury Note/Bond | 1.875% | 9/30/17 | 59,575 | 62,302 |
2
Vanguard® Total Bond Market Index Fund
Schedule of Investments
December 31, 2011
| Face | Market | |||
| Maturity | Amount | Value | ||
| Coupon | Date | ($000) | ($000) | |
| United States Treasury Note/Bond | 1.875% | 10/31/17 | 209,827 | 219,433 |
| United States Treasury Note/Bond | 4.250% | 11/15/17 | 158,250 | 186,958 |
| United States Treasury Note/Bond | 2.750% | 12/31/17 | 275 | 301 |
| United States Treasury Note/Bond | 2.625% | 1/31/18 | 450 | 490 |
| United States Treasury Note/Bond | 3.500% | 2/15/18 | 47,425 | 54,087 |
| United States Treasury Note/Bond | 2.750% | 2/28/18 | 294,925 | 323,450 |
| United States Treasury Note/Bond | 2.875% | 3/31/18 | 34,300 | 37,891 |
| United States Treasury Note/Bond | 2.625% | 4/30/18 | 43,100 | 46,932 |
| United States Treasury Note/Bond | 3.875% | 5/15/18 | 376,346 | 439,030 |
| United States Treasury Note/Bond | 9.125% | 5/15/18 | 3,685 | 5,499 |
| United States Treasury Note/Bond | 2.375% | 5/31/18 | 407,565 | 437,179 |
| United States Treasury Note/Bond | 2.375% | 6/30/18 | 95,075 | 101,894 |
| United States Treasury Note/Bond | 2.250% | 7/31/18 | 30,000 | 31,912 |
| United States Treasury Note/Bond | 4.000% | 8/15/18 | 188,660 | 222,177 |
| United States Treasury Note/Bond | 1.500% | 8/31/18 | 256,250 | 260,014 |
| United States Treasury Note/Bond | 1.750% | 10/31/18 | 181,465 | 186,767 |
| United States Treasury Note/Bond | 3.750% | 11/15/18 | 203,920 | 237,216 |
| United States Treasury Note/Bond | 9.000% | 11/15/18 | 25 | 38 |
| United States Treasury Note/Bond | 2.750% | 2/15/19 | 23,230 | 25,444 |
| United States Treasury Note/Bond | 8.875% | 2/15/19 | 123,475 | 187,219 |
| United States Treasury Note/Bond | 3.125% | 5/15/19 | 161,085 | 180,591 |
| United States Treasury Note/Bond | 3.625% | 8/15/19 | 108,641 | 125,803 |
| United States Treasury Note/Bond | 8.125% | 8/15/19 | 117,735 | 175,112 |
| United States Treasury Note/Bond | 3.375% | 11/15/19 | 471,533 | 537,472 |
| United States Treasury Note/Bond | 3.625% | 2/15/20 | 337,909 | 391,816 |
| United States Treasury Note/Bond | 3.500% | 5/15/20 | 452,328 | 520,250 |
| United States Treasury Note/Bond | 8.750% | 5/15/20 | 2,500 | 3,914 |
| United States Treasury Note/Bond | 2.625% | 8/15/20 | 245,341 | 264,586 |
| United States Treasury Note/Bond | 8.750% | 8/15/20 | 244,040 | 384,822 |
| United States Treasury Note/Bond | 2.625% | 11/15/20 | 102,239 | 110,051 |
| United States Treasury Note/Bond | 3.625% | 2/15/21 | 340,705 | 395,484 |
| United States Treasury Note/Bond | 7.875% | 2/15/21 | 208,392 | 317,960 |
| United States Treasury Note/Bond | 3.125% | 5/15/21 | 240,395 | 268,341 |
| United States Treasury Note/Bond | 8.125% | 5/15/21 | 12,080 | 18,790 |
| United States Treasury Note/Bond | 2.125% | 8/15/21 | 538,613 | 552,078 |
| United States Treasury Note/Bond | 8.125% | 8/15/21 | 136,690 | 214,026 |
| United States Treasury Note/Bond | 2.000% | 11/15/21 | 407,274 | 411,729 |
| United States Treasury Note/Bond | 8.000% | 11/15/21 | 59,855 | 93,523 |
| United States Treasury Note/Bond | 7.250% | 8/15/22 | 2,940 | 4,449 |
| United States Treasury Note/Bond | 7.625% | 11/15/22 | 7,450 | 11,594 |
| United States Treasury Note/Bond | 7.125% | 2/15/23 | 161,760 | 244,562 |
| United States Treasury Note/Bond | 6.250% | 8/15/23 | 687,360 | 983,358 |
| United States Treasury Note/Bond | 7.500% | 11/15/24 | 13,725 | 21,898 |
| United States Treasury Note/Bond | 7.625% | 2/15/25 | 712 | 1,151 |
| United States Treasury Note/Bond | 6.875% | 8/15/25 | 82,450 | 126,934 |
| United States Treasury Note/Bond | 6.000% | 2/15/26 | 13,315 | 19,184 |
| United States Treasury Note/Bond | 6.750% | 8/15/26 | 59,860 | 92,418 |
| United States Treasury Note/Bond | 6.500% | 11/15/26 | 21,079 | 31,968 |
| United States Treasury Note/Bond | 6.625% | 2/15/27 | 41,065 | 63,163 |
| United States Treasury Note/Bond | 6.375% | 8/15/27 | 46,885 | 71,038 |
| United States Treasury Note/Bond | 6.125% | 11/15/27 | 15,485 | 23,007 |
| United States Treasury Note/Bond | 5.500% | 8/15/28 | 55,045 | 77,673 |
| United States Treasury Note/Bond | 5.250% | 11/15/28 | 26,720 | 36,824 |
| United States Treasury Note/Bond | 5.250% | 2/15/29 | 119,790 | 165,441 |
| United States Treasury Note/Bond | 6.125% | 8/15/29 | 189,110 | 286,443 |
| United States Treasury Note/Bond | 6.250% | 5/15/30 | 63,523 | 98,203 |
| United States Treasury Note/Bond | 5.375% | 2/15/31 | 23,215 | 33,078 |
| United States Treasury Note/Bond | 4.500% | 2/15/36 | 1,815 | 2,373 |
| United States Treasury Note/Bond | 4.750% | 2/15/37 | 272,660 | 370,092 |
| United States Treasury Note/Bond | 5.000% | 5/15/37 | 3,449 | 4,850 |
| United States Treasury Note/Bond | 4.375% | 2/15/38 | 43,624 | 56,329 |
| United States Treasury Note/Bond | 4.500% | 5/15/38 | 2,038 | 2,683 |
| United States Treasury Note/Bond | 3.500% | 2/15/39 | 366,586 | 411,606 |
| United States Treasury Note/Bond | 4.250% | 5/15/39 | 327,664 | 416,185 |
3
Vanguard® Total Bond Market Index Fund
Schedule of Investments
December 31, 2011
| Face | Market | |||
| Maturity | Amount | Value | ||
| Coupon | Date | ($000) | ($000) | |
| United States Treasury Note/Bond | 4.500% | 8/15/39 | 455,749 | 601,730 |
| United States Treasury Note/Bond | 4.375% | 11/15/39 | 334,296 | 433,278 |
| United States Treasury Note/Bond | 4.625% | 2/15/40 | 377,451 | 508,204 |
| United States Treasury Note/Bond | 4.375% | 5/15/40 | 261,865 | 339,607 |
| United States Treasury Note/Bond | 3.875% | 8/15/40 | 135,688 | 162,381 |
| United States Treasury Note/Bond | 4.250% | 11/15/40 | 219,825 | 279,866 |
| United States Treasury Note/Bond | 4.750% | 2/15/41 | 298,325 | 410,430 |
| United States Treasury Note/Bond | 4.375% | 5/15/41 | 252,820 | 328,825 |
| United States Treasury Note/Bond | 3.750% | 8/15/41 | 43,890 | 51,523 |
| 39,019,003 | ||||
| Agency Bonds and Notes (4.9%) | ||||
| 1 Ally Financial Inc. | 2.200% | 12/19/12 | 2,950 | 3,006 |
| 1 Citibank NA | 1.750% | 12/28/12 | 42,995 | 43,612 |
| 1 Citigroup Funding Inc. | 2.250% | 12/10/12 | 4,775 | 4,863 |
| Egypt Government AID Bonds | 4.450% | 9/15/15 | 16,750 | 18,739 |
| 2 Federal Agricultural Mortgage Corp. | 1.250% | 12/6/13 | 5,140 | 5,202 |
| 2 Federal Agricultural Mortgage Corp. | 2.125% | 9/15/15 | 2,825 | 2,921 |
| 2 Federal Agricultural Mortgage Corp. | 2.000% | 7/27/16 | 3,575 | 3,664 |
| 2 Federal Farm Credit Bank | 1.875% | 12/7/12 | 9,375 | 9,518 |
| 2 Federal Farm Credit Bank | 1.750% | 2/21/13 | 8,775 | 8,924 |
| 2 Federal Farm Credit Bank | 1.375% | 6/25/13 | 6,800 | 6,907 |
| 2 Federal Farm Credit Bank | 3.875% | 10/7/13 | 37,650 | 39,962 |
| 2 Federal Farm Credit Bank | 1.125% | 2/27/14 | 8,000 | 8,110 |
| 2 Federal Farm Credit Bank | 2.625% | 4/17/14 | 13,185 | 13,812 |
| 2 Federal Farm Credit Bank | 3.000% | 9/22/14 | 5,625 | 5,981 |
| 2 Federal Farm Credit Bank | 1.625% | 11/19/14 | 13,425 | 13,814 |
| 2 Federal Farm Credit Bank | 1.500% | 11/16/15 | 6,825 | 6,986 |
| 2 Federal Farm Credit Bank | 4.875% | 12/16/15 | 1,625 | 1,872 |
| 2 Federal Farm Credit Bank | 5.125% | 8/25/16 | 9,075 | 10,727 |
| 2 Federal Farm Credit Bank | 4.875% | 1/17/17 | 8,030 | 9,459 |
| 2 Federal Farm Credit Bank | 5.150% | 11/15/19 | 15,675 | 19,216 |
| 2 Federal Home Loan Bank of Chicago | 5.625% | 6/13/16 | 3,705 | 4,175 |
| 2 Federal Home Loan Banks | 1.750% | 12/14/12 | 19,360 | 19,639 |
| 2 Federal Home Loan Banks | 1.500% | 1/16/13 | 81,120 | 82,179 |
| 2 Federal Home Loan Banks | 1.625% | 3/20/13 | 11,395 | 11,584 |
| 2 Federal Home Loan Banks | 1.000% | 3/27/13 | 36,900 | 37,237 |
| 2 Federal Home Loan Banks | 3.625% | 5/29/13 | 150 | 157 |
| 2 Federal Home Loan Banks | 3.875% | 6/14/13 | 5,125 | 5,391 |
| 2 Federal Home Loan Banks | 5.375% | 6/14/13 | 12,150 | 13,037 |
| 2 Federal Home Loan Banks | 1.875% | 6/21/13 | 90,705 | 92,830 |
| 2 Federal Home Loan Banks | 5.125% | 8/14/13 | 4,560 | 4,914 |
| 2 Federal Home Loan Banks | 4.000% | 9/6/13 | 46,725 | 49,593 |
| 2 Federal Home Loan Banks | 5.250% | 9/13/13 | 9,200 | 9,954 |
| 2 Federal Home Loan Banks | 4.500% | 9/16/13 | 24,625 | 26,375 |
| 2 Federal Home Loan Banks | 3.625% | 10/18/13 | 65,100 | 68,876 |
| 2 Federal Home Loan Banks | 0.375% | 11/27/13 | 24,925 | 24,935 |
| 2 Federal Home Loan Banks | 4.875% | 11/27/13 | 19,900 | 21,567 |
| 2 Federal Home Loan Banks | 3.125% | 12/13/13 | 32,925 | 34,626 |
| 2 Federal Home Loan Banks | 0.875% | 12/27/13 | 29,800 | 30,089 |
| 2 Federal Home Loan Banks | 1.375% | 5/28/14 | 22,000 | 22,479 |
| 2 Federal Home Loan Banks | 2.500% | 6/13/14 | 37,450 | 39,181 |
| 2 Federal Home Loan Banks | 5.500% | 8/13/14 | 88,275 | 99,595 |
| 2 Federal Home Loan Banks | 4.500% | 11/14/14 | 35,450 | 39,341 |
| 2 Federal Home Loan Banks | 2.750% | 12/12/14 | 18,950 | 20,115 |
| 2 Federal Home Loan Banks | 3.125% | 3/11/16 | 26,225 | 28,468 |
| 2 Federal Home Loan Banks | 5.375% | 5/18/16 | 36,700 | 43,567 |
| 2 Federal Home Loan Banks | 5.125% | 10/19/16 | 15,925 | 18,883 |
| 2 Federal Home Loan Banks | 4.750% | 12/16/16 | 21,510 | 25,292 |
| 2 Federal Home Loan Banks | 4.875% | 5/17/17 | 87,700 | 104,402 |
| 2 Federal Home Loan Banks | 5.000% | 11/17/17 | 7,100 | 8,543 |
| 2 Federal Home Loan Banks | 5.375% | 8/15/18 | 4,750 | 5,876 |
| 2 Federal Home Loan Banks | 4.125% | 3/13/20 | 10,515 | 12,061 |
| 2 Federal Home Loan Banks | 5.250% | 12/11/20 | 6,850 | 8,519 |
| 2 Federal Home Loan Banks | 5.625% | 6/11/21 | 1,125 | 1,437 |
4
Vanguard® Total Bond Market Index Fund
Schedule of Investments
December 31, 2011
| Face | Market | |||
| Maturity | Amount | Value | ||
| Coupon | Date | ($000) | ($000) | |
| 2 Federal Home Loan Banks | 5.375% | 8/15/24 | 24,600 | 31,360 |
| 2 Federal Home Loan Banks | 5.500% | 7/15/36 | 14,250 | 18,483 |
| 3 Federal Home Loan Mortgage Corp. | 0.625% | 12/28/12 | 62,000 | 62,242 |
| 3 Federal Home Loan Mortgage Corp. | 0.750% | 12/28/12 | 50,850 | 51,086 |
| 3 Federal Home Loan Mortgage Corp. | 1.375% | 1/9/13 | 82,395 | 83,346 |
| 3 Federal Home Loan Mortgage Corp. | 0.750% | 3/28/13 | 31,150 | 31,339 |
| 3 Federal Home Loan Mortgage Corp. | 1.625% | 4/15/13 | 91,330 | 92,958 |
| 3 Federal Home Loan Mortgage Corp. | 3.750% | 6/28/13 | 9,790 | 10,293 |
| 3 Federal Home Loan Mortgage Corp. | 4.500% | 7/15/13 | 58,120 | 61,886 |
| 3 Federal Home Loan Mortgage Corp. | 4.125% | 9/27/13 | 29,225 | 31,139 |
| 3 Federal Home Loan Mortgage Corp. | 0.375% | 10/30/13 | 45,600 | 45,610 |
| 3 Federal Home Loan Mortgage Corp. | 4.875% | 11/15/13 | 49,625 | 53,767 |
| 3 Federal Home Loan Mortgage Corp. | 0.375% | 11/27/13 | 32,350 | 32,351 |
| 3 Federal Home Loan Mortgage Corp. | 2.500% | 1/7/14 | 5,300 | 5,516 |
| 3 Federal Home Loan Mortgage Corp. | 4.500% | 1/15/14 | 24,855 | 26,883 |
| 3 Federal Home Loan Mortgage Corp. | 1.375% | 2/25/14 | 44,925 | 45,779 |
| 3 Federal Home Loan Mortgage Corp. | 2.500% | 4/23/14 | 106,825 | 111,708 |
| 3 Federal Home Loan Mortgage Corp. | 5.000% | 7/15/14 | 47,900 | 53,247 |
| 3 Federal Home Loan Mortgage Corp. | 3.000% | 7/28/14 | 82,250 | 87,370 |
| 3 Federal Home Loan Mortgage Corp. | 1.000% | 7/30/14 | 24,625 | 24,904 |
| 3 Federal Home Loan Mortgage Corp. | 1.000% | 8/20/14 | 7,500 | 7,579 |
| 3 Federal Home Loan Mortgage Corp. | 1.000% | 8/27/14 | 12,500 | 12,639 |
| 3 Federal Home Loan Mortgage Corp. | 0.500% | 9/19/14 | 12,500 | 12,451 |
| 3 Federal Home Loan Mortgage Corp. | 0.000% | 11/24/14 | 7,400 | 7,233 |
| 3 Federal Home Loan Mortgage Corp. | 0.750% | 11/25/14 | 33,800 | 33,958 |
| 3 Federal Home Loan Mortgage Corp. | 0.625% | 12/29/14 | 28,000 | 28,015 |
| 3 Federal Home Loan Mortgage Corp. | 5.050% | 1/26/15 | 600 | 679 |
| 3 Federal Home Loan Mortgage Corp. | 2.875% | 2/9/15 | 775 | 827 |
| 3 Federal Home Loan Mortgage Corp. | 1.750% | 9/10/15 | 25,000 | 25,836 |
| 3 Federal Home Loan Mortgage Corp. | 5.250% | 4/18/16 | 48,925 | 57,630 |
| 3 Federal Home Loan Mortgage Corp. | 2.500% | 5/27/16 | 13,600 | 14,462 |
| 3 Federal Home Loan Mortgage Corp. | 5.500% | 7/18/16 | 91,500 | 109,542 |
| 3 Federal Home Loan Mortgage Corp. | 2.000% | 8/25/16 | 34,075 | 35,454 |
| 3 Federal Home Loan Mortgage Corp. | 5.125% | 10/18/16 | 15,775 | 18,736 |
| 3 Federal Home Loan Mortgage Corp. | 5.000% | 2/16/17 | 28,225 | 33,453 |
| 3 Federal Home Loan Mortgage Corp. | 5.000% | 4/18/17 | 10,000 | 11,895 |
| 3 Federal Home Loan Mortgage Corp. | 5.500% | 8/23/17 | 33,450 | 40,935 |
| 3 Federal Home Loan Mortgage Corp. | 5.125% | 11/17/17 | 6,670 | 8,056 |
| 3 Federal Home Loan Mortgage Corp. | 4.875% | 6/13/18 | 22,750 | 27,424 |
| 3 Federal Home Loan Mortgage Corp. | 3.750% | 3/27/19 | 114,225 | 130,458 |
| 3 Federal Home Loan Mortgage Corp. | 6.750% | 9/15/29 | 11,375 | 16,827 |
| 3 Federal Home Loan Mortgage Corp. | 6.750% | 3/15/31 | 38,739 | 58,165 |
| 3 Federal Home Loan Mortgage Corp. | 6.250% | 7/15/32 | 524 | 761 |
| 3 Federal National Mortgage Assn. | 0.375% | 12/28/12 | 15,735 | 15,758 |
| 3 Federal National Mortgage Assn. | 3.625% | 2/12/13 | 80,285 | 83,284 |
| 3 Federal National Mortgage Assn. | 4.750% | 2/21/13 | 9,800 | 10,291 |
| 3 Federal National Mortgage Assn. | 0.750% | 2/26/13 | 35,025 | 35,226 |
| 3 Federal National Mortgage Assn. | 4.375% | 3/15/13 | 86,075 | 90,318 |
| 3 Federal National Mortgage Assn. | 4.625% | 5/1/13 | 23,794 | 25,054 |
| 3 Federal National Mortgage Assn. | 1.750% | 5/7/13 | 10,232 | 10,440 |
| 3 Federal National Mortgage Assn. | 3.875% | 7/12/13 | 14,240 | 15,022 |
| 3 Federal National Mortgage Assn. | 0.500% | 8/9/13 | 27,148 | 27,233 |
| 3 Federal National Mortgage Assn. | 1.250% | 8/20/13 | 40,600 | 41,218 |
| 3 Federal National Mortgage Assn. | 4.625% | 10/15/13 | 77,645 | 83,522 |
| 3 Federal National Mortgage Assn. | 2.875% | 12/11/13 | 11,175 | 11,710 |
| 3 Federal National Mortgage Assn. | 0.750% | 12/18/13 | 121,625 | 122,424 |
| 3 Federal National Mortgage Assn. | 5.125% | 1/2/14 | 3,600 | 3,902 |
| 3 Federal National Mortgage Assn. | 1.250% | 2/27/14 | 121,950 | 123,974 |
| 3 Federal National Mortgage Assn. | 2.750% | 3/13/14 | 37,950 | 39,817 |
| 3 Federal National Mortgage Assn. | 4.125% | 4/15/14 | 26,200 | 28,352 |
| 3 Federal National Mortgage Assn. | 2.500% | 5/15/14 | 42,050 | 44,013 |
| 3 Federal National Mortgage Assn. | 1.125% | 6/27/14 | 12,775 | 12,955 |
| 3 Federal National Mortgage Assn. | 0.875% | 8/28/14 | 32,700 | 32,965 |
| 3 Federal National Mortgage Assn. | 3.000% | 9/16/14 | 32,075 | 34,147 |
5
Vanguard® Total Bond Market Index Fund
Schedule of Investments
December 31, 2011
| Face | Market | ||||
| Maturity | Amount | Value | |||
| Coupon | Date | ($000) | ($000) | ||
| 3 | Federal National Mortgage Assn. | 4.625% | 10/15/14 | 28,500 | 31,664 |
| 3 | Federal National Mortgage Assn. | 0.625% | 10/30/14 | 35,500 | 35,528 |
| 3 | Federal National Mortgage Assn. | 2.625% | 11/20/14 | 8,750 | 9,259 |
| 3 | Federal National Mortgage Assn. | 0.750% | 12/19/14 | 50,525 | 50,752 |
| 3 | Federal National Mortgage Assn. | 5.000% | 4/15/15 | 16,960 | 19,307 |
| 3 | Federal National Mortgage Assn. | 2.375% | 7/28/15 | 30,125 | 31,784 |
| 3 | Federal National Mortgage Assn. | 2.000% | 9/21/15 | 12,000 | 12,469 |
| 3 | Federal National Mortgage Assn. | 4.375% | 10/15/15 | 17,755 | 20,068 |
| 3 | Federal National Mortgage Assn. | 1.625% | 10/26/15 | 18,450 | 18,967 |
| 3 | Federal National Mortgage Assn. | 8.200% | 3/10/16 | 50 | 65 |
| 3 | Federal National Mortgage Assn. | 5.000% | 3/15/16 | 5,850 | 6,814 |
| 3 | Federal National Mortgage Assn. | 2.375% | 4/11/16 | 51,040 | 53,982 |
| 3 | Federal National Mortgage Assn. | 5.250% | 9/15/16 | 22,175 | 26,375 |
| 3 | Federal National Mortgage Assn. | 1.250% | 9/28/16 | 25,600 | 25,749 |
| 3 | Federal National Mortgage Assn. | 1.375% | 11/15/16 | 75,450 | 76,275 |
| 3 | Federal National Mortgage Assn. | 4.875% | 12/15/16 | 25,925 | 30,595 |
| 3 | Federal National Mortgage Assn. | 5.000% | 2/13/17 | 79,525 | 94,231 |
| 3 | Federal National Mortgage Assn. | 5.000% | 5/11/17 | 119,951 | 142,815 |
| 3 | Federal National Mortgage Assn. | 5.375% | 6/12/17 | 20,260 | 24,532 |
| 3 | Federal National Mortgage Assn. | 0.000% | 10/9/19 | 14,545 | 11,048 |
| 3 | Federal National Mortgage Assn. | 6.250% | 5/15/29 | 1,250 | 1,758 |
| 3 | Federal National Mortgage Assn. | 7.125% | 1/15/30 | 24,980 | 38,355 |
| 3 | Federal National Mortgage Assn. | 7.250% | 5/15/30 | 46,901 | 73,163 |
| 3 | Federal National Mortgage Assn. | 6.625% | 11/15/30 | 6,795 | 10,053 |
| 3 | Federal National Mortgage Assn. | 5.625% | 7/15/37 | 7,240 | 9,875 |
| 2 | Financing Corp. Fico | 9.800% | 4/6/18 | 1,750 | 2,575 |
| 2 | Financing Corp. Fico | 10.350% | 8/3/18 | 4,900 | 7,487 |
| 2 | Financing Corp. Fico | 9.650% | 11/2/18 | 10,535 | 15,659 |
| 2 | Financing Corp. Fico | 9.700% | 4/5/19 | 1,575 | 2,391 |
| 1 | General Electric Capital Corp. | 2.125% | 12/21/12 | 19,250 | 19,601 |
| 1 | General Electric Capital Corp. | 2.625% | 12/28/12 | 13,150 | 13,459 |
| Israel Government AID Bond | 5.500% | 12/4/23 | 3,200 | 4,108 | |
| Israel Government AID Bond | 5.500% | 4/26/24 | 19,280 | 24,765 | |
| 1 | JPMorgan Chase & Co. | 2.125% | 12/26/12 | 32,325 | 32,920 |
| Private Export Funding Corp. | 3.550% | 4/15/13 | 2,275 | 2,367 | |
| Private Export Funding Corp. | 3.050% | 10/15/14 | 4,600 | 4,882 | |
| Private Export Funding Corp. | 2.250% | 12/15/17 | 4,600 | 4,797 | |
| Private Export Funding Corp. | 4.375% | 3/15/19 | 8,700 | 10,228 | |
| Private Export Funding Corp. | 4.300% | 12/15/21 | 3,800 | 4,353 | |
| Private Export Funding Corp. | 2.800% | 5/15/22 | 2,625 | 2,651 | |
| Resolution Funding Corp. | 8.125% | 10/15/19 | 450 | 647 | |
| Resolution Funding Corp. | 8.875% | 7/15/20 | 180 | 273 | |
| Resolution Funding Corp. | 8.625% | 1/15/30 | 110 | 183 | |
| Small Business Administration Variable Rate Interest | |||||
| Only Custodial Receipts (U.S. Government | |||||
| Guaranteed) | 2.719% | 7/15/17 | 4,449 | 222 | |
| 2 | Tennessee Valley Authority | 4.750% | 8/1/13 | 4,000 | 4,277 |
| 2 | Tennessee Valley Authority | 5.500% | 7/18/17 | 17,100 | 20,812 |
| 2 | Tennessee Valley Authority | 4.500% | 4/1/18 | 6,325 | 7,437 |
| 2 | Tennessee Valley Authority | 3.875% | 2/15/21 | 9,400 | 10,696 |
| 2 | Tennessee Valley Authority | 6.750% | 11/1/25 | 1,985 | 2,815 |
| 2 | Tennessee Valley Authority | 7.125% | 5/1/30 | 27,025 | 41,127 |
| 2 | Tennessee Valley Authority | 4.650% | 6/15/35 | 15,169 | 17,768 |
| 2 | Tennessee Valley Authority | 5.880% | 4/1/36 | 9,850 | 13,411 |
| 2 | Tennessee Valley Authority | 6.150% | 1/15/38 | 135 | 192 |
| 2 | Tennessee Valley Authority | 5.500% | 6/15/38 | 2,550 | 3,353 |
| 2 | Tennessee Valley Authority | 5.250% | 9/15/39 | 9,068 | 11,573 |
| 2 | Tennessee Valley Authority | 4.875% | 1/15/48 | 6,825 | 8,421 |
| 2 | Tennessee Valley Authority | 5.375% | 4/1/56 | 6,250 | 8,442 |
| 2 | Tennessee Valley Authority | 4.625% | 9/15/60 | 7,468 | 8,800 |
| 4,966,294 | |||||
| Conventional Mortgage-Backed Securities (26.5%) | |||||
| 3,4,5 | Fannie Mae Pool | 3.000% | 1/1/27 | 233,325 | 240,945 |
| 3,4,5 | Fannie Mae Pool | 3.500% | 7/1/13–1/1/42 | 908,970 | 945,731 |
6
Vanguard® Total Bond Market Index Fund
Schedule of Investments
December 31, 2011
| Face | Market | ||||
| Maturity | Amount | Value | |||
| Coupon | Date | ($000) | ($000) | ||
| 3,4,5 | Fannie Mae Pool | 4.000% | 1/1/12–1/1/42 | 2,278,503 | 2,399,872 |
| 3,4,5 | Fannie Mae Pool | 4.500% | 9/1/13–1/1/42 | 2,132,967 | 2,277,153 |
| 3,4,5 | Fannie Mae Pool | 5.000% | 1/1/12–1/1/42 | 2,023,378 | 2,188,971 |
| 3,4,5 | Fannie Mae Pool | 5.500% | 2/1/14–1/1/42 | 1,781,671 | 1,947,300 |
| 3,4,5 | Fannie Mae Pool | 6.000% | 7/1/12–1/1/42 | 1,298,687 | 1,437,747 |
| 3,4,5 | Fannie Mae Pool | 6.500% | 12/1/12–1/1/42 | 415,162 | 464,599 |
| 3,4 | Fannie Mae Pool | 7.000% | 1/1/12–11/1/38 | 116,563 | 132,851 |
| 3,4 | Fannie Mae Pool | 7.500% | 2/1/12–12/1/32 | 7,817 | 8,835 |
| 3,4 | Fannie Mae Pool | 8.000% | 2/1/12–9/1/31 | 2,351 | 2,680 |
| 3,4 | Fannie Mae Pool | 8.500% | 9/1/15–5/1/32 | 953 | 1,090 |
| 3,4 | Fannie Mae Pool | 9.000% | 2/1/17–8/1/30 | 244 | 271 |
| 3,4 | Fannie Mae Pool | 9.500% | 8/1/16–11/1/25 | 297 | 346 |
| 3,4 | Fannie Mae Pool | 10.000% | 10/1/14–11/1/19 | 36 | 39 |
| 3,4 | Fannie Mae Pool | 11.000% | 9/1/19 | 3 | 3 |
| 3,4 | Federal Home Loan Mortgage Corp. | 3.500% | 9/1/26 | 33,450 | 34,896 |
| 3,4,5 | Freddie Mac Gold Pool | 3.000% | 1/1/27 | 163,825 | 169,048 |
| 3,4,5 | Freddie Mac Gold Pool | 3.500% | 6/1/19–1/1/42 | 509,902 | 529,959 |
| 3,4,5 | Freddie Mac Gold Pool | 4.000% | 2/1/12–1/1/42 | 1,420,191 | 1,491,924 |
| 3,4,5 | Freddie Mac Gold Pool | 4.500% | 6/1/12–1/1/42 | 1,517,165 | 1,610,535 |
| 3,4,5 | Freddie Mac Gold Pool | 5.000% | 4/1/12–1/1/42 | 1,338,437 | 1,439,676 |
| 3,4,5 | Freddie Mac Gold Pool | 5.500% | 12/1/13–1/1/42 | 1,305,342 | 1,419,925 |
| 3,4,5 | Freddie Mac Gold Pool | 6.000% | 1/1/12–1/1/42 | 820,635 | 904,319 |
| 3,4,5 | Freddie Mac Gold Pool | 6.500% | 1/1/12–12/1/41 | 238,647 | 267,652 |
| 3,4 | Freddie Mac Gold Pool | 7.000% | 1/1/12–12/1/38 | 52,285 | 59,725 |
| 3,4 | Freddie Mac Gold Pool | 7.500% | 2/1/12–2/1/32 | 4,912 | 5,588 |
| 3,4 | Freddie Mac Gold Pool | 8.000% | 6/1/12–1/1/32 | 4,197 | 4,769 |
| 3,4 | Freddie Mac Gold Pool | 8.500% | 3/1/21–7/1/31 | 782 | 902 |
| 3,4 | Freddie Mac Gold Pool | 9.000% | 7/1/20–3/1/31 | 569 | 644 |
| 3,4 | Freddie Mac Gold Pool | 9.500% | 4/1/16–6/1/25 | 108 | 120 |
| 3,4 | Freddie Mac Gold Pool | 10.000% | 10/1/16–4/1/25 | 14 | 18 |
| 3,4 | Freddie Mac Non Gold Pool | 8.000% | 2/1/17–6/1/17 | 15 | 16 |
| 3,4 | Freddie Mac Non Gold Pool | 8.500% | 6/1/18 | 28 | 33 |
| 3,4 | Freddie Mac Non Gold Pool | 9.500% | 10/1/18–3/1/20 | 3 | 5 |
| 4,5 | Ginnie Mae I Pool | 3.500% | 2/15/26–1/1/42 | 114,817 | 120,511 |
| 4,5 | Ginnie Mae I Pool | 4.000% | 8/15/18–1/1/42 | 523,672 | 561,895 |
| 4,5 | Ginnie Mae I Pool | 4.500% | 5/15/18–1/1/42 | 957,865 | 1,045,249 |
| 4 | Ginnie Mae I Pool | 4.750% | 8/15/33 | 29 | 32 |
| 4,5 | Ginnie Mae I Pool | 5.000% | 1/15/17–1/1/42 | 679,769 | 754,128 |
| 4,5 | Ginnie Mae I Pool | 5.500% | 3/15/15–1/1/42 | 396,638 | 446,482 |
| 4 | Ginnie Mae I Pool | 6.000% | 3/15/13–12/15/40 | 284,412 | 322,533 |
| 4 | Ginnie Mae I Pool | 6.500% | 3/15/13–1/15/39 | 85,361 | 97,475 |
| 4 | Ginnie Mae I Pool | 7.000% | 6/15/12–9/15/36 | 14,681 | 16,982 |
| 4 | Ginnie Mae I Pool | 7.250% | 9/15/25 | 39 | 46 |
| 4 | Ginnie Mae I Pool | 7.500% | 8/15/12–6/15/32 | 5,813 | 6,601 |
| 4 | Ginnie Mae I Pool | 7.750% | 2/15/30 | 3 | 4 |
| 4 | Ginnie Mae I Pool | 7.900% | 2/15/21 | 3 | 3 |
| 4 | Ginnie Mae I Pool | 8.000% | 8/15/16–12/15/30 | 4,135 | 4,676 |
| 4 | Ginnie Mae I Pool | 8.250% | 6/15/27 | 4 | 4 |
| 4 | Ginnie Mae I Pool | 8.500% | 1/15/17–3/15/31 | 863 | 955 |
| 4 | Ginnie Mae I Pool | 9.000% | 5/15/16–2/15/31 | 1,516 | 1,684 |
| 4 | Ginnie Mae I Pool | 9.500% | 7/15/16–9/15/25 | 387 | 436 |
| 4 | Ginnie Mae I Pool | 10.000% | 2/15/18–2/15/25 | 148 | 163 |
| 4 | Ginnie Mae I Pool | 10.500% | 7/15/15–4/15/25 | 98 | 101 |
| 4 | Ginnie Mae I Pool | 11.000% | 9/15/15–11/15/15 | 10 | 11 |
| 4 | Ginnie Mae I Pool | 11.500% | 3/15/13–4/15/16 | 10 | 10 |
| 4,5 | Ginnie Mae II Pool | 3.500% | 10/20/26–1/1/42 | 72,746 | 76,001 |
| 4,5 | Ginnie Mae II Pool | 4.000% | 9/20/25–1/1/42 | 705,224 | 754,656 |
| 4,5 | Ginnie Mae II Pool | 4.500% | 4/20/18–1/1/42 | 1,174,611 | 1,280,850 |
| 4,5 | Ginnie Mae II Pool | 5.000% | 12/20/32–1/1/42 | 799,902 | 885,931 |
| 4 | Ginnie Mae II Pool | 5.500% | 8/20/23–8/20/41 | 300,898 | 337,290 |
| 4 | Ginnie Mae II Pool | 6.000% | 7/20/23–9/20/39 | 165,956 | 187,877 |
| 4 | Ginnie Mae II Pool | 6.500% | 12/20/23–7/20/39 | 59,604 | 67,851 |
| 4 | Ginnie Mae II Pool | 7.000% | 3/20/28–11/20/38 | 3,706 | 4,247 |
| 4 | Ginnie Mae II Pool | 7.500% | 8/20/30 | 9 | 11 |
7
Vanguard® Total Bond Market Index Fund Schedule of Investments December 31, 2011
| Face | Market | ||||
| Maturity | Amount | Value | |||
| Coupon | Date | ($000) | ($000) | ||
| 4 | Ginnie Mae II Pool | 8.500% | 10/20/30 | 19 | 22 |
| 26,962,904 | |||||
| Nonconventional Mortgage-Backed Securities (1.0%) | |||||
| 3,4 | Fannie Mae Pool | 2.246% | 12/1/35 | 22 | 23 |
| 3,4 | Fannie Mae Pool | 2.315% | 10/1/34 | 35 | 38 |
| 3,4 | Fannie Mae Pool | 2.375% | 2/1/36 | 3,884 | 3,960 |
| 3,4 | Fannie Mae Pool | 2.392% | 9/1/33–9/1/34 | 1,677 | 1,774 |
| 3,4 | Fannie Mae Pool | 2.400% | 11/1/32 | 25 | 26 |
| 3,4 | Fannie Mae Pool | 2.440% | 11/1/36 | 73 | 78 |
| 3,4 | Fannie Mae Pool | 2.465% | 12/1/35 | 9,568 | 10,166 |
| 3,4 | Fannie Mae Pool | 2.496% | 12/1/35 | 12,597 | 13,251 |
| 3,4 | Fannie Mae Pool | 2.497% | 5/1/35 | 2,626 | 2,779 |
| 3,4 | Fannie Mae Pool | 2.500% | 2/1/36 | 2,195 | 2,231 |
| 3,4 | Fannie Mae Pool | 2.559% | 1/1/35 | 3,192 | 3,399 |
| 3,4 | Fannie Mae Pool | 2.560% | 9/1/33 | 40 | 43 |
| 3,4 | Fannie Mae Pool | 2.571% | 12/1/40 | 9,487 | 9,754 |
| 3,4 | Fannie Mae Pool | 2.576% | 10/1/40 | 14,567 | 14,984 |
| 3,4 | Fannie Mae Pool | 2.667% | 4/1/36 | 5,597 | 5,917 |
| 3,4 | Fannie Mae Pool | 2.685% | 11/1/33 | 2,950 | 3,172 |
| 3,4 | Fannie Mae Pool | 2.697% | 8/1/35 | 7,920 | 8,075 |
| 3,4 | Fannie Mae Pool | 2.849% | 3/1/41 | 11,568 | 11,983 |
| 3,4 | Fannie Mae Pool | 2.884% | 10/1/36 | 1,979 | 2,138 |
| 3,4 | Fannie Mae Pool | 2.933% | 12/1/40 | 6,696 | 6,909 |
| 3,4 | Fannie Mae Pool | 3.014% | 3/1/41 | 6,342 | 6,590 |
| 3,4 | Fannie Mae Pool | 3.117% | 12/1/40 | 8,057 | 8,381 |
| 3,4 | Fannie Mae Pool | 3.123% | 2/1/41 | 8,148 | 8,485 |
| 3,4 | Fannie Mae Pool | 3.158% | 2/1/41 | 10,305 | 10,663 |
| 3,4 | Fannie Mae Pool | 3.173% | 12/1/40 | 10,483 | 10,917 |
| 3,4 | Fannie Mae Pool | 3.207% | 8/1/40 | 12,450 | 12,964 |
| 3,4 | Fannie Mae Pool | 3.209% | 9/1/40 | 14,007 | 14,584 |
| 3,4 | Fannie Mae Pool | 3.235% | 10/1/40 | 16,782 | 17,488 |
| 3,4 | Fannie Mae Pool | 3.284% | 11/1/40 | 6,336 | 6,603 |
| 3,4 | Fannie Mae Pool | 3.295% | 1/1/40 | 8,109 | 8,451 |
| 3,4 | Fannie Mae Pool | 3.347% | 1/1/40 | 18,450 | 19,243 |
| 3,4 | Fannie Mae Pool | 3.377% | 5/1/40 | 6,066 | 6,337 |
| 3,4 | Fannie Mae Pool | 3.451% | 12/1/39 | 28,150 | 29,381 |
| 3,4 | Fannie Mae Pool | 3.512% | 5/1/40 | 5,128 | 5,368 |
| 3,4 | Fannie Mae Pool | 3.535% | 3/1/40 | 15,577 | 16,304 |
| 3,4 | Fannie Mae Pool | 3.538% | 10/1/39 | 5,410 | 5,658 |
| 3,4 | Fannie Mae Pool | 3.610% | 4/1/41 | 11,549 | 11,989 |
| 3,4 | Fannie Mae Pool | 3.616% | 11/1/39 | 3,021 | 3,160 |
| 3,4 | Fannie Mae Pool | 3.623% | 11/1/39 | 6,775 | 7,092 |
| 3,4 | Fannie Mae Pool | 3.633% | 7/1/39 | 4,759 | 4,982 |
| 3,4 | Fannie Mae Pool | 3.767% | 2/1/40 | 24,968 | 26,477 |
| 3,4 | Fannie Mae Pool | 3.801% | 12/1/35 | 6,821 | 7,241 |
| 3,4 | Fannie Mae Pool | 4.030% | 7/1/35 | 2,455 | 2,544 |
| 3,4 | Fannie Mae Pool | 4.507% | 11/1/34 | 5,110 | 5,416 |
| 3,4 | Fannie Mae Pool | 4.515% | 8/1/37 | 9,713 | 10,169 |
| 3,4 | Fannie Mae Pool | 4.582% | 8/1/35–12/1/36 | 5,081 | 5,382 |
| 3,4 | Fannie Mae Pool | 4.782% | 5/1/33 | 13 | 14 |
| 3,4 | Fannie Mae Pool | 4.875% | 7/1/38 | 2,829 | 3,030 |
| 3,4 | Fannie Mae Pool | 4.919% | 10/1/38 | 12,063 | 12,894 |
| 3,4 | Fannie Mae Pool | 4.952% | 1/1/35 | 17 | 19 |
| 3,4 | Fannie Mae Pool | 4.977% | 12/1/33 | 1,859 | 1,982 |
| 3,4 | Fannie Mae Pool | 5.024% | 11/1/33 | 1,355 | 1,446 |
| 3,4 | Fannie Mae Pool | 5.038% | 1/1/37 | 2,926 | 3,115 |
| 3,4 | Fannie Mae Pool | 5.051% | 3/1/37 | 5,095 | 5,430 |
| 3,4 | Fannie Mae Pool | 5.092% | 3/1/38 | 4,637 | 4,994 |
| 3,4 | Fannie Mae Pool | 5.127% | 8/1/38 | 376 | 407 |
| 3,4 | Fannie Mae Pool | 5.206% | 6/1/35 | 94 | 101 |
| 3,4 | Fannie Mae Pool | 5.208% | 7/1/38 | 658 | 713 |
| 3,4 | Fannie Mae Pool | 5.255% | 3/1/37 | 3,164 | 3,286 |
| 3,4 | Fannie Mae Pool | 5.284% | 11/1/35 | 16 | 17 |
| 3,4 | Fannie Mae Pool | 5.346% | 12/1/35 | 3,085 | 3,365 |
8
Vanguard® Total Bond Market Index Fund
Schedule of Investments
December 31, 2011
| Face | Market | ||||
| Maturity | Amount | Value | |||
| Coupon | Date | ($000) | ($000) | ||
| 3,4 | Fannie Mae Pool | 5.469% | 2/1/37 | 4,893 | 5,026 |
| 3,4 | Fannie Mae Pool | 5.512% | 4/1/37 | 629 | 674 |
| 3,4 | Fannie Mae Pool | 5.573% | 5/1/36 | 2,577 | 2,786 |
| 3,4 | Fannie Mae Pool | 5.626% | 3/1/37 | 2,788 | 2,891 |
| 3,4 | Fannie Mae Pool | 5.639% | 3/1/37 | 5,412 | 5,586 |
| 3,4 | Fannie Mae Pool | 5.650% | 6/1/37 | 2,313 | 2,480 |
| 3,4 | Fannie Mae Pool | 5.664% | 4/1/37 | 3,163 | 3,323 |
| 3,4 | Fannie Mae Pool | 5.710% | 4/1/37 | 4,906 | 5,295 |
| 3,4 | Fannie Mae Pool | 5.726% | 2/1/37 | 3,285 | 3,446 |
| 3,4 | Fannie Mae Pool | 5.736% | 12/1/37 | 7,432 | 8,295 |
| 3,4 | Fannie Mae Pool | 5.886% | 1/1/37 | 486 | 524 |
| 3,4 | Fannie Mae Pool | 5.890% | 11/1/36 | 3,496 | 3,773 |
| 3,4 | Fannie Mae Pool | 5.898% | 10/1/37 | 5,985 | 6,459 |
| 3,4 | Fannie Mae Pool | 5.909% | 6/1/36 | 847 | 912 |
| 3,4 | Fannie Mae Pool | 5.918% | 4/1/36 | 2,918 | 3,137 |
| 3,4 | Fannie Mae Pool | 5.925% | 8/1/37 | 5,217 | 5,523 |
| 3,4 | Fannie Mae Pool | 5.954% | 2/1/37 | 7 | 7 |
| 3,4 | Fannie Mae Pool | 5.986% | 7/1/37 | 1,411 | 1,523 |
| 3,4 | Fannie Mae Pool | 6.304% | 9/1/37 | 2,965 | 3,112 |
| 3,4 | Freddie Mac Non Gold Pool | 2.085% | 1/1/37 | 3,539 | 3,730 |
| 3,4 | Freddie Mac Non Gold Pool | 2.366% | 12/1/34 | 8,005 | 8,429 |
| 3,4 | Freddie Mac Non Gold Pool | 2.375% | 11/1/34 | 3,714 | 3,933 |
| 3,4 | Freddie Mac Non Gold Pool | 2.440% | 12/1/34 | 58 | 60 |
| 3,4 | Freddie Mac Non Gold Pool | 2.477% | 1/1/35 | 425 | 456 |
| 3,4 | Freddie Mac Non Gold Pool | 2.500% | 4/1/33 | 27 | 28 |
| 3,4 | Freddie Mac Non Gold Pool | 2.506% | 3/1/36 | 6,870 | 7,325 |
| 3,4 | Freddie Mac Non Gold Pool | 2.507% | 12/1/34 | 2,854 | 3,002 |
| 3,4 | Freddie Mac Non Gold Pool | 2.515% | 4/1/35 | 332 | 346 |
| 3,4 | Freddie Mac Non Gold Pool | 2.572% | 6/1/37 | 3,339 | 3,548 |
| 3,4 | Freddie Mac Non Gold Pool | 2.580% | 12/1/36 | 4,939 | 5,180 |
| 3,4 | Freddie Mac Non Gold Pool | 2.615% | 12/1/34 | 44 | 46 |
| 3,4 | Freddie Mac Non Gold Pool | 2.627% | 12/1/40 | 7,578 | 7,806 |
| 3,4 | Freddie Mac Non Gold Pool | 2.656% | 5/1/33 | 131 | 139 |
| 3,4 | Freddie Mac Non Gold Pool | 2.713% | 12/1/40 | 15,950 | 16,454 |
| 3,4 | Freddie Mac Non Gold Pool | 2.778% | 3/1/36 | 21 | 22 |
| 3,4 | Freddie Mac Non Gold Pool | 2.780% | 11/1/40 | 7,746 | 8,003 |
| 3,4 | Freddie Mac Non Gold Pool | 2.826% | 1/1/41 | 11,762 | 12,077 |
| 3,4 | Freddie Mac Non Gold Pool | 2.981% | 2/1/41 | 17,196 | 17,862 |
| 3,4 | Freddie Mac Non Gold Pool | 3.090% | 3/1/41 | 9,364 | 9,743 |
| 3,4 | Freddie Mac Non Gold Pool | 3.149% | 11/1/40 | 8,965 | 9,336 |
| 3,4 | Freddie Mac Non Gold Pool | 3.272% | 6/1/40 | 6,833 | 7,126 |
| 3,4 | Freddie Mac Non Gold Pool | 3.334% | 4/1/40 | 10,318 | 10,769 |
| 3,4 | Freddie Mac Non Gold Pool | 3.355% | 5/1/40 | 3,532 | 3,690 |
| 3,4 | Freddie Mac Non Gold Pool | 3.449% | 5/1/40 | 4,150 | 4,337 |
| 3,4 | Freddie Mac Non Gold Pool | 3.590% | 6/1/40 | 9,438 | 9,894 |
| 3,4 | Freddie Mac Non Gold Pool | 3.596% | 6/1/40 | 14,903 | 15,585 |
| 3,4 | Freddie Mac Non Gold Pool | 3.607% | 1/1/40 | 8,957 | 9,379 |
| 3,4 | Freddie Mac Non Gold Pool | 3.670% | 9/1/40 | 13,628 | 14,269 |
| 3,4 | Freddie Mac Non Gold Pool | 3.977% | 3/1/40 | 20,857 | 21,951 |
| 3,4 | Freddie Mac Non Gold Pool | 4.023% | 6/1/36 | 12 | 13 |
| 3,4 | Freddie Mac Non Gold Pool | 4.220% | 3/1/37 | 7,270 | 7,535 |
| 3,4 | Freddie Mac Non Gold Pool | 4.546% | 7/1/35 | 2,770 | 2,948 |
| 3,4 | Freddie Mac Non Gold Pool | 4.677% | 6/1/34 | 28 | 30 |
| 3,4 | Freddie Mac Non Gold Pool | 4.746% | 5/1/38 | 2,845 | 3,037 |
| 3,4 | Freddie Mac Non Gold Pool | 5.006% | 6/1/35 | 11 | 12 |
| 3,4 | Freddie Mac Non Gold Pool | 5.028% | 5/1/35 | 4,693 | 5,057 |
| 3,4 | Freddie Mac Non Gold Pool | 5.035% | 7/1/38 | 7,057 | 7,561 |
| 3,4 | Freddie Mac Non Gold Pool | 5.132% | 4/1/37 | 4,420 | 4,710 |
| 3,4 | Freddie Mac Non Gold Pool | 5.152% | 8/1/34 | 14 | 15 |
| 3,4 | Freddie Mac Non Gold Pool | 5.220% | 11/1/33 | 13 | 14 |
| 3,4 | Freddie Mac Non Gold Pool | 5.259% | 3/1/38 | 9,607 | 10,356 |
| 3,4 | Freddie Mac Non Gold Pool | 5.314% | 3/1/37 | 4,564 | 4,800 |
| 3,4 | Freddie Mac Non Gold Pool | 5.358% | 12/1/35 | 3,549 | 3,756 |
| 3,4 | Freddie Mac Non Gold Pool | 5.396% | 8/1/37 | 170 | 180 |
9
Vanguard® Total Bond Market Index Fund
Schedule of Investments
December 31, 2011
| Face | Market | ||||
| Maturity | Amount | Value | |||
| Coupon | Date | ($000) | ($000) | ||
| 3,4 | Freddie Mac Non Gold Pool | 5.414% | 4/1/37 | 7,179 | 7,506 |
| 3,4 | Freddie Mac Non Gold Pool | 5.487% | 4/1/37 | 72 | 75 |
| 3,4 | Freddie Mac Non Gold Pool | 5.493% | 1/1/38 | 6,528 | 7,024 |
| 3,4 | Freddie Mac Non Gold Pool | 5.523% | 2/1/36 | 3,795 | 4,120 |
| 3,4 | Freddie Mac Non Gold Pool | 5.531% | 5/1/37 | 208 | 216 |
| 3,4 | Freddie Mac Non Gold Pool | 5.534% | 3/1/37 | 1,734 | 1,864 |
| 3,4 | Freddie Mac Non Gold Pool | 5.565% | 4/1/37 | 6,759 | 6,977 |
| 3,4 | Freddie Mac Non Gold Pool | 5.616% | 3/1/37 | 704 | 748 |
| 3,4 | Freddie Mac Non Gold Pool | 5.712% | 6/1/37 | 6,619 | 6,916 |
| 3,4 | Freddie Mac Non Gold Pool | 5.723% | 11/1/36 | 1,892 | 2,030 |
| 3,4 | Freddie Mac Non Gold Pool | 5.726% | 9/1/36 | 13,630 | 14,615 |
| 3,4 | Freddie Mac Non Gold Pool | 5.750% | 5/1/36 | 5,969 | 6,353 |
| 3,4 | Freddie Mac Non Gold Pool | 5.773% | 3/1/37 | 3,095 | 3,334 |
| 3,4 | Freddie Mac Non Gold Pool | 5.781% | 10/1/37 | 5,317 | 5,578 |
| 3,4 | Freddie Mac Non Gold Pool | 5.788% | 9/1/37 | 14,653 | 15,850 |
| 3,4 | Freddie Mac Non Gold Pool | 5.809% | 6/1/37 | 6,832 | 7,364 |
| 3,4 | Freddie Mac Non Gold Pool | 5.829% | 8/1/37 | 6,283 | 6,819 |
| 3,4 | Freddie Mac Non Gold Pool | 5.861% | 5/1/37 | 7,348 | 7,939 |
| 3,4 | Freddie Mac Non Gold Pool | 5.888% | 1/1/37 | 2,214 | 2,384 |
| 3,4 | Freddie Mac Non Gold Pool | 5.904% | 12/1/36 | 2,066 | 2,230 |
| 3,4 | Freddie Mac Non Gold Pool | 6.012% | 3/1/37 | 727 | 759 |
| 3,4 | Freddie Mac Non Gold Pool | 6.027% | 3/1/37 | 171 | 177 |
| 3,4 | Freddie Mac Non Gold Pool | 6.032% | 8/1/37 | 2,226 | 2,404 |
| 3,4 | Freddie Mac Non Gold Pool | 6.065% | 12/1/36 | 4,815 | 5,214 |
| 3,4 | Freddie Mac Non Gold Pool | 6.070% | 10/1/37 | 853 | 922 |
| 3,4 | Freddie Mac Non Gold Pool | 6.107% | 6/1/37 | 3,259 | 3,433 |
| 3,4 | Freddie Mac Non Gold Pool | 6.394% | 2/1/37 | 2,316 | 2,506 |
| 4 | Ginnie Mae II Pool | 2.375% | 6/20/29 | 234 | 242 |
| 4 | Ginnie Mae II Pool | 2.500% | 1/20/41–11/20/41 | 67,032 | 69,415 |
| 4 | Ginnie Mae II Pool | 3.000% | 12/20/40–5/20/41 | 16,967 | 17,706 |
| 4 | Ginnie Mae II Pool | 3.500% | 1/20/41 | 10,650 | 11,322 |
| 4 | Ginnie Mae II Pool | 4.000% | 12/20/39 | 25,707 | 27,307 |
| 4 | Ginnie Mae II Pool | 4.500% | 10/20/39 | 1,888 | 2,048 |
| 4 | Ginnie Mae II Pool | 5.000% | 7/20/38–10/20/38 | 4,631 | 4,949 |
| 1,001,049 | |||||
| Total U.S. Government and Agency Obligations (Cost $67,673,045) | 71,949,250 | ||||
| Asset-Backed/Commercial Mortgage-Backed Securities (2.6%) | |||||
| 6 | BA Covered Bond Issuer | 5.500% | 6/14/12 | 17,750 | 18,006 |
| 4 | Banc of America Merrill Lynch Commercial Mortgage | ||||
| Inc. | 3.878% | 9/11/36 | 108 | 108 | |
| 4 | Banc of America Merrill Lynch Commercial Mortgage | ||||
| Inc. | 4.050% | 11/10/38 | 810 | 810 | |
| 4 | Banc of America Merrill Lynch Commercial Mortgage | ||||
| Inc. | 4.153% | 11/10/38 | 4,250 | 4,387 | |
| 4,7 | Banc of America Merrill Lynch Commercial Mortgage | ||||
| Inc. | 5.544% | 6/10/39 | 11,709 | 12,521 | |
| 4,7 | Banc of America Merrill Lynch Commercial Mortgage | ||||
| Inc. | 4.877% | 7/10/42 | 18,805 | 19,825 | |
| 4,7 | Banc of America Merrill Lynch Commercial Mortgage | ||||
| Inc. | 5.066% | 11/10/42 | 4,335 | 4,439 | |
| 4 | Banc of America Merrill Lynch Commercial Mortgage | ||||
| Inc. | 4.727% | 7/10/43 | 4,695 | 4,833 | |
| 4 | Banc of America Merrill Lynch Commercial Mortgage | ||||
| Inc. | 5.118% | 7/11/43 | 5,620 | 5,662 | |
| 4,7 | Banc of America Merrill Lynch Commercial Mortgage | ||||
| Inc. | 5.731% | 5/10/45 | 7,700 | 8,638 | |
| 4,7 | Banc of America Merrill Lynch Commercial Mortgage | ||||
| Inc. | 5.766% | 5/10/45 | 3,290 | 2,603 | |
| 4,7 | Banc of America Merrill Lynch Commercial Mortgage | ||||
| Inc. | 5.372% | 9/10/45 | 19,690 | 21,737 | |
| 4,7 | Banc of America Merrill Lynch Commercial Mortgage | ||||
| Inc. | 5.421% | 9/10/45 | 185 | 190 | |
10
Vanguard® Total Bond Market Index Fund
Schedule of Investments
December 31, 2011
| Face | Market | ||||
| Maturity | Amount | Value | |||
| Coupon | Date | ($000) | ($000) | ||
| 4,7 | Banc of America Merrill Lynch Commercial Mortgage | ||||
| Inc. | 5.115% | 10/10/45 | 16,101 | 17,760 | |
| 4,7 | Banc of America Merrill Lynch Commercial Mortgage | ||||
| Inc. | 5.120% | 10/10/45 | 875 | 878 | |
| 4 | Banc of America Merrill Lynch Commercial Mortgage | ||||
| Inc. | 5.634% | 7/10/46 | 22,705 | 25,206 | |
| 4,7 | Banc of America Merrill Lynch Commercial Mortgage | ||||
| Inc. | 5.695% | 7/10/46 | 2,850 | 2,169 | |
| 4,7 | Banc of America Merrill Lynch Commercial Mortgage | ||||
| Inc. | 5.193% | 9/10/47 | 3,204 | 3,464 | |
| 4,7 | Banc of America Merrill Lynch Commercial Mortgage | ||||
| Inc. | 5.193% | 9/10/47 | 3,520 | 3,337 | |
| 4 | Banc of America Merrill Lynch Commercial Mortgage | ||||
| Inc. | 5.414% | 9/10/47 | 11,525 | 12,404 | |
| 4 | Banc of America Merrill Lynch Commercial Mortgage | ||||
| Inc. | 5.448% | 9/10/47 | 2,175 | 2,065 | |
| 4,7 | Banc of America Merrill Lynch Commercial Mortgage | ||||
| Inc. | 6.205% | 2/10/51 | 21,200 | 23,892 | |
| 6 | Banco Bilbao Vizcaya Argentaria SA | 5.750% | 7/20/17 | 1,975 | 2,010 |
| 6 | Bank of Scotland plc | 5.250% | 2/21/17 | 12,135 | 12,689 |
| 4 | Bear Stearns Commercial Mortgage Securities | 6.460% | 10/15/36 | 22 | 22 |
| 4,7 | Bear Stearns Commercial Mortgage Securities | 5.532% | 4/12/38 | 21,037 | 23,436 |
| 4,7 | Bear Stearns Commercial Mortgage Securities | 5.533% | 4/12/38 | 4,525 | 4,743 |
| 4 | Bear Stearns Commercial Mortgage Securities | 4.830% | 8/15/38 | 24,377 | 24,668 |
| 4,7 | Bear Stearns Commercial Mortgage Securities | 5.759% | 9/11/38 | 2,650 | 2,105 |
| 4,7 | Bear Stearns Commercial Mortgage Securities | 5.759% | 9/11/38 | 5,500 | 5,665 |
| 4,7 | Bear Stearns Commercial Mortgage Securities | 5.441% | 3/11/39 | 24,500 | 27,269 |
| 4,7 | Bear Stearns Commercial Mortgage Securities | 4.680% | 8/13/39 | 16,300 | 16,937 |
| 4 | Bear Stearns Commercial Mortgage Securities | 4.740% | 3/13/40 | 13,900 | 14,281 |
| 4,7 | Bear Stearns Commercial Mortgage Securities | 5.662% | 6/11/40 | 16,070 | 16,316 |
| 4,7 | Bear Stearns Commercial Mortgage Securities | 5.714% | 6/11/40 | 2,650 | 1,639 |
| 4,7 | Bear Stearns Commercial Mortgage Securities | 5.405% | 12/11/40 | 1,443 | 1,595 |
| 4,7 | Bear Stearns Commercial Mortgage Securities | 5.200% | 1/12/41 | 2,830 | 2,991 |
| 4 | Bear Stearns Commercial Mortgage Securities | 4.750% | 6/11/41 | 4,175 | 3,844 |
| 4,7 | Bear Stearns Commercial Mortgage Securities | 5.582% | 9/11/41 | 1,625 | 1,666 |
| 4,7 | Bear Stearns Commercial Mortgage Securities | 5.568% | 10/12/41 | 8,318 | 8,774 |
| 4 | Bear Stearns Commercial Mortgage Securities | 4.521% | 11/11/41 | 246 | 246 |
| 4 | Bear Stearns Commercial Mortgage Securities | 4.825% | 11/11/41 | 495 | 532 |
| 4 | Bear Stearns Commercial Mortgage Securities | 4.868% | 11/11/41 | 2,300 | 2,080 |
| 4,7 | Bear Stearns Commercial Mortgage Securities | 4.933% | 2/13/42 | 2,500 | 2,707 |
| 4,7 | Bear Stearns Commercial Mortgage Securities | 5.742% | 9/11/42 | 15,900 | 18,184 |
| 4 | Bear Stearns Commercial Mortgage Securities | 5.793% | 9/11/42 | 5,500 | 5,730 |
| 4,7 | Bear Stearns Commercial Mortgage Securities | 5.127% | 10/12/42 | 5,477 | 5,521 |
| 4,7 | Bear Stearns Commercial Mortgage Securities | 5.145% | 10/12/42 | 3,215 | 3,597 |
| 4,7 | Bear Stearns Commercial Mortgage Securities | 5.513% | 1/12/45 | 6,280 | 6,287 |
| 4,7 | Bear Stearns Commercial Mortgage Securities | 5.566% | 1/12/45 | 4,275 | 3,068 |
| 4 | Bear Stearns Commercial Mortgage Securities | 5.613% | 6/11/50 | 10,371 | 10,628 |
| 4,7 | Bear Stearns Commercial Mortgage Securities | 5.694% | 6/11/50 | 21,900 | 24,240 |
| 4 | Bear Stearns Commercial Mortgage Securities | 5.700% | 6/11/50 | 10,400 | 11,401 |
| 4,7 | Bear Stearns Commercial Mortgage Securities | 5.897% | 6/11/50 | 4,553 | 4,320 |
| 4 | Capital One Multi-Asset Execution Trust | 5.050% | 12/17/18 | 36,645 | 41,740 |
| 4 | Capital One Multi-Asset Execution Trust | 5.750% | 7/15/20 | 9,800 | 11,810 |
| 4 | Chase Issuance Trust | 4.650% | 3/15/15 | 32,375 | 33,722 |
| 4 | Chase Issuance Trust | 5.400% | 7/15/15 | 10,025 | 10,707 |
| 6 | Cie de Financement Foncier | 2.125% | 4/22/13 | 7,500 | 7,409 |
| 4 | CIT Group Home Equity Loan Trust | 6.200% | 2/25/30 | 616 | 621 |
| 4 | Citibank Credit Card Issuance Trust | 4.900% | 6/23/16 | 20,125 | 22,053 |
| 4 | Citibank Credit Card Issuance Trust | 4.150% | 7/7/17 | 3,425 | 3,775 |
| 4 | Citibank Credit Card Issuance Trust | 5.650% | 9/20/19 | 8,400 | 10,074 |
| 4 | Citibank Credit Card Issuance Trust | 5.350% | 2/7/20 | 900 | 1,079 |
| 4 | Citigroup Commercial Mortgage Trust | 4.623% | 10/15/41 | 3,475 | 3,528 |
| 4,7 | Citigroup Commercial Mortgage Trust | 4.830% | 5/15/43 | 1,015 | 1,080 |
| 4,7 | Citigroup Commercial Mortgage Trust | 5.728% | 3/15/49 | 12,600 | 13,903 |
| 4 | Citigroup Commercial Mortgage Trust | 5.431% | 10/15/49 | 430 | 479 |
11
Vanguard® Total Bond Market Index Fund
Schedule of Investments
December 31, 2011
| Face | Market | ||||
| Maturity | Amount | Value | |||
| Coupon | Date | ($000) | ($000) | ||
| 4 | Citigroup Commercial Mortgage Trust | 5.462% | 10/15/49 | 3,375 | 3,397 |
| 4 | Citigroup Commercial Mortgage Trust | 5.482% | 10/15/49 | 2,025 | 1,564 |
| 4,7 | Citigroup Commercial Mortgage Trust | 5.697% | 12/10/49 | 17,045 | 18,768 |
| 4,7 | Citigroup Commercial Mortgage Trust | 5.697% | 12/10/49 | 4,350 | 4,270 |
| 4,7 | Citigroup Commercial Mortgage Trust | 6.072% | 12/10/49 | 7,310 | 7,059 |
| 4,7 | Citigroup Commercial Mortgage Trust | 6.072% | 12/10/49 | 17,377 | 19,422 |
| 4,7 | Citigroup/Deutsche Bank Commercial Mortgage Trust | 5.225% | 7/15/44 | 7,000 | 7,401 |
| 4,7 | Citigroup/Deutsche Bank Commercial Mortgage Trust | 5.225% | 7/15/44 | 18,000 | 19,882 |
| 4,7 | Citigroup/Deutsche Bank Commercial Mortgage Trust | 5.886% | 11/15/44 | 18,540 | 20,427 |
| 4 | Citigroup/Deutsche Bank Commercial Mortgage Trust | 5.648% | 10/15/48 | 8,575 | 8,101 |
| 4 | Citigroup/Deutsche Bank Commercial Mortgage Trust | 5.205% | 12/11/49 | 18,385 | 18,531 |
| 4 | Citigroup/Deutsche Bank Commercial Mortgage Trust | 5.322% | 12/11/49 | 13,050 | 13,757 |
| 4,6 | Commercial Mortgage Lease-Backed Certificates | 6.746% | 6/20/31 | 7,012 | 7,500 |
| 4 | Commercial Mortgage Pass Through Certificates | 4.084% | 6/10/38 | 8,200 | 8,400 |
| 4 | Commercial Mortgage Pass Through Certificates | 4.715% | 3/10/39 | 19,816 | 20,808 |
| 4,7 | Commercial Mortgage Pass Through Certificates | 5.116% | 6/10/44 | 22,303 | 24,505 |
| 4,7 | Commercial Mortgage Pass Through Certificates | 5.750% | 6/10/46 | 18,030 | 20,031 |
| 4,7 | Commercial Mortgage Pass Through Certificates | 5.776% | 6/10/46 | 4,025 | 4,113 |
| 4 | Commercial Mortgage Pass Through Certificates | 5.248% | 12/10/46 | 2,138 | 2,139 |
| 4,7 | Commercial Mortgage Pass Through Certificates | 5.814% | 12/10/49 | 17,373 | 19,301 |
| 4,7 | Credit Suisse First Boston Mortgage Securities Corp. | 4.750% | 1/15/37 | 16,575 | 17,301 |
| 4 | Credit Suisse First Boston Mortgage Securities Corp. | 4.877% | 4/15/37 | 925 | 911 |
| 4,7 | Credit Suisse First Boston Mortgage Securities Corp. | 5.014% | 2/15/38 | 14,150 | 15,334 |
| 4,7 | Credit Suisse First Boston Mortgage Securities Corp. | 5.075% | 2/15/38 | 3,375 | 3,322 |
| 4 | Credit Suisse First Boston Mortgage Securities Corp. | 3.936% | 5/15/38 | 15,235 | 15,569 |
| 4,7 | Credit Suisse First Boston Mortgage Securities Corp. | 5.100% | 8/15/38 | 1,565 | 1,677 |
| 4,7 | Credit Suisse First Boston Mortgage Securities Corp. | 5.100% | 8/15/38 | 18,225 | 19,918 |
| 4,7 | Credit Suisse First Boston Mortgage Securities Corp. | 5.190% | 8/15/38 | 3,400 | 3,229 |
| 4,7 | Credit Suisse First Boston Mortgage Securities Corp. | 5.230% | 12/15/40 | 3,290 | 3,037 |
| 4,7 | Credit Suisse Mortgage Capital Certificates | 5.817% | 6/15/38 | 18,434 | 20,519 |
| 4,7 | Credit Suisse Mortgage Capital Certificates | 5.817% | 6/15/38 | 1,147 | 1,131 |
| 4,7 | Credit Suisse Mortgage Capital Certificates | 5.419% | 2/15/39 | 3,350 | 2,933 |
| 4,7 | Credit Suisse Mortgage Capital Certificates | 5.419% | 2/15/39 | 17,450 | 19,317 |
| 4,7 | Credit Suisse Mortgage Capital Certificates | 5.419% | 2/15/39 | 7,675 | 7,680 |
| 4,7 | Credit Suisse Mortgage Capital Certificates | 5.713% | 6/15/39 | 20,985 | 21,881 |
| 4 | Credit Suisse Mortgage Capital Certificates | 5.509% | 9/15/39 | 1,725 | 1,627 |
| 4 | Credit Suisse Mortgage Capital Certificates | 5.311% | 12/15/39 | 15,000 | 16,080 |
| 4 | Credit Suisse Mortgage Capital Certificates | 5.383% | 2/15/40 | 6,450 | 6,568 |
| 4,7 | CW Capital Cobalt Ltd. | 5.816% | 5/15/46 | 11,775 | 12,846 |
| 4,7 | CW Capital Cobalt Ltd. | 5.484% | 4/15/47 | 3,185 | 3,479 |
| 4 | Discover Card Master Trust | 5.650% | 12/15/15 | 23,300 | 24,904 |
| 4 | Discover Card Master Trust | 5.650% | 3/16/20 | 7,975 | 9,520 |
| Federal Housing Administration | 7.430% | 10/1/20 | 3 | 3 | |
| 4,7 | First Union Commercial Mortgage Trust | 6.613% | 10/15/35 | 2,668 | 2,725 |
| 4 | Ford Credit Auto Owner Trust | 4.370% | 10/15/12 | 1,989 | 1,991 |
| 4 | Ford Credit Auto Owner Trust | 2.420% | 11/15/14 | 4,625 | 4,689 |
| 4 | Ford Credit Auto Owner Trust | 2.150% | 6/15/15 | 16,950 | 17,361 |
| 4 | GE Capital Commercial Mortgage Corp. | 6.269% | 12/10/35 | 4,909 | 4,943 |
| 4 | GE Capital Commercial Mortgage Corp. | 5.145% | 7/10/37 | 4,605 | 4,779 |
| 4 | GE Capital Commercial Mortgage Corp. | 4.996% | 12/10/37 | 15,237 | 15,570 |
| 4,7 | GE Capital Commercial Mortgage Corp. | 5.330% | 3/10/44 | 6,675 | 6,576 |
| 4,7 | GE Capital Commercial Mortgage Corp. | 5.330% | 3/10/44 | 22,040 | 24,179 |
| 4,7 | GE Capital Commercial Mortgage Corp. | 4.974% | 7/10/45 | 1,425 | 1,563 |
| 4,7 | GE Capital Commercial Mortgage Corp. | 5.309% | 11/10/45 | 7,048 | 7,089 |
| 4 | GE Capital Commercial Mortgage Corp. | 5.543% | 12/10/49 | 5,925 | 6,192 |
| 4 | GMAC Commercial Mortgage Securities Inc. | 6.700% | 4/15/34 | 559 | 553 |
| 4 | GMAC Commercial Mortgage Securities Inc. | 4.079% | 5/10/36 | 3,000 | 3,065 |
| 4 | GMAC Commercial Mortgage Securities Inc. | 4.908% | 3/10/38 | 2,625 | 2,774 |
| 4 | GMAC Commercial Mortgage Securities Inc. | 4.646% | 4/10/40 | 254 | 256 |
| 4,7 | GMAC Commercial Mortgage Securities Inc. | 5.453% | 5/10/40 | 1,695 | 1,782 |
| 4 | GMAC Commercial Mortgage Securities Inc. | 4.864% | 12/10/41 | 3,925 | 4,162 |
| 4 | GMAC Commercial Mortgage Securities Inc. | 4.754% | 5/10/43 | 1,650 | 1,758 |
| 4 | Greenwich Capital Commercial Funding Corp. | 4.948% | 1/11/35 | 6,429 | 6,550 |
| 4 | Greenwich Capital Commercial Funding Corp. | 4.533% | 1/5/36 | 801 | 808 |
12
Vanguard® Total Bond Market Index Fund
Schedule of Investments
December 31, 2011
| Face | Market | ||||
| Maturity | Amount | Value | |||
| Coupon | Date | ($000) | ($000) | ||
| 4 | Greenwich Capital Commercial Funding Corp. | 4.915% | 1/5/36 | 11,875 | 12,445 |
| 4,7 | Greenwich Capital Commercial Funding Corp. | 5.317% | 6/10/36 | 13,850 | 14,718 |
| 4 | Greenwich Capital Commercial Funding Corp. | 5.117% | 4/10/37 | 3,957 | 3,965 |
| 4,7 | Greenwich Capital Commercial Funding Corp. | 5.224% | 4/10/37 | 18,508 | 19,807 |
| 4,7 | Greenwich Capital Commercial Funding Corp. | 5.277% | 4/10/37 | 4,475 | 4,091 |
| 4,7 | Greenwich Capital Commercial Funding Corp. | 5.882% | 7/10/38 | 2,600 | 2,892 |
| 4,7 | Greenwich Capital Commercial Funding Corp. | 5.882% | 7/10/38 | 2,400 | 2,379 |
| 4 | Greenwich Capital Commercial Funding Corp. | 5.475% | 3/10/39 | 1,625 | 1,527 |
| 4,7 | Greenwich Capital Commercial Funding Corp. | 4.799% | 8/10/42 | 23,400 | 24,975 |
| 4,7 | Greenwich Capital Commercial Funding Corp. | 4.859% | 8/10/42 | 2,000 | 1,992 |
| 4,7 | GS Mortgage Securities Corp. II | 5.506% | 4/10/38 | 7,894 | 7,981 |
| 4,7 | GS Mortgage Securities Corp. II | 5.553% | 4/10/38 | 12,625 | 13,735 |
| 4,7 | GS Mortgage Securities Corp. II | 5.622% | 4/10/38 | 4,750 | 4,699 |
| 4,7 | GS Mortgage Securities Corp. II | 5.396% | 8/10/38 | 14,610 | 15,548 |
| 4 | GS Mortgage Securities Corp. II | 4.608% | 1/10/40 | 14,425 | 14,747 |
| 4 | GS Mortgage Securities Corp. II | 3.707% | 8/10/44 | 3,220 | 3,358 |
| 4 | Honda Auto Receivables Owner Trust | 1.800% | 4/17/17 | 3,225 | 3,276 |
| 4 | JP Morgan Chase Commercial Mortgage Securities | ||||
| Corp. | 5.050% | 12/12/34 | 8,042 | 8,183 | |
| 4 | JP Morgan Chase Commercial Mortgage Securities | ||||
| Corp. | 4.654% | 1/12/37 | 3,250 | 3,324 | |
| 4 | JP Morgan Chase Commercial Mortgage Securities | ||||
| Corp. | 4.985% | 1/12/37 | 11,725 | 12,080 | |
| 4,7 | JP Morgan Chase Commercial Mortgage Securities | ||||
| Corp. | 5.255% | 7/12/37 | 1,365 | 1,427 | |
| 4 | JP Morgan Chase Commercial Mortgage Securities | ||||
| Corp. | 5.376% | 7/12/37 | 8,378 | 8,479 | |
| 4,7 | JP Morgan Chase Commercial Mortgage Securities | ||||
| Corp. | 5.358% | 8/12/37 | 2,000 | 1,855 | |
| 4 | JP Morgan Chase Commercial Mortgage Securities | ||||
| Corp. | 4.824% | 9/12/37 | 1,266 | 1,265 | |
| 4,7 | JP Morgan Chase Commercial Mortgage Securities | ||||
| Corp. | 4.879% | 1/12/38 | 22,414 | 23,519 | |
| 4 | JP Morgan Chase Commercial Mortgage Securities | ||||
| Corp. | 4.404% | 1/12/39 | 11,465 | 11,995 | |
| 4,7 | JP Morgan Chase Commercial Mortgage Securities | ||||
| Corp. | 5.579% | 6/12/41 | 19,325 | 20,831 | |
| 4 | JP Morgan Chase Commercial Mortgage Securities | ||||
| Corp. | 4.780% | 7/15/42 | 1,800 | 1,898 | |
| 4,7 | JP Morgan Chase Commercial Mortgage Securities | ||||
| Corp. | 5.319% | 1/12/43 | 185 | 185 | |
| 4,7 | JP Morgan Chase Commercial Mortgage Securities | ||||
| Corp. | 5.475% | 4/15/43 | 3,722 | 4,079 | |
| 4,7 | JP Morgan Chase Commercial Mortgage Securities | ||||
| Corp. | 5.450% | 12/12/44 | 3,300 | 3,281 | |
| 4,7 | JP Morgan Chase Commercial Mortgage Securities | ||||
| Corp. | 5.247% | 12/15/44 | 4,250 | 4,468 | |
| 4,7 | JP Morgan Chase Commercial Mortgage Securities | ||||
| Corp. | 5.326% | 12/15/44 | 1,375 | 1,335 | |
| 4,7 | JP Morgan Chase Commercial Mortgage Securities | ||||
| Corp. | 5.874% | 4/15/45 | 15,525 | 17,395 | |
| 4,7 | JP Morgan Chase Commercial Mortgage Securities | ||||
| Corp. | 5.875% | 4/15/45 | 3,310 | 2,540 | |
| 4,7 | JP Morgan Chase Commercial Mortgage Securities | ||||
| Corp. | 5.875% | 4/15/45 | 1,750 | 1,802 | |
| 4 | JP Morgan Chase Commercial Mortgage Securities | ||||
| Corp. | 5.593% | 5/12/45 | 3,890 | 3,755 | |
| 4 | JP Morgan Chase Commercial Mortgage Securities | ||||
| Corp. | 5.440% | 5/15/45 | 4,315 | 4,365 | |
| 4 | JP Morgan Chase Commercial Mortgage Securities | ||||
| Corp. | 5.447% | 5/15/45 | 8,000 | 8,213 | |
| 4 | JP Morgan Chase Commercial Mortgage Securities | ||||
| Corp. | 5.440% | 6/12/47 | 10,650 | 11,413 |
13
Vanguard® Total Bond Market Index Fund
Schedule of Investments
December 31, 2011
| Face | Market | ||||
| Maturity | Amount | Value | |||
| Coupon | Date | ($000) | ($000) | ||
| 4,7 | JP Morgan Chase Commercial Mortgage Securities | ||||
| Corp. | 5.816% | 6/15/49 | 7,250 | 7,722 | |
| 4,7 | JP Morgan Chase Commercial Mortgage Securities | ||||
| Corp. | 5.794% | 2/12/51 | 27,885 | 30,755 | |
| 4 | JP Morgan Chase Commercial Mortgage Securities | ||||
| Corp. | 5.855% | 2/12/51 | 6,087 | 6,119 | |
| 4,7 | JP Morgan Chase Commercial Mortgage Securities | ||||
| Corp. | 5.892% | 2/12/51 | 3,350 | 3,327 | |
| 4,7 | JP Morgan Chase Commercial Mortgage Securities | ||||
| Corp. | 5.882% | 2/15/51 | 13,170 | 14,469 | |
| 4,7 | LB-UBS Commercial Mortgage Trust | 4.786% | 10/15/29 | 17,575 | 18,504 |
| 4 | LB-UBS Commercial Mortgage Trust | 4.742% | 2/15/30 | 9,140 | 9,839 |
| 4,7 | LB-UBS Commercial Mortgage Trust | 5.150% | 4/15/30 | 4,100 | 4,501 |
| 4,7 | LB-UBS Commercial Mortgage Trust | 5.197% | 11/15/30 | 17,600 | 19,437 |
| 4,7 | LB-UBS Commercial Mortgage Trust | 5.217% | 2/15/31 | 2,535 | 2,702 |
| 4 | LB-UBS Commercial Mortgage Trust | 4.853% | 9/15/31 | 23,075 | 23,421 |
| 4 | LB-UBS Commercial Mortgage Trust | 4.960% | 12/15/31 | 4,277 | 4,401 |
| 4 | LB-UBS Commercial Mortgage Trust | 4.166% | 5/15/32 | 22,880 | 23,491 |
| 4,7 | LB-UBS Commercial Mortgage Trust | 5.124% | 11/15/32 | 9,550 | 10,012 |
| 4,7 | LB-UBS Commercial Mortgage Trust | 4.931% | 9/15/35 | 21,100 | 21,865 |
| 4,7 | LB-UBS Commercial Mortgage Trust | 5.661% | 3/15/39 | 27,350 | 30,512 |
| 4 | LB-UBS Commercial Mortgage Trust | 5.372% | 9/15/39 | 3,000 | 3,332 |
| 4 | LB-UBS Commercial Mortgage Trust | 5.413% | 9/15/39 | 1,175 | 1,239 |
| 4 | LB-UBS Commercial Mortgage Trust | 5.424% | 2/15/40 | 4,350 | 4,723 |
| 4 | LB-UBS Commercial Mortgage Trust | 5.430% | 2/15/40 | 10,900 | 11,609 |
| 4 | LB-UBS Commercial Mortgage Trust | 5.455% | 2/15/40 | 4,775 | 4,637 |
| 4,7 | LB-UBS Commercial Mortgage Trust | 5.057% | 9/15/40 | 1,625 | 1,494 |
| 4,7 | LB-UBS Commercial Mortgage Trust | 5.276% | 2/15/41 | 3,375 | 3,095 |
| 4,7 | LB-UBS Commercial Mortgage Trust | 6.145% | 4/15/41 | 22,025 | 24,836 |
| 4,7 | LB-UBS Commercial Mortgage Trust | 6.145% | 4/15/41 | 3,020 | 2,851 |
| 4,7 | LB-UBS Commercial Mortgage Trust | 5.866% | 9/15/45 | 17,600 | 19,265 |
| 4,7 | Merrill Lynch Mortgage Trust | 5.236% | 11/12/35 | 10,800 | 11,250 |
| 4,7 | Merrill Lynch Mortgage Trust | 5.107% | 7/12/38 | 965 | 1,015 |
| 4,7 | Merrill Lynch Mortgage Trust | 5.665% | 5/12/39 | 14,050 | 15,863 |
| 4,7 | Merrill Lynch Mortgage Trust | 5.666% | 5/12/39 | 1,825 | 1,908 |
| 4,7 | Merrill Lynch Mortgage Trust | 4.747% | 6/12/43 | 2,500 | 2,716 |
| 4,7 | Merrill Lynch Mortgage Trust | 5.782% | 8/12/43 | 2,865 | 2,882 |
| 4,7 | Merrill Lynch Mortgage Trust | 5.802% | 8/12/43 | 3,325 | 2,233 |
| 4,7 | Merrill Lynch Mortgage Trust | 5.291% | 1/12/44 | 20,875 | 23,131 |
| 4,7 | Merrill Lynch Mortgage Trust | 5.834% | 6/12/50 | 3,260 | 3,073 |
| 4,7 | Merrill Lynch Mortgage Trust | 5.834% | 6/12/50 | 23,068 | 24,875 |
| 4 | Merrill Lynch Mortgage Trust | 5.425% | 2/12/51 | 3,397 | 3,459 |
| 4 | Merrill Lynch Mortgage Trust | 5.690% | 2/12/51 | 17,040 | 18,177 |
| 4,7 | Merrill Lynch/Countrywide Commercial Mortgage Trust | 5.906% | 6/12/46 | 21,125 | 23,909 |
| 4,7 | Merrill Lynch/Countrywide Commercial Mortgage Trust | 5.456% | 7/12/46 | 3,660 | 3,705 |
| 4 | Merrill Lynch/Countrywide Commercial Mortgage Trust | 5.378% | 8/12/48 | 14,870 | 15,524 |
| 4 | Merrill Lynch/Countrywide Commercial Mortgage Trust | 5.590% | 9/12/49 | 8,399 | 8,469 |
| 4 | Merrill Lynch/Countrywide Commercial Mortgage Trust | 5.700% | 9/12/49 | 14,675 | 15,523 |
| 4 | Morgan Stanley Capital I | 4.970% | 4/14/40 | 5,675 | 5,969 |
| 4,7 | Morgan Stanley Capital I | 5.110% | 6/15/40 | 15,050 | 16,092 |
| 4 | Morgan Stanley Capital I | 5.030% | 6/13/41 | 973 | 991 |
| 4,7 | Morgan Stanley Capital I | 5.270% | 6/13/41 | 4,525 | 4,798 |
| 4,7 | Morgan Stanley Capital I | 5.814% | 8/12/41 | 2,175 | 2,397 |
| 4 | Morgan Stanley Capital I | 5.328% | 11/12/41 | 6,460 | 7,118 |
| 4 | Morgan Stanley Capital I | 5.360% | 11/12/41 | 7,400 | 7,136 |
| 4 | Morgan Stanley Capital I | 4.780% | 12/13/41 | 1,900 | 2,046 |
| 4,7 | Morgan Stanley Capital I | 4.840% | 12/13/41 | 1,350 | 1,195 |
| 4 | Morgan Stanley Capital I | 4.970% | 12/15/41 | 10,300 | 10,798 |
| 4 | Morgan Stanley Capital I | 5.168% | 1/14/42 | 3,950 | 4,272 |
| 4,7 | Morgan Stanley Capital I | 5.638% | 6/11/42 | 19,150 | 21,832 |
| 4,7 | Morgan Stanley Capital I | 5.638% | 6/11/42 | 1,375 | 1,415 |
| 4 | Morgan Stanley Capital I | 4.989% | 8/13/42 | 24,800 | 26,982 |
| 4,7 | Morgan Stanley Capital I | 5.073% | 8/13/42 | 3,730 | 3,435 |
| 4,7 | Morgan Stanley Capital I | 5.230% | 9/15/42 | 23,225 | 25,806 |
14
Vanguard® Total Bond Market Index Fund Schedule of Investments December 31, 2011
| Face | Market | ||||
| Maturity | Amount | Value | |||
| Coupon | Date | ($000) | ($000) | ||
| 4,7 | Morgan Stanley Capital I | 5.727% | 10/15/42 | 8,175 | 9,101 |
| 4,7 | Morgan Stanley Capital I | 5.732% | 10/15/42 | 4,325 | 3,751 |
| 4,7 | Morgan Stanley Capital I | 5.732% | 10/15/42 | 700 | 705 |
| 4,7 | Morgan Stanley Capital I | 5.202% | 11/14/42 | 14,450 | 15,907 |
| 4,7 | Morgan Stanley Capital I | 6.278% | 1/11/43 | 18,825 | 22,152 |
| 4 | Morgan Stanley Capital I | 5.332% | 12/15/43 | 9,450 | 10,458 |
| 4,7 | Morgan Stanley Capital I | 5.417% | 3/12/44 | 20,466 | 22,779 |
| 4,7 | Morgan Stanley Capital I | 5.773% | 7/12/44 | 4,396 | 4,654 |
| 4,7 | Morgan Stanley Capital I | 5.793% | 7/12/44 | 4,100 | 3,398 |
| 4 | Morgan Stanley Capital I | 4.660% | 9/13/45 | 3,985 | 4,167 |
| 4,7 | Morgan Stanley Capital I | 5.654% | 4/15/49 | 1,850 | 1,965 |
| 4,7 | Morgan Stanley Capital I | 5.684% | 4/15/49 | 4,775 | 3,857 |
| 4,7 | Morgan Stanley Capital I | 5.692% | 4/15/49 | 15,250 | 16,133 |
| 4,7 | Morgan Stanley Capital I | 5.544% | 11/12/49 | 4,525 | 4,692 |
| 4 | Morgan Stanley Capital I | 5.809% | 12/12/49 | 12,950 | 14,330 |
| 4,7 | Morgan Stanley Capital I | 6.108% | 12/12/49 | 4,675 | 4,580 |
| 4 | Morgan Stanley Capital I | 5.090% | 10/12/52 | 2,540 | 2,539 |
| 4,7 | Morgan Stanley Capital I | 5.204% | 10/12/52 | 5,410 | 5,561 |
| 4 | Morgan Stanley Capital I | 4.770% | 7/15/56 | 3,295 | 3,151 |
| 4 | Morgan Stanley Dean Witter Capital I | 6.390% | 7/15/33 | 244 | 242 |
| 4 | Morgan Stanley Dean Witter Capital I | 4.920% | 3/12/35 | 26,350 | 27,064 |
| 4 | Morgan Stanley Dean Witter Capital I | 4.740% | 11/13/36 | 24,761 | 25,339 |
| 4 | Nissan Auto Receivables Owner Trust | 5.050% | 11/17/14 | 3,699 | 3,756 |
| 6 | Northern Rock Asset Management plc | 5.625% | 6/22/17 | 33,225 | 35,218 |
| 4 | PG&E Energy Recovery Funding LLC | 5.030% | 3/25/14 | 580 | 586 |
| 4 | PSE&G Transition Funding LLC | 6.890% | 12/15/17 | 21,175 | 25,277 |
| 4 | Public Service New Hampshire Funding LLC | 6.480% | 5/1/15 | 100 | 104 |
| 4 | Residential Asset Securities Corp. | 6.489% | 10/25/30 | 146 | 134 |
| 6 | Royal Bank of Canada | 3.125% | 4/14/15 | 9,325 | 9,867 |
| 4 | Salomon Brothers Mortgage Securities VII Inc. | 4.467% | 3/18/36 | 129 | 129 |
| 4,7 | TIAA Seasoned Commercial Mortgage Trust | 5.739% | 8/15/39 | 3,285 | 3,126 |
| 4 | USAA Auto Owner Trust | 4.710% | 2/18/14 | 6,735 | 6,763 |
| 4 | Wachovia Bank Commercial Mortgage Trust | 4.980% | 11/15/34 | 665 | 679 |
| 4 | Wachovia Bank Commercial Mortgage Trust | 4.867% | 2/15/35 | 971 | 995 |
| 4,7 | Wachovia Bank Commercial Mortgage Trust | 5.125% | 8/15/35 | 3,100 | 3,215 |
| 4,7 | Wachovia Bank Commercial Mortgage Trust | 4.964% | 11/15/35 | 10,750 | 11,288 |
| 4 | Wachovia Bank Commercial Mortgage Trust | 4.719% | 1/15/41 | 447 | 444 |
| 4 | Wachovia Bank Commercial Mortgage Trust | 4.748% | 2/15/41 | 20,151 | 21,231 |
| 4,7 | Wachovia Bank Commercial Mortgage Trust | 5.316% | 7/15/41 | 18,350 | 19,597 |
| 4 | Wachovia Bank Commercial Mortgage Trust | 4.803% | 10/15/41 | 18,725 | 19,710 |
| 4,7 | Wachovia Bank Commercial Mortgage Trust | 5.083% | 3/15/42 | 15,075 | 16,402 |
| 4,7 | Wachovia Bank Commercial Mortgage Trust | 5.224% | 3/15/42 | 1,700 | 1,597 |
| 4,7 | Wachovia Bank Commercial Mortgage Trust | 5.118% | 7/15/42 | 6,729 | 7,385 |
| 4,7 | Wachovia Bank Commercial Mortgage Trust | 5.737% | 5/15/43 | 16,025 | 17,901 |
| 4 | Wachovia Bank Commercial Mortgage Trust | 4.699% | 5/15/44 | 14,354 | 15,573 |
| 4 | Wachovia Bank Commercial Mortgage Trust | 4.750% | 5/15/44 | 1,480 | 1,542 |
| 4 | Wachovia Bank Commercial Mortgage Trust | 4.793% | 5/15/44 | 3,325 | 3,094 |
| 4,7 | Wachovia Bank Commercial Mortgage Trust | 5.204% | 10/15/44 | 18,010 | 19,761 |
| 4,7 | Wachovia Bank Commercial Mortgage Trust | 5.204% | 10/15/44 | 1,340 | 1,323 |
| 4,7 | Wachovia Bank Commercial Mortgage Trust | 5.269% | 12/15/44 | 22,500 | 24,871 |
| 4,7 | Wachovia Bank Commercial Mortgage Trust | 5.319% | 12/15/44 | 775 | 805 |
| 4,7 | Wachovia Bank Commercial Mortgage Trust | 5.970% | 6/15/45 | 1,280 | 1,309 |
| 4,7 | Wachovia Bank Commercial Mortgage Trust | 5.765% | 7/15/45 | 11,100 | 12,382 |
| 4 | Wachovia Bank Commercial Mortgage Trust | 5.679% | 10/15/48 | 2,700 | 2,889 |
| 4 | Wachovia Bank Commercial Mortgage Trust | 5.313% | 11/15/48 | 16,475 | 17,560 |
| 4 | Wachovia Bank Commercial Mortgage Trust | 5.339% | 11/15/48 | 2,225 | 2,199 |
| Total Asset-Backed/Commercial Mortgage-Backed Securities (Cost $2,418,241) | 2,676,843 | ||||
| Corporate Bonds (20.7%) | |||||
| Finance (6.9%) | |||||
| Banking (4.5%) | |||||
| 4 | Abbey National Capital Trust I | 8.963% | 12/29/49 | 1,200 | 1,091 |
| Abbey National Treasury Services plc | 2.875% | 4/25/14 | 14,475 | 13,482 | |
15
Vanguard® Total Bond Market Index Fund
Schedule of Investments
December 31, 2011
| Face | Market | |||
| Maturity | Amount | Value | ||
| Coupon | Date | ($000) | ($000) | |
| Abbey National Treasury Services plc | 4.000% | 4/27/16 | 7,400 | 6,655 |
| American Express Bank FSB | 5.500% | 4/16/13 | 8,675 | 9,061 |
| American Express Bank FSB | 6.000% | 9/13/17 | 1,750 | 1,994 |
| American Express Centurion Bank | 5.950% | 6/12/17 | 1,900 | 2,146 |
| American Express Centurion Bank | 6.000% | 9/13/17 | 23,425 | 26,697 |
| American Express Co. | 4.875% | 7/15/13 | 5,821 | 6,081 |
| American Express Co. | 7.250% | 5/20/14 | 1,225 | 1,369 |
| American Express Co. | 5.500% | 9/12/16 | 3,075 | 3,391 |
| American Express Co. | 6.150% | 8/28/17 | 5,575 | 6,368 |
| American Express Co. | 7.000% | 3/19/18 | 42,297 | 50,938 |
| American Express Co. | 8.125% | 5/20/19 | 275 | 354 |
| American Express Co. | 8.150% | 3/19/38 | 845 | 1,260 |
| 4 American Express Co. | 6.800% | 9/1/66 | 6,515 | 6,499 |
| American Express Credit Corp. | 5.875% | 5/2/13 | 4,480 | 4,709 |
| American Express Credit Corp. | 7.300% | 8/20/13 | 20,864 | 22,620 |
| American Express Credit Corp. | 5.125% | 8/25/14 | 14,084 | 15,154 |
| American Express Credit Corp. | 2.800% | 9/19/16 | 36,660 | 37,077 |
| Associates Corp. of North America | 6.950% | 11/1/18 | 250 | 270 |
| Banco Santander Chile | 2.875% | 11/13/12 | 1,475 | 1,479 |
| BanColombia SA | 4.250% | 1/12/16 | 6,150 | 6,093 |
| Bank of America Corp. | 4.875% | 1/15/13 | 15,782 | 15,853 |
| Bank of America Corp. | 4.900% | 5/1/13 | 17,165 | 17,180 |
| Bank of America Corp. | 7.375% | 5/15/14 | 6,125 | 6,342 |
| Bank of America Corp. | 5.375% | 6/15/14 | 2,500 | 2,484 |
| Bank of America Corp. | 5.125% | 11/15/14 | 21,259 | 21,134 |
| Bank of America Corp. | 4.500% | 4/1/15 | 12,560 | 12,134 |
| Bank of America Corp. | 4.750% | 8/1/15 | 225 | 216 |
| Bank of America Corp. | 3.700% | 9/1/15 | 2,050 | 1,905 |
| Bank of America Corp. | 5.250% | 12/1/15 | 3,975 | 3,753 |
| Bank of America Corp. | 3.625% | 3/17/16 | 10,300 | 9,534 |
| Bank of America Corp. | 3.750% | 7/12/16 | 5,750 | 5,331 |
| Bank of America Corp. | 6.500% | 8/1/16 | 21,200 | 21,351 |
| Bank of America Corp. | 5.750% | 8/15/16 | 11,025 | 10,216 |
| Bank of America Corp. | 5.625% | 10/14/16 | 6,350 | 6,140 |
| Bank of America Corp. | 5.420% | 3/15/17 | 14,300 | 12,966 |
| Bank of America Corp. | 6.000% | 9/1/17 | 2,560 | 2,502 |
| Bank of America Corp. | 5.750% | 12/1/17 | 6,525 | 6,218 |
| Bank of America Corp. | 5.650% | 5/1/18 | 66,300 | 62,988 |
| Bank of America Corp. | 7.625% | 6/1/19 | 25,625 | 26,569 |
| Bank of America Corp. | 5.625% | 7/1/20 | 21,215 | 19,591 |
| Bank of America Corp. | 5.875% | 1/5/21 | 750 | 708 |
| Bank of America Corp. | 7.250% | 10/15/25 | 1,400 | 1,298 |
| Bank of America Corp. | 6.800% | 3/15/28 | 1,025 | 904 |
| Bank of America Corp. | 6.500% | 9/15/37 | 3,335 | 2,708 |
| Bank of America NA | 5.300% | 3/15/17 | 24,375 | 22,191 |
| Bank of America NA | 6.100% | 6/15/17 | 11,225 | 10,558 |
| Bank of America NA | 6.000% | 10/15/36 | 8,325 | 6,916 |
| Bank of Montreal | 2.125% | 6/28/13 | 6,475 | 6,579 |
| Bank of Montreal | 1.750% | 4/29/14 | 825 | 838 |
| Bank of New York Mellon Corp. | 4.500% | 4/1/13 | 2,125 | 2,219 |
| Bank of New York Mellon Corp. | 4.300% | 5/15/14 | 10,175 | 10,883 |
| Bank of New York Mellon Corp. | 4.950% | 3/15/15 | 9,750 | 10,511 |
| Bank of New York Mellon Corp. | 2.950% | 6/18/15 | 4,200 | 4,361 |
| Bank of New York Mellon Corp. | 2.300% | 7/28/16 | 925 | 934 |
| Bank of New York Mellon Corp. | 2.400% | 1/17/17 | 9,900 | 9,939 |
| Bank of New York Mellon Corp. | 5.450% | 5/15/19 | 6,240 | 7,159 |
| Bank of New York Mellon Corp. | 4.600% | 1/15/20 | 5,775 | 6,293 |
| Bank of New York Mellon Corp. | 3.550% | 9/23/21 | 2,450 | 2,505 |
| Bank of Nova Scotia | 2.250% | 1/22/13 | 18,220 | 18,469 |
| Bank of Nova Scotia | 2.375% | 12/17/13 | 17,950 | 18,441 |
| Bank of Nova Scotia | 3.400% | 1/22/15 | 550 | 578 |
| Bank of Nova Scotia | 2.050% | 10/7/15 | 500 | 502 |
| Bank of Nova Scotia | 2.900% | 3/29/16 | 750 | 776 |
| Bank of Nova Scotia | 4.375% | 1/13/21 | 1,250 | 1,361 |
16
Vanguard® Total Bond Market Index Fund
Schedule of Investments
December 31, 2011
| Face | Market | ||||
| Maturity | Amount | Value | |||
| Coupon | Date | ($000) | ($000) | ||
| Bank One Capital III | 8.750% | 9/1/30 | 2,700 | 3,401 | |
| Bank One Corp. | 5.250% | 1/30/13 | 6,000 | 6,209 | |
| Bank One Corp. | 4.900% | 4/30/15 | 6,075 | 6,394 | |
| Bank One Corp. | 7.750% | 7/15/25 | 330 | 377 | |
| Bank One Corp. | 7.625% | 10/15/26 | 2,930 | 3,438 | |
| Barclays Bank plc | 2.500% | 1/23/13 | 11,950 | 11,899 | |
| Barclays Bank plc | 5.200% | 7/10/14 | 30,645 | 31,585 | |
| Barclays Bank plc | 3.900% | 4/7/15 | 750 | 756 | |
| Barclays Bank plc | 5.000% | 9/22/16 | 11,300 | 11,679 | |
| Barclays Bank plc | 6.750% | 5/22/19 | 9,225 | 10,224 | |
| Barclays Bank plc | 5.125% | 1/8/20 | 24,900 | 25,553 | |
| Barclays Bank plc | 5.140% | 10/14/20 | 750 | 647 | |
| BB&T Capital Trust II | 6.750% | 6/7/36 | 8,725 | 8,669 | |
| 4 | BB&T Capital Trust IV | 6.820% | 6/12/77 | 3,875 | 3,958 |
| BB&T Corp. | 2.050% | 4/28/14 | 1,450 | 1,466 | |
| BB&T Corp. | 5.200% | 12/23/15 | 5,212 | 5,630 | |
| BB&T Corp. | 3.200% | 3/15/16 | 550 | 572 | |
| BB&T Corp. | 3.950% | 4/29/16 | 1,600 | 1,718 | |
| BB&T Corp. | 4.900% | 6/30/17 | 525 | 570 | |
| BB&T Corp. | 6.850% | 4/30/19 | 3,754 | 4,568 | |
| BB&T Corp. | 5.250% | 11/1/19 | 6,540 | 7,145 | |
| BBVA US Senior SAU | 3.250% | 5/16/14 | 8,600 | 8,142 | |
| Bear Stearns Cos. LLC | 5.350% | 2/1/12 | 14,075 | 14,125 | |
| Bear Stearns Cos. LLC | 5.700% | 11/15/14 | 15,590 | 16,933 | |
| Bear Stearns Cos. LLC | 5.300% | 10/30/15 | 6,415 | 6,911 | |
| Bear Stearns Cos. LLC | 5.550% | 1/22/17 | 8,350 | 8,828 | |
| Bear Stearns Cos. LLC | 6.400% | 10/2/17 | 8,230 | 9,195 | |
| Bear Stearns Cos. LLC | 7.250% | 2/1/18 | 11,053 | 12,935 | |
| Bear Stearns Cos. LLC | 4.650% | 7/2/18 | 1,650 | 1,682 | |
| BNP Paribas SA | 3.250% | 3/11/15 | 3,925 | 3,719 | |
| BNP Paribas SA | 3.600% | 2/23/16 | 28,675 | 26,889 | |
| BNP Paribas SA | 5.000% | 1/15/21 | 29,700 | 28,495 | |
| BNY Mellon NA | 4.750% | 12/15/14 | 2,800 | 3,039 | |
| Branch Banking & Trust Co. | 5.625% | 9/15/16 | 5,825 | 6,638 | |
| Canadian Imperial Bank of Commerce | 1.450% | 9/13/13 | 2,650 | 2,651 | |
| Canadian Imperial Bank of Commerce | 2.350% | 12/11/15 | 775 | 780 | |
| Capital One Bank USA NA | 6.500% | 6/13/13 | 4,550 | 4,793 | |
| Capital One Bank USA NA | 8.800% | 7/15/19 | 14,575 | 16,905 | |
| 4 | Capital One Capital III | 7.686% | 8/1/66 | 5,725 | 5,682 |
| Capital One Capital IV | 6.745% | 2/17/37 | 3,237 | 3,172 | |
| Capital One Capital V | 10.250% | 8/15/39 | 3,675 | 3,804 | |
| Capital One Capital VI | 8.875% | 5/15/40 | 9,725 | 9,944 | |
| Capital One Financial Corp. | 7.375% | 5/23/14 | 8,025 | 8,817 | |
| Capital One Financial Corp. | 2.125% | 7/15/14 | 750 | 740 | |
| Capital One Financial Corp. | 5.500% | 6/1/15 | 8,892 | 9,515 | |
| Capital One Financial Corp. | 3.150% | 7/15/16 | 14,150 | 14,214 | |
| Capital One Financial Corp. | 6.150% | 9/1/16 | 6,469 | 6,745 | |
| Capital One Financial Corp. | 5.250% | 2/21/17 | 1,850 | 1,964 | |
| Capital One Financial Corp. | 6.750% | 9/15/17 | 5,950 | 6,693 | |
| Capital One Financial Corp. | 4.750% | 7/15/21 | 7,825 | 8,111 | |
| 4,6 | Citicorp Lease Pass-Through Trust 1999-1 | 8.040% | 12/15/19 | 14,225 | 16,203 |
| 4 | Citigroup Capital XXI | 8.300% | 12/21/57 | 19,040 | 19,183 |
| Citigroup Inc. | 5.300% | 10/17/12 | 29,273 | 29,747 | |
| Citigroup Inc. | 5.500% | 4/11/13 | 43,395 | 44,311 | |
| Citigroup Inc. | 6.500% | 8/19/13 | 17,490 | 18,168 | |
| Citigroup Inc. | 6.000% | 12/13/13 | 16,140 | 16,720 | |
| Citigroup Inc. | 5.125% | 5/5/14 | 7,550 | 7,724 | |
| Citigroup Inc. | 6.375% | 8/12/14 | 9,015 | 9,464 | |
| Citigroup Inc. | 5.000% | 9/15/14 | 37,676 | 37,340 | |
| Citigroup Inc. | 5.500% | 10/15/14 | 16,200 | 16,764 | |
| Citigroup Inc. | 6.010% | 1/15/15 | 10,725 | 11,235 | |
| Citigroup Inc. | 4.750% | 5/19/15 | 1,900 | 1,932 | |
| Citigroup Inc. | 4.700% | 5/29/15 | 3,350 | 3,384 | |
| Citigroup Inc. | 4.587% | 12/15/15 | 2,100 | 2,115 |
17
Vanguard® Total Bond Market Index Fund
Schedule of Investments
December 31, 2011
| Face | Market | |||
| Maturity | Amount | Value | ||
| Coupon | Date | ($000) | ($000) | |
| Citigroup Inc. | 5.300% | 1/7/16 | 19,100 | 19,813 |
| Citigroup Inc. | 3.953% | 6/15/16 | 725 | 723 |
| Citigroup Inc. | 5.850% | 8/2/16 | 550 | 583 |
| Citigroup Inc. | 5.500% | 2/15/17 | 4,775 | 4,820 |
| Citigroup Inc. | 6.000% | 8/15/17 | 15,925 | 16,769 |
| Citigroup Inc. | 6.125% | 11/21/17 | 11,375 | 12,146 |
| Citigroup Inc. | 6.125% | 5/15/18 | 21,900 | 23,303 |
| Citigroup Inc. | 8.500% | 5/22/19 | 25,205 | 29,860 |
| Citigroup Inc. | 5.375% | 8/9/20 | 6,525 | 6,704 |
| Citigroup Inc. | 6.625% | 6/15/32 | 2,225 | 2,050 |
| Citigroup Inc. | 5.875% | 2/22/33 | 13,700 | 11,517 |
| Citigroup Inc. | 6.000% | 10/31/33 | 10,525 | 8,977 |
| Citigroup Inc. | 5.850% | 12/11/34 | 2,150 | 2,133 |
| Citigroup Inc. | 6.125% | 8/25/36 | 8,175 | 7,139 |
| Citigroup Inc. | 5.875% | 5/29/37 | 12,657 | 12,575 |
| Citigroup Inc. | 6.875% | 3/5/38 | 27,510 | 30,760 |
| Citigroup Inc. | 8.125% | 7/15/39 | 14,090 | 17,230 |
| Comerica Bank | 5.750% | 11/21/16 | 10,775 | 11,824 |
| Comerica Bank | 5.200% | 8/22/17 | 4,600 | 5,009 |
| Comerica Inc. | 4.800% | 5/1/15 | 3,225 | 3,384 |
| Compass Bank | 6.400% | 10/1/17 | 1,875 | 1,908 |
| Compass Bank | 5.900% | 4/1/26 | 1,725 | 1,554 |
| Cooperatieve Centrale Raiffeisen-Boerenleenbank BA | 2.125% | 10/13/15 | 4,450 | 4,351 |
| Cooperatieve Centrale Raiffeisen-Boerenleenbank BA | 4.500% | 1/11/21 | 30,025 | 31,134 |
| Cooperatieve Centrale Raiffeisen-Boerenleenbank BA | 5.250% | 5/24/41 | 50 | 49 |
| Countrywide Financial Corp. | 6.250% | 5/15/16 | 1,820 | 1,717 |
| Credit Suisse | 5.000% | 5/15/13 | 30,460 | 31,330 |
| Credit Suisse | 5.500% | 5/1/14 | 10,600 | 11,103 |
| Credit Suisse | 3.500% | 3/23/15 | 25,625 | 25,650 |
| Credit Suisse | 6.000% | 2/15/18 | 4,844 | 4,781 |
| Credit Suisse | 5.300% | 8/13/19 | 15,000 | 15,426 |
| Credit Suisse | 5.400% | 1/14/20 | 16,040 | 15,018 |
| Credit Suisse | 4.375% | 8/5/20 | 23,317 | 22,854 |
| 4 Credit Suisse AG | 5.860% | 5/29/49 | 11,230 | 9,181 |
| Credit Suisse USA Inc. | 5.500% | 8/15/13 | 6,250 | 6,512 |
| Credit Suisse USA Inc. | 5.125% | 1/15/14 | 2,150 | 2,249 |
| Credit Suisse USA Inc. | 4.875% | 1/15/15 | 7,345 | 7,685 |
| Credit Suisse USA Inc. | 5.125% | 8/15/15 | 24,755 | 25,956 |
| Credit Suisse USA Inc. | 7.125% | 7/15/32 | 11,036 | 13,144 |
| Deutsche Bank AG | 2.375% | 1/11/13 | 8,250 | 8,216 |
| Deutsche Bank AG | 4.875% | 5/20/13 | 24,300 | 24,864 |
| Deutsche Bank AG | 3.875% | 8/18/14 | 750 | 770 |
| Deutsche Bank AG | 3.450% | 3/30/15 | 15,300 | 15,498 |
| Deutsche Bank AG | 3.250% | 1/11/16 | 15,450 | 15,620 |
| Deutsche Bank AG | 6.000% | 9/1/17 | 21,381 | 23,896 |
| Deutsche Bank Financial LLC | 5.375% | 3/2/15 | 5,950 | 5,835 |
| Discover Bank | 8.700% | 11/18/19 | 4,500 | 5,123 |
| Fifth Third Bancorp | 6.250% | 5/1/13 | 5,750 | 6,058 |
| Fifth Third Bancorp | 3.625% | 1/25/16 | 16,000 | 16,363 |
| Fifth Third Bancorp | 5.450% | 1/15/17 | 4,900 | 5,169 |
| Fifth Third Bancorp | 4.500% | 6/1/18 | 1,525 | 1,521 |
| Fifth Third Bancorp | 8.250% | 3/1/38 | 5,040 | 6,235 |
| Fifth Third Bank | 4.750% | 2/1/15 | 8,825 | 9,247 |
| 4 Fifth Third Capital Trust IV | 6.500% | 4/15/67 | 4,200 | 4,116 |
| First Horizon National Corp. | 5.375% | 12/15/15 | 13,850 | 14,144 |
| First Niagara Financial Group Inc. | 6.750% | 3/19/20 | 1,675 | 1,759 |
| First Niagara Financial Group Inc. | 7.250% | 12/15/21 | 725 | 739 |
| First Tennessee Bank NA | 5.050% | 1/15/15 | 2,400 | 2,406 |
| First Tennessee Bank NA | 5.650% | 4/1/16 | 1,690 | 1,696 |
| FleetBoston Financial Corp. | 6.875% | 1/15/28 | 2,750 | 2,468 |
| FleetBoston Financial Corp. | 6.700% | 7/15/28 | 1,900 | 1,655 |
| Goldman Sachs Capital I | 6.345% | 2/15/34 | 16,825 | 14,382 |
| Goldman Sachs Group Inc. | 4.750% | 7/15/13 | 21,645 | 21,901 |
| Goldman Sachs Group Inc. | 5.250% | 10/15/13 | 16,430 | 16,808 |
18
Vanguard® Total Bond Market Index Fund
Schedule of Investments
December 31, 2011
| Face | Market | |||
| Maturity | Amount | Value | ||
| Coupon | Date | ($000) | ($000) | |
| Goldman Sachs Group Inc. | 5.150% | 1/15/14 | 13,995 | 14,211 |
| Goldman Sachs Group Inc. | 6.000% | 5/1/14 | 22,125 | 23,122 |
| Goldman Sachs Group Inc. | 5.000% | 10/1/14 | 27,182 | 27,592 |
| Goldman Sachs Group Inc. | 5.125% | 1/15/15 | 16,610 | 16,954 |
| Goldman Sachs Group Inc. | 3.700% | 8/1/15 | 17,600 | 17,221 |
| Goldman Sachs Group Inc. | 5.350% | 1/15/16 | 37,950 | 38,850 |
| Goldman Sachs Group Inc. | 3.625% | 2/7/16 | 16,820 | 16,229 |
| Goldman Sachs Group Inc. | 5.750% | 10/1/16 | 9,475 | 9,902 |
| Goldman Sachs Group Inc. | 5.625% | 1/15/17 | 12,755 | 12,503 |
| Goldman Sachs Group Inc. | 6.250% | 9/1/17 | 27,565 | 28,819 |
| Goldman Sachs Group Inc. | 5.950% | 1/18/18 | 25,125 | 25,662 |
| Goldman Sachs Group Inc. | 6.150% | 4/1/18 | 13,260 | 13,612 |
| Goldman Sachs Group Inc. | 7.500% | 2/15/19 | 5,590 | 6,210 |
| Goldman Sachs Group Inc. | 5.375% | 3/15/20 | 30,190 | 29,672 |
| Goldman Sachs Group Inc. | 6.000% | 6/15/20 | 18,330 | 18,721 |
| Goldman Sachs Group Inc. | 5.250% | 7/27/21 | 6,500 | 6,343 |
| Goldman Sachs Group Inc. | 5.950% | 1/15/27 | 11,685 | 10,786 |
| Goldman Sachs Group Inc. | 6.125% | 2/15/33 | 18,851 | 18,524 |
| Goldman Sachs Group Inc. | 6.450% | 5/1/36 | 5,535 | 4,966 |
| Goldman Sachs Group Inc. | 6.750% | 10/1/37 | 36,691 | 34,302 |
| Goldman Sachs Group Inc. | 6.250% | 2/1/41 | 15,470 | 15,153 |
| 6 HBOS plc | 6.750% | 5/21/18 | 6,075 | 4,823 |
| HSBC Bank USA NA | 4.625% | 4/1/14 | 5,925 | 6,073 |
| HSBC Bank USA NA | 4.875% | 8/24/20 | 15,365 | 14,481 |
| HSBC Bank USA NA | 5.875% | 11/1/34 | 2,700 | 2,611 |
| HSBC Bank USA NA | 5.625% | 8/15/35 | 2,300 | 2,171 |
| HSBC Holdings plc | 5.100% | 4/5/21 | 37,220 | 39,535 |
| HSBC Holdings plc | 4.875% | 1/14/22 | 425 | 449 |
| HSBC Holdings plc | 7.625% | 5/17/32 | 925 | 941 |
| HSBC Holdings plc | 7.350% | 11/27/32 | 2,040 | 2,045 |
| HSBC Holdings plc | 6.500% | 5/2/36 | 23,970 | 24,488 |
| HSBC Holdings plc | 6.500% | 9/15/37 | 18,250 | 18,422 |
| HSBC Holdings plc | 6.800% | 6/1/38 | 15,810 | 16,335 |
| HSBC Holdings plc | 6.100% | 1/14/42 | 275 | 320 |
| HSBC USA Inc. | 5.000% | 9/27/20 | 5,625 | 5,357 |
| Huntington Bancshares Inc. | 7.000% | 12/15/20 | 4,200 | 4,742 |
| JP Morgan Chase Capital XVII | 5.850% | 8/1/35 | 675 | 673 |
| 4 JP Morgan Chase Capital XVIII | 6.950% | 8/1/66 | 2,025 | 2,031 |
| 4 JP Morgan Chase Capital XX | 6.550% | 9/15/66 | 7,335 | 7,357 |
| 4 JP Morgan Chase Capital XXII | 6.450% | 1/15/87 | 17,600 | 17,512 |
| JP Morgan Chase Capital XXV | 6.800% | 10/1/37 | 10,375 | 10,470 |
| JP Morgan Chase Capital XXVII | 7.000% | 11/1/39 | 7,325 | 7,347 |
| JPMorgan Chase & Co. | 5.750% | 1/2/13 | 6,386 | 6,621 |
| JPMorgan Chase & Co. | 4.750% | 5/1/13 | 24,160 | 25,257 |
| JPMorgan Chase & Co. | 1.650% | 9/30/13 | 1,430 | 1,440 |
| JPMorgan Chase & Co. | 2.050% | 1/24/14 | 1,445 | 1,449 |
| JPMorgan Chase & Co. | 4.875% | 3/15/14 | 18,100 | 18,946 |
| JPMorgan Chase & Co. | 4.650% | 6/1/14 | 40,791 | 42,966 |
| JPMorgan Chase & Co. | 5.125% | 9/15/14 | 21,412 | 22,577 |
| JPMorgan Chase & Co. | 3.700% | 1/20/15 | 5,450 | 5,659 |
| JPMorgan Chase & Co. | 4.750% | 3/1/15 | 3,900 | 4,143 |
| JPMorgan Chase & Co. | 5.250% | 5/1/15 | 5,575 | 5,886 |
| JPMorgan Chase & Co. | 3.400% | 6/24/15 | 34,625 | 35,288 |
| JPMorgan Chase & Co. | 5.150% | 10/1/15 | 8,190 | 8,678 |
| JPMorgan Chase & Co. | 2.600% | 1/15/16 | 15,375 | 15,272 |
| JPMorgan Chase & Co. | 3.450% | 3/1/16 | 775 | 786 |
| JPMorgan Chase & Co. | 3.150% | 7/5/16 | 26,750 | 26,888 |
| JPMorgan Chase & Co. | 6.125% | 6/27/17 | 10,700 | 11,678 |
| JPMorgan Chase & Co. | 6.000% | 1/15/18 | 9,610 | 10,768 |
| JPMorgan Chase & Co. | 6.300% | 4/23/19 | 21,200 | 23,961 |
| JPMorgan Chase & Co. | 4.400% | 7/22/20 | 7,275 | 7,281 |
| JPMorgan Chase & Co. | 4.250% | 10/15/20 | 2,640 | 2,661 |
| JPMorgan Chase & Co. | 4.350% | 8/15/21 | 6,200 | 6,284 |
| JPMorgan Chase & Co. | 6.400% | 5/15/38 | 57,719 | 66,824 |
19
Vanguard® Total Bond Market Index Fund
Schedule of Investments
December 31, 2011
| Face | Market | |||
| Maturity | Amount | Value | ||
| Coupon | Date | ($000) | ($000) | |
| JPMorgan Chase & Co. | 5.500% | 10/15/40 | 31,050 | 32,081 |
| JPMorgan Chase & Co. | 5.600% | 7/15/41 | 12,250 | 13,152 |
| JPMorgan Chase & Co. | 5.400% | 1/6/42 | 6,525 | 6,706 |
| JPMorgan Chase Bank NA | 5.875% | 6/13/16 | 4,346 | 4,727 |
| JPMorgan Chase Bank NA | 6.000% | 7/5/17 | 825 | 889 |
| JPMorgan Chase Bank NA | 6.000% | 10/1/17 | 65 | 69 |
| KeyBank NA | 5.800% | 7/1/14 | 2,825 | 3,016 |
| KeyBank NA | 4.950% | 9/15/15 | 4,675 | 4,907 |
| KeyBank NA | 5.450% | 3/3/16 | 6,275 | 6,783 |
| KeyBank NA | 6.950% | 2/1/28 | 1,925 | 2,132 |
| KeyCorp | 6.500% | 5/14/13 | 4,625 | 4,904 |
| KeyCorp | 5.100% | 3/24/21 | 775 | 807 |
| 6 Lloyds TSB Bank plc | 4.375% | 1/12/15 | 9,640 | 9,248 |
| Lloyds TSB Bank plc | 4.875% | 1/21/16 | 4,825 | 4,663 |
| 6 Lloyds TSB Bank plc | 5.800% | 1/13/20 | 9,425 | 8,945 |
| Lloyds TSB Bank plc | 6.375% | 1/21/21 | 33,900 | 34,007 |
| M&I Marshall & Ilsley Bank | 4.850% | 6/16/15 | 1,250 | 1,320 |
| M&I Marshall & Ilsley Bank | 5.000% | 1/17/17 | 150 | 158 |
| Manufacturers & Traders Trust Co. | 6.625% | 12/4/17 | 5,950 | 6,817 |
| 4 Manufacturers & Traders Trust Co. | 5.585% | 12/28/20 | 450 | 440 |
| MBNA Corp. | 6.125% | 3/1/13 | 4,075 | 4,092 |
| MBNA Corp. | 5.000% | 6/15/15 | 4,775 | 4,656 |
| Mellon Funding Corp. | 5.000% | 12/1/14 | 5,975 | 6,442 |
| Merrill Lynch & Co. Inc. | 5.450% | 2/5/13 | 14,805 | 14,915 |
| Merrill Lynch & Co. Inc. | 6.150% | 4/25/13 | 21,250 | 21,483 |
| Merrill Lynch & Co. Inc. | 5.000% | 2/3/14 | 11,550 | 11,550 |
| Merrill Lynch & Co. Inc. | 5.450% | 7/15/14 | 2,450 | 2,434 |
| Merrill Lynch & Co. Inc. | 5.000% | 1/15/15 | 17,779 | 17,128 |
| Merrill Lynch & Co. Inc. | 6.050% | 5/16/16 | 4,700 | 4,439 |
| Merrill Lynch & Co. Inc. | 5.700% | 5/2/17 | 21,625 | 19,668 |
| Merrill Lynch & Co. Inc. | 6.400% | 8/28/17 | 13,950 | 13,540 |
| Merrill Lynch & Co. Inc. | 6.875% | 4/25/18 | 35,221 | 34,717 |
| Merrill Lynch & Co. Inc. | 6.500% | 7/15/18 | 3,325 | 3,226 |
| Merrill Lynch & Co. Inc. | 6.875% | 11/15/18 | 600 | 585 |
| Merrill Lynch & Co. Inc. | 6.220% | 9/15/26 | 15,250 | 12,574 |
| Merrill Lynch & Co. Inc. | 6.110% | 1/29/37 | 5,475 | 4,179 |
| Merrill Lynch & Co. Inc. | 7.750% | 5/14/38 | 24,108 | 22,906 |
| Morgan Stanley | 5.300% | 3/1/13 | 24,311 | 24,610 |
| Morgan Stanley | 6.750% | 10/15/13 | 600 | 622 |
| Morgan Stanley | 2.875% | 1/24/14 | 11,925 | 11,401 |
| Morgan Stanley | 4.750% | 4/1/14 | 28,017 | 27,672 |
| Morgan Stanley | 6.000% | 5/13/14 | 21,485 | 21,785 |
| Morgan Stanley | 2.875% | 7/28/14 | 3,825 | 3,616 |
| Morgan Stanley | 4.200% | 11/20/14 | 15,675 | 15,120 |
| Morgan Stanley | 4.100% | 1/26/15 | 13,425 | 12,834 |
| Morgan Stanley | 6.000% | 4/28/15 | 51,160 | 51,281 |
| Morgan Stanley | 4.000% | 7/24/15 | 3,750 | 3,520 |
| Morgan Stanley | 5.375% | 10/15/15 | 6,400 | 6,254 |
| Morgan Stanley | 3.450% | 11/2/15 | 9,325 | 8,565 |
| Morgan Stanley | 3.800% | 4/29/16 | 875 | 807 |
| Morgan Stanley | 5.750% | 10/18/16 | 17,175 | 16,749 |
| Morgan Stanley | 5.450% | 1/9/17 | 14,785 | 14,230 |
| Morgan Stanley | 5.550% | 4/27/17 | 3,305 | 3,142 |
| Morgan Stanley | 6.250% | 8/28/17 | 560 | 547 |
| Morgan Stanley | 5.950% | 12/28/17 | 17,475 | 16,708 |
| Morgan Stanley | 6.625% | 4/1/18 | 34,285 | 33,829 |
| Morgan Stanley | 7.300% | 5/13/19 | 12,510 | 12,752 |
| Morgan Stanley | 5.625% | 9/23/19 | 45,350 | 41,782 |
| Morgan Stanley | 5.500% | 7/24/20 | 150 | 137 |
| Morgan Stanley | 5.750% | 1/25/21 | 14,375 | 13,331 |
| Morgan Stanley | 5.500% | 7/28/21 | 8,050 | 7,446 |
| Morgan Stanley | 6.250% | 8/9/26 | 14,825 | 13,910 |
| Morgan Stanley | 7.250% | 4/1/32 | 17,277 | 17,618 |
| National City Bank | 4.625% | 5/1/13 | 2,500 | 2,598 |
20
Vanguard® Total Bond Market Index Fund
Schedule of Investments
December 31, 2011
| Face | Market | ||||
| Maturity | Amount | Value | |||
| Coupon | Date | ($000) | ($000) | ||
| National City Corp. | 4.900% | 1/15/15 | 1,425 | 1,538 | |
| National City Corp. | 6.875% | 5/15/19 | 1,125 | 1,264 | |
| Northern Trust Co. | 6.500% | 8/15/18 | 1,125 | 1,339 | |
| Northern Trust Corp. | 5.500% | 8/15/13 | 1,350 | 1,436 | |
| Northern Trust Corp. | 4.625% | 5/1/14 | 4,200 | 4,509 | |
| Northern Trust Corp. | 3.450% | 11/4/20 | 750 | 769 | |
| Northern Trust Corp. | 3.375% | 8/23/21 | 1,575 | 1,614 | |
| Paribas | 6.950% | 7/22/13 | 900 | 909 | |
| PNC Bank NA | 4.875% | 9/21/17 | 8,425 | 8,799 | |
| PNC Bank NA | 6.000% | 12/7/17 | 1,100 | 1,193 | |
| PNC Funding Corp. | 3.000% | 5/19/14 | 750 | 778 | |
| PNC Funding Corp. | 3.625% | 2/8/15 | 18,150 | 19,121 | |
| PNC Funding Corp. | 4.250% | 9/21/15 | 4,750 | 5,076 | |
| PNC Funding Corp. | 5.250% | 11/15/15 | 8,605 | 9,356 | |
| PNC Funding Corp. | 2.700% | 9/19/16 | 2,150 | 2,185 | |
| PNC Funding Corp. | 5.625% | 2/1/17 | 975 | 1,052 | |
| PNC Funding Corp. | 6.700% | 6/10/19 | 7,134 | 8,664 | |
| PNC Funding Corp. | 5.125% | 2/8/20 | 12,875 | 14,543 | |
| PNC Funding Corp. | 4.375% | 8/11/20 | 10,125 | 10,951 | |
| Royal Bank of Canada | 2.100% | 7/29/13 | 15,400 | 15,681 | |
| Royal Bank of Canada | 1.450% | 10/30/14 | 4,075 | 4,102 | |
| Royal Bank of Canada | 2.625% | 12/15/15 | 5,400 | 5,547 | |
| Royal Bank of Canada | 2.875% | 4/19/16 | 8,300 | 8,595 | |
| Royal Bank of Canada | 2.300% | 7/20/16 | 19,050 | 19,374 | |
| Royal Bank of Scotland Group plc | 6.400% | 10/21/19 | 25,065 | 23,278 | |
| Royal Bank Of Scotland NV | 4.650% | 6/4/18 | 225 | 199 | |
| Royal Bank of Scotland plc | 3.400% | 8/23/13 | 9,950 | 9,651 | |
| Royal Bank of Scotland plc | 3.250% | 1/11/14 | 9,550 | 9,083 | |
| 6 | Royal Bank of Scotland plc | 4.875% | 8/25/14 | 1,700 | 1,680 |
| Royal Bank of Scotland plc | 4.875% | 3/16/15 | 6,200 | 5,915 | |
| Royal Bank of Scotland plc | 3.950% | 9/21/15 | 1,440 | 1,343 | |
| Royal Bank of Scotland plc | 4.375% | 3/16/16 | 5,850 | 5,579 | |
| Royal Bank of Scotland plc | 5.625% | 8/24/20 | 13,825 | 13,274 | |
| Royal Bank of Scotland plc | 6.125% | 1/11/21 | 19,075 | 19,006 | |
| Santander Holdings USA Inc. | 4.625% | 4/19/16 | 9,075 | 8,732 | |
| Santander UK plc | 7.950% | 10/26/29 | 4,500 | 3,744 | |
| SouthTrust Corp. | 5.800% | 6/15/14 | 2,550 | 2,732 | |
| Sovereign Bank | 8.750% | 5/30/18 | 1,595 | 1,769 | |
| 4,6 | Standard Chartered plc | 6.409% | 12/31/49 | 5,825 | 4,820 |
| State Street Bank and Trust Co. | 5.300% | 1/15/16 | 2,800 | 3,148 | |
| State Street Corp. | 4.300% | 5/30/14 | 3,900 | 4,171 | |
| State Street Corp. | 2.875% | 3/7/16 | 23,100 | 23,758 | |
| State Street Corp. | 4.956% | 3/15/18 | 3,875 | 4,028 | |
| State Street Corp. | 4.375% | 3/7/21 | 400 | 438 | |
| SunTrust Bank | 5.000% | 9/1/15 | 39 | 41 | |
| SunTrust Bank | 7.250% | 3/15/18 | 1,000 | 1,121 | |
| SunTrust Banks Inc. | 3.600% | 4/15/16 | 9,450 | 9,617 | |
| SunTrust Banks Inc. | 3.500% | 1/20/17 | 9,865 | 9,898 | |
| SunTrust Banks Inc. | 6.000% | 9/11/17 | 2,508 | 2,773 | |
| 4 | SunTrust Capital VIII | 6.100% | 12/1/66 | 2,102 | 2,060 |
| Toronto-Dominion Bank | 1.375% | 7/14/14 | 3,500 | 3,541 | |
| Toronto-Dominion Bank | 2.500% | 7/14/16 | 5,240 | 5,340 | |
| Toronto-Dominion Bank | 2.375% | 10/19/16 | 9,900 | 10,088 | |
| UBS AG | 2.250% | 8/12/13 | 20,350 | 20,143 | |
| UBS AG | 2.250% | 1/28/14 | 150 | 146 | |
| UBS AG | 3.875% | 1/15/15 | 990 | 985 | |
| UBS AG | 7.000% | 10/15/15 | 2,500 | 2,561 | |
| UBS AG | 5.875% | 7/15/16 | 6,025 | 6,072 | |
| UBS AG | 7.375% | 6/15/17 | 9,550 | 10,213 | |
| UBS AG | 5.875% | 12/20/17 | 29,199 | 30,262 | |
| UBS AG | 5.750% | 4/25/18 | 10,642 | 11,023 | |
| UBS AG | 4.875% | 8/4/20 | 29,035 | 28,728 | |
| 4 | UBS Preferred Funding Trust V | 6.243% | 5/29/49 | 750 | 628 |
21
Vanguard® Total Bond Market Index Fund
Schedule of Investments
December 31, 2011
| Face | Market | |||
| Maturity | Amount | Value | ||
| Coupon | Date | ($000) | ($000) | |
| UFJ Finance Aruba AEC | 6.750% | 7/15/13 | 20,950 | 22,320 |
| Union Bank NA | 5.950% | 5/11/16 | 3,875 | 4,197 |
| Union Bank NA | 3.000% | 6/6/16 | 1,300 | 1,317 |
| UnionBanCal Corp. | 5.250% | 12/16/13 | 2,105 | 2,170 |
| US Bancorp | 2.000% | 6/14/13 | 15,625 | 15,872 |
| US Bancorp | 4.200% | 5/15/14 | 1,475 | 1,576 |
| US Bancorp | 3.150% | 3/4/15 | 1,450 | 1,519 |
| US Bancorp | 2.450% | 7/27/15 | 650 | 667 |
| US Bancorp | 3.442% | 2/1/16 | 17,800 | 18,350 |
| US Bancorp | 2.200% | 11/15/16 | 1,350 | 1,365 |
| US Bancorp | 4.125% | 5/24/21 | 14,400 | 15,892 |
| US Bank NA | 6.300% | 2/4/14 | 8,750 | 9,594 |
| US Bank NA | 4.950% | 10/30/14 | 12,771 | 13,866 |
| USB Capital XIII Trust | 6.625% | 12/15/39 | 875 | 898 |
| Wachovia Bank NA | 4.800% | 11/1/14 | 1,400 | 1,471 |
| Wachovia Bank NA | 4.875% | 2/1/15 | 15,250 | 15,993 |
| Wachovia Bank NA | 5.000% | 8/15/15 | 960 | 1,010 |
| Wachovia Bank NA | 6.000% | 11/15/17 | 8,775 | 9,704 |
| Wachovia Bank NA | 5.850% | 2/1/37 | 16,225 | 16,848 |
| Wachovia Bank NA | 6.600% | 1/15/38 | 14,235 | 16,017 |
| Wachovia Corp. | 5.500% | 5/1/13 | 7,125 | 7,518 |
| Wachovia Corp. | 4.875% | 2/15/14 | 10,990 | 11,476 |
| Wachovia Corp. | 5.250% | 8/1/14 | 7,212 | 7,619 |
| Wachovia Corp. | 5.625% | 10/15/16 | 13,065 | 14,218 |
| Wachovia Corp. | 5.750% | 6/15/17 | 28,025 | 31,649 |
| Wachovia Corp. | 5.750% | 2/1/18 | 1,575 | 1,787 |
| Wachovia Corp. | 6.605% | 10/1/25 | 175 | 199 |
| Wachovia Corp. | 7.500% | 4/15/35 | 925 | 1,156 |
| Wachovia Corp. | 5.500% | 8/1/35 | 4,185 | 4,070 |
| Wachovia Corp. | 6.550% | 10/15/35 | 625 | 674 |
| Wells Fargo & Co. | 4.375% | 1/31/13 | 18,235 | 18,819 |
| Wells Fargo & Co. | 4.950% | 10/16/13 | 4,575 | 4,798 |
| Wells Fargo & Co. | 4.625% | 4/15/14 | 250 | 261 |
| Wells Fargo & Co. | 3.750% | 10/1/14 | 500 | 527 |
| Wells Fargo & Co. | 5.000% | 11/15/14 | 171 | 182 |
| Wells Fargo & Co. | 3.625% | 4/15/15 | 7,720 | 8,084 |
| Wells Fargo & Co. | 3.676% | 6/15/16 | 36,225 | 38,090 |
| Wells Fargo & Co. | 2.625% | 12/15/16 | 16,800 | 16,737 |
| Wells Fargo & Co. | 5.625% | 12/11/17 | 26,350 | 29,905 |
| Wells Fargo & Co. | 4.600% | 4/1/21 | 19,125 | 20,792 |
| Wells Fargo & Co. | 5.375% | 2/7/35 | 4,250 | 4,500 |
| Wells Fargo Bank NA | 4.750% | 2/9/15 | 14,125 | 14,792 |
| Wells Fargo Bank NA | 5.750% | 5/16/16 | 7,900 | 8,671 |
| Wells Fargo Bank NA | 5.950% | 8/26/36 | 12,625 | 13,256 |
| 4 Wells Fargo Capital X | 5.950% | 12/1/86 | 3,725 | 3,716 |
| Westpac Banking Corp. | 2.100% | 8/2/13 | 5,175 | 5,204 |
| Westpac Banking Corp. | 1.850% | 12/9/13 | 17,175 | 17,190 |
| Westpac Banking Corp. | 4.200% | 2/27/15 | 15,075 | 15,749 |
| Westpac Banking Corp. | 3.000% | 8/4/15 | 17,350 | 17,552 |
| Westpac Banking Corp. | 4.875% | 11/19/19 | 12,100 | 12,911 |
| Brokerage (0.1%) | ||||
| Ameriprise Financial Inc. | 5.650% | 11/15/15 | 7,850 | 8,875 |
| Ameriprise Financial Inc. | 7.300% | 6/28/19 | 400 | 482 |
| Ameriprise Financial Inc. | 5.300% | 3/15/20 | 4,617 | 4,957 |
| 4 Ameriprise Financial Inc. | 7.518% | 6/1/66 | 575 | 576 |
| BlackRock Inc. | 3.500% | 12/10/14 | 4,275 | 4,563 |
| BlackRock Inc. | 6.250% | 9/15/17 | 3,375 | 3,931 |
| BlackRock Inc. | 5.000% | 12/10/19 | 8,098 | 8,811 |
| BlackRock Inc. | 4.250% | 5/24/21 | 2,115 | 2,202 |
| Charles Schwab Corp. | 4.950% | 6/1/14 | 9,450 | 10,227 |
| Charles Schwab Corp. | 4.450% | 7/22/20 | 4,550 | 4,847 |
| 6 FMR LLC | 7.490% | 6/15/19 | 800 | 926 |
| Franklin Resources Inc. | 2.000% | 5/20/13 | 6,825 | 6,898 |
22
Vanguard® Total Bond Market Index Fund
Schedule of Investments
December 31, 2011
| Face | Market | |||
| Maturity | Amount | Value | ||
| Coupon | Date | ($000) | ($000) | |
| Franklin Resources Inc. | 3.125% | 5/20/15 | 3,700 | 3,847 |
| Franklin Resources Inc. | 4.625% | 5/20/20 | 1,950 | 2,111 |
| GFI Group Inc. | 8.375% | 7/19/18 | 1,900 | 1,682 |
| Invesco Ltd. | 5.375% | 2/27/13 | 25 | 26 |
| Jefferies Group Inc. | 5.125% | 4/13/18 | 17,250 | 15,158 |
| Jefferies Group Inc. | 8.500% | 7/15/19 | 9,402 | 9,473 |
| Jefferies Group Inc. | 6.875% | 4/15/21 | 3,400 | 3,052 |
| Jefferies Group Inc. | 6.450% | 6/8/27 | 13,560 | 11,170 |
| Jefferies Group Inc. | 6.250% | 1/15/36 | 7,500 | 6,038 |
| Lazard Group LLC | 7.125% | 5/15/15 | 2,150 | 2,313 |
| Lazard Group LLC | 6.850% | 6/15/17 | 7,425 | 7,790 |
| Nomura Holdings Inc. | 5.000% | 3/4/15 | 6,825 | 6,877 |
| Nomura Holdings Inc. | 6.700% | 3/4/20 | 9,550 | 10,046 |
| Raymond James Financial Inc. | 4.250% | 4/15/16 | 1,975 | 2,020 |
| TD Ameritrade Holding Corp. | 4.150% | 12/1/14 | 2,725 | 2,872 |
| TD Ameritrade Holding Corp. | 5.600% | 12/1/19 | 2,425 | 2,621 |
| Finance Companies (0.7%) | ||||
| Block Financial LLC | 7.875% | 1/15/13 | 1,675 | 1,736 |
| Block Financial LLC | 5.125% | 10/30/14 | 8,610 | 8,772 |
| Discover Financial Services | 6.450% | 6/12/17 | 1,825 | 1,909 |
| Discover Financial Services | 10.250% | 7/15/19 | 917 | 1,108 |
| 4 GE Capital Trust I | 6.375% | 11/15/67 | 10,475 | 10,318 |
| General Electric Capital Corp. | 5.250% | 10/19/12 | 39,115 | 40,489 |
| General Electric Capital Corp. | 2.800% | 1/8/13 | 10,500 | 10,690 |
| General Electric Capital Corp. | 5.450% | 1/15/13 | 41,100 | 43,099 |
| General Electric Capital Corp. | 4.800% | 5/1/13 | 24,125 | 25,345 |
| General Electric Capital Corp. | 2.100% | 1/7/14 | 6,050 | 6,146 |
| General Electric Capital Corp. | 5.900% | 5/13/14 | 4,850 | 5,319 |
| General Electric Capital Corp. | 5.500% | 6/4/14 | 14,400 | 15,671 |
| General Electric Capital Corp. | 5.650% | 6/9/14 | 9,000 | 9,797 |
| General Electric Capital Corp. | 3.750% | 11/14/14 | 28,250 | 29,901 |
| General Electric Capital Corp. | 3.500% | 6/29/15 | 2,500 | 2,622 |
| General Electric Capital Corp. | 4.375% | 9/21/15 | 6,900 | 7,447 |
| General Electric Capital Corp. | 2.250% | 11/9/15 | 7,089 | 7,101 |
| General Electric Capital Corp. | 2.950% | 5/9/16 | 31,425 | 32,302 |
| General Electric Capital Corp. | 3.350% | 10/17/16 | 1,450 | 1,509 |
| General Electric Capital Corp. | 5.400% | 2/15/17 | 22,825 | 25,469 |
| General Electric Capital Corp. | 5.625% | 9/15/17 | 20,663 | 22,887 |
| General Electric Capital Corp. | 5.625% | 5/1/18 | 30,289 | 33,859 |
| General Electric Capital Corp. | 6.000% | 8/7/19 | 11,650 | 13,377 |
| General Electric Capital Corp. | 5.500% | 1/8/20 | 4,600 | 5,043 |
| General Electric Capital Corp. | 5.550% | 5/4/20 | 8,550 | 9,368 |
| General Electric Capital Corp. | 5.300% | 2/11/21 | 5,925 | 6,286 |
| General Electric Capital Corp. | 4.650% | 10/17/21 | 5,575 | 5,807 |
| General Electric Capital Corp. | 6.750% | 3/15/32 | 35,731 | 41,693 |
| General Electric Capital Corp. | 6.150% | 8/7/37 | 30,500 | 33,544 |
| General Electric Capital Corp. | 5.875% | 1/14/38 | 40,975 | 43,241 |
| General Electric Capital Corp. | 6.875% | 1/10/39 | 33,250 | 39,622 |
| 4 General Electric Capital Corp. | 6.375% | 11/15/67 | 12,930 | 12,736 |
| 4 HSBC Finance Capital Trust IX | 5.911% | 11/30/35 | 2,125 | 1,748 |
| HSBC Finance Corp. | 4.750% | 7/15/13 | 24,875 | 25,337 |
| HSBC Finance Corp. | 5.250% | 1/15/14 | 5,725 | 5,852 |
| HSBC Finance Corp. | 5.000% | 6/30/15 | 15,200 | 15,408 |
| HSBC Finance Corp. | 5.500% | 1/19/16 | 11,921 | 12,311 |
| HSBC Finance Corp. | 6.676% | 1/15/21 | 36,424 | 37,537 |
| 6 International Lease Finance Corp. | 6.500% | 9/1/14 | 170 | 174 |
| 6 International Lease Finance Corp. | 6.750% | 9/1/16 | 830 | 851 |
| SLM Corp. | 5.375% | 1/15/13 | 4,175 | 4,208 |
| SLM Corp. | 5.000% | 10/1/13 | 4,485 | 4,507 |
| SLM Corp. | 5.375% | 5/15/14 | 2,515 | 2,545 |
| SLM Corp. | 5.050% | 11/14/14 | 2,335 | 2,256 |
| SLM Corp. | 5.000% | 4/15/15 | 30 | 29 |
| SLM Corp. | 6.250% | 1/25/16 | 7,075 | 6,918 |
23
Vanguard® Total Bond Market Index Fund
Schedule of Investments
December 31, 2011
| Face | Market | |||
| Maturity | Amount | Value | ||
| Coupon | Date | ($000) | ($000) | |
| SLM Corp. | 8.450% | 6/15/18 | 17,500 | 18,149 |
| SLM Corp. | 8.000% | 3/25/20 | 6,710 | 6,806 |
| SLM Corp. | 5.625% | 8/1/33 | 7,865 | 5,989 |
| Insurance (1.2%) | ||||
| ACE Capital Trust II | 9.700% | 4/1/30 | 2,035 | 2,710 |
| ACE INA Holdings Inc. | 5.875% | 6/15/14 | 900 | 991 |
| ACE INA Holdings Inc. | 5.600% | 5/15/15 | 6,175 | 6,896 |
| ACE INA Holdings Inc. | 2.600% | 11/23/15 | 6,510 | 6,629 |
| ACE INA Holdings Inc. | 5.700% | 2/15/17 | 2,930 | 3,368 |
| ACE INA Holdings Inc. | 5.800% | 3/15/18 | 1,256 | 1,463 |
| ACE INA Holdings Inc. | 5.900% | 6/15/19 | 2,575 | 3,065 |
| ACE INA Holdings Inc. | 6.700% | 5/15/36 | 750 | 973 |
| AEGON Funding Co. LLC | 5.750% | 12/15/20 | 4,525 | 4,708 |
| Aegon NV | 4.750% | 6/1/13 | 1,900 | 1,945 |
| Aetna Inc. | 6.000% | 6/15/16 | 10,650 | 12,271 |
| Aetna Inc. | 6.500% | 9/15/18 | 2,175 | 2,638 |
| Aetna Inc. | 4.125% | 6/1/21 | 350 | 365 |
| Aetna Inc. | 6.625% | 6/15/36 | 8,900 | 10,965 |
| Aetna Inc. | 6.750% | 12/15/37 | 4,855 | 6,079 |
| Aflac Inc. | 8.500% | 5/15/19 | 950 | 1,167 |
| Aflac Inc. | 6.900% | 12/17/39 | 825 | 922 |
| Aflac Inc. | 6.450% | 8/15/40 | 250 | 264 |
| Alleghany Corp. | 5.625% | 9/15/20 | 1,700 | 1,780 |
| Allied World Assurance Co. Ltd. | 7.500% | 8/1/16 | 15,503 | 17,559 |
| Allstate Corp. | 5.000% | 8/15/14 | 6,325 | 6,848 |
| Allstate Corp. | 6.125% | 12/15/32 | 2,450 | 2,780 |
| Allstate Corp. | 5.350% | 6/1/33 | 895 | 927 |
| Allstate Corp. | 5.550% | 5/9/35 | 2,956 | 3,147 |
| 4 Allstate Corp. | 6.500% | 5/15/57 | 4,475 | 4,050 |
| 4 Allstate Corp. | 6.125% | 5/15/67 | 2,831 | 2,583 |
| Allstate Life Global Funding Trusts | 5.375% | 4/30/13 | 18,900 | 19,957 |
| Alterra Finance LLC | 6.250% | 9/30/20 | 2,000 | 2,106 |
| American Financial Group Inc. | 9.875% | 6/15/19 | 8,114 | 9,512 |
| American International Group Inc. | 4.250% | 5/15/13 | 18,551 | 18,528 |
| American International Group Inc. | 4.250% | 9/15/14 | 5,500 | 5,343 |
| American International Group Inc. | 5.050% | 10/1/15 | 3,200 | 3,100 |
| American International Group Inc. | 4.875% | 9/15/16 | 5,500 | 5,193 |
| American International Group Inc. | 5.600% | 10/18/16 | 2,000 | 1,943 |
| American International Group Inc. | 5.450% | 5/18/17 | 7,425 | 7,117 |
| American International Group Inc. | 5.850% | 1/16/18 | 18,627 | 18,131 |
| American International Group Inc. | 8.250% | 8/15/18 | 3,325 | 3,528 |
| American International Group Inc. | 6.400% | 12/15/20 | 15,040 | 15,153 |
| American International Group Inc. | 6.250% | 5/1/36 | 13,860 | 12,616 |
| American International Group Inc. | 6.250% | 3/15/37 | 4,660 | 3,378 |
| 6 American International Group Inc. | 6.820% | 11/15/37 | 955 | 921 |
| 4 American International Group Inc. | 8.175% | 5/15/68 | 26,400 | 23,826 |
| AON Corp. | 3.500% | 9/30/15 | 5,680 | 5,838 |
| Aon Corp. | 5.000% | 9/30/20 | 3,550 | 3,912 |
| AON Corp. | 8.205% | 1/1/27 | 825 | 954 |
| AON Corp. | 6.250% | 9/30/40 | 3,550 | 4,332 |
| Arch Capital Group Ltd. | 7.350% | 5/1/34 | 4,335 | 5,093 |
| Aspen Insurance Holdings Ltd. | 6.000% | 12/15/20 | 2,075 | 2,092 |
| Assurant Inc. | 5.625% | 2/15/14 | 3,225 | 3,370 |
| Assurant Inc. | 6.750% | 2/15/34 | 5,965 | 6,207 |
| AXA SA | 8.600% | 12/15/30 | 14,882 | 14,644 |
| Axis Capital Holdings Ltd. | 5.750% | 12/1/14 | 2,150 | 2,261 |
| Axis Specialty Finance LLC | 5.875% | 6/1/20 | 21,650 | 22,295 |
| Berkshire Hathaway Finance Corp. | 4.600% | 5/15/13 | 14,658 | 15,381 |
| Berkshire Hathaway Finance Corp. | 5.000% | 8/15/13 | 18,025 | 19,147 |
| Berkshire Hathaway Finance Corp. | 4.850% | 1/15/15 | 9,780 | 10,825 |
| Berkshire Hathaway Finance Corp. | 5.400% | 5/15/18 | 19,450 | 22,663 |
| Berkshire Hathaway Finance Corp. | 5.750% | 1/15/40 | 5,615 | 6,652 |
| Berkshire Hathaway Inc. | 2.125% | 2/11/13 | 14,575 | 14,804 |
24
Vanguard® Total Bond Market Index Fund
Schedule of Investments
December 31, 2011
| Face | Market | |||
| Maturity | Amount | Value | ||
| Coupon | Date | ($000) | ($000) | |
| Berkshire Hathaway Inc. | 3.200% | 2/11/15 | 12,370 | 13,104 |
| Berkshire Hathaway Inc. | 2.200% | 8/15/16 | 11,625 | 11,991 |
| Berkshire Hathaway Inc. | 3.750% | 8/15/21 | 250 | 260 |
| Chubb Corp. | 5.200% | 4/1/13 | 1,575 | 1,652 |
| Chubb Corp. | 5.750% | 5/15/18 | 6,050 | 7,107 |
| Chubb Corp. | 6.000% | 5/11/37 | 5,945 | 7,108 |
| Chubb Corp. | 6.500% | 5/15/38 | 1,900 | 2,406 |
| 4 Chubb Corp. | 6.375% | 3/29/67 | 11,075 | 10,937 |
| Cigna Corp. | 2.750% | 11/15/16 | 3,250 | 3,244 |
| CIGNA Corp. | 5.125% | 6/15/20 | 2,075 | 2,237 |
| CIGNA Corp. | 4.375% | 12/15/20 | 3,550 | 3,615 |
| Cigna Corp. | 4.500% | 3/15/21 | 875 | 896 |
| Cigna Corp. | 4.000% | 2/15/22 | 3,050 | 3,021 |
| CIGNA Corp. | 7.875% | 5/15/27 | 1,025 | 1,266 |
| CIGNA Corp. | 6.150% | 11/15/36 | 8,675 | 9,466 |
| Cigna Corp. | 5.875% | 3/15/41 | 2,200 | 2,334 |
| Cigna Corp. | 5.375% | 2/15/42 | 3,500 | 3,501 |
| Cincinnati Financial Corp. | 6.920% | 5/15/28 | 3,575 | 3,925 |
| Cincinnati Financial Corp. | 6.125% | 11/1/34 | 2,010 | 2,010 |
| CNA Financial Corp. | 5.850% | 12/15/14 | 4,038 | 4,255 |
| CNA Financial Corp. | 6.500% | 8/15/16 | 8,625 | 9,339 |
| CNA Financial Corp. | 7.350% | 11/15/19 | 8,800 | 9,798 |
| CNA Financial Corp. | 5.875% | 8/15/20 | 2,775 | 2,869 |
| CNA Financial Corp. | 5.750% | 8/15/21 | 600 | 612 |
| Coventry Health Care Inc. | 6.300% | 8/15/14 | 9,515 | 10,333 |
| Coventry Health Care Inc. | 5.450% | 6/15/21 | 3,150 | 3,486 |
| Endurance Specialty Holdings Ltd. | 7.000% | 7/15/34 | 6,875 | 6,940 |
| Genworth Financial Inc. | 5.750% | 6/15/14 | 2,496 | 2,533 |
| Genworth Financial Inc. | 4.950% | 10/1/15 | 950 | 898 |
| Genworth Financial Inc. | 8.625% | 12/15/16 | 9,150 | 9,310 |
| Genworth Financial Inc. | 7.700% | 6/15/20 | 1,150 | 1,084 |
| Genworth Financial Inc. | 7.200% | 2/15/21 | 4,100 | 3,688 |
| Genworth Financial Inc. | 6.500% | 6/15/34 | 5,775 | 4,533 |
| Hartford Financial Services Group Inc. | 4.625% | 7/15/13 | 4,125 | 4,226 |
| Hartford Financial Services Group Inc. | 5.500% | 10/15/16 | 3,075 | 3,187 |
| Hartford Financial Services Group Inc. | 5.375% | 3/15/17 | 2,600 | 2,604 |
| Hartford Financial Services Group Inc. | 6.300% | 3/15/18 | 2,900 | 3,039 |
| Hartford Financial Services Group Inc. | 6.000% | 1/15/19 | 1,325 | 1,360 |
| Hartford Financial Services Group Inc. | 5.500% | 3/30/20 | 500 | 499 |
| Hartford Financial Services Group Inc. | 5.950% | 10/15/36 | 2,200 | 2,020 |
| Hartford Financial Services Group Inc. | 6.100% | 10/1/41 | 3,875 | 3,589 |
| HCC Insurance Holdings Inc. | 6.300% | 11/15/19 | 4,250 | 4,635 |
| Humana Inc. | 6.450% | 6/1/16 | 175 | 195 |
| Humana Inc. | 7.200% | 6/15/18 | 6,375 | 7,532 |
| Humana Inc. | 6.300% | 8/1/18 | 200 | 225 |
| Jefferson-Pilot Corp. | 4.750% | 1/30/14 | 1,600 | 1,661 |
| Lincoln National Corp. | 4.300% | 6/15/15 | 250 | 260 |
| Lincoln National Corp. | 8.750% | 7/1/19 | 127 | 154 |
| Lincoln National Corp. | 6.150% | 4/7/36 | 6,950 | 7,060 |
| Lincoln National Corp. | 7.000% | 6/15/40 | 8,425 | 9,475 |
| 4 Lincoln National Corp. | 7.000% | 5/17/66 | 15,950 | 14,435 |
| 4 Lincoln National Corp. | 6.050% | 4/20/67 | 1,700 | 1,415 |
| Loews Corp. | 5.250% | 3/15/16 | 3,200 | 3,527 |
| Loews Corp. | 6.000% | 2/1/35 | 625 | 681 |
| Manulife Financial Corp. | 3.400% | 9/17/15 | 10,500 | 10,552 |
| Manulife Financial Corp. | 4.900% | 9/17/20 | 16,225 | 16,654 |
| Markel Corp. | 7.125% | 9/30/19 | 6,625 | 7,597 |
| Marsh & McLennan Cos. Inc. | 5.750% | 9/15/15 | 8,853 | 9,848 |
| Marsh & McLennan Cos. Inc. | 9.250% | 4/15/19 | 8,150 | 10,780 |
| Marsh & McLennan Cos. Inc. | 4.800% | 7/15/21 | 1,720 | 1,881 |
| Marsh & McLennan Cos. Inc. | 5.875% | 8/1/33 | 400 | 439 |
| MetLife Inc. | 5.000% | 11/24/13 | 4,425 | 4,715 |
| MetLife Inc. | 2.375% | 2/6/14 | 9,725 | 9,859 |
| MetLife Inc. | 5.000% | 6/15/15 | 3,926 | 4,263 |
25
Vanguard® Total Bond Market Index Fund
Schedule of Investments
December 31, 2011
| Face | Market | |||
| Maturity | Amount | Value | ||
| Coupon | Date | ($000) | ($000) | |
| MetLife Inc. | 6.750% | 6/1/16 | 3,900 | 4,501 |
| MetLife Inc. | 7.717% | 2/15/19 | 1,495 | 1,870 |
| MetLife Inc. | 4.750% | 2/8/21 | 4,040 | 4,356 |
| MetLife Inc. | 6.500% | 12/15/32 | 2,700 | 3,213 |
| MetLife Inc. | 6.375% | 6/15/34 | 2,375 | 2,804 |
| MetLife Inc. | 5.700% | 6/15/35 | 725 | 808 |
| MetLife Inc. | 5.875% | 2/6/41 | 10,890 | 12,575 |
| 4 MetLife Inc. | 6.400% | 12/15/66 | 19,317 | 18,231 |
| 4 MetLife Inc. | 10.750% | 8/1/69 | 760 | 996 |
| 6 Metropolitan Life Global Funding I | 5.125% | 6/10/14 | 3,475 | 3,736 |
| 4 Nationwide Financial Services Inc. | 6.750% | 5/15/67 | 350 | 301 |
| OneBeacon US Holdings Inc. | 5.875% | 5/15/13 | 565 | 582 |
| PartnerRe Finance B LLC | 5.500% | 6/1/20 | 11,484 | 11,631 |
| Principal Financial Group Inc. | 7.875% | 5/15/14 | 650 | 726 |
| Principal Financial Group Inc. | 8.875% | 5/15/19 | 4 | 5 |
| Principal Financial Group Inc. | 6.050% | 10/15/36 | 3,275 | 3,460 |
| Principal Life Income Funding Trusts | 5.300% | 4/24/13 | 5,575 | 5,850 |
| Principal Life Income Funding Trusts | 5.100% | 4/15/14 | 4,925 | 5,246 |
| Progressive Corp. | 3.750% | 8/23/21 | 7,450 | 7,738 |
| Progressive Corp. | 6.625% | 3/1/29 | 4,700 | 5,882 |
| Progressive Corp. | 6.250% | 12/1/32 | 25 | 31 |
| 4 Progressive Corp. | 6.700% | 6/15/67 | 7,200 | 7,272 |
| Protective Life Corp. | 7.375% | 10/15/19 | 5,995 | 6,647 |
| Protective Life Corp. | 8.450% | 10/15/39 | 5,100 | 5,871 |
| Prudential Financial Inc. | 2.750% | 1/14/13 | 9,505 | 9,651 |
| Prudential Financial Inc. | 5.150% | 1/15/13 | 2,145 | 2,224 |
| Prudential Financial Inc. | 4.500% | 7/15/13 | 6,225 | 6,454 |
| Prudential Financial Inc. | 4.750% | 4/1/14 | 1,875 | 1,977 |
| Prudential Financial Inc. | 5.100% | 9/20/14 | 10,991 | 11,840 |
| Prudential Financial Inc. | 3.875% | 1/14/15 | 11,250 | 11,638 |
| Prudential Financial Inc. | 6.200% | 1/15/15 | 5,150 | 5,625 |
| Prudential Financial Inc. | 4.750% | 9/17/15 | 2,825 | 2,987 |
| Prudential Financial Inc. | 5.500% | 3/15/16 | 675 | 732 |
| Prudential Financial Inc. | 6.000% | 12/1/17 | 2,800 | 3,109 |
| Prudential Financial Inc. | 5.375% | 6/21/20 | 2,475 | 2,630 |
| Prudential Financial Inc. | 5.750% | 7/15/33 | 900 | 903 |
| Prudential Financial Inc. | 5.400% | 6/13/35 | 9,035 | 8,660 |
| Prudential Financial Inc. | 5.900% | 3/17/36 | 9,737 | 9,895 |
| Prudential Financial Inc. | 5.700% | 12/14/36 | 10,525 | 10,450 |
| Prudential Financial Inc. | 6.625% | 6/21/40 | 5,325 | 5,875 |
| 4 Prudential Financial Inc. | 8.875% | 6/15/68 | 750 | 855 |
| 4 Reinsurance Group of America Inc. | 6.750% | 12/15/65 | 6,950 | 5,977 |
| Swiss Re Solutions Holding Corp. | 6.450% | 3/1/19 | 975 | 1,082 |
| Swiss Re Solutions Holding Corp. | 7.000% | 2/15/26 | 3,450 | 3,868 |
| Swiss Re Solutions Holding Corp. | 7.750% | 6/15/30 | 10,815 | 13,520 |
| Torchmark Corp. | 6.375% | 6/15/16 | 3,500 | 3,837 |
| Transatlantic Holdings Inc. | 8.000% | 11/30/39 | 14,470 | 16,381 |
| Travelers Cos. Inc. | 5.500% | 12/1/15 | 1,025 | 1,151 |
| Travelers Cos. Inc. | 6.250% | 6/20/16 | 2,625 | 3,081 |
| Travelers Cos. Inc. | 5.750% | 12/15/17 | 3,825 | 4,498 |
| Travelers Cos. Inc. | 5.800% | 5/15/18 | 150 | 176 |
| Travelers Cos. Inc. | 5.900% | 6/2/19 | 11,500 | 13,551 |
| Travelers Cos. Inc. | 3.900% | 11/1/20 | 400 | 422 |
| Travelers Cos. Inc. | 6.250% | 6/15/37 | 15,725 | 19,858 |
| Travelers Cos. Inc. | 5.350% | 11/1/40 | 2,370 | 2,747 |
| Travelers Property Casualty Corp. | 5.000% | 3/15/13 | 225 | 234 |
| Travelers Property Casualty Corp. | 6.375% | 3/15/33 | 325 | 401 |
| UnitedHealth Group Inc. | 4.875% | 2/15/13 | 2,350 | 2,451 |
| UnitedHealth Group Inc. | 4.875% | 4/1/13 | 2,850 | 2,986 |
| UnitedHealth Group Inc. | 4.875% | 3/15/15 | 16,831 | 18,609 |
| UnitedHealth Group Inc. | 5.375% | 3/15/16 | 200 | 229 |
| UnitedHealth Group Inc. | 6.000% | 6/15/17 | 7,500 | 8,834 |
| UnitedHealth Group Inc. | 6.000% | 2/15/18 | 19,655 | 23,313 |
| UnitedHealth Group Inc. | 3.875% | 10/15/20 | 170 | 181 |
26
Vanguard® Total Bond Market Index Fund
Schedule of Investments
December 31, 2011
| Face | Market | |||
| Maturity | Amount | Value | ||
| Coupon | Date | ($000) | ($000) | |
| UnitedHealth Group Inc. | 4.700% | 2/15/21 | 675 | 758 |
| UnitedHealth Group Inc. | 5.800% | 3/15/36 | 2,275 | 2,699 |
| UnitedHealth Group Inc. | 6.500% | 6/15/37 | 1,350 | 1,703 |
| UnitedHealth Group Inc. | 6.625% | 11/15/37 | 3,475 | 4,455 |
| UnitedHealth Group Inc. | 6.875% | 2/15/38 | 4,605 | 6,210 |
| UnitedHealth Group Inc. | 5.700% | 10/15/40 | 170 | 203 |
| Unum Group | 7.125% | 9/30/16 | 3,425 | 3,914 |
| Unum Group | 5.625% | 9/15/20 | 2,200 | 2,284 |
| Validus Holdings Ltd. | 8.875% | 1/26/40 | 3,000 | 3,262 |
| WellPoint Inc. | 6.000% | 2/15/14 | 2,225 | 2,423 |
| WellPoint Inc. | 5.000% | 12/15/14 | 3,525 | 3,844 |
| WellPoint Inc. | 5.250% | 1/15/16 | 10,436 | 11,694 |
| WellPoint Inc. | 5.875% | 6/15/17 | 375 | 434 |
| WellPoint Inc. | 7.000% | 2/15/19 | 860 | 1,043 |
| WellPoint Inc. | 4.350% | 8/15/20 | 2,600 | 2,818 |
| WellPoint Inc. | 3.700% | 8/15/21 | 650 | 662 |
| WellPoint Inc. | 5.950% | 12/15/34 | 7,775 | 9,162 |
| WellPoint Inc. | 5.850% | 1/15/36 | 6,660 | 7,784 |
| WellPoint Inc. | 6.375% | 6/15/37 | 1,530 | 1,915 |
| Willis Group Holdings plc | 5.750% | 3/15/21 | 4,051 | 4,325 |
| Willis North America Inc. | 5.625% | 7/15/15 | 3,825 | 4,054 |
| Willis North America Inc. | 6.200% | 3/28/17 | 2,495 | 2,742 |
| Willis North America Inc. | 7.000% | 9/29/19 | 20,300 | 22,603 |
| WR Berkley Corp. | 5.375% | 9/15/20 | 950 | 970 |
| XL Group plc | 5.250% | 9/15/14 | 5,625 | 5,949 |
| XL Group plc | 6.375% | 11/15/24 | 525 | 549 |
| XL Group plc | 6.250% | 5/15/27 | 8,025 | 8,164 |
| XLIT Ltd. | 5.750% | 10/1/21 | 4,195 | 4,442 |
| Other Finance (0.0%) | ||||
| CME Group Inc. | 5.400% | 8/1/13 | 8,450 | 9,020 |
| CME Group Inc. | 5.750% | 2/15/14 | 3,225 | 3,517 |
| NASDAQ OMX Group Inc. | 4.000% | 1/15/15 | 3,275 | 3,366 |
| NASDAQ OMX Group Inc. | 5.550% | 1/15/20 | 5,325 | 5,436 |
| NYSE Euronext | 4.800% | 6/28/13 | 4,435 | 4,662 |
| ORIX Corp. | 4.710% | 4/27/15 | 1,969 | 2,032 |
| ORIX Corp. | 5.000% | 1/12/16 | 4,835 | 5,072 |
| XTRA Finance Corp. | 5.150% | 4/1/17 | 12,925 | 14,370 |
| Real Estate Investment Trusts (0.4%) | ||||
| Arden Realty LP | 5.250% | 3/1/15 | 925 | 985 |
| AvalonBay Communities Inc. | 5.750% | 9/15/16 | 825 | 932 |
| Boston Properties LP | 5.625% | 4/15/15 | 5,175 | 5,702 |
| Boston Properties LP | 5.625% | 11/15/20 | 8,925 | 9,943 |
| Boston Properties LP | 4.125% | 5/15/21 | 1,280 | 1,293 |
| Brandywine Operating Partnership LP | 5.400% | 11/1/14 | 1,000 | 1,038 |
| Brandywine Operating Partnership LP | 7.500% | 5/15/15 | 3,950 | 4,340 |
| Brandywine Operating Partnership LP | 6.000% | 4/1/16 | 6,390 | 6,685 |
| Brandywine Operating Partnership LP | 5.700% | 5/1/17 | 4,580 | 4,744 |
| Brandywine Operating Partnership LP | 4.950% | 4/15/18 | 8,325 | 8,217 |
| Camden Property Trust | 5.700% | 5/15/17 | 5,025 | 5,498 |
| CommonWealth REIT | 6.250% | 8/15/16 | 1,425 | 1,516 |
| CommonWealth REIT | 6.250% | 6/15/17 | 5,075 | 5,379 |
| CommonWealth REIT | 5.875% | 9/15/20 | 3,200 | 3,264 |
| Digital Realty Trust LP | 4.500% | 7/15/15 | 2,400 | 2,446 |
| Digital Realty Trust LP | 5.875% | 2/1/20 | 2,000 | 2,071 |
| Digital Realty Trust LP | 5.250% | 3/15/21 | 12,345 | 12,373 |
| Duke Realty LP | 6.250% | 5/15/13 | 800 | 837 |
| Duke Realty LP | 7.375% | 2/15/15 | 8,425 | 9,299 |
| Duke Realty LP | 5.950% | 2/15/17 | 4,200 | 4,513 |
| Duke Realty LP | 8.250% | 8/15/19 | 3,600 | 4,276 |
| Duke Realty LP | 6.750% | 3/15/20 | 1,025 | 1,128 |
| ERP Operating LP | 5.250% | 9/15/14 | 1,700 | 1,802 |
| ERP Operating LP | 5.125% | 3/15/16 | 825 | 886 |
| ERP Operating LP | 5.375% | 8/1/16 | 3,125 | 3,405 |
27
Vanguard® Total Bond Market Index Fund
Schedule of Investments
December 31, 2011
| Face | Market | |||
| Maturity | Amount | Value | ||
| Coupon | Date | ($000) | ($000) | |
| ERP Operating LP | 5.750% | 6/15/17 | 1,250 | 1,386 |
| ERP Operating LP | 4.750% | 7/15/20 | 1,350 | 1,396 |
| ERP Operating LP | 4.625% | 12/15/21 | 8,030 | 8,254 |
| HCP Inc. | 5.650% | 12/15/13 | 9,655 | 10,175 |
| HCP Inc. | 2.700% | 2/1/14 | 650 | 649 |
| HCP Inc. | 3.750% | 2/1/16 | 17,500 | 17,827 |
| HCP Inc. | 6.300% | 9/15/16 | 2,915 | 3,184 |
| HCP Inc. | 5.625% | 5/1/17 | 100 | 106 |
| HCP Inc. | 6.700% | 1/30/18 | 6,200 | 6,967 |
| HCP Inc. | 5.375% | 2/1/21 | 300 | 314 |
| HCP Inc. | 6.750% | 2/1/41 | 500 | 563 |
| Health Care REIT Inc. | 6.000% | 11/15/13 | 2,175 | 2,289 |
| Health Care REIT Inc. | 3.625% | 3/15/16 | 2,150 | 2,115 |
| Health Care REIT Inc. | 6.200% | 6/1/16 | 9,300 | 9,961 |
| Health Care REIT Inc. | 4.700% | 9/15/17 | 25 | 25 |
| Health Care REIT Inc. | 4.950% | 1/15/21 | 2,335 | 2,237 |
| Health Care REIT Inc. | 5.250% | 1/15/22 | 5,675 | 5,533 |
| Health Care REIT Inc. | 6.500% | 3/15/41 | 3,400 | 3,389 |
| Healthcare Realty Trust Inc. | 5.125% | 4/1/14 | 1,525 | 1,563 |
| Healthcare Realty Trust Inc. | 6.500% | 1/17/17 | 2,800 | 3,016 |
| Healthcare Realty Trust Inc. | 5.750% | 1/15/21 | 2,750 | 2,783 |
| Hospitality Properties Trust | 6.750% | 2/15/13 | 500 | 509 |
| Hospitality Properties Trust | 7.875% | 8/15/14 | 3,550 | 3,855 |
| Hospitality Properties Trust | 5.125% | 2/15/15 | 5,170 | 5,254 |
| Kilroy Realty LP | 5.000% | 11/3/15 | 3,950 | 4,095 |
| Kilroy Realty LP | 4.800% | 7/15/18 | 11,075 | 11,027 |
| Kimco Realty Corp. | 5.783% | 3/15/16 | 1,075 | 1,160 |
| Kimco Realty Corp. | 5.700% | 5/1/17 | 5,625 | 6,089 |
| Kimco Realty Corp. | 6.875% | 10/1/19 | 6,650 | 7,635 |
| Liberty Property LP | 5.125% | 3/2/15 | 8,400 | 8,919 |
| Liberty Property LP | 5.500% | 12/15/16 | 1,975 | 2,140 |
| Liberty Property LP | 6.625% | 10/1/17 | 2,750 | 3,129 |
| Liberty Property LP | 4.750% | 10/1/20 | 225 | 229 |
| Mack-Cali Realty LP | 7.750% | 8/15/19 | 2,200 | 2,615 |
| National Retail Properties Inc. | 6.875% | 10/15/17 | 10,350 | 11,445 |
| Nationwide Health Properties Inc. | 6.250% | 2/1/13 | 4,150 | 4,283 |
| ProLogis LP | 7.625% | 8/15/14 | 600 | 656 |
| ProLogis LP | 4.500% | 8/15/17 | 2,600 | 2,603 |
| ProLogis LP | 7.375% | 10/30/19 | 5,100 | 5,774 |
| ProLogis LP | 6.625% | 12/1/19 | 1,750 | 1,891 |
| ProLogis LP | 6.875% | 3/15/20 | 7,175 | 7,929 |
| Realty Income Corp. | 5.950% | 9/15/16 | 150 | 166 |
| Realty Income Corp. | 6.750% | 8/15/19 | 8,210 | 9,345 |
| Realty Income Corp. | 5.750% | 1/15/21 | 5,175 | 5,599 |
| Realty Income Corp. | 5.875% | 3/15/35 | 360 | 366 |
| Regency Centers LP | 5.250% | 8/1/15 | 2,925 | 3,120 |
| Senior Housing Properties Trust | 4.300% | 1/15/16 | 2,175 | 2,131 |
| Simon Property Group LP | 6.750% | 5/15/14 | 11,480 | 12,673 |
| Simon Property Group LP | 4.200% | 2/1/15 | 2,225 | 2,359 |
| Simon Property Group LP | 5.100% | 6/15/15 | 2,286 | 2,500 |
| Simon Property Group LP | 5.750% | 12/1/15 | 15,350 | 17,118 |
| Simon Property Group LP | 6.100% | 5/1/16 | 1,850 | 2,092 |
| Simon Property Group LP | 5.250% | 12/1/16 | 14,075 | 15,539 |
| Simon Property Group LP | 2.800% | 1/30/17 | 600 | 612 |
| Simon Property Group LP | 5.875% | 3/1/17 | 3,250 | 3,742 |
| Simon Property Group LP | 6.125% | 5/30/18 | 5,225 | 6,022 |
| Simon Property Group LP | 5.650% | 2/1/20 | 6,150 | 7,027 |
| Simon Property Group LP | 4.375% | 3/1/21 | 1,100 | 1,165 |
| Simon Property Group LP | 4.125% | 12/1/21 | 2,250 | 2,356 |
| Simon Property Group LP | 6.750% | 2/1/40 | 7,800 | 10,170 |
| Tanger Properties LP | 6.150% | 11/15/15 | 3,525 | 3,899 |
| UDR Inc. | 4.250% | 6/1/18 | 1,200 | 1,237 |
| Ventas Realty LP / Ventas Capital Corp. | 3.125% | 11/30/15 | 400 | 390 |
| Ventas Realty LP / Ventas Capital Corp. | 4.750% | 6/1/21 | 4,850 | 4,686 |
28
Vanguard® Total Bond Market Index Fund
Schedule of Investments
December 31, 2011
| Face | Market | |||
| Maturity | Amount | Value | ||
| Coupon | Date | ($000) | ($000) | |
| 7,056,685 | ||||
| Industrial (11.5%) | ||||
| Basic Industry (1.1%) | ||||
| Agrium Inc. | 6.750% | 1/15/19 | 7,100 | 8,661 |
| Agrium Inc. | 6.125% | 1/15/41 | 6,550 | 7,932 |
| Air Products & Chemicals Inc. | 2.000% | 8/2/16 | 5,325 | 5,462 |
| Air Products & Chemicals Inc. | 3.000% | 11/3/21 | 2,125 | 2,156 |
| Airgas Inc. | 4.500% | 9/15/14 | 2,325 | 2,464 |
| Airgas Inc. | 3.250% | 10/1/15 | 5,400 | 5,562 |
| Albemarle Corp. | 4.500% | 12/15/20 | 1,300 | 1,385 |
| Alcoa Inc. | 6.000% | 7/15/13 | 5,500 | 5,857 |
| Alcoa Inc. | 5.550% | 2/1/17 | 500 | 535 |
| Alcoa Inc. | 6.750% | 7/15/18 | 200 | 221 |
| Alcoa Inc. | 5.720% | 2/23/19 | 5,288 | 5,441 |
| Alcoa Inc. | 6.150% | 8/15/20 | 13,700 | 14,182 |
| Alcoa Inc. | 5.400% | 4/15/21 | 625 | 628 |
| Alcoa Inc. | 5.870% | 2/23/22 | 2,512 | 2,537 |
| Alcoa Inc. | 5.900% | 2/1/27 | 12,365 | 12,178 |
| Alcoa Inc. | 6.750% | 1/15/28 | 22,761 | 23,199 |
| Alcoa Inc. | 5.950% | 2/1/37 | 8,275 | 7,799 |
| Allegheny Technologies Inc. | 9.375% | 6/1/19 | 25 | 31 |
| AngloGold Ashanti Holdings plc | 5.375% | 4/15/20 | 8,550 | 8,435 |
| AngloGold Ashanti Holdings plc | 6.500% | 4/15/40 | 2,275 | 2,194 |
| ArcelorMittal | 5.375% | 6/1/13 | 16,101 | 16,484 |
| ArcelorMittal | 9.000% | 2/15/15 | 10,970 | 12,117 |
| ArcelorMittal | 3.750% | 8/5/15 | 3,400 | 3,229 |
| ArcelorMittal | 3.750% | 3/1/16 | 4,500 | 4,274 |
| ArcelorMittal | 6.125% | 6/1/18 | 9,025 | 9,166 |
| ArcelorMittal | 9.850% | 6/1/19 | 35,250 | 38,986 |
| ArcelorMittal | 5.250% | 8/5/20 | 3,600 | 3,268 |
| ArcelorMittal | 5.500% | 3/1/21 | 4,700 | 4,307 |
| ArcelorMittal | 7.000% | 10/15/39 | 11,410 | 10,530 |
| ArcelorMittal | 6.750% | 3/1/41 | 14,975 | 13,403 |
| Barrick Gold Corp. | 2.900% | 5/30/16 | 200 | 206 |
| Barrick Gold Corp. | 6.950% | 4/1/19 | 11,574 | 14,167 |
| Barrick Gold Finance Co. | 4.875% | 11/15/14 | 2,700 | 2,942 |
| Barrick Gold Financeco LLC | 6.125% | 9/15/13 | 13,200 | 14,276 |
| Barrick North America Finance LLC | 6.800% | 9/15/18 | 5,325 | 6,408 |
| Barrick North America Finance LLC | 4.400% | 5/30/21 | 5,050 | 5,463 |
| Barrick North America Finance LLC | 7.500% | 9/15/38 | 5,150 | 7,080 |
| Barrick PD Australia Finance Pty Ltd. | 5.950% | 10/15/39 | 4,675 | 5,436 |
| BHP Billiton Finance USA Ltd. | 4.800% | 4/15/13 | 7,676 | 8,103 |
| BHP Billiton Finance USA Ltd. | 5.500% | 4/1/14 | 6,865 | 7,532 |
| BHP Billiton Finance USA Ltd. | 5.250% | 12/15/15 | 14,721 | 16,884 |
| BHP Billiton Finance USA Ltd. | 5.400% | 3/29/17 | 25 | 29 |
| BHP Billiton Finance USA Ltd. | 6.500% | 4/1/19 | 19,500 | 23,984 |
| BHP Billiton Finance USA Ltd. | 3.250% | 11/21/21 | 1,625 | 1,670 |
| Carpenter Technology Corp. | 5.200% | 7/15/21 | 11,175 | 10,898 |
| Celulosa Arauco y Constitucion SA | 5.125% | 7/9/13 | 1,175 | 1,224 |
| Celulosa Arauco y Constitucion SA | 5.625% | 4/20/15 | 3,675 | 3,979 |
| Celulosa Arauco y Constitucion SA | 7.250% | 7/29/19 | 1,225 | 1,446 |
| Celulosa Arauco y Constitucion SA | 5.000% | 1/21/21 | 5,300 | 5,336 |
| Cliffs Natural Resources Inc. | 5.900% | 3/15/20 | 2,850 | 3,053 |
| Cliffs Natural Resources Inc. | 4.875% | 4/1/21 | 1,300 | 1,309 |
| Cliffs Natural Resources Inc. | 6.250% | 10/1/40 | 8,200 | 8,098 |
| Cytec Industries Inc. | 8.950% | 7/1/17 | 1,575 | 1,887 |
| Dow Chemical Co. | 7.600% | 5/15/14 | 12,500 | 14,095 |
| Dow Chemical Co. | 5.900% | 2/15/15 | 32,175 | 35,718 |
| Dow Chemical Co. | 2.500% | 2/15/16 | 625 | 629 |
| Dow Chemical Co. | 5.700% | 5/15/18 | 500 | 560 |
| Dow Chemical Co. | 4.250% | 11/15/20 | 4,892 | 5,087 |
| Dow Chemical Co. | 4.125% | 11/15/21 | 16,325 | 16,855 |
| Dow Chemical Co. | 7.375% | 11/1/29 | 3,550 | 4,505 |
29
Vanguard® Total Bond Market Index Fund
Schedule of Investments
December 31, 2011
| Face | Market | |||
| Maturity | Amount | Value | ||
| Coupon | Date | ($000) | ($000) | |
| Dow Chemical Co. | 9.400% | 5/15/39 | 12,149 | 18,170 |
| Dow Chemical Co. | 5.250% | 11/15/41 | 8,450 | 8,906 |
| Eastman Chemical Co. | 3.000% | 12/15/15 | 675 | 691 |
| Eastman Chemical Co. | 5.500% | 11/15/19 | 2,200 | 2,500 |
| Eastman Chemical Co. | 4.500% | 1/15/21 | 775 | 816 |
| Ecolab Inc. | 2.375% | 12/8/14 | 2,375 | 2,396 |
| Ecolab Inc. | 3.000% | 12/8/16 | 675 | 701 |
| Ecolab Inc. | 4.350% | 12/8/21 | 2,000 | 2,154 |
| Ecolab Inc. | 5.500% | 12/8/41 | 1,950 | 2,184 |
| EI du Pont de Nemours & Co. | 5.000% | 1/15/13 | 6,333 | 6,613 |
| EI du Pont de Nemours & Co. | 5.000% | 7/15/13 | 7,075 | 7,538 |
| EI du Pont de Nemours & Co. | 1.750% | 3/25/14 | 5,000 | 5,120 |
| EI du Pont de Nemours & Co. | 1.950% | 1/15/16 | 2,800 | 2,879 |
| EI du Pont de Nemours & Co. | 2.750% | 4/1/16 | 5,000 | 5,307 |
| EI du Pont de Nemours & Co. | 5.250% | 12/15/16 | 7,586 | 8,875 |
| EI du Pont de Nemours & Co. | 6.000% | 7/15/18 | 6,725 | 8,235 |
| EI du Pont de Nemours & Co. | 4.625% | 1/15/20 | 2,050 | 2,351 |
| EI du Pont de Nemours & Co. | 3.625% | 1/15/21 | 5,150 | 5,603 |
| EI du Pont de Nemours & Co. | 4.250% | 4/1/21 | 2,950 | 3,340 |
| EI du Pont de Nemours & Co. | 6.500% | 1/15/28 | 1,700 | 2,217 |
| EI du Pont de Nemours & Co. | 4.900% | 1/15/41 | 8,275 | 9,417 |
| FMC Corp. | 3.950% | 2/1/22 | 2,600 | 2,635 |
| Freeport-McMoRan Copper & Gold Inc. | 8.375% | 4/1/17 | 10,700 | 11,329 |
| Georgia-Pacific LLC | 8.875% | 5/15/31 | 2,375 | 3,261 |
| ICI Wilmington Inc. | 5.625% | 12/1/13 | 700 | 741 |
| International Paper Co. | 5.300% | 4/1/15 | 4,600 | 4,985 |
| International Paper Co. | 7.950% | 6/15/18 | 5,875 | 7,134 |
| International Paper Co. | 9.375% | 5/15/19 | 21,600 | 27,996 |
| International Paper Co. | 7.500% | 8/15/21 | 28,325 | 34,949 |
| International Paper Co. | 8.700% | 6/15/38 | 1,200 | 1,626 |
| International Paper Co. | 7.300% | 11/15/39 | 625 | 753 |
| 6 Kinross Gold Corp. | 3.625% | 9/1/16 | 2,975 | 2,918 |
| 6 Kinross Gold Corp. | 5.125% | 9/1/21 | 3,100 | 3,076 |
| 6 Kinross Gold Corp. | 6.875% | 9/1/41 | 2,150 | 2,219 |
| Lubrizol Corp. | 5.500% | 10/1/14 | 10,125 | 11,263 |
| Lubrizol Corp. | 8.875% | 2/1/19 | 850 | 1,171 |
| Lubrizol Corp. | 6.500% | 10/1/34 | 5,285 | 6,939 |
| Monsanto Co. | 2.750% | 4/15/16 | 2,400 | 2,520 |
| Monsanto Co. | 5.125% | 4/15/18 | 3,100 | 3,590 |
| Monsanto Co. | 5.875% | 4/15/38 | 1,750 | 2,256 |
| Mosaic Co. | 3.750% | 11/15/21 | 1,350 | 1,358 |
| Mosaic Co. | 4.875% | 11/15/41 | 1,250 | 1,274 |
| Newmont Mining Corp. | 5.125% | 10/1/19 | 1,550 | 1,712 |
| Newmont Mining Corp. | 5.875% | 4/1/35 | 2,600 | 2,940 |
| Newmont Mining Corp. | 6.250% | 10/1/39 | 18,752 | 22,235 |
| Nucor Corp. | 5.000% | 6/1/13 | 200 | 211 |
| Nucor Corp. | 5.750% | 12/1/17 | 1,100 | 1,295 |
| Nucor Corp. | 5.850% | 6/1/18 | 5,200 | 6,205 |
| Nucor Corp. | 4.125% | 9/15/22 | 325 | 348 |
| Nucor Corp. | 6.400% | 12/1/37 | 4,185 | 5,531 |
| Placer Dome Inc. | 6.450% | 10/15/35 | 2,175 | 2,637 |
| Plum Creek Timberlands LP | 5.875% | 11/15/15 | 3,550 | 3,899 |
| Plum Creek Timberlands LP | 4.700% | 3/15/21 | 3,380 | 3,398 |
| Potash Corp. of Saskatchewan Inc. | 4.875% | 3/1/13 | 3,950 | 4,129 |
| Potash Corp. of Saskatchewan Inc. | 5.250% | 5/15/14 | 775 | 850 |
| Potash Corp. of Saskatchewan Inc. | 3.750% | 9/30/15 | 5,350 | 5,750 |
| Potash Corp. of Saskatchewan Inc. | 3.250% | 12/1/17 | 2,100 | 2,193 |
| Potash Corp. of Saskatchewan Inc. | 6.500% | 5/15/19 | 150 | 187 |
| Potash Corp. of Saskatchewan Inc. | 4.875% | 3/30/20 | 6,485 | 7,428 |
| Potash Corp. of Saskatchewan Inc. | 5.875% | 12/1/36 | 1,250 | 1,522 |
| Potash Corp. of Saskatchewan Inc. | 5.625% | 12/1/40 | 3,650 | 4,395 |
| PPG Industries Inc. | 5.750% | 3/15/13 | 3,915 | 4,129 |
| PPG Industries Inc. | 1.900% | 1/15/16 | 6,825 | 6,818 |
| PPG Industries Inc. | 6.650% | 3/15/18 | 8,715 | 10,518 |
30
Vanguard® Total Bond Market Index Fund
Schedule of Investments
December 31, 2011
| Face | Market | |||
| Maturity | Amount | Value | ||
| Coupon | Date | ($000) | ($000) | |
| PPG Industries Inc. | 3.600% | 11/15/20 | 750 | 784 |
| PPG Industries Inc. | 7.700% | 3/15/38 | 5,895 | 8,515 |
| PPG Industries Inc. | 5.500% | 11/15/40 | 875 | 1,004 |
| Praxair Inc. | 3.950% | 6/1/13 | 775 | 811 |
| Praxair Inc. | 4.375% | 3/31/14 | 2,775 | 2,978 |
| Praxair Inc. | 5.250% | 11/15/14 | 6,850 | 7,678 |
| Praxair Inc. | 4.625% | 3/30/15 | 325 | 359 |
| Praxair Inc. | 3.250% | 9/15/15 | 800 | 856 |
| Praxair Inc. | 5.200% | 3/15/17 | 1,100 | 1,271 |
| Praxair Inc. | 4.500% | 8/15/19 | 2,525 | 2,868 |
| Praxair Inc. | 3.000% | 9/1/21 | 3,550 | 3,631 |
| Reliance Steel & Aluminum Co. | 6.200% | 11/15/16 | 250 | 268 |
| Reliance Steel & Aluminum Co. | 6.850% | 11/15/36 | 1,750 | 1,824 |
| Rio Tinto Alcan Inc. | 4.500% | 5/15/13 | 5,875 | 6,126 |
| Rio Tinto Alcan Inc. | 5.200% | 1/15/14 | 675 | 726 |
| Rio Tinto Alcan Inc. | 5.000% | 6/1/15 | 1,775 | 1,933 |
| Rio Tinto Alcan Inc. | 6.125% | 12/15/33 | 10,625 | 13,146 |
| Rio Tinto Alcan Inc. | 5.750% | 6/1/35 | 10,000 | 11,839 |
| Rio Tinto Finance USA Ltd. | 8.950% | 5/1/14 | 22,727 | 26,572 |
| Rio Tinto Finance USA Ltd. | 1.875% | 11/2/15 | 8,725 | 8,821 |
| Rio Tinto Finance USA Ltd. | 2.500% | 5/20/16 | 1,050 | 1,071 |
| Rio Tinto Finance USA Ltd. | 2.250% | 9/20/16 | 2,000 | 2,035 |
| Rio Tinto Finance USA Ltd. | 6.500% | 7/15/18 | 6,310 | 7,599 |
| Rio Tinto Finance USA Ltd. | 9.000% | 5/1/19 | 15,786 | 21,499 |
| Rio Tinto Finance USA Ltd. | 3.500% | 11/2/20 | 9,708 | 9,984 |
| Rio Tinto Finance USA Ltd. | 4.125% | 5/20/21 | 1,125 | 1,206 |
| Rio Tinto Finance USA Ltd. | 3.750% | 9/20/21 | 2,850 | 2,982 |
| Rio Tinto Finance USA Ltd. | 7.125% | 7/15/28 | 4,450 | 5,975 |
| Rio Tinto Finance USA Ltd. | 5.200% | 11/2/40 | 9,650 | 11,035 |
| Rohm & Haas Co. | 5.600% | 3/15/13 | 150 | 157 |
| Rohm & Haas Co. | 6.000% | 9/15/17 | 8,475 | 9,651 |
| RPM International Inc. | 6.125% | 10/15/19 | 925 | 1,005 |
| Sherwin-Williams Co. | 3.125% | 12/15/14 | 3,225 | 3,407 |
| Sigma-Aldrich Corp. | 3.375% | 11/1/20 | 1,585 | 1,659 |
| Southern Copper Corp. | 5.375% | 4/16/20 | 1,800 | 1,850 |
| Southern Copper Corp. | 7.500% | 7/27/35 | 16,075 | 17,395 |
| Southern Copper Corp. | 6.750% | 4/16/40 | 1,950 | 1,939 |
| Teck Resources Ltd. | 9.750% | 5/15/14 | 3,650 | 4,294 |
| Teck Resources Ltd. | 10.250% | 5/15/16 | 10,750 | 12,443 |
| Teck Resources Ltd. | 3.150% | 1/15/17 | 1,550 | 1,584 |
| Teck Resources Ltd. | 3.850% | 8/15/17 | 4,100 | 4,329 |
| Teck Resources Ltd. | 10.750% | 5/15/19 | 9,300 | 11,416 |
| Teck Resources Ltd. | 4.750% | 1/15/22 | 1,525 | 1,635 |
| Teck Resources Ltd. | 6.125% | 10/1/35 | 4,262 | 4,688 |
| Teck Resources Ltd. | 6.000% | 8/15/40 | 350 | 380 |
| Teck Resources Ltd. | 6.250% | 7/15/41 | 4,600 | 5,268 |
| Vale Canada Ltd. | 5.700% | 10/15/15 | 3,550 | 3,877 |
| Vale Canada Ltd. | 7.200% | 9/15/32 | 1,175 | 1,392 |
| Vale Overseas Ltd. | 6.250% | 1/11/16 | 2,050 | 2,287 |
| Vale Overseas Ltd. | 6.250% | 1/23/17 | 2,750 | 3,109 |
| Vale Overseas Ltd. | 5.625% | 9/15/19 | 29,550 | 32,460 |
| Vale Overseas Ltd. | 4.625% | 9/15/20 | 7,700 | 7,963 |
| Vale Overseas Ltd. | 8.250% | 1/17/34 | 2,500 | 3,221 |
| Vale Overseas Ltd. | 6.875% | 11/21/36 | 15,454 | 17,525 |
| Vale Overseas Ltd. | 6.875% | 11/10/39 | 20,370 | 23,389 |
| Valspar Corp. | 7.250% | 6/15/19 | 675 | 816 |
| WMC Finance USA Ltd. | 5.125% | 5/15/13 | 425 | 450 |
| Xstrata Canada Corp. | 5.375% | 6/1/15 | 350 | 380 |
| Xstrata Canada Corp. | 6.000% | 10/15/15 | 1,125 | 1,231 |
| Xstrata Canada Corp. | 5.500% | 6/15/17 | 5,575 | 6,058 |
| Capital Goods (1.1%) | ||||
| 3M Co. | 6.375% | 2/15/28 | 3,650 | 4,894 |
| 3M Co. | 5.700% | 3/15/37 | 6,000 | 8,058 |
31
Vanguard® Total Bond Market Index Fund
Schedule of Investments
December 31, 2011
| Face | Market | |||
| Maturity | Amount | Value | ||
| Coupon | Date | ($000) | ($000) | |
| Acuity Brands Lighting Inc. | 6.000% | 12/15/19 | 2,975 | 3,338 |
| 6 BAE Systems Holdings Inc. | 5.200% | 8/15/15 | 600 | 647 |
| Bemis Co. Inc. | 5.650% | 8/1/14 | 2,625 | 2,846 |
| Black & Decker Corp. | 8.950% | 4/15/14 | 1,200 | 1,385 |
| Black & Decker Corp. | 5.750% | 11/15/16 | 2,325 | 2,703 |
| Boeing Capital Corp. | 5.800% | 1/15/13 | 436 | 459 |
| Boeing Capital Corp. | 3.250% | 10/27/14 | 700 | 747 |
| Boeing Capital Corp. | 2.900% | 8/15/18 | 150 | 156 |
| Boeing Co. | 3.500% | 2/15/15 | 26,450 | 28,499 |
| Boeing Co. | 6.000% | 3/15/19 | 25 | 30 |
| Boeing Co. | 4.875% | 2/15/20 | 6,600 | 7,677 |
| Boeing Co. | 8.750% | 8/15/21 | 800 | 1,171 |
| Boeing Co. | 7.250% | 6/15/25 | 675 | 913 |
| Boeing Co. | 8.750% | 9/15/31 | 850 | 1,307 |
| Boeing Co. | 6.125% | 2/15/33 | 800 | 1,011 |
| Boeing Co. | 6.625% | 2/15/38 | 2,180 | 3,047 |
| Boeing Co. | 6.875% | 3/15/39 | 1,610 | 2,279 |
| Boeing Co. | 5.875% | 2/15/40 | 3,950 | 5,087 |
| Caterpillar Financial Services Corp. | 4.250% | 2/8/13 | 4,175 | 4,339 |
| Caterpillar Financial Services Corp. | 6.200% | 9/30/13 | 620 | 677 |
| Caterpillar Financial Services Corp. | 6.125% | 2/17/14 | 12,175 | 13,479 |
| Caterpillar Financial Services Corp. | 1.650% | 4/1/14 | 425 | 431 |
| Caterpillar Financial Services Corp. | 1.375% | 5/20/14 | 1,740 | 1,762 |
| Caterpillar Financial Services Corp. | 1.125% | 12/15/14 | 6,475 | 6,499 |
| Caterpillar Financial Services Corp. | 4.750% | 2/17/15 | 4,550 | 5,029 |
| Caterpillar Financial Services Corp. | 4.625% | 6/1/15 | 2,625 | 2,907 |
| Caterpillar Financial Services Corp. | 2.650% | 4/1/16 | 650 | 678 |
| Caterpillar Financial Services Corp. | 2.050% | 8/1/16 | 15,125 | 15,599 |
| Caterpillar Financial Services Corp. | 7.150% | 2/15/19 | 38,800 | 49,532 |
| Caterpillar Inc. | 1.375% | 5/27/14 | 7,050 | 7,128 |
| Caterpillar Inc. | 3.900% | 5/27/21 | 7,835 | 8,591 |
| Caterpillar Inc. | 6.625% | 7/15/28 | 2,075 | 2,722 |
| Caterpillar Inc. | 7.300% | 5/1/31 | 1,100 | 1,584 |
| Caterpillar Inc. | 6.050% | 8/15/36 | 8,617 | 11,168 |
| Caterpillar Inc. | 8.250% | 12/15/38 | 800 | 1,312 |
| Caterpillar Inc. | 5.200% | 5/27/41 | 5,000 | 6,008 |
| Caterpillar Inc. | 6.950% | 5/1/42 | 950 | 1,380 |
| Caterpillar Inc. | 7.375% | 3/1/97 | 5,100 | 7,439 |
| Cooper US Inc. | 5.450% | 4/1/15 | 1,925 | 2,151 |
| Cooper US Inc. | 2.375% | 1/15/16 | 1,425 | 1,456 |
| CRH America Inc. | 5.300% | 10/15/13 | 875 | 909 |
| CRH America Inc. | 4.125% | 1/15/16 | 6,425 | 6,433 |
| CRH America Inc. | 6.000% | 9/30/16 | 16,986 | 18,216 |
| CRH America Inc. | 8.125% | 7/15/18 | 11,750 | 13,438 |
| CRH America Inc. | 5.750% | 1/15/21 | 6,800 | 6,930 |
| Danaher Corp. | 2.300% | 6/23/16 | 1,750 | 1,814 |
| Danaher Corp. | 5.625% | 1/15/18 | 2,375 | 2,798 |
| Danaher Corp. | 5.400% | 3/1/19 | 1,700 | 2,034 |
| Danaher Corp. | 3.900% | 6/23/21 | 1,750 | 1,912 |
| Deere & Co. | 6.950% | 4/25/14 | 6,195 | 7,062 |
| Deere & Co. | 4.375% | 10/16/19 | 4,925 | 5,534 |
| Deere & Co. | 5.375% | 10/16/29 | 8,925 | 11,257 |
| Deere & Co. | 8.100% | 5/15/30 | 3,405 | 5,165 |
| Deere & Co. | 7.125% | 3/3/31 | 925 | 1,283 |
| Dover Corp. | 5.450% | 3/15/18 | 6,650 | 7,841 |
| Dover Corp. | 4.300% | 3/1/21 | 550 | 618 |
| Dover Corp. | 5.375% | 10/15/35 | 550 | 668 |
| Dover Corp. | 6.600% | 3/15/38 | 3,115 | 4,407 |
| Dover Corp. | 5.375% | 3/1/41 | 1,350 | 1,656 |
| Eaton Corp. | 4.900% | 5/15/13 | 11,085 | 11,677 |
| Eaton Corp. | 5.600% | 5/15/18 | 11,050 | 13,104 |
| Embraer Overseas Ltd. | 6.375% | 1/24/17 | 4,625 | 4,983 |
| Embraer Overseas Ltd. | 6.375% | 1/15/20 | 4,550 | 4,848 |
| Emerson Electric Co. | 4.500% | 5/1/13 | 2,025 | 2,124 |
32
Vanguard® Total Bond Market Index Fund
Schedule of Investments
December 31, 2011
| Face | Market | |||
| Maturity | Amount | Value | ||
| Coupon | Date | ($000) | ($000) | |
| Emerson Electric Co. | 5.250% | 10/15/18 | 6,625 | 7,832 |
| Emerson Electric Co. | 4.875% | 10/15/19 | 4,575 | 5,329 |
| Emerson Electric Co. | 4.250% | 11/15/20 | 425 | 470 |
| Emerson Electric Co. | 6.000% | 8/15/32 | 940 | 1,206 |
| Emerson Electric Co. | 6.125% | 4/15/39 | 1,575 | 2,136 |
| Emerson Electric Co. | 5.250% | 11/15/39 | 394 | 477 |
| General Dynamics Corp. | 4.250% | 5/15/13 | 14,815 | 15,540 |
| General Dynamics Corp. | 5.250% | 2/1/14 | 13,025 | 14,198 |
| General Dynamics Corp. | 1.375% | 1/15/15 | 2,100 | 2,126 |
| General Dynamics Corp. | 3.875% | 7/15/21 | 7,750 | 8,356 |
| General Electric Co. | 5.000% | 2/1/13 | 29,990 | 31,415 |
| General Electric Co. | 5.250% | 12/6/17 | 33,112 | 38,080 |
| Goodrich Corp. | 6.125% | 3/1/19 | 1,695 | 2,049 |
| Goodrich Corp. | 4.875% | 3/1/20 | 22,925 | 26,142 |
| Goodrich Corp. | 3.600% | 2/1/21 | 275 | 286 |
| Goodrich Corp. | 6.800% | 7/1/36 | 80 | 109 |
| Harsco Corp. | 5.750% | 5/15/18 | 19,063 | 21,985 |
| Honeywell International Inc. | 4.250% | 3/1/13 | 1,200 | 1,252 |
| Honeywell International Inc. | 3.875% | 2/15/14 | 1,125 | 1,198 |
| Honeywell International Inc. | 5.400% | 3/15/16 | 1,650 | 1,923 |
| Honeywell International Inc. | 5.300% | 3/15/17 | 5,100 | 5,924 |
| Honeywell International Inc. | 5.300% | 3/1/18 | 650 | 768 |
| Honeywell International Inc. | 5.000% | 2/15/19 | 3,025 | 3,526 |
| Honeywell International Inc. | 4.250% | 3/1/21 | 750 | 846 |
| Honeywell International Inc. | 5.700% | 3/15/36 | 2,425 | 2,972 |
| Honeywell International Inc. | 5.700% | 3/15/37 | 4,875 | 6,045 |
| Honeywell International Inc. | 5.375% | 3/1/41 | 1,475 | 1,801 |
| Illinois Tool Works Inc. | 5.150% | 4/1/14 | 4,325 | 4,756 |
| Illinois Tool Works Inc. | 6.250% | 4/1/19 | 13,475 | 16,623 |
| Ingersoll-Rand Global Holding Co. Ltd. | 6.000% | 8/15/13 | 4,150 | 4,433 |
| Ingersoll-Rand Global Holding Co. Ltd. | 9.500% | 4/15/14 | 13,475 | 15,679 |
| Ingersoll-Rand Global Holding Co. Ltd. | 6.875% | 8/15/18 | 5,825 | 7,080 |
| John Deere Capital Corp. | 4.900% | 9/9/13 | 8,275 | 8,826 |
| John Deere Capital Corp. | 1.250% | 12/2/14 | 3,000 | 3,032 |
| John Deere Capital Corp. | 2.950% | 3/9/15 | 7,575 | 7,996 |
| John Deere Capital Corp. | 1.850% | 9/15/16 | 9,000 | 9,064 |
| John Deere Capital Corp. | 2.000% | 1/13/17 | 6,550 | 6,678 |
| John Deere Capital Corp. | 5.500% | 4/13/17 | 250 | 295 |
| John Deere Capital Corp. | 2.800% | 9/18/17 | 5,625 | 5,884 |
| John Deere Capital Corp. | 5.750% | 9/10/18 | 3,950 | 4,782 |
| John Deere Capital Corp. | 3.900% | 7/12/21 | 3,950 | 4,284 |
| John Deere Capital Corp. | 3.150% | 10/15/21 | 1,040 | 1,068 |
| Joy Global Inc. | 6.000% | 11/15/16 | 1,850 | 2,094 |
| L-3 Communications Corp. | 5.200% | 10/15/19 | 4,650 | 4,725 |
| L-3 Communications Corp. | 4.750% | 7/15/20 | 8,400 | 8,211 |
| L-3 Communications Corp. | 4.950% | 2/15/21 | 12,725 | 12,579 |
| Lockheed Martin Corp. | 7.650% | 5/1/16 | 4,800 | 5,889 |
| Lockheed Martin Corp. | 4.250% | 11/15/19 | 7,850 | 8,319 |
| Lockheed Martin Corp. | 3.350% | 9/15/21 | 9,250 | 9,191 |
| Lockheed Martin Corp. | 6.150% | 9/1/36 | 12,300 | 14,092 |
| Lockheed Martin Corp. | 5.500% | 11/15/39 | 1,850 | 2,011 |
| Lockheed Martin Corp. | 5.720% | 6/1/40 | 4,432 | 4,968 |
| Lockheed Martin Corp. | 4.850% | 9/15/41 | 1,000 | 1,012 |
| Martin Marietta Materials Inc. | 6.600% | 4/15/18 | 5,450 | 5,768 |
| Northrop Grumman Corp. | 1.850% | 11/15/15 | 2,500 | 2,493 |
| Northrop Grumman Corp. | 5.050% | 8/1/19 | 3,285 | 3,677 |
| Northrop Grumman Corp. | 3.500% | 3/15/21 | 10,953 | 11,110 |
| Northrop Grumman Corp. | 5.050% | 11/15/40 | 7,175 | 7,878 |
| Northrop Grumman Systems Corp. | 7.750% | 2/15/31 | 381 | 540 |
| Owens Corning | 6.500% | 12/1/16 | 30,080 | 32,622 |
| Owens Corning | 7.000% | 12/1/36 | 725 | 736 |
| Parker Hannifin Corp. | 5.500% | 5/15/18 | 950 | 1,118 |
| Parker Hannifin Corp. | 3.500% | 9/15/22 | 500 | 518 |
| Parker Hannifin Corp. | 6.250% | 5/15/38 | 4,735 | 5,943 |
33
Vanguard® Total Bond Market Index Fund
Schedule of Investments
December 31, 2011
| Face | Market | |||
| Maturity | Amount | Value | ||
| Coupon | Date | ($000) | ($000) | |
| Raytheon Co. | 1.400% | 12/15/14 | 2,500 | 2,505 |
| Raytheon Co. | 1.625% | 10/15/15 | 750 | 751 |
| Raytheon Co. | 6.400% | 12/15/18 | 400 | 494 |
| Raytheon Co. | 4.400% | 2/15/20 | 2,500 | 2,749 |
| Raytheon Co. | 3.125% | 10/15/20 | 1,890 | 1,904 |
| Raytheon Co. | 7.200% | 8/15/27 | 3,575 | 4,767 |
| Raytheon Co. | 4.875% | 10/15/40 | 1,700 | 1,787 |
| Raytheon Co. | 4.700% | 12/15/41 | 12,375 | 12,628 |
| Republic Services Inc. | 3.800% | 5/15/18 | 5,100 | 5,311 |
| Republic Services Inc. | 5.500% | 9/15/19 | 17,050 | 19,458 |
| Republic Services Inc. | 5.000% | 3/1/20 | 3,775 | 4,194 |
| Republic Services Inc. | 5.250% | 11/15/21 | 13,435 | 15,204 |
| Republic Services Inc. | 6.086% | 3/15/35 | 2,375 | 2,832 |
| Republic Services Inc. | 6.200% | 3/1/40 | 4,505 | 5,430 |
| Republic Services Inc. | 5.700% | 5/15/41 | 4,450 | 5,167 |
| Rockwell Automation Inc. | 5.650% | 12/1/17 | 1,150 | 1,349 |
| Rockwell Automation Inc. | 6.700% | 1/15/28 | 1,025 | 1,328 |
| Rockwell Automation Inc. | 6.250% | 12/1/37 | 3,975 | 5,059 |
| Rockwell Collins Inc. | 5.250% | 7/15/19 | 850 | 988 |
| Rockwell Collins Inc. | 3.100% | 11/15/21 | 1,550 | 1,572 |
| Roper Industries Inc. | 6.625% | 8/15/13 | 9,250 | 9,966 |
| Roper Industries Inc. | 6.250% | 9/1/19 | 3,725 | 4,400 |
| Sonoco Products Co. | 4.375% | 11/1/21 | 600 | 622 |
| Sonoco Products Co. | 5.750% | 11/1/40 | 5,050 | 5,388 |
| Stanley Black & Decker Inc. | 3.400% | 12/1/21 | 5,600 | 5,681 |
| Stanley Black & Decker Inc. | 5.200% | 9/1/40 | 2,000 | 2,216 |
| Textron Inc. | 5.600% | 12/1/17 | 975 | 1,029 |
| Textron Inc. | 7.250% | 10/1/19 | 4,140 | 4,681 |
| Tyco International Finance SA | 6.000% | 11/15/13 | 6,730 | 7,286 |
| Tyco International Finance SA | 3.750% | 1/15/18 | 1,250 | 1,319 |
| Tyco International Finance SA | 8.500% | 1/15/19 | 3,301 | 4,255 |
| Tyco International Finance SA | 4.625% | 1/15/23 | 975 | 1,044 |
| Tyco International Ltd. / Tyco International Finance SA | 7.000% | 12/15/19 | 2,975 | 3,662 |
| Tyco International Ltd. / Tyco International Finance SA | 6.875% | 1/15/21 | 20,060 | 24,896 |
| United Technologies Corp. | 4.875% | 5/1/15 | 850 | 953 |
| United Technologies Corp. | 5.375% | 12/15/17 | 12,175 | 14,387 |
| United Technologies Corp. | 6.125% | 2/1/19 | 1,458 | 1,801 |
| United Technologies Corp. | 4.500% | 4/15/20 | 23,428 | 26,300 |
| United Technologies Corp. | 6.700% | 8/1/28 | 1,367 | 1,767 |
| United Technologies Corp. | 7.500% | 9/15/29 | 2,325 | 3,260 |
| United Technologies Corp. | 5.400% | 5/1/35 | 7,575 | 8,913 |
| United Technologies Corp. | 6.050% | 6/1/36 | 5,702 | 7,177 |
| United Technologies Corp. | 6.125% | 7/15/38 | 3,308 | 4,139 |
| United Technologies Corp. | 5.700% | 4/15/40 | 8,975 | 10,979 |
| Waste Management Inc. | 5.000% | 3/15/14 | 1,925 | 2,070 |
| Waste Management Inc. | 6.375% | 3/11/15 | 3,400 | 3,886 |
| Waste Management Inc. | 2.600% | 9/1/16 | 3,150 | 3,196 |
| Waste Management Inc. | 6.100% | 3/15/18 | 700 | 827 |
| Waste Management Inc. | 7.375% | 3/11/19 | 15,132 | 19,026 |
| Waste Management Inc. | 4.750% | 6/30/20 | 675 | 743 |
| Waste Management Inc. | 4.600% | 3/1/21 | 7,120 | 7,742 |
| Waste Management Inc. | 7.100% | 8/1/26 | 875 | 1,124 |
| Waste Management Inc. | 7.000% | 7/15/28 | 80 | 101 |
| Waste Management Inc. | 7.750% | 5/15/32 | 2,250 | 3,190 |
| Waste Management Inc. | 6.125% | 11/30/39 | 7,275 | 8,911 |
| Communication (2.2%) | ||||
| Alltel Corp. | 7.000% | 3/15/16 | 5,000 | 5,979 |
| Alltel Corp. | 7.875% | 7/1/32 | 4,725 | 6,825 |
| America Movil SAB de CV | 5.500% | 3/1/14 | 3,230 | 3,467 |
| America Movil SAB de CV | 5.750% | 1/15/15 | 30,242 | 33,499 |
| America Movil SAB de CV | 5.625% | 11/15/17 | 4,240 | 4,897 |
| America Movil SAB de CV | 5.000% | 10/16/19 | 2,500 | 2,782 |
| America Movil SAB de CV | 5.000% | 3/30/20 | 1,000 | 1,111 |
34
Vanguard® Total Bond Market Index Fund
Schedule of Investments
December 31, 2011
| Face | Market | |||
| Maturity | Amount | Value | ||
| Coupon | Date | ($000) | ($000) | |
| America Movil SAB de CV | 6.375% | 3/1/35 | 17,400 | 21,332 |
| America Movil SAB de CV | 6.125% | 11/15/37 | 4,300 | 5,171 |
| America Movil SAB de CV | 6.125% | 3/30/40 | 11,900 | 14,131 |
| American Tower Corp. | 4.625% | 4/1/15 | 6,075 | 6,357 |
| American Tower Corp. | 4.500% | 1/15/18 | 18,815 | 19,160 |
| American Tower Corp. | 5.050% | 9/1/20 | 1,000 | 1,005 |
| AT&T Corp. | 8.000% | 11/15/31 | 15,189 | 21,431 |
| AT&T Inc. | 4.950% | 1/15/13 | 16,685 | 17,404 |
| AT&T Inc. | 6.700% | 11/15/13 | 5,825 | 6,431 |
| AT&T Inc. | 4.850% | 2/15/14 | 8,100 | 8,742 |
| AT&T Inc. | 5.100% | 9/15/14 | 12,510 | 13,797 |
| AT&T Inc. | 2.500% | 8/15/15 | 3,950 | 4,092 |
| AT&T Inc. | 2.950% | 5/15/16 | 3,950 | 4,147 |
| AT&T Inc. | 5.625% | 6/15/16 | 33,520 | 38,791 |
| AT&T Inc. | 5.500% | 2/1/18 | 6,081 | 7,037 |
| AT&T Inc. | 5.600% | 5/15/18 | 6,875 | 7,999 |
| AT&T Inc. | 5.800% | 2/15/19 | 44,820 | 53,060 |
| AT&T Inc. | 3.875% | 8/15/21 | 17,500 | 18,593 |
| AT&T Inc. | 6.450% | 6/15/34 | 5,625 | 6,783 |
| AT&T Inc. | 6.150% | 9/15/34 | 125 | 149 |
| AT&T Inc. | 6.800% | 5/15/36 | 1,137 | 1,441 |
| AT&T Inc. | 6.500% | 9/1/37 | 25,225 | 31,408 |
| AT&T Inc. | 6.300% | 1/15/38 | 23,702 | 29,141 |
| AT&T Inc. | 6.400% | 5/15/38 | 5,895 | 7,344 |
| AT&T Inc. | 6.550% | 2/15/39 | 28,420 | 35,947 |
| AT&T Inc. | 5.350% | 9/1/40 | 11,562 | 12,947 |
| AT&T Inc. | 5.550% | 8/15/41 | 8,650 | 10,169 |
| AT&T Mobility LLC | 7.125% | 12/15/31 | 10,015 | 12,991 |
| Bellsouth Capital Funding Corp. | 7.875% | 2/15/30 | 10,400 | 13,929 |
| BellSouth Corp. | 5.200% | 9/15/14 | 1,650 | 1,823 |
| BellSouth Corp. | 5.200% | 12/15/16 | 6,875 | 7,924 |
| BellSouth Corp. | 6.875% | 10/15/31 | 8,925 | 11,070 |
| BellSouth Corp. | 6.550% | 6/15/34 | 7,511 | 8,896 |
| BellSouth Corp. | 6.000% | 11/15/34 | 4,586 | 5,157 |
| BellSouth Telecommunications Inc. | 6.375% | 6/1/28 | 8,800 | 10,302 |
| British Telecommunications plc | 5.150% | 1/15/13 | 8,323 | 8,620 |
| British Telecommunications plc | 5.950% | 1/15/18 | 11,850 | 13,058 |
| British Telecommunications plc | 9.625% | 12/15/30 | 12,377 | 17,461 |
| CBS Corp. | 8.200% | 5/15/14 | 10,550 | 12,012 |
| CBS Corp. | 4.625% | 5/15/18 | 400 | 417 |
| CBS Corp. | 8.875% | 5/15/19 | 4,575 | 5,874 |
| CBS Corp. | 5.750% | 4/15/20 | 10,025 | 11,252 |
| CBS Corp. | 4.300% | 2/15/21 | 3,775 | 3,923 |
| CBS Corp. | 7.875% | 7/30/30 | 2,196 | 2,758 |
| CBS Corp. | 5.500% | 5/15/33 | 650 | 670 |
| CBS Corp. | 5.900% | 10/15/40 | 800 | 894 |
| Cellco Partnership / Verizon Wireless Capital LLC | 7.375% | 11/15/13 | 21,575 | 24,026 |
| Cellco Partnership / Verizon Wireless Capital LLC | 5.550% | 2/1/14 | 31,767 | 34,548 |
| Cellco Partnership / Verizon Wireless Capital LLC | 8.500% | 11/15/18 | 17,600 | 23,785 |
| CenturyLink Inc. | 5.000% | 2/15/15 | 500 | 509 |
| CenturyLink Inc. | 6.000% | 4/1/17 | 325 | 330 |
| CenturyLink Inc. | 6.150% | 9/15/19 | 2,550 | 2,553 |
| CenturyLink Inc. | 6.450% | 6/15/21 | 5,200 | 5,226 |
| CenturyLink Inc. | 6.875% | 1/15/28 | 800 | 746 |
| CenturyLink Inc. | 7.600% | 9/15/39 | 8,975 | 8,817 |
| Comcast Cable Communications Holdings Inc. | 8.375% | 3/15/13 | 2,777 | 3,021 |
| Comcast Cable Communications Holdings Inc. | 9.455% | 11/15/22 | 7,656 | 10,904 |
| Comcast Cable Communications LLC | 8.875% | 5/1/17 | 2,475 | 3,204 |
| Comcast Corp. | 5.300% | 1/15/14 | 4,180 | 4,509 |
| Comcast Corp. | 6.500% | 1/15/15 | 3,295 | 3,748 |
| Comcast Corp. | 5.900% | 3/15/16 | 10,475 | 12,007 |
| Comcast Corp. | 6.500% | 1/15/17 | 515 | 606 |
| Comcast Corp. | 6.300% | 11/15/17 | 38,075 | 45,171 |
| Comcast Corp. | 5.875% | 2/15/18 | 13,550 | 15,671 |
35
Vanguard® Total Bond Market Index Fund
Schedule of Investments
December 31, 2011
| Face | Market | |||
| Maturity | Amount | Value | ||
| Coupon | Date | ($000) | ($000) | |
| Comcast Corp. | 5.700% | 5/15/18 | 4,600 | 5,292 |
| Comcast Corp. | 5.700% | 7/1/19 | 3,650 | 4,228 |
| Comcast Corp. | 5.150% | 3/1/20 | 4,250 | 4,815 |
| Comcast Corp. | 7.050% | 3/15/33 | 3,000 | 3,787 |
| Comcast Corp. | 5.650% | 6/15/35 | 3,125 | 3,452 |
| Comcast Corp. | 6.500% | 11/15/35 | 15,300 | 18,418 |
| Comcast Corp. | 6.450% | 3/15/37 | 7,718 | 9,344 |
| Comcast Corp. | 6.950% | 8/15/37 | 6,265 | 7,886 |
| Comcast Corp. | 6.400% | 5/15/38 | 14,656 | 17,536 |
| Comcast Corp. | 6.400% | 3/1/40 | 3,100 | 3,876 |
| COX Communications Inc. | 5.450% | 12/15/14 | 10,210 | 11,350 |
| COX Communications Inc. | 5.500% | 10/1/15 | 625 | 701 |
| 6 COX Communications Inc. | 8.375% | 3/1/39 | 4,100 | 5,518 |
| Deutsche Telekom International Finance BV | 5.875% | 8/20/13 | 11,050 | 11,798 |
| Deutsche Telekom International Finance BV | 4.875% | 7/8/14 | 5,025 | 5,349 |
| Deutsche Telekom International Finance BV | 5.750% | 3/23/16 | 7,965 | 8,901 |
| Deutsche Telekom International Finance BV | 6.750% | 8/20/18 | 325 | 388 |
| Deutsche Telekom International Finance BV | 6.000% | 7/8/19 | 7,175 | 8,265 |
| Deutsche Telekom International Finance BV | 8.750% | 6/15/30 | 15,836 | 22,043 |
| DIRECTV Holdings LLC / DIRECTV Financing Co. Inc. | 4.750% | 10/1/14 | 3,875 | 4,184 |
| DIRECTV Holdings LLC / DIRECTV Financing Co. Inc. | 3.550% | 3/15/15 | 8,200 | 8,525 |
| DIRECTV Holdings LLC / DIRECTV Financing Co. Inc. | 3.500% | 3/1/16 | 7,250 | 7,474 |
| DIRECTV Holdings LLC / DIRECTV Financing Co. Inc. | 7.625% | 5/15/16 | 3,575 | 3,790 |
| DIRECTV Holdings LLC / DIRECTV Financing Co. Inc. | 5.875% | 10/1/19 | 29,500 | 33,194 |
| DIRECTV Holdings LLC / DIRECTV Financing Co. Inc. | 5.200% | 3/15/20 | 3,950 | 4,270 |
| DIRECTV Holdings LLC / DIRECTV Financing Co. Inc. | 4.600% | 2/15/21 | 250 | 260 |
| DIRECTV Holdings LLC / DIRECTV Financing Co. Inc. | 5.000% | 3/1/21 | 3,200 | 3,418 |
| DIRECTV Holdings LLC / DIRECTV Financing Co. Inc. | 6.350% | 3/15/40 | 1,875 | 2,130 |
| DIRECTV Holdings LLC / DIRECTV Financing Co. Inc. | 6.000% | 8/15/40 | 3,425 | 3,720 |
| DIRECTV Holdings LLC / DIRECTV Financing Co. Inc. | 6.375% | 3/1/41 | 2,800 | 3,219 |
| Discovery Communications LLC | 5.050% | 6/1/20 | 8,500 | 9,401 |
| Discovery Communications LLC | 4.375% | 6/15/21 | 1,250 | 1,324 |
| Discovery Communications LLC | 6.350% | 6/1/40 | 250 | 302 |
| Embarq Corp. | 6.738% | 6/1/13 | 500 | 521 |
| Embarq Corp. | 7.082% | 6/1/16 | 18,281 | 19,838 |
| Embarq Corp. | 7.995% | 6/1/36 | 8,990 | 9,407 |
| France Telecom SA | 4.375% | 7/8/14 | 8,900 | 9,424 |
| France Telecom SA | 2.125% | 9/16/15 | 1,500 | 1,488 |
| France Telecom SA | 2.750% | 9/14/16 | 7,025 | 7,069 |
| France Telecom SA | 4.125% | 9/14/21 | 7,525 | 7,613 |
| France Telecom SA | 8.500% | 3/1/31 | 17,300 | 24,641 |
| Grupo Televisa SAB | 6.625% | 3/18/25 | 3,350 | 3,890 |
| Grupo Televisa SAB | 8.500% | 3/11/32 | 550 | 725 |
| Grupo Televisa SAB | 6.625% | 1/15/40 | 600 | 681 |
| GTE Corp. | 8.750% | 11/1/21 | 2,935 | 4,099 |
| GTE Corp. | 6.940% | 4/15/28 | 13,105 | 16,411 |
| Koninklijke KPN NV | 8.375% | 10/1/30 | 3,505 | 4,468 |
| McGraw-Hill Cos. Inc. | 5.900% | 11/15/17 | 5,050 | 5,495 |
| McGraw-Hill Cos. Inc. | 6.550% | 11/15/37 | 6,650 | 7,060 |
| NBCUniversal Media LLC | 2.100% | 4/1/14 | 3,300 | 3,341 |
| NBCUniversal Media LLC | 3.650% | 4/30/15 | 8,175 | 8,618 |
| NBCUniversal Media LLC | 2.875% | 4/1/16 | 4,075 | 4,160 |
| NBCUniversal Media LLC | 5.150% | 4/30/20 | 6,950 | 7,767 |
| NBCUniversal Media LLC | 4.375% | 4/1/21 | 8,110 | 8,582 |
| NBCUniversal Media LLC | 6.400% | 4/30/40 | 17,950 | 22,132 |
| NBCUniversal Media LLC | 5.950% | 4/1/41 | 7,600 | 9,041 |
| New Cingular Wireless Services Inc. | 8.750% | 3/1/31 | 195 | 287 |
| News America Inc. | 9.250% | 2/1/13 | 151 | 162 |
| News America Inc. | 5.300% | 12/15/14 | 4,050 | 4,411 |
| News America Inc. | 8.000% | 10/17/16 | 3,840 | 4,692 |
| News America Inc. | 7.250% | 5/18/18 | 150 | 181 |
| News America Inc. | 6.900% | 3/1/19 | 2,500 | 2,947 |
| News America Inc. | 4.500% | 2/15/21 | 9,300 | 9,777 |
| News America Inc. | 7.700% | 10/30/25 | 1,175 | 1,400 |
36
Vanguard® Total Bond Market Index Fund
Schedule of Investments
December 31, 2011
| Face | Market | |||
| Maturity | Amount | Value | ||
| Coupon | Date | ($000) | ($000) | |
| News America Inc. | 6.550% | 3/15/33 | 13,065 | 14,193 |
| News America Inc. | 6.200% | 12/15/34 | 14,366 | 15,425 |
| News America Inc. | 6.400% | 12/15/35 | 17,135 | 18,993 |
| News America Inc. | 8.150% | 10/17/36 | 2,175 | 2,717 |
| News America Inc. | 6.150% | 3/1/37 | 1,028 | 1,130 |
| News America Inc. | 6.650% | 11/15/37 | 2,055 | 2,347 |
| News America Inc. | 6.900% | 8/15/39 | 4,900 | 5,695 |
| News America Inc. | 6.150% | 2/15/41 | 6,325 | 7,248 |
| News America Inc. | 7.750% | 12/1/45 | 1,460 | 1,785 |
| Omnicom Group Inc. | 5.900% | 4/15/16 | 750 | 838 |
| Omnicom Group Inc. | 4.450% | 8/15/20 | 13,800 | 14,169 |
| Pacific Bell Telephone Co. | 7.125% | 3/15/26 | 1,275 | 1,607 |
| Qwest Corp. | 7.500% | 10/1/14 | 8,200 | 9,036 |
| Qwest Corp. | 8.375% | 5/1/16 | 14,450 | 16,379 |
| Qwest Corp. | 6.500% | 6/1/17 | 3,300 | 3,612 |
| Qwest Corp. | 6.750% | 12/1/21 | 3,500 | 3,810 |
| Qwest Corp. | 7.500% | 6/15/23 | 3,925 | 3,945 |
| Qwest Corp. | 7.250% | 9/15/25 | 1,360 | 1,486 |
| Qwest Corp. | 6.875% | 9/15/33 | 6,675 | 6,675 |
| Qwest Corp. | 7.125% | 11/15/43 | 4,775 | 4,680 |
| Reed Elsevier Capital Inc. | 7.750% | 1/15/14 | 3,825 | 4,267 |
| Reed Elsevier Capital Inc. | 8.625% | 1/15/19 | 11,264 | 14,054 |
| Rogers Communications Inc. | 6.375% | 3/1/14 | 13,425 | 14,806 |
| Rogers Communications Inc. | 5.500% | 3/15/14 | 1,450 | 1,562 |
| Rogers Communications Inc. | 6.800% | 8/15/18 | 16,940 | 20,628 |
| Rogers Communications Inc. | 7.500% | 8/15/38 | 725 | 1,007 |
| TCI Communications Inc. | 8.750% | 8/1/15 | 17,750 | 21,588 |
| TCI Communications Inc. | 7.875% | 2/15/26 | 580 | 768 |
| Telecom Italia Capital SA | 5.250% | 11/15/13 | 7,123 | 6,880 |
| Telecom Italia Capital SA | 6.175% | 6/18/14 | 3,100 | 2,989 |
| Telecom Italia Capital SA | 4.950% | 9/30/14 | 5,150 | 4,806 |
| Telecom Italia Capital SA | 5.250% | 10/1/15 | 19,135 | 17,572 |
| Telecom Italia Capital SA | 6.999% | 6/4/18 | 5,920 | 5,479 |
| Telecom Italia Capital SA | 7.175% | 6/18/19 | 21,200 | 19,861 |
| Telecom Italia Capital SA | 6.375% | 11/15/33 | 5,730 | 4,402 |
| Telecom Italia Capital SA | 6.000% | 9/30/34 | 1,325 | 965 |
| Telecom Italia Capital SA | 7.200% | 7/18/36 | 3,140 | 2,605 |
| Telecom Italia Capital SA | 7.721% | 6/4/38 | 5,598 | 4,828 |
| Telefonica Emisiones SAU | 5.855% | 2/4/13 | 1,975 | 2,000 |
| Telefonica Emisiones SAU | 2.582% | 4/26/13 | 4,800 | 4,688 |
| Telefonica Emisiones SAU | 4.949% | 1/15/15 | 17,125 | 17,088 |
| Telefonica Emisiones SAU | 3.729% | 4/27/15 | 4,875 | 4,730 |
| Telefonica Emisiones SAU | 3.992% | 2/16/16 | 10,125 | 9,765 |
| Telefonica Emisiones SAU | 6.421% | 6/20/16 | 15,760 | 16,360 |
| Telefonica Emisiones SAU | 6.221% | 7/3/17 | 266 | 274 |
| Telefonica Emisiones SAU | 5.877% | 7/15/19 | 5,475 | 5,425 |
| Telefonica Emisiones SAU | 5.134% | 4/27/20 | 10,035 | 9,342 |
| Telefonica Emisiones SAU | 5.462% | 2/16/21 | 14,250 | 13,594 |
| Telefonica Emisiones SAU | 7.045% | 6/20/36 | 14,909 | 14,638 |
| Telefonica Europe BV | 8.250% | 9/15/30 | 4,425 | 4,862 |
| Thomson Reuters Corp. | 5.950% | 7/15/13 | 1,965 | 2,096 |
| Thomson Reuters Corp. | 5.700% | 10/1/14 | 8,400 | 9,294 |
| Thomson Reuters Corp. | 6.500% | 7/15/18 | 625 | 747 |
| Thomson Reuters Corp. | 4.700% | 10/15/19 | 1,825 | 2,015 |
| Thomson Reuters Corp. | 5.500% | 8/15/35 | 5,025 | 5,426 |
| Thomson Reuters Corp. | 5.850% | 4/15/40 | 8,475 | 9,666 |
| Time Warner Cable Inc. | 6.200% | 7/1/13 | 7,925 | 8,506 |
| Time Warner Cable Inc. | 8.250% | 2/14/14 | 1,225 | 1,383 |
| Time Warner Cable Inc. | 7.500% | 4/1/14 | 18,875 | 21,160 |
| Time Warner Cable Inc. | 3.500% | 2/1/15 | 3,625 | 3,797 |
| Time Warner Cable Inc. | 5.850% | 5/1/17 | 18,790 | 21,399 |
| Time Warner Cable Inc. | 6.750% | 7/1/18 | 20,030 | 23,769 |
| Time Warner Cable Inc. | 8.750% | 2/14/19 | 7,045 | 9,028 |
| Time Warner Cable Inc. | 8.250% | 4/1/19 | 8,920 | 11,225 |
37
Vanguard® Total Bond Market Index Fund
Schedule of Investments
December 31, 2011
| Face | Market | |||
| Maturity | Amount | Value | ||
| Coupon | Date | ($000) | ($000) | |
| Time Warner Cable Inc. | 5.000% | 2/1/20 | 17,525 | 19,194 |
| Time Warner Cable Inc. | 6.550% | 5/1/37 | 11,861 | 13,527 |
| Time Warner Cable Inc. | 7.300% | 7/1/38 | 95 | 116 |
| Time Warner Cable Inc. | 6.750% | 6/15/39 | 13,600 | 16,137 |
| Time Warner Cable Inc. | 5.875% | 11/15/40 | 28,447 | 30,966 |
| Time Warner Cable Inc. | 5.500% | 9/1/41 | 850 | 892 |
| Time Warner Entertainment Co. LP | 8.375% | 3/15/23 | 1,865 | 2,426 |
| Time Warner Entertainment Co. LP | 8.375% | 7/15/33 | 7,720 | 10,085 |
| United States Cellular Corp. | 6.700% | 12/15/33 | 4,500 | 4,550 |
| Verizon Communications Inc. | 4.350% | 2/15/13 | 1,350 | 1,403 |
| Verizon Communications Inc. | 5.250% | 4/15/13 | 6,250 | 6,598 |
| Verizon Communications Inc. | 4.900% | 9/15/15 | 425 | 477 |
| Verizon Communications Inc. | 5.550% | 2/15/16 | 10,175 | 11,695 |
| Verizon Communications Inc. | 3.000% | 4/1/16 | 3,025 | 3,188 |
| Verizon Communications Inc. | 5.500% | 4/1/17 | 3,000 | 3,462 |
| Verizon Communications Inc. | 5.500% | 2/15/18 | 33,261 | 38,928 |
| Verizon Communications Inc. | 6.100% | 4/15/18 | 7,605 | 9,099 |
| Verizon Communications Inc. | 8.750% | 11/1/18 | 2,675 | 3,612 |
| Verizon Communications Inc. | 6.350% | 4/1/19 | 47,091 | 58,050 |
| Verizon Communications Inc. | 4.600% | 4/1/21 | 13,000 | 14,759 |
| Verizon Communications Inc. | 3.500% | 11/1/21 | 5,700 | 5,937 |
| Verizon Communications Inc. | 5.850% | 9/15/35 | 15,050 | 17,932 |
| Verizon Communications Inc. | 6.250% | 4/1/37 | 2,495 | 3,083 |
| Verizon Communications Inc. | 6.400% | 2/15/38 | 2,180 | 2,752 |
| Verizon Communications Inc. | 6.900% | 4/15/38 | 20,685 | 27,803 |
| Verizon Communications Inc. | 8.950% | 3/1/39 | 11,450 | 18,361 |
| Verizon Communications Inc. | 6.000% | 4/1/41 | 8,175 | 10,198 |
| Verizon Communications Inc. | 4.750% | 11/1/41 | 1,250 | 1,350 |
| Verizon Global Funding Corp. | 4.375% | 6/1/13 | 860 | 901 |
| Verizon Global Funding Corp. | 7.750% | 12/1/30 | 11,691 | 16,264 |
| Verizon Maryland Inc. | 5.125% | 6/15/33 | 405 | 424 |
| Verizon New England Inc. | 7.875% | 11/15/29 | 1,385 | 1,675 |
| Verizon New York Inc. | 7.375% | 4/1/32 | 6,530 | 7,629 |
| Verizon Virginia Inc. | 4.625% | 3/15/13 | 6,000 | 6,266 |
| Vodafone Group plc | 5.000% | 12/16/13 | 8,150 | 8,762 |
| Vodafone Group plc | 4.150% | 6/10/14 | 5,275 | 5,612 |
| Vodafone Group plc | 5.375% | 1/30/15 | 4,175 | 4,631 |
| Vodafone Group plc | 3.375% | 11/24/15 | 1,325 | 1,406 |
| Vodafone Group plc | 5.750% | 3/15/16 | 12,850 | 14,916 |
| Vodafone Group plc | 5.625% | 2/27/17 | 13,706 | 15,900 |
| Vodafone Group plc | 4.625% | 7/15/18 | 200 | 221 |
| Vodafone Group plc | 5.450% | 6/10/19 | 10,475 | 12,266 |
| Vodafone Group plc | 4.375% | 3/16/21 | 500 | 544 |
| Vodafone Group plc | 7.875% | 2/15/30 | 1,650 | 2,386 |
| Vodafone Group plc | 6.250% | 11/30/32 | 7,775 | 9,772 |
| Vodafone Group plc | 6.150% | 2/27/37 | 3,700 | 4,630 |
| Washington Post Co. | 7.250% | 2/1/19 | 2,575 | 2,993 |
| 6 WPP Finance 2010 | 4.750% | 11/21/21 | 7,962 | 7,944 |
| WPP Finance UK | 8.000% | 9/15/14 | 7,225 | 8,092 |
| Consumer Cyclical (1.3%) | ||||
| AutoZone Inc. | 6.500% | 1/15/14 | 2,025 | 2,227 |
| AutoZone Inc. | 5.750% | 1/15/15 | 8,375 | 9,245 |
| AutoZone Inc. | 7.125% | 8/1/18 | 7,950 | 9,537 |
| Best Buy Co. Inc. | 6.750% | 7/15/13 | 9,350 | 9,898 |
| Best Buy Co. Inc. | 5.500% | 3/15/21 | 3,000 | 2,869 |
| BorgWarner Inc. | 4.625% | 9/15/20 | 1,000 | 1,062 |
| Costco Wholesale Corp. | 5.500% | 3/15/17 | 10,725 | 12,827 |
| CVS Caremark Corp. | 4.875% | 9/15/14 | 1,375 | 1,503 |
| CVS Caremark Corp. | 3.250% | 5/18/15 | 2,525 | 2,662 |
| CVS Caremark Corp. | 6.125% | 8/15/16 | 2,475 | 2,888 |
| CVS Caremark Corp. | 5.750% | 6/1/17 | 4,730 | 5,519 |
| CVS Caremark Corp. | 6.600% | 3/15/19 | 17,080 | 20,775 |
| CVS Caremark Corp. | 4.750% | 5/18/20 | 625 | 699 |
38
Vanguard® Total Bond Market Index Fund
Schedule of Investments
December 31, 2011
| Face | Market | |||
| Maturity | Amount | Value | ||
| Coupon | Date | ($000) | ($000) | |
| CVS Caremark Corp. | 6.250% | 6/1/27 | 24,275 | 29,493 |
| CVS Caremark Corp. | 6.125% | 9/15/39 | 3,025 | 3,676 |
| Daimler Finance North America LLC | 6.500% | 11/15/13 | 12,080 | 13,106 |
| 6 Daimler Finance North America LLC | 2.625% | 9/15/16 | 5,125 | 5,118 |
| Daimler Finance North America LLC | 8.500% | 1/18/31 | 4,830 | 6,746 |
| Darden Restaurants Inc. | 6.200% | 10/15/17 | 8,805 | 10,159 |
| Darden Restaurants Inc. | 6.800% | 10/15/37 | 14,375 | 16,595 |
| eBay Inc. | 0.875% | 10/15/13 | 3,050 | 3,066 |
| eBay Inc. | 1.625% | 10/15/15 | 3,050 | 3,071 |
| eBay Inc. | 3.250% | 10/15/20 | 3,100 | 3,105 |
| Expedia Inc. | 5.950% | 8/15/20 | 4,375 | 4,410 |
| Family Dollar Stores Inc. | 5.000% | 2/1/21 | 2,550 | 2,629 |
| Gap Inc. | 5.950% | 4/12/21 | 3,725 | 3,548 |
| Historic TW Inc. | 9.150% | 2/1/23 | 9,550 | 12,969 |
| Historic TW Inc. | 6.625% | 5/15/29 | 7,800 | 9,225 |
| Home Depot Inc. | 5.250% | 12/16/13 | 10,675 | 11,605 |
| Home Depot Inc. | 5.400% | 3/1/16 | 4,851 | 5,615 |
| Home Depot Inc. | 3.950% | 9/15/20 | 4,500 | 4,869 |
| Home Depot Inc. | 4.400% | 4/1/21 | 32,125 | 36,205 |
| Home Depot Inc. | 5.875% | 12/16/36 | 4,725 | 5,921 |
| Home Depot Inc. | 5.400% | 9/15/40 | 1,900 | 2,270 |
| Home Depot Inc. | 5.950% | 4/1/41 | 8,800 | 11,425 |
| Hyatt Hotels Corp. | 3.875% | 8/15/16 | 1,475 | 1,512 |
| Hyatt Hotels Corp. | 5.375% | 8/15/21 | 1,900 | 1,948 |
| International Game Technology | 7.500% | 6/15/19 | 1,125 | 1,311 |
| International Game Technology | 5.500% | 6/15/20 | 3,000 | 3,149 |
| Johnson Controls Inc. | 5.000% | 3/30/20 | 21,962 | 24,587 |
| Johnson Controls Inc. | 6.000% | 1/15/36 | 950 | 1,086 |
| Johnson Controls Inc. | 5.700% | 3/1/41 | 1,300 | 1,455 |
| Johnson Controls Inc. | 5.250% | 12/1/41 | 1,825 | 1,932 |
| Kohl's Corp. | 6.250% | 12/15/17 | 2,300 | 2,757 |
| Kohl's Corp. | 4.000% | 11/1/21 | 5,625 | 5,764 |
| Kohl's Corp. | 6.000% | 1/15/33 | 725 | 808 |
| Kohl's Corp. | 6.875% | 12/15/37 | 3,325 | 4,095 |
| Lowe's Cos. Inc. | 5.400% | 10/15/16 | 15,550 | 17,942 |
| Lowe's Cos. Inc. | 6.100% | 9/15/17 | 2,250 | 2,670 |
| Lowe's Cos. Inc. | 6.875% | 2/15/28 | 560 | 711 |
| Lowe's Cos. Inc. | 6.500% | 3/15/29 | 3,676 | 4,547 |
| Lowe's Cos. Inc. | 5.800% | 10/15/36 | 6,475 | 7,486 |
| Lowe's Cos. Inc. | 5.800% | 4/15/40 | 900 | 1,042 |
| Lowe's Cos. Inc. | 5.125% | 11/15/41 | 1,600 | 1,771 |
| Macy's Retail Holdings Inc. | 8.125% | 7/15/15 | 10,350 | 12,005 |
| Macy's Retail Holdings Inc. | 5.900% | 12/1/16 | 10,900 | 12,170 |
| Macy's Retail Holdings Inc. | 6.900% | 4/1/29 | 10,009 | 11,228 |
| Macy's Retail Holdings Inc. | 6.375% | 3/15/37 | 8,575 | 9,948 |
| Marriott International Inc. | 5.625% | 2/15/13 | 2,375 | 2,459 |
| Marriott International Inc. | 6.200% | 6/15/16 | 1,500 | 1,695 |
| Marriott International Inc. | 6.375% | 6/15/17 | 1,750 | 2,015 |
| McDonald's Corp. | 5.300% | 3/15/17 | 850 | 1,004 |
| McDonald's Corp. | 5.800% | 10/15/17 | 5,550 | 6,778 |
| McDonald's Corp. | 5.350% | 3/1/18 | 6,350 | 7,573 |
| McDonald's Corp. | 5.000% | 2/1/19 | 3,150 | 3,730 |
| McDonald's Corp. | 3.500% | 7/15/20 | 100 | 108 |
| McDonald's Corp. | 6.300% | 10/15/37 | 3,374 | 4,680 |
| McDonald's Corp. | 6.300% | 3/1/38 | 8,550 | 11,941 |
| McDonald's Corp. | 5.700% | 2/1/39 | 2,500 | 3,261 |
| Nordstrom Inc. | 6.750% | 6/1/14 | 1,675 | 1,882 |
| Nordstrom Inc. | 6.250% | 1/15/18 | 10,950 | 13,013 |
| Nordstrom Inc. | 4.750% | 5/1/20 | 3,875 | 4,302 |
| Nordstrom Inc. | 4.000% | 10/15/21 | 8,175 | 8,595 |
| Nordstrom Inc. | 6.950% | 3/15/28 | 1,075 | 1,362 |
| Nordstrom Inc. | 7.000% | 1/15/38 | 1,980 | 2,644 |
| O'Reilly Automotive Inc. | 4.875% | 1/14/21 | 900 | 953 |
| PACCAR Financial Corp. | 2.050% | 6/17/13 | 9,100 | 9,242 |
39
Vanguard® Total Bond Market Index Fund
Schedule of Investments
December 31, 2011
| Face | Market | |||
| Maturity | Amount | Value | ||
| Coupon | Date | ($000) | ($000) | |
| PACCAR Inc. | 6.875% | 2/15/14 | 3,575 | 4,000 |
| Staples Inc. | 9.750% | 1/15/14 | 19,300 | 21,978 |
| Target Corp. | 5.125% | 1/15/13 | 425 | 445 |
| Target Corp. | 4.000% | 6/15/13 | 1,680 | 1,763 |
| Target Corp. | 5.875% | 7/15/16 | 11,850 | 14,102 |
| Target Corp. | 5.375% | 5/1/17 | 6,475 | 7,578 |
| Target Corp. | 6.000% | 1/15/18 | 5,650 | 6,899 |
| Target Corp. | 3.875% | 7/15/20 | 5,200 | 5,755 |
| Target Corp. | 7.000% | 7/15/31 | 3,700 | 5,009 |
| Target Corp. | 6.350% | 11/1/32 | 7,600 | 9,699 |
| Target Corp. | 6.500% | 10/15/37 | 6,975 | 9,214 |
| Target Corp. | 7.000% | 1/15/38 | 11,435 | 16,074 |
| Time Warner Cos. Inc. | 7.570% | 2/1/24 | 1,530 | 1,941 |
| Time Warner Cos. Inc. | 6.950% | 1/15/28 | 80 | 97 |
| Time Warner Inc. | 3.150% | 7/15/15 | 575 | 599 |
| Time Warner Inc. | 5.875% | 11/15/16 | 18,475 | 21,342 |
| Time Warner Inc. | 4.875% | 3/15/20 | 14,350 | 15,608 |
| Time Warner Inc. | 4.700% | 1/15/21 | 3,320 | 3,579 |
| Time Warner Inc. | 4.750% | 3/29/21 | 17,000 | 18,415 |
| Time Warner Inc. | 4.000% | 1/15/22 | 2,400 | 2,470 |
| Time Warner Inc. | 7.625% | 4/15/31 | 13,715 | 17,586 |
| Time Warner Inc. | 7.700% | 5/1/32 | 10,156 | 13,205 |
| Time Warner Inc. | 6.500% | 11/15/36 | 7,050 | 8,633 |
| Time Warner Inc. | 6.200% | 3/15/40 | 4,850 | 5,788 |
| Time Warner Inc. | 6.100% | 7/15/40 | 6,300 | 7,429 |
| Time Warner Inc. | 6.250% | 3/29/41 | 11,175 | 13,458 |
| Time Warner Inc. | 5.375% | 10/15/41 | 2,275 | 2,453 |
| TJX Cos. Inc. | 6.950% | 4/15/19 | 17,510 | 21,809 |
| Toyota Motor Credit Corp. | 3.200% | 6/17/15 | 15,250 | 16,126 |
| Toyota Motor Credit Corp. | 2.800% | 1/11/16 | 2,000 | 2,081 |
| Toyota Motor Credit Corp. | 2.000% | 9/15/16 | 7,400 | 7,497 |
| Toyota Motor Credit Corp. | 4.500% | 6/17/20 | 1,400 | 1,528 |
| Toyota Motor Credit Corp. | 4.250% | 1/11/21 | 5,075 | 5,515 |
| Toyota Motor Credit Corp. | 3.400% | 9/15/21 | 4,700 | 4,882 |
| VF Corp. | 5.950% | 11/1/17 | 2,700 | 3,196 |
| VF Corp. | 3.500% | 9/1/21 | 8,000 | 8,280 |
| VF Corp. | 6.450% | 11/1/37 | 2,375 | 3,055 |
| Viacom Inc. | 4.375% | 9/15/14 | 6,275 | 6,723 |
| Viacom Inc. | 6.250% | 4/30/16 | 3,500 | 4,064 |
| Viacom Inc. | 2.500% | 12/15/16 | 2,900 | 2,913 |
| Viacom Inc. | 3.500% | 4/1/17 | 2,975 | 3,089 |
| Viacom Inc. | 6.125% | 10/5/17 | 3,925 | 4,542 |
| Viacom Inc. | 5.625% | 9/15/19 | 14,660 | 16,557 |
| Viacom Inc. | 3.875% | 12/15/21 | 1,050 | 1,076 |
| Viacom Inc. | 6.875% | 4/30/36 | 10,060 | 12,723 |
| Wal-Mart Stores Inc. | 4.550% | 5/1/13 | 17,071 | 18,003 |
| Wal-Mart Stores Inc. | 7.250% | 6/1/13 | 900 | 984 |
| Wal-Mart Stores Inc. | 1.625% | 4/15/14 | 1,175 | 1,201 |
| Wal-Mart Stores Inc. | 3.200% | 5/15/14 | 20,200 | 21,367 |
| Wal-Mart Stores Inc. | 4.500% | 7/1/15 | 2,450 | 2,743 |
| Wal-Mart Stores Inc. | 2.250% | 7/8/15 | 3,850 | 4,019 |
| Wal-Mart Stores Inc. | 1.500% | 10/25/15 | 21,960 | 22,446 |
| Wal-Mart Stores Inc. | 5.375% | 4/5/17 | 1,650 | 1,949 |
| Wal-Mart Stores Inc. | 5.800% | 2/15/18 | 17,050 | 20,982 |
| Wal-Mart Stores Inc. | 3.625% | 7/8/20 | 36,275 | 39,624 |
| Wal-Mart Stores Inc. | 3.250% | 10/25/20 | 26,525 | 28,331 |
| Wal-Mart Stores Inc. | 4.250% | 4/15/21 | 8,400 | 9,710 |
| Wal-Mart Stores Inc. | 5.875% | 4/5/27 | 18,775 | 22,827 |
| Wal-Mart Stores Inc. | 7.550% | 2/15/30 | 11,645 | 16,928 |
| Wal-Mart Stores Inc. | 5.250% | 9/1/35 | 6,675 | 7,893 |
| Wal-Mart Stores Inc. | 6.500% | 8/15/37 | 21,186 | 29,268 |
| Wal-Mart Stores Inc. | 6.200% | 4/15/38 | 3,395 | 4,546 |
| Wal-Mart Stores Inc. | 5.625% | 4/1/40 | 4,250 | 5,350 |
| Wal-Mart Stores Inc. | 4.875% | 7/8/40 | 1,950 | 2,230 |
40
Vanguard® Total Bond Market Index Fund
Schedule of Investments
December 31, 2011
| Face | Market | |||
| Maturity | Amount | Value | ||
| Coupon | Date | ($000) | ($000) | |
| Wal-Mart Stores Inc. | 5.000% | 10/25/40 | 285 | 332 |
| Wal-Mart Stores Inc. | 5.625% | 4/15/41 | 21,950 | 28,187 |
| Walgreen Co. | 4.875% | 8/1/13 | 14,250 | 15,201 |
| Walgreen Co. | 5.250% | 1/15/19 | 4,100 | 4,873 |
| Walt Disney Co. | 4.500% | 12/15/13 | 8,000 | 8,629 |
| Walt Disney Co. | 0.875% | 12/1/14 | 6,500 | 6,541 |
| Walt Disney Co. | 5.625% | 9/15/16 | 5,525 | 6,539 |
| Walt Disney Co. | 5.875% | 12/15/17 | 5,350 | 6,487 |
| Walt Disney Co. | 2.750% | 8/16/21 | 5,500 | 5,580 |
| Walt Disney Co. | 7.000% | 3/1/32 | 1,825 | 2,523 |
| Walt Disney Co. | 4.375% | 8/16/41 | 3,550 | 3,765 |
| Walt Disney Co. | 4.125% | 12/1/41 | 10,500 | 10,757 |
| Western Union Co. | 6.500% | 2/26/14 | 2,850 | 3,123 |
| Western Union Co. | 5.930% | 10/1/16 | 5,500 | 6,205 |
| Western Union Co. | 5.253% | 4/1/20 | 3,946 | 4,399 |
| Western Union Co. | 6.200% | 11/17/36 | 3,550 | 3,797 |
| Western Union Co. | 6.200% | 6/21/40 | 5,225 | 5,611 |
| Wyndham Worldwide Corp. | 5.750% | 2/1/18 | 2,255 | 2,385 |
| Wyndham Worldwide Corp. | 7.375% | 3/1/20 | 4,755 | 5,409 |
| Yum! Brands Inc. | 6.250% | 4/15/16 | 3,525 | 4,080 |
| Yum! Brands Inc. | 6.250% | 3/15/18 | 125 | 146 |
| Yum! Brands Inc. | 3.875% | 11/1/20 | 825 | 843 |
| Yum! Brands Inc. | 6.875% | 11/15/37 | 8,250 | 10,589 |
| Consumer Noncyclical (2.9%) | ||||
| Abbott Laboratories | 4.350% | 3/15/14 | 2,675 | 2,891 |
| Abbott Laboratories | 2.700% | 5/27/15 | 6,925 | 7,292 |
| Abbott Laboratories | 5.875% | 5/15/16 | 15,811 | 18,584 |
| Abbott Laboratories | 5.600% | 11/30/17 | 16,725 | 20,003 |
| Abbott Laboratories | 5.125% | 4/1/19 | 9,320 | 10,811 |
| Abbott Laboratories | 4.125% | 5/27/20 | 5,617 | 6,224 |
| Abbott Laboratories | 6.150% | 11/30/37 | 5,225 | 6,800 |
| Abbott Laboratories | 6.000% | 4/1/39 | 1,950 | 2,489 |
| Abbott Laboratories | 5.300% | 5/27/40 | 5,435 | 6,529 |
| Allergan Inc. | 5.750% | 4/1/16 | 3,220 | 3,729 |
| Altria Group Inc. | 8.500% | 11/10/13 | 59,995 | 67,812 |
| Altria Group Inc. | 4.125% | 9/11/15 | 425 | 461 |
| Altria Group Inc. | 9.700% | 11/10/18 | 8,615 | 11,599 |
| Altria Group Inc. | 9.250% | 8/6/19 | 16,925 | 22,731 |
| Altria Group Inc. | 9.950% | 11/10/38 | 5,675 | 8,618 |
| Altria Group Inc. | 10.200% | 2/6/39 | 20,775 | 32,329 |
| AmerisourceBergen Corp. | 5.875% | 9/15/15 | 13,561 | 15,446 |
| AmerisourceBergen Corp. | 4.875% | 11/15/19 | 4,000 | 4,484 |
| AmerisourceBergen Corp. | 3.500% | 11/15/21 | 200 | 206 |
| Amgen Inc. | 1.875% | 11/15/14 | 7,150 | 7,258 |
| Amgen Inc. | 4.850% | 11/18/14 | 4,725 | 5,132 |
| Amgen Inc. | 2.300% | 6/15/16 | 8,200 | 8,180 |
| Amgen Inc. | 2.500% | 11/15/16 | 7,175 | 7,235 |
| Amgen Inc. | 5.850% | 6/1/17 | 7,900 | 9,111 |
| Amgen Inc. | 5.700% | 2/1/19 | 2,725 | 3,065 |
| Amgen Inc. | 3.450% | 10/1/20 | 5,575 | 5,460 |
| Amgen Inc. | 4.100% | 6/15/21 | 8,750 | 8,965 |
| Amgen Inc. | 3.875% | 11/15/21 | 8,900 | 9,044 |
| Amgen Inc. | 6.375% | 6/1/37 | 6,625 | 7,588 |
| Amgen Inc. | 6.900% | 6/1/38 | 9,275 | 11,396 |
| Amgen Inc. | 6.400% | 2/1/39 | 8,750 | 10,232 |
| Amgen Inc. | 5.750% | 3/15/40 | 3,425 | 3,727 |
| Amgen Inc. | 4.950% | 10/1/41 | 1,750 | 1,714 |
| Amgen Inc. | 5.150% | 11/15/41 | 7,600 | 7,928 |
| Amgen Inc. | 5.650% | 6/15/42 | 7,675 | 8,307 |
| Anheuser-Busch Cos. LLC | 4.375% | 1/15/13 | 4,175 | 4,319 |
| Anheuser-Busch Cos. LLC | 5.600% | 3/1/17 | 4,750 | 5,582 |
| Anheuser-Busch Cos. LLC | 5.500% | 1/15/18 | 10,375 | 12,057 |
| Anheuser-Busch Cos. LLC | 6.800% | 8/20/32 | 2,275 | 3,009 |
41
Vanguard® Total Bond Market Index Fund Schedule of Investments December 31, 2011
| Face | Market | |||
| Maturity | Amount | Value | ||
| Coupon | Date | ($000) | ($000) | |
| Anheuser-Busch Cos. LLC | 5.750% | 4/1/36 | 5,995 | 7,343 |
| Anheuser-Busch Cos. LLC | 6.450% | 9/1/37 | 470 | 633 |
| Anheuser-Busch InBev Worldwide Inc. | 2.500% | 3/26/13 | 10,675 | 10,911 |
| Anheuser-Busch InBev Worldwide Inc. | 1.500% | 7/14/14 | 12,450 | 12,587 |
| Anheuser-Busch InBev Worldwide Inc. | 5.375% | 11/15/14 | 9,700 | 10,807 |
| Anheuser-Busch InBev Worldwide Inc. | 4.125% | 1/15/15 | 11,025 | 11,900 |
| Anheuser-Busch InBev Worldwide Inc. | 7.750% | 1/15/19 | 7,250 | 9,376 |
| Anheuser-Busch InBev Worldwide Inc. | 6.875% | 11/15/19 | 7,600 | 9,522 |
| Anheuser-Busch InBev Worldwide Inc. | 5.375% | 1/15/20 | 25,360 | 29,830 |
| Anheuser-Busch InBev Worldwide Inc. | 5.000% | 4/15/20 | 10,090 | 11,545 |
| Anheuser-Busch InBev Worldwide Inc. | 4.375% | 2/15/21 | 4,875 | 5,423 |
| Anheuser-Busch InBev Worldwide Inc. | 8.200% | 1/15/39 | 6,400 | 10,118 |
| Anheuser-Busch InBev Worldwide Inc. | 6.375% | 1/15/40 | 10,385 | 14,248 |
| Archer-Daniels-Midland Co. | 8.375% | 4/15/17 | 525 | 682 |
| Archer-Daniels-Midland Co. | 5.450% | 3/15/18 | 8,900 | 10,550 |
| Archer-Daniels-Midland Co. | 4.479% | 3/1/21 | 26,000 | 29,441 |
| Archer-Daniels-Midland Co. | 5.935% | 10/1/32 | 4,275 | 5,313 |
| Archer-Daniels-Midland Co. | 5.375% | 9/15/35 | 3,900 | 4,587 |
| Archer-Daniels-Midland Co. | 5.765% | 3/1/41 | 11,835 | 14,946 |
| 6 Aristotle Holding Inc. | 4.750% | 11/15/21 | 4,925 | 5,090 |
| 6 Aristotle Holding Inc. | 6.125% | 11/15/41 | 4,825 | 5,165 |
| AstraZeneca plc | 5.400% | 6/1/14 | 5,650 | 6,253 |
| AstraZeneca plc | 5.900% | 9/15/17 | 12,710 | 15,322 |
| AstraZeneca plc | 6.450% | 9/15/37 | 17,296 | 23,296 |
| Avon Products Inc. | 5.750% | 3/1/18 | 1,982 | 2,161 |
| Avon Products Inc. | 6.500% | 3/1/19 | 410 | 464 |
| Baptist Health South Florida Obligated Group | 4.590% | 8/15/21 | 1,000 | 1,076 |
| Baxter International Inc. | 4.000% | 3/1/14 | 1,350 | 1,437 |
| Baxter International Inc. | 5.900% | 9/1/16 | 1,700 | 2,026 |
| Baxter International Inc. | 6.250% | 12/1/37 | 11,425 | 15,269 |
| Beam Inc. | 6.375% | 6/15/14 | 1,403 | 1,534 |
| Beam Inc. | 5.375% | 1/15/16 | 1,568 | 1,715 |
| Beam Inc. | 5.875% | 1/15/36 | 2,600 | 2,721 |
| Becton Dickinson and Co. | 1.750% | 11/8/16 | 1,175 | 1,186 |
| Becton Dickinson and Co. | 5.000% | 5/15/19 | 1,125 | 1,303 |
| Becton Dickinson and Co. | 3.250% | 11/12/20 | 5,005 | 5,169 |
| Becton Dickinson and Co. | 3.125% | 11/8/21 | 12,040 | 12,450 |
| Becton Dickinson and Co. | 6.000% | 5/15/39 | 1,000 | 1,286 |
| Becton Dickinson and Co. | 5.000% | 11/12/40 | 100 | 112 |
| Biogen Idec Inc. | 6.000% | 3/1/13 | 8,200 | 8,632 |
| Biogen Idec Inc. | 6.875% | 3/1/18 | 12,825 | 15,536 |
| Boston Scientific Corp. | 4.500% | 1/15/15 | 6,000 | 6,305 |
| Boston Scientific Corp. | 6.250% | 11/15/15 | 12,151 | 13,493 |
| Boston Scientific Corp. | 5.125% | 1/12/17 | 10,000 | 10,763 |
| Boston Scientific Corp. | 6.000% | 1/15/20 | 7,625 | 8,537 |
| Boston Scientific Corp. | 7.000% | 11/15/35 | 1,500 | 1,726 |
| Boston Scientific Corp. | 7.375% | 1/15/40 | 3,000 | 3,807 |
| Bottling Group LLC | 5.000% | 11/15/13 | 10,125 | 10,948 |
| Bottling Group LLC | 6.950% | 3/15/14 | 29,775 | 33,481 |
| Bottling Group LLC | 5.500% | 4/1/16 | 18,975 | 21,982 |
| Bottling Group LLC | 5.125% | 1/15/19 | 1,500 | 1,746 |
| Bristol-Myers Squibb Co. | 5.250% | 8/15/13 | 965 | 1,039 |
| Bristol-Myers Squibb Co. | 5.450% | 5/1/18 | 2,225 | 2,660 |
| Bristol-Myers Squibb Co. | 7.150% | 6/15/23 | 400 | 558 |
| Bristol-Myers Squibb Co. | 6.800% | 11/15/26 | 150 | 201 |
| Bristol-Myers Squibb Co. | 5.875% | 11/15/36 | 13,784 | 17,540 |
| Bristol-Myers Squibb Co. | 6.125% | 5/1/38 | 1,625 | 2,128 |
| Bristol-Myers Squibb Co. | 6.875% | 8/1/97 | 1,030 | 1,404 |
| Bunge Ltd. Finance Corp. | 5.350% | 4/15/14 | 2,025 | 2,135 |
| Bunge Ltd. Finance Corp. | 5.100% | 7/15/15 | 7,625 | 8,042 |
| Bunge Ltd. Finance Corp. | 4.100% | 3/15/16 | 3,775 | 3,879 |
| Bunge Ltd. Finance Corp. | 8.500% | 6/15/19 | 14,950 | 18,296 |
| Campbell Soup Co. | 3.050% | 7/15/17 | 1,425 | 1,520 |
| Campbell Soup Co. | 4.250% | 4/15/21 | 4,500 | 5,019 |
42
Vanguard® Total Bond Market Index Fund
Schedule of Investments
December 31, 2011
| Face | Market | |||
| Maturity | Amount | Value | ||
| Coupon | Date | ($000) | ($000) | |
| Cardinal Health Inc. | 4.000% | 6/15/15 | 550 | 589 |
| Cardinal Health Inc. | 4.625% | 12/15/20 | 6,500 | 6,965 |
| CareFusion Corp. | 5.125% | 8/1/14 | 1,700 | 1,840 |
| CareFusion Corp. | 6.375% | 8/1/19 | 8,215 | 9,667 |
| Celgene Corp. | 2.450% | 10/15/15 | 1,975 | 2,002 |
| Celgene Corp. | 3.950% | 10/15/20 | 1,325 | 1,332 |
| Celgene Corp. | 5.700% | 10/15/40 | 1,650 | 1,819 |
| Church & Dwight Co. Inc. | 3.350% | 12/15/15 | 2,375 | 2,470 |
| Clorox Co. | 5.000% | 3/1/13 | 5,700 | 5,939 |
| Clorox Co. | 5.000% | 1/15/15 | 1,725 | 1,863 |
| Clorox Co. | 3.550% | 11/1/15 | 1,825 | 1,918 |
| Clorox Co. | 5.950% | 10/15/17 | 13,265 | 15,359 |
| Coca-Cola Co. | 0.750% | 11/15/13 | 7,000 | 7,029 |
| Coca-Cola Co. | 3.625% | 3/15/14 | 5,675 | 6,047 |
| Coca-Cola Co. | 1.500% | 11/15/15 | 7,490 | 7,601 |
| Coca-Cola Co. | 1.800% | 9/1/16 | 10,000 | 10,177 |
| Coca-Cola Co. | 5.350% | 11/15/17 | 5,750 | 6,914 |
| Coca-Cola Co. | 4.875% | 3/15/19 | 9,525 | 11,109 |
| Coca-Cola Co. | 3.150% | 11/15/20 | 7,700 | 8,078 |
| Coca-Cola Enterprises Inc. | 3.250% | 8/19/21 | 1,575 | 1,580 |
| Coca-Cola Femsa SAB de CV | 4.625% | 2/15/20 | 1,550 | 1,713 |
| Coca-Cola HBC Finance BV | 5.125% | 9/17/13 | 945 | 983 |
| Coca-Cola HBC Finance BV | 5.500% | 9/17/15 | 8,150 | 8,901 |
| Coca-Cola Refreshments USA Inc. | 7.375% | 3/3/14 | 10,850 | 12,323 |
| Coca-Cola Refreshments USA Inc. | 4.250% | 3/1/15 | 375 | 407 |
| Coca-Cola Refreshments USA Inc. | 8.500% | 2/1/22 | 6,361 | 9,328 |
| Colgate-Palmolive Co. | 0.600% | 11/15/14 | 200 | 200 |
| Colgate-Palmolive Co. | 1.300% | 1/15/17 | 9,375 | 9,304 |
| Colgate-Palmolive Co. | 2.625% | 5/1/17 | 700 | 740 |
| Colgate-Palmolive Co. | 2.450% | 11/15/21 | 3,400 | 3,392 |
| ConAgra Foods Inc. | 5.875% | 4/15/14 | 1,040 | 1,141 |
| ConAgra Foods Inc. | 5.819% | 6/15/17 | 951 | 1,069 |
| ConAgra Foods Inc. | 7.000% | 4/15/19 | 500 | 588 |
| ConAgra Foods Inc. | 9.750% | 3/1/21 | 129 | 175 |
| ConAgra Foods Inc. | 7.125% | 10/1/26 | 1,000 | 1,178 |
| ConAgra Foods Inc. | 7.000% | 10/1/28 | 725 | 841 |
| ConAgra Foods Inc. | 8.250% | 9/15/30 | 4,750 | 6,052 |
| Corn Products International Inc. | 3.200% | 11/1/15 | 650 | 671 |
| Corn Products International Inc. | 4.625% | 11/1/20 | 885 | 937 |
| Corn Products International Inc. | 6.625% | 4/15/37 | 1,625 | 1,929 |
| Covidien International Finance SA | 1.875% | 6/15/13 | 15,840 | 15,987 |
| Covidien International Finance SA | 6.000% | 10/15/17 | 5,225 | 6,189 |
| Covidien International Finance SA | 6.550% | 10/15/37 | 9,518 | 12,126 |
| CR Bard Inc. | 6.700% | 12/1/26 | 5,250 | 6,950 |
| Delhaize Group SA | 5.875% | 2/1/14 | 2,425 | 2,623 |
| Delhaize Group SA | 5.700% | 10/1/40 | 3,387 | 3,418 |
| DENTSPLY International Inc. | 2.750% | 8/15/16 | 2,800 | 2,823 |
| DENTSPLY International Inc. | 4.125% | 8/15/21 | 1,575 | 1,619 |
| Diageo Capital plc | 5.200% | 1/30/13 | 8,275 | 8,673 |
| Diageo Capital plc | 5.500% | 9/30/16 | 1,275 | 1,465 |
| Diageo Capital plc | 5.750% | 10/23/17 | 7,200 | 8,466 |
| Diageo Capital plc | 4.828% | 7/15/20 | 2,430 | 2,766 |
| Diageo Capital plc | 5.875% | 9/30/36 | 1,775 | 2,238 |
| Diageo Finance BV | 5.500% | 4/1/13 | 5,326 | 5,635 |
| Diageo Finance BV | 3.250% | 1/15/15 | 375 | 397 |
| Diageo Finance BV | 5.300% | 10/28/15 | 6,676 | 7,592 |
| Diageo Investment Corp. | 7.450% | 4/15/35 | 700 | 980 |
| Dr Pepper Snapple Group Inc. | 6.120% | 5/1/13 | 1,750 | 1,868 |
| Dr Pepper Snapple Group Inc. | 2.900% | 1/15/16 | 1,150 | 1,193 |
| Dr Pepper Snapple Group Inc. | 6.820% | 5/1/18 | 5,090 | 6,308 |
| Dr Pepper Snapple Group Inc. | 2.600% | 1/15/19 | 6,050 | 6,024 |
| Dr Pepper Snapple Group Inc. | 7.450% | 5/1/38 | 950 | 1,332 |
| Eli Lilly & Co. | 4.200% | 3/6/14 | 2,400 | 2,575 |
| Eli Lilly & Co. | 5.200% | 3/15/17 | 6,400 | 7,420 |
43
Vanguard® Total Bond Market Index Fund
Schedule of Investments
December 31, 2011
| Face | Market | |||
| Maturity | Amount | Value | ||
| Coupon | Date | ($000) | ($000) | |
| Eli Lilly & Co. | 5.500% | 3/15/27 | 5,750 | 6,853 |
| Eli Lilly & Co. | 5.550% | 3/15/37 | 3,286 | 4,016 |
| 6 Energizer Holdings Inc. | 4.700% | 5/19/21 | 3,450 | 3,643 |
| Estee Lauder Cos. Inc. | 6.000% | 5/15/37 | 2,050 | 2,651 |
| Express Scripts Inc. | 6.250% | 6/15/14 | 9,625 | 10,486 |
| Express Scripts Inc. | 3.125% | 5/15/16 | 6,950 | 6,997 |
| Express Scripts Inc. | 7.250% | 6/15/19 | 1,925 | 2,280 |
| Genentech Inc. | 4.750% | 7/15/15 | 2,320 | 2,586 |
| Genentech Inc. | 5.250% | 7/15/35 | 2,675 | 3,180 |
| General Mills Inc. | 5.250% | 8/15/13 | 17,925 | 19,171 |
| General Mills Inc. | 5.200% | 3/17/15 | 835 | 932 |
| General Mills Inc. | 5.700% | 2/15/17 | 23,625 | 27,843 |
| General Mills Inc. | 5.650% | 2/15/19 | 14,917 | 17,717 |
| Gilead Sciences Inc. | 2.400% | 12/1/14 | 2,200 | 2,240 |
| Gilead Sciences Inc. | 3.050% | 12/1/16 | 2,175 | 2,231 |
| Gilead Sciences Inc. | 4.500% | 4/1/21 | 9,525 | 10,034 |
| Gilead Sciences Inc. | 5.650% | 12/1/41 | 1,800 | 1,988 |
| GlaxoSmithKline Capital Inc. | 4.850% | 5/15/13 | 11,025 | 11,676 |
| GlaxoSmithKline Capital Inc. | 4.375% | 4/15/14 | 20,800 | 22,496 |
| GlaxoSmithKline Capital Inc. | 5.650% | 5/15/18 | 33,510 | 40,386 |
| GlaxoSmithKline Capital Inc. | 5.375% | 4/15/34 | 3,500 | 4,134 |
| GlaxoSmithKline Capital Inc. | 6.375% | 5/15/38 | 24,821 | 33,020 |
| Hasbro Inc. | 6.125% | 5/15/14 | 6,900 | 7,586 |
| Hasbro Inc. | 6.300% | 9/15/17 | 5,350 | 6,145 |
| Hasbro Inc. | 6.350% | 3/15/40 | 9,306 | 10,116 |
| Hershey Co. | 5.450% | 9/1/16 | 1,275 | 1,488 |
| Hershey Co. | 1.500% | 11/1/16 | 3,975 | 3,981 |
| Hershey Co. | 4.125% | 12/1/20 | 3,225 | 3,609 |
| HJ Heinz Co. | 5.350% | 7/15/13 | 2,075 | 2,215 |
| HJ Heinz Co. | 2.000% | 9/12/16 | 1,450 | 1,461 |
| HJ Heinz Co. | 3.125% | 9/12/21 | 250 | 251 |
| HJ Heinz Finance Co. | 6.750% | 3/15/32 | 3,325 | 4,267 |
| Hormel Foods Corp. | 4.125% | 4/15/21 | 1,300 | 1,437 |
| Hospira Inc. | 5.900% | 6/15/14 | 1,550 | 1,668 |
| Hospira Inc. | 6.400% | 5/15/15 | 850 | 923 |
| Hospira Inc. | 6.050% | 3/30/17 | 150 | 167 |
| Hospira Inc. | 5.600% | 9/15/40 | 2,700 | 2,672 |
| JM Smucker Co. | 3.500% | 10/15/21 | 2,150 | 2,199 |
| Johnson & Johnson | 5.550% | 8/15/17 | 4,025 | 4,861 |
| Johnson & Johnson | 5.150% | 7/15/18 | 20,675 | 24,883 |
| Johnson & Johnson | 6.950% | 9/1/29 | 4,400 | 6,224 |
| Johnson & Johnson | 4.950% | 5/15/33 | 5,025 | 6,052 |
| Johnson & Johnson | 5.950% | 8/15/37 | 4,565 | 6,233 |
| Johnson & Johnson | 5.850% | 7/15/38 | 1,625 | 2,171 |
| Johnson & Johnson | 4.500% | 9/1/40 | 2,355 | 2,653 |
| Kellogg Co. | 5.125% | 12/3/12 | 7,048 | 7,274 |
| Kellogg Co. | 4.250% | 3/6/13 | 4,225 | 4,386 |
| Kellogg Co. | 4.450% | 5/30/16 | 50 | 56 |
| Kellogg Co. | 4.150% | 11/15/19 | 5,075 | 5,500 |
| Kellogg Co. | 4.000% | 12/15/20 | 650 | 688 |
| Kellogg Co. | 7.450% | 4/1/31 | 6,040 | 8,218 |
| Kimberly-Clark Corp. | 4.875% | 8/15/15 | 5,250 | 5,893 |
| Kimberly-Clark Corp. | 6.125% | 8/1/17 | 8,500 | 10,397 |
| Kimberly-Clark Corp. | 6.250% | 7/15/18 | 175 | 216 |
| Kimberly-Clark Corp. | 3.625% | 8/1/20 | 8,424 | 9,065 |
| Kimberly-Clark Corp. | 3.875% | 3/1/21 | 425 | 470 |
| Kimberly-Clark Corp. | 6.625% | 8/1/37 | 1,275 | 1,802 |
| Kimberly-Clark Corp. | 5.300% | 3/1/41 | 1,725 | 2,128 |
| Koninklijke Philips Electronics NV | 4.625% | 3/11/13 | 3,900 | 4,071 |
| Koninklijke Philips Electronics NV | 5.750% | 3/11/18 | 10,100 | 11,566 |
| Koninklijke Philips Electronics NV | 6.875% | 3/11/38 | 4,225 | 5,349 |
| Kraft Foods Inc. | 2.625% | 5/8/13 | 13,250 | 13,512 |
| Kraft Foods Inc. | 5.250% | 10/1/13 | 675 | 720 |
| Kraft Foods Inc. | 6.750% | 2/19/14 | 150 | 167 |
44
Vanguard® Total Bond Market Index Fund
Schedule of Investments
December 31, 2011
| Face | Market | |||
| Maturity | Amount | Value | ||
| Coupon | Date | ($000) | ($000) | |
| Kraft Foods Inc. | 4.125% | 2/9/16 | 20,325 | 22,067 |
| Kraft Foods Inc. | 6.500% | 8/11/17 | 12,073 | 14,320 |
| Kraft Foods Inc. | 6.125% | 8/23/18 | 10,075 | 11,904 |
| Kraft Foods Inc. | 5.375% | 2/10/20 | 67,115 | 77,309 |
| Kraft Foods Inc. | 6.500% | 11/1/31 | 8,400 | 10,456 |
| Kraft Foods Inc. | 7.000% | 8/11/37 | 9,425 | 12,540 |
| Kraft Foods Inc. | 6.875% | 2/1/38 | 6,000 | 7,912 |
| Kraft Foods Inc. | 6.875% | 1/26/39 | 1,300 | 1,713 |
| Kraft Foods Inc. | 6.500% | 2/9/40 | 13,025 | 16,724 |
| Kroger Co. | 5.500% | 2/1/13 | 1,686 | 1,762 |
| Kroger Co. | 5.000% | 4/15/13 | 3,700 | 3,871 |
| Kroger Co. | 4.950% | 1/15/15 | 1,725 | 1,903 |
| Kroger Co. | 3.900% | 10/1/15 | 500 | 538 |
| Kroger Co. | 6.400% | 8/15/17 | 840 | 1,000 |
| Kroger Co. | 6.800% | 12/15/18 | 2,175 | 2,678 |
| Kroger Co. | 6.150% | 1/15/20 | 15,895 | 19,345 |
| Kroger Co. | 7.700% | 6/1/29 | 7,825 | 10,388 |
| Kroger Co. | 8.000% | 9/15/29 | 1,425 | 1,937 |
| Kroger Co. | 7.500% | 4/1/31 | 2,395 | 3,086 |
| Kroger Co. | 6.900% | 4/15/38 | 6,300 | 8,013 |
| Laboratory Corp. of America Holdings | 5.500% | 2/1/13 | 1,540 | 1,607 |
| Laboratory Corp. of America Holdings | 5.625% | 12/15/15 | 2,500 | 2,806 |
| Laboratory Corp. of America Holdings | 4.625% | 11/15/20 | 200 | 211 |
| Life Technologies Corp. | 4.400% | 3/1/15 | 4,350 | 4,507 |
| Life Technologies Corp. | 3.500% | 1/15/16 | 11,185 | 11,270 |
| Life Technologies Corp. | 6.000% | 3/1/20 | 4,300 | 4,802 |
| Life Technologies Corp. | 5.000% | 1/15/21 | 2,200 | 2,318 |
| Lorillard Tobacco Co. | 8.125% | 6/23/19 | 7,610 | 9,062 |
| Lorillard Tobacco Co. | 8.125% | 5/1/40 | 4,000 | 4,620 |
| Lorillard Tobacco Co. | 7.000% | 8/4/41 | 4,350 | 4,596 |
| Mattel Inc. | 2.500% | 11/1/16 | 450 | 453 |
| Mattel Inc. | 5.450% | 11/1/41 | 1,725 | 1,744 |
| McCormick & Co. Inc. | 3.900% | 7/15/21 | 1,850 | 1,967 |
| McKesson Corp. | 5.250% | 3/1/13 | 10,175 | 10,685 |
| McKesson Corp. | 6.500% | 2/15/14 | 1,650 | 1,830 |
| McKesson Corp. | 3.250% | 3/1/16 | 1,475 | 1,563 |
| McKesson Corp. | 4.750% | 3/1/21 | 6,350 | 7,218 |
| McKesson Corp. | 6.000% | 3/1/41 | 2,050 | 2,637 |
| Mead Johnson Nutrition Co. | 3.500% | 11/1/14 | 6,825 | 7,132 |
| Mead Johnson Nutrition Co. | 4.900% | 11/1/19 | 2,925 | 3,218 |
| Mead Johnson Nutrition Co. | 5.900% | 11/1/39 | 11,170 | 13,388 |
| Medco Health Solutions Inc. | 6.125% | 3/15/13 | 6,450 | 6,791 |
| Medco Health Solutions Inc. | 7.250% | 8/15/13 | 600 | 650 |
| Medco Health Solutions Inc. | 2.750% | 9/15/15 | 8,050 | 8,085 |
| Medco Health Solutions Inc. | 7.125% | 3/15/18 | 14,138 | 16,558 |
| Medtronic Inc. | 4.500% | 3/15/14 | 2,225 | 2,398 |
| Medtronic Inc. | 3.000% | 3/15/15 | 10,050 | 10,639 |
| Medtronic Inc. | 4.750% | 9/15/15 | 4,275 | 4,817 |
| Medtronic Inc. | 5.600% | 3/15/19 | 1,150 | 1,369 |
| Medtronic Inc. | 4.450% | 3/15/20 | 3,615 | 4,083 |
| Medtronic Inc. | 6.500% | 3/15/39 | 2,440 | 3,382 |
| Medtronic Inc. | 5.550% | 3/15/40 | 4,275 | 5,285 |
| Memorial Sloan-Kettering Cancer Center | 5.000% | 7/1/42 | 1,100 | 1,140 |
| Merck & Co. Inc. | 4.375% | 2/15/13 | 3,825 | 3,992 |
| Merck & Co. Inc. | 5.300% | 12/1/13 | 13,325 | 14,554 |
| Merck & Co. Inc. | 4.750% | 3/1/15 | 1,450 | 1,618 |
| Merck & Co. Inc. | 4.000% | 6/30/15 | 9,775 | 10,778 |
| Merck & Co. Inc. | 2.250% | 1/15/16 | 34,525 | 36,048 |
| Merck & Co. Inc. | 6.000% | 9/15/17 | 825 | 1,011 |
| Merck & Co. Inc. | 5.000% | 6/30/19 | 3,975 | 4,686 |
| Merck & Co. Inc. | 3.875% | 1/15/21 | 6,630 | 7,444 |
| Merck & Co. Inc. | 6.400% | 3/1/28 | 4,130 | 5,374 |
| Merck & Co. Inc. | 5.950% | 12/1/28 | 2,150 | 2,703 |
| Merck & Co. Inc. | 6.500% | 12/1/33 | 5,563 | 7,758 |
45
Vanguard® Total Bond Market Index Fund
Schedule of Investments
December 31, 2011
| Face | Market | |||
| Maturity | Amount | Value | ||
| Coupon | Date | ($000) | ($000) | |
| Merck & Co. Inc. | 5.750% | 11/15/36 | 10,775 | 13,621 |
| Merck & Co. Inc. | 6.550% | 9/15/37 | 10,800 | 14,884 |
| Merck & Co. Inc. | 5.850% | 6/30/39 | 1,750 | 2,251 |
| Newell Rubbermaid Inc. | 4.700% | 8/15/20 | 700 | 742 |
| Novant Health Inc. | 5.850% | 11/1/19 | 6,125 | 7,126 |
| Novartis Capital Corp. | 1.900% | 4/24/13 | 40,550 | 41,317 |
| Novartis Capital Corp. | 4.125% | 2/10/14 | 33,225 | 35,469 |
| Novartis Capital Corp. | 2.900% | 4/24/15 | 5,150 | 5,448 |
| Novartis Capital Corp. | 4.400% | 4/24/20 | 400 | 454 |
| Novartis Securities Investment Ltd. | 5.125% | 2/10/19 | 17,975 | 21,118 |
| Partners Healthcare System Inc. | 3.443% | 7/1/21 | 3,450 | 3,496 |
| Pepsi Bottling Group Inc. | 7.000% | 3/1/29 | 9,649 | 13,329 |
| PepsiAmericas Inc. | 4.375% | 2/15/14 | 825 | 886 |
| PepsiAmericas Inc. | 4.875% | 1/15/15 | 1,400 | 1,549 |
| PepsiAmericas Inc. | 5.000% | 5/15/17 | 3,800 | 4,396 |
| PepsiCo Inc. | 4.650% | 2/15/13 | 11,875 | 12,424 |
| PepsiCo Inc. | 3.750% | 3/1/14 | 8,350 | 8,887 |
| PepsiCo Inc. | 2.500% | 5/10/16 | 500 | 521 |
| PepsiCo Inc. | 5.000% | 6/1/18 | 14,350 | 16,638 |
| PepsiCo Inc. | 7.900% | 11/1/18 | 5,228 | 7,016 |
| PepsiCo Inc. | 4.500% | 1/15/20 | 7,275 | 8,227 |
| PepsiCo Inc. | 5.500% | 1/15/40 | 6,500 | 8,041 |
| PepsiCo Inc. | 4.875% | 11/1/40 | 4,000 | 4,623 |
| PerkinElmer Inc. | 5.000% | 11/15/21 | 3,050 | 3,079 |
| Pfizer Inc. | 5.350% | 3/15/15 | 44,225 | 50,113 |
| Pfizer Inc. | 6.200% | 3/15/19 | 21,170 | 26,175 |
| Pfizer Inc. | 7.200% | 3/15/39 | 18,825 | 27,631 |
| Pharmacia Corp. | 6.500% | 12/1/18 | 550 | 690 |
| Pharmacia Corp. | 6.600% | 12/1/28 | 1,750 | 2,286 |
| Philip Morris International Inc. | 4.875% | 5/16/13 | 9,200 | 9,729 |
| Philip Morris International Inc. | 6.875% | 3/17/14 | 43,525 | 49,017 |
| Philip Morris International Inc. | 5.650% | 5/16/18 | 9,805 | 11,625 |
| Philip Morris International Inc. | 4.125% | 5/17/21 | 800 | 888 |
| Philip Morris International Inc. | 6.375% | 5/16/38 | 11,655 | 15,173 |
| Philip Morris International Inc. | 4.375% | 11/15/41 | 3,700 | 3,826 |
| 4 Procter & Gamble - Esop | 9.360% | 1/1/21 | 8,904 | 12,018 |
| Procter & Gamble Co. | 0.700% | 8/15/14 | 3,150 | 3,170 |
| Procter & Gamble Co. | 4.950% | 8/15/14 | 2,300 | 2,558 |
| Procter & Gamble Co. | 3.500% | 2/15/15 | 7,750 | 8,353 |
| Procter & Gamble Co. | 1.800% | 11/15/15 | 5,000 | 5,169 |
| Procter & Gamble Co. | 4.850% | 12/15/15 | 1,250 | 1,430 |
| Procter & Gamble Co. | 1.450% | 8/15/16 | 2,850 | 2,881 |
| Procter & Gamble Co. | 4.700% | 2/15/19 | 2,860 | 3,364 |
| Procter & Gamble Co. | 6.450% | 1/15/26 | 3,875 | 5,248 |
| Procter & Gamble Co. | 5.500% | 2/1/34 | 5,473 | 7,004 |
| Procter & Gamble Co. | 5.800% | 8/15/34 | 225 | 296 |
| Procter & Gamble Co. | 5.550% | 3/5/37 | 12,221 | 16,207 |
| Quest Diagnostics Inc. | 5.450% | 11/1/15 | 6,375 | 7,191 |
| Quest Diagnostics Inc. | 6.400% | 7/1/17 | 140 | 165 |
| Quest Diagnostics Inc. | 4.750% | 1/30/20 | 250 | 267 |
| Quest Diagnostics Inc. | 4.700% | 4/1/21 | 700 | 747 |
| Quest Diagnostics Inc. | 6.950% | 7/1/37 | 3,295 | 4,102 |
| Ralcorp Holdings Inc. | 4.950% | 8/15/20 | 5,725 | 5,814 |
| Ralcorp Holdings Inc. | 6.625% | 8/15/39 | 1,390 | 1,454 |
| Reynolds American Inc. | 7.250% | 6/1/13 | 6,575 | 7,056 |
| Reynolds American Inc. | 7.625% | 6/1/16 | 6,250 | 7,472 |
| Reynolds American Inc. | 6.750% | 6/15/17 | 5,836 | 6,664 |
| Reynolds American Inc. | 7.250% | 6/15/37 | 3,840 | 4,488 |
| Safeway Inc. | 6.250% | 3/15/14 | 6,400 | 7,089 |
| Safeway Inc. | 5.625% | 8/15/14 | 1,855 | 2,006 |
| Safeway Inc. | 6.350% | 8/15/17 | 700 | 794 |
| Safeway Inc. | 5.000% | 8/15/19 | 950 | 1,011 |
| Safeway Inc. | 3.950% | 8/15/20 | 4,650 | 4,607 |
| Safeway Inc. | 7.250% | 2/1/31 | 9,877 | 11,871 |
46
Vanguard® Total Bond Market Index Fund
Schedule of Investments
December 31, 2011
| Face | Market | |||
| Maturity | Amount | Value | ||
| Coupon | Date | ($000) | ($000) | |
| Sanofi | 1.625% | 3/28/14 | 3,000 | 3,051 |
| Sanofi | 1.200% | 9/30/14 | 5,250 | 5,287 |
| Sanofi | 2.625% | 3/29/16 | 21,585 | 22,526 |
| Sanofi | 4.000% | 3/29/21 | 9,871 | 10,932 |
| Sara Lee Corp. | 2.750% | 9/15/15 | 775 | 780 |
| Sara Lee Corp. | 4.100% | 9/15/20 | 350 | 352 |
| Sara Lee Corp. | 6.125% | 11/1/32 | 150 | 154 |
| St. Jude Medical Inc. | 2.200% | 9/15/13 | 4,900 | 4,992 |
| St. Jude Medical Inc. | 3.750% | 7/15/14 | 10,275 | 10,871 |
| St. Jude Medical Inc. | 2.500% | 1/15/16 | 550 | 566 |
| St. Jude Medical Inc. | 4.875% | 7/15/19 | 1,525 | 1,738 |
| Stryker Corp. | 3.000% | 1/15/15 | 2,100 | 2,203 |
| Stryker Corp. | 2.000% | 9/30/16 | 3,875 | 3,948 |
| Stryker Corp. | 4.375% | 1/15/20 | 2,425 | 2,711 |
| Sysco Corp. | 4.200% | 2/12/13 | 1,750 | 1,816 |
| Sysco Corp. | 5.250% | 2/12/18 | 3,625 | 4,240 |
| Sysco Corp. | 5.375% | 9/21/35 | 6,375 | 7,907 |
| Teva Pharmaceutical Finance Co. BV | 2.400% | 11/10/16 | 3,850 | 3,903 |
| Teva Pharmaceutical Finance Co. BV | 3.650% | 11/10/21 | 1,125 | 1,146 |
| Teva Pharmaceutical Finance Co. LLC | 5.550% | 2/1/16 | 775 | 877 |
| Teva Pharmaceutical Finance Co. LLC | 6.150% | 2/1/36 | 5,005 | 6,107 |
| Teva Pharmaceutical Finance II BV / Teva | ||||
| Pharmaceutical Finance III LLC | 3.000% | 6/15/15 | 5,075 | 5,279 |
| Teva Pharmaceutical Finance IV BV | 3.650% | 11/10/21 | 3,400 | 3,434 |
| Teva Pharmaceutical Finance IV LLC | 1.700% | 11/10/14 | 2,575 | 2,593 |
| Thermo Fisher Scientific Inc. | 3.250% | 11/20/14 | 3,700 | 3,929 |
| Thermo Fisher Scientific Inc. | 3.200% | 5/1/15 | 5,825 | 6,182 |
| Thermo Fisher Scientific Inc. | 4.700% | 5/1/20 | 725 | 819 |
| Thermo Fisher Scientific Inc. | 4.500% | 3/1/21 | 200 | 223 |
| Thermo Fisher Scientific Inc. | 3.600% | 8/15/21 | 600 | 631 |
| 6 Tupperware Brands Corp. | 4.750% | 6/1/21 | 700 | 704 |
| Tyson Foods Inc. | 10.500% | 3/1/14 | 4,000 | 4,610 |
| Unilever Capital Corp. | 3.650% | 2/15/14 | 6,275 | 6,675 |
| Unilever Capital Corp. | 4.800% | 2/15/19 | 1,500 | 1,742 |
| Unilever Capital Corp. | 4.250% | 2/10/21 | 6,870 | 7,886 |
| Unilever Capital Corp. | 5.900% | 11/15/32 | 1,678 | 2,190 |
| UST LLC | 5.750% | 3/1/18 | 2,700 | 2,996 |
| Watson Pharmaceuticals Inc. | 5.000% | 8/15/14 | 4,600 | 4,942 |
| Watson Pharmaceuticals Inc. | 6.125% | 8/15/19 | 4,625 | 5,444 |
| Whirlpool Corp. | 5.500% | 3/1/13 | 12,000 | 12,479 |
| Wyeth | 5.500% | 3/15/13 | 15,725 | 16,654 |
| Wyeth | 5.500% | 2/1/14 | 11,586 | 12,696 |
| Wyeth | 5.500% | 2/15/16 | 2,475 | 2,878 |
| Wyeth | 5.450% | 4/1/17 | 925 | 1,085 |
| Wyeth | 6.450% | 2/1/24 | 1,500 | 1,959 |
| Wyeth | 6.500% | 2/1/34 | 3,450 | 4,630 |
| Wyeth | 6.000% | 2/15/36 | 7,425 | 9,513 |
| Wyeth | 5.950% | 4/1/37 | 25,245 | 32,339 |
| Zimmer Holdings Inc. | 1.400% | 11/30/14 | 2,500 | 2,500 |
| Zimmer Holdings Inc. | 4.625% | 11/30/19 | 1,075 | 1,175 |
| Zimmer Holdings Inc. | 3.375% | 11/30/21 | 2,725 | 2,742 |
| Zimmer Holdings Inc. | 5.750% | 11/30/39 | 4,340 | 5,064 |
| Energy (1.5%) | ||||
| Alberta Energy Co. Ltd. | 7.375% | 11/1/31 | 950 | 1,194 |
| Anadarko Finance Co. | 7.500% | 5/1/31 | 1,220 | 1,471 |
| Anadarko Petroleum Corp. | 7.625% | 3/15/14 | 25,675 | 28,579 |
| Anadarko Petroleum Corp. | 5.750% | 6/15/14 | 7,150 | 7,714 |
| Anadarko Petroleum Corp. | 5.950% | 9/15/16 | 35,326 | 40,010 |
| Anadarko Petroleum Corp. | 6.375% | 9/15/17 | 480 | 556 |
| Anadarko Petroleum Corp. | 6.950% | 6/15/19 | 675 | 796 |
| Anadarko Petroleum Corp. | 6.450% | 9/15/36 | 10,720 | 12,351 |
| Anadarko Petroleum Corp. | 7.950% | 6/15/39 | 3,775 | 4,931 |
| Anadarko Petroleum Corp. | 6.200% | 3/15/40 | 1,025 | 1,147 |
47
Vanguard® Total Bond Market Index Fund
Schedule of Investments
December 31, 2011
| Face | Market | |||
| Maturity | Amount | Value | ||
| Coupon | Date | ($000) | ($000) | |
| Apache Corp. | 5.250% | 4/15/13 | 1,774 | 1,877 |
| Apache Corp. | 6.000% | 9/15/13 | 6,365 | 6,957 |
| Apache Corp. | 5.625% | 1/15/17 | 400 | 473 |
| Apache Corp. | 6.900% | 9/15/18 | 7,100 | 9,051 |
| Apache Corp. | 3.625% | 2/1/21 | 1,700 | 1,835 |
| Apache Corp. | 6.000% | 1/15/37 | 7,200 | 9,404 |
| Apache Corp. | 5.100% | 9/1/40 | 11,900 | 14,066 |
| Apache Corp. | 5.250% | 2/1/42 | 6,300 | 7,678 |
| Apache Finance Canada Corp. | 7.750% | 12/15/29 | 1,075 | 1,557 |
| Baker Hughes Inc. | 7.500% | 11/15/18 | 240 | 317 |
| 6 Baker Hughes Inc. | 3.200% | 8/15/21 | 3,675 | 3,783 |
| Baker Hughes Inc. | 6.875% | 1/15/29 | 700 | 957 |
| Baker Hughes Inc. | 5.125% | 9/15/40 | 14,465 | 16,996 |
| BJ Services Co. | 6.000% | 6/1/18 | 2,825 | 3,392 |
| BP Capital Markets plc | 5.250% | 11/7/13 | 17,375 | 18,656 |
| BP Capital Markets plc | 3.625% | 5/8/14 | 5,625 | 5,906 |
| BP Capital Markets plc | 1.700% | 12/5/14 | 2,300 | 2,329 |
| BP Capital Markets plc | 3.875% | 3/10/15 | 9,985 | 10,638 |
| BP Capital Markets plc | 3.125% | 10/1/15 | 17,375 | 18,177 |
| BP Capital Markets plc | 3.200% | 3/11/16 | 20,000 | 20,973 |
| BP Capital Markets plc | 2.248% | 11/1/16 | 7,650 | 7,705 |
| BP Capital Markets plc | 4.750% | 3/10/19 | 11,725 | 13,099 |
| BP Capital Markets plc | 4.742% | 3/11/21 | 14,300 | 16,252 |
| BP Capital Markets plc | 3.561% | 11/1/21 | 6,500 | 6,821 |
| Burlington Resources Finance Co. | 7.200% | 8/15/31 | 750 | 1,039 |
| Burlington Resources Finance Co. | 7.400% | 12/1/31 | 4,275 | 5,884 |
| Cameron International Corp. | 6.375% | 7/15/18 | 975 | 1,151 |
| Cameron International Corp. | 7.000% | 7/15/38 | 100 | 123 |
| Cameron International Corp. | 5.950% | 6/1/41 | 400 | 458 |
| Canadian Natural Resources Ltd. | 5.150% | 2/1/13 | 1,500 | 1,566 |
| Canadian Natural Resources Ltd. | 1.450% | 11/14/14 | 1,300 | 1,307 |
| Canadian Natural Resources Ltd. | 4.900% | 12/1/14 | 5,400 | 5,935 |
| Canadian Natural Resources Ltd. | 6.000% | 8/15/16 | 4,225 | 4,932 |
| Canadian Natural Resources Ltd. | 5.700% | 5/15/17 | 8,801 | 10,299 |
| Canadian Natural Resources Ltd. | 3.450% | 11/15/21 | 525 | 546 |
| Canadian Natural Resources Ltd. | 7.200% | 1/15/32 | 4,800 | 6,291 |
| Canadian Natural Resources Ltd. | 6.450% | 6/30/33 | 5,865 | 7,550 |
| Canadian Natural Resources Ltd. | 6.500% | 2/15/37 | 9,180 | 11,886 |
| Canadian Natural Resources Ltd. | 6.250% | 3/15/38 | 800 | 1,012 |
| Cenovus Energy Inc. | 4.500% | 9/15/14 | 4,625 | 4,989 |
| Cenovus Energy Inc. | 5.700% | 10/15/19 | 4,575 | 5,378 |
| Cenovus Energy Inc. | 6.750% | 11/15/39 | 21,450 | 28,552 |
| Chevron Corp. | 3.950% | 3/3/14 | 6,165 | 6,599 |
| Chevron Corp. | 4.950% | 3/3/19 | 14,025 | 16,610 |
| ConocoPhillips | 4.750% | 2/1/14 | 5,125 | 5,541 |
| ConocoPhillips | 4.600% | 1/15/15 | 11,500 | 12,784 |
| ConocoPhillips | 5.750% | 2/1/19 | 20,225 | 24,450 |
| ConocoPhillips | 5.900% | 10/15/32 | 8,801 | 10,897 |
| ConocoPhillips | 5.900% | 5/15/38 | 6,542 | 8,337 |
| ConocoPhillips | 6.500% | 2/1/39 | 4,000 | 5,501 |
| ConocoPhillips Canada Funding Co. I | 5.625% | 10/15/16 | 28,725 | 33,615 |
| ConocoPhillips Canada Funding Co. I | 5.950% | 10/15/36 | 2,150 | 2,622 |
| ConocoPhillips Holding Co. | 6.950% | 4/15/29 | 9,390 | 12,830 |
| Devon Energy Corp. | 5.625% | 1/15/14 | 8,800 | 9,588 |
| Devon Energy Corp. | 2.400% | 7/15/16 | 750 | 768 |
| Devon Energy Corp. | 4.000% | 7/15/21 | 1,250 | 1,365 |
| Devon Energy Corp. | 7.950% | 4/15/32 | 1,125 | 1,614 |
| Devon Energy Corp. | 5.600% | 7/15/41 | 2,400 | 2,908 |
| Devon Financing Corp. ULC | 7.875% | 9/30/31 | 16,406 | 23,099 |
| Diamond Offshore Drilling Inc. | 5.150% | 9/1/14 | 2,250 | 2,451 |
| Diamond Offshore Drilling Inc. | 4.875% | 7/1/15 | 600 | 654 |
| Diamond Offshore Drilling Inc. | 5.875% | 5/1/19 | 2,700 | 3,123 |
| Diamond Offshore Drilling Inc. | 5.700% | 10/15/39 | 4,000 | 4,447 |
| Encana Corp. | 4.750% | 10/15/13 | 75 | 79 |
48
Vanguard® Total Bond Market Index Fund
Schedule of Investments
December 31, 2011
| Face | Market | |||
| Maturity | Amount | Value | ||
| Coupon | Date | ($000) | ($000) | |
| Encana Corp. | 5.900% | 12/1/17 | 7,450 | 8,442 |
| Encana Corp. | 3.900% | 11/15/21 | 6,450 | 6,461 |
| Encana Corp. | 7.200% | 11/1/31 | 5,675 | 7,008 |
| Encana Corp. | 6.500% | 8/15/34 | 7,800 | 9,169 |
| Encana Corp. | 6.625% | 8/15/37 | 4,479 | 5,388 |
| Encana Corp. | 5.150% | 11/15/41 | 2,420 | 2,467 |
| EnCana Holdings Finance Corp. | 5.800% | 5/1/14 | 4,900 | 5,320 |
| Eni USA Inc. | 7.300% | 11/15/27 | 355 | 463 |
| Ensco plc | 3.250% | 3/15/16 | 4,000 | 4,086 |
| Ensco plc | 4.700% | 3/15/21 | 9,500 | 9,875 |
| EOG Resources Inc. | 6.125% | 10/1/13 | 650 | 707 |
| EOG Resources Inc. | 2.950% | 6/1/15 | 5,350 | 5,605 |
| EOG Resources Inc. | 5.875% | 9/15/17 | 3,025 | 3,634 |
| EOG Resources Inc. | 5.625% | 6/1/19 | 850 | 1,008 |
| EOG Resources Inc. | 4.400% | 6/1/20 | 2,875 | 3,204 |
| EOG Resources Inc. | 4.100% | 2/1/21 | 9,500 | 10,397 |
| Global Marine Inc. | 7.000% | 6/1/28 | 3,150 | 3,044 |
| Halliburton Co. | 6.150% | 9/15/19 | 2,945 | 3,619 |
| Halliburton Co. | 6.700% | 9/15/38 | 10,225 | 13,692 |
| Halliburton Co. | 7.450% | 9/15/39 | 5,060 | 7,280 |
| Halliburton Co. | 4.500% | 11/15/41 | 5,275 | 5,394 |
| Hess Corp. | 8.125% | 2/15/19 | 10,725 | 13,747 |
| Hess Corp. | 7.875% | 10/1/29 | 5,895 | 7,894 |
| Hess Corp. | 7.300% | 8/15/31 | 4,510 | 5,781 |
| Hess Corp. | 7.125% | 3/15/33 | 4,675 | 5,925 |
| Hess Corp. | 6.000% | 1/15/40 | 6,518 | 7,633 |
| Hess Corp. | 5.600% | 2/15/41 | 4,375 | 4,933 |
| Husky Energy Inc. | 5.900% | 6/15/14 | 8,607 | 9,359 |
| Husky Energy Inc. | 6.150% | 6/15/19 | 800 | 905 |
| Husky Energy Inc. | 7.250% | 12/15/19 | 2,435 | 2,982 |
| Husky Energy Inc. | 6.800% | 9/15/37 | 2,175 | 2,747 |
| Kerr-McGee Corp. | 6.950% | 7/1/24 | 12,420 | 14,742 |
| Kerr-McGee Corp. | 7.875% | 9/15/31 | 2,015 | 2,523 |
| Marathon Oil Corp. | 6.000% | 10/1/17 | 10,475 | 12,206 |
| Marathon Oil Corp. | 5.900% | 3/15/18 | 3,997 | 4,673 |
| Marathon Oil Corp. | 6.800% | 3/15/32 | 5,117 | 6,239 |
| Marathon Oil Corp. | 6.600% | 10/1/37 | 610 | 740 |
| Marathon Petroleum Corp. | 3.500% | 3/1/16 | 3,000 | 3,057 |
| Marathon Petroleum Corp. | 5.125% | 3/1/21 | 6,800 | 7,153 |
| Marathon Petroleum Corp. | 6.500% | 3/1/41 | 4,000 | 4,499 |
| Nabors Industries Inc. | 6.150% | 2/15/18 | 17,650 | 19,762 |
| Nabors Industries Inc. | 9.250% | 1/15/19 | 3,025 | 3,804 |
| Nabors Industries Inc. | 5.000% | 9/15/20 | 2,325 | 2,378 |
| Nexen Inc. | 7.875% | 3/15/32 | 5,975 | 7,061 |
| Nexen Inc. | 5.875% | 3/10/35 | 3,287 | 3,350 |
| Nexen Inc. | 6.400% | 5/15/37 | 9,450 | 9,997 |
| Nexen Inc. | 7.500% | 7/30/39 | 7,375 | 8,830 |
| Noble Energy Inc. | 8.250% | 3/1/19 | 3,829 | 5,006 |
| Noble Energy Inc. | 4.150% | 12/15/21 | 8,525 | 8,829 |
| Noble Energy Inc. | 8.000% | 4/1/27 | 525 | 700 |
| Noble Energy Inc. | 6.000% | 3/1/41 | 3,600 | 4,196 |
| Noble Holding International Ltd. | 3.450% | 8/1/15 | 9,050 | 9,422 |
| Noble Holding International Ltd. | 3.050% | 3/1/16 | 4,250 | 4,390 |
| Noble Holding International Ltd. | 4.900% | 8/1/20 | 3,225 | 3,413 |
| Noble Holding International Ltd. | 4.625% | 3/1/21 | 600 | 625 |
| Noble Holding International Ltd. | 6.200% | 8/1/40 | 4,450 | 4,998 |
| Noble Holding International Ltd. | 6.050% | 3/1/41 | 850 | 942 |
| Occidental Petroleum Corp. | 2.500% | 2/1/16 | 9,675 | 10,151 |
| Occidental Petroleum Corp. | 1.750% | 2/15/17 | 3,501 | 3,543 |
| Occidental Petroleum Corp. | 4.100% | 2/1/21 | 14,700 | 16,374 |
| Occidental Petroleum Corp. | 3.125% | 2/15/22 | 1,300 | 1,340 |
| PC Financial Partnership | 5.000% | 11/15/14 | 8,100 | 8,747 |
| Petro-Canada | 4.000% | 7/15/13 | 5,600 | 5,803 |
| Petro-Canada | 6.050% | 5/15/18 | 6,075 | 7,130 |
49
Vanguard® Total Bond Market Index Fund
Schedule of Investments
December 31, 2011
| Face | Market | |||
| Maturity | Amount | Value | ||
| Coupon | Date | ($000) | ($000) | |
| Petro-Canada | 7.875% | 6/15/26 | 1,500 | 1,972 |
| Petro-Canada | 7.000% | 11/15/28 | 1,175 | 1,444 |
| Petro-Canada | 5.350% | 7/15/33 | 4,825 | 5,063 |
| Petro-Canada | 5.950% | 5/15/35 | 6,850 | 7,819 |
| Petro-Canada | 6.800% | 5/15/38 | 4,475 | 5,786 |
| Petrohawk Energy Corp. | 10.500% | 8/1/14 | 1,725 | 1,915 |
| Petrohawk Energy Corp. | 7.875% | 6/1/15 | 1,900 | 2,023 |
| Pride International Inc. | 8.500% | 6/15/19 | 725 | 894 |
| Pride International Inc. | 6.875% | 8/15/20 | 5,000 | 5,837 |
| Rowan Cos. Inc. | 7.875% | 8/1/19 | 7,500 | 8,800 |
| Shell International Finance BV | 1.875% | 3/25/13 | 5,625 | 5,731 |
| Shell International Finance BV | 4.000% | 3/21/14 | 52,575 | 56,307 |
| Shell International Finance BV | 3.100% | 6/28/15 | 13,525 | 14,491 |
| Shell International Finance BV | 3.250% | 9/22/15 | 3,600 | 3,887 |
| Shell International Finance BV | 5.200% | 3/22/17 | 2,950 | 3,446 |
| Shell International Finance BV | 4.300% | 9/22/19 | 27,250 | 31,419 |
| Shell International Finance BV | 4.375% | 3/25/20 | 2,500 | 2,911 |
| Shell International Finance BV | 6.375% | 12/15/38 | 13,494 | 18,407 |
| Shell International Finance BV | 5.500% | 3/25/40 | 3,000 | 3,743 |
| Suncor Energy Inc. | 6.100% | 6/1/18 | 875 | 1,033 |
| Suncor Energy Inc. | 7.150% | 2/1/32 | 1,275 | 1,625 |
| Suncor Energy Inc. | 5.950% | 12/1/34 | 250 | 283 |
| Suncor Energy Inc. | 6.500% | 6/15/38 | 29,905 | 37,612 |
| Suncor Energy Inc. | 6.850% | 6/1/39 | 4,475 | 5,644 |
| Talisman Energy Inc. | 5.125% | 5/15/15 | 1,125 | 1,217 |
| Talisman Energy Inc. | 7.750% | 6/1/19 | 16,137 | 19,891 |
| Talisman Energy Inc. | 3.750% | 2/1/21 | 1,285 | 1,263 |
| Talisman Energy Inc. | 7.250% | 10/15/27 | 850 | 1,031 |
| Talisman Energy Inc. | 5.850% | 2/1/37 | 6,500 | 7,251 |
| Tosco Corp. | 7.800% | 1/1/27 | 900 | 1,266 |
| Tosco Corp. | 8.125% | 2/15/30 | 15,350 | 22,550 |
| Total Capital Canada Ltd. | 1.625% | 1/28/14 | 5,325 | 5,436 |
| Total Capital SA | 3.000% | 6/24/15 | 19,075 | 20,167 |
| Total Capital SA | 2.300% | 3/15/16 | 975 | 1,002 |
| Total Capital SA | 4.450% | 6/24/20 | 6,925 | 7,710 |
| Total Capital SA | 4.125% | 1/28/21 | 17,200 | 18,686 |
| Transocean Inc. | 5.250% | 3/15/13 | 3,375 | 3,454 |
| Transocean Inc. | 4.950% | 11/15/15 | 11,300 | 11,515 |
| Transocean Inc. | 6.000% | 3/15/18 | 6,075 | 6,271 |
| Transocean Inc. | 6.500% | 11/15/20 | 5,135 | 5,299 |
| Transocean Inc. | 7.500% | 4/15/31 | 2,000 | 2,074 |
| Transocean Inc. | 6.800% | 3/15/38 | 5,135 | 5,214 |
| Transocean Inc. | 7.350% | 12/15/41 | 3,150 | 3,481 |
| Valero Energy Corp. | 4.750% | 6/15/13 | 240 | 251 |
| Valero Energy Corp. | 4.500% | 2/1/15 | 2,625 | 2,811 |
| Valero Energy Corp. | 9.375% | 3/15/19 | 7,566 | 9,688 |
| Valero Energy Corp. | 6.125% | 2/1/20 | 12,675 | 14,076 |
| Valero Energy Corp. | 7.500% | 4/15/32 | 6,215 | 7,240 |
| Valero Energy Corp. | 6.625% | 6/15/37 | 14,065 | 15,043 |
| Valero Energy Corp. | 10.500% | 3/15/39 | 6,650 | 9,598 |
| Weatherford International Inc. | 6.350% | 6/15/17 | 5,750 | 6,433 |
| Weatherford International Inc. | 6.800% | 6/15/37 | 275 | 303 |
| Weatherford International Ltd. | 5.150% | 3/15/13 | 736 | 763 |
| Weatherford International Ltd. | 5.500% | 2/15/16 | 1,040 | 1,146 |
| Weatherford International Ltd. | 6.000% | 3/15/18 | 8,325 | 9,245 |
| Weatherford International Ltd. | 9.625% | 3/1/19 | 43,981 | 56,923 |
| Weatherford International Ltd. | 6.500% | 8/1/36 | 7,925 | 8,642 |
| Weatherford International Ltd. | 7.000% | 3/15/38 | 1,750 | 2,004 |
| Williams Cos. Inc. | 7.875% | 9/1/21 | 694 | 856 |
| Williams Cos. Inc. | 7.500% | 1/15/31 | 4,696 | 5,825 |
| Williams Cos. Inc. | 7.750% | 6/15/31 | 1,085 | 1,380 |
| Williams Cos. Inc. | 8.750% | 3/15/32 | 441 | 575 |
| XTO Energy Inc. | 5.750% | 12/15/13 | 4,650 | 5,100 |
| XTO Energy Inc. | 6.250% | 8/1/17 | 9,075 | 11,187 |
50
Vanguard® Total Bond Market Index Fund
Schedule of Investments
December 31, 2011
| Face | Market | |||
| Maturity | Amount | Value | ||
| Coupon | Date | ($000) | ($000) | |
| Other Industrial (0.1%) | ||||
| California Institute of Technology Revenue | 4.700% | 11/1/11 | 11,800 | 11,859 |
| Cintas Corp. No 2 | 6.125% | 12/1/17 | 1,625 | 1,948 |
| Fluor Corp. | 3.375% | 9/15/21 | 3,125 | 3,160 |
| Massachusetts Development Finance Agency Revenue | ||||
| (Harvard University) | 4.875% | 10/15/40 | 7,600 | 8,913 |
| Massachusetts Health & Educational Facilities | ||||
| Authority Revenue (MIT) | 5.600% | 7/1/11 | 9,785 | 13,448 |
| Technology (0.9%) | ||||
| Adobe Systems Inc. | 3.250% | 2/1/15 | 4,525 | 4,750 |
| Adobe Systems Inc. | 4.750% | 2/1/20 | 6,625 | 7,155 |
| Agilent Technologies Inc. | 5.500% | 9/14/15 | 3,125 | 3,441 |
| Agilent Technologies Inc. | 6.500% | 11/1/17 | 14,750 | 17,225 |
| Amphenol Corp. | 4.750% | 11/15/14 | 4,125 | 4,404 |
| Analog Devices Inc. | 5.000% | 7/1/14 | 3,425 | 3,743 |
| Analog Devices Inc. | 3.000% | 4/15/16 | 1,075 | 1,134 |
| Applied Materials Inc. | 2.650% | 6/15/16 | 1,000 | 1,029 |
| Applied Materials Inc. | 4.300% | 6/15/21 | 7,025 | 7,469 |
| Applied Materials Inc. | 5.850% | 6/15/41 | 8,925 | 10,172 |
| Arrow Electronics Inc. | 6.875% | 7/1/13 | 200 | 214 |
| Arrow Electronics Inc. | 3.375% | 11/1/15 | 2,600 | 2,605 |
| Arrow Electronics Inc. | 5.125% | 3/1/21 | 1,185 | 1,199 |
| Avnet Inc. | 6.625% | 9/15/16 | 235 | 263 |
| BMC Software Inc. | 7.250% | 6/1/18 | 2,300 | 2,658 |
| Broadcom Corp. | 2.700% | 11/1/18 | 2,400 | 2,411 |
| CA Inc. | 5.375% | 12/1/19 | 3,500 | 3,797 |
| Cisco Systems Inc. | 1.625% | 3/14/14 | 9,167 | 9,360 |
| Cisco Systems Inc. | 2.900% | 11/17/14 | 1,975 | 2,092 |
| Cisco Systems Inc. | 5.500% | 2/22/16 | 12,090 | 14,069 |
| Cisco Systems Inc. | 3.150% | 3/14/17 | 5,465 | 5,932 |
| Cisco Systems Inc. | 4.950% | 2/15/19 | 24,989 | 28,905 |
| Cisco Systems Inc. | 4.450% | 1/15/20 | 23,670 | 26,920 |
| Cisco Systems Inc. | 5.900% | 2/15/39 | 19,865 | 24,651 |
| Cisco Systems Inc. | 5.500% | 1/15/40 | 4,475 | 5,450 |
| Computer Sciences Corp. | 6.500% | 3/15/18 | 2,200 | 2,158 |
| Corning Inc. | 6.625% | 5/15/19 | 3,180 | 3,848 |
| Corning Inc. | 4.250% | 8/15/20 | 300 | 320 |
| Corning Inc. | 7.250% | 8/15/36 | 300 | 358 |
| Corning Inc. | 5.750% | 8/15/40 | 4,525 | 5,281 |
| Dell Inc. | 4.700% | 4/15/13 | 5,875 | 6,167 |
| Dell Inc. | 1.400% | 9/10/13 | 6,200 | 6,279 |
| Dell Inc. | 2.300% | 9/10/15 | 1,675 | 1,713 |
| Dell Inc. | 3.100% | 4/1/16 | 3,000 | 3,168 |
| Dell Inc. | 5.650% | 4/15/18 | 3,225 | 3,735 |
| Dell Inc. | 5.875% | 6/15/19 | 3,850 | 4,514 |
| Dell Inc. | 6.500% | 4/15/38 | 7,600 | 9,660 |
| Dun & Bradstreet Corp. | 6.000% | 4/1/13 | 4,725 | 4,986 |
| Equifax Inc. | 4.450% | 12/1/14 | 2,175 | 2,302 |
| Equifax Inc. | 6.300% | 7/1/17 | 1,075 | 1,207 |
| Fiserv Inc. | 3.125% | 10/1/15 | 1,100 | 1,125 |
| Fiserv Inc. | 3.125% | 6/15/16 | 1,025 | 1,040 |
| Fiserv Inc. | 6.800% | 11/20/17 | 5,950 | 6,930 |
| Google Inc. | 2.125% | 5/19/16 | 775 | 806 |
| Google Inc. | 3.625% | 5/19/21 | 8,515 | 9,312 |
| Harris Corp. | 5.000% | 10/1/15 | 3,675 | 4,016 |
| Harris Corp. | 5.950% | 12/1/17 | 225 | 263 |
| Harris Corp. | 4.400% | 12/15/20 | 1,725 | 1,756 |
| Harris Corp. | 6.150% | 12/15/40 | 3,750 | 4,265 |
| Hewlett-Packard Co. | 4.500% | 3/1/13 | 12,675 | 13,052 |
| Hewlett-Packard Co. | 1.250% | 9/13/13 | 9,875 | 9,731 |
| Hewlett-Packard Co. | 6.125% | 3/1/14 | 20,450 | 22,082 |
| Hewlett-Packard Co. | 1.550% | 5/30/14 | 4,675 | 4,604 |
| Hewlett-Packard Co. | 4.750% | 6/2/14 | 11,400 | 12,076 |
51
Vanguard® Total Bond Market Index Fund
Schedule of Investments
December 31, 2011
| Face | Market | |||
| Maturity | Amount | Value | ||
| Coupon | Date | ($000) | ($000) | |
| Hewlett-Packard Co. | 2.625% | 12/9/14 | 1,300 | 1,312 |
| Hewlett-Packard Co. | 2.350% | 3/15/15 | 6,350 | 6,291 |
| Hewlett-Packard Co. | 2.125% | 9/13/15 | 12,550 | 12,282 |
| Hewlett-Packard Co. | 2.200% | 12/1/15 | 3,950 | 3,853 |
| Hewlett-Packard Co. | 2.650% | 6/1/16 | 4,925 | 4,877 |
| Hewlett-Packard Co. | 3.000% | 9/15/16 | 16,900 | 17,087 |
| Hewlett-Packard Co. | 3.300% | 12/9/16 | 2,175 | 2,221 |
| Hewlett-Packard Co. | 5.400% | 3/1/17 | 2,035 | 2,241 |
| Hewlett-Packard Co. | 5.500% | 3/1/18 | 6,575 | 7,306 |
| Hewlett-Packard Co. | 3.750% | 12/1/20 | 6,275 | 6,173 |
| Hewlett-Packard Co. | 4.300% | 6/1/21 | 675 | 686 |
| Hewlett-Packard Co. | 4.375% | 9/15/21 | 2,550 | 2,610 |
| Hewlett-Packard Co. | 4.650% | 12/9/21 | 1,250 | 1,318 |
| Hewlett-Packard Co. | 6.000% | 9/15/41 | 5,200 | 5,780 |
| HP Enterprise Services LLC | 6.000% | 8/1/13 | 5,225 | 5,540 |
| Intel Corp. | 1.950% | 10/1/16 | 4,625 | 4,751 |
| Intel Corp. | 3.300% | 10/1/21 | 7,401 | 7,780 |
| Intel Corp. | 4.800% | 10/1/41 | 15,200 | 16,812 |
| International Business Machines Corp. | 2.100% | 5/6/13 | 1,000 | 1,022 |
| International Business Machines Corp. | 7.500% | 6/15/13 | 3,150 | 3,457 |
| International Business Machines Corp. | 1.000% | 8/5/13 | 18,000 | 18,161 |
| International Business Machines Corp. | 6.500% | 10/15/13 | 200 | 221 |
| International Business Machines Corp. | 2.000% | 1/5/16 | 2,000 | 2,061 |
| International Business Machines Corp. | 1.950% | 7/22/16 | 35,775 | 36,692 |
| International Business Machines Corp. | 5.700% | 9/14/17 | 35,351 | 42,826 |
| International Business Machines Corp. | 7.625% | 10/15/18 | 6,475 | 8,686 |
| International Business Machines Corp. | 7.000% | 10/30/25 | 965 | 1,316 |
| International Business Machines Corp. | 6.220% | 8/1/27 | 5,350 | 6,917 |
| International Business Machines Corp. | 6.500% | 1/15/28 | 600 | 795 |
| International Business Machines Corp. | 5.875% | 11/29/32 | 875 | 1,098 |
| International Business Machines Corp. | 5.600% | 11/30/39 | 16,629 | 21,397 |
| Intuit Inc. | 5.750% | 3/15/17 | 1,900 | 2,134 |
| Juniper Networks Inc. | 3.100% | 3/15/16 | 1,095 | 1,133 |
| Juniper Networks Inc. | 4.600% | 3/15/21 | 1,500 | 1,595 |
| Juniper Networks Inc. | 5.950% | 3/15/41 | 2,900 | 3,158 |
| KLA-Tencor Corp. | 6.900% | 5/1/18 | 3,000 | 3,466 |
| Lexmark International Inc. | 5.900% | 6/1/13 | 2,825 | 2,940 |
| Lexmark International Inc. | 6.650% | 6/1/18 | 4,650 | 5,182 |
| Maxim Integrated Products Inc. | 3.450% | 6/14/13 | 1,800 | 1,849 |
| Microsoft Corp. | 0.875% | 9/27/13 | 8,168 | 8,247 |
| Microsoft Corp. | 2.950% | 6/1/14 | 7,800 | 8,265 |
| Microsoft Corp. | 1.625% | 9/25/15 | 7,720 | 7,997 |
| Microsoft Corp. | 4.200% | 6/1/19 | 6,625 | 7,610 |
| Microsoft Corp. | 3.000% | 10/1/20 | 12,620 | 13,338 |
| Microsoft Corp. | 5.200% | 6/1/39 | 2,075 | 2,561 |
| Microsoft Corp. | 4.500% | 10/1/40 | 5,543 | 6,245 |
| Microsoft Corp. | 5.300% | 2/8/41 | 5,190 | 6,571 |
| Motorola Solutions Inc. | 6.000% | 11/15/17 | 4,075 | 4,586 |
| Motorola Solutions Inc. | 7.500% | 5/15/25 | 850 | 1,001 |
| Nokia Oyj | 5.375% | 5/15/19 | 8,400 | 8,500 |
| Nokia Oyj | 6.625% | 5/15/39 | 7,625 | 7,337 |
| Oracle Corp. | 4.950% | 4/15/13 | 1,725 | 1,823 |
| Oracle Corp. | 5.250% | 1/15/16 | 28,071 | 32,341 |
| Oracle Corp. | 5.750% | 4/15/18 | 13,915 | 16,944 |
| Oracle Corp. | 5.000% | 7/8/19 | 16,825 | 19,754 |
| Oracle Corp. | 3.875% | 7/15/20 | 3,250 | 3,563 |
| Oracle Corp. | 6.500% | 4/15/38 | 3,850 | 5,218 |
| Oracle Corp. | 6.125% | 7/8/39 | 7,700 | 10,190 |
| Oracle Corp. | 5.375% | 7/15/40 | 14,925 | 18,328 |
| Pitney Bowes Inc. | 3.875% | 6/15/13 | 4,225 | 4,363 |
| Pitney Bowes Inc. | 4.875% | 8/15/14 | 250 | 266 |
| Pitney Bowes Inc. | 4.750% | 1/15/16 | 12,000 | 12,351 |
| Pitney Bowes Inc. | 5.750% | 9/15/17 | 3,500 | 3,771 |
| Pitney Bowes Inc. | 6.250% | 3/15/19 | 200 | 214 |
52
Vanguard® Total Bond Market Index Fund
Schedule of Investments
December 31, 2011
| Face | Market | |||
| Maturity | Amount | Value | ||
| Coupon | Date | ($000) | ($000) | |
| Pitney Bowes Inc. | 5.250% | 1/15/37 | 450 | 464 |
| SAIC Inc. | 4.450% | 12/1/20 | 1,850 | 1,969 |
| SAIC Inc. | 5.950% | 12/1/40 | 2,550 | 2,764 |
| Science Applications International Corp. | 5.500% | 7/1/33 | 7,370 | 7,488 |
| Symantec Corp. | 2.750% | 9/15/15 | 600 | 609 |
| Symantec Corp. | 4.200% | 9/15/20 | 7,200 | 7,263 |
| Texas Instruments Inc. | 2.375% | 5/16/16 | 3,425 | 3,569 |
| Tyco Electronics Group SA | 7.125% | 10/1/37 | 14,100 | 18,599 |
| Xerox Corp. | 8.250% | 5/15/14 | 6,525 | 7,363 |
| Xerox Corp. | 4.250% | 2/15/15 | 19,175 | 20,240 |
| Xerox Corp. | 6.400% | 3/15/16 | 8,045 | 9,062 |
| Xerox Corp. | 6.750% | 2/1/17 | 3,050 | 3,491 |
| Xerox Corp. | 6.350% | 5/15/18 | 11,850 | 13,366 |
| Xerox Corp. | 5.625% | 12/15/19 | 7,575 | 8,256 |
| Xerox Corp. | 6.750% | 12/15/39 | 675 | 789 |
| Transportation (0.4%) | ||||
| 4 American Airlines 2011-1 Class A Pass Through Trust | 5.250% | 1/31/21 | 1,048 | 978 |
| 4 American Airlines 2011-2 Class A Pass Through Trust | 8.625% | 10/15/21 | 3,750 | 3,891 |
| 4 American Airlines Pass Through Trust 2009-1A | 10.375% | 7/2/19 | 3,684 | 3,914 |
| Burlington Northern Santa Fe LLC | 7.000% | 2/1/14 | 750 | 841 |
| Burlington Northern Santa Fe LLC | 5.650% | 5/1/17 | 6,450 | 7,440 |
| Burlington Northern Santa Fe LLC | 5.750% | 3/15/18 | 8,150 | 9,489 |
| Burlington Northern Santa Fe LLC | 3.600% | 9/1/20 | 3,800 | 3,938 |
| Burlington Northern Santa Fe LLC | 3.450% | 9/15/21 | 3,875 | 3,995 |
| Burlington Northern Santa Fe LLC | 7.000% | 12/15/25 | 5,250 | 7,030 |
| Burlington Northern Santa Fe LLC | 7.950% | 8/15/30 | 80 | 112 |
| Burlington Northern Santa Fe LLC | 6.200% | 8/15/36 | 3,450 | 4,375 |
| Burlington Northern Santa Fe LLC | 6.150% | 5/1/37 | 91 | 114 |
| Burlington Northern Santa Fe LLC | 5.750% | 5/1/40 | 375 | 448 |
| Burlington Northern Santa Fe LLC | 5.050% | 3/1/41 | 7,625 | 8,336 |
| Burlington Northern Santa Fe LLC | 5.400% | 6/1/41 | 7,050 | 8,086 |
| Burlington Northern Santa Fe LLC | 4.950% | 9/15/41 | 1,775 | 1,938 |
| Canadian National Railway Co. | 4.400% | 3/15/13 | 2,575 | 2,684 |
| Canadian National Railway Co. | 4.950% | 1/15/14 | 1,875 | 2,029 |
| Canadian National Railway Co. | 5.800% | 6/1/16 | 750 | 873 |
| Canadian National Railway Co. | 1.450% | 12/15/16 | 1,825 | 1,816 |
| Canadian National Railway Co. | 5.850% | 11/15/17 | 1,150 | 1,378 |
| Canadian National Railway Co. | 5.550% | 3/1/19 | 2,160 | 2,599 |
| Canadian National Railway Co. | 2.850% | 12/15/21 | 1,075 | 1,084 |
| Canadian National Railway Co. | 6.900% | 7/15/28 | 2,375 | 3,282 |
| Canadian National Railway Co. | 6.250% | 8/1/34 | 1,625 | 2,115 |
| Canadian National Railway Co. | 6.200% | 6/1/36 | 2,675 | 3,500 |
| Canadian National Railway Co. | 6.375% | 11/15/37 | 1,550 | 2,080 |
| Canadian Pacific Railway Co. | 4.450% | 3/15/23 | 4,100 | 4,133 |
| Canadian Pacific Railway Co. | 7.125% | 10/15/31 | 275 | 326 |
| Canadian Pacific Railway Co. | 5.950% | 5/15/37 | 1,075 | 1,107 |
| Canadian Pacific Railway Ltd. | 5.750% | 1/15/42 | 650 | 686 |
| Con-way Inc. | 6.700% | 5/1/34 | 4,225 | 4,198 |
| 4 Continental Airlines 1997-4 Class A Pass Through Trust | 6.900% | 1/2/18 | 3,085 | 3,216 |
| 4 Continental Airlines 1998-1 Class A Pass Through Trust | 6.648% | 9/15/17 | 5,871 | 6,062 |
| 4 Continental Airlines 2007-1 Class A Pass Through Trust | 5.983% | 4/19/22 | 1,259 | 1,316 |
| 4 Continental Airlines 2009-2 Class A Pass Through Trust | 7.250% | 11/10/19 | 1,668 | 1,789 |
| CSX Corp. | 6.250% | 4/1/15 | 6,925 | 7,905 |
| CSX Corp. | 5.600% | 5/1/17 | 1,500 | 1,716 |
| CSX Corp. | 7.900% | 5/1/17 | 2,513 | 3,137 |
| CSX Corp. | 6.250% | 3/15/18 | 13,350 | 15,895 |
| CSX Corp. | 7.375% | 2/1/19 | 35,100 | 43,884 |
| CSX Corp. | 6.000% | 10/1/36 | 5,931 | 6,980 |
| CSX Corp. | 6.150% | 5/1/37 | 2,325 | 2,792 |
| CSX Corp. | 6.220% | 4/30/40 | 5,887 | 7,170 |
| 4 Delta Air Lines 2007-1 Class A Pass Through Trust | 6.821% | 8/10/22 | 8,377 | 8,733 |
| 4 Delta Air Lines 2009-1 Class A Pass Through Trust | 7.750% | 12/17/19 | 10,001 | 10,876 |
| 4 Delta Air Lines 2010-2 Class A Pass Through Trust | 4.950% | 5/23/19 | 3,670 | 3,743 |
53
Vanguard® Total Bond Market Index Fund
Schedule of Investments
December 31, 2011
| Face | Market | |||
| Maturity | Amount | Value | ||
| Coupon | Date | ($000) | ($000) | |
| JB Hunt Transport Services Inc. | 3.375% | 9/15/15 | 10,100 | 10,289 |
| Norfolk Southern Corp. | 5.257% | 9/17/14 | 45 | 50 |
| Norfolk Southern Corp. | 5.750% | 1/15/16 | 8,200 | 9,503 |
| Norfolk Southern Corp. | 7.700% | 5/15/17 | 5,125 | 6,496 |
| Norfolk Southern Corp. | 5.750% | 4/1/18 | 2,575 | 3,023 |
| Norfolk Southern Corp. | 5.900% | 6/15/19 | 6,325 | 7,654 |
| Norfolk Southern Corp. | 3.250% | 12/1/21 | 4,400 | 4,460 |
| Norfolk Southern Corp. | 5.590% | 5/17/25 | 534 | 629 |
| Norfolk Southern Corp. | 7.800% | 5/15/27 | 5,500 | 7,760 |
| Norfolk Southern Corp. | 5.640% | 5/17/29 | 2,305 | 2,839 |
| Norfolk Southern Corp. | 7.250% | 2/15/31 | 5,772 | 7,981 |
| 6 Norfolk Southern Corp. | 4.837% | 10/1/41 | 11,566 | 12,351 |
| Norfolk Southern Corp. | 6.000% | 5/23/11 | 9,175 | 10,838 |
| Norfolk Southern Railway Co. | 9.750% | 6/15/20 | 1,554 | 2,260 |
| Ryder System Inc. | 5.850% | 3/1/14 | 1,725 | 1,878 |
| Ryder System Inc. | 3.150% | 3/2/15 | 5,275 | 5,413 |
| Ryder System Inc. | 7.200% | 9/1/15 | 3,650 | 4,266 |
| Ryder System Inc. | 3.600% | 3/1/16 | 3,650 | 3,795 |
| Ryder System Inc. | 5.850% | 11/1/16 | 8,425 | 9,623 |
| Southwest Airlines Co. | 5.250% | 10/1/14 | 175 | 187 |
| Southwest Airlines Co. | 5.750% | 12/15/16 | 3,800 | 4,252 |
| Southwest Airlines Co. | 5.125% | 3/1/17 | 700 | 750 |
| 4 Southwest Airlines Co. 2007-1 Pass Through Trust | 6.150% | 8/1/22 | 1,714 | 1,839 |
| 4 UAL 2009-2A Pass Through Trust | 9.750% | 1/15/17 | 1,049 | 1,157 |
| Union Pacific Corp. | 5.450% | 1/31/13 | 4,375 | 4,589 |
| Union Pacific Corp. | 4.000% | 2/1/21 | 200 | 215 |
| Union Pacific Corp. | 4.163% | 7/15/22 | 26,774 | 28,944 |
| Union Pacific Corp. | 6.625% | 2/1/29 | 1,900 | 2,492 |
| Union Pacific Corp. | 5.780% | 7/15/40 | 5,175 | 6,325 |
| Union Pacific Corp. | 4.750% | 9/15/41 | 7,400 | 8,028 |
| 4 Union Pacific Railroad Co. 2007-3 Pass Through Trust | 6.176% | 1/2/31 | 1,278 | 1,544 |
| United Parcel Service Inc. | 3.875% | 4/1/14 | 10,175 | 10,901 |
| United Parcel Service Inc. | 5.500% | 1/15/18 | 2,360 | 2,838 |
| United Parcel Service Inc. | 5.125% | 4/1/19 | 5,850 | 7,086 |
| United Parcel Service Inc. | 3.125% | 1/15/21 | 17,860 | 18,938 |
| United Parcel Service Inc. | 6.200% | 1/15/38 | 4,650 | 6,227 |
| 11,660,629 | ||||
| Utilities (2.3%) | ||||
| Electric (1.6%) | ||||
| AEP Texas Central Co. | 6.650% | 2/15/33 | 2,300 | 2,942 |
| Alabama Power Co. | 5.200% | 6/1/41 | 3,550 | 4,273 |
| Ameren Corp. | 8.875% | 5/15/14 | 1,000 | 1,128 |
| Ameren Illinois Co. | 6.125% | 11/15/17 | 1,300 | 1,530 |
| Ameren Illinois Co. | 6.250% | 4/1/18 | 4,425 | 5,094 |
| Appalachian Power Co. | 3.400% | 5/24/15 | 5,250 | 5,504 |
| Appalachian Power Co. | 7.950% | 1/15/20 | 350 | 458 |
| Appalachian Power Co. | 4.600% | 3/30/21 | 5,975 | 6,565 |
| Appalachian Power Co. | 5.800% | 10/1/35 | 950 | 1,111 |
| Appalachian Power Co. | 7.000% | 4/1/38 | 700 | 939 |
| Arizona Public Service Co. | 5.800% | 6/30/14 | 625 | 692 |
| Arizona Public Service Co. | 4.650% | 5/15/15 | 2,925 | 3,197 |
| Arizona Public Service Co. | 8.750% | 3/1/19 | 2,300 | 2,922 |
| Arizona Public Service Co. | 5.500% | 9/1/35 | 3,580 | 4,130 |
| Atlantic City Electric Co. | 7.750% | 11/15/18 | 5,225 | 6,903 |
| Baltimore Gas & Electric Co. | 5.900% | 10/1/16 | 3,525 | 4,116 |
| Baltimore Gas & Electric Co. | 3.500% | 11/15/21 | 1,700 | 1,726 |
| Baltimore Gas & Electric Co. | 6.350% | 10/1/36 | 625 | 785 |
| Carolina Power & Light Co. | 5.125% | 9/15/13 | 5,350 | 5,735 |
| Carolina Power & Light Co. | 5.300% | 1/15/19 | 35,600 | 41,767 |
| CenterPoint Energy Houston Electric LLC | 5.700% | 3/15/13 | 13,610 | 14,343 |
| CenterPoint Energy Houston Electric LLC | 5.750% | 1/15/14 | 400 | 437 |
| CenterPoint Energy Houston Electric LLC | 7.000% | 3/1/14 | 225 | 253 |
| CenterPoint Energy Houston Electric LLC | 6.950% | 3/15/33 | 300 | 408 |
54
Vanguard® Total Bond Market Index Fund
Schedule of Investments
December 31, 2011
| Face | Market | |||
| Maturity | Amount | Value | ||
| Coupon | Date | ($000) | ($000) | |
| CenterPoint Energy Inc. | 6.500% | 5/1/18 | 70 | 82 |
| Cleco Power LLC | 6.500% | 12/1/35 | 4,300 | 5,295 |
| Cleco Power LLC | 6.000% | 12/1/40 | 4,075 | 4,898 |
| Cleveland Electric Illuminating Co. | 5.650% | 12/15/13 | 175 | 188 |
| Cleveland Electric Illuminating Co. | 7.880% | 11/1/17 | 2,677 | 3,372 |
| Cleveland Electric Illuminating Co. | 5.500% | 8/15/24 | 900 | 1,054 |
| Columbus Southern Power Co. | 5.850% | 10/1/35 | 5,450 | 6,389 |
| Commonwealth Edison Co. | 5.950% | 8/15/16 | 11,630 | 13,662 |
| Commonwealth Edison Co. | 6.150% | 9/15/17 | 13,650 | 16,106 |
| Commonwealth Edison Co. | 5.800% | 3/15/18 | 2,975 | 3,511 |
| Commonwealth Edison Co. | 4.000% | 8/1/20 | 2,175 | 2,349 |
| Commonwealth Edison Co. | 5.875% | 2/1/33 | 490 | 591 |
| Commonwealth Edison Co. | 5.900% | 3/15/36 | 2,686 | 3,289 |
| Commonwealth Edison Co. | 6.450% | 1/15/38 | 9,205 | 12,071 |
| Connecticut Light & Power Co. | 6.350% | 6/1/36 | 5,100 | 6,602 |
| Consolidated Edison Co. of New York Inc. | 4.875% | 2/1/13 | 2,940 | 3,055 |
| Consolidated Edison Co. of New York Inc. | 5.375% | 12/15/15 | 1,400 | 1,601 |
| Consolidated Edison Co. of New York Inc. | 5.500% | 9/15/16 | 5,675 | 6,656 |
| Consolidated Edison Co. of New York Inc. | 5.850% | 4/1/18 | 350 | 427 |
| Consolidated Edison Co. of New York Inc. | 6.650% | 4/1/19 | 5,975 | 7,549 |
| Consolidated Edison Co. of New York Inc. | 5.300% | 3/1/35 | 6,100 | 7,113 |
| Consolidated Edison Co. of New York Inc. | 5.850% | 3/15/36 | 4,280 | 5,351 |
| Consolidated Edison Co. of New York Inc. | 6.200% | 6/15/36 | 3,000 | 3,882 |
| Consolidated Edison Co. of New York Inc. | 6.300% | 8/15/37 | 5,250 | 6,916 |
| Consolidated Edison Co. of New York Inc. | 6.750% | 4/1/38 | 2,125 | 2,950 |
| Consolidated Edison Co. of New York Inc. | 5.700% | 6/15/40 | 5,250 | 6,597 |
| Consolidated Natural Gas Co. | 5.000% | 12/1/14 | 4,725 | 5,150 |
| Constellation Energy Group Inc. | 4.550% | 6/15/15 | 8,631 | 9,177 |
| Constellation Energy Group Inc. | 5.150% | 12/1/20 | 4,500 | 4,903 |
| Constellation Energy Group Inc. | 7.600% | 4/1/32 | 2,415 | 3,116 |
| Consumers Energy Co. | 5.375% | 4/15/13 | 4,100 | 4,315 |
| Consumers Energy Co. | 5.500% | 8/15/16 | 1,800 | 2,071 |
| Consumers Energy Co. | 6.125% | 3/15/19 | 550 | 667 |
| Consumers Energy Co. | 6.700% | 9/15/19 | 5,000 | 6,330 |
| Detroit Edison Co. | 3.450% | 10/1/20 | 1,700 | 1,787 |
| Detroit Edison Co. | 3.900% | 6/1/21 | 1,575 | 1,726 |
| Detroit Edison Co. | 5.700% | 10/1/37 | 950 | 1,190 |
| Dominion Resources Inc. | 1.800% | 3/15/14 | 3,800 | 3,868 |
| Dominion Resources Inc. | 5.150% | 7/15/15 | 15,258 | 17,105 |
| Dominion Resources Inc. | 2.250% | 9/1/15 | 2,880 | 2,945 |
| Dominion Resources Inc. | 1.950% | 8/15/16 | 5,450 | 5,509 |
| Dominion Resources Inc. | 6.000% | 11/30/17 | 4,625 | 5,478 |
| Dominion Resources Inc. | 6.400% | 6/15/18 | 290 | 351 |
| Dominion Resources Inc. | 8.875% | 1/15/19 | 430 | 570 |
| Dominion Resources Inc. | 4.450% | 3/15/21 | 4,225 | 4,715 |
| Dominion Resources Inc. | 6.300% | 3/15/33 | 1,400 | 1,739 |
| Dominion Resources Inc. | 5.250% | 8/1/33 | 2,575 | 2,827 |
| Dominion Resources Inc. | 5.950% | 6/15/35 | 8,775 | 10,430 |
| Dominion Resources Inc. | 7.000% | 6/15/38 | 425 | 577 |
| Dominion Resources Inc. | 4.900% | 8/1/41 | 8,150 | 8,787 |
| 4 Dominion Resources Inc. | 7.500% | 6/30/66 | 3,775 | 3,926 |
| DTE Energy Co. | 6.375% | 4/15/33 | 175 | 210 |
| Duke Energy Carolinas LLC | 5.750% | 11/15/13 | 400 | 435 |
| Duke Energy Carolinas LLC | 4.300% | 6/15/20 | 5,700 | 6,464 |
| Duke Energy Carolinas LLC | 6.000% | 12/1/28 | 2,750 | 3,396 |
| Duke Energy Carolinas LLC | 6.450% | 10/15/32 | 1,575 | 2,021 |
| Duke Energy Carolinas LLC | 6.100% | 6/1/37 | 7,725 | 9,828 |
| Duke Energy Carolinas LLC | 6.000% | 1/15/38 | 175 | 227 |
| Duke Energy Carolinas LLC | 6.050% | 4/15/38 | 5,005 | 6,543 |
| Duke Energy Carolinas LLC | 5.300% | 2/15/40 | 3,275 | 3,975 |
| Duke Energy Carolinas LLC | 4.250% | 12/15/41 | 5,000 | 5,231 |
| Duke Energy Corp. | 6.300% | 2/1/14 | 4,420 | 4,879 |
| Duke Energy Corp. | 3.950% | 9/15/14 | 4,225 | 4,508 |
| Duke Energy Corp. | 3.350% | 4/1/15 | 4,675 | 4,908 |
55
Vanguard® Total Bond Market Index Fund
Schedule of Investments
December 31, 2011
| Face | Market | |||
| Maturity | Amount | Value | ||
| Coupon | Date | ($000) | ($000) | |
| Duke Energy Corp. | 2.150% | 11/15/16 | 9,075 | 9,154 |
| Duke Energy Corp. | 5.050% | 9/15/19 | 10,000 | 11,283 |
| Duke Energy Indiana Inc. | 5.000% | 9/15/13 | 425 | 450 |
| Duke Energy Indiana Inc. | 6.050% | 6/15/16 | 325 | 374 |
| Duke Energy Indiana Inc. | 6.120% | 10/15/35 | 1,075 | 1,295 |
| Duke Energy Indiana Inc. | 6.350% | 8/15/38 | 8,100 | 10,679 |
| Duke Energy Indiana Inc. | 6.450% | 4/1/39 | 900 | 1,204 |
| Duke Energy Ohio Inc. | 2.100% | 6/15/13 | 3,800 | 3,866 |
| Duke Energy Ohio Inc. | 5.450% | 4/1/19 | 8 | 10 |
| El Paso Electric Co. | 6.000% | 5/15/35 | 1,725 | 2,043 |
| Empresa Nacional de Electricidad SA | 8.350% | 8/1/13 | 2,275 | 2,477 |
| Enersis SA | 7.375% | 1/15/14 | 2,500 | 2,732 |
| Entergy Arkansas Inc. | 3.750% | 2/15/21 | 2,500 | 2,602 |
| Entergy Gulf States Louisiana LLC | 6.000% | 5/1/18 | 8,675 | 9,928 |
| Entergy Louisiana LLC | 5.400% | 11/1/24 | 325 | 370 |
| Exelon Corp. | 4.900% | 6/15/15 | 7,000 | 7,542 |
| Exelon Corp. | 5.625% | 6/15/35 | 1,100 | 1,184 |
| Exelon Generation Co. LLC | 5.350% | 1/15/14 | 3,148 | 3,366 |
| Exelon Generation Co. LLC | 6.200% | 10/1/17 | 2,755 | 3,168 |
| Exelon Generation Co. LLC | 4.000% | 10/1/20 | 8,800 | 9,036 |
| Exelon Generation Co. LLC | 6.250% | 10/1/39 | 1,175 | 1,430 |
| FirstEnergy Corp. | 7.375% | 11/15/31 | 7,855 | 9,704 |
| FirstEnergy Solutions Corp. | 4.800% | 2/15/15 | 6,825 | 7,312 |
| FirstEnergy Solutions Corp. | 6.050% | 8/15/21 | 75 | 84 |
| FirstEnergy Solutions Corp. | 6.800% | 8/15/39 | 2,800 | 3,156 |
| Florida Power & Light Co. | 4.850% | 2/1/13 | 2,375 | 2,478 |
| Florida Power & Light Co. | 5.550% | 11/1/17 | 1,850 | 2,238 |
| Florida Power & Light Co. | 5.950% | 10/1/33 | 225 | 288 |
| Florida Power & Light Co. | 5.625% | 4/1/34 | 3,825 | 4,726 |
| Florida Power & Light Co. | 4.950% | 6/1/35 | 550 | 627 |
| Florida Power & Light Co. | 5.400% | 9/1/35 | 5,650 | 6,761 |
| Florida Power & Light Co. | 6.200% | 6/1/36 | 3,650 | 4,829 |
| Florida Power & Light Co. | 5.650% | 2/1/37 | 3,975 | 4,953 |
| Florida Power & Light Co. | 5.850% | 5/1/37 | 1,675 | 2,152 |
| Florida Power & Light Co. | 5.950% | 2/1/38 | 9,850 | 12,992 |
| Florida Power & Light Co. | 5.960% | 4/1/39 | 1,175 | 1,561 |
| Florida Power & Light Co. | 4.125% | 2/1/42 | 7,700 | 7,944 |
| Florida Power Corp. | 4.800% | 3/1/13 | 9,875 | 10,313 |
| Florida Power Corp. | 5.650% | 6/15/18 | 3,100 | 3,703 |
| Florida Power Corp. | 6.350% | 9/15/37 | 10,125 | 13,577 |
| Florida Power Corp. | 6.400% | 6/15/38 | 6,600 | 8,939 |
| Florida Power Corp. | 5.650% | 4/1/40 | 1,000 | 1,247 |
| Georgia Power Co. | 6.000% | 11/1/13 | 3,000 | 3,272 |
| Georgia Power Co. | 3.000% | 4/15/16 | 3,400 | 3,605 |
| Georgia Power Co. | 5.700% | 6/1/17 | 16,444 | 19,596 |
| Georgia Power Co. | 5.650% | 3/1/37 | 325 | 399 |
| Georgia Power Co. | 5.950% | 2/1/39 | 4,025 | 5,155 |
| Georgia Power Co. | 5.400% | 6/1/40 | 4,000 | 4,811 |
| Great Plains Energy Inc. | 2.750% | 8/15/13 | 3,000 | 3,043 |
| Great Plains Energy Inc. | 4.850% | 6/1/21 | 1,200 | 1,277 |
| Iberdrola International BV | 6.750% | 7/15/36 | 3,650 | 3,938 |
| Indiana Michigan Power Co. | 7.000% | 3/15/19 | 625 | 775 |
| Indiana Michigan Power Co. | 6.050% | 3/15/37 | 8,175 | 10,167 |
| 4 Integrys Energy Group Inc. | 6.110% | 12/1/66 | 4,990 | 4,790 |
| Interstate Power & Light Co. | 6.250% | 7/15/39 | 2,400 | 3,140 |
| Jersey Central Power & Light Co. | 5.625% | 5/1/16 | 8,700 | 9,835 |
| Jersey Central Power & Light Co. | 5.650% | 6/1/17 | 1,925 | 2,211 |
| Kansas City Power & Light Co. | 6.050% | 11/15/35 | 1,725 | 2,023 |
| Kansas City Power & Light Co. | 5.300% | 10/1/41 | 5,450 | 5,903 |
| 4 Kansas Gas & Electric Co. | 5.647% | 3/29/21 | 150 | 156 |
| Kentucky Utilities Co. | 1.625% | 11/1/15 | 750 | 757 |
| Kentucky Utilities Co. | 3.250% | 11/1/20 | 3,550 | 3,694 |
| Kentucky Utilities Co. | 5.125% | 11/1/40 | 2,410 | 2,902 |
| LG&E and KU Energy LLC | 2.125% | 11/15/15 | 2,800 | 2,770 |
56
Vanguard® Total Bond Market Index Fund
Schedule of Investments
December 31, 2011
| Face | Market | |||
| Maturity | Amount | Value | ||
| Coupon | Date | ($000) | ($000) | |
| LG&E and KU Energy LLC | 3.750% | 11/15/20 | 3,655 | 3,705 |
| Louisville Gas & Electric Co. | 5.125% | 11/15/40 | 2,075 | 2,499 |
| Metropolitan Edison Co. | 7.700% | 1/15/19 | 5,236 | 6,622 |
| MidAmerican Energy Co. | 5.125% | 1/15/13 | 6,175 | 6,446 |
| MidAmerican Energy Co. | 5.950% | 7/15/17 | 1,825 | 2,143 |
| MidAmerican Energy Co. | 5.300% | 3/15/18 | 450 | 525 |
| MidAmerican Energy Co. | 6.750% | 12/30/31 | 4,650 | 6,002 |
| MidAmerican Energy Co. | 5.750% | 11/1/35 | 1,400 | 1,705 |
| Midamerican Energy Holdings Co. | 5.000% | 2/15/14 | 1,175 | 1,254 |
| Midamerican Energy Holdings Co. | 5.750% | 4/1/18 | 8,575 | 9,945 |
| Midamerican Energy Holdings Co. | 8.480% | 9/15/28 | 600 | 871 |
| Midamerican Energy Holdings Co. | 6.125% | 4/1/36 | 33,574 | 40,154 |
| Midamerican Energy Holdings Co. | 5.950% | 5/15/37 | 9,250 | 11,086 |
| Midamerican Energy Holdings Co. | 6.500% | 9/15/37 | 2,390 | 2,980 |
| National Rural Utilities Cooperative Finance Corp. | 5.500% | 7/1/13 | 5,775 | 6,188 |
| National Rural Utilities Cooperative Finance Corp. | 4.750% | 3/1/14 | 2,265 | 2,436 |
| National Rural Utilities Cooperative Finance Corp. | 3.875% | 9/16/15 | 6,750 | 7,309 |
| National Rural Utilities Cooperative Finance Corp. | 5.450% | 4/10/17 | 4,600 | 5,231 |
| National Rural Utilities Cooperative Finance Corp. | 5.450% | 2/1/18 | 11,585 | 13,409 |
| National Rural Utilities Cooperative Finance Corp. | 10.375% | 11/1/18 | 21,280 | 30,444 |
| National Rural Utilities Cooperative Finance Corp. | 8.000% | 3/1/32 | 4,550 | 6,474 |
| Nevada Power Co. | 7.125% | 3/15/19 | 16,965 | 21,215 |
| Nevada Power Co. | 6.650% | 4/1/36 | 775 | 1,037 |
| Nevada Power Co. | 6.750% | 7/1/37 | 6,627 | 9,032 |
| Nevada Power Co. | 5.375% | 9/15/40 | 5,605 | 6,620 |
| Nevada Power Co. | 5.450% | 5/15/41 | 900 | 1,076 |
| NextEra Energy Capital Holdings Inc. | 5.350% | 6/15/13 | 2,600 | 2,742 |
| NextEra Energy Capital Holdings Inc. | 2.550% | 11/15/13 | 3,825 | 3,896 |
| NextEra Energy Capital Holdings Inc. | 2.600% | 9/1/15 | 2,000 | 2,030 |
| NextEra Energy Capital Holdings Inc. | 7.875% | 12/15/15 | 825 | 980 |
| NextEra Energy Capital Holdings Inc. | 6.000% | 3/1/19 | 20,650 | 23,994 |
| 4 NextEra Energy Capital Holdings Inc. | 6.350% | 10/1/66 | 2,175 | 2,175 |
| 4 NextEra Energy Capital Holdings Inc. | 6.650% | 6/15/67 | 2,750 | 2,757 |
| Northern States Power Co. | 1.950% | 8/15/15 | 2,225 | 2,272 |
| Northern States Power Co. | 5.250% | 3/1/18 | 1,875 | 2,238 |
| Northern States Power Co. | 5.250% | 7/15/35 | 325 | 398 |
| Northern States Power Co. | 6.250% | 6/1/36 | 1,650 | 2,272 |
| Northern States Power Co. | 6.200% | 7/1/37 | 5,425 | 7,371 |
| Northern States Power Co. | 5.350% | 11/1/39 | 3,700 | 4,567 |
| Northern States Power Co. | 4.850% | 8/15/40 | 525 | 612 |
| NSTAR | 4.500% | 11/15/19 | 6,535 | 7,232 |
| NSTAR Electric Co. | 4.875% | 4/15/14 | 2,600 | 2,805 |
| NSTAR Electric Co. | 5.625% | 11/15/17 | 5,350 | 6,305 |
| NSTAR Electric Co. | 5.500% | 3/15/40 | 2,950 | 3,595 |
| Oglethorpe Power Corp. | 5.950% | 11/1/39 | 1,700 | 2,145 |
| Oglethorpe Power Corp. | 5.375% | 11/1/40 | 4,800 | 5,627 |
| Ohio Edison Co. | 6.400% | 7/15/16 | 3,800 | 4,398 |
| Ohio Power Co. | 5.750% | 9/1/13 | 6,725 | 7,192 |
| Ohio Power Co. | 6.000% | 6/1/16 | 3,275 | 3,771 |
| Oklahoma Gas & Electric Co. | 5.850% | 6/1/40 | 2,925 | 3,651 |
| Oncor Electric Delivery Co. LLC | 5.950% | 9/1/13 | 4,225 | 4,539 |
| Oncor Electric Delivery Co. LLC | 6.375% | 1/15/15 | 7,340 | 8,389 |
| Oncor Electric Delivery Co. LLC | 6.800% | 9/1/18 | 3,325 | 4,042 |
| Oncor Electric Delivery Co. LLC | 7.000% | 9/1/22 | 5,371 | 6,877 |
| Oncor Electric Delivery Co. LLC | 7.000% | 5/1/32 | 2,125 | 2,802 |
| Oncor Electric Delivery Co. LLC | 7.250% | 1/15/33 | 3,680 | 4,941 |
| Oncor Electric Delivery Co. LLC | 7.500% | 9/1/38 | 1,805 | 2,557 |
| Oncor Electric Delivery Co. LLC | 5.250% | 9/30/40 | 325 | 368 |
| Pacific Gas & Electric Co. | 4.800% | 3/1/14 | 16,975 | 18,272 |
| Pacific Gas & Electric Co. | 5.625% | 11/30/17 | 3,425 | 4,057 |
| Pacific Gas & Electric Co. | 3.500% | 10/1/20 | 19,650 | 20,511 |
| Pacific Gas & Electric Co. | 4.250% | 5/15/21 | 4,650 | 5,063 |
| Pacific Gas & Electric Co. | 6.050% | 3/1/34 | 25,462 | 31,685 |
| Pacific Gas & Electric Co. | 5.800% | 3/1/37 | 16,875 | 20,671 |
57
Vanguard® Total Bond Market Index Fund
Schedule of Investments
December 31, 2011
| Face | Market | |||
| Maturity | Amount | Value | ||
| Coupon | Date | ($000) | ($000) | |
| Pacific Gas & Electric Co. | 6.350% | 2/15/38 | 1,800 | 2,327 |
| Pacific Gas & Electric Co. | 6.250% | 3/1/39 | 3,775 | 4,865 |
| Pacific Gas & Electric Co. | 5.400% | 1/15/40 | 4,250 | 4,913 |
| PacifiCorp | 7.700% | 11/15/31 | 1,299 | 1,884 |
| PacifiCorp | 5.250% | 6/15/35 | 100 | 115 |
| PacifiCorp | 5.750% | 4/1/37 | 150 | 185 |
| PacifiCorp | 6.250% | 10/15/37 | 8,625 | 11,435 |
| PacifiCorp | 6.000% | 1/15/39 | 875 | 1,126 |
| Peco Energy Co. | 5.350% | 3/1/18 | 675 | 796 |
| Pennsylvania Electric Co. | 6.050% | 9/1/17 | 3,426 | 3,959 |
| Pennsylvania Electric Co. | 5.200% | 4/1/20 | 10,400 | 11,610 |
| Pennsylvania Electric Co. | 6.150% | 10/1/38 | 10,400 | 12,301 |
| Pepco Holdings Inc. | 2.700% | 10/1/15 | 150 | 152 |
| Potomac Electric Power Co. | 6.500% | 11/15/37 | 7,882 | 10,402 |
| PPL Electric Utilities Corp. | 3.000% | 9/15/21 | 1,075 | 1,083 |
| PPL Electric Utilities Corp. | 6.250% | 5/15/39 | 4,600 | 6,195 |
| PPL Electric Utilities Corp. | 5.200% | 7/15/41 | 3,140 | 3,744 |
| PPL Energy Supply LLC | 6.300% | 7/15/13 | 2,950 | 3,152 |
| PPL Energy Supply LLC | 5.400% | 8/15/14 | 800 | 871 |
| PPL Energy Supply LLC | 6.200% | 5/15/16 | 1,545 | 1,722 |
| PPL Energy Supply LLC | 6.500% | 5/1/18 | 8,025 | 9,112 |
| PPL Energy Supply LLC | 4.600% | 12/15/21 | 1,825 | 1,857 |
| Progress Energy Inc. | 6.050% | 3/15/14 | 875 | 966 |
| Progress Energy Inc. | 4.875% | 12/1/19 | 8,100 | 9,212 |
| Progress Energy Inc. | 7.750% | 3/1/31 | 1,625 | 2,308 |
| Progress Energy Inc. | 7.000% | 10/30/31 | 900 | 1,198 |
| Progress Energy Inc. | 6.000% | 12/1/39 | 6,700 | 8,395 |
| PSEG Power LLC | 2.500% | 4/15/13 | 1,775 | 1,805 |
| PSEG Power LLC | 5.000% | 4/1/14 | 3,150 | 3,374 |
| PSEG Power LLC | 5.500% | 12/1/15 | 14,230 | 15,822 |
| PSEG Power LLC | 2.750% | 9/15/16 | 4,400 | 4,426 |
| PSEG Power LLC | 5.125% | 4/15/20 | 1,701 | 1,901 |
| PSEG Power LLC | 4.150% | 9/15/21 | 3,900 | 4,052 |
| PSEG Power LLC | 8.625% | 4/15/31 | 350 | 516 |
| Public Service Co. of Colorado | 5.500% | 4/1/14 | 165 | 182 |
| Public Service Co. of Colorado | 5.800% | 8/1/18 | 1,475 | 1,768 |
| Public Service Co. of Colorado | 5.125% | 6/1/19 | 8,825 | 10,351 |
| Public Service Co. of Colorado | 3.200% | 11/15/20 | 1,775 | 1,843 |
| Public Service Co. of Colorado | 6.250% | 9/1/37 | 2,325 | 3,126 |
| Public Service Co. of Colorado | 4.750% | 8/15/41 | 2,925 | 3,363 |
| Public Service Co. of Oklahoma | 5.150% | 12/1/19 | 100 | 111 |
| Public Service Co. of Oklahoma | 6.625% | 11/15/37 | 4,675 | 5,944 |
| Public Service Electric & Gas Co. | 0.850% | 8/15/14 | 2,500 | 2,500 |
| Public Service Electric & Gas Co. | 2.700% | 5/1/15 | 3,300 | 3,449 |
| Public Service Electric & Gas Co. | 3.500% | 8/15/20 | 500 | 529 |
| Public Service Electric & Gas Co. | 5.800% | 5/1/37 | 4,600 | 5,959 |
| Public Service Electric & Gas Co. | 5.375% | 11/1/39 | 1,772 | 2,198 |
| Puget Sound Energy Inc. | 5.483% | 6/1/35 | 800 | 942 |
| Puget Sound Energy Inc. | 6.274% | 3/15/37 | 5,175 | 6,752 |
| Puget Sound Energy Inc. | 5.757% | 10/1/39 | 2,675 | 3,291 |
| Puget Sound Energy Inc. | 5.795% | 3/15/40 | 1,515 | 1,890 |
| Puget Sound Energy Inc. | 5.764% | 7/15/40 | 1,700 | 2,132 |
| Puget Sound Energy Inc. | 5.638% | 4/15/41 | 3,025 | 3,699 |
| Puget Sound Energy Inc. | 4.434% | 11/15/41 | 3,900 | 4,072 |
| San Diego Gas & Electric Co. | 5.300% | 11/15/15 | 2,100 | 2,405 |
| San Diego Gas & Electric Co. | 5.350% | 5/15/35 | 800 | 987 |
| San Diego Gas & Electric Co. | 6.000% | 6/1/39 | 1,080 | 1,477 |
| San Diego Gas & Electric Co. | 4.500% | 8/15/40 | 2,450 | 2,737 |
| San Diego Gas & Electric Co. | 3.950% | 11/15/41 | 8,225 | 8,510 |
| SCANA Corp. | 4.750% | 5/15/21 | 2,675 | 2,833 |
| Sierra Pacific Power Co. | 6.000% | 5/15/16 | 4,925 | 5,709 |
| Sierra Pacific Power Co. | 6.750% | 7/1/37 | 4,250 | 5,817 |
| South Carolina Electric & Gas Co. | 6.500% | 11/1/18 | 1,710 | 2,120 |
| South Carolina Electric & Gas Co. | 6.625% | 2/1/32 | 5,825 | 7,537 |
58
Vanguard® Total Bond Market Index Fund
Schedule of Investments
December 31, 2011
| Face | Market | |||
| Maturity | Amount | Value | ||
| Coupon | Date | ($000) | ($000) | |
| South Carolina Electric & Gas Co. | 5.300% | 5/15/33 | 220 | 256 |
| South Carolina Electric & Gas Co. | 6.050% | 1/15/38 | 4,300 | 5,573 |
| South Carolina Electric & Gas Co. | 5.450% | 2/1/41 | 4,200 | 5,026 |
| Southern California Edison Co. | 5.000% | 1/15/14 | 3,350 | 3,626 |
| Southern California Edison Co. | 4.650% | 4/1/15 | 3,600 | 3,962 |
| Southern California Edison Co. | 5.000% | 1/15/16 | 1,175 | 1,337 |
| Southern California Edison Co. | 3.875% | 6/1/21 | 26,275 | 29,035 |
| Southern California Edison Co. | 6.650% | 4/1/29 | 1,536 | 2,027 |
| Southern California Edison Co. | 6.000% | 1/15/34 | 6,675 | 8,648 |
| Southern California Edison Co. | 5.750% | 4/1/35 | 925 | 1,178 |
| Southern California Edison Co. | 5.350% | 7/15/35 | 4,400 | 5,282 |
| Southern California Edison Co. | 5.550% | 1/15/36 | 1,400 | 1,727 |
| Southern California Edison Co. | 5.625% | 2/1/36 | 6,275 | 7,804 |
| Southern California Edison Co. | 5.550% | 1/15/37 | 6,975 | 8,644 |
| Southern California Edison Co. | 5.950% | 2/1/38 | 410 | 534 |
| Southern California Edison Co. | 4.500% | 9/1/40 | 5,075 | 5,538 |
| Southern Co. | 4.150% | 5/15/14 | 3,850 | 4,117 |
| Southern Power Co. | 4.875% | 7/15/15 | 1,550 | 1,707 |
| Southern Power Co. | 5.150% | 9/15/41 | 11,050 | 11,687 |
| Southwestern Electric Power Co. | 5.550% | 1/15/17 | 400 | 448 |
| Southwestern Electric Power Co. | 5.875% | 3/1/18 | 1,142 | 1,312 |
| Southwestern Electric Power Co. | 6.450% | 1/15/19 | 3,625 | 4,228 |
| Southwestern Electric Power Co. | 6.200% | 3/15/40 | 2,175 | 2,724 |
| Tampa Electric Co. | 6.100% | 5/15/18 | 275 | 331 |
| Tampa Electric Co. | 6.550% | 5/15/36 | 3,000 | 3,972 |
| TECO Finance Inc. | 4.000% | 3/15/16 | 2,650 | 2,791 |
| TECO Finance Inc. | 6.572% | 11/1/17 | 2,200 | 2,632 |
| TECO Finance Inc. | 5.150% | 3/15/20 | 2,475 | 2,721 |
| Toledo Edison Co. | 6.150% | 5/15/37 | 6,525 | 7,947 |
| TransAlta Corp. | 4.750% | 1/15/15 | 1,050 | 1,126 |
| TransAlta Corp. | 6.650% | 5/15/18 | 1,325 | 1,525 |
| TransAlta Corp. | 6.500% | 3/15/40 | 650 | 745 |
| Tucson Electric Power Co. | 5.150% | 11/15/21 | 2,125 | 2,259 |
| UIL Holdings Corp. | 4.625% | 10/1/20 | 2,650 | 2,785 |
| Union Electric Co. | 6.700% | 2/1/19 | 6,566 | 7,974 |
| Union Electric Co. | 5.300% | 8/1/37 | 3,000 | 3,608 |
| Union Electric Co. | 8.450% | 3/15/39 | 1,725 | 2,897 |
| Virginia Electric and Power Co. | 5.400% | 1/15/16 | 1,300 | 1,498 |
| Virginia Electric and Power Co. | 5.400% | 4/30/18 | 3,170 | 3,784 |
| Virginia Electric and Power Co. | 5.000% | 6/30/19 | 3,500 | 4,035 |
| Virginia Electric and Power Co. | 3.450% | 9/1/22 | 250 | 262 |
| Virginia Electric and Power Co. | 6.000% | 1/15/36 | 5,575 | 7,031 |
| Virginia Electric and Power Co. | 6.000% | 5/15/37 | 2,100 | 2,689 |
| Virginia Electric and Power Co. | 6.350% | 11/30/37 | 3,450 | 4,578 |
| Virginia Electric and Power Co. | 8.875% | 11/15/38 | 675 | 1,117 |
| Wisconsin Electric Power Co. | 4.250% | 12/15/19 | 4,600 | 5,149 |
| Wisconsin Electric Power Co. | 5.625% | 5/15/33 | 1,025 | 1,267 |
| Wisconsin Electric Power Co. | 5.700% | 12/1/36 | 825 | 1,049 |
| 4 Wisconsin Energy Corp. | 6.250% | 5/15/67 | 14,025 | 14,025 |
| Wisconsin Power & Light Co. | 5.000% | 7/15/19 | 1,175 | 1,361 |
| Wisconsin Power & Light Co. | 6.375% | 8/15/37 | 4,780 | 6,528 |
| Xcel Energy Inc. | 5.613% | 4/1/17 | 592 | 675 |
| Xcel Energy Inc. | 4.700% | 5/15/20 | 1,000 | 1,135 |
| Xcel Energy Inc. | 6.500% | 7/1/36 | 3,050 | 3,910 |
| Natural Gas (0.7%) | ||||
| AGL Capital Corp. | 5.250% | 8/15/19 | 800 | 892 |
| AGL Capital Corp. | 3.500% | 9/15/21 | 3,550 | 3,568 |
| AGL Capital Corp. | 5.875% | 3/15/41 | 3,310 | 3,940 |
| Atmos Energy Corp. | 4.950% | 10/15/14 | 3,320 | 3,635 |
| Atmos Energy Corp. | 8.500% | 3/15/19 | 1,850 | 2,446 |
| Atmos Energy Corp. | 5.500% | 6/15/41 | 5,700 | 6,694 |
| Boardwalk Pipelines LP | 5.500% | 2/1/17 | 3,225 | 3,553 |
59
Vanguard® Total Bond Market Index Fund
Schedule of Investments
December 31, 2011
| Face | Market | |||
| Maturity | Amount | Value | ||
| Coupon | Date | ($000) | ($000) | |
| British Transco Finance Inc. | 6.625% | 6/1/18 | 2,235 | 2,650 |
| Buckeye Partners LP | 6.050% | 1/15/18 | 350 | 385 |
| CenterPoint Energy Resources Corp. | 6.150% | 5/1/16 | 1,350 | 1,569 |
| CenterPoint Energy Resources Corp. | 4.500% | 1/15/21 | 4,226 | 4,467 |
| CenterPoint Energy Resources Corp. | 5.850% | 1/15/41 | 1,750 | 2,017 |
| DCP Midstream LLC | 8.125% | 8/16/30 | 200 | 257 |
| DCP Midstream Operating LP | 3.250% | 10/1/15 | 3,325 | 3,362 |
| El Paso Natural Gas Co. | 5.950% | 4/15/17 | 11,405 | 12,777 |
| El Paso Natural Gas Co. | 8.625% | 1/15/22 | 6,755 | 8,558 |
| Enbridge Energy Partners LP | 6.500% | 4/15/18 | 7,583 | 8,800 |
| Enbridge Energy Partners LP | 9.875% | 3/1/19 | 7,975 | 10,556 |
| Enbridge Energy Partners LP | 7.500% | 4/15/38 | 7,120 | 9,547 |
| Enbridge Inc. | 5.800% | 6/15/14 | 175 | 192 |
| Enbridge Inc. | 5.600% | 4/1/17 | 275 | 311 |
| Energy Transfer Partners LP | 6.000% | 7/1/13 | 10,417 | 10,933 |
| Energy Transfer Partners LP | 8.500% | 4/15/14 | 5,375 | 6,033 |
| Energy Transfer Partners LP | 5.950% | 2/1/15 | 8,475 | 9,176 |
| Energy Transfer Partners LP | 6.125% | 2/15/17 | 1,225 | 1,353 |
| Energy Transfer Partners LP | 6.700% | 7/1/18 | 340 | 378 |
| Energy Transfer Partners LP | 9.000% | 4/15/19 | 38,100 | 45,554 |
| Energy Transfer Partners LP | 6.625% | 10/15/36 | 2,050 | 2,180 |
| Energy Transfer Partners LP | 7.500% | 7/1/38 | 2,590 | 2,961 |
| Energy Transfer Partners LP | 6.050% | 6/1/41 | 800 | 787 |
| 8 Enron Corp. | 7.625% | 9/10/04 | 1,600 | — |
| 8 Enron Corp. | 6.625% | 11/15/05 | 1,075 | — |
| 8 Enron Corp. | 7.125% | 5/15/07 | 6,846 | 1 |
| 8 Enron Corp. | 6.875% | 10/15/07 | 6,700 | 1 |
| 8 Enron Corp. | 6.750% | 8/1/09 | 5,145 | 1 |
| Enterprise Products Operating LLC | 5.650% | 4/1/13 | 3,475 | 3,643 |
| Enterprise Products Operating LLC | 5.900% | 4/15/13 | 2,175 | 2,284 |
| Enterprise Products Operating LLC | 9.750% | 1/31/14 | 12,165 | 14,064 |
| Enterprise Products Operating LLC | 5.000% | 3/1/15 | 3,185 | 3,472 |
| Enterprise Products Operating LLC | 6.300% | 9/15/17 | 16,325 | 19,054 |
| Enterprise Products Operating LLC | 6.650% | 4/15/18 | 2,425 | 2,870 |
| Enterprise Products Operating LLC | 6.500% | 1/31/19 | 6,429 | 7,496 |
| Enterprise Products Operating LLC | 5.200% | 9/1/20 | 3,200 | 3,531 |
| Enterprise Products Operating LLC | 6.875% | 3/1/33 | 1,950 | 2,345 |
| Enterprise Products Operating LLC | 6.650% | 10/15/34 | 8,400 | 9,921 |
| Enterprise Products Operating LLC | 7.550% | 4/15/38 | 2,925 | 3,766 |
| Enterprise Products Operating LLC | 6.125% | 10/15/39 | 5,160 | 5,772 |
| Enterprise Products Operating LLC | 6.450% | 9/1/40 | 725 | 847 |
| Enterprise Products Operating LLC | 5.950% | 2/1/41 | 1,400 | 1,562 |
| Enterprise Products Operating LLC | 5.700% | 2/15/42 | 3,800 | 4,128 |
| EQT Corp. | 6.500% | 4/1/18 | 11,475 | 12,924 |
| EQT Corp. | 8.125% | 6/1/19 | 325 | 384 |
| 8 HNG Internorth | 9.625% | 3/15/06 | 3,680 | — |
| KeySpan Corp. | 8.000% | 11/15/30 | 50 | 67 |
| Kinder Morgan Energy Partners LP | 5.000% | 12/15/13 | 12,425 | 13,185 |
| Kinder Morgan Energy Partners LP | 5.125% | 11/15/14 | 1,925 | 2,086 |
| Kinder Morgan Energy Partners LP | 5.625% | 2/15/15 | 300 | 329 |
| Kinder Morgan Energy Partners LP | 6.000% | 2/1/17 | 230 | 261 |
| Kinder Morgan Energy Partners LP | 5.950% | 2/15/18 | 18,725 | 21,452 |
| Kinder Morgan Energy Partners LP | 6.850% | 2/15/20 | 9,025 | 10,703 |
| Kinder Morgan Energy Partners LP | 7.300% | 8/15/33 | 505 | 607 |
| Kinder Morgan Energy Partners LP | 5.800% | 3/15/35 | 100 | 102 |
| Kinder Morgan Energy Partners LP | 6.500% | 2/1/37 | 13,225 | 14,676 |
| Kinder Morgan Energy Partners LP | 6.950% | 1/15/38 | 7,200 | 8,227 |
| Kinder Morgan Energy Partners LP | 6.500% | 9/1/39 | 6,000 | 6,687 |
| Kinder Morgan Energy Partners LP | 5.625% | 9/1/41 | 8,500 | 8,750 |
| Magellan Midstream Partners LP | 5.650% | 10/15/16 | 875 | 998 |
| Magellan Midstream Partners LP | 6.550% | 7/15/19 | 4,525 | 5,340 |
| Magellan Midstream Partners LP | 4.250% | 2/1/21 | 3,920 | 4,076 |
| National Fuel Gas Co. | 4.900% | 12/1/21 | 550 | 562 |
| National Grid plc | 6.300% | 8/1/16 | 8,600 | 9,896 |
60
Vanguard® Total Bond Market Index Fund
Schedule of Investments
December 31, 2011
| Face | Market | |||
| Maturity | Amount | Value | ||
| Coupon | Date | ($000) | ($000) | |
| Nisource Finance Corp. | 6.150% | 3/1/13 | 194 | 204 |
| Nisource Finance Corp. | 5.400% | 7/15/14 | 5,108 | 5,559 |
| Nisource Finance Corp. | 5.250% | 9/15/17 | 925 | 1,025 |
| Nisource Finance Corp. | 6.400% | 3/15/18 | 13,625 | 15,662 |
| Nisource Finance Corp. | 6.800% | 1/15/19 | 150 | 175 |
| Nisource Finance Corp. | 5.450% | 9/15/20 | 1,600 | 1,763 |
| Nisource Finance Corp. | 4.450% | 12/1/21 | 3,750 | 3,844 |
| Nisource Finance Corp. | 6.125% | 3/1/22 | 1,825 | 2,100 |
| Nisource Finance Corp. | 6.250% | 12/15/40 | 2,225 | 2,440 |
| Nisource Finance Corp. | 5.950% | 6/15/41 | 6,650 | 7,182 |
| Nisource Finance Corp. | 5.800% | 2/1/42 | 4,475 | 4,723 |
| NuStar Logistics LP | 7.650% | 4/15/18 | 4,825 | 5,785 |
| Oneok Inc. | 5.200% | 6/15/15 | 4,000 | 4,385 |
| ONEOK Inc. | 6.000% | 6/15/35 | 5,850 | 6,254 |
| ONEOK Partners LP | 3.250% | 2/1/16 | 2,500 | 2,583 |
| ONEOK Partners LP | 6.150% | 10/1/16 | 4,525 | 5,207 |
| ONEOK Partners LP | 8.625% | 3/1/19 | 16,575 | 21,270 |
| ONEOK Partners LP | 6.650% | 10/1/36 | 12,525 | 14,988 |
| ONEOK Partners LP | 6.850% | 10/15/37 | 4,925 | 5,940 |
| ONEOK Partners LP | 6.125% | 2/1/41 | 5,000 | 5,837 |
| Panhandle Eastern Pipeline Co. LP | 6.200% | 11/1/17 | 8,050 | 9,142 |
| Panhandle Eastern Pipeline Co. LP | 7.000% | 6/15/18 | 300 | 349 |
| Plains All American Pipeline LP / PAA Finance Corp. | 6.125% | 1/15/17 | 4,440 | 5,026 |
| Plains All American Pipeline LP / PAA Finance Corp. | 6.500% | 5/1/18 | 925 | 1,072 |
| Plains All American Pipeline LP / PAA Finance Corp. | 8.750% | 5/1/19 | 2,475 | 3,164 |
| Plains All American Pipeline LP / PAA Finance Corp. | 5.750% | 1/15/20 | 1,400 | 1,579 |
| Plains All American Pipeline LP / PAA Finance Corp. | 5.000% | 2/1/21 | 700 | 762 |
| Questar Corp. | 2.750% | 2/1/16 | 600 | 610 |
| Sempra Energy | 6.000% | 2/1/13 | 700 | 734 |
| Sempra Energy | 2.000% | 3/15/14 | 8,025 | 8,127 |
| Sempra Energy | 6.150% | 6/15/18 | 2,100 | 2,473 |
| Sempra Energy | 6.000% | 10/15/39 | 14,405 | 17,880 |
| Southern California Gas Co. | 5.750% | 11/15/35 | 950 | 1,221 |
| 6 Southern Natural Gas Co. | 5.900% | 4/1/17 | 4,990 | 5,713 |
| Southern Natural Gas Co. | 8.000% | 3/1/32 | 5,832 | 7,285 |
| Southern Union Co. | 7.600% | 2/1/24 | 8,260 | 9,721 |
| Spectra Energy Capital LLC | 6.250% | 2/15/13 | 1,146 | 1,201 |
| Spectra Energy Capital LLC | 5.500% | 3/1/14 | 3,125 | 3,355 |
| Spectra Energy Capital LLC | 5.668% | 8/15/14 | 150 | 164 |
| Spectra Energy Capital LLC | 6.200% | 4/15/18 | 300 | 340 |
| Spectra Energy Capital LLC | 6.750% | 2/15/32 | 2,250 | 2,606 |
| Sunoco Logistics Partners Operations LP | 6.850% | 2/15/40 | 750 | 870 |
| Tennessee Gas Pipeline Co. | 7.000% | 10/15/28 | 120 | 140 |
| Tennessee Gas Pipeline Co. | 7.625% | 4/1/37 | 1,342 | 1,609 |
| Texas Gas Transmission LLC | 4.600% | 6/1/15 | 2,875 | 3,071 |
| TransCanada PipeLines Ltd. | 4.000% | 6/15/13 | 3,950 | 4,126 |
| TransCanada PipeLines Ltd. | 3.400% | 6/1/15 | 500 | 529 |
| TransCanada PipeLines Ltd. | 6.500% | 8/15/18 | 14,500 | 17,739 |
| TransCanada PipeLines Ltd. | 3.800% | 10/1/20 | 7,900 | 8,491 |
| TransCanada PipeLines Ltd. | 5.600% | 3/31/34 | 3,055 | 3,536 |
| TransCanada PipeLines Ltd. | 5.850% | 3/15/36 | 13,375 | 15,967 |
| TransCanada PipeLines Ltd. | 6.200% | 10/15/37 | 7,425 | 9,307 |
| TransCanada PipeLines Ltd. | 7.250% | 8/15/38 | 2,017 | 2,792 |
| TransCanada PipeLines Ltd. | 7.625% | 1/15/39 | 354 | 510 |
| 4 TransCanada PipeLines Ltd. | 6.350% | 5/15/67 | 11,971 | 12,001 |
| Williams Partners LP | 3.800% | 2/15/15 | 2,900 | 3,044 |
| Williams Partners LP | 5.250% | 3/15/20 | 45,420 | 50,430 |
| Williams Partners LP | 4.000% | 11/15/21 | 4,050 | 4,157 |
| Williams Partners LP | 6.300% | 4/15/40 | 2,920 | 3,560 |
| Williams Partners LP / Williams Partners Finance Corp. | 7.250% | 2/1/17 | 11,225 | 13,421 |
| Other Utility (0.0%) | ||||
| American Water Capital Corp. | 6.085% | 10/15/17 | 10,200 | 11,909 |
| American Water Capital Corp. | 6.593% | 10/15/37 | 5,645 | 6,926 |
61
Vanguard® Total Bond Market Index Fund
Schedule of Investments
December 31, 2011
| Face | Market | |||
| Maturity | Amount | Value | ||
| Coupon | Date | ($000) | ($000) | |
| United Utilities plc | 5.375% | 2/1/19 | 4,950 | 5,171 |
| United Utilities plc | 6.875% | 8/15/28 | 850 | 974 |
| Veolia Environnement SA | 6.000% | 6/1/18 | 7,020 | 7,774 |
| Veolia Environnement SA | 6.750% | 6/1/38 | 825 | 984 |
| 2,380,530 | ||||
| Total Corporate Bonds (Cost $19,648,204) | 21,097,844 | |||
| Sovereign Bonds (U.S. Dollar-Denominated) (4.4%) | ||||
| African Development Bank | 1.625% | 2/11/13 | 7,425 | 7,522 |
| African Development Bank | 3.000% | 5/27/14 | 17,625 | 18,583 |
| African Development Bank | 1.250% | 9/2/16 | 6,550 | 6,588 |
| Asian Development Bank | 1.625% | 7/15/13 | 23,725 | 24,144 |
| Asian Development Bank | 3.625% | 9/5/13 | 23,500 | 24,671 |
| Asian Development Bank | 2.750% | 5/21/14 | 18,145 | 19,084 |
| Asian Development Bank | 0.875% | 6/10/14 | 5,350 | 5,394 |
| Asian Development Bank | 4.250% | 10/20/14 | 5,875 | 6,444 |
| Asian Development Bank | 2.625% | 2/9/15 | 30,175 | 31,944 |
| Asian Development Bank | 2.500% | 3/15/16 | 14,550 | 15,502 |
| Asian Development Bank | 5.500% | 6/27/16 | 5,175 | 6,181 |
| Asian Development Bank | 5.250% | 6/12/17 | 600 | 722 |
| Asian Development Bank | 5.593% | 7/16/18 | 3,528 | 4,311 |
| Asian Development Bank | 1.875% | 10/23/18 | 11,250 | 11,465 |
| Banco do Brasil SA | 3.875% | 1/23/17 | 3,125 | 3,089 |
| Brazilian Government International Bond | 10.250% | 6/17/13 | 2,200 | 2,480 |
| Brazilian Government International Bond | 7.875% | 3/7/15 | 8,200 | 9,778 |
| Brazilian Government International Bond | 6.000% | 1/17/17 | 31,055 | 36,365 |
| 4 Brazilian Government International Bond | 8.000% | 1/15/18 | 17,645 | 20,644 |
| Brazilian Government International Bond | 5.875% | 1/15/19 | 42,825 | 50,641 |
| Brazilian Government International Bond | 8.875% | 10/14/19 | 11,650 | 16,252 |
| Brazilian Government International Bond | 4.875% | 1/22/21 | 20,950 | 23,362 |
| Brazilian Government International Bond | 8.875% | 4/15/24 | 3,125 | 4,656 |
| Brazilian Government International Bond | 8.875% | 4/15/24 | 1,500 | 2,243 |
| Brazilian Government International Bond | 8.750% | 2/4/25 | 12,250 | 18,314 |
| Brazilian Government International Bond | 10.125% | 5/15/27 | 12,325 | 20,336 |
| Brazilian Government International Bond | 8.250% | 1/20/34 | 16,525 | 24,870 |
| Brazilian Government International Bond | 7.125% | 1/20/37 | 16,706 | 23,126 |
| Brazilian Government International Bond | 11.000% | 8/17/40 | 13,300 | 17,622 |
| Brazilian Government International Bond | 5.625% | 1/7/41 | 25,825 | 29,957 |
| Canada Government International Bond | 2.375% | 9/10/14 | 4,524 | 4,745 |
| Chile Government International Bond | 5.500% | 1/15/13 | 2,965 | 3,103 |
| Chile Government International Bond | 3.875% | 8/5/20 | 8,850 | 9,634 |
| Chile Government International Bond | 3.250% | 9/14/21 | 1,000 | 1,031 |
| China Development Bank Corp. | 4.750% | 10/8/14 | 3,700 | 3,940 |
| China Development Bank Corp. | 5.000% | 10/15/15 | 1,450 | 1,569 |
| China Government International Bond | 4.750% | 10/29/13 | 5,700 | 6,046 |
| Colombia Government International Bond | 10.750% | 1/15/13 | 2,150 | 2,333 |
| Colombia Government International Bond | 8.250% | 12/22/14 | 3,200 | 3,760 |
| Colombia Government International Bond | 7.375% | 1/27/17 | 10,875 | 13,267 |
| Colombia Government International Bond | 7.375% | 3/18/19 | 13,300 | 16,791 |
| Colombia Government International Bond | 11.750% | 2/25/20 | 3,350 | 5,276 |
| Colombia Government International Bond | 4.375% | 7/12/21 | 14,675 | 15,702 |
| Colombia Government International Bond | 8.125% | 5/21/24 | 5,600 | 7,756 |
| Colombia Government International Bond | 7.375% | 9/18/37 | 9,722 | 13,586 |
| Colombia Government International Bond | 6.125% | 1/18/41 | 19,750 | 24,244 |
| Corp Andina de Fomento | 3.750% | 1/15/16 | 6,125 | 6,189 |
| Corp. Andina de Fomento | 5.200% | 5/21/13 | 2,400 | 2,496 |
| Corp. Andina de Fomento | 5.125% | 5/5/15 | 800 | 848 |
| Corp. Andina de Fomento | 5.750% | 1/12/17 | 16,625 | 18,101 |
| Corp. Andina de Fomento | 8.125% | 6/4/19 | 21,300 | 25,993 |
| Council Of Europe Development Bank | 2.750% | 2/10/15 | 5,675 | 5,875 |
| Council Of Europe Development Bank | 2.625% | 2/16/16 | 6,950 | 7,324 |
| 9 Development Bank of Japan | 4.250% | 6/9/15 | 11,375 | 12,494 |
| European Bank for Reconstruction & Development | 2.750% | 4/20/15 | 19,100 | 20,156 |
62
Vanguard® Total Bond Market Index Fund
Schedule of Investments
December 31, 2011
| Face | Market | |||
| Maturity | Amount | Value | ||
| Coupon | Date | ($000) | ($000) | |
| European Bank for Reconstruction & Development | 1.625% | 9/3/15 | 6,550 | 6,653 |
| European Bank for Reconstruction & Development | 2.500% | 3/15/16 | 8,100 | 8,537 |
| European Bank for Reconstruction & Development | 1.375% | 10/20/16 | 2,550 | 2,562 |
| European Investment Bank | 1.625% | 3/15/13 | 12,800 | 12,869 |
| European Investment Bank | 2.875% | 3/15/13 | 8,100 | 8,272 |
| European Investment Bank | 3.250% | 5/15/13 | 35,700 | 36,742 |
| European Investment Bank | 1.875% | 6/17/13 | 11,650 | 11,782 |
| European Investment Bank | 4.250% | 7/15/13 | 33,575 | 35,155 |
| European Investment Bank | 1.250% | 9/17/13 | 15,975 | 16,006 |
| European Investment Bank | 1.250% | 2/14/14 | 3,400 | 3,396 |
| European Investment Bank | 2.375% | 3/14/14 | 24,750 | 25,319 |
| European Investment Bank | 1.500% | 5/15/14 | 39,400 | 39,577 |
| European Investment Bank | 4.625% | 5/15/14 | 35,482 | 38,210 |
| European Investment Bank | 3.125% | 6/4/14 | 53,200 | 55,491 |
| European Investment Bank | 1.125% | 8/15/14 | 43,050 | 42,850 |
| European Investment Bank | 2.875% | 1/15/15 | 15,400 | 16,059 |
| European Investment Bank | 2.750% | 3/23/15 | 20,100 | 20,933 |
| European Investment Bank | 1.625% | 9/1/15 | 19,025 | 19,024 |
| European Investment Bank | 1.375% | 10/20/15 | 19,325 | 19,147 |
| European Investment Bank | 4.875% | 2/16/16 | 19,250 | 21,646 |
| European Investment Bank | 2.500% | 5/16/16 | 29,250 | 30,197 |
| European Investment Bank | 2.125% | 7/15/16 | 21,800 | 22,081 |
| European Investment Bank | 5.125% | 9/13/16 | 18,700 | 21,459 |
| European Investment Bank | 1.250% | 10/14/16 | 23,925 | 23,430 |
| European Investment Bank | 4.875% | 1/17/17 | 25,625 | 29,167 |
| European Investment Bank | 5.125% | 5/30/17 | 28,695 | 33,302 |
| European Investment Bank | 2.875% | 9/15/20 | 18,000 | 17,995 |
| European Investment Bank | 4.000% | 2/16/21 | 24,075 | 26,227 |
| European Investment Bank | 4.875% | 2/15/36 | 300 | 325 |
| Export Development Canada | 3.500% | 5/16/13 | 9,600 | 9,958 |
| Export Development Canada | 3.125% | 4/24/14 | 225 | 238 |
| Export Development Canada | 2.250% | 5/28/15 | 3,500 | 3,663 |
| Export Development Canada | 1.250% | 10/26/16 | 12,750 | 12,889 |
| Export-Import Bank of Korea | 8.125% | 1/21/14 | 18,550 | 20,496 |
| Export-Import Bank of Korea | 5.875% | 1/14/15 | 19,025 | 20,388 |
| Export-Import Bank of Korea | 5.125% | 3/16/15 | 2,500 | 2,647 |
| Export-Import Bank of Korea | 4.125% | 9/9/15 | 4,925 | 5,077 |
| Export-Import Bank of Korea | 3.750% | 10/20/16 | 11,550 | 11,647 |
| Export-Import Bank of Korea | 5.125% | 6/29/20 | 5,700 | 5,991 |
| Export-Import Bank of Korea | 4.375% | 9/15/21 | 3,725 | 3,689 |
| Finland Government International Bond | 6.950% | 2/15/26 | 1,905 | 2,758 |
| Hungary Government International Bond | 4.750% | 2/3/15 | 8,075 | 7,429 |
| Hungary Government International Bond | 6.250% | 1/29/20 | 10,500 | 9,592 |
| Hungary Government International Bond | 6.375% | 3/29/21 | 6,700 | 6,164 |
| Hungary Government International Bond | 7.625% | 3/29/41 | 5,450 | 4,762 |
| Hydro Quebec | 8.000% | 2/1/13 | 9,675 | 10,388 |
| Hydro Quebec | 7.500% | 4/1/16 | 2,155 | 2,683 |
| Hydro Quebec | 2.000% | 6/30/16 | 24,775 | 25,303 |
| Hydro Quebec | 8.400% | 1/15/22 | 2,675 | 3,895 |
| Hydro Quebec | 8.050% | 7/7/24 | 2,975 | 4,441 |
| Hydro Quebec | 8.500% | 12/1/29 | 400 | 641 |
| Inter-American Development Bank | 3.500% | 3/15/13 | 9,375 | 9,689 |
| Inter-American Development Bank | 1.625% | 7/15/13 | 1,000 | 1,015 |
| Inter-American Development Bank | 3.000% | 4/22/14 | 23,700 | 24,936 |
| Inter-American Development Bank | 2.250% | 7/15/15 | 8,100 | 8,468 |
| Inter-American Development Bank | 4.250% | 9/14/15 | 7,395 | 8,285 |
| Inter-American Development Bank | 5.125% | 9/13/16 | 6,900 | 8,174 |
| Inter-American Development Bank | 1.375% | 10/18/16 | 350 | 355 |
| Inter-American Development Bank | 2.375% | 8/15/17 | 22,800 | 23,987 |
| Inter-American Development Bank | 1.750% | 8/24/18 | 4,900 | 4,942 |
| Inter-American Development Bank | 4.250% | 9/10/18 | 2,950 | 3,468 |
| Inter-American Development Bank | 3.875% | 9/17/19 | 57,400 | 65,937 |
| Inter-American Development Bank | 3.875% | 2/14/20 | 6,425 | 7,407 |
| Inter-American Development Bank | 7.000% | 6/15/25 | 2,775 | 3,966 |
63
Vanguard® Total Bond Market Index Fund
Schedule of Investments
December 31, 2011
| Face | Market | |||
| Maturity | Amount | Value | ||
| Coupon | Date | ($000) | ($000) | |
| International Bank for Reconstruction & Development | 1.750% | 7/15/13 | 17,275 | 17,608 |
| International Bank for Reconstruction & Development | 3.500% | 10/8/13 | 29,250 | 30,777 |
| International Bank for Reconstruction & Development | 0.500% | 11/26/13 | 28,900 | 28,936 |
| International Bank for Reconstruction & Development | 2.375% | 5/26/15 | 43,425 | 45,654 |
| International Bank for Reconstruction & Development | 2.125% | 3/15/16 | 44,275 | 46,537 |
| International Bank for Reconstruction & Development | 5.000% | 4/1/16 | 18,325 | 21,304 |
| International Bank for Reconstruction & Development | 1.000% | 9/15/16 | 12,750 | 12,734 |
| International Bank for Reconstruction & Development | 7.625% | 1/19/23 | 3,350 | 4,865 |
| International Bank for Reconstruction & Development | 8.875% | 3/1/26 | 1,050 | 1,744 |
| International Bank for Reconstruction & Development | 4.750% | 2/15/35 | 1,150 | 1,445 |
| International Finance Corp. | 3.500% | 5/15/13 | 7,100 | 7,378 |
| International Finance Corp. | 3.000% | 4/22/14 | 26,437 | 27,915 |
| International Finance Corp. | 2.750% | 4/20/15 | 10,375 | 11,069 |
| International Finance Corp. | 2.250% | 4/11/16 | 8,700 | 9,186 |
| International Finance Corp. | 1.125% | 11/23/16 | 28,950 | 29,010 |
| International Finance Corp. | 2.125% | 11/17/17 | 14,975 | 15,565 |
| Israel Government International Bond | 4.625% | 6/15/13 | 2,375 | 2,468 |
| Israel Government International Bond | 5.125% | 3/1/14 | 800 | 854 |
| Israel Government International Bond | 5.500% | 11/9/16 | 8,100 | 9,262 |
| Israel Government International Bond | 5.125% | 3/26/19 | 18,700 | 20,928 |
| 9 Japan Bank for International Cooperation | 4.250% | 6/18/13 | 20,125 | 21,104 |
| 9 Japan Finance Corp. | 2.875% | 2/2/15 | 16,150 | 16,957 |
| 9 Japan Finance Corp. | 2.500% | 1/21/16 | 6,100 | 6,340 |
| 9 Japan Finance Corp. | 2.500% | 5/18/16 | 6,100 | 6,400 |
| 9 Japan Finance Corp. | 2.250% | 7/13/16 | 12,125 | 12,589 |
| 9 Japan Finance Organization for Municipalities | 4.625% | 4/21/15 | 6,850 | 7,611 |
| 9 Japan Finance Organization for Municipalities | 5.000% | 5/16/17 | 4,000 | 4,661 |
| 9 Japan Finance Organization for Municipalities | 4.000% | 1/13/21 | 9,200 | 10,326 |
| Korea Development Bank | 5.300% | 1/17/13 | 2,475 | 2,546 |
| Korea Development Bank | 5.750% | 9/10/13 | 9,940 | 10,442 |
| Korea Development Bank | 8.000% | 1/23/14 | 10,800 | 11,898 |
| Korea Development Bank | 4.375% | 8/10/15 | 6,275 | 6,457 |
| Korea Development Bank | 3.250% | 3/9/16 | 12,800 | 12,639 |
| Korea Development Bank | 4.000% | 9/9/16 | 4,250 | 4,303 |
| Korea Development Bank | 3.875% | 5/4/17 | 5,900 | 5,857 |
| Korea Electric Power Corp. | 7.750% | 4/1/13 | 6,075 | 6,463 |
| Korea Finance Corp. | 3.250% | 9/20/16 | 11,100 | 10,903 |
| Korea Finance Corp. | 4.625% | 11/16/21 | 5,975 | 5,973 |
| 10 Kreditanstalt fuer Wiederaufbau | 1.875% | 1/14/13 | 25,500 | 25,838 |
| 10 Kreditanstalt fuer Wiederaufbau | 3.250% | 3/15/13 | 80,400 | 82,910 |
| 10 Kreditanstalt fuer Wiederaufbau | 3.500% | 5/16/13 | 12,075 | 12,546 |
| 10 Kreditanstalt fuer Wiederaufbau | 1.375% | 7/15/13 | 31,350 | 31,656 |
| 10 Kreditanstalt fuer Wiederaufbau | 4.000% | 10/15/13 | 23,825 | 25,201 |
| 10 Kreditanstalt fuer Wiederaufbau | 1.375% | 1/13/14 | 19,175 | 19,374 |
| 10 Kreditanstalt fuer Wiederaufbau | 3.500% | 3/10/14 | 22,925 | 24,204 |
| 10 Kreditanstalt fuer Wiederaufbau | 1.500% | 4/4/14 | 13,675 | 13,840 |
| 10 Kreditanstalt fuer Wiederaufbau | 4.125% | 10/15/14 | 1,425 | 1,544 |
| 10 Kreditanstalt fuer Wiederaufbau | 2.750% | 10/21/14 | 15,275 | 15,987 |
| 10 Kreditanstalt fuer Wiederaufbau | 2.625% | 3/3/15 | 28,625 | 30,019 |
| 10 Kreditanstalt fuer Wiederaufbau | 1.250% | 10/26/15 | 11,575 | 11,628 |
| 10 Kreditanstalt fuer Wiederaufbau | 2.625% | 2/16/16 | 27,900 | 29,275 |
| 10 Kreditanstalt fuer Wiederaufbau | 5.125% | 3/14/16 | 36,250 | 41,717 |
| 10 Kreditanstalt fuer Wiederaufbau | 2.000% | 6/1/16 | 38,400 | 39,370 |
| 10 Kreditanstalt fuer Wiederaufbau | 1.250% | 10/5/16 | 27,075 | 26,881 |
| 10 Kreditanstalt fuer Wiederaufbau | 4.875% | 1/17/17 | 680 | 790 |
| 10 Kreditanstalt fuer Wiederaufbau | 4.375% | 3/15/18 | 17,975 | 20,736 |
| 10 Kreditanstalt fuer Wiederaufbau | 4.500% | 7/16/18 | 14,325 | 16,616 |
| 10 Kreditanstalt fuer Wiederaufbau | 4.875% | 6/17/19 | 24,825 | 29,768 |
| 10 Kreditanstalt fuer Wiederaufbau | 4.000% | 1/27/20 | 30,550 | 34,406 |
| 10 Kreditanstalt fuer Wiederaufbau | 2.750% | 9/8/20 | 45,900 | 47,232 |
| 10 Kreditanstalt fuer Wiederaufbau | 0.000% | 4/18/36 | 17,100 | 7,356 |
| Landesbank Baden-Wuerttemberg | 7.625% | 2/1/23 | 300 | 408 |
| 10 Landwirtschaftliche Rentenbank | 3.250% | 3/15/13 | 20,750 | 21,401 |
| 10 Landwirtschaftliche Rentenbank | 4.125% | 7/15/13 | 18,125 | 19,137 |
64
Vanguard® Total Bond Market Index Fund
Schedule of Investments
December 31, 2011
| Face | Market | |||
| Maturity | Amount | Value | ||
| Coupon | Date | ($000) | ($000) | |
| 10 Landwirtschaftliche Rentenbank | 3.125% | 7/15/15 | 11,395 | 12,068 |
| 10 Landwirtschaftliche Rentenbank | 4.875% | 11/16/15 | 9,250 | 10,452 |
| 10 Landwirtschaftliche Rentenbank | 2.500% | 2/15/16 | 2,675 | 2,789 |
| 10 Landwirtschaftliche Rentenbank | 2.125% | 7/15/16 | 10,750 | 11,007 |
| 10 Landwirtschaftliche Rentenbank | 5.000% | 11/8/16 | 76 | 88 |
| 10 Landwirtschaftliche Rentenbank | 5.125% | 2/1/17 | 6,975 | 8,177 |
| 10 Landwirtschaftliche Rentenbank | 1.875% | 9/17/18 | 4,500 | 4,490 |
| Mexico Government International Bond | 6.375% | 1/16/13 | 10,302 | 10,766 |
| Mexico Government International Bond | 5.875% | 2/17/14 | 28,775 | 31,077 |
| Mexico Government International Bond | 6.625% | 3/3/15 | 433 | 491 |
| Mexico Government International Bond | 11.375% | 9/15/16 | 4,775 | 6,757 |
| Mexico Government International Bond | 5.625% | 1/15/17 | 29,722 | 34,156 |
| Mexico Government International Bond | 5.950% | 3/19/19 | 24,400 | 28,975 |
| Mexico Government International Bond | 5.125% | 1/15/20 | 5,050 | 5,772 |
| Mexico Government International Bond | 8.300% | 8/15/31 | 24,300 | 36,328 |
| Mexico Government International Bond | 6.750% | 9/27/34 | 75,821 | 98,999 |
| Mexico Government International Bond | 6.050% | 1/11/40 | 9,665 | 11,791 |
| Mexico Government International Bond | 5.750% | 10/12/10 | 6,500 | 6,873 |
| Nordic Investment Bank | 1.625% | 1/28/13 | 12,000 | 12,148 |
| Nordic Investment Bank | 2.625% | 10/6/14 | 9,600 | 10,066 |
| Nordic Investment Bank | 2.500% | 7/15/15 | 9,200 | 9,685 |
| Nordic Investment Bank | 2.250% | 3/15/16 | 3,175 | 3,327 |
| Nordic Investment Bank | 5.000% | 2/1/17 | 5,200 | 6,140 |
| North American Development Bank | 4.375% | 2/11/20 | 2,600 | 2,917 |
| 11 Oesterreichische Kontrollbank AG | 1.750% | 3/11/13 | 16,500 | 16,600 |
| 11 Oesterreichische Kontrollbank AG | 1.375% | 1/21/14 | 975 | 975 |
| 11 Oesterreichische Kontrollbank AG | 4.500% | 3/9/15 | 125 | 136 |
| 11 Oesterreichische Kontrollbank AG | 1.750% | 10/5/15 | 5,300 | 5,295 |
| 11 Oesterreichische Kontrollbank AG | 2.000% | 6/3/16 | 10,700 | 10,656 |
| 11 Oesterreichische Kontrollbank AG | 5.000% | 4/25/17 | 13,570 | 15,373 |
| Ontario Electricity Financial Corp. | 7.450% | 3/31/13 | 3,950 | 4,265 |
| Panama Government International Bond | 7.250% | 3/15/15 | 3,400 | 3,930 |
| Panama Government International Bond | 5.200% | 1/30/20 | 20,125 | 22,759 |
| Panama Government International Bond | 7.125% | 1/29/26 | 14,150 | 18,430 |
| Panama Government International Bond | 8.875% | 9/30/27 | 650 | 975 |
| Panama Government International Bond | 9.375% | 4/1/29 | 800 | 1,272 |
| 4 Panama Government International Bond | 6.700% | 1/26/36 | 10,895 | 14,256 |
| Pemex Project Funding Master Trust | 5.750% | 3/1/18 | 34,775 | 38,199 |
| Pemex Project Funding Master Trust | 6.625% | 6/15/35 | 22,171 | 25,120 |
| Pemex Project Funding Master Trust | 6.625% | 6/15/38 | 5,975 | 6,756 |
| Peruvian Government International Bond | 7.125% | 3/30/19 | 20,700 | 25,978 |
| Peruvian Government International Bond | 7.350% | 7/21/25 | 9,475 | 12,578 |
| Peruvian Government International Bond | 8.750% | 11/21/33 | 11,392 | 17,342 |
| 4 Peruvian Government International Bond | 6.550% | 3/14/37 | 12,250 | 15,496 |
| Peruvian Government International Bond | 5.625% | 11/18/50 | 16,275 | 17,814 |
| Petrobras International Finance Co. - Pifco | 3.875% | 1/27/16 | 8,000 | 8,199 |
| Petrobras International Finance Co. - Pifco | 6.125% | 10/6/16 | 13,963 | 15,608 |
| Petrobras International Finance Co. - Pifco | 5.875% | 3/1/18 | 29,475 | 32,196 |
| Petrobras International Finance Co. - Pifco | 8.375% | 12/10/18 | 10,250 | 12,454 |
| Petrobras International Finance Co. - Pifco | 7.875% | 3/15/19 | 21,208 | 25,422 |
| Petrobras International Finance Co. - Pifco | 5.750% | 1/20/20 | 7,252 | 7,738 |
| Petrobras International Finance Co. - Pifco | 5.375% | 1/27/21 | 14,500 | 15,227 |
| Petrobras International Finance Co. - Pifco | 6.875% | 1/20/40 | 7,400 | 8,455 |
| Petrobras International Finance Co. - Pifco | 6.750% | 1/27/41 | 4,125 | 4,701 |
| Petroleos Mexicanos | 4.875% | 3/15/15 | 9,350 | 9,914 |
| Petroleos Mexicanos | 8.000% | 5/3/19 | 5,200 | 6,492 |
| Petroleos Mexicanos | 6.000% | 3/5/20 | 10,825 | 12,125 |
| Petroleos Mexicanos | 5.500% | 1/21/21 | 5,120 | 5,542 |
| Petroleos Mexicanos | 6.500% | 6/2/41 | 18,150 | 20,427 |
| 6 Petroleos Mexicanos | 6.500% | 6/2/41 | 400 | 450 |
| 6 Petronas Capital Ltd. | 5.250% | 8/12/19 | 1,000 | 1,122 |
| Poland Government International Bond | 5.250% | 1/15/14 | 1,695 | 1,752 |
| Poland Government International Bond | 3.875% | 7/16/15 | 14,900 | 15,031 |
| Poland Government International Bond | 5.000% | 10/19/15 | 2,875 | 3,019 |
65
Vanguard® Total Bond Market Index Fund
Schedule of Investments
December 31, 2011
| Face | Market | |||
| Maturity | Amount | Value | ||
| Coupon | Date | ($000) | ($000) | |
| Poland Government International Bond | 6.375% | 7/15/19 | 38,200 | 42,211 |
| Poland Government International Bond | 5.125% | 4/21/21 | 3,925 | 3,994 |
| Poland Government International Bond | 5.000% | 3/23/22 | 8,600 | 8,637 |
| Province of British Columbia | 2.850% | 6/15/15 | 15,300 | 16,252 |
| Province of British Columbia | 2.100% | 5/18/16 | 22,000 | 22,882 |
| Province of British Columbia | 2.650% | 9/22/21 | 1,250 | 1,271 |
| Province of Manitoba | 2.125% | 4/22/13 | 4,850 | 4,946 |
| Province of Manitoba | 2.625% | 7/15/15 | 8,750 | 9,187 |
| Province of Manitoba | 4.900% | 12/6/16 | 13,200 | 15,269 |
| Province of New Brunswick | 2.750% | 6/15/18 | 14,750 | 15,436 |
| Province of Nova Scotia | 2.375% | 7/21/15 | 8,000 | 8,318 |
| Province of Ontario | 1.375% | 1/27/14 | 16,575 | 16,802 |
| Province of Ontario | 4.100% | 6/16/14 | 27,670 | 29,783 |
| Province of Ontario | 2.950% | 2/5/15 | 5,080 | 5,363 |
| Province of Ontario | 2.700% | 6/16/15 | 23,375 | 24,269 |
| Province of Ontario | 1.875% | 9/15/15 | 10,300 | 10,417 |
| Province of Ontario | 4.750% | 1/19/16 | 5,375 | 6,033 |
| Province of Ontario | 5.450% | 4/27/16 | 30,325 | 35,160 |
| Province of Ontario | 2.300% | 5/10/16 | 1,000 | 1,029 |
| Province of Ontario | 1.600% | 9/21/16 | 10,350 | 10,370 |
| Province of Ontario | 3.150% | 12/15/17 | 13,000 | 13,904 |
| Province of Ontario | 3.000% | 7/16/18 | 8,475 | 8,900 |
| Province of Ontario | 4.000% | 10/7/19 | 20,525 | 22,793 |
| Province of Ontario | 4.400% | 4/14/20 | 20,575 | 23,434 |
| Province of Saskatchewan | 7.375% | 7/15/13 | 1,375 | 1,517 |
| Quebec | 4.875% | 5/5/14 | 4,125 | 4,504 |
| Quebec | 4.600% | 5/26/15 | 7,600 | 8,462 |
| Quebec | 5.125% | 11/14/16 | 21,200 | 24,683 |
| Quebec | 4.625% | 5/14/18 | 11,800 | 13,555 |
| Quebec | 3.500% | 7/29/20 | 16,450 | 17,740 |
| Quebec | 2.750% | 8/25/21 | 16,325 | 16,355 |
| Quebec | 7.125% | 2/9/24 | 905 | 1,267 |
| Quebec | 7.500% | 9/15/29 | 7,877 | 11,906 |
| 6 Ras Laffan Liquefied Natural Gas Co. Ltd. III | 5.500% | 9/30/14 | 350 | 375 |
| 6 Ras Laffan Liquefied Natural Gas Co. Ltd. III | 6.750% | 9/30/19 | 350 | 413 |
| Region of Lombardy Italy | 5.804% | 10/25/32 | 6,395 | 5,247 |
| Republic of Italy | 4.375% | 6/15/13 | 125 | 123 |
| Republic of Italy | 2.125% | 9/16/13 | 11,750 | 11,074 |
| Republic of Italy | 4.500% | 1/21/15 | 20,400 | 19,380 |
| Republic of Italy | 3.125% | 1/26/15 | 24,800 | 22,568 |
| Republic of Italy | 4.750% | 1/25/16 | 22,250 | 20,692 |
| Republic of Italy | 5.250% | 9/20/16 | 31,126 | 29,103 |
| Republic of Italy | 6.875% | 9/27/23 | 11,600 | 11,150 |
| Republic of Italy | 5.375% | 6/15/33 | 16,575 | 14,089 |
| Republic of Korea | 4.250% | 6/1/13 | 19,300 | 19,917 |
| Republic of Korea | 5.750% | 4/16/14 | 8,700 | 9,412 |
| Republic of Korea | 4.875% | 9/22/14 | 625 | 670 |
| Republic of Korea | 7.125% | 4/16/19 | 8,013 | 9,965 |
| Republic of Korea | 5.625% | 11/3/25 | 1,425 | 1,681 |
| South Africa Government International Bond | 6.500% | 6/2/14 | 2,425 | 2,659 |
| South Africa Government International Bond | 6.875% | 5/27/19 | 14,875 | 17,944 |
| South Africa Government International Bond | 5.500% | 3/9/20 | 11,650 | 13,005 |
| South Africa Government International Bond | 5.875% | 5/30/22 | 4,300 | 4,951 |
| South Africa Government International Bond | 6.250% | 3/8/41 | 6,900 | 7,961 |
| Statoil ASA | 3.875% | 4/15/14 | 7,250 | 7,726 |
| Statoil ASA | 2.900% | 10/15/14 | 4,625 | 4,851 |
| Statoil ASA | 1.800% | 11/23/16 | 3,550 | 3,599 |
| Statoil ASA | 3.125% | 8/17/17 | 7,000 | 7,323 |
| Statoil ASA | 5.250% | 4/15/19 | 11,825 | 13,654 |
| Statoil ASA | 3.150% | 1/23/22 | 6,350 | 6,528 |
| Statoil ASA | 7.750% | 6/15/23 | 25 | 34 |
| Statoil ASA | 7.250% | 9/23/27 | 5,375 | 7,403 |
| 6 Statoil ASA | 6.500% | 12/1/28 | 975 | 1,276 |
| Statoil ASA | 7.150% | 1/15/29 | 2,950 | 4,021 |
66
Vanguard® Total Bond Market Index Fund
Schedule of Investments
December 31, 2011
| Face | Market | |||
| Maturity | Amount | Value | ||
| Coupon | Date | ($000) | ($000) | |
| Statoil ASA | 5.100% | 8/17/40 | 5,700 | 6,791 |
| Statoil ASA | 4.250% | 11/23/41 | 2,550 | 2,672 |
| Svensk Exportkredit AB | 3.250% | 9/16/14 | 7,775 | 8,032 |
| Svensk Exportkredit AB | 1.750% | 10/20/15 | 13,000 | 12,813 |
| Svensk Exportkredit AB | 2.125% | 7/13/16 | 7,950 | 7,909 |
| Svensk Exportkredit AB | 5.125% | 3/1/17 | 1,350 | 1,534 |
| 6 Temasek Financial I Ltd. | 5.375% | 11/23/39 | 500 | 624 |
| Total Sovereign Bonds (Cost $4,210,807) | 4,468,114 | |||
| Taxable Municipal Bonds (0.9%) | ||||
| Alameda County CA Joint Powers Authority Lease | ||||
| Revenue | 7.046% | 12/1/44 | 200 | 248 |
| American Municipal Power Ohio Inc. Revenue (Prairie | ||||
| State Energy Campus Project) | 7.834% | 2/15/41 | 1,000 | 1,386 |
| American Municipal Power Ohio Inc. Revenue (Prairie | ||||
| State Energy Campus Project) | 6.053% | 2/15/43 | 950 | 1,107 |
| American Municipal Power Ohio Inc. Revenue (Prairie | ||||
| State Energy Campus Project) | 5.939% | 2/15/47 | 4,775 | 5,258 |
| American Municipal Power Ohio Inc. Revenue (Prairie | ||||
| State Energy Campus Project) | 6.270% | 2/15/50 | 1,750 | 1,993 |
| American Municipal Power Ohio Inc. Revenue (Prairie | ||||
| State Energy Campus Project) | 7.499% | 2/15/50 | 1,525 | 1,991 |
| American Municipal Power Ohio Inc. Revenue (Prairie | ||||
| State Energy Campus Project) | 8.084% | 2/15/50 | 8,600 | 12,063 |
| Bay Area Toll Authority California Toll Bridge Revenue | ||||
| (San Francisco Bay Area) | 6.793% | 4/1/30 | 2,375 | 2,861 |
| Bay Area Toll Authority California Toll Bridge Revenue | ||||
| (San Francisco Bay Area) | 6.918% | 4/1/40 | 4,075 | 5,221 |
| Bay Area Toll Authority California Toll Bridge Revenue | ||||
| (San Francisco Bay Area) | 6.263% | 4/1/49 | 6,250 | 8,121 |
| Bay Area Toll Authority California Toll Bridge Revenue | ||||
| (San Francisco Bay Area) | 6.907% | 10/1/50 | 8,800 | 11,475 |
| Board of Regents of the University of Texas System | ||||
| Revenue Financing System Revenue | 5.262% | 7/1/39 | 1,650 | 2,018 |
| Board of Regents of the University of Texas System | ||||
| Revenue Financing System Revenue | 6.276% | 8/15/41 | 1,525 | 1,736 |
| Board of Regents of the University of Texas System | ||||
| Revenue Financing System Revenue | 5.134% | 8/15/42 | 100 | 121 |
| Board of Regents of the University of Texas System | ||||
| Revenue Financing System Revenue | 4.794% | 8/15/46 | 2,300 | 2,634 |
| California Educational Facilities Authority Revenue | ||||
| (Stanford University) | 3.625% | 5/1/14 | 7,650 | 8,167 |
| California Educational Facilities Authority Revenue | ||||
| (Stanford University) | 4.250% | 5/1/16 | 2,250 | 2,529 |
| California GO | 5.250% | 4/1/14 | 3,425 | 3,650 |
| California GO | 5.750% | 3/1/17 | 10,750 | 12,037 |
| California GO | 6.200% | 3/1/19 | 1,400 | 1,583 |
| California GO | 6.200% | 10/1/19 | 11,175 | 12,767 |
| California GO | 5.700% | 11/1/21 | 10,000 | 10,986 |
| California GO | 7.500% | 4/1/34 | 22,550 | 26,985 |
| California GO | 7.950% | 3/1/36 | 500 | 566 |
| California GO | 5.650% | 4/1/39 | 3,775 | 3,982 |
| California GO | 7.550% | 4/1/39 | 185 | 226 |
| California GO | 7.300% | 10/1/39 | 3,510 | 4,182 |
| California GO | 7.350% | 11/1/39 | 21,900 | 26,247 |
| California GO | 7.625% | 3/1/40 | 8,250 | 10,206 |
| California GO | 7.600% | 11/1/40 | 9,150 | 11,307 |
| Central Puget Sound WA Regional Transit Authority | ||||
| Sales & Use Tax Revenue | 5.491% | 11/1/39 | 1,500 | 1,805 |
| Chicago IL Board of Education GO | 6.319% | 11/1/29 | 3,125 | 3,462 |
| Chicago IL Board of Education GO | 6.138% | 12/1/39 | 650 | 697 |
| Chicago IL GO | 7.781% | 1/1/35 | 1,850 | 2,242 |
| Chicago IL Metropolitan Water Reclamation District GO | 5.720% | 12/1/38 | 9,350 | 11,663 |
67
Vanguard® Total Bond Market Index Fund
Schedule of Investments
December 31, 2011
| Face | Market | |||
| Maturity | Amount | Value | ||
| Coupon | Date | ($000) | ($000) | |
| Chicago IL O'Hare International Airport Revenue | 6.845% | 1/1/38 | 1,450 | 1,604 |
| Chicago IL O'Hare International Airport Revenue | 6.395% | 1/1/40 | 1,500 | 1,834 |
| Chicago IL Transit Authority Sales Tax Receipts | ||||
| Revenue | 6.200% | 12/1/40 | 2,850 | 3,206 |
| Chicago IL Transit Authority Transfer Tax Receipts | ||||
| Revenue | 6.899% | 12/1/40 | 7,125 | 8,414 |
| Chicago IL Wastewater Transmission Revenue | 6.900% | 1/1/40 | 1,700 | 2,109 |
| Chicago IL Water Revenue | 6.742% | 11/1/40 | 2,150 | 2,734 |
| Clark County NV Airport Revenue | 6.881% | 7/1/42 | 1,475 | 1,645 |
| Commonwealth Financing Authority Pennsylvania | ||||
| Revenue | 6.218% | 6/1/39 | 6,375 | 7,520 |
| Connecticut GO | 5.090% | 10/1/30 | 8,600 | 9,197 |
| Connecticut GO | 5.850% | 3/15/32 | 5,375 | 6,550 |
| Connecticut Special Tax Revenue (Transportation | ||||
| Infrastructure) | 5.459% | 11/1/30 | 3,300 | 3,753 |
| Cook County IL GO | 6.229% | 11/15/34 | 1,950 | 2,161 |
| Curators of the University of Missouri System Facilities | ||||
| Revenue | 5.960% | 11/1/39 | 3,000 | 3,885 |
| Curators of the University of Missouri System Facilities | ||||
| Revenue | 5.792% | 11/1/41 | 3,000 | 3,760 |
| Dallas County TX Hospital District Revenue | 5.621% | 8/15/44 | 2,100 | 2,588 |
| Dallas TX Area Rapid Transit Revenue | 4.922% | 12/1/41 | 7,850 | 8,897 |
| Dallas TX Area Rapid Transit Revenue | 5.999% | 12/1/44 | 1,050 | 1,383 |
| Dallas TX Area Rapid Transit Revenue | 5.022% | 12/1/48 | 4,700 | 5,368 |
| Dallas TX Independent School District GO | 6.450% | 2/15/35 | 3,850 | 4,549 |
| Denver CO City & County School District No. 1 GO | 5.664% | 12/1/33 | 1,325 | 1,563 |
| Denver CO Public Schools Revenue (City & County of | ||||
| Denver School District No. 1) COP | 7.017% | 12/15/37 | 2,100 | 2,676 |
| District of Columbia Income Tax Revenue | 5.591% | 12/1/34 | 1,125 | 1,371 |
| District of Columbia Income Tax Revenue | 5.582% | 12/1/35 | 1,600 | 1,923 |
| East Baton Rouge LA Sewer Commission Revenue | 6.087% | 2/1/45 | 2,300 | 2,395 |
| East Bay CA Municipal Utility District Water System | ||||
| Revenue | 5.874% | 6/1/40 | 2,100 | 2,619 |
| Georgia GO | 4.503% | 11/1/25 | 5,900 | 6,648 |
| Georgia Municipal Electric Power Authority Revenue | 6.637% | 4/1/57 | 8,175 | 8,622 |
| Georgia Municipal Electric Power Authority Revenue | 6.655% | 4/1/57 | 5,980 | 6,112 |
| Georgia Municipal Electric Power Authority Revenue | 7.055% | 4/1/57 | 3,425 | 3,534 |
| Illinois GO | 2.766% | 1/1/12 | 9,600 | 9,601 |
| Illinois GO | 4.071% | 1/1/14 | 9,600 | 9,900 |
| Illinois GO | 4.511% | 3/1/15 | 11,650 | 12,203 |
| Illinois GO | 5.365% | 3/1/17 | 6,750 | 7,241 |
| Illinois GO | 4.950% | 6/1/23 | 13,275 | 13,108 |
| Illinois GO | 5.100% | 6/1/33 | 42,199 | 38,514 |
| Illinois GO | 6.630% | 2/1/35 | 2,800 | 2,926 |
| Illinois GO | 6.725% | 4/1/35 | 5,275 | 5,565 |
| Illinois GO | 7.350% | 7/1/35 | 550 | 599 |
| Illinois Toll Highway Authority Revenue | 6.184% | 1/1/34 | 880 | 1,039 |
| Illinois Toll Highway Authority Revenue | 5.851% | 12/1/34 | 1,650 | 1,887 |
| Indianapolis IN Local Public Improvement Revenue | 6.116% | 1/15/40 | 9,700 | 12,404 |
| 12 Kansas Development Finance Authority Revenue | ||||
| (Public Employees Retirement System) | 5.501% | 5/1/34 | 4,300 | 4,685 |
| Kentucky Asset/Liability Commission General Fund | ||||
| Revenue | 3.165% | 4/1/18 | 800 | 820 |
| Las Vegas Valley Water District Nevada GO | 7.013% | 6/1/39 | 1,700 | 2,220 |
| Los Angeles CA Community College District GO | 6.600% | 8/1/42 | 5,325 | 6,833 |
| Los Angeles CA Department of Water & Power | ||||
| Revenue | 5.716% | 7/1/39 | 2,000 | 2,315 |
| Los Angeles CA Department of Water & Power | ||||
| Revenue | 6.008% | 7/1/39 | 6,350 | 7,338 |
| Los Angeles CA Department of Water & Power | ||||
| Revenue | 6.166% | 7/1/40 | 1,550 | 1,691 |
| Los Angeles CA Department of Water & Power | ||||
| Revenue | 6.574% | 7/1/45 | 2,700 | 3,609 |
68
Vanguard® Total Bond Market Index Fund
Schedule of Investments
December 31, 2011
| Face | Market | |||
| Maturity | Amount | Value | ||
| Coupon | Date | ($000) | ($000) | |
| Los Angeles CA Department of Water & Power | ||||
| Revenue | 6.603% | 7/1/50 | 350 | 472 |
| Los Angeles CA Unified School District GO | 5.750% | 7/1/34 | 9,225 | 10,206 |
| Los Angeles CA Unified School District GO | 6.758% | 7/1/34 | 2,525 | 3,159 |
| Los Angeles County CA Metropolitan Transportation | ||||
| Authority Sales Tax Revenue | 5.735% | 6/1/39 | 5,200 | 6,224 |
| Los Angeles County CA Public Works Financing | ||||
| Authority Lease Revenue | 7.488% | 8/1/33 | 4,300 | 5,418 |
| Los Angeles County CA Public Works Financing | ||||
| Authority Lease Revenue | 7.618% | 8/1/40 | 2,250 | 2,763 |
| Loudoun County VA Industrial Development Authority | ||||
| Revenue (Howard Hughes Medical Institute) | 3.450% | 9/1/14 | 4,050 | 4,320 |
| Maryland Health & Higher Educational Facilities | ||||
| Authority Revenue (Johns Hopkins University) | 5.250% | 7/1/19 | 7,950 | 9,478 |
| Maryland Transportation Authority Facilities Projects | ||||
| Revenue | 5.888% | 7/1/43 | 2,100 | 2,664 |
| Massachusetts GO | 4.200% | 12/1/21 | 5,000 | 5,539 |
| Massachusetts GO | 4.500% | 8/1/31 | 500 | 530 |
| Massachusetts GO | 5.456% | 12/1/39 | 4,600 | 5,562 |
| Massachusetts School Building Authority Dedicated | ||||
| Sales Tax Revenue | 5.715% | 8/15/39 | 2,550 | 3,168 |
| Massachusetts Transportation Fund Revenue | 5.731% | 6/1/40 | 1,000 | 1,307 |
| Massachusetts Water Pollution Abatement Trust | 5.192% | 8/1/40 | 2,825 | 3,287 |
| Metropolitan Government of Nashville & Davidson | ||||
| County TN GO | 5.707% | 7/1/34 | 2,625 | 3,074 |
| Metropolitan New York Transportation Authority | ||||
| Revenue (Dedicated Tax Fund) | 7.336% | 11/15/39 | 10,955 | 15,415 |
| Metropolitan New York Transportation Authority | ||||
| Revenue (Dedicated Tax Fund) | 6.089% | 11/15/40 | 975 | 1,179 |
| Metropolitan New York Transportation Authority | ||||
| Revenue (Transit Revenue) | 6.548% | 11/15/31 | 700 | 839 |
| Metropolitan New York Transportation Authority | ||||
| Revenue (Transit Revenue) | 5.871% | 11/15/39 | 2,175 | 2,338 |
| Metropolitan New York Transportation Authority | ||||
| Revenue (Transit Revenue) | 6.648% | 11/15/39 | 4,170 | 5,011 |
| Metropolitan Washington DC/VA Airports Authority | ||||
| Dulles Toll Road Revenue | 7.462% | 10/1/46 | 1,375 | 1,530 |
| Metropolitan Water District of Southern California | ||||
| Water Revenue | 6.947% | 7/1/40 | 1,650 | 1,944 |
| Mississippi GO | 5.245% | 11/1/34 | 1,375 | 1,569 |
| Missouri Highways & Transportation Commission Road | ||||
| Revenue | 5.445% | 5/1/33 | 1,650 | 1,945 |
| New Hampshire Health & Educational Facilities | ||||
| Authority Revenue (Dartmouth College) | 4.750% | 6/1/19 | 1,185 | 1,379 |
| 13 New Jersey Economic Development Authority | ||||
| Revenue (State Pension Funding) | 7.425% | 2/15/29 | 8,750 | 10,635 |
| New Jersey Educational Facilities Authority Revenue | ||||
| (Princeton University) | 5.700% | 3/1/39 | 3,625 | 4,731 |
| New Jersey Transportation Trust Fund Authority | ||||
| Transportation System Revenue | 5.754% | 12/15/28 | 12,075 | 13,196 |
| New Jersey Transportation Trust Fund Authority | ||||
| Transportation System Revenue | 6.104% | 12/15/28 | 3,500 | 3,774 |
| New Jersey Transportation Trust Fund Authority | ||||
| Transportation System Revenue | 6.561% | 12/15/40 | 575 | 747 |
| New Jersey Turnpike Authority Revenue | 4.252% | 1/1/16 | 200 | 216 |
| 14 New Jersey Turnpike Authority Revenue | 4.252% | 1/1/16 | 2,350 | 2,438 |
| New Jersey Turnpike Authority Revenue | 7.414% | 1/1/40 | 11,900 | 16,973 |
| New Jersey Turnpike Authority Revenue | 7.102% | 1/1/41 | 3,500 | 4,809 |
| New York City NY GO | 6.246% | 6/1/35 | 2,150 | 2,393 |
| New York City NY GO | 5.968% | 3/1/36 | 3,200 | 3,796 |
| New York City NY GO | 5.985% | 12/1/36 | 1,650 | 1,973 |
| New York City NY GO | 5.517% | 10/1/37 | 8,000 | 9,087 |
| New York City NY GO | 5.846% | 6/1/40 | 2,100 | 2,501 |
69
Vanguard® Total Bond Market Index Fund
Schedule of Investments
December 31, 2011
| Face | Market | |||
| Maturity | Amount | Value | ||
| Coupon | Date | ($000) | ($000) | |
| New York City NY Municipal Water Finance Authority | ||||
| Water & Sewer System Revenue | 5.750% | 6/15/41 | 1,400 | 1,716 |
| New York City NY Municipal Water Finance Authority | ||||
| Water & Sewer System Revenue | 5.724% | 6/15/42 | 450 | 544 |
| New York City NY Municipal Water Finance Authority | ||||
| Water & Sewer System Revenue | 5.952% | 6/15/42 | 2,900 | 3,606 |
| New York City NY Municipal Water Finance Authority | ||||
| Water & Sewer System Revenue | 6.011% | 6/15/42 | 1,050 | 1,312 |
| New York City NY Municipal Water Finance Authority | ||||
| Water & Sewer System Revenue | 5.440% | 6/15/43 | 4,400 | 5,027 |
| New York City NY Municipal Water Finance Authority | ||||
| Water & Sewer System Revenue | 5.882% | 6/15/44 | 15,645 | 19,536 |
| New York City NY Transitional Finance Authority | ||||
| Building Aid Revenue | 6.828% | 7/15/40 | 6,300 | 8,086 |
| New York City NY Transitional Finance Authority Future | ||||
| Tax Revenue | 5.767% | 8/1/36 | 2,125 | 2,500 |
| New York City NY Transitional Finance Authority Future | ||||
| Tax Revenue | 5.508% | 8/1/37 | 8,950 | 10,463 |
| New York State Dormitory Authority Revenue (Personal | ||||
| Income Tax) | 5.500% | 3/15/30 | 6,900 | 8,033 |
| New York State Dormitory Authority Revenue (Personal | ||||
| Income Tax) | 5.289% | 3/15/33 | 3,150 | 3,614 |
| New York State Dormitory Authority Revenue (Personal | ||||
| Income Tax) | 5.628% | 3/15/39 | 2,000 | 2,324 |
| New York State Dormitory Authority Revenue (Personal | ||||
| Income Tax) | 5.389% | 3/15/40 | 1,425 | 1,669 |
| New York State Urban Development Corp. Revenue | ||||
| (Personal Income Tax) | 5.770% | 3/15/39 | 5,675 | 6,771 |
| New York State Urban Development Corp. Revenue | ||||
| (Personal Income Tax) | 5.838% | 3/15/40 | 1,600 | 1,898 |
| North Texas Tollway Authority System Revenue | 6.718% | 1/1/49 | 3,050 | 3,783 |
| Ohio State University General Receipts Revenue | 4.910% | 6/1/40 | 4,400 | 5,047 |
| Ohio State University General Receipts Revenue | 4.800% | 6/1/11 | 2,675 | 2,790 |
| Ohio Water Development Authority Water Pollution | ||||
| Control Loan Fund Revenue | 4.879% | 12/1/34 | 2,550 | 2,882 |
| Orange County CA Local Transportation Authority Sales | ||||
| Tax Revenue | 6.908% | 2/15/41 | 1,650 | 2,218 |
| Oregon Department Transportation Highway Usertax | ||||
| Revenue | 5.834% | 11/15/34 | 2,425 | 2,967 |
| Oregon GO | 5.762% | 6/1/23 | 1,950 | 2,397 |
| Oregon GO | 5.892% | 6/1/27 | 2,725 | 3,204 |
| 14 Oregon School Boards Association GO | 4.759% | 6/30/28 | 2,075 | 2,250 |
| 12 Oregon School Boards Association GO | 5.528% | 6/30/28 | 1,200 | 1,342 |
| Pennsylvania GO | 4.650% | 2/15/26 | 2,875 | 3,237 |
| Pennsylvania GO | 5.350% | 5/1/30 | 7,400 | 8,058 |
| Pennsylvania Public School Building Authority Lease | ||||
| Revenue (School District of Philadelphia) | 5.000% | 9/15/27 | 2,600 | 2,727 |
| Pennsylvania Turnpike Commission Revenue | 6.105% | 12/1/39 | 400 | 488 |
| Pennsylvania Turnpike Commission Revenue | 5.511% | 12/1/45 | 1,450 | 1,648 |
| Pennsylvania Turnpike Commission Revenue | 5.561% | 12/1/49 | 1,475 | 1,670 |
| Port Authority of New York & New Jersey Revenue | 6.040% | 12/1/29 | 2,550 | 3,126 |
| Port Authority of New York & New Jersey Revenue | 5.647% | 11/1/40 | 11,550 | 13,088 |
| Puerto Rico Government Development Bank GO | 3.670% | 5/1/14 | 4,000 | 4,078 |
| Puerto Rico Government Development Bank GO | 4.704% | 5/1/16 | 3,450 | 3,595 |
| Regional Transportation District of Colorado Sales Tax | ||||
| Revenue | 5.844% | 11/1/50 | 3,500 | 4,548 |
| Rutgers State University NJ Revenue | 5.665% | 5/1/40 | 1,850 | 2,195 |
| Salt River Project Arizona Agricultural Improvement & | ||||
| Power District Revenue | 4.839% | 1/1/41 | 1,900 | 2,130 |
| San Antonio TX Electric & Gas Systems Revenue | 5.985% | 2/1/39 | 4,325 | 5,501 |
| San Antonio TX Electric & Gas Systems Revenue | 5.718% | 2/1/41 | 2,725 | 3,262 |
| San Antonio TX Electric & Gas Systems Revenue | 5.808% | 2/1/41 | 4,650 | 5,679 |
| San Diego County CA Water Authority Revenue | 6.138% | 5/1/49 | 2,320 | 2,962 |
70
Vanguard® Total Bond Market Index Fund
Schedule of Investments
December 31, 2011
| Face | Market | ||||
| Maturity | Amount | Value | |||
| Coupon | Date | ($000) | ($000) | ||
| San Francisco CA City & County Public Utility | |||||
| Commission Water Revenue | 6.000% | 11/1/40 | 4,950 | 5,728 | |
| Santa Clara Valley CA Transportation Authority Sales | |||||
| Tax Revenue | 5.876% | 4/1/32 | 8,900 | 10,588 | |
| South Carolina Public Service Authority Revenue | 6.454% | 1/1/50 | 2,000 | 2,746 | |
| Texas GO | 5.517% | 4/1/39 | 3,000 | 3,739 | |
| Texas Transportation Commission Revenue | 5.028% | 4/1/26 | 2,100 | 2,445 | |
| Texas Transportation Commission Revenue | 5.178% | 4/1/30 | 2,025 | 2,390 | |
| Texas Transportation Commission Revenue | 4.631% | 4/1/33 | 6,450 | 7,025 | |
| Texas Transportation Commission Revenue | 4.681% | 4/1/40 | 2,750 | 3,091 | |
| University of California Regents Medical Center | |||||
| Revenue | 6.548% | 5/15/48 | 3,950 | 4,738 | |
| University of California Regents Medical Center | |||||
| Revenue | 6.583% | 5/15/49 | 2,575 | 3,110 | |
| University of California Revenue | 0.887% | 7/1/13 | 1,250 | 1,254 | |
| University of California Revenue | 6.270% | 5/15/31 | 500 | 551 | |
| University of California Revenue | 5.770% | 5/15/43 | 1,000 | 1,149 | |
| University of California Revenue | 5.946% | 5/15/45 | 13,100 | 15,193 | |
| University of Massachusetts Building Authority | |||||
| Revenue | 5.450% | 11/1/40 | 1,700 | 1,999 | |
| University of Southern California | 5.250% | 10/1/11 | 3,900 | 4,866 | |
| University of Virginia Revenue | 6.200% | 9/1/39 | 3,000 | 4,105 | |
| Utah GO | 4.554% | 7/1/24 | 2,425 | 2,860 | |
| Utah GO | 3.539% | 7/1/25 | 6,300 | 6,675 | |
| Utah Transit Authority Sales Tax Revenue | 5.937% | 6/15/39 | 400 | 510 | |
| Washington Convention Center Public Facilities District | |||||
| Revenue | 6.790% | 7/1/40 | 400 | 496 | |
| Washington GO | 5.090% | 8/1/33 | 9,025 | 10,199 | |
| Washington GO | 5.481% | 8/1/39 | 770 | 922 | |
| Washington GO | 5.140% | 8/1/40 | 5,300 | 6,115 | |
| 12 | Wisconsin GO | 4.800% | 5/1/13 | 2,525 | 2,655 |
| 12 | Wisconsin GO | 5.700% | 5/1/26 | 2,800 | 3,215 |
| Total Taxable Municipal Bonds (Cost $815,148) | 936,564 | ||||
| Shares | |||||
| Temporary Cash Investment (4.3%) | |||||
| Money Market Fund (4.3%) | |||||
| 15 | Vanguard Market Liquidity Fund (Cost $4,345,508) | 0.110% | 4,345,507,937 | 4,345,508 | |
| Total Investments (103.6%) (Cost $99,110,953) | 105,474,123 | ||||
| Other Assets and Liabilities—Net (-3.6%) | (3,691,307) | ||||
| Net Assets (100%) | 101,782,816 | ||||
1 Guaranteed by the Federal Deposit Insurance Corporation (FDIC) as part of the Temporary Liquidity Guarantee Program.
2 The issuer operates under a congressional charter; its securities are generally neither guaranteed by the U.S. Treasury nor backed by the full
faith and credit of the U.S. government.
3 The issuer was placed under federal conservatorship in September 2008; since that time, its daily operations have been managed by the Federal
Housing Finance Agency and it receives capital from the U.S. Treasury in exchange for senior preferred stock.
4 The average or expected maturity is shorter than the final maturity shown because of the possibility of interim principal payments and
prepayments or the possibility of the issue being called.
5 Includes securities purchased on a when-issued or delayed-delivery basis for which the fund has not taken delivery as of December 31, 2011.
6 Security exempt from registration under Rule 144A of the Securities Act of 1933. Such securities may be sold in transactions exempt from
registration, normally to qualified institutional buyers. At December 31, 2011, the aggregate value of these securities was $213,175,000,
representing 0.2% of net assets.
7 Adjustable-rate security.
8 Non-income-producing security--security in default.
9 Guaranteed by the Government of Japan.
10 Guaranteed by the Federal Republic of Germany.
11 Guaranteed by the Republic of Austria.
71
Vanguard® Total Bond Market Index Fund
Schedule of Investments
December 31, 2011
12 Scheduled principal and interest payments are guaranteed by AGM (Assured Guaranty Municipal Corporation).
13 Scheduled principal and interest payments are guaranteed by National Public Finance Guarantee Corp.
14 Scheduled principal and interest payments are guaranteed by AMBAC (Ambac Assurance Corporation).
15 Affiliated money market fund available only to Vanguard funds and certain trusts and accounts managed by Vanguard. Rate shown is the 7-day
yield.
COP—Certificate of Participation.
GO—General Obligation Bond.
REIT—Real Estate Investment Trust.
72
Short-Term Bond Index Fund
Financial Statements
Statement of Net Assets – Investments Summary
As of December 31, 2011
This Statement summarizes the fund’s holdings by asset type. Details are reported for each of the fund’s 50 largest individual holdings and for investments that, in total for any issuer, represent more than 1% of the fund’s net assets. The total value of smaller holdings is reported as a single amount within each category.
The fund reports a complete list of its holdings in regulatory filings four times in each fiscal year, at the quarter-ends. For the second and fourth fiscal quarters, the complete listing of the fund’s holdings is available electronically on vanguard.com and on the Securities and Exchange Commission’s website (sec.gov), or you can have it mailed to you without charge by calling 800-662-7447. For the first and third fiscal quarters, the fund files the lists with the SEC on Form N-Q. Shareholders can look up the fund’s Forms N-Q on the SEC’s website. Forms N-Q may also be reviewed and copied at the SEC’s Public Reference Room (see the back cover of this report for further information).
| Face | Market | Percentage | |||
| Maturity | Amount | Value• | of Net | ||
| Coupon | Date | ($000) | ($000) | Assets | |
| U.S. Government and Agency Obligations | |||||
| U.S. Government Securities | |||||
| United States Treasury | |||||
| Note/Bond | 0.375% | 7/31/13 | 466,885 | 467,978 | 2.0% |
| United States Treasury | |||||
| Note/Bond | 2.500% | 3/31/15 | 393,068 | 419,172 | 1.8% |
| United States Treasury | |||||
| Note/Bond | 2.625% | 7/31/14 | 393,725 | 416,919 | 1.8% |
| United States Treasury | |||||
| Note/Bond | 0.875% | 12/31/16 | 400,000 | 400,812 | 1.7% |
| United States Treasury | |||||
| Note/Bond | 1.750% | 5/31/16 | 370,725 | 387,756 | 1.6% |
| United States Treasury | |||||
| Note/Bond | 0.625% | 4/30/13 | 369,825 | 371,907 | 1.6% |
| United States Treasury | |||||
| Note/Bond | 2.375% | 10/31/14 | 351,860 | 371,708 | 1.6% |
| United States Treasury | |||||
| Note/Bond | 0.875% | 11/30/16 | 365,500 | 366,699 | 1.6% |
| United States Treasury | |||||
| Note/Bond | 0.250% | 10/31/13 | 327,095 | 327,147 | 1.4% |
| United States Treasury | |||||
| Note/Bond | 1.875% | 4/30/14 | 276,005 | 286,054 | 1.2% |
| United States Treasury | |||||
| Note/Bond | 1.250% | 10/31/15 | 274,925 | 281,971 | 1.2% |
| United States Treasury | |||||
| Note/Bond | 0.625% | 2/28/13 | 279,505 | 280,947 | 1.2% |
| United States Treasury | |||||
| Note/Bond | 1.000% | 9/30/16 | 277,030 | 279,975 | 1.2% |
| United States Treasury | |||||
| Note/Bond | 1.000% | 10/31/16 | 273,285 | 275,974 | 1.2% |
| United States Treasury | |||||
| Note/Bond | 1.875% | 2/28/14 | 262,020 | 270,944 | 1.1% |
73
Short-Term Bond Index Fund
| Face | Market | Percentage | |||
| Maturity | Amount | Value• | of Net | ||
| Coupon | Date | ($000) | ($000) | Assets | |
| United States Treasury | |||||
| Note/Bond | 2.250% | 5/31/14 | 253,755 | 265,451 | 1.1% |
| United States Treasury | |||||
| Note/Bond | 2.125% | 11/30/14 | 250,135 | 262,759 | 1.1% |
| United States Treasury | |||||
| Note/Bond | 2.625% | 6/30/14 | 242,870 | 256,684 | 1.1% |
| United States Treasury | |||||
| Note/Bond | 0.750% | 3/31/13 | 254,693 | 256,445 | 1.1% |
| United States Treasury | |||||
| Note/Bond | 2.375% | 3/31/16 | 235,947 | 252,720 | 1.1% |
| United States Treasury | |||||
| Note/Bond | 1.750% | 3/31/14 | 241,500 | 249,424 | 1.1% |
| United States Treasury | |||||
| Note/Bond | 3.625% | 5/15/13 | 237,100 | 248,066 | 1.0% |
| United States Treasury | |||||
| Note/Bond | 1.375% | 2/15/13 | 241,618 | 244,827 | 1.0% |
| United States Treasury | |||||
| Note/Bond | 1.375% | 11/30/15 | 233,650 | 240,769 | 1.0% |
| United States Treasury | |||||
| Note/Bond | 1.500% | 6/30/16 | 226,120 | 233,858 | 1.0% |
| United States Treasury | |||||
| Note/Bond | 0.500% | 5/31/13 | 232,625 | 233,569 | 1.0% |
| United States Treasury | |||||
| Note/Bond | 1.875% | 6/30/15 | 215,453 | 225,788 | 1.0% |
| United States Treasury | |||||
| Note/Bond | 2.000% | 4/30/16 | 213,180 | 225,137 | 1.0% |
| United States Treasury | |||||
| Note/Bond | 2.375% | 2/28/15 | 210,482 | 223,374 | 0.9% |
| United States Treasury | |||||
| Note/Bond | 0.375% | 6/30/13 | 201,670 | 202,142 | 0.9% |
| United States Treasury | |||||
| Note/Bond | 0.125% | 8/31/13 | 200,110 | 199,798 | 0.8% |
| United States Treasury | |||||
| Note/Bond | 1.125% | 6/15/13 | 193,978 | 196,494 | 0.8% |
| United States Treasury | |||||
| Note/Bond | 0.125% | 12/31/13 | 189,085 | 188,643 | 0.8% |
| United States Treasury | |||||
| Note/Bond | 2.125% | 2/29/16 | 173,480 | 184,133 | 0.8% |
| United States Treasury | |||||
| Note/Bond | 2.125% | 12/31/15 | 171,800 | 182,242 | 0.8% |
| United States Treasury | |||||
| Note/Bond | 1.375% | 3/15/13 | 178,228 | 180,762 | 0.8% |
| United States Treasury | |||||
| Note/Bond | 1.750% | 4/15/13 | 177,045 | 180,558 | 0.8% |
| United States Treasury | |||||
| Note/Bond | 1.500% | 7/31/16 | 165,825 | 171,448 | 0.7% |
| United States Treasury | |||||
| Note/Bond | 0.250% | 11/30/13 | 165,270 | 165,321 | 0.7% |
| United States Treasury | |||||
| Note/Bond | 1.000% | 8/31/16 | 154,320 | 156,031 | 0.7% |
| United States Treasury | |||||
| Note/Bond | 1.750% | 7/31/15 | 144,035 | 150,360 | 0.6% |
74
Short-Term Bond Index Fund
| Face | Market | Percentage | |||
| Maturity | Amount | Value• | of Net | ||
| Coupon | Date | ($000) | ($000) | Assets | |
| United States Treasury | |||||
| Note/Bond | 0.625% | 7/15/14 | 142,115 | 143,204 | 0.6% |
| United States Treasury | |||||
| Note/Bond | 2.375% | 9/30/14 | 135,155 | 142,630 | 0.6% |
| United States Treasury | |||||
| Note/Bond | 2.750% | 10/31/13 | 132,705 | 138,739 | 0.6% |
| United States Treasury | |||||
| Note/Bond | 4.500% | 2/15/16 | 119,158 | 137,796 | 0.6% |
| United States Treasury | |||||
| Note/Bond | 0.750% | 6/15/14 | 134,035 | 135,480 | 0.6% |
| United States Treasury | |||||
| Note/Bond | 3.125% | 9/30/13 | 127,345 | 133,733 | 0.6% |
| United States Treasury | |||||
| Note/Bond | 0.500% | 10/15/14 | 130,355 | 130,905 | 0.5% |
| United States Treasury | |||||
| Note/Bond | 4.250% | 8/15/13 | 110,525 | 117,691 | 0.5% |
| United States Treasury | |||||
| Note/Bond | 0.250%–11.250% | 2/15/13–11/15/16 | 1,892,806 | 1,991,074 | 8.5% |
| 13,854,018 | 59.0% | ||||
| Agency Bonds and Notes | |||||
| 1 Federal Home Loan Bank of | |||||
| Chicago | 5.625% | 6/13/16 | 4,325 | 4,874 | 0.0% |
| 1 Federal Home Loan Banks | 0.375%–5.500% | 12/14/12–12/16/16 | 608,980 | 630,409 | 2.7% |
| 2 Federal Home Loan Mortgage | |||||
| Corp. | 4.500% | 7/15/13 | 116,495 | 124,043 | 0.5% |
| 2 Federal Home Loan Mortgage | |||||
| Corp. | 0.375%–5.500% | 12/28/12–8/25/16 | 753,025 | 783,431 | 3.3% |
| 2 Federal National Mortgage | |||||
| Assn. | 0.375%–5.250% | 12/28/12–11/15/16 | 1,001,228 | 1,045,217 | 4.5% |
| Agency Bonds and Notes—Other † | 182,589 | 0.8% | |||
| 2,770,563 | 11.8% | ||||
| Total U.S. Government and Agency Obligations (Cost $16,257,432) | 16,624,581 | 70.8% | |||
| 3Asset-Backed/Commercial Mortgage-Backed Securities (Cost $ 16,149) † | 16,538 | 0.1% | |||
| Corporate Bonds | |||||
| Finance | |||||
| 3 Banking † | 1,571,457 | 6.7% | |||
| Brokerage † | 43,453 | 0.2% | |||
| Finance Companies † | 203,227 | 0.8% | |||
| Insurance † | 250,285 | 1.1% | |||
| Other Finance † | 14,862 | 0.1% | |||
| Real Estate Investment Trusts † | 75,663 | 0.3% | |||
| 2,158,947 | 9.2% | ||||
See accompanying Notes, which are an integral part of the Financial Statements.
75
Short-Term Bond Index Fund
| Face | Market | Percentage | |||
| Maturity | Amount | Value• | of Net | ||
| Coupon | Date | ($000) | ($000) | Assets | |
| Industrial | |||||
| 3 Basic Industry † | 222,329 | 0.9% | |||
| Capital Goods † | 243,005 | 1.0% | |||
| Communication † | 469,052 | 2.0% | |||
| 3 Consumer Cyclical † | 251,461 | 1.1% | |||
| Consumer Noncyclical † | 680,058 | 2.9% | |||
| Energy † | 254,454 | 1.1% | |||
| Other Industrial † | 1,935 | 0.0% | |||
| Technology † | 301,734 | 1.3% | |||
| Transportation † | 48,937 | 0.2% | |||
| 2,472,965 | 10.5% | ||||
| Utilities | |||||
| Electric † | 226,934 | 1.0% | |||
| Natural Gas † | 102,776 | 0.4% | |||
| 329,710 | 1.4% | ||||
| Total Corporate Bonds (Cost $4,865,799) | 4,961,622 | 21.1% | |||
| Sovereign Bonds (U.S. Dollar-Denominated) | |||||
| European Investment Bank | 0.875%–5.125% | 3/15/13–10/14/16 | 362,375 | 367,110 | 1.6% |
| 4 Kreditanstalt fuer | |||||
| Wiederaufbau | 1.250%–5.125% | 1/14/13–10/5/16 | 265,975 | 273,834 | 1.2% |
| 4 Landwirtschaftliche | |||||
| Rentenbank | 2.125%–4.125% | 3/15/13–7/15/16 | 35,475 | 37,028 | 0.1% |
| Sovereign Bonds (U.S. Dollar-Denominated)—Other † | 1,045,439 | 4.4% | |||
| Total Sovereign Bonds (Cost $1,691,152) | 1,723,411 | 7.3% | |||
| Taxable Municipal Bonds (Cost $ 28,672) † | 29,540 | 0.1% | |||
| Shares | |||||
| Temporary Cash Investment | |||||
| Money Market Fund | |||||
| 5 Vanguard Market Liquidity Fund | |||||
| (Cost $82,183) | 0.110% | 82,182,802 | 82,183 | 0.3% | |
| Total Investments (Cost $22,941,387) | 23,437,875 | 99.7% | |||
| Other Assets and Liabilities | |||||
| Other Assets | 759,675 | 3.2% | |||
| Liabilities | (694,524) | (2.9%) | |||
| 65,151 | 0.3% | ||||
| Net Assets | 23,503,026 | 100.0% | |||
| At December 31, 2011, net assets consisted of: | |
| Amount | |
| ($000) | |
| Paid-in Capital | 22,997,410 |
76
Short-Term Bond Index Fund
| Undistributed Net Investment Income | — |
| Accumulated Net Realized Gains | 9,128 |
| Unrealized Appreciation (Depreciation) | 496,488 |
| Net Assets | 23,503,026 |
| Investor Shares—Net Assets | |
| Applicable to 358,390,753 outstanding $.001 par value shares of beneficial interest | |
| (unlimited authorization) | 3,802,307 |
| Net Asset Value Per Share—Investor Shares | $10.61 |
| Admiral Shares—Net Assets | |
| Applicable to 385,908,282 outstanding $.001 par value shares of beneficial interest | |
| (unlimited authorization) | 4,094,253 |
| Net Asset Value Per Share—Admiral Shares | $10.61 |
| Signal Shares—Net Assets | |
| Applicable to 619,369,532 outstanding $.001 par value shares of beneficial interest | |
| (unlimited authorization) | 6,571,129 |
| Net Asset Value Per Share—Signal Shares | $10.61 |
| Institutional Shares—Net Assets | |
| Applicable to 79,412,468 outstanding $.001 par value shares of beneficial interest | |
| (unlimited authorization) | 842,517 |
| Net Asset Value Per Share—Institutional Shares | $10.61 |
| Institutional Plus Shares—Net Assets | |
| Applicable to 67,023,638 outstanding $.001 par value shares of beneficial interest | |
| (unlimited authorization) | 711,080 |
| Net Asset Value Per Share—Institutional Plus Shares | $10.61 |
| ETF Shares—Net Assets | |
| Applicable to 92,600,000 outstanding $.001 par value shares of beneficial interest | |
| (unlimited authorization) | 7,481,740 |
| Net Asset Value Per Share—ETF Shares | $80.80 |
• See Note A in Notes to Financial Statements.
† Represents the aggregate value, by category, of securities that are not among the 50 largest holdings and, in total for any issuer, represent
1% or less of net assets.
1 The issuer operates under a congressional charter; its securities are generally neither guaranteed by the U.S. Treasury nor backed by the
full faith and credit of the U.S. government.
2 The issuer was placed under federal conservatorship in September 2008; since that time, its daily operations have been managed by the
Federal Housing Finance Agency and it receives capital from the U.S. Treasury in exchange for senior preferred stock.
3 Security exempt from registration under Rule 144A of the Securities Act of 1933. Such securities may be sold in transactions exempt from
registration, normally to qualified institutional buyers. At December 31, 2011, the aggregate value of these securities was $25,222,000,
representing 0.1% of net assets.
4 Guaranteed by the Federal Republic of Germany.
5 Affiliated money market fund available only to Vanguard funds and certain trusts and accounts managed by Vanguard. Rate shown is the 7-
day yield.
See accompanying Notes, which are an integral part of the Financial Statements.
77
Vanguard® Intermediate-Term Bond Index Fund
Schedule of Investments
December 31, 2011
| Face | Market | ||||
| Maturity | Amount | Value | |||
| Coupon | Date | ($000) | ($000) | ||
| U.S. Government and Agency Obligations (54.6%) | |||||
| U.S. Government Securities (51.9%) | |||||
| United States Treasury Note/Bond | 7.500% | 11/15/16 | 51,995 | 68,577 | |
| United States Treasury Note/Bond | 0.875% | 11/30/16 | 730 | 732 | |
| United States Treasury Note/Bond | 2.750% | 11/30/16 | 60,000 | 65,513 | |
| United States Treasury Note/Bond | 3.250% | 12/31/16 | 175,905 | 196,437 | |
| United States Treasury Note/Bond | 3.125% | 1/31/17 | 134,845 | 149,931 | |
| United States Treasury Note/Bond | 4.625% | 2/15/17 | 88,640 | 105,191 | |
| United States Treasury Note/Bond | 3.000% | 2/28/17 | 94,460 | 104,481 | |
| United States Treasury Note/Bond | 3.250% | 3/31/17 | 95,065 | 106,458 | |
| United States Treasury Note/Bond | 3.125% | 4/30/17 | 26,060 | 29,028 | |
| United States Treasury Note/Bond | 4.500% | 5/15/17 | 130,410 | 154,678 | |
| United States Treasury Note/Bond | 8.750% | 5/15/17 | 83,070 | 117,103 | |
| United States Treasury Note/Bond | 2.750% | 5/31/17 | 50,595 | 55,378 | |
| United States Treasury Note/Bond | 2.500% | 6/30/17 | 43,475 | 47,028 | |
| United States Treasury Note/Bond | 2.375% | 7/31/17 | 3,500 | 3,763 | |
| United States Treasury Note/Bond | 4.750% | 8/15/17 | 167,660 | 201,900 | |
| United States Treasury Note/Bond | 8.875% | 8/15/17 | 71,285 | 102,060 | |
| United States Treasury Note/Bond | 1.875% | 8/31/17 | 3,765 | 3,942 | |
| United States Treasury Note/Bond | 1.875% | 9/30/17 | 49,335 | 51,594 | |
| United States Treasury Note/Bond | 1.875% | 10/31/17 | 60,400 | 63,165 | |
| United States Treasury Note/Bond | 4.250% | 11/15/17 | 2,315 | 2,735 | |
| United States Treasury Note/Bond | 2.250% | 11/30/17 | 19,075 | 20,354 | |
| United States Treasury Note/Bond | 2.625% | 1/31/18 | 2,225 | 2,424 | |
| United States Treasury Note/Bond | 3.500% | 2/15/18 | 164,640 | 187,767 | |
| United States Treasury Note/Bond | 2.875% | 3/31/18 | 8,645 | 9,550 | |
| United States Treasury Note/Bond | 2.625% | 4/30/18 | 10,000 | 10,889 | |
| United States Treasury Note/Bond | 3.875% | 5/15/18 | 152,280 | 177,644 | |
| United States Treasury Note/Bond | 2.375% | 5/31/18 | 50 | 54 | |
| United States Treasury Note/Bond | 2.250% | 7/31/18 | 2,000 | 2,127 | |
| United States Treasury Note/Bond | 4.000% | 8/15/18 | 236,985 | 279,088 | |
| United States Treasury Note/Bond | 1.500% | 8/31/18 | 375 | 380 | |
| United States Treasury Note/Bond | 1.750% | 10/31/18 | 34,320 | 35,323 | |
| United States Treasury Note/Bond | 3.750% | 11/15/18 | 288,580 | 335,699 | |
| United States Treasury Note/Bond | 1.375% | 11/30/18 | 17,300 | 17,360 | |
| United States Treasury Note/Bond | 2.750% | 2/15/19 | 188,060 | 205,984 | |
| United States Treasury Note/Bond | 8.875% | 2/15/19 | 51,850 | 78,618 | |
| United States Treasury Note/Bond | 3.125% | 5/15/19 | 394,410 | 442,169 | |
| United States Treasury Note/Bond | 3.625% | 8/15/19 | 390,915 | 452,668 | |
| United States Treasury Note/Bond | 3.375% | 11/15/19 | 405,489 | 462,193 | |
| United States Treasury Note/Bond | 3.625% | 2/15/20 | 418,952 | 485,787 | |
| United States Treasury Note/Bond | 3.500% | 5/15/20 | 368,735 | 424,104 | |
| United States Treasury Note/Bond | 8.750% | 5/15/20 | 31,875 | 49,904 | |
| United States Treasury Note/Bond | 2.625% | 8/15/20 | 267,160 | 288,116 | |
| United States Treasury Note/Bond | 8.750% | 8/15/20 | 14,970 | 23,606 | |
| United States Treasury Note/Bond | 2.625% | 11/15/20 | 106,362 | 114,489 | |
| United States Treasury Note/Bond | 3.625% | 2/15/21 | 246,010 | 285,563 | |
| United States Treasury Note/Bond | 3.125% | 5/15/21 | 245,788 | 274,361 | |
| United States Treasury Note/Bond | 8.125% | 5/15/21 | 30,000 | 46,664 | |
| United States Treasury Note/Bond | 2.125% | 8/15/21 | 359,333 | 368,316 | |
| United States Treasury Note/Bond | 2.000% | 11/15/21 | 367,880 | 371,905 | |
| United States Treasury Note/Bond | 8.000% | 11/15/21 | 24,375 | 38,086 | |
| 7,120,886 | |||||
| Agency Bonds and Notes (2.7%) | |||||
| 1 | Federal Farm Credit Bank | 4.875% | 1/17/17 | 5,750 | 6,773 |
| 1 | Federal Home Loan Banks | 4.875% | 5/17/17 | 26,265 | 31,267 |
| 1 | Federal Home Loan Banks | 5.000% | 11/17/17 | 14,305 | 17,213 |
| 1 | Federal Home Loan Banks | 5.375% | 8/15/18 | 14,025 | 17,349 |
| 1 | Federal Home Loan Banks | 5.125% | 8/15/19 | 5,260 | 6,463 |
| 1 | Federal Home Loan Banks | 4.125% | 3/13/20 | 15,875 | 18,208 |
| 1 | Federal Home Loan Banks | 5.625% | 6/11/21 | 3,040 | 3,882 |
| 2 | Federal Home Loan Mortgage Corp. | 5.000% | 2/16/17 | 7,000 | 8,296 |
| 2 | Federal Home Loan Mortgage Corp. | 5.125% | 11/17/17 | 18,600 | 22,465 |
78
Vanguard® Intermediate-Term Bond Index Fund
Schedule of Investments
December 31, 2011
| Face | Market | ||||
| Maturity | Amount | Value | |||
| Coupon | Date | ($000) | ($000) | ||
| 2 | Federal Home Loan Mortgage Corp. | 4.875% | 6/13/18 | 11,500 | 13,862 |
| 2 | Federal Home Loan Mortgage Corp. | 3.750% | 3/27/19 | 53,010 | 60,543 |
| 2 | Federal National Mortgage Assn. | 5.000% | 2/13/17 | 45,625 | 54,062 |
| 2 | Federal National Mortgage Assn. | 5.000% | 5/11/17 | 19,005 | 22,628 |
| 2 | Federal National Mortgage Assn. | 5.375% | 6/12/17 | 17,305 | 20,954 |
| 2 | Federal National Mortgage Assn. | 0.000% | 10/9/19 | 15,300 | 11,622 |
| 1 | Financing Corp. Fico | 9.400% | 2/8/18 | 1,475 | 2,115 |
| 1 | Financing Corp. Fico | 10.350% | 8/3/18 | 2,170 | 3,316 |
| 1 | Financing Corp. Fico | 9.650% | 11/2/18 | 12,345 | 18,349 |
| 1 | Financing Corp. Fico | 8.600% | 9/26/19 | 1,275 | 1,834 |
| Private Export Funding Corp. | 2.250% | 12/15/17 | 3,225 | 3,363 | |
| Private Export Funding Corp. | 4.375% | 3/15/19 | 7,000 | 8,229 | |
| 1 | Tennessee Valley Authority | 5.500% | 7/18/17 | 6,200 | 7,546 |
| 1 | Tennessee Valley Authority | 6.250% | 12/15/17 | 2,600 | 3,293 |
| 1 | Tennessee Valley Authority | 4.500% | 4/1/18 | 5,300 | 6,232 |
| 1 | Tennessee Valley Authority | 3.875% | 2/15/21 | 6,100 | 6,941 |
| 376,805 | |||||
| Total U.S. Government and Agency Obligations (Cost $6,793,477) | 7,497,691 | ||||
| Asset-Backed/Commercial Mortgage-Backed Securities (0.1%) | |||||
| 3,4 | Banco Bilbao Vizcaya Argentaria SA | 5.750% | 7/20/17 | 225 | 229 |
| 3,4 | Bank of Scotland plc | 5.250% | 2/21/17 | 2,225 | 2,327 |
| 3,4 | Commercial Mortgage Lease-Backed Certificates | 6.746% | 6/20/31 | 206 | 220 |
| 3,4 | Northern Rock Asset Management plc | 5.625% | 6/22/17 | 4,825 | 5,114 |
| Total Asset-Backed/Commercial Mortgage-Backed Securities (Cost $7,461) | 7,890 | ||||
| Corporate Bonds (38.2%) | |||||
| Finance (12.9%) | |||||
| Banking (8.2%) | |||||
| American Express Bank FSB | 6.000% | 9/13/17 | 650 | 741 | |
| American Express Centurion Bank | 5.950% | 6/12/17 | 3,275 | 3,699 | |
| American Express Centurion Bank | 6.000% | 9/13/17 | 1,075 | 1,225 | |
| American Express Co. | 6.150% | 8/28/17 | 7,575 | 8,653 | |
| American Express Co. | 7.000% | 3/19/18 | 10,800 | 13,006 | |
| American Express Co. | 8.125% | 5/20/19 | 14,325 | 18,460 | |
| Associates Corp. of North America | 6.950% | 11/1/18 | 1,150 | 1,242 | |
| BanColombia SA | 5.950% | 6/3/21 | 1,375 | 1,380 | |
| Bank of America Corp. | 5.420% | 3/15/17 | 8,675 | 7,865 | |
| Bank of America Corp. | 6.000% | 9/1/17 | 3,850 | 3,762 | |
| Bank of America Corp. | 5.750% | 12/1/17 | 6,325 | 6,028 | |
| Bank of America Corp. | 5.650% | 5/1/18 | 27,795 | 26,407 | |
| Bank of America Corp. | 7.625% | 6/1/19 | 9,100 | 9,435 | |
| Bank of America Corp. | 5.625% | 7/1/20 | 26,170 | 24,167 | |
| Bank of America Corp. | 5.875% | 1/5/21 | 7,600 | 7,177 | |
| Bank of America NA | 5.300% | 3/15/17 | 15,050 | 13,701 | |
| Bank of America NA | 6.100% | 6/15/17 | 500 | 470 | |
| Bank of New York Mellon Corp. | 2.400% | 1/17/17 | 4,075 | 4,091 | |
| Bank of New York Mellon Corp. | 5.450% | 5/15/19 | 5,360 | 6,150 | |
| Bank of New York Mellon Corp. | 4.600% | 1/15/20 | 3,675 | 4,005 | |
| Bank of New York Mellon Corp. | 4.150% | 2/1/21 | 2,000 | 2,118 | |
| Bank of Nova Scotia | 4.375% | 1/13/21 | 2,500 | 2,723 | |
| Barclays Bank plc | 6.750% | 5/22/19 | 7,500 | 8,312 | |
| Barclays Bank plc | 5.125% | 1/8/20 | 18,800 | 19,293 | |
| BB&T Corp. | 6.850% | 4/30/19 | 3,475 | 4,229 | |
| Bear Stearns Cos. LLC | 5.550% | 1/22/17 | 12,725 | 13,453 | |
| Bear Stearns Cos. LLC | 6.400% | 10/2/17 | 16,300 | 18,211 | |
| Bear Stearns Cos. LLC | 7.250% | 2/1/18 | 3,350 | 3,920 | |
| BNP Paribas SA | 5.000% | 1/15/21 | 13,950 | 13,384 | |
| Capital One Bank USA NA | 8.800% | 7/15/19 | 4,025 | 4,668 | |
| Capital One Financial Corp. | 6.750% | 9/15/17 | 8,850 | 9,955 | |
| Capital One Financial Corp. | 4.750% | 7/15/21 | 7,375 | 7,645 | |
| 3,4 | Citicorp Lease Pass-Through Trust 1999-1 | 8.040% | 12/15/19 | 2,100 | 2,392 |
79
Vanguard® Intermediate-Term Bond Index Fund
Schedule of Investments
December 31, 2011
| Face | Market | |||
| Maturity | Amount | Value | ||
| Coupon | Date | ($000) | ($000) | |
| Citigroup Inc. | 5.500% | 2/15/17 | 10,250 | 10,346 |
| Citigroup Inc. | 6.000% | 8/15/17 | 13,775 | 14,505 |
| Citigroup Inc. | 6.125% | 11/21/17 | 10,675 | 11,399 |
| Citigroup Inc. | 6.125% | 5/15/18 | 17,100 | 18,195 |
| Citigroup Inc. | 8.500% | 5/22/19 | 9,850 | 11,669 |
| Citigroup Inc. | 5.375% | 8/9/20 | 10,676 | 10,969 |
| Comerica Bank | 5.200% | 8/22/17 | 3,025 | 3,294 |
| Compass Bank | 6.400% | 10/1/17 | 1,800 | 1,832 |
| Cooperatieve Centrale Raiffeisen-Boerenleenbank BA | 4.500% | 1/11/21 | 6,175 | 6,403 |
| Credit Suisse | 6.000% | 2/15/18 | 14,175 | 13,991 |
| Credit Suisse | 5.300% | 8/13/19 | 4,775 | 4,911 |
| Credit Suisse | 5.400% | 1/14/20 | 6,475 | 6,063 |
| Credit Suisse | 4.375% | 8/5/20 | 16,125 | 15,805 |
| 4 Credit Suisse AG | 5.860% | 5/29/49 | 6,200 | 5,068 |
| Deutsche Bank AG | 6.000% | 9/1/17 | 15,750 | 17,602 |
| Discover Bank | 8.700% | 11/18/19 | 2,350 | 2,675 |
| Discover Bank | 7.000% | 4/15/20 | 2,400 | 2,487 |
| Fifth Third Bancorp | 5.450% | 1/15/17 | 3,750 | 3,956 |
| Fifth Third Bancorp | 4.500% | 6/1/18 | 4,550 | 4,538 |
| 4 Fifth Third Capital Trust IV | 6.500% | 4/15/67 | 5,750 | 5,635 |
| First Niagara Financial Group Inc. | 6.750% | 3/19/20 | 1,275 | 1,339 |
| First Niagara Financial Group Inc. | 7.250% | 12/15/21 | 1,245 | 1,270 |
| Goldman Sachs Group Inc. | 5.625% | 1/15/17 | 12,625 | 12,376 |
| Goldman Sachs Group Inc. | 6.250% | 9/1/17 | 18,675 | 19,525 |
| Goldman Sachs Group Inc. | 5.950% | 1/18/18 | 16,750 | 17,108 |
| Goldman Sachs Group Inc. | 6.150% | 4/1/18 | 15,175 | 15,577 |
| Goldman Sachs Group Inc. | 7.500% | 2/15/19 | 5,960 | 6,621 |
| Goldman Sachs Group Inc. | 5.375% | 3/15/20 | 18,300 | 17,986 |
| Goldman Sachs Group Inc. | 6.000% | 6/15/20 | 9,565 | 9,769 |
| Goldman Sachs Group Inc. | 5.250% | 7/27/21 | 14,925 | 14,565 |
| 3 HBOS plc | 6.750% | 5/21/18 | 925 | 734 |
| HSBC Bank USA NA | 4.875% | 8/24/20 | 9,075 | 8,553 |
| HSBC Holdings plc | 5.100% | 4/5/21 | 9,500 | 10,091 |
| HSBC USA Inc. | 5.000% | 9/27/20 | 8,500 | 8,096 |
| Huntington Bancshares Inc. | 7.000% | 12/15/20 | 4,175 | 4,714 |
| JPMorgan Chase & Co. | 6.125% | 6/27/17 | 3,900 | 4,257 |
| JPMorgan Chase & Co. | 6.000% | 1/15/18 | 25,625 | 28,713 |
| JPMorgan Chase & Co. | 6.300% | 4/23/19 | 18,525 | 20,938 |
| JPMorgan Chase & Co. | 4.400% | 7/22/20 | 11,815 | 11,825 |
| JPMorgan Chase & Co. | 4.250% | 10/15/20 | 23,525 | 23,716 |
| JPMorgan Chase & Co. | 4.625% | 5/10/21 | 3,808 | 3,938 |
| JPMorgan Chase & Co. | 4.350% | 8/15/21 | 20,475 | 20,751 |
| JPMorgan Chase Bank NA | 6.000% | 10/1/17 | 6,525 | 6,972 |
| KeyCorp | 5.100% | 3/24/21 | 3,200 | 3,332 |
| Lloyds TSB Bank plc | 6.375% | 1/21/21 | 14,725 | 14,772 |
| M&I Marshall & Ilsley Bank | 4.850% | 6/16/15 | 700 | 739 |
| M&I Marshall & Ilsley Bank | 5.000% | 1/17/17 | 2,015 | 2,118 |
| Manufacturers & Traders Trust Co. | 6.625% | 12/4/17 | 5,425 | 6,215 |
| 4 Manufacturers & Traders Trust Co. | 5.585% | 12/28/20 | 2,400 | 2,349 |
| Merrill Lynch & Co. Inc. | 5.700% | 5/2/17 | 7,075 | 6,435 |
| Merrill Lynch & Co. Inc. | 6.400% | 8/28/17 | 10,250 | 9,949 |
| Merrill Lynch & Co. Inc. | 6.875% | 4/25/18 | 31,850 | 31,395 |
| Merrill Lynch & Co. Inc. | 6.500% | 7/15/18 | 4,125 | 4,002 |
| Morgan Stanley | 5.450% | 1/9/17 | 7,325 | 7,050 |
| Morgan Stanley | 5.550% | 4/27/17 | 18,325 | 17,420 |
| Morgan Stanley | 6.250% | 8/28/17 | 11,200 | 10,936 |
| Morgan Stanley | 5.950% | 12/28/17 | 15,225 | 14,557 |
| Morgan Stanley | 6.625% | 4/1/18 | 13,430 | 13,251 |
| Morgan Stanley | 7.300% | 5/13/19 | 15,175 | 15,468 |
| Morgan Stanley | 5.625% | 9/23/19 | 17,950 | 16,538 |
| Morgan Stanley | 5.500% | 1/26/20 | 5,350 | 4,943 |
| Morgan Stanley | 5.500% | 7/24/20 | 8,925 | 8,134 |
| Morgan Stanley | 5.750% | 1/25/21 | 14,000 | 12,984 |
| Morgan Stanley | 5.500% | 7/28/21 | 5,500 | 5,087 |
80
Vanguard® Intermediate-Term Bond Index Fund
Schedule of Investments
December 31, 2011
| Face | Market | ||||
| Maturity | Amount | Value | |||
| Coupon | Date | ($000) | ($000) | ||
| National City Bank | 5.800% | 6/7/17 | 4,000 | 4,431 | |
| National City Corp. | 6.875% | 5/15/19 | 1,700 | 1,910 | |
| Northern Trust Co. | 6.500% | 8/15/18 | 1,275 | 1,517 | |
| Northern Trust Corp. | 3.450% | 11/4/20 | 950 | 974 | |
| Northern Trust Corp. | 3.375% | 8/23/21 | 2,750 | 2,818 | |
| PNC Bank NA | 4.875% | 9/21/17 | 3,550 | 3,708 | |
| PNC Bank NA | 6.000% | 12/7/17 | 1,125 | 1,221 | |
| PNC Funding Corp. | 5.625% | 2/1/17 | 7,625 | 8,226 | |
| PNC Funding Corp. | 6.700% | 6/10/19 | 6,175 | 7,499 | |
| PNC Funding Corp. | 5.125% | 2/8/20 | 6,010 | 6,789 | |
| PNC Funding Corp. | 4.375% | 8/11/20 | 1,200 | 1,298 | |
| Royal Bank of Scotland Group plc | 6.400% | 10/21/19 | 12,850 | 11,934 | |
| Royal Bank Of Scotland NV | 4.650% | 6/4/18 | 1,925 | 1,705 | |
| Royal Bank of Scotland plc | 5.625% | 8/24/20 | 3,775 | 3,624 | |
| Royal Bank of Scotland plc | 6.125% | 1/11/21 | 6,325 | 6,302 | |
| Sovereign Bank | 8.750% | 5/30/18 | 2,825 | 3,133 | |
| 3,4 | Standard Chartered plc | 6.409% | 12/31/49 | 1,500 | 1,241 |
| State Street Bank and Trust Co. | 5.250% | 10/15/18 | 1,000 | 1,113 | |
| State Street Corp. | 4.956% | 3/15/18 | 4,175 | 4,340 | |
| State Street Corp. | 4.375% | 3/7/21 | 4,500 | 4,933 | |
| SunTrust Bank | 7.250% | 3/15/18 | 3,200 | 3,589 | |
| SunTrust Banks Inc. | 3.500% | 1/20/17 | 800 | 803 | |
| SunTrust Banks Inc. | 6.000% | 9/11/17 | 1,925 | 2,128 | |
| UBS AG | 5.875% | 12/20/17 | 14,775 | 15,313 | |
| UBS AG | 5.750% | 4/25/18 | 15,475 | 16,029 | |
| UBS AG | 4.875% | 8/4/20 | 8,375 | 8,286 | |
| US Bancorp | 4.125% | 5/24/21 | 4,100 | 4,525 | |
| Wachovia Bank NA | 6.000% | 11/15/17 | 5,275 | 5,834 | |
| Wachovia Corp. | 5.750% | 6/15/17 | 10,450 | 11,801 | |
| Wachovia Corp. | 5.750% | 2/1/18 | 10,450 | 11,856 | |
| Wells Fargo & Co. | 5.625% | 12/11/17 | 16,075 | 18,243 | |
| Wells Fargo & Co. | 4.600% | 4/1/21 | 10,825 | 11,768 | |
| Westpac Banking Corp. | 4.875% | 11/19/19 | 11,275 | 12,031 | |
| Brokerage (0.4%) | |||||
| Ameriprise Financial Inc. | 7.300% | 6/28/19 | 600 | 724 | |
| Ameriprise Financial Inc. | 5.300% | 3/15/20 | 5,250 | 5,636 | |
| BlackRock Inc. | 6.250% | 9/15/17 | 2,950 | 3,436 | |
| BlackRock Inc. | 5.000% | 12/10/19 | 3,900 | 4,243 | |
| BlackRock Inc. | 4.250% | 5/24/21 | 4,500 | 4,685 | |
| Charles Schwab Corp. | 4.450% | 7/22/20 | 4,050 | 4,314 | |
| Franklin Resources Inc. | 4.625% | 5/20/20 | 2,250 | 2,436 | |
| GFI Group Inc. | 8.375% | 7/19/18 | 1,075 | 951 | |
| Jefferies Group Inc. | 5.125% | 4/13/18 | 8,342 | 7,331 | |
| Jefferies Group Inc. | 8.500% | 7/15/19 | 3,375 | 3,400 | |
| Jefferies Group Inc. | 6.875% | 4/15/21 | 37 | 33 | |
| Lazard Group LLC | 6.850% | 6/15/17 | 5,525 | 5,797 | |
| Nomura Holdings Inc. | 6.700% | 3/4/20 | 5,100 | 5,365 | |
| TD Ameritrade Holding Corp. | 5.600% | 12/1/19 | 2,225 | 2,405 | |
| Finance Companies (1.2%) | |||||
| Discover Financial Services | 6.450% | 6/12/17 | 3,500 | 3,661 | |
| 4 | GE Capital Trust I | 6.375% | 11/15/67 | 425 | 419 |
| General Electric Capital Corp. | 5.400% | 2/15/17 | 12,600 | 14,060 | |
| General Electric Capital Corp. | 5.625% | 9/15/17 | 2,450 | 2,714 | |
| General Electric Capital Corp. | 5.625% | 5/1/18 | 43,775 | 48,934 | |
| General Electric Capital Corp. | 6.000% | 8/7/19 | 6,925 | 7,952 | |
| General Electric Capital Corp. | 5.500% | 1/8/20 | 4,475 | 4,906 | |
| General Electric Capital Corp. | 5.550% | 5/4/20 | 3,025 | 3,314 | |
| General Electric Capital Corp. | 4.375% | 9/16/20 | 8,425 | 8,569 | |
| General Electric Capital Corp. | 4.625% | 1/7/21 | 5,250 | 5,485 | |
| General Electric Capital Corp. | 5.300% | 2/11/21 | 8,300 | 8,805 | |
| General Electric Capital Corp. | 4.650% | 10/17/21 | 4,975 | 5,182 | |
| 4 | General Electric Capital Corp. | 6.375% | 11/15/67 | 14,525 | 14,307 |
| HSBC Finance Corp. | 6.676% | 1/15/21 | 16,659 | 17,168 |
81
Vanguard® Intermediate-Term Bond Index Fund
Schedule of Investments
December 31, 2011
| Face | Market | |||
| Maturity | Amount | Value | ||
| Coupon | Date | ($000) | ($000) | |
| SLM Corp. | 8.450% | 6/15/18 | 11,375 | 11,797 |
| SLM Corp. | 8.000% | 3/25/20 | 5,250 | 5,325 |
| Insurance (2.1%) | ||||
| ACE INA Holdings Inc. | 5.700% | 2/15/17 | 2,400 | 2,759 |
| ACE INA Holdings Inc. | 5.800% | 3/15/18 | 1,850 | 2,155 |
| ACE INA Holdings Inc. | 5.900% | 6/15/19 | 1,925 | 2,291 |
| AEGON Funding Co. LLC | 5.750% | 12/15/20 | 2,500 | 2,601 |
| Aetna Inc. | 6.500% | 9/15/18 | 1,450 | 1,759 |
| Aetna Inc. | 4.125% | 6/1/21 | 6,675 | 6,964 |
| Aflac Inc. | 8.500% | 5/15/19 | 3,400 | 4,177 |
| Alleghany Corp. | 5.625% | 9/15/20 | 1,450 | 1,519 |
| Allied World Assurance Co. Ltd. | 5.500% | 11/15/20 | 2,225 | 2,247 |
| Allstate Corp. | 6.750% | 5/15/18 | 1,000 | 1,170 |
| Allstate Corp. | 7.450% | 5/16/19 | 2,000 | 2,454 |
| 4 Allstate Corp. | 6.125% | 5/15/67 | 2,575 | 2,350 |
| Alterra Finance LLC | 6.250% | 9/30/20 | 1,565 | 1,648 |
| American Financial Group Inc. | 9.875% | 6/15/19 | 2,625 | 3,077 |
| American International Group Inc. | 5.450% | 5/18/17 | 6,425 | 6,159 |
| American International Group Inc. | 5.850% | 1/16/18 | 13,125 | 12,776 |
| American International Group Inc. | 8.250% | 8/15/18 | 11,120 | 11,797 |
| American International Group Inc. | 6.400% | 12/15/20 | 8,990 | 9,058 |
| Aon Corp. | 5.000% | 9/30/20 | 3,600 | 3,967 |
| Aspen Insurance Holdings Ltd. | 6.000% | 12/15/20 | 1,075 | 1,084 |
| Axis Specialty Finance LLC | 5.875% | 6/1/20 | 4,975 | 5,123 |
| Berkshire Hathaway Finance Corp. | 5.400% | 5/15/18 | 7,100 | 8,273 |
| Berkshire Hathaway Finance Corp. | 4.250% | 1/15/21 | 4,675 | 5,066 |
| Berkshire Hathaway Inc. | 3.750% | 8/15/21 | 2,250 | 2,337 |
| Chubb Corp. | 5.750% | 5/15/18 | 3,500 | 4,111 |
| 4 Chubb Corp. | 6.375% | 3/29/67 | 3,975 | 3,925 |
| CIGNA Corp. | 5.125% | 6/15/20 | 1,491 | 1,607 |
| CIGNA Corp. | 4.375% | 12/15/20 | 1,920 | 1,955 |
| Cigna Corp. | 4.500% | 3/15/21 | 3,700 | 3,790 |
| CNA Financial Corp. | 7.350% | 11/15/19 | 2,240 | 2,494 |
| CNA Financial Corp. | 5.875% | 8/15/20 | 1,800 | 1,861 |
| CNA Financial Corp. | 5.750% | 8/15/21 | 3,095 | 3,157 |
| Coventry Health Care Inc. | 5.950% | 3/15/17 | 3,000 | 3,375 |
| Coventry Health Care Inc. | 5.450% | 6/15/21 | 2,750 | 3,043 |
| Genworth Financial Inc. | 7.700% | 6/15/20 | 3,825 | 3,604 |
| Genworth Financial Inc. | 7.200% | 2/15/21 | 575 | 517 |
| Genworth Financial Inc. | 7.625% | 9/24/21 | 1,225 | 1,126 |
| Hanover Insurance Group Inc. | 6.375% | 6/15/21 | 150 | 162 |
| Hartford Financial Services Group Inc. | 5.375% | 3/15/17 | 2,200 | 2,203 |
| Hartford Financial Services Group Inc. | 6.300% | 3/15/18 | 2,650 | 2,777 |
| Hartford Financial Services Group Inc. | 6.000% | 1/15/19 | 875 | 898 |
| Hartford Financial Services Group Inc. | 5.500% | 3/30/20 | 510 | 509 |
| HCC Insurance Holdings Inc. | 6.300% | 11/15/19 | 1,600 | 1,745 |
| Humana Inc. | 7.200% | 6/15/18 | 5,205 | 6,150 |
| Humana Inc. | 6.300% | 8/1/18 | 785 | 882 |
| Lincoln National Corp. | 8.750% | 7/1/19 | 8,151 | 9,855 |
| Lincoln National Corp. | 6.250% | 2/15/20 | 3,250 | 3,509 |
| Manulife Financial Corp. | 4.900% | 9/17/20 | 3,250 | 3,336 |
| Markel Corp. | 7.125% | 9/30/19 | 1,617 | 1,854 |
| Marsh & McLennan Cos. Inc. | 9.250% | 4/15/19 | 1,950 | 2,579 |
| Marsh & McLennan Cos. Inc. | 4.800% | 7/15/21 | 2,550 | 2,789 |
| MetLife Inc. | 6.817% | 8/15/18 | 5,500 | 6,522 |
| MetLife Inc. | 7.717% | 2/15/19 | 3,829 | 4,789 |
| MetLife Inc. | 4.750% | 2/8/21 | 3,675 | 3,962 |
| PartnerRe Finance B LLC | 5.500% | 6/1/20 | 4,700 | 4,760 |
| Principal Financial Group Inc. | 8.875% | 5/15/19 | 1,750 | 2,172 |
| Progressive Corp. | 3.750% | 8/23/21 | 1,900 | 1,973 |
| 4 Progressive Corp. | 6.700% | 6/15/67 | 4,650 | 4,696 |
| Protective Life Corp. | 7.375% | 10/15/19 | 1,600 | 1,774 |
| Prudential Financial Inc. | 6.000% | 12/1/17 | 6,150 | 6,828 |
82
Vanguard® Intermediate-Term Bond Index Fund
Schedule of Investments
December 31, 2011
| Face | Market | |||
| Maturity | Amount | Value | ||
| Coupon | Date | ($000) | ($000) | |
| Prudential Financial Inc. | 7.375% | 6/15/19 | 6,695 | 7,958 |
| Prudential Financial Inc. | 5.375% | 6/21/20 | 3,500 | 3,719 |
| Reinsurance Group of America Inc. | 5.000% | 6/1/21 | 3,500 | 3,625 |
| Swiss Re Solutions Holding Corp. | 6.450% | 3/1/19 | 400 | 444 |
| Travelers Cos. Inc. | 5.750% | 12/15/17 | 3,550 | 4,175 |
| Travelers Cos. Inc. | 5.800% | 5/15/18 | 3,225 | 3,790 |
| Travelers Cos. Inc. | 5.900% | 6/2/19 | 3,075 | 3,624 |
| UnitedHealth Group Inc. | 6.000% | 6/15/17 | 2,775 | 3,269 |
| UnitedHealth Group Inc. | 6.000% | 2/15/18 | 10,220 | 12,122 |
| UnitedHealth Group Inc. | 4.700% | 2/15/21 | 2,325 | 2,611 |
| UnitedHealth Group Inc. | 3.375% | 11/15/21 | 200 | 207 |
| Unum Group | 5.625% | 9/15/20 | 1,650 | 1,713 |
| WellPoint Inc. | 5.250% | 1/15/16 | 5,900 | 6,611 |
| WellPoint Inc. | 5.875% | 6/15/17 | 4,600 | 5,324 |
| WellPoint Inc. | 4.350% | 8/15/20 | 2,905 | 3,148 |
| Willis Group Holdings plc | 5.750% | 3/15/21 | 3,750 | 4,004 |
| Willis North America Inc. | 6.200% | 3/28/17 | 1,625 | 1,786 |
| Willis North America Inc. | 7.000% | 9/29/19 | 3,250 | 3,619 |
| WR Berkley Corp. | 5.375% | 9/15/20 | 1,875 | 1,914 |
| XLIT Ltd. | 5.750% | 10/1/21 | 2,300 | 2,436 |
| Other Finance (0.0%) | ||||
| NASDAQ OMX Group Inc. | 5.550% | 1/15/20 | 2,700 | 2,756 |
| XTRA Finance Corp. | 5.150% | 4/1/17 | 1,600 | 1,779 |
| Real Estate Investment Trusts (1.0%) | ||||
| Boston Properties LP | 3.700% | 11/15/18 | 3,060 | 3,153 |
| Boston Properties LP | 5.875% | 10/15/19 | 875 | 986 |
| Boston Properties LP | 5.625% | 11/15/20 | 4,775 | 5,319 |
| Boston Properties LP | 4.125% | 5/15/21 | 5,695 | 5,751 |
| Brandywine Operating Partnership LP | 5.700% | 5/1/17 | 3,025 | 3,133 |
| Brandywine Operating Partnership LP | 4.950% | 4/15/18 | 2,500 | 2,468 |
| BRE Properties Inc. | 5.500% | 3/15/17 | 3,000 | 3,264 |
| Camden Property Trust | 5.700% | 5/15/17 | 1,800 | 1,969 |
| CommonWealth REIT | 6.250% | 6/15/17 | 3,200 | 3,392 |
| Digital Realty Trust LP | 5.250% | 3/15/21 | 5,575 | 5,587 |
| Duke Realty LP | 5.950% | 2/15/17 | 4,975 | 5,346 |
| Duke Realty LP | 8.250% | 8/15/19 | 1,125 | 1,336 |
| Duke Realty LP | 6.750% | 3/15/20 | 350 | 385 |
| ERP Operating LP | 5.750% | 6/15/17 | 1,675 | 1,857 |
| ERP Operating LP | 4.750% | 7/15/20 | 6,250 | 6,463 |
| ERP Operating LP | 4.625% | 12/15/21 | 720 | 740 |
| HCP Inc. | 6.000% | 1/30/17 | 2,875 | 3,120 |
| HCP Inc. | 6.700% | 1/30/18 | 4,500 | 5,057 |
| HCP Inc. | 5.375% | 2/1/21 | 10,120 | 10,575 |
| Health Care REIT Inc. | 4.700% | 9/15/17 | 1,850 | 1,847 |
| Health Care REIT Inc. | 6.125% | 4/15/20 | 2,250 | 2,338 |
| Health Care REIT Inc. | 4.950% | 1/15/21 | 2,425 | 2,323 |
| Healthcare Realty Trust Inc. | 6.500% | 1/17/17 | 1,200 | 1,293 |
| Healthcare Realty Trust Inc. | 5.750% | 1/15/21 | 1,500 | 1,518 |
| Hospitality Properties Trust | 5.625% | 3/15/17 | 3,150 | 3,192 |
| Kilroy Realty LP | 4.800% | 7/15/18 | 5,950 | 5,924 |
| Kimco Realty Corp. | 5.700% | 5/1/17 | 1,500 | 1,624 |
| Kimco Realty Corp. | 6.875% | 10/1/19 | 2,957 | 3,395 |
| Liberty Property LP | 6.625% | 10/1/17 | 2,000 | 2,276 |
| Liberty Property LP | 4.750% | 10/1/20 | 2,410 | 2,448 |
| Mack-Cali Realty LP | 7.750% | 8/15/19 | 975 | 1,159 |
| National Retail Properties Inc. | 6.875% | 10/15/17 | 3,000 | 3,317 |
| ProLogis LP | 4.500% | 8/15/17 | 1,200 | 1,202 |
| ProLogis LP | 7.375% | 10/30/19 | 2,600 | 2,944 |
| ProLogis LP | 6.625% | 12/1/19 | 2,225 | 2,405 |
| ProLogis LP | 6.875% | 3/15/20 | 4,300 | 4,752 |
| Realty Income Corp. | 6.750% | 8/15/19 | 4,150 | 4,724 |
| Realty Income Corp. | 5.750% | 1/15/21 | 1,000 | 1,082 |
| Regency Centers LP | 5.875% | 6/15/17 | 2,400 | 2,618 |
83
Vanguard® Intermediate-Term Bond Index Fund
Schedule of Investments
December 31, 2011
| Face | Market | |||
| Maturity | Amount | Value | ||
| Coupon | Date | ($000) | ($000) | |
| Simon Property Group LP | 2.800% | 1/30/17 | 1,425 | 1,454 |
| Simon Property Group LP | 6.125% | 5/30/18 | 3,225 | 3,717 |
| Simon Property Group LP | 5.650% | 2/1/20 | 10,800 | 12,340 |
| Simon Property Group LP | 4.375% | 3/1/21 | 1,235 | 1,308 |
| Simon Property Group LP | 4.125% | 12/1/21 | 1,125 | 1,178 |
| UDR Inc. | 4.250% | 6/1/18 | 850 | 876 |
| Ventas Realty LP / Ventas Capital Corp. | 4.750% | 6/1/21 | 2,650 | 2,560 |
| 1,775,143 | ||||
| Industrial (21.0%) | ||||
| Basic Industry (2.4%) | ||||
| Agrium Inc. | 6.750% | 1/15/19 | 1,750 | 2,135 |
| Air Products & Chemicals Inc. | 3.000% | 11/3/21 | 2,550 | 2,587 |
| Albemarle Corp. | 4.500% | 12/15/20 | 1,050 | 1,118 |
| Alcoa Inc. | 5.550% | 2/1/17 | 4,850 | 5,186 |
| Alcoa Inc. | 6.750% | 7/15/18 | 9,800 | 10,815 |
| Alcoa Inc. | 6.150% | 8/15/20 | 3,250 | 3,364 |
| Alcoa Inc. | 5.400% | 4/15/21 | 7,025 | 7,061 |
| Allegheny Technologies Inc. | 5.950% | 1/15/21 | 3,735 | 3,968 |
| AngloGold Ashanti Holdings plc | 5.375% | 4/15/20 | 2,660 | 2,624 |
| ArcelorMittal | 6.125% | 6/1/18 | 9,343 | 9,489 |
| ArcelorMittal | 9.850% | 6/1/19 | 8,250 | 9,124 |
| ArcelorMittal | 5.250% | 8/5/20 | 325 | 295 |
| ArcelorMittal | 5.500% | 3/1/21 | 10,975 | 10,057 |
| Barrick Gold Corp. | 6.950% | 4/1/19 | 6,100 | 7,467 |
| Barrick North America Finance LLC | 6.800% | 9/15/18 | 2,150 | 2,587 |
| Barrick North America Finance LLC | 4.400% | 5/30/21 | 4,575 | 4,949 |
| BHP Billiton Finance USA Ltd. | 5.400% | 3/29/17 | 1,975 | 2,296 |
| BHP Billiton Finance USA Ltd. | 6.500% | 4/1/19 | 9,150 | 11,254 |
| BHP Billiton Finance USA Ltd. | 3.250% | 11/21/21 | 6,525 | 6,704 |
| Carpenter Technology Corp. | 5.200% | 7/15/21 | 2,350 | 2,292 |
| Celulosa Arauco y Constitucion SA | 7.250% | 7/29/19 | 2,000 | 2,362 |
| Celulosa Arauco y Constitucion SA | 5.000% | 1/21/21 | 1,525 | 1,535 |
| Cliffs Natural Resources Inc. | 5.900% | 3/15/20 | 1,525 | 1,633 |
| Cliffs Natural Resources Inc. | 4.875% | 4/1/21 | 5,150 | 5,187 |
| Cytec Industries Inc. | 8.950% | 7/1/17 | 1,750 | 2,096 |
| Dow Chemical Co. | 4.250% | 11/15/20 | 19,975 | 20,770 |
| Dow Chemical Co. | 4.125% | 11/15/21 | 8,600 | 8,879 |
| Eastman Chemical Co. | 5.500% | 11/15/19 | 650 | 739 |
| Eastman Chemical Co. | 4.500% | 1/15/21 | 1,600 | 1,685 |
| Ecolab Inc. | 4.350% | 12/8/21 | 3,450 | 3,716 |
| EI du Pont de Nemours & Co. | 6.000% | 7/15/18 | 12,675 | 15,521 |
| EI du Pont de Nemours & Co. | 4.625% | 1/15/20 | 4,450 | 5,103 |
| EI du Pont de Nemours & Co. | 4.250% | 4/1/21 | 350 | 396 |
| Freeport-McMoRan Copper & Gold Inc. | 8.375% | 4/1/17 | 12,025 | 12,731 |
| International Paper Co. | 7.950% | 6/15/18 | 7,200 | 8,743 |
| International Paper Co. | 9.375% | 5/15/19 | 3,775 | 4,893 |
| International Paper Co. | 7.500% | 8/15/21 | 5,490 | 6,774 |
| 3 Kinross Gold Corp. | 5.125% | 9/1/21 | 2,300 | 2,282 |
| Lubrizol Corp. | 8.875% | 2/1/19 | 850 | 1,171 |
| Monsanto Co. | 5.125% | 4/15/18 | 925 | 1,071 |
| Mosaic Co. | 3.750% | 11/15/21 | 1,500 | 1,509 |
| Newmont Mining Corp. | 5.125% | 10/1/19 | 4,025 | 4,445 |
| Nucor Corp. | 5.750% | 12/1/17 | 825 | 971 |
| Nucor Corp. | 5.850% | 6/1/18 | 3,275 | 3,908 |
| Plum Creek Timberlands LP | 4.700% | 3/15/21 | 950 | 955 |
| Potash Corp. of Saskatchewan Inc. | 3.250% | 12/1/17 | 7,175 | 7,492 |
| Potash Corp. of Saskatchewan Inc. | 4.875% | 3/30/20 | 1,500 | 1,718 |
| PPG Industries Inc. | 6.650% | 3/15/18 | 3,425 | 4,134 |
| PPG Industries Inc. | 3.600% | 11/15/20 | 3,500 | 3,660 |
| Praxair Inc. | 5.200% | 3/15/17 | 1,500 | 1,734 |
| Praxair Inc. | 4.500% | 8/15/19 | 2,450 | 2,783 |
| Praxair Inc. | 3.000% | 9/1/21 | 4,925 | 5,038 |
| Rio Tinto Finance USA Ltd. | 6.500% | 7/15/18 | 17,650 | 21,255 |
84
Vanguard® Intermediate-Term Bond Index Fund
Schedule of Investments
December 31, 2011
| Face | Market | |||
| Maturity | Amount | Value | ||
| Coupon | Date | ($000) | ($000) | |
| Rio Tinto Finance USA Ltd. | 9.000% | 5/1/19 | 7,225 | 9,840 |
| Rio Tinto Finance USA Ltd. | 4.125% | 5/20/21 | 2,650 | 2,841 |
| Rio Tinto Finance USA Ltd. | 3.750% | 9/20/21 | 3,450 | 3,610 |
| Rohm & Haas Co. | 6.000% | 9/15/17 | 5,825 | 6,633 |
| RPM International Inc. | 6.125% | 10/15/19 | 2,575 | 2,798 |
| Sigma-Aldrich Corp. | 3.375% | 11/1/20 | 550 | 576 |
| Southern Copper Corp. | 5.375% | 4/16/20 | 1,725 | 1,773 |
| Teck Resources Ltd. | 3.150% | 1/15/17 | 1,850 | 1,891 |
| Teck Resources Ltd. | 10.750% | 5/15/19 | 7,250 | 8,899 |
| Vale Overseas Ltd. | 6.250% | 1/23/17 | 2,750 | 3,109 |
| Vale Overseas Ltd. | 5.625% | 9/15/19 | 5,450 | 5,987 |
| Vale Overseas Ltd. | 4.625% | 9/15/20 | 7,300 | 7,550 |
| Valspar Corp. | 7.250% | 6/15/19 | 1,275 | 1,542 |
| Capital Goods (2.2%) | ||||
| Acuity Brands Lighting Inc. | 6.000% | 12/15/19 | 1,675 | 1,879 |
| Allied Waste North America Inc. | 6.875% | 6/1/17 | 5,000 | 5,287 |
| Bemis Co. Inc. | 6.800% | 8/1/19 | 2,300 | 2,754 |
| Boeing Capital Corp. | 2.900% | 8/15/18 | 550 | 570 |
| Boeing Co. | 6.000% | 3/15/19 | 6,975 | 8,482 |
| Boeing Co. | 4.875% | 2/15/20 | 850 | 989 |
| Caterpillar Financial Services Corp. | 5.450% | 4/15/18 | 7,950 | 9,265 |
| Caterpillar Financial Services Corp. | 7.050% | 10/1/18 | 3,500 | 4,443 |
| Caterpillar Financial Services Corp. | 7.150% | 2/15/19 | 7,250 | 9,255 |
| Caterpillar Inc. | 3.900% | 5/27/21 | 6,325 | 6,936 |
| Cooper US Inc. | 3.875% | 12/15/20 | 1,000 | 1,058 |
| CRH America Inc. | 8.125% | 7/15/18 | 4,425 | 5,060 |
| Danaher Corp. | 5.625% | 1/15/18 | 1,200 | 1,414 |
| Danaher Corp. | 5.400% | 3/1/19 | 1,300 | 1,555 |
| Danaher Corp. | 3.900% | 6/23/21 | 4,000 | 4,371 |
| Deere & Co. | 4.375% | 10/16/19 | 700 | 787 |
| Dover Corp. | 5.450% | 3/15/18 | 900 | 1,061 |
| Dover Corp. | 4.300% | 3/1/21 | 5,500 | 6,182 |
| Eaton Corp. | 5.600% | 5/15/18 | 5,325 | 6,315 |
| Embraer Overseas Ltd. | 6.375% | 1/24/17 | 1,550 | 1,670 |
| Embraer Overseas Ltd. | 6.375% | 1/15/20 | 2,800 | 2,984 |
| Emerson Electric Co. | 5.375% | 10/15/17 | 5,000 | 5,890 |
| Emerson Electric Co. | 5.250% | 10/15/18 | 850 | 1,005 |
| Emerson Electric Co. | 4.875% | 10/15/19 | 1,450 | 1,689 |
| General Dynamics Corp. | 3.875% | 7/15/21 | 2,900 | 3,127 |
| General Electric Co. | 5.250% | 12/6/17 | 18,925 | 21,764 |
| Goodrich Corp. | 6.125% | 3/1/19 | 3,472 | 4,196 |
| Goodrich Corp. | 4.875% | 3/1/20 | 2,000 | 2,281 |
| Goodrich Corp. | 3.600% | 2/1/21 | 1,050 | 1,093 |
| Harsco Corp. | 5.750% | 5/15/18 | 4,450 | 5,132 |
| Honeywell International Inc. | 5.300% | 3/15/17 | 1,000 | 1,162 |
| Honeywell International Inc. | 5.300% | 3/1/18 | 4,025 | 4,755 |
| Honeywell International Inc. | 5.000% | 2/15/19 | 3,250 | 3,788 |
| Honeywell International Inc. | 4.250% | 3/1/21 | 4,000 | 4,514 |
| IDEX Corp. | 4.200% | 12/15/21 | 400 | 405 |
| Illinois Tool Works Inc. | 6.250% | 4/1/19 | 5,900 | 7,278 |
| Ingersoll-Rand Global Holding Co. Ltd. | 6.875% | 8/15/18 | 6,100 | 7,415 |
| John Deere Capital Corp. | 5.500% | 4/13/17 | 2,300 | 2,711 |
| John Deere Capital Corp. | 2.800% | 9/18/17 | 1,075 | 1,125 |
| John Deere Capital Corp. | 5.750% | 9/10/18 | 12,100 | 14,648 |
| John Deere Capital Corp. | 3.900% | 7/12/21 | 5,150 | 5,586 |
| L-3 Communications Corp. | 5.200% | 10/15/19 | 4,075 | 4,140 |
| L-3 Communications Corp. | 4.750% | 7/15/20 | 2,700 | 2,639 |
| L-3 Communications Corp. | 4.950% | 2/15/21 | 8,225 | 8,131 |
| Lockheed Martin Corp. | 4.250% | 11/15/19 | 6,300 | 6,676 |
| Lockheed Martin Corp. | 3.350% | 9/15/21 | 5,600 | 5,564 |
| Martin Marietta Materials Inc. | 6.600% | 4/15/18 | 2,050 | 2,169 |
| Northrop Grumman Corp. | 3.500% | 3/15/21 | 5,750 | 5,832 |
| Parker Hannifin Corp. | 5.500% | 5/15/18 | 2,000 | 2,354 |
85
Vanguard® Intermediate-Term Bond Index Fund
Schedule of Investments
December 31, 2011
| Face | Market | |||
| Maturity | Amount | Value | ||
| Coupon | Date | ($000) | ($000) | |
| Raytheon Co. | 6.400% | 12/15/18 | 500 | 618 |
| Raytheon Co. | 4.400% | 2/15/20 | 1,225 | 1,347 |
| Raytheon Co. | 3.125% | 10/15/20 | 8,800 | 8,865 |
| Republic Services Inc. | 3.800% | 5/15/18 | 2,430 | 2,531 |
| Republic Services Inc. | 5.500% | 9/15/19 | 1,825 | 2,083 |
| Republic Services Inc. | 5.000% | 3/1/20 | 6,025 | 6,694 |
| Republic Services Inc. | 5.250% | 11/15/21 | 2,988 | 3,381 |
| Rockwell Collins Inc. | 5.250% | 7/15/19 | 650 | 756 |
| Rockwell Collins Inc. | 3.100% | 11/15/21 | 1,800 | 1,826 |
| Roper Industries Inc. | 6.250% | 9/1/19 | 2,900 | 3,425 |
| Sonoco Products Co. | 4.375% | 11/1/21 | 1,100 | 1,140 |
| Stanley Black & Decker Inc. | 3.400% | 12/1/21 | 775 | 786 |
| Textron Inc. | 5.600% | 12/1/17 | 2,700 | 2,849 |
| Textron Inc. | 7.250% | 10/1/19 | 1,000 | 1,131 |
| Tyco International Finance SA | 3.750% | 1/15/18 | 2,175 | 2,296 |
| Tyco International Finance SA | 8.500% | 1/15/19 | 7,650 | 9,861 |
| Tyco International Ltd. / Tyco International Finance SA | 7.000% | 12/15/19 | 850 | 1,046 |
| United Technologies Corp. | 5.375% | 12/15/17 | 3,850 | 4,550 |
| United Technologies Corp. | 6.125% | 2/1/19 | 8,000 | 9,882 |
| United Technologies Corp. | 4.500% | 4/15/20 | 7,100 | 7,970 |
| Waste Management Inc. | 7.375% | 3/11/19 | 1,450 | 1,823 |
| Waste Management Inc. | 4.750% | 6/30/20 | 6,675 | 7,346 |
| Waste Management Inc. | 4.600% | 3/1/21 | 1,400 | 1,522 |
| Communication (3.5%) | ||||
| America Movil SAB de CV | 5.000% | 10/16/19 | 7,500 | 8,345 |
| America Movil SAB de CV | 5.000% | 3/30/20 | 8,800 | 9,779 |
| American Tower Corp. | 4.500% | 1/15/18 | 5,000 | 5,092 |
| American Tower Corp. | 5.050% | 9/1/20 | 8,070 | 8,110 |
| AT&T Inc. | 5.500% | 2/1/18 | 15,950 | 18,457 |
| AT&T Inc. | 5.600% | 5/15/18 | 4,450 | 5,177 |
| AT&T Inc. | 5.800% | 2/15/19 | 11,175 | 13,229 |
| AT&T Inc. | 4.450% | 5/15/21 | 2,575 | 2,832 |
| AT&T Inc. | 3.875% | 8/15/21 | 7,950 | 8,446 |
| British Telecommunications plc | 5.950% | 1/15/18 | 4,575 | 5,041 |
| CBS Corp. | 8.875% | 5/15/19 | 6,350 | 8,153 |
| CBS Corp. | 5.750% | 4/15/20 | 220 | 247 |
| CBS Corp. | 4.300% | 2/15/21 | 3,300 | 3,429 |
| Cellco Partnership / Verizon Wireless Capital LLC | 8.500% | 11/15/18 | 13,550 | 18,312 |
| CenturyLink Inc. | 6.000% | 4/1/17 | 2,475 | 2,509 |
| CenturyLink Inc. | 6.150% | 9/15/19 | 500 | 501 |
| CenturyLink Inc. | 6.450% | 6/15/21 | 8,575 | 8,618 |
| Comcast Cable Communications LLC | 8.875% | 5/1/17 | 1,700 | 2,201 |
| Comcast Corp. | 6.500% | 1/15/17 | 1,575 | 1,854 |
| Comcast Corp. | 6.300% | 11/15/17 | 7,125 | 8,453 |
| Comcast Corp. | 5.875% | 2/15/18 | 5,375 | 6,216 |
| Comcast Corp. | 5.700% | 5/15/18 | 3,600 | 4,141 |
| Comcast Corp. | 5.700% | 7/1/19 | 1,075 | 1,245 |
| Comcast Corp. | 5.150% | 3/1/20 | 14,050 | 15,918 |
| Deutsche Telekom International Finance BV | 6.750% | 8/20/18 | 4,250 | 5,077 |
| Deutsche Telekom International Finance BV | 6.000% | 7/8/19 | 625 | 720 |
| DIRECTV Holdings LLC / DIRECTV Financing Co. Inc. | 5.875% | 10/1/19 | 6,150 | 6,920 |
| DIRECTV Holdings LLC / DIRECTV Financing Co. Inc. | 5.200% | 3/15/20 | 9,100 | 9,838 |
| DIRECTV Holdings LLC / DIRECTV Financing Co. Inc. | 5.000% | 3/1/21 | 7,500 | 8,012 |
| Discovery Communications LLC | 5.050% | 6/1/20 | 6,300 | 6,968 |
| Discovery Communications LLC | 4.375% | 6/15/21 | 2,150 | 2,277 |
| France Telecom SA | 5.375% | 7/8/19 | 5,100 | 5,611 |
| France Telecom SA | 4.125% | 9/14/21 | 6,125 | 6,197 |
| GTE Corp. | 6.840% | 4/15/18 | 1,000 | 1,197 |
| McGraw-Hill Cos. Inc. | 5.900% | 11/15/17 | 2,950 | 3,210 |
| NBCUniversal Media LLC | 5.150% | 4/30/20 | 11,625 | 12,992 |
| NBCUniversal Media LLC | 4.375% | 4/1/21 | 8,390 | 8,878 |
| News America Inc. | 6.900% | 3/1/19 | 10,800 | 12,733 |
| News America Inc. | 4.500% | 2/15/21 | 4,500 | 4,731 |
86
Vanguard® Intermediate-Term Bond Index Fund
Schedule of Investments
December 31, 2011
| Face | Market | |||
| Maturity | Amount | Value | ||
| Coupon | Date | ($000) | ($000) | |
| Omnicom Group Inc. | 4.450% | 8/15/20 | 5,500 | 5,647 |
| Qwest Corp. | 6.500% | 6/1/17 | 4,000 | 4,379 |
| Reed Elsevier Capital Inc. | 8.625% | 1/15/19 | 4,128 | 5,150 |
| Rogers Communications Inc. | 6.800% | 8/15/18 | 6,715 | 8,177 |
| Telecom Italia Capital SA | 6.999% | 6/4/18 | 2,625 | 2,430 |
| Telecom Italia Capital SA | 7.175% | 6/18/19 | 7,555 | 7,078 |
| Telefonica Emisiones SAU | 5.877% | 7/15/19 | 2,000 | 1,982 |
| Telefonica Emisiones SAU | 5.134% | 4/27/20 | 6,600 | 6,145 |
| Telefonica Emisiones SAU | 5.462% | 2/16/21 | 14,000 | 13,355 |
| Thomson Reuters Corp. | 6.500% | 7/15/18 | 3,950 | 4,718 |
| Thomson Reuters Corp. | 4.700% | 10/15/19 | 1,000 | 1,104 |
| Thomson Reuters Corp. | 3.950% | 9/30/21 | 2,875 | 2,974 |
| Time Warner Cable Inc. | 5.850% | 5/1/17 | 15,625 | 17,794 |
| Time Warner Cable Inc. | 6.750% | 7/1/18 | 13,900 | 16,495 |
| Time Warner Cable Inc. | 8.750% | 2/14/19 | 1,575 | 2,018 |
| Time Warner Cable Inc. | 8.250% | 4/1/19 | 5,475 | 6,890 |
| Time Warner Cable Inc. | 5.000% | 2/1/20 | 8,910 | 9,759 |
| Time Warner Cable Inc. | 4.000% | 9/1/21 | 7,000 | 7,096 |
| Verizon Communications Inc. | 5.500% | 2/15/18 | 10,725 | 12,552 |
| Verizon Communications Inc. | 6.100% | 4/15/18 | 2,250 | 2,692 |
| Verizon Communications Inc. | 8.750% | 11/1/18 | 11,075 | 14,954 |
| Verizon Communications Inc. | 6.350% | 4/1/19 | 7,500 | 9,245 |
| Verizon Communications Inc. | 4.600% | 4/1/21 | 10,525 | 11,949 |
| Verizon Communications Inc. | 3.500% | 11/1/21 | 11,925 | 12,421 |
| Virgin Media Secured Finance plc | 6.500% | 1/15/18 | 2,500 | 2,656 |
| Virgin Media Secured Finance plc | 5.250% | 1/15/21 | 3,000 | 3,182 |
| Vodafone Group plc | 5.625% | 2/27/17 | 7,150 | 8,295 |
| Vodafone Group plc | 4.625% | 7/15/18 | 1,000 | 1,106 |
| Vodafone Group plc | 5.450% | 6/10/19 | 2,400 | 2,810 |
| Vodafone Group plc | 4.375% | 3/16/21 | 2,000 | 2,176 |
| Washington Post Co. | 7.250% | 2/1/19 | 1,075 | 1,250 |
| 3 WPP Finance 2010 | 4.750% | 11/21/21 | 2,800 | 2,794 |
| Consumer Cyclical (1.9%) | ||||
| AutoZone Inc. | 7.125% | 8/1/18 | 2,050 | 2,459 |
| AutoZone Inc. | 4.000% | 11/15/20 | 250 | 255 |
| Best Buy Co. Inc. | 5.500% | 3/15/21 | 3,150 | 3,012 |
| BorgWarner Inc. | 4.625% | 9/15/20 | 950 | 1,009 |
| Costco Wholesale Corp. | 5.500% | 3/15/17 | 4,675 | 5,591 |
| CVS Caremark Corp. | 5.750% | 6/1/17 | 13,600 | 15,869 |
| CVS Caremark Corp. | 6.600% | 3/15/19 | 6,435 | 7,827 |
| CVS Caremark Corp. | 4.125% | 5/15/21 | 1,000 | 1,075 |
| Darden Restaurants Inc. | 6.200% | 10/15/17 | 4,025 | 4,644 |
| Darden Restaurants Inc. | 4.500% | 10/15/21 | 2,250 | 2,317 |
| eBay Inc. | 3.250% | 10/15/20 | 2,175 | 2,179 |
| Expedia Inc. | 5.950% | 8/15/20 | 9,275 | 9,350 |
| Family Dollar Stores Inc. | 5.000% | 2/1/21 | 1,450 | 1,495 |
| Gap Inc. | 5.950% | 4/12/21 | 4,200 | 4,001 |
| Historic TW Inc. | 6.875% | 6/15/18 | 800 | 950 |
| Home Depot Inc. | 3.950% | 9/15/20 | 400 | 433 |
| Home Depot Inc. | 4.400% | 4/1/21 | 8,350 | 9,410 |
| Hyatt Hotels Corp. | 5.375% | 8/15/21 | 900 | 923 |
| International Game Technology | 7.500% | 6/15/19 | 2,100 | 2,447 |
| International Game Technology | 5.500% | 6/15/20 | 650 | 682 |
| Johnson Controls Inc. | 5.000% | 3/30/20 | 2,850 | 3,191 |
| Johnson Controls Inc. | 4.250% | 3/1/21 | 650 | 696 |
| Johnson Controls Inc. | 3.750% | 12/1/21 | 2,750 | 2,844 |
| Kohl's Corp. | 6.250% | 12/15/17 | 4,000 | 4,795 |
| Kohl's Corp. | 4.000% | 11/1/21 | 950 | 973 |
| Lowe's Cos. Inc. | 6.100% | 9/15/17 | 600 | 712 |
| Lowe's Cos. Inc. | 4.625% | 4/15/20 | 2,450 | 2,716 |
| Lowe's Cos. Inc. | 3.750% | 4/15/21 | 500 | 518 |
| Lowe's Cos. Inc. | 3.800% | 11/15/21 | 2,675 | 2,813 |
| Marriott International Inc. | 6.375% | 6/15/17 | 2,450 | 2,820 |
87
Vanguard® Intermediate-Term Bond Index Fund
Schedule of Investments
December 31, 2011
| Face | Market | |||
| Maturity | Amount | Value | ||
| Coupon | Date | ($000) | ($000) | |
| McDonald's Corp. | 5.300% | 3/15/17 | 750 | 885 |
| McDonald's Corp. | 5.800% | 10/15/17 | 3,950 | 4,824 |
| McDonald's Corp. | 5.350% | 3/1/18 | 4,775 | 5,695 |
| McDonald's Corp. | 5.000% | 2/1/19 | 725 | 858 |
| McDonald's Corp. | 3.625% | 5/20/21 | 3,500 | 3,834 |
| Nordstrom Inc. | 6.250% | 1/15/18 | 2,700 | 3,209 |
| Nordstrom Inc. | 4.750% | 5/1/20 | 4,150 | 4,608 |
| Nordstrom Inc. | 4.000% | 10/15/21 | 1,975 | 2,076 |
| O'Reilly Automotive Inc. | 4.875% | 1/14/21 | 1,825 | 1,932 |
| O'Reilly Automotive Inc. | 4.625% | 9/15/21 | 625 | 655 |
| Target Corp. | 6.000% | 1/15/18 | 5,375 | 6,564 |
| Target Corp. | 3.875% | 7/15/20 | 7,200 | 7,969 |
| Time Warner Inc. | 4.875% | 3/15/20 | 6,800 | 7,396 |
| Time Warner Inc. | 4.700% | 1/15/21 | 3,000 | 3,234 |
| Time Warner Inc. | 4.750% | 3/29/21 | 8,575 | 9,289 |
| TJX Cos. Inc. | 6.950% | 4/15/19 | 4,325 | 5,387 |
| Toyota Motor Credit Corp. | 4.500% | 6/17/20 | 3,300 | 3,601 |
| Toyota Motor Credit Corp. | 4.250% | 1/11/21 | 1,475 | 1,603 |
| Toyota Motor Credit Corp. | 3.400% | 9/15/21 | 4,375 | 4,544 |
| VF Corp. | 5.950% | 11/1/17 | 1,125 | 1,332 |
| VF Corp. | 3.500% | 9/1/21 | 1,575 | 1,630 |
| Viacom Inc. | 3.500% | 4/1/17 | 5,350 | 5,556 |
| Viacom Inc. | 6.125% | 10/5/17 | 50 | 58 |
| Viacom Inc. | 5.625% | 9/15/19 | 7,175 | 8,103 |
| Wal-Mart Stores Inc. | 5.375% | 4/5/17 | 2,575 | 3,042 |
| Wal-Mart Stores Inc. | 5.800% | 2/15/18 | 7,225 | 8,891 |
| Wal-Mart Stores Inc. | 3.625% | 7/8/20 | 4,800 | 5,243 |
| Wal-Mart Stores Inc. | 3.250% | 10/25/20 | 10,900 | 11,642 |
| Wal-Mart Stores Inc. | 4.250% | 4/15/21 | 6,250 | 7,224 |
| Walgreen Co. | 5.250% | 1/15/19 | 5,800 | 6,893 |
| Walt Disney Co. | 5.875% | 12/15/17 | 2,600 | 3,153 |
| Walt Disney Co. | 3.750% | 6/1/21 | 600 | 656 |
| Walt Disney Co. | 2.750% | 8/16/21 | 5,575 | 5,656 |
| Western Union Co. | 3.650% | 8/22/18 | 2,600 | 2,670 |
| Wyndham Worldwide Corp. | 5.750% | 2/1/18 | 6,180 | 6,535 |
| Yum! Brands Inc. | 6.250% | 3/15/18 | 7,125 | 8,338 |
| Consumer Noncyclical (5.6%) | ||||
| Abbott Laboratories | 5.600% | 11/30/17 | 8,500 | 10,166 |
| Abbott Laboratories | 5.125% | 4/1/19 | 6,200 | 7,192 |
| Abbott Laboratories | 4.125% | 5/27/20 | 4,225 | 4,682 |
| Allergan Inc. | 3.375% | 9/15/20 | 3,000 | 3,091 |
| Altria Group Inc. | 9.700% | 11/10/18 | 22,400 | 30,159 |
| Altria Group Inc. | 9.250% | 8/6/19 | 3,800 | 5,104 |
| Altria Group Inc. | 4.750% | 5/5/21 | 8,900 | 9,788 |
| AmerisourceBergen Corp. | 3.500% | 11/15/21 | 5,350 | 5,518 |
| Amgen Inc. | 5.850% | 6/1/17 | 8,675 | 10,004 |
| Amgen Inc. | 5.700% | 2/1/19 | 3,025 | 3,403 |
| Amgen Inc. | 3.450% | 10/1/20 | 6,425 | 6,293 |
| Amgen Inc. | 4.100% | 6/15/21 | 3,100 | 3,176 |
| Amgen Inc. | 3.875% | 11/15/21 | 7,500 | 7,621 |
| Anheuser-Busch Cos. LLC | 5.600% | 3/1/17 | 4,100 | 4,818 |
| Anheuser-Busch Cos. LLC | 5.500% | 1/15/18 | 3,900 | 4,532 |
| Anheuser-Busch InBev Worldwide Inc. | 7.750% | 1/15/19 | 6,075 | 7,856 |
| Anheuser-Busch InBev Worldwide Inc. | 6.875% | 11/15/19 | 6,325 | 7,925 |
| Anheuser-Busch InBev Worldwide Inc. | 5.375% | 1/15/20 | 19,650 | 23,114 |
| Anheuser-Busch InBev Worldwide Inc. | 5.000% | 4/15/20 | 2,800 | 3,204 |
| Anheuser-Busch InBev Worldwide Inc. | 4.375% | 2/15/21 | 1,175 | 1,307 |
| Archer-Daniels-Midland Co. | 8.375% | 4/15/17 | 1,375 | 1,787 |
| Archer-Daniels-Midland Co. | 5.450% | 3/15/18 | 2,050 | 2,430 |
| Archer-Daniels-Midland Co. | 4.479% | 3/1/21 | 4,625 | 5,237 |
| 3 Aristotle Holding Inc. | 4.750% | 11/15/21 | 4,625 | 4,780 |
| AstraZeneca plc | 5.900% | 9/15/17 | 7,625 | 9,192 |
| Avon Products Inc. | 5.750% | 3/1/18 | 1,856 | 2,023 |
88
Vanguard® Intermediate-Term Bond Index Fund
Schedule of Investments
December 31, 2011
| Face | Market | |||
| Maturity | Amount | Value | ||
| Coupon | Date | ($000) | ($000) | |
| Avon Products Inc. | 6.500% | 3/1/19 | 385 | 436 |
| Baxter International Inc. | 5.375% | 6/1/18 | 3,500 | 4,108 |
| Baxter International Inc. | 4.250% | 3/15/20 | 3,000 | 3,310 |
| Becton Dickinson and Co. | 5.000% | 5/15/19 | 2,975 | 3,444 |
| Becton Dickinson and Co. | 3.250% | 11/12/20 | 2,820 | 2,913 |
| Becton Dickinson and Co. | 3.125% | 11/8/21 | 5,175 | 5,351 |
| Biogen Idec Inc. | 6.875% | 3/1/18 | 4,950 | 5,996 |
| Boston Scientific Corp. | 5.125% | 1/12/17 | 2,500 | 2,691 |
| Boston Scientific Corp. | 6.000% | 1/15/20 | 6,750 | 7,557 |
| Bottling Group LLC | 5.125% | 1/15/19 | 6,470 | 7,532 |
| Bristol-Myers Squibb Co. | 5.450% | 5/1/18 | 1,425 | 1,704 |
| Bunge Ltd. Finance Corp. | 8.500% | 6/15/19 | 7,375 | 9,026 |
| Campbell Soup Co. | 3.050% | 7/15/17 | 1,850 | 1,974 |
| Campbell Soup Co. | 4.250% | 4/15/21 | 1,550 | 1,729 |
| Cardinal Health Inc. | 4.625% | 12/15/20 | 3,125 | 3,349 |
| CareFusion Corp. | 6.375% | 8/1/19 | 2,750 | 3,236 |
| Celgene Corp. | 3.950% | 10/15/20 | 925 | 930 |
| Clorox Co. | 5.950% | 10/15/17 | 4,000 | 4,631 |
| Coca-Cola Co. | 5.350% | 11/15/17 | 9,325 | 11,212 |
| Coca-Cola Co. | 4.875% | 3/15/19 | 2,400 | 2,799 |
| Coca-Cola Co. | 3.150% | 11/15/20 | 6,500 | 6,819 |
| Coca-Cola Co. | 3.300% | 9/1/21 | 5,525 | 5,830 |
| Coca-Cola Enterprises Inc. | 3.500% | 9/15/20 | 1,100 | 1,149 |
| Coca-Cola Femsa SAB de CV | 4.625% | 2/15/20 | 2,000 | 2,210 |
| Colgate-Palmolive Co. | 1.300% | 1/15/17 | 1,650 | 1,638 |
| Colgate-Palmolive Co. | 2.625% | 5/1/17 | 3,060 | 3,234 |
| Colgate-Palmolive Co. | 2.450% | 11/15/21 | 1,500 | 1,496 |
| ConAgra Foods Inc. | 5.819% | 6/15/17 | 1,500 | 1,686 |
| ConAgra Foods Inc. | 7.000% | 4/15/19 | 500 | 588 |
| Corn Products International Inc. | 4.625% | 11/1/20 | 2,000 | 2,118 |
| Covidien International Finance SA | 6.000% | 10/15/17 | 7,925 | 9,386 |
| CR Bard Inc. | 4.400% | 1/15/21 | 2,000 | 2,249 |
| Delhaize Group SA | 6.500% | 6/15/17 | 2,800 | 3,285 |
| DENTSPLY International Inc. | 4.125% | 8/15/21 | 2,000 | 2,056 |
| Diageo Capital plc | 5.750% | 10/23/17 | 4,800 | 5,644 |
| Diageo Capital plc | 4.828% | 7/15/20 | 975 | 1,110 |
| Dr Pepper Snapple Group Inc. | 6.820% | 5/1/18 | 4,250 | 5,267 |
| Dr Pepper Snapple Group Inc. | 2.600% | 1/15/19 | 825 | 821 |
| Eli Lilly & Co. | 5.200% | 3/15/17 | 4,925 | 5,710 |
| 3 Energizer Holdings Inc. | 4.700% | 5/19/21 | 2,300 | 2,429 |
| Express Scripts Inc. | 7.250% | 6/15/19 | 2,050 | 2,428 |
| General Mills Inc. | 5.700% | 2/15/17 | 5,750 | 6,777 |
| General Mills Inc. | 5.650% | 2/15/19 | 8,175 | 9,709 |
| General Mills Inc. | 3.150% | 12/15/21 | 875 | 893 |
| Gilead Sciences Inc. | 4.500% | 4/1/21 | 4,300 | 4,530 |
| Gilead Sciences Inc. | 4.400% | 12/1/21 | 3,825 | 4,059 |
| GlaxoSmithKline Capital Inc. | 5.650% | 5/15/18 | 14,550 | 17,535 |
| Hasbro Inc. | 6.300% | 9/15/17 | 2,175 | 2,498 |
| HJ Heinz Co. | 3.125% | 9/12/21 | 2,750 | 2,765 |
| Hormel Foods Corp. | 4.125% | 4/15/21 | 875 | 967 |
| Hospira Inc. | 6.050% | 3/30/17 | 2,000 | 2,221 |
| JM Smucker Co. | 3.500% | 10/15/21 | 2,950 | 3,017 |
| Johnson & Johnson | 5.550% | 8/15/17 | 550 | 664 |
| Johnson & Johnson | 5.150% | 7/15/18 | 8,625 | 10,381 |
| Johnson & Johnson | 2.950% | 9/1/20 | 2,000 | 2,121 |
| Kellogg Co. | 3.250% | 5/21/18 | 1,325 | 1,383 |
| Kellogg Co. | 4.150% | 11/15/19 | 4,350 | 4,714 |
| Kellogg Co. | 4.000% | 12/15/20 | 4,275 | 4,526 |
| Kimberly-Clark Corp. | 6.125% | 8/1/17 | 7,000 | 8,562 |
| Kimberly-Clark Corp. | 6.250% | 7/15/18 | 675 | 832 |
| Kimberly-Clark Corp. | 3.625% | 8/1/20 | 1,000 | 1,076 |
| Kimberly-Clark Corp. | 3.875% | 3/1/21 | 2,095 | 2,315 |
| Koninklijke Philips Electronics NV | 5.750% | 3/11/18 | 8,800 | 10,077 |
| Kraft Foods Inc. | 6.500% | 8/11/17 | 13,450 | 15,954 |
89
Vanguard® Intermediate-Term Bond Index Fund
Schedule of Investments
December 31, 2011
| Face | Market | |||
| Maturity | Amount | Value | ||
| Coupon | Date | ($000) | ($000) | |
| Kraft Foods Inc. | 6.125% | 2/1/18 | 5,150 | 6,044 |
| Kraft Foods Inc. | 6.125% | 8/23/18 | 700 | 827 |
| Kraft Foods Inc. | 5.375% | 2/10/20 | 20,100 | 23,153 |
| Kroger Co. | 6.400% | 8/15/17 | 2,350 | 2,799 |
| Kroger Co. | 6.150% | 1/15/20 | 5,369 | 6,534 |
| Laboratory Corp. of America Holdings | 4.625% | 11/15/20 | 3,000 | 3,167 |
| Life Technologies Corp. | 6.000% | 3/1/20 | 6,950 | 7,761 |
| Life Technologies Corp. | 5.000% | 1/15/21 | 3,875 | 4,083 |
| Lorillard Tobacco Co. | 8.125% | 6/23/19 | 4,425 | 5,269 |
| McCormick & Co. Inc. | 3.900% | 7/15/21 | 1,850 | 1,967 |
| McKesson Corp. | 5.700% | 3/1/17 | 1,000 | 1,167 |
| McKesson Corp. | 7.500% | 2/15/19 | 1,825 | 2,340 |
| McKesson Corp. | 4.750% | 3/1/21 | 7,125 | 8,099 |
| Mead Johnson Nutrition Co. | 4.900% | 11/1/19 | 5,725 | 6,299 |
| Medco Health Solutions Inc. | 7.125% | 3/15/18 | 9,800 | 11,478 |
| Medtronic Inc. | 5.600% | 3/15/19 | 1,525 | 1,815 |
| Medtronic Inc. | 4.450% | 3/15/20 | 4,075 | 4,603 |
| Merck & Co. Inc. | 6.000% | 9/15/17 | 1,925 | 2,360 |
| Merck & Co. Inc. | 5.000% | 6/30/19 | 5,525 | 6,513 |
| Merck & Co. Inc. | 3.875% | 1/15/21 | 8,000 | 8,982 |
| Novant Health Inc. | 5.850% | 11/1/19 | 1,300 | 1,512 |
| Novartis Capital Corp. | 4.400% | 4/24/20 | 6,300 | 7,158 |
| Novartis Securities Investment Ltd. | 5.125% | 2/10/19 | 13,625 | 16,007 |
| Partners Healthcare System Inc. | 3.443% | 7/1/21 | 1,325 | 1,343 |
| PepsiAmericas Inc. | 5.000% | 5/15/17 | 750 | 868 |
| PepsiCo Inc. | 5.000% | 6/1/18 | 9,200 | 10,667 |
| PepsiCo Inc. | 7.900% | 11/1/18 | 8,700 | 11,676 |
| PepsiCo Inc. | 4.500% | 1/15/20 | 1,900 | 2,149 |
| PepsiCo Inc. | 3.125% | 11/1/20 | 2,000 | 2,078 |
| PepsiCo Inc. | 3.000% | 8/25/21 | 3,500 | 3,595 |
| PerkinElmer Inc. | 5.000% | 11/15/21 | 1,850 | 1,867 |
| Pfizer Inc. | 6.200% | 3/15/19 | 21,000 | 25,965 |
| Philip Morris International Inc. | 5.650% | 5/16/18 | 16,375 | 19,415 |
| Philip Morris International Inc. | 4.125% | 5/17/21 | 2,000 | 2,221 |
| Philip Morris International Inc. | 2.900% | 11/15/21 | 2,300 | 2,348 |
| Procter & Gamble Co. | 4.700% | 2/15/19 | 9,426 | 11,086 |
| Quest Diagnostics Inc. | 6.400% | 7/1/17 | 1,325 | 1,563 |
| Quest Diagnostics Inc. | 4.750% | 1/30/20 | 1,100 | 1,174 |
| Quest Diagnostics Inc. | 4.700% | 4/1/21 | 1,000 | 1,067 |
| Reynolds American Inc. | 6.750% | 6/15/17 | 6,500 | 7,422 |
| Safeway Inc. | 6.350% | 8/15/17 | 3,400 | 3,855 |
| Safeway Inc. | 5.000% | 8/15/19 | 2,750 | 2,927 |
| Safeway Inc. | 3.950% | 8/15/20 | 1,500 | 1,486 |
| Sanofi | 4.000% | 3/29/21 | 16,600 | 18,384 |
| Sara Lee Corp. | 4.100% | 9/15/20 | 325 | 327 |
| St. Jude Medical Inc. | 4.875% | 7/15/19 | 2,757 | 3,141 |
| Stryker Corp. | 4.375% | 1/15/20 | 1,950 | 2,180 |
| Sysco Corp. | 5.250% | 2/12/18 | 2,500 | 2,924 |
| Teva Pharmaceutical Finance Co. BV | 3.650% | 11/10/21 | 2,350 | 2,393 |
| Teva Pharmaceutical Finance IV BV | 3.650% | 11/10/21 | 2,650 | 2,677 |
| Thermo Fisher Scientific Inc. | 4.700% | 5/1/20 | 650 | 735 |
| Thermo Fisher Scientific Inc. | 4.500% | 3/1/21 | 1,850 | 2,058 |
| Thermo Fisher Scientific Inc. | 3.600% | 8/15/21 | 4,700 | 4,943 |
| Unilever Capital Corp. | 4.800% | 2/15/19 | 2,475 | 2,874 |
| Unilever Capital Corp. | 4.250% | 2/10/21 | 6,880 | 7,898 |
| UST LLC | 5.750% | 3/1/18 | 975 | 1,082 |
| Watson Pharmaceuticals Inc. | 6.125% | 8/15/19 | 2,000 | 2,354 |
| Wyeth | 5.450% | 4/1/17 | 1,725 | 2,024 |
| Zimmer Holdings Inc. | 4.625% | 11/30/19 | 3,175 | 3,471 |
| Zimmer Holdings Inc. | 3.375% | 11/30/21 | 350 | 352 |
| Energy (2.6%) | ||||
| Anadarko Petroleum Corp. | 6.375% | 9/15/17 | 14,900 | 17,255 |
| Anadarko Petroleum Corp. | 6.950% | 6/15/19 | 2,700 | 3,184 |
90
Vanguard® Intermediate-Term Bond Index Fund
Schedule of Investments
December 31, 2011
| Face | Market | |||
| Maturity | Amount | Value | ||
| Coupon | Date | ($000) | ($000) | |
| Apache Corp. | 5.625% | 1/15/17 | 625 | 739 |
| Apache Corp. | 6.900% | 9/15/18 | 3,800 | 4,844 |
| Apache Corp. | 3.625% | 2/1/21 | 3,800 | 4,101 |
| Baker Hughes Inc. | 7.500% | 11/15/18 | 3,000 | 3,967 |
| 3 Baker Hughes Inc. | 3.200% | 8/15/21 | 2,300 | 2,368 |
| BJ Services Co. | 6.000% | 6/1/18 | 1,225 | 1,471 |
| BP Capital Markets plc | 4.750% | 3/10/19 | 4,675 | 5,223 |
| BP Capital Markets plc | 4.500% | 10/1/20 | 5,780 | 6,405 |
| BP Capital Markets plc | 4.742% | 3/11/21 | 7,400 | 8,410 |
| BP Capital Markets plc | 3.561% | 11/1/21 | 2,600 | 2,728 |
| Cameron International Corp. | 6.375% | 7/15/18 | 3,600 | 4,248 |
| Cameron International Corp. | 4.500% | 6/1/21 | 650 | 698 |
| Canadian Natural Resources Ltd. | 5.700% | 5/15/17 | 7,125 | 8,338 |
| Canadian Natural Resources Ltd. | 3.450% | 11/15/21 | 2,600 | 2,704 |
| Cenovus Energy Inc. | 5.700% | 10/15/19 | 5,300 | 6,230 |
| Chevron Corp. | 4.950% | 3/3/19 | 6,300 | 7,461 |
| ConocoPhillips | 5.750% | 2/1/19 | 10,875 | 13,147 |
| ConocoPhillips | 6.000% | 1/15/20 | 5,450 | 6,768 |
| Devon Energy Corp. | 6.300% | 1/15/19 | 2,875 | 3,517 |
| Devon Energy Corp. | 4.000% | 7/15/21 | 3,800 | 4,150 |
| Diamond Offshore Drilling Inc. | 5.875% | 5/1/19 | 1,050 | 1,214 |
| Encana Corp. | 5.900% | 12/1/17 | 4,225 | 4,787 |
| Encana Corp. | 3.900% | 11/15/21 | 3,500 | 3,506 |
| Ensco plc | 4.700% | 3/15/21 | 5,950 | 6,185 |
| EOG Resources Inc. | 5.875% | 9/15/17 | 2,300 | 2,763 |
| EOG Resources Inc. | 6.875% | 10/1/18 | 4,525 | 5,610 |
| EOG Resources Inc. | 4.400% | 6/1/20 | 1,200 | 1,337 |
| EOG Resources Inc. | 4.100% | 2/1/21 | 5,200 | 5,691 |
| Halliburton Co. | 6.150% | 9/15/19 | 4,300 | 5,285 |
| Halliburton Co. | 3.250% | 11/15/21 | 2,200 | 2,268 |
| Hess Corp. | 8.125% | 2/15/19 | 3,925 | 5,031 |
| Husky Energy Inc. | 6.150% | 6/15/19 | 510 | 577 |
| Husky Energy Inc. | 7.250% | 12/15/19 | 3,895 | 4,771 |
| Marathon Oil Corp. | 6.000% | 10/1/17 | 8,775 | 10,225 |
| Marathon Oil Corp. | 5.900% | 3/15/18 | 137 | 160 |
| Marathon Petroleum Corp. | 5.125% | 3/1/21 | 4,000 | 4,208 |
| Nabors Industries Inc. | 6.150% | 2/15/18 | 6,575 | 7,362 |
| Nabors Industries Inc. | 9.250% | 1/15/19 | 6,875 | 8,645 |
| Nabors Industries Inc. | 5.000% | 9/15/20 | 1,450 | 1,483 |
| Nexen Inc. | 6.200% | 7/30/19 | 2,000 | 2,323 |
| Noble Energy Inc. | 8.250% | 3/1/19 | 4,081 | 5,335 |
| Noble Energy Inc. | 4.150% | 12/15/21 | 3,625 | 3,754 |
| Noble Holding International Ltd. | 4.900% | 8/1/20 | 6,715 | 7,106 |
| Noble Holding International Ltd. | 4.625% | 3/1/21 | 1,800 | 1,875 |
| Occidental Petroleum Corp. | 1.750% | 2/15/17 | 11,500 | 11,637 |
| Occidental Petroleum Corp. | 4.100% | 2/1/21 | 4,000 | 4,455 |
| Petro-Canada | 6.050% | 5/15/18 | 7,350 | 8,626 |
| Petrohawk Energy Corp. | 7.250% | 8/15/18 | 3,200 | 3,592 |
| Pride International Inc. | 6.875% | 8/15/20 | 9,660 | 11,278 |
| Rowan Cos. Inc. | 7.875% | 8/1/19 | 2,150 | 2,523 |
| Shell International Finance BV | 5.200% | 3/22/17 | 2,775 | 3,242 |
| Shell International Finance BV | 4.300% | 9/22/19 | 12,775 | 14,729 |
| Shell International Finance BV | 4.375% | 3/25/20 | 3,900 | 4,542 |
| Suncor Energy Inc. | 6.100% | 6/1/18 | 3,575 | 4,221 |
| Talisman Energy Inc. | 7.750% | 6/1/19 | 3,875 | 4,776 |
| Talisman Energy Inc. | 3.750% | 2/1/21 | 4,000 | 3,931 |
| Total Capital SA | 4.450% | 6/24/20 | 4,750 | 5,289 |
| Total Capital SA | 4.125% | 1/28/21 | 6,000 | 6,518 |
| Transocean Inc. | 4.950% | 11/15/15 | 225 | 229 |
| Transocean Inc. | 6.000% | 3/15/18 | 6,750 | 6,968 |
| Transocean Inc. | 6.500% | 11/15/20 | 2,500 | 2,580 |
| Valero Energy Corp. | 6.125% | 6/15/17 | 6,000 | 6,706 |
| Valero Energy Corp. | 9.375% | 3/15/19 | 4,000 | 5,122 |
| Valero Energy Corp. | 6.125% | 2/1/20 | 3,780 | 4,198 |
91
Vanguard® Intermediate-Term Bond Index Fund
Schedule of Investments
December 31, 2011
| Face | Market | |||
| Maturity | Amount | Value | ||
| Coupon | Date | ($000) | ($000) | |
| Weatherford International Inc. | 6.350% | 6/15/17 | 2,035 | 2,277 |
| Weatherford International Ltd. | 6.000% | 3/15/18 | 5,880 | 6,530 |
| Weatherford International Ltd. | 9.625% | 3/1/19 | 7,565 | 9,791 |
| Weatherford International Ltd. | 5.125% | 9/15/20 | 900 | 942 |
| Williams Cos. Inc. | 7.875% | 9/1/21 | 279 | 344 |
| XTO Energy Inc. | 6.250% | 8/1/17 | 3,125 | 3,852 |
| XTO Energy Inc. | 5.500% | 6/15/18 | 1,875 | 2,293 |
| Other Industrial (0.1%) | ||||
| Cintas Corp. No 2 | 6.125% | 12/1/17 | 1,300 | 1,558 |
| Cornell University New York Revenue | 5.450% | 2/1/19 | 1,350 | 1,624 |
| Fluor Corp. | 3.375% | 9/15/21 | 2,300 | 2,326 |
| Technology (1.9%) | ||||
| Adobe Systems Inc. | 4.750% | 2/1/20 | 4,175 | 4,509 |
| Agilent Technologies Inc. | 6.500% | 11/1/17 | 4,725 | 5,518 |
| Agilent Technologies Inc. | 5.000% | 7/15/20 | 3,000 | 3,346 |
| Applied Materials Inc. | 4.300% | 6/15/21 | 6,825 | 7,256 |
| Arrow Electronics Inc. | 5.125% | 3/1/21 | 2,000 | 2,024 |
| BMC Software Inc. | 7.250% | 6/1/18 | 1,550 | 1,792 |
| Broadcom Corp. | 2.700% | 11/1/18 | 1,750 | 1,758 |
| CA Inc. | 5.375% | 12/1/19 | 6,450 | 6,997 |
| Cisco Systems Inc. | 3.150% | 3/14/17 | 1,725 | 1,872 |
| Cisco Systems Inc. | 4.950% | 2/15/19 | 8,892 | 10,285 |
| Cisco Systems Inc. | 4.450% | 1/15/20 | 14,875 | 16,917 |
| Computer Sciences Corp. | 6.500% | 3/15/18 | 3,900 | 3,826 |
| Corning Inc. | 6.625% | 5/15/19 | 950 | 1,150 |
| Corning Inc. | 4.250% | 8/15/20 | 1,447 | 1,543 |
| Dell Inc. | 5.650% | 4/15/18 | 2,500 | 2,895 |
| Dell Inc. | 5.875% | 6/15/19 | 3,675 | 4,309 |
| Equifax Inc. | 6.300% | 7/1/17 | 1,300 | 1,459 |
| Fiserv Inc. | 6.800% | 11/20/17 | 3,150 | 3,669 |
| Fiserv Inc. | 4.750% | 6/15/21 | 2,000 | 2,089 |
| Google Inc. | 3.625% | 5/19/21 | 5,600 | 6,124 |
| Harris Corp. | 5.950% | 12/1/17 | 775 | 905 |
| Harris Corp. | 6.375% | 6/15/19 | 775 | 880 |
| Harris Corp. | 4.400% | 12/15/20 | 4,300 | 4,377 |
| Hewlett-Packard Co. | 5.400% | 3/1/17 | 3,850 | 4,241 |
| Hewlett-Packard Co. | 5.500% | 3/1/18 | 2,125 | 2,361 |
| Hewlett-Packard Co. | 3.750% | 12/1/20 | 6,800 | 6,690 |
| Hewlett-Packard Co. | 4.300% | 6/1/21 | 4,000 | 4,062 |
| Hewlett-Packard Co. | 4.375% | 9/15/21 | 4,000 | 4,094 |
| Hewlett-Packard Co. | 4.650% | 12/9/21 | 7,500 | 7,910 |
| Intel Corp. | 3.300% | 10/1/21 | 11,441 | 12,027 |
| International Business Machines Corp. | 5.700% | 9/14/17 | 25,725 | 31,165 |
| International Business Machines Corp. | 2.900% | 11/1/21 | 4,400 | 4,526 |
| Intuit Inc. | 5.750% | 3/15/17 | 1,025 | 1,151 |
| Juniper Networks Inc. | 4.600% | 3/15/21 | 725 | 771 |
| Lexmark International Inc. | 6.650% | 6/1/18 | 2,975 | 3,316 |
| Microsoft Corp. | 4.200% | 6/1/19 | 9,175 | 10,539 |
| Motorola Solutions Inc. | 6.000% | 11/15/17 | 2,220 | 2,498 |
| Nokia Oyj | 5.375% | 5/15/19 | 9,025 | 9,132 |
| Oracle Corp. | 5.750% | 4/15/18 | 7,600 | 9,254 |
| Oracle Corp. | 5.000% | 7/8/19 | 7,925 | 9,305 |
| Oracle Corp. | 3.875% | 7/15/20 | 10,940 | 11,994 |
| Pitney Bowes Inc. | 5.750% | 9/15/17 | 1,800 | 1,939 |
| Pitney Bowes Inc. | 4.750% | 5/15/18 | 1,000 | 997 |
| SAIC Inc. | 4.450% | 12/1/20 | 1,200 | 1,277 |
| Symantec Corp. | 4.200% | 9/15/20 | 3,705 | 3,738 |
| Tyco Electronics Group SA | 6.550% | 10/1/17 | 4,250 | 4,910 |
| Xerox Corp. | 6.750% | 2/1/17 | 1,650 | 1,888 |
| Xerox Corp. | 6.350% | 5/15/18 | 10,275 | 11,589 |
| Xerox Corp. | 5.625% | 12/15/19 | 2,775 | 3,025 |
| Transportation (0.8%) | ||||
| 4 American Airlines 2011-1 Class A Pass Through Trust | 5.250% | 1/31/21 | 649 | 605 |
92
Vanguard® Intermediate-Term Bond Index Fund
Schedule of Investments
December 31, 2011
| Face | Market | |||
| Maturity | Amount | Value | ||
| Coupon | Date | ($000) | ($000) | |
| 4 American Airlines 2011-2 Class A Pass Through Trust | 8.625% | 10/15/21 | 400 | 415 |
| 4 American Airlines Pass Through Trust 2009-1A | 10.375% | 7/2/19 | 3,004 | 3,191 |
| Burlington Northern Santa Fe LLC | 5.650% | 5/1/17 | 4,150 | 4,787 |
| Burlington Northern Santa Fe LLC | 5.750% | 3/15/18 | 5,400 | 6,287 |
| Burlington Northern Santa Fe LLC | 3.450% | 9/15/21 | 5,525 | 5,696 |
| Canadian National Railway Co. | 5.850% | 11/15/17 | 500 | 599 |
| Canadian National Railway Co. | 5.550% | 5/15/18 | 900 | 1,062 |
| Canadian National Railway Co. | 5.550% | 3/1/19 | 2,000 | 2,406 |
| Canadian National Railway Co. | 2.850% | 12/15/21 | 1,800 | 1,814 |
| Canadian Pacific Railway Co. | 7.250% | 5/15/19 | 1,500 | 1,758 |
| Con-way Inc. | 7.250% | 1/15/18 | 3,400 | 3,834 |
| 4 Continental Airlines 1997-4 Class A Pass Through Trust | 6.900% | 1/2/18 | 1,310 | 1,366 |
| 4 Continental Airlines 1998-1 Class A Pass Through Trust | 6.648% | 9/15/17 | 1,346 | 1,389 |
| 4 Continental Airlines 2009-2 Class A Pass Through Trust | 7.250% | 11/10/19 | 4,171 | 4,473 |
| 4 Continental Airlines 2010-1 Class A Pass Through Trust | 4.750% | 1/12/21 | 2,500 | 2,550 |
| CSX Corp. | 5.600% | 5/1/17 | 3,850 | 4,405 |
| CSX Corp. | 7.900% | 5/1/17 | 282 | 352 |
| CSX Corp. | 6.250% | 3/15/18 | 7,025 | 8,364 |
| CSX Corp. | 7.375% | 2/1/19 | 725 | 907 |
| CSX Corp. | 4.250% | 6/1/21 | 2,025 | 2,163 |
| CSX Corp. | 6.220% | 4/30/40 | 393 | 479 |
| 4 Delta Air Lines 2009-1 Class A Pass Through Trust | 7.750% | 12/17/19 | 1,930 | 2,099 |
| 4 Delta Air Lines 2010-1 Class A Pass Through Trust | 6.200% | 7/2/18 | 2,735 | 2,920 |
| 4 Delta Air Lines 2010-2 Class A Pass Through Trust | 4.950% | 5/23/19 | 3,265 | 3,330 |
| FedEx Corp. | 8.000% | 1/15/19 | 3,315 | 4,351 |
| Norfolk Southern Corp. | 7.700% | 5/15/17 | 2,400 | 3,042 |
| Norfolk Southern Corp. | 5.750% | 4/1/18 | 2,375 | 2,789 |
| Norfolk Southern Corp. | 5.900% | 6/15/19 | 6,900 | 8,350 |
| Norfolk Southern Railway Co. | 9.750% | 6/15/20 | 411 | 598 |
| Ryder System Inc. | 3.500% | 6/1/17 | 1,325 | 1,359 |
| Southwest Airlines Co. | 5.125% | 3/1/17 | 650 | 696 |
| Union Pacific Corp. | 5.700% | 8/15/18 | 3,825 | 4,529 |
| Union Pacific Corp. | 4.163% | 7/15/22 | 4,596 | 4,968 |
| United Parcel Service Inc. | 5.500% | 1/15/18 | 3,100 | 3,727 |
| United Parcel Service Inc. | 5.125% | 4/1/19 | 2,200 | 2,665 |
| United Parcel Service Inc. | 3.125% | 1/15/21 | 6,700 | 7,105 |
| United Parcel Service of America Inc. | 8.375% | 4/1/20 | 500 | 709 |
| 2,873,933 | ||||
| Utilities (4.3%) | ||||
| Electric (2.6%) | ||||
| Alabama Power Co. | 5.500% | 10/15/17 | 1,925 | 2,288 |
| Ameren Illinois Co. | 6.125% | 11/15/17 | 3,100 | 3,649 |
| Ameren Illinois Co. | 6.250% | 4/1/18 | 2,000 | 2,302 |
| Ameren Illinois Co. | 9.750% | 11/15/18 | 2,750 | 3,631 |
| Appalachian Power Co. | 7.950% | 1/15/20 | 675 | 884 |
| Appalachian Power Co. | 4.600% | 3/30/21 | 2,550 | 2,802 |
| Arizona Public Service Co. | 8.750% | 3/1/19 | 2,000 | 2,540 |
| Baltimore Gas & Electric Co. | 3.500% | 11/15/21 | 1,700 | 1,726 |
| Carolina Power & Light Co. | 5.300% | 1/15/19 | 9,725 | 11,410 |
| Carolina Power & Light Co. | 3.000% | 9/15/21 | 2,675 | 2,746 |
| CenterPoint Energy Inc. | 6.500% | 5/1/18 | 4,500 | 5,252 |
| Cleveland Electric Illuminating Co. | 7.880% | 11/1/17 | 250 | 315 |
| Commonwealth Edison Co. | 6.150% | 9/15/17 | 4,250 | 5,015 |
| Commonwealth Edison Co. | 5.800% | 3/15/18 | 2,550 | 3,009 |
| Commonwealth Edison Co. | 4.000% | 8/1/20 | 2,000 | 2,160 |
| Connecticut Light & Power Co. | 5.650% | 5/1/18 | 3,000 | 3,548 |
| Consolidated Edison Co. of New York Inc. | 5.850% | 4/1/18 | 5,000 | 6,098 |
| Consolidated Edison Co. of New York Inc. | 7.125% | 12/1/18 | 2,000 | 2,572 |
| Consolidated Edison Co. of New York Inc. | 6.650% | 4/1/19 | 1,200 | 1,516 |
| Consolidated Edison Co. of New York Inc. | 4.450% | 6/15/20 | 2,000 | 2,282 |
| Constellation Energy Group Inc. | 5.150% | 12/1/20 | 2,000 | 2,179 |
| Consumers Energy Co. | 6.125% | 3/15/19 | 300 | 364 |
| Consumers Energy Co. | 6.700% | 9/15/19 | 8,466 | 10,718 |
93
Vanguard® Intermediate-Term Bond Index Fund
Schedule of Investments
December 31, 2011
| Face | Market | |||
| Maturity | Amount | Value | ||
| Coupon | Date | ($000) | ($000) | |
| Consumers Energy Co. | 5.650% | 4/15/20 | 1,075 | 1,280 |
| Detroit Edison Co. | 3.450% | 10/1/20 | 2,500 | 2,628 |
| Detroit Edison Co. | 3.900% | 6/1/21 | 750 | 822 |
| Dominion Resources Inc. | 6.000% | 11/30/17 | 4,750 | 5,626 |
| Dominion Resources Inc. | 8.875% | 1/15/19 | 5,375 | 7,126 |
| Dominion Resources Inc. | 5.200% | 8/15/19 | 900 | 1,043 |
| Dominion Resources Inc. | 4.450% | 3/15/21 | 11,000 | 12,275 |
| Duke Energy Carolinas LLC | 5.100% | 4/15/18 | 6,750 | 7,901 |
| Duke Energy Carolinas LLC | 4.300% | 6/15/20 | 1,050 | 1,191 |
| Duke Energy Carolinas LLC | 3.900% | 6/15/21 | 2,000 | 2,197 |
| Duke Energy Corp. | 5.050% | 9/15/19 | 10,600 | 11,960 |
| Duke Energy Indiana Inc. | 3.750% | 7/15/20 | 1,450 | 1,551 |
| Entergy Gulf States Louisiana LLC | 6.000% | 5/1/18 | 2,600 | 2,975 |
| Entergy Louisiana LLC | 6.500% | 9/1/18 | 2,625 | 3,165 |
| Exelon Generation Co. LLC | 6.200% | 10/1/17 | 3,500 | 4,025 |
| Exelon Generation Co. LLC | 4.000% | 10/1/20 | 4,875 | 5,006 |
| FirstEnergy Solutions Corp. | 6.050% | 8/15/21 | 5,800 | 6,481 |
| Florida Power & Light Co. | 5.550% | 11/1/17 | 1,950 | 2,359 |
| Florida Power Corp. | 5.650% | 6/15/18 | 2,100 | 2,508 |
| Georgia Power Co. | 5.700% | 6/1/17 | 3,000 | 3,575 |
| Great Plains Energy Inc. | 4.850% | 6/1/21 | 6,095 | 6,484 |
| Indiana Michigan Power Co. | 7.000% | 3/15/19 | 5,747 | 7,129 |
| Jersey Central Power & Light Co. | 5.650% | 6/1/17 | 5,475 | 6,289 |
| Kentucky Utilities Co. | 3.250% | 11/1/20 | 2,300 | 2,394 |
| LG&E and KU Energy LLC | 3.750% | 11/15/20 | 2,025 | 2,053 |
| Metropolitan Edison Co. | 7.700% | 1/15/19 | 2,000 | 2,530 |
| MidAmerican Energy Co. | 5.950% | 7/15/17 | 925 | 1,086 |
| MidAmerican Energy Co. | 5.300% | 3/15/18 | 400 | 467 |
| Midamerican Energy Holdings Co. | 5.750% | 4/1/18 | 5,350 | 6,205 |
| National Rural Utilities Cooperative Finance Corp. | 5.450% | 4/10/17 | 250 | 284 |
| National Rural Utilities Cooperative Finance Corp. | 5.450% | 2/1/18 | 9,625 | 11,140 |
| National Rural Utilities Cooperative Finance Corp. | 10.375% | 11/1/18 | 2,525 | 3,612 |
| Nevada Power Co. | 6.500% | 5/15/18 | 4,217 | 5,080 |
| Nevada Power Co. | 6.500% | 8/1/18 | 4,175 | 5,036 |
| NextEra Energy Capital Holdings Inc. | 6.000% | 3/1/19 | 4,500 | 5,229 |
| NextEra Energy Capital Holdings Inc. | 4.500% | 6/1/21 | 3,000 | 3,199 |
| 4 NextEra Energy Capital Holdings Inc. | 6.650% | 6/15/67 | 1,700 | 1,704 |
| 4 NextEra Energy Capital Holdings Inc. | 7.300% | 9/1/67 | 500 | 520 |
| Northern States Power Co. | 5.250% | 3/1/18 | 5,350 | 6,387 |
| NSTAR | 4.500% | 11/15/19 | 3,500 | 3,873 |
| NSTAR Electric Co. | 5.625% | 11/15/17 | 975 | 1,149 |
| Oncor Electric Delivery Co. LLC | 6.800% | 9/1/18 | 2,500 | 3,039 |
| Pacific Gas & Electric Co. | 5.625% | 11/30/17 | 5,900 | 6,989 |
| Pacific Gas & Electric Co. | 8.250% | 10/15/18 | 1,325 | 1,744 |
| Pacific Gas & Electric Co. | 3.500% | 10/1/20 | 9,525 | 9,942 |
| Pacific Gas & Electric Co. | 4.250% | 5/15/21 | 200 | 218 |
| PacifiCorp | 5.650% | 7/15/18 | 2,575 | 3,046 |
| PacifiCorp | 5.500% | 1/15/19 | 2,740 | 3,230 |
| Peco Energy Co. | 5.350% | 3/1/18 | 2,475 | 2,919 |
| Pennsylvania Electric Co. | 6.050% | 9/1/17 | 2,800 | 3,235 |
| PPL Electric Utilities Corp. | 3.000% | 9/15/21 | 2,800 | 2,820 |
| PPL Energy Supply LLC | 6.500% | 5/1/18 | 750 | 852 |
| PPL Energy Supply LLC | 4.600% | 12/15/21 | 3,725 | 3,791 |
| Progress Energy Inc. | 4.400% | 1/15/21 | 2,000 | 2,199 |
| PSEG Power LLC | 5.125% | 4/15/20 | 5,262 | 5,880 |
| Public Service Co. of Colorado | 5.125% | 6/1/19 | 2,300 | 2,698 |
| Public Service Co. of Colorado | 3.200% | 11/15/20 | 1,800 | 1,869 |
| Public Service Co. of Oklahoma | 5.150% | 12/1/19 | 650 | 725 |
| Public Service Co. of Oklahoma | 4.400% | 2/1/21 | 2,500 | 2,719 |
| Public Service Electric & Gas Co. | 3.500% | 8/15/20 | 2,000 | 2,115 |
| SCANA Corp. | 4.750% | 5/15/21 | 2,800 | 2,965 |
| South Carolina Electric & Gas Co. | 6.500% | 11/1/18 | 2,400 | 2,975 |
| Southern California Edison Co. | 5.500% | 8/15/18 | 4,400 | 5,262 |
| Southern California Edison Co. | 3.875% | 6/1/21 | 3,325 | 3,674 |
94
Vanguard® Intermediate-Term Bond Index Fund
Schedule of Investments
December 31, 2011
| Face | Market | |||
| Maturity | Amount | Value | ||
| Coupon | Date | ($000) | ($000) | |
| Southwestern Electric Power Co. | 5.550% | 1/15/17 | 3,500 | 3,916 |
| Southwestern Electric Power Co. | 6.450% | 1/15/19 | 2,075 | 2,420 |
| Tampa Electric Co. | 6.100% | 5/15/18 | 2,150 | 2,585 |
| Tampa Electric Co. | 5.400% | 5/15/21 | 2,000 | 2,340 |
| TECO Finance Inc. | 5.150% | 3/15/20 | 1,350 | 1,484 |
| TransAlta Corp. | 6.650% | 5/15/18 | 2,975 | 3,423 |
| Tucson Electric Power Co. | 5.150% | 11/15/21 | 1,450 | 1,541 |
| UIL Holdings Corp. | 4.625% | 10/1/20 | 1,850 | 1,944 |
| Union Electric Co. | 6.700% | 2/1/19 | 4,000 | 4,858 |
| United Utilities plc | 5.375% | 2/1/19 | 1,000 | 1,045 |
| Westar Energy Inc. | 8.625% | 12/1/18 | 1,550 | 2,013 |
| Wisconsin Electric Power Co. | 4.250% | 12/15/19 | 1,525 | 1,707 |
| 4 Wisconsin Energy Corp. | 6.250% | 5/15/67 | 5,275 | 5,275 |
| Wisconsin Power & Light Co. | 5.000% | 7/15/19 | 2,275 | 2,635 |
| Xcel Energy Inc. | 4.700% | 5/15/20 | 2,000 | 2,269 |
| Natural Gas (1.6%) | ||||
| AGL Capital Corp. | 5.250% | 8/15/19 | 2,300 | 2,564 |
| Atmos Energy Corp. | 8.500% | 3/15/19 | 2,510 | 3,319 |
| Boardwalk Pipelines LP | 5.500% | 2/1/17 | 3,725 | 4,104 |
| Buckeye Partners LP | 6.050% | 1/15/18 | 4,550 | 5,010 |
| Buckeye Partners LP | 4.875% | 2/1/21 | 2,000 | 2,109 |
| CenterPoint Energy Resources Corp. | 6.000% | 5/15/18 | 5,361 | 6,193 |
| El Paso Natural Gas Co. | 5.950% | 4/15/17 | 2,875 | 3,221 |
| Enbridge Energy Partners LP | 6.500% | 4/15/18 | 3,075 | 3,569 |
| Enbridge Energy Partners LP | 9.875% | 3/1/19 | 1,700 | 2,250 |
| Enbridge Energy Partners LP | 5.200% | 3/15/20 | 1,875 | 2,079 |
| Enbridge Energy Partners LP | 4.200% | 9/15/21 | 3,675 | 3,833 |
| Enbridge Inc. | 5.600% | 4/1/17 | 3,550 | 4,011 |
| Energy Transfer Partners LP | 6.125% | 2/15/17 | 4,850 | 5,356 |
| Energy Transfer Partners LP | 9.000% | 4/15/19 | 12,400 | 14,826 |
| Enterprise Products Operating LLC | 6.300% | 9/15/17 | 2,525 | 2,947 |
| Enterprise Products Operating LLC | 6.650% | 4/15/18 | 550 | 651 |
| Enterprise Products Operating LLC | 6.500% | 1/31/19 | 3,050 | 3,556 |
| Enterprise Products Operating LLC | 5.250% | 1/31/20 | 5,000 | 5,518 |
| Enterprise Products Operating LLC | 5.200% | 9/1/20 | 6,500 | 7,172 |
| EQT Corp. | 6.500% | 4/1/18 | 3,800 | 4,280 |
| EQT Corp. | 8.125% | 6/1/19 | 1,725 | 2,040 |
| EQT Corp. | 4.875% | 11/15/21 | 975 | 984 |
| Kinder Morgan Energy Partners LP | 6.000% | 2/1/17 | 1,000 | 1,136 |
| Kinder Morgan Energy Partners LP | 5.950% | 2/15/18 | 3,250 | 3,723 |
| Kinder Morgan Energy Partners LP | 6.850% | 2/15/20 | 17,025 | 20,191 |
| Magellan Midstream Partners LP | 6.550% | 7/15/19 | 3,475 | 4,101 |
| Magellan Midstream Partners LP | 4.250% | 2/1/21 | 2,400 | 2,496 |
| National Fuel Gas Co. | 4.900% | 12/1/21 | 3,175 | 3,243 |
| Nisource Finance Corp. | 5.250% | 9/15/17 | 500 | 554 |
| Nisource Finance Corp. | 6.400% | 3/15/18 | 10,150 | 11,667 |
| Nisource Finance Corp. | 6.800% | 1/15/19 | 938 | 1,096 |
| Nisource Finance Corp. | 4.450% | 12/1/21 | 150 | 154 |
| NuStar Logistics LP | 7.650% | 4/15/18 | 2,900 | 3,477 |
| ONEOK Partners LP | 8.625% | 3/1/19 | 5,000 | 6,416 |
| Panhandle Eastern Pipeline Co. LP | 6.200% | 11/1/17 | 2,000 | 2,271 |
| Panhandle Eastern Pipeline Co. LP | 7.000% | 6/15/18 | 2,525 | 2,939 |
| Plains All American Pipeline LP / PAA Finance Corp. | 6.125% | 1/15/17 | 2,500 | 2,830 |
| Plains All American Pipeline LP / PAA Finance Corp. | 6.500% | 5/1/18 | 2,675 | 3,101 |
| Plains All American Pipeline LP / PAA Finance Corp. | 8.750% | 5/1/19 | 200 | 256 |
| Plains All American Pipeline LP / PAA Finance Corp. | 5.750% | 1/15/20 | 600 | 677 |
| Plains All American Pipeline LP / PAA Finance Corp. | 5.000% | 2/1/21 | 2,575 | 2,804 |
| Sempra Energy | 6.150% | 6/15/18 | 4,300 | 5,064 |
| Sempra Energy | 9.800% | 2/15/19 | 4,370 | 5,900 |
| 3 Southern Natural Gas Co. | 5.900% | 4/1/17 | 3,650 | 4,179 |
| Southern Natural Gas Co. / Southern Natural Issuing | ||||
| Corp. | 4.400% | 6/15/21 | 575 | 594 |
| Spectra Energy Capital LLC | 6.200% | 4/15/18 | 1,700 | 1,927 |
95
Vanguard® Intermediate-Term Bond Index Fund
Schedule of Investments
December 31, 2011
| Face | Market | |||
| Maturity | Amount | Value | ||
| Coupon | Date | ($000) | ($000) | |
| TransCanada PipeLines Ltd. | 6.500% | 8/15/18 | 9,100 | 11,132 |
| TransCanada PipeLines Ltd. | 7.125% | 1/15/19 | 1,050 | 1,343 |
| TransCanada PipeLines Ltd. | 3.800% | 10/1/20 | 3,975 | 4,272 |
| 4 TransCanada PipeLines Ltd. | 6.350% | 5/15/67 | 6,550 | 6,566 |
| Transcontinental Gas Pipe Line Co. LLC | 6.050% | 6/15/18 | 2,500 | 2,870 |
| Williams Partners LP | 5.250% | 3/15/20 | 9,025 | 10,020 |
| Williams Partners LP | 4.000% | 11/15/21 | 475 | 488 |
| Williams Partners LP / Williams Partners Finance Corp. | 7.250% | 2/1/17 | 6,700 | 8,011 |
| Other Utility (0.1%) | ||||
| American Water Capital Corp. | 6.085% | 10/15/17 | 3,025 | 3,532 |
| Veolia Environnement SA | 6.000% | 6/1/18 | 3,550 | 3,931 |
| 593,464 | ||||
| Total Corporate Bonds (Cost $4,849,691) | 5,242,540 | |||
| Sovereign Bonds (U.S. Dollar-Denominated) (5.9%) | ||||
| Asian Development Bank | 5.250% | 6/12/17 | 2,300 | 2,768 |
| Asian Development Bank | 5.593% | 7/16/18 | 1,975 | 2,413 |
| Asian Development Bank | 1.875% | 10/23/18 | 2,900 | 2,955 |
| Banco do Brasil SA | 3.875% | 1/23/17 | 2,275 | 2,249 |
| Brazilian Government International Bond | 6.000% | 1/17/17 | 33,125 | 38,789 |
| 4 Brazilian Government International Bond | 8.000% | 1/15/18 | 11,050 | 12,929 |
| Brazilian Government International Bond | 5.875% | 1/15/19 | 8,050 | 9,519 |
| Brazilian Government International Bond | 4.875% | 1/22/21 | 6,125 | 6,830 |
| Chile Government International Bond | 3.875% | 8/5/20 | 3,800 | 4,137 |
| Chile Government International Bond | 3.250% | 9/14/21 | 5,500 | 5,672 |
| Colombia Government International Bond | 7.375% | 1/27/17 | 7,200 | 8,784 |
| Colombia Government International Bond | 7.375% | 3/18/19 | 14,125 | 17,833 |
| Colombia Government International Bond | 11.750% | 2/25/20 | 600 | 945 |
| Colombia Government International Bond | 4.375% | 7/12/21 | 9,450 | 10,112 |
| Corp. Andina de Fomento | 5.750% | 1/12/17 | 5,025 | 5,471 |
| Corp. Andina de Fomento | 8.125% | 6/4/19 | 5,600 | 6,834 |
| 5 Development Bank of Japan | 5.125% | 2/1/17 | 3,700 | 4,318 |
| Ecopetrol SA | 7.625% | 7/23/19 | 6,800 | 8,245 |
| European Investment Bank | 4.875% | 1/17/17 | 10,375 | 11,809 |
| European Investment Bank | 5.125% | 5/30/17 | 16,550 | 19,207 |
| European Investment Bank | 2.875% | 9/15/20 | 9,600 | 9,598 |
| European Investment Bank | 4.000% | 2/16/21 | 15,600 | 16,994 |
| Export-Import Bank of Korea | 5.125% | 6/29/20 | 4,400 | 4,624 |
| Export-Import Bank of Korea | 4.000% | 1/29/21 | 5,000 | 4,834 |
| Export-Import Bank of Korea | 4.375% | 9/15/21 | 8,000 | 7,923 |
| Hungary Government International Bond | 6.250% | 1/29/20 | 8,200 | 7,491 |
| Hungary Government International Bond | 6.375% | 3/29/21 | 11,775 | 10,833 |
| Hydro Quebec | 2.000% | 6/30/16 | 3,925 | 4,009 |
| Inter-American Development Bank | 2.375% | 8/15/17 | 7,800 | 8,206 |
| Inter-American Development Bank | 1.750% | 8/24/18 | 11,375 | 11,473 |
| Inter-American Development Bank | 3.875% | 9/17/19 | 9,300 | 10,683 |
| Inter-American Development Bank | 3.875% | 2/14/20 | 5,475 | 6,312 |
| International Finance Corp. | 2.125% | 11/17/17 | 8,600 | 8,939 |
| Israel Government International Bond | 5.125% | 3/26/19 | 8,900 | 9,960 |
| 5 Japan Finance Organization for Municipalities | 5.000% | 5/16/17 | 3,800 | 4,428 |
| 5 Japan Finance Organization for Municipalities | 4.000% | 1/13/21 | 4,500 | 5,051 |
| Korea Development Bank | 3.875% | 5/4/17 | 4,600 | 4,567 |
| Korea Finance Corp. | 4.625% | 11/16/21 | 4,350 | 4,349 |
| 6 Kreditanstalt fuer Wiederaufbau | 4.875% | 1/17/17 | 3,000 | 3,485 |
| 6 Kreditanstalt fuer Wiederaufbau | 4.375% | 3/15/18 | 22,200 | 25,609 |
| 6 Kreditanstalt fuer Wiederaufbau | 4.500% | 7/16/18 | 12,875 | 14,934 |
| 6 Kreditanstalt fuer Wiederaufbau | 4.875% | 6/17/19 | 13,450 | 16,128 |
| 6 Kreditanstalt fuer Wiederaufbau | 4.000% | 1/27/20 | 13,375 | 15,063 |
| 6 Kreditanstalt fuer Wiederaufbau | 2.750% | 9/8/20 | 26,175 | 26,934 |
| 6 Kreditanstalt fuer Wiederaufbau | 2.375% | 8/25/21 | 10,000 | 9,997 |
| 6 Landwirtschaftliche Rentenbank | 5.125% | 2/1/17 | 8,800 | 10,316 |
| 6 Landwirtschaftliche Rentenbank | 2.375% | 9/13/17 | 4,000 | 4,148 |
| 6 Landwirtschaftliche Rentenbank | 1.875% | 9/17/18 | 8,800 | 8,781 |
96
Vanguard® Intermediate-Term Bond Index Fund
Schedule of Investments
December 31, 2011
| Face | Market | |||
| Maturity | Amount | Value | ||
| Coupon | Date | ($000) | ($000) | |
| Mexico Government International Bond | 5.625% | 1/15/17 | 19,200 | 22,064 |
| Mexico Government International Bond | 5.950% | 3/19/19 | 15,764 | 18,720 |
| Mexico Government International Bond | 5.125% | 1/15/20 | 17,625 | 20,146 |
| Nordic Investment Bank | 5.000% | 2/1/17 | 7,650 | 9,032 |
| North American Development Bank | 4.375% | 2/11/20 | 1,200 | 1,346 |
| 7 Oesterreichische Kontrollbank AG | 5.000% | 4/25/17 | 6,425 | 7,279 |
| Panama Government International Bond | 5.200% | 1/30/20 | 3,950 | 4,467 |
| Pemex Project Funding Master Trust | 5.750% | 3/1/18 | 17,325 | 19,031 |
| Peruvian Government International Bond | 7.125% | 3/30/19 | 6,400 | 8,032 |
| Petrobras International Finance Co. - Pifco | 5.875% | 3/1/18 | 15,975 | 17,450 |
| Petrobras International Finance Co. - Pifco | 8.375% | 12/10/18 | 1,500 | 1,823 |
| Petrobras International Finance Co. - Pifco | 7.875% | 3/15/19 | 11,950 | 14,324 |
| Petrobras International Finance Co. - Pifco | 5.750% | 1/20/20 | 11,010 | 11,748 |
| Petrobras International Finance Co. - Pifco | 5.375% | 1/27/21 | 6,550 | 6,878 |
| Petroleos Mexicanos | 8.000% | 5/3/19 | 5,075 | 6,336 |
| Petroleos Mexicanos | 6.000% | 3/5/20 | 5,825 | 6,524 |
| Petroleos Mexicanos | 5.500% | 1/21/21 | 14,300 | 15,478 |
| Poland Government International Bond | 6.375% | 7/15/19 | 17,850 | 19,724 |
| Poland Government International Bond | 5.125% | 4/21/21 | 6,500 | 6,614 |
| Province of British Columbia | 2.650% | 9/22/21 | 3,500 | 3,558 |
| Province of Manitoba | 9.250% | 4/1/20 | 1,500 | 2,226 |
| Province of New Brunswick | 2.750% | 6/15/18 | 6,425 | 6,724 |
| Province of Nova Scotia | 5.125% | 1/26/17 | 3,500 | 4,109 |
| Province of Ontario | 3.150% | 12/15/17 | 1,150 | 1,230 |
| Province of Ontario | 4.000% | 10/7/19 | 16,400 | 18,212 |
| Province of Ontario | 4.400% | 4/14/20 | 16,600 | 18,907 |
| Province of Quebec Canada | 3.500% | 7/29/20 | 2,400 | 2,588 |
| Quebec | 4.625% | 5/14/18 | 4,500 | 5,169 |
| Quebec | 2.750% | 8/25/21 | 9,175 | 9,192 |
| Republic of Italy | 5.375% | 6/12/17 | 6,925 | 6,406 |
| Republic of Korea | 7.125% | 4/16/19 | 6,550 | 8,146 |
| South Africa Government International Bond | 6.875% | 5/27/19 | 9,150 | 11,038 |
| South Africa Government International Bond | 5.500% | 3/9/20 | 8,875 | 9,907 |
| Statoil ASA | 3.125% | 8/17/17 | 6,925 | 7,244 |
| Statoil ASA | 5.250% | 4/15/19 | 9,575 | 11,056 |
| Svensk Exportkredit AB | 5.125% | 3/1/17 | 6,250 | 7,101 |
| Total Sovereign Bonds (Cost $745,746) | 807,317 | |||
| Taxable Municipal Bonds (0.3%) | ||||
| California Educational Facilities Authority Revenue | ||||
| (Stanford University) | 3.625% | 5/1/14 | 2,500 | 2,669 |
| California Educational Facilities Authority Revenue | ||||
| (Stanford University) | 4.250% | 5/1/16 | 800 | 899 |
| California Educational Facilities Authority Revenue | ||||
| (Stanford University) | 4.750% | 5/1/19 | 1,800 | 2,101 |
| California GO | 5.950% | 4/1/16 | 2,800 | 3,155 |
| California GO | 6.200% | 3/1/19 | 500 | 566 |
| California GO | 6.200% | 10/1/19 | 3,925 | 4,484 |
| Illinois GO | 5.365% | 3/1/17 | 14,200 | 15,233 |
| Kentucky Asset/Liability Commission General Fund | ||||
| Revenue | 3.165% | 4/1/18 | 1,250 | 1,281 |
| Loudoun County VA Industrial Development Authority | ||||
| Revenue (Howard Hughes Medical Institute) | 3.450% | 9/1/14 | 2,750 | 2,933 |
| Maryland Health & Higher Educational Facilities | ||||
| Authority Revenue (Johns Hopkins University) | 5.250% | 7/1/19 | 1,200 | 1,431 |
| Massachusetts GO | 4.200% | 12/1/21 | 3,375 | 3,739 |
| New Hampshire Health & Educational Facilities | ||||
| Authority Revenue (Dartmouth College) | 4.750% | 6/1/19 | 1,000 | 1,164 |
| Private Colleges & University Authority of Georgia | ||||
| Revenue (Emory University) | 5.625% | 9/1/19 | 1,000 | 1,214 |
| 8 Wisconsin GO | 4.800% | 5/1/13 | 1,350 | 1,419 |
| Total Taxable Municipal Bonds (Cost $38,766) | 42,288 |
97
Vanguard® Intermediate-Term Bond Index Fund
Schedule of Investments
December 31, 2011
| Market | |||
| Value | |||
| Coupon | Shares | ($000) | |
| Temporary Cash Investment (0.0%) | |||
| Money Market Fund (0.0%) | |||
| 9 Vanguard Market Liquidity Fund (Cost $516) | 0.110% | 516,000 | 516 |
| Total Investments (99.1%) (Cost $12,435,657) | 13,598,242 | ||
| Other Assets and Liabilities—Net (0.9%) | 117,372 | ||
| Net Assets (100%) | 13,715,614 | ||
1 The issuer operates under a congressional charter; its securities are generally neither guaranteed by the U.S. Treasury nor backed by the full
faith and credit of the U.S. government.
2 The issuer was placed under federal conservatorship in September 2008; since that time, its daily operations have been managed by the Federal
Housing Finance Agency and it receives capital from the U.S. Treasury in exchange for senior preferred stock.
3 Security exempt from registration under Rule 144A of the Securities Act of 1933. Such securities may be sold in transactions exempt from
registration, normally to qualified institutional buyers. At December 31, 2011, the aggregate value of these securities was $31,089,000,
representing 0.2% of net assets.
4 The average or expected maturity is shorter than the final maturity shown because of the possibility of interim principal payments and
prepayments or the possibility of the issue being called.
5 Guaranteed by the Government of Japan.
6 Guaranteed by the Federal Republic of Germany.
7 Guaranteed by the Republic of Austria.
8 Scheduled principal and interest payments are guaranteed by AGM (Assured Guaranty Municipal Corporation).
9 Affiliated money market fund available only to Vanguard funds and certain trusts and accounts managed by Vanguard. Rate shown is the 7-day
yield.
GO—General Obligation Bond.
REIT—Real Estate Investment Trust.
98
Vanguard® Long-Term Bond Index Fund
Schedule of Investments
December 31, 2011
| Face | Market | ||||
| Maturity | Amount | Value | |||
| Coupon | Date | ($000) | ($000) | ||
| U.S. Government and Agency Obligations (46.3%) | |||||
| U.S. Government Securities (43.3%) | |||||
| United States Treasury Note/Bond | 0.625% | 12/31/12 | 205 | 206 | |
| United States Treasury Note/Bond | 2.375% | 8/31/14 | 55 | 58 | |
| United States Treasury Note/Bond | 2.375% | 10/31/14 | 230 | 243 | |
| United States Treasury Note/Bond | 9.875% | 11/15/15 | 30 | 41 | |
| United States Treasury Note/Bond | 2.750% | 5/31/17 | 30 | 33 | |
| United States Treasury Note/Bond | 2.000% | 11/15/21 | 4,500 | 4,549 | |
| United States Treasury Note/Bond | 8.000% | 11/15/21 | 690 | 1,078 | |
| United States Treasury Note/Bond | 7.250% | 8/15/22 | 280 | 424 | |
| United States Treasury Note/Bond | 7.125% | 2/15/23 | 57,715 | 87,258 | |
| United States Treasury Note/Bond | 6.250% | 8/15/23 | 68,250 | 97,641 | |
| United States Treasury Note/Bond | 7.500% | 11/15/24 | 22,090 | 35,244 | |
| United States Treasury Note/Bond | 6.875% | 8/15/25 | 51,975 | 80,017 | |
| United States Treasury Note/Bond | 6.000% | 2/15/26 | 13,975 | 20,135 | |
| United States Treasury Note/Bond | 6.750% | 8/15/26 | 21,555 | 33,279 | |
| United States Treasury Note/Bond | 6.625% | 2/15/27 | 5 | 8 | |
| United States Treasury Note/Bond | 6.375% | 8/15/27 | 3,195 | 4,841 | |
| United States Treasury Note/Bond | 6.125% | 11/15/27 | 6,497 | 9,653 | |
| United States Treasury Note/Bond | 5.500% | 8/15/28 | 7,205 | 10,167 | |
| United States Treasury Note/Bond | 5.250% | 11/15/28 | 58,005 | 79,938 | |
| United States Treasury Note/Bond | 5.250% | 2/15/29 | 10,160 | 14,032 | |
| United States Treasury Note/Bond | 6.125% | 8/15/29 | 42,665 | 64,624 | |
| United States Treasury Note/Bond | 6.250% | 5/15/30 | 16,180 | 25,013 | |
| United States Treasury Note/Bond | 5.375% | 2/15/31 | 13,120 | 18,694 | |
| United States Treasury Note/Bond | 4.750% | 2/15/37 | 825 | 1,120 | |
| United States Treasury Note/Bond | 5.000% | 5/15/37 | 7,390 | 10,392 | |
| United States Treasury Note/Bond | 4.375% | 2/15/38 | 47,573 | 61,428 | |
| United States Treasury Note/Bond | 4.500% | 5/15/38 | 66,020 | 86,919 | |
| United States Treasury Note/Bond | 3.500% | 2/15/39 | 35,750 | 40,140 | |
| United States Treasury Note/Bond | 4.250% | 5/15/39 | 111,028 | 141,023 | |
| United States Treasury Note/Bond | 4.500% | 8/15/39 | 127,336 | 168,123 | |
| United States Treasury Note/Bond | 4.375% | 11/15/39 | 152,745 | 197,971 | |
| United States Treasury Note/Bond | 4.625% | 2/15/40 | 104,851 | 141,172 | |
| United States Treasury Note/Bond | 4.375% | 5/15/40 | 81,283 | 105,414 | |
| United States Treasury Note/Bond | 3.875% | 8/15/40 | 61,790 | 73,945 | |
| United States Treasury Note/Bond | 4.250% | 11/15/40 | 133,165 | 169,536 | |
| United States Treasury Note/Bond | 4.750% | 2/15/41 | 98,360 | 135,322 | |
| United States Treasury Note/Bond | 4.375% | 5/15/41 | 80,140 | 104,233 | |
| United States Treasury Note/Bond | 3.750% | 8/15/41 | 56,947 | 66,851 | |
| United States Treasury Note/Bond | 3.125% | 11/15/41 | 8,500 | 8,888 | |
| 2,099,653 | |||||
| Agency Bonds and Notes (3.0%) | |||||
| 1 | Federal Home Loan Banks | 5.625% | 3/14/36 | 1,000 | 1,324 |
| 1 | Federal Home Loan Banks | 5.500% | 7/15/36 | 8,550 | 11,090 |
| 2 | Federal Home Loan Mortgage Corp. | 6.750% | 9/15/29 | 7,700 | 11,391 |
| 2 | Federal Home Loan Mortgage Corp. | 6.750% | 3/15/31 | 10,420 | 15,645 |
| 2 | Federal Home Loan Mortgage Corp. | 6.250% | 7/15/32 | 4,525 | 6,568 |
| 2 | Federal National Mortgage Assn. | 6.250% | 5/15/29 | 9,850 | 13,852 |
| 2 | Federal National Mortgage Assn. | 7.125% | 1/15/30 | 9,075 | 13,934 |
| 2 | Federal National Mortgage Assn. | 7.250% | 5/15/30 | 6,635 | 10,350 |
| 2 | Federal National Mortgage Assn. | 6.625% | 11/15/30 | 3,300 | 4,882 |
| 2 | Federal National Mortgage Assn. | 5.625% | 7/15/37 | 4,575 | 6,240 |
| 2 | Federal National Mortgage Assn. | 6.210% | 8/6/38 | 1,000 | 1,436 |
| Israel Government AID Bond | 5.500% | 12/4/23 | 5,325 | 6,836 | |
| Israel Government AID Bond | 5.500% | 4/26/24 | 4,800 | 6,166 | |
| Private Export Funding Corp. | 2.800% | 5/15/22 | 800 | 808 | |
| Resolution Funding Corp. | 8.625% | 1/15/21 | 850 | 1,282 | |
| 1 | Tennessee Valley Authority | 6.750% | 11/1/25 | 5,750 | 8,153 |
| 1 | Tennessee Valley Authority | 7.125% | 5/1/30 | 1,250 | 1,902 |
| 1 | Tennessee Valley Authority | 4.650% | 6/15/35 | 4,825 | 5,652 |
| 1 | Tennessee Valley Authority | 5.880% | 4/1/36 | 1,000 | 1,362 |
| 1 | Tennessee Valley Authority | 5.980% | 4/1/36 | 1,000 | 1,376 |
99
Vanguard® Long-Term Bond Index Fund
Schedule of Investments
December 31, 2011
| Face | Market | ||||
| Maturity | Amount | Value | |||
| Coupon | Date | ($000) | ($000) | ||
| 1 | Tennessee Valley Authority | 6.150% | 1/15/38 | 2,450 | 3,492 |
| 1 | Tennessee Valley Authority | 5.500% | 6/15/38 | 1,175 | 1,545 |
| 1 | Tennessee Valley Authority | 5.250% | 9/15/39 | 3,375 | 4,307 |
| 1 | Tennessee Valley Authority | 4.875% | 1/15/48 | 2,500 | 3,085 |
| 1 | Tennessee Valley Authority | 5.375% | 4/1/56 | 1,850 | 2,499 |
| 1 | Tennessee Valley Authority | 4.625% | 9/15/60 | 1,700 | 2,003 |
| 147,180 | |||||
| Total U.S. Government and Agency Obligations (Cost $1,847,341) | 2,246,833 | ||||
| Asset-Backed/Commercial Mortgage-Backed Security (0.1%) | |||||
| 3 | PSE&G Transition Funding LLC (Cost $2,500) | 6.890% | 12/15/17 | 2,500 | 2,984 |
| Corporate Bonds (41.2%) | |||||
| Finance (8.1%) | |||||
| Banking (4.4%) | |||||
| 3 | Abbey National Capital Trust I | 8.963% | 12/29/49 | 2,300 | 2,091 |
| American Express Co. | 8.150% | 3/19/38 | 2,625 | 3,916 | |
| Bank of America Corp. | 6.800% | 3/15/28 | 375 | 331 | |
| Bank of America Corp. | 6.500% | 9/15/37 | 1,700 | 1,380 | |
| Bank of America NA | 6.000% | 10/15/36 | 3,725 | 3,095 | |
| Bank One Corp. | 7.750% | 7/15/25 | 2,000 | 2,285 | |
| Bank One Corp. | 7.625% | 10/15/26 | 4,350 | 5,105 | |
| BB&T Capital Trust II | 6.750% | 6/7/36 | 3,325 | 3,304 | |
| 3 | BB&T Capital Trust IV | 6.820% | 6/12/77 | 650 | 664 |
| 3 | Capital One Capital III | 7.686% | 8/1/66 | 1,700 | 1,687 |
| Capital One Capital IV | 6.745% | 2/17/37 | 1,190 | 1,166 | |
| Capital One Capital V | 10.250% | 8/15/39 | 2,350 | 2,432 | |
| Capital One Capital VI | 8.875% | 5/15/40 | 2,775 | 2,837 | |
| 3,4 | Citicorp Lease Pass-Through Trust 1999-1 | 8.040% | 12/15/19 | 450 | 513 |
| 3 | Citigroup Capital XXI | 8.300% | 12/21/57 | 5,155 | 5,194 |
| Citigroup Inc. | 4.500% | 1/14/22 | 4,600 | 4,406 | |
| Citigroup Inc. | 6.625% | 6/15/32 | 2,750 | 2,534 | |
| Citigroup Inc. | 5.875% | 2/22/33 | 1,825 | 1,534 | |
| Citigroup Inc. | 6.000% | 10/31/33 | 3,500 | 2,985 | |
| Citigroup Inc. | 5.850% | 12/11/34 | 2,300 | 2,282 | |
| Citigroup Inc. | 6.125% | 8/25/36 | 3,350 | 2,925 | |
| Citigroup Inc. | 5.875% | 5/29/37 | 1,100 | 1,093 | |
| Citigroup Inc. | 6.875% | 3/5/38 | 7,075 | 7,911 | |
| Citigroup Inc. | 8.125% | 7/15/39 | 5,275 | 6,451 | |
| Compass Bank | 5.900% | 4/1/26 | 1,075 | 969 | |
| Cooperatieve Centrale Raiffeisen-Boerenleenbank BA | 5.250% | 5/24/41 | 3,325 | 3,240 | |
| Credit Suisse USA Inc. | 7.125% | 7/15/32 | 2,600 | 3,097 | |
| Fifth Third Bancorp | 8.250% | 3/1/38 | 2,775 | 3,433 | |
| FleetBoston Financial Corp. | 6.875% | 1/15/28 | 400 | 359 | |
| FleetBoston Financial Corp. | 6.700% | 7/15/28 | 1,200 | 1,045 | |
| Goldman Sachs Capital I | 6.345% | 2/15/34 | 7,350 | 6,283 | |
| Goldman Sachs Group Inc. | 5.750% | 10/1/16 | 75 | 78 | |
| Goldman Sachs Group Inc. | 5.950% | 1/15/27 | 4,050 | 3,738 | |
| Goldman Sachs Group Inc. | 6.125% | 2/15/33 | 6,150 | 6,043 | |
| Goldman Sachs Group Inc. | 6.450% | 5/1/36 | 875 | 785 | |
| Goldman Sachs Group Inc. | 6.750% | 10/1/37 | 12,600 | 11,780 | |
| Goldman Sachs Group Inc. | 6.250% | 2/1/41 | 6,035 | 5,911 | |
| HSBC Bank USA NA | 5.875% | 11/1/34 | 4,100 | 3,965 | |
| HSBC Bank USA NA | 5.625% | 8/15/35 | 2,800 | 2,643 | |
| HSBC Bank USA NA | 7.000% | 1/15/39 | 400 | 432 | |
| HSBC Holdings plc | 4.875% | 1/14/22 | 2,100 | 2,216 | |
| HSBC Holdings plc | 7.625% | 5/17/32 | 1,050 | 1,069 | |
| HSBC Holdings plc | 7.350% | 11/27/32 | 200 | 201 | |
| HSBC Holdings plc | 6.500% | 5/2/36 | 3,425 | 3,499 | |
| HSBC Holdings plc | 6.500% | 9/15/37 | 5,425 | 5,476 | |
| HSBC Holdings plc | 6.800% | 6/1/38 | 4,590 | 4,742 | |
| HSBC Holdings plc | 6.100% | 1/14/42 | 1,750 | 2,034 | |
| JP Morgan Chase Capital XVII | 5.850% | 8/1/35 | 425 | 424 | |
100
Vanguard® Long-Term Bond Index Fund
Schedule of Investments
December 31, 2011
| Face | Market | |||
| Maturity | Amount | Value | ||
| Coupon | Date | ($000) | ($000) | |
| 3 JP Morgan Chase Capital XVIII | 6.950% | 8/1/66 | 1,400 | 1,404 |
| 3 JP Morgan Chase Capital XX | 6.550% | 9/15/66 | 2,575 | 2,583 |
| 3 JP Morgan Chase Capital XXII | 6.450% | 1/15/87 | 3,075 | 3,060 |
| JP Morgan Chase Capital XXV | 6.800% | 10/1/37 | 3,350 | 3,381 |
| JP Morgan Chase Capital XXVII | 7.000% | 11/1/39 | 1,725 | 1,730 |
| JPMorgan Chase & Co. | 6.400% | 5/15/38 | 6,925 | 8,017 |
| JPMorgan Chase & Co. | 5.500% | 10/15/40 | 950 | 982 |
| JPMorgan Chase & Co. | 5.600% | 7/15/41 | 3,650 | 3,919 |
| JPMorgan Chase & Co. | 5.400% | 1/6/42 | 2,850 | 2,929 |
| KeyBank NA | 6.950% | 2/1/28 | 143 | 158 |
| Merrill Lynch & Co. Inc. | 6.220% | 9/15/26 | 4,775 | 3,937 |
| Merrill Lynch & Co. Inc. | 6.110% | 1/29/37 | 3,400 | 2,595 |
| Merrill Lynch & Co. Inc. | 7.750% | 5/14/38 | 4,800 | 4,561 |
| Morgan Stanley | 6.250% | 8/9/26 | 3,250 | 3,049 |
| Morgan Stanley | 7.250% | 4/1/32 | 1,525 | 1,555 |
| Santander UK plc | 7.950% | 10/26/29 | 725 | 603 |
| 3 SunTrust Capital VIII | 6.100% | 12/1/66 | 1,629 | 1,596 |
| UBS AG | 7.000% | 10/15/15 | 1,000 | 1,025 |
| UBS AG | 7.375% | 6/15/17 | 550 | 588 |
| UBS AG | 7.750% | 9/1/26 | 1,000 | 1,161 |
| USB Capital XIII Trust | 6.625% | 12/15/39 | 1,625 | 1,667 |
| Wachovia Bank NA | 5.850% | 2/1/37 | 3,175 | 3,297 |
| Wachovia Bank NA | 6.600% | 1/15/38 | 5,225 | 5,879 |
| Wachovia Corp. | 6.605% | 10/1/25 | 725 | 823 |
| Wachovia Corp. | 7.500% | 4/15/35 | 150 | 187 |
| Wachovia Corp. | 5.500% | 8/1/35 | 4,400 | 4,279 |
| Wachovia Corp. | 6.550% | 10/15/35 | 125 | 135 |
| Wells Fargo & Co. | 5.375% | 2/7/35 | 2,450 | 2,594 |
| Wells Fargo Bank NA | 5.950% | 8/26/36 | 2,175 | 2,284 |
| 3 Wells Fargo Capital X | 5.950% | 12/1/86 | 2,525 | 2,519 |
| Brokerage (0.1%) | ||||
| Jefferies Group Inc. | 6.450% | 6/8/27 | 1,500 | 1,235 |
| Jefferies Group Inc. | 6.250% | 1/15/36 | 1,800 | 1,449 |
| Finance Companies (1.0%) | ||||
| General Electric Capital Corp. | 6.750% | 3/15/32 | 18,975 | 22,141 |
| General Electric Capital Corp. | 6.150% | 8/7/37 | 5,600 | 6,159 |
| General Electric Capital Corp. | 5.875% | 1/14/38 | 12,425 | 13,112 |
| General Electric Capital Corp. | 6.875% | 1/10/39 | 5,800 | 6,912 |
| SLM Corp. | 5.625% | 8/1/33 | 2,350 | 1,789 |
| Insurance (2.5%) | ||||
| ACE Capital Trust II | 9.700% | 4/1/30 | 850 | 1,132 |
| ACE INA Holdings Inc. | 6.700% | 5/15/36 | 1,000 | 1,298 |
| Aetna Inc. | 6.625% | 6/15/36 | 2,850 | 3,511 |
| Aetna Inc. | 6.750% | 12/15/37 | 700 | 876 |
| Aflac Inc. | 6.900% | 12/17/39 | 575 | 643 |
| Aflac Inc. | 6.450% | 8/15/40 | 1,450 | 1,532 |
| Allstate Corp. | 6.125% | 12/15/32 | 1,250 | 1,418 |
| Allstate Corp. | 5.350% | 6/1/33 | 1,950 | 2,020 |
| Allstate Corp. | 5.550% | 5/9/35 | 2,000 | 2,129 |
| Allstate Corp. | 6.900% | 5/15/38 | 300 | 372 |
| 3 Allstate Corp. | 6.500% | 5/15/57 | 1,500 | 1,357 |
| American International Group Inc. | 6.250% | 5/1/36 | 2,350 | 2,139 |
| American International Group Inc. | 6.250% | 3/15/37 | 2,850 | 2,066 |
| 4 American International Group Inc. | 6.820% | 11/15/37 | 586 | 565 |
| 3 American International Group Inc. | 8.175% | 5/15/68 | 9,000 | 8,122 |
| AON Corp. | 8.205% | 1/1/27 | 1,175 | 1,358 |
| AON Corp. | 6.250% | 9/30/40 | 1,525 | 1,861 |
| Arch Capital Group Ltd. | 7.350% | 5/1/34 | 625 | 734 |
| Assurant Inc. | 6.750% | 2/15/34 | 1,200 | 1,249 |
| AXA SA | 8.600% | 12/15/30 | 4,275 | 4,207 |
| Berkshire Hathaway Finance Corp. | 5.750% | 1/15/40 | 1,925 | 2,281 |
| Chubb Corp. | 6.000% | 5/11/37 | 2,075 | 2,481 |
| Chubb Corp. | 6.500% | 5/15/38 | 1,375 | 1,741 |
101
Vanguard® Long-Term Bond Index Fund
Schedule of Investments
December 31, 2011
| Face | Market | |||
| Maturity | Amount | Value | ||
| Coupon | Date | ($000) | ($000) | |
| Cigna Corp. | 4.000% | 2/15/22 | 1,600 | 1,585 |
| CIGNA Corp. | 7.875% | 5/15/27 | 500 | 618 |
| CIGNA Corp. | 6.150% | 11/15/36 | 525 | 573 |
| Cigna Corp. | 5.875% | 3/15/41 | 1,650 | 1,751 |
| Cigna Corp. | 5.375% | 2/15/42 | 2,100 | 2,100 |
| Cincinnati Financial Corp. | 6.920% | 5/15/28 | 1,000 | 1,098 |
| Cincinnati Financial Corp. | 6.125% | 11/1/34 | 850 | 850 |
| Endurance Specialty Holdings Ltd. | 7.000% | 7/15/34 | 1,425 | 1,439 |
| Genworth Financial Inc. | 6.500% | 6/15/34 | 825 | 648 |
| Hartford Financial Services Group Inc. | 5.950% | 10/15/36 | 450 | 413 |
| Hartford Financial Services Group Inc. | 6.625% | 3/30/40 | 500 | 497 |
| Hartford Financial Services Group Inc. | 6.100% | 10/1/41 | 500 | 463 |
| Humana Inc. | 8.150% | 6/15/38 | 250 | 325 |
| Lincoln National Corp. | 6.150% | 4/7/36 | 1,875 | 1,905 |
| Lincoln National Corp. | 7.000% | 6/15/40 | 1,350 | 1,518 |
| Loews Corp. | 6.000% | 2/1/35 | 800 | 871 |
| MetLife Inc. | 6.500% | 12/15/32 | 750 | 892 |
| MetLife Inc. | 6.375% | 6/15/34 | 1,150 | 1,358 |
| MetLife Inc. | 5.700% | 6/15/35 | 475 | 529 |
| MetLife Inc. | 5.875% | 2/6/41 | 4,475 | 5,168 |
| 3 MetLife Inc. | 6.400% | 12/15/66 | 3,415 | 3,223 |
| 3 MetLife Inc. | 10.750% | 8/1/69 | 700 | 917 |
| 3 Nationwide Financial Services Inc. | 6.750% | 5/15/67 | 1,000 | 860 |
| Principal Financial Group Inc. | 6.050% | 10/15/36 | 1,025 | 1,083 |
| Progressive Corp. | 6.625% | 3/1/29 | 1,625 | 2,034 |
| Protective Life Corp. | 8.450% | 10/15/39 | 600 | 691 |
| Prudential Financial Inc. | 5.750% | 7/15/33 | 150 | 150 |
| Prudential Financial Inc. | 5.400% | 6/13/35 | 2,195 | 2,104 |
| Prudential Financial Inc. | 5.900% | 3/17/36 | 1,950 | 1,982 |
| Prudential Financial Inc. | 5.700% | 12/14/36 | 4,575 | 4,542 |
| Prudential Financial Inc. | 6.625% | 12/1/37 | 125 | 136 |
| Prudential Financial Inc. | 6.625% | 6/21/40 | 700 | 772 |
| Prudential Financial Inc. | 5.625% | 5/12/41 | 125 | 121 |
| Swiss Re Solutions Holding Corp. | 7.000% | 2/15/26 | 1,850 | 2,074 |
| Swiss Re Solutions Holding Corp. | 7.750% | 6/15/30 | 600 | 750 |
| Transatlantic Holdings Inc. | 8.000% | 11/30/39 | 800 | 906 |
| Travelers Cos. Inc. | 6.750% | 6/20/36 | 1,000 | 1,318 |
| Travelers Cos. Inc. | 6.250% | 6/15/37 | 1,825 | 2,305 |
| Travelers Cos. Inc. | 5.350% | 11/1/40 | 1,775 | 2,057 |
| Travelers Property Casualty Corp. | 6.375% | 3/15/33 | 1,500 | 1,852 |
| UnitedHealth Group Inc. | 5.800% | 3/15/36 | 1,300 | 1,542 |
| UnitedHealth Group Inc. | 6.500% | 6/15/37 | 700 | 883 |
| UnitedHealth Group Inc. | 6.625% | 11/15/37 | 575 | 737 |
| UnitedHealth Group Inc. | 6.875% | 2/15/38 | 5,375 | 7,249 |
| UnitedHealth Group Inc. | 5.950% | 2/15/41 | 750 | 922 |
| UnitedHealth Group Inc. | 4.625% | 11/15/41 | 625 | 656 |
| Validus Holdings Ltd. | 8.875% | 1/26/40 | 590 | 641 |
| WellPoint Inc. | 5.950% | 12/15/34 | 3,200 | 3,771 |
| WellPoint Inc. | 5.850% | 1/15/36 | 2,475 | 2,893 |
| XL Group plc | 6.375% | 11/15/24 | 1,150 | 1,203 |
| XL Group plc | 6.250% | 5/15/27 | 625 | 636 |
| Real Estate Investment Trusts (0.1%) | ||||
| HCP Inc. | 6.750% | 2/1/41 | 775 | 873 |
| Health Care REIT Inc. | 5.250% | 1/15/22 | 1,400 | 1,365 |
| Health Care REIT Inc. | 6.500% | 3/15/41 | 900 | 897 |
| Realty Income Corp. | 5.875% | 3/15/35 | 595 | 604 |
| Simon Property Group LP | 6.750% | 2/1/40 | 1,350 | 1,760 |
| 393,079 | ||||
| Industrial (26.1%) | ||||
| Basic Industry (2.2%) | ||||
| Agrium Inc. | 6.125% | 1/15/41 | 1,500 | 1,817 |
| Alcoa Inc. | 5.870% | 2/23/22 | 1,550 | 1,565 |
| Alcoa Inc. | 5.900% | 2/1/27 | 4,175 | 4,112 |
102
Vanguard® Long-Term Bond Index Fund
Schedule of Investments
December 31, 2011
| Face | Market | |||
| Maturity | Amount | Value | ||
| Coupon | Date | ($000) | ($000) | |
| Alcoa Inc. | 6.750% | 1/15/28 | 1,225 | 1,249 |
| AngloGold Ashanti Holdings plc | 6.500% | 4/15/40 | 550 | 530 |
| ArcelorMittal | 7.000% | 10/15/39 | 4,300 | 3,968 |
| ArcelorMittal | 6.750% | 3/1/41 | 2,900 | 2,595 |
| Barrick North America Finance LLC | 7.500% | 9/15/38 | 1,225 | 1,684 |
| Barrick North America Finance LLC | 5.700% | 5/30/41 | 1,375 | 1,624 |
| Barrick PD Australia Finance Pty Ltd. | 5.950% | 10/15/39 | 1,750 | 2,035 |
| BHP Billiton Finance USA Ltd. | 6.420% | 3/1/26 | 500 | 617 |
| Cliffs Natural Resources Inc. | 6.250% | 10/1/40 | 2,350 | 2,321 |
| Dow Chemical Co. | 7.375% | 11/1/29 | 3,300 | 4,188 |
| Dow Chemical Co. | 9.400% | 5/15/39 | 2,350 | 3,515 |
| Dow Chemical Co. | 5.250% | 11/15/41 | 1,625 | 1,713 |
| Ecolab Inc. | 5.500% | 12/8/41 | 1,200 | 1,344 |
| EI du Pont de Nemours & Co. | 6.500% | 1/15/28 | 1,175 | 1,533 |
| EI du Pont de Nemours & Co. | 4.900% | 1/15/41 | 1,925 | 2,191 |
| FMC Corp. | 3.950% | 2/1/22 | 625 | 633 |
| 4 Georgia-Pacific LLC | 5.400% | 11/1/20 | 5,000 | 5,524 |
| International Paper Co. | 8.700% | 6/15/38 | 800 | 1,084 |
| International Paper Co. | 7.300% | 11/15/39 | 1,800 | 2,170 |
| International Paper Co. | 6.000% | 11/15/41 | 2,400 | 2,603 |
| 4 Kinross Gold Corp. | 6.875% | 9/1/41 | 700 | 723 |
| Lubrizol Corp. | 6.500% | 10/1/34 | 350 | 459 |
| Monsanto Co. | 5.500% | 8/15/25 | 1,350 | 1,624 |
| Monsanto Co. | 5.875% | 4/15/38 | 650 | 838 |
| Mosaic Co. | 4.875% | 11/15/41 | 400 | 408 |
| Newmont Mining Corp. | 5.875% | 4/1/35 | 1,250 | 1,413 |
| Newmont Mining Corp. | 6.250% | 10/1/39 | 3,450 | 4,091 |
| Nucor Corp. | 4.125% | 9/15/22 | 2,000 | 2,142 |
| Nucor Corp. | 6.400% | 12/1/37 | 575 | 760 |
| Placer Dome Inc. | 6.450% | 10/15/35 | 700 | 849 |
| Potash Corp. of Saskatchewan Inc. | 5.875% | 12/1/36 | 1,465 | 1,784 |
| Potash Corp. of Saskatchewan Inc. | 5.625% | 12/1/40 | 800 | 963 |
| PPG Industries Inc. | 7.700% | 3/15/38 | 650 | 939 |
| PPG Industries Inc. | 5.500% | 11/15/40 | 800 | 918 |
| Reliance Steel & Aluminum Co. | 6.850% | 11/15/36 | 350 | 365 |
| Rio Tinto Alcan Inc. | 5.750% | 6/1/35 | 1,250 | 1,480 |
| Rio Tinto Finance USA Ltd. | 7.125% | 7/15/28 | 4,725 | 6,344 |
| Rio Tinto Finance USA Ltd. | 5.200% | 11/2/40 | 1,350 | 1,544 |
| Southern Copper Corp. | 7.500% | 7/27/35 | 3,500 | 3,787 |
| Southern Copper Corp. | 6.750% | 4/16/40 | 1,750 | 1,740 |
| Teck Resources Ltd. | 4.750% | 1/15/22 | 2,325 | 2,492 |
| Teck Resources Ltd. | 6.125% | 10/1/35 | 1,500 | 1,650 |
| Teck Resources Ltd. | 6.000% | 8/15/40 | 1,525 | 1,654 |
| Teck Resources Ltd. | 6.250% | 7/15/41 | 2,300 | 2,634 |
| Vale Canada Ltd. | 7.200% | 9/15/32 | 1,050 | 1,243 |
| Vale Overseas Ltd. | 8.250% | 1/17/34 | 1,225 | 1,578 |
| Vale Overseas Ltd. | 6.875% | 11/21/36 | 5,625 | 6,379 |
| Vale Overseas Ltd. | 6.875% | 11/10/39 | 4,825 | 5,540 |
| Capital Goods (1.8%) | ||||
| 3M Co. | 6.375% | 2/15/28 | 500 | 670 |
| 3M Co. | 5.700% | 3/15/37 | 2,050 | 2,753 |
| Boeing Co. | 8.750% | 9/15/31 | 850 | 1,307 |
| Boeing Co. | 6.125% | 2/15/33 | 925 | 1,169 |
| Boeing Co. | 6.625% | 2/15/38 | 1,050 | 1,467 |
| Boeing Co. | 6.875% | 3/15/39 | 250 | 354 |
| Boeing Co. | 5.875% | 2/15/40 | 1,225 | 1,578 |
| Caterpillar Inc. | 6.625% | 7/15/28 | 1,575 | 2,066 |
| Caterpillar Inc. | 7.300% | 5/1/31 | 1,200 | 1,729 |
| Caterpillar Inc. | 6.050% | 8/15/36 | 2,225 | 2,884 |
| Caterpillar Inc. | 5.200% | 5/27/41 | 2,285 | 2,746 |
| Caterpillar Inc. | 6.950% | 5/1/42 | 1,425 | 2,070 |
| Deere & Co. | 5.375% | 10/16/29 | 1,975 | 2,491 |
| Deere & Co. | 8.100% | 5/15/30 | 1,000 | 1,517 |
103
Vanguard® Long-Term Bond Index Fund
Schedule of Investments
December 31, 2011
| Face | Market | |||
| Maturity | Amount | Value | ||
| Coupon | Date | ($000) | ($000) | |
| Deere & Co. | 7.125% | 3/3/31 | 200 | 277 |
| Dover Corp. | 5.375% | 10/15/35 | 350 | 425 |
| Dover Corp. | 6.600% | 3/15/38 | 800 | 1,132 |
| Dover Corp. | 5.375% | 3/1/41 | 900 | 1,104 |
| Emerson Electric Co. | 6.000% | 8/15/32 | 400 | 513 |
| Emerson Electric Co. | 6.125% | 4/15/39 | 825 | 1,119 |
| Emerson Electric Co. | 5.250% | 11/15/39 | 175 | 212 |
| Goodrich Corp. | 6.800% | 7/1/36 | 1,000 | 1,357 |
| Honeywell International Inc. | 5.700% | 3/15/36 | 775 | 950 |
| Honeywell International Inc. | 5.700% | 3/15/37 | 1,425 | 1,767 |
| Honeywell International Inc. | 5.375% | 3/1/41 | 1,775 | 2,167 |
| 4 Illinois Tool Works Inc. | 4.875% | 9/15/41 | 1,600 | 1,835 |
| Lockheed Martin Corp. | 6.150% | 9/1/36 | 5,125 | 5,872 |
| Lockheed Martin Corp. | 5.500% | 11/15/39 | 1,200 | 1,304 |
| Lockheed Martin Corp. | 5.720% | 6/1/40 | 189 | 212 |
| Lockheed Martin Corp. | 4.850% | 9/15/41 | 1,000 | 1,012 |
| Northrop Grumman Corp. | 5.050% | 11/15/40 | 1,950 | 2,141 |
| Northrop Grumman Systems Corp. | 7.750% | 2/15/31 | 1,115 | 1,581 |
| Owens Corning | 7.000% | 12/1/36 | 2,800 | 2,842 |
| Parker Hannifin Corp. | 3.500% | 9/15/22 | 100 | 103 |
| Parker Hannifin Corp. | 6.250% | 5/15/38 | 1,225 | 1,538 |
| Raytheon Co. | 7.200% | 8/15/27 | 400 | 533 |
| Raytheon Co. | 4.875% | 10/15/40 | 1,300 | 1,366 |
| Raytheon Co. | 4.700% | 12/15/41 | 1,700 | 1,735 |
| Republic Services Inc. | 6.086% | 3/15/35 | 225 | 268 |
| Republic Services Inc. | 6.200% | 3/1/40 | 2,625 | 3,164 |
| Republic Services Inc. | 5.700% | 5/15/41 | 1,375 | 1,597 |
| Rockwell Automation Inc. | 6.700% | 1/15/28 | 300 | 389 |
| Rockwell Automation Inc. | 6.250% | 12/1/37 | 1,100 | 1,400 |
| Sonoco Products Co. | 5.750% | 11/1/40 | 1,950 | 2,081 |
| Stanley Black & Decker Inc. | 5.200% | 9/1/40 | 700 | 775 |
| Tyco International Finance SA | 4.625% | 1/15/23 | 600 | 643 |
| United Technologies Corp. | 6.700% | 8/1/28 | 250 | 323 |
| United Technologies Corp. | 7.500% | 9/15/29 | 1,875 | 2,629 |
| United Technologies Corp. | 5.400% | 5/1/35 | 1,775 | 2,089 |
| United Technologies Corp. | 6.050% | 6/1/36 | 975 | 1,227 |
| United Technologies Corp. | 6.125% | 7/15/38 | 1,700 | 2,127 |
| United Technologies Corp. | 5.700% | 4/15/40 | 2,975 | 3,639 |
| Waste Management Inc. | 7.100% | 8/1/26 | 800 | 1,028 |
| Waste Management Inc. | 7.000% | 7/15/28 | 3,000 | 3,797 |
| Waste Management Inc. | 7.750% | 5/15/32 | 875 | 1,241 |
| Waste Management Inc. | 6.125% | 11/30/39 | 500 | 612 |
| Communication (6.5%) | ||||
| Alltel Corp. | 7.875% | 7/1/32 | 2,225 | 3,214 |
| America Movil SAB de CV | 6.375% | 3/1/35 | 2,700 | 3,310 |
| America Movil SAB de CV | 6.125% | 11/15/37 | 1,200 | 1,443 |
| America Movil SAB de CV | 6.125% | 3/30/40 | 5,100 | 6,056 |
| Ameritech Capital Funding Corp. | 6.550% | 1/15/28 | 1,000 | 1,116 |
| AT&T Corp. | 8.000% | 11/15/31 | 3,105 | 4,381 |
| AT&T Inc. | 6.450% | 6/15/34 | 5,250 | 6,331 |
| AT&T Inc. | 6.150% | 9/15/34 | 3,000 | 3,568 |
| AT&T Inc. | 6.500% | 9/1/37 | 5,550 | 6,910 |
| AT&T Inc. | 6.300% | 1/15/38 | 9,725 | 11,957 |
| AT&T Inc. | 6.400% | 5/15/38 | 825 | 1,028 |
| AT&T Inc. | 6.550% | 2/15/39 | 3,800 | 4,806 |
| AT&T Inc. | 5.350% | 9/1/40 | 7,405 | 8,292 |
| AT&T Inc. | 5.550% | 8/15/41 | 6,650 | 7,818 |
| AT&T Mobility LLC | 7.125% | 12/15/31 | 2,425 | 3,146 |
| Bellsouth Capital Funding Corp. | 7.875% | 2/15/30 | 4,250 | 5,692 |
| BellSouth Corp. | 6.875% | 10/15/31 | 1,275 | 1,581 |
| BellSouth Corp. | 6.550% | 6/15/34 | 1,475 | 1,747 |
| BellSouth Corp. | 6.000% | 11/15/34 | 1,480 | 1,664 |
| BellSouth Telecommunications Inc. | 6.375% | 6/1/28 | 1,640 | 1,920 |
104
Vanguard® Long-Term Bond Index Fund
Schedule of Investments
December 31, 2011
| Face | Market | |||
| Maturity | Amount | Value | ||
| Coupon | Date | ($000) | ($000) | |
| British Telecommunications plc | 9.625% | 12/15/30 | 6,900 | 9,734 |
| CBS Corp. | 7.875% | 7/30/30 | 4,265 | 5,357 |
| CBS Corp. | 5.500% | 5/15/33 | 225 | 232 |
| CBS Corp. | 5.900% | 10/15/40 | 600 | 671 |
| CenturyLink Inc. | 6.875% | 1/15/28 | 550 | 513 |
| CenturyLink Inc. | 7.600% | 9/15/39 | 4,550 | 4,470 |
| Comcast Cable Communications Holdings Inc. | 9.455% | 11/15/22 | 3,198 | 4,555 |
| Comcast Corp. | 5.650% | 6/15/35 | 5,100 | 5,634 |
| Comcast Corp. | 6.500% | 11/15/35 | 7,225 | 8,698 |
| Comcast Corp. | 6.450% | 3/15/37 | 3,175 | 3,844 |
| Comcast Corp. | 6.950% | 8/15/37 | 3,550 | 4,469 |
| Comcast Corp. | 6.400% | 5/15/38 | 2,400 | 2,872 |
| Deutsche Telekom International Finance BV | 8.750% | 6/15/30 | 8,425 | 11,727 |
| DIRECTV Holdings LLC / DIRECTV Financing Co. Inc. | 6.350% | 3/15/40 | 1,125 | 1,278 |
| DIRECTV Holdings LLC / DIRECTV Financing Co. Inc. | 6.000% | 8/15/40 | 2,250 | 2,444 |
| DIRECTV Holdings LLC / DIRECTV Financing Co. Inc. | 6.375% | 3/1/41 | 2,200 | 2,530 |
| Discovery Communications LLC | 6.350% | 6/1/40 | 1,600 | 1,933 |
| Embarq Corp. | 7.995% | 6/1/36 | 3,900 | 4,081 |
| France Telecom SA | 8.500% | 3/1/31 | 6,590 | 9,386 |
| Grupo Televisa SAB | 6.625% | 3/18/25 | 1,600 | 1,858 |
| Grupo Televisa SAB | 8.500% | 3/11/32 | 250 | 329 |
| Grupo Televisa SAB | 6.625% | 1/15/40 | 875 | 994 |
| GTE Corp. | 6.940% | 4/15/28 | 2,275 | 2,849 |
| Koninklijke KPN NV | 8.375% | 10/1/30 | 2,375 | 3,028 |
| McGraw-Hill Cos. Inc. | 6.550% | 11/15/37 | 1,150 | 1,221 |
| NBCUniversal Media LLC | 6.400% | 4/30/40 | 3,725 | 4,593 |
| NBCUniversal Media LLC | 5.950% | 4/1/41 | 1,700 | 2,022 |
| New Cingular Wireless Services Inc. | 8.750% | 3/1/31 | 2,075 | 3,049 |
| News America Inc. | 6.550% | 3/15/33 | 225 | 244 |
| News America Inc. | 6.200% | 12/15/34 | 6,450 | 6,925 |
| News America Inc. | 6.400% | 12/15/35 | 5,950 | 6,595 |
| News America Inc. | 8.150% | 10/17/36 | 1,225 | 1,530 |
| News America Inc. | 7.850% | 3/1/39 | 750 | 938 |
| News America Inc. | 6.900% | 8/15/39 | 975 | 1,133 |
| News America Inc. | 6.150% | 2/15/41 | 3,525 | 4,039 |
| News America Inc. | 7.750% | 12/1/45 | 1,225 | 1,498 |
| Pacific Bell Telephone Co. | 7.125% | 3/15/26 | 550 | 693 |
| Qwest Corp. | 7.500% | 6/15/23 | 2,350 | 2,362 |
| Qwest Corp. | 7.200% | 11/10/26 | 200 | 201 |
| Qwest Corp. | 6.875% | 9/15/33 | 3,850 | 3,850 |
| Rogers Communications Inc. | 7.500% | 8/15/38 | 1,175 | 1,632 |
| TCI Communications Inc. | 7.875% | 2/15/26 | 2,200 | 2,912 |
| Telecom Italia Capital SA | 6.375% | 11/15/33 | 3,025 | 2,324 |
| Telecom Italia Capital SA | 6.000% | 9/30/34 | 2,050 | 1,494 |
| Telecom Italia Capital SA | 7.200% | 7/18/36 | 1,625 | 1,348 |
| Telecom Italia Capital SA | 7.721% | 6/4/38 | 2,050 | 1,768 |
| Telefonica Emisiones SAU | 7.045% | 6/20/36 | 5,725 | 5,621 |
| Telefonica Europe BV | 8.250% | 9/15/30 | 2,500 | 2,747 |
| Thomson Reuters Corp. | 5.500% | 8/15/35 | 900 | 972 |
| Thomson Reuters Corp. | 5.850% | 4/15/40 | 1,100 | 1,255 |
| Time Warner Cable Inc. | 6.550% | 5/1/37 | 4,000 | 4,562 |
| Time Warner Cable Inc. | 7.300% | 7/1/38 | 2,000 | 2,443 |
| Time Warner Cable Inc. | 6.750% | 6/15/39 | 4,275 | 5,073 |
| Time Warner Cable Inc. | 5.875% | 11/15/40 | 4,050 | 4,409 |
| Time Warner Cable Inc. | 5.500% | 9/1/41 | 1,975 | 2,072 |
| Time Warner Entertainment Co. LP | 8.375% | 3/15/23 | 2,733 | 3,555 |
| Time Warner Entertainment Co. LP | 8.375% | 7/15/33 | 1,950 | 2,547 |
| United States Cellular Corp. | 6.700% | 12/15/33 | 1,450 | 1,466 |
| Verizon Communications Inc. | 5.850% | 9/15/35 | 4,275 | 5,094 |
| Verizon Communications Inc. | 6.250% | 4/1/37 | 2,825 | 3,490 |
| Verizon Communications Inc. | 6.400% | 2/15/38 | 7,450 | 9,404 |
| Verizon Communications Inc. | 6.900% | 4/15/38 | 2,800 | 3,763 |
| Verizon Communications Inc. | 8.950% | 3/1/39 | 1,025 | 1,644 |
| Verizon Communications Inc. | 7.350% | 4/1/39 | 1,250 | 1,735 |
105
Vanguard® Long-Term Bond Index Fund
Schedule of Investments
December 31, 2011
| Face | Market | |||
| Maturity | Amount | Value | ||
| Coupon | Date | ($000) | ($000) | |
| Verizon Communications Inc. | 6.000% | 4/1/41 | 1,675 | 2,090 |
| Verizon Communications Inc. | 4.750% | 11/1/41 | 700 | 756 |
| Verizon Global Funding Corp. | 7.750% | 12/1/30 | 7,550 | 10,503 |
| Verizon Maryland Inc. | 5.125% | 6/15/33 | 500 | 523 |
| Verizon New England Inc. | 7.875% | 11/15/29 | 400 | 484 |
| Verizon New York Inc. | 7.375% | 4/1/32 | 650 | 759 |
| Vodafone Group plc | 7.875% | 2/15/30 | 1,000 | 1,446 |
| Vodafone Group plc | 6.250% | 11/30/32 | 200 | 251 |
| Vodafone Group plc | 6.150% | 2/27/37 | 5,350 | 6,695 |
| Consumer Cyclical (3.4%) | ||||
| CVS Caremark Corp. | 6.250% | 6/1/27 | 3,700 | 4,495 |
| CVS Caremark Corp. | 6.125% | 9/15/39 | 2,925 | 3,554 |
| CVS Caremark Corp. | 5.750% | 5/15/41 | 1,125 | 1,338 |
| Daimler Finance North America LLC | 8.500% | 1/18/31 | 2,900 | 4,050 |
| Darden Restaurants Inc. | 6.800% | 10/15/37 | 1,750 | 2,020 |
| Historic TW Inc. | 9.150% | 2/1/23 | 1,230 | 1,670 |
| Historic TW Inc. | 6.625% | 5/15/29 | 6,975 | 8,249 |
| Home Depot Inc. | 5.875% | 12/16/36 | 5,300 | 6,641 |
| Home Depot Inc. | 5.400% | 9/15/40 | 2,375 | 2,837 |
| Home Depot Inc. | 5.950% | 4/1/41 | 2,250 | 2,921 |
| Johnson Controls Inc. | 6.000% | 1/15/36 | 475 | 543 |
| Johnson Controls Inc. | 5.700% | 3/1/41 | 1,100 | 1,231 |
| Johnson Controls Inc. | 5.250% | 12/1/41 | 550 | 582 |
| Kohl's Corp. | 6.000% | 1/15/33 | 400 | 446 |
| Kohl's Corp. | 6.875% | 12/15/37 | 1,675 | 2,063 |
| Lowe's Cos. Inc. | 6.875% | 2/15/28 | 550 | 698 |
| Lowe's Cos. Inc. | 6.500% | 3/15/29 | 1,800 | 2,227 |
| Lowe's Cos. Inc. | 5.800% | 10/15/36 | 2,250 | 2,601 |
| Lowe's Cos. Inc. | 5.800% | 4/15/40 | 1,175 | 1,361 |
| Lowe's Cos. Inc. | 5.125% | 11/15/41 | 750 | 830 |
| Macy's Retail Holdings Inc. | 6.900% | 4/1/29 | 3,050 | 3,422 |
| Macy's Retail Holdings Inc. | 6.375% | 3/15/37 | 3,100 | 3,597 |
| McDonald's Corp. | 6.300% | 10/15/37 | 1,750 | 2,428 |
| McDonald's Corp. | 6.300% | 3/1/38 | 2,875 | 4,015 |
| McDonald's Corp. | 5.700% | 2/1/39 | 1,250 | 1,631 |
| Nordstrom Inc. | 6.950% | 3/15/28 | 300 | 380 |
| Nordstrom Inc. | 7.000% | 1/15/38 | 1,200 | 1,602 |
| Target Corp. | 7.000% | 7/15/31 | 1,800 | 2,437 |
| Target Corp. | 6.350% | 11/1/32 | 3,825 | 4,882 |
| Target Corp. | 6.500% | 10/15/37 | 3,400 | 4,492 |
| Target Corp. | 7.000% | 1/15/38 | 1,650 | 2,319 |
| Time Warner Cos. Inc. | 7.570% | 2/1/24 | 500 | 634 |
| Time Warner Cos. Inc. | 6.950% | 1/15/28 | 1,000 | 1,210 |
| Time Warner Inc. | 4.000% | 1/15/22 | 100 | 103 |
| Time Warner Inc. | 7.625% | 4/15/31 | 5,935 | 7,610 |
| Time Warner Inc. | 7.700% | 5/1/32 | 1,865 | 2,425 |
| Time Warner Inc. | 6.200% | 3/15/40 | 2,350 | 2,804 |
| Time Warner Inc. | 6.100% | 7/15/40 | 2,425 | 2,860 |
| Time Warner Inc. | 6.250% | 3/29/41 | 2,925 | 3,523 |
| Time Warner Inc. | 5.375% | 10/15/41 | 100 | 108 |
| VF Corp. | 6.450% | 11/1/37 | 1,500 | 1,929 |
| Viacom Inc. | 6.875% | 4/30/36 | 4,775 | 6,039 |
| Wal-Mart Stores Inc. | 5.875% | 4/5/27 | 4,562 | 5,547 |
| Wal-Mart Stores Inc. | 7.550% | 2/15/30 | 4,425 | 6,432 |
| Wal-Mart Stores Inc. | 5.250% | 9/1/35 | 5,300 | 6,267 |
| Wal-Mart Stores Inc. | 6.500% | 8/15/37 | 5,850 | 8,082 |
| Wal-Mart Stores Inc. | 6.200% | 4/15/38 | 4,275 | 5,724 |
| Wal-Mart Stores Inc. | 5.625% | 4/1/40 | 1,000 | 1,259 |
| Wal-Mart Stores Inc. | 4.875% | 7/8/40 | 3,950 | 4,517 |
| Wal-Mart Stores Inc. | 5.000% | 10/25/40 | 1,000 | 1,166 |
| Wal-Mart Stores Inc. | 5.625% | 4/15/41 | 4,350 | 5,586 |
| Walt Disney Co. | 7.000% | 3/1/32 | 1,450 | 2,005 |
| Walt Disney Co. | 4.375% | 8/16/41 | 225 | 239 |
106
Vanguard® Long-Term Bond Index Fund
Schedule of Investments
December 31, 2011
| Face | Market | |||
| Maturity | Amount | Value | ||
| Coupon | Date | ($000) | ($000) | |
| Walt Disney Co. | 4.125% | 12/1/41 | 1,075 | 1,101 |
| Western Union Co. | 6.200% | 11/17/36 | 1,350 | 1,444 |
| Western Union Co. | 6.200% | 6/21/40 | 325 | 349 |
| Yum! Brands Inc. | 6.875% | 11/15/37 | 1,400 | 1,797 |
| Consumer Noncyclical (5.4%) | ||||
| Abbott Laboratories | 6.150% | 11/30/37 | 2,225 | 2,896 |
| Abbott Laboratories | 6.000% | 4/1/39 | 2,050 | 2,616 |
| Abbott Laboratories | 5.300% | 5/27/40 | 2,600 | 3,124 |
| Altria Group Inc. | 9.950% | 11/10/38 | 3,950 | 5,998 |
| Altria Group Inc. | 10.200% | 2/6/39 | 3,725 | 5,797 |
| Amgen Inc. | 6.375% | 6/1/37 | 2,225 | 2,549 |
| Amgen Inc. | 6.400% | 2/1/39 | 5,375 | 6,285 |
| Amgen Inc. | 5.750% | 3/15/40 | 950 | 1,034 |
| Amgen Inc. | 4.950% | 10/1/41 | 1,950 | 1,910 |
| Amgen Inc. | 5.150% | 11/15/41 | 3,050 | 3,182 |
| Amgen Inc. | 5.650% | 6/15/42 | 2,700 | 2,922 |
| Anheuser-Busch Cos. LLC | 6.800% | 8/20/32 | 1,875 | 2,480 |
| Anheuser-Busch Cos. LLC | 5.950% | 1/15/33 | 650 | 789 |
| Anheuser-Busch Cos. LLC | 5.750% | 4/1/36 | 1,575 | 1,929 |
| Anheuser-Busch Cos. LLC | 6.450% | 9/1/37 | 650 | 875 |
| Anheuser-Busch InBev Worldwide Inc. | 8.200% | 1/15/39 | 3,475 | 5,494 |
| Anheuser-Busch InBev Worldwide Inc. | 6.375% | 1/15/40 | 2,225 | 3,053 |
| Archer-Daniels-Midland Co. | 5.935% | 10/1/32 | 255 | 317 |
| Archer-Daniels-Midland Co. | 5.375% | 9/15/35 | 3,850 | 4,528 |
| Archer-Daniels-Midland Co. | 5.765% | 3/1/41 | 2,400 | 3,031 |
| 4 Archer-Daniels-Midland Co. | 4.535% | 3/26/42 | 335 | 356 |
| 4 Aristotle Holding Inc. | 6.125% | 11/15/41 | 1,125 | 1,204 |
| AstraZeneca plc | 6.450% | 9/15/37 | 6,925 | 9,327 |
| Baptist Health South Florida Obligated Group | 4.590% | 8/15/21 | 550 | 592 |
| Baxter International Inc. | 6.250% | 12/1/37 | 800 | 1,069 |
| Beam Inc. | 5.875% | 1/15/36 | 175 | 183 |
| Becton Dickinson and Co. | 6.000% | 5/15/39 | 1,000 | 1,286 |
| Becton Dickinson and Co. | 5.000% | 11/12/40 | 400 | 448 |
| Boston Scientific Corp. | 7.000% | 11/15/35 | 575 | 662 |
| Boston Scientific Corp. | 7.375% | 1/15/40 | 1,150 | 1,459 |
| Bristol-Myers Squibb Co. | 7.150% | 6/15/23 | 1,300 | 1,812 |
| Bristol-Myers Squibb Co. | 6.800% | 11/15/26 | 889 | 1,189 |
| Bristol-Myers Squibb Co. | 5.875% | 11/15/36 | 1,802 | 2,293 |
| Bristol-Myers Squibb Co. | 6.125% | 5/1/38 | 850 | 1,113 |
| Bristol-Myers Squibb Co. | 6.875% | 8/1/97 | 200 | 273 |
| Celgene Corp. | 5.700% | 10/15/40 | 600 | 661 |
| Coca-Cola Refreshments USA Inc. | 8.500% | 2/1/22 | 600 | 880 |
| ConAgra Foods Inc. | 7.125% | 10/1/26 | 150 | 177 |
| ConAgra Foods Inc. | 7.000% | 10/1/28 | 175 | 203 |
| ConAgra Foods Inc. | 8.250% | 9/15/30 | 1,650 | 2,102 |
| Corn Products International Inc. | 6.625% | 4/15/37 | 575 | 683 |
| Covidien International Finance SA | 6.550% | 10/15/37 | 2,275 | 2,898 |
| CR Bard Inc. | 6.700% | 12/1/26 | 500 | 662 |
| Delhaize Group SA | 5.700% | 10/1/40 | 2,739 | 2,764 |
| Diageo Capital plc | 5.875% | 9/30/36 | 750 | 946 |
| Diageo Investment Corp. | 7.450% | 4/15/35 | 1,750 | 2,450 |
| Dr Pepper Snapple Group Inc. | 7.450% | 5/1/38 | 600 | 841 |
| Eli Lilly & Co. | 7.125% | 6/1/25 | 1,100 | 1,524 |
| Eli Lilly & Co. | 5.500% | 3/15/27 | 5,300 | 6,316 |
| Eli Lilly & Co. | 5.550% | 3/15/37 | 750 | 917 |
| Estee Lauder Cos. Inc. | 6.000% | 5/15/37 | 1,025 | 1,326 |
| Genentech Inc. | 5.250% | 7/15/35 | 200 | 238 |
| General Mills Inc. | 5.400% | 6/15/40 | 2,000 | 2,314 |
| Gilead Sciences Inc. | 5.650% | 12/1/41 | 1,600 | 1,767 |
| GlaxoSmithKline Capital Inc. | 5.375% | 4/15/34 | 1,850 | 2,185 |
| GlaxoSmithKline Capital Inc. | 6.375% | 5/15/38 | 5,775 | 7,683 |
| Hasbro Inc. | 6.350% | 3/15/40 | 1,544 | 1,678 |
| HJ Heinz Finance Co. | 6.750% | 3/15/32 | 1,125 | 1,444 |
107
Vanguard® Long-Term Bond Index Fund
Schedule of Investments
December 31, 2011
| Face | Market | |||
| Maturity | Amount | Value | ||
| Coupon | Date | ($000) | ($000) | |
| Hospira Inc. | 5.600% | 9/15/40 | 725 | 717 |
| Johnson & Johnson | 6.950% | 9/1/29 | 2,125 | 3,006 |
| Johnson & Johnson | 4.950% | 5/15/33 | 2,125 | 2,559 |
| Johnson & Johnson | 5.950% | 8/15/37 | 975 | 1,331 |
| Johnson & Johnson | 5.850% | 7/15/38 | 1,525 | 2,037 |
| Johnson & Johnson | 4.500% | 9/1/40 | 1,775 | 1,999 |
| Kellogg Co. | 7.450% | 4/1/31 | 2,350 | 3,197 |
| Kimberly-Clark Corp. | 6.625% | 8/1/37 | 1,975 | 2,791 |
| Kimberly-Clark Corp. | 5.300% | 3/1/41 | 600 | 740 |
| Koninklijke Philips Electronics NV | 6.875% | 3/11/38 | 2,550 | 3,229 |
| Kraft Foods Inc. | 6.500% | 11/1/31 | 2,450 | 3,050 |
| Kraft Foods Inc. | 7.000% | 8/11/37 | 3,050 | 4,058 |
| Kraft Foods Inc. | 6.875% | 2/1/38 | 1,575 | 2,077 |
| Kraft Foods Inc. | 6.875% | 1/26/39 | 400 | 527 |
| Kraft Foods Inc. | 6.500% | 2/9/40 | 7,900 | 10,143 |
| Kroger Co. | 7.700% | 6/1/29 | 375 | 498 |
| Kroger Co. | 8.000% | 9/15/29 | 1,925 | 2,616 |
| Kroger Co. | 7.500% | 4/1/31 | 1,350 | 1,739 |
| Kroger Co. | 5.400% | 7/15/40 | 750 | 807 |
| Lorillard Tobacco Co. | 7.000% | 8/4/41 | 300 | 317 |
| Mattel Inc. | 5.450% | 11/1/41 | 925 | 935 |
| McKesson Corp. | 6.000% | 3/1/41 | 1,550 | 1,993 |
| Mead Johnson Nutrition Co. | 5.900% | 11/1/39 | 1,025 | 1,228 |
| Medtronic Inc. | 6.500% | 3/15/39 | 600 | 832 |
| Medtronic Inc. | 5.550% | 3/15/40 | 1,025 | 1,267 |
| Memorial Sloan-Kettering Cancer Center | 5.000% | 7/1/42 | 800 | 829 |
| Merck & Co. Inc. | 6.300% | 1/1/26 | 500 | 652 |
| Merck & Co. Inc. | 6.400% | 3/1/28 | 2,200 | 2,863 |
| Merck & Co. Inc. | 5.950% | 12/1/28 | 1,050 | 1,320 |
| Merck & Co. Inc. | 6.500% | 12/1/33 | 775 | 1,081 |
| Merck & Co. Inc. | 5.750% | 11/15/36 | 300 | 379 |
| Merck & Co. Inc. | 6.550% | 9/15/37 | 3,850 | 5,306 |
| Merck & Co. Inc. | 5.850% | 6/30/39 | 2,025 | 2,604 |
| Pepsi Bottling Group Inc. | 7.000% | 3/1/29 | 3,675 | 5,077 |
| PepsiCo Inc. | 5.500% | 1/15/40 | 425 | 526 |
| PepsiCo Inc. | 4.875% | 11/1/40 | 3,500 | 4,045 |
| Pfizer Inc. | 7.200% | 3/15/39 | 4,475 | 6,568 |
| Pharmacia Corp. | 6.600% | 12/1/28 | 1,050 | 1,372 |
| Philip Morris International Inc. | 6.375% | 5/16/38 | 3,700 | 4,817 |
| Philip Morris International Inc. | 4.375% | 11/15/41 | 1,650 | 1,706 |
| Procter & Gamble Co. | 6.450% | 1/15/26 | 1,100 | 1,490 |
| Procter & Gamble Co. | 5.800% | 8/15/34 | 100 | 132 |
| Procter & Gamble Co. | 5.550% | 3/5/37 | 5,150 | 6,830 |
| Quest Diagnostics Inc. | 6.950% | 7/1/37 | 925 | 1,152 |
| Quest Diagnostics Inc. | 5.750% | 1/30/40 | 1,000 | 1,080 |
| Ralcorp Holdings Inc. | 6.625% | 8/15/39 | 1,675 | 1,752 |
| Reynolds American Inc. | 7.250% | 6/15/37 | 600 | 701 |
| Safeway Inc. | 7.250% | 2/1/31 | 1,631 | 1,960 |
| Sara Lee Corp. | 6.125% | 11/1/32 | 625 | 644 |
| Sysco Corp. | 5.375% | 9/21/35 | 1,575 | 1,954 |
| Teva Pharmaceutical Finance Co. LLC | 6.150% | 2/1/36 | 1,675 | 2,044 |
| Unilever Capital Corp. | 5.900% | 11/15/32 | 3,325 | 4,339 |
| Wyeth | 6.450% | 2/1/24 | 2,725 | 3,559 |
| Wyeth | 6.000% | 2/15/36 | 2,850 | 3,652 |
| Wyeth | 5.950% | 4/1/37 | 5,875 | 7,526 |
| Zimmer Holdings Inc. | 5.750% | 11/30/39 | 1,100 | 1,283 |
| Energy (4.0%) | ||||
| Alberta Energy Co. Ltd. | 7.375% | 11/1/31 | 1,000 | 1,256 |
| Anadarko Finance Co. | 7.500% | 5/1/31 | 2,000 | 2,412 |
| Anadarko Petroleum Corp. | 6.450% | 9/15/36 | 5,300 | 6,106 |
| Anadarko Petroleum Corp. | 7.950% | 6/15/39 | 50 | 65 |
| Anadarko Petroleum Corp. | 6.200% | 3/15/40 | 1,575 | 1,763 |
| Apache Corp. | 6.000% | 1/15/37 | 1,700 | 2,220 |
108
Vanguard® Long-Term Bond Index Fund
Schedule of Investments
December 31, 2011
| Face | Market | |||
| Maturity | Amount | Value | ||
| Coupon | Date | ($000) | ($000) | |
| Apache Corp. | 5.100% | 9/1/40 | 2,500 | 2,955 |
| Apache Corp. | 5.250% | 2/1/42 | 3,050 | 3,717 |
| Apache Finance Canada Corp. | 7.750% | 12/15/29 | 650 | 942 |
| Baker Hughes Inc. | 6.875% | 1/15/29 | 1,000 | 1,367 |
| Baker Hughes Inc. | 5.125% | 9/15/40 | 3,215 | 3,778 |
| Burlington Resources Finance Co. | 7.200% | 8/15/31 | 1,050 | 1,455 |
| Burlington Resources Finance Co. | 7.400% | 12/1/31 | 1,675 | 2,305 |
| Cameron International Corp. | 5.950% | 6/1/41 | 1,400 | 1,603 |
| Canadian Natural Resources Ltd. | 7.200% | 1/15/32 | 1,400 | 1,835 |
| Canadian Natural Resources Ltd. | 6.450% | 6/30/33 | 1,175 | 1,513 |
| Canadian Natural Resources Ltd. | 6.500% | 2/15/37 | 2,275 | 2,946 |
| Canadian Natural Resources Ltd. | 6.250% | 3/15/38 | 2,315 | 2,929 |
| Cenovus Energy Inc. | 6.750% | 11/15/39 | 3,250 | 4,326 |
| ConocoPhillips | 5.900% | 10/15/32 | 2,750 | 3,405 |
| ConocoPhillips | 5.900% | 5/15/38 | 3,575 | 4,556 |
| ConocoPhillips Canada Funding Co. I | 5.950% | 10/15/36 | 950 | 1,159 |
| ConocoPhillips Holding Co. | 6.950% | 4/15/29 | 1,975 | 2,699 |
| Devon Energy Corp. | 7.950% | 4/15/32 | 435 | 624 |
| Devon Energy Corp. | 5.600% | 7/15/41 | 2,325 | 2,817 |
| Devon Financing Corp. ULC | 7.875% | 9/30/31 | 5,575 | 7,850 |
| Diamond Offshore Drilling Inc. | 5.700% | 10/15/39 | 1,075 | 1,195 |
| Encana Corp. | 6.500% | 8/15/34 | 4,825 | 5,672 |
| Encana Corp. | 6.625% | 8/15/37 | 1,175 | 1,414 |
| Encana Corp. | 6.500% | 2/1/38 | 500 | 592 |
| Encana Corp. | 5.150% | 11/15/41 | 450 | 459 |
| Eni USA Inc. | 7.300% | 11/15/27 | 600 | 783 |
| Global Marine Inc. | 7.000% | 6/1/28 | 800 | 773 |
| Halliburton Co. | 6.700% | 9/15/38 | 4,575 | 6,126 |
| Halliburton Co. | 4.500% | 11/15/41 | 1,000 | 1,023 |
| Hess Corp. | 7.875% | 10/1/29 | 2,625 | 3,515 |
| Hess Corp. | 7.300% | 8/15/31 | 600 | 769 |
| Hess Corp. | 7.125% | 3/15/33 | 925 | 1,172 |
| Hess Corp. | 6.000% | 1/15/40 | 2,100 | 2,459 |
| Hess Corp. | 5.600% | 2/15/41 | 3,000 | 3,382 |
| Husky Energy Inc. | 6.800% | 9/15/37 | 725 | 916 |
| Kerr-McGee Corp. | 6.950% | 7/1/24 | 2,162 | 2,566 |
| Kerr-McGee Corp. | 7.875% | 9/15/31 | 500 | 626 |
| Marathon Oil Corp. | 6.800% | 3/15/32 | 750 | 914 |
| Marathon Oil Corp. | 6.600% | 10/1/37 | 2,400 | 2,911 |
| Marathon Petroleum Corp. | 6.500% | 3/1/41 | 3,000 | 3,374 |
| Nexen Inc. | 7.875% | 3/15/32 | 1,050 | 1,241 |
| Nexen Inc. | 5.875% | 3/10/35 | 1,850 | 1,886 |
| Nexen Inc. | 6.400% | 5/15/37 | 3,300 | 3,491 |
| Nexen Inc. | 7.500% | 7/30/39 | 1,525 | 1,826 |
| Noble Energy Inc. | 8.000% | 4/1/27 | 775 | 1,033 |
| Noble Energy Inc. | 6.000% | 3/1/41 | 1,950 | 2,273 |
| Noble Holding International Ltd. | 6.200% | 8/1/40 | 1,700 | 1,909 |
| Occidental Petroleum Corp. | 3.125% | 2/15/22 | 1,800 | 1,855 |
| Petro-Canada | 7.875% | 6/15/26 | 150 | 197 |
| Petro-Canada | 7.000% | 11/15/28 | 250 | 307 |
| Petro-Canada | 5.350% | 7/15/33 | 1,650 | 1,731 |
| Petro-Canada | 5.950% | 5/15/35 | 2,500 | 2,854 |
| Petro-Canada | 6.800% | 5/15/38 | 2,675 | 3,459 |
| Pride International Inc. | 7.875% | 8/15/40 | 1,500 | 1,909 |
| Shell International Finance BV | 6.375% | 12/15/38 | 6,400 | 8,730 |
| Shell International Finance BV | 5.500% | 3/25/40 | 2,950 | 3,680 |
| Suncor Energy Inc. | 7.150% | 2/1/32 | 800 | 1,019 |
| Suncor Energy Inc. | 5.950% | 12/1/34 | 875 | 991 |
| Suncor Energy Inc. | 6.500% | 6/15/38 | 4,925 | 6,194 |
| Talisman Energy Inc. | 7.250% | 10/15/27 | 450 | 546 |
| Talisman Energy Inc. | 5.850% | 2/1/37 | 3,200 | 3,570 |
| Tosco Corp. | 8.125% | 2/15/30 | 7,500 | 11,018 |
| Total Capital SA | 4.450% | 6/24/20 | 1,000 | 1,113 |
| Transocean Inc. | 6.500% | 11/15/20 | 225 | 232 |
109
Vanguard® Long-Term Bond Index Fund
Schedule of Investments
December 31, 2011
| Face | Market | |||
| Maturity | Amount | Value | ||
| Coupon | Date | ($000) | ($000) | |
| Transocean Inc. | 7.500% | 4/15/31 | 1,525 | 1,581 |
| Transocean Inc. | 6.800% | 3/15/38 | 1,725 | 1,752 |
| Transocean Inc. | 7.350% | 12/15/41 | 1,000 | 1,105 |
| Valero Energy Corp. | 7.500% | 4/15/32 | 950 | 1,107 |
| Valero Energy Corp. | 6.625% | 6/15/37 | 5,325 | 5,695 |
| Weatherford International Inc. | 6.800% | 6/15/37 | 2,900 | 3,199 |
| Weatherford International Ltd. | 6.500% | 8/1/36 | 1,500 | 1,636 |
| Weatherford International Ltd. | 7.000% | 3/15/38 | 1,600 | 1,832 |
| Williams Cos. Inc. | 7.500% | 1/15/31 | 1,764 | 2,188 |
| XTO Energy Inc. | 6.750% | 8/1/37 | 440 | 674 |
| Other Industrial (0.1%) | ||||
| California Institute of Technology Revenue | 4.700% | 11/1/2111 | 1,250 | 1,256 |
| Massachusetts Development Finance Agency Revenue | ||||
| (Harvard University) | 4.875% | 10/15/40 | 1,000 | 1,173 |
| Massachusetts Health & Educational Facilities | ||||
| Authority Revenue (MIT) | 5.600% | 7/1/2111 | 1,950 | 2,680 |
| Technology (1.4%) | ||||
| Applied Materials Inc. | 5.850% | 6/15/41 | 1,350 | 1,539 |
| Cisco Systems Inc. | 5.900% | 2/15/39 | 2,200 | 2,730 |
| Cisco Systems Inc. | 5.500% | 1/15/40 | 7,550 | 9,195 |
| Corning Inc. | 7.250% | 8/15/36 | 600 | 716 |
| Corning Inc. | 5.750% | 8/15/40 | 950 | 1,109 |
| Dell Inc. | 7.100% | 4/15/28 | 500 | 631 |
| Dell Inc. | 6.500% | 4/15/38 | 1,458 | 1,853 |
| Harris Corp. | 6.150% | 12/15/40 | 400 | 455 |
| Hewlett-Packard Co. | 6.000% | 9/15/41 | 3,000 | 3,334 |
| HP Enterprise Services LLC | 7.450% | 10/15/29 | 375 | 462 |
| Intel Corp. | 4.800% | 10/1/41 | 4,275 | 4,728 |
| International Business Machines Corp. | 7.000% | 10/30/25 | 1,050 | 1,432 |
| International Business Machines Corp. | 6.220% | 8/1/27 | 1,600 | 2,069 |
| International Business Machines Corp. | 6.500% | 1/15/28 | 225 | 298 |
| International Business Machines Corp. | 5.875% | 11/29/32 | 950 | 1,192 |
| International Business Machines Corp. | 5.600% | 11/30/39 | 5,470 | 7,038 |
| Juniper Networks Inc. | 5.950% | 3/15/41 | 750 | 817 |
| Microsoft Corp. | 5.200% | 6/1/39 | 2,075 | 2,561 |
| Microsoft Corp. | 4.500% | 10/1/40 | 2,250 | 2,535 |
| Microsoft Corp. | 5.300% | 2/8/41 | 1,800 | 2,279 |
| Motorola Solutions Inc. | 7.500% | 5/15/25 | 525 | 619 |
| Nokia Oyj | 6.625% | 5/15/39 | 1,575 | 1,516 |
| Oracle Corp. | 6.500% | 4/15/38 | 2,775 | 3,761 |
| Oracle Corp. | 6.125% | 7/8/39 | 2,125 | 2,812 |
| Oracle Corp. | 5.375% | 7/15/40 | 6,325 | 7,767 |
| Pitney Bowes Inc. | 5.250% | 1/15/37 | 2,000 | 2,064 |
| SAIC Inc. | 5.950% | 12/1/40 | 350 | 379 |
| Science Applications International Corp. | 5.500% | 7/1/33 | 1,100 | 1,118 |
| Tyco Electronics Group SA | 7.125% | 10/1/37 | 1,250 | 1,649 |
| Xerox Corp. | 6.750% | 12/15/39 | 950 | 1,110 |
| Transportation (1.3%) | ||||
| 3 BNSF Funding Trust I | 6.613% | 12/15/55 | 850 | 871 |
| Burlington Northern Santa Fe LLC | 7.000% | 12/15/25 | 700 | 937 |
| Burlington Northern Santa Fe LLC | 7.950% | 8/15/30 | 1,300 | 1,826 |
| Burlington Northern Santa Fe LLC | 6.200% | 8/15/36 | 775 | 983 |
| Burlington Northern Santa Fe LLC | 6.150% | 5/1/37 | 1,325 | 1,659 |
| Burlington Northern Santa Fe LLC | 5.750% | 5/1/40 | 1,350 | 1,613 |
| Burlington Northern Santa Fe LLC | 5.050% | 3/1/41 | 1,475 | 1,613 |
| Burlington Northern Santa Fe LLC | 5.400% | 6/1/41 | 1,650 | 1,893 |
| Canadian National Railway Co. | 6.250% | 8/1/34 | 2,450 | 3,189 |
| Canadian National Railway Co. | 6.200% | 6/1/36 | 1,925 | 2,518 |
| Canadian Pacific Railway Co. | 4.450% | 3/15/23 | 1,800 | 1,815 |
| Canadian Pacific Railway Co. | 7.125% | 10/15/31 | 1,325 | 1,569 |
| Canadian Pacific Railway Ltd. | 5.750% | 1/15/42 | 325 | 343 |
| Con-way Inc. | 6.700% | 5/1/34 | 650 | 646 |
| 3 Continental Airlines 2007-1 Class A Pass Through Trust | 5.983% | 4/19/22 | 2,556 | 2,671 |
110
Vanguard® Long-Term Bond Index Fund
Schedule of Investments
December 31, 2011
| Face | Market | |||
| Maturity | Amount | Value | ||
| Coupon | Date | ($000) | ($000) | |
| CSX Corp. | 6.000% | 10/1/36 | 175 | 206 |
| CSX Corp. | 6.150% | 5/1/37 | 2,125 | 2,552 |
| CSX Corp. | 6.220% | 4/30/40 | 4,525 | 5,511 |
| CSX Corp. | 5.500% | 4/15/41 | 400 | 450 |
| CSX Corp. | 4.750% | 5/30/42 | 700 | 722 |
| 3 Delta Air Lines 2007-1 Class A Pass Through Trust | 6.821% | 8/10/22 | 1,966 | 2,050 |
| Norfolk Southern Corp. | 5.590% | 5/17/25 | 716 | 844 |
| Norfolk Southern Corp. | 7.800% | 5/15/27 | 2,802 | 3,953 |
| Norfolk Southern Corp. | 5.640% | 5/17/29 | 1,898 | 2,338 |
| Norfolk Southern Corp. | 7.250% | 2/15/31 | 800 | 1,106 |
| 4 Norfolk Southern Corp. | 4.837% | 10/1/41 | 2,400 | 2,563 |
| Norfolk Southern Corp. | 6.000% | 5/23/2111 | 1,625 | 1,920 |
| 3 Southwest Airlines Co. 2007-1 Pass Through Trust | 6.150% | 8/1/22 | 719 | 771 |
| Union Pacific Corp. | 7.125% | 2/1/28 | 600 | 789 |
| Union Pacific Corp. | 6.625% | 2/1/29 | 1,500 | 1,967 |
| Union Pacific Corp. | 6.150% | 5/1/37 | 1,000 | 1,235 |
| Union Pacific Corp. | 4.750% | 9/15/41 | 2,550 | 2,767 |
| 3 Union Pacific Railroad Co. 2007-3 Pass Through Trust | 6.176% | 1/2/31 | 888 | 1,073 |
| United Parcel Service Inc. | 6.200% | 1/15/38 | 3,950 | 5,290 |
| United Parcel Service of America Inc. | 8.375% | 4/1/30 | 500 | 732 |
| 1,264,010 | ||||
| Utilities (7.0%) | ||||
| Electric (5.1%) | ||||
| AEP Texas Central Co. | 6.650% | 2/15/33 | 2,980 | 3,812 |
| Alabama Power Co. | 6.125% | 5/15/38 | 1,000 | 1,343 |
| Alabama Power Co. | 5.500% | 3/15/41 | 500 | 628 |
| Alabama Power Co. | 5.200% | 6/1/41 | 1,375 | 1,655 |
| Appalachian Power Co. | 5.800% | 10/1/35 | 500 | 585 |
| Appalachian Power Co. | 6.375% | 4/1/36 | 825 | 1,023 |
| Arizona Public Service Co. | 5.050% | 9/1/41 | 1,000 | 1,135 |
| Baltimore Gas & Electric Co. | 6.350% | 10/1/36 | 375 | 471 |
| CenterPoint Energy Houston Electric LLC | 6.950% | 3/15/33 | 925 | 1,258 |
| Cleco Power LLC | 6.500% | 12/1/35 | 500 | 616 |
| Cleco Power LLC | 6.000% | 12/1/40 | 1,000 | 1,202 |
| Cleveland Electric Illuminating Co. | 5.500% | 8/15/24 | 1,000 | 1,172 |
| Cleveland Electric Illuminating Co. | 5.950% | 12/15/36 | 1,000 | 1,071 |
| Columbus Southern Power Co. | 5.850% | 10/1/35 | 800 | 938 |
| Commonwealth Edison Co. | 5.875% | 2/1/33 | 250 | 302 |
| Commonwealth Edison Co. | 5.900% | 3/15/36 | 1,950 | 2,388 |
| Commonwealth Edison Co. | 6.450% | 1/15/38 | 400 | 525 |
| Connecticut Light & Power Co. | 6.350% | 6/1/36 | 750 | 971 |
| Consolidated Edison Co. of New York Inc. | 5.300% | 3/1/35 | 1,950 | 2,274 |
| Consolidated Edison Co. of New York Inc. | 5.850% | 3/15/36 | 1,875 | 2,344 |
| Consolidated Edison Co. of New York Inc. | 6.300% | 8/15/37 | 925 | 1,219 |
| Consolidated Edison Co. of New York Inc. | 6.750% | 4/1/38 | 2,675 | 3,714 |
| Consolidated Edison Co. of New York Inc. | 5.700% | 6/15/40 | 750 | 942 |
| Constellation Energy Group Inc. | 7.600% | 4/1/32 | 1,800 | 2,322 |
| Detroit Edison Co. | 5.700% | 10/1/37 | 500 | 626 |
| Dominion Resources Inc. | 6.300% | 3/15/33 | 2,150 | 2,670 |
| Dominion Resources Inc. | 5.950% | 6/15/35 | 1,675 | 1,991 |
| Dominion Resources Inc. | 4.900% | 8/1/41 | 2,100 | 2,264 |
| DTE Energy Co. | 6.375% | 4/15/33 | 800 | 962 |
| Duke Energy Carolinas LLC | 6.000% | 12/1/28 | 1,125 | 1,389 |
| Duke Energy Carolinas LLC | 6.450% | 10/15/32 | 1,050 | 1,347 |
| Duke Energy Carolinas LLC | 6.100% | 6/1/37 | 850 | 1,081 |
| Duke Energy Carolinas LLC | 6.000% | 1/15/38 | 875 | 1,134 |
| Duke Energy Carolinas LLC | 6.050% | 4/15/38 | 3,800 | 4,967 |
| Duke Energy Carolinas LLC | 5.300% | 2/15/40 | 1,400 | 1,699 |
| Duke Energy Indiana Inc. | 6.120% | 10/15/35 | 600 | 723 |
| Duke Energy Indiana Inc. | 6.350% | 8/15/38 | 1,000 | 1,318 |
| El Paso Electric Co. | 6.000% | 5/15/35 | 850 | 1,007 |
| Entergy Gulf States Louisiana LLC | 5.590% | 10/1/24 | 500 | 562 |
| Entergy Louisiana LLC | 5.400% | 11/1/24 | 1,425 | 1,622 |
111
Vanguard® Long-Term Bond Index Fund
Schedule of Investments
December 31, 2011
| Face | Market | |||
| Maturity | Amount | Value | ||
| Coupon | Date | ($000) | ($000) | |
| Entergy Louisiana LLC | 4.440% | 1/15/26 | 425 | 449 |
| Exelon Corp. | 5.625% | 6/15/35 | 1,975 | 2,126 |
| Exelon Generation Co. LLC | 6.250% | 10/1/39 | 3,875 | 4,715 |
| FirstEnergy Corp. | 7.375% | 11/15/31 | 4,550 | 5,621 |
| FirstEnergy Solutions Corp. | 6.800% | 8/15/39 | 645 | 727 |
| Florida Power & Light Co. | 5.950% | 10/1/33 | 950 | 1,215 |
| Florida Power & Light Co. | 5.625% | 4/1/34 | 1,674 | 2,068 |
| Florida Power & Light Co. | 4.950% | 6/1/35 | 150 | 171 |
| Florida Power & Light Co. | 5.400% | 9/1/35 | 1,100 | 1,316 |
| Florida Power & Light Co. | 6.200% | 6/1/36 | 150 | 199 |
| Florida Power & Light Co. | 5.650% | 2/1/37 | 2,150 | 2,679 |
| Florida Power & Light Co. | 5.850% | 5/1/37 | 475 | 610 |
| Florida Power & Light Co. | 5.950% | 2/1/38 | 2,850 | 3,759 |
| Florida Power & Light Co. | 5.960% | 4/1/39 | 650 | 864 |
| Florida Power & Light Co. | 5.690% | 3/1/40 | 750 | 967 |
| Florida Power & Light Co. | 5.250% | 2/1/41 | 1,000 | 1,231 |
| Florida Power & Light Co. | 4.125% | 2/1/42 | 600 | 619 |
| Florida Power Corp. | 6.350% | 9/15/37 | 1,525 | 2,045 |
| Florida Power Corp. | 6.400% | 6/15/38 | 4,425 | 5,993 |
| Florida Power Corp. | 5.650% | 4/1/40 | 500 | 624 |
| Georgia Power Co. | 5.650% | 3/1/37 | 2,575 | 3,163 |
| Georgia Power Co. | 5.950% | 2/1/39 | 1,160 | 1,486 |
| Georgia Power Co. | 5.400% | 6/1/40 | 2,000 | 2,406 |
| Iberdrola International BV | 6.750% | 7/15/36 | 1,425 | 1,538 |
| Indiana Michigan Power Co. | 6.050% | 3/15/37 | 1,775 | 2,208 |
| Interstate Power & Light Co. | 6.250% | 7/15/39 | 975 | 1,276 |
| Kansas City Power & Light Co. | 6.050% | 11/15/35 | 500 | 586 |
| Kansas City Power & Light Co. | 5.300% | 10/1/41 | 750 | 812 |
| Kentucky Utilities Co. | 5.125% | 11/1/40 | 800 | 963 |
| Louisville Gas & Electric Co. | 5.125% | 11/15/40 | 1,700 | 2,047 |
| MidAmerican Energy Co. | 6.750% | 12/30/31 | 1,800 | 2,324 |
| MidAmerican Energy Co. | 5.750% | 11/1/35 | 850 | 1,035 |
| MidAmerican Energy Co. | 5.800% | 10/15/36 | 875 | 1,035 |
| Midamerican Energy Holdings Co. | 8.480% | 9/15/28 | 300 | 435 |
| Midamerican Energy Holdings Co. | 6.125% | 4/1/36 | 8,525 | 10,196 |
| Midamerican Energy Holdings Co. | 5.950% | 5/15/37 | 1,675 | 2,007 |
| Midamerican Energy Holdings Co. | 6.500% | 9/15/37 | 1,700 | 2,120 |
| National Rural Utilities Cooperative Finance Corp. | 8.000% | 3/1/32 | 2,625 | 3,735 |
| Nevada Power Co. | 6.750% | 7/1/37 | 1,800 | 2,453 |
| Nevada Power Co. | 5.375% | 9/15/40 | 1,300 | 1,535 |
| Nevada Power Co. | 5.450% | 5/15/41 | 500 | 598 |
| Northern States Power Co. | 5.250% | 7/15/35 | 1,175 | 1,438 |
| Northern States Power Co. | 6.250% | 6/1/36 | 525 | 723 |
| Northern States Power Co. | 6.200% | 7/1/37 | 1,550 | 2,106 |
| Northern States Power Co. | 5.350% | 11/1/39 | 625 | 771 |
| Northern States Power Co. | 4.850% | 8/15/40 | 800 | 933 |
| NSTAR Electric Co. | 5.500% | 3/15/40 | 725 | 883 |
| Oglethorpe Power Corp. | 5.950% | 11/1/39 | 750 | 946 |
| Oglethorpe Power Corp. | 5.375% | 11/1/40 | 1,450 | 1,700 |
| Ohio Edison Co. | 6.875% | 7/15/36 | 1,000 | 1,219 |
| Ohio Power Co. | 6.600% | 2/15/33 | 400 | 515 |
| Oklahoma Gas & Electric Co. | 5.850% | 6/1/40 | 350 | 437 |
| Oncor Electric Delivery Co. LLC | 7.000% | 9/1/22 | 1,675 | 2,145 |
| Oncor Electric Delivery Co. LLC | 7.000% | 5/1/32 | 2,025 | 2,671 |
| Oncor Electric Delivery Co. LLC | 7.250% | 1/15/33 | 325 | 436 |
| Oncor Electric Delivery Co. LLC | 7.500% | 9/1/38 | 425 | 602 |
| Oncor Electric Delivery Co. LLC | 5.250% | 9/30/40 | 1,175 | 1,332 |
| Pacific Gas & Electric Co. | 6.050% | 3/1/34 | 9,125 | 11,355 |
| Pacific Gas & Electric Co. | 5.800% | 3/1/37 | 2,925 | 3,583 |
| Pacific Gas & Electric Co. | 6.350% | 2/15/38 | 1,500 | 1,939 |
| Pacific Gas & Electric Co. | 5.400% | 1/15/40 | 700 | 809 |
| PacifiCorp | 7.700% | 11/15/31 | 400 | 580 |
| PacifiCorp | 5.250% | 6/15/35 | 1,150 | 1,319 |
| PacifiCorp | 5.750% | 4/1/37 | 1,000 | 1,234 |
112
Vanguard® Long-Term Bond Index Fund
Schedule of Investments
December 31, 2011
| Face | Market | |||
| Maturity | Amount | Value | ||
| Coupon | Date | ($000) | ($000) | |
| PacifiCorp | 6.250% | 10/15/37 | 1,700 | 2,254 |
| Pennsylvania Electric Co. | 6.150% | 10/1/38 | 350 | 414 |
| Potomac Electric Power Co. | 6.500% | 11/15/37 | 2,000 | 2,640 |
| PPL Electric Utilities Corp. | 6.250% | 5/15/39 | 775 | 1,044 |
| PPL Electric Utilities Corp. | 5.200% | 7/15/41 | 400 | 477 |
| Progress Energy Inc. | 7.750% | 3/1/31 | 1,725 | 2,450 |
| Progress Energy Inc. | 6.000% | 12/1/39 | 800 | 1,002 |
| PSEG Power LLC | 8.625% | 4/15/31 | 400 | 589 |
| Public Service Co. of Colorado | 6.250% | 9/1/37 | 1,025 | 1,378 |
| Public Service Co. of Colorado | 6.500% | 8/1/38 | 500 | 712 |
| Public Service Co. of Colorado | 4.750% | 8/15/41 | 800 | 920 |
| Public Service Co. of Oklahoma | 6.625% | 11/15/37 | 300 | 381 |
| Public Service Electric & Gas Co. | 5.800% | 5/1/37 | 2,050 | 2,656 |
| Public Service Electric & Gas Co. | 5.375% | 11/1/39 | 700 | 868 |
| Public Service Electric & Gas Co. | 5.500% | 3/1/40 | 1,550 | 1,964 |
| Puget Sound Energy Inc. | 5.483% | 6/1/35 | 1,725 | 2,032 |
| Puget Sound Energy Inc. | 6.274% | 3/15/37 | 1,425 | 1,859 |
| Puget Sound Energy Inc. | 5.757% | 10/1/39 | 850 | 1,046 |
| Puget Sound Energy Inc. | 5.795% | 3/15/40 | 675 | 842 |
| Puget Sound Energy Inc. | 5.764% | 7/15/40 | 600 | 752 |
| Puget Sound Energy Inc. | 4.434% | 11/15/41 | 650 | 679 |
| San Diego Gas & Electric Co. | 5.350% | 5/15/35 | 1,025 | 1,265 |
| San Diego Gas & Electric Co. | 6.125% | 9/15/37 | 625 | 859 |
| San Diego Gas & Electric Co. | 4.500% | 8/15/40 | 2,225 | 2,485 |
| San Diego Gas & Electric Co. | 3.950% | 11/15/41 | 900 | 931 |
| South Carolina Electric & Gas Co. | 6.625% | 2/1/32 | 500 | 647 |
| South Carolina Electric & Gas Co. | 5.300% | 5/15/33 | 1,850 | 2,154 |
| South Carolina Electric & Gas Co. | 6.050% | 1/15/38 | 775 | 1,005 |
| South Carolina Electric & Gas Co. | 5.450% | 2/1/41 | 500 | 598 |
| Southern California Edison Co. | 6.650% | 4/1/29 | 700 | 924 |
| Southern California Edison Co. | 6.000% | 1/15/34 | 975 | 1,263 |
| Southern California Edison Co. | 5.750% | 4/1/35 | 800 | 1,019 |
| Southern California Edison Co. | 5.350% | 7/15/35 | 2,000 | 2,401 |
| Southern California Edison Co. | 5.550% | 1/15/36 | 100 | 123 |
| Southern California Edison Co. | 5.625% | 2/1/36 | 2,075 | 2,581 |
| Southern California Edison Co. | 5.550% | 1/15/37 | 500 | 620 |
| Southern California Edison Co. | 5.950% | 2/1/38 | 1,675 | 2,183 |
| Southern California Edison Co. | 4.500% | 9/1/40 | 2,275 | 2,483 |
| Southern California Edison Co. | 3.900% | 12/1/41 | 500 | 494 |
| Southern Power Co. | 5.150% | 9/15/41 | 1,225 | 1,296 |
| Southwestern Electric Power Co. | 6.200% | 3/15/40 | 700 | 877 |
| Tampa Electric Co. | 6.550% | 5/15/36 | 450 | 596 |
| Tampa Electric Co. | 6.150% | 5/15/37 | 900 | 1,143 |
| Toledo Edison Co. | 6.150% | 5/15/37 | 500 | 609 |
| TransAlta Corp. | 6.500% | 3/15/40 | 600 | 688 |
| Virginia Electric and Power Co. | 3.450% | 9/1/22 | 750 | 786 |
| Virginia Electric and Power Co. | 6.000% | 1/15/36 | 1,725 | 2,176 |
| Virginia Electric and Power Co. | 6.000% | 5/15/37 | 825 | 1,056 |
| Virginia Electric and Power Co. | 6.350% | 11/30/37 | 1,000 | 1,327 |
| Virginia Electric and Power Co. | 8.875% | 11/15/38 | 1,200 | 1,985 |
| Wisconsin Electric Power Co. | 5.625% | 5/15/33 | 450 | 556 |
| Wisconsin Electric Power Co. | 5.700% | 12/1/36 | 1,575 | 2,002 |
| Wisconsin Power & Light Co. | 6.375% | 8/15/37 | 950 | 1,297 |
| Xcel Energy Inc. | 6.500% | 7/1/36 | 650 | 833 |
| Natural Gas (1.8%) | ||||
| AGL Capital Corp. | 6.000% | 10/1/34 | 850 | 1,007 |
| AGL Capital Corp. | 5.875% | 3/15/41 | 1,225 | 1,458 |
| Atmos Energy Corp. | 5.500% | 6/15/41 | 750 | 881 |
| CenterPoint Energy Resources Corp. | 5.850% | 1/15/41 | 500 | 576 |
| DCP Midstream LLC | 8.125% | 8/16/30 | 500 | 643 |
| El Paso Natural Gas Co. | 8.375% | 6/15/32 | 1,520 | 1,920 |
| Enbridge Energy Partners LP | 7.500% | 4/15/38 | 1,595 | 2,139 |
| Energy Transfer Partners LP | 6.625% | 10/15/36 | 1,625 | 1,728 |
113
Vanguard® Long-Term Bond Index Fund
Schedule of Investments
December 31, 2011
| Face | Market | |||
| Maturity | Amount | Value | ||
| Coupon | Date | ($000) | ($000) | |
| Energy Transfer Partners LP | 7.500% | 7/1/38 | 2,675 | 3,058 |
| Enterprise Products Operating LLC | 6.875% | 3/1/33 | 2,150 | 2,586 |
| Enterprise Products Operating LLC | 6.650% | 10/15/34 | 1,095 | 1,293 |
| Enterprise Products Operating LLC | 7.550% | 4/15/38 | 1,125 | 1,448 |
| Enterprise Products Operating LLC | 6.125% | 10/15/39 | 1,500 | 1,678 |
| Enterprise Products Operating LLC | 6.450% | 9/1/40 | 1,275 | 1,489 |
| Enterprise Products Operating LLC | 5.950% | 2/1/41 | 1,650 | 1,841 |
| Enterprise Products Operating LLC | 5.700% | 2/15/42 | 1,200 | 1,304 |
| KeySpan Corp. | 8.000% | 11/15/30 | 1,175 | 1,565 |
| Kinder Morgan Energy Partners LP | 7.750% | 3/15/32 | 500 | 624 |
| Kinder Morgan Energy Partners LP | 7.300% | 8/15/33 | 1,000 | 1,201 |
| Kinder Morgan Energy Partners LP | 5.800% | 3/15/35 | 1,675 | 1,702 |
| Kinder Morgan Energy Partners LP | 6.500% | 2/1/37 | 3,250 | 3,607 |
| Kinder Morgan Energy Partners LP | 6.950% | 1/15/38 | 2,419 | 2,764 |
| Kinder Morgan Energy Partners LP | 6.500% | 9/1/39 | 3,600 | 4,012 |
| Kinder Morgan Energy Partners LP | 5.625% | 9/1/41 | 900 | 926 |
| Nisource Finance Corp. | 6.125% | 3/1/22 | 2,900 | 3,337 |
| Nisource Finance Corp. | 5.950% | 6/15/41 | 125 | 135 |
| Nisource Finance Corp. | 5.800% | 2/1/42 | 300 | 317 |
| ONEOK Inc. | 6.000% | 6/15/35 | 1,725 | 1,844 |
| ONEOK Partners LP | 6.650% | 10/1/36 | 3,025 | 3,620 |
| ONEOK Partners LP | 6.850% | 10/15/37 | 200 | 241 |
| ONEOK Partners LP | 6.125% | 2/1/41 | 1,825 | 2,130 |
| Plains All American Pipeline LP / PAA Finance Corp. | 6.650% | 1/15/37 | 2,175 | 2,588 |
| Sempra Energy | 6.000% | 10/15/39 | 3,350 | 4,158 |
| Southern California Gas Co. | 5.750% | 11/15/35 | 75 | 96 |
| Southern Natural Gas Co. | 8.000% | 3/1/32 | 1,200 | 1,499 |
| Southern Union Co. | 8.250% | 11/15/29 | 1,650 | 1,957 |
| Spectra Energy Capital LLC | 6.750% | 2/15/32 | 1,705 | 1,975 |
| Sunoco Logistics Partners Operations LP | 4.650% | 2/15/22 | 1,325 | 1,350 |
| Tennessee Gas Pipeline Co. | 7.000% | 3/15/27 | 350 | 415 |
| Tennessee Gas Pipeline Co. | 7.000% | 10/15/28 | 1,400 | 1,631 |
| Texas Eastern Transmission LP | 7.000% | 7/15/32 | 700 | 886 |
| TransCanada PipeLines Ltd. | 5.600% | 3/31/34 | 1,725 | 1,997 |
| TransCanada PipeLines Ltd. | 5.850% | 3/15/36 | 2,575 | 3,074 |
| TransCanada PipeLines Ltd. | 6.200% | 10/15/37 | 650 | 815 |
| TransCanada PipeLines Ltd. | 7.250% | 8/15/38 | 3,850 | 5,329 |
| TransCanada PipeLines Ltd. | 7.625% | 1/15/39 | 1,450 | 2,088 |
| TransCanada PipeLines Ltd. | 6.100% | 6/1/40 | 600 | 762 |
| Williams Partners LP | 6.300% | 4/15/40 | 4,550 | 5,548 |
| Other Utility (0.1%) | ||||
| American Water Capital Corp. | 6.593% | 10/15/37 | 1,925 | 2,362 |
| United Utilities plc | 6.875% | 8/15/28 | 375 | 430 |
| Veolia Environnement SA | 6.750% | 6/1/38 | 575 | 686 |
| 341,845 | ||||
| Total Corporate Bonds (Cost $1,747,020) | 1,998,934 | |||
| Sovereign Bonds (U.S. Dollar-Denominated) (5.2%) | ||||
| Asian Development Bank | 5.593% | 7/16/18 | 4,000 | 4,887 |
| Brazilian Government International Bond | 8.875% | 4/15/24 | 3,000 | 4,470 |
| Brazilian Government International Bond | 8.750% | 2/4/25 | 6,700 | 10,016 |
| Brazilian Government International Bond | 10.125% | 5/15/27 | 6,700 | 11,055 |
| Brazilian Government International Bond | 8.250% | 1/20/34 | 6,375 | 9,594 |
| Brazilian Government International Bond | 7.125% | 1/20/37 | 6,800 | 9,413 |
| Brazilian Government International Bond | 11.000% | 8/17/40 | 5,150 | 6,824 |
| Brazilian Government International Bond | 5.625% | 1/7/41 | 8,950 | 10,382 |
| Colombia Government International Bond | 8.125% | 5/21/24 | 1,450 | 2,008 |
| Colombia Government International Bond | 7.375% | 9/18/37 | 3,750 | 5,241 |
| Colombia Government International Bond | 6.125% | 1/18/41 | 5,100 | 6,260 |
| European Investment Bank | 4.875% | 2/15/36 | 2,400 | 2,597 |
| Finland Government International Bond | 6.950% | 2/15/26 | 695 | 1,006 |
| Hungary Government International Bond | 7.625% | 3/29/41 | 2,140 | 1,870 |
| Hydro Quebec | 8.400% | 1/15/22 | 775 | 1,129 |
114
Vanguard® Long-Term Bond Index Fund
Schedule of Investments
December 31, 2011
| Face | Market | |||
| Maturity | Amount | Value | ||
| Coupon | Date | ($000) | ($000) | |
| Hydro Quebec | 8.050% | 7/7/24 | 5,000 | 7,465 |
| Hydro Quebec | 8.500% | 12/1/29 | 1,200 | 1,923 |
| Inter-American Development Bank | 7.000% | 6/15/25 | 750 | 1,072 |
| Inter-American Development Bank | 3.875% | 10/28/41 | 1,000 | 1,064 |
| International Bank for Reconstruction & Development | 7.625% | 1/19/23 | 1,807 | 2,624 |
| International Bank for Reconstruction & Development | 8.875% | 3/1/26 | 1,000 | 1,661 |
| International Bank for Reconstruction & Development | 4.750% | 2/15/35 | 1,025 | 1,288 |
| Korea Electric Power Corp. | 7.000% | 2/1/27 | 750 | 914 |
| 5 Kreditanstalt fuer Wiederaufbau | 0.000% | 4/18/36 | 6,200 | 2,667 |
| 5 Kreditanstalt fuer Wiederaufbau | 0.000% | 6/29/37 | 825 | 339 |
| Landesbank Baden-Wuerttemberg | 7.625% | 2/1/23 | 700 | 951 |
| Mexico Government International Bond | 8.300% | 8/15/31 | 1,325 | 1,981 |
| Mexico Government International Bond | 7.500% | 4/8/33 | 1,000 | 1,402 |
| Mexico Government International Bond | 6.750% | 9/27/34 | 12,800 | 16,713 |
| Mexico Government International Bond | 6.050% | 1/11/40 | 12,025 | 14,670 |
| Mexico Government International Bond | 5.750% | 10/12/2110 | 4,950 | 5,234 |
| Panama Government International Bond | 7.125% | 1/29/26 | 3,850 | 5,015 |
| Panama Government International Bond | 8.875% | 9/30/27 | 1,350 | 2,025 |
| Panama Government International Bond | 9.375% | 4/1/29 | 1,200 | 1,908 |
| 3 Panama Government International Bond | 6.700% | 1/26/36 | 4,900 | 6,411 |
| Pemex Project Funding Master Trust | 6.625% | 6/15/35 | 6,350 | 7,195 |
| Pemex Project Funding Master Trust | 6.625% | 6/15/38 | 1,375 | 1,555 |
| Peruvian Government International Bond | 7.350% | 7/21/25 | 5,800 | 7,699 |
| Peruvian Government International Bond | 8.750% | 11/21/33 | 3,250 | 4,948 |
| 3 Peruvian Government International Bond | 6.550% | 3/14/37 | 4,975 | 6,293 |
| Peruvian Government International Bond | 5.625% | 11/18/50 | 2,200 | 2,408 |
| Petrobras International Finance Co. - Pifco | 6.875% | 1/20/40 | 3,350 | 3,828 |
| Petrobras International Finance Co. - Pifco | 6.750% | 1/27/41 | 2,275 | 2,593 |
| Petroleos Mexicanos | 6.500% | 6/2/41 | 3,500 | 3,939 |
| 4 Petroleos Mexicanos | 6.500% | 6/2/41 | 1,075 | 1,210 |
| Poland Government International Bond | 5.000% | 3/23/22 | 4,500 | 4,519 |
| Province of British Columbia | 6.500% | 1/15/26 | 1,500 | 2,092 |
| Province of Saskatchewan | 7.375% | 7/15/13 | 600 | 662 |
| Quebec | 7.125% | 2/9/24 | 4,125 | 5,775 |
| Quebec | 7.500% | 9/15/29 | 4,375 | 6,613 |
| Region of Lombardy Italy | 5.804% | 10/25/32 | 2,375 | 1,949 |
| Republic of Italy | 6.875% | 9/27/23 | 6,600 | 6,344 |
| Republic of Italy | 5.375% | 6/15/33 | 5,675 | 4,824 |
| Republic of Korea | 5.625% | 11/3/25 | 900 | 1,062 |
| South Africa Government International Bond | 6.875% | 5/27/19 | 150 | 181 |
| South Africa Government International Bond | 5.875% | 5/30/22 | 2,125 | 2,447 |
| South Africa Government International Bond | 6.250% | 3/8/41 | 1,850 | 2,135 |
| Statoil ASA | 3.150% | 1/23/22 | 975 | 1,002 |
| Statoil ASA | 7.250% | 9/23/27 | 2,500 | 3,443 |
| Statoil ASA | 7.150% | 1/15/29 | 1,000 | 1,363 |
| Statoil ASA | 5.100% | 8/17/40 | 2,300 | 2,740 |
| Statoil ASA | 4.250% | 11/23/41 | 825 | 865 |
| Total Sovereign Bonds (Cost $224,102) | 253,763 | |||
| Taxable Municipal Bonds (6.1%) | ||||
| Alameda County CA Joint Powers Authority Lease | ||||
| Revenue | 7.046% | 12/1/44 | 600 | 743 |
| American Municipal Power Ohio Inc. Revenue (Prairie | ||||
| State Energy Campus Project) | 7.834% | 2/15/41 | 200 | 277 |
| American Municipal Power Ohio Inc. Revenue (Prairie | ||||
| State Energy Campus Project) | 6.053% | 2/15/43 | 600 | 699 |
| American Municipal Power Ohio Inc. Revenue (Prairie | ||||
| State Energy Campus Project) | 5.939% | 2/15/47 | 2,900 | 3,193 |
| American Municipal Power Ohio Inc. Revenue (Prairie | ||||
| State Energy Campus Project) | 6.270% | 2/15/50 | 475 | 541 |
| American Municipal Power Ohio Inc. Revenue (Prairie | ||||
| State Energy Campus Project) | 7.499% | 2/15/50 | 200 | 261 |
115
Vanguard® Long-Term Bond Index Fund
Schedule of Investments
December 31, 2011
| Face | Market | |||
| Maturity | Amount | Value | ||
| Coupon | Date | ($000) | ($000) | |
| American Municipal Power Ohio Inc. Revenue (Prairie | ||||
| State Energy Campus Project) | 8.084% | 2/15/50 | 1,800 | 2,525 |
| Bay Area Toll Authority California Toll Bridge Revenue | ||||
| (San Francisco Bay Area) | 6.793% | 4/1/30 | 600 | 723 |
| Bay Area Toll Authority California Toll Bridge Revenue | ||||
| (San Francisco Bay Area) | 6.918% | 4/1/40 | 950 | 1,217 |
| Bay Area Toll Authority California Toll Bridge Revenue | ||||
| (San Francisco Bay Area) | 6.263% | 4/1/49 | 3,150 | 4,093 |
| Bay Area Toll Authority California Toll Bridge Revenue | ||||
| (San Francisco Bay Area) | 7.043% | 4/1/50 | 2,000 | 2,651 |
| Bay Area Toll Authority California Toll Bridge Revenue | ||||
| (San Francisco Bay Area) | 6.907% | 10/1/50 | 775 | 1,011 |
| Board of Regents of the University of Texas System | ||||
| Revenue Financing System Revenue | 5.262% | 7/1/39 | 550 | 673 |
| Board of Regents of the University of Texas System | ||||
| Revenue Financing System Revenue | 6.276% | 8/15/41 | 675 | 768 |
| Board of Regents of the University of Texas System | ||||
| Revenue Financing System Revenue | 5.134% | 8/15/42 | 500 | 607 |
| Board of Regents of the University of Texas System | ||||
| Revenue Financing System Revenue | 4.794% | 8/15/46 | 575 | 658 |
| California GO | 5.700% | 11/1/21 | 1,300 | 1,428 |
| California GO | 6.650% | 3/1/22 | 1,500 | 1,746 |
| California GO | 7.500% | 4/1/34 | 6,125 | 7,330 |
| California GO | 7.950% | 3/1/36 | 1,500 | 1,698 |
| California GO | 7.550% | 4/1/39 | 5,800 | 7,098 |
| California GO | 7.300% | 10/1/39 | 4,625 | 5,510 |
| California GO | 7.350% | 11/1/39 | 1,950 | 2,337 |
| California GO | 7.625% | 3/1/40 | 3,100 | 3,835 |
| California GO | 7.600% | 11/1/40 | 4,600 | 5,685 |
| Central Puget Sound WA Regional Transit Authority | ||||
| Sales & Use Tax Revenue | 5.491% | 11/1/39 | 650 | 782 |
| Chicago IL Board of Education GO | 6.319% | 11/1/29 | 650 | 720 |
| Chicago IL Board of Education GO | 6.138% | 12/1/39 | 700 | 751 |
| Chicago IL GO | 7.781% | 1/1/35 | 675 | 818 |
| Chicago IL Metropolitan Water Reclamation District GO | 5.720% | 12/1/38 | 1,125 | 1,403 |
| Chicago IL O'Hare International Airport Revenue | 6.845% | 1/1/38 | 600 | 664 |
| Chicago IL O'Hare International Airport Revenue | 6.395% | 1/1/40 | 650 | 795 |
| Chicago IL Transit Authority Transfer Tax Receipts | ||||
| Revenue | 6.899% | 12/1/40 | 4,650 | 5,491 |
| Chicago IL Wastewater Transmission Revenue | 6.900% | 1/1/40 | 575 | 713 |
| Chicago IL Water Revenue | 6.742% | 11/1/40 | 800 | 1,017 |
| Clark County NV Airport Revenue | 6.881% | 7/1/42 | 650 | 725 |
| Clark County NV Airport Revenue | 6.820% | 7/1/45 | 1,000 | 1,271 |
| Colorado Bridge Enterprise Revenue | 6.078% | 12/1/40 | 280 | 353 |
| Commonwealth Financing Authority Pennsylvania | ||||
| Revenue | 6.218% | 6/1/39 | 1,190 | 1,404 |
| Connecticut GO | 5.090% | 10/1/30 | 350 | 374 |
| Connecticut GO | 5.850% | 3/15/32 | 3,250 | 3,960 |
| Connecticut Special Tax Revenue (Transportation | ||||
| Infrastructure) | 5.459% | 11/1/30 | 900 | 1,024 |
| Cook County IL GO | 6.229% | 11/15/34 | 1,050 | 1,163 |
| Curators of the University of Missouri System Facilities | ||||
| Revenue | 5.960% | 11/1/39 | 1,000 | 1,295 |
| Curators of the University of Missouri System Facilities | ||||
| Revenue | 5.792% | 11/1/41 | 200 | 251 |
| Dallas County TX Hospital District Revenue | 5.621% | 8/15/44 | 850 | 1,048 |
| Dallas TX Area Rapid Transit Revenue | 4.922% | 12/1/41 | 400 | 453 |
| Dallas TX Area Rapid Transit Revenue | 5.999% | 12/1/44 | 1,570 | 2,068 |
| Dallas TX Area Rapid Transit Revenue | 5.022% | 12/1/48 | 1,600 | 1,827 |
| Dallas TX Independent School District GO | 6.450% | 2/15/35 | 1,400 | 1,654 |
| Denver CO City & County School District No. 1 GO | 5.664% | 12/1/33 | 525 | 619 |
| Denver CO Public Schools Revenue (City & County of | ||||
| Denver School District No. 1) COP | 7.017% | 12/15/37 | 700 | 892 |
| District of Columbia Income Tax Revenue | 5.591% | 12/1/34 | 675 | 822 |
116
Vanguard® Long-Term Bond Index Fund
Schedule of Investments
December 31, 2011
| Face | Market | |||
| Maturity | Amount | Value | ||
| Coupon | Date | ($000) | ($000) | |
| District of Columbia Income Tax Revenue | 5.582% | 12/1/35 | 625 | 751 |
| East Baton Rouge LA Sewer Commission Revenue | 6.087% | 2/1/45 | 700 | 729 |
| East Bay CA Municipal Utility District Water System | ||||
| Revenue | 5.874% | 6/1/40 | 900 | 1,122 |
| Georgia GO | 4.503% | 11/1/25 | 825 | 930 |
| Georgia Municipal Electric Power Authority Revenue | 6.637% | 4/1/57 | 2,700 | 2,848 |
| Georgia Municipal Electric Power Authority Revenue | 6.655% | 4/1/57 | 2,800 | 2,862 |
| Georgia Municipal Electric Power Authority Revenue | 7.055% | 4/1/57 | 850 | 877 |
| Illinois GO | 4.950% | 6/1/23 | 1,700 | 1,679 |
| Illinois GO | 5.100% | 6/1/33 | 17,475 | 15,949 |
| Illinois GO | 6.630% | 2/1/35 | 1,050 | 1,097 |
| Illinois GO | 6.725% | 4/1/35 | 1,000 | 1,055 |
| Illinois GO | 7.350% | 7/1/35 | 2,250 | 2,452 |
| Illinois Toll Highway Authority Revenue | 6.184% | 1/1/34 | 1,200 | 1,417 |
| Illinois Toll Highway Authority Revenue | 5.851% | 12/1/34 | 600 | 686 |
| Indianapolis IN Local Public Improvement Revenue | 6.116% | 1/15/40 | 875 | 1,119 |
| 6 Kansas Development Finance Authority Revenue | ||||
| (Public Employees Retirement System) | 5.501% | 5/1/34 | 500 | 545 |
| Las Vegas Valley Water District Nevada GO | 7.013% | 6/1/39 | 525 | 686 |
| Los Angeles CA Community College District GO | 6.600% | 8/1/42 | 1,300 | 1,668 |
| Los Angeles CA Community College District GO | 6.750% | 8/1/49 | 700 | 916 |
| Los Angeles CA Department of Water & Power | ||||
| Revenue | 5.716% | 7/1/39 | 775 | 897 |
| Los Angeles CA Department of Water & Power | ||||
| Revenue | 6.008% | 7/1/39 | 775 | 896 |
| Los Angeles CA Department of Water & Power | ||||
| Revenue | 6.166% | 7/1/40 | 625 | 682 |
| Los Angeles CA Department of Water & Power | ||||
| Revenue | 6.574% | 7/1/45 | 1,375 | 1,838 |
| Los Angeles CA Department of Water & Power | ||||
| Revenue | 6.603% | 7/1/50 | 1,500 | 2,021 |
| Los Angeles CA Unified School District GO | 5.755% | 7/1/29 | 1,000 | 1,105 |
| Los Angeles CA Unified School District GO | 5.750% | 7/1/34 | 3,700 | 4,093 |
| Los Angeles CA Unified School District GO | 6.758% | 7/1/34 | 1,700 | 2,127 |
| Los Angeles County CA Metropolitan Transportation | ||||
| Authority Sales Tax Revenue | 5.735% | 6/1/39 | 1,150 | 1,377 |
| Los Angeles County CA Public Works Financing | ||||
| Authority Lease Revenue | 7.488% | 8/1/33 | 700 | 882 |
| Los Angeles County CA Public Works Financing | ||||
| Authority Lease Revenue | 7.618% | 8/1/40 | 700 | 859 |
| Maryland Transportation Authority Facilities Projects | ||||
| Revenue | 5.888% | 7/1/43 | 850 | 1,078 |
| Massachusetts Development Finance Agency Revenue | ||||
| (Harvard University) | 6.300% | 10/1/37 | 1,000 | 1,122 |
| Massachusetts GO | 4.500% | 8/1/31 | 1,500 | 1,591 |
| Massachusetts GO | 5.456% | 12/1/39 | 1,900 | 2,297 |
| Massachusetts School Building Authority Dedicated | ||||
| Sales Tax Revenue | 5.715% | 8/15/39 | 1,050 | 1,305 |
| Massachusetts Transportation Fund Revenue | 5.731% | 6/1/40 | 850 | 1,111 |
| Massachusetts Water Pollution Abatement Trust | 5.192% | 8/1/40 | 900 | 1,047 |
| Metropolitan Government of Nashville & Davidson | ||||
| County TN GO | 5.707% | 7/1/34 | 1,200 | 1,405 |
| Metropolitan New York Transportation Authority | ||||
| Revenue (Dedicated Tax Fund) | 7.336% | 11/15/39 | 3,325 | 4,679 |
| Metropolitan New York Transportation Authority | ||||
| Revenue (Dedicated Tax Fund) | 6.089% | 11/15/40 | 575 | 695 |
| Metropolitan New York Transportation Authority | ||||
| Revenue (Transit Revenue) | 6.548% | 11/15/31 | 500 | 599 |
| Metropolitan New York Transportation Authority | ||||
| Revenue (Transit Revenue) | 5.871% | 11/15/39 | 700 | 752 |
| Metropolitan New York Transportation Authority | ||||
| Revenue (Transit Revenue) | 6.648% | 11/15/39 | 1,750 | 2,103 |
| Metropolitan Washington DC/VA Airports Authority | ||||
| Dulles Toll Road Revenue | 7.462% | 10/1/46 | 775 | 862 |
117
Vanguard® Long-Term Bond Index Fund
Schedule of Investments
December 31, 2011
| Face | Market | |||
| Maturity | Amount | Value | ||
| Coupon | Date | ($000) | ($000) | |
| Metropolitan Water District of Southern California | ||||
| Water Revenue | 6.947% | 7/1/40 | 575 | 678 |
| Mississippi GO | 5.245% | 11/1/34 | 700 | 799 |
| Missouri Highways & Transportation Commission Road | ||||
| Revenue | 5.445% | 5/1/33 | 600 | 707 |
| 7 New Jersey Economic Development Authority | ||||
| Revenue (State Pension Funding) | 7.425% | 2/15/29 | 5,250 | 6,381 |
| New Jersey Educational Facilities Authority Revenue | ||||
| (Princeton University) | 5.700% | 3/1/39 | 1,500 | 1,958 |
| New Jersey Transportation Trust Fund Authority | ||||
| Transportation System Revenue | 5.754% | 12/15/28 | 1,700 | 1,858 |
| New Jersey Transportation Trust Fund Authority | ||||
| Transportation System Revenue | 6.104% | 12/15/28 | 1,150 | 1,240 |
| New Jersey Transportation Trust Fund Authority | ||||
| Transportation System Revenue | 6.561% | 12/15/40 | 1,575 | 2,045 |
| New Jersey Turnpike Authority Revenue | 4.252% | 1/1/16 | 30 | 32 |
| 8 New Jersey Turnpike Authority Revenue | 4.252% | 1/1/16 | 470 | 488 |
| New Jersey Turnpike Authority Revenue | 7.414% | 1/1/40 | 3,050 | 4,350 |
| New Jersey Turnpike Authority Revenue | 7.102% | 1/1/41 | 4,200 | 5,771 |
| New York City NY GO | 5.206% | 10/1/31 | 1,000 | 1,115 |
| New York City NY GO | 6.646% | 12/1/31 | 400 | 468 |
| New York City NY GO | 6.246% | 6/1/35 | 775 | 863 |
| New York City NY GO | 5.968% | 3/1/36 | 300 | 356 |
| New York City NY GO | 5.985% | 12/1/36 | 625 | 747 |
| New York City NY GO | 5.517% | 10/1/37 | 675 | 767 |
| New York City NY GO | 6.271% | 12/1/37 | 1,550 | 1,918 |
| New York City NY GO | 5.846% | 6/1/40 | 400 | 476 |
| New York City NY Municipal Water Finance Authority | ||||
| Water & Sewer System Revenue | 5.750% | 6/15/41 | 800 | 980 |
| New York City NY Municipal Water Finance Authority | ||||
| Water & Sewer System Revenue | 5.790% | 6/15/41 | 500 | 548 |
| New York City NY Municipal Water Finance Authority | ||||
| Water & Sewer System Revenue | 5.724% | 6/15/42 | 550 | 665 |
| New York City NY Municipal Water Finance Authority | ||||
| Water & Sewer System Revenue | 5.952% | 6/15/42 | 800 | 995 |
| New York City NY Municipal Water Finance Authority | ||||
| Water & Sewer System Revenue | 6.011% | 6/15/42 | 1,150 | 1,437 |
| New York City NY Municipal Water Finance Authority | ||||
| Water & Sewer System Revenue | 5.440% | 6/15/43 | 1,000 | 1,143 |
| New York City NY Municipal Water Finance Authority | ||||
| Water & Sewer System Revenue | 5.882% | 6/15/44 | 2,000 | 2,497 |
| New York City NY Transitional Finance Authority | ||||
| Building Aid Revenue | 6.828% | 7/15/40 | 800 | 1,027 |
| New York City NY Transitional Finance Authority Future | ||||
| Tax Revenue | 5.767% | 8/1/36 | 775 | 912 |
| New York City NY Transitional Finance Authority Future | ||||
| Tax Revenue | 5.508% | 8/1/37 | 1,900 | 2,221 |
| New York City NY Transitional Finance Authority Future | ||||
| Tax Revenue | 5.572% | 11/1/38 | 1,150 | 1,345 |
| New York State Dormitory Authority Revenue (Personal | ||||
| Income Tax) | 5.500% | 3/15/30 | 2,500 | 2,911 |
| New York State Dormitory Authority Revenue (Personal | ||||
| Income Tax) | 5.289% | 3/15/33 | 500 | 574 |
| New York State Dormitory Authority Revenue (Personal | ||||
| Income Tax) | 5.628% | 3/15/39 | 2,000 | 2,324 |
| New York State Dormitory Authority Revenue (Personal | ||||
| Income Tax) | 5.389% | 3/15/40 | 600 | 703 |
| New York State Urban Development Corp. Revenue | ||||
| (Personal Income Tax) | 5.770% | 3/15/39 | 1,350 | 1,611 |
| New York State Urban Development Corp. Revenue | ||||
| (Personal Income Tax) | 5.838% | 3/15/40 | 625 | 741 |
| North Texas Tollway Authority System Revenue | 6.718% | 1/1/49 | 2,500 | 3,101 |
| Ohio State University General Receipts Revenue | 4.910% | 6/1/40 | 1,500 | 1,720 |
| Ohio State University General Receipts Revenue | 4.800% | 6/1/2111 | 725 | 756 |
118
Vanguard® Long-Term Bond Index Fund
Schedule of Investments
December 31, 2011
| Face | Market | |||
| Maturity | Amount | Value | ||
| Coupon | Date | ($000) | ($000) | |
| Ohio Water Development Authority Water Pollution | ||||
| Control Loan Fund Revenue | 4.879% | 12/1/34 | 1,125 | 1,272 |
| Orange County CA Local Transportation Authority Sales | ||||
| Tax Revenue | 6.908% | 2/15/41 | 575 | 773 |
| Oregon Department Transportation Highway Usertax | ||||
| Revenue | 5.834% | 11/15/34 | 1,250 | 1,529 |
| Oregon GO | 5.762% | 6/1/23 | 600 | 738 |
| Oregon GO | 5.892% | 6/1/27 | 3,350 | 3,939 |
| 8 Oregon School Boards Association GO | 4.759% | 6/30/28 | 1,850 | 2,006 |
| 6 Oregon School Boards Association GO | 5.528% | 6/30/28 | 1,500 | 1,677 |
| Pennsylvania GO | 4.650% | 2/15/26 | 1,100 | 1,239 |
| Pennsylvania GO | 5.350% | 5/1/30 | 1,000 | 1,089 |
| Pennsylvania Public School Building Authority Lease | ||||
| Revenue (School District of Philadelphia) | 5.000% | 9/15/27 | 1,100 | 1,154 |
| Pennsylvania Turnpike Commission Revenue | 6.105% | 12/1/39 | 600 | 732 |
| Pennsylvania Turnpike Commission Revenue | 5.511% | 12/1/45 | 775 | 881 |
| Pennsylvania Turnpike Commission Revenue | 5.561% | 12/1/49 | 850 | 963 |
| Port Authority of New York & New Jersey Revenue | 6.040% | 12/1/29 | 1,125 | 1,379 |
| Port Authority of New York & New Jersey Revenue | 5.647% | 11/1/40 | 2,750 | 3,116 |
| Port Authority of New York & New Jersey Revenue | 4.926% | 10/1/51 | 2,000 | 2,090 |
| Regional Transportation District of Colorado Sales Tax | ||||
| Revenue | 5.844% | 11/1/50 | 700 | 910 |
| Rutgers State University NJ Revenue | 5.665% | 5/1/40 | 1,050 | 1,246 |
| Salt River Project Arizona Agricultural Improvement & | ||||
| Power District Revenue | 4.839% | 1/1/41 | 1,100 | 1,233 |
| San Antonio TX Electric & Gas Systems Revenue | 5.985% | 2/1/39 | 600 | 763 |
| San Antonio TX Electric & Gas Systems Revenue | 5.718% | 2/1/41 | 950 | 1,137 |
| San Antonio TX Electric & Gas Systems Revenue | 5.808% | 2/1/41 | 1,150 | 1,404 |
| San Diego County CA Regional Transportation Authority | ||||
| Sales Tax Revenue | 5.911% | 4/1/48 | 500 | 636 |
| San Diego County CA Water Authority Revenue | 6.138% | 5/1/49 | 1,200 | 1,532 |
| San Francisco CA City & County Public Utility | ||||
| Commission Water Revenue | 6.000% | 11/1/40 | 1,325 | 1,533 |
| San Francisco CA City & County Public Utility | ||||
| Commission Water Revenue | 6.950% | 11/1/50 | 800 | 1,042 |
| Santa Clara Valley CA Transportation Authority Sales | ||||
| Tax Revenue | 5.876% | 4/1/32 | 1,000 | 1,190 |
| Sonoma County CA Pension Obligation Revenue | 6.000% | 12/1/29 | 750 | 831 |
| South Carolina Public Service Authority Revenue | 6.454% | 1/1/50 | 750 | 1,030 |
| Texas GO | 5.517% | 4/1/39 | 2,920 | 3,640 |
| Texas Transportation Commission Revenue | 5.028% | 4/1/26 | 1,000 | 1,164 |
| Texas Transportation Commission Revenue | 5.178% | 4/1/30 | 2,650 | 3,127 |
| Texas Transportation Commission Revenue | 4.631% | 4/1/33 | 800 | 871 |
| Texas Transportation Commission Revenue | 4.681% | 4/1/40 | 750 | 843 |
| University of California Regents Medical Center | ||||
| Revenue | 6.548% | 5/15/48 | 900 | 1,079 |
| University of California Regents Medical Center | ||||
| Revenue | 6.583% | 5/15/49 | 1,075 | 1,298 |
| University of California Revenue | 5.770% | 5/15/43 | 2,800 | 3,217 |
| University of California Revenue | 5.946% | 5/15/45 | 1,400 | 1,624 |
| University of Massachusetts Building Authority | ||||
| Revenue | 5.450% | 11/1/40 | 575 | 676 |
| University of Southern California | 5.250% | 10/1/2111 | 800 | 998 |
| University of Virginia Revenue | 6.200% | 9/1/39 | 1,000 | 1,368 |
| Utah GO | 4.554% | 7/1/24 | 1,100 | 1,297 |
| Utah GO | 3.539% | 7/1/25 | 1,200 | 1,271 |
| Utah Transit Authority Sales Tax Revenue | 5.937% | 6/15/39 | 700 | 893 |
| Virginia Commonwealth Transportation Board Revenue | 5.350% | 5/15/35 | 300 | 347 |
| Washington Convention Center Public Facilities District | ||||
| Revenue | 6.790% | 7/1/40 | 600 | 744 |
| Washington GO | 5.090% | 8/1/33 | 900 | 1,017 |
| Washington GO | 5.481% | 8/1/39 | 650 | 778 |
| Washington GO | 5.140% | 8/1/40 | 625 | 721 |
119
Vanguard® Long-Term Bond Index Fund
Schedule of Investments
December 31, 2011
| Face | Market | |||
| Maturity | Amount | Value | ||
| Coupon | Date | ($000) | ($000) | |
| 6 Wisconsin GO | 5.700% | 5/1/26 | 1,400 | 1,608 |
| Total Taxable Municipal Bonds (Cost $254,627) | 297,348 | |||
| Shares | ||||
| Temporary Cash Investment (0.3%) | ||||
| Money Market Fund (0.3%) | ||||
| 9 Vanguard Market Liquidity Fund (Cost $12,481) | 0.110% | 12,481,109 | 12,481 | |
| Total Investments (99.2%) (Cost $4,088,071) | 4,812,343 | |||
| Other Assets and Liabilities—Net (0.8%) | 39,934 | |||
| Net Assets (100%) | 4,852,277 | |||
1 The issuer operates under a congressional charter; its securities are generally neither guaranteed by the U.S. Treasury nor backed by the full
faith and credit of the U.S. government.
2 The issuer was placed under federal conservatorship in September 2008; since that time, its daily operations have been managed by the Federal
Housing Finance Agency and it receives capital from the U.S. Treasury in exchange for senior preferred stock.
3 The average or expected maturity is shorter than the final maturity shown because of the possibility of interim principal payments and
prepayments or the possibility of the issue being called.
4 Security exempt from registration under Rule 144A of the Securities Act of 1933. Such securities may be sold in transactions exempt from
registration, normally to qualified institutional buyers. At December 31, 2011, the aggregate value of these securities was $14,493,000,
representing 0.3% of net assets.
5 Guaranteed by the Federal Republic of Germany.
6 Scheduled principal and interest payments are guaranteed by AGM (Assured Guaranty Municipal Corporation).
7 Scheduled principal and interest payments are guaranteed by National Public Finance Guarantee Corp.
8 Scheduled principal and interest payments are guaranteed by AMBAC (Ambac Assurance Corporation).
9 Affiliated money market fund available only to Vanguard funds and certain trusts and accounts managed by Vanguard. Rate shown is the 7-day
yield.
COP—Certificate of Participation.
GO—General Obligation Bond.
REIT—Real Estate Investment Trust.
120
Report of Independent Registered Public Accounting Firm
To the Trustees of Vanguard Bond Index Funds and the Shareholders of Vanguard Total Bond Market
Index Fund, Vanguard Short-Term Bond Index Fund, Vanguard Intermediate-Term Bond Index Fund
and Vanguard Long-Term Bond Index Fund:
We have audited, in accordance with the standards of the Public Company Accounting Oversight Board
(United States), the financial statements (not presented herein) of Vanguard Total Bond Market Index
Fund, Vanguard Short-Term Bond Index Fund, Vanguard Intermediate-Term Bond Index Fund and
Vanguard Long-Term Bond Index Fund (constituting separate portfolios of Vanguard Bond Index Funds,
hereafter referred to as the "Funds") as of December 31, 2011 and for the year then ended and have issued
our unqualified report thereon dated February 15, 2012. Our audits included audits of the Funds'
schedules of investments as of December 31, 2011. These schedules of investments are the responsibility
of the Funds' management. Our responsibility is to express an opinion on these schedules of investments
based on our audits.
In our opinion, the accompanying schedules of investments referred to above, when read in conjunction
with the financial statements of the Funds referred to above, present fairly, in all material respects, the
information set forth therein.
PricewaterhouseCoopers LLP
Philadelphia, PA
February 15, 2012
121
© 2012 The Vanguard Group. Inc.
All rights reserved.
Vanguard Marketing Corporation, Distributor.
SNA 840_022012
Annual Report | December 31, 2011
Vanguard Inflation-Protected
Securities Fund
> Vanguard Inflation-Protected Securities Fund returned 13.24% for Investor
Shares in 2011, as yields fell dramatically and inflation picked up.
> The fund’s return was a step behind that of its benchmark index but well ahead
of the average return of peer-group funds.
> The 30-day SEC yield for each share class was negative at year-end, a
consequence of Vanguard’s conservative approach to calculating this figure.
| Contents | |
| Your Fund’s Total Returns. | 1 |
| Chairman’s Letter. | 2 |
| Advisor’s Report. | 8 |
| Fund Profile. | 10 |
| Performance Summary. | 11 |
| Financial Statements. | 13 |
| About Your Fund’s Expenses. | 25 |
| Glossary. | 27 |
Please note: The opinions expressed in this report are just that—informed opinions. They should not be considered promises or advice.
Also, please keep in mind that the information and opinions cover the period through the date on the front of this report. Of course, the
risks of investing in your fund are spelled out in the prospectus.
See the Glossary for definitions of investment terms used in this report.
About the cover: Vanguard was named for the HMS Vanguard, flagship of British Admiral Horatio Nelson. A ship—whose
performance and safety depend on the work of all hands—has served as a fitting metaphor for the Vanguard crew as we
strive to help clients reach their financial goals.
Your Fund’s Total Returns
| Fiscal Year Ended December 31, 2011 | ||||
| 30-Day SEC | Income | Capital | Total | |
| Yields | Returns | Returns | Returns | |
| Vanguard Inflation-Protected Securities Fund | ||||
| Investor Shares | -0.45% | 4.56% | 8.68% | 13.24% |
| Admiral™ Shares | -0.37 | 4.66 | 8.63 | 13.29 |
| Institutional Shares | -0.33 | 4.70 | 8.69 | 13.39 |
| Barclays Capital U.S. Treasury Inflation Protected | ||||
| Securities Index | 13.56 | |||
| Treasury Inflation-Protected Securities Funds | ||||
| Average | 10.77 | |||
Treasury Inflation-Protected Securities Funds Average: Derived from data provided by Lipper Inc.
Admiral Shares carry lower expenses and are available to investors who meet certain account-balance requirements. Institutional Shares are
available to certain institutional investors who meet specific administrative, service, and account-size criteria.
| Your Fund’s Performance at a Glance | ||||
| December 31, 2010 , Through December 31, 2011 | ||||
| Distributions Per Share | ||||
| Starting | Ending | Income | Capital | |
| Share Price | Share Price | Dividends | Gains | |
| Vanguard Inflation-Protected Securities Fund | ||||
| Investor Shares | $13.00 | $14.11 | $0.567 | $0.018 |
| Admiral Shares | 25.54 | 27.71 | 1.137 | 0.035 |
| Institutional Shares | 10.40 | 11.29 | 0.467 | 0.014 |
1

Chairman’s Letter
Dear Shareholder,
The prices of Treasury Inflation-Protected Securities (TIPS) rallied in 2011 as investors sought shelter from volatile stock markets and Europe’s fiscal disarray along with some protection against future inflation. In this environment, your fund delivered its second-highest return since inception 11 years ago.
For the year, Vanguard Inflation-Protected Securities Fund returned 13.24% for Investor Shares, while the returns of the lower-cost Admiral and Institutional Shares were modestly higher. The fund did not equal the 13.56% return of its benchmark index, but it handily outpaced the 10.77% average return of competitor funds. In contrast to TIPS, the broad investment-grade bond market returned 7.84%, and “nominal” Treasury securities, which don’t include an automatic adjustment for inflation, returned 9.81%, according to the Barclays Capital U.S. Aggregate Bond and U.S. Treasury Indexes.
I want to note that these are unusually strong returns, particularly for TIPS. While we can make no predictions, it would be unwise to count on such impressive performance continuing. One factor: The declining yields that helped boost your fund’s share price last year are now so low that it is questionable whether they will fall substantially farther.
2
Inflation adjustments accounted for about two-thirds of the fund’s total quarterly distributions to shareholders during the year. The balance consisted of coupon interest earned on the fund’s bonds.
The fund finished the year with a negative 30-day SEC yield, an unusual result that should not cause you concern. It reflects the negative yields on some of the fund’s holdings and Vanguard’s decision to exclude adjustments for inflation from our calculation of the 30-day SEC yield. The preceding sentence raises two obvious questions. Why would investors buy bonds with a negative yield? And why does Vanguard exclude adjustments for inflation from its calculation?
First, investors are buying TIPS with negative yields in the expectation that future inflation adjustments to these securities will turn a bond with a negative yield into one that provides a positive long-term return. Second, Vanguard excludes inflation from our 30-day SEC yield calculations because inflation adjustments can vary significantly from month to month, and annualizing the current month’s inflation adjustment may suggest, at times, an unrealistic level of income. When the fund’s income is paid to shareholders, of course, it will reflect any adjustments made to TIPS securities for actual inflation.
| Market Barometer | |||
| Average Annual Total Returns | |||
| Periods Ended December 31, 2011 | |||
| One | Three | Five | |
| Year | Years | Years | |
| Bonds | |||
| Barclays Capital U.S. Aggregate Bond Index (Broad | |||
| taxable market) | 7.84% | 6.77% | 6.50% |
| Barclays Capital Municipal Bond Index (Broad tax-exempt | |||
| market) | 10.70 | 8.57 | 5.22 |
| Citigroup Three-Month U.S. Treasury Bill Index | 0.08 | 0.11 | 1.36 |
| Stocks | |||
| Russell 1000 Index (Large-caps) | 1.50% | 14.81% | -0.02% |
| Russell 2000 Index (Small-caps) | -4.18 | 15.63 | 0.15 |
| Dow Jones U.S. Total Stock Market Index | 0.52 | 15.24 | 0.28 |
| MSCI All Country World Index ex USA (International) | -13.71 | 10.70 | -2.92 |
| CPI | |||
| Consumer Price Index | 2.96% | 2.39% | 2.26% |
3
As yields fell, bonds delivered unexpectedly strong returns
Bond returns in 2011 were a surprise, mainly because so little was expected of them. At the end of 2010, bond yields hovered near historical lows, suggesting that the scope for further declines—and rallies in bond prices—was limited. During 2011, however, interest rates moved lower still as investors sought shelter from stock market turmoil. As I noted, the broad U.S. bond market returned nearly 8%. Municipal bonds, which were battered at the end of 2010, produced even stronger returns than taxable bonds.
The returns of the 3-month U.S. Treasury bill and other money market instruments approached 0%, which was consistent
with the Federal Reserve Board’s interest rate policy but nevertheless a disappointment for savers.
Big dramas and small numbers in the U.S. stock market
The broad U.S. stock market finished 2011 with a modestly positive return, a result that seems surprisingly low-key in light of the economic and political dramas that monopolized investors’ attention for much of the year.
Stock prices rallied and retreated as early optimism about the global economic outlook traded places with anxiety about Europe’s debt crisis and the contentious negotiations in Washington over raising the U.S. debt ceiling to avoid default. The
| Expense Ratios | ||||
| Your Fund Compared With Its Peer Group | ||||
| Investor | Admiral | Institutional | Peer Group | |
| Shares | Shares | Shares | Average | |
| Inflation-Protected Securities Fund | 0.22% | 0.11% | 0.07% | 0.82% |
The fund expense ratios shown are from the prospectus dated April 26, 2011, and represent estimated costs for the current fiscal year. For the
fiscal year ended December 31, 2011, the fund’s expense ratios were 0.20% for Investor Shares, 0.11% for Admiral Shares, and 0.07% for
Institutional Shares. The peer-group expense ratio is derived from data provided by Lipper Inc. and captures information through year-end
2010.
Peer group: Treasury Inflation-Protected Securities Funds.
4
policymaking strife prompted Standard & Poor’s to downgrade the U.S. credit rating. (Vanguard’s confidence in the full faith and credit of the U.S. Treasury remains unshaken.) By year-end, stock prices were again on the rise, with investors refocused on signs of economic improvement.
International stock prices finished the year with a double-digit decline. The weaker performance of stocks outside the United States reflected the greater economic and financial challenges in Europe, Japan’s struggles with natural and nuclear disaster, and skittishness about emerging markets.
Strong demand for Treasuries helped boost TIPS prices
Demand was particularly strong during the year for Treasury bonds, pushing up their prices and lowering their yields. The drop in interest rates was substantial: The yield of the 10-year Treasury bond, for example, fell from 3.30% at year-end 2010 to 1.88% at year-end 2011, the lowest level in decades.
A notable source of demand for bonds was the Federal Reserve, which began a program of buying Treasury bonds, including TIPS, with the goal of stimulating economic activity by lowering intermediate-
| Total Returns | |
| Ten Years Ended December 31, 2011 | |
| Average | |
| Annual Return | |
| Inflation-Protected Securities Fund Investor Shares | 7.33% |
| Barclays Capital U.S. Treasury Inflation Protected Securities Index | 7.57 |
| Treasury Inflation-Protected Securities Funds Average | 6.50 |
| Treasury Inflation-Protected Securities Funds Average: Derived from data provided by Lipper Inc. | |
The figures shown represent past performance, which is not a guarantee of future results. (Current performance may be
lower or higher than the performance data cited. For performance data current to the most recent month-end, visit our
website at vanguard.com/performance.) Note, too, that both investment returns and principal value can fluctuate widely, so
an investor’s shares, when sold, could be worth more or less than their original cost.
5
and long-term interest rates. TIPS got a further boost in demand from investors seeking the safest assets available—a list headed by Treasury securities—as Europe’s sovereign-debt crisis threatened to overwhelm policymakers.
The effect on TIPS prices can be seen in the fund’s capital return, one of the two components of its total return. For the Investor Shares, capital return was a hearty 8.68%—nearly two thirds of the 13.24% total return.
Similarly healthy was the fund’s income return, the other component, which for the Investor Shares was 4.56%. A major
influence on the income return of an inflation-linked fund is, of course, inflation, which accelerated in the past year. As of December 31, consumer prices were 3.0% higher than a year earlier, according to the U.S. Bureau of Labor Statistics. During 2010, the price index rose only 1.4%.
For those who owned the fund’s Investor Shares throughout 2011, higher inflation meant that 36.9 cents (or about two-thirds) of their total income distribution of 56.7 cents a share was based on the trend in consumer prices. The source of the remaining 19.8 cents was the coupon interest payments on the bonds that the fund holds. Distributions for the other share classes followed a similar pattern.
| A note of caution on interest rates, duration, and your fund |
| The Inflation-Protected Securities Fund benefited in 2011 from its relatively long |
| average duration, a measure of sensitivity to interest rate changes. The longer a bond |
| fund’s duration, the more its share price will change—upward or downward—in |
| response to a change in interest rates. |
| As of December 31, 2011, your fund had an average duration of 8.4 years, compared |
| with an average of 5 years for the Barclays Capital U.S. Aggregate Bond Index. The |
| fund’s longer duration was an advantage last year as interest rates fell, but the same |
| attribute would hurt performance if market rates were rising. (For more about the |
| fund’s duration, please see the Advisor’s Report that follows this letter.) |
| We want you to be aware of how your fund could be affected by changes in |
| interest rates, but it’s also important to keep perspective about this. Yes, rising |
| rates can mean a decline in share price, but they also imply higher returns on |
| reinvested income and new investments in the fund. When rates tumble, by contrast, |
| the resulting short-term price gains imply lower returns on future investments. In any |
| case, predicting interest rates is notoriously difficult. A more constructive course is to |
| hold a broadly diversified portfolio that can help you move toward your long-term |
| goals regardless of how short-term market trends affect individual holdings. |
6
A skilled advisory team has produced excellent results
It’s always helpful to take a step back from the financial markets’ distractions and review an investment from a long-term perspective. In the case of Vanguard Inflation-Protected Securities Fund, a look back at the past ten years is gratifying.
As you can see in the table on page 5, the fund’s long-term returns have been in line with those of its benchmark, and have exceeded the average for its peer-group competitors. The fund’s strong performance is a credit to its advisor, Vanguard Fixed Income Group, which has developed deep expertise in portfolio construction and management.
Support also comes from the fund’s low expenses, a Vanguard hallmark that especially benefits investors over the long term. That is because every dollar saved in fund expenses is a dollar that can accrue to you.
TIPS can help investors cope with market and inflation risk
Inflation has often been labeled as an invisible thief, or a hidden tax, because it quietly robs you of purchasing power. As one component of a broadly diversified portfolio of stock and bond funds,
Vanguard Inflation-Protected Securities Fund can provide some defense against inflation risk. Your investment can also enhance diversification within the bond portion of your portfolio, because TIPS can behave differently than their conventional bond counterparts.
On another matter, I would like to welcome Gemma Wright-Casparius to Vanguard as co-manager, with John Hollyer, of the Inflation-Protected Securities Fund. She replaces Ken Volpert, who continues to head our taxable fixed income group. Gemma, who has extensive experience in the market for inflation-linked bonds, had managed a global inflation-linked bond portfolio and a U.S. Treasury bond-oriented portfolio for Singapore’s sovereign wealth fund.
As always, thank you for entrusting your assets to Vanguard.
Sincerely,

F. William McNabb III
Chairman and Chief Executive Officer
January 19, 2012
7
Advisor’s Report
For the year ended December 31, 2011, the Investor Shares of Vanguard Inflation-Protected Securities Fund returned 13.24%. Because of their lower expense ratios, the Admiral Shares returned 13.29% and the Institutional Shares 13.39%. The fund slightly underperformed its benchmark index (+13.56%), but substantially outpaced the average return of competing funds (+10.77%).
Steadily falling interest rates and rising inflation during the first nine months of the year helped produce the fund’s double-digit total return in 2011.
As you can see in the table below, the drop in yields of Treasury bonds took place across the board and was quite dramatic. Investors bid up Treasury prices for a
number of reasons, including worries about the slower-than-anticipated economic recovery and Europe’s seemingly never-ending sovereign-debt crisis. The Federal Reserve was a bidder, too, in its “Operation Twist” campaign of purchasing intermediate- and long-term Treasuries.
The other boost to the fund’s return came in rising income from its bond investments as their principal was adjusted upward by the Treasury in response to higher consumer prices. That is the mechanism by which Treasury Inflation-Protected Securities work to help investors preserve purchasing power. (In deflationary periods, the adjustment would reduce the principal, though never below the face amount of the bond if held to maturity.) Consumer
| Yields of U.S. Treasury Bonds | ||
| December 31, | December 31, | |
| Maturity | 2010 | 2011 |
| 2 years | 0.60% | 0.24% |
| 3 years | 0.99 | 0.36 |
| 5 years | 2.01 | 0.83 |
| 10 years | 3.30 | 1.88 |
| 30 years | 4.34 | 2.90 |
| Source: Vanguard. | ||
8
prices rose steadily in 2011 before declining in October and remaining flat in November and December.
Despite the late-year falloff in consumer price inflation, the possibility of longer-term inflation weighs on investors, as evidenced by the large cash flows into the fund during the year—some $2 billion from both individual investors and institutions. We were able to handle the increased flows efficiently.
Another sign of investors’ concern about inflation is the negative yields that buyers of newly auctioned TIPS have been willing to accept, something that is happening as we write this letter. This phenomenon occurs when investors pay particularly high premiums for TIPS bonds in the expectation that inflation will accelerate in the future, resulting in upward adjustments to the bonds’ principal and thus to the interest they pay. The buyer’s hope is that these adjustments will turn a bond with a negative yield into one that provides a positive long-term return. In the open market, already-issued TIPS with up to 10 years remaining to maturity have been trading at negative yields.
Fueling concern about future inflation, we suspect, are the swollen balance sheets of central banks in the United States and abroad. The Federal Reserve and its counterparts elsewhere have purchased huge amounts of bonds in order to inject money into their nations’ economies and thus, they hope, stimulate
economic growth. Many in the market fear that all this monetary liquidity could encourage a surge in inflation if the U.S. economy’s current pace of recovery from the Great Recession speeds up.
Looking ahead, and barring any negative macroeconomic event, we expect that the inflation rate will continue to moderate, reflecting a slowing global economy. The Federal Reserve, because of its concern about the slow pace of U.S. economic growth, may be contemplating additional easing measures.
Because we can’t know what the future holds, we engage in prudent planning for different interest rate and inflation scenarios. It is important for investors to keep in mind that the fund and its benchmark have relatively high sensitivity to interest rate movements.
A material increase in rates will produce a negative total return. A 1% increase in real yields—that is, yield reflecting expected inflation—would cause the fund’s price to decline by more than 8%. We are sensitive to the potential for inflation outcomes differing from our forecasts, and we are prudently pursuing strategies to help performance in either rising or falling inflation.
John Hollyer, CFA, Principal
Gemma Wright-Casparius, Principal
January 25, 2012
9
Inflation-Protected Securities Fund
Fund Profile
As of December 31, 2011
| Share-Class Characteristics | |||
| Investor | Admiral | Institutional | |
| Shares | Shares | Shares | |
| Ticker Symbol | VIPSX | VAIPX | VIPIX |
| Expense Ratio1 | 0.22% | 0.11% | 0.07% |
| 30-Day SEC Yield2 | -0.45% | -0.37% | -0.33% |
| Financial Attributes | |||
| Barclays | |||
| Inflation | Barclays | ||
| Protected | Aggregate | ||
| Securities | Bond | ||
| Fund | Index | Index | |
| Number of Bonds | 36 | 31 | 7,854 |
| Yield to Maturity | |||
| (before expenses) | 1.7% | 1.7% | 2.2% |
| Average Coupon | 1.7% | 1.7% | 4.0% |
| Average Duration | 8.4 years | 8.4 years | 5.0 years |
| Average Effective | |||
| Maturity | 9.4 years | 9.3 years | 7.1 years |
| Short-Term | |||
| Reserves | 0.7% | — | — |
| Sector Diversification (% of portfolio) | |||
| Treasury/Agency | 98.8% | ||
| Other | 1.2 | ||
The agency and mortgage-backed securities sectors may include issues from government-sponsored enterprises; such issues are not backed by the full faith and credit of the U.S. government.
| Volatility Measures | ||
| Barclays | ||
| Inflation | Barclays | |
| Protected | Aggregate | |
| Securities | Bond | |
| Index | Index | |
| R-Squared | 0.99 | 0.34 |
| Beta | 0.99 | 1.19 |
| These measures show the degree and timing of the fund’s fluctuations compared with the indexes over 36 months. | ||
| Distribution by Maturity (% of portfolio) | |
| Under 1 Year | 1.2% |
| 1 - 3 Years | 14.4 |
| 3 - 5 Years | 18.7 |
| 5 - 10 Years | 32.6 |
| 10 - 20 Years | 27.0 |
| 20 - 30 Years | 6.1 |
| Distribution by Credit Quality (% of portfolio) | |
| U.S. Government | 98.8% |
| Aaa | 1.2 |
| For information about these ratings, see the Glossary entry for Credit Quality. | |
Investment Focus
![]()
1 The expense ratios shown are from the prospectus dated April 26, 2011, and represent estimated costs for the current fiscal year. For the fiscal year ended December 31, 2011, the expense ratios were 0.20% for Investor Shares, 0.11% for Admiral Shares, and 0.07% for Institutional Shares.
2 Yields of inflation-protected securities tend to be lower than those of bonds, because the former do not incorporate market expectations about inflation. The principal amounts—and thus the interest payments—of inflation-protected securities are adjusted over time to reflect inflation.
10
Inflation-Protected Securities Fund
Performance Summary
All of the returns in this report represent past performance, which is not a guarantee of future results that may be achieved by the fund. (Current performance may be lower or higher than the performance data cited. For performance data current to the most recent month-end, visit our website at vanguard.com/performance.) Note, too, that both investment returns and principal value can fluctuate widely, so an investor’s shares, when sold, could be worth more or less than their original cost. The returns shown do not reflect taxes that a shareholder would pay on fund distributions or on the sale of fund shares.
Cumulative Performance: December 31, 2001, Through December 31, 2011
Initial Investment of $10,000
| Average Annual Total Returns | |||||
| Periods Ended December 31, 2011 | |||||
| Final Value | |||||
| One | Five | Ten | of a $10,000 | ||
| Year | Years | Years | Investment | ||
| Inflation-Protected Securities Fund | |||||
| Investor Shares | 13.24% | 7.63% | 7.33% | $20,289 | |
| •••••••• | Barclays Capital U.S. Aggregate Bond | ||||
| Index | 7.84 | 6.50 | 5.78 | 17,535 | |
| – – – – | Barclays Capital U.S. Treasury | ||||
| Inflation Protected Securities Index | 13.56 | 7.95 | 7.57 | 20,749 | |
| Treasury Inflation-Protected | |||||
| Securities Funds Average | 10.77 | 6.45 | 6.50 | 18,777 | |
| Treasury Inflation-Protected Securities Funds Average: Derived from data provided by Lipper Inc. | |||||
| Average Annual Total Returns | ||||
| Periods Ended December 31, 2011 | ||||
| Since | Final Value | |||
| One | Five | Inception | of a $50,000 | |
| Year | Years | (6/10/2005) | Investment | |
| Inflation-Protected Securities Fund Admiral | ||||
| Shares | 13.29% | 7.73% | 6.07% | $73,586 |
| Barclays Capital U.S. Aggregate Bond Index | 7.84 | 6.50 | 5.69 | 71,887 |
| Barclays Capital U.S. Treasury Inflation | ||||
| Protected Securities Index | 13.56 | 7.95 | 6.24 | 74,347 |
| "Since Inception" performance is calculated from the Admiral Shares’ inception date for both the fund and its comparative standards. | ||||
See Financial Highlights for dividend and capital gains information.
11
Inflation-Protected Securities Fund
| Since | Final Value | |||
| One | Five | Inception | of a $5,000,000 | |
| Year | Years | (12/12/2003) | Investment | |
| Inflation-Protected Securities Fund | ||||
| Institutional Shares | 13.39% | 7.79% | 6.19% | $8,106,815 |
| Barclays Capital U.S. Aggregate Bond Index | 7.84 | 6.50 | 5.44 | 7,660,352 |
| Barclays Capital U.S. Treasury Inflation | ||||
| Protected Securities Index | 13.56 | 7.95 | 6.32 | 8,189,783 |
| "Since Inception" performance is calculated from the Institutional Shares’ inception date for both the fund and its comparative standards. | ||||
Fiscal-Year Total Returns (%): December 31, 2001, Through December 31, 2011
| Barclays | ||||
| Inflation | ||||
| Protected | ||||
| Securities | ||||
| Investor Shares | Index | |||
| Fiscal Year | Income Returns | Capital Returns | Total Returns | Total Returns |
| 2002 | 4.55% | 12.06% | 16.61% | 16.57% |
| 2003 | 3.86 | 4.14 | 8.00 | 8.40 |
| 2004 | 4.79 | 3.48 | 8.27 | 8.46 |
| 2005 | 5.44 | -2.85 | 2.59 | 2.84 |
| 2006 | 3.40 | -2.97 | 0.43 | 0.41 |
| 2007 | 5.90 | 5.69 | 11.59 | 11.63 |
| 2008 | 4.62 | -7.47 | -2.85 | -2.35 |
| 2009 | 1.86 | 8.94 | 10.80 | 11.41 |
| 2010 | 2.58 | 3.59 | 6.17 | 6.31 |
| 2011 | 4.56 | 8.68 | 13.24 | 13.56 |
12
Inflation-Protected Securities Fund
Financial Statements
Statement of Net Assets
As of December 31, 2011
The fund reports a complete list of its holdings in regulatory filings four times in each fiscal year, at the quarter-ends. For the second and fourth fiscal quarters, the lists appear in the fund’s semiannual and annual reports to shareholders. For the first and third fiscal quarters, the fund files the lists with the Securities and Exchange Commission on Form N-Q. Shareholders can look up the fund’s Forms N-Q on the SEC’s website at sec.gov. Forms N-Q may also be reviewed and copied at the SEC’s Public Reference Room (see the back cover of this report for further information).
| Face | Market | ||||
| Maturity | Amount | Value | |||
| Coupon | Date | ($000) | ($000) | ||
| U.S. Government and Agency Obligations (98.5%) | |||||
| U.S. Government Securities (98.5%) | |||||
| 1 | United States Treasury Inflation Indexed Bonds | 0.625% | 4/15/13 | 495,000 | 539,210 |
| United States Treasury Inflation Indexed Bonds | 1.875% | 7/15/13 | 976,875 | 1,259,424 | |
| United States Treasury Inflation Indexed Bonds | 2.000% | 1/15/14 | 1,370,000 | 1,777,933 | |
| United States Treasury Inflation Indexed Bonds | 1.250% | 4/15/14 | 1,002,000 | 1,123,616 | |
| United States Treasury Inflation Indexed Bonds | 2.000% | 7/15/14 | 772,845 | 1,000,280 | |
| United States Treasury Inflation Indexed Bonds | 1.625% | 1/15/15 | 847,215 | 1,083,733 | |
| United States Treasury Inflation Indexed Bonds | 0.500% | 4/15/15 | 1,504,600 | 1,645,199 | |
| United States Treasury Inflation Indexed Bonds | 1.875% | 7/15/15 | 671,725 | 862,443 | |
| United States Treasury Inflation Indexed Bonds | 2.000% | 1/15/16 | 546,750 | 697,408 | |
| United States Treasury Inflation Indexed Bonds | 0.125% | 4/15/16 | 2,280,000 | 2,439,276 | |
| United States Treasury Inflation Indexed Bonds | 2.500% | 7/15/16 | 378,425 | 490,899 | |
| United States Treasury Inflation Indexed Bonds | 2.375% | 1/15/17 | 700,525 | 912,860 | |
| United States Treasury Inflation Indexed Bonds | 2.625% | 7/15/17 | 1,324,025 | 1,721,733 | |
| United States Treasury Inflation Indexed Bonds | 1.625% | 1/15/18 | 905,600 | 1,114,723 | |
| United States Treasury Inflation Indexed Bonds | 1.375% | 7/15/18 | 936,500 | 1,113,311 | |
| United States Treasury Inflation Indexed Bonds | 2.125% | 1/15/19 | 561,850 | 704,265 | |
| United States Treasury Inflation Indexed Bonds | 1.875% | 7/15/19 | 833,750 | 1,041,624 | |
| United States Treasury Inflation Indexed Bonds | 1.375% | 1/15/20 | 985,000 | 1,174,124 | |
| United States Treasury Inflation Indexed Bonds | 1.250% | 7/15/20 | 914,100 | 1,073,446 | |
| United States Treasury Inflation Indexed Bonds | 1.125% | 1/15/21 | 1,920,000 | 2,215,538 | |
| United States Treasury Inflation Indexed Bonds | 0.625% | 7/15/21 | 1,499,000 | 1,609,892 | |
| United States Treasury Inflation Indexed Bonds | 2.375% | 1/15/25 | 1,213,770 | 1,852,538 | |
| United States Treasury Inflation Indexed Bonds | 2.000% | 1/15/26 | 1,141,698 | 1,599,758 | |
| United States Treasury Inflation Indexed Bonds | 2.375% | 1/15/27 | 1,157,389 | 1,677,330 | |
| United States Treasury Inflation Indexed Bonds | 1.750% | 1/15/28 | 882,125 | 1,145,710 | |
| United States Treasury Inflation Indexed Bonds | 3.625% | 4/15/28 | 683,890 | 1,422,463 | |
| United States Treasury Inflation Indexed Bonds | 2.500% | 1/15/29 | 607,700 | 854,369 | |
| United States Treasury Inflation Indexed Bonds | 3.875% | 4/15/29 | 924,200 | 1,981,959 | |
| United States Treasury Inflation Indexed Bonds | 3.375% | 4/15/32 | 28,500 | 55,992 | |
| United States Treasury Inflation Indexed Bonds | 2.125% | 2/15/40 | 621,630 | 872,505 | |
| United States Treasury Inflation Indexed Bonds | 2.125% | 2/15/41 | 1,052,500 | 1,467,725 | |
| Total U.S. Government and Agency Obligations (Cost $33,966,920) | 38,531,286 | ||||
| Shares | |||||
| Temporary Cash Investment (0.7%) | |||||
| Money Market Fund (0.7%) | |||||
| 2 | Vanguard Market Liquidity Fund | ||||
| (Cost $274,166) | 0.110% | 274,165,700 | 274,166 | ||
| Total Investments (99.2%) (Cost $34,241,086) | 38,805,452 | ||||
13
Inflation-Protected Securities Fund
| Market | |
| Value | |
| ($000) | |
| Other Assets and Liabilities (0.8%) | |
| Other Assets | 408,181 |
| Liabilities | (93,720) |
| 314,461 | |
| Net Assets (100%) | 39,119,913 |
| At December 31, 2011, net assets consisted of: | |
| Amount | |
| ($000) | |
| Paid-in Capital | 34,692,522 |
| Overdistributed Net Investment Income | (24,811) |
| Accumulated Net Realized Losses | (111,406) |
| Unrealized Appreciation (Depreciation) | |
| Investment Securities | 4,564,366 |
| Futures Contracts | (758) |
| Net Assets | 39,119,913 |
| Investor Shares—Net Assets | |
| Applicable to 1,078,764,087 outstanding $.001 par value shares of | |
| beneficial interest (unlimited authorization) | 15,220,153 |
| Net Asset Value Per Share—Investor Shares | $14.11 |
| Admiral Shares—Net Assets | |
| Applicable to 488,360,227 outstanding $.001 par value shares of | |
| beneficial interest (unlimited authorization) | 13,532,863 |
| Net Asset Value Per Share—Admiral Shares | $27.71 |
| Institutional Shares—Net Assets | |
| Applicable to 918,434,670 outstanding $.001 par value shares of | |
| beneficial interest (unlimited authorization) | 10,366,897 |
| Net Asset Value Per Share—Institutional Shares | $11.29 |
See Note A in Notes to Financial Statements.
1 Securities with a value of $9,406,000 have been segregated as initial margin for open futures contracts.
2 Affiliated money market fund available only to Vanguard funds and certain trusts and accounts managed by Vanguard. Rate shown is the
7-day yield.
See accompanying Notes, which are an integral part of the Financial Statements.
14
Inflation-Protected Securities Fund
Statement of Operations
| Year Ended | |
| December 31, 2011 | |
| ($000) | |
| Investment Income | |
| Income | |
| Interest1 | 1,563,120 |
| Total Income | 1,563,120 |
| Expenses | |
| The Vanguard Group—Note B | |
| Investment Advisory Services | 4,246 |
| Management and Administrative—Investor Shares | 22,171 |
| Management and Administrative—Admiral Shares | 8,731 |
| Management and Administrative—Institutional Shares | 2,664 |
| Marketing and Distribution—Investor Shares | 4,045 |
| Marketing and Distribution—Admiral Shares | 3,235 |
| Marketing and Distribution—Institutional Shares | 2,469 |
| Custodian Fees | 175 |
| Auditing Fees | 34 |
| Shareholders’ Reports—Investor Shares | 270 |
| Shareholders’ Reports—Admiral Shares | 41 |
| Shareholders’ Reports—Institutional Shares | 24 |
| Trustees’ Fees and Expenses | 34 |
| Total Expenses | 48,139 |
| Net Investment Income | 1,514,981 |
| Realized Net Gain (Loss) | |
| Investment Securities Sold | 375,403 |
| Futures Contracts | (95,664) |
| Realized Net Gain (Loss) | 279,739 |
| Change in Unrealized Appreciation (Depreciation) | |
| Investment Securities | 2,607,113 |
| Futures Contracts | 99 |
| Change in Unrealized Appreciation (Depreciation) | 2,607,212 |
| Net Increase (Decrease) in Net Assets Resulting from Operations | 4,401,932 |
| 1 Interest income from an affiliated company of the fund was $773,000. | |
See accompanying Notes, which are an integral part of the Financial Statements.
15
Inflation-Protected Securities Fund
Statement of Changes in Net Assets
| Year Ended December 31, | ||
| 2011 | 2010 | |
| ($000) | ($000) | |
| Increase (Decrease) in Net Assets | ||
| Operations | ||
| Net Investment Income | 1,514,981 | 790,583 |
| Realized Net Gain (Loss) | 279,739 | 139,190 |
| Change in Unrealized Appreciation (Depreciation) | 2,607,212 | 927,194 |
| Net Increase (Decrease) in Net Assets Resulting from Operations | 4,401,932 | 1,856,967 |
| Distributions | ||
| Net Investment Income | ||
| Investor Shares | (589,272) | (329,789) |
| Admiral Shares | (529,978) | (270,301) |
| Institutional Shares | (395,423) | (190,768) |
| Realized Capital Gain | ||
| Investor Shares | (19,064) | — |
| Admiral Shares | (16,843) | — |
| Institutional Shares | (12,623) | — |
| Total Distributions | (1,563,203) | (790,858) |
| Capital Share Transactions | ||
| Investor Shares | 1,101,680 | (520,155) |
| Admiral Shares | 1,106,980 | 2,438,664 |
| Institutional Shares | 1,933,200 | 1,555,333 |
| Net Increase (Decrease) from Capital Share Transactions | 4,141,860 | 3,473,842 |
| Total Increase (Decrease) | 6,980,589 | 4,539,951 |
| Net Assets | ||
| Beginning of Period | 32,139,324 | 27,599,373 |
| End of Period1 | 39,119,913 | 32,139,324 |
| 1 Net Assets—End of Period includes undistributed (overdistributed) net investment income of ($24,811,000) and ($25,119,000). | ||
See accompanying Notes, which are an integral part of the Financial Statements.
16
Inflation-Protected Securities Fund
Financial Highlights
| Investor Shares | ||||||
| Feb. 1, | Year | |||||
| 2007, to | Ended | |||||
| For a Share Outstanding | Year Ended December 31, | Dec. 31, | Jan. 31, | |||
| Throughout Each Period | 2011 | 2010 | 2009 | 2008 | 20071 | 2007 |
| Net Asset Value, Beginning of Period | $13.00 | $12.55 | $11.52 | $12.45 | $11.80 | $12.18 |
| Investment Operations | ||||||
| Net Investment Income | .568 | .319 | .210 | .614 | .651 | .483 |
| Net Realized and Unrealized Gain (Loss) | ||||||
| on Investments | 1.127 | .448 | 1.034 | (.930) | .646 | (.437) |
| Total from Investment Operations | 1.695 | .767 | 1.244 | (.316) | 1.297 | .046 |
| Distributions | ||||||
| Dividends from Net Investment Income | (.567) | (.317) | (.214) | (.614) | (.647) | (.407) |
| Distributions from Realized Capital Gains | (.018) | — | — | — | — | — |
| Return of Capital | — | — | — | — | — | (.019) |
| Total Distributions | (.585) | (.317) | (.214) | (.614) | (.647) | (.426) |
| Net Asset Value, End of Period | $14.11 | $13.00 | $12.55 | $11.52 | $12.45 | $11.80 |
| Total Return2 | 13.24% | 6.17% | 10.80% | -2.85% | 11.40% | 0.43% |
| Ratios/Supplemental Data | ||||||
| Net Assets, End of Period (Millions) | $15,220 | $12,979 | $12,946 | $8,593 | $6,662 | $5,361 |
| Ratio of Total Expenses to | ||||||
| Average Net Assets | 0.20% | 0.22% | 0.25% | 0.20% | 0.20%3 | 0.20% |
| Ratio of Net Investment Income to | ||||||
| Average Net Assets | 4.21% | 2.48% | 2.00% | 5.02% | 5.92%3 | 3.87% |
| Portfolio Turnover Rate | 28% | 29% | 14% | 28% | 21% | 53% |
1 The fund’s fiscal year-end changed from January 31 to December 31, effective December 31, 2007.
2 Total returns do not include account service fees that may have applied in the periods shown. Fund prospectuses provide information about
any applicable account service fees.
3 Annualized.
See accompanying Notes, which are an integral part of the Financial Statements.
17
Inflation-Protected Securities Fund
Financial Highlights
| Admiral Shares | ||||||
| Feb. 1, | Year | |||||
| 2007, to | Ended | |||||
| For a Share Outstanding | Year Ended December 31, | Dec. 31, | Jan. 31, | |||
| Throughout Each Period | 2011 | 2010 | 2009 | 2008 | 20071 | 2007 |
| Net Asset Value, Beginning of Period | $25.54 | $24.65 | $22.62 | $24.45 | $23.17 | $23.91 |
| Investment Operations | ||||||
| Net Investment Income | 1.140 | .654 | .441 | 1.226 | 1.299 | .971 |
| Net Realized and Unrealized Gain (Loss) | ||||||
| on Investments | 2.202 | .888 | 2.037 | (1.829) | 1.278 | (.858) |
| Total from Investment Operations | 3.342 | 1.542 | 2.478 | (.603) | 2.577 | .113 |
| Distributions | ||||||
| Dividends from Net Investment Income | (1.137) | (.652) | (.448) | (1.227) | (1.297) | (.815) |
| Distributions from Realized Capital Gains | (.035) | — | — | — | — | — |
| Return of Capital | — | — | — | — | — | (.038) |
| Total Distributions | (1.172) | (.652) | (.448) | (1.227) | (1.297) | (.853) |
| Net Asset Value, End of Period | $27.71 | $25.54 | $24.65 | $22.62 | $24.45 | $23.17 |
| Total Return | 13.29% | 6.31% | 10.96% | -2.78% | 11.54% | 0.53% |
| Ratios/Supplemental Data | ||||||
| Net Assets, End of Period (Millions) | $13,533 | $11,440 | $8,723 | $4,726 | $3,487 | $2,523 |
| Ratio of Total Expenses to | ||||||
| Average Net Assets | 0.11% | 0.11% | 0.12% | 0.11% | 0.11%2 | 0.11% |
| Ratio of Net Investment Income to | ||||||
| Average Net Assets | 4.30% | 2.59% | 2.13% | 5.11% | 6.01%2 | 3.96% |
| Portfolio Turnover Rate | 28% | 29% | 14% | 28% | 21% | 53% |
| 1 The fund’s fiscal year-end changed from January 31 to December 31, effective December 31, 2007. | ||||||
| 2 Annualized. | ||||||
See accompanying Notes, which are an integral part of the Financial Statements.
18
Inflation-Protected Securities Fund
Financial Highlights
| Institutional Shares | ||||||
| Feb. 1, | Year | |||||
| 2007, to | Ended | |||||
| For a Share Outstanding | Year Ended December 31, | Dec. 31, | Jan. 31, | |||
| Throughout Each Period | 2011 | 2010 | 2009 | 2008 | 20071 | 2007 |
| Net Asset Value, Beginning of Period | $10.40 | $10.04 | $9.21 | $9.96 | $9.44 | $9.74 |
| Investment Operations | ||||||
| Net Investment Income | .468 | .271 | .181 | .502 | .532 | .398 |
| Net Realized and Unrealized Gain (Loss) | ||||||
| on Investments | .903 | .359 | .834 | (.751) | .521 | (.348) |
| Total from Investment Operations | 1.371 | .630 | 1.015 | (.249) | 1.053 | .050 |
| Distributions | ||||||
| Dividends from Net Investment Income | (.467) | (.270) | (.185) | (.501) | (.533) | (.335) |
| Distributions from Realized Capital Gains | (.014) | — | — | — | — | — |
| Return of Capital | — | — | — | — | — | (.015) |
| Total Distributions | (.481) | (.270) | (.185) | (.501) | (.533) | (.350) |
| Net Asset Value, End of Period | $11.29 | $10.40 | $10.04 | $9.21 | $9.96 | $9.44 |
| Total Return | 13.39% | 6.33% | 11.03% | -2.81% | 11.58% | 0.57% |
| Ratios/Supplemental Data | ||||||
| Net Assets, End of Period (Millions) | $10,367 | $7,720 | $5,931 | $3,250 | $2,248 | $1,673 |
| Ratio of Total Expenses to | ||||||
| Average Net Assets | 0.07% | 0.07% | 0.09% | 0.08% | 0.08%2 | 0.08% |
| Ratio of Net Investment Income to | ||||||
| Average Net Assets | 4.34% | 2.63% | 2.16% | 5.14% | 6.04%2 | 3.99% |
| Portfolio Turnover Rate | 28% | 29% | 14% | 28% | 21% | 53% |
| 1 The fund’s fiscal year-end changed from January 31 to December 31, effective December 31, 2007. | ||||||
| 2 Annualized. | ||||||
See accompanying Notes, which are an integral part of the Financial Statements.
19
Inflation-Protected Securities Fund
Notes to Financial Statements
Vanguard Inflation-Protected Securities Fund is registered under the Investment Company Act of 1940 as an open-end investment company, or mutual fund. The fund offers three classes of shares: Investor Shares, Admiral Shares, and Institutional Shares. Investor Shares are available to any investor who meets the fund’s minimum purchase requirements. Admiral Shares and Institutional Shares are designed for investors who meet certain administrative, service, and account-size criteria.
A. The following significant accounting policies conform to generally accepted accounting principles for U.S. mutual funds. The fund consistently follows such policies in preparing its financial statements.
1. Security Valuation: Bonds, and temporary cash investments acquired over 60 days to maturity, are valued using the latest bid prices or using valuations based on a matrix system (which considers such factors as security prices, yields, maturities, and ratings), both as furnished by independent pricing services. Investments in Vanguard Market Liquidity Fund are valued at that fund’s net asset value. Other temporary cash investments are valued at amortized cost, which approximates market value. Securities for which market quotations are not readily available, or whose values have been affected by events occurring before the fund’s pricing time but after the close of the securities’ primary markets, are valued by methods deemed by the board of trustees to represent fair value.
2. Futures Contracts: The fund uses futures contracts to invest in fixed income asset classes with greater efficiency and lower cost than is possible through direct investment, to add value when these instruments are attractively priced, or to adjust sensitivity to changes in interest rates. The primary risks associated with the use of futures contracts are imperfect correlation between changes in market values of bonds held by the fund and the prices of futures contracts, and the possibility of an illiquid market.
Futures contracts are valued based upon their quoted daily settlement prices. The aggregate principal amounts of the contracts are not recorded in the Statement of Net Assets. Fluctuations in the value of the contracts are recorded in the Statement of Net Assets as an asset (liability) and in the Statement of Operations as unrealized appreciation (depreciation) until the contracts are closed, when they are recorded as realized futures gains (losses).
3. Federal Income Taxes: The fund intends to continue to qualify as a regulated investment company and distribute all of its taxable income. Management has analyzed the fund’s tax positions taken for all open federal income tax years (December 31, 2008–2011), and has concluded that no provision for federal income tax is required in the fund’s financial statements.
4. Distributions: Distributions to shareholders are recorded on the ex-dividend date.
5. Other: Interest income includes income distributions received from Vanguard Market Liquidity Fund and is accrued daily. Premiums and discounts on debt securities purchased are amortized and accreted, respectively, to interest income over the lives of the respective securities. Inflation adjustments to the face amount of inflation-indexed securities are included in interest income. Security transactions are accounted for on the date securities are bought or sold. Costs used to determine realized gains (losses) on the sale of investment securities are those of the specific securities sold.
Each class of shares has equal rights as to assets and earnings, except that each class separately bears certain class-specific expenses related to maintenance of shareholder accounts (included in Management and Administrative expenses) and shareholder reporting. Marketing and distribution expenses are allocated to each class of shares based on a method approved by the board of trustees. Income, other non-class-specific expenses, and gains and losses on investments are allocated to each class of shares based on its relative net assets.
20
Inflation-Protected Securities Fund
B. The Vanguard Group furnishes at cost investment advisory, corporate management, administrative, marketing, and distribution services. The costs of such services are allocated to the fund under methods approved by the board of trustees. The fund has committed to provide up to 0.40% of its net assets in capital contributions to Vanguard. At December 31, 2011, the fund had contributed capital of $6,289,000 to Vanguard (included in Other Assets), representing 0.02% of the fund’s net assets and 2.52% of Vanguard’s capitalization. The fund’s trustees and officers are also directors and officers of Vanguard.
C. Various inputs may be used to determine the value of the fund’s investments. These inputs are summarized in three broad levels for financial statement purposes. The inputs or methodologies used to value securities are not necessarily an indication of the risk associated with investing in those securities.
Level 1—Quoted prices in active markets for identical securities.
Level 2—Other significant observable inputs (including quoted prices for similar securities, interest rates, prepayment speeds, credit risk, etc.).
Level 3—Significant unobservable inputs (including the fund’s own assumptions used to determine the fair value of investments).
The following table summarizes the market value of the fund’s investments as of December 31, 2011, based on the inputs used to value them:
| Level 1 | Level 2 | Level 3 | |
| Investments | ($000) | ($000) | ($000) |
| U.S. Government and Agency Obligations | — | 38,531,286 | — |
| Temporary Cash Investments | 274,166 | — | — |
| Futures Contracts—Assets1 | 796 | — | — |
| Futures Contracts—Liabilities1 | (1,197) | — | — |
| Total | 273,765 | 38,531,286 | — |
| 1 Represents variation margin on the last day of the reporting period. | |||
D. At December 31, 2011, the aggregate settlement value of open futures contracts and the related unrealized appreciation (depreciation) were:
| ($000) | ||||
| Aggregate | ||||
| Number of | Settlement | Unrealized | ||
| Long (Short) | Value | Appreciation | ||
| Futures Contracts | Expiration | Contracts | Long (Short) | (Depreciation) |
| 5-Year U.S. Treasury Note | March 2012 | (7,534) | (928,624) | (1,126) |
| 10-Year U.S. Treasury Note | March 2012 | 325 | 42,616 | 248 |
| Ultra Long U.S. Treasury Bond | March 2012 | 50 | 8,009 | 75 |
| 30-Year U.S. Treasury Bond | March 2012 | 45 | 6,517 | 45 |
Unrealized appreciation (depreciation) on open futures contracts is required to be treated as realized gain (loss) for tax purposes.
21
Inflation-Protected Securities Fund
E. Distributions are determined on a tax basis and may differ from net investment income and realized capital gains for financial reporting purposes. Differences may be permanent or temporary. Permanent differences are reclassified among capital accounts in the financial statements to reflect their tax character. Temporary differences arise when certain items of income, expense, gain, or loss are recognized in different periods for financial statement and tax purposes; these differences will reverse at some time in the future. Differences in classification may also result from the treatment of short-term gains as ordinary income for tax purposes.
Certain of the fund’s U.S. Treasury Inflation-Indexed securities experienced deflation adjustments that reduced interest income and the cost of investments for financial statement purposes by an amount greater than the reduction of taxable income; the additional income reduction will be deferred for tax purposes until it is used to offset future inflation adjustments that increase taxable income. The difference becomes permanent if the securities are sold. Deferred inflation adjustments to securities held at December 31, 2011, totaling $1,266,000 are reflected as a reduction of the amount of tax-basis unrealized appreciation of investment securities.
The fund used a tax accounting practice to treat a portion of the price of capital shares redeemed during the year as distributions from realized capital gains. Accordingly, the fund has reclassified $60,176,000 from accumulated net realized losses to paid-in capital.
The fund used a capital loss carryforward of $193,625,000 to offset taxable capital gains realized during the year ended December 31, 2011, reducing the amount of capital gains that would otherwise be available to distribute to shareholders. For tax purposes, at December 31, 2011, the fund had $11,268,000 of ordinary income available for distribution. Capital gains required to be distributed in December 2011 included net gains realized through October 31, 2011. Subsequently, the fund realized losses of $6,258,000 during the period from November 1, 2011, through December 31, 2011, which are deferred and will be treated as realized for tax purposes in fiscal 2012.
The fund had realized losses totaling $105,724,000 through December 31, 2011, which are deferred for tax purposes and reduce the amount of tax-basis unrealized appreciation on investment securities.
At December 31, 2011, the cost of investment securities for tax purposes was $34,348,259,000. Net unrealized appreciation of investment securities for tax purposes was $4,457,193,000, consisting of unrealized gains of $4,457,376,000 on securities that had risen in value since their purchase and $183,000 in unrealized losses on securities that had fallen in value since their purchase.
F. During the year ended December 31, 2011, the fund purchased $13,552,241,000 of investment securities and sold $9,759,328,000 of investment securities, other than temporary cash investments.
22
Inflation-Protected Securities Fund
| G. Capital share transactions for each class of shares were: | ||||
| Year Ended December 31, | ||||
| 2011 | 2010 | |||
| Amount | Shares | Amount | Shares | |
| ($000) | (000) | ($000) | (000) | |
| Investor Shares | ||||
| Issued | 4,985,772 | 364,254 | 5,006,041 | 387,720 |
| Issued in Lieu of Cash Distributions | 558,901 | 40,703 | 301,721 | 23,521 |
| Redeemed | (4,442,993) | (324,301) | (5,827,917) | (444,595) |
| Net Increase (Decrease)—Investor Shares | 1,101,680 | 80,656 | (520,155) | (33,354) |
| Admiral Shares | ||||
| Issued | 4,044,902 | 150,180 | 5,110,172 | 198,605 |
| Issued in Lieu of Cash Distributions | 490,179 | 18,179 | 242,729 | 9,631 |
| Redeemed | (3,428,101) | (127,939) | (2,914,237) | (114,168) |
| Net Increase (Decrease)—Admiral Shares | 1,106,980 | 40,420 | 2,438,664 | 94,068 |
| Institutional Shares | ||||
| Issued | 3,972,147 | 360,928 | 2,738,008 | 264,447 |
| Issued in Lieu of Cash Distributions | 385,233 | 35,047 | 179,127 | 17,446 |
| Redeemed | (2,424,180) | (219,693) | (1,361,802) | (130,385) |
| Net Increase (Decrease)—Institutional Shares | 1,933,200 | 176,282 | 1,555,333 | 151,508 |
H. In preparing the financial statements as of December 31, 2011, management considered the impact of subsequent events for potential recognition or disclosure in these financial statements.
23
Report of Independent Registered
Public Accounting Firm
To the Trustees of Vanguard Bond Index Funds and the Shareholders of Vanguard Inflation-Protected Securities Fund:
In our opinion, the accompanying statement of net assets and the related statements of operations and of changes in net assets and the financial highlights present fairly, in all material respects, the financial position of Vanguard Inflation-Protected Securities Fund (constituting a separate portfolio of Vanguard Bond Index Funds, hereafter referred to as the “Fund”) at December 31, 2011, and the results of its operations for the year then ended, the changes in its net assets for each of the two years in the period then ended and the financial highlights for each of the periods indicated, in conformity with accounting principles generally accepted in the United States of America. These financial statements and financial highlights (hereafter referred to as “financial statements”) are the responsibility of the Fund’s management; our responsibility is to express an opinion on these financial statements based on our audits. We conducted our audits of these financial statements in accordance with the standards of the Public Company Accounting Oversight Board (United States). Those standards require that we plan and perform the audit to obtain reasonable assurance about whether the financial statements are free of material misstatement. An audit includes examining, on a test basis, evidence supporting the amounts and disclosures in the financial statements, assessing the accounting principles used and significant estimates made by management, and evaluating the overall financial statement presentation. We believe that our audits, which included confirmation of securities at December 31, 2011 by correspondence with the custodian and broker and by agreement to the underlying ownership records of Vanguard Market Liquidity Fund, provide a reasonable basis for our opinion.
PricewaterhouseCoopers LLP
Philadelphia, Pennsylvania
February 15, 2012

This information for the fiscal year ended December 31, 2011, is included pursuant to provisions of the
Internal Revenue Code.
The fund distributed $108,707,000 as capital gain dividends (from net long-term capital gains) to
shareholders during the fiscal year.
For nonresident alien shareholders, 100% of income dividends are interest-related dividends.
24
About Your Fund’s Expenses
As a shareholder of the fund, you incur ongoing costs, which include costs for portfolio management, administrative services, and shareholder reports (like this one), among others. Operating expenses, which are deducted from a fund’s gross income, directly reduce the investment return of the fund.
A fund’s expenses are expressed as a percentage of its average net assets. This figure is known as the expense ratio. The following examples are intended to help you understand the ongoing costs (in dollars) of investing in your fund and to compare these costs with those of other mutual funds. The examples are based on an investment of $1,000 made at the beginning of the period shown and held for the entire period.
The accompanying table illustrates your fund’s costs in two ways:
• Based on actual fund return. This section helps you to estimate the actual expenses that you paid over the period. The ”Ending Account Value“ shown is derived from the fund‘s actual return, and the third column shows the dollar amount that would have been paid by an investor who started with $1,000 in the fund. You may use the information here, together with the amount you invested, to estimate the expenses that you paid over the period.
To do so, simply divide your account value by $1,000 (for example, an $8,600 account value divided by $1,000 = 8.6), then multiply the result by the number given for your fund under the heading ”Expenses Paid During Period.“
• Based on hypothetical 5% yearly return. This section is intended to help you compare your fund‘s costs with those of other mutual funds. It assumes that the fund had a yearly return of 5% before expenses, but that the expense ratio is unchanged. In this case—because the return used is not the fund’s actual return—the results do not apply to your investment. The example is useful in making comparisons because the Securities and Exchange Commission requires all mutual funds to calculate expenses based on a 5% return. You can assess your fund’s costs by comparing this hypothetical example with the hypothetical examples that appear in shareholder reports of other funds.
Note that the expenses shown in the table are meant to highlight and help you compare ongoing costs only and do not reflect transaction costs incurred by the fund for buying and selling securities. Further, the expenses do not include any purchase, redemption, or account service fees described in the fund prospectus. If such fees were applied to your account, your costs would be higher. Your fund does not carry a “sales load.”
The calculations assume no shares were bought or sold during the period. Your actual costs may have been higher or lower, depending on the amount of your investment and the timing of any purchases or redemptions.
You can find more information about the fund’s expenses, including annual expense ratios, in the Financial Statements section of this report. For additional information on operating expenses and other shareholder costs, please refer to your fund’s current prospectus.
25
| Six Months Ended December 31, 2011 | |||
| Beginning | Ending | Expenses | |
| Account Value | Account Value | Paid During | |
| Inflation-Protected Securities Fund | 6/30/2011 | 12/31/2011 | Period |
| Based on Actual Fund Return | |||
| Investor Shares | $1,000.00 | $1,075.24 | $0.94 |
| Admiral Shares | 1,000.00 | 1,075.77 | 0.58 |
| Institutional Shares | 1,000.00 | 1,076.44 | 0.37 |
| Based on Hypothetical 5% Yearly Return | |||
| Investor Shares | $1,000.00 | $1,024.30 | $0.92 |
| Admiral Shares | 1,000.00 | 1,024.65 | 0.56 |
| Institutional Shares | 1,000.00 | 1,024.85 | 0.36 |
The calculations are based on expenses incurred in the most recent six-month period. The fund’s annualized six-month expense ratios for that
period are 0.18% for Investor Shares, 0.11% for Admiral Shares, and 0.07% for Institutional Shares. The dollar amounts shown as “Expenses
Paid” are equal to the annualized expense ratio multiplied by the average account value over the period, multiplied by the number of days in
the most recent six-month period, then divided by the number of days in the most recent 12-month period.
26
Glossary
30-Day SEC Yield. A fund’s 30-day SEC yield is derived using a formula specified by the U.S. Securities and Exchange Commission. Under the formula, data related to the fund’s security holdings in the previous 30 days are used to calculate the fund’s hypothetical net income for that period, which is then annualized and divided by the fund’s estimated average net assets over the calculation period. For the purposes of this calculation, a security’s income is based on its current market yield to maturity (for bonds), its actual income (for asset-backed securities), or its projected dividend yield (for stocks). Because the SEC yield represents hypothetical annualized income, it will differ—at times significantly—from the fund’s actual experience. As a result, the fund’s income distributions may be higher or lower than implied by the SEC yield.
Average Coupon. The average interest rate paid on the fixed income securities held by a fund. It is expressed as a percentage of face value.
Average Duration. An estimate of how much the value of the fund’s bonds will fluctuate in response to a change in “real” interest rates—meaning rates without inflation expectations built in. Real interest rates are reflected in market yields for inflation-adjusted securities. To see how the fund’s bond values could change, multiply the average duration by the change in real rates. For example, if the average duration were five years, then the value of the fund’s bonds would decline by about 5% if real interest rates rose by 1 percentage point. Conversely, if real rates fell by a percentage point, the value of the bonds would rise about 5%.
Average Effective Maturity. The average length of time until fixed income securities held by a fund reach maturity and are repaid, taking into consideration the possibility that the issuer may call the bond before its maturity date. The figure reflects the proportion of fund assets represented by each security; it also reflects any futures contracts held. In general, the longer the average effective maturity, the more a fund’s share price will fluctuate in response to changes in market interest rates.
Beta. A measure of the magnitude of a fund’s past share-price fluctuations in relation to the ups and downs of a given market index. The index is assigned a beta of 1.00. Compared with a given index, a fund with a beta of 1.20 typically would have seen its share price rise or fall by 12% when the index rose or fell by 10%. For this report, beta is based on returns over the past 36 months for both the fund and the index. Note that a fund’s beta should be reviewed in conjunction with its R-squared (see definition). The lower the R-squared, the less correlation there is between the fund and the index, and the less reliable beta is as an indicator of volatility.
Credit Quality. Credit-quality ratings are measured on a scale that generally ranges from AAA (highest) to D (lowest). “Not Rated” is used to classify securities for which a rating is not available. U.S. Treasury, U.S. Agency, and U.S. Agency mortgage-backed securities appear under “U.S. Government.” For this report, credit-quality ratings are obtained from Moody’s and S&P, and the higher rating for each issue is used.
Expense Ratio. A fund’s total annual operating expenses expressed as a percentage of the fund’s average net assets. The expense ratio includes management and administrative expenses, but does not include the transaction costs of buying and selling portfolio securities.
27
Inception Date. The date on which the assets of a fund (or one of its share classes) are first invested in accordance with the fund’s investment objective. For funds with a subscription period, the inception date is the day after that period ends. Investment performance is measured from the inception date.
R-Squared. A measure of how much of a fund’s past returns can be explained by the returns from the market in general, as measured by a given index. If a fund’s total returns were precisely synchronized with an index’s returns, its R-squared would be 1.00. If the fund’s returns bore no relationship to the index’s returns, its R-squared would be 0. For this report, R-squared is based on returns over the past 36 months for both the fund and the index.
Short-Term Reserves. The percentage of a fund invested in highly liquid, short-term securities that can be readily converted to cash.
Yield to Maturity. This term generally refers to the rate of return an investor would receive if the fixed income securities held by a fund were held to their maturity dates. For the Inflation-Protected Securities Fund, the calculation is modified by adding in the inflation adjustment made over the past 12 months. This change results in a figure more directly comparable to the yield-to-maturity figures for other types of bond funds. (An unmodified yield to maturity is used in calculating the fund’s 30-Day SEC Yield.)
28
This page intentionally left blank.
This page intentionally left blank.
This page intentionally left blank.
The People Who Govern Your Fund
The trustees of your mutual fund are there to see that the fund is operated and managed in your best interests since, as a shareholder, you are a part owner of the fund. Your fund’s trustees also serve on the board of directors of The Vanguard Group, Inc., which is owned by the Vanguard funds and provides services to them on an at-cost basis.
A majority of Vanguard’s board members are independent, meaning that they have no affiliation with Vanguard or the funds they oversee, apart from the sizable personal investments they have made as private individuals. The independent board members have distinguished backgrounds in business, academia, and public service. Each of the trustees and executive officers oversees 180 Vanguard funds.
The following table provides information for each trustee and executive officer of the fund. More information about the trustees is in the Statement of Additional Information, which can be obtained, without charge, by contacting Vanguard at 800-662-7447, or online at vanguard.com.
| Interested Trustee1 | and President (2006–2008) of Rohm and Haas Co. |
| (chemicals); Director of Tyco International, Ltd. | |
| F. William McNabb III | (diversified manufacturing and services) and Hewlett- |
| Born 1957. Trustee Since July 2009. Chairman of the | Packard Co. (electronic computer manufacturing); |
| Board. Principal Occupation(s) During the Past Five | Senior Advisor at New Mountain Capital; Trustee |
| Years: Chairman of the Board of The Vanguard Group, | of The Conference Board; Member of the Board of |
| Inc., and of each of the investment companies served | Managers of Delphi Automotive LLP (automotive |
| by The Vanguard Group, since January 2010; Director | components). |
| of The Vanguard Group since 2008; Chief Executive | |
| Officer and President of The Vanguard Group and of | Amy Gutmann |
| each of the investment companies served by The | Born 1949. Trustee Since June 2006. Principal |
| Vanguard Group since 2008; Director of Vanguard | Occupation(s) During the Past Five Years: President |
| Marketing Corporation; Managing Director of The | of the University of Pennsylvania; Christopher H. |
| Vanguard Group (1995–2008). | Browne Distinguished Professor of Political Science |
| in the School of Arts and Sciences with secondary | |
| appointments at the Annenberg School for Commu- | |
| Independent Trustees | nication and the Graduate School of Education |
| of the University of Pennsylvania; Director of | |
| Emerson U. Fullwood | Carnegie Corporation of New York, Schuylkill River |
| Born 1948. Trustee Since January 2008. Principal | Development Corporation, and Greater Philadelphia |
| Occupation(s) During the Past Five Years: Executive | Chamber of Commerce; Trustee of the National |
| Chief Staff and Marketing Officer for North America | Constitution Center; Chair of the Presidential |
| and Corporate Vice President (retired 2008) of Xerox | Commission for the Study of Bioethical Issues. |
| Corporation (document management products and | |
| services); Executive in Residence and 2010 | JoAnn Heffernan Heisen |
| Distinguished Minett Professor at the Rochester | Born 1950. Trustee Since July 1998. Principal |
| Institute of Technology; Director of SPX Corporation | Occupation(s) During the Past Five Years: Corporate |
| (multi-industry manufacturing), the United Way of | Vice President and Chief Global Diversity Officer |
| Rochester, Amerigroup Corporation (managed health | (retired 2008) and Member of the Executive |
| care), the University of Rochester Medical Center, | Committee (1997–2008) of Johnson & Johnson |
| Monroe Community College Foundation, and North | (pharmaceuticals/consumer products); Director of |
| Carolina A&T University. | Skytop Lodge Corporation (hotels), the University |
| Medical Center at Princeton, the Robert Wood | |
| Rajiv L. Gupta | Johnson Foundation, and the Center for Work Life |
| Born 1945. Trustee Since December 2001.2 | Policy; Member of the Advisory Board of the |
| Principal Occupation(s) During the Past Five Years: | Maxwell School of Citizenship and Public Affairs |
| Chairman and Chief Executive Officer (retired 2009) | at Syracuse University. |
| F. Joseph Loughrey | Thomas J. Higgins | |
| Born 1949. Trustee Since October 2009. Principal | Born 1957. Chief Financial Officer Since September | |
| Occupation(s) During the Past Five Years: President | 2008. Principal Occupation(s) During the Past Five | |
| and Chief Operating Officer (retired 2009) and Vice | Years: Principal of The Vanguard Group, Inc.; Chief | |
| Chairman of the Board (2008–2009) of Cummins Inc. | Financial Officer of each of the investment companies | |
| (industrial machinery); Director of SKF AB (industrial | served by The Vanguard Group since 2008; Treasurer | |
| machinery), Hillenbrand, Inc. (specialized consumer | of each of the investment companies served by The | |
| services), the Lumina Foundation for Education, and | Vanguard Group (1998–2008). | |
| Oxfam America; Chairman of the Advisory Council | ||
| for the College of Arts and Letters and Member | Kathryn J. Hyatt | |
| of the Advisory Board to the Kellogg Institute for | Born 1955. Treasurer Since November 2008. Principal | |
| International Studies at the University of Notre Dame. | Occupation(s) During the Past Five Years: Principal | |
| of The Vanguard Group, Inc.; Treasurer of each of | ||
| André F. Perold | the investment companies served by The Vanguard | |
| Born 1952. Trustee Since December 2004. Principal | Group since 2008; Assistant Treasurer of each of the | |
| Occupation(s) During the Past Five Years: George | investment companies served by The Vanguard Group | |
| Gund Professor of Finance and Banking at the Harvard | (1988–2008). | |
| Business School (retired July 2011); Chief Investment | ||
| Officer and co-Managing Partner of HighVista | Heidi Stam | |
| Strategies LLC (private investment firm); Director of | Born 1956. Secretary Since July 2005. Principal | |
| Rand Merchant Bank; Overseer of the Museum of | Occupation(s) During the Past Five Years: Managing | |
| Fine Arts Boston. | Director of The Vanguard Group, Inc., since 2006; | |
| General Counsel of The Vanguard Group since 2005; | ||
| Alfred M. Rankin, Jr. | Secretary of The Vanguard Group and of each of the | |
| Born 1941. Trustee Since January 1993. Principal | investment companies served by The Vanguard Group | |
| Occupation(s) During the Past Five Years: Chairman, | since 2005; Director and Senior Vice President of | |
| President, and Chief Executive Officer of NACCO | Vanguard Marketing Corporation since 2005; | |
| Industries, Inc. (forklift trucks/housewares/lignite); | Principal of The Vanguard Group (1997–2006). | |
| Director of Goodrich Corporation (industrial products/ | ||
| aircraft systems and services) and the National | ||
| Association of Manufacturers; Chairman of the | Vanguard Senior Management Team | |
| Federal Reserve Bank of Cleveland; Vice Chairman | ||
| of University Hospitals of Cleveland; President of | R. Gregory Barton | Chris D. McIsaac |
| the Board of The Cleveland Museum of Art. | Mortimer J. Buckley | Michael S. Miller |
| Kathleen C. Gubanich | James M. Norris | |
| Peter F. Volanakis | Paul A. Heller | Glenn W. Reed |
| Born 1955. Trustee Since July 2009. Principal | Martha G. King | George U. Sauter |
| Occupation(s) During the Past Five Years: President | ||
| and Chief Operating Officer (retired 2010) of Corning | ||
| Incorporated (communications equipment); Director of | Chairman Emeritus and Senior Advisor | |
| Corning Incorporated (2000–2010) and Dow Corning | ||
| (2001–2010); Overseer of the Amos Tuck School of | John J. Brennan | |
| Business Administration at Dartmouth College. | Chairman, 1996–2009 | |
| Chief Executive Officer and President, 1996–2008 | ||
| Executive Officers | ||
| Founder | ||
| Glenn Booraem | ||
| Born 1967. Controller Since July 2010. Principal | John C. Bogle | |
| Occupation(s) During the Past Five Years: Principal | Chairman and Chief Executive Officer, 1974–1996 | |
| of The Vanguard Group, Inc.; Controller of each of | ||
| the investment companies served by The Vanguard | ||
| Group since 2010; Assistant Controller of each of | ||
| the investment companies served by The Vanguard | ||
| Group (2001–2010). | ||
1 Mr. McNabb is considered an “interested person,” as defined in the Investment Company Act of 1940, because he is an officer of the
Vanguard funds.
2 December 2002 for Vanguard Equity Income Fund, Vanguard Growth Equity Fund, the Vanguard Municipal Bond Funds, and the Vanguard
State Tax-Exempt Funds.

| P.O. Box 2600 | |
| Valley Forge, PA 19482-2600 | |
| Connect with Vanguard® > vanguard.com | |
| Fund Information > 800-662-7447 | CFA® is a trademark owned by CFA Institute. |
| Direct Investor Account Services > 800-662-2739 | |
| Institutional Investor Services > 800-523-1036 | |
| Text Telephone for People | |
| With Hearing Impairment > 800-749-7273 | |
| This material may be used in conjunction | |
| with the offering of shares of any Vanguard | |
| fund only if preceded or accompanied by | |
| the fund’s current prospectus. | |
| All comparative mutual fund data are from Lipper Inc. or | |
| Morningstar, Inc., unless otherwise noted. | |
| You can obtain a free copy of Vanguard’s proxy voting | |
| guidelines by visiting vanguard.com/proxyreporting or by | |
| calling Vanguard at 800-662-2739. The guidelines are | |
| also available from the SEC’s website, sec.gov. In | |
| addition, you may obtain a free report on how your fund | |
| voted the proxies for securities it owned during the 12 | |
| months ended June 30. To get the report, visit either | |
| vanguard.com/proxyreporting or sec.gov. | |
| You can review and copy information about your fund at | |
| the SEC’s Public Reference Room in Washington, D.C. To | |
| find out more about this public service, call the SEC at | |
| 202-551-8090. Information about your fund is also | |
| available on the SEC’s website, and you can receive | |
| copies of this information, for a fee, by sending a | |
| request in either of two ways: via e-mail addressed to | |
| publicinfo@sec.gov or via regular mail addressed to the | |
| Public Reference Section, Securities and Exchange | |
| Commission, Washington, DC 20549-1520. | |
| © 2012 The Vanguard Group, Inc. | |
| All rights reserved. | |
| Vanguard Marketing Corporation, Distributor. | |
| Q1190 022012 | |
Annual Report | December 31, 2011
Vanguard Total Bond Market II Index Fund
> For 2011, Vanguard Total Bond Market II Index Fund returned 7.59% for Investor
Shares and 7.67% for Institutional Shares.
> All sectors of the broad investment-grade U.S. bond market posted positive
returns for the fiscal year.
> With short-term interest rates anchored near zero, the best performances came
from longer-term maturities.
| Contents | |
| Your Fund’s Total Returns. | 1 |
| Chairman’s Letter. | 2 |
| Fund Profile. | 7 |
| Performance Summary. | 8 |
| Financial Statements. | 10 |
| About Your Fund’s Expenses. | 101 |
| Glossary. | 103 |
Please note: The opinions expressed in this report are just that—informed opinions. They should not be considered promises or advice.
Also, please keep in mind that the information and opinions cover the period through the date on the front of this report. Of course, the
risks of investing in your fund are spelled out in the prospectus.
See the Glossary for definitions of investment terms used in this report.
About the cover: Vanguard was named for the HMS Vanguard, flagship of British Admiral Horatio Nelson. A ship—whose
performance and safety depend on the work of all hands—has served as a fitting metaphor for the Vanguard crew as we
strive to help clients reach their financial goals.
Your Fund’s Total Returns
| Fiscal Year Ended December 31, 2011 | ||||
| 30-Day SEC | Income | Capital | Total | |
| Yields | Returns | Returns | Returns | |
| Vanguard Total Bond Market II Index Fund | ||||
| Investor Shares | 2.14% | 3.11% | 4.48% | 7.59% |
| Institutional Shares | 2.22 | 3.19 | 4.48 | 7.67 |
| Barclays Capital U.S. Aggregate Float Adjusted | ||||
| Index | 7.92 | |||
| Intermediate Investment-Grade Debt Funds | ||||
| Average | 6.09 | |||
| Intermediate Investment-Grade Debt Funds Average: Derived from data provided by Lipper Inc. | ||||
| Institutional Shares are designed for eligible institutional investors who meet specific administrative, service, and account-size criteria. | ||||
| Your Fund’s Performance at a Glance | ||||
| December 31, 2010 , Through December 31, 2011 | ||||
| Distributions Per Share | ||||
| Starting | Ending | Income | Capital | |
| Share Price | Share Price | Dividends | Gains | |
| Vanguard Total Bond Market II Index Fund | ||||
| Investor Shares | $10.50 | $10.87 | $0.315 | $0.100 |
| Institutional Shares | 10.50 | 10.87 | 0.322 | 0.100 |
1

Chairman’s Letter
Dear Shareholder,
Safety and a search for higher yields were key themes for the bond market in 2011. Periods of extreme volatility in stocks during the year benefited the fixed income market in general and U.S. Treasuries in particular, given their “risk-free” status. Within the fixed income arena, the Federal Reserve’s efforts to stimulate the economy by keeping short-term interest rates near zero encouraged investors seeking higher yields to turn toward bonds with longer maturities.
In this environment, the fund did well as it was primarily invested in Treasuries, U.S. government agency bonds, and investment-grade corporate bonds. The fund’s Investor Shares returned 7.59% and Institutional Shares returned 7.67% for the year, more than a full percentage point ahead of the average return of peer funds. A large part of the fund’s outperformance among longer maturities came from capital returns.
While the fund’s return was roughly in line with that of its target index, small deviations—whether positive or negative—may occur given the fund’s sampling approach to approximate the index as well as temporary pricing differences between the fund and its index.
2
As demand drove bond prices higher during the year, the fund’s yield fell (bond prices move inversely to yields). The 30-day SEC yield of the fund’s Investor Shares on December 31 was 2.14%, down from 2.60% a year ago.
Big dramas and small numbers in the U.S. stock market
The broad U.S. stock market finished 2011 with a modestly positive return, a result that seems surprisingly low-key in light of the economic and political dramas that monopolized investors’ attention for much of the year.
Stock prices rallied and retreated as early optimism about the global economic outlook traded places with anxiety about Europe’s debt crisis and the contentious negotiations in Washington over raising the U.S. debt ceiling to avoid default. The policymaking strife prompted Standard & Poor’s to downgrade the U.S. credit rating. (Vanguard’s confidence in the full faith and credit of the U.S. Treasury remains unshaken.) By year-end, stock prices were again on the rise, with investors refocused on signs of economic improvement.
| Market Barometer | |||
| Average Annual Total Returns | |||
| Periods Ended December 31, 2011 | |||
| One | Three | Five | |
| Year | Years | Years | |
| Bonds | |||
| Barclays Capital U.S. Aggregate Bond Index (Broad | |||
| taxable market) | 7.84% | 6.77% | 6.50% |
| Barclays Capital Municipal Bond Index (Broad tax-exempt | |||
| market) | 10.70 | 8.57 | 5.22 |
| Citigroup Three-Month U.S. Treasury Bill Index | 0.08 | 0.11 | 1.36 |
| Stocks | |||
| Russell 1000 Index (Large-caps) | 1.50% | 14.81% | -0.02% |
| Russell 2000 Index (Small-caps) | -4.18 | 15.63 | 0.15 |
| Dow Jones U.S. Total Stock Market Index | 0.52 | 15.24 | 0.28 |
| MSCI All Country World Index ex USA (International) | -13.71 | 10.70 | -2.92 |
| CPI | |||
| Consumer Price Index | 2.96% | 2.39% | 2.26% |
3
International stock prices finished the year with a double-digit decline. The weaker performance of stocks outside the United States reflected the greater economic and financial challenges in Europe, Japan’s struggles with natural and nuclear disaster, and skittishness about emerging markets.
As yields fell, bonds delivered unexpectedly strong returns
Bond returns were also a surprise, mainly because so little was expected of them. At the end of 2010, bond yields hovered near historical lows, suggesting that the scope for further declines—and rallies in bond prices—was limited. During 2011, however, rates moved lower still as investors sought shelter from stock market
turmoil. The broad U.S. bond market returned 7.84%. Municipal bonds, which were battered at the end of 2010, produced even stronger returns than taxable bonds in 2011.
The returns of the 3-month U.S. Treasury bill and other money market instruments approached 0%, which was consistent with the Federal Reserve Board’s interest rate policy but nevertheless a disappointment for savers.
The sweet spot in 2011: long-term Treasuries and top-rated corporates
In 2011, the widening and deepening of the debt crisis in Europe coupled with political gridlock in the United States over
| Expense Ratios | |||
| Your Fund Compared With Its Peer Group | |||
| Investor | Institutional | Peer Group | |
| Shares | Shares | Average | |
| Total Bond Market II Index Fund | 0.12% | 0.07% | 0.91% |
The fund expense ratios shown are from the prospectus dated April 26, 2011, and represent estimated costs for the current fiscal year. For the
fiscal year ended December 31, 2011, the fund’s expense ratios were 0.12% for Investor Shares and 0.05% for Institutional Shares. The
peer-group expense ratio is derived from data provided by Lipper Inc. and captures information through year-end 2010.
Peer group: Intermediate Investment-Grade Debt Funds.
4
the deficit, taxes, and spending led anxious investors to turn to U.S. Treasuries for safety. Demand surged, driving prices up and yields down, even as Standard & Poor’s downgraded the rating of U.S. long-term government debt to AA+ in August.
The shortest end of the Treasury yield curve had little room to move, given that rates were already near zero, but the yield of the 10-year benchmark fell by more than a full percentage point, to 1.88%, and yields at the long end fell by an even greater amount, to 2.90%. For the year as a whole, Treasuries returned almost 10%. This was a major contributor to the performance of the fund, which, like its benchmark, had a sizable stake (about 35% of assets) in Treasuries. The fund holds approximately another 35% of assets in U.S. government agency and government mortgage-backed securities, which are also considered very low risk.
Corporate bonds weren’t far behind, returning a little over 8% in 2011. The difference between their yields and those of comparable Treasuries decreased in the first four months of the year as the economic recovery in the United States seemed to be gaining traction (a narrowing spread indicates that investors are
becoming more comfortable with this grade of bonds). However, the political and economic impasses I’ve already mentioned led to the spread ending the year significantly wider than where it began. Here, too, however, investors were willing to pay for quality, with bonds rated A or higher outperforming their lower-rated counterparts.
In terms of maturity, the significant flattening of the yield curve put the performance of longer-term bonds well out in front. Long-term Treasury returns were almost 30%, while their corporate counterparts came in at more than 17%.
A short but solid track record
We launched Vanguard Total Bond Market II Index Fund near the beginning of 2009 as an investment vehicle for use only as an underlying fund in “funds of funds” sponsored by Vanguard—such as the Vanguard Target Retirement Funds—and those managed by other providers. Since its launch, the fund has returned an annualized 6.93% for Investor Shares, meeting its primary objective of closely tracking the return of its broad, market-weighted benchmark, the Spliced Barclays Capital U.S. Aggregate Float Adjusted Index (which incurs no expenses).
5
Stick to a diversified strategy in good markets and in bad
While bond performances have been very strong of late, especially for Treasuries, it’s important to note that the decline in yields to such low levels means that the opportunity for similarly strong returns is limited in the short term. That said, we continue to believe that bonds are a crucial component of a well-balanced portfolio, and that they will continue to play their role as a diversifier for the riskier assets in a fund-of-funds portfolio, such as stock funds, even once interest rates begin to rise.
Thank you for entrusting your assets to Vanguard.
Sincerely,
F. William McNabb III
Chairman and Chief Executive Officer
January 24, 2012
6
Total Bond Market II Index Fund
Fund Profile
As of December 31, 2011
| Share-Class Characteristics | ||
| Investor | Institutional | |
| Shares | Shares | |
| Ticker Symbol | VTBIX | VTBNX |
| Expense Ratio1 | 0.12% | 0.07% |
| 30-Day SEC Yield | 2.14% | 2.22% |
| Financial Attributes | ||
| Barclays | ||
| Aggregate | ||
| Float Adj | ||
| Fund | Index | |
| Number of Bonds | 4,609 | 7,854 |
| Yield to Maturity | ||
| (before expenses) | 2.2% | 2.2% |
| Average Coupon | 4.0% | 4.0% |
| Average Duration | 5.1 years | 5.1 years |
| Average Effective | ||
| Maturity | 7.2 years | 7.3 years |
| Short-Term | ||
| Reserves | 0.4% | — |
| Sector Diversification (% of portfolio) | |
| Asset-Backed | 0.2% |
| Commercial Mortgage-Backed | 2.2 |
| Finance | 7.0 |
| Foreign | 4.5 |
| Government Mortgage-Backed | 26.9 |
| Industrial | 11.6 |
| Treasury/Agency | 43.3 |
| Utilities | 2.4 |
| Other | 1.9 |
The agency and mortgage-backed securities sectors may include issues from government-sponsored enterprises; such issues are not
backed by the full faith and credit of the U.S. government.
| Distribution by Maturity (% of portfolio) | |
| Under 1 Year | 3.0% |
| 1 - 3 Years | 26.6 |
| 3 - 5 Years | 24.6 |
| 5 - 10 Years | 31.8 |
| 10 - 20 Years | 3.9 |
| 20 - 30 Years | 9.8 |
| Over 30 Years | 0.3 |
| Distribution by Credit Quality (% of portfolio) | |
| U.S. Government | 70.1% |
| Aaa | 3.8 |
| Aa | 5.2 |
| A | 11.2 |
| Baa | 9.6 |
| Less Than Baa | 0.1 |
| For information about these ratings, see the Glossary entry for Credit Quality. | |
Investment Focus

1 The expense ratios shown are from the prospectus dated April 26, 2011, and represent estimated costs for the current fiscal year. For the
fiscal year ended December 31, 2011, the expense ratios were 0.12% for Investor Shares and 0.05% for Institutional Shares.
7
Total Bond Market II Index Fund
Performance Summary
All of the returns in this report represent past performance, which is not a guarantee of future results that may be achieved by the fund. (Current performance may be lower or higher than the performance data cited. For performance data current to the most recent month-end, visit our website at vanguard.com/performance.) Note, too, that both investment returns and principal value can fluctuate widely, so an investor’s shares, when sold, could be worth more or less than their original cost. The returns shown do not reflect taxes that a shareholder would pay on fund distributions or on the sale of fund shares.
Cumulative Performance: January 26, 2009, Through December 31, 2011
Initial Investment of $10,000

| Average Annual Total Returns | ||||
| Periods Ended December 31, 2011 | ||||
| Since | Final Value | |||
| One | Inception | of a $10,000 | ||
| Year | (1/26/2009) | Investment | ||
| Total Bond Market II Index Fund | ||||
| Investor Shares | 7.59% | 6.93% | $12,169 | |
| – – – – | Spliced Barclays Capital U.S. | |||
| Aggregate Float Adjusted Index | 7.92 | 7.14 | 12,237 | |
| Intermediate Investment-Grade Debt | ||||
| Funds Average | 6.09 | 8.89 | 12,833 | |
Spliced Barclays Capital U.S. Aggregate Float Adjusted Index: Barclays Capital U.S. Aggregate Bond Index through December 31, 2009;
Barclays Capital U.S. Aggregate Float Adjusted Index thereafter.
Intermediate Investment-Grade Debt Funds Average: Derived from data provided by Lipper Inc.
"Since Inception" performance is calculated from the Investor Shares’ inception date for both the fund and its comparative standards.
| Since | Final Value | ||
| One | Inception | of a $5,000,000 | |
| Year | (2/17/2009) | Investment | |
| Total Bond Market II Index Fund Institutional | |||
| Shares | 7.67% | 6.94% | $6,060,684 |
| Spliced Barclays Capital U.S. Aggregate Float | |||
| Adjusted Index | 7.92 | 7.12 | 6,090,866 |
| "Since Inception" performance is calculated from the Institutional Shares’ inception date for both the fund and its comparative standard. | |||
See Financial Highlights for dividend and capital gains information.
8
Total Bond Market II Index Fund
Fiscal-Year Total Returns (%): January 26, 2009, Through December 31, 2011
| Spliced | ||||
| Barclays | ||||
| Aggregate | ||||
| Investor Shares | FA Index | |||
| Fiscal Year | Income Returns | Capital Returns | Total Returns | Total Returns |
| 2009 | 3.68% | 2.60% | 6.28% | 6.39% |
| 2010 | 3.42 | 3.00 | 6.42 | 6.58 |
| 2011 | 3.11 | 4.48 | 7.59 | 7.92 |
| Spliced Barclays Capital U.S. Aggregate Float Adjusted Index: Barclays Capital U.S. Aggregate Bond Index through December 31, 2009; | ||||
| Barclays Capital U.S. Aggregate Float Adjusted Index thereafter. | ||||
9
Total Bond Market II Index Fund
Financial Statements
Statement of Net Assets
As of December 31, 2011
The fund reports a complete list of its holdings in regulatory filings four times in each fiscal year, at the quarter-ends. For the second and fourth fiscal quarters, the lists appear in the fund’s semiannual and annual reports to shareholders. For the first and third fiscal quarters, the fund files the lists with the Securities and Exchange Commission on Form N-Q. Shareholders can look up the fund’s Forms N-Q on the SEC’s website at sec.gov. Forms N-Q may also be reviewed and copied at the SEC’s Public Reference Room (see the back cover of this report for further information).
| Face | Market | |||
| Maturity | Amount | Value | ||
| Coupon | Date | ($000) | ($000) | |
| U.S. Government and Agency Obligations (70.9%) | ||||
| U.S. Government Securities (38.6%) | ||||
| United States Treasury Note/Bond | 4.000% | 11/15/12 | 270,475 | 279,476 |
| United States Treasury Note/Bond | 0.500% | 11/30/12 | 91,000 | 91,298 |
| United States Treasury Note/Bond | 3.375% | 11/30/12 | 72,020 | 74,124 |
| United States Treasury Note/Bond | 1.125% | 12/15/12 | 22,835 | 23,046 |
| United States Treasury Note/Bond | 0.625% | 12/31/12 | 138,870 | 139,499 |
| United States Treasury Note/Bond | 1.375% | 1/15/13 | 99,000 | 100,222 |
| United States Treasury Note/Bond | 3.875% | 2/15/13 | 136,075 | 141,666 |
| United States Treasury Note/Bond | 0.625% | 2/28/13 | 27,425 | 27,566 |
| United States Treasury Note/Bond | 2.750% | 2/28/13 | 90,700 | 93,378 |
| United States Treasury Note/Bond | 1.375% | 3/15/13 | 11,600 | 11,765 |
| United States Treasury Note/Bond | 0.750% | 3/31/13 | 110,255 | 111,014 |
| United States Treasury Note/Bond | 1.750% | 4/15/13 | 83,500 | 85,157 |
| United States Treasury Note/Bond | 0.625% | 4/30/13 | 253,575 | 255,003 |
| United States Treasury Note/Bond | 1.375% | 5/15/13 | 247,200 | 251,101 |
| United States Treasury Note/Bond | 0.500% | 5/31/13 | 9,095 | 9,132 |
| United States Treasury Note/Bond | 3.500% | 5/31/13 | 16,300 | 17,049 |
| United States Treasury Note/Bond | 1.125% | 6/15/13 | 44,850 | 45,432 |
| United States Treasury Note/Bond | 0.375% | 6/30/13 | 61,905 | 62,050 |
| United States Treasury Note/Bond | 3.375% | 6/30/13 | 31,200 | 32,658 |
| United States Treasury Note/Bond | 0.375% | 7/31/13 | 70,865 | 71,031 |
| United States Treasury Note/Bond | 3.375% | 7/31/13 | 4,225 | 4,433 |
| United States Treasury Note/Bond | 0.750% | 8/15/13 | 219,625 | 221,479 |
| United States Treasury Note/Bond | 4.250% | 8/15/13 | 26,325 | 28,032 |
| United States Treasury Note/Bond | 3.125% | 8/31/13 | 97,550 | 102,214 |
| United States Treasury Note/Bond | 0.750% | 9/15/13 | 147,400 | 148,666 |
| United States Treasury Note/Bond | 0.125% | 9/30/13 | 210,558 | 210,164 |
| United States Treasury Note/Bond | 3.125% | 9/30/13 | 39,225 | 41,193 |
| United States Treasury Note/Bond | 0.500% | 10/15/13 | 47,475 | 47,690 |
| United States Treasury Note/Bond | 0.250% | 10/31/13 | 17,995 | 17,998 |
| United States Treasury Note/Bond | 4.250% | 11/15/13 | 10,800 | 11,602 |
| United States Treasury Note/Bond | 0.250% | 11/30/13 | 175,000 | 175,054 |
| United States Treasury Note/Bond | 2.000% | 11/30/13 | 28,250 | 29,186 |
| United States Treasury Note/Bond | 0.750% | 12/15/13 | 7,525 | 7,599 |
| United States Treasury Note/Bond | 1.500% | 12/31/13 | 13,735 | 14,076 |
| United States Treasury Note/Bond | 1.000% | 1/15/14 | 2,550 | 2,588 |
| United States Treasury Note/Bond | 1.750% | 1/31/14 | 12,550 | 12,934 |
| United States Treasury Note/Bond | 1.250% | 2/15/14 | 73,700 | 75,220 |
10
| Total Bond Market II Index Fund | ||||
| Face | Market | |||
| Maturity | Amount | Value | ||
| Coupon | Date | ($000) | ($000) | |
| United States Treasury Note/Bond | 1.875% | 2/28/14 | 141,375 | 146,190 |
| United States Treasury Note/Bond | 1.250% | 3/15/14 | 138,635 | 141,581 |
| United States Treasury Note/Bond | 1.750% | 3/31/14 | 51,950 | 53,654 |
| United States Treasury Note/Bond | 1.250% | 4/15/14 | 428,660 | 438,039 |
| United States Treasury Note/Bond | 1.875% | 4/30/14 | 514,625 | 533,362 |
| United States Treasury Note/Bond | 1.000% | 5/15/14 | 161,990 | 164,648 |
| United States Treasury Note/Bond | 4.750% | 5/15/14 | 95,050 | 104,986 |
| United States Treasury Note/Bond | 2.250% | 5/31/14 | 89,650 | 93,782 |
| United States Treasury Note/Bond | 0.750% | 6/15/14 | 291,300 | 294,440 |
| United States Treasury Note/Bond | 2.625% | 6/30/14 | 109,150 | 115,358 |
| United States Treasury Note/Bond | 0.625% | 7/15/14 | 325,625 | 328,119 |
| United States Treasury Note/Bond | 2.625% | 7/31/14 | 107,125 | 113,436 |
| United States Treasury Note/Bond | 0.500% | 8/15/14 | 226,600 | 227,697 |
| United States Treasury Note/Bond | 4.250% | 8/15/14 | 94,225 | 103,825 |
| United States Treasury Note/Bond | 2.375% | 8/31/14 | 59,200 | 62,373 |
| United States Treasury Note/Bond | 0.250% | 9/15/14 | 40,935 | 40,845 |
| United States Treasury Note/Bond | 2.375% | 9/30/14 | 27,450 | 28,968 |
| United States Treasury Note/Bond | 0.500% | 10/15/14 | 724,509 | 727,566 |
| United States Treasury Note/Bond | 2.375% | 10/31/14 | 150,550 | 159,043 |
| United States Treasury Note/Bond | 0.375% | 11/15/14 | 298,225 | 298,458 |
| United States Treasury Note/Bond | 2.125% | 11/30/14 | 126,450 | 132,832 |
| United States Treasury Note/Bond | 0.250% | 12/15/14 | 495,000 | 493,456 |
| United States Treasury Note/Bond | 2.625% | 12/31/14 | 262,025 | 279,465 |
| United States Treasury Note/Bond | 2.250% | 1/31/15 | 58,275 | 61,562 |
| United States Treasury Note/Bond | 4.000% | 2/15/15 | 36,370 | 40,394 |
| United States Treasury Note/Bond | 11.250% | 2/15/15 | 168,700 | 225,135 |
| United States Treasury Note/Bond | 2.375% | 2/28/15 | 1,000 | 1,061 |
| United States Treasury Note/Bond | 4.125% | 5/15/15 | 100,075 | 112,256 |
| United States Treasury Note/Bond | 2.125% | 5/31/15 | 925 | 977 |
| United States Treasury Note/Bond | 1.875% | 6/30/15 | 21,250 | 22,269 |
| United States Treasury Note/Bond | 10.625% | 8/15/15 | 1,775 | 2,418 |
| United States Treasury Note/Bond | 1.250% | 10/31/15 | 1,685 | 1,728 |
| United States Treasury Note/Bond | 4.500% | 11/15/15 | 3,125 | 3,593 |
| United States Treasury Note/Bond | 9.875% | 11/15/15 | 69,875 | 94,757 |
| United States Treasury Note/Bond | 1.375% | 11/30/15 | 425 | 438 |
| United States Treasury Note/Bond | 2.000% | 1/31/16 | 2,115 | 2,232 |
| United States Treasury Note/Bond | 4.500% | 2/15/16 | 33,200 | 38,393 |
| United States Treasury Note/Bond | 9.250% | 2/15/16 | 2,000 | 2,701 |
| United States Treasury Note/Bond | 2.125% | 2/29/16 | 9,406 | 9,984 |
| United States Treasury Note/Bond | 2.375% | 3/31/16 | 6,800 | 7,283 |
| United States Treasury Note/Bond | 2.000% | 4/30/16 | 25 | 26 |
| United States Treasury Note/Bond | 7.250% | 5/15/16 | 3,075 | 3,945 |
| United States Treasury Note/Bond | 1.750% | 5/31/16 | 1,425 | 1,490 |
| United States Treasury Note/Bond | 3.250% | 5/31/16 | 3,050 | 3,385 |
| United States Treasury Note/Bond | 1.500% | 6/30/16 | 30,350 | 31,389 |
| United States Treasury Note/Bond | 4.875% | 8/15/16 | 625 | 741 |
| United States Treasury Note/Bond | 1.000% | 8/31/16 | 1,200 | 1,213 |
| United States Treasury Note/Bond | 3.000% | 8/31/16 | 84,375 | 92,958 |
| United States Treasury Note/Bond | 1.000% | 9/30/16 | 114,380 | 115,596 |
| United States Treasury Note/Bond | 3.000% | 9/30/16 | 72,150 | 79,557 |
| United States Treasury Note/Bond | 1.000% | 10/31/16 | 38,440 | 38,818 |
| United States Treasury Note/Bond | 3.125% | 10/31/16 | 315,950 | 350,458 |
| United States Treasury Note/Bond | 4.625% | 11/15/16 | 59,750 | 70,570 |
| United States Treasury Note/Bond | 0.875% | 11/30/16 | 229,490 | 230,243 |
| United States Treasury Note/Bond | 2.750% | 11/30/16 | 249,165 | 272,058 |
11
| Total Bond Market II Index Fund | ||||
| Face | Market | |||
| Maturity | Amount | Value | ||
| Coupon | Date | ($000) | ($000) | |
| United States Treasury Note/Bond | 3.250% | 12/31/16 | 395,775 | 441,970 |
| United States Treasury Note/Bond | 3.125% | 1/31/17 | 217,675 | 242,028 |
| United States Treasury Note/Bond | 4.625% | 2/15/17 | 33,425 | 39,666 |
| United States Treasury Note/Bond | 3.000% | 2/28/17 | 56,675 | 62,688 |
| United States Treasury Note/Bond | 3.250% | 3/31/17 | 115,650 | 129,509 |
| United States Treasury Note/Bond | 3.125% | 4/30/17 | 337,350 | 375,778 |
| United States Treasury Note/Bond | 4.500% | 5/15/17 | 4,850 | 5,753 |
| United States Treasury Note/Bond | 8.750% | 5/15/17 | 35,864 | 50,557 |
| United States Treasury Note/Bond | 2.750% | 5/31/17 | 209,000 | 228,757 |
| United States Treasury Note/Bond | 2.500% | 6/30/17 | 64,625 | 69,906 |
| United States Treasury Note/Bond | 2.375% | 7/31/17 | 145,425 | 156,355 |
| United States Treasury Note/Bond | 8.875% | 8/15/17 | 41,325 | 59,166 |
| United States Treasury Note/Bond | 1.875% | 8/31/17 | 87,600 | 91,720 |
| United States Treasury Note/Bond | 1.875% | 9/30/17 | 389,675 | 407,514 |
| United States Treasury Note/Bond | 4.250% | 11/15/17 | 3,865 | 4,566 |
| United States Treasury Note/Bond | 2.625% | 1/31/18 | 2,575 | 2,806 |
| United States Treasury Note/Bond | 2.625% | 4/30/18 | 4,225 | 4,601 |
| United States Treasury Note/Bond | 3.875% | 5/15/18 | 100,000 | 116,656 |
| United States Treasury Note/Bond | 9.125% | 5/15/18 | 1,625 | 2,425 |
| United States Treasury Note/Bond | 2.375% | 5/31/18 | 34,500 | 37,007 |
| United States Treasury Note/Bond | 2.375% | 6/30/18 | 112,475 | 120,542 |
| United States Treasury Note/Bond | 4.000% | 8/15/18 | 104,300 | 122,830 |
| United States Treasury Note/Bond | 1.500% | 8/31/18 | 94,750 | 96,142 |
| United States Treasury Note/Bond | 1.375% | 9/30/18 | 242,365 | 243,691 |
| United States Treasury Note/Bond | 1.750% | 10/31/18 | 227,205 | 233,844 |
| United States Treasury Note/Bond | 3.750% | 11/15/18 | 202,750 | 235,855 |
| United States Treasury Note/Bond | 1.375% | 11/30/18 | 75,000 | 75,258 |
| United States Treasury Note/Bond | 1.375% | 12/31/18 | 145,000 | 145,273 |
| United States Treasury Note/Bond | 3.125% | 5/15/19 | 5,650 | 6,334 |
| United States Treasury Note/Bond | 3.625% | 8/15/19 | 172,675 | 199,952 |
| United States Treasury Note/Bond | 8.125% | 8/15/19 | 13,700 | 20,377 |
| United States Treasury Note/Bond | 3.375% | 11/15/19 | 365,313 | 416,398 |
| United States Treasury Note/Bond | 3.625% | 2/15/20 | 26,240 | 30,426 |
| United States Treasury Note/Bond | 3.500% | 5/15/20 | 164,995 | 189,771 |
| United States Treasury Note/Bond | 8.750% | 5/15/20 | 25 | 39 |
| United States Treasury Note/Bond | 2.625% | 8/15/20 | 99,770 | 107,596 |
| United States Treasury Note/Bond | 8.750% | 8/15/20 | 60,755 | 95,803 |
| United States Treasury Note/Bond | 2.625% | 11/15/20 | 6,220 | 6,695 |
| United States Treasury Note/Bond | 3.625% | 2/15/21 | 49,700 | 57,691 |
| United States Treasury Note/Bond | 7.875% | 2/15/21 | 70,550 | 107,644 |
| United States Treasury Note/Bond | 3.125% | 5/15/21 | 246,795 | 275,485 |
| United States Treasury Note/Bond | 8.125% | 5/15/21 | 3,350 | 5,211 |
| United States Treasury Note/Bond | 2.125% | 8/15/21 | 194,360 | 199,219 |
| United States Treasury Note/Bond | 8.125% | 8/15/21 | 42,550 | 66,624 |
| United States Treasury Note/Bond | 2.000% | 11/15/21 | 308,518 | 311,893 |
| United States Treasury Note/Bond | 8.000% | 11/15/21 | 27,775 | 43,398 |
| United States Treasury Note/Bond | 7.250% | 8/15/22 | 75 | 113 |
| United States Treasury Note/Bond | 7.625% | 11/15/22 | 150 | 233 |
| United States Treasury Note/Bond | 7.125% | 2/15/23 | 2,675 | 4,044 |
| United States Treasury Note/Bond | 6.250% | 8/15/23 | 332,950 | 476,328 |
| United States Treasury Note/Bond | 7.500% | 11/15/24 | 6,650 | 10,610 |
| United States Treasury Note/Bond | 6.875% | 8/15/25 | 51,500 | 79,286 |
| United States Treasury Note/Bond | 6.000% | 2/15/26 | 8,060 | 11,613 |
| United States Treasury Note/Bond | 6.750% | 8/15/26 | 43,150 | 66,620 |
| United States Treasury Note/Bond | 6.500% | 11/15/26 | 525 | 796 |
12
| Total Bond Market II Index Fund | ||||
| Face | Market | |||
| Maturity | Amount | Value | ||
| Coupon | Date | ($000) | ($000) | |
| United States Treasury Note/Bond | 6.625% | 2/15/27 | 4,150 | 6,383 |
| United States Treasury Note/Bond | 6.375% | 8/15/27 | 6,850 | 10,379 |
| United States Treasury Note/Bond | 6.125% | 11/15/27 | 350 | 520 |
| United States Treasury Note/Bond | 5.500% | 8/15/28 | 80,775 | 113,981 |
| United States Treasury Note/Bond | 5.250% | 11/15/28 | 80,842 | 111,411 |
| United States Treasury Note/Bond | 5.250% | 2/15/29 | 10,775 | 14,881 |
| United States Treasury Note/Bond | 6.125% | 8/15/29 | 106,930 | 161,966 |
| United States Treasury Note/Bond | 6.250% | 5/15/30 | 10,785 | 16,673 |
| United States Treasury Note/Bond | 5.375% | 2/15/31 | 82,375 | 117,371 |
| United States Treasury Note/Bond | 4.500% | 2/15/36 | 5,470 | 7,152 |
| United States Treasury Note/Bond | 4.750% | 2/15/37 | 203,000 | 275,540 |
| United States Treasury Note/Bond | 4.375% | 2/15/38 | 58,200 | 75,151 |
| United States Treasury Note/Bond | 4.500% | 5/15/38 | 4,079 | 5,370 |
| United States Treasury Note/Bond | 3.500% | 2/15/39 | 210,880 | 236,778 |
| United States Treasury Note/Bond | 4.250% | 5/15/39 | 111,275 | 141,337 |
| United States Treasury Note/Bond | 4.500% | 8/15/39 | 36,566 | 48,278 |
| United States Treasury Note/Bond | 4.375% | 11/15/39 | 133,905 | 173,553 |
| United States Treasury Note/Bond | 4.625% | 2/15/40 | 81,805 | 110,143 |
| United States Treasury Note/Bond | 4.375% | 5/15/40 | 99,820 | 129,455 |
| United States Treasury Note/Bond | 3.875% | 8/15/40 | 39,235 | 46,953 |
| United States Treasury Note/Bond | 4.250% | 11/15/40 | 98,902 | 125,915 |
| United States Treasury Note/Bond | 4.750% | 2/15/41 | 311,707 | 428,840 |
| United States Treasury Note/Bond | 4.375% | 5/15/41 | 74,535 | 96,942 |
| United States Treasury Note/Bond | 3.750% | 8/15/41 | 163,205 | 191,588 |
| 19,313,168 | ||||
| Agency Bonds and Notes (5.1%) | ||||
| 1 Ally Financial Inc. | 2.200% | 12/19/12 | 5,725 | 5,833 |
| 1 Citibank NA | 1.750% | 12/28/12 | 15,950 | 16,179 |
| 1 Citigroup Funding Inc. | 2.250% | 12/10/12 | 1,750 | 1,782 |
| Egypt Government AID Bonds | 4.450% | 9/15/15 | 5,725 | 6,405 |
| 2 Federal Agricultural Mortgage Corp. | 1.250% | 12/6/13 | 2,075 | 2,100 |
| 2 Federal Agricultural Mortgage Corp. | 2.125% | 9/15/15 | 1,050 | 1,086 |
| 2 Federal Agricultural Mortgage Corp. | 2.000% | 7/27/16 | 1,800 | 1,845 |
| 2 Federal Farm Credit Bank | 1.875% | 12/7/12 | 3,525 | 3,579 |
| 2 Federal Farm Credit Bank | 1.750% | 2/21/13 | 3,500 | 3,559 |
| 2 Federal Farm Credit Bank | 1.375% | 6/25/13 | 2,500 | 2,539 |
| 2 Federal Farm Credit Bank | 3.875% | 10/7/13 | 3,250 | 3,450 |
| 2 Federal Farm Credit Bank | 1.125% | 2/27/14 | 5,650 | 5,727 |
| 2 Federal Farm Credit Bank | 2.625% | 4/17/14 | 28,627 | 29,988 |
| 2 Federal Farm Credit Bank | 3.000% | 9/22/14 | 2,075 | 2,206 |
| 2 Federal Farm Credit Bank | 1.625% | 11/19/14 | 5,850 | 6,020 |
| 2 Federal Farm Credit Bank | 1.500% | 11/16/15 | 3,000 | 3,071 |
| 2 Federal Farm Credit Bank | 4.875% | 12/16/15 | 425 | 490 |
| 2 Federal Farm Credit Bank | 5.125% | 8/25/16 | 3,475 | 4,108 |
| 2 Federal Farm Credit Bank | 4.875% | 1/17/17 | 2,750 | 3,239 |
| 2 Federal Farm Credit Bank | 5.150% | 11/15/19 | 5,325 | 6,528 |
| 2 Federal Home Loan Bank of Chicago | 5.625% | 6/13/16 | 825 | 930 |
| 2 Federal Home Loan Banks | 1.750% | 12/14/12 | 6,200 | 6,289 |
| 2 Federal Home Loan Banks | 1.500% | 1/16/13 | 19,300 | 19,552 |
| 2 Federal Home Loan Banks | 1.625% | 3/20/13 | 26,425 | 26,863 |
| 2 Federal Home Loan Banks | 1.000% | 3/27/13 | 59,725 | 60,270 |
| 2 Federal Home Loan Banks | 3.875% | 6/14/13 | 2,610 | 2,745 |
| 2 Federal Home Loan Banks | 5.375% | 6/14/13 | 3,850 | 4,131 |
| 2 Federal Home Loan Banks | 1.875% | 6/21/13 | 111,235 | 113,841 |
| 2 Federal Home Loan Banks | 5.125% | 8/14/13 | 2,480 | 2,672 |
13
| Total Bond Market II Index Fund | ||||
| Face | Market | |||
| Maturity | Amount | Value | ||
| Coupon | Date | ($000) | ($000) | |
| 2 Federal Home Loan Banks | 4.000% | 9/6/13 | 9,175 | 9,738 |
| 2 Federal Home Loan Banks | 5.250% | 9/13/13 | 4,450 | 4,815 |
| 2 Federal Home Loan Banks | 4.500% | 9/16/13 | 6,575 | 7,042 |
| 2 Federal Home Loan Banks | 3.625% | 10/18/13 | 7,370 | 7,798 |
| 2 Federal Home Loan Banks | 0.375% | 11/27/13 | 81,780 | 81,814 |
| 2 Federal Home Loan Banks | 4.875% | 11/27/13 | 6,475 | 7,017 |
| 2 Federal Home Loan Banks | 3.125% | 12/13/13 | 2,675 | 2,813 |
| 2 Federal Home Loan Banks | 0.875% | 12/27/13 | 15,000 | 15,146 |
| 2 Federal Home Loan Banks | 1.375% | 5/28/14 | 11,600 | 11,853 |
| 2 Federal Home Loan Banks | 2.500% | 6/13/14 | 4,975 | 5,205 |
| 2 Federal Home Loan Banks | 5.250% | 6/18/14 | 2,665 | 2,972 |
| 2 Federal Home Loan Banks | 5.500% | 8/13/14 | 9,675 | 10,916 |
| 2 Federal Home Loan Banks | 4.500% | 11/14/14 | 4,650 | 5,160 |
| 2 Federal Home Loan Banks | 2.750% | 12/12/14 | 22,925 | 24,335 |
| 2 Federal Home Loan Banks | 3.125% | 3/11/16 | 16,175 | 17,558 |
| 2 Federal Home Loan Banks | 5.375% | 5/18/16 | 18,800 | 22,318 |
| 2 Federal Home Loan Banks | 5.125% | 10/19/16 | 9,725 | 11,531 |
| 2 Federal Home Loan Banks | 4.750% | 12/16/16 | 12,580 | 14,792 |
| 2 Federal Home Loan Banks | 4.875% | 5/17/17 | 10,500 | 12,500 |
| 2 Federal Home Loan Banks | 4.875% | 9/8/17 | 595 | 707 |
| 2 Federal Home Loan Banks | 5.000% | 11/17/17 | 7,850 | 9,446 |
| 2 Federal Home Loan Banks | 5.375% | 8/15/18 | 5,250 | 6,494 |
| 2 Federal Home Loan Banks | 4.125% | 3/13/20 | 17,255 | 19,791 |
| 2 Federal Home Loan Banks | 5.250% | 12/11/20 | 5,000 | 6,219 |
| 2 Federal Home Loan Banks | 5.625% | 6/11/21 | 5,275 | 6,736 |
| 2 Federal Home Loan Banks | 5.375% | 8/15/24 | 1,585 | 2,021 |
| 2 Federal Home Loan Banks | 5.500% | 7/15/36 | 7,225 | 9,371 |
| 3 Federal Home Loan Mortgage Corp. | 0.625% | 12/28/12 | 24,275 | 24,370 |
| 3 Federal Home Loan Mortgage Corp. | 0.750% | 12/28/12 | 50,000 | 50,232 |
| 3 Federal Home Loan Mortgage Corp. | 1.375% | 1/9/13 | 9,200 | 9,306 |
| 3 Federal Home Loan Mortgage Corp. | 0.750% | 3/28/13 | 52,965 | 53,286 |
| 3 Federal Home Loan Mortgage Corp. | 3.750% | 6/28/13 | 3,900 | 4,100 |
| 3 Federal Home Loan Mortgage Corp. | 4.500% | 7/15/13 | 5,475 | 5,830 |
| 3 Federal Home Loan Mortgage Corp. | 4.125% | 9/27/13 | 14,825 | 15,796 |
| 3 Federal Home Loan Mortgage Corp. | 0.375% | 10/30/13 | 24,240 | 24,245 |
| 3 Federal Home Loan Mortgage Corp. | 4.875% | 11/15/13 | 16,250 | 17,606 |
| 3 Federal Home Loan Mortgage Corp. | 0.375% | 11/27/13 | 52,370 | 52,372 |
| 3 Federal Home Loan Mortgage Corp. | 2.500% | 1/7/14 | 2,000 | 2,081 |
| 3 Federal Home Loan Mortgage Corp. | 4.500% | 1/15/14 | 21,895 | 23,682 |
| 3 Federal Home Loan Mortgage Corp. | 1.375% | 2/25/14 | 33,025 | 33,653 |
| 3 Federal Home Loan Mortgage Corp. | 2.500% | 4/23/14 | 25,650 | 26,822 |
| 3 Federal Home Loan Mortgage Corp. | 5.000% | 7/15/14 | 16,275 | 18,092 |
| 3 Federal Home Loan Mortgage Corp. | 3.000% | 7/28/14 | 23,075 | 24,511 |
| 3 Federal Home Loan Mortgage Corp. | 1.000% | 7/30/14 | 12,000 | 12,136 |
| 3 Federal Home Loan Mortgage Corp. | 1.000% | 8/20/14 | 5,555 | 5,613 |
| 3 Federal Home Loan Mortgage Corp. | 1.000% | 8/27/14 | 6,225 | 6,294 |
| 3 Federal Home Loan Mortgage Corp. | 0.500% | 9/19/14 | 5,950 | 5,927 |
| 3 Federal Home Loan Mortgage Corp. | 0.000% | 11/24/14 | 2,100 | 2,053 |
| 3 Federal Home Loan Mortgage Corp. | 0.750% | 11/25/14 | 14,800 | 14,869 |
| 3 Federal Home Loan Mortgage Corp. | 0.625% | 12/29/14 | 75,000 | 75,040 |
| 3 Federal Home Loan Mortgage Corp. | 5.050% | 1/26/15 | 5,400 | 6,115 |
| 3 Federal Home Loan Mortgage Corp. | 2.875% | 2/9/15 | 10,970 | 11,712 |
| 3 Federal Home Loan Mortgage Corp. | 4.375% | 7/17/15 | 31,780 | 35,729 |
| 3 Federal Home Loan Mortgage Corp. | 1.750% | 9/10/15 | 20,000 | 20,669 |
| 3 Federal Home Loan Mortgage Corp. | 5.250% | 4/18/16 | 1,400 | 1,649 |
14
| Total Bond Market II Index Fund | ||||
| Face | Market | |||
| Maturity | Amount | Value | ||
| Coupon | Date | ($000) | ($000) | |
| 3 Federal Home Loan Mortgage Corp. | 2.500% | 5/27/16 | 29,725 | 31,609 |
| 3 Federal Home Loan Mortgage Corp. | 5.500% | 7/18/16 | 775 | 928 |
| 3 Federal Home Loan Mortgage Corp. | 2.000% | 8/25/16 | 14,770 | 15,368 |
| 3 Federal Home Loan Mortgage Corp. | 5.125% | 10/18/16 | 20,700 | 24,585 |
| 3 Federal Home Loan Mortgage Corp. | 5.000% | 2/16/17 | 12,175 | 14,430 |
| 3 Federal Home Loan Mortgage Corp. | 5.000% | 4/18/17 | 5,000 | 5,948 |
| 3 Federal Home Loan Mortgage Corp. | 5.500% | 8/23/17 | 11,550 | 14,135 |
| 3 Federal Home Loan Mortgage Corp. | 5.125% | 11/17/17 | 7,125 | 8,606 |
| 3 Federal Home Loan Mortgage Corp. | 4.875% | 6/13/18 | 8,805 | 10,614 |
| 3 Federal Home Loan Mortgage Corp. | 3.750% | 3/27/19 | 32,850 | 37,518 |
| 3 Federal Home Loan Mortgage Corp. | 6.750% | 9/15/29 | 3,625 | 5,363 |
| 3 Federal Home Loan Mortgage Corp. | 6.750% | 3/15/31 | 16,050 | 24,099 |
| 3 Federal Home Loan Mortgage Corp. | 6.250% | 7/15/32 | 7,295 | 10,589 |
| 3 Federal National Mortgage Assn. | 0.375% | 12/28/12 | 5,200 | 5,208 |
| 3 Federal National Mortgage Assn. | 3.625% | 2/12/13 | 9,750 | 10,114 |
| 3 Federal National Mortgage Assn. | 4.750% | 2/21/13 | 2,525 | 2,652 |
| 3 Federal National Mortgage Assn. | 0.750% | 2/26/13 | 42,400 | 42,644 |
| 3 Federal National Mortgage Assn. | 4.375% | 3/15/13 | 6,415 | 6,731 |
| 3 Federal National Mortgage Assn. | 4.625% | 5/1/13 | 8,650 | 9,108 |
| 3 Federal National Mortgage Assn. | 1.750% | 5/7/13 | 8,394 | 8,565 |
| 3 Federal National Mortgage Assn. | 1.500% | 6/26/13 | 2,965 | 3,019 |
| 3 Federal National Mortgage Assn. | 3.875% | 7/12/13 | 6,050 | 6,382 |
| 3 Federal National Mortgage Assn. | 0.500% | 8/9/13 | 38,691 | 38,812 |
| 3 Federal National Mortgage Assn. | 1.250% | 8/20/13 | 31,400 | 31,878 |
| 3 Federal National Mortgage Assn. | 4.625% | 10/15/13 | 12,625 | 13,581 |
| 3 Federal National Mortgage Assn. | 2.875% | 12/11/13 | 8,775 | 9,195 |
| 3 Federal National Mortgage Assn. | 0.750% | 12/18/13 | 38,120 | 38,370 |
| 3 Federal National Mortgage Assn. | 5.125% | 1/2/14 | 1,175 | 1,273 |
| 3 Federal National Mortgage Assn. | 1.250% | 2/27/14 | 30,220 | 30,722 |
| 3 Federal National Mortgage Assn. | 2.750% | 3/13/14 | 19,795 | 20,769 |
| 3 Federal National Mortgage Assn. | 4.125% | 4/15/14 | 35,025 | 37,901 |
| 3 Federal National Mortgage Assn. | 2.500% | 5/15/14 | 61,195 | 64,052 |
| 3 Federal National Mortgage Assn. | 1.125% | 6/27/14 | 6,050 | 6,135 |
| 3 Federal National Mortgage Assn. | 0.875% | 8/28/14 | 60,175 | 60,663 |
| 3 Federal National Mortgage Assn. | 3.000% | 9/16/14 | 9,075 | 9,661 |
| 3 Federal National Mortgage Assn. | 4.625% | 10/15/14 | 16,100 | 17,887 |
| 3 Federal National Mortgage Assn. | 0.625% | 10/30/14 | 2,370 | 2,372 |
| 3 Federal National Mortgage Assn. | 2.625% | 11/20/14 | 39,895 | 42,214 |
| 3 Federal National Mortgage Assn. | 0.750% | 12/19/14 | 30,000 | 30,135 |
| 3 Federal National Mortgage Assn. | 5.000% | 4/15/15 | 5,450 | 6,204 |
| 3 Federal National Mortgage Assn. | 2.375% | 7/28/15 | 5,525 | 5,829 |
| 3 Federal National Mortgage Assn. | 2.000% | 9/21/15 | 12,595 | 13,088 |
| 3 Federal National Mortgage Assn. | 4.375% | 10/15/15 | 22,325 | 25,234 |
| 3 Federal National Mortgage Assn. | 1.625% | 10/26/15 | 79,455 | 81,681 |
| 3 Federal National Mortgage Assn. | 5.000% | 3/15/16 | 12,025 | 14,007 |
| 3 Federal National Mortgage Assn. | 2.375% | 4/11/16 | 27,250 | 28,821 |
| 3 Federal National Mortgage Assn. | 5.250% | 9/15/16 | 12,450 | 14,808 |
| 3 Federal National Mortgage Assn. | 1.250% | 9/28/16 | 16,745 | 16,842 |
| 3 Federal National Mortgage Assn. | 1.375% | 11/15/16 | 37,670 | 38,082 |
| 3 Federal National Mortgage Assn. | 4.875% | 12/15/16 | 27,270 | 32,182 |
| 3 Federal National Mortgage Assn. | 5.000% | 2/13/17 | 28,600 | 33,889 |
| 3 Federal National Mortgage Assn. | 5.000% | 5/11/17 | 11,275 | 13,424 |
| 3 Federal National Mortgage Assn. | 5.375% | 6/12/17 | 2,800 | 3,390 |
| 3 Federal National Mortgage Assn. | 0.000% | 10/9/19 | 6,640 | 5,044 |
| 3 Federal National Mortgage Assn. | 6.250% | 5/15/29 | 5,550 | 7,805 |
15
| Total Bond Market II Index Fund | |||||
| Face | Market | ||||
| Maturity | Amount | Value | |||
| Coupon | Date | ($000) | ($000) | ||
| 3 | Federal National Mortgage Assn. | 7.125% | 1/15/30 | 8,520 | 13,082 |
| 3 | Federal National Mortgage Assn. | 7.250% | 5/15/30 | 10,675 | 16,652 |
| 3 | Federal National Mortgage Assn. | 6.625% | 11/15/30 | 9,495 | 14,047 |
| 3 | Federal National Mortgage Assn. | 5.625% | 7/15/37 | 3,246 | 4,427 |
| 2 | Financing Corp. Fico | 9.800% | 4/6/18 | 850 | 1,251 |
| 2 | Financing Corp. Fico | 10.350% | 8/3/18 | 100 | 153 |
| 2 | Financing Corp. Fico | 9.650% | 11/2/18 | 2,375 | 3,530 |
| 2 | Financing Corp. Fico | 9.700% | 4/5/19 | 425 | 645 |
| 1 | General Electric Capital Corp. | 2.125% | 12/21/12 | 5,975 | 6,084 |
| 1 | General Electric Capital Corp. | 2.625% | 12/28/12 | 4,450 | 4,555 |
| Israel Government AID Bond | 5.500% | 12/4/23 | 1,050 | 1,348 | |
| Israel Government AID Bond | 5.500% | 4/26/24 | 6,200 | 7,964 | |
| 1 | JPMorgan Chase & Co. | 2.125% | 12/26/12 | 9,000 | 9,166 |
| Private Export Funding Corp. | 3.050% | 10/15/14 | 4,000 | 4,245 | |
| Private Export Funding Corp. | 2.250% | 12/15/17 | 1,775 | 1,851 | |
| Private Export Funding Corp. | 4.375% | 3/15/19 | 3,217 | 3,782 | |
| Private Export Funding Corp. | 4.300% | 12/15/21 | 3,035 | 3,477 | |
| Private Export Funding Corp. | 2.800% | 5/15/22 | 1,125 | 1,136 | |
| Resolution Funding Corp. | 8.125% | 10/15/19 | 100 | 144 | |
| Resolution Funding Corp. | 8.875% | 7/15/20 | 100 | 152 | |
| 2 | Tennessee Valley Authority | 6.000% | 3/15/13 | 6,000 | 6,412 |
| 2 | Tennessee Valley Authority | 5.500% | 7/18/17 | 6,400 | 7,789 |
| 2 | Tennessee Valley Authority | 4.500% | 4/1/18 | 9,125 | 10,729 |
| 2 | Tennessee Valley Authority | 3.875% | 2/15/21 | 5,170 | 5,883 |
| 2 | Tennessee Valley Authority | 6.750% | 11/1/25 | 550 | 780 |
| 2 | Tennessee Valley Authority | 7.125% | 5/1/30 | 8,975 | 13,658 |
| 2 | Tennessee Valley Authority | 4.650% | 6/15/35 | 1,425 | 1,669 |
| 2 | Tennessee Valley Authority | 5.880% | 4/1/36 | 4,265 | 5,807 |
| 2 | Tennessee Valley Authority | 5.500% | 6/15/38 | 850 | 1,118 |
| 2 | Tennessee Valley Authority | 5.250% | 9/15/39 | 3,150 | 4,020 |
| 2 | Tennessee Valley Authority | 4.875% | 1/15/48 | 14,075 | 17,366 |
| 2 | Tennessee Valley Authority | 5.375% | 4/1/56 | 2,770 | 3,741 |
| 2 | Tennessee Valley Authority | 4.625% | 9/15/60 | 3,365 | 3,965 |
| 2,541,718 | |||||
| Conventional Mortgage-Backed Securities (26.2%) | |||||
| 3,4,5 Fannie Mae Pool | 3.000% | 1/1/27 | 115,100 | 118,859 | |
| 3,4,5 Fannie Mae Pool | 3.500% | 9/1/25–1/1/42 | 444,517 | 462,575 | |
| 3,4,5 Fannie Mae Pool | 4.000% | 1/1/12–1/1/42 | 1,111,820 | 1,171,054 | |
| 3,4,5 Fannie Mae Pool | 4.500% | 2/1/18–1/1/42 | 1,043,114 | 1,113,335 | |
| 3,4,5 Fannie Mae Pool | 5.000% | 3/1/17–1/1/42 | 998,335 | 1,080,017 | |
| 3,4,5 Fannie Mae Pool | 5.500% | 9/1/14–1/1/42 | 863,798 | 944,017 | |
| 3,4,5 Fannie Mae Pool | 6.000% | 9/1/13–1/1/42 | 630,982 | 698,287 | |
| 3,4,5 Fannie Mae Pool | 6.500% | 4/1/16–1/1/42 | 215,019 | 240,549 | |
| 3,4 | Fannie Mae Pool | 7.000% | 9/1/14–12/1/38 | 52,138 | 59,468 |
| 3,4 | Fannie Mae Pool | 7.500% | 7/1/30–12/1/32 | 559 | 648 |
| 3,4 | Fannie Mae Pool | 8.000% | 12/1/29 | 63 | 74 |
| 3,4 | Federal Home Loan Mortgage Corp. | 3.500% | 9/1/26 | 17,250 | 17,996 |
| 3,4,5 Freddie Mac Gold Pool | 3.000% | 1/1/27 | 80,800 | 83,376 | |
| 3,4,5 Freddie Mac Gold Pool | 3.500% | 8/1/25–1/1/42 | 244,998 | 254,599 | |
| 3,4,5 Freddie Mac Gold Pool | 4.000% | 2/1/12–1/1/42 | 695,810 | 730,882 | |
| 3,4,5 Freddie Mac Gold Pool | 4.500% | 6/1/12–1/1/42 | 732,103 | 777,124 | |
| 3,4,5 Freddie Mac Gold Pool | 5.000% | 4/1/12–1/1/42 | 647,983 | 697,186 | |
| 3,4 | Freddie Mac Gold Pool | 5.500% | 12/1/13–1/1/42 | 644,096 | 700,735 |
| 3,4,5 Freddie Mac Gold Pool | 6.000% | 4/1/13–1/1/42 | 391,714 | 431,516 | |
| 3,4 | Freddie Mac Gold Pool | 6.500% | 6/1/13–9/1/39 | 115,477 | 129,592 |
16
| Total Bond Market II Index Fund | |||||
| Face | Market | ||||
| Maturity | Amount | Value | |||
| Coupon | Date | ($000) | ($000) | ||
| 3,4 | Freddie Mac Gold Pool | 7.000% | 6/1/15–12/1/38 | 27,642 | 31,594 |
| 3,4 | Freddie Mac Gold Pool | 7.500% | 4/1/27–2/1/32 | 278 | 325 |
| 3,4 | Freddie Mac Gold Pool | 8.000% | 1/1/27–11/1/31 | 339 | 397 |
| 3,4 | Freddie Mac Gold Pool | 8.500% | 6/1/25 | 64 | 75 |
| 4,5 | Ginnie Mae I Pool | 3.500% | 2/15/26–1/1/42 | 54,859 | 57,576 |
| 4,5 | Ginnie Mae I Pool | 4.000% | 8/15/18–1/1/42 | 269,658 | 289,381 |
| 4,5 | Ginnie Mae I Pool | 4.500% | 6/15/18–1/1/42 | 470,599 | 513,492 |
| 4,5 | Ginnie Mae I Pool | 5.000% | 12/15/17–1/1/42 | 297,230 | 329,757 |
| 4,5 | Ginnie Mae I Pool | 5.500% | 4/15/17–1/1/42 | 167,249 | 188,274 |
| 4,5 | Ginnie Mae I Pool | 6.000% | 4/15/17–11/1/41 | 140,684 | 159,533 |
| 4 | Ginnie Mae I Pool | 6.500% | 5/15/24–8/15/39 | 57,040 | 65,039 |
| 4 | Ginnie Mae I Pool | 7.000% | 7/15/23–9/15/36 | 2,311 | 2,666 |
| 4 | Ginnie Mae I Pool | 7.500% | 12/15/23 | 62 | 72 |
| 4 | Ginnie Mae I Pool | 8.000% | 6/15/25–1/15/27 | 133 | 156 |
| 4 | Ginnie Mae I Pool | 9.000% | 11/15/17–12/15/17 | 145 | 168 |
| 4,5 | Ginnie Mae II Pool | 3.500% | 10/20/26–1/1/42 | 35,269 | 36,845 |
| 4,5 | Ginnie Mae II Pool | 4.000% | 9/20/25–1/1/42 | 326,932 | 349,861 |
| 4,5 | Ginnie Mae II Pool | 4.500% | 8/20/33–1/1/42 | 571,860 | 623,566 |
| 4,5 | Ginnie Mae II Pool | 5.000% | 12/20/32–1/1/42 | 422,002 | 467,339 |
| 4 | Ginnie Mae II Pool | 5.500% | 12/20/33–6/20/41 | 167,853 | 188,193 |
| 4 | Ginnie Mae II Pool | 6.000% | 3/20/31–9/20/41 | 77,220 | 87,448 |
| 4 | Ginnie Mae II Pool | 6.500% | 10/20/28–7/20/39 | 21,625 | 24,625 |
| 4 | Ginnie Mae II Pool | 7.000% | 8/20/34–11/20/38 | 2,441 | 2,795 |
| 13,131,066 | |||||
| Nonconventional Mortgage-Backed Securities (1.0%) | |||||
| 3,4 | Fannie Mae Pool | 2.375% | 2/1/36 | 1,182 | 1,205 |
| 3,4 | Fannie Mae Pool | 2.392% | 9/1/34 | 612 | 648 |
| 3,4 | Fannie Mae Pool | 2.465% | 12/1/35 | 1,836 | 1,951 |
| 3,4 | Fannie Mae Pool | 2.496% | 12/1/35 | 3,813 | 4,011 |
| 3,4 | Fannie Mae Pool | 2.497% | 5/1/35 | 1,219 | 1,290 |
| 3,4 | Fannie Mae Pool | 2.500% | 2/1/36 | 1,374 | 1,396 |
| 3,4 | Fannie Mae Pool | 2.559% | 1/1/35 | 1,549 | 1,649 |
| 3,4 | Fannie Mae Pool | 2.571% | 12/1/40 | 6,807 | 6,998 |
| 3,4 | Fannie Mae Pool | 2.576% | 10/1/40 | 6,052 | 6,225 |
| 3,4 | Fannie Mae Pool | 2.667% | 4/1/36 | 4,096 | 4,330 |
| 3,4 | Fannie Mae Pool | 2.685% | 11/1/33 | 950 | 1,021 |
| 3,4 | Fannie Mae Pool | 2.697% | 8/1/35 | 2,816 | 2,871 |
| 3,4 | Fannie Mae Pool | 2.849% | 3/1/41 | 6,687 | 6,927 |
| 3,4 | Fannie Mae Pool | 2.884% | 10/1/36 | 964 | 1,041 |
| 3,4 | Fannie Mae Pool | 2.933% | 12/1/40 | 4,750 | 4,902 |
| 3,4 | Fannie Mae Pool | 3.014% | 3/1/41 | 2,998 | 3,115 |
| 3,4 | Fannie Mae Pool | 3.117% | 12/1/40 | 4,714 | 4,904 |
| 3,4 | Fannie Mae Pool | 3.123% | 2/1/41 | 3,947 | 4,110 |
| 3,4 | Fannie Mae Pool | 3.158% | 2/1/41 | 6,277 | 6,495 |
| 3,4 | Fannie Mae Pool | 3.173% | 12/1/40 | 6,287 | 6,548 |
| 3,4 | Fannie Mae Pool | 3.207% | 8/1/40 | 4,810 | 5,008 |
| 3,4 | Fannie Mae Pool | 3.209% | 9/1/40 | 5,521 | 5,749 |
| 3,4 | Fannie Mae Pool | 3.235% | 10/1/40 | 11,120 | 11,588 |
| 3,4 | Fannie Mae Pool | 3.284% | 11/1/40 | 5,069 | 5,282 |
| 3,4 | Fannie Mae Pool | 3.295% | 1/1/40 | 2,981 | 3,107 |
| 3,4 | Fannie Mae Pool | 3.347% | 1/1/40 | 8,591 | 8,961 |
| 3,4 | Fannie Mae Pool | 3.377% | 5/1/40 | 3,033 | 3,169 |
| 3,4 | Fannie Mae Pool | 3.451% | 12/1/39 | 12,163 | 12,695 |
| 3,4 | Fannie Mae Pool | 3.512% | 5/1/40 | 2,494 | 2,610 |
| 3,4 | Fannie Mae Pool | 3.535% | 3/1/40 | 11,468 | 12,003 |
17
| Total Bond Market II Index Fund | |||||
| Face | Market | ||||
| Maturity | Amount | Value | |||
| Coupon | Date | ($000) | ($000) | ||
| 3,4 | Fannie Mae Pool | 3.538% | 10/1/39 | 2,492 | 2,606 |
| 3,4 | Fannie Mae Pool | 3.610% | 4/1/41 | 5,530 | 5,741 |
| 3,4 | Fannie Mae Pool | 3.616% | 11/1/39 | 1,385 | 1,449 |
| 3,4 | Fannie Mae Pool | 3.623% | 11/1/39 | 2,448 | 2,563 |
| 3,4 | Fannie Mae Pool | 3.633% | 7/1/39 | 2,326 | 2,435 |
| 3,4 | Fannie Mae Pool | 3.767% | 2/1/40 | 12,155 | 12,889 |
| 3,4 | Fannie Mae Pool | 3.801% | 12/1/35 | 2,181 | 2,315 |
| 3,4 | Fannie Mae Pool | 4.030% | 7/1/35 | 1,166 | 1,209 |
| 3,4 | Fannie Mae Pool | 4.507% | 11/1/34 | 4,117 | 4,363 |
| 3,4 | Fannie Mae Pool | 4.515% | 8/1/37 | 6,792 | 7,111 |
| 3,4 | Fannie Mae Pool | 4.582% | 8/1/35 | 1,653 | 1,752 |
| 3,4 | Fannie Mae Pool | 4.875% | 7/1/38 | 790 | 846 |
| 3,4 | Fannie Mae Pool | 4.919% | 10/1/38 | 5,857 | 6,260 |
| 3,4 | Fannie Mae Pool | 4.977% | 12/1/33 | 655 | 698 |
| 3,4 | Fannie Mae Pool | 5.024% | 11/1/33 | 476 | 508 |
| 3,4 | Fannie Mae Pool | 5.038% | 1/1/37 | 1,039 | 1,106 |
| 3,4 | Fannie Mae Pool | 5.051% | 3/1/37 | 1,753 | 1,869 |
| 3,4 | Fannie Mae Pool | 5.092% | 3/1/38 | 3,593 | 3,869 |
| 3,4 | Fannie Mae Pool | 5.127% | 8/1/38 | 149 | 161 |
| 3,4 | Fannie Mae Pool | 5.208% | 7/1/38 | 221 | 240 |
| 3,4 | Fannie Mae Pool | 5.255% | 3/1/37 | 1,123 | 1,167 |
| 3,4 | Fannie Mae Pool | 5.346% | 12/1/35 | 1,247 | 1,360 |
| 3,4 | Fannie Mae Pool | 5.469% | 2/1/37 | 1,667 | 1,712 |
| 3,4 | Fannie Mae Pool | 5.512% | 4/1/37 | 186 | 200 |
| 3,4 | Fannie Mae Pool | 5.573% | 5/1/36 | 708 | 766 |
| 3,4 | Fannie Mae Pool | 5.626% | 3/1/37 | 1,016 | 1,054 |
| 3,4 | Fannie Mae Pool | 5.639% | 3/1/37 | 4,352 | 4,492 |
| 3,4 | Fannie Mae Pool | 5.650% | 6/1/37 | 643 | 689 |
| 3,4 | Fannie Mae Pool | 5.664% | 4/1/37 | 2,003 | 2,104 |
| 3,4 | Fannie Mae Pool | 5.710% | 4/1/37 | 2,883 | 3,111 |
| 3,4 | Fannie Mae Pool | 5.726% | 2/1/37 | 1,095 | 1,149 |
| 3,4 | Fannie Mae Pool | 5.736% | 12/1/37 | 4,350 | 4,856 |
| 3,4 | Fannie Mae Pool | 5.890% | 11/1/36 | 1,143 | 1,233 |
| 3,4 | Fannie Mae Pool | 5.898% | 10/1/37 | 1,669 | 1,802 |
| 3,4 | Fannie Mae Pool | 5.909% | 6/1/36 | 274 | 295 |
| 3,4 | Fannie Mae Pool | 5.918% | 4/1/36 | 825 | 887 |
| 3,4 | Fannie Mae Pool | 5.925% | 8/1/37 | 1,612 | 1,707 |
| 3,4 | Fannie Mae Pool | 5.986% | 7/1/37 | 683 | 736 |
| 3,4 | Fannie Mae Pool | 6.304% | 9/1/37 | 2,617 | 2,746 |
| 3,4 | Freddie Mac Non Gold Pool | 2.085% | 1/1/37 | 1,258 | 1,325 |
| 3,4 | Freddie Mac Non Gold Pool | 2.366% | 12/1/34 | 2,545 | 2,680 |
| 3,4 | Freddie Mac Non Gold Pool | 2.375% | 11/1/34 | 1,500 | 1,589 |
| 3,4 | Freddie Mac Non Gold Pool | 2.477% | 1/1/35 | 146 | 156 |
| 3,4 | Freddie Mac Non Gold Pool | 2.506% | 3/1/36 | 2,183 | 2,328 |
| 3,4 | Freddie Mac Non Gold Pool | 2.507% | 12/1/34 | 1,030 | 1,083 |
| 3,4 | Freddie Mac Non Gold Pool | 2.515% | 4/1/35 | 87 | 91 |
| 3,4 | Freddie Mac Non Gold Pool | 2.572% | 6/1/37 | 1,473 | 1,565 |
| 3,4 | Freddie Mac Non Gold Pool | 2.580% | 12/1/36 | 1,782 | 1,869 |
| 3,4 | Freddie Mac Non Gold Pool | 2.627% | 12/1/40 | 6,850 | 7,057 |
| 3,4 | Freddie Mac Non Gold Pool | 2.713% | 12/1/40 | 12,333 | 12,722 |
| 3,4 | Freddie Mac Non Gold Pool | 2.780% | 11/1/40 | 3,218 | 3,324 |
| 3,4 | Freddie Mac Non Gold Pool | 2.826% | 1/1/41 | 7,630 | 7,834 |
| 3,4 | Freddie Mac Non Gold Pool | 2.981% | 2/1/41 | 8,069 | 8,382 |
| 3,4 | Freddie Mac Non Gold Pool | 3.090% | 3/1/41 | 4,277 | 4,450 |
| 3,4 | Freddie Mac Non Gold Pool | 3.149% | 11/1/40 | 5,193 | 5,408 |
18
| Total Bond Market II Index Fund | |||||
| Face | Market | ||||
| Maturity | Amount | Value | |||
| Coupon | Date | ($000) | ($000) | ||
| 3,4 | Freddie Mac Non Gold Pool | 3.272% | 6/1/40 | 2,726 | 2,843 |
| 3,4 | Freddie Mac Non Gold Pool | 3.334% | 4/1/40 | 6,753 | 7,048 |
| 3,4 | Freddie Mac Non Gold Pool | 3.355% | 5/1/40 | 2,303 | 2,405 |
| 3,4 | Freddie Mac Non Gold Pool | 3.449% | 5/1/40 | 2,318 | 2,423 |
| 3,4 | Freddie Mac Non Gold Pool | 3.590% | 6/1/40 | 3,990 | 4,183 |
| 3,4 | Freddie Mac Non Gold Pool | 3.596% | 6/1/40 | 10,367 | 10,841 |
| 3,4 | Freddie Mac Non Gold Pool | 3.607% | 1/1/40 | 3,708 | 3,882 |
| 3,4 | Freddie Mac Non Gold Pool | 3.670% | 9/1/40 | 7,353 | 7,699 |
| 3,4 | Freddie Mac Non Gold Pool | 3.977% | 3/1/40 | 10,636 | 11,194 |
| 3,4 | Freddie Mac Non Gold Pool | 4.220% | 3/1/37 | 3,082 | 3,194 |
| 3,4 | Freddie Mac Non Gold Pool | 4.546% | 7/1/35 | 899 | 957 |
| 3,4 | Freddie Mac Non Gold Pool | 4.746% | 5/1/38 | 1,386 | 1,479 |
| 3,4 | Freddie Mac Non Gold Pool | 5.028% | 5/1/35 | 1,510 | 1,627 |
| 3,4 | Freddie Mac Non Gold Pool | 5.035% | 7/1/38 | 1,997 | 2,140 |
| 3,4 | Freddie Mac Non Gold Pool | 5.132% | 4/1/37 | 1,534 | 1,634 |
| 3,4 | Freddie Mac Non Gold Pool | 5.259% | 3/1/38 | 2,691 | 2,901 |
| 3,4 | Freddie Mac Non Gold Pool | 5.314% | 3/1/37 | 1,541 | 1,621 |
| 3,4 | Freddie Mac Non Gold Pool | 5.358% | 12/1/35 | 1,357 | 1,436 |
| 3,4 | Freddie Mac Non Gold Pool | 5.414% | 4/1/37 | 2,540 | 2,656 |
| 3,4 | Freddie Mac Non Gold Pool | 5.493% | 1/1/38 | 3,106 | 3,342 |
| 3,4 | Freddie Mac Non Gold Pool | 5.523% | 2/1/36 | 1,210 | 1,314 |
| 3,4 | Freddie Mac Non Gold Pool | 5.534% | 3/1/37 | 813 | 874 |
| 3,4 | Freddie Mac Non Gold Pool | 5.565% | 4/1/37 | 2,323 | 2,398 |
| 3,4 | Freddie Mac Non Gold Pool | 5.616% | 3/1/37 | 301 | 319 |
| 3,4 | Freddie Mac Non Gold Pool | 5.712% | 6/1/37 | 2,078 | 2,171 |
| 3,4 | Freddie Mac Non Gold Pool | 5.723% | 11/1/36 | 655 | 703 |
| 3,4 | Freddie Mac Non Gold Pool | 5.726% | 9/1/36 | 4,001 | 4,290 |
| 3,4 | Freddie Mac Non Gold Pool | 5.750% | 5/1/36 | 1,899 | 2,021 |
| 3,4 | Freddie Mac Non Gold Pool | 5.773% | 3/1/37 | 1,071 | 1,154 |
| 3,4 | Freddie Mac Non Gold Pool | 5.781% | 10/1/37 | 3,591 | 3,768 |
| 3,4 | Freddie Mac Non Gold Pool | 5.788% | 9/1/37 | 2,862 | 3,096 |
| 3,4 | Freddie Mac Non Gold Pool | 5.809% | 6/1/37 | 1,930 | 2,080 |
| 3,4 | Freddie Mac Non Gold Pool | 5.829% | 8/1/37 | 1,958 | 2,126 |
| 3,4 | Freddie Mac Non Gold Pool | 5.861% | 5/1/37 | 5,546 | 5,992 |
| 3,4 | Freddie Mac Non Gold Pool | 5.888% | 1/1/37 | 625 | 673 |
| 3,4 | Freddie Mac Non Gold Pool | 5.904% | 12/1/36 | 797 | 861 |
| 3,4 | Freddie Mac Non Gold Pool | 6.012% | 3/1/37 | 52 | 55 |
| 3,4 | Freddie Mac Non Gold Pool | 6.027% | 3/1/37 | 56 | 58 |
| 3,4 | Freddie Mac Non Gold Pool | 6.032% | 8/1/37 | 775 | 837 |
| 3,4 | Freddie Mac Non Gold Pool | 6.065% | 12/1/36 | 1,320 | 1,429 |
| 3,4 | Freddie Mac Non Gold Pool | 6.070% | 10/1/37 | 339 | 367 |
| 3,4 | Freddie Mac Non Gold Pool | 6.107% | 6/1/37 | 947 | 998 |
| 3,4 | Freddie Mac Non Gold Pool | 6.394% | 2/1/37 | 947 | 1,024 |
| 4 | Ginnie Mae II Pool | 2.375% | 6/20/29 | 61 | 63 |
| 4 | Ginnie Mae II Pool | 2.500% | 1/20/41–11/20/41 | 37,856 | 39,176 |
| 4 | Ginnie Mae II Pool | 3.000% | 12/20/40–5/20/41 | 7,974 | 8,321 |
| 4 | Ginnie Mae II Pool | 3.500% | 1/20/41 | 4,723 | 5,021 |
| 4 | Ginnie Mae II Pool | 4.000% | 12/20/39 | 12,125 | 12,879 |
| 4 | Ginnie Mae II Pool | 4.500% | 10/20/39 | 865 | 938 |
| 4 | Ginnie Mae II Pool | 5.000% | 7/20/38–10/20/38 | 1,761 | 1,877 |
| 478,116 | |||||
| Total U.S. Government and Agency Obligations (Cost $33,974,535) | 35,464,068 | ||||
19
| Total Bond Market II Index Fund | |||||
| Face | Market | ||||
| Maturity | Amount | Value | |||
| Coupon | Date | ($000) | ($000) | ||
| Asset-Backed/Commercial Mortgage-Backed Securities (2.4%) | |||||
| 4 | Banc of America Merrill Lynch Commercial | ||||
| Mortgage Inc. | 4.050% | 11/10/38 | 256 | 256 | |
| 4 | Banc of America Merrill Lynch Commercial | ||||
| Mortgage Inc. | 4.153% | 11/10/38 | 1,800 | 1,858 | |
| 4,6 | Banc of America Merrill Lynch Commercial | ||||
| Mortgage Inc. | 5.544% | 6/10/39 | 5,296 | 5,663 | |
| 4,6 | Banc of America Merrill Lynch Commercial | ||||
| Mortgage Inc. | 4.877% | 7/10/42 | 13,840 | 14,591 | |
| 4,6 | Banc of America Merrill Lynch Commercial | ||||
| Mortgage Inc. | 5.066% | 11/10/42 | 2,530 | 2,591 | |
| 4 | Banc of America Merrill Lynch Commercial | ||||
| Mortgage Inc. | 4.727% | 7/10/43 | 1,655 | 1,704 | |
| 4,6 | Banc of America Merrill Lynch Commercial | ||||
| Mortgage Inc. | 4.857% | 7/10/43 | 460 | 498 | |
| 4 | Banc of America Merrill Lynch Commercial | ||||
| Mortgage Inc. | 5.118% | 7/11/43 | 1,545 | 1,556 | |
| 4,6 | Banc of America Merrill Lynch Commercial | ||||
| Mortgage Inc. | 5.731% | 5/10/45 | 4,750 | 5,328 | |
| 4,6 | Banc of America Merrill Lynch Commercial | ||||
| Mortgage Inc. | 5.766% | 5/10/45 | 1,380 | 1,092 | |
| 4,6 | Banc of America Merrill Lynch Commercial | ||||
| Mortgage Inc. | 5.372% | 9/10/45 | 6,290 | 6,944 | |
| 4,6 | Banc of America Merrill Lynch Commercial | ||||
| Mortgage Inc. | 5.421% | 9/10/45 | 120 | 124 | |
| 4,6 | Banc of America Merrill Lynch Commercial | ||||
| Mortgage Inc. | 5.115% | 10/10/45 | 4,765 | 5,256 | |
| 4,6 | Banc of America Merrill Lynch Commercial | ||||
| Mortgage Inc. | 5.120% | 10/10/45 | 1,125 | 1,129 | |
| 4 | Banc of America Merrill Lynch Commercial | ||||
| Mortgage Inc. | 5.634% | 7/10/46 | 8,720 | 9,681 | |
| 4,6 | Banc of America Merrill Lynch Commercial | ||||
| Mortgage Inc. | 5.695% | 7/10/46 | 1,150 | 875 | |
| 4,6 | Banc of America Merrill Lynch Commercial | ||||
| Mortgage Inc. | 5.193% | 9/10/47 | 2,505 | 2,709 | |
| 4,6 | Banc of America Merrill Lynch Commercial | ||||
| Mortgage Inc. | 5.193% | 9/10/47 | 1,500 | 1,422 | |
| 4 | Banc of America Merrill Lynch Commercial | ||||
| Mortgage Inc. | 5.414% | 9/10/47 | 5,105 | 5,494 | |
| 4 | Banc of America Merrill Lynch Commercial | ||||
| Mortgage Inc. | 5.448% | 9/10/47 | 890 | 845 | |
| 4,6 | Banc of America Merrill Lynch Commercial | ||||
| Mortgage Inc. | 6.205% | 2/10/51 | 12,600 | 14,200 | |
| 4,6 | Bear Stearns Commercial Mortgage Securities | 5.532% | 4/12/38 | 6,650 | 7,408 |
| 4,6 | Bear Stearns Commercial Mortgage Securities | 5.533% | 4/12/38 | 1,500 | 1,572 |
| 4 | Bear Stearns Commercial Mortgage Securities | 4.830% | 8/15/38 | 11,945 | 12,088 |
| 4,6 | Bear Stearns Commercial Mortgage Securities | 5.759% | 9/11/38 | 1,075 | 854 |
| 4,6 | Bear Stearns Commercial Mortgage Securities | 5.759% | 9/11/38 | 2,225 | 2,292 |
| 4,6 | Bear Stearns Commercial Mortgage Securities | 5.441% | 3/11/39 | 7,290 | 8,114 |
| 4,6 | Bear Stearns Commercial Mortgage Securities | 4.680% | 8/13/39 | 7,000 | 7,274 |
| 4 | Bear Stearns Commercial Mortgage Securities | 4.740% | 3/13/40 | 9,090 | 9,339 |
| 4,6 | Bear Stearns Commercial Mortgage Securities | 5.662% | 6/11/40 | 5,689 | 5,776 |
| 4,6 | Bear Stearns Commercial Mortgage Securities | 5.714% | 6/11/40 | 1,075 | 665 |
| 4,6 | Bear Stearns Commercial Mortgage Securities | 5.405% | 12/11/40 | 940 | 1,039 |
| 4,6 | Bear Stearns Commercial Mortgage Securities | 5.200% | 1/12/41 | 1,300 | 1,374 |
20
| Total Bond Market II Index Fund | |||||
| Face | Market | ||||
| Maturity | Amount | Value | |||
| Coupon | Date | ($000) | ($000) | ||
| 4 | Bear Stearns Commercial Mortgage Securities | 4.750% | 6/11/41 | 1,970 | 1,814 |
| 4,6 | Bear Stearns Commercial Mortgage Securities | 5.582% | 9/11/41 | 1,125 | 1,153 |
| 4,6 | Bear Stearns Commercial Mortgage Securities | 5.568% | 10/12/41 | 3,618 | 3,816 |
| 4 | Bear Stearns Commercial Mortgage Securities | 4.521% | 11/11/41 | 88 | 88 |
| 4 | Bear Stearns Commercial Mortgage Securities | 4.825% | 11/11/41 | 275 | 295 |
| 4 | Bear Stearns Commercial Mortgage Securities | 4.868% | 11/11/41 | 990 | 895 |
| 4,6 | Bear Stearns Commercial Mortgage Securities | 4.933% | 2/13/42 | 1,985 | 2,149 |
| 4,6 | Bear Stearns Commercial Mortgage Securities | 5.742% | 9/11/42 | 7,200 | 8,234 |
| 4 | Bear Stearns Commercial Mortgage Securities | 5.793% | 9/11/42 | 1,825 | 1,901 |
| 4,6 | Bear Stearns Commercial Mortgage Securities | 5.127% | 10/12/42 | 1,817 | 1,831 |
| 4,6 | Bear Stearns Commercial Mortgage Securities | 5.145% | 10/12/42 | 4,125 | 4,615 |
| 4,6 | Bear Stearns Commercial Mortgage Securities | 5.513% | 1/12/45 | 2,475 | 2,478 |
| 4,6 | Bear Stearns Commercial Mortgage Securities | 5.566% | 1/12/45 | 1,775 | 1,274 |
| 4 | Bear Stearns Commercial Mortgage Securities | 5.613% | 6/11/50 | 4,625 | 4,740 |
| 4,6 | Bear Stearns Commercial Mortgage Securities | 5.694% | 6/11/50 | 14,180 | 15,695 |
| 4 | Bear Stearns Commercial Mortgage Securities | 5.700% | 6/11/50 | 6,625 | 7,263 |
| 4,6 | Bear Stearns Commercial Mortgage Securities | 5.897% | 6/11/50 | 1,700 | 1,613 |
| 4 | Capital One Multi-Asset Execution Trust | 5.050% | 12/17/18 | 12,975 | 14,779 |
| 4 | Capital One Multi-Asset Execution Trust | 5.750% | 7/15/20 | 3,380 | 4,073 |
| 4 | Chase Issuance Trust | 4.650% | 3/15/15 | 11,375 | 11,848 |
| 4 | Chase Issuance Trust | 5.400% | 7/15/15 | 3,325 | 3,551 |
| 7 | Cie de Financement Foncier | 2.125% | 4/22/13 | 2,900 | 2,865 |
| 4 | CIT Group Home Equity Loan Trust | 6.200% | 2/25/30 | 197 | 198 |
| 4 | Citibank Credit Card Issuance Trust | 4.900% | 6/23/16 | 7,575 | 8,301 |
| 4 | Citibank Credit Card Issuance Trust | 4.850% | 3/10/17 | 1,155 | 1,289 |
| 4 | Citibank Credit Card Issuance Trust | 4.150% | 7/7/17 | 1,225 | 1,350 |
| 4 | Citibank Credit Card Issuance Trust | 5.650% | 9/20/19 | 5,255 | 6,302 |
| 4 | Citibank Credit Card Issuance Trust | 5.350% | 2/7/20 | 400 | 479 |
| 4 | Citigroup Commercial Mortgage Trust | 4.623% | 10/15/41 | 1,125 | 1,142 |
| 4,6 | Citigroup Commercial Mortgage Trust | 4.830% | 5/15/43 | 445 | 473 |
| 4,6 | Citigroup Commercial Mortgage Trust | 5.728% | 3/15/49 | 6,300 | 6,952 |
| 4 | Citigroup Commercial Mortgage Trust | 5.431% | 10/15/49 | 225 | 251 |
| 4 | Citigroup Commercial Mortgage Trust | 5.462% | 10/15/49 | 1,435 | 1,444 |
| 4 | Citigroup Commercial Mortgage Trust | 5.482% | 10/15/49 | 825 | 637 |
| 4,6 | Citigroup Commercial Mortgage Trust | 5.697% | 12/10/49 | 1,875 | 1,841 |
| 4,6 | Citigroup Commercial Mortgage Trust | 5.697% | 12/10/49 | 6,125 | 6,744 |
| 4,6 | Citigroup Commercial Mortgage Trust | 6.072% | 12/10/49 | 2,935 | 2,834 |
| 4,6 | Citigroup Commercial Mortgage Trust | 6.072% | 12/10/49 | 7,190 | 8,036 |
| 4,6 | Citigroup/Deutsche Bank Commercial | ||||
| Mortgage Trust | 5.225% | 7/15/44 | 6,975 | 7,704 | |
| 4,6 | Citigroup/Deutsche Bank Commercial | ||||
| Mortgage Trust | 5.225% | 7/15/44 | 2,475 | 2,617 | |
| 4,6 | Citigroup/Deutsche Bank Commercial | ||||
| Mortgage Trust | 5.886% | 11/15/44 | 7,000 | 7,713 | |
| 4 | Citigroup/Deutsche Bank Commercial | ||||
| Mortgage Trust | 5.648% | 10/15/48 | 3,150 | 2,976 | |
| 4 | Citigroup/Deutsche Bank Commercial | ||||
| Mortgage Trust | 5.205% | 12/11/49 | 11,989 | 12,085 | |
| 4 | Citigroup/Deutsche Bank Commercial | ||||
| Mortgage Trust | 5.322% | 12/11/49 | 5,995 | 6,320 | |
| 4,7 | Commercial Mortgage Lease-Backed Certificates | 6.746% | 6/20/31 | 2,328 | 2,490 |
| 4 | Commercial Mortgage Pass Through Certificates | 4.084% | 6/10/38 | 2,700 | 2,766 |
| 4 | Commercial Mortgage Pass Through Certificates | 4.715% | 3/10/39 | 8,391 | 8,811 |
| 4,6 | Commercial Mortgage Pass Through Certificates | 5.116% | 6/10/44 | 11,980 | 13,163 |
| 4,6 | Commercial Mortgage Pass Through Certificates | 5.750% | 6/10/46 | 5,365 | 5,960 |
21
| Total Bond Market II Index Fund | |||||
| Face | Market | ||||
| Maturity | Amount | Value | |||
| Coupon | Date | ($000) | ($000) | ||
| 4,6 | Commercial Mortgage Pass Through Certificates | 5.776% | 6/10/46 | 1,715 | 1,753 |
| 4 | Commercial Mortgage Pass Through Certificates | 5.248% | 12/10/46 | 1,692 | 1,693 |
| 4,6 | Commercial Mortgage Pass Through Certificates | 5.814% | 12/10/49 | 6,825 | 7,582 |
| 4,6 | Credit Suisse First Boston Mortgage | ||||
| Securities Corp. | 4.750% | 1/15/37 | 7,075 | 7,385 | |
| 4 | Credit Suisse First Boston Mortgage | ||||
| Securities Corp. | 4.877% | 4/15/37 | 325 | 320 | |
| 4,6 | Credit Suisse First Boston Mortgage | ||||
| Securities Corp. | 5.014% | 2/15/38 | 5,850 | 6,339 | |
| 4,6 | Credit Suisse First Boston Mortgage | ||||
| Securities Corp. | 5.075% | 2/15/38 | 1,325 | 1,304 | |
| 4 | Credit Suisse First Boston Mortgage | ||||
| Securities Corp. | 3.936% | 5/15/38 | 6,210 | 6,346 | |
| 4,6 | Credit Suisse First Boston Mortgage | ||||
| Securities Corp. | 5.100% | 8/15/38 | 520 | 557 | |
| 4,6 | Credit Suisse First Boston Mortgage | ||||
| Securities Corp. | 5.100% | 8/15/38 | 6,775 | 7,404 | |
| 4,6 | Credit Suisse First Boston Mortgage | ||||
| Securities Corp. | 5.190% | 8/15/38 | 1,300 | 1,235 | |
| 4,6 | Credit Suisse First Boston Mortgage | ||||
| Securities Corp. | 5.230% | 12/15/40 | 1,525 | 1,408 | |
| 4,6 | Credit Suisse Mortgage Capital Certificates | 5.817% | 6/15/38 | 5,675 | 6,317 |
| 4,6 | Credit Suisse Mortgage Capital Certificates | 5.817% | 6/15/38 | 350 | 345 |
| 4,6 | Credit Suisse Mortgage Capital Certificates | 5.419% | 2/15/39 | 1,400 | 1,226 |
| 4,6 | Credit Suisse Mortgage Capital Certificates | 5.419% | 2/15/39 | 10,725 | 11,872 |
| 4,6 | Credit Suisse Mortgage Capital Certificates | 5.419% | 2/15/39 | 2,800 | 2,802 |
| 4,6 | Credit Suisse Mortgage Capital Certificates | 5.713% | 6/15/39 | 12,160 | 12,679 |
| 4 | Credit Suisse Mortgage Capital Certificates | 5.509% | 9/15/39 | 550 | 519 |
| 4 | Credit Suisse Mortgage Capital Certificates | 5.311% | 12/15/39 | 7,455 | 7,992 |
| 4 | Credit Suisse Mortgage Capital Certificates | 5.383% | 2/15/40 | 2,830 | 2,882 |
| 4,6 | CW Capital Cobalt Ltd. | 5.816% | 5/15/46 | 5,645 | 6,158 |
| 4,6 | CW Capital Cobalt Ltd. | 5.484% | 4/15/47 | 1,975 | 2,158 |
| 4 | Discover Card Master Trust | 5.650% | 12/15/15 | 7,975 | 8,524 |
| 4 | Discover Card Master Trust | 5.650% | 3/16/20 | 3,687 | 4,401 |
| 4,6 | First Union Commercial Mortgage Trust | 6.613% | 10/15/35 | 858 | 876 |
| 4 | Ford Credit Auto Owner Trust | 4.370% | 10/15/12 | 697 | 697 |
| 4 | Ford Credit Auto Owner Trust | 2.420% | 11/15/14 | 1,875 | 1,901 |
| 4 | Ford Credit Auto Owner Trust | 2.150% | 6/15/15 | 6,800 | 6,965 |
| 4 | GE Capital Commercial Mortgage Corp. | 6.269% | 12/10/35 | 1,285 | 1,294 |
| 4 | GE Capital Commercial Mortgage Corp. | 5.145% | 7/10/37 | 3,925 | 4,073 |
| 4 | GE Capital Commercial Mortgage Corp. | 4.996% | 12/10/37 | 4,332 | 4,426 |
| 4,6 | GE Capital Commercial Mortgage Corp. | 5.330% | 3/10/44 | 11,475 | 12,589 |
| 4,6 | GE Capital Commercial Mortgage Corp. | 5.330% | 3/10/44 | 2,825 | 2,783 |
| 4,6 | GE Capital Commercial Mortgage Corp. | 4.974% | 7/10/45 | 460 | 505 |
| 4,6 | GE Capital Commercial Mortgage Corp. | 5.309% | 11/10/45 | 2,725 | 2,741 |
| 4 | GE Capital Commercial Mortgage Corp. | 5.543% | 12/10/49 | 4,300 | 4,494 |
| 4 | GMAC Commercial Mortgage Securities Inc. | 6.700% | 4/15/34 | 155 | 153 |
| 4 | GMAC Commercial Mortgage Securities Inc. | 4.079% | 5/10/36 | 1,200 | 1,226 |
| 4 | GMAC Commercial Mortgage Securities Inc. | 4.908% | 3/10/38 | 825 | 872 |
| 4 | GMAC Commercial Mortgage Securities Inc. | 4.646% | 4/10/40 | 94 | 95 |
| 4 | GMAC Commercial Mortgage Securities Inc. | 4.864% | 12/10/41 | 3,070 | 3,255 |
| 4 | GMAC Commercial Mortgage Securities Inc. | 4.754% | 5/10/43 | 575 | 613 |
| 4 | Greenwich Capital Commercial Funding Corp. | 4.948% | 1/11/35 | 2,205 | 2,246 |
| 4 | Greenwich Capital Commercial Funding Corp. | 4.533% | 1/5/36 | 226 | 227 |
| 4 | Greenwich Capital Commercial Funding Corp. | 4.915% | 1/5/36 | 4,375 | 4,585 |
22
| Total Bond Market II Index Fund | |||||
| Face | Market | ||||
| Maturity | Amount | Value | |||
| Coupon | Date | ($000) | ($000) | ||
| 4,6 | Greenwich Capital Commercial Funding Corp. | 5.317% | 6/10/36 | 4,875 | 5,181 |
| 4 | Greenwich Capital Commercial Funding Corp. | 5.117% | 4/10/37 | 1,288 | 1,290 |
| 4,6 | Greenwich Capital Commercial Funding Corp. | 5.224% | 4/10/37 | 7,925 | 8,481 |
| 4,6 | Greenwich Capital Commercial Funding Corp. | 5.277% | 4/10/37 | 1,900 | 1,737 |
| 4,6 | Greenwich Capital Commercial Funding Corp. | 5.882% | 7/10/38 | 1,775 | 1,760 |
| 4,6 | Greenwich Capital Commercial Funding Corp. | 5.882% | 7/10/38 | 1,750 | 1,946 |
| 4 | Greenwich Capital Commercial Funding Corp. | 5.475% | 3/10/39 | 575 | 540 |
| 4,6 | Greenwich Capital Commercial Funding Corp. | 4.799% | 8/10/42 | 11,327 | 12,089 |
| 4,6 | Greenwich Capital Commercial Funding Corp. | 4.859% | 8/10/42 | 800 | 797 |
| 4,6 | GS Mortgage Securities Corp. II | 5.506% | 4/10/38 | 3,008 | 3,041 |
| 4,6 | GS Mortgage Securities Corp. II | 5.553% | 4/10/38 | 6,450 | 7,017 |
| 4,6 | GS Mortgage Securities Corp. II | 5.622% | 4/10/38 | 1,725 | 1,706 |
| 4,6 | GS Mortgage Securities Corp. II | 5.396% | 8/10/38 | 8,440 | 8,982 |
| 4 | GS Mortgage Securities Corp. II | 4.608% | 1/10/40 | 4,325 | 4,422 |
| 4 | GS Mortgage Securities Corp. II | 3.707% | 8/10/44 | 1,500 | 1,564 |
| 4 | Honda Auto Receivables Owner Trust | 1.800% | 4/17/17 | 1,475 | 1,498 |
| 4 | JP Morgan Chase Commercial Mortgage | ||||
| Securities Corp. | 5.050% | 12/12/34 | 2,875 | 2,925 | |
| 4 | JP Morgan Chase Commercial Mortgage | ||||
| Securities Corp. | 4.654% | 1/12/37 | 1,225 | 1,253 | |
| 4 | JP Morgan Chase Commercial Mortgage | ||||
| Securities Corp. | 4.985% | 1/12/37 | 3,275 | 3,374 | |
| 4,6 | JP Morgan Chase Commercial Mortgage | ||||
| Securities Corp. | 5.255% | 7/12/37 | 425 | 444 | |
| 4 | JP Morgan Chase Commercial Mortgage | ||||
| Securities Corp. | 5.376% | 7/12/37 | 2,657 | 2,689 | |
| 4,6 | JP Morgan Chase Commercial Mortgage | ||||
| Securities Corp. | 5.358% | 8/12/37 | 800 | 742 | |
| 4 | JP Morgan Chase Commercial Mortgage | ||||
| Securities Corp. | 4.824% | 9/12/37 | 1,173 | 1,172 | |
| 4,6 | JP Morgan Chase Commercial Mortgage | ||||
| Securities Corp. | 4.879% | 1/12/38 | 11,475 | 12,041 | |
| 4 | JP Morgan Chase Commercial Mortgage | ||||
| Securities Corp. | 4.404% | 1/12/39 | 4,625 | 4,839 | |
| 4,6 | JP Morgan Chase Commercial Mortgage | ||||
| Securities Corp. | 5.579% | 6/12/41 | 10,500 | 11,318 | |
| 4 | JP Morgan Chase Commercial Mortgage | ||||
| Securities Corp. | 4.780% | 7/15/42 | 1,175 | 1,239 | |
| 4,6 | JP Morgan Chase Commercial Mortgage | ||||
| Securities Corp. | 5.319% | 1/12/43 | 40 | 40 | |
| 4,6 | JP Morgan Chase Commercial Mortgage | ||||
| Securities Corp. | 5.475% | 4/15/43 | 2,850 | 3,123 | |
| 4,6 | JP Morgan Chase Commercial Mortgage | ||||
| Securities Corp. | 5.450% | 12/12/44 | 1,100 | 1,094 | |
| 4,6 | JP Morgan Chase Commercial Mortgage | ||||
| Securities Corp. | 5.247% | 12/15/44 | 1,480 | 1,556 | |
| 4,6 | JP Morgan Chase Commercial Mortgage | ||||
| Securities Corp. | 5.326% | 12/15/44 | 550 | 534 | |
| 4,6 | JP Morgan Chase Commercial Mortgage | ||||
| Securities Corp. | 5.874% | 4/15/45 | 7,620 | 8,538 | |
| 4,6 | JP Morgan Chase Commercial Mortgage | ||||
| Securities Corp. | 5.875% | 4/15/45 | 1,355 | 1,040 | |
| 4,6 | JP Morgan Chase Commercial Mortgage | ||||
| Securities Corp. | 5.875% | 4/15/45 | 635 | 654 | |
23
| Total Bond Market II Index Fund | |||||
| Face | Market | ||||
| Maturity | Amount | Value | |||
| Coupon | Date | ($000) | ($000) | ||
| 4 | JP Morgan Chase Commercial Mortgage | ||||
| Securities Corp. | 5.593% | 5/12/45 | 2,500 | 2,413 | |
| 4 | JP Morgan Chase Commercial Mortgage | ||||
| Securities Corp. | 5.440% | 5/15/45 | 1,720 | 1,740 | |
| 4 | JP Morgan Chase Commercial Mortgage | ||||
| Securities Corp. | 5.447% | 5/15/45 | 4,715 | 4,841 | |
| 4 | JP Morgan Chase Commercial Mortgage | ||||
| Securities Corp. | 5.440% | 6/12/47 | 6,180 | 6,622 | |
| 4,6 | JP Morgan Chase Commercial Mortgage | ||||
| Securities Corp. | 5.816% | 6/15/49 | 5,610 | 5,976 | |
| 4,6 | JP Morgan Chase Commercial Mortgage | ||||
| Securities Corp. | 5.794% | 2/12/51 | 17,038 | 18,792 | |
| 4 | JP Morgan Chase Commercial Mortgage | ||||
| Securities Corp. | 5.855% | 2/12/51 | 2,530 | 2,543 | |
| 4,6 | JP Morgan Chase Commercial Mortgage | ||||
| Securities Corp. | 5.892% | 2/12/51 | 1,275 | 1,266 | |
| 4,6 | JP Morgan Chase Commercial Mortgage | ||||
| Securities Corp. | 5.882% | 2/15/51 | 6,620 | 7,273 | |
| 4,6 | LB-UBS Commercial Mortgage Trust | 4.786% | 10/15/29 | 6,975 | 7,344 |
| 4 | LB-UBS Commercial Mortgage Trust | 4.742% | 2/15/30 | 4,850 | 5,221 |
| 4,6 | LB-UBS Commercial Mortgage Trust | 5.150% | 4/15/30 | 2,845 | 3,123 |
| 4,6 | LB-UBS Commercial Mortgage Trust | 5.197% | 11/15/30 | 6,855 | 7,571 |
| 4,6 | LB-UBS Commercial Mortgage Trust | 5.217% | 2/15/31 | 925 | 986 |
| 4 | LB-UBS Commercial Mortgage Trust | 4.853% | 9/15/31 | 10,012 | 10,162 |
| 4 | LB-UBS Commercial Mortgage Trust | 4.960% | 12/15/31 | 2,196 | 2,260 |
| 4 | LB-UBS Commercial Mortgage Trust | 4.166% | 5/15/32 | 10,700 | 10,986 |
| 4,6 | LB-UBS Commercial Mortgage Trust | 4.685% | 7/15/32 | 620 | 643 |
| 4,6 | LB-UBS Commercial Mortgage Trust | 5.124% | 11/15/32 | 6,425 | 6,736 |
| 4,6 | LB-UBS Commercial Mortgage Trust | 4.931% | 9/15/35 | 9,600 | 9,948 |
| 4,6 | LB-UBS Commercial Mortgage Trust | 5.661% | 3/15/39 | 12,765 | 14,241 |
| 4 | LB-UBS Commercial Mortgage Trust | 5.372% | 9/15/39 | 1,250 | 1,388 |
| 4 | LB-UBS Commercial Mortgage Trust | 5.413% | 9/15/39 | 425 | 448 |
| 4 | LB-UBS Commercial Mortgage Trust | 5.424% | 2/15/40 | 2,760 | 2,996 |
| 4 | LB-UBS Commercial Mortgage Trust | 5.430% | 2/15/40 | 5,945 | 6,332 |
| 4 | LB-UBS Commercial Mortgage Trust | 5.455% | 2/15/40 | 1,700 | 1,651 |
| 4,6 | LB-UBS Commercial Mortgage Trust | 5.057% | 9/15/40 | 700 | 644 |
| 4,6 | LB-UBS Commercial Mortgage Trust | 5.276% | 2/15/41 | 1,325 | 1,215 |
| 4,6 | LB-UBS Commercial Mortgage Trust | 6.145% | 4/15/41 | 13,125 | 14,800 |
| 4,6 | LB-UBS Commercial Mortgage Trust | 6.145% | 4/15/41 | 1,970 | 1,860 |
| 4,6 | LB-UBS Commercial Mortgage Trust | 5.866% | 9/15/45 | 12,345 | 13,513 |
| 4,6 | Merrill Lynch Mortgage Trust | 5.236% | 11/12/35 | 6,360 | 6,625 |
| 4,6 | Merrill Lynch Mortgage Trust | 5.107% | 7/12/38 | 50 | 53 |
| 4,6 | Merrill Lynch Mortgage Trust | 5.665% | 5/12/39 | 9,440 | 10,658 |
| 4,6 | Merrill Lynch Mortgage Trust | 5.666% | 5/12/39 | 625 | 654 |
| 4,6 | Merrill Lynch Mortgage Trust | 4.747% | 6/12/43 | 890 | 967 |
| 4,6 | Merrill Lynch Mortgage Trust | 5.782% | 8/12/43 | 1,965 | 1,977 |
| 4,6 | Merrill Lynch Mortgage Trust | 5.802% | 8/12/43 | 1,350 | 907 |
| 4,6 | Merrill Lynch Mortgage Trust | 5.291% | 1/12/44 | 7,165 | 7,939 |
| 4,6 | Merrill Lynch Mortgage Trust | 5.834% | 6/12/50 | 14,455 | 15,587 |
| 4,6 | Merrill Lynch Mortgage Trust | 5.834% | 6/12/50 | 1,175 | 1,107 |
| 4 | Merrill Lynch Mortgage Trust | 5.425% | 2/12/51 | 1,246 | 1,269 |
| 4 | Merrill Lynch Mortgage Trust | 5.690% | 2/12/51 | 5,920 | 6,315 |
| 4,6 | Merrill Lynch/Countrywide Commercial | ||||
| Mortgage Trust | 5.906% | 6/12/46 | 12,675 | 14,346 | |
24
| Total Bond Market II Index Fund | |||||
| Face | Market | ||||
| Maturity | Amount | Value | |||
| Coupon | Date | ($000) | ($000) | ||
| 4,6 | Merrill Lynch/Countrywide Commercial | ||||
| Mortgage Trust | 5.456% | 7/12/46 | 300 | 304 | |
| 4 | Merrill Lynch/Countrywide Commercial | ||||
| Mortgage Trust | 5.378% | 8/12/48 | 7,615 | 7,950 | |
| 4 | Merrill Lynch/Countrywide Commercial | ||||
| Mortgage Trust | 5.590% | 9/12/49 | 1,851 | 1,867 | |
| 4 | Merrill Lynch/Countrywide Commercial | ||||
| Mortgage Trust | 5.700% | 9/12/49 | 10,370 | 10,969 | |
| 4 | Morgan Stanley Capital I | 4.970% | 4/14/40 | 4,040 | 4,250 |
| 4,6 | Morgan Stanley Capital I | 5.110% | 6/15/40 | 9,025 | 9,650 |
| 4 | Morgan Stanley Capital I | 5.030% | 6/13/41 | 1,401 | 1,426 |
| 4,6 | Morgan Stanley Capital I | 5.270% | 6/13/41 | 2,185 | 2,317 |
| 4,6 | Morgan Stanley Capital I | 5.814% | 8/12/41 | 775 | 854 |
| 4 | Morgan Stanley Capital I | 5.328% | 11/12/41 | 4,385 | 4,832 |
| 4 | Morgan Stanley Capital I | 5.360% | 11/12/41 | 2,626 | 2,532 |
| 4 | Morgan Stanley Capital I | 4.780% | 12/13/41 | 1,540 | 1,658 |
| 4,6 | Morgan Stanley Capital I | 4.840% | 12/13/41 | 515 | 456 |
| 4 | Morgan Stanley Capital I | 4.970% | 12/15/41 | 7,440 | 7,799 |
| 4 | Morgan Stanley Capital I | 5.168% | 1/14/42 | 1,500 | 1,622 |
| 4,6 | Morgan Stanley Capital I | 5.638% | 6/11/42 | 550 | 566 |
| 4,6 | Morgan Stanley Capital I | 5.638% | 6/11/42 | 9,080 | 10,352 |
| 4 | Morgan Stanley Capital I | 4.989% | 8/13/42 | 9,885 | 10,755 |
| 4,6 | Morgan Stanley Capital I | 5.073% | 8/13/42 | 1,500 | 1,381 |
| 4,6 | Morgan Stanley Capital I | 5.230% | 9/15/42 | 11,050 | 12,278 |
| 4,6 | Morgan Stanley Capital I | 5.727% | 10/15/42 | 3,235 | 3,602 |
| 4,6 | Morgan Stanley Capital I | 5.732% | 10/15/42 | 225 | 226 |
| 4,6 | Morgan Stanley Capital I | 5.732% | 10/15/42 | 1,750 | 1,518 |
| 4,6 | Morgan Stanley Capital I | 5.202% | 11/14/42 | 7,950 | 8,752 |
| 4,6 | Morgan Stanley Capital I | 6.278% | 1/11/43 | 8,770 | 10,320 |
| 4 | Morgan Stanley Capital I | 5.332% | 12/15/43 | 7,160 | 7,924 |
| 4,6 | Morgan Stanley Capital I | 5.417% | 3/12/44 | 11,925 | 13,273 |
| 4,6 | Morgan Stanley Capital I | 5.773% | 7/12/44 | 1,575 | 1,668 |
| 4,6 | Morgan Stanley Capital I | 5.793% | 7/12/44 | 1,475 | 1,222 |
| 4 | Morgan Stanley Capital I | 4.660% | 9/13/45 | 2,465 | 2,577 |
| 4,6 | Morgan Stanley Capital I | 5.654% | 4/15/49 | 1,405 | 1,493 |
| 4,6 | Morgan Stanley Capital I | 5.684% | 4/15/49 | 1,641 | 1,325 |
| 4,6 | Morgan Stanley Capital I | 5.692% | 4/15/49 | 10,255 | 10,849 |
| 4,6 | Morgan Stanley Capital I | 5.544% | 11/12/49 | 1,550 | 1,607 |
| 4 | Morgan Stanley Capital I | 5.809% | 12/12/49 | 6,050 | 6,695 |
| 4,6 | Morgan Stanley Capital I | 6.108% | 12/12/49 | 1,975 | 1,935 |
| 4 | Morgan Stanley Capital I | 5.090% | 10/12/52 | 863 | 863 |
| 4,6 | Morgan Stanley Capital I | 5.204% | 10/12/52 | 1,725 | 1,773 |
| 4 | Morgan Stanley Capital I | 4.770% | 7/15/56 | 1,345 | 1,286 |
| 4 | Morgan Stanley Dean Witter Capital I | 6.390% | 7/15/33 | 87 | 86 |
| 4 | Morgan Stanley Dean Witter Capital I | 4.920% | 3/12/35 | 13,650 | 14,020 |
| 4 | Morgan Stanley Dean Witter Capital I | 4.740% | 11/13/36 | 11,954 | 12,233 |
| 4 | Nissan Auto Receivables Owner Trust | 5.050% | 11/17/14 | 1,275 | 1,295 |
| 7 | Northern Rock Asset Management plc | 5.625% | 6/22/17 | 1,075 | 1,139 |
| 4 | PG&E Energy Recovery Funding LLC | 5.030% | 3/25/14 | 178 | 179 |
| 4 | PSE&G Transition Funding LLC | 6.890% | 12/15/17 | 6,975 | 8,326 |
| 4 | Public Service New Hampshire Funding LLC | 6.480% | 5/1/15 | 145 | 150 |
| 4 | Residential Asset Securities Corp. | 6.489% | 10/25/30 | 51 | 47 |
| 4,6 | TIAA Seasoned Commercial Mortgage Trust | 5.739% | 8/15/39 | 1,385 | 1,318 |
| 4 | USAA Auto Owner Trust | 4.710% | 2/18/14 | 2,283 | 2,292 |
| 4 | Wachovia Bank Commercial Mortgage Trust | 4.980% | 11/15/34 | 190 | 194 |
25
| Total Bond Market II Index Fund | |||||
| Face | Market | ||||
| Maturity | Amount | Value | |||
| Coupon | Date | ($000) | ($000) | ||
| 4 | Wachovia Bank Commercial Mortgage Trust | 4.867% | 2/15/35 | 534 | 547 |
| 4,6 | Wachovia Bank Commercial Mortgage Trust | 5.125% | 8/15/35 | 1,100 | 1,141 |
| 4,6 | Wachovia Bank Commercial Mortgage Trust | 4.964% | 11/15/35 | 4,225 | 4,437 |
| 4 | Wachovia Bank Commercial Mortgage Trust | 4.719% | 1/15/41 | 145 | 144 |
| 4 | Wachovia Bank Commercial Mortgage Trust | 4.748% | 2/15/41 | 7,361 | 7,756 |
| 4,6 | Wachovia Bank Commercial Mortgage Trust | 5.316% | 7/15/41 | 11,150 | 11,908 |
| 4 | Wachovia Bank Commercial Mortgage Trust | 4.803% | 10/15/41 | 10,325 | 10,868 |
| 4,6 | Wachovia Bank Commercial Mortgage Trust | 5.083% | 3/15/42 | 5,820 | 6,332 |
| 4,6 | Wachovia Bank Commercial Mortgage Trust | 5.224% | 3/15/42 | 625 | 587 |
| 4.6 | Wachovia Bank Commercial Mortgage Trust | 5.118% | 7/15/42 | 3,520 | 3,863 |
| 4,6 | Wachovia Bank Commercial Mortgage Trust | 5.737% | 5/15/43 | 6,695 | 7,479 |
| 4 | Wachovia Bank Commercial Mortgage Trust | 4.699% | 5/15/44 | 4,900 | 5,316 |
| 4 | Wachovia Bank Commercial Mortgage Trust | 4.750% | 5/15/44 | 665 | 693 |
| 4 | Wachovia Bank Commercial Mortgage Trust | 4.793% | 5/15/44 | 1,350 | 1,256 |
| 4,6 | Wachovia Bank Commercial Mortgage Trust | 5.204% | 10/15/44 | 10,320 | 11,323 |
| 4,6 | Wachovia Bank Commercial Mortgage Trust | 5.204% | 10/15/44 | 535 | 528 |
| 4,6 | Wachovia Bank Commercial Mortgage Trust | 5.269% | 12/15/44 | 9,790 | 10,822 |
| 4,6 | Wachovia Bank Commercial Mortgage Trust | 5.319% | 12/15/44 | 375 | 390 |
| 4,6 | Wachovia Bank Commercial Mortgage Trust | 5.970% | 6/15/45 | 475 | 486 |
| 4,6 | Wachovia Bank Commercial Mortgage Trust | 5.765% | 7/15/45 | 7,000 | 7,808 |
| 4 | Wachovia Bank Commercial Mortgage Trust | 5.679% | 10/15/48 | 1,787 | 1,912 |
| 4 | Wachovia Bank Commercial Mortgage Trust | 5.313% | 11/15/48 | 5,275 | 5,622 |
| 4 | Wachovia Bank Commercial Mortgage Trust | 5.339% | 11/15/48 | 2,400 | 2,372 |
| Total Asset-Backed/Commercial Mortgage-Backed Securities (Cost $1,025,781) | 1,209,475 | ||||
| Corporate Bonds (20.3%) | |||||
| Finance (6.8%) | |||||
| Banking (4.4%) | |||||
| 4 | Abbey National Capital Trust I | 8.963% | 12/29/49 | 3,275 | 2,978 |
| Abbey National Treasury Services plc | 2.875% | 4/25/14 | 2,475 | 2,305 | |
| Abbey National Treasury Services plc | 4.000% | 4/27/16 | 3,635 | 3,269 | |
| American Express Bank FSB | 5.500% | 4/16/13 | 3,275 | 3,421 | |
| American Express Bank FSB | 6.000% | 9/13/17 | 625 | 712 | |
| American Express Centurion Bank | 5.950% | 6/12/17 | 650 | 734 | |
| American Express Centurion Bank | 6.000% | 9/13/17 | 10,325 | 11,767 | |
| American Express Co. | 4.875% | 7/15/13 | 1,575 | 1,645 | |
| American Express Co. | 7.250% | 5/20/14 | 1,250 | 1,397 | |
| American Express Co. | 5.500% | 9/12/16 | 1,025 | 1,130 | |
| American Express Co. | 6.150% | 8/28/17 | 2,715 | 3,101 | |
| American Express Co. | 7.000% | 3/19/18 | 7,625 | 9,183 | |
| American Express Co. | 8.125% | 5/20/19 | 2,470 | 3,183 | |
| American Express Co. | 8.150% | 3/19/38 | 2,335 | 3,483 | |
| 4 | American Express Co. | 6.800% | 9/1/66 | 2,825 | 2,818 |
| American Express Credit Corp. | 5.875% | 5/2/13 | 3,765 | 3,958 | |
| American Express Credit Corp. | 7.300% | 8/20/13 | 15,300 | 16,588 | |
| American Express Credit Corp. | 5.125% | 8/25/14 | 5,990 | 6,445 | |
| American Express Credit Corp. | 2.750% | 9/15/15 | 7,715 | 7,744 | |
| American Express Credit Corp. | 5.300% | 12/2/15 | 2,000 | 2,196 | |
| American Express Credit Corp. | 2.800% | 9/19/16 | 11,305 | 11,434 | |
| Associates Corp. of North America | 6.950% | 11/1/18 | 100 | 108 | |
| Banco Santander Chile | 2.875% | 11/13/12 | 675 | 677 | |
| BanColombia SA | 4.250% | 1/12/16 | 2,700 | 2,675 | |
| Bank of America Corp. | 4.875% | 1/15/13 | 2,125 | 2,134 | |
| Bank of America Corp. | 4.900% | 5/1/13 | 3,375 | 3,378 | |
| Bank of America Corp. | 7.375% | 5/15/14 | 4,650 | 4,814 | |
26
| Total Bond Market II Index Fund | ||||
| Face | Market | |||
| Maturity | Amount | Value | ||
| Coupon | Date | ($000) | ($000) | |
| Bank of America Corp. | 5.375% | 6/15/14 | 800 | 795 |
| Bank of America Corp. | 5.125% | 11/15/14 | 2,510 | 2,495 |
| Bank of America Corp. | 4.500% | 4/1/15 | 23,170 | 22,385 |
| Bank of America Corp. | 4.750% | 8/1/15 | 275 | 264 |
| Bank of America Corp. | 3.700% | 9/1/15 | 670 | 623 |
| Bank of America Corp. | 5.250% | 12/1/15 | 1,225 | 1,156 |
| Bank of America Corp. | 3.625% | 3/17/16 | 15,275 | 14,139 |
| Bank of America Corp. | 3.750% | 7/12/16 | 8,695 | 8,061 |
| Bank of America Corp. | 6.500% | 8/1/16 | 16,570 | 16,688 |
| Bank of America Corp. | 5.750% | 8/15/16 | 3,250 | 3,012 |
| Bank of America Corp. | 7.800% | 9/15/16 | 5,000 | 5,039 |
| Bank of America Corp. | 5.625% | 10/14/16 | 14,700 | 14,214 |
| Bank of America Corp. | 5.420% | 3/15/17 | 4,575 | 4,148 |
| Bank of America Corp. | 6.000% | 9/1/17 | 400 | 391 |
| Bank of America Corp. | 5.750% | 12/1/17 | 2,380 | 2,268 |
| Bank of America Corp. | 5.650% | 5/1/18 | 11,765 | 11,177 |
| Bank of America Corp. | 7.625% | 6/1/19 | 4,620 | 4,790 |
| Bank of America Corp. | 5.625% | 7/1/20 | 17,665 | 16,313 |
| Bank of America Corp. | 5.875% | 1/5/21 | 6,890 | 6,507 |
| Bank of America Corp. | 5.000% | 5/13/21 | 795 | 726 |
| Bank of America Corp. | 6.800% | 3/15/28 | 600 | 529 |
| Bank of America Corp. | 6.500% | 9/15/37 | 875 | 710 |
| Bank of America NA | 5.300% | 3/15/17 | 6,850 | 6,236 |
| Bank of America NA | 6.100% | 6/15/17 | 1,975 | 1,858 |
| Bank of America NA | 6.000% | 10/15/36 | 2,225 | 1,848 |
| Bank of Montreal | 2.125% | 6/28/13 | 4,990 | 5,070 |
| Bank of New York Mellon Corp. | 4.500% | 4/1/13 | 525 | 548 |
| Bank of New York Mellon Corp. | 4.300% | 5/15/14 | 5,145 | 5,503 |
| Bank of New York Mellon Corp. | 4.950% | 3/15/15 | 2,325 | 2,506 |
| Bank of New York Mellon Corp. | 2.500% | 1/15/16 | 4,050 | 4,143 |
| Bank of New York Mellon Corp. | 2.300% | 7/28/16 | 295 | 298 |
| Bank of New York Mellon Corp. | 2.400% | 1/17/17 | 725 | 728 |
| Bank of New York Mellon Corp. | 5.450% | 5/15/19 | 3,645 | 4,182 |
| Bank of New York Mellon Corp. | 4.600% | 1/15/20 | 6,975 | 7,601 |
| Bank of New York Mellon Corp. | 3.550% | 9/23/21 | 325 | 332 |
| Bank of Nova Scotia | 2.250% | 1/22/13 | 10,180 | 10,319 |
| Bank of Nova Scotia | 2.375% | 12/17/13 | 7,250 | 7,448 |
| Bank of Nova Scotia | 3.400% | 1/22/15 | 265 | 279 |
| Bank of Nova Scotia | 2.050% | 10/7/15 | 1,900 | 1,906 |
| Bank of Nova Scotia | 2.900% | 3/29/16 | 145 | 150 |
| Bank of Nova Scotia | 4.375% | 1/13/21 | 1,570 | 1,710 |
| 7 Bank of Tokyo-Mitsubishi UFJ Ltd. | 2.450% | 9/11/15 | 4,000 | 4,074 |
| Bank One Corp. | 5.250% | 1/30/13 | 1,450 | 1,500 |
| Bank One Corp. | 4.900% | 4/30/15 | 975 | 1,026 |
| Bank One Corp. | 7.625% | 10/15/26 | 425 | 499 |
| Barclays Bank plc | 2.500% | 1/23/13 | 3,610 | 3,595 |
| Barclays Bank plc | 5.200% | 7/10/14 | 23,220 | 23,932 |
| Barclays Bank plc | 3.900% | 4/7/15 | 3,745 | 3,773 |
| Barclays Bank plc | 5.000% | 9/22/16 | 3,390 | 3,504 |
| Barclays Bank plc | 6.750% | 5/22/19 | 3,040 | 3,369 |
| Barclays Bank plc | 5.125% | 1/8/20 | 2,865 | 2,940 |
| Barclays Bank plc | 5.140% | 10/14/20 | 4,745 | 4,095 |
| BB&T Capital Trust II | 6.750% | 6/7/36 | 2,675 | 2,658 |
| 4 BB&T Capital Trust IV | 6.820% | 6/12/77 | 1,600 | 1,634 |
| BB&T Corp. | 2.050% | 4/28/14 | 220 | 222 |
27
| Total Bond Market II Index Fund | |||||
| Face | Market | ||||
| Maturity | Amount | Value | |||
| Coupon | Date | ($000) | ($000) | ||
| BB&T Corp. | 5.200% | 12/23/15 | 9,270 | 10,014 | |
| BB&T Corp. | 3.200% | 3/15/16 | 265 | 276 | |
| BB&T Corp. | 4.900% | 6/30/17 | 100 | 109 | |
| BB&T Corp. | 5.250% | 11/1/19 | 4,350 | 4,752 | |
| BBVA US Senior SAU | 3.250% | 5/16/14 | 4,625 | 4,379 | |
| Bear Stearns Cos. LLC | 5.700% | 11/15/14 | 9,825 | 10,672 | |
| Bear Stearns Cos. LLC | 5.300% | 10/30/15 | 5,900 | 6,356 | |
| Bear Stearns Cos. LLC | 5.550% | 1/22/17 | 2,200 | 2,326 | |
| Bear Stearns Cos. LLC | 6.400% | 10/2/17 | 2,650 | 2,961 | |
| Bear Stearns Cos. LLC | 7.250% | 2/1/18 | 4,580 | 5,360 | |
| Bear Stearns Cos. LLC | 4.650% | 7/2/18 | 425 | 433 | |
| BNP Paribas / BNP Paribas US Medium-Term | |||||
| Note Program LLC | 2.125% | 12/21/12 | 5,145 | 5,013 | |
| BNP Paribas SA | 3.250% | 3/11/15 | 6,105 | 5,784 | |
| BNP Paribas SA | 3.600% | 2/23/16 | 5,770 | 5,411 | |
| BNP Paribas SA | 5.000% | 1/15/21 | 10,365 | 9,944 | |
| BNY Mellon NA | 4.750% | 12/15/14 | 3,350 | 3,635 | |
| Branch Banking & Trust Co. | 5.625% | 9/15/16 | 1,875 | 2,137 | |
| Canadian Imperial Bank of Commerce | 1.450% | 9/13/13 | 1,565 | 1,565 | |
| Canadian Imperial Bank of Commerce | 2.350% | 12/11/15 | 325 | 327 | |
| Capital One Bank USA NA | 6.500% | 6/13/13 | 1,150 | 1,212 | |
| Capital One Bank USA NA | 8.800% | 7/15/19 | 10,900 | 12,642 | |
| 4 | Capital One Capital III | 7.686% | 8/1/66 | 2,145 | 2,129 |
| Capital One Capital IV | 6.745% | 2/17/37 | 1,970 | 1,931 | |
| Capital One Capital V | 10.250% | 8/15/39 | 1,870 | 1,935 | |
| Capital One Capital VI | 8.875% | 5/15/40 | 2,820 | 2,883 | |
| Capital One Financial Corp. | 7.375% | 5/23/14 | 645 | 709 | |
| Capital One Financial Corp. | 2.125% | 7/15/14 | 3,395 | 3,352 | |
| Capital One Financial Corp. | 5.500% | 6/1/15 | 6,650 | 7,116 | |
| Capital One Financial Corp. | 3.150% | 7/15/16 | 6,545 | 6,575 | |
| Capital One Financial Corp. | 6.150% | 9/1/16 | 3,150 | 3,284 | |
| Capital One Financial Corp. | 5.250% | 2/21/17 | 1,075 | 1,141 | |
| Capital One Financial Corp. | 6.750% | 9/15/17 | 1,720 | 1,935 | |
| Capital One Financial Corp. | 4.750% | 7/15/21 | 1,545 | 1,602 | |
| 4,7 | Citicorp Lease Pass-Through Trust 1999-1 | 8.040% | 12/15/19 | 4,025 | 4,585 |
| 4 | Citigroup Capital XXI | 8.300% | 12/21/57 | 9,420 | 9,491 |
| Citigroup Inc. | 6.000% | 2/21/12 | 3,500 | 3,515 | |
| Citigroup Inc. | 5.250% | 2/27/12 | 3,875 | 3,889 | |
| Citigroup Inc. | 5.300% | 10/17/12 | 5,300 | 5,386 | |
| Citigroup Inc. | 5.500% | 4/11/13 | 16,720 | 17,073 | |
| Citigroup Inc. | 6.500% | 8/19/13 | 7,245 | 7,526 | |
| Citigroup Inc. | 6.000% | 12/13/13 | 17,625 | 18,258 | |
| Citigroup Inc. | 5.125% | 5/5/14 | 825 | 844 | |
| Citigroup Inc. | 6.375% | 8/12/14 | 6,510 | 6,834 | |
| Citigroup Inc. | 5.000% | 9/15/14 | 9,120 | 9,039 | |
| Citigroup Inc. | 6.010% | 1/15/15 | 3,635 | 3,808 | |
| Citigroup Inc. | 4.750% | 5/19/15 | 5,635 | 5,730 | |
| Citigroup Inc. | 4.700% | 5/29/15 | 1,000 | 1,010 | |
| Citigroup Inc. | 4.587% | 12/15/15 | 7,345 | 7,398 | |
| Citigroup Inc. | 5.300% | 1/7/16 | 5,550 | 5,757 | |
| Citigroup Inc. | 3.953% | 6/15/16 | 3,965 | 3,952 | |
| Citigroup Inc. | 5.850% | 8/2/16 | 265 | 281 | |
| Citigroup Inc. | 5.500% | 2/15/17 | 160 | 161 | |
| Citigroup Inc. | 6.000% | 8/15/17 | 4,325 | 4,554 | |
| Citigroup Inc. | 6.125% | 11/21/17 | 10,985 | 11,730 | |
28
| Total Bond Market II Index Fund | ||||
| Face | Market | |||
| Maturity | Amount | Value | ||
| Coupon | Date | ($000) | ($000) | |
| Citigroup Inc. | 6.125% | 5/15/18 | 13,653 | 14,528 |
| Citigroup Inc. | 8.500% | 5/22/19 | 18,500 | 21,917 |
| Citigroup Inc. | 5.375% | 8/9/20 | 5,590 | 5,743 |
| Citigroup Inc. | 6.625% | 6/15/32 | 1,925 | 1,774 |
| Citigroup Inc. | 5.875% | 2/22/33 | 3,705 | 3,115 |
| Citigroup Inc. | 6.000% | 10/31/33 | 4,050 | 3,454 |
| Citigroup Inc. | 5.850% | 12/11/34 | 1,005 | 997 |
| Citigroup Inc. | 6.125% | 8/25/36 | 6,060 | 5,292 |
| Citigroup Inc. | 5.875% | 5/29/37 | 4,550 | 4,521 |
| Citigroup Inc. | 6.875% | 3/5/38 | 18,066 | 20,200 |
| Citigroup Inc. | 8.125% | 7/15/39 | 1,575 | 1,926 |
| Comerica Bank | 5.750% | 11/21/16 | 3,775 | 4,143 |
| Comerica Bank | 5.200% | 8/22/17 | 2,800 | 3,049 |
| Comerica Inc. | 4.800% | 5/1/15 | 2,600 | 2,728 |
| Compass Bank | 6.400% | 10/1/17 | 900 | 916 |
| Compass Bank | 5.900% | 4/1/26 | 650 | 586 |
| Cooperatieve Centrale | ||||
| Raiffeisen-Boerenleenbank BA | 2.125% | 10/13/15 | 5,755 | 5,628 |
| Cooperatieve Centrale | ||||
| Raiffeisen-Boerenleenbank BA | 4.500% | 1/11/21 | 12,265 | 12,718 |
| Cooperatieve Centrale | ||||
| Raiffeisen-Boerenleenbank BA | 5.250% | 5/24/41 | 865 | 843 |
| Countrywide Financial Corp. | 6.250% | 5/15/16 | 450 | 424 |
| Credit Suisse AG | 5.860% | 5/29/49 | 4,619 | 3,776 |
| Credit Suisse | 5.000% | 5/15/13 | 13,550 | 13,937 |
| Credit Suisse | 2.200% | 1/14/14 | 7,625 | 7,567 |
| Credit Suisse | 5.500% | 5/1/14 | 7,790 | 8,160 |
| Credit Suisse | 3.500% | 3/23/15 | 11,985 | 11,997 |
| Credit Suisse | 6.000% | 2/15/18 | 6,965 | 6,874 |
| Credit Suisse | 5.300% | 8/13/19 | 9,750 | 10,027 |
| Credit Suisse | 5.400% | 1/14/20 | 4,575 | 4,284 |
| Credit Suisse | 4.375% | 8/5/20 | 4,250 | 4,166 |
| Credit Suisse USA Inc. | 5.500% | 8/15/13 | 2,575 | 2,683 |
| Credit Suisse USA Inc. | 5.125% | 1/15/14 | 625 | 654 |
| Credit Suisse USA Inc. | 4.875% | 1/15/15 | 2,935 | 3,071 |
| Credit Suisse USA Inc. | 5.125% | 8/15/15 | 4,265 | 4,472 |
| Credit Suisse USA Inc. | 5.375% | 3/2/16 | 855 | 909 |
| Credit Suisse USA Inc. | 7.125% | 7/15/32 | 7,310 | 8,706 |
| Deutsche Bank AG | 2.375% | 1/11/13 | 5,295 | 5,273 |
| Deutsche Bank AG | 4.875% | 5/20/13 | 6,090 | 6,231 |
| Deutsche Bank AG | 3.875% | 8/18/14 | 145 | 149 |
| Deutsche Bank AG | 3.450% | 3/30/15 | 5,900 | 5,976 |
| Deutsche Bank AG | 3.250% | 1/11/16 | 4,420 | 4,469 |
| Deutsche Bank AG | 6.000% | 9/1/17 | 15,190 | 16,976 |
| Deutsche Bank Financial LLC | 5.375% | 3/2/15 | 4,545 | 4,457 |
| Discover Bank | 7.000% | 4/15/20 | 1,350 | 1,399 |
| Fifth Third Bancorp | 6.250% | 5/1/13 | 690 | 727 |
| Fifth Third Bancorp | 3.625% | 1/25/16 | 9,525 | 9,741 |
| Fifth Third Bancorp | 4.500% | 6/1/18 | 725 | 723 |
| Fifth Third Bancorp | 8.250% | 3/1/38 | 6,246 | 7,727 |
| Fifth Third Bank | 4.750% | 2/1/15 | 2,800 | 2,934 |
| 4 Fifth Third Capital Trust IV | 6.500% | 4/15/67 | 1,825 | 1,788 |
| First Horizon National Corp. | 5.375% | 12/15/15 | 7,350 | 7,506 |
| First Niagara Financial Group Inc. | 6.750% | 3/19/20 | 675 | 709 |
| First Niagara Financial Group Inc. | 7.250% | 12/15/21 | 440 | 449 |
29
| Total Bond Market II Index Fund | ||||
| Face | Market | |||
| Maturity | Amount | Value | ||
| Coupon | Date | ($000) | ($000) | |
| First Tennessee Bank NA | 5.050% | 1/15/15 | 1,604 | 1,608 |
| FleetBoston Financial Corp. | 6.875% | 1/15/28 | 1,250 | 1,122 |
| FleetBoston Financial Corp. | 6.700% | 7/15/28 | 5,400 | 4,703 |
| Goldman Sachs Capital I | 6.345% | 2/15/34 | 5,375 | 4,595 |
| Goldman Sachs Group Inc. | 4.750% | 7/15/13 | 7,425 | 7,513 |
| Goldman Sachs Group Inc. | 5.250% | 10/15/13 | 12,860 | 13,156 |
| Goldman Sachs Group Inc. | 5.150% | 1/15/14 | 3,125 | 3,173 |
| Goldman Sachs Group Inc. | 6.000% | 5/1/14 | 11,620 | 12,144 |
| Goldman Sachs Group Inc. | 5.000% | 10/1/14 | 11,175 | 11,344 |
| Goldman Sachs Group Inc. | 5.125% | 1/15/15 | 7,115 | 7,262 |
| Goldman Sachs Group Inc. | 3.700% | 8/1/15 | 2,510 | 2,456 |
| Goldman Sachs Group Inc. | 5.350% | 1/15/16 | 19,725 | 20,193 |
| Goldman Sachs Group Inc. | 3.625% | 2/7/16 | 8,785 | 8,476 |
| Goldman Sachs Group Inc. | 5.750% | 10/1/16 | 5,555 | 5,805 |
| Goldman Sachs Group Inc. | 5.625% | 1/15/17 | 4,570 | 4,480 |
| Goldman Sachs Group Inc. | 6.250% | 9/1/17 | 8,980 | 9,388 |
| Goldman Sachs Group Inc. | 5.950% | 1/18/18 | 6,215 | 6,348 |
| Goldman Sachs Group Inc. | 6.150% | 4/1/18 | 7,225 | 7,417 |
| Goldman Sachs Group Inc. | 7.500% | 2/15/19 | 3,255 | 3,616 |
| Goldman Sachs Group Inc. | 5.375% | 3/15/20 | 16,640 | 16,355 |
| Goldman Sachs Group Inc. | 6.000% | 6/15/20 | 14,390 | 14,697 |
| Goldman Sachs Group Inc. | 5.250% | 7/27/21 | 5,725 | 5,587 |
| Goldman Sachs Group Inc. | 5.950% | 1/15/27 | 4,795 | 4,426 |
| Goldman Sachs Group Inc. | 6.125% | 2/15/33 | 15,965 | 15,688 |
| Goldman Sachs Group Inc. | 6.450% | 5/1/36 | 2,175 | 1,951 |
| Goldman Sachs Group Inc. | 6.750% | 10/1/37 | 20,105 | 18,796 |
| Goldman Sachs Group Inc. | 6.250% | 2/1/41 | 11,155 | 10,927 |
| 7 HBOS plc | 6.750% | 5/21/18 | 2,075 | 1,647 |
| HSBC Bank USA NA | 4.625% | 4/1/14 | 9,370 | 9,603 |
| HSBC Bank USA NA | 4.875% | 8/24/20 | 4,275 | 4,029 |
| HSBC Bank USA NA | 5.875% | 11/1/34 | 1,825 | 1,765 |
| HSBC Bank USA NA | 5.625% | 8/15/35 | 1,225 | 1,156 |
| HSBC Bank USA NA | 7.000% | 1/15/39 | 1,025 | 1,107 |
| HSBC Holdings plc | 5.100% | 4/5/21 | 10,895 | 11,573 |
| HSBC Holdings plc | 4.875% | 1/14/22 | 2,350 | 2,480 |
| HSBC Holdings plc | 7.625% | 5/17/32 | 325 | 331 |
| HSBC Holdings plc | 7.350% | 11/27/32 | 600 | 602 |
| HSBC Holdings plc | 6.500% | 5/2/36 | 8,215 | 8,393 |
| HSBC Holdings plc | 6.500% | 9/15/37 | 15,265 | 15,408 |
| HSBC Holdings plc | 6.800% | 6/1/38 | 2,325 | 2,402 |
| HSBC Holdings plc | 6.100% | 1/14/42 | 2,225 | 2,587 |
| HSBC USA Inc. | 5.000% | 9/27/20 | 855 | 814 |
| Huntington Bancshares Inc. | 7.000% | 12/15/20 | 3,950 | 4,460 |
| JP Morgan Chase Capital XVII | 5.850% | 8/1/35 | 250 | 249 |
| 4 JP Morgan Chase Capital XVIII | 6.950% | 8/1/66 | 900 | 903 |
| 4 JP Morgan Chase Capital XX | 6.550% | 9/15/66 | 2,490 | 2,498 |
| 4 JP Morgan Chase Capital XXII | 6.450% | 1/15/87 | 8,430 | 8,388 |
| JP Morgan Chase Capital XXV | 6.800% | 10/1/37 | 3,440 | 3,471 |
| JPMorgan Chase & Co. | 5.750% | 1/2/13 | 9,785 | 10,145 |
| JPMorgan Chase & Co. | 4.750% | 5/1/13 | 9,520 | 9,952 |
| JPMorgan Chase & Co. | 1.650% | 9/30/13 | 8,050 | 8,107 |
| JPMorgan Chase & Co. | 2.050% | 1/24/14 | 8,050 | 8,073 |
| JPMorgan Chase & Co. | 4.875% | 3/15/14 | 8,800 | 9,211 |
| JPMorgan Chase & Co. | 4.650% | 6/1/14 | 22,065 | 23,241 |
| JPMorgan Chase & Co. | 5.125% | 9/15/14 | 15,490 | 16,332 |
30
| Total Bond Market II Index Fund | ||||
| Face | Market | |||
| Maturity | Amount | Value | ||
| Coupon | Date | ($000) | ($000) | |
| JPMorgan Chase & Co. | 3.700% | 1/20/15 | 5,950 | 6,178 |
| JPMorgan Chase & Co. | 4.750% | 3/1/15 | 4,625 | 4,913 |
| JPMorgan Chase & Co. | 5.250% | 5/1/15 | 2,025 | 2,138 |
| JPMorgan Chase & Co. | 3.400% | 6/24/15 | 855 | 871 |
| JPMorgan Chase & Co. | 5.150% | 10/1/15 | 8,195 | 8,683 |
| JPMorgan Chase & Co. | 2.600% | 1/15/16 | 4,525 | 4,495 |
| JPMorgan Chase & Co. | 3.450% | 3/1/16 | 1,355 | 1,373 |
| JPMorgan Chase & Co. | 3.150% | 7/5/16 | 5,945 | 5,976 |
| JPMorgan Chase & Co. | 6.125% | 6/27/17 | 3,325 | 3,629 |
| JPMorgan Chase & Co. | 6.000% | 1/15/18 | 3,385 | 3,793 |
| JPMorgan Chase & Co. | 6.300% | 4/23/19 | 15,560 | 17,587 |
| JPMorgan Chase & Co. | 4.400% | 7/22/20 | 1,295 | 1,296 |
| JPMorgan Chase & Co. | 4.250% | 10/15/20 | 725 | 731 |
| JPMorgan Chase & Co. | 4.625% | 5/10/21 | 815 | 843 |
| JPMorgan Chase & Co. | 4.350% | 8/15/21 | 10,465 | 10,606 |
| JPMorgan Chase & Co. | 6.400% | 5/15/38 | 29,840 | 34,547 |
| JPMorgan Chase & Co. | 5.500% | 10/15/40 | 5,350 | 5,528 |
| JPMorgan Chase & Co. | 5.600% | 7/15/41 | 4,950 | 5,315 |
| JPMorgan Chase & Co. | 5.400% | 1/6/42 | 3,175 | 3,263 |
| JPMorgan Chase Bank NA | 5.875% | 6/13/16 | 7,950 | 8,646 |
| JPMorgan Chase Bank NA | 6.000% | 10/1/17 | 665 | 711 |
| JPMorgan Chase Capital XXVII | 7.000% | 11/1/39 | 3,140 | 3,150 |
| KeyBank NA | 5.800% | 7/1/14 | 850 | 907 |
| KeyBank NA | 5.450% | 3/3/16 | 2,500 | 2,703 |
| KeyCorp | 6.500% | 5/14/13 | 1,500 | 1,590 |
| KeyCorp | 5.100% | 3/24/21 | 6,490 | 6,757 |
| 7 Lloyds TSB Bank plc | 4.375% | 1/12/15 | 3,650 | 3,502 |
| Lloyds TSB Bank plc | 4.875% | 1/21/16 | 7,170 | 6,930 |
| 7 Lloyds TSB Bank plc | 5.800% | 1/13/20 | 3,950 | 3,749 |
| Lloyds TSB Bank plc | 6.375% | 1/21/21 | 7,350 | 7,373 |
| M&I Marshall & Ilsley Bank | 4.850% | 6/16/15 | 350 | 370 |
| M&I Marshall & Ilsley Bank | 5.000% | 1/17/17 | 100 | 105 |
| Manufacturers & Traders Trust Co. | 6.625% | 12/4/17 | 2,475 | 2,836 |
| 4 Manufacturers & Traders Trust Co. | 5.585% | 12/28/20 | 100 | 98 |
| MBNA Corp. | 6.125% | 3/1/13 | 1,375 | 1,381 |
| MBNA Corp. | 5.000% | 6/15/15 | 1,425 | 1,390 |
| Mellon Funding Corp. | 5.000% | 12/1/14 | 875 | 943 |
| Merrill Lynch & Co. Inc. | 5.450% | 2/5/13 | 3,225 | 3,249 |
| Merrill Lynch & Co. Inc. | 6.150% | 4/25/13 | 7,200 | 7,279 |
| Merrill Lynch & Co. Inc. | 5.000% | 2/3/14 | 5,325 | 5,325 |
| Merrill Lynch & Co. Inc. | 5.450% | 7/15/14 | 1,665 | 1,654 |
| Merrill Lynch & Co. Inc. | 5.000% | 1/15/15 | 11,281 | 10,868 |
| Merrill Lynch & Co. Inc. | 6.050% | 5/16/16 | 1,730 | 1,634 |
| Merrill Lynch & Co. Inc. | 5.700% | 5/2/17 | 9,035 | 8,217 |
| Merrill Lynch & Co. Inc. | 6.400% | 8/28/17 | 6,055 | 5,877 |
| Merrill Lynch & Co. Inc. | 6.875% | 4/25/18 | 17,595 | 17,343 |
| Merrill Lynch & Co. Inc. | 6.500% | 7/15/18 | 1,100 | 1,067 |
| Merrill Lynch & Co. Inc. | 6.220% | 9/15/26 | 5,780 | 4,766 |
| Merrill Lynch & Co. Inc. | 6.110% | 1/29/37 | 3,065 | 2,340 |
| Merrill Lynch & Co. Inc. | 7.750% | 5/14/38 | 15,255 | 14,494 |
| Morgan Stanley | 5.625% | 1/9/12 | 5,520 | 5,520 |
| Morgan Stanley | 5.300% | 3/1/13 | 1,435 | 1,453 |
| Morgan Stanley | 6.750% | 10/15/13 | 200 | 207 |
| Morgan Stanley | 2.875% | 1/24/14 | 13,900 | 13,289 |
| Morgan Stanley | 4.750% | 4/1/14 | 14,430 | 14,252 |
31
| Total Bond Market II Index Fund | ||||
| Face | Market | |||
| Maturity | Amount | Value | ||
| Coupon | Date | ($000) | ($000) | |
| Morgan Stanley | 6.000% | 5/13/14 | 12,050 | 12,218 |
| Morgan Stanley | 2.875% | 7/28/14 | 1,050 | 993 |
| Morgan Stanley | 4.200% | 11/20/14 | 3,370 | 3,251 |
| Morgan Stanley | 4.100% | 1/26/15 | 3,300 | 3,155 |
| Morgan Stanley | 6.000% | 4/28/15 | 20,210 | 20,258 |
| Morgan Stanley | 5.375% | 10/15/15 | 3,060 | 2,990 |
| Morgan Stanley | 3.450% | 11/2/15 | 24,800 | 22,780 |
| Morgan Stanley | 3.800% | 4/29/16 | 1,215 | 1,120 |
| Morgan Stanley | 5.750% | 10/18/16 | 4,700 | 4,583 |
| Morgan Stanley | 5.450% | 1/9/17 | 3,815 | 3,672 |
| Morgan Stanley | 5.550% | 4/27/17 | 1,375 | 1,307 |
| Morgan Stanley | 5.950% | 12/28/17 | 5,690 | 5,440 |
| Morgan Stanley | 6.625% | 4/1/18 | 7,565 | 7,464 |
| Morgan Stanley | 7.300% | 5/13/19 | 13,185 | 13,440 |
| Morgan Stanley | 5.625% | 9/23/19 | 23,580 | 21,725 |
| Morgan Stanley | 5.500% | 1/26/20 | 2,750 | 2,541 |
| Morgan Stanley | 5.500% | 7/24/20 | 2,150 | 1,959 |
| Morgan Stanley | 5.750% | 1/25/21 | 10,440 | 9,682 |
| Morgan Stanley | 5.500% | 7/28/21 | 3,125 | 2,891 |
| Morgan Stanley | 6.250% | 8/9/26 | 8,475 | 7,952 |
| Morgan Stanley | 7.250% | 4/1/32 | 7,545 | 7,694 |
| National City Bank | 4.625% | 5/1/13 | 725 | 753 |
| National City Corp. | 4.900% | 1/15/15 | 850 | 917 |
| National City Corp. | 6.875% | 5/15/19 | 4,965 | 5,578 |
| Northern Trust Co. | 6.500% | 8/15/18 | 425 | 506 |
| Northern Trust Corp. | 5.500% | 8/15/13 | 425 | 452 |
| Northern Trust Corp. | 4.625% | 5/1/14 | 1,025 | 1,100 |
| Paribas | 6.950% | 7/22/13 | 325 | 328 |
| PNC Bank NA | 4.875% | 9/21/17 | 3,575 | 3,734 |
| PNC Bank NA | 6.000% | 12/7/17 | 325 | 353 |
| PNC Funding Corp. | 3.000% | 5/19/14 | 145 | 150 |
| PNC Funding Corp. | 3.625% | 2/8/15 | 235 | 248 |
| PNC Funding Corp. | 4.250% | 9/21/15 | 650 | 695 |
| PNC Funding Corp. | 5.250% | 11/15/15 | 6,575 | 7,149 |
| PNC Funding Corp. | 2.700% | 9/19/16 | 1,945 | 1,976 |
| PNC Funding Corp. | 5.625% | 2/1/17 | 325 | 351 |
| PNC Funding Corp. | 6.700% | 6/10/19 | 6,475 | 7,864 |
| PNC Funding Corp. | 5.125% | 2/8/20 | 5,700 | 6,438 |
| PNC Funding Corp. | 4.375% | 8/11/20 | 6,150 | 6,652 |
| Royal Bank of Canada | 2.100% | 7/29/13 | 6,200 | 6,313 |
| Royal Bank of Canada | 1.450% | 10/30/14 | 160 | 161 |
| Royal Bank of Canada | 2.625% | 12/15/15 | 5,600 | 5,752 |
| Royal Bank of Canada | 2.875% | 4/19/16 | 2,075 | 2,149 |
| Royal Bank of Canada | 2.300% | 7/20/16 | 9,255 | 9,413 |
| Royal Bank of Scotland Group plc | 6.400% | 10/21/19 | 8,505 | 7,898 |
| Royal Bank Of Scotland NV | 4.650% | 6/4/18 | 100 | 89 |
| Royal Bank of Scotland plc | 3.400% | 8/23/13 | 5,020 | 4,869 |
| Royal Bank of Scotland plc | 3.250% | 1/11/14 | 6,525 | 6,206 |
| 7 Royal Bank of Scotland plc | 4.875% | 8/25/14 | 1,800 | 1,779 |
| Royal Bank of Scotland plc | 4.875% | 3/16/15 | 4,790 | 4,570 |
| Royal Bank of Scotland plc | 3.950% | 9/21/15 | 795 | 741 |
| Royal Bank of Scotland plc | 4.375% | 3/16/16 | 12,655 | 12,069 |
| Royal Bank of Scotland plc | 5.625% | 8/24/20 | 9,205 | 8,838 |
| Royal Bank of Scotland plc | 6.125% | 1/11/21 | 3,280 | 3,268 |
| Santander Holdings USA Inc. | 4.625% | 4/19/16 | 4,225 | 4,065 |
32
| Total Bond Market II Index Fund | |||||
| Face | Market | ||||
| Maturity | Amount | Value | |||
| Coupon | Date | ($000) | ($000) | ||
| Santander UK plc | 7.950% | 10/26/29 | 590 | 491 | |
| SouthTrust Corp. | 5.800% | 6/15/14 | 750 | 803 | |
| Sovereign Bank | 8.750% | 5/30/18 | 675 | 749 | |
| 4,7 | Standard Chartered plc | 6.409% | 12/31/49 | 1,975 | 1,634 |
| State Street Bank and Trust Co. | 5.300% | 1/15/16 | 2,725 | 3,064 | |
| State Street Bank and Trust Co. | 5.250% | 10/15/18 | 2,879 | 3,205 | |
| State Street Corp. | 4.300% | 5/30/14 | 1,600 | 1,711 | |
| State Street Corp. | 2.875% | 3/7/16 | 6,235 | 6,413 | |
| State Street Corp. | 4.375% | 3/7/21 | 1,385 | 1,518 | |
| SunTrust Bank | 5.000% | 9/1/15 | 16 | 17 | |
| SunTrust Bank | 7.250% | 3/15/18 | 375 | 421 | |
| SunTrust Banks Inc. | 3.600% | 4/15/16 | 4,160 | 4,233 | |
| SunTrust Banks Inc. | 3.500% | 1/20/17 | 4,070 | 4,084 | |
| SunTrust Banks Inc. | 6.000% | 9/11/17 | 1,300 | 1,437 | |
| 4 | SunTrust Capital VIII | 6.100% | 12/1/66 | 657 | 644 |
| Toronto-Dominion Bank | 1.375% | 7/14/14 | 1,660 | 1,679 | |
| Toronto-Dominion Bank | 2.500% | 7/14/16 | 2,495 | 2,543 | |
| Toronto-Dominion Bank | 2.375% | 10/19/16 | 4,320 | 4,402 | |
| UBS AG | 2.250% | 8/12/13 | 8,135 | 8,052 | |
| UBS AG | 2.250% | 1/28/14 | 9,950 | 9,664 | |
| UBS AG | 3.875% | 1/15/15 | 1,890 | 1,880 | |
| UBS AG | 7.000% | 10/15/15 | 1,000 | 1,025 | |
| UBS AG | 5.875% | 7/15/16 | 2,620 | 2,640 | |
| UBS AG | 7.375% | 6/15/17 | 3,000 | 3,208 | |
| UBS AG | 5.875% | 12/20/17 | 7,960 | 8,250 | |
| UBS AG | 5.750% | 4/25/18 | 2,940 | 3,045 | |
| UBS AG | 4.875% | 8/4/20 | 14,450 | 14,297 | |
| UBS AG | 7.750% | 9/1/26 | 1,000 | 1,161 | |
| UBS Preferred Funding Trust V | 6.243% | 5/29/49 | 145 | 121 | |
| UFJ Finance Aruba AEC | 6.750% | 7/15/13 | 9,750 | 10,387 | |
| Union Bank NA | 5.950% | 5/11/16 | 1,375 | 1,489 | |
| Union Bank NA | 3.000% | 6/6/16 | 1,550 | 1,570 | |
| UnionBanCal Corp. | 5.250% | 12/16/13 | 700 | 722 | |
| US Bancorp | 2.000% | 6/14/13 | 5,370 | 5,455 | |
| US Bancorp | 1.125% | 10/30/13 | 3,400 | 3,407 | |
| US Bancorp | 4.200% | 5/15/14 | 175 | 187 | |
| US Bancorp | 3.150% | 3/4/15 | 600 | 629 | |
| US Bancorp | 2.450% | 7/27/15 | 480 | 492 | |
| US Bancorp | 3.442% | 2/1/16 | 4,395 | 4,531 | |
| US Bancorp | 2.200% | 11/15/16 | 4,450 | 4,500 | |
| US Bancorp | 4.125% | 5/24/21 | 10,265 | 11,329 | |
| US Bank NA | 6.300% | 2/4/14 | 3,150 | 3,454 | |
| US Bank NA | 4.950% | 10/30/14 | 5,050 | 5,483 | |
| US Bank NA | 4.800% | 4/15/15 | 850 | 927 | |
| USB Capital XIII Trust | 6.625% | 12/15/39 | 675 | 692 | |
| Wachovia Bank NA | 4.800% | 11/1/14 | 425 | 447 | |
| Wachovia Bank NA | 4.875% | 2/1/15 | 6,050 | 6,345 | |
| Wachovia Bank NA | 5.000% | 8/15/15 | 825 | 868 | |
| Wachovia Bank NA | 6.000% | 11/15/17 | 2,500 | 2,765 | |
| Wachovia Bank NA | 5.850% | 2/1/37 | 5,775 | 5,997 | |
| Wachovia Bank NA | 6.600% | 1/15/38 | 9,845 | 11,077 | |
| Wachovia Corp. | 5.500% | 5/1/13 | 2,103 | 2,219 | |
| Wachovia Corp. | 4.875% | 2/15/14 | 5,275 | 5,508 | |
| Wachovia Corp. | 5.250% | 8/1/14 | 2,490 | 2,630 | |
| Wachovia Corp. | 5.625% | 10/15/16 | 11,800 | 12,841 | |
33
| Total Bond Market II Index Fund | ||||
| Face | Market | |||
| Maturity | Amount | Value | ||
| Coupon | Date | ($000) | ($000) | |
| Wachovia Corp. | 5.750% | 6/15/17 | 6,425 | 7,256 |
| Wachovia Corp. | 5.750% | 2/1/18 | 1,265 | 1,435 |
| Wachovia Corp. | 6.605% | 10/1/25 | 100 | 113 |
| Wachovia Corp. | 7.500% | 4/15/35 | 275 | 344 |
| Wachovia Corp. | 5.500% | 8/1/35 | 1,775 | 1,726 |
| Wachovia Corp. | 6.550% | 10/15/35 | 250 | 269 |
| Wells Fargo & Co. | 4.375% | 1/31/13 | 17,885 | 18,458 |
| Wells Fargo & Co. | 4.950% | 10/16/13 | 1,295 | 1,358 |
| Wells Fargo & Co. | 3.750% | 10/1/14 | 2,345 | 2,471 |
| Wells Fargo & Co. | 3.625% | 4/15/15 | 11,375 | 11,912 |
| Wells Fargo & Co. | 3.676% | 6/15/16 | 13,820 | 14,531 |
| Wells Fargo & Co. | 5.125% | 9/15/16 | 1,060 | 1,146 |
| Wells Fargo & Co. | 5.625% | 12/11/17 | 20,165 | 22,885 |
| Wells Fargo & Co. | 4.600% | 4/1/21 | 7,265 | 7,898 |
| Wells Fargo & Co. | 5.375% | 2/7/35 | 4,700 | 4,977 |
| Wells Fargo Bank NA | 4.750% | 2/9/15 | 5,340 | 5,592 |
| Wells Fargo Bank NA | 5.750% | 5/16/16 | 3,600 | 3,951 |
| Wells Fargo Bank NA | 5.950% | 8/26/36 | 1,725 | 1,811 |
| 4 Wells Fargo Capital X | 5.950% | 12/1/86 | 3,600 | 3,591 |
| Westpac Banking Corp. | 2.100% | 8/2/13 | 2,625 | 2,640 |
| Westpac Banking Corp. | 1.850% | 12/9/13 | 7,815 | 7,822 |
| Westpac Banking Corp. | 4.200% | 2/27/15 | 7,400 | 7,731 |
| Westpac Banking Corp. | 3.000% | 8/4/15 | 4,125 | 4,173 |
| Westpac Banking Corp. | 3.000% | 12/9/15 | 735 | 738 |
| Westpac Banking Corp. | 4.875% | 11/19/19 | 9,370 | 9,998 |
| Brokerage (0.1%) | ||||
| Ameriprise Financial Inc. | 5.650% | 11/15/15 | 5,000 | 5,653 |
| Ameriprise Financial Inc. | 5.300% | 3/15/20 | 775 | 832 |
| 4 Ameriprise Financial Inc. | 7.518% | 6/1/66 | 4,475 | 4,486 |
| BlackRock Inc. | 3.500% | 12/10/14 | 1,700 | 1,814 |
| BlackRock Inc. | 6.250% | 9/15/17 | 1,150 | 1,340 |
| BlackRock Inc. | 5.000% | 12/10/19 | 3,465 | 3,770 |
| BlackRock Inc. | 4.250% | 5/24/21 | 2,125 | 2,212 |
| Charles Schwab Corp. | 4.950% | 6/1/14 | 3,925 | 4,248 |
| Charles Schwab Corp. | 4.450% | 7/22/20 | 1,000 | 1,065 |
| 7 FMR LLC | 7.490% | 6/15/19 | 200 | 232 |
| Franklin Resources Inc. | 2.000% | 5/20/13 | 2,650 | 2,678 |
| Franklin Resources Inc. | 3.125% | 5/20/15 | 1,450 | 1,508 |
| Franklin Resources Inc. | 4.625% | 5/20/20 | 700 | 758 |
| GFI Group Inc. | 8.375% | 7/19/18 | 750 | 664 |
| Jefferies Group Inc. | 3.875% | 11/9/15 | 875 | 772 |
| Jefferies Group Inc. | 5.500% | 3/15/16 | 3,465 | 3,188 |
| Jefferies Group Inc. | 5.125% | 4/13/18 | 9,025 | 7,931 |
| Jefferies Group Inc. | 8.500% | 7/15/19 | 3,000 | 3,023 |
| Jefferies Group Inc. | 6.875% | 4/15/21 | 895 | 803 |
| Jefferies Group Inc. | 6.450% | 6/8/27 | 1,050 | 865 |
| Jefferies Group Inc. | 6.250% | 1/15/36 | 5,280 | 4,250 |
| Lazard Group LLC | 6.850% | 6/15/17 | 2,675 | 2,807 |
| Nomura Holdings Inc. | 5.000% | 3/4/15 | 2,425 | 2,443 |
| Nomura Holdings Inc. | 4.125% | 1/19/16 | 275 | 268 |
| Nomura Holdings Inc. | 6.700% | 3/4/20 | 4,025 | 4,234 |
| Raymond James Financial Inc. | 4.250% | 4/15/16 | 1,000 | 1,023 |
| TD Ameritrade Holding Corp. | 4.150% | 12/1/14 | 1,025 | 1,080 |
| TD Ameritrade Holding Corp. | 5.600% | 12/1/19 | 925 | 1,000 |
34
| Total Bond Market II Index Fund | ||||
| Face | Market | |||
| Maturity | Amount | Value | ||
| Coupon | Date | ($000) | ($000) | |
| Finance Companies (0.7%) | ||||
| Block Financial LLC | 7.875% | 1/15/13 | 525 | 544 |
| Block Financial LLC | 5.125% | 10/30/14 | 5,160 | 5,257 |
| Discover Financial Services | 6.450% | 6/12/17 | 325 | 340 |
| Discover Financial Services | 10.250% | 7/15/19 | 950 | 1,148 |
| General Electric Capital Corp. | 5.250% | 10/19/12 | 24,450 | 25,309 |
| General Electric Capital Corp. | 2.800% | 1/8/13 | 6,975 | 7,101 |
| General Electric Capital Corp. | 5.450% | 1/15/13 | 5,470 | 5,736 |
| General Electric Capital Corp. | 4.800% | 5/1/13 | 8,165 | 8,578 |
| General Electric Capital Corp. | 2.100% | 1/7/14 | 5,100 | 5,181 |
| General Electric Capital Corp. | 5.900% | 5/13/14 | 5,125 | 5,620 |
| General Electric Capital Corp. | 5.500% | 6/4/14 | 5,150 | 5,605 |
| General Electric Capital Corp. | 5.650% | 6/9/14 | 5,800 | 6,314 |
| General Electric Capital Corp. | 3.750% | 11/14/14 | 12,475 | 13,204 |
| General Electric Capital Corp. | 3.500% | 6/29/15 | 5,000 | 5,244 |
| General Electric Capital Corp. | 4.375% | 9/21/15 | 3,500 | 3,777 |
| General Electric Capital Corp. | 2.250% | 11/9/15 | 2,445 | 2,449 |
| General Electric Capital Corp. | 2.950% | 5/9/16 | 3,125 | 3,212 |
| General Electric Capital Corp. | 3.350% | 10/17/16 | 7,700 | 8,014 |
| General Electric Capital Corp. | 5.375% | 10/20/16 | 250 | 279 |
| General Electric Capital Corp. | 5.400% | 2/15/17 | 14,850 | 16,570 |
| General Electric Capital Corp. | 5.625% | 9/15/17 | 6,065 | 6,718 |
| General Electric Capital Corp. | 5.625% | 5/1/18 | 12,050 | 13,470 |
| General Electric Capital Corp. | 6.000% | 8/7/19 | 10,675 | 12,258 |
| General Electric Capital Corp. | 5.500% | 1/8/20 | 1,075 | 1,179 |
| General Electric Capital Corp. | 5.550% | 5/4/20 | 3,275 | 3,588 |
| General Electric Capital Corp. | 4.625% | 1/7/21 | 2,400 | 2,507 |
| General Electric Capital Corp. | 5.300% | 2/11/21 | 3,730 | 3,957 |
| General Electric Capital Corp. | 4.650% | 10/17/21 | 2,465 | 2,568 |
| General Electric Capital Corp. | 6.750% | 3/15/32 | 6,785 | 7,917 |
| General Electric Capital Corp. | 6.150% | 8/7/37 | 19,250 | 21,171 |
| General Electric Capital Corp. | 5.875% | 1/14/38 | 19,490 | 20,568 |
| General Electric Capital Corp. | 6.875% | 1/10/39 | 19,640 | 23,404 |
| 4 General Electric Capital Corp. | 6.375% | 11/15/67 | 12,635 | 12,445 |
| 4 HSBC Finance Capital Trust IX | 5.911% | 11/30/35 | 1,950 | 1,604 |
| HSBC Finance Corp. | 4.750% | 7/15/13 | 4,815 | 4,904 |
| HSBC Finance Corp. | 5.250% | 1/15/14 | 1,425 | 1,457 |
| HSBC Finance Corp. | 5.250% | 4/15/15 | 4,485 | 4,578 |
| HSBC Finance Corp. | 5.000% | 6/30/15 | 11,445 | 11,601 |
| HSBC Finance Corp. | 5.500% | 1/19/16 | 1,545 | 1,596 |
| HSBC Finance Corp. | 6.676% | 1/15/21 | 17,734 | 18,276 |
| SLM Corp. | 5.375% | 1/15/13 | 1,150 | 1,159 |
| SLM Corp. | 5.000% | 10/1/13 | 2,545 | 2,557 |
| SLM Corp. | 5.375% | 5/15/14 | 3,175 | 3,212 |
| SLM Corp. | 5.050% | 11/14/14 | 975 | 942 |
| SLM Corp. | 6.250% | 1/25/16 | 1,685 | 1,648 |
| SLM Corp. | 8.450% | 6/15/18 | 5,845 | 6,062 |
| SLM Corp. | 8.000% | 3/25/20 | 5,795 | 5,878 |
| SLM Corp. | 5.625% | 8/1/33 | 5,895 | 4,489 |
| Insurance (1.2%) | ||||
| ACE Capital Trust II | 9.700% | 4/1/30 | 1,000 | 1,332 |
| ACE INA Holdings Inc. | 5.875% | 6/15/14 | 2,500 | 2,752 |
| ACE INA Holdings Inc. | 5.600% | 5/15/15 | 1,725 | 1,926 |
| ACE INA Holdings Inc. | 2.600% | 11/23/15 | 3,735 | 3,803 |
35
| Total Bond Market II Index Fund | ||||
| Face | Market | |||
| Maturity | Amount | Value | ||
| Coupon | Date | ($000) | ($000) | |
| ACE INA Holdings Inc. | 5.700% | 2/15/17 | 1,400 | 1,609 |
| ACE INA Holdings Inc. | 5.800% | 3/15/18 | 425 | 495 |
| ACE INA Holdings Inc. | 5.900% | 6/15/19 | 785 | 934 |
| ACE INA Holdings Inc. | 6.700% | 5/15/36 | 400 | 519 |
| AEGON Funding Co. LLC | 5.750% | 12/15/20 | 3,016 | 3,138 |
| Aegon NV | 4.750% | 6/1/13 | 800 | 819 |
| Aetna Inc. | 6.000% | 6/15/16 | 6,675 | 7,691 |
| Aetna Inc. | 4.125% | 6/1/21 | 2,230 | 2,327 |
| Aetna Inc. | 6.625% | 6/15/36 | 3,100 | 3,819 |
| Aetna Inc. | 6.750% | 12/15/37 | 925 | 1,158 |
| Aflac Inc. | 8.500% | 5/15/19 | 1,425 | 1,751 |
| Aflac Inc. | 6.900% | 12/17/39 | 2,450 | 2,738 |
| Aflac Inc. | 6.450% | 8/15/40 | 1,050 | 1,109 |
| Alleghany Corp. | 5.625% | 9/15/20 | 1,000 | 1,047 |
| Allied World Assurance Co. Ltd. | 7.500% | 8/1/16 | 6,875 | 7,787 |
| Allstate Corp. | 6.200% | 5/16/14 | 895 | 998 |
| Allstate Corp. | 5.000% | 8/15/14 | 3,325 | 3,600 |
| Allstate Corp. | 7.450% | 5/16/19 | 3,230 | 3,963 |
| Allstate Corp. | 6.125% | 12/15/32 | 950 | 1,078 |
| Allstate Corp. | 5.350% | 6/1/33 | 225 | 233 |
| Allstate Corp. | 5.550% | 5/9/35 | 1,370 | 1,459 |
| Allstate Corp. | 5.950% | 4/1/36 | 1,000 | 1,121 |
| Allstate Corp. | 6.900% | 5/15/38 | 2,655 | 3,288 |
| 4 Allstate Corp. | 6.500% | 5/15/57 | 1,625 | 1,471 |
| 4 Allstate Corp. | 6.125% | 5/15/67 | 1,500 | 1,369 |
| Allstate Life Global Funding Trusts | 5.375% | 4/30/13 | 2,240 | 2,365 |
| Alterra Finance LLC | 6.250% | 9/30/20 | 815 | 858 |
| American Financial Group Inc. | 9.875% | 6/15/19 | 775 | 909 |
| American International Group Inc. | 4.250% | 5/15/13 | 3,550 | 3,546 |
| American International Group Inc. | 4.250% | 9/15/14 | 3,640 | 3,536 |
| American International Group Inc. | 5.050% | 10/1/15 | 4,775 | 4,626 |
| American International Group Inc. | 4.875% | 9/15/16 | 3,200 | 3,022 |
| American International Group Inc. | 5.600% | 10/18/16 | 1,150 | 1,117 |
| American International Group Inc. | 5.450% | 5/18/17 | 2,815 | 2,698 |
| American International Group Inc. | 5.850% | 1/16/18 | 3,300 | 3,212 |
| American International Group Inc. | 8.250% | 8/15/18 | 2,130 | 2,260 |
| American International Group Inc. | 6.400% | 12/15/20 | 7,015 | 7,068 |
| American International Group Inc. | 6.250% | 5/1/36 | 6,500 | 5,917 |
| American International Group Inc. | 6.250% | 3/15/37 | 5,348 | 3,877 |
| 7 American International Group Inc. | 6.820% | 11/15/37 | 1,107 | 1,067 |
| 4 American International Group Inc. | 8.175% | 5/15/68 | 12,340 | 11,137 |
| AON Corp. | 3.500% | 9/30/15 | 2,025 | 2,081 |
| AON Corp. | 5.000% | 9/30/20 | 3,870 | 4,264 |
| AON Corp. | 8.205% | 1/1/27 | 325 | 376 |
| AON Corp. | 6.250% | 9/30/40 | 2,125 | 2,593 |
| Arch Capital Group Ltd. | 7.350% | 5/1/34 | 1,175 | 1,381 |
| Aspen Insurance Holdings Ltd. | 6.000% | 12/15/20 | 4,250 | 4,286 |
| Assurant Inc. | 5.625% | 2/15/14 | 625 | 653 |
| Assurant Inc. | 6.750% | 2/15/34 | 3,825 | 3,980 |
| AXA SA | 8.600% | 12/15/30 | 7,170 | 7,055 |
| Axis Capital Holdings Ltd. | 5.750% | 12/1/14 | 725 | 762 |
| Axis Specialty Finance LLC | 5.875% | 6/1/20 | 5,300 | 5,458 |
| Berkshire Hathaway Finance Corp. | 4.600% | 5/15/13 | 3,775 | 3,961 |
| Berkshire Hathaway Finance Corp. | 5.000% | 8/15/13 | 5,850 | 6,214 |
| Berkshire Hathaway Finance Corp. | 4.850% | 1/15/15 | 1,050 | 1,162 |
36
| Total Bond Market II Index Fund | ||||
| Face | Market | |||
| Maturity | Amount | Value | ||
| Coupon | Date | ($000) | ($000) | |
| Berkshire Hathaway Finance Corp. | 2.450% | 12/15/15 | 2,050 | 2,121 |
| Berkshire Hathaway Finance Corp. | 5.400% | 5/15/18 | 5,670 | 6,607 |
| Berkshire Hathaway Finance Corp. | 4.250% | 1/15/21 | 5,620 | 6,090 |
| Berkshire Hathaway Finance Corp. | 5.750% | 1/15/40 | 145 | 172 |
| Berkshire Hathaway Inc. | 2.125% | 2/11/13 | 2,485 | 2,524 |
| Berkshire Hathaway Inc. | 3.200% | 2/11/15 | 3,700 | 3,920 |
| Berkshire Hathaway Inc. | 2.200% | 8/15/16 | 20,370 | 21,011 |
| Chubb Corp. | 5.200% | 4/1/13 | 425 | 446 |
| Chubb Corp. | 5.750% | 5/15/18 | 940 | 1,104 |
| Chubb Corp. | 6.000% | 5/11/37 | 2,900 | 3,468 |
| 4 Chubb Corp. | 6.375% | 3/29/67 | 6,065 | 5,989 |
| CIGNA Corp. | 2.750% | 11/15/16 | 2,005 | 2,001 |
| CIGNA Corp. | 5.125% | 6/15/20 | 875 | 943 |
| CIGNA Corp. | 4.375% | 12/15/20 | 200 | 204 |
| CIGNA Corp. | 4.500% | 3/15/21 | 1,090 | 1,117 |
| CIGNA Corp. | 4.000% | 2/15/22 | 1,385 | 1,372 |
| CIGNA Corp. | 7.875% | 5/15/27 | 425 | 525 |
| CIGNA Corp. | 6.150% | 11/15/36 | 4,484 | 4,893 |
| CIGNA Corp. | 5.875% | 3/15/41 | 1,865 | 1,979 |
| CIGNA Corp. | 5.375% | 2/15/42 | 1,585 | 1,585 |
| Cincinnati Financial Corp. | 6.920% | 5/15/28 | 4,325 | 4,748 |
| CNA Financial Corp. | 5.850% | 12/15/14 | 2,000 | 2,108 |
| CNA Financial Corp. | 6.500% | 8/15/16 | 1,750 | 1,895 |
| CNA Financial Corp. | 7.350% | 11/15/19 | 1,840 | 2,049 |
| CNA Financial Corp. | 5.875% | 8/15/20 | 1,805 | 1,866 |
| CNA Financial Corp. | 5.750% | 8/15/21 | 6,140 | 6,263 |
| Coventry Health Care Inc. | 6.300% | 8/15/14 | 3,850 | 4,181 |
| Coventry Health Care Inc. | 5.950% | 3/15/17 | 1,800 | 2,025 |
| Coventry Health Care Inc. | 5.450% | 6/15/21 | 1,985 | 2,197 |
| Endurance Specialty Holdings Ltd. | 7.000% | 7/15/34 | 4,729 | 4,774 |
| Genworth Financial Inc. | 5.750% | 6/15/14 | 300 | 305 |
| Genworth Financial Inc. | 4.950% | 10/1/15 | 825 | 780 |
| Genworth Financial Inc. | 8.625% | 12/15/16 | 4,125 | 4,197 |
| Genworth Financial Inc. | 6.515% | 5/22/18 | 350 | 322 |
| Genworth Financial Inc. | 7.700% | 6/15/20 | 535 | 504 |
| Genworth Financial Inc. | 7.625% | 9/24/21 | 500 | 460 |
| Genworth Financial Inc. | 6.500% | 6/15/34 | 3,575 | 2,806 |
| Hartford Financial Services Group Inc. | 4.625% | 7/15/13 | 625 | 640 |
| Hartford Financial Services Group Inc. | 5.500% | 10/15/16 | 975 | 1,010 |
| Hartford Financial Services Group Inc. | 5.375% | 3/15/17 | 900 | 901 |
| Hartford Financial Services Group Inc. | 6.300% | 3/15/18 | 3,150 | 3,301 |
| Hartford Financial Services Group Inc. | 6.000% | 1/15/19 | 425 | 436 |
| Hartford Financial Services Group Inc. | 5.500% | 3/30/20 | 295 | 294 |
| Hartford Financial Services Group Inc. | 5.950% | 10/15/36 | 550 | 505 |
| Hartford Financial Services Group Inc. | 6.100% | 10/1/41 | 1,775 | 1,644 |
| HCC Insurance Holdings Inc. | 6.300% | 11/15/19 | 1,600 | 1,745 |
| Humana Inc. | 7.200% | 6/15/18 | 100 | 118 |
| Humana Inc. | 6.300% | 8/1/18 | 150 | 169 |
| Humana Inc. | 8.150% | 6/15/38 | 2,500 | 3,247 |
| Jefferson-Pilot Corp. | 4.750% | 1/30/14 | 275 | 285 |
| Lincoln National Corp. | 4.300% | 6/15/15 | 1,619 | 1,681 |
| Lincoln National Corp. | 8.750% | 7/1/19 | 900 | 1,088 |
| Lincoln National Corp. | 6.250% | 2/15/20 | 1,745 | 1,884 |
| Lincoln National Corp. | 6.150% | 4/7/36 | 3,450 | 3,505 |
| Lincoln National Corp. | 7.000% | 6/15/40 | 1,285 | 1,445 |
37
| Total Bond Market II Index Fund | ||||
| Face | Market | |||
| Maturity | Amount | Value | ||
| Coupon | Date | ($000) | ($000) | |
| 4 Lincoln National Corp. | 7.000% | 5/17/66 | 6,985 | 6,321 |
| Loews Corp. | 5.250% | 3/15/16 | 950 | 1,047 |
| Loews Corp. | 6.000% | 2/1/35 | 200 | 218 |
| Manulife Financial Corp. | 3.400% | 9/17/15 | 3,875 | 3,894 |
| Manulife Financial Corp. | 4.900% | 9/17/20 | 4,875 | 5,004 |
| Markel Corp. | 7.125% | 9/30/19 | 825 | 946 |
| Marsh & McLennan Cos. Inc. | 4.850% | 2/15/13 | 2,229 | 2,302 |
| Marsh & McLennan Cos. Inc. | 5.750% | 9/15/15 | 56 | 62 |
| Marsh & McLennan Cos. Inc. | 9.250% | 4/15/19 | 5,962 | 7,886 |
| Marsh & McLennan Cos. Inc. | 4.800% | 7/15/21 | 2,265 | 2,477 |
| Marsh & McLennan Cos. Inc. | 5.875% | 8/1/33 | 100 | 110 |
| 7 Massachusetts Mutual Life Insurance Co. | 8.875% | 6/1/39 | 575 | 840 |
| MetLife Inc. | 5.000% | 11/24/13 | 1,275 | 1,359 |
| MetLife Inc. | 2.375% | 2/6/14 | 7,420 | 7,523 |
| MetLife Inc. | 5.000% | 6/15/15 | 2,245 | 2,437 |
| MetLife Inc. | 6.750% | 6/1/16 | 895 | 1,033 |
| MetLife Inc. | 6.817% | 8/15/18 | 895 | 1,061 |
| MetLife Inc. | 7.717% | 2/15/19 | 1,570 | 1,964 |
| MetLife Inc. | 4.750% | 2/8/21 | 3,895 | 4,199 |
| MetLife Inc. | 6.375% | 6/15/34 | 1,770 | 2,090 |
| MetLife Inc. | 5.875% | 2/6/41 | 6,745 | 7,789 |
| 4 MetLife Inc. | 6.400% | 12/15/66 | 5,235 | 4,941 |
| 7 Metropolitan Life Global Funding I | 5.125% | 6/10/14 | 5,225 | 5,617 |
| 4 Nationwide Financial Services Inc. | 6.750% | 5/15/67 | 200 | 172 |
| OneBeacon US Holdings Inc. | 5.875% | 5/15/13 | 215 | 222 |
| PartnerRe Finance B LLC | 5.500% | 6/1/20 | 8,508 | 8,617 |
| Principal Financial Group Inc. | 7.875% | 5/15/14 | 1,525 | 1,704 |
| Principal Financial Group Inc. | 8.875% | 5/15/19 | 590 | 732 |
| Principal Financial Group Inc. | 6.050% | 10/15/36 | 1,825 | 1,928 |
| Principal Life Income Funding Trusts | 5.300% | 4/24/13 | 1,825 | 1,915 |
| Principal Life Income Funding Trusts | 5.100% | 4/15/14 | 1,250 | 1,332 |
| Progressive Corp. | 3.750% | 8/23/21 | 855 | 888 |
| Progressive Corp. | 6.625% | 3/1/29 | 1,300 | 1,627 |
| Progressive Corp. | 6.250% | 12/1/32 | 100 | 123 |
| 4 Progressive Corp. | 6.700% | 6/15/67 | 3,100 | 3,131 |
| Protective Life Corp. | 7.375% | 10/15/19 | 950 | 1,053 |
| Protective Life Corp. | 8.450% | 10/15/39 | 900 | 1,036 |
| Prudential Financial Inc. | 2.750% | 1/14/13 | 1,860 | 1,889 |
| Prudential Financial Inc. | 5.150% | 1/15/13 | 1,830 | 1,897 |
| Prudential Financial Inc. | 4.500% | 7/15/13 | 1,825 | 1,892 |
| Prudential Financial Inc. | 4.750% | 4/1/14 | 650 | 685 |
| Prudential Financial Inc. | 5.100% | 9/20/14 | 6,080 | 6,550 |
| Prudential Financial Inc. | 6.200% | 1/15/15 | 2,750 | 3,004 |
| Prudential Financial Inc. | 4.750% | 9/17/15 | 5,750 | 6,081 |
| Prudential Financial Inc. | 5.500% | 3/15/16 | 175 | 190 |
| Prudential Financial Inc. | 3.000% | 5/12/16 | 1,650 | 1,644 |
| Prudential Financial Inc. | 6.000% | 12/1/17 | 1,550 | 1,721 |
| Prudential Financial Inc. | 7.375% | 6/15/19 | 795 | 945 |
| Prudential Financial Inc. | 5.375% | 6/21/20 | 1,345 | 1,429 |
| Prudential Financial Inc. | 5.750% | 7/15/33 | 1,280 | 1,284 |
| Prudential Financial Inc. | 5.400% | 6/13/35 | 2,775 | 2,660 |
| Prudential Financial Inc. | 5.900% | 3/17/36 | 2,300 | 2,337 |
| Prudential Financial Inc. | 5.700% | 12/14/36 | 6,370 | 6,325 |
| Prudential Financial Inc. | 6.625% | 12/1/37 | 6,050 | 6,566 |
| Prudential Financial Inc. | 5.625% | 5/12/41 | 1,745 | 1,684 |
38
| Total Bond Market II Index Fund | ||||
| Face | Market | |||
| Maturity | Amount | Value | ||
| Coupon | Date | ($000) | ($000) | |
| 4 Reinsurance Group of America Inc. | 6.750% | 12/15/65 | 5,675 | 4,881 |
| Swiss Re Solutions Holding Corp. | 6.450% | 3/1/19 | 675 | 749 |
| Swiss Re Solutions Holding Corp. | 7.000% | 2/15/26 | 1,225 | 1,374 |
| Swiss Re Solutions Holding Corp. | 7.750% | 6/15/30 | 4,075 | 5,094 |
| Torchmark Corp. | 6.375% | 6/15/16 | 1,225 | 1,343 |
| Transatlantic Holdings Inc. | 8.000% | 11/30/39 | 4,425 | 5,009 |
| Travelers Cos. Inc. | 5.500% | 12/1/15 | 3,815 | 4,283 |
| Travelers Cos. Inc. | 6.250% | 6/20/16 | 1,100 | 1,291 |
| Travelers Cos. Inc. | 5.750% | 12/15/17 | 1,375 | 1,617 |
| Travelers Cos. Inc. | 5.800% | 5/15/18 | 965 | 1,134 |
| Travelers Cos. Inc. | 3.900% | 11/1/20 | 2,170 | 2,290 |
| Travelers Cos. Inc. | 6.250% | 6/15/37 | 6,010 | 7,590 |
| Travelers Cos. Inc. | 5.350% | 11/1/40 | 4,245 | 4,920 |
| Travelers Property Casualty Corp. | 6.375% | 3/15/33 | 100 | 123 |
| UnitedHealth Group Inc. | 4.875% | 2/15/13 | 975 | 1,017 |
| UnitedHealth Group Inc. | 4.875% | 4/1/13 | 975 | 1,022 |
| UnitedHealth Group Inc. | 5.000% | 8/15/14 | 4,900 | 5,343 |
| UnitedHealth Group Inc. | 4.875% | 3/15/15 | 875 | 967 |
| UnitedHealth Group Inc. | 1.875% | 11/15/16 | 325 | 326 |
| UnitedHealth Group Inc. | 6.000% | 6/15/17 | 1,825 | 2,150 |
| UnitedHealth Group Inc. | 6.000% | 2/15/18 | 340 | 403 |
| UnitedHealth Group Inc. | 3.875% | 10/15/20 | 5,000 | 5,312 |
| UnitedHealth Group Inc. | 4.700% | 2/15/21 | 835 | 938 |
| UnitedHealth Group Inc. | 3.375% | 11/15/21 | 145 | 150 |
| UnitedHealth Group Inc. | 5.800% | 3/15/36 | 4,525 | 5,369 |
| UnitedHealth Group Inc. | 6.500% | 6/15/37 | 625 | 788 |
| UnitedHealth Group Inc. | 6.625% | 11/15/37 | 1,425 | 1,827 |
| UnitedHealth Group Inc. | 6.875% | 2/15/38 | 7,620 | 10,276 |
| UnitedHealth Group Inc. | 5.950% | 2/15/41 | 250 | 307 |
| UnitedHealth Group Inc. | 4.625% | 11/15/41 | 75 | 79 |
| Unum Group | 7.125% | 9/30/16 | 1,250 | 1,428 |
| Unum Group | 5.625% | 9/15/20 | 825 | 856 |
| Validus Holdings Ltd. | 8.875% | 1/26/40 | 1,150 | 1,250 |
| WellPoint Inc. | 6.000% | 2/15/14 | 550 | 599 |
| WellPoint Inc. | 5.000% | 12/15/14 | 4,650 | 5,071 |
| WellPoint Inc. | 5.250% | 1/15/16 | 1,710 | 1,916 |
| WellPoint Inc. | 5.875% | 6/15/17 | 7,450 | 8,623 |
| WellPoint Inc. | 7.000% | 2/15/19 | 655 | 795 |
| WellPoint Inc. | 3.700% | 8/15/21 | 205 | 209 |
| WellPoint Inc. | 5.950% | 12/15/34 | 3,050 | 3,594 |
| WellPoint Inc. | 5.850% | 1/15/36 | 2,400 | 2,805 |
| WellPoint Inc. | 6.375% | 6/15/37 | 620 | 776 |
| Willis Group Holdings plc | 4.125% | 3/15/16 | 3,775 | 3,809 |
| Willis Group Holdings plc | 5.750% | 3/15/21 | 5,710 | 6,097 |
| Willis North America Inc. | 5.625% | 7/15/15 | 2,200 | 2,332 |
| Willis North America Inc. | 6.200% | 3/28/17 | 1,125 | 1,236 |
| Willis North America Inc. | 7.000% | 9/29/19 | 150 | 167 |
| WR Berkley Corp. | 5.375% | 9/15/20 | 375 | 383 |
| XL Group plc | 5.250% | 9/15/14 | 350 | 370 |
| XL Group plc | 6.375% | 11/15/24 | 175 | 183 |
| XL Group plc | 6.250% | 5/15/27 | 1,392 | 1,416 |
| XLIT Ltd. | 5.750% | 10/1/21 | 6,805 | 7,206 |
39
| Total Bond Market II Index Fund | ||||
| Face | Market | |||
| Maturity | Amount | Value | ||
| Coupon | Date | ($000) | ($000) | |
| Other Finance (0.0%) | ||||
| CME Group Inc. | 5.400% | 8/1/13 | 2,900 | 3,096 |
| CME Group Inc. | 5.750% | 2/15/14 | 1,075 | 1,173 |
| NASDAQ OMX Group Inc. | 4.000% | 1/15/15 | 1,275 | 1,310 |
| NASDAQ OMX Group Inc. | 5.550% | 1/15/20 | 3,800 | 3,879 |
| NYSE Euronext | 4.800% | 6/28/13 | 2,090 | 2,197 |
| ORIX Corp. | 4.710% | 4/27/15 | 2,500 | 2,580 |
| ORIX Corp. | 5.000% | 1/12/16 | 2,340 | 2,455 |
| XTRA Finance Corp. | 5.150% | 4/1/17 | 4,525 | 5,031 |
| Real Estate Investment Trusts (0.4%) | ||||
| Arden Realty LP | 5.250% | 3/1/15 | 250 | 266 |
| AvalonBay Communities Inc. | 5.750% | 9/15/16 | 275 | 311 |
| Boston Properties LP | 5.625% | 4/15/15 | 1,375 | 1,515 |
| Boston Properties LP | 5.625% | 11/15/20 | 4,500 | 5,013 |
| Boston Properties LP | 4.125% | 5/15/21 | 2,210 | 2,232 |
| Brandywine Operating Partnership LP | 5.400% | 11/1/14 | 875 | 908 |
| Brandywine Operating Partnership LP | 7.500% | 5/15/15 | 1,400 | 1,538 |
| Brandywine Operating Partnership LP | 6.000% | 4/1/16 | 5,630 | 5,890 |
| Brandywine Operating Partnership LP | 5.700% | 5/1/17 | 275 | 285 |
| Brandywine Operating Partnership LP | 4.950% | 4/15/18 | 4,250 | 4,195 |
| CommonWealth REIT | 6.250% | 8/15/16 | 575 | 612 |
| CommonWealth REIT | 6.250% | 6/15/17 | 1,725 | 1,828 |
| CommonWealth REIT | 5.875% | 9/15/20 | 1,300 | 1,326 |
| Digital Realty Trust LP | 4.500% | 7/15/15 | 4,550 | 4,638 |
| Digital Realty Trust LP | 5.250% | 3/15/21 | 4,965 | 4,976 |
| Duke Realty LP | 6.250% | 5/15/13 | 2,350 | 2,458 |
| Duke Realty LP | 7.375% | 2/15/15 | 3,675 | 4,056 |
| Duke Realty LP | 5.950% | 2/15/17 | 1,300 | 1,397 |
| Duke Realty LP | 8.250% | 8/15/19 | 875 | 1,039 |
| Duke Realty LP | 6.750% | 3/15/20 | 275 | 303 |
| ERP Operating LP | 5.250% | 9/15/14 | 1,350 | 1,431 |
| ERP Operating LP | 5.125% | 3/15/16 | 3,050 | 3,274 |
| ERP Operating LP | 5.375% | 8/1/16 | 975 | 1,062 |
| ERP Operating LP | 5.750% | 6/15/17 | 550 | 610 |
| ERP Operating LP | 4.750% | 7/15/20 | 385 | 398 |
| ERP Operating LP | 4.625% | 12/15/21 | 1,760 | 1,809 |
| HCP Inc. | 5.650% | 12/15/13 | 2,225 | 2,345 |
| HCP Inc. | 2.700% | 2/1/14 | 1,205 | 1,202 |
| HCP Inc. | 3.750% | 2/1/16 | 11,855 | 12,076 |
| HCP Inc. | 6.300% | 9/15/16 | 950 | 1,038 |
| HCP Inc. | 5.375% | 2/1/21 | 3,690 | 3,856 |
| HCP Inc. | 6.750% | 2/1/41 | 1,675 | 1,886 |
| Health Care REIT Inc. | 6.000% | 11/15/13 | 525 | 552 |
| Health Care REIT Inc. | 3.625% | 3/15/16 | 175 | 172 |
| Health Care REIT Inc. | 6.200% | 6/1/16 | 3,250 | 3,481 |
| Health Care REIT Inc. | 6.125% | 4/15/20 | 350 | 364 |
| Health Care REIT Inc. | 4.950% | 1/15/21 | 8,915 | 8,540 |
| Health Care REIT Inc. | 5.250% | 1/15/22 | 175 | 171 |
| Health Care REIT Inc. | 6.500% | 3/15/41 | 175 | 174 |
| Healthcare Realty Trust Inc. | 6.500% | 1/17/17 | 1,600 | 1,724 |
| Healthcare Realty Trust Inc. | 5.750% | 1/15/21 | 1,205 | 1,220 |
| Hospitality Properties Trust | 7.875% | 8/15/14 | 1,375 | 1,493 |
| Hospitality Properties Trust | 5.125% | 2/15/15 | 1,775 | 1,804 |
| Hospitality Properties Trust | 5.625% | 3/15/17 | 2,000 | 2,026 |
40
| Total Bond Market II Index Fund | ||||
| Face | Market | |||
| Maturity | Amount | Value | ||
| Coupon | Date | ($000) | ($000) | |
| Kilroy Realty LP | 5.000% | 11/3/15 | 3,100 | 3,214 |
| Kilroy Realty LP | 4.800% | 7/15/18 | 2,900 | 2,887 |
| Kimco Realty Corp. | 5.783% | 3/15/16 | 400 | 432 |
| Kimco Realty Corp. | 5.700% | 5/1/17 | 2,250 | 2,436 |
| Kimco Realty Corp. | 6.875% | 10/1/19 | 3,575 | 4,105 |
| Liberty Property LP | 5.125% | 3/2/15 | 3,200 | 3,398 |
| Liberty Property LP | 4.750% | 10/1/20 | 450 | 457 |
| Mack-Cali Realty LP | 7.750% | 8/15/19 | 675 | 802 |
| National Retail Properties Inc. | 6.875% | 10/15/17 | 2,700 | 2,986 |
| Nationwide Health Properties Inc. | 6.250% | 2/1/13 | 1,400 | 1,445 |
| ProLogis LP | 4.500% | 8/15/17 | 775 | 776 |
| ProLogis LP | 6.625% | 5/15/18 | 500 | 547 |
| ProLogis LP | 7.375% | 10/30/19 | 2,075 | 2,349 |
| ProLogis LP | 6.625% | 12/1/19 | 850 | 919 |
| ProLogis LP | 6.875% | 3/15/20 | 3,675 | 4,061 |
| Realty Income Corp. | 6.750% | 8/15/19 | 5,665 | 6,448 |
| Realty Income Corp. | 5.750% | 1/15/21 | 3,000 | 3,246 |
| Regency Centers LP | 5.250% | 8/1/15 | 625 | 667 |
| Senior Housing Properties Trust | 4.300% | 1/15/16 | 700 | 686 |
| Simon Property Group LP | 6.750% | 5/15/14 | 9,850 | 10,874 |
| Simon Property Group LP | 4.200% | 2/1/15 | 1,690 | 1,792 |
| Simon Property Group LP | 5.750% | 12/1/15 | 5,975 | 6,663 |
| Simon Property Group LP | 6.100% | 5/1/16 | 150 | 170 |
| Simon Property Group LP | 5.250% | 12/1/16 | 5,965 | 6,585 |
| Simon Property Group LP | 2.800% | 1/30/17 | 350 | 357 |
| Simon Property Group LP | 5.875% | 3/1/17 | 1,825 | 2,101 |
| Simon Property Group LP | 6.125% | 5/30/18 | 1,875 | 2,161 |
| Simon Property Group LP | 5.650% | 2/1/20 | 3,875 | 4,428 |
| Simon Property Group LP | 4.375% | 3/1/21 | 145 | 154 |
| Simon Property Group LP | 6.750% | 2/1/40 | 3,800 | 4,954 |
| Tanger Properties LP | 6.150% | 11/15/15 | 2,975 | 3,291 |
| UDR Inc. | 4.250% | 6/1/18 | 575 | 593 |
| Ventas Realty LP / Ventas Capital Corp. | 3.125% | 11/30/15 | 1,575 | 1,536 |
| Ventas Realty LP / Ventas Capital Corp. | 4.750% | 6/1/21 | 975 | 942 |
| 3,400,052 | ||||
| Industrial (11.2%) | ||||
| Basic Industry (1.0%) | ||||
| Agrium Inc. | 6.750% | 1/15/19 | 1,500 | 1,830 |
| Agrium Inc. | 6.125% | 1/15/41 | 275 | 333 |
| Air Products & Chemicals Inc. | 2.000% | 8/2/16 | 1,050 | 1,077 |
| Air Products & Chemicals Inc. | 3.000% | 11/3/21 | 2,485 | 2,521 |
| Airgas Inc. | 4.500% | 9/15/14 | 1,800 | 1,907 |
| Airgas Inc. | 3.250% | 10/1/15 | 1,075 | 1,107 |
| Albemarle Corp. | 4.500% | 12/15/20 | 450 | 479 |
| Alcoa Inc. | 6.000% | 7/15/13 | 1,525 | 1,624 |
| Alcoa Inc. | 5.550% | 2/1/17 | 590 | 631 |
| Alcoa Inc. | 6.750% | 7/15/18 | 100 | 110 |
| Alcoa Inc. | 6.150% | 8/15/20 | 13,315 | 13,783 |
| Alcoa Inc. | 5.400% | 4/15/21 | 2,125 | 2,136 |
| Alcoa Inc. | 5.870% | 2/23/22 | 550 | 555 |
| Alcoa Inc. | 5.900% | 2/1/27 | 7,450 | 7,337 |
| Alcoa Inc. | 6.750% | 1/15/28 | 8,030 | 8,185 |
| Alcoa Inc. | 5.950% | 2/1/37 | 440 | 415 |
| Allegheny Technologies Inc. | 9.375% | 6/1/19 | 2,975 | 3,726 |
| AngloGold Ashanti Holdings plc | 5.375% | 4/15/20 | 2,810 | 2,772 |
41
| Total Bond Market II Index Fund | ||||
| Face | Market | |||
| Maturity | Amount | Value | ||
| Coupon | Date | ($000) | ($000) | |
| AngloGold Ashanti Holdings plc | 6.500% | 4/15/40 | 875 | 844 |
| ArcelorMittal | 5.375% | 6/1/13 | 4,025 | 4,121 |
| ArcelorMittal | 9.000% | 2/15/15 | 2,825 | 3,120 |
| ArcelorMittal | 3.750% | 8/5/15 | 2,450 | 2,327 |
| ArcelorMittal | 3.750% | 3/1/16 | 4,725 | 4,487 |
| ArcelorMittal | 6.125% | 6/1/18 | 3,000 | 3,047 |
| ArcelorMittal | 9.850% | 6/1/19 | 6,700 | 7,410 |
| ArcelorMittal | 5.250% | 8/5/20 | 2,500 | 2,269 |
| ArcelorMittal | 5.500% | 3/1/21 | 9,550 | 8,751 |
| ArcelorMittal | 7.000% | 10/15/39 | 8,000 | 7,383 |
| ArcelorMittal | 6.750% | 3/1/41 | 2,915 | 2,609 |
| Barrick Gold Corp. | 2.900% | 5/30/16 | 730 | 753 |
| Barrick Gold Corp. | 6.950% | 4/1/19 | 200 | 245 |
| Barrick Gold Finance Co. | 4.875% | 11/15/14 | 400 | 436 |
| Barrick Gold Financeco LLC | 6.125% | 9/15/13 | 2,275 | 2,460 |
| Barrick North America Finance LLC | 6.800% | 9/15/18 | 6,150 | 7,401 |
| Barrick North America Finance LLC | 4.400% | 5/30/21 | 2,135 | 2,309 |
| Barrick North America Finance LLC | 5.700% | 5/30/41 | 1,625 | 1,919 |
| Barrick PD Australia Finance Pty Ltd. | 5.950% | 10/15/39 | 8,744 | 10,167 |
| BHP Billiton Finance USA Ltd. | 5.500% | 4/1/14 | 5,125 | 5,623 |
| BHP Billiton Finance USA Ltd. | 1.125% | 11/21/14 | 6,625 | 6,647 |
| BHP Billiton Finance USA Ltd. | 5.250% | 12/15/15 | 5,000 | 5,735 |
| BHP Billiton Finance USA Ltd. | 1.875% | 11/21/16 | 2,800 | 2,829 |
| BHP Billiton Finance USA Ltd. | 5.400% | 3/29/17 | 350 | 407 |
| BHP Billiton Finance USA Ltd. | 6.500% | 4/1/19 | 4,390 | 5,400 |
| BHP Billiton Finance USA Ltd. | 3.250% | 11/21/21 | 650 | 668 |
| Carpenter Technology Corp. | 5.200% | 7/15/21 | 5,425 | 5,291 |
| Celulosa Arauco y Constitucion SA | 5.125% | 7/9/13 | 325 | 339 |
| Celulosa Arauco y Constitucion SA | 5.625% | 4/20/15 | 1,000 | 1,083 |
| Celulosa Arauco y Constitucion SA | 7.250% | 7/29/19 | 800 | 945 |
| Celulosa Arauco y Constitucion SA | 5.000% | 1/21/21 | 2,800 | 2,819 |
| Cliffs Natural Resources Inc. | 5.900% | 3/15/20 | 350 | 375 |
| Cliffs Natural Resources Inc. | 4.875% | 4/1/21 | 5,840 | 5,882 |
| Cytec Industries Inc. | 8.950% | 7/1/17 | 550 | 659 |
| Dow Chemical Co. | 7.600% | 5/15/14 | 4,375 | 4,933 |
| Dow Chemical Co. | 5.900% | 2/15/15 | 12,300 | 13,654 |
| Dow Chemical Co. | 2.500% | 2/15/16 | 2,175 | 2,187 |
| Dow Chemical Co. | 8.550% | 5/15/19 | 590 | 768 |
| Dow Chemical Co. | 4.250% | 11/15/20 | 9,465 | 9,842 |
| Dow Chemical Co. | 4.125% | 11/15/21 | 1,415 | 1,461 |
| Dow Chemical Co. | 7.375% | 11/1/29 | 1,500 | 1,904 |
| Dow Chemical Co. | 9.400% | 5/15/39 | 5,865 | 8,772 |
| Dow Chemical Co. | 5.250% | 11/15/41 | 4,125 | 4,347 |
| Eastman Chemical Co. | 3.000% | 12/15/15 | 4,600 | 4,711 |
| Ecolab Inc. | 2.375% | 12/8/14 | 1,400 | 1,413 |
| Ecolab Inc. | 3.000% | 12/8/16 | 1,875 | 1,946 |
| Ecolab Inc. | 5.500% | 12/8/41 | 1,500 | 1,680 |
| EI du Pont de Nemours & Co. | 5.000% | 1/15/13 | 1,509 | 1,576 |
| EI du Pont de Nemours & Co. | 5.000% | 7/15/13 | 2,375 | 2,531 |
| EI du Pont de Nemours & Co. | 1.750% | 3/25/14 | 1,500 | 1,536 |
| EI du Pont de Nemours & Co. | 3.250% | 1/15/15 | 425 | 455 |
| EI du Pont de Nemours & Co. | 2.750% | 4/1/16 | 1,600 | 1,698 |
| EI du Pont de Nemours & Co. | 5.250% | 12/15/16 | 1,330 | 1,556 |
| EI du Pont de Nemours & Co. | 6.000% | 7/15/18 | 11,240 | 13,764 |
| EI du Pont de Nemours & Co. | 4.625% | 1/15/20 | 1,625 | 1,864 |
42
| Total Bond Market II Index Fund | ||||
| Face | Market | |||
| Maturity | Amount | Value | ||
| Coupon | Date | ($000) | ($000) | |
| EI du Pont de Nemours & Co. | 3.625% | 1/15/21 | 3,190 | 3,471 |
| EI du Pont de Nemours & Co. | 4.250% | 4/1/21 | 950 | 1,076 |
| EI du Pont de Nemours & Co. | 6.500% | 1/15/28 | 525 | 685 |
| EI du Pont de Nemours & Co. | 4.900% | 1/15/41 | 2,500 | 2,845 |
| FMC Corp. | 3.950% | 2/1/22 | 1,275 | 1,292 |
| Freeport-McMoRan Copper & Gold Inc. | 8.375% | 4/1/17 | 5,425 | 5,744 |
| Georgia-Pacific LLC | 8.875% | 5/15/31 | 2,375 | 3,261 |
| ICI Wilmington Inc. | 5.625% | 12/1/13 | 200 | 212 |
| International Paper Co. | 5.300% | 4/1/15 | 1,600 | 1,734 |
| International Paper Co. | 7.950% | 6/15/18 | 7,465 | 9,065 |
| International Paper Co. | 9.375% | 5/15/19 | 1,800 | 2,333 |
| International Paper Co. | 7.500% | 8/15/21 | 5,190 | 6,404 |
| International Paper Co. | 7.300% | 11/15/39 | 3,145 | 3,791 |
| Lubrizol Corp. | 5.500% | 10/1/14 | 2,100 | 2,336 |
| Lubrizol Corp. | 8.875% | 2/1/19 | 1,075 | 1,481 |
| Monsanto Co. | 5.125% | 4/15/18 | 850 | 984 |
| Monsanto Co. | 5.875% | 4/15/38 | 4,300 | 5,542 |
| Mosaic Co. | 4.875% | 11/15/41 | 45 | 46 |
| Newmont Mining Corp. | 5.125% | 10/1/19 | 1,000 | 1,104 |
| Newmont Mining Corp. | 5.875% | 4/1/35 | 750 | 848 |
| Newmont Mining Corp. | 6.250% | 10/1/39 | 3,275 | 3,883 |
| Nucor Corp. | 5.000% | 6/1/13 | 100 | 106 |
| Nucor Corp. | 5.750% | 12/1/17 | 840 | 989 |
| Nucor Corp. | 5.850% | 6/1/18 | 1,725 | 2,058 |
| Nucor Corp. | 4.125% | 9/15/22 | 300 | 321 |
| Nucor Corp. | 6.400% | 12/1/37 | 1,875 | 2,478 |
| Placer Dome Inc. | 6.450% | 10/15/35 | 1,050 | 1,273 |
| Plum Creek Timberlands LP | 5.875% | 11/15/15 | 1,250 | 1,373 |
| Plum Creek Timberlands LP | 4.700% | 3/15/21 | 1,345 | 1,352 |
| Potash Corp. of Saskatchewan Inc. | 4.875% | 3/1/13 | 1,050 | 1,097 |
| Potash Corp. of Saskatchewan Inc. | 3.750% | 9/30/15 | 2,000 | 2,150 |
| Potash Corp. of Saskatchewan Inc. | 3.250% | 12/1/17 | 1,200 | 1,253 |
| Potash Corp. of Saskatchewan Inc. | 6.500% | 5/15/19 | 1,077 | 1,339 |
| Potash Corp. of Saskatchewan Inc. | 4.875% | 3/30/20 | 8,065 | 9,238 |
| Potash Corp. of Saskatchewan Inc. | 5.875% | 12/1/36 | 200 | 244 |
| Potash Corp. of Saskatchewan Inc. | 5.625% | 12/1/40 | 375 | 452 |
| PPG Industries Inc. | 5.750% | 3/15/13 | 1,050 | 1,107 |
| PPG Industries Inc. | 1.900% | 1/15/16 | 3,625 | 3,621 |
| PPG Industries Inc. | 6.650% | 3/15/18 | 1,950 | 2,353 |
| PPG Industries Inc. | 5.500% | 11/15/40 | 4,200 | 4,820 |
| Praxair Inc. | 3.950% | 6/1/13 | 200 | 209 |
| Praxair Inc. | 4.375% | 3/31/14 | 825 | 885 |
| Praxair Inc. | 5.250% | 11/15/14 | 2,000 | 2,242 |
| Praxair Inc. | 4.625% | 3/30/15 | 5,435 | 5,995 |
| Praxair Inc. | 5.200% | 3/15/17 | 325 | 376 |
| Praxair Inc. | 4.500% | 8/15/19 | 1,800 | 2,044 |
| Praxair Inc. | 3.000% | 9/1/21 | 2,225 | 2,276 |
| Reliance Steel & Aluminum Co. | 6.200% | 11/15/16 | 100 | 107 |
| Reliance Steel & Aluminum Co. | 6.850% | 11/15/36 | 100 | 104 |
| Rio Tinto Alcan Inc. | 4.500% | 5/15/13 | 1,850 | 1,929 |
| Rio Tinto Alcan Inc. | 5.200% | 1/15/14 | 200 | 215 |
| Rio Tinto Alcan Inc. | 5.000% | 6/1/15 | 250 | 272 |
| Rio Tinto Alcan Inc. | 6.125% | 12/15/33 | 2,725 | 3,372 |
| Rio Tinto Alcan Inc. | 5.750% | 6/1/35 | 7,000 | 8,288 |
| Rio Tinto Finance USA Ltd. | 8.950% | 5/1/14 | 12,425 | 14,527 |
43
| Total Bond Market II Index Fund | ||||
| Face | Market | |||
| Maturity | Amount | Value | ||
| Coupon | Date | ($000) | ($000) | |
| Rio Tinto Finance USA Ltd. | 2.500% | 5/20/16 | 145 | 148 |
| Rio Tinto Finance USA Ltd. | 2.250% | 9/20/16 | 3,200 | 3,256 |
| Rio Tinto Finance USA Ltd. | 6.500% | 7/15/18 | 2,000 | 2,408 |
| Rio Tinto Finance USA Ltd. | 9.000% | 5/1/19 | 17,700 | 24,106 |
| Rio Tinto Finance USA Ltd. | 3.500% | 11/2/20 | 440 | 453 |
| Rio Tinto Finance USA Ltd. | 3.750% | 9/20/21 | 2,700 | 2,825 |
| Rio Tinto Finance USA Ltd. | 7.125% | 7/15/28 | 1,375 | 1,846 |
| Rio Tinto Finance USA Ltd. | 5.200% | 11/2/40 | 1,735 | 1,984 |
| Rohm & Haas Co. | 6.000% | 9/15/17 | 2,325 | 2,647 |
| RPM International Inc. | 6.125% | 10/15/19 | 650 | 706 |
| Sherwin-Williams Co. | 3.125% | 12/15/14 | 1,350 | 1,426 |
| Sigma-Aldrich Corp. | 3.375% | 11/1/20 | 600 | 628 |
| Southern Copper Corp. | 5.375% | 4/16/20 | 1,000 | 1,028 |
| Southern Copper Corp. | 7.500% | 7/27/35 | 6,525 | 7,061 |
| Southern Copper Corp. | 6.750% | 4/16/40 | 1,600 | 1,591 |
| Teck Resources Ltd. | 9.750% | 5/15/14 | 1,421 | 1,672 |
| Teck Resources Ltd. | 5.375% | 10/1/15 | 4,991 | 5,439 |
| Teck Resources Ltd. | 10.250% | 5/15/16 | 4,175 | 4,833 |
| Teck Resources Ltd. | 3.150% | 1/15/17 | 700 | 715 |
| Teck Resources Ltd. | 10.750% | 5/15/19 | 4,050 | 4,971 |
| Teck Resources Ltd. | 4.750% | 1/15/22 | 700 | 750 |
| Teck Resources Ltd. | 6.000% | 8/15/40 | 3,500 | 3,796 |
| Teck Resources Ltd. | 6.250% | 7/15/41 | 4,830 | 5,532 |
| Vale Canada Ltd. | 5.700% | 10/15/15 | 1,200 | 1,310 |
| Vale Canada Ltd. | 7.200% | 9/15/32 | 3,141 | 3,720 |
| Vale Overseas Ltd. | 6.250% | 1/11/16 | 2,240 | 2,499 |
| Vale Overseas Ltd. | 6.250% | 1/23/17 | 850 | 961 |
| Vale Overseas Ltd. | 5.625% | 9/15/19 | 5,550 | 6,096 |
| Vale Overseas Ltd. | 4.625% | 9/15/20 | 8,835 | 9,137 |
| Vale Overseas Ltd. | 8.250% | 1/17/34 | 800 | 1,031 |
| Vale Overseas Ltd. | 6.875% | 11/21/36 | 5,620 | 6,373 |
| Vale Overseas Ltd. | 6.875% | 11/10/39 | 10,040 | 11,528 |
| Valspar Corp. | 7.250% | 6/15/19 | 400 | 484 |
| WMC Finance USA Ltd. | 5.125% | 5/15/13 | 575 | 608 |
| Xstrata Canada Corp. | 5.375% | 6/1/15 | 100 | 109 |
| Xstrata Canada Corp. | 6.000% | 10/15/15 | 325 | 356 |
| Xstrata Canada Corp. | 5.500% | 6/15/17 | 1,975 | 2,146 |
| Capital Goods (1.1%) | ||||
| 3M Co. | 1.375% | 9/29/16 | 1,630 | 1,649 |
| 3M Co. | 6.375% | 2/15/28 | 1,300 | 1,743 |
| 3M Co. | 5.700% | 3/15/37 | 2,345 | 3,150 |
| Acuity Brands Lighting Inc. | 6.000% | 12/15/19 | 800 | 898 |
| 7 BAE Systems Holdings Inc. | 5.200% | 8/15/15 | 100 | 108 |
| Bemis Co. Inc. | 5.650% | 8/1/14 | 7,225 | 7,834 |
| Black & Decker Corp. | 8.950% | 4/15/14 | 2,300 | 2,654 |
| Black & Decker Corp. | 5.750% | 11/15/16 | 625 | 727 |
| Boeing Capital Corp. | 6.500% | 2/15/12 | 4,425 | 4,454 |
| Boeing Capital Corp. | 5.800% | 1/15/13 | 1,475 | 1,554 |
| Boeing Capital Corp. | 3.250% | 10/27/14 | 2,850 | 3,040 |
| Boeing Capital Corp. | 2.125% | 8/15/16 | 885 | 906 |
| Boeing Capital Corp. | 4.700% | 10/27/19 | 5,875 | 6,685 |
| Boeing Co. | 5.125% | 2/15/13 | 885 | 928 |
| Boeing Co. | 5.000% | 3/15/14 | 985 | 1,075 |
| Boeing Co. | 3.500% | 2/15/15 | 4,135 | 4,455 |
44
| Total Bond Market II Index Fund | ||||
| Face | Market | |||
| Maturity | Amount | Value | ||
| Coupon | Date | ($000) | ($000) | |
| Boeing Co. | 6.000% | 3/15/19 | 725 | 882 |
| Boeing Co. | 4.875% | 2/15/20 | 1,825 | 2,123 |
| Boeing Co. | 8.750% | 8/15/21 | 200 | 293 |
| Boeing Co. | 7.250% | 6/15/25 | 325 | 439 |
| Boeing Co. | 8.750% | 9/15/31 | 300 | 461 |
| Boeing Co. | 6.125% | 2/15/33 | 225 | 284 |
| Boeing Co. | 6.625% | 2/15/38 | 525 | 734 |
| Boeing Co. | 5.875% | 2/15/40 | 1,930 | 2,485 |
| Caterpillar Financial Services Corp. | 4.250% | 2/8/13 | 1,725 | 1,793 |
| Caterpillar Financial Services Corp. | 2.000% | 4/5/13 | 5,475 | 5,571 |
| Caterpillar Financial Services Corp. | 1.550% | 12/20/13 | 2,095 | 2,130 |
| Caterpillar Financial Services Corp. | 6.125% | 2/17/14 | 9,150 | 10,130 |
| Caterpillar Financial Services Corp. | 1.650% | 4/1/14 | 450 | 456 |
| Caterpillar Financial Services Corp. | 1.375% | 5/20/14 | 5,405 | 5,472 |
| Caterpillar Financial Services Corp. | 4.750% | 2/17/15 | 1,350 | 1,492 |
| Caterpillar Financial Services Corp. | 4.625% | 6/1/15 | 2,725 | 3,018 |
| Caterpillar Financial Services Corp. | 2.650% | 4/1/16 | 450 | 469 |
| Caterpillar Financial Services Corp. | 2.050% | 8/1/16 | 3,630 | 3,744 |
| Caterpillar Financial Services Corp. | 7.150% | 2/15/19 | 14,290 | 18,243 |
| Caterpillar Inc. | 1.375% | 5/27/14 | 1,200 | 1,213 |
| Caterpillar Inc. | 3.900% | 5/27/21 | 3,330 | 3,651 |
| Caterpillar Inc. | 6.625% | 7/15/28 | 200 | 262 |
| Caterpillar Inc. | 7.300% | 5/1/31 | 675 | 972 |
| Caterpillar Inc. | 6.050% | 8/15/36 | 3,991 | 5,172 |
| Caterpillar Inc. | 8.250% | 12/15/38 | 200 | 328 |
| Caterpillar Inc. | 5.200% | 5/27/41 | 3,385 | 4,068 |
| Caterpillar Inc. | 6.950% | 5/1/42 | 325 | 472 |
| Caterpillar Inc. | 7.375% | 3/1/97 | 1,825 | 2,662 |
| Cooper US Inc. | 5.450% | 4/1/15 | 950 | 1,062 |
| Cooper US Inc. | 2.375% | 1/15/16 | 3,575 | 3,654 |
| Cooper US Inc. | 3.875% | 12/15/20 | 200 | 212 |
| CRH America Inc. | 5.300% | 10/15/13 | 450 | 467 |
| CRH America Inc. | 4.125% | 1/15/16 | 3,800 | 3,805 |
| CRH America Inc. | 6.000% | 9/30/16 | 4,500 | 4,826 |
| CRH America Inc. | 8.125% | 7/15/18 | 3,275 | 3,745 |
| CRH America Inc. | 5.750% | 1/15/21 | 8,340 | 8,500 |
| Danaher Corp. | 2.300% | 6/23/16 | 1,800 | 1,865 |
| Danaher Corp. | 5.625% | 1/15/18 | 850 | 1,002 |
| Danaher Corp. | 3.900% | 6/23/21 | 1,000 | 1,093 |
| Deere & Co. | 6.950% | 4/25/14 | 3,925 | 4,475 |
| Deere & Co. | 5.375% | 10/16/29 | 3,695 | 4,660 |
| Deere & Co. | 8.100% | 5/15/30 | 1,525 | 2,313 |
| Dover Corp. | 4.875% | 10/15/15 | 2,225 | 2,517 |
| Dover Corp. | 5.450% | 3/15/18 | 2,250 | 2,653 |
| Dover Corp. | 4.300% | 3/1/21 | 830 | 933 |
| Dover Corp. | 5.375% | 10/15/35 | 100 | 121 |
| Dover Corp. | 6.600% | 3/15/38 | 975 | 1,379 |
| Dover Corp. | 5.375% | 3/1/41 | 895 | 1,098 |
| Eaton Corp. | 4.900% | 5/15/13 | 2,175 | 2,291 |
| Eaton Corp. | 5.600% | 5/15/18 | 5,855 | 6,943 |
| Embraer Overseas Ltd. | 6.375% | 1/24/17 | 4,450 | 4,795 |
| Embraer Overseas Ltd. | 6.375% | 1/15/20 | 575 | 613 |
| Emerson Electric Co. | 4.500% | 5/1/13 | 1,275 | 1,337 |
| Emerson Electric Co. | 5.125% | 12/1/16 | 2,125 | 2,478 |
| Emerson Electric Co. | 5.250% | 10/15/18 | 2,200 | 2,601 |
45
| Total Bond Market II Index Fund | ||||
| Face | Market | |||
| Maturity | Amount | Value | ||
| Coupon | Date | ($000) | ($000) | |
| Emerson Electric Co. | 4.875% | 10/15/19 | 2,275 | 2,650 |
| Emerson Electric Co. | 4.250% | 11/15/20 | 950 | 1,051 |
| Emerson Electric Co. | 5.250% | 11/15/39 | 515 | 624 |
| General Dynamics Corp. | 4.250% | 5/15/13 | 2,850 | 2,989 |
| General Dynamics Corp. | 5.250% | 2/1/14 | 3,450 | 3,761 |
| General Dynamics Corp. | 1.375% | 1/15/15 | 5,000 | 5,062 |
| General Dynamics Corp. | 3.875% | 7/15/21 | 5,000 | 5,391 |
| General Electric Co. | 5.000% | 2/1/13 | 10,065 | 10,543 |
| General Electric Co. | 5.250% | 12/6/17 | 18,145 | 20,867 |
| Goodrich Corp. | 6.290% | 7/1/16 | 1,000 | 1,177 |
| Goodrich Corp. | 6.125% | 3/1/19 | 3,600 | 4,351 |
| Goodrich Corp. | 4.875% | 3/1/20 | 4,657 | 5,310 |
| Goodrich Corp. | 3.600% | 2/1/21 | 1,540 | 1,603 |
| Harsco Corp. | 2.700% | 10/15/15 | 1,000 | 1,018 |
| Harsco Corp. | 5.750% | 5/15/18 | 4,800 | 5,536 |
| Honeywell International Inc. | 4.250% | 3/1/13 | 475 | 495 |
| Honeywell International Inc. | 3.875% | 2/15/14 | 550 | 585 |
| Honeywell International Inc. | 5.400% | 3/15/16 | 2,330 | 2,716 |
| Honeywell International Inc. | 5.300% | 3/15/17 | 1,375 | 1,597 |
| Honeywell International Inc. | 5.300% | 3/1/18 | 175 | 207 |
| Honeywell International Inc. | 5.000% | 2/15/19 | 2,520 | 2,937 |
| Honeywell International Inc. | 4.250% | 3/1/21 | 145 | 164 |
| Honeywell International Inc. | 5.700% | 3/15/36 | 1,600 | 1,961 |
| Honeywell International Inc. | 5.700% | 3/15/37 | 495 | 614 |
| Honeywell International Inc. | 5.375% | 3/1/41 | 3,145 | 3,839 |
| Illinois Tool Works Inc. | 5.150% | 4/1/14 | 9,664 | 10,627 |
| Illinois Tool Works Inc. | 6.250% | 4/1/19 | 2,650 | 3,269 |
| 7 Illinois Tool Works Inc. | 3.375% | 9/15/21 | 895 | 936 |
| 7 Illinois Tool Works Inc. | 4.875% | 9/15/41 | 895 | 1,026 |
| Ingersoll-Rand Global Holding Co. Ltd. | 6.000% | 8/15/13 | 1,425 | 1,522 |
| Ingersoll-Rand Global Holding Co. Ltd. | 9.500% | 4/15/14 | 5,175 | 6,021 |
| Ingersoll-Rand Global Holding Co. Ltd. | 6.875% | 8/15/18 | 1,850 | 2,249 |
| John Deere Capital Corp. | 1.875% | 6/17/13 | 765 | 780 |
| John Deere Capital Corp. | 4.900% | 9/9/13 | 2,925 | 3,120 |
| John Deere Capital Corp. | 1.250% | 12/2/14 | 2,225 | 2,249 |
| John Deere Capital Corp. | 2.950% | 3/9/15 | 5,075 | 5,357 |
| John Deere Capital Corp. | 1.850% | 9/15/16 | 815 | 821 |
| John Deere Capital Corp. | 2.000% | 1/13/17 | 2,350 | 2,396 |
| John Deere Capital Corp. | 5.500% | 4/13/17 | 150 | 177 |
| John Deere Capital Corp. | 2.800% | 9/18/17 | 4,225 | 4,420 |
| John Deere Capital Corp. | 5.750% | 9/10/18 | 4,035 | 4,885 |
| John Deere Capital Corp. | 3.900% | 7/12/21 | 875 | 949 |
| John Deere Capital Corp. | 3.150% | 10/15/21 | 3,620 | 3,719 |
| Joy Global Inc. | 6.000% | 11/15/16 | 575 | 651 |
| L-3 Communications Corp. | 5.200% | 10/15/19 | 3,005 | 3,053 |
| L-3 Communications Corp. | 4.750% | 7/15/20 | 2,950 | 2,884 |
| L-3 Communications Corp. | 4.950% | 2/15/21 | 5,100 | 5,042 |
| Lockheed Martin Corp. | 7.650% | 5/1/16 | 3,950 | 4,846 |
| Lockheed Martin Corp. | 2.125% | 9/15/16 | 5,775 | 5,793 |
| Lockheed Martin Corp. | 4.250% | 11/15/19 | 2,720 | 2,882 |
| Lockheed Martin Corp. | 3.350% | 9/15/21 | 920 | 914 |
| Lockheed Martin Corp. | 6.150% | 9/1/36 | 5,960 | 6,829 |
| Lockheed Martin Corp. | 5.500% | 11/15/39 | 1,745 | 1,896 |
| Lockheed Martin Corp. | 5.720% | 6/1/40 | 4,626 | 5,186 |
| Martin Marietta Materials Inc. | 6.600% | 4/15/18 | 1,850 | 1,958 |
46
| Total Bond Market II Index Fund | ||||
| Face | Market | |||
| Maturity | Amount | Value | ||
| Coupon | Date | ($000) | ($000) | |
| Northrop Grumman Corp. | 1.850% | 11/15/15 | 7,659 | 7,637 |
| Northrop Grumman Corp. | 3.500% | 3/15/21 | 1,425 | 1,445 |
| Northrop Grumman Corp. | 5.050% | 11/15/40 | 1,875 | 2,059 |
| Northrop Grumman Systems Corp. | 7.750% | 2/15/31 | 1,295 | 1,836 |
| Owens Corning | 6.500% | 12/1/16 | 10,020 | 10,867 |
| Owens Corning | 9.000% | 6/15/19 | 1,500 | 1,789 |
| Owens Corning | 7.000% | 12/1/36 | 325 | 330 |
| Parker Hannifin Corp. | 5.500% | 5/15/18 | 450 | 530 |
| Parker Hannifin Corp. | 3.500% | 9/15/22 | 1,625 | 1,683 |
| Parker Hannifin Corp. | 6.250% | 5/15/38 | 550 | 690 |
| Raytheon Co. | 1.400% | 12/15/14 | 1,400 | 1,403 |
| Raytheon Co. | 1.625% | 10/15/15 | 645 | 646 |
| Raytheon Co. | 6.400% | 12/15/18 | 100 | 124 |
| Raytheon Co. | 4.400% | 2/15/20 | 500 | 550 |
| Raytheon Co. | 3.125% | 10/15/20 | 1,525 | 1,536 |
| Raytheon Co. | 7.200% | 8/15/27 | 1,225 | 1,634 |
| Raytheon Co. | 4.875% | 10/15/40 | 575 | 604 |
| Raytheon Co. | 4.700% | 12/15/41 | 6,400 | 6,531 |
| Republic Services Inc. | 3.800% | 5/15/18 | 6,590 | 6,863 |
| Republic Services Inc. | 5.500% | 9/15/19 | 4,000 | 4,565 |
| Republic Services Inc. | 5.000% | 3/1/20 | 4,100 | 4,555 |
| Republic Services Inc. | 5.250% | 11/15/21 | 3,550 | 4,017 |
| Republic Services Inc. | 6.086% | 3/15/35 | 825 | 984 |
| Republic Services Inc. | 6.200% | 3/1/40 | 2,455 | 2,959 |
| Republic Services Inc. | 5.700% | 5/15/41 | 3,300 | 3,832 |
| Rockwell Automation Inc. | 5.650% | 12/1/17 | 600 | 704 |
| Rockwell Automation Inc. | 6.700% | 1/15/28 | 325 | 421 |
| Rockwell Automation Inc. | 6.250% | 12/1/37 | 1,500 | 1,909 |
| Rockwell Collins Inc. | 5.250% | 7/15/19 | 275 | 320 |
| Rockwell Collins Inc. | 3.100% | 11/15/21 | 1,000 | 1,014 |
| Roper Industries Inc. | 6.625% | 8/15/13 | 3,175 | 3,421 |
| Roper Industries Inc. | 6.250% | 9/1/19 | 3,500 | 4,134 |
| Sonoco Products Co. | 4.375% | 11/1/21 | 435 | 451 |
| Sonoco Products Co. | 5.750% | 11/1/40 | 2,135 | 2,278 |
| Stanley Black & Decker Inc. | 3.400% | 12/1/21 | 2,425 | 2,460 |
| Textron Inc. | 5.600% | 12/1/17 | 2,191 | 2,312 |
| Tyco International Finance SA | 6.000% | 11/15/13 | 1,275 | 1,380 |
| Tyco International Finance SA | 3.375% | 10/15/15 | 8,405 | 8,799 |
| Tyco International Finance SA | 3.750% | 1/15/18 | 350 | 369 |
| Tyco International Finance SA | 8.500% | 1/15/19 | 430 | 554 |
| Tyco International Finance SA | 4.625% | 1/15/23 | 225 | 241 |
| Tyco International Ltd. / Tyco International | ||||
| Finance SA | 7.000% | 12/15/19 | 2,375 | 2,923 |
| Tyco International Ltd. / Tyco International | ||||
| Finance SA | 6.875% | 1/15/21 | 5,100 | 6,330 |
| United Technologies Corp. | 4.875% | 5/1/15 | 360 | 404 |
| United Technologies Corp. | 5.375% | 12/15/17 | 4,925 | 5,820 |
| United Technologies Corp. | 6.125% | 2/1/19 | 3,190 | 3,940 |
| United Technologies Corp. | 4.500% | 4/15/20 | 10,255 | 11,512 |
| United Technologies Corp. | 6.700% | 8/1/28 | 325 | 420 |
| United Technologies Corp. | 7.500% | 9/15/29 | 825 | 1,157 |
| United Technologies Corp. | 5.400% | 5/1/35 | 600 | 706 |
| United Technologies Corp. | 6.050% | 6/1/36 | 1,790 | 2,253 |
| United Technologies Corp. | 6.125% | 7/15/38 | 7,450 | 9,322 |
| United Technologies Corp. | 5.700% | 4/15/40 | 2,375 | 2,905 |
47
| Total Bond Market II Index Fund | ||||
| Face | Market | |||
| Maturity | Amount | Value | ||
| Coupon | Date | ($000) | ($000) | |
| Waste Management Inc. | 5.000% | 3/15/14 | 495 | 532 |
| Waste Management Inc. | 6.375% | 3/11/15 | 9,650 | 11,030 |
| Waste Management Inc. | 2.600% | 9/1/16 | 145 | 147 |
| Waste Management Inc. | 6.100% | 3/15/18 | 175 | 207 |
| Waste Management Inc. | 7.375% | 3/11/19 | 4,670 | 5,872 |
| Waste Management Inc. | 4.600% | 3/1/21 | 175 | 190 |
| Waste Management Inc. | 7.100% | 8/1/26 | 325 | 418 |
| Waste Management Inc. | 7.750% | 5/15/32 | 365 | 518 |
| Waste Management Inc. | 6.125% | 11/30/39 | 4,175 | 5,114 |
| Communication (2.3%) | ||||
| America Movil SAB de CV | 5.500% | 3/1/14 | 1,735 | 1,862 |
| America Movil SAB de CV | 5.750% | 1/15/15 | 6,989 | 7,742 |
| America Movil SAB de CV | 5.000% | 10/16/19 | 2,700 | 3,004 |
| America Movil SAB de CV | 5.000% | 3/30/20 | 9,440 | 10,490 |
| America Movil SAB de CV | 6.375% | 3/1/35 | 2,275 | 2,789 |
| America Movil SAB de CV | 6.125% | 11/15/37 | 1,575 | 1,894 |
| America Movil SAB de CV | 6.125% | 3/30/40 | 10,465 | 12,427 |
| American Tower Corp. | 4.500% | 1/15/18 | 15,000 | 15,275 |
| American Tower Corp. | 5.050% | 9/1/20 | 295 | 296 |
| American Tower Corp. | 5.900% | 11/1/21 | 4,540 | 4,789 |
| AT&T Corp. | 8.000% | 11/15/31 | 5,699 | 8,041 |
| AT&T Inc. | 4.950% | 1/15/13 | 8,700 | 9,075 |
| AT&T Inc. | 6.700% | 11/15/13 | 11,325 | 12,502 |
| AT&T Inc. | 4.850% | 2/15/14 | 4,200 | 4,533 |
| AT&T Inc. | 5.100% | 9/15/14 | 5,775 | 6,369 |
| AT&T Inc. | 2.500% | 8/15/15 | 17,290 | 17,910 |
| AT&T Inc. | 2.950% | 5/15/16 | 8,240 | 8,651 |
| AT&T Inc. | 5.625% | 6/15/16 | 7,225 | 8,361 |
| AT&T Inc. | 2.400% | 8/15/16 | 1,355 | 1,392 |
| AT&T Inc. | 5.500% | 2/1/18 | 2,190 | 2,534 |
| AT&T Inc. | 5.600% | 5/15/18 | 1,225 | 1,425 |
| AT&T Inc. | 5.800% | 2/15/19 | 1,425 | 1,687 |
| AT&T Inc. | 4.450% | 5/15/21 | 590 | 649 |
| AT&T Inc. | 3.875% | 8/15/21 | 16,885 | 17,939 |
| AT&T Inc. | 6.450% | 6/15/34 | 2,025 | 2,442 |
| AT&T Inc. | 6.500% | 9/1/37 | 12,125 | 15,097 |
| AT&T Inc. | 6.300% | 1/15/38 | 16,865 | 20,735 |
| AT&T Inc. | 6.400% | 5/15/38 | 2,675 | 3,333 |
| AT&T Inc. | 6.550% | 2/15/39 | 4,165 | 5,268 |
| AT&T Inc. | 5.350% | 9/1/40 | 19,078 | 21,363 |
| AT&T Inc. | 5.550% | 8/15/41 | 1,615 | 1,899 |
| AT&T Mobility LLC | 7.125% | 12/15/31 | 525 | 681 |
| Bellsouth Capital Funding Corp. | 7.875% | 2/15/30 | 5,200 | 6,964 |
| BellSouth Corp. | 5.200% | 9/15/14 | 425 | 470 |
| BellSouth Corp. | 5.200% | 12/15/16 | 1,875 | 2,161 |
| BellSouth Corp. | 6.875% | 10/15/31 | 1,625 | 2,016 |
| BellSouth Corp. | 6.550% | 6/15/34 | 1,750 | 2,073 |
| BellSouth Corp. | 6.000% | 11/15/34 | 1,175 | 1,321 |
| BellSouth Telecommunications Inc. | 6.375% | 6/1/28 | 2,750 | 3,219 |
| BellSouth Telecommunications Inc. | 7.000% | 12/1/95 | 400 | 501 |
| British Telecommunications plc | 5.150% | 1/15/13 | 825 | 854 |
| British Telecommunications plc | 5.950% | 1/15/18 | 10,410 | 11,471 |
| British Telecommunications plc | 9.625% | 12/15/30 | 5,325 | 7,512 |
| CBS Corp. | 4.625% | 5/15/18 | 100 | 104 |
48
| Total Bond Market II Index Fund | ||||
| Face | Market | |||
| Maturity | Amount | Value | ||
| Coupon | Date | ($000) | ($000) | |
| CBS Corp. | 8.875% | 5/15/19 | 1,100 | 1,412 |
| CBS Corp. | 5.750% | 4/15/20 | 12,390 | 13,906 |
| CBS Corp. | 4.300% | 2/15/21 | 4,150 | 4,312 |
| CBS Corp. | 7.875% | 7/30/30 | 450 | 565 |
| CBS Corp. | 5.500% | 5/15/33 | 200 | 206 |
| Cellco Partnership / Verizon Wireless Capital LLC | 7.375% | 11/15/13 | 10,070 | 11,214 |
| Cellco Partnership / Verizon Wireless Capital LLC | 5.550% | 2/1/14 | 7,634 | 8,302 |
| Cellco Partnership / Verizon Wireless Capital LLC | 8.500% | 11/15/18 | 12,615 | 17,048 |
| CenturyLink Inc. | 6.000% | 4/1/17 | 100 | 101 |
| CenturyLink Inc. | 6.150% | 9/15/19 | 1,675 | 1,677 |
| CenturyLink Inc. | 6.450% | 6/15/21 | 3,465 | 3,482 |
| CenturyLink Inc. | 6.875% | 1/15/28 | 300 | 280 |
| CenturyLink Inc. | 7.600% | 9/15/39 | 3,550 | 3,488 |
| Comcast Cable Communications Holdings Inc. | 8.375% | 3/15/13 | 55 | 60 |
| Comcast Cable Communications Holdings Inc. | 9.455% | 11/15/22 | 2,000 | 2,849 |
| Comcast Cable Communications LLC | 8.875% | 5/1/17 | 975 | 1,262 |
| Comcast Corp. | 5.300% | 1/15/14 | 1,850 | 1,995 |
| Comcast Corp. | 6.500% | 1/15/15 | 1,350 | 1,536 |
| Comcast Corp. | 5.850% | 11/15/15 | 3,760 | 4,285 |
| Comcast Corp. | 5.900% | 3/15/16 | 12,110 | 13,882 |
| Comcast Corp. | 6.500% | 1/15/17 | 150 | 177 |
| Comcast Corp. | 6.300% | 11/15/17 | 3,475 | 4,123 |
| Comcast Corp. | 5.875% | 2/15/18 | 3,800 | 4,395 |
| Comcast Corp. | 5.700% | 5/15/18 | 4,625 | 5,321 |
| Comcast Corp. | 5.700% | 7/1/19 | 3,995 | 4,627 |
| Comcast Corp. | 5.150% | 3/1/20 | 6,780 | 7,682 |
| Comcast Corp. | 7.050% | 3/15/33 | 2,000 | 2,525 |
| Comcast Corp. | 5.650% | 6/15/35 | 2,450 | 2,707 |
| Comcast Corp. | 6.500% | 11/15/35 | 16,100 | 19,382 |
| Comcast Corp. | 6.450% | 3/15/37 | 1,825 | 2,209 |
| Comcast Corp. | 6.950% | 8/15/37 | 5,680 | 7,150 |
| Comcast Corp. | 6.400% | 5/15/38 | 1,975 | 2,363 |
| Comcast Corp. | 6.400% | 3/1/40 | 1,475 | 1,844 |
| COX Communications Inc. | 5.450% | 12/15/14 | 10,700 | 11,894 |
| COX Communications Inc. | 5.500% | 10/1/15 | 100 | 112 |
| Deutsche Telekom International Finance BV | 5.250% | 7/22/13 | 440 | 462 |
| Deutsche Telekom International Finance BV | 5.875% | 8/20/13 | 5,635 | 6,017 |
| Deutsche Telekom International Finance BV | 4.875% | 7/8/14 | 1,775 | 1,890 |
| Deutsche Telekom International Finance BV | 5.750% | 3/23/16 | 2,500 | 2,794 |
| Deutsche Telekom International Finance BV | 6.750% | 8/20/18 | 100 | 119 |
| Deutsche Telekom International Finance BV | 6.000% | 7/8/19 | 11,525 | 13,275 |
| Deutsche Telekom International Finance BV | 8.750% | 6/15/30 | 2,915 | 4,058 |
| DIRECTV Holdings LLC / DIRECTV | ||||
| Financing Co. Inc. | 4.750% | 10/1/14 | 1,550 | 1,674 |
| DIRECTV Holdings LLC / DIRECTV | ||||
| Financing Co. Inc. | 3.550% | 3/15/15 | 6,425 | 6,680 |
| DIRECTV Holdings LLC / DIRECTV | ||||
| Financing Co. Inc. | 3.500% | 3/1/16 | 3,000 | 3,093 |
| DIRECTV Holdings LLC / DIRECTV | ||||
| Financing Co. Inc. | 7.625% | 5/15/16 | 750 | 795 |
| DIRECTV Holdings LLC / DIRECTV | ||||
| Financing Co. Inc. | 5.875% | 10/1/19 | 12,975 | 14,600 |
| DIRECTV Holdings LLC / DIRECTV | ||||
| Financing Co. Inc. | 4.600% | 2/15/21 | 1,950 | 2,027 |
49
| Total Bond Market II Index Fund | ||||
| Face | Market | |||
| Maturity | Amount | Value | ||
| Coupon | Date | ($000) | ($000) | |
| DIRECTV Holdings LLC / DIRECTV | ||||
| Financing Co. Inc. | 5.000% | 3/1/21 | 13,475 | 14,395 |
| DIRECTV Holdings LLC / DIRECTV | ||||
| Financing Co. Inc. | 6.000% | 8/15/40 | 325 | 353 |
| Discovery Communications LLC | 5.050% | 6/1/20 | 500 | 553 |
| Discovery Communications LLC | 4.375% | 6/15/21 | 870 | 922 |
| Discovery Communications LLC | 6.350% | 6/1/40 | 4,060 | 4,905 |
| Embarq Corp. | 7.082% | 6/1/16 | 6,050 | 6,565 |
| Embarq Corp. | 7.995% | 6/1/36 | 9,849 | 10,306 |
| France Telecom SA | 4.375% | 7/8/14 | 3,850 | 4,077 |
| France Telecom SA | 2.125% | 9/16/15 | 5,000 | 4,959 |
| France Telecom SA | 2.750% | 9/14/16 | 4,180 | 4,206 |
| France Telecom SA | 5.375% | 7/8/19 | 6,825 | 7,508 |
| France Telecom SA | 4.125% | 9/14/21 | 16,295 | 16,485 |
| France Telecom SA | 8.500% | 3/1/31 | 4,465 | 6,360 |
| Grupo Televisa SAB | 6.625% | 3/18/25 | 1,300 | 1,509 |
| Grupo Televisa SAB | 8.500% | 3/11/32 | 200 | 264 |
| Grupo Televisa SAB | 6.625% | 1/15/40 | 500 | 568 |
| GTE Corp. | 8.750% | 11/1/21 | 1,700 | 2,374 |
| GTE Corp. | 6.940% | 4/15/28 | 1,050 | 1,315 |
| Koninklijke KPN NV | 8.375% | 10/1/30 | 1,550 | 1,976 |
| McGraw-Hill Cos. Inc. | 5.900% | 11/15/17 | 1,750 | 1,904 |
| McGraw-Hill Cos. Inc. | 6.550% | 11/15/37 | 1,600 | 1,699 |
| NBCUniversal Media LLC | 2.100% | 4/1/14 | 3,700 | 3,746 |
| NBCUniversal Media LLC | 3.650% | 4/30/15 | 7,250 | 7,643 |
| NBCUniversal Media LLC | 2.875% | 4/1/16 | 2,030 | 2,072 |
| NBCUniversal Media LLC | 5.150% | 4/30/20 | 7,550 | 8,438 |
| NBCUniversal Media LLC | 4.375% | 4/1/21 | 295 | 312 |
| NBCUniversal Media LLC | 6.400% | 4/30/40 | 8,200 | 10,110 |
| NBCUniversal Media LLC | 5.950% | 4/1/41 | 1,700 | 2,022 |
| New Cingular Wireless Services Inc. | 8.750% | 3/1/31 | 1,720 | 2,527 |
| News America Inc. | 5.300% | 12/15/14 | 4,945 | 5,386 |
| News America Inc. | 8.000% | 10/17/16 | 1,450 | 1,772 |
| News America Inc. | 6.900% | 3/1/19 | 5,340 | 6,296 |
| News America Inc. | 4.500% | 2/15/21 | 11,440 | 12,026 |
| News America Inc. | 7.700% | 10/30/25 | 200 | 238 |
| News America Inc. | 6.550% | 3/15/33 | 4,915 | 5,339 |
| News America Inc. | 6.200% | 12/15/34 | 5,500 | 5,905 |
| News America Inc. | 6.400% | 12/15/35 | 4,200 | 4,655 |
| News America Inc. | 8.150% | 10/17/36 | 625 | 781 |
| News America Inc. | 6.650% | 11/15/37 | 3,000 | 3,426 |
| News America Inc. | 7.850% | 3/1/39 | 250 | 313 |
| News America Inc. | 6.900% | 8/15/39 | 1,850 | 2,150 |
| News America Inc. | 6.150% | 2/15/41 | 5,830 | 6,681 |
| News America Inc. | 7.750% | 12/1/45 | 425 | 520 |
| Omnicom Group Inc. | 5.900% | 4/15/16 | 1,675 | 1,872 |
| Omnicom Group Inc. | 4.450% | 8/15/20 | 4,550 | 4,672 |
| Pacific Bell Telephone Co. | 7.125% | 3/15/26 | 425 | 536 |
| Qwest Corp. | 7.500% | 10/1/14 | 2,625 | 2,893 |
| Qwest Corp. | 7.625% | 6/15/15 | 2,500 | 2,750 |
| Qwest Corp. | 8.375% | 5/1/16 | 2,675 | 3,032 |
| Qwest Corp. | 6.500% | 6/1/17 | 1,125 | 1,231 |
| Qwest Corp. | 6.750% | 12/1/21 | 5,590 | 6,084 |
| Qwest Corp. | 7.500% | 6/15/23 | 1,325 | 1,332 |
| Qwest Corp. | 7.250% | 9/15/25 | 1,400 | 1,530 |
50
| Total Bond Market II Index Fund | ||||
| Face | Market | |||
| Maturity | Amount | Value | ||
| Coupon | Date | ($000) | ($000) | |
| Qwest Corp. | 6.875% | 9/15/33 | 2,900 | 2,900 |
| Qwest Corp. | 7.125% | 11/15/43 | 4,500 | 4,410 |
| Reed Elsevier Capital Inc. | 7.750% | 1/15/14 | 1,000 | 1,116 |
| Reed Elsevier Capital Inc. | 8.625% | 1/15/19 | 3,365 | 4,198 |
| Rogers Communications Inc. | 6.375% | 3/1/14 | 5,275 | 5,818 |
| Rogers Communications Inc. | 5.500% | 3/15/14 | 2,605 | 2,807 |
| Rogers Communications Inc. | 6.800% | 8/15/18 | 7,350 | 8,950 |
| Rogers Communications Inc. | 7.500% | 8/15/38 | 100 | 139 |
| TCI Communications Inc. | 8.750% | 8/1/15 | 4,175 | 5,078 |
| TCI Communications Inc. | 7.875% | 2/15/26 | 300 | 397 |
| Telecom Italia Capital SA | 5.250% | 11/15/13 | 6,850 | 6,617 |
| Telecom Italia Capital SA | 6.175% | 6/18/14 | 2,065 | 1,991 |
| Telecom Italia Capital SA | 4.950% | 9/30/14 | 7,475 | 6,976 |
| Telecom Italia Capital SA | 5.250% | 10/1/15 | 3,795 | 3,485 |
| Telecom Italia Capital SA | 6.999% | 6/4/18 | 200 | 185 |
| Telecom Italia Capital SA | 6.375% | 11/15/33 | 2,875 | 2,209 |
| Telecom Italia Capital SA | 6.000% | 9/30/34 | 200 | 146 |
| Telecom Italia Capital SA | 7.200% | 7/18/36 | 1,100 | 912 |
| Telecom Italia Capital SA | 7.721% | 6/4/38 | 11,915 | 10,276 |
| Telefonica Emisiones SAU | 5.855% | 2/4/13 | 6,525 | 6,608 |
| Telefonica Emisiones SAU | 4.949% | 1/15/15 | 3,775 | 3,767 |
| Telefonica Emisiones SAU | 3.992% | 2/16/16 | 11,190 | 10,792 |
| Telefonica Emisiones SAU | 6.421% | 6/20/16 | 4,975 | 5,164 |
| Telefonica Emisiones SAU | 5.877% | 7/15/19 | 7,375 | 7,308 |
| Telefonica Emisiones SAU | 5.134% | 4/27/20 | 545 | 507 |
| Telefonica Emisiones SAU | 5.462% | 2/16/21 | 6,490 | 6,191 |
| Telefonica Emisiones SAU | 7.045% | 6/20/36 | 8,785 | 8,625 |
| Telefonica Europe BV | 8.250% | 9/15/30 | 1,500 | 1,648 |
| Thomson Reuters Corp. | 5.950% | 7/15/13 | 725 | 773 |
| Thomson Reuters Corp. | 5.700% | 10/1/14 | 5,075 | 5,615 |
| Thomson Reuters Corp. | 6.500% | 7/15/18 | 250 | 299 |
| Thomson Reuters Corp. | 4.700% | 10/15/19 | 1,625 | 1,794 |
| Thomson Reuters Corp. | 3.950% | 9/30/21 | 2,000 | 2,069 |
| Thomson Reuters Corp. | 5.500% | 8/15/35 | 1,500 | 1,620 |
| Thomson Reuters Corp. | 5.850% | 4/15/40 | 1,400 | 1,597 |
| Time Warner Cable Inc. | 8.250% | 2/14/14 | 875 | 988 |
| Time Warner Cable Inc. | 7.500% | 4/1/14 | 8,075 | 9,052 |
| Time Warner Cable Inc. | 3.500% | 2/1/15 | 925 | 969 |
| Time Warner Cable Inc. | 5.850% | 5/1/17 | 9,600 | 10,933 |
| Time Warner Cable Inc. | 6.750% | 7/1/18 | 9,150 | 10,858 |
| Time Warner Cable Inc. | 8.750% | 2/14/19 | 3,100 | 3,972 |
| Time Warner Cable Inc. | 8.250% | 4/1/19 | 12,550 | 15,793 |
| Time Warner Cable Inc. | 5.000% | 2/1/20 | 9,295 | 10,180 |
| Time Warner Cable Inc. | 4.000% | 9/1/21 | 3,050 | 3,092 |
| Time Warner Cable Inc. | 6.750% | 6/15/39 | 3,572 | 4,238 |
| Time Warner Cable Inc. | 5.875% | 11/15/40 | 20,250 | 22,043 |
| Time Warner Cable Inc. | 5.500% | 9/1/41 | 1,950 | 2,046 |
| Time Warner Entertainment Co. LP | 8.375% | 3/15/23 | 800 | 1,041 |
| Time Warner Entertainment Co. LP | 8.375% | 7/15/33 | 2,975 | 3,886 |
| United States Cellular Corp. | 6.700% | 12/15/33 | 1,025 | 1,036 |
| Verizon Communications Inc. | 4.350% | 2/15/13 | 200 | 208 |
| Verizon Communications Inc. | 5.250% | 4/15/13 | 4,575 | 4,830 |
| Verizon Communications Inc. | 1.950% | 3/28/14 | 890 | 909 |
| Verizon Communications Inc. | 4.900% | 9/15/15 | 575 | 645 |
| Verizon Communications Inc. | 5.550% | 2/15/16 | 15,350 | 17,643 |
51
| Total Bond Market II Index Fund | ||||
| Face | Market | |||
| Maturity | Amount | Value | ||
| Coupon | Date | ($000) | ($000) | |
| Verizon Communications Inc. | 3.000% | 4/1/16 | 7,470 | 7,873 |
| Verizon Communications Inc. | 2.000% | 11/1/16 | 11,546 | 11,633 |
| Verizon Communications Inc. | 5.500% | 4/1/17 | 1,450 | 1,673 |
| Verizon Communications Inc. | 5.500% | 2/15/18 | 16,300 | 19,077 |
| Verizon Communications Inc. | 6.100% | 4/15/18 | 3,920 | 4,690 |
| Verizon Communications Inc. | 8.750% | 11/1/18 | 2,365 | 3,193 |
| Verizon Communications Inc. | 6.350% | 4/1/19 | 2,925 | 3,606 |
| Verizon Communications Inc. | 4.600% | 4/1/21 | 6,460 | 7,334 |
| Verizon Communications Inc. | 3.500% | 11/1/21 | 5,335 | 5,557 |
| Verizon Communications Inc. | 5.850% | 9/15/35 | 7,650 | 9,115 |
| Verizon Communications Inc. | 6.250% | 4/1/37 | 1,675 | 2,069 |
| Verizon Communications Inc. | 6.400% | 2/15/38 | 5,061 | 6,388 |
| Verizon Communications Inc. | 6.900% | 4/15/38 | 4,625 | 6,216 |
| Verizon Communications Inc. | 8.950% | 3/1/39 | 4,300 | 6,896 |
| Verizon Communications Inc. | 7.350% | 4/1/39 | 1,200 | 1,666 |
| Verizon Communications Inc. | 6.000% | 4/1/41 | 5,280 | 6,587 |
| Verizon Communications Inc. | 4.750% | 11/1/41 | 175 | 189 |
| Verizon Global Funding Corp. | 4.375% | 6/1/13 | 200 | 210 |
| Verizon Global Funding Corp. | 7.750% | 12/1/30 | 5,190 | 7,220 |
| Verizon Maryland Inc. | 5.125% | 6/15/33 | 175 | 183 |
| Verizon New England Inc. | 7.875% | 11/15/29 | 1,225 | 1,482 |
| Verizon New York Inc. | 7.375% | 4/1/32 | 650 | 759 |
| Verizon Virginia Inc. | 4.625% | 3/15/13 | 1,725 | 1,802 |
| Vodafone Group plc | 5.000% | 12/16/13 | 475 | 511 |
| Vodafone Group plc | 4.150% | 6/10/14 | 590 | 628 |
| Vodafone Group plc | 5.375% | 1/30/15 | 6,775 | 7,515 |
| Vodafone Group plc | 5.750% | 3/15/16 | 1,825 | 2,118 |
| Vodafone Group plc | 5.625% | 2/27/17 | 16,490 | 19,130 |
| Vodafone Group plc | 5.450% | 6/10/19 | 5,000 | 5,855 |
| Vodafone Group plc | 6.250% | 11/30/32 | 2,675 | 3,362 |
| Vodafone Group plc | 6.150% | 2/27/37 | 3,420 | 4,280 |
| Washington Post Co. | 7.250% | 2/1/19 | 875 | 1,017 |
| 7 WPP Finance 2010 | 4.750% | 11/21/21 | 6,801 | 6,786 |
| WPP Finance UK | 8.000% | 9/15/14 | 2,625 | 2,940 |
| Consumer Cyclical (1.2%) | ||||
| AutoZone Inc. | 6.500% | 1/15/14 | 2,000 | 2,199 |
| AutoZone Inc. | 5.750% | 1/15/15 | 4,050 | 4,471 |
| Best Buy Co. Inc. | 6.750% | 7/15/13 | 2,875 | 3,043 |
| BorgWarner Inc. | 4.625% | 9/15/20 | 400 | 425 |
| Costco Wholesale Corp. | 5.500% | 3/15/17 | 3,500 | 4,186 |
| CVS Caremark Corp. | 4.875% | 9/15/14 | 1,675 | 1,831 |
| CVS Caremark Corp. | 3.250% | 5/18/15 | 2,245 | 2,367 |
| CVS Caremark Corp. | 6.125% | 8/15/16 | 2,375 | 2,772 |
| CVS Caremark Corp. | 5.750% | 6/1/17 | 590 | 688 |
| CVS Caremark Corp. | 6.600% | 3/15/19 | 6,065 | 7,377 |
| CVS Caremark Corp. | 4.750% | 5/18/20 | 1,000 | 1,118 |
| CVS Caremark Corp. | 6.250% | 6/1/27 | 10,150 | 12,332 |
| CVS Caremark Corp. | 6.125% | 9/15/39 | 175 | 213 |
| CVS Caremark Corp. | 5.750% | 5/15/41 | 4,695 | 5,582 |
| Daimler Finance North America LLC | 6.500% | 11/15/13 | 7,100 | 7,703 |
| 7 Daimler Finance North America LLC | 2.625% | 9/15/16 | 2,300 | 2,297 |
| Daimler Finance North America LLC | 8.500% | 1/18/31 | 4,995 | 6,976 |
| Darden Restaurants Inc. | 6.200% | 10/15/17 | 1,850 | 2,135 |
| Darden Restaurants Inc. | 4.500% | 10/15/21 | 105 | 108 |
52
| Total Bond Market II Index Fund | ||||
| Face | Market | |||
| Maturity | Amount | Value | ||
| Coupon | Date | ($000) | ($000) | |
| Darden Restaurants Inc. | 6.800% | 10/15/37 | 6,745 | 7,787 |
| eBay Inc. | 0.875% | 10/15/13 | 1,150 | 1,156 |
| eBay Inc. | 1.625% | 10/15/15 | 1,150 | 1,158 |
| eBay Inc. | 3.250% | 10/15/20 | 1,175 | 1,177 |
| Expedia Inc. | 7.456% | 8/15/18 | 250 | 279 |
| Expedia Inc. | 5.950% | 8/15/20 | 6,400 | 6,452 |
| Family Dollar Stores Inc. | 5.000% | 2/1/21 | 1,275 | 1,315 |
| Gap Inc. | 5.950% | 4/12/21 | 1,675 | 1,595 |
| Historic TW Inc. | 9.150% | 2/1/23 | 3,425 | 4,651 |
| Historic TW Inc. | 6.625% | 5/15/29 | 2,925 | 3,459 |
| Home Depot Inc. | 5.250% | 12/16/13 | 6,050 | 6,577 |
| Home Depot Inc. | 5.400% | 3/1/16 | 6,970 | 8,068 |
| Home Depot Inc. | 4.400% | 4/1/21 | 6,480 | 7,303 |
| Home Depot Inc. | 5.875% | 12/16/36 | 2,880 | 3,609 |
| Home Depot Inc. | 5.400% | 9/15/40 | 7,590 | 9,066 |
| Home Depot Inc. | 5.950% | 4/1/41 | 2,725 | 3,538 |
| International Game Technology | 7.500% | 6/15/19 | 875 | 1,020 |
| International Game Technology | 5.500% | 6/15/20 | 1,030 | 1,081 |
| Johnson Controls Inc. | 2.600% | 12/1/16 | 1,475 | 1,487 |
| Johnson Controls Inc. | 5.000% | 3/30/20 | 2,300 | 2,575 |
| Johnson Controls Inc. | 4.250% | 3/1/21 | 5,405 | 5,787 |
| Johnson Controls Inc. | 3.750% | 12/1/21 | 1,425 | 1,474 |
| Johnson Controls Inc. | 6.000% | 1/15/36 | 350 | 400 |
| Johnson Controls Inc. | 5.700% | 3/1/41 | 795 | 890 |
| Johnson Controls Inc. | 5.250% | 12/1/41 | 1,475 | 1,562 |
| Kohl’s Corp. | 6.250% | 12/15/17 | 1,550 | 1,858 |
| Kohl’s Corp. | 4.000% | 11/1/21 | 7,380 | 7,562 |
| Kohl’s Corp. | 6.000% | 1/15/33 | 300 | 334 |
| Kohl’s Corp. | 6.875% | 12/15/37 | 700 | 862 |
| Lowe’s Cos. Inc. | 5.400% | 10/15/16 | 1,925 | 2,221 |
| Lowe’s Cos. Inc. | 6.100% | 9/15/17 | 875 | 1,038 |
| Lowe’s Cos. Inc. | 4.625% | 4/15/20 | 3,355 | 3,719 |
| Lowe’s Cos. Inc. | 3.750% | 4/15/21 | 4,045 | 4,187 |
| Lowe’s Cos. Inc. | 3.800% | 11/15/21 | 775 | 815 |
| Lowe’s Cos. Inc. | 6.875% | 2/15/28 | 350 | 444 |
| Lowe’s Cos. Inc. | 6.500% | 3/15/29 | 1,050 | 1,299 |
| Lowe’s Cos. Inc. | 5.800% | 10/15/36 | 7,175 | 8,295 |
| Lowe’s Cos. Inc. | 5.800% | 4/15/40 | 120 | 139 |
| Lowe’s Cos. Inc. | 5.125% | 11/15/41 | 1,200 | 1,328 |
| Macy’s Retail Holdings Inc. | 8.125% | 7/15/15 | 5,515 | 6,397 |
| Macy’s Retail Holdings Inc. | 5.900% | 12/1/16 | 3,775 | 4,215 |
| Macy’s Retail Holdings Inc. | 6.900% | 4/1/29 | 4,850 | 5,441 |
| Macy’s Retail Holdings Inc. | 6.375% | 3/15/37 | 2,300 | 2,668 |
| Marriott International Inc. | 5.625% | 2/15/13 | 850 | 880 |
| Marriott International Inc. | 6.200% | 6/15/16 | 550 | 621 |
| Marriott International Inc. | 6.375% | 6/15/17 | 650 | 748 |
| McDonald’s Corp. | 5.300% | 3/15/17 | 300 | 354 |
| McDonald’s Corp. | 5.800% | 10/15/17 | 1,825 | 2,229 |
| McDonald’s Corp. | 5.350% | 3/1/18 | 2,870 | 3,423 |
| McDonald’s Corp. | 5.000% | 2/1/19 | 4,525 | 5,358 |
| McDonald’s Corp. | 2.625% | 1/15/22 | 6,090 | 6,104 |
| McDonald’s Corp. | 6.300% | 10/15/37 | 325 | 451 |
| McDonald’s Corp. | 6.300% | 3/1/38 | 1,825 | 2,549 |
| Nordstrom Inc. | 6.750% | 6/1/14 | 175 | 197 |
| Nordstrom Inc. | 6.250% | 1/15/18 | 5,625 | 6,685 |
53
| Total Bond Market II Index Fund | ||||
| Face | Market | |||
| Maturity | Amount | Value | ||
| Coupon | Date | ($000) | ($000) | |
| Nordstrom Inc. | 4.750% | 5/1/20 | 1,200 | 1,332 |
| Nordstrom Inc. | 4.000% | 10/15/21 | 3,440 | 3,617 |
| Nordstrom Inc. | 6.950% | 3/15/28 | 425 | 538 |
| Nordstrom Inc. | 7.000% | 1/15/38 | 1,275 | 1,702 |
| O’Reilly Automotive Inc. | 4.875% | 1/14/21 | 600 | 635 |
| PACCAR Inc. | 6.875% | 2/15/14 | 1,200 | 1,343 |
| Staples Inc. | 9.750% | 1/15/14 | 6,300 | 7,174 |
| Target Corp. | 5.125% | 1/15/13 | 625 | 654 |
| Target Corp. | 4.000% | 6/15/13 | 600 | 629 |
| Target Corp. | 5.875% | 7/15/16 | 3,575 | 4,254 |
| Target Corp. | 5.375% | 5/1/17 | 100 | 117 |
| Target Corp. | 6.000% | 1/15/18 | 3,555 | 4,341 |
| Target Corp. | 3.875% | 7/15/20 | 3,655 | 4,045 |
| Target Corp. | 7.000% | 7/15/31 | 1,425 | 1,929 |
| Target Corp. | 6.350% | 11/1/32 | 2,075 | 2,648 |
| Target Corp. | 6.500% | 10/15/37 | 2,400 | 3,170 |
| Target Corp. | 7.000% | 1/15/38 | 13,170 | 18,513 |
| Time Warner Cos. Inc. | 7.570% | 2/1/24 | 325 | 412 |
| Time Warner Cos. Inc. | 6.950% | 1/15/28 | 150 | 182 |
| Time Warner Inc. | 3.150% | 7/15/15 | 8,518 | 8,878 |
| Time Warner Inc. | 5.875% | 11/15/16 | 2,525 | 2,917 |
| Time Warner Inc. | 4.875% | 3/15/20 | 4,860 | 5,286 |
| Time Warner Inc. | 4.700% | 1/15/21 | 4,250 | 4,581 |
| Time Warner Inc. | 4.750% | 3/29/21 | 7,975 | 8,639 |
| Time Warner Inc. | 4.000% | 1/15/22 | 295 | 304 |
| Time Warner Inc. | 7.625% | 4/15/31 | 5,700 | 7,309 |
| Time Warner Inc. | 7.700% | 5/1/32 | 7,850 | 10,207 |
| Time Warner Inc. | 6.500% | 11/15/36 | 7,990 | 9,784 |
| Time Warner Inc. | 6.200% | 3/15/40 | 950 | 1,134 |
| Time Warner Inc. | 6.100% | 7/15/40 | 3,150 | 3,715 |
| Time Warner Inc. | 6.250% | 3/29/41 | 5,275 | 6,352 |
| Time Warner Inc. | 5.375% | 10/15/41 | 295 | 318 |
| TJX Cos. Inc. | 4.200% | 8/15/15 | 6,265 | 6,860 |
| TJX Cos. Inc. | 6.950% | 4/15/19 | 6,150 | 7,660 |
| Toyota Motor Credit Corp. | 3.200% | 6/17/15 | 5,500 | 5,816 |
| Toyota Motor Credit Corp. | 2.800% | 1/11/16 | 1,890 | 1,966 |
| Toyota Motor Credit Corp. | 2.000% | 9/15/16 | 3,125 | 3,166 |
| Toyota Motor Credit Corp. | 4.250% | 1/11/21 | 4,200 | 4,564 |
| Toyota Motor Credit Corp. | 3.400% | 9/15/21 | 1,495 | 1,553 |
| VF Corp. | 5.950% | 11/1/17 | 850 | 1,006 |
| VF Corp. | 3.500% | 9/1/21 | 4,695 | 4,859 |
| VF Corp. | 6.450% | 11/1/37 | 625 | 804 |
| Viacom Inc. | 4.375% | 9/15/14 | 375 | 402 |
| Viacom Inc. | 2.500% | 12/15/16 | 300 | 301 |
| Viacom Inc. | 3.500% | 4/1/17 | 835 | 867 |
| Viacom Inc. | 6.125% | 10/5/17 | 1,250 | 1,446 |
| Viacom Inc. | 5.625% | 9/15/19 | 12,235 | 13,818 |
| Viacom Inc. | 3.875% | 12/15/21 | 1,575 | 1,614 |
| Viacom Inc. | 6.875% | 4/30/36 | 4,560 | 5,767 |
| Wal-Mart Stores Inc. | 4.250% | 4/15/13 | 25 | 26 |
| Wal-Mart Stores Inc. | 4.550% | 5/1/13 | 2,840 | 2,995 |
| Wal-Mart Stores Inc. | 7.250% | 6/1/13 | 550 | 601 |
| Wal-Mart Stores Inc. | 1.625% | 4/15/14 | 5,910 | 6,043 |
| Wal-Mart Stores Inc. | 3.200% | 5/15/14 | 2,100 | 2,221 |
| Wal-Mart Stores Inc. | 2.875% | 4/1/15 | 2,425 | 2,573 |
54
| Total Bond Market II Index Fund | ||||
| Face | Market | |||
| Maturity | Amount | Value | ||
| Coupon | Date | ($000) | ($000) | |
| Wal-Mart Stores Inc. | 4.500% | 7/1/15 | 2,225 | 2,491 |
| Wal-Mart Stores Inc. | 2.250% | 7/8/15 | 1,275 | 1,331 |
| Wal-Mart Stores Inc. | 1.500% | 10/25/15 | 12,135 | 12,404 |
| Wal-Mart Stores Inc. | 5.375% | 4/5/17 | 625 | 738 |
| Wal-Mart Stores Inc. | 5.800% | 2/15/18 | 5,920 | 7,285 |
| Wal-Mart Stores Inc. | 3.625% | 7/8/20 | 3,950 | 4,315 |
| Wal-Mart Stores Inc. | 3.250% | 10/25/20 | 6,795 | 7,258 |
| Wal-Mart Stores Inc. | 4.250% | 4/15/21 | 19,735 | 22,812 |
| Wal-Mart Stores Inc. | 5.875% | 4/5/27 | 11,050 | 13,435 |
| Wal-Mart Stores Inc. | 7.550% | 2/15/30 | 3,650 | 5,306 |
| Wal-Mart Stores Inc. | 5.250% | 9/1/35 | 1,560 | 1,845 |
| Wal-Mart Stores Inc. | 6.500% | 8/15/37 | 8,515 | 11,763 |
| Wal-Mart Stores Inc. | 6.200% | 4/15/38 | 6,400 | 8,570 |
| Wal-Mart Stores Inc. | 5.625% | 4/1/40 | 1,700 | 2,140 |
| Wal-Mart Stores Inc. | 4.875% | 7/8/40 | 875 | 1,001 |
| Wal-Mart Stores Inc. | 5.000% | 10/25/40 | 1,850 | 2,156 |
| Wal-Mart Stores Inc. | 5.625% | 4/15/41 | 6,060 | 7,782 |
| Walgreen Co. | 4.875% | 8/1/13 | 3,695 | 3,942 |
| Walgreen Co. | 5.250% | 1/15/19 | 1,970 | 2,341 |
| Walt Disney Co. | 4.500% | 12/15/13 | 2,595 | 2,799 |
| Walt Disney Co. | 6.200% | 6/20/14 | 2,000 | 2,257 |
| Walt Disney Co. | 0.875% | 12/1/14 | 7,225 | 7,270 |
| Walt Disney Co. | 1.350% | 8/16/16 | 235 | 235 |
| Walt Disney Co. | 5.625% | 9/15/16 | 3,425 | 4,053 |
| Walt Disney Co. | 5.875% | 12/15/17 | 1,875 | 2,274 |
| Walt Disney Co. | 7.000% | 3/1/32 | 325 | 449 |
| Walt Disney Co. | 4.375% | 8/16/41 | 325 | 345 |
| Walt Disney Co. | 4.125% | 12/1/41 | 5,250 | 5,379 |
| Western Union Co. | 6.500% | 2/26/14 | 3,275 | 3,589 |
| Western Union Co. | 5.930% | 10/1/16 | 1,825 | 2,059 |
| Western Union Co. | 5.253% | 4/1/20 | 240 | 268 |
| Western Union Co. | 6.200% | 11/17/36 | 850 | 909 |
| Western Union Co. | 6.200% | 6/21/40 | 1,100 | 1,181 |
| Wyndham Worldwide Corp. | 5.750% | 2/1/18 | 5,000 | 5,287 |
| Yum! Brands Inc. | 4.250% | 9/15/15 | 2,000 | 2,144 |
| Yum! Brands Inc. | 6.250% | 4/15/16 | 2,850 | 3,299 |
| Yum! Brands Inc. | 6.250% | 3/15/18 | 1,750 | 2,048 |
| Yum! Brands Inc. | 5.300% | 9/15/19 | 685 | 769 |
| Yum! Brands Inc. | 3.875% | 11/1/20 | 1,175 | 1,201 |
| Yum! Brands Inc. | 6.875% | 11/15/37 | 1,350 | 1,733 |
| Consumer Noncyclical (2.8%) | ||||
| Abbott Laboratories | 4.350% | 3/15/14 | 1,075 | 1,162 |
| Abbott Laboratories | 2.700% | 5/27/15 | 1,000 | 1,053 |
| Abbott Laboratories | 5.875% | 5/15/16 | 6,385 | 7,505 |
| Abbott Laboratories | 5.600% | 11/30/17 | 4,450 | 5,322 |
| Abbott Laboratories | 5.125% | 4/1/19 | 8,615 | 9,994 |
| Abbott Laboratories | 4.125% | 5/27/20 | 3,000 | 3,324 |
| Abbott Laboratories | 6.150% | 11/30/37 | 5,600 | 7,289 |
| Abbott Laboratories | 6.000% | 4/1/39 | 575 | 734 |
| Abbott Laboratories | 5.300% | 5/27/40 | 3,755 | 4,511 |
| Allergan Inc. | 5.750% | 4/1/16 | 400 | 463 |
| Allergan Inc. | 3.375% | 9/15/20 | 5,000 | 5,151 |
| Altria Group Inc. | 8.500% | 11/10/13 | 8,745 | 9,884 |
| Altria Group Inc. | 7.750% | 2/6/14 | 4,600 | 5,203 |
55
| Total Bond Market II Index Fund | ||||
| Face | Market | |||
| Maturity | Amount | Value | ||
| Coupon | Date | ($000) | ($000) | |
| Altria Group Inc. | 4.125% | 9/11/15 | 500 | 542 |
| Altria Group Inc. | 9.700% | 11/10/18 | 3,890 | 5,237 |
| Altria Group Inc. | 9.250% | 8/6/19 | 665 | 893 |
| Altria Group Inc. | 4.750% | 5/5/21 | 2,150 | 2,364 |
| Altria Group Inc. | 9.950% | 11/10/38 | 15,390 | 23,371 |
| Altria Group Inc. | 10.200% | 2/6/39 | 7,400 | 11,515 |
| AmerisourceBergen Corp. | 5.875% | 9/15/15 | 7,375 | 8,400 |
| AmerisourceBergen Corp. | 4.875% | 11/15/19 | 975 | 1,093 |
| Amgen Inc. | 1.875% | 11/15/14 | 1,660 | 1,685 |
| Amgen Inc. | 4.850% | 11/18/14 | 9,375 | 10,183 |
| Amgen Inc. | 2.300% | 6/15/16 | 6,870 | 6,854 |
| Amgen Inc. | 2.500% | 11/15/16 | 1,660 | 1,674 |
| Amgen Inc. | 5.850% | 6/1/17 | 7,750 | 8,938 |
| Amgen Inc. | 5.700% | 2/1/19 | 1,320 | 1,485 |
| Amgen Inc. | 3.450% | 10/1/20 | 825 | 808 |
| Amgen Inc. | 4.100% | 6/15/21 | 1,765 | 1,808 |
| Amgen Inc. | 3.875% | 11/15/21 | 1,660 | 1,687 |
| Amgen Inc. | 6.375% | 6/1/37 | 2,200 | 2,520 |
| Amgen Inc. | 6.900% | 6/1/38 | 2,300 | 2,826 |
| Amgen Inc. | 6.400% | 2/1/39 | 2,725 | 3,186 |
| Amgen Inc. | 5.750% | 3/15/40 | 2,665 | 2,900 |
| Amgen Inc. | 4.950% | 10/1/41 | 4,275 | 4,187 |
| Amgen Inc. | 5.150% | 11/15/41 | 1,655 | 1,726 |
| Amgen Inc. | 5.650% | 6/15/42 | 2,350 | 2,543 |
| Anheuser-Busch Cos. LLC | 4.375% | 1/15/13 | 1,150 | 1,190 |
| Anheuser-Busch Cos. LLC | 5.600% | 3/1/17 | 1,375 | 1,616 |
| Anheuser-Busch Cos. LLC | 5.500% | 1/15/18 | 6,307 | 7,330 |
| Anheuser-Busch Cos. LLC | 6.800% | 8/20/32 | 775 | 1,025 |
| Anheuser-Busch Cos. LLC | 5.750% | 4/1/36 | 2,905 | 3,558 |
| Anheuser-Busch InBev Worldwide Inc. | 2.500% | 3/26/13 | 3,800 | 3,884 |
| Anheuser-Busch InBev Worldwide Inc. | 1.500% | 7/14/14 | 825 | 834 |
| Anheuser-Busch InBev Worldwide Inc. | 5.375% | 11/15/14 | 4,290 | 4,780 |
| Anheuser-Busch InBev Worldwide Inc. | 4.125% | 1/15/15 | 4,590 | 4,954 |
| Anheuser-Busch InBev Worldwide Inc. | 2.875% | 2/15/16 | 6,200 | 6,562 |
| Anheuser-Busch InBev Worldwide Inc. | 7.750% | 1/15/19 | 4,040 | 5,225 |
| Anheuser-Busch InBev Worldwide Inc. | 6.875% | 11/15/19 | 3,675 | 4,605 |
| Anheuser-Busch InBev Worldwide Inc. | 5.375% | 1/15/20 | 11,690 | 13,751 |
| Anheuser-Busch InBev Worldwide Inc. | 5.000% | 4/15/20 | 2,600 | 2,975 |
| Anheuser-Busch InBev Worldwide Inc. | 4.375% | 2/15/21 | 3,875 | 4,311 |
| Anheuser-Busch InBev Worldwide Inc. | 8.200% | 1/15/39 | 8,590 | 13,580 |
| Anheuser-Busch InBev Worldwide Inc. | 6.375% | 1/15/40 | 2,825 | 3,876 |
| Archer-Daniels-Midland Co. | 8.375% | 4/15/17 | 100 | 130 |
| Archer-Daniels-Midland Co. | 5.450% | 3/15/18 | 3,625 | 4,297 |
| Archer-Daniels-Midland Co. | 4.479% | 3/1/21 | 2,145 | 2,429 |
| Archer-Daniels-Midland Co. | 5.935% | 10/1/32 | 1,775 | 2,206 |
| Archer-Daniels-Midland Co. | 5.375% | 9/15/35 | 2,025 | 2,382 |
| Archer-Daniels-Midland Co. | 5.765% | 3/1/41 | 7,095 | 8,960 |
| 7 Aristotle Holding Inc. | 4.750% | 11/15/21 | 3,000 | 3,101 |
| 7 Aristotle Holding Inc. | 6.125% | 11/15/41 | 2,825 | 3,024 |
| AstraZeneca plc | 5.900% | 9/15/17 | 10,840 | 13,068 |
| AstraZeneca plc | 6.450% | 9/15/37 | 8,280 | 11,152 |
| Avon Products Inc. | 5.750% | 3/1/18 | 2,460 | 2,682 |
| Avon Products Inc. | 6.500% | 3/1/19 | 1,160 | 1,314 |
| Baptist Health South Florida Obligated Group | 4.590% | 8/15/21 | 375 | 404 |
| Baxter International Inc. | 5.900% | 9/1/16 | 875 | 1,043 |
56
| Total Bond Market II Index Fund | ||||
| Face | Market | |||
| Maturity | Amount | Value | ||
| Coupon | Date | ($000) | ($000) | |
| Baxter International Inc. | 1.850% | 1/15/17 | 4,050 | 4,058 |
| Baxter International Inc. | 4.250% | 3/15/20 | 900 | 993 |
| Beam Inc. | 5.875% | 1/15/36 | 875 | 916 |
| Becton Dickinson and Co. | 1.750% | 11/8/16 | 90 | 91 |
| Becton Dickinson and Co. | 5.000% | 5/15/19 | 450 | 521 |
| Becton Dickinson and Co. | 3.250% | 11/12/20 | 8,340 | 8,614 |
| Becton Dickinson and Co. | 3.125% | 11/8/21 | 2,985 | 3,087 |
| Biogen Idec Inc. | 6.000% | 3/1/13 | 750 | 790 |
| Biogen Idec Inc. | 6.875% | 3/1/18 | 11,300 | 13,689 |
| Boston Scientific Corp. | 4.500% | 1/15/15 | 8,295 | 8,717 |
| Boston Scientific Corp. | 6.250% | 11/15/15 | 6,000 | 6,663 |
| Boston Scientific Corp. | 5.125% | 1/12/17 | 3,750 | 4,036 |
| Boston Scientific Corp. | 6.000% | 1/15/20 | 3,870 | 4,333 |
| Boston Scientific Corp. | 7.000% | 11/15/35 | 700 | 805 |
| Boston Scientific Corp. | 7.375% | 1/15/40 | 1,400 | 1,777 |
| Bottling Group LLC | 5.000% | 11/15/13 | 2,700 | 2,919 |
| Bottling Group LLC | 6.950% | 3/15/14 | 4,225 | 4,751 |
| Bottling Group LLC | 5.500% | 4/1/16 | 4,050 | 4,692 |
| Bottling Group LLC | 5.125% | 1/15/19 | 1,500 | 1,746 |
| Bristol-Myers Squibb Co. | 5.250% | 8/15/13 | 650 | 700 |
| Bristol-Myers Squibb Co. | 5.450% | 5/1/18 | 11,240 | 13,438 |
| Bristol-Myers Squibb Co. | 7.150% | 6/15/23 | 100 | 139 |
| Bristol-Myers Squibb Co. | 6.800% | 11/15/26 | 100 | 134 |
| Bristol-Myers Squibb Co. | 5.875% | 11/15/36 | 2,888 | 3,675 |
| Bristol-Myers Squibb Co. | 6.125% | 5/1/38 | 460 | 603 |
| Bristol-Myers Squibb Co. | 6.875% | 8/1/97 | 325 | 443 |
| Bunge Ltd. Finance Corp. | 5.100% | 7/15/15 | 575 | 606 |
| Bunge Ltd. Finance Corp. | 8.500% | 6/15/19 | 13,150 | 16,093 |
| Campbell Soup Co. | 3.050% | 7/15/17 | 525 | 560 |
| Campbell Soup Co. | 4.250% | 4/15/21 | 2,175 | 2,426 |
| Cardinal Health Inc. | 4.000% | 6/15/15 | 100 | 107 |
| Cardinal Health Inc. | 4.625% | 12/15/20 | 4,935 | 5,288 |
| CareFusion Corp. | 5.125% | 8/1/14 | 1,985 | 2,148 |
| CareFusion Corp. | 6.375% | 8/1/19 | 5,085 | 5,984 |
| Celgene Corp. | 2.450% | 10/15/15 | 750 | 760 |
| Celgene Corp. | 3.950% | 10/15/20 | 5,075 | 5,102 |
| Celgene Corp. | 5.700% | 10/15/40 | 600 | 661 |
| Church & Dwight Co. Inc. | 3.350% | 12/15/15 | 1,000 | 1,040 |
| Clorox Co. | 5.000% | 3/1/13 | 1,635 | 1,703 |
| Clorox Co. | 5.000% | 1/15/15 | 525 | 567 |
| Clorox Co. | 3.550% | 11/1/15 | 1,850 | 1,945 |
| Clorox Co. | 5.950% | 10/15/17 | 8,722 | 10,099 |
| Coca-Cola Co. | 0.750% | 11/15/13 | 6,200 | 6,226 |
| Coca-Cola Co. | 1.500% | 11/15/15 | 9,500 | 9,641 |
| Coca-Cola Co. | 1.800% | 9/1/16 | 2,900 | 2,951 |
| Coca-Cola Co. | 5.350% | 11/15/17 | 2,850 | 3,427 |
| Coca-Cola Co. | 4.875% | 3/15/19 | 5,910 | 6,893 |
| Coca-Cola Co. | 3.150% | 11/15/20 | 1,100 | 1,154 |
| Coca-Cola Co. | 3.300% | 9/1/21 | 5,865 | 6,189 |
| Coca-Cola Enterprises Inc. | 2.125% | 9/15/15 | 1,595 | 1,623 |
| Coca-Cola Femsa SAB de CV | 4.625% | 2/15/20 | 775 | 856 |
| Coca-Cola HBC Finance BV | 5.125% | 9/17/13 | 325 | 338 |
| Coca-Cola HBC Finance BV | 5.500% | 9/17/15 | 3,500 | 3,822 |
| Coca-Cola Refreshments USA Inc. | 7.375% | 3/3/14 | 4,425 | 5,026 |
| Coca-Cola Refreshments USA Inc. | 4.250% | 3/1/15 | 2,200 | 2,390 |
57
| Total Bond Market II Index Fund | ||||
| Face | Market | |||
| Maturity | Amount | Value | ||
| Coupon | Date | ($000) | ($000) | |
| Coca-Cola Refreshments USA Inc. | 8.500% | 2/1/22 | 1,800 | 2,640 |
| Colgate-Palmolive Co. | 0.600% | 11/15/14 | 745 | 745 |
| Colgate-Palmolive Co. | 1.300% | 1/15/17 | 4,375 | 4,342 |
| Colgate-Palmolive Co. | 2.450% | 11/15/21 | 1,510 | 1,506 |
| ConAgra Foods Inc. | 5.875% | 4/15/14 | 1,295 | 1,421 |
| ConAgra Foods Inc. | 5.819% | 6/15/17 | 225 | 253 |
| ConAgra Foods Inc. | 7.125% | 10/1/26 | 940 | 1,108 |
| ConAgra Foods Inc. | 7.000% | 10/1/28 | 250 | 290 |
| Corn Products International Inc. | 3.200% | 11/1/15 | 1,700 | 1,755 |
| Corn Products International Inc. | 4.625% | 11/1/20 | 890 | 943 |
| Corn Products International Inc. | 6.625% | 4/15/37 | 575 | 683 |
| Covidien International Finance SA | 1.875% | 6/15/13 | 8,000 | 8,074 |
| Covidien International Finance SA | 6.000% | 10/15/17 | 1,995 | 2,363 |
| Covidien International Finance SA | 6.550% | 10/15/37 | 4,849 | 6,178 |
| CR Bard Inc. | 4.400% | 1/15/21 | 2,220 | 2,496 |
| CR Bard Inc. | 6.700% | 12/1/26 | 1,800 | 2,383 |
| Delhaize Group SA | 5.875% | 2/1/14 | 1,400 | 1,514 |
| Delhaize Group SA | 6.500% | 6/15/17 | 235 | 276 |
| Delhaize Group SA | 5.700% | 10/1/40 | 6,241 | 6,299 |
| Diageo Capital plc | 5.200% | 1/30/13 | 2,615 | 2,741 |
| Diageo Capital plc | 5.500% | 9/30/16 | 425 | 488 |
| Diageo Capital plc | 5.750% | 10/23/17 | 3,885 | 4,568 |
| Diageo Capital plc | 4.828% | 7/15/20 | 3,100 | 3,529 |
| Diageo Capital plc | 5.875% | 9/30/36 | 200 | 252 |
| Diageo Finance BV | 5.300% | 10/28/15 | 1,800 | 2,047 |
| Diageo Investment Corp. | 7.450% | 4/15/35 | 200 | 280 |
| Dr Pepper Snapple Group Inc. | 6.120% | 5/1/13 | 525 | 560 |
| Dr Pepper Snapple Group Inc. | 2.900% | 1/15/16 | 3,045 | 3,159 |
| Dr Pepper Snapple Group Inc. | 6.820% | 5/1/18 | 420 | 521 |
| Dr Pepper Snapple Group Inc. | 2.600% | 1/15/19 | 2,785 | 2,773 |
| Dr Pepper Snapple Group Inc. | 7.450% | 5/1/38 | 425 | 596 |
| Eli Lilly & Co. | 4.200% | 3/6/14 | 2,200 | 2,360 |
| Eli Lilly & Co. | 5.200% | 3/15/17 | 2,625 | 3,043 |
| Eli Lilly & Co. | 5.500% | 3/15/27 | 2,950 | 3,516 |
| Eli Lilly & Co. | 5.550% | 3/15/37 | 1,800 | 2,200 |
| Eli Lilly & Co. | 5.950% | 11/15/37 | 235 | 302 |
| 7 Energizer Holdings Inc. | 4.700% | 5/19/21 | 1,325 | 1,399 |
| Estee Lauder Cos. Inc. | 6.000% | 5/15/37 | 200 | 259 |
| Express Scripts Inc. | 6.250% | 6/15/14 | 6,700 | 7,299 |
| Genentech Inc. | 4.750% | 7/15/15 | 800 | 892 |
| Genentech Inc. | 5.250% | 7/15/35 | 300 | 357 |
| General Mills Inc. | 5.250% | 8/15/13 | 1,650 | 1,765 |
| General Mills Inc. | 5.200% | 3/17/15 | 2,000 | 2,233 |
| General Mills Inc. | 5.700% | 2/15/17 | 2,525 | 2,976 |
| General Mills Inc. | 5.650% | 2/15/19 | 6,725 | 7,987 |
| General Mills Inc. | 3.150% | 12/15/21 | 5,950 | 6,073 |
| General Mills Inc. | 5.400% | 6/15/40 | 4,505 | 5,213 |
| Gilead Sciences Inc. | 3.050% | 12/1/16 | 375 | 385 |
| Gilead Sciences Inc. | 4.500% | 4/1/21 | 4,900 | 5,162 |
| Gilead Sciences Inc. | 5.650% | 12/1/41 | 1,550 | 1,712 |
| GlaxoSmithKline Capital Inc. | 4.850% | 5/15/13 | 9,920 | 10,506 |
| GlaxoSmithKline Capital Inc. | 4.375% | 4/15/14 | 6,225 | 6,733 |
| GlaxoSmithKline Capital Inc. | 5.650% | 5/15/18 | 5,555 | 6,695 |
| GlaxoSmithKline Capital Inc. | 5.375% | 4/15/34 | 950 | 1,122 |
| GlaxoSmithKline Capital Inc. | 6.375% | 5/15/38 | 14,535 | 19,336 |
58
| Total Bond Market II Index Fund | ||||
| Face | Market | |||
| Maturity | Amount | Value | ||
| Coupon | Date | ($000) | ($000) | |
| Hasbro Inc. | 6.125% | 5/15/14 | 5,000 | 5,497 |
| Hasbro Inc. | 6.300% | 9/15/17 | 2,125 | 2,441 |
| Hasbro Inc. | 6.350% | 3/15/40 | 1,200 | 1,304 |
| Hershey Co. | 5.450% | 9/1/16 | 425 | 496 |
| Hershey Co. | 1.500% | 11/1/16 | 2,125 | 2,128 |
| Hershey Co. | 4.125% | 12/1/20 | 1,710 | 1,913 |
| HJ Heinz Co. | 5.350% | 7/15/13 | 7,775 | 8,300 |
| HJ Heinz Finance Co. | 6.750% | 3/15/32 | 1,125 | 1,444 |
| Hormel Foods Corp. | 4.125% | 4/15/21 | 625 | 691 |
| Hospira Inc. | 5.900% | 6/15/14 | 500 | 538 |
| Hospira Inc. | 6.400% | 5/15/15 | 275 | 299 |
| Hospira Inc. | 6.050% | 3/30/17 | 100 | 111 |
| Hospira Inc. | 5.600% | 9/15/40 | 1,075 | 1,064 |
| JM Smucker Co. | 3.500% | 10/15/21 | 995 | 1,017 |
| Johnson & Johnson | 1.200% | 5/15/14 | 835 | 850 |
| Johnson & Johnson | 5.550% | 8/15/17 | 1,700 | 2,053 |
| Johnson & Johnson | 5.150% | 7/15/18 | 4,550 | 5,476 |
| Johnson & Johnson | 2.950% | 9/1/20 | 10,000 | 10,606 |
| Johnson & Johnson | 6.730% | 11/15/23 | 1,203 | 1,735 |
| Johnson & Johnson | 6.950% | 9/1/29 | 1,300 | 1,839 |
| Johnson & Johnson | 4.950% | 5/15/33 | 1,600 | 1,927 |
| Johnson & Johnson | 5.950% | 8/15/37 | 1,555 | 2,123 |
| Johnson & Johnson | 4.500% | 9/1/40 | 1,370 | 1,543 |
| Kellogg Co. | 1.875% | 11/17/16 | 4,400 | 4,422 |
| Kellogg Co. | 4.000% | 12/15/20 | 9,005 | 9,534 |
| Kellogg Co. | 7.450% | 4/1/31 | 1,150 | 1,565 |
| Kimberly-Clark Corp. | 4.875% | 8/15/15 | 1,875 | 2,105 |
| Kimberly-Clark Corp. | 6.125% | 8/1/17 | 2,475 | 3,027 |
| Kimberly-Clark Corp. | 7.500% | 11/1/18 | 800 | 1,060 |
| Kimberly-Clark Corp. | 3.625% | 8/1/20 | 3,150 | 3,390 |
| Kimberly-Clark Corp. | 3.875% | 3/1/21 | 2,940 | 3,249 |
| Kimberly-Clark Corp. | 6.625% | 8/1/37 | 200 | 283 |
| Kimberly-Clark Corp. | 5.300% | 3/1/41 | 1,600 | 1,974 |
| Koninklijke Philips Electronics NV | 4.625% | 3/11/13 | 2,550 | 2,662 |
| Koninklijke Philips Electronics NV | 5.750% | 3/11/18 | 2,750 | 3,149 |
| Koninklijke Philips Electronics NV | 6.875% | 3/11/38 | 4,720 | 5,976 |
| Kraft Foods Inc. | 6.000% | 2/11/13 | 2,950 | 3,108 |
| Kraft Foods Inc. | 2.625% | 5/8/13 | 8,300 | 8,464 |
| Kraft Foods Inc. | 5.250% | 10/1/13 | 3,100 | 3,308 |
| Kraft Foods Inc. | 6.750% | 2/19/14 | 200 | 223 |
| Kraft Foods Inc. | 4.125% | 2/9/16 | 6,365 | 6,911 |
| Kraft Foods Inc. | 6.500% | 8/11/17 | 5,775 | 6,850 |
| Kraft Foods Inc. | 6.125% | 2/1/18 | 690 | 810 |
| Kraft Foods Inc. | 6.125% | 8/23/18 | 8,240 | 9,736 |
| Kraft Foods Inc. | 5.375% | 2/10/20 | 19,190 | 22,105 |
| Kraft Foods Inc. | 6.500% | 11/1/31 | 3,275 | 4,076 |
| Kraft Foods Inc. | 7.000% | 8/11/37 | 3,675 | 4,890 |
| Kraft Foods Inc. | 6.875% | 2/1/38 | 4,975 | 6,561 |
| Kraft Foods Inc. | 6.875% | 1/26/39 | 525 | 692 |
| Kraft Foods Inc. | 6.500% | 2/9/40 | 8,345 | 10,715 |
| Kroger Co. | 5.500% | 2/1/13 | 425 | 444 |
| Kroger Co. | 5.000% | 4/15/13 | 1,050 | 1,099 |
| Kroger Co. | 4.950% | 1/15/15 | 1,950 | 2,151 |
| Kroger Co. | 3.900% | 10/1/15 | 2,350 | 2,527 |
| Kroger Co. | 6.400% | 8/15/17 | 435 | 518 |
59
| Total Bond Market II Index Fund | ||||
| Face | Market | |||
| Maturity | Amount | Value | ||
| Coupon | Date | ($000) | ($000) | |
| Kroger Co. | 6.800% | 12/15/18 | 2,400 | 2,955 |
| Kroger Co. | 6.150% | 1/15/20 | 590 | 718 |
| Kroger Co. | 7.700% | 6/1/29 | 2,800 | 3,717 |
| Kroger Co. | 8.000% | 9/15/29 | 3,775 | 5,130 |
| Kroger Co. | 7.500% | 4/1/31 | 625 | 805 |
| Laboratory Corp. of America Holdings | 5.500% | 2/1/13 | 425 | 444 |
| Laboratory Corp. of America Holdings | 5.625% | 12/15/15 | 1,025 | 1,150 |
| Laboratory Corp. of America Holdings | 4.625% | 11/15/20 | 235 | 248 |
| Life Technologies Corp. | 4.400% | 3/1/15 | 1,700 | 1,761 |
| Life Technologies Corp. | 3.500% | 1/15/16 | 2,800 | 2,821 |
| Life Technologies Corp. | 6.000% | 3/1/20 | 2,340 | 2,613 |
| Life Technologies Corp. | 5.000% | 1/15/21 | 1,350 | 1,422 |
| Lorillard Tobacco Co. | 3.500% | 8/4/16 | 760 | 766 |
| Lorillard Tobacco Co. | 8.125% | 6/23/19 | 3,075 | 3,662 |
| Lorillard Tobacco Co. | 8.125% | 5/1/40 | 1,000 | 1,155 |
| Lorillard Tobacco Co. | 7.000% | 8/4/41 | 1,550 | 1,638 |
| Mattel Inc. | 2.500% | 11/1/16 | 225 | 226 |
| Mattel Inc. | 5.450% | 11/1/41 | 845 | 854 |
| McCormick & Co. Inc. | 3.900% | 7/15/21 | 875 | 930 |
| McKesson Corp. | 5.250% | 3/1/13 | 3,450 | 3,623 |
| McKesson Corp. | 6.500% | 2/15/14 | 6,000 | 6,653 |
| McKesson Corp. | 4.750% | 3/1/21 | 1,740 | 1,978 |
| McKesson Corp. | 6.000% | 3/1/41 | 5,000 | 6,431 |
| Mead Johnson Nutrition Co. | 3.500% | 11/1/14 | 2,525 | 2,639 |
| Mead Johnson Nutrition Co. | 4.900% | 11/1/19 | 2,309 | 2,540 |
| Mead Johnson Nutrition Co. | 5.900% | 11/1/39 | 3,410 | 4,087 |
| Medco Health Solutions Inc. | 6.125% | 3/15/13 | 1,425 | 1,500 |
| Medco Health Solutions Inc. | 7.250% | 8/15/13 | 625 | 677 |
| Medco Health Solutions Inc. | 7.125% | 3/15/18 | 9,080 | 10,634 |
| Medco Health Solutions Inc. | 4.125% | 9/15/20 | 590 | 588 |
| Medtronic Inc. | 4.500% | 3/15/14 | 1,000 | 1,078 |
| Medtronic Inc. | 3.000% | 3/15/15 | 4,495 | 4,758 |
| Medtronic Inc. | 4.750% | 9/15/15 | 1,775 | 2,000 |
| Medtronic Inc. | 4.450% | 3/15/20 | 1,650 | 1,864 |
| Medtronic Inc. | 4.125% | 3/15/21 | 590 | 649 |
| Medtronic Inc. | 6.500% | 3/15/39 | 500 | 693 |
| Medtronic Inc. | 5.550% | 3/15/40 | 2,100 | 2,596 |
| Memorial Sloan-Kettering Cancer Center | 5.000% | 7/1/42 | 700 | 725 |
| Merck & Co. Inc. | 4.375% | 2/15/13 | 1,225 | 1,278 |
| Merck & Co. Inc. | 5.300% | 12/1/13 | 1,295 | 1,414 |
| Merck & Co. Inc. | 4.750% | 3/1/15 | 1,200 | 1,339 |
| Merck & Co. Inc. | 4.000% | 6/30/15 | 2,590 | 2,856 |
| Merck & Co. Inc. | 2.250% | 1/15/16 | 3,850 | 4,020 |
| Merck & Co. Inc. | 6.000% | 9/15/17 | 2,300 | 2,820 |
| Merck & Co. Inc. | 5.000% | 6/30/19 | 7,445 | 8,776 |
| Merck & Co. Inc. | 3.875% | 1/15/21 | 5,970 | 6,703 |
| Merck & Co. Inc. | 6.400% | 3/1/28 | 1,525 | 1,984 |
| Merck & Co. Inc. | 5.950% | 12/1/28 | 775 | 974 |
| Merck & Co. Inc. | 6.500% | 12/1/33 | 4,675 | 6,520 |
| Merck & Co. Inc. | 5.750% | 11/15/36 | 325 | 411 |
| Merck & Co. Inc. | 6.550% | 9/15/37 | 5,015 | 6,912 |
| Merck & Co. Inc. | 5.850% | 6/30/39 | 1,025 | 1,318 |
| Novant Health Inc. | 5.850% | 11/1/19 | 2,125 | 2,472 |
| Novartis Capital Corp. | 1.900% | 4/24/13 | 3,190 | 3,250 |
| Novartis Capital Corp. | 4.125% | 2/10/14 | 6,525 | 6,966 |
60
| Total Bond Market II Index Fund | ||||
| Face | Market | |||
| Maturity | Amount | Value | ||
| Coupon | Date | ($000) | ($000) | |
| Novartis Capital Corp. | 2.900% | 4/24/15 | 14,370 | 15,201 |
| Novartis Securities Investment Ltd. | 5.125% | 2/10/19 | 10,590 | 12,442 |
| Partners Healthcare System Inc. | 3.443% | 7/1/21 | 1,700 | 1,723 |
| PepsiAmericas Inc. | 4.375% | 2/15/14 | 100 | 107 |
| PepsiAmericas Inc. | 4.875% | 1/15/15 | 5,100 | 5,643 |
| PepsiAmericas Inc. | 5.000% | 5/15/17 | 1,400 | 1,620 |
| PepsiCo Inc. | 4.650% | 2/15/13 | 2,900 | 3,034 |
| PepsiCo Inc. | 0.875% | 10/25/13 | 5,885 | 5,910 |
| PepsiCo Inc. | 3.750% | 3/1/14 | 1,150 | 1,224 |
| PepsiCo Inc. | 2.500% | 5/10/16 | 11,390 | 11,864 |
| PepsiCo Inc. | 5.000% | 6/1/18 | 425 | 493 |
| PepsiCo Inc. | 7.900% | 11/1/18 | 2,050 | 2,751 |
| PepsiCo Inc. | 4.500% | 1/15/20 | 2,800 | 3,166 |
| PepsiCo Inc. | 3.125% | 11/1/20 | 4,200 | 4,363 |
| PepsiCo Inc. | 3.000% | 8/25/21 | 1,530 | 1,572 |
| PepsiCo Inc. | 5.500% | 1/15/40 | 5,425 | 6,711 |
| PepsiCo Inc. | 4.875% | 11/1/40 | 4,510 | 5,212 |
| PerkinElmer Inc. | 5.000% | 11/15/21 | 1,410 | 1,423 |
| Pfizer Inc. | 5.350% | 3/15/15 | 15,865 | 17,977 |
| Pfizer Inc. | 6.200% | 3/15/19 | 7,740 | 9,570 |
| Pfizer Inc. | 7.200% | 3/15/39 | 11,090 | 16,278 |
| Pharmacia Corp. | 6.500% | 12/1/18 | 200 | 251 |
| Pharmacia Corp. | 6.600% | 12/1/28 | 625 | 817 |
| Philip Morris International Inc. | 4.875% | 5/16/13 | 6,650 | 7,032 |
| Philip Morris International Inc. | 6.875% | 3/17/14 | 4,340 | 4,888 |
| Philip Morris International Inc. | 2.500% | 5/16/16 | 5,000 | 5,187 |
| Philip Morris International Inc. | 5.650% | 5/16/18 | 9,290 | 11,015 |
| Philip Morris International Inc. | 4.500% | 3/26/20 | 575 | 651 |
| Philip Morris International Inc. | 4.125% | 5/17/21 | 530 | 588 |
| Philip Morris International Inc. | 6.375% | 5/16/38 | 5,600 | 7,290 |
| Philip Morris International Inc. | 4.375% | 11/15/41 | 7,855 | 8,123 |
| 4 Procter & Gamble - Esop | 9.360% | 1/1/21 | 2,841 | 3,835 |
| Procter & Gamble Co. | 0.700% | 8/15/14 | 590 | 594 |
| Procter & Gamble Co. | 4.950% | 8/15/14 | 850 | 945 |
| Procter & Gamble Co. | 3.500% | 2/15/15 | 4,500 | 4,850 |
| Procter & Gamble Co. | 1.800% | 11/15/15 | 6,925 | 7,159 |
| Procter & Gamble Co. | 1.450% | 8/15/16 | 27,045 | 27,339 |
| Procter & Gamble Co. | 4.700% | 2/15/19 | 2,215 | 2,605 |
| Procter & Gamble Co. | 6.450% | 1/15/26 | 2,750 | 3,725 |
| Procter & Gamble Co. | 5.800% | 8/15/34 | 250 | 329 |
| Procter & Gamble Co. | 5.550% | 3/5/37 | 4,345 | 5,762 |
| Quest Diagnostics Inc. | 5.450% | 11/1/15 | 4,000 | 4,512 |
| Quest Diagnostics Inc. | 6.400% | 7/1/17 | 175 | 206 |
| Quest Diagnostics Inc. | 4.700% | 4/1/21 | 235 | 251 |
| Quest Diagnostics Inc. | 6.950% | 7/1/37 | 1,225 | 1,525 |
| Ralcorp Holdings Inc. | 6.625% | 8/15/39 | 4,550 | 4,758 |
| Reynolds American Inc. | 7.250% | 6/1/13 | 1,575 | 1,690 |
| Reynolds American Inc. | 7.625% | 6/1/16 | 850 | 1,016 |
| Reynolds American Inc. | 7.250% | 6/15/37 | 1,225 | 1,432 |
| Safeway Inc. | 6.250% | 3/15/14 | 5,850 | 6,480 |
| Safeway Inc. | 3.400% | 12/1/16 | 775 | 794 |
| Safeway Inc. | 6.350% | 8/15/17 | 1,325 | 1,502 |
| Safeway Inc. | 3.950% | 8/15/20 | 1,820 | 1,803 |
| Safeway Inc. | 4.750% | 12/1/21 | 575 | 590 |
| Safeway Inc. | 7.250% | 2/1/31 | 1,825 | 2,193 |
61
| Total Bond Market II Index Fund | ||||
| Face | Market | |||
| Maturity | Amount | Value | ||
| Coupon | Date | ($000) | ($000) | |
| Sanofi | 1.625% | 3/28/14 | 1,050 | 1,068 |
| Sanofi | 2.625% | 3/29/16 | 10,800 | 11,271 |
| Sanofi | 4.000% | 3/29/21 | 8,865 | 9,818 |
| Sara Lee Corp. | 6.125% | 11/1/32 | 2,175 | 2,240 |
| St. Jude Medical Inc. | 2.200% | 9/15/13 | 3,025 | 3,082 |
| St. Jude Medical Inc. | 3.750% | 7/15/14 | 2,875 | 3,042 |
| St. Jude Medical Inc. | 2.500% | 1/15/16 | 1,475 | 1,517 |
| St. Jude Medical Inc. | 4.875% | 7/15/19 | 500 | 570 |
| Stryker Corp. | 3.000% | 1/15/15 | 800 | 839 |
| Stryker Corp. | 2.000% | 9/30/16 | 2,285 | 2,328 |
| Stryker Corp. | 4.375% | 1/15/20 | 700 | 783 |
| Sysco Corp. | 4.200% | 2/12/13 | 625 | 648 |
| Sysco Corp. | 5.250% | 2/12/18 | 3,875 | 4,532 |
| Sysco Corp. | 5.375% | 9/21/35 | 4,948 | 6,137 |
| Teva Pharmaceutical Finance Co. BV | 2.400% | 11/10/16 | 2,060 | 2,088 |
| Teva Pharmaceutical Finance Co. BV | 3.650% | 11/10/21 | 615 | 626 |
| Teva Pharmaceutical Finance Co. LLC | 5.550% | 2/1/16 | 3,225 | 3,649 |
| Teva Pharmaceutical Finance II BV / | ||||
| Teva Pharmaceutical Finance III LLC | 3.000% | 6/15/15 | 1,950 | 2,028 |
| Teva Pharmaceutical Finance IV BV | 3.650% | 11/10/21 | 1,835 | 1,853 |
| Teva Pharmaceutical Finance IV LLC | 1.700% | 11/10/14 | 1,380 | 1,390 |
| Thermo Fisher Scientific Inc. | 2.050% | 2/21/14 | 2,500 | 2,568 |
| Thermo Fisher Scientific Inc. | 3.200% | 5/1/15 | 1,725 | 1,831 |
| Thermo Fisher Scientific Inc. | 2.250% | 8/15/16 | 295 | 302 |
| Thermo Fisher Scientific Inc. | 4.700% | 5/1/20 | 525 | 593 |
| Thermo Fisher Scientific Inc. | 4.500% | 3/1/21 | 1,850 | 2,058 |
| Unilever Capital Corp. | 3.650% | 2/15/14 | 1,525 | 1,622 |
| Unilever Capital Corp. | 4.800% | 2/15/19 | 700 | 813 |
| Unilever Capital Corp. | 4.250% | 2/10/21 | 10,010 | 11,491 |
| Unilever Capital Corp. | 5.900% | 11/15/32 | 900 | 1,175 |
| UST LLC | 5.750% | 3/1/18 | 1,000 | 1,110 |
| Watson Pharmaceuticals Inc. | 5.000% | 8/15/14 | 1,250 | 1,343 |
| Whirlpool Corp. | 5.500% | 3/1/13 | 4,075 | 4,238 |
| Whirlpool Corp. | 8.600% | 5/1/14 | 900 | 1,004 |
| Wyeth | 5.500% | 3/15/13 | 2,750 | 2,912 |
| Wyeth | 5.500% | 2/1/14 | 1,350 | 1,479 |
| Wyeth | 5.500% | 2/15/16 | 5,240 | 6,094 |
| Wyeth | 5.450% | 4/1/17 | 2,950 | 3,461 |
| Wyeth | 6.450% | 2/1/24 | 2,625 | 3,428 |
| Wyeth | 6.500% | 2/1/34 | 1,450 | 1,946 |
| Wyeth | 6.000% | 2/15/36 | 3,575 | 4,580 |
| Wyeth | 5.950% | 4/1/37 | 7,390 | 9,466 |
| Zimmer Holdings Inc. | 1.400% | 11/30/14 | 800 | 800 |
| Zimmer Holdings Inc. | 4.625% | 11/30/19 | 2,495 | 2,727 |
| Zimmer Holdings Inc. | 3.375% | 11/30/21 | 800 | 805 |
| Zimmer Holdings Inc. | 5.750% | 11/30/39 | 1,075 | 1,254 |
| Energy (1.4%) | ||||
| Alberta Energy Co. Ltd. | 7.375% | 11/1/31 | 425 | 534 |
| Anadarko Finance Co. | 7.500% | 5/1/31 | 4,600 | 5,547 |
| Anadarko Petroleum Corp. | 7.625% | 3/15/14 | 7,363 | 8,196 |
| Anadarko Petroleum Corp. | 5.750% | 6/15/14 | 800 | 863 |
| Anadarko Petroleum Corp. | 5.950% | 9/15/16 | 6,505 | 7,368 |
| Anadarko Petroleum Corp. | 6.375% | 9/15/17 | 525 | 608 |
| Anadarko Petroleum Corp. | 6.950% | 6/15/19 | 500 | 590 |
62
| Total Bond Market II Index Fund | ||||
| Face | Market | |||
| Maturity | Amount | Value | ||
| Coupon | Date | ($000) | ($000) | |
| Anadarko Petroleum Corp. | 6.450% | 9/15/36 | 9,025 | 10,398 |
| Anadarko Petroleum Corp. | 7.950% | 6/15/39 | 1,925 | 2,514 |
| Anadarko Petroleum Corp. | 6.200% | 3/15/40 | 3,040 | 3,402 |
| Apache Corp. | 5.250% | 4/15/13 | 300 | 317 |
| Apache Corp. | 6.000% | 9/15/13 | 1,925 | 2,104 |
| Apache Corp. | 5.625% | 1/15/17 | 250 | 296 |
| Apache Corp. | 6.900% | 9/15/18 | 5,450 | 6,947 |
| Apache Corp. | 3.625% | 2/1/21 | 6,160 | 6,648 |
| Apache Corp. | 5.100% | 9/1/40 | 4,725 | 5,585 |
| Apache Corp. | 5.250% | 2/1/42 | 740 | 902 |
| Apache Finance Canada Corp. | 7.750% | 12/15/29 | 400 | 579 |
| 7 Baker Hughes Inc. | 3.200% | 8/15/21 | 3,295 | 3,392 |
| Baker Hughes Inc. | 6.875% | 1/15/29 | 300 | 410 |
| Baker Hughes Inc. | 5.125% | 9/15/40 | 5,965 | 7,009 |
| BJ Services Co. | 6.000% | 6/1/18 | 850 | 1,021 |
| BP Capital Markets plc | 5.250% | 11/7/13 | 5,475 | 5,879 |
| BP Capital Markets plc | 3.625% | 5/8/14 | 3,650 | 3,832 |
| BP Capital Markets plc | 1.700% | 12/5/14 | 3,200 | 3,240 |
| BP Capital Markets plc | 3.875% | 3/10/15 | 4,525 | 4,821 |
| BP Capital Markets plc | 3.125% | 10/1/15 | 6,500 | 6,800 |
| BP Capital Markets plc | 3.200% | 3/11/16 | 9,495 | 9,957 |
| BP Capital Markets plc | 2.248% | 11/1/16 | 800 | 806 |
| BP Capital Markets plc | 4.750% | 3/10/19 | 5,300 | 5,921 |
| BP Capital Markets plc | 4.500% | 10/1/20 | 7,295 | 8,084 |
| BP Capital Markets plc | 4.742% | 3/11/21 | 5,315 | 6,040 |
| BP Capital Markets plc | 3.561% | 11/1/21 | 2,000 | 2,099 |
| Burlington Resources Finance Co. | 7.200% | 8/15/31 | 300 | 416 |
| Burlington Resources Finance Co. | 7.400% | 12/1/31 | 1,775 | 2,443 |
| Cameron International Corp. | 6.375% | 7/15/18 | 4,400 | 5,192 |
| Cameron International Corp. | 7.000% | 7/15/38 | 100 | 123 |
| Canadian Natural Resources Ltd. | 5.150% | 2/1/13 | 475 | 496 |
| Canadian Natural Resources Ltd. | 1.450% | 11/14/14 | 2,000 | 2,011 |
| Canadian Natural Resources Ltd. | 4.900% | 12/1/14 | 4,225 | 4,644 |
| Canadian Natural Resources Ltd. | 6.000% | 8/15/16 | 1,150 | 1,342 |
| Canadian Natural Resources Ltd. | 5.700% | 5/15/17 | 885 | 1,036 |
| Canadian Natural Resources Ltd. | 3.450% | 11/15/21 | 1,500 | 1,560 |
| Canadian Natural Resources Ltd. | 7.200% | 1/15/32 | 1,875 | 2,457 |
| Canadian Natural Resources Ltd. | 6.450% | 6/30/33 | 2,025 | 2,607 |
| Canadian Natural Resources Ltd. | 6.500% | 2/15/37 | 5,600 | 7,250 |
| Canadian Natural Resources Ltd. | 6.250% | 3/15/38 | 2,030 | 2,568 |
| Cenovus Energy Inc. | 4.500% | 9/15/14 | 590 | 636 |
| Cenovus Energy Inc. | 5.700% | 10/15/19 | 7,050 | 8,288 |
| Cenovus Energy Inc. | 6.750% | 11/15/39 | 2,725 | 3,627 |
| Chevron Corp. | 3.950% | 3/3/14 | 3,375 | 3,612 |
| Chevron Corp. | 4.950% | 3/3/19 | 2,750 | 3,257 |
| ConocoPhillips | 4.750% | 2/1/14 | 5,550 | 6,000 |
| ConocoPhillips | 4.600% | 1/15/15 | 7,190 | 7,993 |
| ConocoPhillips | 5.750% | 2/1/19 | 13,565 | 16,399 |
| ConocoPhillips | 6.000% | 1/15/20 | 470 | 584 |
| ConocoPhillips | 5.900% | 10/15/32 | 725 | 898 |
| ConocoPhillips | 5.900% | 5/15/38 | 2,120 | 2,702 |
| ConocoPhillips | 6.500% | 2/1/39 | 6,138 | 8,441 |
| ConocoPhillips Canada Funding Co. I | 5.625% | 10/15/16 | 4,525 | 5,295 |
| ConocoPhillips Canada Funding Co. I | 5.950% | 10/15/36 | 4,825 | 5,885 |
| ConocoPhillips Holding Co. | 6.950% | 4/15/29 | 2,850 | 3,894 |
63
| Total Bond Market II Index Fund | ||||
| Face | Market | |||
| Maturity | Amount | Value | ||
| Coupon | Date | ($000) | ($000) | |
| Devon Energy Corp. | 5.625% | 1/15/14 | 1,475 | 1,607 |
| Devon Energy Corp. | 2.400% | 7/15/16 | 800 | 819 |
| Devon Energy Corp. | 4.000% | 7/15/21 | 2,000 | 2,184 |
| Devon Energy Corp. | 7.950% | 4/15/32 | 1,650 | 2,367 |
| Devon Energy Corp. | 5.600% | 7/15/41 | 3,020 | 3,659 |
| Devon Financing Corp. ULC | 7.875% | 9/30/31 | 8,275 | 11,651 |
| Diamond Offshore Drilling Inc. | 4.875% | 7/1/15 | 2,275 | 2,479 |
| Diamond Offshore Drilling Inc. | 5.875% | 5/1/19 | 850 | 983 |
| Diamond Offshore Drilling Inc. | 5.700% | 10/15/39 | 1,850 | 2,057 |
| Encana Corp. | 5.900% | 12/1/17 | 2,100 | 2,380 |
| Encana Corp. | 6.500% | 5/15/19 | 885 | 1,048 |
| Encana Corp. | 3.900% | 11/15/21 | 1,000 | 1,002 |
| Encana Corp. | 7.200% | 11/1/31 | 1,800 | 2,223 |
| Encana Corp. | 6.500% | 8/15/34 | 2,925 | 3,438 |
| Encana Corp. | 6.625% | 8/15/37 | 4,700 | 5,654 |
| Encana Corp. | 5.150% | 11/15/41 | 1,500 | 1,529 |
| EnCana Holdings Finance Corp. | 5.800% | 5/1/14 | 4,350 | 4,722 |
| Eni USA Inc. | 7.300% | 11/15/27 | 175 | 228 |
| Ensco plc | 3.250% | 3/15/16 | 5,960 | 6,087 |
| Ensco plc | 4.700% | 3/15/21 | 9,250 | 9,615 |
| EOG Resources Inc. | 6.125% | 10/1/13 | 575 | 626 |
| EOG Resources Inc. | 2.500% | 2/1/16 | 705 | 730 |
| EOG Resources Inc. | 5.875% | 9/15/17 | 1,900 | 2,282 |
| EOG Resources Inc. | 5.625% | 6/1/19 | 3,350 | 3,972 |
| EOG Resources Inc. | 4.400% | 6/1/20 | 325 | 362 |
| EOG Resources Inc. | 4.100% | 2/1/21 | 4,900 | 5,363 |
| Global Marine Inc. | 7.000% | 6/1/28 | 5,850 | 5,654 |
| Halliburton Co. | 3.250% | 11/15/21 | 4,235 | 4,366 |
| Halliburton Co. | 6.700% | 9/15/38 | 920 | 1,232 |
| Halliburton Co. | 7.450% | 9/15/39 | 900 | 1,295 |
| Halliburton Co. | 4.500% | 11/15/41 | 4,645 | 4,750 |
| Hess Corp. | 8.125% | 2/15/19 | 7,715 | 9,889 |
| Hess Corp. | 7.875% | 10/1/29 | 1,450 | 1,942 |
| Hess Corp. | 7.125% | 3/15/33 | 1,375 | 1,743 |
| Hess Corp. | 5.600% | 2/15/41 | 7,580 | 8,546 |
| Husky Energy Inc. | 5.900% | 6/15/14 | 7,025 | 7,639 |
| Husky Energy Inc. | 6.150% | 6/15/19 | 200 | 226 |
| Husky Energy Inc. | 7.250% | 12/15/19 | 2,020 | 2,474 |
| Husky Energy Inc. | 6.800% | 9/15/37 | 875 | 1,105 |
| Kerr-McGee Corp. | 6.950% | 7/1/24 | 3,300 | 3,917 |
| Kerr-McGee Corp. | 7.875% | 9/15/31 | 875 | 1,096 |
| Marathon Oil Corp. | 6.000% | 10/1/17 | 10,460 | 12,188 |
| Marathon Oil Corp. | 5.900% | 3/15/18 | 1,228 | 1,436 |
| Marathon Oil Corp. | 6.800% | 3/15/32 | 2,670 | 3,256 |
| Marathon Petroleum Corp. | 3.500% | 3/1/16 | 1,000 | 1,019 |
| Marathon Petroleum Corp. | 5.125% | 3/1/21 | 2,425 | 2,551 |
| Marathon Petroleum Corp. | 6.500% | 3/1/41 | 1,500 | 1,687 |
| Nabors Industries Inc. | 6.150% | 2/15/18 | 3,180 | 3,560 |
| Nabors Industries Inc. | 9.250% | 1/15/19 | 4,375 | 5,501 |
| Nabors Industries Inc. | 5.000% | 9/15/20 | 2,675 | 2,736 |
| Nexen Inc. | 7.875% | 3/15/32 | 325 | 384 |
| Nexen Inc. | 5.875% | 3/10/35 | 690 | 703 |
| Nexen Inc. | 6.400% | 5/15/37 | 7,850 | 8,305 |
| Nexen Inc. | 7.500% | 7/30/39 | 3,400 | 4,071 |
| Noble Energy Inc. | 8.250% | 3/1/19 | 3,235 | 4,229 |
64
| Total Bond Market II Index Fund | ||||
| Face | Market | |||
| Maturity | Amount | Value | ||
| Coupon | Date | ($000) | ($000) | |
| Noble Energy Inc. | 4.150% | 12/15/21 | 4,250 | 4,401 |
| Noble Energy Inc. | 8.000% | 4/1/27 | 275 | 367 |
| Noble Holding International Ltd. | 3.050% | 3/1/16 | 440 | 454 |
| Noble Holding International Ltd. | 4.900% | 8/1/20 | 900 | 952 |
| Noble Holding International Ltd. | 4.625% | 3/1/21 | 2,500 | 2,603 |
| Noble Holding International Ltd. | 6.200% | 8/1/40 | 1,400 | 1,572 |
| Noble Holding International Ltd. | 6.050% | 3/1/41 | 2,500 | 2,771 |
| Occidental Petroleum Corp. | 2.500% | 2/1/16 | 3,405 | 3,573 |
| Occidental Petroleum Corp. | 4.125% | 6/1/16 | 2,620 | 2,923 |
| Occidental Petroleum Corp. | 1.750% | 2/15/17 | 2,000 | 2,024 |
| Occidental Petroleum Corp. | 4.100% | 2/1/21 | 5,100 | 5,681 |
| Occidental Petroleum Corp. | 3.125% | 2/15/22 | 3,000 | 3,091 |
| PC Financial Partnership | 5.000% | 11/15/14 | 900 | 972 |
| Petro-Canada | 4.000% | 7/15/13 | 1,325 | 1,373 |
| Petro-Canada | 7.875% | 6/15/26 | 500 | 657 |
| Petro-Canada | 7.000% | 11/15/28 | 475 | 584 |
| Petro-Canada | 5.350% | 7/15/33 | 1,425 | 1,495 |
| Petro-Canada | 5.950% | 5/15/35 | 2,900 | 3,310 |
| Petro-Canada | 6.800% | 5/15/38 | 525 | 679 |
| Rowan Cos. Inc. | 5.000% | 9/1/17 | 750 | 793 |
| Rowan Cos. Inc. | 7.875% | 8/1/19 | 875 | 1,027 |
| Shell International Finance BV | 1.875% | 3/25/13 | 7,905 | 8,053 |
| Shell International Finance BV | 4.000% | 3/21/14 | 4,210 | 4,509 |
| Shell International Finance BV | 3.100% | 6/28/15 | 14,300 | 15,321 |
| Shell International Finance BV | 3.250% | 9/22/15 | 1,400 | 1,512 |
| Shell International Finance BV | 5.200% | 3/22/17 | 975 | 1,139 |
| Shell International Finance BV | 4.300% | 9/22/19 | 3,100 | 3,574 |
| Shell International Finance BV | 6.375% | 12/15/38 | 13,267 | 18,098 |
| Shell International Finance BV | 5.500% | 3/25/40 | 6,750 | 8,421 |
| Suncor Energy Inc. | 6.100% | 6/1/18 | 50 | 59 |
| Suncor Energy Inc. | 7.150% | 2/1/32 | 425 | 542 |
| Suncor Energy Inc. | 5.950% | 12/1/34 | 175 | 198 |
| Suncor Energy Inc. | 6.500% | 6/15/38 | 15,080 | 18,966 |
| Suncor Energy Inc. | 6.850% | 6/1/39 | 4,265 | 5,380 |
| Talisman Energy Inc. | 5.125% | 5/15/15 | 375 | 406 |
| Talisman Energy Inc. | 7.750% | 6/1/19 | 11,525 | 14,206 |
| Talisman Energy Inc. | 3.750% | 2/1/21 | 7,425 | 7,297 |
| Talisman Energy Inc. | 7.250% | 10/15/27 | 200 | 243 |
| Tosco Corp. | 8.125% | 2/15/30 | 4,950 | 7,272 |
| Total Capital Canada Ltd. | 1.625% | 1/28/14 | 4,500 | 4,594 |
| Total Capital SA | 3.000% | 6/24/15 | 5,800 | 6,132 |
| Total Capital SA | 2.300% | 3/15/16 | 7,265 | 7,468 |
| Total Capital SA | 4.450% | 6/24/20 | 2,200 | 2,450 |
| Total Capital SA | 4.125% | 1/28/21 | 2,805 | 3,047 |
| Transocean Inc. | 5.250% | 3/15/13 | 1,125 | 1,151 |
| Transocean Inc. | 4.950% | 11/15/15 | 8,150 | 8,305 |
| Transocean Inc. | 6.000% | 3/15/18 | 6,375 | 6,581 |
| Transocean Inc. | 7.500% | 4/15/31 | 1,575 | 1,633 |
| Valero Energy Corp. | 4.750% | 6/15/13 | 2,400 | 2,515 |
| Valero Energy Corp. | 6.125% | 6/15/17 | 2,705 | 3,023 |
| Valero Energy Corp. | 9.375% | 3/15/19 | 1,575 | 2,017 |
| Valero Energy Corp. | 6.125% | 2/1/20 | 250 | 278 |
| Valero Energy Corp. | 7.500% | 4/15/32 | 1,725 | 2,009 |
| Valero Energy Corp. | 6.625% | 6/15/37 | 10,331 | 11,050 |
| Valero Energy Corp. | 10.500% | 3/15/39 | 3,000 | 4,330 |
65
| Total Bond Market II Index Fund | ||||
| Face | Market | |||
| Maturity | Amount | Value | ||
| Coupon | Date | ($000) | ($000) | |
| Weatherford International Inc. | 6.350% | 6/15/17 | 4,625 | 5,174 |
| Weatherford International Inc. | 6.800% | 6/15/37 | 3,050 | 3,365 |
| Weatherford International Ltd. | 5.150% | 3/15/13 | 203 | 211 |
| Weatherford International Ltd. | 5.500% | 2/15/16 | 2,000 | 2,204 |
| Weatherford International Ltd. | 6.000% | 3/15/18 | 6,140 | 6,819 |
| Weatherford International Ltd. | 9.625% | 3/1/19 | 5,200 | 6,730 |
| Weatherford International Ltd. | 5.125% | 9/15/20 | 4,010 | 4,195 |
| Weatherford International Ltd. | 6.500% | 8/1/36 | 2,750 | 2,999 |
| Weatherford International Ltd. | 7.000% | 3/15/38 | 2,480 | 2,840 |
| Williams Cos. Inc. | 7.500% | 1/15/31 | 1,329 | 1,648 |
| Williams Cos. Inc. | 7.750% | 6/15/31 | 842 | 1,071 |
| Williams Cos. Inc. | 8.750% | 3/15/32 | 310 | 404 |
| XTO Energy Inc. | 5.750% | 12/15/13 | 2,200 | 2,413 |
| XTO Energy Inc. | 6.250% | 8/1/17 | 6,250 | 7,705 |
| Other Industrial (0.0%) | ||||
| California Institute of Technology Revenue | 4.700% | 11/1/2111 | 5,700 | 5,729 |
| Cintas Corp. No 2 | 6.125% | 12/1/17 | 850 | 1,019 |
| Fluor Corp. | 3.375% | 9/15/21 | 1,500 | 1,517 |
| Massachusetts Development Finance Agency | ||||
| Revenue (Harvard University) | 4.875% | 10/15/40 | 2,925 | 3,430 |
| Massachusetts Health & Educational Facilities | ||||
| Authority Revenue (MIT) | 5.600% | 7/1/2111 | 4,000 | 5,497 |
| Technology (1.0%) | ||||
| Adobe Systems Inc. | 3.250% | 2/1/15 | 1,525 | 1,601 |
| Adobe Systems Inc. | 4.750% | 2/1/20 | 1,275 | 1,377 |
| Agilent Technologies Inc. | 2.500% | 7/15/13 | 2,387 | 2,413 |
| Agilent Technologies Inc. | 5.500% | 9/14/15 | 1,300 | 1,432 |
| Agilent Technologies Inc. | 6.500% | 11/1/17 | 5,325 | 6,219 |
| Amphenol Corp. | 4.750% | 11/15/14 | 2,475 | 2,642 |
| Analog Devices Inc. | 5.000% | 7/1/14 | 1,200 | 1,311 |
| Analog Devices Inc. | 3.000% | 4/15/16 | 875 | 923 |
| Applied Materials Inc. | 2.650% | 6/15/16 | 525 | 540 |
| Applied Materials Inc. | 4.300% | 6/15/21 | 3,840 | 4,083 |
| Arrow Electronics Inc. | 3.375% | 11/1/15 | 1,225 | 1,227 |
| Arrow Electronics Inc. | 5.125% | 3/1/21 | 515 | 521 |
| Avnet Inc. | 6.625% | 9/15/16 | 225 | 252 |
| Avnet Inc. | 5.875% | 6/15/20 | 4,300 | 4,545 |
| BMC Software Inc. | 7.250% | 6/1/18 | 825 | 954 |
| Broadcom Corp. | 1.500% | 11/1/13 | 5,800 | 5,849 |
| Broadcom Corp. | 2.700% | 11/1/18 | 385 | 387 |
| CA Inc. | 6.125% | 12/1/14 | 5,000 | 5,556 |
| CA Inc. | 5.375% | 12/1/19 | 3,545 | 3,845 |
| Cisco Systems Inc. | 1.625% | 3/14/14 | 11,165 | 11,400 |
| Cisco Systems Inc. | 5.500% | 2/22/16 | 11,783 | 13,712 |
| Cisco Systems Inc. | 3.150% | 3/14/17 | 3,000 | 3,256 |
| Cisco Systems Inc. | 4.950% | 2/15/19 | 5,525 | 6,391 |
| Cisco Systems Inc. | 5.900% | 2/15/39 | 6,600 | 8,190 |
| Cisco Systems Inc. | 5.500% | 1/15/40 | 9,270 | 11,290 |
| Computer Sciences Corp. | 5.500% | 3/15/13 | 295 | 295 |
| Computer Sciences Corp. | 6.500% | 3/15/18 | 100 | 98 |
| Corning Inc. | 6.625% | 5/15/19 | 275 | 333 |
| Corning Inc. | 7.250% | 8/15/36 | 100 | 119 |
| Corning Inc. | 5.750% | 8/15/40 | 7,135 | 8,327 |
66
| Total Bond Market II Index Fund | ||||
| Face | Market | |||
| Maturity | Amount | Value | ||
| Coupon | Date | ($000) | ($000) | |
| Dell Inc. | 4.700% | 4/15/13 | 2,615 | 2,745 |
| Dell Inc. | 1.400% | 9/10/13 | 2,700 | 2,735 |
| Dell Inc. | 2.100% | 4/1/14 | 6,400 | 6,526 |
| Dell Inc. | 3.100% | 4/1/16 | 500 | 528 |
| Dell Inc. | 5.650% | 4/15/18 | 1,100 | 1,274 |
| Dell Inc. | 5.875% | 6/15/19 | 1,250 | 1,466 |
| Dell Inc. | 6.500% | 4/15/38 | 1,200 | 1,525 |
| Dun & Bradstreet Corp. | 6.000% | 4/1/13 | 1,275 | 1,345 |
| Dun & Bradstreet Corp. | 2.875% | 11/15/15 | 350 | 359 |
| Equifax Inc. | 4.450% | 12/1/14 | 775 | 820 |
| Equifax Inc. | 6.300% | 7/1/17 | 425 | 477 |
| Fiserv Inc. | 3.125% | 10/1/15 | 1,000 | 1,023 |
| Fiserv Inc. | 3.125% | 6/15/16 | 3,415 | 3,466 |
| Fiserv Inc. | 6.800% | 11/20/17 | 2,150 | 2,504 |
| Google Inc. | 1.250% | 5/19/14 | 470 | 477 |
| Google Inc. | 2.125% | 5/19/16 | 375 | 390 |
| Google Inc. | 3.625% | 5/19/21 | 3,325 | 3,636 |
| Harris Corp. | 5.000% | 10/1/15 | 2,500 | 2,732 |
| Harris Corp. | 6.375% | 6/15/19 | 250 | 284 |
| Harris Corp. | 4.400% | 12/15/20 | 2,675 | 2,723 |
| Harris Corp. | 6.150% | 12/15/40 | 750 | 853 |
| Hewlett-Packard Co. | 4.500% | 3/1/13 | 8,680 | 8,938 |
| Hewlett-Packard Co. | 1.250% | 9/13/13 | 4,815 | 4,745 |
| Hewlett-Packard Co. | 6.125% | 3/1/14 | 10,125 | 10,933 |
| Hewlett-Packard Co. | 1.550% | 5/30/14 | 1,400 | 1,379 |
| Hewlett-Packard Co. | 4.750% | 6/2/14 | 725 | 768 |
| Hewlett-Packard Co. | 2.625% | 12/9/14 | 4,500 | 4,540 |
| Hewlett-Packard Co. | 2.350% | 3/15/15 | 1,300 | 1,288 |
| Hewlett-Packard Co. | 2.125% | 9/13/15 | 4,275 | 4,184 |
| Hewlett-Packard Co. | 2.200% | 12/1/15 | 1,625 | 1,585 |
| Hewlett-Packard Co. | 2.650% | 6/1/16 | 1,300 | 1,287 |
| Hewlett-Packard Co. | 3.000% | 9/15/16 | 1,875 | 1,896 |
| Hewlett-Packard Co. | 3.300% | 12/9/16 | 1,225 | 1,251 |
| Hewlett-Packard Co. | 5.400% | 3/1/17 | 975 | 1,074 |
| Hewlett-Packard Co. | 5.500% | 3/1/18 | 7,325 | 8,139 |
| Hewlett-Packard Co. | 3.750% | 12/1/20 | 5,250 | 5,165 |
| Hewlett-Packard Co. | 4.375% | 9/15/21 | 3,000 | 3,071 |
| Hewlett-Packard Co. | 4.650% | 12/9/21 | 1,375 | 1,450 |
| Hewlett-Packard Co. | 6.000% | 9/15/41 | 5,090 | 5,657 |
| HP Enterprise Services LLC | 6.000% | 8/1/13 | 1,775 | 1,882 |
| Intel Corp. | 1.950% | 10/1/16 | 5,200 | 5,341 |
| Intel Corp. | 3.300% | 10/1/21 | 2,000 | 2,102 |
| Intel Corp. | 4.800% | 10/1/41 | 6,870 | 7,598 |
| International Business Machines Corp. | 2.100% | 5/6/13 | 850 | 869 |
| International Business Machines Corp. | 7.500% | 6/15/13 | 1,200 | 1,317 |
| International Business Machines Corp. | 1.000% | 8/5/13 | 6,425 | 6,482 |
| International Business Machines Corp. | 6.500% | 10/15/13 | 2,875 | 3,170 |
| International Business Machines Corp. | 0.875% | 10/31/14 | 4,375 | 4,391 |
| International Business Machines Corp. | 2.000% | 1/5/16 | 8,425 | 8,682 |
| International Business Machines Corp. | 1.950% | 7/22/16 | 8,175 | 8,385 |
| International Business Machines Corp. | 5.700% | 9/14/17 | 19,200 | 23,260 |
| International Business Machines Corp. | 2.900% | 11/1/21 | 1,950 | 2,006 |
| International Business Machines Corp. | 7.000% | 10/30/25 | 4,850 | 6,615 |
| International Business Machines Corp. | 6.220% | 8/1/27 | 1,975 | 2,554 |
| International Business Machines Corp. | 6.500% | 1/15/28 | 100 | 133 |
67
| Total Bond Market II Index Fund | ||||
| Face | Market | |||
| Maturity | Amount | Value | ||
| Coupon | Date | ($000) | ($000) | |
| International Business Machines Corp. | 5.875% | 11/29/32 | 225 | 282 |
| International Business Machines Corp. | 5.600% | 11/30/39 | 7,200 | 9,264 |
| Intuit Inc. | 5.750% | 3/15/17 | 575 | 646 |
| Juniper Networks Inc. | 3.100% | 3/15/16 | 1,000 | 1,034 |
| Juniper Networks Inc. | 4.600% | 3/15/21 | 900 | 957 |
| Juniper Networks Inc. | 5.950% | 3/15/41 | 1,000 | 1,089 |
| KLA-Tencor Corp. | 6.900% | 5/1/18 | 1,350 | 1,560 |
| Lexmark International Inc. | 5.900% | 6/1/13 | 925 | 963 |
| Lexmark International Inc. | 6.650% | 6/1/18 | 1,700 | 1,895 |
| Maxim Integrated Products Inc. | 3.450% | 6/14/13 | 700 | 719 |
| Microsoft Corp. | 0.875% | 9/27/13 | 2,960 | 2,989 |
| Microsoft Corp. | 2.950% | 6/1/14 | 3,240 | 3,433 |
| Microsoft Corp. | 1.625% | 9/25/15 | 2,800 | 2,901 |
| Microsoft Corp. | 4.200% | 6/1/19 | 965 | 1,108 |
| Microsoft Corp. | 3.000% | 10/1/20 | 4,750 | 5,020 |
| Microsoft Corp. | 4.000% | 2/8/21 | 3,950 | 4,454 |
| Microsoft Corp. | 5.200% | 6/1/39 | 4,375 | 5,400 |
| Microsoft Corp. | 4.500% | 10/1/40 | 2,810 | 3,166 |
| Microsoft Corp. | 5.300% | 2/8/41 | 2,500 | 3,165 |
| Nokia Oyj | 5.375% | 5/15/19 | 6,600 | 6,678 |
| Nokia Oyj | 6.625% | 5/15/39 | 5,840 | 5,620 |
| Oracle Corp. | 4.950% | 4/15/13 | 4,215 | 4,454 |
| Oracle Corp. | 3.750% | 7/8/14 | 2,850 | 3,065 |
| Oracle Corp. | 5.250% | 1/15/16 | 13,250 | 15,265 |
| Oracle Corp. | 5.750% | 4/15/18 | 2,635 | 3,209 |
| Oracle Corp. | 5.000% | 7/8/19 | 5,500 | 6,457 |
| Oracle Corp. | 3.875% | 7/15/20 | 1,625 | 1,782 |
| Oracle Corp. | 6.500% | 4/15/38 | 2,900 | 3,930 |
| Oracle Corp. | 6.125% | 7/8/39 | 5,855 | 7,748 |
| Oracle Corp. | 5.375% | 7/15/40 | 6,950 | 8,535 |
| Pitney Bowes Inc. | 3.875% | 6/15/13 | 1,325 | 1,368 |
| Pitney Bowes Inc. | 4.875% | 8/15/14 | 690 | 733 |
| Pitney Bowes Inc. | 4.750% | 1/15/16 | 4,475 | 4,606 |
| Pitney Bowes Inc. | 5.750% | 9/15/17 | 950 | 1,023 |
| Pitney Bowes Inc. | 5.250% | 1/15/37 | 1,975 | 2,038 |
| SAIC Inc. | 4.450% | 12/1/20 | 2,660 | 2,831 |
| SAIC Inc. | 5.950% | 12/1/40 | 800 | 867 |
| Science Applications International Corp. | 5.500% | 7/1/33 | 250 | 254 |
| Symantec Corp. | 2.750% | 9/15/15 | 2,300 | 2,336 |
| Symantec Corp. | 4.200% | 9/15/20 | 800 | 807 |
| Texas Instruments Inc. | 1.375% | 5/15/14 | 690 | 700 |
| Texas Instruments Inc. | 2.375% | 5/16/16 | 4,675 | 4,872 |
| Tyco Electronics Group SA | 6.550% | 10/1/17 | 295 | 341 |
| Tyco Electronics Group SA | 4.875% | 1/15/21 | 4,500 | 4,821 |
| Tyco Electronics Group SA | 7.125% | 10/1/37 | 4,575 | 6,035 |
| Xerox Corp. | 8.250% | 5/15/14 | 7,550 | 8,519 |
| Xerox Corp. | 4.250% | 2/15/15 | 4,280 | 4,518 |
| Xerox Corp. | 6.400% | 3/15/16 | 1,525 | 1,718 |
| Xerox Corp. | 6.750% | 2/1/17 | 1,100 | 1,259 |
| Xerox Corp. | 6.350% | 5/15/18 | 6,045 | 6,818 |
| Xerox Corp. | 5.625% | 12/15/19 | 1,165 | 1,270 |
| Xerox Corp. | 4.500% | 5/15/21 | 265 | 269 |
68
| Total Bond Market II Index Fund | ||||
| Face | Market | |||
| Maturity | Amount | Value | ||
| Coupon | Date | ($000) | ($000) | |
| Transportation (0.4%) | ||||
| 4 American Airlines 2011-1 Class A | ||||
| Pass Through Trust | 5.250% | 1/31/21 | 449 | 419 |
| 4 American Airlines 2011-2 Class A | ||||
| Pass Through Trust | 8.625% | 10/15/21 | 975 | 1,012 |
| 4 American Airlines Pass Through Trust 2009-1A | 10.375% | 7/2/19 | 1,525 | 1,621 |
| Burlington Northern Santa Fe LLC | 5.650% | 5/1/17 | 1,025 | 1,182 |
| Burlington Northern Santa Fe LLC | 5.750% | 3/15/18 | 850 | 990 |
| Burlington Northern Santa Fe LLC | 3.600% | 9/1/20 | 750 | 777 |
| Burlington Northern Santa Fe LLC | 4.100% | 6/1/21 | 590 | 635 |
| Burlington Northern Santa Fe LLC | 3.450% | 9/15/21 | 10,590 | 10,918 |
| Burlington Northern Santa Fe LLC | 7.000% | 12/15/25 | 1,700 | 2,276 |
| Burlington Northern Santa Fe LLC | 6.200% | 8/15/36 | 1,300 | 1,649 |
| Burlington Northern Santa Fe LLC | 5.750% | 5/1/40 | 3,850 | 4,599 |
| Burlington Northern Santa Fe LLC | 5.050% | 3/1/41 | 1,800 | 1,968 |
| Canadian National Railway Co. | 4.400% | 3/15/13 | 875 | 912 |
| Canadian National Railway Co. | 4.950% | 1/15/14 | 125 | 135 |
| Canadian National Railway Co. | 5.800% | 6/1/16 | 200 | 233 |
| Canadian National Railway Co. | 1.450% | 12/15/16 | 200 | 199 |
| Canadian National Railway Co. | 5.850% | 11/15/17 | 350 | 419 |
| Canadian National Railway Co. | 5.550% | 3/1/19 | 5,385 | 6,479 |
| Canadian National Railway Co. | 2.850% | 12/15/21 | 500 | 504 |
| Canadian National Railway Co. | 6.900% | 7/15/28 | 100 | 138 |
| Canadian National Railway Co. | 6.250% | 8/1/34 | 575 | 748 |
| Canadian National Railway Co. | 6.200% | 6/1/36 | 1,375 | 1,799 |
| Canadian Pacific Railway Co. | 4.450% | 3/15/23 | 2,375 | 2,394 |
| Canadian Pacific Railway Co. | 7.125% | 10/15/31 | 200 | 237 |
| Canadian Pacific Railway Co. | 5.950% | 5/15/37 | 325 | 335 |
| Con-way Inc. | 6.700% | 5/1/34 | 2,475 | 2,459 |
| 4 Continental Airlines 1997-4 Class A | ||||
| Pass Through Trust | 6.900% | 1/2/18 | 826 | 861 |
| 4 Continental Airlines 1998-1 Class A | ||||
| Pass Through Trust | 6.648% | 9/15/17 | 2,194 | 2,266 |
| 4 Continental Airlines 2007-1 Class A | ||||
| Pass Through Trust | 5.983% | 4/19/22 | 302 | 316 |
| 4 Continental Airlines 2009-2 Class A | ||||
| Pass Through Trust | 7.250% | 11/10/19 | 1,112 | 1,193 |
| 4 Continental Airlines 2010-1 Class A | ||||
| Pass Through Trust | 4.750% | 1/12/21 | 5,000 | 5,100 |
| CSX Corp. | 5.500% | 8/1/13 | 1,900 | 2,021 |
| CSX Corp. | 6.250% | 4/1/15 | 1,325 | 1,512 |
| CSX Corp. | 5.600% | 5/1/17 | 450 | 515 |
| CSX Corp. | 7.900% | 5/1/17 | 886 | 1,106 |
| CSX Corp. | 6.250% | 3/15/18 | 4,875 | 5,804 |
| CSX Corp. | 7.375% | 2/1/19 | 6,550 | 8,189 |
| CSX Corp. | 3.700% | 10/30/20 | 8,765 | 8,918 |
| CSX Corp. | 4.250% | 6/1/21 | 590 | 630 |
| CSX Corp. | 6.000% | 10/1/36 | 1,675 | 1,971 |
| CSX Corp. | 6.150% | 5/1/37 | 900 | 1,081 |
| CSX Corp. | 6.220% | 4/30/40 | 2,614 | 3,183 |
| CSX Corp. | 4.750% | 5/30/42 | 590 | 609 |
| 4 Delta Air Lines 2007-1 Class A | ||||
| Pass Through Trust | 6.821% | 8/10/22 | 2,951 | 3,077 |
| 4 Delta Air Lines 2009-1 Class A | ||||
| Pass Through Trust | 7.750% | 12/17/19 | 4,825 | 5,247 |
69
| Total Bond Market II Index Fund | ||||
| Face | Market | |||
| Maturity | Amount | Value | ||
| Coupon | Date | ($000) | ($000) | |
| 4 Delta Air Lines 2010-2 Class A | ||||
| Pass Through Trust | 4.950% | 5/23/19 | 1,716 | 1,750 |
| FedEx Corp. | 8.000% | 1/15/19 | 175 | 230 |
| JB Hunt Transport Services Inc. | 3.375% | 9/15/15 | 3,800 | 3,871 |
| Norfolk Southern Corp. | 5.257% | 9/17/14 | 1,845 | 2,033 |
| Norfolk Southern Corp. | 5.750% | 1/15/16 | 2,825 | 3,274 |
| Norfolk Southern Corp. | 7.700% | 5/15/17 | 1,525 | 1,933 |
| Norfolk Southern Corp. | 5.750% | 4/1/18 | 875 | 1,027 |
| Norfolk Southern Corp. | 5.900% | 6/15/19 | 2,765 | 3,346 |
| Norfolk Southern Corp. | 5.590% | 5/17/25 | 100 | 118 |
| Norfolk Southern Corp. | 7.800% | 5/15/27 | 1,280 | 1,806 |
| Norfolk Southern Corp. | 5.640% | 5/17/29 | 525 | 647 |
| 7 Norfolk Southern Corp. | 4.837% | 10/1/41 | 4,673 | 4,990 |
| Norfolk Southern Corp. | 6.000% | 5/23/2111 | 9,325 | 11,015 |
| Norfolk Southern Railway Co. | 9.750% | 6/15/20 | 775 | 1,127 |
| 4 Northwest Airlines 2007-1 Class A | ||||
| Pass Through Trust | 7.027% | 11/1/19 | 403 | 413 |
| Ryder System Inc. | 5.850% | 3/1/14 | 600 | 653 |
| Ryder System Inc. | 3.150% | 3/2/15 | 4,840 | 4,967 |
| Ryder System Inc. | 7.200% | 9/1/15 | 1,250 | 1,461 |
| Ryder System Inc. | 3.600% | 3/1/16 | 2,060 | 2,142 |
| Ryder System Inc. | 5.850% | 11/1/16 | 6,075 | 6,938 |
| Southwest Airlines Co. | 5.250% | 10/1/14 | 260 | 278 |
| Southwest Airlines Co. | 5.750% | 12/15/16 | 1,125 | 1,259 |
| Southwest Airlines Co. | 5.125% | 3/1/17 | 250 | 268 |
| 4 Southwest Airlines Co. 2007-1 Pass Through Trust | 6.150% | 8/1/22 | 773 | 829 |
| 4 UAL 2009-2A Pass Through Trust | 9.750% | 1/15/17 | 1,521 | 1,677 |
| Union Pacific Corp. | 5.450% | 1/31/13 | 1,325 | 1,390 |
| Union Pacific Corp. | 6.125% | 2/15/20 | 350 | 428 |
| Union Pacific Corp. | 4.000% | 2/1/21 | 4,325 | 4,649 |
| Union Pacific Corp. | 4.163% | 7/15/22 | 4,740 | 5,124 |
| Union Pacific Corp. | 7.125% | 2/1/28 | 1,605 | 2,111 |
| Union Pacific Corp. | 6.625% | 2/1/29 | 400 | 525 |
| Union Pacific Corp. | 5.780% | 7/15/40 | 900 | 1,100 |
| Union Pacific Corp. | 4.750% | 9/15/41 | 3,025 | 3,282 |
| 4 Union Pacific Railroad Co. 2007-3 | ||||
| Pass Through Trust | 6.176% | 1/2/31 | 428 | 517 |
| United Parcel Service Inc. | 3.875% | 4/1/14 | 3,550 | 3,803 |
| United Parcel Service Inc. | 5.500% | 1/15/18 | 2,200 | 2,645 |
| United Parcel Service Inc. | 5.125% | 4/1/19 | 1,875 | 2,271 |
| United Parcel Service Inc. | 3.125% | 1/15/21 | 9,900 | 10,498 |
| United Parcel Service Inc. | 6.200% | 1/15/38 | 2,385 | 3,194 |
| 5,599,777 | ||||
| Utilities (2.3%) | ||||
| Electric (1.6%) | ||||
| AEP Texas Central Co. | 6.650% | 2/15/33 | 800 | 1,023 |
| Alabama Power Co. | 6.125% | 5/15/38 | 1,000 | 1,343 |
| Alabama Power Co. | 5.200% | 6/1/41 | 3,300 | 3,972 |
| Ameren Illinois Co. | 6.125% | 11/15/17 | 550 | 647 |
| Ameren Illinois Co. | 6.250% | 4/1/18 | 1,275 | 1,468 |
| Appalachian Power Co. | 3.400% | 5/24/15 | 1,300 | 1,363 |
| Appalachian Power Co. | 4.600% | 3/30/21 | 6,500 | 7,142 |
| Appalachian Power Co. | 5.800% | 10/1/35 | 250 | 292 |
| Appalachian Power Co. | 7.000% | 4/1/38 | 515 | 691 |
| Arizona Public Service Co. | 5.800% | 6/30/14 | 100 | 111 |
70
| Total Bond Market II Index Fund | ||||
| Face | Market | |||
| Maturity | Amount | Value | ||
| Coupon | Date | ($000) | ($000) | |
| Arizona Public Service Co. | 4.650% | 5/15/15 | 400 | 437 |
| Arizona Public Service Co. | 5.500% | 9/1/35 | 2,100 | 2,422 |
| Atlantic City Electric Co. | 7.750% | 11/15/18 | 2,700 | 3,567 |
| Baltimore Gas & Electric Co. | 5.900% | 10/1/16 | 100 | 117 |
| Baltimore Gas & Electric Co. | 3.500% | 11/15/21 | 1,600 | 1,624 |
| Baltimore Gas & Electric Co. | 6.350% | 10/1/36 | 200 | 251 |
| Carolina Power & Light Co. | 5.125% | 9/15/13 | 1,825 | 1,956 |
| CenterPoint Energy Houston Electric LLC | 5.700% | 3/15/13 | 4,275 | 4,505 |
| CenterPoint Energy Houston Electric LLC | 5.750% | 1/15/14 | 100 | 109 |
| CenterPoint Energy Houston Electric LLC | 7.000% | 3/1/14 | 1,350 | 1,521 |
| CenterPoint Energy Houston Electric LLC | 6.950% | 3/15/33 | 100 | 136 |
| CenterPoint Energy Inc. | 6.500% | 5/1/18 | 150 | 175 |
| Cleco Power LLC | 6.000% | 12/1/40 | 1,600 | 1,923 |
| Cleveland Electric Illuminating Co. | 5.700% | 4/1/17 | 4,203 | 4,707 |
| Cleveland Electric Illuminating Co. | 7.880% | 11/1/17 | 425 | 535 |
| Cleveland Electric Illuminating Co. | 5.500% | 8/15/24 | 1,125 | 1,318 |
| Columbus Southern Power Co. | 5.850% | 10/1/35 | 1,750 | 2,052 |
| Commonwealth Edison Co. | 5.950% | 8/15/16 | 2,975 | 3,495 |
| Commonwealth Edison Co. | 1.950% | 9/1/16 | 885 | 884 |
| Commonwealth Edison Co. | 6.150% | 9/15/17 | 15,207 | 17,944 |
| Commonwealth Edison Co. | 5.800% | 3/15/18 | 1,075 | 1,269 |
| Commonwealth Edison Co. | 4.000% | 8/1/20 | 5,000 | 5,400 |
| Commonwealth Edison Co. | 5.875% | 2/1/33 | 100 | 121 |
| Commonwealth Edison Co. | 5.900% | 3/15/36 | 875 | 1,072 |
| Commonwealth Edison Co. | 6.450% | 1/15/38 | 3,020 | 3,960 |
| Connecticut Light & Power Co. | 6.350% | 6/1/36 | 2,225 | 2,880 |
| Consolidated Edison Co. of New York Inc. | 4.875% | 2/1/13 | 950 | 987 |
| Consolidated Edison Co. of New York Inc. | 5.550% | 4/1/14 | 335 | 367 |
| Consolidated Edison Co. of New York Inc. | 5.375% | 12/15/15 | 3,213 | 3,674 |
| Consolidated Edison Co. of New York Inc. | 5.500% | 9/15/16 | 2,225 | 2,610 |
| Consolidated Edison Co. of New York Inc. | 6.650% | 4/1/19 | 5,000 | 6,318 |
| Consolidated Edison Co. of New York Inc. | 5.300% | 3/1/35 | 550 | 641 |
| Consolidated Edison Co. of New York Inc. | 5.850% | 3/15/36 | 3,290 | 4,113 |
| Consolidated Edison Co. of New York Inc. | 6.200% | 6/15/36 | 1,878 | 2,430 |
| Consolidated Edison Co. of New York Inc. | 6.750% | 4/1/38 | 625 | 868 |
| Consolidated Edison Co. of New York Inc. | 5.700% | 6/15/40 | 5,460 | 6,861 |
| Consolidated Natural Gas Co. | 5.000% | 12/1/14 | 4,660 | 5,079 |
| Constellation Energy Group Inc. | 4.550% | 6/15/15 | 4,750 | 5,051 |
| Constellation Energy Group Inc. | 5.150% | 12/1/20 | 3,705 | 4,037 |
| Constellation Energy Group Inc. | 7.600% | 4/1/32 | 700 | 903 |
| Consumers Energy Co. | 5.375% | 4/15/13 | 1,250 | 1,316 |
| Consumers Energy Co. | 5.500% | 8/15/16 | 800 | 921 |
| Consumers Energy Co. | 6.125% | 3/15/19 | 125 | 152 |
| Consumers Energy Co. | 6.700% | 9/15/19 | 3,960 | 5,013 |
| Detroit Edison Co. | 3.450% | 10/1/20 | 7,005 | 7,362 |
| Detroit Edison Co. | 5.700% | 10/1/37 | 425 | 532 |
| Dominion Resources Inc. | 5.150% | 7/15/15 | 5,600 | 6,278 |
| Dominion Resources Inc. | 2.250% | 9/1/15 | 2,782 | 2,845 |
| Dominion Resources Inc. | 1.950% | 8/15/16 | 2,150 | 2,173 |
| Dominion Resources Inc. | 5.600% | 11/15/16 | 670 | 780 |
| Dominion Resources Inc. | 6.000% | 11/30/17 | 1,750 | 2,073 |
| Dominion Resources Inc. | 6.400% | 6/15/18 | 300 | 363 |
| Dominion Resources Inc. | 5.200% | 8/15/19 | 300 | 348 |
| Dominion Resources Inc. | 6.300% | 3/15/33 | 350 | 435 |
| Dominion Resources Inc. | 5.250% | 8/1/33 | 825 | 906 |
71
| Total Bond Market II Index Fund | ||||
| Face | Market | |||
| Maturity | Amount | Value | ||
| Coupon | Date | ($000) | ($000) | |
| Dominion Resources Inc. | 5.950% | 6/15/35 | 2,375 | 2,823 |
| Dominion Resources Inc. | 7.000% | 6/15/38 | 605 | 822 |
| Dominion Resources Inc. | 4.900% | 8/1/41 | 4,075 | 4,393 |
| 4 Dominion Resources Inc. | 7.500% | 6/30/66 | 950 | 988 |
| DTE Energy Co. | 6.375% | 4/15/33 | 100 | 120 |
| Duke Energy Carolinas LLC | 5.750% | 11/15/13 | 100 | 109 |
| Duke Energy Carolinas LLC | 5.100% | 4/15/18 | 2,000 | 2,341 |
| Duke Energy Carolinas LLC | 4.300% | 6/15/20 | 2,500 | 2,835 |
| Duke Energy Carolinas LLC | 3.900% | 6/15/21 | 2,068 | 2,272 |
| Duke Energy Carolinas LLC | 6.000% | 12/1/28 | 2,994 | 3,698 |
| Duke Energy Carolinas LLC | 6.450% | 10/15/32 | 825 | 1,058 |
| Duke Energy Carolinas LLC | 6.100% | 6/1/37 | 2,225 | 2,831 |
| Duke Energy Carolinas LLC | 6.000% | 1/15/38 | 200 | 259 |
| Duke Energy Carolinas LLC | 6.050% | 4/15/38 | 775 | 1,013 |
| Duke Energy Carolinas LLC | 5.300% | 2/15/40 | 590 | 716 |
| Duke Energy Carolinas LLC | 4.250% | 12/15/41 | 1,500 | 1,569 |
| Duke Energy Corp. | 5.650% | 6/15/13 | 1,325 | 1,412 |
| Duke Energy Corp. | 3.950% | 9/15/14 | 4,350 | 4,641 |
| Duke Energy Corp. | 3.350% | 4/1/15 | 4,650 | 4,882 |
| Duke Energy Corp. | 2.150% | 11/15/16 | 925 | 933 |
| Duke Energy Corp. | 5.050% | 9/15/19 | 3,775 | 4,259 |
| Duke Energy Indiana Inc. | 5.000% | 9/15/13 | 275 | 291 |
| Duke Energy Indiana Inc. | 6.050% | 6/15/16 | 1,600 | 1,842 |
| Duke Energy Indiana Inc. | 3.750% | 7/15/20 | 2,500 | 2,674 |
| Duke Energy Indiana Inc. | 6.120% | 10/15/35 | 325 | 391 |
| Duke Energy Indiana Inc. | 6.350% | 8/15/38 | 2,675 | 3,527 |
| Duke Energy Ohio Inc. | 2.100% | 6/15/13 | 675 | 687 |
| El Paso Electric Co. | 6.000% | 5/15/35 | 600 | 710 |
| Empresa Nacional de Electricidad SA | 8.350% | 8/1/13 | 625 | 681 |
| Entergy Arkansas Inc. | 3.750% | 2/15/21 | 3,350 | 3,487 |
| Entergy Gulf States Louisiana LLC | 3.950% | 10/1/20 | 675 | 689 |
| Entergy Gulf States Louisiana LLC | 5.590% | 10/1/24 | 1,670 | 1,876 |
| Entergy Louisiana LLC | 5.400% | 11/1/24 | 450 | 512 |
| Exelon Corp. | 4.900% | 6/15/15 | 1,400 | 1,508 |
| Exelon Corp. | 5.625% | 6/15/35 | 200 | 215 |
| Exelon Generation Co. LLC | 6.200% | 10/1/17 | 295 | 339 |
| Exelon Generation Co. LLC | 4.000% | 10/1/20 | 6,800 | 6,983 |
| FirstEnergy Corp. | 7.375% | 11/15/31 | 8,715 | 10,766 |
| FirstEnergy Solutions Corp. | 4.800% | 2/15/15 | 3,500 | 3,750 |
| Florida Power & Light Co. | 4.850% | 2/1/13 | 625 | 652 |
| Florida Power & Light Co. | 5.550% | 11/1/17 | 2,675 | 3,236 |
| Florida Power & Light Co. | 5.950% | 10/1/33 | 225 | 288 |
| Florida Power & Light Co. | 5.625% | 4/1/34 | 2,160 | 2,669 |
| Florida Power & Light Co. | 4.950% | 6/1/35 | 250 | 285 |
| Florida Power & Light Co. | 5.400% | 9/1/35 | 425 | 509 |
| Florida Power & Light Co. | 6.200% | 6/1/36 | 1,050 | 1,389 |
| Florida Power & Light Co. | 5.650% | 2/1/37 | 725 | 903 |
| Florida Power & Light Co. | 5.850% | 5/1/37 | 1,265 | 1,625 |
| Florida Power & Light Co. | 5.950% | 2/1/38 | 3,100 | 4,089 |
| Florida Power & Light Co. | 5.960% | 4/1/39 | 6,100 | 8,104 |
| Florida Power & Light Co. | 5.690% | 3/1/40 | 425 | 548 |
| Florida Power & Light Co. | 5.250% | 2/1/41 | 500 | 615 |
| Florida Power & Light Co. | 4.125% | 2/1/42 | 1,250 | 1,290 |
| Florida Power Corp. | 4.800% | 3/1/13 | 3,075 | 3,211 |
| Florida Power Corp. | 5.100% | 12/1/15 | 590 | 671 |
72
| Total Bond Market II Index Fund | ||||
| Face | Market | |||
| Maturity | Amount | Value | ||
| Coupon | Date | ($000) | ($000) | |
| Florida Power Corp. | 5.650% | 6/15/18 | 1,175 | 1,403 |
| Florida Power Corp. | 6.350% | 9/15/37 | 1,375 | 1,844 |
| Florida Power Corp. | 6.400% | 6/15/38 | 11,900 | 16,118 |
| Florida Power Corp. | 5.650% | 4/1/40 | 3,500 | 4,366 |
| Georgia Power Co. | 3.000% | 4/15/16 | 6,625 | 7,025 |
| Georgia Power Co. | 5.700% | 6/1/17 | 2,525 | 3,009 |
| Georgia Power Co. | 5.650% | 3/1/37 | 100 | 123 |
| Georgia Power Co. | 5.400% | 6/1/40 | 1,575 | 1,894 |
| Great Plains Energy Inc. | 2.750% | 8/15/13 | 1,475 | 1,496 |
| Iberdrola International BV | 6.750% | 7/15/36 | 4,285 | 4,623 |
| Indiana Michigan Power Co. | 7.000% | 3/15/19 | 550 | 682 |
| Indiana Michigan Power Co. | 6.050% | 3/15/37 | 2,850 | 3,544 |
| 4 Integrys Energy Group Inc. | 6.110% | 12/1/66 | 1,600 | 1,536 |
| Interstate Power & Light Co. | 6.250% | 7/15/39 | 925 | 1,210 |
| Jersey Central Power & Light Co. | 5.625% | 5/1/16 | 2,525 | 2,854 |
| Jersey Central Power & Light Co. | 5.650% | 6/1/17 | 775 | 890 |
| Kansas City Power & Light Co. | 6.050% | 11/15/35 | 525 | 616 |
| Kansas City Power & Light Co. | 5.300% | 10/1/41 | 2,545 | 2,756 |
| 4 Kansas Gas & Electric Co. | 5.647% | 3/29/21 | 83 | 87 |
| Kentucky Utilities Co. | 1.625% | 11/1/15 | 2,795 | 2,822 |
| Kentucky Utilities Co. | 3.250% | 11/1/20 | 1,250 | 1,301 |
| Kentucky Utilities Co. | 5.125% | 11/1/40 | 3,575 | 4,305 |
| LG&E and KU Energy LLC | 2.125% | 11/15/15 | 1,350 | 1,336 |
| LG&E and KU Energy LLC | 3.750% | 11/15/20 | 1,600 | 1,622 |
| Louisville Gas & Electric Co. | 1.625% | 11/15/15 | 4,875 | 4,902 |
| Louisville Gas & Electric Co. | 5.125% | 11/15/40 | 825 | 994 |
| Metropolitan Edison Co. | 7.700% | 1/15/19 | 1,348 | 1,705 |
| MidAmerican Energy Co. | 5.125% | 1/15/13 | 1,700 | 1,774 |
| MidAmerican Energy Co. | 5.950% | 7/15/17 | 2,810 | 3,300 |
| MidAmerican Energy Co. | 5.300% | 3/15/18 | 100 | 117 |
| MidAmerican Energy Co. | 6.750% | 12/30/31 | 4,150 | 5,357 |
| MidAmerican Energy Co. | 5.750% | 11/1/35 | 1,575 | 1,918 |
| Midamerican Energy Holdings Co. | 5.000% | 2/15/14 | 425 | 454 |
| Midamerican Energy Holdings Co. | 5.750% | 4/1/18 | 1,275 | 1,479 |
| Midamerican Energy Holdings Co. | 8.480% | 9/15/28 | 100 | 145 |
| Midamerican Energy Holdings Co. | 6.125% | 4/1/36 | 9,725 | 11,631 |
| Midamerican Energy Holdings Co. | 5.950% | 5/15/37 | 8,042 | 9,638 |
| Midamerican Energy Holdings Co. | 6.500% | 9/15/37 | 8,230 | 10,263 |
| National Rural Utilities Cooperative Finance Corp. | 5.500% | 7/1/13 | 2,610 | 2,797 |
| National Rural Utilities Cooperative Finance Corp. | 4.750% | 3/1/14 | 3,375 | 3,629 |
| National Rural Utilities Cooperative Finance Corp. | 3.050% | 3/1/16 | 2,950 | 3,109 |
| National Rural Utilities Cooperative Finance Corp. | 5.450% | 4/10/17 | 175 | 199 |
| National Rural Utilities Cooperative Finance Corp. | 5.450% | 2/1/18 | 1,525 | 1,765 |
| National Rural Utilities Cooperative Finance Corp. | 10.375% | 11/1/18 | 3,500 | 5,007 |
| National Rural Utilities Cooperative Finance Corp. | 8.000% | 3/1/32 | 975 | 1,387 |
| Nevada Power Co. | 6.500% | 5/15/18 | 1,290 | 1,554 |
| Nevada Power Co. | 6.500% | 8/1/18 | 7,270 | 8,769 |
| Nevada Power Co. | 7.125% | 3/15/19 | 4,150 | 5,190 |
| Nevada Power Co. | 6.650% | 4/1/36 | 590 | 789 |
| Nevada Power Co. | 6.750% | 7/1/37 | 325 | 443 |
| Nevada Power Co. | 5.375% | 9/15/40 | 400 | 472 |
| Nevada Power Co. | 5.450% | 5/15/41 | 500 | 598 |
| NextEra Energy Capital Holdings Inc. | 5.350% | 6/15/13 | 3,725 | 3,929 |
| NextEra Energy Capital Holdings Inc. | 2.550% | 11/15/13 | 2,375 | 2,419 |
| NextEra Energy Capital Holdings Inc. | 2.600% | 9/1/15 | 350 | 355 |
73
| Total Bond Market II Index Fund | ||||
| Face | Market | |||
| Maturity | Amount | Value | ||
| Coupon | Date | ($000) | ($000) | |
| NextEra Energy Capital Holdings Inc. | 7.875% | 12/15/15 | 2,000 | 2,376 |
| NextEra Energy Capital Holdings Inc. | 6.000% | 3/1/19 | 3,613 | 4,198 |
| NextEra Energy Capital Holdings Inc. | 4.500% | 6/1/21 | 885 | 944 |
| 4 NextEra Energy Capital Holdings Inc. | 6.350% | 10/1/66 | 2,075 | 2,075 |
| 4 NextEra Energy Capital Holdings Inc. | 6.650% | 6/15/67 | 1,503 | 1,507 |
| Northern States Power Co. | 1.950% | 8/15/15 | 425 | 434 |
| Northern States Power Co. | 5.250% | 3/1/18 | 625 | 746 |
| Northern States Power Co. | 5.250% | 7/15/35 | 100 | 122 |
| Northern States Power Co. | 6.250% | 6/1/36 | 525 | 723 |
| Northern States Power Co. | 6.200% | 7/1/37 | 1,475 | 2,004 |
| Northern States Power Co. | 5.350% | 11/1/39 | 1,325 | 1,635 |
| NSTAR | 4.500% | 11/15/19 | 8,482 | 9,387 |
| NSTAR Electric Co. | 4.875% | 4/15/14 | 625 | 674 |
| NSTAR Electric Co. | 5.625% | 11/15/17 | 2,060 | 2,428 |
| NSTAR Electric Co. | 5.500% | 3/15/40 | 1,250 | 1,523 |
| Oglethorpe Power Corp. | 5.950% | 11/1/39 | 600 | 757 |
| Oglethorpe Power Corp. | 5.375% | 11/1/40 | 2,595 | 3,042 |
| Ohio Edison Co. | 6.400% | 7/15/16 | 1,275 | 1,476 |
| Ohio Power Co. | 5.750% | 9/1/13 | 2,025 | 2,166 |
| Ohio Power Co. | 6.000% | 6/1/16 | 1,520 | 1,750 |
| Ohio Power Co. | 5.375% | 10/1/21 | 3,000 | 3,427 |
| Oklahoma Gas & Electric Co. | 5.850% | 6/1/40 | 1,200 | 1,498 |
| Oncor Electric Delivery Co. LLC | 5.950% | 9/1/13 | 4,800 | 5,157 |
| Oncor Electric Delivery Co. LLC | 6.375% | 1/15/15 | 2,150 | 2,457 |
| Oncor Electric Delivery Co. LLC | 6.800% | 9/1/18 | 3,170 | 3,854 |
| Oncor Electric Delivery Co. LLC | 7.000% | 9/1/22 | 2,900 | 3,713 |
| Oncor Electric Delivery Co. LLC | 7.000% | 5/1/32 | 1,000 | 1,319 |
| Oncor Electric Delivery Co. LLC | 7.250% | 1/15/33 | 150 | 201 |
| Oncor Electric Delivery Co. LLC | 7.500% | 9/1/38 | 1,800 | 2,549 |
| Pacific Gas & Electric Co. | 4.800% | 3/1/14 | 6,370 | 6,857 |
| Pacific Gas & Electric Co. | 5.625% | 11/30/17 | 4,375 | 5,182 |
| Pacific Gas & Electric Co. | 8.250% | 10/15/18 | 4,105 | 5,403 |
| Pacific Gas & Electric Co. | 3.500% | 10/1/20 | 3,590 | 3,747 |
| Pacific Gas & Electric Co. | 4.250% | 5/15/21 | 4,400 | 4,790 |
| Pacific Gas & Electric Co. | 6.050% | 3/1/34 | 11,165 | 13,894 |
| Pacific Gas & Electric Co. | 5.800% | 3/1/37 | 2,695 | 3,301 |
| Pacific Gas & Electric Co. | 6.350% | 2/15/38 | 4,000 | 5,171 |
| Pacific Gas & Electric Co. | 6.250% | 3/1/39 | 1,325 | 1,708 |
| Pacific Gas & Electric Co. | 5.400% | 1/15/40 | 1,500 | 1,734 |
| PacifiCorp | 7.700% | 11/15/31 | 1,185 | 1,719 |
| PacifiCorp | 5.250% | 6/15/35 | 125 | 143 |
| PacifiCorp | 5.750% | 4/1/37 | 590 | 728 |
| Peco Energy Co. | 5.350% | 3/1/18 | 575 | 678 |
| Pennsylvania Electric Co. | 6.050% | 9/1/17 | 1,378 | 1,592 |
| Pennsylvania Electric Co. | 5.200% | 4/1/20 | 5,045 | 5,632 |
| Pennsylvania Electric Co. | 6.150% | 10/1/38 | 2,250 | 2,661 |
| Pepco Holdings Inc. | 2.700% | 10/1/15 | 295 | 299 |
| Potomac Electric Power Co. | 6.500% | 11/15/37 | 3,383 | 4,465 |
| PPL Electric Utilities Corp. | 3.000% | 9/15/21 | 590 | 594 |
| PPL Electric Utilities Corp. | 6.250% | 5/15/39 | 275 | 370 |
| PPL Energy Supply LLC | 6.300% | 7/15/13 | 1,000 | 1,069 |
| PPL Energy Supply LLC | 5.400% | 8/15/14 | 200 | 218 |
| PPL Energy Supply LLC | 6.200% | 5/15/16 | 3,149 | 3,511 |
| PPL Energy Supply LLC | 6.500% | 5/1/18 | 525 | 596 |
| Progress Energy Inc. | 6.050% | 3/15/14 | 625 | 690 |
74
| Total Bond Market II Index Fund | ||||
| Face | Market | |||
| Maturity | Amount | Value | ||
| Coupon | Date | ($000) | ($000) | |
| Progress Energy Inc. | 5.625% | 1/15/16 | 2,795 | 3,196 |
| Progress Energy Inc. | 7.750% | 3/1/31 | 625 | 888 |
| Progress Energy Inc. | 6.000% | 12/1/39 | 590 | 739 |
| PSEG Power LLC | 2.500% | 4/15/13 | 2,100 | 2,135 |
| PSEG Power LLC | 5.000% | 4/1/14 | 2,425 | 2,597 |
| PSEG Power LLC | 5.500% | 12/1/15 | 3,125 | 3,475 |
| PSEG Power LLC | 5.320% | 9/15/16 | 885 | 987 |
| PSEG Power LLC | 5.125% | 4/15/20 | 540 | 603 |
| PSEG Power LLC | 4.150% | 9/15/21 | 1,100 | 1,143 |
| PSEG Power LLC | 8.625% | 4/15/31 | 975 | 1,437 |
| Public Service Co. of Colorado | 5.500% | 4/1/14 | 175 | 193 |
| Public Service Co. of Colorado | 5.800% | 8/1/18 | 425 | 510 |
| Public Service Co. of Colorado | 5.125% | 6/1/19 | 3,925 | 4,604 |
| Public Service Co. of Colorado | 3.200% | 11/15/20 | 5,900 | 6,127 |
| Public Service Co. of Colorado | 6.250% | 9/1/37 | 475 | 639 |
| Public Service Co. of Oklahoma | 5.150% | 12/1/19 | 650 | 725 |
| Public Service Co. of Oklahoma | 6.625% | 11/15/37 | 1,550 | 1,971 |
| Public Service Electric & Gas Co. | 3.500% | 8/15/20 | 625 | 661 |
| Public Service Electric & Gas Co. | 5.800% | 5/1/37 | 3,275 | 4,243 |
| Public Service Electric & Gas Co. | 5.500% | 3/1/40 | 2,725 | 3,453 |
| Puget Sound Energy Inc. | 5.483% | 6/1/35 | 1,350 | 1,590 |
| Puget Sound Energy Inc. | 6.274% | 3/15/37 | 1,525 | 1,990 |
| Puget Sound Energy Inc. | 5.757% | 10/1/39 | 1,400 | 1,722 |
| Puget Sound Energy Inc. | 5.795% | 3/15/40 | 660 | 824 |
| Puget Sound Energy Inc. | 5.764% | 7/15/40 | 600 | 752 |
| Puget Sound Energy Inc. | 4.434% | 11/15/41 | 4,800 | 5,012 |
| San Diego Gas & Electric Co. | 5.300% | 11/15/15 | 650 | 744 |
| San Diego Gas & Electric Co. | 5.350% | 5/15/35 | 250 | 309 |
| San Diego Gas & Electric Co. | 5.350% | 5/15/40 | 2,000 | 2,525 |
| San Diego Gas & Electric Co. | 4.500% | 8/15/40 | 3,295 | 3,680 |
| San Diego Gas & Electric Co. | 3.950% | 11/15/41 | 400 | 414 |
| SCANA Corp. | 6.250% | 4/1/20 | 4,455 | 5,160 |
| SCANA Corp. | 4.750% | 5/15/21 | 1,795 | 1,901 |
| Sierra Pacific Power Co. | 6.000% | 5/15/16 | 4,050 | 4,694 |
| Sierra Pacific Power Co. | 6.750% | 7/1/37 | 1,450 | 1,985 |
| South Carolina Electric & Gas Co. | 6.500% | 11/1/18 | 2,275 | 2,820 |
| South Carolina Electric & Gas Co. | 6.625% | 2/1/32 | 2,525 | 3,267 |
| South Carolina Electric & Gas Co. | 6.050% | 1/15/38 | 1,550 | 2,009 |
| Southern California Edison Co. | 5.000% | 1/15/14 | 2,725 | 2,949 |
| Southern California Edison Co. | 5.750% | 3/15/14 | 700 | 772 |
| Southern California Edison Co. | 4.650% | 4/1/15 | 425 | 468 |
| Southern California Edison Co. | 5.000% | 1/15/16 | 1,025 | 1,167 |
| Southern California Edison Co. | 3.875% | 6/1/21 | 2,000 | 2,210 |
| Southern California Edison Co. | 6.650% | 4/1/29 | 150 | 198 |
| Southern California Edison Co. | 6.000% | 1/15/34 | 1,000 | 1,296 |
| Southern California Edison Co. | 5.750% | 4/1/35 | 325 | 414 |
| Southern California Edison Co. | 5.350% | 7/15/35 | 4,185 | 5,024 |
| Southern California Edison Co. | 5.550% | 1/15/36 | 500 | 617 |
| Southern California Edison Co. | 5.625% | 2/1/36 | 1,875 | 2,332 |
| Southern California Edison Co. | 5.950% | 2/1/38 | 2,800 | 3,650 |
| Southern California Edison Co. | 4.500% | 9/1/40 | 10,307 | 11,248 |
| Southern Co. | 2.375% | 9/15/15 | 2,850 | 2,928 |
| Southern Co. | 1.950% | 9/1/16 | 590 | 597 |
| Southern Power Co. | 4.875% | 7/15/15 | 2,125 | 2,341 |
| Southern Power Co. | 5.150% | 9/15/41 | 6,640 | 7,023 |
75
| Total Bond Market II Index Fund | ||||
| Face | Market | |||
| Maturity | Amount | Value | ||
| Coupon | Date | ($000) | ($000) | |
| Southwestern Electric Power Co. | 5.550% | 1/15/17 | 100 | 112 |
| Southwestern Electric Power Co. | 6.450% | 1/15/19 | 4,763 | 5,555 |
| Tampa Electric Co. | 6.100% | 5/15/18 | 475 | 571 |
| Tampa Electric Co. | 6.550% | 5/15/36 | 1,075 | 1,423 |
| TECO Finance Inc. | 4.000% | 3/15/16 | 1,100 | 1,159 |
| TECO Finance Inc. | 6.572% | 11/1/17 | 470 | 562 |
| TECO Finance Inc. | 5.150% | 3/15/20 | 6,000 | 6,597 |
| Toledo Edison Co. | 6.150% | 5/15/37 | 275 | 335 |
| TransAlta Corp. | 4.750% | 1/15/15 | 400 | 429 |
| TransAlta Corp. | 6.650% | 5/15/18 | 425 | 489 |
| Tucson Electric Power Co. | 5.150% | 11/15/21 | 1,045 | 1,111 |
| UIL Holdings Corp. | 4.625% | 10/1/20 | 1,000 | 1,051 |
| Union Electric Co. | 6.700% | 2/1/19 | 2,007 | 2,437 |
| Union Electric Co. | 5.100% | 10/1/19 | 350 | 405 |
| Union Electric Co. | 8.450% | 3/15/39 | 2,300 | 3,863 |
| Virginia Electric and Power Co. | 5.400% | 1/15/16 | 5,250 | 6,048 |
| Virginia Electric and Power Co. | 3.450% | 9/1/22 | 8,000 | 8,387 |
| Virginia Electric and Power Co. | 6.000% | 1/15/36 | 1,575 | 1,986 |
| Virginia Electric and Power Co. | 8.875% | 11/15/38 | 900 | 1,489 |
| Wisconsin Electric Power Co. | 6.000% | 4/1/14 | 825 | 911 |
| Wisconsin Electric Power Co. | 4.250% | 12/15/19 | 2,650 | 2,966 |
| Wisconsin Electric Power Co. | 2.950% | 9/15/21 | 3,915 | 3,992 |
| Wisconsin Electric Power Co. | 5.625% | 5/15/33 | 325 | 402 |
| Wisconsin Electric Power Co. | 5.700% | 12/1/36 | 200 | 254 |
| 4 Wisconsin Energy Corp. | 6.250% | 5/15/67 | 5,325 | 5,325 |
| Wisconsin Power & Light Co. | 5.000% | 7/15/19 | 475 | 550 |
| Wisconsin Power & Light Co. | 6.375% | 8/15/37 | 1,400 | 1,912 |
| Xcel Energy Inc. | 5.613% | 4/1/17 | 275 | 314 |
| Xcel Energy Inc. | 4.700% | 5/15/20 | 7,095 | 8,049 |
| Xcel Energy Inc. | 6.500% | 7/1/36 | 4,215 | 5,404 |
| Natural Gas (0.7%) | ||||
| AGL Capital Corp. | 5.250% | 8/15/19 | 1,600 | 1,784 |
| AGL Capital Corp. | 3.500% | 9/15/21 | 650 | 653 |
| AGL Capital Corp. | 5.875% | 3/15/41 | 1,200 | 1,428 |
| Atmos Energy Corp. | 4.950% | 10/15/14 | 2,125 | 2,327 |
| Atmos Energy Corp. | 8.500% | 3/15/19 | 450 | 595 |
| Atmos Energy Corp. | 5.500% | 6/15/41 | 3,000 | 3,523 |
| Boardwalk Pipelines LP | 5.500% | 2/1/17 | 925 | 1,019 |
| British Transco Finance Inc. | 6.625% | 6/1/18 | 3,175 | 3,764 |
| Buckeye Partners LP | 6.050% | 1/15/18 | 100 | 110 |
| CenterPoint Energy Resources Corp. | 6.150% | 5/1/16 | 970 | 1,128 |
| CenterPoint Energy Resources Corp. | 4.500% | 1/15/21 | 2,501 | 2,644 |
| CenterPoint Energy Resources Corp. | 6.625% | 11/1/37 | 2,300 | 2,860 |
| CenterPoint Energy Resources Corp. | 5.850% | 1/15/41 | 625 | 720 |
| DCP Midstream LLC | 8.125% | 8/16/30 | 175 | 225 |
| DCP Midstream Operating LP | 3.250% | 10/1/15 | 1,200 | 1,213 |
| El Paso Natural Gas Co. | 5.950% | 4/15/17 | 11,365 | 12,732 |
| Enbridge Energy Partners LP | 6.500% | 4/15/18 | 3,625 | 4,207 |
| Enbridge Energy Partners LP | 9.875% | 3/1/19 | 5,180 | 6,856 |
| Enbridge Energy Partners LP | 5.200% | 3/15/20 | 525 | 582 |
| Enbridge Inc. | 4.900% | 3/1/15 | 800 | 871 |
| Enbridge Inc. | 5.600% | 4/1/17 | 2,160 | 2,441 |
| Energy Transfer Partners LP | 8.500% | 4/15/14 | 5,000 | 5,612 |
76
| Total Bond Market II Index Fund | ||||
| Face | Market | |||
| Maturity | Amount | Value | ||
| Coupon | Date | ($000) | ($000) | |
| Energy Transfer Partners LP | 5.950% | 2/1/15 | 5,370 | 5,814 |
| Energy Transfer Partners LP | 6.125% | 2/15/17 | 1,970 | 2,175 |
| Energy Transfer Partners LP | 9.000% | 4/15/19 | 1,825 | 2,182 |
| Energy Transfer Partners LP | 4.650% | 6/1/21 | 705 | 688 |
| Energy Transfer Partners LP | 6.625% | 10/15/36 | 750 | 798 |
| Energy Transfer Partners LP | 7.500% | 7/1/38 | 7,257 | 8,296 |
| 8 Enron Corp. | 7.625% | 9/10/04 | 400 | — |
| 8 Enron Corp. | 6.625% | 11/15/05 | 300 | — |
| 8 Enron Corp. | 7.125% | 5/15/07 | 1,800 | — |
| 8 Enron Corp. | 6.875% | 10/15/07 | 1,800 | — |
| 8 Enron Corp. | 6.750% | 8/1/09 | 1,300 | — |
| Enterprise Products Operating LLC | 5.650% | 4/1/13 | 950 | 996 |
| Enterprise Products Operating LLC | 5.900% | 4/15/13 | 625 | 656 |
| Enterprise Products Operating LLC | 9.750% | 1/31/14 | 7,325 | 8,468 |
| Enterprise Products Operating LLC | 5.600% | 10/15/14 | 9,615 | 10,574 |
| Enterprise Products Operating LLC | 6.300% | 9/15/17 | 4,850 | 5,661 |
| Enterprise Products Operating LLC | 6.650% | 4/15/18 | 975 | 1,154 |
| Enterprise Products Operating LLC | 6.500% | 1/31/19 | 1,750 | 2,041 |
| Enterprise Products Operating LLC | 5.200% | 9/1/20 | 3,590 | 3,961 |
| Enterprise Products Operating LLC | 6.875% | 3/1/33 | 5,398 | 6,492 |
| Enterprise Products Operating LLC | 7.550% | 4/15/38 | 3,130 | 4,030 |
| Enterprise Products Operating LLC | 5.950% | 2/1/41 | 2,105 | 2,349 |
| EQT Corp. | 6.500% | 4/1/18 | 3,175 | 3,576 |
| EQT Corp. | 8.125% | 6/1/19 | 2,275 | 2,691 |
| 8 HNG Internorth | 9.625% | 3/15/06 | 1,000 | — |
| KeySpan Corp. | 8.000% | 11/15/30 | 50 | 67 |
| Kinder Morgan Energy Partners LP | 5.000% | 12/15/13 | 5,800 | 6,155 |
| Kinder Morgan Energy Partners LP | 5.125% | 11/15/14 | 3,250 | 3,522 |
| Kinder Morgan Energy Partners LP | 3.500% | 3/1/16 | 4,085 | 4,241 |
| Kinder Morgan Energy Partners LP | 5.950% | 2/15/18 | 3,300 | 3,781 |
| Kinder Morgan Energy Partners LP | 6.850% | 2/15/20 | 2,300 | 2,728 |
| Kinder Morgan Energy Partners LP | 5.300% | 9/15/20 | 5,000 | 5,436 |
| Kinder Morgan Energy Partners LP | 7.300% | 8/15/33 | 350 | 420 |
| Kinder Morgan Energy Partners LP | 6.500% | 2/1/37 | 700 | 777 |
| Kinder Morgan Energy Partners LP | 6.950% | 1/15/38 | 5,190 | 5,930 |
| Kinder Morgan Energy Partners LP | 6.500% | 9/1/39 | 5,275 | 5,879 |
| Kinder Morgan Energy Partners LP | 5.625% | 9/1/41 | 500 | 515 |
| Magellan Midstream Partners LP | 5.650% | 10/15/16 | 3,910 | 4,460 |
| Magellan Midstream Partners LP | 6.550% | 7/15/19 | 1,750 | 2,065 |
| Magellan Midstream Partners LP | 4.250% | 2/1/21 | 3,950 | 4,107 |
| National Grid plc | 6.300% | 8/1/16 | 2,450 | 2,819 |
| Nisource Finance Corp. | 6.150% | 3/1/13 | 46 | 48 |
| Nisource Finance Corp. | 5.400% | 7/15/14 | 425 | 463 |
| Nisource Finance Corp. | 5.250% | 9/15/17 | 650 | 720 |
| Nisource Finance Corp. | 6.400% | 3/15/18 | 885 | 1,017 |
| Nisource Finance Corp. | 6.800% | 1/15/19 | 4,250 | 4,965 |
| Nisource Finance Corp. | 5.450% | 9/15/20 | 1,400 | 1,543 |
| Nisource Finance Corp. | 6.125% | 3/1/22 | 9,045 | 10,409 |
| Nisource Finance Corp. | 6.250% | 12/15/40 | 2,350 | 2,577 |
| Nisource Finance Corp. | 5.800% | 2/1/42 | 75 | 79 |
| NuStar Logistics LP | 7.650% | 4/15/18 | 2,700 | 3,237 |
| Oneok Inc. | 5.200% | 6/15/15 | 1,000 | 1,096 |
| Oneok Inc. | 6.000% | 6/15/35 | 5,165 | 5,521 |
| ONEOK Partners LP | 3.250% | 2/1/16 | 4,050 | 4,185 |
| ONEOK Partners LP | 6.150% | 10/1/16 | 9,265 | 10,661 |
77
| Total Bond Market II Index Fund | ||||
| Face | Market | |||
| Maturity | Amount | Value | ||
| Coupon | Date | ($000) | ($000) | |
| ONEOK Partners LP | 8.625% | 3/1/19 | 2,500 | 3,208 |
| ONEOK Partners LP | 6.650% | 10/1/36 | 4,775 | 5,714 |
| ONEOK Partners LP | 6.850% | 10/15/37 | 2,575 | 3,106 |
| ONEOK Partners LP | 6.125% | 2/1/41 | 3,005 | 3,508 |
| Panhandle Eastern Pipeline Co. LP | 6.200% | 11/1/17 | 2,900 | 3,293 |
| Panhandle Eastern Pipeline Co. LP | 7.000% | 6/15/18 | 325 | 378 |
| Plains All American Pipeline LP / | ||||
| PAA Finance Corp. | 6.125% | 1/15/17 | 2,000 | 2,264 |
| Plains All American Pipeline LP / | ||||
| PAA Finance Corp. | 8.750% | 5/1/19 | 125 | 160 |
| Plains All American Pipeline LP / | ||||
| PAA Finance Corp. | 5.000% | 2/1/21 | 5,300 | 5,772 |
| Plains All American Pipeline LP / | ||||
| PAA Finance Corp. | 6.700% | 5/15/36 | 295 | 350 |
| Questar Corp. | 2.750% | 2/1/16 | 2,075 | 2,111 |
| Sempra Energy | 6.000% | 2/1/13 | 200 | 210 |
| Sempra Energy | 6.500% | 6/1/16 | 3,885 | 4,539 |
| Sempra Energy | 9.800% | 2/15/19 | 1,500 | 2,025 |
| Sempra Energy | 6.000% | 10/15/39 | 7,005 | 8,695 |
| Southern California Gas Co. | 5.750% | 11/15/35 | 400 | 514 |
| 7 Southern Natural Gas Co. | 5.900% | 4/1/17 | 1,950 | 2,233 |
| Southern Natural Gas Co. | 8.000% | 3/1/32 | 2,299 | 2,872 |
| Southern Natural Gas Co. / | ||||
| Southern Natural Issuing Corp. | 4.400% | 6/15/21 | 1,725 | 1,782 |
| Southern Union Co. | 7.600% | 2/1/24 | 8,345 | 9,821 |
| Southern Union Co. | 8.250% | 11/15/29 | 700 | 830 |
| Spectra Energy Capital LLC | 6.250% | 2/15/13 | 325 | 341 |
| Spectra Energy Capital LLC | 5.500% | 3/1/14 | 1,250 | 1,342 |
| Spectra Energy Capital LLC | 5.668% | 8/15/14 | 100 | 109 |
| Spectra Energy Capital LLC | 8.000% | 10/1/19 | 835 | 1,060 |
| Spectra Energy Capital LLC | 6.750% | 2/15/32 | 725 | 840 |
| Tennessee Gas Pipeline Co. | 7.500% | 4/1/17 | 720 | 860 |
| Texas Eastern Transmission LP | 7.000% | 7/15/32 | 100 | 127 |
| Texas Gas Transmission LLC | 4.600% | 6/1/15 | 1,275 | 1,362 |
| TransCanada PipeLines Ltd. | 4.000% | 6/15/13 | 1,800 | 1,880 |
| TransCanada PipeLines Ltd. | 3.400% | 6/1/15 | 4,000 | 4,234 |
| TransCanada PipeLines Ltd. | 6.500% | 8/15/18 | 10,540 | 12,894 |
| TransCanada PipeLines Ltd. | 3.800% | 10/1/20 | 6,140 | 6,599 |
| TransCanada PipeLines Ltd. | 5.600% | 3/31/34 | 1,400 | 1,620 |
| TransCanada PipeLines Ltd. | 5.850% | 3/15/36 | 2,675 | 3,193 |
| TransCanada PipeLines Ltd. | 6.200% | 10/15/37 | 1,425 | 1,786 |
| TransCanada PipeLines Ltd. | 7.250% | 8/15/38 | 300 | 415 |
| TransCanada PipeLines Ltd. | 7.625% | 1/15/39 | 690 | 994 |
| 4 TransCanada PipeLines Ltd. | 6.350% | 5/15/67 | 4,100 | 4,110 |
| Transcontinental Gas Pipe Line Co. LLC | 6.050% | 6/15/18 | 295 | 339 |
| Williams Partners LP | 3.800% | 2/15/15 | 1,200 | 1,259 |
| Williams Partners LP | 5.250% | 3/15/20 | 7,901 | 8,772 |
| Williams Partners LP | 6.300% | 4/15/40 | 10,650 | 12,986 |
| Williams Partners LP / Williams Partners | ||||
| Finance Corp. | 7.250% | 2/1/17 | 7,000 | 8,369 |
78
| Total Bond Market II Index Fund | ||||
| Face | Market | |||
| Maturity | Amount | Value | ||
| Coupon | Date | ($000) | ($000) | |
| Other Utility (0.0%) | ||||
| American Water Capital Corp. | 6.085% | 10/15/17 | 2,425 | 2,831 |
| American Water Capital Corp. | 6.593% | 10/15/37 | 1,875 | 2,301 |
| United Utilities plc | 5.375% | 2/1/19 | 5,400 | 5,641 |
| Veolia Environnement SA | 6.000% | 6/1/18 | 6,000 | 6,644 |
| 1,163,956 | ||||
| Total Corporate Bonds (Cost $9,418,966) | 10,163,785 | |||
| Sovereign Bonds (U.S. Dollar-Denominated) (4.4%) | ||||
| African Development Bank | 1.625% | 2/11/13 | 2,800 | 2,837 |
| African Development Bank | 3.000% | 5/27/14 | 9,560 | 10,080 |
| African Development Bank | 1.250% | 9/2/16 | 3,100 | 3,118 |
| Asian Development Bank | 1.625% | 7/15/13 | 6,625 | 6,742 |
| Asian Development Bank | 3.625% | 9/5/13 | 7,400 | 7,769 |
| Asian Development Bank | 2.750% | 5/21/14 | 8,875 | 9,334 |
| Asian Development Bank | 0.875% | 6/10/14 | 500 | 504 |
| Asian Development Bank | 4.250% | 10/20/14 | 3,550 | 3,894 |
| Asian Development Bank | 2.625% | 2/9/15 | 20,005 | 21,177 |
| Asian Development Bank | 2.500% | 3/15/16 | 11,150 | 11,880 |
| Asian Development Bank | 5.500% | 6/27/16 | 5,450 | 6,509 |
| Asian Development Bank | 5.250% | 6/12/17 | 100 | 120 |
| Asian Development Bank | 5.593% | 7/16/18 | 1,700 | 2,077 |
| Asian Development Bank | 1.875% | 10/23/18 | 120 | 122 |
| Banco do Brasil SA | 3.875% | 1/23/17 | 1,650 | 1,631 |
| Brazilian Government International Bond | 10.250% | 6/17/13 | 800 | 902 |
| Brazilian Government International Bond | 10.500% | 7/14/14 | 1,275 | 1,568 |
| Brazilian Government International Bond | 7.875% | 3/7/15 | 4,875 | 5,813 |
| Brazilian Government International Bond | 6.000% | 1/17/17 | 12,330 | 14,438 |
| 4 Brazilian Government International Bond | 8.000% | 1/15/18 | 7,204 | 8,429 |
| Brazilian Government International Bond | 5.875% | 1/15/19 | 31,050 | 36,717 |
| Brazilian Government International Bond | 8.875% | 10/14/19 | 3,600 | 5,022 |
| Brazilian Government International Bond | 4.875% | 1/22/21 | 11,970 | 13,348 |
| Brazilian Government International Bond | 8.875% | 4/15/24 | 1,525 | 2,272 |
| Brazilian Government International Bond | 8.750% | 2/4/25 | 4,200 | 6,279 |
| Brazilian Government International Bond | 10.125% | 5/15/27 | 4,200 | 6,930 |
| Brazilian Government International Bond | 7.125% | 1/20/37 | 11,425 | 15,816 |
| Brazilian Government International Bond | 11.000% | 8/17/40 | 4,350 | 5,764 |
| Brazilian Government International Bond | 5.625% | 1/7/41 | 25,475 | 29,551 |
| Canada Government International Bond | 2.375% | 9/10/14 | 4,385 | 4,599 |
| Chile Government International Bond | 5.500% | 1/15/13 | 1,000 | 1,047 |
| Chile Government International Bond | 3.875% | 8/5/20 | 6,850 | 7,457 |
| China Development Bank Corp. | 4.750% | 10/8/14 | 2,625 | 2,795 |
| China Development Bank Corp. | 5.000% | 10/15/15 | 525 | 568 |
| China Government International Bond | 4.750% | 10/29/13 | 1,800 | 1,909 |
| Colombia Government International Bond | 10.750% | 1/15/13 | 1,050 | 1,139 |
| Colombia Government International Bond | 8.250% | 12/22/14 | 2,000 | 2,350 |
| Colombia Government International Bond | 7.375% | 1/27/17 | 4,900 | 5,978 |
| Colombia Government International Bond | 7.375% | 3/18/19 | 5,550 | 7,007 |
| Colombia Government International Bond | 11.750% | 2/25/20 | 1,050 | 1,654 |
| Colombia Government International Bond | 4.375% | 7/12/21 | 9,795 | 10,481 |
| Colombia Government International Bond | 8.125% | 5/21/24 | 2,800 | 3,878 |
| Colombia Government International Bond | 7.375% | 9/18/37 | 4,500 | 6,289 |
| Colombia Government International Bond | 6.125% | 1/18/41 | 3,000 | 3,683 |
| Corp. Andina de Fomento | 5.200% | 5/21/13 | 725 | 754 |
| Corp. Andina de Fomento | 5.125% | 5/5/15 | 3,775 | 4,002 |
79
| Total Bond Market II Index Fund | ||||
| Face | Market | |||
| Maturity | Amount | Value | ||
| Coupon | Date | ($000) | ($000) | |
| Corp. Andina de Fomento | 3.750% | 1/15/16 | 9,060 | 9,155 |
| Corp. Andina de Fomento | 5.750% | 1/12/17 | 4,700 | 5,117 |
| Corp. Andina de Fomento | 8.125% | 6/4/19 | 1,775 | 2,166 |
| Council Of Europe Development Bank | 2.750% | 2/10/15 | 2,200 | 2,277 |
| Council Of Europe Development Bank | 2.625% | 2/16/16 | 4,240 | 4,468 |
| 9 Development Bank of Japan | 4.250% | 6/9/15 | 5,815 | 6,387 |
| Ecopetrol SA | 7.625% | 7/23/19 | 1,725 | 2,092 |
| European Bank for Reconstruction & Development | 2.750% | 4/20/15 | 7,700 | 8,126 |
| European Bank for Reconstruction & Development | 1.625% | 9/3/15 | 1,800 | 1,828 |
| European Bank for Reconstruction & Development | 2.500% | 3/15/16 | 5,975 | 6,298 |
| European Bank for Reconstruction & Development | 1.375% | 10/20/16 | 4,735 | 4,757 |
| European Investment Bank | 1.625% | 3/15/13 | 7,800 | 7,842 |
| European Investment Bank | 2.875% | 3/15/13 | 2,825 | 2,885 |
| European Investment Bank | 3.250% | 5/15/13 | 6,900 | 7,101 |
| European Investment Bank | 1.875% | 6/17/13 | 6,500 | 6,574 |
| European Investment Bank | 4.250% | 7/15/13 | 11,900 | 12,460 |
| European Investment Bank | 1.250% | 9/17/13 | 12,275 | 12,299 |
| European Investment Bank | 1.250% | 2/14/14 | 24,090 | 24,062 |
| European Investment Bank | 2.375% | 3/14/14 | 7,400 | 7,570 |
| European Investment Bank | 1.500% | 5/15/14 | 13,575 | 13,636 |
| European Investment Bank | 4.625% | 5/15/14 | 11,075 | 11,927 |
| European Investment Bank | 3.125% | 6/4/14 | 16,395 | 17,101 |
| European Investment Bank | 1.125% | 8/15/14 | 12,900 | 12,840 |
| European Investment Bank | 0.875% | 12/15/14 | 17,220 | 16,947 |
| European Investment Bank | 2.875% | 1/15/15 | 7,875 | 8,212 |
| European Investment Bank | 2.750% | 3/23/15 | 10,325 | 10,753 |
| European Investment Bank | 1.625% | 9/1/15 | 19,545 | 19,544 |
| European Investment Bank | 1.375% | 10/20/15 | 4,545 | 4,503 |
| European Investment Bank | 4.875% | 2/16/16 | 9,500 | 10,683 |
| European Investment Bank | 2.250% | 3/15/16 | 18,400 | 18,788 |
| European Investment Bank | 2.500% | 5/16/16 | 15,700 | 16,208 |
| European Investment Bank | 2.125% | 7/15/16 | 6,000 | 6,077 |
| European Investment Bank | 5.125% | 9/13/16 | 14,700 | 16,869 |
| European Investment Bank | 1.250% | 10/14/16 | 6,650 | 6,512 |
| European Investment Bank | 4.875% | 1/17/17 | 6,325 | 7,199 |
| European Investment Bank | 5.125% | 5/30/17 | 9,150 | 10,619 |
| European Investment Bank | 2.875% | 9/15/20 | 12,900 | 12,897 |
| European Investment Bank | 4.000% | 2/16/21 | 8,575 | 9,341 |
| European Investment Bank | 4.875% | 2/15/36 | 100 | 108 |
| Export Development Canada | 2.375% | 3/19/12 | 3,825 | 3,836 |
| Export Development Canada | 3.500% | 5/16/13 | 4,650 | 4,824 |
| Export Development Canada | 3.125% | 4/24/14 | 15,175 | 16,039 |
| Export Development Canada | 2.250% | 5/28/15 | 1,550 | 1,622 |
| Export Development Canada | 1.250% | 10/26/16 | 705 | 713 |
| Export-Import Bank of Korea | 8.125% | 1/21/14 | 11,800 | 13,038 |
| Export-Import Bank of Korea | 5.875% | 1/14/15 | 1,750 | 1,875 |
| Export-Import Bank of Korea | 5.125% | 3/16/15 | 3,275 | 3,467 |
| Export-Import Bank of Korea | 4.125% | 9/9/15 | 5,925 | 6,108 |
| Export-Import Bank of Korea | 3.750% | 10/20/16 | 4,800 | 4,840 |
| Export-Import Bank of Korea | 4.000% | 1/29/21 | 2,500 | 2,417 |
| Finland Government International Bond | 6.950% | 2/15/26 | 1,000 | 1,448 |
| Hungary Government International Bond | 4.750% | 2/3/15 | 1,050 | 966 |
| Hungary Government International Bond | 6.250% | 1/29/20 | 7,990 | 7,299 |
| Hungary Government International Bond | 6.375% | 3/29/21 | 8,465 | 7,788 |
| Hungary Government International Bond | 7.625% | 3/29/41 | 575 | 502 |
| Hydro Quebec | 8.000% | 2/1/13 | 2,750 | 2,953 |
80
| Total Bond Market II Index Fund | ||||
| Face | Market | |||
| Maturity | Amount | Value | ||
| Coupon | Date | ($000) | ($000) | |
| Hydro Quebec | 7.500% | 4/1/16 | 3,650 | 4,545 |
| Hydro Quebec | 2.000% | 6/30/16 | 10,000 | 10,213 |
| Hydro Quebec | 8.400% | 1/15/22 | 3,040 | 4,427 |
| Hydro Quebec | 8.050% | 7/7/24 | 1,350 | 2,015 |
| Hydro Quebec | 8.500% | 12/1/29 | 100 | 160 |
| Inter-American Development Bank | 3.500% | 3/15/13 | 2,625 | 2,713 |
| Inter-American Development Bank | 3.000% | 4/22/14 | 19,725 | 20,754 |
| Inter-American Development Bank | 2.250% | 7/15/15 | 9,625 | 10,063 |
| Inter-American Development Bank | 4.250% | 9/14/15 | 3,450 | 3,865 |
| Inter-American Development Bank | 5.125% | 9/13/16 | 100 | 118 |
| Inter-American Development Bank | 1.375% | 10/18/16 | 4,310 | 4,370 |
| Inter-American Development Bank | 2.375% | 8/15/17 | 5,100 | 5,366 |
| Inter-American Development Bank | 1.750% | 8/24/18 | 6,795 | 6,853 |
| Inter-American Development Bank | 3.875% | 9/17/19 | 16,750 | 19,241 |
| Inter-American Development Bank | 3.875% | 2/14/20 | 2,300 | 2,651 |
| Inter-American Development Bank | 7.000% | 6/15/25 | 1,125 | 1,608 |
| International Bank for Reconstruction | ||||
| & Development | 1.750% | 7/15/13 | 14,200 | 14,473 |
| International Bank for Reconstruction | ||||
| & Development | 3.500% | 10/8/13 | 7,410 | 7,797 |
| International Bank for Reconstruction | ||||
| & Development | 0.500% | 11/26/13 | 2,525 | 2,528 |
| International Bank for Reconstruction | ||||
| & Development | 1.125% | 8/25/14 | 10,275 | 10,453 |
| International Bank for Reconstruction | ||||
| & Development | 2.375% | 5/26/15 | 31,070 | 32,665 |
| International Bank for Reconstruction | ||||
| & Development | 2.125% | 3/15/16 | 20,450 | 21,495 |
| International Bank for Reconstruction | ||||
| & Development | 5.000% | 4/1/16 | 9,475 | 11,015 |
| International Bank for Reconstruction | ||||
| & Development | 1.000% | 9/15/16 | 5,995 | 5,988 |
| International Bank for Reconstruction | ||||
| & Development | 7.625% | 1/19/23 | 950 | 1,380 |
| International Bank for Reconstruction | ||||
| & Development | 8.875% | 3/1/26 | 450 | 747 |
| International Finance Corp. | 3.500% | 5/15/13 | 2,350 | 2,442 |
| International Finance Corp. | 3.000% | 4/22/14 | 11,675 | 12,328 |
| International Finance Corp. | 2.750% | 4/20/15 | 3,250 | 3,467 |
| International Finance Corp. | 2.250% | 4/11/16 | 5,000 | 5,279 |
| International Finance Corp. | 1.125% | 11/23/16 | 13,975 | 14,004 |
| International Finance Corp. | 2.125% | 11/17/17 | 10,175 | 10,576 |
| Israel Government International Bond | 4.625% | 6/15/13 | 750 | 779 |
| Israel Government International Bond | 5.125% | 3/1/14 | 200 | 214 |
| Israel Government International Bond | 5.500% | 11/9/16 | 3,480 | 3,979 |
| Israel Government International Bond | 5.125% | 3/26/19 | 5,350 | 5,987 |
| 9 Japan Bank for International Cooperation | 4.250% | 6/18/13 | 4,800 | 5,034 |
| 9 Japan Finance Corp. | 2.875% | 2/2/15 | 6,300 | 6,615 |
| 9 Japan Finance Corp. | 1.875% | 9/24/15 | 6,065 | 6,165 |
| 9 Japan Finance Corp. | 2.500% | 1/21/16 | 5,600 | 5,821 |
| 9 Japan Finance Corp. | 2.500% | 5/18/16 | 6,000 | 6,295 |
| 9 Japan Finance Corp. | 2.250% | 7/13/16 | 5,000 | 5,191 |
| 9 Japan Finance Organization for Municipalities | 4.625% | 4/21/15 | 2,675 | 2,972 |
| 9 Japan Finance Organization for Municipalities | 5.000% | 5/16/17 | 1,100 | 1,282 |
| 9 Japan Finance Organization for Municipalities | 4.000% | 1/13/21 | 5,625 | 6,314 |
81
| Total Bond Market II Index Fund | |||||
| Face | Market | ||||
| Maturity | Amount | Value | |||
| Coupon | Date | ($000) | ($000) | ||
| Korea Development Bank | 5.300% | 1/17/13 | 1,200 | 1,234 | |
| Korea Development Bank | 5.750% | 9/10/13 | 3,300 | 3,467 | |
| Korea Development Bank | 8.000% | 1/23/14 | 3,150 | 3,470 | |
| Korea Development Bank | 4.375% | 8/10/15 | 11,800 | 12,143 | |
| Korea Development Bank | 3.250% | 3/9/16 | 1,180 | 1,165 | |
| Korea Development Bank | 4.000% | 9/9/16 | 2,500 | 2,531 | |
| Korea Development Bank | 3.875% | 5/4/17 | 2,500 | 2,482 | |
| Korea Electric Power Corp. | 7.750% | 4/1/13 | 2,200 | 2,341 | |
| Korea Finance Corp. | 3.250% | 9/20/16 | 4,000 | 3,929 | |
| Korea Finance Corp. | 4.625% | 11/16/21 | 4,000 | 3,999 | |
| 10 | Kreditanstalt fuer Wiederaufbau | 1.875% | 1/14/13 | 12,900 | 13,071 |
| 10 | Kreditanstalt fuer Wiederaufbau | 3.250% | 3/15/13 | 19,600 | 20,212 |
| 10 | Kreditanstalt fuer Wiederaufbau | 3.500% | 5/16/13 | 4,000 | 4,156 |
| 10 | Kreditanstalt fuer Wiederaufbau | 1.375% | 7/15/13 | 18,400 | 18,580 |
| 10 | Kreditanstalt fuer Wiederaufbau | 4.000% | 10/15/13 | 7,500 | 7,933 |
| 10 | Kreditanstalt fuer Wiederaufbau | 1.375% | 1/13/14 | 12,700 | 12,832 |
| 10 | Kreditanstalt fuer Wiederaufbau | 3.500% | 3/10/14 | 300 | 317 |
| 10 | Kreditanstalt fuer Wiederaufbau | 1.500% | 4/4/14 | 275 | 278 |
| 10 | Kreditanstalt fuer Wiederaufbau | 4.125% | 10/15/14 | 575 | 623 |
| 10 | Kreditanstalt fuer Wiederaufbau | 2.750% | 10/21/14 | 19,090 | 19,979 |
| 10 | Kreditanstalt fuer Wiederaufbau | 2.625% | 3/3/15 | 11,875 | 12,453 |
| 10 | Kreditanstalt fuer Wiederaufbau | 1.250% | 10/26/15 | 15,400 | 15,471 |
| 10 | Kreditanstalt fuer Wiederaufbau | 2.625% | 2/16/16 | 3,450 | 3,620 |
| 10 | Kreditanstalt fuer Wiederaufbau | 5.125% | 3/14/16 | 14,000 | 16,111 |
| 10 | Kreditanstalt fuer Wiederaufbau | 2.000% | 6/1/16 | 19,000 | 19,480 |
| 10 | Kreditanstalt fuer Wiederaufbau | 1.250% | 10/5/16 | 15,230 | 15,121 |
| 10 | Kreditanstalt fuer Wiederaufbau | 4.375% | 3/15/18 | 18,850 | 21,745 |
| 10 | Kreditanstalt fuer Wiederaufbau | 4.500% | 7/16/18 | 6,425 | 7,452 |
| 10 | Kreditanstalt fuer Wiederaufbau | 4.875% | 6/17/19 | 19,300 | 23,143 |
| 10 | Kreditanstalt fuer Wiederaufbau | 4.000% | 1/27/20 | 5,500 | 6,194 |
| 10 | Kreditanstalt fuer Wiederaufbau | 2.750% | 9/8/20 | 30,850 | 31,745 |
| 10 | Kreditanstalt fuer Wiederaufbau | 2.375% | 8/25/21 | 9,590 | 9,588 |
| 10 | Kreditanstalt fuer Wiederaufbau | 0.000% | 4/18/36 | 7,000 | 3,011 |
| 10 | Kreditanstalt fuer Wiederaufbau | 0.000% | 6/29/37 | 5,450 | 2,238 |
| 10 | Landwirtschaftliche Rentenbank | 3.250% | 3/15/13 | 7,000 | 7,219 |
| 10 | Landwirtschaftliche Rentenbank | 4.125% | 7/15/13 | 3,045 | 3,215 |
| 10 | Landwirtschaftliche Rentenbank | 3.125% | 7/15/15 | 6,605 | 6,995 |
| 10 | Landwirtschaftliche Rentenbank | 4.875% | 11/16/15 | 10,650 | 12,034 |
| 10 | Landwirtschaftliche Rentenbank | 2.500% | 2/15/16 | 7,220 | 7,527 |
| 10 | Landwirtschaftliche Rentenbank | 2.125% | 7/15/16 | 175 | 179 |
| 10 | Landwirtschaftliche Rentenbank | 5.125% | 2/1/17 | 2,000 | 2,345 |
| 10 | Landwirtschaftliche Rentenbank | 1.875% | 9/17/18 | 5,600 | 5,588 |
| Mexico Government International Bond | 6.375% | 1/16/13 | 4,525 | 4,729 | |
| Mexico Government International Bond | 5.875% | 2/17/14 | 8,025 | 8,667 | |
| Mexico Government International Bond | 6.625% | 3/3/15 | 2,975 | 3,377 | |
| Mexico Government International Bond | 11.375% | 9/15/16 | 1,325 | 1,875 | |
| Mexico Government International Bond | 5.625% | 1/15/17 | 25,620 | 29,442 | |
| Mexico Government International Bond | 5.950% | 3/19/19 | 7,775 | 9,233 | |
| Mexico Government International Bond | 5.125% | 1/15/20 | 27,890 | 31,880 | |
| Mexico Government International Bond | 8.300% | 8/15/31 | 3,125 | 4,672 | |
| Mexico Government International Bond | 6.750% | 9/27/34 | 11,800 | 15,407 | |
| Mexico Government International Bond | 6.050% | 1/11/40 | 18,760 | 22,887 | |
| Mexico Government International Bond | 5.750% | 10/12/2110 | 1,150 | 1,216 | |
| Nordic Investment Bank | 1.625% | 1/28/13 | 5,300 | 5,365 | |
| Nordic Investment Bank | 2.625% | 10/6/14 | 4,000 | 4,194 | |
82
| Total Bond Market II Index Fund | |||||
| Face | Market | ||||
| Maturity | Amount | Value | |||
| Coupon | Date | ($000) | ($000) | ||
| Nordic Investment Bank | 2.500% | 7/15/15 | 3,865 | 4,069 | |
| Nordic Investment Bank | 2.250% | 3/15/16 | 4,250 | 4,454 | |
| Nordic Investment Bank | 5.000% | 2/1/17 | 1,150 | 1,358 | |
| North American Development Bank | 4.375% | 2/11/20 | 975 | 1,094 | |
| 11 | Oesterreichische Kontrollbank AG | 1.750% | 3/11/13 | 6,900 | 6,942 |
| 11 | Oesterreichische Kontrollbank AG | 1.375% | 1/21/14 | 14,250 | 14,252 |
| 11 | Oesterreichische Kontrollbank AG | 4.500% | 3/9/15 | 2,600 | 2,824 |
| 11 | Oesterreichische Kontrollbank AG | 2.000% | 6/3/16 | 2,500 | 2,490 |
| 11 | Oesterreichische Kontrollbank AG | 5.000% | 4/25/17 | 4,025 | 4,560 |
| Ontario Electricity Financial Corp. | 7.450% | 3/31/13 | 1,450 | 1,566 | |
| Panama Government International Bond | 7.250% | 3/15/15 | 4,000 | 4,623 | |
| Panama Government International Bond | 5.200% | 1/30/20 | 10,455 | 11,824 | |
| Panama Government International Bond | 7.125% | 1/29/26 | 6,500 | 8,466 | |
| 4 | Panama Government International Bond | 6.700% | 1/26/36 | 5,300 | 6,935 |
| Pemex Project Funding Master Trust | 7.375% | 12/15/14 | 2,500 | 2,814 | |
| Pemex Project Funding Master Trust | 5.750% | 3/1/18 | 11,125 | 12,220 | |
| Pemex Project Funding Master Trust | 6.625% | 6/15/35 | 9,100 | 10,310 | |
| Pemex Project Funding Master Trust | 6.625% | 6/15/38 | 2,025 | 2,290 | |
| Peruvian Government International Bond | 7.125% | 3/30/19 | 12,350 | 15,499 | |
| Peruvian Government International Bond | 7.350% | 7/21/25 | 1,525 | 2,024 | |
| Peruvian Government International Bond | 8.750% | 11/21/33 | 11,427 | 17,396 | |
| 4 | Peruvian Government International Bond | 6.550% | 3/14/37 | 5,200 | 6,578 |
| Petrobras International Finance Co. - Pifco | 3.875% | 1/27/16 | 4,100 | 4,202 | |
| Petrobras International Finance Co. - Pifco | 6.125% | 10/6/16 | 13,325 | 14,895 | |
| Petrobras International Finance Co. - Pifco | 5.875% | 3/1/18 | 6,775 | 7,400 | |
| Petrobras International Finance Co. - Pifco | 8.375% | 12/10/18 | 2,300 | 2,795 | |
| Petrobras International Finance Co. - Pifco | 7.875% | 3/15/19 | 9,575 | 11,478 | |
| Petrobras International Finance Co. - Pifco | 5.750% | 1/20/20 | 9,260 | 9,880 | |
| Petrobras International Finance Co. - Pifco | 5.375% | 1/27/21 | 5,200 | 5,461 | |
| Petrobras International Finance Co. - Pifco | 6.875% | 1/20/40 | 4,525 | 5,170 | |
| Petrobras International Finance Co. - Pifco | 6.750% | 1/27/41 | 1,650 | 1,880 | |
| Petroleos Mexicanos | 4.875% | 3/15/15 | 4,875 | 5,169 | |
| Petroleos Mexicanos | 8.000% | 5/3/19 | 1,675 | 2,091 | |
| Petroleos Mexicanos | 6.000% | 3/5/20 | 4,150 | 4,648 | |
| Petroleos Mexicanos | 5.500% | 1/21/21 | 7,645 | 8,275 | |
| Petroleos Mexicanos | 6.500% | 6/2/41 | 1,800 | 2,026 | |
| 7 | Petroleos Mexicanos | 6.500% | 6/2/41 | 3,600 | 4,052 |
| Poland Government International Bond | 5.250% | 1/15/14 | 800 | 827 | |
| Poland Government International Bond | 3.875% | 7/16/15 | 13,100 | 13,215 | |
| Poland Government International Bond | 5.000% | 10/19/15 | 750 | 788 | |
| Poland Government International Bond | 6.375% | 7/15/19 | 16,585 | 18,326 | |
| Poland Government International Bond | 5.125% | 4/21/21 | 1,850 | 1,882 | |
| Poland Government International Bond | 5.000% | 3/23/22 | 1,060 | 1,065 | |
| Province of British Columbia | 2.850% | 6/15/15 | 6,100 | 6,480 | |
| Province of British Columbia | 2.100% | 5/18/16 | 13,280 | 13,812 | |
| Province of Manitoba | 1.375% | 4/28/14 | 7,000 | 7,104 | |
| Province of Manitoba | 2.625% | 7/15/15 | 1,475 | 1,549 | |
| Province of Manitoba | 4.900% | 12/6/16 | 6,065 | 7,015 | |
| Province of New Brunswick | 2.750% | 6/15/18 | 7,125 | 7,456 | |
| Province of Nova Scotia | 2.375% | 7/21/15 | 6,390 | 6,644 | |
| Province of Nova Scotia | 5.125% | 1/26/17 | 1,000 | 1,174 | |
| Province of Nova Scotia | 9.125% | 5/1/21 | 1,280 | 1,916 | |
| Province of Ontario | 1.375% | 1/27/14 | 14,675 | 14,876 | |
| Province of Ontario | 4.100% | 6/16/14 | 13,250 | 14,262 | |
| Province of Ontario | 2.950% | 2/5/15 | 1,475 | 1,557 | |
83
| Total Bond Market II Index Fund | ||||
| Face | Market | |||
| Maturity | Amount | Value | ||
| Coupon | Date | ($000) | ($000) | |
| Province of Ontario | 2.700% | 6/16/15 | 10,800 | 11,213 |
| Province of Ontario | 1.875% | 9/15/15 | 2,500 | 2,528 |
| Province of Ontario | 4.750% | 1/19/16 | 4,325 | 4,855 |
| Province of Ontario | 5.450% | 4/27/16 | 5,675 | 6,580 |
| Province of Ontario | 2.300% | 5/10/16 | 6,840 | 7,038 |
| Province of Ontario | 1.600% | 9/21/16 | 9,200 | 9,218 |
| Province of Ontario | 3.150% | 12/15/17 | 5,525 | 5,909 |
| Province of Ontario | 3.000% | 7/16/18 | 2,550 | 2,678 |
| Province of Ontario | 4.000% | 10/7/19 | 3,750 | 4,164 |
| Province of Ontario | 4.400% | 4/14/20 | 9,200 | 10,478 |
| Province of Saskatchewan | 7.375% | 7/15/13 | 425 | 469 |
| Quebec | 4.875% | 5/5/14 | 275 | 300 |
| Quebec | 4.600% | 5/26/15 | 2,250 | 2,505 |
| Quebec | 5.125% | 11/14/16 | 7,275 | 8,470 |
| Quebec | 4.625% | 5/14/18 | 7,000 | 8,041 |
| Quebec | 3.500% | 7/29/20 | 6,770 | 7,301 |
| Quebec | 2.750% | 8/25/21 | 8,475 | 8,491 |
| Quebec | 7.125% | 2/9/24 | 325 | 455 |
| Quebec | 7.500% | 9/15/29 | 6,875 | 10,392 |
| Region of Lombardy Italy | 5.804% | 10/25/32 | 1,050 | 861 |
| Republic of Italy | 4.375% | 6/15/13 | 4,350 | 4,274 |
| Republic of Italy | 2.125% | 9/16/13 | 13,075 | 12,323 |
| Republic of Italy | 4.500% | 1/21/15 | 4,000 | 3,800 |
| Republic of Italy | 3.125% | 1/26/15 | 13,165 | 11,980 |
| Republic of Italy | 4.750% | 1/25/16 | 12,350 | 11,486 |
| Republic of Italy | 5.250% | 9/20/16 | 10,855 | 10,149 |
| Republic of Italy | 6.875% | 9/27/23 | 4,600 | 4,422 |
| Republic of Italy | 5.375% | 6/15/33 | 5,650 | 4,803 |
| Republic of Korea | 4.250% | 6/1/13 | 5,700 | 5,882 |
| Republic of Korea | 5.750% | 4/16/14 | 3,175 | 3,435 |
| Republic of Korea | 4.875% | 9/22/14 | 6,785 | 7,278 |
| Republic of Korea | 7.125% | 4/16/19 | 3,175 | 3,949 |
| Republic of Korea | 5.625% | 11/3/25 | 575 | 678 |
| South Africa Government International Bond | 6.875% | 5/27/19 | 7,375 | 8,896 |
| South Africa Government International Bond | 5.500% | 3/9/20 | 5,890 | 6,575 |
| South Africa Government International Bond | 5.875% | 5/30/22 | 1,075 | 1,238 |
| South Africa Government International Bond | 6.250% | 3/8/41 | 7,100 | 8,192 |
| Statoil ASA | 3.875% | 4/15/14 | 1,250 | 1,332 |
| Statoil ASA | 2.900% | 10/15/14 | 950 | 996 |
| Statoil ASA | 1.800% | 11/23/16 | 300 | 304 |
| Statoil ASA | 3.125% | 8/17/17 | 5,590 | 5,848 |
| Statoil ASA | 5.250% | 4/15/19 | 7,215 | 8,331 |
| Statoil ASA | 3.150% | 1/23/22 | 3,175 | 3,264 |
| Statoil ASA | 7.250% | 9/23/27 | 1,975 | 2,720 |
| 7 Statoil ASA | 6.500% | 12/1/28 | 225 | 294 |
| Statoil ASA | 7.150% | 1/15/29 | 1,165 | 1,588 |
| Statoil ASA | 5.100% | 8/17/40 | 4,000 | 4,766 |
| Statoil ASA | 4.250% | 11/23/41 | 1,300 | 1,362 |
| Svensk Exportkredit AB | 3.250% | 9/16/14 | 5,050 | 5,217 |
| Svensk Exportkredit AB | 1.750% | 10/20/15 | 2,600 | 2,563 |
| Svensk Exportkredit AB | 2.125% | 7/13/16 | 7,360 | 7,322 |
| Svensk Exportkredit AB | 5.125% | 3/1/17 | 550 | 625 |
| Total Sovereign Bonds (Cost $2,082,653) | 2,194,399 | |||
84
| Total Bond Market II Index Fund | ||||
| Face | Market | |||
| Maturity | Amount | Value | ||
| Coupon | Date | ($000) | ($000) | |
| Taxable Municipal Bonds (0.9%) | ||||
| Alameda County CA Joint Powers Authority | ||||
| Lease Revenue | 7.046% | 12/1/44 | 100 | 124 |
| American Municipal Power Ohio Inc. Revenue | ||||
| (Prairie State Energy Campus Project) | 7.834% | 2/15/41 | 575 | 797 |
| American Municipal Power Ohio Inc. Revenue | ||||
| (Prairie State Energy Campus Project) | 6.053% | 2/15/43 | 400 | 466 |
| American Municipal Power Ohio Inc. Revenue | ||||
| (Prairie State Energy Campus Project) | 5.939% | 2/15/47 | 2,750 | 3,028 |
| American Municipal Power Ohio Inc. Revenue | ||||
| (Prairie State Energy Campus Project) | 6.270% | 2/15/50 | 1,090 | 1,241 |
| American Municipal Power Ohio Inc. Revenue | ||||
| (Prairie State Energy Campus Project) | 7.499% | 2/15/50 | 750 | 979 |
| American Municipal Power Ohio Inc. Revenue | ||||
| (Prairie State Energy Campus Project) | 8.084% | 2/15/50 | 3,050 | 4,278 |
| Bay Area Toll Authority California Toll Bridge | ||||
| Revenue (San Francisco Bay Area) | 6.793% | 4/1/30 | 875 | 1,054 |
| Bay Area Toll Authority California Toll Bridge | ||||
| Revenue (San Francisco Bay Area) | 6.918% | 4/1/40 | 1,500 | 1,922 |
| Bay Area Toll Authority California Toll Bridge | ||||
| Revenue (San Francisco Bay Area) | 6.263% | 4/1/49 | 4,283 | 5,565 |
| Bay Area Toll Authority California Toll Bridge | ||||
| Revenue (San Francisco Bay Area) | 6.907% | 10/1/50 | 4,065 | 5,301 |
| Board of Regents of the University of Texas | ||||
| System Revenue Financing System Revenue | 5.262% | 7/1/39 | 650 | 795 |
| Board of Regents of the University of Texas | ||||
| System Revenue Financing System Revenue | 6.276% | 8/15/41 | 525 | 598 |
| Board of Regents of the University of Texas | ||||
| System Revenue Financing System Revenue | 5.134% | 8/15/42 | 150 | 182 |
| Board of Regents of the University of Texas | ||||
| System Revenue Financing System Revenue | 4.794% | 8/15/46 | 1,665 | 1,907 |
| California Educational Facilities Authority Revenue | ||||
| (Stanford University) | 3.625% | 5/1/14 | 2,250 | 2,402 |
| California Educational Facilities Authority Revenue | ||||
| (Stanford University) | 4.250% | 5/1/16 | 750 | 843 |
| California GO | 5.250% | 4/1/14 | 1,675 | 1,785 |
| California GO | 3.950% | 11/1/15 | 2,550 | 2,691 |
| California GO | 5.750% | 3/1/17 | 4,000 | 4,479 |
| California GO | 6.200% | 3/1/19 | 1,100 | 1,244 |
| California GO | 6.200% | 10/1/19 | 4,935 | 5,638 |
| California GO | 5.700% | 11/1/21 | 4,655 | 5,114 |
| California GO | 7.500% | 4/1/34 | 14,380 | 17,208 |
| California GO | 5.650% | 4/1/39 | 1,225 | 1,292 |
| California GO | 7.550% | 4/1/39 | 295 | 361 |
| California GO | 7.300% | 10/1/39 | 1,200 | 1,430 |
| California GO | 7.350% | 11/1/39 | 8,200 | 9,828 |
| California GO | 7.625% | 3/1/40 | 2,950 | 3,649 |
| California GO | 7.600% | 11/1/40 | 2,900 | 3,584 |
| Central Puget Sound WA Regional Transit | ||||
| Authority Sales & Use Tax Revenue | 5.491% | 11/1/39 | 550 | 662 |
| Chicago IL Board of Education GO | 6.319% | 11/1/29 | 1,025 | 1,136 |
| Chicago IL Board of Education GO | 6.138% | 12/1/39 | 400 | 429 |
| Chicago IL GO | 7.781% | 1/1/35 | 825 | 1,000 |
| Chicago IL Metropolitan Water Reclamation | ||||
| District GO | 5.720% | 12/1/38 | 2,675 | 3,337 |
85
| Total Bond Market II Index Fund | ||||
| Face | Market | |||
| Maturity | Amount | Value | ||
| Coupon | Date | ($000) | ($000) | |
| Chicago IL O’Hare International Airport Revenue | 6.845% | 1/1/38 | 400 | 442 |
| Chicago IL O’Hare International Airport Revenue | 6.395% | 1/1/40 | 600 | 734 |
| Chicago IL Transit Authority Sales Tax | ||||
| Receipts Revenue | 6.200% | 12/1/40 | 1,650 | 1,856 |
| Chicago IL Transit Authority Transfer Tax | ||||
| Receipts Revenue | 6.899% | 12/1/40 | 3,065 | 3,619 |
| Chicago IL Wastewater Transmission Revenue | 6.900% | 1/1/40 | 600 | 744 |
| Chicago IL Water Revenue | 6.742% | 11/1/40 | 900 | 1,145 |
| Clark County NV Airport Revenue | 6.881% | 7/1/42 | 550 | 613 |
| Commonwealth Financing Authority Pennsylvania | ||||
| Revenue | 6.218% | 6/1/39 | 2,350 | 2,772 |
| Connecticut GO | 5.090% | 10/1/30 | 800 | 856 |
| Connecticut GO | 5.850% | 3/15/32 | 6,665 | 8,122 |
| Connecticut Special Tax Revenue | ||||
| (Transportation Infrastructure) | 5.459% | 11/1/30 | 100 | 114 |
| Cook County IL GO | 6.229% | 11/15/34 | 750 | 831 |
| Curators of the University of Missouri System | ||||
| Facilities Revenue | 5.960% | 11/1/39 | 1,000 | 1,295 |
| Curators of the University of Missouri System | ||||
| Facilities Revenue | 5.792% | 11/1/41 | 2,700 | 3,384 |
| Dallas County TX Hospital District Revenue | 5.621% | 8/15/44 | 750 | 924 |
| Dallas TX Area Rapid Transit Revenue | 4.922% | 12/1/41 | 1,650 | 1,870 |
| Dallas TX Area Rapid Transit Revenue | 5.999% | 12/1/44 | 1,100 | 1,449 |
| Dallas TX Area Rapid Transit Revenue | 5.022% | 12/1/48 | 2,675 | 3,055 |
| Dallas TX Independent School District GO | 6.450% | 2/15/35 | 1,500 | 1,772 |
| Denver CO City & County School District No. 1 GO | 5.664% | 12/1/33 | 525 | 619 |
| Denver CO Public Schools Revenue | ||||
| (City & County of Denver School District No. 1) | ||||
| COP | 7.017% | 12/15/37 | 1,050 | 1,338 |
| District of Columbia Income Tax Revenue | 5.591% | 12/1/34 | 450 | 548 |
| District of Columbia Income Tax Revenue | 5.582% | 12/1/35 | 650 | 781 |
| East Baton Rouge LA Sewer Commission | ||||
| Revenue | 6.087% | 2/1/45 | 975 | 1,015 |
| East Bay CA Municipal Utility District Water | ||||
| System Revenue | 5.874% | 6/1/40 | 4,400 | 5,488 |
| Georgia GO | 4.503% | 11/1/25 | 2,300 | 2,592 |
| Georgia Municipal Electric Power | ||||
| Authority Revenue | 6.637% | 4/1/57 | 6,445 | 6,797 |
| Georgia Municipal Electric Power | ||||
| Authority Revenue | 6.655% | 4/1/57 | 2,250 | 2,300 |
| Georgia Municipal Electric Power | ||||
| Authority Revenue | 7.055% | 4/1/57 | 1,275 | 1,316 |
| Illinois GO | 2.766% | 1/1/12 | 4,800 | 4,800 |
| Illinois GO | 4.071% | 1/1/14 | 5,980 | 6,167 |
| Illinois GO | 4.511% | 3/1/15 | 3,350 | 3,509 |
| Illinois GO | 5.365% | 3/1/17 | 3,000 | 3,218 |
| Illinois GO | 5.665% | 3/1/18 | 5,000 | 5,355 |
| Illinois GO | 4.950% | 6/1/23 | 5,125 | 5,061 |
| Illinois GO | 5.100% | 6/1/33 | 14,230 | 12,987 |
| Illinois GO | 6.630% | 2/1/35 | 1,050 | 1,097 |
| Illinois GO | 6.725% | 4/1/35 | 3,250 | 3,429 |
| Illinois GO | 7.350% | 7/1/35 | 4,200 | 4,578 |
| Illinois Toll Highway Authority Revenue | 6.184% | 1/1/34 | 460 | 543 |
| Illinois Toll Highway Authority Revenue | 5.851% | 12/1/34 | 625 | 715 |
| Indianapolis IN Local Public Improvement Revenue | 6.116% | 1/15/40 | 3,700 | 4,731 |
86
| Total Bond Market II Index Fund | |||||
| Face | Market | ||||
| Maturity | Amount | Value | |||
| Coupon | Date | ($000) | ($000) | ||
| 12 | Kansas Development Finance Authority Revenue | ||||
| (Public Employees Retirement System) | 5.501% | 5/1/34 | 1,525 | 1,662 | |
| Kentucky Asset/Liability Commission General Fund | |||||
| Revenue | 3.165% | 4/1/18 | 300 | 307 | |
| Las Vegas Valley Water District Nevada GO | 7.013% | 6/1/39 | 650 | 849 | |
| Los Angeles CA Community College District GO | 6.600% | 8/1/42 | 1,950 | 2,502 | |
| Los Angeles CA Department of Water & Power | |||||
| Revenue | 5.716% | 7/1/39 | 850 | 984 | |
| Los Angeles CA Department of Water | |||||
| & Power Revenue | 6.008% | 7/1/39 | 2,400 | 2,773 | |
| Los Angeles CA Department of Water | |||||
| & Power Revenue | 6.166% | 7/1/40 | 600 | 654 | |
| Los Angeles CA Department of Water | |||||
| & Power Revenue | 6.574% | 7/1/45 | 5,215 | 6,971 | |
| Los Angeles CA Department of Water | |||||
| & Power Revenue | 6.603% | 7/1/50 | 500 | 674 | |
| Los Angeles CA Unified School District GO | 5.755% | 7/1/29 | 1,500 | 1,657 | |
| Los Angeles CA Unified School District GO | 5.750% | 7/1/34 | 7,190 | 7,954 | |
| Los Angeles County CA Metropolitan | |||||
| Transportation Authority Sales Tax Revenue | 5.735% | 6/1/39 | 2,200 | 2,633 | |
| Los Angeles County CA Public Works Financing | |||||
| Authority Lease Revenue | 7.488% | 8/1/33 | 1,700 | 2,142 | |
| Los Angeles County CA Public Works Financing | |||||
| Authority Lease Revenue | 7.618% | 8/1/40 | 750 | 921 | |
| Loudoun County VA Industrial Development | |||||
| Authority Revenue (Howard Hughes | |||||
| Medical Institute) | 3.450% | 9/1/14 | 1,450 | 1,547 | |
| Maryland Health & Higher Educational Facilities | |||||
| Authority Revenue (Johns Hopkins University) | 5.250% | 7/1/19 | 2,275 | 2,712 | |
| Maryland Transportation Authority Facilities | |||||
| Projects Revenue | 5.888% | 7/1/43 | 700 | 888 | |
| Massachusetts GO | 4.200% | 12/1/21 | 3,000 | 3,323 | |
| Massachusetts GO | 5.456% | 12/1/39 | 3,440 | 4,159 | |
| Massachusetts School Building Authority | |||||
| Dedicated Sales Tax Revenue | 5.715% | 8/15/39 | 1,950 | 2,423 | |
| Massachusetts Transportation Fund Revenue | 5.731% | 6/1/40 | 475 | 621 | |
| Massachusetts Water Pollution Abatement Trust | 5.192% | 8/1/40 | 2,415 | 2,810 | |
| Metropolitan Government of Nashville | |||||
| & Davidson County TN GO | 5.707% | 7/1/34 | 1,000 | 1,171 | |
| Metropolitan New York Transportation Authority | |||||
| Revenue (Dedicated Tax Fund) | 7.336% | 11/15/39 | 3,950 | 5,558 | |
| Metropolitan New York Transportation Authority | |||||
| Revenue (Dedicated Tax Fund) | 6.089% | 11/15/40 | 400 | 484 | |
| Metropolitan New York Transportation Authority | |||||
| Revenue (Transit Revenue) | 6.548% | 11/15/31 | 300 | 359 | |
| Metropolitan New York Transportation Authority | |||||
| Revenue (Transit Revenue) | 5.871% | 11/15/39 | 800 | 860 | |
| Metropolitan New York Transportation Authority | |||||
| Revenue (Transit Revenue) | 6.648% | 11/15/39 | 2,340 | 2,812 | |
| Metropolitan New York Transportation Authority | |||||
| Revenue (Transit Revenue) | 6.668% | 11/15/39 | 2,000 | 2,478 | |
| Metropolitan Washington DC/VA Airports | |||||
| Authority Dulles Toll Road Revenue | 7.462% | 10/1/46 | 525 | 584 | |
| Metropolitan Water District of Southern California | |||||
| Water Revenue | 6.947% | 7/1/40 | 650 | 766 | |
87
| Total Bond Market II Index Fund | |||||
| Face | Market | ||||
| Maturity | Amount | Value | |||
| Coupon | Date | ($000) | ($000) | ||
| Mississippi GO | 5.245% | 11/1/34 | 700 | 799 | |
| Missouri Highways & Transportation Commission | |||||
| Road Revenue | 5.445% | 5/1/33 | 600 | 707 | |
| New Hampshire Health & Educational Facilities | |||||
| Authority Revenue (Dartmouth College) | 4.750% | 6/1/19 | 275 | 320 | |
| 13 | New Jersey Economic Development Authority | ||||
| Revenue (State Pension Funding) | 7.425% | 2/15/29 | 3,765 | 4,576 | |
| New Jersey Educational Facilities Authority | |||||
| Revenue (Princeton University) | 5.700% | 3/1/39 | 1,500 | 1,958 | |
| New Jersey Transportation Trust Fund Authority | |||||
| Transportation System Revenue | 5.754% | 12/15/28 | 1,855 | 2,027 | |
| New Jersey Transportation Trust Fund Authority | |||||
| Transportation System Revenue | 6.561% | 12/15/40 | 5,290 | 6,869 | |
| 14 | New Jersey Turnpike Authority Revenue | 4.252% | 1/1/16 | 735 | 762 |
| New Jersey Turnpike Authority Revenue | 7.414% | 1/1/40 | 4,400 | 6,276 | |
| New Jersey Turnpike Authority Revenue | 7.102% | 1/1/41 | 4,000 | 5,496 | |
| New York City NY GO | 6.646% | 12/1/31 | 100 | 117 | |
| New York City NY GO | 6.246% | 6/1/35 | 750 | 835 | |
| New York City NY GO | 5.968% | 3/1/36 | 1,840 | 2,183 | |
| New York City NY GO | 5.985% | 12/1/36 | 600 | 717 | |
| New York City NY GO | 5.517% | 10/1/37 | 3,225 | 3,663 | |
| New York City NY GO | 6.271% | 12/1/37 | 3,450 | 4,269 | |
| New York City NY GO | 5.846% | 6/1/40 | 750 | 893 | |
| New York City NY Municipal Water Finance | |||||
| Authority Water & Sewer System Revenue | 5.750% | 6/15/41 | 500 | 613 | |
| New York City NY Municipal Water Finance | |||||
| Authority Water & Sewer System Revenue | 5.790% | 6/15/41 | 4,000 | 4,383 | |
| New York City NY Municipal Water Finance | |||||
| Authority Water & Sewer System Revenue | 5.952% | 6/15/42 | 1,150 | 1,430 | |
| New York City NY Municipal Water Finance | |||||
| Authority Water & Sewer System Revenue | 6.011% | 6/15/42 | 350 | 437 | |
| New York City NY Municipal Water Finance | |||||
| Authority Water & Sewer System Revenue | 5.440% | 6/15/43 | 1,400 | 1,600 | |
| New York City NY Municipal Water Finance | |||||
| Authority Water & Sewer System Revenue | 5.882% | 6/15/44 | 3,890 | 4,857 | |
| New York City NY Transitional Finance Authority | |||||
| Building Aid Revenue | 6.828% | 7/15/40 | 2,500 | 3,209 | |
| New York City NY Transitional Finance Authority | |||||
| Future Tax Revenue | 5.767% | 8/1/36 | 750 | 882 | |
| New York City NY Transitional Finance Authority | |||||
| Future Tax Revenue | 5.508% | 8/1/37 | 3,300 | 3,858 | |
| New York City NY Transitional Finance Authority | |||||
| Future Tax Revenue | 5.572% | 11/1/38 | 1,000 | 1,169 | |
| New York State Dormitory Authority Revenue | |||||
| (Personal Income Tax) | 5.500% | 3/15/30 | 3,395 | 3,953 | |
| New York State Dormitory Authority Revenue | |||||
| (Personal Income Tax) | 5.289% | 3/15/33 | 1,250 | 1,434 | |
| New York State Dormitory Authority Revenue | |||||
| (Personal Income Tax) | 5.628% | 3/15/39 | 900 | 1,046 | |
| New York State Dormitory Authority Revenue | |||||
| (Personal Income Tax) | 5.389% | 3/15/40 | 750 | 879 | |
| New York State Urban Development Corp. | |||||
| Revenue (Personal Income Tax) | 5.770% | 3/15/39 | 2,175 | 2,595 | |
| New York State Urban Development Corp. | |||||
| Revenue (Personal Income Tax) | 5.838% | 3/15/40 | 650 | 771 | |
88
| Total Bond Market II Index Fund | |||||
| Face | Market | ||||
| Maturity | Amount | Value | |||
| Coupon | Date | ($000) | ($000) | ||
| North Texas Tollway Authority System Revenue | 6.718% | 1/1/49 | 1,250 | 1,551 | |
| Ohio State University General Receipts Revenue | 4.910% | 6/1/40 | 1,575 | 1,806 | |
| Ohio State University General Receipts Revenue | 4.800% | 6/1/2111 | 1,135 | 1,184 | |
| Ohio Water Development Authority Water Pollution | |||||
| Control Loan Fund Revenue | 4.879% | 12/1/34 | 1,000 | 1,130 | |
| Orange County CA Local Transportation Authority | |||||
| Sales Tax Revenue | 6.908% | 2/15/41 | 650 | 874 | |
| Oregon Department Transportation Highway | |||||
| Usertax Revenue | 5.834% | 11/15/34 | 1,050 | 1,285 | |
| Oregon GO | 5.762% | 6/1/23 | 650 | 799 | |
| Oregon GO | 5.892% | 6/1/27 | 975 | 1,146 | |
| 14 | Oregon School Boards Association GO | 4.759% | 6/30/28 | 700 | 759 |
| 12 | Oregon School Boards Association GO | 5.528% | 6/30/28 | 375 | 419 |
| Pennsylvania GO | 4.650% | 2/15/26 | 850 | 957 | |
| Pennsylvania GO | 5.350% | 5/1/30 | 3,000 | 3,267 | |
| Pennsylvania Public School Building Authority | |||||
| Lease Revenue (School District of Philadelphia) | 5.000% | 9/15/27 | 1,000 | 1,049 | |
| Pennsylvania Turnpike Commission Revenue | 5.511% | 12/1/45 | 550 | 625 | |
| Pennsylvania Turnpike Commission Revenue | 5.561% | 12/1/49 | 550 | 623 | |
| Port Authority of New York & New Jersey | |||||
| Revenue | 6.040% | 12/1/29 | 850 | 1,042 | |
| Port Authority of New York & New Jersey | |||||
| Revenue | 5.647% | 11/1/40 | 4,700 | 5,326 | |
| Port Authority of New York & New Jersey | |||||
| Revenue | 4.926% | 10/1/51 | 4,465 | 4,666 | |
| Puerto Rico Government Development Bank GO | 3.670% | 5/1/14 | 2,000 | 2,039 | |
| Puerto Rico Government Development Bank GO | 4.704% | 5/1/16 | 1,750 | 1,823 | |
| Regional Transportation District of Colorado | |||||
| Sales Tax Revenue | 5.844% | 11/1/50 | 1,400 | 1,819 | |
| Rutgers State University NJ Revenue | 5.665% | 5/1/40 | 725 | 860 | |
| Salt River Project Arizona Agricultural Improvement | |||||
| & Power District Revenue | 4.839% | 1/1/41 | 750 | 841 | |
| San Antonio TX Electric & Gas Systems Revenue | 5.985% | 2/1/39 | 1,500 | 1,908 | |
| San Antonio TX Electric & Gas Systems Revenue | 5.718% | 2/1/41 | 1,175 | 1,407 | |
| San Antonio TX Electric & Gas Systems Revenue | 5.808% | 2/1/41 | 1,875 | 2,290 | |
| San Diego County CA Water Authority Revenue | 6.138% | 5/1/49 | 750 | 958 | |
| San Francisco CA City & County Public Utility | |||||
| Commission Water Revenue | 6.000% | 11/1/40 | 1,600 | 1,852 | |
| San Francisco CA City & County Public Utility | |||||
| Commission Water Revenue | 6.950% | 11/1/50 | 3,000 | 3,909 | |
| Santa Clara Valley CA Transportation Authority | |||||
| Sales Tax Revenue | 5.876% | 4/1/32 | 3,855 | 4,586 | |
| Sonoma County CA Pension Obligation Revenue | 6.000% | 12/1/29 | 775 | 859 | |
| South Carolina Public Service Authority Revenue | 6.454% | 1/1/50 | 4,125 | 5,663 | |
| Texas GO | 5.517% | 4/1/39 | 1,590 | 1,982 | |
| Texas Transportation Commission Revenue | 5.028% | 4/1/26 | 750 | 873 | |
| Texas Transportation Commission Revenue | 5.178% | 4/1/30 | 800 | 944 | |
| Texas Transportation Commission Revenue | 4.631% | 4/1/33 | 2,300 | 2,505 | |
| Texas Transportation Commission Revenue | 4.681% | 4/1/40 | 1,075 | 1,208 | |
| University of California Regents Medical Center | |||||
| Revenue | 6.548% | 5/15/48 | 1,600 | 1,919 | |
| University of California Regents Medical Center | |||||
| Revenue | 6.583% | 5/15/49 | 975 | 1,178 | |
| University of California Revenue | 0.887% | 7/1/13 | 600 | 602 | |
| University of California Revenue | 5.770% | 5/15/43 | 5,790 | 6,652 | |
89
| Total Bond Market II Index Fund | |||||
| Face | Market | ||||
| Maturity | Amount | Value | |||
| Coupon | Date | ($000) | ($000) | ||
| University of California Revenue | 5.946% | 5/15/45 | 4,700 | 5,451 | |
| University of Massachusetts Building Authority | |||||
| Revenue | 5.450% | 11/1/40 | 600 | 706 | |
| University of Southern California | 5.250% | 10/1/2111 | 1,800 | 2,246 | |
| University of Virginia Revenue | 6.200% | 9/1/39 | 1,000 | 1,368 | |
| Utah GO | 4.554% | 7/1/24 | 1,000 | 1,179 | |
| Utah GO | 3.539% | 7/1/25 | 2,300 | 2,437 | |
| Utah Transit Authority Sales Tax Revenue | 5.937% | 6/15/39 | 100 | 128 | |
| Virginia Commonwealth Transportation | |||||
| Board Revenue | 5.350% | 5/15/35 | 730 | 843 | |
| Washington GO | 5.090% | 8/1/33 | 3,825 | 4,322 | |
| Washington GO | 5.481% | 8/1/39 | 270 | 323 | |
| Washington GO | 5.140% | 8/1/40 | 1,770 | 2,042 | |
| 12 | Wisconsin GO | 4.800% | 5/1/13 | 775 | 815 |
| 12 | Wisconsin GO | 5.700% | 5/1/26 | 1,800 | 2,067 |
| Total Taxable Municipal Bonds (Cost $392,655) | 453,863 | ||||
| Shares | |||||
| Temporary Cash Investments (5.0%) | |||||
| Money Market Fund (5.0%) | |||||
| 15 | Vanguard Market Liquidity Fund | 0.110% | 2,502,021,901 | 2,502,022 | |
| Face | |||||
| Amount | |||||
| ($000) | |||||
| U.S. Government and Agency Obligations (0.0%) | |||||
| United States Treasury Bill | 0.009% | 2/9/12 | 485 | 485 | |
| Total Temporary Cash Investments (Cost $2,502,507) | 2,502,507 | ||||
| Total Investments (103.9%) (Cost $49,397,097) | 51,988,097 | ||||
| Other Assets and Liabilities (-3.9%) | |||||
| Other Assets | 860,573 | ||||
| Liabilities | (2,819,316) | ||||
| (1,958,743) | |||||
| Net Assets (100%) | 50,029,354 | ||||
| Statement of Assets and Liabilities | |||||
| Assets | |||||
| Investments in Securities, at Value | 51,988,097 | ||||
| Receivables for Investment Securities Sold | 124,749 | ||||
| Receivables for Capital Shares Issued | 377,607 | ||||
| Other Assets | 358,217 | ||||
| Total Assets | 52,848,670 | ||||
| Liabilities | |||||
| Payables for Investment Securities Purchased | 2,787,173 | ||||
| Other Liabilities | 32,143 | ||||
| Total Liabilities | 2,819,316 | ||||
| Net Assets | 50,029,354 | ||||
90
| Total Bond Market II Index Fund | |
| At December 31, 2011, net assets consisted of: | |
| Amount | |
| ($000) | |
| Paid-in Capital | 47,364,710 |
| Undistributed Net Investment Income | — |
| Accumulated Net Realized Gains | 73,644 |
| Unrealized Appreciation (Depreciation) | 2,591,000 |
| Net Assets | 50,029,354 |
| Investor Shares—Net Assets | |
| Applicable to 3,277,046,612 outstanding $.001 par value shares of | |
| beneficial interest (unlimited authorization) | 35,626,355 |
| Net Asset Value Per Share—Investor Shares | $10.87 |
| Institutional Shares—Net Assets | |
| Applicable to 1,324,815,611 outstanding $.001 par value shares of | |
| beneficial interest (unlimited authorization) | 14,402,999 |
| Net Asset Value Per Share—Institutional Shares | $10.87 |
See Note A in Notes to Financial Statements.
1 Guaranteed by the Federal Deposit Insurance Corporation (FDIC) as part of the Temporary Liquidity Guarantee Program.
2 The issuer operates under a congressional charter; its securities are generally neither guaranteed by the U.S. Treasury nor backed by the
full faith and credit of the U.S. government.
3 The issuer was placed under federal conservatorship in September 2008; since that time, its daily operations have been managed by the
Federal Housing Finance Agency and it receives capital from the U.S. Treasury in exchange for senior preferred stock.
4 The average or expected maturity is shorter than the final maturity shown because of the possibility of interim principal payments and
prepayments or the possibility of the issue being called.
5 Includes securities purchased on a when-issued or delayed-delivery basis for which the fund has not taken delivery as of
December 31, 2011.
6 Adjustable-rate security.
7 Security exempt from registration under Rule 144A of the Securities Act of 1933. Such securities may be sold in transactions exempt from
registration, normally to qualified institutional buyers. At December 31, 2011, the aggregate value of these securities was $68,858,000,
representing 0.1% of net assets.
8 Non-income-producing security—security in default.
9 Guaranteed by the Government of Japan.
10 Guaranteed by the Federal Republic of Germany.
11 Guaranteed by the Republic of Austria.
12 Scheduled principal and interest payments are guaranteed by AGM (Assured Guaranty Municipal Corporation).
13 Scheduled principal and interest payments are guaranteed by National Public Finance Guarantee Corp.
14 Scheduled principal and interest payments are guaranteed by AMBAC (Ambac Assurance Corporation).
15 Affiliated money market fund available only to Vanguard funds and certain trusts and accounts managed by Vanguard. Rate shown is the
7-day yield.
GO—General Obligation Bond.
REIT—Real Estate Investment Trust.
See accompanying Notes, which are an integral part of the Financial Statements.
91
Total Bond Market II Index Fund
Statement of Operations
| Year Ended | |
| December 31, 2011 | |
| ($000) | |
| Investment Income | |
| Income | |
| Interest1 | 1,319,465 |
| Security Lending | 245 |
| Total Income | 1,319,710 |
| Expenses | |
| The Vanguard Group—Note B | |
| Investment Advisory Services | 2,400 |
| Management and Administrative—Investor Shares | 26,475 |
| Management and Administrative—Institutional Shares | 1,874 |
| Marketing and Distribution—Investor Shares | 8,587 |
| Marketing and Distribution—Institutional Shares | 3,331 |
| Custodian Fees | 554 |
| Auditing Fees | 38 |
| Shareholders’ Reports—Investor Shares | 4 |
| Shareholders’ Reports—Institutional Shares | 2 |
| Trustees’ Fees and Expenses | 44 |
| Total Expenses | 43,309 |
| Net Investment Income | 1,276,401 |
| Realized Net Gain (Loss) on Investment Securities Sold | 606,244 |
| Change in Unrealized Appreciation (Depreciation) of Investment Securities | 1,449,483 |
| Net Increase (Decrease) in Net Assets Resulting from Operations | 3,332,128 |
| 1 Interest income from an affiliated company of the fund was $3,098,000. | |
See accompanying Notes, which are an integral part of the Financial Statements.
92
Total Bond Market II Index Fund
Statement of Changes in Net Assets
| Year Ended December 31, | ||
| 2011 | 2010 | |
| ($000) | ($000) | |
| Increase (Decrease) in Net Assets | ||
| Operations | ||
| Net Investment Income | 1,276,401 | 1,037,911 |
| Realized Net Gain (Loss) | 606,244 | 255,322 |
| Change in Unrealized Appreciation (Depreciation) | 1,449,483 | 578,680 |
| Net Increase (Decrease) in Net Assets Resulting from Operations | 3,332,128 | 1,871,913 |
| Distributions | ||
| Net Investment Income | ||
| Investor Shares | (912,622) | (759,123) |
| Institutional Shares | (363,779) | (278,788) |
| Realized Capital Gain1 | ||
| Investor Shares | (322,238) | (176,360) |
| Institutional Shares | (128,546) | (67,869) |
| Total Distributions | (1,727,185) | (1,282,140) |
| Capital Share Transactions | ||
| Investor Shares | 6,660,476 | 6,919,889 |
| Institutional Shares | 3,327,888 | 3,418,568 |
| Net Increase (Decrease) from Capital Share Transactions | 9,988,364 | 10,338,457 |
| Total Increase (Decrease) | 11,593,307 | 10,928,230 |
| Net Assets | ||
| Beginning of Period | 38,436,047 | 27,507,817 |
| End of Period | 50,029,354 | 38,436,047 |
| 1 Includes fiscal 2011 and 2010 short-term gain distributions totaling $193,837,000 and $179,580,000, respectively. Short-term gain | ||
| distributions are treated as ordinary income dividends for tax purposes. | ||
See accompanying Notes, which are an integral part of the Financial Statements.
93
Total Bond Market II Index Fund
Financial Highlights
| Investor Shares | |||
| Jan. 26, | |||
| Year Ended | 20091 to | ||
| December 31, | Dec. 31, | ||
| For a Share Outstanding Throughout Each Period | 2011 | 2010 | 2009 |
| Net Asset Value, Beginning of Period | $10.50 | $10.26 | $10.00 |
| Investment Operations | |||
| Net Investment Income | .315 | .345 | .358 |
| Net Realized and Unrealized Gain (Loss) on Investments | .470 | .308 | .260 |
| Total from Investment Operations | .785 | .653 | .618 |
| Distributions | |||
| Dividends from Net Investment Income | (.315) | (.345) | (.358) |
| Distributions from Realized Capital Gains | (.100) | (.068) | — |
| Total Distributions | (.415) | (.413) | (.358) |
| Net Asset Value, End of Period | $10.87 | $10.50 | $10.26 |
| Total Return2 | 7.59% | 6.42% | 6.28% |
| Ratios/Supplemental Data | |||
| Net Assets, End of Period (Millions) | $35,626 | $27,807 | $20,432 |
| Ratio of Total Expenses to Average Net Assets | 0.12% | 0.12% | 0.11%3 |
| Ratio of Net Investment Income to Average Net Assets | 2.94% | 3.25% | 3.76%3 |
| Portfolio Turnover Rate | 134%4 | 105%4 | 110% |
| 1 Inception. | |||
| 2 Total returns do not include account service fees that may have applied in the periods shown. Fund prospectuses provide information about any applicable account service fees. | |||
| 3 Annualized. | |||
| 4 Includes 41% and 31% attributable to mortgage-dollar-roll activity. | |||
See accompanying Notes, which are an integral part of the Financial Statements.
94
Total Bond Market II Index Fund
Financial Highlights
| Institutional Shares | |||
| Feb. 17, | |||
| Year Ended | 20091 to | ||
| December 31, | Dec. 31, | ||
| For a Share Outstanding Throughout Each Period | 2011 | 2010 | 2009 |
| Net Asset Value, Beginning of Period | $10.50 | $10.26 | $10.03 |
| Investment Operations | |||
| Net Investment Income | .322 | .350 | .338 |
| Net Realized and Unrealized Gain (Loss) on Investments | .470 | .308 | .230 |
| Total from Investment Operations | .792 | .658 | .568 |
| Distributions | |||
| Dividends from Net Investment Income | (.322) | (.350) | (.338) |
| Distributions from Realized Capital Gains | (.100) | (.068) | — |
| Total Distributions | (.422) | (.418) | (.338) |
| Net Asset Value, End of Period | $10.87 | $10.50 | $10.26 |
| Total Return | 7.67% | 6.47% | 5.80% |
| Ratios/Supplemental Data | |||
| Net Assets, End of Period (Millions) | $14,403 | $10,629 | $7,076 |
| Ratio of Total Expenses to Average Net Assets | 0.05% | 0.07% | 0.07%2 |
| Ratio of Net Investment Income to Average Net Assets | 3.01% | 3.30% | 3.80%2 |
| Portfolio Turnover Rate | 134%3 | 105%3 | 110% |
| 1 Inception. | |||
| 2 Annualized. | |||
| 3 Includes 41% and 31% attributable to mortgage-dollar-roll activity. | |||
See accompanying Notes, which are an integral part of the Financial Statements.
95
Total Bond Market II Index Fund
Notes to Financial Statements
Vanguard Total Bond Market II Index Fund is registered under the Investment Company Act of 1940 as an open-end investment company, or mutual fund. The fund has been established by Vanguard as an investment vehicle for Vanguard funds-of-funds as well as certain similar trusts and accounts (“eligible investors”). The fund is not available to other investors. Certain of the fund’s investments are in corporate debt instruments; the issuers’ abilities to meet their obligations may be affected by economic developments in their respective industries. The fund offers two classes of shares: Investor Shares and Institutional Shares. Investor Shares are available to any investor who meets the fund’s minimum purchase requirements. Institutional Shares are designed for investors who meet certain administrative, service, and account-size criteria.
A. The following significant accounting policies conform to generally accepted accounting principles for U.S. mutual funds. The fund consistently follows such policies in preparing its financial statements.
1. Security Valuation: Bonds, and temporary cash investments acquired over 60 days to maturity, are valued using the latest bid prices or using valuations based on a matrix system (which considers such factors as security prices, yields, maturities, and ratings), both as furnished by independent pricing services. Investments in Vanguard Market Liquidity Fund are valued at that fund’s net asset value. Other temporary cash investments are valued at amortized cost, which approximates market value. Securities for which market quotations are not readily available, or whose values have been affected by events occurring before the fund’s pricing time but after the close of the securities’ primary markets, are valued by methods deemed by the board of trustees to represent fair value.
2. To Be Announced (TBA) Transactions: A TBA transaction is an agreement to buy or sell mortgage-backed securities with agreed-upon characteristics (face amount, coupon, maturity) for settlement at a future date. The fund may enter into TBA sells to reduce its exposure to the mortgage-backed securities market or in order to dispose of mortgage-backed securities it owns under delayed-delivery arrangements. For TBA purchases, the fund maintains cash or short-term investments until settlement date in an amount sufficient to meet the purchase price.
3. Mortgage Dollar Rolls: The fund enters into mortgage-dollar-roll transactions, in which the fund sells mortgage-backed securities to a dealer and simultaneously agrees to purchase similar securities in the future at a predetermined price. The proceeds of the securities sold in mortgage-dollar-roll transactions are typically invested in high-quality short-term fixed income securities. The fund forgoes principal and interest paid on the securities sold, and is compensated by interest earned on the proceeds of the sale and by a lower price on the securities to be repurchased. The fund has also entered into mortgage-dollar-roll transactions in which the fund buys mortgage-backed securities from a dealer pursuant to a TBA transaction and simultaneously agrees to sell similar securities in the future at a predetermined price. The securities bought in mortgage-dollar-roll transactions are used to cover an open TBA sell position. The fund continues to earn interest on mortgage-backed security pools already held and receives a lower price on the securities to be sold in the future. The fund accounts for mortgage-dollar-roll transactions as purchases and sales; as such, these transactions may increase the fund’s portfolio turnover rate. Amounts to be received or paid in connection with open mortgage dollar rolls are included in Receivables for Investment Securities Sold (Other Assets) or Payables for Investment Securities Purchased (Liabilities) in the Statement of Net Assets. The primary risk associated with mortgage dollar rolls is that a counterparty will default on its obligations. This risk is mitigated by entering into mortgage dollar rolls only with highly rated counterparties, allocating transactions among numerous counterparties, and monitoring exposure to each counterparty.
96
Total Bond Market II Index Fund
In April 2011, the Financial Accounting Standards Board adopted Accounting Standards Update (ASU) 2011-03, “Transfers and Servicing (Topic 860)—Reconsideration of Effective Control for Repurchase Agreements.” The ASU takes effect for periods beginning after December 15, 2011. Under the ASU, certain mortgage-dollar-roll transactions that previously would have been accounted for as purchases and sales may be accounted for as financing transactions. Treating these transactions as financing would have no impact on total return, but certain transactions that previously resulted in realized gains and losses would instead be reflected in net income and unrealized gains and losses. Management has concluded that treating the mortgage-dollar-roll arrangements entered into by the fund as purchases and sales continues to be appropriate.
4. Federal Income Taxes: The fund intends to continue to qualify as a regulated investment company and distribute all of its taxable income. Management has analyzed the fund’s tax positions taken for all open federal income tax years (December 31, 2009–2011), and has concluded that no provision for federal income tax is required in the fund’s financial statements.
5. Distributions: Distributions from net investment income are declared daily and paid on the first business day of the following month. Annual distributions from realized capital gains, if any, are recorded on the ex-dividend date.
6. Security Lending: The fund has lent its securities to qualified institutional borrowers to earn additional income. Security loans are required to be secured at all times by collateral at least equal to the market value of securities loaned. The fund invests cash collateral received in Vanguard Market Liquidity Fund, and records a liability for the return of the collateral, during the period the securities are on loan. Security lending income represents fees charged to borrowers plus income earned on investing cash collateral, less expenses associated with the loan. Effective August 2011, the fund is no longer permitted to lend its securities.
7. Other: Interest income includes income distributions received from Vanguard Market Liquidity Fund and is accrued daily. Premiums and discounts on debt securities purchased are amortized and accreted, respectively, to interest income over the lives of the respective securities. Security transactions are accounted for on the date securities are bought or sold. Costs used to determine realized gains (losses) on the sale of investment securities are those of the specific securities sold.
Each class of shares has equal rights as to assets and earnings, except that each class separately bears certain class-specific expenses related to maintenance of shareholder accounts (included in Management and Administrative expenses) and shareholder reporting. Marketing and distribution expenses are allocated to each class of shares based on a method approved by the board of trustees. Income, other non-class-specific expenses, and gains and losses on investments are allocated to each class of shares based on its relative net assets.
B. The Vanguard Group furnishes at cost investment advisory, corporate management, administrative, marketing, and distribution services. The costs of such services are allocated to the fund under methods approved by the board of trustees. The fund has committed to provide up to 0.40% of its net assets in capital contributions to Vanguard. At December 31, 2011, the fund had contributed capital of $7,746,000 to Vanguard (included in Other Assets), representing 0.02% of the fund’s net assets and 3.10% of Vanguard’s capitalization. The fund’s trustees and officers are also directors and officers of Vanguard.
97
Total Bond Market II Index Fund
C. Various inputs may be used to determine the value of the fund’s investments. These inputs are summarized in three broad levels for financial statement purposes. The inputs or methodologies used to value securities are not necessarily an indication of the risk associated with investing in those securities.
Level 1—Quoted prices in active markets for identical securities.
Level 2—Other significant observable inputs (including quoted prices for similar securities, interest
rates, prepayment speeds, credit risk, etc.).
Level 3—Significant unobservable inputs (including the fund’s own assumptions used to determine
the fair value of investments).
The following table summarizes the market value of the fund’s investments as of December 31, 2011, based on the inputs used to value them:
| Level 1 | Level 2 | Level 3 | |
| Investments | ($000) | ($000) | ($000) |
| U.S. Government and Agency Obligations | — | 35,464,068 | — |
| Asset-Backed/Commercial Mortgage-Backed Securities | — | 1,209,475 | — |
| Corporate Bonds | — | 10,163,785 | — |
| Sovereign Bonds | — | 2,194,399 | — |
| Taxable Municipal Bonds | — | 453,863 | — |
| Temporary Cash Investments | 2,502,022 | 485 | — |
| Total | 2,502,022 | 49,486,075 | — |
The following table summarizes changes in investments valued based on Level 3 inputs during the year ended December 31, 2011. Transfers into or out of Level 3 are recognized based on values as of the date of transfer.
| Investments in | |
| Corporate Bonds | |
| Amount Valued Based on Level 3 Inputs | ($000) |
| Balance as of December 31, 2010 | 8 |
| Change in Unrealized Appreciation (Depreciation) | (8) |
| Balance as of December 31, 2011 | — |
D. Capital gain distributions are determined on a tax basis and may differ from realized capital gains for financial reporting purposes. Differences may be permanent or temporary. Permanent differences are reclassified among capital accounts in the financial statements to reflect their tax character. Temporary differences arise when gains or losses are recognized in different periods for financial statement and tax purposes; these differences will reverse at some time in the future.
The fund used a tax accounting practice to treat a portion of the price of capital shares redeemed during the year as distributions from realized capital gains. Accordingly, the fund has reclassified $70,282,000 from accumulated net realized gains to paid-in capital.
For tax purposes, at December 31, 2011, the fund had short-term and long-term capital gains of $37,775,000 and $37,028,000, respectively, available for distribution. Short-term gain distributions are treated as ordinary income dividends for tax purposes.
98
Total Bond Market II Index Fund
At December 31, 2011, the cost of investment securities for tax purposes was $49,398,256,000. Net unrealized appreciation of investment securities for tax purposes was $2,589,841,000, consisting of unrealized gains of $2,654,121,000 on securities that had risen in value since their purchase and $64,280,000 in unrealized losses on securities that had fallen in value since their purchase.
E. During the year ended December 31, 2011, the fund purchased $5,554,974,000 of investment securities and sold $2,410,256,000 of investment securities, other than U.S. government securities and temporary cash investments. Purchases and sales of U.S. government securities were $61,206,186,000 and $54,821,922,000, respectively.
| F. Capital share transactions for each class of shares were: | ||||
| Year Ended December 31, | ||||
| 2011 | 2010 | |||
| Amount | Shares | Amount | Shares | |
| ($000) | (000) | ($000) | (000) | |
| Investor Shares | ||||
| Issued | 14,291,256 | 1,331,278 | 11,116,495 | 1,054,319 |
| Issued in Lieu of Cash Distributions | 1,234,860 | 114,928 | 935,480 | 88,664 |
| Redeemed | (8,865,640) | (817,930) | (5,132,086) | (486,284) |
| Net Increase (Decrease)—Investor Shares | 6,660,476 | 628,276 | 6,919,889 | 656,699 |
| Institutional Shares | ||||
| Issued | 6,184,677 | 575,475 | 4,549,822 | 429,893 |
| Issued in Lieu of Cash Distributions | 492,325 | 45,803 | 346,656 | 32,844 |
| Redeemed | (3,349,114) | (308,997) | (1,477,910) | (140,107) |
| Net Increase (Decrease) —Institutional Shares | 3,327,888 | 312,281 | 3,418,568 | 322,630 |
G. In preparing the financial statements as of December 31, 2011, management considered the impact of subsequent events for potential recognition or disclosure in these financial statements.
99
Report of Independent Registered
Public Accounting Firm
To the Trustees of Vanguard Bond Index Funds and the Shareholders of Vanguard Total Bond Market II Index Fund:
In our opinion, the accompanying statements of net assets and assets and liabilities and the related statements of operations and of changes in net assets and the financial highlights present fairly, in all material respects, the financial position of Vanguard Total Bond Market II Index Fund (constituting a separate portfolio of Vanguard Bond Index Funds, hereafter referred to as the “Fund”) at December 31, 2011, the results of its operations for the year then ended, the changes in its net assets for each of the two years for the period then ended and the financial highlights for each of the periods indicated, in conformity with accounting principles generally accepted in the United States of America. These financial statements and financial highlights (hereafter referred to as “financial statements”) are the responsibility of the Fund’s management; our responsibility is to express an opinion on these financial statements based on our audits. We conducted our audits of these financial statements in accordance with the standards of the Public Company Accounting Oversight Board (United States). Those standards require that we plan and perform the audit to obtain reasonable assurance about whether the financial statements are free of material misstatement. An audit includes examining, on a test basis, evidence supporting the amounts and disclosures in the financial statements, assessing the accounting principles used and significant estimates made by management, and evaluating the overall financial statement presentation. We believe that our audits, which included confirmation of securities at December 31, 2011 by correspondence with the custodian and brokers and by agreement to the underlying ownership records of Vanguard Market Liquidity Fund, provide a reasonable basis for our opinion.
PricewaterhouseCoopers LLP
Philadelphia, Pennsylvania
February 16, 2012

This information for the fiscal year ended December 31, 2011, is included pursuant to provisions of
the Internal Revenue Code.
The fund distributed $296,258,000 as capital gain dividends (from net long-term capital gains) to
shareholders during the fiscal year.
For nonresident alien shareholders, 100% of short-term capital gain dividends distributed by the fund
are qualified short-term capital gains.
For nonresident alien shareholders, 87.5% of income dividends are interest-related dividends.
100
About Your Fund’s Expenses
As a shareholder of the fund, you incur ongoing costs, which include costs for portfolio management, administrative services, and shareholder reports (like this one), among others. Operating expenses, which are deducted from a fund’s gross income, directly reduce the investment return of the fund.
A fund’s expenses are expressed as a percentage of its average net assets. This figure is known as the expense ratio. The following examples are intended to help you understand the ongoing costs (in dollars) of investing in your fund and to compare these costs with those of other mutual funds. The examples are based on an investment of $1,000 made at the beginning of the period shown and held for the entire period.
The accompanying table illustrates your fund’s costs in two ways:
• Based on actual fund return. This section helps you to estimate the actual expenses that you paid over the period. The ”Ending Account Value“ shown is derived from the fund‘s actual return, and the third column shows the dollar amount that would have been paid by an investor who started with $1,000 in the fund. You may use the information here, together with the amount you invested, to estimate the expenses that you paid over the period.
To do so, simply divide your account value by $1,000 (for example, an $8,600 account value divided by $1,000 = 8.6), then multiply the result by the number given for your fund under the heading ”Expenses Paid During Period.“
• Based on hypothetical 5% yearly return. This section is intended to help you compare your fund‘s costs with those of other mutual funds. It assumes that the fund had a yearly return of 5% before expenses, but that the expense ratio is unchanged. In this case—because the return used is not the fund’s actual return—the results do not apply to your investment. The example is useful in making comparisons because the Securities and Exchange Commission requires all mutual funds to calculate expenses based on a 5% return. You can assess your fund’s costs by comparing this hypothetical example with the hypothetical examples that appear in shareholder reports of other funds.
Note that the expenses shown in the table are meant to highlight and help you compare ongoing costs only and do not reflect transaction costs incurred by the fund for buying and selling securities. Further, the expenses do not include any purchase, redemption, or account service fees described in the fund prospectus. If such fees were applied to your account, your costs would be higher. Your fund does not carry a “sales load.”
The calculations assume no shares were bought or sold during the period. Your actual costs may have been higher or lower, depending on the amount of your investment and the timing of any purchases or redemptions.
You can find more information about the fund’s expenses, including annual expense ratios, in the Financial Statements section of this report. For additional information on operating expenses and other shareholder costs, please refer to your fund’s current prospectus.
101
| Six Months Ended December 31, 2011 | |||
| Beginning | Ending | Expenses | |
| Account Value | Account Value | Paid During | |
| Total Bond Market II Index Fund | 6/30/2011 | 12/31/2011 | Period |
| Based on Actual Fund Return | |||
| Investor Shares | $1,000.00 | $1,049.89 | $0.62 |
| Institutional Shares | 1,000.00 | 1,050.35 | 0.16 |
| Based on Hypothetical 5% Yearly Return | |||
| Investor Shares | $1,000.00 | $1,024.60 | $0.61 |
| Institutional Shares | 1,000.00 | 1,025.05 | 0.15 |
The calculations are based on expenses incurred in the most recent six-month period. The fund’s annualized six-month expense ratios for that
period are 0.12% for Investor Shares and 0.03% for Institutional Shares. The dollar amounts shown as “Expenses Paid” are equal to the
annualized expense ratio multiplied by the average account value over the period, multiplied by the number of days in the most recent
six-month period, then divided by the number of days in the most recent 12-month period.
102
Glossary
30-Day SEC Yield. A fund’s 30-day SEC yield is derived using a formula specified by the U.S. Securities and Exchange Commission. Under the formula, data related to the fund’s security holdings in the previous 30 days are used to calculate the fund’s hypothetical net income for that period, which is then annualized and divided by the fund’s estimated average net assets over the calculation period. For the purposes of this calculation, a security’s income is based on its current market yield to maturity (for bonds), its actual income (for asset-backed securities), or its projected dividend yield (for stocks). Because the SEC yield represents hypothetical annualized income, it will differ—at times significantly—from the fund’s actual experience. As a result, the fund’s income distributions may be higher or lower than implied by the SEC yield.
Average Coupon. The average interest rate paid on the fixed income securities held by a fund. It is expressed as a percentage of face value.
Average Duration. An estimate of how much the value of the bonds held by a fund will fluctuate in response to a change in interest rates. To see how the value could change, multiply the average duration by the change in rates. If interest rates rise by 1 percentage point, the value of the bonds in a fund with an average duration of five years would decline by about 5%. If rates decrease by a percentage point, the value would rise by 5%.
Average Effective Maturity. The average length of time until fixed income securities held by a fund reach maturity and are repaid, taking into consideration the possibility that the issuer may call the bond before its maturity date. The figure reflects the proportion of fund assets represented by each security; it also reflects any futures contracts held. In general, the longer the average effective maturity, the more a fund’s share price will fluctuate in response to changes in market interest rates.
Credit Quality. Credit-quality ratings are measured on a scale that generally ranges from AAA (highest) to D (lowest). “Not Rated” is used to classify securities for which a rating is not available. U.S. Treasury, U.S. Agency, and U.S. Agency mortgage-backed securities appear under “U.S. Government.” Credit-quality ratings are obtained from Barclays Capital using ratings generally derived from Moody’s, Fitch, and S&P. When ratings from all three agencies are used, the median rating is shown. When ratings from two of the agencies are used, the lower rating is shown.
Expense Ratio. A fund’s total annual operating expenses expressed as a percentage of the fund’s average net assets. The expense ratio includes management and administrative expenses, but does not include the transaction costs of buying and selling portfolio securities.
Inception Date. The date on which the assets of a fund (or one of its share classes) are first invested in accordance with the fund’s investment objective. For funds with a subscription period, the inception date is the day after that period ends. Investment performance is measured from the inception date.
Short-Term Reserves. The percentage of a fund invested in highly liquid, short-term securities that can be readily converted to cash.
Yield to Maturity. The rate of return an investor would receive if the fixed income securities held by a fund were held to their maturity dates.
103
The People Who Govern Your Fund
The trustees of your mutual fund are there to see that the fund is operated and managed in your best interests since, as a shareholder, you are a part owner of the fund. Your fund’s trustees also serve on the board of directors of The Vanguard Group, Inc., which is owned by the Vanguard funds and provides services to them on an at-cost basis.
A majority of Vanguard’s board members are independent, meaning that they have no affiliation with Vanguard or the funds they oversee, apart from the sizable personal investments they have made as private individuals. The independent board members have distinguished backgrounds in business, academia, and public service. Each of the trustees and executive officers oversees 180 Vanguard funds.
The following table provides information for each trustee and executive officer of the fund. More information about the trustees is in the Statement of Additional Information, which can be obtained, without charge, by contacting Vanguard at 800-662-7447, or online at vanguard.com.
| Interested Trustee1 | and President (2006–2008) of Rohm and Haas Co. |
| (chemicals); Director of Tyco International, Ltd. | |
| F. William McNabb III | (diversified manufacturing and services) and Hewlett- |
| Born 1957. Trustee Since July 2009. Chairman of the | Packard Co. (electronic computer manufacturing); |
| Board. Principal Occupation(s) During the Past Five | Senior Advisor at New Mountain Capital; Trustee |
| Years: Chairman of the Board of The Vanguard Group, | of The Conference Board; Member of the Board of |
| Inc., and of each of the investment companies served | Managers of Delphi Automotive LLP (automotive |
| by The Vanguard Group, since January 2010; Director | components). |
| of The Vanguard Group since 2008; Chief Executive | |
| Officer and President of The Vanguard Group and of | Amy Gutmann |
| each of the investment companies served by The | Born 1949. Trustee Since June 2006. Principal |
| Vanguard Group since 2008; Director of Vanguard | Occupation(s) During the Past Five Years: President |
| Marketing Corporation; Managing Director of The | of the University of Pennsylvania; Christopher H. |
| Vanguard Group (1995–2008). | Browne Distinguished Professor of Political Science |
| in the School of Arts and Sciences with secondary | |
| appointments at the Annenberg School for Commu- | |
| Independent Trustees | nication and the Graduate School of Education |
| of the University of Pennsylvania; Director of | |
| Emerson U. Fullwood | Carnegie Corporation of New York, Schuylkill River |
| Born 1948. Trustee Since January 2008. Principal | Development Corporation, and Greater Philadelphia |
| Occupation(s) During the Past Five Years: Executive | Chamber of Commerce; Trustee of the National |
| Chief Staff and Marketing Officer for North America | Constitution Center; Chair of the Presidential |
| and Corporate Vice President (retired 2008) of Xerox | Commission for the Study of Bioethical Issues. |
| Corporation (document management products and | |
| services); Executive in Residence and 2010 | JoAnn Heffernan Heisen |
| Distinguished Minett Professor at the Rochester | Born 1950. Trustee Since July 1998. Principal |
| Institute of Technology; Director of SPX Corporation | Occupation(s) During the Past Five Years: Corporate |
| (multi-industry manufacturing), the United Way of | Vice President and Chief Global Diversity Officer |
| Rochester, Amerigroup Corporation (managed health | (retired 2008) and Member of the Executive |
| care), the University of Rochester Medical Center, | Committee (1997–2008) of Johnson & Johnson |
| Monroe Community College Foundation, and North | (pharmaceuticals/consumer products); Director of |
| Carolina A&T University. | Skytop Lodge Corporation (hotels), the University |
| Medical Center at Princeton, the Robert Wood | |
| Rajiv L. Gupta | Johnson Foundation, and the Center for Work Life |
| Born 1945. Trustee Since December 2001.2 | Policy; Member of the Advisory Board of the |
| Principal Occupation(s) During the Past Five Years: | Maxwell School of Citizenship and Public Affairs |
| Chairman and Chief Executive Officer (retired 2009) | at Syracuse University. |
| F. Joseph Loughrey | Thomas J. Higgins | |
| Born 1949. Trustee Since October 2009. Principal | Born 1957. Chief Financial Officer Since September | |
| Occupation(s) During the Past Five Years: President | 2008. Principal Occupation(s) During the Past Five | |
| and Chief Operating Officer (retired 2009) and Vice | Years: Principal of The Vanguard Group, Inc.; Chief | |
| Chairman of the Board (2008–2009) of Cummins Inc. | Financial Officer of each of the investment companies | |
| (industrial machinery); Director of SKF AB (industrial | served by The Vanguard Group since 2008; Treasurer | |
| machinery), Hillenbrand, Inc. (specialized consumer | of each of the investment companies served by The | |
| services), the Lumina Foundation for Education, and | Vanguard Group (1998–2008). | |
| Oxfam America; Chairman of the Advisory Council | ||
| for the College of Arts and Letters and Member | Kathryn J. Hyatt | |
| of the Advisory Board to the Kellogg Institute for | Born 1955. Treasurer Since November 2008. Principal | |
| International Studies at the University of Notre Dame. | Occupation(s) During the Past Five Years: Principal | |
| of The Vanguard Group, Inc.; Treasurer of each of | ||
| André F. Perold | the investment companies served by The Vanguard | |
| Born 1952. Trustee Since December 2004. Principal | Group since 2008; Assistant Treasurer of each of the | |
| Occupation(s) During the Past Five Years: George | investment companies served by The Vanguard Group | |
| Gund Professor of Finance and Banking at the Harvard | (1988–2008). | |
| Business School (retired July 2011); Chief Investment | ||
| Officer and co-Managing Partner of HighVista | Heidi Stam | |
| Strategies LLC (private investment firm); Director of | Born 1956. Secretary Since July 2005. Principal | |
| Rand Merchant Bank; Overseer of the Museum of | Occupation(s) During the Past Five Years: Managing | |
| Fine Arts Boston. | Director of The Vanguard Group, Inc., since 2006; | |
| General Counsel of The Vanguard Group since 2005; | ||
| Alfred M. Rankin, Jr. | Secretary of The Vanguard Group and of each of the | |
| Born 1941. Trustee Since January 1993. Principal | investment companies served by The Vanguard Group | |
| Occupation(s) During the Past Five Years: Chairman, | since 2005; Director and Senior Vice President of | |
| President, and Chief Executive Officer of NACCO | Vanguard Marketing Corporation since 2005; | |
| Industries, Inc. (forklift trucks/housewares/lignite); | Principal of The Vanguard Group (1997–2006). | |
| Director of Goodrich Corporation (industrial products/ | ||
| aircraft systems and services) and the National | ||
| Association of Manufacturers; Chairman of the | Vanguard Senior Management Team | |
| Federal Reserve Bank of Cleveland; Vice Chairman | ||
| of University Hospitals of Cleveland; President of | R. Gregory Barton | Chris D. McIsaac |
| the Board of The Cleveland Museum of Art. | Mortimer J. Buckley | Michael S. Miller |
| Kathleen C. Gubanich | James M. Norris | |
| Peter F. Volanakis | Paul A. Heller | Glenn W. Reed |
| Born 1955. Trustee Since July 2009. Principal | Martha G. King | George U. Sauter |
| Occupation(s) During the Past Five Years: President | ||
| and Chief Operating Officer (retired 2010) of Corning | ||
| Incorporated (communications equipment); Director of | Chairman Emeritus and Senior Advisor | |
| Corning Incorporated (2000–2010) and Dow Corning | ||
| (2001–2010); Overseer of the Amos Tuck School of | John J. Brennan | |
| Business Administration at Dartmouth College. | Chairman, 1996–2009 | |
| Chief Executive Officer and President, 1996–2008 | ||
| Executive Officers | ||
| Founder | ||
| Glenn Booraem | ||
| Born 1967. Controller Since July 2010. Principal | John C. Bogle | |
| Occupation(s) During the Past Five Years: Principal | Chairman and Chief Executive Officer, 1974–1996 | |
| of The Vanguard Group, Inc.; Controller of each of | ||
| the investment companies served by The Vanguard | ||
| Group since 2010; Assistant Controller of each of | ||
| the investment companies served by The Vanguard | ||
| Group (2001–2010). | ||
1 Mr. McNabb is considered an “interested person,” as defined in the Investment Company Act of 1940, because he is an officer of the
Vanguard funds.
2 December 2002 for Vanguard Equity Income Fund, Vanguard Growth Equity Fund, the Vanguard Municipal Bond Funds, and the Vanguard
State Tax-Exempt Funds.

| P.O. Box 2600 | |
| Valley Forge, PA 19482-2600 | |
| Connect with Vanguard® > vanguard.com | |
| Fund Information > 800-662-7447 | |
| Direct Investor Account Services > 800-662-2739 | |
| Institutional Investor Services > 800-523-1036 | |
| Text Telephone for People | |
| With Hearing Impairment > 800-749-7273 | �� |
| This material may be used in conjunction | |
| with the offering of shares of any Vanguard | |
| fund only if preceded or accompanied by | |
| the fund’s current prospectus. | |
| All comparative mutual fund data are from Lipper Inc. or | |
| Morningstar, Inc., unless otherwise noted. | |
| You can obtain a free copy of Vanguard’s proxy voting | |
| guidelines by visiting vanguard.com/proxyreporting or by | |
| calling Vanguard at 800-662-2739. The guidelines are | |
| also available from the SEC’s website, sec.gov. In | |
| addition, you may obtain a free report on how your fund | |
| voted the proxies for securities it owned during the 12 | |
| months ended June 30. To get the report, visit either | |
| vanguard.com/proxyreporting or sec.gov. | |
| You can review and copy information about your fund at | |
| the SEC’s Public Reference Room in Washington, D.C. To | |
| find out more about this public service, call the SEC at | |
| 202-551-8090. Information about your fund is also | |
| available on the SEC’s website, and you can receive | |
| copies of this information, for a fee, by sending a | |
| request in either of two ways: via e-mail addressed to | |
| publicinfo@sec.gov or via regular mail addressed to the | |
| Public Reference Section, Securities and Exchange | |
| Commission, Washington, DC 20549-1520. | |
| © 2012 The Vanguard Group, Inc. | |
| All rights reserved. | |
| Vanguard Marketing Corporation, Distributor. | |
| Q6350 022012 | |
Item 2: Code of Ethics. The Registrant has adopted a code of ethics that applies to the Registrant’s principal executive officer, principal financial officer, principal accounting officer or controller or persons performing similar functions. The Code of Ethics was amended during the reporting period covered by this report to make certain technical, non-material changes.
Item 3: Audit Committee Financial Expert. The following members of the Audit Committee have been determined by the Registrant’s Board of Trustees to be Audit Committee Financial Experts serving on its Audit Committee, and to be independent: Charles D. Ellis, Rajiv L. Gupta, JoAnn Heffernan Heisen, André F. Perold, and Alfred M. Rankin, Jr.
Item 4: Principal Accountant Fees and Services.
(a) Audit Fees.
Audit Fees of the Registrant
Fiscal Year Ended December 31, 2011: $227,000
Fiscal Year Ended December 31, 2010: $229,000
Aggregate Audit Fees of Registered Investment Companies in the Vanguard Group.
Fiscal Year Ended December 31, 2011: $3,978,540
Fiscal Year Ended December 31, 2010: $3,607,060
(b) Audit-Related Fees.
Fiscal Year Ended December 31, 2011: $1,341,750
Fiscal Year Ended December 31, 2010: $791,350
Includes fees billed in connection with assurance and related services provided to the Registrant, The Vanguard Group, Inc., Vanguard Marketing Corporation, and other registered investment companies in the Vanguard Group.
(c) Tax Fees.
Fiscal Year Ended December 31, 2011: $373,830
Fiscal Year Ended December 31, 2010: $336,090
Includes fees billed in connection with tax compliance, planning and advice services provided to the Registrant, The Vanguard Group, Inc., Vanguard Marketing Corporation, and other registered investment companies in the Vanguard Group and related to income and excise taxes.
(d) All Other Fees.
Fiscal Year Ended December 31, 2011: $16,000
Fiscal Year Ended December 31, 2010: $16,000
Includes fees billed for services related to risk management and privacy matters. Services were provided to the Registrant, The Vanguard Group, Inc., Vanguard Marketing Corporation, and other registered investment companies in the Vanguard Group.
(e) (1) Pre-Approval Policies. The policy of the Registrant’s Audit Committee is to consider and, if appropriate, approve before the principal accountant is engaged for such services, all specific audit and non-audit services provided to: (1) the Registrant; (2) The Vanguard Group, Inc.; (3) other entities controlled by The Vanguard Group, Inc. that provide ongoing services to the Registrant; and (4) other registered investment companies in the Vanguard Group. In making a determination, the Audit Committee considers whether the services are consistent with maintaining the principal accountant’s independence.
In the event of a contingency situation in which the principal accountant is needed to provide services in between scheduled Audit Committee meetings, the Chairman of the Audit Committee would be called on to consider and, if appropriate, pre-approve audit or permitted non-audit services in an amount sufficient to complete services through the next Audit Committee meeting, and to determine if such services would be consistent with maintaining the accountant’s independence. At the next scheduled Audit Committee meeting, services and fees would be presented to the Audit Committee for formal consideration, and, if appropriate, approval by the entire Audit Committee. The Audit Committee would again consider whether such services and fees are consistent with maintaining the principal accountant’s independence.
The Registrant’s Audit Committee is informed at least annually of all audit and non-audit services provided by the principal accountant to the Vanguard complex, whether such services are provided to: (1) the Registrant; (2) The Vanguard Group, Inc.; (3) other entities controlled by The Vanguard Group, Inc. that provide ongoing services to the Registrant; or (4) other registered investment companies in the Vanguard Group.
(2) No percentage of the principal accountant’s fees or services were approved pursuant to the waiver provision of paragraph (c)(7)(i)(C) of Rule 2-01 of Regulation S-X.
(f) For the most recent fiscal year, over 50% of the hours worked under the principal accountant’s engagement were not performed by persons other than full-time, permanent employees of the principal accountant.
(g) Aggregate Non-Audit Fees.
Fiscal Year Ended December 31, 2011: $389,830
Fiscal Year Ended December 31, 2010: $352,090
Includes fees billed for non-audit services provided to the Registrant, The Vanguard Group, Inc., Vanguard Marketing Corporation, and other registered investment companies in the Vanguard Group.
(h) For the most recent fiscal year, the Audit Committee has determined that the provision of all non-audit services was consistent with maintaining the principal accountant’s independence.
Item 5: Audit Committee of Listed Registrants.
The Registrant is a listed issuer as defined in rule 10A-3 under the Securities Exchange Act of 1934 (“Exchange Act”). The Registrant has a separately-designated standing audit committee established in accordance with Section 3(a)(58)(A) of the Exchange Act. The Registrant’s audit committee members are: Emerson U. Fullwood, Rajiv L. Gupta, Amy Gutmann, JoAnn Heffernan Heisen, F. Joseph Loughrey, André F. Perold, Alfred M. Rankin, Jr., and Peter F. Volanakis.
Item 6: Investments. Not Applicable.
Item 7: Disclosure of Proxy Voting Policies and Procedures for Closed-End Management Investment Companies.
Not Applicable.
Item 8: Portfolio Managers of Closed-End Management Investment Companies. Not Applicable.
Item 9: Purchase of Equity Securities by Closed-End Management Investment Company and Affiliated Purchasers.
Not Applicable.
Item 10: Submission of Matters to a Vote of Security Holders.
Not Applicable.
Item 11: Controls and Procedures.
(a) Disclosure Controls and Procedures. The Principal Executive and Financial Officers concluded that the Registrant's Disclosure Controls and Procedures are effective based on their evaluation of the Disclosure Controls and Procedures as of a date within 90 days of the filing date of this report.
(b) Internal Control Over Financial Reporting. There were no significant changes in Registrant’s Internal Control Over Financial Reporting or in other factors that could significantly affect this control subsequent to the date of the evaluation, including any corrective actions with regard to significant deficiencies and material weaknesses.
Item 12: Exhibits.
(a) Code of Ethics.
(b) Certifications.
Pursuant to the requirements of the Securities Exchange Act of 1934 and the Investment Company Act of 1940, the registrant has duly caused this report to be signed on its behalf by the undersigned, thereunto duly authorized.
| VANGUARD BOND INDEX FUNDS | |
| BY: | /s/ F. WILLIAM MCNABB III* |
| F. WILLIAM MCNABB III | |
| CHIEF EXECUTIVE OFFICER | |
| Date: February 21, 2012 | |
Pursuant to the requirements of the Securities Exchange Act of 1934 and the Investment Company Act of 1940, this report has been signed below by the following persons on behalf of the registrant and in the capacities and on the dates indicated.
| VANGUARD BOND INDEX FUNDS | |
| BY: | /s/ F. WILLIAM MCNABB III* |
| F. WILLIAM MCNABB III | |
| CHIEF EXECUTIVE OFFICER | |
Date: February 21, 2012 | |
| VANGUARD BOND INDEX FUNDS | |
| BY: | /s/ THOMAS J. HIGGINS* |
| THOMAS J. HIGGINS | |
| CHIEF FINANCIAL OFFICER | |
Date: February 21, 2012 | |
* By: /s/ Heidi Stam
Heidi Stam, pursuant to a Power of Attorney filed on November 28, 2011 see file Number
33-23444, Incorporated by Reference.