UNITED STATES
SECURITIES AND EXCHANGE COMMISSION
Washington, D.C. 20549
FORM N-CSR
CERTIFIED SHAREHOLDER REPORT
OF
REGISTERED MANAGEMENT INVESTMENT COMPANIES
Investment Company Act file number: 811-04681
Name of Registrant: Vanguard Bond Index Funds
Address of Registrant:
P.O. Box 2600
Valley Forge, PA 19482
Name and address of agent for service:
Heidi Stam, Esquire
P.O. Box 876
Valley Forge, PA 19482
Registrant’s telephone number, including area code: (610) 669-1000
Date of fiscal year end: December 31
Date of reporting period: January 1, 2013 – December 31, 2013
Item 1: Reports to Shareholders
|
| Annual Report | December 31, 2013 |
| Vanguard Bond Index Funds |
 |
Vanguard’s Principles for Investing Success
We want to give you the best chance of investment success. These principles,
grounded in Vanguard’s research and experience, can put you on the right path.
Goals. Create clear, appropriate investment goals.
Balance. Develop a suitable asset allocation using broadly diversified funds.
Cost. Minimize cost.
Discipline. Maintain perspective and long-term discipline.
A single theme unites these principles: Focus on the things you can control.
We believe there is no wiser course for any investor.
| Contents | |
| Your Fund’s Total Returns. | 1 |
| Chairman’s Letter. | 4 |
| Short-Term Bond Index Fund. | 10 |
| Intermediate-Term Bond Index Fund. | 30 |
| Long-Term Bond Index Fund. | 51 |
| About Your Fund’s Expenses. | 72 |
| Glossary. | 75 |
Please note: The opinions expressed in this report are just that—informed opinions. They should not be considered promises or advice. Also, please keep in mind that the information and opinions cover the period through the date on the front of this report. Of course, the risks of investing in your fund are spelled out in the prospectus.
See the Glossary for definitions of investment terms used in this report.
About the cover: The ship’s wheel represents leadership and guidance, essential qualities in navigating difficult seas. This one is a replica based on an 18th-century British vessel. The HMSVanguard, another ship of that era, served as the flagship for British Admiral Horatio Nelson when he defeated a French fleet at the Battle of the Nile.
Your Fund’s Total Returns
| Fiscal Year Ended December 31, 2013 | ||||
| 30-Day SEC | Income | Capital | Total | |
| Yield | Returns | Returns | Returns | |
| Vanguard Short-Term Bond Index Fund | ||||
| Investor Shares | 0.68% | 1.10% | -1.03% | 0.07% |
| Admiral™ Shares | 0.78 | 1.20 | -1.03 | 0.17 |
| Signal® Shares | 0.78 | 1.20 | -1.03 | 0.17 |
| Institutional Shares | 0.81 | 1.23 | -1.03 | 0.20 |
| Institutional Plus Shares | 0.83 | 1.25 | -1.03 | 0.22 |
| ETF Shares | 0.78 | |||
| Market Price | 0.13 | |||
| Net Asset Value | 0.17 | |||
| Barclays U.S. 1–5 Year Government/Credit Float | ||||
| Adjusted Index | 0.29 | |||
| Spliced 1–5 Year Investment-Grade Debt Funds | ||||
| Average | 0.29 | |||
| For a benchmark description, see the Glossary. | ||||
| Spliced 1–5 Year Investment-Grade Debt Funds Average: Derived from data provided by Lipper, a Thomson Reuters Company. | ||||
| Vanguard Intermediate-Term Bond Index Fund | ||||
| Investor Shares | 2.73% | 2.71% | -6.25% | -3.54% |
| Admiral Shares | 2.83 | 2.80 | -6.25 | -3.45 |
| Signal Shares | 2.83 | 2.80 | -6.25 | -3.45 |
| Institutional Shares | 2.86 | 2.83 | -6.25 | -3.42 |
| Institutional Plus Shares | 2.88 | 2.85 | -6.25 | -3.40 |
| ETF Shares | 2.83 | |||
| Market Price | -3.66 | |||
| Net Asset Value | -3.44 | |||
| Barclays U.S. 5–10 Year Government/Credit Float | ||||
| Adjusted Index | -3.37 | |||
| Spliced Intermediate Investment-Grade Debt | ||||
| Funds Average | -1.78 | |||
| For a benchmark description, see the Glossary. | ||||
| Spliced Intermediate Investment-Grade Debt Funds Average: Derived from data provided by Lipper, a Thomson Reuters Company. | ||||
Admiral Shares carry lower expenses and are available to investors who meet certain account-balance requirements. Signal Shares, Institutional Shares, and Institutional Plus Shares are available to certain institutional investors who meet specific administrative, service, and account-size criteria. The Vanguard ETF® Shares shown are traded on the NYSE Arca exchange and are available only through brokers. The table provides ETF returns based on both the NYSE Arca market price and the net asset value for a share. U.S. Pat. Nos. 6,879,964; 7,337,138; 7,720,749; 7,925,573; 8,090,646; and 8,417,623.
1
Your Fund’s Total Returns
| Fiscal Year Ended December 31, 2013 | ||||
| 30-Day SEC | Income | Capital | Total | |
| Yield | Returns | Returns | Returns | |
| Vanguard Long-Term Bond Index Fund | ||||
| Investor Shares | 4.54% | 3.76% | -12.89% | -9.13% |
| Institutional Shares | 4.67 | 3.88 | -12.89 | -9.01 |
| Institutional Plus Shares | 4.69 | 3.90 | -12.89 | -8.99 |
| ETF Shares | 4.64 | |||
| Market Price | -8.91 | |||
| Net Asset Value | -9.03 | |||
| Barclays U.S. Long Government/Credit Float | ||||
| Adjusted Index | -8.83 | |||
| Spliced Corporate A-Rated Debt Funds Average | -1.78 | |||
| For a benchmark description, see the Glossary. | ||||
| Spliced Corporate A-Rated Debt Funds Average: Derived from data provided by Lipper, a Thomson Reuters Company. | ||||
Institutional Shares and Institutional Plus Shares are available to certain institutional investors who meet specific administrative, service, and account-size criteria. The Vanguard ETF® Shares shown are traded on the NYSE Arca exchange and are available only through brokers. The table provides ETF returns based on both the NYSE Arca market price and the net asset value for a share. U.S. Pat. Nos. 6,879,964; 7,337,138; 7,720,749; 7,925,573; 8,090,646; and 8,417,623.
For the ETF Shares, the market price is determined by the midpoint of the bid-offer spread as of the closing time of the New York Stock Exchange (generally 4 p.m., Eastern time). The net asset value is also determined as of the NYSE closing time. For more information about how the ETF Shares' market prices have compared with their net asset value, visit vanguard.com, select your ETF, and then select the Price and Performance tab. The ETF premium/discount analysis there shows the percentages of days on which the ETF Shares' market price was above or below the NAV.
2
Your Fund’s Performance at a Glance
| December 31, 2012, Through December 31, 2013 | ||||
| Distributions Per Share | ||||
| Starting | Ending | Income | Capital | |
| Share Price | Share Price | Dividends | Gains | |
| Vanguard Short-Term Bond Index Fund | ||||
| Investor Shares | $10.63 | $10.49 | $0.116 | $0.031 |
| Admiral Shares | 10.63 | 10.49 | 0.127 | 0.031 |
| Signal Shares | 10.63 | 10.49 | 0.127 | 0.031 |
| Institutional Shares | 10.63 | 10.49 | 0.130 | 0.031 |
| Institutional Plus Shares | 10.63 | 10.49 | 0.132 | 0.031 |
| ETF Shares | 80.94 | 79.89 | 0.950 | 0.237 |
| Vanguard Intermediate-Term Bond Index Fund | ||||
| Investor Shares | $11.96 | $11.09 | $0.329 | $0.125 |
| Admiral Shares | 11.96 | 11.09 | 0.340 | 0.125 |
| Signal Shares | 11.96 | 11.09 | 0.340 | 0.125 |
| Institutional Shares | 11.96 | 11.09 | 0.344 | 0.125 |
| Institutional Plus Shares | 11.96 | 11.09 | 0.346 | 0.125 |
| ETF Shares | 88.07 | 81.65 | 2.523 | 0.921 |
| Vanguard Long-Term Bond Index Fund | ||||
| Investor Shares | $14.27 | $12.41 | $0.557 | $0.023 |
| Institutional Shares | 14.27 | 12.41 | 0.574 | 0.023 |
| Institutional Plus Shares | 14.27 | 12.41 | 0.577 | 0.023 |
| ETF Shares | 93.73 | 81.45 | 3.813 | 0.151 |
3

Chairman’s Letter
Dear Shareholder,
While domestic stocks enjoyed a banner year in 2013 as investors became more confident about the health of the economy, the broad U.S. taxable bond market posted its first calendar-year loss in more than a decade. Concern about when the Federal Reserve might begin to reduce its massive bond-buying program contributed to a sharp rise in bond yields.
Because bond yields and prices move in opposite directions, U.S. investment-grade bonds as a whole experienced price declines over the year, with higher-rated and longer-dated securities seeing the biggest losses (credit ratings are determined by independent agencies). Vanguard Short-Term Bond Index Fund returned 0.07% for the 12 months ended December 31, 2013, as the income generated by its holdings was enough to offset price declines. (Returns are for Investor Shares.) That wasn’t the case, however, for Vanguard Intermediate-Term Bond Index Fund, which returned –3.54%, and Vanguard Long-Term Bond Index Fund, which returned –9.13%.
All three funds came close to matching their expense-free target indexes; their returns, particularly for the intermediate-term and long-term funds, trailed the average returns for their peer groups, which include actively managed funds.
Falling bond prices pushed the 30-day SEC yield for Investor Shares of the Short-Term Fund up to 0.68%, compared with 0.42% a year earlier. The comparable figures were
4
2.73% versus 1.67% for the Intermediate-Term Fund and 4.54% versus 3.52% for the Long-Term Fund.
Please note that in December, we announced plans to streamline Vanguard’s share-class offerings by phasing out Signal Shares. The Signal Shares of the Short-Term Bond Index Fund and the Intermediate-Term Bond Index Fund will be converted to Admiral Shares by October 2014.
Before moving on to discuss the markets, I want to mention an important transition at Vanguard. We announced in November that Robert F. Auwaerter, principal and head of Vanguard Fixed Income Group, intends to retire in March 2014. At the conclusion of this letter, I’ll have more to say about Bob’s important contributions to Vanguard in his 32-year career, and I’ll introduce his successor, Gregory Davis.
Bond returns faltered as the Fed’s phaseout loomed
The broad U.S. taxable bond market returned –2.02% for 2013, its first negative calendar-year return since 1999, when it returned –0.82%, as investors sold bonds in anticipation of further price declines. Municipal bonds returned –2.55% in aggregate.
International bond markets (as measured by the Barclays Global Aggregate Index ex USD) returned –3.08%. As for money market funds and savings accounts,
| Market Barometer | |||
| Average Annual Total Returns | |||
| Periods Ended December 31, 2013 | |||
| One | Three | Five | |
| Year | Years | Years | |
| Bonds | |||
| Barclays U.S. Aggregate Bond Index (Broad taxable | |||
| market) | -2.02% | 3.26% | 4.44% |
| Barclays Municipal Bond Index (Broad tax-exempt market) | -2.55 | 4.83 | 5.89 |
| Citigroup Three-Month U.S. Treasury Bill Index | 0.05 | 0.06 | 0.09 |
| Stocks | |||
| Russell 1000 Index (Large-caps) | 33.11% | 16.30% | 18.59% |
| Russell 2000 Index (Small-caps) | 38.82 | 15.67 | 20.08 |
| Russell 3000 Index (Broad U.S. market) | 33.55 | 16.24 | 18.71 |
| MSCI All Country World Index ex USA (International) | 15.29 | 5.14 | 12.81 |
| CPI | |||
| Consumer Price Index | 1.50% | 2.07% | 2.08% |
5
returns remained tiny as the Fed held short-term interest rates between 0% and 0.25%.
Earnings, optimism, and stimulus made it a big year for U.S. stocks
U.S. stocks surged about 34%, their best calendar-year finish since 1995. Corporations posted solid earnings and investors placed a higher premium on those earnings; the Federal Reserve’s easy monetary policy also supported stock markets.
International stocks, in aggregate, returned about 15%, with the developed markets of Europe and the Pacific region posting double-digit results and emerging-market stocks dipping into negative territory.
For 2014, Vanguard Chief Economist Joe Davis and his team are guarded in their outlook for global stock returns, and their forecast for the bond market remains muted. While Joe readily acknowledges that such forecasts are accompanied by uncertainty, he writes, “We believe a balanced and diversified, low-cost portfolio can remain a high-value proposition in the decade ahead.” (You can read more about our expectations for bond and stock returns in Vanguard’s Economic and Investment Outlook, available at vanguard.com/research.)
All eyes on the Federal Reserve
Throughout 2013, the Federal Reserve bought about $40 billion per month of mortgage bonds to support the housing
| Expense Ratios | |||||||
| Your Fund Compared With Its Peer Group | |||||||
| Peer | |||||||
| Investor | Admiral | Signal | Institutional | Institutional | ETF | Group | |
| Shares | Shares | Shares | Shares | Plus Shares | Shares | Average | |
| Short-Term Bond Index Fund | 0.20% | 0.10% | 0.10% | 0.07% | 0.05% | 0.10% | 0.82% |
| Intermediate-Term Bond Index | |||||||
| Fund | 0.20 | 0.10 | 0.10 | 0.07 | 0.05 | 0.10 | 0.84 |
| Long-Term Bond Index Fund | 0.20 | — | — | 0.07 | 0.05 | 0.10 | 0.97 |
The fund expense ratios shown are from the prospectus dated April 29, 2013 (August 20, 2013 for Institutional and Institutional Plus Shares of Short-Term Bond Index Fund and Intermediate-Term Bond Index Fund), and represent estimated costs for the current fiscal year. For the fiscal year ended December 31, 2013, the funds’ expense ratios were: for the Short-Term Bond Index Fund, 0.20% for Investor Shares, 0.10% for Admiral Shares, 0.10% for Signal Shares, 0.07% for Institutional Shares, 0.05% for Institutional Plus Shares, and 0.10% for ETF Shares; for the Intermediate-Term Bond Index Fund, 0.20% for Investor Shares, 0.10% for Admiral Shares, 0.10% for Signal Shares, 0.07% for Institutional Shares, 0.05% for Institutional Plus Shares, and 0.10% for ETF Shares; and for the Long-Term Bond Index Fund, 0.20% for Investor Shares, 0.07% for Institutional Shares, 0.05% for Institutional Plus Shares, and 0.10% for ETF Shares. Peer-group expense ratios are derived from data provided by Lipper, a Thomson Reuters Company, and capture information through year-end 2012.
Peer groups: For the Short-Term Bond Index Fund, 1–5 Year Investment-Grade Debt Funds; for the Intermediate-Term Bond Index Fund, Core Bond Funds; for the Long-Term Bond Index Fund, Corporate A-Rated Debt Funds.
6
market and about $45 billion per month of Treasuries to hold borrowing costs down for households and businesses. Given the magnitude of this support, it was not surprising that the bond market swooned in the spring when Fed officials signaled that further improvements in the housing and labor markets might warrant a “tapering” of its purchases. The suspense over when the Fed might act ended in December with its announcement that gradual decreases would begin in January 2014.
The prospect of a more solid footing for the economy and less accommodation from the Fed affected U.S. Treasuries the most. The yield of the 3-year Treasury note climbed 40 basis points over the year to 0.76%, while the 10-year yield jumped 121 basis points to 2.97%. (A basis-point is one-hundredth of a percentage point.) The resulting decline in prices put the return for these securities, which made up about one-third or more of each of the three funds’ assets, at –2.75% for the
| Total Returns | |
| Ten Years Ended December 31, 2013 | |
| Average | |
| Annual Return | |
| Short-Term Bond Index Fund Investor Shares | 3.27% |
| Spliced Barclays U.S. 1–5 Year Government/Credit Float Adjusted Index | 3.41 |
| Spliced 1–5 Year Investment-Grade Debt Funds Average | 2.62 |
| For a benchmark description, see the Glossary. | |
| Spliced 1–5 Year Investment-Grade Debt Funds Average: Derived from data provided by Lipper, a Thomson Reuters Company. | |
| Intermediate-Term Bond Index Fund Investor Shares | 5.28% |
| Spliced Barclays U.S. 5–10 Year Government/Credit Float Adjusted Index | 5.34 |
| Spliced Intermediate Investment-Grade Debt Funds Average | 3.98 |
| For a benchmark description, see the Glossary. | |
| Spliced Intermediate Investment-Grade Debt Funds Average: Derived from data provided by Lipper, a Thomson Reuters Company. |
| Long-Term Bond Index Fund Investor Shares | 6.25% |
| Spliced Barclays U.S. Long Government/Credit Float Adjusted Index | 6.36 |
| Spliced Corporate A-Rated Debt Funds Average | 4.12 |
| For a benchmark description, see the Glossary. | |
| Spliced Corporate A-Rated Debt Funds Average: Derived from data provided by Lipper, a Thomson Reuters Company. |
The figures shown represent past performance, which is not a guarantee of future results. (Current performance may be lower or higher than the performance data cited. For performance data current to the most recent month-end, visit our website at vanguard.com/performance.) Note, too, that both investment returns and principal value can fluctuate widely, so an investor’s shares, when sold, could be worth more or less than their original cost.
7
12-month period. Long-term Treasuries, which are more sensitive to interest rate movements, lost more than four times that amount.
Corporate bonds, whose weighting in the three funds ranged between roughly 20% and 50%, generally fared a little better than Treasuries as they had more of a cushion from the income they generated. Overall, corporate bonds returned –1.53% for the year, with lower-rated investment-grade securities outperforming their higher-rated counterparts.
Within corporate bonds, financials produced a slightly positive return as investor sentiment toward this sector continued to improve, while industrials and utilities turned in negative results. And in terms of maturity, shorter-term corporate bonds held up better than their longer-term counterparts. That general trend in the bond market was clearly reflected in the funds’ performances, with only the Short-Term Fund eking out a positive result.
A better perspective on performance through a longer-term lens
Thankfully for bond investors, returns have not always been so low. Even including this year’s poor result, the average annual returns for Investor Shares during the ten years ended December 31, 2013, were 3.27% for the Short-Term Fund, 5.28% for
the Intermediate-Term Fund, and 6.25% for the Long-Term Fund. And the funds very often achieved those results with less extreme swings in performance from one calendar year to the next than the broad U.S. stock market over the same period.
In cumulative terms, Investor Shares of the funds were up between roughly 38% and 83% for the same time frame. Although some of that performance came from price appreciation, the bulk of it came from income generated when bond yields were higher than they are now.
A low expense ratio helped all three funds fulfill their mission of closely tracking their expense-free benchmarks during the ten-year period. Investor Shares of the funds also outpaced their peer groups (which include index as well as actively managed funds) by between 65 and 213 basis points.
Bob Auwaerter’s retirement marks the end of a remarkable era
In mid-September 2008, about two weeks after I succeeded Jack Brennan as Vanguard’s chief executive officer, Lehman Brothers went bankrupt, igniting the nation’s worst financial crisis in 70 years. It was, to put it mildly, an extremely challenging time. Through it all, I was able to depend on Bob Auwaerter’s strong command of the Fixed Income Group,
8
which persevered under these treacherous conditions. Although that was a difficult period for Vanguard and the industry, it was far from the only time I was grateful to have Bob at the helm of our bond group.
Bob, who joined Vanguard in 1981, was an original member of the three-person Fixed Income Group, headed by Ian MacKinnon. Over the years, he held various leadership roles in the department, and he eventually succeeded Ian as its head in 2003. He earned a reputation at Vanguard and within the industry as an extremely dedicated, honest, and insightful decision-maker and leader.
The Fixed Income Group that Bob helped start had total assets of about $1.3 billion in seven funds. He tracked his positions in the two funds he managed on index cards stored in a small metal box. Thirty-two years later, the 120-person group oversees $750 billion, which represents nearly one-third of Vanguard’s assets under management.
On behalf of our clients, I thank Bob for more than three decades of exemplary service and wish him the best in his retirement.
We’re fortunate that Greg Davis will become the head of the Fixed Income Group. Greg currently serves as chief investment officer for the Asia Pacific region and as a director of Vanguard Investments Australia. He joined Vanguard in 1999 and had been head of bond indexing and a senior portfolio manager in the Fixed Income Group. Greg is an eminently qualified successor and has a strong commitment to the Vanguard way of investing. I couldn’t be more confident in his ability to lead the Fixed Income Group and its deep and talented team.
As always, thank you for investing with Vanguard.
Sincerely,
F. William McNabb III
Chairman and Chief Executive Officer
January 16, 2014
9
Short-Term Bond Index Fund
Fund Profile
As of December 31, 2013
| Share-Class Characteristics | ||||||
| Investor | Admiral | Signal | Institutional | Institutional | ||
| Shares | Shares | Shares | Shares | Plus Shares | ETF Shares | |
| Ticker Symbol | VBISX | VBIRX | VBSSX | VBITX | VBIPX | BSV |
| Expense Ratio1 | 0.20% | 0.10% | 0.10% | 0.07% | 0.05% | 0.10% |
| 30-Day SEC Yield | 0.68% | 0.78% | 0.78% | 0.81% | 0.83% | 0.78% |
| Financial Attributes | |||
| Barclays | |||
| 1–5 Year | |||
| Gov/ | Barclays | ||
| Credit | Aggregate | ||
| Float Adj | Float Adj | ||
| Fund | Index | Index | |
| Number of Bonds | 1,794 | 2,830 | 8,701 |
| Yield to Maturity | |||
| (before expenses) | 1.0% | 1.0% | 2.4% |
| Average Coupon | 1.9% | 2.2% | 3.3% |
| Average Duration | 2.7 years | 2.6 years | 5.5 years |
| Average Effective | |||
| Maturity | 2.7 years | 2.8 years | 7.5 years |
| Short-Term | |||
| Reserves | 0.6% | — | — |
| Sector Diversification (% of portfolio) | |
| Finance | 10.1% |
| Foreign | 7.4 |
| Industrial | 11.2 |
| Treasury/Agency | 69.0 |
| Utilities | 1.7 |
| Other | 0.6 |
The agency and mortgage-backed securities sectors may include issues from government-sponsored enterprises; such issues are generally not backed by the full faith and credit of the U.S. government.
| Volatility Measures | ||
| Barclays | ||
| 1–5 Year | ||
| Gov/ | ||
| Credit | Barclays | |
| Float Adj | Aggregate Float | |
| Index | Adj Index | |
| R-Squared | 0.98 | 0.69 |
| Beta | 0.99 | 0.36 |
These measures show the degree and timing of the fund’s fluctuations compared with the indexes over 36 months.
| Distribution by Credit Quality (% of portfolio) | |
| U.S. Government | 69.0% |
| Aaa | 5.4 |
| Aa | 4.6 |
| A | 11.9 |
| Baa | 9.1 |
For information about these ratings, see the Glossary entry for Credit Quality.
| Distribution by Effective Maturity | |
| (% of portfolio) | |
| Under 1 Year | 3.0% |
| 1 - 3 Years | 59.7 |
| 3 - 5 Years | 37.3 |
1 The expense ratios shown are from the prospectus dated April 29, 2013 (August 20, 2013 for Institutional and Institutional Plus Shares), and represent estimated costs for the current fiscal year. For the fiscal year ended December 31, 2013, the expense ratios were 0.20% for Investor Shares, 0.10% for Admiral Shares, 0.10% for Signal Shares, 0.07% for Institutional Shares, 0.05% for Institutional Plus Shares, and 0.10% for ETF Shares.
10
Short-Term Bond Index Fund
Investment Focus
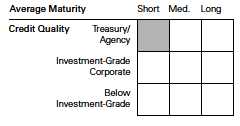
11
Short-Term Bond Index Fund
Performance Summary
All of the returns in this report represent past performance, which is not a guarantee of future results that may be achieved by the fund. (Current performance may be lower or higher than the performance data cited. For performance data current to the most recent month-end, visit our website at vanguard.com/performance.) Note, too, that both investment returns and principal value can fluctuate widely, so an investor’s shares, when sold, could be worth more or less than their original cost. The returns shown do not reflect taxes that a shareholder would pay on fund distributions or on the sale of fund shares.
Cumulative Performance: December 31, 2003, Through December 31, 2013
Initial Investment of $10,000

| Average Annual Total Returns | ||||
| Periods Ended December 31, 2013 | ||||
| Final Value | ||||
| One | Five | Ten | of a $10,000 | |
| Year | Years | Years | Investment | |
| Short-Term Bond Index Fund Investor | ||||
| Shares | 0.07% | 2.62% | 3.27% | $13,798 |
| Spliced Barclays U.S. 1–5 Year | ||||
| Government/Credit Float Adjusted | ||||
| Index | 0.29 | 2.86 | 3.41 | 13,981 |
| Spliced 1–5 Year Investment-Grade | ||||
| Debt Funds Average | 0.29 | 4.10 | 2.62 | 12,953 |
| Spliced Barclays U.S. Aggregate Float | ||||
| Adjusted Index | -1.97 | 4.50 | 4.57 | 15,640 |
For a benchmark description, see the Glossary.
Spliced 1–5 Year Investment-Grade Debt Funds Average: Derived from data provided by Lipper, a Thomson Reuters Company.
| Final Value | ||||
| One | Five | Ten | of a $10,000 | |
| Year | Years | Years | Investment | |
| Short-Term Bond Index Fund Admiral Shares | 0.17% | 2.73% | 3.36% | $13,921 |
| Spliced Barclays U.S. 1–5 Year | ||||
| Government/Credit Float Adjusted Index | 0.29 | 2.86 | 3.41 | 13,981 |
| Spliced Barclays U.S. Aggregate Float | ||||
| Adjusted Index | -1.97 | 4.50 | 4.57 | 15,640 |
See Financial Highlights for dividend and capital gains information.
12
Short-Term Bond Index Fund
| Average Annual Total Returns | ||||
| Periods Ended December 31, 2013 | ||||
| Since | Final Value | |||
| One | Five | Inception | of a $10,000 | |
| Year | Years | (3/30/2007) | Investment | |
| Short-Term Bond Index Fund Signal Shares | 0.17% | 2.73% | 3.67% | $12,756 |
| Spliced Barclays U.S. 1–5 Year | ||||
| Government/Credit Float Adjusted Index | 0.29 | 2.86 | 3.71 | 12,787 |
| Spliced Barclays U.S. Aggregate Float | ||||
| Adjusted Index | -1.97 | 4.50 | 4.90 | 13,818 |
| "Since Inception" performance is calculated from the Signal Shares’ inception date for both the fund and its comparative standards. | ||||
| Since | Final Value | ||
| One | Inception | of a $5,000,000 | |
| Year | (9/27/2011) | Investment | |
| Short-Term Bond Index Fund Institutional | |||
| Shares | 0.20% | 1.21% | $5,137,830 |
| Barclays U.S. 1–5 Year Government/Credit | |||
| Float Adjusted Index | 0.29 | 1.30 | 5,147,561 |
| Spliced Barclays U.S. Aggregate Float | |||
| Adjusted Index | -1.97 | 1.68 | 5,192,024 |
| "Since Inception" performance is calculated from the Institutional Shares’ inception date for both the fund and its comparative standards. | |||
| Since | Final Value | ||
| One | Inception | of a $100,000,000 | |
| Year | (9/29/2011) | Investment | |
| Short-Term Bond Index Fund Institutional Plus | |||
| Shares | 0.22% | 1.23% | $102,803,279 |
| Barclays U.S. 1–5 Year Government/Credit | |||
| Float Adjusted Index | 0.29 | 1.29 | 102,943,501 |
| Spliced Barclays U.S. Aggregate Float Adjusted | |||
| Index | -1.97 | 1.56 | 103,561,616 |
| "Since Inception" performance is calculated from the Institutional Plus Shares’ inception date for both the fund and its comparative standards. | |||
13
Short-Term Bond Index Fund
| Average Annual Total Returns | ||||
| Periods Ended December 31, 2013 | ||||
| Since | Final Value | |||
| One | Five | Inception | of a $10,000 | |
| Year | Years | (4/3/2007) | Investment | |
| Short-Term Bond Index Fund | ||||
| ETF Shares Net Asset Value | 0.17% | 2.72% | 3.67% | $12,749 |
| Spliced Barclays U.S. 1–5 Year | ||||
| Government/Credit Float Adjusted Index | 0.29 | 2.86 | 3.72 | 12,791 |
| Spliced Barclays U.S. Aggregate Float | ||||
| Adjusted Index | -1.97 | 4.50 | 4.91 | 13,821 |
| "Since Inception" performance is calculated from the ETF Shares’ inception date for both the fund and its comparative standards. | ||||
| Cumulative Returns of ETF Shares: April 3, 2007, Through December 31, 2013 | |||
| Since | |||
| One | Five | Inception | |
| Year | Years | (4/3/2007) | |
| Short-Term Bond Index Fund ETF Shares Market | |||
| Price | 0.13% | 11.05% | 27.49% |
| Short-Term Bond Index Fund ETF Shares Net Asset | |||
| Value | 0.17 | 14.38 | 27.49 |
| Spliced Barclays U.S. 1–5 Year Government/Credit | |||
| Float Adjusted Index | 0.29 | 15.15 | 27.91 |
| "Since Inception" performance is calculated from the ETF Shares’ inception date for both the fund and its comparative standards. | |||
| Fiscal-Year Total Returns (%): December 31, 2003, Through December 31, 2013 | ||||
| Spliced | ||||
| Barclays | ||||
| 1–5 Year | ||||
| Gov/Credit | ||||
| Investor Shares | FA Index | |||
| Fiscal Year | Income Returns | Capital Returns | Total Returns | Total Returns |
| 2004 | 2.98% | -1.28% | 1.70% | 1.85% |
| 2005 | 3.48 | -2.17 | 1.31 | 1.44 |
| 2006 | 4.39 | -0.30 | 4.09 | 4.22 |
| 2007 | 4.79 | 2.43 | 7.22 | 7.27 |
| 2008 | 3.95 | 1.48 | 5.43 | 5.12 |
| 2009 | 2.91 | 1.37 | 4.28 | 4.62 |
| 2010 | 2.22 | 1.70 | 3.92 | 4.08 |
| 2011 | 1.85 | 1.11 | 2.96 | 3.13 |
| 2012 | 1.46 | 0.49 | 1.95 | 2.24 |
| 2013 | 1.10 | -1.03 | 0.07 | 0.29 |
| For a benchmark description, see the Glossary. | ||||
14
Short-Term Bond Index Fund
Financial Statements
Statement of Net Assets—Investments Summary
As of December 31, 2013
This Statement summarizes the fund’s holdings by asset type. Details are reported for each of the fund’s 50 largest individual holdings and for investments that, in total for any issuer, represent more than 1% of the fund’s net assets. The total value of smaller holdings is reported as a single amount within each category.
The fund reports a complete list of its holdings in regulatory filings four times in each fiscal year, at the quarter-ends. For the second and fourth fiscal quarters, the complete listing of the fund’s holdings is available electronically on vanguard.com and on the Securities and Exchange Commission’s website (sec.gov), or you can have it mailed to you without charge by calling 800-662-7447. For the first and third fiscal quarters, the fund files the lists with the SEC on Form N-Q. Shareholders can look up the fund’s Forms N-Q on the SEC’s website. Forms N-Q may also be reviewed and copied at the SEC’s Public Reference Room (see the back cover of this report for further information).
| Face | Market | Percentage | |||
| Maturity | Amount | Value | of Net | ||
| Coupon | Date | ($000) | ($000) | Assets | |
| U.S. Government and Agency Obligations | |||||
| U.S. Government Securities | |||||
| United States Treasury Note/Bond | 0.250% | 2/28/15 | 824,873 | 825,384 | 2.4% |
| United States Treasury Note/Bond | 0.625% | 11/15/16 | 539,225 | 537,543 | 1.6% |
| United States Treasury Note/Bond | 2.125% | 12/31/15 | 502,805 | 520,011 | 1.5% |
| United States Treasury Note/Bond | 1.250% | 11/30/18 | 522,149 | 510,724 | 1.5% |
| United States Treasury Note/Bond | 0.625% | 10/15/16 | 440,900 | 440,071 | 1.3% |
| United States Treasury Note/Bond | 2.250% | 1/31/15 | 418,930 | 428,289 | 1.3% |
| United States Treasury Note/Bond | 0.625% | 9/30/17 | 434,350 | 425,255 | 1.2% |
| United States Treasury Note/Bond | 0.375% | 11/15/15 | 394,130 | 394,374 | 1.2% |
| United States Treasury Note/Bond | 2.500% | 3/31/15 | 383,208 | 394,045 | 1.2% |
| United States Treasury Note/Bond | 1.375% | 9/30/18 | 395,935 | 390,922 | 1.1% |
| United States Treasury Note/Bond | 0.875% | 4/30/17 | 380,374 | 379,187 | 1.1% |
| United States Treasury Note/Bond | 1.750% | 5/31/16 | 363,300 | 373,745 | 1.1% |
| United States Treasury Note/Bond | 1.000% | 9/30/16 | 365,305 | 368,388 | 1.1% |
| United States Treasury Note/Bond | 1.500% | 12/31/18 | 365,250 | 361,028 | 1.1% |
| United States Treasury Note/Bond | 0.625% | 8/31/17 | 358,101 | 351,387 | 1.0% |
| United States Treasury Note/Bond | 4.500% | 2/15/16 | 321,738 | 349,539 | 1.0% |
| United States Treasury Note/Bond | 0.625% | 12/15/16 | 341,325 | 339,939 | 1.0% |
| United States Treasury Note/Bond | 0.625% | 8/15/16 | 333,625 | 333,625 | 1.0% |
| United States Treasury Note/Bond | 0.250% | 5/15/16 | 332,935 | 330,854 | 1.0% |
| United States Treasury Note/Bond | 0.625% | 5/31/17 | 333,840 | 329,460 | 1.0% |
| United States Treasury Note/Bond | 0.750% | 3/31/18 | 330,380 | 320,882 | 0.9% |
| United States Treasury Note/Bond | 1.375% | 11/30/15 | 313,435 | 319,509 | 0.9% |
| United States Treasury Note/Bond | 1.000% | 5/31/18 | 325,427 | 318,258 | 0.9% |
| United States Treasury Note/Bond | 1.375% | 6/30/18 | 307,450 | 305,049 | 0.9% |
| United States Treasury Note/Bond | 0.750% | 6/30/17 | 304,565 | 301,330 | 0.9% |
| United States Treasury Note/Bond | 1.250% | 10/31/15 | 294,925 | 299,809 | 0.9% |
| United States Treasury Note/Bond | 0.875% | 9/15/16 | 294,235 | 295,936 | 0.9% |
| United States Treasury Note/Bond | 2.125% | 11/30/14 | 289,315 | 294,424 | 0.9% |
| United States Treasury Note/Bond | 5.125% | 5/15/16 | 256,630 | 284,377 | 0.8% |
| United States Treasury Note/Bond | 0.750% | 2/28/18 | 290,115 | 282,410 | 0.8% |
| United States Treasury Note/Bond | 1.500% | 8/31/18 | 283,545 | 282,039 | 0.8% |
15
| Short-Term Bond Index Fund | |||||
| Face | Market | Percentage | |||
| Maturity | Amount | Value | of Net | ||
| Coupon | Date | ($000) | ($000) | Assets | |
| United States Treasury Note/Bond | 0.625% | 7/15/16 | 271,475 | 271,814 | 0.8% |
| United States Treasury Note/Bond | 0.500% | 7/31/17 | 273,240 | 267,433 | 0.8% |
| United States Treasury Note/Bond | 1.000% | 10/31/16 | 262,873 | 264,845 | 0.8% |
| United States Treasury Note/Bond | 0.250% | 12/15/15 | 259,995 | 259,426 | 0.8% |
| United States Treasury Note/Bond | 1.000% | 3/31/17 | 258,640 | 259,206 | 0.8% |
| United States Treasury Note/Bond | 2.375% | 2/28/15 | 248,322 | 254,530 | 0.7% |
| United States Treasury Note/Bond | 0.250% | 4/15/16 | 251,490 | 250,155 | 0.7% |
| United States Treasury Note/Bond | 0.125% | 12/31/14 | 247,670 | 247,593 | 0.7% |
| United States Treasury Note/Bond | 2.000% | 1/31/16 | 235,350 | 243,072 | 0.7% |
| United States Treasury Note/Bond | 0.875% | 2/28/17 | 242,840 | 242,765 | 0.7% |
| United States Treasury Note/Bond | 0.250% | 1/31/15 | 241,525 | 241,713 | 0.7% |
| United States Treasury Note/Bond | 2.375% | 3/31/16 | 228,047 | 237,846 | 0.7% |
| United States Treasury Note/Bond | 0.375% | 4/15/15 | 234,910 | 235,460 | 0.7% |
| United States Treasury Note/Bond | 0.625% | 11/30/17 | 241,125 | 235,022 | 0.7% |
| United States Treasury Note/Bond | 2.000% | 4/30/16 | 213,315 | 220,649 | 0.7% |
| United States Treasury Note/Bond | 0.750% | 12/31/17 | 223,235 | 218,212 | 0.6% |
| United States Treasury Note/Bond | 0.875% | 12/31/16 | 216,791 | 217,266 | 0.6% |
| United States Treasury Note/Bond | 1.375% | 7/31/18 | 218,985 | 216,931 | 0.6% |
| United States Treasury Note/Bond | 0.625% | 4/30/18 | 223,730 | 215,689 | 0.6% |
| United States Treasury | |||||
| Note/Bond | 0.125%–11.250% | 11/30/14–10/31/18 | 4,889,381 | 4,964,368 | 14.5% |
| 21,251,788 | 62.2% | ||||
| Agency Bonds and Notes | |||||
| 1 Federal Home Loan Banks | 0.250%–5.625% | 1/16/15–8/15/18 | 465,210 | 474,768 | 1.4% |
| 2 Federal Home Loan | |||||
| Mortgage Corp. | 0.500%–5.500% | 2/9/15–6/13/18 | 751,040 | 763,135 | 2.3% |
| 2 Federal National | |||||
| Mortgage Assn. | 0.375%–5.250% | 3/16/15–11/27/18 | 1,051,595 | 1,066,970 | 3.1% |
| Agency Bonds and Notes—Other † | 105,188 | 0.3% | |||
| 2,410,061 | 7.1% | ||||
| Total U.S. Government and Agency Obligations (Cost $23,666,033) | 23,661,849 | 69.3% | |||
| Corporate Bonds | |||||
| Finance | |||||
| 3 Banking † | 2,561,361 | 7.5% | |||
| Brokerage † | 54,929 | 0.2% | |||
| Finance Companies † | 245,275 | 0.7% | |||
| Insurance † | 362,330 | 1.1% | |||
| Other Finance † | 15,786 | 0.0% | |||
| Real Estate Investment Trusts † | 134,858 | 0.4% | |||
| 3,374,539 | 9.9% | ||||
| Industrial | |||||
| Basic Industry † | 277,875 | 0.8% | |||
| Capital Goods † | 323,893 | 1.0% | |||
| Communication † | 589,348 | 1.7% | |||
| Consumer Cyclical † | 547,175 | 1.6% | |||
| 3 Consumer Noncyclical † | 1,000,603 | 2.9% | |||
| 3 Energy † | 472,123 | 1.4% | |||
| 3 Technology † | 426,292 | 1.3% | |||
| Transportation † | 76,940 | 0.2% | |||
| 3,714,249 | 10.9% | ||||
16
| Short-Term Bond Index Fund | ||||||
| Face | Market | Percentage | ||||
| Maturity | Amount | Value | of Net | |||
| Coupon | Date | ($000) | ($000) | Assets | ||
| Utilities | ||||||
| 3 | Electric † | 352,388 | 1.0% | |||
| 3 | Natural Gas † | 204,774 | 0.6% | |||
| Other Utility † | 4,015 | 0.0% | ||||
| 561,177 | 1.6% | |||||
| Total Corporate Bonds (Cost $7,564,327) | 7,649,965 | 22.4% | ||||
| Sovereign Bonds (U.S. Dollar-Denominated) | ||||||
| European Investment | ||||||
| Bank | 0.500%–5.125% | 6/4/14–12/18/18 | 442,945 | 452,006 | 1.3% | |
| FMS Wertmanagement | ||||||
| AoeR | 0.625%–1.625% | 4/18/16–11/20/18 | 37,525 | 37,185 | 0.1% | |
| 4 | KFW | 0.500%–5.125% | 1/12/15–7/16/18 | 347,900 | 353,152 | 1.0% |
| Sovereign Bonds | ||||||
| (U.S. Dollar-Denominated)—Other † | 1,630,967 | 4.8% | ||||
| Total Sovereign Bonds (Cost $2,456,649) | 2,473,310 | 7.2% | ||||
| Taxable Municipal Bonds (Cost $28,882) † | 28,558 | 0.1% | ||||
| Shares | ||||||
| Temporary Cash Investment | ||||||
| Money Market Fund | ||||||
| 5 | Vanguard Market Liquidity Fund | |||||
| (Cost $215,355) | 0.125% | 215,355,000 | 215,355 | 0.7% | ||
| Total Investments (Cost $33,931,246) | 34,029,037 | 99.7% | ||||
| Other Assets and Liabilities | ||||||
| Other Assets | 1,046,308 | 3.0% | ||||
| Liabilities | (927,671) | (2.7%) | ||||
| 118,637 | 0.3% | |||||
| Net Assets | 34,147,674 | 100.0% | ||||
| At December 31, 2013, net assets consisted of: | |
| Amount | |
| ($000) | |
| Paid-in Capital | 34,043,326 |
| Undistributed Net Investment Income | — |
| Accumulated Net Realized Gains | 6,557 |
| Unrealized Appreciation (Depreciation) | 97,791 |
| Net Assets | 34,147,674 |
| Investor Shares—Net Assets | |
| Applicable to 286,316,603 outstanding $.001 par value shares of | |
| beneficial interest (unlimited authorization) | 3,002,648 |
| Net Asset Value Per Share—Investor Shares | $10.49 |
17
Short-Term Bond Index Fund
| Amount | |
| ($000) | |
| Admiral Shares—Net Assets | |
| Applicable to 480,133,216 outstanding $.001 par value shares of | |
| beneficial interest (unlimited authorization) | 5,035,232 |
| Net Asset Value Per Share—Admiral Shares | $10.49 |
| Signal Shares—Net Assets | |
| Applicable to 670,796,418 outstanding $.001 par value shares of | |
| beneficial interest (unlimited authorization) | 7,034,749 |
| Net Asset Value Per Share—Signal Shares | $10.49 |
| Institutional Shares—Net Assets | |
| Applicable to 312,907,600 outstanding $.001 par value shares of | |
| beneficial interest (unlimited authorization) | 3,281,507 |
| Net Asset Value Per Share—Institutional Shares | $10.49 |
| Institutional Plus Shares—Net Assets | |
| Applicable to 178,117,323 outstanding $.001 par value shares of | |
| beneficial interest (unlimited authorization) | 1,867,944 |
| Net Asset Value Per Share—Institutional Plus Shares | $10.49 |
| ETF Shares—Net Assets | |
| Applicable to 174,312,541 outstanding $.001 par value shares of | |
| beneficial interest (unlimited authorization) | 13,925,594 |
| Net Asset Value Per Share—ETF Shares | $79.89 |
See Note A in Notes to Financial Statements.
† Represents the aggregate value, by category, of securities that are not among the 50 largest holdings and, in total for any issuer, represent
1% or less of net assets.
1 The issuer operates under a congressional charter; its securities are generally neither guaranteed by the U.S. Treasury nor backed by the full
faith and credit of the U.S. government.
2 The issuer was placed under federal conservatorship in September 2008; since that time, its daily operations have been managed by the
Federal Housing Finance Agency and it receives capital from the U.S. Treasury, as needed to maintain a positive net worth, in exchange for
senior preferred stock.
3 Certain of the fund’s securities are exempt from registration under Rule 144A of the Securities Act of 1933. Such securities may be sold
in transactions exempt from registration, normally to qualified institutional buyers. At December 31, 2013, the aggregate value of these
securities was $41,175,000, representing 0.1% of net assets.
4 Guaranteed by the Federal Republic of Germany.
5 Affiliated money market fund available only to Vanguard funds and certain trusts and accounts managed by Vanguard. Rate shown is the
7-day yield.
See accompanying Notes, which are an integral part of the Financial Statements.
18
Short-Term Bond Index Fund
| Statement of Operations | |
| Year Ended | |
| December 31, 2013 | |
| ($000) | |
| Investment Income | |
| Income | |
| Interest1 | 394,349 |
| Total Income | 394,349 |
| Expenses | |
| The Vanguard Group—Note B | |
| Investment Advisory Services | 985 |
| Management and Administrative—Investor Shares | 5,050 |
| Management and Administrative—Admiral Shares | 3,440 |
| Management and Administrative—Signal Shares | 4,485 |
| Management and Administrative—Institutional Shares | 1,064 |
| Management and Administrative—Institutional Plus Shares | 400 |
| Management and Administrative—ETF Shares | 8,693 |
| Marketing and Distribution—Investor Shares | 816 |
| Marketing and Distribution—Admiral Shares | 925 |
| Marketing and Distribution—Signal Shares | 1,624 |
| Marketing and Distribution—Institutional Shares | 695 |
| Marketing and Distribution—Institutional Plus Shares | 288 |
| Marketing and Distribution—ETF Shares | 2,959 |
| Custodian Fees | 180 |
| Auditing Fees | 42 |
| Shareholders’ Reports—Investor Shares | 30 |
| Shareholders’ Reports—Admiral Shares | 45 |
| Shareholders’ Reports—Signal Shares | 63 |
| Shareholders’ Reports—Institutional Shares | 26 |
| Shareholders’ Reports—Institutional Plus Shares | 15 |
| Shareholders’ Reports—ETF Shares | 119 |
| Trustees’ Fees and Expenses | 35 |
| Total Expenses | 31,979 |
| Net Investment Income | 362,370 |
| Realized Net Gain (Loss) on Investment Securities Sold | 102,602 |
| Change in Unrealized Appreciation (Depreciation) of Investment Securities | (407,270) |
| Net Increase (Decrease) in Net Assets Resulting from Operations | 57,702 |
| 1 Interest income from an affiliated company of the fund was $209,000. | |
See accompanying Notes, which are an integral part of the Financial Statements.
19
Short-Term Bond Index Fund
| Statement of Changes in Net Assets | ||
| Year Ended December 31, | ||
| 2013 | 2012 | |
| ($000) | ($000) | |
| Increase (Decrease) in Net Assets | ||
| Operations | ||
| Net Investment Income | 362,370 | 383,420 |
| Realized Net Gain (Loss) | 102,602 | 104,486 |
| Change in Unrealized Appreciation (Depreciation) | (407,270) | 8,573 |
| Net Increase (Decrease) in Net Assets Resulting from Operations | 57,702 | 496,479 |
| Distributions | ||
| Net Investment Income | ||
| Investor Shares | (33,136) | (49,436) |
| Admiral Shares | (54,985) | (65,391) |
| Signal Shares | (76,531) | (93,749) |
| Institutional Shares | (33,150) | (31,404) |
| Institutional Plus Shares | (18,853) | (15,421) |
| ETF Shares | (145,715) | (128,019) |
| Realized Capital Gain1 | ||
| Investor Shares | (8,859) | (9,652) |
| Admiral Shares | (14,411) | (13,105) |
| Signal Shares | (19,783) | (17,059) |
| Institutional Shares | (8,767) | (7,652) |
| Institutional Plus Shares | (5,085) | (3,157) |
| ETF Shares | (39,575) | (27,398) |
| Total Distributions | (458,850) | (461,443) |
| Capital Share Transactions | ||
| Investor Shares | (142,927) | (623,500) |
| Admiral Shares | 696,553 | 301,045 |
| Signal Shares | 1,545,446 | (1,013,087) |
| Institutional Shares | 667,150 | 1,808,508 |
| Institutional Plus Shares | 782,482 | 391,065 |
| ETF Shares | 4,795,948 | 1,802,077 |
| Net Increase (Decrease) from Capital Share Transactions | 8,344,652 | 2,666,108 |
| Total Increase (Decrease) | 7,943,504 | 2,701,144 |
| Net Assets | ||
| Beginning of Period | 26,204,170 | 23,503,026 |
| End of Period | 34,147,674 | 26,204,170 |
1 Includes fiscal 2013 and 2012 short-term gain distributions totaling $2,695,000 and $12,122,000, respectively. Short-term gain distributions are treated as ordinary income dividends for tax purposes.
See accompanying Notes, which are an integral part of the Financial Statements.
20
Short-Term Bond Index Fund
Financial Highlights
| Investor Shares | |||||
| For a Share Outstanding | Year Ended December 31, | ||||
| Throughout Each Period | 2013 | 2012 | 2011 | 2010 | 2009 |
| Net Asset Value, Beginning of Period | $10.63 | $10.61 | $10.55 | $10.42 | $10.28 |
| Investment Operations | |||||
| Net Investment Income | .116 | .153 | .193 | .229 | .293 |
| Net Realized and Unrealized Gain (Loss) | |||||
| on Investments | (.109) | .052 | .117 | .177 | .141 |
| Total from Investment Operations | .007 | .205 | .310 | .406 | .434 |
| Distributions | |||||
| Dividends from Net Investment Income | (.116) | (.153) | (.193) | (.229) | (.293) |
| Distributions from Realized Capital Gains | (.031) | (.032) | (.057) | (.047) | (.001) |
| Total Distributions | (.147) | (.185) | (.250) | (.276) | (.294) |
| Net Asset Value, End of Period | $10.49 | $10.63 | $10.61 | $10.55 | $10.42 |
| Total Return1 | 0.07% | 1.95% | 2.96% | 3.92% | 4.28% |
| Ratios/Supplemental Data | |||||
| Net Assets, End of Period (Millions) | $3,003 | $3,185 | $3,802 | $4,226 | $5,283 |
| Ratio of Total Expenses to | |||||
| Average Net Assets | 0.20% | 0.20% | 0.22% | 0.22% | 0.22% |
| Ratio of Net Investment Income to | |||||
| Average Net Assets | 1.09% | 1.44% | 1.81% | 2.15% | 2.78% |
| Portfolio Turnover Rate2 | 50% | 51% | 67% | 58% | 77% |
1 Total returns do not include account service fees that may have applied in the periods shown. Fund prospectuses provide information about any applicable account service fees.
2 Excludes the value of portfolio securities received or delivered as a result of in-kind purchases or redemptions of the fund’s capital shares, including ETF Creation Units.
See accompanying Notes, which are an integral part of the Financial Statements.
21
Short-Term Bond Index Fund
Financial Highlights
| Admiral Shares | |||||
| For a Share Outstanding | Year Ended December 31, | ||||
| Throughout Each Period | 2013 | 2012 | 2011 | 2010 | 2009 |
| Net Asset Value, Beginning of Period | $10.63 | $10.61 | $10.55 | $10.42 | $10.28 |
| Investment Operations | |||||
| Net Investment Income | .127 | .164 | .205 | .240 | .303 |
| Net Realized and Unrealized Gain (Loss) | |||||
| on Investments | (.109) | .052 | .117 | .177 | .141 |
| Total from Investment Operations | .018 | .216 | .322 | .417 | .444 |
| Distributions | |||||
| Dividends from Net Investment Income | (.127) | (.164) | (.205) | (.240) | (.303) |
| Distributions from Realized Capital Gains | (.031) | (.032) | (.057) | (.047) | (.001) |
| Total Distributions | (.158) | (.196) | (.262) | (.287) | (.304) |
| Net Asset Value, End of Period | $10.49 | $10.63 | $10.61 | $10.55 | $10.42 |
| Total Return1 | 0.17% | 2.05% | 3.08% | 4.03% | 4.38% |
| Ratios/Supplemental Data | |||||
| Net Assets, End of Period (Millions) | $5,035 | $4,401 | $4,094 | $3,766 | $1,961 |
| Ratio of Total Expenses to | |||||
| Average Net Assets | 0.10% | 0.10% | 0.11% | 0.11% | 0.12% |
| Ratio of Net Investment Income to | |||||
| Average Net Assets | 1.19% | 1.54% | 1.92% | 2.26% | 2.88% |
| Portfolio Turnover Rate2 | 50% | 51% | 67% | 58% | 77% |
1 Total returns do not include account service fees that may have applied in the periods shown. Fund prospectuses provide information about any applicable account service fees.
2 Excludes the value of portfolio securities received or delivered as a result of in-kind purchases or redemptions of the fund’s capital shares, including ETF Creation Units.
See accompanying Notes, which are an integral part of the Financial Statements.
22
Short-Term Bond Index Fund
Financial Highlights
| Signal Shares | |||||
| For a Share Outstanding | Year Ended December 31, | ||||
| Throughout Each Period | 2013 | 2012 | 2011 | 2010 | 2009 |
| Net Asset Value, Beginning of Period | $10.63 | $10.61 | $10.55 | $10.42 | $10.28 |
| Investment Operations | |||||
| Net Investment Income | .127 | .164 | .205 | .240 | .303 |
| Net Realized and Unrealized Gain (Loss) | |||||
| on Investments | (.109) | .052 | .117 | .177 | .141 |
| Total from Investment Operations | .018 | .216 | .322 | .417 | .444 |
| Distributions | |||||
| Dividends from Net Investment Income | (.127) | (.164) | (.205) | (.240) | (.303) |
| Distributions from Realized Capital Gains | (.031) | (.032) | (.057) | (.047) | (.001) |
| Total Distributions | (.158) | (.196) | (.262) | (.287) | (.304) |
| Net Asset Value, End of Period | $10.49 | $10.63 | $10.61 | $10.55 | $10.42 |
| Total Return | 0.17% | 2.05% | 3.08% | 4.03% | 4.38% |
| Ratios/Supplemental Data | |||||
| Net Assets, End of Period (Millions) | $7,035 | $5,570 | $6,571 | $6,987 | $5,080 |
| Ratio of Total Expenses to | |||||
| Average Net Assets | 0.10% | 0.10% | 0.11% | 0.11% | 0.12% |
| Ratio of Net Investment Income to | |||||
| Average Net Assets | 1.19% | 1.54% | 1.92% | 2.26% | 2.88% |
| Portfolio Turnover Rate1 | 50% | 51% | 67% | 58% | 77% |
1 Excludes the value of portfolio securities received or delivered as a result of in-kind purchases or redemptions of the fund’s capital shares, including ETF Creation Units.
See accompanying Notes, which are an integral part of the Financial Statements.
23
Short-Term Bond Index Fund
Financial Highlights
| Institutional Shares | |||
| Sept. 27, | |||
| Year Ended | 20111 to | ||
| December 31, | Dec. 31, | ||
| For a Share Outstanding Throughout Each Period | 2013 | 2012 | 2011 |
| Net Asset Value, Beginning of Period | $10.63 | $10.61 | $10.66 |
| Investment Operations | |||
| Net Investment Income | .130 | .167 | .050 |
| Net Realized and Unrealized Gain (Loss) on Investments | (.109) | .052 | (.001) |
| Total from Investment Operations | .021 | .219 | .049 |
| Distributions | |||
| Dividends from Net Investment Income | (.130) | (.167) | (.050) |
| Distributions from Realized Capital Gains | (.031) | (.032) | (.049) |
| Total Distributions | (.161) | (.199) | (.099) |
| Net Asset Value, End of Period | $10.49 | $10.63 | $10.61 |
| Total Return | 0.20% | 2.08% | 0.47% |
| Ratios/Supplemental Data | |||
| Net Assets, End of Period (Millions) | $3,282 | $2,652 | $843 |
| Ratio of Total Expenses to Average Net Assets | 0.07% | 0.07% | 0.07%2 |
| Ratio of Net Investment Income to Average Net Assets | 1.22% | 1.57% | 1.96%2 |
| Portfolio Turnover Rate3 | 50% | 51% | 67% |
1 Inception.
2 Annualized.
3 Excludes the value of portfolio securities received or delivered as a result of in-kind purchases or redemptions of the fund’s capital shares, including ETF Creation Units.
See accompanying Notes, which are an integral part of the Financial Statements.
24
Short-Term Bond Index Fund
Financial Highlights
| Institutional Plus Shares | |||
| Sept. 29, | |||
| Year Ended | 20111 to | ||
| December 31, | Dec. 31, | ||
| For a Share Outstanding Throughout Each Period | 2013 | 2012 | 2011 |
| Net Asset Value, Beginning of Period | $10.63 | $10.61 | $10.66 |
| Investment Operations | |||
| Net Investment Income | .132 | .169 | .051 |
| Net Realized and Unrealized Gain (Loss) on Investments | (.109) | .052 | (.001) |
| Total from Investment Operations | .023 | .221 | .050 |
| Distributions | |||
| Dividends from Net Investment Income | (.132) | (.169) | (.051) |
| Distributions from Realized Capital Gains | (.031) | (.032) | (.049) |
| Total Distributions | (.163) | (.201) | (.100) |
| Net Asset Value, End of Period | $10.49 | $10.63 | $10.61 |
| Total Return | 0.22% | 2.10% | 0.47% |
| Ratios/Supplemental Data | |||
| Net Assets, End of Period (Millions) | $1,868 | $1,103 | $711 |
| Ratio of Total Expenses to Average Net Assets | 0.05% | 0.05% | 0.05%2 |
| Ratio of Net Investment Income to Average Net Assets | 1.24% | 1.59% | 1.98%2 |
| Portfolio Turnover Rate3 | 50% | 51% | 67% |
1 Inception.
2 Annualized.
3 Excludes the value of portfolio securities received or delivered as a result of in-kind purchases or redemptions of the fund’s capital shares, including ETF Creation Units.
See accompanying Notes, which are an integral part of the Financial Statements.
25
Short-Term Bond Index Fund
Financial Highlights
| ETF Shares | |||||
| For a Share Outstanding | Year Ended December 31, | ||||
| Throughout Each Period | 2013 | 2012 | 2011 | 2010 | 2009 |
| Net Asset Value, Beginning of Period | $80.94 | $80.80 | $80.35 | $79.35 | $78.13 |
| Investment Operations | |||||
| Net Investment Income | .950 | 1.239 | 1.538 | 1.796 | 2.196 |
| Net Realized and Unrealized Gain (Loss) | |||||
| on Investments | (.813) | .384 | .885 | 1.359 | 1.228 |
| Total from Investment Operations | .137 | 1.623 | 2.423 | 3.155 | 3.424 |
| Distributions | |||||
| Dividends from Net Investment Income | (.950) | (1.239) | (1.538) | (1.796) | (2.196) |
| Distributions from Realized Capital Gains | (.237) | (.244) | (.435) | (.359) | (.008) |
| Total Distributions | (1.187) | (1.483) | (1.973) | (2.155) | (2.204) |
| Net Asset Value, End of Period | $79.89 | $80.94 | $80.80 | $80.35 | $79.35 |
| Total Return | 0.17% | 2.02% | 3.04% | 4.00% | 4.44% |
| Ratios/Supplemental Data | |||||
| Net Assets, End of Period (Millions) | $13,926 | $9,292 | $7,482 | $5,640 | $3,682 |
| Ratio of Total Expenses to | |||||
| Average Net Assets | 0.10% | 0.10% | 0.11% | 0.11% | 0.12% |
| Ratio of Net Investment Income to | |||||
| Average Net Assets | 1.19% | 1.54% | 1.92% | 2.26% | 2.88% |
| Portfolio Turnover Rate1 | 50% | 51% | 67% | 58% | 77% |
1 Excludes the value of portfolio securities received or delivered as a result of in-kind purchases or redemptions of the fund’s capital shares, including ETF Creation Units.
See accompanying Notes, which are an integral part of the Financial Statements.
26
Short-Term Bond Index Fund
Notes to Financial Statements
Vanguard Short-Term Bond Index Fund is registered under the Investment Company Act of 1940 as an open-end investment company, or mutual fund. Certain of the fund’s investments are in corporate debt instruments; the issuers’ abilities to meet their obligations may be affected by economic developments in their respective industries. The fund offers six classes of shares: Investor Shares, Admiral Shares, Signal Shares, Institutional Shares, Institutional Plus Shares, and ETF Shares. Investor Shares are available to any investor who meets the fund’s minimum purchase requirements. Admiral Shares, Signal Shares, Institutional Shares, and Institutional Plus Shares are designed for investors who meet certain administrative, service, and account-size criteria. ETF Shares are listed for trading on NYSE Arca; they can be purchased and sold through a broker.
A. The following significant accounting policies conform to generally accepted accounting principles for U.S. mutual funds. The fund consistently follows such policies in preparing its financial statements.
1. Security Valuation: Bonds, and temporary cash investments acquired over 60 days to maturity, are valued using the latest bid prices or using valuations based on a matrix system (which considers such factors as security prices, yields, maturities, and ratings), both as furnished by independent pricing services. Investments in Vanguard Market Liquidity Fund are valued at that fund’s net asset value. Other temporary cash investments are valued at amortized cost, which approximates market value. Securities for which market quotations are not readily available, or whose values have been affected by events occurring before the fund’s pricing time but after the close of the securities’ primary markets, are valued by methods deemed by the board of trustees to represent fair value.
2. Federal Income Taxes: The fund intends to continue to qualify as a regulated investment company and distribute all of its taxable income. Management has analyzed the fund’s tax positions taken for all open federal income tax years (December 31, 2010–2013), and has concluded that no provision for federal income tax is required in the fund’s financial statements.
3. Distributions: Distributions from net investment income are declared daily by all share classes except ETF Shares, and paid on the first business day of the following month. Monthly income dividends from ETF Shares, and annual distributions from realized capital gains, if any, are recorded on the ex-dividend date.
4. Other: Interest income includes income distributions received from Vanguard Market Liquidity Fund and is accrued daily. Premiums and discounts on debt securities purchased are amortized and accreted, respectively, to interest income over the lives of the respective securities. Security transactions are accounted for on the date securities are bought or sold. Costs used to determine realized gains (losses) on the sale of investment securities are those of the specific securities sold.
Each class of shares has equal rights as to assets and earnings, except that each class separately bears certain class-specific expenses related to maintenance of shareholder accounts (included in Management and Administrative expenses) and shareholder reporting. Marketing and distribution expenses are allocated to each class of shares based on a method approved by the board of trustees. Income, other non-class-specific expenses, and gains and losses on investments are allocated to each class of shares based on its relative net assets.
B. The Vanguard Group furnishes at cost investment advisory, corporate management, administrative, marketing, and distribution services. The costs of such services are allocated to the fund under methods approved by the board of trustees. The fund has committed to provide up to 0.40% of its net assets in capital contributions to Vanguard. At December 31, 2013, the fund had contributed capital of $3,835,000 to Vanguard (included in Other Assets), representing 0.01% of the fund’s net assets and 1.53% of Vanguard’s capitalization. The fund’s trustees and officers are also directors and officers of Vanguard.
27
Short-Term Bond Index Fund
C. Various inputs may be used to determine the value of the fund’s investments. These inputs are summarized in three broad levels for financial statement purposes. The inputs or methodologies used to value securities are not necessarily an indication of the risk associated with investing in those securities.
Level 1—Quoted prices in active markets for identical securities.
Level 2—Other significant observable inputs (including quoted prices for similar securities, interest rates, prepayment speeds, credit risk, etc.).
Level 3—Significant unobservable inputs (including the fund’s own assumptions used to determine the fair value of investments).
The following table summarizes the market value of the fund’s investments as of December 31, 2013, based on the inputs used to value them:
| Level 1 | Level 2 | Level 3 | |
| Investments | ($000) | ($000) | ($000) |
| U.S. Government and Agency Obligations | — | 23,661,849 | — |
| Corporate Bonds | — | 7,649,965 | — |
| Sovereign Bonds | — | 2,473,310 | — |
| Taxable Municipal Bonds | — | 28,558 | — |
| Temporary Cash Investments | 215,355 | — | — |
| Total | 215,355 | 33,813,682 | — |
D. Capital gain distributions are determined on a tax basis and may differ from realized capital gains for financial reporting purposes. Differences may be permanent or temporary. Permanent differences are reclassified among capital accounts in the financial statements to reflect their tax character. Temporary differences arise when gains or losses are recognized in different periods for financial statement and tax purposes. These differences will reverse at some time in the future.
During the year ended December 31, 2013, the fund realized $2,963,000 of net capital gains resulting from in-kind redemptions—in which shareholders exchanged fund shares for securities held by the fund rather than for cash. Because such gains are not taxable to the fund, and are not distributed to shareholders, they have been reclassified from accumulated net realized gains to paid-in capital.
The fund used a tax accounting practice to treat a portion of the price of capital shares redeemed during the year as distributions from realized capital gains. Accordingly, the fund has reclassified $14,090,000 from accumulated net realized gains to paid-in capital.
For tax purposes, at December 31, 2013, the fund had $7,011,000 of long-term capital gains available for distribution.
At December 31, 2013, the cost of investment securities for tax purposes was $33,931,699,000. Net unrealized appreciation of investment securities for tax purposes was $97,338,000, consisting of unrealized gains of $248,959,000 on securities that had risen in value since their purchase and $151,621,000 in unrealized losses on securities that had fallen in value since their purchase.
E. During the year ended December 31, 2013, the fund purchased $5,295,496,000 of investment securities and sold $2,519,654,000 of investment securities, other than U.S. government securities and temporary cash investments. Purchases and sales of U.S. government securities were $18,170,983,000 and $12,670,891,000, respectively. Total purchases and sales include $4,944,524,000 and $222,109,000, respectively, in connection with in-kind purchases and redemptions of the fund’s capital shares.
28
Short-Term Bond Index Fund
F. Capital share transactions for each class of shares were:
| Year Ended December 31, | ||||
| 2013 | 2012 | |||
| Amount | Shares | Amount | Shares | |
| ($000) | (000) | ($000) | (000) | |
| Investor Shares | ||||
| Issued | 1,121,489 | 106,261 | 1,073,476 | 100,830 |
| Issued in Lieu of Cash Distributions | 36,188 | 3,430 | 51,290 | 4,819 |
| Redeemed | (1,300,604) | (123,095) | (1,748,266) | (164,319) |
| Net Increase (Decrease)—Investor Shares | (142,927) | (13,404) | (623,500) | (58,670) |
| Admiral Shares | ||||
| Issued | 2,354,277 | 222,983 | 1,583,609 | 148,773 |
| Issued in Lieu of Cash Distributions | 62,819 | 5,955 | 70,682 | 6,640 |
| Redeemed | (1,720,543) | (162,978) | (1,353,246) | (127,149) |
| Net Increase (Decrease)—Admiral Shares | 696,553 | 65,960 | 301,045 | 28,264 |
| Signal Shares | ||||
| Issued | 4,707,716 | 446,274 | 2,635,608 | 247,718 |
| Issued in Lieu of Cash Distributions | 64,714 | 6,134 | 87,941 | 8,262 |
| Redeemed | (3,226,984) | (305,806) | (3,736,636) | (351,155) |
| Net Increase (Decrease)—Signal Shares | 1,545,446 | 146,602 | (1,013,087) | (95,175) |
| Institutional Shares | ||||
| Issued | 1,997,562 | 189,356 | 2,468,762 | 232,108 |
| Issued in Lieu of Cash Distributions | 37,753 | 3,580 | 35,498 | 3,335 |
| Redeemed | (1,368,165) | (129,577) | (695,752) | (65,307) |
| Net Increase (Decrease) —Institutional Shares | 667,150 | 63,359 | 1,808,508 | 170,136 |
| Institutional Plus Shares | ||||
| Issued | 1,154,151 | 109,576 | 640,671 | 60,257 |
| Issued in Lieu of Cash Distributions | 21,114 | 2,003 | 16,304 | 1,532 |
| Redeemed | (392,783) | (37,299) | (265,910) | (24,975) |
| Net Increase (Decrease) —Institutional Plus Shares | 782,482 | 74,280 | 391,065 | 36,814 |
| ETF Shares | ||||
| Issued | 5,005,761 | 62,100 | 1,972,000 | 24,313 |
| Issued in Lieu of Cash Distributions | — | — | — | — |
| Redeemed | (209,813) | (2,600) | (169,923) | (2,100) |
| Net Increase (Decrease)—ETF Shares | 4,795,948 | 59,500 | 1,802,077 | 22,213 |
G. Management has determined that no material events or transactions occurred subsequent to December 31, 2013, that would require recognition or disclosure in these financial statements.
29
Intermediate-Term Bond Index Fund
Fund Profile
As of December 31, 2013
| Share-Class Characteristics | ||||||
| Investor | Admiral | Signal | Institutional | Institutional | ||
| Shares | Shares | Shares | Shares | Plus Shares | ETF Shares | |
| Ticker Symbol | VBIIX | VBILX | VIBSX | VBIMX | VBIUX | BIV |
| Expense Ratio1 | 0.20% | 0.10% | 0.10% | 0.07% | 0.05% | 0.10% |
| 30-Day SEC Yield | 2.73% | 2.83% | 2.83% | 2.86% | 2.88% | 2.83% |
| Financial Attributes | |||
| Barclays | |||
| 5–10 Year | |||
| Gov/ | Barclays | ||
| Credit | Aggregate | ||
| Float Adj | Float Adj | ||
| Fund | Index | Index | |
| Number of Bonds | 1,517 | 1,952 | 8,701 |
| Yield to Maturity | |||
| (before expenses) | 3.0% | 3.0% | 2.4% |
| Average Coupon | 3.5% | 3.4% | 3.3% |
| Average Duration | 6.5 years | 6.5 years | 5.5 years |
| Average Effective | |||
| Maturity | 7.2 years | 7.2 years | 7.5 years |
| Short-Term | |||
| Reserves | 0.1% | — | — |
| Sector Diversification (% of portfolio) | |
| Finance | 12.8% |
| Foreign | 7.4 |
| Industrial | 25.4 |
| Treasury/Agency | 50.2 |
| Utilities | 4.1 |
| Other | 0.1 |
The agency and mortgage-backed securities sectors may include issues from government-sponsored enterprises; such issues are generally not backed by the full faith and credit of the U.S. government.
| Volatility Measures | ||
| Barclays | ||
| 5–10 Year | ||
| Gov/ | ||
| Credit | Barclays | |
| Float Adj | Aggregate Float | |
| Index | Adj Index | |
| R-Squared | 0.99 | 0.96 |
| Beta | 1.02 | 1.54 |
These measures show the degree and timing of the fund’s fluctuations compared with the indexes over 36 months.
| Distribution by Credit Quality (% of portfolio) | |
| U.S. Government | 50.1% |
| Aaa | 2.1 |
| Aa | 4.8 |
| A | 18.6 |
| Baa | 24.4 |
For information about these ratings, see the Glossary entry for Credit Quality.
| Distribution by Effective Maturity | |
| (% of portfolio) | |
| Under 1 Year | 0.1% |
| 1 - 3 Years | 0.1 |
| 3 - 5 Years | 2.1 |
| 5 - 10 Years | 97.6 |
| 10 - 20 Years | 0.1 |
1 The expense ratios shown are from the prospectus dated April 29, 2013 (August 20, 2013 for Institutional and Institutional Plus Shares), and represent estimated costs for the current fiscal year. For the fiscal year ended December 31, 2013, the expense ratios were 0.20% for Investor Shares, 0.10% for Admiral Shares, 0.10% for Signal Shares, 0.07% for Institutional Shares, 0.05% for Institutional Plus Shares, and 0.10% for ETF Shares.
30
Intermediate-Term Bond Index Fund
Investment Focus
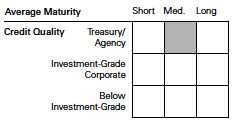
31
Intermediate-Term Bond Index Fund
Performance Summary
All of the returns in this report represent past performance, which is not a guarantee of future results that may be achieved by the fund. (Current performance may be lower or higher than the performance data cited. For performance data current to the most recent month-end, visit our website at vanguard.com/performance.) Note, too, that both investment returns and principal value can fluctuate widely, so an investor’s shares, when sold, could be worth more or less than their original cost. The returns shown do not reflect taxes that a shareholder would pay on fund distributions or on the sale of fund shares.
Cumulative Performance: December 31, 2003, Through December 31, 2013
Initial Investment of $10,000

| Average Annual Total Returns | ||||
| Periods Ended December 31, 2013 | ||||
| Final Value | ||||
| One | Five | Ten | of a $10,000 | |
| Year | Years | Years | Investment | |
| Intermediate-Term Bond Index Fund | ||||
| Investor Shares | -3.54% | 5.91% | 5.28% | $16,736 |
| Spliced Barclays U.S. 5–10 Year | ||||
| Government/Credit Float Adjusted | ||||
| Index | -3.37 | 6.00 | 5.34 | 16,827 |
| Spliced Intermediate Investment-Grade | ||||
| Debt Funds Average | -1.78 | 6.16 | 3.98 | 14,771 |
| Spliced Barclays U.S. Aggregate Float | ||||
| Adjusted Index | -1.97 | 4.50 | 4.57 | 15,640 |
For a benchmark description, see the Glossary.
Spliced Intermediate Investment-Grade Debt Funds Average: Derived from data provided by Lipper, a Thomson Reuters Company.
| Final Value | ||||
| One | Five | Ten | of a $10,000 | |
| Year | Years | Years | Investment | |
| Intermediate-Term Bond Index Fund Admiral | ||||
| Shares | -3.45% | 6.02% | 5.38% | $16,886 |
| Spliced Barclays U.S. 5–10 Year | ||||
| Government/Credit Float Adjusted Index | -3.37 | 6.00 | 5.34 | 16,827 |
| Spliced Barclays U.S. Aggregate Float | ||||
| Adjusted Index | -1.97 | 4.50 | 4.57 | 15,640 |
See Financial Highlights for dividend and capital gains information.
32
Intermediate-Term Bond Index Fund
| Average Annual Total Returns | ||||
| Periods Ended December 31, 2013 | ||||
| Since | Final Value | |||
| One | Five | Inception | of a $10,000 | |
| Year | Years | (6/4/2007) | Investment | |
| Intermediate-Term Bond Index Fund Signal | ||||
| Shares | -3.45% | 6.02% | 6.38% | $15,017 |
| Spliced Barclays U.S. 5–10 Year | ||||
| Government/Credit Float Adjusted Index | -3.37 | 6.00 | 6.35 | 14,989 |
| Spliced Barclays U.S. Aggregate Float | ||||
| Adjusted Index | -1.97 | 4.50 | 5.10 | 13,866 |
| "Since Inception" performance is calculated from the Signal Shares’ inception date for both the fund and its comparative standards. | ||||
| Since | Final Value | |||
| One | Five | Inception | of a $5,000,000 | |
| Year | Years | (1/26/2006) | Investment | |
| Intermediate-Term Bond Index Fund | ||||
| Institutional Shares | -3.42% | 6.06% | 5.98% | $7,923,201 |
| Spliced Barclays U.S. 5–10 Year | ||||
| Government/Credit Float Adjusted Index | -3.37 | 6.00 | 5.89 | 7,871,097 |
| Spliced Barclays U.S. Aggregate Float | ||||
| Adjusted Index | -1.97 | 4.50 | 4.93 | 7,321,496 |
| "Since Inception" performance is calculated from the Institutional Shares’ inception date for both the fund and its comparative standards. | ||||
| Since | Final Value | ||
| One | Inception | of a $100,000,000 | |
| Year | (11/30/2011) | Investment | |
| Intermediate-Term Bond Index Fund | |||
| Institutional Plus Shares | -3.40% | 2.52% | $105,335,452 |
| Barclays U.S. 5–10 Year Government/Credit | |||
| Float Adjusted Index | -3.37 | 2.54 | 105,377,419 |
| Spliced Barclays U.S. Aggregate Float Adjusted | |||
| Index | -1.97 | 1.62 | 103,411,254 |
| "Since Inception" performance is calculated from the Institutional Plus Shares’ inception date for both the fund and its comparative standards. | |||
33
Intermediate-Term Bond Index Fund
| Average Annual Total Returns | ||||
| Periods Ended December 31, 2013 | ||||
| Since | Final Value | |||
| One | Five | Inception | of a $10,000 | |
| Year | Years | (4/3/2007) | Investment | |
| Intermediate-Term Bond Index Fund | ||||
| ETF Shares Net Asset Value | -3.44% | 5.99% | 6.10% | $14,907 |
| Spliced Barclays U.S. 5–10 Year | ||||
| Government/Credit Float Adjusted Index | -3.37 | 6.00 | 6.07 | 14,885 |
| Spliced Barclays U.S. Aggregate Float | ||||
| Adjusted Index | -1.97 | 4.50 | 4.91 | 13,821 |
| "Since Inception" performance is calculated from the ETF Shares’ inception date for both the fund and its comparative standards. | ||||
| Cumulative Returns of ETF Shares: April 3, 2007, Through December 31, 2013 | |||
| Since | |||
| One | Five | Inception | |
| Year | Years | (4/3/2007) | |
| Intermediate-Term Bond Index Fund ETF Shares | |||
| Market Price | -3.66% | 30.02% | 49.01% |
| Intermediate-Term Bond Index Fund ETF Shares | |||
| Net Asset Value | -3.44 | 33.77 | 49.07 |
| Spliced Barclays U.S. 5–10 Year Government/Credit | |||
| Float Adjusted Index | -3.37 | 33.79 | 48.85 |
| "Since Inception" performance is calculated from the ETF Shares’ inception date for both the fund and its comparative standards. | |||
| Fiscal-Year Total Returns (%): December 31, 2003, Through December 31, 2013 | ||||
| Spliced | ||||
| Barclays | ||||
| 5–10 Year | ||||
| Gov/Credit | ||||
| Investor Shares | FA Index | |||
| Fiscal Year | Income Returns | Capital Returns | Total Returns | Total Returns |
| 2004 | 4.87% | 0.35% | 5.22% | 5.30% |
| 2005 | 4.64 | -2.89 | 1.75 | 1.83 |
| 2006 | 4.97 | -1.06 | 3.91 | 3.81 |
| 2007 | 5.17 | 2.44 | 7.61 | 7.55 |
| 2008 | 4.93 | 0.00 | 4.93 | 5.06 |
| 2009 | 4.69 | 2.10 | 6.79 | 6.50 |
| 2010 | 4.26 | 5.11 | 9.37 | 9.44 |
| 2011 | 4.01 | 6.61 | 10.62 | 10.79 |
| 2012 | 3.23 | 3.68 | 6.91 | 7.22 |
| 2013 | 2.71 | -6.25 | -3.54 | -3.37 |
| For a benchmark description, see the Glossary. | ||||
34
Intermediate-Term Bond Index Fund
Financial Statements
Statement of Net Assets—Investments Summary
As of December 31, 2013
This Statement summarizes the fund’s holdings by asset type. Details are reported for each of the fund’s 50 largest individual holdings and for investments that, in total for any issuer, represent more than 1% of the fund’s net assets. The total value of smaller holdings is reported as a single amount within each category.
The fund reports a complete list of its holdings in regulatory filings four times in each fiscal year, at the quarter-ends. For the second and fourth fiscal quarters, the complete listing of the fund’s holdings is available electronically on vanguard.com and on the Securities and Exchange Commission’s website (sec.gov), or you can have it mailed to you without charge by calling 800-662-7447. For the first and third fiscal quarters, the fund files the lists with the SEC on Form N-Q. Shareholders can look up the fund’s Forms N-Q on the SEC’s website. Forms N-Q may also be reviewed and copied at the SEC’s Public Reference Room (see the back cover of this report for further information).
| Face | Market | Percentage | |||
| Maturity | Amount | Value | of Net | ||
| Coupon | Date | ($000) | ($000) | Assets | |
| U.S. Government and Agency Obligations | |||||
| U.S. Government Securities | |||||
| United States Treasury Note/Bond | 2.500% | 8/15/23 | 707,100 | 677,600 | 4.7% |
| United States Treasury Note/Bond | 2.000% | 9/30/20 | 561,300 | 547,969 | 3.8% |
| United States Treasury Note/Bond | 3.625% | 8/15/19 | 418,425 | 455,560 | 3.1% |
| United States Treasury Note/Bond | 3.500% | 5/15/20 | 359,300 | 387,257 | 2.7% |
| United States Treasury Note/Bond | 3.125% | 5/15/19 | 349,595 | 372,319 | 2.6% |
| United States Treasury Note/Bond | 3.625% | 2/15/20 | 337,327 | 366,843 | 2.5% |
| United States Treasury Note/Bond | 1.750% | 5/15/23 | 381,530 | 343,198 | 2.4% |
| United States Treasury Note/Bond | 2.750% | 11/15/23 | 324,167 | 316,468 | 2.2% |
| United States Treasury Note/Bond | 3.375% | 11/15/19 | 240,524 | 258,489 | 1.8% |
| United States Treasury Note/Bond | 3.625% | 2/15/21 | 234,780 | 253,048 | 1.8% |
| United States Treasury Note/Bond | 3.125% | 5/15/21 | 226,783 | 236,067 | 1.6% |
| United States Treasury Note/Bond | 1.625% | 11/15/22 | 240,240 | 216,442 | 1.5% |
| United States Treasury Note/Bond | 2.000% | 11/15/21 | 200,890 | 191,410 | 1.3% |
| United States Treasury Note/Bond | 2.625% | 8/15/20 | 183,285 | 186,808 | 1.3% |
| United States Treasury Note/Bond | 1.125% | 4/30/20 | 191,450 | 178,736 | 1.2% |
| United States Treasury Note/Bond | 1.625% | 8/15/22 | 192,267 | 174,363 | 1.2% |
| United States Treasury Note/Bond | 1.375% | 5/31/20 | 164,785 | 156,005 | 1.1% |
| United States Treasury Note/Bond | 2.375% | 12/31/20 | 144,400 | 143,655 | 1.0% |
| United States Treasury Note/Bond | 1.875% | 6/30/20 | 131,450 | 128,123 | 0.9% |
| United States Treasury Note/Bond | 3.750% | 11/15/18 | 115,235 | 126,399 | 0.9% |
| United States Treasury Note/Bond | 2.000% | 11/30/20 | 122,325 | 118,941 | 0.8% |
| United States Treasury Note/Bond | 1.250% | 2/29/20 | 123,736 | 117,007 | 0.8% |
| United States Treasury Note/Bond | 2.625% | 11/15/20 | 111,542 | 113,215 | 0.8% |
| United States Treasury Note/Bond | 2.750% | 2/15/19 | 96,700 | 101,263 | 0.7% |
| United States Treasury Note/Bond | 1.750% | 10/31/20 | 97,100 | 93,033 | 0.6% |
| United States Treasury Note/Bond | 1.750% | 5/15/22 | 97,980 | 90,433 | 0.6% |
| United States Treasury Note/Bond | 2.125% | 8/15/21 | 89,768 | 86,823 | 0.6% |
| United States Treasury Note/Bond | 3.875% | 5/15/18 | 78,550 | 86,553 | 0.6% |
| United States Treasury Note/Bond | 2.000% | 7/31/20 | 85,525 | 83,921 | 0.6% |
| United States Treasury Note/Bond | 4.000% | 8/15/18 | 61,809 | 68,531 | 0.5% |
| United States Treasury Note/Bond | 8.875% | 2/15/19 | 47,350 | 63,982 | 0.4% |
35
| Intermediate-Term Bond Index Fund | |||||
| Face | Market | Percentage | |||
| Maturity | Amount | Value | of Net | ||
| Coupon | Date | ($000) | ($000) | Assets | |
| United States Treasury Note/Bond | 1.250% | 11/30/18 | 25,000 | 24,453 | 0.2% |
| 1 United States Treasury | |||||
| Note/Bond | 1.000%–8.750% | 2/15/18–2/15/22 | 115,644 | 120,977 | 0.8% |
| 6,885,891 | 47.6% | ||||
| Agency Bonds and Notes | |||||
| 2 Federal Home Loan Mortgage Corp. | 1.250% | 10/2/19 | 68,820 | 65,261 | 0.4% |
| 2 Federal Home Loan Mortgage Corp. | 2.375% | 1/13/22 | 55,765 | 53,102 | 0.4% |
| 2 Federal Home Loan Mortgage Corp. | 1.375% | 5/1/20 | 30,000 | 28,110 | 0.2% |
| 2 Federal Home Loan Mortgage Corp. | 3.750% | 3/27/19 | 24,475 | 26,603 | 0.2% |
| 2 Federal Home Loan Mortgage Corp. | 1.750% | 5/30/19 | 26,705 | 26,306 | 0.2% |
| 2 Federal Home Loan Mortgage Corp. | 1.250% | 8/1/19 | 22,000 | 21,017 | 0.1% |
| 2 Federal National Mortgage Assn. | 10/9/19 | 47,300 | 40,064 | 0.3% | |
| Agency Bonds and Notes—Other † | 144,919 | 1.0% | |||
| 405,382 | 2.8% | ||||
| Total U.S. Government and Agency Obligations (Cost $7,273,403) | 7,291,273 | 50.4% | |||
| Corporate Bonds | |||||
| Finance | |||||
| Banking | |||||
| Bank of America Corp. | 5.625% | 7/1/20 | 25,670 | 29,161 | 0.2% |
| Bank of America Corp. | 3.300% | 1/11/23 | 24,525 | 23,171 | 0.2% |
| Goldman Sachs Group Inc. | 5.750% | 1/24/22 | 19,550 | 21,970 | 0.1% |
| JPMorgan Chase & Co. | 4.350% | 8/15/21 | 21,950 | 23,156 | 0.2% |
| 3 Banking—Other † | 912,803 | 6.3% | |||
| Brokerage † | 71,428 | 0.5% | |||
| Finance Companies † | 143,363 | 1.0% | |||
| Insurance † | 326,008 | 2.2% | |||
| Other Finance † | 11,894 | 0.1% | |||
| 3 Real Estate Investment Trusts † | 258,238 | 1.8% | |||
| 1,821,192 | 12.6% | ||||
| Industrial | |||||
| Basic Industry † | 473,336 | 3.3% | |||
| 3 Capital Goods † | 337,346 | 2.3% | |||
| Communication | |||||
| Verizon Communications Inc. | 5.150% | 9/15/23 | 56,940 | 60,972 | 0.4% |
| Communication—Other † | 449,480 | 3.1% | |||
| Consumer Cyclical † | 407,850 | 2.8% | |||
| Consumer Noncyclical | |||||
| Pfizer Inc. | 6.200% | 3/15/19 | 22,325 | 26,470 | 0.2% |
| 3 Consumer Noncyclical—Other † | 857,154 | 5.9% | |||
| 3 Energy † | 474,373 | 3.3% | |||
| 3 Other Industrial † | 11,449 | 0.1% | |||
| Technology | |||||
| Apple Inc. | 2.400% | 5/3/23 | 29,450 | 26,323 | 0.2% |
| 3 Technology—Other † | 316,212 | 2.2% | |||
| 3 Transportation † | 136,505 | 0.9% | |||
| 3,577,470 | 24.7% | ||||
| Utilities | |||||
| 3 Electric † | 332,606 | 2.3% | |||
| Natural Gas † | 251,862 | 1.8% | |||
| Other Utility † | 1,069 | 0.0% | |||
| 585,537 | 4.1% | ||||
| Total Corporate Bonds (Cost $5,934,355) | 5,984,199 | 41.4% | |||
36
| Intermediate-Term Bond Index Fund | |||||
| Face | Market | Percentage | |||
| Maturity | Amount | Value | of Net | ||
| Coupon | Date | ($000) | ($000) | Assets | |
| Sovereign Bonds (U.S. Dollar-Denominated) | |||||
| 4 KFW | 2.750% | 9/8/20 | 26,275 | 26,391 | 0.2% |
| 4 KFW | 2.125% | 1/17/23 | 28,250 | 25,822 | 0.2% |
| Petrobras International Finance Co. | 5.375% | 1/27/21 | 25,540 | 25,327 | 0.2% |
| Republic of Poland | 6.375% | 7/15/19 | 18,700 | 21,856 | 0.1% |
| United Mexican States | 4.000% | 10/2/23 | 22,413 | 22,049 | 0.2% |
| 3 Sovereign Bonds | |||||
| (U.S. Dollar-Denominated)—Other † | 900,161 | 6.2% | |||
| Total Sovereign Bonds (Cost $1,036,521) | 1,021,606 | 7.1% | |||
| Taxable Municipal Bonds (Cost $48,108) † | 48,923 | 0.3% | |||
| Shares | |||||
| Temporary Cash Investment | |||||
| Money Market Fund | |||||
| 5 Vanguard Market Liquidity Fund | |||||
| (Cost $20,064) | 0.125% | 20,064,000 | 20,064 | 0.1% | |
| Total Investments (Cost $14,312,451) | 14,366,065 | 99.3% | |||
| Other Assets and Liabilities | |||||
| Other Assets | 437,808 | 3.0% | |||
| Liabilities | (336,801) | (2.3%) | |||
| 101,007 | 0.7% | ||||
| Net Assets | 14,467,072 | 100.0% | |||
| At December 31, 2013, net assets consisted of: | |
| Amount | |
| ($000) | |
| Paid-in Capital | 14,408,712 |
| Undistributed Net Investment Income | — |
| Accumulated Net Realized Gains | 5,176 |
| Unrealized Appreciation (Depreciation) | |
| Investment Securities | 53,614 |
| Futures Contracts | (430) |
| Net Assets | 14,467,072 |
| Investor Shares—Net Assets | |
| Applicable to 140,509,301 outstanding $.001 par value shares of | |
| beneficial interest (unlimited authorization) | 1,558,300 |
| Net Asset Value Per Share—Investor Shares | $11.09 |
37
Intermediate-Term Bond Index Fund
| Amount | |
| ($000) | |
| Admiral Shares—Net Assets | |
| Applicable to 479,681,954 outstanding $.001 par value shares of | |
| beneficial interest (unlimited authorization) | 5,319,839 |
| Net Asset Value Per Share—Admiral Shares | $11.09 |
| Signal Shares—Net Assets | |
| Applicable to 225,933,072 outstanding $.001 par value shares of | |
| beneficial interest (unlimited authorization) | 2,505,691 |
| Net Asset Value Per Share—Signal Shares | $11.09 |
| Institutional Shares—Net Assets | |
| Applicable to 105,645,434 outstanding $.001 par value shares of | |
| beneficial interest (unlimited authorization) | 1,171,596 |
| Net Asset Value Per Share—Institutional Shares | $11.09 |
| Institutional Plus Shares—Net Assets | |
| Applicable to 19,514,638 outstanding $.001 par value shares of | |
| beneficial interest (unlimited authorization) | 216,428 |
| Net Asset Value Per Share—Institutional Plus Shares | $11.09 |
| ETF Shares—Net Assets | |
| Applicable to 45,254,060 outstanding $.001 par value shares of | |
| beneficial interest (unlimited authorization) | 3,695,218 |
| Net Asset Value Per Share—ETF Shares | $81.65 |
See Note A in Notes to Financial Statements.
† Represents the aggregate value, by category, of securities that are not among the 50 largest holdings and, in total for any issuer, represent
1% or less of net assets.
1 Securities with a value of $284,000 have been segregated as initial margin for open futures contracts.
2 The issuer was placed under federal conservatorship in September 2008; since that time, its daily operations have been managed by the
Federal Housing Finance Agency and it receives capital from the U.S. Treasury, as needed to maintain a positive net worth, in exchange for
senior preferred stock.
3 Certain of the fund’s securities are exempt from registration under Rule 144A of the Securities Act of 1933. Such securities may be sold in
transactions exempt from registration, normally to qualified institutional buyers. At December 31, 2013, the aggregate value of these
securities was $49,357,000, representing 0.3% of net assets.
4 Guaranteed by the Federal Republic of Germany.
5 Affiliated money market fund available only to Vanguard funds and certain trusts and accounts managed by Vanguard. Rate shown is the
7-day yield.
See accompanying Notes, which are an integral part of the Financial Statements.
38
Intermediate-Term Bond Index Fund
| Statement of Operations | |
| Year Ended | |
| December 31, 2013 | |
| ($000) | |
| Investment Income | |
| Income | |
| Interest1 | 486,583 |
| Total Income | 486,583 |
| Expenses | |
| The Vanguard Group—Note B | |
| Investment Advisory Services | 547 |
| Management and Administrative—Investor Shares | 3,064 |
| Management and Administrative—Admiral Shares | 4,525 |
| Management and Administrative—Signal Shares | 1,887 |
| Management and Administrative—Institutional Shares | 464 |
| Management and Administrative—Institutional Plus Shares | 59 |
| Management and Administrative—ETF Shares | 2,754 |
| Marketing and Distribution—Investor Shares | 526 |
| Marketing and Distribution—Admiral Shares | 991 |
| Marketing and Distribution—Signal Shares | 789 |
| Marketing and Distribution—Institutional Shares | 296 |
| Marketing and Distribution—Institutional Plus Shares | 45 |
| Marketing and Distribution—ETF Shares | 1,129 |
| Custodian Fees | 134 |
| Auditing Fees | 40 |
| Shareholders’ Reports—Investor Shares | 26 |
| Shareholders’ Reports—Admiral Shares | 5 |
| Shareholders’ Reports—Signal Shares | 19 |
| Shareholders’ Reports—Institutional Shares | 3 |
| Shareholders’ Reports—Institutional Plus Shares | — |
| Shareholders’ Reports—ETF Shares | 43 |
| Trustees’ Fees and Expenses | 20 |
| Total Expenses | 17,366 |
| Net Investment Income | 469,217 |
| Realized Net Gain (Loss) | |
| Investment Securities Sold | 194,429 |
| Futures Contracts | 505 |
| Realized Net Gain (Loss) | 194,934 |
| Change in Unrealized Appreciation (Depreciation) | |
| Investment Securities | (1,257,069) |
| Futures Contracts | (315) |
| Change in Unrealized Appreciation (Depreciation) | (1,257,384) |
| Net Increase (Decrease) in Net Assets Resulting from Operations | (593,233) |
1 Interest income from an affiliated company of the fund was $101,000.
See accompanying Notes, which are an integral part of the Financial Statements.
39
Intermediate-Term Bond Index Fund
| Statement of Changes in Net Assets | ||
| Year Ended December 31, | ||
| 2013 | 2012 | |
| ($000) | ($000) | |
| Increase (Decrease) in Net Assets | ||
| Operations | ||
| Net Investment Income | 469,217 | 494,691 |
| Realized Net Gain (Loss) | 194,934 | 405,012 |
| Change in Unrealized Appreciation (Depreciation) | (1,257,384) | 147,983 |
| Net Increase (Decrease) in Net Assets Resulting from Operations | (593,233) | 1,047,686 |
| Distributions | ||
| Net Investment Income | ||
| Investor Shares | (52,656) | (66,242) |
| Admiral Shares | (170,522) | (184,117) |
| Signal Shares | (83,246) | (97,850) |
| Institutional Shares | (34,671) | (27,544) |
| Institutional Plus Shares | (6,903) | (4,606) |
| ETF Shares | (121,219) | (114,332) |
| Realized Capital Gain1 | ||
| Investor Shares | (18,973) | (42,277) |
| Admiral Shares | (61,326) | (122,475) |
| Signal Shares | (29,225) | (62,514) |
| Institutional Shares | (12,508) | (20,935) |
| Institutional Plus Shares | (2,471) | (4,379) |
| ETF Shares | (43,476) | (84,354) |
| Total Distributions | (637,196) | (831,625) |
| Capital Share Transactions | ||
| Investor Shares | (420,823) | (44,277) |
| Admiral Shares | (487,937) | 849,221 |
| Signal Shares | (386,383) | 365,265 |
| Institutional Shares | 108,052 | 456,712 |
| Institutional Plus Shares | (5,346) | 132,663 |
| ETF Shares | (336,666) | 1,535,345 |
| Net Increase (Decrease) from Capital Share Transactions | (1,529,103) | 3,294,929 |
| Total Increase (Decrease) | (2,759,532) | 3,510,990 |
| Net Assets | ||
| Beginning of Period | 17,226,604 | 13,715,614 |
| End of Period | 14,467,072 | 17,226,604 |
1 Includes fiscal 2013 and 2012 short-term gain distributions totaling $5,740,000 and $26,422,000, respectively. Short-term gain distributions are treated as ordinary income dividends for tax purposes.
See accompanying Notes, which are an integral part of the Financial Statements.
40
Intermediate-Term Bond Index Fund
Financial Highlights
| Investor Shares | |||||
| For a Share Outstanding | Year Ended December 31, | ||||
| Throughout Each Period | 2013 | 2012 | 2011 | 2010 | 2009 |
| Net Asset Value, Beginning of Period | $11.96 | $11.77 | $11.21 | $10.72 | $10.50 |
| Investment Operations | |||||
| Net Investment Income | .329 | .370 | .425 | .448 | .474 |
| Net Realized and Unrealized Gain (Loss) | |||||
| on Investments | (.745) | .432 | .738 | .547 | .220 |
| Total from Investment Operations | (.416) | .802 | 1.163 | .995 | .694 |
| Distributions | |||||
| Dividends from Net Investment Income | (.329) | (.370) | (.425) | (.448) | (.474) |
| Distributions from Realized Capital Gains | (.125) | (.242) | (.178) | (.057) | — |
| Total Distributions | (.454) | (.612) | (.603) | (.505) | (.474) |
| Net Asset Value, End of Period | $11.09 | $11.96 | $11.77 | $11.21 | $10.72 |
| Total Return1 | -3.54% | 6.91% | 10.62% | 9.37% | 6.79% |
| Ratios/Supplemental Data | |||||
| Net Assets, End of Period (Millions) | $1,558 | $2,120 | $2,129 | $2,378 | $3,479 |
| Ratio of Total Expenses to | |||||
| Average Net Assets | 0.20% | 0.20% | 0.22% | 0.22% | 0.22% |
| Ratio of Net Investment Income to | |||||
| Average Net Assets | 2.84% | 3.07% | 3.65% | 3.97% | 4.50% |
| Portfolio Turnover Rate2 | 70% | 65% | 61% | 46% | 72% |
1 Total returns do not include account service fees that may have applied in the periods shown. Fund prospectuses provide information about any applicable account service fees.
2 Excludes the value of portfolio securities received or delivered as a result of in-kind purchases or redemptions of the fund’s capital shares, including ETF Creation Units.
See accompanying Notes, which are an integral part of the Financial Statements.
41
Intermediate-Term Bond Index Fund
Financial Highlights
| Admiral Shares | |||||
| For a Share Outstanding | Year Ended December 31, | ||||
| Throughout Each Period | 2013 | 2012 | 2011 | 2010 | 2009 |
| Net Asset Value, Beginning of Period | $11.96 | $11.77 | $11.21 | $10.72 | $10.50 |
| Investment Operations | |||||
| Net Investment Income | .340 | .381 | .437 | .461 | .485 |
| Net Realized and Unrealized Gain (Loss) | |||||
| on Investments | (.745) | .432 | .738 | .547 | .220 |
| Total from Investment Operations | (.405) | .813 | 1.175 | 1.008 | .705 |
| Distributions | |||||
| Dividends from Net Investment Income | (.340) | (.381) | (.437) | (.461) | (.485) |
| Distributions from Realized Capital Gains | (.125) | (.242) | (.178) | (.057) | — |
| Total Distributions | (.465) | (.623) | (.615) | (.518) | (.485) |
| Net Asset Value, End of Period | $11.09 | $11.96 | $11.77 | $11.21 | $10.72 |
| Total Return1 | -3.45% | 7.02% | 10.74% | 9.49% | 6.89% |
| Ratios/Supplemental Data | |||||
| Net Assets, End of Period (Millions) | $5,320 | $6,252 | $5,320 | $4,623 | $2,508 |
| Ratio of Total Expenses to | |||||
| Average Net Assets | 0.10% | 0.10% | 0.11% | 0.11% | 0.12% |
| Ratio of Net Investment Income to | |||||
| Average Net Assets | 2.94% | 3.17% | 3.76% | 4.08% | 4.60% |
| Portfolio Turnover Rate2 | 70% | 65% | 61% | 46% | 72% |
1 Total returns do not include account service fees that may have applied in the periods shown. Fund prospectuses provide information about any applicable account service fees.
2 Excludes the value of portfolio securities received or delivered as a result of in-kind purchases or redemptions of the fund’s capital shares, including ETF Creation Units.
See accompanying Notes, which are an integral part of the Financial Statements.
42
Intermediate-Term Bond Index Fund
Financial Highlights
| Signal Shares | |||||
| For a Share Outstanding | Year Ended December 31, | ||||
| Throughout Each Period | 2013 | 2012 | 2011 | 2010 | 2009 |
| Net Asset Value, Beginning of Period | $11.96 | $11.77 | $11.21 | $10.72 | $10.50 |
| Investment Operations | |||||
| Net Investment Income | .340 | .381 | .437 | .461 | .485 |
| Net Realized and Unrealized Gain (Loss) | |||||
| on Investments | (.745) | .432 | .738 | .547 | .220 |
| Total from Investment Operations | (.405) | .813 | 1.175 | 1.008 | .705 |
| Distributions | |||||
| Dividends from Net Investment Income | (.340) | (.381) | (.437) | (.461) | (.485) |
| Distributions from Realized Capital Gains | (.125) | (.242) | (.178) | (.057) | — |
| Total Distributions | (.465) | (.623) | (.615) | (.518) | (.485) |
| Net Asset Value, End of Period | $11.09 | $11.96 | $11.77 | $11.21 | $10.72 |
| Total Return | -3.45% | 7.02% | 10.74% | 9.49% | 6.89% |
| Ratios/Supplemental Data | |||||
| Net Assets, End of Period (Millions) | $2,506 | $3,106 | $2,690 | $2,255 | $1,918 |
| Ratio of Total Expenses to | |||||
| Average Net Assets | 0.10% | 0.10% | 0.11% | 0.11% | 0.12% |
| Ratio of Net Investment Income to | |||||
| Average Net Assets | 2.94% | 3.17% | 3.76% | 4.08% | 4.60% |
| Portfolio Turnover Rate1 | 70% | 65% | 61% | 46% | 72% |
1 Excludes the value of portfolio securities received or delivered as a result of in-kind purchases or redemptions of the fund’s capital shares, including ETF Creation Units.
See accompanying Notes, which are an integral part of the Financial Statements.
43
Intermediate-Term Bond Index Fund
Financial Highlights
| Institutional Shares | |||||
| For a Share Outstanding | Year Ended December 31, | ||||
| Throughout Each Period | 2013 | 2012 | 2011 | 2010 | 2009 |
| Net Asset Value, Beginning of Period | $11.96 | $11.77 | $11.21 | $10.72 | $10.50 |
| Investment Operations | |||||
| Net Investment Income | .344 | .385 | .442 | .465 | .490 |
| Net Realized and Unrealized Gain (Loss) | |||||
| on Investments | (.745) | .432 | .738 | .547 | .220 |
| Total from Investment Operations | (.401) | .817 | 1.180 | 1.012 | .710 |
| Distributions | |||||
| Dividends from Net Investment Income | (.344) | (.385) | (.442) | (.465) | (.490) |
| Distributions from Realized Capital Gains | (.125) | (.242) | (.178) | (.057) | — |
| Total Distributions | (.469) | (.627) | (.620) | (.522) | (.490) |
| Net Asset Value, End of Period | $11.09 | $11.96 | $11.77 | $11.21 | $10.72 |
| Total Return | -3.42% | 7.05% | 10.78% | 9.53% | 6.95% |
| Ratios/Supplemental Data | |||||
| Net Assets, End of Period (Millions) | $1,172 | $1,154 | $689 | $582 | $522 |
| Ratio of Total Expenses to | |||||
| Average Net Assets | 0.07% | 0.07% | 0.07% | 0.07% | 0.07% |
| Ratio of Net Investment Income to | |||||
| Average Net Assets | 2.97% | 3.20% | 3.80% | 4.12% | 4.65% |
| Portfolio Turnover Rate1 | 70% | 65% | 61% | 46% | 72% |
1 Excludes the value of portfolio securities received or delivered as a result of in-kind purchases or redemptions of the fund’s capital shares, including ETF Creation Units.
See accompanying Notes, which are an integral part of the Financial Statements.
44
Intermediate-Term Bond Index Fund
Financial Highlights
| Institutional Plus Shares | |||
| Nov. 30, | |||
| Year Ended | 20111 to | ||
| December 31, | Dec. 31, | ||
| For a Share Outstanding Throughout Each Period | 2013 | 2012 | 2011 |
| Net Asset Value, Beginning of Period | $11.96 | $11.77 | $11.73 |
| Investment Operations | |||
| Net Investment Income | .346 | .388 | .072 |
| Net Realized and Unrealized Gain (Loss) on Investments | (.745) | .432 | .178 |
| Total from Investment Operations | (.399) | .820 | .250 |
| Distributions | |||
| Dividends from Net Investment Income | (.346) | (.388) | (.072) |
| Distributions from Realized Capital Gains | (.125) | (.242) | (.138) |
| Total Distributions | (.471) | (.630) | (.210) |
| Net Asset Value, End of Period | $11.09 | $11.96 | $11.77 |
| Total Return | -3.40% | 7.07% | 1.84% |
| Ratios/Supplemental Data | |||
| Net Assets, End of Period (Millions) | $216 | $239 | $107 |
| Ratio of Total Expenses to Average Net Assets | 0.05% | 0.05% | 0.05%2 |
| Ratio of Net Investment Income to Average Net Assets | 2.99% | 3.22% | 3.82%2 |
| Portfolio Turnover Rate3 | 70% | 65% | 61% |
1 Inception.
2 Annualized.
3 Excludes the value of portfolio securities received or delivered as a result of in-kind purchases or redemptions of the fund’s capital shares, including ETF Creation Units.
See accompanying Notes, which are an integral part of the Financial Statements.
45
Intermediate-Term Bond Index Fund
Financial Highlights
| ETF Shares | |||||
| For a Share Outstanding | Year Ended December 31, | ||||
| Throughout Each Period | 2013 | 2012 | 2011 | 2010 | 2009 |
| Net Asset Value, Beginning of Period | $88.07 | $86.63 | $82.56 | $78.85 | $77.19 |
| Investment Operations | |||||
| Net Investment Income | 2.523 | 2.764 | 3.183 | 3.326 | 3.474 |
| Net Realized and Unrealized Gain (Loss) | |||||
| on Investments | (5.499) | 3.225 | 5.383 | 4.131 | 1.660 |
| Total from Investment Operations | (2.976) | 5.989 | 8.566 | 7.457 | 5.134 |
| Distributions | |||||
| Dividends from Net Investment Income | (2.523) | (2.764) | (3.183) | (3.326) | (3.474) |
| Distributions from Realized Capital Gains | (.921) | (1.785) | (1.313) | (.421) | — |
| Total Distributions | (3.444) | (4.549) | (4.496) | (3.747) | (3.474) |
| Net Asset Value, End of Period | $81.65 | $88.07 | $86.63 | $82.56 | $78.85 |
| Total Return | -3.44% | 7.02% | 10.62% | 9.55% | 6.82% |
| Ratios/Supplemental Data | |||||
| Net Assets, End of Period (Millions) | $3,695 | $4,356 | $2,781 | $1,932 | $1,230 |
| Ratio of Total Expenses to | |||||
| Average Net Assets | 0.10% | 0.10% | 0.11% | 0.11% | 0.12% |
| Ratio of Net Investment Income to | |||||
| Average Net Assets | 2.94% | 3.17% | 3.76% | 4.08% | 4.60% |
| Portfolio Turnover Rate1 | 70% | 65% | 61% | 46% | 72% |
1 Excludes the value of portfolio securities received or delivered as a result of in-kind purchases or redemptions of the fund’s capital shares, including ETF Creation Units.
See accompanying Notes, which are an integral part of the Financial Statements.
46
Intermediate-Term Bond Index Fund
Notes to Financial Statements
Vanguard Intermediate-Term Bond Index Fund is registered under the Investment Company Act of 1940 as an open-end investment company, or mutual fund. Certain of the fund’s investments are in corporate debt instruments; the issuers’ abilities to meet their obligations may be affected by economic developments in their respective industries. The fund offers six classes of shares: Investor Shares, Admiral Shares, Signal Shares, Institutional Shares, Institutional Plus Shares, and ETF Shares. Investor Shares are available to any investor who meets the fund’s minimum purchase requirements. Admiral Shares, Signal Shares, Institutional Shares, and Institutional Plus Shares are designed for investors who meet certain administrative, service, and account-size criteria. ETF Shares are listed for trading on NYSE Arca; they can be purchased and sold through a broker.
A. The following significant accounting policies conform to generally accepted accounting principles for U.S. mutual funds. The fund consistently follows such policies in preparing its financial statements.
1. Security Valuation: Bonds, and temporary cash investments acquired over 60 days to maturity, are valued using the latest bid prices or using valuations based on a matrix system (which considers such factors as security prices, yields, maturities, and ratings), both as furnished by independent pricing services. Structured debt securities, including mortgages and asset-backed securities, are valued using the latest bid prices or using valuations based on a matrix system that considers such factors as issuer, tranche, nominal or option adjusted spreads, weighted average coupon, weighted average maturity, credit enhancements, and collateral. Investments in Vanguard Market Liquidity Fund are valued at that fund’s net asset value. Other temporary cash investments are valued at amortized cost, which approximates market value. Securities for which market quotations are not readily available, or whose values have been affected by events occurring before the fund’s pricing time but after the close of the securities’ primary markets, are valued by methods deemed by the board of trustees to represent fair value.
2. Futures Contracts: The fund may use futures contracts to invest in fixed income asset classes with greater efficiency and lower cost than is possible through direct investment, to add value when these instruments are attractively priced, or to adjust sensitivity to changes in interest rates. The primary risks associated with the use of futures contracts are imperfect correlation between changes in market values of bonds held by the fund and the prices of futures contracts, and the possibility of an illiquid market. Counterparty risk involving futures is mitigated because a regulated clearinghouse is the counterparty instead of the clearing broker. To further mitigate counterparty risk, the fund trades futures contracts on an exchange, monitors the financial strength of its clearing brokers and clearinghouse, and has entered into clearing agreements with its clearing brokers. The clearinghouse imposes initial margin requirements to secure the fund’s performance and requires daily settlement of variation margin representing changes in the market value of each contract.
Futures contracts are valued at their quoted daily settlement prices. The aggregate notional amounts of the contracts are not recorded in the Statement of Net Assets. Fluctuations in the value of the contracts are recorded in the Statement of Net Assets as an asset (liability) and in the Statement of Operations as unrealized appreciation (depreciation) until the contracts are closed, when they are recorded as realized futures gains (losses).
During the year ended December 31, 2013, the fund’s average investments in long and short futures contracts each represented less than 1% of net assets, based on quarterly average aggregate settlement values.
47
Intermediate-Term Bond Index Fund
3. Federal Income Taxes: The fund intends to continue to qualify as a regulated investment company and distribute all of its taxable income. Management has analyzed the fund’s tax positions taken for all open federal income tax years (December 31, 2010–2013), and has concluded that no provision for federal income tax is required in the fund’s financial statements.
4. Distributions: Distributions from net investment income are declared daily by all share classes except ETF Shares, and paid on the first business day of the following month. Monthly income dividends from ETF Shares, and annual distributions from realized capital gains, if any, are recorded on the ex-dividend date.
5. Other: Interest income includes income distributions received from Vanguard Market Liquidity Fund and is accrued daily. Premiums and discounts on debt securities purchased are amortized and accreted, respectively, to interest income over the lives of the respective securities. Security transactions are accounted for on the date securities are bought or sold. Costs used to determine realized gains (losses) on the sale of investment securities are those of the specific securities sold.
Each class of shares has equal rights as to assets and earnings, except that each class separately bears certain class-specific expenses related to maintenance of shareholder accounts (included in Management and Administrative expenses) and shareholder reporting. Marketing and distribution expenses are allocated to each class of shares based on a method approved by the board of trustees. Income, other non-class-specific expenses, and gains and losses on investments are allocated to each class of shares based on its relative net assets.
B. The Vanguard Group furnishes at cost investment advisory, corporate management, administrative, marketing, and distribution services. The costs of such services are allocated to the fund under methods approved by the board of trustees. The fund has committed to provide up to 0.40% of its net assets in capital contributions to Vanguard. At December 31, 2013, the fund had contributed capital of $1,653,000 to Vanguard (included in Other Assets), representing 0.01% of the fund’s net assets and 0.66% of Vanguard’s capitalization. The fund’s trustees and officers are also directors and officers of Vanguard.
C. Various inputs may be used to determine the value of the fund’s investments. These inputs are summarized in three broad levels for financial statement purposes. The inputs or methodologies used to value securities are not necessarily an indication of the risk associated with investing in those securities.
Level 1—Quoted prices in active markets for identical securities.
Level 2—Other significant observable inputs (including quoted prices for similar securities, interest rates, prepayment speeds, credit risk, etc.).
Level 3—Significant unobservable inputs (including the fund’s own assumptions used to determine the fair value of investments).
48
Intermediate-Term Bond Index Fund
The following table summarizes the market value of the fund’s investments as of December 31, 2013, based on the inputs used to value them:
| Level 1 | Level 2 | Level 3 | |
| Investments | ($000) | ($000) | ($000) |
| U.S. Government and Agency Obligations | — | 7,291,273 | — |
| Corporate Bonds | — | 5,984,199 | — |
| Sovereign Bonds | — | 1,021,606 | — |
| Taxable Municipal Bonds | — | 48,923 | — |
| Temporary Cash Investments | 20,064 | — | — |
| Futures Contracts—Liabilities1 | (25) | — | — |
| Total | 20,039 | 14,346,001 | — |
| 1 Represents variation margin on the last day of the reporting period. |
D. At December 31, 2013, the aggregate settlement value of open futures contracts and the related unrealized appreciation (depreciation) were:
| ($000) | ||||
| Aggregate | ||||
| Number of | Settlement | Unrealized | ||
| Long (Short) | Value | Appreciation | ||
| Futures Contracts | Expiration | Contracts | Long (Short) | (Depreciation) |
| 5-Year United States Treasury Note | March 2014 | 268 | 31,976 | (430) |
Unrealized appreciation (depreciation) on open futures contracts is required to be treated as realized gain (loss) for tax purposes.
E. Capital gain distributions are determined on a tax basis and may differ from realized capital gains for financial reporting purposes. Differences may be permanent or temporary. Permanent differences are reclassified among capital accounts in the financial statements to reflect their tax character. Temporary differences arise when gains or losses are recognized in different periods for financial statement and tax purposes. These differences will reverse at some time in the future.
During the year ended December 31, 2013, the fund realized $42,819,000 of net capital gains resulting from in-kind redemptions—in which shareholders exchanged fund shares for securities held by the fund rather than for cash. Because such gains are not taxable to the fund, and are not distributed to shareholders, they have been reclassified from accumulated net realized gains to paid-in capital.
The fund used a tax accounting practice to treat a portion of the price of capital shares redeemed during the year as distributions from realized capital gains. Accordingly, the fund has reclassified $42,638,000 from accumulated net realized gains to paid-in capital.
For tax purposes, at December 31, 2013, the fund had short-term and long-term capital gains of $269,000 and $5,859,000, respectively, available for distribution. Short-term gain distributions are treated as ordinary income dividends for tax purposes.
At December 31, 2013, the cost of investment securities for tax purposes was $14,313,833,000. Net unrealized appreciation of investment securities for tax purposes was $52,232,000, consisting of unrealized gains of $400,712,000 on securities that had risen in value since their purchase and $348,480,000 in unrealized losses on securities that had fallen in value since their purchase.
49
Intermediate-Term Bond Index Fund
F. During the year ended December 31, 2013, the fund purchased $2,710,803,000 of investment securities and sold $3,269,744,000 of investment securities, other than U.S. government securities and temporary cash investments. Purchases and sales of U.S. government securities were $8,726,276,000 and $9,703,406,000, respectively. Total purchases and sales include $522,934,000 and $855,009,000, respectively, in connection with in-kind purchases and redemptions of the fund’s capital shares.
G. Capital share transactions for each class of shares were:
| Year Ended December 31, | ||||
| 2013 | 2012 | |||
| Amount | Shares | Amount | Shares | |
| ($000) | (000) | ($000) | (000) | |
| Investor Shares | ||||
| Issued | 358,829 | 30,865 | 685,594 | 57,212 |
| Issued in Lieu of Cash Distributions | 62,696 | 5,450 | 95,907 | 8,005 |
| Redeemed | (842,348) | (73,071) | (825,778) | (68,890) |
| Net Increase (Decrease)—Investor Shares | (420,823) | (36,756) | (44,277) | (3,673) |
| Admiral Shares | ||||
| Issued | 1,125,597 | 96,914 | 1,516,192 | 126,289 |
| Issued in Lieu of Cash Distributions | 204,301 | 17,779 | 271,409 | 22,648 |
| Redeemed | (1,817,835) | (157,761) | (938,380) | (78,309) |
| Net Increase (Decrease) —Admiral Shares | (487,937) | (43,068) | 849,221 | 70,628 |
| Signal Shares | ||||
| Issued | 855,478 | 73,869 | 1,399,412 | 116,921 |
| Issued in Lieu of Cash Distributions | 92,355 | 8,038 | 133,047 | 11,102 |
| Redeemed | (1,334,216) | (115,705) | (1,167,194) | (96,955) |
| Net Increase (Decrease)—Signal Shares | (386,383) | (33,798) | 365,265 | 31,068 |
| Institutional Shares | ||||
| Issued | 551,727 | 47,829 | 613,776 | 50,882 |
| Issued in Lieu of Cash Distributions | 44,670 | 3,890 | 44,475 | 3,710 |
| Redeemed | (488,345) | (42,542) | (201,539) | (16,651) |
| Net Increase (Decrease) —Institutional Shares | 108,052 | 9,177 | 456,712 | 37,941 |
| Institutional Plus Shares | ||||
| Issued | 42,650 | 3,684 | 138,285 | 11,387 |
| Issued in Lieu of Cash Distributions | 9,150 | 796 | 8,983 | 749 |
| Redeemed | (57,146) | (4,975) | (14,605) | (1,216) |
| Net Increase (Decrease) —Institutional Plus Shares | (5,346) | (495) | 132,663 | 10,920 |
| ETF Shares | ||||
| Issued | 530,844 | 6,200 | 1,650,916 | 18,654 |
| Issued in Lieu of Cash Distributions | — | — | — | — |
| Redeemed | (867,510) | (10,400) | (115,571) | (1,300) |
| Net Increase (Decrease)—ETF Shares | (336,666) | (4,200) | 1,535,345 | 17,354 |
H. Management has determined that no material events or transactions occurred subsequent to December 31, 2013, that would require recognition or disclosure in these financial statements.
50
Long-Term Bond Index Fund
Fund Profile
As of December 31, 2013
| Share-Class Characteristics | ||||
| Investor | Institutional | Institutional | ||
| Shares | Shares | Plus Shares | ETF Shares | |
| Ticker Symbol | VBLTX | VBLLX | VBLIX | BLV |
| Expense Ratio1 | 0.20% | 0.07% | 0.05% | 0.10% |
| 30-Day SEC Yield | 4.54% | 4.67% | 4.69% | 4.64% |
| Financial Attributes | |||
| Barclays | |||
| Long | |||
| Gov/ | Barclays | ||
| Credit | Aggregate | ||
| Float Adj | Float Adj | ||
| Fund | Index | Index | |
| Number of Bonds | 1,655 | 1,842 | 8,701 |
| Yield to Maturity | |||
| (before expenses) | 4.7% | 4.8% | 2.4% |
| Average Coupon | 5.3% | 5.3% | 3.3% |
| Average Duration | 13.9 years | 13.9 years | 5.5 years |
| Average Effective | |||
| Maturity | 23.9 years | 24.0 years | 7.5 years |
| Short-Term | |||
| Reserves | 0.3% | — | — |
| Sector Diversification (% of portfolio) | |
| Finance | 9.7% |
| Foreign | 14.0 |
| Industrial | 32.1 |
| Treasury/Agency | 35.0 |
| Utilities | 9.0 |
| Other | 0.2 |
The agency and mortgage-backed securities sectors may include issues from government-sponsored enterprises; such issues are generally not backed by the full faith and credit of the U.S. government.
| Volatility Measures | ||
| Barclays | ||
| Long | ||
| Gov/ | ||
| Credit | Barclays | |
| Float Adj | Aggregate Float | |
| Index | Adj Index | |
| R-Squared | 0.99 | 0.83 |
| Beta | 1.01 | 3.06 |
These measures show the degree and timing of the fund’s fluctuations compared with the indexes over 36 months.
| Distribution by Credit Quality (% of portfolio) | |
| U.S. Government | 35.1% |
| Aaa | 1.7 |
| Aa | 7.1 |
| A | 25.5 |
| Baa | 30.6 |
For information about these ratings, see the Glossary entry for Credit Quality.
| Distribution by Effective Maturity | |
| (% of portfolio) | |
| Under 1 Year | 0.2% |
| 1 - 3 Years | 0.2 |
| 3 - 5 Years | 0.1 |
| 5 - 10 Years | 1.7 |
| 10 - 20 Years | 24.3 |
| 20 - 30 Years | 71.2 |
| Over 30 Years | 2.3 |
1 The expense ratios shown are from the prospectus dated April 29, 2013, and represent estimated costs for the current fiscal year. For the fiscal year ended December 31, 2013, the expense ratios were 0.20% for Investor Shares, 0.07% for Institutional Shares, 0.05% for Institutional Plus Shares, and 0.10% for ETF Shares.
51
Long-Term Bond Index Fund
Investment Focus
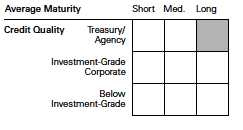
52
Long-Term Bond Index Fund
Performance Summary
All of the returns in this report represent past performance, which is not a guarantee of future results that may be achieved by the fund. (Current performance may be lower or higher than the performance data cited. For performance data current to the most recent month-end, visit our website at vanguard.com/performance.) Note, too, that both investment returns and principal value can fluctuate widely, so an investor’s shares, when sold, could be worth more or less than their original cost. The returns shown do not reflect taxes that a shareholder would pay on fund distributions or on the sale of fund shares.
Cumulative Performance: December 31, 2003, Through December 31, 2013
Initial Investment of $10,000
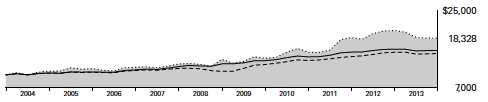
| Average Annual Total Returns | ||||
| Periods Ended December 31, 2013 | ||||
| Final Value | ||||
| One | Five | Ten | of a $10,000 | |
| Year | Years | Years | Investment | |
| Long-Term Bond Index Fund Investor | ||||
| Shares | -9.13% | 6.19% | 6.25% | $18,328 |
| Spliced Barclays U.S. Long | ||||
| Government/Credit Float Adjusted | ||||
| Index | -8.83 | 6.41 | 6.36 | 18,519 |
| Spliced Corporate A-Rated Debt Funds | ||||
| Average | -1.78 | 6.73 | 4.12 | 14,971 |
| Spliced Barclays U.S. Aggregate Float | ||||
| Adjusted Index | -1.97 | 4.50 | 4.57 | 15,640 |
For a benchmark description, see the Glossary.
Spliced Corporate A-Rated Debt Funds Average: Derived from data provided by Lipper, a Thomson Reuters Company.
| Since | Final Value | |||
| One | Five | Inception | of a $5,000,000 | |
| Year | Years | (2/2/2006) | Investment | |
| Long-Term Bond Index Fund Institutional | ||||
| Shares | -9.01% | 6.34% | 6.45% | $8,196,004 |
| Spliced Barclays U.S. Long | ||||
| Government/Credit Float Adjusted Index | -8.83 | 6.41 | 6.41 | 8,175,025 |
| Spliced Barclays U.S. Aggregate Float | ||||
| Adjusted Index | -1.97 | 4.50 | 4.95 | 7,327,600 |
| "Since Inception" performance is calculated from the Institutional Shares’ inception date for both the fund and its comparative standards. | ||||
| See Financial Highlights for dividend and capital gains information. | ||||
53
Long-Term Bond Index Fund
| Average Annual Total Returns | |||
| Periods Ended December 31, 2013 | |||
| Since | Final Value | ||
| One | Inception | of a $100,000,000 | |
| Year | (10/6/2011) | Investment | |
| Long-Term Bond Index Fund Institutional Plus | |||
| Shares | -8.99% | 1.10% | $102,478,718 |
| Barclays U.S. Long Government/Credit Float | |||
| Adjusted Index | -8.83 | 1.12 | 102,526,464 |
| Spliced Barclays U.S. Aggregate Float Adjusted | |||
| Index | -1.97 | 1.68 | 103,802,817 |
| "Since Inception" performance is calculated from the Institutional Plus Shares’ inception date for both the fund and its comparative standards. | |||
| Since | Final Value | |||
| One | Five | Inception | of a $10,000 | |
| Year | Years | (4/3/2007) | Investment | |
| Long-Term Bond Index Fund | ||||
| ETF Shares Net Asset Value | -9.03% | 6.26% | 6.79% | $15,577 |
| Spliced Barclays U.S. Long | ||||
| Government/Credit Float Adjusted Index | -8.83 | 6.41 | 6.84 | 15,622 |
| Spliced Barclays U.S. Aggregate Float | ||||
| Adjusted Index | -1.97 | 4.50 | 4.91 | 13,821 |
| "Since Inception" performance is calculated from the ETF Shares’ inception date for both the fund and its comparative standards. | ||||
| Cumulative Returns of ETF Shares: April 3, 2007, Through December 31, 2013 | |||
| Since | |||
| One | Five | Inception | |
| Year | Years | (4/3/2007) | |
| Long-Term Bond Index Fund ETF Shares Market | |||
| Price | -8.91% | 33.73% | 56.12% |
| Long-Term Bond Index Fund ETF Shares Net Asset | |||
| Value | -9.03 | 35.47 | 55.77 |
| Spliced Barclays U.S. Long Government/Credit Float | |||
| Adjusted Index | -8.83 | 36.40 | 56.22 |
| "Since Inception" performance is calculated from the ETF Shares’ inception date for both the fund and its comparative standards. | |||
54
Long-Term Bond Index Fund
| Fiscal-Year Total Returns (%): December 31, 2003, Through December 31, 2013 | ||||
| Spliced | ||||
| Barclays | ||||
| Long | ||||
| Gov/Credit | ||||
| Investor Shares | FA Index | |||
| Fiscal Year | Income Returns | Capital Returns | Total Returns | Total Returns |
| 2004 | 5.62% | 2.78% | 8.40% | 8.56% |
| 2005 | 5.15 | 0.17 | 5.32 | 5.34 |
| 2006 | 5.29 | -2.62 | 2.67 | 2.71 |
| 2007 | 5.55 | 1.04 | 6.59 | 6.60 |
| 2008 | 5.81 | 2.83 | 8.64 | 8.44 |
| 2009 | 5.27 | -3.51 | 1.76 | 1.92 |
| 2010 | 5.21 | 5.06 | 10.27 | 10.16 |
| 2011 | 5.51 | 16.55 | 22.06 | 22.49 |
| 2012 | 4.23 | 4.26 | 8.49 | 8.79 |
| 2013 | 3.76 | -12.89 | -9.13 | -8.83 |
| For a benchmark description, see the Glossary. | ||||
55
Long-Term Bond Index Fund
Financial Statements
Statement of Net Assets—Investments Summary
As of December 31, 2013
This Statement summarizes the fund’s holdings by asset type. Details are reported for each of the fund’s 50 largest individual holdings and for investments that, in total for any issuer, represent more than 1% of the fund’s net assets. The total value of smaller holdings is reported as a single amount within each category.
The fund reports a complete list of its holdings in regulatory filings four times in each fiscal year, at the quarter-ends. For the second and fourth fiscal quarters, the complete listing of the fund’s holdings is available electronically on vanguard.com and on the Securities and Exchange Commission’s website (sec.gov), or you can have it mailed to you without charge by calling 800-662-7447. For the first and third fiscal quarters, the fund files the lists with the SEC on Form N-Q. Shareholders can look up the fund’s Forms N-Q on the SEC’s website. Forms N-Q may also be reviewed and copied at the SEC’s Public Reference Room (see the back cover of this report for further information).
| Face | Market | Percentage | |||
| Maturity | Amount | Value | of Net | ||
| Coupon | Date | ($000) | ($000) | Assets | |
| U.S. Government and Agency Obligations | |||||
| U.S. Government Securities | |||||
| United States Treasury Note/Bond | 3.625% | 8/15/43 | 166,180 | 156,131 | 2.7% |
| United States Treasury Note/Bond | 2.750% | 8/15/42 | 148,023 | 116,684 | 2.0% |
| United States Treasury Note/Bond | 3.125% | 2/15/43 | 135,190 | 115,144 | 2.0% |
| United States Treasury Note/Bond | 4.250% | 11/15/40 | 108,350 | 114,749 | 2.0% |
| United States Treasury Note/Bond | 2.750% | 11/15/42 | 125,625 | 98,793 | 1.7% |
| United States Treasury Note/Bond | 4.750% | 2/15/41 | 77,355 | 88,595 | 1.6% |
| United States Treasury Note/Bond | 4.375% | 5/15/40 | 67,978 | 73,501 | 1.3% |
| United States Treasury Note/Bond | 3.875% | 8/15/40 | 67,055 | 66,740 | 1.2% |
| United States Treasury Note/Bond | 3.000% | 5/15/42 | 77,915 | 64,998 | 1.1% |
| United States Treasury Note/Bond | 4.375% | 11/15/39 | 55,225 | 59,729 | 1.1% |
| United States Treasury Note/Bond | 4.375% | 5/15/41 | 54,925 | 59,310 | 1.0% |
| United States Treasury Note/Bond | 3.125% | 11/15/41 | 68,095 | 58,509 | 1.0% |
| United States Treasury Note/Bond | 4.625% | 2/15/40 | 51,701 | 58,099 | 1.0% |
| United States Treasury Note/Bond | 4.250% | 5/15/39 | 50,773 | 53,882 | 0.9% |
| United States Treasury Note/Bond | 5.375% | 2/15/31 | 43,735 | 53,411 | 0.9% |
| United States Treasury Note/Bond | 2.875% | 5/15/43 | 64,715 | 52,177 | 0.9% |
| United States Treasury Note/Bond | 5.500% | 8/15/28 | 41,680 | 51,214 | 0.9% |
| United States Treasury Note/Bond | 4.500% | 5/15/38 | 42,065 | 46,416 | 0.8% |
| United States Treasury Note/Bond | 6.875% | 8/15/25 | 33,665 | 45,721 | 0.8% |
| United States Treasury Note/Bond | 3.125% | 2/15/42 | 52,948 | 45,419 | 0.8% |
| United States Treasury Note/Bond | 6.125% | 8/15/29 | 34,015 | 44,539 | 0.8% |
| United States Treasury Note/Bond | 5.250% | 11/15/28 | 35,405 | 42,486 | 0.7% |
| United States Treasury Note/Bond | 4.500% | 8/15/39 | 28,031 | 30,918 | 0.5% |
| United States Treasury Note/Bond | 6.250% | 5/15/30 | 19,860 | 26,442 | 0.5% |
| United States Treasury Note/Bond | 2.750% | 11/15/23 | 27,075 | 26,432 | 0.5% |
| United States Treasury Note/Bond | 4.375% | 2/15/38 | 22,298 | 24,151 | 0.4% |
| United States Treasury Note/Bond | 5.000% | 5/15/37 | 20,000 | 23,691 | 0.4% |
| United States Treasury Note/Bond | 3.750% | 11/15/43 | 23,000 | 22,116 | 0.4% |
56
Long-Term Bond Index Fund
| Face | Market | Percentage | ||||
| Maturity | Amount | Value | of Net | |||
| Coupon | Date | ($000) | ($000) | Assets | ||
| United States Treasury Note/Bond | 3.500% | 2/15/39 | 21,295 | 19,954 | 0.4% | |
| United States Treasury Note/Bond | 6.125% | 11/15/27 | 14,775 | 19,171 | 0.3% | |
| United States Treasury Note/Bond | 4.500% | 2/15/36 | 17,090 | 18,935 | 0.3% | |
| United States Treasury Note/Bond | 1.750% | 5/15/23 | 19,106 | 17,186 | 0.3% | |
| United States Treasury Note/Bond | 5.250% | 2/15/29 | 13,915 | 16,698 | 0.3% | |
| United States Treasury Note/Bond | 6.375% | 8/15/27 | 11,955 | 15,831 | 0.3% | |
| United States Treasury | ||||||
| Note/Bond | 2.500%–7.625% | 8/15/23–8/15/41 | 34,155 | 43,187 | 0.8% | |
| 1,870,959 | 32.6% | |||||
| Agency Bonds and Notes | ||||||
| 1 | Federal Home Loan Mortgage Corp. | 6.750% | 3/15/31 | 16,260 | 21,490 | 0.4% |
| 1 | Federal Home Loan Mortgage Corp. | 6.250% | 7/15/32 | 10,067 | 12,690 | 0.2% |
| 1 | Federal National Mortgage Assn. | 6.250% | 5/15/29 | 11,900 | 14,841 | 0.3% |
| 1 | Federal National Mortgage Assn. | 7.125% | 1/15/30 | 9,175 | 12,412 | 0.2% |
| 1 | Federal National Mortgage Assn. | 7.250% | 5/15/30 | 8,835 | 12,077 | 0.2% |
| 1 | Federal National Mortgage Assn. | 6.625% | 11/15/30 | 9,050 | 11,760 | 0.2% |
| 1,2 | Federal National | |||||
| Mortgage Assn. | 5.625%–6.210% | 4/18/36–8/6/38 | 7,160 | 8,361 | 0.1% | |
| Agency Bonds and Notes—Other † | 61,629 | 1.1% | ||||
| 155,260 | 2.7% | |||||
| Total U.S. Government and Agency Obligations (Cost $2,103,093) | 2,026,219 | 35.3% | ||||
| Corporate Bonds | ||||||
| Finance | ||||||
| Banking | ||||||
| Goldman Sachs Group Inc. | 6.750% | 10/1/37 | 15,690 | 17,307 | 0.3% | |
| 3 | Banking—Other † | 244,936 | 4.3% | |||
| Brokerage † | 7,984 | 0.1% | ||||
| Finance Companies | ||||||
| General Electric Capital Corp. | 5.875% | 1/14/38 | 19,425 | 21,951 | 0.4% | |
| General Electric Capital Corp. | 6.750% | 3/15/32 | 16,330 | 20,154 | 0.4% | |
| General Electric | ||||||
| Capital Corp. | 6.150%–6.875% | 8/7/37–1/10/39 | 16,030 | 19,644 | 0.3% | |
| Insurance | ||||||
| 2 | American International Group Inc. | 8.175% | 5/15/68 | 10,575 | 12,690 | 0.2% |
| Berkshire Hathaway | ||||||
| Finance Corp. | 4.300%–5.750% | 1/15/40–5/15/43 | 6,300 | 6,227 | 0.1% | |
| Berkshire Hathaway Inc. | 4.500% | 2/11/43 | 2,125 | 1,965 | 0.1% | |
| Insurance—Other † | 166,221 | 2.9% | ||||
| Other Finance † | 1,919 | 0.0% | ||||
| Real Estate Investment Trusts † | 15,274 | 0.3% | ||||
| 536,272 | 9.4% | |||||
| Industrial | ||||||
| Basic Industry | ||||||
| Lubrizol Corp. | 6.500% | 10/1/34 | 925 | 1,121 | 0.0% | |
| 3 | Basic Industry—Other † | 170,708 | 3.0% | |||
| Capital Goods | ||||||
| General Electric Co. | 4.125% | 10/9/42 | 6,400 | 5,866 | 0.1% | |
| 3 | Capital Goods—Other † | 118,902 | 2.1% | |||
| Communication | ||||||
| Alltel Corp. | 6.800%–7.875% | 5/1/29–7/1/32 | 2,825 | 3,660 | 0.1% | |
57
Long-Term Bond Index Fund
| Face | Market | Percentage | |||
| Maturity | Amount | Value | of Net | ||
| Coupon | Date | ($000) | ($000) | Assets | |
| Ameritech Capital Funding Corp. | 6.550% | 1/15/28 | 1,000 | 1,079 | 0.0% |
| AT&T Corp. | 8.000% | 11/15/31 | 1,696 | 2,257 | 0.0% |
| AT&T Inc. | 4.300%–6.550% | 6/15/34–6/15/45 | 46,836 | 47,427 | 0.8% |
| AT&T Mobility LLC | 7.125% | 12/15/31 | 1,950 | 2,365 | 0.0% |
| Bellsouth Capital Funding Corp. | 7.875% | 2/15/30 | 2,118 | 2,480 | 0.1% |
| BellSouth Corp. | 6.000%–6.875% | 10/15/31–11/15/34 | 2,646 | 2,838 | 0.1% |
| BellSouth | |||||
| Telecommunications LLC | 0.000%–6.375% | 6/1/28–12/15/95 | 2,150 | 2,223 | 0.0% |
| Deutsche Telekom | |||||
| International Finance BV | 8.750% | 6/15/30 | 9,900 | 14,064 | 0.3% |
| GTE Corp. | 6.940% | 4/15/28 | 2,675 | 3,027 | 0.1% |
| New Cingular Wireless | |||||
| Services Inc. | 8.750% | 3/1/31 | 2,215 | 3,111 | 0.1% |
| Pacific Bell Telephone Co. | 7.125% | 3/15/26 | 1,847 | 2,217 | 0.0% |
| Verizon Communications Inc. | 6.550% | 9/15/43 | 44,005 | 51,532 | 0.9% |
| Verizon Communications Inc. | 6.400% | 9/15/33 | 19,050 | 21,963 | 0.4% |
| Verizon | |||||
| Communications Inc. | 3.850%–7.750% | 12/1/30–11/1/42 | 35,273 | 39,060 | 0.7% |
| Verizon Maryland LLC | 5.125% | 6/15/33 | 950 | 924 | 0.0% |
| Verizon New England Inc. | 7.875% | 11/15/29 | 490 | 571 | 0.0% |
| Verizon New York Inc. | 7.375% | 4/1/32 | 1,175 | 1,327 | 0.0% |
| 3 Communication—Other † | 230,556 | 4.0% | |||
| 3 Consumer Cyclical † | 236,991 | 4.1% | |||
| 3 Consumer Noncyclical † | 391,292 | 6.8% | |||
| Energy † | 242,631 | 4.2% | |||
| Other Industrial † | 8,776 | 0.2% | |||
| Technology † | 88,916 | 1.6% | |||
| Transportation | |||||
| 2 BNSF Funding Trust I | 6.613% | 12/15/55 | 850 | 932 | 0.0% |
| Burlington Northern | |||||
| Santa Fe LLC | 4.375%–7.950% | 12/15/25–9/1/43 | 17,915 | 18,712 | 0.3% |
| 3 Transportation—Other † | 74,288 | 1.3% | |||
| 1,791,816 | 31.3% | ||||
| Utilities | |||||
| Electric | |||||
| MidAmerican Energy Co. | 5.750%–6.750% | 12/30/31–10/15/36 | 4,270 | 4,963 | 0.1% |
| 3 MidAmerican Energy | |||||
| Holdings Co. | 5.150%–8.480% | 9/15/28–11/15/43 | 13,370 | 14,978 | 0.2% |
| Nevada Power Co. | 5.375%–6.750% | 4/1/36–5/15/41 | 4,075 | 4,777 | 0.1% |
| PacifiCorp | 4.100%–7.700% | 11/15/31–2/1/42 | 9,843 | 10,945 | 0.2% |
| Sierra Pacific Power Co. | 6.750% | 7/1/37 | 670 | 813 | 0.0% |
| Electric—Other † | 315,459 | 5.5% | |||
| 3 Natural Gas † | 147,386 | 2.6% | |||
| Other Utility † | 7,765 | 0.1% | |||
| 507,086 | 8.8% | ||||
| Total Corporate Bonds (Cost $2,788,579) | 2,835,174 | 49.5% | |||
58
Long-Term Bond Index Fund
| Face | Market | Percentage | ||||
| Maturity | Amount | Value | of Net | |||
| Coupon | Date | ($000) | ($000) | Assets | ||
| Sovereign Bonds (U.S. Dollar-Denominated) | ||||||
| 2 | Federative Republic | |||||
| of Brazil | 4.250%–11.000% | 4/15/24–1/7/41 | 53,745 | 61,875 | 1.1% | |
| Pemex Project Funding | ||||||
| Master Trust | 6.625% | 6/15/35–6/15/38 | 8,995 | 9,345 | 0.2% | |
| 2 | Petroleos Mexicanos | 2.290%–6.500% | 1/18/24–6/27/44 | 20,275 | 19,883 | 0.3% |
| United Mexican States | 6.050% | 1/11/40 | 14,295 | 15,546 | 0.3% | |
| United Mexican States | 4.750% | 3/8/44 | 14,215 | 12,805 | 0.2% | |
| United Mexican States | 5.750%–8.300% | 8/15/31–10/12/10 | 21,197 | 23,919 | 0.4% | |
| Sovereign Bonds | ||||||
| (U.S. Dollar-Denominated)—Other † | 295,918 | 5.2% | ||||
| Total Sovereign Bonds (Cost $467,670) | 439,291 | 7.7% | ||||
| Taxable Municipal Bonds | ||||||
| Illinois GO | 5.100% | 6/1/33 | 20,130 | 18,757 | 0.3% | |
| Taxable Municipal Bonds—Other † | 338,051 | 5.9% | ||||
| Total Taxable Municipal Bonds (Cost $338,838) | 356,808 | 6.2% | ||||
| Shares | ||||||
| Temporary Cash Investment | ||||||
| Money Market Fund | ||||||
| 4 | Vanguard Market Liquidity Fund | |||||
| (Cost $18,370) | 0.125% | 18,369,830 | 18,370 | 0.3% | ||
| Total Investments (Cost $5,716,550) | 5,675,862 | 99.0% | ||||
| Other Assets and Liabilities | ||||||
| Other Assets | 100,343 | 1.7% | ||||
| Liabilities | (41,022) | (0.7%) | ||||
| 59,321 | 1.0% | |||||
| Net Assets | 5,735,183 | 100.0% | ||||
59
Long-Term Bond Index Fund
| At December 31, 2013, net assets consisted of: | |
| Amount | |
| ($000) | |
| Paid-in Capital | 5,798,950 |
| Undistributed Net Investment Income | — |
| Accumulated Net Realized Losses | (23,079) |
| Unrealized Appreciation (Depreciation) | (40,688) |
| Net Assets | 5,735,183 |
| Investor Shares—Net Assets | |
| Applicable to 162,714,418 outstanding $.001 par value shares of | |
| beneficial interest (unlimited authorization) | 2,018,753 |
| Net Asset Value Per Share—Investor Shares | $12.41 |
| Institutional Shares—Net Assets | |
| Applicable to 143,791,101 outstanding $.001 par value shares of | |
| beneficial interest (unlimited authorization) | 1,783,928 |
| Net Asset Value Per Share—Institutional Shares | $12.41 |
| Institutional Plus Shares—Net Assets | |
| Applicable to 116,374,069 outstanding $.001 par value shares of | |
| beneficial interest (unlimited authorization) | 1,443,809 |
| Net Asset Value Per Share—Institutional Plus Shares | $12.41 |
| ETF Shares—Net Assets | |
| Applicable to 6,000,000 outstanding $.001 par value shares of | |
| beneficial interest (unlimited authorization) | 488,693 |
| Net Asset Value Per Share—ETF Shares | $81.45 |
See Note A in Notes to Financial Statements.
† Represents the aggregate value, by category, of securities that are not among the 50 largest holdings and, in total for any issuer, represent
1% or less of net assets.
1 The issuer was placed under federal conservatorship in September 2008; since that time, its daily operations have been managed by the
Federal Housing Finance Agency and it receives capital from the U.S. Treasury, as needed to maintain a positive net worth, in exchange for
senior preferred stock.
3 Certain of the fund’s securities are exempt from registration under Rule 144A of the Securities Act of 1933. Such securities may be sold in transactions exempt from registration, normally to qualified institutional buyers. At December 31, 2013, the aggregate value of these securities was $14,185,000, representing 0.2% of net assets.
4 Affiliated money market fund available only to Vanguard funds and certain trusts and accounts managed by Vanguard. Rate shown is the 7-day yield.
GO - General Obligation Bond.See accompanying Notes, which are an integral part of the Financial Statements.
60
Long-Term Bond Index Fund
| Statement of Operations | |
| Year Ended | |
| December 31, 2013 | |
| ($000) | |
| Investment Income | |
| Income | |
| Interest1 | 253,202 |
| Total Income | 253,202 |
| Expenses | |
| The Vanguard Group—Note B | |
| Investment Advisory Services | 193 |
| Management and Administrative—Investor Shares | 4,103 |
| Management and Administrative—Institutional Shares | 667 |
| Management and Administrative—Institutional Plus Shares | 242 |
| Management and Administrative—ETF Shares | 427 |
| Marketing and Distribution—Investor Shares | 590 |
| Marketing and Distribution—Institutional Shares | 406 |
| Marketing and Distribution—Institutional Plus Shares | 214 |
| Marketing and Distribution—ETF Shares | 198 |
| Custodian Fees | 45 |
| Auditing Fees | 39 |
| Shareholders’ Reports—Investor Shares | 3 |
| Shareholders’ Reports—Institutional Shares | 1 |
| Shareholders’ Reports—Institutional Plus Shares | — |
| Shareholders’ Reports—ETF Shares | 16 |
| Trustees’ Fees and Expenses | 7 |
| Total Expenses | 7,151 |
| Net Investment Income | 246,051 |
| Realized Net Gain (Loss) on Investment Securities Sold | 14,569 |
| Change in Unrealized Appreciation (Depreciation) of Investment Securities | (825,885) |
| Net Increase (Decrease) in Net Assets Resulting from Operations | (565,265) |
| 1 Interest income from an affiliated company of the fund was $33,000. | |
See accompanying Notes, which are an integral part of the Financial Statements.
61
Long-Term Bond Index Fund
| Statement of Changes in Net Assets | ||
| Year Ended December 31, | ||
| 2013 | 2012 | |
| ($000) | ($000) | |
| Increase (Decrease) in Net Assets | ||
| Operations | ||
| Net Investment Income | 246,051 | 223,101 |
| Realized Net Gain (Loss) | 14,569 | 164,814 |
| Change in Unrealized Appreciation (Depreciation) | (825,885) | 60,925 |
| Net Increase (Decrease) in Net Assets Resulting from Operations | (565,265) | 448,840 |
| Distributions | ||
| Net Investment Income | ||
| Investor Shares | (101,049) | (112,809) |
| Institutional Shares | (71,742) | (56,818) |
| Institutional Plus Shares | (44,188) | (24,405) |
| ETF Shares | (29,072) | (29,069) |
| Realized Capital Gain1 | ||
| Investor Shares | (4,474) | (45,929) |
| Institutional Shares | (2,680) | (23,876) |
| Institutional Plus Shares | (936) | (6,776) |
| ETF Shares | (1,238) | (12,833) |
| Total Distributions | (255,379) | (312,515) |
| Capital Share Transactions | ||
| Investor Shares | (538,463) | 111,752 |
| Institutional Shares | 443,518 | 371,209 |
| Institutional Plus Shares | 1,159,289 | (41,665) |
| ETF Shares | (217,791) | 279,376 |
| Net Increase (Decrease) from Capital Share Transactions | 846,553 | 720,672 |
| Total Increase (Decrease) | 25,909 | 856,997 |
| Net Assets | ||
| Beginning of Period | 5,709,274 | 4,852,277 |
| End of Period | 5,735,183 | 5,709,274 |
1 Includes fiscal 2013 and 2012 short-term gain distributions totaling $811,000 and $16,561,000, respectively. Short-term gain distributions are treated as ordinary income dividends for tax purposes.
See accompanying Notes, which are an integral part of the Financial Statements.
62
Long-Term Bond Index Fund
Financial Highlights
| Investor Shares | |||||
| For a Share Outstanding | Year Ended December 31, | ||||
| Throughout Each Period | 2013 | 2012 | 2011 | 2010 | 2009 |
| Net Asset Value, Beginning of Period | $14.27 | $13.91 | $12.04 | $11.56 | $11.98 |
| Investment Operations | |||||
| Net Investment Income | .557 | .570 | .587 | .595 | .608 |
| Net Realized and Unrealized Gain (Loss) | |||||
| on Investments | (1.837) | .591 | 1.991 | .583 | (.420) |
| Total from Investment Operations | (1.280) | 1.161 | 2.578 | 1.178 | .188 |
| Distributions | |||||
| Dividends from Net Investment Income | (.557) | (.570) | (.587) | (.595) | (.608) |
| Distributions from Realized Capital Gains | (.023) | (.231) | (.121) | (.103) | — |
| Total Distributions | (.580) | (.801) | (.708) | (.698) | (.608) |
| Net Asset Value, End of Period | $12.41 | $14.27 | $13.91 | $12.04 | $11.56 |
| Total Return1 | -9.13% | 8.49% | 22.06% | 10.27% | 1.76% |
| Ratios/Supplemental Data | |||||
| Net Assets, End of Period (Millions) | $2,019 | $2,904 | $2,727 | $2,250 | $2,049 |
| Ratio of Total Expenses to | |||||
| Average Net Assets | 0.20% | 0.20% | 0.22% | 0.22% | 0.22% |
| Ratio of Net Investment Income to | |||||
| Average Net Assets | 4.21% | 4.00% | 4.62% | 4.87% | 5.33% |
| Portfolio Turnover Rate2 | 50% | 41% | 45% | 54% | 69% |
1 Total returns do not include account service fees that may have applied in the periods shown. Fund prospectuses provide information about any applicable account service fees.
2 Excludes the value of portfolio securities received or delivered as a result of in-kind purchases or redemptions of the fund’s capital shares, including ETF Creation Units.
See accompanying Notes, which are an integral part of the Financial Statements.
63
Long-Term Bond Index Fund
Financial Highlights
| Institutional Shares | |||||
| For a Share Outstanding | Year Ended December 31, | ||||
| Throughout Each Period | 2013 | 2012 | 2011 | 2010 | 2009 |
| Net Asset Value, Beginning of Period | $14.27 | $13.91 | $12.04 | $11.56 | $11.98 |
| Investment Operations | |||||
| Net Investment Income | .574 | .589 | .606 | .613 | .625 |
| Net Realized and Unrealized Gain (Loss) | |||||
| on Investments | (1.837) | .591 | 1.991 | .583 | (.420) |
| Total from Investment Operations | (1.263) | 1.180 | 2.597 | 1.196 | .205 |
| Distributions | |||||
| Dividends from Net Investment Income | (.574) | (.589) | (.606) | (.613) | (.625) |
| Distributions from Realized Capital Gains | (.023) | (.231) | (.121) | (.103) | — |
| Total Distributions | (.597) | (.820) | (.727) | (.716) | (.625) |
| Net Asset Value, End of Period | $12.41 | $14.27 | $13.91 | $12.04 | $11.56 |
| Total Return | -9.01% | 8.63% | 22.24% | 10.44% | 1.91% |
| Ratios/Supplemental Data | |||||
| Net Assets, End of Period (Millions) | $1,784 | $1,576 | $1,174 | $1,229 | $509 |
| Ratio of Total Expenses to | |||||
| Average Net Assets | 0.07% | 0.07% | 0.07% | 0.07% | 0.07% |
| Ratio of Net Investment Income to | |||||
| Average Net Assets | 4.34% | 4.13% | 4.77% | 5.02% | 5.48% |
| Portfolio Turnover Rate1 | 50% | 41% | 45% | 54% | 69% |
1 Excludes the value of portfolio securities received or delivered as a result of in-kind purchases or redemptions of the fund’s capital shares, including ETF Creation Units.
See accompanying Notes, which are an integral part of the Financial Statements.
64
Long-Term Bond Index Fund
Financial Highlights
| Institutional Plus Shares | |||
| Oct. 6, | |||
| Year Ended | 20111 to | ||
| December 31, | Dec. 31, | ||
| For a Share Outstanding Throughout Each Period | 2013 | 2012 | 2011 |
| Net Asset Value, Beginning of Period | $14.27 | $13.91 | $13.69 |
| Investment Operations | |||
| Net Investment Income | .577 | .592 | .152 |
| Net Realized and Unrealized Gain (Loss) on Investments | (1.837) | .591 | .341 |
| Total from Investment Operations | (1.260) | 1.183 | .493 |
| Distributions | |||
| Dividends from Net Investment Income | (.577) | (.592) | (.152) |
| Distributions from Realized Capital Gains | (.023) | (.231) | (.121) |
| Total Distributions | (.600) | (.823) | (.273) |
| Net Asset Value, End of Period | $12.41 | $14.27 | $13.91 |
| Total Return | -8.99% | 8.65% | 3.64% |
| Ratios/Supplemental Data | |||
| Net Assets, End of Period (Millions) | $1,444 | $424 | $440 |
| Ratio of Total Expenses to Average Net Assets | 0.05% | 0.05% | 0.05%2 |
| Ratio of Net Investment Income to Average Net Assets | 4.36% | 4.15% | 4.79%2 |
| Portfolio Turnover Rate3 | 50% | 41% | 45% |
1 Inception.
2 Annualized.
3 Excludes the value of portfolio securities received or delivered as a result of in-kind purchases or redemptions of the fund’s capital shares, including ETF Creation Units.
See accompanying Notes, which are an integral part of the Financial Statements.
65
Long-Term Bond Index Fund
Financial Highlights
| ETF Shares | |||||
| For a Share Outstanding | Year Ended December 31, | ||||
| Throughout Each Period | 2013 | 2012 | 2011 | 2010 | 2009 |
| Net Asset Value, Beginning of Period | $93.73 | $91.40 | $79.07 | $75.91 | $78.66 |
| Investment Operations | |||||
| Net Investment Income | 3.813 | 3.790 | 3.904 | 3.954 | 4.005 |
| Net Realized and Unrealized Gain (Loss) | |||||
| on Investments | (12.129) | 3.851 | 13.127 | 3.836 | (2.750) |
| Total from Investment Operations | (8.316) | 7.641 | 17.031 | 7.790 | 1.255 |
| Distributions | |||||
| Dividends from Net Investment Income | (3.813) | (3.790) | (3.904) | (3.954) | (4.005) |
| Distributions from Realized Capital Gains | (.151) | (1.521) | (.797) | (.676) | — |
| Total Distributions | (3.964) | (5.311) | (4.701) | (4.630) | (4.005) |
| Net Asset Value, End of Period | $81.45 | $93.73 | $91.40 | $79.07 | $75.91 |
| Total Return | -9.03% | 8.49% | 22.18% | 10.36% | 1.79% |
| Ratios/Supplemental Data | |||||
| Net Assets, End of Period (Millions) | $489 | $806 | $512 | $324 | $311 |
| Ratio of Total Expenses to | |||||
| Average Net Assets | 0.10% | 0.10% | 0.11% | 0.11% | 0.12% |
| Ratio of Net Investment Income to | |||||
| Average Net Assets | 4.31% | 4.10% | 4.73% | 4.98% | 5.43% |
| Portfolio Turnover Rate1 | 50% | 41% | 45% | 54% | 69% |
1 Excludes the value of portfolio securities received or delivered as a result of in-kind purchases or redemptions of the fund’s capital shares, including ETF Creation Units.
See accompanying Notes, which are an integral part of the Financial Statements.
66
Long-Term Bond Index Fund
Notes to Financial Statements
Vanguard Long-Term Bond Index Fund is registered under the Investment Company Act of 1940 as an open-end investment company, or mutual fund. Certain of the fund’s investments are in corporate debt instruments; the issuers’ abilities to meet their obligations may be affected by economic developments in their respective industries. The fund offers four classes of shares: Investor Shares, Institutional Shares, Institutional Plus Shares, and ETF Shares. Investor Shares are available to any investor who meets the fund’s minimum purchase requirements. Institutional Shares and Institutional Plus Shares are designed for investors who meet certain administrative, service, and account-size criteria. ETF Shares are listed for trading on NYSE Arca; they can be purchased and sold through a broker.
A. The following significant accounting policies conform to generally accepted accounting principles for U.S. mutual funds. The fund consistently follows such policies in preparing its financial statements.
1. Security Valuation: Bonds, and temporary cash investments acquired over 60 days to maturity, are valued using the latest bid prices or using valuations based on a matrix system (which considers such factors as security prices, yields, maturities, and ratings), both as furnished by independent pricing services. Investments in Vanguard Market Liquidity Fund are valued at that fund’s net asset value. Other temporary cash investments are valued at amortized cost, which approximates market value. Securities for which market quotations are not readily available, or whose values have been affected by events occurring before the fund’s pricing time but after the close of the securities’ primary markets, are valued by methods deemed by the board of trustees to represent fair value.
2. Federal Income Taxes: The fund intends to continue to qualify as a regulated investment company and distribute all of its taxable income. Management has analyzed the fund’s tax positions taken for all open federal income tax years (December 31, 2010–2013), and has concluded that no provision for federal income tax is required in the fund’s financial statements.
3. Distributions: Distributions from net investment income are declared daily by all share classes except ETF Shares, and paid on the first business day of the following month. Monthly income dividends from ETF Shares, and annual distributions from realized capital gains, if any, are recorded on the ex-dividend date.
4. Other: Interest income includes income distributions received from Vanguard Market Liquidity Fund and is accrued daily. Premiums and discounts on debt securities purchased are amortized and accreted, respectively, to interest income over the lives of the respective securities. Security transactions are accounted for on the date securities are bought or sold. Costs used to determine realized gains (losses) on the sale of investment securities are those of the specific securities sold.
Each class of shares has equal rights as to assets and earnings, except that each class separately bears certain class-specific expenses related to maintenance of shareholder accounts (included in Management and Administrative expenses) and shareholder reporting. Marketing and distribution expenses are allocated to each class of shares based on a method approved by the board of trustees. Income, other non-class-specific expenses, and gains and losses on investments are allocated to each class of shares based on its relative net assets.
B. The Vanguard Group furnishes at cost investment advisory, corporate management, administrative, marketing, and distribution services. The costs of such services are allocated to the fund under methods approved by the board of trustees. The fund has committed to provide up to 0.40% of its net assets in capital contributions to Vanguard. At December 31, 2013, the fund had contributed capital of $631,000 to Vanguard (included in Other Assets), representing 0.01% of the fund’s net assets and 0.25% of Vanguard’s capitalization. The fund’s trustees and officers are also directors and officers of Vanguard.
67
Long-Term Bond Index Fund
C. Various inputs may be used to determine the value of the fund’s investments. These inputs are summarized in three broad levels for financial statement purposes. The inputs or methodologies used to value securities are not necessarily an indication of the risk associated with investing in those securities.
Level 1—Quoted prices in active markets for identical securities.
Level 2—Other significant observable inputs (including quoted prices for similar securities, interest rates, prepayment speeds, credit risk, etc.).
Level 3—Significant unobservable inputs (including the fund’s own assumptions used to determine the fair value of investments).
The following table summarizes the market value of the fund’s investments as of December 31, 2013, based on the inputs used to value them:
| Level 1 | Level 2 | Level 3 | |
| Investments | ($000) | ($000) | ($000) |
| U.S. Government and Agency Obligations | — | 2,026,219 | — |
| Corporate Bonds | — | 2,835,174 | — |
| Sovereign Bonds | — | 439,291 | — |
| Taxable Municipal Bonds | — | 356,808 | — |
| Temporary Cash Investments | 18,370 | — | — |
| Total | 18,370 | 5,657,492 | — |
D. Capital gain distributions are determined on a tax basis and may differ from realized capital gains for financial reporting purposes. Differences may be permanent or temporary. Permanent differences are reclassified among capital accounts in the financial statements to reflect their tax character. Temporary differences arise when gains or losses are recognized in different periods for financial statement and tax purposes. These differences will reverse at some time in the future.
For tax purposes, at December 31, 2013, the fund had available capital losses totaling $20,710,000 that may be carried forward indefinitely to offset future net capital gains.
During the year ended December 31, 2013, the fund realized $37,167,000 of net capital gains resulting from in-kind redemptions—in which shareholders exchanged fund shares for securities held by the fund rather than for cash. Because such gains are not taxable to the fund, and are not distributed to shareholders, they have been reclassified from accumulated net realized losses to paid-in capital.
At December 31, 2013, the cost of investment securities for tax purposes was $5,718,998,000. Net unrealized depreciation of investment securities for tax purposes was $43,136,000, consisting of unrealized gains of $218,115,000 on securities that had risen in value since their purchase and $261,251,000 in unrealized losses on securities that had fallen in value since their purchase.
E. During the year ended December 31, 2013, the fund purchased $1,403,914,000 of investment securities and sold $668,686,000 of investment securities, other than U.S. government securities and temporary cash investments. Purchases and sales of U.S. government securities were $2,582,854,000 and $2,486,740,000, respectively. Total purchases and sales include $140,401,000 and $332,117,000, respectively, in connection with in-kind purchases and redemptions of the fund’s capital shares.
68
Long-Term Bond Index Fund
F. Capital share transactions for each class of shares were:
| Year Ended December 31, | ||||
| 2013 | 2012 | |||
| Amount | Shares | Amount | Shares | |
| ($000) | (000) | ($000) | (000) | |
| Investor Shares | ||||
| Issued | 419,097 | 31,273 | 864,958 | 60,629 |
| Issued in Lieu of Cash Distributions | 91,692 | 6,934 | 138,563 | 9,703 |
| Redeemed | (1,049,252) | (79,063) | (891,769) | (62,746) |
| Net Increase (Decrease)—Investor Shares | (538,463) | (40,856) | 111,752 | 7,586 |
| Institutional Shares | ||||
| Issued | 803,345 | 61,587 | 538,584 | 38,068 |
| Issued in Lieu of Cash Distributions | 67,973 | 5,171 | 74,915 | 5,242 |
| Redeemed | (427,800) | (33,429) | (242,290) | (17,244) |
| Net Increase (Decrease) —Institutional Shares | 443,518 | 33,329 | 371,209 | 26,066 |
| Institutional Plus Shares | ||||
| Issued | 1,142,252 | 85,377 | 277,344 | 19,782 |
| Issued in Lieu of Cash Distributions | 45,125 | 3,475 | 30,299 | 2,113 |
| Redeemed | (28,088) | (2,169) | (349,308) | (23,803) |
| Net Increase (Decrease) —Institutional Plus Shares | 1,159,289 | 86,683 | (41,665) | (1,908) |
| ETF Shares | ||||
| Issued | 125,513 | 1,400 | 288,310 | 3,100 |
| Issued in Lieu of Cash Distributions | — | — | — | — |
| Redeemed | (343,304) | (4,000) | (8,934) | (100) |
| Net Increase (Decrease)—ETF Shares | (217,791) | (2,600) | 279,376 | 3,000 |
G. Management has determined that no material events or transactions occurred subsequent to December 31, 2013, that would require recognition or disclosure in these financial statements.
69
Report of Independent Registered Public Accounting Firm
To the Trustees of Vanguard Bond Index Funds and the Shareholders of Vanguard Short-Term Bond Index Fund, Vanguard Intermediate-Term Bond Index Fund and Vanguard Long-Term Bond Index Fund:
In our opinion, the accompanying statements of net assets—investments summary and the related statements of operations and of changes in net assets and the financial highlights present fairly, in all material respects, the financial position of Vanguard Short-Term Bond Index Fund, Vanguard Intermediate-Term Bond Index Fund and Vanguard Long-Term Bond Index Fund (constituting separate portfolios of Vanguard Bond Index Funds, hereafter referred to as the “Funds”) at December 31, 2013, the results of each of their operations for the year then ended, the changes in each of their net assets for each of the two years in the period then ended, and the financial highlights for each of the periods indicated, in conformity with accounting principles generally accepted in the United States of America. These financial statements and financial highlights (hereafter referred to as “financial statements”) are the responsibility of the Funds’ management; our responsibility is to express an opinion on these financial statements based on our audits. We conducted our audits of these financial statements in accordance with the standards of the Public Company Accounting Oversight Board (United States). Those standards require that we plan and perform the audit to obtain reasonable assurance about whether the financial statements are free of material misstatement. An audit includes examining, on a test basis, evidence supporting the amounts and disclosures in the financial statements, assessing the accounting principles used and significant estimates made by management, and evaluating the overall financial statement presentation. We believe that our audits, which included confirmation of securities at December 31, 2013 by correspondence with the custodian and broker and by agreement to the underlying ownership records of the transfer agent, provide a reasonable basis for our opinion.
/s/PricewaterhouseCoopers LLP
Philadelphia, Pennsylvania
February 14, 2014
70
Special 2013 tax information (unaudited) for Vanguard Short-Term Bond Index Fund
This information for the fiscal year ended December 31, 2013, is included pursuant to provisions of the Internal Revenue Code.
The fund distributed $109,101,000 as capital gain dividends (from net long-term capital gains) to shareholders during the fiscal year.
For nonresident alien shareholders, 100% of short-term capital gain dividends distributed by the fund are qualified short-term capital gains.
For nonresident alien shareholders, 82.2% of income dividends are interest-related dividends.
Special 2013 tax information (unaudited) for Vanguard Intermediate-Term Bond Index Fund
This information for the fiscal year ended December 31, 2013, is included pursuant to provisions of the Internal Revenue Code.
The fund distributed $204,879,000 as capital gain dividends (from net long-term capital gains) to shareholders during the fiscal year.
For nonresident alien shareholders, 100% of short-term capital gain dividends distributed by the fund are qualified short-term capital gains.
For nonresident alien shareholders, 84.0% of income dividends are interest-related dividends.
Special 2013 tax information (unaudited) for Vanguard Long-Term Bond Index Fund
This information for the fiscal year ended December 31, 2013, is included pursuant to provisions of the Internal Revenue Code.
The fund distributed $8,517,000 as capital gain dividends (from net long-term capital gains) to shareholders during the fiscal year.
For nonresident alien shareholders, 100% of short-term capital gain dividends distributed by the fund are qualified short-term capital gains.
For nonresident alien shareholders, 75.8% of income dividends are interest-related dividends.
71
About Your Fund’s Expenses
As a shareholder of the fund, you incur ongoing costs, which include costs for portfolio management, administrative services, and shareholder reports (like this one), among others. Operating expenses, which are deducted from a fund’s gross income, directly reduce the investment return of the fund.
A fund’s expenses are expressed as a percentage of its average net assets. This figure is known as the expense ratio. The following examples are intended to help you understand the ongoing costs (in dollars) of investing in your fund and to compare these costs with those of other mutual funds. The examples are based on an investment of $1,000 made at the beginning of the period shown and held for the entire period.
The accompanying table illustrates your fund’s costs in two ways:
• Based on actual fund return. This section helps you to estimate the actual expenses that you paid over the period. The ”Ending Account Value“ shown is derived from the fund‘s actual return, and the third column shows the dollar amount that would have been paid by an investor who started with $1,000 in the fund. You may use the information here, together with the amount you invested, to estimate the expenses that you paid over the period.
To do so, simply divide your account value by $1,000 (for example, an $8,600 account value divided by $1,000 = 8.6), then multiply the result by the number given for your fund under the heading ”Expenses Paid During Period.“
• Based on hypothetical 5% yearly return. This section is intended to help you compare your fund‘s costs with those of other mutual funds. It assumes that the fund had a yearly return of 5% before expenses, but that the expense ratio is unchanged. In this case—because the return used is not the fund’s actual return—the results do not apply to your investment. The example is useful in making comparisons because the Securities and Exchange Commission requires all mutual funds to calculate expenses based on a 5% return. You can assess your fund’s costs by comparing this hypothetical example with the hypothetical examples that appear in shareholder reports of other funds.
Note that the expenses shown in the table are meant to highlight and help you compare ongoing costs only and do not reflect transaction costs incurred by the fund for buying and selling securities. Further, the expenses do not include any purchase, redemption, or account service fees described in the fund prospectus. If such fees were applied to your account, your costs would be higher. Your fund does not carry a “sales load.”
The calculations assume no shares were bought or sold during the period. Your actual costs may have been higher or lower, depending on the amount of your investment and the timing of any purchases or redemptions.
You can find more information about the fund’s expenses, including annual expense ratios, in the Financial Statements section of this report. For additional information on operating expenses and other shareholder costs, please refer to your fund’s current prospectus.
72
| Six Months Ended December 31, 2013 | |||
| Beginning | Ending | Expenses | |
| Account Value | Account Value | Paid During | |
| 6/30/2013 | 12/31/2013 | Period | |
| Based on Actual Fund Return | |||
| Short-Term Bond Index Fund | |||
| Investor Shares | $1,000.00 | $1,006.53 | $1.01 |
| Admiral Shares | 1,000.00 | 1,007.03 | 0.51 |
| Signal Shares | 1,000.00 | 1,007.03 | 0.51 |
| Institutional Shares | 1,000.00 | 1,007.18 | 0.35 |
| Institutional Plus Shares | 1,000.00 | 1,007.29 | 0.25 |
| ETF Shares | 1,000.00 | 1,007.14 | 0.51 |
| Intermediate-Term Bond Index Fund | |||
| Investor Shares | $1,000.00 | $1,001.28 | $1.01 |
| Admiral Shares | 1,000.00 | 1,001.78 | 0.50 |
| Signal Shares | 1,000.00 | 1,001.78 | 0.50 |
| Institutional Shares | 1,000.00 | 1,001.93 | 0.35 |
| Institutional Plus Shares | 1,000.00 | 1,002.03 | 0.25 |
| ETF Shares | 1,000.00 | 1,001.43 | 0.50 |
| Long-Term Bond Index Fund | |||
| Investor Shares | $1,000.00 | $985.17 | $1.00 |
| Institutional Shares | 1,000.00 | 985.81 | 0.35 |
| Institutional Plus Shares | 1,000.00 | 985.91 | 0.25 |
| ETF Shares | 1,000.00 | 985.25 | 0.50 |
73
| Six Months Ended December 31, 2013 | |||
| Beginning | Ending | Expenses | |
| Account Value | Account Value | Paid During | |
| 6/30/2013 | 12/31/2013 | Period | |
| Based on Hypothetical 5% Yearly Return | |||
| Short-Term Bond Index Fund | |||
| Investor Shares | $1,000.00 | $1,024.20 | $1.02 |
| Admiral Shares | 1,000.00 | 1,024.70 | 0.51 |
| Signal Shares | 1,000.00 | 1,024.70 | 0.51 |
| Institutional Shares | 1,000.00 | 1,024.85 | 0.36 |
| Institutional Plus Shares | 1,000.00 | 1,024.95 | 0.26 |
| ETF Shares | 1,000.00 | 1,024.70 | 0.51 |
| Intermediate-Term Bond Index Fund | |||
| Investor Shares | $1,000.00 | $1,024.20 | $1.02 |
| Admiral Shares | 1,000.00 | 1,024.70 | 0.51 |
| Signal Shares | 1,000.00 | 1,024.70 | 0.51 |
| Institutional Shares | 1,000.00 | 1,024.85 | 0.36 |
| Institutional Plus Shares | 1,000.00 | 1,024.95 | 0.26 |
| ETF Shares | 1,000.00 | 1,024.70 | 0.51 |
| Long-Term Bond Index Fund | |||
| Investor Shares | $1,000.00 | $1,024.20 | $1.02 |
| Institutional Shares | 1,000.00 | 1,024.85 | 0.36 |
| Institutional Plus Shares | 1,000.00 | 1,024.95 | 0.26 |
| ETF Shares | 1,000.00 | 1,024.70 | 0.51 |
The calculations are based on expenses incurred in the most recent six-month period. The funds’ annualized six-month expense ratios for that period are: for the Short-Term Bond Index Fund, 0.20% for Investor Shares, 0.10% for Admiral Shares, 0.10% for Signal Shares, 0.07% for Institutional Shares, 0.05% for Institutional Plus Shares, and 0.10% for ETF Shares; for the Intermediate-Term Bond Index Fund, 0.20% for Investor Shares, 0.10% for Admiral Shares, 0.10% for Signal Shares, 0.07% for Institutional Shares, 0.05% for Institutional Plus Shares, and 0.10% for ETF Shares; and for the Long-Term Bond Index Fund, 0.20% for Investor Shares, 0.07% for Institutional Shares, 0.05% for Institutional Plus Shares, and 0.10% for ETF Shares. The dollar amounts shown as “Expenses Paid” are equal to the annualized expense ratio multiplied by the average account value over the period, multiplied by the number of days in the most recent six-month period, then divided by the number of days in the most recent 12-month period.
74
Glossary
30-Day SEC Yield. A fund’s 30-day SEC yield is derived using a formula specified by the U.S. Securities and Exchange Commission. Under the formula, data related to the fund’s security holdings in the previous 30 days are used to calculate the fund’s hypothetical net income for that period, which is then annualized and divided by the fund’s estimated average net assets over the calculation period. For the purposes of this calculation, a security’s income is based on its current market yield to maturity (for bonds), its actual income (for asset-backed securities), or its projected dividend yield (for stocks). Because the SEC yield represents hypothetical annualized income, it will differ—at times significantly—from the fund’s actual experience. As a result, the fund’s income distributions may be higher or lower than implied by the SEC yield.
Average Coupon. The average interest rate paid on the fixed income securities held by a fund. It is expressed as a percentage of face value.
Average Duration. An estimate of how much the value of the bonds held by a fund will fluctuate in response to a change in interest rates. To see how the value could change, multiply the average duration by the change in rates. If interest rates rise by 1 percentage point, the value of the bonds in a fund with an average duration of five years would decline by about 5%. If rates decrease by a percentage point, the value would rise by 5%.
Average Effective Maturity. The average length of time until fixed income securities held by a fund reach maturity and are repaid, taking into consideration the possibility that the issuer may call the bond before its maturity date. The figure reflects the proportion of fund assets represented by each security; it also reflects any futures contracts held. In general, the longer the average effective maturity, the more a fund’s share price will fluctuate in response to changes in market interest rates.
Beta. A measure of the magnitude of a fund’s past share-price fluctuations in relation to the ups and downs of a given market index. The index is assigned a beta of 1.00. Compared with a given index, a fund with a beta of 1.20 typically would have seen its share price rise or fall by 12% when the index rose or fell by 10%. For this report, beta is based on returns over the past 36 months for both the fund and the index. Note that a fund’s beta should be reviewed in conjunction with its R-squared (see definition). The lower the R-squared, the less correlation there is between the fund and the index, and the less reliable beta is as an indicator of volatility.
Credit Quality. Credit-quality ratings are measured on a scale that generally ranges from AAA (highest) to D (lowest). “Not Rated” is used to classify securities for which a rating is not available. U.S. Treasury, U.S. Agency, and U.S. Agency mortgage-backed securities appear under “U.S. Government.” Credit-quality ratings are obtained from Barclays using ratings generally derived from Moody’s, Fitch, and S&P. When ratings from all three agencies are used, the median rating is shown. When ratings from two of the agencies are used, the lower rating is shown.
Expense Ratio. A fund’s total annual operating expenses expressed as a percentage of the fund’s average net assets. The expense ratio includes management and administrative expenses, but does not include the transaction costs of buying and selling portfolio securities.
Inception Date. The date on which the assets of a fund (or one of its share classes) are first invested in accordance with the fund’s investment objective. For funds with a subscription period, the inception date is the day after that period ends. Investment performance is measured from the inception date.
75
R-Squared. A measure of how much of a fund’s past returns can be explained by the returns from the market in general, as measured by a given index. If a fund’s total returns were precisely synchronized with an index’s returns, its R-squared would be 1.00. If the fund’s returns bore no relationship to the index’s returns, its R-squared would be 0. For this report, R-squared is based on returns over the past 36 months for both the fund and the index.
Short-Term Reserves. The percentage of a fund invested in highly liquid, short-term securities that can be readily converted to cash.
Yield to Maturity. The rate of return an investor would receive if the fixed income securities held by a fund were held to their maturity dates.
Benchmark Information
Spliced Barclays U.S. 1–5 Year Government/Credit Float Adjusted Index: Barclays U.S. 1–5 Year Government/Credit Bond Index through December 31, 2009; Barclays U.S. 1–5 Year Government/Credit Float Adjusted Index thereafter.
Spliced Barclays U.S. 5–10 Year Government/Credit Float Adjusted Index: Barclays U.S. 5–10 Year Government/Credit Bond Index through December 31, 2009; Barclays U.S. 5–10 Year Government/Credit Float Adjusted Index thereafter.
Spliced Barclays U.S. Long Government/Credit Float Adjusted Index: Barclays U.S. Long Government/Credit Bond Index through December 31, 2009; Barclays U.S. Long Government/Credit Float Adjusted Index thereafter.
Spliced 1–5 Year Investment-Grade Debt Funds Average: Based on average returns for 1–5 Year U.S. Government Funds through December 31, 2001, and average returns for 1–5 Year Investment Grade Debt Funds thereafter. Derived from data provided by Lipper, a Thomson Reuters Company.
Spliced Barclays U.S. Aggregate Float Adjusted Index: Barclays U.S. Aggregate Bond Index through December 31, 2009; Barclays U.S. Aggregate Float Adjusted Index thereafter.
Spliced Corporate A-Rated Debt Funds Average: Based on average returns for General Government Funds through December 31, 2001, and average returns for Corporate A-Rated Debt Funds thereafter. Derived from data provided by Lipper, a Thomson Reuters Company.
Spliced Intermediate Investment-Grade Debt Funds Average: Based on average returns for Intermediate U.S. Government Funds through December 31, 2001; Intermediate Investment-Grade Debt Funds Average through August 31, 2013; Core Bond Funds Average thereafter.
76
This page intentionally left blank.
This page intentionally left blank.
This page intentionally left blank.
The People Who Govern Your Fund
The trustees of your mutual fund are there to see that the fund is operated and managed in your best interests since, as a shareholder, you are a part owner of the fund. Your fund’s trustees also serve on the board of directors of The Vanguard Group, Inc., which is owned by the Vanguard funds and provides services to them on an at-cost basis.
A majority of Vanguard’s board members are independent, meaning that they have no affiliation with Vanguard or the funds they oversee, apart from the sizable personal investments they have made as private individuals. The independent board members have distinguished backgrounds in business, academia, and public service. Each of the trustees and executive officers oversees 182 Vanguard funds.
The following table provides information for each trustee and executive officer of the fund. More information about the trustees is in the Statement of Additional Information, which can be obtained, without charge, by contacting Vanguard at 800-662-7447, or online at vanguard.com.
| InterestedTrustee1 | and Delphi Automotive LLP (automotive components); |
| Senior Advisor at New Mountain Capital; Trustee of | |
| F. William McNabb III | The Conference Board. |
| Born 1957. Trustee Since July 2009. Chairman of the | |
| Board. Principal Occupation(s) During the Past Five | Amy Gutmann |
| Years: Chairman of the Board of The Vanguard Group, | Born 1949. Trustee Since June 2006. Principal |
| Inc., and of each of the investment companies served | Occupation(s) During the Past Five Years: President |
| by The Vanguard Group, since January 2010; Director | of the University of Pennsylvania; Christopher H. |
| of The Vanguard Group since 2008; Chief Executive | Browne Distinguished Professor of Political Science |
| Officer and President of The Vanguard Group and of | in the School of Arts and Sciences with secondary |
| each of the investment companies served by The | appointments at the Annenberg School for |
| Vanguard Group since 2008; Director of Vanguard | Communication and the Graduate School of Education |
| Marketing Corporation; Managing Director of The | of the University of Pennsylvania; Member of the |
| Vanguard Group (1995–2008). | National Commission on the Humanities and Social |
| Sciences; Trustee of Carnegie Corporation of New | |
| York and of the National Constitution Center; Chair | |
| IndependentTrustees | of the U.S. Presidential Commission for the Study |
| Emerson U. Fullwood | of Bioethical Issues. |
| Born 1948. Trustee Since January 2008. Principal | |
| Occupation(s) During the Past Five Years: Executive | JoAnn Heffernan Heisen |
| Chief Staff and Marketing Officer for North America | Born 1950. Trustee Since July 1998. Principal |
| and Corporate Vice President (retired 2008) of Xerox | Occupation(s) During the Past Five Years: Corporate |
| Corporation (document management products and | Vice President and Chief Global Diversity Officer |
| services); Executive in Residence and 2010 | (retired 2008) and Member of the Executive |
| Distinguished Minett Professor at the Rochester | Committee (1997–2008) of Johnson & Johnson |
| Institute of Technology; Director of SPX Corporation | (pharmaceuticals/medical devices/consumer |
| (multi-industry manufacturing), the United Way of | products); Director of Skytop Lodge Corporation |
| Rochester, Amerigroup Corporation (managed health | (hotels), the University Medical Center at Princeton, |
| care), the University of Rochester Medical Center, | the Robert Wood Johnson Foundation, and the Center |
| Monroe Community College Foundation, and North | for Talent Innovation; Member of the Advisory Board |
| Carolina A&T University. | of the Maxwell School of Citizenship and Public Affairs |
| at Syracuse University. | |
| Rajiv L. Gupta | F. Joseph Loughrey |
| Born 1945. Trustee Since December 2001.2 | Born 1949. Trustee Since October 2009. Principal |
| Principal Occupation(s) During the Past Five Years: | Occupation(s) During the Past Five Years: President |
| Chairman and Chief Executive Officer (retired 2009) | and Chief Operating Officer (retired 2009) of Cummins |
| and President (2006–2008) of Rohm and Haas Co. | Inc. (industrial machinery); Chairman of the Board of |
| (chemicals); Director of Tyco International, Ltd. | Hillenbrand, Inc. (specialized consumer services) and |
| (diversified manufacturing and services), Hewlett- | of Oxfam America; Director of SKF AB (industrial |
| Packard Co. (electronic computer manufacturing), | |
| machinery), Hyster-Yale Materials Handling, Inc. | Executive Officers | |
| (forklift trucks), and the Lumina Foundation for | ||
| Education; Member of the Advisory Council for the | Glenn Booraem | |
| College of Arts and Letters and of the Advisory Board | Born 1967. Controller Since July 2010. Principal | |
| to the Kellogg Institute for International Studies, both | Occupation(s) During the Past Five Years: Principal | |
| at the University of Notre Dame. | of The Vanguard Group, Inc.; Controller of each of | |
| the investment companies served by The Vanguard | ||
| Mark Loughridge | Group; Assistant Controller of each of the investment | |
| Born 1953. Trustee Since March 2012. Principal | companies served by The Vanguard Group (2001–2010). | |
| Occupation(s) During the Past Five Years: Senior Vice | ||
| President and Chief Financial Officer at IBM (information | Thomas J. Higgins | |
| technology services); Fiduciary Member of IBM’s | Born 1957. Chief Financial Officer Since September | |
| Retirement Plan Committee. | 2008. Principal Occupation(s) During the Past Five | |
| Years: Principal of The Vanguard Group, Inc.; Chief | ||
| Scott C. Malpass | Financial Officer of each of the investment companies | |
| Born 1962. Trustee Since March 2012. Principal | served by The Vanguard Group; Treasurer of each of | |
| Occupation(s) During the Past Five Years: Chief | the investment companies served by The Vanguard | |
| Investment Officer and Vice President at the University | Group (1998–2008). | |
| of Notre Dame; Assistant Professor of Finance at the | ||
| Mendoza College of Business at Notre Dame; Member | Kathryn J. Hyatt | |
| of the Notre Dame 403(b) Investment Committee; | Born 1955. Treasurer Since November 2008. Principal | |
| Director of TIFF Advisory Services, Inc. (investment | Occupation(s) During the Past Five Years: Principal of | |
| advisor); Member of the Investment Advisory | The Vanguard Group, Inc.; Treasurer of each of the | |
| Committees of the Financial Industry Regulatory | investment companies served by The Vanguard | |
| Authority (FINRA) and of Major League Baseball. | Group; Assistant Treasurer of each of the investment | |
| companies served by The Vanguard Group (1988–2008). | ||
| André F. Perold | ||
| Born 1952. Trustee Since December 2004. Principal | Heidi Stam | |
| Occupation(s) During the Past Five Years: George | Born 1956. Secretary Since July 2005. Principal | |
| Gund Professor of Finance and Banking at the Harvard | Occupation(s) During the Past Five Years: Managing | |
| Business School (retired 2011); Chief Investment | Director of The Vanguard Group, Inc.; General Counsel | |
| Officer and Managing Partner of HighVista Strategies | of The Vanguard Group; Secretary of The Vanguard | |
| LLC (private investment firm); Director of Rand | Group and of each of the investment companies | |
| Merchant Bank; Overseer of the Museum of Fine | served by The Vanguard Group; Director and Senior | |
| Arts Boston. | Vice President of Vanguard Marketing Corporation. | |
| Alfred M. Rankin, Jr. | Vanguard Senior ManagementTeam | |
| Born 1941. Trustee Since January 1993. Principal | ||
| Occupation(s) During the Past Five Years: Chairman, | Mortimer J. Buckley | Chris D. McIsaac |
| President, and Chief Executive Officer of NACCO | Kathleen C. Gubanich | Michael S. Miller |
| Industries, Inc. (housewares/lignite) and of Hyster-Yale | Paul A. Heller | James M. Norris |
| Materials Handling, Inc. (forklift trucks); Director of | Martha G. King | Glenn W. Reed |
| the National Association of Manufacturers; Chairman | John T. Marcante | |
| of the Board of University Hospitals of Cleveland; | ||
| Advisory Chairman of the Board of The Cleveland | ||
| Museum of Art. | Chairman Emeritus and Senior Advisor | |
| John J. Brennan | ||
| Peter F. Volanakis | Chairman, 1996–2009 | |
| Born 1955. Trustee Since July 2009. Principal | Chief Executive Officer and President, 1996–2008 | |
| Occupation(s) During the Past Five Years: President | ||
| and Chief Operating Officer (retired 2010) of Corning | ||
| Incorporated (communications equipment); Director | Founder | |
| of SPX Corporation (multi-industry manufacturing); | ||
| Overseer of the Amos Tuck School of Business | John C. Bogle | |
| Administration at Dartmouth College; Advisor to the | Chairman and Chief Executive Officer, 1974–1996 | |
| Norris Cotton Cancer Center. | ||
1 Mr. McNabb is considered an “interested person,” as defined in the Investment Company Act of 1940, because he is an officer of the Vanguard funds.
2 December 2002 for Vanguard Equity Income Fund, Vanguard Growth Equity Fund, the Vanguard Municipal Bond Funds, and the Vanguard State Tax-Exempt Funds.
 | |
| P.O. Box 2600 | |
| Valley Forge, PA 19482-2600 |
Connect with Vanguard® > vanguard.com
| The Vanguard ETFs are not sponsored, endorsed, sold, | |
| Fund Information > 800-662-7447 | or promoted by Barclays. Barclays does not make any |
| Direct Investor Account Services > 800-662-2739 | representation regarding the advisability of investing in |
| Institutional Investor Services > 800-523-1036 | Vanguard ETFs or the advisability of investing in |
| Text Telephone for People | securities generally. Barclays’ only relationship with |
| With Hearing Impairment > 800-749-7273 | Vanguard is the licensing of the Index, which is |
| determined, composed, and calculated by Barclays | |
| This material may be used in conjunction | without regard to Vanguard or the Vanguard ETFs. |
| with the offering of shares of any Vanguard | Barclays has no obligation to take the needs of |
| fund only if preceded or accompanied by | Vanguard or the owners of the Vanguard ETFs into |
| the fund’s current prospectus. | consideration in determining, composing, or calculating |
| the Index. Barclays has no obligation or liability in | |
| All comparative mutual fund data are from Lipper, a | connection with administration, marketing, or trading |
| Thomson Reuters Company, or Morningstar, Inc., unless | of the Vanguard ETFs. Source of index data: Barclays |
| otherwise noted. | Global Family of Indices. Copyright 2014, Barclays. All |
| rights reserved. | |
| You can obtain a free copy of Vanguard’s proxy voting | |
| guidelines by visiting vanguard.com/proxyreporting or by | |
| calling Vanguard at 800-662-2739. The guidelines are | |
| also available from the SEC’s website, sec.gov. In | |
| addition, you may obtain a free report on how your fund | |
| voted the proxies for securities it owned during the 12 | |
| months ended June 30. To get the report, visit either | |
| vanguard.com/proxyreporting or sec.gov. | |
| You can review and copy information about your fund at | |
| the SEC’s Public Reference Room in Washington, D.C. To | |
| find out more about this public service, call the SEC at | |
| 202-551-8090. Information about your fund is also | |
| available on the SEC’s website, and you can receive | |
| copies of this information, for a fee, by sending a | |
| request in either of two ways: via e-mail addressed to | |
| publicinfo@sec.gov or via regular mail addressed to the | |
| Public Reference Section, Securities and Exchange | |
| Commission, Washington, DC 20549-1520. | |
| © 2014 The Vanguard Group, Inc. | |
| All rights reserved. | |
| Vanguard Marketing Corporation, Distributor. | |
| Q3140 022014 | |
|
| Annual Report | December 31, 2013 |
| Vanguard Total Bond Market Index Fund |
 |
Vanguard’s Principles for Investing Success
We want to give you the best chance of investment success. These principles,
grounded in Vanguard’s research and experience, can put you on the right path.
Goals. Create clear, appropriate investment goals.
Balance. Develop a suitable asset allocation using broadly diversified funds.
Cost. Minimize cost.
Discipline. Maintain perspective and long-term discipline.
A single theme unites these principles: Focus on the things you can control.
We believe there is no wiser course for any investor.
| Contents | |
| Your Fund’s Total Returns. | 1 |
| Chairman’s Letter. | 2 |
| Fund Profile. | 9 |
| Performance Summary. | 11 |
| Financial Statements. | 14 |
| About Your Fund’s Expenses. | 31 |
| Glossary. | 33 |
Please note: The opinions expressed in this report are just that—informed opinions. They should not be considered promises or advice. Also, please keep in mind that the information and opinions cover the period through the date on the front of this report. Of course, the risks of investing in your fund are spelled out in the prospectus.
See the Glossary for definitions of investment terms used in this report.
About the cover: The ship’s wheel represents leadership and guidance, essential qualities in navigating difficult seas. This one is a replica based on an 18th-century British vessel. The HMSVanguard, another ship of that era, served as the flagship for British Admiral Horatio Nelson when he defeated a French fleet at the Battle of the Nile.
Your Fund’s Total Returns
| Fiscal Year Ended December 31, 2013 | ||||
| 30-Day SEC | Income | Capital | Total | |
| Yield | Returns | Returns | Returns | |
| Vanguard Total Bond Market Index Fund | ||||
| Investor Shares | 2.11% | 2.29% | -4.55% | -2.26% |
| Admiral™ Shares | 2.23 | 2.40 | -4.55 | -2.15 |
| Signal® Shares | 2.23 | 2.40 | -4.55 | -2.15 |
| Institutional Shares | 2.24 | 2.41 | -4.55 | -2.14 |
| Institutional Plus Shares | 2.26 | 2.43 | -4.55 | -2.12 |
| ETF Shares | 2.23 | |||
| Market Price | -2.11 | |||
| Net Asset Value | -2.14 | |||
| Barclays U.S. Aggregate Float Adjusted Index | -1.97 | |||
| Spliced Intermediate Investment-Grade Debt | ||||
| Funds Average | -1.78 | |||
| For a benchmark description, see the Glossary. | ||||
| Spliced Intermediate Investment-Grade Debt Funds Average: Derived from data provided by Lipper, a Thomson Reuters Company. | ||||
Admiral Shares carry lower expenses and are available to investors who meet certain account-balance requirements. Signal Shares, Institutional Shares, and Institutional Plus Shares are available to certain institutional investors who meet specific administrative, service, and account-size criteria. The Vanguard ETF® Shares shown are traded on the NYSE Arca exchange and are available only through brokers. The table provides ETF returns based on both the NYSE Arca market price and the net asset value for a share. U.S. Pat. Nos. 6,879,964; 7,337,138; 7,720,749; 7,925,573; 8,090,646; and 8,417,623.
For the ETF Shares, the market price is determined by the midpoint of the bid-offer spread as of the closing time of the New York Stock Exchange (generally 4 p.m., Eastern time). The net asset value is also determined as of the NYSE closing time. For more information about how the ETF Shares' market prices have compared with their net asset value, visit vanguard.com, select your ETF, and then select the Price and Performance tab. The ETF premium/discount analysis there shows the percentages of days on which the ETF Shares' market price was above or below the NAV.
1

Chairman’s Letter
Dear Shareholder,
While domestic stocks enjoyed a banner year in 2013 as investors became more confident about the health of the economy, the broad U.S. taxable bond market posted its first calendar-year loss in more than a decade. Concern about when the Federal Reserve might begin to reduce its massive bond-buying program contributed to a steep rise in bond yields, especially for higher-rated and longer-dated securities.
Because bond yields and prices move in opposite directions, U.S. investment-grade bonds (as defined by independent rating agencies) as a whole experienced price declines over the year. With only about half of those losses being offset by income earned, Investor Shares of the Total Bond Market Index Fund returned –2.26% for the 12 months ended December 31, 2013. That performance came close to matching the –1.97% return of the fund’s expense-free benchmark but lagged the average return of –1.78% for its peer group, which includes actively managed funds.
Falling bond prices pushed the 30-day SEC yield for the fund’s Investor Shares up to 2.11% on December 31, 2013, compared with 1.49% a year earlier.
2
Please note that in December, we announced plans to streamline Vanguard’s share-class offerings by phasing out Signal Shares. Your fund’s Signal Shares will be converted to Admiral Shares by October 2014.
Before moving on to discuss the markets, I want to mention an important transition at Vanguard. We announced in November that Robert F. Auwaerter, principal and head of Vanguard Fixed Income Group, intends to retire in March 2014. At the conclusion of this letter, I’ll have more to say about Bob’s important contributions to Vanguard in his 32-year career, and I’ll introduce his successor, Gregory Davis.
Bond returns faltered as the Fed’s phaseout loomed
The broad U.S. taxable bond market returned –2.02% in 2013, its first negative calendar-year return since 1999, when it returned –0.82%, as investors sold bonds in anticipation of further price declines. Municipal bonds returned –2.55% in aggregate.
International bond markets (as measured by the Barclays Global Aggregate Index ex USD) returned –3.08%. As for money market funds and savings accounts, returns remained tiny as the Fed held short-term interest rates between 0% and 0.25%.
| Market Barometer | |||
| Average Annual Total Returns | |||
| Periods Ended December 31, 2013 | |||
| One | Three | Five | |
| Year | Years | Years | |
| Bonds | |||
| Barclays U.S. Aggregate Bond Index (Broad taxable | |||
| market) | -2.02% | 3.26% | 4.44% |
| Barclays Municipal Bond Index (Broad tax-exempt market) | -2.55 | 4.83 | 5.89 |
| Citigroup Three-Month U.S. Treasury Bill Index | 0.05 | 0.06 | 0.09 |
| Stocks | |||
| Russell 1000 Index (Large-caps) | 33.11% | 16.30% | 18.59% |
| Russell 2000 Index (Small-caps) | 38.82 | 15.67 | 20.08 |
| Russell 3000 Index (Broad U.S. market) | 33.55 | 16.24 | 18.71 |
| MSCI All Country World Index ex USA (International) | 15.29 | 5.14 | 12.81 |
| CPI | |||
| Consumer Price Index | 1.50% | 2.07% | 2.08% |
3
Earnings, optimism, and stimulus made it a big year for U.S. stocks
For the 12 months ended December 31, U.S. stocks surged about 34%, their best calendar-year finish since 1995. Corporations posted solid earnings, and investors placed a higher premium on those earnings; the Federal Reserve’s easy monetary policy also supported stock markets.
International stocks, in aggregate, returned about 15%, with the developed markets of Europe and the Pacific region posting double-digit results and emerging-market stocks dipping into negative territory.
For 2014, Vanguard Chief Economist Joe Davis and his team are guarded in their outlook for global stock returns, and their forecast for the bond market remains muted. While Joe readily acknowledges that such forecasts are accompanied by uncertainty, he writes, “We believe . . . a balanced, diversified, low-cost portfolio can remain a high-value proposition in the decade ahead.” (You can read more about our expectations for bond and stock returns in Vanguard’s Economic and Investment Outlook, available at vanguard.com/ research.)
All eyes on the Federal Reserve
Throughout 2013, the Federal Reserve bought about $40 billion per month of mortgage bonds to support the housing market and about $45 billion per month of Treasuries to hold borrowing costs down for households and businesses. Given the magnitude of this support, it was not surprising that the bond market
| Expense Ratios | |||||||
| Your Fund Compared With Its Peer Group | |||||||
| Peer | |||||||
| Investor | Admiral | Signal | Institutional | Institutional | ETF | Group | |
| Shares | Shares | Shares | Shares | Plus Shares | Shares | Average | |
| Total Bond Market Index Fund | 0.20% | 0.10% | 0.10% | 0.07% | 0.05% | 0.10% | 0.84% |
The fund expense ratios shown are from the prospectus dated April 29, 2013, and represent estimated costs for the current fiscal year. For the fiscal year ended December 31, 2013, the fund’s expense ratios were 0.20% for Investor Shares, 0.08% for Admiral Shares, 0.08% for Signal Shares, 0.07% for Institutional Shares, 0.05% for Institutional Plus Shares, and 0.08% for ETF Shares. The peer-group expense ratio is derived from data provided by Lipper, a Thomson Reuters Company, and captures information through year-end 2012.
Peer group: Core Bond Funds Average.
4
swooned in the spring when Fed officials signaled that further improvements in the housing and labor markets might warrant a “tapering” of its purchases. The suspense over when the Fed might act ended in December with its announcement that gradual decreases would begin in January 2014.
The prospect of more solid footing for the economy and less accommodation from the Fed affected Treasuries the most. The yield of the 3-year Treasury note climbed 40 basis points over the year to 0.76%, while the 10-year yield jumped 121 basis points to 2.97%. (A basis point is one-hundredth of a percentage point.) The resulting decline in prices put the return for these securities, which made up roughly 40% of the fund’s assets, at –2.75% for the 12-month period. Long-term Treasuries, which are more sensitive to interest rate movements, lost more than four times that amount.
The higher yields generally available from bonds outside of Treasuries meant those securities produced more income to counter price declines. Government mortgage-backed securities, another heavyweight sector for the fund, had yields higher than comparable Treasuries primarily because they carry the additional risk of prepayment. They returned –1.41% for the year.
Corporate bonds, representing about one quarter of the fund at the end of the year, returned –1.53%, but here, too, riskier, higher-yielding investment-grade
| Total Returns | |
| Ten Years Ended December 31, 2013 | |
| Average | |
| Annual Return | |
| Total Bond Market Index Fund Investor Shares | 4.42% |
| Spliced Barclays U.S. Aggregate Float Adjusted Index | 4.57 |
| Spliced Intermediate Investment-Grade Debt Funds Average | 3.98 |
| For a benchmark description, see the Glossary. | |
| Spliced Intermediate Investment-Grade Debt Funds Average: Derived from data provided by Lipper, a Thomson Reuters Company. | |
The figures shown represent past performance, which is not a guarantee of future results. (Current performance may be lower or higher than the performance data cited. For performance data current to the most recent month-end, visit our website at vanguard.com/performance.) Note, too, that both investment returns and principal value can fluctuate widely, so an investor’s shares, when sold, could be worth more or less than their original cost.
5
bonds weathered the rise in interest rates better than their higher-rated counterparts. Corporate bonds rated Baa by Moody’s Investors Service returned –0.93%, while those rated Aaa returned –4.69%.
Financials produced a positive return as investor sentiment toward the sector continued to improve, while industrials and utilities turned in negative results. Shorter-term corporate bonds held up better than their longer-term counterparts.
A better perspective on performance through a longer-term lens
Thankfully for bond investors, returns have not always been so low. Even including this year’s poor result, Investor Shares of the fund had an average annual return of 4.42% for the ten years ended December 31, 2013, and they have had less extreme swings in performance from one calendar year to the next than the broad U.S. stock market over the same period. Although some of that performance came from price appreciation, the bulk of it came from income generated when bond yields were higher than they are now.
A low expense ratio helped the fund fulfill its investment strategy of closely tracking its benchmark (4.57%) during the ten-year period. The portfolio also outpaced the average return of its peers (3.98%), a group that includes index funds as well as actively managed funds.
Bob Auwaerter’s retirement marks the end of a remarkable era
In mid-September 2008, about two weeks after I succeeded Jack Brennan as Vanguard’s chief executive officer, Lehman Brothers went bankrupt, igniting the nation’s worst financial crisis in 70 years. It was, to put it mildly, an extremely challenging time. Through it all, I was able to depend on Bob Auwaerter’s strong command of the Fixed Income Group, which persevered under these treacherous conditions. Although that was a difficult period for Vanguard and the industry, it was far from the only time I was grateful to have Bob at the helm of our bond group.
Bob, who joined Vanguard in 1981, was an original member of the three-person Fixed Income Group, headed by Ian MacKinnon. Over the years, Bob held various leadership roles in the department, and he eventually succeeded Ian as its head in 2003. He earned a reputation at Vanguard and within the industry as an extremely dedicated, honest, and insightful decision-maker and leader.
The Fixed Income Group that Bob helped start had total assets of about $1.3 billion in seven funds. He tracked his positions in the two funds he managed on index cards stored in a small metal box. Thirty-two years later, the 120-person group oversees $750 billion, which represents nearly one-third of Vanguard’s assets under management.
6
On behalf of our clients, I thank Bob for more than three decades of exemplary service and wish him the best in his retirement.
We’re fortunate that Greg Davis will become the head of the Fixed Income Group. Greg currently serves as chief investment officer for the Asia Pacific region and as a director of Vanguard Investments Australia. He joined Vanguard in 1999 and had been head of bond indexing and a senior portfolio manager in the Fixed Income Group. Greg is an eminently qualified successor and has a strong commitment to the Vanguard way of investing. I couldn’t be more confident in his ability to lead the Fixed Income Group and its deep and talented team.
As always, thank you for investing with Vanguard.
Sincerely,

F. William McNabb III
Chairman and Chief Executive Officer
January 16, 2014
7
| Your Fund’s Performance at a Glance | ||||
| December 31, 2012, Through December 31, 2013 | ||||
| Distributions Per Share | ||||
| Starting | Ending | Income | Capital | |
| Share Price | Share Price | Dividends | Gains | |
| Vanguard Total Bond Market Index Fund | ||||
| Investor Shares | $11.09 | $10.56 | $0.256 | $0.026 |
| Admiral Shares | 11.09 | 10.56 | 0.269 | 0.026 |
| Signal Shares | 11.09 | 10.56 | 0.269 | 0.026 |
| Institutional Shares | 11.09 | 10.56 | 0.270 | 0.026 |
| Institutional Plus Shares | 11.09 | 10.56 | 0.272 | 0.026 |
| ETF Shares | 83.92 | 79.91 | 2.031 | 0.198 |
8
Total Bond Market Index Fund
Fund Profile
As of December 31, 2013
| Share-Class Characteristics | ||||||
| Investor | Admiral | Signal | Institutional | Institutional | ||
| Shares | Shares | Shares | Shares | Plus Shares | ETF Shares | |
| Ticker Symbol | VBMFX | VBTLX | VBTSX | VBTIX | VBMPX | BND |
| Expense Ratio1 | 0.20% | 0.10% | 0.10% | 0.07% | 0.05% | 0.10% |
| 30-Day SEC Yield | 2.11% | 2.23% | 2.23% | 2.24% | 2.26% | 2.23% |
| Financial Attributes | ||
| Barclays | ||
| Aggregate | ||
| Float Adj | ||
| Fund | Index | |
| Number of Bonds | 5,249 | 8,701 |
| Yield to Maturity | ||
| (before expenses) | 2.4% | 2.4% |
| Average Coupon | 3.5% | 3.3% |
| Average Duration | 5.5 years | 5.5 years |
| Average Effective | ||
| Maturity | 7.5 years | 7.5 years |
| Short-Term | ||
| Reserves | 2.5% | — |
| Sector Diversification (% of portfolio) | |
| Asset-Backed | 0.4% |
| Commercial Mortgage-Backed | 2.1 |
| Finance | 8.3 |
| Foreign | 6.5 |
| Government Mortgage-Backed | 21.3 |
| Industrial | 14.0 |
| Treasury/Agency | 44.1 |
| Utilities | 2.8 |
| Other | 0.5 |
The agency and mortgage-backed securities sectors may include issues from government-sponsored enterprises; such issues are generally not backed by the full faith and credit of the U.S. government.
| Volatility Measures | |
| Barclays | |
| Aggregate | |
| Float Adj | |
| Index | |
| R-Squared | 0.99 |
| Beta | 1.01 |
These measures show the degree and timing of the fund’s fluctuations compared with the index over 36 months.
| Distribution by Credit Quality (% of portfolio) | |
| U.S. Government | 65.4% |
| Aaa | 5.0 |
| Aa | 4.2 |
| A | 12.5 |
| Baa | 12.9 |
For information about these ratings, see the Glossary entry for Credit Quality.
| Distribution by Effective Maturity | |
| (% of portfolio) | |
| Under 1 Year | 1.7% |
| 1 - 3 Years | 26.5 |
| 3 - 5 Years | 20.0 |
| 5 - 10 Years | 35.0 |
| 10 - 20 Years | 6.8 |
| 20 - 30 Years | 9.6 |
| Over 30 Years | 0.4 |
1 The expense ratios shown are from the prospectus dated April 29, 2013, and represent estimated costs for the current fiscal year. For the fiscal year ended December 31, 2013, the expense ratios were 0.20% for Investor Shares, 0.08% for Admiral Shares, 0.08% for Signal Shares, 0.07% for Institutional Shares, 0.05% for Institutional Plus Shares, and 0.08% for ETF Shares.
9
Total Bond Market Index Fund
Investment Focus
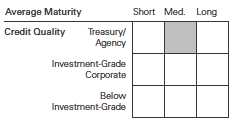
10
Total Bond Market Index Fund
Performance Summary
All of the returns in this report represent past performance, which is not a guarantee of future results that may be achieved by the fund. (Current performance may be lower or higher than the performance data cited. For performance data current to the most recent month-end, visit our website at vanguard.com/performance.) Note, too, that both investment returns and principal value can fluctuate widely, so an investor’s shares, when sold, could be worth more or less than their original cost. The returns shown do not reflect taxes that a shareholder would pay on fund distributions or on the sale of fund shares.
Cumulative Performance: December 31, 2003, Through December 31, 2013
Initial Investment of $10,000

| Average Annual Total Returns | ||||
| Periods Ended December 31, 2013 | ||||
| Final Value | ||||
| One | Five | Ten | of a $10,000 | |
| Year | Years | Years | Investment | |
| Total Bond Market Index Fund Investor | ||||
| Shares | -2.26% | 4.28% | 4.42% | $15,415 |
| Spliced Barclays U.S. Aggregate Float | ||||
| Adjusted Index | -1.97 | 4.50 | 4.57 | 15,640 |
| Spliced Intermediate Investment-Grade | ||||
| Debt Funds Average | -1.78 | 6.16 | 3.98 | 14,771 |
For a benchmark description, see the Glossary.
Spliced Intermediate Investment-Grade Debt Funds Average: Derived from data provided by Lipper, a Thomson Reuters Company.
| Final Value | ||||
| One | Five | Ten | of a $10,000 | |
| Year | Years | Years | Investment | |
| Total Bond Market Index Fund Admiral | ||||
| Shares | -2.15% | 4.39% | 4.53% | $15,570 |
| Spliced Barclays U.S. Aggregate Float | ||||
| Adjusted Index | -1.97 | 4.50 | 4.57 | 15,640 |
See Financial Highlights for dividend and capital gains information.
11
Total Bond Market Index Fund
| Average Annual Total Returns | ||||
| Periods Ended December 31, 2013 | ||||
| Since | Final Value | |||
| One | Five | Inception | of a $10,000 | |
| Year | Years | (9/1/2006) | Investment | |
| Total Bond Market Index Fund Signal Shares | -2.15% | 4.39% | 4.95% | $14,255 |
| Spliced Barclays U.S. Aggregate Float | ||||
| Adjusted Index | -1.97 | 4.50 | 5.01 | 14,315 |
| "Since Inception" performance is calculated from the Signal Shares’ inception date for both the fund and its comparative standard. | ||||
| Final Value | ||||
| One | Five | Ten | of a $5,000,000 | |
| Year | Years | Years | Investment | |
| Total Bond Market Index Fund Institutional | ||||
| Shares | -2.14% | 4.43% | 4.56% | $7,810,879 |
| Spliced Barclays U.S. Aggregate Float | ||||
| Adjusted Index | -1.97 | 4.50 | 4.57 | 7,819,919 |
| Final Value | ||||
| One | Five | Ten | of a $100,000,000 | |
| Year | Years | Years | Investment | |
| Total Bond Market Index Fund Institutional | ||||
| Plus Shares | -2.12% | 4.44% | 4.57% | $156,338,911 |
| Spliced Barclays U.S. Aggregate Float Adjusted | ||||
| Index | -1.97 | 4.50 | 4.57 | 156,398,373 |
The creation of the Institutional Plus Shares occurred on February 5, 2010, when Vanguard Total Bond Market Index Fund acquired the net assets of Vanguard Institutional Total Bond Market Index Fund. For the periods ended December 31, 2013, the returns and other data shown in the table above reflect a blend of historical performance of the fund’s Institutional Shares prior to February 5, 2010, and of the Institutional Plus Shares from then on.
| Since | Final Value | |||
| One | Five | Inception | of a $10,000 | |
| Year | Years | (4/3/2007) | Investment | |
| Total Bond Market Index FundETF Shares | ||||
| Net Asset Value | -2.14% | 4.37% | 4.82% | $13,736 |
| Spliced Barclays U.S. Aggregate Float | ||||
| Adjusted Index | -1.97 | 4.50 | 4.91 | 13,821 |
| "Since Inception" performance is calculated from the ETF Shares’ inception date for both the fund and its comparative standard. | ||||
12
Total Bond Market Index Fund
| Cumulative Returns of ETF Shares: April 3, 2007, Through December 31, 2013 | |||
| Since | |||
| One | Five | Inception | |
| Year | Years | (4/3/2007) | |
| Total Bond Market Index Fund ETF Shares Market | |||
| Price | -2.11% | 20.69% | 37.50% |
| Total Bond Market Index Fund ETF Shares Net | |||
| Asset Value | -2.14 | 23.84 | 37.36 |
| Spliced Barclays U.S. Aggregate Float Adjusted | |||
| Index | -1.97 | 24.60 | 38.21 |
| "Since Inception" performance is calculated from the ETF Shares’ inception date for both the fund and its comparative standard. | |||
| Fiscal-Year Total Returns (%): December 31, 2003, Through December 31, 2013 | ||||
| Spliced | ||||
| Barclays | ||||
| Aggregate | ||||
| Investor Shares | FA Index | |||
| Fiscal Year | Income Returns | Capital Returns | Total Returns | Total Returns |
| 2004 | 4.43% | -0.19% | 4.24% | 4.34% |
| 2005 | 4.43 | -2.03 | 2.40 | 2.43 |
| 2006 | 4.97 | -0.70 | 4.27 | 4.33 |
| 2007 | 5.22 | 1.70 | 6.92 | 6.97 |
| 2008 | 4.85 | 0.20 | 5.05 | 5.24 |
| 2009 | 4.26 | 1.67 | 5.93 | 5.93 |
| 2010 | 3.55 | 2.87 | 6.42 | 6.58 |
| 2011 | 3.30 | 4.26 | 7.56 | 7.92 |
| 2012 | 2.63 | 1.42 | 4.05 | 4.32 |
| 2013 | 2.29 | -4.55 | -2.26 | -1.97 |
| For a benchmark description, see the Glossary. | ||||
13
Total Bond Market Index Fund
Financial Statements
Statement of Net Assets—Investments Summary
As of December 31, 2013
This Statement summarizes the fund’s holdings by asset type. Details are reported for each of the fund’s 50 largest individual holdings and for investments that, in total for any issuer, represent more than 1% of the fund’s net assets. The total value of smaller holdings is reported as a single amount within each category.
The fund reports a complete list of its holdings in regulatory filings four times in each fiscal year, at the quarter-ends. For the second and fourth fiscal quarters, the complete listing of the fund’s holdings is available electronically on vanguard.com and on the Securities and Exchange Commission’s website (sec.gov), or you can have it mailed to you without charge by calling 800-662-7447. For the first and third fiscal quarters, the fund files the lists with the SEC on Form N-Q. Shareholders can look up the fund’s Forms N-Q on the SEC’s website. Forms N-Q may also be reviewed and copied at the SEC’s Public Reference Room (see the back cover of this report for further information).
| Face | Market | Percentage | |||
| Maturity | Amount | Value | of Net | ||
| Coupon | Date | ($000) | ($000) | Assets | |
| U.S. Government and Agency Obligations | |||||
| U.S. Government Securities | |||||
| United States Treasury Note/Bond | 0.375% | 11/15/15 | 774,369 | 774,849 | 0.7% |
| United States Treasury Note/Bond | 1.750% | 5/15/23 | 755,748 | 679,818 | 0.6% |
| United States Treasury Note/Bond | 0.375% | 6/15/15 | 649,520 | 650,839 | 0.6% |
| United States Treasury Note/Bond | 6.250% | 8/15/23 | 496,404 | 636,484 | 0.6% |
| United States Treasury Note/Bond | 0.250% | 5/15/16 | 637,695 | 633,709 | 0.6% |
| United States Treasury Note/Bond | 0.250% | 2/15/15 | 626,838 | 627,327 | 0.6% |
| United States Treasury Note/Bond | 0.375% | 4/15/15 | 623,195 | 624,653 | 0.6% |
| United States Treasury Note/Bond | 1.500% | 8/31/18 | 623,260 | 619,950 | 0.6% |
| United States Treasury Note/Bond | 2.125% | 11/30/14 | 598,846 | 609,422 | 0.6% |
| United States Treasury Note/Bond | 0.625% | 7/15/16 | 565,590 | 566,297 | 0.5% |
| United States Treasury Note/Bond | 0.250% | 7/15/15 | 558,835 | 558,835 | 0.5% |
| United States Treasury Note/Bond | 0.375% | 2/15/16 | 542,755 | 542,245 | 0.5% |
| United States Treasury Note/Bond | 1.000% | 5/31/18 | 541,255 | 529,331 | 0.5% |
| United States Treasury Note/Bond | 0.875% | 1/31/18 | 527,215 | 516,998 | 0.5% |
| United States Treasury Note/Bond | 0.250% | 10/15/15 | 512,405 | 511,683 | 0.5% |
| United States Treasury Note/Bond | 0.250% | 8/15/15 | 505,229 | 505,072 | 0.5% |
| United States Treasury Note/Bond | 2.500% | 6/30/17 | 473,135 | 496,498 | 0.5% |
| United States Treasury Note/Bond | 2.500% | 8/15/23 | 513,585 | 492,158 | 0.5% |
| United States Treasury Note/Bond | 2.750% | 11/15/23 | 501,440 | 489,531 | 0.4% |
| United States Treasury Note/Bond | 3.000% | 9/30/16 | 452,335 | 480,746 | 0.4% |
| United States Treasury Note/Bond | 4.750% | 8/15/17 | 416,570 | 470,466 | 0.4% |
| United States Treasury Note/Bond | 3.500% | 5/15/20 | 409,488 | 441,350 | 0.4% |
| United States Treasury Note/Bond | 0.375% | 1/15/16 | 438,200 | 438,064 | 0.4% |
| United States Treasury Note/Bond | 2.625% | 11/15/20 | 425,174 | 431,552 | 0.4% |
| United States Treasury Note/Bond | 2.750% | 11/15/42 | 541,919 | 426,171 | 0.4% |
| United States Treasury Note/Bond | 1.375% | 5/31/20 | 439,675 | 416,249 | 0.4% |
| United States Treasury Note/Bond | 2.375% | 6/30/18 | 397,275 | 411,863 | 0.4% |
| United States Treasury Note/Bond | 1.250% | 11/30/18 | 411,875 | 402,863 | 0.4% |
| United States Treasury Note/Bond | 3.625% | 2/15/21 | 366,502 | 395,020 | 0.4% |
| United States Treasury Note/Bond | 4.500% | 11/15/15 | 365,884 | 394,181 | 0.4% |
| United States Treasury Note/Bond | 2.375% | 5/31/18 | 370,220 | 384,162 | 0.4% |
| United States Treasury Note/Bond | 1.375% | 1/31/20 | 388,708 | 371,457 | 0.3% |
| United States Treasury Note/Bond | 3.125% | 5/15/21 | 352,640 | 367,077 | 0.3% |
14
Total Bond Market Index Fund
| Face | Market | Percentage | ||||
| Maturity | Amount | Value• | of Net | |||
| Coupon | Date | ($000) | ($000) | Assets | ||
| United States Treasury Note/Bond | 0.625% | 11/30/17 | 374,425 | 364,948 | 0.3% | |
| United States Treasury Note/Bond | 3.250% | 6/30/16 | 339,965 | 362,702 | 0.3% | |
| United States Treasury Note/Bond | 2.375% | 2/28/15 | 351,287 | 360,069 | 0.3% | |
| United States Treasury Note/Bond | 3.000% | 8/31/16 | 332,417 | 353,090 | 0.3% | |
| United States Treasury Note/Bond | 2.000% | 11/15/21 | 363,657 | 346,496 | 0.3% | |
| United States Treasury Note/Bond | 3.875% | 5/15/18 | 310,948 | 342,627 | 0.3% | |
| United States Treasury Note/Bond | 0.625% | 8/15/16 | 337,575 | 337,575 | 0.3% | |
| United States Treasury Note/Bond | 8.750% | 8/15/20 | 238,040 | 333,739 | 0.3% | |
| United States Treasury Note/Bond | 2.375% | 12/31/20 | 334,100 | 332,376 | 0.3% | |
| United States Treasury Note/Bond | 5.125% | 5/15/16 | 299,480 | 331,860 | 0.3% | |
| United States Treasury Note/Bond | 3.125% | 1/31/17 | 306,380 | 327,539 | 0.3% | |
| United States Treasury Note/Bond | 0.125% | 4/30/15 | 319,900 | 319,500 | 0.3% | |
| United States Treasury Note/Bond | 1.375% | 9/30/18 | 319,306 | 315,264 | 0.3% | |
| United States Treasury Note/Bond | 2.750% | 2/28/18 | 296,045 | 312,650 | 0.3% | |
| United States Treasury Note/Bond | 2.750% | 5/31/17 | 294,770 | 311,996 | 0.3% | |
| United States Treasury | ||||||
| Note/Bond | 0.125%–11.250% | 10/31/14–11/15/43 | 19,698,542 | 20,458,524 | 18.9% | |
| 42,407,875 | 39.2% | |||||
| Agency Bonds and Notes | ||||||
| 1 | Federal Home Loan | |||||
| Mortgage Corp. | 0.500%–6.750% | 1/26/15–7/15/32 | 1,394,899 | 1,440,020 | 1.3% | |
| 1 | Federal National | |||||
| Mortgage Assn. | 0%–8.200% | 3/16/15–7/15/37 | 1,699,185 | 1,775,949 | 1.7% | |
| Agency Bonds and | ||||||
| Notes—Other † | 991,475 | 0.9% | ||||
| 4,207,444 | 3.9% | |||||
| Conventional Mortgage-Backed Securities | ||||||
| 1,2,3 Fannie Mae Pool | 3.000% | 1/1/29 | 308,395 | 314,474 | 0.3% | |
| 1,2,3 Fannie Mae Pool | 2.000%–11.000% | 1/1/14–1/1/44 | 10,092,871 | 10,474,483 | 9.7% | |
| 1,2,3 Freddie Mac Gold Pool | 2.000%–10.000% | 1/1/14–1/1/44 | 6,249,639 | 6,475,815 | 6.0% | |
| 1,3 | Freddie Mac Non Gold | |||||
| Pool | 8.000%–10.500% | 12/1/15–3/1/20 | 20 | 22 | 0.0% | |
| 2,3 | Ginnie Mae I Pool | 3.000%–11.500% | 1/15/14–1/1/44 | 2,203,011 | 2,335,457 | 2.1% |
| 2,3 | Ginnie Mae II Pool | 3.000% | 8/20/43 | 369,614 | 357,875 | 0.3% |
| 2,3 | Ginnie Mae II Pool | 2.500%–8.500% | 4/20/18–1/1/44 | 4,225,721 | 4,407,565 | 4.1% |
| 24,365,691 | 22.5% | |||||
| Nonconventional Mortgage-Backed Securities | ||||||
| 1,3,4 Fannie Mae Pool | 1.438%–6.116% | 11/1/32–7/1/43 | 464,967 | 476,357 | 0.4% | |
| 1,3,4 Freddie Mac Non Gold | ||||||
| Pool | 1.730%–6.328% | 4/1/33–3/1/42 | 173,868 | 181,032 | 0.2% | |
| 3,4 | Ginnie Mae II Pool | 1.625%–5.000% | 6/20/29–6/20/43 | 172,824 | 179,130 | 0.2% |
| 836,519 | 0.8% | |||||
| Total U.S. Government and Agency Obligations (Cost $71,478,669) | 71,817,529 | 66.4% | ||||
| 5Asset-Backed/Commercial Mortgage-Backed Securities (Cost $2,653,033) † | 2,836,291 | 2.6% | ||||
| Corporate Bonds | ||||||
| Finance | ||||||
| 5 | Banking † | 5,590,482 | 5.2% | |||
| 5 | Brokerage † | 207,667 | 0.2% | |||
| 5 | Finance Companies † | 670,590 | 0.6% | |||
| 5 | Insurance † | 1,485,102 | 1.4% | |||
| Other Finance † | 51,512 | 0.0% | ||||
| 5 | Real Estate Investment Trusts † | 619,965 | 0.6% | |||
| 8,625,318 | 8.0% | |||||
15
Total Bond Market Index Fund
| Market | Percentage | ||||
| Value | of Net | ||||
| ($000) | Assets | ||||
| Industrial | |||||
| Basic Industry † | 1,417,837 | 1.3% | |||
| 5 | Capital Goods † | 1,267,286 | 1.2% | ||
| 5 | Communication † | 2,580,942 | 2.4% | ||
| 5 | Consumer Cyclical † | 1,888,948 | 1.7% | ||
| 5 | Consumer Noncyclical † | 3,570,629 | 3.3% | ||
| 5 | Energy † | 1,892,525 | 1.8% | ||
| 5 | Other Industrial † | 53,877 | 0.0% | ||
| 5 | Technology † | 1,283,849 | 1.2% | ||
| 5 | Transportation † | 507,608 | 0.5% | ||
| 14,463,501 | 13.4% | ||||
| Utilities | |||||
| 5 | Electric † | 1,871,457 | 1.7% | ||
| 5 | Natural Gas † | 964,644 | 0.9% | ||
| Other Utility † | 36,314 | 0.0% | |||
| 2,872,415 | 2.6% | ||||
| Total Corporate Bonds (Cost $25,176,178) | 25,961,234 | 24.0% | |||
| 5Sovereign Bonds (U.S. Dollar-Denominated) (Cost $5,820,367) † | 5,838,782 | 5.4% | |||
| Taxable Municipal Bonds (Cost $962,075) † | 1,025,113 | 1.0% | |||
| Coupon | Shares | ||||
| Temporary Cash Investment | |||||
| Money Market Fund | |||||
| 6 | Vanguard Market Liquidity Fund | ||||
| (Cost $2,788,041) | 0.125% | 2,788,040,796 | 2,788,041 | 2.6% | |
| Total Investments (Cost $108,878,363) | 110,266,990 | 102.0% | |||
| Other Assets and Liabilities | |||||
| Other Assets | 2,023,902 | 1.9% | |||
| Liabilities | (4,175,471) | (3.9%) | |||
| (2,151,569) | (2.0%) | ||||
| Net Assets | 108,115,421 | 100.0% | |||
| At December 31, 2013, net assets consisted of: | |
| Amount | |
| ($000) | |
| Paid-in Capital | 106,724,247 |
| Undistributed Net Investment Income | — |
| Accumulated Net Realized Gains | 2,547 |
| Unrealized Appreciation (Depreciation) | 1,388,627 |
| Net Assets | 108,115,421 |
| Investor Shares—Net Assets | |
| Applicable to 752,065,019 outstanding $.001 par value shares of | |
| beneficial interest (unlimited authorization) | 7,938,896 |
| Net Asset Value Per Share—Investor Shares | $10.56 |
16
Total Bond Market Index Fund
| Amount | |
| ($000) | |
| Admiral Shares—Net Assets | |
| Applicable to 3,168,915,588 outstanding $.001 par value shares of | |
| beneficial interest (unlimited authorization) | 33,450,400 |
| Net Asset Value Per Share—Admiral Shares | $10.56 |
| Signal Shares—Net Assets | |
| Applicable to 973,455,296 outstanding $.001 par value shares of | |
| beneficial interest (unlimited authorization) | 10,275,732 |
| Net Asset Value Per Share—Signal Shares | $10.56 |
| Institutional Shares—Net Assets | |
| Applicable to 1,914,195,039 outstanding $.001 par value shares of | |
| beneficial interest (unlimited authorization) | 20,205,715 |
| Net Asset Value Per Share—Institutional Shares | $10.56 |
| Institutional Plus Shares—Net Assets | |
| Applicable to 1,762,751,183 outstanding $.001 par value shares of | |
| beneficial interest (unlimited authorization) | 18,607,208 |
| Net Asset Value Per Share—Institutional Plus Shares | $10.56 |
| ETF Shares—Net Assets | |
| Applicable to 220,723,018 outstanding $.001 par value shares of | |
| beneficial interest (unlimited authorization) | 17,637,470 |
| Net Asset Value Per Share—ETF Shares | $79.91 |
See Note A in Notes to Financial Statements.
† Represents the aggregate value, by category, of securities that are not among the 50 largest holdings and, in total for any issuer, represent
1% or less of net assets.
1 The issuer was placed under federal conservatorship in September 2008; since that time, its daily operations have been managed by the
Federal Housing Finance Agency and it receives capital from the U.S. Treasury, as needed to maintain a positive net worth, in exchange for
senior preferred stock.
2 Includes securities purchased on a when-issued or delayed-delivery basis for which the fund has not taken delivery as of December 31, 2013.
3 The average or expected maturity is shorter than the final maturity shown because of the possibility of interim principal payments and
prepayments or the possibility of the issue being called.
4 Adjustable-rate security.
5 Certain of the fund’s securities are exempt from registration under Rule 144A of the Securities Act of 1933. Such securities may be sold
in transactions exempt from registration, normally to qualified institutional buyers. At December 31, 2013, the aggregate value of these
securities was $224,298,000, representing 0.2% of net assets.
6 Affiliated money market fund available only to Vanguard funds and certain trusts and accounts managed by Vanguard. Rate shown is the
7-day yield.
See accompanying Notes, which are an integral part of the Financial Statements.
17
Total Bond Market Index Fund
| Statement of Operations | |
| Year Ended | |
| December 31, 2013 | |
| ($000) | |
| Investment Income | |
| Income | |
| Interest1 | 2,880,979 |
| Total Income | 2,880,979 |
| Expenses | |
| The Vanguard Group—Note B | |
| Investment Advisory Services | 3,795 |
| Management and Administrative—Investor Shares | 16,599 |
| Management and Administrative—Admiral Shares | 20,331 |
| Management and Administrative—Signal Shares | 5,667 |
| Management and Administrative—Institutional Shares | 7,861 |
| Management and Administrative—Institutional Plus Shares | 4,286 |
| Management and Administrative—ETF Shares | 8,176 |
| Marketing and Distribution—Investor Shares | 2,751 |
| Marketing and Distribution—Admiral Shares | 5,528 |
| Marketing and Distribution—Signal Shares | 3,287 |
| Marketing and Distribution—Institutional Shares | 5,686 |
| Marketing and Distribution—Institutional Plus Shares | 3,619 |
| Marketing and Distribution—ETF Shares | 4,670 |
| Custodian Fees | 1,283 |
| Auditing Fees | 45 |
| Shareholders’ Reports—Investor Shares | 73 |
| Shareholders’ Reports—Admiral Shares | 32 |
| Shareholders’ Reports—Signal Shares | 84 |
| Shareholders’ Reports—Institutional Shares | 126 |
| Shareholders’ Reports—Institutional Plus Shares | 63 |
| Shareholders’ Reports—ETF Shares | 310 |
| Trustees’ Fees and Expenses | 140 |
| Total Expenses | 94,412 |
| Net Investment Income | 2,786,567 |
| Realized Net Gain (Loss) on Investment Securities Sold | 186,970 |
| Change in Unrealized Appreciation (Depreciation) of Investment Securities | (5,493,010) |
| Net Increase (Decrease) in Net Assets Resulting from Operations | (2,519,473) |
| 1 Interest income from an affiliated company of the fund was $6,318,000. | |
See accompanying Notes, which are an integral part of the Financial Statements.
18
Total Bond Market Index Fund
| Statement of Changes in Net Assets | ||
| Year Ended December 31, | ||
| 2013 | 2012 | |
| ($000) | ($000) | |
| Increase (Decrease) in Net Assets | ||
| Operations | ||
| Net Investment Income | 2,786,567 | 2,931,208 |
| Realized Net Gain (Loss) | 186,970 | 895,845 |
| Change in Unrealized Appreciation (Depreciation) | (5,493,010) | 518,467 |
| Net Increase (Decrease) in Net Assets Resulting from Operations | (2,519,473) | 4,345,520 |
| Distributions | ||
| Net Investment Income | ||
| Investor Shares | (234,458) | (314,951) |
| Admiral Shares | (854,682) | (891,746) |
| Signal Shares | (297,984) | (313,291) |
| Institutional Shares | (522,499) | (625,592) |
| Institutional Plus Shares | (442,677) | (344,935) |
| ETF Shares | (434,267) | (440,693) |
| Realized Capital Gain1 | ||
| Investor Shares | (24,380) | (70,625) |
| Admiral Shares | (83,008) | (208,039) |
| Signal Shares | (28,879) | (73,540) |
| Institutional Shares | (50,535) | (136,043) |
| Institutional Plus Shares | (42,229) | (89,745) |
| ETF Shares | (42,985) | (103,303) |
| Total Distributions | (3,058,583) | (3,612,503) |
| Capital Share Transactions | ||
| Investor Shares | (3,348,785) | (885,346) |
| Admiral Shares | (375,365) | 3,945,471 |
| Signal Shares | (1,712,566) | 1,570,109 |
| Institutional Shares | (1,234,164) | (489,700) |
| Institutional Plus Shares | 3,150,527 | 6,746,640 |
| ETF Shares | 545,368 | 3,265,455 |
| Net Increase (Decrease) from Capital Share Transactions | (2,974,985) | 14,152,629 |
| Total Increase (Decrease) | (8,553,041) | 14,885,646 |
| Net Assets | ||
| Beginning of Period | 116,668,462 | 101,782,816 |
| End of Period | 108,115,421 | 116,668,462 |
1 Includes fiscal 2013 and 2012 short-term gain distributions totaling $10,552,000 and $277,968,000, respectively. Short-term gain distributions are treated as ordinary income dividends for tax purposes.
See accompanying Notes, which are an integral part of the Financial Statements.
19
Total Bond Market Index Fund
Financial Highlights
| Investor Shares | |||||
| For a Share Outstanding | Year Ended December 31, | ||||
| Throughout Each Period | 2013 | 2012 | 2011 | 2010 | 2009 |
| Net Asset Value, Beginning of Period | $11.09 | $11.00 | $10.60 | $10.35 | $10.18 |
| Investment Operations | |||||
| Net Investment Income | . 256 | . 285 | .337 | .362 | .421 |
| Net Realized and Unrealized Gain (Loss) | |||||
| on Investments | (. 504) | .156 | .451 | .297 | .170 |
| Total from Investment Operations | (.248) | .441 | .788 | .659 | . 591 |
| Distributions | |||||
| Dividends from Net Investment Income | (.256) | (.285) | (. 337) | (. 362) | (. 421) |
| Distributions from Realized Capital Gains | (. 026) | (. 066) | (. 051) | (. 047) | — |
| Total Distributions | (.282) | (. 351) | (. 388) | (.409) | (.421) |
| Net Asset Value, End of Period | $10.56 | $11.09 | $11.00 | $10.60 | $10.35 |
| Total Return1 | -2.26% | 4.05% | 7.56% | 6.42% | 5.93% |
| Ratios/Supplemental Data | |||||
| Net Assets, End of Period (Millions) | $7,939 | $11,794 | $12,584 | $14,437 | $19,555 |
| Ratio of Total Expenses to Average Net Assets | 0.20% | 0.20% | 0.22% | 0.22% | 0.22% |
| Ratio of Net Investment Income to | |||||
| Average Net Assets | 2.37% | 2.55% | 3.12% | 3.38% | 4.09% |
| Portfolio Turnover Rate2 | 73%3 | 80%3 | 73%3 | 75%3 | 80% |
1 Total returns do not include account service fees that may have applied in the periods shown. Fund prospectuses provide information about
any applicable account service fees.
2 Excludes the value of portfolio securities received or delivered as a result of in-kind purchases or redemptions of the fund’s capital shares,
including ETF Creation Units.
3 Includes 45%, 49%, 34%, and 28% attributable to mortgage-dollar-roll activity.
See accompanying Notes, which are an integral part of the Financial Statements.
20
Total Bond Market Index Fund
Financial Highlights
| Admiral Shares | |||||
| For a Share Outstanding | Year Ended December 31, | ||||
| Throughout Each Period | 2013 | 2012 | 2011 | 2010 | 2009 |
| Net Asset Value, Beginning of Period | $11.09 | $11.00 | $10.60 | $10.35 | $10.18 |
| Investment Operations | |||||
| Net Investment Income | .269 | .296 | .350 | .374 | .432 |
| Net Realized and Unrealized Gain (Loss) | |||||
| on Investments | (. 504) | .156 | .451 | .297 | .170 |
| Total from Investment Operations | (.235) | .452 | . 801 | .671 | .602 |
| Distributions | |||||
| Dividends from Net Investment Income | (. 269) | (. 296) | (. 350) | (. 374) | (.432) |
| Distributions from Realized Capital Gains | (. 026) | (. 066) | (. 051) | (. 047) | — |
| Total Distributions | (. 295) | (. 362) | (. 401) | (.421) | (.432) |
| Net Asset Value, End of Period | $10.56 | $11.09 | $11.00 | $10.60 | $10.35 |
| Total Return1 | -2.15% | 4.15% | 7.69% | 6.54% | 6.04% |
| Ratios/Supplemental Data | |||||
| Net Assets, End of Period (Millions) | $33,450 | $35,533 | $31,366 | $27,200 | $17,932 |
| Ratio of Total Expenses to Average Net Assets | 0.08% | 0.10% | 0.10% | 0.11% | 0.12% |
| Ratio of Net Investment Income to | |||||
| Average Net Assets | 2.49% | 2.65% | 3.24% | 3.49% | 4.19% |
| Portfolio Turnover Rate2 | 73%3 | 80%3 | 73%3 | 75%3 | 80% |
1 Total returns do not include account service fees that may have applied in the periods shown. Fund prospectuses provide information about
any applicable account service fees.
2 Excludes the value of portfolio securities received or delivered as a result of in-kind purchases or redemptions of the fund’s capital shares,
including ETF Creation Units.
3 Includes 45%, 49%, 34%, and 28% attributable to mortgage-dollar-roll activity.
See accompanying Notes, which are an integral part of the Financial Statements.
21
Total Bond Market Index Fund
Financial Highlights
| Signal Shares | |||||
| For a Share Outstanding | Year Ended December 31, | ||||
| Throughout Each Period | 2013 | 2012 | 2011 | 2010 | 2009 |
| Net Asset Value, Beginning of Period | $11.09 | $11.00 | $10.60 | $10.35 | $10.18 |
| Investment Operations | |||||
| Net Investment Income | .269 | .296 | .350 | .374 | .432 |
| Net Realized and Unrealized Gain (Loss) | |||||
| on Investments | (. 504) | .156 | .451 | .297 | .170 |
| Total from Investment Operations | (.235) | .452 | . 801 | .671 | .602 |
| Distributions | |||||
| Dividends from Net Investment Income | (. 269) | (. 296) | (. 350) | (. 374) | (.432) |
| Distributions from Realized Capital Gains | (. 026) | (. 066) | (. 051) | (. 047) | — |
| Total Distributions | (. 295) | (. 362) | (. 401) | (.421) | (.432) |
| Net Asset Value, End of Period | $10.56 | $11.09 | $11.00 | $10.60 | $10.35 |
| Total Return | -2.15% | 4.15% | 7.69% | 6.54% | 6.04% |
| Ratios/Supplemental Data | |||||
| Net Assets, End of Period (Millions) | $10,276 | $12,586 | $10,938 | $8,813 | $8,450 |
| Ratio of Total Expenses to Average Net Assets | 0.08% | 0.10% | 0.10% | 0.11% | 0.12% |
| Ratio of Net Investment Income to | |||||
| Average Net Assets | 2.49% | 2.65% | 3.24% | 3.49% | 4.19% |
| Portfolio Turnover Rate1 | 73%2 | 80%2 | 73%2 | 75%2 | 80% |
1 Excludes the value of portfolio securities received or delivered as a result of in-kind purchases or redemptions of the fund’s capital shares,
including ETF Creation Units.
2 Includes 45%, 49%, 34%, and 28% attributable to mortgage-dollar-roll activity.
See accompanying Notes, which are an integral part of the Financial Statements.
22
Total Bond Market Index Fund
Financial Highlights
| Institutional Shares | |||||
| For a Share Outstanding | Year Ended December 31, | ||||
| Throughout Each Period | 2013 | 2012 | 2011 | 2010 | 2009 |
| Net Asset Value, Beginning of Period | $11.09 | $11.00 | $10.60 | $10.35 | $10.18 |
| Investment Operations | |||||
| Net Investment Income | . 270 | .299 | .353 | .378 | .437 |
| Net Realized and Unrealized Gain (Loss) | |||||
| on Investments | (. 504) | .156 | .451 | .297 | .170 |
| Total from Investment Operations | (.234) | .455 | .804 | .675 | .607 |
| Distributions | |||||
| Dividends from Net Investment Income | (.270) | (. 299) | (. 353) | (. 378) | (.437) |
| Distributions from Realized Capital Gains | (. 026) | (. 066) | (. 051) | (. 047) | — |
| Total Distributions | (. 296) | (. 365) | (. 404) | (.425) | (. 437) |
| Net Asset Value, End of Period | $10.56 | $11.09 | $11.00 | $10.60 | $10.35 |
| Total Return | -2.14% | 4.18% | 7.72% | 6.58% | 6.09% |
| Ratios/Supplemental Data | |||||
| Net Assets, End of Period (Millions) | $20,206 | $22,494 | $22,812 | $20,419 | $15,692 |
| Ratio of Total Expenses to Average Net Assets | 0.07% | 0.07% | 0.07% | 0.07% | 0.07% |
| Ratio of Net Investment Income to | |||||
| Average Net Assets | 2.50% | 2.68% | 3.27% | 3.53% | 4.24% |
| Portfolio Turnover Rate1 | 73%2 | 80%2 | 73%2 | 75%2 | 80% |
1 Excludes the value of portfolio securities received or delivered as a result of in-kind purchases or redemptions of the fund’s capital shares,
including ETF Creation Units.
2 Includes 45%, 49%, 34%, and 28% attributable to mortgage-dollar-roll activity.
See accompanying Notes, which are an integral part of the Financial Statements.
23
Total Bond Market Index Fund
Financial Highlights
| Institutional Plus Shares | ||||
| Feb. 5, | ||||
| 20101 to | ||||
| Year Ended December 31, | Dec. 31, | |||
| For a Share Outstanding Throughout Each Period | 2013 | 2012 | 2011 | 2010 |
| Net Asset Value, Beginning of Period | $11.09 | $11.00 | $10.60 | $10.50 |
| Investment Operations | ||||
| Net Investment Income | . 272 | .301 | .355 | .343 |
| Net Realized and Unrealized Gain (Loss) on Investments | (.504) | .156 | .451 | .147 |
| Total from Investment Operations | (.232) | .457 | .806 | .490 |
| Distributions | ||||
| Dividends from Net Investment Income | (.272) | (. 301) | (. 355) | (. 343) |
| Distributions from Realized Capital Gains | (. 026) | (. 066) | (. 051) | (. 047) |
| Total Distributions | (.298) | (.367) | (.406) | (.390) |
| Net Asset Value, End of Period | $10.56 | $11.09 | $11.00 | $10.60 |
| Total Return | -2.12% | 4.20% | 7.74% | 4.68% |
| Ratios/Supplemental Data | ||||
| Net Assets, End of Period (Millions) | $18,607 | $16,294 | $9,486 | $6,358 |
| Ratio of Total Expenses to Average Net Assets | 0.05% | 0.05% | 0.05% | 0.05%2 |
| Ratio of Net Investment Income to Average Net Assets | 2.52% | 2.70% | 3.29% | 3.55%2 |
| Portfolio Turnover Rate 3 | 73%4 | 80%4 | 73%4 | 75%4 |
1 Inception.
2 Annualized.
3 Excludes the value of portfolio securities received or delivered as a result of in-kind purchases or redemptions of the fund’s capital shares,
including ETF Creation Units.
4 Includes 45%, 49%, 34%, and 28% attributable to mortgage-dollar-roll activity.
See accompanying Notes, which are an integral part of the Financial Statements.
24
Total Bond Market Index Fund
Financial Highlights
| ETF Shares | |||||
| For a Share Outstanding | Year Ended December 31, | ||||
| Throughout Each Period | 2013 | 2012 | 2011 | 2010 | 2009 |
| Net Asset Value, Beginning of Period | $83.92 | $83.31 | $80.21 | $78.31 | $76.93 |
| Investment Operations | |||||
| Net Investment Income | 2.031 | 2.222 | 2.598 | 2.793 | 3.163 |
| Net Realized and Unrealized Gain (Loss) | |||||
| on Investments | (3.812) | 1.111 | 3.487 | 2.256 | 1.380 |
| Total from Investment Operations | (1.781) | 3.333 | 6.085 | 5.049 | 4.543 |
| Distributions | |||||
| Dividends from Net Investment Income | (2.031) | (2.222) | (2.598) | (2.793) | (3.163) |
| Distributions from Realized Capital Gains | (.198) | (. 501) | (. 387) | (.356) | — |
| Total Distributions | (2.229) | (2.723) | (2.985) | (3.149) | (3.163) |
| Net Asset Value, End of Period | $79.91 | $83.92 | $83.31 | $80.21 | $78.31 |
| Total Return | -2.14% | 4.04% | 7.71% | 6.51% | 6.03% |
| Ratios/Supplemental Data | |||||
| Net Assets, End of Period (Millions) | $17,637 | $17,968 | $14,596 | $9,048 | $6,242 |
| Ratio of Total Expenses to Average Net Assets | 0.08% | 0.10% | 0.10% | 0.11% | 0.12% |
| Ratio of Net Investment Income to | |||||
| Average Net Assets | 2.49% | 2.65% | 3.24% | 3.49% | 4.19% |
| Portfolio Turnover Rate1 | 73%2 | 80%2 | 73%2 | 75%2 | 80% |
1 Excludes the value of portfolio securities received or delivered as a result of in-kind purchases or redemptions of the fund’s capital shares,
including ETF Creation Units.
2 Includes 45%, 49%, 34%, and 28% attributable to mortgage-dollar-roll activity.
See accompanying Notes, which are an integral part of the Financial Statements.
25
Total Bond Market Index Fund
Notes to Financial Statements
Vanguard Total Bond Market Index Fund is registered under the Investment Company Act of 1940 as an open-end investment company, or mutual fund. Certain of the fund’s investments are in corporate debt instruments; the issuers’ abilities to meet their obligations may be affected by economic developments in their respective industries. The fund offers six classes of shares: Investor Shares, Admiral Shares, Signal Shares, Institutional Shares, Institutional Plus Shares and ETF Shares. Investor Shares are available to any investor who meets the fund’s minimum purchase requirements. Admiral Shares, Signal Shares, Institutional Shares, and Institutional Plus Shares are designed for investors who meet certain administrative, service, and account-size criteria. ETF Shares are listed for trading on NYSE Arca; they can be purchased and sold through a broker.
A. The following significant accounting policies conform to generally accepted accounting principles for U.S. mutual funds. The fund consistently follows such policies in preparing its financial statements.
1. Security Valuation: Bonds, and temporary cash investments acquired over 60 days to maturity, are valued using the latest bid prices or using valuations based on a matrix system (which considers such factors as security prices, yields, maturities, and ratings), both as furnished by independent pricing services. Structured debt securities, including mortgages and asset-backed securities, are valued using the latest bid prices or using valuations based on a matrix system that considers such factors as issuer, tranche, nominal or option-adjusted spreads, weighted average coupon, weighted average maturity, credit enhancements, and collateral. Investments in Vanguard Market Liquidity Fund are valued at that fund’s net asset value. Other temporary cash investments are valued at amortized cost, which approximates market value. Securities for which market quotations are not readily available, or whose values have been affected by events occurring before the fund’s pricing time but after the close of the securities’ primary markets, are valued by methods deemed by the board of trustees to represent fair value.
2. To Be Announced (TBA) Transactions: A TBA transaction is an agreement to buy or sell mortgage-backed securities with agreed-upon characteristics (face amount, coupon, maturity) for settlement at a future date. The fund may enter into TBA sells to reduce its exposure to the mortgage-backed securities market or in order to dispose of mortgage-backed securities it owns under delayed-delivery arrangements. For TBA purchases, the fund maintains cash or short-term investments until settlement date in an amount sufficient to meet the purchase price.
3. Mortgage Dollar Rolls: The fund enters into mortgage-dollar-roll transactions, in which the fund sells mortgage-backed securities to a dealer and simultaneously agrees to purchase similar securities in the future at a predetermined price. The proceeds of the securities sold in mortgage-dollar-roll transactions are typically invested in high-quality short-term fixed income securities. The fund forgoes principal and interest paid on the securities sold, and is compensated by interest earned on the proceeds of the sale and by a lower price on the securities to be repurchased. The fund has also entered into mortgage-dollar-roll transactions in which the fund buys mortgage-backed securities from a dealer pursuant to a TBA transaction and simultaneously agrees to sell similar securities in the future at a predetermined price. The securities bought in mortgage-dollar-roll transactions are used to cover an open TBA sell position. The fund continues to earn interest on mortgage-backed security pools already held and receives a lower price on the securities to be sold in the future. The fund accounts for mortgage-dollar-roll transactions as purchases and sales; as such, these transactions may increase the fund’s portfolio turnover rate. Amounts to be received or paid in connection with open mortgage dollar rolls are included in Receivables for Investment Securities Sold (Other Assets) or Payables for Investment Securities Purchased (Liabilities) in the Statement of Net Assets. The
26
Total Bond Market Index Fund
primary risk associated with mortgage dollar rolls is that a counterparty will default on its obligations. This risk is mitigated by, among other things, performing a credit analysis of counterparties, allocating transactions among numerous counterparties, and monitoring exposure to each counterparty.
4. Federal Income Taxes: The fund intends to continue to qualify as a regulated investment company and distribute all of its taxable income. Management has analyzed the fund’s tax positions taken for all open federal income tax years (December 31, 2010–2013), and has concluded that no provision for federal income tax is required in the fund’s financial statements.
5. Distributions: Distributions from net investment income are declared daily by all share classes except ETF Shares, and paid on the first business day of the following month. Monthly income dividends from ETF Shares, and annual distributions from realized capital gains, if any, are recorded on the ex-dividend date.
6. Other: Interest income includes income distributions received from Vanguard Market Liquidity Fund and is accrued daily. Premiums and discounts on debt securities purchased are amortized and accreted, respectively, to interest income over the lives of the respective securities. Security transactions are accounted for on the date securities are bought or sold. Costs used to determine realized gains (losses) on the sale of investment securities are those of the specific securities sold.
Each class of shares has equal rights as to assets and earnings, except that each class separately bears certain class-specific expenses related to maintenance of shareholder accounts (included in Management and Administrative expenses) and shareholder reporting. Marketing and distribution expenses are allocated to each class of shares based on a method approved by the board of trustees. Income, other non-class-specific expenses, and gains and losses on investments are allocated to each class of shares based on its relative net assets.
B. The Vanguard Group furnishes at cost investment advisory, corporate management, administrative, marketing, and distribution services. The costs of such services are allocated to the fund under methods approved by the board of trustees. The fund has committed to provide up to 0.40% of its net assets in capital contributions to Vanguard. At December 31, 2013, the fund had contributed capital of $12,251,000 to Vanguard (included in Other Assets), representing 0.01% of the fund’s net assets and 4.90% of Vanguard’s capitalization. The fund’s trustees and officers are also directors and officers of Vanguard.
C. Various inputs may be used to determine the value of the fund’s investments. These inputs are summarized in three broad levels for financial statement purposes. The inputs or methodologies used to value securities are not necessarily an indication of the risk associated with investing in those securities.
Level 1—Quoted prices in active markets for identical securities.
Level 2—Other significant observable inputs (including quoted prices for similar securities, interest rates, prepayment speeds, credit risk, etc.).
Level 3—Significant unobservable inputs (including the fund’s own assumptions used to determine the fair value of investments).
27
Total Bond Market Index Fund
The following table summarizes the market value of the fund’s investments as of December 31, 2013, based on the inputs used to value them:
| Level 1 | Level 2 | Level 3 | |
| Investments | ($000) | ($000) | ($000) |
| U.S. Government and Agency Obligations | — | 71,817,520 | 9 |
| Asset-Backed/Commercial Mortgage-Backed Securities | — | 2,836,289 | 2 |
| Corporate Bonds | — | 25,961,231 | 3 |
| Sovereign Bonds | — | 5,838,782 | — |
| Taxable Municipal Bonds | — | 1,025,113 | — |
| Temporary Cash Investments | 2,788,041 | — | — |
| Total | 2,788,041 | 107,478,935 | 14 |
D. Capital gain distributions are determined on a tax basis and may differ from realized capital gains for financial reporting purposes. Differences may be permanent or temporary. Permanent differences are reclassified among capital accounts in the financial statements to reflect their tax character. Temporary differences arise when gains or losses are recognized in different periods for financial statement and tax purposes. These differences will reverse at some time in the future.
During the year ended December 31, 2013, the fund realized $54,010,000 of net capital gains resulting from in-kind redemptions—in which shareholders exchanged fund shares for securities held by the fund rather than for cash. Because such gains are not taxable to the fund, and are not distributed to shareholders, they have been reclassified from accumulated net realized gains to paid-in capital.
The fund used a tax accounting practice to treat a portion of the price of capital shares redeemed during the year as distributions from realized capital gains. Accordingly, the fund has reclassified $46,846,000 from accumulated net realized gains to paid-in capital.
For tax purposes, at December 31, 2013, the fund had short-term and long-term capital gains of $1,753,000 and $10,950,000, respectively, available for distribution. Short-term gain distributions are treated as ordinary income dividends for tax purposes.
At December 31, 2013, the cost of investment securities for tax purposes was $108,888,519,000. Net unrealized appreciation of investment securities for tax purposes was $1,378,471,000, consisting of unrealized gains of $3,078,062,000 on securities that had risen in value since their purchase and $1,699,591,000 in unrealized losses on securities that had fallen in value since their purchase.
E. During the year ended December 31, 2013, the fund purchased $8,298,113,000 of investment securities and sold $5,694,854,000 of investment securities, other than U.S. government securities and temporary cash investments. Purchases and sales of U.S. government securities were $75,247,578,000 and $80,222,073,000, respectively. Total purchases and sales include $1,804,730,000 and $1,348,811,000, respectively, in connection with in-kind purchases and redemptions of the fund’s capital shares.
28
Total Bond Market Index Fund
F. Capital share transactions for each class of shares were:
| Year Ended December 31, | ||||
| 2013 | 2012 | |||
| Amount | Shares | Amount | Shares | |
| ($000) | (000) | ($000) | (000) | |
| Investor Shares | ||||
| Issued | 1,420,671 | 130,390 | 3,004,609 | 271,304 |
| Issued in Lieu of Cash Distributions | 246,555 | 22,813 | 366,587 | 33,018 |
| Redeemed | (5,016,011) | (465,110) | (4,256,542) | (383,796) |
| Net Increase (Decrease)—Investor Shares | (3,348,785) | (311,907) | (885,346) | (79,474) |
| Admiral Shares | ||||
| Issued | 6,534,069 | 604,049 | 7,014,203 | 631,886 |
| Issued in Lieu of Cash Distributions | 860,542 | 79,740 | 1,011,310 | 91,066 |
| Redeemed | (7,769,976) | (720,245) | (4,080,042) | (367,793) |
| Net Increase (Decrease) —Admiral Shares | (375,365) | (36,456) | 3,945,471 | 355,159 |
| Signal Shares | ||||
| Issued | 3,912,890 | 361,499 | 4,823,976 | 434,974 |
| Issued in Lieu of Cash Distributions | 288,775 | 26,743 | 343,228 | 30,909 |
| Redeemed | (5,914,231) | (550,120) | (3,597,095) | (324,510) |
| Net Increase (Decrease)—Signal Shares | (1,712,566) | (161,878) | 1,570,109 | 141,373 |
| Institutional Shares | ||||
| Issued | 6,543,589 | 605,896 | 7,813,071 | 705,177 |
| Issued in Lieu of Cash Distributions | 539,989 | 50,025 | 725,517 | 65,345 |
| Redeemed | (8,317,742) | (770,852) | (9,028,288) | (814,314) |
| Net Increase (Decrease) —Institutional Shares | (1,234,164) | (114,931) | (489,700) | (43,792) |
| Institutional Plus Shares | ||||
| Issued | 6,791,909 | 630,634 | 7,964,692 | 717,892 |
| Issued in Lieu of Cash Distributions | 464,040 | 43,038 | 405,539 | 36,496 |
| Redeemed | (4,105,422) | (380,801) | (1,623,591) | (146,504) |
| Net Increase (Decrease) —Institutional Plus Shares | 3,150,527 | 292,871 | 6,746,640 | 607,884 |
| ETF Shares | ||||
| Issued | 2,356,538 | 29,000 | 3,974,327 | 47,323 |
| Issued in Lieu of Cash Distributions | — | — | — | — |
| Redeemed | (1,811,170) | (22,400) | (708,872) | (8,400) |
| Net Increase (Decrease)—ETF Shares | 545,368 | 6,600 | 3,265,455 | 38,923 |
G. Management has determined that no material events or transactions occurred subsequent to December 31, 2013, that would require recognition or disclosure in these financial statements.
29
Report of Independent Registered Public Accounting Firm
To the Trustees of Vanguard Bond Index Funds and the Shareholders of Vanguard Total Bond Market Index Fund:
In our opinion, the accompanying statement of net assets - investments summary and the related statements of operations and of changes in net assets and the financial highlights present fairly, in all material respects, the financial position of Vanguard Total Bond Market Index Fund (constituting a separate portfolio of Vanguard Bond Index Funds, hereafter referred to as the “Fund”) at December 31, 2013, the results of its operations for the year then ended, the changes in its net assets for each of the two years in the period then ended, and the financial highlights for each of the periods indicated, in conformity with accounting principles generally accepted in the United States of America. These financial statements and financial highlights (hereafter referred to as “financial statements”) are the responsibility of the Fund’s management; our responsibility is to express an opinion on these financial statements based on our audits. We conducted our audits of these financial statements in accordance with the standards of the Public Company Accounting Oversight Board (United States). Those standards require that we plan and perform the audit to obtain reasonable assurance about whether the financial statements are free of material misstatement. An audit includes examining, on a test basis, evidence supporting the amounts and disclosures in the financial statements, assessing the accounting principles used and significant estimates made by management, and evaluating the overall financial statement presentation. We believe that our audits, which included confirmation of securities at December 31, 2013 by correspondence with the custodian and brokers and by agreement to the underlying ownership records of the transfer agent, provide a reasonable basis for our opinion.
/s/PricewaterhouseCoopers LLP
Philadelphia, Pennsylvania
February 14, 2014
Special 2013 tax information (unaudited) for Vanguard Total Bond Market Index Fund
This information for the fiscal year ended December 31, 2013, is included pursuant to provisions of the Internal Revenue Code.
The fund distributed $308,310,000 as capital gain dividends (from net long-term capital gains) to shareholders during the fiscal year.
For nonresident alien shareholders, 100% of short-term capital gain dividends distributed by the fund are qualified short-term capital gains.
For nonresident alien shareholders, 86.3% of income dividends are interest-related dividends.
30
About Your Fund’s Expenses
As a shareholder of the fund, you incur ongoing costs, which include costs for portfolio management, administrative services, and shareholder reports (like this one), among others. Operating expenses, which are deducted from a fund’s gross income, directly reduce the investment return of the fund.
A fund’s expenses are expressed as a percentage of its average net assets. This figure is known as the expense ratio. The following examples are intended to help you understand the ongoing costs (in dollars) of investing in your fund and to compare these costs with those of other mutual funds. The examples are based on an investment of $1,000 made at the beginning of the period shown and held for the entire period.
The accompanying table illustrates your fund’s costs in two ways:
• Based on actual fund return. This section helps you to estimate the actual expenses that you paid over the period. The ”Ending Account Value“ shown is derived from the fund‘s actual return, and the third column shows the dollar amount that would have been paid by an investor who started with $1,000 in the fund. You may use the information here, together with the amount you invested, to estimate the expenses that you paid over the period.
To do so, simply divide your account value by $1,000 (for example, an $8,600 account value divided by $1,000 = 8.6), then multiply the result by the number given for your fund under the heading ”Expenses Paid During Period.“
• Based on hypothetical 5% yearly return. This section is intended to help you compare your fund‘s costs with those of other mutual funds. It assumes that the fund had a yearly return of 5% before expenses, but that the expense ratio is unchanged. In this case—because the return used is not the fund’s actual return—the results do not apply to your investment. The example is useful in making comparisons because the Securities and Exchange Commission requires all mutual funds to calculate expenses based on a 5% return. You can assess your fund’s costs by comparing this hypothetical example with the hypothetical examples that appear in shareholder reports of other funds.
Note that the expenses shown in the table are meant to highlight and help you compare ongoing costs only and do not reflect transaction costs incurred by the fund for buying and selling securities. Further, the expenses do not include any purchase, redemption, or account service fees described in the fund prospectus. If such fees were applied to your account, your costs would be higher. Your fund does not carry a “sales load.”
The calculations assume no shares were bought or sold during the period. Your actual costs may have been higher or lower, depending on the amount of your investment and the timing of any purchases or redemptions.
You can find more information about the fund’s expenses, including annual expense ratios, in the Financial Statements section of this report. For additional information on operating expenses and other shareholder costs, please refer to your fund’s current prospectus.
31
| Six Months Ended December 31, 2013 | |||
| Beginning | Ending | Expenses | |
| Account Value | Account Value | Paid During | |
| Total Bond Market Index Fund | 6/30/2013 | 12/31/2013 | Period |
| Based on Actual Fund Return | |||
| Investor Shares | $1,000.00 | $1,002.86 | $1.01 |
| Admiral Shares | 1,000.00 | 1,003.46 | 0.40 |
| Signal Shares | 1,000.00 | 1,003.46 | 0.40 |
| Institutional Shares | 1,000.00 | 1,003.51 | 0.35 |
| Institutional Plus Shares | 1,000.00 | 1,003.61 | 0.25 |
| ETF Shares | 1,000.00 | 1,003.15 | 0.40 |
| Based on Hypothetical 5% Yearly Return | |||
| Investor Shares | $1,000.00 | $1,024.20 | $1.02 |
| Admiral Shares | 1,000.00 | 1,024.80 | 0.41 |
| Signal Shares | 1,000.00 | 1,024.80 | 0.41 |
| Institutional Shares | 1,000.00 | 1,024.85 | 0.36 |
| Institutional Plus Shares | 1,000.00 | 1,024.95 | 0.26 |
| ETF Shares | 1,000.00 | 1,024.80 | 0.41 |
The calculations are based on expenses incurred in the most recent six-month period. The fund’s annualized six-month expense ratios for that period are 0.20% for Investor Shares, 0.08% for Admiral Shares, 0.08% for Signal Shares, 0.07% for Institutional Shares, 0.05% for Institutional Plus Shares, and 0.08% for ETF Shares. The dollar amounts shown as “Expenses Paid” are equal to the annualized expense ratio multiplied by the average account value over the period, multiplied by the number of days in the most recent six-month period, then divided by the number of days in the most recent 12-month period.
32
Glossary
30-Day SEC Yield. A fund’s 30-day SEC yield is derived using a formula specified by the U.S. Securities and Exchange Commission. Under the formula, data related to the fund’s security holdings in the previous 30 days are used to calculate the fund’s hypothetical net income for that period, which is then annualized and divided by the fund’s estimated average net assets over the calculation period. For the purposes of this calculation, a security’s income is based on its current market yield to maturity (for bonds), its actual income (for asset-backed securities), or its projected dividend yield (for stocks). Because the SEC yield represents hypothetical annualized income, it will differ—at times significantly—from the fund’s actual experience. As a result, the fund’s income distributions may be higher or lower than implied by the SEC yield.
Average Coupon. The average interest rate paid on the fixed income securities held by a fund. It is expressed as a percentage of face value.
Average Duration. An estimate of how much the value of the bonds held by a fund will fluctuate in response to a change in interest rates. To see how the value could change, multiply the average duration by the change in rates. If interest rates rise by 1 percentage point, the value of the bonds in a fund with an average duration of five years would decline by about 5%. If rates decrease by a percentage point, the value would rise by 5%.
Average Effective Maturity. The average length of time until fixed income securities held by a fund reach maturity and are repaid, taking into consideration the possibility that the issuer may call the bond before its maturity date. The figure reflects the proportion of fund assets represented by each security; it also reflects any futures contracts held. In general, the longer the average effective maturity, the more a fund’s share price will fluctuate in response to changes in market interest rates.
Beta. A measure of the magnitude of a fund’s past share-price fluctuations in relation to the ups and downs of a given market index. The index is assigned a beta of 1.00. Compared with a given index, a fund with a beta of 1.20 typically would have seen its share price rise or fall by 12% when the index rose or fell by 10%. For this report, beta is based on returns over the past 36 months for both the fund and the index. Note that a fund’s beta should be reviewed in conjunction with its R-squared (see definition). The lower the R-squared, the less correlation there is between the fund and the index, and the less reliable beta is as an indicator of volatility.
Credit Quality. Credit-quality ratings are measured on a scale that generally ranges from AAA (highest) to D (lowest). “Not Rated” is used to classify securities for which a rating is not available. U.S. Treasury, U.S. Agency, and U.S. Agency mortgage-backed securities appear under “U.S. Government.” Credit-quality ratings are obtained from Barclays using ratings generally derived from Moody’s, Fitch, and S&P. When ratings from all three agencies are used, the median rating is shown. When ratings from two of the agencies are used, the lower rating is shown.
Expense Ratio. A fund’s total annual operating expenses expressed as a percentage of the fund’s average net assets. The expense ratio includes management and administrative expenses, but does not include the transaction costs of buying and selling portfolio securities.
Inception Date. The date on which the assets of a fund (or one of its share classes) are first invested in accordance with the fund’s investment objective. For funds with a subscription period, the inception date is the day after that period ends. Investment performance is measured from the inception date.
33
R-Squared. A measure of how much of a fund’s past returns can be explained by the returns from the market in general, as measured by a given index. If a fund’s total returns were precisely synchronized with an index’s returns, its R-squared would be 1.00. If the fund’s returns bore no relationship to the index’s returns, its R-squared would be 0. For this report, R-squared is based on returns over the past 36 months for both the fund and the index.
Short-Term Reserves. The percentage of a fund invested in highly liquid, short-term securities that can be readily converted to cash.
Yield to Maturity. The rate of return an investor would receive if the fixed income securities held by a fund were held to their maturity dates.
Benchmark Information
Spliced Barclays U.S. Aggregate Float Adjusted Index: Barclays U.S. Aggregate Bond Index through December 31, 2009; Barclays U.S. Aggregate Float Adjusted Index thereafter.
Spliced Intermediate Investment-Grade Debt Funds Average: Intermediate U.S. Government Funds Average through December 31, 2001; Intermediate Investment-Grade Debt Funds Average through August 31, 2013; Core Bond Funds Average thereafter.
34
This page intentionally left blank.
The People Who Govern Your Fund
The trustees of your mutual fund are there to see that the fund is operated and managed in your best interests since, as a shareholder, you are a part owner of the fund. Your fund’s trustees also serve on the board of directors of The Vanguard Group, Inc., which is owned by the Vanguard funds and provides services to them on an at-cost basis.
A majority of Vanguard’s board members are independent, meaning that they have no affiliation with Vanguard or the funds they oversee, apart from the sizable personal investments they have made as private individuals. The independent board members have distinguished backgrounds in business, academia, and public service. Each of the trustees and executive officers oversees 182 Vanguard funds.
The following table provides information for each trustee and executive officer of the fund. More information about the trustees is in the Statement of Additional Information, which can be obtained, without charge, by contacting Vanguard at 800-662-7447, or online at vanguard.com.
| InterestedTrustee1 | and Delphi Automotive LLP (automotive components); |
| Senior Advisor at New Mountain Capital; Trustee of | |
| F. William McNabb III | The Conference Board. |
| Born 1957. Trustee Since July 2009. Chairman of the | |
| Board. Principal Occupation(s) During the Past Five | Amy Gutmann |
| Years: Chairman of the Board of The Vanguard Group, | Born 1949. Trustee Since June 2006. Principal |
| Inc., and of each of the investment companies served | Occupation(s) During the Past Five Years: President |
| by The Vanguard Group, since January 2010; Director | of the University of Pennsylvania; Christopher H. |
| of The Vanguard Group since 2008; Chief Executive | Browne Distinguished Professor of Political Science |
| Officer and President of The Vanguard Group and of | in the School of Arts and Sciences with secondary |
| each of the investment companies served by The | appointments at the Annenberg School for |
| Vanguard Group since 2008; Director of Vanguard | Communication and the Graduate School of Education |
| Marketing Corporation; Managing Director of The | of the University of Pennsylvania; Member of the |
| Vanguard Group (1995–2008). | National Commission on the Humanities and Social |
| Sciences; Trustee of Carnegie Corporation of New | |
| IndependentTrustees | York and of the National Constitution Center; Chair |
| of the U.S. Presidential Commission for the Study | |
| Emerson U. Fullwood | of Bioethical Issues. |
| Born 1948. Trustee Since January 2008. Principal | |
| Occupation(s) During the Past Five Years: Executive | JoAnn Heffernan Heisen |
| Chief Staff and Marketing Officer for North America | Born 1950. Trustee Since July 1998. Principal |
| and Corporate Vice President (retired 2008) of Xerox | Occupation(s) During the Past Five Years: Corporate |
| Corporation (document management products and | Vice President and Chief Global Diversity Officer |
| services); Executive in Residence and 2010 | (retired 2008) and Member of the Executive |
| Distinguished Minett Professor at the Rochester | Committee (1997–2008) of Johnson & Johnson |
| Institute of Technology; Director of SPX Corporation | (pharmaceuticals/medical devices/consumer |
| (multi-industry manufacturing), the United Way of | products); Director of Skytop Lodge Corporation |
| Rochester, Amerigroup Corporation (managed health | (hotels), the University Medical Center at Princeton, |
| care), the University of Rochester Medical Center, | the Robert Wood Johnson Foundation, and the Center |
| Monroe Community College Foundation, and North | for Talent Innovation; Member of the Advisory Board |
| Carolina A&T University. | of the Maxwell School of Citizenship and Public Affairs |
| at Syracuse University. | |
| Rajiv L. Gupta | F. Joseph Loughrey |
| Born 1945. Trustee Since December 2001.2 | Born 1949. Trustee Since October 2009. Principal |
| Principal Occupation(s) During the Past Five Years: | Occupation(s) During the Past Five Years: President |
| Chairman and Chief Executive Officer (retired 2009) | and Chief Operating Officer (retired 2009) of Cummins |
| and President (2006–2008) of Rohm and Haas Co. | Inc. (industrial machinery); Chairman of the Board of |
| (chemicals); Director of Tyco International, Ltd. | Hillenbrand, Inc. (specialized consumer services) and |
| (diversified manufacturing and services), Hewlett- | of Oxfam America; Director of SKF AB (industrial |
| Packard Co. (electronic computer manufacturing), | |
| machinery), Hyster-Yale Materials Handling, Inc. | Executive Officers | |
| (forklift trucks), and the Lumina Foundation for | ||
| Education; Member of the Advisory Council for the | Glenn Booraem | |
| College of Arts and Letters and of the Advisory Board | Born 1967. Controller Since July 2010. Principal | |
| to the Kellogg Institute for International Studies, both | Occupation(s) During the Past Five Years: Principal | |
| at the University of Notre Dame. | of The Vanguard Group, Inc.; Controller of each of | |
| the investment companies served by The Vanguard | ||
| Mark Loughridge | Group; Assistant Controller of each of the investment | |
| Born 1953. Trustee Since March 2012. Principal | companies served by The Vanguard Group (2001–2010). | |
| Occupation(s) During the Past Five Years: Senior Vice | ||
| President and Chief Financial Officer at IBM (information | Thomas J. Higgins | |
| technology services); Fiduciary Member of IBM’s | Born 1957. Chief Financial Officer Since September | |
| Retirement Plan Committee. | 2008. Principal Occupation(s) During the Past Five | |
| Years: Principal of The Vanguard Group, Inc.; Chief | ||
| Scott C. Malpass | Financial Officer of each of the investment companies | |
| Born 1962. Trustee Since March 2012. Principal | served by The Vanguard Group; Treasurer of each of | |
| Occupation(s) During the Past Five Years: Chief | the investment companies served by The Vanguard | |
| Investment Officer and Vice President at the University | Group (1998–2008). | |
| of Notre Dame; Assistant Professor of Finance at the | ||
| Mendoza College of Business at Notre Dame; Member | Kathryn J. Hyatt | |
| of the Notre Dame 403(b) Investment Committee; | Born 1955. Treasurer Since November 2008. Principal | |
| Director of TIFF Advisory Services, Inc. (investment | Occupation(s) During the Past Five Years: Principal of | |
| advisor); Member of the Investment Advisory | The Vanguard Group, Inc.; Treasurer of each of the | |
| Committees of the Financial Industry Regulatory | investment companies served by The Vanguard | |
| Authority (FINRA) and of Major League Baseball. | Group; Assistant Treasurer of each of the investment | |
| companies served by The Vanguard Group (1988–2008). | ||
| André F. Perold | ||
| Born 1952. Trustee Since December 2004. Principal | Heidi Stam | |
| Occupation(s) During the Past Five Years: George | Born 1956. Secretary Since July 2005. Principal | |
| Gund Professor of Finance and Banking at the Harvard | Occupation(s) During the Past Five Years: Managing | |
| Business School (retired 2011); Chief Investment | Director of The Vanguard Group, Inc.; General Counsel | |
| Officer and Managing Partner of HighVista Strategies | of The Vanguard Group; Secretary of The Vanguard | |
| LLC (private investment firm); Director of Rand | Group and of each of the investment companies | |
| Merchant Bank; Overseer of the Museum of Fine | served by The Vanguard Group; Director and Senior | |
| Arts Boston. | Vice President of Vanguard Marketing Corporation. | |
| Alfred M. Rankin, Jr. | ||
| Vanguard Senior ManagementTeam | ||
| Born 1941. Trustee Since January 1993. Principal | ||
| Occupation(s) During the Past Five Years: Chairman, | Mortimer J. Buckley | Chris D. McIsaac |
| President, and Chief Executive Officer of NACCO | Kathleen C. Gubanich | Michael S. Miller |
| Industries, Inc. (housewares/lignite) and of Hyster-Yale | Paul A. Heller | James M. Norris |
| Materials Handling, Inc. (forklift trucks); Director of | Martha G. King | Glenn W. Reed |
| the National Association of Manufacturers; Chairman | John T. Marcante | |
| of the Board of University Hospitals of Cleveland; | ||
| Advisory Chairman of the Board of The Cleveland | ||
| Museum of Art. | Chairman Emeritus and Senior Advisor | |
| Peter F. Volanakis | John J. Brennan | |
| Born 1955. Trustee Since July 2009. Principal | Chairman, 1996–2009 | |
| Occupation(s) During the Past Five Years: President | Chief Executive Officer and President, 1996–2008 | |
| and Chief Operating Officer (retired 2010) of Corning | ||
| Incorporated (communications equipment); Director | Founder | |
| of SPX Corporation (multi-industry manufacturing); | ||
| Overseer of the Amos Tuck School of Business | John C. Bogle | |
| Administration at Dartmouth College; Advisor to the | Chairman and Chief Executive Officer, 1974–1996 | |
| Norris Cotton Cancer Center. | ||
1 Mr. McNabb is considered an “interested person,” as defined in the Investment Company Act of 1940, because he is an officer of the Vanguard funds.
2 December 2002 for Vanguard Equity Income Fund, Vanguard Growth Equity Fund, the Vanguard Municipal Bond Funds, and the Vanguard State Tax-Exempt Funds.
 | |
| P.O. Box 2600 | |
| Valley Forge, PA 19482-2600 |
Connect with Vanguard® > vanguard.com
| The Vanguard ETFs are not sponsored, endorsed, sold, | |
| Fund Information > 800-662-7447 | or promoted by Barclays. Barclays does not make any |
| Direct Investor Account Services > 800-662-2739 | representation regarding the advisability of investing in |
| Institutional Investor Services > 800-523-1036 | Vanguard ETFs or the advisability of investing in |
| Text Telephone for People | securities generally. Barclays’ only relationship with |
| With Hearing Impairment > 800-749-7273 | Vanguard is the licensing of the Index, which is |
| determined, composed, and calculated by Barclays | |
| This material may be used in conjunction | without regard to Vanguard or the Vanguard ETFs. |
| with the offering of shares of any Vanguard | Barclays has no obligation to take the needs of |
| fund only if preceded or accompanied by | Vanguard or the owners of the Vanguard ETFs into |
| the fund’s current prospectus. | consideration in determining, composing, or calculating |
| the Index. Barclays has no obligation or liability in | |
| All comparative mutual fund data are from Lipper, a | connection with administration, marketing, or trading |
| Thomson Reuters Company, or Morningstar, Inc., unless | of the Vanguard ETFs. Source of index data: Barclays |
| otherwise noted. | Global Family of Indices. Copyright 2014, Barclays. All |
| rights reserved. | |
| You can obtain a free copy of Vanguard’s proxy voting | |
| guidelines by visiting vanguard.com/proxyreporting or by | |
| calling Vanguard at 800-662-2739. The guidelines are | |
| also available from the SEC’s website, sec.gov. In | |
| addition, you may obtain a free report on how your fund | |
| voted the proxies for securities it owned during the 12 | |
| months ended June 30. To get the report, visit either | |
| vanguard.com/proxyreporting or sec.gov. | |
| You can review and copy information about your fund at | |
| the SEC’s Public Reference Room in Washington, D.C. To | |
| find out more about this public service, call the SEC at | |
| 202-551-8090. Information about your fund is also | |
| available on the SEC’s website, and you can receive | |
| copies of this information, for a fee, by sending a | |
| request in either of two ways: via e-mail addressed to | |
| publicinfo@sec.gov or via regular mail addressed to the | |
| Public Reference Section, Securities and Exchange | |
| Commission, Washington, DC 20549-1520. | |
| © 2014 The Vanguard Group, Inc. | |
| All rights reserved. | |
| Vanguard Marketing Corporation, Distributor. | |
| Q840 022014 | |
|
| Annual Report | December 31, 2013 |
| Vanguard Total Bond Market II Index Fund |
 |
Vanguard’s Principles for Investing Success
We want to give you the best chance of investment success. These principles,
grounded in Vanguard’s research and experience, can put you on the right path.
Goals. Create clear, appropriate investment goals.
Balance. Develop a suitable asset allocation using broadly diversified funds.
Cost. Minimize cost.
Discipline. Maintain perspective and long-term discipline.
A single theme unites these principles: Focus on the things you can control.
We believe there is no wiser course for any investor.
| Contents | |
| Your Fund’s Total Returns. | 1 |
| Chairman’s Letter. | 2 |
| Fund Profile. | 8 |
| Performance Summary. | 9 |
| Financial Statements. | 11 |
| About Your Fund’s Expenses. | 126 |
| Glossary. | 128 |
Please note: The opinions expressed in this report are just that—informed opinions. They should not be considered promises or advice. Also, please keep in mind that the information and opinions cover the period through the date on the front of this report. Of course, the risks of investing in your fund are spelled out in the prospectus.
See the Glossary for definitions of investment terms used in this report.
About the cover: The ship’s wheel represents leadership and guidance, essential qualities in navigating difficult seas. This one is a replica based on an 18th-century British vessel. The HMSVanguard, another ship of that era, served as the flagship for British Admiral Horatio Nelson when he defeated a French fleet at the Battle of the Nile.
Your Fund’s Total Returns
| Fiscal Year Ended December 31, 2013 | ||||
| 30-Day SEC | Income | Capital | Total | |
| Yield | Returns | Returns | Returns | |
| Vanguard Total Bond Market II Index Fund | ||||
| Investor Shares | 2.05% | 2.00% | -4.26% | -2.26% |
| Institutional Shares | 2.12 | 2.06 | -4.26 | -2.20 |
| Barclays U.S. Aggregate Float Adjusted Index | -1.97 | |||
| Spliced Core Bond Funds Average | -1.78 |
For a benchmark description, see the Glossary.
Spliced Core Bond Funds Average: Derived from data provided by Lipper, a Thomson Reuters Company.
Institutional Shares are designed for eligible institutional investors who meet specific administrative, service, and account-size criteria.
| Your Fund’s Performance at a Glance | ||||
| December 31, 2012, Through December 31, 2013 | ||||
| Distributions Per Share | ||||
| Starting | Ending | |||
| Share | Share | Income | Capital | |
| Price | Price | Dividends | Gains | |
| Vanguard Total Bond Market II Index Fund | ||||
| Investor Shares | $10.97 | $10.49 | $0.221 | $0.013 |
| Institutional Shares | 10.97 | 10.49 | 0.228 | 0.013 |
1

Chairman’s Letter
Dear Shareholder,
While domestic stocks enjoyed a banner year in 2013 as investors became more confident about the health of the economy, the broad U.S. taxable bond market posted its first calendar-year loss in more than a decade. Concern about when the Federal Reserve might begin to reduce its massive bond-buying program contributed to a sharp rise in bond yields, especially for higher-rated and longer-dated securities.
Because bond yields and prices move in opposite directions, U.S. bonds rated investment grade (as determined by independent credit agencies) as a whole experienced price declines over the year. With less than half those losses being offset by income earned, Investor Shares of the Total Bond Market II Index Fund returned –2.26% for the 12 months ended December 31, 2013. That performance nearly matched the –1.97% return of the fund’s expense-free benchmark but lagged the average return of –1.78% for its peer group, which includes actively managed funds.
Falling bond prices pushed the 30-day SEC yield for the fund’s Investor Shares up to 2.05% on December 31, compared with 1.41% a year earlier.
Before moving on to discuss the markets, I want to mention an important transition at Vanguard. We announced in November that Robert F. Auwaerter, principal and head of Vanguard’s Fixed Income Group,
2
intends to retire in March 2014. At the conclusion of this letter, I’ll have more to say about Bob’s important contributions to Vanguard in his 32-year career, and I’ll introduce his successor, Gregory Davis.
Bond returns faltered as the Fed’s phaseout loomed
The broad U.S. taxable bond market returned –2.02% in 2013, its first negative calendar-year return since 1999, when it returned –0.82%, as investors sold bonds in anticipation of further price declines. Municipal bonds returned –2.55% in aggregate.
International bond markets (as measured by the Barclays Global Aggregate Index ex USD) returned –3.08%. As for money market funds and savings accounts, returns remained tiny as the Fed held short-term interest rates between 0% and 0.25%.
Earnings, optimism, and stimulus made it a big year for U.S. stocks
For the 12 months ended December 31, U.S. stocks surged about 34%, their best calendar-year finish since 1995. Corporations posted solid earnings, and investors placed a higher premium on those earnings; the Fed’s easy monetary policy also supported stock markets.
International stocks, in aggregate, returned about 15%, with the developed markets of Europe and the Pacific region posting double-digit results and emerging-market stocks dipping into negative territory.
| Market Barometer | |||
| Average Annual Total Returns | |||
| Periods Ended December 31, 2013 | |||
| One | Three | Five | |
| Year | Years | Years | |
| Bonds | |||
| Barclays U.S. Aggregate Bond Index (Broad taxable | |||
| market) | -2.02% | 3.26% | 4.44% |
| Barclays Municipal Bond Index (Broad tax-exempt market) | -2.55 | 4.83 | 5.89 |
| Citigroup Three-Month U.S. Treasury Bill Index | 0.05 | 0.06 | 0.09 |
| Stocks | |||
| Russell 1000 Index (Large-caps) | 33.11% | 16.30% | 18.59% |
| Russell 2000 Index (Small-caps) | 38.82 | 15.67 | 20.08 |
| Russell 3000 Index (Broad U.S. market) | 33.55 | 16.24 | 18.71 |
| MSCI All Country World Index ex USA (International) | 15.29 | 5.14 | 12.81 |
| CPI | |||
| Consumer Price Index | 1.50% | 2.07% | 2.08% |
3
For 2014, Vanguard Chief Economist Joe Davis and his team are guarded in their outlook for global stock returns, and their forecast for the bond market remains muted. While Joe readily acknowledges that such forecasts are accompanied by uncertainty, he writes, “We believe a balanced and diversified, low-cost portfolio can remain a high-value proposition in the decade ahead.” (You can read more about our expectations for bond and stock returns in Vanguard’s Economic and Investment Outlook, available at vanguard.com/ research.)
All eyes were on the Federal Reserve as it announced ‘tapering’
Throughout 2013, the Federal Reserve bought about $40 billion per month of mortgage bonds to support the housing market and about $45 billion per month of Treasuries to hold borrowing costs down for households and businesses. Given the magnitude of this support, it was not surprising that the bond market swooned in the spring when Fed officials signaled that further improvements in the housing and labor markets might warrant a “tapering” of its purchases. The suspense over when the Fed might act ended in December with its announcement that gradual decreases would begin in January 2014.
The prospect of a more solid footing for the economy and less accommodation from the Fed affected Treasuries the most. The yield of the 3-year Treasury note climbed 40 basis points over the year to 0.76%, while the 10-year yield jumped
| Expense Ratios | |||
| Your Fund Compared With Its Peer Group | |||
| Investor | Institutional | Peer Group | |
| Shares | Shares | Average | |
| Total Bond Market II Index Fund | 0.12% | 0.05% | 0.84% |
The fund expense ratios shown are from the prospectus dated April 29, 2013, and represent estimated costs for the current fiscal year. For the fiscal year ended December 31, 2013, the fund’s expense ratios were 0.12% for Investor Shares and 0.05% for Institutional Shares. The peer-group expense ratio is derived from data provided by Lipper, a Thomson Reuters Company, and captures information through year-end 2012.
Peer group: Core Bond Funds Average.
4
121 basis points to 2.97%. (A basis point is one-hundredth of a percentage point.) The resulting decline in prices put the return for Treasuries, which made up roughly 40% of the fund’s assets, at –2.75% for the 12-month period. Long-term Treasuries, which are more sensitive to interest rate movements, lost more than four times that amount.
The higher yields generally available from bonds outside of Treasuries meant those securities produced more income to counter price declines. Government mortgage-backed securities, another heavyweight sector that accounted for a little less than one-quarter of the portfolio at the end of the year, had yields higher than comparable Treasuries primarily because they carry the additional risk of prepayment. They returned –1.41% for the year.
Corporate bonds, representing more than one-fifth of the fund, returned –1.53%. But here, too, riskier, higher-yielding investment-grade bonds weathered the rise in interest rates better than their higher-rated counterparts. Corporate bonds rated Baa by Moody’s Investors Service returned –0.93%, while those rated Aaa returned –4.69%.
Financials produced a positive return as investor sentiment toward the sector continued to improve, while industrials and utilities turned in negative results. Shorter-term corporate bonds held up better than their longer-term counterparts.
| Total Returns | |
| Inception Through December 31, 2013 | |
| Average | |
| Annual Return | |
| Total Bond Market II Index Fund Investor Shares (Returns since inception: 1/26/2009) | 4.39% |
| Spliced Barclays U.S. Aggregate Float Adjusted Index | 4.65 |
| Spliced Core Bond Funds Average | 6.22 |
For a benchmark description, see the Glossary.
Spliced Core Bond Funds Average: Derived from data provided by Lipper, a Thomson Reuters Company.
The figures shown represent past performance, which is not a guarantee of future results. (Current performance may be lower or higher than the performance data cited. For performance data current to the most recent month-end, visit our website at vanguard.com/performance.) Note, too, that both investment returns and principal value can fluctuate widely, so an investor’s shares, when sold, could be worth more or less than their original cost.
5
The fund has a short but solid track record
Vanguard Total Bond Market II Index Fund was launched about five years ago. The fund’s average annual return for that period was 4.39%, not far off that of its benchmark (4.65%).
Credit for this good start is due to the fund’s advisor, the Vanguard Fixed Income Group, whose deep experience and sophisticated portfolio tracking techniques have enabled the fund to track the performance of its benchmark closely while keeping the costs associated with doing that very low.
Bob Auwaerter’s retirement marks the end of a remarkable era
In mid-September 2008, about two weeks after I succeeded Jack Brennan as Vanguard’s chief executive officer, Lehman Brothers went bankrupt, igniting the nation’s worst financial crisis in 70 years. It was, to put it mildly, an extremely challenging time. Through it all, I was able to depend on Bob Auwaerter’s strong command of the Fixed Income Group, which persevered under these treacherous conditions. Although that was a difficult period for Vanguard and the industry, it was far from the only time I was grateful to have Bob at the helm of our bond group.
Bob, who joined Vanguard in 1981, was an original member of the three-person Fixed Income Group, headed by Ian MacKinnon. Over the years, Bob held various leadership roles in the department, and he eventually succeeded Ian as its head in 2003. He earned a reputation at Vanguard and within the industry as an extremely dedicated, honest, and insightful decision-maker and leader.
The Fixed Income Group that Bob helped start had total assets of about $1.3 billion in seven funds. He tracked his positions in the two funds he managed on index cards stored in a small metal box. Thirty-two years later, the 120-person group oversees $750 billion, which represents nearly one-third of Vanguard’s assets under management.
On behalf of our clients, I thank Bob for more than three decades of exemplary service and wish him the best in his retirement.
We’re fortunate that Greg Davis will become the head of the Fixed Income Group. Greg currently serves as chief investment officer for the Asia Pacific region and as a director of Vanguard Investments Australia. He joined Vanguard in 1999 and has been head of bond indexing and a senior portfolio
6
manager in the Fixed Income Group. Greg is an eminently qualified successor and has a strong commitment to the Vanguard way of investing. I couldn’t be more confident in his ability to lead the Fixed Income Group and its deep and talented team.
As always, thank you for investing with Vanguard.
Sincerely,

F. William McNabb III
Chairman and Chief Executive Officer
January 22, 2014
7
Total Bond Market II Index Fund
Fund Profile
As of December 31, 2013
| Share-Class Characteristics | ||
| Investor | Institutional | |
| Shares | Shares | |
| Ticker Symbol | VTBIX | VTBNX |
| Expense Ratio1 | 0.12% | 0.05% |
| 30-Day SEC Yield | 2.05% | 2.12% |
| Financial Attributes | ||
| Barclays | ||
| Aggregate | ||
| Float Adj | ||
| Fund | Index | |
| Number of Bonds | 5,121 | 8,701 |
| Yield to Maturity | ||
| (before expenses) | 2.4% | 2.4% |
| Average Coupon | 3.2% | 3.3% |
| Average Duration | 5.5 years | 5.5 years |
| Average Effective | ||
| Maturity | 7.4 years | 7.5 years |
| Short-Term | ||
| Reserves | 0.1% | — |
| Sector Diversification (% of portfolio) | |
| Asset-Backed | 0.4% |
| Commercial Mortgage-Backed | 1.7 |
| Finance | 7.9 |
| Foreign | 6.1 |
| Government Mortgage-Backed | 22.0 |
| Industrial | 13.7 |
| Treasury/Agency | 44.8 |
| Utilities | 2.7 |
| Other | 0.7 |
The agency and mortgage-backed securities sectors may include issues from government-sponsored enterprises; such issues are generally not backed by the full faith and credit of the U.S. government.
| Volatility Measures | |
| Barclays | |
| Aggregate | |
| Float Adj | |
| Index | |
| R-Squared | 0.99 |
| Beta | 1.01 |
These measures show the degree and timing of the fund’s fluctuations compared with the index over 36 months.
| Distribution by Effective Maturity | |
| (% of portfolio) | |
| Under 1 Year | 3.1% |
| 1 - 3 Years | 26.3 |
| 3 - 5 Years | 19.6 |
| 5 - 10 Years | 34.9 |
| 10 - 20 Years | 6.6 |
| 20 - 30 Years | 9.1 |
| Over 30 Years | 0.4 |
| Distribution by Credit Quality (% of portfolio) | |
| U.S. Government | 66.8% |
| Aaa | 4.7 |
| Aa | 3.9 |
| A | 12.0 |
| Baa | 12.6 |
For information about these ratings, see the Glossary entry for Credit Quality.
Investment Focus
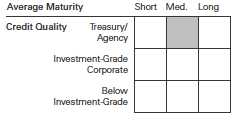
1 The expense ratios shown are from the prospectus dated April 29, 2013, and represent estimated costs for the current fiscal year. For the fiscal year ended December 31, 2013, the expense ratios were 0.12% for Investor Shares and 0.05% for Institutional Shares.
8
Total Bond Market II Index Fund
Performance Summary
All of the returns in this report represent past performance, which is not a guarantee of future results that may be achieved by the fund. (Current performance may be lower or higher than the performance data cited. For performance data current to the most recent month-end, visit our website at vanguard.com/performance.) Note, too, that both investment returns and principal value can fluctuate widely, so an investor’s shares, when sold, could be worth more or less than their original cost. The returns shown do not reflect taxes that a shareholder would pay on fund distributions or on the sale of fund shares.
Cumulative Performance: January 26, 2009, Through December 31, 2013
Initial Investment of $10,000
| Average Annual Total Returns | |||
| Periods Ended December 31, 2013 | |||
| Since | Final Value | ||
| One | Inception | of a $10,000 | |
| Year | (1/26/2009) | Investment | |
| Total Bond Market II Index Fund | |||
| Investor Shares | -2.26% | 4.39% | $12,359 |
| Spliced Barclays U.S. Aggregate Float | |||
| Adjusted Index | -1.97 | 4.65 | 12,514 |
| Spliced Core Bond Funds Average | -1.78 | 6.22 | 13,465 |
For a benchmark description, see the Glossary.
Spliced Core Bond Funds Average: Derived from data provided by Lipper, a Thomson Reuters Company.
"Since Inception" performance is calculated from the Investor Shares’ inception date for both the fund and its comparative standards.
| Since | Final Value | ||
| One | Inception | of a $5,000,000 | |
| Year | (2/17/2009) | Investment | |
| Total Bond Market II Index Fund Institutional | |||
| Shares | -2.20% | 4.39% | $6,163,924 |
| Spliced Barclays U.S. Aggregate Float | |||
| Adjusted Index | -1.97 | 4.62 | 6,228,499 |
| "Since Inception" performance is calculated from the Institutional Shares’ inception date for both the fund and its comparative standard. | |||
See Financial Highlights for dividend and capital gains information.
9
Total Bond Market II Index Fund
| Fiscal-Year Total Returns (%): January 26, 2009, Through December 31, 2013 | ||||
| Spliced | ||||
| Barclays | ||||
| Aggregate | ||||
| Investor Shares | FA Index | |||
| Fiscal Year | Income Returns | Capital Returns | Total Returns | Total Returns |
| 2009 | 3.68% | 2.60% | 6.28% | 6.39% |
| 2010 | 3.42 | 3.00 | 6.42 | 6.58 |
| 2011 | 3.11 | 4.48 | 7.59 | 7.92 |
| 2012 | 2.36 | 1.55 | 3.91 | 4.32 |
| 2013 | 2.00 | -4.26 | -2.26 | -1.97 |
| For a benchmark description, see the Glossary. | ||||
10
Total Bond Market II Index Fund
Financial Statements
Statement of Net Assets
As of December 31, 2013
The fund reports a complete list of its holdings in regulatory filings four times in each fiscal year, at the quarter-ends. For the second and fourth fiscal quarters, the lists appear in the fund’s semiannual and annual reports to shareholders. For the first and third fiscal quarters, the fund files the lists with the Securities and Exchange Commission on Form N-Q. Shareholders can look up the fund’s Forms N-Q on the SEC’s website at sec.gov. Forms N-Q may also be reviewed and copied at the SEC’s Public Reference Room (see the back cover of this report for further information).
| Face | Market | |||
| Maturity | Amount | Value | ||
| Coupon | Date | ($000) | ($000) | |
| U.S. Government and Agency Obligations (67.9%) | ||||
| U.S. Government Securities (41.9%) | ||||
| United States Treasury Note/Bond | 0.375% | 11/15/14 | 210,245 | 210,640 |
| United States Treasury Note/Bond | 2.125% | 11/30/14 | 121,075 | 123,213 |
| United States Treasury Note/Bond | 0.250% | 12/15/14 | 165,845 | 165,974 |
| United States Treasury Note/Bond | 0.125% | 12/31/14 | 274,378 | 274,293 |
| United States Treasury Note/Bond | 2.625% | 12/31/14 | 850,725 | 871,330 |
| United States Treasury Note/Bond | 0.250% | 1/15/15 | 301,045 | 301,280 |
| United States Treasury Note/Bond | 2.250% | 1/31/15 | 105,850 | 108,215 |
| United States Treasury Note/Bond | 0.250% | 2/15/15 | 209,419 | 209,582 |
| United States Treasury Note/Bond | 4.000% | 2/15/15 | 4,570 | 4,763 |
| United States Treasury Note/Bond | 11.250% | 2/15/15 | 159,350 | 178,969 |
| United States Treasury Note/Bond | 0.250% | 2/28/15 | 168,275 | 168,379 |
| United States Treasury Note/Bond | 2.375% | 2/28/15 | 1,000 | 1,025 |
| United States Treasury Note/Bond | 0.375% | 3/15/15 | 37,375 | 37,451 |
| United States Treasury Note/Bond | 0.250% | 3/31/15 | 133,150 | 133,213 |
| United States Treasury Note/Bond | 0.375% | 4/15/15 | 348,550 | 349,366 |
| United States Treasury Note/Bond | 0.125% | 4/30/15 | 3,275 | 3,271 |
| United States Treasury Note/Bond | 0.250% | 5/15/15 | 134,075 | 134,158 |
| United States Treasury Note/Bond | 4.125% | 5/15/15 | 126,175 | 132,877 |
| United States Treasury Note/Bond | 0.250% | 5/31/15 | 35,570 | 35,587 |
| United States Treasury Note/Bond | 2.125% | 5/31/15 | 925 | 950 |
| United States Treasury Note/Bond | 0.375% | 6/15/15 | 142,375 | 142,664 |
| United States Treasury Note/Bond | 1.875% | 6/30/15 | 163,800 | 167,767 |
| United States Treasury Note/Bond | 0.250% | 7/15/15 | 593,435 | 593,435 |
| United States Treasury Note/Bond | 0.250% | 7/31/15 | 30,000 | 29,995 |
| United States Treasury Note/Bond | 1.750% | 7/31/15 | 15,000 | 15,349 |
| United States Treasury Note/Bond | 0.250% | 8/15/15 | 444,982 | 444,844 |
| United States Treasury Note/Bond | 4.250% | 8/15/15 | 34,850 | 37,077 |
| United States Treasury Note/Bond | 10.625% | 8/15/15 | 1,775 | 2,070 |
| United States Treasury Note/Bond | 1.250% | 8/31/15 | 25,000 | 25,398 |
| United States Treasury Note/Bond | 0.250% | 9/15/15 | 181,000 | 180,830 |
| United States Treasury Note/Bond | 0.250% | 9/30/15 | 147,500 | 147,361 |
| United States Treasury Note/Bond | 0.250% | 10/15/15 | 284,695 | 284,294 |
| United States Treasury Note/Bond | 0.250% | 10/31/15 | 42,875 | 42,815 |
| United States Treasury Note/Bond | 1.250% | 10/31/15 | 193,835 | 197,045 |
| United States Treasury Note/Bond | 0.375% | 11/15/15 | 402,568 | 402,818 |
| United States Treasury Note/Bond | 4.500% | 11/15/15 | 29,850 | 32,159 |
| United States Treasury Note/Bond | 9.875% | 11/15/15 | 69,875 | 82,234 |
11
| Total Bond Market II Index Fund | ||||
| Face | Market | |||
| Maturity | Amount | Value | ||
| Coupon | Date | ($000) | ($000) | |
| United States Treasury Note/Bond | 1.375% | 11/30/15 | 115,425 | 117,662 |
| United States Treasury Note/Bond | 0.250% | 12/15/15 | 135,743 | 135,446 |
| United States Treasury Note/Bond | 0.250% | 12/31/15 | 600,000 | 598,314 |
| United States Treasury Note/Bond | 2.125% | 12/31/15 | 375,000 | 387,832 |
| United States Treasury Note/Bond | 0.375% | 1/15/16 | 364,102 | 363,989 |
| United States Treasury Note/Bond | 2.000% | 1/31/16 | 2,115 | 2,184 |
| United States Treasury Note/Bond | 0.375% | 2/15/16 | 406,825 | 406,443 |
| United States Treasury Note/Bond | 4.500% | 2/15/16 | 355,275 | 385,974 |
| United States Treasury Note/Bond | 9.250% | 2/15/16 | 17,000 | 20,156 |
| United States Treasury Note/Bond | 2.125% | 2/29/16 | 9,406 | 9,748 |
| United States Treasury Note/Bond | 0.375% | 3/15/16 | 336,750 | 336,225 |
| United States Treasury Note/Bond | 2.375% | 3/31/16 | 24,900 | 25,970 |
| United States Treasury Note/Bond | 0.250% | 5/15/16 | 571,700 | 568,127 |
| United States Treasury Note/Bond | 5.125% | 5/15/16 | 135,850 | 150,538 |
| United States Treasury Note/Bond | 7.250% | 5/15/16 | 48,425 | 56,067 |
| United States Treasury Note/Bond | 1.750% | 5/31/16 | 143,425 | 147,548 |
| United States Treasury Note/Bond | 3.250% | 5/31/16 | 3,050 | 3,247 |
| United States Treasury Note/Bond | 0.500% | 6/15/16 | 325,825 | 325,470 |
| United States Treasury Note/Bond | 1.500% | 6/30/16 | 26,537 | 27,147 |
| United States Treasury Note/Bond | 0.625% | 7/15/16 | 151,700 | 151,890 |
| United States Treasury Note/Bond | 1.500% | 7/31/16 | 69,500 | 71,085 |
| United States Treasury Note/Bond | 0.625% | 8/15/16 | 201,120 | 201,120 |
| United States Treasury Note/Bond | 4.875% | 8/15/16 | 22,875 | 25,413 |
| United States Treasury Note/Bond | 1.000% | 8/31/16 | 144,200 | 145,530 |
| United States Treasury Note/Bond | 3.000% | 8/31/16 | 84,375 | 89,622 |
| United States Treasury Note/Bond | 0.875% | 9/15/16 | 715,670 | 719,807 |
| United States Treasury Note/Bond | 1.000% | 9/30/16 | 91,350 | 92,121 |
| United States Treasury Note/Bond | 3.000% | 9/30/16 | 72,150 | 76,682 |
| United States Treasury Note/Bond | 0.625% | 10/15/16 | 206,400 | 206,012 |
| United States Treasury Note/Bond | 1.000% | 10/31/16 | 105,062 | 105,850 |
| United States Treasury Note/Bond | 3.125% | 10/31/16 | 102,475 | 109,329 |
| United States Treasury Note/Bond | 0.625% | 11/15/16 | 756,525 | 754,165 |
| United States Treasury Note/Bond | 0.875% | 11/30/16 | 125,208 | 125,599 |
| United States Treasury Note/Bond | 2.750% | 11/30/16 | 249,165 | 263,337 |
| United States Treasury Note/Bond | 0.625% | 12/15/16 | 500,000 | 497,970 |
| United States Treasury Note/Bond | 0.875% | 12/31/16 | 135,000 | 135,296 |
| United States Treasury Note/Bond | 3.250% | 12/31/16 | 86,325 | 92,584 |
| United States Treasury Note/Bond | 0.875% | 1/31/17 | 88,125 | 88,208 |
| United States Treasury Note/Bond | 3.125% | 1/31/17 | 212,675 | 227,362 |
| United States Treasury Note/Bond | 4.625% | 2/15/17 | 3,425 | 3,820 |
| United States Treasury Note/Bond | 0.875% | 2/28/17 | 95,521 | 95,491 |
| United States Treasury Note/Bond | 3.000% | 2/28/17 | 5,300 | 5,647 |
| United States Treasury Note/Bond | 1.000% | 3/31/17 | 109,355 | 109,594 |
| United States Treasury Note/Bond | 3.250% | 3/31/17 | 115,650 | 124,269 |
| United States Treasury Note/Bond | 0.875% | 4/30/17 | 587,650 | 585,817 |
| United States Treasury Note/Bond | 3.125% | 4/30/17 | 78,275 | 83,779 |
| United States Treasury Note/Bond | 4.500% | 5/15/17 | 36,125 | 40,308 |
| United States Treasury Note/Bond | 8.750% | 5/15/17 | 56,744 | 71,302 |
| United States Treasury Note/Bond | 0.625% | 5/31/17 | 95,260 | 94,010 |
| United States Treasury Note/Bond | 2.750% | 5/31/17 | 210,580 | 222,886 |
| United States Treasury Note/Bond | 0.750% | 6/30/17 | 57,760 | 57,147 |
| United States Treasury Note/Bond | 2.500% | 6/30/17 | 71,625 | 75,162 |
| United States Treasury Note/Bond | 0.500% | 7/31/17 | 350,560 | 343,111 |
| United States Treasury Note/Bond | 2.375% | 7/31/17 | 143,425 | 149,835 |
| United States Treasury Note/Bond | 8.875% | 8/15/17 | 41,325 | 52,728 |
12
| Total Bond Market II Index Fund | ||||
| Face | Market | |||
| Maturity | Amount | Value | ||
| Coupon | Date | ($000) | ($000) | |
| United States Treasury Note/Bond | 0.625% | 8/31/17 | 249,040 | 244,370 |
| United States Treasury Note/Bond | 1.875% | 8/31/17 | 81,700 | 83,858 |
| United States Treasury Note/Bond | 0.625% | 9/30/17 | 12,945 | 12,674 |
| United States Treasury Note/Bond | 1.875% | 9/30/17 | 52,200 | 53,521 |
| United States Treasury Note/Bond | 0.750% | 10/31/17 | 6,315 | 6,199 |
| United States Treasury Note/Bond | 4.250% | 11/15/17 | 3,865 | 4,302 |
| United States Treasury Note/Bond | 0.625% | 11/30/17 | 21,225 | 20,688 |
| United States Treasury Note/Bond | 0.875% | 1/31/18 | 140,495 | 137,772 |
| United States Treasury Note/Bond | 2.625% | 1/31/18 | 2,575 | 2,707 |
| United States Treasury Note/Bond | 3.500% | 2/15/18 | 47,980 | 52,073 |
| United States Treasury Note/Bond | 0.750% | 2/28/18 | 96,295 | 93,737 |
| United States Treasury Note/Bond | 0.750% | 3/31/18 | 75,380 | 73,213 |
| United States Treasury Note/Bond | 0.625% | 4/30/18 | 122,705 | 118,295 |
| United States Treasury Note/Bond | 2.625% | 4/30/18 | 26,125 | 27,415 |
| United States Treasury Note/Bond | 3.875% | 5/15/18 | 25,200 | 27,767 |
| United States Treasury Note/Bond | 9.125% | 5/15/18 | 11,300 | 14,983 |
| United States Treasury Note/Bond | 1.000% | 5/31/18 | 334,092 | 326,732 |
| United States Treasury Note/Bond | 2.375% | 5/31/18 | 33,300 | 34,554 |
| United States Treasury Note/Bond | 1.375% | 6/30/18 | 95,020 | 94,278 |
| United States Treasury Note/Bond | 2.375% | 6/30/18 | 177,475 | 183,992 |
| United States Treasury Note/Bond | 1.375% | 7/31/18 | 70,000 | 69,343 |
| United States Treasury Note/Bond | 2.250% | 7/31/18 | 94,450 | 97,313 |
| United States Treasury Note/Bond | 4.000% | 8/15/18 | 35,765 | 39,654 |
| United States Treasury Note/Bond | 1.500% | 8/31/18 | 160,000 | 159,150 |
| United States Treasury Note/Bond | 1.375% | 9/30/18 | 299,725 | 295,930 |
| United States Treasury Note/Bond | 1.250% | 10/31/18 | 146,905 | 143,967 |
| United States Treasury Note/Bond | 1.750% | 10/31/18 | 147,280 | 147,856 |
| United States Treasury Note/Bond | 3.750% | 11/15/18 | 202,750 | 222,392 |
| United States Treasury Note/Bond | 1.250% | 11/30/18 | 667,075 | 652,479 |
| United States Treasury Note/Bond | 1.375% | 11/30/18 | 107,560 | 105,913 |
| United States Treasury Note/Bond | 1.375% | 12/31/18 | 228,625 | 224,695 |
| United States Treasury Note/Bond | 1.500% | 12/31/18 | 225,750 | 223,140 |
| United States Treasury Note/Bond | 1.250% | 1/31/19 | 50,775 | 49,490 |
| United States Treasury Note/Bond | 2.750% | 2/15/19 | 80,365 | 84,157 |
| United States Treasury Note/Bond | 1.375% | 2/28/19 | 208,800 | 204,363 |
| United States Treasury Note/Bond | 1.500% | 3/31/19 | 34,900 | 34,300 |
| United States Treasury Note/Bond | 1.250% | 4/30/19 | 65,075 | 63,000 |
| United States Treasury Note/Bond | 3.125% | 5/15/19 | 8,125 | 8,653 |
| United States Treasury Note/Bond | 1.125% | 5/31/19 | 124,725 | 119,659 |
| United States Treasury Note/Bond | 1.000% | 6/30/19 | 189,025 | 179,604 |
| United States Treasury Note/Bond | 0.875% | 7/31/19 | 121,400 | 114,230 |
| United States Treasury Note/Bond | 3.625% | 8/15/19 | 175,150 | 190,695 |
| United States Treasury Note/Bond | 8.125% | 8/15/19 | 2,209 | 2,941 |
| United States Treasury Note/Bond | 1.000% | 8/31/19 | 219,069 | 207,020 |
| United States Treasury Note/Bond | 1.000% | 9/30/19 | 42,300 | 39,894 |
| United States Treasury Note/Bond | 1.250% | 10/31/19 | 11,600 | 11,085 |
| United States Treasury Note/Bond | 3.375% | 11/15/19 | 138,400 | 148,737 |
| United States Treasury Note/Bond | 1.000% | 11/30/19 | 25,000 | 23,461 |
| United States Treasury Note/Bond | 1.125% | 12/31/19 | 110,015 | 103,827 |
| United States Treasury Note/Bond | 1.375% | 1/31/20 | 133,000 | 127,097 |
| United States Treasury Note/Bond | 3.625% | 2/15/20 | 26,240 | 28,536 |
| United States Treasury Note/Bond | 8.500% | 2/15/20 | 5,018 | 6,874 |
| United States Treasury Note/Bond | 1.250% | 2/29/20 | 15,300 | 14,468 |
| United States Treasury Note/Bond | 1.125% | 4/30/20 | 259,175 | 241,963 |
| United States Treasury Note/Bond | 3.500% | 5/15/20 | 164,995 | 177,833 |
13
| Total Bond Market II Index Fund | ||||
| Face | Market | |||
| Maturity | Amount | Value | ||
| Coupon | Date | ($000) | ($000) | |
| United States Treasury Note/Bond | 1.375% | 5/31/20 | 110,615 | 104,721 |
| United States Treasury Note/Bond | 1.875% | 6/30/20 | 147,670 | 143,932 |
| United States Treasury Note/Bond | 2.625% | 8/15/20 | 98,220 | 100,108 |
| United States Treasury Note/Bond | 8.750% | 8/15/20 | 21,755 | 30,501 |
| United States Treasury Note/Bond | 2.125% | 8/31/20 | 111,975 | 110,417 |
| United States Treasury Note/Bond | 1.750% | 10/31/20 | 192,375 | 184,318 |
| United States Treasury Note/Bond | 2.625% | 11/15/20 | 225,145 | 228,522 |
| United States Treasury Note/Bond | 2.000% | 11/30/20 | 270,250 | 262,775 |
| United States Treasury Note/Bond | 2.375% | 12/31/20 | 230,000 | 228,813 |
| United States Treasury Note/Bond | 7.875% | 2/15/21 | 67,550 | 91,784 |
| United States Treasury Note/Bond | 3.125% | 5/15/21 | 229,845 | 239,255 |
| United States Treasury Note/Bond | 2.125% | 8/15/21 | 381,860 | 369,331 |
| United States Treasury Note/Bond | 8.125% | 8/15/21 | 34,550 | 47,998 |
| United States Treasury Note/Bond | 2.000% | 11/15/21 | 526,291 | 501,455 |
| United States Treasury Note/Bond | 8.000% | 11/15/21 | 9,450 | 13,109 |
| United States Treasury Note/Bond | 2.000% | 2/15/22 | 161,535 | 153,004 |
| United States Treasury Note/Bond | 7.250% | 8/15/22 | 75 | 101 |
| United States Treasury Note/Bond | 1.625% | 11/15/22 | 141,406 | 127,398 |
| United States Treasury Note/Bond | 7.625% | 11/15/22 | 150 | 208 |
| United States Treasury Note/Bond | 2.000% | 2/15/23 | 142,139 | 131,589 |
| United States Treasury Note/Bond | 7.125% | 2/15/23 | 2,675 | 3,601 |
| United States Treasury Note/Bond | 1.750% | 5/15/23 | 303,742 | 273,225 |
| United States Treasury Note/Bond | 2.500% | 8/15/23 | 314,810 | 301,676 |
| United States Treasury Note/Bond | 6.250% | 8/15/23 | 31,045 | 39,806 |
| United States Treasury Note/Bond | 2.750% | 11/15/23 | 470,589 | 459,413 |
| United States Treasury Note/Bond | 7.500% | 11/15/24 | 1,650 | 2,326 |
| United States Treasury Note/Bond | 6.875% | 8/15/25 | 93,750 | 127,324 |
| United States Treasury Note/Bond | 6.000% | 2/15/26 | 1,750 | 2,229 |
| United States Treasury Note/Bond | 6.750% | 8/15/26 | 4,300 | 5,834 |
| United States Treasury Note/Bond | 6.500% | 11/15/26 | 101,715 | 135,504 |
| United States Treasury Note/Bond | 6.625% | 2/15/27 | 56,650 | 76,345 |
| United States Treasury Note/Bond | 6.375% | 8/15/27 | 6,850 | 9,071 |
| United States Treasury Note/Bond | 6.125% | 11/15/27 | 350 | 454 |
| United States Treasury Note/Bond | 5.500% | 8/15/28 | 30,775 | 37,815 |
| United States Treasury Note/Bond | 5.250% | 11/15/28 | 32,342 | 38,810 |
| United States Treasury Note/Bond | 5.250% | 2/15/29 | 21,575 | 25,890 |
| United States Treasury Note/Bond | 6.125% | 8/15/29 | 76,930 | 100,731 |
| United States Treasury Note/Bond | 6.250% | 5/15/30 | 3,435 | 4,573 |
| United States Treasury Note/Bond | 5.375% | 2/15/31 | 284,875 | 347,904 |
| United States Treasury Note/Bond | 4.750% | 2/15/37 | 163,000 | 186,712 |
| United States Treasury Note/Bond | 5.000% | 5/15/37 | 35,084 | 41,558 |
| United States Treasury Note/Bond | 4.375% | 2/15/38 | 49,200 | 53,289 |
| United States Treasury Note/Bond | 4.500% | 5/15/38 | 40,079 | 44,225 |
| United States Treasury Note/Bond | 3.500% | 2/15/39 | 149,805 | 140,372 |
| United States Treasury Note/Bond | 4.250% | 5/15/39 | 79,425 | 84,290 |
| United States Treasury Note/Bond | 4.500% | 8/15/39 | 50,306 | 55,486 |
| United States Treasury Note/Bond | 4.375% | 11/15/39 | 107,905 | 116,706 |
| United States Treasury Note/Bond | 4.625% | 2/15/40 | 20,305 | 22,818 |
| United States Treasury Note/Bond | 4.375% | 5/15/40 | 99,820 | 107,930 |
| United States Treasury Note/Bond | 3.875% | 8/15/40 | 44,745 | 44,535 |
| United States Treasury Note/Bond | 4.250% | 11/15/40 | 103,577 | 109,694 |
| United States Treasury Note/Bond | 4.750% | 2/15/41 | 140,092 | 160,449 |
| United States Treasury Note/Bond | 4.375% | 5/15/41 | 24,535 | 26,494 |
| United States Treasury Note/Bond | 3.125% | 11/15/41 | 1,230 | 1,057 |
| United States Treasury Note/Bond | 3.125% | 2/15/42 | 40,509 | 34,749 |
14
| Total Bond Market II Index Fund | ||||
| Face | Market | |||
| Maturity | Amount | Value | ||
| Coupon | Date | ($000) | ($000) | |
| United States Treasury Note/Bond | 3.000% | 5/15/42 | 11,825 | 9,865 |
| United States Treasury Note/Bond | 2.750% | 8/15/42 | 460,438 | 362,954 |
| United States Treasury Note/Bond | 2.750% | 11/15/42 | 689,130 | 541,939 |
| United States Treasury Note/Bond | 3.125% | 2/15/43 | 16,409 | 13,976 |
| United States Treasury Note/Bond | 2.875% | 5/15/43 | 22,200 | 17,899 |
| United States Treasury Note/Bond | 3.625% | 8/15/43 | 371,309 | 348,855 |
| 30,399,237 | ||||
| Agency Bonds and Notes (3.6%) | ||||
| Arab Republic of Egypt | 4.450% | 9/15/15 | 5,725 | 6,115 |
| 1 Federal Agricultural Mortgage Corp. | 2.125% | 9/15/15 | 1,050 | 1,080 |
| 1 Federal Agricultural Mortgage Corp. | 2.000% | 7/27/16 | 1,800 | 1,855 |
| 1 Federal Farm Credit Banks | 0.270% | 2/24/15 | 5,450 | 5,447 |
| 1 Federal Farm Credit Banks | 0.500% | 6/23/15 | 4,000 | 4,009 |
| 1 Federal Farm Credit Banks | 1.500% | 11/16/15 | 3,000 | 3,059 |
| 1 Federal Farm Credit Banks | 4.875% | 12/16/15 | 425 | 462 |
| 1 Federal Farm Credit Banks | 1.050% | 3/28/16 | 2,000 | 2,021 |
| 1 Federal Farm Credit Banks | 5.125% | 8/25/16 | 2,475 | 2,761 |
| 1 Federal Farm Credit Banks | 4.875% | 1/17/17 | 7,100 | 7,946 |
| 1 Federal Farm Credit Banks | 5.150% | 11/15/19 | 5,325 | 6,137 |
| 1 Federal Farm Credit Banks | 3.500% | 12/20/23 | 5,000 | 4,954 |
| 1 Federal Home Loan Banks | 0.250% | 1/16/15 | 27,200 | 27,216 |
| 1 Federal Home Loan Banks | 0.250% | 2/20/15 | 55,150 | 55,118 |
| 1 Federal Home Loan Banks | 0.375% | 8/28/15 | 55,000 | 55,012 |
| 1 Federal Home Loan Banks | 0.500% | 11/20/15 | 20,900 | 20,927 |
| 1 Federal Home Loan Banks | 3.125% | 3/11/16 | 13,525 | 14,282 |
| 1 Federal Home Loan Banks | 5.375% | 5/18/16 | 18,800 | 20,934 |
| 1 Federal Home Loan Banks | 5.625% | 6/13/16 | 825 | 916 |
| 1 Federal Home Loan Banks | 0.375% | 6/24/16 | 25,000 | 24,823 |
| 1 Federal Home Loan Banks | 5.125% | 10/19/16 | 8,125 | 9,082 |
| 1 Federal Home Loan Banks | 4.750% | 12/16/16 | 10,505 | 11,716 |
| 1 Federal Home Loan Banks | 0.625% | 12/28/16 | 9,900 | 9,848 |
| 1 Federal Home Loan Banks | 4.875% | 5/17/17 | 10,500 | 11,849 |
| 1 Federal Home Loan Banks | 1.000% | 6/21/17 | 7,450 | 7,439 |
| 1 Federal Home Loan Banks | 4.875% | 9/8/17 | 595 | 671 |
| 1 Federal Home Loan Banks | 5.000% | 11/17/17 | 30,695 | 35,092 |
| 1 Federal Home Loan Banks | 2.750% | 6/8/18 | 13,550 | 14,153 |
| 1 Federal Home Loan Banks | 5.375% | 8/15/18 | 5,250 | 6,062 |
| 1 Federal Home Loan Banks | 1.875% | 3/13/20 | 3,425 | 3,302 |
| 1 Federal Home Loan Banks | 4.125% | 3/13/20 | 11,555 | 12,616 |
| 1 Federal Home Loan Banks | 3.375% | 6/12/20 | 15,200 | 15,889 |
| 1 Federal Home Loan Banks | 5.250% | 12/11/20 | 5,000 | 5,752 |
| 1 Federal Home Loan Banks | 5.625% | 6/11/21 | 16,950 | 19,890 |
| 1 Federal Home Loan Banks | 2.125% | 3/10/23 | 37,600 | 33,429 |
| 1 Federal Home Loan Banks | 5.375% | 8/15/24 | 1,585 | 1,812 |
| 1 Federal Home Loan Banks | 5.500% | 7/15/36 | 6,025 | 6,928 |
| 2 Federal Home Loan Mortgage Corp. | 4.500% | 1/15/15 | 985 | 1,029 |
| 2 Federal Home Loan Mortgage Corp. | 5.050% | 1/26/15 | 5,450 | 5,732 |
| 2 Federal Home Loan Mortgage Corp. | 2.875% | 2/9/15 | 7,670 | 7,896 |
| 2 Federal Home Loan Mortgage Corp. | 0.500% | 4/17/15 | 29,250 | 29,332 |
| 2 Federal Home Loan Mortgage Corp. | 4.375% | 7/17/15 | 56,124 | 59,592 |
| 2 Federal Home Loan Mortgage Corp. | 1.750% | 9/10/15 | 16,700 | 17,084 |
| 2 Federal Home Loan Mortgage Corp. | 5.250% | 4/18/16 | 1,400 | 1,550 |
| 2 Federal Home Loan Mortgage Corp. | 0.500% | 5/13/16 | 20,000 | 19,990 |
| 2 Federal Home Loan Mortgage Corp. | 2.500% | 5/27/16 | 29,725 | 31,113 |
| 2 Federal Home Loan Mortgage Corp. | 5.500% | 7/18/16 | 775 | 870 |
15
| Total Bond Market II Index Fund | ||||
| Face | Market | |||
| Maturity | Amount | Value | ||
| Coupon | Date | ($000) | ($000) | |
| 2 Federal Home Loan Mortgage Corp. | 2.000% | 8/25/16 | 31,545 | 32,632 |
| 2 Federal Home Loan Mortgage Corp. | 0.875% | 10/14/16 | 83,000 | 83,252 |
| 2 Federal Home Loan Mortgage Corp. | 5.000% | 2/16/17 | 19,175 | 21,587 |
| 2 Federal Home Loan Mortgage Corp. | 1.000% | 3/8/17 | 18,000 | 18,042 |
| 2 Federal Home Loan Mortgage Corp. | 5.000% | 4/18/17 | 5,000 | 5,651 |
| 2 Federal Home Loan Mortgage Corp. | 1.250% | 5/12/17 | 50,000 | 50,371 |
| 2 Federal Home Loan Mortgage Corp. | 1.000% | 6/29/17 | 73,500 | 73,238 |
| 2 Federal Home Loan Mortgage Corp. | 1.000% | 7/28/17 | 8,750 | 8,706 |
| 2 Federal Home Loan Mortgage Corp. | 5.500% | 8/23/17 | 11,550 | 13,330 |
| 2 Federal Home Loan Mortgage Corp. | 1.000% | 9/29/17 | 98,125 | 97,144 |
| 2 Federal Home Loan Mortgage Corp. | 5.125% | 11/17/17 | 5,950 | 6,801 |
| 2 Federal Home Loan Mortgage Corp. | 0.750% | 1/12/18 | 13,375 | 13,014 |
| 2 Federal Home Loan Mortgage Corp. | 0.875% | 3/7/18 | 20,900 | 20,337 |
| 2 Federal Home Loan Mortgage Corp. | 4.875% | 6/13/18 | 8,805 | 10,004 |
| 2 Federal Home Loan Mortgage Corp. | 3.750% | 3/27/19 | 16,500 | 17,935 |
| 2 Federal Home Loan Mortgage Corp. | 1.750% | 5/30/19 | 35,175 | 34,650 |
| 2 Federal Home Loan Mortgage Corp. | 1.250% | 8/1/19 | 13,200 | 12,610 |
| 2 Federal Home Loan Mortgage Corp. | 1.250% | 10/2/19 | 43,700 | 41,440 |
| 2 Federal Home Loan Mortgage Corp. | 1.375% | 5/1/20 | 16,700 | 15,648 |
| 2 Federal Home Loan Mortgage Corp. | 2.375% | 1/13/22 | 56,650 | 53,944 |
| 2 Federal Home Loan Mortgage Corp. | 6.750% | 9/15/29 | 1,150 | 1,508 |
| 2 Federal Home Loan Mortgage Corp. | 6.750% | 3/15/31 | 13,400 | 17,710 |
| 2 Federal Home Loan Mortgage Corp. | 6.250% | 7/15/32 | 8,382 | 10,566 |
| 2 Federal National Mortgage Assn. | 0.375% | 3/16/15 | 40,525 | 40,551 |
| 2 Federal National Mortgage Assn. | 0.500% | 5/27/15 | 19,000 | 19,058 |
| 2 Federal National Mortgage Assn. | 0.500% | 7/2/15 | 3,750 | 3,759 |
| 2 Federal National Mortgage Assn. | 2.375% | 7/28/15 | 5,525 | 5,700 |
| 2 Federal National Mortgage Assn. | 2.000% | 9/21/15 | 12,595 | 12,931 |
| 2 Federal National Mortgage Assn. | 0.500% | 9/28/15 | 30,000 | 30,067 |
| 2 Federal National Mortgage Assn. | 4.375% | 10/15/15 | 51,825 | 55,486 |
| 2 Federal National Mortgage Assn. | 1.625% | 10/26/15 | 79,455 | 81,213 |
| 2 Federal National Mortgage Assn. | 0.375% | 12/21/15 | 13,525 | 13,518 |
| 2 Federal National Mortgage Assn. | 5.000% | 3/15/16 | 12,025 | 13,211 |
| 2 Federal National Mortgage Assn. | 0.500% | 3/30/16 | 74,650 | 74,614 |
| 2 Federal National Mortgage Assn. | 2.375% | 4/11/16 | 22,775 | 23,718 |
| 2 Federal National Mortgage Assn. | 0.375% | 7/5/16 | 22,700 | 22,554 |
| 2 Federal National Mortgage Assn. | 0.625% | 8/26/16 | 50,000 | 49,909 |
| 2 Federal National Mortgage Assn. | 5.250% | 9/15/16 | 7,225 | 8,099 |
| 2 Federal National Mortgage Assn. | 1.250% | 9/28/16 | 43,645 | 44,242 |
| 2 Federal National Mortgage Assn. | 1.375% | 11/15/16 | 31,470 | 31,996 |
| 2 Federal National Mortgage Assn. | 1.250% | 1/30/17 | 21,100 | 21,340 |
| 2 Federal National Mortgage Assn. | 5.000% | 2/13/17 | 50,225 | 56,526 |
| 2 Federal National Mortgage Assn. | 1.125% | 4/27/17 | 56,300 | 56,539 |
| 2 Federal National Mortgage Assn. | 5.000% | 5/11/17 | 11,275 | 12,723 |
| 2 Federal National Mortgage Assn. | 5.375% | 6/12/17 | 2,800 | 3,206 |
| 2 Federal National Mortgage Assn. | 0.875% | 8/28/17 | 15,650 | 15,477 |
| 2 Federal National Mortgage Assn. | 0.875% | 10/26/17 | 71,575 | 70,408 |
| 2 Federal National Mortgage Assn. | 0.875% | 12/20/17 | 71,025 | 69,714 |
| 2 Federal National Mortgage Assn. | 0.875% | 2/8/18 | 64,425 | 62,798 |
| 2 Federal National Mortgage Assn. | 0.875% | 5/21/18 | 47,380 | 45,847 |
| 2 Federal National Mortgage Assn. | 1.875% | 9/18/18 | 72,975 | 73,244 |
| 2 Federal National Mortgage Assn. | 1.625% | 11/27/18 | 41,640 | 41,178 |
| 2 Federal National Mortgage Assn. | 0.000% | 10/9/19 | 6,640 | 5,624 |
| 2 Federal National Mortgage Assn. | 6.250% | 5/15/29 | 5,550 | 6,922 |
| 2 Federal National Mortgage Assn. | 7.125% | 1/15/30 | 7,120 | 9,632 |
16
| Total Bond Market II Index Fund | |||||
| Face | Market | ||||
| Maturity | Amount | Value | |||
| Coupon | Date | ($000) | ($000) | ||
| 2 | Federal National Mortgage Assn. | 7.250% | 5/15/30 | 28,925 | 39,539 |
| 2 | Federal National Mortgage Assn. | 6.625% | 11/15/30 | 16,295 | 21,174 |
| 2 | Federal National Mortgage Assn. | 5.625% | 7/15/37 | 2,721 | 3,229 |
| 1 | Financing Corp. | 9.800% | 4/6/18 | 850 | 1,134 |
| 1 | Financing Corp. | 10.350% | 8/3/18 | 100 | 137 |
| 1 | Financing Corp. | 9.650% | 11/2/18 | 2,375 | 3,185 |
| 1 | Financing Corp. | 9.700% | 4/5/19 | 425 | 583 |
| Hashemite Kingdom of Jordan | 2.503% | 10/30/20 | 6,375 | 6,224 | |
| Private Export Funding Corp. | 1.375% | 2/15/17 | 1,000 | 1,010 | |
| Private Export Funding Corp. | 2.250% | 12/15/17 | 1,775 | 1,821 | |
| Private Export Funding Corp. | 1.875% | 7/15/18 | 2,200 | 2,203 | |
| Private Export Funding Corp. | 4.375% | 3/15/19 | 3,217 | 3,560 | |
| Private Export Funding Corp. | 1.450% | 8/15/19 | 2,300 | 2,190 | |
| Private Export Funding Corp. | 4.300% | 12/15/21 | 3,035 | 3,257 | |
| Private Export Funding Corp. | 2.800% | 5/15/22 | 1,125 | 1,079 | |
| Private Export Funding Corp. | 2.050% | 11/15/22 | 15,350 | 13,625 | |
| Private Export Funding Corp. | 2.450% | 7/15/24 | 4,750 | 4,240 | |
| Resolution Funding Corp. | 8.125% | 10/15/19 | 100 | 131 | |
| Resolution Funding Corp. | 8.875% | 7/15/20 | 100 | 137 | |
| State of Israel | 5.500% | 9/18/23 | 6,375 | 7,370 | |
| State of Israel | 5.500% | 12/4/23 | 6,502 | 7,483 | |
| State of Israel | 5.500% | 4/26/24 | 5,075 | 5,856 | |
| 1 | Tennessee Valley Authority | 5.500% | 7/18/17 | 6,400 | 7,329 |
| 1 | Tennessee Valley Authority | 4.500% | 4/1/18 | 6,425 | 7,111 |
| 1 | Tennessee Valley Authority | 1.750% | 10/15/18 | 9,500 | 9,434 |
| 1 | Tennessee Valley Authority | 3.875% | 2/15/21 | 5,170 | 5,453 |
| 1 | Tennessee Valley Authority | 1.875% | 8/15/22 | 3,750 | 3,326 |
| 1 | Tennessee Valley Authority | 6.750% | 11/1/25 | 550 | 697 |
| 1 | Tennessee Valley Authority | 7.125% | 5/1/30 | 8,975 | 11,801 |
| 1 | Tennessee Valley Authority | 4.650% | 6/15/35 | 3,425 | 3,402 |
| 1 | Tennessee Valley Authority | 5.880% | 4/1/36 | 4,265 | 4,922 |
| 1 | Tennessee Valley Authority | 5.500% | 6/15/38 | 850 | 936 |
| 1 | Tennessee Valley Authority | 5.250% | 9/15/39 | 3,150 | 3,310 |
| 1 | Tennessee Valley Authority | 3.500% | 12/15/42 | 5,500 | 4,344 |
| 1 | Tennessee Valley Authority | 4.875% | 1/15/48 | 14,075 | 13,520 |
| 1 | Tennessee Valley Authority | 5.375% | 4/1/56 | 2,770 | 2,804 |
| 1 | Tennessee Valley Authority | 4.625% | 9/15/60 | 3,365 | 2,989 |
| 2,597,261 | |||||
| Conventional Mortgage-Backed Securities (21.8%) | |||||
| 2,3 | Fannie Mae Pool | 2.000% | 8/1/28–10/1/28 | 58,751 | 56,485 |
| 2,3,4 Fannie Mae Pool | 2.500% | 3/1/27–1/1/43 | 379,996 | 374,940 | |
| 2,3,4 Fannie Mae Pool | 3.000% | 11/1/20–1/1/44 | 1,178,067 | 1,153,180 | |
| 2,3,4 Fannie Mae Pool | 3.500% | 9/1/25–1/1/44 | 1,390,807 | 1,404,883 | |
| 2,3,4 Fannie Mae Pool | 4.000% | 6/1/18–1/1/44 | 1,257,033 | 1,305,664 | |
| 2,3,4 Fannie Mae Pool | 4.500% | 1/1/15–1/1/44 | 875,217 | 931,131 | |
| 2,3,4 Fannie Mae Pool | 5.000% | 3/1/17–1/1/44 | 663,641 | 721,394 | |
| 2,3,4 Fannie Mae Pool | 5.500% | 9/1/14–1/1/44 | 537,333 | 591,158 | |
| 2,3 | Fannie Mae Pool | 6.000% | 1/1/00–1/1/44 | 348,363 | 387,872 |
| 2,3 | Fannie Mae Pool | 6.500% | 4/1/16–5/1/40 | 127,580 | 142,968 |
| 2,3 | Fannie Mae Pool | 7.000% | 9/1/14–12/1/38 | 36,957 | 41,954 |
| 2,3 | Fannie Mae Pool | 7.500% | 7/1/30–12/1/32 | 360 | 410 |
| 2,3 | Fannie Mae Pool | 8.000% | 12/1/29 | 40 | 46 |
| 2,3 | Freddie Mac Gold Pool | 2.000% | 8/1/28 | 12,509 | 11,991 |
| 2,3,4 Freddie Mac Gold Pool | 2.500% | 2/1/28–2/1/43 | 328,685 | 323,941 | |
| 2,3,4 Freddie Mac Gold Pool | 3.000% | 11/1/26–1/1/44 | 626,552 | 612,369 | |
17
Total Bond Market II Index Fund
| Face | Market | ||||
| Maturity | Amount | Value | |||
| Coupon | Date | ($000) | ($000) | ||
| 2,3,4 Freddie Mac Gold Pool | 3.500% | 9/1/25–1/1/44 | 730,503 | 733,953 | |
| 2,3,4 Freddie Mac Gold Pool | 4.000% | 2/1/14–1/1/44 | 693,830 | 717,988 | |
| 2,3,4 Freddie Mac Gold Pool | 4.500% | 5/1/14–1/1/44 | 568,612 | 603,403 | |
| 2,3,4 Freddie Mac Gold Pool | 5.000% | 4/1/17–1/1/44 | 407,065 | 439,231 | |
| 2,3,4 Freddie Mac Gold Pool | 5.500% | 2/1/14–1/1/44 | 326,155 | 357,130 | |
| 2,3,4 Freddie Mac Gold Pool | 6.000% | 2/1/14–1/1/44 | 212,434 | 235,883 | |
| 2,3 | Freddie Mac Gold Pool | 6.500% | 1/1/14–9/1/39 | 58,619 | 65,718 |
| 2,3 | Freddie Mac Gold Pool | 7.000% | 6/1/15–12/1/38 | 18,395 | 20,961 |
| 2,3 | Freddie Mac Gold Pool | 7.500% | 4/1/27–2/1/32 | 194 | 220 |
| 2,3 | Freddie Mac Gold Pool | 8.000% | 1/1/27–11/1/31 | 228 | 262 |
| 2,3 | Freddie Mac Gold Pool | 8.500% | 6/1/25 | 46 | 53 |
| 3 | Ginnie Mae I Pool | 3.000% | 1/15/26–8/15/43 | 129,614 | 126,073 |
| 3,4 | Ginnie Mae I Pool | 3.500% | 11/15/25–1/1/44 | 155,161 | 157,328 |
| 3,4 | Ginnie Mae I Pool | 4.000% | 8/15/18–1/1/44 | 241,986 | 252,323 |
| 3,4 | Ginnie Mae I Pool | 4.500% | 6/15/18–1/1/44 | 361,922 | 387,107 |
| 3,4 | Ginnie Mae I Pool | 5.000% | 12/15/17–1/1/44 | 221,018 | 240,202 |
| 3 | Ginnie Mae I Pool | 5.500% | 4/15/17–6/15/41 | 113,519 | 125,275 |
| 3 | Ginnie Mae I Pool | 6.000% | 4/15/17–6/15/41 | 89,125 | 99,314 |
| 3 | Ginnie Mae I Pool | 6.500% | 5/15/24–8/15/39 | 27,780 | 31,126 |
| 3 | Ginnie Mae I Pool | 7.000% | 7/15/23–9/15/36 | 1,475 | 1,670 |
| 3 | Ginnie Mae I Pool | 7.500% | 12/15/23 | 41 | 47 |
| 3 | Ginnie Mae I Pool | 8.000% | 6/15/25–1/15/27 | 89 | 102 |
| 3 | Ginnie Mae I Pool | 9.000% | 11/15/17–12/15/17 | 68 | 77 |
| 3 | Ginnie Mae II Pool | 2.500% | 2/20/28–6/20/28 | 14,880 | 14,950 |
| 3,4 | Ginnie Mae II Pool | 3.000% | 10/20/26–1/1/44 | 534,559 | 519,384 |
| 3,4 | Ginnie Mae II Pool | 3.500% | 9/20/25–1/1/44 | 856,759 | 866,557 |
| 3,4 | Ginnie Mae II Pool | 4.000% | 9/20/25–1/1/44 | 566,891 | 590,986 |
| 3,4 | Ginnie Mae II Pool | 4.500% | 8/20/33–1/1/44 | 548,025 | 588,178 |
| 3 | Ginnie Mae II Pool | 5.000% | 12/20/32–1/1/44 | 331,334 | 362,173 |
| 3,4 | Ginnie Mae II Pool | 5.500% | 8/20/23–1/1/44 | 107,998 | 119,086 |
| 3 | Ginnie Mae II Pool | 6.000% | 3/20/31–9/20/41 | 55,426 | 61,874 |
| 3 | Ginnie Mae II Pool | 6.500% | 10/20/28–11/20/39 | 21,501 | 24,147 |
| 3 | Ginnie Mae II Pool | 7.000% | 8/20/34–11/20/38 | 3,897 | 4,395 |
| 15,807,562 | |||||
| Nonconventional Mortgage-Backed Securities (0.6%) | |||||
| 2,3,5 Fannie Mae Pool | 1.438% | 4/1/37 | 1,370 | 1,427 | |
| 2,3,5 Fannie Mae Pool | 1.961% | 9/1/37 | 1,870 | 2,008 | |
| 2,3 | Fannie Mae Pool | 2.111% | 3/1/43 | 6,902 | 6,781 |
| 2,3 | Fannie Mae Pool | 2.197% | 9/1/42 | 6,153 | 6,140 |
| 2,3 | Fannie Mae Pool | 2.198% | 12/1/41 | 5,008 | 5,260 |
| 2,3 | Fannie Mae Pool | 2.204% | 6/1/43 | 7,436 | 7,366 |
| 2,3,5 Fannie Mae Pool | 2.224% | 8/1/37 | 902 | 953 | |
| 2,3,5 Fannie Mae Pool | 2.225% | 12/1/33 | 313 | 328 | |
| 2,3,5 Fannie Mae Pool | 2.235% | 6/1/37 | 492 | 519 | |
| 2,3 | Fannie Mae Pool | 2.243% | 10/1/42 | 5,160 | 5,151 |
| 2,3,5 Fannie Mae Pool | 2.254% | 11/1/33 | 234 | 246 | |
| 2,3,5 Fannie Mae Pool | 2.258% | 11/1/36 | 500 | 533 | |
| 2,3 | Fannie Mae Pool | 2.267% | 7/1/43 | 8,065 | 7,767 |
| 2,3,5 Fannie Mae Pool | 2.273% | 9/1/34 | 418 | 439 | |
| 2,3,5 Fannie Mae Pool | 2.278% | 8/1/35 | 855 | 914 | |
| 2,3,5 Fannie Mae Pool | 2.392% | 12/1/35 | 681 | 726 | |
| 2,3 | Fannie Mae Pool | 2.407% | 7/1/42 | 6,679 | 6,709 |
| 2,3 | Fannie Mae Pool | 2.408% | 5/1/42 | 11,161 | 11,209 |
| 2,3,5 Fannie Mae Pool | 2.415% | 6/1/36 | 17 | 18 | |
| 2,3,5 Fannie Mae Pool | 2.439% | 7/1/35 | 664 | 699 | |
18
| Total Bond Market II Index Fund | |||||
| Face | Market | ||||
| Maturity | Amount | Value | |||
| Coupon | Date | ($000) | ($000) | ||
| 2,3,5 Fannie Mae Pool | 2.440% | 2/1/36 | 828 | 845 | |
| 2,3 | Fannie Mae Pool | 2.446% | 5/1/43 | 13,477 | 13,056 |
| 2,3 | Fannie Mae Pool | 2.472% | 10/1/42 | 6,239 | 6,278 |
| 2,3 | Fannie Mae Pool | 2.515% | 12/1/40 | 2,414 | 2,438 |
| 2,3 | Fannie Mae Pool | 2.528% | 10/1/40 | 3,027 | 3,067 |
| 2,3,5 Fannie Mae Pool | 2.553% | 1/1/35 | 960 | 1,035 | |
| 2,3,5 Fannie Mae Pool | 2.560% | 11/1/33 | 682 | 743 | |
| 2,3,5 Fannie Mae Pool | 2.593% | 4/1/36 | 344 | 360 | |
| 2,3,5 Fannie Mae Pool | 2.604% | 1/1/37 | 884 | 953 | |
| 2,3,5 Fannie Mae Pool | 2.607% | 5/1/35 | 816 | 862 | |
| 2,3 | Fannie Mae Pool | 2.617% | 11/1/41 | 4,392 | 4,462 |
| 2,3,5 Fannie Mae Pool | 2.622% | 2/1/36 | 856 | 918 | |
| 2,3 | Fannie Mae Pool | 2.623% | 12/1/41 | 4,569 | 4,611 |
| 2,3 | Fannie Mae Pool | 2.674% | 1/1/42 | 4,795 | 4,879 |
| 2,3 | Fannie Mae Pool | 2.770% | 3/1/42 | 6,530 | 6,669 |
| 2,3 | Fannie Mae Pool | 2.782% | 1/1/42 | 4,813 | 4,908 |
| 2,3 | Fannie Mae Pool | 2.804% | 3/1/41 | 3,235 | 3,325 |
| 2,3,5 Fannie Mae Pool | 2.824% | 10/1/36 | 726 | 793 | |
| 2,3 | Fannie Mae Pool | 2.826% | 11/1/41 | 4,004 | 4,105 |
| 2,3 | Fannie Mae Pool | 2.912% | 12/1/40 | 2,488 | 2,527 |
| 2,3 | Fannie Mae Pool | 2.934% | 5/1/42 | 2,674 | 2,839 |
| 2,3 | Fannie Mae Pool | 2.994% | 3/1/42 | 5,008 | 5,303 |
| 2,3,5 Fannie Mae Pool | 3.000% | 11/1/34 | 1,176 | 1,233 | |
| 2,3 | Fannie Mae Pool | 3.035% | 3/1/41 | 4,053 | 4,127 |
| 2,3 | Fannie Mae Pool | 3.065% | 2/1/42 | 5,193 | 5,486 |
| 2,3 | Fannie Mae Pool | 3.085% | 2/1/41 | 2,854 | 2,929 |
| 2,3 | Fannie Mae Pool | 3.126% | 2/1/41 | 1,778 | 1,829 |
| 2,3 | Fannie Mae Pool | 3.151% | 2/1/41 | 3,186 | 3,274 |
| 2,3 | Fannie Mae Pool | 3.152% | 12/1/40 | 2,456 | 2,500 |
| 2,3 | Fannie Mae Pool | 3.192% | 9/1/40 | 1,897 | 1,930 |
| 2,3 | Fannie Mae Pool | 3.223% | 8/1/40 | 2,273 | 2,313 |
| 2,3 | Fannie Mae Pool | 3.224% | 12/1/40 | 3,206 | 3,269 |
| 2,3 | Fannie Mae Pool | 3.265% | 1/1/41 | 2,627 | 2,743 |
| 2,3 | Fannie Mae Pool | 3.266% | 10/1/40 | 4,116 | 4,199 |
| 2,3 | Fannie Mae Pool | 3.291% | 5/1/41 | 3,675 | 3,810 |
| 2,3 | Fannie Mae Pool | 3.294% | 1/1/40 | 1,257 | 1,306 |
| 2,3 | Fannie Mae Pool | 3.296% | 11/1/40 | 2,790 | 2,845 |
| 2,3 | Fannie Mae Pool | 3.306% | 7/1/42 | 3,634 | 3,908 |
| 2,3 | Fannie Mae Pool | 3.333% | 8/1/42 | 5,006 | 5,189 |
| 2,3 | Fannie Mae Pool | 3.407% | 1/1/40 | 3,702 | 3,848 |
| 2,3 | Fannie Mae Pool | 3.408% | 5/1/40 | 1,175 | 1,199 |
| 2,3 | Fannie Mae Pool | 3.431% | 12/1/39 | 5,011 | 5,236 |
| 2,3 | Fannie Mae Pool | 3.495% | 5/1/40 | 946 | 964 |
| 2,3 | Fannie Mae Pool | 3.517% | 10/1/39 | 1,127 | 1,174 |
| 2,3 | Fannie Mae Pool | 3.519% | 3/1/40 | 5,570 | 5,810 |
| 2,3 | Fannie Mae Pool | 3.554% | 6/1/41 | 827 | 858 |
| 2,3 | Fannie Mae Pool | 3.563% | 7/1/41 | 5,195 | 5,372 |
| 2,3 | Fannie Mae Pool | 3.580% | 8/1/39 | 1,394 | 1,445 |
| 2,3 | Fannie Mae Pool | 3.587% | 11/1/39 | 649 | 676 |
| 2,3 | Fannie Mae Pool | 3.644% | 4/1/41 | 2,851 | 2,935 |
| 2,3 | Fannie Mae Pool | 3.662% | 11/1/39 | 979 | 1,020 |
| 2,3 | Fannie Mae Pool | 3.693% | 7/1/39 | 691 | 719 |
| 2,3 | Fannie Mae Pool | 3.698% | 5/1/40 | 5,498 | 5,746 |
| 2,3 | Fannie Mae Pool | 3.748% | 6/1/41 | 3,820 | 3,985 |
| 2,3 | Fannie Mae Pool | 3.816% | 9/1/40 | 3,643 | 3,767 |
19
| Total Bond Market II Index Fund | |||||
| Face | Market | ||||
| Maturity | Amount | Value | |||
| Coupon | Date | ($000) | ($000) | ||
| 2,3 | Fannie Mae Pool | 3.827% | 2/1/40 | 4,975 | 5,175 |
| 2,3 | Fannie Mae Pool | 4.211% | 12/1/39 | 3,816 | 3,990 |
| 2,3,5 Fannie Mae Pool | 4.218% | 10/1/38 | 2,361 | 2,501 | |
| 2,3 | Fannie Mae Pool | 4.850% | 7/1/38 | 260 | 272 |
| 2,3 | Fannie Mae Pool | 5.148% | 3/1/38 | 1,799 | 1,894 |
| 2,3,5 Fannie Mae Pool | 5.167% | 11/1/39 | 2,129 | 2,297 | |
| 2,3 | Fannie Mae Pool | 5.243% | 7/1/36 | 755 | 786 |
| 2,3 | Fannie Mae Pool | 5.259% | 7/1/38 | 144 | 150 |
| 2,3,5 Fannie Mae Pool | 5.333% | 8/1/39 | 4,701 | 5,066 | |
| 2,3,5 Fannie Mae Pool | 5.384% | 4/1/37 | 42 | 44 | |
| 2,3 | Fannie Mae Pool | 5.550% | 5/1/36 | 351 | 369 |
| 2,3 | Fannie Mae Pool | 5.675% | 4/1/37 | 1,472 | 1,552 |
| 2,3 | Fannie Mae Pool | 5.788% | 10/1/37 | 661 | 697 |
| 2,3 | Fannie Mae Pool | 5.794% | 12/1/37 | 1,586 | 1,655 |
| 2,3 | Fannie Mae Pool | 6.014% | 7/1/37 | 286 | 305 |
| 2,3 | Fannie Mae Pool | 6.116% | 10/1/37 | 2,243 | 2,369 |
| 2,3,5 Freddie Mac Non Gold Pool | 1.730% | 6/1/37 | 534 | 549 | |
| 2,3,5 Freddie Mac Non Gold Pool | 1.949% | 3/1/37 | 45 | 47 | |
| 2,3,5 Freddie Mac Non Gold Pool | 2.064% | 1/1/37 | 878 | 933 | |
| 2,3,5 Freddie Mac Non Gold Pool | 2.220% | 7/1/35 | 555 | 589 | |
| 2,3,5 Freddie Mac Non Gold Pool | 2.291% | 10/1/37 | 1,127 | 1,166 | |
| 2,3,5 Freddie Mac Non Gold Pool | 2.357% | 12/1/34 | 622 | 645 | |
| 2,3,5 Freddie Mac Non Gold Pool | 2.375% | 11/1/34–11/1/36 | 1,940 | 2,035 | |
| 2,3,5 Freddie Mac Non Gold Pool | 2.386% | 12/1/36 | 916 | 956 | |
| 2,3,5 Freddie Mac Non Gold Pool | 2.445% | 3/1/37 | 45 | 47 | |
| 2,3,5 Freddie Mac Non Gold Pool | 2.531% | 6/1/37 | 840 | 904 | |
| 2,3,5 Freddie Mac Non Gold Pool | 2.539% | 8/1/37 | 1,160 | 1,233 | |
| 2,3,5 Freddie Mac Non Gold Pool | 2.548% | 12/1/35 | 610 | 647 | |
| 2,3 | Freddie Mac Non Gold Pool | 2.575% | 2/1/42 | 2,353 | 2,467 |
| 2,3,5 Freddie Mac Non Gold Pool | 2.598% | 4/1/35 | 53 | 56 | |
| 2,3,5 Freddie Mac Non Gold Pool | 2.602% | 1/1/35 | 118 | 128 | |
| 2,3 | Freddie Mac Non Gold Pool | 2.624% | 12/1/40 | 2,877 | 2,927 |
| 2,3 | Freddie Mac Non Gold Pool | 2.696% | 11/1/40 | 1,238 | 1,259 |
| 2,3 | Freddie Mac Non Gold Pool | 2.720% | 12/1/40 | 5,883 | 5,996 |
| 2,3 | Freddie Mac Non Gold Pool | 2.758% | 2/1/42 | 4,426 | 4,679 |
| 2,3 | Freddie Mac Non Gold Pool | 2.783% | 1/1/41 | 4,076 | 4,127 |
| 2,3 | Freddie Mac Non Gold Pool | 2.887% | 2/1/41 | 4,288 | 4,456 |
| 2,3 | Freddie Mac Non Gold Pool | 2.957% | 2/1/41 | 1,794 | 1,865 |
| 2,3 | Freddie Mac Non Gold Pool | 3.085% | 3/1/41 | 1,551 | 1,616 |
| 2,3 | Freddie Mac Non Gold Pool | 3.088% | 6/1/41 | 1,738 | 1,796 |
| 2,3,5 Freddie Mac Non Gold Pool | 3.140% | 12/1/36 | 411 | 434 | |
| 2,3 | Freddie Mac Non Gold Pool | 3.144% | 11/1/40 | 3,217 | 3,294 |
| 2,3 | Freddie Mac Non Gold Pool | 3.238% | 6/1/40 | 1,284 | 1,315 |
| 2,3 | Freddie Mac Non Gold Pool | 3.356% | 5/1/40 | 728 | 754 |
| 2,3 | Freddie Mac Non Gold Pool | 3.420% | 3/1/42 | 5,381 | 5,661 |
| 2,3 | Freddie Mac Non Gold Pool | 3.457% | 8/1/40 | 3,340 | 3,428 |
| 2,3 | Freddie Mac Non Gold Pool | 3.464% | 5/1/40 | 779 | 798 |
| 2,3 | Freddie Mac Non Gold Pool | 3.487% | 4/1/40 | 2,948 | 3,071 |
| 2,3 | Freddie Mac Non Gold Pool | 3.550% | 11/1/39 | 4,007 | 4,178 |
| 2,3 | Freddie Mac Non Gold Pool | 3.585% | 6/1/40 | 1,513 | 1,572 |
| 2,3 | Freddie Mac Non Gold Pool | 3.625% | 6/1/40 | 3,756 | 3,849 |
| 2,3 | Freddie Mac Non Gold Pool | 3.645% | 1/1/40 | 1,826 | 1,904 |
| 2,3 | Freddie Mac Non Gold Pool | 3.670% | 9/1/40 | 4,443 | 4,565 |
| 2,3,5 Freddie Mac Non Gold Pool | 3.695% | 1/1/37 | 314 | 334 | |
| 2,3 | Freddie Mac Non Gold Pool | 4.029% | 3/1/40 | 4,640 | 4,853 |
20
| Total Bond Market II Index Fund | |||||
| Face | Market | ||||
| Maturity | Amount | Value | |||
| Coupon | Date | ($000) | ($000) | ||
| 2,3,5 Freddie Mac Non Gold Pool | 4.277% | 3/1/37 | 254 | 269 | |
| 2,3 | Freddie Mac Non Gold Pool | 4.507% | 5/1/38 | 175 | 184 |
| 2,3 | Freddie Mac Non Gold Pool | 4.753% | 12/1/35 | 2,769 | 2,917 |
| 2,3 | Freddie Mac Non Gold Pool | 4.814% | 10/1/36 | 972 | 1,008 |
| 2,3 | Freddie Mac Non Gold Pool | 5.104% | 7/1/38 | 777 | 816 |
| 2,3 | Freddie Mac Non Gold Pool | 5.250% | 3/1/38 | 1,418 | 1,498 |
| 2,3 | Freddie Mac Non Gold Pool | 5.365% | 1/1/38 | 451 | 481 |
| 2,3 | Freddie Mac Non Gold Pool | 5.438% | 3/1/37 | 97 | 98 |
| 2,3 | Freddie Mac Non Gold Pool | 5.473% | 2/1/36 | 379 | 395 |
| 2,3 | Freddie Mac Non Gold Pool | 5.633% | 3/1/37 | 654 | 696 |
| 2,3 | Freddie Mac Non Gold Pool | 5.749% | 9/1/37 | 756 | 800 |
| 2,3 | Freddie Mac Non Gold Pool | 5.780% | 10/1/37 | 23 | 24 |
| 2,3 | Freddie Mac Non Gold Pool | 5.867% | 5/1/37 | 3,260 | 3,450 |
| 2,3 | Freddie Mac Non Gold Pool | 5.906% | 6/1/37 | 693 | 741 |
| 2,3 | Freddie Mac Non Gold Pool | 6.084% | 12/1/36 | 592 | 625 |
| 2,3 | Freddie Mac Non Gold Pool | 6.245% | 8/1/37 | 319 | 339 |
| 2,3 | Freddie Mac Non Gold Pool | 6.328% | 2/1/37 | 225 | 239 |
| 3,5 | Ginnie Mae II Pool | 1.625% | 6/20/29 | 47 | 48 |
| 3 | Ginnie Mae II Pool | 2.000% | 6/20/43 | 8,810 | 8,837 |
| 3 | Ginnie Mae II Pool | 2.500% | 11/20/40–1/20/42 | 36,705 | 38,158 |
| 3 | Ginnie Mae II Pool | 3.000% | 11/20/40–11/20/41 | 20,007 | 20,615 |
| 3,5 | Ginnie Mae II Pool | 3.500% | 10/20/39–10/20/41 | 22,115 | 23,210 |
| 3 | Ginnie Mae II Pool | 3.750% | 1/20/40 | 3,827 | 3,928 |
| 3 | Ginnie Mae II Pool | 4.000% | 9/20/39–10/20/41 | 26,134 | 27,099 |
| 3,5 | Ginnie Mae II Pool | 5.000% | 7/20/38–10/20/38 | 594 | 606 |
| 485,149 | |||||
| Total U.S. Government and Agency Obligations (Cost $49,754,050) | 49,289,209 | ||||
| Asset-Backed/Commercial Mortgage-Backed Securities (2.2%) | |||||
| 3 | AEP Texas Central Transition Funding II LLC | ||||
| 2006-A | 5.170% | 1/1/18 | 1,992 | 2,211 | |
| 3 | Ally Auto Receivables Trust 2011-2 | 1.980% | 4/15/16 | 3,699 | 3,718 |
| 3 | Ally Auto Receivables Trust 2011-4 | 1.140% | 6/15/16 | 1,696 | 1,703 |
| 3 | Ally Auto Receivables Trust 2012-5 | 0.850% | 1/16/18 | 3,305 | 3,296 |
| 3 | Ally Auto Receivables Trust 2013-2 | 0.790% | 1/15/18 | 1,100 | 1,101 |
| 3 | Ally Auto Receivables Trust 2013-2 | 1.240% | 11/15/18 | 700 | 706 |
| 3 | American Express Credit Account Secured Note | ||||
| Trust 2013-3 | 0.980% | 5/15/19 | 1,000 | 997 | |
| 3 | AmeriCredit Automobile Receivables Trust 2012-1 | 1.230% | 9/8/16 | 825 | 827 |
| 3 | AmeriCredit Automobile Receivables Trust 2013-1 | 0.610% | 10/10/17 | 1,029 | 1,026 |
| 3 | AmeriCredit Automobile Receivables Trust 2013-2 | 0.650% | 12/8/17 | 719 | 717 |
| 3 | AmeriCredit Automobile Receivables Trust 2013-3 | 0.920% | 4/9/18 | 1,635 | 1,634 |
| 3 | AmeriCredit Automobile Receivables Trust 2013-4 | 0.960% | 4/9/18 | 620 | 619 |
| 3 | AmeriCredit Automobile Receivables Trust 2013-5 | 0.900% | 9/10/18 | 800 | 799 |
| 3 | AmeriCredit Automobile Receivables Trust 2013-5 | 1.520% | 1/8/19 | 400 | 401 |
| 3 | Banc of America Commercial Mortgage | ||||
| Trust 2004-3 | 5.556% | 6/10/39 | 3,034 | 3,061 | |
| 3 | Banc of America Commercial Mortgage | ||||
| Trust 2004-4 | 4.877% | 7/10/42 | 12,353 | 12,499 | |
| 3 | Banc of America Commercial Mortgage | ||||
| Trust 2005-1 | 5.171% | 11/10/42 | 2,188 | 2,211 | |
| 3 | Banc of America Commercial Mortgage | ||||
| Trust 2005-2 | 4.857% | 7/10/43 | 460 | 479 | |
| 3 | Banc of America Commercial Mortgage | ||||
| Trust 2005-5 | 5.115% | 10/10/45 | 5,265 | 5,567 | |
21
| Total Bond Market II Index Fund | ||||
| Face | Market | |||
| Maturity | Amount | Value | ||
| Coupon | Date | ($000) | ($000) | |
| 3 Banc of America Commercial Mortgage | ||||
| Trust 2005-6 | 5.184% | 9/10/47 | 1,500 | 1,593 |
| 3 Banc of America Commercial Mortgage | ||||
| Trust 2005-6 | 5.184% | 9/10/47 | 2,623 | 2,822 |
| 3 Banc of America Commercial Mortgage | ||||
| Trust 2006-1 | 5.372% | 9/10/45 | 9,085 | 9,742 |
| 3 Banc of America Commercial Mortgage | ||||
| Trust 2006-1 | 5.421% | 9/10/45 | 247 | 266 |
| 3 Banc of America Commercial Mortgage | ||||
| Trust 2006-2 | 5.734% | 5/10/45 | 7,560 | 8,239 |
| 3 Banc of America Commercial Mortgage | ||||
| Trust 2006-2 | 5.769% | 5/10/45 | 1,380 | 1,457 |
| 3 Banc of America Commercial Mortgage | ||||
| Trust 2006-3 | 5.889% | 7/10/44 | 398 | 432 |
| 3 Banc of America Commercial Mortgage | ||||
| Trust 2006-4 | 5.634% | 7/10/46 | 16,720 | 18,113 |
| 3 Banc of America Commercial Mortgage | ||||
| Trust 2006-5 | 5.414% | 9/10/47 | 5,210 | 5,643 |
| 3 Banc of America Commercial Mortgage | ||||
| Trust 2006-5 | 5.448% | 9/10/47 | 890 | 938 |
| 3 Banc of America Commercial Mortgage | ||||
| Trust 2007-2 | 5.623% | 4/10/49 | 450 | 498 |
| 3 Banc of America Commercial Mortgage | ||||
| Trust 2008-1 | 6.207% | 2/10/51 | 12,600 | 14,272 |
| 3 Bear Stearns Commercial Mortgage Securities | ||||
| Trust 2004-PWR6 | 4.825% | 11/11/41 | 275 | 282 |
| 3 Bear Stearns Commercial Mortgage Securities | ||||
| Trust 2004-PWR6 | 4.868% | 11/11/41 | 990 | 1,015 |
| 3 Bear Stearns Commercial Mortgage Securities | ||||
| Trust 2004-TOP14 | 5.200% | 1/12/41 | 350 | 351 |
| 3 Bear Stearns Commercial Mortgage Securities | ||||
| Trust 2005-PWR10 | 5.405% | 12/11/40 | 5,720 | 6,051 |
| 3 Bear Stearns Commercial Mortgage Securities | ||||
| Trust 2005-PWR8 | 4.750% | 6/11/41 | 1,970 | 2,034 |
| 3 Bear Stearns Commercial Mortgage Securities | ||||
| Trust 2005-TOP18 | 4.933% | 2/13/42 | 1,882 | 1,956 |
| 3 Bear Stearns Commercial Mortgage Securities | ||||
| Trust 2005-TOP20 | 5.138% | 10/12/42 | 5,515 | 5,843 |
| 3 Bear Stearns Commercial Mortgage Securities | ||||
| Trust 2006-PWR11 | 5.439% | 3/11/39 | 11,300 | 12,120 |
| 3 Bear Stearns Commercial Mortgage Securities | ||||
| Trust 2006-PWR12 | 5.712% | 9/11/38 | 1,800 | 1,944 |
| 3 Bear Stearns Commercial Mortgage Securities | ||||
| Trust 2006-PWR12 | 5.751% | 9/11/38 | 2,225 | 2,423 |
| 3 Bear Stearns Commercial Mortgage Securities | ||||
| Trust 2006-PWR13 | 5.582% | 9/11/41 | 1,125 | 1,246 |
| 3 Bear Stearns Commercial Mortgage Securities | ||||
| Trust 2006-TOP22 | 5.579% | 4/12/38 | 9,270 | 10,005 |
| 3 Bear Stearns Commercial Mortgage Securities | ||||
| Trust 2006-TOP22 | 5.579% | 4/12/38 | 1,500 | 1,624 |
| 3 Bear Stearns Commercial Mortgage Securities | ||||
| Trust 2006-TOP24 | 5.568% | 10/12/41 | 3,675 | 4,029 |
| 3 Bear Stearns Commercial Mortgage Securities | ||||
| Trust 2007-PWR16 | 5.654% | 6/11/40 | 1,408 | 1,429 |
22
| Total Bond Market II Index Fund | ||||
| Face | Market | |||
| Maturity | Amount | Value | ||
| Coupon | Date | ($000) | ($000) | |
| 3 Bear Stearns Commercial Mortgage Securities | ||||
| Trust 2007-PWR16 | 5.706% | 6/11/40 | 3,600 | 4,046 |
| 3 Bear Stearns Commercial Mortgage Securities | ||||
| Trust 2007-PWR17 | 5.694% | 6/11/50 | 14,821 | 16,494 |
| 3 Bear Stearns Commercial Mortgage Securities | ||||
| Trust 2007-PWR17 | 5.887% | 6/11/50 | 4,095 | 4,616 |
| 3 Bear Stearns Commercial Mortgage Securities | ||||
| Trust 2007-PWR18 | 5.700% | 6/11/50 | 6,625 | 7,422 |
| 3 Bear Stearns Commercial Mortgage Securities | ||||
| Trust 2007-TOP26 | 5.471% | 1/12/45 | 3,102 | 3,424 |
| 3 Bear Stearns Commercial Mortgage Securities | ||||
| Trust 2007-TOP26 | 5.513% | 1/12/45 | 2,475 | 2,674 |
| 3 Bear Stearns Commercial Mortgage Securities | ||||
| Trust 2007-TOP28 | 5.742% | 9/11/42 | 8,100 | 9,108 |
| 3 Bear Stearns Commercial Mortgage Securities | ||||
| Trust 2007-TOP28 | 5.793% | 9/11/42 | 1,269 | 1,284 |
| 3 Capital Auto Receivables Asset Trust 2013-1 | 0.790% | 6/20/17 | 2,058 | 2,050 |
| 3 Capital Auto Receivables Asset Trust 2013-3 | 1.040% | 11/21/16 | 2,230 | 2,233 |
| 3 Capital Auto Receivables Asset Trust 2013-3 | 1.310% | 12/20/17 | 2,233 | 2,249 |
| 3 Capital Auto Receivables Asset Trust 2013-3 | 1.680% | 4/20/18 | 1,340 | 1,350 |
| 3 Capital Auto Receivables Asset Trust 2013-4 | 1.090% | 3/20/18 | 1,850 | 1,855 |
| 3 Capital Auto Receivables Asset Trust 2013-4 | 1.470% | 7/20/18 | 700 | 702 |
| 3 Capital Auto Receivables Asset Trust 2013-4 | 2.060% | 10/22/18 | 700 | 705 |
| 3 Capital One Multi-asset Execution Trust 2006-A3 | 5.050% | 12/17/18 | 12,975 | 14,122 |
| 3 Capital One Multi-asset Execution Trust 2007-A7 | 5.750% | 7/15/20 | 7,190 | 8,254 |
| 3 CarMax Auto Owner Trust 2012-3 | 0.790% | 4/16/18 | 1,320 | 1,311 |
| 3 Carmax Auto Owner Trust 2013-2 | 0.640% | 1/16/18 | 1,917 | 1,915 |
| 3 Carmax Auto Owner Trust 2013-2 | 0.840% | 11/15/18 | 799 | 791 |
| 3 Carmax Auto Owner Trust 2013-3 | 0.970% | 4/16/18 | 2,240 | 2,256 |
| 3 Carmax Auto Owner Trust 2013-3 | 1.490% | 1/15/19 | 1,210 | 1,222 |
| 3 Carmax Auto Owner Trust 2013-4 | 0.800% | 7/16/18 | 900 | 900 |
| 3 Carmax Auto Owner Trust 2013-4 | 1.280% | 5/15/19 | 375 | 374 |
| 3 CD 2005-CD1 Commercial Mortgage Trust | 5.218% | 7/15/44 | 7,550 | 7,996 |
| 3 CD 2005-CD1 Commercial Mortgage Trust | 5.218% | 7/15/44 | 2,475 | 2,652 |
| 3 CD 2006-CD3 Mortgage Trust | 5.617% | 10/15/48 | 15,021 | 16,157 |
| 3 CD 2006-CD3 Mortgage Trust | 5.648% | 10/15/48 | 4,150 | 4,573 |
| 3 CD 2007-CD4 Commercial Mortgage Trust | 5.205% | 12/11/49 | 419 | 418 |
| 3 CD 2007-CD4 Commercial Mortgage Trust | 5.322% | 12/11/49 | 9,395 | 10,374 |
| 3 CD 2007-CD5 Mortgage Trust | 5.886% | 11/15/44 | 6,839 | 7,675 |
| 3 CenterPoint Energy Transition Bond Co. II LLC | ||||
| 2005-A | 5.170% | 8/1/19 | 1,120 | 1,217 |
| 3 CenterPoint Energy Transition Bond Co. II LLC | ||||
| 2005-A | 5.302% | 8/1/20 | 654 | 754 |
| 3 CenterPoint Energy Transition Bond Co. IV LLC | ||||
| 2012-1 | 3.028% | 10/15/25 | 5,300 | 5,069 |
| 3 Chase Issuance Trust 2006-A2 | 5.160% | 4/16/18 | 7,446 | 8,129 |
| 3 Chase Issuance Trust 2012-A5 | 0.590% | 8/15/17 | 3,404 | 3,400 |
| 3 Chase Issuance Trust 2012-A7 | 2.160% | 9/16/24 | 12,805 | 11,708 |
| 3 Chase Issuance Trust 2013-A8 | 1.010% | 10/15/18 | 6,425 | 6,393 |
| 3 Citibank Credit Card Issuance Trust 2003-A7 | 4.150% | 7/7/17 | 4,676 | 4,924 |
| 3 Citibank Credit Card Issuance Trust 2004-A8 | 4.900% | 12/12/16 | 6,116 | 6,349 |
| 3 Citibank Credit Card Issuance Trust 2005-A2 | 4.850% | 3/10/17 | 2,975 | 3,118 |
| 3 Citibank Credit Card Issuance Trust 2005-A9 | 5.100% | 11/20/17 | 11,399 | 12,325 |
| 3 Citibank Credit Card Issuance Trust 2007-A8 | 5.650% | 9/20/19 | 7,150 | 8,199 |
| 3 Citibank Credit Card Issuance Trust 2008-A1 | 5.350% | 2/7/20 | 6,114 | 6,972 |
23
| Total Bond Market II Index Fund | |||||
| Face | Market | ||||
| Maturity | Amount | Value | |||
| Coupon | Date | ($000) | ($000) | ||
| 3 | Citibank Credit Card Issuance Trust 2009-A4 | 4.900% | 6/23/16 | 7,800 | 7,960 |
| 3 | Citibank Credit Card Issuance Trust 2013-A10 | 0.730% | 2/7/18 | 2,900 | 2,896 |
| 3 | Citigroup Commercial Mortgage Trust 2005-C3 | 4.830% | 5/15/43 | 4,020 | 4,195 |
| 3 | Citigroup Commercial Mortgage Trust 2006-C4 | 5.778% | 3/15/49 | 7,075 | 7,681 |
| 3 | Citigroup Commercial Mortgage Trust 2006-C4 | 5.778% | 3/15/49 | 2,000 | 2,180 |
| 3 | Citigroup Commercial Mortgage Trust 2006-C5 | 5.431% | 10/15/49 | 2,275 | 2,477 |
| 3 | Citigroup Commercial Mortgage Trust 2006-C5 | 5.462% | 10/15/49 | 1,585 | 1,742 |
| 3 | Citigroup Commercial Mortgage Trust 2007-C6 | 5.705% | 12/10/49 | 9,145 | 10,306 |
| 3 | Citigroup Commercial Mortgage Trust 2008-C7 | 6.132% | 12/10/49 | 11,348 | 12,835 |
| 3 | Citigroup Commercial Mortgage Trust 2012-GC8 | 3.024% | 9/10/45 | 3,950 | 3,771 |
| 3 | Citigroup Commercial Mortgage Trust 2013-GC11 | 3.093% | 4/10/46 | 1,400 | 1,321 |
| 3 | Citigroup Commercial Mortgage Trust 2013-GC11 | 3.422% | 4/10/46 | 1,300 | 1,237 |
| 3 | Citigroup Commercial Mortgage Trust 2013-GC15 | 3.161% | 9/10/46 | 1,700 | 1,753 |
| 3 | Citigroup Commercial Mortgage Trust 2013-GC15 | 3.942% | 9/10/46 | 800 | 830 |
| 3 | Citigroup Commercial Mortgage Trust 2013-GC15 | 4.371% | 9/10/46 | 1,200 | 1,235 |
| 3 | Citigroup Commercial Mortgage Trust 2013-GC15 | 4.649% | 9/10/46 | 1,700 | 1,758 |
| 3 | Citigroup Commercial Mortgage Trust 2013-GC17 | 3.675% | 11/10/46 | 550 | 562 |
| 3 | Citigroup Commercial Mortgage Trust 2013-GC17 | 4.131% | 11/10/46 | 1,825 | 1,865 |
| 3 | Citigroup Commercial Mortgage Trust 2013-GC17 | 4.544% | 11/10/46 | 750 | 773 |
| 3 | Citigroup Commercial Mortgage Trust 2013-GC17 | 5.095% | 11/10/46 | 750 | 775 |
| 3 | COBALT CMBS Commercial Mortgage Trust | ||||
| 2007-C2 | 5.484% | 4/15/47 | 1,952 | 2,153 | |
| 3 | COBALT CMBS Commercial Mortgage Trust | ||||
| 2007-C3 | 5.770% | 5/15/46 | 6,645 | 7,374 | |
| 3 | COMM 2004-LNB2 Mortgage Trust | 4.715% | 3/10/39 | 686 | 688 |
| 3 | COMM 2005-C6 Mortgage Trust | 5.116% | 6/10/44 | 11,980 | 12,617 |
| 3 | COMM 2006-C7 Mortgage Trust | 5.752% | 6/10/46 | 11,500 | 12,476 |
| 3 | COMM 2006-C7 Mortgage Trust | 5.777% | 6/10/46 | 1,815 | 1,960 |
| 3 | COMM 2007-C9 Mortgage Trust | 5.800% | 12/10/49 | 7,325 | 8,269 |
| 3 | COMM 2012-CCRE2 Mortgage Trust | 3.147% | 8/15/45 | 1,285 | 1,241 |
| 3 | COMM 2012-CCRE2 Mortgage Trust | 3.791% | 8/15/45 | 1,825 | 1,802 |
| 3 | COMM 2012-CCRE3 Mortgage Trust | 2.822% | 10/15/45 | 5,000 | 4,705 |
| 3,6 | COMM 2012-CCRE3 Mortgage Trust | 3.416% | 10/15/45 | 2,195 | 2,090 |
| 3 | COMM 2012-CCRE4 Mortgage Trust | 2.853% | 10/15/45 | 6,200 | 5,826 |
| 3 | COMM 2012-CCRE5 Mortgage Trust | 2.771% | 12/10/45 | 1,500 | 1,397 |
| 3 | COMM 2013-CCRE11 Mortgage Trust | 3.047% | 10/10/46 | 1,310 | 1,344 |
| 3 | COMM 2013-CCRE11 Mortgage Trust | 3.660% | 10/10/46 | 1,310 | 1,330 |
| 3 | COMM 2013-CCRE11 Mortgage Trust | 3.983% | 10/10/46 | 1,750 | 1,771 |
| 3 | COMM 2013-CCRE11 Mortgage Trust | 4.258% | 10/10/46 | 2,190 | 2,244 |
| 3 | COMM 2013-CCRE11 Mortgage Trust | 4.715% | 10/10/46 | 1,310 | 1,370 |
| 3 | COMM 2013-CCRE12 Mortgage Trust | 1.295% | 10/10/46 | 692 | 690 |
| 3 | COMM 2013-CCRE12 Mortgage Trust | 2.904% | 10/10/46 | 1,075 | 1,100 |
| 3 | COMM 2013-CCRE12 Mortgage Trust | 3.623% | 10/10/46 | 1,075 | 1,096 |
| 3 | COMM 2013-CCRE12 Mortgage Trust | 3.765% | 10/10/46 | 1,425 | 1,417 |
| 3 | COMM 2013-CCRE12 Mortgage Trust | 4.046% | 10/10/46 | 1,075 | 1,084 |
| 3 | COMM 2013-CCRE12 Mortgage Trust | 4.300% | 10/10/46 | 700 | 708 |
| 3 | COMM 2013-CCRE12 Mortgage Trust | 4.762% | 10/10/46 | 350 | 352 |
| 3 | COMM 2013-CCRE13 Mortgage Trust | 1.259% | 10/10/46 | 550 | 548 |
| 3 | COMM 2013-CCRE13 Mortgage Trust | 3.039% | 10/10/46 | 550 | 565 |
| 3 | COMM 2013-CCRE13 Mortgage Trust | 3.706% | 10/10/46 | 375 | 383 |
| 3 | COMM 2013-CCRE13 Mortgage Trust | 4.194% | 10/10/46 | 3,700 | 3,796 |
| 3 | COMM 2013-CCRE13 Mortgage Trust | 4.449% | 10/10/46 | 1,100 | 1,125 |
| 3 | COMM 2013-CCRE6 Mortgage Trust | 3.101% | 3/10/46 | 1,744 | 1,662 |
| 3 | COMM 2013-CCRE7 Mortgage Trust | 3.213% | 3/10/46 | 1,425 | 1,367 |
| 3 | COMM 2013-CCRE8 Mortgage Trust | 3.612% | 6/10/46 | 1,788 | 1,765 |
24
| Total Bond Market II Index Fund | |||||
| Face | Market | ||||
| Maturity | Amount | Value | |||
| Coupon | Date | ($000) | ($000) | ||
| 3 | COMM 2013-CCRE9 Mortgage Trust | 4.237% | 7/10/45 | 2,295 | 2,375 |
| 3 | COMM 2013-CCRE9 Mortgage Trust | 4.210% | 8/10/46 | 660 | 681 |
| 3 | COMM 2013-LC13 Mortgage Trust | 3.009% | 8/10/46 | 2,020 | 2,071 |
| 3 | COMM 2013-LC13 Mortgage Trust | 4.205% | 8/10/46 | 2,020 | 2,076 |
| 3 | COMM 2013-LC6 Mortgage Trust | 2.941% | 1/10/46 | 3,931 | 3,687 |
| 3 | COMM 2013-LC6 Mortgage Trust | 3.282% | 1/10/46 | 2,184 | 2,061 |
| 3 | Commercial Mortgage Trust 2004-GG1 | 5.317% | 6/10/36 | 1,811 | 1,822 |
| 3 | Commercial Mortgage Trust 2005-GG3 | 4.799% | 8/10/42 | 12,827 | 13,201 |
| 3 | Commercial Mortgage Trust 2005-GG3 | 4.859% | 8/10/42 | 1,775 | 1,839 |
| 3 | Commercial Mortgage Trust 2005-GG5 | 5.224% | 4/10/37 | 7,925 | 8,339 |
| 3 | Commercial Mortgage Trust 2005-GG5 | 5.277% | 4/10/37 | 1,900 | 2,019 |
| 3 | Commercial Mortgage Trust 2006-GG7 | 5.820% | 7/10/38 | 2,234 | 2,436 |
| 3 | Commercial Mortgage Trust 2007-GG9 | 5.475% | 3/10/39 | 640 | 680 |
| 3,6 | Commercial Mortgages Lease-Backed Certificates | ||||
| Series 2001-CMLB-1 | 6.746% | 6/20/31 | 1,197 | 1,254 | |
| 3 | Credit Suisse Commercial Mortgage Trust | ||||
| Series 2006-C1 | 5.465% | 2/15/39 | 2,225 | 2,386 | |
| 3 | Credit Suisse Commercial Mortgage Trust | ||||
| Series 2006-C1 | 5.465% | 2/15/39 | 10,725 | 11,429 | |
| 3 | Credit Suisse Commercial Mortgage Trust | ||||
| Series 2006-C1 | 5.465% | 2/15/39 | 2,800 | 3,015 | |
| 3 | Credit Suisse Commercial Mortgage Trust | ||||
| Series 2006-C3 | 5.791% | 6/15/38 | 5,514 | 6,000 | |
| 3 | Credit Suisse Commercial Mortgage Trust | ||||
| Series 2006-C3 | 5.791% | 6/15/38 | 2,700 | 2,931 | |
| 3 | Credit Suisse Commercial Mortgage Trust | ||||
| Series 2006-C4 | 5.509% | 9/15/39 | 550 | 591 | |
| 3 | Credit Suisse Commercial Mortgage Trust | ||||
| Series 2006-C5 | 5.311% | 12/15/39 | 7,455 | 8,079 | |
| 3 | Credit Suisse Commercial Mortgage Trust | ||||
| Series 2007-C1 | 5.383% | 2/15/40 | 2,757 | 2,980 | |
| 3 | Credit Suisse Commercial Mortgage Trust | ||||
| Series 2007-C3 | 5.683% | 6/15/39 | 9,858 | 10,767 | |
| 3 | CSFB Commercial Mortgage Trust 2005-C1 | 5.014% | 2/15/38 | 5,237 | 5,384 |
| 3 | CSFB Commercial Mortgage Trust 2005-C1 | 5.075% | 2/15/38 | 2,009 | 2,078 |
| 3 | CSFB Commercial Mortgage Trust 2005-C4 | 5.190% | 8/15/38 | 1,375 | 1,440 |
| 3 | CSFB Commercial Mortgage Trust 2005-C5 | 5.100% | 8/15/38 | 520 | 553 |
| 3 | CSFB Commercial Mortgage Trust 2005-C5 | 5.100% | 8/15/38 | 6,775 | 7,112 |
| 3 | CSFB Commercial Mortgage Trust 2005-C6 | 5.230% | 12/15/40 | 1,525 | 1,603 |
| 3 | Discover Card Execution Note Trust 2007-A1 | 5.650% | 3/16/20 | 9,453 | 10,814 |
| 3 | Ford Credit Auto Lease Trust 2013-B | 0.760% | 9/15/16 | 800 | 802 |
| 3 | Ford Credit Auto Lease Trust 2013-B | 0.960% | 10/15/16 | 650 | 652 |
| 3 | Ford Credit Auto Owner Trust 2010-A | 2.150% | 6/15/15 | 1,780 | 1,784 |
| 3 | Ford Credit Auto Owner Trust 2011-A | 1.650% | 5/15/16 | 774 | 778 |
| 3 | Ford Credit Auto Owner Trust 2012-A | 1.150% | 6/15/17 | 3,525 | 3,544 |
| 3 | Ford Credit Auto Owner Trust 2012-B | 0.720% | 12/15/16 | 428 | 429 |
| 3 | Ford Credit Auto Owner Trust 2013-A | 0.550% | 7/15/17 | 2,761 | 2,760 |
| 3 | Ford Credit Auto Owner Trust 2013-B | 0.570% | 10/15/17 | 1,600 | 1,598 |
| 3 | Ford Credit Auto Owner Trust 2013-B | 0.760% | 8/15/18 | 800 | 797 |
| 3 | Ford Credit Auto Owner Trust 2013-C | 0.820% | 12/15/17 | 2,077 | 2,082 |
| 3 | Ford Credit Auto Owner Trust 2013-C | 1.250% | 10/15/18 | 692 | 696 |
| 3 | Ford Credit Auto Owner Trust 2013-D | 0.670% | 4/15/18 | 2,100 | 2,100 |
| 3 | Ford Credit Auto Owner Trust 2013-D | 1.110% | 2/15/19 | 350 | 350 |
| 3 | Ford Credit Floorplan Master Owner Trust A | ||||
| Series 2013-5 | 1.500% | 9/15/18 | 2,800 | 2,825 | |
25
| Total Bond Market II Index Fund | ||||
| Face | Market | |||
| Maturity | Amount | Value | ||
| Coupon | Date | ($000) | ($000) | |
| 3 GE Capital Credit Card Master Note Trust | ||||
| Series 2012-7 | 1.760% | 9/15/22 | 5,644 | 5,440 |
| 3 GE Commercial Mortgage Corp. Series | ||||
| 2005-C3 Trust | 4.974% | 7/10/45 | 4,460 | 4,685 |
| 3 GE Commercial Mortgage Corp. Series | ||||
| 2005-C4 Trust | 5.310% | 11/10/45 | 2,725 | 2,901 |
| 3 GE Commercial Mortgage Corp. Series | ||||
| 2006-C1 Trust | 5.280% | 3/10/44 | 2,825 | 3,071 |
| 3 GE Commercial Mortgage Corp. Series | ||||
| 2006-C1 Trust | 5.280% | 3/10/44 | 12,475 | 13,309 |
| 3 GE Commercial Mortgage Corp. Series | ||||
| 2007-C1 Trust | 5.543% | 12/10/49 | 4,300 | 4,612 |
| 3 GMAC Commercial Mortgage Securities Inc. | ||||
| Series 2004-C1 Trust | 4.908% | 3/10/38 | 318 | 319 |
| 3 GMAC Commercial Mortgage Securities Inc. | ||||
| Series 2004-C3 Trust | 4.864% | 12/10/41 | 3,175 | 3,255 |
| 3 GMAC Commercial Mortgage Securities Inc. | ||||
| Series 2005-C1 Trust | 4.754% | 5/10/43 | 1,055 | 1,098 |
| 3 GS Mortgage Securities Trust 2004-GG2 | 5.396% | 8/10/38 | 6,644 | 6,729 |
| 3 GS Mortgage Securities Trust 2006-GG6 | 5.506% | 4/10/38 | 402 | 402 |
| 3 GS Mortgage Securities Trust 2006-GG6 | 5.553% | 4/10/38 | 8,350 | 8,971 |
| 3 GS Mortgage Securities Trust 2006-GG6 | 5.622% | 4/10/38 | 1,725 | 1,838 |
| 3 GS Mortgage Securities Trust 2011-GC5 | 3.707% | 8/10/44 | 1,500 | 1,525 |
| 3 GS Mortgage Securities Trust 2012-GC6 | 3.482% | 1/10/45 | 6,250 | 6,321 |
| 3 GS Mortgage Securities Trust 2012-GCJ7 | 3.377% | 5/10/45 | 3,825 | 3,805 |
| 3 GS Mortgage Securities Trust 2012-GCJ9 | 2.773% | 11/10/45 | 2,955 | 2,760 |
| 3 GS Mortgage Securities Trust 2013-GC10 | 2.943% | 2/10/46 | 3,494 | 3,283 |
| 3 GS Mortgage Securities Trust 2013-GC10 | 3.279% | 2/10/46 | 1,310 | 1,239 |
| 3 GS Mortgage Securities Trust 2013-GCJ12 | 3.135% | 6/10/46 | 2,255 | 2,135 |
| 3 GS Mortgage Securities Trust 2013-GCJ12 | 3.375% | 6/10/46 | 966 | 915 |
| 3 GS Mortgage Securities Trust 2013-GCJ14 | 2.995% | 8/10/46 | 1,875 | 1,927 |
| 3 GS Mortgage Securities Trust 2013-GCJ14 | 3.817% | 8/10/46 | 1,340 | 1,387 |
| 3 GS Mortgage Securities Trust 2013-GCJ14 | 4.243% | 8/10/46 | 6,700 | 6,914 |
| 3 GS Mortgage Securities Trust 2013-GCJ16 | 3.033% | 11/10/46 | 2,000 | 2,059 |
| 3 GS Mortgage Securities Trust 2013-GCJ16 | 3.813% | 11/10/46 | 710 | 732 |
| 3 GS Mortgage Securities Trust 2013-GCJ16 | 4.271% | 11/10/46 | 1,150 | 1,189 |
| 3 Honda Auto Receivables 2011-1 Owner Trust | 1.800% | 4/17/17 | 1,228 | 1,233 |
| 3 Honda Auto Receivables 2012-4 Owner Trust | 0.660% | 12/18/18 | 2,950 | 2,950 |
| 3 Honda Auto Receivables 2013-1 Owner Trust | 0.480% | 11/21/16 | 3,433 | 3,432 |
| 3 Honda Auto Receivables 2013-1 Owner Trust | 0.620% | 3/21/19 | 2,746 | 2,736 |
| 3 Honda Auto Receivables 2013-2 Owner Trust | 0.530% | 2/16/17 | 1,077 | 1,074 |
| 3 Honda Auto Receivables 2013-2 Owner Trust | 0.660% | 6/17/19 | 1,077 | 1,071 |
| 3 Honda Auto Receivables 2013-4 Owner Trust | 0.690% | 9/18/17 | 1,250 | 1,251 |
| 3 Honda Auto Receivables 2013-4 Owner Trust | 1.040% | 2/18/20 | 1,100 | 1,097 |
| 3 Hyundai Auto Receivables Trust 2012-C | 0.730% | 6/15/18 | 2,000 | 1,993 |
| 3 Hyundai Auto Receivables Trust 2013-A | 0.560% | 7/17/17 | 2,620 | 2,613 |
| 3 Hyundai Auto Receivables Trust 2013-A | 0.750% | 9/17/18 | 4,367 | 4,337 |
| 3 Hyundai Auto Receivables Trust 2013-B | 0.710% | 9/15/17 | 2,675 | 2,675 |
| 3 Hyundai Auto Receivables Trust 2013-B | 1.010% | 2/15/19 | 1,325 | 1,323 |
| 3 Hyundai Auto Receivables Trust 2013-C | 1.010% | 2/15/18 | 1,040 | 1,044 |
| 3 Hyundai Auto Receivables Trust 2013-C | 1.550% | 3/15/19 | 1,730 | 1,750 |
| 3 JP Morgan Chase Commercial Mortgage | ||||
| Securities Trust 2004-CIBC10 | 4.654% | 1/12/37 | 808 | 808 |
| 3 JP Morgan Chase Commercial Mortgage | ||||
| Securities Trust 2004-CIBC8 | 4.404% | 1/12/39 | 1,229 | 1,232 |
26
| Total Bond Market II Index Fund | ||||
| Face | Market | |||
| Maturity | Amount | Value | ||
| Coupon | Date | ($000) | ($000) | |
| 3 JP Morgan Chase Commercial Mortgage | ||||
| Securities Trust 2004-CIBC9 | 5.569% | 6/12/41 | 9,143 | 9,299 |
| 3 JP Morgan Chase Commercial Mortgage | ||||
| Securities Trust 2005-CIBC11 | 5.389% | 8/12/37 | 1,180 | 1,231 |
| 3 JP Morgan Chase Commercial Mortgage | ||||
| Securities Trust 2005-CIBC13 | 5.285% | 1/12/43 | 1,000 | 1,070 |
| 3 JP Morgan Chase Commercial Mortgage | ||||
| Securities Trust 2005-LDP2 | 4.780% | 7/15/42 | 1,785 | 1,881 |
| 3 JP Morgan Chase Commercial Mortgage | ||||
| Securities Trust 2005-LDP4 | 4.918% | 10/15/42 | 11,532 | 12,108 |
| 3 JP Morgan Chase Commercial Mortgage | ||||
| Securities Trust 2005-LDP5 | 5.200% | 12/15/44 | 7,391 | 7,865 |
| 3 JP Morgan Chase Commercial Mortgage | ||||
| Securities Trust 2005-LDP5 | 5.242% | 12/15/44 | 1,480 | 1,604 |
| 3 JP Morgan Chase Commercial Mortgage | ||||
| Securities Trust 2005-LDP5 | 5.321% | 12/15/44 | 585 | 617 |
| 3 JP Morgan Chase Commercial Mortgage | ||||
| Securities Trust 2006-CIBC14 | 5.445% | 12/12/44 | 1,100 | 1,181 |
| 3 JP Morgan Chase Commercial Mortgage | ||||
| Securities Trust 2006-CIBC16 | 5.593% | 5/12/45 | 4,180 | 4,570 |
| 3 JP Morgan Chase Commercial Mortgage | ||||
| Securities Trust 2006-LDP6 | 5.475% | 4/15/43 | 3,217 | 3,483 |
| 3 JP Morgan Chase Commercial Mortgage | ||||
| Securities Trust 2006-LDP7 | 5.863% | 4/15/45 | 10,290 | 11,184 |
| 3 JP Morgan Chase Commercial Mortgage | ||||
| Securities Trust 2006-LDP7 | 5.863% | 4/15/45 | 2,360 | 2,600 |
| 3 JP Morgan Chase Commercial Mortgage | ||||
| Securities Trust 2006-LDP8 | 5.440% | 5/15/45 | 1,720 | 1,884 |
| 3 JP Morgan Chase Commercial Mortgage | ||||
| Securities Trust 2006-LDP8 | 5.447% | 5/15/45 | 220 | 222 |
| 3 JP Morgan Chase Commercial Mortgage | ||||
| Securities Trust 2007-CIBC18 | 5.440% | 6/12/47 | 6,510 | 7,125 |
| 3 JP Morgan Chase Commercial Mortgage | ||||
| Securities Trust 2007-CIBC20 | 5.794% | 2/12/51 | 19,976 | 22,347 |
| 3 JP Morgan Chase Commercial Mortgage | ||||
| Securities Trust 2007-CIBC20 | 5.874% | 2/12/51 | 1,650 | 1,867 |
| 3 JP Morgan Chase Commercial Mortgage | ||||
| Securities Trust 2007-LDP11 | 5.806% | 6/15/49 | 5,610 | 6,243 |
| 3 JP Morgan Chase Commercial Mortgage | ||||
| Securities Trust 2007-LDP12 | 5.882% | 2/15/51 | 6,620 | 7,357 |
| 3 JP Morgan Chase Commercial Mortgage | ||||
| Securities Trust 2012-C6 | 3.507% | 5/15/45 | 4,875 | 4,835 |
| 3 JP Morgan Chase Commercial Mortgage | ||||
| Securities Trust 2012-C8 | 2.829% | 10/15/45 | 11,575 | 10,903 |
| 3 JP Morgan Chase Commercial Mortgage | ||||
| Securities Trust 2012-CIBX | 3.483% | 6/15/45 | 3,816 | 3,804 |
| 3 JP Morgan Chase Commercial Mortgage | ||||
| Securities Trust 2012-LC9 | 2.840% | 12/15/47 | 2,250 | 2,105 |
| 3 JP Morgan Chase Commercial Mortgage | ||||
| Securities Trust 2013-C10 | 3.143% | 12/15/47 | 1,389 | 1,332 |
| 3 JP Morgan Chase Commercial Mortgage | ||||
| Securities Trust 2013-C10 | 3.372% | 12/15/47 | 1,042 | 991 |
| 3 JP Morgan Chase Commercial Mortgage | ||||
| Securities Trust 2013-C16 | 3.674% | 12/15/46 | 1,250 | 1,279 |
27
| Total Bond Market II Index Fund | ||||
| Face | Market | |||
| Maturity | Amount | Value | ||
| Coupon | Date | ($000) | ($000) | |
| 3 JP Morgan Chase Commercial Mortgage | ||||
| Securities Trust 2013-C16 | 3.881% | 12/15/46 | 1,500 | 1,504 |
| 3 JP Morgan Chase Commercial Mortgage | ||||
| Securities Trust 2013-C16 | 4.166% | 12/15/46 | 2,600 | 2,662 |
| 3 JP Morgan Chase Commercial Mortgage | ||||
| Securities Trust 2013-C16 | 4.517% | 12/15/46 | 1,250 | 1,285 |
| 3 JP Morgan Chase Commercial Mortgage | ||||
| Securities Trust 2013-C16 | 4.944% | 12/15/46 | 1,250 | 1,283 |
| 3 JP Morgan Chase Commercial Mortgage | ||||
| Securities Trust 2013-LC11 | 2.960% | 4/15/46 | 1,466 | 1,375 |
| 3 JPMBB Commercial Mortgage Securities Trust | ||||
| 2013-C12 | 3.664% | 7/15/45 | 982 | 972 |
| 3 JPMBB Commercial Mortgage Securities Trust | ||||
| 2013-C12 | 4.026% | 7/15/45 | 655 | 657 |
| 3 JPMBB Commercial Mortgage Securities Trust | ||||
| 2013-C14 | 3.761% | 8/15/46 | 990 | 1,020 |
| 3 JPMBB Commercial Mortgage Securities Trust | ||||
| 2013-C14 | 4.133% | 8/15/46 | 2,640 | 2,704 |
| 3 JPMBB Commercial Mortgage Securities Trust | ||||
| 2013-C14 | 4.409% | 8/15/46 | 740 | 759 |
| 3 JPMBB Commercial Mortgage Securities Trust | ||||
| 2013-C15 | 1.233% | 11/15/45 | 1,224 | 1,221 |
| 3 JPMBB Commercial Mortgage Securities Trust | ||||
| 2013-C15 | 2.977% | 11/15/45 | 5,030 | 5,150 |
| 3 JPMBB Commercial Mortgage Securities Trust | ||||
| 2013-C15 | 3.659% | 11/15/45 | 505 | 517 |
| 3 JPMBB Commercial Mortgage Securities Trust | ||||
| 2013-C15 | 4.131% | 11/15/45 | 3,520 | 3,597 |
| 3 JPMBB Commercial Mortgage Securities Trust | ||||
| 2013-C15 | 4.420% | 11/15/45 | 2,010 | 2,053 |
| 3 JPMBB Commercial Mortgage Securities Trust | ||||
| 2013-C17 | 3.003% | 1/15/47 | 1,550 | 1,583 |
| 3 JPMBB Commercial Mortgage Securities Trust | ||||
| 2013-C17 | 3.705% | 1/15/47 | 1,163 | 1,183 |
| 3 JPMBB Commercial Mortgage Securities Trust | ||||
| 2013-C17 | 4.199% | 1/15/47 | 3,875 | 3,934 |
| 3 JPMBB Commercial Mortgage Securities Trust | ||||
| 2013-C17 | 4.458% | 1/15/47 | 775 | 787 |
| 3 JPMBB Commercial Mortgage Securities Trust | ||||
| 2013-C17 | 4.887% | 1/15/47 | 1,163 | 1,167 |
| 3 LB-UBS Commercial Mortgage Trust 2004-C7 | 4.786% | 10/15/29 | 6,969 | 7,095 |
| 3 LB-UBS Commercial Mortgage Trust 2005-C1 | 4.742% | 2/15/30 | 4,850 | 4,975 |
| 3 LB-UBS Commercial Mortgage Trust 2005-C2 | 5.150% | 4/15/30 | 2,845 | 2,963 |
| 3 LB-UBS Commercial Mortgage Trust 2005-C5 | 5.057% | 9/15/40 | 750 | 777 |
| 3 LB-UBS Commercial Mortgage Trust 2005-C7 | 5.197% | 11/15/30 | 6,855 | 7,199 |
| 3 LB-UBS Commercial Mortgage Trust 2006-C1 | 5.217% | 2/15/31 | 3,588 | 3,893 |
| 3 LB-UBS Commercial Mortgage Trust 2006-C3 | 5.661% | 3/15/39 | 15,740 | 16,960 |
| 3 LB-UBS Commercial Mortgage Trust 2006-C4 | 5.858% | 6/15/38 | 6,813 | 7,414 |
| 3 LB-UBS Commercial Mortgage Trust 2006-C6 | 5.372% | 9/15/39 | 10,060 | 10,951 |
| 3 LB-UBS Commercial Mortgage Trust 2006-C6 | 5.413% | 9/15/39 | 1,176 | 1,299 |
| 3 LB-UBS Commercial Mortgage Trust 2006-C7 | 5.347% | 11/15/38 | 1,150 | 1,261 |
| 3 LB-UBS Commercial Mortgage Trust 2006-C7 | 5.378% | 11/15/38 | 1,585 | 1,713 |
| 3 LB-UBS Commercial Mortgage Trust 2007-C1 | 5.424% | 2/15/40 | 3,900 | 4,294 |
| 3 LB-UBS Commercial Mortgage Trust 2007-C2 | 5.430% | 2/15/40 | 6,466 | 7,096 |
| 3 LB-UBS Commercial Mortgage Trust 2007-C7 | 5.866% | 9/15/45 | 9,687 | 10,853 |
28
| Total Bond Market II Index Fund | ||||
| Face | Market | |||
| Maturity | Amount | Value | ||
| Coupon | Date | ($000) | ($000) | |
| 3 LB-UBS Commercial Mortgage Trust 2008-C1 | 6.151% | 4/15/41 | 1,970 | 2,222 |
| 3 LB-UBS Commercial Mortgage Trust 2008-C1 | 6.151% | 4/15/41 | 13,125 | 15,037 |
| 3 Mercedes-Benz Auto Lease Trust 2013-B | 0.760% | 7/15/19 | 350 | 349 |
| 3 Mercedes-Benz Auto Receivables Trust 2013-1 | 0.780% | 8/15/17 | 692 | 696 |
| 3 Mercedes-Benz Auto Receivables Trust 2013-1 | 1.130% | 11/15/19 | 692 | 693 |
| 3 Merrill Lynch Mortgage Trust 2005-CIP1 | 5.107% | 7/12/38 | 811 | 852 |
| 3 Merrill Lynch Mortgage Trust 2005-LC1 | 5.291% | 1/12/44 | 8,269 | 8,872 |
| 3 Merrill Lynch Mortgage Trust 2005-MCP1 | 4.747% | 6/12/43 | 2,605 | 2,698 |
| 3 Merrill Lynch Mortgage Trust 2006-C1 | 5.676% | 5/12/39 | 9,440 | 10,112 |
| 3 Merrill Lynch Mortgage Trust 2006-C1 | 5.676% | 5/12/39 | 625 | 679 |
| 3 Merrill Lynch Mortgage Trust 2006-C2 | 5.782% | 8/12/43 | 1,965 | 2,147 |
| 3 Merrill Lynch Mortgage Trust 2007-C1 | 5.858% | 6/12/50 | 15,155 | 16,775 |
| 3 Merrill Lynch Mortgage Trust 2008-C1 | 5.690% | 2/12/51 | 7,450 | 8,333 |
| 3 ML-CFC Commercial Mortgage Trust 2006-2 | 5.886% | 6/12/46 | 13,410 | 14,634 |
| 3 ML-CFC Commercial Mortgage Trust 2006-3 | 5.456% | 7/12/46 | 300 | 326 |
| 3 ML-CFC Commercial Mortgage Trust 2006-4 | 5.204% | 12/12/49 | 1,225 | 1,333 |
| 3 ML-CFC Commercial Mortgage Trust 2007-5 | 5.378% | 8/12/48 | 7,615 | 8,285 |
| 3 ML-CFC Commercial Mortgage Trust 2007-9 | 5.590% | 9/12/49 | 325 | 325 |
| 3 ML-CFC Commercial Mortgage Trust 2007-9 | 5.700% | 9/12/49 | 10,995 | 12,186 |
| 3 Morgan Stanley Bank of America Merrill Lynch | ||||
| Trust 2012-C5 | 3.176% | 8/15/45 | 1,600 | 1,548 |
| 3 Morgan Stanley Bank of America Merrill Lynch | ||||
| Trust 2012-C6 | 2.858% | 11/15/45 | 4,000 | 3,763 |
| 3 Morgan Stanley Bank of America Merrill Lynch | ||||
| Trust 2013-C11 | 4.219% | 8/15/46 | 990 | 1,020 |
| 3 Morgan Stanley Bank of America Merrill Lynch | ||||
| Trust 2013-C11 | 4.419% | 8/15/46 | 490 | 499 |
| 3 Morgan Stanley Bank of America Merrill Lynch | ||||
| Trust 2013-C12 | 3.001% | 10/15/46 | 2,260 | 2,322 |
| 3 Morgan Stanley Bank of America Merrill Lynch | ||||
| Trust 2013-C12 | 4.259% | 10/15/46 | 2,260 | 2,335 |
| 3 Morgan Stanley Bank of America Merrill Lynch | ||||
| Trust 2013-C13 | 2.936% | 11/15/46 | 1,100 | 1,124 |
| 3 Morgan Stanley Bank of America Merrill Lynch | ||||
| Trust 2013-C13 | 4.039% | 11/15/46 | 2,200 | 2,229 |
| 3 Morgan Stanley Bank of America Merrill Lynch | ||||
| Trust 2013-C13 | 4.744% | 11/15/46 | 1,100 | 1,127 |
| 3 Morgan Stanley Bank of America Merrill Lynch | ||||
| Trust 2013-C7 | 2.918% | 2/15/46 | 1,707 | 1,603 |
| 3 Morgan Stanley Bank of America Merrill Lynch | ||||
| Trust 2013-C7 | 3.214% | 2/15/46 | 341 | 318 |
| 3 Morgan Stanley Bank of America Merrill Lynch | ||||
| Trust 2013-C8 | 3.134% | 12/15/48 | 2,100 | 2,002 |
| 3 Morgan Stanley Bank of America Merrill Lynch | ||||
| Trust 2013-C8 | 3.376% | 12/15/48 | 1,000 | 949 |
| 3 Morgan Stanley Bank of America Merrill Lynch | ||||
| Trust 2013-C9 | 3.102% | 5/15/46 | 1,275 | 1,207 |
| 3 Morgan Stanley Bank of America Merrill Lynch | ||||
| Trust 2013-C9 | 3.456% | 5/15/46 | 975 | 929 |
| 3 Morgan Stanley Capital I Trust 2004-HQ4 | 4.970% | 4/14/40 | 3,354 | 3,396 |
| 3 Morgan Stanley Capital I Trust 2004-IQ8 | 5.110% | 6/15/40 | 6,124 | 6,213 |
| 3 Morgan Stanley Capital I Trust 2004-TOP15 | 5.270% | 6/13/41 | 1,746 | 1,766 |
| 3 Morgan Stanley Capital I Trust 2005-HQ5 | 5.168% | 1/14/42 | 1,443 | 1,482 |
| 3 Morgan Stanley Capital I Trust 2005-HQ6 | 4.989% | 8/13/42 | 13,445 | 14,070 |
| 3 Morgan Stanley Capital I Trust 2005-HQ6 | 5.073% | 8/13/42 | 1,595 | 1,672 |
29
| Total Bond Market II Index Fund | ||||
| Face | Market | |||
| Maturity | Amount | Value | ||
| Coupon | Date | ($000) | ($000) | |
| 3 Morgan Stanley Capital I Trust 2005-HQ7 | 5.207% | 11/14/42 | 7,950 | 8,382 |
| 3 Morgan Stanley Capital I Trust 2005-IQ10 | 5.230% | 9/15/42 | 10,239 | 10,823 |
| 3 Morgan Stanley Capital I Trust 2005-IQ9 | 4.770% | 7/15/56 | 1,345 | 1,393 |
| 3 Morgan Stanley Capital I Trust 2005-TOP17 | 4.780% | 12/13/41 | 6,080 | 6,227 |
| 3 Morgan Stanley Capital I Trust 2005-TOP17 | 4.840% | 12/13/41 | 515 | 529 |
| 3 Morgan Stanley Capital I Trust 2005-TOP19 | 4.985% | 6/12/47 | 2,200 | 2,294 |
| 3 Morgan Stanley Capital I Trust 2006-HQ10 | 5.328% | 11/12/41 | 9,911 | 10,802 |
| 3 Morgan Stanley Capital I Trust 2006-HQ10 | 5.360% | 11/12/41 | 2,626 | 2,847 |
| 3 Morgan Stanley Capital I Trust 2006-HQ8 | 5.417% | 3/12/44 | 11,925 | 12,776 |
| 3 Morgan Stanley Capital I Trust 2006-HQ8 | 5.466% | 3/12/44 | 2,503 | 2,727 |
| 3 Morgan Stanley Capital I Trust 2006-HQ9 | 5.773% | 7/12/44 | 3,425 | 3,793 |
| 3 Morgan Stanley Capital I Trust 2006-HQ9 | 5.793% | 7/12/44 | 1,475 | 1,599 |
| 3 Morgan Stanley Capital I Trust 2006-IQ11 | 5.668% | 10/15/42 | 3,554 | 3,807 |
| 3 Morgan Stanley Capital I Trust 2006-IQ11 | 5.672% | 10/15/42 | 225 | 243 |
| 3 Morgan Stanley Capital I Trust 2006-IQ11 | 5.672% | 10/15/42 | 1,750 | 1,854 |
| 3 Morgan Stanley Capital I Trust 2006-IQ12 | 5.332% | 12/15/43 | 8,304 | 9,022 |
| 3 Morgan Stanley Capital I Trust 2006-TOP21 | 5.204% | 10/12/52 | 2,775 | 2,985 |
| 3 Morgan Stanley Capital I Trust 2006-TOP23 | 5.810% | 8/12/41 | 775 | 848 |
| 3 Morgan Stanley Capital I Trust 2007-IQ14 | 5.654% | 4/15/49 | 956 | 991 |
| 3 Morgan Stanley Capital I Trust 2007-IQ14 | 5.692% | 4/15/49 | 9,610 | 10,529 |
| 3 Morgan Stanley Capital I Trust 2007-IQ16 | 5.809% | 12/12/49 | 9,518 | 10,603 |
| 3 Morgan Stanley Capital I Trust 2007-IQ16 | 6.094% | 12/12/49 | 1,975 | 2,231 |
| 3 Morgan Stanley Capital I Trust 2007-TOP25 | 5.514% | 11/12/49 | 1,280 | 1,414 |
| 3 Morgan Stanley Capital I Trust 2007-TOP25 | 5.544% | 11/12/49 | 1,750 | 1,900 |
| 3 Morgan Stanley Capital I Trust 2007-TOP27 | 5.648% | 6/11/42 | 9,205 | 10,303 |
| 3 Morgan Stanley Capital I Trust 2007-TOP27 | 5.648% | 6/11/42 | 2,475 | 2,742 |
| 3 Morgan Stanley Capital I Trust 2008-TOP29 | 6.280% | 1/11/43 | 17,980 | 20,762 |
| 3 Morgan Stanley Capital I Trust 2012-C4 | 3.244% | 3/15/45 | 6,000 | 5,887 |
| 3 Nissan Auto Receivables 2012-B Owner Trust | 0.660% | 12/17/18 | 2,655 | 2,653 |
| 3 Nissan Auto Receivables 2013-A Owner Trust | 0.500% | 5/15/17 | 3,072 | 3,072 |
| 3 Nissan Auto Receivables 2013-A Owner Trust | 0.750% | 7/15/19 | 6,100 | 6,071 |
| 3 Nissan Auto Receivables 2013-B Owner Trust | 0.840% | 11/15/17 | 1,385 | 1,390 |
| 3 Nissan Auto Receivables 2013-B Owner Trust | 1.310% | 10/15/19 | 1,040 | 1,045 |
| 3 Nissan Auto Receivables 2013-C Owner Trust | 0.670% | 8/15/18 | 1,850 | 1,850 |
| 3 Nissan Auto Receivables 2013-C Owner Trust | 1.300% | 6/15/20 | 1,150 | 1,151 |
| 6 Northern Rock Asset Management plc | 5.625% | 6/22/17 | 1,075 | 1,210 |
| 3 PSE&G Transition Funding LLC Series 2001-1 | 6.890% | 12/15/17 | 14,975 | 16,196 |
| 3 Royal Bank of Canada | 0.625% | 12/5/16 | 5,000 | 4,996 |
| 3 Royal Bank of Canada | 1.200% | 9/19/18 | 11,600 | 11,474 |
| 3 Royal Bank of Canada | 2.000% | 10/1/19 | 12,000 | 11,936 |
| 3 Santander Drive Auto Receivables Trust 2013-1 | 0.620% | 6/15/17 | 2,731 | 2,731 |
| 3 Santander Drive Auto Receivables Trust 2013-2 | 0.700% | 9/15/17 | 3,480 | 3,482 |
| 3 Santander Drive Auto Receivables Trust 2013-3 | 0.700% | 10/16/17 | 1,600 | 1,599 |
| 3 Santander Drive Auto Receivables Trust 2013-4 | 1.110% | 12/15/17 | 1,000 | 1,004 |
| 3 TIAA Seasoned Commercial Mortgage Trust | ||||
| 2007-C4 | 5.565% | 8/15/39 | 1,385 | 1,475 |
| 3 Toyota Auto Receivables 2012-A Owner Trust | 0.990% | 8/15/17 | 5,668 | 5,691 |
| 3 Toyota Auto Receivables 2013-A Owner Trust | 0.550% | 1/17/17 | 710 | 709 |
| 3 Toyota Auto Receivables 2013-A Owner Trust | 0.690% | 11/15/18 | 1,160 | 1,159 |
| 3 UBS-Barclays Commercial Mortgage Trust | ||||
| 2013-C5 | 3.185% | 3/10/46 | 2,770 | 2,654 |
| 3 UBS-Barclays Commercial Mortgage Trust | ||||
| 2013-C6 | 3.244% | 4/10/46 | 1,775 | 1,704 |
| 3 UBS-Barclays Commercial Mortgage Trust | ||||
| 2013-C6 | 3.469% | 4/10/46 | 700 | 669 |
30
| Total Bond Market II Index Fund | ||||
| Face | Market | |||
| Maturity | Amount | Value | ||
| Coupon | Date | ($000) | ($000) | |
| 3 Volkswagen Auto Loan Enhanced Trust 2012-1 | 1.150% | 7/20/18 | 6,480 | 6,534 |
| 3 Volkswagen Auto Loan Enhanced Trust 2013-2 | 0.700% | 4/20/18 | 1,100 | 1,098 |
| 3 Volkswagen Auto Loan Enhanced Trust 2013-2 | 1.160% | 3/20/20 | 550 | 547 |
| 3 Wachovia Bank Commercial Mortgage Trust | ||||
| Series 2004-C12 | 5.288% | 7/15/41 | 5,690 | 5,769 |
| 3 Wachovia Bank Commercial Mortgage Trust | ||||
| Series 2004-C15 | 4.803% | 10/15/41 | 10,325 | 10,586 |
| 3 Wachovia Bank Commercial Mortgage Trust | ||||
| Series 2005-C17 | 5.083% | 3/15/42 | 7,030 | 7,295 |
| 3 Wachovia Bank Commercial Mortgage Trust | ||||
| Series 2005-C17 | 5.224% | 3/15/42 | 625 | 648 |
| 3 Wachovia Bank Commercial Mortgage Trust | ||||
| Series 2005-C19 | 4.699% | 5/15/44 | 4,730 | 4,925 |
| 3 Wachovia Bank Commercial Mortgage Trust | ||||
| Series 2005-C19 | 4.750% | 5/15/44 | 665 | 699 |
| 3 Wachovia Bank Commercial Mortgage Trust | ||||
| Series 2005-C19 | 4.793% | 5/15/44 | 1,350 | 1,417 |
| 3 Wachovia Bank Commercial Mortgage Trust | ||||
| Series 2005-C20 | 5.118% | 7/15/42 | 3,312 | 3,481 |
| 3 Wachovia Bank Commercial Mortgage Trust | ||||
| Series 2005-C21 | 5.239% | 10/15/44 | 535 | 561 |
| 3 Wachovia Bank Commercial Mortgage Trust | ||||
| Series 2005-C21 | 5.239% | 10/15/44 | 15,218 | 16,107 |
| 3 Wachovia Bank Commercial Mortgage Trust | ||||
| Series 2005-C22 | 5.289% | 12/15/44 | 10,300 | 10,933 |
| 3 Wachovia Bank Commercial Mortgage Trust | ||||
| Series 2005-C22 | 5.339% | 12/15/44 | 475 | 506 |
| 3 Wachovia Bank Commercial Mortgage Trust | ||||
| Series 2006-C25 | 5.724% | 5/15/43 | 7,320 | 7,890 |
| 3 Wachovia Bank Commercial Mortgage Trust | ||||
| Series 2006-C26 | 5.967% | 6/15/45 | 475 | 521 |
| 3 Wachovia Bank Commercial Mortgage Trust | ||||
| Series 2006-C27 | 5.765% | 7/15/45 | 6,005 | 6,487 |
| 3 Wachovia Bank Commercial Mortgage Trust | ||||
| Series 2006-C28 | 5.679% | 10/15/48 | 2,397 | 2,406 |
| 3 Wachovia Bank Commercial Mortgage Trust | ||||
| Series 2006-C29 | 5.339% | 11/15/48 | 2,400 | 2,638 |
| 3 Wells Fargo Commercial Mortgage Trust | ||||
| 2012-LC5 | 2.918% | 10/15/45 | 1,975 | 1,868 |
| 3 WFRBS Commercial Mortgage Trust 2012-C10 | 2.875% | 12/15/45 | 2,500 | 2,341 |
| 3 WFRBS Commercial Mortgage Trust 2012-C6 | 3.440% | 4/15/45 | 3,875 | 3,866 |
| 3 WFRBS Commercial Mortgage Trust 2012-C7 | 3.431% | 6/15/45 | 3,411 | 3,373 |
| 3 WFRBS Commercial Mortgage Trust 2012-C7 | 4.090% | 6/15/45 | 2,200 | 2,224 |
| 3 WFRBS Commercial Mortgage Trust 2012-C8 | 3.001% | 8/15/45 | 1,600 | 1,526 |
| 3 WFRBS Commercial Mortgage Trust 2012-C9 | 2.870% | 11/15/45 | 3,300 | 3,100 |
| 3 WFRBS Commercial Mortgage Trust 2013-C11 | 3.071% | 3/15/45 | 2,414 | 2,292 |
| 3 WFRBS Commercial Mortgage Trust 2013-C12 | 3.198% | 3/15/48 | 1,045 | 1,001 |
| 3 WFRBS Commercial Mortgage Trust 2013-C12 | 3.560% | 3/15/48 | 495 | 473 |
| 3 WFRBS Commercial Mortgage Trust 2013-C13 | 3.001% | 5/15/45 | 2,154 | 1,992 |
| 3 WFRBS Commercial Mortgage Trust 2013-C13 | 3.345% | 5/15/45 | 421 | 398 |
| 3 WFRBS Commercial Mortgage Trust 2013-C14 | 3.337% | 6/15/46 | 3,250 | 3,133 |
| 3 WFRBS Commercial Mortgage Trust 2013-C14 | 3.488% | 6/15/46 | 1,625 | 1,561 |
| 3 WFRBS Commercial Mortgage Trust 2013-C15 | 3.720% | 8/15/46 | 660 | 679 |
| 3 WFRBS Commercial Mortgage Trust 2013-C15 | 4.153% | 8/15/46 | 2,640 | 2,691 |
| 3 WFRBS Commercial Mortgage Trust 2013-C15 | 4.358% | 8/15/46 | 660 | 672 |
31
| Total Bond Market II Index Fund | ||||
| Face | Market | |||
| Maturity | Amount | Value | ||
| Coupon | Date | ($000) | ($000) | |
| 3 WFRBS Commercial Mortgage Trust 2013-C16 | 3.223% | 9/15/46 | 2,530 | 2,628 |
| 3 WFRBS Commercial Mortgage Trust 2013-C16 | 3.963% | 9/15/46 | 1,520 | 1,583 |
| 3 WFRBS Commercial Mortgage Trust 2013-C16 | 4.415% | 9/15/46 | 1,520 | 1,586 |
| 3 WFRBS Commercial Mortgage Trust 2013-C16 | 4.668% | 9/15/46 | 2,530 | 2,635 |
| 3 WFRBS Commercial Mortgage Trust 2013-C17 | 2.921% | 12/15/46 | 725 | 742 |
| 3 WFRBS Commercial Mortgage Trust 2013-C17 | 3.558% | 12/15/46 | 725 | 735 |
| 3 WFRBS Commercial Mortgage Trust 2013-C17 | 4.023% | 12/15/46 | 925 | 936 |
| 3 WFRBS Commercial Mortgage Trust 2013-C17 | 4.255% | 12/15/46 | 725 | 730 |
| 3 WFRBS Commercial Mortgage Trust 2013-C17 | 4.788% | 12/15/46 | 725 | 731 |
| 3 WFRBS Commercial Mortgage Trust 2013-C18 | 3.027% | 12/15/46 | 750 | 772 |
| 3 WFRBS Commercial Mortgage Trust 2013-C18 | 3.651% | 12/15/46 | 1,500 | 1,545 |
| 3 WFRBS Commercial Mortgage Trust 2013-C18 | 4.162% | 12/15/46 | 3,268 | 3,366 |
| 3 WFRBS Commercial Mortgage Trust 2013-C18 | 4.387% | 12/15/46 | 375 | 386 |
| 3 WFRBS Commercial Mortgage Trust 2013-C18 | 4.676% | 12/15/46 | 563 | 575 |
| 3 WFRBS Commercial Mortgage Trust 2013-UBS1 | 2.927% | 3/15/46 | 1,850 | 1,891 |
| 3 WFRBS Commercial Mortgage Trust 2013-UBS1 | 3.591% | 3/15/46 | 1,100 | 1,122 |
| 3 WFRBS Commercial Mortgage Trust 2013-UBS1 | 4.079% | 3/15/46 | 1,475 | 1,499 |
| 3 WFRBS Commercial Mortgage Trust 2013-UBS1 | 4.634% | 3/15/46 | 375 | 379 |
| 3 World Omni Auto Receivables Trust 2012-B | 0.810% | 1/15/19 | 1,817 | 1,815 |
| 3 World Omni Auto Receivables Trust 2013-B | 0.830% | 8/15/18 | 1,250 | 1,250 |
| 3 World Omni Auto Receivables Trust 2013-B | 1.320% | 1/15/20 | 550 | 546 |
| 3 World Omni Automobile Lease Securitization Trust | ||||
| 2013-A | 1.100% | 12/15/16 | 1,720 | 1,727 |
| Total Asset-Backed/Commercial Mortgage-Backed Securities (Cost $1,487,657) | 1,607,427 | |||
| Corporate Bonds (23.2%) | ||||
| Finance (7.6%) | ||||
| Banking (5.0%) | ||||
| Abbey National Treasury Services plc | 4.000% | 4/27/16 | 3,635 | 3,859 |
| Abbey National Treasury Services plc | 3.050% | 8/23/18 | 5,725 | 5,896 |
| American Express Bank FSB | 6.000% | 9/13/17 | 1,275 | 1,464 |
| American Express Centurion Bank | 0.875% | 11/13/15 | 500 | 501 |
| American Express Centurion Bank | 5.950% | 6/12/17 | 650 | 735 |
| American Express Centurion Bank | 6.000% | 9/13/17 | 3,700 | 4,232 |
| American Express Co. | 5.500% | 9/12/16 | 1,025 | 1,141 |
| American Express Co. | 6.150% | 8/28/17 | 11,715 | 13,512 |
| American Express Co. | 7.000% | 3/19/18 | 15,044 | 17,972 |
| American Express Co. | 1.550% | 5/22/18 | 4,675 | 4,556 |
| American Express Co. | 2.650% | 12/2/22 | 5,040 | 4,649 |
| American Express Co. | 4.050% | 12/3/42 | 850 | 740 |
| 3 American Express Co. | 6.800% | 9/1/66 | 2,825 | 3,016 |
| American Express Credit Corp. | 1.750% | 6/12/15 | 1,525 | 1,551 |
| American Express Credit Corp. | 2.750% | 9/15/15 | 7,715 | 7,983 |
| American Express Credit Corp. | 5.300% | 12/2/15 | 2,000 | 2,161 |
| American Express Credit Corp. | 1.300% | 7/29/16 | 2,000 | 2,016 |
| American Express Credit Corp. | 2.800% | 9/19/16 | 13,215 | 13,817 |
| American Express Credit Corp. | 2.375% | 3/24/17 | 5,700 | 5,859 |
| American Express Credit Corp. | 2.125% | 7/27/18 | 10,700 | 10,752 |
| Associates Corp. of North America | 6.950% | 11/1/18 | 65 | 77 |
| Australia & New Zealand Banking Group Ltd. | 0.900% | 2/12/16 | 12,232 | 12,219 |
| Australia & New Zealand Banking Group Ltd. | 1.875% | 10/6/17 | 3,750 | 3,734 |
| Australia & New Zealand Banking Group Ltd. | 1.450% | 5/15/18 | 3,000 | 2,906 |
| Bancolombia SA | 4.250% | 1/12/16 | 7,700 | 8,009 |
| Bank of America Corp. | 4.500% | 4/1/15 | 10,395 | 10,871 |
| Bank of America Corp. | 4.750% | 8/1/15 | 275 | 291 |
32
| Total Bond Market II Index Fund | ||||
| Face | Market | |||
| Maturity | Amount | Value | ||
| Coupon | Date | ($000) | ($000) | |
| Bank of America Corp. | 3.700% | 9/1/15 | 670 | 701 |
| Bank of America Corp. | 1.500% | 10/9/15 | 13,500 | 13,635 |
| Bank of America Corp. | 5.250% | 12/1/15 | 1,225 | 1,311 |
| Bank of America Corp. | 1.250% | 1/11/16 | 7,100 | 7,123 |
| Bank of America Corp. | 3.625% | 3/17/16 | 15,275 | 16,047 |
| Bank of America Corp. | 3.750% | 7/12/16 | 8,695 | 9,242 |
| Bank of America Corp. | 6.500% | 8/1/16 | 29,070 | 32,771 |
| Bank of America Corp. | 5.750% | 8/15/16 | 3,250 | 3,573 |
| Bank of America Corp. | 7.800% | 9/15/16 | 2,850 | 3,304 |
| Bank of America Corp. | 5.625% | 10/14/16 | 14,700 | 16,347 |
| Bank of America Corp. | 1.350% | 11/21/16 | 3,450 | 3,442 |
| Bank of America Corp. | 5.420% | 3/15/17 | 7,425 | 8,156 |
| Bank of America Corp. | 3.875% | 3/22/17 | 500 | 534 |
| Bank of America Corp. | 6.000% | 9/1/17 | 400 | 456 |
| Bank of America Corp. | 5.750% | 12/1/17 | 6,880 | 7,814 |
| Bank of America Corp. | 2.000% | 1/11/18 | 25,350 | 25,276 |
| Bank of America Corp. | 5.650% | 5/1/18 | 26,030 | 29,565 |
| Bank of America Corp. | 2.600% | 1/15/19 | 8,675 | 8,689 |
| Bank of America Corp. | 7.625% | 6/1/19 | 5,720 | 7,089 |
| Bank of America Corp. | 5.625% | 7/1/20 | 10,865 | 12,343 |
| Bank of America Corp. | 5.875% | 1/5/21 | 6,890 | 7,912 |
| Bank of America Corp. | 5.000% | 5/13/21 | 4,795 | 5,232 |
| Bank of America Corp. | 5.700% | 1/24/22 | 3,586 | 4,044 |
| Bank of America Corp. | 3.300% | 1/11/23 | 28,600 | 27,021 |
| Bank of America Corp. | 4.100% | 7/24/23 | 15,400 | 15,400 |
| Bank of America Corp. | 5.875% | 2/7/42 | 10,550 | 12,085 |
| Bank of America NA | 1.125% | 11/14/16 | 6,975 | 6,973 |
| Bank of America NA | 5.300% | 3/15/17 | 15,125 | 16,667 |
| Bank of America NA | 6.100% | 6/15/17 | 1,975 | 2,233 |
| Bank of America NA | 6.000% | 10/15/36 | 6,975 | 7,851 |
| Bank of Montreal | 0.800% | 11/6/15 | 3,900 | 3,917 |
| Bank of Montreal | 1.300% | 7/15/16 | 1,900 | 1,914 |
| Bank of Montreal | 2.500% | 1/11/17 | 11,225 | 11,533 |
| Bank of Montreal | 1.400% | 9/11/17 | 7,000 | 6,880 |
| Bank of Montreal | 2.375% | 1/25/19 | 5,775 | 5,737 |
| Bank of Montreal | 2.550% | 11/6/22 | 3,925 | 3,593 |
| Bank of New York Mellon Corp. | 1.200% | 2/20/15 | 1,700 | 1,713 |
| Bank of New York Mellon Corp. | 4.950% | 3/15/15 | 2,325 | 2,439 |
| Bank of New York Mellon Corp. | 0.700% | 10/23/15 | 1,100 | 1,101 |
| Bank of New York Mellon Corp. | 2.500% | 1/15/16 | 4,050 | 4,179 |
| Bank of New York Mellon Corp. | 2.300% | 7/28/16 | 2,679 | 2,764 |
| Bank of New York Mellon Corp. | 2.400% | 1/17/17 | 725 | 745 |
| Bank of New York Mellon Corp. | 1.969% | 6/20/17 | 3,200 | 3,227 |
| Bank of New York Mellon Corp. | 1.300% | 1/25/18 | 1,975 | 1,924 |
| Bank of New York Mellon Corp. | 1.350% | 3/6/18 | 7,000 | 6,801 |
| Bank of New York Mellon Corp. | 2.100% | 8/1/18 | 1,548 | 1,540 |
| Bank of New York Mellon Corp. | 2.100% | 1/15/19 | 2,675 | 2,648 |
| Bank of New York Mellon Corp. | 5.450% | 5/15/19 | 6,645 | 7,513 |
| Bank of New York Mellon Corp. | 4.600% | 1/15/20 | 6,975 | 7,634 |
| Bank of New York Mellon Corp. | 4.150% | 2/1/21 | 1,250 | 1,322 |
| Bank of New York Mellon Corp. | 3.550% | 9/23/21 | 5,700 | 5,784 |
| Bank of Nova Scotia | 1.850% | 1/12/15 | 10,220 | 10,374 |
| Bank of Nova Scotia | 3.400% | 1/22/15 | 3,440 | 3,548 |
| Bank of Nova Scotia | 2.050% | 10/7/15 | 5,900 | 6,048 |
| Bank of Nova Scotia | 0.750% | 10/9/15 | 5,375 | 5,396 |
33
| Total Bond Market II Index Fund | ||||
| Face | Market | |||
| Maturity | Amount | Value | ||
| Coupon | Date | ($000) | ($000) | |
| Bank of Nova Scotia | 2.900% | 3/29/16 | 145 | 151 |
| Bank of Nova Scotia | 1.375% | 7/15/16 | 6,450 | 6,510 |
| Bank of Nova Scotia | 2.550% | 1/12/17 | 6,830 | 7,085 |
| Bank of Nova Scotia | 1.375% | 12/18/17 | 4,590 | 4,515 |
| Bank of Nova Scotia | 2.050% | 10/30/18 | 27,525 | 27,409 |
| Bank of Nova Scotia | 4.375% | 1/13/21 | 1,570 | 1,685 |
| 6 Bank of Tokyo-Mitsubishi UFJ Ltd. | 2.450% | 9/11/15 | 4,000 | 4,096 |
| Bank One Capital III | 8.750% | 9/1/30 | 290 | 371 |
| Bank One Corp. | 4.900% | 4/30/15 | 975 | 1,026 |
| Bank One Corp. | 7.625% | 10/15/26 | 975 | 1,199 |
| Bank One Corp. | 8.000% | 4/29/27 | 2,500 | 3,158 |
| Barclays Bank plc | 2.750% | 2/23/15 | 4,375 | 4,474 |
| Barclays Bank plc | 3.900% | 4/7/15 | 3,745 | 3,897 |
| Barclays Bank plc | 5.000% | 9/22/16 | 16,390 | 18,025 |
| 6 Barclays Bank plc | 6.050% | 12/4/17 | 700 | 780 |
| Barclays Bank plc | 6.750% | 5/22/19 | 3,040 | 3,653 |
| Barclays Bank plc | 5.125% | 1/8/20 | 2,815 | 3,120 |
| Barclays Bank plc | 5.140% | 10/14/20 | 4,745 | 5,054 |
| BB&T Corp. | 5.200% | 12/23/15 | 10,874 | 11,736 |
| BB&T Corp. | 3.200% | 3/15/16 | 7,170 | 7,514 |
| BB&T Corp. | 2.150% | 3/22/17 | 3,800 | 3,851 |
| BB&T Corp. | 4.900% | 6/30/17 | 100 | 110 |
| BB&T Corp. | 1.600% | 8/15/17 | 915 | 907 |
| BB&T Corp. | 1.450% | 1/12/18 | 925 | 903 |
| BB&T Corp. | 2.050% | 6/19/18 | 3,000 | 2,973 |
| BB&T Corp. | 5.250% | 11/1/19 | 3,750 | 4,194 |
| BB&T Corp. | 3.950% | 3/22/22 | 4,049 | 3,985 |
| BBVA US Senior SAU | 4.664% | 10/9/15 | 9,955 | 10,473 |
| Bear Stearns Cos. LLC | 5.300% | 10/30/15 | 5,900 | 6,357 |
| Bear Stearns Cos. LLC | 5.550% | 1/22/17 | 2,200 | 2,448 |
| Bear Stearns Cos. LLC | 6.400% | 10/2/17 | 9,650 | 11,268 |
| Bear Stearns Cos. LLC | 7.250% | 2/1/18 | 11,905 | 14,132 |
| Bear Stearns Cos. LLC | 4.650% | 7/2/18 | 425 | 463 |
| BNP Paribas SA | 3.250% | 3/11/15 | 9,355 | 9,627 |
| BNP Paribas SA | 3.600% | 2/23/16 | 10,575 | 11,122 |
| BNP Paribas SA | 2.375% | 9/14/17 | 16,175 | 16,484 |
| BNP Paribas SA | 2.700% | 8/20/18 | 12,950 | 13,138 |
| BNP Paribas SA | 5.000% | 1/15/21 | 17,865 | 19,486 |
| BNP Paribas SA | 3.250% | 3/3/23 | 19,325 | 18,179 |
| BNY Mellon NA | 4.750% | 12/15/14 | 3,350 | 3,483 |
| BPCE SA | 2.500% | 12/10/18 | 5,500 | 5,458 |
| Branch Banking & Trust Co. | 5.625% | 9/15/16 | 1,875 | 2,084 |
| Branch Banking & Trust Co. | 1.050% | 12/1/16 | 475 | 473 |
| Branch Banking & Trust Co. | 2.300% | 10/15/18 | 6,000 | 5,995 |
| Canadian Imperial Bank of Commerce | 0.900% | 10/1/15 | 3,475 | 3,496 |
| Canadian Imperial Bank of Commerce | 2.350% | 12/11/15 | 3,620 | 3,738 |
| Canadian Imperial Bank of Commerce | 1.350% | 7/18/16 | 3,625 | 3,646 |
| Capital One Bank USA NA | 8.800% | 7/15/19 | 6,825 | 8,641 |
| Capital One Bank USA NA | 3.375% | 2/15/23 | 6,085 | 5,647 |
| Capital One Financial Corp. | 2.150% | 3/23/15 | 2,870 | 2,918 |
| Capital One Financial Corp. | 5.500% | 6/1/15 | 6,650 | 7,064 |
| Capital One Financial Corp. | 1.000% | 11/6/15 | 2,000 | 2,000 |
| Capital One Financial Corp. | 3.150% | 7/15/16 | 9,545 | 9,962 |
| Capital One Financial Corp. | 6.150% | 9/1/16 | 3,150 | 3,509 |
| Capital One Financial Corp. | 6.750% | 9/15/17 | 2,070 | 2,413 |
34
| Total Bond Market II Index Fund | |||||
| Face | Market | ||||
| Maturity | Amount | Value | |||
| Coupon | Date | ($000) | ($000) | ||
| Capital One Financial Corp. | 4.750% | 7/15/21 | 1,545 | 1,638 | |
| Capital One Financial Corp. | 3.500% | 6/15/23 | 1,210 | 1,133 | |
| Capital One NA | 1.500% | 3/22/18 | 6,075 | 5,913 | |
| 3,6 | Citicorp Lease Pass-Through Trust 1999-1 | 8.040% | 12/15/19 | 4,025 | 4,762 |
| Citigroup Inc. | 6.010% | 1/15/15 | 3,448 | 3,629 | |
| Citigroup Inc. | 2.650% | 3/2/15 | 11,900 | 12,142 | |
| Citigroup Inc. | 4.750% | 5/19/15 | 4,738 | 4,982 | |
| Citigroup Inc. | 4.700% | 5/29/15 | 3,650 | 3,840 | |
| Citigroup Inc. | 2.250% | 8/7/15 | 5,000 | 5,103 | |
| Citigroup Inc. | 4.587% | 12/15/15 | 4,695 | 5,015 | |
| Citigroup Inc. | 5.300% | 1/7/16 | 5,550 | 5,993 | |
| Citigroup Inc. | 1.250% | 1/15/16 | 6,575 | 6,590 | |
| Citigroup Inc. | 1.300% | 4/1/16 | 6,825 | 6,833 | |
| Citigroup Inc. | 3.953% | 6/15/16 | 7,465 | 7,933 | |
| Citigroup Inc. | 1.700% | 7/25/16 | 7,050 | 7,114 | |
| Citigroup Inc. | 5.850% | 8/2/16 | 265 | 294 | |
| Citigroup Inc. | 4.450% | 1/10/17 | 10,650 | 11,533 | |
| Citigroup Inc. | 5.500% | 2/15/17 | 12,485 | 13,753 | |
| Citigroup Inc. | 6.000% | 8/15/17 | 3,441 | 3,935 | |
| Citigroup Inc. | 6.125% | 11/21/17 | 20,170 | 23,244 | |
| Citigroup Inc. | 1.750% | 5/1/18 | 10,075 | 9,903 | |
| Citigroup Inc. | 6.125% | 5/15/18 | 21,457 | 24,874 | |
| Citigroup Inc. | 2.500% | 9/26/18 | 10,875 | 10,949 | |
| Citigroup Inc. | 8.500% | 5/22/19 | 13,415 | 17,156 | |
| Citigroup Inc. | 5.375% | 8/9/20 | 14,014 | 15,874 | |
| Citigroup Inc. | 4.500% | 1/14/22 | 14,300 | 15,057 | |
| Citigroup Inc. | 4.050% | 7/30/22 | 4,300 | 4,245 | |
| Citigroup Inc. | 3.375% | 3/1/23 | 6,600 | 6,223 | |
| Citigroup Inc. | 3.500% | 5/15/23 | 10,425 | 9,635 | |
| Citigroup Inc. | 3.875% | 10/25/23 | 7,425 | 7,267 | |
| Citigroup Inc. | 5.500% | 9/13/25 | 3,425 | 3,600 | |
| Citigroup Inc. | 6.625% | 1/15/28 | 2,700 | 3,115 | |
| Citigroup Inc. | 6.625% | 6/15/32 | 1,925 | 2,147 | |
| Citigroup Inc. | 5.875% | 2/22/33 | 5,180 | 5,312 | |
| Citigroup Inc. | 6.000% | 10/31/33 | 2,900 | 3,047 | |
| Citigroup Inc. | 5.850% | 12/11/34 | 530 | 572 | |
| Citigroup Inc. | 6.125% | 8/25/36 | 7,610 | 8,094 | |
| Citigroup Inc. | 5.875% | 5/29/37 | 3,482 | 3,836 | |
| Citigroup Inc. | 6.875% | 3/5/38 | 4,919 | 6,105 | |
| Citigroup Inc. | 8.125% | 7/15/39 | 5,575 | 7,791 | |
| Citigroup Inc. | 5.875% | 1/30/42 | 2,825 | 3,139 | |
| Citigroup Inc. | 6.675% | 9/13/43 | 5,000 | 5,706 | |
| Citigroup Inc. | 4.950% | 11/7/43 | 10,000 | 9,916 | |
| Comerica Bank | 5.750% | 11/21/16 | 3,775 | 4,238 | |
| Comerica Bank | 5.200% | 8/22/17 | 2,800 | 3,095 | |
| Comerica Inc. | 4.800% | 5/1/15 | 1,100 | 1,155 | |
| Commonwealth Bank of Australia | 1.950% | 3/16/15 | 7,200 | 7,324 | |
| Commonwealth Bank of Australia | 1.250% | 9/18/15 | 9,300 | 9,409 | |
| Commonwealth Bank of Australia | 1.900% | 9/18/17 | 2,000 | 1,996 | |
| Commonwealth Bank of Australia | 2.500% | 9/20/18 | 4,000 | 4,032 | |
| Compass Bank | 6.400% | 10/1/17 | 2,000 | 2,204 | |
| Cooperatieve Centrale | |||||
| Raiffeisen-Boerenleenbank BA | 2.125% | 10/13/15 | 8,730 | 8,955 | |
| Cooperatieve Centrale | |||||
| Raiffeisen-Boerenleenbank BA | 3.375% | 1/19/17 | 14,150 | 14,906 | |
35
| Total Bond Market II Index Fund | ||||
| Face | Market | |||
| Maturity | Amount | Value | ||
| Coupon | Date | ($000) | ($000) | |
| Cooperatieve Centrale | ||||
| Raiffeisen-Boerenleenbank BA | 4.500% | 1/11/21 | 12,265 | 12,959 |
| Cooperatieve Centrale | ||||
| Raiffeisen-Boerenleenbank BA | 3.875% | 2/8/22 | 11,025 | 11,059 |
| Cooperatieve Centrale | ||||
| Raiffeisen-Boerenleenbank BA | 3.950% | 11/9/22 | 5,975 | 5,767 |
| Cooperatieve Centrale | ||||
| Raiffeisen-Boerenleenbank BA | 4.625% | 12/1/23 | 6,525 | 6,553 |
| Cooperatieve Centrale | ||||
| Raiffeisen-Boerenleenbank BA | 5.250% | 5/24/41 | 8,715 | 8,888 |
| Cooperatieve Centrale | ||||
| Raiffeisen-Boerenleenbank BA | 5.750% | 12/1/43 | 5,425 | 5,727 |
| Countrywide Financial Corp. | 6.250% | 5/15/16 | 450 | 496 |
| Credit Suisse | 3.500% | 3/23/15 | 11,985 | 12,393 |
| Credit Suisse | 6.000% | 2/15/18 | 10,564 | 12,197 |
| Credit Suisse | 5.300% | 8/13/19 | 8,700 | 9,798 |
| Credit Suisse | 5.400% | 1/14/20 | 7,275 | 8,067 |
| Credit Suisse | 4.375% | 8/5/20 | 4,150 | 4,423 |
| Credit Suisse USA Inc. | 4.875% | 1/15/15 | 8,935 | 9,334 |
| Credit Suisse USA Inc. | 5.125% | 8/15/15 | 5,683 | 6,089 |
| Credit Suisse USA Inc. | 5.375% | 3/2/16 | 680 | 747 |
| Credit Suisse USA Inc. | 7.125% | 7/15/32 | 5,385 | 7,009 |
| Deutsche Bank AG | 3.450% | 3/30/15 | 6,200 | 6,400 |
| Deutsche Bank AG | 3.250% | 1/11/16 | 13,370 | 13,972 |
| Deutsche Bank AG | 6.000% | 9/1/17 | 7,995 | 9,126 |
| 3 Deutsche Bank AG | 4.296% | 5/24/28 | 7,025 | 6,348 |
| Deutsche Bank Financial LLC | 5.375% | 3/2/15 | 4,545 | 4,755 |
| Discover Bank | 2.000% | 2/21/18 | 5,000 | 4,913 |
| Discover Bank | 7.000% | 4/15/20 | 1,350 | 1,562 |
| Discover Bank | 4.200% | 8/8/23 | 1,350 | 1,325 |
| Discover Financial Services | 6.450% | 6/12/17 | 325 | 367 |
| Discover Financial Services | 5.200% | 4/27/22 | 950 | 982 |
| Discover Financial Services | 3.850% | 11/21/22 | 5,630 | 5,333 |
| Fifth Third Bancorp | 3.625% | 1/25/16 | 3,775 | 3,959 |
| Fifth Third Bancorp | 4.500% | 6/1/18 | 725 | 777 |
| Fifth Third Bancorp | 3.500% | 3/15/22 | 6,025 | 5,857 |
| Fifth Third Bancorp | 4.300% | 1/16/24 | 8,050 | 7,863 |
| Fifth Third Bancorp | 8.250% | 3/1/38 | 3,946 | 5,191 |
| Fifth Third Bank | 4.750% | 2/1/15 | 2,800 | 2,917 |
| Fifth Third Bank | 1.150% | 11/18/16 | 2,000 | 1,996 |
| Fifth Third Bank | 1.450% | 2/28/18 | 5,000 | 4,849 |
| First Horizon National Corp. | 5.375% | 12/15/15 | 7,825 | 8,413 |
| First Niagara Financial Group Inc. | 6.750% | 3/19/20 | 1,350 | 1,550 |
| First Niagara Financial Group Inc. | 7.250% | 12/15/21 | 1,215 | 1,394 |
| FirstMerit Corp. | 4.350% | 2/4/23 | 4,950 | 4,848 |
| Goldman Sachs Capital I | 6.345% | 2/15/34 | 5,375 | 5,418 |
| Goldman Sachs Group Inc. | 5.125% | 1/15/15 | 8,040 | 8,397 |
| Goldman Sachs Group Inc. | 3.300% | 5/3/15 | 1,475 | 1,519 |
| Goldman Sachs Group Inc. | 3.700% | 8/1/15 | 3,210 | 3,344 |
| Goldman Sachs Group Inc. | 1.600% | 11/23/15 | 5,950 | 6,009 |
| Goldman Sachs Group Inc. | 5.350% | 1/15/16 | 14,375 | 15,530 |
| Goldman Sachs Group Inc. | 3.625% | 2/7/16 | 22,140 | 23,161 |
| Goldman Sachs Group Inc. | 5.750% | 10/1/16 | 3,330 | 3,709 |
| Goldman Sachs Group Inc. | 5.625% | 1/15/17 | 7,170 | 7,894 |
| Goldman Sachs Group Inc. | 6.250% | 9/1/17 | 12,380 | 14,183 |
36
| Total Bond Market II Index Fund | ||||
| Face | Market | |||
| Maturity | Amount | Value | ||
| Coupon | Date | ($000) | ($000) | |
| Goldman Sachs Group Inc. | 5.950% | 1/18/18 | 6,215 | 7,067 |
| Goldman Sachs Group Inc. | 2.375% | 1/22/18 | 9,225 | 9,246 |
| Goldman Sachs Group Inc. | 6.150% | 4/1/18 | 28,975 | 33,242 |
| Goldman Sachs Group Inc. | 2.900% | 7/19/18 | 32,825 | 33,375 |
| Goldman Sachs Group Inc. | 7.500% | 2/15/19 | 14,755 | 17,935 |
| Goldman Sachs Group Inc. | 5.375% | 3/15/20 | 24,740 | 27,475 |
| Goldman Sachs Group Inc. | 6.000% | 6/15/20 | 18,290 | 20,929 |
| Goldman Sachs Group Inc. | 5.250% | 7/27/21 | 17,950 | 19,683 |
| Goldman Sachs Group Inc. | 5.750% | 1/24/22 | 29,850 | 33,545 |
| Goldman Sachs Group Inc. | 3.625% | 1/22/23 | 9,700 | 9,326 |
| Goldman Sachs Group Inc. | 5.950% | 1/15/27 | 4,795 | 5,072 |
| Goldman Sachs Group Inc. | 6.125% | 2/15/33 | 7,990 | 8,957 |
| Goldman Sachs Group Inc. | 6.450% | 5/1/36 | 11,000 | 11,640 |
| Goldman Sachs Group Inc. | 6.750% | 10/1/37 | 19,355 | 21,350 |
| Goldman Sachs Group Inc. | 6.250% | 2/1/41 | 12,205 | 14,008 |
| HSBC Bank USA NA | 4.875% | 8/24/20 | 4,275 | 4,633 |
| HSBC Bank USA NA | 5.875% | 11/1/34 | 2,575 | 2,793 |
| HSBC Bank USA NA | 5.625% | 8/15/35 | 3,950 | 4,154 |
| HSBC Bank USA NA | 7.000% | 1/15/39 | 325 | 406 |
| HSBC Holdings plc | 5.100% | 4/5/21 | 12,020 | 13,338 |
| HSBC Holdings plc | 4.875% | 1/14/22 | 2,350 | 2,527 |
| HSBC Holdings plc | 4.000% | 3/30/22 | 4,125 | 4,219 |
| HSBC Holdings plc | 7.625% | 5/17/32 | 325 | 405 |
| HSBC Holdings plc | 7.350% | 11/27/32 | 600 | 731 |
| HSBC Holdings plc | 6.500% | 5/2/36 | 15,965 | 18,865 |
| HSBC Holdings plc | 6.500% | 9/15/37 | 13,815 | 16,257 |
| HSBC Holdings plc | 6.800% | 6/1/38 | 6,125 | 7,496 |
| HSBC Holdings plc | 6.100% | 1/14/42 | 2,225 | 2,641 |
| HSBC USA Inc. | 2.375% | 2/13/15 | 10,500 | 10,706 |
| HSBC USA Inc. | 1.625% | 1/16/18 | 11,975 | 11,817 |
| HSBC USA Inc. | 2.625% | 9/24/18 | 4,025 | 4,095 |
| HSBC USA Inc. | 5.000% | 9/27/20 | 4,455 | 4,789 |
| Huntington Bancshares Inc. | 2.600% | 8/2/18 | 1,100 | 1,099 |
| Huntington Bancshares Inc. | 7.000% | 12/15/20 | 6,900 | 8,062 |
| Huntington National Bank | 1.350% | 8/2/16 | 800 | 802 |
| Intesa Sanpaolo SPA | 3.125% | 1/15/16 | 7,650 | 7,781 |
| Intesa Sanpaolo SPA | 3.875% | 1/16/18 | 4,775 | 4,857 |
| Intesa Sanpaolo SPA | 3.875% | 1/15/19 | 12,475 | 12,423 |
| JPMorgan Chase & Co. | 3.700% | 1/20/15 | 22,325 | 23,004 |
| JPMorgan Chase & Co. | 4.750% | 3/1/15 | 4,625 | 4,837 |
| JPMorgan Chase & Co. | 1.875% | 3/20/15 | 3,500 | 3,547 |
| JPMorgan Chase & Co. | 5.250% | 5/1/15 | 5,525 | 5,825 |
| JPMorgan Chase & Co. | 3.400% | 6/24/15 | 1,965 | 2,041 |
| JPMorgan Chase & Co. | 5.150% | 10/1/15 | 4,695 | 5,026 |
| JPMorgan Chase & Co. | 1.100% | 10/15/15 | 11,150 | 11,192 |
| JPMorgan Chase & Co. | 2.600% | 1/15/16 | 4,525 | 4,687 |
| JPMorgan Chase & Co. | 1.125% | 2/26/16 | 24,425 | 24,446 |
| JPMorgan Chase & Co. | 3.450% | 3/1/16 | 1,420 | 1,488 |
| JPMorgan Chase & Co. | 3.150% | 7/5/16 | 19,504 | 20,420 |
| JPMorgan Chase & Co. | 6.125% | 6/27/17 | 3,325 | 3,779 |
| JPMorgan Chase & Co. | 2.000% | 8/15/17 | 11,050 | 11,182 |
| JPMorgan Chase & Co. | 6.000% | 1/15/18 | 14,967 | 17,230 |
| JPMorgan Chase & Co. | 1.800% | 1/25/18 | 3,800 | 3,768 |
| JPMorgan Chase & Co. | 1.625% | 5/15/18 | 13,325 | 13,037 |
| JPMorgan Chase & Co. | 6.300% | 4/23/19 | 16,210 | 19,075 |
37
| Total Bond Market II Index Fund | ||||
| Face | Market | |||
| Maturity | Amount | Value | ||
| Coupon | Date | ($000) | ($000) | |
| JPMorgan Chase & Co. | 4.950% | 3/25/20 | 1,300 | 1,443 |
| JPMorgan Chase & Co. | 4.400% | 7/22/20 | 10,795 | 11,587 |
| JPMorgan Chase & Co. | 4.250% | 10/15/20 | 11,350 | 12,014 |
| JPMorgan Chase & Co. | 4.625% | 5/10/21 | 815 | 875 |
| JPMorgan Chase & Co. | 4.350% | 8/15/21 | 33,290 | 35,119 |
| JPMorgan Chase & Co. | 4.500% | 1/24/22 | 13,325 | 14,099 |
| JPMorgan Chase & Co. | 3.250% | 9/23/22 | 17,450 | 16,705 |
| JPMorgan Chase & Co. | 3.200% | 1/25/23 | 11,875 | 11,220 |
| JPMorgan Chase & Co. | 3.375% | 5/1/23 | 6,800 | 6,306 |
| JPMorgan Chase & Co. | 6.400% | 5/15/38 | 14,865 | 17,720 |
| JPMorgan Chase & Co. | 5.500% | 10/15/40 | 5,825 | 6,302 |
| JPMorgan Chase & Co. | 5.600% | 7/15/41 | 6,300 | 6,838 |
| JPMorgan Chase & Co. | 5.400% | 1/6/42 | 3,175 | 3,383 |
| JPMorgan Chase & Co. | 5.625% | 8/16/43 | 8,360 | 8,810 |
| JPMorgan Chase Bank NA | 5.875% | 6/13/16 | 7,950 | 8,786 |
| JPMorgan Chase Bank NA | 6.000% | 10/1/17 | 9,579 | 10,949 |
| KeyBank NA | 5.800% | 7/1/14 | 850 | 872 |
| KeyBank NA | 5.450% | 3/3/16 | 2,500 | 2,718 |
| KeyBank NA | 1.650% | 2/1/18 | 11,150 | 10,927 |
| KeyCorp | 3.750% | 8/13/15 | 725 | 758 |
| KeyCorp | 2.300% | 12/13/18 | 3,275 | 3,249 |
| KeyCorp | 5.100% | 3/24/21 | 6,490 | 7,039 |
| 6 Lloyds Bank plc | 4.375% | 1/12/15 | 2,725 | 2,826 |
| Lloyds Bank plc | 4.875% | 1/21/16 | 5,370 | 5,774 |
| Lloyds Bank plc | 4.200% | 3/28/17 | 5,050 | 5,417 |
| Lloyds Bank plc | 2.300% | 11/27/18 | 13,850 | 13,808 |
| 6 Lloyds Bank plc | 5.800% | 1/13/20 | 2,950 | 3,383 |
| Lloyds Bank plc | 6.375% | 1/21/21 | 5,500 | 6,524 |
| Manufacturers & Traders Trust Co. | 6.625% | 12/4/17 | 2,475 | 2,866 |
| 3 Manufacturers & Traders Trust Co. | 5.585% | 12/28/20 | 100 | 102 |
| MBNA Corp. | 5.000% | 6/15/15 | 1,425 | 1,506 |
| Merrill Lynch & Co. Inc. | 5.000% | 1/15/15 | 11,281 | 11,750 |
| Merrill Lynch & Co. Inc. | 6.050% | 5/16/16 | 1,730 | 1,900 |
| Merrill Lynch & Co. Inc. | 5.700% | 5/2/17 | 9,035 | 10,025 |
| Merrill Lynch & Co. Inc. | 6.400% | 8/28/17 | 11,055 | 12,749 |
| Merrill Lynch & Co. Inc. | 6.875% | 4/25/18 | 21,670 | 25,595 |
| Merrill Lynch & Co. Inc. | 6.500% | 7/15/18 | 10,060 | 11,797 |
| Merrill Lynch & Co. Inc. | 6.110% | 1/29/37 | 7,915 | 8,430 |
| Merrill Lynch & Co. Inc. | 7.750% | 5/14/38 | 11,205 | 14,325 |
| Morgan Stanley | 4.100% | 1/26/15 | 3,300 | 3,411 |
| Morgan Stanley | 6.000% | 4/28/15 | 14,391 | 15,330 |
| Morgan Stanley | 5.375% | 10/15/15 | 17,660 | 18,994 |
| Morgan Stanley | 3.450% | 11/2/15 | 17,100 | 17,836 |
| Morgan Stanley | 1.750% | 2/25/16 | 2,800 | 2,836 |
| Morgan Stanley | 3.800% | 4/29/16 | 10,290 | 10,873 |
| Morgan Stanley | 5.750% | 10/18/16 | 4,700 | 5,238 |
| Morgan Stanley | 5.450% | 1/9/17 | 3,815 | 4,219 |
| Morgan Stanley | 4.750% | 3/22/17 | 9,990 | 10,919 |
| Morgan Stanley | 5.550% | 4/27/17 | 12,000 | 13,322 |
| Morgan Stanley | 5.950% | 12/28/17 | 12,065 | 13,751 |
| Morgan Stanley | 6.625% | 4/1/18 | 7,565 | 8,826 |
| Morgan Stanley | 2.125% | 4/25/18 | 27,475 | 27,305 |
| Morgan Stanley | 7.300% | 5/13/19 | 13,185 | 16,015 |
| Morgan Stanley | 5.625% | 9/23/19 | 11,555 | 13,093 |
| Morgan Stanley | 5.500% | 1/26/20 | 7,750 | 8,679 |
38
| Total Bond Market II Index Fund | ||||
| Face | Market | |||
| Maturity | Amount | Value | ||
| Coupon | Date | ($000) | ($000) | |
| Morgan Stanley | 5.500% | 7/24/20 | 2,150 | 2,402 |
| Morgan Stanley | 5.750% | 1/25/21 | 12,940 | 14,650 |
| Morgan Stanley | 5.500% | 7/28/21 | 3,175 | 3,544 |
| Morgan Stanley | 4.875% | 11/1/22 | 7,625 | 7,747 |
| Morgan Stanley | 3.750% | 2/25/23 | 5,400 | 5,245 |
| Morgan Stanley | 4.100% | 5/22/23 | 10,975 | 10,577 |
| Morgan Stanley | 5.000% | 11/24/25 | 8,250 | 8,264 |
| Morgan Stanley | 6.250% | 8/9/26 | 9,600 | 11,041 |
| Morgan Stanley | 7.250% | 4/1/32 | 6,895 | 8,571 |
| Morgan Stanley | 6.375% | 7/24/42 | 14,975 | 17,393 |
| Murray Street Investment Trust I | 4.647% | 3/9/17 | 6,300 | 6,790 |
| National Australia Bank Ltd. | 2.000% | 3/9/15 | 3,800 | 3,869 |
| National Australia Bank Ltd. | 1.600% | 8/7/15 | 6,275 | 6,367 |
| National Australia Bank Ltd. | 0.900% | 1/20/16 | 7,500 | 7,499 |
| National Australia Bank Ltd. | 2.750% | 3/9/17 | 3,800 | 3,922 |
| National Australia Bank Ltd. | 2.300% | 7/25/18 | 3,225 | 3,249 |
| National Australia Bank Ltd. | 3.000% | 1/20/23 | 3,200 | 2,975 |
| National Bank of Canada | 1.500% | 6/26/15 | 2,400 | 2,433 |
| National Bank of Canada | 1.450% | 11/7/17 | 2,200 | 2,146 |
| National City Bank | 5.800% | 6/7/17 | 2,055 | 2,314 |
| National City Corp. | 4.900% | 1/15/15 | 850 | 889 |
| National City Corp. | 6.875% | 5/15/19 | 4,965 | 5,882 |
| Northern Trust Co. | 6.500% | 8/15/18 | 425 | 501 |
| Northern Trust Corp. | 2.375% | 8/2/22 | 10,550 | 9,729 |
| Northern Trust Corp. | 3.950% | 10/30/25 | 4,325 | 4,174 |
| People’s United Financial Inc. | 3.650% | 12/6/22 | 2,945 | 2,771 |
| PNC Bank NA | 0.800% | 1/28/16 | 2,500 | 2,490 |
| PNC Bank NA | 1.150% | 11/1/16 | 1,250 | 1,249 |
| PNC Bank NA | 4.875% | 9/21/17 | 3,575 | 3,925 |
| PNC Bank NA | 6.000% | 12/7/17 | 1,950 | 2,222 |
| PNC Bank NA | 2.700% | 11/1/22 | 2,350 | 2,128 |
| PNC Bank NA | 2.950% | 1/30/23 | 4,500 | 4,118 |
| PNC Bank NA | 4.200% | 11/1/25 | 7,000 | 6,821 |
| PNC Financial Services Group Inc. | 2.854% | 11/9/22 | 2,875 | 2,654 |
| PNC Funding Corp. | 3.000% | 5/19/14 | 145 | 146 |
| PNC Funding Corp. | 3.625% | 2/8/15 | 235 | 243 |
| PNC Funding Corp. | 4.250% | 9/21/15 | 650 | 687 |
| PNC Funding Corp. | 5.250% | 11/15/15 | 7,550 | 8,124 |
| PNC Funding Corp. | 2.700% | 9/19/16 | 1,945 | 2,026 |
| PNC Funding Corp. | 5.625% | 2/1/17 | 325 | 360 |
| PNC Funding Corp. | 6.700% | 6/10/19 | 6,475 | 7,823 |
| PNC Funding Corp. | 5.125% | 2/8/20 | 5,700 | 6,383 |
| PNC Funding Corp. | 4.375% | 8/11/20 | 6,975 | 7,510 |
| PNC Funding Corp. | 3.300% | 3/8/22 | 4,000 | 3,921 |
| Regions Financial Corp. | 2.000% | 5/15/18 | 7,000 | 6,795 |
| Royal Bank of Canada | 1.150% | 3/13/15 | 2,475 | 2,497 |
| Royal Bank of Canada | 0.800% | 10/30/15 | 4,050 | 4,063 |
| Royal Bank of Canada | 2.625% | 12/15/15 | 9,125 | 9,476 |
| Royal Bank of Canada | 2.875% | 4/19/16 | 2,075 | 2,165 |
| Royal Bank of Canada | 2.300% | 7/20/16 | 19,255 | 19,918 |
| Royal Bank of Canada | 2.200% | 7/27/18 | 12,375 | 12,443 |
| Royal Bank of Scotland Group plc | 2.550% | 9/18/15 | 2,950 | 3,018 |
| Royal Bank of Scotland Group plc | 6.400% | 10/21/19 | 10,630 | 12,253 |
| Royal Bank of Scotland NV | 4.650% | 6/4/18 | 1,700 | 1,743 |
| 6 Royal Bank of Scotland plc | 4.875% | 8/25/14 | 1,075 | 1,101 |
39
| Total Bond Market II Index Fund | ||||
| Face | Market | |||
| Maturity | Amount | Value | ||
| Coupon | Date | ($000) | ($000) | |
| Royal Bank of Scotland plc | 4.875% | 3/16/15 | 2,515 | 2,628 |
| Royal Bank of Scotland plc | 3.950% | 9/21/15 | 545 | 573 |
| Royal Bank of Scotland plc | 4.375% | 3/16/16 | 12,030 | 12,842 |
| Royal Bank of Scotland plc | 5.625% | 8/24/20 | 7,355 | 8,213 |
| Royal Bank of Scotland plc | 6.125% | 1/11/21 | 2,630 | 2,967 |
| Santander Bank NA | 8.750% | 5/30/18 | 675 | 811 |
| Santander Holdings USA Inc. | 3.000% | 9/24/15 | 300 | 308 |
| Santander Holdings USA Inc. | 4.625% | 4/19/16 | 4,025 | 4,286 |
| Santander Holdings USA Inc. | 3.450% | 8/27/18 | 5,325 | 5,443 |
| Societe Generale SA | 2.750% | 10/12/17 | 5,025 | 5,149 |
| Societe Generale SA | 2.625% | 10/1/18 | 17,500 | 17,584 |
| State Street Bank & Trust Co. | 5.300% | 1/15/16 | 2,725 | 2,943 |
| State Street Bank & Trust Co. | 5.250% | 10/15/18 | 2,879 | 3,231 |
| State Street Corp. | 2.875% | 3/7/16 | 6,235 | 6,487 |
| State Street Corp. | 5.375% | 4/30/17 | 185 | 206 |
| State Street Corp. | 4.956% | 3/15/18 | 868 | 944 |
| State Street Corp. | 4.375% | 3/7/21 | 1,385 | 1,495 |
| State Street Corp. | 3.100% | 5/15/23 | 11,175 | 10,248 |
| State Street Corp. | 3.700% | 11/20/23 | 7,200 | 7,141 |
| Sumitomo Mitsui Banking Corp. | 1.350% | 7/18/15 | 3,700 | 3,731 |
| Sumitomo Mitsui Banking Corp. | 0.900% | 1/18/16 | 200 | 199 |
| Sumitomo Mitsui Banking Corp. | 1.450% | 7/19/16 | 400 | 402 |
| Sumitomo Mitsui Banking Corp. | 1.800% | 7/18/17 | 6,925 | 6,867 |
| Sumitomo Mitsui Banking Corp. | 1.500% | 1/18/18 | 2,750 | 2,680 |
| Sumitomo Mitsui Banking Corp. | 2.500% | 7/19/18 | 7,025 | 7,068 |
| Sumitomo Mitsui Banking Corp. | 3.200% | 7/18/22 | 2,675 | 2,527 |
| Sumitomo Mitsui Banking Corp. | 3.000% | 1/18/23 | 550 | 505 |
| Sumitomo Mitsui Banking Corp. | 3.950% | 7/19/23 | 2,350 | 2,335 |
| SunTrust Bank | 5.000% | 9/1/15 | 916 | 970 |
| SunTrust Bank | 7.250% | 3/15/18 | 1,200 | 1,414 |
| SunTrust Bank | 2.750% | 5/1/23 | 2,150 | 1,939 |
| SunTrust Banks Inc. | 3.600% | 4/15/16 | 4,160 | 4,380 |
| SunTrust Banks Inc. | 3.500% | 1/20/17 | 4,070 | 4,288 |
| SunTrust Banks Inc. | 6.000% | 9/11/17 | 2,550 | 2,899 |
| SunTrust Banks Inc. | 2.350% | 11/1/18 | 2,075 | 2,064 |
| Svenska Handelsbanken AB | 2.875% | 4/4/17 | 10,975 | 11,427 |
| Svenska Handelsbanken AB | 1.625% | 3/21/18 | 1,975 | 1,946 |
| Svenska Handelsbanken AB | 2.500% | 1/25/19 | 6,750 | 6,730 |
| Toronto-Dominion Bank | 1.375% | 7/14/14 | 2,660 | 2,676 |
| Toronto-Dominion Bank | 2.500% | 7/14/16 | 2,495 | 2,588 |
| Toronto-Dominion Bank | 2.375% | 10/19/16 | 9,078 | 9,429 |
| Toronto-Dominion Bank | 1.400% | 4/30/18 | 5,125 | 4,998 |
| Toronto-Dominion Bank | 2.625% | 9/10/18 | 10,000 | 10,259 |
| UBS AG | 3.875% | 1/15/15 | 1,890 | 1,953 |
| UBS AG | 7.000% | 10/15/15 | 1,000 | 1,103 |
| UBS AG | 5.875% | 7/15/16 | 3,670 | 4,071 |
| UBS AG | 7.375% | 6/15/17 | 3,350 | 3,812 |
| UBS AG | 5.875% | 12/20/17 | 9,485 | 10,862 |
| UBS AG | 5.750% | 4/25/18 | 9,140 | 10,462 |
| UBS AG | 4.875% | 8/4/20 | 15,550 | 17,249 |
| UBS AG | 7.750% | 9/1/26 | 1,325 | 1,621 |
| Union Bank NA | 5.950% | 5/11/16 | 1,375 | 1,521 |
| Union Bank NA | 1.500% | 9/26/16 | 2,275 | 2,297 |
| Union Bank NA | 2.125% | 6/16/17 | 1,800 | 1,824 |
| Union Bank NA | 2.625% | 9/26/18 | 13,800 | 14,020 |
40
| Total Bond Market II Index Fund | ||||
| Face | Market | |||
| Maturity | Amount | Value | ||
| Coupon | Date | ($000) | ($000) | |
| UnionBanCal Corp. | 3.500% | 6/18/22 | 4,150 | 4,067 |
| US Bancorp | 3.150% | 3/4/15 | 600 | 619 |
| US Bancorp | 2.450% | 7/27/15 | 480 | 494 |
| US Bancorp | 3.442% | 2/1/16 | 4,395 | 4,575 |
| US Bancorp | 2.200% | 11/15/16 | 9,450 | 9,743 |
| US Bancorp | 1.650% | 5/15/17 | 6,650 | 6,701 |
| US Bancorp | 1.950% | 11/15/18 | 2,475 | 2,456 |
| US Bancorp | 4.125% | 5/24/21 | 4,615 | 4,884 |
| US Bancorp | 3.000% | 3/15/22 | 4,225 | 4,078 |
| US Bancorp | 2.950% | 7/15/22 | 6,275 | 5,824 |
| US Bank NA | 4.800% | 4/15/15 | 850 | 894 |
| Vesey Street Investment Trust I | 4.404% | 9/1/16 | 625 | 670 |
| Wachovia Bank NA | 4.875% | 2/1/15 | 4,840 | 5,059 |
| Wachovia Bank NA | 5.000% | 8/15/15 | 577 | 614 |
| Wachovia Bank NA | 6.000% | 11/15/17 | 2,500 | 2,881 |
| Wachovia Bank NA | 5.850% | 2/1/37 | 5,775 | 6,524 |
| Wachovia Bank NA | 6.600% | 1/15/38 | 13,195 | 16,183 |
| Wachovia Corp. | 5.625% | 10/15/16 | 11,800 | 13,205 |
| Wachovia Corp. | 5.750% | 6/15/17 | 11,950 | 13,640 |
| Wachovia Corp. | 5.750% | 2/1/18 | 12,165 | 14,008 |
| Wachovia Corp. | 6.605% | 10/1/25 | 100 | 114 |
| Wachovia Corp. | 5.500% | 8/1/35 | 1,775 | 1,826 |
| Wachovia Corp. | 6.550% | 10/15/35 | 250 | 280 |
| Wells Fargo & Co. | 1.250% | 2/13/15 | 17,550 | 17,697 |
| Wells Fargo & Co. | 3.625% | 4/15/15 | 11,375 | 11,819 |
| Wells Fargo & Co. | 1.500% | 7/1/15 | 3,350 | 3,399 |
| Wells Fargo & Co. | 3.676% | 6/15/16 | 13,820 | 14,677 |
| Wells Fargo & Co. | 1.250% | 7/20/16 | 4,000 | 4,020 |
| Wells Fargo & Co. | 5.125% | 9/15/16 | 1,060 | 1,164 |
| Wells Fargo & Co. | 2.625% | 12/15/16 | 5,400 | 5,647 |
| Wells Fargo & Co. | 2.100% | 5/8/17 | 3,625 | 3,692 |
| Wells Fargo & Co. | 5.625% | 12/11/17 | 11,390 | 13,052 |
| Wells Fargo & Co. | 1.500% | 1/16/18 | 8,800 | 8,699 |
| Wells Fargo & Co. | 4.600% | 4/1/21 | 15,890 | 17,167 |
| Wells Fargo & Co. | 3.500% | 3/8/22 | 11,450 | 11,458 |
| Wells Fargo & Co. | 3.450% | 2/13/23 | 7,575 | 7,116 |
| Wells Fargo & Co. | 4.125% | 8/15/23 | 19,350 | 19,266 |
| Wells Fargo & Co. | 5.375% | 2/7/35 | 4,475 | 4,799 |
| Wells Fargo & Co. | 5.375% | 11/2/43 | 12,379 | 12,584 |
| Wells Fargo Bank NA | 4.750% | 2/9/15 | 4,005 | 4,176 |
| Wells Fargo Bank NA | 5.750% | 5/16/16 | 3,600 | 3,971 |
| Wells Fargo Bank NA | 5.950% | 8/26/36 | 2,700 | 3,036 |
| 3 Wells Fargo Capital X | 5.950% | 12/1/86 | 3,600 | 3,519 |
| Westpac Banking Corp. | 4.200% | 2/27/15 | 7,400 | 7,714 |
| Westpac Banking Corp. | 3.000% | 8/4/15 | 4,125 | 4,286 |
| Westpac Banking Corp. | 1.125% | 9/25/15 | 12,275 | 12,405 |
| Westpac Banking Corp. | 3.000% | 12/9/15 | 1,735 | 1,812 |
| Westpac Banking Corp. | 0.950% | 1/12/16 | 2,550 | 2,553 |
| Westpac Banking Corp. | 2.000% | 8/14/17 | 4,750 | 4,777 |
| Westpac Banking Corp. | 1.600% | 1/12/18 | 4,250 | 4,190 |
| Westpac Banking Corp. | 2.250% | 7/30/18 | 8,400 | 8,430 |
| Westpac Banking Corp. | 4.875% | 11/19/19 | 10,420 | 11,513 |
| Zions Bancorporation | 4.500% | 6/13/23 | 2,700 | 2,627 |
41
| Total Bond Market II Index Fund | ||||
| Face | Market | |||
| Maturity | Amount | Value | ||
| Coupon | Date | ($000) | ($000) | |
| Brokerage (0.2%) | ||||
| Ameriprise Financial Inc. | 5.650% | 11/15/15 | 2,500 | 2,718 |
| Ameriprise Financial Inc. | 5.300% | 3/15/20 | 2,575 | 2,884 |
| Ameriprise Financial Inc. | 4.000% | 10/15/23 | 2,400 | 2,373 |
| 3 Ameriprise Financial Inc. | 7.518% | 6/1/66 | 4,475 | 4,973 |
| BlackRock Inc. | 1.375% | 6/1/15 | 875 | 886 |
| BlackRock Inc. | 6.250% | 9/15/17 | 1,150 | 1,334 |
| BlackRock Inc. | 5.000% | 12/10/19 | 3,840 | 4,343 |
| BlackRock Inc. | 4.250% | 5/24/21 | 7,525 | 7,949 |
| BlackRock Inc. | 3.375% | 6/1/22 | 7,250 | 7,122 |
| Charles Schwab Corp. | 0.850% | 12/4/15 | 600 | 600 |
| Charles Schwab Corp. | 4.450% | 7/22/20 | 1,000 | 1,073 |
| Charles Schwab Corp. | 3.225% | 9/1/22 | 5,814 | 5,557 |
| Eaton Vance Corp. | 3.625% | 6/15/23 | 1,925 | 1,837 |
| 6 FMR LLC | 7.490% | 6/15/19 | 200 | 239 |
| Franklin Resources Inc. | 3.125% | 5/20/15 | 1,450 | 1,494 |
| Franklin Resources Inc. | 1.375% | 9/15/17 | 1,400 | 1,370 |
| Franklin Resources Inc. | 4.625% | 5/20/20 | 700 | 756 |
| Franklin Resources Inc. | 2.800% | 9/15/22 | 4,875 | 4,527 |
| Invesco Finance plc | 3.125% | 11/30/22 | 6,575 | 6,064 |
| Invesco Finance plc | 4.000% | 1/30/24 | 3,050 | 3,030 |
| Invesco Finance plc | 5.375% | 11/30/43 | 6,450 | 6,450 |
| Jefferies Group LLC | 3.875% | 11/9/15 | 1,475 | 1,542 |
| Jefferies Group LLC | 5.125% | 4/13/18 | 3,975 | 4,287 |
| Jefferies Group LLC | 8.500% | 7/15/19 | 3,000 | 3,632 |
| Jefferies Group LLC | 6.875% | 4/15/21 | 7,020 | 8,002 |
| Jefferies Group LLC | 5.125% | 1/20/23 | 2,425 | 2,449 |
| Jefferies Group LLC | 6.450% | 6/8/27 | 1,175 | 1,214 |
| Jefferies Group LLC | 6.250% | 1/15/36 | 1,780 | 1,713 |
| Jefferies Group LLC | 6.500% | 1/20/43 | 1,600 | 1,581 |
| Lazard Group LLC | 6.850% | 6/15/17 | 2,675 | 3,026 |
| Lazard Group LLC | 4.250% | 11/14/20 | 1,675 | 1,670 |
| Legg Mason Inc. | 5.500% | 5/21/19 | 1,825 | 2,000 |
| Leucadia National Corp. | 5.500% | 10/18/23 | 8,225 | 8,212 |
| Leucadia National Corp. | 6.625% | 10/23/43 | 625 | 609 |
| Nomura Holdings Inc. | 5.000% | 3/4/15 | 2,425 | 2,532 |
| Nomura Holdings Inc. | 4.125% | 1/19/16 | 275 | 290 |
| Nomura Holdings Inc. | 2.000% | 9/13/16 | 8,500 | 8,555 |
| Nomura Holdings Inc. | 6.700% | 3/4/20 | 4,025 | 4,622 |
| Raymond James Financial Inc. | 4.250% | 4/15/16 | 1,000 | 1,063 |
| Raymond James Financial Inc. | 8.600% | 8/15/19 | 5,000 | 6,327 |
| TD Ameritrade Holding Corp. | 4.150% | 12/1/14 | 1,025 | 1,059 |
| TD Ameritrade Holding Corp. | 5.600% | 12/1/19 | 925 | 1,060 |
| Finance Companies (0.6%) | ||||
| Air Lease Corp. | 5.625% | 4/1/17 | 15,000 | 16,500 |
| Air Lease Corp. | 3.375% | 1/15/19 | 8,000 | 8,040 |
| Air Lease Corp. | 4.750% | 3/1/20 | 8,000 | 8,300 |
| Ares Capital Corp. | 4.875% | 11/30/18 | 600 | 615 |
| Block Financial LLC | 5.500% | 11/1/22 | 1,500 | 1,537 |
| GATX Corp. | 2.375% | 7/30/18 | 3,000 | 2,992 |
| GATX Corp. | 4.750% | 6/15/22 | 2,050 | 2,053 |
| 3 GE Capital Trust I | 6.375% | 11/15/67 | 1,069 | 1,157 |
| General Electric Capital Corp. | 2.150% | 1/9/15 | 11,450 | 11,663 |
| General Electric Capital Corp. | 4.875% | 3/4/15 | 5,000 | 5,253 |
42
| Total Bond Market II Index Fund | ||||
| Face | Market | |||
| Maturity | Amount | Value | ||
| Coupon | Date | ($000) | ($000) | |
| General Electric Capital Corp. | 3.500% | 6/29/15 | 5,000 | 5,218 |
| General Electric Capital Corp. | 1.625% | 7/2/15 | 16,825 | 17,094 |
| General Electric Capital Corp. | 4.375% | 9/21/15 | 5,300 | 5,623 |
| General Electric Capital Corp. | 2.250% | 11/9/15 | 14,920 | 15,377 |
| General Electric Capital Corp. | 1.000% | 12/11/15 | 1,125 | 1,136 |
| General Electric Capital Corp. | 1.000% | 1/8/16 | 5,250 | 5,263 |
| General Electric Capital Corp. | 2.950% | 5/9/16 | 4,225 | 4,419 |
| General Electric Capital Corp. | 1.500% | 7/12/16 | 6,575 | 6,661 |
| General Electric Capital Corp. | 3.350% | 10/17/16 | 9,325 | 9,899 |
| General Electric Capital Corp. | 5.400% | 2/15/17 | 5,850 | 6,504 |
| General Electric Capital Corp. | 2.300% | 4/27/17 | 12,700 | 13,013 |
| General Electric Capital Corp. | 5.625% | 9/15/17 | 6,065 | 6,898 |
| General Electric Capital Corp. | 1.600% | 11/20/17 | 2,650 | 2,644 |
| General Electric Capital Corp. | 1.625% | 4/2/18 | 7,125 | 7,045 |
| General Electric Capital Corp. | 5.625% | 5/1/18 | 30,000 | 34,501 |
| General Electric Capital Corp. | 6.000% | 8/7/19 | 10,675 | 12,530 |
| General Electric Capital Corp. | 2.100% | 12/11/19 | 900 | 878 |
| General Electric Capital Corp. | 5.500% | 1/8/20 | 5,550 | 6,347 |
| General Electric Capital Corp. | 5.550% | 5/4/20 | 9,275 | 10,686 |
| General Electric Capital Corp. | 4.375% | 9/16/20 | 5,000 | 5,398 |
| General Electric Capital Corp. | 4.625% | 1/7/21 | 3,425 | 3,722 |
| General Electric Capital Corp. | 5.300% | 2/11/21 | 8,330 | 9,292 |
| General Electric Capital Corp. | 4.650% | 10/17/21 | 20,965 | 22,922 |
| General Electric Capital Corp. | 3.150% | 9/7/22 | 4,000 | 3,861 |
| General Electric Capital Corp. | 3.100% | 1/9/23 | 6,015 | 5,705 |
| General Electric Capital Corp. | 6.750% | 3/15/32 | 21,585 | 26,640 |
| General Electric Capital Corp. | 6.150% | 8/7/37 | 11,072 | 12,766 |
| General Electric Capital Corp. | 5.875% | 1/14/38 | 30,490 | 34,455 |
| General Electric Capital Corp. | 6.875% | 1/10/39 | 23,425 | 29,997 |
| 3 General Electric Capital Corp. | 6.375% | 11/15/67 | 11,566 | 12,520 |
| 3 HSBC Finance Capital Trust IX | 5.911% | 11/30/35 | 1,950 | 2,021 |
| HSBC Finance Corp. | 5.250% | 4/15/15 | 4,485 | 4,725 |
| HSBC Finance Corp. | 5.000% | 6/30/15 | 11,445 | 12,106 |
| HSBC Finance Corp. | 5.500% | 1/19/16 | 1,545 | 1,677 |
| HSBC Finance Corp. | 6.676% | 1/15/21 | 15,159 | 17,442 |
| Prospect Capital Corp. | 5.875% | 3/15/23 | 750 | 721 |
| Insurance (1.3%) | ||||
| ACE Capital Trust II | 9.700% | 4/1/30 | 1,000 | 1,425 |
| ACE INA Holdings Inc. | 5.600% | 5/15/15 | 1,725 | 1,840 |
| ACE INA Holdings Inc. | 2.600% | 11/23/15 | 3,735 | 3,863 |
| ACE INA Holdings Inc. | 5.700% | 2/15/17 | 1,400 | 1,567 |
| ACE INA Holdings Inc. | 5.800% | 3/15/18 | 675 | 772 |
| ACE INA Holdings Inc. | 5.900% | 6/15/19 | 785 | 916 |
| ACE INA Holdings Inc. | 2.700% | 3/13/23 | 2,100 | 1,921 |
| ACE INA Holdings Inc. | 6.700% | 5/15/36 | 400 | 499 |
| ACE INA Holdings Inc. | 4.150% | 3/13/43 | 475 | 427 |
| AEGON Funding Co. LLC | 5.750% | 12/15/20 | 5,641 | 6,306 |
| Aetna Inc. | 6.000% | 6/15/16 | 6,675 | 7,453 |
| Aetna Inc. | 1.500% | 11/15/17 | 1,000 | 985 |
| Aetna Inc. | 6.500% | 9/15/18 | 1,500 | 1,764 |
| Aetna Inc. | 3.950% | 9/1/20 | 5,500 | 5,688 |
| Aetna Inc. | 4.125% | 6/1/21 | 2,230 | 2,332 |
| Aetna Inc. | 2.750% | 11/15/22 | 9,260 | 8,495 |
| Aetna Inc. | 6.625% | 6/15/36 | 3,100 | 3,675 |
43
| Total Bond Market II Index Fund | ||||
| Face | Market | |||
| Maturity | Amount | Value | ||
| Coupon | Date | ($000) | ($000) | |
| Aetna Inc. | 6.750% | 12/15/37 | 1,425 | 1,725 |
| Aetna Inc. | 4.125% | 11/15/42 | 1,675 | 1,458 |
| Aflac Inc. | 2.650% | 2/15/17 | 2,565 | 2,648 |
| Aflac Inc. | 8.500% | 5/15/19 | 4,984 | 6,350 |
| Aflac Inc. | 3.625% | 6/15/23 | 2,300 | 2,219 |
| Aflac Inc. | 6.900% | 12/17/39 | 1,900 | 2,322 |
| Aflac Inc. | 6.450% | 8/15/40 | 1,050 | 1,225 |
| AIG Life Holdings Inc. | 8.500% | 7/1/30 | 3,825 | 4,791 |
| Alleghany Corp. | 5.625% | 9/15/20 | 1,000 | 1,096 |
| Alleghany Corp. | 4.950% | 6/27/22 | 3,200 | 3,330 |
| Allied World Assurance Co. Ltd. | 7.500% | 8/1/16 | 6,875 | 7,867 |
| Allstate Corp. | 3.150% | 6/15/23 | 2,200 | 2,081 |
| Allstate Corp. | 5.350% | 6/1/33 | 225 | 238 |
| Allstate Corp. | 5.550% | 5/9/35 | 745 | 811 |
| Allstate Corp. | 5.950% | 4/1/36 | 525 | 597 |
| Allstate Corp. | 4.500% | 6/15/43 | 1,575 | 1,483 |
| 3 Allstate Corp. | 5.750% | 8/15/53 | 2,000 | 2,025 |
| 3 Allstate Corp. | 6.125% | 5/15/67 | 5,075 | 5,303 |
| 3 Allstate Corp. | 6.500% | 5/15/67 | 3,850 | 4,018 |
| Alterra Finance LLC | 6.250% | 9/30/20 | 815 | 916 |
| American Financial Group Inc. | 9.875% | 6/15/19 | 775 | 999 |
| American International Group Inc. | 3.000% | 3/20/15 | 6,600 | 6,776 |
| American International Group Inc. | 2.375% | 8/24/15 | 525 | 537 |
| American International Group Inc. | 5.050% | 10/1/15 | 4,775 | 5,120 |
| American International Group Inc. | 4.875% | 9/15/16 | 3,200 | 3,510 |
| American International Group Inc. | 5.600% | 10/18/16 | 4,825 | 5,380 |
| American International Group Inc. | 3.800% | 3/22/17 | 7,775 | 8,287 |
| American International Group Inc. | 5.450% | 5/18/17 | 2,815 | 3,146 |
| American International Group Inc. | 5.850% | 1/16/18 | 10,525 | 12,071 |
| American International Group Inc. | 8.250% | 8/15/18 | 12,880 | 16,127 |
| American International Group Inc. | 3.375% | 8/15/20 | 1,625 | 1,638 |
| American International Group Inc. | 6.400% | 12/15/20 | 11,675 | 13,785 |
| American International Group Inc. | 4.875% | 6/1/22 | 10,300 | 11,013 |
| American International Group Inc. | 4.125% | 2/15/24 | 3,275 | 3,252 |
| American International Group Inc. | 6.250% | 5/1/36 | 15,420 | 17,757 |
| American International Group Inc. | 6.820% | 11/15/37 | 1,107 | 1,338 |
| 3 American International Group Inc. | 8.175% | 5/15/68 | 10,315 | 12,378 |
| 3 American International Group Inc. | 6.250% | 3/15/87 | 5,348 | 5,341 |
| Aon Corp. | 3.500% | 9/30/15 | 2,025 | 2,114 |
| Aon Corp. | 5.000% | 9/30/20 | 6,370 | 6,987 |
| Aon Corp. | 8.205% | 1/1/27 | 475 | 570 |
| Aon Corp. | 6.250% | 9/30/40 | 2,125 | 2,404 |
| Aon plc | 4.000% | 11/27/23 | 2,675 | 2,626 |
| Aon plc | 4.450% | 5/24/43 | 1,350 | 1,194 |
| Arch Capital Group Ltd. | 7.350% | 5/1/34 | 1,175 | 1,474 |
| Arch Capital Group US Inc. | 5.144% | 11/1/43 | 2,300 | 2,290 |
| Aspen Insurance Holdings Ltd. | 6.000% | 12/15/20 | 4,250 | 4,693 |
| Aspen Insurance Holdings Ltd. | 4.650% | 11/15/23 | 8,900 | 8,754 |
| Assurant Inc. | 4.000% | 3/15/23 | 1,000 | 953 |
| Assurant Inc. | 6.750% | 2/15/34 | 3,825 | 4,076 |
| AXA SA | 8.600% | 12/15/30 | 7,170 | 8,775 |
| Axis Specialty Finance LLC | 5.875% | 6/1/20 | 5,300 | 5,800 |
| Berkshire Hathaway Finance Corp. | 4.850% | 1/15/15 | 1,050 | 1,099 |
| Berkshire Hathaway Finance Corp. | 2.450% | 12/15/15 | 2,050 | 2,120 |
| Berkshire Hathaway Finance Corp. | 1.600% | 5/15/17 | 3,400 | 3,426 |
44
| Total Bond Market II Index Fund | ||||
| Face | Market | |||
| Maturity | Amount | Value | ||
| Coupon | Date | ($000) | ($000) | |
| Berkshire Hathaway Finance Corp. | 5.400% | 5/15/18 | 13,645 | 15,656 |
| Berkshire Hathaway Finance Corp. | 2.900% | 10/15/20 | 550 | 544 |
| Berkshire Hathaway Finance Corp. | 4.250% | 1/15/21 | 6,020 | 6,345 |
| Berkshire Hathaway Finance Corp. | 3.000% | 5/15/22 | 3,325 | 3,180 |
| Berkshire Hathaway Finance Corp. | 5.750% | 1/15/40 | 145 | 159 |
| Berkshire Hathaway Finance Corp. | 4.400% | 5/15/42 | 2,100 | 1,897 |
| Berkshire Hathaway Inc. | 3.200% | 2/11/15 | 3,700 | 3,812 |
| Berkshire Hathaway Inc. | 0.800% | 2/11/16 | 2,025 | 2,030 |
| Berkshire Hathaway Inc. | 2.200% | 8/15/16 | 20,370 | 21,054 |
| Berkshire Hathaway Inc. | 1.900% | 1/31/17 | 5,000 | 5,095 |
| Berkshire Hathaway Inc. | 1.550% | 2/9/18 | 225 | 222 |
| Berkshire Hathaway Inc. | 3.000% | 2/11/23 | 1,575 | 1,477 |
| Berkshire Hathaway Inc. | 4.500% | 2/11/43 | 8,675 | 8,021 |
| Chubb Corp. | 5.750% | 5/15/18 | 940 | 1,080 |
| Chubb Corp. | 6.000% | 5/11/37 | 2,375 | 2,745 |
| 3 Chubb Corp. | 6.375% | 3/29/67 | 4,690 | 5,124 |
| Cigna Corp. | 2.750% | 11/15/16 | 8,005 | 8,317 |
| Cigna Corp. | 5.125% | 6/15/20 | 875 | 965 |
| Cigna Corp. | 4.375% | 12/15/20 | 200 | 211 |
| Cigna Corp. | 4.500% | 3/15/21 | 1,090 | 1,150 |
| Cigna Corp. | 4.000% | 2/15/22 | 1,385 | 1,408 |
| Cigna Corp. | 7.875% | 5/15/27 | 425 | 528 |
| Cigna Corp. | 6.150% | 11/15/36 | 9,259 | 10,408 |
| Cigna Corp. | 5.875% | 3/15/41 | 1,865 | 2,049 |
| Cigna Corp. | 5.375% | 2/15/42 | 3,575 | 3,741 |
| Cincinnati Financial Corp. | 6.920% | 5/15/28 | 4,325 | 4,999 |
| CNA Financial Corp. | 6.500% | 8/15/16 | 1,750 | 1,969 |
| CNA Financial Corp. | 7.350% | 11/15/19 | 1,840 | 2,230 |
| CNA Financial Corp. | 5.875% | 8/15/20 | 1,805 | 2,048 |
| CNA Financial Corp. | 5.750% | 8/15/21 | 1,515 | 1,689 |
| Coventry Health Care Inc. | 5.950% | 3/15/17 | 1,800 | 2,037 |
| Coventry Health Care Inc. | 5.450% | 6/15/21 | 1,985 | 2,201 |
| Endurance Specialty Holdings Ltd. | 7.000% | 7/15/34 | 1,279 | 1,381 |
| First American Financial Corp. | 4.300% | 2/1/23 | 1,025 | 975 |
| Genworth Holdings Inc. | 8.625% | 12/15/16 | 4,125 | 4,891 |
| Genworth Holdings Inc. | 6.515% | 5/22/18 | 350 | 398 |
| Genworth Holdings Inc. | 7.700% | 6/15/20 | 535 | 635 |
| Genworth Holdings Inc. | 7.625% | 9/24/21 | 11,982 | 14,227 |
| Genworth Holdings Inc. | 4.800% | 2/15/24 | 2,300 | 2,268 |
| Genworth Holdings Inc. | 6.500% | 6/15/34 | 1,125 | 1,201 |
| Hartford Financial Services Group Inc. | 5.500% | 10/15/16 | 975 | 1,084 |
| Hartford Financial Services Group Inc. | 5.375% | 3/15/17 | 900 | 994 |
| Hartford Financial Services Group Inc. | 4.000% | 10/15/17 | 5,225 | 5,557 |
| Hartford Financial Services Group Inc. | 6.300% | 3/15/18 | 2,134 | 2,452 |
| Hartford Financial Services Group Inc. | 6.000% | 1/15/19 | 925 | 1,057 |
| Hartford Financial Services Group Inc. | 5.500% | 3/30/20 | 5,000 | 5,621 |
| Hartford Financial Services Group Inc. | 5.125% | 4/15/22 | 825 | 897 |
| Hartford Financial Services Group Inc. | 5.950% | 10/15/36 | 125 | 138 |
| Hartford Financial Services Group Inc. | 6.100% | 10/1/41 | 1,650 | 1,860 |
| Hartford Financial Services Group Inc. | 6.625% | 4/15/42 | 1,793 | 2,147 |
| HCC Insurance Holdings Inc. | 6.300% | 11/15/19 | 1,600 | 1,853 |
| Humana Inc. | 7.200% | 6/15/18 | 2,375 | 2,801 |
| Humana Inc. | 6.300% | 8/1/18 | 150 | 171 |
| Humana Inc. | 3.150% | 12/1/22 | 3,825 | 3,518 |
| Humana Inc. | 8.150% | 6/15/38 | 2,025 | 2,667 |
45
| Total Bond Market II Index Fund | ||||
| Face | Market | |||
| Maturity | Amount | Value | ||
| Coupon | Date | ($000) | ($000) | |
| Humana Inc. | 4.625% | 12/1/42 | 2,175 | 1,937 |
| Infinity Property & Casualty Corp. | 5.000% | 9/19/22 | 950 | 948 |
| ING US Inc. | 2.900% | 2/15/18 | 3,905 | 3,987 |
| ING US Inc. | 5.500% | 7/15/22 | 525 | 569 |
| ING US Inc. | 5.700% | 7/15/43 | 925 | 962 |
| Lincoln National Corp. | 4.300% | 6/15/15 | 1,619 | 1,696 |
| Lincoln National Corp. | 8.750% | 7/1/19 | 900 | 1,157 |
| Lincoln National Corp. | 6.250% | 2/15/20 | 4,745 | 5,462 |
| Lincoln National Corp. | 4.850% | 6/24/21 | 1,132 | 1,208 |
| Lincoln National Corp. | 4.200% | 3/15/22 | 100 | 102 |
| Lincoln National Corp. | 4.000% | 9/1/23 | 325 | 319 |
| Lincoln National Corp. | 6.150% | 4/7/36 | 3,450 | 3,867 |
| Lincoln National Corp. | 7.000% | 6/15/40 | 1,385 | 1,731 |
| 3 Lincoln National Corp. | 7.000% | 5/17/66 | 9,635 | 9,816 |
| 3 Lincoln National Corp. | 6.050% | 4/20/67 | 2,108 | 2,100 |
| Loews Corp. | 2.625% | 5/15/23 | 3,800 | 3,401 |
| Loews Corp. | 6.000% | 2/1/35 | 200 | 220 |
| Loews Corp. | 4.125% | 5/15/43 | 4,675 | 3,970 |
| Manulife Financial Corp. | 3.400% | 9/17/15 | 4,025 | 4,195 |
| Manulife Financial Corp. | 4.900% | 9/17/20 | 4,875 | 5,201 |
| Markel Corp. | 7.125% | 9/30/19 | 825 | 982 |
| Markel Corp. | 4.900% | 7/1/22 | 4,865 | 5,025 |
| Markel Corp. | 3.625% | 3/30/23 | 2,175 | 2,036 |
| Markel Corp. | 5.000% | 3/30/43 | 575 | 532 |
| Marsh & McLennan Cos. Inc. | 9.250% | 4/15/19 | 5,962 | 7,705 |
| Marsh & McLennan Cos. Inc. | 4.800% | 7/15/21 | 2,265 | 2,406 |
| Marsh & McLennan Cos. Inc. | 5.875% | 8/1/33 | 3,975 | 4,214 |
| 6 Massachusetts Mutual Life Insurance Co. | 8.875% | 6/1/39 | 575 | 821 |
| MetLife Inc. | 5.000% | 6/15/15 | 2,245 | 2,383 |
| MetLife Inc. | 6.750% | 6/1/16 | 895 | 1,016 |
| MetLife Inc. | 1.756% | 12/15/17 | 7,625 | 7,537 |
| MetLife Inc. | 6.817% | 8/15/18 | 895 | 1,072 |
| MetLife Inc. | 7.717% | 2/15/19 | 1,570 | 1,947 |
| MetLife Inc. | 4.750% | 2/8/21 | 8,895 | 9,599 |
| MetLife Inc. | 3.048% | 12/15/22 | 2,425 | 2,254 |
| MetLife Inc. | 6.500% | 12/15/32 | 250 | 298 |
| MetLife Inc. | 6.375% | 6/15/34 | 1,770 | 2,086 |
| MetLife Inc. | 5.700% | 6/15/35 | 3,400 | 3,700 |
| MetLife Inc. | 5.875% | 2/6/41 | 6,870 | 7,621 |
| MetLife Inc. | 4.125% | 8/13/42 | 7,350 | 6,353 |
| MetLife Inc. | 4.875% | 11/13/43 | 2,300 | 2,230 |
| 3 MetLife Inc. | 6.400% | 12/15/66 | 5,235 | 5,399 |
| 6 Metropolitan Life Global Funding I | 5.125% | 6/10/14 | 5,225 | 5,326 |
| Montpelier Re Holdings Ltd. | 4.700% | 10/15/22 | 275 | 270 |
| Munich Re America Corp. | 7.450% | 12/15/26 | 1,200 | 1,480 |
| 3 Nationwide Financial Services Inc. | 6.750% | 5/15/67 | 400 | 394 |
| OneBeacon US Holdings Inc. | 4.600% | 11/9/22 | 1,000 | 980 |
| 6 Pacific LifeCorp | 5.125% | 1/30/43 | 200 | 182 |
| PartnerRe Finance B LLC | 5.500% | 6/1/20 | 8,508 | 9,207 |
| Primerica Inc. | 4.750% | 7/15/22 | 475 | 487 |
| Principal Financial Group Inc. | 8.875% | 5/15/19 | 10,090 | 12,898 |
| Principal Financial Group Inc. | 6.050% | 10/15/36 | 1,825 | 2,058 |
| Principal Life Income Funding Trusts | 5.100% | 4/15/14 | 1,250 | 1,266 |
| ProAssurance Corp. | 5.300% | 11/15/23 | 875 | 897 |
| Progressive Corp. | 3.750% | 8/23/21 | 5,855 | 5,980 |
46
| Total Bond Market II Index Fund | ||||
| Face | Market | |||
| Maturity | Amount | Value | ||
| Coupon | Date | ($000) | ($000) | |
| Progressive Corp. | 6.625% | 3/1/29 | 725 | 854 |
| 3 Progressive Corp. | 6.700% | 6/15/67 | 3,100 | 3,352 |
| Protective Life Corp. | 7.375% | 10/15/19 | 950 | 1,145 |
| Protective Life Corp. | 8.450% | 10/15/39 | 6,144 | 7,756 |
| Prudential Financial Inc. | 3.875% | 1/14/15 | 5,360 | 5,537 |
| Prudential Financial Inc. | 6.200% | 1/15/15 | 2,750 | 2,903 |
| Prudential Financial Inc. | 4.750% | 9/17/15 | 5,750 | 6,128 |
| Prudential Financial Inc. | 5.500% | 3/15/16 | 1,575 | 1,720 |
| Prudential Financial Inc. | 3.000% | 5/12/16 | 3,150 | 3,278 |
| Prudential Financial Inc. | 6.000% | 12/1/17 | 5,000 | 5,740 |
| Prudential Financial Inc. | 2.300% | 8/15/18 | 3,400 | 3,401 |
| Prudential Financial Inc. | 7.375% | 6/15/19 | 795 | 973 |
| Prudential Financial Inc. | 5.375% | 6/21/20 | 1,945 | 2,186 |
| Prudential Financial Inc. | 5.750% | 7/15/33 | 1,280 | 1,370 |
| Prudential Financial Inc. | 5.400% | 6/13/35 | 2,775 | 2,848 |
| Prudential Financial Inc. | 5.900% | 3/17/36 | 2,300 | 2,503 |
| Prudential Financial Inc. | 5.700% | 12/14/36 | 6,370 | 6,808 |
| Prudential Financial Inc. | 6.625% | 12/1/37 | 2,100 | 2,509 |
| Prudential Financial Inc. | 5.625% | 5/12/41 | 1,745 | 1,859 |
| 3 Prudential Financial Inc. | 5.875% | 9/15/42 | 4,850 | 4,929 |
| 3 Prudential Financial Inc. | 5.625% | 6/15/43 | 11,000 | 10,821 |
| Prudential Financial Inc. | 5.100% | 8/15/43 | 1,525 | 1,519 |
| 3 Prudential Financial Inc. | 5.200% | 3/15/44 | 1,875 | 1,809 |
| Reinsurance Group of America Inc. | 5.625% | 3/15/17 | 1,500 | 1,644 |
| Reinsurance Group of America Inc. | 6.450% | 11/15/19 | 1,000 | 1,153 |
| 3 Reinsurance Group of America Inc. | 6.750% | 12/15/65 | 5,675 | 5,625 |
| Swiss Re Solutions Holding Corp. | 7.000% | 2/15/26 | 2,425 | 2,878 |
| Torchmark Corp. | 6.375% | 6/15/16 | 1,225 | 1,353 |
| Torchmark Corp. | 9.250% | 6/15/19 | 895 | 1,146 |
| Transatlantic Holdings Inc. | 8.000% | 11/30/39 | 6,325 | 7,789 |
| Travelers Cos. Inc. | 5.500% | 12/1/15 | 3,815 | 4,161 |
| Travelers Cos. Inc. | 6.250% | 6/20/16 | 1,100 | 1,236 |
| Travelers Cos. Inc. | 5.750% | 12/15/17 | 4,475 | 5,126 |
| Travelers Cos. Inc. | 5.800% | 5/15/18 | 1,215 | 1,399 |
| Travelers Cos. Inc. | 3.900% | 11/1/20 | 2,170 | 2,280 |
| Travelers Cos. Inc. | 6.750% | 6/20/36 | 1,525 | 1,903 |
| Travelers Cos. Inc. | 6.250% | 6/15/37 | 3,035 | 3,600 |
| Travelers Cos. Inc. | 5.350% | 11/1/40 | 4,245 | 4,572 |
| Travelers Cos. Inc. | 4.600% | 8/1/43 | 2,025 | 1,976 |
| Trinity Acquisition plc | 4.625% | 8/15/23 | 750 | 733 |
| Trinity Acquisition plc | 6.125% | 8/15/43 | 2,325 | 2,325 |
| UnitedHealth Group Inc. | 4.875% | 3/15/15 | 875 | 919 |
| UnitedHealth Group Inc. | 0.850% | 10/15/15 | 3,275 | 3,291 |
| UnitedHealth Group Inc. | 1.875% | 11/15/16 | 325 | 332 |
| UnitedHealth Group Inc. | 6.000% | 6/15/17 | 3,825 | 4,403 |
| UnitedHealth Group Inc. | 1.400% | 10/15/17 | 2,450 | 2,426 |
| UnitedHealth Group Inc. | 6.000% | 2/15/18 | 8,060 | 9,297 |
| UnitedHealth Group Inc. | 3.875% | 10/15/20 | 5,000 | 5,229 |
| UnitedHealth Group Inc. | 4.700% | 2/15/21 | 1,135 | 1,229 |
| UnitedHealth Group Inc. | 3.375% | 11/15/21 | 145 | 142 |
| UnitedHealth Group Inc. | 2.875% | 3/15/22 | 3,300 | 3,136 |
| UnitedHealth Group Inc. | 2.750% | 2/15/23 | 3,600 | 3,277 |
| UnitedHealth Group Inc. | 5.800% | 3/15/36 | 4,525 | 4,959 |
| UnitedHealth Group Inc. | 6.500% | 6/15/37 | 625 | 742 |
| UnitedHealth Group Inc. | 6.625% | 11/15/37 | 550 | 663 |
47
| Total Bond Market II Index Fund | ||||
| Face | Market | |||
| Maturity | Amount | Value | ||
| Coupon | Date | ($000) | ($000) | |
| UnitedHealth Group Inc. | 6.875% | 2/15/38 | 7,620 | 9,406 |
| UnitedHealth Group Inc. | 5.950% | 2/15/41 | 250 | 280 |
| UnitedHealth Group Inc. | 4.625% | 11/15/41 | 2,475 | 2,314 |
| UnitedHealth Group Inc. | 4.375% | 3/15/42 | 1,000 | 918 |
| UnitedHealth Group Inc. | 3.950% | 10/15/42 | 2,200 | 1,866 |
| UnitedHealth Group Inc. | 4.250% | 3/15/43 | 7,225 | 6,506 |
| Unum Group | 5.625% | 9/15/20 | 825 | 901 |
| Unum Group | 5.750% | 8/15/42 | 1,925 | 1,984 |
| Validus Holdings Ltd. | 8.875% | 1/26/40 | 2,950 | 3,761 |
| WellPoint Inc. | 5.000% | 12/15/14 | 4,650 | 4,845 |
| WellPoint Inc. | 1.250% | 9/10/15 | 2,825 | 2,848 |
| WellPoint Inc. | 5.250% | 1/15/16 | 1,860 | 2,011 |
| WellPoint Inc. | 2.375% | 2/15/17 | 1,700 | 1,726 |
| WellPoint Inc. | 5.875% | 6/15/17 | 3,725 | 4,212 |
| WellPoint Inc. | 1.875% | 1/15/18 | 2,975 | 2,935 |
| WellPoint Inc. | 7.000% | 2/15/19 | 655 | 776 |
| WellPoint Inc. | 3.700% | 8/15/21 | 205 | 204 |
| WellPoint Inc. | 3.125% | 5/15/22 | 9,620 | 9,007 |
| WellPoint Inc. | 3.300% | 1/15/23 | 4,200 | 3,940 |
| WellPoint Inc. | 5.950% | 12/15/34 | 5,050 | 5,419 |
| WellPoint Inc. | 5.850% | 1/15/36 | 2,400 | 2,579 |
| WellPoint Inc. | 6.375% | 6/15/37 | 3,620 | 4,100 |
| WellPoint Inc. | 4.625% | 5/15/42 | 2,000 | 1,840 |
| WellPoint Inc. | 4.650% | 1/15/43 | 4,375 | 4,032 |
| Willis Group Holdings plc | 4.125% | 3/15/16 | 3,775 | 3,957 |
| Willis Group Holdings plc | 5.750% | 3/15/21 | 1,885 | 2,031 |
| Willis North America Inc. | 6.200% | 3/28/17 | 1,125 | 1,237 |
| WR Berkley Corp. | 5.375% | 9/15/20 | 375 | 401 |
| WR Berkley Corp. | 4.625% | 3/15/22 | 7,300 | 7,371 |
| XL Group plc | 6.375% | 11/15/24 | 175 | 200 |
| XL Group plc | 6.250% | 5/15/27 | 2,192 | 2,427 |
| XLIT Ltd. | 5.750% | 10/1/21 | 4,030 | 4,544 |
| XLIT Ltd. | 5.250% | 12/15/43 | 350 | 353 |
| Other Finance (0.0%) | ||||
| CME Group Inc. | 3.000% | 9/15/22 | 5,000 | 4,695 |
| CME Group Inc. | 5.300% | 9/15/43 | 2,625 | 2,724 |
| IntercontinentalExchange Group Inc. | 2.500% | 10/15/18 | 1,100 | 1,107 |
| IntercontinentalExchange Group Inc. | 4.000% | 10/15/23 | 1,975 | 1,975 |
| Jones Lang LaSalle Inc. | 4.400% | 11/15/22 | 150 | 144 |
| NASDAQ OMX Group Inc. | 5.550% | 1/15/20 | 3,800 | 4,085 |
| ORIX Corp. | 4.710% | 4/27/15 | 1,500 | 1,564 |
| ORIX Corp. | 5.000% | 1/12/16 | 2,340 | 2,490 |
| ORIX Corp. | 3.750% | 3/9/17 | 2,700 | 2,806 |
| XTRA Finance Corp. | 5.150% | 4/1/17 | 4,525 | 5,003 |
| Real Estate Investment Trusts (0.5%) | ||||
| Alexandria Real Estate Equities Inc. | 4.600% | 4/1/22 | 2,575 | 2,596 |
| Alexandria Real Estate Equities Inc. | 3.900% | 6/15/23 | 375 | 350 |
| Arden Realty LP | 5.250% | 3/1/15 | 250 | 261 |
| AvalonBay Communities Inc. | 5.750% | 9/15/16 | 275 | 307 |
| AvalonBay Communities Inc. | 2.950% | 9/15/22 | 325 | 297 |
| AvalonBay Communities Inc. | 2.850% | 3/15/23 | 2,320 | 2,085 |
| AvalonBay Communities Inc. | 4.200% | 12/15/23 | 1,655 | 1,639 |
| BioMed Realty LP | 3.850% | 4/15/16 | 2,500 | 2,608 |
48
| Total Bond Market II Index Fund | ||||
| Face | Market | |||
| Maturity | Amount | Value | ||
| Coupon | Date | ($000) | ($000) | |
| BioMed Realty LP | 4.250% | 7/15/22 | 3,050 | 2,913 |
| Boston Properties LP | 5.625% | 4/15/15 | 1,375 | 1,459 |
| Boston Properties LP | 3.700% | 11/15/18 | 2,035 | 2,147 |
| Boston Properties LP | 5.625% | 11/15/20 | 4,925 | 5,523 |
| Boston Properties LP | 4.125% | 5/15/21 | 1,410 | 1,437 |
| Boston Properties LP | 3.850% | 2/1/23 | 8,700 | 8,504 |
| Boston Properties LP | 3.800% | 2/1/24 | 5,300 | 5,073 |
| Brandywine Operating Partnership LP | 5.700% | 5/1/17 | 275 | 301 |
| Brandywine Operating Partnership LP | 4.950% | 4/15/18 | 4,250 | 4,548 |
| Brandywine Operating Partnership LP | 3.950% | 2/15/23 | 1,300 | 1,220 |
| BRE Properties Inc. | 5.500% | 3/15/17 | 975 | 1,069 |
| BRE Properties Inc. | 3.375% | 1/15/23 | 1,125 | 1,030 |
| Camden Property Trust | 2.950% | 12/15/22 | 3,950 | 3,566 |
| CBL & Associates LP | 5.250% | 12/1/23 | 2,950 | 2,941 |
| CommonWealth REIT | 6.250% | 6/15/17 | 1,725 | 1,831 |
| CommonWealth REIT | 6.650% | 1/15/18 | 975 | 1,067 |
| CommonWealth REIT | 5.875% | 9/15/20 | 1,300 | 1,336 |
| Corporate Office Properties LP | 3.600% | 5/15/23 | 1,300 | 1,176 |
| CubeSmart LP | 4.375% | 12/15/23 | 2,850 | 2,781 |
| 6 DCT Industrial Trust Inc. | 4.500% | 10/15/23 | 425 | 414 |
| DDR Corp. | 7.875% | 9/1/20 | 3,300 | 4,047 |
| DDR Corp. | 3.500% | 1/15/21 | 1,950 | 1,893 |
| DDR Corp. | 4.625% | 7/15/22 | 4,550 | 4,632 |
| DDR Corp. | 3.375% | 5/15/23 | 3,825 | 3,483 |
| Digital Realty Trust LP | 4.500% | 7/15/15 | 1,450 | 1,513 |
| Digital Realty Trust LP | 5.250% | 3/15/21 | 4,965 | 5,069 |
| Digital Realty Trust LP | 3.625% | 10/1/22 | 175 | 157 |
| Duke Realty LP | 7.375% | 2/15/15 | 3,675 | 3,931 |
| Duke Realty LP | 5.950% | 2/15/17 | 5,225 | 5,787 |
| Duke Realty LP | 6.750% | 3/15/20 | 275 | 317 |
| Duke Realty LP | 3.625% | 4/15/23 | 4,915 | 4,511 |
| EPR Properties | 5.750% | 8/15/22 | 575 | 587 |
| EPR Properties | 5.250% | 7/15/23 | 3,375 | 3,293 |
| Equity One Inc. | 3.750% | 11/15/22 | 2,000 | 1,858 |
| ERP Operating LP | 5.250% | 9/15/14 | 1,350 | 1,394 |
| ERP Operating LP | 5.125% | 3/15/16 | 3,050 | 3,319 |
| ERP Operating LP | 5.375% | 8/1/16 | 975 | 1,076 |
| ERP Operating LP | 5.750% | 6/15/17 | 550 | 617 |
| ERP Operating LP | 4.750% | 7/15/20 | 385 | 413 |
| ERP Operating LP | 4.625% | 12/15/21 | 4,400 | 4,634 |
| ERP Operating LP | 3.000% | 4/15/23 | 4,875 | 4,443 |
| Essex Portfolio LP | 3.250% | 5/1/23 | 1,425 | 1,286 |
| Federal Realty Investment Trust | 3.000% | 8/1/22 | 1,600 | 1,487 |
| Federal Realty Investment Trust | 2.750% | 6/1/23 | 950 | 848 |
| HCP Inc. | 3.750% | 2/1/16 | 7,630 | 7,999 |
| HCP Inc. | 6.300% | 9/15/16 | 950 | 1,068 |
| HCP Inc. | 2.625% | 2/1/20 | 5,000 | 4,760 |
| HCP Inc. | 5.375% | 2/1/21 | 3,690 | 4,004 |
| HCP Inc. | 3.150% | 8/1/22 | 3,375 | 3,074 |
| HCP Inc. | 4.250% | 11/15/23 | 8,750 | 8,570 |
| HCP Inc. | 6.750% | 2/1/41 | 925 | 1,096 |
| Health Care REIT Inc. | 3.625% | 3/15/16 | 175 | 183 |
| Health Care REIT Inc. | 6.200% | 6/1/16 | 3,250 | 3,608 |
| Health Care REIT Inc. | 4.700% | 9/15/17 | 1,850 | 2,014 |
| Health Care REIT Inc. | 2.250% | 3/15/18 | 8,900 | 8,804 |
49
| Total Bond Market II Index Fund | ||||
| Face | Market | |||
| Maturity | Amount | Value | ||
| Coupon | Date | ($000) | ($000) | |
| Health Care REIT Inc. | 6.125% | 4/15/20 | 3,850 | 4,327 |
| Health Care REIT Inc. | 4.950% | 1/15/21 | 5,340 | 5,618 |
| Health Care REIT Inc. | 5.250% | 1/15/22 | 175 | 186 |
| Health Care REIT Inc. | 3.750% | 3/15/23 | 1,650 | 1,554 |
| Health Care REIT Inc. | 6.500% | 3/15/41 | 175 | 191 |
| Health Care REIT Inc. | 5.125% | 3/15/43 | 4,450 | 4,079 |
| Healthcare Realty Trust Inc. | 6.500% | 1/17/17 | 1,600 | 1,782 |
| Healthcare Realty Trust Inc. | 5.750% | 1/15/21 | 4,666 | 5,046 |
| Healthcare Realty Trust Inc. | 3.750% | 4/15/23 | 1,500 | 1,385 |
| Healthcare Trust of America Holdings LP | 3.700% | 4/15/23 | 875 | 804 |
| Hospitality Properties Trust | 5.125% | 2/15/15 | 1,775 | 1,821 |
| Hospitality Properties Trust | 5.625% | 3/15/17 | 3,150 | 3,423 |
| Hospitality Properties Trust | 6.700% | 1/15/18 | 6,600 | 7,338 |
| Kilroy Realty LP | 5.000% | 11/3/15 | 3,100 | 3,313 |
| Kilroy Realty LP | 4.800% | 7/15/18 | 7,125 | 7,657 |
| Kilroy Realty LP | 3.800% | 1/15/23 | 4,300 | 3,994 |
| Kimco Realty Corp. | 5.783% | 3/15/16 | 3,125 | 3,414 |
| Kimco Realty Corp. | 5.700% | 5/1/17 | 1,250 | 1,389 |
| Kimco Realty Corp. | 4.300% | 2/1/18 | 840 | 892 |
| Kimco Realty Corp. | 6.875% | 10/1/19 | 3,750 | 4,466 |
| Kimco Realty Corp. | 3.125% | 6/1/23 | 175 | 158 |
| Liberty Property LP | 5.125% | 3/2/15 | 4,170 | 4,353 |
| Liberty Property LP | 6.625% | 10/1/17 | 1,800 | 2,053 |
| Liberty Property LP | 4.750% | 10/1/20 | 450 | 471 |
| Liberty Property LP | 3.375% | 6/15/23 | 1,775 | 1,610 |
| Liberty Property LP | 4.400% | 2/15/24 | 1,700 | 1,667 |
| Mack-Cali Realty LP | 2.500% | 12/15/17 | 1,700 | 1,692 |
| Mack-Cali Realty LP | 7.750% | 8/15/19 | 2,175 | 2,595 |
| Mack-Cali Realty LP | 4.500% | 4/18/22 | 350 | 343 |
| Mack-Cali Realty LP | 3.150% | 5/15/23 | 5,850 | 5,081 |
| Mid-America Apartments LP | 4.300% | 10/15/23 | 1,000 | 973 |
| National Retail Properties Inc. | 6.875% | 10/15/17 | 6,950 | 8,019 |
| National Retail Properties Inc. | 3.800% | 10/15/22 | 1,600 | 1,523 |
| Omega Healthcare Investors Inc. | 6.750% | 10/15/22 | 3,258 | 3,539 |
| Omega Healthcare Investors Inc. | 5.875% | 3/15/24 | 685 | 692 |
| Piedmont Operating Partnership LP | 3.400% | 6/1/23 | 975 | 872 |
| Post Apartment Homes LP | 3.375% | 12/1/22 | 3,025 | 2,771 |
| ProLogis LP | 4.500% | 8/15/17 | 775 | 836 |
| ProLogis LP | 6.625% | 5/15/18 | 443 | 517 |
| ProLogis LP | 2.750% | 2/15/19 | 3,025 | 3,005 |
| ProLogis LP | 6.875% | 3/15/20 | 3,675 | 4,326 |
| ProLogis LP | 4.250% | 8/15/23 | 1,800 | 1,778 |
| Realty Income Corp. | 2.000% | 1/31/18 | 700 | 686 |
| Realty Income Corp. | 6.750% | 8/15/19 | 5,665 | 6,606 |
| Realty Income Corp. | 5.750% | 1/15/21 | 3,000 | 3,307 |
| Realty Income Corp. | 3.250% | 10/15/22 | 825 | 749 |
| Realty Income Corp. | 4.650% | 8/1/23 | 800 | 804 |
| Regency Centers LP | 5.250% | 8/1/15 | 625 | 663 |
| Regency Centers LP | 5.875% | 6/15/17 | 3,400 | 3,762 |
| Regency Centers LP | 4.800% | 4/15/21 | 2,000 | 2,071 |
| Retail Opportunity Investments Corp. | 5.000% | 12/15/23 | 1,250 | 1,246 |
| Senior Housing Properties Trust | 4.300% | 1/15/16 | 700 | 726 |
| Simon Property Group LP | 4.200% | 2/1/15 | 1,690 | 1,740 |
| Simon Property Group LP | 5.750% | 12/1/15 | 5,975 | 6,470 |
| Simon Property Group LP | 6.100% | 5/1/16 | 150 | 166 |
50
| Total Bond Market II Index Fund | ||||
| Face | Market | |||
| Maturity | Amount | Value | ||
| Coupon | Date | ($000) | ($000) | |
| Simon Property Group LP | 5.250% | 12/1/16 | 5,965 | 6,606 |
| Simon Property Group LP | 2.800% | 1/30/17 | 3,525 | 3,616 |
| Simon Property Group LP | 5.875% | 3/1/17 | 4,675 | 5,222 |
| Simon Property Group LP | 2.150% | 9/15/17 | 6,250 | 6,343 |
| Simon Property Group LP | 6.125% | 5/30/18 | 1,875 | 2,171 |
| Simon Property Group LP | 5.650% | 2/1/20 | 3,875 | 4,397 |
| Simon Property Group LP | 4.375% | 3/1/21 | 1,895 | 1,998 |
| Simon Property Group LP | 3.375% | 3/15/22 | 1,675 | 1,633 |
| Simon Property Group LP | 2.750% | 2/1/23 | 3,650 | 3,332 |
| Simon Property Group LP | 6.750% | 2/1/40 | 4,175 | 5,209 |
| Simon Property Group LP | 4.750% | 3/15/42 | 1,300 | 1,258 |
| Tanger Properties LP | 6.150% | 11/15/15 | 2,975 | 3,240 |
| Tanger Properties LP | 3.875% | 12/1/23 | 725 | 696 |
| UDR Inc. | 4.250% | 6/1/18 | 575 | 606 |
| UDR Inc. | 3.700% | 10/1/20 | 1,250 | 1,251 |
| UDR Inc. | 4.625% | 1/10/22 | 3,800 | 3,893 |
| Ventas Realty LP / Ventas Capital Corp. | 3.125% | 11/30/15 | 7,905 | 8,221 |
| Ventas Realty LP / Ventas Capital Corp. | 2.000% | 2/15/18 | 1,125 | 1,106 |
| Ventas Realty LP / Ventas Capital Corp. | 4.000% | 4/30/19 | 4,125 | 4,309 |
| Ventas Realty LP / Ventas Capital Corp. | 2.700% | 4/1/20 | 2,425 | 2,317 |
| Ventas Realty LP / Ventas Capital Corp. | 4.750% | 6/1/21 | 975 | 1,021 |
| Ventas Realty LP / Ventas Capital Corp. | 4.250% | 3/1/22 | 1,125 | 1,127 |
| Ventas Realty LP / Ventas Capital Corp. | 3.250% | 8/15/22 | 5,375 | 4,961 |
| Vornado Realty LP | 5.000% | 1/15/22 | 5,500 | 5,713 |
| Washington REIT | 4.950% | 10/1/20 | 800 | 836 |
| Washington REIT | 3.950% | 10/15/22 | 1,050 | 1,001 |
| Weingarten Realty Investors | 3.375% | 10/15/22 | 675 | 617 |
| Weingarten Realty Investors | 3.500% | 4/15/23 | 2,125 | 1,939 |
| Weingarten Realty Investors | 4.450% | 1/15/24 | 600 | 590 |
| 5,523,477 | ||||
| Industrial (13.0%) | ||||
| Basic Industry (1.3%) | ||||
| Agrium Inc. | 6.750% | 1/15/19 | 1,500 | 1,748 |
| Agrium Inc. | 3.150% | 10/1/22 | 9,300 | 8,547 |
| Agrium Inc. | 3.500% | 6/1/23 | 625 | 582 |
| Agrium Inc. | 6.125% | 1/15/41 | 275 | 293 |
| Agrium Inc. | 4.900% | 6/1/43 | 875 | 805 |
| Air Products & Chemicals Inc. | 2.000% | 8/2/16 | 1,050 | 1,074 |
| Air Products & Chemicals Inc. | 1.200% | 10/15/17 | 1,075 | 1,053 |
| Air Products & Chemicals Inc. | 3.000% | 11/3/21 | 6,785 | 6,500 |
| Airgas Inc. | 3.250% | 10/1/15 | 1,075 | 1,114 |
| Airgas Inc. | 1.650% | 2/15/18 | 4,000 | 3,907 |
| Albemarle Corp. | 4.500% | 12/15/20 | 450 | 462 |
| Alcoa Inc. | 6.750% | 7/15/18 | 190 | 216 |
| Alcoa Inc. | 5.720% | 2/23/19 | 490 | 525 |
| Alcoa Inc. | 6.150% | 8/15/20 | 3,790 | 4,081 |
| Alcoa Inc. | 5.400% | 4/15/21 | 7,000 | 7,177 |
| Alcoa Inc. | 5.870% | 2/23/22 | 550 | 568 |
| Alcoa Inc. | 5.900% | 2/1/27 | 3,500 | 3,444 |
| Alcoa Inc. | 6.750% | 1/15/28 | 390 | 407 |
| Alcoa Inc. | 5.950% | 2/1/37 | 5,440 | 5,003 |
| Allegheny Technologies Inc. | 9.375% | 6/1/19 | 2,975 | 3,633 |
| Allegheny Technologies Inc. | 5.950% | 1/15/21 | 2,000 | 2,074 |
| Barrick Gold Corp. | 6.950% | 4/1/19 | 350 | 404 |
| Barrick Gold Corp. | 3.850% | 4/1/22 | 6,200 | 5,571 |
51
| Total Bond Market II Index Fund | ||||
| Face | Market | |||
| Maturity | Amount | Value | ||
| Coupon | Date | ($000) | ($000) | |
| Barrick Gold Corp. | 4.100% | 5/1/23 | 6,325 | 5,698 |
| Barrick Gold Corp. | 5.250% | 4/1/42 | 1,850 | 1,517 |
| Barrick North America Finance LLC | 6.800% | 9/15/18 | 2,700 | 3,109 |
| Barrick North America Finance LLC | 4.400% | 5/30/21 | 13,135 | 12,636 |
| Barrick North America Finance LLC | 5.700% | 5/30/41 | 2,975 | 2,543 |
| Barrick North America Finance LLC | 5.750% | 5/1/43 | 5,725 | 5,149 |
| Barrick PD Australia Finance Pty Ltd. | 5.950% | 10/15/39 | 2,744 | 2,366 |
| BHP Billiton Finance USA Ltd. | 1.000% | 2/24/15 | 7,450 | 7,496 |
| BHP Billiton Finance USA Ltd. | 5.250% | 12/15/15 | 3,000 | 3,262 |
| BHP Billiton Finance USA Ltd. | 1.875% | 11/21/16 | 2,800 | 2,862 |
| BHP Billiton Finance USA Ltd. | 1.625% | 2/24/17 | 8,050 | 8,062 |
| BHP Billiton Finance USA Ltd. | 5.400% | 3/29/17 | 1,425 | 1,588 |
| BHP Billiton Finance USA Ltd. | 2.050% | 9/30/18 | 8,767 | 8,741 |
| BHP Billiton Finance USA Ltd. | 6.500% | 4/1/19 | 4,390 | 5,221 |
| BHP Billiton Finance USA Ltd. | 3.250% | 11/21/21 | 5,150 | 5,122 |
| BHP Billiton Finance USA Ltd. | 2.875% | 2/24/22 | 14,675 | 14,000 |
| BHP Billiton Finance USA Ltd. | 3.850% | 9/30/23 | 8,725 | 8,739 |
| BHP Billiton Finance USA Ltd. | 4.125% | 2/24/42 | 4,100 | 3,610 |
| BHP Billiton Finance USA Ltd. | 5.000% | 9/30/43 | 11,125 | 11,238 |
| Cabot Corp. | 2.550% | 1/15/18 | 200 | 199 |
| Cabot Corp. | 3.700% | 7/15/22 | 400 | 380 |
| Carpenter Technology Corp. | 5.200% | 7/15/21 | 5,575 | 5,686 |
| Celulosa Arauco y Constitucion SA | 5.625% | 4/20/15 | 1,000 | 1,054 |
| Celulosa Arauco y Constitucion SA | 7.250% | 7/29/19 | 800 | 919 |
| Celulosa Arauco y Constitucion SA | 5.000% | 1/21/21 | 2,800 | 2,832 |
| Celulosa Arauco y Constitucion SA | 4.750% | 1/11/22 | 2,000 | 1,935 |
| CF Industries Inc. | 6.875% | 5/1/18 | 11,650 | 13,529 |
| CF Industries Inc. | 7.125% | 5/1/20 | 9,510 | 11,198 |
| CF Industries Inc. | 3.450% | 6/1/23 | 1,100 | 1,007 |
| CF Industries Inc. | 4.950% | 6/1/43 | 2,900 | 2,620 |
| Cliffs Natural Resources Inc. | 3.950% | 1/15/18 | 875 | 881 |
| Cliffs Natural Resources Inc. | 5.900% | 3/15/20 | 1,225 | 1,294 |
| Cliffs Natural Resources Inc. | 4.800% | 10/1/20 | 1,550 | 1,527 |
| Cliffs Natural Resources Inc. | 4.875% | 4/1/21 | 5,960 | 5,785 |
| Cliffs Natural Resources Inc. | 6.250% | 10/1/40 | 3,000 | 2,541 |
| Cytec Industries Inc. | 3.500% | 4/1/23 | 225 | 206 |
| Domtar Corp. | 6.250% | 9/1/42 | 475 | 455 |
| Domtar Corp. | 6.750% | 2/15/44 | 3,325 | 3,381 |
| Dow Chemical Co. | 2.500% | 2/15/16 | 2,175 | 2,243 |
| Dow Chemical Co. | 8.550% | 5/15/19 | 11,889 | 15,394 |
| Dow Chemical Co. | 4.250% | 11/15/20 | 9,865 | 10,486 |
| Dow Chemical Co. | 4.125% | 11/15/21 | 5,240 | 5,405 |
| Dow Chemical Co. | 7.375% | 11/1/29 | 1,500 | 1,924 |
| Dow Chemical Co. | 9.400% | 5/15/39 | 5,865 | 8,752 |
| Dow Chemical Co. | 5.250% | 11/15/41 | 5,265 | 5,277 |
| Dow Chemical Co. | 4.375% | 11/15/42 | 3,450 | 3,025 |
| Eastman Chemical Co. | 3.000% | 12/15/15 | 4,600 | 4,770 |
| Eastman Chemical Co. | 2.400% | 6/1/17 | 2,100 | 2,126 |
| Eastman Chemical Co. | 4.500% | 1/15/21 | 6,810 | 7,008 |
| Eastman Chemical Co. | 3.600% | 8/15/22 | 1,275 | 1,222 |
| Eastman Chemical Co. | 4.800% | 9/1/42 | 2,750 | 2,589 |
| Ecolab Inc. | 1.000% | 8/9/15 | 550 | 552 |
| Ecolab Inc. | 3.000% | 12/8/16 | 1,875 | 1,967 |
| Ecolab Inc. | 1.450% | 12/8/17 | 6,375 | 6,247 |
| Ecolab Inc. | 4.350% | 12/8/21 | 10,100 | 10,470 |
52
| Total Bond Market II Index Fund | ||||
| Face | Market | |||
| Maturity | Amount | Value | ||
| Coupon | Date | ($000) | ($000) | |
| Ecolab Inc. | 5.500% | 12/8/41 | 1,500 | 1,607 |
| EI du Pont de Nemours & Co. | 3.250% | 1/15/15 | 425 | 438 |
| EI du Pont de Nemours & Co. | 2.750% | 4/1/16 | 1,600 | 1,668 |
| EI du Pont de Nemours & Co. | 5.250% | 12/15/16 | 1,330 | 1,494 |
| EI du Pont de Nemours & Co. | 6.000% | 7/15/18 | 15,590 | 18,116 |
| EI du Pont de Nemours & Co. | 4.625% | 1/15/20 | 3,115 | 3,390 |
| EI du Pont de Nemours & Co. | 3.625% | 1/15/21 | 15,068 | 15,354 |
| EI du Pont de Nemours & Co. | 4.250% | 4/1/21 | 5,950 | 6,283 |
| EI du Pont de Nemours & Co. | 2.800% | 2/15/23 | 1,750 | 1,606 |
| EI du Pont de Nemours & Co. | 6.500% | 1/15/28 | 525 | 635 |
| EI du Pont de Nemours & Co. | 4.900% | 1/15/41 | 8,100 | 7,952 |
| EI du Pont de Nemours & Co. | 4.150% | 2/15/43 | 1,125 | 993 |
| FMC Corp. | 3.950% | 2/1/22 | 1,275 | 1,267 |
| Freeport-McMoRan Copper & Gold Inc. | 1.400% | 2/13/15 | 6,100 | 6,137 |
| Freeport-McMoRan Copper & Gold Inc. | 2.150% | 3/1/17 | 2,000 | 2,021 |
| Freeport-McMoRan Copper & Gold Inc. | 2.375% | 3/15/18 | 10,780 | 10,764 |
| Freeport-McMoRan Copper & Gold Inc. | 3.100% | 3/15/20 | 6,275 | 6,144 |
| Freeport-McMoRan Copper & Gold Inc. | 3.550% | 3/1/22 | 16,074 | 15,241 |
| Freeport-McMoRan Copper & Gold Inc. | 3.875% | 3/15/23 | 13,005 | 12,257 |
| Freeport-McMoRan Copper & Gold Inc. | 5.450% | 3/15/43 | 6,180 | 5,890 |
| Georgia-Pacific LLC | 8.875% | 5/15/31 | 2,250 | 3,119 |
| Glencore Canada Corp. | 5.375% | 6/1/15 | 100 | 105 |
| Glencore Canada Corp. | 6.000% | 10/15/15 | 325 | 352 |
| Glencore Canada Corp. | 5.500% | 6/15/17 | 1,975 | 2,145 |
| Goldcorp Inc. | 2.125% | 3/15/18 | 5,800 | 5,654 |
| Goldcorp Inc. | 3.700% | 3/15/23 | 4,825 | 4,308 |
| International Paper Co. | 5.300% | 4/1/15 | 1,600 | 1,688 |
| International Paper Co. | 7.950% | 6/15/18 | 7,465 | 9,122 |
| International Paper Co. | 9.375% | 5/15/19 | 1,800 | 2,361 |
| International Paper Co. | 7.500% | 8/15/21 | 7,265 | 8,908 |
| International Paper Co. | 4.750% | 2/15/22 | 11,875 | 12,386 |
| International Paper Co. | 7.300% | 11/15/39 | 4,170 | 5,136 |
| International Paper Co. | 6.000% | 11/15/41 | 6,100 | 6,592 |
| Kinross Gold Corp. | 6.875% | 9/1/41 | 1,275 | 1,137 |
| Lubrizol Corp. | 5.500% | 10/1/14 | 600 | 623 |
| Lubrizol Corp. | 8.875% | 2/1/19 | 1,075 | 1,403 |
| LYB International Finance BV | 5.250% | 7/15/43 | 1,625 | 1,619 |
| LyondellBasell Industries NV | 5.000% | 4/15/19 | 8,475 | 9,365 |
| LyondellBasell Industries NV | 6.000% | 11/15/21 | 4,375 | 5,020 |
| LyondellBasell Industries NV | 5.750% | 4/15/24 | 4,400 | 4,913 |
| Monsanto Co. | 5.125% | 4/15/18 | 850 | 955 |
| Monsanto Co. | 2.200% | 7/15/22 | 650 | 588 |
| Monsanto Co. | 5.875% | 4/15/38 | 950 | 1,092 |
| Monsanto Co. | 3.600% | 7/15/42 | 2,000 | 1,636 |
| Mosaic Co. | 4.250% | 11/15/23 | 2,700 | 2,672 |
| Mosaic Co. | 5.450% | 11/15/33 | 1,600 | 1,630 |
| Mosaic Co. | 4.875% | 11/15/41 | 4,045 | 3,647 |
| Mosaic Co. | 5.625% | 11/15/43 | 1,600 | 1,614 |
| Newmont Mining Corp. | 5.125% | 10/1/19 | 3,525 | 3,638 |
| Newmont Mining Corp. | 3.500% | 3/15/22 | 9,050 | 7,691 |
| Newmont Mining Corp. | 5.875% | 4/1/35 | 750 | 634 |
| Newmont Mining Corp. | 6.250% | 10/1/39 | 3,450 | 3,041 |
| Newmont Mining Corp. | 4.875% | 3/15/42 | 3,775 | 2,788 |
| Nucor Corp. | 5.750% | 12/1/17 | 7,265 | 8,269 |
| Nucor Corp. | 5.850% | 6/1/18 | 1,725 | 1,957 |
53
| Total Bond Market II Index Fund | ||||
| Face | Market | |||
| Maturity | Amount | Value | ||
| Coupon | Date | ($000) | ($000) | |
| Nucor Corp. | 4.125% | 9/15/22 | 300 | 300 |
| Nucor Corp. | 4.000% | 8/1/23 | 6,425 | 6,265 |
| Nucor Corp. | 6.400% | 12/1/37 | 1,875 | 2,081 |
| Nucor Corp. | 5.200% | 8/1/43 | 5,200 | 5,067 |
| Packaging Corp. of America | 3.900% | 6/15/22 | 2,275 | 2,206 |
| Packaging Corp. of America | 4.500% | 11/1/23 | 3,525 | 3,528 |
| Placer Dome Inc. | 6.450% | 10/15/35 | 1,050 | 972 |
| Plains Exploration & Production Co. | 6.125% | 6/15/19 | 2,875 | 3,162 |
| Plains Exploration & Production Co. | 6.500% | 11/15/20 | 9,475 | 10,470 |
| Plains Exploration & Production Co. | 6.750% | 2/1/22 | 2,050 | 2,263 |
| Plum Creek Timberlands LP | 4.700% | 3/15/21 | 445 | 459 |
| Plum Creek Timberlands LP | 3.250% | 3/15/23 | 1,000 | 903 |
| Potash Corp. of Saskatchewan Inc. | 3.750% | 9/30/15 | 2,000 | 2,098 |
| Potash Corp. of Saskatchewan Inc. | 3.250% | 12/1/17 | 8,500 | 8,873 |
| Potash Corp. of Saskatchewan Inc. | 6.500% | 5/15/19 | 1,077 | 1,275 |
| Potash Corp. of Saskatchewan Inc. | 4.875% | 3/30/20 | 8,065 | 8,681 |
| Potash Corp. of Saskatchewan Inc. | 5.875% | 12/1/36 | 200 | 214 |
| Potash Corp. of Saskatchewan Inc. | 5.625% | 12/1/40 | 375 | 396 |
| PPG Industries Inc. | 1.900% | 1/15/16 | 3,625 | 3,683 |
| PPG Industries Inc. | 6.650% | 3/15/18 | 225 | 262 |
| PPG Industries Inc. | 7.700% | 3/15/38 | 175 | 227 |
| PPG Industries Inc. | 5.500% | 11/15/40 | 950 | 990 |
| Praxair Inc. | 4.625% | 3/30/15 | 6,685 | 7,026 |
| Praxair Inc. | 4.500% | 8/15/19 | 1,800 | 1,989 |
| Praxair Inc. | 3.000% | 9/1/21 | 2,225 | 2,180 |
| Praxair Inc. | 2.450% | 2/15/22 | 6,000 | 5,542 |
| Praxair Inc. | 2.200% | 8/15/22 | 8,025 | 7,150 |
| Praxair Inc. | 3.550% | 11/7/42 | 500 | 403 |
| Rayonier Inc. | 3.750% | 4/1/22 | 1,000 | 940 |
| Reliance Steel & Aluminum Co. | 6.200% | 11/15/16 | 100 | 109 |
| Reliance Steel & Aluminum Co. | 4.500% | 4/15/23 | 1,700 | 1,658 |
| Reliance Steel & Aluminum Co. | 6.850% | 11/15/36 | 100 | 99 |
| Rio Tinto Alcan Inc. | 5.000% | 6/1/15 | 250 | 264 |
| Rio Tinto Alcan Inc. | 6.125% | 12/15/33 | 5,725 | 6,367 |
| Rio Tinto Alcan Inc. | 5.750% | 6/1/35 | 3,000 | 3,123 |
| Rio Tinto Finance USA Ltd. | 1.875% | 11/2/15 | 2,000 | 2,033 |
| Rio Tinto Finance USA Ltd. | 2.500% | 5/20/16 | 145 | 149 |
| Rio Tinto Finance USA Ltd. | 2.250% | 9/20/16 | 3,200 | 3,299 |
| Rio Tinto Finance USA Ltd. | 6.500% | 7/15/18 | 19,725 | 23,204 |
| Rio Tinto Finance USA Ltd. | 9.000% | 5/1/19 | 10,200 | 13,354 |
| Rio Tinto Finance USA Ltd. | 3.500% | 11/2/20 | 440 | 445 |
| Rio Tinto Finance USA Ltd. | 4.125% | 5/20/21 | 4,500 | 4,657 |
| Rio Tinto Finance USA Ltd. | 3.750% | 9/20/21 | 2,700 | 2,695 |
| Rio Tinto Finance USA Ltd. | 7.125% | 7/15/28 | 2,225 | 2,740 |
| Rio Tinto Finance USA Ltd. | 5.200% | 11/2/40 | 4,560 | 4,677 |
| Rio Tinto Finance USA plc | 1.125% | 3/20/15 | 2,000 | 2,011 |
| Rio Tinto Finance USA plc | 1.375% | 6/17/16 | 8,000 | 8,052 |
| Rio Tinto Finance USA plc | 2.000% | 3/22/17 | 3,075 | 3,085 |
| Rio Tinto Finance USA plc | 1.625% | 8/21/17 | 5,075 | 5,068 |
| Rio Tinto Finance USA plc | 2.250% | 12/14/18 | 3,200 | 3,181 |
| Rio Tinto Finance USA plc | 3.500% | 3/22/22 | 2,175 | 2,128 |
| Rio Tinto Finance USA plc | 2.875% | 8/21/22 | 8,775 | 8,134 |
| Rio Tinto Finance USA plc | 4.750% | 3/22/42 | 3,475 | 3,357 |
| Rio Tinto Finance USA plc | 4.125% | 8/21/42 | 5,200 | 4,530 |
| Rohm & Haas Co. | 6.000% | 9/15/17 | 1,657 | 1,881 |
54
| Total Bond Market II Index Fund | ||||
| Face | Market | |||
| Maturity | Amount | Value | ||
| Coupon | Date | ($000) | ($000) | |
| Rohm & Haas Co. | 7.850% | 7/15/29 | 4,775 | 6,310 |
| RPM International Inc. | 6.125% | 10/15/19 | 650 | 728 |
| RPM International Inc. | 3.450% | 11/15/22 | 2,275 | 2,082 |
| Sherwin-Williams Co. | 1.350% | 12/15/17 | 2,825 | 2,753 |
| Sherwin-Williams Co. | 4.000% | 12/15/42 | 1,200 | 1,023 |
| Sigma-Aldrich Corp. | 3.375% | 11/1/20 | 600 | 594 |
| Southern Copper Corp. | 5.375% | 4/16/20 | 400 | 427 |
| Southern Copper Corp. | 3.500% | 11/8/22 | 1,550 | 1,420 |
| Southern Copper Corp. | 7.500% | 7/27/35 | 8,475 | 8,778 |
| Southern Copper Corp. | 6.750% | 4/16/40 | 1,600 | 1,539 |
| Southern Copper Corp. | 5.250% | 11/8/42 | 2,875 | 2,323 |
| Syngenta Finance NV | 3.125% | 3/28/22 | 2,250 | 2,151 |
| Syngenta Finance NV | 4.375% | 3/28/42 | 1,250 | 1,155 |
| Teck Resources Ltd. | 5.375% | 10/1/15 | 4,991 | 5,328 |
| Teck Resources Ltd. | 3.150% | 1/15/17 | 700 | 724 |
| Teck Resources Ltd. | 2.500% | 2/1/18 | 4,000 | 4,038 |
| Teck Resources Ltd. | 4.750% | 1/15/22 | 700 | 699 |
| Teck Resources Ltd. | 3.750% | 2/1/23 | 10,050 | 9,323 |
| Teck Resources Ltd. | 6.125% | 10/1/35 | 2,625 | 2,533 |
| Teck Resources Ltd. | 6.000% | 8/15/40 | 2,500 | 2,390 |
| Teck Resources Ltd. | 6.250% | 7/15/41 | 6,401 | 6,339 |
| Teck Resources Ltd. | 5.200% | 3/1/42 | 2,575 | 2,257 |
| Teck Resources Ltd. | 5.400% | 2/1/43 | 475 | 433 |
| Vale Canada Ltd. | 5.700% | 10/15/15 | 1,200 | 1,285 |
| Vale Canada Ltd. | 7.200% | 9/15/32 | 3,541 | 3,586 |
| Vale Overseas Ltd. | 6.250% | 1/11/16 | 1,240 | 1,350 |
| Vale Overseas Ltd. | 6.250% | 1/23/17 | 6,850 | 7,605 |
| Vale Overseas Ltd. | 5.625% | 9/15/19 | 5,550 | 6,016 |
| Vale Overseas Ltd. | 4.625% | 9/15/20 | 8,835 | 9,041 |
| Vale Overseas Ltd. | 4.375% | 1/11/22 | 12,805 | 12,397 |
| Vale Overseas Ltd. | 8.250% | 1/17/34 | 800 | 917 |
| Vale Overseas Ltd. | 6.875% | 11/21/36 | 20,370 | 20,877 |
| Vale Overseas Ltd. | 6.875% | 11/10/39 | 7,015 | 7,198 |
| Valspar Corp. | 7.250% | 6/15/19 | 400 | 473 |
| Valspar Corp. | 4.200% | 1/15/22 | 375 | 372 |
| Westlake Chemical Corp. | 3.600% | 7/15/22 | 400 | 379 |
| Westvaco Corp. | 7.950% | 2/15/31 | 3,050 | 3,529 |
| Weyerhaeuser Co. | 7.375% | 10/1/19 | 4,364 | 5,337 |
| Weyerhaeuser Co. | 8.500% | 1/15/25 | 1,300 | 1,663 |
| Weyerhaeuser Co. | 7.375% | 3/15/32 | 3,625 | 4,446 |
| Weyerhaeuser Co. | 6.875% | 12/15/33 | 1,250 | 1,473 |
| Capital Goods (1.1%) | ||||
| 3M Co. | 1.375% | 9/29/16 | 1,630 | 1,655 |
| 3M Co. | 2.000% | 6/26/22 | 5,000 | 4,558 |
| 3M Co. | 6.375% | 2/15/28 | 1,300 | 1,582 |
| 3M Co. | 5.700% | 3/15/37 | 2,345 | 2,694 |
| ABB Finance USA Inc. | 1.625% | 5/8/17 | 1,200 | 1,197 |
| ABB Finance USA Inc. | 2.875% | 5/8/22 | 6,110 | 5,759 |
| ABB Finance USA Inc. | 4.375% | 5/8/42 | 1,250 | 1,140 |
| Acuity Brands Lighting Inc. | 6.000% | 12/15/19 | 800 | 867 |
| Bemis Co. Inc. | 6.800% | 8/1/19 | 200 | 233 |
| Black & Decker Corp. | 5.750% | 11/15/16 | 625 | 703 |
| Boeing Capital Corp. | 2.125% | 8/15/16 | 885 | 913 |
| Boeing Capital Corp. | 2.900% | 8/15/18 | 1,000 | 1,037 |
55
| Total Bond Market II Index Fund | ||||
| Face | Market | |||
| Maturity | Amount | Value | ||
| Coupon | Date | ($000) | ($000) | |
| Boeing Capital Corp. | 4.700% | 10/27/19 | 5,875 | 6,592 |
| Boeing Co. | 3.500% | 2/15/15 | 4,135 | 4,270 |
| Boeing Co. | 0.950% | 5/15/18 | 7,500 | 7,192 |
| Boeing Co. | 6.000% | 3/15/19 | 725 | 854 |
| Boeing Co. | 4.875% | 2/15/20 | 2,100 | 2,339 |
| Boeing Co. | 8.750% | 8/15/21 | 200 | 268 |
| Boeing Co. | 7.250% | 6/15/25 | 325 | 408 |
| Boeing Co. | 6.125% | 2/15/33 | 225 | 268 |
| Boeing Co. | 6.625% | 2/15/38 | 525 | 669 |
| Boeing Co. | 6.875% | 3/15/39 | 1,440 | 1,899 |
| Boeing Co. | 5.875% | 2/15/40 | 3,780 | 4,473 |
| Carlisle Cos. Inc. | 3.750% | 11/15/22 | 1,650 | 1,545 |
| Caterpillar Financial Services Corp. | 4.750% | 2/17/15 | 1,350 | 1,414 |
| Caterpillar Financial Services Corp. | 1.050% | 3/26/15 | 1,700 | 1,711 |
| Caterpillar Financial Services Corp. | 4.625% | 6/1/15 | 2,725 | 2,880 |
| Caterpillar Financial Services Corp. | 2.050% | 8/1/16 | 3,630 | 3,728 |
| Caterpillar Financial Services Corp. | 1.750% | 3/24/17 | 2,000 | 2,005 |
| Caterpillar Financial Services Corp. | 1.250% | 11/6/17 | 850 | 838 |
| Caterpillar Financial Services Corp. | 5.450% | 4/15/18 | 9,142 | 10,374 |
| Caterpillar Financial Services Corp. | 7.150% | 2/15/19 | 14,290 | 17,532 |
| Caterpillar Financial Services Corp. | 2.850% | 6/1/22 | 6,104 | 5,796 |
| Caterpillar Inc. | 0.950% | 6/26/15 | 1,950 | 1,963 |
| Caterpillar Inc. | 1.500% | 6/26/17 | 6,155 | 6,143 |
| Caterpillar Inc. | 3.900% | 5/27/21 | 13,330 | 13,850 |
| Caterpillar Inc. | 6.050% | 8/15/36 | 3,991 | 4,558 |
| Caterpillar Inc. | 5.200% | 5/27/41 | 75 | 78 |
| Caterpillar Inc. | 3.803% | 8/15/42 | 8,194 | 6,869 |
| Cooper US Inc. | 5.450% | 4/1/15 | 950 | 1,005 |
| Cooper US Inc. | 2.375% | 1/15/16 | 5,575 | 5,741 |
| Cooper US Inc. | 3.875% | 12/15/20 | 200 | 203 |
| Crane Co. | 2.750% | 12/15/18 | 2,000 | 1,995 |
| Crane Co. | 4.450% | 12/15/23 | 2,400 | 2,375 |
| CRH America Inc. | 4.125% | 1/15/16 | 4,050 | 4,273 |
| CRH America Inc. | 6.000% | 9/30/16 | 4,500 | 5,032 |
| CRH America Inc. | 8.125% | 7/15/18 | 11,275 | 13,824 |
| CRH America Inc. | 5.750% | 1/15/21 | 4,115 | 4,507 |
| Danaher Corp. | 2.300% | 6/23/16 | 1,800 | 1,858 |
| Danaher Corp. | 5.625% | 1/15/18 | 850 | 972 |
| Danaher Corp. | 3.900% | 6/23/21 | 2,625 | 2,709 |
| Deere & Co. | 2.600% | 6/8/22 | 5,065 | 4,746 |
| Deere & Co. | 5.375% | 10/16/29 | 3,695 | 4,127 |
| Deere & Co. | 8.100% | 5/15/30 | 2,061 | 2,845 |
| Deere & Co. | 3.900% | 6/9/42 | 4,725 | 4,126 |
| Dover Corp. | 4.875% | 10/15/15 | 2,225 | 2,391 |
| Dover Corp. | 5.450% | 3/15/18 | 2,250 | 2,549 |
| Dover Corp. | 4.300% | 3/1/21 | 830 | 876 |
| Dover Corp. | 6.600% | 3/15/38 | 975 | 1,187 |
| Dover Corp. | 5.375% | 3/1/41 | 895 | 956 |
| Eaton Corp. | 1.500% | 11/2/17 | 1,000 | 986 |
| Eaton Corp. | 5.600% | 5/15/18 | 5,855 | 6,586 |
| Eaton Corp. | 2.750% | 11/2/22 | 11,675 | 10,863 |
| Eaton Corp. | 4.000% | 11/2/32 | 2,430 | 2,215 |
| Eaton Corp. | 4.150% | 11/2/42 | 2,550 | 2,266 |
| 6 Embraer Overseas Ltd. | 5.696% | 9/16/23 | 11,454 | 11,419 |
| Emerson Electric Co. | 5.125% | 12/1/16 | 2,125 | 2,375 |
56
| Total Bond Market II Index Fund | ||||
| Face | Market | |||
| Maturity | Amount | Value | ||
| Coupon | Date | ($000) | ($000) | |
| Emerson Electric Co. | 5.250% | 10/15/18 | 2,200 | 2,506 |
| Emerson Electric Co. | 4.875% | 10/15/19 | 2,275 | 2,559 |
| Emerson Electric Co. | 4.250% | 11/15/20 | 2,707 | 2,905 |
| Emerson Electric Co. | 2.625% | 2/15/23 | 1,500 | 1,404 |
| Emerson Electric Co. | 6.000% | 8/15/32 | 750 | 847 |
| Emerson Electric Co. | 6.125% | 4/15/39 | 1,000 | 1,179 |
| Emerson Electric Co. | 5.250% | 11/15/39 | 440 | 463 |
| Exelis Inc. | 4.250% | 10/1/16 | 1,900 | 2,005 |
| Flowserve Corp. | 3.500% | 9/15/22 | 6,980 | 6,578 |
| Flowserve Corp. | 4.000% | 11/15/23 | 1,575 | 1,525 |
| General Dynamics Corp. | 1.375% | 1/15/15 | 5,000 | 5,051 |
| General Dynamics Corp. | 1.000% | 11/15/17 | 6,225 | 6,041 |
| General Dynamics Corp. | 3.875% | 7/15/21 | 5,250 | 5,411 |
| General Dynamics Corp. | 2.250% | 11/15/22 | 8,500 | 7,624 |
| General Dynamics Corp. | 3.600% | 11/15/42 | 1,650 | 1,350 |
| General Electric Co. | 0.850% | 10/9/15 | 7,375 | 7,421 |
| General Electric Co. | 5.250% | 12/6/17 | 20,845 | 23,652 |
| General Electric Co. | 2.700% | 10/9/22 | 16,475 | 15,393 |
| General Electric Co. | 4.125% | 10/9/42 | 23,500 | 21,539 |
| Harsco Corp. | 5.750% | 5/15/18 | 3,540 | 3,714 |
| Honeywell International Inc. | 5.400% | 3/15/16 | 2,330 | 2,561 |
| Honeywell International Inc. | 5.300% | 3/15/17 | 2,375 | 2,653 |
| Honeywell International Inc. | 5.300% | 3/1/18 | 4,250 | 4,827 |
| Honeywell International Inc. | 5.000% | 2/15/19 | 2,520 | 2,842 |
| Honeywell International Inc. | 4.250% | 3/1/21 | 4,545 | 4,872 |
| Honeywell International Inc. | 3.350% | 12/1/23 | 3,050 | 2,972 |
| Honeywell International Inc. | 5.700% | 3/15/36 | 1,600 | 1,794 |
| Honeywell International Inc. | 5.700% | 3/15/37 | 495 | 553 |
| Honeywell International Inc. | 5.375% | 3/1/41 | 6,345 | 6,932 |
| Illinois Tool Works Inc. | 6.250% | 4/1/19 | 2,650 | 3,140 |
| Illinois Tool Works Inc. | 3.375% | 9/15/21 | 895 | 891 |
| Illinois Tool Works Inc. | 4.875% | 9/15/41 | 895 | 880 |
| Illinois Tool Works Inc. | 3.900% | 9/1/42 | 6,875 | 5,856 |
| Ingersoll-Rand Global Holding Co. Ltd. | 6.875% | 8/15/18 | 4,650 | 5,462 |
| 6 Ingersoll-Rand Global Holding Co. Ltd. | 2.875% | 1/15/19 | 1,100 | 1,089 |
| 6 Ingersoll-Rand Global Holding Co. Ltd. | 4.250% | 6/15/23 | 1,875 | 1,827 |
| 6 Ingersoll-Rand Global Holding Co. Ltd. | 5.750% | 6/15/43 | 450 | 454 |
| John Deere Capital Corp. | 2.950% | 3/9/15 | 1,875 | 1,930 |
| John Deere Capital Corp. | 0.875% | 4/17/15 | 875 | 880 |
| John Deere Capital Corp. | 0.950% | 6/29/15 | 3,000 | 3,024 |
| John Deere Capital Corp. | 0.700% | 9/4/15 | 1,100 | 1,105 |
| John Deere Capital Corp. | 0.750% | 1/22/16 | 175 | 175 |
| John Deere Capital Corp. | 1.850% | 9/15/16 | 815 | 834 |
| John Deere Capital Corp. | 2.000% | 1/13/17 | 2,350 | 2,391 |
| John Deere Capital Corp. | 1.400% | 3/15/17 | 1,600 | 1,597 |
| John Deere Capital Corp. | 5.500% | 4/13/17 | 150 | 168 |
| John Deere Capital Corp. | 2.800% | 9/18/17 | 4,225 | 4,411 |
| John Deere Capital Corp. | 1.200% | 10/10/17 | 4,400 | 4,305 |
| John Deere Capital Corp. | 5.350% | 4/3/18 | 1,225 | 1,380 |
| John Deere Capital Corp. | 5.750% | 9/10/18 | 14,160 | 16,442 |
| John Deere Capital Corp. | 1.950% | 12/13/18 | 5,000 | 4,968 |
| John Deere Capital Corp. | 2.250% | 4/17/19 | 1,275 | 1,270 |
| John Deere Capital Corp. | 1.700% | 1/15/20 | 5,400 | 5,067 |
| John Deere Capital Corp. | 3.900% | 7/12/21 | 875 | 905 |
| John Deere Capital Corp. | 3.150% | 10/15/21 | 3,095 | 3,057 |
57
| Total Bond Market II Index Fund | ||||
| Face | Market | |||
| Maturity | Amount | Value | ||
| Coupon | Date | ($000) | ($000) | |
| John Deere Capital Corp. | 2.750% | 3/15/22 | 2,250 | 2,125 |
| John Deere Capital Corp. | 2.800% | 1/27/23 | 2,975 | 2,766 |
| Joy Global Inc. | 6.000% | 11/15/16 | 575 | 642 |
| Kennametal Inc. | 2.650% | 11/1/19 | 1,950 | 1,911 |
| Kennametal Inc. | 3.875% | 2/15/22 | 2,050 | 1,957 |
| L-3 Communications Corp. | 5.200% | 10/15/19 | 10,230 | 11,141 |
| L-3 Communications Corp. | 4.750% | 7/15/20 | 2,950 | 3,057 |
| L-3 Communications Corp. | 4.950% | 2/15/21 | 5,100 | 5,326 |
| Legrand France SA | 8.500% | 2/15/25 | 400 | 515 |
| Lockheed Martin Corp. | 7.650% | 5/1/16 | 3,950 | 4,551 |
| Lockheed Martin Corp. | 2.125% | 9/15/16 | 5,775 | 5,940 |
| Lockheed Martin Corp. | 4.250% | 11/15/19 | 6,245 | 6,715 |
| Lockheed Martin Corp. | 3.350% | 9/15/21 | 1,945 | 1,922 |
| Lockheed Martin Corp. | 6.150% | 9/1/36 | 10,235 | 11,588 |
| Lockheed Martin Corp. | 5.500% | 11/15/39 | 1,945 | 2,046 |
| Lockheed Martin Corp. | 5.720% | 6/1/40 | 4,626 | 4,952 |
| Martin Marietta Materials Inc. | 6.600% | 4/15/18 | 1,850 | 2,085 |
| Mohawk Industries Inc. | 6.125% | 1/15/16 | 3,000 | 3,285 |
| Mohawk Industries Inc. | 3.850% | 2/1/23 | 8,525 | 8,037 |
| Northrop Grumman Corp. | 1.750% | 6/1/18 | 3,525 | 3,454 |
| Northrop Grumman Corp. | 3.500% | 3/15/21 | 1,425 | 1,418 |
| Northrop Grumman Corp. | 3.250% | 8/1/23 | 3,275 | 3,042 |
| Northrop Grumman Corp. | 5.050% | 11/15/40 | 1,875 | 1,823 |
| Northrop Grumman Corp. | 4.750% | 6/1/43 | 3,300 | 3,123 |
| Northrop Grumman Systems Corp. | 7.750% | 2/15/31 | 2,870 | 3,649 |
| Owens Corning | 6.500% | 12/1/16 | 4,170 | 4,624 |
| Owens Corning | 9.000% | 6/15/19 | 253 | 311 |
| Owens Corning | 4.200% | 12/15/22 | 4,875 | 4,664 |
| Owens Corning | 7.000% | 12/1/36 | 3,075 | 3,301 |
| Parker Hannifin Corp. | 5.500% | 5/15/18 | 1,250 | 1,420 |
| Parker Hannifin Corp. | 3.500% | 9/15/22 | 1,625 | 1,597 |
| Parker Hannifin Corp. | 6.250% | 5/15/38 | 550 | 655 |
| Pentair Finance SA | 1.350% | 12/1/15 | 1,500 | 1,508 |
| Pentair Finance SA | 5.000% | 5/15/21 | 4,805 | 5,021 |
| Precision Castparts Corp. | 0.700% | 12/20/15 | 1,975 | 1,979 |
| Precision Castparts Corp. | 1.250% | 1/15/18 | 1,825 | 1,787 |
| Precision Castparts Corp. | 2.500% | 1/15/23 | 4,770 | 4,334 |
| Precision Castparts Corp. | 3.900% | 1/15/43 | 1,625 | 1,412 |
| Raytheon Co. | 6.400% | 12/15/18 | 100 | 119 |
| Raytheon Co. | 4.400% | 2/15/20 | 500 | 535 |
| Raytheon Co. | 3.125% | 10/15/20 | 4,175 | 4,179 |
| Raytheon Co. | 2.500% | 12/15/22 | 7,875 | 7,155 |
| Raytheon Co. | 7.200% | 8/15/27 | 1,225 | 1,498 |
| Raytheon Co. | 4.875% | 10/15/40 | 400 | 397 |
| Raytheon Co. | 4.700% | 12/15/41 | 3,400 | 3,285 |
| Republic Services Inc. | 3.800% | 5/15/18 | 6,970 | 7,381 |
| Republic Services Inc. | 5.500% | 9/15/19 | 4,000 | 4,514 |
| Republic Services Inc. | 5.000% | 3/1/20 | 4,100 | 4,509 |
| Republic Services Inc. | 5.250% | 11/15/21 | 2,650 | 2,890 |
| Republic Services Inc. | 3.550% | 6/1/22 | 2,200 | 2,127 |
| Republic Services Inc. | 4.750% | 5/15/23 | 525 | 546 |
| Republic Services Inc. | 6.086% | 3/15/35 | 825 | 899 |
| Republic Services Inc. | 6.200% | 3/1/40 | 3,430 | 3,942 |
| Republic Services Inc. | 5.700% | 5/15/41 | 3,300 | 3,517 |
| Rockwell Automation Inc. | 5.650% | 12/1/17 | 600 | 675 |
58
| Total Bond Market II Index Fund | ||||
| Face | Market | |||
| Maturity | Amount | Value | ||
| Coupon | Date | ($000) | ($000) | |
| Rockwell Automation Inc. | 6.700% | 1/15/28 | 325 | 394 |
| Rockwell Automation Inc. | 6.250% | 12/1/37 | 1,500 | 1,743 |
| Rockwell Collins Inc. | 5.250% | 7/15/19 | 275 | 312 |
| Rockwell Collins Inc. | 3.100% | 11/15/21 | 1,000 | 967 |
| Roper Industries Inc. | 1.850% | 11/15/17 | 175 | 174 |
| Roper Industries Inc. | 2.050% | 10/1/18 | 8,450 | 8,242 |
| Roper Industries Inc. | 6.250% | 9/1/19 | 3,000 | 3,450 |
| Roper Industries Inc. | 3.125% | 11/15/22 | 400 | 367 |
| Snap-on Inc. | 6.125% | 9/1/21 | 2,000 | 2,262 |
| Sonoco Products Co. | 4.375% | 11/1/21 | 435 | 443 |
| Sonoco Products Co. | 5.750% | 11/1/40 | 2,910 | 3,077 |
| Stanley Black & Decker Inc. | 3.400% | 12/1/21 | 2,425 | 2,405 |
| Stanley Black & Decker Inc. | 2.900% | 11/1/22 | 3,000 | 2,784 |
| Textron Inc. | 5.600% | 12/1/17 | 3,416 | 3,792 |
| Tyco International Finance SA | 8.500% | 1/15/19 | 1,130 | 1,384 |
| Tyco International Finance SA / | ||||
| Tyco International Ltd. | 7.000% | 12/15/19 | 1,375 | 1,612 |
| Tyco International Finance SA / | ||||
| Tyco International Ltd. | 6.875% | 1/15/21 | 4,100 | 4,726 |
| United Technologies Corp. | 4.875% | 5/1/15 | 360 | 381 |
| United Technologies Corp. | 1.800% | 6/1/17 | 6,085 | 6,187 |
| United Technologies Corp. | 5.375% | 12/15/17 | 10,675 | 12,166 |
| United Technologies Corp. | 6.125% | 2/1/19 | 3,190 | 3,768 |
| United Technologies Corp. | 4.500% | 4/15/20 | 10,255 | 11,184 |
| United Technologies Corp. | 3.100% | 6/1/22 | 14,318 | 14,057 |
| United Technologies Corp. | 6.700% | 8/1/28 | 325 | 398 |
| United Technologies Corp. | 7.500% | 9/15/29 | 3,825 | 5,043 |
| United Technologies Corp. | 5.400% | 5/1/35 | 600 | 672 |
| United Technologies Corp. | 6.050% | 6/1/36 | 1,915 | 2,234 |
| United Technologies Corp. | 6.125% | 7/15/38 | 7,450 | 8,871 |
| United Technologies Corp. | 5.700% | 4/15/40 | 3,025 | 3,462 |
| United Technologies Corp. | 4.500% | 6/1/42 | 14,990 | 14,490 |
| Waste Management Inc. | 6.375% | 3/11/15 | 2,650 | 2,821 |
| Waste Management Inc. | 2.600% | 9/1/16 | 145 | 150 |
| Waste Management Inc. | 6.100% | 3/15/18 | 950 | 1,095 |
| Waste Management Inc. | 7.375% | 3/11/19 | 4,670 | 5,637 |
| Waste Management Inc. | 4.750% | 6/30/20 | 5,000 | 5,429 |
| Waste Management Inc. | 4.600% | 3/1/21 | 6,425 | 6,823 |
| Waste Management Inc. | 7.100% | 8/1/26 | 325 | 395 |
| Waste Management Inc. | 7.750% | 5/15/32 | 2,365 | 3,071 |
| Waste Management Inc. | 6.125% | 11/30/39 | 4,175 | 4,757 |
| Communication (2.3%) | ||||
| 21st Century Fox America Inc. | 5.300% | 12/15/14 | 4,945 | 5,166 |
| 21st Century Fox America Inc. | 8.000% | 10/17/16 | 1,450 | 1,707 |
| 21st Century Fox America Inc. | 6.900% | 3/1/19 | 4,340 | 5,220 |
| 21st Century Fox America Inc. | 4.500% | 2/15/21 | 7,050 | 7,536 |
| 21st Century Fox America Inc. | 3.000% | 9/15/22 | 11,850 | 11,128 |
| 6 21st Century Fox America Inc. | 4.000% | 10/1/23 | 1,075 | 1,060 |
| 21st Century Fox America Inc. | 7.700% | 10/30/25 | 200 | 247 |
| 21st Century Fox America Inc. | 6.550% | 3/15/33 | 5,465 | 6,257 |
| 21st Century Fox America Inc. | 6.200% | 12/15/34 | 5,500 | 6,126 |
| 21st Century Fox America Inc. | 6.400% | 12/15/35 | 5,550 | 6,302 |
| 21st Century Fox America Inc. | 8.150% | 10/17/36 | 625 | 793 |
| 21st Century Fox America Inc. | 6.150% | 3/1/37 | 3,000 | 3,293 |
59
| Total Bond Market II Index Fund | ||||
| Face | Market | |||
| Maturity | Amount | Value | ||
| Coupon | Date | ($000) | ($000) | |
| 21st Century Fox America Inc. | 6.650% | 11/15/37 | 3,000 | 3,480 |
| 21st Century Fox America Inc. | 7.850% | 3/1/39 | 250 | 318 |
| 21st Century Fox America Inc. | 6.900% | 8/15/39 | 2,275 | 2,722 |
| 21st Century Fox America Inc. | 6.150% | 2/15/41 | 3,825 | 4,264 |
| 6 21st Century Fox America Inc. | 5.400% | 10/1/43 | 1,200 | 1,230 |
| 21st Century Fox America Inc. | 7.750% | 12/1/45 | 425 | 533 |
| Alltel Corp. | 7.875% | 7/1/32 | 300 | 392 |
| America Movil SAB de CV | 5.750% | 1/15/15 | 2,989 | 3,130 |
| America Movil SAB de CV | 2.375% | 9/8/16 | 8,500 | 8,708 |
| America Movil SAB de CV | 5.625% | 11/15/17 | 1,150 | 1,295 |
| America Movil SAB de CV | 5.000% | 10/16/19 | 5,700 | 6,186 |
| America Movil SAB de CV | 5.000% | 3/30/20 | 9,440 | 10,307 |
| America Movil SAB de CV | 3.125% | 7/16/22 | 6,900 | 6,329 |
| America Movil SAB de CV | 6.375% | 3/1/35 | 2,275 | 2,465 |
| America Movil SAB de CV | 6.125% | 11/15/37 | 1,575 | 1,664 |
| America Movil SAB de CV | 6.125% | 3/30/40 | 7,540 | 8,124 |
| America Movil SAB de CV | 4.375% | 7/16/42 | 5,250 | 4,399 |
| American Tower Corp. | 7.000% | 10/15/17 | 100 | 116 |
| American Tower Corp. | 4.500% | 1/15/18 | 16,300 | 17,533 |
| American Tower Corp. | 5.050% | 9/1/20 | 295 | 312 |
| American Tower Corp. | 5.900% | 11/1/21 | 5,615 | 6,120 |
| American Tower Corp. | 3.500% | 1/31/23 | 18,300 | 16,615 |
| American Tower Corp. | 5.000% | 2/15/24 | 1,210 | 1,222 |
| AT&T Corp. | 8.000% | 11/15/31 | 4,774 | 6,354 |
| AT&T Inc. | 2.500% | 8/15/15 | 9,265 | 9,511 |
| AT&T Inc. | 0.800% | 12/1/15 | 2,600 | 2,596 |
| AT&T Inc. | 0.900% | 2/12/16 | 1,275 | 1,272 |
| AT&T Inc. | 2.950% | 5/15/16 | 5,740 | 5,998 |
| AT&T Inc. | 5.625% | 6/15/16 | 6,225 | 6,898 |
| AT&T Inc. | 2.400% | 8/15/16 | 2,355 | 2,428 |
| AT&T Inc. | 1.600% | 2/15/17 | 13,965 | 13,972 |
| AT&T Inc. | 1.700% | 6/1/17 | 11,086 | 11,143 |
| AT&T Inc. | 1.400% | 12/1/17 | 13,010 | 12,818 |
| AT&T Inc. | 5.500% | 2/1/18 | 10,290 | 11,633 |
| AT&T Inc. | 5.600% | 5/15/18 | 3,700 | 4,210 |
| AT&T Inc. | 2.375% | 11/27/18 | 10,000 | 10,019 |
| AT&T Inc. | 5.800% | 2/15/19 | 3,925 | 4,536 |
| AT&T Inc. | 4.450% | 5/15/21 | 590 | 621 |
| AT&T Inc. | 3.875% | 8/15/21 | 11,485 | 11,617 |
| AT&T Inc. | 3.000% | 2/15/22 | 7,975 | 7,496 |
| AT&T Inc. | 2.625% | 12/1/22 | 17,850 | 16,064 |
| AT&T Inc. | 6.450% | 6/15/34 | 4,195 | 4,695 |
| AT&T Inc. | 6.500% | 9/1/37 | 5,931 | 6,732 |
| AT&T Inc. | 6.300% | 1/15/38 | 6,840 | 7,561 |
| AT&T Inc. | 6.400% | 5/15/38 | 3,100 | 3,461 |
| AT&T Inc. | 6.550% | 2/15/39 | 4,165 | 4,723 |
| AT&T Inc. | 5.350% | 9/1/40 | 23,753 | 23,571 |
| AT&T Inc. | 5.550% | 8/15/41 | 5,550 | 5,594 |
| AT&T Inc. | 4.300% | 12/15/42 | 6,586 | 5,605 |
| AT&T Inc. | 4.350% | 6/15/45 | 10,158 | 8,547 |
| AT&T Mobility LLC | 7.125% | 12/15/31 | 275 | 334 |
| Bellsouth Capital Funding Corp. | 7.875% | 2/15/30 | 2,607 | 3,052 |
| BellSouth Corp. | 6.875% | 10/15/31 | 3,486 | 3,855 |
| BellSouth Corp. | 6.550% | 6/15/34 | 628 | 670 |
| BellSouth Corp. | 6.000% | 11/15/34 | 419 | 422 |
60
| Total Bond Market II Index Fund | ||||
| Face | Market | |||
| Maturity | Amount | Value | ||
| Coupon | Date | ($000) | ($000) | |
| BellSouth Telecommunications LLC | 6.375% | 6/1/28 | 2,875 | 3,099 |
| British Telecommunications plc | 5.950% | 1/15/18 | 13,310 | 15,202 |
| British Telecommunications plc | 9.625% | 12/15/30 | 8,075 | 12,038 |
| CBS Corp. | 1.950% | 7/1/17 | 175 | 176 |
| CBS Corp. | 4.625% | 5/15/18 | 100 | 109 |
| CBS Corp. | 8.875% | 5/15/19 | 1,100 | 1,404 |
| CBS Corp. | 5.750% | 4/15/20 | 12,390 | 13,918 |
| CBS Corp. | 4.300% | 2/15/21 | 4,150 | 4,234 |
| CBS Corp. | 7.875% | 7/30/30 | 450 | 561 |
| CBS Corp. | 5.500% | 5/15/33 | 200 | 198 |
| CBS Corp. | 4.850% | 7/1/42 | 5,225 | 4,716 |
| CC Holdings GS V LLC / Crown Castle GS III Corp. | 3.849% | 4/15/23 | 5,050 | 4,687 |
| Cellco Partnership / Verizon Wireless Capital LLC | 8.500% | 11/15/18 | 21,165 | 26,914 |
| Comcast Cable Communications Holdings Inc. | 9.455% | 11/15/22 | 2,000 | 2,763 |
| Comcast Cable Communications LLC | 8.875% | 5/1/17 | 975 | 1,196 |
| Comcast Corp. | 6.500% | 1/15/15 | 1,350 | 1,432 |
| Comcast Corp. | 5.850% | 11/15/15 | 4,560 | 4,986 |
| Comcast Corp. | 5.900% | 3/15/16 | 17,110 | 18,929 |
| Comcast Corp. | 6.500% | 1/15/17 | 150 | 172 |
| Comcast Corp. | 6.300% | 11/15/17 | 3,775 | 4,405 |
| Comcast Corp. | 5.875% | 2/15/18 | 6,750 | 7,770 |
| Comcast Corp. | 5.700% | 5/15/18 | 10,675 | 12,290 |
| Comcast Corp. | 5.700% | 7/1/19 | 2,645 | 3,060 |
| Comcast Corp. | 5.150% | 3/1/20 | 5,055 | 5,643 |
| Comcast Corp. | 3.125% | 7/15/22 | 1,925 | 1,839 |
| Comcast Corp. | 2.850% | 1/15/23 | 8,666 | 8,023 |
| Comcast Corp. | 4.250% | 1/15/33 | 11,700 | 10,774 |
| Comcast Corp. | 7.050% | 3/15/33 | 2,000 | 2,439 |
| Comcast Corp. | 5.650% | 6/15/35 | 2,900 | 3,078 |
| Comcast Corp. | 6.500% | 11/15/35 | 13,475 | 15,660 |
| Comcast Corp. | 6.450% | 3/15/37 | 1,825 | 2,105 |
| Comcast Corp. | 6.950% | 8/15/37 | 8,950 | 11,003 |
| Comcast Corp. | 6.400% | 5/15/38 | 1,975 | 2,257 |
| Comcast Corp. | 6.400% | 3/1/40 | 4,300 | 4,969 |
| Comcast Corp. | 4.650% | 7/15/42 | 15,550 | 14,385 |
| Comcast Corp. | 4.500% | 1/15/43 | 1,425 | 1,285 |
| COX Communications Inc. | 5.500% | 10/1/15 | 100 | 107 |
| Deutsche Telekom International Finance BV | 5.750% | 3/23/16 | 2,500 | 2,741 |
| Deutsche Telekom International Finance BV | 6.750% | 8/20/18 | 9,875 | 11,632 |
| Deutsche Telekom International Finance BV | 6.000% | 7/8/19 | 6,525 | 7,560 |
| Deutsche Telekom International Finance BV | 8.750% | 6/15/30 | 15,544 | 22,082 |
| DIRECTV Holdings LLC / | ||||
| DIRECTV Financing Co. Inc. | 3.550% | 3/15/15 | 5,000 | 5,166 |
| DIRECTV Holdings LLC / | ||||
| DIRECTV Financing Co. Inc. | 3.125% | 2/15/16 | 5,700 | 5,931 |
| DIRECTV Holdings LLC / | ||||
| DIRECTV Financing Co. Inc. | 3.500% | 3/1/16 | 3,000 | 3,148 |
| DIRECTV Holdings LLC / | ||||
| DIRECTV Financing Co. Inc. | 1.750% | 1/15/18 | 275 | 270 |
| DIRECTV Holdings LLC / | ||||
| DIRECTV Financing Co. Inc. | 5.875% | 10/1/19 | 6,300 | 7,165 |
| DIRECTV Holdings LLC / | ||||
| DIRECTV Financing Co. Inc. | 5.200% | 3/15/20 | 2,425 | 2,644 |
| DIRECTV Holdings LLC / | ||||
| DIRECTV Financing Co. Inc. | 4.600% | 2/15/21 | 1,950 | 2,010 |
61
| Total Bond Market II Index Fund | ||||
| Face | Market | |||
| Maturity | Amount | Value | ||
| Coupon | Date | ($000) | ($000) | |
| DIRECTV Holdings LLC / | ||||
| DIRECTV Financing Co. Inc. | 5.000% | 3/1/21 | 19,875 | 20,910 |
| DIRECTV Holdings LLC / | ||||
| DIRECTV Financing Co. Inc. | 3.800% | 3/15/22 | 10,000 | 9,544 |
| DIRECTV Holdings LLC / | ||||
| DIRECTV Financing Co. Inc. | 6.350% | 3/15/40 | 3,500 | 3,630 |
| DIRECTV Holdings LLC / | ||||
| DIRECTV Financing Co. Inc. | 6.000% | 8/15/40 | 325 | 321 |
| DIRECTV Holdings LLC / | ||||
| DIRECTV Financing Co. Inc. | 6.375% | 3/1/41 | 2,600 | 2,668 |
| DIRECTV Holdings LLC / | ||||
| DIRECTV Financing Co. Inc. | 5.150% | 3/15/42 | 8,600 | 7,692 |
| Discovery Communications LLC | 5.050% | 6/1/20 | 8,600 | 9,374 |
| Discovery Communications LLC | 4.375% | 6/15/21 | 870 | 898 |
| Discovery Communications LLC | 3.300% | 5/15/22 | 4,125 | 3,907 |
| Discovery Communications LLC | 3.250% | 4/1/23 | 3,475 | 3,227 |
| Discovery Communications LLC | 6.350% | 6/1/40 | 3,035 | 3,349 |
| Discovery Communications LLC | 4.950% | 5/15/42 | 1,750 | 1,623 |
| Embarq Corp. | 7.082% | 6/1/16 | 4,925 | 5,516 |
| Embarq Corp. | 7.995% | 6/1/36 | 9,974 | 10,036 |
| Graham Holdings Co. | 7.250% | 2/1/19 | 875 | 1,038 |
| Grupo Televisa SAB | 6.000% | 5/15/18 | 875 | 974 |
| Grupo Televisa SAB | 6.625% | 3/18/25 | 1,475 | 1,636 |
| Grupo Televisa SAB | 8.500% | 3/11/32 | 275 | 343 |
| Grupo Televisa SAB | 6.625% | 1/15/40 | 3,795 | 4,022 |
| GTE Corp. | 8.750% | 11/1/21 | 1,700 | 2,151 |
| GTE Corp. | 6.940% | 4/15/28 | 1,750 | 1,980 |
| Interpublic Group of Cos. Inc. | 3.750% | 2/15/23 | 8,350 | 7,815 |
| Koninklijke KPN NV | 8.375% | 10/1/30 | 3,900 | 4,930 |
| McGraw Hill Financial Inc. | 5.900% | 11/15/17 | 1,750 | 1,908 |
| McGraw Hill Financial Inc. | 6.550% | 11/15/37 | 1,600 | 1,522 |
| Moody’s Corp. | 5.500% | 9/1/20 | 438 | 471 |
| Moody’s Corp. | 4.500% | 9/1/22 | 9,842 | 9,682 |
| NBCUniversal Media LLC | 3.650% | 4/30/15 | 3,450 | 3,588 |
| NBCUniversal Media LLC | 2.875% | 4/1/16 | 5,830 | 6,067 |
| NBCUniversal Media LLC | 5.150% | 4/30/20 | 8,550 | 9,543 |
| NBCUniversal Media LLC | 4.375% | 4/1/21 | 3,120 | 3,297 |
| NBCUniversal Media LLC | 2.875% | 1/15/23 | 9,150 | 8,482 |
| NBCUniversal Media LLC | 6.400% | 4/30/40 | 8,200 | 9,415 |
| NBCUniversal Media LLC | 5.950% | 4/1/41 | 1,700 | 1,862 |
| NBCUniversal Media LLC | 4.450% | 1/15/43 | 5,525 | 4,943 |
| New Cingular Wireless Services Inc. | 8.750% | 3/1/31 | 1,370 | 1,924 |
| Nippon Telegraph & Telephone Corp. | 1.400% | 7/18/17 | 825 | 814 |
| Omnicom Group Inc. | 5.900% | 4/15/16 | 3,675 | 4,064 |
| Omnicom Group Inc. | 4.450% | 8/15/20 | 7,550 | 7,979 |
| Omnicom Group Inc. | 3.625% | 5/1/22 | 17,890 | 17,332 |
| Orange SA | 2.125% | 9/16/15 | 5,000 | 5,080 |
| Orange SA | 2.750% | 9/14/16 | 4,180 | 4,339 |
| Orange SA | 5.375% | 7/8/19 | 6,825 | 7,581 |
| Orange SA | 4.125% | 9/14/21 | 12,095 | 12,194 |
| Orange SA | 8.750% | 3/1/31 | 4,840 | 6,622 |
| Pacific Bell Telephone Co. | 7.125% | 3/15/26 | 425 | 510 |
| Qwest Corp. | 6.500% | 6/1/17 | 1,125 | 1,262 |
| Qwest Corp. | 6.750% | 12/1/21 | 5,590 | 6,085 |
| Qwest Corp. | 7.250% | 9/15/25 | 1,400 | 1,493 |
62
| Total Bond Market II Index Fund | ||||
| Face | Market | |||
| Maturity | Amount | Value | ||
| Coupon | Date | ($000) | ($000) | |
| Qwest Corp. | 6.875% | 9/15/33 | 3,175 | 3,036 |
| Qwest Corp. | 7.125% | 11/15/43 | 4,500 | 4,331 |
| Reed Elsevier Capital Inc. | 3.125% | 10/15/22 | 6,234 | 5,712 |
| Rogers Communications Inc. | 6.800% | 8/15/18 | 7,350 | 8,773 |
| Rogers Communications Inc. | 3.000% | 3/15/23 | 1,575 | 1,446 |
| Rogers Communications Inc. | 4.100% | 10/1/23 | 4,250 | 4,198 |
| Rogers Communications Inc. | 7.500% | 8/15/38 | 100 | 124 |
| Rogers Communications Inc. | 4.500% | 3/15/43 | 125 | 106 |
| TCI Communications Inc. | 8.750% | 8/1/15 | 4,175 | 4,687 |
| TCI Communications Inc. | 7.875% | 2/15/26 | 1,375 | 1,779 |
| TCI Communications Inc. | 7.125% | 2/15/28 | 450 | 551 |
| Telefonica Emisiones SAU | 4.949% | 1/15/15 | 3,775 | 3,924 |
| Telefonica Emisiones SAU | 3.992% | 2/16/16 | 6,190 | 6,491 |
| Telefonica Emisiones SAU | 6.421% | 6/20/16 | 4,975 | 5,552 |
| Telefonica Emisiones SAU | 3.192% | 4/27/18 | 9,700 | 9,886 |
| Telefonica Emisiones SAU | 5.877% | 7/15/19 | 11,625 | 13,023 |
| Telefonica Emisiones SAU | 5.134% | 4/27/20 | 5,545 | 5,883 |
| Telefonica Emisiones SAU | 5.462% | 2/16/21 | 5,540 | 5,851 |
| Telefonica Emisiones SAU | 4.570% | 4/27/23 | 4,000 | 3,952 |
| Telefonica Emisiones SAU | 7.045% | 6/20/36 | 8,260 | 9,192 |
| Telefonica Europe BV | 8.250% | 9/15/30 | 1,500 | 1,773 |
| Thomson Reuters Corp. | 1.300% | 2/23/17 | 1,750 | 1,741 |
| Thomson Reuters Corp. | 6.500% | 7/15/18 | 4,250 | 4,924 |
| Thomson Reuters Corp. | 4.700% | 10/15/19 | 1,625 | 1,764 |
| Thomson Reuters Corp. | 3.950% | 9/30/21 | 3,500 | 3,475 |
| Thomson Reuters Corp. | 4.300% | 11/23/23 | 2,675 | 2,675 |
| Thomson Reuters Corp. | 5.500% | 8/15/35 | 2,975 | 2,878 |
| Thomson Reuters Corp. | 5.850% | 4/15/40 | 10,610 | 10,790 |
| Thomson Reuters Corp. | 5.650% | 11/23/43 | 2,500 | 2,491 |
| Time Warner Cable Inc. | 7.500% | 4/1/14 | 8,075 | 8,206 |
| Time Warner Cable Inc. | 3.500% | 2/1/15 | 925 | 949 |
| Time Warner Cable Inc. | 5.850% | 5/1/17 | 5,600 | 6,131 |
| Time Warner Cable Inc. | 6.750% | 7/1/18 | 9,225 | 10,426 |
| Time Warner Cable Inc. | 8.750% | 2/14/19 | 3,100 | 3,707 |
| Time Warner Cable Inc. | 8.250% | 4/1/19 | 12,550 | 14,798 |
| Time Warner Cable Inc. | 5.000% | 2/1/20 | 4,295 | 4,360 |
| Time Warner Cable Inc. | 4.125% | 2/15/21 | 3,806 | 3,559 |
| Time Warner Cable Inc. | 4.000% | 9/1/21 | 3,050 | 2,803 |
| Time Warner Cable Inc. | 6.550% | 5/1/37 | 3,000 | 2,754 |
| Time Warner Cable Inc. | 6.750% | 6/15/39 | 4,572 | 4,276 |
| Time Warner Cable Inc. | 5.875% | 11/15/40 | 12,475 | 10,686 |
| Time Warner Cable Inc. | 5.500% | 9/1/41 | 1,950 | 1,614 |
| Time Warner Cable Inc. | 4.500% | 9/15/42 | 8,075 | 5,991 |
| Time Warner Entertainment Co. LP | 8.375% | 3/15/23 | 1,300 | 1,488 |
| Time Warner Entertainment Co. LP | 8.375% | 7/15/33 | 3,550 | 3,830 |
| United States Cellular Corp. | 6.700% | 12/15/33 | 9,950 | 9,383 |
| Verizon Communications Inc. | 4.900% | 9/15/15 | 575 | 614 |
| Verizon Communications Inc. | 0.700% | 11/2/15 | 250 | 250 |
| Verizon Communications Inc. | 5.550% | 2/15/16 | 8,350 | 9,134 |
| Verizon Communications Inc. | 3.000% | 4/1/16 | 7,870 | 8,209 |
| Verizon Communications Inc. | 2.500% | 9/15/16 | 12,150 | 12,582 |
| Verizon Communications Inc. | 2.000% | 11/1/16 | 11,546 | 11,806 |
| Verizon Communications Inc. | 5.500% | 4/1/17 | 4,300 | 4,845 |
| Verizon Communications Inc. | 1.100% | 11/1/17 | 1,350 | 1,321 |
| Verizon Communications Inc. | 5.500% | 2/15/18 | 10,725 | 12,124 |
63
| Total Bond Market II Index Fund | ||||
| Face | Market | |||
| Maturity | Amount | Value | ||
| Coupon | Date | ($000) | ($000) | |
| Verizon Communications Inc. | 6.100% | 4/15/18 | 6,470 | 7,496 |
| Verizon Communications Inc. | 3.650% | 9/14/18 | 28,170 | 29,821 |
| Verizon Communications Inc. | 8.750% | 11/1/18 | 6,535 | 8,360 |
| Verizon Communications Inc. | 6.350% | 4/1/19 | 7,925 | 9,331 |
| Verizon Communications Inc. | 4.500% | 9/15/20 | 21,500 | 22,997 |
| Verizon Communications Inc. | 4.600% | 4/1/21 | 6,460 | 6,910 |
| Verizon Communications Inc. | 3.500% | 11/1/21 | 7,185 | 7,122 |
| Verizon Communications Inc. | 2.450% | 11/1/22 | 11,450 | 10,118 |
| Verizon Communications Inc. | 5.150% | 9/15/23 | 61,875 | 66,257 |
| Verizon Communications Inc. | 7.750% | 12/1/30 | 5,190 | 6,588 |
| Verizon Communications Inc. | 6.400% | 9/15/33 | 26,100 | 30,091 |
| Verizon Communications Inc. | 5.850% | 9/15/35 | 7,650 | 8,082 |
| Verizon Communications Inc. | 6.250% | 4/1/37 | 3,825 | 4,228 |
| Verizon Communications Inc. | 6.400% | 2/15/38 | 5,000 | 5,623 |
| Verizon Communications Inc. | 6.900% | 4/15/38 | 5,125 | 6,084 |
| Verizon Communications Inc. | 7.350% | 4/1/39 | 8,800 | 10,861 |
| Verizon Communications Inc. | 6.000% | 4/1/41 | 16,355 | 17,588 |
| Verizon Communications Inc. | 4.750% | 11/1/41 | 8,175 | 7,486 |
| Verizon Communications Inc. | 3.850% | 11/1/42 | 5,200 | 4,228 |
| Verizon Communications Inc. | 6.550% | 9/15/43 | 65,275 | 76,440 |
| Verizon Maryland LLC | 5.125% | 6/15/33 | 2,675 | 2,601 |
| Verizon New England Inc. | 7.875% | 11/15/29 | 1,225 | 1,428 |
| Verizon New York Inc. | 7.375% | 4/1/32 | 7,900 | 8,919 |
| Vodafone Group plc | 5.375% | 1/30/15 | 6,775 | 7,124 |
| Vodafone Group plc | 0.900% | 2/19/16 | 1,475 | 1,471 |
| Vodafone Group plc | 5.750% | 3/15/16 | 1,825 | 2,002 |
| Vodafone Group plc | 2.875% | 3/16/16 | 3,000 | 3,104 |
| Vodafone Group plc | 5.625% | 2/27/17 | 16,490 | 18,568 |
| Vodafone Group plc | 1.625% | 3/20/17 | 1,300 | 1,298 |
| Vodafone Group plc | 1.250% | 9/26/17 | 13,725 | 13,366 |
| Vodafone Group plc | 1.500% | 2/19/18 | 5,400 | 5,270 |
| Vodafone Group plc | 4.625% | 7/15/18 | 2,200 | 2,432 |
| Vodafone Group plc | 5.450% | 6/10/19 | 5,000 | 5,686 |
| Vodafone Group plc | 2.500% | 9/26/22 | 1,500 | 1,329 |
| Vodafone Group plc | 2.950% | 2/19/23 | 7,625 | 6,952 |
| Vodafone Group plc | 6.250% | 11/30/32 | 2,675 | 2,931 |
| Vodafone Group plc | 6.150% | 2/27/37 | 7,420 | 8,012 |
| Vodafone Group plc | 4.375% | 2/19/43 | 6,175 | 5,403 |
| WPP Finance 2010 | 4.750% | 11/21/21 | 10,301 | 10,691 |
| WPP Finance 2010 | 3.625% | 9/7/22 | 9,360 | 9,018 |
| WPP Finance 2010 | 5.125% | 9/7/42 | 700 | 634 |
| WPP Finance 2010 | 5.625% | 11/15/43 | 5,200 | 5,126 |
| Consumer Cyclical (1.7%) | ||||
| Advance Auto Parts Inc. | 5.750% | 5/1/20 | 1,275 | 1,385 |
| Advance Auto Parts Inc. | 4.500% | 12/1/23 | 1,850 | 1,840 |
| Amazon.com Inc. | 0.650% | 11/27/15 | 3,075 | 3,075 |
| Amazon.com Inc. | 1.200% | 11/29/17 | 6,650 | 6,528 |
| Amazon.com Inc. | 2.500% | 11/29/22 | 4,300 | 3,878 |
| American Honda Finance Corp. | 1.125% | 10/7/16 | 5,000 | 5,012 |
| American Honda Finance Corp. | 2.125% | 10/10/18 | 3,650 | 3,624 |
| AutoZone Inc. | 5.750% | 1/15/15 | 4,050 | 4,257 |
| AutoZone Inc. | 7.125% | 8/1/18 | 3,200 | 3,807 |
| BorgWarner Inc. | 4.625% | 9/15/20 | 400 | 421 |
| Brinker International Inc. | 2.600% | 5/15/18 | 325 | 322 |
64
| Total Bond Market II Index Fund | ||||
| Face | Market | |||
| Maturity | Amount | Value | ||
| Coupon | Date | ($000) | ($000) | |
| Brinker International Inc. | 3.875% | 5/15/23 | 13,225 | 11,966 |
| Carnival Corp. | 1.200% | 2/5/16 | 1,600 | 1,596 |
| Carnival Corp. | 1.875% | 12/15/17 | 1,250 | 1,240 |
| Carnival Corp. | 3.950% | 10/15/20 | 1,175 | 1,175 |
| Costco Wholesale Corp. | 0.650% | 12/7/15 | 5,000 | 5,018 |
| Costco Wholesale Corp. | 5.500% | 3/15/17 | 5,400 | 6,073 |
| Costco Wholesale Corp. | 1.125% | 12/15/17 | 8,175 | 8,028 |
| Costco Wholesale Corp. | 1.700% | 12/15/19 | 6,700 | 6,447 |
| Cummins Inc. | 3.650% | 10/1/23 | 2,750 | 2,710 |
| Cummins Inc. | 4.875% | 10/1/43 | 3,175 | 3,165 |
| CVS Caremark Corp. | 3.250% | 5/18/15 | 2,245 | 2,323 |
| CVS Caremark Corp. | 6.125% | 8/15/16 | 1,425 | 1,606 |
| CVS Caremark Corp. | 1.200% | 12/5/16 | 1,800 | 1,805 |
| CVS Caremark Corp. | 5.750% | 6/1/17 | 12,488 | 14,183 |
| CVS Caremark Corp. | 2.250% | 12/5/18 | 3,000 | 3,005 |
| CVS Caremark Corp. | 4.750% | 5/18/20 | 1,125 | 1,220 |
| CVS Caremark Corp. | 4.125% | 5/15/21 | 250 | 260 |
| CVS Caremark Corp. | 2.750% | 12/1/22 | 5,025 | 4,626 |
| CVS Caremark Corp. | 4.000% | 12/5/23 | 5,570 | 5,552 |
| CVS Caremark Corp. | 6.250% | 6/1/27 | 4,175 | 4,863 |
| CVS Caremark Corp. | 6.125% | 9/15/39 | 3,975 | 4,509 |
| CVS Caremark Corp. | 5.750% | 5/15/41 | 3,595 | 3,885 |
| CVS Caremark Corp. | 5.300% | 12/5/43 | 2,025 | 2,085 |
| 6 Daimler Finance North America LLC | 2.625% | 9/15/16 | 2,300 | 2,370 |
| Daimler Finance North America LLC | 8.500% | 1/18/31 | 4,070 | 5,885 |
| Darden Restaurants Inc. | 6.200% | 10/15/17 | 2,025 | 2,253 |
| Darden Restaurants Inc. | 4.500% | 10/15/21 | 230 | 223 |
| Darden Restaurants Inc. | 3.350% | 11/1/22 | 1,850 | 1,584 |
| Dollar General Corp. | 3.250% | 4/15/23 | 10,420 | 9,560 |
| eBay Inc. | 1.625% | 10/15/15 | 1,150 | 1,172 |
| eBay Inc. | 1.350% | 7/15/17 | 5,375 | 5,368 |
| eBay Inc. | 3.250% | 10/15/20 | 1,175 | 1,201 |
| eBay Inc. | 2.600% | 7/15/22 | 800 | 736 |
| eBay Inc. | 4.000% | 7/15/42 | 5,075 | 4,292 |
| Expedia Inc. | 7.456% | 8/15/18 | 250 | 291 |
| Expedia Inc. | 5.950% | 8/15/20 | 10,800 | 11,680 |
| Family Dollar Stores Inc. | 5.000% | 2/1/21 | 1,275 | 1,308 |
| Ford Holdings LLC | 9.300% | 3/1/30 | 175 | 237 |
| Ford Motor Co. | 6.500% | 8/1/18 | 1,025 | 1,185 |
| Ford Motor Co. | 6.625% | 10/1/28 | 3,075 | 3,466 |
| Ford Motor Co. | 6.375% | 2/1/29 | 2,375 | 2,605 |
| Ford Motor Co. | 7.450% | 7/16/31 | 9,475 | 11,592 |
| Ford Motor Co. | 4.750% | 1/15/43 | 10,125 | 9,092 |
| Ford Motor Co. | 7.400% | 11/1/46 | 2,650 | 3,186 |
| Ford Motor Credit Co. LLC | 3.875% | 1/15/15 | 10,350 | 10,679 |
| Ford Motor Credit Co. LLC | 7.000% | 4/15/15 | 10,725 | 11,536 |
| Ford Motor Credit Co. LLC | 2.750% | 5/15/15 | 6,475 | 6,642 |
| Ford Motor Credit Co. LLC | 12.000% | 5/15/15 | 3,200 | 3,670 |
| Ford Motor Credit Co. LLC | 5.625% | 9/15/15 | 4,400 | 4,728 |
| Ford Motor Credit Co. LLC | 4.207% | 4/15/16 | 3,100 | 3,304 |
| Ford Motor Credit Co. LLC | 3.984% | 6/15/16 | 1,875 | 1,991 |
| Ford Motor Credit Co. LLC | 8.000% | 12/15/16 | 14,575 | 17,149 |
| Ford Motor Credit Co. LLC | 4.250% | 2/3/17 | 2,750 | 2,960 |
| Ford Motor Credit Co. LLC | 3.000% | 6/12/17 | 8,500 | 8,813 |
| Ford Motor Credit Co. LLC | 6.625% | 8/15/17 | 9,725 | 11,237 |
65
| Total Bond Market II Index Fund | ||||
| Face | Market | |||
| Maturity | Amount | Value | ||
| Coupon | Date | ($000) | ($000) | |
| Ford Motor Credit Co. LLC | 5.000% | 5/15/18 | 11,375 | 12,633 |
| Ford Motor Credit Co. LLC | 8.125% | 1/15/20 | 14,565 | 18,277 |
| Ford Motor Credit Co. LLC | 5.750% | 2/1/21 | 10,075 | 11,243 |
| Ford Motor Credit Co. LLC | 5.875% | 8/2/21 | 9,350 | 10,590 |
| Ford Motor Credit Co. LLC | 4.250% | 9/20/22 | 4,925 | 4,925 |
| Ford Motor Credit Co. LLC | 4.375% | 8/6/23 | 8,325 | 8,341 |
| Gap Inc. | 5.950% | 4/12/21 | 14,175 | 15,574 |
| Historic TW Inc. | 9.150% | 2/1/23 | 3,425 | 4,528 |
| Historic TW Inc. | 6.625% | 5/15/29 | 4,425 | 5,064 |
| Home Depot Inc. | 5.400% | 3/1/16 | 7,970 | 8,766 |
| Home Depot Inc. | 2.250% | 9/10/18 | 11,800 | 11,993 |
| Home Depot Inc. | 4.400% | 4/1/21 | 5,230 | 5,622 |
| Home Depot Inc. | 2.700% | 4/1/23 | 7,000 | 6,446 |
| Home Depot Inc. | 3.750% | 2/15/24 | 8,225 | 8,163 |
| Home Depot Inc. | 5.875% | 12/16/36 | 12,772 | 14,680 |
| Home Depot Inc. | 5.400% | 9/15/40 | 1,890 | 2,020 |
| Home Depot Inc. | 5.950% | 4/1/41 | 5,575 | 6,418 |
| Home Depot Inc. | 4.875% | 2/15/44 | 5,000 | 5,064 |
| Host Hotels & Resorts LP | 5.875% | 6/15/19 | 5,926 | 6,415 |
| Host Hotels & Resorts LP | 6.000% | 10/1/21 | 3,000 | 3,278 |
| Host Hotels & Resorts LP | 5.250% | 3/15/22 | 3,794 | 3,955 |
| Host Hotels & Resorts LP | 3.750% | 10/15/23 | 1,125 | 1,050 |
| Hyatt Hotels Corp. | 3.375% | 7/15/23 | 4,450 | 4,056 |
| International Game Technology | 7.500% | 6/15/19 | 2,765 | 3,211 |
| International Game Technology | 5.500% | 6/15/20 | 2,105 | 2,241 |
| Johnson Controls Inc. | 5.500% | 1/15/16 | 4,000 | 4,346 |
| Johnson Controls Inc. | 2.600% | 12/1/16 | 1,475 | 1,529 |
| Johnson Controls Inc. | 5.000% | 3/30/20 | 2,300 | 2,517 |
| Johnson Controls Inc. | 4.250% | 3/1/21 | 5,405 | 5,621 |
| Johnson Controls Inc. | 3.750% | 12/1/21 | 1,425 | 1,426 |
| Johnson Controls Inc. | 6.000% | 1/15/36 | 350 | 373 |
| Johnson Controls Inc. | 5.700% | 3/1/41 | 795 | 826 |
| Johnson Controls Inc. | 5.250% | 12/1/41 | 1,475 | 1,430 |
| Kohl’s Corp. | 6.250% | 12/15/17 | 2,625 | 3,015 |
| Kohl’s Corp. | 4.000% | 11/1/21 | 2,955 | 2,929 |
| Kohl’s Corp. | 6.000% | 1/15/33 | 300 | 302 |
| Kohl’s Corp. | 6.875% | 12/15/37 | 700 | 777 |
| Lowe’s Cos. Inc. | 5.400% | 10/15/16 | 1,925 | 2,148 |
| Lowe’s Cos. Inc. | 6.100% | 9/15/17 | 875 | 1,000 |
| Lowe’s Cos. Inc. | 4.625% | 4/15/20 | 3,355 | 3,661 |
| Lowe’s Cos. Inc. | 3.750% | 4/15/21 | 4,045 | 4,154 |
| Lowe’s Cos. Inc. | 3.800% | 11/15/21 | 3,775 | 3,891 |
| Lowe’s Cos. Inc. | 3.120% | 4/15/22 | 2,125 | 2,051 |
| Lowe’s Cos. Inc. | 3.875% | 9/15/23 | 4,275 | 4,307 |
| Lowe’s Cos. Inc. | 6.875% | 2/15/28 | 350 | 429 |
| Lowe’s Cos. Inc. | 6.500% | 3/15/29 | 1,050 | 1,238 |
| Lowe’s Cos. Inc. | 5.800% | 10/15/36 | 7,175 | 7,883 |
| Lowe’s Cos. Inc. | 5.800% | 4/15/40 | 120 | 133 |
| Lowe’s Cos. Inc. | 5.125% | 11/15/41 | 1,200 | 1,229 |
| Lowe’s Cos. Inc. | 4.650% | 4/15/42 | 6,800 | 6,567 |
| Lowe’s Cos. Inc. | 5.000% | 9/15/43 | 5,650 | 5,681 |
| Macy’s Retail Holdings Inc. | 7.875% | 7/15/15 | 5,515 | 6,081 |
| Macy’s Retail Holdings Inc. | 5.900% | 12/1/16 | 2,626 | 2,948 |
| Macy’s Retail Holdings Inc. | 3.875% | 1/15/22 | 9,100 | 9,072 |
| Macy’s Retail Holdings Inc. | 2.875% | 2/15/23 | 10,608 | 9,606 |
66
| Total Bond Market II Index Fund | ||||
| Face | Market | |||
| Maturity | Amount | Value | ||
| Coupon | Date | ($000) | ($000) | |
| Macy’s Retail Holdings Inc. | 6.900% | 4/1/29 | 1,500 | 1,684 |
| Macy’s Retail Holdings Inc. | 6.375% | 3/15/37 | 2,300 | 2,554 |
| Macy’s Retail Holdings Inc. | 5.125% | 1/15/42 | 5,325 | 5,075 |
| Macy’s Retail Holdings Inc. | 4.300% | 2/15/43 | 2,725 | 2,290 |
| Marriott International Inc. | 3.000% | 3/1/19 | 1,750 | 1,759 |
| Marriott International Inc. | 3.375% | 10/15/20 | 1,050 | 1,034 |
| Marriott International Inc. | 3.250% | 9/15/22 | 7,925 | 7,354 |
| McDonald’s Corp. | 5.300% | 3/15/17 | 300 | 336 |
| McDonald’s Corp. | 5.800% | 10/15/17 | 4,050 | 4,668 |
| McDonald’s Corp. | 5.350% | 3/1/18 | 5,020 | 5,716 |
| McDonald’s Corp. | 5.000% | 2/1/19 | 4,525 | 5,123 |
| McDonald’s Corp. | 2.625% | 1/15/22 | 11,090 | 10,558 |
| McDonald’s Corp. | 6.300% | 10/15/37 | 325 | 391 |
| McDonald’s Corp. | 6.300% | 3/1/38 | 1,825 | 2,213 |
| McDonald’s Corp. | 3.700% | 2/15/42 | 7,525 | 6,364 |
| McDonald’s Corp. | 3.625% | 5/1/43 | 3,150 | 2,625 |
| MDC Holdings Inc. | 6.000% | 1/15/43 | 6,975 | 6,004 |
| NIKE Inc. | 2.250% | 5/1/23 | 375 | 335 |
| NIKE Inc. | 3.625% | 5/1/43 | 1,125 | 938 |
| Nordstrom Inc. | 6.250% | 1/15/18 | 5,625 | 6,504 |
| Nordstrom Inc. | 4.750% | 5/1/20 | 2,675 | 2,923 |
| Nordstrom Inc. | 4.000% | 10/15/21 | 7,190 | 7,437 |
| Nordstrom Inc. | 7.000% | 1/15/38 | 1,275 | 1,626 |
| NVR Inc. | 3.950% | 9/15/22 | 1,900 | 1,814 |
| O’Reilly Automotive Inc. | 4.875% | 1/14/21 | 600 | 626 |
| O’Reilly Automotive Inc. | 3.800% | 9/1/22 | 4,554 | 4,368 |
| O’Reilly Automotive Inc. | 3.850% | 6/15/23 | 1,000 | 958 |
| PACCAR Financial Corp. | 1.050% | 6/5/15 | 750 | 756 |
| PACCAR Financial Corp. | 1.150% | 8/16/16 | 5,150 | 5,165 |
| PACCAR Financial Corp. | 1.600% | 3/15/17 | 3,725 | 3,714 |
| QVC Inc. | 5.125% | 7/2/22 | 425 | 420 |
| QVC Inc. | 4.375% | 3/15/23 | 650 | 610 |
| QVC Inc. | 5.950% | 3/15/43 | 3,075 | 2,776 |
| Ralph Lauren Corp. | 2.125% | 9/26/18 | 1,675 | 1,674 |
| Staples Inc. | 2.750% | 1/12/18 | 9,000 | 9,143 |
| Staples Inc. | 4.375% | 1/12/23 | 1,628 | 1,549 |
| Starbucks Corp. | 0.875% | 12/5/16 | 2,525 | 2,515 |
| Starbucks Corp. | 2.000% | 12/5/18 | 1,700 | 1,687 |
| Starbucks Corp. | 3.850% | 10/1/23 | 2,850 | 2,861 |
| Starwood Hotels & Resorts Worldwide Inc. | 3.125% | 2/15/23 | 5,500 | 4,967 |
| Target Corp. | 5.875% | 7/15/16 | 2,825 | 3,185 |
| Target Corp. | 5.375% | 5/1/17 | 850 | 957 |
| Target Corp. | 6.000% | 1/15/18 | 3,555 | 4,104 |
| Target Corp. | 3.875% | 7/15/20 | 5,630 | 5,930 |
| Target Corp. | 2.900% | 1/15/22 | 10,700 | 10,240 |
| Target Corp. | 6.350% | 11/1/32 | 2,075 | 2,435 |
| Target Corp. | 6.500% | 10/15/37 | 7,100 | 8,477 |
| Target Corp. | 7.000% | 1/15/38 | 4,850 | 6,146 |
| Target Corp. | 4.000% | 7/1/42 | 5,000 | 4,317 |
| Time Warner Cos. Inc. | 7.570% | 2/1/24 | 325 | 397 |
| Time Warner Cos. Inc. | 6.950% | 1/15/28 | 7,150 | 8,400 |
| Time Warner Inc. | 3.150% | 7/15/15 | 8,518 | 8,834 |
| Time Warner Inc. | 5.875% | 11/15/16 | 2,525 | 2,847 |
| Time Warner Inc. | 4.875% | 3/15/20 | 4,860 | 5,337 |
| Time Warner Inc. | 4.700% | 1/15/21 | 4,350 | 4,622 |
67
| Total Bond Market II Index Fund | ||||
| Face | Market | |||
| Maturity | Amount | Value | ||
| Coupon | Date | ($000) | ($000) | |
| Time Warner Inc. | 4.750% | 3/29/21 | 7,975 | 8,496 |
| Time Warner Inc. | 4.000% | 1/15/22 | 295 | 297 |
| Time Warner Inc. | 3.400% | 6/15/22 | 250 | 243 |
| Time Warner Inc. | 4.050% | 12/15/23 | 525 | 521 |
| Time Warner Inc. | 7.625% | 4/15/31 | 5,700 | 7,169 |
| Time Warner Inc. | 7.700% | 5/1/32 | 6,050 | 7,727 |
| Time Warner Inc. | 6.500% | 11/15/36 | 9,090 | 10,119 |
| Time Warner Inc. | 6.200% | 3/15/40 | 950 | 1,033 |
| Time Warner Inc. | 6.100% | 7/15/40 | 4,150 | 4,524 |
| Time Warner Inc. | 6.250% | 3/29/41 | 5,275 | 5,842 |
| Time Warner Inc. | 5.375% | 10/15/41 | 295 | 298 |
| Time Warner Inc. | 4.900% | 6/15/42 | 2,985 | 2,834 |
| Time Warner Inc. | 5.350% | 12/15/43 | 1,200 | 1,210 |
| TJX Cos. Inc. | 6.950% | 4/15/19 | 1,425 | 1,721 |
| TJX Cos. Inc. | 2.500% | 5/15/23 | 2,800 | 2,528 |
| Toyota Motor Credit Corp. | 1.000% | 2/17/15 | 4,850 | 4,880 |
| Toyota Motor Credit Corp. | 3.200% | 6/17/15 | 5,500 | 5,715 |
| Toyota Motor Credit Corp. | 0.875% | 7/17/15 | 2,700 | 2,713 |
| Toyota Motor Credit Corp. | 2.800% | 1/11/16 | 1,890 | 1,962 |
| Toyota Motor Credit Corp. | 2.000% | 9/15/16 | 3,125 | 3,201 |
| Toyota Motor Credit Corp. | 2.050% | 1/12/17 | 15,855 | 16,208 |
| Toyota Motor Credit Corp. | 1.250% | 10/5/17 | 5,100 | 5,001 |
| Toyota Motor Credit Corp. | 1.375% | 1/10/18 | 6,125 | 6,023 |
| Toyota Motor Credit Corp. | 2.000% | 10/24/18 | 7,625 | 7,603 |
| Toyota Motor Credit Corp. | 4.500% | 6/17/20 | 1,723 | 1,870 |
| Toyota Motor Credit Corp. | 4.250% | 1/11/21 | 4,200 | 4,489 |
| Toyota Motor Credit Corp. | 3.400% | 9/15/21 | 1,845 | 1,869 |
| Toyota Motor Credit Corp. | 3.300% | 1/12/22 | 5,725 | 5,673 |
| Toyota Motor Credit Corp. | 2.625% | 1/10/23 | 6,975 | 6,415 |
| VF Corp. | 5.950% | 11/1/17 | 1,975 | 2,238 |
| VF Corp. | 3.500% | 9/1/21 | 4,695 | 4,670 |
| VF Corp. | 6.450% | 11/1/37 | 1,275 | 1,498 |
| Viacom Inc. | 1.250% | 2/27/15 | 3,600 | 3,617 |
| Viacom Inc. | 2.500% | 12/15/16 | 300 | 310 |
| Viacom Inc. | 3.500% | 4/1/17 | 5,335 | 5,656 |
| Viacom Inc. | 6.125% | 10/5/17 | 1,250 | 1,431 |
| Viacom Inc. | 2.500% | 9/1/18 | 3,025 | 3,052 |
| Viacom Inc. | 5.625% | 9/15/19 | 10,235 | 11,669 |
| Viacom Inc. | 3.875% | 12/15/21 | 13,790 | 13,729 |
| Viacom Inc. | 4.250% | 9/1/23 | 8,600 | 8,566 |
| Viacom Inc. | 6.875% | 4/30/36 | 6,585 | 7,578 |
| Viacom Inc. | 4.500% | 2/27/42 | 2,500 | 2,140 |
| Viacom Inc. | 4.375% | 3/15/43 | 333 | 280 |
| Viacom Inc. | 5.850% | 9/1/43 | 8,750 | 9,111 |
| Wal-Mart Stores Inc. | 2.875% | 4/1/15 | 2,425 | 2,502 |
| Wal-Mart Stores Inc. | 4.500% | 7/1/15 | 2,225 | 2,362 |
| Wal-Mart Stores Inc. | 2.250% | 7/8/15 | 1,275 | 1,311 |
| Wal-Mart Stores Inc. | 1.500% | 10/25/15 | 12,135 | 12,366 |
| Wal-Mart Stores Inc. | 5.375% | 4/5/17 | 625 | 705 |
| Wal-Mart Stores Inc. | 5.800% | 2/15/18 | 8,295 | 9,590 |
| Wal-Mart Stores Inc. | 1.950% | 12/15/18 | 10,375 | 10,362 |
| Wal-Mart Stores Inc. | 3.625% | 7/8/20 | 4,750 | 4,990 |
| Wal-Mart Stores Inc. | 3.250% | 10/25/20 | 6,795 | 6,932 |
| Wal-Mart Stores Inc. | 4.250% | 4/15/21 | 13,235 | 14,228 |
| Wal-Mart Stores Inc. | 2.550% | 4/11/23 | 5,000 | 4,556 |
68
| Total Bond Market II Index Fund | ||||
| Face | Market | |||
| Maturity | Amount | Value | ||
| Coupon | Date | ($000) | ($000) | |
| Wal-Mart Stores Inc. | 5.875% | 4/5/27 | 11,575 | 13,697 |
| Wal-Mart Stores Inc. | 7.550% | 2/15/30 | 3,650 | 4,898 |
| Wal-Mart Stores Inc. | 5.250% | 9/1/35 | 3,280 | 3,540 |
| Wal-Mart Stores Inc. | 6.500% | 8/15/37 | 8,515 | 10,596 |
| Wal-Mart Stores Inc. | 6.200% | 4/15/38 | 13,305 | 16,079 |
| Wal-Mart Stores Inc. | 5.625% | 4/1/40 | 2,050 | 2,323 |
| Wal-Mart Stores Inc. | 4.875% | 7/8/40 | 8,595 | 8,686 |
| Wal-Mart Stores Inc. | 5.000% | 10/25/40 | 5,300 | 5,537 |
| Wal-Mart Stores Inc. | 5.625% | 4/15/41 | 6,060 | 6,852 |
| Wal-Mart Stores Inc. | 4.000% | 4/11/43 | 5,000 | 4,436 |
| Wal-Mart Stores Inc. | 4.750% | 10/2/43 | 11,350 | 11,378 |
| Walgreen Co. | 1.000% | 3/13/15 | 3,600 | 3,617 |
| Walgreen Co. | 1.800% | 9/15/17 | 4,300 | 4,334 |
| Walgreen Co. | 5.250% | 1/15/19 | 1,970 | 2,210 |
| Walgreen Co. | 3.100% | 9/15/22 | 7,550 | 7,076 |
| Walgreen Co. | 4.400% | 9/15/42 | 1,300 | 1,152 |
| Walt Disney Co. | 0.875% | 12/1/14 | 7,225 | 7,265 |
| Walt Disney Co. | 0.450% | 12/1/15 | 1,650 | 1,649 |
| Walt Disney Co. | 1.350% | 8/16/16 | 235 | 238 |
| Walt Disney Co. | 5.625% | 9/15/16 | 3,425 | 3,858 |
| Walt Disney Co. | 1.125% | 2/15/17 | 3,775 | 3,768 |
| Walt Disney Co. | 1.100% | 12/1/17 | 4,000 | 3,953 |
| Walt Disney Co. | 5.875% | 12/15/17 | 1,875 | 2,167 |
| Walt Disney Co. | 2.350% | 12/1/22 | 4,700 | 4,266 |
| Walt Disney Co. | 7.000% | 3/1/32 | 325 | 413 |
| Walt Disney Co. | 4.125% | 12/1/41 | 7,633 | 6,895 |
| Walt Disney Co. | 3.700% | 12/1/42 | 2,875 | 2,405 |
| Western Union Co. | 6.500% | 2/26/14 | 3,275 | 3,303 |
| Western Union Co. | 5.930% | 10/1/16 | 1,825 | 2,026 |
| Western Union Co. | 5.253% | 4/1/20 | 347 | 370 |
| Western Union Co. | 6.200% | 11/17/36 | 3,350 | 3,128 |
| Western Union Co. | 6.200% | 6/21/40 | 1,100 | 997 |
| Wyndham Worldwide Corp. | 2.500% | 3/1/18 | 975 | 973 |
| Wyndham Worldwide Corp. | 4.250% | 3/1/22 | 1,300 | 1,266 |
| Wyndham Worldwide Corp. | 3.900% | 3/1/23 | 600 | 564 |
| Yum! Brands Inc. | 4.250% | 9/15/15 | 2,000 | 2,115 |
| Yum! Brands Inc. | 6.250% | 4/15/16 | 2,850 | 3,166 |
| Yum! Brands Inc. | 6.250% | 3/15/18 | 379 | 438 |
| Yum! Brands Inc. | 5.300% | 9/15/19 | 685 | 770 |
| Yum! Brands Inc. | 3.875% | 11/1/20 | 1,175 | 1,186 |
| Yum! Brands Inc. | 6.875% | 11/15/37 | 1,224 | 1,397 |
| Consumer Noncyclical (3.3%) | ||||
| Abbott Laboratories | 5.125% | 4/1/19 | 6,846 | 7,774 |
| Abbott Laboratories | 4.125% | 5/27/20 | 3,000 | 3,237 |
| Abbott Laboratories | 6.150% | 11/30/37 | 2,405 | 2,824 |
| Abbott Laboratories | 6.000% | 4/1/39 | 350 | 406 |
| Abbott Laboratories | 5.300% | 5/27/40 | 2,255 | 2,471 |
| AbbVie Inc. | 1.200% | 11/6/15 | 23,850 | 24,108 |
| AbbVie Inc. | 1.750% | 11/6/17 | 16,785 | 16,749 |
| AbbVie Inc. | 2.000% | 11/6/18 | 12,725 | 12,559 |
| AbbVie Inc. | 2.900% | 11/6/22 | 15,000 | 14,027 |
| AbbVie Inc. | 4.400% | 11/6/42 | 10,750 | 10,075 |
| Actavis Inc. | 1.875% | 10/1/17 | 4,525 | 4,499 |
| Actavis Inc. | 3.250% | 10/1/22 | 15,900 | 14,837 |
69
| Total Bond Market II Index Fund | ||||
| Face | Market | |||
| Maturity | Amount | Value | ||
| Coupon | Date | ($000) | ($000) | |
| Actavis Inc. | 4.625% | 10/1/42 | 1,225 | 1,115 |
| Allergan Inc. | 5.750% | 4/1/16 | 400 | 443 |
| Allergan Inc. | 3.375% | 9/15/20 | 5,000 | 5,110 |
| Altria Group Inc. | 4.125% | 9/11/15 | 775 | 819 |
| Altria Group Inc. | 9.700% | 11/10/18 | 3,244 | 4,273 |
| Altria Group Inc. | 9.250% | 8/6/19 | 401 | 528 |
| Altria Group Inc. | 4.750% | 5/5/21 | 6,150 | 6,585 |
| Altria Group Inc. | 2.850% | 8/9/22 | 18,050 | 16,615 |
| Altria Group Inc. | 2.950% | 5/2/23 | 425 | 383 |
| Altria Group Inc. | 4.000% | 1/31/24 | 13,350 | 13,064 |
| Altria Group Inc. | 9.950% | 11/10/38 | 3,559 | 5,410 |
| Altria Group Inc. | 10.200% | 2/6/39 | 5,395 | 8,378 |
| Altria Group Inc. | 4.250% | 8/9/42 | 3,400 | 2,889 |
| Altria Group Inc. | 4.500% | 5/2/43 | 5,175 | 4,552 |
| Altria Group Inc. | 5.375% | 1/31/44 | 7,325 | 7,312 |
| AmerisourceBergen Corp. | 5.875% | 9/15/15 | 1,875 | 2,033 |
| AmerisourceBergen Corp. | 4.875% | 11/15/19 | 975 | 1,080 |
| AmerisourceBergen Corp. | 3.500% | 11/15/21 | 1,900 | 1,868 |
| Amgen Inc. | 2.300% | 6/15/16 | 2,820 | 2,909 |
| Amgen Inc. | 2.500% | 11/15/16 | 1,660 | 1,724 |
| Amgen Inc. | 2.125% | 5/15/17 | 3,850 | 3,915 |
| Amgen Inc. | 5.850% | 6/1/17 | 7,750 | 8,807 |
| Amgen Inc. | 6.150% | 6/1/18 | 6,505 | 7,593 |
| Amgen Inc. | 5.700% | 2/1/19 | 1,320 | 1,522 |
| Amgen Inc. | 3.450% | 10/1/20 | 825 | 838 |
| Amgen Inc. | 4.100% | 6/15/21 | 6,765 | 7,056 |
| Amgen Inc. | 3.875% | 11/15/21 | 1,660 | 1,704 |
| Amgen Inc. | 3.625% | 5/15/22 | 17,075 | 16,874 |
| Amgen Inc. | 6.375% | 6/1/37 | 2,200 | 2,517 |
| Amgen Inc. | 6.900% | 6/1/38 | 5,023 | 6,066 |
| Amgen Inc. | 6.400% | 2/1/39 | 3,250 | 3,726 |
| Amgen Inc. | 5.750% | 3/15/40 | 2,665 | 2,844 |
| Amgen Inc. | 4.950% | 10/1/41 | 9,275 | 8,787 |
| Amgen Inc. | 5.150% | 11/15/41 | 6,880 | 6,835 |
| Amgen Inc. | 5.650% | 6/15/42 | 3,800 | 4,015 |
| Amgen Inc. | 5.375% | 5/15/43 | 1,950 | 1,997 |
| Anheuser-Busch Cos. LLC | 5.600% | 3/1/17 | 1,375 | 1,539 |
| Anheuser-Busch Cos. LLC | 5.500% | 1/15/18 | 6,307 | 7,173 |
| Anheuser-Busch Cos. LLC | 6.800% | 8/20/32 | 775 | 950 |
| Anheuser-Busch Cos. LLC | 5.750% | 4/1/36 | 2,905 | 3,252 |
| Anheuser-Busch InBev Finance Inc. | 0.800% | 1/15/16 | 5,000 | 5,003 |
| Anheuser-Busch InBev Finance Inc. | 1.250% | 1/17/18 | 13,465 | 13,160 |
| Anheuser-Busch InBev Finance Inc. | 2.625% | 1/17/23 | 10,425 | 9,571 |
| Anheuser-Busch InBev Finance Inc. | 4.000% | 1/17/43 | 5,225 | 4,601 |
| Anheuser-Busch InBev Worldwide Inc. | 4.125% | 1/15/15 | 4,590 | 4,762 |
| Anheuser-Busch InBev Worldwide Inc. | 3.625% | 4/15/15 | 3,175 | 3,303 |
| Anheuser-Busch InBev Worldwide Inc. | 0.800% | 7/15/15 | 4,475 | 4,496 |
| Anheuser-Busch InBev Worldwide Inc. | 2.875% | 2/15/16 | 1,893 | 1,979 |
| Anheuser-Busch InBev Worldwide Inc. | 1.375% | 7/15/17 | 7,545 | 7,527 |
| Anheuser-Busch InBev Worldwide Inc. | 7.750% | 1/15/19 | 10,060 | 12,557 |
| Anheuser-Busch InBev Worldwide Inc. | 6.875% | 11/15/19 | 3,675 | 4,500 |
| Anheuser-Busch InBev Worldwide Inc. | 5.375% | 1/15/20 | 16,040 | 18,287 |
| Anheuser-Busch InBev Worldwide Inc. | 5.000% | 4/15/20 | 4,450 | 4,988 |
| Anheuser-Busch InBev Worldwide Inc. | 4.375% | 2/15/21 | 3,875 | 4,152 |
| Anheuser-Busch InBev Worldwide Inc. | 2.500% | 7/15/22 | 11,800 | 10,928 |
70
| Total Bond Market II Index Fund | ||||
| Face | Market | |||
| Maturity | Amount | Value | ||
| Coupon | Date | ($000) | ($000) | |
| Anheuser-Busch InBev Worldwide Inc. | 8.200% | 1/15/39 | 4,715 | 6,888 |
| Anheuser-Busch InBev Worldwide Inc. | 6.375% | 1/15/40 | 3,075 | 3,751 |
| Anheuser-Busch InBev Worldwide Inc. | 3.750% | 7/15/42 | 9,950 | 8,344 |
| Archer-Daniels-Midland Co. | 8.375% | 4/15/17 | 100 | 122 |
| Archer-Daniels-Midland Co. | 5.450% | 3/15/18 | 3,625 | 4,109 |
| Archer-Daniels-Midland Co. | 4.479% | 3/1/21 | 2,145 | 2,266 |
| Archer-Daniels-Midland Co. | 5.935% | 10/1/32 | 650 | 715 |
| Archer-Daniels-Midland Co. | 5.375% | 9/15/35 | 3,225 | 3,431 |
| Archer-Daniels-Midland Co. | 5.765% | 3/1/41 | 4,970 | 5,504 |
| Archer-Daniels-Midland Co. | 4.016% | 4/16/43 | 2,125 | 1,807 |
| 3 Ascension Health Alliance | 4.847% | 11/15/53 | 4,875 | 4,635 |
| AstraZeneca plc | 5.900% | 9/15/17 | 11,965 | 13,692 |
| AstraZeneca plc | 1.950% | 9/18/19 | 2,500 | 2,449 |
| AstraZeneca plc | 6.450% | 9/15/37 | 17,105 | 20,327 |
| AstraZeneca plc | 4.000% | 9/18/42 | 1,000 | 859 |
| Avon Products Inc. | 5.750% | 3/1/18 | 2,460 | 2,646 |
| Avon Products Inc. | 6.500% | 3/1/19 | 1,160 | 1,259 |
| Avon Products Inc. | 4.600% | 3/15/20 | 6,000 | 5,987 |
| Avon Products Inc. | 5.000% | 3/15/23 | 200 | 195 |
| Avon Products Inc. | 6.950% | 3/15/43 | 3,300 | 3,196 |
| Baptist Health South Florida Obligated | ||||
| Group Revenue | 4.590% | 8/15/21 | 850 | 877 |
| Baxter International Inc. | 5.900% | 9/1/16 | 875 | 986 |
| Baxter International Inc. | 1.850% | 1/15/17 | 8,350 | 8,459 |
| Baxter International Inc. | 4.250% | 3/15/20 | 3,000 | 3,231 |
| Baxter International Inc. | 2.400% | 8/15/22 | 8,535 | 7,735 |
| Baxter International Inc. | 3.200% | 6/15/23 | 4,911 | 4,687 |
| Baxter International Inc. | 3.650% | 8/15/42 | 1,400 | 1,152 |
| Beam Inc. | 1.875% | 5/15/17 | 1,825 | 1,830 |
| Beam Inc. | 1.750% | 6/15/18 | 1,025 | 999 |
| Beam Inc. | 3.250% | 5/15/22 | 1,400 | 1,336 |
| Beam Inc. | 3.250% | 6/15/23 | 850 | 798 |
| Becton Dickinson & Co. | 1.750% | 11/8/16 | 90 | 92 |
| Becton Dickinson & Co. | 5.000% | 5/15/19 | 450 | 504 |
| Becton Dickinson & Co. | 3.250% | 11/12/20 | 8,340 | 8,355 |
| Becton Dickinson & Co. | 3.125% | 11/8/21 | 2,985 | 2,923 |
| Becton Dickinson & Co. | 5.000% | 11/12/40 | 6,622 | 6,806 |
| Biogen Idec Inc. | 6.875% | 3/1/18 | 600 | 705 |
| Boston Scientific Corp. | 6.250% | 11/15/15 | 6,000 | 6,560 |
| Boston Scientific Corp. | 5.125% | 1/12/17 | 3,750 | 4,092 |
| Boston Scientific Corp. | 2.650% | 10/1/18 | 1,050 | 1,057 |
| Boston Scientific Corp. | 6.000% | 1/15/20 | 3,870 | 4,450 |
| Boston Scientific Corp. | 4.125% | 10/1/23 | 7,600 | 7,524 |
| Boston Scientific Corp. | 7.000% | 11/15/35 | 2,850 | 3,376 |
| Boston Scientific Corp. | 7.375% | 1/15/40 | 1,125 | 1,391 |
| Bottling Group LLC | 5.500% | 4/1/16 | 4,050 | 4,468 |
| Bottling Group LLC | 5.125% | 1/15/19 | 4,169 | 4,702 |
| Bristol-Myers Squibb Co. | 5.450% | 5/1/18 | 7,215 | 8,244 |
| Bristol-Myers Squibb Co. | 1.750% | 3/1/19 | 2,375 | 2,313 |
| Bristol-Myers Squibb Co. | 2.000% | 8/1/22 | 3,275 | 2,896 |
| Bristol-Myers Squibb Co. | 7.150% | 6/15/23 | 100 | 125 |
| Bristol-Myers Squibb Co. | 3.250% | 11/1/23 | 3,625 | 3,471 |
| Bristol-Myers Squibb Co. | 6.800% | 11/15/26 | 100 | 126 |
| Bristol-Myers Squibb Co. | 5.875% | 11/15/36 | 2,863 | 3,290 |
| Bristol-Myers Squibb Co. | 6.125% | 5/1/38 | 910 | 1,067 |
71
| Total Bond Market II Index Fund | ||||
| Face | Market | |||
| Maturity | Amount | Value | ||
| Coupon | Date | ($000) | ($000) | |
| Bristol-Myers Squibb Co. | 3.250% | 8/1/42 | 1,575 | 1,225 |
| Bristol-Myers Squibb Co. | 4.500% | 3/1/44 | 5,875 | 5,619 |
| Brown-Forman Corp. | 1.000% | 1/15/18 | 800 | 772 |
| Brown-Forman Corp. | 2.250% | 1/15/23 | 1,375 | 1,217 |
| Brown-Forman Corp. | 3.750% | 1/15/43 | 1,800 | 1,510 |
| Bunge Ltd. Finance Corp. | 5.100% | 7/15/15 | 575 | 607 |
| Bunge Ltd. Finance Corp. | 8.500% | 6/15/19 | 6,975 | 8,606 |
| Campbell Soup Co. | 3.050% | 7/15/17 | 525 | 549 |
| Campbell Soup Co. | 4.250% | 4/15/21 | 2,175 | 2,205 |
| Campbell Soup Co. | 2.500% | 8/2/22 | 4,000 | 3,523 |
| Campbell Soup Co. | 3.800% | 8/2/42 | 1,300 | 1,006 |
| Cardinal Health Inc. | 4.000% | 6/15/15 | 100 | 105 |
| Cardinal Health Inc. | 1.700% | 3/15/18 | 3,850 | 3,780 |
| Cardinal Health Inc. | 4.625% | 12/15/20 | 4,935 | 5,312 |
| Cardinal Health Inc. | 3.200% | 6/15/22 | 5,000 | 4,743 |
| Cardinal Health Inc. | 3.200% | 3/15/23 | 3,450 | 3,227 |
| Cardinal Health Inc. | 4.600% | 3/15/43 | 475 | 442 |
| CareFusion Corp. | 6.375% | 8/1/19 | 5,085 | 5,773 |
| Catholic Health Initiatives Colorado GO | 1.600% | 11/1/17 | 2,150 | 2,086 |
| 3 Catholic Health Initiatives Colorado GO | 4.350% | 11/1/42 | 7,400 | 6,408 |
| Celgene Corp. | 2.450% | 10/15/15 | 750 | 772 |
| Celgene Corp. | 2.300% | 8/15/18 | 2,500 | 2,495 |
| Celgene Corp. | 3.950% | 10/15/20 | 5,075 | 5,270 |
| Celgene Corp. | 3.250% | 8/15/22 | 2,250 | 2,131 |
| Celgene Corp. | 4.000% | 8/15/23 | 2,050 | 2,024 |
| Celgene Corp. | 5.700% | 10/15/40 | 1,350 | 1,428 |
| Celgene Corp. | 5.250% | 8/15/43 | 3,100 | 3,112 |
| Church & Dwight Co. Inc. | 3.350% | 12/15/15 | 1,000 | 1,047 |
| Clorox Co. | 5.000% | 1/15/15 | 525 | 549 |
| Clorox Co. | 3.550% | 11/1/15 | 1,850 | 1,941 |
| Clorox Co. | 5.950% | 10/15/17 | 2,832 | 3,225 |
| Coca-Cola Co. | 0.750% | 3/13/15 | 575 | 578 |
| Coca-Cola Co. | 1.500% | 11/15/15 | 3,775 | 3,844 |
| Coca-Cola Co. | 1.800% | 9/1/16 | 2,900 | 2,983 |
| Coca-Cola Co. | 5.350% | 11/15/17 | 7,825 | 8,894 |
| Coca-Cola Co. | 1.650% | 3/14/18 | 725 | 721 |
| Coca-Cola Co. | 1.150% | 4/1/18 | 150 | 146 |
| Coca-Cola Co. | 1.650% | 11/1/18 | 4,100 | 4,046 |
| Coca-Cola Co. | 4.875% | 3/15/19 | 5,910 | 6,652 |
| Coca-Cola Co. | 2.450% | 11/1/20 | 6,600 | 6,417 |
| Coca-Cola Co. | 3.150% | 11/15/20 | 1,100 | 1,114 |
| Coca-Cola Co. | 3.300% | 9/1/21 | 13,175 | 13,246 |
| Coca-Cola Co. | 2.500% | 4/1/23 | 5,000 | 4,575 |
| Coca-Cola Co. | 3.200% | 11/1/23 | 13,700 | 13,140 |
| Coca-Cola Enterprises Inc. | 2.125% | 9/15/15 | 1,595 | 1,629 |
| Coca-Cola Enterprises Inc. | 3.500% | 9/15/20 | 350 | 351 |
| Coca-Cola Femsa SAB de CV | 4.625% | 2/15/20 | 775 | 827 |
| Coca-Cola Femsa SAB de CV | 3.875% | 11/26/23 | 10,250 | 10,186 |
| Coca-Cola HBC Finance BV | 5.500% | 9/17/15 | 3,500 | 3,742 |
| Coca-Cola Refreshments USA Inc. | 8.500% | 2/1/22 | 1,800 | 2,332 |
| Colgate-Palmolive Co. | 1.300% | 1/15/17 | 4,375 | 4,369 |
| Colgate-Palmolive Co. | 2.450% | 11/15/21 | 1,510 | 1,426 |
| Colgate-Palmolive Co. | 2.300% | 5/3/22 | 7,025 | 6,493 |
| Colgate-Palmolive Co. | 1.950% | 2/1/23 | 5,250 | 4,581 |
| ConAgra Foods Inc. | 1.300% | 1/25/16 | 2,500 | 2,508 |
72
| Total Bond Market II Index Fund | ||||
| Face | Market | |||
| Maturity | Amount | Value | ||
| Coupon | Date | ($000) | ($000) | |
| ConAgra Foods Inc. | 5.819% | 6/15/17 | 225 | 253 |
| ConAgra Foods Inc. | 1.900% | 1/25/18 | 9,710 | 9,580 |
| ConAgra Foods Inc. | 2.100% | 3/15/18 | 5,990 | 5,936 |
| ConAgra Foods Inc. | 3.250% | 9/15/22 | 5,000 | 4,695 |
| ConAgra Foods Inc. | 3.200% | 1/25/23 | 6,350 | 5,871 |
| ConAgra Foods Inc. | 7.125% | 10/1/26 | 1,515 | 1,836 |
| ConAgra Foods Inc. | 8.250% | 9/15/30 | 675 | 869 |
| ConAgra Foods Inc. | 4.650% | 1/25/43 | 5,250 | 4,766 |
| Covidien International Finance SA | 1.350% | 5/29/15 | 2,500 | 2,522 |
| Covidien International Finance SA | 6.000% | 10/15/17 | 4,332 | 4,965 |
| Covidien International Finance SA | 3.200% | 6/15/22 | 10,869 | 10,455 |
| Covidien International Finance SA | 2.950% | 6/15/23 | 8,500 | 7,848 |
| Covidien International Finance SA | 6.550% | 10/15/37 | 3,199 | 3,902 |
| CR Bard Inc. | 1.375% | 1/15/18 | 4,050 | 3,933 |
| CR Bard Inc. | 4.400% | 1/15/21 | 2,220 | 2,327 |
| Delhaize Group SA | 6.500% | 6/15/17 | 235 | 264 |
| Delhaize Group SA | 5.700% | 10/1/40 | 14,041 | 13,174 |
| DENTSPLY International Inc. | 2.750% | 8/15/16 | 100 | 103 |
| DENTSPLY International Inc. | 4.125% | 8/15/21 | 125 | 125 |
| Diageo Capital plc | 5.500% | 9/30/16 | 425 | 476 |
| Diageo Capital plc | 1.500% | 5/11/17 | 10,750 | 10,762 |
| Diageo Capital plc | 5.750% | 10/23/17 | 8,676 | 9,898 |
| Diageo Capital plc | 4.828% | 7/15/20 | 3,100 | 3,408 |
| Diageo Capital plc | 2.625% | 4/29/23 | 16,000 | 14,560 |
| Diageo Capital plc | 5.875% | 9/30/36 | 200 | 229 |
| Diageo Capital plc | 3.875% | 4/29/43 | 1,200 | 1,031 |
| Diageo Finance BV | 5.300% | 10/28/15 | 1,800 | 1,950 |
| Diageo Investment Corp. | 2.875% | 5/11/22 | 7,575 | 7,219 |
| Diageo Investment Corp. | 7.450% | 4/15/35 | 200 | 261 |
| Diageo Investment Corp. | 4.250% | 5/11/42 | 3,650 | 3,312 |
| Dignity Health California GO | 3.125% | 11/1/22 | 900 | 808 |
| Dignity Health California GO | 4.500% | 11/1/42 | 4,400 | 3,539 |
| Dr Pepper Snapple Group Inc. | 2.900% | 1/15/16 | 3,045 | 3,162 |
| Dr Pepper Snapple Group Inc. | 6.820% | 5/1/18 | 1,795 | 2,117 |
| Dr Pepper Snapple Group Inc. | 2.600% | 1/15/19 | 7,785 | 7,860 |
| Dr Pepper Snapple Group Inc. | 2.000% | 1/15/20 | 2,475 | 2,339 |
| Dr Pepper Snapple Group Inc. | 2.700% | 11/15/22 | 1,300 | 1,178 |
| Dr Pepper Snapple Group Inc. | 7.450% | 5/1/38 | 425 | 540 |
| Edwards Lifesciences Corp. | 2.875% | 10/15/18 | 950 | 949 |
| Eli Lilly & Co. | 5.200% | 3/15/17 | 3,925 | 4,379 |
| Eli Lilly & Co. | 5.500% | 3/15/27 | 2,950 | 3,361 |
| Eli Lilly & Co. | 5.550% | 3/15/37 | 6,100 | 6,678 |
| Eli Lilly & Co. | 5.950% | 11/15/37 | 235 | 270 |
| Energizer Holdings Inc. | 4.700% | 5/19/21 | 1,325 | 1,337 |
| Energizer Holdings Inc. | 4.700% | 5/24/22 | 1,750 | 1,745 |
| Estee Lauder Cos. Inc. | 2.350% | 8/15/22 | 1,700 | 1,527 |
| Estee Lauder Cos. Inc. | 6.000% | 5/15/37 | 200 | 219 |
| Estee Lauder Cos. Inc. | 3.700% | 8/15/42 | 600 | 489 |
| Express Scripts Holding Co. | 2.100% | 2/12/15 | 6,700 | 6,798 |
| Express Scripts Holding Co. | 3.125% | 5/15/16 | 5,000 | 5,230 |
| Express Scripts Holding Co. | 3.500% | 11/15/16 | 7,134 | 7,560 |
| Express Scripts Holding Co. | 2.650% | 2/15/17 | 7,015 | 7,238 |
| Express Scripts Holding Co. | 4.750% | 11/15/21 | 5,738 | 6,065 |
| Express Scripts Holding Co. | 3.900% | 2/15/22 | 22,150 | 22,058 |
| Express Scripts Holding Co. | 6.125% | 11/15/41 | 8,880 | 9,976 |
73
| Total Bond Market II Index Fund | ||||
| Face | Market | |||
| Maturity | Amount | Value | ||
| Coupon | Date | ($000) | ($000) | |
| Flowers Foods Inc. | 4.375% | 4/1/22 | 1,500 | 1,475 |
| Fomento Economico Mexicano SAB de CV | 2.875% | 5/10/23 | 600 | 525 |
| Fomento Economico Mexicano SAB de CV | 4.375% | 5/10/43 | 2,600 | 2,132 |
| Genentech Inc. | 4.750% | 7/15/15 | 800 | 850 |
| Genentech Inc. | 5.250% | 7/15/35 | 5,020 | 5,297 |
| General Mills Inc. | 5.200% | 3/17/15 | 2,000 | 2,109 |
| General Mills Inc. | 5.700% | 2/15/17 | 2,525 | 2,827 |
| General Mills Inc. | 5.650% | 2/15/19 | 6,725 | 7,810 |
| General Mills Inc. | 3.150% | 12/15/21 | 11,875 | 11,621 |
| General Mills Inc. | 5.400% | 6/15/40 | 4,505 | 4,765 |
| Genzyme Corp. | 3.625% | 6/15/15 | 2,875 | 3,001 |
| Gilead Sciences Inc. | 3.050% | 12/1/16 | 5,375 | 5,679 |
| Gilead Sciences Inc. | 4.500% | 4/1/21 | 2,025 | 2,167 |
| Gilead Sciences Inc. | 4.400% | 12/1/21 | 13,452 | 14,319 |
| Gilead Sciences Inc. | 5.650% | 12/1/41 | 1,325 | 1,461 |
| GlaxoSmithKline Capital Inc. | 5.650% | 5/15/18 | 11,580 | 13,318 |
| GlaxoSmithKline Capital Inc. | 2.800% | 3/18/23 | 6,216 | 5,732 |
| GlaxoSmithKline Capital Inc. | 5.375% | 4/15/34 | 775 | 840 |
| GlaxoSmithKline Capital Inc. | 6.375% | 5/15/38 | 14,760 | 18,019 |
| GlaxoSmithKline Capital Inc. | 4.200% | 3/18/43 | 175 | 158 |
| GlaxoSmithKline Capital plc | 0.750% | 5/8/15 | 4,475 | 4,496 |
| GlaxoSmithKline Capital plc | 1.500% | 5/8/17 | 13,500 | 13,529 |
| GlaxoSmithKline Capital plc | 2.850% | 5/8/22 | 7,725 | 7,321 |
| Hasbro Inc. | 6.300% | 9/15/17 | 1,375 | 1,559 |
| Hasbro Inc. | 6.350% | 3/15/40 | 1,200 | 1,263 |
| Hershey Co. | 5.450% | 9/1/16 | 425 | 475 |
| Hershey Co. | 1.500% | 11/1/16 | 2,125 | 2,161 |
| Hershey Co. | 4.125% | 12/1/20 | 1,710 | 1,828 |
| Hormel Foods Corp. | 4.125% | 4/15/21 | 625 | 646 |
| Ingredion Inc. | 3.200% | 11/1/15 | 1,700 | 1,763 |
| Ingredion Inc. | 4.625% | 11/1/20 | 890 | 928 |
| Ingredion Inc. | 6.625% | 4/15/37 | 575 | 643 |
| International Flavors & Fragrances Inc. | 3.200% | 5/1/23 | 525 | 485 |
| JM Smucker Co. | 3.500% | 10/15/21 | 995 | 990 |
| Johnson & Johnson | 5.550% | 8/15/17 | 1,700 | 1,942 |
| Johnson & Johnson | 5.150% | 7/15/18 | 4,550 | 5,208 |
| Johnson & Johnson | 1.650% | 12/5/18 | 1,250 | 1,238 |
| Johnson & Johnson | 2.950% | 9/1/20 | 10,000 | 10,133 |
| Johnson & Johnson | 3.550% | 5/15/21 | 7,325 | 7,609 |
| Johnson & Johnson | 6.730% | 11/15/23 | 1,203 | 1,501 |
| Johnson & Johnson | 3.375% | 12/5/23 | 1,250 | 1,237 |
| Johnson & Johnson | 6.950% | 9/1/29 | 1,300 | 1,708 |
| Johnson & Johnson | 4.950% | 5/15/33 | 1,600 | 1,719 |
| Johnson & Johnson | 4.375% | 12/5/33 | 3,835 | 3,846 |
| Johnson & Johnson | 5.950% | 8/15/37 | 1,330 | 1,577 |
| Johnson & Johnson | 4.500% | 9/1/40 | 1,370 | 1,354 |
| Johnson & Johnson | 4.500% | 12/5/43 | 1,000 | 990 |
| Kaiser Foundation Hospitals | 3.500% | 4/1/22 | 900 | 855 |
| Kaiser Foundation Hospitals | 4.875% | 4/1/42 | 1,800 | 1,695 |
| Kellogg Co. | 4.450% | 5/30/16 | 3,200 | 3,453 |
| Kellogg Co. | 1.875% | 11/17/16 | 4,400 | 4,478 |
| Kellogg Co. | 4.000% | 12/15/20 | 9,005 | 9,320 |
| Kellogg Co. | 3.125% | 5/17/22 | 9,410 | 8,919 |
| Kellogg Co. | 7.450% | 4/1/31 | 1,150 | 1,444 |
| Kimberly-Clark Corp. | 4.875% | 8/15/15 | 1,875 | 2,008 |
74
| Total Bond Market II Index Fund | ||||
| Face | Market | |||
| Maturity | Amount | Value | ||
| Coupon | Date | ($000) | ($000) | |
| Kimberly-Clark Corp. | 6.125% | 8/1/17 | 5,804 | 6,715 |
| Kimberly-Clark Corp. | 7.500% | 11/1/18 | 800 | 993 |
| Kimberly-Clark Corp. | 3.625% | 8/1/20 | 3,150 | 3,284 |
| Kimberly-Clark Corp. | 3.875% | 3/1/21 | 2,940 | 3,058 |
| Kimberly-Clark Corp. | 2.400% | 3/1/22 | 4,825 | 4,500 |
| Kimberly-Clark Corp. | 2.400% | 6/1/23 | 1,600 | 1,446 |
| Kimberly-Clark Corp. | 6.625% | 8/1/37 | 200 | 250 |
| Kimberly-Clark Corp. | 5.300% | 3/1/41 | 1,950 | 2,102 |
| Kimberly-Clark Corp. | 3.700% | 6/1/43 | 1,275 | 1,072 |
| Koninklijke Philips NV | 5.750% | 3/11/18 | 2,725 | 3,117 |
| Koninklijke Philips NV | 3.750% | 3/15/22 | 8,500 | 8,541 |
| Koninklijke Philips NV | 6.875% | 3/11/38 | 4,795 | 5,711 |
| Koninklijke Philips NV | 5.000% | 3/15/42 | 9,575 | 9,469 |
| Kraft Foods Group Inc. | 1.625% | 6/4/15 | 1,400 | 1,419 |
| Kraft Foods Group Inc. | 2.250% | 6/5/17 | 2,150 | 2,184 |
| Kraft Foods Group Inc. | 6.125% | 8/23/18 | 15,240 | 17,752 |
| Kraft Foods Group Inc. | 5.375% | 2/10/20 | 2,539 | 2,848 |
| Kraft Foods Group Inc. | 3.500% | 6/6/22 | 10,825 | 10,593 |
| Kraft Foods Group Inc. | 6.875% | 1/26/39 | 150 | 183 |
| Kraft Foods Group Inc. | 6.500% | 2/9/40 | 2,700 | 3,153 |
| Kraft Foods Group Inc. | 5.000% | 6/4/42 | 5,375 | 5,236 |
| Kroger Co. | 4.950% | 1/15/15 | 1,950 | 2,033 |
| Kroger Co. | 3.900% | 10/1/15 | 2,350 | 2,480 |
| Kroger Co. | 2.200% | 1/15/17 | 6,775 | 6,888 |
| Kroger Co. | 6.400% | 8/15/17 | 435 | 499 |
| Kroger Co. | 6.800% | 12/15/18 | 2,400 | 2,869 |
| Kroger Co. | 2.300% | 1/15/19 | 1,850 | 1,842 |
| Kroger Co. | 6.150% | 1/15/20 | 650 | 742 |
| Kroger Co. | 3.300% | 1/15/21 | 1,850 | 1,841 |
| Kroger Co. | 3.850% | 8/1/23 | 2,500 | 2,455 |
| Kroger Co. | 7.700% | 6/1/29 | 2,800 | 3,403 |
| Kroger Co. | 8.000% | 9/15/29 | 8,675 | 10,888 |
| Kroger Co. | 7.500% | 4/1/31 | 625 | 757 |
| Kroger Co. | 5.150% | 8/1/43 | 1,000 | 979 |
| Laboratory Corp. of America Holdings | 5.625% | 12/15/15 | 1,025 | 1,114 |
| Laboratory Corp. of America Holdings | 2.200% | 8/23/17 | 9,175 | 9,221 |
| Laboratory Corp. of America Holdings | 2.500% | 11/1/18 | 500 | 495 |
| Laboratory Corp. of America Holdings | 4.625% | 11/15/20 | 235 | 246 |
| Laboratory Corp. of America Holdings | 3.750% | 8/23/22 | 725 | 702 |
| Laboratory Corp. of America Holdings | 4.000% | 11/1/23 | 550 | 528 |
| Life Technologies Corp. | 4.400% | 3/1/15 | 1,700 | 1,770 |
| Life Technologies Corp. | 3.500% | 1/15/16 | 2,800 | 2,909 |
| Life Technologies Corp. | 6.000% | 3/1/20 | 2,340 | 2,690 |
| Life Technologies Corp. | 5.000% | 1/15/21 | 1,350 | 1,464 |
| Lorillard Tobacco Co. | 3.500% | 8/4/16 | 13,355 | 14,051 |
| Lorillard Tobacco Co. | 2.300% | 8/21/17 | 5,100 | 5,135 |
| Lorillard Tobacco Co. | 8.125% | 6/23/19 | 2,825 | 3,447 |
| Lorillard Tobacco Co. | 3.750% | 5/20/23 | 2,475 | 2,251 |
| Lorillard Tobacco Co. | 8.125% | 5/1/40 | 1,000 | 1,201 |
| Lorillard Tobacco Co. | 7.000% | 8/4/41 | 1,550 | 1,679 |
| Mattel Inc. | 2.500% | 11/1/16 | 1,125 | 1,160 |
| Mattel Inc. | 1.700% | 3/15/18 | 550 | 539 |
| Mattel Inc. | 3.150% | 3/15/23 | 750 | 694 |
| Mattel Inc. | 5.450% | 11/1/41 | 845 | 842 |
| 3 Mayo Clinic | 3.774% | 11/15/43 | 1,125 | 911 |
75
| Total Bond Market II Index Fund | ||||
| Face | Market | |||
| Maturity | Amount | Value | ||
| Coupon | Date | ($000) | ($000) | |
| 3 Mayo Clinic | 4.000% | 11/15/47 | 1,125 | 923 |
| McCormick & Co. Inc. | 3.900% | 7/15/21 | 875 | 899 |
| McCormick & Co. Inc. | 3.500% | 9/1/23 | 1,400 | 1,370 |
| McKesson Corp. | 3.250% | 3/1/16 | 1,628 | 1,700 |
| McKesson Corp. | 5.700% | 3/1/17 | 5,000 | 5,582 |
| McKesson Corp. | 4.750% | 3/1/21 | 1,740 | 1,847 |
| McKesson Corp. | 2.700% | 12/15/22 | 5,600 | 5,018 |
| McKesson Corp. | 6.000% | 3/1/41 | 5,500 | 6,141 |
| Mead Johnson Nutrition Co. | 4.900% | 11/1/19 | 2,309 | 2,523 |
| Mead Johnson Nutrition Co. | 5.900% | 11/1/39 | 1,135 | 1,221 |
| Medco Health Solutions Inc. | 2.750% | 9/15/15 | 3,025 | 3,115 |
| Medco Health Solutions Inc. | 7.125% | 3/15/18 | 9,080 | 10,750 |
| Medco Health Solutions Inc. | 4.125% | 9/15/20 | 590 | 612 |
| Medtronic Inc. | 3.000% | 3/15/15 | 4,495 | 4,639 |
| Medtronic Inc. | 4.750% | 9/15/15 | 1,775 | 1,901 |
| Medtronic Inc. | 1.375% | 4/1/18 | 6,845 | 6,714 |
| Medtronic Inc. | 5.600% | 3/15/19 | 1,000 | 1,157 |
| Medtronic Inc. | 4.450% | 3/15/20 | 1,650 | 1,813 |
| Medtronic Inc. | 4.125% | 3/15/21 | 590 | 618 |
| Medtronic Inc. | 3.125% | 3/15/22 | 17,680 | 17,310 |
| Medtronic Inc. | 6.500% | 3/15/39 | 500 | 607 |
| Medtronic Inc. | 5.550% | 3/15/40 | 1,725 | 1,886 |
| Medtronic Inc. | 4.500% | 3/15/42 | 4,875 | 4,590 |
| Memorial Sloan-Kettering Cancer Center | ||||
| New York GO | 5.000% | 7/1/42 | 700 | 689 |
| Memorial Sloan-Kettering Cancer Center | ||||
| New York GO | 4.125% | 7/1/52 | 4,425 | 3,622 |
| Merck & Co. Inc. | 2.250% | 1/15/16 | 3,850 | 3,970 |
| Merck & Co. Inc. | 6.000% | 9/15/17 | 2,300 | 2,674 |
| Merck & Co. Inc. | 1.100% | 1/31/18 | 3,775 | 3,678 |
| Merck & Co. Inc. | 3.875% | 1/15/21 | 11,720 | 12,327 |
| Merck & Co. Inc. | 2.400% | 9/15/22 | 8,750 | 7,978 |
| Merck & Co. Inc. | 2.800% | 5/18/23 | 15,000 | 13,950 |
| Merck & Co. Inc. | 6.500% | 12/1/33 | 4,400 | 5,446 |
| Merck & Co. Inc. | 6.550% | 9/15/37 | 5,015 | 6,212 |
| Merck & Co. Inc. | 3.600% | 9/15/42 | 1,800 | 1,484 |
| Merck & Co. Inc. | 4.150% | 5/18/43 | 6,375 | 5,797 |
| Merck Sharp & Dohme Corp. | 4.750% | 3/1/15 | 1,200 | 1,259 |
| Merck Sharp & Dohme Corp. | 4.000% | 6/30/15 | 2,590 | 2,724 |
| Merck Sharp & Dohme Corp. | 5.000% | 6/30/19 | 7,445 | 8,448 |
| Merck Sharp & Dohme Corp. | 6.400% | 3/1/28 | 1,525 | 1,838 |
| Merck Sharp & Dohme Corp. | 5.950% | 12/1/28 | 775 | 901 |
| Merck Sharp & Dohme Corp. | 5.750% | 11/15/36 | 325 | 365 |
| Merck Sharp & Dohme Corp. | 5.850% | 6/30/39 | 1,025 | 1,192 |
| Molson Coors Brewing Co. | 2.000% | 5/1/17 | 725 | 728 |
| Molson Coors Brewing Co. | 3.500% | 5/1/22 | 800 | 785 |
| Molson Coors Brewing Co. | 5.000% | 5/1/42 | 5,975 | 5,804 |
| Mondelez International Inc. | 4.125% | 2/9/16 | 6,590 | 6,996 |
| Mondelez International Inc. | 6.500% | 8/11/17 | 11,975 | 13,924 |
| Mondelez International Inc. | 6.125% | 2/1/18 | 4,790 | 5,537 |
| Mondelez International Inc. | 5.375% | 2/10/20 | 15,386 | 17,471 |
| Mondelez International Inc. | 6.500% | 11/1/31 | 4,211 | 4,813 |
| Mondelez International Inc. | 7.000% | 8/11/37 | 3,675 | 4,543 |
| Mondelez International Inc. | 6.875% | 2/1/38 | 7,250 | 8,822 |
| Mondelez International Inc. | 6.500% | 2/9/40 | 14,795 | 17,610 |
76
| Total Bond Market II Index Fund | ||||
| Face | Market | |||
| Maturity | Amount | Value | ||
| Coupon | Date | ($000) | ($000) | |
| 6 Mylan Inc. | 1.800% | 6/24/16 | 1,500 | 1,518 |
| Mylan Inc. | 1.350% | 11/29/16 | 2,525 | 2,522 |
| 6 Mylan Inc. | 2.600% | 6/24/18 | 5,020 | 5,027 |
| Mylan Inc. | 2.550% | 3/28/19 | 2,300 | 2,278 |
| Mylan Inc. | 4.200% | 11/29/23 | 9,300 | 9,137 |
| Mylan Inc. | 5.400% | 11/29/43 | 1,875 | 1,888 |
| Newell Rubbermaid Inc. | 2.050% | 12/1/17 | 3,200 | 3,187 |
| Newell Rubbermaid Inc. | 4.000% | 6/15/22 | 4,520 | 4,403 |
| Novant Health Inc. | 5.850% | 11/1/19 | 2,125 | 2,372 |
| Novant Health Inc. | 4.371% | 11/1/43 | 1,000 | 834 |
| Novartis Capital Corp. | 2.900% | 4/24/15 | 14,370 | 14,849 |
| Novartis Capital Corp. | 2.400% | 9/21/22 | 26,175 | 23,936 |
| Novartis Capital Corp. | 3.700% | 9/21/42 | 3,075 | 2,643 |
| Novartis Securities Investment Ltd. | 5.125% | 2/10/19 | 10,590 | 11,964 |
| Partners Healthcare System Massachusetts GO | 3.443% | 7/1/21 | 1,700 | 1,674 |
| Pepsi Bottling Group Inc. | 7.000% | 3/1/29 | 375 | 469 |
| PepsiAmericas Inc. | 4.875% | 1/15/15 | 5,100 | 5,329 |
| PepsiAmericas Inc. | 5.000% | 5/15/17 | 1,400 | 1,546 |
| PepsiCo Inc. | 0.750% | 3/5/15 | 3,125 | 3,136 |
| PepsiCo Inc. | 0.700% | 8/13/15 | 1,910 | 1,915 |
| PepsiCo Inc. | 2.500% | 5/10/16 | 11,390 | 11,816 |
| PepsiCo Inc. | 1.250% | 8/13/17 | 9,200 | 9,130 |
| PepsiCo Inc. | 5.000% | 6/1/18 | 425 | 479 |
| PepsiCo Inc. | 7.900% | 11/1/18 | 1,575 | 1,978 |
| PepsiCo Inc. | 2.250% | 1/7/19 | 3,050 | 3,058 |
| PepsiCo Inc. | 4.500% | 1/15/20 | 2,800 | 3,061 |
| PepsiCo Inc. | 3.125% | 11/1/20 | 4,925 | 4,908 |
| PepsiCo Inc. | 3.000% | 8/25/21 | 11,530 | 11,344 |
| PepsiCo Inc. | 2.750% | 3/5/22 | 16,050 | 15,190 |
| PepsiCo Inc. | 5.500% | 1/15/40 | 1,425 | 1,549 |
| PepsiCo Inc. | 4.875% | 11/1/40 | 4,285 | 4,254 |
| PepsiCo Inc. | 4.000% | 3/5/42 | 6,600 | 5,721 |
| PerkinElmer Inc. | 5.000% | 11/15/21 | 1,410 | 1,436 |
| 6 Perrigo Co. plc | 1.300% | 11/8/16 | 200 | 199 |
| 6 Perrigo Co. plc | 4.000% | 11/15/23 | 14,216 | 13,853 |
| 6 Perrigo Co. plc | 5.300% | 11/15/43 | 750 | 734 |
| Pfizer Inc. | 5.350% | 3/15/15 | 11,340 | 11,993 |
| Pfizer Inc. | 1.500% | 6/15/18 | 5,675 | 5,594 |
| Pfizer Inc. | 6.200% | 3/15/19 | 19,670 | 23,322 |
| Pfizer Inc. | 3.000% | 6/15/23 | 5,300 | 4,990 |
| Pfizer Inc. | 7.200% | 3/15/39 | 9,940 | 13,379 |
| Pfizer Inc. | 4.300% | 6/15/43 | 6,000 | 5,625 |
| Pharmacia Corp. | 6.500% | 12/1/18 | 6,000 | 7,222 |
| Pharmacia Corp. | 6.600% | 12/1/28 | 625 | 769 |
| Philip Morris International Inc. | 2.500% | 5/16/16 | 5,000 | 5,184 |
| Philip Morris International Inc. | 1.625% | 3/20/17 | 3,250 | 3,270 |
| Philip Morris International Inc. | 1.125% | 8/21/17 | 5,575 | 5,483 |
| Philip Morris International Inc. | 5.650% | 5/16/18 | 11,040 | 12,698 |
| Philip Morris International Inc. | 4.500% | 3/26/20 | 575 | 620 |
| Philip Morris International Inc. | 4.125% | 5/17/21 | 2,758 | 2,873 |
| Philip Morris International Inc. | 2.900% | 11/15/21 | 1,500 | 1,436 |
| Philip Morris International Inc. | 2.500% | 8/22/22 | 3,000 | 2,728 |
| Philip Morris International Inc. | 2.625% | 3/6/23 | 5,125 | 4,610 |
| Philip Morris International Inc. | 3.600% | 11/15/23 | 550 | 532 |
| Philip Morris International Inc. | 6.375% | 5/16/38 | 5,600 | 6,612 |
77
| Total Bond Market II Index Fund | ||||
| Face | Market | |||
| Maturity | Amount | Value | ||
| Coupon | Date | ($000) | ($000) | |
| Philip Morris International Inc. | 4.375% | 11/15/41 | 3,155 | 2,854 |
| Philip Morris International Inc. | 4.500% | 3/20/42 | 10,620 | 9,876 |
| Philip Morris International Inc. | 3.875% | 8/21/42 | 125 | 105 |
| Philip Morris International Inc. | 4.125% | 3/4/43 | 2,850 | 2,483 |
| Philip Morris International Inc. | 4.875% | 11/15/43 | 6,725 | 6,653 |
| 3 Procter & Gamble - Esop | 9.360% | 1/1/21 | 2,436 | 3,117 |
| Procter & Gamble Co. | 3.500% | 2/15/15 | 4,500 | 4,652 |
| Procter & Gamble Co. | 1.800% | 11/15/15 | 6,925 | 7,092 |
| Procter & Gamble Co. | 1.450% | 8/15/16 | 9,645 | 9,798 |
| Procter & Gamble Co. | 4.700% | 2/15/19 | 5,265 | 5,896 |
| Procter & Gamble Co. | 2.300% | 2/6/22 | 5,164 | 4,835 |
| Procter & Gamble Co. | 6.450% | 1/15/26 | 12,750 | 15,805 |
| Procter & Gamble Co. | 5.500% | 2/1/34 | 5,000 | 5,583 |
| Procter & Gamble Co. | 5.800% | 8/15/34 | 250 | 288 |
| Procter & Gamble Co. | 5.550% | 3/5/37 | 4,345 | 4,953 |
| Quest Diagnostics Inc. | 5.450% | 11/1/15 | 4,000 | 4,311 |
| Quest Diagnostics Inc. | 6.400% | 7/1/17 | 175 | 199 |
| Quest Diagnostics Inc. | 4.700% | 4/1/21 | 1,335 | 1,366 |
| Quest Diagnostics Inc. | 6.950% | 7/1/37 | 1,460 | 1,609 |
| Reynolds American Inc. | 1.050% | 10/30/15 | 2,125 | 2,131 |
| Reynolds American Inc. | 6.750% | 6/15/17 | 2,725 | 3,132 |
| Reynolds American Inc. | 7.750% | 6/1/18 | 1,000 | 1,206 |
| Reynolds American Inc. | 3.250% | 11/1/22 | 5,850 | 5,366 |
| Reynolds American Inc. | 4.850% | 9/15/23 | 900 | 926 |
| Reynolds American Inc. | 7.250% | 6/15/37 | 675 | 788 |
| Reynolds American Inc. | 4.750% | 11/1/42 | 7,025 | 6,208 |
| Reynolds American Inc. | 6.150% | 9/15/43 | 725 | 779 |
| Safeway Inc. | 3.400% | 12/1/16 | 7,831 | 8,158 |
| Safeway Inc. | 6.350% | 8/15/17 | 1,325 | 1,488 |
| Safeway Inc. | 5.000% | 8/15/19 | 3,500 | 3,721 |
| Safeway Inc. | 4.750% | 12/1/21 | 575 | 575 |
| Safeway Inc. | 7.250% | 2/1/31 | 3,270 | 3,336 |
| Sanofi | 2.625% | 3/29/16 | 10,800 | 11,226 |
| Sanofi | 1.250% | 4/10/18 | 5,000 | 4,872 |
| Sanofi | 4.000% | 3/29/21 | 8,865 | 9,267 |
| St. Jude Medical Inc. | 2.500% | 1/15/16 | 1,475 | 1,514 |
| St. Jude Medical Inc. | 3.250% | 4/15/23 | 18,100 | 16,842 |
| St. Jude Medical Inc. | 4.750% | 4/15/43 | 8,575 | 8,054 |
| Stryker Corp. | 3.000% | 1/15/15 | 800 | 821 |
| Stryker Corp. | 2.000% | 9/30/16 | 2,285 | 2,347 |
| Stryker Corp. | 4.375% | 1/15/20 | 700 | 756 |
| Sysco Corp. | 5.250% | 2/12/18 | 7,995 | 8,967 |
| Sysco Corp. | 2.600% | 6/12/22 | 2,325 | 2,119 |
| Sysco Corp. | 5.375% | 9/21/35 | 1,898 | 1,975 |
| Teva Pharmaceutical Finance Co. BV | 2.400% | 11/10/16 | 2,060 | 2,118 |
| Teva Pharmaceutical Finance Co. BV | 3.650% | 11/10/21 | 615 | 602 |
| Teva Pharmaceutical Finance Co. BV | 2.950% | 12/18/22 | 17,225 | 15,560 |
| Teva Pharmaceutical Finance II BV / | ||||
| Teva Pharmaceutical Finance III LLC | 3.000% | 6/15/15 | 1,950 | 2,012 |
| Teva Pharmaceutical Finance IV BV | 3.650% | 11/10/21 | 3,310 | 3,204 |
| Teva Pharmaceutical Finance IV LLC | 2.250% | 3/18/20 | 10,575 | 10,026 |
| Thermo Fisher Scientific Inc. | 3.250% | 11/20/14 | 5,000 | 5,112 |
| Thermo Fisher Scientific Inc. | 3.200% | 5/1/15 | 1,725 | 1,778 |
| Thermo Fisher Scientific Inc. | 2.250% | 8/15/16 | 1,845 | 1,888 |
| Thermo Fisher Scientific Inc. | 1.300% | 2/1/17 | 825 | 823 |
78
| Total Bond Market II Index Fund | ||||
| Face | Market | |||
| Maturity | Amount | Value | ||
| Coupon | Date | ($000) | ($000) | |
| Thermo Fisher Scientific Inc. | 1.850% | 1/15/18 | 3,000 | 2,987 |
| Thermo Fisher Scientific Inc. | 2.400% | 2/1/19 | 245 | 244 |
| Thermo Fisher Scientific Inc. | 4.700% | 5/1/20 | 525 | 570 |
| Thermo Fisher Scientific Inc. | 4.500% | 3/1/21 | 8,450 | 8,915 |
| Thermo Fisher Scientific Inc. | 3.600% | 8/15/21 | 5,000 | 4,970 |
| Thermo Fisher Scientific Inc. | 3.150% | 1/15/23 | 450 | 419 |
| Thermo Fisher Scientific Inc. | 4.150% | 2/1/24 | 2,125 | 2,111 |
| Thermo Fisher Scientific Inc. | 5.300% | 2/1/44 | 600 | 609 |
| Tupperware Brands Corp. | 4.750% | 6/1/21 | 2,000 | 1,999 |
| Tyson Foods Inc. | 4.500% | 6/15/22 | 5,600 | 5,684 |
| Unilever Capital Corp. | 0.850% | 8/2/17 | 9,885 | 9,623 |
| Unilever Capital Corp. | 4.800% | 2/15/19 | 700 | 784 |
| Unilever Capital Corp. | 4.250% | 2/10/21 | 10,810 | 11,539 |
| Unilever Capital Corp. | 5.900% | 11/15/32 | 3,025 | 3,679 |
| UST LLC | 5.750% | 3/1/18 | 1,975 | 2,238 |
| Whirlpool Corp. | 8.600% | 5/1/14 | 900 | 923 |
| Whirlpool Corp. | 4.700% | 6/1/22 | 4,700 | 4,875 |
| Wyeth LLC | 5.500% | 2/15/16 | 5,240 | 5,763 |
| Wyeth LLC | 5.450% | 4/1/17 | 2,950 | 3,321 |
| Wyeth LLC | 6.450% | 2/1/24 | 2,625 | 3,146 |
| Wyeth LLC | 6.500% | 2/1/34 | 3,100 | 3,772 |
| Wyeth LLC | 6.000% | 2/15/36 | 3,700 | 4,338 |
| Wyeth LLC | 5.950% | 4/1/37 | 8,190 | 9,507 |
| Zimmer Holdings Inc. | 1.400% | 11/30/14 | 850 | 856 |
| Zimmer Holdings Inc. | 4.625% | 11/30/19 | 2,495 | 2,724 |
| Zimmer Holdings Inc. | 3.375% | 11/30/21 | 800 | 770 |
| Zimmer Holdings Inc. | 5.750% | 11/30/39 | 1,600 | 1,757 |
| Zoetis Inc. | 1.150% | 2/1/16 | 975 | 977 |
| Zoetis Inc. | 1.875% | 2/1/18 | 6,350 | 6,300 |
| Zoetis Inc. | 3.250% | 2/1/23 | 11,110 | 10,376 |
| Zoetis Inc. | 4.700% | 2/1/43 | 775 | 726 |
| Energy (1.7%) | ||||
| Alberta Energy Co. Ltd. | 7.375% | 11/1/31 | 1,425 | 1,677 |
| Anadarko Finance Co. | 7.500% | 5/1/31 | 5,125 | 6,244 |
| Anadarko Petroleum Corp. | 5.950% | 9/15/16 | 11,530 | 12,867 |
| Anadarko Petroleum Corp. | 6.375% | 9/15/17 | 5,000 | 5,743 |
| Anadarko Petroleum Corp. | 8.700% | 3/15/19 | 4,045 | 5,138 |
| Anadarko Petroleum Corp. | 6.950% | 6/15/19 | 500 | 597 |
| Anadarko Petroleum Corp. | 6.450% | 9/15/36 | 13,230 | 14,876 |
| Anadarko Petroleum Corp. | 7.950% | 6/15/39 | 200 | 264 |
| Apache Corp. | 5.625% | 1/15/17 | 250 | 281 |
| Apache Corp. | 1.750% | 4/15/17 | 2,100 | 2,110 |
| Apache Corp. | 6.900% | 9/15/18 | 9,745 | 11,774 |
| Apache Corp. | 3.625% | 2/1/21 | 5,260 | 5,410 |
| Apache Corp. | 3.250% | 4/15/22 | 2,751 | 2,706 |
| Apache Corp. | 6.000% | 1/15/37 | 9,775 | 10,967 |
| Apache Corp. | 5.100% | 9/1/40 | 6,575 | 6,619 |
| Apache Corp. | 5.250% | 2/1/42 | 740 | 758 |
| Apache Corp. | 4.750% | 4/15/43 | 3,025 | 2,907 |
| Apache Corp. | 4.250% | 1/15/44 | 1,100 | 980 |
| Baker Hughes Inc. | 7.500% | 11/15/18 | 3,425 | 4,265 |
| Baker Hughes Inc. | 3.200% | 8/15/21 | 9,470 | 9,394 |
| Baker Hughes Inc. | 6.875% | 1/15/29 | 300 | 370 |
| Baker Hughes Inc. | 5.125% | 9/15/40 | 6,140 | 6,434 |
79
| Total Bond Market II Index Fund | ||||
| Face | Market | |||
| Maturity | Amount | Value | ||
| Coupon | Date | ($000) | ($000) | |
| BJ Services Co. | 6.000% | 6/1/18 | 150 | 173 |
| BP Capital Markets plc | 3.875% | 3/10/15 | 4,525 | 4,705 |
| BP Capital Markets plc | 3.125% | 10/1/15 | 6,500 | 6,798 |
| BP Capital Markets plc | 0.700% | 11/6/15 | 2,500 | 2,509 |
| BP Capital Markets plc | 3.200% | 3/11/16 | 9,495 | 9,973 |
| BP Capital Markets plc | 2.248% | 11/1/16 | 5,775 | 5,989 |
| BP Capital Markets plc | 1.846% | 5/5/17 | 4,200 | 4,232 |
| BP Capital Markets plc | 1.375% | 11/6/17 | 1,000 | 986 |
| BP Capital Markets plc | 1.375% | 5/10/18 | 4,000 | 3,889 |
| BP Capital Markets plc | 2.241% | 9/26/18 | 6,650 | 6,672 |
| BP Capital Markets plc | 4.750% | 3/10/19 | 4,300 | 4,782 |
| BP Capital Markets plc | 4.500% | 10/1/20 | 12,150 | 13,138 |
| BP Capital Markets plc | 4.742% | 3/11/21 | 10,315 | 11,169 |
| BP Capital Markets plc | 3.561% | 11/1/21 | 10,520 | 10,542 |
| BP Capital Markets plc | 3.245% | 5/6/22 | 6,800 | 6,565 |
| BP Capital Markets plc | 2.500% | 11/6/22 | 7,675 | 6,986 |
| BP Capital Markets plc | 2.750% | 5/10/23 | 6,800 | 6,187 |
| BP Capital Markets plc | 3.994% | 9/26/23 | 2,700 | 2,718 |
| Burlington Resources Finance Co. | 7.200% | 8/15/31 | 975 | 1,242 |
| Burlington Resources Finance Co. | 7.400% | 12/1/31 | 1,775 | 2,304 |
| Cameron International Corp. | 6.375% | 7/15/18 | 7,875 | 9,216 |
| Cameron International Corp. | 7.000% | 7/15/38 | 440 | 533 |
| Cameron International Corp. | 5.125% | 12/15/43 | 400 | 397 |
| Canadian Natural Resources Ltd. | 4.900% | 12/1/14 | 4,225 | 4,391 |
| Canadian Natural Resources Ltd. | 6.000% | 8/15/16 | 1,150 | 1,290 |
| Canadian Natural Resources Ltd. | 5.700% | 5/15/17 | 1,935 | 2,176 |
| Canadian Natural Resources Ltd. | 3.450% | 11/15/21 | 6,500 | 6,381 |
| Canadian Natural Resources Ltd. | 7.200% | 1/15/32 | 1,875 | 2,226 |
| Canadian Natural Resources Ltd. | 6.450% | 6/30/33 | 2,025 | 2,273 |
| Canadian Natural Resources Ltd. | 5.850% | 2/1/35 | 350 | 369 |
| Canadian Natural Resources Ltd. | 6.500% | 2/15/37 | 2,200 | 2,491 |
| Canadian Natural Resources Ltd. | 6.250% | 3/15/38 | 2,100 | 2,347 |
| Canadian Natural Resources Ltd. | 6.750% | 2/1/39 | 1,500 | 1,768 |
| Cenovus Energy Inc. | 5.700% | 10/15/19 | 8,550 | 9,735 |
| Cenovus Energy Inc. | 3.000% | 8/15/22 | 2,975 | 2,787 |
| Cenovus Energy Inc. | 3.800% | 9/15/23 | 5,000 | 4,865 |
| Cenovus Energy Inc. | 6.750% | 11/15/39 | 3,525 | 4,105 |
| Cenovus Energy Inc. | 4.450% | 9/15/42 | 3,175 | 2,816 |
| Chevron Corp. | 0.889% | 6/24/16 | 6,000 | 6,020 |
| Chevron Corp. | 1.104% | 12/5/17 | 5,775 | 5,677 |
| Chevron Corp. | 1.718% | 6/24/18 | 9,925 | 9,893 |
| Chevron Corp. | 4.950% | 3/3/19 | 2,750 | 3,131 |
| Chevron Corp. | 2.355% | 12/5/22 | 9,125 | 8,311 |
| Chevron Corp. | 3.191% | 6/24/23 | 5,500 | 5,291 |
| Conoco Funding Co. | 7.250% | 10/15/31 | 2,225 | 2,912 |
| ConocoPhillips | 4.600% | 1/15/15 | 11,640 | 12,136 |
| ConocoPhillips | 6.650% | 7/15/18 | 2,475 | 2,964 |
| ConocoPhillips | 5.750% | 2/1/19 | 8,690 | 10,120 |
| ConocoPhillips | 6.000% | 1/15/20 | 5,220 | 6,140 |
| ConocoPhillips | 5.900% | 10/15/32 | 725 | 829 |
| ConocoPhillips | 5.900% | 5/15/38 | 1,370 | 1,593 |
| ConocoPhillips | 6.500% | 2/1/39 | 12,438 | 15,556 |
| ConocoPhillips Canada Funding Co. I | 5.625% | 10/15/16 | 4,525 | 5,081 |
| ConocoPhillips Canada Funding Co. I | 5.950% | 10/15/36 | 3,025 | 3,502 |
| ConocoPhillips Co. | 1.050% | 12/15/17 | 4,000 | 3,926 |
80
| Total Bond Market II Index Fund | ||||
| Face | Market | |||
| Maturity | Amount | Value | ||
| Coupon | Date | ($000) | ($000) | |
| ConocoPhillips Co. | 2.400% | 12/15/22 | 2,400 | 2,181 |
| ConocoPhillips Holding Co. | 6.950% | 4/15/29 | 2,850 | 3,592 |
| Continental Resources Inc. | 5.000% | 9/15/22 | 14,975 | 15,555 |
| Continental Resources Inc. | 4.500% | 4/15/23 | 8,200 | 8,313 |
| Devon Energy Corp. | 2.400% | 7/15/16 | 800 | 825 |
| Devon Energy Corp. | 6.300% | 1/15/19 | 3,300 | 3,875 |
| Devon Energy Corp. | 4.000% | 7/15/21 | 2,000 | 2,050 |
| Devon Energy Corp. | 3.250% | 5/15/22 | 11,325 | 10,812 |
| Devon Energy Corp. | 7.950% | 4/15/32 | 1,350 | 1,757 |
| Devon Energy Corp. | 5.600% | 7/15/41 | 3,645 | 3,773 |
| Devon Energy Corp. | 4.750% | 5/15/42 | 6,650 | 6,149 |
| Devon Financing Co. LLC | 7.875% | 9/30/31 | 9,125 | 11,737 |
| Diamond Offshore Drilling Inc. | 4.875% | 7/1/15 | 2,275 | 2,420 |
| Diamond Offshore Drilling Inc. | 5.875% | 5/1/19 | 2,733 | 3,177 |
| Diamond Offshore Drilling Inc. | 5.700% | 10/15/39 | 4,690 | 5,081 |
| Encana Corp. | 5.900% | 12/1/17 | 2,275 | 2,580 |
| Encana Corp. | 3.900% | 11/15/21 | 11,885 | 11,805 |
| Encana Corp. | 7.200% | 11/1/31 | 1,800 | 2,057 |
| Encana Corp. | 6.500% | 8/15/34 | 2,925 | 3,212 |
| Encana Corp. | 6.625% | 8/15/37 | 4,950 | 5,468 |
| EnCana Holdings Finance Corp. | 5.800% | 5/1/14 | 4,350 | 4,425 |
| Eni USA Inc. | 7.300% | 11/15/27 | 175 | 216 |
| Ensco plc | 3.250% | 3/15/16 | 6,335 | 6,620 |
| Ensco plc | 4.700% | 3/15/21 | 4,250 | 4,494 |
| EOG Resources Inc. | 2.500% | 2/1/16 | 705 | 729 |
| EOG Resources Inc. | 5.875% | 9/15/17 | 2,200 | 2,537 |
| EOG Resources Inc. | 5.625% | 6/1/19 | 3,350 | 3,879 |
| EOG Resources Inc. | 4.400% | 6/1/20 | 1,880 | 2,027 |
| EOG Resources Inc. | 4.100% | 2/1/21 | 9,450 | 9,905 |
| EOG Resources Inc. | 2.625% | 3/15/23 | 5,750 | 5,242 |
| EQT Corp. | 6.500% | 4/1/18 | 3,175 | 3,594 |
| EQT Corp. | 8.125% | 6/1/19 | 2,975 | 3,613 |
| EQT Corp. | 4.875% | 11/15/21 | 2,500 | 2,560 |
| FMC Technologies Inc. | 2.000% | 10/1/17 | 1,500 | 1,488 |
| FMC Technologies Inc. | 3.450% | 10/1/22 | 1,400 | 1,303 |
| Global Marine Inc. | 7.000% | 6/1/28 | 5,850 | 6,093 |
| Halliburton Co. | 1.000% | 8/1/16 | 4,625 | 4,639 |
| Halliburton Co. | 2.000% | 8/1/18 | 4,625 | 4,628 |
| Halliburton Co. | 5.900% | 9/15/18 | 50 | 58 |
| Halliburton Co. | 6.150% | 9/15/19 | 800 | 952 |
| Halliburton Co. | 3.250% | 11/15/21 | 4,235 | 4,186 |
| Halliburton Co. | 3.500% | 8/1/23 | 7,650 | 7,413 |
| Halliburton Co. | 6.700% | 9/15/38 | 5,720 | 7,021 |
| Halliburton Co. | 7.450% | 9/15/39 | 1,534 | 2,046 |
| Halliburton Co. | 4.500% | 11/15/41 | 1,245 | 1,176 |
| Halliburton Co. | 4.750% | 8/1/43 | 4,575 | 4,479 |
| Hess Corp. | 8.125% | 2/15/19 | 9,829 | 12,244 |
| Hess Corp. | 7.875% | 10/1/29 | 1,450 | 1,841 |
| Hess Corp. | 7.300% | 8/15/31 | 950 | 1,155 |
| Hess Corp. | 7.125% | 3/15/33 | 1,525 | 1,830 |
| Hess Corp. | 6.000% | 1/15/40 | 7,900 | 8,554 |
| Hess Corp. | 5.600% | 2/15/41 | 3,205 | 3,326 |
| Husky Energy Inc. | 6.150% | 6/15/19 | 200 | 228 |
| Husky Energy Inc. | 7.250% | 12/15/19 | 2,020 | 2,447 |
| Husky Energy Inc. | 6.800% | 9/15/37 | 5,510 | 6,639 |
81
| Total Bond Market II Index Fund | ||||
| Face | Market | |||
| Maturity | Amount | Value | ||
| Coupon | Date | ($000) | ($000) | |
| Kerr-McGee Corp. | 6.950% | 7/1/24 | 3,300 | 3,841 |
| Kerr-McGee Corp. | 7.875% | 9/15/31 | 875 | 1,085 |
| Marathon Oil Corp. | 6.000% | 10/1/17 | 17,810 | 20,443 |
| Marathon Oil Corp. | 5.900% | 3/15/18 | 1,228 | 1,410 |
| Marathon Oil Corp. | 2.800% | 11/1/22 | 8,600 | 7,918 |
| Marathon Oil Corp. | 6.800% | 3/15/32 | 2,670 | 3,178 |
| Marathon Oil Corp. | 6.600% | 10/1/37 | 4,800 | 5,766 |
| Marathon Petroleum Corp. | 3.500% | 3/1/16 | 1,000 | 1,050 |
| Marathon Petroleum Corp. | 5.125% | 3/1/21 | 400 | 433 |
| Marathon Petroleum Corp. | 6.500% | 3/1/41 | 1,550 | 1,771 |
| Murphy Oil Corp. | 2.500% | 12/1/17 | 3,100 | 3,133 |
| Murphy Oil Corp. | 3.700% | 12/1/22 | 1,400 | 1,288 |
| Murphy Oil Corp. | 7.050% | 5/1/29 | 2,000 | 2,131 |
| Murphy Oil Corp. | 5.125% | 12/1/42 | 875 | 752 |
| 6 Nabors Industries Inc. | 2.350% | 9/15/16 | 1,275 | 1,295 |
| Nabors Industries Inc. | 6.150% | 2/15/18 | 9,545 | 10,737 |
| Nabors Industries Inc. | 9.250% | 1/15/19 | 875 | 1,088 |
| Nabors Industries Inc. | 5.000% | 9/15/20 | 5,985 | 6,212 |
| 6 Nabors Industries Inc. | 5.100% | 9/15/23 | 4,025 | 4,031 |
| National Oilwell Varco Inc. | 1.350% | 12/1/17 | 1,875 | 1,855 |
| National Oilwell Varco Inc. | 2.600% | 12/1/22 | 15,465 | 14,206 |
| National Oilwell Varco Inc. | 3.950% | 12/1/42 | 1,400 | 1,228 |
| Noble Energy Inc. | 4.150% | 12/15/21 | 12,300 | 12,626 |
| Noble Energy Inc. | 8.000% | 4/1/27 | 4,895 | 6,238 |
| Noble Energy Inc. | 6.000% | 3/1/41 | 825 | 896 |
| Noble Holding International Ltd. | 3.050% | 3/1/16 | 440 | 452 |
| Noble Holding International Ltd. | 2.500% | 3/15/17 | 2,400 | 2,406 |
| Noble Holding International Ltd. | 4.900% | 8/1/20 | 1,891 | 1,993 |
| Noble Holding International Ltd. | 3.950% | 3/15/22 | 3,250 | 3,148 |
| Noble Holding International Ltd. | 6.200% | 8/1/40 | 1,400 | 1,461 |
| Noble Holding International Ltd. | 6.050% | 3/1/41 | 2,500 | 2,559 |
| Noble Holding International Ltd. | 5.250% | 3/15/42 | 2,475 | 2,361 |
| Occidental Petroleum Corp. | 2.500% | 2/1/16 | 3,405 | 3,528 |
| Occidental Petroleum Corp. | 4.125% | 6/1/16 | 2,620 | 2,818 |
| Occidental Petroleum Corp. | 1.750% | 2/15/17 | 15,100 | 15,314 |
| Occidental Petroleum Corp. | 1.500% | 2/15/18 | 4,650 | 4,585 |
| Occidental Petroleum Corp. | 4.100% | 2/1/21 | 11,060 | 11,678 |
| Occidental Petroleum Corp. | 3.125% | 2/15/22 | 7,725 | 7,495 |
| Occidental Petroleum Corp. | 2.700% | 2/15/23 | 6,575 | 6,018 |
| Petro-Canada | 6.050% | 5/15/18 | 7,250 | 8,354 |
| Petro-Canada | 7.875% | 6/15/26 | 500 | 641 |
| Petro-Canada | 7.000% | 11/15/28 | 475 | 577 |
| Petro-Canada | 5.350% | 7/15/33 | 1,425 | 1,438 |
| Petro-Canada | 5.950% | 5/15/35 | 8,455 | 9,114 |
| Petro-Canada | 6.800% | 5/15/38 | 5,525 | 6,596 |
| Petrohawk Energy Corp. | 7.250% | 8/15/18 | 3,000 | 3,229 |
| Petrohawk Energy Corp. | 6.250% | 6/1/19 | 6,300 | 6,914 |
| Phillips 66 | 1.950% | 3/5/15 | 2,745 | 2,785 |
| Phillips 66 | 2.950% | 5/1/17 | 7,475 | 7,779 |
| Phillips 66 | 4.300% | 4/1/22 | 16,885 | 17,130 |
| Phillips 66 | 5.875% | 5/1/42 | 6,950 | 7,506 |
| Pioneer Natural Resources Co. | 6.875% | 5/1/18 | 1,175 | 1,382 |
| Pioneer Natural Resources Co. | 3.950% | 7/15/22 | 2,810 | 2,816 |
| Pioneer Natural Resources Co. | 7.200% | 1/15/28 | 4,378 | 5,262 |
| Pride International Inc. | 6.875% | 8/15/20 | 6,000 | 7,158 |
82
| Total Bond Market II Index Fund | ||||
| Face | Market | |||
| Maturity | Amount | Value | ||
| Coupon | Date | ($000) | ($000) | |
| Pride International Inc. | 7.875% | 8/15/40 | 3,000 | 4,029 |
| Rowan Cos. Inc. | 7.875% | 8/1/19 | 875 | 1,059 |
| Rowan Cos. Inc. | 4.875% | 6/1/22 | 6,250 | 6,368 |
| Schlumberger Investment SA | 3.650% | 12/1/23 | 8,575 | 8,476 |
| Shell International Finance BV | 3.100% | 6/28/15 | 14,300 | 14,839 |
| Shell International Finance BV | 3.250% | 9/22/15 | 1,400 | 1,465 |
| Shell International Finance BV | 0.625% | 12/4/15 | 4,000 | 4,009 |
| Shell International Finance BV | 5.200% | 3/22/17 | 4,150 | 4,648 |
| Shell International Finance BV | 1.125% | 8/21/17 | 2,000 | 1,972 |
| Shell International Finance BV | 1.900% | 8/10/18 | 6,175 | 6,144 |
| Shell International Finance BV | 2.000% | 11/15/18 | 1,725 | 1,724 |
| Shell International Finance BV | 4.300% | 9/22/19 | 3,100 | 3,392 |
| Shell International Finance BV | 4.375% | 3/25/20 | 2,000 | 2,187 |
| Shell International Finance BV | 2.375% | 8/21/22 | 10,190 | 9,321 |
| Shell International Finance BV | 2.250% | 1/6/23 | 3,250 | 2,887 |
| Shell International Finance BV | 3.400% | 8/12/23 | 1,500 | 1,458 |
| Shell International Finance BV | 6.375% | 12/15/38 | 12,942 | 15,947 |
| Shell International Finance BV | 5.500% | 3/25/40 | 1,525 | 1,689 |
| Shell International Finance BV | 3.625% | 8/21/42 | 4,000 | 3,314 |
| Shell International Finance BV | 4.550% | 8/12/43 | 6,200 | 5,981 |
| Southwestern Energy Co. | 7.500% | 2/1/18 | 4,125 | 4,878 |
| Southwestern Energy Co. | 4.100% | 3/15/22 | 4,650 | 4,586 |
| Suncor Energy Inc. | 6.100% | 6/1/18 | 4,900 | 5,663 |
| Suncor Energy Inc. | 7.150% | 2/1/32 | 3,625 | 4,629 |
| Suncor Energy Inc. | 5.950% | 12/1/34 | 175 | 187 |
| Suncor Energy Inc. | 6.500% | 6/15/38 | 11,580 | 13,412 |
| Suncor Energy Inc. | 6.850% | 6/1/39 | 6,455 | 7,756 |
| Talisman Energy Inc. | 5.125% | 5/15/15 | 375 | 392 |
| Talisman Energy Inc. | 7.750% | 6/1/19 | 11,525 | 13,821 |
| Talisman Energy Inc. | 5.850% | 2/1/37 | 300 | 292 |
| Tosco Corp. | 7.800% | 1/1/27 | 315 | 418 |
| Tosco Corp. | 8.125% | 2/15/30 | 4,950 | 6,868 |
| Total Capital Canada Ltd. | 1.450% | 1/15/18 | 10,455 | 10,361 |
| Total Capital Canada Ltd. | 2.750% | 7/15/23 | 3,800 | 3,507 |
| Total Capital International SA | 0.750% | 1/25/16 | 3,400 | 3,398 |
| Total Capital International SA | 1.000% | 8/12/16 | 4,000 | 4,008 |
| Total Capital International SA | 1.500% | 2/17/17 | 1,075 | 1,075 |
| Total Capital International SA | 1.550% | 6/28/17 | 8,350 | 8,345 |
| Total Capital International SA | 2.875% | 2/17/22 | 6,000 | 5,684 |
| Total Capital International SA | 2.700% | 1/25/23 | 7,550 | 6,952 |
| Total Capital International SA | 3.700% | 1/15/24 | 3,625 | 3,586 |
| Total Capital SA | 3.000% | 6/24/15 | 5,800 | 6,015 |
| Total Capital SA | 2.300% | 3/15/16 | 7,265 | 7,480 |
| Total Capital SA | 2.125% | 8/10/18 | 3,500 | 3,510 |
| Total Capital SA | 4.450% | 6/24/20 | 5,075 | 5,498 |
| Total Capital SA | 4.125% | 1/28/21 | 2,805 | 2,953 |
| Transocean Inc. | 4.950% | 11/15/15 | 9,650 | 10,342 |
| Transocean Inc. | 6.000% | 3/15/18 | 7,375 | 8,292 |
| Transocean Inc. | 6.500% | 11/15/20 | 5,015 | 5,709 |
| Transocean Inc. | 6.375% | 12/15/21 | 13,638 | 15,300 |
| Transocean Inc. | 3.800% | 10/15/22 | 9,651 | 9,145 |
| Transocean Inc. | 7.500% | 4/15/31 | 1,575 | 1,828 |
| Transocean Inc. | 6.800% | 3/15/38 | 2,925 | 3,264 |
| Transocean Inc. | 7.350% | 12/15/41 | 575 | 687 |
| Valero Energy Corp. | 6.125% | 6/15/17 | 7,655 | 8,746 |
83
| Total Bond Market II Index Fund | ||||
| Face | Market | |||
| Maturity | Amount | Value | ||
| Coupon | Date | ($000) | ($000) | |
| Valero Energy Corp. | 9.375% | 3/15/19 | 1,575 | 2,043 |
| Valero Energy Corp. | 6.125% | 2/1/20 | 8,950 | 10,209 |
| Valero Energy Corp. | 7.500% | 4/15/32 | 3,775 | 4,592 |
| Valero Energy Corp. | 6.625% | 6/15/37 | 9,931 | 11,287 |
| Weatherford International LLC | 6.350% | 6/15/17 | 7,593 | 8,609 |
| Weatherford International LLC | 6.800% | 6/15/37 | 250 | 269 |
| Weatherford International Ltd. | 5.500% | 2/15/16 | 2,000 | 2,169 |
| Weatherford International Ltd. | 6.000% | 3/15/18 | 1,890 | 2,130 |
| Weatherford International Ltd. | 9.625% | 3/1/19 | 5,200 | 6,699 |
| Weatherford International Ltd. | 4.500% | 4/15/22 | 5,500 | 5,534 |
| Weatherford International Ltd. | 6.500% | 8/1/36 | 2,750 | 2,865 |
| Weatherford International Ltd. | 7.000% | 3/15/38 | 2,480 | 2,725 |
| Weatherford International Ltd. | 6.750% | 9/15/40 | 2,595 | 2,789 |
| Weatherford International Ltd. | 5.950% | 4/15/42 | 450 | 452 |
| XTO Energy Inc. | 6.250% | 8/1/17 | 6,250 | 7,266 |
| XTO Energy Inc. | 5.500% | 6/15/18 | 100 | 115 |
| Other Industrial (0.0%) | ||||
| California Institute of Technology GO | 4.700% | 11/1/11 | 5,700 | 4,862 |
| Cintas Corp. No 2 | 6.125% | 12/1/17 | 1,875 | 2,118 |
| Cintas Corp. No 2 | 3.250% | 6/1/22 | 1,725 | 1,645 |
| Fluor Corp. | 3.375% | 9/15/21 | 1,500 | 1,457 |
| Howard Hughes Medical Institute | 3.500% | 9/1/23 | 3,975 | 3,892 |
| 3 Johns Hopkins University Maryland GO | 4.083% | 7/1/53 | 3,700 | 3,170 |
| Massachusetts Institute of Technology GO | 5.600% | 7/1/11 | 4,100 | 4,649 |
| 3 Northwestern University GO | 4.643% | 12/1/44 | 2,375 | 2,328 |
| President & Fellows of Harvard College | ||||
| Massachusetts GO | 3.619% | 10/1/37 | 3,150 | 2,684 |
| University of Pennsylvania GO | 4.674% | 9/1/12 | 5,500 | 4,841 |
| 6 URS Corp. | 5.500% | 4/1/22 | 3,600 | 3,546 |
| Technology (1.1%) | ||||
| Adobe Systems Inc. | 3.250% | 2/1/15 | 3,420 | 3,516 |
| Adobe Systems Inc. | 4.750% | 2/1/20 | 1,275 | 1,385 |
| Agilent Technologies Inc. | 5.500% | 9/14/15 | 1,300 | 1,401 |
| Agilent Technologies Inc. | 6.500% | 11/1/17 | 9,575 | 11,089 |
| Agilent Technologies Inc. | 3.200% | 10/1/22 | 4,315 | 3,943 |
| Agilent Technologies Inc. | 3.875% | 7/15/23 | 2,350 | 2,227 |
| Altera Corp. | 1.750% | 5/15/17 | 1,250 | 1,233 |
| Altera Corp. | 2.500% | 11/15/18 | 12,675 | 12,591 |
| Altera Corp. | 4.100% | 11/15/23 | 2,050 | 1,977 |
| Analog Devices Inc. | 3.000% | 4/15/16 | 875 | 914 |
| Analog Devices Inc. | 2.875% | 6/1/23 | 2,600 | 2,361 |
| Apple Inc. | 0.450% | 5/3/16 | 7,200 | 7,159 |
| Apple Inc. | 1.000% | 5/3/18 | 11,750 | 11,372 |
| Apple Inc. | 2.400% | 5/3/23 | 23,075 | 20,625 |
| Apple Inc. | 3.850% | 5/4/43 | 11,175 | 9,337 |
| Applied Materials Inc. | 2.650% | 6/15/16 | 525 | 545 |
| Applied Materials Inc. | 4.300% | 6/15/21 | 3,840 | 3,946 |
| Applied Materials Inc. | 5.850% | 6/15/41 | 5,460 | 5,593 |
| Arrow Electronics Inc. | 3.375% | 11/1/15 | 1,225 | 1,270 |
| Arrow Electronics Inc. | 5.125% | 3/1/21 | 515 | 529 |
| Arrow Electronics Inc. | 4.500% | 3/1/23 | 3,450 | 3,334 |
| Autodesk Inc. | 1.950% | 12/15/17 | 5,300 | 5,247 |
| Autodesk Inc. | 3.600% | 12/15/22 | 825 | 764 |
84
| Total Bond Market II Index Fund | ||||
| Face | Market | |||
| Maturity | Amount | Value | ||
| Coupon | Date | ($000) | ($000) | |
| Avnet Inc. | 6.625% | 9/15/16 | 225 | 253 |
| Avnet Inc. | 5.875% | 6/15/20 | 4,300 | 4,595 |
| Avnet Inc. | 4.875% | 12/1/22 | 1,450 | 1,451 |
| Baidu Inc. | 2.250% | 11/28/17 | 7,700 | 7,664 |
| Baidu Inc. | 3.500% | 11/28/22 | 7,200 | 6,590 |
| Broadcom Corp. | 2.700% | 11/1/18 | 5,385 | 5,466 |
| Broadcom Corp. | 2.500% | 8/15/22 | 3,405 | 3,041 |
| Broadridge Financial Solutions Inc. | 3.950% | 9/1/20 | 650 | 652 |
| CA Inc. | 5.375% | 12/1/19 | 3,545 | 3,953 |
| Cisco Systems Inc. | 5.500% | 2/22/16 | 11,783 | 12,972 |
| Cisco Systems Inc. | 3.150% | 3/14/17 | 11,975 | 12,674 |
| Cisco Systems Inc. | 4.950% | 2/15/19 | 5,975 | 6,710 |
| Cisco Systems Inc. | 4.450% | 1/15/20 | 8,300 | 9,021 |
| Cisco Systems Inc. | 5.900% | 2/15/39 | 1,600 | 1,777 |
| Cisco Systems Inc. | 5.500% | 1/15/40 | 21,870 | 23,077 |
| Computer Sciences Corp. | 2.500% | 9/15/15 | 100 | 102 |
| Computer Sciences Corp. | 6.500% | 3/15/18 | 400 | 461 |
| Corning Inc. | 6.625% | 5/15/19 | 275 | 331 |
| Corning Inc. | 3.700% | 11/15/23 | 3,300 | 3,249 |
| Corning Inc. | 7.250% | 8/15/36 | 100 | 114 |
| Corning Inc. | 4.700% | 3/15/37 | 4,000 | 3,792 |
| Corning Inc. | 5.750% | 8/15/40 | 7,135 | 7,692 |
| Dun & Bradstreet Corp. | 2.875% | 11/15/15 | 350 | 361 |
| Dun & Bradstreet Corp. | 4.375% | 12/1/22 | 950 | 916 |
| EMC Corp. | 1.875% | 6/1/18 | 12,185 | 12,062 |
| EMC Corp. | 2.650% | 6/1/20 | 10,620 | 10,453 |
| EMC Corp. | 3.375% | 6/1/23 | 14,825 | 14,239 |
| Equifax Inc. | 4.450% | 12/1/14 | 775 | 800 |
| Equifax Inc. | 6.300% | 7/1/17 | 425 | 484 |
| Fidelity National Information Services Inc. | 2.000% | 4/15/18 | 925 | 901 |
| Fidelity National Information Services Inc. | 5.000% | 3/15/22 | 7,850 | 8,017 |
| Fidelity National Information Services Inc. | 3.500% | 4/15/23 | 3,800 | 3,474 |
| Fiserv Inc. | 3.125% | 10/1/15 | 1,000 | 1,036 |
| Fiserv Inc. | 3.125% | 6/15/16 | 3,415 | 3,569 |
| Fiserv Inc. | 6.800% | 11/20/17 | 2,525 | 2,910 |
| Fiserv Inc. | 3.500% | 10/1/22 | 2,425 | 2,255 |
| Google Inc. | 1.250% | 5/19/14 | 470 | 472 |
| Google Inc. | 2.125% | 5/19/16 | 375 | 387 |
| Google Inc. | 3.625% | 5/19/21 | 3,325 | 3,455 |
| Harris Corp. | 5.950% | 12/1/17 | 1,300 | 1,461 |
| Harris Corp. | 6.375% | 6/15/19 | 250 | 290 |
| Harris Corp. | 4.400% | 12/15/20 | 2,675 | 2,762 |
| Harris Corp. | 6.150% | 12/15/40 | 750 | 800 |
| Hewlett-Packard Co. | 2.625% | 12/9/14 | 4,500 | 4,577 |
| Hewlett-Packard Co. | 2.350% | 3/15/15 | 1,300 | 1,323 |
| Hewlett-Packard Co. | 2.125% | 9/13/15 | 4,275 | 4,364 |
| Hewlett-Packard Co. | 2.650% | 6/1/16 | 1,050 | 1,083 |
| Hewlett-Packard Co. | 3.000% | 9/15/16 | 1,875 | 1,951 |
| Hewlett-Packard Co. | 3.300% | 12/9/16 | 1,425 | 1,490 |
| Hewlett-Packard Co. | 5.400% | 3/1/17 | 2,100 | 2,308 |
| Hewlett-Packard Co. | 2.600% | 9/15/17 | 9,210 | 9,427 |
| Hewlett-Packard Co. | 5.500% | 3/1/18 | 7,450 | 8,290 |
| Hewlett-Packard Co. | 3.750% | 12/1/20 | 12,550 | 12,535 |
| Hewlett-Packard Co. | 4.300% | 6/1/21 | 3,680 | 3,701 |
| Hewlett-Packard Co. | 4.375% | 9/15/21 | 13,375 | 13,597 |
85
| Total Bond Market II Index Fund | ||||
| Face | Market | |||
| Maturity | Amount | Value | ||
| Coupon | Date | ($000) | ($000) | |
| Hewlett-Packard Co. | 4.650% | 12/9/21 | 4,650 | 4,790 |
| Hewlett-Packard Co. | 6.000% | 9/15/41 | 2,895 | 2,897 |
| Intel Corp. | 1.950% | 10/1/16 | 5,200 | 5,357 |
| Intel Corp. | 1.350% | 12/15/17 | 18,105 | 17,917 |
| Intel Corp. | 3.300% | 10/1/21 | 2,000 | 1,996 |
| Intel Corp. | 2.700% | 12/15/22 | 6,000 | 5,512 |
| Intel Corp. | 4.000% | 12/15/32 | 3,300 | 3,026 |
| Intel Corp. | 4.800% | 10/1/41 | 9,870 | 9,656 |
| Intel Corp. | 4.250% | 12/15/42 | 7,325 | 6,424 |
| International Business Machines Corp. | 0.875% | 10/31/14 | 3,960 | 3,978 |
| International Business Machines Corp. | 0.550% | 2/6/15 | 1,200 | 1,203 |
| International Business Machines Corp. | 2.000% | 1/5/16 | 5,925 | 6,087 |
| International Business Machines Corp. | 1.950% | 7/22/16 | 8,175 | 8,404 |
| International Business Machines Corp. | 1.250% | 2/6/17 | 15,425 | 15,422 |
| International Business Machines Corp. | 5.700% | 9/14/17 | 25,325 | 29,082 |
| International Business Machines Corp. | 1.625% | 5/15/20 | 475 | 446 |
| International Business Machines Corp. | 2.900% | 11/1/21 | 1,950 | 1,883 |
| International Business Machines Corp. | 3.375% | 8/1/23 | 5,325 | 5,174 |
| International Business Machines Corp. | 7.000% | 10/30/25 | 4,850 | 6,079 |
| International Business Machines Corp. | 6.220% | 8/1/27 | 1,975 | 2,335 |
| International Business Machines Corp. | 6.500% | 1/15/28 | 100 | 123 |
| International Business Machines Corp. | 5.875% | 11/29/32 | 225 | 259 |
| International Business Machines Corp. | 5.600% | 11/30/39 | 1,098 | 1,227 |
| International Business Machines Corp. | 4.000% | 6/20/42 | 9,197 | 8,174 |
| Intuit Inc. | 5.750% | 3/15/17 | 575 | 648 |
| Jabil Circuit Inc. | 5.625% | 12/15/20 | 1,375 | 1,430 |
| Juniper Networks Inc. | 3.100% | 3/15/16 | 1,000 | 1,030 |
| Juniper Networks Inc. | 4.600% | 3/15/21 | 900 | 912 |
| Juniper Networks Inc. | 5.950% | 3/15/41 | 5,500 | 5,445 |
| KLA-Tencor Corp. | 6.900% | 5/1/18 | 6,175 | 7,244 |
| Leidos Holdings Inc. | 4.450% | 12/1/20 | 2,660 | 2,655 |
| Leidos Holdings Inc. | 5.950% | 12/1/40 | 800 | 764 |
| Leidos Inc. | 5.500% | 7/1/33 | 250 | 228 |
| Lexmark International Inc. | 6.650% | 6/1/18 | 1,850 | 2,075 |
| Lexmark International Inc. | 5.125% | 3/15/20 | 1,450 | 1,481 |
| Maxim Integrated Products Inc. | 3.375% | 3/15/23 | 375 | 342 |
| Microsoft Corp. | 1.625% | 9/25/15 | 5,405 | 5,528 |
| Microsoft Corp. | 0.875% | 11/15/17 | 2,550 | 2,504 |
| Microsoft Corp. | 1.000% | 5/1/18 | 4,050 | 3,965 |
| Microsoft Corp. | 1.625% | 12/6/18 | 3,625 | 3,577 |
| Microsoft Corp. | 4.200% | 6/1/19 | 1,465 | 1,618 |
| Microsoft Corp. | 3.000% | 10/1/20 | 4,750 | 4,831 |
| Microsoft Corp. | 4.000% | 2/8/21 | 3,950 | 4,193 |
| Microsoft Corp. | 2.125% | 11/15/22 | 4,350 | 3,935 |
| Microsoft Corp. | 2.375% | 5/1/23 | 5,950 | 5,399 |
| Microsoft Corp. | 3.625% | 12/15/23 | 2,000 | 1,999 |
| Microsoft Corp. | 5.200% | 6/1/39 | 4,375 | 4,614 |
| Microsoft Corp. | 4.500% | 10/1/40 | 3,135 | 2,997 |
| Microsoft Corp. | 5.300% | 2/8/41 | 2,500 | 2,679 |
| Microsoft Corp. | 3.500% | 11/15/42 | 7,830 | 6,403 |
| Microsoft Corp. | 3.750% | 5/1/43 | 1,865 | 1,594 |
| Microsoft Corp. | 4.875% | 12/15/43 | 5,075 | 5,164 |
| Motorola Solutions Inc. | 6.000% | 11/15/17 | 1,750 | 1,978 |
| Motorola Solutions Inc. | 3.750% | 5/15/22 | 3,000 | 2,910 |
| NetApp Inc. | 2.000% | 12/15/17 | 2,175 | 2,168 |
86
| Total Bond Market II Index Fund | |||||
| Face | Market | ||||
| Maturity | Amount | Value | |||
| Coupon | Date | ($000) | ($000) | ||
| Oracle Corp. | 5.250% | 1/15/16 | 13,250 | 14,450 | |
| Oracle Corp. | 1.200% | 10/15/17 | 21,300 | 21,007 | |
| Oracle Corp. | 5.750% | 4/15/18 | 8,610 | 9,974 | |
| Oracle Corp. | 2.375% | 1/15/19 | 3,825 | 3,854 | |
| Oracle Corp. | 5.000% | 7/8/19 | 5,500 | 6,234 | |
| Oracle Corp. | 3.875% | 7/15/20 | 3,475 | 3,664 | |
| Oracle Corp. | 2.500% | 10/15/22 | 10,575 | 9,714 | |
| Oracle Corp. | 6.500% | 4/15/38 | 2,900 | 3,524 | |
| Oracle Corp. | 6.125% | 7/8/39 | 5,605 | 6,532 | |
| Oracle Corp. | 5.375% | 7/15/40 | 9,597 | 10,264 | |
| Pitney Bowes Inc. | 5.750% | 9/15/17 | 950 | 1,049 | |
| Pitney Bowes Inc. | 6.250% | 3/15/19 | 375 | 422 | |
| 6 | Seagate HDD Cayman | 3.750% | 11/15/18 | 20,025 | 20,225 |
| Seagate HDD Cayman | 6.875% | 5/1/20 | 5,000 | 5,400 | |
| Seagate HDD Cayman | 7.000% | 11/1/21 | 4,325 | 4,768 | |
| 6 | Seagate HDD Cayman | 4.750% | 6/1/23 | 14,750 | 13,754 |
| Symantec Corp. | 2.750% | 9/15/15 | 2,300 | 2,369 | |
| Symantec Corp. | 2.750% | 6/15/17 | 3,275 | 3,333 | |
| Symantec Corp. | 3.950% | 6/15/22 | 3,150 | 3,049 | |
| Telefonaktiebolaget LM Ericsson | 4.125% | 5/15/22 | 1,250 | 1,224 | |
| Texas Instruments Inc. | 0.450% | 8/3/15 | 1,625 | 1,625 | |
| Texas Instruments Inc. | 2.375% | 5/16/16 | 4,675 | 4,850 | |
| Texas Instruments Inc. | 1.650% | 8/3/19 | 5,000 | 4,834 | |
| Texas Instruments Inc. | 2.250% | 5/1/23 | 4,000 | 3,532 | |
| Total System Services Inc. | 2.375% | 6/1/18 | 1,100 | 1,069 | |
| Total System Services Inc. | 3.750% | 6/1/23 | 100 | 92 | |
| Tyco Electronics Group SA | 6.550% | 10/1/17 | 6,866 | 7,851 | |
| Tyco Electronics Group SA | 4.875% | 1/15/21 | 4,500 | 4,675 | |
| Tyco Electronics Group SA | 7.125% | 10/1/37 | 4,575 | 5,315 | |
| Verisk Analytics Inc. | 4.125% | 9/12/22 | 2,700 | 2,618 | |
| Xerox Corp. | 4.250% | 2/15/15 | 4,280 | 4,441 | |
| Xerox Corp. | 6.400% | 3/15/16 | 1,525 | 1,688 | |
| Xerox Corp. | 6.750% | 2/1/17 | 2,750 | 3,119 | |
| Xerox Corp. | 2.950% | 3/15/17 | 3,425 | 3,547 | |
| Xerox Corp. | 6.350% | 5/15/18 | 11,270 | 12,979 | |
| Xerox Corp. | 5.625% | 12/15/19 | 1,165 | 1,301 | |
| Xerox Corp. | 4.500% | 5/15/21 | 12,765 | 13,119 | |
| Transportation (0.5%) | |||||
| 3 | American Airlines 2011-1 Class A | ||||
| Pass Through Trust | 5.250% | 7/31/22 | 385 | 408 | |
| 3,6 | American Airlines 2013-1 Class A | ||||
| Pass Through Trust | 4.000% | 1/15/27 | 2,460 | 2,411 | |
| 3,6 | American Airlines 2013-2 Class A | ||||
| Pass Through Trust | 4.950% | 7/15/24 | 1,350 | 1,416 | |
| Burlington Northern Santa Fe LLC | 5.650% | 5/1/17 | 1,025 | 1,157 | |
| Burlington Northern Santa Fe LLC | 5.750% | 3/15/18 | 5,975 | 6,850 | |
| Burlington Northern Santa Fe LLC | 3.600% | 9/1/20 | 3,950 | 4,032 | |
| Burlington Northern Santa Fe LLC | 4.100% | 6/1/21 | 590 | 612 | |
| Burlington Northern Santa Fe LLC | 3.450% | 9/15/21 | 10,590 | 10,470 | |
| Burlington Northern Santa Fe LLC | 3.050% | 3/15/22 | 375 | 355 | |
| Burlington Northern Santa Fe LLC | 3.050% | 9/1/22 | 600 | 564 | |
| Burlington Northern Santa Fe LLC | 7.000% | 12/15/25 | 1,700 | 2,080 | |
| Burlington Northern Santa Fe LLC | 6.200% | 8/15/36 | 225 | 254 | |
| Burlington Northern Santa Fe LLC | 6.150% | 5/1/37 | 4,150 | 4,682 | |
87
| Total Bond Market II Index Fund | ||||
| Face | Market | |||
| Maturity | Amount | Value | ||
| Coupon | Date | ($000) | ($000) | |
| Burlington Northern Santa Fe LLC | 5.750% | 5/1/40 | 11,600 | 12,695 |
| Burlington Northern Santa Fe LLC | 5.050% | 3/1/41 | 1,800 | 1,780 |
| Burlington Northern Santa Fe LLC | 4.950% | 9/15/41 | 1,230 | 1,213 |
| Burlington Northern Santa Fe LLC | 4.400% | 3/15/42 | 5,004 | 4,501 |
| Burlington Northern Santa Fe LLC | 4.375% | 9/1/42 | 1,425 | 1,275 |
| Burlington Northern Santa Fe LLC | 4.450% | 3/15/43 | 525 | 478 |
| Canadian National Railway Co. | 5.800% | 6/1/16 | 200 | 222 |
| Canadian National Railway Co. | 1.450% | 12/15/16 | 2,870 | 2,894 |
| Canadian National Railway Co. | 5.850% | 11/15/17 | 350 | 401 |
| Canadian National Railway Co. | 5.550% | 3/1/19 | 5,385 | 6,182 |
| Canadian National Railway Co. | 2.850% | 12/15/21 | 8,200 | 7,888 |
| Canadian National Railway Co. | 6.900% | 7/15/28 | 100 | 127 |
| Canadian National Railway Co. | 6.250% | 8/1/34 | 325 | 383 |
| Canadian National Railway Co. | 6.200% | 6/1/36 | 5,850 | 6,981 |
| Canadian National Railway Co. | 6.375% | 11/15/37 | 1,100 | 1,331 |
| Canadian Pacific Railway Co. | 7.250% | 5/15/19 | 2,570 | 3,126 |
| Canadian Pacific Railway Co. | 4.450% | 3/15/23 | 3,830 | 3,932 |
| Canadian Pacific Railway Co. | 7.125% | 10/15/31 | 1,181 | 1,416 |
| Canadian Pacific Railway Co. | 5.950% | 5/15/37 | 9,010 | 9,847 |
| Canadian Pacific Railway Ltd. | 4.500% | 1/15/22 | 3,825 | 3,947 |
| Canadian Pacific Railway Ltd. | 5.750% | 1/15/42 | 1,460 | 1,570 |
| Con-way Inc. | 7.250% | 1/15/18 | 2,075 | 2,383 |
| Con-way Inc. | 6.700% | 5/1/34 | 2,475 | 2,509 |
| 3 Continental Airlines 1998-1 Class A | ||||
| Pass Through Trust | 6.648% | 3/15/19 | 1,421 | 1,512 |
| 3 Continental Airlines 2007-1 Class A | ||||
| Pass Through Trust | 5.983% | 4/19/22 | 279 | 305 |
| 3 Continental Airlines 2009-2 Class A | ||||
| Pass Through Trust | 7.250% | 5/10/21 | 991 | 1,140 |
| 3 Continental Airlines 2010-1 Class A | ||||
| Pass Through Trust | 4.750% | 1/12/21 | 4,460 | 4,739 |
| 3 Continental Airlines 2012-1 Class A | ||||
| Pass Through Trust | 4.150% | 10/11/25 | 6,232 | 6,263 |
| 3 Continental Airlines 2012-2 Class A | ||||
| Pass Through Trust | 4.000% | 4/29/26 | 775 | 773 |
| CSX Corp. | 6.250% | 4/1/15 | 1,325 | 1,417 |
| CSX Corp. | 7.900% | 5/1/17 | 9,886 | 11,802 |
| CSX Corp. | 6.250% | 3/15/18 | 3,875 | 4,486 |
| CSX Corp. | 7.375% | 2/1/19 | 5,050 | 6,139 |
| CSX Corp. | 4.250% | 6/1/21 | 590 | 616 |
| CSX Corp. | 3.700% | 11/1/23 | 700 | 680 |
| CSX Corp. | 6.000% | 10/1/36 | 1,675 | 1,832 |
| CSX Corp. | 6.150% | 5/1/37 | 900 | 1,012 |
| CSX Corp. | 6.220% | 4/30/40 | 7,164 | 8,111 |
| CSX Corp. | 4.750% | 5/30/42 | 2,990 | 2,836 |
| CSX Corp. | 4.100% | 3/15/44 | 3,225 | 2,733 |
| 3 Delta Air Lines 2007-1 Class A | ||||
| Pass Through Trust | 6.821% | 2/10/24 | 2,625 | 2,970 |
| 3 Delta Air Lines 2009-1 Class A | ||||
| Pass Through Trust | 7.750% | 12/17/19 | 4,539 | 5,299 |
| 3 Delta Air Lines 2010-1 Class A | ||||
| Pass Through Trust | 6.200% | 1/2/20 | 2,503 | 2,797 |
| 3 Delta Air Lines 2010-2 Class A | ||||
| Pass Through Trust | 4.950% | 5/23/19 | 1,394 | 1,507 |
88
| Total Bond Market II Index Fund | ||||
| Face | Market | |||
| Maturity | Amount | Value | ||
| Coupon | Date | ($000) | ($000) | |
| 3 Delta Air Lines 2012-1 Class A | ||||
| Pass Through Trust | 4.750% | 11/7/21 | 535 | 573 |
| FedEx Corp. | 8.000% | 1/15/19 | 175 | 218 |
| FedEx Corp. | 2.625% | 8/1/22 | 1,575 | 1,427 |
| FedEx Corp. | 3.875% | 8/1/42 | 1,000 | 816 |
| 3 Hawaiian Airlines 2013-1 Class A | ||||
| Pass Through Certificates | 3.900% | 1/15/26 | 14,350 | 13,274 |
| JB Hunt Transport Services Inc. | 3.375% | 9/15/15 | 3,800 | 3,942 |
| Kansas City Southern de Mexico SA de CV | 2.350% | 5/15/20 | 1,375 | 1,278 |
| Kansas City Southern de Mexico SA de CV | 3.000% | 5/15/23 | 7,525 | 6,788 |
| 6 Kansas City Southern Railway Co. | 4.300% | 5/15/43 | 1,800 | 1,563 |
| Norfolk Southern Corp. | 5.257% | 9/17/14 | 1,845 | 1,903 |
| Norfolk Southern Corp. | 5.750% | 1/15/16 | 2,825 | 3,089 |
| Norfolk Southern Corp. | 7.700% | 5/15/17 | 3,525 | 4,202 |
| Norfolk Southern Corp. | 5.750% | 4/1/18 | 875 | 999 |
| Norfolk Southern Corp. | 5.900% | 6/15/19 | 4,390 | 5,077 |
| Norfolk Southern Corp. | 3.000% | 4/1/22 | 2,400 | 2,278 |
| Norfolk Southern Corp. | 2.903% | 2/15/23 | 1,889 | 1,746 |
| Norfolk Southern Corp. | 5.590% | 5/17/25 | 133 | 146 |
| Norfolk Southern Corp. | 7.800% | 5/15/27 | 1,025 | 1,304 |
| Norfolk Southern Corp. | 7.250% | 2/15/31 | 811 | 993 |
| Norfolk Southern Corp. | 4.837% | 10/1/41 | 1,198 | 1,151 |
| Norfolk Southern Corp. | 3.950% | 10/1/42 | 2,825 | 2,370 |
| Norfolk Southern Corp. | 6.000% | 5/23/11 | 6,750 | 7,136 |
| Norfolk Southern Railway Co. | 9.750% | 6/15/20 | 775 | 1,055 |
| 3 Northwest Airlines 2007-1 Class A | ||||
| Pass Through Trust | 7.027% | 11/1/19 | 365 | 410 |
| Ryder System Inc. | 7.200% | 9/1/15 | 3,450 | 3,792 |
| Ryder System Inc. | 3.600% | 3/1/16 | 2,060 | 2,151 |
| Ryder System Inc. | 5.850% | 11/1/16 | 1,125 | 1,248 |
| Ryder System Inc. | 2.500% | 3/1/18 | 5,593 | 5,620 |
| Ryder System Inc. | 2.450% | 11/15/18 | 2,400 | 2,373 |
| Southwest Airlines Co. | 5.250% | 10/1/14 | 260 | 268 |
| 3 Southwest Airlines Co. 2007-1 | ||||
| Pass Through Trust | 6.150% | 2/1/24 | 703 | 804 |
| 3 UAL 2009-2A Pass Through Trust | 9.750% | 7/15/18 | 1,127 | 1,294 |
| Union Pacific Corp. | 5.700% | 8/15/18 | 850 | 980 |
| Union Pacific Corp. | 4.000% | 2/1/21 | 4,325 | 4,490 |
| Union Pacific Corp. | 4.163% | 7/15/22 | 4,740 | 4,885 |
| Union Pacific Corp. | 2.750% | 4/15/23 | 4,500 | 4,123 |
| 6 Union Pacific Corp. | 3.646% | 2/15/24 | 323 | 313 |
| Union Pacific Corp. | 6.625% | 2/1/29 | 820 | 987 |
| Union Pacific Corp. | 4.750% | 9/15/41 | 3,825 | 3,702 |
| Union Pacific Corp. | 4.750% | 12/15/43 | 3,375 | 3,268 |
| 6 Union Pacific Corp. | 4.821% | 2/1/44 | 7,780 | 7,560 |
| 3 Union Pacific Railroad Co. 2007-3 | ||||
| Pass Through Trust | 6.176% | 1/2/31 | 394 | 449 |
| 3 United Airlines 2013-1 Class A | ||||
| Pass Through Trust | 4.300% | 2/15/27 | 200 | 204 |
| United Parcel Service Inc. | 1.125% | 10/1/17 | 875 | 864 |
| United Parcel Service Inc. | 5.500% | 1/15/18 | 6,505 | 7,432 |
| United Parcel Service Inc. | 5.125% | 4/1/19 | 3,875 | 4,418 |
| United Parcel Service Inc. | 3.125% | 1/15/21 | 8,300 | 8,334 |
| United Parcel Service Inc. | 2.450% | 10/1/22 | 15,675 | 14,445 |
| United Parcel Service Inc. | 6.200% | 1/15/38 | 2,260 | 2,732 |
89
| Total Bond Market II Index Fund | ||||
| Face | Market | |||
| Maturity | Amount | Value | ||
| Coupon | Date | ($000) | ($000) | |
| United Parcel Service Inc. | 3.625% | 10/1/42 | 2,000 | 1,673 |
| 3 US Airways Inc. 2012-2 Class A | ||||
| Pass Through Trust | 4.625% | 12/3/26 | 797 | 810 |
| 9,432,149 | ||||
| Utilities (2.6%) | ||||
| Electric (1.7%) | ||||
| AEP Texas Central Co. | 6.650% | 2/15/33 | 2,952 | 3,402 |
| Alabama Power Co. | 3.550% | 12/1/23 | 8,800 | 8,706 |
| Alabama Power Co. | 5.650% | 3/15/35 | 1,000 | 1,045 |
| Alabama Power Co. | 6.125% | 5/15/38 | 1,000 | 1,182 |
| Alabama Power Co. | 6.000% | 3/1/39 | 1,750 | 2,042 |
| Alabama Power Co. | 5.200% | 6/1/41 | 5,575 | 5,918 |
| Alabama Power Co. | 4.100% | 1/15/42 | 1,475 | 1,318 |
| Alabama Power Co. | 3.850% | 12/1/42 | 1,850 | 1,578 |
| Ameren Illinois Co. | 2.700% | 9/1/22 | 6,345 | 5,928 |
| Ameren Illinois Co. | 4.800% | 12/15/43 | 1,575 | 1,586 |
| American Electric Power Co. Inc. | 1.650% | 12/15/17 | 75 | 73 |
| Appalachian Power Co. | 3.400% | 5/24/15 | 1,300 | 1,341 |
| Appalachian Power Co. | 4.600% | 3/30/21 | 4,350 | 4,650 |
| Appalachian Power Co. | 5.800% | 10/1/35 | 400 | 418 |
| Appalachian Power Co. | 6.375% | 4/1/36 | 750 | 824 |
| Appalachian Power Co. | 6.700% | 8/15/37 | 3,750 | 4,300 |
| Appalachian Power Co. | 7.000% | 4/1/38 | 1,665 | 1,996 |
| Arizona Public Service Co. | 4.650% | 5/15/15 | 400 | 420 |
| Arizona Public Service Co. | 8.750% | 3/1/19 | 1,298 | 1,649 |
| Arizona Public Service Co. | 5.500% | 9/1/35 | 2,100 | 2,257 |
| Arizona Public Service Co. | 4.500% | 4/1/42 | 4,525 | 4,293 |
| Atlantic City Electric Co. | 7.750% | 11/15/18 | 2,700 | 3,333 |
| Baltimore Gas & Electric Co. | 5.900% | 10/1/16 | 100 | 112 |
| Baltimore Gas & Electric Co. | 3.500% | 11/15/21 | 4,825 | 4,825 |
| Baltimore Gas & Electric Co. | 3.350% | 7/1/23 | 1,325 | 1,270 |
| Baltimore Gas & Electric Co. | 6.350% | 10/1/36 | 250 | 295 |
| CenterPoint Energy Houston Electric LLC | 2.250% | 8/1/22 | 2,500 | 2,265 |
| CenterPoint Energy Houston Electric LLC | 6.950% | 3/15/33 | 100 | 128 |
| CenterPoint Energy Houston Electric LLC | 3.550% | 8/1/42 | 5,450 | 4,489 |
| CenterPoint Energy Inc. | 6.500% | 5/1/18 | 5,650 | 6,586 |
| Cleco Power LLC | 6.000% | 12/1/40 | 1,600 | 1,742 |
| Cleveland Electric Illuminating Co. | 5.700% | 4/1/17 | 1,695 | 1,852 |
| Cleveland Electric Illuminating Co. | 7.880% | 11/1/17 | 600 | 720 |
| Cleveland Electric Illuminating Co. | 5.500% | 8/15/24 | 1,125 | 1,216 |
| CMS Energy Corp. | 8.750% | 6/15/19 | 2,500 | 3,157 |
| Commonwealth Edison Co. | 5.950% | 8/15/16 | 450 | 503 |
| Commonwealth Edison Co. | 1.950% | 9/1/16 | 885 | 903 |
| Commonwealth Edison Co. | 6.150% | 9/15/17 | 15,357 | 17,734 |
| Commonwealth Edison Co. | 5.800% | 3/15/18 | 6,635 | 7,645 |
| Commonwealth Edison Co. | 4.000% | 8/1/20 | 5,000 | 5,302 |
| Commonwealth Edison Co. | 3.400% | 9/1/21 | 3,000 | 3,012 |
| Commonwealth Edison Co. | 5.875% | 2/1/33 | 100 | 113 |
| Commonwealth Edison Co. | 5.900% | 3/15/36 | 1,315 | 1,493 |
| Commonwealth Edison Co. | 6.450% | 1/15/38 | 3,020 | 3,655 |
| Commonwealth Edison Co. | 3.800% | 10/1/42 | 4,450 | 3,794 |
| Connecticut Light & Power Co. | 5.500% | 2/1/19 | 1,365 | 1,565 |
| Connecticut Light & Power Co. | 2.500% | 1/15/23 | 7,275 | 6,626 |
| Connecticut Light & Power Co. | 6.350% | 6/1/36 | 2,400 | 2,883 |
| Consolidated Edison Co. of New York Inc. | 5.375% | 12/15/15 | 3,213 | 3,494 |
90
| Total Bond Market II Index Fund | ||||
| Face | Market | |||
| Maturity | Amount | Value | ||
| Coupon | Date | ($000) | ($000) | |
| Consolidated Edison Co. of New York Inc. | 5.500% | 9/15/16 | 2,225 | 2,477 |
| Consolidated Edison Co. of New York Inc. | 6.650% | 4/1/19 | 5,000 | 6,010 |
| Consolidated Edison Co. of New York Inc. | 4.450% | 6/15/20 | 6,000 | 6,477 |
| Consolidated Edison Co. of New York Inc. | 5.300% | 3/1/35 | 550 | 590 |
| Consolidated Edison Co. of New York Inc. | 5.850% | 3/15/36 | 3,615 | 4,127 |
| Consolidated Edison Co. of New York Inc. | 6.200% | 6/15/36 | 1,878 | 2,210 |
| Consolidated Edison Co. of New York Inc. | 5.700% | 12/1/36 | 450 | 506 |
| Consolidated Edison Co. of New York Inc. | 6.750% | 4/1/38 | 200 | 252 |
| Consolidated Edison Co. of New York Inc. | 5.700% | 6/15/40 | 5,460 | 6,197 |
| Consolidated Edison Co. of New York Inc. | 3.950% | 3/1/43 | 400 | 351 |
| Consolidated Natural Gas Co. | 5.000% | 12/1/14 | 4,660 | 4,833 |
| Constellation Energy Group Inc. | 4.550% | 6/15/15 | 4,750 | 4,983 |
| Constellation Energy Group Inc. | 5.150% | 12/1/20 | 3,705 | 3,941 |
| Consumers Energy Co. | 5.500% | 8/15/16 | 800 | 892 |
| Consumers Energy Co. | 5.650% | 9/15/18 | 1,800 | 2,072 |
| Consumers Energy Co. | 6.125% | 3/15/19 | 5,791 | 6,833 |
| Consumers Energy Co. | 6.700% | 9/15/19 | 7,960 | 9,668 |
| Consumers Energy Co. | 5.650% | 4/15/20 | 1,375 | 1,573 |
| Consumers Energy Co. | 2.850% | 5/15/22 | 13,516 | 12,893 |
| Consumers Energy Co. | 3.375% | 8/15/23 | 1,175 | 1,144 |
| Consumers Energy Co. | 3.950% | 5/15/43 | 4,225 | 3,739 |
| 6 Dayton Power & Light Co. | 1.875% | 9/15/16 | 525 | 529 |
| Delmarva Power & Light Co. | 3.500% | 11/15/23 | 975 | 952 |
| Delmarva Power & Light Co. | 4.000% | 6/1/42 | 3,650 | 3,239 |
| Dominion Resources Inc. | 2.250% | 9/1/15 | 2,782 | 2,852 |
| Dominion Resources Inc. | 1.950% | 8/15/16 | 2,150 | 2,185 |
| Dominion Resources Inc. | 5.600% | 11/15/16 | 670 | 744 |
| Dominion Resources Inc. | 1.400% | 9/15/17 | 4,075 | 4,009 |
| Dominion Resources Inc. | 6.000% | 11/30/17 | 1,750 | 2,004 |
| Dominion Resources Inc. | 6.400% | 6/15/18 | 300 | 351 |
| Dominion Resources Inc. | 5.200% | 8/15/19 | 300 | 336 |
| Dominion Resources Inc. | 2.750% | 9/15/22 | 4,800 | 4,396 |
| Dominion Resources Inc. | 6.300% | 3/15/33 | 350 | 404 |
| Dominion Resources Inc. | 5.950% | 6/15/35 | 6,100 | 6,751 |
| Dominion Resources Inc. | 4.900% | 8/1/41 | 4,075 | 3,923 |
| Dominion Resources Inc. | 4.050% | 9/15/42 | 1,725 | 1,437 |
| 3 Dominion Resources Inc. | 7.500% | 6/30/66 | 700 | 754 |
| DTE Electric Co. | 3.450% | 10/1/20 | 7,005 | 7,174 |
| DTE Electric Co. | 2.650% | 6/15/22 | 6,025 | 5,641 |
| DTE Electric Co. | 3.650% | 3/15/24 | 4,625 | 4,574 |
| DTE Electric Co. | 5.700% | 10/1/37 | 2,025 | 2,308 |
| DTE Electric Co. | 3.950% | 6/15/42 | 4,325 | 3,841 |
| DTE Energy Co. | 6.375% | 4/15/33 | 100 | 114 |
| Duke Energy Carolinas LLC | 1.750% | 12/15/16 | 2,785 | 2,843 |
| Duke Energy Carolinas LLC | 5.250% | 1/15/18 | 2,000 | 2,262 |
| Duke Energy Carolinas LLC | 5.100% | 4/15/18 | 2,000 | 2,248 |
| Duke Energy Carolinas LLC | 4.300% | 6/15/20 | 2,500 | 2,688 |
| Duke Energy Carolinas LLC | 3.900% | 6/15/21 | 9,068 | 9,467 |
| Duke Energy Carolinas LLC | 6.000% | 12/1/28 | 2,994 | 3,397 |
| Duke Energy Carolinas LLC | 6.450% | 10/15/32 | 6,425 | 7,573 |
| Duke Energy Carolinas LLC | 6.100% | 6/1/37 | 2,225 | 2,536 |
| Duke Energy Carolinas LLC | 6.000% | 1/15/38 | 900 | 1,050 |
| Duke Energy Carolinas LLC | 6.050% | 4/15/38 | 525 | 626 |
| Duke Energy Carolinas LLC | 5.300% | 2/15/40 | 5,290 | 5,753 |
| Duke Energy Carolinas LLC | 4.250% | 12/15/41 | 5,850 | 5,500 |
91
| Total Bond Market II Index Fund | ||||
| Face | Market | |||
| Maturity | Amount | Value | ||
| Coupon | Date | ($000) | ($000) | |
| Duke Energy Carolinas LLC | 4.000% | 9/30/42 | 6,125 | 5,520 |
| Duke Energy Corp. | 3.950% | 9/15/14 | 4,350 | 4,454 |
| Duke Energy Corp. | 3.350% | 4/1/15 | 4,650 | 4,793 |
| Duke Energy Corp. | 2.150% | 11/15/16 | 925 | 950 |
| Duke Energy Corp. | 1.625% | 8/15/17 | 525 | 523 |
| Duke Energy Corp. | 2.100% | 6/15/18 | 1,650 | 1,642 |
| Duke Energy Corp. | 5.050% | 9/15/19 | 3,775 | 4,169 |
| Duke Energy Corp. | 3.050% | 8/15/22 | 1,550 | 1,467 |
| Duke Energy Corp. | 3.950% | 10/15/23 | 1,850 | 1,856 |
| Duke Energy Florida Inc. | 0.650% | 11/15/15 | 2,700 | 2,705 |
| Duke Energy Florida Inc. | 5.100% | 12/1/15 | 590 | 640 |
| Duke Energy Florida Inc. | 5.650% | 6/15/18 | 1,175 | 1,349 |
| Duke Energy Florida Inc. | 6.350% | 9/15/37 | 775 | 941 |
| Duke Energy Florida Inc. | 6.400% | 6/15/38 | 4,800 | 5,927 |
| Duke Energy Florida Inc. | 5.650% | 4/1/40 | 4,200 | 4,747 |
| Duke Energy Indiana Inc. | 6.050% | 6/15/16 | 1,600 | 1,783 |
| Duke Energy Indiana Inc. | 3.750% | 7/15/20 | 2,500 | 2,588 |
| Duke Energy Indiana Inc. | 6.120% | 10/15/35 | 325 | 352 |
| Duke Energy Indiana Inc. | 6.350% | 8/15/38 | 3,775 | 4,581 |
| Duke Energy Indiana Inc. | 4.200% | 3/15/42 | 1,000 | 920 |
| Duke Energy Indiana Inc. | 4.900% | 7/15/43 | 850 | 885 |
| Duke Energy Ohio Inc. | 5.450% | 4/1/19 | 1,700 | 1,940 |
| Duke Energy Progress Inc. | 5.300% | 1/15/19 | 5,000 | 5,683 |
| Duke Energy Progress Inc. | 2.800% | 5/15/22 | 3,000 | 2,853 |
| Duke Energy Progress Inc. | 6.300% | 4/1/38 | 3,025 | 3,669 |
| Duke Energy Progress Inc. | 4.100% | 5/15/42 | 3,625 | 3,332 |
| Edison International | 3.750% | 9/15/17 | 1,690 | 1,778 |
| El Paso Electric Co. | 6.000% | 5/15/35 | 600 | 620 |
| Entergy Arkansas Inc. | 3.750% | 2/15/21 | 3,350 | 3,417 |
| Entergy Gulf States Louisiana LLC | 6.000% | 5/1/18 | 4,675 | 5,342 |
| Entergy Gulf States Louisiana LLC | 3.950% | 10/1/20 | 3,175 | 3,301 |
| Entergy Gulf States Louisiana LLC | 5.590% | 10/1/24 | 9,000 | 10,055 |
| Entergy Louisiana LLC | 4.050% | 9/1/23 | 5,650 | 5,708 |
| Entergy Louisiana LLC | 5.400% | 11/1/24 | 5,627 | 6,245 |
| Entergy Mississippi Inc. | 3.100% | 7/1/23 | 300 | 280 |
| Exelon Corp. | 4.900% | 6/15/15 | 1,400 | 1,476 |
| Exelon Corp. | 5.625% | 6/15/35 | 200 | 198 |
| Exelon Generation Co. LLC | 6.200% | 10/1/17 | 9,320 | 10,526 |
| Exelon Generation Co. LLC | 4.000% | 10/1/20 | 3,300 | 3,290 |
| Exelon Generation Co. LLC | 5.750% | 10/1/41 | 2,200 | 2,099 |
| Exelon Generation Co. LLC | 5.600% | 6/15/42 | 848 | 792 |
| Florida Power & Light Co. | 5.550% | 11/1/17 | 5,000 | 5,696 |
| Florida Power & Light Co. | 2.750% | 6/1/23 | 2,400 | 2,242 |
| Florida Power & Light Co. | 5.950% | 10/1/33 | 225 | 264 |
| Florida Power & Light Co. | 5.625% | 4/1/34 | 2,160 | 2,457 |
| Florida Power & Light Co. | 5.400% | 9/1/35 | 425 | 467 |
| Florida Power & Light Co. | 6.200% | 6/1/36 | 1,050 | 1,256 |
| Florida Power & Light Co. | 5.650% | 2/1/37 | 725 | 817 |
| Florida Power & Light Co. | 5.850% | 5/1/37 | 1,265 | 1,457 |
| Florida Power & Light Co. | 5.950% | 2/1/38 | 3,250 | 3,793 |
| Florida Power & Light Co. | 5.960% | 4/1/39 | 6,100 | 7,144 |
| Florida Power & Light Co. | 5.690% | 3/1/40 | 425 | 485 |
| Florida Power & Light Co. | 5.250% | 2/1/41 | 500 | 540 |
| Florida Power & Light Co. | 4.125% | 2/1/42 | 6,250 | 5,735 |
| Georgia Power Co. | 0.750% | 8/10/15 | 1,075 | 1,077 |
92
| Total Bond Market II Index Fund | ||||
| Face | Market | |||
| Maturity | Amount | Value | ||
| Coupon | Date | ($000) | ($000) | |
| Georgia Power Co. | 0.625% | 11/15/15 | 1,550 | 1,550 |
| Georgia Power Co. | 3.000% | 4/15/16 | 6,625 | 6,925 |
| Georgia Power Co. | 5.700% | 6/1/17 | 2,525 | 2,844 |
| Georgia Power Co. | 2.850% | 5/15/22 | 1,425 | 1,343 |
| Georgia Power Co. | 5.650% | 3/1/37 | 100 | 108 |
| Georgia Power Co. | 5.400% | 6/1/40 | 375 | 392 |
| Georgia Power Co. | 4.750% | 9/1/40 | 1,600 | 1,534 |
| Georgia Power Co. | 4.300% | 3/15/42 | 4,300 | 3,857 |
| Iberdrola International BV | 6.750% | 7/15/36 | 4,285 | 4,666 |
| Indiana Michigan Power Co. | 7.000% | 3/15/19 | 550 | 653 |
| Indiana Michigan Power Co. | 6.050% | 3/15/37 | 2,850 | 3,092 |
| 3 Integrys Energy Group Inc. | 6.110% | 12/1/66 | 2,345 | 2,368 |
| Interstate Power & Light Co. | 6.250% | 7/15/39 | 925 | 1,093 |
| ITC Holdings Corp. | 4.050% | 7/1/23 | 5,500 | 5,398 |
| ITC Holdings Corp. | 5.300% | 7/1/43 | 1,600 | 1,566 |
| Jersey Central Power & Light Co. | 5.625% | 5/1/16 | 2,525 | 2,748 |
| Jersey Central Power & Light Co. | 5.650% | 6/1/17 | 2,775 | 3,069 |
| 3 John Sevier Combined Cycle Generation LLC | 4.626% | 1/15/42 | 1,471 | 1,429 |
| Kansas City Power & Light Co. | 6.050% | 11/15/35 | 125 | 137 |
| Kansas City Power & Light Co. | 5.300% | 10/1/41 | 4,795 | 4,792 |
| 3 Kansas Gas & Electric Co. | 5.647% | 3/29/21 | 69 | 73 |
| Kentucky Utilities Co. | 1.625% | 11/1/15 | 2,795 | 2,847 |
| Kentucky Utilities Co. | 3.250% | 11/1/20 | 4,775 | 4,845 |
| Kentucky Utilities Co. | 5.125% | 11/1/40 | 3,575 | 3,765 |
| Kentucky Utilities Co. | 4.650% | 11/15/43 | 425 | 421 |
| LG&E & KU Energy LLC | 2.125% | 11/15/15 | 1,350 | 1,373 |
| LG&E & KU Energy LLC | 3.750% | 11/15/20 | 1,600 | 1,616 |
| LG&E & KU Energy LLC | 4.375% | 10/1/21 | 3,625 | 3,722 |
| Louisville Gas & Electric Co. | 1.625% | 11/15/15 | 4,875 | 4,968 |
| Louisville Gas & Electric Co. | 5.125% | 11/15/40 | 2,165 | 2,276 |
| Louisville Gas & Electric Co. | 4.650% | 11/15/43 | 725 | 720 |
| Metropolitan Edison Co. | 7.700% | 1/15/19 | 1,348 | 1,627 |
| MidAmerican Energy Co. | 5.950% | 7/15/17 | 2,810 | 3,222 |
| MidAmerican Energy Co. | 5.300% | 3/15/18 | 100 | 113 |
| MidAmerican Energy Co. | 6.750% | 12/30/31 | 4,150 | 5,075 |
| MidAmerican Energy Co. | 5.750% | 11/1/35 | 1,575 | 1,759 |
| MidAmerican Energy Co. | 5.800% | 10/15/36 | 1,350 | 1,511 |
| MidAmerican Energy Holdings Co. | 5.750% | 4/1/18 | 5,961 | 6,800 |
| 6 MidAmerican Energy Holdings Co. | 2.000% | 11/15/18 | 1,000 | 983 |
| 6 MidAmerican Energy Holdings Co. | 3.750% | 11/15/23 | 5,925 | 5,758 |
| MidAmerican Energy Holdings Co. | 8.480% | 9/15/28 | 100 | 135 |
| MidAmerican Energy Holdings Co. | 6.125% | 4/1/36 | 9,725 | 11,035 |
| MidAmerican Energy Holdings Co. | 5.950% | 5/15/37 | 5,017 | 5,548 |
| MidAmerican Energy Holdings Co. | 6.500% | 9/15/37 | 8,230 | 9,647 |
| 6 MidAmerican Energy Holdings Co. | 5.150% | 11/15/43 | 4,025 | 4,041 |
| Midamerican Funding LLC | 6.927% | 3/1/29 | 3,935 | 4,722 |
| Mississippi Power Co. | 4.250% | 3/15/42 | 4,475 | 3,895 |
| National Rural Utilities Cooperative Finance Corp. | 1.000% | 2/2/15 | 6,550 | 6,591 |
| National Rural Utilities Cooperative Finance Corp. | 3.050% | 3/1/16 | 2,950 | 3,074 |
| National Rural Utilities Cooperative Finance Corp. | 5.450% | 4/10/17 | 175 | 195 |
| National Rural Utilities Cooperative Finance Corp. | 5.450% | 2/1/18 | 4,950 | 5,581 |
| National Rural Utilities Cooperative Finance Corp. | 10.375% | 11/1/18 | 5,475 | 7,381 |
| National Rural Utilities Cooperative Finance Corp. | 2.350% | 6/15/20 | 7,975 | 7,665 |
| National Rural Utilities Cooperative Finance Corp. | 3.050% | 2/15/22 | 7,510 | 7,294 |
| National Rural Utilities Cooperative Finance Corp. | 8.000% | 3/1/32 | 1,025 | 1,378 |
93
| Total Bond Market II Index Fund | ||||
| Face | Market | |||
| Maturity | Amount | Value | ||
| Coupon | Date | ($000) | ($000) | |
| National Rural Utilities Cooperative Finance Corp. | 4.023% | 11/1/32 | 4,060 | 3,755 |
| Nevada Power Co. | 6.500% | 5/15/18 | 1,865 | 2,204 |
| Nevada Power Co. | 6.500% | 8/1/18 | 14,093 | 16,784 |
| Nevada Power Co. | 7.125% | 3/15/19 | 4,150 | 5,046 |
| Nevada Power Co. | 6.650% | 4/1/36 | 965 | 1,174 |
| Nevada Power Co. | 6.750% | 7/1/37 | 975 | 1,206 |
| Nevada Power Co. | 5.450% | 5/15/41 | 500 | 541 |
| NextEra Energy Capital Holdings Inc. | 1.200% | 6/1/15 | 3,250 | 3,266 |
| NextEra Energy Capital Holdings Inc. | 2.600% | 9/1/15 | 350 | 359 |
| NextEra Energy Capital Holdings Inc. | 7.875% | 12/15/15 | 2,000 | 2,260 |
| NextEra Energy Capital Holdings Inc. | 6.000% | 3/1/19 | 3,613 | 4,091 |
| NextEra Energy Capital Holdings Inc. | 4.500% | 6/1/21 | 885 | 913 |
| NextEra Energy Capital Holdings Inc. | 3.625% | 6/15/23 | 3,175 | 2,968 |
| 3 NextEra Energy Capital Holdings Inc. | 6.350% | 10/1/66 | 2,075 | 2,075 |
| 3 NextEra Energy Capital Holdings Inc. | 6.650% | 6/15/67 | 1,503 | 1,533 |
| 3 NextEra Energy Capital Holdings Inc. | 7.300% | 9/1/67 | 325 | 358 |
| Northern States Power Co. | 1.950% | 8/15/15 | 425 | 433 |
| Northern States Power Co. | 5.250% | 3/1/18 | 1,225 | 1,389 |
| Northern States Power Co. | 2.600% | 5/15/23 | 1,330 | 1,221 |
| Northern States Power Co. | 5.250% | 7/15/35 | 100 | 106 |
| Northern States Power Co. | 6.250% | 6/1/36 | 525 | 626 |
| Northern States Power Co. | 6.200% | 7/1/37 | 1,695 | 2,018 |
| Northern States Power Co. | 5.350% | 11/1/39 | 1,325 | 1,433 |
| Northern States Power Co. | 4.850% | 8/15/40 | 950 | 961 |
| Northern States Power Co. | 3.400% | 8/15/42 | 400 | 322 |
| NSTAR Electric Co. | 5.625% | 11/15/17 | 4,360 | 4,938 |
| NSTAR Electric Co. | 2.375% | 10/15/22 | 1,700 | 1,541 |
| NSTAR Electric Co. | 5.500% | 3/15/40 | 3,505 | 3,900 |
| NSTAR LLC | 4.500% | 11/15/19 | 8,482 | 9,200 |
| Oglethorpe Power Corp. | 5.950% | 11/1/39 | 600 | 652 |
| Oglethorpe Power Corp. | 5.375% | 11/1/40 | 3,345 | 3,417 |
| Ohio Power Co. | 6.000% | 6/1/16 | 1,520 | 1,681 |
| Ohio Power Co. | 5.375% | 10/1/21 | 3,775 | 4,205 |
| Ohio Power Co. | 5.850% | 10/1/35 | 1,050 | 1,128 |
| Oklahoma Gas & Electric Co. | 5.850% | 6/1/40 | 1,200 | 1,361 |
| Oklahoma Gas & Electric Co. | 5.250% | 5/15/41 | 1,250 | 1,326 |
| Oklahoma Gas & Electric Co. | 3.900% | 5/1/43 | 1,225 | 1,053 |
| Oncor Electric Delivery Co. LLC | 6.375% | 1/15/15 | 2,150 | 2,269 |
| Oncor Electric Delivery Co. LLC | 6.800% | 9/1/18 | 3,170 | 3,725 |
| Oncor Electric Delivery Co. LLC | 7.000% | 9/1/22 | 2,900 | 3,458 |
| Oncor Electric Delivery Co. LLC | 7.000% | 5/1/32 | 1,000 | 1,221 |
| Oncor Electric Delivery Co. LLC | 7.250% | 1/15/33 | 150 | 188 |
| Oncor Electric Delivery Co. LLC | 7.500% | 9/1/38 | 1,800 | 2,334 |
| Oncor Electric Delivery Co. LLC | 5.300% | 6/1/42 | 2,500 | 2,593 |
| Pacific Gas & Electric Co. | 5.625% | 11/30/17 | 9,876 | 11,186 |
| Pacific Gas & Electric Co. | 8.250% | 10/15/18 | 4,105 | 5,147 |
| Pacific Gas & Electric Co. | 3.500% | 10/1/20 | 3,590 | 3,655 |
| Pacific Gas & Electric Co. | 4.250% | 5/15/21 | 4,400 | 4,618 |
| Pacific Gas & Electric Co. | 3.250% | 9/15/21 | 4,226 | 4,144 |
| Pacific Gas & Electric Co. | 2.450% | 8/15/22 | 475 | 428 |
| Pacific Gas & Electric Co. | 3.250% | 6/15/23 | 1,675 | 1,586 |
| Pacific Gas & Electric Co. | 6.050% | 3/1/34 | 11,165 | 12,806 |
| Pacific Gas & Electric Co. | 5.800% | 3/1/37 | 9,005 | 9,954 |
| Pacific Gas & Electric Co. | 6.350% | 2/15/38 | 4,000 | 4,662 |
| Pacific Gas & Electric Co. | 6.250% | 3/1/39 | 1,073 | 1,244 |
94
| Total Bond Market II Index Fund | ||||
| Face | Market | |||
| Maturity | Amount | Value | ||
| Coupon | Date | ($000) | ($000) | |
| Pacific Gas & Electric Co. | 5.400% | 1/15/40 | 850 | 900 |
| Pacific Gas & Electric Co. | 4.450% | 4/15/42 | 5,275 | 4,926 |
| Pacific Gas & Electric Co. | 4.600% | 6/15/43 | 2,500 | 2,378 |
| PacifiCorp | 2.950% | 2/1/22 | 11,250 | 10,764 |
| PacifiCorp | 7.700% | 11/15/31 | 1,185 | 1,573 |
| PacifiCorp | 5.250% | 6/15/35 | 125 | 132 |
| PacifiCorp | 5.750% | 4/1/37 | 215 | 246 |
| PacifiCorp | 4.100% | 2/1/42 | 1,600 | 1,448 |
| Peco Energy Co. | 1.200% | 10/15/16 | 2,900 | 2,913 |
| Peco Energy Co. | 5.350% | 3/1/18 | 575 | 652 |
| Peco Energy Co. | 2.375% | 9/15/22 | 875 | 794 |
| Peco Energy Co. | 5.950% | 10/1/36 | 500 | 579 |
| Pennsylvania Electric Co. | 6.150% | 10/1/38 | 9,075 | 9,459 |
| Pepco Holdings Inc. | 2.700% | 10/1/15 | 295 | 303 |
| Potomac Electric Power Co. | 6.500% | 11/15/37 | 4,043 | 4,997 |
| PPL Capital Funding Inc. | 1.900% | 6/1/18 | 1,600 | 1,564 |
| PPL Capital Funding Inc. | 3.400% | 6/1/23 | 6,700 | 6,233 |
| PPL Capital Funding Inc. | 4.700% | 6/1/43 | 4,300 | 3,874 |
| PPL Electric Utilities Corp. | 3.000% | 9/15/21 | 590 | 580 |
| PPL Electric Utilities Corp. | 6.250% | 5/15/39 | 800 | 963 |
| PPL Electric Utilities Corp. | 5.200% | 7/15/41 | 225 | 239 |
| PPL Electric Utilities Corp. | 4.750% | 7/15/43 | 3,725 | 3,729 |
| PPL Energy Supply LLC | 6.200% | 5/15/16 | 3,149 | 3,466 |
| PPL Energy Supply LLC | 6.500% | 5/1/18 | 525 | 583 |
| Progress Energy Inc. | 5.625% | 1/15/16 | 2,795 | 3,042 |
| Progress Energy Inc. | 4.400% | 1/15/21 | 5,186 | 5,488 |
| Progress Energy Inc. | 3.150% | 4/1/22 | 5,800 | 5,575 |
| Progress Energy Inc. | 7.750% | 3/1/31 | 625 | 802 |
| Progress Energy Inc. | 6.000% | 12/1/39 | 590 | 659 |
| PSEG Power LLC | 5.500% | 12/1/15 | 3,125 | 3,386 |
| PSEG Power LLC | 5.320% | 9/15/16 | 885 | 974 |
| PSEG Power LLC | 5.125% | 4/15/20 | 415 | 452 |
| PSEG Power LLC | 4.150% | 9/15/21 | 1,275 | 1,292 |
| PSEG Power LLC | 8.625% | 4/15/31 | 975 | 1,322 |
| Public Service Co. of Colorado | 5.500% | 4/1/14 | 175 | 177 |
| Public Service Co. of Colorado | 5.800% | 8/1/18 | 425 | 493 |
| Public Service Co. of Colorado | 5.125% | 6/1/19 | 3,925 | 4,435 |
| Public Service Co. of Colorado | 3.200% | 11/15/20 | 5,900 | 5,951 |
| Public Service Co. of Colorado | 6.250% | 9/1/37 | 475 | 578 |
| Public Service Co. of Colorado | 4.750% | 8/15/41 | 1,500 | 1,508 |
| Public Service Co. of Colorado | 3.600% | 9/15/42 | 800 | 665 |
| Public Service Co. of New Hampshire | 3.500% | 11/1/23 | 425 | 415 |
| Public Service Co. of Oklahoma | 5.150% | 12/1/19 | 650 | 719 |
| Public Service Co. of Oklahoma | 4.400% | 2/1/21 | 2,585 | 2,710 |
| Public Service Co. of Oklahoma | 6.625% | 11/15/37 | 1,550 | 1,793 |
| Public Service Electric & Gas Co. | 3.500% | 8/15/20 | 625 | 644 |
| Public Service Electric & Gas Co. | 2.375% | 5/15/23 | 5,925 | 5,317 |
| Public Service Electric & Gas Co. | 5.800% | 5/1/37 | 3,275 | 3,759 |
| Public Service Electric & Gas Co. | 5.375% | 11/1/39 | 4,189 | 4,580 |
| Public Service Electric & Gas Co. | 3.950% | 5/1/42 | 3,800 | 3,387 |
| Public Service Electric & Gas Co. | 3.650% | 9/1/42 | 4,575 | 3,858 |
| Puget Sound Energy Inc. | 5.483% | 6/1/35 | 2,350 | 2,565 |
| Puget Sound Energy Inc. | 6.274% | 3/15/37 | 1,525 | 1,808 |
| Puget Sound Energy Inc. | 5.757% | 10/1/39 | 1,400 | 1,594 |
| Puget Sound Energy Inc. | 5.795% | 3/15/40 | 660 | 754 |
95
| Total Bond Market II Index Fund | ||||
| Face | Market | |||
| Maturity | Amount | Value | ||
| Coupon | Date | ($000) | ($000) | |
| Puget Sound Energy Inc. | 5.764% | 7/15/40 | 600 | 683 |
| Puget Sound Energy Inc. | 4.434% | 11/15/41 | 4,800 | 4,588 |
| San Diego Gas & Electric Co. | 5.300% | 11/15/15 | 650 | 703 |
| San Diego Gas & Electric Co. | 3.000% | 8/15/21 | 4,350 | 4,289 |
| San Diego Gas & Electric Co. | 6.000% | 6/1/26 | 4,000 | 4,763 |
| San Diego Gas & Electric Co. | 5.350% | 5/15/35 | 250 | 273 |
| San Diego Gas & Electric Co. | 5.350% | 5/15/40 | 2,000 | 2,210 |
| San Diego Gas & Electric Co. | 4.500% | 8/15/40 | 3,295 | 3,243 |
| San Diego Gas & Electric Co. | 3.950% | 11/15/41 | 400 | 360 |
| SCANA Corp. | 6.250% | 4/1/20 | 4,455 | 4,943 |
| SCANA Corp. | 4.750% | 5/15/21 | 1,795 | 1,840 |
| Sierra Pacific Power Co. | 6.000% | 5/15/16 | 4,050 | 4,529 |
| Sierra Pacific Power Co. | 3.375% | 8/15/23 | 1,450 | 1,402 |
| Sierra Pacific Power Co. | 6.750% | 7/1/37 | 1,450 | 1,759 |
| South Carolina Electric & Gas Co. | 5.250% | 11/1/18 | 1,500 | 1,711 |
| South Carolina Electric & Gas Co. | 6.500% | 11/1/18 | 2,700 | 3,229 |
| South Carolina Electric & Gas Co. | 6.625% | 2/1/32 | 2,525 | 3,114 |
| South Carolina Electric & Gas Co. | 6.050% | 1/15/38 | 1,550 | 1,806 |
| South Carolina Electric & Gas Co. | 4.600% | 6/15/43 | 2,300 | 2,237 |
| Southern California Edison Co. | 4.650% | 4/1/15 | 425 | 446 |
| Southern California Edison Co. | 5.000% | 1/15/16 | 1,025 | 1,110 |
| Southern California Edison Co. | 3.875% | 6/1/21 | 2,000 | 2,098 |
| Southern California Edison Co. | 3.500% | 10/1/23 | 7,300 | 7,152 |
| Southern California Edison Co. | 6.650% | 4/1/29 | 150 | 178 |
| Southern California Edison Co. | 6.000% | 1/15/34 | 1,000 | 1,164 |
| Southern California Edison Co. | 5.750% | 4/1/35 | 325 | 368 |
| Southern California Edison Co. | 5.350% | 7/15/35 | 4,185 | 4,531 |
| Southern California Edison Co. | 5.550% | 1/15/36 | 500 | 553 |
| Southern California Edison Co. | 5.625% | 2/1/36 | 1,875 | 2,088 |
| Southern California Edison Co. | 5.950% | 2/1/38 | 2,800 | 3,246 |
| Southern California Edison Co. | 4.500% | 9/1/40 | 10,307 | 9,943 |
| Southern California Edison Co. | 4.050% | 3/15/42 | 1,575 | 1,413 |
| Southern California Edison Co. | 3.900% | 3/15/43 | 725 | 634 |
| Southern California Edison Co. | 4.650% | 10/1/43 | 5,725 | 5,675 |
| Southern Co. | 2.375% | 9/15/15 | 2,850 | 2,917 |
| Southern Co. | 1.950% | 9/1/16 | 590 | 601 |
| Southern Power Co. | 4.875% | 7/15/15 | 2,125 | 2,255 |
| Southern Power Co. | 5.150% | 9/15/41 | 6,640 | 6,530 |
| Southern Power Co. | 5.250% | 7/15/43 | 5,275 | 5,264 |
| Southwestern Electric Power Co. | 5.550% | 1/15/17 | 100 | 110 |
| Southwestern Electric Power Co. | 5.875% | 3/1/18 | 75 | 84 |
| Southwestern Electric Power Co. | 6.450% | 1/15/19 | 4,763 | 5,468 |
| Southwestern Electric Power Co. | 3.550% | 2/15/22 | 4,200 | 4,090 |
| Southwestern Public Service Co. | 4.500% | 8/15/41 | 2,079 | 1,992 |
| Tampa Electric Co. | 6.100% | 5/15/18 | 2,175 | 2,526 |
| Tampa Electric Co. | 5.400% | 5/15/21 | 2,590 | 2,912 |
| Tampa Electric Co. | 2.600% | 9/15/22 | 1,000 | 923 |
| Tampa Electric Co. | 6.550% | 5/15/36 | 675 | 812 |
| TECO Finance Inc. | 4.000% | 3/15/16 | 1,100 | 1,168 |
| TECO Finance Inc. | 6.572% | 11/1/17 | 470 | 542 |
| TECO Finance Inc. | 5.150% | 3/15/20 | 6,000 | 6,546 |
| Toledo Edison Co. | 6.150% | 5/15/37 | 4,244 | 4,590 |
| TransAlta Corp. | 4.750% | 1/15/15 | 400 | 414 |
| TransAlta Corp. | 6.650% | 5/15/18 | 2,325 | 2,612 |
| Tucson Electric Power Co. | 5.150% | 11/15/21 | 1,045 | 1,117 |
96
| Total Bond Market II Index Fund | ||||
| Face | Market | |||
| Maturity | Amount | Value | ||
| Coupon | Date | ($000) | ($000) | |
| UIL Holdings Corp. | 4.625% | 10/1/20 | 1,000 | 1,020 |
| Union Electric Co. | 6.700% | 2/1/19 | 2,432 | 2,903 |
| Union Electric Co. | 5.300% | 8/1/37 | 2,919 | 3,113 |
| Union Electric Co. | 8.450% | 3/15/39 | 2,000 | 2,992 |
| Virginia Electric & Power Co. | 5.400% | 1/15/16 | 5,250 | 5,723 |
| Virginia Electric & Power Co. | 2.950% | 1/15/22 | 2,025 | 1,957 |
| Virginia Electric & Power Co. | 3.450% | 9/1/22 | 11,095 | 11,037 |
| Virginia Electric & Power Co. | 2.750% | 3/15/23 | 6,300 | 5,846 |
| Virginia Electric & Power Co. | 6.000% | 1/15/36 | 1,575 | 1,820 |
| Virginia Electric & Power Co. | 4.000% | 1/15/43 | 2,575 | 2,301 |
| Westar Energy Inc. | 8.625% | 12/1/18 | 1,250 | 1,593 |
| Westar Energy Inc. | 4.125% | 3/1/42 | 4,375 | 3,988 |
| Westar Energy Inc. | 4.625% | 9/1/43 | 2,900 | 2,854 |
| Western Massachusetts Electric Co. | 3.500% | 9/15/21 | 1,050 | 1,036 |
| Wisconsin Electric Power Co. | 4.250% | 12/15/19 | 2,650 | 2,902 |
| Wisconsin Electric Power Co. | 2.950% | 9/15/21 | 3,915 | 3,843 |
| Wisconsin Electric Power Co. | 3.650% | 12/15/42 | 400 | 333 |
| 3 Wisconsin Energy Corp. | 6.250% | 5/15/67 | 5,175 | 5,337 |
| Wisconsin Power & Light Co. | 5.000% | 7/15/19 | 475 | 532 |
| Wisconsin Power & Light Co. | 2.250% | 11/15/22 | 3,850 | 3,442 |
| Wisconsin Power & Light Co. | 6.375% | 8/15/37 | 1,625 | 1,947 |
| Wisconsin Public Service Corp. | 3.671% | 12/1/42 | 2,050 | 1,747 |
| Xcel Energy Inc. | 5.613% | 4/1/17 | 275 | 303 |
| Xcel Energy Inc. | 4.700% | 5/15/20 | 8,320 | 9,118 |
| Xcel Energy Inc. | 6.500% | 7/1/36 | 4,215 | 4,984 |
| Natural Gas (0.9%) | ||||
| AGL Capital Corp. | 5.250% | 8/15/19 | 1,600 | 1,781 |
| AGL Capital Corp. | 3.500% | 9/15/21 | 1,580 | 1,573 |
| AGL Capital Corp. | 5.875% | 3/15/41 | 5,700 | 6,226 |
| AGL Capital Corp. | 4.400% | 6/1/43 | 1,000 | 903 |
| Atmos Energy Corp. | 8.500% | 3/15/19 | 450 | 574 |
| Atmos Energy Corp. | 5.500% | 6/15/41 | 4,050 | 4,367 |
| Atmos Energy Corp. | 4.150% | 1/15/43 | 275 | 246 |
| Boardwalk Pipelines LP | 5.500% | 2/1/17 | 925 | 1,010 |
| Boardwalk Pipelines LP | 3.375% | 2/1/23 | 3,250 | 2,906 |
| British Transco Finance Inc. | 6.625% | 6/1/18 | 3,375 | 3,961 |
| Buckeye Partners LP | 6.050% | 1/15/18 | 1,125 | 1,262 |
| Buckeye Partners LP | 2.650% | 11/15/18 | 4,175 | 4,120 |
| Buckeye Partners LP | 4.150% | 7/1/23 | 650 | 620 |
| Buckeye Partners LP | 5.850% | 11/15/43 | 3,525 | 3,459 |
| CenterPoint Energy Resources Corp. | 6.150% | 5/1/16 | 970 | 1,072 |
| CenterPoint Energy Resources Corp. | 6.000% | 5/15/18 | 2,636 | 3,035 |
| CenterPoint Energy Resources Corp. | 4.500% | 1/15/21 | 7,501 | 8,008 |
| CenterPoint Energy Resources Corp. | 6.625% | 11/1/37 | 2,300 | 2,793 |
| CenterPoint Energy Resources Corp. | 5.850% | 1/15/41 | 625 | 706 |
| DCP Midstream Operating LP | 3.250% | 10/1/15 | 1,200 | 1,240 |
| DCP Midstream Operating LP | 2.500% | 12/1/17 | 6,550 | 6,591 |
| DCP Midstream Operating LP | 4.950% | 4/1/22 | 1,000 | 1,011 |
| 6 Dominion Gas Holdings LLC | 3.550% | 11/1/23 | 4,000 | 3,839 |
| 6 Dominion Gas Holdings LLC | 4.800% | 11/1/43 | 5,650 | 5,430 |
| El Paso Natural Gas Co. LLC | 5.950% | 4/15/17 | 1,340 | 1,488 |
| El Paso Pipeline Partners Operating Co. LLC | 6.500% | 4/1/20 | 9,961 | 11,405 |
| El Paso Pipeline Partners Operating Co. LLC | 5.000% | 10/1/21 | 7,265 | 7,577 |
| El Paso Pipeline Partners Operating Co. LLC | 4.700% | 11/1/42 | 6,400 | 5,480 |
97
| Total Bond Market II Index Fund | ||||
| Face | Market | |||
| Maturity | Amount | Value | ||
| Coupon | Date | ($000) | ($000) | |
| Enbridge Energy Partners LP | 9.875% | 3/1/19 | 5,180 | 6,745 |
| Enbridge Energy Partners LP | 5.200% | 3/15/20 | 525 | 567 |
| Enbridge Energy Partners LP | 4.200% | 9/15/21 | 5,000 | 5,042 |
| Enbridge Energy Partners LP | 7.500% | 4/15/38 | 4,500 | 5,309 |
| Enbridge Inc. | 4.900% | 3/1/15 | 800 | 837 |
| Enbridge Inc. | 5.600% | 4/1/17 | 2,160 | 2,394 |
| Energy Transfer Partners LP | 5.950% | 2/1/15 | 5,370 | 5,658 |
| Energy Transfer Partners LP | 6.125% | 2/15/17 | 4,200 | 4,696 |
| Energy Transfer Partners LP | 6.700% | 7/1/18 | 948 | 1,100 |
| Energy Transfer Partners LP | 9.000% | 4/15/19 | 1,679 | 2,125 |
| Energy Transfer Partners LP | 4.150% | 10/1/20 | 10,250 | 10,421 |
| Energy Transfer Partners LP | 4.650% | 6/1/21 | 2,230 | 2,289 |
| Energy Transfer Partners LP | 5.200% | 2/1/22 | 6,610 | 6,929 |
| Energy Transfer Partners LP | 3.600% | 2/1/23 | 7,125 | 6,601 |
| Energy Transfer Partners LP | 8.250% | 11/15/29 | 400 | 483 |
| Energy Transfer Partners LP | 6.625% | 10/15/36 | 750 | 805 |
| Energy Transfer Partners LP | 7.500% | 7/1/38 | 3,507 | 4,115 |
| Energy Transfer Partners LP | 6.050% | 6/1/41 | 11,675 | 11,872 |
| Energy Transfer Partners LP | 6.500% | 2/1/42 | 10,790 | 11,558 |
| Energy Transfer Partners LP | 5.150% | 2/1/43 | 5,350 | 4,854 |
| 7 Enron Corp. | 7.625% | 9/10/04 | 400 | — |
| 7 Enron Corp. | 6.625% | 11/15/05 | 300 | — |
| 7 Enron Corp. | 7.125% | 5/15/07 | 1,800 | — |
| 7 Enron Corp. | 6.875% | 10/15/07 | 1,800 | — |
| 7 Enron Corp. | 6.750% | 8/1/09 | 1,300 | — |
| Enterprise Products Operating LLC | 5.600% | 10/15/14 | 9,615 | 9,992 |
| Enterprise Products Operating LLC | 1.250% | 8/13/15 | 3,175 | 3,200 |
| Enterprise Products Operating LLC | 6.300% | 9/15/17 | 4,200 | 4,862 |
| Enterprise Products Operating LLC | 6.650% | 4/15/18 | 1,900 | 2,240 |
| Enterprise Products Operating LLC | 6.500% | 1/31/19 | 6,750 | 7,997 |
| Enterprise Products Operating LLC | 5.200% | 9/1/20 | 3,600 | 3,996 |
| Enterprise Products Operating LLC | 3.350% | 3/15/23 | 5,000 | 4,733 |
| Enterprise Products Operating LLC | 6.875% | 3/1/33 | 5,498 | 6,528 |
| Enterprise Products Operating LLC | 6.650% | 10/15/34 | 235 | 273 |
| Enterprise Products Operating LLC | 7.550% | 4/15/38 | 3,130 | 3,923 |
| Enterprise Products Operating LLC | 6.125% | 10/15/39 | 500 | 547 |
| Enterprise Products Operating LLC | 6.450% | 9/1/40 | 2,425 | 2,762 |
| Enterprise Products Operating LLC | 5.950% | 2/1/41 | 2,505 | 2,709 |
| Enterprise Products Operating LLC | 5.700% | 2/15/42 | 2,425 | 2,535 |
| Enterprise Products Operating LLC | 4.850% | 8/15/42 | 5,063 | 4,748 |
| Enterprise Products Operating LLC | 4.450% | 2/15/43 | 5,125 | 4,514 |
| Enterprise Products Operating LLC | 4.850% | 3/15/44 | 1,000 | 936 |
| 3 Enterprise Products Operating LLC | 8.375% | 8/1/66 | 2,425 | 2,689 |
| Gulf South Pipeline Co. LP | 4.000% | 6/15/22 | 1,725 | 1,686 |
| 7 Internorth Inc. | 9.625% | 3/15/06 | 1,000 | — |
| KeySpan Corp. | 8.000% | 11/15/30 | 50 | 64 |
| Kinder Morgan Energy Partners LP | 3.500% | 3/1/16 | 6,460 | 6,768 |
| Kinder Morgan Energy Partners LP | 5.950% | 2/15/18 | 8,350 | 9,497 |
| Kinder Morgan Energy Partners LP | 2.650% | 2/1/19 | 2,275 | 2,251 |
| Kinder Morgan Energy Partners LP | 9.000% | 2/1/19 | 5,127 | 6,531 |
| Kinder Morgan Energy Partners LP | 6.850% | 2/15/20 | 2,300 | 2,734 |
| Kinder Morgan Energy Partners LP | 5.300% | 9/15/20 | 5,000 | 5,486 |
| Kinder Morgan Energy Partners LP | 4.150% | 3/1/22 | 2,825 | 2,811 |
| Kinder Morgan Energy Partners LP | 3.950% | 9/1/22 | 12,725 | 12,379 |
| Kinder Morgan Energy Partners LP | 3.450% | 2/15/23 | 7,925 | 7,331 |
98
| Total Bond Market II Index Fund | ||||
| Face | Market | |||
| Maturity | Amount | Value | ||
| Coupon | Date | ($000) | ($000) | |
| Kinder Morgan Energy Partners LP | 3.500% | 9/1/23 | 6,500 | 5,991 |
| Kinder Morgan Energy Partners LP | 7.400% | 3/15/31 | 980 | 1,151 |
| Kinder Morgan Energy Partners LP | 7.300% | 8/15/33 | 1,700 | 1,998 |
| Kinder Morgan Energy Partners LP | 6.500% | 2/1/37 | 6,150 | 6,757 |
| Kinder Morgan Energy Partners LP | 6.950% | 1/15/38 | 5,665 | 6,525 |
| Kinder Morgan Energy Partners LP | 6.500% | 9/1/39 | 6,925 | 7,613 |
| Kinder Morgan Energy Partners LP | 6.550% | 9/15/40 | 5,000 | 5,576 |
| Kinder Morgan Energy Partners LP | 6.375% | 3/1/41 | 3,600 | 3,915 |
| Kinder Morgan Energy Partners LP | 5.625% | 9/1/41 | 500 | 497 |
| Kinder Morgan Energy Partners LP | 5.000% | 8/15/42 | 2,775 | 2,545 |
| Kinder Morgan Energy Partners LP | 5.000% | 3/1/43 | 3,700 | 3,366 |
| Magellan Midstream Partners LP | 5.650% | 10/15/16 | 3,910 | 4,382 |
| Magellan Midstream Partners LP | 6.550% | 7/15/19 | 6,750 | 7,968 |
| Magellan Midstream Partners LP | 4.250% | 2/1/21 | 3,950 | 4,126 |
| Magellan Midstream Partners LP | 4.200% | 12/1/42 | 525 | 442 |
| Magellan Midstream Partners LP | 5.150% | 10/15/43 | 1,925 | 1,892 |
| National Fuel Gas Co. | 6.500% | 4/15/18 | 5,129 | 5,871 |
| National Grid plc | 6.300% | 8/1/16 | 2,450 | 2,754 |
| Nisource Finance Corp. | 5.250% | 9/15/17 | 2,200 | 2,434 |
| Nisource Finance Corp. | 6.400% | 3/15/18 | 885 | 1,019 |
| Nisource Finance Corp. | 6.800% | 1/15/19 | 4,250 | 4,969 |
| Nisource Finance Corp. | 5.450% | 9/15/20 | 1,400 | 1,554 |
| Nisource Finance Corp. | 6.125% | 3/1/22 | 11,745 | 13,060 |
| Nisource Finance Corp. | 6.250% | 12/15/40 | 2,350 | 2,549 |
| Nisource Finance Corp. | 5.950% | 6/15/41 | 3,150 | 3,306 |
| Nisource Finance Corp. | 5.800% | 2/1/42 | 75 | 78 |
| Nisource Finance Corp. | 4.800% | 2/15/44 | 2,475 | 2,233 |
| ONEOK Inc. | 5.200% | 6/15/15 | 1,000 | 1,058 |
| ONEOK Inc. | 4.250% | 2/1/22 | 1,250 | 1,170 |
| ONEOK Inc. | 6.000% | 6/15/35 | 5,165 | 4,849 |
| ONEOK Partners LP | 3.250% | 2/1/16 | 4,050 | 4,204 |
| ONEOK Partners LP | 3.200% | 9/15/18 | 4,400 | 4,497 |
| ONEOK Partners LP | 8.625% | 3/1/19 | 2,500 | 3,112 |
| ONEOK Partners LP | 3.375% | 10/1/22 | 5,675 | 5,316 |
| ONEOK Partners LP | 6.650% | 10/1/36 | 3,775 | 4,165 |
| ONEOK Partners LP | 6.850% | 10/15/37 | 2,575 | 2,905 |
| Panhandle Eastern Pipe Line Co. LP | 6.200% | 11/1/17 | 5,453 | 6,216 |
| Panhandle Eastern Pipe Line Co. LP | 7.000% | 6/15/18 | 325 | 376 |
| Piedmont Natural Gas Co. Inc. | 4.650% | 8/1/43 | 1,375 | 1,324 |
| Plains All American Pipeline LP / | ||||
| PAA Finance Corp. | 6.125% | 1/15/17 | 2,000 | 2,267 |
| Plains All American Pipeline LP / | ||||
| PAA Finance Corp. | 8.750% | 5/1/19 | 125 | 160 |
| Plains All American Pipeline LP / | ||||
| PAA Finance Corp. | 5.000% | 2/1/21 | 3,460 | 3,792 |
| Plains All American Pipeline LP / | ||||
| PAA Finance Corp. | 3.650% | 6/1/22 | 1,500 | 1,467 |
| Plains All American Pipeline LP / | ||||
| PAA Finance Corp. | 2.850% | 1/31/23 | 2,200 | 1,993 |
| Plains All American Pipeline LP / | ||||
| PAA Finance Corp. | 3.850% | 10/15/23 | 1,675 | 1,630 |
| Plains All American Pipeline LP / | ||||
| PAA Finance Corp. | 6.700% | 5/15/36 | 1,320 | 1,550 |
| Plains All American Pipeline LP / | ||||
| PAA Finance Corp. | 5.150% | 6/1/42 | 1,825 | 1,771 |
99
| Total Bond Market II Index Fund | |||||
| Face | Market | ||||
| Maturity | Amount | Value | |||
| Coupon | Date | ($000) | ($000) | ||
| Plains All American Pipeline LP / | |||||
| PAA Finance Corp. | 4.300% | 1/31/43 | 725 | 624 | |
| Questar Corp. | 2.750% | 2/1/16 | 2,075 | 2,137 | |
| Sempra Energy | 6.500% | 6/1/16 | 3,885 | 4,365 | |
| Sempra Energy | 2.300% | 4/1/17 | 175 | 178 | |
| Sempra Energy | 6.150% | 6/15/18 | 2,775 | 3,194 | |
| Sempra Energy | 9.800% | 2/15/19 | 1,500 | 1,980 | |
| Sempra Energy | 2.875% | 10/1/22 | 2,125 | 1,946 | |
| Sempra Energy | 4.050% | 12/1/23 | 7,375 | 7,268 | |
| Sempra Energy | 6.000% | 10/15/39 | 3,985 | 4,390 | |
| Southern California Gas Co. | 5.750% | 11/15/35 | 400 | 458 | |
| Southern California Gas Co. | 3.750% | 9/15/42 | 3,325 | 2,894 | |
| 6 | Southern Natural Gas Co. LLC | 5.900% | 4/1/17 | 1,950 | 2,190 |
| Southern Natural Gas Co. LLC | 8.000% | 3/1/32 | 2,299 | 2,931 | |
| Southern Natural Gas Co. LLC / | |||||
| Southern Natural Issuing Corp. | 4.400% | 6/15/21 | 7,315 | 7,497 | |
| Spectra Energy Capital LLC | 6.200% | 4/15/18 | 8,600 | 9,697 | |
| Spectra Energy Capital LLC | 8.000% | 10/1/19 | 835 | 993 | |
| Spectra Energy Capital LLC | 6.750% | 2/15/32 | 725 | 745 | |
| Spectra Energy Partners LP | 2.950% | 9/25/18 | 575 | 583 | |
| Spectra Energy Partners LP | 5.950% | 9/25/43 | 940 | 1,013 | |
| Sunoco Logistics Partners Operations LP | 3.450% | 1/15/23 | 3,500 | 3,205 | |
| Sunoco Logistics Partners Operations LP | 6.850% | 2/15/40 | 3,236 | 3,581 | |
| Sunoco Logistics Partners Operations LP | 4.950% | 1/15/43 | 8,125 | 7,240 | |
| Tennessee Gas Pipeline Co. LLC | 7.500% | 4/1/17 | 720 | 838 | |
| Tennessee Gas Pipeline Co. LLC | 7.000% | 3/15/27 | 725 | 850 | |
| Texas Eastern Transmission LP | 7.000% | 7/15/32 | 6,905 | 8,212 | |
| Texas Gas Transmission LLC | 4.600% | 6/1/15 | 1,275 | 1,337 | |
| TransCanada PipeLines Ltd. | 0.750% | 1/15/16 | 3,025 | 3,019 | |
| TransCanada PipeLines Ltd. | 6.500% | 8/15/18 | 12,040 | 14,202 | |
| TransCanada PipeLines Ltd. | 3.800% | 10/1/20 | 9,990 | 10,320 | |
| TransCanada PipeLines Ltd. | 2.500% | 8/1/22 | 6,075 | 5,535 | |
| TransCanada PipeLines Ltd. | 3.750% | 10/16/23 | 4,775 | 4,634 | |
| TransCanada PipeLines Ltd. | 5.600% | 3/31/34 | 1,400 | 1,472 | |
| TransCanada PipeLines Ltd. | 5.850% | 3/15/36 | 3,225 | 3,502 | |
| TransCanada PipeLines Ltd. | 6.200% | 10/15/37 | 6,975 | 7,916 | |
| TransCanada PipeLines Ltd. | 7.250% | 8/15/38 | 300 | 380 | |
| TransCanada PipeLines Ltd. | 7.625% | 1/15/39 | 690 | 919 | |
| TransCanada PipeLines Ltd. | 5.000% | 10/16/43 | 6,000 | 5,880 | |
| 3 | TransCanada PipeLines Ltd. | 6.350% | 5/15/67 | 4,100 | 4,213 |
| Transcontinental Gas Pipe Line Co. LLC | 6.050% | 6/15/18 | 1,545 | 1,783 | |
| Transcontinental Gas Pipe Line Co. LLC | 4.450% | 8/1/42 | 3,723 | 3,273 | |
| Western Gas Partners LP | 5.375% | 6/1/21 | 2,950 | 3,155 | |
| Williams Cos. Inc. | 7.500% | 1/15/31 | 2,304 | 2,424 | |
| Williams Cos. Inc. | 7.750% | 6/15/31 | 1,967 | 2,109 | |
| Williams Cos. Inc. | 8.750% | 3/15/32 | 3,560 | 4,210 | |
| Williams Partners LP | 3.800% | 2/15/15 | 1,200 | 1,240 | |
| Williams Partners LP | 5.250% | 3/15/20 | 11,901 | 12,961 | |
| Williams Partners LP | 4.000% | 11/15/21 | 3,000 | 2,960 | |
| Williams Partners LP | 3.350% | 8/15/22 | 850 | 788 | |
| Williams Partners LP | 6.300% | 4/15/40 | 4,495 | 4,838 | |
| Williams Partners LP | 5.800% | 11/15/43 | 9,125 | 9,289 | |
| Williams Partners LP / | |||||
| Williams Partners Finance Corp. | 7.250% | 2/1/17 | 2,250 | 2,607 | |
| 100 | |||||
| Total Bond Market II Index Fund | ||||
| Face | Market | |||
| Maturity | Amount | Value | ||
| Coupon | Date | ($000) | ($000) | |
| Other Utility (0.0%) | ||||
| American Water Capital Corp. | 6.085% | 10/15/17 | 8,041 | 9,140 |
| American Water Capital Corp. | 6.593% | 10/15/37 | 6,125 | 7,343 |
| United Utilities plc | 5.375% | 2/1/19 | 5,400 | 5,772 |
| Veolia Environnement SA | 6.000% | 6/1/18 | 6,000 | 6,786 |
| Veolia Environnement SA | 6.750% | 6/1/38 | 1,300 | 1,413 |
| 1,893,624 | ||||
| Total Corporate Bonds (Cost $16,580,444) | 16,849,250 | |||
| Sovereign Bonds (U.S. Dollar-Denominated) (5.2%) | ||||
| African Development Bank | 1.250% | 9/2/16 | 3,100 | 3,137 |
| African Development Bank | 0.750% | 10/18/16 | 8,850 | 8,805 |
| African Development Bank | 1.125% | 3/15/17 | 4,200 | 4,217 |
| African Development Bank | 0.875% | 3/15/18 | 4,700 | 4,551 |
| African Development Bank | 1.625% | 10/2/18 | 16,500 | 16,264 |
| Asian Development Bank | 4.250% | 10/20/14 | 3,550 | 3,663 |
| Asian Development Bank | 2.625% | 2/9/15 | 20,005 | 20,502 |
| Asian Development Bank | 2.500% | 3/15/16 | 11,150 | 11,607 |
| Asian Development Bank | 5.500% | 6/27/16 | 5,450 | 6,094 |
| Asian Development Bank | 1.125% | 3/15/17 | 34,275 | 34,417 |
| Asian Development Bank | 5.250% | 6/12/17 | 100 | 114 |
| Asian Development Bank | 5.593% | 7/16/18 | 1,700 | 1,970 |
| Asian Development Bank | 1.875% | 10/23/18 | 5,120 | 5,144 |
| Asian Development Bank | 1.750% | 3/21/19 | 12,350 | 12,214 |
| Asian Development Bank | 1.375% | 3/23/20 | 2,750 | 2,588 |
| Banco do Brasil SA | 3.875% | 1/23/17 | 6,650 | 6,799 |
| Banco do Brasil SA | 3.875% | 10/10/22 | 5,375 | 4,675 |
| Canada | 0.875% | 2/14/17 | 22,250 | 22,240 |
| China Development Bank Corp. | 4.750% | 10/8/14 | 2,625 | 2,700 |
| China Development Bank Corp. | 5.000% | 10/15/15 | 525 | 558 |
| CNOOC Finance 2013 Ltd. | 1.750% | 5/9/18 | 2,850 | 2,788 |
| CNOOC Finance 2013 Ltd. | 3.000% | 5/9/23 | 13,900 | 12,407 |
| Corp. Andina de Fomento | 5.125% | 5/5/15 | 3,775 | 3,884 |
| Corp. Andina de Fomento | 3.750% | 1/15/16 | 9,460 | 9,826 |
| Corp. Andina de Fomento | 8.125% | 6/4/19 | 1,375 | 1,659 |
| Corp. Andina de Fomento | 4.375% | 6/15/22 | 17,046 | 17,028 |
| Council Of Europe Development Bank | 2.750% | 2/10/15 | 2,200 | 2,258 |
| Council Of Europe Development Bank | 2.625% | 2/16/16 | 4,565 | 4,751 |
| Council Of Europe Development Bank | 1.500% | 2/22/17 | 6,000 | 6,079 |
| Council Of Europe Development Bank | 1.500% | 6/19/17 | 1,350 | 1,363 |
| Council Of Europe Development Bank | 1.000% | 3/7/18 | 10,450 | 10,176 |
| Council Of Europe Development Bank | 1.125% | 5/31/18 | 4,550 | 4,437 |
| 8 Development Bank of Japan Inc. | 4.250% | 6/9/15 | 5,815 | 6,126 |
| Ecopetrol SA | 7.625% | 7/23/19 | 6,725 | 7,952 |
| Ecopetrol SA | 5.875% | 9/18/23 | 800 | 845 |
| Ecopetrol SA | 7.375% | 9/18/43 | 10,000 | 10,684 |
| European Bank for Reconstruction & Development | 2.750% | 4/20/15 | 7,700 | 7,940 |
| European Bank for Reconstruction & Development | 1.625% | 9/3/15 | 1,800 | 1,836 |
| European Bank for Reconstruction & Development | 2.500% | 3/15/16 | 11,975 | 12,468 |
| European Bank for Reconstruction & Development | 1.375% | 10/20/16 | 4,735 | 4,811 |
| European Bank for Reconstruction & Development | 1.000% | 2/16/17 | 5,000 | 5,009 |
| European Bank for Reconstruction & Development | 0.750% | 9/1/17 | 8,075 | 7,959 |
| European Bank for Reconstruction & Development | 1.000% | 9/17/18 | 2,050 | 1,973 |
| European Bank for Reconstruction & Development | 1.625% | 11/15/18 | 4,675 | 4,652 |
| European Bank for Reconstruction & Development | 1.500% | 3/16/20 | 10,950 | 10,398 |
101
| Total Bond Market II Index Fund | |||||
| Face | Market | ||||
| Maturity | Amount | Value | |||
| Coupon | Date | ($000) | ($000) | ||
| European Investment Bank | 0.875% | 12/15/14 | 21,220 | 21,340 | |
| European Investment Bank | 2.875% | 1/15/15 | 7,875 | 8,085 | |
| European Investment Bank | 2.750% | 3/23/15 | 10,325 | 10,627 | |
| European Investment Bank | 1.125% | 4/15/15 | 26,000 | 26,269 | |
| European Investment Bank | 1.000% | 7/15/15 | 24,000 | 24,236 | |
| European Investment Bank | 1.625% | 9/1/15 | 19,545 | 19,952 | |
| European Investment Bank | 1.375% | 10/20/15 | 4,545 | 4,632 | |
| European Investment Bank | 4.875% | 2/16/16 | 9,500 | 10,364 | |
| European Investment Bank | 2.250% | 3/15/16 | 19,400 | 20,115 | |
| European Investment Bank | 0.625% | 4/15/16 | 22,700 | 22,700 | |
| European Investment Bank | 2.500% | 5/16/16 | 15,700 | 16,370 | |
| European Investment Bank | 2.125% | 7/15/16 | 6,000 | 6,211 | |
| European Investment Bank | 0.500% | 8/15/16 | 10,000 | 9,886 | |
| European Investment Bank | 5.125% | 9/13/16 | 14,700 | 16,380 | |
| European Investment Bank | 1.250% | 10/14/16 | 6,650 | 6,729 | |
| European Investment Bank | 1.125% | 12/15/16 | 1,500 | 1,507 | |
| European Investment Bank | 4.875% | 1/17/17 | 5,500 | 6,136 | |
| European Investment Bank | 1.750% | 3/15/17 | 35,100 | 35,855 | |
| European Investment Bank | 5.125% | 5/30/17 | 9,150 | 10,365 | |
| European Investment Bank | 1.625% | 6/15/17 | 1,000 | 1,016 | |
| European Investment Bank | 1.125% | 9/15/17 | 14,425 | 14,353 | |
| European Investment Bank | 1.000% | 12/15/17 | 13,850 | 13,647 | |
| European Investment Bank | 1.000% | 3/15/18 | 20,575 | 20,099 | |
| European Investment Bank | 1.000% | 6/15/18 | 35,000 | 33,929 | |
| European Investment Bank | 1.625% | 12/18/18 | 34,225 | 33,794 | |
| European Investment Bank | 2.875% | 9/15/20 | 14,650 | 14,806 | |
| European Investment Bank | 4.000% | 2/16/21 | 11,575 | 12,434 | |
| European Investment Bank | 4.875% | 2/15/36 | 100 | 109 | |
| Export Development Canada | 2.250% | 5/28/15 | 1,550 | 1,593 | |
| Export Development Canada | 1.250% | 10/26/16 | 705 | 715 | |
| Export Development Canada | 0.625% | 12/15/16 | 1,675 | 1,664 | |
| Export Development Canada | 0.750% | 12/15/17 | 9,025 | 8,811 | |
| Export Development Canada | 1.500% | 10/3/18 | 15,125 | 14,863 | |
| Export-Import Bank of Korea | 5.875% | 1/14/15 | 1,750 | 1,839 | |
| Export-Import Bank of Korea | 5.125% | 3/16/15 | 3,275 | 3,433 | |
| Export-Import Bank of Korea | 4.125% | 9/9/15 | 5,925 | 6,215 | |
| Export-Import Bank of Korea | 3.750% | 10/20/16 | 5,575 | 5,907 | |
| Export-Import Bank of Korea | 4.000% | 1/11/17 | 4,250 | 4,502 | |
| Export-Import Bank of Korea | 1.750% | 2/27/18 | 3,675 | 3,562 | |
| Export-Import Bank of Korea | 2.875% | 9/17/18 | 8,000 | 8,033 | |
| Export-Import Bank of Korea | 5.125% | 6/29/20 | 3,600 | 3,950 | |
| Export-Import Bank of Korea | 4.000% | 1/29/21 | 2,500 | 2,542 | |
| Export-Import Bank of Korea | 4.375% | 9/15/21 | 4,000 | 4,160 | |
| Export-Import Bank of Korea | 5.000% | 4/11/22 | 8,300 | 8,988 | |
| Federative Republic of Brazil | 7.875% | 3/7/15 | 4,875 | 5,226 | |
| Federative Republic of Brazil | 6.000% | 1/17/17 | 21,330 | 23,623 | |
| 3 | Federative Republic of Brazil | 8.000% | 1/15/18 | 12,113 | 13,445 |
| Federative Republic of Brazil | 5.875% | 1/15/19 | 16,050 | 18,008 | |
| Federative Republic of Brazil | 8.875% | 10/14/19 | 3,600 | 4,650 | |
| Federative Republic of Brazil | 4.875% | 1/22/21 | 7,470 | 7,823 | |
| Federative Republic of Brazil | 2.625% | 1/5/23 | 9,425 | 8,096 | |
| Federative Republic of Brazil | 8.875% | 4/15/24 | 1,525 | 2,018 | |
| Federative Republic of Brazil | 4.250% | 1/7/25 | 9,600 | 9,064 | |
| Federative Republic of Brazil | 8.750% | 2/4/25 | 4,200 | 5,565 | |
| Federative Republic of Brazil | 10.125% | 5/15/27 | 4,200 | 6,174 | |
| 102 | |||||
| Total Bond Market II Index Fund | ||||
| Face | Market | |||
| Maturity | Amount | Value | ||
| Coupon | Date | ($000) | ($000) | |
| Federative Republic of Brazil | 8.250% | 1/20/34 | 5,750 | 7,288 |
| Federative Republic of Brazil | 7.125% | 1/20/37 | 11,425 | 13,030 |
| 3 Federative Republic of Brazil | 11.000% | 8/17/40 | 4,350 | 4,942 |
| Federative Republic of Brazil | 5.625% | 1/7/41 | 33,250 | 31,920 |
| FMS Wertmanagement AoeR | 0.625% | 4/18/16 | 15,000 | 14,980 |
| FMS Wertmanagement AoeR | 1.000% | 11/21/17 | 4,350 | 4,274 |
| FMS Wertmanagement AoeR | 1.625% | 11/20/18 | 11,000 | 10,842 |
| Hydro-Quebec | 7.500% | 4/1/16 | 3,650 | 4,182 |
| Hydro-Quebec | 2.000% | 6/30/16 | 14,825 | 15,241 |
| Hydro-Quebec | 1.375% | 6/19/17 | 9,300 | 9,303 |
| Hydro-Quebec | 8.400% | 1/15/22 | 3,040 | 3,963 |
| Hydro-Quebec | 8.050% | 7/7/24 | 1,350 | 1,784 |
| Hydro-Quebec | 8.500% | 12/1/29 | 100 | 141 |
| Inter-American Development Bank | 2.250% | 7/15/15 | 9,625 | 9,891 |
| Inter-American Development Bank | 0.500% | 8/17/15 | 4,900 | 4,909 |
| Inter-American Development Bank | 4.250% | 9/14/15 | 3,450 | 3,670 |
| Inter-American Development Bank | 5.125% | 9/13/16 | 100 | 111 |
| Inter-American Development Bank | 1.375% | 10/18/16 | 9,810 | 9,977 |
| Inter-American Development Bank | 0.875% | 11/15/16 | 6,025 | 6,035 |
| Inter-American Development Bank | 1.125% | 3/15/17 | 10,650 | 10,707 |
| Inter-American Development Bank | 2.375% | 8/15/17 | 5,100 | 5,320 |
| Inter-American Development Bank | 0.875% | 3/15/18 | 9,925 | 9,669 |
| Inter-American Development Bank | 1.750% | 8/24/18 | 7,670 | 7,686 |
| Inter-American Development Bank | 1.125% | 9/12/19 | 24,800 | 23,354 |
| Inter-American Development Bank | 3.875% | 9/17/19 | 16,750 | 18,279 |
| Inter-American Development Bank | 3.875% | 2/14/20 | 2,300 | 2,494 |
| Inter-American Development Bank | 2.125% | 11/9/20 | 10,400 | 10,050 |
| Inter-American Development Bank | 3.000% | 10/4/23 | 2,350 | 2,276 |
| Inter-American Development Bank | 7.000% | 6/15/25 | 1,125 | 1,446 |
| Inter-American Development Bank | 3.200% | 8/7/42 | 2,000 | 1,568 |
| International Bank for Reconstruction & | ||||
| Development | 2.375% | 5/26/15 | 31,070 | 31,945 |
| International Bank for Reconstruction & | ||||
| Development | 2.125% | 3/15/16 | 24,450 | 25,274 |
| International Bank for Reconstruction & | ||||
| Development | 5.000% | 4/1/16 | 9,975 | 10,947 |
| International Bank for Reconstruction & | ||||
| Development | 0.500% | 4/15/16 | 16,700 | 16,597 |
| International Bank for Reconstruction & | ||||
| Development | 1.000% | 9/15/16 | 5,995 | 6,037 |
| International Bank for Reconstruction & | ||||
| Development | 0.875% | 4/17/17 | 33,975 | 33,879 |
| International Bank for Reconstruction & | ||||
| Development | 1.125% | 7/18/17 | 7,500 | 7,504 |
| International Bank for Reconstruction & | ||||
| Development | 2.125% | 11/1/20 | 5,200 | 5,045 |
| International Bank for Reconstruction & | ||||
| Development | 7.625% | 1/19/23 | 950 | 1,278 |
| International Bank for Reconstruction & | ||||
| Development | 2.125% | 2/13/23 | 11,700 | 10,775 |
| International Bank for Reconstruction & | ||||
| Development | 8.875% | 3/1/26 | 450 | 675 |
| International Finance Corp. | 2.750% | 4/20/15 | 3,250 | 3,350 |
| International Finance Corp. | 2.250% | 4/11/16 | 5,000 | 5,174 |
| International Finance Corp. | 0.625% | 11/15/16 | 9,450 | 9,408 |
103
| Total Bond Market II Index Fund | |||||
| Face | Market | ||||
| Maturity | Amount | Value | |||
| Coupon | Date | ($000) | ($000) | ||
| International Finance Corp. | 1.125% | 11/23/16 | 14,950 | 15,094 | |
| International Finance Corp. | 1.000% | 4/24/17 | 5,650 | 5,629 | |
| International Finance Corp. | 2.125% | 11/17/17 | 24,800 | 25,509 | |
| International Finance Corp. | 0.625% | 12/21/17 | 6,850 | 6,612 | |
| International Finance Corp. | 1.750% | 9/4/18 | 6,400 | 6,379 | |
| 8 | Japan Bank for International Cooperation | 2.875% | 2/2/15 | 6,300 | 6,467 |
| 8 | Japan Bank for International Cooperation | 1.875% | 9/24/15 | 6,065 | 6,208 |
| 8 | Japan Bank for International Cooperation | 2.500% | 1/21/16 | 5,600 | 5,803 |
| 8 | Japan Bank for International Cooperation | 2.500% | 5/18/16 | 6,200 | 6,449 |
| 8 | Japan Bank for International Cooperation | 2.250% | 7/13/16 | 5,000 | 5,175 |
| 8 | Japan Bank for International Cooperation | 1.125% | 7/19/17 | 6,675 | 6,608 |
| 8 | Japan Bank for International Cooperation | 1.750% | 7/31/18 | 13,125 | 13,010 |
| 8 | Japan Bank for International Cooperation | 1.750% | 11/13/18 | 19,900 | 19,656 |
| 8 | Japan Bank for International Cooperation | 2.125% | 2/7/19 | 5,000 | 4,981 |
| 8 | Japan Bank for International Cooperation | 3.375% | 7/31/23 | 2,400 | 2,349 |
| 8 | Japan Finance Organization for Municipalities | 4.625% | 4/21/15 | 2,675 | 2,813 |
| 8 | Japan Finance Organization for Municipalities | 5.000% | 5/16/17 | 1,600 | 1,785 |
| 8 | Japan Finance Organization for Municipalities | 4.000% | 1/13/21 | 5,625 | 5,997 |
| 9 | KFW | 1.000% | 1/12/15 | 19,825 | 19,912 |
| 9 | KFW | 2.625% | 3/3/15 | 11,875 | 12,181 |
| 9 | KFW | 0.625% | 4/24/15 | 15,700 | 15,761 |
| 9 | KFW | 0.500% | 9/30/15 | 34,175 | 34,124 |
| 9 | KFW | 1.250% | 10/26/15 | 15,400 | 15,559 |
| 9 | KFW | 2.625% | 2/16/16 | 3,450 | 3,596 |
| 9 | KFW | 5.125% | 3/14/16 | 14,000 | 15,325 |
| 9 | KFW | 0.500% | 4/19/16 | 16,000 | 15,882 |
| 9 | KFW | 2.000% | 6/1/16 | 19,000 | 19,534 |
| 9 | KFW | 1.250% | 10/5/16 | 15,230 | 15,409 |
| 9 | KFW | 0.625% | 12/15/16 | 30,150 | 29,923 |
| 9 | KFW | 4.875% | 1/17/17 | 3,000 | 3,335 |
| 9 | KFW | 1.250% | 2/15/17 | 29,000 | 29,190 |
| 9 | KFW | 0.875% | 9/5/17 | 14,200 | 14,022 |
| 9 | KFW | 4.375% | 3/15/18 | 18,850 | 20,852 |
| 9 | KFW | 1.000% | 6/11/18 | 14,000 | 13,556 |
| 9 | KFW | 4.500% | 7/16/18 | 6,425 | 7,182 |
| 9 | KFW | 4.875% | 6/17/19 | 20,075 | 22,826 |
| 9 | KFW | 4.000% | 1/27/20 | 5,500 | 5,989 |
| 9 | KFW | 2.750% | 9/8/20 | 23,250 | 23,353 |
| 9 | KFW | 2.750% | 10/1/20 | 6,200 | 6,244 |
| 9 | KFW | 2.375% | 8/25/21 | 9,590 | 9,324 |
| 9 | KFW | 2.625% | 1/25/22 | 14,000 | 13,656 |
| 9 | KFW | 2.000% | 10/4/22 | 24,875 | 22,855 |
| 9 | KFW | 2.125% | 1/17/23 | 30,000 | 27,421 |
| 9 | KFW | 0.000% | 4/18/36 | 7,000 | 2,740 |
| 9 | KFW | 0.000% | 6/29/37 | 5,450 | 2,028 |
| Korea Development Bank | 4.375% | 8/10/15 | 11,800 | 12,410 | |
| Korea Development Bank | 3.250% | 3/9/16 | 1,180 | 1,227 | |
| Korea Development Bank | 4.000% | 9/9/16 | 2,500 | 2,662 | |
| Korea Development Bank | 3.875% | 5/4/17 | 2,500 | 2,638 | |
| Korea Development Bank | 3.500% | 8/22/17 | 3,450 | 3,596 | |
| Korea Development Bank | 1.500% | 1/22/18 | 2,500 | 2,408 | |
| Korea Development Bank | 3.000% | 9/14/22 | 5,000 | 4,698 | |
| Korea Finance Corp. | 3.250% | 9/20/16 | 4,000 | 4,174 | |
| Korea Finance Corp. | 2.250% | 8/7/17 | 1,475 | 1,477 | |
| Korea Finance Corp. | 4.625% | 11/16/21 | 4,000 | 4,200 | |
| 104 | |||||
| Total Bond Market II Index Fund | |||||
| Face | Market | ||||
| Maturity | Amount | Value | |||
| Coupon | Date | ($000) | ($000) | ||
| 9 | Landwirtschaftliche Rentenbank | 3.125% | 7/15/15 | 6,605 | 6,863 |
| 9 | Landwirtschaftliche Rentenbank | 4.875% | 11/16/15 | 10,650 | 11,480 |
| 9 | Landwirtschaftliche Rentenbank | 2.500% | 2/15/16 | 7,220 | 7,504 |
| 9 | Landwirtschaftliche Rentenbank | 2.125% | 7/15/16 | 175 | 180 |
| 9 | Landwirtschaftliche Rentenbank | 5.125% | 2/1/17 | 10,700 | 11,932 |
| 9 | Landwirtschaftliche Rentenbank | 0.875% | 9/12/17 | 2,325 | 2,284 |
| 9 | Landwirtschaftliche Rentenbank | 2.375% | 9/13/17 | 4,000 | 4,126 |
| 9 | Landwirtschaftliche Rentenbank | 1.000% | 4/4/18 | 13,000 | 12,679 |
| 9 | Landwirtschaftliche Rentenbank | 1.875% | 9/17/18 | 5,600 | 5,595 |
| 9 | Landwirtschaftliche Rentenbank | 1.375% | 10/23/19 | 3,000 | 2,853 |
| Nexen Energy ULC | 7.875% | 3/15/32 | 325 | 423 | |
| Nexen Energy ULC | 5.875% | 3/10/35 | 690 | 739 | |
| Nexen Energy ULC | 6.400% | 5/15/37 | 13,400 | 15,158 | |
| Nexen Energy ULC | 7.500% | 7/30/39 | 3,400 | 4,309 | |
| Nordic Investment Bank | 2.625% | 10/6/14 | 4,000 | 4,073 | |
| Nordic Investment Bank | 2.500% | 7/15/15 | 3,865 | 3,991 | |
| Nordic Investment Bank | 2.250% | 3/15/16 | 4,250 | 4,403 | |
| Nordic Investment Bank | 0.500% | 4/14/16 | 3,150 | 3,142 | |
| Nordic Investment Bank | 5.000% | 2/1/17 | 1,150 | 1,291 | |
| Nordic Investment Bank | 1.000% | 3/7/17 | 2,250 | 2,255 | |
| Nordic Investment Bank | 0.750% | 1/17/18 | 14,450 | 13,998 | |
| North American Development Bank | 2.300% | 10/10/18 | 2,387 | 2,350 | |
| North American Development Bank | 4.375% | 2/11/20 | 975 | 1,017 | |
| North American Development Bank | 2.400% | 10/26/22 | 3,300 | 2,925 | |
| 10 | Oesterreichische Kontrollbank AG | 4.500% | 3/9/15 | 2,600 | 2,726 |
| 10 | Oesterreichische Kontrollbank AG | 2.000% | 6/3/16 | 24,500 | 25,228 |
| 10 | Oesterreichische Kontrollbank AG | 0.750% | 12/15/16 | 8,000 | 7,973 |
| 10 | Oesterreichische Kontrollbank AG | 5.000% | 4/25/17 | 4,025 | 4,537 |
| 3 | Oriental Republic of Uruguay | 8.000% | 11/18/22 | 3,900 | 4,797 |
| 3 | Oriental Republic of Uruguay | 4.500% | 8/14/24 | 12,000 | 11,995 |
| 3 | Oriental Republic of Uruguay | 7.625% | 3/21/36 | 1,425 | 1,714 |
| 3 | Oriental Republic of Uruguay | 4.125% | 11/20/45 | 16,579 | 12,574 |
| Pemex Project Funding Master Trust | 5.750% | 3/1/18 | 24,575 | 27,387 | |
| Pemex Project Funding Master Trust | 6.625% | 6/15/35 | 9,100 | 9,484 | |
| Pemex Project Funding Master Trust | 6.625% | 6/15/38 | 2,025 | 2,068 | |
| Petrobras Global Finance BV | 2.000% | 5/20/16 | 11,000 | 10,883 | |
| Petrobras Global Finance BV | 3.000% | 1/15/19 | 1,000 | 937 | |
| Petrobras Global Finance BV | 4.375% | 5/20/23 | 11,000 | 9,774 | |
| Petrobras Global Finance BV | 5.625% | 5/20/43 | 3,600 | 2,919 | |
| Petrobras International Finance Co. | 2.875% | 2/6/15 | 5,150 | 5,222 | |
| Petrobras International Finance Co. | 3.875% | 1/27/16 | 3,350 | 3,441 | |
| Petrobras International Finance Co. | 6.125% | 10/6/16 | 3,325 | 3,598 | |
| Petrobras International Finance Co. | 3.500% | 2/6/17 | 12,250 | 12,379 | |
| Petrobras International Finance Co. | 5.875% | 3/1/18 | 18,500 | 19,674 | |
| Petrobras International Finance Co. | 8.375% | 12/10/18 | 2,300 | 2,690 | |
| Petrobras International Finance Co. | 7.875% | 3/15/19 | 7,575 | 8,614 | |
| Petrobras International Finance Co. | 5.750% | 1/20/20 | 26,485 | 27,231 | |
| Petrobras International Finance Co. | 5.375% | 1/27/21 | 18,325 | 18,172 | |
| Petrobras International Finance Co. | 6.875% | 1/20/40 | 18,025 | 16,996 | |
| Petrobras International Finance Co. | 6.750% | 1/27/41 | 7,700 | 7,134 | |
| Petroleos Mexicanos | 4.875% | 3/15/15 | 9,875 | 10,340 | |
| Petroleos Mexicanos | 8.000% | 5/3/19 | 6,675 | 8,069 | |
| Petroleos Mexicanos | 6.000% | 3/5/20 | 5,000 | 5,544 | |
| Petroleos Mexicanos | 5.500% | 1/21/21 | 12,645 | 13,585 | |
| Petroleos Mexicanos | 4.875% | 1/24/22 | 19,850 | 20,334 | |
105
| Total Bond Market II Index Fund | |||||
| Face | Market | ||||
| Maturity | Amount | Value | |||
| Coupon | Date | ($000) | ($000) | ||
| Petroleos Mexicanos | 3.500% | 1/30/23 | 5,850 | 5,260 | |
| Petroleos Mexicanos | 4.875% | 1/18/24 | 700 | 695 | |
| 3 | Petroleos Mexicanos | 2.290% | 2/15/24 | 1,500 | 1,476 |
| Petroleos Mexicanos | 6.500% | 6/2/41 | 10,725 | 11,116 | |
| Petroleos Mexicanos | 5.500% | 6/27/44 | 20,400 | 18,479 | |
| Province of British Columbia | 2.850% | 6/15/15 | 6,100 | 6,317 | |
| Province of British Columbia | 2.100% | 5/18/16 | 5,280 | 5,450 | |
| Province of British Columbia | 1.200% | 4/25/17 | 4,900 | 4,892 | |
| Province of British Columbia | 2.650% | 9/22/21 | 8,200 | 7,967 | |
| Province of British Columbia | 2.000% | 10/23/22 | 10,000 | 8,943 | |
| Province of Manitoba | 2.625% | 7/15/15 | 1,475 | 1,522 | |
| Province of Manitoba | 4.900% | 12/6/16 | 6,065 | 6,770 | |
| Province of Manitoba | 1.300% | 4/3/17 | 4,050 | 4,078 | |
| Province of Manitoba | 1.125% | 6/1/18 | 1,250 | 1,220 | |
| Province of Manitoba | 2.100% | 9/6/22 | 3,000 | 2,703 | |
| Province of New Brunswick | 2.750% | 6/15/18 | 7,575 | 7,870 | |
| Province of Nova Scotia | 2.375% | 7/21/15 | 6,390 | 6,569 | |
| Province of Nova Scotia | 5.125% | 1/26/17 | 1,000 | 1,117 | |
| Province of Nova Scotia | 9.125% | 5/1/21 | 1,280 | 1,715 | |
| Province of Ontario | 2.950% | 2/5/15 | 1,475 | 1,516 | |
| Province of Ontario | 0.950% | 5/26/15 | 15,000 | 15,104 | |
| Province of Ontario | 2.700% | 6/16/15 | 10,800 | 11,144 | |
| Province of Ontario | 1.875% | 9/15/15 | 2,500 | 2,558 | |
| Province of Ontario | 4.750% | 1/19/16 | 4,325 | 4,671 | |
| Province of Ontario | 5.450% | 4/27/16 | 6,125 | 6,770 | |
| Province of Ontario | 2.300% | 5/10/16 | 26,290 | 27,145 | |
| Province of Ontario | 1.000% | 7/22/16 | 14,100 | 14,108 | |
| Province of Ontario | 1.600% | 9/21/16 | 9,200 | 9,353 | |
| Province of Ontario | 1.100% | 10/25/17 | 10,650 | 10,523 | |
| Province of Ontario | 3.150% | 12/15/17 | 5,525 | 5,841 | |
| Province of Ontario | 1.200% | 2/14/18 | 5,600 | 5,480 | |
| Province of Ontario | 3.000% | 7/16/18 | 2,550 | 2,665 | |
| Province of Ontario | 2.000% | 9/27/18 | 12,500 | 12,486 | |
| Province of Ontario | 1.650% | 9/27/19 | 11,000 | 10,502 | |
| Province of Ontario | 4.000% | 10/7/19 | 3,750 | 4,036 | |
| Province of Ontario | 4.400% | 4/14/20 | 9,200 | 10,054 | |
| Province of Ontario | 2.450% | 6/29/22 | 2,025 | 1,862 | |
| Quebec | 4.600% | 5/26/15 | 2,250 | 2,380 | |
| Quebec | 5.125% | 11/14/16 | 7,275 | 8,112 | |
| Quebec | 4.625% | 5/14/18 | 9,075 | 10,147 | |
| Quebec | 3.500% | 7/29/20 | 8,770 | 9,081 | |
| Quebec | 2.750% | 8/25/21 | 13,475 | 12,987 | |
| Quebec | 2.625% | 2/13/23 | 15,300 | 13,971 | |
| Quebec | 7.125% | 2/9/24 | 325 | 406 | |
| Quebec | 7.500% | 9/15/29 | 6,875 | 9,040 | |
| Region of Lombardy Italy | 5.804% | 10/25/32 | 1,050 | 956 | |
| Republic of Chile | 3.875% | 8/5/20 | 6,850 | 7,148 | |
| Republic of Chile | 3.250% | 9/14/21 | 200 | 196 | |
| Republic of Chile | 2.250% | 10/30/22 | 10,400 | 9,209 | |
| Republic of Chile | 3.625% | 10/30/42 | 3,600 | 2,807 | |
| Republic of Colombia | 7.375% | 1/27/17 | 4,900 | 5,672 | |
| Republic of Colombia | 7.375% | 3/18/19 | 20,550 | 24,722 | |
| Republic of Colombia | 11.750% | 2/25/20 | 1,050 | 1,507 | |
| Republic of Colombia | 4.375% | 7/12/21 | 9,795 | 10,113 | |
| 3 | Republic of Colombia | 2.625% | 3/15/23 | 11,950 | 10,416 |
| 106 | |||||
| Total Bond Market II Index Fund | ||||
| Face | Market | |||
| Maturity | Amount | Value | ||
| Coupon | Date | ($000) | ($000) | |
| Republic of Colombia | 4.000% | 2/26/24 | 7,100 | 6,869 |
| Republic of Colombia | 8.125% | 5/21/24 | 2,800 | 3,588 |
| Republic of Colombia | 7.375% | 9/18/37 | 9,500 | 11,661 |
| Republic of Colombia | 6.125% | 1/18/41 | 9,250 | 9,827 |
| Republic of Finland | 6.950% | 2/15/26 | 1,000 | 1,238 |
| Republic of Italy | 4.500% | 1/21/15 | 4,000 | 4,152 |
| Republic of Italy | 3.125% | 1/26/15 | 15,815 | 16,193 |
| Republic of Italy | 4.750% | 1/25/16 | 14,850 | 15,821 |
| Republic of Italy | 5.250% | 9/20/16 | 10,855 | 11,838 |
| Republic of Italy | 5.375% | 6/12/17 | 14,400 | 15,785 |
| Republic of Italy | 6.875% | 9/27/23 | 5,725 | 6,795 |
| Republic of Italy | 5.375% | 6/15/33 | 12,650 | 13,320 |
| Republic of Korea | 5.125% | 12/7/16 | 3,000 | 3,331 |
| Republic of Korea | 7.125% | 4/16/19 | 12,578 | 15,323 |
| Republic of Korea | 3.875% | 9/11/23 | 3,300 | 3,346 |
| Republic of Korea | 5.625% | 11/3/25 | 575 | 651 |
| Republic of Panama | 5.200% | 1/30/20 | 15,655 | 17,004 |
| Republic of Panama | 7.125% | 1/29/26 | 11,500 | 13,714 |
| 3 Republic of Panama | 6.700% | 1/26/36 | 9,848 | 11,005 |
| Republic of Peru | 7.125% | 3/30/19 | 12,550 | 15,123 |
| Republic of Peru | 7.350% | 7/21/25 | 6,525 | 8,221 |
| Republic of Peru | 8.750% | 11/21/33 | 11,427 | 16,255 |
| 3 Republic of Peru | 6.550% | 3/14/37 | 5,500 | 6,325 |
| Republic of Peru | 5.625% | 11/18/50 | 5,400 | 5,288 |
| Republic of Philippines | 9.375% | 1/18/17 | 5,000 | 6,081 |
| Republic of Philippines | 6.500% | 1/20/20 | 3,100 | 3,642 |
| Republic of Philippines | 4.000% | 1/15/21 | 17,525 | 18,051 |
| 3 Republic of Philippines | 7.500% | 9/25/24 | 7,550 | 9,381 |
| Republic of Philippines | 9.500% | 10/21/24 | 1,700 | 2,405 |
| Republic of Philippines | 10.625% | 3/16/25 | 8,525 | 13,001 |
| Republic of Philippines | 5.500% | 3/30/26 | 6,800 | 7,446 |
| Republic of Philippines | 9.500% | 2/2/30 | 8,950 | 13,291 |
| Republic of Philippines | 7.750% | 1/14/31 | 7,250 | 9,543 |
| Republic of Philippines | 6.375% | 1/15/32 | 5,650 | 6,568 |
| Republic of Philippines | 6.375% | 10/23/34 | 13,725 | 16,298 |
| Republic of Philippines | 5.000% | 1/13/37 | 1,950 | 2,026 |
| Republic of Poland | 3.875% | 7/16/15 | 9,550 | 9,971 |
| Republic of Poland | 5.000% | 10/19/15 | 750 | 805 |
| Republic of Poland | 6.375% | 7/15/19 | 12,960 | 15,147 |
| Republic of Poland | 5.125% | 4/21/21 | 12,850 | 13,958 |
| Republic of Poland | 5.000% | 3/23/22 | 18,185 | 19,368 |
| Republic of Poland | 3.000% | 3/17/23 | 8,700 | 7,906 |
| Republic of South Africa | 6.875% | 5/27/19 | 7,375 | 8,393 |
| Republic of South Africa | 5.500% | 3/9/20 | 9,890 | 10,507 |
| Republic of South Africa | 4.665% | 1/17/24 | 5,300 | 5,081 |
| Republic of South Africa | 5.875% | 9/16/25 | 11,000 | 11,412 |
| Republic of South Africa | 6.250% | 3/8/41 | 2,100 | 2,176 |
| Republic of Turkey | 7.000% | 9/26/16 | 17,900 | 19,645 |
| Republic of Turkey | 7.500% | 7/14/17 | 12,175 | 13,642 |
| Republic of Turkey | 6.750% | 4/3/18 | 10,275 | 11,159 |
| Republic of Turkey | 7.000% | 3/11/19 | 17,700 | 19,381 |
| Republic of Turkey | 7.000% | 6/5/20 | 13,100 | 14,299 |
| Republic of Turkey | 5.625% | 3/30/21 | 1,475 | 1,481 |
| Republic of Turkey | 5.125% | 3/25/22 | 8,925 | 8,550 |
| Republic of Turkey | 7.375% | 2/5/25 | 16,475 | 17,785 |
107
| Total Bond Market II Index Fund | ||||
| Face | Market | |||
| Maturity | Amount | Value | ||
| Coupon | Date | ($000) | ($000) | |
| Republic of Turkey | 11.875% | 1/15/30 | 13,000 | 19,396 |
| Republic of Turkey | 8.000% | 2/14/34 | 11,400 | 12,643 |
| Republic of Turkey | 6.875% | 3/17/36 | 13,100 | 12,851 |
| Republic of Turkey | 6.750% | 5/30/40 | 16,000 | 15,472 |
| Republic of Turkey | 6.000% | 1/14/41 | 9,500 | 8,341 |
| State of Israel | 5.500% | 11/9/16 | 3,480 | 3,884 |
| State of Israel | 5.125% | 3/26/19 | 5,350 | 6,035 |
| State of Israel | 4.000% | 6/30/22 | 15,300 | 15,740 |
| State of Israel | 3.150% | 6/30/23 | 2,300 | 2,180 |
| State of Israel | 4.500% | 1/30/43 | 5,100 | 4,477 |
| Statoil ASA | 3.875% | 4/15/14 | 1,250 | 1,262 |
| Statoil ASA | 1.800% | 11/23/16 | 300 | 308 |
| Statoil ASA | 3.125% | 8/17/17 | 5,590 | 5,885 |
| Statoil ASA | 6.700% | 1/15/18 | 1,000 | 1,176 |
| Statoil ASA | 1.200% | 1/17/18 | 2,000 | 1,952 |
| Statoil ASA | 1.950% | 11/8/18 | 3,500 | 3,473 |
| Statoil ASA | 5.250% | 4/15/19 | 7,215 | 8,164 |
| Statoil ASA | 2.900% | 11/8/20 | 1,000 | 992 |
| Statoil ASA | 3.150% | 1/23/22 | 3,175 | 3,093 |
| Statoil ASA | 2.450% | 1/17/23 | 14,300 | 13,010 |
| Statoil ASA | 2.650% | 1/15/24 | 3,500 | 3,168 |
| Statoil ASA | 3.700% | 3/1/24 | 4,300 | 4,271 |
| Statoil ASA | 7.250% | 9/23/27 | 1,975 | 2,543 |
| 6 Statoil ASA | 6.500% | 12/1/28 | 225 | 275 |
| Statoil ASA | 7.150% | 1/15/29 | 1,165 | 1,486 |
| Statoil ASA | 5.100% | 8/17/40 | 4,000 | 4,134 |
| Statoil ASA | 4.250% | 11/23/41 | 2,300 | 2,086 |
| Statoil ASA | 3.950% | 5/15/43 | 1,400 | 1,219 |
| Statoil ASA | 4.800% | 11/8/43 | 5,000 | 5,020 |
| Svensk Exportkredit AB | 1.750% | 10/20/15 | 2,600 | 2,657 |
| Svensk Exportkredit AB | 0.625% | 5/31/16 | 4,100 | 4,076 |
| Svensk Exportkredit AB | 2.125% | 7/13/16 | 7,360 | 7,576 |
| Svensk Exportkredit AB | 5.125% | 3/1/17 | 550 | 615 |
| Svensk Exportkredit AB | 1.750% | 5/30/17 | 4,050 | 4,126 |
| Svensk Exportkredit AB | 1.125% | 4/5/18 | 15,000 | 14,597 |
| United Mexican States | 6.625% | 3/3/15 | 1 | 1 |
| United Mexican States | 11.375% | 9/15/16 | 1,325 | 1,691 |
| United Mexican States | 5.625% | 1/15/17 | 27,465 | 30,619 |
| United Mexican States | 5.950% | 3/19/19 | 12,363 | 14,279 |
| United Mexican States | 3.625% | 3/15/22 | 17,050 | 16,811 |
| United Mexican States | 4.000% | 10/2/23 | 34,492 | 33,931 |
| United Mexican States | 8.300% | 8/15/31 | 3,125 | 4,230 |
| United Mexican States | 6.750% | 9/27/34 | 11,400 | 13,452 |
| United Mexican States | 6.050% | 1/11/40 | 18,760 | 20,401 |
| United Mexican States | 4.750% | 3/8/44 | 28,883 | 26,019 |
| United Mexican States | 5.750% | 10/12/10 | 16,260 | 14,794 |
| Total Sovereign Bonds (Cost $3,758,187) | 3,730,915 | |||
| Taxable Municipal Bonds (0.8%) | ||||
| Alameda County CA Joint Powers Authority | ||||
| Lease Revenue | 7.046% | 12/1/44 | 4,080 | 4,511 |
| American Municipal Power Ohio Inc. Revenue | ||||
| (Prairie State Energy Campus Project) | 7.834% | 2/15/41 | 575 | 726 |
| American Municipal Power Ohio Inc. Revenue | ||||
| (Prairie State Energy Campus Project) | 6.053% | 2/15/43 | 400 | 416 |
108
| Total Bond Market II Index Fund | ||||
| Face | Market | |||
| Maturity | Amount | Value | ||
| Coupon | Date | ($000) | ($000) | |
| American Municipal Power Ohio Inc. Revenue | ||||
| (Prairie State Energy Campus Project) | 5.939% | 2/15/47 | 3,000 | 3,082 |
| American Municipal Power Ohio Inc. Revenue | ||||
| (Prairie State Energy Campus Project) | 6.270% | 2/15/50 | 1,090 | 1,161 |
| American Municipal Power Ohio Inc. Revenue | ||||
| (Prairie State Energy Campus Project) | 7.499% | 2/15/50 | 750 | 909 |
| American Municipal Power Ohio Inc. Revenue | ||||
| (Prairie State Energy Campus Project) | 8.084% | 2/15/50 | 3,050 | 4,037 |
| Bay Area Toll Authority California Toll Bridge | ||||
| Revenue (San Francisco Bay Area) | 6.793% | 4/1/30 | 875 | 1,027 |
| Bay Area Toll Authority California Toll Bridge | ||||
| Revenue (San Francisco Bay Area) | 6.918% | 4/1/40 | 1,500 | 1,832 |
| Bay Area Toll Authority California Toll Bridge | ||||
| Revenue (San Francisco Bay Area) | 6.263% | 4/1/49 | 4,283 | 5,137 |
| Bay Area Toll Authority California Toll Bridge | ||||
| Revenue (San Francisco Bay Area) | 7.043% | 4/1/50 | 1,325 | 1,629 |
| Bay Area Toll Authority California Toll Bridge | ||||
| Revenue (San Francisco Bay Area) | 6.907% | 10/1/50 | 4,565 | 5,531 |
| California Educational Facilities Authority Revenue | ||||
| (Stanford University) | 4.250% | 5/1/16 | 750 | 812 |
| California GO | 3.950% | 11/1/15 | 2,550 | 2,702 |
| California GO | 5.750% | 3/1/17 | 4,000 | 4,475 |
| California GO | 6.200% | 3/1/19 | 1,100 | 1,278 |
| California GO | 6.200% | 10/1/19 | 4,935 | 5,759 |
| California GO | 5.700% | 11/1/21 | 4,655 | 5,239 |
| California GO | 7.500% | 4/1/34 | 12,380 | 15,754 |
| California GO | 7.550% | 4/1/39 | 14,045 | 18,202 |
| California GO | 7.300% | 10/1/39 | 1,200 | 1,509 |
| California GO | 7.350% | 11/1/39 | 7,525 | 9,593 |
| California GO | 7.625% | 3/1/40 | 3,350 | 4,411 |
| California GO | 7.600% | 11/1/40 | 13,885 | 18,331 |
| Central Puget Sound WA Regional Transit | ||||
| Authority Sales & Use Tax Revenue | 5.491% | 11/1/39 | 550 | 605 |
| Chicago IL Board of Education GO | 6.319% | 11/1/29 | 1,025 | 994 |
| Chicago IL Board of Education GO | 6.138% | 12/1/39 | 4,400 | 3,855 |
| Chicago IL GO | 7.781% | 1/1/35 | 825 | 914 |
| Chicago IL Metropolitan Water Reclamation | ||||
| District GO | 5.720% | 12/1/38 | 3,060 | 3,321 |
| Chicago IL O’Hare International Airport Revenue | 6.845% | 1/1/38 | 400 | 427 |
| Chicago IL O’Hare International Airport Revenue | 6.395% | 1/1/40 | 600 | 669 |
| Chicago IL Transit Authority Sales Tax | ||||
| Receipts Revenue | 6.200% | 12/1/40 | 1,650 | 1,750 |
| Chicago IL Transit Authority Transfer Tax | ||||
| Receipts Revenue | 6.899% | 12/1/40 | 4,255 | 4,769 |
| Chicago IL Wastewater Transmission Revenue | 6.900% | 1/1/40 | 600 | 669 |
| Chicago IL Water Revenue | 6.742% | 11/1/40 | 900 | 999 |
| Clark County NV Airport Revenue | 6.881% | 7/1/42 | 550 | 593 |
| Commonwealth Financing Authority | ||||
| Pennsylvania Revenue | 6.218% | 6/1/39 | 2,350 | 2,554 |
| Connecticut GO | 5.090% | 10/1/30 | 800 | 789 |
| Connecticut GO | 5.850% | 3/15/32 | 6,665 | 7,467 |
| Connecticut Special Tax Revenue | ||||
| (Transportation Infrastructure) | 5.459% | 11/1/30 | 100 | 104 |
| Cook County IL GO | 6.229% | 11/15/34 | 750 | 749 |
109
| Total Bond Market II Index Fund | |||||
| Face | Market | ||||
| Maturity | Amount | Value | |||
| Coupon | Date | ($000) | ($000) | ||
| Curators of the University of Missouri | |||||
| System Facilities Revenue | 5.960% | 11/1/39 | 1,000 | 1,189 | |
| Curators of the University of Missouri | |||||
| System Facilities Revenue | 5.792% | 11/1/41 | 1,000 | 1,160 | |
| Dallas County TX Hospital District Revenue | 5.621% | 8/15/44 | 850 | 935 | |
| Dallas TX Area Rapid Transit Revenue | 4.922% | 12/1/41 | 1,650 | 1,709 | |
| Dallas TX Area Rapid Transit Revenue | 5.999% | 12/1/44 | 1,100 | 1,303 | |
| Dallas TX Area Rapid Transit Revenue | 5.022% | 12/1/48 | 2,675 | 2,736 | |
| Dallas TX Independent School District GO | 6.450% | 2/15/35 | 1,500 | 1,679 | |
| Dartmouth College New Hampshire GO | 4.750% | 6/1/19 | 275 | 307 | |
| Denver CO City & County School District | |||||
| No. 1 COP | 7.017% | 12/15/37 | 1,050 | 1,219 | |
| Denver CO City & County School District | |||||
| No. 1 GO | 5.664% | 12/1/33 | 525 | 575 | |
| District of Columbia Income Tax Revenue | 5.591% | 12/1/34 | 450 | 496 | |
| District of Columbia Income Tax Revenue | 5.582% | 12/1/35 | 650 | 712 | |
| East Baton Rouge LA Sewer | |||||
| Commission Revenue | 6.087% | 2/1/45 | 975 | 1,009 | |
| Energy Northwest Washington Electric Revenue | |||||
| (Columbia Generating Station) | 2.197% | 7/1/19 | 2,000 | 1,954 | |
| Florida Hurricane Catastrophe Fund | |||||
| Finance Corp. Revenue | 2.107% | 7/1/18 | 6,475 | 6,311 | |
| Florida Hurricane Catastrophe Fund | |||||
| Finance Corp. Revenue | 2.995% | 7/1/20 | 6,600 | 6,246 | |
| George Washington University District of | |||||
| Columbia GO | 3.485% | 9/15/22 | 5,700 | 5,474 | |
| Georgia GO | 4.503% | 11/1/25 | 2,300 | 2,436 | |
| Georgia Municipal Electric Power | |||||
| Authority Revenue | 6.637% | 4/1/57 | 6,445 | 6,781 | |
| Georgia Municipal Electric Power | |||||
| Authority Revenue | 6.655% | 4/1/57 | 2,250 | 2,351 | |
| Georgia Municipal Electric Power | |||||
| Authority Revenue | 7.055% | 4/1/57 | 5,100 | 5,160 | |
| Illinois GO | 4.511% | 3/1/15 | 3,350 | 3,476 | |
| Illinois GO | 5.365% | 3/1/17 | 3,000 | 3,234 | |
| Illinois GO | 5.665% | 3/1/18 | 5,000 | 5,451 | |
| Illinois GO | 4.950% | 6/1/23 | 5,125 | 4,970 | |
| Illinois GO | 5.100% | 6/1/33 | 31,430 | 29,286 | |
| Illinois GO | 6.630% | 2/1/35 | 1,050 | 1,097 | |
| Illinois GO | 6.725% | 4/1/35 | 3,250 | 3,425 | |
| Illinois GO | 7.350% | 7/1/35 | 5,950 | 6,631 | |
| Illinois Toll Highway Authority Revenue | 6.184% | 1/1/34 | 460 | 528 | |
| Illinois Toll Highway Authority Revenue | 5.851% | 12/1/34 | 625 | 693 | |
| Indianapolis IN Local Public Improvement Revenue | 6.116% | 1/15/40 | 3,700 | 4,285 | |
| JobsOhio Beverage System Statewide Liquor | |||||
| Profits Revenue | 3.985% | 1/1/29 | 3,600 | 3,286 | |
| JobsOhio Beverage System Statewide Liquor | |||||
| Profits Revenue | 4.532% | 1/1/35 | 2,350 | 2,176 | |
| Kansas Department of Transportation | |||||
| Highway Revenue | 4.596% | 9/1/35 | 3,000 | 2,954 | |
| 11 | Kansas Development Finance Authority Revenue | ||||
| (Public Employees Retirement System) | 5.501% | 5/1/34 | 1,525 | 1,568 | |
| Kentucky Asset/Liability Commission General | |||||
| Fund Revenue | 3.165% | 4/1/18 | 248 | 255 | |
| Las Vegas Valley Water District Nevada GO | 7.013% | 6/1/39 | 650 | 713 | |
110
| Total Bond Market II Index Fund | |||||
| Face | Market | ||||
| Maturity | Amount | Value | |||
| Coupon | Date | ($000) | ($000) | ||
| Los Angeles CA Community College District GO | 6.600% | 8/1/42 | 2,150 | 2,662 | |
| Los Angeles CA Department of Water & | |||||
| Power Revenue | 5.716% | 7/1/39 | 850 | 936 | |
| Los Angeles CA Department of Water & | |||||
| Power Revenue | 6.008% | 7/1/39 | 2,400 | 2,688 | |
| Los Angeles CA Department of Water & | |||||
| Power Revenue | 6.166% | 7/1/40 | 600 | 636 | |
| Los Angeles CA Department of Water & | |||||
| Power Revenue | 6.574% | 7/1/45 | 5,215 | 6,509 | |
| Los Angeles CA Department of Water & | |||||
| Power Revenue | 6.603% | 7/1/50 | 500 | 617 | |
| Los Angeles CA Unified School District GO | 5.755% | 7/1/29 | 1,800 | 1,975 | |
| Los Angeles CA Unified School District GO | 5.750% | 7/1/34 | 7,190 | 7,916 | |
| Los Angeles County CA Metropolitan | |||||
| Transportation Authority Sales Tax Revenue | 5.735% | 6/1/39 | 2,200 | 2,367 | |
| Los Angeles County CA Public Works | |||||
| Financing Authority Lease Revenue | 7.488% | 8/1/33 | 1,700 | 2,040 | |
| Los Angeles County CA Public Works | |||||
| Financing Authority Lease Revenue | 7.618% | 8/1/40 | 850 | 1,000 | |
| Maryland Transportation Authority Facilities | |||||
| Projects Revenue | 5.888% | 7/1/43 | 800 | 867 | |
| Massachusetts GO | 4.200% | 12/1/21 | 5,950 | 6,265 | |
| Massachusetts GO | 5.456% | 12/1/39 | 4,690 | 5,099 | |
| Massachusetts School Building Authority | |||||
| Dedicated Sales Tax Revenue | 5.715% | 8/15/39 | 2,100 | 2,352 | |
| Massachusetts Transportation Fund Revenue | 5.731% | 6/1/40 | 475 | 540 | |
| Massachusetts Water Pollution Abatement Trust | 5.192% | 8/1/40 | 2,415 | 2,464 | |
| Metropolitan Government of Nashville & | |||||
| Davidson County TN Convention Center | |||||
| Authority Tourism Tax Revenue | 6.731% | 7/1/43 | 1,500 | 1,663 | |
| Metropolitan Government of Nashville & | |||||
| Davidson County TN GO | 5.707% | 7/1/34 | 1,000 | 1,071 | |
| Metropolitan Washington DC/VA Airports | |||||
| Authority Dulles Toll Road Revenue | 7.462% | 10/1/46 | 525 | 589 | |
| Metropolitan Water District of | |||||
| Southern California Revenue | 6.947% | 7/1/40 | 650 | 726 | |
| Mississippi GO | 5.245% | 11/1/34 | 700 | 732 | |
| Missouri Highways & Transportation Commission | |||||
| Road Revenue | 5.445% | 5/1/33 | 600 | 651 | |
| 12 | New Jersey Economic Development Authority | ||||
| Revenue (State Pension Funding) | 7.425% | 2/15/29 | 8,065 | 9,665 | |
| New Jersey Transportation Trust Fund Authority | |||||
| Transportation System Revenue | 5.754% | 12/15/28 | 2,355 | 2,541 | |
| New Jersey Transportation Trust Fund Authority | |||||
| Transportation System Revenue | 6.561% | 12/15/40 | 5,680 | 6,656 | |
| 13 | New Jersey Turnpike Authority Revenue | 4.252% | 1/1/16 | 425 | 438 |
| New Jersey Turnpike Authority Revenue | 7.414% | 1/1/40 | 6,400 | 8,528 | |
| New Jersey Turnpike Authority Revenue | 7.102% | 1/1/41 | 10,190 | 13,048 | |
| New York City NY GO | 6.646% | 12/1/31 | 100 | 110 | |
| New York City NY GO | 6.246% | 6/1/35 | 950 | 1,013 | |
| New York City NY GO | 5.968% | 3/1/36 | 1,840 | 2,071 | |
| New York City NY GO | 5.985% | 12/1/36 | 600 | 673 | |
| New York City NY GO | 5.517% | 10/1/37 | 3,225 | 3,372 | |
| New York City NY GO | 6.271% | 12/1/37 | 5,950 | 6,943 | |
| New York City NY GO | 5.846% | 6/1/40 | 750 | 817 | |
111
| Total Bond Market II Index Fund | ||||
| Face | Market | |||
| Maturity | Amount | Value | ||
| Coupon | Date | ($000) | ($000) | |
| New York City NY Municipal Water Finance | ||||
| Authority Water & Sewer System Revenue | 5.750% | 6/15/41 | 500 | 564 |
| New York City NY Municipal Water Finance | ||||
| Authority Water & Sewer System Revenue | 5.790% | 6/15/41 | 4,000 | 4,172 |
| New York City NY Municipal Water Finance | ||||
| Authority Water & Sewer System Revenue | 5.952% | 6/15/42 | 1,150 | 1,331 |
| New York City NY Municipal Water Finance | ||||
| Authority Water & Sewer System Revenue | 6.011% | 6/15/42 | 350 | 408 |
| New York City NY Municipal Water Finance | ||||
| Authority Water & Sewer System Revenue | 5.440% | 6/15/43 | 2,400 | 2,577 |
| New York City NY Municipal Water Finance | ||||
| Authority Water & Sewer System Revenue | 5.882% | 6/15/44 | 7,290 | 8,302 |
| New York City NY Transitional Finance Authority | ||||
| Building Aid Revenue | 6.828% | 7/15/40 | 2,500 | 2,997 |
| New York City NY Transitional Finance Authority | ||||
| Future Tax Revenue | 5.767% | 8/1/36 | 750 | 851 |
| New York City NY Transitional Finance Authority | ||||
| Future Tax Revenue | 5.508% | 8/1/37 | 3,300 | 3,618 |
| New York City NY Transitional Finance Authority | ||||
| Future Tax Revenue | 5.572% | 11/1/38 | 1,000 | 1,110 |
| New York Metropolitan Transportation Authority | ||||
| Revenue (Dedicated Tax Fund) | 7.336% | 11/15/39 | 3,950 | 5,170 |
| New York Metropolitan Transportation Authority | ||||
| Revenue (Dedicated Tax Fund) | 6.089% | 11/15/40 | 400 | 457 |
| New York Metropolitan Transportation Authority | ||||
| Revenue (Transit Revenue) | 6.548% | 11/15/31 | 300 | 343 |
| New York Metropolitan Transportation Authority | ||||
| Revenue (Transit Revenue) | 5.871% | 11/15/39 | 975 | 1,045 |
| New York Metropolitan Transportation Authority | ||||
| Revenue (Transit Revenue) | 6.648% | 11/15/39 | 2,540 | 2,952 |
| New York Metropolitan Transportation Authority | ||||
| Revenue (Transit Revenue) | 6.668% | 11/15/39 | 2,000 | 2,359 |
| New York State Dormitory Authority Revenue | ||||
| (Personal Income Tax) | 5.500% | 3/15/30 | 3,745 | 4,070 |
| New York State Dormitory Authority Revenue | ||||
| (Personal Income Tax) | 5.289% | 3/15/33 | 1,250 | 1,326 |
| New York State Dormitory Authority Revenue | ||||
| (Personal Income Tax) | 5.628% | 3/15/39 | 900 | 992 |
| New York State Dormitory Authority Revenue | ||||
| (Personal Income Tax) | 5.389% | 3/15/40 | 750 | 809 |
| New York State Urban Development Corp. | ||||
| Revenue (Personal Income Tax) | 5.770% | 3/15/39 | 2,375 | 2,592 |
| New York State Urban Development Corp. | ||||
| Revenue (Personal Income Tax) | 5.838% | 3/15/40 | 650 | 732 |
| New York University Hospitals Center Revenue | 4.428% | 7/1/42 | 1,850 | 1,547 |
| New York University Hospitals Center Revenue | 5.750% | 7/1/43 | 3,050 | 3,079 |
| North Texas Tollway Authority System Revenue | 6.718% | 1/1/49 | 3,525 | 4,284 |
| Ohio State University General Receipts Revenue | 4.910% | 6/1/40 | 1,575 | 1,578 |
| Ohio State University General Receipts Revenue | 4.800% | 6/1/11 | 5,456 | 4,748 |
| Ohio Water Development Authority Water | ||||
| Pollution Control Loan Fund Revenue | 4.879% | 12/1/34 | 1,000 | 1,014 |
| Orange County CA Local Transportation Authority | ||||
| Sales Tax Revenue | 6.908% | 2/15/41 | 650 | 805 |
| Oregon Department of Transportation Highway | ||||
| User Tax Revenue | 5.834% | 11/15/34 | 1,050 | 1,209 |
112
| Total Bond Market II Index Fund | |||||
| Face | Market | ||||
| Maturity | Amount | Value | |||
| Coupon | Date | ($000) | ($000) | ||
| Oregon GO | 5.762% | 6/1/23 | 850 | 981 | |
| Oregon GO | 5.892% | 6/1/27 | 975 | 1,118 | |
| 13 | Oregon School Boards Association GO | 4.759% | 6/30/28 | 11,450 | 12,013 |
| 11 | Oregon School Boards Association GO | 5.528% | 6/30/28 | 375 | 401 |
| Pennsylvania GO | 4.650% | 2/15/26 | 2,015 | 2,079 | |
| Pennsylvania GO | 5.350% | 5/1/30 | 3,000 | 3,101 | |
| Pennsylvania Public School Building Authority | |||||
| Lease Revenue (School District of Philadelphia) | 5.000% | 9/15/27 | 999 | 1,037 | |
| Pennsylvania Turnpike Commission Revenue | 5.511% | 12/1/45 | 2,250 | 2,387 | |
| Pennsylvania Turnpike Commission Revenue | 5.561% | 12/1/49 | 550 | 588 | |
| Port Authority of New York & | |||||
| New Jersey Revenue | 6.040% | 12/1/29 | 850 | 976 | |
| Port Authority of New York & | |||||
| New Jersey Revenue | 5.647% | 11/1/40 | 4,900 | 5,342 | |
| Port Authority of New York & | |||||
| New Jersey Revenue | 4.926% | 10/1/51 | 4,465 | 4,195 | |
| Port Authority of New York & | |||||
| New Jersey Revenue | 4.458% | 10/1/62 | 10,250 | 8,690 | |
| President & Fellows of Harvard University | |||||
| Massachusetts GO | 4.875% | 10/15/40 | 2,925 | 2,996 | |
| Princeton University New Jersey GO | 5.700% | 3/1/39 | 1,650 | 1,885 | |
| Puerto Rico Government Development | |||||
| Bank Revenue | 3.670% | 5/1/14 | 2,000 | 1,896 | |
| Puerto Rico Government Development | |||||
| Bank Revenue | 4.704% | 5/1/16 | 1,750 | 1,431 | |
| Regional Transportation District of Colorado | |||||
| Sales Tax Revenue | 5.844% | 11/1/50 | 1,400 | 1,616 | |
| Rutgers State University NJ Revenue | 5.665% | 5/1/40 | 875 | 962 | |
| Salt River Project Arizona Agricultural | |||||
| Improvement & Power District Revenue | 4.839% | 1/1/41 | 750 | 758 | |
| San Antonio TX Electric & Gas Systems Revenue | 5.985% | 2/1/39 | 1,500 | 1,785 | |
| San Antonio TX Electric & Gas Systems Revenue | 5.718% | 2/1/41 | 1,175 | 1,326 | |
| San Antonio TX Electric & Gas Systems Revenue | 5.808% | 2/1/41 | 5,350 | 6,066 | |
| San Antonio TX Electric & Gas Systems Revenue | 4.427% | 2/1/42 | 1,360 | 1,271 | |
| San Diego County CA Regional Transportation | |||||
| Commission Sales Tax Revenue | 5.911% | 4/1/48 | 1,470 | 1,682 | |
| San Diego County CA Water Authority Revenue | 6.138% | 5/1/49 | 1,340 | 1,567 | |
| San Francisco CA City & County Public Utilities | |||||
| Commission Water Revenue | 6.000% | 11/1/40 | 1,600 | 1,838 | |
| San Francisco CA City & County Public Utilities | |||||
| Commission Water Revenue | 6.950% | 11/1/50 | 3,000 | 3,732 | |
| Santa Clara Valley CA Transportation Authority | |||||
| Sales Tax Revenue | 5.876% | 4/1/32 | 3,855 | 4,212 | |
| Sonoma County CA Pension Obligation Revenue | 6.000% | 12/1/29 | 775 | 766 | |
| South Carolina Public Service Authority Revenue | 6.454% | 1/1/50 | 2,125 | 2,313 | |
| Texas GO | 5.517% | 4/1/39 | 1,590 | 1,783 | |
| Texas Transportation Commission Revenue | 5.028% | 4/1/26 | 750 | 807 | |
| Texas Transportation Commission Revenue | 5.178% | 4/1/30 | 3,300 | 3,541 | |
| Texas Transportation Commission Revenue | 4.631% | 4/1/33 | 2,300 | 2,327 | |
| Texas Transportation Commission Revenue | 4.681% | 4/1/40 | 1,375 | 1,380 | |
| Tufts University Massachusetts GO | 5.017% | 4/15/12 | 4,700 | 4,263 | |
| University of California Regents General Revenue | 4.601% | 5/15/31 | 9,830 | 9,775 | |
| University of California Regents | |||||
| Medical Center Revenue | 6.548% | 5/15/48 | 1,600 | 1,862 | |
113
| Total Bond Market II Index Fund | ||||
| Face | Market | |||
| Maturity | Amount | Value | ||
| Coupon | Date | ($000) | ($000) | |
| University of California Regents | ||||
| Medical Center Revenue | 6.583% | 5/15/49 | 975 | 1,139 |
| University of California Revenue | 1.796% | 7/1/19 | 1,000 | 960 |
| University of California Revenue | 5.770% | 5/15/43 | 5,790 | 6,424 |
| University of California Revenue | 5.946% | 5/15/45 | 4,950 | 5,541 |
| University of California Revenue | 4.858% | 5/15/12 | 5,125 | 4,434 |
| University of Massachusetts | ||||
| Building Authority Revenue | 5.450% | 11/1/40 | 600 | 643 |
| University of Southern California Revenue | 5.250% | 10/1/11 | 1,800 | 1,888 |
| University of Texas System Revenue | ||||
| Financing System Revenue | 5.262% | 7/1/39 | 650 | 695 |
| University of Texas System Revenue | ||||
| Financing System Revenue | 6.276% | 8/15/41 | 525 | 572 |
| University of Texas System Revenue | ||||
| Financing System Revenue | 5.134% | 8/15/42 | 150 | 160 |
| University of Texas System Revenue | ||||
| Financing System Revenue | 4.794% | 8/15/46 | 1,665 | 1,673 |
| University of Virginia Revenue | 6.200% | 9/1/39 | 1,000 | 1,217 |
| Utah GO | 4.554% | 7/1/24 | 1,000 | 1,062 |
| Utah GO | 3.539% | 7/1/25 | 4,300 | 4,203 |
| Utah Transit Authority Sales Tax Revenue | 5.937% | 6/15/39 | 100 | 112 |
| Virginia Commonwealth Transportation | ||||
| Board Revenue | 5.350% | 5/15/35 | 730 | 767 |
| Washington GO | 5.090% | 8/1/33 | 3,825 | 3,980 |
| Washington GO | 5.481% | 8/1/39 | 270 | 288 |
| Washington GO | 5.140% | 8/1/40 | 1,920 | 1,979 |
| 11 Wisconsin GO | 5.700% | 5/1/26 | 3,020 | 3,304 |
| Total Taxable Municipal Bonds (Cost $573,651) | 598,131 | |||
| Shares | ||||
| Temporary Cash Investment (4.8%) | ||||
| Money Market Fund (4.8%) | ||||
| 14 Vanguard Market Liquidity Fund | ||||
| (Cost $3,473,574) | 0.125% | 3,473,573,757 | 3,473,574 | |
| Total Investments (104.1%) (Cost $75,627,563) | 75,548,506 | |||
| Other Assets and Liabilities (-4.1%) | ||||
| Other Assets | 1,991,558 | |||
| Liabilities | (4,950,617) | |||
| (2,959,059) | ||||
| Net Assets (100%) | 72,589,447 | |||
114
| Total Bond Market II Index Fund | |
| At December 31, 2013, net assets consisted of: | |
| Amount | |
| ($000) | |
| Paid-in Capital | 72,712,399 |
| Undistributed Net Investment Income | — |
| Accumulated Net Realized Losses | (43,895) |
| Unrealized Appreciation (Depreciation) | (79,057) |
| Net Assets | 72,589,447 |
| Investor Shares—Net Assets | |
| Applicable to 4,525,954,540 outstanding $.001 par value shares of | |
| beneficial interest (unlimited authorization) | 47,496,610 |
| Net Asset Value Per Share—Investor Shares | $10.49 |
| Institutional Shares—Net Assets | |
| Applicable to 2,391,218,477 outstanding $.001 par value shares of | |
| beneficial interest (unlimited authorization) | 25,092,837 |
| Net Asset Value Per Share—Institutional Shares | $10.49 |
See Note A in Notes to Financial Statements.
1 The issuer operates under a congressional charter; its securities are generally neither guaranteed by the U.S. Treasury nor backed by the
full faith and credit of the U.S. government.
2 The issuer was placed under federal conservatorship in September 2008; since that time, its daily operations have been managed by the
Federal Housing Finance Agency and it receives capital from the U.S. Treasury, as needed to maintain a positive net worth, in exchange
for senior preferred stock.
3 The average or expected maturity is shorter than the final maturity shown because of the possibility of interim principal payments and
prepayments or the possibility of the issue being called.
4 Includes securities purchased on a when-issued or delayed-delivery basis for which the fund has not taken delivery as of December 31, 2013.
5 Adjustable-rate security.
6 Security exempt from registration under Rule 144A of the Securities Act of 1933. Such securities may be sold in transactions exempt from
registration, normally to qualified institutional buyers. At December 31, 2013, the aggregate value of these securities was $148,423,000,
representing 0.2% of net assets.
7 Non-income-producing security—security in default.
8 Guaranteed by the Government of Japan.
9 Guaranteed by the Federal Republic of Germany.
10 Guaranteed by the Republic of Austria.
11 Scheduled principal and interest payments are guaranteed by AGM (Assured Guaranty Municipal Corporation).
12 Scheduled principal and interest payments are guaranteed by National Public Finance Guarantee Corp.
13 Scheduled principal and interest payments are guaranteed by AMBAC (Ambac Assurance Corporation).
14 Affiliated money market fund available only to Vanguard funds and certain trusts and accounts managed by Vanguard. Rate shown is the
7-day yield.
COP—Certificate of Participation.
GO—General Obligation Bond.
REIT—Real Estate Investment Trust.
See accompanying Notes, which are an integral part of the Financial Statements.
115
| Total Bond Market II Index Fund | |
| Statement of Assets and Liabilities | |
| As of December 31, 2013 | |
| Amount | |
| ($000) | |
| Assets | |
| Investments in Securities, at Value | |
| Unaffiliated Issuers | 72,074,932 |
| Affiliated Vanguard Funds | 3,473,574 |
| Total Investment in Securities | 75,548,506 |
| Receivables for Investment Securities Sold | 531,282 |
| Capital Shares Issued | 974,590 |
| Other Assets | 485,686 |
| Total Assets | 77,540,064 |
| Liabilities | |
| Payables for Investment Securities Purchased | 4,878,955 |
| Other Liabilities | 71,662 |
| Total Liabilities | 4,950,617 |
| Net Assets | 72,589,447 |
See accompanying Notes, which are an integral part of the Financial Statements.
116
| Total Bond Market II Index Fund | |
| Statement of Operations | |
| Year Ended | |
| December 31, 2013 | |
| ($000) | |
| Investment Income | |
| Income | |
| Interest1 | 1,466,478 |
| Total Income | 1,466,478 |
| Expenses | |
| The Vanguard Group—Note B | |
| Investment Advisory Services | 2,234 |
| Management and Administrative—Investor Shares | 41,152 |
| Management and Administrative—Institutional Shares | 4,280 |
| Marketing and Distribution—Investor Shares | 11,872 |
| Marketing and Distribution—Institutional Shares | 5,329 |
| Custodian Fees | 787 |
| Auditing Fees | 39 |
| Shareholders’ Reports—Investor Shares | 3 |
| Shareholders’ Reports—Institutional Shares | 2 |
| Trustees’ Fees and Expenses | 83 |
| Total Expenses | 65,781 |
| Net Investment Income | 1,400,697 |
| Realized Net Gain (Loss) on Investment Securities Sold | 499,456 |
| Change in Unrealized Appreciation (Depreciation) of Investment Securities | (3,193,047) |
| Net Increase (Decrease) in Net Assets Resulting from Operations | (1,292,894) |
| 1 Interest income from an affiliated company of the fund was $5,195,000. | |
See accompanying Notes, which are an integral part of the Financial Statements.
117
| Total Bond Market II Index Fund | ||
| Statement of Changes in Net Assets | ||
| Year Ended December 31, | ||
| 2013 | 2012 | |
| ($000) | ($000) | |
| Increase (Decrease) in Net Assets | ||
| Operations | ||
| Net Investment Income | 1,400,697 | 1,338,482 |
| Realized Net Gain (Loss) | 499,456 | 372,777 |
| Change in Unrealized Appreciation (Depreciation) | (3,193,047) | 522,990 |
| Net Increase (Decrease) in Net Assets Resulting from Operations | (1,292,894) | 2,234,249 |
| Distributions | ||
| Net Investment Income | ||
| Investor Shares | (948,041) | (939,104) |
| Institutional Shares | (452,656) | (399,378) |
| Realized Capital Gain1 | ||
| Investor Shares | (59,345) | (274,184) |
| Institutional Shares | (26,449) | (111,105) |
| Total Distributions | (1,486,491) | (1,723,771) |
| Capital Share Transactions | ||
| Investor Shares | 3,624,042 | 9,770,145 |
| Institutional Shares | 7,282,749 | 4,152,064 |
| Net Increase (Decrease) from Capital Share Transactions | 10,906,791 | 13,922,209 |
| Total Increase (Decrease) | 8,127,406 | 14,432,687 |
| Net Assets | ||
| Beginning of Period | 64,462,041 | 50,029,354 |
| End of Period | 72,589,447 | 64,462,041 |
1 Includes fiscal 2013 and 2012 short-term gain distributions totaling $6,546,000 and $198,127,000, respectively. Short-term gain distributions are treated as ordinary income dividends for tax purposes.
See accompanying Notes, which are an integral part of the Financial Statements.
118
| Total Bond Market II Index Fund | |||||
| Financial Highlights | |||||
| Investor Shares | |||||
| Jan. 26, | |||||
| 20091 to | |||||
| For a Share Outstanding | Year Ended December 31, | Dec. 31, | |||
| Throughout Each Period | 2013 | 2012 | 2011 | 2010 | 2009 |
| Net Asset Value, Beginning of Period | $10.97 | $10.87 | $10.50 | $10.26 | $10.00 |
| Investment Operations | |||||
| Net Investment Income | .221 | .253 | .315 | .345 | .358 |
| Net Realized and Unrealized Gain (Loss) | |||||
| on Investments | (.467) | .168 | .470 | . 308 | .260 |
| Total from Investment Operations | (.246) | .421 | .785 | .653 | .618 |
| Distributions | |||||
| Dividends from Net Investment Income | (. 221) | (. 253) | (. 315) | (. 345) | (. 358) |
| Distributions from Realized Capital Gains | (.013) | (.068) | (.100) | (. 068) | — |
| Total Distributions | (. 234) | (. 321) | (. 415) | (. 413) | (. 358) |
| Net Asset Value, End of Period | $10.49 | $10.97 | $10.87 | $10.50 | $10.26 |
| Total Return2 | -2.26% | 3.91% | 7.59% | 6.42% | 6.28% |
| Ratios/Supplemental Data | |||||
| Net Assets, End of Period (Millions) | $47,497 | $45,758 | $35,626 | $27,807 | $20,432 |
| Ratio of Total Expenses to Average Net Assets | 0.12% | 0.12% | 0.12% | 0.12% | 0.11%3 |
| Ratio of Net Investment Income to | |||||
| Average Net Assets | 2.07% | 2.29% | 2.94% | 3.25% | 3.76%3 |
| Portfolio Turnover Rate 5 | 111%4 | 102%4 | 134%4 | 105%4 | 110% |
1 Inception.
2 Total returns do not include account service fees that may have applied in the periods shown. Fund prospectuses provide information about
any applicable account service fees.
3 Annualized.
4 Includes 52%, 53%, 41%, and 31% attributable to mortgage-dollar-roll activity.
5 Excludes the value of portfolio securities received or delivered as a result of in-kind purchases or redemptions of the fund’s capital shares.
See accompanying Notes, which are an integral part of the Financial Statements.
119
| Total Bond Market II Index Fund | |||||
| Financial Highlights | |||||
| Institutional Shares | |||||
| Feb. 17, | |||||
| 20091 to | |||||
| For a Share Outstanding | Year Ended December 31, | Dec. 31, | |||
| Throughout Each Period | 2013 | 2012 | 2011 | 2010 | 2009 |
| Net Asset Value, Beginning of Period | $10.97 | $10.87 | $10.50 | $10.26 | $10.03 |
| Investment Operations | |||||
| Net Investment Income | . 228 | .261 | .322 | .350 | .338 |
| Net Realized and Unrealized Gain (Loss) | |||||
| on Investments | (.467) | .168 | .470 | . 308 | .230 |
| Total from Investment Operations | (.239) | .429 | .792 | .658 | .568 |
| Distributions | |||||
| Dividends from Net Investment Income | (.228) | (. 261) | (. 322) | (. 350) | (. 338) |
| Distributions from Realized Capital Gains | (.013) | (.068) | (.100) | (. 068) | — |
| Total Distributions | (. 241) | (. 329) | (. 422) | (. 418) | (.338) |
| Net Asset Value, End of Period | $10.49 | $10.97 | $10.87 | $10.50 | $10.26 |
| Total Return | -2.20% | 3.99% | 7.67% | 6.47% | 5.80% |
| Ratios/Supplemental Data | |||||
| Net Assets, End of Period (Millions) | $25,093 | $18,704 | $14,403 | $10,629 | $7,076 |
| Ratio of Total Expenses to Average Net Assets | 0.05% | 0.05% | 0.05% | 0.07% | 0.07%2 |
| Ratio of Net Investment Income to | |||||
| Average Net Assets | 2.14% | 2.36% | 3.01% | 3.30% | 3.80%2 |
| Portfolio Turnover Rate 4 | 111%3 | 102%3 | 134%3 | 105%3 | 110% |
1 Inception.
2 Annualized.
3 Includes 52%, 53%, 41%, and 31% attributable to mortgage-dollar-roll activity.
4 Excludes the value of portfolio securities received or delivered as a result of in-kind purchases or redemptions of the fund’s capital shares.
See accompanying Notes, which are an integral part of the Financial Statements.
120
Total Bond Market II Index Fund
Notes to Financial Statements
Vanguard Total Bond Market II Index Fund is registered under the Investment Company Act of 1940 as an open-end investment company, or mutual fund. The fund has been established by Vanguard as an investment vehicle for Vanguard funds-of-funds as well as certain similar trusts and accounts (“eligible investors”). The fund is not available to other investors. Certain of the fund’s investments are in corporate debt instruments; the issuers’ abilities to meet their obligations may be affected by economic developments in their respective industries. The fund offers two classes of shares: Investor Shares and Institutional Shares. Investor Shares are available to any investor who meets the fund’s minimum purchase requirements. Institutional Shares are designed for investors who meet certain administrative, service, and account-size criteria.
A. The following significant accounting policies conform to generally accepted accounting principles for U.S. mutual funds. The fund consistently follows such policies in preparing its financial statements.
1. Security Valuation: Bonds, and temporary cash investments acquired over 60 days to maturity, are valued using the latest bid prices or using valuations based on a matrix system (which considers such factors as security prices, yields, maturities, and ratings), both as furnished by independent pricing services. Structured debt securities, including mortgages and asset-backed securities, are valued using the latest bid prices or using valuations based on a matrix system that considers such factors as issuer, tranche, nominal or option-adjusted spreads, weighted average coupon, weighted average maturity, credit enhancements, and collateral. Investments in Vanguard Market Liquidity Fund are valued at that fund’s net asset value. Other temporary cash investments are valued at amortized cost, which approximates market value. Securities for which market quotations are not readily available, or whose values have been affected by events occurring before the fund’s pricing time but after the close of the securities’ primary markets, are valued by methods deemed by the board of trustees to represent fair value.
2. To Be Announced (TBA) Transactions: A TBA transaction is an agreement to buy or sell mortgage-backed securities with agreed-upon characteristics (face amount, coupon, maturity) for settlement at a future date. The fund may enter into TBA sells to reduce its exposure to the mortgage-backed securities market or in order to dispose of mortgage-backed securities it owns under delayed-delivery arrangements. For TBA purchases, the fund maintains cash or short-term investments until settlement date in an amount sufficient to meet the purchase price.
3. Mortgage Dollar Rolls: The fund enters into mortgage-dollar-roll transactions, in which the fund sells mortgage-backed securities to a dealer and simultaneously agrees to purchase similar securities in the future at a predetermined price. The proceeds of the securities sold in mortgage-dollar-roll transactions are typically invested in high-quality short-term fixed income securities. The fund forgoes principal and interest paid on the securities sold, and is compensated by interest earned on the proceeds of the sale and by a lower price on the securities to be repurchased. The fund has also entered into mortgage-dollar-roll transactions in which the fund buys mortgage-backed securities from a dealer pursuant to a TBA transaction and simultaneously agrees to sell similar securities in the future at a predetermined price. The securities bought in mortgage-dollar-roll transactions are used to cover an open TBA sell position. The fund continues to earn interest on mortgage-backed security pools already held and receives a lower price on the securities to be sold in the future. The fund accounts for mortgage-dollar-roll transactions as purchases and sales; as such, these transactions may increase the fund’s portfolio turnover rate. Amounts to be received or paid in connection with open mortgage dollar rolls are included in Receivables for Investment Securities Sold or Payables for Investment Securities Purchased in the Statement of Assets and Liabilities. The primary risk
121
Total Bond Market II Index Fund
associated with mortgage dollar rolls is that a counterparty will default on its obligations. This risk is mitigated by, among other things, performing a credit analysis of counterparties, allocating transactions among numerous counterparties, and monitoring exposure to each counterparty.
4. Federal Income Taxes: The fund intends to continue to qualify as a regulated investment company and distribute all of its taxable income. Management has analyzed the fund’s tax positions taken for all open federal income tax years (December 31, 2010–2013), and has concluded that no provision for federal income tax is required in the fund’s financial statements.
5. Distributions: Distributions from net investment income are declared daily and paid on the first business day of the following month. Annual distributions from realized capital gains, if any, are recorded on the ex-dividend date.
6. Other: Interest income includes income distributions received from Vanguard Market Liquidity Fund and is accrued daily. Premiums and discounts on debt securities purchased are amortized and accreted, respectively, to interest income over the lives of the respective securities. Security transactions are accounted for on the date securities are bought or sold. Costs used to determine realized gains (losses) on the sale of investment securities are those of the specific securities sold.
Each class of shares has equal rights as to assets and earnings, except that each class separately bears certain class-specific expenses related to maintenance of shareholder accounts (included in Management and Administrative expenses) and shareholder reporting. Marketing and distribution expenses are allocated to each class of shares based on a method approved by the board of trustees. Income, other non-class-specific expenses, and gains and losses on investments are allocated to each class of shares based on its relative net assets.
B. The Vanguard Group furnishes at cost investment advisory, corporate management, administrative, marketing, and distribution services. The costs of such services are allocated to the fund under methods approved by the board of trustees. The fund has committed to provide up to 0.40% of its net assets in capital contributions to Vanguard. At December 31, 2013, the fund had contributed capital of $7,888,000 to Vanguard (included in Other Assets), representing 0.01% of the fund’s net assets and 3.15% of Vanguard’s capitalization. The fund’s trustees and officers are also directors and officers of Vanguard.
C. Various inputs may be used to determine the value of the fund’s investments. These inputs are summarized in three broad levels for financial statement purposes. The inputs or methodologies used to value securities are not necessarily an indication of the risk associated with investing in those securities.
Level 1—Quoted prices in active markets for identical securities.
Level 2—Other significant observable inputs (including quoted prices for similar securities, interest rates, prepayment speeds, credit risk, etc.).
Level 3—Significant unobservable inputs (including the fund’s own assumptions used to determine the fair value of investments).
122
Total Bond Market II Index Fund
The following table summarizes the market value of the fund’s investments as of December 31, 2013, based on the inputs used to value them:
| Level 1 | Level 2 | Level 3 | |
| Investments | ($000) | ($000) | ($000) |
| U.S. Government and Agency Obligations | — | 49,289,209 | — |
| Asset-Backed/Commercial Mortgage-Backed Securities | — | 1,607,427 | — |
| Corporate Bonds | — | 16,849,250 | — |
| Sovereign Bonds | — | 3,730,915 | — |
| Taxable Municipal Bonds | — | 598,131 | — |
| Temporary Cash Investments | 3,473,574 | — | — |
| Total | 3,473,574 | 72,074,932 | — |
D. Capital gain distributions are determined on a tax basis and may differ from realized capital gains for financial reporting purposes. Differences may be permanent or temporary. Permanent differences are reclassified among capital accounts in the financial statements to reflect their tax character. Temporary differences arise when gains or losses are recognized in different periods for financial statement and tax purposes. These differences will reverse at some time in the future.
During the year ended December 31, 2013, the fund realized $487,563,000 of net capital gains resulting from in-kind redemptions—in which shareholders exchanged fund shares for securities held by the fund rather than for cash. Because such gains are not taxable to the fund, and are not distributed to shareholders, they have been reclassified from accumulated net realized losses to paid-in capital.
The fund used a tax accounting practice to treat a portion of the price of capital shares redeemed during the year as distributions from realized capital gains. Accordingly, the fund has reclassified $15,297,000 from accumulated net realized losses to paid-in capital. Capital gains required to be distributed in December 2013 included gains realized through October 31, 2013; subsequently the fund realized losses of $35,076,000 which are deferred and will be treated as realized for tax purposes in 2014.
At December 31, 2013, the cost of investment securities for tax purposes was $75,636,381,000. Net unrealized depreciation of investment securities for tax purposes was $87,875,000, consisting of unrealized gains of $1,212,201,000 on securities that had risen in value since their purchase and $1,300,076,000 in unrealized losses on securities that had fallen in value since their purchase.
E. During the year ended December 31, 2013, the fund purchased $8,962,870,000 of investment securities and sold $4,009,688,000 of investment securities, other than U.S. government securities and temporary cash investments. Purchases and sales of U.S. government securities were $86,089,470,000 and $79,737,541,000, respectively. Total purchases and sales include $0 and $9,624,058,000, respectively, in connection with in-kind purchases and redemptions of the fund’s capital shares.
123
Total Bond Market II Index Fund
| F. Capital share transactions for each class of shares were: | ||||
| Year Ended December 31, | ||||
| 2013 | 2012 | |||
| Amount | Shares | Amount | Shares | |
| ($000) | (000) | ($000) | (000) | |
| Investor Shares | ||||
| Issued | 16,469,680 | 1,533,565 | 12,199,836 | 1,113,398 |
| Issued in Lieu of Cash Distributions | 1,007,385 | 94,089 | 1,136,024 | 103,375 |
| Redeemed | (13,853,023) | (1,271,087) | (3,565,715) | (324,432) |
| Net Increase (Decrease)—Investor Shares | 3,624,042 | 356,567 | 9,770,145 | 892,341 |
| Institutional Shares | ||||
| Issued | 10,572,975 | 990,066 | 5,607,710 | 512,189 |
| Issued in Lieu of Cash Distributions | 479,105 | 44,814 | 510,012 | 46,433 |
| Redeemed | (3,769,331) | (347,979) | (1,965,658) | (179,120) |
| Net Increase (Decrease) —Institutional Shares | 7,282,749 | 686,901 | 4,152,064 | 379,502 |
G. Management has determined that no material events or transactions occurred subsequent to December 31, 2013, that would require recognition or disclosure in these financial statements.
124
Report of Independent Registered Public Accounting Firm
To the Trustees of Vanguard Bond Index Funds and the Shareholders of Vanguard Total Bond Market II Index Fund: In our opinion, the accompanying statement of net assets, statement of assets and liabilities and the related statements of operations and of changes in net assets and the financial highlights present fairly, in all material respects, the financial position of Vanguard Total Bond Market II Index Fund (constituting a separate portfolio of Vanguard Bond Index Funds, hereafter referred to as the “Fund”) at December 31, 2013, the results of its operations for the year then ended, the changes in its net assets for each of the two years for the period then ended, and the financial highlights for each of the periods indicated, in conformity with accounting principles generally accepted in the United States of America. These financial statements and financial highlights (hereafter referred to as “financial statements”) are the responsibility of the Fund’s management; our responsibility is to express an opinion on these financial statements based on our audits. We conducted our audits of these financial statements in accordance with the standards of the Public Company Accounting Oversight Board (United States). Those standards require that we plan and perform the audit to obtain reasonable assurance about whether the financial statements are free of material misstatement. An audit includes examining, on a test basis, evidence supporting the amounts and disclosures in the financial statements, assessing the accounting principles used and significant estimates made by management, and evaluating the overall financial statement presentation. We believe that our audits, which included confirmation of securities at December 31, 2013 by correspondence with the custodian and brokers and by agreement to the underlying ownership records of Vanguard the transfer agent, provide a reasonable basis for our opinion.
/s/PricewaterhouseCoopers LLP
Philadelphia, Pennsylvania
February 18, 2014
Special 2013 tax information (unaudited) for Vanguard Total Bond Market II Index Fund
This information for the fiscal year ended December 31, 2013, is included pursuant to provisions of the Internal Revenue Code.
The fund distributed $98,432,000 as capital gain dividends (from net long-term capital gains) to shareholders during the fiscal year.
For nonresident alien shareholders, 100% of short-term capital gain dividends distributed by the fund are qualified short-term capital gains.
For nonresident alien shareholders, 85.5% of income dividends are interest-related dividends.
125
About Your Fund’s Expenses
As a shareholder of the fund, you incur ongoing costs, which include costs for portfolio management, administrative services, and shareholder reports (like this one), among others. Operating expenses, which are deducted from a fund’s gross income, directly reduce the investment return of the fund.
A fund’s expenses are expressed as a percentage of its average net assets. This figure is known as the expense ratio. The following examples are intended to help you understand the ongoing costs (in dollars) of investing in your fund and to compare these costs with those of other mutual funds. The examples are based on an investment of $1,000 made at the beginning of the period shown and held for the entire period.
The accompanying table illustrates your fund’s costs in two ways:
• Based on actual fund return. This section helps you to estimate the actual expenses that you paid over the period. The ”Ending Account Value“ shown is derived from the fund‘s actual return, and the third column shows the dollar amount that would have been paid by an investor who started with $1,000 in the fund. You may use the information here, together with the amount you invested, to estimate the expenses that you paid over the period.
To do so, simply divide your account value by $1,000 (for example, an $8,600 account value divided by $1,000 = 8.6), then multiply the result by the number given for your fund under the heading ”Expenses Paid During Period.“
• Based on hypothetical 5% yearly return. This section is intended to help you compare your fund‘s costs with those of other mutual funds. It assumes that the fund had a yearly return of 5% before expenses, but that the expense ratio is unchanged. In this case—because the return used is not the fund’s actual return—the results do not apply to your investment. The example is useful in making comparisons because the Securities and Exchange Commission requires all mutual funds to calculate expenses based on a 5% return. You can assess your fund’s costs by comparing this hypothetical example with the hypothetical examples that appear in shareholder reports of other funds.
Note that the expenses shown in the table are meant to highlight and help you compare ongoing costs only and do not reflect transaction costs incurred by the fund for buying and selling securities. Further, the expenses do not include any purchase, redemption, or account service fees described in the fund prospectus. If such fees were applied to your account, your costs would be higher. Your fund does not carry a “sales load.”
The calculations assume no shares were bought or sold during the period. Your actual costs may have been higher or lower, depending on the amount of your investment and the timing of any purchases or redemptions.
You can find more information about the fund’s expenses, including annual expense ratios, in the Financial Statements section of this report. For additional information on operating expenses and other shareholder costs, please refer to your fund’s current prospectus.
126
| Six Months Ended December 31, 2013 | |||
| Beginning | Ending | Expenses | |
| Account Value | Account Value | Paid During | |
| Total Bond Market II Index Fund | 6/30/2013 | 12/31/2013 | Period |
| Based on Actual Fund Return | |||
| Investor Shares | $1,000.00 | $1,001.87 | $0.61 |
| Institutional Shares | 1,000.00 | 1,002.23 | 0.25 |
| Based on Hypothetical 5% Yearly Return | |||
| Investor Shares | $1,000.00 | $1,024.60 | $0.61 |
| Institutional Shares | 1,000.00 | 1,024.95 | 0.26 |
The calculations are based on expenses incurred in the most recent six-month period. The fund’s annualized six-month expense ratios for that period are 0.12% for Investor Shares and 0.05% for Institutional Shares. The dollar amounts shown as “Expenses Paid” are equal to the annualized expense ratio multiplied by the average account value over the period, multiplied by the number of days in the most recent six-month period, then divided by the number of days in the most recent 12-month period.
127
Glossary
30-Day SEC Yield. A fund’s 30-day SEC yield is derived using a formula specified by the U.S. Securities and Exchange Commission. Under the formula, data related to the fund’s security holdings in the previous 30 days are used to calculate the fund’s hypothetical net income for that period, which is then annualized and divided by the fund’s estimated average net assets over the calculation period. For the purposes of this calculation, a security’s income is based on its current market yield to maturity (for bonds), its actual income (for asset-backed securities), or its projected dividend yield (for stocks). Because the SEC yield represents hypothetical annualized income, it will differ—at times significantly—from the fund’s actual experience. As a result, the fund’s income distributions may be higher or lower than implied by the SEC yield.
Average Coupon. The average interest rate paid on the fixed income securities held by a fund. It is expressed as a percentage of face value.
Average Duration. An estimate of how much the value of the bonds held by a fund will fluctuate in response to a change in interest rates. To see how the value could change, multiply the average duration by the change in rates. If interest rates rise by 1 percentage point, the value of the bonds in a fund with an average duration of five years would decline by about 5%. If rates decrease by a percentage point, the value would rise by 5%.
Average Effective Maturity. The average length of time until fixed income securities held by a fund reach maturity and are repaid, taking into consideration the possibility that the issuer may call the bond before its maturity date. The figure reflects the proportion of fund assets represented by each security; it also reflects any futures contracts held. In general, the longer the average effective maturity, the more a fund’s share price will fluctuate in response to changes in market interest rates.
Credit Quality. Credit-quality ratings are measured on a scale that generally ranges from AAA (highest) to D (lowest). “Not Rated” is used to classify securities for which a rating is not available. U.S. Treasury, U.S. Agency, and U.S. Agency mortgage-backed securities appear under “U.S. Government.” Credit-quality ratings are obtained from Barclays using ratings generally derived from Moody’s, Fitch, and S&P. When ratings from all three agencies are used, the median rating is shown. When ratings from two of the agencies are used, the lower rating is shown.
Expense Ratio. A fund’s total annual operating expenses expressed as a percentage of the fund’s average net assets. The expense ratio includes management and administrative expenses, but does not include the transaction costs of buying and selling portfolio securities.
Inception Date. The date on which the assets of a fund (or one of its share classes) are first invested in accordance with the fund’s investment objective. For funds with a subscription period, the inception date is the day after that period ends. Investment performance is measured from the inception date.
Short-Term Reserves. The percentage of a fund invested in highly liquid, short-term securities that can be readily converted to cash.
Yield to Maturity. The rate of return an investor would receive if the fixed income securities held by a fund were held to their maturity dates.
128
Benchmark Information
Spliced Barclays U.S. Aggregate Float Adjusted Index: Barclays U.S. Aggregate Bond Index through December 31, 2009; Barclays U.S. Aggregate Float Adjusted Index thereafter.
Spliced Core Bond Funds Average: Intermediate Investment-Grade Debt Funds Average through August 31, 2013; Core Bond Funds Average thereafter.
129
This page intentionally left blank.
This page intentionally left blank.
The People Who Govern Your Fund
The trustees of your mutual fund are there to see that the fund is operated and managed in your best interests since, as a shareholder, you are a part owner of the fund. Your fund’s trustees also serve on the board of directors of The Vanguard Group, Inc., which is owned by the Vanguard funds and provides services to them on an at-cost basis.
A majority of Vanguard’s board members are independent, meaning that they have no affiliation with Vanguard or the funds they oversee, apart from the sizable personal investments they have made as private individuals. The independent board members have distinguished backgrounds in business, academia, and public service. Each of the trustees and executive officers oversees 182 Vanguard funds.
The following table provides information for each trustee and executive officer of the fund. More information about the trustees is in the Statement of Additional Information, which can be obtained, without charge, by contacting Vanguard at 800-662-7447, or online at vanguard.com.
| InterestedTrustee1 | and Delphi Automotive LLP (automotive components); |
| Senior Advisor at New Mountain Capital; Trustee of | |
| F. William McNabb III | The Conference Board. |
| Born 1957. Trustee Since July 2009. Chairman of the | |
| Board. Principal Occupation(s) During the Past Five | Amy Gutmann |
| Years: Chairman of the Board of The Vanguard Group, | Born 1949. Trustee Since June 2006. Principal |
| Inc., and of each of the investment companies served | Occupation(s) During the Past Five Years: President |
| by The Vanguard Group, since January 2010; Director | of the University of Pennsylvania; Christopher H. |
| of The Vanguard Group since 2008; Chief Executive | Browne Distinguished Professor of Political Science |
| Officer and President of The Vanguard Group and of | in the School of Arts and Sciences with secondary |
| each of the investment companies served by The | appointments at the Annenberg School for |
| Vanguard Group since 2008; Director of Vanguard | Communication and the Graduate School of Education |
| Marketing Corporation; Managing Director of The | of the University of Pennsylvania; Member of the |
| Vanguard Group (1995–2008). | National Commission on the Humanities and Social |
| Sciences; Trustee of Carnegie Corporation of New | |
| IndependentTrustees | York and of the National Constitution Center; Chair |
| of the U.S. Presidential Commission for the Study | |
| Emerson U. Fullwood | of Bioethical Issues. |
| Born 1948. Trustee Since January 2008. Principal | |
| Occupation(s) During the Past Five Years: Executive | JoAnn Heffernan Heisen |
| Chief Staff and Marketing Officer for North America | Born 1950. Trustee Since July 1998. Principal |
| and Corporate Vice President (retired 2008) of Xerox | Occupation(s) During the Past Five Years: Corporate |
| Corporation (document management products and | Vice President and Chief Global Diversity Officer |
| services); Executive in Residence and 2010 | (retired 2008) and Member of the Executive |
| Distinguished Minett Professor at the Rochester | Committee (1997–2008) of Johnson & Johnson |
| Institute of Technology; Director of SPX Corporation | (pharmaceuticals/medical devices/consumer |
| (multi-industry manufacturing), the United Way of | products); Director of Skytop Lodge Corporation |
| Rochester, Amerigroup Corporation (managed health | (hotels), the University Medical Center at Princeton, |
| care), the University of Rochester Medical Center, | the Robert Wood Johnson Foundation, and the Center |
| Monroe Community College Foundation, and North | for Talent Innovation; Member of the Advisory Board |
| Carolina A&T University. | of the Maxwell School of Citizenship and Public Affairs |
| at Syracuse University. | |
| Rajiv L. Gupta | |
| Born 1945. Trustee Since December 2001.2 | F. Joseph Loughrey |
| Principal Occupation(s) During the Past Five Years: | Born 1949. Trustee Since October 2009. Principal |
| Chairman and Chief Executive Officer (retired 2009) | Occupation(s) During the Past Five Years: President |
| and President (2006–2008) of Rohm and Haas Co. | and Chief Operating Officer (retired 2009) of Cummins |
| (chemicals); Director of Tyco International, Ltd. | Inc. (industrial machinery); Chairman of the Board of |
| (diversified manufacturing and services), Hewlett- | Hillenbrand, Inc. (specialized consumer services) and |
| Packard Co. (electronic computer manufacturing), | of Oxfam America; Director of SKF AB (industrial |
| machinery), Hyster-Yale Materials Handling, Inc. | Executive Officers | |
| (forklift trucks), and the Lumina Foundation for | ||
| Education; Member of the Advisory Council for the | Glenn Booraem | |
| College of Arts and Letters and of the Advisory Board | Born 1967. Controller Since July 2010. Principal | |
| to the Kellogg Institute for International Studies, both | Occupation(s) During the Past Five Years: Principal | |
| at the University of Notre Dame. | of The Vanguard Group, Inc.; Controller of each of | |
| the investment companies served by The Vanguard | ||
| Mark Loughridge | Group; Assistant Controller of each of the investment | |
| Born 1953. Trustee Since March 2012. Principal | companies served by The Vanguard Group (2001–2010). | |
| Occupation(s) During the Past Five Years: Senior Vice | ||
| President and Chief Financial Officer at IBM (information | Thomas J. Higgins | |
| technology services); Fiduciary Member of IBM’s | Born 1957. Chief Financial Officer Since September | |
| Retirement Plan Committee. | 2008. Principal Occupation(s) During the Past Five | |
| Years: Principal of The Vanguard Group, Inc.; Chief | ||
| Scott C. Malpass | Financial Officer of each of the investment companies | |
| Born 1962. Trustee Since March 2012. Principal | served by The Vanguard Group; Treasurer of each of | |
| Occupation(s) During the Past Five Years: Chief | the investment companies served by The Vanguard | |
| Investment Officer and Vice President at the University | Group (1998–2008). | |
| of Notre Dame; Assistant Professor of Finance at the | ||
| Mendoza College of Business at Notre Dame; Member | Kathryn J. Hyatt | |
| of the Notre Dame 403(b) Investment Committee; | Born 1955. Treasurer Since November 2008. Principal | |
| Director of TIFF Advisory Services, Inc. (investment | Occupation(s) During the Past Five Years: Principal of | |
| advisor); Member of the Investment Advisory | The Vanguard Group, Inc.; Treasurer of each of the | |
| Committees of the Financial Industry Regulatory | investment companies served by The Vanguard | |
| Authority (FINRA) and of Major League Baseball. | Group; Assistant Treasurer of each of the investment | |
| companies served by The Vanguard Group (1988–2008). | ||
| André F. Perold | ||
| Born 1952. Trustee Since December 2004. Principal | Heidi Stam | |
| Occupation(s) During the Past Five Years: George | Born 1956. Secretary Since July 2005. Principal | |
| Gund Professor of Finance and Banking at the Harvard | Occupation(s) During the Past Five Years: Managing | |
| Business School (retired 2011); Chief Investment | Director of The Vanguard Group, Inc.; General Counsel | |
| Officer and Managing Partner of HighVista Strategies | of The Vanguard Group; Secretary of The Vanguard | |
| LLC (private investment firm); Director of Rand | Group and of each of the investment companies | |
| Merchant Bank; Overseer of the Museum of Fine | served by The Vanguard Group; Director and Senior | |
| Arts Boston. | Vice President of Vanguard Marketing Corporation. | |
| Alfred M. Rankin, Jr. | ||
| Vanguard Senior ManagementTeam | ||
| Born 1941. Trustee Since January 1993. Principal | ||
| Occupation(s) During the Past Five Years: Chairman, | Mortimer J. Buckley | Chris D. McIsaac |
| President, and Chief Executive Officer of NACCO | Kathleen C. Gubanich | Michael S. Miller |
| Industries, Inc. (housewares/lignite) and of Hyster-Yale | Paul A. Heller | James M. Norris |
| Materials Handling, Inc. (forklift trucks); Director of | Martha G. King | Glenn W. Reed |
| the National Association of Manufacturers; Chairman | John T. Marcante | |
| of the Board of University Hospitals of Cleveland; | ||
| Advisory Chairman of the Board of The Cleveland | ||
| Museum of Art. | Chairman Emeritus and Senior Advisor | |
| Peter F. Volanakis | John J. Brennan | |
| Born 1955. Trustee Since July 2009. Principal | Chairman, 1996–2009 | |
| Occupation(s) During the Past Five Years: President | Chief Executive Officer and President, 1996–2008 | |
| and Chief Operating Officer (retired 2010) of Corning | ||
| Incorporated (communications equipment); Director | Founder | |
| of SPX Corporation (multi-industry manufacturing); | ||
| Overseer of the Amos Tuck School of Business | John C. Bogle | |
| Administration at Dartmouth College; Advisor to the | Chairman and Chief Executive Officer, 1974–1996 | |
| Norris Cotton Cancer Center. | ||
1 Mr. McNabb is considered an “interested person,” as defined in the Investment Company Act of 1940, because he is an officer of the Vanguard funds.
2 December 2002 for Vanguard Equity Income Fund, Vanguard Growth Equity Fund, the Vanguard Municipal Bond Funds, and the Vanguard State Tax-Exempt Funds.
 | |
| P.O. Box 2600 | |
| Valley Forge, PA 19482-2600 | |
| Connect with Vanguard® > vanguard.com | |
Fund Information > 800-662-7447 | |
© 2014 The Vanguard Group, Inc. |
|
| Annual Report | December 31, 2013 |
| Vanguard Inflation-Protected |
| Securities Fund |
 |
Vanguard’s Principles for Investing Success
We want to give you the best chance of investment success. These principles,
grounded in Vanguard’s research and experience, can put you on the right path.
Goals. Create clear, appropriate investment goals.
Balance. Develop a suitable asset allocation using broadly diversified funds.
Cost. Minimize cost.
Discipline. Maintain perspective and long-term discipline.
A single theme unites these principles: Focus on the things you can control.
We believe there is no wiser course for any investor.
| Contents | |
| Your Fund’s Total Returns. | 1 |
| Chairman’s Letter. | 2 |
| Advisor’s Report. | 9 |
| Fund Profile. | 12 |
| Performance Summary. | 13 |
| Financial Statements. | 15 |
| About Your Fund’s Expenses. | 28 |
| Glossary. | 30 |
Please note: The opinions expressed in this report are just that—informed opinions. They should not be considered promises or advice. Also, please keep in mind that the information and opinions cover the period through the date on the front of this report. Of course, the risks of investing in your fund are spelled out in the prospectus.
See the Glossary for definitions of investment terms used in this report.
About the cover: The ship’s wheel represents leadership and guidance, essential qualities in navigating difficult seas. This one is a replica based on an 18th-century British vessel. The HMSVanguard, another ship of that era, served as the flagship for British Admiral Horatio Nelson when he defeated a French fleet at the Battle of the Nile.
Your Fund’s Total Returns
| Fiscal Year Ended December 31, 2013 | ||||
| 30-Day SEC | Income | Capital | Total | |
| Yield | Returns | Returns | Returns | |
| Vanguard Inflation-Protected Securities Fund | ||||
| Investor Shares | -0.04% | 1.88% | -10.80% | -8.92% |
| Admiral™ Shares | 0.06 | 2.02 | -10.88 | -8.86 |
| Institutional Shares | 0.09 | 2.05 | -10.88 | -8.83 |
| Barclays U.S. Treasury Inflation Protected | ||||
| Securities Index | -8.61 | |||
| Inflation-Protected Bond Funds Average | -7.76 | |||
Inflation-Protected Bond Funds Average: Derived from data provided by Lipper, a Thomson Reuters Company.
Admiral Shares carry lower expenses and are available to investors who meet certain account-balance requirements. Institutional Shares are available to certain institutional investors who meet specific administrative, service, and account-size criteria.
| Your Fund’s Performance at a Glance | ||||
| December 31, 2012, Through December 31, 2013 | ||||
| Distributions Per Share | ||||
| Starting | Ending | |||
| Share | Share | Income | Capital | |
| Price | Price | Dividends | Gains | |
| Vanguard Inflation-Protected Securities Fund | ||||
| Investor Shares | $14.53 | $12.98 | $0.216 | $0.045 |
| Admiral Shares | 28.54 | 25.47 | 0.465 | 0.089 |
| Institutional Shares | 11.62 | 10.37 | 0.193 | 0.036 |
1

Chairman’s Letter
Dear Shareholder,
The fiscal year ended December 31, 2013, was characterized by rising yields and lowered inflation expectations, factors that made the period a difficult one for Treasury Inflation-Protected Securities (TIPS) and for Vanguard Inflation-Protected Securities Fund.
The fund returned –8.92% for Investor Shares, the steepest fiscal-year decline since it began operations in 2001. That was a step behind its benchmark, the Barclays U.S. Treasury Inflation Protected Securities Index, whose –8.61% return reflected the biggest yearly drop for TIPS since their 1997 introduction. The fund also lagged the –7.76% average return of its peer group, which consists of funds of both shorter and longer maturities.
The rise in yields, and decline in bond prices, affected bonds overall—a consequence of investors’ skittishness and speculation about when the Federal Reserve would cut back its stimulative bond-buying program. More specific to TIPS was that inflation unexpectedly remained low, despite the Fed’s expansionary policy and a strengthening economy. This led some investors to abandon TIPS and their inflation-buffering potential, pushing prices down. (Bond yields and prices move in opposite directions.)
2
These trends contrast sharply with the earlier environment for TIPS; demand for them had been so high since early 2011 that investors had accepted negative yields. This atypical phenomenon for bonds resulted from investors’ willingness to pay premium prices for the securities, expecting that inflation would exceed the level reflected in TIPS prices and thus lead to a positive long-term return.
The SEC yield for the fund’s Investor Shares, which started the year at –1.09%, stood at –1.20% as of March 31, a record month-end low for the fund. As investors’ inflation outlook changed, the yield began steadily rising, and the Investor Shares’ yield ended 2013 at a just-barely-negative –0.04% (after briefly edging into positive territory). The fund’s other share classes ended with slightly positive yields.
Before going on to discuss the markets, I want to mention an important transition at Vanguard. We announced in early November that Robert F. Auwaerter, principal and head of Vanguard Fixed Income Group, intends to retire in March 2014. Later in this letter, I’ll have more to say about Bob’s important contributions to Vanguard during his 32-year career, and I’ll introduce his successor, Gregory Davis.
| Market Barometer | |||
| Average Annual Total Returns | |||
| Periods Ended December 31, 2013 | |||
| One | Three | Five | |
| Year | Years | Years | |
| Bonds | |||
| Barclays U.S. Aggregate Bond Index (Broad taxable | |||
| market) | -2.02% | 3.26% | 4.44% |
| Barclays Municipal Bond Index (Broad tax-exempt market) | -2.55 | 4.83 | 5.89 |
| Citigroup Three-Month U.S. Treasury Bill Index | 0.05 | 0.06 | 0.09 |
| Stocks | |||
| Russell 1000 Index (Large-caps) | 33.11% | 16.30% | 18.59% |
| Russell 2000 Index (Small-caps) | 38.82 | 15.67 | 20.08 |
| Russell 3000 Index (Broad U.S. market) | 33.55 | 16.24 | 18.71 |
| MSCI All Country World Index ex USA (International) | 15.29 | 5.14 | 12.81 |
| CPI | |||
| Consumer Price Index | 1.50% | 2.07% | 2.08% |
3
Bond returns faltered in 2013 as the Fed’s phaseout loomed
In mid-December, the Fed ended the uncertainty over the next step in its bond-buying program by announcing that it would begin paring its purchases in January 2014. Since it first suggested the possibility earlier in the year, rattled investors had sold bonds in anticipation of lower prices once a source of heavy bond demand lessened.
The broad U.S. taxable bond market, which includes TIPS, returned –2.02% for the 12 months ended December 31—its first negative calendar-year result since 1999 and its worst since 1994. Municipal bonds returned –2.55% in aggregate.
The yield of the 10-year Treasury note closed at 2.97%, up from 1.76% at the close of December 2012.
International bond markets, as measured by the Barclays Global Aggregate Index ex USD, returned –3.08%. Money market fund and savings account returns remained tiny as the Fed, in a separate effort to stimulate the economy, held its target short-term interest rate between 0% and 0.25%.
Earnings, optimism, and stimulus made it a big year for U.S. stocks
U.S. stocks surged about 34% during the year, their best calendar-year finish since 1995. Corporations posted solid earnings, and investors placed a higher premium on
| Expense Ratios | ||||
| Your Fund Compared With Its Peer Group | ||||
| Investor | Admiral | Institutional | Peer Group | |
| Shares | Shares | Shares | Average | |
| Inflation-Protected Securities Fund | 0.20% | 0.10% | 0.07% | 0.80% |
The fund expense ratios shown are from the prospectus dated April 29, 2013, and represent estimated costs for the current fiscal year. For the fiscal year ended December 31, 2013, the fund’s expense ratios were 0.20% for Investor Shares, 0.10% for Admiral Shares, and 0.07% for Institutional Shares. The peer-group expense ratio is derived from data provided by Lipper, a Thomson Reuters Company, and captures information through year-end 2012.
Peer group: Inflation-Protected Bond Funds.
4
those earnings. The Fed’s bond-buying also supported stock markets; in fact, markets slumped a bit in the summer (before snapping back) when questions arose about the timing of the program’s unwinding.
International stocks, in aggregate, returned about 15%, with the developed markets of Europe and the Pacific region posting double-digit results and emerging-market stocks dipping into negative territory.
For 2014, Vanguard Chief Economist Joe Davis and his team are guarded in their outlook for global stock returns, and their forecast for the bond market remains muted. While Joe readily acknowledges that such forecasts are accompanied by uncertainty, he writes, “We believe a balanced and diversified, low-cost portfolio can remain a high-value proposition in the decade ahead.” (You can read more about our expectations for bond and stock returns in Vanguard’s Economic and Investment Outlook, available at vanguard.com/research.)
The fund’s longer duration led to a deeper price decline
Investors’ changing view of inflation can be captured in the “break-even inflation rate”—the difference in yields between conventional and inflation-protected Treasury bonds. At the start of 2013, according to this measure, investors expected inflation to average 2.20% annually over the next five years; the expected inflation rate had risen to about 2.50% during the early months
| Total Returns | |
| Ten Years Ended December 31, 2013 | |
| Average | |
| Annual Return | |
| Inflation-Protected Securities Fund Investor Shares | 4.59% |
| Barclays U.S. Treasury Inflation Protected Securities Index | 4.85 |
| Inflation-Protected Bond Funds Average | 3.95 |
Inflation-Protected Bond Funds Average: Derived from data provided by Lipper, a Thomson Reuters Company.
The figures shown represent past performance, which is not a guarantee of future results. (Current performance may be lower or higher than the performance data cited. For performance data current to the most recent month-end, visit our website at vanguard.com/performance.) Note, too, that both investment returns and principal value can fluctuate widely, so an investor’s shares, when sold, could be worth more or less than their original cost.
5
of the year, only to shrink to 2.09% by year-end. If inflation is higher than the break-even rate, holders of TIPS would outperform holders of conventional
Treasuries; if inflation is lower than the rate, conventional Treasuries would do better.
| Understanding your fund’s dividend distributions |
| During the first three quarters of the year, Vanguard Inflation-Protected Securities Fund may |
| hold back some dividends to minimize the risk of overdistributing income for the full year, a |
| potential recordkeeping headache for shareholders. |
| This risk is greatest during periods of low or negative inflation and low or negative yields on |
| inflation-indexed securities, conditions that have characterized the TIPS market for much of |
| the past few years. |
| If the combination of any inflation adjustment to the face value of the fund’s securities and |
| the fund’s interest income in a given quarter isn’t enough to produce positive income, the |
| fund would have to reclassify some of the earlier dividend payments as “overdistributed.” |
| This scenario may not materialize, of course, and when the accountants close the books |
| on the fund’s fiscal year, the fund will distribute whatever income it has kept in reserve. |
| The result can be significant variation in the quarterly dividend. |
| Dividends can vary widely from quarter to quarter |
| (Investor Shares of Vanguard Inflation-Protected Securities Fund) |
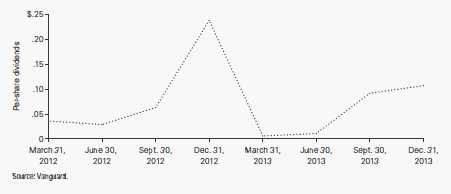 |
6
Although the tame inflation rate seemed to prompt a shift by investors away from TIPS in 2013, I should note that a market consists of investors with varying goals and perspectives. For every seller of a security, there is a buyer with an opposing view. And, as the advisor explains in the report that follows this letter, demand in the TIPS market from other investors, such as central banks and insurers, is quite solid.
The rise in yields during the year affected intermediate-term TIPS—the focus of Vanguard Inflation-Protected Securities Fund—more than shorter-maturity TIPS. As a result, the fund’s counterpart, Vanguard Short-Term Inflation-Protected Securities Index Fund, weathered the period a bit better, returning –1.62%. The difference reflects your fund’s longer “duration,” or sensitivity to interest rate changes. The longer a bond’s duration, the more its price will drop when rates rise (or will go up when rates fall). On the other hand, the trade-off for the fund’s greater volatility is its potential for higher yields.
The fund’s long-term results highlight the advisor’s skill
Over the decade ended December 31, 2013, the average annual return of the fund’s Investor Shares was 4.59%, a bit less than that of its index but ahead of the average return of peers. The results reflect deft management by the fund’s advisor, Vanguard Fixed Income Group, across a variety of market and economic conditions, including the 2008–2009 financial crisis.
Helping results are the fund’s low expenses, which offer important advantages. They allow more of the fund’s return to be passed along to shareholders. They also mean the fund has no need to take extra risks to overcome the performance drag created by higher costs.
Bob Auwaerter’s retirement marks the end of a remarkable era
In mid-September 2008, about two weeks after I succeeded Jack Brennan as Vanguard’s chief executive officer, Lehman Brothers went bankrupt, igniting the nation’s worst financial crisis in 70 years. It was, to put it mildly, an extremely challenging time. Through it all, I was able to depend on Bob Auwaerter’s strong command of the Fixed Income Group, which persevered under these treacherous conditions. Although that was a difficult period for Vanguard and the industry, it was far from the only time I was grateful to have Bob at the helm of our bond group.
Bob, who joined Vanguard in 1981, was an original member of the three-person Fixed Income Group headed by Ian MacKinnon. Over the years, he held various leadership roles in the department, and he eventually succeeded Ian as its head in 2003. He earned a reputation at Vanguard and within the industry as an extremely dedicated, honest, and insightful decision-maker and leader.
7
The Fixed Income Group that Bob helped start had initial total assets of about $1.3 billion in seven funds. He tracked his positions in the two funds he managed then on index cards stored in a small metal box. Thirty-two years later, the 120-person group oversees $750 billion, which represents nearly one-third of Vanguard’s assets under management.
On behalf of our clients, I thank Bob for more than three decades of exemplary service and wish him the best in his retirement.
We’re fortunate that Greg Davis will become the head of the Fixed Income Group. Greg currently serves as chief investment officer for the Asia-Pacific region and as a director of Vanguard Investments Australia. He joined Vanguard in 1999 and had also been head of bond indexing and a senior portfolio manager in the Fixed Income Group. Greg is an eminently qualified successor and has a strong commitment to the Vanguard way of investing. I couldn’t be more confident in his ability to lead the Fixed Income Group and its deep and talented team.
As always, thank you for investing with Vanguard.
Sincerely,

F. William McNabb III
Chairman and Chief Executive Officer
January 21, 2014
8
Advisor’s Report
For the 12 months ended December 31, 2013, Investor Shares of Vanguard Inflation-Protected Securities Fund returned –8.92%. The fund’s result was a bit behind that of its benchmark, the Barclays U.S. Treasury Inflation Protected Securities Index, which returned –8.61%, and behind the –7.76% average return of other TIPS funds, including those with longer and shorter maturities.
The investment environment
The almost 9% decline in the return of Treasury Inflation-Protected Securities (TIPS) for 2013, especially after four years of strong returns, was extraordinary for bonds of such high credit quality (as determined by independent credit-rating agencies). Conventional Treasury bonds,
which enjoy the same full-faith-and-credit backing of the federal government as do TIPS, declined about 3%. The only previous calendar-year decline for TIPS came during the financial crisis, in 2008, when the asset class returned about –2%. It is important to remember that the duration of the TIPS fund (its sensitivity to interest rate changes) is greater than that of conventional Treasury bonds; as such, the sharp rise in interest rates had a more adverse impact.
To an extent during 2013, the same factors influenced TIPS, conventional Treasuries, and other investment-grade bonds. Some investors may have shifted from bonds to stocks, given the year’s heady stock rally. More pervasively, starting in May,
| Yields of U.S. Treasury Inflation-Protected Securities | |||
| (Real Yields) | |||
| December 31, | June 30, | December 31, | |
| Maturity | 2012 | 2013 | 2013 |
| 2 years | –1.73% | –0.93% | –1.38% |
| 3 years | –1.67 | –0.68 | –1.00 |
| 5 years | –1.53 | –0.18 | –0.25 |
| 7 years | –1.28 | 0.20 | 0.35 |
| 10 years | –0.76 | 0.58 | 0.85 |
| 20 years | 0.13 | 1.11 | 1.49 |
| 30 years | 0.46 | 1.33 | 1.66 |
| Source: Vanguard. | |||
9
speculation ran rampant in bond markets worldwide about when, and by how much, the Federal Reserve would pare back its monthly $85 billion purchases of Treasury bonds (including about $1.25 billion in TIPS) and mortgage-backed securities—a policy designed to pump money into the economy and lower long-term interest rates. Many investors sold bonds in anticipation of price declines as the Fed reduced demand; that had the effect of lowering prices generally and raising interest rates. (Bond prices and interest rates move inversely.) Rates were rising because of faster U.S. economic growth in the second half of the year, though, even as the Fed maintained its policy of pushing rates down. The Fed finally announced in mid-December that it would scale back its purchases beginning in January 2014.
Factors specific to TIPS also affected returns: Many investors sold them because inflation was far lower than they had expected. As you know, TIPS are designed to provide an income that is adjusted for inflation—and it had seemed that forces that would foster potentially strong inflation were in place. One was the surprising strength of the U.S. economy. Another, and particularly critical, force was the Fed’s unprecedented monetary strategy. Yet inflation was tame: Consumer prices rose only 1.5% for the year, slower than the increases of 1.7% in 2012 and 3.0% in 2011.
The market environment
The heavy TIPS sales in 2013 reversed a two-year trend in which the fund’s yield had turned negative. That had come about based on strong demand that boosted their prices to levels that would generate a positive long-term return only if inflation was greater than generally expected. (The market’s view of inflation is indicated by the break-even inflation rate—the difference in yields between conventional Treasuries, which have no explicit inflation adjustment, and TIPS, which do.)
In essence, until early 2013, investors expected the worst: The fund’s SEC yield for Investor Shares slid from –0.09% (its first negative yield) on May 31, 2011, to –1.20% on March 31, 2013. As investors’ pessimism about inflation rose, they sold their TIPS holdings, forcing real yields to rise; on December 31, the fund’s yield stood at –0.04%.
The market, in effect, reset itself at yield levels that have drawn “natural buyers”—institutions (both in and outside the United States) that consider TIPS a good fit with their long-term needs. These include central banks, insurance companies, and pension plans. Another indication of solid demand for TIPS is the virtually nonexistent inventories of bonds available for sale from investment banks at the end of the year.
10
The gradual disappearance of negative yields has affected longer-term and intermediate-term TIPS, which are the focus of your fund. Shorter-term TIPS—the province of Vanguard Short-Term Inflation-Protected Securities Index Fund—still incurred them. This is a consequence of Fed policy that has continued to anchor short-term rates near zero even as its bond-tapering plan has had the effect of lifting long-term rates.
The outlook
The economic expansion has so far appeared durable, and we expect inflation to return to its historical average annual level of close to 2%. The Fed’s announcement that it would begin reducing its bond purchases, along with a two-year federal budget deal, has added a measure of clarity to the bond markets. The central bank has noted, for instance, that its timing and degree of future reductions would be “data-dependent.” Given a backdrop of moderate global growth and tame inflation, we do not anticipate any rise in short-term rates in the immediate future. The general expectation is that the Fed will finish its reduced-purchase program over the next 12 to 18 months. Interest rates could trend moderately higher, and the fund’s performance could remain volatile.
Gemma Wright-Casparius, Principal
Vanguard Fixed Income Group
January 26, 2014
11
Inflation-Protected Securities Fund
Fund Profile
As of December 31, 2013
| Share-Class Characteristics | |||
| Investor | Admiral | Institutional | |
| Shares | Shares | Shares | |
| Ticker Symbol | VIPSX | VAIPX | VIPIX |
| Expense Ratio1 | 0.20% | 0.10% | 0.07% |
| 30-Day SEC Yield2 | -0.04% | 0.06% | 0.09% |
| Financial Attributes | |||
| Barclays | |||
| Inflation | Barclays | ||
| Protected | Aggregate | ||
| Securities | Bond | ||
| Fund | Index | Index | |
| Number of Bonds | 39 | 34 | 8,701 |
| Yield to Maturity | |||
| (before expenses) | 2.4% | 2.4% | 2.5% |
| Average Coupon | 1.1% | 1.2% | 3.3% |
| Average Duration | 7.6 years | 7.7 years | 5.5 years |
| Average Effective | |||
| Maturity | 8.2 years | 8.1 years | 7.6 years |
| Short-Term | |||
| Reserves | 0.9% | — | — |
| Sector Diversification (% of portfolio) | |
| Treasury/Agency | 99.8% |
| Other | 0.2 |
The agency and mortgage-backed securities sectors may include issues from government-sponsored enterprises; such issues are generally not backed by the full faith and credit of the U.S. government.
| Volatility Measures | ||
| Barclays | ||
| Inflation | Barclays | |
| Protected | Aggregate | |
| Securities | Bond | |
| Index | Index | |
| R-Squared | 0.99 | 0.71 |
| Beta | 1.01 | 1.69 |
These measures show the degree and timing of the fund’s fluctuations compared with the indexes over 36 months.
| Distribution by Effective Maturity | |
| (% of portfolio) | |
| Under 1 Year | 0.2% |
| 1 - 3 Years | 15.1 |
| 3 - 5 Years | 22.5 |
| 5 - 10 Years | 38.1 |
| 10 - 20 Years | 18.2 |
| 20 - 30 Years | 5.9 |
| Distribution by Credit Quality (% of portfolio) | |
| U.S. Government | 99.8% |
| Aaa | 0.2 |
For information about these ratings, see the Glossary entry for Credit Quality.
Investment Focus
1 The expense ratios shown are from the prospectus dated April 29, 2013, and represent estimated costs for the current fiscal year. For the fiscal
year ended December 31, 2013, the expense ratios were 0.20% for Investor Shares, 0.10% for Admiral Shares, and 0.07% for Institutional Shares.
2 Yields of inflation-protected securities tend to be lower than those of bonds, because the former do not incorporate market expectations about
inflation. The principal amounts—and thus the interest payments—of inflation-protected securities are adjusted over time to reflect inflation.
12
Inflation-Protected Securities Fund
Performance Summary
All of the returns in this report represent past performance, which is not a guarantee of future results that may be achieved by the fund. (Current performance may be lower or higher than the performance data cited. For performance data current to the most recent month-end, visit our website at vanguard.com/performance.) Note, too, that both investment returns and principal value can fluctuate widely, so an investor’s shares, when sold, could be worth more or less than their original cost. The returns shown do not reflect taxes that a shareholder would pay on fund distributions or on the sale of fund shares.
Cumulative Performance: December 31, 2003, Through December 31, 2013
Initial Investment of $10,000

| Average Annual Total Returns | ||||
| Periods Ended December 31, 2013 | ||||
| Final Value | ||||
| One | Five | Ten | of a $10,000 | |
| Year | Years | Years | Investment | |
| Inflation-Protected Securities Fund | ||||
| Investor Shares | -8.92% | 5.31% | 4.59% | $15,667 |
| Barclays U.S. Treasury Inflation | ||||
| Protected Securities Index | -8.61 | 5.63 | 4.85 | 16,055 |
| Inflation-Protected Bond Funds Average | -7.76 | 5.01 | 3.95 | 14,732 |
| Barclays U.S. Aggregate Bond Index | -2.02 | 4.44 | 4.55 | 15,599 |
Inflation-Protected Bond Funds Average: Derived from data provided by Lipper, a Thomson Reuters Company.
| Since | Final Value | |||
| One | Five | Inception | of a $50,000 | |
| Year | Years | (6/10/2005) | Investment | |
| Inflation-Protected Securities Fund Admiral | ||||
| Shares | -8.86% | 5.42% | 4.30% | $71,691 |
| Barclays U.S. Treasury Inflation Protected | ||||
| Securities Index | -8.61 | 5.63 | 4.47 | 72,691 |
| Barclays U.S. Aggregate Bond Index | -2.02 | 4.44 | 4.59 | 73,401 |
| "Since Inception" performance is calculated from the Admiral Shares’ inception date for both the fund and its comparative standards. | ||||
See Financial Highlights for dividend and capital gains information.
13
Inflation-Protected Securities Fund
| Average Annual Total Returns | ||||
| Periods Ended December 31, 2013 | ||||
| Final Value | ||||
| One | Five | Ten | of a $5,000,000 | |
| Year | Years | Years | Investment | |
| Inflation-Protected Securities Fund | ||||
| Institutional Shares | -8.83% | 5.46% | 4.71% | $7,921,767 |
| Barclays U.S. Treasury Inflation Protected | ||||
| Securities Index | -8.61 | 5.63 | 4.85 | 8,027,394 |
| Barclays U.S. Aggregate Bond Index | -2.02 | 4.44 | 4.55 | 7,799,554 |
| Fiscal-Year Total Returns (%): December 31, 2003, Through December 31, 2013 | ||||
| Barclays | ||||
| Inflation | ||||
| Protected | ||||
| Securities | ||||
| Investor Shares | Index | |||
| Fiscal Year | Income Returns | Capital Returns | Total Returns | Total Returns |
| 2004 | 4.79% | 3.48% | 8.27% | 8.46% |
| 2005 | 5.44 | -2.85 | 2.59 | 2.84 |
| 2006 | 3.40 | -2.97 | 0.43 | 0.41 |
| 2007 | 5.90 | 5.69 | 11.59 | 11.63 |
| 2008 | 4.62 | -7.47 | -2.85 | -2.35 |
| 2009 | 1.86 | 8.94 | 10.80 | 11.41 |
| 2010 | 2.58 | 3.59 | 6.17 | 6.31 |
| 2011 | 4.56 | 8.68 | 13.24 | 13.56 |
| 2012 | 2.62 | 4.16 | 6.78 | 6.98 |
| 2013 | 1.88 | -10.80 | -8.92 | -8.61 |
14
Inflation-Protected Securities Fund
Financial Statements
Statement of Net Assets
As of December 31, 2013
The fund reports a complete list of its holdings in regulatory filings four times in each fiscal year, at the quarter-ends. For the second and fourth fiscal quarters, the lists appear in the fund’s semiannual and annual reports to shareholders. For the first and third fiscal quarters, the fund files the lists with the Securities and Exchange Commission on Form N-Q. Shareholders can look up the fund’s Forms N-Q on the SEC’s website at sec.gov. Forms N-Q may also be reviewed and copied at the SEC’s Public Reference Room (see the back cover of this report for further information).
| Face | Market | ||||
| Maturity | Amount | Value | |||
| Coupon | Date | ($000) | ($000) | ||
| U.S. Government and Agency Obligations (99.0%) | |||||
| U.S. Government Securities (99.0%) | |||||
| United States Treasury Inflation Indexed Bonds | 1.625% | 1/15/15 | 246,447 | 310,475 | |
| 1 | United States Treasury Inflation Indexed Bonds | 0.500% | 4/15/15 | 619,410 | 682,231 |
| United States Treasury Inflation Indexed Bonds | 1.875% | 7/15/15 | 483,071 | 611,287 | |
| United States Treasury Inflation Indexed Bonds | 2.000% | 1/15/16 | 517,348 | 648,802 | |
| United States Treasury Inflation Indexed Bonds | 0.125% | 4/15/16 | 1,194,286 | 1,297,592 | |
| United States Treasury Inflation Indexed Bonds | 2.500% | 7/15/16 | 541,666 | 687,290 | |
| United States Treasury Inflation Indexed Bonds | 2.375% | 1/15/17 | 455,389 | 580,283 | |
| United States Treasury Inflation Indexed Bonds | 0.125% | 4/15/17 | 1,359,331 | 1,436,589 | |
| United States Treasury Inflation Indexed Bonds | 2.625% | 7/15/17 | 399,743 | 506,685 | |
| United States Treasury Inflation Indexed Bonds | 1.625% | 1/15/18 | 430,561 | 521,691 | |
| United States Treasury Inflation Indexed Bonds | 0.125% | 4/15/18 | 1,949,846 | 2,009,053 | |
| United States Treasury Inflation Indexed Bonds | 1.375% | 7/15/18 | 427,475 | 501,821 | |
| United States Treasury Inflation Indexed Bonds | 2.125% | 1/15/19 | 404,783 | 491,572 | |
| United States Treasury Inflation Indexed Bonds | 1.875% | 7/15/19 | 447,550 | 543,760 | |
| United States Treasury Inflation Indexed Bonds | 1.375% | 1/15/20 | 552,000 | 639,751 | |
| United States Treasury Inflation Indexed Bonds | 1.250% | 7/15/20 | 866,600 | 991,984 | |
| United States Treasury Inflation Indexed Bonds | 1.125% | 1/15/21 | 993,289 | 1,112,990 | |
| United States Treasury Inflation Indexed Bonds | 0.625% | 7/15/21 | 1,082,026 | 1,136,802 | |
| United States Treasury Inflation Indexed Bonds | 0.125% | 1/15/22 | 1,199,279 | 1,187,790 | |
| United States Treasury Inflation Indexed Bonds | 0.125% | 7/15/22 | 1,258,978 | 1,223,051 | |
| United States Treasury Inflation Indexed Bonds | 0.125% | 1/15/23 | 1,267,545 | 1,209,361 | |
| United States Treasury Inflation Indexed Bonds | 0.375% | 7/15/23 | 1,266,000 | 1,223,257 | |
| United States Treasury Inflation Indexed Bonds | 2.375% | 1/15/25 | 661,940 | 941,493 | |
| United States Treasury Inflation Indexed Bonds | 2.000% | 1/15/26 | 509,698 | 663,199 | |
| United States Treasury Inflation Indexed Bonds | 2.375% | 1/15/27 | 414,539 | 551,787 | |
| United States Treasury Inflation Indexed Bonds | 1.750% | 1/15/28 | 434,750 | 517,602 | |
| United States Treasury Inflation Indexed Bonds | 3.625% | 4/15/28 | 318,890 | 607,887 | |
| United States Treasury Inflation Indexed Bonds | 2.500% | 1/15/29 | 429,297 | 547,315 | |
| United States Treasury Inflation Indexed Bonds | 3.875% | 4/15/29 | 357,121 | 693,793 | |
| United States Treasury Inflation Indexed Bonds | 3.375% | 4/15/32 | 142,522 | 248,907 | |
| United States Treasury Inflation Indexed Bonds | 2.125% | 2/15/40 | 251,630 | 304,437 | |
| United States Treasury Inflation Indexed Bonds | 2.125% | 2/15/41 | 309,921 | 369,923 | |
| United States Treasury Inflation Indexed Bonds | 0.750% | 2/15/42 | 661,214 | 547,262 | |
| United States Treasury Inflation Indexed Bonds | 0.625% | 2/15/43 | 410,750 | 319,517 | |
| United States Treasury Note/Bond | 1.375% | 5/31/20 | 28,000 | 26,508 | |
| United States Treasury Note/Bond | 2.125% | 8/31/20 | 28,000 | 27,611 | |
| United States Treasury Note/Bond | 2.000% | 9/30/20 | 94,000 | 91,767 | |
15
Inflation-Protected Securities Fund
| Face | Market | |||
| Maturity | Amount | Value | ||
| Coupon | Date | ($000) | ($000) | |
| United States Treasury Note/Bond | 3.125% | 5/15/21 | 38,000 | 39,556 |
| United States Treasury Note/Bond | 1.750% | 5/15/23 | 214,000 | 192,499 |
| Total U.S. Government and Agency Obligations (Cost $25,718,160) | 26,245,180 | |||
| Shares | ||||
| Temporary Cash Investment (0.9%) | ||||
| Money Market Fund (0.9%) | ||||
| 2 Vanguard Market Liquidity Fund (Cost $237,257) | 0.125% | 237,256,621 | 237,257 | |
| Total Investments (99.9%) (Cost $25,955,417) | 26,482,437 | |||
| Other Assets and Liabilities (0.1%) | ||||
| Other Assets | 328,589 | |||
| Liabilities | (309,362) | |||
| 19,227 | ||||
| Net Assets (100%) | 26,501,664 | |||
| At December 31, 2013, net assets consisted of: | |
| Amount | |
| ($000) | |
| Paid-in Capital | 25,982,014 |
| Undistributed Net Investment Income | 79,947 |
| Accumulated Net Realized Losses | (87,114) |
| Unrealized Appreciation (Depreciation) | |
| Investment Securities | 527,020 |
| Futures Contracts | (203) |
| Net Assets | 26,501,664 |
| Investor Shares—Net Assets | |
| Applicable to 506,888,831 outstanding $.001 par value shares of | |
| beneficial interest (unlimited authorization) | 6,577,454 |
| Net Asset Value Per Share—Investor Shares | $12.98 |
| Admiral Shares—Net Assets | |
| Applicable to 432,061,041 outstanding $.001 par value shares of | |
| beneficial interest (unlimited authorization) | 11,005,432 |
| Net Asset Value Per Share—Admiral Shares | $25.47 |
| Institutional Shares—Net Assets | |
| Applicable to 859,710,964 outstanding $.001 par value shares of | |
| beneficial interest (unlimited authorization) | 8,918,778 |
| Net Asset Value Per Share—Institutional Shares | $10.37 |
See Note A in Notes to Financial Statements.
1 Securities with a value of $3,373,000 have been segregated as initial margin for open futures contracts.
2 Affiliated money market fund available only to Vanguard funds and certain trusts and accounts managed by Vanguard. Rate shown is the 7-day yield.
See accompanying Notes, which are an integral part of the Financial Statements.
16
Inflation-Protected Securities Fund
| Statement of Operations | |
| Year Ended | |
| December 31, 2013 | |
| ($000) | |
| Investment Income | |
| Income | |
| Interest1 | 537,023 |
| Total Income | 537,023 |
| Expenses | |
| The Vanguard Group—Note B | |
| Investment Advisory Services | 3,564 |
| Management and Administrative—Investor Shares | 16,527 |
| Management and Administrative—Admiral Shares | 9,129 |
| Management and Administrative—Institutional Shares | 3,248 |
| Marketing and Distribution—Investor Shares | 3,189 |
| Marketing and Distribution—Admiral Shares | 3,002 |
| Marketing and Distribution—Institutional Shares | 3,077 |
| Custodian Fees | 190 |
| Auditing Fees | 34 |
| Shareholders’ Reports—Investor Shares | 190 |
| Shareholders’ Reports—Admiral Shares | 71 |
| Shareholders’ Reports—Institutional Shares | 61 |
| Trustees’ Fees and Expenses | 48 |
| Total Expenses | 42,330 |
| Net Investment Income | 494,693 |
| Realized Net Gain (Loss) | |
| Investment Securities Sold | 1,233,322 |
| Futures Contracts | 36,819 |
| Options on Futures Contracts | (1,091) |
| Realized Net Gain (Loss) | 1,269,050 |
| Change in Unrealized Appreciation (Depreciation) | |
| Investment Securities | (4,899,078) |
| Futures Contracts | (89) |
| Options on Futures Contracts | 100 |
| Change in Unrealized Appreciation (Depreciation) | (4,899,067) |
| Net Increase (Decrease) in Net Assets Resulting from Operations | (3,135,324) |
| 1 Interest income from an affiliated company of the fund was $423,000. | |
See accompanying Notes, which are an integral part of the Financial Statements.
17
Inflation-Protected Securities Fund
| Statement of Changes in Net Assets | ||
| Year Ended December 31, | ||
| 2013 | 2012 | |
| ($000) | ($000) | |
| Increase (Decrease) in Net Assets | ||
| Operations | ||
| Net Investment Income | 494,693 | 1,120,050 |
| Realized Net Gain (Loss) | 1,269,050 | 813,969 |
| Change in Unrealized Appreciation (Depreciation) | (4,899,067) | 862,276 |
| Net Increase (Decrease) in Net Assets Resulting from Operations | (3,135,324) | 2,796,295 |
| Distributions | ||
| Net Investment Income | ||
| Investor Shares | (118,821) | (399,208) |
| Admiral Shares | (211,386) | (402,677) |
| Institutional Shares | (173,452) | (316,233) |
| Realized Capital Gain1 | ||
| Investor Shares | (47,339) | (180,801) |
| Admiral Shares | (48,826) | (180,421) |
| Institutional Shares | (38,147) | (139,058) |
| Total Distributions | (637,971) | (1,618,398) |
| Capital Share Transactions | ||
| Investor Shares | (8,462,840) | 373,569 |
| Admiral Shares | (3,445,883) | 2,097,716 |
| Institutional Shares | (2,394,098) | 1,808,685 |
| Net Increase (Decrease) from Capital Share Transactions | (14,302,821) | 4,279,970 |
| Total Increase (Decrease) | (18,076,116) | 5,457,867 |
| Net Assets | ||
| Beginning of Period | 44,577,780 | 39,119,913 |
| End of Period2 | 26,501,664 | 44,577,780 |
1 Includes fiscal 2013 and 2012 short-term gain distributions totaling $8,954,000 and $77,894,000, respectively. Short-term gain distributions are treated as ordinary income dividends for tax purposes.
2 Net Assets—End of Period includes undistributed (overdistributed) net investment income of $79,947,000 and ($20,938,000).
See accompanying Notes, which are an integral part of the Financial Statements.
18
Inflation-Protected Securities Fund
Financial Highlights
| Investor Shares | |||||
| For a Share Outstanding | Year Ended December 31, | ||||
| Throughout Each Period | 2013 | 2012 | 2011 | 2010 | 2009 |
| Net Asset Value, Beginning of Period | $14.53 | $14.11 | $13.00 | $12.55 | $11.52 |
| Investment Operations | |||||
| Net Investment Income | . 210 | . 367 | .568 | .319 | .210 |
| Net Realized and Unrealized Gain (Loss) | |||||
| on Investments | (1.499) | .586 | 1.127 | .448 | 1.034 |
| Total from Investment Operations | (1.289) | .953 | 1.695 | .767 | 1.244 |
| Distributions | |||||
| Dividends from Net Investment Income | (. 216) | (. 366) | (. 567) | (.317) | (.214) |
| Distributions from Realized Capital Gains | (.045) | (.167) | (.018) | — | — |
| Total Distributions | (. 261) | (. 533) | (. 585) | (. 317) | (.214) |
| Net Asset Value, End of Period | $12.98 | $14.53 | $14.11 | $13.00 | $12.55 |
| Total Return1 | -8.92% | 6.78% | 13.24% | 6.17% | 10.80% |
| Ratios/Supplemental Data | |||||
| Net Assets, End of Period (Millions) | $6,577 | $16,075 | $15,220 | $12,979 | $12,946 |
| Ratio of Total Expenses to | |||||
| Average Net Assets | 0.20% | 0.20% | 0.20% | 0.22% | 0.25% |
| Ratio of Net Investment Income to | |||||
| Average Net Assets | 1.33% | 2.55% | 4.21% | 2.48% | 2.00% |
| Portfolio Turnover Rate | 44%2 | 33% | 28% | 29% | 14% |
1 Total returns do not include account service fees that may have applied in the periods shown. Fund prospectuses provide information about any applicable account service fees.
2 Excludes the value of portfolio securities received or delivered as a result of in-kind purchases or redemptions of the fund’s capital shares.
See accompanying Notes, which are an integral part of the Financial Statements.
19
Inflation-Protected Securities Fund
Financial Highlights
| Admiral Shares | |||||
| For a Share Outstanding | Year Ended December 31, | ||||
| Throughout Each Period | 2013 | 2012 | 2011 | 2010 | 2009 |
| Net Asset Value, Beginning of Period | $28.54 | $27.71 | $25.54 | $24.65 | $22.62 |
| Investment Operations | |||||
| Net Investment Income | . 449 | .750 | 1.140 | .654 | .441 |
| Net Realized and Unrealized Gain (Loss) | |||||
| on Investments | (2.965) | 1.155 | 2.202 | .888 | 2.037 |
| Total from Investment Operations | (2.516) | 1.905 | 3.342 | 1.542 | 2.478 |
| Distributions | |||||
| Dividends from Net Investment Income | (.465) | (.747) | (1.137) | (. 652) | (. 448) |
| Distributions from Realized Capital Gains | (.089) | (. 328) | (.035) | — | — |
| Total Distributions | (.554) | (1.075) | (1.172) | (. 652) | (. 448) |
| Net Asset Value, End of Period | $25.47 | $28.54 | $27.71 | $25.54 | $24.65 |
| Total Return | -8.86% | 6.90% | 13.29% | 6.31% | 10.96% |
| Ratios/Supplemental Data | |||||
| Net Assets, End of Period (Millions) | $11,005 | $16,011 | $13,533 | $11,440 | $8,723 |
| Ratio of Total Expenses to | |||||
| Average Net Assets | 0.10% | 0.10% | 0.11% | 0.11% | 0.12% |
| Ratio of Net Investment Income to | |||||
| Average Net Assets | 1.43% | 2.65% | 4.30% | 2.59% | 2.13% |
| Portfolio Turnover Rate | 44%1 | 33% | 28% | 29% | 14% |
1 Excludes the value of portfolio securities received or delivered as a result of in-kind purchases or redemptions of the fund’s capital shares.
See accompanying Notes, which are an integral part of the Financial Statements.
20
Inflation-Protected Securities Fund
Financial Highlights
| Institutional Shares | |||||
| For a Share Outstanding | Year Ended December 31, | ||||
| Throughout Each Period | 2013 | 2012 | 2011 | 2010 | 2009 |
| Net Asset Value, Beginning of Period | $11.62 | $11.29 | $10.40 | $10.04 | $9.21 |
| Investment Operations | |||||
| Net Investment Income | .187 | .310 | .468 | .271 | .181 |
| Net Realized and Unrealized Gain (Loss) | |||||
| on Investments | (1.208) | .463 | .903 | .359 | .834 |
| Total from Investment Operations | (1.021) | .773 | 1.371 | .630 | 1.015 |
| Distributions | |||||
| Dividends from Net Investment Income | (.193) | (. 309) | (. 467) | (.270) | (.185) |
| Distributions from Realized Capital Gains | (.036) | (.134) | (.014) | — | — |
| Total Distributions | (.229) | (.443) | (. 481) | (.270) | (.185) |
| Net Asset Value, End of Period | $10.37 | $11.62 | $11.29 | $10.40 | $10.04 |
| Total Return | -8.83% | 6.87% | 13.39% | 6.33% | 11.03% |
| Ratios/Supplemental Data | |||||
| Net Assets, End of Period (Millions) | $8,919 | $12,491 | $10,367 | $7,720 | $5,931 |
| Ratio of Total Expenses to | |||||
| Average Net Assets | 0.07% | 0.07% | 0.07% | 0.07% | 0.09% |
| Ratio of Net Investment Income to | |||||
| Average Net Assets | 1.46% | 2.68% | 4.34% | 2.63% | 2.16% |
| Portfolio Turnover Rate | 44%1 | 33% | 28% | 29% | 14% |
1 Excludes the value of portfolio securities received or delivered as a result of in-kind purchases or redemptions of the fund’s capital shares.
See accompanying Notes, which are an integral part of the Financial Statements.
21
Inflation-Protected Securities Fund
Notes to Financial Statements
Vanguard Inflation-Protected Securities Fund is registered under the Investment Company Act of 1940 as an open-end investment company, or mutual fund. The fund offers three classes of shares: Investor Shares, Admiral Shares, and Institutional Shares. Investor Shares are available to any investor who meets the fund’s minimum purchase requirements. Admiral Shares and Institutional Shares are designed for investors who meet certain administrative, service, and account-size criteria.
A. The following significant accounting policies conform to generally accepted accounting principles for U.S. mutual funds. The fund consistently follows such policies in preparing its financial statements.
1. Security Valuation: Bonds, and temporary cash investments acquired over 60 days to maturity, are valued using the latest bid prices or using valuations based on a matrix system (which considers such factors as security prices, yields, maturities, and ratings), both as furnished by independent pricing services. Investments in Vanguard Market Liquidity Fund are valued at that fund’s net asset value. Other temporary cash investments are valued at amortized cost, which approximates market value. Securities for which market quotations are not readily available, or whose values have been affected by events occurring before the fund’s pricing time but after the close of the securities’ primary markets, are valued by methods deemed by the board of trustees to represent fair value.
2. Futures and Options: The fund may use futures contracts and options on futures contracts to invest in fixed income asset classes with greater efficiency and lower cost than is possible through direct investment, to add value when these instruments are attractively priced, or to adjust sensitivity to changes in interest rates. The primary risks associated with the use of futures contracts are imperfect correlation between changes in market values of bonds held by the fund and the prices of futures contracts, and the possibility of an illiquid market. The primary risk associated with purchasing options is that interest rates move in such a way that the option is out-of-the-money, the position is worthless at expiration, and the fund loses the premium paid. The primary risk associated with writing options is that interest rates move in such a way that the option is in-the-money, the counterparty exercises the option, and the fund loses an amount equal to the market value of the option written less the premium received. Counterparty risk involving futures and exchange-traded options is mitigated because a regulated clearinghouse is the counterparty instead of the clearing broker. To further mitigate counterparty risk, the fund trades futures and options on an exchange, monitors the financial strength of its clearing brokers and clearinghouse, and has entered into clearing agreements with its clearing brokers. The clearinghouse imposes initial margin requirements to secure the fund’s performance and requires daily settlement of variation margin representing changes in the market value of each contract.
Futures contracts are valued at their quoted daily settlement prices. The aggregate notional amounts of the contracts are not recorded in the Statement of Net Assets. Fluctuations in the value of the contracts are recorded in the Statement of Net Assets as an asset (liability) and in the Statement of Operations as unrealized appreciation (depreciation) until the contracts are closed, when they are recorded as realized futures gains (losses).
During the year ended December 31, 2013, the fund’s average investments in long and short futures contracts represented 1% and 2% of net assets, respectively, based on quarterly average aggregate settlement values.
22
Inflation-Protected Securities Fund
Options on futures contracts are also valued at their quoted daily settlement prices. The premium paid for a purchased option is recorded as an asset that is subsequently adjusted daily to the current market value of the option purchased. The premium received for a written option is recorded as an asset with an equal liability that is subsequently adjusted daily to the current market value of the option written. Fluctuations in the value of the options are recorded as unrealized appreciation (depreciation) until expired, closed, or exercised, at which time realized gains (losses) are recognized.
During the year ended December 31, 2013, the fund’s average investments in options purchased and options written each represented less than 1% of net assets, based on quarterly average market values. The fund had no open options on futures contracts at December 31, 2013.
3. Federal Income Taxes: The fund intends to continue to qualify as a regulated investment company and distribute all of its taxable income. Management has analyzed the fund’s tax positions taken for all open federal income tax years (December 31, 2010–2013), and has concluded that no provision for federal income tax is required in the fund’s financial statements.
4. Distributions: Distributions to shareholders are recorded on the ex-dividend date.
5. Other: Interest income includes income distributions received from Vanguard Market Liquidity Fund and is accrued daily. Premiums and discounts on debt securities purchased are amortized and accreted, respectively, to interest income over the lives of the respective securities. Inflation adjustments to the face amount of inflation-indexed securities are included in interest income. Security transactions are accounted for on the date securities are bought or sold. Costs used to determine realized gains (losses) on the sale of investment securities are those of the specific securities sold.
Each class of shares has equal rights as to assets and earnings, except that each class separately bears certain class-specific expenses related to maintenance of shareholder accounts (included in Management and Administrative expenses) and shareholder reporting. Marketing and distribution expenses are allocated to each class of shares based on a method approved by the board of trustees. Income, other non-class-specific expenses, and gains and losses on investments are allocated to each class of shares based on its relative net assets.
B. The Vanguard Group furnishes at cost investment advisory, corporate management, administrative, marketing, and distribution services. The costs of such services are allocated to the fund under methods approved by the board of trustees. The fund has committed to provide up to 0.40% of its net assets in capital contributions to Vanguard. At December 31, 2013, the fund had contributed capital of $3,129,000 to Vanguard (included in Other Assets), representing 0.01% of the fund’s net assets and 1.25% of Vanguard’s capitalization. The fund’s trustees and officers are also directors and officers of Vanguard.
23
Inflation-Protected Securities Fund
C. Various inputs may be used to determine the value of the fund’s investments. These inputs are summarized in three broad levels for financial statement purposes. The inputs or methodologies used to value securities are not necessarily an indication of the risk associated with investing in those securities.
Level 1—Quoted prices in active markets for identical securities.
Level 2—Other significant observable inputs (including quoted prices for similar securities, interest rates, prepayment speeds, credit risk, etc.).
Level 3—Significant unobservable inputs (including the fund’s own assumptions used to determine the fair value of investments).
The following table summarizes the market value of the fund’s investments as of December 31, 2013, based on the inputs used to value them:
| Level 1 | Level 2 | Level 3 | |
| Investments | ($000) | ($000) | ($000) |
| U.S. Government and Agency Obligations | — | 26,245,180 | — |
| Temporary Cash Investments | 237,257 | — | — |
| Futures Contracts—Assets1 | 26 | — | — |
| Futures Contracts—Liabilities1 | (466) | — | — |
| Total | 236,817 | 26,245,180 | — |
| 1 Represents variation margin on the last day of the reporting period. |
D. At December 31, 2013, the aggregate settlement value of open futures contracts and the related unrealized appreciation (depreciation) were:
| ($000) | ||||
| Aggregate | ||||
| Number of | Settlement | Unrealized | ||
| Long (Short) | Value | Appreciation | ||
| Futures Contracts | Expiration | Contracts | Long (Short) | (Depreciation) |
| 5-Year U.S. Treasury Note | March 2014 | (2,612) | (311,644) | 3 |
| Ultra Long U.S. Treasury Bond | March 2014 | 216 | 29,430 | (206) |
| (203) |
Unrealized appreciation (depreciation) on open futures contracts is required to be treated as realized gain (loss) for tax purposes.
E. Distributions are determined on a tax basis and may differ from net investment income and realized capital gains for financial reporting purposes. Differences may be permanent or temporary. Permanent differences are reclassified among capital accounts in the financial statements to reflect their tax character. Temporary differences arise when certain items of income, expense, gain, or loss are recognized in different periods for financial statement and tax purposes. These differences will reverse at some time in the future. Differences in classification may also result from the treatment of short-term gains as ordinary income for tax purposes.
24
Inflation-Protected Securities Fund
Certain of the fund’s U.S. Treasury inflation-indexed securities experienced deflation and amortization adjustments that reduced interest income and the cost of investments for financial statement purposes by an amount greater than the reduction of taxable income; the additional income reduction will be deferred for tax purposes until it is used to offset future inflation adjustments that increase taxable income. The difference becomes permanent if the securities are sold. During the year ended December 31, 2013, the fund realized gains of $109,851,000 that were included in ordinary income for tax purposes as a result of deferred deflation and amortization adjustments; accordingly, such gains have been reclassified from accumulated net realized losses to undistributed net investment income. Deferred inflation and amortization adjustments to securities held at December 31, 2013, totaling $1,924,000 are reflected as a reduction of the amount of tax-basis unrealized appreciation of investment securities.
During the year ended December 31, 2013, the fund realized $1,138,394,000 of net capital gains resulting from in-kind redemptions—in which shareholders exchanged fund shares for securities held by the fund rather than for cash. Because such gains are not taxable to the fund, and are not distributed to shareholders, they have been reclassified from accumulated net realized losses to paid-in capital.
The fund used a tax accounting practice to treat a portion of the price of capital shares redeemed during the year as distributions from realized capital gains. Accordingly, the fund has reclassified $60,915,000 from accumulated net realized losses to paid-in capital.
For tax purposes, at December 31, 2013, the fund had $116,887,000 of ordinary income available for distribution. Capital gains required to be distributed in December 2013 included gains realized through October 31, 2013; subsequently the fund realized losses of $83,183,000 which are deferred and will be treated as realized for tax purposes in 2014.
At December 31, 2013, the cost of investment securities for tax purposes was $25,960,017,000. Net unrealized appreciation of investment securities for tax purposes was $522,420,000, consisting of unrealized gains of $1,220,216,000 on securities that had risen in value since their purchase and $697,796,000 in unrealized losses on securities that had fallen in value since their purchase.
F. During the year ended December 31, 2013, the fund purchased $15,409,612,000 of investment securities and sold $29,189,804,000 of investment securities, other than temporary cash investments. Purchases and sales include $0 and $5,282,613,000, respectively, in connection with in-kind purchases and redemptions of the fund’s capital shares.
The following table summarizes the fund’s options written during the year ended December 31, 2013.
| Premiums | ||
| Number of | Received | |
| Options | Contracts | ($000) |
| Balance at December 31, 2012 | — | — |
| Options written | 18,526 | 10,438 |
| Options expired | — | — |
| Options closed | (18,526) | (10,438) |
| Options exercised | — | — |
| Options open at December 31, 2013 | — | — |
25
Inflation-Protected Securities Fund
G. Capital share transactions for each class of shares were:
| Year Ended December 31, | ||||
| 2013 | 2012 | |||
| Amount | Shares | Amount | Shares | |
| ($000) | (000) | ($000) | (000) | |
| Investor Shares | ||||
| Issued | 1,984,525 | 140,608 | 4,645,025 | 318,868 |
| Issued in Lieu of Cash Distributions | 154,507 | 11,388 | 537,023 | 36,895 |
| Redeemed | (10,601,872) | (751,523) | (4,808,479) | (328,111) |
| Net Increase (Decrease)—Investor Shares | (8,462,840) | (599,527) | 373,569 | 27,652 |
| Admiral Shares | ||||
| Issued | 3,171,043 | 115,579 | 5,069,516 | 176,097 |
| Issued in Lieu of Cash Distributions | 232,213 | 8,799 | 526,627 | 18,423 |
| Redeemed | (6,849,139) | (253,390) | (3,498,427) | (121,807) |
| Net Increase (Decrease) —Admiral Shares | (3,445,883) | (129,012) | 2,097,716 | 72,713 |
| Institutional Shares | ||||
| Issued | 2,399,444 | 216,915 | 4,072,574 | 349,474 |
| Issued in Lieu of Cash Distributions | 200,066 | 18,628 | 431,260 | 37,044 |
| Redeemed | (4,993,608) | (450,615) | (2,695,149) | (230,169) |
| Net Increase (Decrease) —Institutional Shares | (2,394,098) | (215,072) | 1,808,685 | 156,349 |
H. Management has determined that no material events or transactions occurred subsequent to December 31, 2013, that would require recognition or disclosure in these financial statements.
26
Report of Independent Registered Public Accounting Firm
To the Trustees of Vanguard Bond Index Funds and the Shareholders of Vanguard Inflation-Protected Securities Fund: In our opinion, the accompanying statement of net assets and the related statements of operations and of changes in net assets and the financial highlights present fairly, in all material respects, the financial position of Vanguard Inflation-Protected Securities Fund (constituting a separate portfolio of Vanguard Bond Index Funds, hereafter referred to as the “Fund”) at December 31, 2013, the results of its operations for the year then ended, the changes in its net assets for each of the two years in the period then ended, and the financial highlights for the five years in the period then ended, in conformity with accounting principles generally accepted in the United States of America. These financial statements and financial highlights (hereafter referred to as “financial statements”) are the responsibility of the Fund’s management; our responsibility is to express an opinion on these financial statements based on our audits. We conducted our audits of these financial statements in accordance with the standards of the Public Company Accounting Oversight Board (United States). Those standards require that we plan and perform the audit to obtain reasonable assurance about whether the financial statements are free of material misstatement. An audit includes examining, on a test basis, evidence supporting the amounts and disclosures in the financial statements, assessing the accounting principles used and significant estimates made by management, and evaluating the overall financial statement presentation. We believe that our audits, which included confirmation of securities at December 31, 2013 by correspondence with the custodian and broker and by agreement to the underlying ownership records of the transfer agent, provide a reasonable basis for our opinion.
/s/PricewaterhouseCoopers LLP
Philadelphia, Pennsylvania
February 18, 2014
Special 2013 tax information (unaudited) for Vanguard Inflation-Protected Securities Fund
This information for the fiscal year ended December 31, 2013, is included pursuant to provisions of the Internal Revenue Code.
The fund distributed $186,964,000 as capital gain dividends (from net long-term capital gains) to shareholders during the fiscal year.
For nonresident alien shareholders, 100% of short-term capital gain dividends distributed by the fund are qualified short-term capital gains.
For nonresident alien shareholders, 100% of income dividends are interest-related dividends.
27
About Your Fund’s Expenses
As a shareholder of the fund, you incur ongoing costs, which include costs for portfolio management, administrative services, and shareholder reports (like this one), among others. Operating expenses, which are deducted from a fund’s gross income, directly reduce the investment return of the fund.
A fund’s expenses are expressed as a percentage of its average net assets. This figure is known as the expense ratio. The following examples are intended to help you understand the ongoing costs (in dollars) of investing in your fund and to compare these costs with those of other mutual funds. The examples are based on an investment of $1,000 made at the beginning of the period shown and held for the entire period.
The accompanying table illustrates your fund’s costs in two ways:
• Based on actual fund return. This section helps you to estimate the actual expenses that you paid over the period. The ”Ending Account Value“ shown is derived from the fund‘s actual return, and the third column shows the dollar amount that would have been paid by an investor who started with $1,000 in the fund. You may use the information here, together with the amount you invested, to estimate the expenses that you paid over the period.
To do so, simply divide your account value by $1,000 (for example, an $8,600 account value divided by $1,000 = 8.6), then multiply the result by the number given for your fund under the heading ”Expenses Paid During Period.“
• Based on hypothetical 5% yearly return. This section is intended to help you compare your fund‘s costs with those of other mutual funds. It assumes that the fund had a yearly return of 5% before expenses, but that the expense ratio is unchanged. In this case—because the return used is not the fund’s actual return—the results do not apply to your investment. The example is useful in making comparisons because the Securities and Exchange Commission requires all mutual funds to calculate expenses based on a 5% return. You can assess your fund’s costs by comparing this hypothetical example with the hypothetical examples that appear in shareholder reports of other funds.
Note that the expenses shown in the table are meant to highlight and help you compare ongoing costs only and do not reflect transaction costs incurred by the fund for buying and selling securities. Further, the expenses do not include any purchase, redemption, or account service fees described in the fund prospectus. If such fees were applied to your account, your costs would be higher. Your fund does not carry a “sales load.”
The calculations assume no shares were bought or sold during the period. Your actual costs may have been higher or lower, depending on the amount of your investment and the timing of any purchases or redemptions.
You can find more information about the fund’s expenses, including annual expense ratios, in the Financial Statements section of this report. For additional information on operating expenses and other shareholder costs, please refer to your fund’s current prospectus.
28
| Six Months Ended December 31, 2013 | |||
| Beginning | Ending | Expenses | |
| Account Value | Account Value | Paid During | |
| Inflation-Protected Securities Fund | 6/30/2013 | 12/31/2013 | Period |
| Based on Actual Fund Return | |||
| Investor Shares | $1,000.00 | $986.30 | $1.00 |
| Admiral Shares | 1,000.00 | 986.72 | 0.50 |
| Institutional Shares | 1,000.00 | 986.45 | 0.35 |
| Based on Hypothetical 5% Yearly Return | |||
| Investor Shares | $1,000.00 | $1,024.20 | $1.02 |
| Admiral Shares | 1,000.00 | 1,024.70 | 0.51 |
| Institutional Shares | 1,000.00 | 1,024.85 | 0.36 |
The calculations are based on expenses incurred in the most recent six-month period. The fund’s annualized six-month expense ratios for that period are 0.20% for Investor Shares, 0.10% for Admiral Shares, and 0.07% for Institutional Shares. The dollar amounts shown as “Expenses Paid” are equal to the annualized expense ratio multiplied by the average account value over the period, multiplied by the number of days in the most recent six-month period, then divided by the number of days in the most recent 12-month period.
29
Glossary
30-Day SEC Yield. A fund’s 30-day SEC yield is derived using a formula specified by the U.S. Securities and Exchange Commission. Under the formula, data related to the fund’s security holdings in the previous 30 days are used to calculate the fund’s hypothetical net income for that period, which is then annualized and divided by the fund’s estimated average net assets over the calculation period. For the purposes of this calculation, a security’s income is based on its current market yield to maturity (for bonds), its actual income (for asset-backed securities), or its projected dividend yield (for stocks). Because the SEC yield represents hypothetical annualized income, it will differ—at times significantly—from the fund’s actual experience. As a result, the fund’s income distributions may be higher or lower than implied by the SEC yield.
Average Coupon. The average interest rate paid on the fixed income securities held by a fund. It is expressed as a percentage of face value.
Average Duration. An estimate of how much the value of the fund’s bonds will fluctuate in response to a change in “real” interest rates—meaning rates without inflation expectations built in. Real interest rates are reflected in market yields for inflation-adjusted securities. To see how the fund’s bond values could change, multiply the average duration by the change in real rates. For example, if the average duration were five years, then the value of the fund’s bonds would decline by about 5% if real interest rates rose by 1 percentage point. Conversely, if real rates fell by a percentage point, the value of the bonds would rise about 5%.
Average Effective Maturity. The average length of time until fixed income securities held by a fund reach maturity and are repaid, taking into consideration the possibility that the issuer may call the bond before its maturity date. The figure reflects the proportion of fund assets represented by each security; it also reflects any futures contracts held. In general, the longer the average effective maturity, the more a fund’s share price will fluctuate in response to changes in market interest rates.
Beta. A measure of the magnitude of a fund’s past share-price fluctuations in relation to the ups and downs of a given market index. The index is assigned a beta of 1.00. Compared with a given index, a fund with a beta of 1.20 typically would have seen its share price rise or fall by 12% when the index rose or fell by 10%. For this report, beta is based on returns over the past 36 months for both the fund and the index. Note that a fund’s beta should be reviewed in conjunction with its R-squared (see definition). The lower the R-squared, the less correlation there is between the fund and the index, and the less reliable beta is as an indicator of volatility.
Credit Quality. Credit-quality ratings are measured on a scale that generally ranges from AAA (highest) to D (lowest). “Not Rated” is used to classify securities for which a rating is not available. U.S. Treasury, U.S. Agency, and U.S. Agency mortgage-backed securities appear under “U.S. Government.” For this report, credit-quality ratings are obtained from Moody’s and S&P, and the higher rating for each issue is used.
Expense Ratio. A fund’s total annual operating expenses expressed as a percentage of the fund’s average net assets. The expense ratio includes management and administrative expenses, but does not include the transaction costs of buying and selling portfolio securities.
30
Inception Date. The date on which the assets of a fund (or one of its share classes) are first invested in accordance with the fund’s investment objective. For funds with a subscription period, the inception date is the day after that period ends. Investment performance is measured from the inception date.
R-Squared. A measure of how much of a fund’s past returns can be explained by the returns from the market in general, as measured by a given index. If a fund’s total returns were precisely synchronized with an index’s returns, its R-squared would be 1.00. If the fund’s returns bore no relationship to the index’s returns, its R-squared would be 0. For this report, R-squared is based on returns over the past 36 months for both the fund and the index.
Short-Term Reserves. The percentage of a fund invested in highly liquid, short-term securities that can be readily converted to cash.
Yield to Maturity. This term generally refers to the rate of return an investor would receive if the fixed income securities held by a fund were held to their maturity dates. For the Inflation-Protected Securities Fund, the calculation is modified by adding in the inflation adjustment made over the past 12 months. This change results in a figure more directly comparable to the yield-to-maturity figures for other types of bond funds. (An unmodified yield to maturity is used in calculating the fund’s 30-Day SEC Yield.)
31
The People Who Govern Your Fund
The trustees of your mutual fund are there to see that the fund is operated and managed in your best interests since, as a shareholder, you are a part owner of the fund. Your fund’s trustees also serve on the board of directors of The Vanguard Group, Inc., which is owned by the Vanguard funds and provides services to them on an at-cost basis.
A majority of Vanguard’s board members are independent, meaning that they have no affiliation with Vanguard or the funds they oversee, apart from the sizable personal investments they have made as private individuals. The independent board members have distinguished backgrounds in business, academia, and public service. Each of the trustees and executive officers oversees 182 Vanguard funds.
The following table provides information for each trustee and executive officer of the fund. More information about the trustees is in the Statement of Additional Information, which can be obtained, without charge, by contacting Vanguard at 800-662-7447, or online at vanguard.com.
| InterestedTrustee1 | and Delphi Automotive LLP (automotive components); |
| Senior Advisor at New Mountain Capital; Trustee of | |
| F. William McNabb III | The Conference Board. |
| Born 1957. Trustee Since July 2009. Chairman of the | |
| Board. Principal Occupation(s) During the Past Five | Amy Gutmann |
| Years: Chairman of the Board of The Vanguard Group, | Born 1949. Trustee Since June 2006. Principal |
| Inc., and of each of the investment companies served | Occupation(s) During the Past Five Years: President |
| by The Vanguard Group, since January 2010; Director | of the University of Pennsylvania; Christopher H. |
| of The Vanguard Group since 2008; Chief Executive | Browne Distinguished Professor of Political Science |
| Officer and President of The Vanguard Group and of | in the School of Arts and Sciences with secondary |
| each of the investment companies served by The | appointments at the Annenberg School for |
| Vanguard Group since 2008; Director of Vanguard | Communication and the Graduate School of Education |
| Marketing Corporation; Managing Director of The | of the University of Pennsylvania; Member of the |
| Vanguard Group (1995–2008). | National Commission on the Humanities and Social |
| Sciences; Trustee of Carnegie Corporation of New | |
| IndependentTrustees | York and of the National Constitution Center; Chair |
| of the U.S. Presidential Commission for the Study | |
| Emerson U. Fullwood | of Bioethical Issues. |
| Born 1948. Trustee Since January 2008. Principal | |
| Occupation(s) During the Past Five Years: Executive | JoAnn Heffernan Heisen |
| Chief Staff and Marketing Officer for North America | Born 1950. Trustee Since July 1998. Principal |
| and Corporate Vice President (retired 2008) of Xerox | Occupation(s) During the Past Five Years: Corporate |
| Corporation (document management products and | Vice President and Chief Global Diversity Officer |
| services); Executive in Residence and 2010 | (retired 2008) and Member of the Executive |
| Distinguished Minett Professor at the Rochester | Committee (1997–2008) of Johnson & Johnson |
| Institute of Technology; Director of SPX Corporation | (pharmaceuticals/medical devices/consumer |
| (multi-industry manufacturing), the United Way of | products); Director of Skytop Lodge Corporation |
| Rochester, Amerigroup Corporation (managed health | (hotels), the University Medical Center at Princeton, |
| care), the University of Rochester Medical Center, | the Robert Wood Johnson Foundation, and the Center |
| Monroe Community College Foundation, and North | for Talent Innovation; Member of the Advisory Board |
| Carolina A&T University. | of the Maxwell School of Citizenship and Public Affairs |
| at Syracuse University. | |
| Rajiv L. Gupta | F. Joseph Loughrey |
| Born 1945. Trustee Since December 2001.2 | Born 1949. Trustee Since October 2009. Principal |
| Principal Occupation(s) During the Past Five Years: | Occupation(s) During the Past Five Years: President |
| Chairman and Chief Executive Officer (retired 2009) | and Chief Operating Officer (retired 2009) of Cummins |
| and President (2006–2008) of Rohm and Haas Co. | Inc. (industrial machinery); Chairman of the Board of |
| (chemicals); Director of Tyco International, Ltd. | Hillenbrand, Inc. (specialized consumer services) and |
| (diversified manufacturing and services), Hewlett- | of Oxfam America; Director of SKF AB (industrial |
| Packard Co. (electronic computer manufacturing), | |
| machinery), Hyster-Yale Materials Handling, Inc. | Executive Officers | |
| (forklift trucks), and the Lumina Foundation for | ||
| Education; Member of the Advisory Council for the | Glenn Booraem | |
| College of Arts and Letters and of the Advisory Board | Born 1967. Controller Since July 2010. Principal | |
| to the Kellogg Institute for International Studies, both | Occupation(s) During the Past Five Years: Principal | |
| at the University of Notre Dame. | of The Vanguard Group, Inc.; Controller of each of | |
| the investment companies served by The Vanguard | ||
| Mark Loughridge | Group; Assistant Controller of each of the investment | |
| Born 1953. Trustee Since March 2012. Principal | companies served by The Vanguard Group (2001–2010). | |
| Occupation(s) During the Past Five Years: Senior Vice | ||
| President and Chief Financial Officer at IBM (information | Thomas J. Higgins | |
| technology services); Fiduciary Member of IBM’s | Born 1957. Chief Financial Officer Since September | |
| Retirement Plan Committee. | 2008. Principal Occupation(s) During the Past Five | |
| Years: Principal of The Vanguard Group, Inc.; Chief | ||
| Scott C. Malpass | Financial Officer of each of the investment companies | |
| Born 1962. Trustee Since March 2012. Principal | served by The Vanguard Group; Treasurer of each of | |
| Occupation(s) During the Past Five Years: Chief | the investment companies served by The Vanguard | |
| Investment Officer and Vice President at the University | Group (1998–2008). | |
| of Notre Dame; Assistant Professor of Finance at the | ||
| Mendoza College of Business at Notre Dame; Member | Kathryn J. Hyatt | |
| of the Notre Dame 403(b) Investment Committee; | Born 1955. Treasurer Since November 2008. Principal | |
| Director of TIFF Advisory Services, Inc. (investment | Occupation(s) During the Past Five Years: Principal of | |
| advisor); Member of the Investment Advisory | The Vanguard Group, Inc.; Treasurer of each of the | |
| Committees of the Financial Industry Regulatory | investment companies served by The Vanguard | |
| Authority (FINRA) and of Major League Baseball. | Group; Assistant Treasurer of each of the investment | |
| companies served by The Vanguard Group (1988–2008). | ||
| André F. Perold | ||
| Born 1952. Trustee Since December 2004. Principal | Heidi Stam | |
| Occupation(s) During the Past Five Years: George | Born 1956. Secretary Since July 2005. Principal | |
| Gund Professor of Finance and Banking at the Harvard | Occupation(s) During the Past Five Years: Managing | |
| Business School (retired 2011); Chief Investment | Director of The Vanguard Group, Inc.; General Counsel | |
| Officer and Managing Partner of HighVista Strategies | of The Vanguard Group; Secretary of The Vanguard | |
| LLC (private investment firm); Director of Rand | Group and of each of the investment companies | |
| Merchant Bank; Overseer of the Museum of Fine | served by The Vanguard Group; Director and Senior | |
| Arts Boston. | Vice President of Vanguard Marketing Corporation. | |
| Alfred M. Rankin, Jr. | Vanguard Senior ManagementTeam | |
| Born 1941. Trustee Since January 1993. Principal | ||
| Occupation(s) During the Past Five Years: Chairman, | Mortimer J. Buckley | Chris D. McIsaac |
| President, and Chief Executive Officer of NACCO | Kathleen C. Gubanich | Michael S. Miller |
| Industries, Inc. (housewares/lignite) and of Hyster-Yale | Paul A. Heller | James M. Norris |
| Materials Handling, Inc. (forklift trucks); Director of | Martha G. King | Glenn W. Reed |
| the National Association of Manufacturers; Chairman | John T. Marcante | |
| of the Board of University Hospitals of Cleveland; | ||
| Advisory Chairman of the Board of The Cleveland | ||
| Museum of Art. | Chairman Emeritus and Senior Advisor | |
| John J. Brennan | ||
| Peter F. Volanakis | Chairman, 1996–2009 | |
| Born 1955. Trustee Since July 2009. Principal | Chief Executive Officer and President, 1996–2008 | |
| Occupation(s) During the Past Five Years: President | ||
| and Chief Operating Officer (retired 2010) of Corning | Founder | |
| Incorporated (communications equipment); Director | ||
| of SPX Corporation (multi-industry manufacturing); | John C. Bogle | |
| Overseer of the Amos Tuck School of Business | Chairman and Chief Executive Officer, 1974–1996 | |
| Administration at Dartmouth College; Advisor to the | ||
| Norris Cotton Cancer Center. | ||
1 Mr. McNabb is considered an “interested person,” as defined in the Investment Company Act of 1940, because he is an officer of the Vanguard funds.
2 December 2002 for Vanguard Equity Income Fund, Vanguard Growth Equity Fund, the Vanguard Municipal Bond Funds, and the Vanguard State Tax-Exempt Funds.
 | |
| P.O. Box 2600 | |
| Valley Forge, PA 19482-2600 | |
Connect with Vanguard® > vanguard.com | |
Fund Information > 800-662-7447 | |
© 2014 The Vanguard Group, Inc. |
Item 2: Code of Ethics. The Registrant has adopted a code of ethics that applies to the Registrant’s principal
executive officer, principal financial officer, principal accounting officer or controller or persons performing similar
functions. The Code of Ethics was amended during the reporting period covered by this report to make certain
technical, non-material changes.
Item 3: Audit Committee Financial Expert. The following members of the Audit Committee have been determined by
the Registrant’s Board of Trustees to be Audit Committee Financial Experts serving on its Audit Committee, and to be
independent: Rajiv L. Gupta, Amy Gutmann, JoAnn Heffernan Heisen, F. Joseph Loughrey, Mark Loughridge, Scott
C. Malpass, André F. Perold, and Alfred M. Rankin, Jr.
Item 4: Principal Accountant Fees and Services.
(a) Audit Fees.
Audit Fees of the Registrant
Fiscal Year Ended December 31, 2013: $239,000
Fiscal Year Ended December 31, 2012: $237,000
Aggregate Audit Fees of Registered Investment Companies in the Vanguard Group.
Fiscal Year Ended December 31, 2013: $5,714,113
Fiscal Year Ended December 31, 2012: $4,809,780
Includes fees billed in connection with audits of the Registrant and other registered investment companies in
the Vanguard complex. Also includes fees billed in connection with audits of The Vanguard Group, Inc. and
Vanguard Marketing Corporation for Fiscal Year Ended December 31, 2013.
(b) Audit-Related Fees.
Fiscal Year Ended December 31, 2013: $1,552,950
Fiscal Year Ended December 31, 2012: $1,812,565
Includes fees billed in connection with assurance and related services provided to the Registrant, other
registered investment companies in the Vanguard complex, The Vanguard Group, Inc., and Vanguard
Marketing Corporation.
(c) Tax Fees.
Fiscal Year Ended December 31, 2013: $110,000
Fiscal Year Ended December 31, 2012: $490,518
Includes fees billed in connection with tax compliance, planning, and advice services provided to the
Registrant, other registered investment companies in the Vanguard complex, The Vanguard Group, Inc., and
Vanguard Marketing Corporation. Also includes fees billed in connection with certain tax services related to
audits of the Registrant and other registered investment companies in the Vanguard complex for Fiscal Year
Ended December 31, 2012.
(d) All Other Fees.
Fiscal Year Ended December 31, 2013: $132,000
Fiscal Year Ended December 31, 2012: $16,000
Includes fees billed for services related to tax reported information provided to the Registrant, other registered
investment companies in the Vanguard complex, The Vanguard Group, Inc., and Vanguard Marketing
Corporation.
(e) (1) Pre-Approval Policies. The policy of the Registrant’s Audit Committee is to consider and, if
appropriate, approve before the principal accountant is engaged for such services, all specific audit and non-
audit services provided to: the Registrant, other registered investment companies in the Vanguard complex,
The Vanguard Group, Inc., and entities controlled by The Vanguard Group, Inc. that provide ongoing services
to the Registrant. In making a determination, the Audit Committee considers whether the services are
consistent with maintaining the principal accountant’s independence.
In the event of a contingency situation in which the principal accountant is needed to provide services in
between scheduled Audit Committee meetings, the Chairman of the Audit Committee would be called on to
consider and, if appropriate, pre-approve audit or permitted non-audit services in an amount sufficient to
complete services through the next Audit Committee meeting, and to determine if such services would be
consistent with maintaining the accountant’s independence. At the next scheduled Audit Committee meeting,
services and fees would be presented to the Audit Committee for formal consideration, and, if appropriate,
approval by the entire Audit Committee. The Audit Committee would again consider whether such services and
fees are consistent with maintaining the principal accountant’s independence.
The Registrant’s Audit Committee is informed at least annually of all audit and non-audit services provided
by the principal accountant to the Vanguard complex, whether such services are provided to: the Registrant,
other registered investment companies in the Vanguard complex, The Vanguard Group, Inc., or other entities
controlled by The Vanguard Group, Inc. that provide ongoing services to the Registrant.
(2) No percentage of the principal accountant’s fees or services were approved pursuant to the waiver
provision of paragraph (c)(7)(i)(C) of Rule 2-01 of Regulation S-X.
(f) For the most recent fiscal year, over 50% of the hours worked under the principal accountant’s
engagement were not performed by persons other than full-time, permanent employees of the principal
accountant.
(g) Aggregate Non-Audit Fees.
Fiscal Year Ended December 31, 2013: $242,000
Fiscal Year Ended December 31, 2012: $506,518
Includes fees billed for non-audit services provided to the Registrant, other registered investment companies in
the Vanguard complex, The Vanguard Group, Inc., and Vanguard Marketing Corporation.
(h) For the most recent fiscal year, the Audit Committee has determined that the provision of all non-audit
services was consistent with maintaining the principal accountant’s independence.
Item 5: Audit Committee of Listed Registrants.
The Registrant is a listed issuer as defined in rule 10A-3 under the Securities Exchange Act of 1934 (“Exchange Act”).
The Registrant has a separately-designated standing audit committee established in accordance with Section
3(a)(58)(A) of the Exchange Act. The Registrant’s audit committee members are: Emerson U. Fullwood, Rajiv L.
Gupta, Amy Gutmann, JoAnn Heffernan Heisen, F. Joseph Loughrey, Mark Loughridge, Scott C. Malpass, André F.
Perold, Alfred M. Rankin, Jr., and Peter F. Volanakis.
Item 6: Investments.
Report of Independent Registered Public Accounting Firm
To the Trustees of Vanguard Bond Index Funds and the Shareholders of Vanguard Short-Term Bond Index Fund, Vanguard Intermediate-Term Bond Index Fund and Vanguard Long-Term Bond Index Fund:
We have audited, in accordance with the standards of the Public Company Accounting Oversight Board (United States), the financial statements of Vanguard Short-Term Bond Index Fund, Vanguard Intermediate-Term Bond Index Fund and Vanguard Long-Term Bond Index Fund (constituting separate portfolios of Vanguard Bond Index Funds, hereafter referred to as the “Funds”) as of December 31, 2013 and for the year then ended and have issued our unqualified report thereon dated February 14, 2014 (which report and financial statements are included in Item 1 of this Certified Shareholder Report on Form N-CSR). Our audits included audits of the Funds' schedules of investments as of December 31, 2013 appearing in Item 6 of this Form N-CSR. These schedules of investments are the responsibility of the Funds' management. Our responsibility is to express an opinion on the schedules of investments based on our audits.
In our opinion, the schedules of investments referred to above, when read in conjunction with the financial statements of the Funds referred to above, present fairly, in all material respects, the information set forth therein.

February 14, 2014
PricewaterhouseCoopers LLP, Two Commerce Square, 2001 Market Street, Suite 1700, Philadelphia, PA 19103-7042
T: (267) 330-3000, F: (267) 330-3300, www.pwc.com/us
Vanguard® Short-Term Bond Index Fund
Schedule of Investments
December 31, 2013
| Face | Market | |||
| Maturity | Amount | Value | ||
| Coupon | Date | ($000) | ($000) | |
| U.S. Government and Agency Obligations (69.3%) | ||||
| U.S. Government Securities (62.2%) | ||||
| United States Treasury Note/Bond | 0.250% | 11/30/14 | 207,280 | 207,475 |
| United States Treasury Note/Bond | 2.125% | 11/30/14 | 289,315 | 294,424 |
| United States Treasury Note/Bond | 0.125% | 12/31/14 | 247,670 | 247,593 |
| United States Treasury Note/Bond | 2.625% | 12/31/14 | 42,705 | 43,739 |
| United States Treasury Note/Bond | 0.250% | 1/15/15 | 13,075 | 13,085 |
| United States Treasury Note/Bond | 0.250% | 1/31/15 | 241,525 | 241,713 |
| United States Treasury Note/Bond | 2.250% | 1/31/15 | 418,930 | 428,289 |
| United States Treasury Note/Bond | 0.250% | 2/15/15 | 14,116 | 14,127 |
| United States Treasury Note/Bond | 4.000% | 2/15/15 | 39,505 | 41,178 |
| United States Treasury Note/Bond | 11.250% | 2/15/15 | 40,292 | 45,253 |
| United States Treasury Note/Bond | 0.250% | 2/28/15 | 824,873 | 825,384 |
| United States Treasury Note/Bond | 2.375% | 2/28/15 | 248,322 | 254,530 |
| United States Treasury Note/Bond | 0.375% | 3/15/15 | 108,690 | 108,911 |
| United States Treasury Note/Bond | 0.250% | 3/31/15 | 1,530 | 1,531 |
| United States Treasury Note/Bond | 2.500% | 3/31/15 | 383,208 | 394,045 |
| United States Treasury Note/Bond | 0.375% | 4/15/15 | 234,910 | 235,460 |
| United States Treasury Note/Bond | 0.125% | 4/30/15 | 138,220 | 138,047 |
| United States Treasury Note/Bond | 2.500% | 4/30/15 | 161,927 | 166,811 |
| United States Treasury Note/Bond | 0.250% | 5/15/15 | 168,440 | 168,544 |
| United States Treasury Note/Bond | 4.125% | 5/15/15 | 46,325 | 48,786 |
| United States Treasury Note/Bond | 0.250% | 5/31/15 | 98,475 | 98,521 |
| United States Treasury Note/Bond | 2.125% | 5/31/15 | 93,740 | 96,230 |
| United States Treasury Note/Bond | 0.375% | 6/15/15 | 10,345 | 10,366 |
| United States Treasury Note/Bond | 0.375% | 6/30/15 | 60,075 | 60,197 |
| United States Treasury Note/Bond | 1.875% | 6/30/15 | 80,313 | 82,258 |
| United States Treasury Note/Bond | 0.250% | 7/15/15 | 18,950 | 18,950 |
| United States Treasury Note/Bond | 0.250% | 7/31/15 | 81,325 | 81,312 |
| United States Treasury Note/Bond | 1.750% | 7/31/15 | 154,035 | 157,621 |
| United States Treasury Note/Bond | 0.250% | 8/15/15 | 210,505 | 210,440 |
| United States Treasury Note/Bond | 4.250% | 8/15/15 | 82,620 | 87,900 |
| United States Treasury Note/Bond | 0.375% | 8/31/15 | 143,125 | 143,348 |
| United States Treasury Note/Bond | 1.250% | 8/31/15 | 70,163 | 71,281 |
| United States Treasury Note/Bond | 0.250% | 9/15/15 | 2,050 | 2,048 |
| United States Treasury Note/Bond | 1.250% | 9/30/15 | 88,454 | 89,891 |
| United States Treasury Note/Bond | 0.250% | 10/15/15 | 135,710 | 135,519 |
| United States Treasury Note/Bond | 1.250% | 10/31/15 | 294,925 | 299,809 |
| United States Treasury Note/Bond | 0.375% | 11/15/15 | 394,130 | 394,374 |
| United States Treasury Note/Bond | 4.500% | 11/15/15 | 24,170 | 26,039 |
| United States Treasury Note/Bond | 0.250% | 11/30/15 | 10,000 | 9,980 |
| United States Treasury Note/Bond | 1.375% | 11/30/15 | 313,435 | 319,509 |
| United States Treasury Note/Bond | 0.250% | 12/15/15 | 259,995 | 259,426 |
| United States Treasury Note/Bond | 2.125% | 12/31/15 | 502,805 | 520,011 |
| United States Treasury Note/Bond | 0.375% | 1/15/16 | 129,999 | 129,959 |
| United States Treasury Note/Bond | 2.000% | 1/31/16 | 235,350 | 243,072 |
| United States Treasury Note/Bond | 0.375% | 2/15/16 | 147,825 | 147,686 |
| United States Treasury Note/Bond | 4.500% | 2/15/16 | 321,738 | 349,539 |
| United States Treasury Note/Bond | 2.125% | 2/29/16 | 173,480 | 179,796 |
| United States Treasury Note/Bond | 2.625% | 2/29/16 | 20,360 | 21,327 |
| United States Treasury Note/Bond | 0.375% | 3/15/16 | 148,800 | 148,568 |
| United States Treasury Note/Bond | 2.250% | 3/31/16 | 6,900 | 7,174 |
| United States Treasury Note/Bond | 2.375% | 3/31/16 | 228,047 | 237,846 |
| United States Treasury Note/Bond | 0.250% | 4/15/16 | 251,490 | 250,155 |
| United States Treasury Note/Bond | 2.000% | 4/30/16 | 213,315 | 220,649 |
| United States Treasury Note/Bond | 2.625% | 4/30/16 | 55,760 | 58,496 |
| United States Treasury Note/Bond | 0.250% | 5/15/16 | 332,935 | 330,854 |
| United States Treasury Note/Bond | 5.125% | 5/15/16 | 256,630 | 284,377 |
| United States Treasury Note/Bond | 1.750% | 5/31/16 | 363,300 | 373,745 |
| United States Treasury Note/Bond | 3.250% | 5/31/16 | 198,630 | 211,479 |
| United States Treasury Note/Bond | 0.500% | 6/15/16 | 162,495 | 162,318 |
| United States Treasury Note/Bond | 1.500% | 6/30/16 | 102,816 | 105,178 |
| United States Treasury Note/Bond | 3.250% | 6/30/16 | 4,795 | 5,116 |
1
| Vanguard® Short-Term Bond Index Fund | ||||
| Schedule of Investments | ||||
| December 31, 2013 | ||||
| Face | Market | |||
| Maturity | Amount | Value | ||
| Coupon | Date | ($000) | ($000) | |
| United States Treasury Note/Bond | 0.625% | 7/15/16 | 271,475 | 271,814 |
| United States Treasury Note/Bond | 1.500% | 7/31/16 | 146,825 | 150,174 |
| United States Treasury Note/Bond | 0.625% | 8/15/16 | 333,625 | 333,625 |
| United States Treasury Note/Bond | 4.875% | 8/15/16 | 63,200 | 70,211 |
| United States Treasury Note/Bond | 1.000% | 8/31/16 | 177,680 | 179,318 |
| United States Treasury Note/Bond | 3.000% | 8/31/16 | 73,175 | 77,726 |
| United States Treasury Note/Bond | 0.875% | 9/15/16 | 294,235 | 295,936 |
| United States Treasury Note/Bond | 1.000% | 9/30/16 | 365,305 | 368,388 |
| United States Treasury Note/Bond | 3.000% | 9/30/16 | 1,190 | 1,265 |
| United States Treasury Note/Bond | 0.625% | 10/15/16 | 440,900 | 440,071 |
| United States Treasury Note/Bond | 1.000% | 10/31/16 | 262,873 | 264,845 |
| United States Treasury Note/Bond | 0.625% | 11/15/16 | 539,225 | 537,543 |
| United States Treasury Note/Bond | 4.625% | 11/15/16 | 1,070 | 1,188 |
| United States Treasury Note/Bond | 0.875% | 11/30/16 | 177,422 | 177,976 |
| United States Treasury Note/Bond | 0.625% | 12/15/16 | 341,325 | 339,939 |
| United States Treasury Note/Bond | 0.875% | 12/31/16 | 216,791 | 217,266 |
| United States Treasury Note/Bond | 0.875% | 1/31/17 | 48,120 | 48,165 |
| United States Treasury Note/Bond | 0.875% | 2/28/17 | 242,840 | 242,765 |
| United States Treasury Note/Bond | 1.000% | 3/31/17 | 258,640 | 259,206 |
| United States Treasury Note/Bond | 3.250% | 3/31/17 | 1,830 | 1,966 |
| United States Treasury Note/Bond | 0.875% | 4/30/17 | 380,374 | 379,187 |
| United States Treasury Note/Bond | 0.625% | 5/31/17 | 333,840 | 329,460 |
| United States Treasury Note/Bond | 0.750% | 6/30/17 | 304,565 | 301,330 |
| United States Treasury Note/Bond | 0.500% | 7/31/17 | 273,240 | 267,433 |
| United States Treasury Note/Bond | 2.375% | 7/31/17 | 60,340 | 63,037 |
| United States Treasury Note/Bond | 0.625% | 8/31/17 | 358,101 | 351,387 |
| United States Treasury Note/Bond | 0.625% | 9/30/17 | 434,350 | 425,255 |
| United States Treasury Note/Bond | 0.750% | 10/31/17 | 191,684 | 188,149 |
| United States Treasury Note/Bond | 1.875% | 10/31/17 | 14,400 | 14,758 |
| United States Treasury Note/Bond | 0.625% | 11/30/17 | 241,125 | 235,022 |
| United States Treasury Note/Bond | 0.750% | 12/31/17 | 223,235 | 218,212 |
| United States Treasury Note/Bond | 2.750% | 12/31/17 | 101,845 | 107,605 |
| United States Treasury Note/Bond | 0.875% | 1/31/18 | 170,530 | 167,225 |
| United States Treasury Note/Bond | 0.750% | 2/28/18 | 290,115 | 282,410 |
| United States Treasury Note/Bond | 0.750% | 3/31/18 | 330,380 | 320,882 |
| United States Treasury Note/Bond | 0.625% | 4/30/18 | 223,730 | 215,689 |
| United States Treasury Note/Bond | 9.125% | 5/15/18 | 900 | 1,193 |
| United States Treasury Note/Bond | 1.000% | 5/31/18 | 325,427 | 318,258 |
| United States Treasury Note/Bond | 1.375% | 6/30/18 | 307,450 | 305,049 |
| United States Treasury Note/Bond | 1.375% | 7/31/18 | 218,985 | 216,931 |
| United States Treasury Note/Bond | 1.500% | 8/31/18 | 283,545 | 282,039 |
| United States Treasury Note/Bond | 1.375% | 9/30/18 | 395,935 | 390,922 |
| United States Treasury Note/Bond | 1.250% | 10/31/18 | 161,150 | 157,927 |
| United States Treasury Note/Bond | 1.250% | 11/30/18 | 522,149 | 510,724 |
| United States Treasury Note/Bond | 1.500% | 12/31/18 | 365,250 | 361,028 |
| 21,251,788 | ||||
| Agency Bonds and Notes (7.1%) | ||||
| 1 Federal Agricultural Mortgage Corp. | 2.125% | 9/15/15 | 1,925 | 1,980 |
| 1 Federal Agricultural Mortgage Corp. | 2.000% | 7/27/16 | 2,250 | 2,319 |
| 1 Federal Farm Credit Banks | 0.270% | 2/24/15 | 1,800 | 1,799 |
| 1 Federal Farm Credit Banks | 0.500% | 6/23/15 | 4,500 | 4,510 |
| 1 Federal Farm Credit Banks | 1.500% | 11/16/15 | 4,500 | 4,588 |
| 1 Federal Farm Credit Banks | 4.875% | 12/16/15 | 13,730 | 14,925 |
| 1 Federal Farm Credit Banks | 1.050% | 3/28/16 | 3,525 | 3,562 |
| 1 Federal Farm Credit Banks | 5.125% | 8/25/16 | 14,700 | 16,401 |
| 1 Federal Farm Credit Banks | 4.875% | 1/17/17 | 1,400 | 1,567 |
| 1 Federal Home Loan Banks | 0.250% | 1/16/15 | 32,265 | 32,284 |
| 1 Federal Home Loan Banks | 0.250% | 2/20/15 | 58,775 | 58,741 |
| 1 Federal Home Loan Banks | 0.375% | 8/28/15 | 60,000 | 60,013 |
| 1 Federal Home Loan Banks | 1.750% | 9/11/15 | 30,000 | 30,661 |
| 1 Federal Home Loan Banks | 0.500% | 11/20/15 | 47,360 | 47,421 |
| 1 Federal Home Loan Banks | 3.125% | 3/11/16 | 2,650 | 2,798 |
| 1 Federal Home Loan Banks | 5.375% | 5/18/16 | 1,920 | 2,138 |
| 1 Federal Home Loan Banks | 5.625% | 6/13/16 | 4,325 | 4,800 |
2
| Vanguard® Short-Term Bond Index Fund | ||||
| Schedule of Investments | ||||
| December 31, 2013 | ||||
| Face | Market | |||
| Maturity | Amount | Value | ||
| Coupon | Date | ($000) | ($000) | |
| 1 Federal Home Loan Banks | 0.375% | 6/24/16 | 47,000 | 46,666 |
| 1 Federal Home Loan Banks | 4.750% | 12/16/16 | 17,420 | 19,429 |
| 1 Federal Home Loan Banks | 0.625% | 12/28/16 | 61,550 | 61,224 |
| 1 Federal Home Loan Banks | 4.875% | 5/17/17 | 29,920 | 33,764 |
| 1 Federal Home Loan Banks | 1.000% | 6/21/17 | 42,325 | 42,261 |
| 1 Federal Home Loan Banks | 2.750% | 6/8/18 | 15,675 | 16,373 |
| 1 Federal Home Loan Banks | 5.375% | 8/15/18 | 14,025 | 16,195 |
| 2 Federal Home Loan Mortgage Corp. | 2.875% | 2/9/15 | 59,475 | 61,225 |
| 2 Federal Home Loan Mortgage Corp. | 0.500% | 4/17/15 | 112,250 | 112,565 |
| 2 Federal Home Loan Mortgage Corp. | 4.375% | 7/17/15 | 21,305 | 22,622 |
| 2 Federal Home Loan Mortgage Corp. | 1.750% | 9/10/15 | 86,025 | 88,004 |
| 2 Federal Home Loan Mortgage Corp. | 5.250% | 4/18/16 | 16,500 | 18,269 |
| 2 Federal Home Loan Mortgage Corp. | 0.500% | 5/13/16 | 15,000 | 14,992 |
| 2 Federal Home Loan Mortgage Corp. | 2.500% | 5/27/16 | 20,420 | 21,373 |
| 2 Federal Home Loan Mortgage Corp. | 5.500% | 7/18/16 | 25,000 | 28,059 |
| 2 Federal Home Loan Mortgage Corp. | 2.000% | 8/25/16 | 69,425 | 71,817 |
| 2 Federal Home Loan Mortgage Corp. | 0.875% | 10/14/16 | 42,000 | 42,128 |
| 2 Federal Home Loan Mortgage Corp. | 1.000% | 3/8/17 | 12,925 | 12,956 |
| 2 Federal Home Loan Mortgage Corp. | 1.250% | 5/12/17 | 40,710 | 41,012 |
| 2 Federal Home Loan Mortgage Corp. | 1.000% | 6/29/17 | 22,375 | 22,295 |
| 2 Federal Home Loan Mortgage Corp. | 1.000% | 7/28/17 | 47,560 | 47,320 |
| 2 Federal Home Loan Mortgage Corp. | 5.500% | 8/23/17 | 1,630 | 1,881 |
| 2 Federal Home Loan Mortgage Corp. | 1.000% | 9/29/17 | 33,700 | 33,363 |
| 2 Federal Home Loan Mortgage Corp. | 0.750% | 1/12/18 | 36,065 | 35,091 |
| 2 Federal Home Loan Mortgage Corp. | 0.875% | 3/7/18 | 77,175 | 75,096 |
| 2 Federal Home Loan Mortgage Corp. | 4.875% | 6/13/18 | 11,500 | 13,067 |
| 2 Federal National Mortgage Assn. | 0.375% | 3/16/15 | 56,490 | 56,526 |
| 2 Federal National Mortgage Assn. | 0.500% | 5/27/15 | 23,110 | 23,181 |
| 2 Federal National Mortgage Assn. | 0.500% | 7/2/15 | 30,285 | 30,361 |
| 2 Federal National Mortgage Assn. | 2.375% | 7/28/15 | 67,710 | 69,856 |
| 2 Federal National Mortgage Assn. | 0.500% | 9/28/15 | 35,395 | 35,474 |
| 2 Federal National Mortgage Assn. | 4.375% | 10/15/15 | 42,460 | 45,459 |
| 2 Federal National Mortgage Assn. | 1.625% | 10/26/15 | 27,320 | 27,924 |
| 2 Federal National Mortgage Assn. | 0.375% | 12/21/15 | 20,215 | 20,205 |
| 2 Federal National Mortgage Assn. | 5.000% | 3/15/16 | 52,800 | 58,008 |
| 2 Federal National Mortgage Assn. | 0.500% | 3/30/16 | 25,600 | 25,588 |
| 2 Federal National Mortgage Assn. | 2.375% | 4/11/16 | 42,340 | 44,092 |
| 2 Federal National Mortgage Assn. | 0.375% | 7/5/16 | 19,325 | 19,200 |
| 2 Federal National Mortgage Assn. | 0.625% | 8/26/16 | 50,000 | 49,909 |
| 2 Federal National Mortgage Assn. | 5.250% | 9/15/16 | 5,850 | 6,557 |
| 2 Federal National Mortgage Assn. | 1.250% | 9/28/16 | 26,115 | 26,472 |
| 2 Federal National Mortgage Assn. | 1.375% | 11/15/16 | 53,800 | 54,700 |
| 2 Federal National Mortgage Assn. | 1.250% | 1/30/17 | 20,000 | 20,228 |
| 2 Federal National Mortgage Assn. | 5.000% | 2/13/17 | 49,000 | 55,148 |
| 2 Federal National Mortgage Assn. | 1.125% | 4/27/17 | 57,180 | 57,423 |
| 2 Federal National Mortgage Assn. | 0.875% | 8/28/17 | 33,800 | 33,427 |
| 2 Federal National Mortgage Assn. | 0.875% | 10/26/17 | 59,200 | 58,234 |
| 2 Federal National Mortgage Assn. | 0.875% | 12/20/17 | 58,750 | 57,665 |
| 2 Federal National Mortgage Assn. | 0.875% | 2/8/18 | 58,475 | 56,998 |
| 2 Federal National Mortgage Assn. | 0.875% | 5/21/18 | 46,360 | 44,860 |
| 2 Federal National Mortgage Assn. | 1.875% | 9/18/18 | 31,025 | 31,140 |
| 2 Federal National Mortgage Assn. | 1.625% | 11/27/18 | 58,990 | 58,335 |
| 1 Financing Corp. | 9.800% | 4/6/18 | 1,440 | 1,921 |
| 1 Financing Corp. | 10.350% | 8/3/18 | 3,755 | 5,126 |
| 1 Financing Corp. | 9.650% | 11/2/18 | 12,540 | 16,819 |
| Private Export Funding Corp. | 1.375% | 2/15/17 | 500 | 505 |
| Private Export Funding Corp. | 2.250% | 12/15/17 | 3,225 | 3,309 |
| Private Export Funding Corp. | 1.875% | 7/15/18 | 4,000 | 4,006 |
| 1 Tennessee Valley Authority | 5.500% | 7/18/17 | 6,200 | 7,100 |
| 1 Tennessee Valley Authority | 6.250% | 12/15/17 | 2,600 | 3,082 |
| 1 Tennessee Valley Authority | 4.500% | 4/1/18 | 8,300 | 9,186 |
3
| Vanguard® Short-Term Bond Index Fund | ||||
| Schedule of Investments | ||||
| December 31, 2013 | ||||
| Face | Market | |||
| Maturity | Amount | Value | ||
| Coupon | Date | ($000) | ($000) | |
| 1 Tennessee Valley Authority | 1.750% | 10/15/18 | 2,500 | 2,483 |
| 2,410,061 | ||||
| Total U.S. Government and Agency Obligations (Cost $23,666,033) | 23,661,849 | |||
| Corporate Bonds (22.4%) | ||||
| Finance (9.9%) | ||||
| Banking (7.5%) | ||||
| Abbey National Treasury Services plc | 4.000% | 4/27/16 | 9,175 | 9,740 |
| Abbey National Treasury Services plc | 3.050% | 8/23/18 | 7,700 | 7,929 |
| American Express Bank FSB | 6.000% | 9/13/17 | 500 | 574 |
| American Express Centurion Bank | 5.950% | 6/12/17 | 2,175 | 2,460 |
| American Express Centurion Bank | 6.000% | 9/13/17 | 2,250 | 2,574 |
| American Express Co. | 5.500% | 9/12/16 | 2,575 | 2,865 |
| American Express Co. | 6.150% | 8/28/17 | 12,375 | 14,273 |
| American Express Co. | 7.000% | 3/19/18 | 6,600 | 7,884 |
| American Express Co. | 1.550% | 5/22/18 | 5,575 | 5,433 |
| 3 American Express Co. | 6.800% | 9/1/66 | 5,225 | 5,578 |
| American Express Credit Corp. | 1.750% | 6/12/15 | 5,741 | 5,839 |
| American Express Credit Corp. | 2.750% | 9/15/15 | 5,992 | 6,200 |
| American Express Credit Corp. | 1.300% | 7/29/16 | 6,250 | 6,300 |
| American Express Credit Corp. | 2.800% | 9/19/16 | 15,450 | 16,154 |
| American Express Credit Corp. | 2.375% | 3/24/17 | 10,325 | 10,613 |
| American Express Credit Corp. | 2.125% | 7/27/18 | 5,925 | 5,954 |
| Associates Corp. of North America | 6.950% | 11/1/18 | 408 | 486 |
| Australia & New Zealand Banking Group Ltd. | 0.900% | 2/12/16 | 6,185 | 6,178 |
| Australia & New Zealand Banking Group Ltd. | 1.875% | 10/6/17 | 9,900 | 9,857 |
| Bancolombia SA | 4.250% | 1/12/16 | 3,050 | 3,172 |
| Bank of America Corp. | 4.500% | 4/1/15 | 28,775 | 30,094 |
| Bank of America Corp. | 4.750% | 8/1/15 | 575 | 609 |
| Bank of America Corp. | 3.700% | 9/1/15 | 6,735 | 7,042 |
| Bank of America Corp. | 1.500% | 10/9/15 | 7,215 | 7,287 |
| Bank of America Corp. | 5.250% | 12/1/15 | 6,000 | 6,423 |
| Bank of America Corp. | 1.250% | 1/11/16 | 4,600 | 4,615 |
| Bank of America Corp. | 3.625% | 3/17/16 | 25,125 | 26,395 |
| Bank of America Corp. | 3.750% | 7/12/16 | 14,750 | 15,678 |
| Bank of America Corp. | 6.500% | 8/1/16 | 19,855 | 22,383 |
| Bank of America Corp. | 5.750% | 8/15/16 | 3,900 | 4,287 |
| Bank of America Corp. | 7.800% | 9/15/16 | 2,967 | 3,440 |
| Bank of America Corp. | 5.625% | 10/14/16 | 1,950 | 2,168 |
| Bank of America Corp. | 1.350% | 11/21/16 | 3,100 | 3,093 |
| Bank of America Corp. | 5.420% | 3/15/17 | 3,850 | 4,229 |
| Bank of America Corp. | 3.875% | 3/22/17 | 2,500 | 2,668 |
| Bank of America Corp. | 6.000% | 9/1/17 | 7,467 | 8,520 |
| Bank of America Corp. | 5.750% | 12/1/17 | 19,600 | 22,262 |
| Bank of America Corp. | 2.000% | 1/11/18 | 11,725 | 11,691 |
| Bank of America Corp. | 5.650% | 5/1/18 | 22,025 | 25,016 |
| Bank of America NA | 1.125% | 11/14/16 | 7,975 | 7,973 |
| Bank of America NA | 5.300% | 3/15/17 | 12,275 | 13,526 |
| Bank of America NA | 6.100% | 6/15/17 | 250 | 283 |
| Bank of Montreal | 0.800% | 11/6/15 | 4,250 | 4,269 |
| Bank of Montreal | 1.300% | 7/15/16 | 5,025 | 5,062 |
| Bank of Montreal | 2.500% | 1/11/17 | 11,225 | 11,533 |
| Bank of Montreal | 1.400% | 9/11/17 | 2,767 | 2,720 |
| Bank of Montreal | 1.450% | 4/9/18 | 11,100 | 10,819 |
| Bank of New York Mellon Corp. | 3.100% | 1/15/15 | 10,500 | 10,787 |
| Bank of New York Mellon Corp. | 1.200% | 2/20/15 | 5,000 | 5,038 |
| Bank of New York Mellon Corp. | 4.950% | 3/15/15 | 1,700 | 1,784 |
| Bank of New York Mellon Corp. | 0.700% | 10/23/15 | 2,000 | 2,002 |
| Bank of New York Mellon Corp. | 2.500% | 1/15/16 | 3,250 | 3,354 |
| Bank of New York Mellon Corp. | 2.300% | 7/28/16 | 5,050 | 5,211 |
| Bank of New York Mellon Corp. | 2.400% | 1/17/17 | 2,575 | 2,646 |
| Bank of New York Mellon Corp. | 1.969% | 6/20/17 | 2,000 | 2,017 |
| Bank of New York Mellon Corp. | 1.300% | 1/25/18 | 1,100 | 1,072 |
4
| Vanguard® Short-Term Bond Index Fund | ||||
| Schedule of Investments | ||||
| December 31, 2013 | ||||
| Face | Market | |||
| Maturity | Amount | Value | ||
| Coupon | Date | ($000) | ($000) | |
| Bank of New York Mellon Corp. | 1.350% | 3/6/18 | 10,000 | 9,715 |
| Bank of Nova Scotia | 1.850% | 1/12/15 | 5,865 | 5,953 |
| Bank of Nova Scotia | 3.400% | 1/22/15 | 11,900 | 12,272 |
| Bank of Nova Scotia | 2.050% | 10/7/15 | 7,375 | 7,560 |
| Bank of Nova Scotia | 0.750% | 10/9/15 | 8,450 | 8,483 |
| Bank of Nova Scotia | 0.950% | 3/15/16 | 4,000 | 4,004 |
| Bank of Nova Scotia | 2.900% | 3/29/16 | 2,000 | 2,083 |
| Bank of Nova Scotia | 1.375% | 7/15/16 | 3,150 | 3,179 |
| Bank of Nova Scotia | 1.100% | 12/13/16 | 2,600 | 2,615 |
| Bank of Nova Scotia | 2.550% | 1/12/17 | 16,175 | 16,779 |
| Bank of Nova Scotia | 1.375% | 12/18/17 | 4,450 | 4,378 |
| Bank of Nova Scotia | 1.450% | 4/25/18 | 1,500 | 1,460 |
| Bank of Nova Scotia | 2.050% | 10/30/18 | 8,225 | 8,190 |
| 4 Bank of Tokyo-Mitsubishi UFJ Ltd. | 2.450% | 9/11/15 | 2,000 | 2,048 |
| Bank One Corp. | 4.900% | 4/30/15 | 2,375 | 2,499 |
| Barclays Bank plc | 2.750% | 2/23/15 | 3,875 | 3,963 |
| Barclays Bank plc | 3.900% | 4/7/15 | 680 | 708 |
| Barclays Bank plc | 5.000% | 9/22/16 | 8,775 | 9,650 |
| BB&T Corp. | 5.200% | 12/23/15 | 7,379 | 7,964 |
| BB&T Corp. | 3.200% | 3/15/16 | 4,075 | 4,270 |
| BB&T Corp. | 3.950% | 4/29/16 | 3,250 | 3,466 |
| BB&T Corp. | 2.150% | 3/22/17 | 2,950 | 2,990 |
| BB&T Corp. | 4.900% | 6/30/17 | 2,000 | 2,193 |
| BB&T Corp. | 1.450% | 1/12/18 | 5,900 | 5,761 |
| BB&T Corp. | 2.050% | 6/19/18 | 6,860 | 6,797 |
| BBVA US Senior SAU | 4.664% | 10/9/15 | 11,900 | 12,519 |
| Bear Stearns Cos. LLC | 5.300% | 10/30/15 | 30 | 32 |
| Bear Stearns Cos. LLC | 5.550% | 1/22/17 | 3,500 | 3,894 |
| Bear Stearns Cos. LLC | 6.400% | 10/2/17 | 14,825 | 17,311 |
| Bear Stearns Cos. LLC | 7.250% | 2/1/18 | 17,950 | 21,308 |
| Bear Stearns Cos. LLC | 4.650% | 7/2/18 | 4,939 | 5,377 |
| BNP Paribas SA | 3.250% | 3/11/15 | 3,425 | 3,525 |
| BNP Paribas SA | 3.600% | 2/23/16 | 14,740 | 15,502 |
| BNP Paribas SA | 1.250% | 12/12/16 | 3,250 | 3,248 |
| BNP Paribas SA | 2.375% | 9/14/17 | 21,775 | 22,191 |
| BNP Paribas SA | 2.700% | 8/20/18 | 9,075 | 9,207 |
| BNP Paribas SA | 2.400% | 12/12/18 | 4,500 | 4,507 |
| BNY Mellon NA | 4.750% | 12/15/14 | 1,300 | 1,351 |
| BPCE SA | 2.500% | 12/10/18 | 7,200 | 7,145 |
| Branch Banking & Trust Co. | 1.450% | 10/3/16 | 3,800 | 3,832 |
| Branch Banking & Trust Co. | 1.050% | 12/1/16 | 825 | 822 |
| Branch Banking & Trust Co. | 2.300% | 10/15/18 | 4,750 | 4,746 |
| Canadian Imperial Bank of Commerce | 0.900% | 10/1/15 | 3,675 | 3,697 |
| Canadian Imperial Bank of Commerce | 2.350% | 12/11/15 | 7,940 | 8,199 |
| Canadian Imperial Bank of Commerce | 1.550% | 1/23/18 | 7,650 | 7,469 |
| Capital One Bank USA NA | 2.150% | 11/21/18 | 1,200 | 1,191 |
| Capital One Financial Corp. | 2.150% | 3/23/15 | 4,960 | 5,042 |
| Capital One Financial Corp. | 1.000% | 11/6/15 | 2,525 | 2,526 |
| Capital One Financial Corp. | 3.150% | 7/15/16 | 11,150 | 11,637 |
| Capital One Financial Corp. | 6.150% | 9/1/16 | 8,075 | 8,995 |
| Capital One Financial Corp. | 6.750% | 9/15/17 | 3,775 | 4,400 |
| Capital One NA | 1.500% | 3/22/18 | 2,550 | 2,482 |
| Citigroup Inc. | 6.010% | 1/15/15 | 7,982 | 8,401 |
| Citigroup Inc. | 2.650% | 3/2/15 | 7,250 | 7,397 |
| Citigroup Inc. | 4.750% | 5/19/15 | 8,299 | 8,726 |
| Citigroup Inc. | 4.700% | 5/29/15 | 9,275 | 9,757 |
| Citigroup Inc. | 2.250% | 8/7/15 | 5,000 | 5,103 |
| Citigroup Inc. | 4.587% | 12/15/15 | 8,400 | 8,973 |
| Citigroup Inc. | 5.300% | 1/7/16 | 7,850 | 8,476 |
| Citigroup Inc. | 1.250% | 1/15/16 | 8,075 | 8,094 |
| Citigroup Inc. | 1.300% | 4/1/16 | 4,479 | 4,484 |
| Citigroup Inc. | 3.953% | 6/15/16 | 13,725 | 14,585 |
| Citigroup Inc. | 1.700% | 7/25/16 | 5,450 | 5,500 |
| Citigroup Inc. | 4.450% | 1/10/17 | 16,825 | 18,221 |
5
| Vanguard® Short-Term Bond Index Fund | ||||
| Schedule of Investments | ||||
| December 31, 2013 | ||||
| Face | Market | |||
| Maturity | Amount | Value | ||
| Coupon | Date | ($000) | ($000) | |
| Citigroup Inc. | 5.500% | 2/15/17 | 11,850 | 13,053 |
| Citigroup Inc. | 6.000% | 8/15/17 | 5,727 | 6,549 |
| Citigroup Inc. | 6.125% | 11/21/17 | 19,075 | 21,982 |
| Citigroup Inc. | 1.750% | 5/1/18 | 12,000 | 11,795 |
| Citigroup Inc. | 6.125% | 5/15/18 | 8,600 | 9,969 |
| Citigroup Inc. | 2.500% | 9/26/18 | 16,875 | 16,990 |
| Comerica Bank | 5.750% | 11/21/16 | 1,000 | 1,123 |
| Comerica Bank | 5.200% | 8/22/17 | 2,900 | 3,205 |
| Comerica Inc. | 4.800% | 5/1/15 | 1,500 | 1,576 |
| Comerica Inc. | 3.000% | 9/16/15 | 3,900 | 4,048 |
| Commonwealth Bank of Australia | 1.950% | 3/16/15 | 9,000 | 9,154 |
| Commonwealth Bank of Australia | 1.250% | 9/18/15 | 9,575 | 9,687 |
| Commonwealth Bank of Australia | 1.900% | 9/18/17 | 4,075 | 4,067 |
| Commonwealth Bank of Australia | 2.500% | 9/20/18 | 4,925 | 4,965 |
| Cooperatieve Centrale Raiffeisen-Boerenleenbank BA | 2.125% | 10/13/15 | 7,150 | 7,334 |
| Cooperatieve Centrale Raiffeisen-Boerenleenbank BA | 3.375% | 1/19/17 | 14,025 | 14,774 |
| Cooperatieve Centrale Raiffeisen-Boerenleenbank BA | 1.700% | 3/19/18 | 16,250 | 16,058 |
| Countrywide Financial Corp. | 6.250% | 5/15/16 | 2,326 | 2,563 |
| Credit Suisse | 3.500% | 3/23/15 | 10,444 | 10,800 |
| Credit Suisse | 6.000% | 2/15/18 | 10,125 | 11,690 |
| Credit Suisse USA Inc. | 4.875% | 1/15/15 | 5,755 | 6,012 |
| Credit Suisse USA Inc. | 5.125% | 8/15/15 | 6,750 | 7,232 |
| Credit Suisse USA Inc. | 5.375% | 3/2/16 | 9,096 | 9,987 |
| Deutsche Bank AG | 3.450% | 3/30/15 | 10,350 | 10,684 |
| Deutsche Bank AG | 3.250% | 1/11/16 | 14,175 | 14,814 |
| Deutsche Bank AG | 6.000% | 9/1/17 | 15,550 | 17,750 |
| Discover Bank | 2.000% | 2/21/18 | 3,500 | 3,439 |
| Discover Financial Services | 6.450% | 6/12/17 | 2,575 | 2,910 |
| Fifth Third Bancorp | 3.625% | 1/25/16 | 9,425 | 9,884 |
| Fifth Third Bancorp | 4.500% | 6/1/18 | 4,175 | 4,473 |
| Fifth Third Bank | 4.750% | 2/1/15 | 2,800 | 2,917 |
| Fifth Third Bank | 0.900% | 2/26/16 | 500 | 497 |
| Fifth Third Bank | 1.150% | 11/18/16 | 650 | 649 |
| Fifth Third Bank | 1.450% | 2/28/18 | 2,500 | 2,424 |
| First Horizon National Corp. | 5.375% | 12/15/15 | 4,325 | 4,650 |
| Goldman Sachs Group Inc. | 5.125% | 1/15/15 | 8,850 | 9,243 |
| Goldman Sachs Group Inc. | 3.300% | 5/3/15 | 7,450 | 7,673 |
| Goldman Sachs Group Inc. | 3.700% | 8/1/15 | 20,175 | 21,019 |
| Goldman Sachs Group Inc. | 1.600% | 11/23/15 | 6,875 | 6,943 |
| Goldman Sachs Group Inc. | 5.350% | 1/15/16 | 11,650 | 12,586 |
| Goldman Sachs Group Inc. | 3.625% | 2/7/16 | 23,725 | 24,819 |
| Goldman Sachs Group Inc. | 5.750% | 10/1/16 | 7,450 | 8,299 |
| Goldman Sachs Group Inc. | 5.625% | 1/15/17 | 11,625 | 12,800 |
| Goldman Sachs Group Inc. | 6.250% | 9/1/17 | 15,550 | 17,815 |
| Goldman Sachs Group Inc. | 5.950% | 1/18/18 | 28,500 | 32,406 |
| Goldman Sachs Group Inc. | 2.375% | 1/22/18 | 11,450 | 11,476 |
| Goldman Sachs Group Inc. | 6.150% | 4/1/18 | 22,158 | 25,421 |
| Goldman Sachs Group Inc. | 2.900% | 7/19/18 | 16,700 | 16,980 |
| HSBC Bank USA NA | 6.000% | 8/9/17 | 1,050 | 1,181 |
| HSBC USA Inc. | 2.375% | 2/13/15 | 9,825 | 10,018 |
| HSBC USA Inc. | 1.625% | 1/16/18 | 11,650 | 11,497 |
| HSBC USA Inc. | 2.625% | 9/24/18 | 3,750 | 3,815 |
| Huntington Bancshares Inc. | 2.600% | 8/2/18 | 1,625 | 1,624 |
| Huntington National Bank | 1.350% | 8/2/16 | 1,575 | 1,578 |
| Huntington National Bank | 1.300% | 11/20/16 | 2,750 | 2,743 |
| Intesa Sanpaolo SPA | 3.125% | 1/15/16 | 8,775 | 8,925 |
| Intesa Sanpaolo SPA | 3.875% | 1/16/18 | 9,825 | 9,993 |
| JPMorgan Chase & Co. | 3.700% | 1/20/15 | 14,950 | 15,404 |
| JPMorgan Chase & Co. | 4.750% | 3/1/15 | 3,550 | 3,713 |
| JPMorgan Chase & Co. | 1.875% | 3/20/15 | 6,550 | 6,638 |
| JPMorgan Chase & Co. | 5.250% | 5/1/15 | 3,975 | 4,191 |
| JPMorgan Chase & Co. | 3.400% | 6/24/15 | 13,760 | 14,294 |
| JPMorgan Chase & Co. | 5.150% | 10/1/15 | 3,000 | 3,212 |
| JPMorgan Chase & Co. | 1.100% | 10/15/15 | 12,275 | 12,321 |
6
| Vanguard® Short-Term Bond Index Fund | ||||
| Schedule of Investments | ||||
| December 31, 2013 | ||||
| Face | Market | |||
| Maturity | Amount | Value | ||
| Coupon | Date | ($000) | ($000) | |
| JPMorgan Chase & Co. | 2.600% | 1/15/16 | 7,723 | 7,999 |
| JPMorgan Chase & Co. | 1.125% | 2/26/16 | 6,125 | 6,130 |
| JPMorgan Chase & Co. | 3.450% | 3/1/16 | 16,265 | 17,046 |
| JPMorgan Chase & Co. | 3.150% | 7/5/16 | 28,975 | 30,336 |
| JPMorgan Chase & Co. | 2.000% | 8/15/17 | 9,038 | 9,146 |
| JPMorgan Chase & Co. | 6.000% | 1/15/18 | 27,725 | 31,916 |
| JPMorgan Chase & Co. | 1.800% | 1/25/18 | 3,450 | 3,421 |
| JPMorgan Chase & Co. | 1.625% | 5/15/18 | 12,525 | 12,255 |
| JPMorgan Chase Bank NA | 5.875% | 6/13/16 | 375 | 414 |
| JPMorgan Chase Bank NA | 6.000% | 7/5/17 | 3,000 | 3,391 |
| JPMorgan Chase Bank NA | 6.000% | 10/1/17 | 16,575 | 18,946 |
| KeyBank NA | 4.950% | 9/15/15 | 1,000 | 1,062 |
| KeyBank NA | 5.450% | 3/3/16 | 3,525 | 3,833 |
| KeyBank NA | 1.650% | 2/1/18 | 12,725 | 12,470 |
| KeyCorp | 3.750% | 8/13/15 | 3,529 | 3,691 |
| KeyCorp | 2.300% | 12/13/18 | 1,150 | 1,141 |
| Lloyds Bank plc | 4.875% | 1/21/16 | 12,800 | 13,763 |
| Lloyds Bank plc | 4.200% | 3/28/17 | 1,150 | 1,234 |
| Lloyds Bank plc | 2.300% | 11/27/18 | 6,575 | 6,555 |
| Manufacturers & Traders Trust Co. | 6.625% | 12/4/17 | 3,550 | 4,111 |
| Manufacturers & Traders Trust Co. | 1.450% | 3/7/18 | 250 | 243 |
| 3 Manufacturers & Traders Trust Co. | 5.585% | 12/28/20 | 900 | 921 |
| Merrill Lynch & Co. Inc. | 5.000% | 1/15/15 | 10,400 | 10,832 |
| Merrill Lynch & Co. Inc. | 6.050% | 5/16/16 | 7,690 | 8,447 |
| Merrill Lynch & Co. Inc. | 5.700% | 5/2/17 | 5,000 | 5,548 |
| Merrill Lynch & Co. Inc. | 6.400% | 8/28/17 | 12,600 | 14,531 |
| Merrill Lynch & Co. Inc. | 6.875% | 4/25/18 | 28,160 | 33,260 |
| Merrill Lynch & Co. Inc. | 6.875% | 11/15/18 | 5,025 | 5,982 |
| Morgan Stanley | 4.100% | 1/26/15 | 8,075 | 8,347 |
| Morgan Stanley | 6.000% | 4/28/15 | 11,375 | 12,117 |
| Morgan Stanley | 4.000% | 7/24/15 | 3,000 | 3,136 |
| Morgan Stanley | 5.375% | 10/15/15 | 7,465 | 8,029 |
| Morgan Stanley | 3.450% | 11/2/15 | 6,925 | 7,223 |
| Morgan Stanley | 1.750% | 2/25/16 | 6,800 | 6,888 |
| Morgan Stanley | 3.800% | 4/29/16 | 13,500 | 14,265 |
| Morgan Stanley | 5.750% | 10/18/16 | 10,150 | 11,311 |
| Morgan Stanley | 5.450% | 1/9/17 | 9,975 | 11,031 |
| Morgan Stanley | 4.750% | 3/22/17 | 9,065 | 9,908 |
| Morgan Stanley | 5.550% | 4/27/17 | 9,750 | 10,824 |
| Morgan Stanley | 6.250% | 8/28/17 | 7,125 | 8,153 |
| Morgan Stanley | 5.950% | 12/28/17 | 10,850 | 12,366 |
| Morgan Stanley | 6.625% | 4/1/18 | 23,209 | 27,078 |
| Morgan Stanley | 2.125% | 4/25/18 | 15,100 | 15,007 |
| Murray Street Investment Trust I | 4.647% | 3/9/17 | 8,650 | 9,323 |
| National Australia Bank Ltd. | 2.000% | 3/9/15 | 5,475 | 5,574 |
| National Australia Bank Ltd. | 1.600% | 8/7/15 | 7,000 | 7,102 |
| National Australia Bank Ltd. | 0.900% | 1/20/16 | 2,500 | 2,500 |
| National Australia Bank Ltd. | 1.300% | 7/25/16 | 3,050 | 3,068 |
| National Australia Bank Ltd. | 2.750% | 3/9/17 | 7,475 | 7,715 |
| National Australia Bank Ltd. | 2.300% | 7/25/18 | 5,025 | 5,063 |
| National Bank of Canada | 1.500% | 6/26/15 | 2,400 | 2,433 |
| National Bank of Canada | 1.450% | 11/7/17 | 3,350 | 3,269 |
| National City Bank | 5.800% | 6/7/17 | 2,225 | 2,506 |
| Northern Trust Co. | 6.500% | 8/15/18 | 1,275 | 1,504 |
| PNC Bank NA | 1.150% | 11/1/16 | 4,600 | 4,596 |
| PNC Bank NA | 4.875% | 9/21/17 | 300 | 329 |
| PNC Bank NA | 6.000% | 12/7/17 | 1,125 | 1,282 |
| PNC Funding Corp. | 5.400% | 6/10/14 | 300 | 306 |
| PNC Funding Corp. | 3.625% | 2/8/15 | 18,675 | 19,290 |
| PNC Funding Corp. | 5.250% | 11/15/15 | 2,100 | 2,260 |
| PNC Funding Corp. | 2.700% | 9/19/16 | 6,450 | 6,718 |
| PNC Funding Corp. | 5.625% | 2/1/17 | 6,977 | 7,734 |
| Regions Financial Corp. | 5.750% | 6/15/15 | 2,150 | 2,289 |
| Regions Financial Corp. | 2.000% | 5/15/18 | 7,375 | 7,159 |
7
| Vanguard® Short-Term Bond Index Fund | ||||
| Schedule of Investments | ||||
| December 31, 2013 | ||||
| Face | Market | |||
| Maturity | Amount | Value | ||
| Coupon | Date | ($000) | ($000) | |
| Royal Bank of Canada | 1.150% | 3/13/15 | 250 | 252 |
| Royal Bank of Canada | 0.800% | 10/30/15 | 15,425 | 15,476 |
| Royal Bank of Canada | 2.625% | 12/15/15 | 14,925 | 15,499 |
| Royal Bank of Canada | 0.850% | 3/8/16 | 4,750 | 4,737 |
| Royal Bank of Canada | 2.875% | 4/19/16 | 200 | 209 |
| Royal Bank of Canada | 2.300% | 7/20/16 | 2,325 | 2,405 |
| Royal Bank of Canada | 1.450% | 9/9/16 | 4,375 | 4,424 |
| Royal Bank of Canada | 1.500% | 1/16/18 | 6,275 | 6,158 |
| Royal Bank of Canada | 2.200% | 7/27/18 | 9,925 | 9,979 |
| Royal Bank of Scotland Group plc | 2.550% | 9/18/15 | 11,244 | 11,503 |
| 4 Royal Bank of Scotland plc | 4.875% | 8/25/14 | 2,400 | 2,458 |
| Royal Bank of Scotland plc | 4.875% | 3/16/15 | 4,525 | 4,729 |
| Royal Bank of Scotland plc | 3.950% | 9/21/15 | 5,302 | 5,570 |
| Royal Bank of Scotland plc | 4.375% | 3/16/16 | 7,000 | 7,472 |
| Santander Bank NA | 8.750% | 5/30/18 | 2,825 | 3,396 |
| Santander Holdings USA Inc. | 3.000% | 9/24/15 | 275 | 282 |
| Santander Holdings USA Inc. | 4.625% | 4/19/16 | 4,250 | 4,525 |
| Santander Holdings USA Inc. | 3.450% | 8/27/18 | 3,625 | 3,706 |
| Societe Generale SA | 2.750% | 10/12/17 | 5,675 | 5,815 |
| Societe Generale SA | 2.625% | 10/1/18 | 9,200 | 9,244 |
| State Street Bank & Trust Co. | 5.250% | 10/15/18 | 775 | 870 |
| State Street Corp. | 2.875% | 3/7/16 | 4,438 | 4,618 |
| State Street Corp. | 4.956% | 3/15/18 | 6,619 | 7,197 |
| State Street Corp. | 1.350% | 5/15/18 | 4,675 | 4,536 |
| Sumitomo Mitsui Banking Corp. | 1.350% | 7/18/15 | 4,825 | 4,865 |
| Sumitomo Mitsui Banking Corp. | 0.900% | 1/18/16 | 800 | 798 |
| Sumitomo Mitsui Banking Corp. | 1.450% | 7/19/16 | 3,150 | 3,169 |
| Sumitomo Mitsui Banking Corp. | 1.800% | 7/18/17 | 5,800 | 5,751 |
| Sumitomo Mitsui Banking Corp. | 1.500% | 1/18/18 | 3,075 | 2,996 |
| Sumitomo Mitsui Banking Corp. | 2.500% | 7/19/18 | 2,425 | 2,440 |
| SunTrust Bank | 7.250% | 3/15/18 | 3,200 | 3,771 |
| SunTrust Banks Inc. | 3.600% | 4/15/16 | 10,225 | 10,766 |
| SunTrust Banks Inc. | 3.500% | 1/20/17 | 2,085 | 2,197 |
| SunTrust Banks Inc. | 6.000% | 9/11/17 | 1,615 | 1,836 |
| Svenska Handelsbanken AB | 3.125% | 7/12/16 | 7,500 | 7,843 |
| Svenska Handelsbanken AB | 2.875% | 4/4/17 | 3,550 | 3,696 |
| Svenska Handelsbanken AB | 1.625% | 3/21/18 | 8,075 | 7,954 |
| Toronto-Dominion Bank | 2.500% | 7/14/16 | 4,585 | 4,756 |
| Toronto-Dominion Bank | 2.375% | 10/19/16 | 11,400 | 11,841 |
| Toronto-Dominion Bank | 1.400% | 4/30/18 | 9,075 | 8,850 |
| Toronto-Dominion Bank | 2.625% | 9/10/18 | 10,000 | 10,259 |
| UBS AG | 3.875% | 1/15/15 | 10,400 | 10,747 |
| UBS AG | 5.875% | 7/15/16 | 4,800 | 5,324 |
| UBS AG | 5.875% | 12/20/17 | 15,450 | 17,693 |
| UBS AG | 5.750% | 4/25/18 | 6,701 | 7,670 |
| Union Bank NA | 5.950% | 5/11/16 | 2,300 | 2,544 |
| Union Bank NA | 1.500% | 9/26/16 | 4,425 | 4,468 |
| Union Bank NA | 2.125% | 6/16/17 | 2,575 | 2,610 |
| Union Bank NA | 2.625% | 9/26/18 | 8,550 | 8,686 |
| US Bancorp | 3.150% | 3/4/15 | 4,800 | 4,949 |
| US Bancorp | 2.450% | 7/27/15 | 1,750 | 1,799 |
| US Bancorp | 3.442% | 2/1/16 | 4,325 | 4,502 |
| US Bancorp | 2.200% | 11/15/16 | 9,605 | 9,903 |
| US Bancorp | 1.650% | 5/15/17 | 6,000 | 6,046 |
| US Bancorp | 1.950% | 11/15/18 | 4,225 | 4,193 |
| US Bank NA | 6.300% | 2/4/14 | 1,850 | 1,859 |
| 3 US Bank NA | 3.778% | 4/29/20 | 1,000 | 1,036 |
| Vesey Street Investment Trust I | 4.404% | 9/1/16 | 1,900 | 2,038 |
| Wachovia Bank NA | 5.000% | 8/15/15 | 7,000 | 7,452 |
| Wachovia Bank NA | 5.600% | 3/15/16 | 400 | 437 |
| Wachovia Bank NA | 6.000% | 11/15/17 | 1,875 | 2,161 |
| Wachovia Corp. | 5.625% | 10/15/16 | 18,050 | 20,200 |
| Wachovia Corp. | 5.750% | 6/15/17 | 4,450 | 5,079 |
| Wachovia Corp. | 5.750% | 2/1/18 | 15,350 | 17,675 |
8
| Vanguard® Short-Term Bond Index Fund | ||||
| Schedule of Investments | ||||
| December 31, 2013 | ||||
| Face | Market | |||
| Maturity | Amount | Value | ||
| Coupon | Date | ($000) | ($000) | |
| Wells Fargo & Co. | 1.250% | 2/13/15 | 14,675 | 14,798 |
| Wells Fargo & Co. | 3.625% | 4/15/15 | 8,100 | 8,416 |
| Wells Fargo & Co. | 1.500% | 7/1/15 | 8,825 | 8,955 |
| Wells Fargo & Co. | 3.676% | 6/15/16 | 21,325 | 22,648 |
| Wells Fargo & Co. | 1.250% | 7/20/16 | 10,075 | 10,124 |
| Wells Fargo & Co. | 5.125% | 9/15/16 | 2,500 | 2,746 |
| Wells Fargo & Co. | 2.625% | 12/15/16 | 8,115 | 8,486 |
| Wells Fargo & Co. | 2.100% | 5/8/17 | 2,900 | 2,954 |
| Wells Fargo & Co. | 5.625% | 12/11/17 | 21,145 | 24,230 |
| Wells Fargo & Co. | 1.500% | 1/16/18 | 5,650 | 5,585 |
| Wells Fargo Bank NA | 4.750% | 2/9/15 | 6,112 | 6,373 |
| Wells Fargo Bank NA | 5.750% | 5/16/16 | 4,825 | 5,322 |
| Westpac Banking Corp. | 4.200% | 2/27/15 | 5,875 | 6,124 |
| Westpac Banking Corp. | 3.000% | 8/4/15 | 13,625 | 14,158 |
| Westpac Banking Corp. | 1.125% | 9/25/15 | 4,175 | 4,219 |
| Westpac Banking Corp. | 3.000% | 12/9/15 | 7,080 | 7,394 |
| Westpac Banking Corp. | 0.950% | 1/12/16 | 3,825 | 3,830 |
| Westpac Banking Corp. | 1.050% | 11/25/16 | 300 | 299 |
| Westpac Banking Corp. | 2.000% | 8/14/17 | 17,350 | 17,448 |
| Westpac Banking Corp. | 1.600% | 1/12/18 | 5,300 | 5,225 |
| Zions Bancorporation | 4.500% | 3/27/17 | 2,400 | 2,539 |
| Brokerage (0.2%) | ||||
| Ameriprise Financial Inc. | 5.650% | 11/15/15 | 2,250 | 2,447 |
| BlackRock Inc. | 3.500% | 12/10/14 | 5,050 | 5,196 |
| BlackRock Inc. | 1.375% | 6/1/15 | 600 | 608 |
| BlackRock Inc. | 6.250% | 9/15/17 | 200 | 232 |
| Charles Schwab Corp. | 0.850% | 12/4/15 | 1,300 | 1,299 |
| Charles Schwab Corp. | 2.200% | 7/25/18 | 825 | 825 |
| Eaton Vance Corp. | 6.500% | 10/2/17 | 242 | 275 |
| Franklin Resources Inc. | 3.125% | 5/20/15 | 1,400 | 1,443 |
| Franklin Resources Inc. | 1.375% | 9/15/17 | 2,300 | 2,251 |
| Jefferies Group LLC | 3.875% | 11/9/15 | 5,200 | 5,437 |
| Jefferies Group LLC | 5.125% | 4/13/18 | 4,250 | 4,583 |
| Lazard Group LLC | 6.850% | 6/15/17 | 2,925 | 3,309 |
| Leucadia National Corp. | 8.125% | 9/15/15 | 1,000 | 1,107 |
| Nomura Holdings Inc. | 5.000% | 3/4/15 | 6,000 | 6,264 |
| Nomura Holdings Inc. | 4.125% | 1/19/16 | 7,000 | 7,369 |
| Nomura Holdings Inc. | 2.000% | 9/13/16 | 8,750 | 8,807 |
| Raymond James Financial Inc. | 4.250% | 4/15/16 | 575 | 611 |
| TD Ameritrade Holding Corp. | 4.150% | 12/1/14 | 2,775 | 2,866 |
| Finance Companies (0.7%) | ||||
| Air Lease Corp. | 5.625% | 4/1/17 | 3,225 | 3,548 |
| Ares Capital Corp. | 4.875% | 11/30/18 | 2,100 | 2,154 |
| GATX Corp. | 3.500% | 7/15/16 | 3,960 | 4,134 |
| 3 GE Capital Trust I | 6.375% | 11/15/67 | 2,060 | 2,230 |
| General Electric Capital Corp. | 3.750% | 11/14/14 | 20,200 | 20,795 |
| General Electric Capital Corp. | 2.150% | 1/9/15 | 1,085 | 1,105 |
| General Electric Capital Corp. | 4.875% | 3/4/15 | 4,350 | 4,570 |
| General Electric Capital Corp. | 3.500% | 6/29/15 | 6,000 | 6,262 |
| General Electric Capital Corp. | 1.625% | 7/2/15 | 10,566 | 10,735 |
| General Electric Capital Corp. | 4.375% | 9/21/15 | 8,500 | 9,018 |
| General Electric Capital Corp. | 2.250% | 11/9/15 | 25,675 | 26,461 |
| General Electric Capital Corp. | 1.000% | 12/11/15 | 14,610 | 14,748 |
| General Electric Capital Corp. | 1.000% | 1/8/16 | 3,180 | 3,188 |
| General Electric Capital Corp. | 5.000% | 1/8/16 | 325 | 351 |
| General Electric Capital Corp. | 2.950% | 5/9/16 | 29,700 | 31,061 |
| General Electric Capital Corp. | 1.500% | 7/12/16 | 250 | 253 |
| General Electric Capital Corp. | 2.900% | 1/9/17 | 8,700 | 9,056 |
| General Electric Capital Corp. | 5.400% | 2/15/17 | 9,600 | 10,673 |
| General Electric Capital Corp. | 2.300% | 4/27/17 | 5,125 | 5,251 |
| General Electric Capital Corp. | 5.625% | 9/15/17 | 8,200 | 9,327 |
| General Electric Capital Corp. | 1.600% | 11/20/17 | 11,925 | 11,897 |
| General Electric Capital Corp. | 1.625% | 4/2/18 | 3,850 | 3,807 |
9
| Vanguard® Short-Term Bond Index Fund | ||||
| Schedule of Investments | ||||
| December 31, 2013 | ||||
| Face | Market | |||
| Maturity | Amount | Value | ||
| Coupon | Date | ($000) | ($000) | |
| General Electric Capital Corp. | 5.625% | 5/1/18 | 13,184 | 15,162 |
| 3 General Electric Capital Corp. | 6.375% | 11/15/67 | 10,975 | 11,880 |
| 3 HSBC Finance Capital Trust IX | 5.911% | 11/30/35 | 4,625 | 4,793 |
| HSBC Finance Corp. | 5.250% | 4/15/15 | 300 | 316 |
| HSBC Finance Corp. | 5.500% | 1/19/16 | 20,725 | 22,500 |
| Insurance (1.1%) | ||||
| ACE INA Holdings Inc. | 5.600% | 5/15/15 | 2,050 | 2,187 |
| ACE INA Holdings Inc. | 2.600% | 11/23/15 | 2,825 | 2,922 |
| ACE INA Holdings Inc. | 5.700% | 2/15/17 | 1,400 | 1,567 |
| ACE INA Holdings Inc. | 5.800% | 3/15/18 | 1,500 | 1,716 |
| Aetna Inc. | 6.000% | 6/15/16 | 4,330 | 4,835 |
| Aetna Inc. | 1.750% | 5/15/17 | 200 | 199 |
| Aetna Inc. | 1.500% | 11/15/17 | 11,200 | 11,033 |
| Aflac Inc. | 3.450% | 8/15/15 | 749 | 783 |
| Aflac Inc. | 2.650% | 2/15/17 | 4,755 | 4,910 |
| Allied World Assurance Co. Ltd. | 7.500% | 8/1/16 | 4,500 | 5,149 |
| 3 Allstate Corp. | 6.125% | 5/15/67 | 1,150 | 1,202 |
| American International Group Inc. | 3.000% | 3/20/15 | 4,050 | 4,158 |
| American International Group Inc. | 2.375% | 8/24/15 | 825 | 843 |
| American International Group Inc. | 5.050% | 10/1/15 | 2,000 | 2,144 |
| American International Group Inc. | 4.875% | 9/15/16 | 10,700 | 11,737 |
| American International Group Inc. | 5.600% | 10/18/16 | 2,175 | 2,425 |
| American International Group Inc. | 3.800% | 3/22/17 | 6,425 | 6,848 |
| American International Group Inc. | 5.450% | 5/18/17 | 5,655 | 6,320 |
| American International Group Inc. | 5.850% | 1/16/18 | 10,925 | 12,530 |
| American International Group Inc. | 8.250% | 8/15/18 | 19,110 | 23,927 |
| Aon Corp. | 3.500% | 9/30/15 | 3,350 | 3,498 |
| Aon Corp. | 3.125% | 5/27/16 | 3,000 | 3,128 |
| Assurant Inc. | 2.500% | 3/15/18 | 700 | 685 |
| Axis Capital Holdings Ltd. | 5.750% | 12/1/14 | 1,800 | 1,881 |
| Berkshire Hathaway Finance Corp. | 4.850% | 1/15/15 | 1,875 | 1,962 |
| Berkshire Hathaway Finance Corp. | 1.600% | 5/15/17 | 19,150 | 19,298 |
| Berkshire Hathaway Finance Corp. | 5.400% | 5/15/18 | 7,000 | 8,032 |
| Berkshire Hathaway Inc. | 3.200% | 2/11/15 | 18,275 | 18,829 |
| Berkshire Hathaway Inc. | 2.200% | 8/15/16 | 2,500 | 2,584 |
| Berkshire Hathaway Inc. | 1.900% | 1/31/17 | 6,300 | 6,420 |
| Berkshire Hathaway Inc. | 1.550% | 2/9/18 | 75 | 74 |
| Chubb Corp. | 5.750% | 5/15/18 | 4,100 | 4,712 |
| 3 Chubb Corp. | 6.375% | 3/29/67 | 2,800 | 3,059 |
| Cigna Corp. | 2.750% | 11/15/16 | 7,925 | 8,234 |
| CNA Financial Corp. | 6.500% | 8/15/16 | 3,950 | 4,444 |
| Genworth Holdings Inc. | 8.625% | 12/15/16 | 2,400 | 2,845 |
| Genworth Holdings Inc. | 6.515% | 5/22/18 | 3,375 | 3,838 |
| Hartford Financial Services Group Inc. | 5.500% | 10/15/16 | 4,525 | 5,030 |
| Hartford Financial Services Group Inc. | 5.375% | 3/15/17 | 525 | 580 |
| Hartford Financial Services Group Inc. | 6.300% | 3/15/18 | 680 | 781 |
| ING US Inc. | 2.900% | 2/15/18 | 10,870 | 11,099 |
| Lincoln National Corp. | 4.300% | 6/15/15 | 2,000 | 2,095 |
| 3 Lincoln National Corp. | 7.000% | 5/17/66 | 6,925 | 7,055 |
| Loews Corp. | 5.250% | 3/15/16 | 1,275 | 1,390 |
| Manulife Financial Corp. | 3.400% | 9/17/15 | 4,025 | 4,195 |
| Marsh & McLennan Cos. Inc. | 2.300% | 4/1/17 | 1,100 | 1,113 |
| Marsh & McLennan Cos. Inc. | 2.550% | 10/15/18 | 400 | 400 |
| MetLife Inc. | 5.000% | 6/15/15 | 10,425 | 11,066 |
| MetLife Inc. | 6.750% | 6/1/16 | 6,830 | 7,754 |
| MetLife Inc. | 6.817% | 8/15/18 | 4,800 | 5,747 |
| Principal Financial Group Inc. | 1.850% | 11/15/17 | 400 | 398 |
| 3 Progressive Corp. | 6.700% | 6/15/67 | 3,775 | 4,082 |
| Prudential Financial Inc. | 3.875% | 1/14/15 | 4,675 | 4,829 |
| Prudential Financial Inc. | 6.200% | 1/15/15 | 5,479 | 5,784 |
| Prudential Financial Inc. | 4.750% | 9/17/15 | 11,120 | 11,852 |
| Prudential Financial Inc. | 3.000% | 5/12/16 | 6,015 | 6,260 |
| Prudential Financial Inc. | 6.100% | 6/15/17 | 250 | 285 |
10
| Vanguard® Short-Term Bond Index Fund | ||||
| Schedule of Investments | ||||
| December 31, 2013 | ||||
| Face | Market | |||
| Maturity | Amount | Value | ||
| Coupon | Date | ($000) | ($000) | |
| 3 Prudential Financial Inc. | 8.875% | 6/15/68 | 2,581 | 3,142 |
| 3 Reinsurance Group of America Inc. | 6.750% | 12/15/65 | 2,800 | 2,775 |
| 3 StanCorp Financial Group Inc. | 6.900% | 6/1/67 | 1,000 | 997 |
| Torchmark Corp. | 6.375% | 6/15/16 | 1,250 | 1,380 |
| Transatlantic Holdings Inc. | 5.750% | 12/14/15 | 3,275 | 3,551 |
| Travelers Cos. Inc. | 5.500% | 12/1/15 | 4,100 | 4,472 |
| Travelers Cos. Inc. | 6.250% | 6/20/16 | 1,325 | 1,489 |
| Travelers Cos. Inc. | 5.800% | 5/15/18 | 2,825 | 3,254 |
| UnitedHealth Group Inc. | 0.850% | 10/15/15 | 4,132 | 4,152 |
| UnitedHealth Group Inc. | 1.875% | 11/15/16 | 450 | 460 |
| UnitedHealth Group Inc. | 6.000% | 6/15/17 | 2,775 | 3,194 |
| UnitedHealth Group Inc. | 1.400% | 10/15/17 | 2,500 | 2,476 |
| UnitedHealth Group Inc. | 6.000% | 2/15/18 | 7,875 | 9,083 |
| Unum Group | 7.125% | 9/30/16 | 1,800 | 2,045 |
| WellPoint Inc. | 5.000% | 12/15/14 | 1,475 | 1,537 |
| WellPoint Inc. | 1.250% | 9/10/15 | 5,235 | 5,278 |
| WellPoint Inc. | 5.250% | 1/15/16 | 8,025 | 8,676 |
| WellPoint Inc. | 2.375% | 2/15/17 | 1,200 | 1,218 |
| WellPoint Inc. | 5.875% | 6/15/17 | 1,885 | 2,131 |
| WellPoint Inc. | 1.875% | 1/15/18 | 625 | 617 |
| Willis Group Holdings plc | 4.125% | 3/15/16 | 2,525 | 2,647 |
| Willis North America Inc. | 6.200% | 3/28/17 | 2,200 | 2,420 |
| XL Group plc | 5.250% | 9/15/14 | 1,455 | 1,500 |
| XLIT Ltd. | 2.300% | 12/15/18 | 1,100 | 1,083 |
| Other Finance (0.0%) | ||||
| IntercontinentalExchange Group Inc. | 2.500% | 10/15/18 | 425 | 428 |
| NASDAQ OMX Group Inc. | 4.000% | 1/15/15 | 1,750 | 1,799 |
| NYSE Euronext | 2.000% | 10/5/17 | 4,325 | 4,307 |
| ORIX Corp. | 4.710% | 4/27/15 | 750 | 782 |
| ORIX Corp. | 5.000% | 1/12/16 | 4,590 | 4,885 |
| ORIX Corp. | 3.750% | 3/9/17 | 3,450 | 3,585 |
| Real Estate Investment Trusts (0.4%) | ||||
| Arden Realty LP | 5.250% | 3/1/15 | 1,250 | 1,305 |
| AvalonBay Communities Inc. | 5.750% | 9/15/16 | 1,250 | 1,397 |
| BioMed Realty LP | 3.850% | 4/15/16 | 3,700 | 3,860 |
| Brandywine Operating Partnership LP | 5.700% | 5/1/17 | 3,475 | 3,803 |
| Brandywine Operating Partnership LP | 4.950% | 4/15/18 | 200 | 214 |
| BRE Properties Inc. | 5.500% | 3/15/17 | 2,175 | 2,384 |
| CommonWealth REIT | 6.250% | 6/15/17 | 2,200 | 2,336 |
| CommonWealth REIT | 6.650% | 1/15/18 | 2,850 | 3,120 |
| Digital Realty Trust LP | 4.500% | 7/15/15 | 5,225 | 5,453 |
| Duke Realty LP | 7.375% | 2/15/15 | 2,700 | 2,888 |
| ERP Operating LP | 6.584% | 4/13/15 | 820 | 879 |
| ERP Operating LP | 5.125% | 3/15/16 | 2,565 | 2,791 |
| ERP Operating LP | 5.375% | 8/1/16 | 3,575 | 3,947 |
| ERP Operating LP | 5.750% | 6/15/17 | 4,507 | 5,055 |
| HCP Inc. | 3.750% | 2/1/16 | 4,600 | 4,822 |
| HCP Inc. | 6.300% | 9/15/16 | 1,000 | 1,125 |
| HCP Inc. | 6.700% | 1/30/18 | 4,500 | 5,216 |
| Health Care REIT Inc. | 3.625% | 3/15/16 | 4,950 | 5,182 |
| Health Care REIT Inc. | 6.200% | 6/1/16 | 975 | 1,082 |
| Health Care REIT Inc. | 4.700% | 9/15/17 | 50 | 54 |
| Health Care REIT Inc. | 2.250% | 3/15/18 | 6,514 | 6,444 |
| Hospitality Properties Trust | 5.625% | 3/15/17 | 2,575 | 2,799 |
| Hospitality Properties Trust | 6.700% | 1/15/18 | 2,000 | 2,224 |
| Kilroy Realty LP | 5.000% | 11/3/15 | 2,325 | 2,485 |
| Kilroy Realty LP | 4.800% | 7/15/18 | 850 | 913 |
| Kimco Realty Corp. | 5.783% | 3/15/16 | 1,025 | 1,120 |
| Kimco Realty Corp. | 5.700% | 5/1/17 | 1,500 | 1,666 |
| Kimco Realty Corp. | 4.300% | 2/1/18 | 1,250 | 1,328 |
| Liberty Property LP | 5.125% | 3/2/15 | 4,500 | 4,697 |
| Mack-Cali Realty LP | 2.500% | 12/15/17 | 1,650 | 1,642 |
| ProLogis LP | 4.500% | 8/15/17 | 200 | 216 |
11
| Vanguard® Short-Term Bond Index Fund | ||||
| Schedule of Investments | ||||
| December 31, 2013 | ||||
| Face | Market | |||
| Maturity | Amount | Value | ||
| Coupon | Date | ($000) | ($000) | |
| ProLogis LP | 6.625% | 5/15/18 | 5,109 | 5,964 |
| Realty Income Corp. | 2.000% | 1/31/18 | 3,700 | 3,624 |
| Regency Centers LP | 5.250% | 8/1/15 | 3,200 | 3,395 |
| Senior Housing Properties Trust | 4.300% | 1/15/16 | 1,000 | 1,037 |
| Simon Property Group LP | 4.200% | 2/1/15 | 6,100 | 6,279 |
| Simon Property Group LP | 5.100% | 6/15/15 | 3,000 | 3,192 |
| Simon Property Group LP | 5.250% | 12/1/16 | 6,225 | 6,894 |
| Simon Property Group LP | 2.800% | 1/30/17 | 4,500 | 4,616 |
| Simon Property Group LP | 2.150% | 9/15/17 | 2,935 | 2,979 |
| Simon Property Group LP | 6.125% | 5/30/18 | 3,225 | 3,735 |
| Tanger Properties LP | 6.150% | 11/15/15 | 50 | 54 |
| UDR Inc. | 4.250% | 6/1/18 | 850 | 895 |
| Ventas Realty LP / Ventas Capital Corp. | 3.125% | 11/30/15 | 1,100 | 1,144 |
| Ventas Realty LP / Ventas Capital Corp. | 2.000% | 2/15/18 | 7,700 | 7,570 |
| Vornado Realty LP | 4.250% | 4/1/15 | 1,000 | 1,033 |
| 3,374,539 | ||||
| Industrial (10.9%) | ||||
| Basic Industry (0.8%) | ||||
| Air Products & Chemicals Inc. | 2.000% | 8/2/16 | 3,975 | 4,064 |
| Airgas Inc. | 3.250% | 10/1/15 | 2,950 | 3,057 |
| Airgas Inc. | 1.650% | 2/15/18 | 1,650 | 1,612 |
| Alcoa Inc. | 5.550% | 2/1/17 | 2,600 | 2,818 |
| Alcoa Inc. | 6.750% | 7/15/18 | 5,875 | 6,672 |
| Barrick North America Finance LLC | 6.800% | 9/15/18 | 575 | 662 |
| BHP Billiton Finance USA Ltd. | 1.000% | 2/24/15 | 3,250 | 3,270 |
| BHP Billiton Finance USA Ltd. | 1.875% | 11/21/16 | 2,650 | 2,709 |
| BHP Billiton Finance USA Ltd. | 1.625% | 2/24/17 | 15,926 | 15,949 |
| BHP Billiton Finance USA Ltd. | 5.400% | 3/29/17 | 1,675 | 1,867 |
| BHP Billiton Finance USA Ltd. | 2.050% | 9/30/18 | 12,665 | 12,627 |
| Celulosa Arauco y Constitucion SA | 5.625% | 4/20/15 | 3,475 | 3,661 |
| CF Industries Inc. | 6.875% | 5/1/18 | 5,000 | 5,806 |
| Dow Chemical Co. | 2.500% | 2/15/16 | 2,530 | 2,609 |
| Dow Chemical Co. | 5.700% | 5/15/18 | 5,375 | 6,144 |
| Eastman Chemical Co. | 3.000% | 12/15/15 | 1,025 | 1,063 |
| Eastman Chemical Co. | 2.400% | 6/1/17 | 10,098 | 10,225 |
| Ecolab Inc. | 1.000% | 8/9/15 | 1,987 | 1,994 |
| Ecolab Inc. | 3.000% | 12/8/16 | 7,200 | 7,553 |
| Ecolab Inc. | 1.450% | 12/8/17 | 3,725 | 3,650 |
| EI du Pont de Nemours & Co. | 3.250% | 1/15/15 | 5,000 | 5,147 |
| EI du Pont de Nemours & Co. | 2.750% | 4/1/16 | 2,000 | 2,086 |
| EI du Pont de Nemours & Co. | 5.250% | 12/15/16 | 5,990 | 6,729 |
| EI du Pont de Nemours & Co. | 6.000% | 7/15/18 | 7,325 | 8,512 |
| Freeport-McMoRan Copper & Gold Inc. | 1.400% | 2/13/15 | 125 | 126 |
| Freeport-McMoRan Copper & Gold Inc. | 2.150% | 3/1/17 | 1,875 | 1,894 |
| Freeport-McMoRan Copper & Gold Inc. | 2.375% | 3/15/18 | 13,180 | 13,160 |
| Georgia-Pacific LLC | 7.700% | 6/15/15 | 1,250 | 1,370 |
| Glencore Canada Corp. | 6.000% | 10/15/15 | 1,575 | 1,705 |
| Goldcorp Inc. | 2.125% | 3/15/18 | 7,450 | 7,263 |
| International Paper Co. | 5.300% | 4/1/15 | 3,000 | 3,166 |
| International Paper Co. | 5.250% | 4/1/16 | 2,950 | 3,202 |
| International Paper Co. | 7.950% | 6/15/18 | 12,075 | 14,755 |
| Lubrizol Corp. | 5.500% | 10/1/14 | 1,850 | 1,920 |
| Monsanto Co. | 2.750% | 4/15/16 | 1,250 | 1,305 |
| Monsanto Co. | 5.125% | 4/15/18 | 925 | 1,040 |
| Nucor Corp. | 5.750% | 12/1/17 | 5,609 | 6,384 |
| Nucor Corp. | 5.850% | 6/1/18 | 1,300 | 1,475 |
| Plum Creek Timberlands LP | 5.875% | 11/15/15 | 1,650 | 1,789 |
| Potash Corp. of Saskatchewan Inc. | 3.750% | 9/30/15 | 6,000 | 6,293 |
| Potash Corp. of Saskatchewan Inc. | 3.250% | 12/1/17 | 1,225 | 1,279 |
| PPG Industries Inc. | 1.900% | 1/15/16 | 3,675 | 3,733 |
| PPG Industries Inc. | 6.650% | 3/15/18 | 950 | 1,106 |
| Praxair Inc. | 4.625% | 3/30/15 | 1,625 | 1,708 |
| Praxair Inc. | 5.375% | 11/1/16 | 700 | 785 |
12
| Vanguard® Short-Term Bond Index Fund | ||||
| Schedule of Investments | ||||
| December 31, 2013 | ||||
| Face | Market | |||
| Maturity | Amount | Value | ||
| Coupon | Date | ($000) | ($000) | |
| Praxair Inc. | 5.200% | 3/15/17 | 1,250 | 1,387 |
| Praxair Inc. | 1.050% | 11/7/17 | 7,000 | 6,840 |
| Praxair Inc. | 1.250% | 11/7/18 | 2,500 | 2,401 |
| Rio Tinto Finance USA Ltd. | 1.875% | 11/2/15 | 11,695 | 11,886 |
| Rio Tinto Finance USA Ltd. | 2.500% | 5/20/16 | 2,025 | 2,085 |
| Rio Tinto Finance USA Ltd. | 2.250% | 9/20/16 | 1,950 | 2,010 |
| Rio Tinto Finance USA Ltd. | 6.500% | 7/15/18 | 4,525 | 5,323 |
| Rio Tinto Finance USA plc | 1.125% | 3/20/15 | 2,670 | 2,685 |
| Rio Tinto Finance USA plc | 1.375% | 6/17/16 | 5,000 | 5,032 |
| Rio Tinto Finance USA plc | 2.000% | 3/22/17 | 10,700 | 10,734 |
| Rio Tinto Finance USA plc | 1.625% | 8/21/17 | 2,500 | 2,496 |
| Rio Tinto Finance USA plc | 2.250% | 12/14/18 | 3,750 | 3,728 |
| Sherwin-Williams Co. | 3.125% | 12/15/14 | 1,900 | 1,946 |
| Teck Resources Ltd. | 3.150% | 1/15/17 | 3,575 | 3,696 |
| Teck Resources Ltd. | 3.850% | 8/15/17 | 50 | 53 |
| Teck Resources Ltd. | 2.500% | 2/1/18 | 1,950 | 1,969 |
| Vale Canada Ltd. | 5.700% | 10/15/15 | 1,125 | 1,205 |
| Vale Overseas Ltd. | 6.250% | 1/11/16 | 5,425 | 5,908 |
| Vale Overseas Ltd. | 6.250% | 1/23/17 | 9,500 | 10,547 |
| Capital Goods (1.0%) | ||||
| 3M Co. | 1.375% | 9/29/16 | 5,650 | 5,735 |
| 3M Co. | 1.000% | 6/26/17 | 3,000 | 2,973 |
| Black & Decker Corp. | 5.750% | 11/15/16 | 625 | 703 |
| Boeing Capital Corp. | 2.125% | 8/15/16 | 4,675 | 4,824 |
| Boeing Co. | 3.500% | 2/15/15 | 17,425 | 17,993 |
| Boeing Co. | 3.750% | 11/20/16 | 700 | 756 |
| Caterpillar Financial Services Corp. | 1.050% | 3/26/15 | 800 | 805 |
| Caterpillar Financial Services Corp. | 1.100% | 5/29/15 | 2,320 | 2,341 |
| Caterpillar Financial Services Corp. | 4.625% | 6/1/15 | 2,000 | 2,114 |
| Caterpillar Financial Services Corp. | 0.700% | 11/6/15 | 2,335 | 2,341 |
| Caterpillar Financial Services Corp. | 2.650% | 4/1/16 | 1,725 | 1,790 |
| Caterpillar Financial Services Corp. | 2.050% | 8/1/16 | 6,650 | 6,829 |
| Caterpillar Financial Services Corp. | 1.625% | 6/1/17 | 15,000 | 14,971 |
| Caterpillar Financial Services Corp. | 1.250% | 11/6/17 | 4,225 | 4,167 |
| Caterpillar Financial Services Corp. | 1.300% | 3/1/18 | 4,250 | 4,140 |
| Caterpillar Financial Services Corp. | 5.450% | 4/15/18 | 350 | 397 |
| Caterpillar Financial Services Corp. | 2.450% | 9/6/18 | 2,800 | 2,838 |
| Caterpillar Inc. | 0.950% | 6/26/15 | 7,230 | 7,279 |
| Caterpillar Inc. | 5.700% | 8/15/16 | 675 | 758 |
| Caterpillar Inc. | 1.500% | 6/26/17 | 5,125 | 5,115 |
| Cooper US Inc. | 2.375% | 1/15/16 | 2,500 | 2,575 |
| Cooper US Inc. | 6.100% | 7/1/17 | 500 | 569 |
| Crane Co. | 2.750% | 12/15/18 | 2,500 | 2,494 |
| CRH America Inc. | 4.125% | 1/15/16 | 8,500 | 8,969 |
| CRH America Inc. | 6.000% | 9/30/16 | 4,350 | 4,864 |
| Danaher Corp. | 2.300% | 6/23/16 | 1,500 | 1,548 |
| Danaher Corp. | 5.625% | 1/15/18 | 700 | 801 |
| Eaton Corp. | 0.950% | 11/2/15 | 100 | 100 |
| Eaton Corp. | 1.500% | 11/2/17 | 8,200 | 8,085 |
| Eaton Corp. | 5.600% | 5/15/18 | 3,725 | 4,190 |
| Exelis Inc. | 4.250% | 10/1/16 | 1,175 | 1,240 |
| General Dynamics Corp. | 1.375% | 1/15/15 | 6,000 | 6,061 |
| General Dynamics Corp. | 1.000% | 11/15/17 | 6,000 | 5,823 |
| General Electric Co. | 0.850% | 10/9/15 | 7,875 | 7,924 |
| General Electric Co. | 5.250% | 12/6/17 | 29,850 | 33,869 |
| Harsco Corp. | 5.750% | 5/15/18 | 1,220 | 1,280 |
| Honeywell International Inc. | 5.300% | 3/1/18 | 1,525 | 1,732 |
| Illinois Tool Works Inc. | 5.150% | 4/1/14 | 3,775 | 3,817 |
| Ingersoll-Rand Global Holding Co. Ltd. | 6.875% | 8/15/18 | 50 | 59 |
| John Deere Capital Corp. | 2.950% | 3/9/15 | 13,675 | 14,077 |
| John Deere Capital Corp. | 0.875% | 4/17/15 | 12,550 | 12,626 |
| John Deere Capital Corp. | 0.950% | 6/29/15 | 5,690 | 5,736 |
| John Deere Capital Corp. | 0.700% | 9/4/15 | 2,800 | 2,813 |
13
| Vanguard® Short-Term Bond Index Fund | ||||
| Schedule of Investments | ||||
| December 31, 2013 | ||||
| Face | Market | |||
| Maturity | Amount | Value | ||
| Coupon | Date | ($000) | ($000) | |
| John Deere Capital Corp. | 2.250% | 6/7/16 | 150 | 155 |
| John Deere Capital Corp. | 1.850% | 9/15/16 | 5,650 | 5,781 |
| John Deere Capital Corp. | 1.400% | 3/15/17 | 8,000 | 7,984 |
| John Deere Capital Corp. | 1.300% | 3/12/18 | 300 | 294 |
| John Deere Capital Corp. | 5.350% | 4/3/18 | 350 | 394 |
| John Deere Capital Corp. | 1.950% | 12/13/18 | 1,500 | 1,490 |
| Joy Global Inc. | 6.000% | 11/15/16 | 875 | 976 |
| L-3 Communications Corp. | 3.950% | 11/15/16 | 2,100 | 2,233 |
| Lockheed Martin Corp. | 2.125% | 9/15/16 | 7,400 | 7,612 |
| Martin Marietta Materials Inc. | 6.600% | 4/15/18 | 100 | 113 |
| Mohawk Industries Inc. | 6.125% | 1/15/16 | 9,000 | 9,856 |
| Northrop Grumman Corp. | 1.750% | 6/1/18 | 1,375 | 1,347 |
| Owens Corning | 6.500% | 12/1/16 | 4,447 | 4,931 |
| Pentair Finance SA | 1.350% | 12/1/15 | 1,000 | 1,006 |
| Precision Castparts Corp. | 0.700% | 12/20/15 | 7,125 | 7,140 |
| Precision Castparts Corp. | 1.250% | 1/15/18 | 4,075 | 3,991 |
| Raytheon Co. | 6.750% | 3/15/18 | 3,000 | 3,553 |
| Raytheon Co. | 6.400% | 12/15/18 | 500 | 593 |
| Republic Services Inc. | 3.800% | 5/15/18 | 150 | 159 |
| Roper Industries Inc. | 1.850% | 11/15/17 | 4,350 | 4,320 |
| Roper Industries Inc. | 2.050% | 10/1/18 | 4,650 | 4,535 |
| United Technologies Corp. | 4.875% | 5/1/15 | 10,000 | 10,586 |
| United Technologies Corp. | 1.800% | 6/1/17 | 14,735 | 14,981 |
| United Technologies Corp. | 5.375% | 12/15/17 | 2,410 | 2,747 |
| Waste Management Inc. | 6.375% | 3/11/15 | 1,600 | 1,703 |
| Waste Management Inc. | 2.600% | 9/1/16 | 2,500 | 2,584 |
| Waste Management Inc. | 6.100% | 3/15/18 | 2,350 | 2,708 |
| Communication (1.7%) | ||||
| 21st Century Fox America Inc. | 5.300% | 12/15/14 | 2,450 | 2,560 |
| America Movil SAB de CV | 5.750% | 1/15/15 | 5,938 | 6,217 |
| America Movil SAB de CV | 3.625% | 3/30/15 | 6,600 | 6,809 |
| America Movil SAB de CV | 2.375% | 9/8/16 | 5,550 | 5,686 |
| American Tower Corp. | 4.625% | 4/1/15 | 3,709 | 3,880 |
| American Tower Corp. | 4.500% | 1/15/18 | 11,550 | 12,423 |
| AT&T Inc. | 2.500% | 8/15/15 | 16,875 | 17,322 |
| AT&T Inc. | 0.800% | 12/1/15 | 2,075 | 2,072 |
| AT&T Inc. | 0.900% | 2/12/16 | 8,094 | 8,075 |
| AT&T Inc. | 2.950% | 5/15/16 | 6,425 | 6,714 |
| AT&T Inc. | 5.625% | 6/15/16 | 4,175 | 4,626 |
| AT&T Inc. | 2.400% | 8/15/16 | 4,200 | 4,330 |
| AT&T Inc. | 1.600% | 2/15/17 | 14,750 | 14,757 |
| AT&T Inc. | 1.700% | 6/1/17 | 11,888 | 11,950 |
| AT&T Inc. | 1.400% | 12/1/17 | 15,275 | 15,050 |
| AT&T Inc. | 5.500% | 2/1/18 | 15,579 | 17,613 |
| AT&T Inc. | 5.600% | 5/15/18 | 5,400 | 6,144 |
| AT&T Inc. | 2.375% | 11/27/18 | 3,650 | 3,657 |
| British Telecommunications plc | 2.000% | 6/22/15 | 14,550 | 14,802 |
| British Telecommunications plc | 5.950% | 1/15/18 | 3,825 | 4,369 |
| CBS Corp. | 1.950% | 7/1/17 | 1,925 | 1,936 |
| CC Holdings GS V LLC / Crown Castle GS III Corp. | 2.381% | 12/15/17 | 2,325 | 2,303 |
| Cellco Partnership / Verizon Wireless Capital LLC | 8.500% | 11/15/18 | 10,000 | 12,716 |
| Comcast Cable Communications LLC | 8.875% | 5/1/17 | 1,000 | 1,227 |
| Comcast Corp. | 6.500% | 1/15/15 | 500 | 530 |
| Comcast Corp. | 5.850% | 11/15/15 | 12,600 | 13,778 |
| Comcast Corp. | 5.900% | 3/15/16 | 9,122 | 10,092 |
| Comcast Corp. | 4.950% | 6/15/16 | 2,175 | 2,376 |
| Comcast Corp. | 6.500% | 1/15/17 | 3,093 | 3,550 |
| Comcast Corp. | 6.300% | 11/15/17 | 4,400 | 5,134 |
| Comcast Corp. | 5.875% | 2/15/18 | 7,225 | 8,317 |
| Comcast Corp. | 5.700% | 5/15/18 | 6,386 | 7,352 |
| COX Communications Inc. | 5.500% | 10/1/15 | 1,775 | 1,905 |
| Deutsche Telekom International Finance BV | 5.750% | 3/23/16 | 3,900 | 4,276 |
| Deutsche Telekom International Finance BV | 6.750% | 8/20/18 | 5,400 | 6,360 |
14
| Vanguard® Short-Term Bond Index Fund | ||||
| Schedule of Investments | ||||
| December 31, 2013 | ||||
| Face | Market | |||
| Maturity | Amount | Value | ||
| Coupon | Date | ($000) | ($000) | |
| DIRECTV Holdings LLC / DIRECTV Financing Co. Inc. | 3.550% | 3/15/15 | 5,835 | 6,028 |
| DIRECTV Holdings LLC / DIRECTV Financing Co. Inc. | 3.125% | 2/15/16 | 3,765 | 3,917 |
| DIRECTV Holdings LLC / DIRECTV Financing Co. Inc. | 3.500% | 3/1/16 | 13,625 | 14,296 |
| DIRECTV Holdings LLC / DIRECTV Financing Co. Inc. | 2.400% | 3/15/17 | 9,000 | 9,186 |
| DIRECTV Holdings LLC / DIRECTV Financing Co. Inc. | 1.750% | 1/15/18 | 3,000 | 2,944 |
| Discovery Communications LLC | 3.700% | 6/1/15 | 3,950 | 4,112 |
| Embarq Corp. | 7.082% | 6/1/16 | 9,275 | 10,388 |
| GTE Corp. | 6.840% | 4/15/18 | 2,200 | 2,564 |
| NBCUniversal Media LLC | 3.650% | 4/30/15 | 4,650 | 4,836 |
| NBCUniversal Media LLC | 2.875% | 4/1/16 | 9,250 | 9,625 |
| Nippon Telegraph & Telephone Corp. | 1.400% | 7/18/17 | 2,325 | 2,294 |
| Omnicom Group Inc. | 5.900% | 4/15/16 | 15,015 | 16,603 |
| Orange SA | 2.125% | 9/16/15 | 600 | 610 |
| Orange SA | 2.750% | 9/14/16 | 3,150 | 3,270 |
| Qwest Corp. | 6.500% | 6/1/17 | 4,450 | 4,991 |
| Rogers Communications Inc. | 6.375% | 3/1/14 | 200 | 202 |
| Rogers Communications Inc. | 7.500% | 3/15/15 | 3,000 | 3,244 |
| Rogers Communications Inc. | 6.800% | 8/15/18 | 4,190 | 5,001 |
| Scripps Networks Interactive Inc. | 2.700% | 12/15/16 | 2,325 | 2,414 |
| Telefonica Emisiones SAU | 4.949% | 1/15/15 | 3,388 | 3,522 |
| Telefonica Emisiones SAU | 3.729% | 4/27/15 | 5,825 | 6,015 |
| Telefonica Emisiones SAU | 3.992% | 2/16/16 | 12,500 | 13,109 |
| Telefonica Emisiones SAU | 6.421% | 6/20/16 | 5,000 | 5,580 |
| Telefonica Emisiones SAU | 3.192% | 4/27/18 | 6,400 | 6,523 |
| Thomson Reuters Corp. | 1.300% | 2/23/17 | 5,000 | 4,973 |
| Thomson Reuters Corp. | 6.500% | 7/15/18 | 325 | 377 |
| Time Warner Cable Inc. | 3.500% | 2/1/15 | 1,125 | 1,155 |
| Time Warner Cable Inc. | 5.850% | 5/1/17 | 8,800 | 9,635 |
| Time Warner Cable Inc. | 6.750% | 7/1/18 | 12,000 | 13,562 |
| Verizon Communications Inc. | 4.900% | 9/15/15 | 64 | 68 |
| Verizon Communications Inc. | 0.700% | 11/2/15 | 518 | 517 |
| Verizon Communications Inc. | 5.550% | 2/15/16 | 10,000 | 10,939 |
| Verizon Communications Inc. | 3.000% | 4/1/16 | 12,830 | 13,383 |
| Verizon Communications Inc. | 2.500% | 9/15/16 | 26,040 | 26,966 |
| Verizon Communications Inc. | 2.000% | 11/1/16 | 5,265 | 5,384 |
| Verizon Communications Inc. | 5.500% | 4/1/17 | 100 | 113 |
| Verizon Communications Inc. | 1.100% | 11/1/17 | 4,500 | 4,402 |
| Verizon Communications Inc. | 5.500% | 2/15/18 | 13,250 | 14,979 |
| Verizon Communications Inc. | 6.100% | 4/15/18 | 7,375 | 8,544 |
| Verizon Communications Inc. | 3.650% | 9/14/18 | 26,630 | 28,190 |
| Verizon Communications Inc. | 8.750% | 11/1/18 | 454 | 581 |
| Vodafone Group plc | 5.000% | 9/15/15 | 1,000 | 1,071 |
| Vodafone Group plc | 3.375% | 11/24/15 | 4,527 | 4,741 |
| Vodafone Group plc | 0.900% | 2/19/16 | 5,124 | 5,111 |
| Vodafone Group plc | 5.750% | 3/15/16 | 5,350 | 5,869 |
| Vodafone Group plc | 5.625% | 2/27/17 | 8,762 | 9,866 |
| Vodafone Group plc | 1.625% | 3/20/17 | 5,200 | 5,194 |
| Vodafone Group plc | 1.250% | 9/26/17 | 4,250 | 4,139 |
| Vodafone Group plc | 1.500% | 2/19/18 | 7,000 | 6,831 |
| Vodafone Group plc | 4.625% | 7/15/18 | 5,320 | 5,882 |
| WPP Finance UK | 8.000% | 9/15/14 | 4,475 | 4,694 |
| Consumer Cyclical (1.6%) | ||||
| Amazon.com Inc. | 0.650% | 11/27/15 | 9,372 | 9,371 |
| Amazon.com Inc. | 1.200% | 11/29/17 | 4,200 | 4,123 |
| American Honda Finance Corp. | 1.125% | 10/7/16 | 5,500 | 5,513 |
| American Honda Finance Corp. | 2.125% | 10/10/18 | 4,900 | 4,864 |
| AutoZone Inc. | 5.500% | 11/15/15 | 1,075 | 1,164 |
| AutoZone Inc. | 7.125% | 8/1/18 | 3,975 | 4,730 |
| Brinker International Inc. | 2.600% | 5/15/18 | 850 | 841 |
| Carnival Corp. | 1.200% | 2/5/16 | 1,950 | 1,945 |
| Carnival Corp. | 1.875% | 12/15/17 | 2,525 | 2,505 |
| Costco Wholesale Corp. | 0.650% | 12/7/15 | 5,825 | 5,845 |
| Costco Wholesale Corp. | 5.500% | 3/15/17 | 2,225 | 2,502 |
15
| Vanguard® Short-Term Bond Index Fund | ||||
| Schedule of Investments | ||||
| December 31, 2013 | ||||
| Face | Market | |||
| Maturity | Amount | Value | ||
| Coupon | Date | ($000) | ($000) | |
| Costco Wholesale Corp. | 1.125% | 12/15/17 | 9,525 | 9,354 |
| CVS Caremark Corp. | 3.250% | 5/18/15 | 11,550 | 11,950 |
| CVS Caremark Corp. | 6.125% | 8/15/16 | 600 | 676 |
| CVS Caremark Corp. | 1.200% | 12/5/16 | 1,000 | 1,003 |
| CVS Caremark Corp. | 5.750% | 6/1/17 | 4,910 | 5,576 |
| CVS Caremark Corp. | 2.250% | 12/5/18 | 1,500 | 1,503 |
| Dollar General Corp. | 4.125% | 7/15/17 | 4,000 | 4,255 |
| eBay Inc. | 1.625% | 10/15/15 | 1,975 | 2,014 |
| eBay Inc. | 1.350% | 7/15/17 | 4,475 | 4,469 |
| Expedia Inc. | 7.456% | 8/15/18 | 2,500 | 2,913 |
| Ford Motor Credit Co. LLC | 3.875% | 1/15/15 | 10,425 | 10,756 |
| Ford Motor Credit Co. LLC | 7.000% | 4/15/15 | 14,725 | 15,838 |
| Ford Motor Credit Co. LLC | 2.750% | 5/15/15 | 7,175 | 7,360 |
| Ford Motor Credit Co. LLC | 12.000% | 5/15/15 | 4,650 | 5,333 |
| Ford Motor Credit Co. LLC | 5.625% | 9/15/15 | 7,400 | 7,952 |
| Ford Motor Credit Co. LLC | 2.500% | 1/15/16 | 858 | 878 |
| Ford Motor Credit Co. LLC | 4.207% | 4/15/16 | 12,700 | 13,535 |
| Ford Motor Credit Co. LLC | 3.984% | 6/15/16 | 2,250 | 2,389 |
| Ford Motor Credit Co. LLC | 8.000% | 12/15/16 | 5,300 | 6,260 |
| Ford Motor Credit Co. LLC | 4.250% | 2/3/17 | 8,325 | 8,962 |
| Ford Motor Credit Co. LLC | 3.000% | 6/12/17 | 4,902 | 5,083 |
| Ford Motor Credit Co. LLC | 6.625% | 8/15/17 | 7,800 | 9,012 |
| Ford Motor Credit Co. LLC | 2.375% | 1/16/18 | 9,150 | 9,237 |
| Ford Motor Credit Co. LLC | 5.000% | 5/15/18 | 11,206 | 12,446 |
| Ford Motor Credit Co. LLC | 2.875% | 10/1/18 | 3,000 | 3,069 |
| Historic TW Inc. | 6.875% | 6/15/18 | 550 | 656 |
| Home Depot Inc. | 5.400% | 3/1/16 | 15,575 | 17,131 |
| Home Depot Inc. | 2.250% | 9/10/18 | 5,875 | 5,971 |
| Hyatt Hotels Corp. | 3.875% | 8/15/16 | 1,075 | 1,137 |
| Johnson Controls Inc. | 1.750% | 3/1/14 | 1,000 | 1,002 |
| Johnson Controls Inc. | 5.500% | 1/15/16 | 1,450 | 1,575 |
| Johnson Controls Inc. | 2.600% | 12/1/16 | 800 | 829 |
| Kohl's Corp. | 6.250% | 12/15/17 | 6,075 | 6,978 |
| Lowe's Cos. Inc. | 2.125% | 4/15/16 | 500 | 513 |
| Lowe's Cos. Inc. | 5.400% | 10/15/16 | 9,825 | 10,964 |
| Lowe's Cos. Inc. | 1.625% | 4/15/17 | 5,450 | 5,501 |
| Macy's Retail Holdings Inc. | 7.875% | 7/15/15 | 10,125 | 11,164 |
| Macy's Retail Holdings Inc. | 5.900% | 12/1/16 | 4,062 | 4,560 |
| Marriott International Inc. | 6.200% | 6/15/16 | 1,400 | 1,559 |
| Marriott International Inc. | 6.375% | 6/15/17 | 1,275 | 1,452 |
| McDonald's Corp. | 0.750% | 5/29/15 | 4,500 | 4,520 |
| McDonald's Corp. | 5.300% | 3/15/17 | 500 | 560 |
| McDonald's Corp. | 5.800% | 10/15/17 | 3,750 | 4,322 |
| McDonald's Corp. | 5.350% | 3/1/18 | 4,836 | 5,506 |
| Nordstrom Inc. | 6.750% | 6/1/14 | 1,150 | 1,179 |
| Nordstrom Inc. | 6.250% | 1/15/18 | 1,475 | 1,706 |
| PACCAR Financial Corp. | 1.050% | 6/5/15 | 1,300 | 1,310 |
| PACCAR Financial Corp. | 0.800% | 2/8/16 | 2,750 | 2,747 |
| PACCAR Financial Corp. | 1.150% | 8/16/16 | 5,125 | 5,140 |
| PACCAR Financial Corp. | 1.600% | 3/15/17 | 1,350 | 1,346 |
| Ralph Lauren Corp. | 2.125% | 9/26/18 | 1,700 | 1,699 |
| Staples Inc. | 2.750% | 1/12/18 | 3,000 | 3,048 |
| Starbucks Corp. | 0.875% | 12/5/16 | 2,700 | 2,689 |
| Starbucks Corp. | 6.250% | 8/15/17 | 1,250 | 1,457 |
| Starbucks Corp. | 2.000% | 12/5/18 | 1,975 | 1,960 |
| Starwood Hotels & Resorts Worldwide Inc. | 7.375% | 11/15/15 | 115 | 128 |
| Starwood Hotels & Resorts Worldwide Inc. | 6.750% | 5/15/18 | 2,105 | 2,433 |
| Target Corp. | 1.125% | 7/18/14 | 1,050 | 1,055 |
| Target Corp. | 5.875% | 7/15/16 | 3,225 | 3,636 |
| Target Corp. | 5.375% | 5/1/17 | 5,850 | 6,585 |
| Target Corp. | 6.000% | 1/15/18 | 4,450 | 5,137 |
| Time Warner Inc. | 3.150% | 7/15/15 | 9,000 | 9,334 |
| Time Warner Inc. | 5.875% | 11/15/16 | 50 | 56 |
| TJX Cos. Inc. | 4.200% | 8/15/15 | 4,590 | 4,844 |
16
| Vanguard® Short-Term Bond Index Fund | ||||
| Schedule of Investments | ||||
| December 31, 2013 | ||||
| Face | Market | |||
| Maturity | Amount | Value | ||
| Coupon | Date | ($000) | ($000) | |
| Toyota Motor Credit Corp. | 1.000% | 2/17/15 | 5,325 | 5,358 |
| Toyota Motor Credit Corp. | 3.200% | 6/17/15 | 11,200 | 11,638 |
| Toyota Motor Credit Corp. | 0.875% | 7/17/15 | 13,125 | 13,190 |
| Toyota Motor Credit Corp. | 2.800% | 1/11/16 | 7,225 | 7,501 |
| Toyota Motor Credit Corp. | 2.000% | 9/15/16 | 6,500 | 6,657 |
| Toyota Motor Credit Corp. | 2.050% | 1/12/17 | 9,000 | 9,201 |
| Toyota Motor Credit Corp. | 1.250% | 10/5/17 | 3,155 | 3,094 |
| Toyota Motor Credit Corp. | 1.375% | 1/10/18 | 2,150 | 2,114 |
| Toyota Motor Credit Corp. | 2.000% | 10/24/18 | 11,000 | 10,969 |
| Viacom Inc. | 1.250% | 2/27/15 | 8,800 | 8,842 |
| Viacom Inc. | 4.250% | 9/15/15 | 2,300 | 2,429 |
| Viacom Inc. | 6.250% | 4/30/16 | 7,500 | 8,371 |
| Viacom Inc. | 2.500% | 12/15/16 | 1,425 | 1,474 |
| Viacom Inc. | 3.500% | 4/1/17 | 2,850 | 3,022 |
| Viacom Inc. | 2.500% | 9/1/18 | 1,000 | 1,009 |
| Wal-Mart Stores Inc. | 2.875% | 4/1/15 | 5,130 | 5,292 |
| Wal-Mart Stores Inc. | 4.500% | 7/1/15 | 689 | 731 |
| Wal-Mart Stores Inc. | 2.250% | 7/8/15 | 5,050 | 5,193 |
| Wal-Mart Stores Inc. | 1.500% | 10/25/15 | 14,975 | 15,261 |
| Wal-Mart Stores Inc. | 0.600% | 4/11/16 | 5,383 | 5,380 |
| Wal-Mart Stores Inc. | 5.800% | 2/15/18 | 11,390 | 13,168 |
| Wal-Mart Stores Inc. | 1.125% | 4/11/18 | 4,675 | 4,554 |
| Wal-Mart Stores Inc. | 1.950% | 12/15/18 | 475 | 474 |
| Walgreen Co. | 1.000% | 3/13/15 | 14,450 | 14,517 |
| Walgreen Co. | 1.800% | 9/15/17 | 6,825 | 6,879 |
| Walt Disney Co. | 1.350% | 8/16/16 | 3,750 | 3,799 |
| Walt Disney Co. | 1.125% | 2/15/17 | 11,436 | 11,416 |
| Walt Disney Co. | 1.100% | 12/1/17 | 6,075 | 6,003 |
| Western Union Co. | 5.930% | 10/1/16 | 2,150 | 2,387 |
| Western Union Co. | 2.875% | 12/10/17 | 4,600 | 4,705 |
| Wyndham Worldwide Corp. | 2.950% | 3/1/17 | 3,475 | 3,540 |
| Wyndham Worldwide Corp. | 2.500% | 3/1/18 | 225 | 225 |
| Yum! Brands Inc. | 6.250% | 4/15/16 | 150 | 167 |
| Consumer Noncyclical (2.9%) | ||||
| AbbVie Inc. | 1.200% | 11/6/15 | 25,490 | 25,765 |
| AbbVie Inc. | 1.750% | 11/6/17 | 23,325 | 23,275 |
| Actavis Inc. | 1.875% | 10/1/17 | 10,400 | 10,340 |
| Allergan Inc. | 1.350% | 3/15/18 | 2,975 | 2,892 |
| Altria Group Inc. | 4.125% | 9/11/15 | 11,125 | 11,755 |
| Altria Group Inc. | 9.700% | 11/10/18 | 6,032 | 7,945 |
| AmerisourceBergen Corp. | 5.875% | 9/15/15 | 2,175 | 2,359 |
| Amgen Inc. | 2.300% | 6/15/16 | 3,550 | 3,662 |
| Amgen Inc. | 2.500% | 11/15/16 | 2,625 | 2,726 |
| Amgen Inc. | 2.125% | 5/15/17 | 16,600 | 16,880 |
| Amgen Inc. | 5.850% | 6/1/17 | 11,725 | 13,324 |
| Anheuser-Busch Cos. LLC | 5.500% | 1/15/18 | 3,875 | 4,407 |
| Anheuser-Busch InBev Finance Inc. | 1.250% | 1/17/18 | 4,150 | 4,056 |
| Anheuser-Busch InBev Worldwide Inc. | 4.125% | 1/15/15 | 7,550 | 7,833 |
| Anheuser-Busch InBev Worldwide Inc. | 0.800% | 7/15/15 | 10,000 | 10,046 |
| Anheuser-Busch InBev Worldwide Inc. | 2.875% | 2/15/16 | 15,910 | 16,631 |
| Anheuser-Busch InBev Worldwide Inc. | 1.375% | 7/15/17 | 19,130 | 19,083 |
| Archer-Daniels-Midland Co. | 8.375% | 4/15/17 | 625 | 761 |
| Archer-Daniels-Midland Co. | 5.450% | 3/15/18 | 3,275 | 3,712 |
| AstraZeneca plc | 5.900% | 9/15/17 | 8,000 | 9,155 |
| Avon Products Inc. | 2.375% | 3/15/16 | 1,475 | 1,491 |
| Avon Products Inc. | 5.750% | 3/1/18 | 2,356 | 2,534 |
| Baxter International Inc. | 4.625% | 3/15/15 | 2,750 | 2,884 |
| Baxter International Inc. | 5.900% | 9/1/16 | 3,300 | 3,718 |
| Baxter International Inc. | 5.375% | 6/1/18 | 975 | 1,107 |
| Baxter International Inc. | 1.850% | 6/15/18 | 7,530 | 7,490 |
| Beam Inc. | 1.875% | 5/15/17 | 875 | 877 |
| Beam Inc. | 1.750% | 6/15/18 | 925 | 902 |
| Becton Dickinson & Co. | 1.750% | 11/8/16 | 300 | 305 |
17
| Vanguard® Short-Term Bond Index Fund | ||||
| Schedule of Investments | ||||
| December 31, 2013 | ||||
| Face | Market | |||
| Maturity | Amount | Value | ||
| Coupon | Date | ($000) | ($000) | |
| Biogen Idec Inc. | 6.875% | 3/1/18 | 4,950 | 5,815 |
| Boston Scientific Corp. | 6.250% | 11/15/15 | 8,000 | 8,747 |
| Boston Scientific Corp. | 6.400% | 6/15/16 | 6,000 | 6,717 |
| Boston Scientific Corp. | 5.125% | 1/12/17 | 1,850 | 2,019 |
| Bottling Group LLC | 6.950% | 3/15/14 | 9,725 | 9,849 |
| Bristol-Myers Squibb Co. | 0.875% | 8/1/17 | 5,750 | 5,620 |
| Bristol-Myers Squibb Co. | 5.450% | 5/1/18 | 4,025 | 4,599 |
| Brown-Forman Corp. | 2.500% | 1/15/16 | 625 | 647 |
| Brown-Forman Corp. | 1.000% | 1/15/18 | 2,275 | 2,195 |
| Bunge Ltd. Finance Corp. | 5.100% | 7/15/15 | 1,925 | 2,033 |
| Bunge Ltd. Finance Corp. | 4.100% | 3/15/16 | 1,375 | 1,452 |
| Bunge Ltd. Finance Corp. | 3.200% | 6/15/17 | 3,475 | 3,580 |
| Campbell Soup Co. | 3.050% | 7/15/17 | 1,975 | 2,067 |
| Cardinal Health Inc. | 4.000% | 6/15/15 | 1,875 | 1,963 |
| Cardinal Health Inc. | 1.700% | 3/15/18 | 8,550 | 8,394 |
| Catholic Health Initiatives Colorado GO | 1.600% | 11/1/17 | 1,450 | 1,407 |
| Celgene Corp. | 2.450% | 10/15/15 | 5,600 | 5,764 |
| Celgene Corp. | 1.900% | 8/15/17 | 2,150 | 2,141 |
| Church & Dwight Co. Inc. | 3.350% | 12/15/15 | 1,225 | 1,282 |
| Clorox Co. | 5.000% | 1/15/15 | 3,700 | 3,869 |
| Coca-Cola Co. | 1.500% | 11/15/15 | 12,125 | 12,347 |
| Coca-Cola Co. | 1.800% | 9/1/16 | 2,700 | 2,777 |
| Coca-Cola Co. | 5.350% | 11/15/17 | 15,900 | 18,073 |
| Coca-Cola Co. | 1.150% | 4/1/18 | 4,000 | 3,901 |
| Coca-Cola Co. | 1.650% | 11/1/18 | 4,175 | 4,120 |
| Coca-Cola Enterprises Inc. | 2.125% | 9/15/15 | 6,900 | 7,047 |
| Coca-Cola Femsa SAB de CV | 2.375% | 11/26/18 | 1,000 | 996 |
| Coca-Cola HBC Finance BV | 5.500% | 9/17/15 | 2,000 | 2,138 |
| Colgate-Palmolive Co. | 2.625% | 5/1/17 | 3,085 | 3,193 |
| Colgate-Palmolive Co. | 0.900% | 5/1/18 | 2,050 | 1,971 |
| Colgate-Palmolive Co. | 1.500% | 11/1/18 | 1,575 | 1,546 |
| ConAgra Foods Inc. | 1.300% | 1/25/16 | 7,575 | 7,600 |
| ConAgra Foods Inc. | 1.900% | 1/25/18 | 9,675 | 9,546 |
| Covidien International Finance SA | 1.350% | 5/29/15 | 5,203 | 5,249 |
| Covidien International Finance SA | 2.800% | 6/15/15 | 5,000 | 5,150 |
| CR Bard Inc. | 1.375% | 1/15/18 | 3,175 | 3,083 |
| Delhaize Group SA | 6.500% | 6/15/17 | 1,600 | 1,799 |
| DENTSPLY International Inc. | 2.750% | 8/15/16 | 1,500 | 1,544 |
| Diageo Capital plc | 5.500% | 9/30/16 | 4,450 | 4,984 |
| Diageo Capital plc | 1.500% | 5/11/17 | 8,375 | 8,384 |
| Diageo Capital plc | 5.750% | 10/23/17 | 3,875 | 4,421 |
| Diageo Capital plc | 1.125% | 4/29/18 | 2,750 | 2,649 |
| Diageo Finance BV | 5.300% | 10/28/15 | 3,075 | 3,332 |
| Dr Pepper Snapple Group Inc. | 2.900% | 1/15/16 | 4,600 | 4,777 |
| Dr Pepper Snapple Group Inc. | 6.820% | 5/1/18 | 2,962 | 3,494 |
| Edwards Lifesciences Corp. | 2.875% | 10/15/18 | 1,925 | 1,922 |
| Eli Lilly & Co. | 5.200% | 3/15/17 | 5,750 | 6,415 |
| Express Scripts Holding Co. | 2.100% | 2/12/15 | 9,200 | 9,335 |
| Express Scripts Holding Co. | 3.125% | 5/15/16 | 2,832 | 2,962 |
| Express Scripts Holding Co. | 3.500% | 11/15/16 | 12,500 | 13,246 |
| Express Scripts Holding Co. | 2.650% | 2/15/17 | 13,550 | 13,981 |
| Genentech Inc. | 4.750% | 7/15/15 | 5,500 | 5,847 |
| General Mills Inc. | 5.200% | 3/17/15 | 13,450 | 14,186 |
| General Mills Inc. | 5.700% | 2/15/17 | 300 | 336 |
| Genzyme Corp. | 3.625% | 6/15/15 | 5,125 | 5,350 |
| Gilead Sciences Inc. | 3.050% | 12/1/16 | 3,500 | 3,698 |
| GlaxoSmithKline Capital Inc. | 0.700% | 3/18/16 | 2,825 | 2,814 |
| GlaxoSmithKline Capital Inc. | 5.650% | 5/15/18 | 13,295 | 15,291 |
| GlaxoSmithKline Capital plc | 1.500% | 5/8/17 | 23,800 | 23,852 |
| Hasbro Inc. | 6.300% | 9/15/17 | 375 | 425 |
| Hershey Co. | 4.850% | 8/15/15 | 150 | 160 |
| Hershey Co. | 5.450% | 9/1/16 | 700 | 783 |
| Hershey Co. | 1.500% | 11/1/16 | 3,225 | 3,279 |
| Ingredion Inc. | 3.200% | 11/1/15 | 350 | 363 |
18
| Vanguard® Short-Term Bond Index Fund | ||||
| Schedule of Investments | ||||
| December 31, 2013 | ||||
| Face | Market | |||
| Maturity | Amount | Value | ||
| Coupon | Date | ($000) | ($000) | |
| Johnson & Johnson | 5.550% | 8/15/17 | 4,225 | 4,828 |
| Johnson & Johnson | 5.150% | 7/15/18 | 6,600 | 7,555 |
| Johnson & Johnson | 1.650% | 12/5/18 | 3,475 | 3,443 |
| Kellogg Co. | 1.125% | 5/15/15 | 1,302 | 1,311 |
| Kellogg Co. | 4.450% | 5/30/16 | 50 | 54 |
| Kellogg Co. | 1.875% | 11/17/16 | 6,000 | 6,106 |
| Kellogg Co. | 1.750% | 5/17/17 | 475 | 475 |
| Kellogg Co. | 3.250% | 5/21/18 | 5,150 | 5,382 |
| Kimberly-Clark Corp. | 4.875% | 8/15/15 | 175 | 187 |
| Kimberly-Clark Corp. | 6.125% | 8/1/17 | 6,625 | 7,664 |
| Kimberly-Clark Corp. | 6.250% | 7/15/18 | 675 | 796 |
| Kimberly-Clark Corp. | 7.500% | 11/1/18 | 2,265 | 2,813 |
| Kraft Foods Group Inc. | 1.625% | 6/4/15 | 3,200 | 3,243 |
| Kraft Foods Group Inc. | 2.250% | 6/5/17 | 8,925 | 9,064 |
| Kraft Foods Group Inc. | 6.125% | 8/23/18 | 4,533 | 5,280 |
| Kroger Co. | 3.900% | 10/1/15 | 7,000 | 7,387 |
| Kroger Co. | 2.200% | 1/15/17 | 1,075 | 1,093 |
| Kroger Co. | 2.300% | 1/15/19 | 6,500 | 6,472 |
| Laboratory Corp. of America Holdings | 2.200% | 8/23/17 | 3,125 | 3,141 |
| Laboratory Corp. of America Holdings | 2.500% | 11/1/18 | 1,425 | 1,411 |
| Life Technologies Corp. | 4.400% | 3/1/15 | 4,475 | 4,660 |
| Life Technologies Corp. | 3.500% | 1/15/16 | 1,725 | 1,792 |
| Lorillard Tobacco Co. | 3.500% | 8/4/16 | 7,150 | 7,522 |
| Mattel Inc. | 2.500% | 11/1/16 | 1,150 | 1,186 |
| Mattel Inc. | 1.700% | 3/15/18 | 1,300 | 1,274 |
| McKesson Corp. | 0.950% | 12/4/15 | 1,294 | 1,294 |
| McKesson Corp. | 3.250% | 3/1/16 | 13,875 | 14,488 |
| Mead Johnson Nutrition Co. | 3.500% | 11/1/14 | 5,225 | 5,343 |
| Medco Health Solutions Inc. | 2.750% | 9/15/15 | 2,550 | 2,626 |
| Medco Health Solutions Inc. | 7.125% | 3/15/18 | 8,735 | 10,342 |
| Medtronic Inc. | 4.500% | 3/15/14 | 1,975 | 1,991 |
| Medtronic Inc. | 3.000% | 3/15/15 | 5,300 | 5,470 |
| Medtronic Inc. | 2.625% | 3/15/16 | 2,500 | 2,592 |
| Medtronic Inc. | 1.375% | 4/1/18 | 4,100 | 4,022 |
| Merck & Co. Inc. | 2.250% | 1/15/16 | 18,700 | 19,284 |
| Merck & Co. Inc. | 1.100% | 1/31/18 | 13,350 | 13,007 |
| Merck Sharp & Dohme Corp. | 4.750% | 3/1/15 | 4,875 | 5,115 |
| Molson Coors Brewing Co. | 2.000% | 5/1/17 | 250 | 251 |
| Mondelez International Inc. | 4.125% | 2/9/16 | 9,030 | 9,587 |
| Mondelez International Inc. | 6.500% | 8/11/17 | 7,275 | 8,459 |
| Mondelez International Inc. | 6.125% | 2/1/18 | 7,200 | 8,323 |
| 4 Mylan Inc. | 1.800% | 6/24/16 | 3,989 | 4,037 |
| Mylan Inc. | 1.350% | 11/29/16 | 4,275 | 4,270 |
| 4 Mylan Inc. | 2.600% | 6/24/18 | 2,475 | 2,478 |
| Newell Rubbermaid Inc. | 2.050% | 12/1/17 | 1,175 | 1,170 |
| Novartis Capital Corp. | 2.900% | 4/24/15 | 13,225 | 13,666 |
| PepsiAmericas Inc. | 4.875% | 1/15/15 | 1,525 | 1,593 |
| PepsiCo Inc. | 3.100% | 1/15/15 | 2,900 | 2,980 |
| PepsiCo Inc. | 0.750% | 3/5/15 | 1,000 | 1,003 |
| PepsiCo Inc. | 0.700% | 8/13/15 | 50 | 50 |
| PepsiCo Inc. | 0.700% | 2/26/16 | 12,000 | 11,956 |
| PepsiCo Inc. | 2.500% | 5/10/16 | 5,000 | 5,187 |
| PepsiCo Inc. | 5.000% | 6/1/18 | 4,899 | 5,518 |
| PepsiCo Inc. | 7.900% | 11/1/18 | 5,925 | 7,440 |
| 4 Perrigo Co. plc | 1.300% | 11/8/16 | 3,100 | 3,091 |
| 4 Perrigo Co. plc | 2.300% | 11/8/18 | 3,000 | 2,961 |
| Pfizer Inc. | 5.350% | 3/15/15 | 17,100 | 18,085 |
| Pfizer Inc. | 0.900% | 1/15/17 | 10,000 | 9,939 |
| Philip Morris International Inc. | 2.500% | 5/16/16 | 6,000 | 6,220 |
| Philip Morris International Inc. | 1.625% | 3/20/17 | 404 | 407 |
| Philip Morris International Inc. | 1.125% | 8/21/17 | 11,725 | 11,532 |
| Philip Morris International Inc. | 5.650% | 5/16/18 | 8,425 | 9,691 |
| Procter & Gamble Co. | 3.500% | 2/15/15 | 4,529 | 4,682 |
| Procter & Gamble Co. | 3.150% | 9/1/15 | 1,300 | 1,358 |
19
| Vanguard® Short-Term Bond Index Fund | ||||
| Schedule of Investments | ||||
| December 31, 2013 | ||||
| Face | Market | |||
| Maturity | Amount | Value | ||
| Coupon | Date | ($000) | ($000) | |
| Procter & Gamble Co. | 1.800% | 11/15/15 | 10,875 | 11,137 |
| Procter & Gamble Co. | 4.850% | 12/15/15 | 5,500 | 5,953 |
| Procter & Gamble Co. | 1.450% | 8/15/16 | 4,450 | 4,521 |
| Quest Diagnostics Inc. | 3.200% | 4/1/16 | 2,100 | 2,186 |
| Reynolds American Inc. | 1.050% | 10/30/15 | 2,850 | 2,859 |
| Reynolds American Inc. | 6.750% | 6/15/17 | 4,725 | 5,430 |
| Reynolds American Inc. | 7.750% | 6/1/18 | 150 | 181 |
| Safeway Inc. | 3.400% | 12/1/16 | 5,000 | 5,209 |
| Sanofi | 2.625% | 3/29/16 | 10,050 | 10,447 |
| Sanofi | 1.250% | 4/10/18 | 10,035 | 9,779 |
| Stryker Corp. | 3.000% | 1/15/15 | 1,500 | 1,539 |
| Stryker Corp. | 2.000% | 9/30/16 | 3,075 | 3,158 |
| Teva Pharmaceutical Finance Co. BV | 2.400% | 11/10/16 | 2,750 | 2,828 |
| Teva Pharmaceutical Finance II BV / Teva | ||||
| Pharmaceutical Finance III LLC | 3.000% | 6/15/15 | 9,813 | 10,127 |
| Thermo Fisher Scientific Inc. | 3.200% | 5/1/15 | 1,600 | 1,649 |
| Thermo Fisher Scientific Inc. | 3.200% | 3/1/16 | 3,300 | 3,451 |
| Thermo Fisher Scientific Inc. | 2.250% | 8/15/16 | 8,000 | 8,185 |
| Thermo Fisher Scientific Inc. | 1.300% | 2/1/17 | 295 | 294 |
| Thermo Fisher Scientific Inc. | 1.850% | 1/15/18 | 4,000 | 3,983 |
| Unilever Capital Corp. | 0.450% | 7/30/15 | 1,150 | 1,150 |
| Unilever Capital Corp. | 0.850% | 8/2/17 | 6,375 | 6,206 |
| Whirlpool Corp. | 8.600% | 5/1/14 | 1,100 | 1,129 |
| Wyeth LLC | 5.500% | 2/15/16 | 5,600 | 6,158 |
| Wyeth LLC | 5.450% | 4/1/17 | 900 | 1,013 |
| Zimmer Holdings Inc. | 1.400% | 11/30/14 | 1,075 | 1,082 |
| Zoetis Inc. | 1.150% | 2/1/16 | 5,400 | 5,413 |
| Zoetis Inc. | 1.875% | 2/1/18 | 3,475 | 3,448 |
| Energy (1.4%) | ||||
| Anadarko Petroleum Corp. | 6.375% | 9/15/17 | 16,800 | 19,297 |
| Apache Corp. | 5.625% | 1/15/17 | 150 | 169 |
| Apache Corp. | 1.750% | 4/15/17 | 7,050 | 7,083 |
| Apache Corp. | 6.900% | 9/15/18 | 1,750 | 2,114 |
| BP Capital Markets plc | 3.875% | 3/10/15 | 10,925 | 11,360 |
| BP Capital Markets plc | 3.125% | 10/1/15 | 15,725 | 16,447 |
| BP Capital Markets plc | 0.700% | 11/6/15 | 4,175 | 4,190 |
| BP Capital Markets plc | 3.200% | 3/11/16 | 10,550 | 11,081 |
| BP Capital Markets plc | 2.248% | 11/1/16 | 1,000 | 1,037 |
| BP Capital Markets plc | 1.846% | 5/5/17 | 5,600 | 5,642 |
| BP Capital Markets plc | 1.375% | 11/6/17 | 9,150 | 9,019 |
| BP Capital Markets plc | 1.375% | 5/10/18 | 8,975 | 8,727 |
| BP Capital Markets plc | 2.241% | 9/26/18 | 3,675 | 3,687 |
| Cameron International Corp. | 1.150% | 12/15/16 | 2,700 | 2,696 |
| Cameron International Corp. | 6.375% | 7/15/18 | 4,525 | 5,296 |
| Canadian Natural Resources Ltd. | 6.000% | 8/15/16 | 4,000 | 4,486 |
| Canadian Natural Resources Ltd. | 5.700% | 5/15/17 | 5,275 | 5,933 |
| Canadian Natural Resources Ltd. | 5.900% | 2/1/18 | 1,025 | 1,166 |
| Chevron Corp. | 0.889% | 6/24/16 | 3,000 | 3,010 |
| Chevron Corp. | 1.104% | 12/5/17 | 5,975 | 5,874 |
| Chevron Corp. | 1.718% | 6/24/18 | 9,150 | 9,121 |
| ConocoPhillips | 4.600% | 1/15/15 | 11,600 | 12,094 |
| ConocoPhillips | 6.650% | 7/15/18 | 2,180 | 2,611 |
| ConocoPhillips Canada Funding Co. I | 5.625% | 10/15/16 | 2,000 | 2,246 |
| ConocoPhillips Co. | 1.050% | 12/15/17 | 9,000 | 8,834 |
| Devon Energy Corp. | 2.400% | 7/15/16 | 1,800 | 1,855 |
| Devon Energy Corp. | 1.875% | 5/15/17 | 4,350 | 4,384 |
| Encana Corp. | 5.900% | 12/1/17 | 1,275 | 1,446 |
| Ensco plc | 3.250% | 3/15/16 | 8,025 | 8,386 |
| EOG Resources Inc. | 2.950% | 6/1/15 | 1,725 | 1,786 |
| EOG Resources Inc. | 6.875% | 10/1/18 | 2,850 | 3,447 |
| FMC Technologies Inc. | 2.000% | 10/1/17 | 650 | 645 |
| Halliburton Co. | 1.000% | 8/1/16 | 1,750 | 1,755 |
| Halliburton Co. | 2.000% | 8/1/18 | 1,750 | 1,751 |
20
| Vanguard® Short-Term Bond Index Fund | ||||
| Schedule of Investments | ||||
| December 31, 2013 | ||||
| Face | Market | |||
| Maturity | Amount | Value | ||
| Coupon | Date | ($000) | ($000) | |
| Halliburton Co. | 5.900% | 9/15/18 | 3,450 | 4,019 |
| Marathon Oil Corp. | 0.900% | 11/1/15 | 3,310 | 3,319 |
| Marathon Oil Corp. | 5.900% | 3/15/18 | 8,700 | 9,988 |
| Marathon Petroleum Corp. | 3.500% | 3/1/16 | 3,550 | 3,727 |
| Murphy Oil Corp. | 2.500% | 12/1/17 | 5,000 | 5,053 |
| 4 Nabors Industries Inc. | 2.350% | 9/15/16 | 4,400 | 4,469 |
| Nabors Industries Inc. | 6.150% | 2/15/18 | 5,575 | 6,271 |
| National Oilwell Varco Inc. | 1.350% | 12/1/17 | 3,500 | 3,463 |
| Noble Holding International Ltd. | 3.450% | 8/1/15 | 5,100 | 5,290 |
| Noble Holding International Ltd. | 2.500% | 3/15/17 | 700 | 702 |
| Occidental Petroleum Corp. | 2.500% | 2/1/16 | 12,200 | 12,642 |
| Occidental Petroleum Corp. | 4.125% | 6/1/16 | 2,800 | 3,012 |
| Occidental Petroleum Corp. | 1.750% | 2/15/17 | 10,500 | 10,649 |
| Occidental Petroleum Corp. | 1.500% | 2/15/18 | 1,500 | 1,479 |
| Petro-Canada | 6.050% | 5/15/18 | 4,462 | 5,141 |
| Petrohawk Energy Corp. | 10.500% | 8/1/14 | 2,400 | 2,418 |
| Petrohawk Energy Corp. | 7.875% | 6/1/15 | 2,400 | 2,463 |
| Petrohawk Energy Corp. | 7.250% | 8/15/18 | 1,650 | 1,776 |
| Phillips 66 | 2.950% | 5/1/17 | 14,132 | 14,708 |
| Pioneer Natural Resources Co. | 6.650% | 3/15/17 | 5,000 | 5,743 |
| Pioneer Natural Resources Co. | 6.875% | 5/1/18 | 1,450 | 1,706 |
| Shell International Finance BV | 3.100% | 6/28/15 | 8,050 | 8,353 |
| Shell International Finance BV | 3.250% | 9/22/15 | 2,850 | 2,983 |
| Shell International Finance BV | 0.625% | 12/4/15 | 6,376 | 6,390 |
| Shell International Finance BV | 5.200% | 3/22/17 | 5,000 | 5,600 |
| Shell International Finance BV | 1.125% | 8/21/17 | 9,545 | 9,414 |
| Shell International Finance BV | 1.900% | 8/10/18 | 6,700 | 6,666 |
| Shell International Finance BV | 2.000% | 11/15/18 | 900 | 899 |
| Southwestern Energy Co. | 7.500% | 2/1/18 | 2,550 | 3,015 |
| Suncor Energy Inc. | 6.100% | 6/1/18 | 14,100 | 16,297 |
| Talisman Energy Inc. | 5.125% | 5/15/15 | 4,150 | 4,339 |
| Total Capital Canada Ltd. | 1.450% | 1/15/18 | 11,025 | 10,925 |
| Total Capital International SA | 0.750% | 1/25/16 | 3,600 | 3,597 |
| Total Capital International SA | 1.000% | 8/12/16 | 700 | 701 |
| Total Capital International SA | 1.500% | 2/17/17 | 3,700 | 3,700 |
| Total Capital International SA | 1.550% | 6/28/17 | 6,650 | 6,646 |
| Total Capital SA | 3.000% | 6/24/15 | 11,025 | 11,434 |
| Total Capital SA | 3.125% | 10/2/15 | 855 | 893 |
| Total Capital SA | 2.300% | 3/15/16 | 8,394 | 8,642 |
| Total Capital SA | 2.125% | 8/10/18 | 4,950 | 4,965 |
| Transocean Inc. | 4.950% | 11/15/15 | 3,970 | 4,255 |
| Transocean Inc. | 5.050% | 12/15/16 | 4,525 | 4,993 |
| Transocean Inc. | 2.500% | 10/15/17 | 6,750 | 6,847 |
| Transocean Inc. | 6.000% | 3/15/18 | 15,175 | 17,061 |
| Valero Energy Corp. | 4.500% | 2/1/15 | 450 | 468 |
| Valero Energy Corp. | 6.125% | 6/15/17 | 9,815 | 11,214 |
| Weatherford International LLC | 6.350% | 6/15/17 | 8,235 | 9,337 |
| Weatherford International Ltd. | 6.000% | 3/15/18 | 1,075 | 1,211 |
| XTO Energy Inc. | 6.250% | 8/1/17 | 1,522 | 1,769 |
| XTO Energy Inc. | 5.500% | 6/15/18 | 2,425 | 2,796 |
| Technology (1.3%) | ||||
| Adobe Systems Inc. | 3.250% | 2/1/15 | 3,925 | 4,035 |
| Agilent Technologies Inc. | 5.500% | 9/14/15 | 3,180 | 3,428 |
| Agilent Technologies Inc. | 6.500% | 11/1/17 | 4,775 | 5,530 |
| Altera Corp. | 1.750% | 5/15/17 | 3,745 | 3,694 |
| Altera Corp. | 2.500% | 11/15/18 | 2,550 | 2,533 |
| Analog Devices Inc. | 3.000% | 4/15/16 | 2,113 | 2,207 |
| Apple Inc. | 0.450% | 5/3/16 | 8,975 | 8,924 |
| Apple Inc. | 1.000% | 5/3/18 | 23,325 | 22,574 |
| Applied Materials Inc. | 2.650% | 6/15/16 | 2,500 | 2,596 |
| Arrow Electronics Inc. | 3.375% | 11/1/15 | 4,200 | 4,353 |
| Autodesk Inc. | 1.950% | 12/15/17 | 1,225 | 1,213 |
| Avnet Inc. | 6.625% | 9/15/16 | 1,400 | 1,574 |
21
| Vanguard® Short-Term Bond Index Fund | ||||
| Schedule of Investments | ||||
| December 31, 2013 | ||||
| Face | Market | |||
| Maturity | Amount | Value | ||
| Coupon | Date | ($000) | ($000) | |
| Baidu Inc. | 2.250% | 11/28/17 | 4,200 | 4,180 |
| Baidu Inc. | 3.250% | 8/6/18 | 1,000 | 1,008 |
| Broadcom Corp. | 2.375% | 11/1/15 | 1,100 | 1,130 |
| Broadcom Corp. | 2.700% | 11/1/18 | 3,766 | 3,823 |
| Cisco Systems Inc. | 5.500% | 2/22/16 | 21,925 | 24,137 |
| Computer Sciences Corp. | 2.500% | 9/15/15 | 1,000 | 1,021 |
| Computer Sciences Corp. | 6.500% | 3/15/18 | 2,525 | 2,910 |
| Corning Inc. | 1.450% | 11/15/17 | 6,350 | 6,330 |
| Dun & Bradstreet Corp. | 2.875% | 11/15/15 | 875 | 902 |
| Dun & Bradstreet Corp. | 3.250% | 12/1/17 | 2,100 | 2,131 |
| EMC Corp. | 1.875% | 6/1/18 | 19,825 | 19,625 |
| Equifax Inc. | 4.450% | 12/1/14 | 1,000 | 1,033 |
| Fidelity National Information Services Inc. | 2.000% | 4/15/18 | 1,250 | 1,217 |
| Fiserv Inc. | 3.125% | 6/15/16 | 925 | 967 |
| Fiserv Inc. | 6.800% | 11/20/17 | 2,725 | 3,141 |
| Google Inc. | 2.125% | 5/19/16 | 5,575 | 5,761 |
| Harris Corp. | 5.950% | 12/1/17 | 1,750 | 1,967 |
| Hewlett-Packard Co. | 2.350% | 3/15/15 | 3,850 | 3,918 |
| Hewlett-Packard Co. | 2.125% | 9/13/15 | 7,825 | 7,988 |
| Hewlett-Packard Co. | 2.200% | 12/1/15 | 50 | 51 |
| Hewlett-Packard Co. | 2.650% | 6/1/16 | 9,860 | 10,170 |
| Hewlett-Packard Co. | 3.000% | 9/15/16 | 7,660 | 7,969 |
| Hewlett-Packard Co. | 3.300% | 12/9/16 | 2,775 | 2,902 |
| Hewlett-Packard Co. | 2.600% | 9/15/17 | 6,780 | 6,939 |
| Hewlett-Packard Co. | 5.500% | 3/1/18 | 1,660 | 1,847 |
| Intel Corp. | 1.950% | 10/1/16 | 11,100 | 11,434 |
| Intel Corp. | 1.350% | 12/15/17 | 20,130 | 19,921 |
| International Business Machines Corp. | 0.550% | 2/6/15 | 9,200 | 9,220 |
| International Business Machines Corp. | 0.750% | 5/11/15 | 1,000 | 1,006 |
| International Business Machines Corp. | 2.000% | 1/5/16 | 4,100 | 4,212 |
| International Business Machines Corp. | 0.450% | 5/6/16 | 2,050 | 2,034 |
| International Business Machines Corp. | 1.950% | 7/22/16 | 14,791 | 15,205 |
| International Business Machines Corp. | 1.250% | 2/6/17 | 5,365 | 5,364 |
| International Business Machines Corp. | 5.700% | 9/14/17 | 14,450 | 16,594 |
| International Business Machines Corp. | 1.250% | 2/8/18 | 8,400 | 8,243 |
| International Business Machines Corp. | 7.625% | 10/15/18 | 6,610 | 8,265 |
| Intuit Inc. | 5.750% | 3/15/17 | 2,000 | 2,255 |
| Jabil Circuit Inc. | 8.250% | 3/15/18 | 1,350 | 1,583 |
| Juniper Networks Inc. | 3.100% | 3/15/16 | 500 | 515 |
| KLA-Tencor Corp. | 6.900% | 5/1/18 | 3,600 | 4,223 |
| Lexmark International Inc. | 6.650% | 6/1/18 | 2,675 | 3,001 |
| Microsoft Corp. | 1.625% | 9/25/15 | 12,300 | 12,580 |
| Microsoft Corp. | 2.500% | 2/8/16 | 3,900 | 4,052 |
| Microsoft Corp. | 1.625% | 12/6/18 | 1,000 | 987 |
| National Semiconductor Corp. | 6.600% | 6/15/17 | 2,575 | 3,007 |
| NetApp Inc. | 2.000% | 12/15/17 | 2,500 | 2,492 |
| Oracle Corp. | 5.250% | 1/15/16 | 4,989 | 5,441 |
| Oracle Corp. | 1.200% | 10/15/17 | 20,950 | 20,662 |
| Oracle Corp. | 5.750% | 4/15/18 | 5,455 | 6,319 |
| Pitney Bowes Inc. | 5.750% | 9/15/17 | 2,200 | 2,429 |
| Pitney Bowes Inc. | 5.600% | 3/15/18 | 1,825 | 1,977 |
| 4 Seagate HDD Cayman | 3.750% | 11/15/18 | 9,300 | 9,393 |
| Symantec Corp. | 2.750% | 9/15/15 | 3,375 | 3,477 |
| Symantec Corp. | 2.750% | 6/15/17 | 2,200 | 2,239 |
| Tech Data Corp. | 3.750% | 9/21/17 | 2,500 | 2,590 |
| Texas Instruments Inc. | 0.450% | 8/3/15 | 4,800 | 4,801 |
| Texas Instruments Inc. | 2.375% | 5/16/16 | 11,225 | 11,644 |
| Total System Services Inc. | 2.375% | 6/1/18 | 425 | 413 |
| Tyco Electronics Group SA | 1.600% | 2/3/15 | 2,800 | 2,824 |
| Tyco Electronics Group SA | 6.550% | 10/1/17 | 2,755 | 3,150 |
| Xerox Corp. | 4.250% | 2/15/15 | 15,875 | 16,472 |
| Xerox Corp. | 6.400% | 3/15/16 | 3,000 | 3,322 |
| Xerox Corp. | 2.950% | 3/15/17 | 5,825 | 6,033 |
| Xerox Corp. | 6.350% | 5/15/18 | 1,029 | 1,185 |
22
| Vanguard® Short-Term Bond Index Fund | ||||
| Schedule of Investments | ||||
| December 31, 2013 | ||||
| Face | Market | |||
| Maturity | Amount | Value | ||
| Coupon | Date | ($000) | ($000) | |
| Transportation (0.2%) | ||||
| Burlington Northern Santa Fe LLC | 5.650% | 5/1/17 | 5,625 | 6,352 |
| Burlington Northern Santa Fe LLC | 5.750% | 3/15/18 | 2,221 | 2,546 |
| Canadian National Railway Co. | 5.800% | 6/1/16 | 1,250 | 1,387 |
| Canadian National Railway Co. | 1.450% | 12/15/16 | 5,425 | 5,470 |
| Canadian National Railway Co. | 5.850% | 11/15/17 | 475 | 545 |
| CSX Corp. | 6.250% | 4/1/15 | 1,925 | 2,058 |
| CSX Corp. | 5.600% | 5/1/17 | 3,400 | 3,827 |
| CSX Corp. | 6.250% | 3/15/18 | 8,475 | 9,811 |
| JB Hunt Transport Services Inc. | 3.375% | 9/15/15 | 3,100 | 3,216 |
| Norfolk Southern Corp. | 5.750% | 1/15/16 | 1,197 | 1,309 |
| Norfolk Southern Corp. | 7.700% | 5/15/17 | 5,600 | 6,675 |
| Ryder System Inc. | 3.150% | 3/2/15 | 1,450 | 1,488 |
| Ryder System Inc. | 3.600% | 3/1/16 | 4,000 | 4,177 |
| Ryder System Inc. | 5.850% | 11/1/16 | 100 | 111 |
| Ryder System Inc. | 2.500% | 3/1/17 | 2,400 | 2,443 |
| Ryder System Inc. | 2.500% | 3/1/18 | 2,500 | 2,512 |
| Ryder System Inc. | 2.450% | 11/15/18 | 4,375 | 4,326 |
| Southwest Airlines Co. | 5.750% | 12/15/16 | 20 | 22 |
| 3 UAL 2009-1 Pass Through Trust | 10.400% | 5/1/18 | 925 | 1,062 |
| 3 UAL 2009-2A Pass Through Trust | 9.750% | 7/15/18 | 5,081 | 5,836 |
| Union Pacific Corp. | 5.750% | 11/15/17 | 1,700 | 1,944 |
| Union Pacific Corp. | 5.700% | 8/15/18 | 2,600 | 2,996 |
| United Parcel Service Inc. | 5.500% | 1/15/18 | 5,975 | 6,827 |
| 3,714,249 | ||||
| Utilities (1.6%) | ||||
| Electric (1.0%) | ||||
| Alabama Power Co. | 0.550% | 10/15/15 | 1,600 | 1,596 |
| Ameren Illinois Co. | 6.125% | 11/15/17 | 2,000 | 2,282 |
| American Electric Power Co. Inc. | 1.650% | 12/15/17 | 4,800 | 4,702 |
| Appalachian Power Co. | 3.400% | 5/24/15 | 4,500 | 4,643 |
| Arizona Public Service Co. | 4.650% | 5/15/15 | 975 | 1,024 |
| Baltimore Gas & Electric Co. | 5.900% | 10/1/16 | 2,225 | 2,494 |
| CenterPoint Energy Inc. | 6.500% | 5/1/18 | 2,550 | 2,972 |
| Cleveland Electric Illuminating Co. | 5.700% | 4/1/17 | 519 | 567 |
| Cleveland Electric Illuminating Co. | 8.875% | 11/15/18 | 1,400 | 1,774 |
| CMS Energy Corp. | 6.550% | 7/17/17 | 2,500 | 2,875 |
| CMS Energy Corp. | 5.050% | 2/15/18 | 2,500 | 2,750 |
| Commonwealth Edison Co. | 4.700% | 4/15/15 | 3,045 | 3,199 |
| Commonwealth Edison Co. | 5.950% | 8/15/16 | 1,975 | 2,208 |
| Commonwealth Edison Co. | 1.950% | 9/1/16 | 2,000 | 2,040 |
| Commonwealth Edison Co. | 6.150% | 9/15/17 | 2,525 | 2,916 |
| Commonwealth Edison Co. | 5.800% | 3/15/18 | 500 | 576 |
| Connecticut Light & Power Co. | 5.650% | 5/1/18 | 650 | 744 |
| Consolidated Edison Co. of New York Inc. | 5.500% | 9/15/16 | 3,400 | 3,786 |
| Consolidated Edison Co. of New York Inc. | 5.850% | 4/1/18 | 5,320 | 6,149 |
| Consolidated Edison Co. of New York Inc. | 7.125% | 12/1/18 | 1,525 | 1,864 |
| Consumers Energy Co. | 5.500% | 8/15/16 | 2,550 | 2,842 |
| Consumers Energy Co. | 5.650% | 9/15/18 | 2,625 | 3,022 |
| 4 Dayton Power & Light Co. | 1.875% | 9/15/16 | 1,550 | 1,562 |
| Dominion Resources Inc. | 5.150% | 7/15/15 | 1,895 | 2,018 |
| Dominion Resources Inc. | 1.950% | 8/15/16 | 6,050 | 6,150 |
| Dominion Resources Inc. | 6.000% | 11/30/17 | 6,620 | 7,580 |
| Dominion Resources Inc. | 6.400% | 6/15/18 | 750 | 878 |
| Duke Energy Carolinas LLC | 5.300% | 10/1/15 | 793 | 857 |
| Duke Energy Carolinas LLC | 1.750% | 12/15/16 | 5,000 | 5,103 |
| Duke Energy Carolinas LLC | 5.100% | 4/15/18 | 5,525 | 6,210 |
| Duke Energy Corp. | 3.350% | 4/1/15 | 2,000 | 2,061 |
| Duke Energy Corp. | 1.625% | 8/15/17 | 9,040 | 9,005 |
| Duke Energy Corp. | 2.100% | 6/15/18 | 2,125 | 2,115 |
| Duke Energy Corp. | 6.250% | 6/15/18 | 695 | 804 |
| Duke Energy Florida Inc. | 5.100% | 12/1/15 | 1,175 | 1,274 |
| Duke Energy Florida Inc. | 5.650% | 6/15/18 | 3,425 | 3,931 |
23
| Vanguard® Short-Term Bond Index Fund | ||||
| Schedule of Investments | ||||
| December 31, 2013 | ||||
| Face | Market | |||
| Maturity | Amount | Value | ||
| Coupon | Date | ($000) | ($000) | |
| Duke Energy Progress Inc. | 5.150% | 4/1/15 | 2,000 | 2,114 |
| Duke Energy Progress Inc. | 5.250% | 12/15/15 | 3,000 | 3,267 |
| Enersis SA | 7.375% | 1/15/14 | 1,000 | 1,001 |
| Entergy Gulf States Louisiana LLC | 6.000% | 5/1/18 | 7,000 | 7,998 |
| Exelon Corp. | 4.900% | 6/15/15 | 5,475 | 5,773 |
| Exelon Generation Co. LLC | 6.200% | 10/1/17 | 5,025 | 5,675 |
| Florida Power & Light Co. | 5.550% | 11/1/17 | 50 | 57 |
| Georgia Power Co. | 0.625% | 11/15/15 | 4,730 | 4,729 |
| Georgia Power Co. | 3.000% | 4/15/16 | 2,400 | 2,509 |
| Georgia Power Co. | 5.700% | 6/1/17 | 3,200 | 3,604 |
| Georgia Power Co. | 5.400% | 6/1/18 | 3,500 | 3,937 |
| 3 Integrys Energy Group Inc. | 6.110% | 12/1/66 | 1,000 | 1,010 |
| Jersey Central Power & Light Co. | 5.650% | 6/1/17 | 1,125 | 1,244 |
| Kentucky Utilities Co. | 1.625% | 11/1/15 | 2,550 | 2,598 |
| LG&E & KU Energy LLC | 2.125% | 11/15/15 | 2,650 | 2,696 |
| Louisville Gas & Electric Co. | 1.625% | 11/15/15 | 5,500 | 5,605 |
| MidAmerican Energy Co. | 5.950% | 7/15/17 | 925 | 1,061 |
| MidAmerican Energy Co. | 5.300% | 3/15/18 | 900 | 1,013 |
| 4 MidAmerican Energy Holdings Co. | 1.100% | 5/15/17 | 5,425 | 5,396 |
| MidAmerican Energy Holdings Co. | 5.750% | 4/1/18 | 4,375 | 4,991 |
| 4 MidAmerican Energy Holdings Co. | 2.000% | 11/15/18 | 1,825 | 1,794 |
| Mississippi Power Co. | 2.350% | 10/15/16 | 3,075 | 3,162 |
| National Rural Utilities Cooperative Finance Corp. | 3.875% | 9/16/15 | 3,250 | 3,424 |
| National Rural Utilities Cooperative Finance Corp. | 3.050% | 3/1/16 | 1,200 | 1,251 |
| National Rural Utilities Cooperative Finance Corp. | 5.450% | 4/10/17 | 6,045 | 6,748 |
| National Rural Utilities Cooperative Finance Corp. | 5.450% | 2/1/18 | 8,975 | 10,118 |
| National Rural Utilities Cooperative Finance Corp. | 10.375% | 11/1/18 | 125 | 169 |
| Nevada Power Co. | 6.500% | 5/15/18 | 4,725 | 5,585 |
| Nevada Power Co. | 6.500% | 8/1/18 | 6,750 | 8,039 |
| NextEra Energy Capital Holdings Inc. | 1.200% | 6/1/15 | 750 | 754 |
| NextEra Energy Capital Holdings Inc. | 2.600% | 9/1/15 | 1,900 | 1,950 |
| NextEra Energy Capital Holdings Inc. | 7.875% | 12/15/15 | 4,800 | 5,424 |
| 3 NextEra Energy Capital Holdings Inc. | 6.350% | 10/1/66 | 2,225 | 2,225 |
| 3 NextEra Energy Capital Holdings Inc. | 6.650% | 6/15/67 | 5,050 | 5,151 |
| Northeast Utilities | 1.450% | 5/1/18 | 3,700 | 3,570 |
| Northern States Power Co. | 1.950% | 8/15/15 | 1,200 | 1,223 |
| Northern States Power Co. | 5.250% | 3/1/18 | 2,325 | 2,636 |
| NSTAR Electric Co. | 5.625% | 11/15/17 | 1,525 | 1,727 |
| Ohio Power Co. | 6.000% | 6/1/16 | 425 | 470 |
| Ohio Power Co. | 6.050% | 5/1/18 | 1,000 | 1,142 |
| Oncor Electric Delivery Co. LLC | 6.375% | 1/15/15 | 3,200 | 3,378 |
| Oncor Electric Delivery Co. LLC | 6.800% | 9/1/18 | 1,475 | 1,733 |
| Pacific Gas & Electric Co. | 5.625% | 11/30/17 | 11,500 | 13,026 |
| Pacific Gas & Electric Co. | 8.250% | 10/15/18 | 2,625 | 3,291 |
| PacifiCorp | 5.650% | 7/15/18 | 4,150 | 4,760 |
| Peco Energy Co. | 1.200% | 10/15/16 | 4,750 | 4,771 |
| Peco Energy Co. | 5.350% | 3/1/18 | 1,775 | 2,014 |
| Pennsylvania Electric Co. | 6.050% | 9/1/17 | 2,550 | 2,853 |
| Pepco Holdings Inc. | 2.700% | 10/1/15 | 2,200 | 2,257 |
| PPL Capital Funding Inc. | 1.900% | 6/1/18 | 2,625 | 2,567 |
| PPL Energy Supply LLC | 6.500% | 5/1/18 | 1,500 | 1,665 |
| Progress Energy Inc. | 5.625% | 1/15/16 | 2,500 | 2,721 |
| PSEG Power LLC | 5.500% | 12/1/15 | 3,000 | 3,250 |
| PSEG Power LLC | 2.750% | 9/15/16 | 300 | 311 |
| PSEG Power LLC | 5.320% | 9/15/16 | 1,300 | 1,430 |
| Public Service Co. of New Mexico | 7.950% | 5/15/18 | 3,531 | 4,197 |
| Public Service Electric & Gas Co. | 2.700% | 5/1/15 | 1,814 | 1,867 |
| Public Service Electric & Gas Co. | 2.300% | 9/15/18 | 8,225 | 8,310 |
| Scottish Power Ltd. | 5.375% | 3/15/15 | 3,200 | 3,358 |
| Sierra Pacific Power Co. | 6.000% | 5/15/16 | 1,000 | 1,118 |
| South Carolina Electric & Gas Co. | 5.250% | 11/1/18 | 4,583 | 5,226 |
| Southern California Edison Co. | 4.150% | 9/15/14 | 3,000 | 3,077 |
| Southern California Edison Co. | 5.500% | 8/15/18 | 1,575 | 1,810 |
| Southern Co. | 2.375% | 9/15/15 | 2,010 | 2,057 |
24
| Vanguard® Short-Term Bond Index Fund | ||||
| Schedule of Investments | ||||
| December 31, 2013 | ||||
| Face | Market | |||
| Maturity | Amount | Value | ||
| Coupon | Date | ($000) | ($000) | |
| Southern Power Co. | 4.875% | 7/15/15 | 2,050 | 2,175 |
| Southwestern Electric Power Co. | 5.550% | 1/15/17 | 2,825 | 3,107 |
| Tampa Electric Co. | 6.100% | 5/15/18 | 2,845 | 3,304 |
| TECO Finance Inc. | 4.000% | 3/15/16 | 375 | 398 |
| TransAlta Corp. | 4.750% | 1/15/15 | 2,988 | 3,096 |
| TransAlta Corp. | 6.650% | 5/15/18 | 1,725 | 1,938 |
| Union Electric Co. | 5.400% | 2/1/16 | 5,000 | 5,423 |
| Virginia Electric & Power Co. | 5.400% | 1/15/16 | 100 | 109 |
| Virginia Electric & Power Co. | 5.950% | 9/15/17 | 2,125 | 2,451 |
| Virginia Electric & Power Co. | 1.200% | 1/15/18 | 6,005 | 5,832 |
| Virginia Electric & Power Co. | 5.400% | 4/30/18 | 75 | 85 |
| Wisconsin Electric Power Co. | 1.700% | 6/15/18 | 500 | 494 |
| 3 Wisconsin Energy Corp. | 6.250% | 5/15/67 | 2,400 | 2,475 |
| Xcel Energy Inc. | 0.750% | 5/9/16 | 1,050 | 1,041 |
| Natural Gas (0.6%) | ||||
| Boardwalk Pipelines LP | 5.500% | 2/1/17 | 2,025 | 2,212 |
| Buckeye Partners LP | 6.050% | 1/15/18 | 400 | 449 |
| Buckeye Partners LP | 2.650% | 11/15/18 | 1,000 | 987 |
| CenterPoint Energy Resources Corp. | 6.125% | 11/1/17 | 3,212 | 3,684 |
| CenterPoint Energy Resources Corp. | 6.000% | 5/15/18 | 1,800 | 2,072 |
| Colorado Interstate Gas Co. LLC | 6.800% | 11/15/15 | 8,800 | 9,719 |
| DCP Midstream Operating LP | 2.500% | 12/1/17 | 11,145 | 11,214 |
| El Paso Natural Gas Co. LLC | 5.950% | 4/15/17 | 3,025 | 3,359 |
| Enbridge Energy Partners LP | 6.500% | 4/15/18 | 4,575 | 5,283 |
| Enbridge Inc. | 4.900% | 3/1/15 | 4,950 | 5,180 |
| Energy Transfer Partners LP | 6.125% | 2/15/17 | 8,200 | 9,169 |
| Energy Transfer Partners LP | 6.700% | 7/1/18 | 14,000 | 16,247 |
| 5 Enron Corp. | 9.125% | 4/1/03 | 2,000 | — |
| 5 Enron Corp. | 7.625% | 9/10/04 | 1,000 | — |
| Enterprise Products Operating LLC | 5.600% | 10/15/14 | 100 | 104 |
| Enterprise Products Operating LLC | 3.700% | 6/1/15 | 1,000 | 1,041 |
| Enterprise Products Operating LLC | 1.250% | 8/13/15 | 300 | 302 |
| Enterprise Products Operating LLC | 3.200% | 2/1/16 | 2,025 | 2,118 |
| Enterprise Products Operating LLC | 6.300% | 9/15/17 | 6,850 | 7,929 |
| Enterprise Products Operating LLC | 6.650% | 4/15/18 | 3,025 | 3,567 |
| 3 Enterprise Products Operating LLC | 8.375% | 8/1/66 | 2,300 | 2,550 |
| 3 Enterprise Products Operating LLC | 7.034% | 1/15/68 | 3,822 | 4,223 |
| 5 Internorth Inc. | 9.625% | 3/15/06 | 1,500 | — |
| Kinder Morgan Energy Partners LP | 3.500% | 3/1/16 | 2,660 | 2,787 |
| Kinder Morgan Energy Partners LP | 6.000% | 2/1/17 | 8,000 | 8,990 |
| Kinder Morgan Energy Partners LP | 5.950% | 2/15/18 | 10,750 | 12,227 |
| National Grid plc | 6.300% | 8/1/16 | 3,450 | 3,878 |
| Nisource Finance Corp. | 5.250% | 9/15/17 | 3,800 | 4,205 |
| Nisource Finance Corp. | 6.400% | 3/15/18 | 7,375 | 8,488 |
| ONEOK Inc. | 5.200% | 6/15/15 | 1,825 | 1,932 |
| ONEOK Partners LP | 3.250% | 2/1/16 | 3,100 | 3,218 |
| ONEOK Partners LP | 2.000% | 10/1/17 | 5,900 | 5,831 |
| Panhandle Eastern Pipe Line Co. LP | 6.200% | 11/1/17 | 3,000 | 3,420 |
| Panhandle Eastern Pipe Line Co. LP | 7.000% | 6/15/18 | 800 | 926 |
| Plains All American Pipeline LP / PAA Finance Corp. | 6.125% | 1/15/17 | 2,500 | 2,834 |
| Plains All American Pipeline LP / PAA Finance Corp. | 6.500% | 5/1/18 | 1,450 | 1,697 |
| Sempra Energy | 6.500% | 6/1/16 | 4,200 | 4,719 |
| Sempra Energy | 2.300% | 4/1/17 | 7,400 | 7,517 |
| 4 Southern Natural Gas Co. LLC | 5.900% | 4/1/17 | 1,325 | 1,488 |
| Spectra Energy Capital LLC | 6.200% | 4/15/18 | 3,300 | 3,721 |
| Spectra Energy Partners LP | 2.950% | 6/15/16 | 2,000 | 2,076 |
| Spectra Energy Partners LP | 2.950% | 9/25/18 | 1,725 | 1,748 |
| Texas Gas Transmission LLC | 4.600% | 6/1/15 | 325 | 341 |
| TransCanada PipeLines Ltd. | 0.875% | 3/2/15 | 2,015 | 2,022 |
| TransCanada PipeLines Ltd. | 3.400% | 6/1/15 | 5,496 | 5,710 |
| TransCanada PipeLines Ltd. | 0.750% | 1/15/16 | 3,166 | 3,160 |
| TransCanada PipeLines Ltd. | 6.500% | 8/15/18 | 3,200 | 3,775 |
| 3 TransCanada PipeLines Ltd. | 6.350% | 5/15/67 | 4,475 | 4,598 |
25
| Vanguard® Short-Term Bond Index Fund | ||||
| Schedule of Investments | ||||
| December 31, 2013 | ||||
| Face | Market | |||
| Maturity | Amount | Value | ||
| Coupon | Date | ($000) | ($000) | |
| Western Gas Partners LP | 2.600% | 8/15/18 | 1,500 | 1,482 |
| Williams Partners LP | 3.800% | 2/15/15 | 3,225 | 3,332 |
| Williams Partners LP / Williams Partners Finance Corp. | 7.250% | 2/1/17 | 6,250 | 7,243 |
| Other Utility (0.0%) | ||||
| Veolia Environnement SA | 6.000% | 6/1/18 | 3,550 | 4,015 |
| 561,177 | ||||
| Total Corporate Bonds (Cost $7,564,327) | 7,649,965 | |||
| Sovereign Bonds (U.S. Dollar-Denominated) (7.2%) | ||||
| African Development Bank | 6.875% | 10/15/15 | 105 | 115 |
| African Development Bank | 2.500% | 3/15/16 | 100 | 104 |
| African Development Bank | 1.250% | 9/2/16 | 50 | 51 |
| African Development Bank | 1.125% | 3/15/17 | 7,000 | 7,029 |
| African Development Bank | 0.875% | 3/15/18 | 30,500 | 29,531 |
| Asian Development Bank | 2.625% | 2/9/15 | 18,000 | 18,447 |
| Asian Development Bank | 0.500% | 8/17/15 | 1,000 | 1,002 |
| Asian Development Bank | 2.500% | 3/15/16 | 26,850 | 27,950 |
| Asian Development Bank | 0.500% | 6/20/16 | 17,000 | 16,936 |
| Asian Development Bank | 1.125% | 3/15/17 | 10,350 | 10,393 |
| Asian Development Bank | 5.250% | 6/12/17 | 2,300 | 2,625 |
| Asian Development Bank | 5.593% | 7/16/18 | 2,380 | 2,758 |
| Asian Development Bank | 1.750% | 9/11/18 | 4,900 | 4,906 |
| Asian Development Bank | 1.875% | 10/23/18 | 3,960 | 3,978 |
| Banco do Brasil SA | 3.875% | 1/23/17 | 2,275 | 2,326 |
| Canada | 0.875% | 2/14/17 | 23,800 | 23,790 |
| China Development Bank Corp. | 4.750% | 10/8/14 | 1,375 | 1,414 |
| China Development Bank Corp. | 5.000% | 10/15/15 | 3,450 | 3,666 |
| CNOOC Finance 2013 Ltd. | 1.750% | 5/9/18 | 9,675 | 9,464 |
| Corp. Andina de Fomento | 5.125% | 5/5/15 | 2,925 | 3,010 |
| Corp. Andina de Fomento | 3.750% | 1/15/16 | 5,883 | 6,111 |
| Corp. Andina de Fomento | 5.750% | 1/12/17 | 400 | 439 |
| Council Of Europe Development Bank | 1.500% | 1/15/15 | 3,000 | 3,036 |
| Council Of Europe Development Bank | 2.750% | 2/10/15 | 3,700 | 3,798 |
| Council Of Europe Development Bank | 2.625% | 2/16/16 | 4,600 | 4,788 |
| Council Of Europe Development Bank | 1.250% | 9/22/16 | 6,000 | 6,063 |
| Council Of Europe Development Bank | 1.500% | 2/22/17 | 1,750 | 1,773 |
| Council Of Europe Development Bank | 1.500% | 6/19/17 | 14,175 | 14,312 |
| Council Of Europe Development Bank | 1.000% | 3/7/18 | 6,075 | 5,916 |
| Council Of Europe Development Bank | 1.125% | 5/31/18 | 6,250 | 6,095 |
| 6 Development Bank of Japan Inc. | 4.250% | 6/9/15 | 5,000 | 5,267 |
| 6 Development Bank of Japan Inc. | 5.125% | 2/1/17 | 3,700 | 4,138 |
| European Bank for Reconstruction & Development | 5.000% | 5/19/14 | 3,400 | 3,461 |
| European Bank for Reconstruction & Development | 2.750% | 4/20/15 | 6,250 | 6,445 |
| European Bank for Reconstruction & Development | 1.625% | 9/3/15 | 1,750 | 1,785 |
| European Bank for Reconstruction & Development | 2.500% | 3/15/16 | 11,950 | 12,442 |
| European Bank for Reconstruction & Development | 1.375% | 10/20/16 | 7,600 | 7,721 |
| European Bank for Reconstruction & Development | 1.000% | 2/16/17 | 10,000 | 10,018 |
| European Bank for Reconstruction & Development | 0.750% | 9/1/17 | 8,625 | 8,501 |
| European Bank for Reconstruction & Development | 1.000% | 6/15/18 | 4,000 | 3,894 |
| European Bank for Reconstruction & Development | 1.000% | 9/17/18 | 7,850 | 7,557 |
| European Bank for Reconstruction & Development | 1.625% | 11/15/18 | 5,475 | 5,448 |
| European Investment Bank | 3.125% | 6/4/14 | 29,450 | 29,777 |
| European Investment Bank | 2.875% | 1/15/15 | 11,000 | 11,293 |
| European Investment Bank | 2.750% | 3/23/15 | 11,275 | 11,605 |
| European Investment Bank | 1.125% | 4/15/15 | 21,300 | 21,520 |
| European Investment Bank | 1.625% | 9/1/15 | 23,550 | 24,040 |
| European Investment Bank | 1.375% | 10/20/15 | 13,500 | 13,758 |
| European Investment Bank | 4.625% | 10/20/15 | 1,095 | 1,177 |
| European Investment Bank | 2.250% | 3/15/16 | 9,350 | 9,695 |
| European Investment Bank | 0.625% | 4/15/16 | 17,250 | 17,250 |
| European Investment Bank | 2.500% | 5/16/16 | 13,325 | 13,894 |
| European Investment Bank | 2.125% | 7/15/16 | 19,900 | 20,601 |
26
| Vanguard® Short-Term Bond Index Fund | ||||
| Schedule of Investments | ||||
| December 31, 2013 | ||||
| Face | Market | |||
| Maturity | Amount | Value | ||
| Coupon | Date | ($000) | ($000) | |
| European Investment Bank | 0.500% | 8/15/16 | 20,500 | 20,266 |
| European Investment Bank | 5.125% | 9/13/16 | 4,000 | 4,457 |
| European Investment Bank | 1.250% | 10/14/16 | 22,000 | 22,262 |
| European Investment Bank | 1.125% | 12/15/16 | 48,500 | 48,739 |
| European Investment Bank | 4.875% | 1/17/17 | 17,100 | 19,077 |
| European Investment Bank | 1.750% | 3/15/17 | 25,000 | 25,538 |
| European Investment Bank | 5.125% | 5/30/17 | 25,000 | 28,319 |
| European Investment Bank | 1.625% | 6/15/17 | 19,000 | 19,295 |
| European Investment Bank | 1.125% | 9/15/17 | 30,350 | 30,199 |
| European Investment Bank | 1.000% | 12/15/17 | 15,000 | 14,781 |
| European Investment Bank | 1.000% | 3/15/18 | 15,000 | 14,653 |
| European Investment Bank | 1.000% | 6/15/18 | 17,000 | 16,480 |
| European Investment Bank | 1.625% | 12/18/18 | 13,500 | 13,330 |
| Export Development Canada | 2.250% | 5/28/15 | 4,725 | 4,856 |
| Export Development Canada | 0.500% | 9/15/15 | 10,000 | 10,031 |
| Export Development Canada | 1.250% | 10/27/15 | 3,000 | 3,048 |
| Export Development Canada | 1.250% | 10/26/16 | 8,000 | 8,116 |
| Export Development Canada | 0.625% | 12/15/16 | 3,325 | 3,303 |
| Export Development Canada | 0.750% | 12/15/17 | 1,850 | 1,806 |
| Export Development Canada | 1.500% | 10/3/18 | 3,775 | 3,710 |
| Export-Import Bank of Korea | 5.875% | 1/14/15 | 5,375 | 5,650 |
| Export-Import Bank of Korea | 5.125% | 3/16/15 | 1,700 | 1,782 |
| Export-Import Bank of Korea | 4.125% | 9/9/15 | 7,125 | 7,473 |
| Export-Import Bank of Korea | 3.750% | 10/20/16 | 2,400 | 2,543 |
| Export-Import Bank of Korea | 4.000% | 1/11/17 | 13,175 | 13,955 |
| Export-Import Bank of Korea | 1.750% | 2/27/18 | 3,250 | 3,150 |
| Export-Import Bank of Korea | 2.875% | 9/17/18 | 7,500 | 7,531 |
| Federative Republic of Brazil | 7.875% | 3/7/15 | 12,525 | 13,427 |
| Federative Republic of Brazil | 6.000% | 1/17/17 | 9,600 | 10,632 |
| FMS Wertmanagement AoeR | 0.625% | 4/18/16 | 9,550 | 9,537 |
| FMS Wertmanagement AoeR | 1.125% | 10/14/16 | 5,000 | 5,033 |
| FMS Wertmanagement AoeR | 1.000% | 11/21/17 | 9,725 | 9,555 |
| FMS Wertmanagement AoeR | 1.625% | 11/20/18 | 13,250 | 13,060 |
| Hydro-Quebec | 2.000% | 6/30/16 | 9,855 | 10,132 |
| Hydro-Quebec | 1.375% | 6/19/17 | 1,800 | 1,801 |
| Inter-American Development Bank | 4.500% | 9/15/14 | 3,000 | 3,087 |
| Inter-American Development Bank | 2.250% | 7/15/15 | 8,125 | 8,349 |
| Inter-American Development Bank | 0.500% | 8/17/15 | 5,950 | 5,961 |
| Inter-American Development Bank | 4.250% | 9/14/15 | 5,550 | 5,903 |
| Inter-American Development Bank | 1.375% | 10/18/16 | 16,750 | 17,036 |
| Inter-American Development Bank | 0.875% | 11/15/16 | 13,550 | 13,573 |
| Inter-American Development Bank | 1.125% | 3/15/17 | 20,575 | 20,686 |
| Inter-American Development Bank | 2.375% | 8/15/17 | 7,800 | 8,136 |
| Inter-American Development Bank | 0.875% | 3/15/18 | 8,725 | 8,500 |
| Inter-American Development Bank | 1.750% | 8/24/18 | 14,325 | 14,355 |
| International Bank for Reconstruction & Development | 2.375% | 5/26/15 | 26,110 | 26,845 |
| International Bank for Reconstruction & Development | 0.375% | 11/16/15 | 11,500 | 11,481 |
| International Bank for Reconstruction & Development | 2.125% | 3/15/16 | 37,625 | 38,894 |
| International Bank for Reconstruction & Development | 5.000% | 4/1/16 | 4,600 | 5,048 |
| International Bank for Reconstruction & Development | 0.500% | 4/15/16 | 12,000 | 11,926 |
| International Bank for Reconstruction & Development | 1.000% | 9/15/16 | 23,400 | 23,565 |
| International Bank for Reconstruction & Development | 0.875% | 4/17/17 | 21,500 | 21,439 |
| International Bank for Reconstruction & Development | 1.125% | 7/18/17 | 11,700 | 11,706 |
| International Finance Corp. | 2.750% | 4/20/15 | 13,550 | 13,967 |
| International Finance Corp. | 2.250% | 4/11/16 | 3,400 | 3,519 |
| International Finance Corp. | 0.500% | 5/16/16 | 1,850 | 1,842 |
| International Finance Corp. | 0.625% | 11/15/16 | 1,500 | 1,493 |
| International Finance Corp. | 1.125% | 11/23/16 | 31,675 | 31,981 |
| International Finance Corp. | 1.000% | 4/24/17 | 4,800 | 4,782 |
| International Finance Corp. | 0.875% | 6/15/18 | 19,000 | 18,345 |
| International Finance Corp. | 1.750% | 9/4/18 | 22,400 | 22,326 |
| 6 Japan Bank for International Cooperation | 2.875% | 2/2/15 | 7,700 | 7,904 |
| 6 Japan Bank for International Cooperation | 1.875% | 9/24/15 | 4,200 | 4,299 |
| 6 Japan Bank for International Cooperation | 2.500% | 1/21/16 | 6,200 | 6,425 |
27
| Vanguard® Short-Term Bond Index Fund | ||||
| Schedule of Investments | ||||
| December 31, 2013 | ||||
| Face | Market | |||
| Maturity | Amount | Value | ||
| Coupon | Date | ($000) | ($000) | |
| 6 Japan Bank for International Cooperation | 2.500% | 5/18/16 | 6,800 | 7,073 |
| 6 Japan Bank for International Cooperation | 2.250% | 7/13/16 | 12,480 | 12,916 |
| 6 Japan Bank for International Cooperation | 1.125% | 7/19/17 | 12,325 | 12,202 |
| 6 Japan Bank for International Cooperation | 1.750% | 7/31/18 | 14,500 | 14,373 |
| 6 Japan Bank for International Cooperation | 1.750% | 11/13/18 | 12,200 | 12,050 |
| 6 Japan Finance Organization for Municipalities | 4.625% | 4/21/15 | 6,075 | 6,389 |
| 6 Japan Finance Organization for Municipalities | 5.000% | 5/16/17 | 3,800 | 4,239 |
| 7 KFW | 1.000% | 1/12/15 | 27,450 | 27,570 |
| 7 KFW | 2.625% | 3/3/15 | 10,650 | 10,924 |
| 7 KFW | 0.625% | 4/24/15 | 17,250 | 17,317 |
| 7 KFW | 0.500% | 9/30/15 | 24,500 | 24,463 |
| 7 KFW | 1.250% | 10/26/15 | 26,725 | 27,001 |
| 7 KFW | 2.625% | 2/16/16 | 18,050 | 18,813 |
| 7 KFW | 5.125% | 3/14/16 | 11,875 | 12,999 |
| 7 KFW | 0.500% | 4/19/16 | 29,750 | 29,531 |
| 7 KFW | 2.000% | 6/1/16 | 18,975 | 19,509 |
| 7 KFW | 1.250% | 10/5/16 | 24,100 | 24,384 |
| 7 KFW | 0.625% | 12/15/16 | 21,300 | 21,139 |
| 7 KFW | 1.250% | 2/15/17 | 23,650 | 23,805 |
| 7 KFW | 0.875% | 9/5/17 | 27,600 | 27,254 |
| 7 KFW | 4.375% | 3/15/18 | 18,750 | 20,741 |
| 7 KFW | 1.000% | 6/11/18 | 34,400 | 33,310 |
| 7 KFW | 4.500% | 7/16/18 | 12,875 | 14,392 |
| Korea Development Bank | 4.375% | 8/10/15 | 14,475 | 15,223 |
| Korea Development Bank | 3.250% | 3/9/16 | 1,875 | 1,949 |
| Korea Development Bank | 3.875% | 5/4/17 | 9,600 | 10,130 |
| Korea Development Bank | 3.500% | 8/22/17 | 6,500 | 6,775 |
| Korea Development Bank | 1.500% | 1/22/18 | 1,000 | 963 |
| Korea Finance Corp. | 3.250% | 9/20/16 | 4,200 | 4,382 |
| Korea Finance Corp. | 2.250% | 8/7/17 | 2,650 | 2,653 |
| 7 Landwirtschaftliche Rentenbank | 3.125% | 7/15/15 | 10,000 | 10,391 |
| 7 Landwirtschaftliche Rentenbank | 2.500% | 2/15/16 | 10,150 | 10,549 |
| 7 Landwirtschaftliche Rentenbank | 2.125% | 7/15/16 | 11,400 | 11,743 |
| 7 Landwirtschaftliche Rentenbank | 5.000% | 11/8/16 | 800 | 888 |
| 7 Landwirtschaftliche Rentenbank | 5.125% | 2/1/17 | 6,690 | 7,460 |
| 7 Landwirtschaftliche Rentenbank | 0.875% | 9/12/17 | 6,125 | 6,017 |
| 7 Landwirtschaftliche Rentenbank | 1.000% | 4/4/18 | 13,000 | 12,679 |
| 7 Landwirtschaftliche Rentenbank | 1.875% | 9/17/18 | 10,800 | 10,790 |
| Nordic Investment Bank | 2.500% | 7/15/15 | 2,625 | 2,711 |
| Nordic Investment Bank | 2.250% | 3/15/16 | 7,275 | 7,537 |
| Nordic Investment Bank | 0.500% | 4/14/16 | 13,125 | 13,091 |
| Nordic Investment Bank | 5.000% | 2/1/17 | 7,650 | 8,589 |
| Nordic Investment Bank | 1.000% | 3/7/17 | 4,850 | 4,860 |
| North American Development Bank | 2.300% | 10/10/18 | 2,700 | 2,658 |
| 8 Oesterreichische Kontrollbank AG | 1.125% | 7/6/15 | 5,300 | 5,352 |
| 8 Oesterreichische Kontrollbank AG | 1.750% | 10/5/15 | 12,075 | 12,337 |
| 8 Oesterreichische Kontrollbank AG | 4.875% | 2/16/16 | 5,329 | 5,796 |
| 8 Oesterreichische Kontrollbank AG | 2.000% | 6/3/16 | 7,850 | 8,083 |
| 8 Oesterreichische Kontrollbank AG | 0.750% | 12/15/16 | 6,100 | 6,080 |
| 8 Oesterreichische Kontrollbank AG | 1.125% | 5/29/18 | 12,050 | 11,739 |
| Pemex Project Funding Master Trust | 5.750% | 3/1/18 | 9,575 | 10,671 |
| Petrobras Global Finance BV | 2.000% | 5/20/16 | 6,000 | 5,936 |
| Petrobras International Finance Co. | 2.875% | 2/6/15 | 500 | 507 |
| Petrobras International Finance Co. | 3.875% | 1/27/16 | 24,625 | 25,292 |
| Petrobras International Finance Co. | 3.500% | 2/6/17 | 14,100 | 14,249 |
| Petrobras International Finance Co. | 5.875% | 3/1/18 | 6,000 | 6,381 |
| Petrobras International Finance Co. | 8.375% | 12/10/18 | 1,915 | 2,239 |
| Petroleos Mexicanos | 4.875% | 3/15/15 | 9,550 | 9,999 |
| Petroleos Mexicanos | 3.500% | 7/18/18 | 17,000 | 17,458 |
| Province of British Columbia | 2.850% | 6/15/15 | 6,125 | 6,343 |
| Province of British Columbia | 2.100% | 5/18/16 | 8,600 | 8,877 |
| Province of British Columbia | 1.200% | 4/25/17 | 4,000 | 3,993 |
| Province of Manitoba | 2.625% | 7/15/15 | 4,525 | 4,670 |
| Province of Manitoba | 4.900% | 12/6/16 | 4,000 | 4,465 |
28
| Vanguard® Short-Term Bond Index Fund | ||||
| Schedule of Investments | ||||
| December 31, 2013 | ||||
| Face | Market | |||
| Maturity | Amount | Value | ||
| Coupon | Date | ($000) | ($000) | |
| Province of Manitoba | 1.125% | 6/1/18 | 1,625 | 1,587 |
| Province of New Brunswick | 5.200% | 2/21/17 | 200 | 224 |
| Province of New Brunswick | 2.750% | 6/15/18 | 6,425 | 6,675 |
| Province of Nova Scotia | 2.375% | 7/21/15 | 4,250 | 4,369 |
| Province of Nova Scotia | 5.125% | 1/26/17 | 245 | 274 |
| Province of Ontario | 4.500% | 2/3/15 | 1,310 | 1,368 |
| Province of Ontario | 2.950% | 2/5/15 | 18,525 | 19,038 |
| Province of Ontario | 0.950% | 5/26/15 | 21,875 | 22,027 |
| Province of Ontario | 2.700% | 6/16/15 | 5,750 | 5,933 |
| Province of Ontario | 1.875% | 9/15/15 | 900 | 921 |
| Province of Ontario | 2.300% | 5/10/16 | 15,800 | 16,314 |
| Province of Ontario | 1.000% | 7/22/16 | 21,800 | 21,813 |
| Province of Ontario | 1.600% | 9/21/16 | 24,600 | 25,010 |
| Province of Ontario | 1.100% | 10/25/17 | 14,800 | 14,623 |
| Province of Ontario | 3.150% | 12/15/17 | 1,150 | 1,216 |
| Province of Ontario | 1.200% | 2/14/18 | 17,000 | 16,636 |
| Province of Ontario | 2.000% | 9/27/18 | 5,950 | 5,944 |
| Quebec | 4.600% | 5/26/15 | 7,400 | 7,828 |
| Quebec | 5.125% | 11/14/16 | 22,225 | 24,782 |
| Republic of Colombia | 7.375% | 1/27/17 | 5,600 | 6,482 |
| Republic of Italy | 4.500% | 1/21/15 | 10,100 | 10,483 |
| Republic of Italy | 3.125% | 1/26/15 | 19,700 | 20,171 |
| Republic of Italy | 4.750% | 1/25/16 | 13,000 | 13,850 |
| Republic of Italy | 5.250% | 9/20/16 | 19,700 | 21,485 |
| Republic of Panama | 7.250% | 3/15/15 | 915 | 979 |
| Republic of Peru | 9.875% | 2/6/15 | 7,425 | 8,137 |
| Republic of Poland | 3.875% | 7/16/15 | 15,045 | 15,708 |
| Republic of Turkey | 7.250% | 3/15/15 | 25,825 | 27,116 |
| Republic of Turkey | 7.000% | 9/26/16 | 10,400 | 11,414 |
| Republic of Turkey | 7.500% | 7/14/17 | 8,725 | 9,776 |
| Republic of Turkey | 6.750% | 4/3/18 | 8,575 | 9,312 |
| State of Israel | 5.500% | 11/9/16 | 4,025 | 4,492 |
| Statoil ASA | 1.800% | 11/23/16 | 5,475 | 5,625 |
| Statoil ASA | 3.125% | 8/17/17 | 4,800 | 5,053 |
| Statoil ASA | 6.700% | 1/15/18 | 2,720 | 3,199 |
| Statoil ASA | 1.200% | 1/17/18 | 1,475 | 1,440 |
| Statoil ASA | 1.150% | 5/15/18 | 5,000 | 4,836 |
| Statoil ASA | 1.950% | 11/8/18 | 700 | 695 |
| Svensk Exportkredit AB | 0.625% | 9/4/15 | 6,800 | 6,763 |
| Svensk Exportkredit AB | 1.750% | 10/20/15 | 4,400 | 4,496 |
| Svensk Exportkredit AB | 0.625% | 5/31/16 | 10,800 | 10,736 |
| Svensk Exportkredit AB | 2.125% | 7/13/16 | 5,500 | 5,661 |
| Svensk Exportkredit AB | 5.125% | 3/1/17 | 6,250 | 6,993 |
| Svensk Exportkredit AB | 1.750% | 5/30/17 | 1,975 | 2,012 |
| Svensk Exportkredit AB | 1.125% | 4/5/18 | 6,000 | 5,839 |
| United Mexican States | 11.375% | 9/15/16 | 11,075 | 14,132 |
| United Mexican States | 5.625% | 1/15/17 | 18,775 | 20,931 |
| Total Sovereign Bonds (Cost $2,456,649) | 2,473,310 | |||
| Taxable Municipal Bonds (0.1%) | ||||
| California GO | 5.450% | 4/1/15 | 460 | 486 |
| California GO | 3.950% | 11/1/15 | 6,405 | 6,787 |
| California GO | 1.050% | 2/1/16 | 145 | 146 |
| California GO | 5.950% | 4/1/16 | 2,890 | 3,203 |
| Illinois GO | 4.511% | 3/1/15 | 550 | 571 |
| Illinois GO | 5.365% | 3/1/17 | 5,000 | 5,390 |
| Illinois GO | 5.665% | 3/1/18 | 8,500 | 9,267 |
| Puerto Rico Government Development Bank Revenue | 3.670% | 5/1/14 | 700 | 664 |
| Puerto Rico Government Development Bank Revenue | 4.704% | 5/1/16 | 2,500 | 2,044 |
| Total Taxable Municipal Bonds (Cost $28,882) | 28,558 | |||
29
| Vanguard® Short-Term Bond Index Fund | |||
| Schedule of Investments | |||
| December 31, 2013 | |||
| Market | |||
| Value | |||
| Coupon | Shares | ($000) | |
| Temporary Cash Investment (0.7%) | |||
| Money Market Fund (0.7%) | |||
| 9 Vanguard Market Liquidity Fund (Cost $215,355) | 0.125% | 215,355,000 | 215,355 |
| Total Investments (99.7%) (Cost $33,931,246) | 34,029,037 | ||
| Other Assets and Liabilities—Net (0.3%) | 118,637 | ||
| Net Assets (100%) | 34,147,674 | ||
1 The issuer operates under a congressional charter; its securities are generally neither guaranteed by the U.S. Treasury nor backed by the full
faith and credit of the U.S. government.
2 The issuer was placed under federal conservatorship in September 2008; since that time, its daily operations have been managed by the Federal Housing Finance Agency and it receives capital from the U.S. Treasury, as needed to maintain a positive net worth, in exchange for senior preferred stock.
3 The average or expected maturity is shorter than the final maturity shown because of the possibility of interim principal payments and prepayments or the possibility of the issue being called.
4 Security exempt from registration under Rule 144A of the Securities Act of 1933. Such securities may be sold in transactions exempt from registration, normally to qualified institutional buyers. At December 31, 2013, the aggregate value of these securities was $41,175,000, representing 0.1% of net assets.
5 Non-income-producing security--security in default.
6 Guaranteed by the Government of Japan.
7 Guaranteed by the Federal Republic of Germany.
8 Guaranteed by the Republic of Austria.
9 Affiliated money market fund available only to Vanguard funds and certain trusts and accounts managed by Vanguard. Rate shown is the 7-day yield.
GO—General Obligation Bond.
REIT—Real Estate Investment Trust.
30
Vanguard® Intermediate-Term Bond Index Fund
Schedule of Investments
December 31, 2013
| Face | Market | ||||
| Maturity | Amount | Value | |||
| Coupon | Date | ($000) | ($000) | ||
| U.S. Government and Agency Obligations (50.4%) | |||||
| U.S. Government Securities (47.6%) | |||||
| United States Treasury Note/Bond | 3.500% | 2/15/18 | 13,878 | 15,062 | |
| United States Treasury Note/Bond | 3.875% | 5/15/18 | 78,550 | 86,553 | |
| United States Treasury Note/Bond | 4.000% | 8/15/18 | 61,809 | 68,531 | |
| United States Treasury Note/Bond | 3.750% | 11/15/18 | 115,235 | 126,399 | |
| United States Treasury Note/Bond | 1.250% | 11/30/18 | 25,000 | 24,453 | |
| United States Treasury Note/Bond | 2.750% | 2/15/19 | 96,700 | 101,263 | |
| United States Treasury Note/Bond | 8.875% | 2/15/19 | 47,350 | 63,982 | |
| United States Treasury Note/Bond | 3.125% | 5/15/19 | 349,595 | 372,319 | |
| United States Treasury Note/Bond | 3.625% | 8/15/19 | 418,425 | 455,560 | |
| United States Treasury Note/Bond | 1.000% | 9/30/19 | 17,000 | 16,033 | |
| United States Treasury Note/Bond | 3.375% | 11/15/19 | 240,524 | 258,489 | |
| United States Treasury Note/Bond | 1.125% | 12/31/19 | 17,616 | 16,625 | |
| United States Treasury Note/Bond | 1.375% | 1/31/20 | 15,195 | 14,521 | |
| United States Treasury Note/Bond | 3.625% | 2/15/20 | 337,327 | 366,843 | |
| United States Treasury Note/Bond | 8.500% | 2/15/20 | 3,230 | 4,425 | |
| United States Treasury Note/Bond | 1.250% | 2/29/20 | 123,736 | 117,007 | |
| United States Treasury Note/Bond | 1.125% | 4/30/20 | 191,450 | 178,736 | |
| United States Treasury Note/Bond | 3.500% | 5/15/20 | 359,300 | 387,257 | |
| United States Treasury Note/Bond | 1.375% | 5/31/20 | 164,785 | 156,005 | |
| United States Treasury Note/Bond | 1.875% | 6/30/20 | 131,450 | 128,123 | |
| United States Treasury Note/Bond | 2.000% | 7/31/20 | 85,525 | 83,921 | |
| United States Treasury Note/Bond | 2.625% | 8/15/20 | 183,285 | 186,808 | |
| United States Treasury Note/Bond | 8.750% | 8/15/20 | 14,970 | 20,988 | |
| United States Treasury Note/Bond | 2.125% | 8/31/20 | 16,000 | 15,777 | |
| United States Treasury Note/Bond | 2.000% | 9/30/20 | 561,300 | 547,969 | |
| United States Treasury Note/Bond | 1.750% | 10/31/20 | 97,100 | 93,033 | |
| United States Treasury Note/Bond | 2.625% | 11/15/20 | 111,542 | 113,215 | |
| United States Treasury Note/Bond | 2.000% | 11/30/20 | 122,325 | 118,941 | |
| United States Treasury Note/Bond | 2.375% | 12/31/20 | 144,400 | 143,655 | |
| United States Treasury Note/Bond | 3.625% | 2/15/21 | 234,780 | 253,048 | |
| United States Treasury Note/Bond | 3.125% | 5/15/21 | 226,783 | 236,067 | |
| United States Treasury Note/Bond | 2.125% | 8/15/21 | 89,768 | 86,823 | |
| United States Treasury Note/Bond | 8.125% | 8/15/21 | 1,300 | 1,806 | |
| United States Treasury Note/Bond | 2.000% | 11/15/21 | 200,890 | 191,410 | |
| United States Treasury Note/Bond | 8.000% | 11/15/21 | 350 | 486 | |
| 1 | United States Treasury Note/Bond | 2.000% | 2/15/22 | 16,105 | 15,254 |
| United States Treasury Note/Bond | 1.750% | 5/15/22 | 97,980 | 90,433 | |
| United States Treasury Note/Bond | 1.625% | 8/15/22 | 192,267 | 174,363 | |
| United States Treasury Note/Bond | 1.625% | 11/15/22 | 240,240 | 216,442 | |
| United States Treasury Note/Bond | 1.750% | 5/15/23 | 381,530 | 343,198 | |
| United States Treasury Note/Bond | 2.500% | 8/15/23 | 707,100 | 677,600 | |
| United States Treasury Note/Bond | 2.750% | 11/15/23 | 324,167 | 316,468 | |
| 6,885,891 | |||||
| Agency Bonds and Notes (2.8%) | |||||
| 2 | Federal Farm Credit Banks | 3.500% | 12/20/23 | 4,250 | 4,211 |
| 2 | Federal Home Loan Banks | 5.375% | 5/15/19 | 11,885 | 13,810 |
| 2 | Federal Home Loan Banks | 5.125% | 8/15/19 | 4,145 | 4,765 |
| 2 | Federal Home Loan Banks | 1.250% | 12/13/19 | 8,875 | 8,316 |
| 2 | Federal Home Loan Banks | 1.875% | 3/13/20 | 3,645 | 3,514 |
| 2 | Federal Home Loan Banks | 4.125% | 3/13/20 | 16,110 | 17,589 |
| 2 | Federal Home Loan Banks | 3.375% | 6/12/20 | 7,025 | 7,344 |
| 2 | Federal Home Loan Banks | 5.250% | 12/11/20 | 3,250 | 3,739 |
| 2 | Federal Home Loan Banks | 5.625% | 6/11/21 | 13,365 | 15,684 |
| 2 | Federal Home Loan Banks | 2.125% | 3/10/23 | 7,200 | 6,401 |
| 3 | Federal Home Loan Mortgage Corp. | 3.750% | 3/27/19 | 24,475 | 26,603 |
| 3 | Federal Home Loan Mortgage Corp. | 1.750% | 5/30/19 | 26,705 | 26,306 |
| 3 | Federal Home Loan Mortgage Corp. | 1.250% | 8/1/19 | 22,000 | 21,017 |
| 3 | Federal Home Loan Mortgage Corp. | 1.250% | 10/2/19 | 68,820 | 65,261 |
| 3 | Federal Home Loan Mortgage Corp. | 1.375% | 5/1/20 | 30,000 | 28,110 |
| 3 | Federal Home Loan Mortgage Corp. | 2.375% | 1/13/22 | 55,765 | 53,102 |
| 3 | Federal National Mortgage Assn. | 0.000% | 10/9/19 | 47,300 | 40,064 |
31
| Vanguard® Intermediate-Term Bond Index Fund | |||||
| Schedule of Investments | |||||
| December 31, 2013 | |||||
| Face | Market | ||||
| Maturity | Amount | Value | |||
| Coupon | Date | ($000) | ($000) | ||
| 2 | Financing Corp. | 8.600% | 9/26/19 | 1,750 | 2,329 |
| Hashemite Kingdom of Jordan | 2.503% | 10/30/20 | 7,250 | 7,079 | |
| Private Export Funding Corp. | 4.375% | 3/15/19 | 7,000 | 7,746 | |
| Private Export Funding Corp. | 1.450% | 8/15/19 | 4,400 | 4,190 | |
| Private Export Funding Corp. | 4.300% | 12/15/21 | 9,940 | 10,668 | |
| Private Export Funding Corp. | 2.800% | 5/15/22 | 3,725 | 3,574 | |
| Private Export Funding Corp. | 2.050% | 11/15/22 | 10,276 | 9,121 | |
| State of Israel | 5.500% | 9/18/23 | 1,000 | 1,156 | |
| 2 | Tennessee Valley Authority | 3.875% | 2/15/21 | 6,100 | 6,433 |
| 2 | Tennessee Valley Authority | 1.875% | 8/15/22 | 8,175 | 7,250 |
| 405,382 | |||||
| Total U.S. Government and Agency Obligations (Cost $7,273,403) | 7,291,273 | ||||
| Corporate Bonds (41.4%) | |||||
| Finance (12.6%) | |||||
| Banking (7.0%) | |||||
| American Express Co. | 2.650% | 12/2/22 | 10,048 | 9,268 | |
| Bancolombia SA | 5.950% | 6/3/21 | 6,425 | 6,670 | |
| Bank of America Corp. | 2.600% | 1/15/19 | 9,150 | 9,164 | |
| Bank of America Corp. | 7.625% | 6/1/19 | 9,500 | 11,774 | |
| Bank of America Corp. | 5.625% | 7/1/20 | 25,670 | 29,161 | |
| Bank of America Corp. | 5.875% | 1/5/21 | 7,600 | 8,727 | |
| Bank of America Corp. | 5.000% | 5/13/21 | 10,500 | 11,456 | |
| Bank of America Corp. | 5.700% | 1/24/22 | 12,175 | 13,730 | |
| Bank of America Corp. | 3.300% | 1/11/23 | 24,525 | 23,171 | |
| Bank of America Corp. | 4.100% | 7/24/23 | 2,550 | 2,550 | |
| Bank of Montreal | 2.375% | 1/25/19 | 4,850 | 4,818 | |
| Bank of Montreal | 2.550% | 11/6/22 | 6,100 | 5,584 | |
| Bank of New York Mellon Corp. | 5.450% | 5/15/19 | 7,360 | 8,321 | |
| Bank of New York Mellon Corp. | 4.600% | 1/15/20 | 3,675 | 4,022 | |
| Bank of New York Mellon Corp. | 4.150% | 2/1/21 | 2,000 | 2,115 | |
| Bank of New York Mellon Corp. | 3.550% | 9/23/21 | 3,725 | 3,780 | |
| Bank of Nova Scotia | 4.375% | 1/13/21 | 4,500 | 4,830 | |
| Barclays Bank plc | 6.750% | 5/22/19 | 8,125 | 9,763 | |
| Barclays Bank plc | 5.125% | 1/8/20 | 8,475 | 9,394 | |
| Barclays Bank plc | 5.140% | 10/14/20 | 4,800 | 5,113 | |
| BB&T Corp. | 6.850% | 4/30/19 | 5,311 | 6,405 | |
| BB&T Corp. | 5.250% | 11/1/19 | 600 | 671 | |
| BB&T Corp. | 3.950% | 3/22/22 | 1,600 | 1,575 | |
| BNP Paribas SA | 5.000% | 1/15/21 | 11,650 | 12,707 | |
| BNP Paribas SA | 3.250% | 3/3/23 | 4,925 | 4,633 | |
| Capital One Bank USA NA | 8.800% | 7/15/19 | 1,575 | 1,994 | |
| Capital One Bank USA NA | 3.375% | 2/15/23 | 8,340 | 7,740 | |
| Capital One Financial Corp. | 4.750% | 7/15/21 | 6,225 | 6,600 | |
| Capital One Financial Corp. | 3.500% | 6/15/23 | 4,350 | 4,073 | |
| 4,5 | Citicorp Lease Pass-Through Trust 1999-1 | 8.040% | 12/15/19 | 2,100 | 2,485 |
| Citigroup Inc. | 8.500% | 5/22/19 | 15,771 | 20,169 | |
| Citigroup Inc. | 5.375% | 8/9/20 | 11,526 | 13,056 | |
| Citigroup Inc. | 4.500% | 1/14/22 | 13,325 | 14,031 | |
| Citigroup Inc. | 4.050% | 7/30/22 | 3,450 | 3,406 | |
| Citigroup Inc. | 3.375% | 3/1/23 | 7,625 | 7,190 | |
| Citigroup Inc. | 3.500% | 5/15/23 | 7,975 | 7,371 | |
| Citigroup Inc. | 3.875% | 10/25/23 | 9,925 | 9,714 | |
| Cooperatieve Centrale Raiffeisen-Boerenleenbank BA | 4.500% | 1/11/21 | 2,675 | 2,826 | |
| Cooperatieve Centrale Raiffeisen-Boerenleenbank BA | 3.875% | 2/8/22 | 16,925 | 16,977 | |
| Cooperatieve Centrale Raiffeisen-Boerenleenbank BA | 3.950% | 11/9/22 | 10,625 | 10,255 | |
| Cooperatieve Centrale Raiffeisen-Boerenleenbank BA | 4.625% | 12/1/23 | 5,425 | 5,448 | |
| Credit Suisse | 5.300% | 8/13/19 | 6,125 | 6,898 | |
| Credit Suisse | 5.400% | 1/14/20 | 7,050 | 7,817 | |
| Credit Suisse | 4.375% | 8/5/20 | 6,950 | 7,407 | |
| 5 | Deutsche Bank AG | 4.296% | 5/24/28 | 7,625 | 6,891 |
| Discover Bank | 7.000% | 4/15/20 | 2,400 | 2,777 | |
| Discover Bank | 4.200% | 8/8/23 | 3,775 | 3,705 | |
32
| Vanguard® Intermediate-Term Bond Index Fund | ||||
| Schedule of Investments | ||||
| December 31, 2013 | ||||
| Face | Market | |||
| Maturity | Amount | Value | ||
| Coupon | Date | ($000) | ($000) | |
| Discover Financial Services | 3.850% | 11/21/22 | 5,343 | 5,061 |
| Fifth Third Bancorp | 3.500% | 3/15/22 | 1,875 | 1,823 |
| Fifth Third Bancorp | 4.300% | 1/16/24 | 3,150 | 3,077 |
| First Niagara Financial Group Inc. | 6.750% | 3/19/20 | 1,600 | 1,837 |
| First Niagara Financial Group Inc. | 7.250% | 12/15/21 | 1,720 | 1,973 |
| FirstMerit Corp. | 4.350% | 2/4/23 | 1,500 | 1,469 |
| Goldman Sachs Group Inc. | 7.500% | 2/15/19 | 16,710 | 20,311 |
| Goldman Sachs Group Inc. | 5.375% | 3/15/20 | 14,400 | 15,992 |
| Goldman Sachs Group Inc. | 6.000% | 6/15/20 | 10,290 | 11,775 |
| Goldman Sachs Group Inc. | 5.250% | 7/27/21 | 19,825 | 21,739 |
| Goldman Sachs Group Inc. | 5.750% | 1/24/22 | 19,550 | 21,970 |
| Goldman Sachs Group Inc. | 3.625% | 1/22/23 | 12,025 | 11,562 |
| HSBC Bank USA NA | 4.875% | 8/24/20 | 6,350 | 6,882 |
| HSBC Holdings plc | 5.100% | 4/5/21 | 13,975 | 15,508 |
| HSBC Holdings plc | 4.875% | 1/14/22 | 2,500 | 2,688 |
| HSBC Holdings plc | 4.000% | 3/30/22 | 9,600 | 9,818 |
| HSBC USA Inc. | 5.000% | 9/27/20 | 4,000 | 4,299 |
| Huntington Bancshares Inc. | 7.000% | 12/15/20 | 1,600 | 1,869 |
| Intesa Sanpaolo SPA | 3.875% | 1/15/19 | 6,125 | 6,100 |
| JPMorgan Chase & Co. | 6.300% | 4/23/19 | 14,975 | 17,622 |
| JPMorgan Chase & Co. | 4.400% | 7/22/20 | 13,815 | 14,829 |
| JPMorgan Chase & Co. | 4.250% | 10/15/20 | 16,900 | 17,888 |
| JPMorgan Chase & Co. | 4.625% | 5/10/21 | 8,308 | 8,919 |
| JPMorgan Chase & Co. | 4.350% | 8/15/21 | 21,950 | 23,156 |
| JPMorgan Chase & Co. | 4.500% | 1/24/22 | 13,500 | 14,284 |
| JPMorgan Chase & Co. | 3.250% | 9/23/22 | 17,425 | 16,681 |
| JPMorgan Chase & Co. | 3.200% | 1/25/23 | 11,900 | 11,243 |
| JPMorgan Chase & Co. | 3.375% | 5/1/23 | 10,150 | 9,413 |
| KeyCorp | 5.100% | 3/24/21 | 5,550 | 6,020 |
| Lloyds Bank plc | 6.375% | 1/21/21 | 8,275 | 9,816 |
| Morgan Stanley | 7.300% | 5/13/19 | 14,775 | 17,946 |
| Morgan Stanley | 5.625% | 9/23/19 | 14,175 | 16,062 |
| Morgan Stanley | 5.500% | 1/26/20 | 8,275 | 9,267 |
| Morgan Stanley | 5.500% | 7/24/20 | 8,925 | 9,973 |
| Morgan Stanley | 5.750% | 1/25/21 | 15,875 | 17,973 |
| Morgan Stanley | 5.500% | 7/28/21 | 11,700 | 13,061 |
| Morgan Stanley | 4.875% | 11/1/22 | 9,700 | 9,856 |
| Morgan Stanley | 3.750% | 2/25/23 | 13,075 | 12,700 |
| Morgan Stanley | 4.100% | 5/22/23 | 10,900 | 10,504 |
| National Australia Bank Ltd. | 3.000% | 1/20/23 | 4,350 | 4,045 |
| National City Corp. | 6.875% | 5/15/19 | 2,000 | 2,369 |
| Northern Trust Corp. | 3.450% | 11/4/20 | 1,700 | 1,749 |
| Northern Trust Corp. | 3.375% | 8/23/21 | 2,750 | 2,767 |
| Northern Trust Corp. | 2.375% | 8/2/22 | 4,350 | 4,012 |
| People's United Financial Inc. | 3.650% | 12/6/22 | 2,425 | 2,282 |
| PNC Bank NA | 2.700% | 11/1/22 | 4,400 | 3,984 |
| PNC Bank NA | 2.950% | 1/30/23 | 4,800 | 4,392 |
| PNC Bank NA | 3.800% | 7/25/23 | 3,375 | 3,264 |
| PNC Financial Services Group Inc. | 2.854% | 11/9/22 | 3,625 | 3,346 |
| PNC Funding Corp. | 6.700% | 6/10/19 | 1,975 | 2,386 |
| PNC Funding Corp. | 5.125% | 2/8/20 | 6,210 | 6,954 |
| PNC Funding Corp. | 4.375% | 8/11/20 | 1,200 | 1,292 |
| PNC Funding Corp. | 3.300% | 3/8/22 | 8,075 | 7,916 |
| Royal Bank of Scotland Group plc | 6.400% | 10/21/19 | 10,500 | 12,103 |
| Royal Bank of Scotland plc | 5.625% | 8/24/20 | 3,025 | 3,378 |
| Royal Bank of Scotland plc | 6.125% | 1/11/21 | 7,200 | 8,123 |
| State Street Corp. | 4.375% | 3/7/21 | 4,651 | 5,020 |
| State Street Corp. | 3.100% | 5/15/23 | 5,075 | 4,654 |
| State Street Corp. | 3.700% | 11/20/23 | 4,415 | 4,379 |
| Sumitomo Mitsui Banking Corp. | 3.200% | 7/18/22 | 4,600 | 4,346 |
| Sumitomo Mitsui Banking Corp. | 3.000% | 1/18/23 | 875 | 804 |
| Sumitomo Mitsui Banking Corp. | 3.950% | 7/19/23 | 2,975 | 2,956 |
| SunTrust Bank | 2.750% | 5/1/23 | 2,875 | 2,593 |
| Svenska Handelsbanken AB | 2.500% | 1/25/19 | 7,425 | 7,403 |
33
| Vanguard® Intermediate-Term Bond Index Fund | ||||
| Schedule of Investments | ||||
| December 31, 2013 | ||||
| Face | Market | |||
| Maturity | Amount | Value | ||
| Coupon | Date | ($000) | ($000) | |
| UBS AG | 4.875% | 8/4/20 | 10,375 | 11,509 |
| UnionBanCal Corp. | 3.500% | 6/18/22 | 1,575 | 1,543 |
| US Bancorp | 4.125% | 5/24/21 | 5,325 | 5,636 |
| US Bancorp | 3.000% | 3/15/22 | 5,500 | 5,309 |
| US Bancorp | 2.950% | 7/15/22 | 6,925 | 6,428 |
| Wells Fargo & Co. | 2.150% | 1/15/19 | 975 | 972 |
| Wells Fargo & Co. | 4.600% | 4/1/21 | 13,375 | 14,450 |
| Wells Fargo & Co. | 3.500% | 3/8/22 | 13,075 | 13,084 |
| Wells Fargo & Co. | 3.450% | 2/13/23 | 9,050 | 8,501 |
| Wells Fargo & Co. | 4.125% | 8/15/23 | 7,625 | 7,592 |
| 4 Wells Fargo & Co. | 4.480% | 1/16/24 | 4,439 | 4,438 |
| Westpac Banking Corp. | 4.875% | 11/19/19 | 10,895 | 12,038 |
| Zions Bancorporation | 4.500% | 6/13/23 | 1,075 | 1,046 |
| Brokerage (0.5%) | ||||
| Ameriprise Financial Inc. | 7.300% | 6/28/19 | 600 | 736 |
| Ameriprise Financial Inc. | 5.300% | 3/15/20 | 5,225 | 5,852 |
| Ameriprise Financial Inc. | 4.000% | 10/15/23 | 3,075 | 3,040 |
| BlackRock Inc. | 5.000% | 12/10/19 | 4,475 | 5,061 |
| BlackRock Inc. | 4.250% | 5/24/21 | 3,925 | 4,146 |
| BlackRock Inc. | 3.375% | 6/1/22 | 3,775 | 3,709 |
| Charles Schwab Corp. | 4.450% | 7/22/20 | 5,550 | 5,957 |
| Charles Schwab Corp. | 3.225% | 9/1/22 | 1,375 | 1,314 |
| Eaton Vance Corp. | 3.625% | 6/15/23 | 1,500 | 1,431 |
| Franklin Resources Inc. | 4.625% | 5/20/20 | 2,250 | 2,429 |
| Franklin Resources Inc. | 2.800% | 9/15/22 | 2,075 | 1,927 |
| Invesco Finance plc | 3.125% | 11/30/22 | 4,050 | 3,735 |
| Jefferies Group LLC | 8.500% | 7/15/19 | 3,725 | 4,510 |
| Jefferies Group LLC | 6.875% | 4/15/21 | 3,927 | 4,476 |
| Jefferies Group LLC | 5.125% | 1/20/23 | 3,450 | 3,484 |
| Lazard Group LLC | 4.250% | 11/14/20 | 1,875 | 1,870 |
| Legg Mason Inc. | 5.500% | 5/21/19 | 3,175 | 3,479 |
| Leucadia National Corp. | 5.500% | 10/18/23 | 3,800 | 3,794 |
| Nomura Holdings Inc. | 6.700% | 3/4/20 | 5,250 | 6,029 |
| Raymond James Financial Inc. | 8.600% | 8/15/19 | 1,500 | 1,898 |
| TD Ameritrade Holding Corp. | 5.600% | 12/1/19 | 2,225 | 2,551 |
| Finance Companies (1.0%) | ||||
| Air Lease Corp. | 3.375% | 1/15/19 | 5,525 | 5,553 |
| Air Lease Corp. | 4.750% | 3/1/20 | 2,000 | 2,075 |
| Block Financial LLC | 5.500% | 11/1/22 | 3,000 | 3,073 |
| GATX Corp. | 4.750% | 6/15/22 | 2,000 | 2,003 |
| GATX Corp. | 3.900% | 3/30/23 | 1,275 | 1,202 |
| General Electric Capital Corp. | 6.000% | 8/7/19 | 10,665 | 12,519 |
| General Electric Capital Corp. | 2.100% | 12/11/19 | 1,325 | 1,293 |
| General Electric Capital Corp. | 5.500% | 1/8/20 | 10,725 | 12,264 |
| General Electric Capital Corp. | 5.550% | 5/4/20 | 6,025 | 6,942 |
| General Electric Capital Corp. | 4.375% | 9/16/20 | 11,875 | 12,821 |
| General Electric Capital Corp. | 4.625% | 1/7/21 | 12,650 | 13,748 |
| General Electric Capital Corp. | 5.300% | 2/11/21 | 10,602 | 11,827 |
| General Electric Capital Corp. | 4.650% | 10/17/21 | 14,075 | 15,389 |
| General Electric Capital Corp. | 3.150% | 9/7/22 | 7,300 | 7,046 |
| General Electric Capital Corp. | 3.100% | 1/9/23 | 17,050 | 16,172 |
| HSBC Finance Corp. | 6.676% | 1/15/21 | 15,284 | 17,585 |
| Prospect Capital Corp. | 5.875% | 3/15/23 | 1,925 | 1,851 |
| Insurance (2.2%) | ||||
| ACE INA Holdings Inc. | 5.900% | 6/15/19 | 3,725 | 4,348 |
| ACE INA Holdings Inc. | 2.700% | 3/13/23 | 1,525 | 1,395 |
| AEGON Funding Co. LLC | 5.750% | 12/15/20 | 2,500 | 2,795 |
| Aetna Inc. | 4.125% | 6/1/21 | 2,475 | 2,588 |
| Aetna Inc. | 2.750% | 11/15/22 | 7,675 | 7,041 |
| Aflac Inc. | 8.500% | 5/15/19 | 3,000 | 3,822 |
| Aflac Inc. | 4.000% | 2/15/22 | 3,550 | 3,567 |
| Aflac Inc. | 3.625% | 6/15/23 | 2,000 | 1,929 |
| Alleghany Corp. | 5.625% | 9/15/20 | 1,450 | 1,590 |
34
| Vanguard® Intermediate-Term Bond Index Fund | ||||
| Schedule of Investments | ||||
| December 31, 2013 | ||||
| Face | Market | |||
| Maturity | Amount | Value | ||
| Coupon | Date | ($000) | ($000) | |
| Alleghany Corp. | 4.950% | 6/27/22 | 3,500 | 3,643 |
| Allied World Assurance Co. Ltd. | 5.500% | 11/15/20 | 2,225 | 2,402 |
| Allstate Corp. | 3.150% | 6/15/23 | 4,800 | 4,540 |
| 5 Allstate Corp. | 5.750% | 8/15/53 | 3,975 | 4,025 |
| Alterra Finance LLC | 6.250% | 9/30/20 | 1,565 | 1,758 |
| American Financial Group Inc. | 9.875% | 6/15/19 | 2,625 | 3,385 |
| American International Group Inc. | 3.375% | 8/15/20 | 4,025 | 4,057 |
| American International Group Inc. | 6.400% | 12/15/20 | 8,790 | 10,378 |
| American International Group Inc. | 4.875% | 6/1/22 | 8,250 | 8,821 |
| Aon Corp. | 5.000% | 9/30/20 | 3,600 | 3,948 |
| Aon plc | 4.000% | 11/27/23 | 850 | 834 |
| Aspen Insurance Holdings Ltd. | 6.000% | 12/15/20 | 1,075 | 1,187 |
| Aspen Insurance Holdings Ltd. | 4.650% | 11/15/23 | 2,900 | 2,853 |
| Assurant Inc. | 4.000% | 3/15/23 | 1,725 | 1,644 |
| Axis Specialty Finance LLC | 5.875% | 6/1/20 | 5,100 | 5,581 |
| Berkshire Hathaway Finance Corp. | 2.900% | 10/15/20 | 4,200 | 4,156 |
| Berkshire Hathaway Finance Corp. | 4.250% | 1/15/21 | 4,925 | 5,191 |
| Berkshire Hathaway Finance Corp. | 3.000% | 5/15/22 | 4,045 | 3,868 |
| Berkshire Hathaway Inc. | 3.750% | 8/15/21 | 3,250 | 3,334 |
| Berkshire Hathaway Inc. | 3.000% | 2/11/23 | 1,225 | 1,148 |
| Cigna Corp. | 8.500% | 5/1/19 | 2,000 | 2,556 |
| Cigna Corp. | 5.125% | 6/15/20 | 1,491 | 1,645 |
| Cigna Corp. | 4.375% | 12/15/20 | 1,920 | 2,025 |
| Cigna Corp. | 4.500% | 3/15/21 | 1,575 | 1,662 |
| Cigna Corp. | 4.000% | 2/15/22 | 3,325 | 3,380 |
| CNA Financial Corp. | 7.350% | 11/15/19 | 2,240 | 2,715 |
| CNA Financial Corp. | 5.875% | 8/15/20 | 1,800 | 2,042 |
| CNA Financial Corp. | 5.750% | 8/15/21 | 3,095 | 3,451 |
| Coventry Health Care Inc. | 5.450% | 6/15/21 | 2,750 | 3,049 |
| Fidelity National Financial Inc. | 5.500% | 9/1/22 | 775 | 803 |
| First American Financial Corp. | 4.300% | 2/1/23 | 1,425 | 1,355 |
| Genworth Holdings Inc. | 7.700% | 6/15/20 | 3,825 | 4,540 |
| Genworth Holdings Inc. | 7.200% | 2/15/21 | 2,075 | 2,399 |
| Genworth Holdings Inc. | 7.625% | 9/24/21 | 4,050 | 4,809 |
| Genworth Holdings Inc. | 4.900% | 8/15/23 | 1,000 | 998 |
| Hanover Insurance Group Inc. | 6.375% | 6/15/21 | 150 | 163 |
| Hartford Financial Services Group Inc. | 6.000% | 1/15/19 | 1,575 | 1,799 |
| Hartford Financial Services Group Inc. | 5.500% | 3/30/20 | 2,700 | 3,035 |
| Hartford Financial Services Group Inc. | 5.125% | 4/15/22 | 4,675 | 5,083 |
| HCC Insurance Holdings Inc. | 6.300% | 11/15/19 | 1,600 | 1,853 |
| Humana Inc. | 3.150% | 12/1/22 | 1,800 | 1,656 |
| Infinity Property & Casualty Corp. | 5.000% | 9/19/22 | 1,350 | 1,347 |
| ING US Inc. | 5.500% | 7/15/22 | 3,625 | 3,932 |
| Lincoln National Corp. | 8.750% | 7/1/19 | 5,451 | 7,009 |
| Lincoln National Corp. | 6.250% | 2/15/20 | 3,250 | 3,741 |
| Lincoln National Corp. | 4.200% | 3/15/22 | 300 | 305 |
| Loews Corp. | 2.625% | 5/15/23 | 2,425 | 2,170 |
| Manulife Financial Corp. | 4.900% | 9/17/20 | 3,250 | 3,467 |
| Markel Corp. | 7.125% | 9/30/19 | 1,617 | 1,925 |
| Markel Corp. | 4.900% | 7/1/22 | 3,450 | 3,564 |
| Markel Corp. | 3.625% | 3/30/23 | 2,000 | 1,872 |
| Marsh & McLennan Cos. Inc. | 9.250% | 4/15/19 | 1,950 | 2,520 |
| Marsh & McLennan Cos. Inc. | 4.800% | 7/15/21 | 4,350 | 4,621 |
| Marsh & McLennan Cos. Inc. | 4.050% | 10/15/23 | 150 | 147 |
| MetLife Inc. | 7.717% | 2/15/19 | 4,079 | 5,057 |
| MetLife Inc. | 4.750% | 2/8/21 | 7,875 | 8,498 |
| MetLife Inc. | 3.048% | 12/15/22 | 1,900 | 1,766 |
| Montpelier Re Holdings Ltd. | 4.700% | 10/15/22 | 1,425 | 1,397 |
| OneBeacon US Holdings Inc. | 4.600% | 11/9/22 | 1,425 | 1,397 |
| PartnerRe Finance B LLC | 5.500% | 6/1/20 | 5,700 | 6,169 |
| Primerica Inc. | 4.750% | 7/15/22 | 1,750 | 1,794 |
| Principal Financial Group Inc. | 8.875% | 5/15/19 | 2,750 | 3,515 |
| Principal Financial Group Inc. | 3.300% | 9/15/22 | 1,700 | 1,610 |
| ProAssurance Corp. | 5.300% | 11/15/23 | 900 | 923 |
35
| Vanguard® Intermediate-Term Bond Index Fund | ||||
| Schedule of Investments | ||||
| December 31, 2013 | ||||
| Face | Market | |||
| Maturity | Amount | Value | ||
| Coupon | Date | ($000) | ($000) | |
| Progressive Corp. | 3.750% | 8/23/21 | 2,100 | 2,145 |
| Protective Life Corp. | 7.375% | 10/15/19 | 1,600 | 1,928 |
| Prudential Financial Inc. | 7.375% | 6/15/19 | 7,545 | 9,232 |
| Prudential Financial Inc. | 5.375% | 6/21/20 | 3,800 | 4,272 |
| Prudential Financial Inc. | 4.500% | 11/15/20 | 3,425 | 3,665 |
| 5 Prudential Financial Inc. | 5.875% | 9/15/42 | 5,375 | 5,462 |
| 5 Prudential Financial Inc. | 5.625% | 6/15/43 | 6,675 | 6,567 |
| Reinsurance Group of America Inc. | 6.450% | 11/15/19 | 2,000 | 2,306 |
| Reinsurance Group of America Inc. | 5.000% | 6/1/21 | 3,500 | 3,676 |
| Reinsurance Group of America Inc. | 4.700% | 9/15/23 | 500 | 505 |
| Torchmark Corp. | 3.800% | 9/15/22 | 2,300 | 2,204 |
| Travelers Cos. Inc. | 5.900% | 6/2/19 | 2,775 | 3,240 |
| UnitedHealth Group Inc. | 1.625% | 3/15/19 | 3,125 | 3,007 |
| UnitedHealth Group Inc. | 4.700% | 2/15/21 | 2,625 | 2,842 |
| UnitedHealth Group Inc. | 3.375% | 11/15/21 | 500 | 490 |
| UnitedHealth Group Inc. | 2.875% | 3/15/22 | 6,500 | 6,177 |
| UnitedHealth Group Inc. | 2.750% | 2/15/23 | 5,000 | 4,552 |
| UnitedHealth Group Inc. | 2.875% | 3/15/23 | 3,725 | 3,457 |
| Unum Group | 5.625% | 9/15/20 | 1,650 | 1,803 |
| WellPoint Inc. | 4.350% | 8/15/20 | 14,005 | 14,778 |
| WellPoint Inc. | 3.700% | 8/15/21 | 1,850 | 1,842 |
| WellPoint Inc. | 3.125% | 5/15/22 | 4,000 | 3,745 |
| WellPoint Inc. | 3.300% | 1/15/23 | 200 | 188 |
| Willis Group Holdings plc | 5.750% | 3/15/21 | 3,900 | 4,201 |
| WR Berkley Corp. | 5.375% | 9/15/20 | 1,875 | 2,005 |
| WR Berkley Corp. | 4.625% | 3/15/22 | 3,500 | 3,534 |
| XLIT Ltd. | 5.750% | 10/1/21 | 2,300 | 2,593 |
| Other Finance (0.1%) | ||||
| CME Group Inc. | 3.000% | 9/15/22 | 2,525 | 2,371 |
| IntercontinentalExchange Group Inc. | 4.000% | 10/15/23 | 2,575 | 2,575 |
| Jones Lang LaSalle Inc. | 4.400% | 11/15/22 | 1,300 | 1,250 |
| NASDAQ OMX Group Inc. | 5.550% | 1/15/20 | 5,300 | 5,698 |
| Real Estate Investment Trusts (1.8%) | ||||
| Alexandria Real Estate Equities Inc. | 4.600% | 4/1/22 | 2,650 | 2,672 |
| Alexandria Real Estate Equities Inc. | 3.900% | 6/15/23 | 2,025 | 1,889 |
| American Campus Communities Operating Partnership | ||||
| LP | 3.750% | 4/15/23 | 1,800 | 1,674 |
| AvalonBay Communities Inc. | 2.950% | 9/15/22 | 3,025 | 2,764 |
| AvalonBay Communities Inc. | 2.850% | 3/15/23 | 1,500 | 1,348 |
| AvalonBay Communities Inc. | 4.200% | 12/15/23 | 1,390 | 1,377 |
| BioMed Realty LP | 4.250% | 7/15/22 | 2,000 | 1,910 |
| Boston Properties LP | 5.875% | 10/15/19 | 875 | 1,012 |
| Boston Properties LP | 5.625% | 11/15/20 | 4,875 | 5,467 |
| Boston Properties LP | 4.125% | 5/15/21 | 7,370 | 7,513 |
| Boston Properties LP | 3.850% | 2/1/23 | 800 | 782 |
| Boston Properties LP | 3.125% | 9/1/23 | 5,050 | 4,600 |
| Brandywine Operating Partnership LP | 3.950% | 2/15/23 | 1,600 | 1,502 |
| Camden Property Trust | 2.950% | 12/15/22 | 4,950 | 4,469 |
| CBL & Associates LP | 5.250% | 12/1/23 | 2,200 | 2,193 |
| Corporate Office Properties LP | 3.600% | 5/15/23 | 1,950 | 1,764 |
| CubeSmart LP | 4.375% | 12/15/23 | 3,150 | 3,074 |
| 4 DCT Industrial Trust Inc. | 4.500% | 10/15/23 | 1,125 | 1,095 |
| DDR Corp. | 7.875% | 9/1/20 | 2,000 | 2,453 |
| DDR Corp. | 3.500% | 1/15/21 | 1,625 | 1,577 |
| DDR Corp. | 4.625% | 7/15/22 | 4,425 | 4,505 |
| DDR Corp. | 3.375% | 5/15/23 | 925 | 842 |
| Digital Realty Trust LP | 5.250% | 3/15/21 | 5,575 | 5,692 |
| Digital Realty Trust LP | 3.625% | 10/1/22 | 1,125 | 1,011 |
| Duke Realty LP | 8.250% | 8/15/19 | 1,125 | 1,383 |
| Duke Realty LP | 6.750% | 3/15/20 | 350 | 403 |
| Duke Realty LP | 3.875% | 10/15/22 | 4,850 | 4,618 |
| Duke Realty LP | 3.625% | 4/15/23 | 2,525 | 2,317 |
| EPR Properties | 7.750% | 7/15/20 | 500 | 577 |
36
| Vanguard® Intermediate-Term Bond Index Fund | ||||
| Schedule of Investments | ||||
| December 31, 2013 | ||||
| Face | Market | |||
| Maturity | Amount | Value | ||
| Coupon | Date | ($000) | ($000) | |
| EPR Properties | 5.750% | 8/15/22 | 2,875 | 2,933 |
| EPR Properties | 5.250% | 7/15/23 | 1,800 | 1,757 |
| Equity One Inc. | 3.750% | 11/15/22 | 2,000 | 1,858 |
| ERP Operating LP | 4.750% | 7/15/20 | 6,250 | 6,702 |
| ERP Operating LP | 4.625% | 12/15/21 | 3,770 | 3,971 |
| ERP Operating LP | 3.000% | 4/15/23 | 575 | 524 |
| Essex Portfolio LP | 3.250% | 5/1/23 | 4,205 | 3,796 |
| Federal Realty Investment Trust | 3.000% | 8/1/22 | 1,525 | 1,417 |
| Federal Realty Investment Trust | 2.750% | 6/1/23 | 1,600 | 1,428 |
| HCP Inc. | 2.625% | 2/1/20 | 3,600 | 3,427 |
| HCP Inc. | 5.375% | 2/1/21 | 10,446 | 11,336 |
| HCP Inc. | 4.250% | 11/15/23 | 3,650 | 3,575 |
| Health Care REIT Inc. | 4.125% | 4/1/19 | 3,695 | 3,894 |
| Health Care REIT Inc. | 6.125% | 4/15/20 | 3,750 | 4,215 |
| Health Care REIT Inc. | 4.950% | 1/15/21 | 5,425 | 5,707 |
| Health Care REIT Inc. | 5.250% | 1/15/22 | 1,800 | 1,910 |
| Health Care REIT Inc. | 3.750% | 3/15/23 | 600 | 565 |
| Healthcare Realty Trust Inc. | 5.750% | 1/15/21 | 1,500 | 1,622 |
| Healthcare Realty Trust Inc. | 3.750% | 4/15/23 | 2,125 | 1,962 |
| Healthcare Trust of America Holdings LP | 3.700% | 4/15/23 | 1,625 | 1,492 |
| Hospitality Properties Trust | 5.000% | 8/15/22 | 2,275 | 2,305 |
| Hospitality Properties Trust | 4.500% | 6/15/23 | 2,875 | 2,770 |
| Kilroy Realty LP | 3.800% | 1/15/23 | 375 | 348 |
| Kimco Realty Corp. | 6.875% | 10/1/19 | 2,957 | 3,522 |
| Kimco Realty Corp. | 3.125% | 6/1/23 | 1,250 | 1,126 |
| Liberty Property LP | 4.750% | 10/1/20 | 6,210 | 6,505 |
| Mack-Cali Realty LP | 7.750% | 8/15/19 | 3,975 | 4,743 |
| Mack-Cali Realty LP | 4.500% | 4/18/22 | 2,100 | 2,059 |
| Mid-America Apartments LP | 4.300% | 10/15/23 | 1,525 | 1,485 |
| National Retail Properties Inc. | 3.800% | 10/15/22 | 1,000 | 952 |
| National Retail Properties Inc. | 3.300% | 4/15/23 | 4,000 | 3,639 |
| Omega Healthcare Investors Inc. | 6.750% | 10/15/22 | 3,550 | 3,856 |
| Piedmont Operating Partnership LP | 3.400% | 6/1/23 | 1,325 | 1,185 |
| ProLogis LP | 6.875% | 3/15/20 | 4,300 | 5,062 |
| ProLogis LP | 4.250% | 8/15/23 | 2,450 | 2,420 |
| Realty Income Corp. | 6.750% | 8/15/19 | 4,150 | 4,840 |
| Realty Income Corp. | 5.750% | 1/15/21 | 1,000 | 1,102 |
| Realty Income Corp. | 3.250% | 10/15/22 | 2,425 | 2,202 |
| Realty Income Corp. | 4.650% | 8/1/23 | 3,425 | 3,441 |
| Regency Centers LP | 4.800% | 4/15/21 | 2,500 | 2,588 |
| Retail Opportunity Investments Corp. | 5.000% | 12/15/23 | 1,150 | 1,146 |
| Simon Property Group LP | 5.650% | 2/1/20 | 10,800 | 12,255 |
| Simon Property Group LP | 4.375% | 3/1/21 | 10,285 | 10,843 |
| Simon Property Group LP | 4.125% | 12/1/21 | 6,075 | 6,297 |
| Simon Property Group LP | 3.375% | 3/15/22 | 3,450 | 3,364 |
| Tanger Properties LP | 3.875% | 12/1/23 | 2,975 | 2,858 |
| UDR Inc. | 3.700% | 10/1/20 | 250 | 250 |
| UDR Inc. | 4.625% | 1/10/22 | 3,325 | 3,407 |
| Ventas Realty LP / Ventas Capital Corp. | 4.000% | 4/30/19 | 4,000 | 4,178 |
| Ventas Realty LP / Ventas Capital Corp. | 2.700% | 4/1/20 | 2,875 | 2,747 |
| Ventas Realty LP / Ventas Capital Corp. | 4.750% | 6/1/21 | 2,900 | 3,038 |
| Ventas Realty LP / Ventas Capital Corp. | 4.250% | 3/1/22 | 2,590 | 2,595 |
| Ventas Realty LP / Ventas Capital Corp. | 3.250% | 8/15/22 | 4,250 | 3,923 |
| Vornado Realty LP | 5.000% | 1/15/22 | 2,000 | 2,078 |
| Washington REIT | 4.950% | 10/1/20 | 3,150 | 3,293 |
| Weingarten Realty Investors | 3.375% | 10/15/22 | 1,275 | 1,166 |
| Weingarten Realty Investors | 3.500% | 4/15/23 | 2,275 | 2,076 |
| 1,821,192 | ||||
| Industrial (24.7%) | ||||
| Basic Industry (3.3%) | ||||
| Agrium Inc. | 6.750% | 1/15/19 | 2,550 | 2,972 |
| Agrium Inc. | 3.150% | 10/1/22 | 3,600 | 3,308 |
| Agrium Inc. | 3.500% | 6/1/23 | 1,925 | 1,791 |
37
| Vanguard® Intermediate-Term Bond Index Fund | ||||
| Schedule of Investments | ||||
| December 31, 2013 | ||||
| Face | Market | |||
| Maturity | Amount | Value | ||
| Coupon | Date | ($000) | ($000) | |
| Air Products & Chemicals Inc. | 3.000% | 11/3/21 | 5,550 | 5,317 |
| Air Products & Chemicals Inc. | 2.750% | 2/3/23 | 1,250 | 1,149 |
| Albemarle Corp. | 4.500% | 12/15/20 | 1,050 | 1,079 |
| Alcoa Inc. | 5.720% | 2/23/19 | 1,100 | 1,178 |
| Alcoa Inc. | 6.150% | 8/15/20 | 5,600 | 6,030 |
| Alcoa Inc. | 5.400% | 4/15/21 | 4,525 | 4,639 |
| Alcoa Inc. | 5.870% | 2/23/22 | 3,050 | 3,147 |
| Allegheny Technologies Inc. | 5.950% | 1/15/21 | 3,735 | 3,874 |
| Allegheny Technologies Inc. | 5.875% | 8/15/23 | 1,000 | 1,008 |
| Barrick Gold Corp. | 6.950% | 4/1/19 | 6,450 | 7,451 |
| Barrick Gold Corp. | 3.850% | 4/1/22 | 7,225 | 6,492 |
| Barrick Gold Corp. | 4.100% | 5/1/23 | 3,950 | 3,559 |
| Barrick North America Finance LLC | 4.400% | 5/30/21 | 5,513 | 5,304 |
| Barrick PD Australia Finance Pty Ltd. | 4.950% | 1/15/20 | 2,700 | 2,731 |
| BHP Billiton Finance USA Ltd. | 6.500% | 4/1/19 | 7,875 | 9,366 |
| BHP Billiton Finance USA Ltd. | 3.250% | 11/21/21 | 5,200 | 5,171 |
| BHP Billiton Finance USA Ltd. | 2.875% | 2/24/22 | 3,675 | 3,506 |
| BHP Billiton Finance USA Ltd. | 3.850% | 9/30/23 | 11,450 | 11,468 |
| Cabot Corp. | 3.700% | 7/15/22 | 1,200 | 1,139 |
| Carpenter Technology Corp. | 5.200% | 7/15/21 | 2,350 | 2,397 |
| Carpenter Technology Corp. | 4.450% | 3/1/23 | 925 | 884 |
| Celulosa Arauco y Constitucion SA | 7.250% | 7/29/19 | 2,100 | 2,412 |
| Celulosa Arauco y Constitucion SA | 5.000% | 1/21/21 | 1,525 | 1,543 |
| Celulosa Arauco y Constitucion SA | 4.750% | 1/11/22 | 2,925 | 2,830 |
| CF Industries Inc. | 7.125% | 5/1/20 | 9,000 | 10,597 |
| CF Industries Inc. | 3.450% | 6/1/23 | 250 | 229 |
| Cliffs Natural Resources Inc. | 5.900% | 3/15/20 | 975 | 1,030 |
| Cliffs Natural Resources Inc. | 4.800% | 10/1/20 | 4,850 | 4,778 |
| Cliffs Natural Resources Inc. | 4.875% | 4/1/21 | 3,200 | 3,106 |
| Dow Chemical Co. | 8.550% | 5/15/19 | 11,225 | 14,534 |
| Dow Chemical Co. | 4.250% | 11/15/20 | 6,200 | 6,590 |
| Dow Chemical Co. | 4.125% | 11/15/21 | 6,250 | 6,447 |
| Dow Chemical Co. | 3.000% | 11/15/22 | 9,835 | 9,156 |
| Eastman Chemical Co. | 5.500% | 11/15/19 | 3,650 | 4,048 |
| Eastman Chemical Co. | 4.500% | 1/15/21 | 1,600 | 1,647 |
| Eastman Chemical Co. | 3.600% | 8/15/22 | 7,025 | 6,733 |
| Ecolab Inc. | 4.350% | 12/8/21 | 9,400 | 9,744 |
| EI du Pont de Nemours & Co. | 4.625% | 1/15/20 | 4,755 | 5,175 |
| EI du Pont de Nemours & Co. | 3.625% | 1/15/21 | 6,025 | 6,139 |
| EI du Pont de Nemours & Co. | 4.250% | 4/1/21 | 3,000 | 3,168 |
| EI du Pont de Nemours & Co. | 2.800% | 2/15/23 | 3,800 | 3,488 |
| FMC Corp. | 3.950% | 2/1/22 | 3,050 | 3,031 |
| Freeport-McMoRan Copper & Gold Inc. | 3.100% | 3/15/20 | 8,375 | 8,201 |
| Freeport-McMoRan Copper & Gold Inc. | 3.550% | 3/1/22 | 9,565 | 9,069 |
| Freeport-McMoRan Copper & Gold Inc. | 3.875% | 3/15/23 | 12,520 | 11,800 |
| Goldcorp Inc. | 3.700% | 3/15/23 | 6,400 | 5,714 |
| International Paper Co. | 9.375% | 5/15/19 | 3,975 | 5,213 |
| International Paper Co. | 7.500% | 8/15/21 | 7,465 | 9,153 |
| International Paper Co. | 4.750% | 2/15/22 | 5,960 | 6,216 |
| Kinross Gold Corp. | 5.125% | 9/1/21 | 2,450 | 2,339 |
| Lubrizol Corp. | 8.875% | 2/1/19 | 1,100 | 1,435 |
| LyondellBasell Industries NV | 5.000% | 4/15/19 | 11,475 | 12,680 |
| LyondellBasell Industries NV | 6.000% | 11/15/21 | 5,750 | 6,598 |
| Methanex Corp. | 3.250% | 12/15/19 | 1,975 | 1,957 |
| Monsanto Co. | 2.200% | 7/15/22 | 1,450 | 1,312 |
| Mosaic Co. | 3.750% | 11/15/21 | 1,950 | 1,913 |
| Mosaic Co. | 4.250% | 11/15/23 | 4,000 | 3,959 |
| NewMarket Corp. | 4.100% | 12/15/22 | 300 | 285 |
| Newmont Mining Corp. | 5.125% | 10/1/19 | 5,025 | 5,186 |
| Newmont Mining Corp. | 3.500% | 3/15/22 | 7,765 | 6,599 |
| Nucor Corp. | 4.125% | 9/15/22 | 2,950 | 2,949 |
| Nucor Corp. | 4.000% | 8/1/23 | 1,075 | 1,048 |
| Packaging Corp. of America | 3.900% | 6/15/22 | 1,900 | 1,843 |
| Packaging Corp. of America | 4.500% | 11/1/23 | 3,650 | 3,653 |
38
| Vanguard® Intermediate-Term Bond Index Fund | ||||
| Schedule of Investments | ||||
| December 31, 2013 | ||||
| Face | Market | |||
| Maturity | Amount | Value | ||
| Coupon | Date | ($000) | ($000) | |
| Plains Exploration & Production Co. | 6.125% | 6/15/19 | 4,215 | 4,637 |
| Plains Exploration & Production Co. | 6.500% | 11/15/20 | 8,500 | 9,393 |
| Plains Exploration & Production Co. | 6.625% | 5/1/21 | 1,820 | 2,007 |
| Plains Exploration & Production Co. | 6.750% | 2/1/22 | 5,625 | 6,209 |
| Plains Exploration & Production Co. | 6.875% | 2/15/23 | 7,600 | 8,455 |
| Plum Creek Timberlands LP | 4.700% | 3/15/21 | 3,300 | 3,405 |
| Potash Corp. of Saskatchewan Inc. | 4.875% | 3/30/20 | 1,800 | 1,937 |
| PPG Industries Inc. | 3.600% | 11/15/20 | 6,350 | 6,442 |
| Praxair Inc. | 4.500% | 8/15/19 | 2,450 | 2,707 |
| Praxair Inc. | 4.050% | 3/15/21 | 575 | 598 |
| Praxair Inc. | 3.000% | 9/1/21 | 4,925 | 4,826 |
| Praxair Inc. | 2.450% | 2/15/22 | 10,725 | 9,907 |
| Praxair Inc. | 2.200% | 8/15/22 | 2,250 | 2,005 |
| Rayonier Inc. | 3.750% | 4/1/22 | 250 | 235 |
| Reliance Steel & Aluminum Co. | 4.500% | 4/15/23 | 2,125 | 2,073 |
| Rio Tinto Finance USA Ltd. | 9.000% | 5/1/19 | 8,525 | 11,161 |
| Rio Tinto Finance USA Ltd. | 4.125% | 5/20/21 | 3,325 | 3,441 |
| Rio Tinto Finance USA Ltd. | 3.750% | 9/20/21 | 5,775 | 5,763 |
| Rio Tinto Finance USA plc | 3.500% | 3/22/22 | 11,300 | 11,055 |
| Rio Tinto Finance USA plc | 2.875% | 8/21/22 | 10,025 | 9,292 |
| RPM International Inc. | 6.125% | 10/15/19 | 2,575 | 2,883 |
| RPM International Inc. | 3.450% | 11/15/22 | 2,900 | 2,654 |
| Sigma-Aldrich Corp. | 3.375% | 11/1/20 | 750 | 743 |
| Southern Copper Corp. | 5.375% | 4/16/20 | 1,725 | 1,842 |
| Southern Copper Corp. | 3.500% | 11/8/22 | 1,500 | 1,375 |
| Syngenta Finance NV | 3.125% | 3/28/22 | 2,500 | 2,390 |
| Teck Resources Ltd. | 3.000% | 3/1/19 | 6,100 | 6,059 |
| Teck Resources Ltd. | 4.750% | 1/15/22 | 5,825 | 5,813 |
| Teck Resources Ltd. | 3.750% | 2/1/23 | 1,500 | 1,392 |
| Vale Overseas Ltd. | 5.625% | 9/15/19 | 6,250 | 6,775 |
| Vale Overseas Ltd. | 4.625% | 9/15/20 | 7,125 | 7,291 |
| Vale Overseas Ltd. | 4.375% | 1/11/22 | 10,870 | 10,524 |
| Valspar Corp. | 7.250% | 6/15/19 | 1,275 | 1,509 |
| Valspar Corp. | 4.200% | 1/15/22 | 1,550 | 1,536 |
| Westlake Chemical Corp. | 3.600% | 7/15/22 | 550 | 521 |
| Weyerhaeuser Co. | 7.375% | 10/1/19 | 3,250 | 3,974 |
| Capital Goods (2.3%) | ||||
| 3M Co. | 2.000% | 6/26/22 | 3,125 | 2,849 |
| ABB Finance USA Inc. | 2.875% | 5/8/22 | 7,165 | 6,754 |
| Acuity Brands Lighting Inc. | 6.000% | 12/15/19 | 1,675 | 1,816 |
| Bemis Co. Inc. | 6.800% | 8/1/19 | 2,300 | 2,683 |
| Boeing Co. | 6.000% | 3/15/19 | 8,225 | 9,690 |
| Boeing Co. | 4.875% | 2/15/20 | 6,100 | 6,795 |
| Carlisle Cos. Inc. | 3.750% | 11/15/22 | 3,350 | 3,138 |
| Caterpillar Financial Services Corp. | 7.150% | 2/15/19 | 8,550 | 10,490 |
| Caterpillar Financial Services Corp. | 2.850% | 6/1/22 | 2,750 | 2,611 |
| Caterpillar Inc. | 3.900% | 5/27/21 | 1,850 | 1,922 |
| Caterpillar Inc. | 2.600% | 6/26/22 | 5,200 | 4,841 |
| Cooper US Inc. | 3.875% | 12/15/20 | 5,000 | 5,065 |
| Crane Co. | 4.450% | 12/15/23 | 2,500 | 2,474 |
| Danaher Corp. | 5.400% | 3/1/19 | 1,450 | 1,664 |
| Danaher Corp. | 3.900% | 6/23/21 | 2,025 | 2,090 |
| Deere & Co. | 4.375% | 10/16/19 | 850 | 940 |
| Deere & Co. | 2.600% | 6/8/22 | 7,200 | 6,746 |
| Dover Corp. | 4.300% | 3/1/21 | 5,500 | 5,805 |
| Eaton Corp. | 2.750% | 11/2/22 | 5,975 | 5,559 |
| 4 Embraer Overseas Ltd. | 5.696% | 9/16/23 | 5,143 | 5,127 |
| Embraer SA | 5.150% | 6/15/22 | 1,800 | 1,796 |
| Emerson Electric Co. | 4.875% | 10/15/19 | 1,550 | 1,744 |
| Emerson Electric Co. | 4.250% | 11/15/20 | 1,400 | 1,502 |
| Emerson Electric Co. | 2.625% | 2/15/23 | 6,525 | 6,107 |
| Flowserve Corp. | 3.500% | 9/15/22 | 8,025 | 7,563 |
| General Dynamics Corp. | 3.875% | 7/15/21 | 4,075 | 4,200 |
39
| Vanguard® Intermediate-Term Bond Index Fund | ||||
| Schedule of Investments | ||||
| December 31, 2013 | ||||
| Face | Market | |||
| Maturity | Amount | Value | ||
| Coupon | Date | ($000) | ($000) | |
| General Dynamics Corp. | 2.250% | 11/15/22 | 5,325 | 4,776 |
| General Electric Co. | 2.700% | 10/9/22 | 19,025 | 17,775 |
| Honeywell International Inc. | 5.000% | 2/15/19 | 3,700 | 4,173 |
| Honeywell International Inc. | 4.250% | 3/1/21 | 8,126 | 8,710 |
| IDEX Corp. | 4.200% | 12/15/21 | 400 | 396 |
| Illinois Tool Works Inc. | 6.250% | 4/1/19 | 5,900 | 6,990 |
| 4 Ingersoll-Rand Global Holding Co. Ltd. | 2.875% | 1/15/19 | 2,000 | 1,980 |
| 4 Ingersoll-Rand Global Holding Co. Ltd. | 4.250% | 6/15/23 | 2,175 | 2,119 |
| John Deere Capital Corp. | 1.700% | 1/15/20 | 2,325 | 2,182 |
| John Deere Capital Corp. | 3.900% | 7/12/21 | 6,200 | 6,412 |
| John Deere Capital Corp. | 3.150% | 10/15/21 | 2,800 | 2,766 |
| John Deere Capital Corp. | 2.750% | 3/15/22 | 425 | 401 |
| John Deere Capital Corp. | 2.800% | 1/27/23 | 275 | 256 |
| Joy Global Inc. | 5.125% | 10/15/21 | 3,420 | 3,547 |
| Kennametal Inc. | 2.650% | 11/1/19 | 2,550 | 2,499 |
| Kennametal Inc. | 3.875% | 2/15/22 | 2,425 | 2,315 |
| L-3 Communications Corp. | 5.200% | 10/15/19 | 6,400 | 6,970 |
| L-3 Communications Corp. | 4.750% | 7/15/20 | 2,700 | 2,798 |
| L-3 Communications Corp. | 4.950% | 2/15/21 | 4,900 | 5,117 |
| Lockheed Martin Corp. | 4.250% | 11/15/19 | 6,300 | 6,774 |
| Lockheed Martin Corp. | 3.350% | 9/15/21 | 5,900 | 5,829 |
| Mohawk Industries Inc. | 3.850% | 2/1/23 | 3,725 | 3,512 |
| Northrop Grumman Corp. | 3.500% | 3/15/21 | 6,450 | 6,417 |
| Owens Corning | 9.000% | 6/15/19 | 943 | 1,160 |
| Pentair Finance SA | 5.000% | 5/15/21 | 3,000 | 3,135 |
| Pentair Finance SA | 3.150% | 9/15/22 | 3,100 | 2,799 |
| Precision Castparts Corp. | 2.500% | 1/15/23 | 3,700 | 3,362 |
| Raytheon Co. | 4.400% | 2/15/20 | 1,225 | 1,312 |
| Raytheon Co. | 3.125% | 10/15/20 | 6,850 | 6,856 |
| Raytheon Co. | 2.500% | 12/15/22 | 7,725 | 7,019 |
| Republic Services Inc. | 5.500% | 9/15/19 | 1,825 | 2,059 |
| Republic Services Inc. | 5.000% | 3/1/20 | 6,025 | 6,626 |
| Republic Services Inc. | 5.250% | 11/15/21 | 9,188 | 10,020 |
| Republic Services Inc. | 3.550% | 6/1/22 | 925 | 894 |
| Republic Services Inc. | 4.750% | 5/15/23 | 725 | 754 |
| Rockwell Collins Inc. | 5.250% | 7/15/19 | 650 | 736 |
| Rockwell Collins Inc. | 3.100% | 11/15/21 | 1,800 | 1,741 |
| Rockwell Collins Inc. | 3.700% | 12/15/23 | 500 | 494 |
| Roper Industries Inc. | 6.250% | 9/1/19 | 2,900 | 3,335 |
| Roper Industries Inc. | 3.125% | 11/15/22 | 2,275 | 2,086 |
| Snap-on Inc. | 6.125% | 9/1/21 | 2,825 | 3,195 |
| Sonoco Products Co. | 4.375% | 11/1/21 | 1,100 | 1,120 |
| Stanley Black & Decker Inc. | 3.400% | 12/1/21 | 4,775 | 4,736 |
| Stanley Black & Decker Inc. | 2.900% | 11/1/22 | 1,825 | 1,694 |
| Textron Inc. | 7.250% | 10/1/19 | 1,000 | 1,160 |
| Tyco International Finance SA | 8.500% | 1/15/19 | 3,175 | 3,890 |
| Tyco International Finance SA / Tyco International Ltd. | 7.000% | 12/15/19 | 600 | 703 |
| United Technologies Corp. | 6.125% | 2/1/19 | 10,325 | 12,196 |
| United Technologies Corp. | 4.500% | 4/15/20 | 7,400 | 8,070 |
| United Technologies Corp. | 3.100% | 6/1/22 | 14,200 | 13,942 |
| Waste Management Inc. | 7.375% | 3/11/19 | 1,550 | 1,871 |
| Waste Management Inc. | 4.750% | 6/30/20 | 8,800 | 9,555 |
| Waste Management Inc. | 4.600% | 3/1/21 | 3,900 | 4,141 |
| Communication (3.5%) | ||||
| 21st Century Fox America Inc. | 6.900% | 3/1/19 | 10,800 | 12,989 |
| 21st Century Fox America Inc. | 4.500% | 2/15/21 | 5,050 | 5,398 |
| America Movil SAB de CV | 5.000% | 10/16/19 | 4,500 | 4,884 |
| America Movil SAB de CV | 5.000% | 3/30/20 | 11,300 | 12,338 |
| America Movil SAB de CV | 3.125% | 7/16/22 | 8,050 | 7,384 |
| American Tower Corp. | 5.050% | 9/1/20 | 8,070 | 8,531 |
| American Tower Corp. | 5.900% | 11/1/21 | 3,400 | 3,706 |
| American Tower Corp. | 4.700% | 3/15/22 | 550 | 547 |
| American Tower Corp. | 3.500% | 1/31/23 | 7,751 | 7,037 |
40
| Vanguard® Intermediate-Term Bond Index Fund | ||||
| Schedule of Investments | ||||
| December 31, 2013 | ||||
| Face | Market | |||
| Maturity | Amount | Value | ||
| Coupon | Date | ($000) | ($000) | |
| AT&T Inc. | 5.800% | 2/15/19 | 11,325 | 13,087 |
| AT&T Inc. | 4.450% | 5/15/21 | 4,075 | 4,292 |
| AT&T Inc. | 3.875% | 8/15/21 | 7,950 | 8,041 |
| AT&T Inc. | 3.000% | 2/15/22 | 10,725 | 10,081 |
| AT&T Inc. | 2.625% | 12/1/22 | 7,850 | 7,064 |
| CBS Corp. | 8.875% | 5/15/19 | 6,350 | 8,103 |
| CBS Corp. | 5.750% | 4/15/20 | 220 | 247 |
| CBS Corp. | 4.300% | 2/15/21 | 3,300 | 3,367 |
| CBS Corp. | 3.375% | 3/1/22 | 1,800 | 1,719 |
| CC Holdings GS V LLC / Crown Castle GS III Corp. | 3.849% | 4/15/23 | 1,075 | 998 |
| Comcast Cable Communications Holdings Inc. | 9.455% | 11/15/22 | 5,923 | 8,184 |
| Comcast Corp. | 5.700% | 7/1/19 | 4,625 | 5,350 |
| Comcast Corp. | 5.150% | 3/1/20 | 2,625 | 2,930 |
| Comcast Corp. | 3.125% | 7/15/22 | 2,675 | 2,556 |
| Comcast Corp. | 2.850% | 1/15/23 | 6,900 | 6,388 |
| Deutsche Telekom International Finance BV | 6.000% | 7/8/19 | 625 | 724 |
| DIRECTV Holdings LLC / DIRECTV Financing Co. Inc. | 5.875% | 10/1/19 | 8,150 | 9,269 |
| DIRECTV Holdings LLC / DIRECTV Financing Co. Inc. | 5.200% | 3/15/20 | 9,305 | 10,146 |
| DIRECTV Holdings LLC / DIRECTV Financing Co. Inc. | 5.000% | 3/1/21 | 7,620 | 8,017 |
| DIRECTV Holdings LLC / DIRECTV Financing Co. Inc. | 3.800% | 3/15/22 | 5,150 | 4,915 |
| Discovery Communications LLC | 5.625% | 8/15/19 | 3,600 | 4,044 |
| Discovery Communications LLC | 5.050% | 6/1/20 | 5,200 | 5,668 |
| Discovery Communications LLC | 4.375% | 6/15/21 | 4,350 | 4,491 |
| Discovery Communications LLC | 3.300% | 5/15/22 | 1,900 | 1,800 |
| Graham Holdings Co. | 7.250% | 2/1/19 | 1,075 | 1,275 |
| Interpublic Group of Cos. Inc. | 4.000% | 3/15/22 | 3,000 | 2,868 |
| Interpublic Group of Cos. Inc. | 3.750% | 2/15/23 | 2,000 | 1,872 |
| Moody's Corp. | 5.500% | 9/1/20 | 200 | 215 |
| Moody's Corp. | 4.500% | 9/1/22 | 6,450 | 6,345 |
| NBCUniversal Media LLC | 5.150% | 4/30/20 | 11,135 | 12,428 |
| NBCUniversal Media LLC | 4.375% | 4/1/21 | 13,065 | 13,807 |
| NBCUniversal Media LLC | 2.875% | 1/15/23 | 7,850 | 7,277 |
| Omnicom Group Inc. | 4.450% | 8/15/20 | 13,350 | 14,108 |
| Orange SA | 5.375% | 7/8/19 | 5,100 | 5,665 |
| Orange SA | 4.125% | 9/14/21 | 8,625 | 8,695 |
| Qwest Corp. | 6.750% | 12/1/21 | 3,230 | 3,516 |
| Reed Elsevier Capital Inc. | 3.125% | 10/15/22 | 6,313 | 5,784 |
| Rogers Communications Inc. | 3.000% | 3/15/23 | 2,665 | 2,446 |
| Rogers Communications Inc. | 4.100% | 10/1/23 | 1,000 | 988 |
| Telefonica Emisiones SAU | 5.877% | 7/15/19 | 2,000 | 2,241 |
| Telefonica Emisiones SAU | 5.134% | 4/27/20 | 6,700 | 7,108 |
| Telefonica Emisiones SAU | 5.462% | 2/16/21 | 13,510 | 14,268 |
| Telefonica Emisiones SAU | 4.570% | 4/27/23 | 3,500 | 3,458 |
| Thomson Reuters Corp. | 4.700% | 10/15/19 | 2,350 | 2,552 |
| Thomson Reuters Corp. | 3.950% | 9/30/21 | 1,375 | 1,365 |
| Thomson Reuters Corp. | 4.300% | 11/23/23 | 3,400 | 3,400 |
| Time Warner Cable Inc. | 8.750% | 2/14/19 | 3,750 | 4,484 |
| Time Warner Cable Inc. | 8.250% | 4/1/19 | 5,875 | 6,927 |
| Time Warner Cable Inc. | 5.000% | 2/1/20 | 11,185 | 11,354 |
| Time Warner Cable Inc. | 4.125% | 2/15/21 | 3,175 | 2,969 |
| Time Warner Cable Inc. | 4.000% | 9/1/21 | 11,000 | 10,109 |
| Time Warner Entertainment Co. LP | 8.375% | 3/15/23 | 1,703 | 1,949 |
| Verizon Communications Inc. | 6.350% | 4/1/19 | 13,500 | 15,895 |
| Verizon Communications Inc. | 4.500% | 9/15/20 | 18,405 | 19,686 |
| Verizon Communications Inc. | 4.600% | 4/1/21 | 8,025 | 8,585 |
| Verizon Communications Inc. | 3.500% | 11/1/21 | 8,350 | 8,276 |
| Verizon Communications Inc. | 2.450% | 11/1/22 | 10,175 | 8,991 |
| Verizon Communications Inc. | 5.150% | 9/15/23 | 56,940 | 60,972 |
| Vodafone Group plc | 5.450% | 6/10/19 | 2,970 | 3,378 |
| Vodafone Group plc | 4.375% | 3/16/21 | 5,500 | 5,715 |
| Vodafone Group plc | 2.500% | 9/26/22 | 7,650 | 6,775 |
| Vodafone Group plc | 2.950% | 2/19/23 | 8,660 | 7,896 |
| WPP Finance 2010 | 4.750% | 11/21/21 | 6,975 | 7,239 |
| WPP Finance 2010 | 3.625% | 9/7/22 | 3,400 | 3,276 |
41
| Vanguard® Intermediate-Term Bond Index Fund | ||||
| Schedule of Investments | ||||
| December 31, 2013 | ||||
| Face | Market | |||
| Maturity | Amount | Value | ||
| Coupon | Date | ($000) | ($000) | |
| Consumer Cyclical (2.8%) | ||||
| Advance Auto Parts Inc. | 5.750% | 5/1/20 | 1,725 | 1,874 |
| Advance Auto Parts Inc. | 4.500% | 1/15/22 | 1,500 | 1,509 |
| Advance Auto Parts Inc. | 4.500% | 12/1/23 | 1,375 | 1,367 |
| Amazon.com Inc. | 2.500% | 11/29/22 | 8,425 | 7,599 |
| AutoZone Inc. | 4.000% | 11/15/20 | 250 | 257 |
| AutoZone Inc. | 3.700% | 4/15/22 | 2,400 | 2,307 |
| AutoZone Inc. | 3.125% | 7/15/23 | 2,025 | 1,832 |
| BorgWarner Inc. | 4.625% | 9/15/20 | 950 | 1,000 |
| Brinker International Inc. | 3.875% | 5/15/23 | 5,550 | 5,022 |
| Carnival Corp. | 3.950% | 10/15/20 | 2,775 | 2,775 |
| Costco Wholesale Corp. | 1.700% | 12/15/19 | 4,775 | 4,594 |
| Cummins Inc. | 3.650% | 10/1/23 | 1,300 | 1,281 |
| CVS Caremark Corp. | 4.750% | 5/18/20 | 50 | 54 |
| CVS Caremark Corp. | 4.125% | 5/15/21 | 1,000 | 1,042 |
| CVS Caremark Corp. | 2.750% | 12/1/22 | 7,225 | 6,651 |
| CVS Caremark Corp. | 4.000% | 12/5/23 | 8,600 | 8,572 |
| Darden Restaurants Inc. | 4.500% | 10/15/21 | 2,250 | 2,182 |
| Darden Restaurants Inc. | 3.350% | 11/1/22 | 2,700 | 2,312 |
| Delphi Corp. | 5.000% | 2/15/23 | 3,000 | 3,090 |
| Dollar General Corp. | 3.250% | 4/15/23 | 5,120 | 4,697 |
| eBay Inc. | 3.250% | 10/15/20 | 2,935 | 3,000 |
| eBay Inc. | 2.600% | 7/15/22 | 5,575 | 5,126 |
| Expedia Inc. | 5.950% | 8/15/20 | 3,425 | 3,704 |
| Family Dollar Stores Inc. | 5.000% | 2/1/21 | 1,450 | 1,487 |
| Ford Motor Credit Co. LLC | 8.125% | 1/15/20 | 7,425 | 9,317 |
| Ford Motor Credit Co. LLC | 5.750% | 2/1/21 | 8,775 | 9,792 |
| Ford Motor Credit Co. LLC | 5.875% | 8/2/21 | 10,075 | 11,411 |
| Ford Motor Credit Co. LLC | 4.250% | 9/20/22 | 7,850 | 7,850 |
| Ford Motor Credit Co. LLC | 4.375% | 8/6/23 | 1,100 | 1,102 |
| Gap Inc. | 5.950% | 4/12/21 | 12,450 | 13,679 |
| Home Depot Inc. | 3.950% | 9/15/20 | 400 | 426 |
| Home Depot Inc. | 4.400% | 4/1/21 | 5,825 | 6,261 |
| Home Depot Inc. | 2.700% | 4/1/23 | 2,175 | 2,003 |
| Host Hotels & Resorts LP | 5.875% | 6/15/19 | 1,000 | 1,083 |
| Host Hotels & Resorts LP | 6.000% | 10/1/21 | 3,000 | 3,278 |
| Host Hotels & Resorts LP | 5.250% | 3/15/22 | 5,500 | 5,734 |
| Host Hotels & Resorts LP | 4.750% | 3/1/23 | 922 | 930 |
| Host Hotels & Resorts LP | 3.750% | 10/15/23 | 375 | 350 |
| Hyatt Hotels Corp. | 5.375% | 8/15/21 | 900 | 962 |
| Hyatt Hotels Corp. | 3.375% | 7/15/23 | 2,025 | 1,846 |
| International Game Technology | 7.500% | 6/15/19 | 2,625 | 3,048 |
| International Game Technology | 5.500% | 6/15/20 | 1,575 | 1,677 |
| Johnson Controls Inc. | 5.000% | 3/30/20 | 2,850 | 3,119 |
| Johnson Controls Inc. | 4.250% | 3/1/21 | 850 | 884 |
| Johnson Controls Inc. | 3.750% | 12/1/21 | 3,850 | 3,853 |
| Kohl's Corp. | 4.000% | 11/1/21 | 3,100 | 3,073 |
| Kohl's Corp. | 3.250% | 2/1/23 | 2,810 | 2,568 |
| Lowe's Cos. Inc. | 4.625% | 4/15/20 | 2,750 | 3,000 |
| Lowe's Cos. Inc. | 3.750% | 4/15/21 | 500 | 513 |
| Lowe's Cos. Inc. | 3.800% | 11/15/21 | 4,000 | 4,123 |
| Lowe's Cos. Inc. | 3.120% | 4/15/22 | 4,450 | 4,295 |
| Lowe's Cos. Inc. | 3.875% | 9/15/23 | 2,600 | 2,620 |
| Macy's Retail Holdings Inc. | 3.875% | 1/15/22 | 8,800 | 8,773 |
| Macy's Retail Holdings Inc. | 2.875% | 2/15/23 | 1,000 | 906 |
| Macy's Retail Holdings Inc. | 4.375% | 9/1/23 | 575 | 577 |
| Marriott International Inc. | 3.000% | 3/1/19 | 975 | 980 |
| Marriott International Inc. | 3.375% | 10/15/20 | 3,275 | 3,226 |
| Marriott International Inc. | 3.250% | 9/15/22 | 2,600 | 2,413 |
| McDonald's Corp. | 5.000% | 2/1/19 | 725 | 821 |
| McDonald's Corp. | 1.875% | 5/29/19 | 2,000 | 1,960 |
| McDonald's Corp. | 3.625% | 5/20/21 | 3,500 | 3,606 |
| McDonald's Corp. | 2.625% | 1/15/22 | 5,800 | 5,522 |
42
| Vanguard® Intermediate-Term Bond Index Fund | ||||
| Schedule of Investments | ||||
| December 31, 2013 | ||||
| Face | Market | |||
| Maturity | Amount | Value | ||
| Coupon | Date | ($000) | ($000) | |
| NIKE Inc. | 2.250% | 5/1/23 | 2,420 | 2,163 |
| Nordstrom Inc. | 4.750% | 5/1/20 | 2,675 | 2,923 |
| Nordstrom Inc. | 4.000% | 10/15/21 | 5,050 | 5,224 |
| NVR Inc. | 3.950% | 9/15/22 | 2,725 | 2,601 |
| O'Reilly Automotive Inc. | 4.875% | 1/14/21 | 1,825 | 1,905 |
| O'Reilly Automotive Inc. | 4.625% | 9/15/21 | 2,125 | 2,189 |
| O'Reilly Automotive Inc. | 3.800% | 9/1/22 | 2,500 | 2,398 |
| O'Reilly Automotive Inc. | 3.850% | 6/15/23 | 2,175 | 2,083 |
| QVC Inc. | 5.125% | 7/2/22 | 2,850 | 2,816 |
| QVC Inc. | 4.375% | 3/15/23 | 3,225 | 3,028 |
| Staples Inc. | 4.375% | 1/12/23 | 2,875 | 2,736 |
| Starbucks Corp. | 3.850% | 10/1/23 | 6,650 | 6,676 |
| Starwood Hotels & Resorts Worldwide Inc. | 3.125% | 2/15/23 | 1,230 | 1,111 |
| Target Corp. | 3.875% | 7/15/20 | 5,225 | 5,504 |
| Target Corp. | 2.900% | 1/15/22 | 5,225 | 5,000 |
| Time Warner Inc. | 4.875% | 3/15/20 | 3,300 | 3,624 |
| Time Warner Inc. | 4.700% | 1/15/21 | 3,250 | 3,454 |
| Time Warner Inc. | 4.750% | 3/29/21 | 9,175 | 9,775 |
| Time Warner Inc. | 4.000% | 1/15/22 | 5,100 | 5,138 |
| Time Warner Inc. | 3.400% | 6/15/22 | 3,000 | 2,920 |
| Time Warner Inc. | 4.050% | 12/15/23 | 2,150 | 2,134 |
| TJX Cos. Inc. | 6.950% | 4/15/19 | 4,325 | 5,225 |
| TJX Cos. Inc. | 2.500% | 5/15/23 | 425 | 384 |
| Toyota Motor Credit Corp. | 4.500% | 6/17/20 | 4,700 | 5,100 |
| Toyota Motor Credit Corp. | 4.250% | 1/11/21 | 1,475 | 1,576 |
| Toyota Motor Credit Corp. | 3.400% | 9/15/21 | 5,005 | 5,069 |
| Toyota Motor Credit Corp. | 3.300% | 1/12/22 | 6,800 | 6,738 |
| Toyota Motor Credit Corp. | 2.625% | 1/10/23 | 3,725 | 3,426 |
| VF Corp. | 3.500% | 9/1/21 | 3,575 | 3,556 |
| Viacom Inc. | 5.625% | 9/15/19 | 2,900 | 3,306 |
| Viacom Inc. | 4.500% | 3/1/21 | 950 | 996 |
| Viacom Inc. | 3.125% | 6/15/22 | 4,875 | 4,532 |
| Viacom Inc. | 4.250% | 9/1/23 | 7,775 | 7,744 |
| Wal-Mart Stores Inc. | 3.625% | 7/8/20 | 8,650 | 9,088 |
| Wal-Mart Stores Inc. | 3.250% | 10/25/20 | 11,200 | 11,426 |
| Wal-Mart Stores Inc. | 4.250% | 4/15/21 | 7,450 | 8,009 |
| Wal-Mart Stores Inc. | 2.550% | 4/11/23 | 9,300 | 8,474 |
| Walgreen Co. | 5.250% | 1/15/19 | 6,600 | 7,404 |
| Walgreen Co. | 3.100% | 9/15/22 | 6,225 | 5,834 |
| Walt Disney Co. | 3.750% | 6/1/21 | 1,600 | 1,651 |
| Walt Disney Co. | 2.750% | 8/16/21 | 5,875 | 5,659 |
| Walt Disney Co. | 2.550% | 2/15/22 | 6,000 | 5,572 |
| Walt Disney Co. | 2.350% | 12/1/22 | 3,125 | 2,836 |
| Wyndham Worldwide Corp. | 4.250% | 3/1/22 | 3,000 | 2,921 |
| Wyndham Worldwide Corp. | 3.900% | 3/1/23 | 5,325 | 5,007 |
| Consumer Noncyclical (6.1%) | ||||
| Abbott Laboratories | 5.125% | 4/1/19 | 5,171 | 5,872 |
| Abbott Laboratories | 4.125% | 5/27/20 | 1,825 | 1,969 |
| AbbVie Inc. | 2.900% | 11/6/22 | 21,550 | 20,152 |
| Actavis Inc. | 6.125% | 8/15/19 | 2,000 | 2,304 |
| Actavis Inc. | 3.250% | 10/1/22 | 6,950 | 6,486 |
| Allergan Inc. | 3.375% | 9/15/20 | 3,000 | 3,066 |
| Allergan Inc. | 2.800% | 3/15/23 | 1,325 | 1,227 |
| Altria Group Inc. | 9.250% | 8/6/19 | 2,361 | 3,108 |
| Altria Group Inc. | 4.750% | 5/5/21 | 11,200 | 11,993 |
| Altria Group Inc. | 2.850% | 8/9/22 | 15,425 | 14,199 |
| AmerisourceBergen Corp. | 3.500% | 11/15/21 | 3,900 | 3,834 |
| Amgen Inc. | 5.700% | 2/1/19 | 4,825 | 5,562 |
| Amgen Inc. | 3.450% | 10/1/20 | 4,500 | 4,570 |
| Amgen Inc. | 4.100% | 6/15/21 | 6,700 | 6,988 |
| Amgen Inc. | 3.875% | 11/15/21 | 11,400 | 11,699 |
| Amgen Inc. | 3.625% | 5/15/22 | 4,100 | 4,052 |
| Anheuser-Busch InBev Finance Inc. | 2.625% | 1/17/23 | 8,375 | 7,689 |
43
| Vanguard® Intermediate-Term Bond Index Fund | ||||
| Schedule of Investments | ||||
| December 31, 2013 | ||||
| Face | Market | |||
| Maturity | Amount | Value | ||
| Coupon | Date | ($000) | ($000) | |
| Anheuser-Busch InBev Worldwide Inc. | 7.750% | 1/15/19 | 9,785 | 12,214 |
| Anheuser-Busch InBev Worldwide Inc. | 6.875% | 11/15/19 | 6,325 | 7,744 |
| Anheuser-Busch InBev Worldwide Inc. | 5.375% | 1/15/20 | 15,800 | 18,013 |
| Anheuser-Busch InBev Worldwide Inc. | 5.000% | 4/15/20 | 4,365 | 4,893 |
| Anheuser-Busch InBev Worldwide Inc. | 4.375% | 2/15/21 | 1,175 | 1,259 |
| Anheuser-Busch InBev Worldwide Inc. | 2.500% | 7/15/22 | 21,200 | 19,634 |
| Archer-Daniels-Midland Co. | 4.479% | 3/1/21 | 4,000 | 4,225 |
| AstraZeneca plc | 1.950% | 9/18/19 | 4,060 | 3,976 |
| Avon Products Inc. | 6.500% | 3/1/19 | 385 | 418 |
| Avon Products Inc. | 4.600% | 3/15/20 | 2,575 | 2,569 |
| Avon Products Inc. | 5.000% | 3/15/23 | 2,725 | 2,661 |
| Baxter International Inc. | 4.250% | 3/15/20 | 2,850 | 3,070 |
| Baxter International Inc. | 2.400% | 8/15/22 | 1,625 | 1,473 |
| Baxter International Inc. | 3.200% | 6/15/23 | 7,175 | 6,847 |
| Beam Inc. | 3.250% | 5/15/22 | 925 | 882 |
| Beam Inc. | 3.250% | 6/15/23 | 500 | 469 |
| Becton Dickinson & Co. | 5.000% | 5/15/19 | 2,975 | 3,329 |
| Becton Dickinson & Co. | 3.250% | 11/12/20 | 2,820 | 2,825 |
| Becton Dickinson & Co. | 3.125% | 11/8/21 | 4,975 | 4,871 |
| Bio-Rad Laboratories Inc. | 4.875% | 12/15/20 | 2,000 | 2,045 |
| Boston Scientific Corp. | 6.000% | 1/15/20 | 6,250 | 7,187 |
| Bottling Group LLC | 5.125% | 1/15/19 | 5,720 | 6,452 |
| Bristol-Myers Squibb Co. | 1.750% | 3/1/19 | 1,550 | 1,510 |
| Bristol-Myers Squibb Co. | 2.000% | 8/1/22 | 6,075 | 5,372 |
| Bristol-Myers Squibb Co. | 7.150% | 6/15/23 | 425 | 530 |
| Brown-Forman Corp. | 2.250% | 1/15/23 | 575 | 509 |
| Campbell Soup Co. | 4.500% | 2/15/19 | 400 | 437 |
| Campbell Soup Co. | 4.250% | 4/15/21 | 1,550 | 1,571 |
| Campbell Soup Co. | 2.500% | 8/2/22 | 3,000 | 2,642 |
| Cardinal Health Inc. | 4.625% | 12/15/20 | 4,125 | 4,440 |
| Cardinal Health Inc. | 3.200% | 6/15/22 | 100 | 95 |
| Cardinal Health Inc. | 3.200% | 3/15/23 | 2,575 | 2,408 |
| CareFusion Corp. | 6.375% | 8/1/19 | 4,750 | 5,393 |
| Catholic Health Initiatives Colorado GO | 2.950% | 11/1/22 | 3,200 | 2,897 |
| Celgene Corp. | 3.950% | 10/15/20 | 1,925 | 1,999 |
| Celgene Corp. | 3.250% | 8/15/22 | 6,225 | 5,896 |
| Celgene Corp. | 4.000% | 8/15/23 | 3,400 | 3,357 |
| Clorox Co. | 3.800% | 11/15/21 | 100 | 100 |
| Clorox Co. | 3.050% | 9/15/22 | 3,650 | 3,410 |
| Coca-Cola Co. | 4.875% | 3/15/19 | 2,400 | 2,701 |
| Coca-Cola Co. | 2.450% | 11/1/20 | 11,725 | 11,400 |
| Coca-Cola Co. | 3.150% | 11/15/20 | 3,785 | 3,834 |
| Coca-Cola Co. | 3.300% | 9/1/21 | 7,125 | 7,163 |
| Coca-Cola Co. | 2.500% | 4/1/23 | 925 | 846 |
| Coca-Cola Co. | 3.200% | 11/1/23 | 9,250 | 8,872 |
| Coca-Cola Enterprises Inc. | 3.500% | 9/15/20 | 4,600 | 4,616 |
| Coca-Cola Enterprises Inc. | 4.500% | 9/1/21 | 2,000 | 2,085 |
| Coca-Cola Femsa SAB de CV | 4.625% | 2/15/20 | 2,000 | 2,135 |
| Coca-Cola Femsa SAB de CV | 3.875% | 11/26/23 | 4,800 | 4,770 |
| Coca-Cola Refreshments USA Inc. | 8.500% | 2/1/22 | 300 | 389 |
| Colgate-Palmolive Co. | 2.450% | 11/15/21 | 1,500 | 1,416 |
| Colgate-Palmolive Co. | 2.300% | 5/3/22 | 2,700 | 2,495 |
| Colgate-Palmolive Co. | 2.100% | 5/1/23 | 5,550 | 4,888 |
| ConAgra Foods Inc. | 7.000% | 4/15/19 | 850 | 1,008 |
| ConAgra Foods Inc. | 3.250% | 9/15/22 | 4,875 | 4,578 |
| ConAgra Foods Inc. | 3.200% | 1/25/23 | 8,105 | 7,494 |
| Covidien International Finance SA | 3.200% | 6/15/22 | 3,475 | 3,343 |
| Covidien International Finance SA | 2.950% | 6/15/23 | 6,175 | 5,701 |
| CR Bard Inc. | 4.400% | 1/15/21 | 2,125 | 2,227 |
| Delhaize Group SA | 4.125% | 4/10/19 | 1,500 | 1,540 |
| DENTSPLY International Inc. | 4.125% | 8/15/21 | 2,000 | 2,002 |
| Diageo Capital plc | 4.828% | 7/15/20 | 1,215 | 1,336 |
| Diageo Capital plc | 2.625% | 4/29/23 | 2,350 | 2,139 |
| Diageo Investment Corp. | 2.875% | 5/11/22 | 10,000 | 9,530 |
44
| Vanguard® Intermediate-Term Bond Index Fund | ||||
| Schedule of Investments | ||||
| December 31, 2013 | ||||
| Face | Market | |||
| Maturity | Amount | Value | ||
| Coupon | Date | ($000) | ($000) | |
| Dignity Health California GO | 3.125% | 11/1/22 | 1,600 | 1,437 |
| Dr Pepper Snapple Group Inc. | 2.600% | 1/15/19 | 825 | 833 |
| Dr Pepper Snapple Group Inc. | 3.200% | 11/15/21 | 4,000 | 3,854 |
| Dr Pepper Snapple Group Inc. | 2.700% | 11/15/22 | 500 | 453 |
| Energizer Holdings Inc. | 4.700% | 5/19/21 | 2,300 | 2,321 |
| Energizer Holdings Inc. | 4.700% | 5/24/22 | 3,650 | 3,640 |
| Estee Lauder Cos. Inc. | 2.350% | 8/15/22 | 2,475 | 2,224 |
| Express Scripts Holding Co. | 7.250% | 6/15/19 | 2,050 | 2,495 |
| Express Scripts Holding Co. | 4.750% | 11/15/21 | 3,823 | 4,041 |
| Express Scripts Holding Co. | 3.900% | 2/15/22 | 5,675 | 5,651 |
| Flowers Foods Inc. | 4.375% | 4/1/22 | 1,000 | 983 |
| Fomento Economico Mexicano SAB de CV | 2.875% | 5/10/23 | 1,600 | 1,401 |
| General Mills Inc. | 5.650% | 2/15/19 | 8,275 | 9,610 |
| General Mills Inc. | 3.150% | 12/15/21 | 5,075 | 4,967 |
| Gilead Sciences Inc. | 4.500% | 4/1/21 | 4,550 | 4,868 |
| Gilead Sciences Inc. | 4.400% | 12/1/21 | 2,275 | 2,422 |
| GlaxoSmithKline Capital Inc. | 2.800% | 3/18/23 | 4,350 | 4,012 |
| GlaxoSmithKline Capital plc | 2.850% | 5/8/22 | 10,950 | 10,378 |
| Hershey Co. | 2.625% | 5/1/23 | 3,000 | 2,748 |
| Hillshire Brands Co. | 4.100% | 9/15/20 | 173 | 176 |
| Hormel Foods Corp. | 4.125% | 4/15/21 | 875 | 904 |
| Ingredion Inc. | 4.625% | 11/1/20 | 2,000 | 2,085 |
| International Flavors & Fragrances Inc. | 3.200% | 5/1/23 | 1,525 | 1,409 |
| JM Smucker Co. | 3.500% | 10/15/21 | 3,950 | 3,931 |
| Johnson & Johnson | 2.950% | 9/1/20 | 2,000 | 2,027 |
| Johnson & Johnson | 3.550% | 5/15/21 | 675 | 701 |
| Johnson & Johnson | 3.375% | 12/5/23 | 4,100 | 4,057 |
| Kaiser Foundation Hospitals | 3.500% | 4/1/22 | 1,825 | 1,734 |
| Kellogg Co. | 4.150% | 11/15/19 | 4,950 | 5,323 |
| Kellogg Co. | 4.000% | 12/15/20 | 4,923 | 5,095 |
| Kellogg Co. | 3.125% | 5/17/22 | 6,525 | 6,185 |
| Kimberly-Clark Corp. | 3.625% | 8/1/20 | 1,000 | 1,042 |
| Kimberly-Clark Corp. | 3.875% | 3/1/21 | 2,095 | 2,179 |
| Kimberly-Clark Corp. | 2.400% | 3/1/22 | 1,600 | 1,492 |
| Kimberly-Clark Corp. | 2.400% | 6/1/23 | 4,125 | 3,727 |
| Koninklijke Philips NV | 3.750% | 3/15/22 | 7,450 | 7,486 |
| Kraft Foods Group Inc. | 5.375% | 2/10/20 | 1,923 | 2,157 |
| Kraft Foods Group Inc. | 3.500% | 6/6/22 | 13,525 | 13,235 |
| Kroger Co. | 6.150% | 1/15/20 | 6,269 | 7,153 |
| Kroger Co. | 3.300% | 1/15/21 | 3,325 | 3,308 |
| Kroger Co. | 3.400% | 4/15/22 | 3,000 | 2,878 |
| Kroger Co. | 3.850% | 8/1/23 | 1,625 | 1,596 |
| Laboratory Corp. of America Holdings | 4.625% | 11/15/20 | 3,000 | 3,137 |
| Laboratory Corp. of America Holdings | 3.750% | 8/23/22 | 2,600 | 2,516 |
| Laboratory Corp. of America Holdings | 4.000% | 11/1/23 | 1,875 | 1,801 |
| Life Technologies Corp. | 6.000% | 3/1/20 | 4,000 | 4,599 |
| Life Technologies Corp. | 5.000% | 1/15/21 | 4,025 | 4,364 |
| Lorillard Tobacco Co. | 8.125% | 6/23/19 | 4,425 | 5,400 |
| Lorillard Tobacco Co. | 6.875% | 5/1/20 | 3,975 | 4,588 |
| Lorillard Tobacco Co. | 3.750% | 5/20/23 | 2,975 | 2,706 |
| Mattel Inc. | 3.150% | 3/15/23 | 2,000 | 1,850 |
| McCormick & Co. Inc. | 3.900% | 7/15/21 | 1,850 | 1,900 |
| McCormick & Co. Inc. | 3.500% | 9/1/23 | 475 | 465 |
| McKesson Corp. | 7.500% | 2/15/19 | 1,825 | 2,218 |
| McKesson Corp. | 4.750% | 3/1/21 | 3,425 | 3,636 |
| Mead Johnson Nutrition Co. | 4.900% | 11/1/19 | 5,725 | 6,255 |
| Medtronic Inc. | 5.600% | 3/15/19 | 1,525 | 1,765 |
| Medtronic Inc. | 4.450% | 3/15/20 | 8,975 | 9,859 |
| Medtronic Inc. | 3.125% | 3/15/22 | 3,350 | 3,280 |
| Medtronic Inc. | 2.750% | 4/1/23 | 5,225 | 4,836 |
| Merck & Co. Inc. | 3.875% | 1/15/21 | 8,125 | 8,546 |
| Merck & Co. Inc. | 2.400% | 9/15/22 | 2,550 | 2,325 |
| Merck & Co. Inc. | 2.800% | 5/18/23 | 5,950 | 5,534 |
| Merck Sharp & Dohme Corp. | 5.000% | 6/30/19 | 7,425 | 8,425 |
45
| Vanguard® Intermediate-Term Bond Index Fund | ||||
| Schedule of Investments | ||||
| December 31, 2013 | ||||
| Face | Market | |||
| Maturity | Amount | Value | ||
| Coupon | Date | ($000) | ($000) | |
| Molson Coors Brewing Co. | 3.500% | 5/1/22 | 2,800 | 2,748 |
| Mondelez International Inc. | 5.375% | 2/10/20 | 11,852 | 13,458 |
| Mylan Inc. | 2.550% | 3/28/19 | 1,725 | 1,709 |
| Mylan Inc. | 4.200% | 11/29/23 | 1,725 | 1,695 |
| Newell Rubbermaid Inc. | 4.000% | 6/15/22 | 4,400 | 4,286 |
| Novant Health Inc. | 5.850% | 11/1/19 | 1,300 | 1,451 |
| Novartis Capital Corp. | 4.400% | 4/24/20 | 6,300 | 6,829 |
| Novartis Capital Corp. | 2.400% | 9/21/22 | 6,225 | 5,693 |
| Novartis Securities Investment Ltd. | 5.125% | 2/10/19 | 15,898 | 17,961 |
| Partners Healthcare System Massachusetts GO | 3.443% | 7/1/21 | 1,325 | 1,305 |
| PepsiCo Inc. | 2.250% | 1/7/19 | 1,000 | 1,003 |
| PepsiCo Inc. | 4.500% | 1/15/20 | 1,900 | 2,077 |
| PepsiCo Inc. | 3.125% | 11/1/20 | 4,200 | 4,186 |
| PepsiCo Inc. | 3.000% | 8/25/21 | 3,700 | 3,640 |
| PepsiCo Inc. | 2.750% | 3/5/22 | 10,475 | 9,914 |
| PepsiCo Inc. | 2.750% | 3/1/23 | 5,000 | 4,619 |
| PerkinElmer Inc. | 5.000% | 11/15/21 | 3,850 | 3,922 |
| 4 Perrigo Co. Ltd. | 4.000% | 11/15/23 | 4,725 | 4,604 |
| Pfizer Inc. | 6.200% | 3/15/19 | 22,325 | 26,470 |
| Pfizer Inc. | 3.000% | 6/15/23 | 2,525 | 2,377 |
| Philip Morris International Inc. | 1.875% | 1/15/19 | 2,575 | 2,527 |
| Philip Morris International Inc. | 4.500% | 3/26/20 | 2,200 | 2,372 |
| Philip Morris International Inc. | 4.125% | 5/17/21 | 2,000 | 2,083 |
| Philip Morris International Inc. | 2.900% | 11/15/21 | 5,200 | 4,977 |
| Philip Morris International Inc. | 2.500% | 8/22/22 | 3,625 | 3,296 |
| Philip Morris International Inc. | 2.625% | 3/6/23 | 3,700 | 3,329 |
| Philip Morris International Inc. | 3.600% | 11/15/23 | 3,225 | 3,121 |
| Procter & Gamble Co. | 4.700% | 2/15/19 | 10,451 | 11,703 |
| Procter & Gamble Co. | 2.300% | 2/6/22 | 7,400 | 6,929 |
| Quest Diagnostics Inc. | 4.750% | 1/30/20 | 1,100 | 1,149 |
| Quest Diagnostics Inc. | 4.700% | 4/1/21 | 1,350 | 1,382 |
| Reynolds American Inc. | 3.250% | 11/1/22 | 4,350 | 3,990 |
| Reynolds American Inc. | 4.850% | 9/15/23 | 2,125 | 2,186 |
| Safeway Inc. | 5.000% | 8/15/19 | 4,250 | 4,518 |
| Safeway Inc. | 3.950% | 8/15/20 | 3,250 | 3,242 |
| Sanofi | 4.000% | 3/29/21 | 17,000 | 17,770 |
| St. Jude Medical Inc. | 3.250% | 4/15/23 | 5,325 | 4,955 |
| Stryker Corp. | 4.375% | 1/15/20 | 1,950 | 2,106 |
| Sysco Corp. | 2.600% | 6/12/22 | 1,950 | 1,777 |
| Teva Pharmaceutical Finance Co. BV | 3.650% | 11/10/21 | 4,650 | 4,550 |
| Teva Pharmaceutical Finance Co. BV | 2.950% | 12/18/22 | 10,550 | 9,530 |
| Teva Pharmaceutical Finance IV BV | 3.650% | 11/10/21 | 2,650 | 2,565 |
| Teva Pharmaceutical Finance IV LLC | 2.250% | 3/18/20 | 2,725 | 2,583 |
| Thermo Fisher Scientific Inc. | 2.400% | 2/1/19 | 1,200 | 1,193 |
| Thermo Fisher Scientific Inc. | 4.700% | 5/1/20 | 650 | 705 |
| Thermo Fisher Scientific Inc. | 4.500% | 3/1/21 | 2,950 | 3,112 |
| Thermo Fisher Scientific Inc. | 3.600% | 8/15/21 | 11,625 | 11,556 |
| Thermo Fisher Scientific Inc. | 3.150% | 1/15/23 | 1,275 | 1,187 |
| Tupperware Brands Corp. | 4.750% | 6/1/21 | 3,225 | 3,223 |
| Tyson Foods Inc. | 4.500% | 6/15/22 | 6,150 | 6,242 |
| Unilever Capital Corp. | 4.800% | 2/15/19 | 2,475 | 2,773 |
| Unilever Capital Corp. | 4.250% | 2/10/21 | 6,880 | 7,344 |
| Whirlpool Corp. | 4.850% | 6/15/21 | 3,500 | 3,685 |
| Zimmer Holdings Inc. | 4.625% | 11/30/19 | 3,175 | 3,467 |
| Zimmer Holdings Inc. | 3.375% | 11/30/21 | 350 | 337 |
| Zoetis Inc. | 3.250% | 2/1/23 | 5,450 | 5,090 |
| Energy (3.3%) | ||||
| Anadarko Petroleum Corp. | 8.700% | 3/15/19 | 2,955 | 3,754 |
| Anadarko Petroleum Corp. | 6.950% | 6/15/19 | 1,475 | 1,760 |
| Apache Corp. | 3.625% | 2/1/21 | 4,125 | 4,243 |
| Apache Corp. | 3.250% | 4/15/22 | 2,586 | 2,543 |
| Baker Hughes Inc. | 3.200% | 8/15/21 | 4,800 | 4,761 |
| BP Capital Markets plc | 4.750% | 3/10/19 | 3,825 | 4,254 |
46
| Vanguard® Intermediate-Term Bond Index Fund | ||||
| Schedule of Investments | ||||
| December 31, 2013 | ||||
| Face | Market | |||
| Maturity | Amount | Value | ||
| Coupon | Date | ($000) | ($000) | |
| BP Capital Markets plc | 4.500% | 10/1/20 | 8,730 | 9,440 |
| BP Capital Markets plc | 4.742% | 3/11/21 | 11,900 | 12,886 |
| BP Capital Markets plc | 3.561% | 11/1/21 | 6,800 | 6,814 |
| BP Capital Markets plc | 3.245% | 5/6/22 | 9,400 | 9,076 |
| BP Capital Markets plc | 2.500% | 11/6/22 | 7,275 | 6,622 |
| BP Capital Markets plc | 2.750% | 5/10/23 | 7,500 | 6,824 |
| Cameron International Corp. | 4.500% | 6/1/21 | 650 | 682 |
| Cameron International Corp. | 3.600% | 4/30/22 | 850 | 832 |
| Cameron International Corp. | 4.000% | 12/15/23 | 1,000 | 986 |
| Canadian Natural Resources Ltd. | 3.450% | 11/15/21 | 2,875 | 2,822 |
| Cenovus Energy Inc. | 5.700% | 10/15/19 | 7,825 | 8,909 |
| Cenovus Energy Inc. | 3.000% | 8/15/22 | 4,275 | 4,005 |
| Chevron Corp. | 4.950% | 3/3/19 | 8,300 | 9,449 |
| Chevron Corp. | 2.427% | 6/24/20 | 6,500 | 6,389 |
| Chevron Corp. | 2.355% | 12/5/22 | 11,750 | 10,702 |
| Chevron Corp. | 3.191% | 6/24/23 | 7,625 | 7,335 |
| ConocoPhillips | 5.750% | 2/1/19 | 13,675 | 15,925 |
| ConocoPhillips | 6.000% | 1/15/20 | 3,275 | 3,852 |
| ConocoPhillips Co. | 2.400% | 12/15/22 | 5,925 | 5,386 |
| Continental Resources Inc. | 5.000% | 9/15/22 | 10,400 | 10,803 |
| Continental Resources Inc. | 4.500% | 4/15/23 | 10,075 | 10,214 |
| Devon Energy Corp. | 6.300% | 1/15/19 | 6,375 | 7,485 |
| Devon Energy Corp. | 4.000% | 7/15/21 | 4,000 | 4,099 |
| Diamond Offshore Drilling Inc. | 5.875% | 5/1/19 | 2,600 | 3,023 |
| Diamond Offshore Drilling Inc. | 3.450% | 11/1/23 | 425 | 411 |
| Encana Corp. | 6.500% | 5/15/19 | 1,300 | 1,524 |
| Encana Corp. | 3.900% | 11/15/21 | 3,700 | 3,675 |
| Ensco plc | 4.700% | 3/15/21 | 7,050 | 7,455 |
| EOG Resources Inc. | 5.625% | 6/1/19 | 2,202 | 2,550 |
| EOG Resources Inc. | 4.400% | 6/1/20 | 2,700 | 2,911 |
| EOG Resources Inc. | 4.100% | 2/1/21 | 9,675 | 10,141 |
| EOG Resources Inc. | 2.625% | 3/15/23 | 1,955 | 1,782 |
| EQT Corp. | 8.125% | 6/1/19 | 1,775 | 2,156 |
| EQT Corp. | 4.875% | 11/15/21 | 3,225 | 3,302 |
| FMC Technologies Inc. | 3.450% | 10/1/22 | 2,975 | 2,770 |
| Halliburton Co. | 6.150% | 9/15/19 | 4,300 | 5,119 |
| Halliburton Co. | 3.250% | 11/15/21 | 2,200 | 2,174 |
| Halliburton Co. | 3.500% | 8/1/23 | 4,025 | 3,900 |
| Hess Corp. | 8.125% | 2/15/19 | 5,985 | 7,455 |
| Husky Energy Inc. | 6.150% | 6/15/19 | 510 | 580 |
| Husky Energy Inc. | 7.250% | 12/15/19 | 3,895 | 4,718 |
| Marathon Oil Corp. | 2.800% | 11/1/22 | 7,350 | 6,767 |
| Marathon Petroleum Corp. | 5.125% | 3/1/21 | 3,450 | 3,736 |
| Murphy Oil Corp. | 3.700% | 12/1/22 | 2,600 | 2,391 |
| Nabors Industries Inc. | 9.250% | 1/15/19 | 1,400 | 1,742 |
| Nabors Industries Inc. | 5.000% | 9/15/20 | 1,450 | 1,505 |
| Nabors Industries Inc. | 4.625% | 9/15/21 | 3,800 | 3,811 |
| 4 Nabors Industries Inc. | 5.100% | 9/15/23 | 3,525 | 3,530 |
| National Oilwell Varco Inc. | 2.600% | 12/1/22 | 7,810 | 7,174 |
| Noble Energy Inc. | 8.250% | 3/1/19 | 5,001 | 6,237 |
| Noble Energy Inc. | 4.150% | 12/15/21 | 5,625 | 5,774 |
| Noble Holding International Ltd. | 4.900% | 8/1/20 | 2,790 | 2,940 |
| Noble Holding International Ltd. | 4.625% | 3/1/21 | 1,800 | 1,860 |
| Noble Holding International Ltd. | 3.950% | 3/15/22 | 2,825 | 2,736 |
| Occidental Petroleum Corp. | 4.100% | 2/1/21 | 8,925 | 9,424 |
| Occidental Petroleum Corp. | 3.125% | 2/15/22 | 6,275 | 6,088 |
| Occidental Petroleum Corp. | 2.700% | 2/15/23 | 7,600 | 6,956 |
| Petrohawk Energy Corp. | 6.250% | 6/1/19 | 3,040 | 3,336 |
| Phillips 66 | 4.300% | 4/1/22 | 9,500 | 9,638 |
| Pioneer Natural Resources Co. | 7.500% | 1/15/20 | 3,400 | 4,125 |
| Pride International Inc. | 8.500% | 6/15/19 | 700 | 884 |
| Pride International Inc. | 6.875% | 8/15/20 | 9,660 | 11,524 |
| Rowan Cos. Inc. | 7.875% | 8/1/19 | 2,150 | 2,601 |
| Rowan Cos. Inc. | 4.875% | 6/1/22 | 4,975 | 5,069 |
47
| Vanguard® Intermediate-Term Bond Index Fund | ||||
| Schedule of Investments | ||||
| December 31, 2013 | ||||
| Face | Market | |||
| Maturity | Amount | Value | ||
| Coupon | Date | ($000) | ($000) | |
| Sasol Financing International plc | 4.500% | 11/14/22 | 1,700 | 1,576 |
| Shell International Finance BV | 4.300% | 9/22/19 | 12,975 | 14,199 |
| Shell International Finance BV | 4.375% | 3/25/20 | 3,950 | 4,319 |
| Shell International Finance BV | 2.375% | 8/21/22 | 1,500 | 1,372 |
| Shell International Finance BV | 2.250% | 1/6/23 | 4,975 | 4,420 |
| Shell International Finance BV | 3.400% | 8/12/23 | 4,500 | 4,375 |
| Southwestern Energy Co. | 4.100% | 3/15/22 | 1,925 | 1,899 |
| Talisman Energy Inc. | 7.750% | 6/1/19 | 3,875 | 4,647 |
| Talisman Energy Inc. | 3.750% | 2/1/21 | 5,550 | 5,379 |
| Total Capital Canada Ltd. | 2.750% | 7/15/23 | 1,550 | 1,430 |
| Total Capital International SA | 2.875% | 2/17/22 | 2,700 | 2,558 |
| Total Capital International SA | 2.700% | 1/25/23 | 3,800 | 3,499 |
| Total Capital SA | 4.450% | 6/24/20 | 8,925 | 9,670 |
| Total Capital SA | 4.125% | 1/28/21 | 6,130 | 6,454 |
| Total Capital SA | 4.250% | 12/15/21 | 2,230 | 2,342 |
| Transocean Inc. | 6.500% | 11/15/20 | 4,525 | 5,151 |
| Transocean Inc. | 6.375% | 12/15/21 | 12,638 | 14,178 |
| Transocean Inc. | 3.800% | 10/15/22 | 925 | 877 |
| Valero Energy Corp. | 9.375% | 3/15/19 | 4,000 | 5,188 |
| Valero Energy Corp. | 6.125% | 2/1/20 | 7,180 | 8,190 |
| Weatherford International Ltd. | 9.625% | 3/1/19 | 7,765 | 10,003 |
| Weatherford International Ltd. | 4.500% | 4/15/22 | 4,275 | 4,301 |
| Other Industrial (0.1%) | ||||
| Cintas Corp. No 2 | 4.300% | 6/1/21 | 1,300 | 1,349 |
| Cintas Corp. No 2 | 3.250% | 6/1/22 | 1,450 | 1,383 |
| Fluor Corp. | 3.375% | 9/15/21 | 2,300 | 2,234 |
| 4 URS Corp. | 5.500% | 4/1/22 | 5,000 | 4,925 |
| Valmont Industries Inc. | 6.625% | 4/20/20 | 1,390 | 1,558 |
| Technology (2.4%) | ||||
| Adobe Systems Inc. | 4.750% | 2/1/20 | 4,325 | 4,699 |
| Agilent Technologies Inc. | 5.000% | 7/15/20 | 3,100 | 3,335 |
| Agilent Technologies Inc. | 3.200% | 10/1/22 | 4,475 | 4,089 |
| Altera Corp. | 4.100% | 11/15/23 | 2,025 | 1,953 |
| Amphenol Corp. | 4.000% | 2/1/22 | 1,925 | 1,882 |
| Analog Devices Inc. | 2.875% | 6/1/23 | 2,825 | 2,565 |
| Apple Inc. | 2.400% | 5/3/23 | 29,450 | 26,323 |
| Applied Materials Inc. | 4.300% | 6/15/21 | 3,725 | 3,828 |
| Arrow Electronics Inc. | 6.000% | 4/1/20 | 1,184 | 1,291 |
| Arrow Electronics Inc. | 5.125% | 3/1/21 | 2,000 | 2,055 |
| Arrow Electronics Inc. | 4.500% | 3/1/23 | 1,725 | 1,667 |
| Autodesk Inc. | 3.600% | 12/15/22 | 1,550 | 1,435 |
| Avnet Inc. | 4.875% | 12/1/22 | 3,725 | 3,729 |
| Baidu Inc. | 3.500% | 11/28/22 | 3,725 | 3,409 |
| Broadcom Corp. | 2.500% | 8/15/22 | 2,500 | 2,232 |
| Broadridge Financial Solutions Inc. | 3.950% | 9/1/20 | 1,900 | 1,904 |
| CA Inc. | 5.375% | 12/1/19 | 2,725 | 3,039 |
| CA Inc. | 4.500% | 8/15/23 | 2,700 | 2,665 |
| Cisco Systems Inc. | 4.950% | 2/15/19 | 11,617 | 13,047 |
| Cisco Systems Inc. | 4.450% | 1/15/20 | 10,950 | 11,901 |
| Corning Inc. | 6.625% | 5/15/19 | 950 | 1,145 |
| Corning Inc. | 4.250% | 8/15/20 | 1,447 | 1,527 |
| Corning Inc. | 3.700% | 11/15/23 | 2,500 | 2,461 |
| Dun & Bradstreet Corp. | 4.375% | 12/1/22 | 1,225 | 1,181 |
| EMC Corp. | 2.650% | 6/1/20 | 10,597 | 10,431 |
| EMC Corp. | 3.375% | 6/1/23 | 6,200 | 5,955 |
| Equifax Inc. | 3.300% | 12/15/22 | 1,000 | 917 |
| Fidelity National Information Services Inc. | 5.000% | 3/15/22 | 2,225 | 2,272 |
| Fidelity National Information Services Inc. | 3.500% | 4/15/23 | 8,650 | 7,907 |
| Fiserv Inc. | 4.625% | 10/1/20 | 5,147 | 5,277 |
| Fiserv Inc. | 3.500% | 10/1/22 | 1,615 | 1,502 |
| Google Inc. | 3.625% | 5/19/21 | 2,150 | 2,234 |
| Harris Corp. | 6.375% | 6/15/19 | 775 | 900 |
| Harris Corp. | 4.400% | 12/15/20 | 4,740 | 4,894 |
48
| Vanguard® Intermediate-Term Bond Index Fund | |||||
| Schedule of Investments | |||||
| December 31, 2013 | |||||
| Face | Market | ||||
| Maturity | Amount | Value | |||
| Coupon | Date | ($000) | ($000) | ||
| Hewlett-Packard Co. | 4.300% | 6/1/21 | 9,125 | 9,176 | |
| Hewlett-Packard Co. | 4.375% | 9/15/21 | 10,950 | 11,132 | |
| Hewlett-Packard Co. | 4.650% | 12/9/21 | 4,850 | 4,996 | |
| Intel Corp. | 3.300% | 10/1/21 | 12,616 | 12,590 | |
| Intel Corp. | 2.700% | 12/15/22 | 8,550 | 7,855 | |
| International Business Machines Corp. | 1.625% | 5/15/20 | 5,371 | 5,049 | |
| International Business Machines Corp. | 2.900% | 11/1/21 | 4,475 | 4,322 | |
| International Business Machines Corp. | 1.875% | 8/1/22 | 8,600 | 7,520 | |
| International Business Machines Corp. | 3.375% | 8/1/23 | 8,675 | 8,429 | |
| Jabil Circuit Inc. | 5.625% | 12/15/20 | 3,188 | 3,316 | |
| Jabil Circuit Inc. | 4.700% | 9/15/22 | 1,700 | 1,636 | |
| Juniper Networks Inc. | 4.600% | 3/15/21 | 725 | 735 | |
| Leidos Holdings Inc. | 4.450% | 12/1/20 | 1,200 | 1,198 | |
| Lexmark International Inc. | 5.125% | 3/15/20 | 875 | 894 | |
| Maxim Integrated Products Inc. | 3.375% | 3/15/23 | 2,375 | 2,167 | |
| Microsoft Corp. | 4.200% | 6/1/19 | 9,175 | 10,136 | |
| Microsoft Corp. | 3.000% | 10/1/20 | 4,025 | 4,094 | |
| Microsoft Corp. | 2.125% | 11/15/22 | 4,100 | 3,709 | |
| Microsoft Corp. | 2.375% | 5/1/23 | 1,375 | 1,248 | |
| Microsoft Corp. | 3.625% | 12/15/23 | 4,725 | 4,723 | |
| Motorola Solutions Inc. | 3.750% | 5/15/22 | 6,050 | 5,868 | |
| Oracle Corp. | 2.375% | 1/15/19 | 4,300 | 4,332 | |
| Oracle Corp. | 5.000% | 7/8/19 | 11,375 | 12,894 | |
| Oracle Corp. | 3.875% | 7/15/20 | 10,940 | 11,537 | |
| Oracle Corp. | 2.500% | 10/15/22 | 9,600 | 8,818 | |
| Pitney Bowes Inc. | 6.250% | 3/15/19 | 3,700 | 4,165 | |
| Seagate HDD Cayman | 6.875% | 5/1/20 | 3,225 | 3,483 | |
| Seagate HDD Cayman | 7.000% | 11/1/21 | 3,000 | 3,307 | |
| 4 | Seagate HDD Cayman | 4.750% | 6/1/23 | 4,000 | 3,730 |
| Symantec Corp. | 4.200% | 9/15/20 | 4,005 | 4,118 | |
| Symantec Corp. | 3.950% | 6/15/22 | 2,650 | 2,565 | |
| Telefonaktiebolaget LM Ericsson | 4.125% | 5/15/22 | 5,750 | 5,628 | |
| Texas Instruments Inc. | 1.650% | 8/3/19 | 3,700 | 3,578 | |
| Total System Services Inc. | 3.750% | 6/1/23 | 1,600 | 1,464 | |
| Tyco Electronics Group SA | 3.500% | 2/3/22 | 3,075 | 2,917 | |
| Verisk Analytics Inc. | 4.125% | 9/12/22 | 4,575 | 4,437 | |
| Xerox Corp. | 5.625% | 12/15/19 | 2,875 | 3,209 | |
| Xerox Corp. | 4.500% | 5/15/21 | 5,750 | 5,909 | |
| Transportation (0.9%) | |||||
| 5 | American Airlines 2011-1 Class A Pass Through Trust | 5.250% | 7/31/22 | 557 | 590 |
| 4,5 | American Airlines 2013-2 Class A Pass Through Trust | 4.950% | 7/15/24 | 6,800 | 7,131 |
| Burlington Northern Santa Fe LLC | 4.700% | 10/1/19 | 2,021 | 2,231 | |
| Burlington Northern Santa Fe LLC | 3.600% | 9/1/20 | 800 | 816 | |
| Burlington Northern Santa Fe LLC | 4.100% | 6/1/21 | 777 | 806 | |
| Burlington Northern Santa Fe LLC | 3.450% | 9/15/21 | 5,525 | 5,462 | |
| Burlington Northern Santa Fe LLC | 3.050% | 3/15/22 | 4,225 | 4,001 | |
| Burlington Northern Santa Fe LLC | 3.050% | 9/1/22 | 4,200 | 3,946 | |
| Burlington Northern Santa Fe LLC | 3.000% | 3/15/23 | 1,900 | 1,765 | |
| Canadian National Railway Co. | 5.550% | 3/1/19 | 2,000 | 2,296 | |
| Canadian National Railway Co. | 2.850% | 12/15/21 | 3,050 | 2,934 | |
| Canadian National Railway Co. | 2.250% | 11/15/22 | 1,200 | 1,075 | |
| Canadian Pacific Railway Co. | 7.250% | 5/15/19 | 8,079 | 9,828 | |
| Canadian Pacific Railway Co. | 4.450% | 3/15/23 | 1,530 | 1,570 | |
| Canadian Pacific Railway Ltd. | 4.500% | 1/15/22 | 1,000 | 1,032 | |
| 5 | Continental Airlines 1998-1 Class A Pass Through Trust | 6.648% | 3/15/19 | 871 | 927 |
| 5 | Continental Airlines 2007-1 Class A Pass Through Trust | 5.983% | 4/19/22 | 430 | 470 |
| 5 | Continental Airlines 2009-2 Class A Pass Through Trust | 7.250% | 5/10/21 | 3,717 | 4,275 |
| 5 | Continental Airlines 2010-1 Class A Pass Through Trust | 4.750% | 1/12/21 | 2,230 | 2,370 |
| CSX Corp. | 7.375% | 2/1/19 | 1,325 | 1,611 | |
| CSX Corp. | 4.250% | 6/1/21 | 7,325 | 7,646 | |
| CSX Corp. | 3.700% | 11/1/23 | 2,375 | 2,306 | |
| 5 | Delta Air Lines 2007-1 Class A Pass Through Trust | 6.821% | 2/10/24 | 2,489 | 2,816 |
| 5 | Delta Air Lines 2009-1 Class A Pass Through Trust | 7.750% | 12/17/19 | 3,796 | 4,432 |
49
| Vanguard® Intermediate-Term Bond Index Fund | ||||
| Schedule of Investments | ||||
| December 31, 2013 | ||||
| Face | Market | |||
| Maturity | Amount | Value | ||
| Coupon | Date | ($000) | ($000) | |
| 5 Delta Air Lines 2010-2 Class A Pass Through Trust | 4.950% | 5/23/19 | 2,652 | 2,867 |
| 5 Delta Air Lines 2012-1 Class A Pass Through Trust | 4.750% | 11/7/21 | 1,860 | 1,992 |
| FedEx Corp. | 8.000% | 1/15/19 | 3,315 | 4,126 |
| FedEx Corp. | 2.625% | 8/1/22 | 2,475 | 2,242 |
| Kansas City Southern de Mexico SA de CV | 2.350% | 5/15/20 | 7,325 | 6,810 |
| Kansas City Southern de Mexico SA de CV | 3.000% | 5/15/23 | 800 | 722 |
| Norfolk Southern Corp. | 5.900% | 6/15/19 | 5,275 | 6,100 |
| Norfolk Southern Corp. | 3.250% | 12/1/21 | 2,500 | 2,433 |
| Norfolk Southern Corp. | 3.000% | 4/1/22 | 2,200 | 2,088 |
| Norfolk Southern Corp. | 2.903% | 2/15/23 | 77 | 71 |
| Norfolk Southern Railway Co. | 9.750% | 6/15/20 | 411 | 560 |
| Ryder System Inc. | 2.350% | 2/26/19 | 1,700 | 1,669 |
| 5 Southwest Airlines Co. 2007-1 Pass Through Trust | 6.150% | 2/1/24 | 978 | 1,119 |
| Union Pacific Corp. | 4.000% | 2/1/21 | 1,400 | 1,453 |
| Union Pacific Corp. | 4.163% | 7/15/22 | 6,421 | 6,618 |
| Union Pacific Corp. | 2.950% | 1/15/23 | 2,175 | 2,021 |
| Union Pacific Corp. | 2.750% | 4/15/23 | 1,800 | 1,649 |
| United Parcel Service Inc. | 5.125% | 4/1/19 | 5,811 | 6,625 |
| United Parcel Service Inc. | 3.125% | 1/15/21 | 5,550 | 5,572 |
| United Parcel Service Inc. | 2.450% | 10/1/22 | 7,365 | 6,787 |
| United Parcel Service of America Inc. | 8.375% | 4/1/20 | 500 | 645 |
| 3,577,470 | ||||
| Utilities (4.1%) | ||||
| Electric (2.3%) | ||||
| Alabama Power Co. | 3.375% | 10/1/20 | 745 | 758 |
| Ameren Illinois Co. | 2.700% | 9/1/22 | 2,595 | 2,424 |
| Appalachian Power Co. | 7.950% | 1/15/20 | 775 | 963 |
| Appalachian Power Co. | 4.600% | 3/30/21 | 1,700 | 1,817 |
| Arizona Public Service Co. | 8.750% | 3/1/19 | 4,875 | 6,191 |
| Baltimore Gas & Electric Co. | 3.500% | 11/15/21 | 3,575 | 3,575 |
| Baltimore Gas & Electric Co. | 3.350% | 7/1/23 | 1,750 | 1,677 |
| CMS Energy Corp. | 8.750% | 6/15/19 | 3,370 | 4,256 |
| CMS Energy Corp. | 6.250% | 2/1/20 | 2,000 | 2,299 |
| CMS Energy Corp. | 5.050% | 3/15/22 | 3,500 | 3,780 |
| Commonwealth Edison Co. | 4.000% | 8/1/20 | 2,000 | 2,121 |
| Commonwealth Edison Co. | 3.400% | 9/1/21 | 2,050 | 2,058 |
| Connecticut Light & Power Co. | 2.500% | 1/15/23 | 4,083 | 3,719 |
| Consolidated Edison Co. of New York Inc. | 6.650% | 4/1/19 | 3,500 | 4,207 |
| Consolidated Edison Co. of New York Inc. | 4.450% | 6/15/20 | 2,000 | 2,159 |
| Constellation Energy Group Inc. | 5.150% | 12/1/20 | 2,150 | 2,287 |
| Consumers Energy Co. | 6.125% | 3/15/19 | 300 | 354 |
| Consumers Energy Co. | 6.700% | 9/15/19 | 4,116 | 4,999 |
| Consumers Energy Co. | 5.650% | 4/15/20 | 1,075 | 1,230 |
| Consumers Energy Co. | 2.850% | 5/15/22 | 3,000 | 2,862 |
| Consumers Energy Co. | 3.375% | 8/15/23 | 1,700 | 1,656 |
| Delmarva Power & Light Co. | 3.500% | 11/15/23 | 1,425 | 1,391 |
| Dominion Resources Inc. | 8.875% | 1/15/19 | 5,425 | 6,920 |
| Dominion Resources Inc. | 5.200% | 8/15/19 | 900 | 1,009 |
| Dominion Resources Inc. | 4.450% | 3/15/21 | 2,750 | 2,909 |
| Dominion Resources Inc. | 2.750% | 9/15/22 | 1,600 | 1,465 |
| DTE Electric Co. | 3.450% | 10/1/20 | 4,030 | 4,127 |
| DTE Electric Co. | 3.900% | 6/1/21 | 800 | 831 |
| DTE Electric Co. | 2.650% | 6/15/22 | 1,450 | 1,358 |
| Duke Energy Carolinas LLC | 4.300% | 6/15/20 | 3,075 | 3,306 |
| Duke Energy Carolinas LLC | 3.900% | 6/15/21 | 2,000 | 2,088 |
| Duke Energy Corp. | 5.050% | 9/15/19 | 7,925 | 8,753 |
| Duke Energy Corp. | 3.050% | 8/15/22 | 2,350 | 2,225 |
| Duke Energy Florida Inc. | 3.100% | 8/15/21 | 2,000 | 1,965 |
| Duke Energy Indiana Inc. | 3.750% | 7/15/20 | 1,750 | 1,811 |
| Duke Energy Ohio Inc. | 5.450% | 4/1/19 | 2,625 | 2,996 |
| Duke Energy Progress Inc. | 5.300% | 1/15/19 | 4,950 | 5,627 |
| Duke Energy Progress Inc. | 3.000% | 9/15/21 | 5,400 | 5,280 |
| Duke Energy Progress Inc. | 2.800% | 5/15/22 | 2,500 | 2,378 |
50
| Vanguard® Intermediate-Term Bond Index Fund | ||||
| Schedule of Investments | ||||
| December 31, 2013 | ||||
| Face | Market | |||
| Maturity | Amount | Value | ||
| Coupon | Date | ($000) | ($000) | |
| Entergy Arkansas Inc. | 3.050% | 6/1/23 | 1,800 | 1,687 |
| Entergy Corp. | 5.125% | 9/15/20 | 2,125 | 2,241 |
| Entergy Gulf States Louisiana LLC | 3.950% | 10/1/20 | 2,500 | 2,599 |
| Entergy Louisiana LLC | 4.050% | 9/1/23 | 4,500 | 4,546 |
| Entergy Mississippi Inc. | 3.100% | 7/1/23 | 175 | 164 |
| Entergy Texas Inc. | 7.125% | 2/1/19 | 3,810 | 4,484 |
| Exelon Generation Co. LLC | 5.200% | 10/1/19 | 2,400 | 2,594 |
| Exelon Generation Co. LLC | 4.000% | 10/1/20 | 3,300 | 3,290 |
| Exelon Generation Co. LLC | 4.250% | 6/15/22 | 4,000 | 3,841 |
| FirstEnergy Solutions Corp. | 6.050% | 8/15/21 | 2,600 | 2,774 |
| Florida Power & Light Co. | 2.750% | 6/1/23 | 1,500 | 1,401 |
| Georgia Power Co. | 2.850% | 5/15/22 | 4,300 | 4,051 |
| Great Plains Energy Inc. | 4.850% | 6/1/21 | 6,095 | 6,412 |
| Indiana Michigan Power Co. | 7.000% | 3/15/19 | 5,747 | 6,821 |
| Indiana Michigan Power Co. | 3.200% | 3/15/23 | 575 | 536 |
| ITC Holdings Corp. | 4.050% | 7/1/23 | 900 | 883 |
| Kansas City Power & Light Co. | 3.150% | 3/15/23 | 1,225 | 1,136 |
| Kentucky Utilities Co. | 3.250% | 11/1/20 | 2,300 | 2,334 |
| LG&E & KU Energy LLC | 3.750% | 11/15/20 | 5,525 | 5,581 |
| Metropolitan Edison Co. | 7.700% | 1/15/19 | 2,000 | 2,414 |
| 4 MidAmerican Energy Holdings Co. | 3.750% | 11/15/23 | 4,275 | 4,154 |
| National Rural Utilities Cooperative Finance Corp. | 2.350% | 6/15/20 | 2,750 | 2,643 |
| National Rural Utilities Cooperative Finance Corp. | 3.050% | 2/15/22 | 4,200 | 4,079 |
| 5 National Rural Utilities Cooperative Finance Corp. | 4.750% | 4/30/43 | 2,100 | 1,933 |
| Nevada Power Co. | 7.125% | 3/15/19 | 2,100 | 2,553 |
| NextEra Energy Capital Holdings Inc. | 6.000% | 3/1/19 | 3,700 | 4,189 |
| NextEra Energy Capital Holdings Inc. | 4.500% | 6/1/21 | 3,000 | 3,095 |
| NextEra Energy Capital Holdings Inc. | 3.625% | 6/15/23 | 325 | 304 |
| Northern States Power Co. | 2.150% | 8/15/22 | 825 | 739 |
| Northern States Power Co. | 2.600% | 5/15/23 | 1,300 | 1,194 |
| NSTAR Electric Co. | 2.375% | 10/15/22 | 1,575 | 1,428 |
| NSTAR LLC | 4.500% | 11/15/19 | 3,500 | 3,796 |
| Ohio Power Co. | 5.375% | 10/1/21 | 2,875 | 3,202 |
| Oncor Electric Delivery Co. LLC | 4.100% | 6/1/22 | 2,950 | 2,973 |
| Oncor Electric Delivery Co. LLC | 7.000% | 9/1/22 | 1,550 | 1,848 |
| Pacific Gas & Electric Co. | 3.500% | 10/1/20 | 11,985 | 12,201 |
| Pacific Gas & Electric Co. | 4.250% | 5/15/21 | 200 | 210 |
| Pacific Gas & Electric Co. | 3.250% | 9/15/21 | 2,500 | 2,451 |
| Pacific Gas & Electric Co. | 2.450% | 8/15/22 | 1,925 | 1,734 |
| Pacific Gas & Electric Co. | 3.250% | 6/15/23 | 2,150 | 2,036 |
| PacifiCorp | 5.500% | 1/15/19 | 2,740 | 3,146 |
| PacifiCorp | 3.850% | 6/15/21 | 200 | 207 |
| PacifiCorp | 2.950% | 2/1/22 | 4,275 | 4,091 |
| Peco Energy Co. | 2.375% | 9/15/22 | 2,450 | 2,223 |
| Pennsylvania Electric Co. | 5.200% | 4/1/20 | 1,700 | 1,813 |
| Portland General Electric Co. | 6.100% | 4/15/19 | 2,850 | 3,338 |
| PPL Capital Funding Inc. | 4.200% | 6/15/22 | 2,501 | 2,496 |
| PPL Capital Funding Inc. | 3.400% | 6/1/23 | 3,200 | 2,977 |
| PPL Electric Utilities Corp. | 3.000% | 9/15/21 | 3,600 | 3,537 |
| PPL Energy Supply LLC | 4.600% | 12/15/21 | 3,300 | 3,177 |
| Progress Energy Inc. | 4.400% | 1/15/21 | 2,000 | 2,116 |
| Progress Energy Inc. | 3.150% | 4/1/22 | 3,500 | 3,364 |
| PSEG Power LLC | 5.125% | 4/15/20 | 3,937 | 4,287 |
| PSEG Power LLC | 4.150% | 9/15/21 | 1,225 | 1,241 |
| Public Service Co. of Colorado | 5.125% | 6/1/19 | 2,300 | 2,599 |
| Public Service Co. of Colorado | 3.200% | 11/15/20 | 3,300 | 3,328 |
| Public Service Co. of Colorado | 2.250% | 9/15/22 | 2,500 | 2,262 |
| Public Service Co. of New Hampshire | 3.500% | 11/1/23 | 1,100 | 1,073 |
| Public Service Co. of Oklahoma | 5.150% | 12/1/19 | 650 | 719 |
| Public Service Co. of Oklahoma | 4.400% | 2/1/21 | 2,000 | 2,096 |
| Public Service Electric & Gas Co. | 3.500% | 8/15/20 | 2,000 | 2,062 |
| Public Service Electric & Gas Co. | 2.375% | 5/15/23 | 1,025 | 920 |
| San Diego Gas & Electric Co. | 3.000% | 8/15/21 | 1,950 | 1,923 |
| San Diego Gas & Electric Co. | 3.600% | 9/1/23 | 1,400 | 1,397 |
51
| Vanguard® Intermediate-Term Bond Index Fund | ||||
| Schedule of Investments | ||||
| December 31, 2013 | ||||
| Face | Market | |||
| Maturity | Amount | Value | ||
| Coupon | Date | ($000) | ($000) | |
| SCANA Corp. | 4.750% | 5/15/21 | 3,050 | 3,126 |
| SCANA Corp. | 4.125% | 2/1/22 | 2,825 | 2,739 |
| Sierra Pacific Power Co. | 3.375% | 8/15/23 | 1,400 | 1,354 |
| Southern California Edison Co. | 3.875% | 6/1/21 | 2,125 | 2,229 |
| Southern California Edison Co. | 3.500% | 10/1/23 | 2,225 | 2,180 |
| Southwestern Electric Power Co. | 6.450% | 1/15/19 | 3,472 | 3,986 |
| Southwestern Electric Power Co. | 3.550% | 2/15/22 | 1,575 | 1,534 |
| Tampa Electric Co. | 5.400% | 5/15/21 | 3,500 | 3,935 |
| Tampa Electric Co. | 2.600% | 9/15/22 | 2,050 | 1,892 |
| TECO Finance Inc. | 5.150% | 3/15/20 | 1,350 | 1,473 |
| Toledo Edison Co. | 7.250% | 5/1/20 | 285 | 340 |
| Tucson Electric Power Co. | 5.150% | 11/15/21 | 2,050 | 2,192 |
| UIL Holdings Corp. | 4.625% | 10/1/20 | 1,850 | 1,887 |
| Union Electric Co. | 6.700% | 2/1/19 | 3,000 | 3,581 |
| Virginia Electric & Power Co. | 2.950% | 1/15/22 | 3,200 | 3,093 |
| Virginia Electric & Power Co. | 3.450% | 9/1/22 | 1,550 | 1,542 |
| Western Massachusetts Electric Co. | 3.500% | 9/15/21 | 2,275 | 2,245 |
| Wisconsin Electric Power Co. | 4.250% | 12/15/19 | 1,525 | 1,670 |
| Wisconsin Power & Light Co. | 5.000% | 7/15/19 | 2,275 | 2,550 |
| Wisconsin Power & Light Co. | 2.250% | 11/15/22 | 1,850 | 1,654 |
| Xcel Energy Inc. | 4.700% | 5/15/20 | 2,400 | 2,630 |
| Natural Gas (1.8%) | ||||
| AGL Capital Corp. | 5.250% | 8/15/19 | 2,300 | 2,561 |
| Atmos Energy Corp. | 8.500% | 3/15/19 | 2,510 | 3,204 |
| Buckeye Partners LP | 4.875% | 2/1/21 | 3,475 | 3,549 |
| Buckeye Partners LP | 4.150% | 7/1/23 | 4,000 | 3,812 |
| CenterPoint Energy Resources Corp. | 4.500% | 1/15/21 | 3,802 | 4,059 |
| Copano Energy LLC / Copano Energy Finance Corp. | 7.125% | 4/1/21 | 2,320 | 2,671 |
| DCP Midstream Operating LP | 4.950% | 4/1/22 | 1,750 | 1,770 |
| DCP Midstream Operating LP | 3.875% | 3/15/23 | 3,150 | 2,911 |
| El Paso Pipeline Partners Operating Co. LLC | 6.500% | 4/1/20 | 3,500 | 4,007 |
| El Paso Pipeline Partners Operating Co. LLC | 5.000% | 10/1/21 | 6,500 | 6,779 |
| Enbridge Energy Partners LP | 9.875% | 3/1/19 | 1,900 | 2,474 |
| Enbridge Energy Partners LP | 5.200% | 3/15/20 | 1,875 | 2,024 |
| Enbridge Energy Partners LP | 4.200% | 9/15/21 | 3,675 | 3,706 |
| Enbridge Inc. | 4.000% | 10/1/23 | 950 | 931 |
| Energy Transfer Partners LP | 9.000% | 4/15/19 | 11,353 | 14,372 |
| Energy Transfer Partners LP | 4.150% | 10/1/20 | 2,700 | 2,745 |
| Energy Transfer Partners LP | 4.650% | 6/1/21 | 425 | 436 |
| Energy Transfer Partners LP | 5.200% | 2/1/22 | 4,440 | 4,654 |
| Energy Transfer Partners LP | 3.600% | 2/1/23 | 3,000 | 2,779 |
| Enterprise Products Operating LLC | 6.500% | 1/31/19 | 3,500 | 4,147 |
| Enterprise Products Operating LLC | 5.250% | 1/31/20 | 5,400 | 6,018 |
| Enterprise Products Operating LLC | 5.200% | 9/1/20 | 2,575 | 2,858 |
| Enterprise Products Operating LLC | 4.050% | 2/15/22 | 4,300 | 4,359 |
| Enterprise Products Operating LLC | 3.350% | 3/15/23 | 3,500 | 3,313 |
| Gulf South Pipeline Co. LP | 4.000% | 6/15/22 | 3,175 | 3,104 |
| Kinder Morgan Energy Partners LP | 2.650% | 2/1/19 | 5,975 | 5,912 |
| Kinder Morgan Energy Partners LP | 6.850% | 2/15/20 | 12,875 | 15,306 |
| Kinder Morgan Energy Partners LP | 5.800% | 3/1/21 | 2,150 | 2,394 |
| Kinder Morgan Energy Partners LP | 4.150% | 3/1/22 | 1,475 | 1,468 |
| Kinder Morgan Energy Partners LP | 3.950% | 9/1/22 | 3,975 | 3,867 |
| Kinder Morgan Energy Partners LP | 3.450% | 2/15/23 | 4,050 | 3,746 |
| Kinder Morgan Energy Partners LP | 3.500% | 9/1/23 | 2,850 | 2,627 |
| Magellan Midstream Partners LP | 6.550% | 7/15/19 | 2,275 | 2,686 |
| Magellan Midstream Partners LP | 4.250% | 2/1/21 | 1,800 | 1,880 |
| National Fuel Gas Co. | 4.900% | 12/1/21 | 3,875 | 4,011 |
| National Fuel Gas Co. | 3.750% | 3/1/23 | 4,275 | 4,003 |
| Nisource Finance Corp. | 6.800% | 1/15/19 | 3,938 | 4,604 |
| Nisource Finance Corp. | 5.450% | 9/15/20 | 815 | 905 |
| Nisource Finance Corp. | 4.450% | 12/1/21 | 1,425 | 1,451 |
| Nisource Finance Corp. | 6.125% | 3/1/22 | 2,875 | 3,197 |
| Nisource Finance Corp. | 3.850% | 2/15/23 | 600 | 576 |
52
| Vanguard® Intermediate-Term Bond Index Fund | ||||
| Schedule of Investments | ||||
| December 31, 2013 | ||||
| Face | Market | |||
| Maturity | Amount | Value | ||
| Coupon | Date | ($000) | ($000) | |
| ONEOK Inc. | 4.250% | 2/1/22 | 3,450 | 3,230 |
| ONEOK Partners LP | 8.625% | 3/1/19 | 5,000 | 6,223 |
| ONEOK Partners LP | 3.375% | 10/1/22 | 73 | 68 |
| Plains All American Pipeline LP / PAA Finance Corp. | 8.750% | 5/1/19 | 690 | 884 |
| Plains All American Pipeline LP / PAA Finance Corp. | 5.750% | 1/15/20 | 2,725 | 3,114 |
| Plains All American Pipeline LP / PAA Finance Corp. | 5.000% | 2/1/21 | 4,625 | 5,068 |
| Plains All American Pipeline LP / PAA Finance Corp. | 3.650% | 6/1/22 | 3,700 | 3,619 |
| Plains All American Pipeline LP / PAA Finance Corp. | 3.850% | 10/15/23 | 1,225 | 1,192 |
| Sempra Energy | 9.800% | 2/15/19 | 4,370 | 5,768 |
| Sempra Energy | 2.875% | 10/1/22 | 850 | 778 |
| Southern Natural Gas Co. LLC / Southern Natural | ||||
| Issuing Corp. | 4.400% | 6/15/21 | 3,575 | 3,664 |
| Spectra Energy Capital LLC | 3.300% | 3/15/23 | 3,210 | 2,829 |
| Spectra Energy Partners LP | 4.600% | 6/15/21 | 1,850 | 1,915 |
| Sunoco Logistics Partners Operations LP | 5.500% | 2/15/20 | 3,305 | 3,540 |
| Sunoco Logistics Partners Operations LP | 3.450% | 1/15/23 | 4,975 | 4,556 |
| TransCanada PipeLines Ltd. | 7.125% | 1/15/19 | 2,800 | 3,393 |
| TransCanada PipeLines Ltd. | 3.800% | 10/1/20 | 8,810 | 9,101 |
| TransCanada PipeLines Ltd. | 2.500% | 8/1/22 | 7,550 | 6,879 |
| TransCanada PipeLines Ltd. | 3.750% | 10/16/23 | 2,875 | 2,790 |
| Western Gas Partners LP | 5.375% | 6/1/21 | 5,600 | 5,989 |
| Williams Cos. Inc. | 7.875% | 9/1/21 | 279 | 324 |
| Williams Cos. Inc. | 3.700% | 1/15/23 | 7,000 | 6,104 |
| Williams Partners LP | 5.250% | 3/15/20 | 8,835 | 9,622 |
| Williams Partners LP | 4.000% | 11/15/21 | 4,625 | 4,563 |
| Williams Partners LP | 3.350% | 8/15/22 | 5,150 | 4,773 |
| Other Utility (0.0%) | ||||
| United Utilities plc | 5.375% | 2/1/19 | 1,000 | 1,069 |
| 585,537 | ||||
| Total Corporate Bonds (Cost $5,934,355) | 5,984,199 | |||
| Sovereign Bonds (U.S. Dollar-Denominated) (7.1%) | ||||
| Asian Development Bank | 1.750% | 3/21/19 | 10,550 | 10,434 |
| Asian Development Bank | 1.375% | 3/23/20 | 4,000 | 3,765 |
| Banco do Brasil SA | 3.875% | 10/10/22 | 10,925 | 9,503 |
| 4 CNOOC Finance 2012 Ltd. | 3.875% | 5/2/22 | 4,200 | 4,039 |
| CNOOC Finance 2013 Ltd. | 3.000% | 5/9/23 | 3,975 | 3,548 |
| Corp. Andina de Fomento | 8.125% | 6/4/19 | 5,600 | 6,758 |
| Corp. Andina de Fomento | 4.375% | 6/15/22 | 10,020 | 10,009 |
| Ecopetrol SA | 7.625% | 7/23/19 | 8,800 | 10,406 |
| Ecopetrol SA | 5.875% | 9/18/23 | 4,325 | 4,570 |
| European Bank for Reconstruction & Development | 1.500% | 3/16/20 | 4,050 | 3,846 |
| European Investment Bank | 2.875% | 9/15/20 | 14,525 | 14,679 |
| European Investment Bank | 4.000% | 2/16/21 | 11,750 | 12,622 |
| Export-Import Bank of Korea | 5.125% | 6/29/20 | 4,400 | 4,827 |
| Export-Import Bank of Korea | 4.000% | 1/29/21 | 5,000 | 5,083 |
| Export-Import Bank of Korea | 4.375% | 9/15/21 | 8,000 | 8,320 |
| Export-Import Bank of Korea | 5.000% | 4/11/22 | 4,400 | 4,765 |
| Federative Republic of Brazil | 5.875% | 1/15/19 | 6,125 | 6,872 |
| Federative Republic of Brazil | 4.875% | 1/22/21 | 19,825 | 20,762 |
| Federative Republic of Brazil | 2.625% | 1/5/23 | 15,500 | 13,314 |
| Hydro-Quebec | 9.400% | 2/1/21 | 2,000 | 2,723 |
| Hydro-Quebec | 8.400% | 1/15/22 | 4,825 | 6,289 |
| Inter-American Development Bank | 1.125% | 9/12/19 | 9,200 | 8,664 |
| Inter-American Development Bank | 3.875% | 9/17/19 | 9,500 | 10,367 |
| Inter-American Development Bank | 3.875% | 2/14/20 | 5,675 | 6,154 |
| Inter-American Development Bank | 2.125% | 11/9/20 | 9,250 | 8,939 |
| Inter-American Development Bank | 3.000% | 10/4/23 | 5,550 | 5,376 |
| International Bank for Reconstruction & Development | 2.125% | 11/1/20 | 6,650 | 6,451 |
| International Bank for Reconstruction & Development | 7.625% | 1/19/23 | 1,857 | 2,499 |
| International Bank for Reconstruction & Development | 2.125% | 2/13/23 | 15,000 | 13,814 |
| 6 Japan Bank for International Cooperation | 2.125% | 2/7/19 | 6,300 | 6,276 |
53
| Vanguard® Intermediate-Term Bond Index Fund | ||||
| Schedule of Investments | ||||
| December 31, 2013 | ||||
| Face | Market | |||
| Maturity | Amount | Value | ||
| Coupon | Date | ($000) | ($000) | |
| 6 Japan Bank for International Cooperation | 3.375% | 7/31/23 | 2,375 | 2,324 |
| 6 Japan Finance Organization for Municipalities | 4.000% | 1/13/21 | 6,000 | 6,397 |
| 7 KFW | 4.875% | 6/17/19 | 14,520 | 16,510 |
| 7 KFW | 4.000% | 1/27/20 | 13,675 | 14,890 |
| 7 KFW | 2.750% | 9/8/20 | 26,275 | 26,391 |
| 7 KFW | 2.750% | 10/1/20 | 7,850 | 7,906 |
| 7 KFW | 2.375% | 8/25/21 | 15,000 | 14,584 |
| 7 KFW | 2.625% | 1/25/22 | 15,460 | 15,080 |
| 7 KFW | 2.000% | 10/4/22 | 14,550 | 13,368 |
| 7 KFW | 2.125% | 1/17/23 | 28,250 | 25,822 |
| Korea Development Bank | 3.000% | 9/14/22 | 5,000 | 4,698 |
| Korea Finance Corp. | 4.625% | 11/16/21 | 4,350 | 4,568 |
| 7 Landwirtschaftliche Rentenbank | 1.375% | 10/23/19 | 2,375 | 2,259 |
| Nexen Energy ULC | 6.200% | 7/30/19 | 3,500 | 4,033 |
| North American Development Bank | 4.375% | 2/11/20 | 1,200 | 1,251 |
| North American Development Bank | 2.400% | 10/26/22 | 2,200 | 1,950 |
| 5 Oriental Republic of Uruguay | 8.000% | 11/18/22 | 3,430 | 4,219 |
| Petrobras Global Finance BV | 3.000% | 1/15/19 | 11,500 | 10,773 |
| Petrobras Global Finance BV | 4.375% | 5/20/23 | 14,600 | 12,973 |
| Petrobras International Finance Co. | 7.875% | 3/15/19 | 16,200 | 18,422 |
| Petrobras International Finance Co. | 5.750% | 1/20/20 | 14,115 | 14,513 |
| Petrobras International Finance Co. | 5.375% | 1/27/21 | 25,540 | 25,327 |
| Petroleos Mexicanos | 8.000% | 5/3/19 | 10,300 | 12,451 |
| Petroleos Mexicanos | 6.000% | 3/5/20 | 5,825 | 6,459 |
| Petroleos Mexicanos | 5.500% | 1/21/21 | 16,660 | 17,899 |
| Petroleos Mexicanos | 4.875% | 1/24/22 | 16,400 | 16,800 |
| Petroleos Mexicanos | 3.500% | 1/30/23 | 7,000 | 6,294 |
| Province of British Columbia | 2.650% | 9/22/21 | 5,000 | 4,858 |
| Province of British Columbia | 2.000% | 10/23/22 | 7,000 | 6,260 |
| Province of Manitoba | 1.750% | 5/30/19 | 9,025 | 8,831 |
| Province of Manitoba | 9.250% | 4/1/20 | 1,500 | 1,986 |
| Province of Manitoba | 2.100% | 9/6/22 | 3,550 | 3,198 |
| Province of Nova Scotia | 8.250% | 7/30/22 | 4,700 | 6,165 |
| Province of Ontario | 1.650% | 9/27/19 | 9,350 | 8,927 |
| Province of Ontario | 4.000% | 10/7/19 | 8,800 | 9,472 |
| Province of Ontario | 4.400% | 4/14/20 | 17,000 | 18,579 |
| Province of Ontario | 2.450% | 6/29/22 | 2,150 | 1,977 |
| Quebec | 3.500% | 7/29/20 | 2,700 | 2,796 |
| Quebec | 2.750% | 8/25/21 | 20,350 | 19,613 |
| Quebec | 2.625% | 2/13/23 | 2,575 | 2,351 |
| Republic of Chile | 3.875% | 8/5/20 | 3,800 | 3,965 |
| Republic of Chile | 3.250% | 9/14/21 | 8,500 | 8,318 |
| Republic of Chile | 2.250% | 10/30/22 | 3,275 | 2,900 |
| Republic of Colombia | 7.375% | 3/18/19 | 11,125 | 13,383 |
| Republic of Colombia | 11.750% | 2/25/20 | 600 | 861 |
| Republic of Colombia | 4.375% | 7/12/21 | 11,250 | 11,616 |
| 5 Republic of Colombia | 2.625% | 3/15/23 | 6,225 | 5,426 |
| Republic of Italy | 6.875% | 9/27/23 | 13,900 | 16,498 |
| Republic of Korea | 7.125% | 4/16/19 | 10,650 | 12,974 |
| Republic of Korea | 3.875% | 9/11/23 | 2,500 | 2,535 |
| Republic of Panama | 5.200% | 1/30/20 | 4,675 | 5,078 |
| Republic of Peru | 7.125% | 3/30/19 | 6,900 | 8,314 |
| Republic of Philippines | 9.875% | 1/15/19 | 5,000 | 6,575 |
| Republic of Philippines | 8.375% | 6/17/19 | 2,650 | 3,359 |
| Republic of Philippines | 6.500% | 1/20/20 | 6,075 | 7,138 |
| Republic of Philippines | 4.000% | 1/15/21 | 13,350 | 13,750 |
| Republic of Poland | 6.375% | 7/15/19 | 18,700 | 21,856 |
| Republic of Poland | 5.125% | 4/21/21 | 9,500 | 10,319 |
| Republic of Poland | 5.000% | 3/23/22 | 16,650 | 17,734 |
| Republic of Poland | 3.000% | 3/17/23 | 6,805 | 6,184 |
| Republic of South Africa | 6.875% | 5/27/19 | 9,150 | 10,414 |
| Republic of South Africa | 5.500% | 3/9/20 | 13,305 | 14,135 |
| Republic of South Africa | 5.875% | 5/30/22 | 3,000 | 3,208 |
| Republic of Turkey | 7.000% | 3/11/19 | 14,075 | 15,412 |
54
| Vanguard® Intermediate-Term Bond Index Fund | ||||
| Schedule of Investments | ||||
| December 31, 2013 | ||||
| Face | Market | |||
| Maturity | Amount | Value | ||
| Coupon | Date | ($000) | ($000) | |
| Republic of Turkey | 7.000% | 6/5/20 | 5,150 | 5,621 |
| Republic of Turkey | 5.625% | 3/30/21 | 15,600 | 15,662 |
| Republic of Turkey | 5.125% | 3/25/22 | 3,475 | 3,329 |
| Republic of Turkey | 6.250% | 9/26/22 | 19,700 | 20,281 |
| Republic of Turkey | 3.250% | 3/23/23 | 3,000 | 2,470 |
| State of Israel | 5.125% | 3/26/19 | 9,230 | 10,412 |
| State of Israel | 4.000% | 6/30/22 | 9,475 | 9,748 |
| State of Israel | 3.150% | 6/30/23 | 3,100 | 2,938 |
| Statoil ASA | 5.250% | 4/15/19 | 9,825 | 11,118 |
| Statoil ASA | 2.900% | 11/8/20 | 7,300 | 7,238 |
| Statoil ASA | 3.150% | 1/23/22 | 975 | 950 |
| Statoil ASA | 2.450% | 1/17/23 | 2,700 | 2,456 |
| United Mexican States | 5.950% | 3/19/19 | 16,413 | 18,956 |
| United Mexican States | 5.125% | 1/15/20 | 9,001 | 9,954 |
| United Mexican States | 3.625% | 3/15/22 | 17,874 | 17,624 |
| United Mexican States | 4.000% | 10/2/23 | 22,413 | 22,049 |
| Total Sovereign Bonds (Cost $1,036,521) | 1,021,606 | |||
| Taxable Municipal Bonds (0.3%) | ||||
| California Educational Facilities Authority Revenue | ||||
| (Stanford University) | 3.625% | 5/1/14 | 2,500 | 2,527 |
| California Educational Facilities Authority Revenue | ||||
| (Stanford University) | 4.250% | 5/1/16 | 800 | 866 |
| California Educational Facilities Authority Revenue | ||||
| (Stanford University) | 4.750% | 5/1/19 | 1,800 | 2,017 |
| California GO | 6.200% | 3/1/19 | 500 | 581 |
| California GO | 6.200% | 10/1/19 | 3,925 | 4,580 |
| California GO | 5.700% | 11/1/21 | 1,300 | 1,463 |
| California GO | 6.650% | 3/1/22 | 3,500 | 4,086 |
| Cornell University New York GO | 5.450% | 2/1/19 | 1,350 | 1,546 |
| Dartmouth College New Hampshire GO | 4.750% | 6/1/19 | 2,150 | 2,397 |
| Emory University Georgia GO | 5.625% | 9/1/19 | 1,000 | 1,160 |
| Energy Northwest Washington Electric Revenue | ||||
| (Columbia Generating Station) | 2.197% | 7/1/19 | 1,650 | 1,612 |
| Florida Hurricane Catastrophe Fund Finance Corp. | ||||
| Revenue | 2.995% | 7/1/20 | 6,250 | 5,915 |
| Illinois GO | 5.877% | 3/1/19 | 3,980 | 4,332 |
| Illinois GO | 4.950% | 6/1/23 | 1,700 | 1,649 |
| Massachusetts GO | 4.200% | 12/1/21 | 3,375 | 3,554 |
| Princeton University New Jersey GO | 4.950% | 3/1/19 | 5,325 | 6,035 |
| Puerto Rico Government Development Bank Revenue | 5.000% | 8/1/23 | 3,000 | 1,772 |
| University of California Revenue | 1.796% | 7/1/19 | 2,950 | 2,831 |
| Total Taxable Municipal Bonds (Cost $48,108) | 48,923 | |||
| Shares | ||||
| Temporary Cash Investment (0.1%) | ||||
| Money Market Fund (0.1%) | ||||
| 8 Vanguard Market Liquidity Fund (Cost $20,064) | 0.125% | 20,064,000 | 20,064 | |
| Total Investments (99.3%) (Cost $14,312,451) | 14,366,065 | |||
| Other Assets and Liabilities—Net (0.7%) | 101,007 | |||
| Net Assets (100%) | 14,467,072 | |||
1 Securities with a value of $284,000 have been segregated as initial margin for open futures contracts.
2 The issuer operates under a congressional charter; its securities are generally neither guaranteed by the U.S. Treasury nor backed by the full
faith and credit of the U.S. government.
3 The issuer was placed under federal conservatorship in September 2008; since that time, its daily operations have been managed by the Federal
Housing Finance Agency and it receives capital from the U.S. Treasury, as needed to maintain a positive net worth, in exchange for senior
preferred stock.
55
Vanguard® Intermediate-Term Bond Index Fund
Schedule of Investments
December 31, 2013
4 Security exempt from registration under Rule 144A of the Securities Act of 1933. Such securities may be sold in transactions exempt from
registration, normally to qualified institutional buyers. At December 31, 2013, the aggregate value of these securities was $49,357,000,
representing 0.3% of net assets.
5 The average or expected maturity is shorter than the final maturity shown because of the possibility of interim principal payments and
prepayments or the possibility of the issue being called.
6 Guaranteed by the Government of Japan.
7 Guaranteed by the Federal Republic of Germany.
8 Affiliated money market fund available only to Vanguard funds and certain trusts and accounts managed by Vanguard. Rate shown is the 7-day
yield.
GO—General Obligation Bond.
REIT—Real Estate Investment Trust.
56
Vanguard® Long-Term Bond Index Fund
Schedule of Investments
December 31, 2013
| Face | Market | ||||
| Maturity | Amount | Value | |||
| Coupon | Date | ($000) | ($000) | ||
| U.S. Government and Agency Obligations (35.3%) | |||||
| U.S. Government Securities (32.6%) | |||||
| United States Treasury Note/Bond | 1.750% | 5/15/23 | 19,106 | 17,186 | |
| United States Treasury Note/Bond | 2.500% | 8/15/23 | 1,100 | 1,054 | |
| United States Treasury Note/Bond | 6.250% | 8/15/23 | 3,705 | 4,750 | |
| United States Treasury Note/Bond | 2.750% | 11/15/23 | 27,075 | 26,432 | |
| United States Treasury Note/Bond | 7.500% | 11/15/24 | 3,110 | 4,385 | |
| United States Treasury Note/Bond | 7.625% | 2/15/25 | 2,250 | 3,207 | |
| United States Treasury Note/Bond | 6.875% | 8/15/25 | 33,665 | 45,721 | |
| United States Treasury Note/Bond | 6.000% | 2/15/26 | 6,090 | 7,755 | |
| United States Treasury Note/Bond | 6.750% | 8/15/26 | 7,700 | 10,447 | |
| United States Treasury Note/Bond | 6.500% | 11/15/26 | 4,105 | 5,469 | |
| United States Treasury Note/Bond | 6.375% | 8/15/27 | 11,955 | 15,831 | |
| United States Treasury Note/Bond | 6.125% | 11/15/27 | 14,775 | 19,171 | |
| United States Treasury Note/Bond | 5.500% | 8/15/28 | 41,680 | 51,214 | |
| United States Treasury Note/Bond | 5.250% | 11/15/28 | 35,405 | 42,486 | |
| United States Treasury Note/Bond | 5.250% | 2/15/29 | 13,915 | 16,698 | |
| United States Treasury Note/Bond | 6.125% | 8/15/29 | 34,015 | 44,539 | |
| United States Treasury Note/Bond | 6.250% | 5/15/30 | 19,860 | 26,442 | |
| United States Treasury Note/Bond | 5.375% | 2/15/31 | 43,735 | 53,411 | |
| United States Treasury Note/Bond | 4.500% | 2/15/36 | 17,090 | 18,935 | |
| United States Treasury Note/Bond | 4.750% | 2/15/37 | 1,180 | 1,352 | |
| United States Treasury Note/Bond | 5.000% | 5/15/37 | 20,000 | 23,691 | |
| United States Treasury Note/Bond | 4.375% | 2/15/38 | 22,298 | 24,151 | |
| United States Treasury Note/Bond | 4.500% | 5/15/38 | 42,065 | 46,416 | |
| United States Treasury Note/Bond | 3.500% | 2/15/39 | 21,295 | 19,954 | |
| United States Treasury Note/Bond | 4.250% | 5/15/39 | 50,773 | 53,882 | |
| United States Treasury Note/Bond | 4.500% | 8/15/39 | 28,031 | 30,918 | |
| United States Treasury Note/Bond | 4.375% | 11/15/39 | 55,225 | 59,729 | |
| United States Treasury Note/Bond | 4.625% | 2/15/40 | 51,701 | 58,099 | |
| United States Treasury Note/Bond | 4.375% | 5/15/40 | 67,978 | 73,501 | |
| United States Treasury Note/Bond | 3.875% | 8/15/40 | 67,055 | 66,740 | |
| United States Treasury Note/Bond | 4.250% | 11/15/40 | 108,350 | 114,749 | |
| United States Treasury Note/Bond | 4.750% | 2/15/41 | 77,355 | 88,595 | |
| United States Treasury Note/Bond | 4.375% | 5/15/41 | 54,925 | 59,310 | |
| United States Treasury Note/Bond | 3.750% | 8/15/41 | 4,915 | 4,768 | |
| United States Treasury Note/Bond | 3.125% | 11/15/41 | 68,095 | 58,509 | |
| United States Treasury Note/Bond | 3.125% | 2/15/42 | 52,948 | 45,419 | |
| United States Treasury Note/Bond | 3.000% | 5/15/42 | 77,915 | 64,998 | |
| United States Treasury Note/Bond | 2.750% | 8/15/42 | 148,023 | 116,684 | |
| United States Treasury Note/Bond | 2.750% | 11/15/42 | 125,625 | 98,793 | |
| United States Treasury Note/Bond | 3.125% | 2/15/43 | 135,190 | 115,144 | |
| United States Treasury Note/Bond | 2.875% | 5/15/43 | 64,715 | 52,177 | |
| United States Treasury Note/Bond | 3.625% | 8/15/43 | 166,180 | 156,131 | |
| United States Treasury Note/Bond | 3.750% | 11/15/43 | 23,000 | 22,116 | |
| 1,870,959 | |||||
| Agency Bonds and Notes (2.7%) | |||||
| 1 | Federal Home Loan Banks | 5.375% | 8/15/24 | 100 | 114 |
| 1 | Federal Home Loan Banks | 5.625% | 3/14/36 | 1,000 | 1,161 |
| 1 | Federal Home Loan Banks | 5.500% | 7/15/36 | 5,865 | 6,744 |
| 2 | Federal Home Loan Mortgage Corp. | 6.750% | 9/15/29 | 2,490 | 3,265 |
| 2 | Federal Home Loan Mortgage Corp. | 6.750% | 3/15/31 | 16,260 | 21,490 |
| 2 | Federal Home Loan Mortgage Corp. | 6.250% | 7/15/32 | 10,067 | 12,690 |
| 2 | Federal National Mortgage Assn. | 6.250% | 5/15/29 | 11,900 | 14,841 |
| 2 | Federal National Mortgage Assn. | 7.125% | 1/15/30 | 9,175 | 12,412 |
| 2 | Federal National Mortgage Assn. | 7.250% | 5/15/30 | 8,835 | 12,077 |
| 2 | Federal National Mortgage Assn. | 6.625% | 11/15/30 | 9,050 | 11,760 |
| 2,3 | Federal National Mortgage Assn. | 6.000% | 4/18/36 | 2,000 | 2,186 |
| 2 | Federal National Mortgage Assn. | 5.625% | 7/15/37 | 4,160 | 4,936 |
| 2 | Federal National Mortgage Assn. | 6.210% | 8/6/38 | 1,000 | 1,239 |
| Private Export Funding Corp. | 2.450% | 7/15/24 | 3,350 | 2,990 | |
| Resolution Funding Corp. | 8.625% | 1/15/21 | 850 | 1,159 | |
| State of Israel | 5.500% | 4/26/24 | 6,275 | 7,241 | |
57
| Vanguard® Long-Term Bond Index Fund | |||||
| Schedule of Investments | |||||
| December 31, 2013 | |||||
| Face | Market | ||||
| Maturity | Amount | Value | |||
| Coupon | Date | ($000) | ($000) | ||
| 1 | Tennessee Valley Authority | 6.750% | 11/1/25 | 5,330 | 6,752 |
| 1 | Tennessee Valley Authority | 7.125% | 5/1/30 | 3,970 | 5,220 |
| 1 | Tennessee Valley Authority | 4.650% | 6/15/35 | 4,975 | 4,941 |
| 1 | Tennessee Valley Authority | 5.880% | 4/1/36 | 1,500 | 1,731 |
| 1 | Tennessee Valley Authority | 5.980% | 4/1/36 | 1,000 | 1,180 |
| 1 | Tennessee Valley Authority | 6.150% | 1/15/38 | 2,450 | 2,911 |
| 1 | Tennessee Valley Authority | 5.500% | 6/15/38 | 1,175 | 1,294 |
| 1 | Tennessee Valley Authority | 5.250% | 9/15/39 | 5,845 | 6,141 |
| 1 | Tennessee Valley Authority | 3.500% | 12/15/42 | 3,150 | 2,488 |
| 1 | Tennessee Valley Authority | 4.875% | 1/15/48 | 2,650 | 2,546 |
| 1 | Tennessee Valley Authority | 5.375% | 4/1/56 | 1,950 | 1,974 |
| 1 | Tennessee Valley Authority | 4.625% | 9/15/60 | 2,000 | 1,777 |
| 155,260 | |||||
| Total U.S. Government and Agency Obligations (Cost $2,103,093) | 2,026,219 | ||||
| Corporate Bonds (49.5%) | |||||
| Finance (9.4%) | |||||
| Banking (4.6%) | |||||
| American Express Co. | 4.050% | 12/3/42 | 3,031 | 2,639 | |
| Bank of America Corp. | 5.875% | 2/7/42 | 5,270 | 6,037 | |
| Bank of America NA | 6.000% | 10/15/36 | 3,600 | 4,052 | |
| Bank of New York Mellon Corp. | 3.950% | 11/18/25 | 1,125 | 1,109 | |
| Bank One Capital III | 8.750% | 9/1/30 | 725 | 926 | |
| Bank One Corp. | 7.625% | 10/15/26 | 4,975 | 6,117 | |
| Bank One Corp. | 8.000% | 4/29/27 | 185 | 234 | |
| 3,4 | Citicorp Lease Pass-Through Trust 1999-1 | 8.040% | 12/15/19 | 450 | 532 |
| Citigroup Inc. | 5.500% | 9/13/25 | 3,900 | 4,099 | |
| Citigroup Inc. | 6.625% | 1/15/28 | 125 | 144 | |
| Citigroup Inc. | 6.625% | 6/15/32 | 3,350 | 3,736 | |
| Citigroup Inc. | 5.875% | 2/22/33 | 2,900 | 2,974 | |
| Citigroup Inc. | 6.000% | 10/31/33 | 2,025 | 2,128 | |
| Citigroup Inc. | 5.850% | 12/11/34 | 1,636 | 1,765 | |
| Citigroup Inc. | 6.125% | 8/25/36 | 5,815 | 6,185 | |
| Citigroup Inc. | 5.875% | 5/29/37 | 1,950 | 2,148 | |
| Citigroup Inc. | 6.875% | 3/5/38 | 3,540 | 4,393 | |
| Citigroup Inc. | 8.125% | 7/15/39 | 6,695 | 9,356 | |
| Citigroup Inc. | 5.875% | 1/30/42 | 2,915 | 3,239 | |
| Citigroup Inc. | 6.675% | 9/13/43 | 3,350 | 3,823 | |
| Citigroup Inc. | 4.950% | 11/7/43 | 1,500 | 1,487 | |
| Cooperatieve Centrale Raiffeisen-Boerenleenbank BA | 5.250% | 5/24/41 | 3,025 | 3,085 | |
| Cooperatieve Centrale Raiffeisen-Boerenleenbank BA | 5.750% | 12/1/43 | 4,375 | 4,618 | |
| Credit Suisse USA Inc. | 7.125% | 7/15/32 | 2,200 | 2,863 | |
| Fifth Third Bancorp | 4.300% | 1/16/24 | 975 | 952 | |
| Fifth Third Bancorp | 8.250% | 3/1/38 | 2,945 | 3,874 | |
| Goldman Sachs Capital I | 6.345% | 2/15/34 | 7,750 | 7,812 | |
| Goldman Sachs Group Inc. | 5.950% | 1/15/27 | 2,800 | 2,962 | |
| Goldman Sachs Group Inc. | 6.125% | 2/15/33 | 7,700 | 8,632 | |
| Goldman Sachs Group Inc. | 6.450% | 5/1/36 | 4,200 | 4,444 | |
| Goldman Sachs Group Inc. | 6.750% | 10/1/37 | 15,690 | 17,307 | |
| Goldman Sachs Group Inc. | 6.250% | 2/1/41 | 6,700 | 7,690 | |
| HSBC Bank USA NA | 5.875% | 11/1/34 | 4,090 | 4,436 | |
| HSBC Bank USA NA | 5.625% | 8/15/35 | 3,425 | 3,601 | |
| HSBC Bank USA NA | 7.000% | 1/15/39 | 1,325 | 1,654 | |
| HSBC Holdings plc | 7.625% | 5/17/32 | 1,050 | 1,309 | |
| HSBC Holdings plc | 7.350% | 11/27/32 | 200 | 244 | |
| HSBC Holdings plc | 6.500% | 5/2/36 | 5,925 | 7,001 | |
| HSBC Holdings plc | 6.500% | 9/15/37 | 6,750 | 7,943 | |
| HSBC Holdings plc | 6.800% | 6/1/38 | 4,240 | 5,189 | |
| HSBC Holdings plc | 6.100% | 1/14/42 | 2,350 | 2,789 | |
| JPMorgan Chase & Co. | 6.400% | 5/15/38 | 6,600 | 7,867 | |
| JPMorgan Chase & Co. | 5.500% | 10/15/40 | 4,275 | 4,625 | |
| JPMorgan Chase & Co. | 5.600% | 7/15/41 | 4,175 | 4,531 | |
| JPMorgan Chase & Co. | 5.400% | 1/6/42 | 4,130 | 4,401 | |
58
| Vanguard® Long-Term Bond Index Fund | ||||
| Schedule of Investments | ||||
| December 31, 2013 | ||||
| Face | Market | |||
| Maturity | Amount | Value | ||
| Coupon | Date | ($000) | ($000) | |
| JPMorgan Chase & Co. | 5.625% | 8/16/43 | 3,550 | 3,741 |
| KeyBank NA | 6.950% | 2/1/28 | 868 | 1,025 |
| Merrill Lynch & Co. Inc. | 6.110% | 1/29/37 | 5,825 | 6,204 |
| Merrill Lynch & Co. Inc. | 7.750% | 5/14/38 | 6,175 | 7,894 |
| Morgan Stanley | 5.000% | 11/24/25 | 5,625 | 5,635 |
| Morgan Stanley | 6.250% | 8/9/26 | 2,075 | 2,387 |
| Morgan Stanley | 7.250% | 4/1/32 | 2,875 | 3,574 |
| Morgan Stanley | 6.375% | 7/24/42 | 5,775 | 6,708 |
| Northern Trust Corp. | 3.950% | 10/30/25 | 2,100 | 2,027 |
| PNC Bank NA | 4.200% | 11/1/25 | 1,225 | 1,194 |
| UBS AG | 7.750% | 9/1/26 | 1,500 | 1,836 |
| Wachovia Bank NA | 5.850% | 2/1/37 | 3,875 | 4,378 |
| Wachovia Bank NA | 6.600% | 1/15/38 | 7,375 | 9,045 |
| Wachovia Corp. | 6.605% | 10/1/25 | 1,725 | 1,962 |
| Wachovia Corp. | 7.574% | 8/1/26 | 125 | 153 |
| Wachovia Corp. | 7.500% | 4/15/35 | 1,350 | 1,652 |
| Wachovia Corp. | 5.500% | 8/1/35 | 1,510 | 1,554 |
| Wachovia Corp. | 6.550% | 10/15/35 | 125 | 140 |
| Wells Fargo & Co. | 5.375% | 2/7/35 | 2,450 | 2,627 |
| Wells Fargo & Co. | 5.375% | 11/2/43 | 5,450 | 5,540 |
| Wells Fargo Bank NA | 5.950% | 8/26/36 | 3,155 | 3,547 |
| 3 Wells Fargo Capital X | 5.950% | 12/1/86 | 2,525 | 2,468 |
| Brokerage (0.1%) | ||||
| Invesco Finance plc | 4.000% | 1/30/24 | 2,000 | 1,987 |
| Invesco Finance plc | 5.375% | 11/30/43 | 1,600 | 1,600 |
| Jefferies Group LLC | 6.450% | 6/8/27 | 900 | 930 |
| Jefferies Group LLC | 6.250% | 1/15/36 | 1,150 | 1,107 |
| Jefferies Group LLC | 6.500% | 1/20/43 | 1,575 | 1,556 |
| Leucadia National Corp. | 6.625% | 10/23/43 | 825 | 804 |
| Finance Companies (1.1%) | ||||
| General Electric Capital Corp. | 6.750% | 3/15/32 | 16,330 | 20,154 |
| General Electric Capital Corp. | 6.150% | 8/7/37 | 6,930 | 7,991 |
| General Electric Capital Corp. | 5.875% | 1/14/38 | 19,425 | 21,951 |
| General Electric Capital Corp. | 6.875% | 1/10/39 | 9,100 | 11,653 |
| Insurance (3.3%) | ||||
| ACE Capital Trust II | 9.700% | 4/1/30 | 850 | 1,211 |
| ACE INA Holdings Inc. | 6.700% | 5/15/36 | 1,000 | 1,247 |
| ACE INA Holdings Inc. | 4.150% | 3/13/43 | 1,350 | 1,214 |
| Aetna Inc. | 6.625% | 6/15/36 | 2,700 | 3,200 |
| Aetna Inc. | 6.750% | 12/15/37 | 1,325 | 1,603 |
| Aetna Inc. | 4.500% | 5/15/42 | 1,450 | 1,340 |
| Aetna Inc. | 4.125% | 11/15/42 | 1,075 | 936 |
| Aflac Inc. | 6.900% | 12/17/39 | 1,125 | 1,375 |
| Aflac Inc. | 6.450% | 8/15/40 | 1,285 | 1,500 |
| AIG Life Holdings Inc. | 8.500% | 7/1/30 | 250 | 313 |
| Allstate Corp. | 5.350% | 6/1/33 | 1,950 | 2,066 |
| Allstate Corp. | 5.550% | 5/9/35 | 1,300 | 1,416 |
| Allstate Corp. | 5.950% | 4/1/36 | 550 | 626 |
| Allstate Corp. | 4.500% | 6/15/43 | 1,125 | 1,060 |
| 3 Allstate Corp. | 6.500% | 5/15/67 | 1,000 | 1,044 |
| American International Group Inc. | 4.125% | 2/15/24 | 4,125 | 4,096 |
| American International Group Inc. | 6.250% | 5/1/36 | 1,425 | 1,641 |
| American International Group Inc. | 6.820% | 11/15/37 | 826 | 998 |
| 3 American International Group Inc. | 8.175% | 5/15/68 | 10,575 | 12,690 |
| 3 American International Group Inc. | 6.250% | 3/15/87 | 2,975 | 2,971 |
| Aon Corp. | 8.205% | 1/1/27 | 250 | 300 |
| Aon Corp. | 6.250% | 9/30/40 | 1,600 | 1,810 |
| Aon plc | 4.250% | 12/12/42 | 575 | 490 |
| Aon plc | 4.450% | 5/24/43 | 1,325 | 1,172 |
| Arch Capital Group Ltd. | 7.350% | 5/1/34 | 625 | 784 |
| Arch Capital Group US Inc. | 5.144% | 11/1/43 | 1,550 | 1,543 |
| Assurant Inc. | 6.750% | 2/15/34 | 1,200 | 1,279 |
| AXA SA | 8.600% | 12/15/30 | 4,275 | 5,232 |
59
| Vanguard® Long-Term Bond Index Fund | ||||
| Schedule of Investments | ||||
| December 31, 2013 | ||||
| Face | Market | |||
| Maturity | Amount | Value | ||
| Coupon | Date | ($000) | ($000) | |
| Berkshire Hathaway Finance Corp. | 5.750% | 1/15/40 | 2,875 | 3,154 |
| Berkshire Hathaway Finance Corp. | 4.400% | 5/15/42 | 1,775 | 1,603 |
| Berkshire Hathaway Finance Corp. | 4.300% | 5/15/43 | 1,650 | 1,470 |
| Berkshire Hathaway Inc. | 4.500% | 2/11/43 | 2,125 | 1,965 |
| Chubb Corp. | 6.000% | 5/11/37 | 2,600 | 3,005 |
| Chubb Corp. | 6.500% | 5/15/38 | 1,375 | 1,680 |
| Cigna Corp. | 7.875% | 5/15/27 | 500 | 621 |
| Cigna Corp. | 6.150% | 11/15/36 | 525 | 590 |
| Cigna Corp. | 5.875% | 3/15/41 | 1,785 | 1,961 |
| Cigna Corp. | 5.375% | 2/15/42 | 2,445 | 2,558 |
| Cincinnati Financial Corp. | 6.920% | 5/15/28 | 1,200 | 1,387 |
| Cincinnati Financial Corp. | 6.125% | 11/1/34 | 1,350 | 1,407 |
| Endurance Specialty Holdings Ltd. | 7.000% | 7/15/34 | 1,425 | 1,539 |
| Genworth Holdings Inc. | 4.800% | 2/15/24 | 1,600 | 1,577 |
| Genworth Holdings Inc. | 6.500% | 6/15/34 | 825 | 881 |
| Hartford Financial Services Group Inc. | 5.950% | 10/15/36 | 875 | 963 |
| Hartford Financial Services Group Inc. | 6.625% | 3/30/40 | 486 | 583 |
| Hartford Financial Services Group Inc. | 6.100% | 10/1/41 | 2,100 | 2,368 |
| Hartford Financial Services Group Inc. | 4.300% | 4/15/43 | 400 | 349 |
| Humana Inc. | 8.150% | 6/15/38 | 725 | 955 |
| Humana Inc. | 4.625% | 12/1/42 | 1,300 | 1,158 |
| ING US Inc. | 5.700% | 7/15/43 | 750 | 780 |
| Lincoln National Corp. | 6.150% | 4/7/36 | 2,825 | 3,167 |
| Lincoln National Corp. | 7.000% | 6/15/40 | 1,350 | 1,687 |
| Loews Corp. | 6.000% | 2/1/35 | 800 | 879 |
| Loews Corp. | 4.125% | 5/15/43 | 1,600 | 1,359 |
| Markel Corp. | 5.000% | 3/30/43 | 1,100 | 1,017 |
| Marsh & McLennan Cos. Inc. | 5.875% | 8/1/33 | 875 | 928 |
| MetLife Inc. | 6.500% | 12/15/32 | 1,050 | 1,252 |
| MetLife Inc. | 6.375% | 6/15/34 | 1,150 | 1,355 |
| MetLife Inc. | 5.700% | 6/15/35 | 1,775 | 1,931 |
| MetLife Inc. | 5.875% | 2/6/41 | 5,400 | 5,990 |
| MetLife Inc. | 4.125% | 8/13/42 | 2,075 | 1,793 |
| MetLife Inc. | 4.875% | 11/13/43 | 1,400 | 1,357 |
| 3 MetLife Inc. | 6.400% | 12/15/66 | 3,415 | 3,522 |
| 3 MetLife Inc. | 10.750% | 8/1/69 | 1,340 | 1,981 |
| Munich Re America Corp. | 7.450% | 12/15/26 | 1,000 | 1,233 |
| 3 Nationwide Financial Services Inc. | 6.750% | 5/15/67 | 1,000 | 984 |
| Principal Financial Group Inc. | 6.050% | 10/15/36 | 2,225 | 2,510 |
| Principal Financial Group Inc. | 4.625% | 9/15/42 | 375 | 347 |
| Principal Financial Group Inc. | 4.350% | 5/15/43 | 800 | 715 |
| Progressive Corp. | 6.625% | 3/1/29 | 2,200 | 2,591 |
| Protective Life Corp. | 8.450% | 10/15/39 | 900 | 1,136 |
| Prudential Financial Inc. | 5.750% | 7/15/33 | 150 | 161 |
| Prudential Financial Inc. | 5.400% | 6/13/35 | 1,820 | 1,868 |
| Prudential Financial Inc. | 5.900% | 3/17/36 | 1,350 | 1,469 |
| Prudential Financial Inc. | 5.700% | 12/14/36 | 5,100 | 5,450 |
| Prudential Financial Inc. | 6.625% | 12/1/37 | 1,375 | 1,642 |
| Prudential Financial Inc. | 6.625% | 6/21/40 | 600 | 722 |
| Prudential Financial Inc. | 6.200% | 11/15/40 | 1,350 | 1,541 |
| Prudential Financial Inc. | 5.625% | 5/12/41 | 125 | 133 |
| Prudential Financial Inc. | 5.100% | 8/15/43 | 650 | 648 |
| 3 Prudential Financial Inc. | 5.200% | 3/15/44 | 1,100 | 1,061 |
| Swiss Re Solutions Holding Corp. | 7.000% | 2/15/26 | 1,115 | 1,323 |
| Transatlantic Holdings Inc. | 8.000% | 11/30/39 | 800 | 985 |
| Travelers Cos. Inc. | 6.750% | 6/20/36 | 1,000 | 1,248 |
| Travelers Cos. Inc. | 6.250% | 6/15/37 | 2,175 | 2,580 |
| Travelers Cos. Inc. | 5.350% | 11/1/40 | 2,125 | 2,289 |
| Travelers Cos. Inc. | 4.600% | 8/1/43 | 1,975 | 1,927 |
| Travelers Property Casualty Corp. | 6.375% | 3/15/33 | 1,250 | 1,500 |
| Trinity Acquisition plc | 6.125% | 8/15/43 | 900 | 900 |
| UnitedHealth Group Inc. | 5.800% | 3/15/36 | 1,635 | 1,792 |
| UnitedHealth Group Inc. | 6.500% | 6/15/37 | 890 | 1,056 |
| UnitedHealth Group Inc. | 6.625% | 11/15/37 | 1,575 | 1,898 |
60
| Vanguard® Long-Term Bond Index Fund | ||||
| Schedule of Investments | ||||
| December 31, 2013 | ||||
| Face | Market | |||
| Maturity | Amount | Value | ||
| Coupon | Date | ($000) | ($000) | |
| UnitedHealth Group Inc. | 6.875% | 2/15/38 | 3,860 | 4,765 |
| UnitedHealth Group Inc. | 5.950% | 2/15/41 | 1,500 | 1,683 |
| UnitedHealth Group Inc. | 4.625% | 11/15/41 | 1,700 | 1,589 |
| UnitedHealth Group Inc. | 4.375% | 3/15/42 | 1,500 | 1,377 |
| UnitedHealth Group Inc. | 3.950% | 10/15/42 | 1,500 | 1,272 |
| UnitedHealth Group Inc. | 4.250% | 3/15/43 | 2,800 | 2,521 |
| Unum Group | 5.750% | 8/15/42 | 650 | 670 |
| Validus Holdings Ltd. | 8.875% | 1/26/40 | 940 | 1,198 |
| WellPoint Inc. | 5.950% | 12/15/34 | 441 | 473 |
| WellPoint Inc. | 5.850% | 1/15/36 | 2,575 | 2,767 |
| WellPoint Inc. | 6.375% | 6/15/37 | 1,220 | 1,382 |
| WellPoint Inc. | 4.625% | 5/15/42 | 3,300 | 3,036 |
| WellPoint Inc. | 4.650% | 1/15/43 | 2,325 | 2,143 |
| WellPoint Inc. | 5.100% | 1/15/44 | 1,725 | 1,706 |
| XL Group plc | 6.375% | 11/15/24 | 1,150 | 1,314 |
| XL Group plc | 6.250% | 5/15/27 | 825 | 913 |
| XLIT Ltd. | 5.250% | 12/15/43 | 650 | 656 |
| Other Finance (0.0%) | ||||
| CME Group Inc. | 5.300% | 9/15/43 | 1,850 | 1,919 |
| Real Estate Investment Trusts (0.3%) | ||||
| Boston Properties LP | 3.800% | 2/1/24 | 1,625 | 1,555 |
| Camden Property Trust | 4.250% | 1/15/24 | 700 | 690 |
| HCP Inc. | 6.750% | 2/1/41 | 1,600 | 1,897 |
| Health Care REIT Inc. | 4.500% | 1/15/24 | 475 | 469 |
| Health Care REIT Inc. | 6.500% | 3/15/41 | 900 | 981 |
| Health Care REIT Inc. | 5.125% | 3/15/43 | 1,400 | 1,284 |
| Liberty Property LP | 4.400% | 2/15/24 | 1,125 | 1,103 |
| Omega Healthcare Investors Inc. | 5.875% | 3/15/24 | 1,200 | 1,212 |
| Realty Income Corp. | 5.875% | 3/15/35 | 920 | 939 |
| Simon Property Group LP | 6.750% | 2/1/40 | 1,350 | 1,684 |
| Simon Property Group LP | 4.750% | 3/15/42 | 2,100 | 2,032 |
| Ventas Realty LP | 5.700% | 9/30/43 | 750 | 764 |
| Weingarten Realty Investors | 4.450% | 1/15/24 | 675 | 664 |
| 536,272 | ||||
| Industrial (31.3%) | ||||
| Basic Industry (3.0%) | ||||
| Agrium Inc. | 6.125% | 1/15/41 | 1,850 | 1,973 |
| Agrium Inc. | 4.900% | 6/1/43 | 2,325 | 2,138 |
| Alcoa Inc. | 5.900% | 2/1/27 | 1,395 | 1,372 |
| Alcoa Inc. | 6.750% | 1/15/28 | 1,185 | 1,236 |
| Alcoa Inc. | 5.950% | 2/1/37 | 1,025 | 943 |
| Barrick Gold Corp. | 5.250% | 4/1/42 | 1,775 | 1,455 |
| Barrick North America Finance LLC | 7.500% | 9/15/38 | 1,050 | 1,053 |
| Barrick North America Finance LLC | 5.700% | 5/30/41 | 2,400 | 2,052 |
| Barrick North America Finance LLC | 5.750% | 5/1/43 | 2,775 | 2,496 |
| Barrick PD Australia Finance Pty Ltd. | 5.950% | 10/15/39 | 2,320 | 2,000 |
| BHP Billiton Finance USA Ltd. | 6.420% | 3/1/26 | 500 | 583 |
| BHP Billiton Finance USA Ltd. | 4.125% | 2/24/42 | 2,860 | 2,518 |
| BHP Billiton Finance USA Ltd. | 5.000% | 9/30/43 | 7,600 | 7,677 |
| CF Industries Inc. | 4.950% | 6/1/43 | 2,475 | 2,236 |
| Cliffs Natural Resources Inc. | 6.250% | 10/1/40 | 1,375 | 1,165 |
| Domtar Corp. | 6.250% | 9/1/42 | 1,375 | 1,316 |
| Dow Chemical Co. | 7.375% | 11/1/29 | 2,300 | 2,950 |
| Dow Chemical Co. | 9.400% | 5/15/39 | 1,950 | 2,910 |
| Dow Chemical Co. | 5.250% | 11/15/41 | 2,675 | 2,681 |
| Dow Chemical Co. | 4.375% | 11/15/42 | 3,700 | 3,244 |
| Eastman Chemical Co. | 4.800% | 9/1/42 | 2,425 | 2,283 |
| Ecolab Inc. | 5.500% | 12/8/41 | 2,440 | 2,613 |
| EI du Pont de Nemours & Co. | 6.500% | 1/15/28 | 775 | 938 |
| EI du Pont de Nemours & Co. | 5.600% | 12/15/36 | 625 | 671 |
| EI du Pont de Nemours & Co. | 4.900% | 1/15/41 | 2,575 | 2,528 |
| EI du Pont de Nemours & Co. | 4.150% | 2/15/43 | 2,075 | 1,831 |
61
| Vanguard® Long-Term Bond Index Fund | ||||
| Schedule of Investments | ||||
| December 31, 2013 | ||||
| Face | Market | |||
| Maturity | Amount | Value | ||
| Coupon | Date | ($000) | ($000) | |
| FMC Corp. | 4.100% | 2/1/24 | 1,150 | 1,144 |
| Freeport-McMoRan Copper & Gold Inc. | 5.450% | 3/15/43 | 6,505 | 6,200 |
| 4 Georgia-Pacific LLC | 5.400% | 11/1/20 | 1,500 | 1,669 |
| Georgia-Pacific LLC | 7.375% | 12/1/25 | 775 | 954 |
| Georgia-Pacific LLC | 7.250% | 6/1/28 | 1,200 | 1,454 |
| Georgia-Pacific LLC | 8.875% | 5/15/31 | 1,500 | 2,079 |
| International Paper Co. | 8.700% | 6/15/38 | 795 | 1,098 |
| International Paper Co. | 7.300% | 11/15/39 | 1,890 | 2,328 |
| International Paper Co. | 6.000% | 11/15/41 | 2,250 | 2,432 |
| Kinross Gold Corp. | 6.875% | 9/1/41 | 695 | 620 |
| Lubrizol Corp. | 6.500% | 10/1/34 | 925 | 1,121 |
| LYB International Finance BV | 5.250% | 7/15/43 | 1,200 | 1,196 |
| LyondellBasell Industries NV | 5.750% | 4/15/24 | 3,875 | 4,327 |
| Monsanto Co. | 5.500% | 8/15/25 | 1,350 | 1,518 |
| Monsanto Co. | 5.875% | 4/15/38 | 1,350 | 1,552 |
| Monsanto Co. | 3.600% | 7/15/42 | 425 | 348 |
| Mosaic Co. | 5.450% | 11/15/33 | 1,100 | 1,121 |
| Mosaic Co. | 4.875% | 11/15/41 | 830 | 748 |
| Mosaic Co. | 5.625% | 11/15/43 | 1,000 | 1,009 |
| Newmont Mining Corp. | 5.875% | 4/1/35 | 1,210 | 1,022 |
| Newmont Mining Corp. | 6.250% | 10/1/39 | 2,485 | 2,190 |
| Newmont Mining Corp. | 4.875% | 3/15/42 | 2,725 | 2,013 |
| Nucor Corp. | 6.400% | 12/1/37 | 2,350 | 2,608 |
| Nucor Corp. | 5.200% | 8/1/43 | 1,100 | 1,072 |
| Placer Dome Inc. | 6.450% | 10/15/35 | 700 | 648 |
| Potash Corp. of Saskatchewan Inc. | 5.875% | 12/1/36 | 1,465 | 1,571 |
| Potash Corp. of Saskatchewan Inc. | 5.625% | 12/1/40 | 2,600 | 2,746 |
| PPG Industries Inc. | 7.700% | 3/15/38 | 650 | 843 |
| PPG Industries Inc. | 5.500% | 11/15/40 | 275 | 287 |
| Praxair Inc. | 3.550% | 11/7/42 | 950 | 766 |
| Reliance Steel & Aluminum Co. | 6.850% | 11/15/36 | 350 | 348 |
| Rio Tinto Alcan Inc. | 5.750% | 6/1/35 | 4,350 | 4,528 |
| Rio Tinto Finance USA Ltd. | 7.125% | 7/15/28 | 3,175 | 3,910 |
| Rio Tinto Finance USA Ltd. | 5.200% | 11/2/40 | 2,175 | 2,231 |
| Rio Tinto Finance USA plc | 4.750% | 3/22/42 | 1,250 | 1,208 |
| Rio Tinto Finance USA plc | 4.125% | 8/21/42 | 4,150 | 3,615 |
| Rohm & Haas Co. | 7.850% | 7/15/29 | 2,500 | 3,304 |
| Southern Copper Corp. | 7.500% | 7/27/35 | 3,850 | 3,988 |
| Southern Copper Corp. | 6.750% | 4/16/40 | 2,510 | 2,414 |
| Southern Copper Corp. | 5.250% | 11/8/42 | 3,050 | 2,464 |
| Syngenta Finance NV | 4.375% | 3/28/42 | 650 | 600 |
| Teck Resources Ltd. | 6.125% | 10/1/35 | 1,500 | 1,448 |
| Teck Resources Ltd. | 6.000% | 8/15/40 | 2,275 | 2,175 |
| Teck Resources Ltd. | 6.250% | 7/15/41 | 2,550 | 2,525 |
| Teck Resources Ltd. | 5.200% | 3/1/42 | 2,595 | 2,275 |
| Teck Resources Ltd. | 5.400% | 2/1/43 | 525 | 479 |
| Vale Canada Ltd. | 7.200% | 9/15/32 | 1,050 | 1,063 |
| Vale Overseas Ltd. | 8.250% | 1/17/34 | 1,225 | 1,404 |
| Vale Overseas Ltd. | 6.875% | 11/21/36 | 9,255 | 9,485 |
| Vale Overseas Ltd. | 6.875% | 11/10/39 | 6,255 | 6,419 |
| Vale SA | 5.625% | 9/11/42 | 3,575 | 3,202 |
| Westvaco Corp. | 7.950% | 2/15/31 | 1,875 | 2,169 |
| Weyerhaeuser Co. | 8.500% | 1/15/25 | 875 | 1,119 |
| Weyerhaeuser Co. | 7.375% | 3/15/32 | 4,050 | 4,967 |
| Weyerhaeuser Co. | 6.875% | 12/15/33 | 800 | 943 |
| Capital Goods (2.2%) | ||||
| 3M Co. | 6.375% | 2/15/28 | 500 | 608 |
| 3M Co. | 5.700% | 3/15/37 | 1,150 | 1,321 |
| ABB Finance USA Inc. | 4.375% | 5/8/42 | 1,525 | 1,391 |
| Boeing Co. | 7.950% | 8/15/24 | 875 | 1,171 |
| Boeing Co. | 6.125% | 2/15/33 | 925 | 1,100 |
| Boeing Co. | 6.625% | 2/15/38 | 1,050 | 1,337 |
| Boeing Co. | 6.875% | 3/15/39 | 2,375 | 3,131 |
62
| Vanguard® Long-Term Bond Index Fund | ||||
| Schedule of Investments | ||||
| December 31, 2013 | ||||
| Face | Market | |||
| Maturity | Amount | Value | ||
| Coupon | Date | ($000) | ($000) | |
| Boeing Co. | 5.875% | 2/15/40 | 1,275 | 1,509 |
| Caterpillar Inc. | 5.300% | 9/15/35 | 600 | 630 |
| Caterpillar Inc. | 6.050% | 8/15/36 | 2,725 | 3,112 |
| Caterpillar Inc. | 5.200% | 5/27/41 | 1,200 | 1,249 |
| Caterpillar Inc. | 3.803% | 8/15/42 | 4,741 | 3,975 |
| Deere & Co. | 5.375% | 10/16/29 | 1,975 | 2,206 |
| Deere & Co. | 8.100% | 5/15/30 | 1,000 | 1,380 |
| Deere & Co. | 7.125% | 3/3/31 | 200 | 255 |
| Deere & Co. | 3.900% | 6/9/42 | 3,400 | 2,969 |
| Dover Corp. | 5.375% | 10/15/35 | 825 | 881 |
| Dover Corp. | 6.600% | 3/15/38 | 725 | 883 |
| Dover Corp. | 5.375% | 3/1/41 | 900 | 962 |
| Eaton Corp. | 4.000% | 11/2/32 | 2,020 | 1,841 |
| Eaton Corp. | 4.150% | 11/2/42 | 2,750 | 2,443 |
| Emerson Electric Co. | 6.000% | 8/15/32 | 1,650 | 1,862 |
| Emerson Electric Co. | 6.125% | 4/15/39 | 825 | 973 |
| Emerson Electric Co. | 5.250% | 11/15/39 | 175 | 184 |
| General Dynamics Corp. | 3.600% | 11/15/42 | 1,900 | 1,555 |
| General Electric Co. | 4.125% | 10/9/42 | 6,400 | 5,866 |
| Honeywell International Inc. | 5.700% | 3/15/36 | 2,500 | 2,804 |
| Honeywell International Inc. | 5.700% | 3/15/37 | 1,525 | 1,703 |
| Honeywell International Inc. | 5.375% | 3/1/41 | 1,920 | 2,098 |
| Illinois Tool Works Inc. | 4.875% | 9/15/41 | 2,100 | 2,066 |
| Illinois Tool Works Inc. | 3.900% | 9/1/42 | 2,750 | 2,342 |
| 4 Ingersoll-Rand Global Holding Co. Ltd. | 5.750% | 6/15/43 | 1,200 | 1,211 |
| Legrand France SA | 8.500% | 2/15/25 | 825 | 1,062 |
| Lockheed Martin Corp. | 6.150% | 9/1/36 | 5,135 | 5,814 |
| Lockheed Martin Corp. | 5.500% | 11/15/39 | 1,350 | 1,420 |
| Lockheed Martin Corp. | 5.720% | 6/1/40 | 2,189 | 2,343 |
| Lockheed Martin Corp. | 4.850% | 9/15/41 | 425 | 418 |
| Lockheed Martin Corp. | 4.070% | 12/15/42 | 1,925 | 1,675 |
| Northrop Grumman Corp. | 5.050% | 11/15/40 | 1,800 | 1,750 |
| Northrop Grumman Corp. | 4.750% | 6/1/43 | 2,650 | 2,508 |
| Northrop Grumman Systems Corp. | 7.750% | 2/15/31 | 1,315 | 1,672 |
| Owens Corning | 7.000% | 12/1/36 | 1,450 | 1,557 |
| Parker Hannifin Corp. | 6.250% | 5/15/38 | 995 | 1,184 |
| Precision Castparts Corp. | 3.900% | 1/15/43 | 1,275 | 1,108 |
| Raytheon Co. | 7.200% | 8/15/27 | 400 | 489 |
| Raytheon Co. | 4.875% | 10/15/40 | 1,300 | 1,289 |
| Raytheon Co. | 4.700% | 12/15/41 | 1,975 | 1,908 |
| Republic Services Inc. | 6.200% | 3/1/40 | 1,860 | 2,138 |
| Republic Services Inc. | 5.700% | 5/15/41 | 2,250 | 2,398 |
| Rockwell Automation Inc. | 6.700% | 1/15/28 | 300 | 364 |
| Rockwell Automation Inc. | 6.250% | 12/1/37 | 800 | 929 |
| Sonoco Products Co. | 5.750% | 11/1/40 | 1,950 | 2,062 |
| Stanley Black & Decker Inc. | 5.200% | 9/1/40 | 1,200 | 1,194 |
| United Technologies Corp. | 6.700% | 8/1/28 | 1,175 | 1,440 |
| United Technologies Corp. | 7.500% | 9/15/29 | 1,875 | 2,472 |
| United Technologies Corp. | 5.400% | 5/1/35 | 1,775 | 1,989 |
| United Technologies Corp. | 6.050% | 6/1/36 | 2,275 | 2,654 |
| United Technologies Corp. | 6.125% | 7/15/38 | 2,275 | 2,709 |
| United Technologies Corp. | 5.700% | 4/15/40 | 3,335 | 3,816 |
| United Technologies Corp. | 4.500% | 6/1/42 | 10,200 | 9,860 |
| Waste Management Inc. | 7.100% | 8/1/26 | 1,745 | 2,119 |
| Waste Management Inc. | 7.000% | 7/15/28 | 1,395 | 1,692 |
| Waste Management Inc. | 7.750% | 5/15/32 | 1,375 | 1,786 |
| Waste Management Inc. | 6.125% | 11/30/39 | 1,695 | 1,931 |
| Communication (7.6%) | ||||
| 21st Century Fox America Inc. | 6.550% | 3/15/33 | 225 | 258 |
| 21st Century Fox America Inc. | 6.200% | 12/15/34 | 5,990 | 6,672 |
| 21st Century Fox America Inc. | 6.400% | 12/15/35 | 5,830 | 6,620 |
| 21st Century Fox America Inc. | 8.150% | 10/17/36 | 1,225 | 1,554 |
| 21st Century Fox America Inc. | 6.150% | 3/1/37 | 2,580 | 2,832 |
63
| Vanguard® Long-Term Bond Index Fund | ||||
| Schedule of Investments | ||||
| December 31, 2013 | ||||
| Face | Market | |||
| Maturity | Amount | Value | ||
| Coupon | Date | ($000) | ($000) | |
| 21st Century Fox America Inc. | 6.650% | 11/15/37 | 1,750 | 2,030 |
| 21st Century Fox America Inc. | 7.850% | 3/1/39 | 825 | 1,049 |
| 21st Century Fox America Inc. | 6.900% | 8/15/39 | 2,700 | 3,231 |
| 21st Century Fox America Inc. | 6.150% | 2/15/41 | 1,725 | 1,923 |
| 4 21st Century Fox America Inc. | 5.400% | 10/1/43 | 500 | 512 |
| 21st Century Fox America Inc. | 7.750% | 12/1/45 | 1,395 | 1,751 |
| Alltel Corp. | 6.800% | 5/1/29 | 200 | 231 |
| Alltel Corp. | 7.875% | 7/1/32 | 2,625 | 3,429 |
| America Movil SAB de CV | 6.375% | 3/1/35 | 2,810 | 3,044 |
| America Movil SAB de CV | 6.125% | 11/15/37 | 875 | 924 |
| America Movil SAB de CV | 6.125% | 3/30/40 | 5,670 | 6,109 |
| America Movil SAB de CV | 4.375% | 7/16/42 | 3,050 | 2,556 |
| American Tower Corp. | 5.000% | 2/15/24 | 2,500 | 2,526 |
| Ameritech Capital Funding Corp. | 6.550% | 1/15/28 | 1,000 | 1,079 |
| AT&T Corp. | 8.000% | 11/15/31 | 1,696 | 2,257 |
| AT&T Inc. | 6.450% | 6/15/34 | 4,335 | 4,851 |
| AT&T Inc. | 6.150% | 9/15/34 | 2,400 | 2,584 |
| AT&T Inc. | 6.500% | 9/1/37 | 2,560 | 2,906 |
| AT&T Inc. | 6.300% | 1/15/38 | 4,510 | 4,985 |
| AT&T Inc. | 6.400% | 5/15/38 | 1,775 | 1,982 |
| AT&T Inc. | 6.550% | 2/15/39 | 6,385 | 7,240 |
| AT&T Inc. | 5.350% | 9/1/40 | 9,381 | 9,309 |
| AT&T Inc. | 5.550% | 8/15/41 | 2,955 | 2,978 |
| AT&T Inc. | 4.300% | 12/15/42 | 4,725 | 4,021 |
| AT&T Inc. | 4.350% | 6/15/45 | 7,810 | 6,571 |
| AT&T Mobility LLC | 7.125% | 12/15/31 | 1,950 | 2,365 |
| Bellsouth Capital Funding Corp. | 7.875% | 2/15/30 | 2,118 | 2,480 |
| BellSouth Corp. | 6.875% | 10/15/31 | 1,202 | 1,329 |
| BellSouth Corp. | 6.550% | 6/15/34 | 915 | 977 |
| BellSouth Corp. | 6.000% | 11/15/34 | 529 | 532 |
| BellSouth Telecommunications LLC | 6.375% | 6/1/28 | 1,565 | 1,687 |
| BellSouth Telecommunications LLC | 0.000% | 12/15/95 | 585 | 536 |
| British Telecommunications plc | 9.625% | 12/15/30 | 7,775 | 11,590 |
| CBS Corp. | 7.875% | 7/30/30 | 4,815 | 6,003 |
| CBS Corp. | 5.500% | 5/15/33 | 225 | 222 |
| CBS Corp. | 5.900% | 10/15/40 | 600 | 617 |
| CBS Corp. | 4.850% | 7/1/42 | 1,575 | 1,421 |
| Comcast Corp. | 4.250% | 1/15/33 | 4,550 | 4,190 |
| Comcast Corp. | 7.050% | 3/15/33 | 700 | 854 |
| Comcast Corp. | 5.650% | 6/15/35 | 4,650 | 4,935 |
| Comcast Corp. | 6.500% | 11/15/35 | 5,715 | 6,642 |
| Comcast Corp. | 6.450% | 3/15/37 | 4,525 | 5,219 |
| Comcast Corp. | 6.950% | 8/15/37 | 5,335 | 6,559 |
| Comcast Corp. | 6.400% | 5/15/38 | 2,175 | 2,486 |
| Comcast Corp. | 6.400% | 3/1/40 | 1,625 | 1,878 |
| Comcast Corp. | 4.650% | 7/15/42 | 4,950 | 4,579 |
| Comcast Corp. | 4.500% | 1/15/43 | 2,325 | 2,097 |
| Deutsche Telekom International Finance BV | 8.750% | 6/15/30 | 9,900 | 14,064 |
| Deutsche Telekom International Finance BV | 9.250% | 6/1/32 | 1,055 | 1,561 |
| DIRECTV Holdings LLC / DIRECTV Financing Co. Inc. | 6.350% | 3/15/40 | 2,510 | 2,603 |
| DIRECTV Holdings LLC / DIRECTV Financing Co. Inc. | 6.000% | 8/15/40 | 3,300 | 3,263 |
| DIRECTV Holdings LLC / DIRECTV Financing Co. Inc. | 6.375% | 3/1/41 | 3,800 | 3,900 |
| DIRECTV Holdings LLC / DIRECTV Financing Co. Inc. | 5.150% | 3/15/42 | 2,900 | 2,594 |
| Discovery Communications LLC | 6.350% | 6/1/40 | 2,400 | 2,649 |
| Discovery Communications LLC | 4.950% | 5/15/42 | 1,425 | 1,322 |
| Discovery Communications LLC | 4.875% | 4/1/43 | 2,675 | 2,461 |
| Embarq Corp. | 7.995% | 6/1/36 | 4,870 | 4,900 |
| Grupo Televisa SAB | 6.625% | 3/18/25 | 1,600 | 1,774 |
| Grupo Televisa SAB | 8.500% | 3/11/32 | 250 | 311 |
| Grupo Televisa SAB | 6.625% | 1/15/40 | 2,035 | 2,157 |
| GTE Corp. | 6.940% | 4/15/28 | 2,675 | 3,027 |
| Koninklijke KPN NV | 8.375% | 10/1/30 | 2,825 | 3,571 |
| McGraw Hill Financial Inc. | 6.550% | 11/15/37 | 1,150 | 1,094 |
| Moody's Corp. | 4.875% | 2/15/24 | 1,400 | 1,398 |
64
| Vanguard® Long-Term Bond Index Fund | ||||
| Schedule of Investments | ||||
| December 31, 2013 | ||||
| Face | Market | |||
| Maturity | Amount | Value | ||
| Coupon | Date | ($000) | ($000) | |
| NBCUniversal Media LLC | 6.400% | 4/30/40 | 3,695 | 4,243 |
| NBCUniversal Media LLC | 5.950% | 4/1/41 | 3,100 | 3,396 |
| NBCUniversal Media LLC | 4.450% | 1/15/43 | 2,925 | 2,617 |
| New Cingular Wireless Services Inc. | 8.750% | 3/1/31 | 2,215 | 3,111 |
| Orange SA | 8.750% | 3/1/31 | 6,890 | 9,427 |
| Orange SA | 5.375% | 1/13/42 | 2,075 | 2,075 |
| Pacific Bell Telephone Co. | 7.125% | 3/15/26 | 1,847 | 2,217 |
| Qwest Corp. | 7.200% | 11/10/26 | 200 | 201 |
| Qwest Corp. | 6.875% | 9/15/33 | 4,450 | 4,255 |
| Qwest Corp. | 7.125% | 11/15/43 | 1,500 | 1,444 |
| Rogers Communications Inc. | 7.500% | 8/15/38 | 1,575 | 1,956 |
| Rogers Communications Inc. | 4.500% | 3/15/43 | 825 | 699 |
| Rogers Communications Inc. | 5.450% | 10/1/43 | 650 | 668 |
| TCI Communications Inc. | 7.875% | 2/15/26 | 1,200 | 1,553 |
| TCI Communications Inc. | 7.125% | 2/15/28 | 1,095 | 1,340 |
| Telefonica Emisiones SAU | 7.045% | 6/20/36 | 6,325 | 7,039 |
| Telefonica Europe BV | 8.250% | 9/15/30 | 3,100 | 3,663 |
| Thomson Reuters Corp. | 5.500% | 8/15/35 | 2,040 | 1,974 |
| Thomson Reuters Corp. | 5.850% | 4/15/40 | 1,625 | 1,652 |
| Thomson Reuters Corp. | 4.500% | 5/23/43 | 200 | 167 |
| Thomson Reuters Corp. | 5.650% | 11/23/43 | 1,525 | 1,520 |
| Time Warner Cable Inc. | 6.550% | 5/1/37 | 3,785 | 3,475 |
| Time Warner Cable Inc. | 7.300% | 7/1/38 | 3,025 | 2,990 |
| Time Warner Cable Inc. | 6.750% | 6/15/39 | 3,875 | 3,624 |
| Time Warner Cable Inc. | 5.875% | 11/15/40 | 4,300 | 3,683 |
| Time Warner Cable Inc. | 5.500% | 9/1/41 | 3,150 | 2,607 |
| Time Warner Cable Inc. | 4.500% | 9/15/42 | 4,325 | 3,209 |
| Time Warner Entertainment Co. LP | 8.375% | 7/15/33 | 2,825 | 3,048 |
| United States Cellular Corp. | 6.700% | 12/15/33 | 2,210 | 2,084 |
| Verizon Communications Inc. | 7.750% | 12/1/30 | 6,725 | 8,537 |
| Verizon Communications Inc. | 7.750% | 6/15/32 | 208 | 267 |
| Verizon Communications Inc. | 6.400% | 9/15/33 | 19,050 | 21,963 |
| Verizon Communications Inc. | 5.850% | 9/15/35 | 4,475 | 4,728 |
| Verizon Communications Inc. | 6.250% | 4/1/37 | 5,375 | 5,942 |
| Verizon Communications Inc. | 6.400% | 2/15/38 | 7,815 | 8,788 |
| Verizon Communications Inc. | 6.900% | 4/15/38 | 3,000 | 3,561 |
| Verizon Communications Inc. | 7.350% | 4/1/39 | 60 | 74 |
| Verizon Communications Inc. | 6.000% | 4/1/41 | 2,900 | 3,119 |
| Verizon Communications Inc. | 4.750% | 11/1/41 | 2,050 | 1,877 |
| Verizon Communications Inc. | 3.850% | 11/1/42 | 2,665 | 2,167 |
| Verizon Communications Inc. | 6.550% | 9/15/43 | 44,005 | 51,532 |
| Verizon Maryland LLC | 5.125% | 6/15/33 | 950 | 924 |
| Verizon New England Inc. | 7.875% | 11/15/29 | 490 | 571 |
| Verizon New York Inc. | 7.375% | 4/1/32 | 1,175 | 1,327 |
| Vodafone Group plc | 7.875% | 2/15/30 | 2,000 | 2,507 |
| Vodafone Group plc | 6.250% | 11/30/32 | 1,150 | 1,260 |
| Vodafone Group plc | 6.150% | 2/27/37 | 5,250 | 5,669 |
| Vodafone Group plc | 4.375% | 2/19/43 | 4,375 | 3,828 |
| WPP Finance 2010 | 5.125% | 9/7/42 | 875 | 792 |
| WPP Finance 2010 | 5.625% | 11/15/43 | 3,500 | 3,450 |
| Consumer Cyclical (4.1%) | ||||
| Cummins Inc. | 4.875% | 10/1/43 | 2,650 | 2,642 |
| CVS Caremark Corp. | 6.250% | 6/1/27 | 3,600 | 4,193 |
| CVS Caremark Corp. | 6.125% | 9/15/39 | 3,825 | 4,338 |
| CVS Caremark Corp. | 5.750% | 5/15/41 | 2,375 | 2,567 |
| CVS Caremark Corp. | 5.300% | 12/5/43 | 1,825 | 1,879 |
| Daimler Finance North America LLC | 8.500% | 1/18/31 | 4,240 | 6,131 |
| eBay Inc. | 4.000% | 7/15/42 | 2,450 | 2,072 |
| Ford Holdings LLC | 9.300% | 3/1/30 | 1,925 | 2,602 |
| Ford Motor Co. | 6.625% | 10/1/28 | 1,625 | 1,832 |
| Ford Motor Co. | 6.375% | 2/1/29 | 1,025 | 1,124 |
| Ford Motor Co. | 7.450% | 7/16/31 | 5,650 | 6,912 |
| Ford Motor Co. | 4.750% | 1/15/43 | 5,525 | 4,961 |
65
| Vanguard® Long-Term Bond Index Fund | ||||
| Schedule of Investments | ||||
| December 31, 2013 | ||||
| Face | Market | |||
| Maturity | Amount | Value | ||
| Coupon | Date | ($000) | ($000) | |
| Ford Motor Co. | 7.400% | 11/1/46 | 1,125 | 1,353 |
| Historic TW Inc. | 6.625% | 5/15/29 | 5,375 | 6,151 |
| Home Depot Inc. | 3.750% | 2/15/24 | 2,150 | 2,134 |
| Home Depot Inc. | 5.875% | 12/16/36 | 8,300 | 9,540 |
| Home Depot Inc. | 5.400% | 9/15/40 | 1,625 | 1,737 |
| Home Depot Inc. | 5.950% | 4/1/41 | 3,275 | 3,770 |
| Home Depot Inc. | 4.200% | 4/1/43 | 2,875 | 2,599 |
| Home Depot Inc. | 4.875% | 2/15/44 | 2,200 | 2,228 |
| Johnson Controls Inc. | 6.000% | 1/15/36 | 675 | 720 |
| Johnson Controls Inc. | 5.700% | 3/1/41 | 1,100 | 1,143 |
| Johnson Controls Inc. | 5.250% | 12/1/41 | 635 | 616 |
| Kohl's Corp. | 6.000% | 1/15/33 | 400 | 402 |
| Kohl's Corp. | 6.875% | 12/15/37 | 1,795 | 1,992 |
| Lowe's Cos. Inc. | 6.875% | 2/15/28 | 550 | 674 |
| Lowe's Cos. Inc. | 6.500% | 3/15/29 | 1,300 | 1,533 |
| Lowe's Cos. Inc. | 5.800% | 10/15/36 | 2,250 | 2,472 |
| Lowe's Cos. Inc. | 6.650% | 9/15/37 | 425 | 513 |
| Lowe's Cos. Inc. | 5.800% | 4/15/40 | 2,175 | 2,420 |
| Lowe's Cos. Inc. | 5.125% | 11/15/41 | 1,525 | 1,562 |
| Lowe's Cos. Inc. | 4.650% | 4/15/42 | 2,560 | 2,472 |
| Lowe's Cos. Inc. | 5.000% | 9/15/43 | 3,125 | 3,142 |
| Macy's Retail Holdings Inc. | 6.900% | 4/1/29 | 3,050 | 3,424 |
| Macy's Retail Holdings Inc. | 6.375% | 3/15/37 | 2,425 | 2,693 |
| Macy's Retail Holdings Inc. | 5.125% | 1/15/42 | 800 | 762 |
| Macy's Retail Holdings Inc. | 4.300% | 2/15/43 | 1,175 | 987 |
| McDonald's Corp. | 6.300% | 10/15/37 | 1,975 | 2,378 |
| McDonald's Corp. | 6.300% | 3/1/38 | 1,500 | 1,819 |
| McDonald's Corp. | 5.700% | 2/1/39 | 1,250 | 1,404 |
| McDonald's Corp. | 3.700% | 2/15/42 | 3,425 | 2,896 |
| McDonald's Corp. | 3.625% | 5/1/43 | 1,275 | 1,063 |
| MDC Holdings Inc. | 6.000% | 1/15/43 | 700 | 602 |
| NIKE Inc. | 3.625% | 5/1/43 | 1,475 | 1,229 |
| Nordstrom Inc. | 6.950% | 3/15/28 | 1,225 | 1,468 |
| Nordstrom Inc. | 7.000% | 1/15/38 | 800 | 1,020 |
| 4 Nordstrom Inc. | 5.000% | 1/15/44 | 1,120 | 1,094 |
| QVC Inc. | 5.950% | 3/15/43 | 575 | 519 |
| Target Corp. | 6.350% | 11/1/32 | 1,900 | 2,230 |
| Target Corp. | 6.500% | 10/15/37 | 5,600 | 6,686 |
| Target Corp. | 7.000% | 1/15/38 | 5,269 | 6,677 |
| Time Warner Cos. Inc. | 7.570% | 2/1/24 | 500 | 610 |
| Time Warner Cos. Inc. | 6.950% | 1/15/28 | 1,000 | 1,175 |
| Time Warner Inc. | 7.625% | 4/15/31 | 6,200 | 7,798 |
| Time Warner Inc. | 7.700% | 5/1/32 | 4,565 | 5,830 |
| Time Warner Inc. | 6.500% | 11/15/36 | 950 | 1,058 |
| Time Warner Inc. | 6.200% | 3/15/40 | 2,350 | 2,555 |
| Time Warner Inc. | 6.100% | 7/15/40 | 2,210 | 2,409 |
| Time Warner Inc. | 6.250% | 3/29/41 | 2,925 | 3,240 |
| Time Warner Inc. | 5.375% | 10/15/41 | 2,350 | 2,370 |
| Time Warner Inc. | 4.900% | 6/15/42 | 1,725 | 1,638 |
| Time Warner Inc. | 5.350% | 12/15/43 | 1,325 | 1,336 |
| VF Corp. | 6.450% | 11/1/37 | 1,500 | 1,763 |
| Viacom Inc. | 6.875% | 4/30/36 | 4,410 | 5,075 |
| Viacom Inc. | 4.375% | 3/15/43 | 4,362 | 3,667 |
| Viacom Inc. | 4.875% | 6/15/43 | 1,000 | 909 |
| Viacom Inc. | 5.850% | 9/1/43 | 2,825 | 2,941 |
| Wal-Mart Stores Inc. | 5.875% | 4/5/27 | 4,037 | 4,777 |
| Wal-Mart Stores Inc. | 7.550% | 2/15/30 | 4,125 | 5,536 |
| Wal-Mart Stores Inc. | 5.250% | 9/1/35 | 6,265 | 6,762 |
| Wal-Mart Stores Inc. | 6.500% | 8/15/37 | 6,550 | 8,151 |
| Wal-Mart Stores Inc. | 6.200% | 4/15/38 | 4,555 | 5,505 |
| Wal-Mart Stores Inc. | 5.625% | 4/1/40 | 2,850 | 3,229 |
| Wal-Mart Stores Inc. | 4.875% | 7/8/40 | 3,850 | 3,891 |
| Wal-Mart Stores Inc. | 5.000% | 10/25/40 | 3,700 | 3,866 |
| Wal-Mart Stores Inc. | 5.625% | 4/15/41 | 5,550 | 6,275 |
66
| Vanguard® Long-Term Bond Index Fund | ||||
| Schedule of Investments | ||||
| December 31, 2013 | ||||
| Face | Market | |||
| Maturity | Amount | Value | ||
| Coupon | Date | ($000) | ($000) | |
| Wal-Mart Stores Inc. | 4.000% | 4/11/43 | 2,950 | 2,617 |
| Wal-Mart Stores Inc. | 4.750% | 10/2/43 | 2,775 | 2,782 |
| Walgreen Co. | 4.400% | 9/15/42 | 1,450 | 1,285 |
| Walt Disney Co. | 7.000% | 3/1/32 | 1,450 | 1,841 |
| Walt Disney Co. | 4.375% | 8/16/41 | 1,025 | 954 |
| Walt Disney Co. | 4.125% | 12/1/41 | 1,975 | 1,784 |
| Walt Disney Co. | 3.700% | 12/1/42 | 1,600 | 1,339 |
| Western Union Co. | 6.200% | 11/17/36 | 1,950 | 1,821 |
| Western Union Co. | 6.200% | 6/21/40 | 325 | 294 |
| Yum! Brands Inc. | 6.875% | 11/15/37 | 465 | 531 |
| Consumer Noncyclical (6.8%) | ||||
| Abbott Laboratories | 6.150% | 11/30/37 | 725 | 851 |
| Abbott Laboratories | 6.000% | 4/1/39 | 1,225 | 1,420 |
| Abbott Laboratories | 5.300% | 5/27/40 | 2,550 | 2,795 |
| AbbVie Inc. | 4.400% | 11/6/42 | 8,225 | 7,709 |
| Actavis Inc. | 4.625% | 10/1/42 | 2,875 | 2,616 |
| Ahold Finance USA LLC | 6.875% | 5/1/29 | 1,550 | 1,828 |
| Altria Group Inc. | 4.000% | 1/31/24 | 3,575 | 3,498 |
| Altria Group Inc. | 9.950% | 11/10/38 | 2,850 | 4,332 |
| Altria Group Inc. | 10.200% | 2/6/39 | 2,796 | 4,342 |
| Altria Group Inc. | 4.250% | 8/9/42 | 2,050 | 1,742 |
| Altria Group Inc. | 4.500% | 5/2/43 | 2,075 | 1,825 |
| Altria Group Inc. | 5.375% | 1/31/44 | 4,125 | 4,117 |
| Amgen Inc. | 6.375% | 6/1/37 | 2,175 | 2,488 |
| Amgen Inc. | 6.900% | 6/1/38 | 1,250 | 1,509 |
| Amgen Inc. | 6.400% | 2/1/39 | 3,875 | 4,442 |
| Amgen Inc. | 5.750% | 3/15/40 | 1,800 | 1,921 |
| Amgen Inc. | 4.950% | 10/1/41 | 2,210 | 2,094 |
| Amgen Inc. | 5.150% | 11/15/41 | 6,315 | 6,274 |
| Amgen Inc. | 5.650% | 6/15/42 | 3,635 | 3,841 |
| Amgen Inc. | 5.375% | 5/15/43 | 2,550 | 2,611 |
| Anheuser-Busch Cos. LLC | 6.800% | 8/20/32 | 1,875 | 2,298 |
| Anheuser-Busch Cos. LLC | 5.950% | 1/15/33 | 650 | 742 |
| Anheuser-Busch Cos. LLC | 5.750% | 4/1/36 | 1,575 | 1,763 |
| Anheuser-Busch Cos. LLC | 6.450% | 9/1/37 | 650 | 799 |
| Anheuser-Busch Cos. LLC | 6.500% | 2/1/43 | 140 | 172 |
| Anheuser-Busch InBev Finance Inc. | 4.000% | 1/17/43 | 2,665 | 2,347 |
| Anheuser-Busch InBev Worldwide Inc. | 8.200% | 1/15/39 | 4,225 | 6,172 |
| Anheuser-Busch InBev Worldwide Inc. | 8.000% | 11/15/39 | 1,925 | 2,771 |
| Anheuser-Busch InBev Worldwide Inc. | 6.375% | 1/15/40 | 1,225 | 1,495 |
| Anheuser-Busch InBev Worldwide Inc. | 3.750% | 7/15/42 | 3,450 | 2,893 |
| Archer-Daniels-Midland Co. | 5.935% | 10/1/32 | 1,630 | 1,794 |
| Archer-Daniels-Midland Co. | 5.375% | 9/15/35 | 2,225 | 2,367 |
| Archer-Daniels-Midland Co. | 5.765% | 3/1/41 | 1,700 | 1,883 |
| Archer-Daniels-Midland Co. | 4.535% | 3/26/42 | 660 | 614 |
| Archer-Daniels-Midland Co. | 4.016% | 4/16/43 | 700 | 595 |
| 3 Ascension Health Alliance | 4.847% | 11/15/53 | 1,225 | 1,165 |
| AstraZeneca plc | 6.450% | 9/15/37 | 8,150 | 9,685 |
| AstraZeneca plc | 4.000% | 9/18/42 | 1,750 | 1,503 |
| Avon Products Inc. | 6.950% | 3/15/43 | 750 | 726 |
| Baxter International Inc. | 6.250% | 12/1/37 | 800 | 942 |
| Baxter International Inc. | 3.650% | 8/15/42 | 1,175 | 967 |
| Baxter International Inc. | 4.500% | 6/15/43 | 150 | 144 |
| Becton Dickinson & Co. | 6.000% | 5/15/39 | 1,000 | 1,153 |
| Becton Dickinson & Co. | 5.000% | 11/12/40 | 900 | 925 |
| Boston Scientific Corp. | 7.000% | 11/15/35 | 1,375 | 1,629 |
| Boston Scientific Corp. | 7.375% | 1/15/40 | 850 | 1,051 |
| Bristol-Myers Squibb Co. | 6.800% | 11/15/26 | 889 | 1,119 |
| Bristol-Myers Squibb Co. | 5.875% | 11/15/36 | 2,077 | 2,387 |
| Bristol-Myers Squibb Co. | 6.125% | 5/1/38 | 1,400 | 1,641 |
| Bristol-Myers Squibb Co. | 3.250% | 8/1/42 | 1,350 | 1,050 |
| Bristol-Myers Squibb Co. | 4.500% | 3/1/44 | 1,675 | 1,602 |
| Bristol-Myers Squibb Co. | 6.875% | 8/1/97 | 525 | 651 |
67
| Vanguard® Long-Term Bond Index Fund | ||||
| Schedule of Investments | ||||
| December 31, 2013 | ||||
| Face | Market | |||
| Maturity | Amount | Value | ||
| Coupon | Date | ($000) | ($000) | |
| Brown-Forman Corp. | 3.750% | 1/15/43 | 575 | 482 |
| Campbell Soup Co. | 3.800% | 8/2/42 | 1,100 | 851 |
| Cardinal Health Inc. | 4.600% | 3/15/43 | 775 | 722 |
| 3 Catholic Health Initiatives Colorado GO | 4.350% | 11/1/42 | 2,625 | 2,273 |
| Celgene Corp. | 5.700% | 10/15/40 | 600 | 635 |
| Celgene Corp. | 5.250% | 8/15/43 | 1,200 | 1,205 |
| Coca-Cola Femsa SAB de CV | 5.250% | 11/26/43 | 1,175 | 1,200 |
| ConAgra Foods Inc. | 7.125% | 10/1/26 | 1,575 | 1,909 |
| ConAgra Foods Inc. | 7.000% | 10/1/28 | 425 | 500 |
| ConAgra Foods Inc. | 8.250% | 9/15/30 | 1,650 | 2,123 |
| ConAgra Foods Inc. | 4.650% | 1/25/43 | 3,425 | 3,109 |
| Covidien International Finance SA | 6.550% | 10/15/37 | 2,675 | 3,263 |
| CR Bard Inc. | 6.700% | 12/1/26 | 500 | 597 |
| Delhaize Group SA | 5.700% | 10/1/40 | 3,239 | 3,039 |
| Diageo Capital plc | 5.875% | 9/30/36 | 750 | 858 |
| Diageo Capital plc | 3.875% | 4/29/43 | 1,475 | 1,267 |
| Diageo Investment Corp. | 7.450% | 4/15/35 | 1,750 | 2,282 |
| Diageo Investment Corp. | 4.250% | 5/11/42 | 1,750 | 1,588 |
| Dignity Health California GO | 4.500% | 11/1/42 | 1,150 | 925 |
| Dr Pepper Snapple Group Inc. | 7.450% | 5/1/38 | 560 | 712 |
| Eli Lilly & Co. | 7.125% | 6/1/25 | 800 | 1,016 |
| Eli Lilly & Co. | 5.500% | 3/15/27 | 5,300 | 6,038 |
| Eli Lilly & Co. | 5.550% | 3/15/37 | 1,625 | 1,779 |
| Estee Lauder Cos. Inc. | 6.000% | 5/15/37 | 1,025 | 1,124 |
| Estee Lauder Cos. Inc. | 3.700% | 8/15/42 | 2,825 | 2,301 |
| Express Scripts Holding Co. | 6.125% | 11/15/41 | 2,925 | 3,286 |
| Fomento Economico Mexicano SAB de CV | 4.375% | 5/10/43 | 1,925 | 1,578 |
| Genentech Inc. | 5.250% | 7/15/35 | 1,550 | 1,636 |
| General Mills Inc. | 5.400% | 6/15/40 | 1,775 | 1,877 |
| General Mills Inc. | 4.150% | 2/15/43 | 825 | 726 |
| Gilead Sciences Inc. | 5.650% | 12/1/41 | 2,745 | 3,028 |
| GlaxoSmithKline Capital Inc. | 5.375% | 4/15/34 | 1,450 | 1,572 |
| GlaxoSmithKline Capital Inc. | 6.375% | 5/15/38 | 7,919 | 9,667 |
| GlaxoSmithKline Capital Inc. | 4.200% | 3/18/43 | 1,400 | 1,268 |
| Hasbro Inc. | 6.350% | 3/15/40 | 1,829 | 1,924 |
| Ingredion Inc. | 6.625% | 4/15/37 | 575 | 643 |
| Johnson & Johnson | 6.950% | 9/1/29 | 850 | 1,117 |
| Johnson & Johnson | 4.950% | 5/15/33 | 1,825 | 1,961 |
| Johnson & Johnson | 4.375% | 12/5/33 | 2,850 | 2,858 |
| Johnson & Johnson | 5.950% | 8/15/37 | 2,980 | 3,534 |
| Johnson & Johnson | 5.850% | 7/15/38 | 1,525 | 1,803 |
| Johnson & Johnson | 4.500% | 9/1/40 | 1,900 | 1,878 |
| Johnson & Johnson | 4.500% | 12/5/43 | 1,000 | 990 |
| Kaiser Foundation Hospitals | 4.875% | 4/1/42 | 1,701 | 1,602 |
| Kellogg Co. | 7.450% | 4/1/31 | 3,000 | 3,768 |
| Kimberly-Clark Corp. | 6.625% | 8/1/37 | 2,825 | 3,537 |
| Kimberly-Clark Corp. | 5.300% | 3/1/41 | 540 | 582 |
| Kimberly-Clark Corp. | 3.700% | 6/1/43 | 875 | 736 |
| Koninklijke Philips NV | 6.875% | 3/11/38 | 2,655 | 3,162 |
| Koninklijke Philips NV | 5.000% | 3/15/42 | 1,700 | 1,681 |
| Kraft Foods Group Inc. | 6.875% | 1/26/39 | 2,475 | 3,026 |
| Kraft Foods Group Inc. | 6.500% | 2/9/40 | 4,125 | 4,818 |
| Kraft Foods Group Inc. | 5.000% | 6/4/42 | 5,095 | 4,964 |
| Kroger Co. | 8.000% | 9/15/29 | 1,925 | 2,416 |
| Kroger Co. | 7.500% | 4/1/31 | 1,700 | 2,059 |
| Kroger Co. | 6.900% | 4/15/38 | 400 | 466 |
| Kroger Co. | 5.400% | 7/15/40 | 750 | 738 |
| Kroger Co. | 5.000% | 4/15/42 | 900 | 849 |
| Kroger Co. | 5.150% | 8/1/43 | 1,250 | 1,223 |
| Lorillard Tobacco Co. | 8.125% | 5/1/40 | 1,479 | 1,777 |
| Lorillard Tobacco Co. | 7.000% | 8/4/41 | 955 | 1,035 |
| Mattel Inc. | 5.450% | 11/1/41 | 1,225 | 1,221 |
| 3 Mayo Clinic | 3.774% | 11/15/43 | 950 | 770 |
| 3 Mayo Clinic | 4.000% | 11/15/47 | 1,200 | 984 |
68
| Vanguard® Long-Term Bond Index Fund | ||||
| Schedule of Investments | ||||
| December 31, 2013 | ||||
| Face | Market | |||
| Maturity | Amount | Value | ||
| Coupon | Date | ($000) | ($000) | |
| McKesson Corp. | 6.000% | 3/1/41 | 2,115 | 2,361 |
| Mead Johnson Nutrition Co. | 5.900% | 11/1/39 | 835 | 898 |
| Medtronic Inc. | 6.500% | 3/15/39 | 600 | 729 |
| Medtronic Inc. | 5.550% | 3/15/40 | 1,400 | 1,530 |
| Medtronic Inc. | 4.500% | 3/15/42 | 1,050 | 989 |
| Medtronic Inc. | 4.000% | 4/1/43 | 2,225 | 1,958 |
| Memorial Sloan-Kettering Cancer Center New York GO | 5.000% | 7/1/42 | 975 | 960 |
| Memorial Sloan-Kettering Cancer Center New York GO | 4.125% | 7/1/52 | 1,400 | 1,146 |
| Merck & Co. Inc. | 6.500% | 12/1/33 | 3,970 | 4,914 |
| Merck & Co. Inc. | 6.550% | 9/15/37 | 4,255 | 5,271 |
| Merck & Co. Inc. | 3.600% | 9/15/42 | 775 | 639 |
| Merck & Co. Inc. | 4.150% | 5/18/43 | 4,425 | 4,024 |
| Merck Sharp & Dohme Corp. | 6.300% | 1/1/26 | 500 | 596 |
| Merck Sharp & Dohme Corp. | 6.400% | 3/1/28 | 1,700 | 2,049 |
| Merck Sharp & Dohme Corp. | 5.950% | 12/1/28 | 1,050 | 1,220 |
| Merck Sharp & Dohme Corp. | 5.750% | 11/15/36 | 700 | 787 |
| Merck Sharp & Dohme Corp. | 5.850% | 6/30/39 | 1,425 | 1,657 |
| Molson Coors Brewing Co. | 5.000% | 5/1/42 | 3,100 | 3,011 |
| Mondelez International Inc. | 6.500% | 11/1/31 | 2,575 | 2,943 |
| Mondelez International Inc. | 7.000% | 8/11/37 | 1,920 | 2,373 |
| Mondelez International Inc. | 6.875% | 2/1/38 | 2,035 | 2,476 |
| Mondelez International Inc. | 6.875% | 1/26/39 | 1,260 | 1,545 |
| Mondelez International Inc. | 6.500% | 2/9/40 | 6,250 | 7,439 |
| Mylan Inc. | 5.400% | 11/29/43 | 1,340 | 1,349 |
| Novant Health Inc. | 4.371% | 11/1/43 | 975 | 813 |
| Novartis Capital Corp. | 3.700% | 9/21/42 | 1,500 | 1,289 |
| Pepsi Bottling Group Inc. | 7.000% | 3/1/29 | 4,075 | 5,096 |
| PepsiCo Inc. | 5.500% | 1/15/40 | 125 | 136 |
| PepsiCo Inc. | 4.875% | 11/1/40 | 3,415 | 3,390 |
| PepsiCo Inc. | 4.000% | 3/5/42 | 2,770 | 2,401 |
| PepsiCo Inc. | 3.600% | 8/13/42 | 1,625 | 1,333 |
| 4 Perrigo Co. Plc | 5.300% | 11/15/43 | 400 | 392 |
| Pfizer Inc. | 7.200% | 3/15/39 | 5,190 | 6,986 |
| Pfizer Inc. | 4.300% | 6/15/43 | 1,800 | 1,687 |
| Pharmacia Corp. | 6.600% | 12/1/28 | 1,050 | 1,293 |
| Philip Morris International Inc. | 6.375% | 5/16/38 | 4,490 | 5,301 |
| Philip Morris International Inc. | 4.375% | 11/15/41 | 2,150 | 1,945 |
| Philip Morris International Inc. | 4.500% | 3/20/42 | 1,875 | 1,744 |
| Philip Morris International Inc. | 3.875% | 8/21/42 | 2,175 | 1,836 |
| Philip Morris International Inc. | 4.125% | 3/4/43 | 2,500 | 2,178 |
| Philip Morris International Inc. | 4.875% | 11/15/43 | 1,625 | 1,607 |
| Procter & Gamble Co. | 6.450% | 1/15/26 | 1,100 | 1,364 |
| Procter & Gamble Co. | 5.500% | 2/1/34 | 1,000 | 1,117 |
| Procter & Gamble Co. | 5.800% | 8/15/34 | 200 | 231 |
| Procter & Gamble Co. | 5.550% | 3/5/37 | 4,225 | 4,817 |
| Quest Diagnostics Inc. | 6.950% | 7/1/37 | 715 | 788 |
| Quest Diagnostics Inc. | 5.750% | 1/30/40 | 1,000 | 978 |
| Reynolds American Inc. | 7.250% | 6/15/37 | 850 | 992 |
| Reynolds American Inc. | 4.750% | 11/1/42 | 2,975 | 2,629 |
| Reynolds American Inc. | 6.150% | 9/15/43 | 1,300 | 1,396 |
| Safeway Inc. | 7.250% | 2/1/31 | 2,286 | 2,332 |
| St. Jude Medical Inc. | 4.750% | 4/15/43 | 3,125 | 2,935 |
| Stryker Corp. | 4.100% | 4/1/43 | 1,000 | 891 |
| Sysco Corp. | 5.375% | 9/21/35 | 2,425 | 2,523 |
| Teva Pharmaceutical Finance Co. LLC | 6.150% | 2/1/36 | 2,975 | 3,255 |
| Thermo Fisher Scientific Inc. | 4.150% | 2/1/24 | 1,500 | 1,490 |
| Thermo Fisher Scientific Inc. | 5.300% | 2/1/44 | 1,175 | 1,192 |
| Unilever Capital Corp. | 5.900% | 11/15/32 | 3,900 | 4,744 |
| Wyeth LLC | 6.450% | 2/1/24 | 2,725 | 3,266 |
| Wyeth LLC | 6.500% | 2/1/34 | 2,660 | 3,237 |
| Wyeth LLC | 6.000% | 2/15/36 | 2,350 | 2,755 |
| Wyeth LLC | 5.950% | 4/1/37 | 6,535 | 7,586 |
| Zimmer Holdings Inc. | 5.750% | 11/30/39 | 1,100 | 1,208 |
| Zoetis Inc. | 4.700% | 2/1/43 | 3,650 | 3,417 |
69
| Vanguard® Long-Term Bond Index Fund | ||||
| Schedule of Investments | ||||
| December 31, 2013 | ||||
| Face | Market | |||
| Maturity | Amount | Value | ||
| Coupon | Date | ($000) | ($000) | |
| Energy (4.2%) | ||||
| Alberta Energy Co. Ltd. | 7.375% | 11/1/31 | 1,000 | 1,177 |
| Anadarko Finance Co. | 7.500% | 5/1/31 | 2,835 | 3,454 |
| Anadarko Petroleum Corp. | 6.450% | 9/15/36 | 5,825 | 6,550 |
| Anadarko Petroleum Corp. | 7.950% | 6/15/39 | 1,050 | 1,385 |
| Anadarko Petroleum Corp. | 6.200% | 3/15/40 | 1,525 | 1,678 |
| Apache Corp. | 6.000% | 1/15/37 | 3,056 | 3,429 |
| Apache Corp. | 5.100% | 9/1/40 | 4,250 | 4,278 |
| Apache Corp. | 5.250% | 2/1/42 | 1,575 | 1,614 |
| Apache Corp. | 4.750% | 4/15/43 | 3,800 | 3,652 |
| Apache Corp. | 4.250% | 1/15/44 | 2,150 | 1,915 |
| Apache Finance Canada Corp. | 7.750% | 12/15/29 | 650 | 851 |
| Baker Hughes Inc. | 6.875% | 1/15/29 | 1,000 | 1,234 |
| Baker Hughes Inc. | 5.125% | 9/15/40 | 3,765 | 3,945 |
| Burlington Resources Finance Co. | 7.200% | 8/15/31 | 1,050 | 1,338 |
| Burlington Resources Finance Co. | 7.400% | 12/1/31 | 1,675 | 2,174 |
| Cameron International Corp. | 7.000% | 7/15/38 | 350 | 424 |
| Cameron International Corp. | 5.950% | 6/1/41 | 1,400 | 1,530 |
| Cameron International Corp. | 5.125% | 12/15/43 | 1,350 | 1,340 |
| Canadian Natural Resources Ltd. | 7.200% | 1/15/32 | 1,275 | 1,514 |
| Canadian Natural Resources Ltd. | 6.450% | 6/30/33 | 875 | 982 |
| Canadian Natural Resources Ltd. | 5.850% | 2/1/35 | 650 | 686 |
| Canadian Natural Resources Ltd. | 6.500% | 2/15/37 | 2,490 | 2,819 |
| Canadian Natural Resources Ltd. | 6.250% | 3/15/38 | 1,290 | 1,442 |
| Canadian Natural Resources Ltd. | 6.750% | 2/1/39 | 1,650 | 1,945 |
| Cenovus Energy Inc. | 6.750% | 11/15/39 | 4,305 | 5,013 |
| Cenovus Energy Inc. | 4.450% | 9/15/42 | 1,700 | 1,508 |
| Cenovus Energy Inc. | 5.200% | 9/15/43 | 1,575 | 1,557 |
| Conoco Funding Co. | 7.250% | 10/15/31 | 1,195 | 1,564 |
| ConocoPhillips | 5.900% | 10/15/32 | 2,300 | 2,631 |
| ConocoPhillips | 5.900% | 5/15/38 | 2,425 | 2,819 |
| ConocoPhillips | 6.500% | 2/1/39 | 6,825 | 8,536 |
| ConocoPhillips Canada Funding Co. I | 5.950% | 10/15/36 | 1,100 | 1,273 |
| ConocoPhillips Holding Co. | 6.950% | 4/15/29 | 2,925 | 3,686 |
| Devon Energy Corp. | 7.950% | 4/15/32 | 2,535 | 3,299 |
| Devon Energy Corp. | 5.600% | 7/15/41 | 4,260 | 4,410 |
| Devon Energy Corp. | 4.750% | 5/15/42 | 525 | 485 |
| Devon Financing Co. LLC | 7.875% | 9/30/31 | 4,615 | 5,936 |
| Diamond Offshore Drilling Inc. | 5.700% | 10/15/39 | 1,575 | 1,706 |
| Diamond Offshore Drilling Inc. | 4.875% | 11/1/43 | 1,500 | 1,463 |
| Encana Corp. | 7.200% | 11/1/31 | 250 | 286 |
| Encana Corp. | 6.500% | 8/15/34 | 4,700 | 5,162 |
| Encana Corp. | 6.625% | 8/15/37 | 1,175 | 1,298 |
| Encana Corp. | 6.500% | 2/1/38 | 1,775 | 1,944 |
| Encana Corp. | 5.150% | 11/15/41 | 1,160 | 1,085 |
| Eni USA Inc. | 7.300% | 11/15/27 | 600 | 742 |
| Global Marine Inc. | 7.000% | 6/1/28 | 800 | 833 |
| Halliburton Co. | 6.700% | 9/15/38 | 5,025 | 6,168 |
| Halliburton Co. | 7.450% | 9/15/39 | 275 | 367 |
| Halliburton Co. | 4.500% | 11/15/41 | 1,350 | 1,275 |
| Halliburton Co. | 4.750% | 8/1/43 | 1,900 | 1,860 |
| Hess Corp. | 7.875% | 10/1/29 | 2,625 | 3,332 |
| Hess Corp. | 7.300% | 8/15/31 | 895 | 1,088 |
| Hess Corp. | 7.125% | 3/15/33 | 925 | 1,110 |
| Hess Corp. | 6.000% | 1/15/40 | 4,390 | 4,753 |
| Hess Corp. | 5.600% | 2/15/41 | 2,425 | 2,517 |
| Husky Energy Inc. | 6.800% | 9/15/37 | 1,150 | 1,386 |
| Kerr-McGee Corp. | 6.950% | 7/1/24 | 1,497 | 1,742 |
| Kerr-McGee Corp. | 7.875% | 9/15/31 | 1,000 | 1,240 |
| Marathon Oil Corp. | 6.800% | 3/15/32 | 1,600 | 1,904 |
| Marathon Oil Corp. | 6.600% | 10/1/37 | 3,150 | 3,784 |
| Marathon Petroleum Corp. | 6.500% | 3/1/41 | 3,900 | 4,456 |
| Murphy Oil Corp. | 7.050% | 5/1/29 | 500 | 533 |
70
| Vanguard® Long-Term Bond Index Fund | ||||
| Schedule of Investments | ||||
| December 31, 2013 | ||||
| Face | Market | |||
| Maturity | Amount | Value | ||
| Coupon | Date | ($000) | ($000) | |
| Murphy Oil Corp. | 5.125% | 12/1/42 | 350 | 301 |
| National Oilwell Varco Inc. | 3.950% | 12/1/42 | 5,100 | 4,474 |
| Noble Energy Inc. | 8.000% | 4/1/27 | 1,275 | 1,625 |
| Noble Energy Inc. | 6.000% | 3/1/41 | 1,950 | 2,117 |
| Noble Energy Inc. | 5.250% | 11/15/43 | 2,750 | 2,732 |
| Noble Holding International Ltd. | 6.200% | 8/1/40 | 1,900 | 1,983 |
| Noble Holding International Ltd. | 6.050% | 3/1/41 | 350 | 358 |
| Noble Holding International Ltd. | 5.250% | 3/15/42 | 1,425 | 1,360 |
| Petro-Canada | 7.875% | 6/15/26 | 625 | 801 |
| Petro-Canada | 7.000% | 11/15/28 | 1,425 | 1,731 |
| Petro-Canada | 5.350% | 7/15/33 | 1,350 | 1,362 |
| Petro-Canada | 5.950% | 5/15/35 | 2,580 | 2,781 |
| Petro-Canada | 6.800% | 5/15/38 | 3,000 | 3,582 |
| Phillips 66 | 5.875% | 5/1/42 | 5,700 | 6,156 |
| Pioneer Natural Resources Co. | 7.200% | 1/15/28 | 500 | 601 |
| Pride International Inc. | 7.875% | 8/15/40 | 1,550 | 2,082 |
| Rowan Cos. Inc. | 5.400% | 12/1/42 | 950 | 879 |
| Shell International Finance BV | 6.375% | 12/15/38 | 7,240 | 8,921 |
| Shell International Finance BV | 5.500% | 3/25/40 | 2,525 | 2,797 |
| Shell International Finance BV | 3.625% | 8/21/42 | 1,900 | 1,574 |
| Shell International Finance BV | 4.550% | 8/12/43 | 3,625 | 3,497 |
| Suncor Energy Inc. | 7.150% | 2/1/32 | 800 | 1,022 |
| Suncor Energy Inc. | 5.950% | 12/1/34 | 555 | 593 |
| Suncor Energy Inc. | 6.500% | 6/15/38 | 2,580 | 2,988 |
| Suncor Energy Inc. | 6.850% | 6/1/39 | 2,150 | 2,583 |
| Talisman Energy Inc. | 7.250% | 10/15/27 | 450 | 505 |
| Talisman Energy Inc. | 5.850% | 2/1/37 | 2,725 | 2,650 |
| Talisman Energy Inc. | 6.250% | 2/1/38 | 1,500 | 1,522 |
| Talisman Energy Inc. | 5.500% | 5/15/42 | 1,100 | 1,032 |
| Tosco Corp. | 7.800% | 1/1/27 | 105 | 139 |
| Tosco Corp. | 8.125% | 2/15/30 | 3,775 | 5,238 |
| Total Capital International SA | 3.700% | 1/15/24 | 3,050 | 3,017 |
| Transocean Inc. | 7.500% | 4/15/31 | 1,725 | 2,002 |
| Transocean Inc. | 6.800% | 3/15/38 | 3,100 | 3,459 |
| Transocean Inc. | 7.350% | 12/15/41 | 855 | 1,022 |
| Valero Energy Corp. | 7.500% | 4/15/32 | 3,221 | 3,918 |
| Valero Energy Corp. | 6.625% | 6/15/37 | 3,575 | 4,063 |
| Weatherford International LLC | 6.800% | 6/15/37 | 2,900 | 3,123 |
| Weatherford International Ltd. | 6.500% | 8/1/36 | 3,055 | 3,183 |
| Weatherford International Ltd. | 7.000% | 3/15/38 | 1,400 | 1,539 |
| Weatherford International Ltd. | 6.750% | 9/15/40 | 600 | 645 |
| XTO Energy Inc. | 6.750% | 8/1/37 | 440 | 567 |
| Other Industrial (0.2%) | ||||
| California Institute of Technology GO | 4.700% | 11/1/11 | 1,375 | 1,173 |
| 3 Johns Hopkins University Maryland GO | 4.083% | 7/1/53 | 1,175 | 1,007 |
| Massachusetts Institute of Technology GO | 5.600% | 7/1/11 | 3,025 | 3,430 |
| 3 Northwestern University GO | 4.643% | 12/1/44 | 1,550 | 1,519 |
| President & Fellows of Harvard College Massachusetts | ||||
| GO | 3.619% | 10/1/37 | 900 | 767 |
| University of Pennsylvania GO | 4.674% | 9/1/12 | 1,000 | 880 |
| Technology (1.6%) | ||||
| Apple Inc. | 3.850% | 5/4/43 | 7,900 | 6,601 |
| Applied Materials Inc. | 5.850% | 6/15/41 | 1,800 | 1,844 |
| Cisco Systems Inc. | 5.900% | 2/15/39 | 5,550 | 6,163 |
| Cisco Systems Inc. | 5.500% | 1/15/40 | 6,235 | 6,579 |
| Corning Inc. | 7.250% | 8/15/36 | 600 | 687 |
| Corning Inc. | 4.700% | 3/15/37 | 2,800 | 2,654 |
| Corning Inc. | 5.750% | 8/15/40 | 950 | 1,024 |
| Corning Inc. | 4.750% | 3/15/42 | 2,075 | 1,987 |
| Harris Corp. | 6.150% | 12/15/40 | 845 | 901 |
| Hewlett-Packard Co. | 6.000% | 9/15/41 | 3,555 | 3,558 |
| HP Enterprise Services LLC | 7.450% | 10/15/29 | 775 | 865 |
| Intel Corp. | 4.000% | 12/15/32 | 2,500 | 2,293 |
71
| Vanguard® Long-Term Bond Index Fund | |||||
| Schedule of Investments | |||||
| December 31, 2013 | |||||
| Face | Market | ||||
| Maturity | Amount | Value | |||
| Coupon | Date | ($000) | ($000) | ||
| Intel Corp. | 4.800% | 10/1/41 | 3,945 | 3,859 | |
| Intel Corp. | 4.250% | 12/15/42 | 3,175 | 2,785 | |
| International Business Machines Corp. | 7.000% | 10/30/25 | 1,625 | 2,037 | |
| International Business Machines Corp. | 6.220% | 8/1/27 | 1,600 | 1,891 | |
| International Business Machines Corp. | 6.500% | 1/15/28 | 225 | 276 | |
| International Business Machines Corp. | 5.875% | 11/29/32 | 2,150 | 2,478 | |
| International Business Machines Corp. | 5.600% | 11/30/39 | 2,728 | 3,048 | |
| International Business Machines Corp. | 4.000% | 6/20/42 | 3,753 | 3,335 | |
| Juniper Networks Inc. | 5.950% | 3/15/41 | 1,350 | 1,337 | |
| Leidos Holdings Inc. | 5.950% | 12/1/40 | 350 | 334 | |
| Leidos Inc. | 5.500% | 7/1/33 | 1,100 | 1,003 | |
| Microsoft Corp. | 5.200% | 6/1/39 | 2,755 | 2,906 | |
| Microsoft Corp. | 4.500% | 10/1/40 | 2,465 | 2,356 | |
| Microsoft Corp. | 5.300% | 2/8/41 | 3,375 | 3,616 | |
| Microsoft Corp. | 3.500% | 11/15/42 | 2,850 | 2,331 | |
| Microsoft Corp. | 3.750% | 5/1/43 | 185 | 158 | |
| Microsoft Corp. | 4.875% | 12/15/43 | 750 | 763 | |
| Motorola Solutions Inc. | 7.500% | 5/15/25 | 975 | 1,154 | |
| Oracle Corp. | 6.500% | 4/15/38 | 3,200 | 3,889 | |
| Oracle Corp. | 6.125% | 7/8/39 | 3,475 | 4,049 | |
| Oracle Corp. | 5.375% | 7/15/40 | 7,145 | 7,641 | |
| Tyco Electronics Group SA | 7.125% | 10/1/37 | 1,250 | 1,452 | |
| Xerox Corp. | 6.750% | 12/15/39 | 975 | 1,062 | |
| Transportation (1.6%) | |||||
| 3,4 | American Airlines 2013-1 Class A Pass Through Trust | 4.000% | 1/15/27 | 1,020 | 1,000 |
| 3 | BNSF Funding Trust I | 6.613% | 12/15/55 | 850 | 932 |
| Burlington Northern Santa Fe LLC | 7.000% | 12/15/25 | 1,200 | 1,468 | |
| Burlington Northern Santa Fe LLC | 7.950% | 8/15/30 | 1,300 | 1,707 | |
| Burlington Northern Santa Fe LLC | 6.200% | 8/15/36 | 1,575 | 1,777 | |
| Burlington Northern Santa Fe LLC | 6.150% | 5/1/37 | 2,075 | 2,341 | |
| Burlington Northern Santa Fe LLC | 5.750% | 5/1/40 | 2,195 | 2,402 | |
| Burlington Northern Santa Fe LLC | 5.050% | 3/1/41 | 1,325 | 1,311 | |
| Burlington Northern Santa Fe LLC | 5.400% | 6/1/41 | 1,310 | 1,361 | |
| Burlington Northern Santa Fe LLC | 4.950% | 9/15/41 | 350 | 345 | |
| Burlington Northern Santa Fe LLC | 4.400% | 3/15/42 | 1,310 | 1,178 | |
| Burlington Northern Santa Fe LLC | 4.375% | 9/1/42 | 3,675 | 3,289 | |
| Burlington Northern Santa Fe LLC | 4.450% | 3/15/43 | 850 | 774 | |
| Burlington Northern Santa Fe LLC | 5.150% | 9/1/43 | 750 | 759 | |
| Canadian National Railway Co. | 6.900% | 7/15/28 | 1,500 | 1,907 | |
| Canadian National Railway Co. | 6.250% | 8/1/34 | 2,450 | 2,885 | |
| Canadian National Railway Co. | 6.200% | 6/1/36 | 1,550 | 1,850 | |
| Canadian National Railway Co. | 3.500% | 11/15/42 | 1,075 | 854 | |
| Canadian Pacific Railway Co. | 7.125% | 10/15/31 | 1,950 | 2,338 | |
| Canadian Pacific Railway Co. | 5.750% | 3/15/33 | 1,275 | 1,344 | |
| Canadian Pacific Railway Co. | 5.950% | 5/15/37 | 1,545 | 1,689 | |
| Con-way Inc. | 6.700% | 5/1/34 | 1,050 | 1,065 | |
| 3 | Continental Airlines 2012-1 Class A Pass Through Trust | 4.150% | 10/11/25 | 1,585 | 1,593 |
| 3 | Continental Airlines 2012-2 Class A Pass Through Trust | 4.000% | 4/29/26 | 2,950 | 2,943 |
| CSX Corp. | 6.000% | 10/1/36 | 175 | 191 | |
| CSX Corp. | 6.150% | 5/1/37 | 2,280 | 2,562 | |
| CSX Corp. | 6.220% | 4/30/40 | 4,225 | 4,783 | |
| CSX Corp. | 5.500% | 4/15/41 | 400 | 419 | |
| CSX Corp. | 4.750% | 5/30/42 | 1,675 | 1,589 | |
| CSX Corp. | 4.400% | 3/1/43 | 525 | 469 | |
| CSX Corp. | 4.100% | 3/15/44 | 2,850 | 2,415 | |
| FedEx Corp. | 3.875% | 8/1/42 | 1,250 | 1,020 | |
| FedEx Corp. | 4.100% | 4/15/43 | 500 | 424 | |
| 3 | Hawaiian Airlines 2013-1 Class A Pass Through | ||||
| Certificates | 3.900% | 1/15/26 | 2,175 | 2,012 | |
| 4 | Kansas City Southern Railway Co. | 4.300% | 5/15/43 | 2,325 | 2,019 |
| Norfolk Southern Corp. | 5.590% | 5/17/25 | 631 | 692 | |
72
| Vanguard® Long-Term Bond Index Fund | ||||
| Schedule of Investments | ||||
| December 31, 2013 | ||||
| Face | Market | |||
| Maturity | Amount | Value | ||
| Coupon | Date | ($000) | ($000) | |
| Norfolk Southern Corp. | 7.800% | 5/15/27 | 2,242 | 2,853 |
| Norfolk Southern Corp. | 7.250% | 2/15/31 | 560 | 686 |
| Norfolk Southern Corp. | 7.050% | 5/1/37 | 600 | 731 |
| Norfolk Southern Corp. | 4.837% | 10/1/41 | 2,423 | 2,327 |
| Norfolk Southern Corp. | 3.950% | 10/1/42 | 1,125 | 944 |
| Norfolk Southern Corp. | 4.800% | 8/15/43 | 1,200 | 1,159 |
| Norfolk Southern Corp. | 7.900% | 5/15/97 | 250 | 333 |
| Norfolk Southern Corp. | 6.000% | 3/15/05 | 1,400 | 1,485 |
| Norfolk Southern Corp. | 6.000% | 5/23/11 | 1,625 | 1,718 |
| Union Pacific Corp. | 6.625% | 2/1/29 | 1,900 | 2,286 |
| Union Pacific Corp. | 4.750% | 9/15/41 | 2,880 | 2,788 |
| Union Pacific Corp. | 4.250% | 4/15/43 | 975 | 867 |
| Union Pacific Corp. | 4.750% | 12/15/43 | 825 | 799 |
| 4 Union Pacific Corp. | 4.821% | 2/1/44 | 1,990 | 1,934 |
| 3 Union Pacific Railroad Co. 2007-3 Pass Through Trust | 6.176% | 1/2/31 | 817 | 931 |
| 3 United Airlines 2013-1 Class A Pass Through Trust | 4.300% | 2/15/27 | 1,175 | 1,197 |
| United Parcel Service Inc. | 6.200% | 1/15/38 | 3,410 | 4,123 |
| United Parcel Service Inc. | 4.875% | 11/15/40 | 2,110 | 2,158 |
| United Parcel Service Inc. | 3.625% | 10/1/42 | 3,075 | 2,572 |
| United Parcel Service of America Inc. | 8.375% | 4/1/30 | 500 | 673 |
| 3 US Airways 2013-1 Class A Pass Through Trust | 3.950% | 5/15/27 | 1,725 | 1,686 |
| 3 US Airways Inc. 2012-2 Class A Pass Through Trust | 4.625% | 12/3/26 | 1,943 | 1,975 |
| 1,791,816 | ||||
| Utilities (8.8%) | ||||
| Electric (6.1%) | ||||
| AEP Texas Central Co. | 6.650% | 2/15/33 | 2,305 | 2,656 |
| Alabama Power Co. | 5.650% | 3/15/35 | 500 | 522 |
| Alabama Power Co. | 6.125% | 5/15/38 | 1,000 | 1,182 |
| Alabama Power Co. | 6.000% | 3/1/39 | 1,450 | 1,692 |
| Alabama Power Co. | 5.500% | 3/15/41 | 500 | 545 |
| Alabama Power Co. | 5.200% | 6/1/41 | 1,075 | 1,141 |
| Alabama Power Co. | 4.100% | 1/15/42 | 800 | 715 |
| Alabama Power Co. | 3.850% | 12/1/42 | 1,250 | 1,066 |
| Ameren Illinois Co. | 4.800% | 12/15/43 | 825 | 831 |
| Appalachian Power Co. | 5.800% | 10/1/35 | 475 | 496 |
| Appalachian Power Co. | 6.375% | 4/1/36 | 1,225 | 1,346 |
| Appalachian Power Co. | 6.700% | 8/15/37 | 500 | 573 |
| Appalachian Power Co. | 7.000% | 4/1/38 | 2,093 | 2,509 |
| Arizona Public Service Co. | 5.050% | 9/1/41 | 850 | 869 |
| Arizona Public Service Co. | 4.500% | 4/1/42 | 1,510 | 1,433 |
| Baltimore Gas & Electric Co. | 6.350% | 10/1/36 | 1,075 | 1,267 |
| CenterPoint Energy Houston Electric LLC | 6.950% | 3/15/33 | 925 | 1,182 |
| CenterPoint Energy Houston Electric LLC | 3.550% | 8/1/42 | 1,600 | 1,318 |
| Cleco Power LLC | 6.500% | 12/1/35 | 500 | 568 |
| Cleco Power LLC | 6.000% | 12/1/40 | 1,000 | 1,088 |
| Cleveland Electric Illuminating Co. | 5.500% | 8/15/24 | 1,500 | 1,621 |
| Cleveland Electric Illuminating Co. | 5.950% | 12/15/36 | 1,000 | 1,003 |
| CMS Energy Corp. | 4.700% | 3/31/43 | 850 | 786 |
| Commonwealth Edison Co. | 5.900% | 3/15/36 | 3,500 | 3,973 |
| Commonwealth Edison Co. | 6.450% | 1/15/38 | 1,475 | 1,785 |
| Commonwealth Edison Co. | 3.800% | 10/1/42 | 650 | 554 |
| Commonwealth Edison Co. | 4.600% | 8/15/43 | 2,100 | 2,036 |
| Connecticut Light & Power Co. | 6.350% | 6/1/36 | 1,250 | 1,502 |
| Consolidated Edison Co. of New York Inc. | 5.300% | 3/1/35 | 1,950 | 2,091 |
| Consolidated Edison Co. of New York Inc. | 5.850% | 3/15/36 | 2,575 | 2,940 |
| Consolidated Edison Co. of New York Inc. | 5.700% | 12/1/36 | 1,550 | 1,742 |
| Consolidated Edison Co. of New York Inc. | 6.300% | 8/15/37 | 1,300 | 1,573 |
| Consolidated Edison Co. of New York Inc. | 6.750% | 4/1/38 | 2,025 | 2,555 |
| Consolidated Edison Co. of New York Inc. | 5.500% | 12/1/39 | 875 | 966 |
| Consolidated Edison Co. of New York Inc. | 5.700% | 6/15/40 | 1,150 | 1,305 |
| Consolidated Edison Co. of New York Inc. | 4.200% | 3/15/42 | 1,000 | 912 |
| Consolidated Edison Co. of New York Inc. | 3.950% | 3/1/43 | 850 | 746 |
| Consumers Energy Co. | 3.950% | 5/15/43 | 1,950 | 1,726 |
73
| Vanguard® Long-Term Bond Index Fund | ||||
| Schedule of Investments | ||||
| December 31, 2013 | ||||
| Face | Market | |||
| Maturity | Amount | Value | ||
| Coupon | Date | ($000) | ($000) | |
| Delmarva Power & Light Co. | 4.000% | 6/1/42 | 1,250 | 1,109 |
| Dominion Resources Inc. | 6.300% | 3/15/33 | 2,250 | 2,598 |
| Dominion Resources Inc. | 5.950% | 6/15/35 | 2,625 | 2,905 |
| Dominion Resources Inc. | 4.900% | 8/1/41 | 1,100 | 1,059 |
| Dominion Resources Inc. | 4.050% | 9/15/42 | 100 | 83 |
| DTE Electric Co. | 3.650% | 3/15/24 | 1,600 | 1,582 |
| DTE Electric Co. | 5.700% | 10/1/37 | 1,860 | 2,120 |
| DTE Electric Co. | 3.950% | 6/15/42 | 1,125 | 999 |
| DTE Electric Co. | 4.000% | 4/1/43 | 900 | 804 |
| DTE Energy Co. | 6.375% | 4/15/33 | 1,700 | 1,938 |
| Duke Energy Carolinas LLC | 6.000% | 12/1/28 | 1,125 | 1,277 |
| Duke Energy Carolinas LLC | 6.450% | 10/15/32 | 1,050 | 1,238 |
| Duke Energy Carolinas LLC | 6.100% | 6/1/37 | 1,275 | 1,453 |
| Duke Energy Carolinas LLC | 6.000% | 1/15/38 | 1,955 | 2,280 |
| Duke Energy Carolinas LLC | 6.050% | 4/15/38 | 3,550 | 4,231 |
| Duke Energy Carolinas LLC | 5.300% | 2/15/40 | 2,000 | 2,175 |
| Duke Energy Carolinas LLC | 4.250% | 12/15/41 | 1,725 | 1,622 |
| Duke Energy Carolinas LLC | 4.000% | 9/30/42 | 1,900 | 1,712 |
| Duke Energy Florida Inc. | 6.350% | 9/15/37 | 1,595 | 1,936 |
| Duke Energy Florida Inc. | 6.400% | 6/15/38 | 3,350 | 4,136 |
| Duke Energy Florida Inc. | 5.650% | 4/1/40 | 795 | 899 |
| Duke Energy Indiana Inc. | 6.120% | 10/15/35 | 1,055 | 1,141 |
| Duke Energy Indiana Inc. | 6.350% | 8/15/38 | 2,350 | 2,852 |
| Duke Energy Indiana Inc. | 4.200% | 3/15/42 | 700 | 644 |
| Duke Energy Indiana Inc. | 4.900% | 7/15/43 | 1,500 | 1,561 |
| Duke Energy Progress Inc. | 6.300% | 4/1/38 | 1,775 | 2,153 |
| Duke Energy Progress Inc. | 4.100% | 5/15/42 | 475 | 437 |
| Duke Energy Progress Inc. | 4.100% | 3/15/43 | 1,000 | 912 |
| El Paso Electric Co. | 6.000% | 5/15/35 | 850 | 879 |
| Entergy Gulf States Louisiana LLC | 5.590% | 10/1/24 | 1,150 | 1,285 |
| Entergy Louisiana LLC | 5.400% | 11/1/24 | 1,875 | 2,081 |
| Entergy Louisiana LLC | 4.440% | 1/15/26 | 425 | 430 |
| Exelon Corp. | 5.625% | 6/15/35 | 2,810 | 2,776 |
| Exelon Generation Co. LLC | 6.250% | 10/1/39 | 1,155 | 1,166 |
| Exelon Generation Co. LLC | 5.750% | 10/1/41 | 550 | 525 |
| Exelon Generation Co. LLC | 5.600% | 6/15/42 | 2,745 | 2,563 |
| FirstEnergy Solutions Corp. | 6.800% | 8/15/39 | 695 | 701 |
| Florida Power & Light Co. | 5.950% | 10/1/33 | 950 | 1,115 |
| Florida Power & Light Co. | 5.625% | 4/1/34 | 1,674 | 1,905 |
| Florida Power & Light Co. | 4.950% | 6/1/35 | 460 | 480 |
| Florida Power & Light Co. | 5.400% | 9/1/35 | 1,190 | 1,307 |
| Florida Power & Light Co. | 6.200% | 6/1/36 | 1,150 | 1,376 |
| Florida Power & Light Co. | 5.650% | 2/1/37 | 1,525 | 1,717 |
| Florida Power & Light Co. | 5.850% | 5/1/37 | 475 | 547 |
| Florida Power & Light Co. | 5.950% | 2/1/38 | 2,100 | 2,451 |
| Florida Power & Light Co. | 5.960% | 4/1/39 | 1,825 | 2,137 |
| Florida Power & Light Co. | 5.690% | 3/1/40 | 750 | 856 |
| Florida Power & Light Co. | 5.250% | 2/1/41 | 1,095 | 1,182 |
| Florida Power & Light Co. | 5.125% | 6/1/41 | 625 | 668 |
| Florida Power & Light Co. | 4.125% | 2/1/42 | 1,775 | 1,629 |
| Florida Power & Light Co. | 4.050% | 6/1/42 | 1,325 | 1,205 |
| Florida Power & Light Co. | 3.800% | 12/15/42 | 1,375 | 1,195 |
| Georgia Power Co. | 5.650% | 3/1/37 | 2,575 | 2,772 |
| Georgia Power Co. | 5.950% | 2/1/39 | 725 | 813 |
| Georgia Power Co. | 5.400% | 6/1/40 | 1,500 | 1,568 |
| Georgia Power Co. | 4.750% | 9/1/40 | 1,625 | 1,558 |
| Georgia Power Co. | 4.300% | 3/15/42 | 2,300 | 2,063 |
| Iberdrola International BV | 6.750% | 7/15/36 | 1,495 | 1,628 |
| Indiana Michigan Power Co. | 6.050% | 3/15/37 | 425 | 461 |
| Interstate Power & Light Co. | 6.250% | 7/15/39 | 1,100 | 1,300 |
| ITC Holdings Corp. | 5.300% | 7/1/43 | 950 | 930 |
| Jersey Central Power & Light Co. | 6.150% | 6/1/37 | 750 | 771 |
| 3 John Sevier Combined Cycle Generation LLC | 4.626% | 1/15/42 | 2,226 | 2,163 |
| Kansas City Power & Light Co. | 6.050% | 11/15/35 | 900 | 984 |
74
| Vanguard® Long-Term Bond Index Fund | ||||
| Schedule of Investments | ||||
| December 31, 2013 | ||||
| Face | Market | |||
| Maturity | Amount | Value | ||
| Coupon | Date | ($000) | ($000) | |
| Kansas City Power & Light Co. | 5.300% | 10/1/41 | 1,500 | 1,499 |
| Kentucky Utilities Co. | 5.125% | 11/1/40 | 1,800 | 1,896 |
| Kentucky Utilities Co. | 4.650% | 11/15/43 | 1,800 | 1,784 |
| Louisville Gas & Electric Co. | 5.125% | 11/15/40 | 1,975 | 2,076 |
| Louisville Gas & Electric Co. | 4.650% | 11/15/43 | 75 | 75 |
| MidAmerican Energy Co. | 6.750% | 12/30/31 | 1,795 | 2,195 |
| MidAmerican Energy Co. | 5.750% | 11/1/35 | 850 | 949 |
| MidAmerican Energy Co. | 5.800% | 10/15/36 | 1,625 | 1,819 |
| MidAmerican Energy Holdings Co. | 8.480% | 9/15/28 | 420 | 567 |
| MidAmerican Energy Holdings Co. | 6.125% | 4/1/36 | 4,745 | 5,384 |
| MidAmerican Energy Holdings Co. | 5.950% | 5/15/37 | 1,675 | 1,852 |
| MidAmerican Energy Holdings Co. | 6.500% | 9/15/37 | 3,680 | 4,314 |
| 4 MidAmerican Energy Holdings Co. | 5.150% | 11/15/43 | 2,850 | 2,861 |
| Mississippi Power Co. | 4.250% | 3/15/42 | 1,625 | 1,414 |
| National Rural Utilities Cooperative Finance Corp. | 8.000% | 3/1/32 | 1,775 | 2,386 |
| National Rural Utilities Cooperative Finance Corp. | 4.023% | 11/1/32 | 1,189 | 1,100 |
| Nevada Power Co. | 6.650% | 4/1/36 | 775 | 943 |
| Nevada Power Co. | 6.750% | 7/1/37 | 1,800 | 2,226 |
| Nevada Power Co. | 5.375% | 9/15/40 | 970 | 1,035 |
| Nevada Power Co. | 5.450% | 5/15/41 | 530 | 573 |
| Northern States Power Co. | 5.250% | 7/15/35 | 1,175 | 1,250 |
| Northern States Power Co. | 6.250% | 6/1/36 | 525 | 626 |
| Northern States Power Co. | 6.200% | 7/1/37 | 1,550 | 1,845 |
| Northern States Power Co. | 5.350% | 11/1/39 | 625 | 676 |
| Northern States Power Co. | 4.850% | 8/15/40 | 1,200 | 1,214 |
| Northern States Power Co. | 3.400% | 8/15/42 | 475 | 382 |
| NSTAR Electric Co. | 5.500% | 3/15/40 | 850 | 946 |
| Oglethorpe Power Corp. | 5.950% | 11/1/39 | 750 | 815 |
| Oglethorpe Power Corp. | 5.375% | 11/1/40 | 1,730 | 1,767 |
| Oglethorpe Power Corp. | 4.200% | 12/1/42 | 700 | 608 |
| Oglethorpe Power Corp. | 5.250% | 9/1/50 | 675 | 653 |
| Ohio Edison Co. | 6.875% | 7/15/36 | 1,000 | 1,166 |
| Ohio Power Co. | 6.600% | 2/15/33 | 900 | 1,043 |
| Ohio Power Co. | 5.850% | 10/1/35 | 300 | 322 |
| Oklahoma Gas & Electric Co. | 5.850% | 6/1/40 | 350 | 397 |
| Oklahoma Gas & Electric Co. | 5.250% | 5/15/41 | 750 | 796 |
| Oklahoma Gas & Electric Co. | 3.900% | 5/1/43 | 1,375 | 1,182 |
| Oncor Electric Delivery Co. LLC | 7.000% | 5/1/32 | 1,550 | 1,893 |
| Oncor Electric Delivery Co. LLC | 7.250% | 1/15/33 | 455 | 571 |
| Oncor Electric Delivery Co. LLC | 7.500% | 9/1/38 | 1,265 | 1,640 |
| Oncor Electric Delivery Co. LLC | 5.250% | 9/30/40 | 1,175 | 1,214 |
| Oncor Electric Delivery Co. LLC | 4.550% | 12/1/41 | 810 | 761 |
| Oncor Electric Delivery Co. LLC | 5.300% | 6/1/42 | 1,325 | 1,375 |
| Pacific Gas & Electric Co. | 6.050% | 3/1/34 | 9,290 | 10,656 |
| Pacific Gas & Electric Co. | 5.800% | 3/1/37 | 3,130 | 3,460 |
| Pacific Gas & Electric Co. | 6.350% | 2/15/38 | 2,800 | 3,263 |
| Pacific Gas & Electric Co. | 6.250% | 3/1/39 | 1,600 | 1,856 |
| Pacific Gas & Electric Co. | 5.400% | 1/15/40 | 1,180 | 1,249 |
| Pacific Gas & Electric Co. | 4.500% | 12/15/41 | 750 | 702 |
| Pacific Gas & Electric Co. | 4.450% | 4/15/42 | 1,475 | 1,377 |
| Pacific Gas & Electric Co. | 4.600% | 6/15/43 | 1,700 | 1,617 |
| Pacific Gas & Electric Co. | 5.125% | 11/15/43 | 1,700 | 1,748 |
| PacifiCorp | 7.700% | 11/15/31 | 400 | 531 |
| PacifiCorp | 5.250% | 6/15/35 | 1,150 | 1,217 |
| PacifiCorp | 6.100% | 8/1/36 | 1,050 | 1,231 |
| PacifiCorp | 5.750% | 4/1/37 | 1,375 | 1,573 |
| PacifiCorp | 6.250% | 10/15/37 | 2,143 | 2,576 |
| PacifiCorp | 6.000% | 1/15/39 | 1,725 | 2,007 |
| PacifiCorp | 4.100% | 2/1/42 | 2,000 | 1,810 |
| Peco Energy Co. | 5.950% | 10/1/36 | 340 | 394 |
| Pennsylvania Electric Co. | 6.150% | 10/1/38 | 850 | 886 |
| Potomac Electric Power Co. | 6.500% | 11/15/37 | 2,000 | 2,472 |
| Potomac Electric Power Co. | 7.900% | 12/15/38 | 160 | 226 |
| Potomac Electric Power Co. | 4.150% | 3/15/43 | 725 | 659 |
75
| Vanguard® Long-Term Bond Index Fund | ||||
| Schedule of Investments | ||||
| December 31, 2013 | ||||
| Face | Market | |||
| Maturity | Amount | Value | ||
| Coupon | Date | ($000) | ($000) | |
| PPL Capital Funding Inc. | 4.700% | 6/1/43 | 975 | 878 |
| PPL Electric Utilities Corp. | 6.250% | 5/15/39 | 1,275 | 1,535 |
| PPL Electric Utilities Corp. | 5.200% | 7/15/41 | 800 | 849 |
| PPL Electric Utilities Corp. | 4.750% | 7/15/43 | 150 | 150 |
| Progress Energy Inc. | 7.750% | 3/1/31 | 1,725 | 2,215 |
| Progress Energy Inc. | 7.000% | 10/30/31 | 900 | 1,086 |
| Progress Energy Inc. | 6.000% | 12/1/39 | 1,775 | 1,983 |
| PSEG Power LLC | 8.625% | 4/15/31 | 1,075 | 1,458 |
| Public Service Co. of Colorado | 6.250% | 9/1/37 | 1,025 | 1,248 |
| Public Service Co. of Colorado | 6.500% | 8/1/38 | 630 | 781 |
| Public Service Co. of Colorado | 4.750% | 8/15/41 | 1,300 | 1,307 |
| Public Service Co. of Colorado | 3.600% | 9/15/42 | 1,850 | 1,538 |
| Public Service Co. of Oklahoma | 6.625% | 11/15/37 | 300 | 347 |
| Public Service Electric & Gas Co. | 5.800% | 5/1/37 | 2,050 | 2,353 |
| Public Service Electric & Gas Co. | 5.375% | 11/1/39 | 2,850 | 3,116 |
| Public Service Electric & Gas Co. | 3.950% | 5/1/42 | 875 | 780 |
| Public Service Electric & Gas Co. | 3.650% | 9/1/42 | 2,425 | 2,045 |
| Puget Sound Energy Inc. | 7.020% | 12/1/27 | 1,146 | 1,445 |
| Puget Sound Energy Inc. | 5.483% | 6/1/35 | 1,725 | 1,883 |
| Puget Sound Energy Inc. | 6.724% | 6/15/36 | 128 | 158 |
| Puget Sound Energy Inc. | 6.274% | 3/15/37 | 1,775 | 2,104 |
| Puget Sound Energy Inc. | 5.757% | 10/1/39 | 1,450 | 1,650 |
| Puget Sound Energy Inc. | 5.795% | 3/15/40 | 675 | 771 |
| Puget Sound Energy Inc. | 5.764% | 7/15/40 | 720 | 820 |
| Puget Sound Energy Inc. | 5.638% | 4/15/41 | 325 | 365 |
| Puget Sound Energy Inc. | 4.434% | 11/15/41 | 650 | 621 |
| San Diego Gas & Electric Co. | 6.000% | 6/1/26 | 500 | 595 |
| San Diego Gas & Electric Co. | 5.350% | 5/15/35 | 1,025 | 1,118 |
| San Diego Gas & Electric Co. | 6.125% | 9/15/37 | 841 | 1,002 |
| San Diego Gas & Electric Co. | 6.000% | 6/1/39 | 325 | 387 |
| San Diego Gas & Electric Co. | 5.350% | 5/15/40 | 200 | 221 |
| San Diego Gas & Electric Co. | 4.500% | 8/15/40 | 2,225 | 2,190 |
| San Diego Gas & Electric Co. | 3.950% | 11/15/41 | 900 | 809 |
| San Diego Gas & Electric Co. | 4.300% | 4/1/42 | 500 | 475 |
| Sierra Pacific Power Co. | 6.750% | 7/1/37 | 670 | 813 |
| South Carolina Electric & Gas Co. | 6.625% | 2/1/32 | 500 | 617 |
| South Carolina Electric & Gas Co. | 5.300% | 5/15/33 | 1,850 | 1,972 |
| South Carolina Electric & Gas Co. | 6.050% | 1/15/38 | 1,200 | 1,399 |
| South Carolina Electric & Gas Co. | 5.450% | 2/1/41 | 500 | 543 |
| South Carolina Electric & Gas Co. | 4.350% | 2/1/42 | 1,895 | 1,766 |
| South Carolina Electric & Gas Co. | 4.600% | 6/15/43 | 825 | 802 |
| Southern California Edison Co. | 6.650% | 4/1/29 | 200 | 238 |
| Southern California Edison Co. | 6.000% | 1/15/34 | 1,260 | 1,467 |
| Southern California Edison Co. | 5.750% | 4/1/35 | 800 | 907 |
| Southern California Edison Co. | 5.350% | 7/15/35 | 2,000 | 2,165 |
| Southern California Edison Co. | 5.550% | 1/15/36 | 100 | 111 |
| Southern California Edison Co. | 5.625% | 2/1/36 | 2,625 | 2,924 |
| Southern California Edison Co. | 5.550% | 1/15/37 | 500 | 552 |
| Southern California Edison Co. | 5.950% | 2/1/38 | 2,675 | 3,101 |
| Southern California Edison Co. | 6.050% | 3/15/39 | 325 | 381 |
| Southern California Edison Co. | 5.500% | 3/15/40 | 625 | 689 |
| Southern California Edison Co. | 4.500% | 9/1/40 | 2,525 | 2,436 |
| Southern California Edison Co. | 3.900% | 12/1/41 | 1,175 | 1,032 |
| Southern California Edison Co. | 4.050% | 3/15/42 | 875 | 785 |
| Southern California Edison Co. | 3.900% | 3/15/43 | 500 | 437 |
| Southern California Edison Co. | 4.650% | 10/1/43 | 2,500 | 2,478 |
| Southern Power Co. | 5.150% | 9/15/41 | 1,725 | 1,696 |
| Southern Power Co. | 5.250% | 7/15/43 | 500 | 499 |
| Southwestern Electric Power Co. | 6.200% | 3/15/40 | 400 | 436 |
| Southwestern Public Service Co. | 4.500% | 8/15/41 | 1,450 | 1,389 |
| Tampa Electric Co. | 6.550% | 5/15/36 | 800 | 963 |
| Tampa Electric Co. | 6.150% | 5/15/37 | 700 | 808 |
| Tampa Electric Co. | 4.100% | 6/15/42 | 2,750 | 2,463 |
| Toledo Edison Co. | 6.150% | 5/15/37 | 875 | 946 |
76
| Vanguard® Long-Term Bond Index Fund | ||||
| Schedule of Investments | ||||
| December 31, 2013 | ||||
| Face | Market | |||
| Maturity | Amount | Value | ||
| Coupon | Date | ($000) | ($000) | |
| TransAlta Corp. | 6.500% | 3/15/40 | 600 | 576 |
| Union Electric Co. | 5.300% | 8/1/37 | 1,675 | 1,787 |
| Union Electric Co. | 8.450% | 3/15/39 | 300 | 449 |
| Union Electric Co. | 3.900% | 9/15/42 | 1,675 | 1,471 |
| Virginia Electric & Power Co. | 6.000% | 1/15/36 | 1,725 | 1,993 |
| Virginia Electric & Power Co. | 6.000% | 5/15/37 | 1,725 | 1,994 |
| Virginia Electric & Power Co. | 6.350% | 11/30/37 | 1,300 | 1,559 |
| Virginia Electric & Power Co. | 8.875% | 11/15/38 | 1,460 | 2,239 |
| Virginia Electric & Power Co. | 4.000% | 1/15/43 | 2,175 | 1,943 |
| Virginia Electric & Power Co. | 4.650% | 8/15/43 | 1,700 | 1,677 |
| Westar Energy Inc. | 4.125% | 3/1/42 | 1,235 | 1,126 |
| Westar Energy Inc. | 4.100% | 4/1/43 | 900 | 818 |
| Westar Energy Inc. | 4.625% | 9/1/43 | 800 | 787 |
| Wisconsin Electric Power Co. | 5.625% | 5/15/33 | 450 | 499 |
| Wisconsin Electric Power Co. | 5.700% | 12/1/36 | 850 | 947 |
| Wisconsin Electric Power Co. | 3.650% | 12/15/42 | 325 | 270 |
| Wisconsin Power & Light Co. | 6.375% | 8/15/37 | 975 | 1,168 |
| Wisconsin Public Service Corp. | 3.671% | 12/1/42 | 850 | 724 |
| Xcel Energy Inc. | 6.500% | 7/1/36 | 650 | 769 |
| Xcel Energy Inc. | 4.800% | 9/15/41 | 600 | 583 |
| Natural Gas (2.6%) | ||||
| AGL Capital Corp. | 6.000% | 10/1/34 | 850 | 956 |
| AGL Capital Corp. | 5.875% | 3/15/41 | 1,725 | 1,884 |
| AGL Capital Corp. | 4.400% | 6/1/43 | 1,350 | 1,219 |
| Atmos Energy Corp. | 5.500% | 6/15/41 | 1,550 | 1,671 |
| Atmos Energy Corp. | 4.150% | 1/15/43 | 1,400 | 1,253 |
| Buckeye Partners LP | 5.850% | 11/15/43 | 900 | 883 |
| CenterPoint Energy Resources Corp. | 5.850% | 1/15/41 | 1,600 | 1,807 |
| DCP Midstream LLC | 8.125% | 8/16/30 | 1,075 | 1,311 |
| 4 Dominion Gas Holdings LLC | 4.800% | 11/1/43 | 1,000 | 961 |
| El Paso Natural Gas Co. LLC | 8.375% | 6/15/32 | 782 | 1,007 |
| El Paso Pipeline Partners Operating Co. LLC | 7.500% | 11/15/40 | 1,500 | 1,773 |
| El Paso Pipeline Partners Operating Co. LLC | 4.700% | 11/1/42 | 1,650 | 1,413 |
| Enbridge Energy Partners LP | 7.500% | 4/15/38 | 2,170 | 2,560 |
| Enbridge Energy Partners LP | 5.500% | 9/15/40 | 425 | 409 |
| Energy Transfer Partners LP | 7.600% | 2/1/24 | 450 | 537 |
| Energy Transfer Partners LP | 8.250% | 11/15/29 | 950 | 1,146 |
| Energy Transfer Partners LP | 6.625% | 10/15/36 | 750 | 805 |
| Energy Transfer Partners LP | 7.500% | 7/1/38 | 2,775 | 3,256 |
| Energy Transfer Partners LP | 6.050% | 6/1/41 | 3,050 | 3,102 |
| Energy Transfer Partners LP | 6.500% | 2/1/42 | 4,930 | 5,281 |
| Energy Transfer Partners LP | 5.150% | 2/1/43 | 1,250 | 1,134 |
| Enterprise Products Operating LLC | 6.875% | 3/1/33 | 2,275 | 2,701 |
| Enterprise Products Operating LLC | 6.650% | 10/15/34 | 1,070 | 1,243 |
| Enterprise Products Operating LLC | 5.750% | 3/1/35 | 850 | 896 |
| Enterprise Products Operating LLC | 7.550% | 4/15/38 | 1,225 | 1,535 |
| Enterprise Products Operating LLC | 6.125% | 10/15/39 | 1,500 | 1,641 |
| Enterprise Products Operating LLC | 6.450% | 9/1/40 | 1,275 | 1,452 |
| Enterprise Products Operating LLC | 5.950% | 2/1/41 | 2,325 | 2,515 |
| Enterprise Products Operating LLC | 5.700% | 2/15/42 | 1,225 | 1,281 |
| Enterprise Products Operating LLC | 4.850% | 8/15/42 | 1,750 | 1,641 |
| Enterprise Products Operating LLC | 4.450% | 2/15/43 | 2,950 | 2,598 |
| Enterprise Products Operating LLC | 4.850% | 3/15/44 | 2,150 | 2,013 |
| KeySpan Corp. | 8.000% | 11/15/30 | 1,175 | 1,507 |
| Kinder Morgan Energy Partners LP | 4.150% | 2/1/24 | 2,725 | 2,627 |
| Kinder Morgan Energy Partners LP | 7.400% | 3/15/31 | 500 | 587 |
| Kinder Morgan Energy Partners LP | 7.750% | 3/15/32 | 500 | 606 |
| Kinder Morgan Energy Partners LP | 7.300% | 8/15/33 | 1,600 | 1,880 |
| Kinder Morgan Energy Partners LP | 5.800% | 3/15/35 | 2,575 | 2,618 |
| Kinder Morgan Energy Partners LP | 6.500% | 2/1/37 | 1,900 | 2,087 |
| Kinder Morgan Energy Partners LP | 6.950% | 1/15/38 | 3,769 | 4,341 |
| Kinder Morgan Energy Partners LP | 6.500% | 9/1/39 | 1,875 | 2,061 |
| Kinder Morgan Energy Partners LP | 6.550% | 9/15/40 | 375 | 418 |
77
| Vanguard® Long-Term Bond Index Fund | ||||
| Schedule of Investments | ||||
| December 31, 2013 | ||||
| Face | Market | |||
| Maturity | Amount | Value | ||
| Coupon | Date | ($000) | ($000) | |
| Kinder Morgan Energy Partners LP | 6.375% | 3/1/41 | 1,750 | 1,903 |
| Kinder Morgan Energy Partners LP | 5.625% | 9/1/41 | 1,275 | 1,266 |
| Kinder Morgan Energy Partners LP | 5.000% | 8/15/42 | 1,500 | 1,376 |
| Kinder Morgan Energy Partners LP | 5.000% | 3/1/43 | 2,100 | 1,910 |
| Magellan Midstream Partners LP | 6.400% | 5/1/37 | 175 | 200 |
| Magellan Midstream Partners LP | 4.200% | 12/1/42 | 1,150 | 968 |
| Magellan Midstream Partners LP | 5.150% | 10/15/43 | 1,875 | 1,843 |
| Nisource Finance Corp. | 6.250% | 12/15/40 | 730 | 792 |
| Nisource Finance Corp. | 5.950% | 6/15/41 | 2,625 | 2,755 |
| Nisource Finance Corp. | 5.800% | 2/1/42 | 700 | 725 |
| Nisource Finance Corp. | 5.250% | 2/15/43 | 2,250 | 2,177 |
| Nisource Finance Corp. | 4.800% | 2/15/44 | 1,625 | 1,466 |
| ONEOK Inc. | 6.000% | 6/15/35 | 975 | 915 |
| ONEOK Partners LP | 6.650% | 10/1/36 | 2,025 | 2,234 |
| ONEOK Partners LP | 6.850% | 10/15/37 | 200 | 226 |
| ONEOK Partners LP | 6.125% | 2/1/41 | 2,100 | 2,227 |
| Piedmont Natural Gas Co. Inc. | 4.650% | 8/1/43 | 850 | 818 |
| Plains All American Pipeline LP / PAA Finance Corp. | 6.700% | 5/15/36 | 845 | 992 |
| Plains All American Pipeline LP / PAA Finance Corp. | 6.650% | 1/15/37 | 2,225 | 2,607 |
| Plains All American Pipeline LP / PAA Finance Corp. | 5.150% | 6/1/42 | 600 | 582 |
| Plains All American Pipeline LP / PAA Finance Corp. | 4.300% | 1/31/43 | 350 | 301 |
| Sempra Energy | 6.000% | 10/15/39 | 3,450 | 3,801 |
| Southern California Gas Co. | 5.750% | 11/15/35 | 75 | 86 |
| Southern California Gas Co. | 3.750% | 9/15/42 | 1,350 | 1,175 |
| Southern Natural Gas Co. LLC | 8.000% | 3/1/32 | 2,158 | 2,751 |
| Spectra Energy Capital LLC | 6.750% | 2/15/32 | 905 | 930 |
| Spectra Energy Partners LP | 4.750% | 3/15/24 | 3,000 | 3,075 |
| Spectra Energy Partners LP | 5.950% | 9/25/43 | 1,000 | 1,077 |
| Sunoco Logistics Partners Operations LP | 6.850% | 2/15/40 | 850 | 941 |
| Sunoco Logistics Partners Operations LP | 6.100% | 2/15/42 | 1,000 | 1,013 |
| Sunoco Logistics Partners Operations LP | 4.950% | 1/15/43 | 1,650 | 1,470 |
| Tennessee Gas Pipeline Co. LLC | 7.000% | 3/15/27 | 1,466 | 1,719 |
| Tennessee Gas Pipeline Co. LLC | 7.000% | 10/15/28 | 1,400 | 1,645 |
| Tennessee Gas Pipeline Co. LLC | 7.625% | 4/1/37 | 110 | 139 |
| Texas Eastern Transmission LP | 7.000% | 7/15/32 | 1,100 | 1,308 |
| TransCanada PipeLines Ltd. | 5.600% | 3/31/34 | 1,425 | 1,498 |
| TransCanada PipeLines Ltd. | 5.850% | 3/15/36 | 3,150 | 3,420 |
| TransCanada PipeLines Ltd. | 6.200% | 10/15/37 | 2,500 | 2,837 |
| TransCanada PipeLines Ltd. | 7.250% | 8/15/38 | 3,850 | 4,873 |
| TransCanada PipeLines Ltd. | 7.625% | 1/15/39 | 1,740 | 2,317 |
| TransCanada PipeLines Ltd. | 6.100% | 6/1/40 | 475 | 534 |
| TransCanada PipeLines Ltd. | 5.000% | 10/16/43 | 1,075 | 1,054 |
| Transcontinental Gas Pipe Line Co. LLC | 5.400% | 8/15/41 | 750 | 764 |
| Transcontinental Gas Pipe Line Co. LLC | 4.450% | 8/1/42 | 1,075 | 945 |
| Williams Cos. Inc. | 7.500% | 1/15/31 | 1,151 | 1,211 |
| Williams Cos. Inc. | 8.750% | 3/15/32 | 1,191 | 1,408 |
| Williams Partners LP | 6.300% | 4/15/40 | 1,765 | 1,900 |
| Williams Partners LP | 5.800% | 11/15/43 | 2,550 | 2,596 |
| Other Utility (0.1%) | ||||
| American Water Capital Corp. | 3.850% | 3/1/24 | 825 | 810 |
| American Water Capital Corp. | 6.593% | 10/15/37 | 2,675 | 3,207 |
| American Water Capital Corp. | 4.300% | 12/1/42 | 750 | 673 |
| United Utilities plc | 6.875% | 8/15/28 | 1,425 | 1,526 |
| Veolia Environnement SA | 6.750% | 6/1/38 | 1,425 | 1,549 |
| 507,086 | ||||
| Total Corporate Bonds (Cost $2,788,579) | 2,835,174 | |||
| Sovereign Bonds (U.S. Dollar-Denominated) (7.7%) | ||||
| Asian Development Bank | 5.593% | 7/16/18 | 4,000 | 4,636 |
| Asian Development Bank | 5.820% | 6/16/28 | 240 | 285 |
| CNOOC Finance 2013 Ltd. | 4.250% | 5/9/43 | 2,500 | 2,077 |
| Ecopetrol SA | 7.375% | 9/18/43 | 2,500 | 2,671 |
| European Investment Bank | 4.875% | 2/15/36 | 1,600 | 1,745 |
78
| Vanguard® Long-Term Bond Index Fund | ||||
| Schedule of Investments | ||||
| December 31, 2013 | ||||
| Face | Market | |||
| Maturity | Amount | Value | ||
| Coupon | Date | ($000) | ($000) | |
| Federative Republic of Brazil | 8.875% | 4/15/24 | 3,000 | 3,970 |
| Federative Republic of Brazil | 8.875% | 4/15/24 | 5,025 | 6,651 |
| Federative Republic of Brazil | 4.250% | 1/7/25 | 7,600 | 7,175 |
| Federative Republic of Brazil | 8.750% | 2/4/25 | 4,200 | 5,565 |
| Federative Republic of Brazil | 10.125% | 5/15/27 | 2,400 | 3,528 |
| Federative Republic of Brazil | 8.250% | 1/20/34 | 7,675 | 9,728 |
| Federative Republic of Brazil | 7.125% | 1/20/37 | 8,095 | 9,232 |
| 3 Federative Republic of Brazil | 11.000% | 8/17/40 | 5,150 | 5,850 |
| Federative Republic of Brazil | 5.625% | 1/7/41 | 10,600 | 10,176 |
| Hydro-Quebec | 8.050% | 7/7/24 | 5,000 | 6,606 |
| Hydro-Quebec | 8.500% | 12/1/29 | 1,321 | 1,862 |
| Inter-American Development Bank | 7.000% | 6/15/25 | 750 | 964 |
| Inter-American Development Bank | 3.875% | 10/28/41 | 1,200 | 1,074 |
| Inter-American Development Bank | 3.200% | 8/7/42 | 1,750 | 1,372 |
| International Bank for Reconstruction & Development | 8.875% | 3/1/26 | 1,000 | 1,499 |
| International Bank for Reconstruction & Development | 4.750% | 2/15/35 | 1,775 | 1,898 |
| 5 KFW | 0.000% | 4/18/36 | 11,500 | 4,501 |
| 5 KFW | 0.000% | 6/29/37 | 825 | 307 |
| Korea Electric Power Corp. | 7.000% | 2/1/27 | 750 | 877 |
| Nexen Energy ULC | 7.875% | 3/15/32 | 1,800 | 2,341 |
| Nexen Energy ULC | 5.875% | 3/10/35 | 1,850 | 1,981 |
| Nexen Energy ULC | 6.400% | 5/15/37 | 3,740 | 4,231 |
| Nexen Energy ULC | 7.500% | 7/30/39 | 1,525 | 1,932 |
| 3 Oriental Republic of Uruguay | 4.500% | 8/14/24 | 5,200 | 5,198 |
| 3 Oriental Republic of Uruguay | 7.625% | 3/21/36 | 4,943 | 5,944 |
| 3 Oriental Republic of Uruguay | 4.125% | 11/20/45 | 2,100 | 1,593 |
| Pemex Project Funding Master Trust | 6.625% | 6/15/35 | 7,620 | 7,941 |
| Pemex Project Funding Master Trust | 6.625% | 6/15/38 | 1,375 | 1,404 |
| Petrobras Global Finance BV | 5.625% | 5/20/43 | 2,700 | 2,189 |
| Petrobras International Finance Co. | 6.875% | 1/20/40 | 4,900 | 4,620 |
| Petrobras International Finance Co. | 6.750% | 1/27/41 | 7,295 | 6,759 |
| Petroleos Mexicanos | 4.875% | 1/18/24 | 2,800 | 2,780 |
| 3 Petroleos Mexicanos | 2.290% | 2/15/24 | 1,900 | 1,869 |
| Petroleos Mexicanos | 6.500% | 6/2/41 | 8,625 | 8,939 |
| Petroleos Mexicanos | 5.500% | 6/27/44 | 6,950 | 6,295 |
| Province of British Columbia | 6.500% | 1/15/26 | 1,500 | 1,863 |
| Province of British Columbia | 7.250% | 9/1/36 | 500 | 688 |
| Quebec | 7.125% | 2/9/24 | 2,925 | 3,656 |
| Quebec | 7.500% | 9/15/29 | 5,715 | 7,514 |
| Region of Lombardy Italy | 5.804% | 10/25/32 | 2,375 | 2,162 |
| Republic of Chile | 3.625% | 10/30/42 | 2,925 | 2,280 |
| Republic of Colombia | 4.000% | 2/26/24 | 5,650 | 5,466 |
| Republic of Colombia | 8.125% | 5/21/24 | 3,650 | 4,677 |
| Republic of Colombia | 7.375% | 9/18/37 | 4,772 | 5,858 |
| Republic of Colombia | 6.125% | 1/18/41 | 7,225 | 7,676 |
| Republic of Finland | 6.950% | 2/15/26 | 695 | 860 |
| Republic of Italy | 5.375% | 6/15/33 | 6,925 | 7,292 |
| Republic of Korea | 5.625% | 11/3/25 | 1,475 | 1,669 |
| Republic of Panama | 7.125% | 1/29/26 | 4,215 | 5,026 |
| Republic of Panama | 8.875% | 9/30/27 | 1,460 | 1,956 |
| Republic of Panama | 9.375% | 4/1/29 | 2,135 | 2,946 |
| 3 Republic of Panama | 6.700% | 1/26/36 | 6,926 | 7,740 |
| 3 Republic of Panama | 4.300% | 4/29/53 | 1,350 | 1,033 |
| Republic of Peru | 7.350% | 7/21/25 | 6,900 | 8,694 |
| Republic of Peru | 8.750% | 11/21/33 | 6,050 | 8,606 |
| 3 Republic of Peru | 6.550% | 3/14/37 | 3,125 | 3,594 |
| Republic of Peru | 5.625% | 11/18/50 | 5,020 | 4,916 |
| 3 Republic of Philippines | 7.500% | 9/25/24 | 4,375 | 5,436 |
| Republic of Philippines | 9.500% | 10/21/24 | 200 | 283 |
| Republic of Philippines | 10.625% | 3/16/25 | 4,975 | 7,587 |
| Republic of Philippines | 5.500% | 3/30/26 | 3,525 | 3,860 |
| Republic of Philippines | 9.500% | 2/2/30 | 5,250 | 7,796 |
| Republic of Philippines | 7.750% | 1/14/31 | 7,275 | 9,576 |
| Republic of Philippines | 6.375% | 1/15/32 | 1,900 | 2,209 |
79
| Vanguard® Long-Term Bond Index Fund | ||||
| Schedule of Investments | ||||
| December 31, 2013 | ||||
| Face | Market | |||
| Maturity | Amount | Value | ||
| Coupon | Date | ($000) | ($000) | |
| Republic of Philippines | 6.375% | 10/23/34 | 8,950 | 10,628 |
| Republic of Philippines | 5.000% | 1/13/37 | 2,875 | 2,986 |
| Republic of South Africa | 6.875% | 5/27/19 | 150 | 171 |
| Republic of South Africa | 4.665% | 1/17/24 | 5,375 | 5,153 |
| Republic of South Africa | 5.875% | 9/16/25 | 5,200 | 5,395 |
| Republic of South Africa | 6.250% | 3/8/41 | 850 | 881 |
| Republic of Turkey | 7.375% | 2/5/25 | 8,850 | 9,554 |
| Republic of Turkey | 11.875% | 1/15/30 | 4,150 | 6,192 |
| Republic of Turkey | 8.000% | 2/14/34 | 5,675 | 6,294 |
| Republic of Turkey | 6.875% | 3/17/36 | 9,000 | 8,829 |
| Republic of Turkey | 7.250% | 3/5/38 | 2,000 | 2,058 |
| Republic of Turkey | 6.750% | 5/30/40 | 7,000 | 6,769 |
| Republic of Turkey | 6.000% | 1/14/41 | 9,700 | 8,517 |
| State of Israel | 4.500% | 1/30/43 | 3,500 | 3,073 |
| Statoil ASA | 3.700% | 3/1/24 | 3,000 | 2,980 |
| Statoil ASA | 7.250% | 9/23/27 | 2,500 | 3,219 |
| Statoil ASA | 6.800% | 1/15/28 | 185 | 228 |
| Statoil ASA | 7.150% | 1/15/29 | 1,090 | 1,390 |
| Statoil ASA | 5.100% | 8/17/40 | 2,300 | 2,377 |
| Statoil ASA | 4.250% | 11/23/41 | 1,925 | 1,746 |
| Statoil ASA | 3.950% | 5/15/43 | 4,470 | 3,891 |
| Statoil ASA | 4.800% | 11/8/43 | 1,500 | 1,506 |
| United Mexican States | 8.300% | 8/15/31 | 3,460 | 4,684 |
| United Mexican States | 7.500% | 4/8/33 | 3,300 | 4,117 |
| United Mexican States | 6.750% | 9/27/34 | 7,337 | 8,658 |
| United Mexican States | 6.050% | 1/11/40 | 14,295 | 15,546 |
| United Mexican States | 4.750% | 3/8/44 | 14,215 | 12,805 |
| United Mexican States | 5.750% | 10/12/10 | 7,100 | 6,460 |
| Total Sovereign Bonds (Cost $467,670) | 439,291 | |||
| Taxable Municipal Bonds (6.2%) | ||||
| Alameda County CA Joint Powers Authority Lease | ||||
| Revenue | 7.046% | 12/1/44 | 1,100 | 1,216 |
| American Municipal Power Ohio Inc. Revenue | ||||
| (Hydroelectric Projects) | 6.449% | 2/15/44 | 680 | 727 |
| American Municipal Power Ohio Inc. Revenue (Prairie | ||||
| State Energy Campus Project) | 7.834% | 2/15/41 | 645 | 815 |
| American Municipal Power Ohio Inc. Revenue (Prairie | ||||
| State Energy Campus Project) | 6.053% | 2/15/43 | 550 | 571 |
| American Municipal Power Ohio Inc. Revenue (Prairie | ||||
| State Energy Campus Project) | 5.939% | 2/15/47 | 2,700 | 2,773 |
| American Municipal Power Ohio Inc. Revenue (Prairie | ||||
| State Energy Campus Project) | 6.270% | 2/15/50 | 450 | 479 |
| American Municipal Power Ohio Inc. Revenue (Prairie | ||||
| State Energy Campus Project) | 7.499% | 2/15/50 | 175 | 212 |
| American Municipal Power Ohio Inc. Revenue (Prairie | ||||
| State Energy Campus Project) | 8.084% | 2/15/50 | 2,845 | 3,766 |
| Bay Area Toll Authority California Toll Bridge Revenue | ||||
| (San Francisco Bay Area) | 6.793% | 4/1/30 | 600 | 704 |
| Bay Area Toll Authority California Toll Bridge Revenue | ||||
| (San Francisco Bay Area) | 6.918% | 4/1/40 | 1,095 | 1,337 |
| Bay Area Toll Authority California Toll Bridge Revenue | ||||
| (San Francisco Bay Area) | 6.263% | 4/1/49 | 3,550 | 4,258 |
| Bay Area Toll Authority California Toll Bridge Revenue | ||||
| (San Francisco Bay Area) | 7.043% | 4/1/50 | 2,850 | 3,503 |
| Bay Area Toll Authority California Toll Bridge Revenue | ||||
| (San Francisco Bay Area) | 6.907% | 10/1/50 | 1,305 | 1,581 |
| California GO | 7.700% | 11/1/30 | 1,100 | 1,274 |
| California GO | 7.500% | 4/1/34 | 8,280 | 10,536 |
| California GO | 7.950% | 3/1/36 | 1,450 | 1,682 |
| California GO | 7.550% | 4/1/39 | 6,390 | 8,281 |
| California GO | 7.300% | 10/1/39 | 4,830 | 6,074 |
| California GO | 7.350% | 11/1/39 | 3,675 | 4,685 |
80
| Vanguard® Long-Term Bond Index Fund | ||||
| Schedule of Investments | ||||
| December 31, 2013 | ||||
| Face | Market | |||
| Maturity | Amount | Value | ||
| Coupon | Date | ($000) | ($000) | |
| California GO | 7.625% | 3/1/40 | 4,865 | 6,405 |
| California GO | 7.600% | 11/1/40 | 5,250 | 6,931 |
| California Public Works Board Lease Revenue (Various | ||||
| Capital Projects) | 8.361% | 10/1/34 | 725 | 876 |
| Central Puget Sound WA Regional Transit Authority | ||||
| Sales & Use Tax Revenue | 5.491% | 11/1/39 | 650 | 715 |
| Chicago IL Board of Education GO | 6.319% | 11/1/29 | 805 | 781 |
| Chicago IL Board of Education GO | 6.138% | 12/1/39 | 800 | 701 |
| Chicago IL GO | 7.781% | 1/1/35 | 675 | 748 |
| Chicago IL GO | 5.432% | 1/1/42 | 900 | 759 |
| Chicago IL Metropolitan Water Reclamation District GO | 5.720% | 12/1/38 | 1,425 | 1,547 |
| Chicago IL O'Hare International Airport Revenue | 6.845% | 1/1/38 | 600 | 640 |
| Chicago IL O'Hare International Airport Revenue | 6.395% | 1/1/40 | 1,150 | 1,283 |
| Chicago IL Transit Authority Sales Tax Receipts | ||||
| Revenue | 6.200% | 12/1/40 | 200 | 212 |
| Chicago IL Transit Authority Transfer Tax Receipts | ||||
| Revenue | 6.899% | 12/1/40 | 5,450 | 6,109 |
| Chicago IL Wastewater Transmission Revenue | 6.900% | 1/1/40 | 575 | 641 |
| Chicago IL Water Revenue | 6.742% | 11/1/40 | 800 | 888 |
| Clark County NV Airport Revenue | 6.881% | 7/1/42 | 1,650 | 1,778 |
| Clark County NV Airport Revenue | 6.820% | 7/1/45 | 1,000 | 1,246 |
| Colorado Bridge Enterprise Revenue | 6.078% | 12/1/40 | 280 | 323 |
| Commonwealth Financing Authority Pennsylvania | ||||
| Revenue | 6.218% | 6/1/39 | 1,190 | 1,293 |
| Connecticut GO | 5.090% | 10/1/30 | 1,350 | 1,332 |
| Connecticut GO | 5.850% | 3/15/32 | 4,150 | 4,649 |
| Connecticut Special Tax Revenue (Transportation | ||||
| Infrastructure) | 5.459% | 11/1/30 | 900 | 934 |
| Cook County IL GO | 6.229% | 11/15/34 | 1,050 | 1,049 |
| Curators of the University of Missouri System Facilities | ||||
| Revenue | 5.960% | 11/1/39 | 1,220 | 1,451 |
| Curators of the University of Missouri System Facilities | ||||
| Revenue | 5.792% | 11/1/41 | 200 | 232 |
| Dallas County TX Hospital District Revenue | 5.621% | 8/15/44 | 850 | 935 |
| Dallas TX Area Rapid Transit Revenue | 4.922% | 12/1/41 | 515 | 533 |
| Dallas TX Area Rapid Transit Revenue | 5.999% | 12/1/44 | 1,570 | 1,860 |
| Dallas TX Area Rapid Transit Revenue | 5.022% | 12/1/48 | 1,665 | 1,703 |
| Dallas TX Convention Center Hotel Development Corp. | ||||
| Hotel Revenue | 7.088% | 1/1/42 | 990 | 1,118 |
| Dallas TX Independent School District GO | 6.450% | 2/15/35 | 1,495 | 1,674 |
| Denver CO City & County School District No. 1 COP | 4.242% | 12/15/37 | 800 | 712 |
| Denver CO City & County School District No. 1 COP | 7.017% | 12/15/37 | 850 | 987 |
| Denver CO City & County School District No. 1 GO | 5.664% | 12/1/33 | 525 | 575 |
| District of Columbia Income Tax Revenue | 5.591% | 12/1/34 | 675 | 743 |
| District of Columbia Income Tax Revenue | 5.582% | 12/1/35 | 735 | 806 |
| District of Columbia Water & Sewer Authority Public | ||||
| Utility Revenue | 5.522% | 10/1/44 | 575 | 599 |
| East Baton Rouge LA Sewer Commission Revenue | 6.087% | 2/1/45 | 700 | 725 |
| East Bay CA Municipal Utility District Water System | ||||
| Revenue | 5.874% | 6/1/40 | 1,990 | 2,259 |
| Georgia GO | 4.503% | 11/1/25 | 825 | 874 |
| Georgia Municipal Electric Power Authority Revenue | 6.637% | 4/1/57 | 4,325 | 4,550 |
| Georgia Municipal Electric Power Authority Revenue | 6.655% | 4/1/57 | 2,825 | 2,952 |
| Georgia Municipal Electric Power Authority Revenue | 7.055% | 4/1/57 | 850 | 860 |
| Houston TX GO | 6.290% | 3/1/32 | 900 | 1,007 |
| Illinois GO | 5.100% | 6/1/33 | 20,130 | 18,757 |
| Illinois GO | 6.630% | 2/1/35 | 2,975 | 3,107 |
| Illinois GO | 6.725% | 4/1/35 | 2,000 | 2,107 |
| Illinois GO | 7.350% | 7/1/35 | 750 | 836 |
| Illinois Toll Highway Authority Revenue | 6.184% | 1/1/34 | 1,200 | 1,378 |
| Illinois Toll Highway Authority Revenue | 5.851% | 12/1/34 | 600 | 666 |
| Indianapolis IN Local Public Improvement Revenue | 6.116% | 1/15/40 | 1,075 | 1,245 |
| JobsOhio Beverage System Statewide Liquor Profits | ||||
| Revenue | 3.985% | 1/1/29 | 1,125 | 1,027 |
81
| Vanguard® Long-Term Bond Index Fund | ||||
| Schedule of Investments | ||||
| December 31, 2013 | ||||
| Face | Market | |||
| Maturity | Amount | Value | ||
| Coupon | Date | ($000) | ($000) | |
| JobsOhio Beverage System Statewide Liquor Profits | ||||
| Revenue | 4.532% | 1/1/35 | 1,050 | 972 |
| Kansas Department of Transportation Highway | ||||
| Revenue | 4.596% | 9/1/35 | 925 | 911 |
| 6 Kansas Development Finance Authority Revenue | ||||
| (Public Employees Retirement System) | 5.501% | 5/1/34 | 500 | 514 |
| Las Vegas Valley Water District Nevada GO | 7.013% | 6/1/39 | 525 | 576 |
| Los Angeles CA Community College District GO | 6.600% | 8/1/42 | 2,300 | 2,848 |
| Los Angeles CA Community College District GO | 6.750% | 8/1/49 | 700 | 884 |
| Los Angeles CA Department of Airports International | ||||
| Airport Revenue | 6.582% | 5/15/39 | 305 | 353 |
| Los Angeles CA Department of Water & Power | ||||
| Revenue | 5.716% | 7/1/39 | 775 | 853 |
| Los Angeles CA Department of Water & Power | ||||
| Revenue | 6.008% | 7/1/39 | 775 | 868 |
| Los Angeles CA Department of Water & Power | ||||
| Revenue | 6.166% | 7/1/40 | 625 | 662 |
| Los Angeles CA Department of Water & Power | ||||
| Revenue | 6.574% | 7/1/45 | 1,375 | 1,716 |
| Los Angeles CA Department of Water & Power | ||||
| Revenue | 6.603% | 7/1/50 | 1,500 | 1,851 |
| Los Angeles CA Unified School District GO | 5.755% | 7/1/29 | 1,105 | 1,213 |
| Los Angeles CA Unified School District GO | 5.750% | 7/1/34 | 3,795 | 4,178 |
| Los Angeles CA Unified School District GO | 6.758% | 7/1/34 | 2,660 | 3,281 |
| Los Angeles County CA Metropolitan Transportation | ||||
| Authority Sales Tax Revenue | 5.735% | 6/1/39 | 1,150 | 1,237 |
| Los Angeles County CA Public Works Financing | ||||
| Authority Lease Revenue | 7.488% | 8/1/33 | 700 | 840 |
| Los Angeles County CA Public Works Financing | ||||
| Authority Lease Revenue | 7.618% | 8/1/40 | 700 | 823 |
| Maryland Transportation Authority Facilities Projects | ||||
| Revenue | 5.888% | 7/1/43 | 850 | 921 |
| Massachusetts GO | 4.500% | 8/1/31 | 1,500 | 1,442 |
| Massachusetts GO | 5.456% | 12/1/39 | 2,850 | 3,099 |
| Massachusetts School Building Authority Dedicated | ||||
| Sales Tax Revenue | 5.715% | 8/15/39 | 1,050 | 1,176 |
| Massachusetts Transportation Fund Revenue | 5.731% | 6/1/40 | 850 | 966 |
| Massachusetts Water Pollution Abatement Trust | 5.192% | 8/1/40 | 900 | 918 |
| Metropolitan Government of Nashville & Davidson | ||||
| County TN Convention Center Authority Tourism Tax | ||||
| Revenue | 6.731% | 7/1/43 | 1,000 | 1,109 |
| Metropolitan Government of Nashville & Davidson | ||||
| County TN GO | 5.707% | 7/1/34 | 1,200 | 1,285 |
| Metropolitan Washington DC/VA Airports Authority | ||||
| Dulles Toll Road Revenue | 7.462% | 10/1/46 | 855 | 959 |
| Metropolitan Water District of Southern California | ||||
| Revenue | 6.947% | 7/1/40 | 575 | 642 |
| Mississippi GO | 5.245% | 11/1/34 | 700 | 732 |
| Missouri Highways & Transportation Commission Road | ||||
| Revenue | 5.445% | 5/1/33 | 600 | 651 |
| 7 New Jersey Economic Development Authority | ||||
| Revenue (State Pension Funding) | 7.425% | 2/15/29 | 5,600 | 6,711 |
| New Jersey Transportation Trust Fund Authority | ||||
| Transportation System Revenue | 5.754% | 12/15/28 | 1,700 | 1,834 |
| New Jersey Transportation Trust Fund Authority | ||||
| Transportation System Revenue | 6.104% | 12/15/28 | 1,150 | 1,234 |
| New Jersey Transportation Trust Fund Authority | ||||
| Transportation System Revenue | 6.561% | 12/15/40 | 2,325 | 2,724 |
| 8 New Jersey Turnpike Authority Revenue | 4.252% | 1/1/16 | 30 | 31 |
| New Jersey Turnpike Authority Revenue | 7.414% | 1/1/40 | 4,689 | 6,248 |
| New Jersey Turnpike Authority Revenue | 7.102% | 1/1/41 | 4,460 | 5,711 |
| New York City NY GO | 5.206% | 10/1/31 | 1,070 | 1,115 |
| New York City NY GO | 6.646% | 12/1/31 | 400 | 442 |
| New York City NY GO | 6.246% | 6/1/35 | 1,075 | 1,146 |
82
| Vanguard® Long-Term Bond Index Fund | ||||
| Schedule of Investments | ||||
| December 31, 2013 | ||||
| Face | Market | |||
| Maturity | Amount | Value | ||
| Coupon | Date | ($000) | ($000) | |
| New York City NY GO | 5.968% | 3/1/36 | 415 | 467 |
| New York City NY GO | 5.985% | 12/1/36 | 625 | 701 |
| New York City NY GO | 5.517% | 10/1/37 | 1,875 | 1,961 |
| New York City NY GO | 6.271% | 12/1/37 | 1,620 | 1,890 |
| New York City NY GO | 5.846% | 6/1/40 | 400 | 436 |
| New York City NY Municipal Water Finance Authority | ||||
| Water & Sewer System Revenue | 5.750% | 6/15/41 | 900 | 1,015 |
| New York City NY Municipal Water Finance Authority | ||||
| Water & Sewer System Revenue | 5.790% | 6/15/41 | 500 | 522 |
| New York City NY Municipal Water Finance Authority | ||||
| Water & Sewer System Revenue | 5.724% | 6/15/42 | 550 | 617 |
| New York City NY Municipal Water Finance Authority | ||||
| Water & Sewer System Revenue | 5.952% | 6/15/42 | 800 | 926 |
| New York City NY Municipal Water Finance Authority | ||||
| Water & Sewer System Revenue | 6.011% | 6/15/42 | 1,475 | 1,720 |
| New York City NY Municipal Water Finance Authority | ||||
| Water & Sewer System Revenue | 5.440% | 6/15/43 | 1,995 | 2,142 |
| New York City NY Municipal Water Finance Authority | ||||
| Water & Sewer System Revenue | 5.882% | 6/15/44 | 2,070 | 2,358 |
| New York City NY Transitional Finance Authority | ||||
| Building Aid Revenue | 6.828% | 7/15/40 | 800 | 959 |
| New York City NY Transitional Finance Authority Future | ||||
| Tax Revenue | 5.267% | 5/1/27 | 200 | 215 |
| New York City NY Transitional Finance Authority Future | ||||
| Tax Revenue | 5.767% | 8/1/36 | 775 | 879 |
| New York City NY Transitional Finance Authority Future | ||||
| Tax Revenue | 5.508% | 8/1/37 | 2,215 | 2,428 |
| New York City NY Transitional Finance Authority Future | ||||
| Tax Revenue | 5.572% | 11/1/38 | 1,150 | 1,276 |
| New York Metropolitan Transportation Authority | ||||
| Revenue (Dedicated Tax Fund) | 7.336% | 11/15/39 | 5,025 | 6,576 |
| New York Metropolitan Transportation Authority | ||||
| Revenue (Dedicated Tax Fund) | 6.089% | 11/15/40 | 575 | 657 |
| New York Metropolitan Transportation Authority | ||||
| Revenue (Transit Revenue) | 6.548% | 11/15/31 | 500 | 573 |
| New York Metropolitan Transportation Authority | ||||
| Revenue (Transit Revenue) | 5.871% | 11/15/39 | 700 | 751 |
| New York Metropolitan Transportation Authority | ||||
| Revenue (Transit Revenue) | 6.648% | 11/15/39 | 1,750 | 2,034 |
| New York State Dormitory Authority Revenue (Personal | ||||
| Income Tax) | 5.500% | 3/15/30 | 2,550 | 2,771 |
| New York State Dormitory Authority Revenue (Personal | ||||
| Income Tax) | 5.289% | 3/15/33 | 500 | 530 |
| New York State Dormitory Authority Revenue (Personal | ||||
| Income Tax) | 5.628% | 3/15/39 | 2,000 | 2,204 |
| New York State Dormitory Authority Revenue (Personal | ||||
| Income Tax) | 5.389% | 3/15/40 | 635 | 685 |
| New York State Urban Development Corp. Revenue | ||||
| (Personal Income Tax) | 5.770% | 3/15/39 | 1,625 | 1,773 |
| New York State Urban Development Corp. Revenue | ||||
| (Personal Income Tax) | 5.838% | 3/15/40 | 625 | 704 |
| New York University Hospitals Center Revenue | 4.428% | 7/1/42 | 1,025 | 857 |
| New York University Hospitals Center Revenue | 5.750% | 7/1/43 | 925 | 934 |
| North Carolina Turnpike Authority Revenue | 6.700% | 1/1/39 | 170 | 183 |
| North Texas Tollway Authority System Revenue | 6.718% | 1/1/49 | 2,635 | 3,203 |
| Ohio State University General Receipts Revenue | 4.910% | 6/1/40 | 1,500 | 1,503 |
| Ohio State University General Receipts Revenue | 4.800% | 6/1/11 | 1,400 | 1,218 |
| Ohio Water Development Authority Water Pollution | ||||
| Control Loan Fund Revenue | 4.879% | 12/1/34 | 1,125 | 1,141 |
| Orange County CA Local Transportation Authority Sales | ||||
| Tax Revenue | 6.908% | 2/15/41 | 1,060 | 1,313 |
| Oregon Department of Transportation Highway User | ||||
| Tax Revenue | 5.834% | 11/15/34 | 1,305 | 1,502 |
| Oregon GO | 5.892% | 6/1/27 | 3,500 | 4,013 |
83
| Vanguard® Long-Term Bond Index Fund | ||||
| Schedule of Investments | ||||
| December 31, 2013 | ||||
| Face | Market | |||
| Maturity | Amount | Value | ||
| Coupon | Date | ($000) | ($000) | |
| 8 Oregon School Boards Association GO | 4.759% | 6/30/28 | 3,350 | 3,515 |
| 6 Oregon School Boards Association GO | 5.528% | 6/30/28 | 1,500 | 1,604 |
| Pennsylvania GO | 4.650% | 2/15/26 | 2,100 | 2,167 |
| Pennsylvania GO | 5.350% | 5/1/30 | 1,000 | 1,034 |
| Pennsylvania Public School Building Authority Lease | ||||
| Revenue (School District of Philadelphia) | 5.000% | 9/15/27 | 1,098 | 1,140 |
| Pennsylvania Turnpike Commission Revenue | 6.105% | 12/1/39 | 600 | 693 |
| Pennsylvania Turnpike Commission Revenue | 5.511% | 12/1/45 | 1,575 | 1,671 |
| Pennsylvania Turnpike Commission Revenue | 5.561% | 12/1/49 | 850 | 908 |
| Phoenix AZ GO | 5.269% | 7/1/34 | 100 | 101 |
| Port Authority of New York & New Jersey Revenue | 6.040% | 12/1/29 | 2,260 | 2,595 |
| Port Authority of New York & New Jersey Revenue | 5.647% | 11/1/40 | 2,795 | 3,047 |
| Port Authority of New York & New Jersey Revenue | 5.647% | 11/1/40 | 25 | 27 |
| Port Authority of New York & New Jersey Revenue | 4.926% | 10/1/51 | 800 | 752 |
| Port Authority of New York & New Jersey Revenue | 4.458% | 10/1/62 | 7,325 | 6,210 |
| Port of Seattle WA Revenue | 7.000% | 5/1/36 | 100 | 111 |
| President & Fellows of Harvard College Massachusetts | ||||
| GO | 6.300% | 10/1/37 | 1,000 | 1,105 |
| President & Fellows of Harvard College Massachusetts | ||||
| GO | 4.875% | 10/15/40 | 1,150 | 1,178 |
| Princeton University New Jersey GO | 5.700% | 3/1/39 | 1,650 | 1,885 |
| Regional Transportation District of Colorado Sales Tax | ||||
| Revenue | 5.844% | 11/1/50 | 810 | 935 |
| Rutgers State University NJ Revenue | 5.665% | 5/1/40 | 1,050 | 1,155 |
| Sacramento CA Municipal Utility District Revenue | 6.156% | 5/15/36 | 905 | 976 |
| Salt River Project Arizona Agricultural Improvement & | ||||
| Power District Revenue | 4.839% | 1/1/41 | 1,100 | 1,111 |
| San Antonio TX Electric & Gas Systems Revenue | 5.985% | 2/1/39 | 600 | 714 |
| San Antonio TX Electric & Gas Systems Revenue | 5.718% | 2/1/41 | 1,190 | 1,343 |
| San Antonio TX Electric & Gas Systems Revenue | 5.808% | 2/1/41 | 1,150 | 1,304 |
| San Antonio TX Electric & Gas Systems Revenue | 4.427% | 2/1/42 | 1,100 | 1,028 |
| San Diego County CA Regional Transportation | ||||
| Commission Sales Tax Revenue | 5.911% | 4/1/48 | 865 | 990 |
| San Diego County CA Water Authority Revenue | 6.138% | 5/1/49 | 1,700 | 1,988 |
| San Francisco CA City & County Public Utilities | ||||
| Commission Water Revenue | 6.000% | 11/1/40 | 1,325 | 1,522 |
| San Francisco CA City & County Public Utilities | ||||
| Commission Water Revenue | 6.950% | 11/1/50 | 1,300 | 1,617 |
| Santa Clara Valley CA Transportation Authority Sales | ||||
| Tax Revenue | 5.876% | 4/1/32 | 1,000 | 1,093 |
| Sonoma County CA Pension Obligation Revenue | 6.000% | 12/1/29 | 750 | 741 |
| South Carolina Public Service Authority Revenue | 6.454% | 1/1/50 | 1,150 | 1,252 |
| Texas GO | 5.517% | 4/1/39 | 2,920 | 3,275 |
| Texas Transportation Commission Revenue | 5.028% | 4/1/26 | 1,000 | 1,076 |
| Texas Transportation Commission Revenue | 5.178% | 4/1/30 | 3,650 | 3,917 |
| Texas Transportation Commission Revenue | 4.631% | 4/1/33 | 1,060 | 1,073 |
| Texas Transportation Commission Revenue | 4.681% | 4/1/40 | 750 | 753 |
| Tufts University Massachusetts GO | 5.017% | 4/15/12 | 1,035 | 939 |
| University of California Regents Medical Center | ||||
| Revenue | 6.548% | 5/15/48 | 900 | 1,048 |
| University of California Regents Medical Center | ||||
| Revenue | 6.583% | 5/15/49 | 1,075 | 1,255 |
| University of California Revenue | 5.770% | 5/15/43 | 2,800 | 3,107 |
| University of California Revenue | 5.946% | 5/15/45 | 1,400 | 1,567 |
| University of California Revenue | 4.858% | 5/15/12 | 3,500 | 3,028 |
| University of Massachusetts Building Authority | ||||
| Revenue | 5.450% | 11/1/40 | 575 | 616 |
| University of Southern California Revenue | 5.250% | 10/1/11 | 950 | 996 |
| University of Texas System Revenue Financing System | ||||
| Revenue | 5.262% | 7/1/39 | 620 | 663 |
| University of Texas System Revenue Financing System | ||||
| Revenue | 6.276% | 8/15/41 | 890 | 970 |
| University of Texas System Revenue Financing System | ||||
| Revenue | 5.134% | 8/15/42 | 550 | 586 |
84
| Vanguard® Long-Term Bond Index Fund | ||||
| Schedule of Investments | ||||
| December 31, 2013 | ||||
| Face | Market | |||
| Maturity | Amount | Value | ||
| Coupon | Date | ($000) | ($000) | |
| University of Texas System Revenue Financing System | ||||
| Revenue | 4.794% | 8/15/46 | 1,575 | 1,583 |
| University of Virginia Revenue | 6.200% | 9/1/39 | 330 | 402 |
| Utah GO | 4.554% | 7/1/24 | 1,100 | 1,169 |
| Utah GO | 3.539% | 7/1/25 | 1,200 | 1,173 |
| Utah Transit Authority Sales Tax Revenue | 5.937% | 6/15/39 | 700 | 783 |
| Virginia Commonwealth Transportation Board Revenue | 5.350% | 5/15/35 | 300 | 315 |
| Washington Convention Center Public Facilities District | ||||
| Revenue | 6.790% | 7/1/40 | 600 | 642 |
| Washington GO | 5.090% | 8/1/33 | 945 | 983 |
| Washington GO | 5.481% | 8/1/39 | 650 | 693 |
| Washington GO | 5.140% | 8/1/40 | 1,210 | 1,247 |
| 6 Wisconsin GO | 5.700% | 5/1/26 | 1,400 | 1,532 |
| Total Taxable Municipal Bonds (Cost $338,838) | 356,808 | |||
| Shares | ||||
| Temporary Cash Investment (0.3%) | ||||
| Money Market Fund (0.3%) | ||||
| 9 Vanguard Market Liquidity Fund (Cost $18,370) | 0.125% | 18,369,830 | 18,370 | |
| Total Investments (99.0%) (Cost $5,716,550) | 5,675,862 | |||
| Other Assets and Liabilities—Net (1.0%) | 59,321 | |||
| Net Assets (100%) | 5,735,183 | |||
1 The issuer operates under a congressional charter; its securities are generally neither guaranteed by the U.S. Treasury nor backed by the full
faith and credit of the U.S. government.
2 The issuer was placed under federal conservatorship in September 2008; since that time, its daily operations have been managed by the Federal
Housing Finance Agency and it receives capital from the U.S. Treasury, as needed to maintain a positive net worth, in exchange for senior
preferred stock.
3 The average or expected maturity is shorter than the final maturity shown because of the possibility of interim principal payments and
prepayments or the possibility of the issue being called.
4 Security exempt from registration under Rule 144A of the Securities Act of 1933. Such securities may be sold in transactions exempt from
registration, normally to qualified institutional buyers. At December 31, 2013, the aggregate value of these securities was $14,185,000,
representing 0.2% of net assets.
5 Guaranteed by the Federal Republic of Germany.
6 Scheduled principal and interest payments are guaranteed by AGM (Assured Guaranty Municipal Corporation).
7 Scheduled principal and interest payments are guaranteed by National Public Finance Guarantee Corp.
8 Scheduled principal and interest payments are guaranteed by AMBAC (Ambac Assurance Corporation).
9 Affiliated money market fund available only to Vanguard funds and certain trusts and accounts managed by Vanguard. Rate shown is the 7-day
yield.
COP—Certificate of Participation.
GO—General Obligation Bond.
REIT—Real Estate Investment Trust.
85
| © 2014 The Vanguard Group, Inc. | |
| All rights reserved. | |
| Vanguard Marketing Corporation, Distributor. | |
| SNA3140_022014 |
Report of Independent Registered Public Accounting Firm
To the Trustees of Vanguard Bond Index Funds and the Shareholders of Vanguard Total Bond Market Index Fund:
We have audited, in accordance with the standards of the Public Company Accounting Oversight Board (United States), the financial statements of Vanguard Total Bond Market Index Fund (constituting separate portfolio of Vanguard Bond Index Funds, hereafter referred to as the “Fund") as of December 31, 2013 and for the year then ended and have issued our unqualified report thereon dated February 14, 2014 (which report and financial statements are included in Item 1 of this Certified Shareholder Report on Form N-CSR). Our audit included an audit of the Fund's schedule of investments as of December 31, 2013 appearing in Item 6 of this Form N-CSR. This schedule of investments is the responsibility of the Fund's management. Our responsibility is to express an opinion on the schedule of investments based on our audit.
In our opinion, the schedule of investments referred to above, when read in conjunction with the financial statements of the Fund referred to above, presents fairly, in all material respects, the information set forth therein.

February 14, 2014
PricewaterhouseCoopers LLP, Two Commerce Square, 2001 Market Street, Suite 1700, Philadelphia, PA 19103-7042
T: (267) 330-3000, F: (267) 330-3300, www.pwc.com/us
Vanguard® Total Bond Market Index Fund
Schedule of Investments
December 31, 2013
| Face | Market | |||
| Maturity | Amount | Value | ||
| Coupon | Date | ($000) | ($000) | |
| U.S. Government and Agency Obligations (66.4%) | ||||
| U.S. Government Securities (39.2%) | ||||
| United States Treasury Note/Bond | 2.375% | 10/31/14 | 297,410 | 302,847 |
| United States Treasury Note/Bond | 2.125% | 11/30/14 | 598,846 | 609,422 |
| United States Treasury Note/Bond | 0.125% | 12/31/14 | 21,207 | 21,200 |
| United States Treasury Note/Bond | 2.625% | 12/31/14 | 93,830 | 96,103 |
| United States Treasury Note/Bond | 0.250% | 1/15/15 | 41,345 | 41,377 |
| United States Treasury Note/Bond | 0.250% | 1/31/15 | 3,978 | 3,981 |
| United States Treasury Note/Bond | 2.250% | 1/31/15 | 144,162 | 147,383 |
| United States Treasury Note/Bond | 0.250% | 2/15/15 | 626,838 | 627,327 |
| United States Treasury Note/Bond | 4.000% | 2/15/15 | 61,186 | 63,777 |
| United States Treasury Note/Bond | 11.250% | 2/15/15 | 42,200 | 47,396 |
| United States Treasury Note/Bond | 0.250% | 2/28/15 | 210,925 | 211,056 |
| United States Treasury Note/Bond | 2.375% | 2/28/15 | 351,287 | 360,069 |
| United States Treasury Note/Bond | 0.375% | 3/15/15 | 168,814 | 169,157 |
| United States Treasury Note/Bond | 0.250% | 3/31/15 | 3,325 | 3,327 |
| United States Treasury Note/Bond | 2.500% | 3/31/15 | 161,945 | 166,525 |
| United States Treasury Note/Bond | 0.375% | 4/15/15 | 623,195 | 624,653 |
| United States Treasury Note/Bond | 0.125% | 4/30/15 | 319,900 | 319,500 |
| United States Treasury Note/Bond | 2.500% | 4/30/15 | 185,635 | 191,234 |
| United States Treasury Note/Bond | 0.250% | 5/15/15 | 88,610 | 88,665 |
| United States Treasury Note/Bond | 4.125% | 5/15/15 | 220,955 | 232,692 |
| United States Treasury Note/Bond | 2.125% | 5/31/15 | 87,010 | 89,321 |
| United States Treasury Note/Bond | 0.375% | 6/15/15 | 649,520 | 650,839 |
| United States Treasury Note/Bond | 1.875% | 6/30/15 | 153,457 | 157,174 |
| United States Treasury Note/Bond | 0.250% | 7/15/15 | 558,835 | 558,835 |
| United States Treasury Note/Bond | 0.250% | 7/31/15 | 46,050 | 46,043 |
| United States Treasury Note/Bond | 1.750% | 7/31/15 | 240,648 | 246,250 |
| United States Treasury Note/Bond | 0.250% | 8/15/15 | 505,229 | 505,072 |
| United States Treasury Note/Bond | 4.250% | 8/15/15 | 17,215 | 18,315 |
| United States Treasury Note/Bond | 10.625% | 8/15/15 | 5,935 | 6,922 |
| United States Treasury Note/Bond | 0.375% | 8/31/15 | 10,200 | 10,216 |
| United States Treasury Note/Bond | 1.250% | 8/31/15 | 93,965 | 95,463 |
| United States Treasury Note/Bond | 0.250% | 9/15/15 | 190,275 | 190,096 |
| United States Treasury Note/Bond | 0.250% | 9/30/15 | 1,250 | 1,249 |
| United States Treasury Note/Bond | 1.250% | 9/30/15 | 197,850 | 201,065 |
| United States Treasury Note/Bond | 0.250% | 10/15/15 | 512,405 | 511,683 |
| United States Treasury Note/Bond | 1.250% | 10/31/15 | 125,615 | 127,695 |
| United States Treasury Note/Bond | 0.375% | 11/15/15 | 774,369 | 774,849 |
| United States Treasury Note/Bond | 4.500% | 11/15/15 | 365,884 | 394,181 |
| United States Treasury Note/Bond | 9.875% | 11/15/15 | 262,900 | 309,402 |
| United States Treasury Note/Bond | 1.375% | 11/30/15 | 290,672 | 296,305 |
| United States Treasury Note/Bond | 0.250% | 12/15/15 | 260,679 | 260,108 |
| United States Treasury Note/Bond | 0.250% | 12/31/15 | 2,600 | 2,593 |
| United States Treasury Note/Bond | 2.125% | 12/31/15 | 248,055 | 256,543 |
| United States Treasury Note/Bond | 0.375% | 1/15/16 | 438,200 | 438,064 |
| United States Treasury Note/Bond | 2.000% | 1/31/16 | 107,615 | 111,146 |
| United States Treasury Note/Bond | 0.375% | 2/15/16 | 542,755 | 542,245 |
| United States Treasury Note/Bond | 4.500% | 2/15/16 | 215,493 | 234,114 |
| United States Treasury Note/Bond | 9.250% | 2/15/16 | 2,210 | 2,620 |
| United States Treasury Note/Bond | 2.125% | 2/29/16 | 76,050 | 78,819 |
| United States Treasury Note/Bond | 2.625% | 2/29/16 | 145,122 | 152,015 |
| United States Treasury Note/Bond | 0.375% | 3/15/16 | 301,525 | 301,055 |
| United States Treasury Note/Bond | 2.250% | 3/31/16 | 714 | 742 |
| United States Treasury Note/Bond | 2.375% | 3/31/16 | 9,010 | 9,397 |
| United States Treasury Note/Bond | 0.250% | 4/15/16 | 255,625 | 254,268 |
| United States Treasury Note/Bond | 2.000% | 4/30/16 | 78,680 | 81,385 |
| United States Treasury Note/Bond | 2.625% | 4/30/16 | 245,360 | 257,397 |
| United States Treasury Note/Bond | 0.250% | 5/15/16 | 637,695 | 633,709 |
| United States Treasury Note/Bond | 5.125% | 5/15/16 | 299,480 | 331,860 |
| United States Treasury Note/Bond | 7.250% | 5/15/16 | 8,085 | 9,361 |
| United States Treasury Note/Bond | 1.750% | 5/31/16 | 7,435 | 7,649 |
| United States Treasury Note/Bond | 0.500% | 6/15/16 | 137,580 | 137,430 |
1
| Vanguard® Total Bond Market Index Fund | ||||
| Schedule of Investments | ||||
| December 31, 2013 | ||||
| Face | Market | |||
| Maturity | Amount | Value | ||
| Coupon | Date | ($000) | ($000) | |
| United States Treasury Note/Bond | 1.500% | 6/30/16 | 123,634 | 126,474 |
| United States Treasury Note/Bond | 3.250% | 6/30/16 | 339,965 | 362,702 |
| United States Treasury Note/Bond | 0.625% | 7/15/16 | 565,590 | 566,297 |
| United States Treasury Note/Bond | 1.500% | 7/31/16 | 1,310 | 1,340 |
| United States Treasury Note/Bond | 0.625% | 8/15/16 | 337,575 | 337,575 |
| United States Treasury Note/Bond | 4.875% | 8/15/16 | 433 | 481 |
| United States Treasury Note/Bond | 1.000% | 8/31/16 | 11,470 | 11,576 |
| United States Treasury Note/Bond | 3.000% | 8/31/16 | 332,417 | 353,090 |
| United States Treasury Note/Bond | 1.000% | 9/30/16 | 262,120 | 264,332 |
| United States Treasury Note/Bond | 3.000% | 9/30/16 | 452,335 | 480,746 |
| United States Treasury Note/Bond | 0.625% | 10/15/16 | 220,425 | 220,011 |
| United States Treasury Note/Bond | 1.000% | 10/31/16 | 184,945 | 186,332 |
| United States Treasury Note/Bond | 3.125% | 10/31/16 | 211,860 | 226,029 |
| United States Treasury Note/Bond | 0.625% | 11/15/16 | 284,950 | 284,061 |
| United States Treasury Note/Bond | 4.625% | 11/15/16 | 100,171 | 111,190 |
| United States Treasury Note/Bond | 7.500% | 11/15/16 | 85,617 | 101,991 |
| United States Treasury Note/Bond | 0.875% | 11/30/16 | 6,436 | 6,456 |
| United States Treasury Note/Bond | 2.750% | 11/30/16 | 213,362 | 225,498 |
| United States Treasury Note/Bond | 0.625% | 12/15/16 | 291,300 | 290,117 |
| United States Treasury Note/Bond | 3.250% | 12/31/16 | 120,510 | 129,247 |
| United States Treasury Note/Bond | 0.875% | 1/31/17 | 85,500 | 85,580 |
| United States Treasury Note/Bond | 3.125% | 1/31/17 | 306,380 | 327,539 |
| United States Treasury Note/Bond | 4.625% | 2/15/17 | 51,240 | 57,148 |
| United States Treasury Note/Bond | 0.875% | 2/28/17 | 69,524 | 69,502 |
| United States Treasury Note/Bond | 3.000% | 2/28/17 | 20,230 | 21,554 |
| United States Treasury Note/Bond | 1.000% | 3/31/17 | 242,035 | 242,565 |
| United States Treasury Note/Bond | 3.250% | 3/31/17 | 3,235 | 3,476 |
| United States Treasury Note/Bond | 0.875% | 4/30/17 | 172,000 | 171,463 |
| United States Treasury Note/Bond | 3.125% | 4/30/17 | 11,200 | 11,987 |
| United States Treasury Note/Bond | 4.500% | 5/15/17 | 31,335 | 34,963 |
| United States Treasury Note/Bond | 8.750% | 5/15/17 | 187,065 | 235,058 |
| United States Treasury Note/Bond | 0.625% | 5/31/17 | 276,970 | 273,336 |
| United States Treasury Note/Bond | 2.750% | 5/31/17 | 294,770 | 311,996 |
| United States Treasury Note/Bond | 0.750% | 6/30/17 | 125,890 | 124,553 |
| United States Treasury Note/Bond | 2.500% | 6/30/17 | 473,135 | 496,498 |
| United States Treasury Note/Bond | 0.500% | 7/31/17 | 646 | 633 |
| United States Treasury Note/Bond | 2.375% | 7/31/17 | 66,800 | 69,785 |
| United States Treasury Note/Bond | 4.750% | 8/15/17 | 416,570 | 470,466 |
| United States Treasury Note/Bond | 8.875% | 8/15/17 | 36,810 | 46,967 |
| United States Treasury Note/Bond | 0.625% | 8/31/17 | 178,595 | 175,246 |
| United States Treasury Note/Bond | 1.875% | 8/31/17 | 6,275 | 6,441 |
| United States Treasury Note/Bond | 0.625% | 9/30/17 | 146,625 | 143,555 |
| United States Treasury Note/Bond | 1.875% | 9/30/17 | 39,575 | 40,577 |
| United States Treasury Note/Bond | 0.750% | 10/31/17 | 94,985 | 93,233 |
| United States Treasury Note/Bond | 1.875% | 10/31/17 | 242,827 | 248,859 |
| United States Treasury Note/Bond | 4.250% | 11/15/17 | 184,530 | 205,404 |
| United States Treasury Note/Bond | 0.625% | 11/30/17 | 374,425 | 364,948 |
| United States Treasury Note/Bond | 0.750% | 12/31/17 | 3,235 | 3,162 |
| United States Treasury Note/Bond | 0.875% | 1/31/18 | 527,215 | 516,998 |
| United States Treasury Note/Bond | 2.625% | 1/31/18 | 450 | 473 |
| United States Treasury Note/Bond | 3.500% | 2/15/18 | 151,535 | 164,462 |
| United States Treasury Note/Bond | 0.750% | 2/28/18 | 154,735 | 150,625 |
| United States Treasury Note/Bond | 2.750% | 2/28/18 | 296,045 | 312,650 |
| United States Treasury Note/Bond | 0.750% | 3/31/18 | 129,070 | 125,359 |
| United States Treasury Note/Bond | 2.875% | 3/31/18 | 34,300 | 36,342 |
| United States Treasury Note/Bond | 0.625% | 4/30/18 | 47,950 | 46,227 |
| United States Treasury Note/Bond | 2.625% | 4/30/18 | 36,750 | 38,565 |
| United States Treasury Note/Bond | 3.875% | 5/15/18 | 310,948 | 342,627 |
| United States Treasury Note/Bond | 9.125% | 5/15/18 | 20,800 | 27,580 |
| United States Treasury Note/Bond | 1.000% | 5/31/18 | 541,255 | 529,331 |
| United States Treasury Note/Bond | 2.375% | 5/31/18 | 370,220 | 384,162 |
| United States Treasury Note/Bond | 1.375% | 6/30/18 | 137,070 | 135,999 |
| United States Treasury Note/Bond | 2.375% | 6/30/18 | 397,275 | 411,863 |
| United States Treasury Note/Bond | 1.375% | 7/31/18 | 146,630 | 145,255 |
2
| Vanguard® Total Bond Market Index Fund | ||||
| Schedule of Investments | ||||
| December 31, 2013 | ||||
| Face | Market | |||
| Maturity | Amount | Value | ||
| Coupon | Date | ($000) | ($000) | |
| United States Treasury Note/Bond | 2.250% | 7/31/18 | 28,950 | 29,827 |
| United States Treasury Note/Bond | 4.000% | 8/15/18 | 1,997 | 2,214 |
| United States Treasury Note/Bond | 1.500% | 8/31/18 | 623,260 | 619,950 |
| United States Treasury Note/Bond | 1.375% | 9/30/18 | 319,306 | 315,264 |
| United States Treasury Note/Bond | 1.250% | 10/31/18 | 16,960 | 16,621 |
| United States Treasury Note/Bond | 1.750% | 10/31/18 | 161,595 | 162,227 |
| United States Treasury Note/Bond | 3.750% | 11/15/18 | 216,870 | 237,880 |
| United States Treasury Note/Bond | 9.000% | 11/15/18 | 25 | 34 |
| United States Treasury Note/Bond | 1.250% | 11/30/18 | 411,875 | 402,863 |
| United States Treasury Note/Bond | 1.375% | 12/31/18 | 57,775 | 56,782 |
| United States Treasury Note/Bond | 1.500% | 12/31/18 | 251,275 | 248,370 |
| United States Treasury Note/Bond | 1.250% | 1/31/19 | 3,000 | 2,924 |
| United States Treasury Note/Bond | 2.750% | 2/15/19 | 15,060 | 15,771 |
| United States Treasury Note/Bond | 8.875% | 2/15/19 | 121,630 | 164,353 |
| United States Treasury Note/Bond | 1.375% | 2/28/19 | 91,700 | 89,751 |
| United States Treasury Note/Bond | 1.500% | 3/31/19 | 33,050 | 32,482 |
| United States Treasury Note/Bond | 1.250% | 4/30/19 | 204,890 | 198,358 |
| United States Treasury Note/Bond | 3.125% | 5/15/19 | 125,985 | 134,174 |
| United States Treasury Note/Bond | 1.125% | 5/31/19 | 73,375 | 70,394 |
| United States Treasury Note/Bond | 1.000% | 6/30/19 | 48,300 | 45,893 |
| United States Treasury Note/Bond | 0.875% | 7/31/19 | 12,985 | 12,218 |
| United States Treasury Note/Bond | 3.625% | 8/15/19 | 196,162 | 213,571 |
| United States Treasury Note/Bond | 8.125% | 8/15/19 | 86,669 | 115,378 |
| United States Treasury Note/Bond | 1.000% | 9/30/19 | 7,893 | 7,444 |
| United States Treasury Note/Bond | 3.375% | 11/15/19 | 263,421 | 283,096 |
| United States Treasury Note/Bond | 1.000% | 11/30/19 | 157,175 | 147,499 |
| United States Treasury Note/Bond | 1.125% | 12/31/19 | 30,782 | 29,051 |
| United States Treasury Note/Bond | 1.375% | 1/31/20 | 388,708 | 371,457 |
| United States Treasury Note/Bond | 3.625% | 2/15/20 | 218,797 | 237,942 |
| United States Treasury Note/Bond | 8.500% | 2/15/20 | 15,165 | 20,774 |
| United States Treasury Note/Bond | 1.250% | 2/29/20 | 244,216 | 230,936 |
| United States Treasury Note/Bond | 1.125% | 4/30/20 | 229,925 | 214,656 |
| United States Treasury Note/Bond | 3.500% | 5/15/20 | 409,488 | 441,350 |
| United States Treasury Note/Bond | 1.375% | 5/31/20 | 439,675 | 416,249 |
| United States Treasury Note/Bond | 1.875% | 6/30/20 | 288,675 | 281,369 |
| United States Treasury Note/Bond | 2.000% | 7/31/20 | 213,050 | 209,055 |
| United States Treasury Note/Bond | 2.625% | 8/15/20 | 245,942 | 250,669 |
| United States Treasury Note/Bond | 8.750% | 8/15/20 | 238,040 | 333,739 |
| United States Treasury Note/Bond | 2.125% | 8/31/20 | 151,515 | 149,407 |
| United States Treasury Note/Bond | 2.000% | 9/30/20 | 106,880 | 104,342 |
| United States Treasury Note/Bond | 1.750% | 10/31/20 | 154,650 | 148,173 |
| United States Treasury Note/Bond | 2.625% | 11/15/20 | 425,174 | 431,552 |
| United States Treasury Note/Bond | 2.000% | 11/30/20 | 198,100 | 192,621 |
| United States Treasury Note/Bond | 2.375% | 12/31/20 | 334,100 | 332,376 |
| United States Treasury Note/Bond | 3.625% | 2/15/21 | 366,502 | 395,020 |
| United States Treasury Note/Bond | 7.875% | 2/15/21 | 208,624 | 283,468 |
| United States Treasury Note/Bond | 3.125% | 5/15/21 | 352,640 | 367,077 |
| United States Treasury Note/Bond | 8.125% | 8/15/21 | 136,690 | 189,892 |
| United States Treasury Note/Bond | 2.000% | 11/15/21 | 363,657 | 346,496 |
| United States Treasury Note/Bond | 8.000% | 11/15/21 | 64,031 | 88,823 |
| United States Treasury Note/Bond | 2.000% | 2/15/22 | 3,802 | 3,601 |
| United States Treasury Note/Bond | 1.750% | 5/15/22 | 11,509 | 10,622 |
| United States Treasury Note/Bond | 1.625% | 8/15/22 | 11,520 | 10,447 |
| United States Treasury Note/Bond | 7.250% | 8/15/22 | 3,014 | 4,066 |
| United States Treasury Note/Bond | 1.625% | 11/15/22 | 230,974 | 208,094 |
| United States Treasury Note/Bond | 7.625% | 11/15/22 | 6,566 | 9,085 |
| United States Treasury Note/Bond | 2.000% | 2/15/23 | 118,826 | 110,007 |
| United States Treasury Note/Bond | 7.125% | 2/15/23 | 163,535 | 220,159 |
| United States Treasury Note/Bond | 1.750% | 5/15/23 | 755,748 | 679,818 |
| United States Treasury Note/Bond | 2.500% | 8/15/23 | 513,585 | 492,158 |
| United States Treasury Note/Bond | 6.250% | 8/15/23 | 496,404 | 636,484 |
| United States Treasury Note/Bond | 2.750% | 11/15/23 | 501,440 | 489,531 |
| United States Treasury Note/Bond | 7.500% | 11/15/24 | 1,325 | 1,868 |
| United States Treasury Note/Bond | 7.625% | 2/15/25 | 2,112 | 3,010 |
3
| Vanguard® Total Bond Market Index Fund | ||||
| Schedule of Investments | ||||
| December 31, 2013 | ||||
| Face | Market | |||
| Maturity | Amount | Value | ||
| Coupon | Date | ($000) | ($000) | |
| United States Treasury Note/Bond | 6.875% | 8/15/25 | 83,770 | 113,770 |
| United States Treasury Note/Bond | 6.000% | 2/15/26 | 50,679 | 64,537 |
| United States Treasury Note/Bond | 6.750% | 8/15/26 | 32,360 | 43,903 |
| United States Treasury Note/Bond | 6.500% | 11/15/26 | 45,224 | 60,247 |
| United States Treasury Note/Bond | 6.375% | 8/15/27 | 40,910 | 54,174 |
| United States Treasury Note/Bond | 5.500% | 8/15/28 | 41,275 | 50,717 |
| United States Treasury Note/Bond | 5.250% | 11/15/28 | 6,600 | 7,920 |
| United States Treasury Note/Bond | 5.250% | 2/15/29 | 120,295 | 144,354 |
| United States Treasury Note/Bond | 6.125% | 8/15/29 | 150,935 | 197,631 |
| United States Treasury Note/Bond | 6.250% | 5/15/30 | 70,458 | 93,808 |
| United States Treasury Note/Bond | 5.375% | 2/15/31 | 38,320 | 46,798 |
| United States Treasury Note/Bond | 4.500% | 2/15/36 | 119 | 132 |
| United States Treasury Note/Bond | 4.375% | 2/15/38 | 103 | 112 |
| United States Treasury Note/Bond | 4.500% | 5/15/38 | 1,268 | 1,399 |
| United States Treasury Note/Bond | 3.500% | 2/15/39 | 104,509 | 97,928 |
| United States Treasury Note/Bond | 4.250% | 5/15/39 | 219,703 | 233,159 |
| United States Treasury Note/Bond | 4.500% | 8/15/39 | 57,527 | 63,451 |
| United States Treasury Note/Bond | 4.375% | 11/15/39 | 271,151 | 293,266 |
| United States Treasury Note/Bond | 4.625% | 2/15/40 | 185,832 | 208,829 |
| United States Treasury Note/Bond | 4.375% | 5/15/40 | 241,725 | 261,365 |
| United States Treasury Note/Bond | 3.875% | 8/15/40 | 174,217 | 173,400 |
| United States Treasury Note/Bond | 4.250% | 11/15/40 | 203,155 | 215,153 |
| United States Treasury Note/Bond | 4.750% | 2/15/41 | 231,530 | 265,174 |
| United States Treasury Note/Bond | 4.375% | 5/15/41 | 130,808 | 141,252 |
| United States Treasury Note/Bond | 3.750% | 8/15/41 | 10 | 10 |
| United States Treasury Note/Bond | 3.125% | 11/15/41 | 109,150 | 93,784 |
| United States Treasury Note/Bond | 3.125% | 2/15/42 | 85,613 | 73,440 |
| United States Treasury Note/Bond | 3.000% | 5/15/42 | 164,354 | 137,107 |
| United States Treasury Note/Bond | 2.750% | 8/15/42 | 286,790 | 226,071 |
| United States Treasury Note/Bond | 2.750% | 11/15/42 | 541,919 | 426,171 |
| United States Treasury Note/Bond | 3.125% | 2/15/43 | 155,938 | 132,816 |
| United States Treasury Note/Bond | 2.875% | 5/15/43 | 73,210 | 59,026 |
| United States Treasury Note/Bond | 3.625% | 8/15/43 | 194,270 | 182,522 |
| United States Treasury Note/Bond | 3.750% | 11/15/43 | 64,400 | 61,924 |
| 42,407,875 | ||||
| Agency Bonds and Notes (3.9%) | ||||
| Arab Republic of Egypt | 4.450% | 9/15/15 | 16,750 | 17,891 |
| 1 Federal Agricultural Mortgage Corp. | 2.125% | 9/15/15 | 2,825 | 2,906 |
| 1 Federal Agricultural Mortgage Corp. | 2.000% | 7/27/16 | 3,575 | 3,684 |
| 1 Federal Farm Credit Banks | 0.270% | 2/24/15 | 10,000 | 9,994 |
| 1 Federal Farm Credit Banks | 0.500% | 6/23/15 | 8,550 | 8,569 |
| 1 Federal Farm Credit Banks | 1.500% | 11/16/15 | 6,825 | 6,958 |
| 1 Federal Farm Credit Banks | 4.875% | 12/16/15 | 1,625 | 1,766 |
| 1 Federal Farm Credit Banks | 1.050% | 3/28/16 | 4,000 | 4,042 |
| 1 Federal Farm Credit Banks | 5.125% | 8/25/16 | 9,075 | 10,125 |
| 1 Federal Farm Credit Banks | 4.875% | 1/17/17 | 8,030 | 8,987 |
| 1 Federal Farm Credit Banks | 5.150% | 11/15/19 | 15,675 | 18,065 |
| 1 Federal Farm Credit Banks | 3.500% | 12/20/23 | 5,000 | 4,954 |
| 1 Federal Home Loan Banks | 0.250% | 1/16/15 | 22,750 | 22,763 |
| 1 Federal Home Loan Banks | 0.250% | 2/20/15 | 45,975 | 45,948 |
| 1 Federal Home Loan Banks | 0.375% | 8/28/15 | 54,700 | 54,712 |
| 1 Federal Home Loan Banks | 0.500% | 11/20/15 | 4,370 | 4,376 |
| 1 Federal Home Loan Banks | 3.125% | 3/11/16 | 26,225 | 27,693 |
| 1 Federal Home Loan Banks | 5.375% | 5/18/16 | 36,700 | 40,866 |
| 1 Federal Home Loan Banks | 5.625% | 6/13/16 | 3,705 | 4,112 |
| 1 Federal Home Loan Banks | 0.375% | 6/24/16 | 24,800 | 24,624 |
| 1 Federal Home Loan Banks | 5.125% | 10/19/16 | 15,845 | 17,711 |
| 1 Federal Home Loan Banks | 4.750% | 12/16/16 | 21,510 | 23,991 |
| 1 Federal Home Loan Banks | 0.625% | 12/28/16 | 16,200 | 16,114 |
| 1 Federal Home Loan Banks | 4.875% | 5/17/17 | 114,335 | 129,024 |
| 1 Federal Home Loan Banks | 1.000% | 6/21/17 | 26,320 | 26,280 |
| 1 Federal Home Loan Banks | 5.000% | 11/17/17 | 7,280 | 8,323 |
| 1 Federal Home Loan Banks | 2.750% | 6/8/18 | 26,950 | 28,150 |
| 1 Federal Home Loan Banks | 5.375% | 8/15/18 | 4,750 | 5,485 |
4
| Vanguard® Total Bond Market Index Fund | ||||
| Schedule of Investments | ||||
| December 31, 2013 | ||||
| Face | Market | |||
| Maturity | Amount | Value | ||
| Coupon | Date | ($000) | ($000) | |
| 1 Federal Home Loan Banks | 1.875% | 3/13/20 | 2,075 | 2,000 |
| 1 Federal Home Loan Banks | 4.125% | 3/13/20 | 8,440 | 9,215 |
| 1 Federal Home Loan Banks | 3.375% | 6/12/20 | 25,725 | 26,892 |
| 1 Federal Home Loan Banks | 5.250% | 12/11/20 | 6,850 | 7,881 |
| 1 Federal Home Loan Banks | 5.625% | 6/11/21 | 19,450 | 22,824 |
| 1 Federal Home Loan Banks | 2.125% | 3/10/23 | 32,200 | 28,628 |
| 1 Federal Home Loan Banks | 5.375% | 8/15/24 | 24,600 | 28,121 |
| 1 Federal Home Loan Banks | 5.500% | 7/15/36 | 19,860 | 22,836 |
| 2 Federal Home Loan Mortgage Corp. | 5.050% | 1/26/15 | 600 | 631 |
| 2 Federal Home Loan Mortgage Corp. | 2.875% | 2/9/15 | 728 | 749 |
| 2 Federal Home Loan Mortgage Corp. | 0.500% | 4/17/15 | 126,635 | 126,991 |
| 2 Federal Home Loan Mortgage Corp. | 4.375% | 7/17/15 | 44,535 | 47,287 |
| 2 Federal Home Loan Mortgage Corp. | 1.750% | 9/10/15 | 31,675 | 32,404 |
| 2 Federal Home Loan Mortgage Corp. | 5.250% | 4/18/16 | 48,925 | 54,170 |
| 2 Federal Home Loan Mortgage Corp. | 0.500% | 5/13/16 | 26,000 | 25,987 |
| 2 Federal Home Loan Mortgage Corp. | 2.500% | 5/27/16 | 20,158 | 21,099 |
| 2 Federal Home Loan Mortgage Corp. | 5.500% | 7/18/16 | 91,500 | 102,694 |
| 2 Federal Home Loan Mortgage Corp. | 2.000% | 8/25/16 | 51,675 | 53,455 |
| 2 Federal Home Loan Mortgage Corp. | 0.875% | 10/14/16 | 38,050 | 38,166 |
| 2 Federal Home Loan Mortgage Corp. | 5.000% | 2/16/17 | 28,225 | 31,775 |
| 2 Federal Home Loan Mortgage Corp. | 1.000% | 3/8/17 | 35,000 | 35,083 |
| 2 Federal Home Loan Mortgage Corp. | 5.000% | 4/18/17 | 10,000 | 11,302 |
| 2 Federal Home Loan Mortgage Corp. | 1.250% | 5/12/17 | 90,075 | 90,744 |
| 2 Federal Home Loan Mortgage Corp. | 1.000% | 6/29/17 | 51,125 | 50,942 |
| 2 Federal Home Loan Mortgage Corp. | 1.000% | 7/28/17 | 22,000 | 21,889 |
| 2 Federal Home Loan Mortgage Corp. | 5.500% | 8/23/17 | 33,450 | 38,606 |
| 2 Federal Home Loan Mortgage Corp. | 1.000% | 9/29/17 | 87,700 | 86,823 |
| 2 Federal Home Loan Mortgage Corp. | 5.125% | 11/17/17 | 26,045 | 29,772 |
| 2 Federal Home Loan Mortgage Corp. | 0.750% | 1/12/18 | 30,175 | 29,360 |
| 2 Federal Home Loan Mortgage Corp. | 0.875% | 3/7/18 | 28,400 | 27,635 |
| 2 Federal Home Loan Mortgage Corp. | 4.875% | 6/13/18 | 22,750 | 25,849 |
| 2 Federal Home Loan Mortgage Corp. | 3.750% | 3/27/19 | 60,988 | 66,290 |
| 2 Federal Home Loan Mortgage Corp. | 1.750% | 5/30/19 | 62,047 | 61,121 |
| 2 Federal Home Loan Mortgage Corp. | 1.250% | 8/1/19 | 32,600 | 31,143 |
| 2 Federal Home Loan Mortgage Corp. | 1.250% | 10/2/19 | 103,400 | 98,052 |
| 2 Federal Home Loan Mortgage Corp. | 1.375% | 5/1/20 | 64,000 | 59,967 |
| 2 Federal Home Loan Mortgage Corp. | 2.375% | 1/13/22 | 71,824 | 68,394 |
| 2 Federal Home Loan Mortgage Corp. | 6.750% | 9/15/29 | 3,606 | 4,729 |
| 2 Federal Home Loan Mortgage Corp. | 6.750% | 3/15/31 | 42,744 | 56,493 |
| 2 Federal Home Loan Mortgage Corp. | 6.250% | 7/15/32 | 8,264 | 10,418 |
| 2 Federal National Mortgage Assn. | 0.375% | 3/16/15 | 104,085 | 104,152 |
| 2 Federal National Mortgage Assn. | 5.000% | 4/15/15 | 1,260 | 1,336 |
| 2 Federal National Mortgage Assn. | 0.500% | 5/27/15 | 44,853 | 44,990 |
| 2 Federal National Mortgage Assn. | 0.500% | 7/2/15 | 9,728 | 9,753 |
| 2 Federal National Mortgage Assn. | 2.375% | 7/28/15 | 30,125 | 31,080 |
| 2 Federal National Mortgage Assn. | 2.000% | 9/21/15 | 12,000 | 12,320 |
| 2 Federal National Mortgage Assn. | 0.500% | 9/28/15 | 47,450 | 47,555 |
| 2 Federal National Mortgage Assn. | 4.375% | 10/15/15 | 54,105 | 57,927 |
| 2 Federal National Mortgage Assn. | 1.625% | 10/26/15 | 18,807 | 19,223 |
| 2 Federal National Mortgage Assn. | 0.375% | 12/21/15 | 29,225 | 29,210 |
| 2 Federal National Mortgage Assn. | 8.200% | 3/10/16 | 50 | 58 |
| 2 Federal National Mortgage Assn. | 5.000% | 3/15/16 | 5,850 | 6,427 |
| 2 Federal National Mortgage Assn. | 0.500% | 3/30/16 | 43,425 | 43,404 |
| 2 Federal National Mortgage Assn. | 2.375% | 4/11/16 | 79,005 | 82,275 |
| 2 Federal National Mortgage Assn. | 0.375% | 7/5/16 | 30,000 | 29,807 |
| 2 Federal National Mortgage Assn. | 0.625% | 8/26/16 | 55,450 | 55,349 |
| 2 Federal National Mortgage Assn. | 5.250% | 9/15/16 | 12,850 | 14,404 |
| 2 Federal National Mortgage Assn. | 1.250% | 9/28/16 | 65,225 | 66,117 |
| 2 Federal National Mortgage Assn. | 1.375% | 11/15/16 | 75,450 | 76,712 |
| 2 Federal National Mortgage Assn. | 1.250% | 1/30/17 | 25,100 | 25,386 |
| 2 Federal National Mortgage Assn. | 5.000% | 2/13/17 | 79,525 | 89,502 |
| 2 Federal National Mortgage Assn. | 1.125% | 4/27/17 | 117,975 | 118,476 |
| 2 Federal National Mortgage Assn. | 5.000% | 5/11/17 | 142,481 | 160,778 |
| 2 Federal National Mortgage Assn. | 5.375% | 6/12/17 | 91,570 | 104,850 |
5
| Vanguard® Total Bond Market Index Fund | |||||
| Schedule of Investments | |||||
| December 31, 2013 | |||||
| Face | Market | ||||
| Maturity | Amount | Value | |||
| Coupon | Date | ($000) | ($000) | ||
| 2 | Federal National Mortgage Assn. | 0.875% | 10/26/17 | 82,000 | 80,663 |
| 2 | Federal National Mortgage Assn. | 0.875% | 12/20/17 | 50,000 | 49,077 |
| 2 | Federal National Mortgage Assn. | 0.875% | 2/8/18 | 79,000 | 77,004 |
| 2 | Federal National Mortgage Assn. | 0.875% | 5/21/18 | 93,435 | 90,411 |
| 2 | Federal National Mortgage Assn. | 1.875% | 9/18/18 | 41,050 | 41,201 |
| 2 | Federal National Mortgage Assn. | 1.625% | 11/27/18 | 70,460 | 69,678 |
| 2 | Federal National Mortgage Assn. | 0.000% | 10/9/19 | 14,545 | 12,320 |
| 2 | Federal National Mortgage Assn. | 6.250% | 5/15/29 | 4,295 | 5,356 |
| 2 | Federal National Mortgage Assn. | 7.125% | 1/15/30 | 26,389 | 35,700 |
| 2 | Federal National Mortgage Assn. | 7.250% | 5/15/30 | 47,677 | 65,172 |
| 2 | Federal National Mortgage Assn. | 6.625% | 11/15/30 | 6,975 | 9,063 |
| 2 | Federal National Mortgage Assn. | 5.625% | 7/15/37 | 7,765 | 9,213 |
| 1 | Financing Corp. | 9.800% | 4/6/18 | 1,750 | 2,335 |
| 1 | Financing Corp. | 10.350% | 8/3/18 | 4,900 | 6,689 |
| 1 | Financing Corp. | 9.650% | 11/2/18 | 10,535 | 14,130 |
| 1 | Financing Corp. | 9.700% | 4/5/19 | 1,575 | 2,161 |
| Hashemite Kingdom of Jordan | 2.503% | 10/30/20 | 10,100 | 9,861 | |
| Private Export Funding Corp. | 4.950% | 11/15/15 | 41 | 44 | |
| Private Export Funding Corp. | 1.375% | 2/15/17 | 2,025 | 2,046 | |
| Private Export Funding Corp. | 2.250% | 12/15/17 | 4,600 | 4,720 | |
| Private Export Funding Corp. | 1.875% | 7/15/18 | 4,300 | 4,307 | |
| Private Export Funding Corp. | 4.375% | 3/15/19 | 8,700 | 9,627 | |
| Private Export Funding Corp. | 1.450% | 8/15/19 | 3,800 | 3,619 | |
| Private Export Funding Corp. | 4.300% | 12/15/21 | 3,800 | 4,078 | |
| Private Export Funding Corp. | 2.800% | 5/15/22 | 2,625 | 2,519 | |
| Private Export Funding Corp. | 2.050% | 11/15/22 | 8,300 | 7,367 | |
| Private Export Funding Corp. | 2.450% | 7/15/24 | 8,300 | 7,408 | |
| Resolution Funding Corp. | 8.125% | 10/15/19 | 450 | 588 | |
| Resolution Funding Corp. | 8.875% | 7/15/20 | 180 | 246 | |
| Resolution Funding Corp. | 8.625% | 1/15/30 | 110 | 166 | |
| Small Business Administration Variable Rate Interest | |||||
| Only Custodial Receipts (U.S. Government | |||||
| Guaranteed) | 2.719% | 7/15/17 | 4,449 | 9 | |
| State of Israel | 5.500% | 9/18/23 | 242 | 280 | |
| State of Israel | 5.500% | 12/4/23 | 3,213 | 3,698 | |
| State of Israel | 5.500% | 4/26/24 | 20,405 | 23,546 | |
| 1 | Tennessee Valley Authority | 5.500% | 7/18/17 | 17,208 | 19,707 |
| 1 | Tennessee Valley Authority | 4.500% | 4/1/18 | 6,325 | 7,000 |
| 1 | Tennessee Valley Authority | 1.750% | 10/15/18 | 7,000 | 6,951 |
| 1 | Tennessee Valley Authority | 3.875% | 2/15/21 | 9,400 | 9,914 |
| 1 | Tennessee Valley Authority | 1.875% | 8/15/22 | 7,300 | 6,474 |
| 1 | Tennessee Valley Authority | 6.750% | 11/1/25 | 2,565 | 3,250 |
| 1 | Tennessee Valley Authority | 7.125% | 5/1/30 | 27,055 | 35,574 |
| 1 | Tennessee Valley Authority | 4.650% | 6/15/35 | 15,169 | 15,066 |
| 1 | Tennessee Valley Authority | 5.880% | 4/1/36 | 9,850 | 11,367 |
| 1 | Tennessee Valley Authority | 6.150% | 1/15/38 | 920 | 1,093 |
| 1 | Tennessee Valley Authority | 5.500% | 6/15/38 | 2,550 | 2,809 |
| 1 | Tennessee Valley Authority | 5.250% | 9/15/39 | 9,108 | 9,570 |
| 1 | Tennessee Valley Authority | 3.500% | 12/15/42 | 9,000 | 7,108 |
| 1 | Tennessee Valley Authority | 4.875% | 1/15/48 | 6,951 | 6,677 |
| 1 | Tennessee Valley Authority | 5.375% | 4/1/56 | 6,250 | 6,328 |
| 1 | Tennessee Valley Authority | 4.625% | 9/15/60 | 7,468 | 6,633 |
| 4,207,444 | |||||
| Conventional Mortgage-Backed Securities (22.5%) | |||||
| 2,3 | Fannie Mae Pool | 2.000% | 8/1/28–9/1/28 | 87,067 | 83,710 |
| 2,3,4 | Fannie Mae Pool | 2.500% | 8/1/27–1/1/43 | 581,398 | 572,872 |
| 2,3,4 | Fannie Mae Pool | 3.000% | 9/1/20–1/1/44 | 1,786,928 | 1,748,447 |
| 2,3,4 | Fannie Mae Pool | 3.500% | 10/1/18–1/1/44 | 2,075,258 | 2,092,421 |
| 2,3,4 | Fannie Mae Pool | 4.000% | 7/1/14–1/1/44 | 1,859,714 | 1,929,781 |
| 2,3,4 | Fannie Mae Pool | 4.500% | 1/1/18–1/1/44 | 1,337,375 | 1,422,239 |
| 2,3,4 | Fannie Mae Pool | 5.000% | 3/1/17–1/1/44 | 1,035,671 | 1,125,380 |
| 2,3 | Fannie Mae Pool | 5.500% | 2/1/14–1/1/44 | 804,396 | 885,129 |
| 2,3 | Fannie Mae Pool | 6.000% | 1/1/14–1/1/44 | 566,026 | 628,972 |
6
| Vanguard® Total Bond Market Index Fund | |||||
| Schedule of Investments | |||||
| December 31, 2013 | |||||
| Face | Market | ||||
| Maturity | Amount | Value | |||
| Coupon | Date | ($000) | ($000) | ||
| 2,3 | Fannie Mae Pool | 6.500% | 2/1/14–10/1/39 | 194,924 | 218,151 |
| 2,3 | Fannie Mae Pool | 7.000% | 3/1/14–11/1/38 | 65,051 | 73,582 |
| 2,3 | Fannie Mae Pool | 7.500% | 4/1/15–12/1/32 | 4,849 | 5,371 |
| 2,3 | Fannie Mae Pool | 8.000% | 6/1/15–9/1/31 | 1,569 | 1,741 |
| 2,3 | Fannie Mae Pool | 8.500% | 9/1/15–5/1/32 | 632 | 707 |
| 2,3 | Fannie Mae Pool | 9.000% | 2/1/17–8/1/30 | 178 | 194 |
| 2,3 | Fannie Mae Pool | 9.500% | 3/1/17–11/1/25 | 223 | 252 |
| 2,3 | Fannie Mae Pool | 10.000% | 10/1/14–12/1/17 | 6 | 7 |
| 2,3 | Fannie Mae Pool | 11.000% | 9/1/19 | 1 | 1 |
| 2,3 | Freddie Mac Gold Pool | 2.000% | 7/1/28–8/1/28 | 31,077 | 29,821 |
| 2,3,4 | Freddie Mac Gold Pool | 2.500% | 3/1/27–3/1/43 | 489,002 | 481,370 |
| 2,3,4 | Freddie Mac Gold Pool | 3.000% | 3/1/21–11/1/43 | 944,551 | 922,353 |
| 2,3,4 | Freddie Mac Gold Pool | 3.500% | 8/1/25–9/1/43 | 1,128,401 | 1,134,131 |
| 2,3,4 | Freddie Mac Gold Pool | 4.000% | 5/1/14–1/1/44 | 1,081,756 | 1,119,675 |
| 2,3,4 | Freddie Mac Gold Pool | 4.500% | 12/1/17–1/1/44 | 869,881 | 923,140 |
| 2,3,4 | Freddie Mac Gold Pool | 5.000% | 4/1/14–1/1/44 | 625,862 | 674,653 |
| 2,3,4 | Freddie Mac Gold Pool | 5.500% | 1/1/14–1/1/44 | 568,170 | 622,276 |
| 2,3,4 | Freddie Mac Gold Pool | 6.000% | 2/1/14–1/1/44 | 359,391 | 398,237 |
| 2,3 | Freddie Mac Gold Pool | 6.500% | 1/1/14–9/1/39 | 110,205 | 123,313 |
| 2,3 | Freddie Mac Gold Pool | 7.000% | 7/1/14–12/1/38 | 34,748 | 39,467 |
| 2,3 | Freddie Mac Gold Pool | 7.500% | 10/1/14–2/1/32 | 2,852 | 3,195 |
| 2,3 | Freddie Mac Gold Pool | 8.000% | 12/1/14–1/1/32 | 2,738 | 3,064 |
| 2,3 | Freddie Mac Gold Pool | 8.500% | 3/1/21–7/1/31 | 516 | 582 |
| 2,3 | Freddie Mac Gold Pool | 9.000% | 7/1/20–3/1/31 | 409 | 452 |
| 2,3 | Freddie Mac Gold Pool | 9.500% | 4/1/16–6/1/25 | 71 | 77 |
| 2,3 | Freddie Mac Gold Pool | 10.000% | 10/1/16–4/1/25 | 9 | 9 |
| 2,3 | Freddie Mac Non Gold Pool | 8.000% | 2/1/17–6/1/17 | 4 | 4 |
| 2,3 | Freddie Mac Non Gold Pool | 8.500% | 6/1/18 | 13 | 15 |
| 2,3 | Freddie Mac Non Gold Pool | 9.500% | 10/1/18–3/1/20 | 3 | 3 |
| 3 | Ginnie Mae I Pool | 3.000% | 1/15/26–8/15/43 | 208,433 | 202,550 |
| 3,4 | Ginnie Mae I Pool | 3.500% | 11/15/25–1/1/44 | 238,736 | 242,346 |
| 3,4 | Ginnie Mae I Pool | 4.000% | 8/15/18–1/1/44 | 413,711 | 431,171 |
| 3,4 | Ginnie Mae I Pool | 4.500% | 5/15/18–1/1/44 | 550,551 | 588,764 |
| 3 | Ginnie Mae I Pool | 4.750% | 8/15/33 | 14 | 15 |
| 3,4 | Ginnie Mae I Pool | 5.000% | 1/15/17–1/1/44 | 348,446 | 378,901 |
| 3 | Ginnie Mae I Pool | 5.500% | 3/15/15–2/15/41 | 213,088 | 235,356 |
| 3,4 | Ginnie Mae I Pool | 6.000% | 1/15/14–12/1/43 | 163,177 | 181,907 |
| 3 | Ginnie Mae I Pool | 6.500% | 2/15/14–1/15/39 | 47,953 | 53,515 |
| 3 | Ginnie Mae I Pool | 7.000% | 11/15/14–9/15/36 | 9,963 | 11,127 |
| 3 | Ginnie Mae I Pool | 7.250% | 9/15/25 | 35 | 37 |
| 3 | Ginnie Mae I Pool | 7.500% | 5/15/17–6/15/32 | 4,144 | 4,571 |
| 3 | Ginnie Mae I Pool | 7.750% | 2/15/30 | 3 | 3 |
| 3 | Ginnie Mae I Pool | 8.000% | 1/15/17–12/15/30 | 2,832 | 3,120 |
| 3 | Ginnie Mae I Pool | 8.250% | 6/15/27 | 2 | 3 |
| 3 | Ginnie Mae I Pool | 8.500% | 1/15/17–3/15/31 | 638 | 681 |
| 3 | Ginnie Mae I Pool | 9.000% | 5/15/16–2/15/31 | 877 | 943 |
| 3 | Ginnie Mae I Pool | 9.500% | 7/15/16–9/15/25 | 256 | 284 |
| 3 | Ginnie Mae I Pool | 10.000% | 2/15/18–2/15/25 | 91 | 100 |
| 3 | Ginnie Mae I Pool | 10.500% | 7/15/15–4/15/25 | 57 | 58 |
| 3 | Ginnie Mae I Pool | 11.000% | 9/15/15–11/15/15 | 3 | 4 |
| 3 | Ginnie Mae I Pool | 11.500% | 8/15/15–4/15/16 | 1 | 1 |
| 3 | Ginnie Mae II Pool | 2.500% | 2/20/28–6/20/28 | 26,609 | 26,726 |
| 3,4 | Ginnie Mae II Pool | 3.000% | 10/20/26–1/1/44 | 803,801 | 780,828 |
| 3,4 | Ginnie Mae II Pool | 3.500% | 9/20/25–1/1/44 | 1,289,571 | 1,303,374 |
| 3,4 | Ginnie Mae II Pool | 4.000% | 9/20/25–1/1/44 | 822,860 | 858,132 |
| 3,4 | Ginnie Mae II Pool | 4.500% | 4/20/18–1/1/44 | 826,287 | 887,773 |
| 3,4 | Ginnie Mae II Pool | 5.000% | 12/20/32–1/1/44 | 512,165 | 560,076 |
| 3 | Ginnie Mae II Pool | 5.500% | 8/20/23–9/20/41 | 163,611 | 180,246 |
| 3 | Ginnie Mae II Pool | 6.000% | 7/20/23–12/20/41 | 98,085 | 109,441 |
| 3 | Ginnie Mae II Pool | 6.500% | 12/20/23–9/20/40 | 45,349 | 50,951 |
| 3 | Ginnie Mae II Pool | 7.000% | 3/20/28–11/20/38 | 6,975 | 7,868 |
7
| Vanguard® Total Bond Market Index Fund | |||||
| Schedule of Investments | |||||
| December 31, 2013 | |||||
| Face | Market | ||||
| Maturity | Amount | Value | |||
| Coupon | Date | ($000) | ($000) | ||
| 3 | Ginnie Mae II Pool | 7.500% | 8/20/30 | 7 | 7 |
| 3 | Ginnie Mae II Pool | 8.500% | 10/20/30 | 15 | 18 |
| 24,365,691 | |||||
| Nonconventional Mortgage-Backed Securities (0.8%) | |||||
| 2,3,5 | Fannie Mae Pool | 1.438% | 4/1/37 | 2,164 | 2,253 |
| 2,3,5 | Fannie Mae Pool | 1.961% | 9/1/37 | 2,119 | 2,275 |
| 2,3 | Fannie Mae Pool | 2.111% | 3/1/43 | 12,035 | 11,815 |
| 2,3,5 | Fannie Mae Pool | 2.114% | 12/1/35 | 9 | 10 |
| 2,3,5 | Fannie Mae Pool | 2.192% | 10/1/34 | 25 | 27 |
| 2,3 | Fannie Mae Pool | 2.197% | 9/1/42 | 11,360 | 11,331 |
| 2,3 | Fannie Mae Pool | 2.198% | 12/1/41 | 8,174 | 8,585 |
| 2,3 | Fannie Mae Pool | 2.204% | 6/1/43 | 12,962 | 12,832 |
| 2,3,5 | Fannie Mae Pool | 2.215% | 7/1/34 | 497 | 532 |
| 2,3,5 | Fannie Mae Pool | 2.220% | 1/1/35 | 336 | 351 |
| 2,3,5 | Fannie Mae Pool | 2.224% | 8/1/37 | 2,919 | 3,085 |
| 2,3,5 | Fannie Mae Pool | 2.225% | 12/1/33 | 888 | 933 |
| 2,3,5 | Fannie Mae Pool | 2.235% | 6/1/37 | 1,768 | 1,869 |
| 2,3 | Fannie Mae Pool | 2.243% | 10/1/42 | 8,426 | 8,405 |
| 2,3,5 | Fannie Mae Pool | 2.254% | 11/1/33 | 665 | 701 |
| 2,3,5 | Fannie Mae Pool | 2.258% | 11/1/36 | 1,529 | 1,630 |
| 2,3 | Fannie Mae Pool | 2.267% | 7/1/43 | 14,055 | 13,516 |
| 2,3,5 | Fannie Mae Pool | 2.273% | 9/1/34 | 1,132 | 1,189 |
| 2,3,5 | Fannie Mae Pool | 2.278% | 8/1/35 | 2,597 | 2,777 |
| 2,3,5 | Fannie Mae Pool | 2.315% | 12/1/36 | 42 | 44 |
| 2,3,5 | Fannie Mae Pool | 2.317% | 5/1/36 | 156 | 167 |
| 2,3,5 | Fannie Mae Pool | 2.335% | 2/1/37 | 6 | 6 |
| 2,3,5 | Fannie Mae Pool | 2.374% | 4/1/36 | 430 | 458 |
| 2,3,5 | Fannie Mae Pool | 2.392% | 5/1/33–12/1/35 | 1,708 | 1,819 |
| 2,3,5 | Fannie Mae Pool | 2.400% | 11/1/32 | 18 | 19 |
| 2,3 | Fannie Mae Pool | 2.407% | 7/1/42 | 11,640 | 11,685 |
| 2,3 | Fannie Mae Pool | 2.408% | 5/1/42 | 19,853 | 19,930 |
| 2,3,5 | Fannie Mae Pool | 2.415% | 6/1/36 | 53 | 56 |
| 2,3,5 | Fannie Mae Pool | 2.439% | 7/1/35 | 1,397 | 1,471 |
| 2,3,5 | Fannie Mae Pool | 2.440% | 2/1/36–11/1/36 | 2,766 | 2,826 |
| 2,3 | Fannie Mae Pool | 2.446% | 5/1/43 | 23,236 | 22,481 |
| 2,3 | Fannie Mae Pool | 2.472% | 10/1/42 | 10,906 | 10,967 |
| 2,3 | Fannie Mae Pool | 2.515% | 12/1/40 | 4,722 | 4,764 |
| 2,3 | Fannie Mae Pool | 2.528% | 10/1/40 | 7,005 | 7,093 |
| 2,3,5 | Fannie Mae Pool | 2.553% | 1/1/35 | 1,978 | 2,133 |
| 2,3,5 | Fannie Mae Pool | 2.560% | 9/1/33–11/1/33 | 2,147 | 2,337 |
| 2,3,5 | Fannie Mae Pool | 2.584% | 4/1/37 | 363 | 383 |
| 2,3,5 | Fannie Mae Pool | 2.593% | 4/1/36 | 1,218 | 1,275 |
| 2,3,5 | Fannie Mae Pool | 2.601% | 4/1/37 | 474 | 512 |
| 2,3,5 | Fannie Mae Pool | 2.604% | 1/1/37 | 2,490 | 2,686 |
| 2,3,5 | Fannie Mae Pool | 2.607% | 5/1/35 | 1,758 | 1,856 |
| 2,3 | Fannie Mae Pool | 2.617% | 11/1/41 | 7,728 | 7,849 |
| 2,3,5 | Fannie Mae Pool | 2.622% | 2/1/36 | 1,368 | 1,468 |
| 2,3 | Fannie Mae Pool | 2.623% | 12/1/41 | 8,041 | 8,112 |
| 2,3 | Fannie Mae Pool | 2.674% | 1/1/42 | 8,438 | 8,582 |
| 2,3 | Fannie Mae Pool | 2.770% | 3/1/42 | 9,540 | 9,739 |
| 2,3 | Fannie Mae Pool | 2.782% | 1/1/42 | 6,341 | 6,462 |
| 2,3 | Fannie Mae Pool | 2.804% | 3/1/41 | 6,008 | 6,173 |
| 2,3,5 | Fannie Mae Pool | 2.824% | 10/1/36 | 1,491 | 1,629 |
| 2,3 | Fannie Mae Pool | 2.826% | 11/1/41 | 7,642 | 7,833 |
| 2,3 | Fannie Mae Pool | 2.912% | 12/1/40 | 3,793 | 3,850 |
| 2,3 | Fannie Mae Pool | 2.934% | 5/1/42 | 1,384 | 1,470 |
| 2,3 | Fannie Mae Pool | 2.994% | 3/1/42 | 2,035 | 2,154 |
| 2,3,5 | Fannie Mae Pool | 3.000% | 11/1/34 | 1,459 | 1,531 |
| 2,3 | Fannie Mae Pool | 3.035% | 3/1/41 | 8,201 | 8,346 |
| 2,3 | Fannie Mae Pool | 3.065% | 2/1/42 | 8,482 | 8,960 |
| 2,3 | Fannie Mae Pool | 3.085% | 2/1/41 | 3,760 | 3,857 |
| 2,3 | Fannie Mae Pool | 3.126% | 2/1/41 | 3,671 | 3,774 |
| 2,3 | Fannie Mae Pool | 3.151% | 2/1/41 | 5,231 | 5,372 |
| 2,3 | Fannie Mae Pool | 3.152% | 12/1/40 | 4,197 | 4,270 |
8
| Vanguard® Total Bond Market Index Fund | |||||
| Schedule of Investments | |||||
| December 31, 2013 | |||||
| Face | Market | ||||
| Maturity | Amount | Value | |||
| Coupon | Date | ($000) | ($000) | ||
| 2,3 | Fannie Mae Pool | 3.192% | 9/1/40 | 4,812 | 4,894 |
| 2,3 | Fannie Mae Pool | 3.223% | 8/1/40 | 5,883 | 5,983 |
| 2,3 | Fannie Mae Pool | 3.224% | 12/1/40 | 5,345 | 5,446 |
| 2,3 | Fannie Mae Pool | 3.265% | 1/1/41 | 5,054 | 5,276 |
| 2,3 | Fannie Mae Pool | 3.266% | 10/1/40 | 6,212 | 6,333 |
| 2,3 | Fannie Mae Pool | 3.291% | 5/1/41 | 6,752 | 7,000 |
| 2,3 | Fannie Mae Pool | 3.294% | 1/1/40 | 3,419 | 3,554 |
| 2,3 | Fannie Mae Pool | 3.296% | 11/1/40 | 3,487 | 3,553 |
| 2,3 | Fannie Mae Pool | 3.306% | 7/1/42 | 3,916 | 4,212 |
| 2,3 | Fannie Mae Pool | 3.333% | 8/1/42 | 9,380 | 9,718 |
| 2,3 | Fannie Mae Pool | 3.407% | 1/1/40 | 7,950 | 8,263 |
| 2,3 | Fannie Mae Pool | 3.408% | 5/1/40 | 2,350 | 2,398 |
| 2,3 | Fannie Mae Pool | 3.431% | 12/1/39 | 11,303 | 11,810 |
| 2,3 | Fannie Mae Pool | 3.495% | 5/1/40 | 1,945 | 1,982 |
| 2,3 | Fannie Mae Pool | 3.517% | 10/1/39 | 2,448 | 2,548 |
| 2,3 | Fannie Mae Pool | 3.519% | 3/1/40 | 7,566 | 7,892 |
| 2,3 | Fannie Mae Pool | 3.554% | 6/1/41 | 1,506 | 1,563 |
| 2,3,5 | Fannie Mae Pool | 3.555% | 1/1/37 | 114 | 121 |
| 2,3 | Fannie Mae Pool | 3.563% | 7/1/41 | 9,542 | 9,864 |
| 2,3 | Fannie Mae Pool | 3.580% | 8/1/39 | 2,820 | 2,922 |
| 2,3 | Fannie Mae Pool | 3.587% | 11/1/39 | 1,416 | 1,474 |
| 2,3 | Fannie Mae Pool | 3.644% | 4/1/41 | 5,816 | 5,985 |
| 2,3 | Fannie Mae Pool | 3.662% | 11/1/39 | 2,709 | 2,822 |
| 2,3 | Fannie Mae Pool | 3.693% | 7/1/39 | 1,413 | 1,470 |
| 2,3 | Fannie Mae Pool | 3.698% | 5/1/40 | 8,393 | 8,771 |
| 2,3 | Fannie Mae Pool | 3.748% | 6/1/41 | 6,842 | 7,136 |
| 2,3 | Fannie Mae Pool | 3.816% | 9/1/40 | 7,038 | 7,276 |
| 2,3 | Fannie Mae Pool | 3.827% | 2/1/40 | 10,219 | 10,630 |
| 2,3 | Fannie Mae Pool | 4.211% | 12/1/39 | 7,829 | 8,183 |
| 2,3,5 | Fannie Mae Pool | 4.218% | 10/1/38 | 4,864 | 5,151 |
| 2,3 | Fannie Mae Pool | 4.850% | 7/1/38 | 930 | 975 |
| 2,3 | Fannie Mae Pool | 4.919% | 1/1/35 | 9 | 9 |
| 2,3 | Fannie Mae Pool | 5.137% | 10/1/37 | 72 | 78 |
| 2,3 | Fannie Mae Pool | 5.148% | 3/1/38 | 2,321 | 2,444 |
| 2,3,5 | Fannie Mae Pool | 5.167% | 11/1/39 | 3,380 | 3,646 |
| 2,3 | Fannie Mae Pool | 5.207% | 6/1/35 | 18 | 19 |
| 2,3 | Fannie Mae Pool | 5.228% | 11/1/35 | 5 | 5 |
| 2,3 | Fannie Mae Pool | 5.243% | 7/1/36 | 1,523 | 1,585 |
| 2,3 | Fannie Mae Pool | 5.259% | 7/1/38 | 427 | 446 |
| 2,3,5 | Fannie Mae Pool | 5.333% | 8/1/39 | 7,600 | 8,189 |
| 2,3,5 | Fannie Mae Pool | 5.384% | 4/1/37 | 141 | 149 |
| 2,3 | Fannie Mae Pool | 5.550% | 5/1/36 | 1,276 | 1,343 |
| 2,3 | Fannie Mae Pool | 5.675% | 4/1/37 | 2,504 | 2,640 |
| 2,3 | Fannie Mae Pool | 5.788% | 10/1/37 | 2,368 | 2,498 |
| 2,3 | Fannie Mae Pool | 5.794% | 12/1/37 | 2,710 | 2,826 |
| 2,3 | Fannie Mae Pool | 6.014% | 7/1/37 | 592 | 631 |
| 2,3 | Fannie Mae Pool | 6.116% | 10/1/37 | 3,912 | 4,129 |
| 2,3,5 | Freddie Mac Non Gold Pool | 1.730% | 6/1/37 | 1,836 | 1,887 |
| 2,3,5 | Freddie Mac Non Gold Pool | 1.949% | 3/1/37 | 629 | 653 |
| 2,3,5 | Freddie Mac Non Gold Pool | 2.064% | 1/1/37 | 2,471 | 2,626 |
| 2,3,5 | Freddie Mac Non Gold Pool | 2.157% | 8/1/37 | 111 | 115 |
| 2,3,5 | Freddie Mac Non Gold Pool | 2.171% | 5/1/37 | 137 | 146 |
| 2,3,5 | Freddie Mac Non Gold Pool | 2.220% | 7/1/35 | 1,711 | 1,814 |
| 2,3,5 | Freddie Mac Non Gold Pool | 2.250% | 6/1/35 | 6 | 7 |
| 2,3,5 | Freddie Mac Non Gold Pool | 2.291% | 10/1/37 | 1,669 | 1,727 |
| 2,3,5 | Freddie Mac Non Gold Pool | 2.357% | 12/1/34 | 1,724 | 1,788 |
| 2,3,5 | Freddie Mac Non Gold Pool | 2.375% | 11/1/34–11/1/36 | 5,374 | 5,637 |
| 2,3,5 | Freddie Mac Non Gold Pool | 2.386% | 12/1/34–12/1/36 | 2,561 | 2,672 |
| 2,3,5 | Freddie Mac Non Gold Pool | 2.398% | 6/1/36 | 11 | 11 |
| 2,3,5 | Freddie Mac Non Gold Pool | 2.412% | 4/1/37 | 46 | 48 |
| 2,3,5 | Freddie Mac Non Gold Pool | 2.440% | 12/1/34 | 45 | 47 |
| 2,3,5 | Freddie Mac Non Gold Pool | 2.445% | 3/1/37 | 136 | 143 |
| 2,3,5 | Freddie Mac Non Gold Pool | 2.518% | 3/1/36 | 15 | 16 |
| 2,3,5 | Freddie Mac Non Gold Pool | 2.531% | 6/1/37 | 1,904 | 2,049 |
9
| Vanguard® Total Bond Market Index Fund | |||||
| Schedule of Investments | |||||
| December 31, 2013 | |||||
| Face | Market | ||||
| Maturity | Amount | Value | |||
| Coupon | Date | ($000) | ($000) | ||
| 2,3,5 | Freddie Mac Non Gold Pool | 2.534% | 11/1/33 | 5 | 5 |
| 2,3,5 | Freddie Mac Non Gold Pool | 2.539% | 8/1/37 | 3,722 | 3,955 |
| 2,3,5 | Freddie Mac Non Gold Pool | 2.548% | 12/1/35 | 1,594 | 1,692 |
| 2,3,5 | Freddie Mac Non Gold Pool | 2.568% | 3/1/36 | 52 | 55 |
| 2,3 | Freddie Mac Non Gold Pool | 2.575% | 2/1/42 | 4,578 | 4,801 |
| 2,3,5 | Freddie Mac Non Gold Pool | 2.598% | 4/1/35 | 202 | 214 |
| 2,3,5 | Freddie Mac Non Gold Pool | 2.602% | 1/1/35 | 343 | 374 |
| 2,3 | Freddie Mac Non Gold Pool | 2.624% | 12/1/40 | 3,183 | 3,236 |
| 2,3,5 | Freddie Mac Non Gold Pool | 2.625% | 4/1/33 | 19 | 20 |
| 2,3,5 | Freddie Mac Non Gold Pool | 2.667% | 5/1/33 | 74 | 79 |
| 2,3 | Freddie Mac Non Gold Pool | 2.696% | 11/1/40 | 2,979 | 3,029 |
| 2,3 | Freddie Mac Non Gold Pool | 2.720% | 12/1/40 | 7,609 | 7,751 |
| 2,3 | Freddie Mac Non Gold Pool | 2.758% | 2/1/42 | 4,848 | 5,125 |
| 2,3 | Freddie Mac Non Gold Pool | 2.783% | 1/1/41 | 6,284 | 6,358 |
| 2,3 | Freddie Mac Non Gold Pool | 2.887% | 2/1/41 | 9,139 | 9,494 |
| 2,3 | Freddie Mac Non Gold Pool | 2.957% | 2/1/41 | 2,080 | 2,161 |
| 2,3 | Freddie Mac Non Gold Pool | 3.085% | 3/1/41 | 3,395 | 3,538 |
| 2,3 | Freddie Mac Non Gold Pool | 3.088% | 6/1/41 | 3,693 | 3,815 |
| 2,3,5 | Freddie Mac Non Gold Pool | 3.140% | 12/1/36 | 1,067 | 1,126 |
| 2,3 | Freddie Mac Non Gold Pool | 3.144% | 11/1/40 | 5,553 | 5,684 |
| 2,3 | Freddie Mac Non Gold Pool | 3.238% | 6/1/40 | 3,218 | 3,295 |
| 2,3 | Freddie Mac Non Gold Pool | 3.356% | 5/1/40 | 1,117 | 1,157 |
| 2,3 | Freddie Mac Non Gold Pool | 3.361% | 6/1/41 | 685 | 701 |
| 2,3 | Freddie Mac Non Gold Pool | 3.420% | 3/1/42 | 5,421 | 5,704 |
| 2,3 | Freddie Mac Non Gold Pool | 3.457% | 8/1/40 | 6,380 | 6,548 |
| 2,3 | Freddie Mac Non Gold Pool | 3.464% | 5/1/40 | 1,395 | 1,428 |
| 2,3 | Freddie Mac Non Gold Pool | 3.487% | 4/1/40 | 4,504 | 4,692 |
| 2,3 | Freddie Mac Non Gold Pool | 3.550% | 11/1/39 | 7,727 | 8,056 |
| 2,3 | Freddie Mac Non Gold Pool | 3.585% | 6/1/40 | 3,474 | 3,608 |
| 2,3 | Freddie Mac Non Gold Pool | 3.625% | 6/1/40 | 5,644 | 5,780 |
| 2,3 | Freddie Mac Non Gold Pool | 3.645% | 1/1/40 | 4,412 | 4,600 |
| 2,3 | Freddie Mac Non Gold Pool | 3.670% | 9/1/40 | 5,694 | 5,848 |
| 2,3,5 | Freddie Mac Non Gold Pool | 3.695% | 1/1/37 | 1,113 | 1,182 |
| 2,3 | Freddie Mac Non Gold Pool | 4.029% | 3/1/40 | 8,414 | 8,798 |
| 2,3 | Freddie Mac Non Gold Pool | 4.037% | 12/1/39 | 1,088 | 1,139 |
| 2,3,5 | Freddie Mac Non Gold Pool | 4.277% | 3/1/37 | 541 | 574 |
| 2,3 | Freddie Mac Non Gold Pool | 4.507% | 5/1/38 | 359 | 378 |
| 2,3 | Freddie Mac Non Gold Pool | 4.678% | 6/1/34 | 9 | 9 |
| 2,3 | Freddie Mac Non Gold Pool | 4.753% | 12/1/35 | 4,118 | 4,338 |
| 2,3 | Freddie Mac Non Gold Pool | 4.814% | 10/1/36 | 1,961 | 2,033 |
| 2,3 | Freddie Mac Non Gold Pool | 5.104% | 7/1/38 | 2,746 | 2,881 |
| 2,3 | Freddie Mac Non Gold Pool | 5.209% | 8/1/34 | 4 | 4 |
| 2,3 | Freddie Mac Non Gold Pool | 5.250% | 3/1/38 | 4,457 | 4,705 |
| 2,3 | Freddie Mac Non Gold Pool | 5.365% | 1/1/38 | 947 | 1,011 |
| 2,3 | Freddie Mac Non Gold Pool | 5.438% | 3/1/37 | 227 | 230 |
| 2,3 | Freddie Mac Non Gold Pool | 5.473% | 2/1/36 | 1,190 | 1,238 |
| 2,3 | Freddie Mac Non Gold Pool | 5.633% | 3/1/37 | 1,890 | 2,011 |
| 2,3 | Freddie Mac Non Gold Pool | 5.749% | 9/1/37 | 3,868 | 4,093 |
| 2,3 | Freddie Mac Non Gold Pool | 5.780% | 10/1/37 | 57 | 61 |
| 2,3 | Freddie Mac Non Gold Pool | 5.867% | 5/1/37 | 4,320 | 4,570 |
| 2,3 | Freddie Mac Non Gold Pool | 5.906% | 6/1/37 | 2,455 | 2,622 |
| 2,3 | Freddie Mac Non Gold Pool | 6.084% | 12/1/36 | 2,161 | 2,281 |
| 2,3 | Freddie Mac Non Gold Pool | 6.245% | 8/1/37 | 918 | 973 |
| 2,3 | Freddie Mac Non Gold Pool | 6.328% | 2/1/37 | 549 | 586 |
| 3,5 | Ginnie Mae II Pool | 1.625% | 6/20/29 | 179 | 184 |
| 3 | Ginnie Mae II Pool | 2.000% | 6/20/43 | 9,642 | 9,667 |
| 3 | Ginnie Mae II Pool | 2.500% | 1/20/41–1/20/42 | 54,384 | 56,654 |
| 3 | Ginnie Mae II Pool | 3.000% | 11/20/40–11/20/41 | 34,550 | 35,588 |
| 3,5 | Ginnie Mae II Pool | 3.500% | 10/20/39–10/20/41 | 28,132 | 29,454 |
| 3 | Ginnie Mae II Pool | 3.750% | 1/20/40 | 3,852 | 3,954 |
| 3 | Ginnie Mae II Pool | 4.000% | 9/20/39–10/20/41 | 40,461 | 41,967 |
10
| Vanguard® Total Bond Market Index Fund | |||||
| Schedule of Investments | |||||
| December 31, 2013 | |||||
| Face | Market | ||||
| Maturity | Amount | Value | |||
| Coupon | Date | ($000) | ($000) | ||
| 3,5 | Ginnie Mae II Pool | 5.000% | 7/20/38–10/20/38 | 1,624 | 1,662 |
| 836,519 | |||||
| Total U.S. Government and Agency Obligations (Cost $71,478,669) | 71,817,529 | ||||
| Asset-Backed/Commercial Mortgage-Backed Securities (2.6%) | |||||
| 3 | AEP Texas Central Transition Funding II LLC 2006-A | 5.170% | 1/1/18 | 3,251 | 3,609 |
| 3 | Ally Auto Receivables Trust 2011-2 | 1.980% | 4/15/16 | 6,899 | 6,936 |
| 3 | Ally Auto Receivables Trust 2011-4 | 1.140% | 6/15/16 | 3,071 | 3,084 |
| 3 | Ally Auto Receivables Trust 2012-5 | 0.850% | 1/16/18 | 6,120 | 6,104 |
| 3 | Ally Auto Receivables Trust 2013-2 | 0.790% | 1/15/18 | 1,650 | 1,651 |
| 3 | Ally Auto Receivables Trust 2013-2 | 1.240% | 11/15/18 | 1,125 | 1,134 |
| 3 | American Express Credit Account Secured Note Trust | ||||
| 2013-3 | 0.980% | 5/15/19 | 1,500 | 1,495 | |
| 3 | AmeriCredit Automobile Receivables Trust 2012-1 | 1.230% | 9/8/16 | 1,525 | 1,529 |
| 3 | AmeriCredit Automobile Receivables Trust 2013-1 | 0.610% | 10/10/17 | 1,801 | 1,796 |
| 3 | AmeriCredit Automobile Receivables Trust 2013-2 | 0.650% | 12/8/17 | 1,162 | 1,159 |
| 3 | AmeriCredit Automobile Receivables Trust 2013-3 | 0.920% | 4/9/18 | 2,960 | 2,958 |
| 3 | AmeriCredit Automobile Receivables Trust 2013-4 | 0.960% | 4/9/18 | 1,040 | 1,038 |
| 3 | AmeriCredit Automobile Receivables Trust 2013-5 | 0.900% | 9/10/18 | 1,200 | 1,199 |
| 3 | AmeriCredit Automobile Receivables Trust 2013-5 | 1.520% | 1/8/19 | 600 | 601 |
| 3 | Banc of America Commercial Mortgage Trust 2004-3 | 5.556% | 6/10/39 | 6,709 | 6,769 |
| 3 | Banc of America Commercial Mortgage Trust 2004-4 | 4.877% | 7/10/42 | 16,641 | 16,837 |
| 3 | Banc of America Commercial Mortgage Trust 2005-1 | 5.171% | 11/10/42 | 3,435 | 3,471 |
| 3 | Banc of America Commercial Mortgage Trust 2005-5 | 5.115% | 10/10/45 | 16,101 | 17,024 |
| 3 | Banc of America Commercial Mortgage Trust 2005-6 | 5.184% | 9/10/47 | 3,500 | 3,766 |
| 3 | Banc of America Commercial Mortgage Trust 2005-6 | 5.184% | 9/10/47 | 3,540 | 3,761 |
| 3 | Banc of America Commercial Mortgage Trust 2006-1 | 5.372% | 9/10/45 | 20,200 | 21,661 |
| 3 | Banc of America Commercial Mortgage Trust 2006-1 | 5.421% | 9/10/45 | 185 | 199 |
| 3 | Banc of America Commercial Mortgage Trust 2006-2 | 5.734% | 5/10/45 | 11,600 | 12,641 |
| 3 | Banc of America Commercial Mortgage Trust 2006-2 | 5.769% | 5/10/45 | 3,290 | 3,473 |
| 3 | Banc of America Commercial Mortgage Trust 2006-3 | 5.889% | 7/10/44 | 696 | 756 |
| 3 | Banc of America Commercial Mortgage Trust 2006-4 | 5.634% | 7/10/46 | 25,675 | 27,814 |
| 3 | Banc of America Commercial Mortgage Trust 2006-5 | 5.390% | 9/10/47 | 320 | 331 |
| 3 | Banc of America Commercial Mortgage Trust 2006-5 | 5.414% | 9/10/47 | 11,525 | 12,482 |
| 3 | Banc of America Commercial Mortgage Trust 2006-5 | 5.448% | 9/10/47 | 2,175 | 2,292 |
| 3 | Banc of America Commercial Mortgage Trust 2008-1 | 6.207% | 2/10/51 | 21,550 | 24,410 |
| 6 | Banco Bilbao Vizcaya Argentaria SA | 5.750% | 7/20/17 | 1,975 | 2,142 |
| 6 | Bank of Scotland plc | 5.250% | 2/21/17 | 12,135 | 13,538 |
| 3 | Bear Stearns Commercial Mortgage Securities Trust | ||||
| 2004-PWR6 | 4.825% | 11/11/41 | 495 | 507 | |
| 3 | Bear Stearns Commercial Mortgage Securities Trust | ||||
| 2004-PWR6 | 4.868% | 11/11/41 | 2,300 | 2,358 | |
| 3 | Bear Stearns Commercial Mortgage Securities Trust | ||||
| 2004-TOP14 | 5.200% | 1/12/41 | 763 | 765 | |
| 3 | Bear Stearns Commercial Mortgage Securities Trust | ||||
| 2005-PWR10 | 5.405% | 12/11/40 | 5,239 | 5,542 | |
| 3 | Bear Stearns Commercial Mortgage Securities Trust | ||||
| 2005-PWR8 | 4.750% | 6/11/41 | 4,175 | 4,310 | |
| 3 | Bear Stearns Commercial Mortgage Securities Trust | ||||
| 2005-PWR9 | 4.871% | 9/11/42 | 25 | 26 | |
| 3 | Bear Stearns Commercial Mortgage Securities Trust | ||||
| 2005-TOP18 | 4.933% | 2/13/42 | 2,749 | 2,858 | |
| 3 | Bear Stearns Commercial Mortgage Securities Trust | ||||
| 2005-TOP20 | 5.138% | 10/12/42 | 3,215 | 3,406 | |
| 3 | Bear Stearns Commercial Mortgage Securities Trust | ||||
| 2006-PWR11 | 5.439% | 3/11/39 | 24,500 | 26,277 | |
| 3 | Bear Stearns Commercial Mortgage Securities Trust | ||||
| 2006-PWR12 | 5.712% | 9/11/38 | 260 | 281 | |
| 3 | Bear Stearns Commercial Mortgage Securities Trust | ||||
| 2006-PWR12 | 5.751% | 9/11/38 | 5,500 | 5,990 | |
| 3 | Bear Stearns Commercial Mortgage Securities Trust | ||||
| 2006-PWR13 | 5.582% | 9/11/41 | 1,625 | 1,800 | |
11
| Vanguard® Total Bond Market Index Fund | ||||
| Schedule of Investments | ||||
| December 31, 2013 | ||||
| Face | Market | |||
| Maturity | Amount | Value | ||
| Coupon | Date | ($000) | ($000) | |
| 3 Bear Stearns Commercial Mortgage Securities Trust | ||||
| 2006-TOP22 | 5.579% | 4/12/38 | 22,517 | 24,302 |
| 3 Bear Stearns Commercial Mortgage Securities Trust | ||||
| 2006-TOP22 | 5.579% | 4/12/38 | 4,525 | 4,900 |
| 3 Bear Stearns Commercial Mortgage Securities Trust | ||||
| 2006-TOP24 | 5.568% | 10/12/41 | 8,375 | 9,182 |
| 3 Bear Stearns Commercial Mortgage Securities Trust | ||||
| 2007-PWR16 | 5.654% | 6/11/40 | 3,977 | 4,036 |
| 3 Bear Stearns Commercial Mortgage Securities Trust | ||||
| 2007-PWR16 | 5.706% | 6/11/40 | 6,275 | 7,052 |
| 3 Bear Stearns Commercial Mortgage Securities Trust | ||||
| 2007-PWR17 | 5.694% | 6/11/50 | 21,900 | 24,371 |
| 3 Bear Stearns Commercial Mortgage Securities Trust | ||||
| 2007-PWR17 | 5.887% | 6/11/50 | 6,853 | 7,725 |
| 3 Bear Stearns Commercial Mortgage Securities Trust | ||||
| 2007-PWR18 | 5.700% | 6/11/50 | 10,400 | 11,651 |
| 3 Bear Stearns Commercial Mortgage Securities Trust | ||||
| 2007-TOP26 | 5.471% | 1/12/45 | 5,340 | 5,894 |
| 3 Bear Stearns Commercial Mortgage Securities Trust | ||||
| 2007-TOP26 | 5.513% | 1/12/45 | 6,280 | 6,784 |
| 3 Bear Stearns Commercial Mortgage Securities Trust | ||||
| 2007-TOP28 | 5.742% | 9/11/42 | 15,900 | 17,878 |
| 3 Bear Stearns Commercial Mortgage Securities Trust | ||||
| 2007-TOP28 | 5.793% | 9/11/42 | 3,824 | 3,871 |
| 3 Capital Auto Receivables Asset Trust 2013-1 | 0.790% | 6/20/17 | 3,603 | 3,589 |
| 3 Capital Auto Receivables Asset Trust 2013-3 | 1.040% | 11/21/16 | 2,445 | 2,448 |
| 3 Capital Auto Receivables Asset Trust 2013-3 | 1.310% | 12/20/17 | 2,446 | 2,463 |
| 3 Capital Auto Receivables Asset Trust 2013-3 | 1.680% | 4/20/18 | 1,470 | 1,481 |
| 3 Capital Auto Receivables Asset Trust 2013-4 | 1.090% | 3/20/18 | 2,700 | 2,707 |
| 3 Capital Auto Receivables Asset Trust 2013-4 | 1.470% | 7/20/18 | 1,000 | 1,002 |
| 3 Capital Auto Receivables Asset Trust 2013-4 | 2.060% | 10/22/18 | 1,000 | 1,007 |
| 3 Capital One Multi-asset Execution Trust 2006-A3 | 5.050% | 12/17/18 | 36,645 | 39,884 |
| 3 Capital One Multi-asset Execution Trust 2007-A7 | 5.750% | 7/15/20 | 10,300 | 11,824 |
| 3 CarMax Auto Owner Trust 2012-3 | 0.790% | 4/16/18 | 2,450 | 2,434 |
| 3 Carmax Auto Owner Trust 2013-2 | 0.640% | 1/16/18 | 3,604 | 3,600 |
| 3 Carmax Auto Owner Trust 2013-2 | 0.840% | 11/15/18 | 1,502 | 1,487 |
| 3 Carmax Auto Owner Trust 2013-3 | 0.970% | 4/16/18 | 3,790 | 3,817 |
| 3 Carmax Auto Owner Trust 2013-3 | 1.490% | 1/15/19 | 2,040 | 2,060 |
| 3 Carmax Auto Owner Trust 2013-4 | 0.800% | 7/16/18 | 1,450 | 1,450 |
| 3 Carmax Auto Owner Trust 2013-4 | 1.280% | 5/15/19 | 550 | 548 |
| 3 CD 2005-CD1 Commercial Mortgage Trust | 5.218% | 7/15/44 | 7,000 | 7,500 |
| 3 CD 2005-CD1 Commercial Mortgage Trust | 5.218% | 7/15/44 | 18,000 | 19,063 |
| 3 CD 2006-CD2 Mortgage Trust | 5.304% | 1/15/46 | 680 | 725 |
| 3 CD 2006-CD3 Mortgage Trust | 5.617% | 10/15/48 | 10,960 | 11,789 |
| 3 CD 2006-CD3 Mortgage Trust | 5.648% | 10/15/48 | 8,575 | 9,450 |
| 3 CD 2007-CD4 Commercial Mortgage Trust | 5.205% | 12/11/49 | 642 | 641 |
| 3 CD 2007-CD4 Commercial Mortgage Trust | 5.322% | 12/11/49 | 13,050 | 14,410 |
| 3 CD 2007-CD5 Mortgage Trust | 5.886% | 11/15/44 | 18,139 | 20,355 |
| 3 CenterPoint Energy Transition Bond Co. II LLC 2005-A | 5.170% | 8/1/19 | 2,029 | 2,204 |
| 3 CenterPoint Energy Transition Bond Co. II LLC 2005-A | 5.302% | 8/1/20 | 1,184 | 1,365 |
| 3 CenterPoint Energy Transition Bond Co. IV LLC 2012-1 | 3.028% | 10/15/25 | 9,483 | 9,070 |
| 3 Chase Issuance Trust 2006-A2 | 5.160% | 4/16/18 | 14,352 | 15,669 |
| 3 Chase Issuance Trust 2012-A5 | 0.590% | 8/15/17 | 5,845 | 5,838 |
| 3 Chase Issuance Trust 2012-A7 | 2.160% | 9/16/24 | 17,440 | 15,945 |
| 3 Chase Issuance Trust 2013-A8 | 1.010% | 10/15/18 | 10,225 | 10,174 |
| 3 Citibank Credit Card Issuance Trust 2003-A7 | 4.150% | 7/7/17 | 9,185 | 9,673 |
| 3 Citibank Credit Card Issuance Trust 2004-A8 | 4.900% | 12/12/16 | 10,512 | 10,913 |
| 3 Citibank Credit Card Issuance Trust 2005-A2 | 4.850% | 3/10/17 | 4,650 | 4,874 |
| 3 Citibank Credit Card Issuance Trust 2005-A9 | 5.100% | 11/20/17 | 13,301 | 14,381 |
| 3 Citibank Credit Card Issuance Trust 2007-A8 | 5.650% | 9/20/19 | 10,600 | 12,155 |
| 3 Citibank Credit Card Issuance Trust 2008-A1 | 5.350% | 2/7/20 | 11,546 | 13,167 |
| 3 Citibank Credit Card Issuance Trust 2009-A4 | 4.900% | 6/23/16 | 20,125 | 20,537 |
| 3 Citibank Credit Card Issuance Trust 2013-A10 | 0.730% | 2/7/18 | 4,650 | 4,644 |
| 3 Citigroup Commercial Mortgage Trust 2005-C3 | 4.830% | 5/15/43 | 6,990 | 7,294 |
12
| Vanguard® Total Bond Market Index Fund | |||||
| Schedule of Investments | |||||
| December 31, 2013 | |||||
| Face | Market | ||||
| Maturity | Amount | Value | |||
| Coupon | Date | ($000) | ($000) | ||
| 3 | Citigroup Commercial Mortgage Trust 2006-C4 | 5.778% | 3/15/49 | 2,500 | 2,725 |
| 3 | Citigroup Commercial Mortgage Trust 2006-C4 | 5.778% | 3/15/49 | 12,620 | 13,702 |
| 3 | Citigroup Commercial Mortgage Trust 2006-C5 | 5.431% | 10/15/49 | 3,625 | 3,946 |
| 3 | Citigroup Commercial Mortgage Trust 2006-C5 | 5.462% | 10/15/49 | 3,375 | 3,709 |
| 3 | Citigroup Commercial Mortgage Trust 2007-C6 | 5.705% | 12/10/49 | 20,075 | 22,624 |
| 3 | Citigroup Commercial Mortgage Trust 2008-C7 | 6.132% | 12/10/49 | 22,115 | 25,013 |
| 3 | Citigroup Commercial Mortgage Trust 2012-GC8 | 3.024% | 9/10/45 | 5,450 | 5,203 |
| 3 | Citigroup Commercial Mortgage Trust 2013-GC11 | 3.093% | 4/10/46 | 2,300 | 2,171 |
| 3 | Citigroup Commercial Mortgage Trust 2013-GC11 | 3.422% | 4/10/46 | 2,000 | 1,902 |
| 3 | Citigroup Commercial Mortgage Trust 2013-GC15 | 3.161% | 9/10/46 | 2,900 | 2,990 |
| 3 | Citigroup Commercial Mortgage Trust 2013-GC15 | 3.942% | 9/10/46 | 1,200 | 1,244 |
| 3 | Citigroup Commercial Mortgage Trust 2013-GC15 | 4.371% | 9/10/46 | 1,975 | 2,032 |
| 3 | Citigroup Commercial Mortgage Trust 2013-GC15 | 4.649% | 9/10/46 | 2,875 | 2,973 |
| 3 | Citigroup Commercial Mortgage Trust 2013-GC17 | 3.675% | 11/10/46 | 875 | 894 |
| 3 | Citigroup Commercial Mortgage Trust 2013-GC17 | 4.131% | 11/10/46 | 2,900 | 2,963 |
| 3 | Citigroup Commercial Mortgage Trust 2013-GC17 | 4.544% | 11/10/46 | 1,150 | 1,185 |
| 3 | Citigroup Commercial Mortgage Trust 2013-GC17 | 5.095% | 11/10/46 | 1,150 | 1,188 |
| 3 | COBALT CMBS Commercial Mortgage Trust 2007-C2 | 5.484% | 4/15/47 | 3,149 | 3,473 |
| 3 | COBALT CMBS Commercial Mortgage Trust 2007-C3 | 5.770% | 5/15/46 | 11,775 | 13,068 |
| 3 | COMM 2004-LNB2 Mortgage Trust | 4.715% | 3/10/39 | 1,621 | 1,624 |
| 3 | COMM 2005-C6 Mortgage Trust | 5.116% | 6/10/44 | 22,303 | 23,490 |
| 3 | COMM 2006-C7 Mortgage Trust | 5.752% | 6/10/46 | 19,200 | 20,829 |
| 3 | COMM 2006-C7 Mortgage Trust | 5.777% | 6/10/46 | 4,025 | 4,346 |
| 3 | COMM 2007-C9 Mortgage Trust | 5.800% | 12/10/49 | 17,413 | 19,658 |
| 3 | COMM 2012-CCRE2 Mortgage Trust | 3.147% | 8/15/45 | 2,485 | 2,401 |
| 3 | COMM 2012-CCRE2 Mortgage Trust | 3.791% | 8/15/45 | 2,950 | 2,913 |
| 3 | COMM 2012-CCRE3 Mortgage Trust | 2.822% | 10/15/45 | 5,000 | 4,705 |
| 3,6 | COMM 2012-CCRE3 Mortgage Trust | 3.416% | 10/15/45 | 3,548 | 3,378 |
| 3 | COMM 2012-CCRE4 Mortgage Trust | 2.853% | 10/15/45 | 5,150 | 4,839 |
| 3 | COMM 2012-CCRE5 Mortgage Trust | 2.771% | 12/10/45 | 1,500 | 1,397 |
| 3 | COMM 2013-CCRE11 Mortgage Trust | 3.047% | 10/10/46 | 1,430 | 1,467 |
| 3 | COMM 2013-CCRE11 Mortgage Trust | 3.660% | 10/10/46 | 1,430 | 1,452 |
| 3 | COMM 2013-CCRE11 Mortgage Trust | 3.983% | 10/10/46 | 1,910 | 1,933 |
| 3 | COMM 2013-CCRE11 Mortgage Trust | 4.258% | 10/10/46 | 2,390 | 2,449 |
| 3 | COMM 2013-CCRE11 Mortgage Trust | 4.715% | 10/10/46 | 1,430 | 1,496 |
| 3 | COMM 2013-CCRE12 Mortgage Trust | 1.295% | 10/10/46 | 1,137 | 1,134 |
| 3 | COMM 2013-CCRE12 Mortgage Trust | 2.904% | 10/10/46 | 1,700 | 1,739 |
| 3 | COMM 2013-CCRE12 Mortgage Trust | 3.623% | 10/10/46 | 1,700 | 1,733 |
| 3 | COMM 2013-CCRE12 Mortgage Trust | 3.765% | 10/10/46 | 2,275 | 2,261 |
| 3 | COMM 2013-CCRE12 Mortgage Trust | 4.046% | 10/10/46 | 1,700 | 1,714 |
| 3 | COMM 2013-CCRE12 Mortgage Trust | 4.300% | 10/10/46 | 1,150 | 1,164 |
| 3 | COMM 2013-CCRE12 Mortgage Trust | 4.762% | 10/10/46 | 575 | 579 |
| 3 | COMM 2013-CCRE13 Mortgage Trust | 1.259% | 10/10/46 | 875 | 871 |
| 3 | COMM 2013-CCRE13 Mortgage Trust | 3.039% | 10/10/46 | 875 | 899 |
| 3 | COMM 2013-CCRE13 Mortgage Trust | 3.706% | 10/10/46 | 575 | 588 |
| 3 | COMM 2013-CCRE13 Mortgage Trust | 4.194% | 10/10/46 | 5,850 | 6,002 |
| 3 | COMM 2013-CCRE13 Mortgage Trust | 4.449% | 10/10/46 | 1,750 | 1,790 |
| 3 | COMM 2013-CCRE6 Mortgage Trust | 3.101% | 3/10/46 | 2,908 | 2,772 |
| 3 | COMM 2013-CCRE7 Mortgage Trust | 3.213% | 3/10/46 | 2,300 | 2,206 |
| 3 | COMM 2013-CCRE8 Mortgage Trust | 3.612% | 6/10/46 | 3,262 | 3,220 |
| 3 | COMM 2013-CCRE9 Mortgage Trust | 4.237% | 7/10/45 | 4,060 | 4,201 |
| 3 | COMM 2013-CCRE9 Mortgage Trust | 4.210% | 8/10/46 | 1,120 | 1,155 |
| 3 | COMM 2013-LC13 Mortgage Trust | 3.009% | 8/10/46 | 1,680 | 1,723 |
| 3 | COMM 2013-LC13 Mortgage Trust | 4.205% | 8/10/46 | 1,680 | 1,727 |
| 3 | COMM 2013-LC6 Mortgage Trust | 2.941% | 1/10/46 | 4,586 | 4,301 |
| 3 | COMM 2013-LC6 Mortgage Trust | 3.282% | 1/10/46 | 2,547 | 2,404 |
| 3 | Commercial Mortgage Trust 2004-GG1 | 5.317% | 6/10/36 | 5,144 | 5,177 |
| 3 | Commercial Mortgage Trust 2005-GG3 | 4.799% | 8/10/42 | 23,400 | 24,083 |
| 3 | Commercial Mortgage Trust 2005-GG3 | 4.859% | 8/10/42 | 3,850 | 3,989 |
| 3 | Commercial Mortgage Trust 2005-GG5 | 5.224% | 4/10/37 | 18,908 | 19,896 |
| 3 | Commercial Mortgage Trust 2005-GG5 | 5.277% | 4/10/37 | 4,475 | 4,756 |
| 3 | Commercial Mortgage Trust 2006-GG7 | 5.820% | 7/10/38 | 2,553 | 2,784 |
| 3 | Commercial Mortgage Trust 2007-GG9 | 5.475% | 3/10/39 | 1,625 | 1,725 |
13
| Vanguard® Total Bond Market Index Fund | |||||
| Schedule of Investments | |||||
| December 31, 2013 | |||||
| Face | Market | ||||
| Maturity | Amount | Value | |||
| Coupon | Date | ($000) | ($000) | ||
| 3,6 | Commercial Mortgages Lease-Backed Certificates | ||||
| Series 2001-CMLB-1 | 6.746% | 6/20/31 | 3,712 | 3,889 | |
| 3 | Credit Suisse Commercial Mortgage Trust Series 2006- | ||||
| C1 | 5.465% | 2/15/39 | 4,435 | 4,755 | |
| 3 | Credit Suisse Commercial Mortgage Trust Series 2006- | ||||
| C1 | 5.465% | 2/15/39 | 7,675 | 8,266 | |
| 3 | Credit Suisse Commercial Mortgage Trust Series 2006- | ||||
| C1 | 5.465% | 2/15/39 | 17,565 | 18,718 | |
| 3 | Credit Suisse Commercial Mortgage Trust Series 2006- | ||||
| C3 | 5.791% | 6/15/38 | 17,910 | 19,490 | |
| 3 | Credit Suisse Commercial Mortgage Trust Series 2006- | ||||
| C3 | 5.791% | 6/15/38 | 4,266 | 4,631 | |
| 3 | Credit Suisse Commercial Mortgage Trust Series 2006- | ||||
| C4 | 5.509% | 9/15/39 | 1,725 | 1,855 | |
| 3 | Credit Suisse Commercial Mortgage Trust Series 2006- | ||||
| C5 | 5.311% | 12/15/39 | 15,020 | 16,277 | |
| 3 | Credit Suisse Commercial Mortgage Trust Series 2007- | ||||
| C1 | 5.383% | 2/15/40 | 6,284 | 6,793 | |
| 3 | Credit Suisse Commercial Mortgage Trust Series 2007- | ||||
| C3 | 5.683% | 6/15/39 | 17,012 | 18,582 | |
| 3 | CSFB Commercial Mortgage Trust 2005-C1 | 5.014% | 2/15/38 | 12,668 | 13,022 |
| 3 | CSFB Commercial Mortgage Trust 2005-C1 | 5.075% | 2/15/38 | 4,724 | 4,886 |
| 3 | CSFB Commercial Mortgage Trust 2005-C3 | 4.645% | 7/15/37 | 41 | 42 |
| 3 | CSFB Commercial Mortgage Trust 2005-C4 | 5.190% | 8/15/38 | 3,400 | 3,560 |
| 3 | CSFB Commercial Mortgage Trust 2005-C5 | 5.100% | 8/15/38 | 18,225 | 19,133 |
| 3 | CSFB Commercial Mortgage Trust 2005-C5 | 5.100% | 8/15/38 | 1,565 | 1,665 |
| 3 | CSFB Commercial Mortgage Trust 2005-C6 | 5.230% | 12/15/40 | 3,290 | 3,458 |
| 3 | Discover Card Execution Note Trust 2007-A1 | 5.650% | 3/16/20 | 14,891 | 17,035 |
| 2 | Federal Housing Administration | 7.430% | 10/1/20 | 1 | 2 |
| 3 | Ford Credit Auto Lease Trust 2013-B | 0.760% | 9/15/16 | 1,200 | 1,203 |
| 3 | Ford Credit Auto Lease Trust 2013-B | 0.960% | 10/15/16 | 850 | 853 |
| 3 | Ford Credit Auto Owner Trust 2010-A | 2.150% | 6/15/15 | 4,438 | 4,448 |
| 3 | Ford Credit Auto Owner Trust 2011-A | 1.650% | 5/15/16 | 1,567 | 1,576 |
| 3 | Ford Credit Auto Owner Trust 2012-A | 1.150% | 6/15/17 | 6,825 | 6,862 |
| 3 | Ford Credit Auto Owner Trust 2012-B | 0.720% | 12/15/16 | 942 | 944 |
| 3 | Ford Credit Auto Owner Trust 2013-A | 0.550% | 7/15/17 | 4,608 | 4,606 |
| 3 | Ford Credit Auto Owner Trust 2013-B | 0.570% | 10/15/17 | 3,000 | 2,997 |
| 3 | Ford Credit Auto Owner Trust 2013-B | 0.760% | 8/15/18 | 1,500 | 1,494 |
| 3 | Ford Credit Auto Owner Trust 2013-C | 0.820% | 12/15/17 | 3,539 | 3,547 |
| 3 | Ford Credit Auto Owner Trust 2013-C | 1.250% | 10/15/18 | 1,180 | 1,187 |
| 3 | Ford Credit Auto Owner Trust 2013-D | 0.670% | 4/15/18 | 3,400 | 3,400 |
| 3 | Ford Credit Auto Owner Trust 2013-D | 1.110% | 2/15/19 | 550 | 550 |
| 3 | Ford Credit Floorplan Master Owner Trust A Series | ||||
| 2013-5 | 1.500% | 9/15/18 | 4,675 | 4,716 | |
| 3 | GE Capital Credit Card Master Note Trust Series 2012-7 | 1.760% | 9/15/22 | 6,545 | 6,308 |
| 3 | GE Commercial Mortgage Corp. Series 2005-C1 Trust | 4.578% | 6/10/48 | 217 | 219 |
| 3 | GE Commercial Mortgage Corp. Series 2005-C3 Trust | 4.974% | 7/10/45 | 9,275 | 9,742 |
| 3 | GE Commercial Mortgage Corp. Series 2005-C4 Trust | 5.310% | 11/10/45 | 7,048 | 7,503 |
| 3 | GE Commercial Mortgage Corp. Series 2006-C1 Trust | 5.280% | 3/10/44 | 22,040 | 23,514 |
| 3 | GE Commercial Mortgage Corp. Series 2006-C1 Trust | 5.280% | 3/10/44 | 6,675 | 7,257 |
| 3 | GE Commercial Mortgage Corp. Series 2007-C1 Trust | 5.543% | 12/10/49 | 5,925 | 6,355 |
| 3 | GMAC Commercial Mortgage Securities Inc. Series | ||||
| 2004-C1 Trust | 4.908% | 3/10/38 | 1,011 | 1,015 | |
| 3 | GMAC Commercial Mortgage Securities Inc. Series | ||||
| 2004-C3 Trust | 4.864% | 12/10/41 | 4,150 | 4,255 | |
| 3 | GMAC Commercial Mortgage Securities Inc. Series | ||||
| 2005-C1 Trust | 4.754% | 5/10/43 | 1,650 | 1,717 | |
| 3 | GS Mortgage Securities Trust 2004-GG2 | 5.396% | 8/10/38 | 11,506 | 11,652 |
| 3 | GS Mortgage Securities Trust 2006-GG6 | 5.506% | 4/10/38 | 1,055 | 1,055 |
| 3 | GS Mortgage Securities Trust 2006-GG6 | 5.553% | 4/10/38 | 13,665 | 14,681 |
| 3 | GS Mortgage Securities Trust 2006-GG6 | 5.622% | 4/10/38 | 4,750 | 5,062 |
| 3 | GS Mortgage Securities Trust 2007-GG10 | 5.804% | 8/10/45 | 1,125 | 1,232 |
| 3 | GS Mortgage Securities Trust 2011-GC5 | 3.707% | 8/10/44 | 3,220 | 3,274 |
14
| Vanguard® Total Bond Market Index Fund | ||||
| Schedule of Investments | ||||
| December 31, 2013 | ||||
| Face | Market | |||
| Maturity | Amount | Value | ||
| Coupon | Date | ($000) | ($000) | |
| 3 GS Mortgage Securities Trust 2012-GC6 | 3.482% | 1/10/45 | 12,500 | 12,643 |
| 3 GS Mortgage Securities Trust 2012-GCJ7 | 3.377% | 5/10/45 | 7,475 | 7,435 |
| 3 GS Mortgage Securities Trust 2012-GCJ9 | 2.773% | 11/10/45 | 5,530 | 5,164 |
| 3 GS Mortgage Securities Trust 2013-GC10 | 2.943% | 2/10/46 | 4,077 | 3,831 |
| 3 GS Mortgage Securities Trust 2013-GC10 | 3.279% | 2/10/46 | 1,529 | 1,446 |
| 3 GS Mortgage Securities Trust 2013-GCJ12 | 3.135% | 6/10/46 | 4,182 | 3,960 |
| 3 GS Mortgage Securities Trust 2013-GCJ12 | 3.375% | 6/10/46 | 1,792 | 1,698 |
| 3 GS Mortgage Securities Trust 2013-GCJ14 | 2.995% | 8/10/46 | 2,055 | 2,112 |
| 3 GS Mortgage Securities Trust 2013-GCJ14 | 3.817% | 8/10/46 | 1,470 | 1,522 |
| 3 GS Mortgage Securities Trust 2013-GCJ14 | 4.243% | 8/10/46 | 7,350 | 7,584 |
| 3 GS Mortgage Securities Trust 2013-GCJ16 | 3.033% | 11/10/46 | 2,600 | 2,677 |
| 3 GS Mortgage Securities Trust 2013-GCJ16 | 3.813% | 11/10/46 | 1,100 | 1,135 |
| 3 GS Mortgage Securities Trust 2013-GCJ16 | 4.271% | 11/10/46 | 1,525 | 1,576 |
| 3 Honda Auto Receivables 2011-1 Owner Trust | 1.800% | 4/17/17 | 2,685 | 2,697 |
| 3 Honda Auto Receivables 2012-1 Owner Trust | 0.970% | 4/16/18 | 1,025 | 1,029 |
| 3 Honda Auto Receivables 2012-4 Owner Trust | 0.660% | 12/18/18 | 5,500 | 5,500 |
| 3 Honda Auto Receivables 2013-1 Owner Trust | 0.480% | 11/21/16 | 6,002 | 5,999 |
| 3 Honda Auto Receivables 2013-1 Owner Trust | 0.620% | 3/21/19 | 4,802 | 4,785 |
| 3 Honda Auto Receivables 2013-2 Owner Trust | 0.530% | 2/16/17 | 1,718 | 1,713 |
| 3 Honda Auto Receivables 2013-2 Owner Trust | 0.660% | 6/17/19 | 1,718 | 1,708 |
| 3 Honda Auto Receivables 2013-4 Owner Trust | 0.690% | 9/18/17 | 1,975 | 1,976 |
| 3 Honda Auto Receivables 2013-4 Owner Trust | 1.040% | 2/18/20 | 1,650 | 1,646 |
| 3 Hyundai Auto Receivables Trust 2012-C | 0.730% | 6/15/18 | 2,575 | 2,565 |
| 3 Hyundai Auto Receivables Trust 2013-A | 0.560% | 7/17/17 | 3,058 | 3,049 |
| 3 Hyundai Auto Receivables Trust 2013-A | 0.750% | 9/17/18 | 5,096 | 5,061 |
| 3 Hyundai Auto Receivables Trust 2013-B | 0.710% | 9/15/17 | 4,800 | 4,801 |
| 3 Hyundai Auto Receivables Trust 2013-B | 1.010% | 2/15/19 | 2,400 | 2,397 |
| 3 Hyundai Auto Receivables Trust 2013-C | 1.010% | 2/15/18 | 1,730 | 1,736 |
| 3 Hyundai Auto Receivables Trust 2013-C | 1.550% | 3/15/19 | 2,890 | 2,923 |
| 3 JP Morgan Chase Commercial Mortgage Securities | ||||
| Trust 2004-CIBC10 | 4.654% | 1/12/37 | 2,144 | 2,144 |
| 3 JP Morgan Chase Commercial Mortgage Securities | ||||
| Trust 2004-CIBC10 | 4.899% | 1/12/37 | 540 | 553 |
| 3 JP Morgan Chase Commercial Mortgage Securities | ||||
| Trust 2004-CIBC8 | 4.404% | 1/12/39 | 3,047 | 3,055 |
| 3 JP Morgan Chase Commercial Mortgage Securities | ||||
| Trust 2004-CIBC9 | 5.569% | 6/12/41 | 16,828 | 17,115 |
| 3 JP Morgan Chase Commercial Mortgage Securities | ||||
| Trust 2005-CIBC11 | 5.389% | 8/12/37 | 2,000 | 2,086 |
| 3 JP Morgan Chase Commercial Mortgage Securities | ||||
| Trust 2005-CIBC13 | 5.285% | 1/12/43 | 1,750 | 1,872 |
| 3 JP Morgan Chase Commercial Mortgage Securities | ||||
| Trust 2005-LDP2 | 4.738% | 7/15/42 | 940 | 984 |
| 3 JP Morgan Chase Commercial Mortgage Securities | ||||
| Trust 2005-LDP2 | 4.780% | 7/15/42 | 2,375 | 2,503 |
| 3 JP Morgan Chase Commercial Mortgage Securities | ||||
| Trust 2005-LDP4 | 4.918% | 10/15/42 | 12,485 | 13,108 |
| 3 JP Morgan Chase Commercial Mortgage Securities | ||||
| Trust 2005-LDP5 | 5.200% | 12/15/44 | 7,144 | 7,602 |
| 3 JP Morgan Chase Commercial Mortgage Securities | ||||
| Trust 2005-LDP5 | 5.242% | 12/15/44 | 4,250 | 4,605 |
| 3 JP Morgan Chase Commercial Mortgage Securities | ||||
| Trust 2005-LDP5 | 5.321% | 12/15/44 | 1,390 | 1,467 |
| 3 JP Morgan Chase Commercial Mortgage Securities | ||||
| Trust 2006-CIBC14 | 5.445% | 12/12/44 | 3,300 | 3,544 |
| 3 JP Morgan Chase Commercial Mortgage Securities | ||||
| Trust 2006-CIBC16 | 5.593% | 5/12/45 | 7,121 | 7,786 |
| 3 JP Morgan Chase Commercial Mortgage Securities | ||||
| Trust 2006-LDP6 | 5.475% | 4/15/43 | 3,574 | 3,870 |
| 3 JP Morgan Chase Commercial Mortgage Securities | ||||
| Trust 2006-LDP7 | 5.863% | 4/15/45 | 19,218 | 20,888 |
| 3 JP Morgan Chase Commercial Mortgage Securities | ||||
| Trust 2006-LDP7 | 5.863% | 4/15/45 | 3,300 | 3,636 |
15
| Vanguard® Total Bond Market Index Fund | ||||
| Schedule of Investments | ||||
| December 31, 2013 | ||||
| Face | Market | |||
| Maturity | Amount | Value | ||
| Coupon | Date | ($000) | ($000) | |
| 3 JP Morgan Chase Commercial Mortgage Securities | ||||
| Trust 2006-LDP8 | 5.440% | 5/15/45 | 4,525 | 4,957 |
| 3 JP Morgan Chase Commercial Mortgage Securities | ||||
| Trust 2006-LDP8 | 5.447% | 5/15/45 | 372 | 376 |
| 3 JP Morgan Chase Commercial Mortgage Securities | ||||
| Trust 2007-CIBC18 | 5.440% | 6/12/47 | 10,665 | 11,672 |
| 3 JP Morgan Chase Commercial Mortgage Securities | ||||
| Trust 2007-CIBC20 | 5.794% | 2/12/51 | 28,300 | 31,659 |
| 3 JP Morgan Chase Commercial Mortgage Securities | ||||
| Trust 2007-CIBC20 | 5.874% | 2/12/51 | 3,350 | 3,790 |
| 3 JP Morgan Chase Commercial Mortgage Securities | ||||
| Trust 2007-LDP11 | 5.806% | 6/15/49 | 8,035 | 8,941 |
| 3 JP Morgan Chase Commercial Mortgage Securities | ||||
| Trust 2007-LDP12 | 5.882% | 2/15/51 | 13,170 | 14,636 |
| 3 JP Morgan Chase Commercial Mortgage Securities | ||||
| Trust 2012-C6 | 3.507% | 5/15/45 | 9,250 | 9,174 |
| 3 JP Morgan Chase Commercial Mortgage Securities | ||||
| Trust 2012-C8 | 2.829% | 10/15/45 | 6,675 | 6,287 |
| 3 JP Morgan Chase Commercial Mortgage Securities | ||||
| Trust 2012-CIBX | 3.483% | 6/15/45 | 7,490 | 7,467 |
| 3 JP Morgan Chase Commercial Mortgage Securities | ||||
| Trust 2012-LC9 | 2.840% | 12/15/47 | 3,750 | 3,508 |
| 3 JP Morgan Chase Commercial Mortgage Securities | ||||
| Trust 2013-C10 | 3.143% | 12/15/47 | 2,314 | 2,219 |
| 3 JP Morgan Chase Commercial Mortgage Securities | ||||
| Trust 2013-C10 | 3.372% | 12/15/47 | 1,735 | 1,651 |
| 3 JP Morgan Chase Commercial Mortgage Securities | ||||
| Trust 2013-C16 | 3.674% | 12/15/46 | 1,600 | 1,637 |
| 3 JP Morgan Chase Commercial Mortgage Securities | ||||
| Trust 2013-C16 | 3.881% | 12/15/46 | 2,300 | 2,306 |
| 3 JP Morgan Chase Commercial Mortgage Securities | ||||
| Trust 2013-C16 | 4.166% | 12/15/46 | 3,100 | 3,174 |
| 3 JP Morgan Chase Commercial Mortgage Securities | ||||
| Trust 2013-C16 | 4.517% | 12/15/46 | 1,600 | 1,645 |
| 3 JP Morgan Chase Commercial Mortgage Securities | ||||
| Trust 2013-C16 | 4.944% | 12/15/46 | 1,600 | 1,643 |
| 3 JP Morgan Chase Commercial Mortgage Securities | ||||
| Trust 2013-LC11 | 2.960% | 4/15/46 | 2,678 | 2,512 |
| 3 JPMBB Commercial Mortgage Securities Trust 2013- | ||||
| C12 | 3.664% | 7/15/45 | 1,776 | 1,758 |
| 3 JPMBB Commercial Mortgage Securities Trust 2013- | ||||
| C12 | 4.026% | 7/15/45 | 1,184 | 1,187 |
| 3 JPMBB Commercial Mortgage Securities Trust 2013- | ||||
| C14 | 3.761% | 8/15/46 | 1,680 | 1,731 |
| 3 JPMBB Commercial Mortgage Securities Trust 2013- | ||||
| C14 | 4.133% | 8/15/46 | 4,470 | 4,579 |
| 3 JPMBB Commercial Mortgage Securities Trust 2013- | ||||
| C14 | 4.409% | 8/15/46 | 1,260 | 1,293 |
| 3 JPMBB Commercial Mortgage Securities Trust 2013- | ||||
| C15 | 1.233% | 11/15/45 | 1,024 | 1,021 |
| 3 JPMBB Commercial Mortgage Securities Trust 2013- | ||||
| C15 | 2.977% | 11/15/45 | 4,200 | 4,300 |
| 3 JPMBB Commercial Mortgage Securities Trust 2013- | ||||
| C15 | 3.659% | 11/15/45 | 420 | 430 |
| 3 JPMBB Commercial Mortgage Securities Trust 2013- | ||||
| C15 | 4.131% | 11/15/45 | 2,940 | 3,005 |
| 3 JPMBB Commercial Mortgage Securities Trust 2013- | ||||
| C15 | 4.420% | 11/15/45 | 1,680 | 1,716 |
| 3 JPMBB Commercial Mortgage Securities Trust 2013- | ||||
| C17 | 3.003% | 1/15/47 | 2,200 | 2,246 |
| 3 JPMBB Commercial Mortgage Securities Trust 2013- | ||||
| C17 | 3.705% | 1/15/47 | 1,650 | 1,679 |
| 3 JPMBB Commercial Mortgage Securities Trust 2013- | ||||
| C17 | 4.199% | 1/15/47 | 5,500 | 5,584 |
16
| Vanguard® Total Bond Market Index Fund | ||||
| Schedule of Investments | ||||
| December 31, 2013 | ||||
| Face | Market | |||
| Maturity | Amount | Value | ||
| Coupon | Date | ($000) | ($000) | |
| 3 JPMBB Commercial Mortgage Securities Trust 2013- | ||||
| C17 | 4.458% | 1/15/47 | 1,100 | 1,117 |
| 3 JPMBB Commercial Mortgage Securities Trust 2013- | ||||
| C17 | 4.887% | 1/15/47 | 1,650 | 1,657 |
| 3 LB Commercial Mortgage Trust 2007-C3 | 5.884% | 7/15/44 | 660 | 744 |
| 3 LB-UBS Commercial Mortgage Trust 2004-C7 | 4.786% | 10/15/29 | 17,560 | 17,878 |
| 3 LB-UBS Commercial Mortgage Trust 2005-C1 | 4.742% | 2/15/30 | 9,140 | 9,375 |
| 3 LB-UBS Commercial Mortgage Trust 2005-C2 | 5.150% | 4/15/30 | 4,395 | 4,577 |
| 3 LB-UBS Commercial Mortgage Trust 2005-C5 | 5.057% | 9/15/40 | 1,625 | 1,683 |
| 3 LB-UBS Commercial Mortgage Trust 2005-C7 | 5.197% | 11/15/30 | 17,600 | 18,482 |
| 3 LB-UBS Commercial Mortgage Trust 2006-C1 | 5.217% | 2/15/31 | 4,599 | 4,990 |
| 3 LB-UBS Commercial Mortgage Trust 2006-C3 | 5.661% | 3/15/39 | 30,750 | 33,133 |
| 3 LB-UBS Commercial Mortgage Trust 2006-C4 | 5.858% | 6/15/38 | 9,775 | 10,638 |
| 3 LB-UBS Commercial Mortgage Trust 2006-C6 | 5.372% | 9/15/39 | 13,351 | 14,533 |
| 3 LB-UBS Commercial Mortgage Trust 2006-C6 | 5.413% | 9/15/39 | 1,175 | 1,298 |
| 3 LB-UBS Commercial Mortgage Trust 2006-C7 | 5.347% | 11/15/38 | 2,288 | 2,508 |
| 3 LB-UBS Commercial Mortgage Trust 2006-C7 | 5.378% | 11/15/38 | 3,125 | 3,377 |
| 3 LB-UBS Commercial Mortgage Trust 2007-C1 | 5.424% | 2/15/40 | 5,650 | 6,220 |
| 3 LB-UBS Commercial Mortgage Trust 2007-C2 | 5.430% | 2/15/40 | 10,457 | 11,477 |
| 3 LB-UBS Commercial Mortgage Trust 2007-C7 | 5.866% | 9/15/45 | 13,357 | 14,965 |
| 3 LB-UBS Commercial Mortgage Trust 2008-C1 | 6.151% | 4/15/41 | 3,020 | 3,406 |
| 3 LB-UBS Commercial Mortgage Trust 2008-C1 | 6.151% | 4/15/41 | 22,075 | 25,290 |
| 3 Mercedes-Benz Auto Lease Trust 2013-B | 0.760% | 7/15/19 | 550 | 549 |
| 3 Mercedes-Benz Auto Receivables Trust 2013-1 | 0.780% | 8/15/17 | 1,180 | 1,187 |
| 3 Mercedes-Benz Auto Receivables Trust 2013-1 | 1.130% | 11/15/19 | 1,180 | 1,181 |
| 3 Merrill Lynch Mortgage Trust 2005-CIP1 | 5.107% | 7/12/38 | 1,915 | 2,011 |
| 3 Merrill Lynch Mortgage Trust 2005-LC1 | 5.291% | 1/12/44 | 19,637 | 21,070 |
| 3 Merrill Lynch Mortgage Trust 2005-MCP1 | 4.747% | 6/12/43 | 2,500 | 2,590 |
| 3 Merrill Lynch Mortgage Trust 2006-C1 | 5.676% | 5/12/39 | 14,050 | 15,050 |
| 3 Merrill Lynch Mortgage Trust 2006-C1 | 5.676% | 5/12/39 | 1,825 | 1,983 |
| 3 Merrill Lynch Mortgage Trust 2006-C2 | 5.782% | 8/12/43 | 2,865 | 3,131 |
| 3 Merrill Lynch Mortgage Trust 2007-C1 | 5.858% | 6/12/50 | 23,068 | 25,534 |
| 3 Merrill Lynch Mortgage Trust 2008-C1 | 5.690% | 2/12/51 | 17,185 | 19,221 |
| 3 ML-CFC Commercial Mortgage Trust 2006-2 | 5.886% | 6/12/46 | 21,125 | 23,053 |
| 3 ML-CFC Commercial Mortgage Trust 2006-3 | 5.456% | 7/12/46 | 3,660 | 3,972 |
| 3 ML-CFC Commercial Mortgage Trust 2006-4 | 5.204% | 12/12/49 | 2,496 | 2,716 |
| 3 ML-CFC Commercial Mortgage Trust 2007-5 | 5.378% | 8/12/48 | 14,870 | 16,179 |
| 3 ML-CFC Commercial Mortgage Trust 2007-8 | 5.857% | 8/12/49 | 795 | 807 |
| 3 ML-CFC Commercial Mortgage Trust 2007-9 | 5.590% | 9/12/49 | 1,473 | 1,472 |
| 3 ML-CFC Commercial Mortgage Trust 2007-9 | 5.700% | 9/12/49 | 14,675 | 16,265 |
| 3 Morgan Stanley Bank of America Merrill Lynch Trust | ||||
| 2012-C5 | 3.176% | 8/15/45 | 3,025 | 2,927 |
| 3 Morgan Stanley Bank of America Merrill Lynch Trust | ||||
| 2012-C6 | 2.858% | 11/15/45 | 3,000 | 2,822 |
| 3 Morgan Stanley Bank of America Merrill Lynch Trust | ||||
| 2013-C10 | 4.083% | 7/15/46 | 8,000 | 8,175 |
| 3 Morgan Stanley Bank of America Merrill Lynch Trust | ||||
| 2013-C11 | 4.219% | 8/15/46 | 1,680 | 1,732 |
| 3 Morgan Stanley Bank of America Merrill Lynch Trust | ||||
| 2013-C11 | 4.419% | 8/15/46 | 840 | 856 |
| 3 Morgan Stanley Bank of America Merrill Lynch Trust | ||||
| 2013-C12 | 3.001% | 10/15/46 | 2,340 | 2,404 |
| 3 Morgan Stanley Bank of America Merrill Lynch Trust | ||||
| 2013-C12 | 4.259% | 10/15/46 | 2,340 | 2,418 |
| 3 Morgan Stanley Bank of America Merrill Lynch Trust | ||||
| 2013-C13 | 2.936% | 11/15/46 | 1,750 | 1,788 |
| 3 Morgan Stanley Bank of America Merrill Lynch Trust | ||||
| 2013-C13 | 4.039% | 11/15/46 | 3,500 | 3,546 |
| 3 Morgan Stanley Bank of America Merrill Lynch Trust | ||||
| 2013-C13 | 4.744% | 11/15/46 | 1,750 | 1,793 |
| 3 Morgan Stanley Bank of America Merrill Lynch Trust | ||||
| 2013-C7 | 2.918% | 2/15/46 | 3,011 | 2,828 |
| 3 Morgan Stanley Bank of America Merrill Lynch Trust | ||||
| 2013-C7 | 3.214% | 2/15/46 | 599 | 558 |
17
| Vanguard® Total Bond Market Index Fund | ||||
| Schedule of Investments | ||||
| December 31, 2013 | ||||
| Face | Market | |||
| Maturity | Amount | Value | ||
| Coupon | Date | ($000) | ($000) | |
| 3 Morgan Stanley Bank of America Merrill Lynch Trust | ||||
| 2013-C8 | 3.134% | 12/15/48 | 3,475 | 3,314 |
| 3 Morgan Stanley Bank of America Merrill Lynch Trust | ||||
| 2013-C8 | 3.376% | 12/15/48 | 1,800 | 1,709 |
| 3 Morgan Stanley Bank of America Merrill Lynch Trust | ||||
| 2013-C9 | 3.102% | 5/15/46 | 2,475 | 2,343 |
| 3 Morgan Stanley Bank of America Merrill Lynch Trust | ||||
| 2013-C9 | 3.456% | 5/15/46 | 1,800 | 1,715 |
| 3 Morgan Stanley Capital I Trust 2004-HQ4 | 4.970% | 4/14/40 | 4,711 | 4,770 |
| 3 Morgan Stanley Capital I Trust 2004-IQ8 | 5.110% | 6/15/40 | 10,212 | 10,361 |
| 3 Morgan Stanley Capital I Trust 2004-TOP15 | 5.270% | 6/13/41 | 3,615 | 3,658 |
| 3 Morgan Stanley Capital I Trust 2005-HQ5 | 5.168% | 1/14/42 | 3,867 | 3,972 |
| 3 Morgan Stanley Capital I Trust 2005-HQ6 | 4.989% | 8/13/42 | 26,760 | 28,004 |
| 3 Morgan Stanley Capital I Trust 2005-HQ6 | 5.073% | 8/13/42 | 3,730 | 3,911 |
| 3 Morgan Stanley Capital I Trust 2005-HQ7 | 5.207% | 11/14/42 | 14,450 | 15,235 |
| 3 Morgan Stanley Capital I Trust 2005-IQ10 | 5.230% | 9/15/42 | 21,521 | 22,747 |
| 3 Morgan Stanley Capital I Trust 2005-IQ9 | 4.770% | 7/15/56 | 3,295 | 3,413 |
| 3 Morgan Stanley Capital I Trust 2005-TOP17 | 4.780% | 12/13/41 | 10,751 | 11,012 |
| 3 Morgan Stanley Capital I Trust 2005-TOP17 | 4.840% | 12/13/41 | 1,350 | 1,386 |
| 3 Morgan Stanley Capital I Trust 2005-TOP19 | 4.985% | 6/12/47 | 3,115 | 3,249 |
| 3 Morgan Stanley Capital I Trust 2006-HQ10 | 5.328% | 11/12/41 | 5,866 | 6,393 |
| 3 Morgan Stanley Capital I Trust 2006-HQ10 | 5.360% | 11/12/41 | 7,400 | 8,022 |
| 3 Morgan Stanley Capital I Trust 2006-HQ8 | 5.417% | 3/12/44 | 20,466 | 21,926 |
| 3 Morgan Stanley Capital I Trust 2006-HQ8 | 5.466% | 3/12/44 | 4,875 | 5,312 |
| 3 Morgan Stanley Capital I Trust 2006-HQ9 | 5.773% | 7/12/44 | 4,596 | 5,090 |
| 3 Morgan Stanley Capital I Trust 2006-HQ9 | 5.793% | 7/12/44 | 4,100 | 4,446 |
| 3 Morgan Stanley Capital I Trust 2006-IQ11 | 5.668% | 10/15/42 | 7,122 | 7,629 |
| 3 Morgan Stanley Capital I Trust 2006-IQ11 | 5.672% | 10/15/42 | 700 | 757 |
| 3 Morgan Stanley Capital I Trust 2006-IQ11 | 5.672% | 10/15/42 | 4,325 | 4,582 |
| 3 Morgan Stanley Capital I Trust 2006-IQ12 | 5.332% | 12/15/43 | 11,374 | 12,356 |
| 3 Morgan Stanley Capital I Trust 2006-TOP21 | 5.204% | 10/12/52 | 6,200 | 6,668 |
| 3 Morgan Stanley Capital I Trust 2006-TOP23 | 5.741% | 8/12/41 | 6 | 6 |
| 3 Morgan Stanley Capital I Trust 2006-TOP23 | 5.810% | 8/12/41 | 2,175 | 2,379 |
| 3 Morgan Stanley Capital I Trust 2007-IQ14 | 5.654% | 4/15/49 | 1,258 | 1,305 |
| 3 Morgan Stanley Capital I Trust 2007-IQ14 | 5.692% | 4/15/49 | 14,295 | 15,662 |
| 3 Morgan Stanley Capital I Trust 2007-IQ16 | 5.809% | 12/12/49 | 13,528 | 15,070 |
| 3 Morgan Stanley Capital I Trust 2007-IQ16 | 6.094% | 12/12/49 | 4,675 | 5,281 |
| 3 Morgan Stanley Capital I Trust 2007-TOP25 | 5.514% | 11/12/49 | 2,395 | 2,646 |
| 3 Morgan Stanley Capital I Trust 2007-TOP25 | 5.544% | 11/12/49 | 4,525 | 4,913 |
| 3 Morgan Stanley Capital I Trust 2007-TOP27 | 5.648% | 6/11/42 | 20,815 | 23,299 |
| 3 Morgan Stanley Capital I Trust 2007-TOP27 | 5.648% | 6/11/42 | 5,075 | 5,622 |
| 3 Morgan Stanley Capital I Trust 2008-TOP29 | 6.280% | 1/11/43 | 24,385 | 28,158 |
| 3 Morgan Stanley Capital I Trust 2012-C4 | 3.244% | 3/15/45 | 7,000 | 6,868 |
| 3 Nissan Auto Receivables 2012-B Owner Trust | 0.660% | 12/17/18 | 4,945 | 4,942 |
| 3 Nissan Auto Receivables 2013-A Owner Trust | 0.500% | 5/15/17 | 5,419 | 5,419 |
| 3 Nissan Auto Receivables 2013-A Owner Trust | 0.750% | 7/15/19 | 10,750 | 10,700 |
| 3 Nissan Auto Receivables 2013-B Owner Trust | 0.840% | 11/15/17 | 2,360 | 2,368 |
| 3 Nissan Auto Receivables 2013-B Owner Trust | 1.310% | 10/15/19 | 1,770 | 1,778 |
| 3 Nissan Auto Receivables 2013-C Owner Trust | 0.670% | 8/15/18 | 2,800 | 2,800 |
| 3 Nissan Auto Receivables 2013-C Owner Trust | 1.300% | 6/15/20 | 1,600 | 1,602 |
| 6 Northern Rock Asset Management plc | 5.625% | 6/22/17 | 33,225 | 37,384 |
| 3 PSE&G Transition Funding LLC Series 2001-1 | 6.890% | 12/15/17 | 29,052 | 31,421 |
| 6 Royal Bank of Canada | 3.125% | 4/14/15 | 9,325 | 9,638 |
| 3 Royal Bank of Canada | 0.625% | 12/5/16 | 9,010 | 9,002 |
| 3 Royal Bank of Canada | 1.200% | 9/19/18 | 11,315 | 11,192 |
| 3 Royal Bank of Canada | 2.000% | 10/1/19 | 20,000 | 19,893 |
| 3 Santander Drive Auto Receivables Trust 2013-1 | 0.620% | 6/15/17 | 4,817 | 4,816 |
| 3 Santander Drive Auto Receivables Trust 2013-2 | 0.700% | 9/15/17 | 5,778 | 5,781 |
| 3 Santander Drive Auto Receivables Trust 2013-3 | 0.700% | 10/16/17 | 3,000 | 2,999 |
| 3 Santander Drive Auto Receivables Trust 2013-4 | 1.110% | 12/15/17 | 1,750 | 1,756 |
| 3 TIAA Seasoned Commercial Mortgage Trust 2007-C4 | 5.565% | 8/15/39 | 3,285 | 3,498 |
| 3 Toyota Auto Receivables 2012-A Owner Trust | 0.990% | 8/15/17 | 10,815 | 10,858 |
| 3 Toyota Auto Receivables 2013-A Owner Trust | 0.550% | 1/17/17 | 1,150 | 1,148 |
| 3 Toyota Auto Receivables 2013-A Owner Trust | 0.690% | 11/15/18 | 1,625 | 1,624 |
18
| Vanguard® Total Bond Market Index Fund | ||||
| Schedule of Investments | ||||
| December 31, 2013 | ||||
| Face | Market | |||
| Maturity | Amount | Value | ||
| Coupon | Date | ($000) | ($000) | |
| 3 UBS-Barclays Commercial Mortgage Trust 2013-C5 | 3.185% | 3/10/46 | 4,636 | 4,442 |
| 3 UBS-Barclays Commercial Mortgage Trust 2013-C6 | 3.244% | 4/10/46 | 2,875 | 2,759 |
| 3 UBS-Barclays Commercial Mortgage Trust 2013-C6 | 3.469% | 4/10/46 | 1,150 | 1,099 |
| 3 Volkswagen Auto Loan Enhanced Trust 2012-1 | 1.150% | 7/20/18 | 12,366 | 12,469 |
| 3 Volkswagen Auto Loan Enhanced Trust 2013-2 | 0.700% | 4/20/18 | 1,750 | 1,746 |
| 3 Volkswagen Auto Loan Enhanced Trust 2013-2 | 1.160% | 3/20/20 | 875 | 871 |
| 3 Wachovia Bank Commercial Mortgage Trust Series | ||||
| 2004-C12 | 5.288% | 7/15/41 | 9,365 | 9,495 |
| 3 Wachovia Bank Commercial Mortgage Trust Series | ||||
| 2004-C15 | 4.803% | 10/15/41 | 18,725 | 19,199 |
| 3 Wachovia Bank Commercial Mortgage Trust Series | ||||
| 2005-C17 | 5.083% | 3/15/42 | 15,485 | 16,070 |
| 3 Wachovia Bank Commercial Mortgage Trust Series | ||||
| 2005-C17 | 5.224% | 3/15/42 | 1,700 | 1,764 |
| 3 Wachovia Bank Commercial Mortgage Trust Series | ||||
| 2005-C19 | 4.699% | 5/15/44 | 13,857 | 14,428 |
| 3 Wachovia Bank Commercial Mortgage Trust Series | ||||
| 2005-C19 | 4.750% | 5/15/44 | 1,480 | 1,555 |
| 3 Wachovia Bank Commercial Mortgage Trust Series | ||||
| 2005-C19 | 4.793% | 5/15/44 | 3,325 | 3,491 |
| 3 Wachovia Bank Commercial Mortgage Trust Series | ||||
| 2005-C20 | 5.118% | 7/15/42 | 6,330 | 6,654 |
| 3 Wachovia Bank Commercial Mortgage Trust Series | ||||
| 2005-C21 | 5.239% | 10/15/44 | 17,490 | 18,513 |
| 3 Wachovia Bank Commercial Mortgage Trust Series | ||||
| 2005-C21 | 5.239% | 10/15/44 | 1,340 | 1,405 |
| 3 Wachovia Bank Commercial Mortgage Trust Series | ||||
| 2005-C22 | 5.289% | 12/15/44 | 23,040 | 24,456 |
| 3 Wachovia Bank Commercial Mortgage Trust Series | ||||
| 2005-C22 | 5.339% | 12/15/44 | 790 | 842 |
| 3 Wachovia Bank Commercial Mortgage Trust Series | ||||
| 2006-C25 | 5.724% | 5/15/43 | 16,025 | 17,273 |
| 3 Wachovia Bank Commercial Mortgage Trust Series | ||||
| 2006-C26 | 5.967% | 6/15/45 | 1,300 | 1,426 |
| 3 Wachovia Bank Commercial Mortgage Trust Series | ||||
| 2006-C27 | 5.765% | 7/15/45 | 9,368 | 10,121 |
| 3 Wachovia Bank Commercial Mortgage Trust Series | ||||
| 2006-C28 | 5.679% | 10/15/48 | 3,975 | 3,990 |
| 3 Wachovia Bank Commercial Mortgage Trust Series | ||||
| 2006-C29 | 5.339% | 11/15/48 | 2,225 | 2,446 |
| 3 Wells Fargo Commercial Mortgage Trust 2012-LC5 | 2.918% | 10/15/45 | 3,675 | 3,476 |
| 3 WFRBS Commercial Mortgage Trust 2012-C10 | 2.875% | 12/15/45 | 3,000 | 2,809 |
| 3 WFRBS Commercial Mortgage Trust 2012-C6 | 3.440% | 4/15/45 | 7,425 | 7,407 |
| 3 WFRBS Commercial Mortgage Trust 2012-C7 | 3.431% | 6/15/45 | 4,975 | 4,920 |
| 3 WFRBS Commercial Mortgage Trust 2012-C7 | 4.090% | 6/15/45 | 4,400 | 4,449 |
| 3 WFRBS Commercial Mortgage Trust 2012-C8 | 3.001% | 8/15/45 | 3,100 | 2,956 |
| 3 WFRBS Commercial Mortgage Trust 2012-C9 | 2.870% | 11/15/45 | 6,125 | 5,754 |
| 3 WFRBS Commercial Mortgage Trust 2013-C11 | 3.071% | 3/15/45 | 4,148 | 3,938 |
| 3 WFRBS Commercial Mortgage Trust 2013-C12 | 3.198% | 3/15/48 | 1,733 | 1,660 |
| 3 WFRBS Commercial Mortgage Trust 2013-C12 | 3.560% | 3/15/48 | 820 | 783 |
| 3 WFRBS Commercial Mortgage Trust 2013-C13 | 3.001% | 5/15/45 | 3,436 | 3,177 |
| 3 WFRBS Commercial Mortgage Trust 2013-C13 | 3.345% | 5/15/45 | 673 | 636 |
| 3 WFRBS Commercial Mortgage Trust 2013-C14 | 3.337% | 6/15/46 | 6,000 | 5,785 |
| 3 WFRBS Commercial Mortgage Trust 2013-C14 | 3.488% | 6/15/46 | 3,000 | 2,882 |
| 3 WFRBS Commercial Mortgage Trust 2013-C15 | 3.720% | 8/15/46 | 1,120 | 1,152 |
| 3 WFRBS Commercial Mortgage Trust 2013-C15 | 4.153% | 8/15/46 | 4,470 | 4,556 |
| 3 WFRBS Commercial Mortgage Trust 2013-C15 | 4.358% | 8/15/46 | 1,120 | 1,141 |
| 3 WFRBS Commercial Mortgage Trust 2013-C16 | 3.223% | 9/15/46 | 2,100 | 2,181 |
| 3 WFRBS Commercial Mortgage Trust 2013-C16 | 3.963% | 9/15/46 | 1,250 | 1,301 |
| 3 WFRBS Commercial Mortgage Trust 2013-C16 | 4.415% | 9/15/46 | 1,250 | 1,304 |
| 3 WFRBS Commercial Mortgage Trust 2013-C16 | 4.668% | 9/15/46 | 2,100 | 2,187 |
| 3 WFRBS Commercial Mortgage Trust 2013-C17 | 2.921% | 12/15/46 | 1,150 | 1,177 |
| 3 WFRBS Commercial Mortgage Trust 2013-C17 | 3.558% | 12/15/46 | 1,150 | 1,166 |
| 3 WFRBS Commercial Mortgage Trust 2013-C17 | 4.023% | 12/15/46 | 1,450 | 1,468 |
19
| Vanguard® Total Bond Market Index Fund | ||||
| Schedule of Investments | ||||
| December 31, 2013 | ||||
| Face | Market | |||
| Maturity | Amount | Value | ||
| Coupon | Date | ($000) | ($000) | |
| 3 WFRBS Commercial Mortgage Trust 2013-C17 | 4.255% | 12/15/46 | 1,150 | 1,158 |
| 3 WFRBS Commercial Mortgage Trust 2013-C17 | 4.788% | 12/15/46 | 1,150 | 1,159 |
| 3 WFRBS Commercial Mortgage Trust 2013-C18 | 3.027% | 12/15/46 | 1,150 | 1,184 |
| 3 WFRBS Commercial Mortgage Trust 2013-C18 | 3.651% | 12/15/46 | 2,300 | 2,369 |
| 3 WFRBS Commercial Mortgage Trust 2013-C18 | 4.162% | 12/15/46 | 5,010 | 5,160 |
| 3 WFRBS Commercial Mortgage Trust 2013-C18 | 4.387% | 12/15/46 | 575 | 592 |
| 3 WFRBS Commercial Mortgage Trust 2013-C18 | 4.676% | 12/15/46 | 862 | 880 |
| 3 WFRBS Commercial Mortgage Trust 2013-UBS1 | 2.927% | 3/15/46 | 2,900 | 2,964 |
| 3 WFRBS Commercial Mortgage Trust 2013-UBS1 | 3.591% | 3/15/46 | 1,750 | 1,785 |
| 3 WFRBS Commercial Mortgage Trust 2013-UBS1 | 4.079% | 3/15/46 | 2,350 | 2,388 |
| 3 WFRBS Commercial Mortgage Trust 2013-UBS1 | 4.634% | 3/15/46 | 575 | 581 |
| 3 World Omni Auto Receivables Trust 2012-B | 0.810% | 1/15/19 | 3,367 | 3,363 |
| 3 World Omni Auto Receivables Trust 2013-B | 0.830% | 8/15/18 | 1,975 | 1,974 |
| 3 World Omni Auto Receivables Trust 2013-B | 1.320% | 1/15/20 | 825 | 819 |
| 3 World Omni Automobile Lease Securitization Trust | ||||
| 2013-A | 1.100% | 12/15/16 | 2,860 | 2,872 |
| Total Asset-Backed/Commercial Mortgage-Backed Securities (Cost $2,653,033) | 2,836,291 | |||
| Corporate Bonds (24.0%) | ||||
| Finance (8.0%) | ||||
| Banking (5.2%) | ||||
| Abbey National Treasury Services plc | 4.000% | 4/27/16 | 8,300 | 8,811 |
| Abbey National Treasury Services plc | 3.050% | 8/23/18 | 8,275 | 8,522 |
| American Express Bank FSB | 6.000% | 9/13/17 | 1,750 | 2,010 |
| American Express Centurion Bank | 5.950% | 6/12/17 | 2,700 | 3,053 |
| American Express Centurion Bank | 6.000% | 9/13/17 | 13,425 | 15,356 |
| American Express Co. | 5.500% | 9/12/16 | 3,075 | 3,422 |
| American Express Co. | 6.150% | 8/28/17 | 5,605 | 6,465 |
| American Express Co. | 7.000% | 3/19/18 | 57,917 | 69,188 |
| American Express Co. | 2.650% | 12/2/22 | 381 | 351 |
| American Express Co. | 4.050% | 12/3/42 | 1,140 | 993 |
| 3 American Express Co. | 6.800% | 9/1/66 | 5,415 | 5,781 |
| American Express Credit Corp. | 1.750% | 6/12/15 | 775 | 788 |
| American Express Credit Corp. | 2.750% | 9/15/15 | 300 | 310 |
| American Express Credit Corp. | 2.800% | 9/19/16 | 36,860 | 38,539 |
| American Express Credit Corp. | 2.375% | 3/24/17 | 2,550 | 2,621 |
| American Express Credit Corp. | 2.125% | 7/27/18 | 875 | 879 |
| Associates Corp. of North America | 6.950% | 11/1/18 | 161 | 192 |
| Australia & New Zealand Banking Group Ltd. | 0.900% | 2/12/16 | 7,975 | 7,966 |
| Australia & New Zealand Banking Group Ltd. | 1.875% | 10/6/17 | 4,425 | 4,406 |
| Bancolombia SA | 4.250% | 1/12/16 | 11,910 | 12,388 |
| Bank of America Corp. | 4.500% | 4/1/15 | 31,760 | 33,216 |
| Bank of America Corp. | 4.750% | 8/1/15 | 245 | 260 |
| Bank of America Corp. | 3.700% | 9/1/15 | 3,250 | 3,398 |
| Bank of America Corp. | 1.500% | 10/9/15 | 3,625 | 3,661 |
| Bank of America Corp. | 5.250% | 12/1/15 | 4,275 | 4,576 |
| Bank of America Corp. | 1.250% | 1/11/16 | 10,525 | 10,560 |
| Bank of America Corp. | 3.625% | 3/17/16 | 11,200 | 11,766 |
| Bank of America Corp. | 3.750% | 7/12/16 | 9,575 | 10,177 |
| Bank of America Corp. | 6.500% | 8/1/16 | 27,200 | 30,663 |
| Bank of America Corp. | 5.750% | 8/15/16 | 11,195 | 12,306 |
| Bank of America Corp. | 5.625% | 10/14/16 | 6,370 | 7,084 |
| Bank of America Corp. | 1.350% | 11/21/16 | 5,200 | 5,188 |
| Bank of America Corp. | 5.420% | 3/15/17 | 14,300 | 15,708 |
| Bank of America Corp. | 3.875% | 3/22/17 | 13,000 | 13,873 |
| Bank of America Corp. | 6.000% | 9/1/17 | 2,560 | 2,921 |
| Bank of America Corp. | 5.750% | 12/1/17 | 11,375 | 12,920 |
| Bank of America Corp. | 2.000% | 1/11/18 | 30,800 | 30,710 |
| Bank of America Corp. | 5.650% | 5/1/18 | 59,475 | 67,551 |
| Bank of America Corp. | 2.600% | 1/15/19 | 14,000 | 14,022 |
| Bank of America Corp. | 7.625% | 6/1/19 | 25,670 | 31,815 |
| Bank of America Corp. | 5.625% | 7/1/20 | 43,265 | 49,149 |
| Bank of America Corp. | 5.875% | 1/5/21 | 2,700 | 3,100 |
20
| Vanguard® Total Bond Market Index Fund | ||||
| Schedule of Investments | ||||
| December 31, 2013 | ||||
| Face | Market | |||
| Maturity | Amount | Value | ||
| Coupon | Date | ($000) | ($000) | |
| Bank of America Corp. | 5.000% | 5/13/21 | 7,050 | 7,692 |
| Bank of America Corp. | 5.700% | 1/24/22 | 7,700 | 8,684 |
| Bank of America Corp. | 3.300% | 1/11/23 | 18,300 | 17,289 |
| Bank of America Corp. | 5.875% | 2/7/42 | 19,724 | 22,594 |
| Bank of America NA | 1.125% | 11/14/16 | 11,200 | 11,197 |
| Bank of America NA | 5.300% | 3/15/17 | 17,335 | 19,102 |
| Bank of America NA | 6.100% | 6/15/17 | 15,575 | 17,607 |
| Bank of America NA | 6.000% | 10/15/36 | 8,325 | 9,370 |
| Bank of Montreal | 0.800% | 11/6/15 | 7,525 | 7,558 |
| Bank of Montreal | 1.300% | 7/15/16 | 7,100 | 7,152 |
| Bank of Montreal | 2.500% | 1/11/17 | 22,160 | 22,769 |
| Bank of Montreal | 1.400% | 9/11/17 | 1,550 | 1,523 |
| Bank of Montreal | 2.375% | 1/25/19 | 6,175 | 6,135 |
| Bank of Montreal | 2.550% | 11/6/22 | 12,250 | 11,214 |
| Bank of New York Mellon Corp. | 1.200% | 2/20/15 | 100 | 101 |
| Bank of New York Mellon Corp. | 4.950% | 3/15/15 | 9,750 | 10,229 |
| Bank of New York Mellon Corp. | 2.950% | 6/18/15 | 4,200 | 4,349 |
| Bank of New York Mellon Corp. | 0.700% | 10/23/15 | 1,725 | 1,726 |
| Bank of New York Mellon Corp. | 2.300% | 7/28/16 | 4,423 | 4,564 |
| Bank of New York Mellon Corp. | 2.400% | 1/17/17 | 20,010 | 20,562 |
| Bank of New York Mellon Corp. | 1.969% | 6/20/17 | 6,900 | 6,958 |
| Bank of New York Mellon Corp. | 1.300% | 1/25/18 | 3,250 | 3,166 |
| Bank of New York Mellon Corp. | 2.100% | 1/15/19 | 17,100 | 16,925 |
| Bank of New York Mellon Corp. | 5.450% | 5/15/19 | 4,645 | 5,252 |
| Bank of New York Mellon Corp. | 4.600% | 1/15/20 | 5,775 | 6,321 |
| Bank of New York Mellon Corp. | 3.550% | 9/23/21 | 4,970 | 5,044 |
| Bank of New York Mellon Corp. | 3.950% | 11/18/25 | 6,525 | 6,433 |
| Bank of Nova Scotia | 1.850% | 1/12/15 | 20,370 | 20,676 |
| Bank of Nova Scotia | 3.400% | 1/22/15 | 7,120 | 7,343 |
| Bank of Nova Scotia | 2.050% | 10/7/15 | 500 | 513 |
| Bank of Nova Scotia | 0.750% | 10/9/15 | 9,650 | 9,688 |
| Bank of Nova Scotia | 2.900% | 3/29/16 | 750 | 781 |
| Bank of Nova Scotia | 1.375% | 7/15/16 | 25,100 | 25,335 |
| Bank of Nova Scotia | 1.100% | 12/13/16 | 10,800 | 10,861 |
| Bank of Nova Scotia | 2.550% | 1/12/17 | 12,060 | 12,511 |
| Bank of Nova Scotia | 1.375% | 12/18/17 | 6,525 | 6,419 |
| Bank of Nova Scotia | 2.050% | 10/30/18 | 15,800 | 15,733 |
| Bank of Nova Scotia | 4.375% | 1/13/21 | 1,250 | 1,342 |
| Bank One Capital III | 8.750% | 9/1/30 | 1,825 | 2,332 |
| Bank One Corp. | 4.900% | 4/30/15 | 6,075 | 6,392 |
| Bank One Corp. | 7.625% | 10/15/26 | 2,040 | 2,508 |
| Bank One Corp. | 8.000% | 4/29/27 | 2,500 | 3,158 |
| Barclays Bank plc | 2.750% | 2/23/15 | 12,225 | 12,502 |
| Barclays Bank plc | 3.900% | 4/7/15 | 750 | 780 |
| Barclays Bank plc | 5.000% | 9/22/16 | 12,100 | 13,307 |
| Barclays Bank plc | 6.750% | 5/22/19 | 9,225 | 11,085 |
| Barclays Bank plc | 5.125% | 1/8/20 | 21,725 | 24,081 |
| Barclays Bank plc | 5.140% | 10/14/20 | 1,530 | 1,630 |
| BB&T Corp. | 5.200% | 12/23/15 | 5,952 | 6,424 |
| BB&T Corp. | 3.200% | 3/15/16 | 4,018 | 4,211 |
| BB&T Corp. | 3.950% | 4/29/16 | 750 | 800 |
| BB&T Corp. | 2.150% | 3/22/17 | 6,075 | 6,157 |
| BB&T Corp. | 4.900% | 6/30/17 | 1,225 | 1,343 |
| BB&T Corp. | 1.600% | 8/15/17 | 4,375 | 4,334 |
| BB&T Corp. | 1.450% | 1/12/18 | 3,725 | 3,637 |
| BB&T Corp. | 2.050% | 6/19/18 | 9,025 | 8,943 |
| BB&T Corp. | 6.850% | 4/30/19 | 3,754 | 4,528 |
| BB&T Corp. | 5.250% | 11/1/19 | 5,240 | 5,860 |
| BBVA US Senior SAU | 4.664% | 10/9/15 | 18,000 | 18,937 |
| Bear Stearns Cos. LLC | 5.300% | 10/30/15 | 6,440 | 6,939 |
| Bear Stearns Cos. LLC | 5.550% | 1/22/17 | 21,150 | 23,531 |
| Bear Stearns Cos. LLC | 6.400% | 10/2/17 | 17,730 | 20,703 |
| Bear Stearns Cos. LLC | 7.250% | 2/1/18 | 24,838 | 29,485 |
| Bear Stearns Cos. LLC | 4.650% | 7/2/18 | 1,650 | 1,796 |
21
| Vanguard® Total Bond Market Index Fund | |||||
| Schedule of Investments | |||||
| December 31, 2013 | |||||
| Face | Market | ||||
| Maturity | Amount | Value | |||
| Coupon | Date | ($000) | ($000) | ||
| BNP Paribas SA | 3.250% | 3/11/15 | 3,925 | 4,039 | |
| BNP Paribas SA | 3.600% | 2/23/16 | 25,175 | 26,477 | |
| BNP Paribas SA | 1.250% | 12/12/16 | 13,775 | 13,765 | |
| BNP Paribas SA | 2.375% | 9/14/17 | 19,920 | 20,301 | |
| BNP Paribas SA | 2.700% | 8/20/18 | 4,275 | 4,337 | |
| BNP Paribas SA | 2.400% | 12/12/18 | 10,875 | 10,892 | |
| BNP Paribas SA | 5.000% | 1/15/21 | 40,975 | 44,693 | |
| BPCE SA | 2.500% | 12/10/18 | 8,475 | 8,410 | |
| Branch Banking & Trust Co. | 5.625% | 9/15/16 | 5,825 | 6,475 | |
| Branch Banking & Trust Co. | 1.050% | 12/1/16 | 10,300 | 10,261 | |
| Branch Banking & Trust Co. | 2.300% | 10/15/18 | 8,200 | 8,194 | |
| Canadian Imperial Bank of Commerce | 0.900% | 10/1/15 | 8,450 | 8,501 | |
| Canadian Imperial Bank of Commerce | 2.350% | 12/11/15 | 10,656 | 11,003 | |
| Canadian Imperial Bank of Commerce | 1.350% | 7/18/16 | 5,375 | 5,406 | |
| Capital One Bank USA NA | 1.150% | 11/21/16 | 2,800 | 2,782 | |
| Capital One Bank USA NA | 2.150% | 11/21/18 | 4,700 | 4,666 | |
| Capital One Bank USA NA | 8.800% | 7/15/19 | 5,450 | 6,900 | |
| Capital One Bank USA NA | 3.375% | 2/15/23 | 13,080 | 12,138 | |
| Capital One Financial Corp. | 5.500% | 6/1/15 | 8,892 | 9,446 | |
| Capital One Financial Corp. | 3.150% | 7/15/16 | 15,150 | 15,811 | |
| Capital One Financial Corp. | 6.150% | 9/1/16 | 8,034 | 8,950 | |
| Capital One Financial Corp. | 6.750% | 9/15/17 | 9,900 | 11,540 | |
| Capital One Financial Corp. | 4.750% | 7/15/21 | 7,825 | 8,297 | |
| Capital One Financial Corp. | 3.500% | 6/15/23 | 3,657 | 3,424 | |
| 3,6 | Citicorp Lease Pass-Through Trust 1999-1 | 8.040% | 12/15/19 | 14,225 | 16,829 |
| Citigroup Inc. | 6.010% | 1/15/15 | 10,162 | 10,695 | |
| Citigroup Inc. | 2.650% | 3/2/15 | 1,875 | 1,913 | |
| Citigroup Inc. | 4.750% | 5/19/15 | 1,807 | 1,900 | |
| Citigroup Inc. | 4.700% | 5/29/15 | 4,125 | 4,339 | |
| Citigroup Inc. | 2.250% | 8/7/15 | 11,450 | 11,686 | |
| Citigroup Inc. | 4.587% | 12/15/15 | 1,325 | 1,415 | |
| Citigroup Inc. | 5.300% | 1/7/16 | 19,120 | 20,645 | |
| Citigroup Inc. | 1.300% | 4/1/16 | 1,800 | 1,802 | |
| Citigroup Inc. | 3.953% | 6/15/16 | 11,050 | 11,743 | |
| Citigroup Inc. | 1.700% | 7/25/16 | 10,475 | 10,571 | |
| Citigroup Inc. | 5.850% | 8/2/16 | 550 | 611 | |
| Citigroup Inc. | 1.300% | 11/15/16 | 4,475 | 4,458 | |
| Citigroup Inc. | 4.450% | 1/10/17 | 22,895 | 24,794 | |
| Citigroup Inc. | 5.500% | 2/15/17 | 8,945 | 9,853 | |
| Citigroup Inc. | 6.000% | 8/15/17 | 22,113 | 25,288 | |
| Citigroup Inc. | 6.125% | 11/21/17 | 20,890 | 24,073 | |
| Citigroup Inc. | 1.750% | 5/1/18 | 15,350 | 15,088 | |
| Citigroup Inc. | 6.125% | 5/15/18 | 22,520 | 26,106 | |
| Citigroup Inc. | 2.500% | 9/26/18 | 28,463 | 28,657 | |
| Citigroup Inc. | 8.500% | 5/22/19 | 27,102 | 34,660 | |
| Citigroup Inc. | 5.375% | 8/9/20 | 17,500 | 19,823 | |
| Citigroup Inc. | 4.500% | 1/14/22 | 24,789 | 26,102 | |
| Citigroup Inc. | 4.050% | 7/30/22 | 5,075 | 5,010 | |
| Citigroup Inc. | 3.375% | 3/1/23 | 10,275 | 9,688 | |
| Citigroup Inc. | 3.500% | 5/15/23 | 8,000 | 7,394 | |
| Citigroup Inc. | 3.875% | 10/25/23 | 1,050 | 1,028 | |
| Citigroup Inc. | 5.500% | 9/13/25 | 5,475 | 5,754 | |
| Citigroup Inc. | 6.625% | 6/15/32 | 2,265 | 2,526 | |
| Citigroup Inc. | 5.875% | 2/22/33 | 17,845 | 18,301 | |
| Citigroup Inc. | 6.000% | 10/31/33 | 7,020 | 7,375 | |
| Citigroup Inc. | 5.850% | 12/11/34 | 3,069 | 3,312 | |
| Citigroup Inc. | 6.125% | 8/25/36 | 10,175 | 10,822 | |
| Citigroup Inc. | 5.875% | 5/29/37 | 3,801 | 4,187 | |
| Citigroup Inc. | 6.875% | 3/5/38 | 8,920 | 11,070 | |
| Citigroup Inc. | 8.125% | 7/15/39 | 15,015 | 20,982 | |
| Citigroup Inc. | 5.875% | 1/30/42 | 9,330 | 10,367 | |
| Citigroup Inc. | 6.675% | 9/13/43 | 10,000 | 11,412 | |
| Comerica Bank | 5.750% | 11/21/16 | 10,775 | 12,096 | |
| Comerica Bank | 5.200% | 8/22/17 | 4,600 | 5,084 | |
22
| Vanguard® Total Bond Market Index Fund | ||||
| Schedule of Investments | ||||
| December 31, 2013 | ||||
| Face | Market | |||
| Maturity | Amount | Value | ||
| Coupon | Date | ($000) | ($000) | |
| Comerica Inc. | 4.800% | 5/1/15 | 3,225 | 3,388 |
| Commonwealth Bank of Australia | 1.950% | 3/16/15 | 12,625 | 12,842 |
| Commonwealth Bank of Australia | 1.250% | 9/18/15 | 8,575 | 8,675 |
| Commonwealth Bank of Australia | 1.900% | 9/18/17 | 4,200 | 4,192 |
| Commonwealth Bank of Australia | 2.500% | 9/20/18 | 2,200 | 2,218 |
| Compass Bank | 6.400% | 10/1/17 | 1,875 | 2,066 |
| Cooperatieve Centrale Raiffeisen-Boerenleenbank BA | 2.125% | 10/13/15 | 5,050 | 5,180 |
| Cooperatieve Centrale Raiffeisen-Boerenleenbank BA | 3.375% | 1/19/17 | 28,390 | 29,907 |
| Cooperatieve Centrale Raiffeisen-Boerenleenbank BA | 1.700% | 3/19/18 | 6,550 | 6,473 |
| Cooperatieve Centrale Raiffeisen-Boerenleenbank BA | 4.500% | 1/11/21 | 20,275 | 21,423 |
| Cooperatieve Centrale Raiffeisen-Boerenleenbank BA | 3.875% | 2/8/22 | 21,070 | 21,135 |
| Cooperatieve Centrale Raiffeisen-Boerenleenbank BA | 3.950% | 11/9/22 | 10,400 | 10,038 |
| Cooperatieve Centrale Raiffeisen-Boerenleenbank BA | 4.625% | 12/1/23 | 3,000 | 3,013 |
| Cooperatieve Centrale Raiffeisen-Boerenleenbank BA | 5.250% | 5/24/41 | 6,595 | 6,726 |
| Cooperatieve Centrale Raiffeisen-Boerenleenbank BA | 5.750% | 12/1/43 | 3,000 | 3,167 |
| Countrywide Financial Corp. | 6.250% | 5/15/16 | 1,820 | 2,005 |
| Credit Suisse | 3.500% | 3/23/15 | 25,625 | 26,498 |
| Credit Suisse | 6.000% | 2/15/18 | 3,400 | 3,926 |
| Credit Suisse | 5.300% | 8/13/19 | 12,675 | 14,275 |
| Credit Suisse | 5.400% | 1/14/20 | 4,486 | 4,974 |
| Credit Suisse | 4.375% | 8/5/20 | 17,492 | 18,641 |
| Credit Suisse USA Inc. | 4.875% | 1/15/15 | 7,400 | 7,730 |
| Credit Suisse USA Inc. | 5.125% | 8/15/15 | 26,780 | 28,691 |
| Credit Suisse USA Inc. | 7.125% | 7/15/32 | 8,879 | 11,557 |
| Deutsche Bank AG | 3.450% | 3/30/15 | 15,300 | 15,793 |
| Deutsche Bank AG | 3.250% | 1/11/16 | 20,525 | 21,450 |
| Deutsche Bank AG | 6.000% | 9/1/17 | 16,081 | 18,356 |
| 3 Deutsche Bank AG | 4.296% | 5/24/28 | 13,775 | 12,448 |
| Deutsche Bank Financial LLC | 5.375% | 3/2/15 | 3,450 | 3,609 |
| Discover Bank | 2.000% | 2/21/18 | 5,500 | 5,404 |
| Discover Bank | 4.200% | 8/8/23 | 5,175 | 5,079 |
| Discover Financial Services | 6.450% | 6/12/17 | 1,825 | 2,062 |
| Discover Financial Services | 5.200% | 4/27/22 | 917 | 948 |
| Discover Financial Services | 3.850% | 11/21/22 | 9,195 | 8,710 |
| Fifth Third Bancorp | 3.625% | 1/25/16 | 16,800 | 17,618 |
| Fifth Third Bancorp | 5.450% | 1/15/17 | 10,255 | 11,252 |
| Fifth Third Bancorp | 4.500% | 6/1/18 | 1,535 | 1,645 |
| Fifth Third Bancorp | 3.500% | 3/15/22 | 1,825 | 1,774 |
| Fifth Third Bancorp | 4.300% | 1/16/24 | 3,000 | 2,930 |
| Fifth Third Bancorp | 8.250% | 3/1/38 | 5,950 | 7,827 |
| Fifth Third Bank | 4.750% | 2/1/15 | 8,825 | 9,195 |
| Fifth Third Bank | 1.150% | 11/18/16 | 2,975 | 2,969 |
| First Horizon National Corp. | 5.375% | 12/15/15 | 13,850 | 14,891 |
| First Niagara Financial Group Inc. | 6.750% | 3/19/20 | 1,675 | 1,923 |
| First Niagara Financial Group Inc. | 7.250% | 12/15/21 | 2,850 | 3,270 |
| FirstMerit Corp. | 4.350% | 2/4/23 | 2,250 | 2,204 |
| Goldman Sachs Capital I | 6.345% | 2/15/34 | 16,155 | 16,284 |
| Goldman Sachs Group Inc. | 5.000% | 10/1/14 | 10,937 | 11,285 |
| Goldman Sachs Group Inc. | 5.125% | 1/15/15 | 18,385 | 19,201 |
| Goldman Sachs Group Inc. | 3.300% | 5/3/15 | 250 | 257 |
| Goldman Sachs Group Inc. | 3.700% | 8/1/15 | 17,100 | 17,815 |
| Goldman Sachs Group Inc. | 1.600% | 11/23/15 | 5,800 | 5,857 |
| Goldman Sachs Group Inc. | 5.350% | 1/15/16 | 23,620 | 25,519 |
| Goldman Sachs Group Inc. | 3.625% | 2/7/16 | 23,165 | 24,233 |
| Goldman Sachs Group Inc. | 5.750% | 10/1/16 | 4,150 | 4,623 |
| Goldman Sachs Group Inc. | 5.625% | 1/15/17 | 20,135 | 22,169 |
| Goldman Sachs Group Inc. | 6.250% | 9/1/17 | 27,800 | 31,850 |
| Goldman Sachs Group Inc. | 5.950% | 1/18/18 | 41,610 | 47,313 |
| Goldman Sachs Group Inc. | 2.375% | 1/22/18 | 20,350 | 20,396 |
| Goldman Sachs Group Inc. | 6.150% | 4/1/18 | 21,865 | 25,085 |
| Goldman Sachs Group Inc. | 2.900% | 7/19/18 | 20,625 | 20,971 |
| Goldman Sachs Group Inc. | 7.500% | 2/15/19 | 5,990 | 7,281 |
| Goldman Sachs Group Inc. | 5.375% | 3/15/20 | 33,080 | 36,737 |
| Goldman Sachs Group Inc. | 6.000% | 6/15/20 | 17,995 | 20,591 |
23
| Vanguard® Total Bond Market Index Fund | ||||
| Schedule of Investments | ||||
| December 31, 2013 | ||||
| Face | Market | |||
| Maturity | Amount | Value | ||
| Coupon | Date | ($000) | ($000) | |
| Goldman Sachs Group Inc. | 5.250% | 7/27/21 | 6,500 | 7,127 |
| Goldman Sachs Group Inc. | 5.750% | 1/24/22 | 33,550 | 37,703 |
| Goldman Sachs Group Inc. | 3.625% | 1/22/23 | 16,725 | 16,080 |
| Goldman Sachs Group Inc. | 5.950% | 1/15/27 | 15,685 | 16,590 |
| Goldman Sachs Group Inc. | 6.125% | 2/15/33 | 18,511 | 20,751 |
| Goldman Sachs Group Inc. | 6.450% | 5/1/36 | 5,755 | 6,090 |
| Goldman Sachs Group Inc. | 6.750% | 10/1/37 | 39,841 | 43,948 |
| Goldman Sachs Group Inc. | 6.250% | 2/1/41 | 17,996 | 20,655 |
| HSBC Bank USA NA | 6.000% | 8/9/17 | 775 | 871 |
| HSBC Bank USA NA | 4.875% | 8/24/20 | 15,615 | 16,924 |
| HSBC Bank USA NA | 5.875% | 11/1/34 | 3,850 | 4,176 |
| HSBC Bank USA NA | 5.625% | 8/15/35 | 1,395 | 1,467 |
| HSBC Holdings plc | 5.100% | 4/5/21 | 38,565 | 42,795 |
| HSBC Holdings plc | 4.875% | 1/14/22 | 475 | 511 |
| HSBC Holdings plc | 4.000% | 3/30/22 | 5,545 | 5,671 |
| HSBC Holdings plc | 7.625% | 5/17/32 | 925 | 1,154 |
| HSBC Holdings plc | 7.350% | 11/27/32 | 2,040 | 2,487 |
| HSBC Holdings plc | 6.500% | 5/2/36 | 26,720 | 31,574 |
| HSBC Holdings plc | 6.500% | 9/15/37 | 19,150 | 22,534 |
| HSBC Holdings plc | 6.800% | 6/1/38 | 15,810 | 19,349 |
| HSBC Holdings plc | 6.100% | 1/14/42 | 370 | 439 |
| HSBC USA Inc. | 2.375% | 2/13/15 | 12,400 | 12,643 |
| HSBC USA Inc. | 1.625% | 1/16/18 | 14,550 | 14,359 |
| HSBC USA Inc. | 5.000% | 9/27/20 | 5,625 | 6,046 |
| Huntington Bancshares Inc. | 7.000% | 12/15/20 | 4,200 | 4,907 |
| Huntington National Bank | 1.350% | 8/2/16 | 1,125 | 1,127 |
| Huntington National Bank | 1.300% | 11/20/16 | 4,525 | 4,514 |
| Intesa Sanpaolo SPA | 3.125% | 1/15/16 | 13,900 | 14,138 |
| Intesa Sanpaolo SPA | 3.875% | 1/16/18 | 8,950 | 9,103 |
| Intesa Sanpaolo SPA | 3.875% | 1/15/19 | 10,450 | 10,407 |
| JPMorgan Chase & Co. | 3.700% | 1/20/15 | 19,425 | 20,016 |
| JPMorgan Chase & Co. | 4.750% | 3/1/15 | 18,150 | 18,982 |
| JPMorgan Chase & Co. | 1.875% | 3/20/15 | 11,025 | 11,174 |
| JPMorgan Chase & Co. | 5.250% | 5/1/15 | 5,575 | 5,877 |
| JPMorgan Chase & Co. | 3.400% | 6/24/15 | 31,975 | 33,215 |
| JPMorgan Chase & Co. | 5.150% | 10/1/15 | 5,190 | 5,556 |
| JPMorgan Chase & Co. | 1.100% | 10/15/15 | 17,150 | 17,214 |
| JPMorgan Chase & Co. | 2.600% | 1/15/16 | 15,375 | 15,925 |
| JPMorgan Chase & Co. | 3.450% | 3/1/16 | 13,350 | 13,991 |
| JPMorgan Chase & Co. | 3.150% | 7/5/16 | 42,950 | 44,967 |
| JPMorgan Chase & Co. | 6.125% | 6/27/17 | 5,385 | 6,120 |
| JPMorgan Chase & Co. | 2.000% | 8/15/17 | 22,650 | 22,921 |
| JPMorgan Chase & Co. | 6.000% | 1/15/18 | 19,670 | 22,644 |
| JPMorgan Chase & Co. | 1.800% | 1/25/18 | 8,775 | 8,701 |
| JPMorgan Chase & Co. | 1.625% | 5/15/18 | 35,325 | 34,562 |
| JPMorgan Chase & Co. | 6.300% | 4/23/19 | 21,920 | 25,794 |
| JPMorgan Chase & Co. | 4.400% | 7/22/20 | 4,375 | 4,696 |
| JPMorgan Chase & Co. | 4.250% | 10/15/20 | 2,640 | 2,794 |
| JPMorgan Chase & Co. | 4.625% | 5/10/21 | 500 | 537 |
| JPMorgan Chase & Co. | 4.350% | 8/15/21 | 7,775 | 8,202 |
| JPMorgan Chase & Co. | 4.500% | 1/24/22 | 25,525 | 27,008 |
| JPMorgan Chase & Co. | 3.250% | 9/23/22 | 5,045 | 4,830 |
| JPMorgan Chase & Co. | 3.200% | 1/25/23 | 425 | 402 |
| JPMorgan Chase & Co. | 3.375% | 5/1/23 | 3,200 | 2,968 |
| JPMorgan Chase & Co. | 6.400% | 5/15/38 | 59,314 | 70,704 |
| JPMorgan Chase & Co. | 5.500% | 10/15/40 | 30,700 | 33,216 |
| JPMorgan Chase & Co. | 5.600% | 7/15/41 | 11,245 | 12,205 |
| JPMorgan Chase & Co. | 5.400% | 1/6/42 | 7,550 | 8,045 |
| JPMorgan Chase & Co. | 5.625% | 8/16/43 | 11,675 | 12,303 |
| JPMorgan Chase Bank NA | 5.875% | 6/13/16 | 4,346 | 4,803 |
| JPMorgan Chase Bank NA | 6.000% | 7/5/17 | 825 | 932 |
| JPMorgan Chase Bank NA | 6.000% | 10/1/17 | 4,615 | 5,275 |
| KeyBank NA | 5.800% | 7/1/14 | 2,825 | 2,897 |
| KeyBank NA | 4.950% | 9/15/15 | 4,675 | 4,967 |
24
| Vanguard® Total Bond Market Index Fund | ||||
| Schedule of Investments | ||||
| December 31, 2013 | ||||
| Face | Market | |||
| Maturity | Amount | Value | ||
| Coupon | Date | ($000) | ($000) | |
| KeyBank NA | 5.450% | 3/3/16 | 6,275 | 6,823 |
| KeyBank NA | 1.650% | 2/1/18 | 19,265 | 18,879 |
| KeyBank NA | 6.950% | 2/1/28 | 1,200 | 1,417 |
| KeyCorp | 5.100% | 3/24/21 | 925 | 1,003 |
| Lloyds Bank plc | 4.875% | 1/21/16 | 3,625 | 3,898 |
| Lloyds Bank plc | 4.200% | 3/28/17 | 800 | 858 |
| Lloyds Bank plc | 2.300% | 11/27/18 | 8,850 | 8,823 |
| 6 Lloyds Bank plc | 5.800% | 1/13/20 | 7,075 | 8,113 |
| Lloyds Bank plc | 6.375% | 1/21/21 | 10,425 | 12,367 |
| Manufacturers & Traders Trust Co. | 6.625% | 12/4/17 | 5,950 | 6,891 |
| 3 Manufacturers & Traders Trust Co. | 5.585% | 12/28/20 | 75 | 77 |
| MBNA Corp. | 5.000% | 6/15/15 | 4,775 | 5,047 |
| Merrill Lynch & Co. Inc. | 5.000% | 1/15/15 | 21,699 | 22,601 |
| Merrill Lynch & Co. Inc. | 6.050% | 5/16/16 | 4,700 | 5,163 |
| Merrill Lynch & Co. Inc. | 5.700% | 5/2/17 | 5,600 | 6,214 |
| Merrill Lynch & Co. Inc. | 6.400% | 8/28/17 | 14,015 | 16,163 |
| Merrill Lynch & Co. Inc. | 6.875% | 4/25/18 | 58,784 | 69,431 |
| Merrill Lynch & Co. Inc. | 6.500% | 7/15/18 | 1,410 | 1,653 |
| Merrill Lynch & Co. Inc. | 6.875% | 11/15/18 | 600 | 714 |
| Merrill Lynch & Co. Inc. | 6.110% | 1/29/37 | 575 | 612 |
| Merrill Lynch & Co. Inc. | 7.750% | 5/14/38 | 24,903 | 31,836 |
| Morgan Stanley | 4.100% | 1/26/15 | 13,425 | 13,877 |
| Morgan Stanley | 6.000% | 4/28/15 | 24,460 | 26,056 |
| Morgan Stanley | 4.000% | 7/24/15 | 3,750 | 3,920 |
| Morgan Stanley | 5.375% | 10/15/15 | 6,500 | 6,991 |
| Morgan Stanley | 3.450% | 11/2/15 | 9,325 | 9,727 |
| Morgan Stanley | 1.750% | 2/25/16 | 5,425 | 5,495 |
| Morgan Stanley | 3.800% | 4/29/16 | 875 | 925 |
| Morgan Stanley | 5.750% | 10/18/16 | 17,330 | 19,313 |
| Morgan Stanley | 5.450% | 1/9/17 | 14,785 | 16,351 |
| Morgan Stanley | 4.750% | 3/22/17 | 21,893 | 23,930 |
| Morgan Stanley | 5.550% | 4/27/17 | 10,000 | 11,101 |
| Morgan Stanley | 6.250% | 8/28/17 | 2,010 | 2,300 |
| Morgan Stanley | 5.950% | 12/28/17 | 18,075 | 20,601 |
| Morgan Stanley | 6.625% | 4/1/18 | 35,085 | 40,933 |
| Morgan Stanley | 2.125% | 4/25/18 | 29,275 | 29,094 |
| Morgan Stanley | 7.300% | 5/13/19 | 13,910 | 16,896 |
| Morgan Stanley | 5.625% | 9/23/19 | 47,250 | 53,540 |
| Morgan Stanley | 5.500% | 7/24/20 | 1,045 | 1,168 |
| Morgan Stanley | 5.750% | 1/25/21 | 18,275 | 20,691 |
| Morgan Stanley | 5.500% | 7/28/21 | 8,550 | 9,545 |
| Morgan Stanley | 4.875% | 11/1/22 | 14,450 | 14,682 |
| Morgan Stanley | 3.750% | 2/25/23 | 12,875 | 12,505 |
| Morgan Stanley | 4.100% | 5/22/23 | 15,825 | 15,250 |
| Morgan Stanley | 5.000% | 11/24/25 | 13,000 | 13,022 |
| Morgan Stanley | 6.250% | 8/9/26 | 9,825 | 11,300 |
| Morgan Stanley | 7.250% | 4/1/32 | 7,527 | 9,357 |
| Morgan Stanley | 6.375% | 7/24/42 | 16,463 | 19,122 |
| Murray Street Investment Trust I | 4.647% | 3/9/17 | 16,188 | 17,447 |
| National Australia Bank Ltd. | 2.000% | 3/9/15 | 7,325 | 7,457 |
| National Australia Bank Ltd. | 1.600% | 8/7/15 | 5,575 | 5,656 |
| National Australia Bank Ltd. | 0.900% | 1/20/16 | 1,075 | 1,075 |
| National Australia Bank Ltd. | 1.300% | 7/25/16 | 15,550 | 15,642 |
| National Australia Bank Ltd. | 2.750% | 3/9/17 | 2,625 | 2,709 |
| National Australia Bank Ltd. | 2.300% | 7/25/18 | 10,850 | 10,931 |
| National Australia Bank Ltd. | 3.000% | 1/20/23 | 5,175 | 4,812 |
| National Bank of Canada | 1.500% | 6/26/15 | 4,725 | 4,789 |
| National Bank of Canada | 1.450% | 11/7/17 | 3,250 | 3,171 |
| National City Bank | 5.800% | 6/7/17 | 1,800 | 2,027 |
| National City Corp. | 4.900% | 1/15/15 | 1,445 | 1,511 |
| National City Corp. | 6.875% | 5/15/19 | 1,065 | 1,262 |
| Northern Trust Co. | 6.500% | 8/15/18 | 1,125 | 1,327 |
| Northern Trust Corp. | 4.625% | 5/1/14 | 4,200 | 4,256 |
| Northern Trust Corp. | 3.450% | 11/4/20 | 750 | 772 |
25
| Vanguard® Total Bond Market Index Fund | ||||
| Schedule of Investments | ||||
| December 31, 2013 | ||||
| Face | Market | |||
| Maturity | Amount | Value | ||
| Coupon | Date | ($000) | ($000) | |
| Northern Trust Corp. | 3.375% | 8/23/21 | 1,675 | 1,686 |
| Northern Trust Corp. | 3.950% | 10/30/25 | 7,075 | 6,828 |
| People's United Financial Inc. | 3.650% | 12/6/22 | 450 | 423 |
| PNC Bank NA | 0.800% | 1/28/16 | 1,800 | 1,793 |
| PNC Bank NA | 4.875% | 9/21/17 | 9,675 | 10,622 |
| PNC Bank NA | 6.000% | 12/7/17 | 1,100 | 1,253 |
| PNC Bank NA | 2.700% | 11/1/22 | 6,175 | 5,592 |
| PNC Bank NA | 2.950% | 1/30/23 | 3,075 | 2,814 |
| PNC Bank NA | 3.800% | 7/25/23 | 13,825 | 13,372 |
| PNC Bank NA | 4.200% | 11/1/25 | 350 | 341 |
| PNC Financial Services Group Inc. | 2.854% | 11/9/22 | 6,825 | 6,300 |
| PNC Funding Corp. | 3.625% | 2/8/15 | 18,381 | 18,986 |
| PNC Funding Corp. | 4.250% | 9/21/15 | 4,775 | 5,048 |
| PNC Funding Corp. | 5.250% | 11/15/15 | 9,045 | 9,732 |
| PNC Funding Corp. | 2.700% | 9/19/16 | 2,350 | 2,448 |
| PNC Funding Corp. | 5.625% | 2/1/17 | 975 | 1,081 |
| PNC Funding Corp. | 6.700% | 6/10/19 | 6,354 | 7,677 |
| PNC Funding Corp. | 5.125% | 2/8/20 | 18,175 | 20,352 |
| PNC Funding Corp. | 4.375% | 8/11/20 | 10,175 | 10,956 |
| PNC Funding Corp. | 3.300% | 3/8/22 | 11,875 | 11,641 |
| Regions Financial Corp. | 2.000% | 5/15/18 | 17,400 | 16,891 |
| Royal Bank of Canada | 0.800% | 10/30/15 | 12,825 | 12,867 |
| Royal Bank of Canada | 2.625% | 12/15/15 | 12,975 | 13,474 |
| Royal Bank of Canada | 2.875% | 4/19/16 | 8,300 | 8,659 |
| Royal Bank of Canada | 2.300% | 7/20/16 | 31,050 | 32,118 |
| Royal Bank of Canada | 2.200% | 7/27/18 | 19,850 | 19,959 |
| Royal Bank of Scotland Group plc | 2.550% | 9/18/15 | 7,825 | 8,005 |
| Royal Bank of Scotland Group plc | 6.400% | 10/21/19 | 19,230 | 22,166 |
| Royal Bank of Scotland NV | 4.650% | 6/4/18 | 225 | 231 |
| 6 Royal Bank of Scotland plc | 4.875% | 8/25/14 | 1,025 | 1,050 |
| Royal Bank of Scotland plc | 4.875% | 3/16/15 | 3,250 | 3,396 |
| Royal Bank of Scotland plc | 3.950% | 9/21/15 | 1,015 | 1,066 |
| Royal Bank of Scotland plc | 4.375% | 3/16/16 | 5,645 | 6,026 |
| Royal Bank of Scotland plc | 5.625% | 8/24/20 | 13,650 | 15,242 |
| Royal Bank of Scotland plc | 6.125% | 1/11/21 | 15,250 | 17,205 |
| Santander Bank NA | 8.750% | 5/30/18 | 1,070 | 1,286 |
| Santander Holdings USA Inc. | 3.000% | 9/24/15 | 270 | 277 |
| Santander Holdings USA Inc. | 4.625% | 4/19/16 | 9,075 | 9,662 |
| Santander Holdings USA Inc. | 3.450% | 8/27/18 | 6,925 | 7,079 |
| Societe Generale SA | 2.750% | 10/12/17 | 9,375 | 9,606 |
| Societe Generale SA | 2.625% | 10/1/18 | 26,700 | 26,828 |
| State Street Bank & Trust Co. | 5.300% | 1/15/16 | 2,800 | 3,024 |
| State Street Corp. | 4.300% | 5/30/14 | 2,665 | 2,707 |
| State Street Corp. | 2.875% | 3/7/16 | 7,325 | 7,621 |
| State Street Corp. | 4.956% | 3/15/18 | 5,825 | 6,334 |
| State Street Corp. | 1.350% | 5/15/18 | 9,075 | 8,805 |
| State Street Corp. | 4.375% | 3/7/21 | 400 | 432 |
| State Street Corp. | 3.100% | 5/15/23 | 6,475 | 5,938 |
| State Street Corp. | 3.700% | 11/20/23 | 7,575 | 7,513 |
| Sumitomo Mitsui Banking Corp. | 1.350% | 7/18/15 | 7,800 | 7,864 |
| Sumitomo Mitsui Banking Corp. | 0.900% | 1/18/16 | 625 | 623 |
| Sumitomo Mitsui Banking Corp. | 1.450% | 7/19/16 | 2,900 | 2,918 |
| Sumitomo Mitsui Banking Corp. | 1.800% | 7/18/17 | 12,675 | 12,569 |
| Sumitomo Mitsui Banking Corp. | 2.500% | 7/19/18 | 3,325 | 3,346 |
| Sumitomo Mitsui Banking Corp. | 3.200% | 7/18/22 | 5,025 | 4,747 |
| Sumitomo Mitsui Banking Corp. | 3.000% | 1/18/23 | 550 | 505 |
| Sumitomo Mitsui Banking Corp. | 3.950% | 7/19/23 | 4,650 | 4,621 |
| SunTrust Bank | 5.000% | 9/1/15 | 39 | 41 |
| SunTrust Bank | 7.250% | 3/15/18 | 1,000 | 1,178 |
| SunTrust Bank | 2.750% | 5/1/23 | 6,250 | 5,638 |
| SunTrust Banks Inc. | 3.600% | 4/15/16 | 14,450 | 15,214 |
| SunTrust Banks Inc. | 3.500% | 1/20/17 | 9,865 | 10,393 |
| SunTrust Banks Inc. | 6.000% | 9/11/17 | 2,508 | 2,851 |
| Svenska Handelsbanken AB | 3.125% | 7/12/16 | 250 | 261 |
26
| Vanguard® Total Bond Market Index Fund | ||||
| Schedule of Investments | ||||
| December 31, 2013 | ||||
| Face | Market | |||
| Maturity | Amount | Value | ||
| Coupon | Date | ($000) | ($000) | |
| Svenska Handelsbanken AB | 2.875% | 4/4/17 | 20,775 | 21,631 |
| Svenska Handelsbanken AB | 1.625% | 3/21/18 | 4,750 | 4,679 |
| Svenska Handelsbanken AB | 2.500% | 1/25/19 | 7,025 | 7,004 |
| Toronto-Dominion Bank | 2.500% | 7/14/16 | 7,240 | 7,511 |
| Toronto-Dominion Bank | 2.375% | 10/19/16 | 11,300 | 11,737 |
| Toronto-Dominion Bank | 1.400% | 4/30/18 | 16,665 | 16,251 |
| Toronto-Dominion Bank | 2.625% | 9/10/18 | 12,000 | 12,311 |
| UBS AG | 3.875% | 1/15/15 | 1,490 | 1,540 |
| UBS AG | 7.000% | 10/15/15 | 2,500 | 2,758 |
| UBS AG | 5.875% | 7/15/16 | 6,025 | 6,683 |
| UBS AG | 7.375% | 6/15/17 | 12,924 | 14,707 |
| UBS AG | 5.875% | 12/20/17 | 30,024 | 34,382 |
| UBS AG | 5.750% | 4/25/18 | 11,542 | 13,212 |
| UBS AG | 4.875% | 8/4/20 | 23,035 | 25,552 |
| Union Bank NA | 5.950% | 5/11/16 | 3,875 | 4,287 |
| Union Bank NA | 1.500% | 9/26/16 | 3,075 | 3,105 |
| Union Bank NA | 2.125% | 6/16/17 | 2,075 | 2,103 |
| Union Bank NA | 2.625% | 9/26/18 | 3,575 | 3,632 |
| UnionBanCal Corp. | 3.500% | 6/18/22 | 8,125 | 7,962 |
| US Bancorp | 3.150% | 3/4/15 | 1,475 | 1,521 |
| US Bancorp | 2.450% | 7/27/15 | 650 | 668 |
| US Bancorp | 3.442% | 2/1/16 | 18,400 | 19,154 |
| US Bancorp | 2.200% | 11/15/16 | 12,250 | 12,630 |
| US Bancorp | 1.650% | 5/15/17 | 4,100 | 4,131 |
| US Bancorp | 1.950% | 11/15/18 | 4,125 | 4,093 |
| US Bancorp | 4.125% | 5/24/21 | 6,800 | 7,197 |
| US Bancorp | 3.000% | 3/15/22 | 1,825 | 1,762 |
| US Bancorp | 2.950% | 7/15/22 | 13,185 | 12,238 |
| Vesey Street Investment Trust I | 4.404% | 9/1/16 | 1,225 | 1,314 |
| Wachovia Bank NA | 4.875% | 2/1/15 | 13,436 | 14,045 |
| Wachovia Bank NA | 5.000% | 8/15/15 | 672 | 715 |
| Wachovia Bank NA | 6.000% | 11/15/17 | 8,775 | 10,112 |
| Wachovia Bank NA | 5.850% | 2/1/37 | 16,325 | 18,444 |
| Wachovia Bank NA | 6.600% | 1/15/38 | 14,735 | 18,072 |
| Wachovia Corp. | 5.625% | 10/15/16 | 13,085 | 14,643 |
| Wachovia Corp. | 5.750% | 6/15/17 | 28,035 | 32,000 |
| Wachovia Corp. | 5.750% | 2/1/18 | 3,950 | 4,548 |
| Wachovia Corp. | 6.605% | 10/1/25 | 3,175 | 3,611 |
| Wachovia Corp. | 5.500% | 8/1/35 | 11,680 | 12,017 |
| Wachovia Corp. | 6.550% | 10/15/35 | 7,625 | 8,525 |
| Wells Fargo & Co. | 1.250% | 2/13/15 | 24,500 | 24,705 |
| Wells Fargo & Co. | 3.625% | 4/15/15 | 7,720 | 8,021 |
| Wells Fargo & Co. | 1.500% | 7/1/15 | 3,675 | 3,729 |
| Wells Fargo & Co. | 3.676% | 6/15/16 | 41,525 | 44,101 |
| Wells Fargo & Co. | 5.125% | 9/15/16 | 10 | 11 |
| Wells Fargo & Co. | 2.625% | 12/15/16 | 34,600 | 36,180 |
| Wells Fargo & Co. | 2.100% | 5/8/17 | 21,450 | 21,849 |
| Wells Fargo & Co. | 5.625% | 12/11/17 | 26,625 | 30,509 |
| Wells Fargo & Co. | 1.500% | 1/16/18 | 150 | 148 |
| Wells Fargo & Co. | 4.600% | 4/1/21 | 21,425 | 23,146 |
| Wells Fargo & Co. | 3.500% | 3/8/22 | 270 | 270 |
| Wells Fargo & Co. | 3.450% | 2/13/23 | 6,925 | 6,505 |
| Wells Fargo & Co. | 4.125% | 8/15/23 | 11,300 | 11,251 |
| 6 Wells Fargo & Co. | 4.480% | 1/16/24 | 1,987 | 1,987 |
| Wells Fargo & Co. | 5.375% | 2/7/35 | 4,275 | 4,584 |
| Wells Fargo Bank NA | 4.750% | 2/9/15 | 10,594 | 11,047 |
| Wells Fargo Bank NA | 5.750% | 5/16/16 | 8,150 | 8,990 |
| Wells Fargo Bank NA | 5.950% | 8/26/36 | 9,635 | 10,833 |
| 3 Wells Fargo Capital X | 5.950% | 12/1/86 | 3,007 | 2,939 |
| Westpac Banking Corp. | 4.200% | 2/27/15 | 15,075 | 15,715 |
| Westpac Banking Corp. | 3.000% | 8/4/15 | 17,710 | 18,403 |
| Westpac Banking Corp. | 1.125% | 9/25/15 | 8,400 | 8,489 |
| Westpac Banking Corp. | 0.950% | 1/12/16 | 6,300 | 6,308 |
| Westpac Banking Corp. | 2.000% | 8/14/17 | 4,050 | 4,073 |
27
| Vanguard® Total Bond Market Index Fund | ||||
| Schedule of Investments | ||||
| December 31, 2013 | ||||
| Face | Market | |||
| Maturity | Amount | Value | ||
| Coupon | Date | ($000) | ($000) | |
| Westpac Banking Corp. | 1.600% | 1/12/18 | 10,600 | 10,451 |
| Westpac Banking Corp. | 2.250% | 7/30/18 | 14,625 | 14,678 |
| Westpac Banking Corp. | 4.875% | 11/19/19 | 15,115 | 16,701 |
| Zions Bancorporation | 4.500% | 6/13/23 | 5,110 | 4,972 |
| Brokerage (0.2%) | ||||
| Ameriprise Financial Inc. | 5.650% | 11/15/15 | 1,275 | 1,386 |
| Ameriprise Financial Inc. | 7.300% | 6/28/19 | 3,547 | 4,352 |
| Ameriprise Financial Inc. | 5.300% | 3/15/20 | 3,642 | 4,079 |
| Ameriprise Financial Inc. | 4.000% | 10/15/23 | 7,875 | 7,786 |
| 3 Ameriprise Financial Inc. | 7.518% | 6/1/66 | 825 | 917 |
| BlackRock Inc. | 1.375% | 6/1/15 | 2,100 | 2,127 |
| BlackRock Inc. | 6.250% | 9/15/17 | 3,375 | 3,914 |
| BlackRock Inc. | 5.000% | 12/10/19 | 8,098 | 9,158 |
| BlackRock Inc. | 4.250% | 5/24/21 | 6,515 | 6,882 |
| BlackRock Inc. | 3.375% | 6/1/22 | 10,800 | 10,609 |
| Charles Schwab Corp. | 4.450% | 7/22/20 | 7,050 | 7,567 |
| Charles Schwab Corp. | 3.225% | 9/1/22 | 4,250 | 4,062 |
| Eaton Vance Corp. | 3.625% | 6/15/23 | 3,075 | 2,934 |
| 6 FMR LLC | 7.490% | 6/15/19 | 800 | 956 |
| Franklin Resources Inc. | 3.125% | 5/20/15 | 3,700 | 3,813 |
| Franklin Resources Inc. | 1.375% | 9/15/17 | 1,600 | 1,565 |
| Franklin Resources Inc. | 4.625% | 5/20/20 | 1,950 | 2,105 |
| Franklin Resources Inc. | 2.800% | 9/15/22 | 8,650 | 8,033 |
| Invesco Finance plc | 3.125% | 11/30/22 | 6,725 | 6,202 |
| Invesco Finance plc | 4.000% | 1/30/24 | 8,225 | 8,170 |
| Invesco Finance plc | 5.375% | 11/30/43 | 10,275 | 10,275 |
| Jefferies Group LLC | 3.875% | 11/9/15 | 1,225 | 1,281 |
| Jefferies Group LLC | 5.125% | 4/13/18 | 6,205 | 6,692 |
| Jefferies Group LLC | 8.500% | 7/15/19 | 8,107 | 9,816 |
| Jefferies Group LLC | 6.875% | 4/15/21 | 12,275 | 13,992 |
| Jefferies Group LLC | 5.125% | 1/20/23 | 1,400 | 1,414 |
| Jefferies Group LLC | 6.450% | 6/8/27 | 2,285 | 2,362 |
| Jefferies Group LLC | 6.250% | 1/15/36 | 7,350 | 7,075 |
| Lazard Group LLC | 6.850% | 6/15/17 | 8,425 | 9,532 |
| Legg Mason Inc. | 5.500% | 5/21/19 | 2,550 | 2,794 |
| Leucadia National Corp. | 5.500% | 10/18/23 | 5,000 | 4,992 |
| Leucadia National Corp. | 6.625% | 10/23/43 | 2,725 | 2,656 |
| Nomura Holdings Inc. | 5.000% | 3/4/15 | 6,825 | 7,126 |
| Nomura Holdings Inc. | 2.000% | 9/13/16 | 16,525 | 16,632 |
| Nomura Holdings Inc. | 6.700% | 3/4/20 | 8,300 | 9,532 |
| Raymond James Financial Inc. | 4.250% | 4/15/16 | 1,975 | 2,099 |
| TD Ameritrade Holding Corp. | 5.600% | 12/1/19 | 2,425 | 2,780 |
| Finance Companies (0.6%) | ||||
| Air Lease Corp. | 5.625% | 4/1/17 | 1,000 | 1,100 |
| Air Lease Corp. | 3.375% | 1/15/19 | 18,700 | 18,793 |
| Air Lease Corp. | 4.750% | 3/1/20 | 7,700 | 7,989 |
| Ares Capital Corp. | 4.875% | 11/30/18 | 1,475 | 1,513 |
| GATX Corp. | 4.750% | 6/15/22 | 4,600 | 4,606 |
| 3 GE Capital Trust I | 6.375% | 11/15/67 | 10,600 | 11,474 |
| General Electric Capital Corp. | 2.150% | 1/9/15 | 8,500 | 8,658 |
| General Electric Capital Corp. | 4.875% | 3/4/15 | 85 | 89 |
| General Electric Capital Corp. | 3.500% | 6/29/15 | 2,500 | 2,609 |
| General Electric Capital Corp. | 1.625% | 7/2/15 | 9,650 | 9,804 |
| General Electric Capital Corp. | 4.375% | 9/21/15 | 17,100 | 18,142 |
| General Electric Capital Corp. | 2.250% | 11/9/15 | 24,664 | 25,419 |
| General Electric Capital Corp. | 1.000% | 12/11/15 | 2,975 | 3,003 |
| General Electric Capital Corp. | 5.000% | 1/8/16 | 125 | 135 |
| General Electric Capital Corp. | 2.950% | 5/9/16 | 32,801 | 34,305 |
| General Electric Capital Corp. | 1.500% | 7/12/16 | 11,375 | 11,523 |
| General Electric Capital Corp. | 3.350% | 10/17/16 | 4,234 | 4,495 |
| General Electric Capital Corp. | 2.900% | 1/9/17 | 4,875 | 5,075 |
| General Electric Capital Corp. | 5.400% | 2/15/17 | 28,350 | 31,518 |
| General Electric Capital Corp. | 2.300% | 4/27/17 | 21,900 | 22,440 |
28
| Vanguard® Total Bond Market Index Fund | ||||
| Schedule of Investments | ||||
| December 31, 2013 | ||||
| Face | Market | |||
| Maturity | Amount | Value | ||
| Coupon | Date | ($000) | ($000) | |
| General Electric Capital Corp. | 5.625% | 9/15/17 | 21,988 | 25,009 |
| General Electric Capital Corp. | 1.600% | 11/20/17 | 3,550 | 3,542 |
| General Electric Capital Corp. | 1.625% | 4/2/18 | 19,700 | 19,478 |
| General Electric Capital Corp. | 5.625% | 5/1/18 | 32,679 | 37,582 |
| General Electric Capital Corp. | 6.000% | 8/7/19 | 11,830 | 13,886 |
| General Electric Capital Corp. | 2.100% | 12/11/19 | 1,675 | 1,634 |
| General Electric Capital Corp. | 5.500% | 1/8/20 | 12,940 | 14,797 |
| General Electric Capital Corp. | 5.550% | 5/4/20 | 13,700 | 15,784 |
| General Electric Capital Corp. | 4.625% | 1/7/21 | 23,400 | 25,431 |
| General Electric Capital Corp. | 5.300% | 2/11/21 | 5,275 | 5,884 |
| General Electric Capital Corp. | 4.650% | 10/17/21 | 13,923 | 15,223 |
| General Electric Capital Corp. | 3.150% | 9/7/22 | 2,000 | 1,931 |
| General Electric Capital Corp. | 3.100% | 1/9/23 | 9,350 | 8,868 |
| General Electric Capital Corp. | 6.750% | 3/15/32 | 45,846 | 56,583 |
| General Electric Capital Corp. | 6.150% | 8/7/37 | 23,065 | 26,594 |
| General Electric Capital Corp. | 5.875% | 1/14/38 | 50,100 | 56,615 |
| General Electric Capital Corp. | 6.875% | 1/10/39 | 31,790 | 40,709 |
| 3 General Electric Capital Corp. | 6.375% | 11/15/67 | 9,230 | 9,991 |
| 3 HSBC Finance Capital Trust IX | 5.911% | 11/30/35 | 1,725 | 1,788 |
| HSBC Finance Corp. | 5.000% | 6/30/15 | 18,460 | 19,526 |
| HSBC Finance Corp. | 5.500% | 1/19/16 | 2,321 | 2,520 |
| HSBC Finance Corp. | 6.676% | 1/15/21 | 36,749 | 42,283 |
| 6 International Lease Finance Corp. | 6.500% | 9/1/14 | 170 | 176 |
| 6 International Lease Finance Corp. | 6.750% | 9/1/16 | 665 | 743 |
| Prospect Capital Corp. | 5.875% | 3/15/23 | 1,375 | 1,323 |
| Insurance (1.4%) | ||||
| ACE Capital Trust II | 9.700% | 4/1/30 | 2,089 | 2,977 |
| ACE INA Holdings Inc. | 5.600% | 5/15/15 | 6,675 | 7,121 |
| ACE INA Holdings Inc. | 2.600% | 11/23/15 | 9,455 | 9,780 |
| ACE INA Holdings Inc. | 5.700% | 2/15/17 | 2,948 | 3,300 |
| ACE INA Holdings Inc. | 5.800% | 3/15/18 | 1,256 | 1,437 |
| ACE INA Holdings Inc. | 5.900% | 6/15/19 | 2,575 | 3,006 |
| ACE INA Holdings Inc. | 2.700% | 3/13/23 | 3,500 | 3,201 |
| ACE INA Holdings Inc. | 6.700% | 5/15/36 | 1,040 | 1,297 |
| ACE INA Holdings Inc. | 4.150% | 3/13/43 | 2,015 | 1,812 |
| AEGON Funding Co. LLC | 5.750% | 12/15/20 | 11,600 | 12,968 |
| Aetna Inc. | 6.000% | 6/15/16 | 10,650 | 11,891 |
| Aetna Inc. | 1.750% | 5/15/17 | 1,600 | 1,596 |
| Aetna Inc. | 1.500% | 11/15/17 | 4,100 | 4,039 |
| Aetna Inc. | 6.500% | 9/15/18 | 2,175 | 2,557 |
| Aetna Inc. | 4.125% | 6/1/21 | 350 | 366 |
| Aetna Inc. | 2.750% | 11/15/22 | 9,750 | 8,944 |
| Aetna Inc. | 6.625% | 6/15/36 | 9,127 | 10,819 |
| Aetna Inc. | 6.750% | 12/15/37 | 6,055 | 7,328 |
| Aetna Inc. | 4.500% | 5/15/42 | 2,653 | 2,451 |
| Aetna Inc. | 4.125% | 11/15/42 | 1,668 | 1,452 |
| Aflac Inc. | 2.650% | 2/15/17 | 7,520 | 7,765 |
| Aflac Inc. | 8.500% | 5/15/19 | 950 | 1,210 |
| Aflac Inc. | 4.000% | 2/15/22 | 3,525 | 3,542 |
| Aflac Inc. | 6.900% | 12/17/39 | 725 | 886 |
| Aflac Inc. | 6.450% | 8/15/40 | 4,998 | 5,833 |
| AIG Life Holdings Inc. | 8.500% | 7/1/30 | 2,200 | 2,756 |
| Alleghany Corp. | 5.625% | 9/15/20 | 1,700 | 1,864 |
| Alleghany Corp. | 4.950% | 6/27/22 | 3,050 | 3,174 |
| Allied World Assurance Co. Ltd. | 7.500% | 8/1/16 | 15,503 | 17,739 |
| Allstate Corp. | 3.150% | 6/15/23 | 8,100 | 7,661 |
| Allstate Corp. | 5.350% | 6/1/33 | 1,354 | 1,434 |
| Allstate Corp. | 5.550% | 5/9/35 | 2,606 | 2,838 |
| Allstate Corp. | 5.950% | 4/1/36 | 53 | 60 |
| Allstate Corp. | 4.500% | 6/15/43 | 6,150 | 5,792 |
| 3 Allstate Corp. | 5.750% | 8/15/53 | 3,400 | 3,443 |
| 3 Allstate Corp. | 6.125% | 5/15/67 | 1,431 | 1,495 |
| 3 Allstate Corp. | 6.500% | 5/15/67 | 4,475 | 4,671 |
29
| Vanguard® Total Bond Market Index Fund | ||||
| Schedule of Investments | ||||
| December 31, 2013 | ||||
| Face | Market | |||
| Maturity | Amount | Value | ||
| Coupon | Date | ($000) | ($000) | |
| Alterra Finance LLC | 6.250% | 9/30/20 | 2,000 | 2,247 |
| American Financial Group Inc. | 9.875% | 6/15/19 | 8,114 | 10,464 |
| American International Group Inc. | 3.000% | 3/20/15 | 6,275 | 6,442 |
| American International Group Inc. | 2.375% | 8/24/15 | 900 | 920 |
| American International Group Inc. | 5.050% | 10/1/15 | 3,200 | 3,431 |
| American International Group Inc. | 4.875% | 9/15/16 | 8,928 | 9,793 |
| American International Group Inc. | 5.600% | 10/18/16 | 6,300 | 7,024 |
| American International Group Inc. | 3.800% | 3/22/17 | 11,675 | 12,444 |
| American International Group Inc. | 5.450% | 5/18/17 | 7,445 | 8,320 |
| American International Group Inc. | 5.850% | 1/16/18 | 31,912 | 36,600 |
| American International Group Inc. | 8.250% | 8/15/18 | 13,425 | 16,809 |
| American International Group Inc. | 3.375% | 8/15/20 | 6,450 | 6,502 |
| American International Group Inc. | 6.400% | 12/15/20 | 19,590 | 23,130 |
| American International Group Inc. | 4.875% | 6/1/22 | 8,400 | 8,982 |
| American International Group Inc. | 4.125% | 2/15/24 | 7,375 | 7,324 |
| American International Group Inc. | 6.250% | 5/1/36 | 9,660 | 11,124 |
| American International Group Inc. | 6.820% | 11/15/37 | 955 | 1,154 |
| 3 American International Group Inc. | 8.175% | 5/15/68 | 23,233 | 27,879 |
| 3 American International Group Inc. | 6.250% | 3/15/87 | 4,660 | 4,654 |
| Aon Corp. | 3.500% | 9/30/15 | 5,680 | 5,931 |
| Aon Corp. | 5.000% | 9/30/20 | 13,210 | 14,488 |
| Aon Corp. | 8.205% | 1/1/27 | 1,669 | 2,001 |
| Aon Corp. | 6.250% | 9/30/40 | 3,550 | 4,016 |
| Aon plc | 4.450% | 5/24/43 | 1,900 | 1,680 |
| Arch Capital Group Ltd. | 7.350% | 5/1/34 | 4,335 | 5,438 |
| Arch Capital Group US Inc. | 5.144% | 11/1/43 | 750 | 747 |
| Aspen Insurance Holdings Ltd. | 6.000% | 12/15/20 | 2,075 | 2,291 |
| Aspen Insurance Holdings Ltd. | 4.650% | 11/15/23 | 10,725 | 10,550 |
| Assurant Inc. | 4.000% | 3/15/23 | 75 | 72 |
| Assurant Inc. | 6.750% | 2/15/34 | 5,965 | 6,357 |
| AXA SA | 8.600% | 12/15/30 | 15,032 | 18,396 |
| Axis Specialty Finance LLC | 5.875% | 6/1/20 | 9,650 | 10,560 |
| Berkshire Hathaway Finance Corp. | 4.850% | 1/15/15 | 6,780 | 7,094 |
| Berkshire Hathaway Finance Corp. | 1.600% | 5/15/17 | 7,950 | 8,012 |
| Berkshire Hathaway Finance Corp. | 1.300% | 5/15/18 | 7,075 | 6,903 |
| Berkshire Hathaway Finance Corp. | 5.400% | 5/15/18 | 19,450 | 22,316 |
| Berkshire Hathaway Finance Corp. | 2.000% | 8/15/18 | 6,900 | 6,911 |
| Berkshire Hathaway Finance Corp. | 2.900% | 10/15/20 | 5,400 | 5,343 |
| Berkshire Hathaway Finance Corp. | 4.250% | 1/15/21 | 850 | 896 |
| Berkshire Hathaway Finance Corp. | 3.000% | 5/15/22 | 11,100 | 10,615 |
| Berkshire Hathaway Finance Corp. | 5.750% | 1/15/40 | 5,723 | 6,278 |
| Berkshire Hathaway Finance Corp. | 4.400% | 5/15/42 | 10,575 | 9,553 |
| Berkshire Hathaway Finance Corp. | 4.300% | 5/15/43 | 4,600 | 4,098 |
| Berkshire Hathaway Inc. | 3.200% | 2/11/15 | 13,240 | 13,641 |
| Berkshire Hathaway Inc. | 0.800% | 2/11/16 | 1,000 | 1,002 |
| Berkshire Hathaway Inc. | 2.200% | 8/15/16 | 16,625 | 17,183 |
| Berkshire Hathaway Inc. | 1.900% | 1/31/17 | 200 | 204 |
| Berkshire Hathaway Inc. | 1.550% | 2/9/18 | 275 | 271 |
| Berkshire Hathaway Inc. | 3.750% | 8/15/21 | 250 | 257 |
| Berkshire Hathaway Inc. | 3.400% | 1/31/22 | 825 | 820 |
| Berkshire Hathaway Inc. | 3.000% | 2/11/23 | 7,250 | 6,797 |
| Berkshire Hathaway Inc. | 4.500% | 2/11/43 | 2,000 | 1,849 |
| Chubb Corp. | 5.750% | 5/15/18 | 6,050 | 6,953 |
| Chubb Corp. | 6.000% | 5/11/37 | 5,960 | 6,889 |
| Chubb Corp. | 6.500% | 5/15/38 | 1,905 | 2,328 |
| 3 Chubb Corp. | 6.375% | 3/29/67 | 11,075 | 12,099 |
| Cigna Corp. | 2.750% | 11/15/16 | 3,775 | 3,922 |
| Cigna Corp. | 5.125% | 6/15/20 | 6,525 | 7,199 |
| Cigna Corp. | 4.375% | 12/15/20 | 3,600 | 3,797 |
| Cigna Corp. | 4.500% | 3/15/21 | 875 | 923 |
| Cigna Corp. | 4.000% | 2/15/22 | 9,675 | 9,836 |
| Cigna Corp. | 7.875% | 5/15/27 | 1,025 | 1,273 |
| Cigna Corp. | 6.150% | 11/15/36 | 3,143 | 3,533 |
| Cigna Corp. | 5.875% | 3/15/41 | 2,525 | 2,774 |
30
| Vanguard® Total Bond Market Index Fund | ||||
| Schedule of Investments | ||||
| December 31, 2013 | ||||
| Face | Market | |||
| Maturity | Amount | Value | ||
| Coupon | Date | ($000) | ($000) | |
| Cigna Corp. | 5.375% | 2/15/42 | 7,700 | 8,057 |
| Cincinnati Financial Corp. | 6.920% | 5/15/28 | 3,575 | 4,132 |
| Cincinnati Financial Corp. | 6.125% | 11/1/34 | 2,010 | 2,095 |
| CNA Financial Corp. | 6.500% | 8/15/16 | 3,625 | 4,078 |
| CNA Financial Corp. | 7.350% | 11/15/19 | 8,800 | 10,667 |
| CNA Financial Corp. | 5.875% | 8/15/20 | 2,875 | 3,262 |
| CNA Financial Corp. | 5.750% | 8/15/21 | 600 | 669 |
| Coventry Health Care Inc. | 5.950% | 3/15/17 | 2,000 | 2,263 |
| Coventry Health Care Inc. | 5.450% | 6/15/21 | 3,150 | 3,493 |
| Endurance Specialty Holdings Ltd. | 7.000% | 7/15/34 | 6,875 | 7,424 |
| Fidelity National Financial Inc. | 5.500% | 9/1/22 | 150 | 155 |
| First American Financial Corp. | 4.300% | 2/1/23 | 2,675 | 2,543 |
| Genworth Holdings Inc. | 8.625% | 12/15/16 | 9,150 | 10,849 |
| Genworth Holdings Inc. | 7.700% | 6/15/20 | 1,150 | 1,365 |
| Genworth Holdings Inc. | 7.200% | 2/15/21 | 4,000 | 4,624 |
| Genworth Holdings Inc. | 7.625% | 9/24/21 | 3,720 | 4,417 |
| Genworth Holdings Inc. | 4.800% | 2/15/24 | 9,325 | 9,193 |
| Genworth Holdings Inc. | 6.500% | 6/15/34 | 5,675 | 6,059 |
| Hartford Financial Services Group Inc. | 5.500% | 10/15/16 | 3,075 | 3,418 |
| Hartford Financial Services Group Inc. | 5.375% | 3/15/17 | 2,600 | 2,871 |
| Hartford Financial Services Group Inc. | 4.000% | 10/15/17 | 925 | 984 |
| Hartford Financial Services Group Inc. | 6.300% | 3/15/18 | 6,670 | 7,663 |
| Hartford Financial Services Group Inc. | 6.000% | 1/15/19 | 2,675 | 3,056 |
| Hartford Financial Services Group Inc. | 5.125% | 4/15/22 | 825 | 897 |
| Hartford Financial Services Group Inc. | 5.950% | 10/15/36 | 2,340 | 2,574 |
| Hartford Financial Services Group Inc. | 6.100% | 10/1/41 | 2,375 | 2,678 |
| Hartford Financial Services Group Inc. | 4.300% | 4/15/43 | 6,600 | 5,762 |
| HCC Insurance Holdings Inc. | 6.300% | 11/15/19 | 3,250 | 3,765 |
| Humana Inc. | 6.450% | 6/1/16 | 175 | 195 |
| Humana Inc. | 7.200% | 6/15/18 | 6,005 | 7,081 |
| Humana Inc. | 6.300% | 8/1/18 | 200 | 228 |
| Humana Inc. | 3.150% | 12/1/22 | 6,000 | 5,519 |
| Humana Inc. | 4.625% | 12/1/42 | 4,493 | 4,002 |
| Infinity Property & Casualty Corp. | 5.000% | 9/19/22 | 1,975 | 1,971 |
| ING US Inc. | 2.900% | 2/15/18 | 3,800 | 3,880 |
| ING US Inc. | 5.500% | 7/15/22 | 1,050 | 1,139 |
| ING US Inc. | 5.700% | 7/15/43 | 4,350 | 4,526 |
| Lincoln National Corp. | 4.300% | 6/15/15 | 250 | 262 |
| Lincoln National Corp. | 8.750% | 7/1/19 | 197 | 253 |
| Lincoln National Corp. | 4.200% | 3/15/22 | 2,650 | 2,692 |
| Lincoln National Corp. | 4.000% | 9/1/23 | 5,675 | 5,572 |
| Lincoln National Corp. | 6.150% | 4/7/36 | 7,200 | 8,071 |
| Lincoln National Corp. | 7.000% | 6/15/40 | 1,325 | 1,656 |
| 3 Lincoln National Corp. | 7.000% | 5/17/66 | 15,325 | 15,612 |
| 3 Lincoln National Corp. | 6.050% | 4/20/67 | 700 | 697 |
| Loews Corp. | 5.250% | 3/15/16 | 3,200 | 3,488 |
| Loews Corp. | 2.625% | 5/15/23 | 2,075 | 1,857 |
| Loews Corp. | 6.000% | 2/1/35 | 625 | 687 |
| Loews Corp. | 4.125% | 5/15/43 | 7,450 | 6,326 |
| Manulife Financial Corp. | 3.400% | 9/17/15 | 10,500 | 10,943 |
| Manulife Financial Corp. | 4.900% | 9/17/20 | 14,550 | 15,523 |
| Markel Corp. | 7.125% | 9/30/19 | 6,625 | 7,888 |
| Markel Corp. | 4.900% | 7/1/22 | 700 | 723 |
| Markel Corp. | 3.625% | 3/30/23 | 625 | 585 |
| Markel Corp. | 5.000% | 3/30/43 | 2,825 | 2,611 |
| Marsh & McLennan Cos. Inc. | 2.300% | 4/1/17 | 450 | 455 |
| Marsh & McLennan Cos. Inc. | 2.550% | 10/15/18 | 3,225 | 3,222 |
| Marsh & McLennan Cos. Inc. | 9.250% | 4/15/19 | 6,650 | 8,594 |
| Marsh & McLennan Cos. Inc. | 4.800% | 7/15/21 | 1,720 | 1,827 |
| Marsh & McLennan Cos. Inc. | 4.050% | 10/15/23 | 4,400 | 4,316 |
| Marsh & McLennan Cos. Inc. | 5.875% | 8/1/33 | 2,134 | 2,262 |
| MetLife Inc. | 5.000% | 6/15/15 | 5,306 | 5,632 |
| MetLife Inc. | 6.750% | 6/1/16 | 4,755 | 5,398 |
| MetLife Inc. | 1.756% | 12/15/17 | 4,325 | 4,275 |
31
| Vanguard® Total Bond Market Index Fund | ||||
| Schedule of Investments | ||||
| December 31, 2013 | ||||
| Face | Market | |||
| Maturity | Amount | Value | ||
| Coupon | Date | ($000) | ($000) | |
| MetLife Inc. | 6.817% | 8/15/18 | 1,350 | 1,616 |
| MetLife Inc. | 7.717% | 2/15/19 | 3,271 | 4,056 |
| MetLife Inc. | 4.750% | 2/8/21 | 4,240 | 4,576 |
| MetLife Inc. | 3.048% | 12/15/22 | 4,650 | 4,322 |
| MetLife Inc. | 6.500% | 12/15/32 | 2,725 | 3,250 |
| MetLife Inc. | 6.375% | 6/15/34 | 2,375 | 2,799 |
| MetLife Inc. | 5.700% | 6/15/35 | 775 | 843 |
| MetLife Inc. | 5.875% | 2/6/41 | 11,140 | 12,358 |
| MetLife Inc. | 4.125% | 8/13/42 | 8,970 | 7,753 |
| MetLife Inc. | 4.875% | 11/13/43 | 5,625 | 5,454 |
| 3 MetLife Inc. | 6.400% | 12/15/66 | 19,647 | 20,261 |
| 3 MetLife Inc. | 10.750% | 8/1/69 | 760 | 1,124 |
| 6 Metropolitan Life Global Funding I | 5.125% | 6/10/14 | 3,475 | 3,542 |
| Montpelier Re Holdings Ltd. | 4.700% | 10/15/22 | 550 | 539 |
| Munich Re America Corp. | 7.450% | 12/15/26 | 2,350 | 2,899 |
| 3 Nationwide Financial Services Inc. | 6.750% | 5/15/67 | 350 | 344 |
| OneBeacon US Holdings Inc. | 4.600% | 11/9/22 | 1,700 | 1,666 |
| PartnerRe Finance B LLC | 5.500% | 6/1/20 | 12,484 | 13,510 |
| Primerica Inc. | 4.750% | 7/15/22 | 900 | 923 |
| Principal Financial Group Inc. | 1.850% | 11/15/17 | 1,300 | 1,294 |
| Principal Financial Group Inc. | 8.875% | 5/15/19 | 1,238 | 1,583 |
| Principal Financial Group Inc. | 3.300% | 9/15/22 | 2,375 | 2,249 |
| Principal Financial Group Inc. | 3.125% | 5/15/23 | 3,645 | 3,376 |
| Principal Financial Group Inc. | 6.050% | 10/15/36 | 4,400 | 4,963 |
| Principal Financial Group Inc. | 4.625% | 9/15/42 | 2,305 | 2,133 |
| Principal Financial Group Inc. | 4.350% | 5/15/43 | 3,593 | 3,213 |
| ProAssurance Corp. | 5.300% | 11/15/23 | 1,375 | 1,410 |
| Progressive Corp. | 3.750% | 8/23/21 | 7,450 | 7,609 |
| Progressive Corp. | 6.625% | 3/1/29 | 4,600 | 5,417 |
| Progressive Corp. | 6.250% | 12/1/32 | 25 | 29 |
| 3 Progressive Corp. | 6.700% | 6/15/67 | 7,100 | 7,677 |
| Protective Life Corp. | 7.375% | 10/15/19 | 5,005 | 6,030 |
| Protective Life Corp. | 8.450% | 10/15/39 | 5,810 | 7,335 |
| Prudential Financial Inc. | 3.875% | 1/14/15 | 15,470 | 15,981 |
| Prudential Financial Inc. | 6.200% | 1/15/15 | 5,150 | 5,437 |
| Prudential Financial Inc. | 4.750% | 9/17/15 | 4,805 | 5,121 |
| Prudential Financial Inc. | 5.500% | 3/15/16 | 3,773 | 4,120 |
| Prudential Financial Inc. | 6.000% | 12/1/17 | 4,052 | 4,652 |
| Prudential Financial Inc. | 7.375% | 6/15/19 | 70 | 86 |
| Prudential Financial Inc. | 5.375% | 6/21/20 | 2,755 | 3,097 |
| Prudential Financial Inc. | 5.750% | 7/15/33 | 495 | 530 |
| Prudential Financial Inc. | 5.400% | 6/13/35 | 9,035 | 9,274 |
| Prudential Financial Inc. | 5.900% | 3/17/36 | 11,462 | 12,472 |
| Prudential Financial Inc. | 5.700% | 12/14/36 | 11,293 | 12,069 |
| Prudential Financial Inc. | 6.625% | 12/1/37 | 28 | 33 |
| Prudential Financial Inc. | 6.625% | 6/21/40 | 5,325 | 6,405 |
| Prudential Financial Inc. | 5.625% | 5/12/41 | 268 | 286 |
| 3 Prudential Financial Inc. | 5.875% | 9/15/42 | 4,150 | 4,217 |
| 3 Prudential Financial Inc. | 5.625% | 6/15/43 | 17,390 | 17,107 |
| Prudential Financial Inc. | 5.100% | 8/15/43 | 1,700 | 1,694 |
| 3 Prudential Financial Inc. | 5.200% | 3/15/44 | 6,025 | 5,814 |
| 3 Prudential Financial Inc. | 8.875% | 6/15/68 | 750 | 913 |
| Reinsurance Group of America Inc. | 4.700% | 9/15/23 | 5,775 | 5,827 |
| 3 Reinsurance Group of America Inc. | 6.750% | 12/15/65 | 6,950 | 6,889 |
| StanCorp Financial Group Inc. | 5.000% | 8/15/22 | 1,275 | 1,251 |
| Swiss Re Solutions Holding Corp. | 7.000% | 2/15/26 | 1,964 | 2,331 |
| Torchmark Corp. | 6.375% | 6/15/16 | 3,500 | 3,864 |
| Transatlantic Holdings Inc. | 8.000% | 11/30/39 | 9,470 | 11,662 |
| Travelers Cos. Inc. | 5.500% | 12/1/15 | 1,025 | 1,118 |
| Travelers Cos. Inc. | 6.250% | 6/20/16 | 2,625 | 2,950 |
| Travelers Cos. Inc. | 5.750% | 12/15/17 | 3,825 | 4,381 |
| Travelers Cos. Inc. | 5.800% | 5/15/18 | 150 | 173 |
| Travelers Cos. Inc. | 5.900% | 6/2/19 | 11,500 | 13,425 |
| Travelers Cos. Inc. | 3.900% | 11/1/20 | 550 | 578 |
32
| Vanguard® Total Bond Market Index Fund | ||||
| Schedule of Investments | ||||
| December 31, 2013 | ||||
| Face | Market | |||
| Maturity | Amount | Value | ||
| Coupon | Date | ($000) | ($000) | |
| Travelers Cos. Inc. | 6.750% | 6/20/36 | 10 | 13 |
| Travelers Cos. Inc. | 6.250% | 6/15/37 | 5,768 | 6,842 |
| Travelers Cos. Inc. | 5.350% | 11/1/40 | 2,415 | 2,601 |
| Travelers Cos. Inc. | 4.600% | 8/1/43 | 14,700 | 14,342 |
| Travelers Property Casualty Corp. | 6.375% | 3/15/33 | 675 | 810 |
| Trinity Acquisition plc | 4.625% | 8/15/23 | 3,350 | 3,275 |
| Trinity Acquisition plc | 6.125% | 8/15/43 | 3,650 | 3,650 |
| UnitedHealth Group Inc. | 4.875% | 3/15/15 | 19,006 | 19,965 |
| UnitedHealth Group Inc. | 5.375% | 3/15/16 | 200 | 218 |
| UnitedHealth Group Inc. | 6.000% | 6/15/17 | 7,650 | 8,805 |
| UnitedHealth Group Inc. | 6.000% | 2/15/18 | 16,045 | 18,507 |
| UnitedHealth Group Inc. | 1.625% | 3/15/19 | 4,300 | 4,138 |
| UnitedHealth Group Inc. | 3.875% | 10/15/20 | 170 | 178 |
| UnitedHealth Group Inc. | 4.700% | 2/15/21 | 1,950 | 2,111 |
| UnitedHealth Group Inc. | 2.875% | 3/15/22 | 2,650 | 2,518 |
| UnitedHealth Group Inc. | 2.750% | 2/15/23 | 5,045 | 4,593 |
| UnitedHealth Group Inc. | 5.800% | 3/15/36 | 2,593 | 2,842 |
| UnitedHealth Group Inc. | 6.500% | 6/15/37 | 1,350 | 1,602 |
| UnitedHealth Group Inc. | 6.625% | 11/15/37 | 4,025 | 4,851 |
| UnitedHealth Group Inc. | 6.875% | 2/15/38 | 17,563 | 21,679 |
| UnitedHealth Group Inc. | 5.700% | 10/15/40 | 170 | 184 |
| UnitedHealth Group Inc. | 5.950% | 2/15/41 | 2,705 | 3,035 |
| UnitedHealth Group Inc. | 4.625% | 11/15/41 | 4,780 | 4,468 |
| UnitedHealth Group Inc. | 4.375% | 3/15/42 | 270 | 248 |
| UnitedHealth Group Inc. | 3.950% | 10/15/42 | 7,708 | 6,538 |
| UnitedHealth Group Inc. | 4.250% | 3/15/43 | 8,750 | 7,879 |
| Unum Group | 7.125% | 9/30/16 | 3,425 | 3,891 |
| Unum Group | 5.625% | 9/15/20 | 2,200 | 2,404 |
| Unum Group | 5.750% | 8/15/42 | 1,900 | 1,959 |
| Validus Holdings Ltd. | 8.875% | 1/26/40 | 3,800 | 4,845 |
| WellPoint Inc. | 5.000% | 12/15/14 | 3,525 | 3,673 |
| WellPoint Inc. | 1.250% | 9/10/15 | 3,100 | 3,125 |
| WellPoint Inc. | 5.250% | 1/15/16 | 11,186 | 12,093 |
| WellPoint Inc. | 5.875% | 6/15/17 | 425 | 481 |
| WellPoint Inc. | 1.875% | 1/15/18 | 5,400 | 5,328 |
| WellPoint Inc. | 7.000% | 2/15/19 | 860 | 1,019 |
| WellPoint Inc. | 4.350% | 8/15/20 | 2,750 | 2,902 |
| WellPoint Inc. | 3.700% | 8/15/21 | 1,850 | 1,841 |
| WellPoint Inc. | 3.125% | 5/15/22 | 3,150 | 2,949 |
| WellPoint Inc. | 3.300% | 1/15/23 | 9,665 | 9,066 |
| WellPoint Inc. | 5.950% | 12/15/34 | 7,525 | 8,075 |
| WellPoint Inc. | 5.850% | 1/15/36 | 6,685 | 7,183 |
| WellPoint Inc. | 6.375% | 6/15/37 | 5,268 | 5,966 |
| WellPoint Inc. | 4.625% | 5/15/42 | 6,118 | 5,629 |
| WellPoint Inc. | 4.650% | 1/15/43 | 9,218 | 8,496 |
| Willis Group Holdings plc | 5.750% | 3/15/21 | 4,051 | 4,364 |
| Willis North America Inc. | 6.200% | 3/28/17 | 2,495 | 2,744 |
| WR Berkley Corp. | 5.375% | 9/15/20 | 950 | 1,016 |
| XL Group plc | 6.375% | 11/15/24 | 525 | 600 |
| XL Group plc | 6.250% | 5/15/27 | 2,225 | 2,464 |
| XLIT Ltd. | 2.300% | 12/15/18 | 1,050 | 1,034 |
| XLIT Ltd. | 5.750% | 10/1/21 | 4,845 | 5,462 |
| XLIT Ltd. | 5.250% | 12/15/43 | 1,850 | 1,866 |
| Other Finance (0.0%) | ||||
| CME Group Inc. | 5.300% | 9/15/43 | 4,375 | 4,539 |
| IntercontinentalExchange Group Inc. | 2.500% | 10/15/18 | 1,800 | 1,811 |
| IntercontinentalExchange Group Inc. | 4.000% | 10/15/23 | 3,025 | 3,025 |
| Jones Lang LaSalle Inc. | 4.400% | 11/15/22 | 825 | 793 |
| NASDAQ OMX Group Inc. | 4.000% | 1/15/15 | 3,275 | 3,367 |
| NASDAQ OMX Group Inc. | 5.550% | 1/15/20 | 7,700 | 8,278 |
| ORIX Corp. | 4.710% | 4/27/15 | 1,969 | 2,053 |
| ORIX Corp. | 5.000% | 1/12/16 | 4,835 | 5,146 |
| ORIX Corp. | 3.750% | 3/9/17 | 7,900 | 8,209 |
33
| Vanguard® Total Bond Market Index Fund | ||||
| Schedule of Investments | ||||
| December 31, 2013 | ||||
| Face | Market | |||
| Maturity | Amount | Value | ||
| Coupon | Date | ($000) | ($000) | |
| XTRA Finance Corp. | 5.150% | 4/1/17 | 12,925 | 14,291 |
| Real Estate Investment Trusts (0.6%) | ||||
| Alexandria Real Estate Equities Inc. | 4.600% | 4/1/22 | 5,025 | 5,066 |
| Alexandria Real Estate Equities Inc. | 3.900% | 6/15/23 | 450 | 420 |
| Arden Realty LP | 5.250% | 3/1/15 | 925 | 966 |
| AvalonBay Communities Inc. | 5.750% | 9/15/16 | 825 | 922 |
| AvalonBay Communities Inc. | 2.850% | 3/15/23 | 3,770 | 3,388 |
| AvalonBay Communities Inc. | 4.200% | 12/15/23 | 2,555 | 2,530 |
| BioMed Realty LP | 3.850% | 4/15/16 | 5,525 | 5,764 |
| BioMed Realty LP | 4.250% | 7/15/22 | 2,000 | 1,910 |
| Boston Properties LP | 5.625% | 4/15/15 | 5,175 | 5,492 |
| Boston Properties LP | 3.700% | 11/15/18 | 800 | 844 |
| Boston Properties LP | 5.875% | 10/15/19 | 20 | 23 |
| Boston Properties LP | 5.625% | 11/15/20 | 8,925 | 10,008 |
| Boston Properties LP | 4.125% | 5/15/21 | 3,365 | 3,430 |
| Boston Properties LP | 3.850% | 2/1/23 | 13,238 | 12,940 |
| Boston Properties LP | 3.125% | 9/1/23 | 550 | 501 |
| Boston Properties LP | 3.800% | 2/1/24 | 7,525 | 7,202 |
| Brandywine Operating Partnership LP | 5.700% | 5/1/17 | 6,830 | 7,475 |
| Brandywine Operating Partnership LP | 4.950% | 4/15/18 | 3,325 | 3,558 |
| BRE Properties Inc. | 5.500% | 3/15/17 | 25 | 27 |
| BRE Properties Inc. | 3.375% | 1/15/23 | 5,375 | 4,923 |
| Camden Property Trust | 2.950% | 12/15/22 | 4,225 | 3,814 |
| Camden Property Trust | 4.250% | 1/15/24 | 1,000 | 986 |
| CBL & Associates LP | 5.250% | 12/1/23 | 4,750 | 4,735 |
| CommonWealth REIT | 6.250% | 6/15/17 | 5,075 | 5,388 |
| CommonWealth REIT | 5.875% | 9/15/20 | 3,200 | 3,288 |
| Corporate Office Properties LP | 3.600% | 5/15/23 | 2,475 | 2,239 |
| CubeSmart LP | 4.375% | 12/15/23 | 4,400 | 4,294 |
| 6 DCT Industrial Trust Inc. | 4.500% | 10/15/23 | 700 | 682 |
| DDR Corp. | 7.875% | 9/1/20 | 5,000 | 6,131 |
| DDR Corp. | 3.500% | 1/15/21 | 3,225 | 3,131 |
| DDR Corp. | 4.625% | 7/15/22 | 8,425 | 8,576 |
| DDR Corp. | 3.375% | 5/15/23 | 8,625 | 7,853 |
| Digital Realty Trust LP | 4.500% | 7/15/15 | 2,400 | 2,505 |
| Digital Realty Trust LP | 5.875% | 2/1/20 | 2,000 | 2,122 |
| Digital Realty Trust LP | 5.250% | 3/15/21 | 8,395 | 8,571 |
| Duke Realty LP | 7.375% | 2/15/15 | 8,425 | 9,011 |
| Duke Realty LP | 5.950% | 2/15/17 | 5,400 | 5,980 |
| Duke Realty LP | 8.250% | 8/15/19 | 3,600 | 4,426 |
| Duke Realty LP | 6.750% | 3/15/20 | 1,025 | 1,181 |
| Duke Realty LP | 3.625% | 4/15/23 | 3,525 | 3,235 |
| EPR Properties | 5.750% | 8/15/22 | 1,100 | 1,122 |
| EPR Properties | 5.250% | 7/15/23 | 6,300 | 6,148 |
| Equity One Inc. | 3.750% | 11/15/22 | 3,000 | 2,787 |
| ERP Operating LP | 5.250% | 9/15/14 | 1,700 | 1,755 |
| ERP Operating LP | 5.125% | 3/15/16 | 825 | 898 |
| ERP Operating LP | 5.375% | 8/1/16 | 3,125 | 3,450 |
| ERP Operating LP | 5.750% | 6/15/17 | 2,375 | 2,664 |
| ERP Operating LP | 4.750% | 7/15/20 | 2,210 | 2,370 |
| ERP Operating LP | 4.625% | 12/15/21 | 10,935 | 11,518 |
| ERP Operating LP | 3.000% | 4/15/23 | 2,328 | 2,122 |
| Essex Portfolio LP | 3.250% | 5/1/23 | 925 | 835 |
| Federal Realty Investment Trust | 3.000% | 8/1/22 | 3,050 | 2,835 |
| Federal Realty Investment Trust | 2.750% | 6/1/23 | 1,375 | 1,227 |
| HCP Inc. | 3.750% | 2/1/16 | 24,725 | 25,919 |
| HCP Inc. | 6.300% | 9/15/16 | 9,415 | 10,588 |
| HCP Inc. | 6.000% | 1/30/17 | 3,220 | 3,598 |
| HCP Inc. | 5.625% | 5/1/17 | 100 | 111 |
| HCP Inc. | 6.700% | 1/30/18 | 1,200 | 1,391 |
| HCP Inc. | 3.750% | 2/1/19 | 4,525 | 4,683 |
| HCP Inc. | 2.625% | 2/1/20 | 675 | 643 |
| HCP Inc. | 5.375% | 2/1/21 | 300 | 326 |
34
| Vanguard® Total Bond Market Index Fund | ||||
| Schedule of Investments | ||||
| December 31, 2013 | ||||
| Face | Market | |||
| Maturity | Amount | Value | ||
| Coupon | Date | ($000) | ($000) | |
| HCP Inc. | 3.150% | 8/1/22 | 700 | 638 |
| HCP Inc. | 6.750% | 2/1/41 | 500 | 593 |
| Health Care REIT Inc. | 3.625% | 3/15/16 | 2,150 | 2,251 |
| Health Care REIT Inc. | 6.200% | 6/1/16 | 9,300 | 10,324 |
| Health Care REIT Inc. | 4.700% | 9/15/17 | 3,675 | 4,000 |
| Health Care REIT Inc. | 2.250% | 3/15/18 | 4,550 | 4,501 |
| Health Care REIT Inc. | 4.125% | 4/1/19 | 4,055 | 4,274 |
| Health Care REIT Inc. | 4.950% | 1/15/21 | 8,335 | 8,769 |
| Health Care REIT Inc. | 5.250% | 1/15/22 | 6,675 | 7,083 |
| Health Care REIT Inc. | 3.750% | 3/15/23 | 3,275 | 3,085 |
| Health Care REIT Inc. | 6.500% | 3/15/41 | 3,400 | 3,707 |
| Health Care REIT Inc. | 5.125% | 3/15/43 | 3,125 | 2,865 |
| Healthcare Realty Trust Inc. | 6.500% | 1/17/17 | 2,800 | 3,118 |
| Healthcare Realty Trust Inc. | 5.750% | 1/15/21 | 2,550 | 2,758 |
| Healthcare Realty Trust Inc. | 3.750% | 4/15/23 | 75 | 69 |
| Healthcare Trust of America Holdings LP | 3.700% | 4/15/23 | 1,425 | 1,309 |
| Hospitality Properties Trust | 5.125% | 2/15/15 | 5,170 | 5,305 |
| Hospitality Properties Trust | 6.700% | 1/15/18 | 10,375 | 11,536 |
| Hospitality Properties Trust | 4.500% | 6/15/23 | 750 | 723 |
| Kilroy Realty LP | 5.000% | 11/3/15 | 3,950 | 4,222 |
| Kilroy Realty LP | 4.800% | 7/15/18 | 11,225 | 12,062 |
| Kilroy Realty LP | 3.800% | 1/15/23 | 3,025 | 2,810 |
| Kimco Realty Corp. | 5.783% | 3/15/16 | 1,075 | 1,174 |
| Kimco Realty Corp. | 5.700% | 5/1/17 | 5,625 | 6,249 |
| Kimco Realty Corp. | 4.300% | 2/1/18 | 1,580 | 1,678 |
| Kimco Realty Corp. | 6.875% | 10/1/19 | 6,150 | 7,324 |
| Kimco Realty Corp. | 3.125% | 6/1/23 | 900 | 810 |
| Liberty Property LP | 5.125% | 3/2/15 | 8,400 | 8,768 |
| Liberty Property LP | 5.500% | 12/15/16 | 1,875 | 2,069 |
| Liberty Property LP | 6.625% | 10/1/17 | 2,750 | 3,136 |
| Liberty Property LP | 4.750% | 10/1/20 | 225 | 236 |
| Liberty Property LP | 3.375% | 6/15/23 | 1,250 | 1,134 |
| Liberty Property LP | 4.400% | 2/15/24 | 1,300 | 1,275 |
| Mack-Cali Realty LP | 2.500% | 12/15/17 | 650 | 647 |
| Mack-Cali Realty LP | 7.750% | 8/15/19 | 6,525 | 7,785 |
| Mack-Cali Realty LP | 4.500% | 4/18/22 | 3,000 | 2,941 |
| Mid-America Apartments LP | 4.300% | 10/15/23 | 1,300 | 1,265 |
| National Retail Properties Inc. | 6.875% | 10/15/17 | 10,350 | 11,941 |
| National Retail Properties Inc. | 5.500% | 7/15/21 | 2,500 | 2,718 |
| National Retail Properties Inc. | 3.300% | 4/15/23 | 5,000 | 4,549 |
| Omega Healthcare Investors Inc. | 6.750% | 10/15/22 | 2,309 | 2,508 |
| Omega Healthcare Investors Inc. | 5.875% | 3/15/24 | 1,524 | 1,539 |
| Piedmont Operating Partnership LP | 3.400% | 6/1/23 | 1,825 | 1,632 |
| Post Apartment Homes LP | 3.375% | 12/1/22 | 1,825 | 1,672 |
| ProLogis LP | 4.500% | 8/15/17 | 2,600 | 2,806 |
| ProLogis LP | 6.625% | 5/15/18 | 18 | 21 |
| ProLogis LP | 2.750% | 2/15/19 | 2,400 | 2,384 |
| ProLogis LP | 6.875% | 3/15/20 | 7,225 | 8,505 |
| ProLogis LP | 4.250% | 8/15/23 | 4,245 | 4,192 |
| Realty Income Corp. | 5.950% | 9/15/16 | 150 | 166 |
| Realty Income Corp. | 2.000% | 1/31/18 | 875 | 857 |
| Realty Income Corp. | 6.750% | 8/15/19 | 8,210 | 9,574 |
| Realty Income Corp. | 5.750% | 1/15/21 | 5,175 | 5,705 |
| Realty Income Corp. | 5.875% | 3/15/35 | 6,660 | 6,798 |
| Regency Centers LP | 5.250% | 8/1/15 | 2,925 | 3,103 |
| Retail Opportunity Investments Corp. | 5.000% | 12/15/23 | 1,675 | 1,670 |
| Senior Housing Properties Trust | 4.300% | 1/15/16 | 1,650 | 1,712 |
| Simon Property Group LP | 4.200% | 2/1/15 | 4,225 | 4,349 |
| Simon Property Group LP | 5.100% | 6/15/15 | 2,296 | 2,443 |
| Simon Property Group LP | 5.750% | 12/1/15 | 15,350 | 16,621 |
| Simon Property Group LP | 6.100% | 5/1/16 | 1,850 | 2,043 |
| Simon Property Group LP | 5.250% | 12/1/16 | 17,641 | 19,537 |
| Simon Property Group LP | 2.800% | 1/30/17 | 2,685 | 2,754 |
| Simon Property Group LP | 5.875% | 3/1/17 | 3,250 | 3,630 |
35
| Vanguard® Total Bond Market Index Fund | ||||
| Schedule of Investments | ||||
| December 31, 2013 | ||||
| Face | Market | |||
| Maturity | Amount | Value | ||
| Coupon | Date | ($000) | ($000) | |
| Simon Property Group LP | 2.150% | 9/15/17 | 5,725 | 5,810 |
| Simon Property Group LP | 6.125% | 5/30/18 | 5,250 | 6,080 |
| Simon Property Group LP | 5.650% | 2/1/20 | 6,950 | 7,886 |
| Simon Property Group LP | 4.375% | 3/1/21 | 3,900 | 4,112 |
| Simon Property Group LP | 4.125% | 12/1/21 | 2,313 | 2,397 |
| Simon Property Group LP | 3.375% | 3/15/22 | 2,725 | 2,657 |
| Simon Property Group LP | 2.750% | 2/1/23 | 2,150 | 1,963 |
| Simon Property Group LP | 6.750% | 2/1/40 | 7,643 | 9,535 |
| Simon Property Group LP | 4.750% | 3/15/42 | 1,900 | 1,839 |
| Tanger Properties LP | 6.150% | 11/15/15 | 3,525 | 3,839 |
| Tanger Properties LP | 3.875% | 12/1/23 | 2,400 | 2,305 |
| UDR Inc. | 4.250% | 6/1/18 | 1,200 | 1,264 |
| UDR Inc. | 3.700% | 10/1/20 | 875 | 875 |
| UDR Inc. | 4.625% | 1/10/22 | 7,145 | 7,320 |
| Ventas Realty LP | 1.550% | 9/26/16 | 1,400 | 1,408 |
| Ventas Realty LP | 5.700% | 9/30/43 | 4,475 | 4,556 |
| Ventas Realty LP / Ventas Capital Corp. | 3.125% | 11/30/15 | 10,400 | 10,815 |
| Ventas Realty LP / Ventas Capital Corp. | 2.000% | 2/15/18 | 4,125 | 4,055 |
| Ventas Realty LP / Ventas Capital Corp. | 2.700% | 4/1/20 | 2,450 | 2,341 |
| Ventas Realty LP / Ventas Capital Corp. | 4.750% | 6/1/21 | 4,900 | 5,133 |
| Ventas Realty LP / Ventas Capital Corp. | 4.250% | 3/1/22 | 495 | 496 |
| Ventas Realty LP / Ventas Capital Corp. | 3.250% | 8/15/22 | 5,000 | 4,615 |
| Washington REIT | 4.950% | 10/1/20 | 475 | 497 |
| Washington REIT | 3.950% | 10/15/22 | 2,650 | 2,527 |
| Weingarten Realty Investors | 3.375% | 10/15/22 | 1,275 | 1,166 |
| Weingarten Realty Investors | 3.500% | 4/15/23 | 3,925 | 3,582 |
| Weingarten Realty Investors | 4.450% | 1/15/24 | 450 | 443 |
| 8,625,318 | ||||
| Industrial (13.4%) | ||||
| Basic Industry (1.3%) | ||||
| Agrium Inc. | 6.750% | 1/15/19 | 7,100 | 8,275 |
| Agrium Inc. | 3.150% | 10/1/22 | 1,200 | 1,103 |
| Agrium Inc. | 6.125% | 1/15/41 | 6,550 | 6,984 |
| Air Products & Chemicals Inc. | 2.000% | 8/2/16 | 5,325 | 5,444 |
| Air Products & Chemicals Inc. | 3.000% | 11/3/21 | 2,125 | 2,036 |
| Air Products & Chemicals Inc. | 2.750% | 2/3/23 | 7,125 | 6,550 |
| Airgas Inc. | 3.250% | 10/1/15 | 5,400 | 5,596 |
| Albemarle Corp. | 4.500% | 12/15/20 | 500 | 514 |
| Alcoa Inc. | 5.550% | 2/1/17 | 13 | 14 |
| Alcoa Inc. | 5.720% | 2/23/19 | 8,573 | 9,184 |
| Alcoa Inc. | 6.150% | 8/15/20 | 3,518 | 3,788 |
| Alcoa Inc. | 5.400% | 4/15/21 | 300 | 308 |
| Alcoa Inc. | 5.870% | 2/23/22 | 2,337 | 2,411 |
| Alcoa Inc. | 5.900% | 2/1/27 | 1,087 | 1,069 |
| Alcoa Inc. | 6.750% | 1/15/28 | 18,666 | 19,476 |
| Alcoa Inc. | 5.950% | 2/1/37 | 6,288 | 5,783 |
| Allegheny Technologies Inc. | 9.375% | 6/1/19 | 5,304 | 6,477 |
| Barrick Gold Corp. | 6.950% | 4/1/19 | 994 | 1,148 |
| Barrick Gold Corp. | 3.850% | 4/1/22 | 2,075 | 1,865 |
| Barrick Gold Corp. | 4.100% | 5/1/23 | 16,100 | 14,505 |
| Barrick Gold Corp. | 5.250% | 4/1/42 | 425 | 348 |
| Barrick North America Finance LLC | 6.800% | 9/15/18 | 4,325 | 4,980 |
| Barrick North America Finance LLC | 4.400% | 5/30/21 | 10,300 | 9,909 |
| Barrick North America Finance LLC | 7.500% | 9/15/38 | 5,150 | 5,164 |
| Barrick North America Finance LLC | 5.700% | 5/30/41 | 6,893 | 5,893 |
| Barrick North America Finance LLC | 5.750% | 5/1/43 | 9,975 | 8,971 |
| Barrick PD Australia Finance Pty Ltd. | 5.950% | 10/15/39 | 2,693 | 2,322 |
| BHP Billiton Finance USA Ltd. | 1.000% | 2/24/15 | 16,475 | 16,576 |
| BHP Billiton Finance USA Ltd. | 5.250% | 12/15/15 | 11,721 | 12,746 |
| BHP Billiton Finance USA Ltd. | 1.625% | 2/24/17 | 11,450 | 11,467 |
| BHP Billiton Finance USA Ltd. | 5.400% | 3/29/17 | 50 | 56 |
| BHP Billiton Finance USA Ltd. | 2.050% | 9/30/18 | 1,000 | 997 |
| BHP Billiton Finance USA Ltd. | 6.500% | 4/1/19 | 17,860 | 21,242 |
36
| Vanguard® Total Bond Market Index Fund | ||||
| Schedule of Investments | ||||
| December 31, 2013 | ||||
| Face | Market | |||
| Maturity | Amount | Value | ||
| Coupon | Date | ($000) | ($000) | |
| BHP Billiton Finance USA Ltd. | 3.250% | 11/21/21 | 4,001 | 3,979 |
| BHP Billiton Finance USA Ltd. | 2.875% | 2/24/22 | 9,100 | 8,681 |
| BHP Billiton Finance USA Ltd. | 3.850% | 9/30/23 | 10,775 | 10,792 |
| BHP Billiton Finance USA Ltd. | 4.125% | 2/24/42 | 11,163 | 9,828 |
| BHP Billiton Finance USA Ltd. | 5.000% | 9/30/43 | 17,950 | 18,133 |
| Cabot Corp. | 2.550% | 1/15/18 | 475 | 474 |
| Cabot Corp. | 3.700% | 7/15/22 | 625 | 593 |
| Carpenter Technology Corp. | 5.200% | 7/15/21 | 11,175 | 11,398 |
| Celulosa Arauco y Constitucion SA | 5.625% | 4/20/15 | 3,675 | 3,872 |
| Celulosa Arauco y Constitucion SA | 7.250% | 7/29/19 | 1,225 | 1,407 |
| Celulosa Arauco y Constitucion SA | 5.000% | 1/21/21 | 5,300 | 5,361 |
| Celulosa Arauco y Constitucion SA | 4.750% | 1/11/22 | 2,625 | 2,540 |
| CF Industries Inc. | 6.875% | 5/1/18 | 16,918 | 19,646 |
| CF Industries Inc. | 7.125% | 5/1/20 | 7,275 | 8,566 |
| CF Industries Inc. | 3.450% | 6/1/23 | 600 | 549 |
| CF Industries Inc. | 4.950% | 6/1/43 | 3,605 | 3,257 |
| Cliffs Natural Resources Inc. | 3.950% | 1/15/18 | 1,000 | 1,007 |
| Cliffs Natural Resources Inc. | 5.900% | 3/15/20 | 1,275 | 1,347 |
| Cliffs Natural Resources Inc. | 4.800% | 10/1/20 | 2,000 | 1,970 |
| Cliffs Natural Resources Inc. | 4.875% | 4/1/21 | 12,100 | 11,744 |
| Cliffs Natural Resources Inc. | 6.250% | 10/1/40 | 6,128 | 5,190 |
| Domtar Corp. | 6.250% | 9/1/42 | 850 | 814 |
| Domtar Corp. | 6.750% | 2/15/44 | 5,000 | 5,084 |
| Dow Chemical Co. | 2.500% | 2/15/16 | 825 | 851 |
| Dow Chemical Co. | 5.700% | 5/15/18 | 500 | 571 |
| Dow Chemical Co. | 8.550% | 5/15/19 | 15,525 | 20,102 |
| Dow Chemical Co. | 4.250% | 11/15/20 | 7,809 | 8,300 |
| Dow Chemical Co. | 4.125% | 11/15/21 | 6,150 | 6,344 |
| Dow Chemical Co. | 3.000% | 11/15/22 | 5,815 | 5,414 |
| Dow Chemical Co. | 7.375% | 11/1/29 | 1,888 | 2,421 |
| Dow Chemical Co. | 9.400% | 5/15/39 | 12,297 | 18,349 |
| Dow Chemical Co. | 5.250% | 11/15/41 | 10,393 | 10,417 |
| Dow Chemical Co. | 4.375% | 11/15/42 | 4,075 | 3,573 |
| Eastman Chemical Co. | 3.000% | 12/15/15 | 675 | 700 |
| Eastman Chemical Co. | 2.400% | 6/1/17 | 5,324 | 5,391 |
| Eastman Chemical Co. | 5.500% | 11/15/19 | 4,675 | 5,185 |
| Eastman Chemical Co. | 4.500% | 1/15/21 | 775 | 798 |
| Eastman Chemical Co. | 3.600% | 8/15/22 | 18,255 | 17,495 |
| Eastman Chemical Co. | 4.800% | 9/1/42 | 5,493 | 5,172 |
| Ecolab Inc. | 1.000% | 8/9/15 | 1,700 | 1,706 |
| Ecolab Inc. | 3.000% | 12/8/16 | 14,825 | 15,552 |
| Ecolab Inc. | 1.450% | 12/8/17 | 4,807 | 4,710 |
| Ecolab Inc. | 4.350% | 12/8/21 | 7,120 | 7,381 |
| Ecolab Inc. | 5.500% | 12/8/41 | 9,905 | 10,608 |
| EI du Pont de Nemours & Co. | 3.250% | 1/15/15 | 62 | 64 |
| EI du Pont de Nemours & Co. | 1.950% | 1/15/16 | 2,800 | 2,865 |
| EI du Pont de Nemours & Co. | 2.750% | 4/1/16 | 5,200 | 5,423 |
| EI du Pont de Nemours & Co. | 5.250% | 12/15/16 | 7,601 | 8,539 |
| EI du Pont de Nemours & Co. | 6.000% | 7/15/18 | 9,455 | 10,987 |
| EI du Pont de Nemours & Co. | 4.625% | 1/15/20 | 5,002 | 5,444 |
| EI du Pont de Nemours & Co. | 3.625% | 1/15/21 | 15,210 | 15,498 |
| EI du Pont de Nemours & Co. | 4.250% | 4/1/21 | 2,950 | 3,115 |
| EI du Pont de Nemours & Co. | 2.800% | 2/15/23 | 9,525 | 8,742 |
| EI du Pont de Nemours & Co. | 6.500% | 1/15/28 | 1,700 | 2,057 |
| EI du Pont de Nemours & Co. | 4.900% | 1/15/41 | 11,278 | 11,072 |
| EI du Pont de Nemours & Co. | 4.150% | 2/15/43 | 5,400 | 4,765 |
| FMC Corp. | 3.950% | 2/1/22 | 2,600 | 2,584 |
| Freeport-McMoRan Copper & Gold Inc. | 1.400% | 2/13/15 | 1,675 | 1,685 |
| Freeport-McMoRan Copper & Gold Inc. | 2.150% | 3/1/17 | 1,300 | 1,313 |
| Freeport-McMoRan Copper & Gold Inc. | 2.375% | 3/15/18 | 28,955 | 28,911 |
| Freeport-McMoRan Copper & Gold Inc. | 3.100% | 3/15/20 | 18,660 | 18,272 |
| Freeport-McMoRan Copper & Gold Inc. | 3.550% | 3/1/22 | 10,025 | 9,505 |
| Freeport-McMoRan Copper & Gold Inc. | 3.875% | 3/15/23 | 22,030 | 20,763 |
| Freeport-McMoRan Copper & Gold Inc. | 5.450% | 3/15/43 | 15,460 | 14,735 |
37
| Vanguard® Total Bond Market Index Fund | ||||
| Schedule of Investments | ||||
| December 31, 2013 | ||||
| Face | Market | |||
| Maturity | Amount | Value | ||
| Coupon | Date | ($000) | ($000) | |
| Georgia-Pacific LLC | 8.000% | 1/15/24 | 18 | 23 |
| Georgia-Pacific LLC | 7.750% | 11/15/29 | 18 | 23 |
| Georgia-Pacific LLC | 8.875% | 5/15/31 | 2,425 | 3,362 |
| Glencore Canada Corp. | 5.375% | 6/1/15 | 350 | 367 |
| Glencore Canada Corp. | 6.000% | 10/15/15 | 1,125 | 1,218 |
| Glencore Canada Corp. | 5.500% | 6/15/17 | 4,675 | 5,078 |
| Goldcorp Inc. | 2.125% | 3/15/18 | 16,060 | 15,657 |
| Goldcorp Inc. | 3.700% | 3/15/23 | 9,600 | 8,571 |
| International Paper Co. | 5.300% | 4/1/15 | 4,600 | 4,854 |
| International Paper Co. | 7.950% | 6/15/18 | 5,895 | 7,203 |
| International Paper Co. | 9.375% | 5/15/19 | 22,188 | 29,098 |
| International Paper Co. | 7.500% | 8/15/21 | 20,845 | 25,558 |
| International Paper Co. | 8.700% | 6/15/38 | 1,200 | 1,657 |
| International Paper Co. | 7.300% | 11/15/39 | 643 | 792 |
| Kinross Gold Corp. | 5.125% | 9/1/21 | 3,100 | 2,959 |
| Kinross Gold Corp. | 6.875% | 9/1/41 | 2,150 | 1,916 |
| Lubrizol Corp. | 8.875% | 2/1/19 | 850 | 1,109 |
| Lubrizol Corp. | 6.500% | 10/1/34 | 5,285 | 6,406 |
| LyondellBasell Industries NV | 5.000% | 4/15/19 | 15,675 | 17,321 |
| LyondellBasell Industries NV | 6.000% | 11/15/21 | 16,800 | 19,278 |
| LyondellBasell Industries NV | 5.750% | 4/15/24 | 7,450 | 8,319 |
| Monsanto Co. | 2.750% | 4/15/16 | 1,750 | 1,827 |
| Monsanto Co. | 5.125% | 4/15/18 | 3,100 | 3,485 |
| Monsanto Co. | 2.200% | 7/15/22 | 3,725 | 3,371 |
| Monsanto Co. | 5.500% | 8/15/25 | 23 | 26 |
| Monsanto Co. | 5.875% | 4/15/38 | 1,750 | 2,011 |
| Monsanto Co. | 3.600% | 7/15/42 | 3,725 | 3,047 |
| Mosaic Co. | 3.750% | 11/15/21 | 1,750 | 1,717 |
| Mosaic Co. | 4.250% | 11/15/23 | 5,500 | 5,443 |
| Mosaic Co. | 5.450% | 11/15/33 | 2,600 | 2,649 |
| Mosaic Co. | 4.875% | 11/15/41 | 1,250 | 1,127 |
| Mosaic Co. | 5.625% | 11/15/43 | 3,150 | 3,178 |
| Newmont Mining Corp. | 5.125% | 10/1/19 | 1,470 | 1,517 |
| Newmont Mining Corp. | 3.500% | 3/15/22 | 7,760 | 6,595 |
| Newmont Mining Corp. | 5.875% | 4/1/35 | 2,605 | 2,201 |
| Newmont Mining Corp. | 6.250% | 10/1/39 | 18,752 | 16,529 |
| Newmont Mining Corp. | 4.875% | 3/15/42 | 1,418 | 1,047 |
| Nucor Corp. | 5.750% | 12/1/17 | 1,100 | 1,252 |
| Nucor Corp. | 5.850% | 6/1/18 | 6,855 | 7,777 |
| Nucor Corp. | 4.125% | 9/15/22 | 325 | 325 |
| Nucor Corp. | 4.000% | 8/1/23 | 10,745 | 10,478 |
| Nucor Corp. | 6.400% | 12/1/37 | 4,845 | 5,377 |
| Nucor Corp. | 5.200% | 8/1/43 | 7,850 | 7,648 |
| Packaging Corp. of America | 3.900% | 6/15/22 | 4,500 | 4,364 |
| Packaging Corp. of America | 4.500% | 11/1/23 | 4,925 | 4,928 |
| Placer Dome Inc. | 6.450% | 10/15/35 | 2,175 | 2,014 |
| Plum Creek Timberlands LP | 5.875% | 11/15/15 | 3,050 | 3,308 |
| Plum Creek Timberlands LP | 4.700% | 3/15/21 | 5,155 | 5,320 |
| Potash Corp. of Saskatchewan Inc. | 3.750% | 9/30/15 | 5,350 | 5,611 |
| Potash Corp. of Saskatchewan Inc. | 3.250% | 12/1/17 | 4,345 | 4,536 |
| Potash Corp. of Saskatchewan Inc. | 6.500% | 5/15/19 | 170 | 201 |
| Potash Corp. of Saskatchewan Inc. | 4.875% | 3/30/20 | 6,485 | 6,980 |
| Potash Corp. of Saskatchewan Inc. | 5.875% | 12/1/36 | 1,275 | 1,367 |
| Potash Corp. of Saskatchewan Inc. | 5.625% | 12/1/40 | 3,768 | 3,979 |
| PPG Industries Inc. | 1.900% | 1/15/16 | 6,825 | 6,933 |
| PPG Industries Inc. | 6.650% | 3/15/18 | 1,770 | 2,062 |
| PPG Industries Inc. | 3.600% | 11/15/20 | 1,650 | 1,674 |
| PPG Industries Inc. | 7.700% | 3/15/38 | 4,825 | 6,255 |
| PPG Industries Inc. | 5.500% | 11/15/40 | 875 | 912 |
| Praxair Inc. | 4.625% | 3/30/15 | 325 | 342 |
| Praxair Inc. | 3.250% | 9/15/15 | 800 | 837 |
| Praxair Inc. | 5.200% | 3/15/17 | 1,100 | 1,221 |
| Praxair Inc. | 4.500% | 8/15/19 | 2,640 | 2,917 |
| Praxair Inc. | 3.000% | 9/1/21 | 3,550 | 3,478 |
38
| Vanguard® Total Bond Market Index Fund | ||||
| Schedule of Investments | ||||
| December 31, 2013 | ||||
| Face | Market | |||
| Maturity | Amount | Value | ||
| Coupon | Date | ($000) | ($000) | |
| Praxair Inc. | 2.450% | 2/15/22 | 19,000 | 17,551 |
| Praxair Inc. | 2.200% | 8/15/22 | 4,000 | 3,564 |
| Praxair Inc. | 3.550% | 11/7/42 | 1,000 | 807 |
| Rayonier Inc. | 3.750% | 4/1/22 | 1,750 | 1,645 |
| Reliance Steel & Aluminum Co. | 6.200% | 11/15/16 | 250 | 272 |
| Reliance Steel & Aluminum Co. | 4.500% | 4/15/23 | 1,425 | 1,390 |
| Reliance Steel & Aluminum Co. | 6.850% | 11/15/36 | 1,750 | 1,739 |
| Rio Tinto Alcan Inc. | 5.000% | 6/1/15 | 1,775 | 1,874 |
| Rio Tinto Alcan Inc. | 6.125% | 12/15/33 | 14,094 | 15,674 |
| Rio Tinto Alcan Inc. | 5.750% | 6/1/35 | 10,454 | 10,882 |
| Rio Tinto Finance USA Ltd. | 1.875% | 11/2/15 | 12,475 | 12,679 |
| Rio Tinto Finance USA Ltd. | 2.500% | 5/20/16 | 1,200 | 1,235 |
| Rio Tinto Finance USA Ltd. | 2.250% | 9/20/16 | 2,000 | 2,062 |
| Rio Tinto Finance USA Ltd. | 6.500% | 7/15/18 | 9,210 | 10,834 |
| Rio Tinto Finance USA Ltd. | 9.000% | 5/1/19 | 9,521 | 12,465 |
| Rio Tinto Finance USA Ltd. | 3.500% | 11/2/20 | 9,708 | 9,808 |
| Rio Tinto Finance USA Ltd. | 4.125% | 5/20/21 | 2,425 | 2,510 |
| Rio Tinto Finance USA Ltd. | 3.750% | 9/20/21 | 4,075 | 4,067 |
| Rio Tinto Finance USA Ltd. | 7.125% | 7/15/28 | 6,609 | 8,140 |
| Rio Tinto Finance USA Ltd. | 5.200% | 11/2/40 | 11,460 | 11,755 |
| Rio Tinto Finance USA plc | 1.375% | 6/17/16 | 7,156 | 7,202 |
| Rio Tinto Finance USA plc | 2.000% | 3/22/17 | 7,400 | 7,424 |
| Rio Tinto Finance USA plc | 1.625% | 8/21/17 | 6,250 | 6,241 |
| Rio Tinto Finance USA plc | 2.250% | 12/14/18 | 6,775 | 6,734 |
| Rio Tinto Finance USA plc | 3.500% | 3/22/22 | 4,425 | 4,329 |
| Rio Tinto Finance USA plc | 2.875% | 8/21/22 | 8,220 | 7,619 |
| Rio Tinto Finance USA plc | 4.750% | 3/22/42 | 5,268 | 5,090 |
| Rio Tinto Finance USA plc | 4.125% | 8/21/42 | 5,024 | 4,376 |
| Rohm & Haas Co. | 6.000% | 9/15/17 | 2,791 | 3,169 |
| Rohm & Haas Co. | 7.850% | 7/15/29 | 2,650 | 3,502 |
| RPM International Inc. | 6.125% | 10/15/19 | 2,225 | 2,491 |
| RPM International Inc. | 3.450% | 11/15/22 | 4,550 | 4,163 |
| Sherwin-Williams Co. | 3.125% | 12/15/14 | 3,225 | 3,304 |
| Sherwin-Williams Co. | 4.000% | 12/15/42 | 2,000 | 1,705 |
| Sigma-Aldrich Corp. | 3.375% | 11/1/20 | 1,735 | 1,719 |
| Southern Copper Corp. | 5.375% | 4/16/20 | 1,800 | 1,922 |
| Southern Copper Corp. | 7.500% | 7/27/35 | 16,450 | 17,039 |
| Southern Copper Corp. | 6.750% | 4/16/40 | 2,000 | 1,924 |
| Southern Copper Corp. | 5.250% | 11/8/42 | 7,545 | 6,096 |
| Syngenta Finance NV | 3.125% | 3/28/22 | 4,100 | 3,920 |
| Syngenta Finance NV | 4.375% | 3/28/42 | 2,675 | 2,471 |
| Teck Resources Ltd. | 3.150% | 1/15/17 | 1,550 | 1,602 |
| Teck Resources Ltd. | 3.850% | 8/15/17 | 4,100 | 4,312 |
| Teck Resources Ltd. | 2.500% | 2/1/18 | 11,125 | 11,231 |
| Teck Resources Ltd. | 4.500% | 1/15/21 | 4,250 | 4,268 |
| Teck Resources Ltd. | 4.750% | 1/15/22 | 2,725 | 2,720 |
| Teck Resources Ltd. | 3.750% | 2/1/23 | 4,168 | 3,867 |
| Teck Resources Ltd. | 6.125% | 10/1/35 | 6,762 | 6,526 |
| Teck Resources Ltd. | 6.000% | 8/15/40 | 7,455 | 7,127 |
| Teck Resources Ltd. | 6.250% | 7/15/41 | 4,618 | 4,574 |
| Teck Resources Ltd. | 5.200% | 3/1/42 | 8,975 | 7,868 |
| Teck Resources Ltd. | 5.400% | 2/1/43 | 693 | 632 |
| Vale Canada Ltd. | 5.700% | 10/15/15 | 3,575 | 3,829 |
| Vale Canada Ltd. | 7.200% | 9/15/32 | 1,175 | 1,190 |
| Vale Overseas Ltd. | 6.250% | 1/11/16 | 1,050 | 1,143 |
| Vale Overseas Ltd. | 6.250% | 1/23/17 | 6,270 | 6,961 |
| Vale Overseas Ltd. | 5.625% | 9/15/19 | 29,700 | 32,196 |
| Vale Overseas Ltd. | 4.625% | 9/15/20 | 7,750 | 7,931 |
| Vale Overseas Ltd. | 4.375% | 1/11/22 | 13,250 | 12,828 |
| Vale Overseas Ltd. | 8.250% | 1/17/34 | 2,500 | 2,866 |
| Vale Overseas Ltd. | 6.875% | 11/21/36 | 23,499 | 24,084 |
| Vale Overseas Ltd. | 6.875% | 11/10/39 | 18,815 | 19,307 |
| Vale SA | 5.625% | 9/11/42 | 315 | 282 |
| Valspar Corp. | 7.250% | 6/15/19 | 675 | 799 |
39
| Vanguard® Total Bond Market Index Fund | ||||
| Schedule of Investments | ||||
| December 31, 2013 | ||||
| Face | Market | |||
| Maturity | Amount | Value | ||
| Coupon | Date | ($000) | ($000) | |
| Valspar Corp. | 4.200% | 1/15/22 | 975 | 966 |
| Westlake Chemical Corp. | 3.600% | 7/15/22 | 775 | 734 |
| Westvaco Corp. | 8.200% | 1/15/30 | 18 | 21 |
| Westvaco Corp. | 7.950% | 2/15/31 | 5,103 | 5,904 |
| Weyerhaeuser Co. | 7.375% | 10/1/19 | 7,991 | 9,772 |
| Weyerhaeuser Co. | 8.500% | 1/15/25 | 2,250 | 2,878 |
| Weyerhaeuser Co. | 7.375% | 3/15/32 | 6,225 | 7,634 |
| Weyerhaeuser Co. | 6.875% | 12/15/33 | 2,500 | 2,945 |
| Capital Goods (1.2%) | ||||
| 3M Co. | 6.375% | 2/15/28 | 3,650 | 4,440 |
| 3M Co. | 5.700% | 3/15/37 | 6,023 | 6,920 |
| ABB Finance USA Inc. | 1.625% | 5/8/17 | 2,500 | 2,494 |
| ABB Finance USA Inc. | 2.875% | 5/8/22 | 4,965 | 4,680 |
| ABB Finance USA Inc. | 4.375% | 5/8/42 | 1,678 | 1,531 |
| Acuity Brands Lighting Inc. | 6.000% | 12/15/19 | 2,050 | 2,222 |
| Avery Dennison Corp. | 3.350% | 4/15/23 | 6,650 | 6,056 |
| Black & Decker Corp. | 5.750% | 11/15/16 | 2,325 | 2,616 |
| Boeing Capital Corp. | 2.900% | 8/15/18 | 150 | 156 |
| Boeing Co. | 3.500% | 2/15/15 | 26,450 | 27,312 |
| Boeing Co. | 3.750% | 11/20/16 | 20 | 22 |
| Boeing Co. | 0.950% | 5/15/18 | 475 | 456 |
| Boeing Co. | 6.000% | 3/15/19 | 25 | 30 |
| Boeing Co. | 4.875% | 2/15/20 | 7,775 | 8,661 |
| Boeing Co. | 8.750% | 8/15/21 | 1,600 | 2,142 |
| Boeing Co. | 7.950% | 8/15/24 | 1,148 | 1,537 |
| Boeing Co. | 7.250% | 6/15/25 | 675 | 848 |
| Boeing Co. | 8.750% | 9/15/31 | 850 | 1,199 |
| Boeing Co. | 6.125% | 2/15/33 | 500 | 595 |
| Boeing Co. | 6.625% | 2/15/38 | 2,305 | 2,935 |
| Boeing Co. | 6.875% | 3/15/39 | 1,003 | 1,322 |
| Boeing Co. | 5.875% | 2/15/40 | 4,950 | 5,858 |
| Carlisle Cos. Inc. | 3.750% | 11/15/22 | 3,077 | 2,882 |
| Caterpillar Financial Services Corp. | 1.125% | 12/15/14 | 6,475 | 6,525 |
| Caterpillar Financial Services Corp. | 4.750% | 2/17/15 | 4,560 | 4,776 |
| Caterpillar Financial Services Corp. | 4.625% | 6/1/15 | 2,625 | 2,775 |
| Caterpillar Financial Services Corp. | 2.050% | 8/1/16 | 30,175 | 30,988 |
| Caterpillar Financial Services Corp. | 1.000% | 11/25/16 | 3,000 | 2,987 |
| Caterpillar Financial Services Corp. | 5.450% | 4/15/18 | 114 | 129 |
| Caterpillar Financial Services Corp. | 7.150% | 2/15/19 | 32,983 | 40,466 |
| Caterpillar Inc. | 0.950% | 6/26/15 | 725 | 730 |
| Caterpillar Inc. | 3.900% | 5/27/21 | 4,578 | 4,757 |
| Caterpillar Inc. | 6.050% | 8/15/36 | 8,617 | 9,841 |
| Caterpillar Inc. | 5.200% | 5/27/41 | 50 | 52 |
| Caterpillar Inc. | 3.803% | 8/15/42 | 19,044 | 15,966 |
| Cooper US Inc. | 5.450% | 4/1/15 | 1,925 | 2,035 |
| Cooper US Inc. | 2.375% | 1/15/16 | 3,025 | 3,115 |
| Cooper US Inc. | 3.875% | 12/15/20 | 1,250 | 1,266 |
| Crane Co. | 2.750% | 12/15/18 | 750 | 748 |
| Crane Co. | 4.450% | 12/15/23 | 1,000 | 990 |
| CRH America Inc. | 4.125% | 1/15/16 | 6,425 | 6,779 |
| CRH America Inc. | 6.000% | 9/30/16 | 17,236 | 19,273 |
| CRH America Inc. | 8.125% | 7/15/18 | 7,400 | 9,073 |
| CRH America Inc. | 5.750% | 1/15/21 | 6,800 | 7,448 |
| Danaher Corp. | 1.300% | 6/23/14 | 2,500 | 2,513 |
| Danaher Corp. | 2.300% | 6/23/16 | 1,750 | 1,806 |
| Danaher Corp. | 5.625% | 1/15/18 | 2,385 | 2,727 |
| Danaher Corp. | 5.400% | 3/1/19 | 1,700 | 1,951 |
| Danaher Corp. | 3.900% | 6/23/21 | 3,110 | 3,210 |
| Deere & Co. | 4.375% | 10/16/19 | 5,125 | 5,666 |
| Deere & Co. | 2.600% | 6/8/22 | 4,113 | 3,854 |
| Deere & Co. | 5.375% | 10/16/29 | 8,943 | 9,988 |
| Deere & Co. | 8.100% | 5/15/30 | 3,415 | 4,713 |
| Deere & Co. | 7.125% | 3/3/31 | 925 | 1,178 |
40
| Vanguard® Total Bond Market Index Fund | ||||
| Schedule of Investments | ||||
| December 31, 2013 | ||||
| Face | Market | |||
| Maturity | Amount | Value | ||
| Coupon | Date | ($000) | ($000) | |
| Deere & Co. | 3.900% | 6/9/42 | 8,933 | 7,801 |
| Dover Corp. | 5.450% | 3/15/18 | 6,650 | 7,535 |
| Dover Corp. | 4.300% | 3/1/21 | 850 | 897 |
| Dover Corp. | 5.375% | 10/15/35 | 550 | 587 |
| Dover Corp. | 6.600% | 3/15/38 | 3,115 | 3,793 |
| Dover Corp. | 5.375% | 3/1/41 | 1,368 | 1,462 |
| Eaton Corp. | 1.500% | 11/2/17 | 7,660 | 7,552 |
| Eaton Corp. | 5.600% | 5/15/18 | 11,050 | 12,430 |
| Eaton Corp. | 2.750% | 11/2/22 | 15,900 | 14,794 |
| Eaton Corp. | 4.000% | 11/2/32 | 4,325 | 3,942 |
| Eaton Corp. | 4.150% | 11/2/42 | 2,275 | 2,021 |
| 6 Embraer Overseas Ltd. | 5.696% | 9/16/23 | 15,075 | 15,029 |
| Embraer SA | 5.150% | 6/15/22 | 6,500 | 6,484 |
| Emerson Electric Co. | 5.250% | 10/15/18 | 6,635 | 7,558 |
| Emerson Electric Co. | 4.875% | 10/15/19 | 5,675 | 6,384 |
| Emerson Electric Co. | 4.250% | 11/15/20 | 425 | 456 |
| Emerson Electric Co. | 2.625% | 2/15/23 | 4,275 | 4,001 |
| Emerson Electric Co. | 6.000% | 8/15/32 | 940 | 1,061 |
| Emerson Electric Co. | 6.125% | 4/15/39 | 1,960 | 2,311 |
| Emerson Electric Co. | 5.250% | 11/15/39 | 269 | 283 |
| Exelis Inc. | 4.250% | 10/1/16 | 3,525 | 3,720 |
| Flowserve Corp. | 3.500% | 9/15/22 | 9,775 | 9,212 |
| Flowserve Corp. | 4.000% | 11/15/23 | 3,825 | 3,703 |
| General Dynamics Corp. | 1.375% | 1/15/15 | 2,100 | 2,121 |
| General Dynamics Corp. | 1.000% | 11/15/17 | 11,425 | 11,087 |
| General Dynamics Corp. | 3.875% | 7/15/21 | 11,125 | 11,466 |
| General Dynamics Corp. | 2.250% | 11/15/22 | 14,800 | 13,275 |
| General Dynamics Corp. | 3.600% | 11/15/42 | 3,418 | 2,797 |
| General Electric Co. | 0.850% | 10/9/15 | 16,700 | 16,805 |
| General Electric Co. | 5.250% | 12/6/17 | 35,882 | 40,714 |
| General Electric Co. | 2.700% | 10/9/22 | 16,123 | 15,064 |
| General Electric Co. | 4.125% | 10/9/42 | 18,365 | 16,832 |
| Harsco Corp. | 5.750% | 5/15/18 | 7,968 | 8,360 |
| Honeywell International Inc. | 5.400% | 3/15/16 | 1,650 | 1,813 |
| Honeywell International Inc. | 5.300% | 3/15/17 | 5,110 | 5,709 |
| Honeywell International Inc. | 5.300% | 3/1/18 | 2,660 | 3,021 |
| Honeywell International Inc. | 5.000% | 2/15/19 | 4,575 | 5,159 |
| Honeywell International Inc. | 4.250% | 3/1/21 | 15,720 | 16,850 |
| Honeywell International Inc. | 3.350% | 12/1/23 | 3,925 | 3,825 |
| Honeywell International Inc. | 5.700% | 3/15/36 | 1,235 | 1,385 |
| Honeywell International Inc. | 5.700% | 3/15/37 | 4,980 | 5,562 |
| Honeywell International Inc. | 5.375% | 3/1/41 | 3,493 | 3,816 |
| Illinois Tool Works Inc. | 6.250% | 4/1/19 | 12,475 | 14,780 |
| Illinois Tool Works Inc. | 4.875% | 9/15/41 | 45 | 44 |
| Illinois Tool Works Inc. | 3.900% | 9/1/42 | 12,800 | 10,903 |
| Ingersoll-Rand Global Holding Co. Ltd. | 6.875% | 8/15/18 | 5,880 | 6,907 |
| 6 Ingersoll-Rand Global Holding Co. Ltd. | 2.875% | 1/15/19 | 1,850 | 1,832 |
| 6 Ingersoll-Rand Global Holding Co. Ltd. | 4.250% | 6/15/23 | 3,725 | 3,629 |
| 6 Ingersoll-Rand Global Holding Co. Ltd. | 5.750% | 6/15/43 | 650 | 656 |
| John Deere Capital Corp. | 1.250% | 12/2/14 | 3,000 | 3,028 |
| John Deere Capital Corp. | 2.950% | 3/9/15 | 7,600 | 7,824 |
| John Deere Capital Corp. | 0.950% | 6/29/15 | 1,425 | 1,436 |
| John Deere Capital Corp. | 0.700% | 9/4/15 | 2,050 | 2,059 |
| John Deere Capital Corp. | 0.750% | 1/22/16 | 700 | 699 |
| John Deere Capital Corp. | 2.250% | 6/7/16 | 300 | 310 |
| John Deere Capital Corp. | 1.850% | 9/15/16 | 9,000 | 9,209 |
| John Deere Capital Corp. | 2.000% | 1/13/17 | 8,450 | 8,599 |
| John Deere Capital Corp. | 5.500% | 4/13/17 | 3,350 | 3,758 |
| John Deere Capital Corp. | 2.800% | 9/18/17 | 7,400 | 7,725 |
| John Deere Capital Corp. | 1.200% | 10/10/17 | 2,650 | 2,593 |
| John Deere Capital Corp. | 1.300% | 3/12/18 | 5,600 | 5,494 |
| John Deere Capital Corp. | 5.750% | 9/10/18 | 3,950 | 4,587 |
| John Deere Capital Corp. | 1.950% | 12/13/18 | 4,500 | 4,471 |
| John Deere Capital Corp. | 2.250% | 4/17/19 | 3,000 | 2,988 |
41
| Vanguard® Total Bond Market Index Fund | ||||
| Schedule of Investments | ||||
| December 31, 2013 | ||||
| Face | Market | |||
| Maturity | Amount | Value | ||
| Coupon | Date | ($000) | ($000) | |
| John Deere Capital Corp. | 1.700% | 1/15/20 | 4,175 | 3,918 |
| John Deere Capital Corp. | 3.900% | 7/12/21 | 4,850 | 5,016 |
| John Deere Capital Corp. | 3.150% | 10/15/21 | 4,040 | 3,990 |
| John Deere Capital Corp. | 2.750% | 3/15/22 | 750 | 708 |
| John Deere Capital Corp. | 2.800% | 1/27/23 | 2,225 | 2,069 |
| Joy Global Inc. | 6.000% | 11/15/16 | 1,065 | 1,188 |
| Kennametal Inc. | 2.650% | 11/1/19 | 3,625 | 3,553 |
| Kennametal Inc. | 3.875% | 2/15/22 | 1,900 | 1,814 |
| L-3 Communications Corp. | 5.200% | 10/15/19 | 10,150 | 11,054 |
| L-3 Communications Corp. | 4.750% | 7/15/20 | 8,400 | 8,705 |
| L-3 Communications Corp. | 4.950% | 2/15/21 | 7,975 | 8,329 |
| Legrand France SA | 8.500% | 2/15/25 | 425 | 547 |
| Lockheed Martin Corp. | 7.650% | 5/1/16 | 5,650 | 6,510 |
| Lockheed Martin Corp. | 2.125% | 9/15/16 | 1,300 | 1,337 |
| Lockheed Martin Corp. | 4.250% | 11/15/19 | 7,875 | 8,467 |
| Lockheed Martin Corp. | 3.350% | 9/15/21 | 9,250 | 9,138 |
| Lockheed Martin Corp. | 6.150% | 9/1/36 | 18,350 | 20,775 |
| Lockheed Martin Corp. | 5.500% | 11/15/39 | 1,850 | 1,946 |
| Lockheed Martin Corp. | 5.720% | 6/1/40 | 2,432 | 2,604 |
| Lockheed Martin Corp. | 4.850% | 9/15/41 | 1,575 | 1,548 |
| Martin Marietta Materials Inc. | 6.600% | 4/15/18 | 4,450 | 5,015 |
| Mohawk Industries Inc. | 6.125% | 1/15/16 | 3,000 | 3,285 |
| Mohawk Industries Inc. | 3.850% | 2/1/23 | 12,200 | 11,501 |
| Northrop Grumman Corp. | 5.050% | 8/1/19 | 3,285 | 3,649 |
| Northrop Grumman Corp. | 3.500% | 3/15/21 | 9,828 | 9,778 |
| Northrop Grumman Corp. | 3.250% | 8/1/23 | 5,000 | 4,644 |
| Northrop Grumman Corp. | 5.050% | 11/15/40 | 7,175 | 6,975 |
| Northrop Grumman Corp. | 4.750% | 6/1/43 | 6,225 | 5,891 |
| Northrop Grumman Systems Corp. | 7.750% | 2/15/31 | 381 | 484 |
| Owens Corning | 6.500% | 12/1/16 | 24,493 | 27,158 |
| Owens Corning | 4.200% | 12/15/22 | 9,850 | 9,424 |
| Owens Corning | 7.000% | 12/1/36 | 725 | 778 |
| Parker Hannifin Corp. | 5.500% | 5/15/18 | 950 | 1,079 |
| Parker Hannifin Corp. | 3.500% | 9/15/22 | 500 | 492 |
| Parker Hannifin Corp. | 6.250% | 5/15/38 | 3,985 | 4,742 |
| Pentair Finance SA | 1.350% | 12/1/15 | 3,463 | 3,482 |
| Pentair Finance SA | 5.000% | 5/15/21 | 1,275 | 1,332 |
| Precision Castparts Corp. | 0.700% | 12/20/15 | 3,975 | 3,983 |
| Precision Castparts Corp. | 1.250% | 1/15/18 | 2,625 | 2,571 |
| Precision Castparts Corp. | 2.500% | 1/15/23 | 3,425 | 3,112 |
| Precision Castparts Corp. | 3.900% | 1/15/43 | 3,125 | 2,716 |
| Raytheon Co. | 6.400% | 12/15/18 | 275 | 326 |
| Raytheon Co. | 4.400% | 2/15/20 | 3,820 | 4,090 |
| Raytheon Co. | 3.125% | 10/15/20 | 3,440 | 3,443 |
| Raytheon Co. | 2.500% | 12/15/22 | 5,450 | 4,952 |
| Raytheon Co. | 7.200% | 8/15/27 | 4,710 | 5,761 |
| Raytheon Co. | 4.875% | 10/15/40 | 1,718 | 1,703 |
| Raytheon Co. | 4.700% | 12/15/41 | 7,375 | 7,126 |
| Republic Services Inc. | 3.800% | 5/15/18 | 2,525 | 2,674 |
| Republic Services Inc. | 5.500% | 9/15/19 | 17,050 | 19,239 |
| Republic Services Inc. | 5.000% | 3/1/20 | 3,795 | 4,174 |
| Republic Services Inc. | 5.250% | 11/15/21 | 10,110 | 11,026 |
| Republic Services Inc. | 3.550% | 6/1/22 | 1,700 | 1,644 |
| Republic Services Inc. | 4.750% | 5/15/23 | 950 | 988 |
| Republic Services Inc. | 6.086% | 3/15/35 | 2,600 | 2,832 |
| Republic Services Inc. | 6.200% | 3/1/40 | 4,523 | 5,198 |
| Republic Services Inc. | 5.700% | 5/15/41 | 5,918 | 6,307 |
| Rockwell Automation Inc. | 5.650% | 12/1/17 | 1,150 | 1,294 |
| Rockwell Automation Inc. | 6.700% | 1/15/28 | 1,025 | 1,242 |
| Rockwell Automation Inc. | 6.250% | 12/1/37 | 3,985 | 4,630 |
| Rockwell Collins Inc. | 5.250% | 7/15/19 | 850 | 963 |
| Rockwell Collins Inc. | 3.100% | 11/15/21 | 1,550 | 1,499 |
| Roper Industries Inc. | 1.850% | 11/15/17 | 2,550 | 2,532 |
| Roper Industries Inc. | 2.050% | 10/1/18 | 8,100 | 7,900 |
42
| Vanguard® Total Bond Market Index Fund | ||||
| Schedule of Investments | ||||
| December 31, 2013 | ||||
| Face | Market | |||
| Maturity | Amount | Value | ||
| Coupon | Date | ($000) | ($000) | |
| Roper Industries Inc. | 6.250% | 9/1/19 | 3,725 | 4,284 |
| Roper Industries Inc. | 3.125% | 11/15/22 | 725 | 665 |
| Snap-on Inc. | 6.125% | 9/1/21 | 3,700 | 4,185 |
| Sonoco Products Co. | 4.375% | 11/1/21 | 745 | 759 |
| Sonoco Products Co. | 5.750% | 11/1/40 | 5,050 | 5,340 |
| Stanley Black & Decker Inc. | 3.400% | 12/1/21 | 4,325 | 4,289 |
| Stanley Black & Decker Inc. | 2.900% | 11/1/22 | 1,450 | 1,346 |
| Stanley Black & Decker Inc. | 5.200% | 9/1/40 | 2,018 | 2,008 |
| Textron Inc. | 5.600% | 12/1/17 | 375 | 416 |
| Textron Inc. | 7.250% | 10/1/19 | 4,140 | 4,804 |
| Tyco International Finance SA | 8.500% | 1/15/19 | 2,301 | 2,819 |
| Tyco International Finance SA / Tyco International Ltd. | 7.000% | 12/15/19 | 1,975 | 2,316 |
| Tyco International Finance SA / Tyco International Ltd. | 6.875% | 1/15/21 | 16,060 | 18,513 |
| United Technologies Corp. | 4.875% | 5/1/15 | 1,060 | 1,122 |
| United Technologies Corp. | 1.800% | 6/1/17 | 9,620 | 9,781 |
| United Technologies Corp. | 5.375% | 12/15/17 | 12,195 | 13,898 |
| United Technologies Corp. | 6.125% | 2/1/19 | 433 | 511 |
| United Technologies Corp. | 4.500% | 4/15/20 | 23,803 | 25,958 |
| United Technologies Corp. | 3.100% | 6/1/22 | 24,177 | 23,737 |
| United Technologies Corp. | 6.700% | 8/1/28 | 2,397 | 2,939 |
| United Technologies Corp. | 7.500% | 9/15/29 | 3,325 | 4,383 |
| United Technologies Corp. | 5.400% | 5/1/35 | 7,175 | 8,039 |
| United Technologies Corp. | 6.050% | 6/1/36 | 7,352 | 8,578 |
| United Technologies Corp. | 6.125% | 7/15/38 | 3,388 | 4,034 |
| United Technologies Corp. | 5.700% | 4/15/40 | 11,332 | 12,967 |
| United Technologies Corp. | 4.500% | 6/1/42 | 28,080 | 27,144 |
| Waste Management Inc. | 6.375% | 3/11/15 | 3,700 | 3,939 |
| Waste Management Inc. | 2.600% | 9/1/16 | 3,150 | 3,255 |
| Waste Management Inc. | 6.100% | 3/15/18 | 700 | 807 |
| Waste Management Inc. | 7.375% | 3/11/19 | 15,132 | 18,264 |
| Waste Management Inc. | 4.750% | 6/30/20 | 3,675 | 3,990 |
| Waste Management Inc. | 4.600% | 3/1/21 | 7,120 | 7,561 |
| Waste Management Inc. | 7.000% | 7/15/28 | 208 | 252 |
| Waste Management Inc. | 7.750% | 5/15/32 | 1,850 | 2,403 |
| Waste Management Inc. | 6.125% | 11/30/39 | 6,743 | 7,683 |
| Communication (2.4%) | ||||
| 21st Century Fox America Inc. | 5.300% | 12/15/14 | 4,050 | 4,231 |
| 21st Century Fox America Inc. | 8.000% | 10/17/16 | 3,840 | 4,521 |
| 21st Century Fox America Inc. | 7.250% | 5/18/18 | 150 | 181 |
| 21st Century Fox America Inc. | 6.900% | 3/1/19 | 2,770 | 3,332 |
| 21st Century Fox America Inc. | 4.500% | 2/15/21 | 7,350 | 7,856 |
| 21st Century Fox America Inc. | 3.000% | 9/15/22 | 3,050 | 2,864 |
| 21st Century Fox America Inc. | 7.700% | 10/30/25 | 1,175 | 1,452 |
| 21st Century Fox America Inc. | 6.550% | 3/15/33 | 13,065 | 14,958 |
| 21st Century Fox America Inc. | 6.200% | 12/15/34 | 14,541 | 16,196 |
| 21st Century Fox America Inc. | 6.400% | 12/15/35 | 24,245 | 27,529 |
| 21st Century Fox America Inc. | 8.150% | 10/17/36 | 2,175 | 2,760 |
| 21st Century Fox America Inc. | 6.150% | 3/1/37 | 9,723 | 10,674 |
| 21st Century Fox America Inc. | 6.650% | 11/15/37 | 660 | 766 |
| 21st Century Fox America Inc. | 6.900% | 8/15/39 | 7,260 | 8,688 |
| 21st Century Fox America Inc. | 6.150% | 2/15/41 | 45 | 50 |
| 6 21st Century Fox America Inc. | 5.400% | 10/1/43 | 250 | 256 |
| 21st Century Fox America Inc. | 7.750% | 12/1/45 | 1,460 | 1,833 |
| Alltel Corp. | 7.000% | 3/15/16 | 3,500 | 3,940 |
| Alltel Corp. | 7.875% | 7/1/32 | 4,183 | 5,464 |
| America Movil SAB de CV | 5.750% | 1/15/15 | 27,251 | 28,532 |
| America Movil SAB de CV | 3.625% | 3/30/15 | 70 | 72 |
| America Movil SAB de CV | 5.625% | 11/15/17 | 6,590 | 7,420 |
| America Movil SAB de CV | 5.000% | 10/16/19 | 1,225 | 1,330 |
| America Movil SAB de CV | 5.000% | 3/30/20 | 300 | 328 |
| America Movil SAB de CV | 3.125% | 7/16/22 | 5,150 | 4,724 |
| America Movil SAB de CV | 6.375% | 3/1/35 | 17,540 | 19,004 |
| America Movil SAB de CV | 6.125% | 11/15/37 | 4,318 | 4,561 |
43
| Vanguard® Total Bond Market Index Fund | ||||
| Schedule of Investments | ||||
| December 31, 2013 | ||||
| Face | Market | |||
| Maturity | Amount | Value | ||
| Coupon | Date | ($000) | ($000) | |
| America Movil SAB de CV | 6.125% | 3/30/40 | 11,900 | 12,821 |
| America Movil SAB de CV | 4.375% | 7/16/42 | 9,675 | 8,107 |
| American Tower Corp. | 4.625% | 4/1/15 | 6,075 | 6,355 |
| American Tower Corp. | 4.500% | 1/15/18 | 19,665 | 21,152 |
| American Tower Corp. | 5.900% | 11/1/21 | 7,025 | 7,657 |
| American Tower Corp. | 3.500% | 1/31/23 | 18,775 | 17,047 |
| Ameritech Capital Funding Corp. | 6.550% | 1/15/28 | 20 | 22 |
| AT&T Corp. | 8.000% | 11/15/31 | 12,654 | 16,842 |
| AT&T Inc. | 2.500% | 8/15/15 | 4,650 | 4,773 |
| AT&T Inc. | 0.800% | 12/1/15 | 1,025 | 1,023 |
| AT&T Inc. | 0.900% | 2/12/16 | 7,875 | 7,856 |
| AT&T Inc. | 2.950% | 5/15/16 | 3,800 | 3,971 |
| AT&T Inc. | 5.625% | 6/15/16 | 28,820 | 31,935 |
| AT&T Inc. | 1.700% | 6/1/17 | 28,225 | 28,371 |
| AT&T Inc. | 1.400% | 12/1/17 | 1,525 | 1,502 |
| AT&T Inc. | 5.500% | 2/1/18 | 5,256 | 5,942 |
| AT&T Inc. | 5.600% | 5/15/18 | 8,975 | 10,211 |
| AT&T Inc. | 2.375% | 11/27/18 | 17,500 | 17,533 |
| AT&T Inc. | 5.800% | 2/15/19 | 44,450 | 51,366 |
| AT&T Inc. | 3.875% | 8/15/21 | 17,600 | 17,802 |
| AT&T Inc. | 3.000% | 2/15/22 | 9,550 | 8,976 |
| AT&T Inc. | 2.625% | 12/1/22 | 5,600 | 5,040 |
| AT&T Inc. | 6.450% | 6/15/34 | 4,500 | 5,036 |
| AT&T Inc. | 6.150% | 9/15/34 | 100 | 108 |
| AT&T Inc. | 6.500% | 9/1/37 | 13,663 | 15,509 |
| AT&T Inc. | 6.300% | 1/15/38 | 10,022 | 11,078 |
| AT&T Inc. | 6.400% | 5/15/38 | 6,320 | 7,056 |
| AT&T Inc. | 6.550% | 2/15/39 | 27,539 | 31,228 |
| AT&T Inc. | 5.350% | 9/1/40 | 23,037 | 22,861 |
| AT&T Inc. | 5.550% | 8/15/41 | 4,925 | 4,964 |
| AT&T Inc. | 4.300% | 12/15/42 | 7,915 | 6,736 |
| AT&T Inc. | 4.350% | 6/15/45 | 10,530 | 8,860 |
| AT&T Mobility LLC | 7.125% | 12/15/31 | 8,015 | 9,722 |
| Bellsouth Capital Funding Corp. | 7.875% | 2/15/30 | 5,215 | 6,106 |
| Bellsouth Capital Funding Corp. | 7.120% | 7/15/97 | 350 | 358 |
| BellSouth Corp. | 6.875% | 10/15/31 | 7,465 | 8,255 |
| BellSouth Corp. | 6.550% | 6/15/34 | 2,680 | 2,861 |
| BellSouth Corp. | 6.000% | 11/15/34 | 2,037 | 2,050 |
| BellSouth Telecommunications LLC | 6.375% | 6/1/28 | 4,400 | 4,743 |
| British Telecommunications plc | 2.000% | 6/22/15 | 3,600 | 3,662 |
| British Telecommunications plc | 1.625% | 6/28/16 | 4,325 | 4,363 |
| British Telecommunications plc | 5.950% | 1/15/18 | 11,850 | 13,535 |
| British Telecommunications plc | 9.625% | 12/15/30 | 15,217 | 22,685 |
| CBS Corp. | 1.950% | 7/1/17 | 1,125 | 1,131 |
| CBS Corp. | 4.625% | 5/15/18 | 400 | 435 |
| CBS Corp. | 8.875% | 5/15/19 | 4,275 | 5,455 |
| CBS Corp. | 5.750% | 4/15/20 | 10,060 | 11,301 |
| CBS Corp. | 4.300% | 2/15/21 | 3,775 | 3,851 |
| CBS Corp. | 3.375% | 3/1/22 | 2,475 | 2,363 |
| CBS Corp. | 7.875% | 7/30/30 | 2,389 | 2,978 |
| CBS Corp. | 5.500% | 5/15/33 | 668 | 660 |
| CBS Corp. | 5.900% | 10/15/40 | 1,025 | 1,054 |
| CBS Corp. | 4.850% | 7/1/42 | 3,443 | 3,107 |
| CC Holdings GS V LLC / Crown Castle GS III Corp. | 3.849% | 4/15/23 | 3,695 | 3,430 |
| Cellco Partnership / Verizon Wireless Capital LLC | 8.500% | 11/15/18 | 13,064 | 16,612 |
| Comcast Cable Communications Holdings Inc. | 9.455% | 11/15/22 | 7,226 | 9,984 |
| Comcast Cable Communications LLC | 8.875% | 5/1/17 | 2,475 | 3,036 |
| Comcast Corp. | 6.500% | 1/15/15 | 3,295 | 3,495 |
| Comcast Corp. | 5.850% | 11/15/15 | 65 | 71 |
| Comcast Corp. | 5.900% | 3/15/16 | 10,630 | 11,760 |
| Comcast Corp. | 4.950% | 6/15/16 | 1,200 | 1,311 |
| Comcast Corp. | 6.500% | 1/15/17 | 515 | 591 |
| Comcast Corp. | 6.300% | 11/15/17 | 38,355 | 44,755 |
| Comcast Corp. | 5.875% | 2/15/18 | 17,275 | 19,885 |
44
| Vanguard® Total Bond Market Index Fund | ||||
| Schedule of Investments | ||||
| December 31, 2013 | ||||
| Face | Market | |||
| Maturity | Amount | Value | ||
| Coupon | Date | ($000) | ($000) | |
| Comcast Corp. | 5.700% | 5/15/18 | 4,640 | 5,342 |
| Comcast Corp. | 5.700% | 7/1/19 | 4,850 | 5,611 |
| Comcast Corp. | 5.150% | 3/1/20 | 4,325 | 4,828 |
| Comcast Corp. | 3.125% | 7/15/22 | 1,100 | 1,051 |
| Comcast Corp. | 2.850% | 1/15/23 | 6,050 | 5,601 |
| Comcast Corp. | 4.250% | 1/15/33 | 9,197 | 8,469 |
| Comcast Corp. | 7.050% | 3/15/33 | 3,000 | 3,659 |
| Comcast Corp. | 5.650% | 6/15/35 | 3,071 | 3,259 |
| Comcast Corp. | 6.500% | 11/15/35 | 16,050 | 18,653 |
| Comcast Corp. | 6.450% | 3/15/37 | 6,918 | 7,978 |
| Comcast Corp. | 6.950% | 8/15/37 | 14,170 | 17,421 |
| Comcast Corp. | 6.400% | 5/15/38 | 15,471 | 17,681 |
| Comcast Corp. | 4.650% | 7/15/42 | 9,470 | 8,761 |
| Comcast Corp. | 4.500% | 1/15/43 | 2,150 | 1,939 |
| COX Communications Inc. | 5.500% | 10/1/15 | 625 | 671 |
| Deutsche Telekom International Finance BV | 5.750% | 3/23/16 | 8,040 | 8,815 |
| Deutsche Telekom International Finance BV | 6.750% | 8/20/18 | 4,265 | 5,024 |
| Deutsche Telekom International Finance BV | 6.000% | 7/8/19 | 8,175 | 9,471 |
| Deutsche Telekom International Finance BV | 8.750% | 6/15/30 | 29,060 | 41,284 |
| DIRECTV Holdings LLC / DIRECTV Financing Co. Inc. | 3.550% | 3/15/15 | 6,550 | 6,767 |
| DIRECTV Holdings LLC / DIRECTV Financing Co. Inc. | 3.125% | 2/15/16 | 6,825 | 7,101 |
| DIRECTV Holdings LLC / DIRECTV Financing Co. Inc. | 3.500% | 3/1/16 | 7,250 | 7,607 |
| DIRECTV Holdings LLC / DIRECTV Financing Co. Inc. | 2.400% | 3/15/17 | 7,375 | 7,527 |
| DIRECTV Holdings LLC / DIRECTV Financing Co. Inc. | 5.875% | 10/1/19 | 29,520 | 33,572 |
| DIRECTV Holdings LLC / DIRECTV Financing Co. Inc. | 5.200% | 3/15/20 | 9,235 | 10,069 |
| DIRECTV Holdings LLC / DIRECTV Financing Co. Inc. | 4.600% | 2/15/21 | 1,050 | 1,082 |
| DIRECTV Holdings LLC / DIRECTV Financing Co. Inc. | 5.000% | 3/1/21 | 1,700 | 1,789 |
| DIRECTV Holdings LLC / DIRECTV Financing Co. Inc. | 3.800% | 3/15/22 | 20,800 | 19,852 |
| DIRECTV Holdings LLC / DIRECTV Financing Co. Inc. | 6.350% | 3/15/40 | 4,975 | 5,160 |
| DIRECTV Holdings LLC / DIRECTV Financing Co. Inc. | 6.000% | 8/15/40 | 8,520 | 8,426 |
| DIRECTV Holdings LLC / DIRECTV Financing Co. Inc. | 6.375% | 3/1/41 | 4,094 | 4,201 |
| DIRECTV Holdings LLC / DIRECTV Financing Co. Inc. | 5.150% | 3/15/42 | 16,795 | 15,022 |
| Discovery Communications LLC | 5.050% | 6/1/20 | 15,450 | 16,840 |
| Discovery Communications LLC | 4.375% | 6/15/21 | 4,600 | 4,749 |
| Discovery Communications LLC | 3.300% | 5/15/22 | 6,600 | 6,252 |
| Discovery Communications LLC | 3.250% | 4/1/23 | 2,500 | 2,321 |
| Discovery Communications LLC | 6.350% | 6/1/40 | 295 | 326 |
| Discovery Communications LLC | 4.950% | 5/15/42 | 8,000 | 7,421 |
| Discovery Communications LLC | 4.875% | 4/1/43 | 1,075 | 989 |
| Embarq Corp. | 7.082% | 6/1/16 | 9,131 | 10,227 |
| Embarq Corp. | 7.995% | 6/1/36 | 9,260 | 9,318 |
| Graham Holdings Co. | 7.250% | 2/1/19 | 2,975 | 3,530 |
| Grupo Televisa SAB | 6.625% | 3/18/25 | 3,350 | 3,715 |
| Grupo Televisa SAB | 8.500% | 3/11/32 | 550 | 685 |
| Grupo Televisa SAB | 6.625% | 1/15/40 | 5,918 | 6,272 |
| GTE Corp. | 8.750% | 11/1/21 | 2,935 | 3,714 |
| GTE Corp. | 6.940% | 4/15/28 | 13,105 | 14,828 |
| Interpublic Group of Cos. Inc. | 3.750% | 2/15/23 | 5,800 | 5,428 |
| Koninklijke KPN NV | 8.375% | 10/1/30 | 3,533 | 4,465 |
| McGraw Hill Financial Inc. | 5.900% | 11/15/17 | 3,485 | 3,801 |
| McGraw Hill Financial Inc. | 6.550% | 11/15/37 | 6,450 | 6,134 |
| Moody's Corp. | 4.500% | 9/1/22 | 13,000 | 12,789 |
| Moody's Corp. | 4.875% | 2/15/24 | 2,900 | 2,896 |
| NBCUniversal Media LLC | 3.650% | 4/30/15 | 3,975 | 4,134 |
| NBCUniversal Media LLC | 2.875% | 4/1/16 | 8,375 | 8,715 |
| NBCUniversal Media LLC | 5.150% | 4/30/20 | 6,960 | 7,768 |
| NBCUniversal Media LLC | 4.375% | 4/1/21 | 8,910 | 9,416 |
| NBCUniversal Media LLC | 2.875% | 1/15/23 | 7,775 | 7,207 |
| NBCUniversal Media LLC | 6.400% | 4/30/40 | 21,950 | 25,203 |
| NBCUniversal Media LLC | 5.950% | 4/1/41 | 7,645 | 8,375 |
| NBCUniversal Media LLC | 4.450% | 1/15/43 | 8,125 | 7,269 |
| New Cingular Wireless Services Inc. | 8.750% | 3/1/31 | 145 | 204 |
| Nippon Telegraph & Telephone Corp. | 1.400% | 7/18/17 | 2,125 | 2,096 |
| Omnicom Group Inc. | 5.900% | 4/15/16 | 750 | 829 |
45
| Vanguard® Total Bond Market Index Fund | ||||
| Schedule of Investments | ||||
| December 31, 2013 | ||||
| Face | Market | |||
| Maturity | Amount | Value | ||
| Coupon | Date | ($000) | ($000) | |
| Omnicom Group Inc. | 6.250% | 7/15/19 | 20 | 23 |
| Omnicom Group Inc. | 4.450% | 8/15/20 | 15,650 | 16,539 |
| Omnicom Group Inc. | 3.625% | 5/1/22 | 20,425 | 19,788 |
| Orange SA | 2.125% | 9/16/15 | 1,500 | 1,524 |
| Orange SA | 2.750% | 9/14/16 | 7,025 | 7,292 |
| Orange SA | 5.375% | 7/8/19 | 825 | 916 |
| Orange SA | 4.125% | 9/14/21 | 10,025 | 10,107 |
| Orange SA | 8.750% | 3/1/31 | 17,315 | 23,691 |
| Orange SA | 5.375% | 1/13/42 | 15,400 | 15,402 |
| Qwest Corp. | 6.500% | 6/1/17 | 4,200 | 4,711 |
| Qwest Corp. | 6.750% | 12/1/21 | 4,775 | 5,198 |
| Qwest Corp. | 7.250% | 9/15/25 | 1,360 | 1,450 |
| Qwest Corp. | 6.875% | 9/15/33 | 11,994 | 11,469 |
| Qwest Corp. | 7.125% | 11/15/43 | 13,275 | 12,777 |
| Reed Elsevier Capital Inc. | 3.125% | 10/15/22 | 15,783 | 14,460 |
| Rogers Communications Inc. | 5.500% | 3/15/14 | 1,450 | 1,464 |
| Rogers Communications Inc. | 7.500% | 3/15/15 | 58 | 63 |
| Rogers Communications Inc. | 6.800% | 8/15/18 | 16,055 | 19,163 |
| Rogers Communications Inc. | 3.000% | 3/15/23 | 3,175 | 2,914 |
| Rogers Communications Inc. | 7.500% | 8/15/38 | 725 | 900 |
| Scripps Networks Interactive Inc. | 2.700% | 12/15/16 | 980 | 1,017 |
| TCI Communications Inc. | 8.750% | 8/1/15 | 17,750 | 19,925 |
| TCI Communications Inc. | 7.875% | 2/15/26 | 3,268 | 4,228 |
| TCI Communications Inc. | 7.125% | 2/15/28 | 1,347 | 1,648 |
| Telefonica Emisiones SAU | 4.949% | 1/15/15 | 17,325 | 18,011 |
| Telefonica Emisiones SAU | 3.729% | 4/27/15 | 4,875 | 5,034 |
| Telefonica Emisiones SAU | 3.992% | 2/16/16 | 10,125 | 10,618 |
| Telefonica Emisiones SAU | 6.421% | 6/20/16 | 12,660 | 14,129 |
| Telefonica Emisiones SAU | 6.221% | 7/3/17 | 266 | 300 |
| Telefonica Emisiones SAU | 3.192% | 4/27/18 | 15,400 | 15,696 |
| Telefonica Emisiones SAU | 5.877% | 7/15/19 | 6,728 | 7,537 |
| Telefonica Emisiones SAU | 5.134% | 4/27/20 | 8,960 | 9,506 |
| Telefonica Emisiones SAU | 5.462% | 2/16/21 | 14,775 | 15,603 |
| Telefonica Emisiones SAU | 4.570% | 4/27/23 | 1,775 | 1,754 |
| Telefonica Emisiones SAU | 7.045% | 6/20/36 | 9,674 | 10,766 |
| Telefonica Europe BV | 8.250% | 9/15/30 | 4,595 | 5,430 |
| Thomson Reuters Corp. | 1.300% | 2/23/17 | 5,000 | 4,973 |
| Thomson Reuters Corp. | 4.700% | 10/15/19 | 1,825 | 1,982 |
| Thomson Reuters Corp. | 4.300% | 11/23/23 | 6,025 | 6,025 |
| Thomson Reuters Corp. | 5.500% | 8/15/35 | 7,375 | 7,136 |
| Thomson Reuters Corp. | 5.850% | 4/15/40 | 6,475 | 6,585 |
| Thomson Reuters Corp. | 4.500% | 5/23/43 | 1,500 | 1,253 |
| Thomson Reuters Corp. | 5.650% | 11/23/43 | 5,750 | 5,730 |
| Time Warner Cable Inc. | 3.500% | 2/1/15 | 4,625 | 4,747 |
| Time Warner Cable Inc. | 5.850% | 5/1/17 | 18,270 | 20,004 |
| Time Warner Cable Inc. | 6.750% | 7/1/18 | 20,030 | 22,638 |
| Time Warner Cable Inc. | 8.750% | 2/14/19 | 7,065 | 8,448 |
| Time Warner Cable Inc. | 8.250% | 4/1/19 | 8,020 | 9,456 |
| Time Warner Cable Inc. | 5.000% | 2/1/20 | 17,525 | 17,790 |
| Time Warner Cable Inc. | 4.125% | 2/15/21 | 1,000 | 935 |
| Time Warner Cable Inc. | 6.550% | 5/1/37 | 11,361 | 10,431 |
| Time Warner Cable Inc. | 7.300% | 7/1/38 | 140 | 138 |
| Time Warner Cable Inc. | 6.750% | 6/15/39 | 13,640 | 12,757 |
| Time Warner Cable Inc. | 5.875% | 11/15/40 | 25,047 | 21,455 |
| Time Warner Cable Inc. | 5.500% | 9/1/41 | 7,850 | 6,497 |
| Time Warner Cable Inc. | 4.500% | 9/15/42 | 2,750 | 2,040 |
| Time Warner Entertainment Co. LP | 8.375% | 3/15/23 | 1,865 | 2,134 |
| Time Warner Entertainment Co. LP | 8.375% | 7/15/33 | 7,175 | 7,740 |
| United States Cellular Corp. | 6.700% | 12/15/33 | 8,585 | 8,096 |
| Verizon Communications Inc. | 1.250% | 11/3/14 | 100 | 101 |
| Verizon Communications Inc. | 4.900% | 9/15/15 | 425 | 454 |
| Verizon Communications Inc. | 5.550% | 2/15/16 | 10,417 | 11,395 |
| Verizon Communications Inc. | 3.000% | 4/1/16 | 12,275 | 12,804 |
| Verizon Communications Inc. | 2.500% | 9/15/16 | 19,745 | 20,447 |
46
| Vanguard® Total Bond Market Index Fund | ||||
| Schedule of Investments | ||||
| December 31, 2013 | ||||
| Face | Market | |||
| Maturity | Amount | Value | ||
| Coupon | Date | ($000) | ($000) | |
| Verizon Communications Inc. | 5.500% | 4/1/17 | 3,000 | 3,380 |
| Verizon Communications Inc. | 1.100% | 11/1/17 | 1,250 | 1,223 |
| Verizon Communications Inc. | 5.500% | 2/15/18 | 26,997 | 30,520 |
| Verizon Communications Inc. | 6.100% | 4/15/18 | 7,605 | 8,811 |
| Verizon Communications Inc. | 3.650% | 9/14/18 | 34,154 | 36,155 |
| Verizon Communications Inc. | 8.750% | 11/1/18 | 2,587 | 3,309 |
| Verizon Communications Inc. | 6.350% | 4/1/19 | 47,361 | 55,764 |
| Verizon Communications Inc. | 4.500% | 9/15/20 | 20,245 | 21,654 |
| Verizon Communications Inc. | 4.600% | 4/1/21 | 11,100 | 11,874 |
| Verizon Communications Inc. | 3.500% | 11/1/21 | 11,450 | 11,349 |
| Verizon Communications Inc. | 2.450% | 11/1/22 | 10,475 | 9,256 |
| Verizon Communications Inc. | 5.150% | 9/15/23 | 85,085 | 91,111 |
| Verizon Communications Inc. | 7.750% | 12/1/30 | 13,651 | 17,329 |
| Verizon Communications Inc. | 7.750% | 6/15/32 | 20 | 26 |
| Verizon Communications Inc. | 6.400% | 9/15/33 | 42,500 | 48,999 |
| Verizon Communications Inc. | 5.850% | 9/15/35 | 2,315 | 2,446 |
| Verizon Communications Inc. | 6.250% | 4/1/37 | 895 | 989 |
| Verizon Communications Inc. | 6.400% | 2/15/38 | 6,602 | 7,424 |
| Verizon Communications Inc. | 6.900% | 4/15/38 | 17,535 | 20,817 |
| Verizon Communications Inc. | 6.000% | 4/1/41 | 15,450 | 16,615 |
| Verizon Communications Inc. | 4.750% | 11/1/41 | 5,790 | 5,302 |
| Verizon Communications Inc. | 3.850% | 11/1/42 | 3,425 | 2,785 |
| Verizon Communications Inc. | 6.550% | 9/15/43 | 107,735 | 126,162 |
| Verizon Maryland LLC | 5.125% | 6/15/33 | 1,955 | 1,901 |
| Verizon New England Inc. | 7.875% | 11/15/29 | 1,385 | 1,615 |
| Verizon New York Inc. | 7.375% | 4/1/32 | 9,227 | 10,418 |
| Vodafone Group plc | 5.375% | 1/30/15 | 4,175 | 4,390 |
| Vodafone Group plc | 5.000% | 9/15/15 | 30 | 32 |
| Vodafone Group plc | 3.375% | 11/24/15 | 1,525 | 1,597 |
| Vodafone Group plc | 0.900% | 2/19/16 | 2,294 | 2,288 |
| Vodafone Group plc | 5.750% | 3/15/16 | 18,900 | 20,735 |
| Vodafone Group plc | 5.625% | 2/27/17 | 14,106 | 15,883 |
| Vodafone Group plc | 1.625% | 3/20/17 | 24,025 | 23,996 |
| Vodafone Group plc | 1.250% | 9/26/17 | 20,565 | 20,026 |
| Vodafone Group plc | 1.500% | 2/19/18 | 3,200 | 3,123 |
| Vodafone Group plc | 4.625% | 7/15/18 | 200 | 221 |
| Vodafone Group plc | 5.450% | 6/10/19 | 11,255 | 12,800 |
| Vodafone Group plc | 4.375% | 3/16/21 | 500 | 520 |
| Vodafone Group plc | 2.500% | 9/26/22 | 2,850 | 2,524 |
| Vodafone Group plc | 2.950% | 2/19/23 | 8,295 | 7,563 |
| Vodafone Group plc | 7.875% | 2/15/30 | 780 | 978 |
| Vodafone Group plc | 6.250% | 11/30/32 | 7,775 | 8,518 |
| Vodafone Group plc | 6.150% | 2/27/37 | 6,513 | 7,032 |
| Vodafone Group plc | 4.375% | 2/19/43 | 9,720 | 8,505 |
| WPP Finance 2010 | 4.750% | 11/21/21 | 12,581 | 13,057 |
| WPP Finance 2010 | 3.625% | 9/7/22 | 14,738 | 14,200 |
| Consumer Cyclical (1.7%) | ||||
| Advance Auto Parts Inc. | 4.500% | 12/1/23 | 5,075 | 5,047 |
| Amazon.com Inc. | 0.650% | 11/27/15 | 7,975 | 7,974 |
| Amazon.com Inc. | 1.200% | 11/29/17 | 4,850 | 4,761 |
| Amazon.com Inc. | 2.500% | 11/29/22 | 18,325 | 16,528 |
| American Honda Finance Corp. | 1.125% | 10/7/16 | 8,250 | 8,270 |
| American Honda Finance Corp. | 2.125% | 10/10/18 | 6,150 | 6,105 |
| AutoZone Inc. | 5.750% | 1/15/15 | 8,375 | 8,802 |
| AutoZone Inc. | 7.125% | 8/1/18 | 7,950 | 9,459 |
| AutoZone Inc. | 2.875% | 1/15/23 | 3,525 | 3,182 |
| AutoZone Inc. | 3.125% | 7/15/23 | 375 | 339 |
| BorgWarner Inc. | 4.625% | 9/15/20 | 1,000 | 1,053 |
| Brinker International Inc. | 2.600% | 5/15/18 | 675 | 668 |
| Brinker International Inc. | 3.875% | 5/15/23 | 7,800 | 7,058 |
| Carnival Corp. | 1.200% | 2/5/16 | 4,550 | 4,537 |
| Carnival Corp. | 1.875% | 12/15/17 | 300 | 298 |
| Carnival Corp. | 3.950% | 10/15/20 | 1,800 | 1,800 |
47
| Vanguard® Total Bond Market Index Fund | ||||
| Schedule of Investments | ||||
| December 31, 2013 | ||||
| Face | Market | |||
| Maturity | Amount | Value | ||
| Coupon | Date | ($000) | ($000) | |
| Costco Wholesale Corp. | 5.500% | 3/15/17 | 11,783 | 13,252 |
| Costco Wholesale Corp. | 1.125% | 12/15/17 | 3,000 | 2,946 |
| Costco Wholesale Corp. | 1.700% | 12/15/19 | 8,005 | 7,702 |
| Cummins Inc. | 3.650% | 10/1/23 | 4,625 | 4,558 |
| Cummins Inc. | 4.875% | 10/1/43 | 5,325 | 5,309 |
| CVS Caremark Corp. | 3.250% | 5/18/15 | 2,375 | 2,457 |
| CVS Caremark Corp. | 6.125% | 8/15/16 | 1,061 | 1,196 |
| CVS Caremark Corp. | 1.200% | 12/5/16 | 2,500 | 2,507 |
| CVS Caremark Corp. | 5.750% | 6/1/17 | 9,574 | 10,873 |
| CVS Caremark Corp. | 4.750% | 5/18/20 | 625 | 678 |
| CVS Caremark Corp. | 2.750% | 12/1/22 | 275 | 253 |
| CVS Caremark Corp. | 4.000% | 12/5/23 | 3,300 | 3,289 |
| CVS Caremark Corp. | 6.250% | 6/1/27 | 27,969 | 32,577 |
| CVS Caremark Corp. | 6.125% | 9/15/39 | 13,043 | 14,794 |
| CVS Caremark Corp. | 5.750% | 5/15/41 | 18 | 19 |
| CVS Caremark Corp. | 5.300% | 12/5/43 | 3,175 | 3,270 |
| 6 Daimler Finance North America LLC | 2.625% | 9/15/16 | 5,125 | 5,281 |
| Daimler Finance North America LLC | 8.500% | 1/18/31 | 4,384 | 6,339 |
| Darden Restaurants Inc. | 6.200% | 10/15/17 | 8,200 | 9,121 |
| Dollar General Corp. | 3.250% | 4/15/23 | 17,180 | 15,762 |
| eBay Inc. | 1.625% | 10/15/15 | 3,596 | 3,666 |
| eBay Inc. | 1.350% | 7/15/17 | 9,000 | 8,989 |
| eBay Inc. | 3.250% | 10/15/20 | 3,280 | 3,352 |
| eBay Inc. | 2.600% | 7/15/22 | 3,850 | 3,540 |
| eBay Inc. | 4.000% | 7/15/42 | 4,368 | 3,694 |
| Expedia Inc. | 5.950% | 8/15/20 | 2,000 | 2,163 |
| Family Dollar Stores Inc. | 5.000% | 2/1/21 | 2,550 | 2,616 |
| Ford Holdings LLC | 9.300% | 3/1/30 | 4,525 | 6,116 |
| Ford Motor Co. | 6.625% | 10/1/28 | 4,646 | 5,237 |
| Ford Motor Co. | 6.375% | 2/1/29 | 6,044 | 6,630 |
| Ford Motor Co. | 7.450% | 7/16/31 | 18,605 | 22,762 |
| Ford Motor Co. | 4.750% | 1/15/43 | 3,946 | 3,543 |
| Ford Motor Co. | 7.400% | 11/1/46 | 5,325 | 6,402 |
| Ford Motor Credit Co. LLC | 3.875% | 1/15/15 | 12,425 | 12,820 |
| Ford Motor Credit Co. LLC | 7.000% | 4/15/15 | 8,475 | 9,116 |
| Ford Motor Credit Co. LLC | 2.750% | 5/15/15 | 14,450 | 14,823 |
| Ford Motor Credit Co. LLC | 12.000% | 5/15/15 | 6,400 | 7,340 |
| Ford Motor Credit Co. LLC | 5.625% | 9/15/15 | 13,200 | 14,185 |
| Ford Motor Credit Co. LLC | 4.207% | 4/15/16 | 6,250 | 6,661 |
| Ford Motor Credit Co. LLC | 1.700% | 5/9/16 | 7,675 | 7,738 |
| Ford Motor Credit Co. LLC | 3.984% | 6/15/16 | 3,650 | 3,876 |
| Ford Motor Credit Co. LLC | 8.000% | 12/15/16 | 10,000 | 11,811 |
| Ford Motor Credit Co. LLC | 4.250% | 2/3/17 | 5,450 | 5,867 |
| Ford Motor Credit Co. LLC | 3.000% | 6/12/17 | 13,075 | 13,557 |
| Ford Motor Credit Co. LLC | 6.625% | 8/15/17 | 19,023 | 21,980 |
| Ford Motor Credit Co. LLC | 5.000% | 5/15/18 | 11,420 | 12,683 |
| Ford Motor Credit Co. LLC | 2.875% | 10/1/18 | 7,200 | 7,366 |
| Ford Motor Credit Co. LLC | 8.125% | 1/15/20 | 6,450 | 8,094 |
| Ford Motor Credit Co. LLC | 5.750% | 2/1/21 | 9,575 | 10,685 |
| Ford Motor Credit Co. LLC | 5.875% | 8/2/21 | 11,900 | 13,478 |
| Ford Motor Credit Co. LLC | 4.250% | 9/20/22 | 6,700 | 6,700 |
| Ford Motor Credit Co. LLC | 4.375% | 8/6/23 | 20,330 | 20,369 |
| Gap Inc. | 5.950% | 4/12/21 | 11,025 | 12,113 |
| Historic TW Inc. | 9.150% | 2/1/23 | 7,650 | 10,113 |
| Historic TW Inc. | 6.625% | 5/15/29 | 7,845 | 8,977 |
| Home Depot Inc. | 5.400% | 3/1/16 | 6,223 | 6,845 |
| Home Depot Inc. | 3.950% | 9/15/20 | 4,500 | 4,797 |
| Home Depot Inc. | 4.400% | 4/1/21 | 33,125 | 35,606 |
| Home Depot Inc. | 2.700% | 4/1/23 | 5,175 | 4,765 |
| Home Depot Inc. | 3.750% | 2/15/24 | 8,900 | 8,833 |
| Home Depot Inc. | 5.875% | 12/16/36 | 7,685 | 8,833 |
| Home Depot Inc. | 5.400% | 9/15/40 | 1,900 | 2,030 |
| Home Depot Inc. | 5.950% | 4/1/41 | 13,243 | 15,246 |
| Home Depot Inc. | 4.200% | 4/1/43 | 9,400 | 8,499 |
48
| Vanguard® Total Bond Market Index Fund | ||||
| Schedule of Investments | ||||
| December 31, 2013 | ||||
| Face | Market | |||
| Maturity | Amount | Value | ||
| Coupon | Date | ($000) | ($000) | |
| Home Depot Inc. | 4.875% | 2/15/44 | 7,725 | 7,824 |
| Host Hotels & Resorts LP | 6.000% | 10/1/21 | 11,075 | 12,099 |
| Host Hotels & Resorts LP | 5.250% | 3/15/22 | 5,000 | 5,213 |
| Host Hotels & Resorts LP | 4.750% | 3/1/23 | 7,450 | 7,515 |
| Hyatt Hotels Corp. | 3.875% | 8/15/16 | 1,475 | 1,560 |
| Hyatt Hotels Corp. | 5.375% | 8/15/21 | 1,250 | 1,336 |
| Hyatt Hotels Corp. | 3.375% | 7/15/23 | 2,875 | 2,620 |
| International Game Technology | 7.500% | 6/15/19 | 3,625 | 4,210 |
| International Game Technology | 5.500% | 6/15/20 | 3,000 | 3,194 |
| Johnson Controls Inc. | 5.500% | 1/15/16 | 3,000 | 3,260 |
| Johnson Controls Inc. | 5.000% | 3/30/20 | 21,987 | 24,063 |
| Johnson Controls Inc. | 3.750% | 12/1/21 | 50 | 50 |
| Johnson Controls Inc. | 6.000% | 1/15/36 | 2,100 | 2,240 |
| Johnson Controls Inc. | 5.700% | 3/1/41 | 1,300 | 1,351 |
| Johnson Controls Inc. | 5.250% | 12/1/41 | 5,183 | 5,025 |
| Kohl's Corp. | 6.250% | 12/15/17 | 2,725 | 3,130 |
| Kohl's Corp. | 4.000% | 11/1/21 | 5,625 | 5,576 |
| Kohl's Corp. | 3.250% | 2/1/23 | 2,018 | 1,845 |
| Kohl's Corp. | 6.000% | 1/15/33 | 725 | 729 |
| Kohl's Corp. | 6.875% | 12/15/37 | 3,325 | 3,690 |
| Lowe's Cos. Inc. | 5.000% | 10/15/15 | 20 | 22 |
| Lowe's Cos. Inc. | 2.125% | 4/15/16 | 150 | 154 |
| Lowe's Cos. Inc. | 5.400% | 10/15/16 | 15,550 | 17,352 |
| Lowe's Cos. Inc. | 1.625% | 4/15/17 | 6,675 | 6,737 |
| Lowe's Cos. Inc. | 6.100% | 9/15/17 | 3,350 | 3,828 |
| Lowe's Cos. Inc. | 3.800% | 11/15/21 | 2,400 | 2,474 |
| Lowe's Cos. Inc. | 3.120% | 4/15/22 | 3,525 | 3,402 |
| Lowe's Cos. Inc. | 3.875% | 9/15/23 | 3,675 | 3,703 |
| Lowe's Cos. Inc. | 6.875% | 2/15/28 | 560 | 686 |
| Lowe's Cos. Inc. | 6.500% | 3/15/29 | 3,694 | 4,355 |
| Lowe's Cos. Inc. | 5.500% | 10/15/35 | 218 | 232 |
| Lowe's Cos. Inc. | 5.800% | 10/15/36 | 8,549 | 9,393 |
| Lowe's Cos. Inc. | 5.800% | 4/15/40 | 550 | 612 |
| Lowe's Cos. Inc. | 5.125% | 11/15/41 | 5,600 | 5,735 |
| Lowe's Cos. Inc. | 4.650% | 4/15/42 | 10,868 | 10,496 |
| Lowe's Cos. Inc. | 5.000% | 9/15/43 | 1,825 | 1,835 |
| Macy's Retail Holdings Inc. | 7.875% | 7/15/15 | 10,350 | 11,412 |
| Macy's Retail Holdings Inc. | 5.900% | 12/1/16 | 10,015 | 11,242 |
| Macy's Retail Holdings Inc. | 7.450% | 7/15/17 | 5,000 | 5,880 |
| Macy's Retail Holdings Inc. | 3.875% | 1/15/22 | 6,200 | 6,181 |
| Macy's Retail Holdings Inc. | 2.875% | 2/15/23 | 1,648 | 1,492 |
| Macy's Retail Holdings Inc. | 6.650% | 7/15/24 | 50 | 57 |
| Macy's Retail Holdings Inc. | 6.900% | 4/1/29 | 14,858 | 16,682 |
| Macy's Retail Holdings Inc. | 6.900% | 1/15/32 | 25 | 28 |
| Macy's Retail Holdings Inc. | 6.700% | 7/15/34 | 250 | 283 |
| Macy's Retail Holdings Inc. | 6.375% | 3/15/37 | 8,925 | 9,910 |
| Macy's Retail Holdings Inc. | 4.300% | 2/15/43 | 893 | 750 |
| Marriott International Inc. | 6.200% | 6/15/16 | 1,500 | 1,671 |
| Marriott International Inc. | 6.375% | 6/15/17 | 1,750 | 1,993 |
| Marriott International Inc. | 3.000% | 3/1/19 | 2,300 | 2,312 |
| Marriott International Inc. | 3.375% | 10/15/20 | 10,600 | 10,441 |
| McDonald's Corp. | 0.750% | 5/29/15 | 2,750 | 2,762 |
| McDonald's Corp. | 5.300% | 3/15/17 | 2,950 | 3,303 |
| McDonald's Corp. | 5.800% | 10/15/17 | 5,580 | 6,431 |
| McDonald's Corp. | 5.350% | 3/1/18 | 7,750 | 8,824 |
| McDonald's Corp. | 5.000% | 2/1/19 | 3,150 | 3,567 |
| McDonald's Corp. | 1.875% | 5/29/19 | 7,100 | 6,959 |
| McDonald's Corp. | 3.500% | 7/15/20 | 100 | 104 |
| McDonald's Corp. | 2.625% | 1/15/22 | 800 | 762 |
| McDonald's Corp. | 6.300% | 10/15/37 | 3,478 | 4,188 |
| McDonald's Corp. | 6.300% | 3/1/38 | 8,650 | 10,487 |
| McDonald's Corp. | 5.700% | 2/1/39 | 2,500 | 2,809 |
| McDonald's Corp. | 3.700% | 2/15/42 | 4,344 | 3,674 |
| McDonald's Corp. | 3.625% | 5/1/43 | 7,125 | 5,938 |
49
| Vanguard® Total Bond Market Index Fund | ||||
| Schedule of Investments | ||||
| December 31, 2013 | ||||
| Face | Market | |||
| Maturity | Amount | Value | ||
| Coupon | Date | ($000) | ($000) | |
| MDC Holdings Inc. | 6.000% | 1/15/43 | 2,000 | 1,721 |
| NIKE Inc. | 2.250% | 5/1/23 | 805 | 720 |
| NIKE Inc. | 3.625% | 5/1/43 | 1,800 | 1,500 |
| Nordstrom Inc. | 6.250% | 1/15/18 | 11,075 | 12,806 |
| Nordstrom Inc. | 4.750% | 5/1/20 | 3,875 | 4,235 |
| Nordstrom Inc. | 4.000% | 10/15/21 | 12,516 | 12,947 |
| Nordstrom Inc. | 6.950% | 3/15/28 | 3,175 | 3,806 |
| Nordstrom Inc. | 7.000% | 1/15/38 | 1,980 | 2,526 |
| NVR Inc. | 3.950% | 9/15/22 | 3,800 | 3,627 |
| O'Reilly Automotive Inc. | 4.875% | 1/14/21 | 900 | 939 |
| O'Reilly Automotive Inc. | 4.625% | 9/15/21 | 3,200 | 3,297 |
| O'Reilly Automotive Inc. | 3.800% | 9/1/22 | 575 | 552 |
| O'Reilly Automotive Inc. | 3.850% | 6/15/23 | 1,400 | 1,341 |
| PACCAR Financial Corp. | 0.800% | 2/8/16 | 3,450 | 3,446 |
| PACCAR Financial Corp. | 1.150% | 8/16/16 | 10,000 | 10,029 |
| PACCAR Financial Corp. | 1.600% | 3/15/17 | 1,165 | 1,162 |
| QVC Inc. | 5.125% | 7/2/22 | 875 | 865 |
| QVC Inc. | 4.375% | 3/15/23 | 1,050 | 986 |
| QVC Inc. | 5.950% | 3/15/43 | 4,425 | 3,994 |
| Ralph Lauren Corp. | 2.125% | 9/26/18 | 2,825 | 2,824 |
| Staples Inc. | 2.750% | 1/12/18 | 10,000 | 10,159 |
| Starbucks Corp. | 0.875% | 12/5/16 | 6,725 | 6,698 |
| Starbucks Corp. | 2.000% | 12/5/18 | 4,300 | 4,267 |
| Starwood Hotels & Resorts Worldwide Inc. | 6.750% | 5/15/18 | 10 | 12 |
| Starwood Hotels & Resorts Worldwide Inc. | 3.125% | 2/15/23 | 2,866 | 2,588 |
| Target Corp. | 5.875% | 7/15/16 | 9,350 | 10,543 |
| Target Corp. | 5.375% | 5/1/17 | 8,975 | 10,102 |
| Target Corp. | 6.000% | 1/15/18 | 5,650 | 6,522 |
| Target Corp. | 3.875% | 7/15/20 | 2,400 | 2,528 |
| Target Corp. | 2.900% | 1/15/22 | 8,565 | 8,196 |
| Target Corp. | 6.350% | 11/1/32 | 7,645 | 8,972 |
| Target Corp. | 6.500% | 10/15/37 | 8,670 | 10,352 |
| Target Corp. | 7.000% | 1/15/38 | 9,892 | 12,536 |
| Target Corp. | 4.000% | 7/1/42 | 9,100 | 7,857 |
| Time Warner Cos. Inc. | 7.570% | 2/1/24 | 1,680 | 2,050 |
| Time Warner Cos. Inc. | 6.950% | 1/15/28 | 85 | 100 |
| Time Warner Inc. | 3.150% | 7/15/15 | 575 | 596 |
| Time Warner Inc. | 5.875% | 11/15/16 | 18,535 | 20,898 |
| Time Warner Inc. | 4.875% | 3/15/20 | 3,095 | 3,399 |
| Time Warner Inc. | 4.700% | 1/15/21 | 3,320 | 3,528 |
| Time Warner Inc. | 4.750% | 3/29/21 | 18,400 | 19,603 |
| Time Warner Inc. | 4.000% | 1/15/22 | 2,400 | 2,418 |
| Time Warner Inc. | 4.050% | 12/15/23 | 825 | 819 |
| Time Warner Inc. | 7.625% | 4/15/31 | 13,715 | 17,249 |
| Time Warner Inc. | 7.700% | 5/1/32 | 11,235 | 14,348 |
| Time Warner Inc. | 6.500% | 11/15/36 | 7,650 | 8,516 |
| Time Warner Inc. | 6.200% | 3/15/40 | 4,895 | 5,321 |
| Time Warner Inc. | 6.100% | 7/15/40 | 10,300 | 11,227 |
| Time Warner Inc. | 6.250% | 3/29/41 | 11,195 | 12,399 |
| Time Warner Inc. | 5.375% | 10/15/41 | 2,275 | 2,295 |
| Time Warner Inc. | 5.350% | 12/15/43 | 1,850 | 1,865 |
| TJX Cos. Inc. | 6.950% | 4/15/19 | 17,510 | 21,152 |
| TJX Cos. Inc. | 2.500% | 5/15/23 | 50 | 45 |
| Toyota Motor Credit Corp. | 1.000% | 2/17/15 | 4,825 | 4,855 |
| Toyota Motor Credit Corp. | 3.200% | 6/17/15 | 15,285 | 15,882 |
| Toyota Motor Credit Corp. | 2.800% | 1/11/16 | 2,000 | 2,076 |
| Toyota Motor Credit Corp. | 2.000% | 9/15/16 | 8,350 | 8,552 |
| Toyota Motor Credit Corp. | 2.050% | 1/12/17 | 17,200 | 17,583 |
| Toyota Motor Credit Corp. | 1.250% | 10/5/17 | 6,300 | 6,178 |
| Toyota Motor Credit Corp. | 1.375% | 1/10/18 | 14,000 | 13,767 |
| Toyota Motor Credit Corp. | 2.000% | 10/24/18 | 5,275 | 5,260 |
| Toyota Motor Credit Corp. | 4.500% | 6/17/20 | 5,400 | 5,859 |
| Toyota Motor Credit Corp. | 4.250% | 1/11/21 | 4,075 | 4,355 |
| Toyota Motor Credit Corp. | 3.400% | 9/15/21 | 7,124 | 7,215 |
50
| Vanguard® Total Bond Market Index Fund | ||||
| Schedule of Investments | ||||
| December 31, 2013 | ||||
| Face | Market | |||
| Maturity | Amount | Value | ||
| Coupon | Date | ($000) | ($000) | |
| Toyota Motor Credit Corp. | 3.300% | 1/12/22 | 16,600 | 16,450 |
| Toyota Motor Credit Corp. | 2.625% | 1/10/23 | 9,900 | 9,105 |
| VF Corp. | 5.950% | 11/1/17 | 2,700 | 3,060 |
| VF Corp. | 3.500% | 9/1/21 | 8,000 | 7,957 |
| VF Corp. | 6.450% | 11/1/37 | 2,398 | 2,818 |
| Viacom Inc. | 4.375% | 9/15/14 | 6,275 | 6,441 |
| Viacom Inc. | 1.250% | 2/27/15 | 2,900 | 2,914 |
| Viacom Inc. | 4.250% | 9/15/15 | 300 | 317 |
| Viacom Inc. | 6.250% | 4/30/16 | 3,400 | 3,795 |
| Viacom Inc. | 2.500% | 12/15/16 | 2,950 | 3,051 |
| Viacom Inc. | 3.500% | 4/1/17 | 12,025 | 12,749 |
| Viacom Inc. | 6.125% | 10/5/17 | 5,925 | 6,784 |
| Viacom Inc. | 2.500% | 9/1/18 | 175 | 177 |
| Viacom Inc. | 5.625% | 9/15/19 | 14,810 | 16,885 |
| Viacom Inc. | 3.875% | 12/15/21 | 1,050 | 1,045 |
| Viacom Inc. | 4.250% | 9/1/23 | 2,275 | 2,266 |
| Viacom Inc. | 6.875% | 4/30/36 | 10,023 | 11,535 |
| Viacom Inc. | 4.500% | 2/27/42 | 3,425 | 2,931 |
| Viacom Inc. | 4.375% | 3/15/43 | 448 | 377 |
| Viacom Inc. | 5.850% | 9/1/43 | 8,800 | 9,163 |
| Wal-Mart Stores Inc. | 4.500% | 7/1/15 | 2,450 | 2,601 |
| Wal-Mart Stores Inc. | 2.250% | 7/8/15 | 4,150 | 4,267 |
| Wal-Mart Stores Inc. | 1.500% | 10/25/15 | 21,960 | 22,379 |
| Wal-Mart Stores Inc. | 2.800% | 4/15/16 | 300 | 314 |
| Wal-Mart Stores Inc. | 5.375% | 4/5/17 | 1,650 | 1,862 |
| Wal-Mart Stores Inc. | 5.800% | 2/15/18 | 13,450 | 15,550 |
| Wal-Mart Stores Inc. | 3.625% | 7/8/20 | 38,550 | 40,500 |
| Wal-Mart Stores Inc. | 3.250% | 10/25/20 | 26,550 | 27,086 |
| Wal-Mart Stores Inc. | 4.250% | 4/15/21 | 14,600 | 15,695 |
| Wal-Mart Stores Inc. | 2.550% | 4/11/23 | 11,000 | 10,023 |
| Wal-Mart Stores Inc. | 5.875% | 4/5/27 | 18,830 | 22,282 |
| Wal-Mart Stores Inc. | 7.550% | 2/15/30 | 13,390 | 17,970 |
| Wal-Mart Stores Inc. | 5.250% | 9/1/35 | 6,201 | 6,693 |
| Wal-Mart Stores Inc. | 6.500% | 8/15/37 | 21,336 | 26,551 |
| Wal-Mart Stores Inc. | 6.200% | 4/15/38 | 5,819 | 7,032 |
| Wal-Mart Stores Inc. | 5.625% | 4/1/40 | 4,250 | 4,815 |
| Wal-Mart Stores Inc. | 4.875% | 7/8/40 | 2,100 | 2,122 |
| Wal-Mart Stores Inc. | 5.000% | 10/25/40 | 1,900 | 1,985 |
| Wal-Mart Stores Inc. | 5.625% | 4/15/41 | 21,995 | 24,868 |
| Wal-Mart Stores Inc. | 4.000% | 4/11/43 | 9,246 | 8,203 |
| Walgreen Co. | 1.000% | 3/13/15 | 5,250 | 5,274 |
| Walgreen Co. | 1.800% | 9/15/17 | 3,300 | 3,326 |
| Walgreen Co. | 5.250% | 1/15/19 | 4,125 | 4,627 |
| Walgreen Co. | 3.100% | 9/15/22 | 11,725 | 10,989 |
| Walgreen Co. | 4.400% | 9/15/42 | 7,475 | 6,625 |
| Walt Disney Co. | 6.200% | 6/20/14 | 15 | 15 |
| Walt Disney Co. | 0.450% | 12/1/15 | 4,000 | 3,997 |
| Walt Disney Co. | 1.350% | 8/16/16 | 1,200 | 1,216 |
| Walt Disney Co. | 5.625% | 9/15/16 | 5,525 | 6,223 |
| Walt Disney Co. | 1.125% | 2/15/17 | 4,275 | 4,267 |
| Walt Disney Co. | 1.100% | 12/1/17 | 10,408 | 10,285 |
| Walt Disney Co. | 5.875% | 12/15/17 | 5,360 | 6,193 |
| Walt Disney Co. | 2.750% | 8/16/21 | 7,600 | 7,321 |
| Walt Disney Co. | 2.550% | 2/15/22 | 5,586 | 5,188 |
| Walt Disney Co. | 2.350% | 12/1/22 | 5,050 | 4,584 |
| Walt Disney Co. | 7.000% | 3/1/32 | 1,943 | 2,467 |
| Walt Disney Co. | 4.375% | 8/16/41 | 3,560 | 3,312 |
| Walt Disney Co. | 4.125% | 12/1/41 | 10,525 | 9,507 |
| Walt Disney Co. | 3.700% | 12/1/42 | 4,670 | 3,907 |
| Western Union Co. | 6.500% | 2/26/14 | 2,850 | 2,875 |
| Western Union Co. | 5.930% | 10/1/16 | 3,525 | 3,913 |
| Western Union Co. | 5.253% | 4/1/20 | 3,946 | 4,203 |
| Western Union Co. | 6.200% | 11/17/36 | 5,973 | 5,577 |
| Western Union Co. | 6.200% | 6/21/40 | 5,225 | 4,734 |
51
| Vanguard® Total Bond Market Index Fund | ||||
| Schedule of Investments | ||||
| December 31, 2013 | ||||
| Face | Market | |||
| Maturity | Amount | Value | ||
| Coupon | Date | ($000) | ($000) | |
| Wyndham Worldwide Corp. | 2.950% | 3/1/17 | 750 | 764 |
| Wyndham Worldwide Corp. | 2.500% | 3/1/18 | 1,150 | 1,148 |
| Wyndham Worldwide Corp. | 4.250% | 3/1/22 | 10,545 | 10,268 |
| Wyndham Worldwide Corp. | 3.900% | 3/1/23 | 500 | 470 |
| Yum! Brands Inc. | 6.250% | 4/15/16 | 3,535 | 3,926 |
| Yum! Brands Inc. | 6.250% | 3/15/18 | 1,325 | 1,533 |
| Yum! Brands Inc. | 3.875% | 11/1/20 | 825 | 833 |
| Yum! Brands Inc. | 6.875% | 11/15/37 | 2,129 | 2,430 |
| Consumer Noncyclical (3.3%) | ||||
| Abbott Laboratories | 5.125% | 4/1/19 | 19,951 | 22,656 |
| Abbott Laboratories | 4.125% | 5/27/20 | 6,717 | 7,247 |
| Abbott Laboratories | 6.150% | 11/30/37 | 5,968 | 7,008 |
| Abbott Laboratories | 6.000% | 4/1/39 | 1,175 | 1,362 |
| AbbVie Inc. | 1.200% | 11/6/15 | 25,375 | 25,649 |
| AbbVie Inc. | 1.750% | 11/6/17 | 28,475 | 28,414 |
| AbbVie Inc. | 2.000% | 11/6/18 | 12,350 | 12,189 |
| AbbVie Inc. | 2.900% | 11/6/22 | 23,213 | 21,707 |
| AbbVie Inc. | 4.400% | 11/6/42 | 22,044 | 20,661 |
| Actavis Inc. | 1.875% | 10/1/17 | 9,115 | 9,062 |
| Actavis Inc. | 6.125% | 8/15/19 | 3,875 | 4,464 |
| Actavis Inc. | 3.250% | 10/1/22 | 18,117 | 16,906 |
| Actavis Inc. | 4.625% | 10/1/42 | 5,450 | 4,959 |
| Allergan Inc. | 5.750% | 4/1/16 | 4,495 | 4,977 |
| Allergan Inc. | 2.800% | 3/15/23 | 1,800 | 1,667 |
| Altria Group Inc. | 4.125% | 9/11/15 | 425 | 449 |
| Altria Group Inc. | 9.700% | 11/10/18 | 7,388 | 9,731 |
| Altria Group Inc. | 9.250% | 8/6/19 | 11,035 | 14,525 |
| Altria Group Inc. | 4.750% | 5/5/21 | 5,535 | 5,927 |
| Altria Group Inc. | 2.950% | 5/2/23 | 7,825 | 7,060 |
| Altria Group Inc. | 4.000% | 1/31/24 | 6,325 | 6,189 |
| Altria Group Inc. | 9.950% | 11/10/38 | 3,969 | 6,033 |
| Altria Group Inc. | 10.200% | 2/6/39 | 17,060 | 26,494 |
| Altria Group Inc. | 4.250% | 8/9/42 | 13,546 | 11,509 |
| Altria Group Inc. | 4.500% | 5/2/43 | 9,600 | 8,445 |
| Altria Group Inc. | 5.375% | 1/31/44 | 10,925 | 10,905 |
| AmerisourceBergen Corp. | 5.875% | 9/15/15 | 8,461 | 9,175 |
| AmerisourceBergen Corp. | 4.875% | 11/15/19 | 5,345 | 5,920 |
| AmerisourceBergen Corp. | 3.500% | 11/15/21 | 3,900 | 3,834 |
| Amgen Inc. | 2.300% | 6/15/16 | 11,000 | 11,348 |
| Amgen Inc. | 2.500% | 11/15/16 | 7,175 | 7,450 |
| Amgen Inc. | 2.125% | 5/15/17 | 6,900 | 7,016 |
| Amgen Inc. | 5.850% | 6/1/17 | 11,120 | 12,637 |
| Amgen Inc. | 5.700% | 2/1/19 | 13,200 | 15,215 |
| Amgen Inc. | 3.450% | 10/1/20 | 5,825 | 5,916 |
| Amgen Inc. | 4.100% | 6/15/21 | 8,950 | 9,335 |
| Amgen Inc. | 3.875% | 11/15/21 | 10,450 | 10,724 |
| Amgen Inc. | 3.625% | 5/15/22 | 14,524 | 14,353 |
| Amgen Inc. | 6.375% | 6/1/37 | 1,625 | 1,859 |
| Amgen Inc. | 6.900% | 6/1/38 | 11,080 | 13,380 |
| Amgen Inc. | 6.400% | 2/1/39 | 9,725 | 11,149 |
| Amgen Inc. | 5.750% | 3/15/40 | 4,735 | 5,053 |
| Amgen Inc. | 4.950% | 10/1/41 | 1,995 | 1,890 |
| Amgen Inc. | 5.150% | 11/15/41 | 19,645 | 19,517 |
| Amgen Inc. | 5.650% | 6/15/42 | 9,925 | 10,486 |
| Amgen Inc. | 5.375% | 5/15/43 | 2,125 | 2,176 |
| Anheuser-Busch Cos. LLC | 5.600% | 3/1/17 | 8,850 | 9,903 |
| Anheuser-Busch Cos. LLC | 5.500% | 1/15/18 | 10,480 | 11,919 |
| Anheuser-Busch Cos. LLC | 6.800% | 8/20/32 | 2,275 | 2,788 |
| Anheuser-Busch Cos. LLC | 5.950% | 1/15/33 | 10 | 11 |
| Anheuser-Busch Cos. LLC | 5.750% | 4/1/36 | 5,995 | 6,711 |
| Anheuser-Busch Cos. LLC | 6.450% | 9/1/37 | 670 | 824 |
| Anheuser-Busch InBev Finance Inc. | 1.250% | 1/17/18 | 9,450 | 9,236 |
| Anheuser-Busch InBev Finance Inc. | 2.625% | 1/17/23 | 3,000 | 2,754 |
52
| Vanguard® Total Bond Market Index Fund | ||||
| Schedule of Investments | ||||
| December 31, 2013 | ||||
| Face | Market | |||
| Maturity | Amount | Value | ||
| Coupon | Date | ($000) | ($000) | |
| Anheuser-Busch InBev Finance Inc. | 4.000% | 1/17/43 | 9,165 | 8,070 |
| Anheuser-Busch InBev Worldwide Inc. | 4.125% | 1/15/15 | 11,062 | 11,476 |
| Anheuser-Busch InBev Worldwide Inc. | 0.800% | 7/15/15 | 20,733 | 20,828 |
| Anheuser-Busch InBev Worldwide Inc. | 1.375% | 7/15/17 | 10,922 | 10,895 |
| Anheuser-Busch InBev Worldwide Inc. | 7.750% | 1/15/19 | 8,687 | 10,844 |
| Anheuser-Busch InBev Worldwide Inc. | 6.875% | 11/15/19 | 6,900 | 8,448 |
| Anheuser-Busch InBev Worldwide Inc. | 5.375% | 1/15/20 | 21,707 | 24,747 |
| Anheuser-Busch InBev Worldwide Inc. | 5.000% | 4/15/20 | 10,090 | 11,309 |
| Anheuser-Busch InBev Worldwide Inc. | 4.375% | 2/15/21 | 6,150 | 6,590 |
| Anheuser-Busch InBev Worldwide Inc. | 2.500% | 7/15/22 | 16,434 | 15,220 |
| Anheuser-Busch InBev Worldwide Inc. | 8.200% | 1/15/39 | 6,418 | 9,375 |
| Anheuser-Busch InBev Worldwide Inc. | 6.375% | 1/15/40 | 10,603 | 12,936 |
| Anheuser-Busch InBev Worldwide Inc. | 3.750% | 7/15/42 | 21,455 | 17,992 |
| Archer-Daniels-Midland Co. | 8.375% | 4/15/17 | 525 | 639 |
| Archer-Daniels-Midland Co. | 5.450% | 3/15/18 | 8,900 | 10,088 |
| Archer-Daniels-Midland Co. | 4.479% | 3/1/21 | 14,100 | 14,893 |
| Archer-Daniels-Midland Co. | 5.935% | 10/1/32 | 4,275 | 4,705 |
| Archer-Daniels-Midland Co. | 5.375% | 9/15/35 | 3,618 | 3,849 |
| Archer-Daniels-Midland Co. | 5.765% | 3/1/41 | 8,285 | 9,176 |
| Archer-Daniels-Midland Co. | 4.535% | 3/26/42 | 18 | 17 |
| Archer-Daniels-Midland Co. | 4.016% | 4/16/43 | 3,565 | 3,031 |
| 3 Ascension Health Alliance | 4.847% | 11/15/53 | 8,900 | 8,462 |
| AstraZeneca plc | 5.900% | 9/15/17 | 19,455 | 22,264 |
| AstraZeneca plc | 1.950% | 9/18/19 | 475 | 465 |
| AstraZeneca plc | 6.450% | 9/15/37 | 20,916 | 24,856 |
| AstraZeneca plc | 4.000% | 9/18/42 | 10,950 | 9,403 |
| Avon Products Inc. | 2.375% | 3/15/16 | 2,600 | 2,628 |
| Avon Products Inc. | 5.750% | 3/1/18 | 1,982 | 2,132 |
| Avon Products Inc. | 6.500% | 3/1/19 | 410 | 445 |
| Avon Products Inc. | 4.600% | 3/15/20 | 6,425 | 6,411 |
| Avon Products Inc. | 5.000% | 3/15/23 | 2,125 | 2,075 |
| Avon Products Inc. | 6.950% | 3/15/43 | 5,725 | 5,544 |
| Baptist Health South Florida Obligated Group Revenue | 4.590% | 8/15/21 | 1,000 | 1,032 |
| Baxter International Inc. | 4.625% | 3/15/15 | 5 | 5 |
| Baxter International Inc. | 5.900% | 9/1/16 | 1,700 | 1,915 |
| Baxter International Inc. | 5.375% | 6/1/18 | 5,000 | 5,679 |
| Baxter International Inc. | 1.850% | 6/15/18 | 10,700 | 10,643 |
| Baxter International Inc. | 2.400% | 8/15/22 | 3,895 | 3,530 |
| Baxter International Inc. | 6.250% | 12/1/37 | 3,925 | 4,621 |
| Baxter International Inc. | 3.650% | 8/15/42 | 3,643 | 2,998 |
| Baxter International Inc. | 4.500% | 6/15/43 | 2,300 | 2,215 |
| Beam Inc. | 5.375% | 1/15/16 | 5 | 5 |
| Beam Inc. | 1.875% | 5/15/17 | 1,025 | 1,028 |
| Beam Inc. | 1.750% | 6/15/18 | 275 | 268 |
| Beam Inc. | 3.250% | 5/15/22 | 2,050 | 1,956 |
| Beam Inc. | 3.250% | 6/15/23 | 550 | 516 |
| Becton Dickinson & Co. | 1.750% | 11/8/16 | 1,700 | 1,731 |
| Becton Dickinson & Co. | 5.000% | 5/15/19 | 1,125 | 1,259 |
| Becton Dickinson & Co. | 3.250% | 11/12/20 | 5,025 | 5,034 |
| Becton Dickinson & Co. | 3.125% | 11/8/21 | 14,790 | 14,482 |
| Becton Dickinson & Co. | 6.000% | 5/15/39 | 1,000 | 1,153 |
| Becton Dickinson & Co. | 5.000% | 11/12/40 | 100 | 103 |
| Biogen Idec Inc. | 6.875% | 3/1/18 | 12,825 | 15,065 |
| Boston Scientific Corp. | 6.250% | 11/15/15 | 12,151 | 13,285 |
| Boston Scientific Corp. | 5.125% | 1/12/17 | 10,000 | 10,912 |
| Boston Scientific Corp. | 6.000% | 1/15/20 | 8,095 | 9,309 |
| Boston Scientific Corp. | 7.000% | 11/15/35 | 6,400 | 7,581 |
| Boston Scientific Corp. | 7.375% | 1/15/40 | 2,150 | 2,658 |
| Bottling Group LLC | 5.500% | 4/1/16 | 18,985 | 20,943 |
| Bottling Group LLC | 5.125% | 1/15/19 | 3,475 | 3,920 |
| Bristol-Myers Squibb Co. | 0.875% | 8/1/17 | 6,925 | 6,769 |
| Bristol-Myers Squibb Co. | 5.450% | 5/1/18 | 2,225 | 2,542 |
| Bristol-Myers Squibb Co. | 1.750% | 3/1/19 | 1,750 | 1,705 |
| Bristol-Myers Squibb Co. | 2.000% | 8/1/22 | 4,334 | 3,832 |
53
| Vanguard® Total Bond Market Index Fund | ||||
| Schedule of Investments | ||||
| December 31, 2013 | ||||
| Face | Market | |||
| Maturity | Amount | Value | ||
| Coupon | Date | ($000) | ($000) | |
| Bristol-Myers Squibb Co. | 7.150% | 6/15/23 | 400 | 499 |
| Bristol-Myers Squibb Co. | 3.250% | 11/1/23 | 2,975 | 2,849 |
| Bristol-Myers Squibb Co. | 6.800% | 11/15/26 | 290 | 365 |
| Bristol-Myers Squibb Co. | 5.875% | 11/15/36 | 13,857 | 15,923 |
| Bristol-Myers Squibb Co. | 6.125% | 5/1/38 | 1,925 | 2,257 |
| Bristol-Myers Squibb Co. | 3.250% | 8/1/42 | 3,193 | 2,484 |
| Bristol-Myers Squibb Co. | 4.500% | 3/1/44 | 5,125 | 4,902 |
| Bristol-Myers Squibb Co. | 6.875% | 8/1/97 | 1,030 | 1,277 |
| Brown-Forman Corp. | 1.000% | 1/15/18 | 1,275 | 1,230 |
| Brown-Forman Corp. | 2.250% | 1/15/23 | 2,400 | 2,125 |
| Brown-Forman Corp. | 3.750% | 1/15/43 | 1,675 | 1,405 |
| Bunge Ltd. Finance Corp. | 5.100% | 7/15/15 | 7,625 | 8,054 |
| Bunge Ltd. Finance Corp. | 4.100% | 3/15/16 | 3,750 | 3,961 |
| Bunge Ltd. Finance Corp. | 8.500% | 6/15/19 | 14,950 | 18,446 |
| Campbell Soup Co. | 3.050% | 7/15/17 | 1,275 | 1,334 |
| Campbell Soup Co. | 4.250% | 4/15/21 | 3,725 | 3,776 |
| Campbell Soup Co. | 2.500% | 8/2/22 | 3,575 | 3,148 |
| Campbell Soup Co. | 3.800% | 8/2/42 | 4,628 | 3,581 |
| Cardinal Health Inc. | 4.000% | 6/15/15 | 800 | 837 |
| Cardinal Health Inc. | 1.700% | 3/15/18 | 1,000 | 982 |
| Cardinal Health Inc. | 4.625% | 12/15/20 | 11,640 | 12,530 |
| Cardinal Health Inc. | 3.200% | 6/15/22 | 20 | 19 |
| Cardinal Health Inc. | 3.200% | 3/15/23 | 6,000 | 5,612 |
| Cardinal Health Inc. | 4.600% | 3/15/43 | 2,075 | 1,932 |
| CareFusion Corp. | 6.375% | 8/1/19 | 10,532 | 11,957 |
| 3 Catholic Health Initiatives Colorado GO | 4.350% | 11/1/42 | 9,250 | 8,010 |
| Celgene Corp. | 2.450% | 10/15/15 | 1,975 | 2,033 |
| Celgene Corp. | 1.900% | 8/15/17 | 2,525 | 2,515 |
| Celgene Corp. | 2.300% | 8/15/18 | 1,075 | 1,073 |
| Celgene Corp. | 3.950% | 10/15/20 | 1,325 | 1,376 |
| Celgene Corp. | 3.250% | 8/15/22 | 14,825 | 14,042 |
| Celgene Corp. | 4.000% | 8/15/23 | 1,500 | 1,481 |
| Celgene Corp. | 5.700% | 10/15/40 | 1,650 | 1,745 |
| Celgene Corp. | 5.250% | 8/15/43 | 4,850 | 4,869 |
| Church & Dwight Co. Inc. | 3.350% | 12/15/15 | 2,375 | 2,486 |
| Clorox Co. | 5.000% | 1/15/15 | 1,725 | 1,804 |
| Clorox Co. | 3.550% | 11/1/15 | 1,825 | 1,915 |
| Clorox Co. | 5.950% | 10/15/17 | 15,415 | 17,554 |
| Coca-Cola Co. | 0.750% | 3/13/15 | 1,800 | 1,808 |
| Coca-Cola Co. | 1.500% | 11/15/15 | 11,490 | 11,701 |
| Coca-Cola Co. | 1.800% | 9/1/16 | 9,800 | 10,079 |
| Coca-Cola Co. | 5.350% | 11/15/17 | 5,750 | 6,536 |
| Coca-Cola Co. | 1.150% | 4/1/18 | 350 | 341 |
| Coca-Cola Co. | 1.650% | 11/1/18 | 19,000 | 18,751 |
| Coca-Cola Co. | 4.875% | 3/15/19 | 8,775 | 9,876 |
| Coca-Cola Co. | 2.450% | 11/1/20 | 10,300 | 10,015 |
| Coca-Cola Co. | 3.150% | 11/15/20 | 8,100 | 8,205 |
| Coca-Cola Co. | 3.300% | 9/1/21 | 3,350 | 3,368 |
| Coca-Cola Co. | 3.200% | 11/1/23 | 22,425 | 21,508 |
| Coca-Cola Enterprises Inc. | 3.500% | 9/15/20 | 1,150 | 1,154 |
| Coca-Cola Enterprises Inc. | 3.250% | 8/19/21 | 1,575 | 1,514 |
| Coca-Cola Femsa SAB de CV | 4.625% | 2/15/20 | 1,550 | 1,654 |
| Coca-Cola Femsa SAB de CV | 3.875% | 11/26/23 | 16,000 | 15,900 |
| Coca-Cola HBC Finance BV | 5.500% | 9/17/15 | 8,150 | 8,713 |
| Coca-Cola Refreshments USA Inc. | 8.500% | 2/1/22 | 6,361 | 8,242 |
| Colgate-Palmolive Co. | 1.300% | 1/15/17 | 9,375 | 9,362 |
| Colgate-Palmolive Co. | 2.625% | 5/1/17 | 700 | 725 |
| Colgate-Palmolive Co. | 2.450% | 11/15/21 | 3,400 | 3,210 |
| Colgate-Palmolive Co. | 1.950% | 2/1/23 | 1,125 | 982 |
| Colgate-Palmolive Co. | 2.100% | 5/1/23 | 1,125 | 991 |
| ConAgra Foods Inc. | 1.350% | 9/10/15 | 5,965 | 6,011 |
| ConAgra Foods Inc. | 1.300% | 1/25/16 | 400 | 401 |
| ConAgra Foods Inc. | 5.819% | 6/15/17 | 951 | 1,070 |
| ConAgra Foods Inc. | 1.900% | 1/25/18 | 17,925 | 17,686 |
54
| Vanguard® Total Bond Market Index Fund | ||||
| Schedule of Investments | ||||
| December 31, 2013 | ||||
| Face | Market | |||
| Maturity | Amount | Value | ||
| Coupon | Date | ($000) | ($000) | |
| ConAgra Foods Inc. | 7.000% | 4/15/19 | 810 | 961 |
| ConAgra Foods Inc. | 3.250% | 9/15/22 | 6,170 | 5,794 |
| ConAgra Foods Inc. | 3.200% | 1/25/23 | 13,236 | 12,238 |
| ConAgra Foods Inc. | 7.125% | 10/1/26 | 3,245 | 3,933 |
| ConAgra Foods Inc. | 7.000% | 10/1/28 | 1,020 | 1,199 |
| ConAgra Foods Inc. | 8.250% | 9/15/30 | 4,799 | 6,176 |
| ConAgra Foods Inc. | 4.650% | 1/25/43 | 8,250 | 7,489 |
| Covidien International Finance SA | 1.350% | 5/29/15 | 1,600 | 1,614 |
| Covidien International Finance SA | 2.800% | 6/15/15 | 1,750 | 1,802 |
| Covidien International Finance SA | 6.000% | 10/15/17 | 4,460 | 5,111 |
| Covidien International Finance SA | 3.200% | 6/15/22 | 5,425 | 5,218 |
| Covidien International Finance SA | 2.950% | 6/15/23 | 7,900 | 7,294 |
| Covidien International Finance SA | 6.550% | 10/15/37 | 9,841 | 12,004 |
| CR Bard Inc. | 1.375% | 1/15/18 | 3,250 | 3,156 |
| CR Bard Inc. | 6.700% | 12/1/26 | 5,250 | 6,268 |
| Delhaize Group SA | 6.500% | 6/15/17 | 3,700 | 4,161 |
| Delhaize Group SA | 4.125% | 4/10/19 | 1,500 | 1,540 |
| Delhaize Group SA | 5.700% | 10/1/40 | 5,532 | 5,190 |
| DENTSPLY International Inc. | 2.750% | 8/15/16 | 2,800 | 2,882 |
| DENTSPLY International Inc. | 4.125% | 8/15/21 | 1,575 | 1,576 |
| Diageo Capital plc | 0.625% | 4/29/16 | 5,300 | 5,275 |
| Diageo Capital plc | 5.500% | 9/30/16 | 1,275 | 1,428 |
| Diageo Capital plc | 1.500% | 5/11/17 | 13,145 | 13,159 |
| Diageo Capital plc | 5.750% | 10/23/17 | 6,404 | 7,306 |
| Diageo Capital plc | 1.125% | 4/29/18 | 1,550 | 1,493 |
| Diageo Capital plc | 4.828% | 7/15/20 | 1,555 | 1,710 |
| Diageo Capital plc | 2.625% | 4/29/23 | 16,050 | 14,606 |
| Diageo Capital plc | 5.875% | 9/30/36 | 1,875 | 2,145 |
| Diageo Capital plc | 3.875% | 4/29/43 | 12,000 | 10,306 |
| Diageo Finance BV | 3.250% | 1/15/15 | 375 | 386 |
| Diageo Finance BV | 5.300% | 10/28/15 | 7,026 | 7,612 |
| Diageo Investment Corp. | 2.875% | 5/11/22 | 2,425 | 2,311 |
| Diageo Investment Corp. | 7.450% | 4/15/35 | 1,000 | 1,304 |
| Diageo Investment Corp. | 4.250% | 5/11/42 | 3,748 | 3,401 |
| Dignity Health California GO | 3.125% | 11/1/22 | 2,100 | 1,886 |
| Dignity Health California GO | 4.500% | 11/1/42 | 8,325 | 6,695 |
| Dr Pepper Snapple Group Inc. | 2.900% | 1/15/16 | 1,150 | 1,194 |
| Dr Pepper Snapple Group Inc. | 6.820% | 5/1/18 | 5,847 | 6,897 |
| Dr Pepper Snapple Group Inc. | 2.600% | 1/15/19 | 6,050 | 6,108 |
| Dr Pepper Snapple Group Inc. | 2.000% | 1/15/20 | 275 | 260 |
| Dr Pepper Snapple Group Inc. | 3.200% | 11/15/21 | 1,225 | 1,180 |
| Dr Pepper Snapple Group Inc. | 2.700% | 11/15/22 | 2,475 | 2,242 |
| Dr Pepper Snapple Group Inc. | 7.450% | 5/1/38 | 950 | 1,208 |
| Edwards Lifesciences Corp. | 2.875% | 10/15/18 | 1,550 | 1,548 |
| Eli Lilly & Co. | 5.200% | 3/15/17 | 6,420 | 7,162 |
| Eli Lilly & Co. | 7.125% | 6/1/25 | 220 | 279 |
| Eli Lilly & Co. | 5.500% | 3/15/27 | 5,768 | 6,571 |
| Eli Lilly & Co. | 6.770% | 1/1/36 | 1,250 | 1,566 |
| Eli Lilly & Co. | 5.550% | 3/15/37 | 3,854 | 4,219 |
| Eli Lilly & Co. | 5.950% | 11/15/37 | 800 | 918 |
| Energizer Holdings Inc. | 4.700% | 5/19/21 | 3,600 | 3,633 |
| Energizer Holdings Inc. | 4.700% | 5/24/22 | 575 | 573 |
| Estee Lauder Cos. Inc. | 2.350% | 8/15/22 | 1,500 | 1,348 |
| Estee Lauder Cos. Inc. | 6.000% | 5/15/37 | 2,105 | 2,309 |
| Estee Lauder Cos. Inc. | 3.700% | 8/15/42 | 4,925 | 4,012 |
| Express Scripts Holding Co. | 2.100% | 2/12/15 | 4,400 | 4,465 |
| Express Scripts Holding Co. | 3.125% | 5/15/16 | 7,150 | 7,478 |
| Express Scripts Holding Co. | 2.650% | 2/15/17 | 18,075 | 18,650 |
| Express Scripts Holding Co. | 7.250% | 6/15/19 | 1,945 | 2,367 |
| Express Scripts Holding Co. | 4.750% | 11/15/21 | 13,125 | 13,873 |
| Express Scripts Holding Co. | 3.900% | 2/15/22 | 13,200 | 13,145 |
| Express Scripts Holding Co. | 6.125% | 11/15/41 | 4,778 | 5,368 |
| Flowers Foods Inc. | 4.375% | 4/1/22 | 2,900 | 2,852 |
| Fomento Economico Mexicano SAB de CV | 2.875% | 5/10/23 | 1,000 | 875 |
55
| Vanguard® Total Bond Market Index Fund | ||||
| Schedule of Investments | ||||
| December 31, 2013 | ||||
| Face | Market | |||
| Maturity | Amount | Value | ||
| Coupon | Date | ($000) | ($000) | |
| Fomento Economico Mexicano SAB de CV | 4.375% | 5/10/43 | 4,100 | 3,362 |
| Genentech Inc. | 4.750% | 7/15/15 | 2,675 | 2,844 |
| Genentech Inc. | 5.250% | 7/15/35 | 3,125 | 3,298 |
| General Mills Inc. | 5.200% | 3/17/15 | 875 | 923 |
| General Mills Inc. | 5.700% | 2/15/17 | 28,685 | 32,119 |
| General Mills Inc. | 5.650% | 2/15/19 | 15,217 | 17,671 |
| General Mills Inc. | 3.150% | 12/15/21 | 100 | 98 |
| General Mills Inc. | 5.400% | 6/15/40 | 550 | 582 |
| General Mills Inc. | 4.150% | 2/15/43 | 375 | 330 |
| Gilead Sciences Inc. | 2.400% | 12/1/14 | 2,200 | 2,237 |
| Gilead Sciences Inc. | 3.050% | 12/1/16 | 7,325 | 7,740 |
| Gilead Sciences Inc. | 4.500% | 4/1/21 | 9,986 | 10,685 |
| Gilead Sciences Inc. | 4.400% | 12/1/21 | 5,400 | 5,748 |
| Gilead Sciences Inc. | 5.650% | 12/1/41 | 2,695 | 2,973 |
| GlaxoSmithKline Capital Inc. | 0.700% | 3/18/16 | 9,150 | 9,115 |
| GlaxoSmithKline Capital Inc. | 5.650% | 5/15/18 | 34,452 | 39,623 |
| GlaxoSmithKline Capital Inc. | 2.800% | 3/18/23 | 1,175 | 1,084 |
| GlaxoSmithKline Capital Inc. | 5.375% | 4/15/34 | 3,500 | 3,795 |
| GlaxoSmithKline Capital Inc. | 6.375% | 5/15/38 | 27,926 | 34,091 |
| GlaxoSmithKline Capital Inc. | 4.200% | 3/18/43 | 7,050 | 6,385 |
| GlaxoSmithKline Capital plc | 1.500% | 5/8/17 | 1,000 | 1,002 |
| GlaxoSmithKline Capital plc | 2.850% | 5/8/22 | 1,395 | 1,322 |
| Hasbro Inc. | 6.300% | 9/15/17 | 5,350 | 6,067 |
| Hasbro Inc. | 6.350% | 3/15/40 | 9,326 | 9,812 |
| Hershey Co. | 5.450% | 9/1/16 | 1,275 | 1,426 |
| Hershey Co. | 1.500% | 11/1/16 | 3,975 | 4,042 |
| Hershey Co. | 4.125% | 12/1/20 | 3,325 | 3,554 |
| Hillshire Brands Co. | 4.100% | 9/15/20 | 187 | 191 |
| Hormel Foods Corp. | 4.125% | 4/15/21 | 1,300 | 1,343 |
| Ingredion Inc. | 3.200% | 11/1/15 | 650 | 674 |
| Ingredion Inc. | 4.625% | 11/1/20 | 885 | 923 |
| Ingredion Inc. | 6.625% | 4/15/37 | 1,625 | 1,816 |
| International Flavors & Fragrances Inc. | 3.200% | 5/1/23 | 925 | 855 |
| JM Smucker Co. | 3.500% | 10/15/21 | 2,200 | 2,190 |
| Johnson & Johnson | 5.550% | 8/15/17 | 4,695 | 5,365 |
| Johnson & Johnson | 5.150% | 7/15/18 | 5,400 | 6,181 |
| Johnson & Johnson | 1.650% | 12/5/18 | 6,250 | 6,193 |
| Johnson & Johnson | 3.375% | 12/5/23 | 6,100 | 6,036 |
| Johnson & Johnson | 6.950% | 9/1/29 | 4,400 | 5,781 |
| Johnson & Johnson | 4.950% | 5/15/33 | 5,025 | 5,400 |
| Johnson & Johnson | 4.375% | 12/5/33 | 4,425 | 4,437 |
| Johnson & Johnson | 5.950% | 8/15/37 | 5,015 | 5,948 |
| Johnson & Johnson | 5.850% | 7/15/38 | 1,924 | 2,274 |
| Johnson & Johnson | 4.500% | 9/1/40 | 2,355 | 2,328 |
| Johnson & Johnson | 4.850% | 5/15/41 | 20 | 21 |
| Johnson & Johnson | 4.500% | 12/5/43 | 4,975 | 4,923 |
| Kaiser Foundation Hospitals | 3.500% | 4/1/22 | 1,350 | 1,283 |
| Kaiser Foundation Hospitals | 4.875% | 4/1/42 | 3,800 | 3,578 |
| Kellogg Co. | 1.125% | 5/15/15 | 2,800 | 2,819 |
| Kellogg Co. | 4.450% | 5/30/16 | 50 | 54 |
| Kellogg Co. | 1.875% | 11/17/16 | 15,850 | 16,130 |
| Kellogg Co. | 3.250% | 5/21/18 | 7,600 | 7,942 |
| Kellogg Co. | 4.150% | 11/15/19 | 8,175 | 8,792 |
| Kellogg Co. | 3.125% | 5/17/22 | 2,850 | 2,701 |
| Kellogg Co. | 7.450% | 4/1/31 | 6,475 | 8,133 |
| Kimberly-Clark Corp. | 4.875% | 8/15/15 | 5,250 | 5,621 |
| Kimberly-Clark Corp. | 6.125% | 8/1/17 | 8,950 | 10,354 |
| Kimberly-Clark Corp. | 6.250% | 7/15/18 | 175 | 206 |
| Kimberly-Clark Corp. | 3.625% | 8/1/20 | 8,424 | 8,782 |
| Kimberly-Clark Corp. | 3.875% | 3/1/21 | 425 | 442 |
| Kimberly-Clark Corp. | 2.400% | 3/1/22 | 5,900 | 5,503 |
| Kimberly-Clark Corp. | 2.400% | 6/1/23 | 450 | 407 |
| Kimberly-Clark Corp. | 6.625% | 8/1/37 | 1,510 | 1,890 |
| Kimberly-Clark Corp. | 5.300% | 3/1/41 | 6,418 | 6,918 |
56
| Vanguard® Total Bond Market Index Fund | ||||
| Schedule of Investments | ||||
| December 31, 2013 | ||||
| Face | Market | |||
| Maturity | Amount | Value | ||
| Coupon | Date | ($000) | ($000) | |
| Kimberly-Clark Corp. | 3.700% | 6/1/43 | 2,050 | 1,724 |
| Koninklijke Philips NV | 5.750% | 3/11/18 | 10,400 | 11,895 |
| Koninklijke Philips NV | 3.750% | 3/15/22 | 11,100 | 11,154 |
| Koninklijke Philips NV | 6.875% | 3/11/38 | 4,300 | 5,121 |
| Koninklijke Philips NV | 5.000% | 3/15/42 | 5,950 | 5,884 |
| Kraft Foods Group Inc. | 1.625% | 6/4/15 | 2,000 | 2,027 |
| Kraft Foods Group Inc. | 2.250% | 6/5/17 | 9,000 | 9,140 |
| Kraft Foods Group Inc. | 6.125% | 8/23/18 | 10,210 | 11,893 |
| Kraft Foods Group Inc. | 5.375% | 2/10/20 | 8,888 | 9,971 |
| Kraft Foods Group Inc. | 3.500% | 6/6/22 | 10,735 | 10,505 |
| Kraft Foods Group Inc. | 6.875% | 1/26/39 | 18,608 | 22,753 |
| Kraft Foods Group Inc. | 6.500% | 2/9/40 | 4,080 | 4,765 |
| Kraft Foods Group Inc. | 5.000% | 6/4/42 | 6,570 | 6,401 |
| Kroger Co. | 4.950% | 1/15/15 | 1,725 | 1,799 |
| Kroger Co. | 3.900% | 10/1/15 | 320 | 338 |
| Kroger Co. | 6.400% | 8/15/17 | 7,325 | 8,410 |
| Kroger Co. | 6.800% | 12/15/18 | 2,175 | 2,600 |
| Kroger Co. | 6.150% | 1/15/20 | 7,895 | 9,009 |
| Kroger Co. | 3.300% | 1/15/21 | 2,900 | 2,886 |
| Kroger Co. | 3.400% | 4/15/22 | 875 | 839 |
| Kroger Co. | 3.850% | 8/1/23 | 2,500 | 2,455 |
| Kroger Co. | 7.700% | 6/1/29 | 8,200 | 9,967 |
| Kroger Co. | 8.000% | 9/15/29 | 1,435 | 1,801 |
| Kroger Co. | 7.500% | 4/1/31 | 7,395 | 8,959 |
| Kroger Co. | 6.900% | 4/15/38 | 6,318 | 7,359 |
| Kroger Co. | 5.400% | 7/15/40 | 18 | 18 |
| Kroger Co. | 5.000% | 4/15/42 | 925 | 872 |
| Kroger Co. | 5.150% | 8/1/43 | 700 | 685 |
| Laboratory Corp. of America Holdings | 5.625% | 12/15/15 | 2,500 | 2,718 |
| Laboratory Corp. of America Holdings | 2.200% | 8/23/17 | 2,355 | 2,367 |
| Laboratory Corp. of America Holdings | 2.500% | 11/1/18 | 2,025 | 2,005 |
| Laboratory Corp. of America Holdings | 4.625% | 11/15/20 | 200 | 209 |
| Laboratory Corp. of America Holdings | 3.750% | 8/23/22 | 860 | 832 |
| Laboratory Corp. of America Holdings | 4.000% | 11/1/23 | 1,775 | 1,705 |
| Life Technologies Corp. | 4.400% | 3/1/15 | 4,350 | 4,530 |
| Life Technologies Corp. | 3.500% | 1/15/16 | 11,185 | 11,622 |
| Life Technologies Corp. | 6.000% | 3/1/20 | 4,300 | 4,944 |
| Life Technologies Corp. | 5.000% | 1/15/21 | 2,200 | 2,385 |
| Lorillard Tobacco Co. | 3.500% | 8/4/16 | 7,500 | 7,891 |
| Lorillard Tobacco Co. | 8.125% | 6/23/19 | 7,828 | 9,552 |
| Lorillard Tobacco Co. | 6.875% | 5/1/20 | 100 | 115 |
| Lorillard Tobacco Co. | 3.750% | 5/20/23 | 8,325 | 7,571 |
| Lorillard Tobacco Co. | 8.125% | 5/1/40 | 4,000 | 4,806 |
| Lorillard Tobacco Co. | 7.000% | 8/4/41 | 4,375 | 4,740 |
| Mattel Inc. | 2.500% | 11/1/16 | 450 | 464 |
| Mattel Inc. | 1.700% | 3/15/18 | 2,275 | 2,230 |
| Mattel Inc. | 3.150% | 3/15/23 | 800 | 740 |
| Mattel Inc. | 5.450% | 11/1/41 | 1,518 | 1,513 |
| 3 Mayo Clinic | 3.774% | 11/15/43 | 11,800 | 9,559 |
| 3 Mayo Clinic | 4.000% | 11/15/47 | 4,025 | 3,301 |
| McCormick & Co. Inc. | 3.900% | 7/15/21 | 1,850 | 1,900 |
| McCormick & Co. Inc. | 3.500% | 9/1/23 | 1,800 | 1,761 |
| McKesson Corp. | 0.950% | 12/4/15 | 4,775 | 4,774 |
| McKesson Corp. | 3.250% | 3/1/16 | 1,475 | 1,540 |
| McKesson Corp. | 5.700% | 3/1/17 | 1,015 | 1,133 |
| McKesson Corp. | 7.500% | 2/15/19 | 34 | 41 |
| McKesson Corp. | 4.750% | 3/1/21 | 14,695 | 15,599 |
| McKesson Corp. | 2.700% | 12/15/22 | 1,800 | 1,613 |
| McKesson Corp. | 6.000% | 3/1/41 | 4,093 | 4,570 |
| Mead Johnson Nutrition Co. | 4.900% | 11/1/19 | 2,935 | 3,207 |
| Mead Johnson Nutrition Co. | 5.900% | 11/1/39 | 11,175 | 12,022 |
| Medco Health Solutions Inc. | 2.750% | 9/15/15 | 10,525 | 10,837 |
| Medco Health Solutions Inc. | 7.125% | 3/15/18 | 15,138 | 17,923 |
| Medtronic Inc. | 3.000% | 3/15/15 | 15,775 | 16,282 |
57
| Vanguard® Total Bond Market Index Fund | ||||
| Schedule of Investments | ||||
| December 31, 2013 | ||||
| Face | Market | |||
| Maturity | Amount | Value | ||
| Coupon | Date | ($000) | ($000) | |
| Medtronic Inc. | 4.750% | 9/15/15 | 4,450 | 4,766 |
| Medtronic Inc. | 1.375% | 4/1/18 | 12,575 | 12,334 |
| Medtronic Inc. | 5.600% | 3/15/19 | 1,150 | 1,331 |
| Medtronic Inc. | 4.450% | 3/15/20 | 2,465 | 2,708 |
| Medtronic Inc. | 2.750% | 4/1/23 | 15,200 | 14,067 |
| Medtronic Inc. | 6.500% | 3/15/39 | 2,445 | 2,969 |
| Medtronic Inc. | 5.550% | 3/15/40 | 4,275 | 4,673 |
| Medtronic Inc. | 4.500% | 3/15/42 | 4,095 | 3,855 |
| Medtronic Inc. | 4.000% | 4/1/43 | 4,250 | 3,740 |
| Memorial Sloan-Kettering Cancer Center New York GO | 5.000% | 7/1/42 | 1,250 | 1,231 |
| Memorial Sloan-Kettering Cancer Center New York GO | 4.125% | 7/1/52 | 8,100 | 6,630 |
| Merck & Co. Inc. | 2.250% | 1/15/16 | 35,050 | 36,144 |
| Merck & Co. Inc. | 6.000% | 9/15/17 | 2,450 | 2,849 |
| Merck & Co. Inc. | 1.100% | 1/31/18 | 3,573 | 3,481 |
| Merck & Co. Inc. | 1.300% | 5/18/18 | 12,800 | 12,439 |
| Merck & Co. Inc. | 3.875% | 1/15/21 | 7,230 | 7,605 |
| Merck & Co. Inc. | 2.800% | 5/18/23 | 12,300 | 11,439 |
| Merck & Co. Inc. | 6.500% | 12/1/33 | 4,118 | 5,097 |
| Merck & Co. Inc. | 6.550% | 9/15/37 | 11,263 | 13,952 |
| Merck & Co. Inc. | 3.600% | 9/15/42 | 2,947 | 2,429 |
| Merck & Co. Inc. | 4.150% | 5/18/43 | 9,750 | 8,866 |
| Merck Sharp & Dohme Corp. | 4.750% | 3/1/15 | 1,470 | 1,542 |
| Merck Sharp & Dohme Corp. | 4.000% | 6/30/15 | 9,775 | 10,279 |
| Merck Sharp & Dohme Corp. | 5.000% | 6/30/19 | 5,535 | 6,280 |
| Merck Sharp & Dohme Corp. | 6.400% | 3/1/28 | 4,148 | 5,000 |
| Merck Sharp & Dohme Corp. | 5.950% | 12/1/28 | 2,150 | 2,499 |
| Merck Sharp & Dohme Corp. | 5.750% | 11/15/36 | 10,775 | 12,115 |
| Merck Sharp & Dohme Corp. | 5.850% | 6/30/39 | 1,855 | 2,157 |
| Molson Coors Brewing Co. | 2.000% | 5/1/17 | 1,300 | 1,306 |
| Molson Coors Brewing Co. | 3.500% | 5/1/22 | 1,450 | 1,423 |
| Molson Coors Brewing Co. | 5.000% | 5/1/42 | 13,812 | 13,416 |
| Mondelez International Inc. | 4.125% | 2/9/16 | 12,325 | 13,085 |
| Mondelez International Inc. | 6.500% | 8/11/17 | 5 | 6 |
| Mondelez International Inc. | 6.125% | 2/1/18 | 435 | 503 |
| Mondelez International Inc. | 5.375% | 2/10/20 | 28,691 | 32,579 |
| Mondelez International Inc. | 6.500% | 11/1/31 | 8,615 | 9,846 |
| Mondelez International Inc. | 7.000% | 8/11/37 | 11,606 | 14,346 |
| Mondelez International Inc. | 6.875% | 2/1/38 | 9,363 | 11,393 |
| Mondelez International Inc. | 6.875% | 1/26/39 | 1,300 | 1,594 |
| Mondelez International Inc. | 6.500% | 2/9/40 | 16,150 | 19,223 |
| 6 Mylan Inc. | 1.800% | 6/24/16 | 1,150 | 1,164 |
| Mylan Inc. | 1.350% | 11/29/16 | 5,000 | 4,994 |
| 6 Mylan Inc. | 2.600% | 6/24/18 | 2,600 | 2,604 |
| Mylan Inc. | 2.550% | 3/28/19 | 4,500 | 4,457 |
| Mylan Inc. | 4.200% | 11/29/23 | 4,350 | 4,274 |
| Mylan Inc. | 5.400% | 11/29/43 | 3,550 | 3,574 |
| Newell Rubbermaid Inc. | 2.000% | 6/15/15 | 625 | 633 |
| Newell Rubbermaid Inc. | 2.050% | 12/1/17 | 2,525 | 2,515 |
| Newell Rubbermaid Inc. | 4.700% | 8/15/20 | 700 | 731 |
| Newell Rubbermaid Inc. | 4.000% | 6/15/22 | 450 | 438 |
| Novant Health Inc. | 5.850% | 11/1/19 | 6,125 | 6,837 |
| Novant Health Inc. | 4.371% | 11/1/43 | 7,100 | 5,918 |
| Novartis Capital Corp. | 2.900% | 4/24/15 | 20,705 | 21,395 |
| Novartis Capital Corp. | 4.400% | 4/24/20 | 425 | 461 |
| Novartis Capital Corp. | 2.400% | 9/21/22 | 17,825 | 16,300 |
| Novartis Capital Corp. | 3.700% | 9/21/42 | 3,850 | 3,310 |
| Novartis Securities Investment Ltd. | 5.125% | 2/10/19 | 13,500 | 15,252 |
| Partners Healthcare System Massachusetts GO | 3.443% | 7/1/21 | 3,450 | 3,397 |
| Pepsi Bottling Group Inc. | 7.000% | 3/1/29 | 10,024 | 12,535 |
| PepsiAmericas Inc. | 4.875% | 1/15/15 | 1,275 | 1,332 |
| PepsiAmericas Inc. | 5.000% | 5/15/17 | 3,800 | 4,198 |
| PepsiCo Inc. | 3.100% | 1/15/15 | 400 | 411 |
| PepsiCo Inc. | 2.500% | 5/10/16 | 10,500 | 10,893 |
| PepsiCo Inc. | 1.250% | 8/13/17 | 5,075 | 5,037 |
58
| Vanguard® Total Bond Market Index Fund | ||||
| Schedule of Investments | ||||
| December 31, 2013 | ||||
| Face | Market | |||
| Maturity | Amount | Value | ||
| Coupon | Date | ($000) | ($000) | |
| PepsiCo Inc. | 5.000% | 6/1/18 | 14,670 | 16,525 |
| PepsiCo Inc. | 7.900% | 11/1/18 | 4,003 | 5,027 |
| PepsiCo Inc. | 2.250% | 1/7/19 | 11,500 | 11,529 |
| PepsiCo Inc. | 4.500% | 1/15/20 | 7,930 | 8,668 |
| PepsiCo Inc. | 3.000% | 8/25/21 | 7,187 | 7,071 |
| PepsiCo Inc. | 2.750% | 3/5/22 | 6,250 | 5,915 |
| PepsiCo Inc. | 5.500% | 1/15/40 | 8,825 | 9,593 |
| PepsiCo Inc. | 4.875% | 11/1/40 | 4,550 | 4,517 |
| PepsiCo Inc. | 4.000% | 3/5/42 | 10,625 | 9,210 |
| PepsiCo Inc. | 3.600% | 8/13/42 | 3,856 | 3,164 |
| PerkinElmer Inc. | 5.000% | 11/15/21 | 1,275 | 1,299 |
| 6 Perrigo Co. plc | 1.300% | 11/8/16 | 2,900 | 2,892 |
| 6 Perrigo Co. plc | 2.300% | 11/8/18 | 2,850 | 2,813 |
| 6 Perrigo Co. plc | 4.000% | 11/15/23 | 3,925 | 3,825 |
| 6 Perrigo Co. plc | 5.300% | 11/15/43 | 1,450 | 1,419 |
| Pfizer Inc. | 5.350% | 3/15/15 | 40,725 | 43,070 |
| Pfizer Inc. | 1.500% | 6/15/18 | 5,400 | 5,323 |
| Pfizer Inc. | 6.200% | 3/15/19 | 27,120 | 32,155 |
| Pfizer Inc. | 3.000% | 6/15/23 | 6,050 | 5,697 |
| Pfizer Inc. | 7.200% | 3/15/39 | 10,335 | 13,911 |
| Pfizer Inc. | 4.300% | 6/15/43 | 1,100 | 1,031 |
| Pharmacia Corp. | 6.600% | 12/1/28 | 1,750 | 2,154 |
| Philip Morris International Inc. | 2.500% | 5/16/16 | 3,065 | 3,178 |
| Philip Morris International Inc. | 1.625% | 3/20/17 | 5,150 | 5,183 |
| Philip Morris International Inc. | 5.650% | 5/16/18 | 10,980 | 12,629 |
| Philip Morris International Inc. | 1.875% | 1/15/19 | 14,500 | 14,227 |
| Philip Morris International Inc. | 4.125% | 5/17/21 | 800 | 833 |
| Philip Morris International Inc. | 2.625% | 3/6/23 | 5,000 | 4,498 |
| Philip Morris International Inc. | 3.600% | 11/15/23 | 9,400 | 9,096 |
| Philip Morris International Inc. | 6.375% | 5/16/38 | 22,722 | 26,827 |
| Philip Morris International Inc. | 4.375% | 11/15/41 | 8,750 | 7,915 |
| Philip Morris International Inc. | 4.500% | 3/20/42 | 5,118 | 4,759 |
| Philip Morris International Inc. | 3.875% | 8/21/42 | 7,250 | 6,118 |
| Philip Morris International Inc. | 4.125% | 3/4/43 | 2,150 | 1,873 |
| Philip Morris International Inc. | 4.875% | 11/15/43 | 10,750 | 10,634 |
| 3 Procter & Gamble - Esop | 9.360% | 1/1/21 | 7,634 | 9,768 |
| Procter & Gamble Co. | 0.700% | 8/15/14 | 2,950 | 2,959 |
| Procter & Gamble Co. | 3.500% | 2/15/15 | 7,750 | 8,012 |
| Procter & Gamble Co. | 1.800% | 11/15/15 | 5,000 | 5,120 |
| Procter & Gamble Co. | 4.850% | 12/15/15 | 1,275 | 1,380 |
| Procter & Gamble Co. | 1.450% | 8/15/16 | 3,650 | 3,708 |
| Procter & Gamble Co. | 1.600% | 11/15/18 | 6,700 | 6,624 |
| Procter & Gamble Co. | 4.700% | 2/15/19 | 3,495 | 3,914 |
| Procter & Gamble Co. | 2.300% | 2/6/22 | 7,350 | 6,882 |
| Procter & Gamble Co. | 6.450% | 1/15/26 | 3,875 | 4,804 |
| Procter & Gamble Co. | 5.500% | 2/1/34 | 5,963 | 6,658 |
| Procter & Gamble Co. | 5.800% | 8/15/34 | 270 | 312 |
| Procter & Gamble Co. | 5.550% | 3/5/37 | 12,895 | 14,701 |
| Quest Diagnostics Inc. | 5.450% | 11/1/15 | 6,375 | 6,871 |
| Quest Diagnostics Inc. | 6.400% | 7/1/17 | 140 | 159 |
| Quest Diagnostics Inc. | 4.700% | 4/1/21 | 1,600 | 1,637 |
| Quest Diagnostics Inc. | 6.950% | 7/1/37 | 4,175 | 4,602 |
| Quest Diagnostics Inc. | 5.750% | 1/30/40 | 18 | 18 |
| Reynolds American Inc. | 6.750% | 6/15/17 | 5,836 | 6,707 |
| Reynolds American Inc. | 4.850% | 9/15/23 | 1,300 | 1,337 |
| Reynolds American Inc. | 7.250% | 6/15/37 | 3,858 | 4,502 |
| Reynolds American Inc. | 4.750% | 11/1/42 | 10,125 | 8,948 |
| Reynolds American Inc. | 6.150% | 9/15/43 | 1,300 | 1,396 |
| Safeway Inc. | 3.400% | 12/1/16 | 9,500 | 9,897 |
| Safeway Inc. | 6.350% | 8/15/17 | 5,230 | 5,874 |
| Safeway Inc. | 5.000% | 8/15/19 | 1,020 | 1,084 |
| Safeway Inc. | 3.950% | 8/15/20 | 1,200 | 1,197 |
| Safeway Inc. | 7.250% | 2/1/31 | 5,877 | 5,996 |
| Sanofi | 2.625% | 3/29/16 | 32,376 | 33,654 |
59
| Vanguard® Total Bond Market Index Fund | ||||
| Schedule of Investments | ||||
| December 31, 2013 | ||||
| Face | Market | |||
| Maturity | Amount | Value | ||
| Coupon | Date | ($000) | ($000) | |
| Sanofi | 1.250% | 4/10/18 | 12,075 | 11,766 |
| Sanofi | 4.000% | 3/29/21 | 10,846 | 11,338 |
| St. Jude Medical Inc. | 2.500% | 1/15/16 | 550 | 564 |
| St. Jude Medical Inc. | 3.250% | 4/15/23 | 7,725 | 7,188 |
| St. Jude Medical Inc. | 4.750% | 4/15/43 | 6,950 | 6,528 |
| Stryker Corp. | 3.000% | 1/15/15 | 2,100 | 2,155 |
| Stryker Corp. | 2.000% | 9/30/16 | 5,390 | 5,536 |
| Stryker Corp. | 4.375% | 1/15/20 | 1,425 | 1,539 |
| Sysco Corp. | 5.250% | 2/12/18 | 2,625 | 2,944 |
| Sysco Corp. | 5.375% | 9/21/35 | 6,375 | 6,634 |
| Teva Pharmaceutical Finance Co. BV | 2.400% | 11/10/16 | 6,893 | 7,087 |
| Teva Pharmaceutical Finance Co. BV | 3.650% | 11/10/21 | 1,125 | 1,101 |
| Teva Pharmaceutical Finance Co. BV | 2.950% | 12/18/22 | 11,275 | 10,185 |
| Teva Pharmaceutical Finance Co. LLC | 6.150% | 2/1/36 | 5,819 | 6,366 |
| Teva Pharmaceutical Finance II BV / Teva | ||||
| Pharmaceutical Finance III LLC | 3.000% | 6/15/15 | 5,325 | 5,495 |
| Teva Pharmaceutical Finance IV BV | 3.650% | 11/10/21 | 8,400 | 8,132 |
| Teva Pharmaceutical Finance IV LLC | 2.250% | 3/18/20 | 10,325 | 9,789 |
| Thermo Fisher Scientific Inc. | 3.200% | 5/1/15 | 6,650 | 6,855 |
| Thermo Fisher Scientific Inc. | 3.200% | 3/1/16 | 11,115 | 11,624 |
| Thermo Fisher Scientific Inc. | 1.300% | 2/1/17 | 1,550 | 1,546 |
| Thermo Fisher Scientific Inc. | 1.850% | 1/15/18 | 6,610 | 6,581 |
| Thermo Fisher Scientific Inc. | 2.400% | 2/1/19 | 1,000 | 994 |
| Thermo Fisher Scientific Inc. | 4.700% | 5/1/20 | 725 | 787 |
| Thermo Fisher Scientific Inc. | 4.500% | 3/1/21 | 10,400 | 10,972 |
| Thermo Fisher Scientific Inc. | 3.600% | 8/15/21 | 1,500 | 1,491 |
| Thermo Fisher Scientific Inc. | 4.150% | 2/1/24 | 2,500 | 2,483 |
| Thermo Fisher Scientific Inc. | 5.300% | 2/1/44 | 1,700 | 1,724 |
| Tupperware Brands Corp. | 4.750% | 6/1/21 | 2,800 | 2,798 |
| Tyson Foods Inc. | 6.600% | 4/1/16 | 70 | 78 |
| Tyson Foods Inc. | 4.500% | 6/15/22 | 17,855 | 18,123 |
| Unilever Capital Corp. | 3.650% | 2/15/14 | 6,275 | 6,297 |
| Unilever Capital Corp. | 0.450% | 7/30/15 | 450 | 450 |
| Unilever Capital Corp. | 2.750% | 2/10/16 | 200 | 208 |
| Unilever Capital Corp. | 0.850% | 8/2/17 | 5,700 | 5,549 |
| Unilever Capital Corp. | 4.800% | 2/15/19 | 1,500 | 1,681 |
| Unilever Capital Corp. | 4.250% | 2/10/21 | 6,870 | 7,333 |
| Unilever Capital Corp. | 5.900% | 11/15/32 | 4,025 | 4,896 |
| UST LLC | 5.750% | 3/1/18 | 2,700 | 3,060 |
| Whirlpool Corp. | 4.850% | 6/15/21 | 2,500 | 2,632 |
| Whirlpool Corp. | 4.700% | 6/1/22 | 1,675 | 1,737 |
| Wyeth LLC | 5.500% | 2/15/16 | 2,485 | 2,733 |
| Wyeth LLC | 5.450% | 4/1/17 | 925 | 1,041 |
| Wyeth LLC | 6.450% | 2/1/24 | 1,500 | 1,798 |
| Wyeth LLC | 6.500% | 2/1/34 | 5,875 | 7,149 |
| Wyeth LLC | 6.000% | 2/15/36 | 10,730 | 12,579 |
| Wyeth LLC | 5.950% | 4/1/37 | 25,954 | 30,129 |
| Zimmer Holdings Inc. | 4.625% | 11/30/19 | 1,075 | 1,174 |
| Zimmer Holdings Inc. | 3.375% | 11/30/21 | 2,725 | 2,623 |
| Zimmer Holdings Inc. | 5.750% | 11/30/39 | 4,340 | 4,767 |
| Zoetis Inc. | 1.150% | 2/1/16 | 14,500 | 14,534 |
| Zoetis Inc. | 1.875% | 2/1/18 | 1,525 | 1,513 |
| Zoetis Inc. | 3.250% | 2/1/23 | 11,935 | 11,147 |
| Zoetis Inc. | 4.700% | 2/1/43 | 3,253 | 3,046 |
| Energy (1.8%) | ||||
| Alberta Energy Co. Ltd. | 7.375% | 11/1/31 | 3,409 | 4,011 |
| Anadarko Finance Co. | 7.500% | 5/1/31 | 1,238 | 1,508 |
| Anadarko Petroleum Corp. | 5.950% | 9/15/16 | 36,306 | 40,516 |
| Anadarko Petroleum Corp. | 6.375% | 9/15/17 | 7,730 | 8,879 |
| Anadarko Petroleum Corp. | 6.450% | 9/15/36 | 9,840 | 11,064 |
| Anadarko Petroleum Corp. | 7.950% | 6/15/39 | 3,475 | 4,585 |
| Anadarko Petroleum Corp. | 6.200% | 3/15/40 | 7,085 | 7,796 |
| Apache Corp. | 5.625% | 1/15/17 | 850 | 956 |
60
| Vanguard® Total Bond Market Index Fund | ||||
| Schedule of Investments | ||||
| December 31, 2013 | ||||
| Face | Market | |||
| Maturity | Amount | Value | ||
| Coupon | Date | ($000) | ($000) | |
| Apache Corp. | 1.750% | 4/15/17 | 800 | 804 |
| Apache Corp. | 6.900% | 9/15/18 | 7,100 | 8,579 |
| Apache Corp. | 3.625% | 2/1/21 | 4,700 | 4,834 |
| Apache Corp. | 3.250% | 4/15/22 | 3,818 | 3,755 |
| Apache Corp. | 6.000% | 1/15/37 | 11,020 | 12,364 |
| Apache Corp. | 5.100% | 9/1/40 | 12,830 | 12,915 |
| Apache Corp. | 5.250% | 2/1/42 | 9,300 | 9,529 |
| Apache Corp. | 4.750% | 4/15/43 | 4,000 | 3,844 |
| Apache Finance Canada Corp. | 7.750% | 12/15/29 | 1,080 | 1,414 |
| Baker Hughes Inc. | 7.500% | 11/15/18 | 240 | 299 |
| Baker Hughes Inc. | 6.875% | 1/15/29 | 990 | 1,222 |
| Baker Hughes Inc. | 5.125% | 9/15/40 | 18,010 | 18,873 |
| BJ Services Co. | 6.000% | 6/1/18 | 4,450 | 5,123 |
| BP Capital Markets plc | 3.875% | 3/10/15 | 9,985 | 10,383 |
| BP Capital Markets plc | 3.125% | 10/1/15 | 18,385 | 19,229 |
| BP Capital Markets plc | 0.700% | 11/6/15 | 5,500 | 5,519 |
| BP Capital Markets plc | 3.200% | 3/11/16 | 20,350 | 21,374 |
| BP Capital Markets plc | 2.248% | 11/1/16 | 10,653 | 11,047 |
| BP Capital Markets plc | 1.846% | 5/5/17 | 17,675 | 17,808 |
| BP Capital Markets plc | 1.375% | 11/6/17 | 3,350 | 3,302 |
| BP Capital Markets plc | 1.375% | 5/10/18 | 14,225 | 13,832 |
| BP Capital Markets plc | 2.241% | 9/26/18 | 3,875 | 3,888 |
| BP Capital Markets plc | 4.750% | 3/10/19 | 9,785 | 10,881 |
| BP Capital Markets plc | 4.742% | 3/11/21 | 14,300 | 15,484 |
| BP Capital Markets plc | 3.561% | 11/1/21 | 7,335 | 7,350 |
| BP Capital Markets plc | 3.245% | 5/6/22 | 11,175 | 10,789 |
| BP Capital Markets plc | 2.500% | 11/6/22 | 16,292 | 14,830 |
| BP Capital Markets plc | 2.750% | 5/10/23 | 11,315 | 10,296 |
| Burlington Resources Finance Co. | 7.200% | 8/15/31 | 750 | 956 |
| Burlington Resources Finance Co. | 7.400% | 12/1/31 | 4,275 | 5,549 |
| Cameron International Corp. | 1.600% | 4/30/15 | 4,050 | 4,083 |
| Cameron International Corp. | 1.150% | 12/15/16 | 2,200 | 2,197 |
| Cameron International Corp. | 6.375% | 7/15/18 | 975 | 1,141 |
| Cameron International Corp. | 4.000% | 12/15/23 | 3,200 | 3,156 |
| Cameron International Corp. | 7.000% | 7/15/38 | 1,245 | 1,509 |
| Cameron International Corp. | 5.950% | 6/1/41 | 400 | 437 |
| Cameron International Corp. | 5.125% | 12/15/43 | 3,075 | 3,052 |
| Canadian Natural Resources Ltd. | 6.000% | 8/15/16 | 4,225 | 4,738 |
| Canadian Natural Resources Ltd. | 5.700% | 5/15/17 | 12,561 | 14,127 |
| Canadian Natural Resources Ltd. | 3.450% | 11/15/21 | 525 | 515 |
| Canadian Natural Resources Ltd. | 7.200% | 1/15/32 | 4,818 | 5,720 |
| Canadian Natural Resources Ltd. | 6.450% | 6/30/33 | 5,865 | 6,583 |
| Canadian Natural Resources Ltd. | 5.850% | 2/1/35 | 175 | 185 |
| Canadian Natural Resources Ltd. | 6.500% | 2/15/37 | 9,505 | 10,761 |
| Canadian Natural Resources Ltd. | 6.250% | 3/15/38 | 980 | 1,095 |
| Cenovus Energy Inc. | 5.700% | 10/15/19 | 4,675 | 5,323 |
| Cenovus Energy Inc. | 3.000% | 8/15/22 | 800 | 749 |
| Cenovus Energy Inc. | 6.750% | 11/15/39 | 21,471 | 25,004 |
| Cenovus Energy Inc. | 4.450% | 9/15/42 | 2,838 | 2,517 |
| Chevron Corp. | 0.889% | 6/24/16 | 1,725 | 1,731 |
| Chevron Corp. | 1.104% | 12/5/17 | 11,550 | 11,354 |
| Chevron Corp. | 1.718% | 6/24/18 | 12,090 | 12,051 |
| Chevron Corp. | 4.950% | 3/3/19 | 12,880 | 14,664 |
| Chevron Corp. | 2.427% | 6/24/20 | 5,000 | 4,915 |
| Chevron Corp. | 2.355% | 12/5/22 | 12,675 | 11,544 |
| Chevron Corp. | 3.191% | 6/24/23 | 2,075 | 1,996 |
| ConocoPhillips | 4.600% | 1/15/15 | 12,915 | 13,465 |
| ConocoPhillips | 6.650% | 7/15/18 | 35 | 42 |
| ConocoPhillips | 5.750% | 2/1/19 | 29,145 | 33,941 |
| ConocoPhillips | 5.900% | 10/15/32 | 10,051 | 11,497 |
| ConocoPhillips | 5.900% | 5/15/38 | 4,287 | 4,984 |
| ConocoPhillips | 6.500% | 2/1/39 | 7,443 | 9,309 |
| ConocoPhillips Canada Funding Co. I | 5.625% | 10/15/16 | 28,725 | 32,254 |
| ConocoPhillips Canada Funding Co. I | 5.950% | 10/15/36 | 4,470 | 5,174 |
61
| Vanguard® Total Bond Market Index Fund | ||||
| Schedule of Investments | ||||
| December 31, 2013 | ||||
| Face | Market | |||
| Maturity | Amount | Value | ||
| Coupon | Date | ($000) | ($000) | |
| ConocoPhillips Co. | 1.050% | 12/15/17 | 1,000 | 982 |
| ConocoPhillips Co. | 2.400% | 12/15/22 | 1,000 | 909 |
| ConocoPhillips Holding Co. | 6.950% | 4/15/29 | 9,465 | 11,929 |
| Continental Resources Inc. | 5.000% | 9/15/22 | 21,025 | 21,840 |
| Continental Resources Inc. | 4.500% | 4/15/23 | 11,428 | 11,585 |
| Devon Energy Corp. | 2.400% | 7/15/16 | 750 | 773 |
| Devon Energy Corp. | 1.875% | 5/15/17 | 1,525 | 1,537 |
| Devon Energy Corp. | 6.300% | 1/15/19 | 10 | 12 |
| Devon Energy Corp. | 4.000% | 7/15/21 | 4,250 | 4,356 |
| Devon Energy Corp. | 3.250% | 5/15/22 | 5,825 | 5,561 |
| Devon Energy Corp. | 7.950% | 4/15/32 | 7,650 | 9,957 |
| Devon Energy Corp. | 5.600% | 7/15/41 | 6,518 | 6,747 |
| Devon Energy Corp. | 4.750% | 5/15/42 | 18 | 17 |
| Devon Financing Co. LLC | 7.875% | 9/30/31 | 16,536 | 21,269 |
| Diamond Offshore Drilling Inc. | 4.875% | 7/1/15 | 600 | 638 |
| Diamond Offshore Drilling Inc. | 5.875% | 5/1/19 | 2,700 | 3,139 |
| Diamond Offshore Drilling Inc. | 3.450% | 11/1/23 | 1,950 | 1,884 |
| Diamond Offshore Drilling Inc. | 5.700% | 10/15/39 | 4,760 | 5,157 |
| Diamond Offshore Drilling Inc. | 4.875% | 11/1/43 | 5,525 | 5,390 |
| Encana Corp. | 5.900% | 12/1/17 | 6,075 | 6,888 |
| Encana Corp. | 3.900% | 11/15/21 | 6,450 | 6,407 |
| Encana Corp. | 7.200% | 11/1/31 | 5,675 | 6,485 |
| Encana Corp. | 6.500% | 8/15/34 | 8,993 | 9,877 |
| Encana Corp. | 6.625% | 8/15/37 | 4,479 | 4,948 |
| Encana Corp. | 6.500% | 2/1/38 | 18 | 20 |
| Encana Corp. | 5.150% | 11/15/41 | 18 | 17 |
| Ensco plc | 3.250% | 3/15/16 | 4,675 | 4,885 |
| Ensco plc | 4.700% | 3/15/21 | 4,700 | 4,970 |
| EOG Resources Inc. | 2.950% | 6/1/15 | 5,485 | 5,680 |
| EOG Resources Inc. | 5.875% | 9/15/17 | 5,325 | 6,141 |
| EOG Resources Inc. | 5.625% | 6/1/19 | 35 | 41 |
| EOG Resources Inc. | 4.400% | 6/1/20 | 5,875 | 6,333 |
| EOG Resources Inc. | 4.100% | 2/1/21 | 9,550 | 10,010 |
| EOG Resources Inc. | 2.625% | 3/15/23 | 9,993 | 9,111 |
| EQT Corp. | 6.500% | 4/1/18 | 16,425 | 18,593 |
| EQT Corp. | 8.125% | 6/1/19 | 325 | 395 |
| FMC Technologies Inc. | 2.000% | 10/1/17 | 3,000 | 2,975 |
| FMC Technologies Inc. | 3.450% | 10/1/22 | 1,100 | 1,024 |
| Global Marine Inc. | 7.000% | 6/1/28 | 3,150 | 3,281 |
| Halliburton Co. | 1.000% | 8/1/16 | 5,125 | 5,140 |
| Halliburton Co. | 2.000% | 8/1/18 | 5,125 | 5,129 |
| Halliburton Co. | 5.900% | 9/15/18 | 3,015 | 3,512 |
| Halliburton Co. | 6.150% | 9/15/19 | 2,120 | 2,524 |
| Halliburton Co. | 3.500% | 8/1/23 | 5,075 | 4,918 |
| Halliburton Co. | 6.700% | 9/15/38 | 10,240 | 12,568 |
| Halliburton Co. | 7.450% | 9/15/39 | 5,088 | 6,785 |
| Halliburton Co. | 4.500% | 11/15/41 | 5,275 | 4,983 |
| Halliburton Co. | 4.750% | 8/1/43 | 5,825 | 5,703 |
| Hess Corp. | 8.125% | 2/15/19 | 11,269 | 14,038 |
| Hess Corp. | 7.875% | 10/1/29 | 5,895 | 7,483 |
| Hess Corp. | 7.300% | 8/15/31 | 4,528 | 5,507 |
| Hess Corp. | 7.125% | 3/15/33 | 4,241 | 5,089 |
| Hess Corp. | 6.000% | 1/15/40 | 10,618 | 11,497 |
| Hess Corp. | 5.600% | 2/15/41 | 2,300 | 2,387 |
| Husky Energy Inc. | 6.150% | 6/15/19 | 800 | 910 |
| Husky Energy Inc. | 7.250% | 12/15/19 | 2,435 | 2,950 |
| Husky Energy Inc. | 3.950% | 4/15/22 | 3,150 | 3,115 |
| Husky Energy Inc. | 6.800% | 9/15/37 | 2,500 | 3,012 |
| Kerr-McGee Corp. | 6.950% | 7/1/24 | 9,020 | 10,498 |
| Kerr-McGee Corp. | 7.875% | 9/15/31 | 1,604 | 1,989 |
| Marathon Oil Corp. | 0.900% | 11/1/15 | 2,510 | 2,517 |
| Marathon Oil Corp. | 6.000% | 10/1/17 | 14,175 | 16,271 |
| Marathon Oil Corp. | 5.900% | 3/15/18 | 4,047 | 4,646 |
| Marathon Oil Corp. | 2.800% | 11/1/22 | 6,125 | 5,639 |
62
| Vanguard® Total Bond Market Index Fund | ||||
| Schedule of Investments | ||||
| December 31, 2013 | ||||
| Face | Market | |||
| Maturity | Amount | Value | ||
| Coupon | Date | ($000) | ($000) | |
| Marathon Oil Corp. | 6.800% | 3/15/32 | 7,367 | 8,767 |
| Marathon Oil Corp. | 6.600% | 10/1/37 | 4,438 | 5,331 |
| Marathon Petroleum Corp. | 3.500% | 3/1/16 | 3,000 | 3,149 |
| Marathon Petroleum Corp. | 5.125% | 3/1/21 | 6,800 | 7,364 |
| Marathon Petroleum Corp. | 6.500% | 3/1/41 | 13,795 | 15,761 |
| Murphy Oil Corp. | 3.700% | 12/1/22 | 5,120 | 4,709 |
| Murphy Oil Corp. | 7.050% | 5/1/29 | 4,700 | 5,007 |
| Murphy Oil Corp. | 5.125% | 12/1/42 | 2,044 | 1,757 |
| 6 Nabors Industries Inc. | 2.350% | 9/15/16 | 1,550 | 1,574 |
| Nabors Industries Inc. | 6.150% | 2/15/18 | 22,650 | 25,478 |
| Nabors Industries Inc. | 9.250% | 1/15/19 | 600 | 746 |
| Nabors Industries Inc. | 5.000% | 9/15/20 | 2,325 | 2,413 |
| 6 Nabors Industries Inc. | 5.100% | 9/15/23 | 900 | 901 |
| National Oilwell Varco Inc. | 1.350% | 12/1/17 | 13,525 | 13,381 |
| National Oilwell Varco Inc. | 2.600% | 12/1/22 | 15,275 | 14,032 |
| National Oilwell Varco Inc. | 3.950% | 12/1/42 | 4,773 | 4,187 |
| Noble Energy Inc. | 8.250% | 3/1/19 | 3,829 | 4,775 |
| Noble Energy Inc. | 4.150% | 12/15/21 | 8,975 | 9,213 |
| Noble Energy Inc. | 8.000% | 4/1/27 | 525 | 669 |
| Noble Energy Inc. | 6.000% | 3/1/41 | 10,645 | 11,558 |
| Noble Energy Inc. | 5.250% | 11/15/43 | 5,725 | 5,687 |
| Noble Holding International Ltd. | 3.450% | 8/1/15 | 9,200 | 9,542 |
| Noble Holding International Ltd. | 3.050% | 3/1/16 | 4,250 | 4,365 |
| Noble Holding International Ltd. | 4.900% | 8/1/20 | 3,825 | 4,031 |
| Noble Holding International Ltd. | 3.950% | 3/15/22 | 1,225 | 1,187 |
| Noble Holding International Ltd. | 6.200% | 8/1/40 | 4,468 | 4,663 |
| Noble Holding International Ltd. | 6.050% | 3/1/41 | 1,020 | 1,044 |
| Noble Holding International Ltd. | 5.250% | 3/15/42 | 1,225 | 1,169 |
| Occidental Petroleum Corp. | 2.500% | 2/1/16 | 9,675 | 10,025 |
| Occidental Petroleum Corp. | 1.750% | 2/15/17 | 4,551 | 4,616 |
| Occidental Petroleum Corp. | 1.500% | 2/15/18 | 2,550 | 2,515 |
| Occidental Petroleum Corp. | 4.100% | 2/1/21 | 15,225 | 16,076 |
| Occidental Petroleum Corp. | 3.125% | 2/15/22 | 2,375 | 2,304 |
| Occidental Petroleum Corp. | 2.700% | 2/15/23 | 10,068 | 9,214 |
| Petro-Canada | 6.050% | 5/15/18 | 12,390 | 14,276 |
| Petro-Canada | 7.875% | 6/15/26 | 2,800 | 3,590 |
| Petro-Canada | 5.350% | 7/15/33 | 4,825 | 4,869 |
| Petro-Canada | 5.950% | 5/15/35 | 7,060 | 7,610 |
| Petro-Canada | 6.800% | 5/15/38 | 8,063 | 9,626 |
| Petrohawk Energy Corp. | 10.500% | 8/1/14 | 1,725 | 1,738 |
| Petrohawk Energy Corp. | 7.875% | 6/1/15 | 1,900 | 1,950 |
| Petrohawk Energy Corp. | 6.250% | 6/1/19 | 3,350 | 3,677 |
| Phillips 66 | 1.950% | 3/5/15 | 2,250 | 2,283 |
| Phillips 66 | 2.950% | 5/1/17 | 19,250 | 20,034 |
| Phillips 66 | 4.300% | 4/1/22 | 12,325 | 12,504 |
| Phillips 66 | 5.875% | 5/1/42 | 15,668 | 16,922 |
| Pioneer Natural Resources Co. | 5.875% | 7/15/16 | 325 | 361 |
| Pioneer Natural Resources Co. | 6.875% | 5/1/18 | 3,250 | 3,824 |
| Pioneer Natural Resources Co. | 3.950% | 7/15/22 | 3,910 | 3,918 |
| Pride International Inc. | 8.500% | 6/15/19 | 725 | 916 |
| Pride International Inc. | 6.875% | 8/15/20 | 14,600 | 17,418 |
| Pride International Inc. | 7.875% | 8/15/40 | 9,100 | 12,221 |
| Rowan Cos. Inc. | 7.875% | 8/1/19 | 6,000 | 7,259 |
| Rowan Cos. Inc. | 4.875% | 6/1/22 | 1,200 | 1,223 |
| Rowan Cos. Inc. | 5.400% | 12/1/42 | 4,225 | 3,909 |
| Schlumberger Investment SA | 3.650% | 12/1/23 | 8,325 | 8,229 |
| Shell International Finance BV | 3.100% | 6/28/15 | 13,625 | 14,138 |
| Shell International Finance BV | 3.250% | 9/22/15 | 3,600 | 3,768 |
| Shell International Finance BV | 0.625% | 12/4/15 | 75 | 75 |
| Shell International Finance BV | 1.900% | 8/10/18 | 5,000 | 4,975 |
| Shell International Finance BV | 2.000% | 11/15/18 | 2,375 | 2,373 |
| Shell International Finance BV | 4.300% | 9/22/19 | 27,285 | 29,858 |
| Shell International Finance BV | 4.375% | 3/25/20 | 4,650 | 5,085 |
| Shell International Finance BV | 2.375% | 8/21/22 | 8,000 | 7,318 |
63
| Vanguard® Total Bond Market Index Fund | ||||
| Schedule of Investments | ||||
| December 31, 2013 | ||||
| Face | Market | |||
| Maturity | Amount | Value | ||
| Coupon | Date | ($000) | ($000) | |
| Shell International Finance BV | 2.250% | 1/6/23 | 1,850 | 1,644 |
| Shell International Finance BV | 3.400% | 8/12/23 | 15,395 | 14,967 |
| Shell International Finance BV | 6.375% | 12/15/38 | 25,728 | 31,701 |
| Shell International Finance BV | 5.500% | 3/25/40 | 3,018 | 3,344 |
| Shell International Finance BV | 4.550% | 8/12/43 | 7,575 | 7,307 |
| Southwestern Energy Co. | 4.100% | 3/15/22 | 2,447 | 2,413 |
| Suncor Energy Inc. | 6.100% | 6/1/18 | 875 | 1,011 |
| Suncor Energy Inc. | 7.150% | 2/1/32 | 4,903 | 6,261 |
| Suncor Energy Inc. | 5.950% | 12/1/34 | 260 | 278 |
| Suncor Energy Inc. | 6.500% | 6/15/38 | 22,355 | 25,891 |
| Suncor Energy Inc. | 6.850% | 6/1/39 | 4,519 | 5,430 |
| Talisman Energy Inc. | 7.750% | 6/1/19 | 16,137 | 19,351 |
| Talisman Energy Inc. | 3.750% | 2/1/21 | 1,285 | 1,245 |
| Talisman Energy Inc. | 7.250% | 10/15/27 | 850 | 954 |
| Talisman Energy Inc. | 5.850% | 2/1/37 | 6,500 | 6,320 |
| Talisman Energy Inc. | 6.250% | 2/1/38 | 173 | 176 |
| Talisman Energy Inc. | 5.500% | 5/15/42 | 18 | 17 |
| Tosco Corp. | 7.800% | 1/1/27 | 725 | 961 |
| Tosco Corp. | 8.125% | 2/15/30 | 16,855 | 23,386 |
| Total Capital Canada Ltd. | 1.625% | 1/28/14 | 5,325 | 5,330 |
| Total Capital Canada Ltd. | 1.450% | 1/15/18 | 4,325 | 4,286 |
| Total Capital Canada Ltd. | 2.750% | 7/15/23 | 11,155 | 10,294 |
| Total Capital International SA | 0.750% | 1/25/16 | 8,250 | 8,244 |
| Total Capital International SA | 1.000% | 8/12/16 | 1,800 | 1,803 |
| Total Capital International SA | 1.500% | 2/17/17 | 300 | 300 |
| Total Capital International SA | 1.550% | 6/28/17 | 8,525 | 8,520 |
| Total Capital International SA | 2.875% | 2/17/22 | 4,200 | 3,979 |
| Total Capital International SA | 2.700% | 1/25/23 | 5,400 | 4,972 |
| Total Capital International SA | 3.700% | 1/15/24 | 2,500 | 2,473 |
| Total Capital SA | 3.000% | 6/24/15 | 21,075 | 21,858 |
| Total Capital SA | 2.300% | 3/15/16 | 975 | 1,004 |
| Total Capital SA | 2.125% | 8/10/18 | 7,320 | 7,342 |
| Total Capital SA | 4.450% | 6/24/20 | 6,200 | 6,717 |
| Total Capital SA | 4.125% | 1/28/21 | 22,400 | 23,584 |
| Transocean Inc. | 4.950% | 11/15/15 | 11,700 | 12,539 |
| Transocean Inc. | 2.500% | 10/15/17 | 5,750 | 5,832 |
| Transocean Inc. | 6.000% | 3/15/18 | 9,135 | 10,271 |
| Transocean Inc. | 6.500% | 11/15/20 | 7,560 | 8,606 |
| Transocean Inc. | 6.375% | 12/15/21 | 13,300 | 14,921 |
| Transocean Inc. | 3.800% | 10/15/22 | 3,100 | 2,937 |
| Transocean Inc. | 7.500% | 4/15/31 | 2,038 | 2,365 |
| Transocean Inc. | 6.800% | 3/15/38 | 5,763 | 6,431 |
| Transocean Inc. | 7.350% | 12/15/41 | 8,975 | 10,726 |
| Valero Energy Corp. | 4.500% | 2/1/15 | 2,625 | 2,730 |
| Valero Energy Corp. | 9.375% | 3/15/19 | 8,351 | 10,830 |
| Valero Energy Corp. | 6.125% | 2/1/20 | 12,675 | 14,457 |
| Valero Energy Corp. | 7.500% | 4/15/32 | 10,571 | 12,857 |
| Valero Energy Corp. | 6.625% | 6/15/37 | 8,908 | 10,124 |
| Valero Energy Corp. | 10.500% | 3/15/39 | 23 | 34 |
| Weatherford International LLC | 6.350% | 6/15/17 | 5,750 | 6,520 |
| Weatherford International LLC | 6.800% | 6/15/37 | 275 | 296 |
| Weatherford International Ltd. | 5.500% | 2/15/16 | 10 | 11 |
| Weatherford International Ltd. | 6.000% | 3/15/18 | 8,360 | 9,420 |
| Weatherford International Ltd. | 9.625% | 3/1/19 | 40,056 | 51,602 |
| Weatherford International Ltd. | 6.500% | 8/1/36 | 539 | 562 |
| Weatherford International Ltd. | 7.000% | 3/15/38 | 1,750 | 1,923 |
| Weatherford International Ltd. | 6.750% | 9/15/40 | 1,018 | 1,094 |
| Weatherford International Ltd. | 5.950% | 4/15/42 | 18 | 18 |
| XTO Energy Inc. | 6.250% | 8/1/17 | 9,075 | 10,550 |
| XTO Energy Inc. | 5.500% | 6/15/18 | 500 | 576 |
| Other Industrial (0.0%) | ||||
| California Institute of Technology GO | 4.700% | 11/1/11 | 11,800 | 10,066 |
| Cintas Corp. No 2 | 6.125% | 12/1/17 | 1,625 | 1,835 |
64
| Vanguard® Total Bond Market Index Fund | ||||
| Schedule of Investments | ||||
| December 31, 2013 | ||||
| Face | Market | |||
| Maturity | Amount | Value | ||
| Coupon | Date | ($000) | ($000) | |
| Cintas Corp. No 2 | 3.250% | 6/1/22 | 4,000 | 3,815 |
| Fluor Corp. | 3.375% | 9/15/21 | 2,425 | 2,355 |
| Howard Hughes Medical Institute | 3.500% | 9/1/23 | 1,650 | 1,615 |
| 3 Johns Hopkins University Maryland GO | 4.083% | 7/1/53 | 4,125 | 3,535 |
| Massachusetts Institute of Technology GO | 5.600% | 7/1/11 | 9,085 | 10,301 |
| 3 Northwestern University GO | 4.643% | 12/1/44 | 3,750 | 3,676 |
| President & Fellows of Harvard College Massachusetts | ||||
| GO | 3.619% | 10/1/37 | 1,750 | 1,491 |
| University of Pennsylvania GO | 4.674% | 9/1/12 | 10,350 | 9,110 |
| 6 URS Corp. | 5.500% | 4/1/22 | 6,170 | 6,078 |
| Technology (1.2%) | ||||
| Adobe Systems Inc. | 3.250% | 2/1/15 | 4,525 | 4,652 |
| Adobe Systems Inc. | 4.750% | 2/1/20 | 6,625 | 7,199 |
| Agilent Technologies Inc. | 5.500% | 9/14/15 | 3,125 | 3,369 |
| Agilent Technologies Inc. | 6.500% | 11/1/17 | 3,350 | 3,880 |
| Agilent Technologies Inc. | 5.000% | 7/15/20 | 4,400 | 4,734 |
| Agilent Technologies Inc. | 3.200% | 10/1/22 | 6,200 | 5,665 |
| Agilent Technologies Inc. | 3.875% | 7/15/23 | 650 | 616 |
| Altera Corp. | 1.750% | 5/15/17 | 7,250 | 7,150 |
| Altera Corp. | 2.500% | 11/15/18 | 12,550 | 12,466 |
| Altera Corp. | 4.100% | 11/15/23 | 3,300 | 3,183 |
| Amphenol Corp. | 4.000% | 2/1/22 | 550 | 538 |
| Analog Devices Inc. | 3.000% | 4/15/16 | 1,075 | 1,123 |
| Analog Devices Inc. | 2.875% | 6/1/23 | 5,400 | 4,904 |
| Apple Inc. | 0.450% | 5/3/16 | 13,700 | 13,623 |
| Apple Inc. | 1.000% | 5/3/18 | 24,950 | 24,147 |
| Apple Inc. | 2.400% | 5/3/23 | 34,100 | 30,480 |
| Apple Inc. | 3.850% | 5/4/43 | 20,450 | 17,087 |
| Applied Materials Inc. | 2.650% | 6/15/16 | 1,000 | 1,039 |
| Applied Materials Inc. | 4.300% | 6/15/21 | 7,025 | 7,219 |
| Applied Materials Inc. | 5.850% | 6/15/41 | 9,245 | 9,470 |
| Arrow Electronics Inc. | 3.375% | 11/1/15 | 2,600 | 2,695 |
| Arrow Electronics Inc. | 5.125% | 3/1/21 | 1,185 | 1,217 |
| Arrow Electronics Inc. | 4.500% | 3/1/23 | 2,154 | 2,082 |
| Autodesk Inc. | 1.950% | 12/15/17 | 9,014 | 8,924 |
| Autodesk Inc. | 3.600% | 12/15/22 | 1,600 | 1,482 |
| Avnet Inc. | 6.625% | 9/15/16 | 235 | 264 |
| Avnet Inc. | 4.875% | 12/1/22 | 4,175 | 4,179 |
| Baidu Inc. | 2.250% | 11/28/17 | 4,650 | 4,628 |
| Baidu Inc. | 3.500% | 11/28/22 | 14,750 | 13,499 |
| Broadcom Corp. | 2.700% | 11/1/18 | 7,030 | 7,136 |
| Broadcom Corp. | 2.500% | 8/15/22 | 10,100 | 9,019 |
| Broadridge Financial Solutions Inc. | 3.950% | 9/1/20 | 1,100 | 1,103 |
| CA Inc. | 2.875% | 8/15/18 | 3,000 | 3,005 |
| CA Inc. | 5.375% | 12/1/19 | 3,500 | 3,903 |
| CA Inc. | 4.500% | 8/15/23 | 4,175 | 4,120 |
| Cisco Systems Inc. | 5.500% | 2/22/16 | 13,085 | 14,405 |
| Cisco Systems Inc. | 3.150% | 3/14/17 | 7,165 | 7,583 |
| Cisco Systems Inc. | 4.950% | 2/15/19 | 25,264 | 28,374 |
| Cisco Systems Inc. | 4.450% | 1/15/20 | 24,345 | 26,459 |
| Cisco Systems Inc. | 5.900% | 2/15/39 | 19,568 | 21,728 |
| Cisco Systems Inc. | 5.500% | 1/15/40 | 3,235 | 3,414 |
| Computer Sciences Corp. | 2.500% | 9/15/15 | 2,500 | 2,553 |
| Computer Sciences Corp. | 6.500% | 3/15/18 | 5,150 | 5,934 |
| Corning Inc. | 1.450% | 11/15/17 | 800 | 798 |
| Corning Inc. | 6.625% | 5/15/19 | 3,180 | 3,832 |
| Corning Inc. | 4.250% | 8/15/20 | 300 | 317 |
| Corning Inc. | 3.700% | 11/15/23 | 3,900 | 3,840 |
| Corning Inc. | 7.250% | 8/15/36 | 300 | 343 |
| Corning Inc. | 4.700% | 3/15/37 | 8,368 | 7,933 |
| Corning Inc. | 5.750% | 8/15/40 | 4,535 | 4,889 |
| Corning Inc. | 4.750% | 3/15/42 | 1,078 | 1,032 |
| Dun & Bradstreet Corp. | 3.250% | 12/1/17 | 800 | 812 |
65
| Vanguard® Total Bond Market Index Fund | ||||
| Schedule of Investments | ||||
| December 31, 2013 | ||||
| Face | Market | |||
| Maturity | Amount | Value | ||
| Coupon | Date | ($000) | ($000) | |
| Dun & Bradstreet Corp. | 4.375% | 12/1/22 | 1,725 | 1,663 |
| EMC Corp. | 1.875% | 6/1/18 | 21,829 | 21,608 |
| EMC Corp. | 2.650% | 6/1/20 | 9,965 | 9,809 |
| EMC Corp. | 3.375% | 6/1/23 | 10,370 | 9,960 |
| Equifax Inc. | 4.450% | 12/1/14 | 2,175 | 2,247 |
| Equifax Inc. | 6.300% | 7/1/17 | 1,075 | 1,225 |
| Fidelity National Information Services Inc. | 2.000% | 4/15/18 | 1,475 | 1,436 |
| Fidelity National Information Services Inc. | 5.000% | 3/15/22 | 6,794 | 6,938 |
| Fidelity National Information Services Inc. | 3.500% | 4/15/23 | 7,075 | 6,467 |
| Fiserv Inc. | 3.125% | 10/1/15 | 1,100 | 1,140 |
| Fiserv Inc. | 3.125% | 6/15/16 | 1,025 | 1,071 |
| Fiserv Inc. | 6.800% | 11/20/17 | 5,950 | 6,858 |
| Fiserv Inc. | 3.500% | 10/1/22 | 6,800 | 6,322 |
| Google Inc. | 2.125% | 5/19/16 | 1,575 | 1,627 |
| Google Inc. | 3.625% | 5/19/21 | 8,515 | 8,847 |
| Harris Corp. | 5.950% | 12/1/17 | 2,975 | 3,345 |
| Harris Corp. | 4.400% | 12/15/20 | 1,725 | 1,781 |
| Harris Corp. | 6.150% | 12/15/40 | 3,493 | 3,726 |
| Hewlett-Packard Co. | 1.550% | 5/30/14 | 2,675 | 2,685 |
| Hewlett-Packard Co. | 2.350% | 3/15/15 | 6,400 | 6,512 |
| Hewlett-Packard Co. | 2.125% | 9/13/15 | 12,597 | 12,860 |
| Hewlett-Packard Co. | 2.650% | 6/1/16 | 2,475 | 2,553 |
| Hewlett-Packard Co. | 3.000% | 9/15/16 | 17,900 | 18,623 |
| Hewlett-Packard Co. | 3.300% | 12/9/16 | 10,710 | 11,202 |
| Hewlett-Packard Co. | 5.400% | 3/1/17 | 2,035 | 2,236 |
| Hewlett-Packard Co. | 2.600% | 9/15/17 | 8,735 | 8,940 |
| Hewlett-Packard Co. | 5.500% | 3/1/18 | 6,575 | 7,316 |
| Hewlett-Packard Co. | 3.750% | 12/1/20 | 6,275 | 6,267 |
| Hewlett-Packard Co. | 4.300% | 6/1/21 | 4,025 | 4,048 |
| Hewlett-Packard Co. | 4.375% | 9/15/21 | 13,550 | 13,775 |
| Hewlett-Packard Co. | 4.650% | 12/9/21 | 3,700 | 3,811 |
| Hewlett-Packard Co. | 6.000% | 9/15/41 | 8,868 | 8,874 |
| HP Enterprise Services LLC | 7.450% | 10/15/29 | 1,950 | 2,177 |
| Intel Corp. | 1.950% | 10/1/16 | 6,425 | 6,618 |
| Intel Corp. | 1.350% | 12/15/17 | 43,637 | 43,184 |
| Intel Corp. | 3.300% | 10/1/21 | 11,901 | 11,876 |
| Intel Corp. | 2.700% | 12/15/22 | 11,620 | 10,675 |
| Intel Corp. | 4.000% | 12/15/32 | 4,325 | 3,966 |
| Intel Corp. | 4.800% | 10/1/41 | 17,832 | 17,445 |
| Intel Corp. | 4.250% | 12/15/42 | 12,950 | 11,358 |
| International Business Machines Corp. | 0.875% | 10/31/14 | 200 | 201 |
| International Business Machines Corp. | 0.550% | 2/6/15 | 7,600 | 7,617 |
| International Business Machines Corp. | 2.000% | 1/5/16 | 2,525 | 2,594 |
| International Business Machines Corp. | 1.950% | 7/22/16 | 36,575 | 37,600 |
| International Business Machines Corp. | 1.250% | 2/6/17 | 9,500 | 9,498 |
| International Business Machines Corp. | 5.700% | 9/14/17 | 39,151 | 44,959 |
| International Business Machines Corp. | 1.250% | 2/8/18 | 1,300 | 1,276 |
| International Business Machines Corp. | 7.625% | 10/15/18 | 7,575 | 9,472 |
| International Business Machines Corp. | 1.875% | 8/1/22 | 3,300 | 2,886 |
| International Business Machines Corp. | 3.375% | 8/1/23 | 8,150 | 7,919 |
| International Business Machines Corp. | 7.000% | 10/30/25 | 965 | 1,209 |
| International Business Machines Corp. | 6.220% | 8/1/27 | 9,850 | 11,644 |
| International Business Machines Corp. | 6.500% | 1/15/28 | 620 | 760 |
| International Business Machines Corp. | 5.600% | 11/30/39 | 10,054 | 11,232 |
| International Business Machines Corp. | 4.000% | 6/20/42 | 9,703 | 8,624 |
| Intuit Inc. | 5.750% | 3/15/17 | 1,900 | 2,143 |
| Jabil Circuit Inc. | 5.625% | 12/15/20 | 2,650 | 2,756 |
| Juniper Networks Inc. | 3.100% | 3/15/16 | 1,095 | 1,127 |
| Juniper Networks Inc. | 4.600% | 3/15/21 | 1,750 | 1,773 |
| Juniper Networks Inc. | 5.950% | 3/15/41 | 2,900 | 2,871 |
| KLA-Tencor Corp. | 6.900% | 5/1/18 | 3,575 | 4,194 |
| Leidos Holdings Inc. | 4.450% | 12/1/20 | 3,350 | 3,344 |
| Leidos Holdings Inc. | 5.950% | 12/1/40 | 2,550 | 2,437 |
| Leidos Inc. | 5.500% | 7/1/33 | 7,370 | 6,718 |
66
| Vanguard® Total Bond Market Index Fund | |||||
| Schedule of Investments | |||||
| December 31, 2013 | |||||
| Face | Market | ||||
| Maturity | Amount | Value | |||
| Coupon | Date | ($000) | ($000) | ||
| Lexmark International Inc. | 6.650% | 6/1/18 | 4,950 | 5,552 | |
| Maxim Integrated Products Inc. | 3.375% | 3/15/23 | 725 | 662 | |
| Microsoft Corp. | 1.625% | 9/25/15 | 20,645 | 21,115 | |
| Microsoft Corp. | 1.000% | 5/1/18 | 4,350 | 4,258 | |
| Microsoft Corp. | 1.625% | 12/6/18 | 1,075 | 1,061 | |
| Microsoft Corp. | 4.200% | 6/1/19 | 7,445 | 8,225 | |
| Microsoft Corp. | 3.000% | 10/1/20 | 13,020 | 13,243 | |
| Microsoft Corp. | 2.125% | 11/15/22 | 2,000 | 1,809 | |
| Microsoft Corp. | 2.375% | 5/1/23 | 4,050 | 3,675 | |
| Microsoft Corp. | 3.625% | 12/15/23 | 800 | 800 | |
| Microsoft Corp. | 5.200% | 6/1/39 | 4,853 | 5,118 | |
| Microsoft Corp. | 4.500% | 10/1/40 | 5,543 | 5,299 | |
| Microsoft Corp. | 5.300% | 2/8/41 | 5,235 | 5,609 | |
| Microsoft Corp. | 3.500% | 11/15/42 | 12,575 | 10,283 | |
| Microsoft Corp. | 3.750% | 5/1/43 | 1,975 | 1,688 | |
| Microsoft Corp. | 4.875% | 12/15/43 | 1,075 | 1,094 | |
| Motorola Solutions Inc. | 6.000% | 11/15/17 | 3,075 | 3,475 | |
| Motorola Solutions Inc. | 3.750% | 5/15/22 | 6,350 | 6,159 | |
| Motorola Solutions Inc. | 7.500% | 5/15/25 | 410 | 485 | |
| NetApp Inc. | 2.000% | 12/15/17 | 1,000 | 997 | |
| NetApp Inc. | 3.250% | 12/15/22 | 1,000 | 903 | |
| Oracle Corp. | 5.250% | 1/15/16 | 28,091 | 30,636 | |
| Oracle Corp. | 1.200% | 10/15/17 | 18,575 | 18,320 | |
| Oracle Corp. | 5.750% | 4/15/18 | 17,727 | 20,535 | |
| Oracle Corp. | 2.375% | 1/15/19 | 9,300 | 9,370 | |
| Oracle Corp. | 5.000% | 7/8/19 | 16,845 | 19,094 | |
| Oracle Corp. | 3.875% | 7/15/20 | 9,775 | 10,308 | |
| Oracle Corp. | 2.500% | 10/15/22 | 10,425 | 9,576 | |
| Oracle Corp. | 6.500% | 4/15/38 | 3,915 | 4,758 | |
| Oracle Corp. | 6.125% | 7/8/39 | 7,220 | 8,414 | |
| Oracle Corp. | 5.375% | 7/15/40 | 19,870 | 21,250 | |
| Pitney Bowes Inc. | 5.750% | 9/15/17 | 7,000 | 7,728 | |
| Pitney Bowes Inc. | 6.250% | 3/15/19 | 200 | 225 | |
| 6 | Seagate HDD Cayman | 3.750% | 11/15/18 | 8,675 | 8,762 |
| Seagate HDD Cayman | 7.000% | 11/1/21 | 4,770 | 5,259 | |
| 6 | Seagate HDD Cayman | 4.750% | 6/1/23 | 8,000 | 7,460 |
| Symantec Corp. | 2.750% | 9/15/15 | 600 | 618 | |
| Symantec Corp. | 2.750% | 6/15/17 | 4,400 | 4,477 | |
| Symantec Corp. | 4.200% | 9/15/20 | 7,200 | 7,403 | |
| Symantec Corp. | 3.950% | 6/15/22 | 5,925 | 5,734 | |
| Telefonaktiebolaget LM Ericsson | 4.125% | 5/15/22 | 5,676 | 5,556 | |
| Texas Instruments Inc. | 0.450% | 8/3/15 | 9,750 | 9,753 | |
| Texas Instruments Inc. | 2.375% | 5/16/16 | 3,425 | 3,553 | |
| Texas Instruments Inc. | 1.650% | 8/3/19 | 9,250 | 8,944 | |
| Total System Services Inc. | 2.375% | 6/1/18 | 1,300 | 1,264 | |
| Tyco Electronics Group SA | 6.550% | 10/1/17 | 45 | 51 | |
| Tyco Electronics Group SA | 3.500% | 2/3/22 | 2,225 | 2,110 | |
| Tyco Electronics Group SA | 7.125% | 10/1/37 | 14,100 | 16,381 | |
| Verisk Analytics Inc. | 4.125% | 9/12/22 | 4,975 | 4,824 | |
| Xerox Corp. | 4.250% | 2/15/15 | 19,875 | 20,623 | |
| Xerox Corp. | 6.400% | 3/15/16 | 8,045 | 8,907 | |
| Xerox Corp. | 6.750% | 2/1/17 | 3,085 | 3,499 | |
| Xerox Corp. | 2.950% | 3/15/17 | 250 | 259 | |
| Xerox Corp. | 6.350% | 5/15/18 | 17,575 | 20,240 | |
| Xerox Corp. | 5.625% | 12/15/19 | 7,675 | 8,568 | |
| Xerox Corp. | 4.500% | 5/15/21 | 5,750 | 5,909 | |
| Transportation (0.5%) | |||||
| 3,6 | American Airlines 2013-1 Class A Pass Through Trust | 4.000% | 1/15/27 | 780 | 764 |
| 3,6 | American Airlines 2013-2 Class A Pass Through Trust | 4.950% | 7/15/24 | 2,400 | 2,517 |
| Burlington Northern Santa Fe LLC | 5.650% | 5/1/17 | 4,050 | 4,573 | |
| Burlington Northern Santa Fe LLC | 5.750% | 3/15/18 | 2,767 | 3,172 | |
| Burlington Northern Santa Fe LLC | 4.700% | 10/1/19 | 200 | 221 | |
| Burlington Northern Santa Fe LLC | 3.600% | 9/1/20 | 5,800 | 5,920 | |
67
| Vanguard® Total Bond Market Index Fund | ||||
| Schedule of Investments | ||||
| December 31, 2013 | ||||
| Face | Market | |||
| Maturity | Amount | Value | ||
| Coupon | Date | ($000) | ($000) | |
| Burlington Northern Santa Fe LLC | 3.450% | 9/15/21 | 3,875 | 3,831 |
| Burlington Northern Santa Fe LLC | 3.050% | 3/15/22 | 2,850 | 2,699 |
| Burlington Northern Santa Fe LLC | 3.050% | 9/1/22 | 5,279 | 4,959 |
| Burlington Northern Santa Fe LLC | 3.850% | 9/1/23 | 3,700 | 3,662 |
| Burlington Northern Santa Fe LLC | 7.000% | 12/15/25 | 6,711 | 8,213 |
| Burlington Northern Santa Fe LLC | 7.950% | 8/15/30 | 80 | 105 |
| Burlington Northern Santa Fe LLC | 6.200% | 8/15/36 | 3,450 | 3,893 |
| Burlington Northern Santa Fe LLC | 6.150% | 5/1/37 | 3,084 | 3,480 |
| Burlington Northern Santa Fe LLC | 5.750% | 5/1/40 | 6,965 | 7,623 |
| Burlington Northern Santa Fe LLC | 5.050% | 3/1/41 | 8,180 | 8,091 |
| Burlington Northern Santa Fe LLC | 5.400% | 6/1/41 | 7,200 | 7,480 |
| Burlington Northern Santa Fe LLC | 4.950% | 9/15/41 | 1,775 | 1,750 |
| Burlington Northern Santa Fe LLC | 4.400% | 3/15/42 | 5,893 | 5,300 |
| Burlington Northern Santa Fe LLC | 4.375% | 9/1/42 | 1,350 | 1,208 |
| Canadian National Railway Co. | 5.800% | 6/1/16 | 750 | 832 |
| Canadian National Railway Co. | 1.450% | 12/15/16 | 1,825 | 1,840 |
| Canadian National Railway Co. | 5.850% | 11/15/17 | 175 | 201 |
| Canadian National Railway Co. | 5.550% | 3/1/19 | 1,160 | 1,332 |
| Canadian National Railway Co. | 2.850% | 12/15/21 | 1,075 | 1,034 |
| Canadian National Railway Co. | 2.250% | 11/15/22 | 8,000 | 7,164 |
| Canadian National Railway Co. | 6.900% | 7/15/28 | 2,725 | 3,464 |
| Canadian National Railway Co. | 6.250% | 8/1/34 | 1,625 | 1,913 |
| Canadian National Railway Co. | 6.200% | 6/1/36 | 2,675 | 3,192 |
| Canadian National Railway Co. | 6.375% | 11/15/37 | 2,018 | 2,442 |
| Canadian National Railway Co. | 3.500% | 11/15/42 | 10,925 | 8,684 |
| Canadian Pacific Railway Co. | 4.450% | 3/15/23 | 4,518 | 4,638 |
| Canadian Pacific Railway Co. | 7.125% | 10/15/31 | 1,185 | 1,421 |
| Canadian Pacific Railway Co. | 5.950% | 5/15/37 | 8,093 | 8,845 |
| Canadian Pacific Railway Ltd. | 5.750% | 1/15/42 | 14,775 | 15,889 |
| Con-way Inc. | 6.700% | 5/1/34 | 4,225 | 4,284 |
| 3 Continental Airlines 2007-1 Class A Pass Through Trust | 5.983% | 4/19/22 | 1,470 | 1,606 |
| 3 Continental Airlines 2009-2 Class A Pass Through Trust | 7.250% | 5/10/21 | 1,012 | 1,164 |
| 3 Continental Airlines 2012-1 Class A Pass Through Trust | 4.150% | 10/11/25 | 20,215 | 20,316 |
| 3 Continental Airlines 2012-2 Class A Pass Through Trust | 4.000% | 4/29/26 | 718 | 716 |
| CSX Corp. | 6.250% | 4/1/15 | 45 | 48 |
| CSX Corp. | 7.900% | 5/1/17 | 2,795 | 3,337 |
| CSX Corp. | 6.250% | 3/15/18 | 2,850 | 3,299 |
| CSX Corp. | 7.375% | 2/1/19 | 35,150 | 42,732 |
| CSX Corp. | 4.250% | 6/1/21 | 2,550 | 2,662 |
| CSX Corp. | 6.000% | 10/1/36 | 5,969 | 6,530 |
| CSX Corp. | 6.150% | 5/1/37 | 2,335 | 2,624 |
| CSX Corp. | 6.220% | 4/30/40 | 6,205 | 7,025 |
| CSX Corp. | 4.750% | 5/30/42 | 5,115 | 4,852 |
| CSX Corp. | 4.400% | 3/1/43 | 18 | 16 |
| CSX Corp. | 4.100% | 3/15/44 | 6,550 | 5,551 |
| 3 Delta Air Lines 2007-1 Class A Pass Through Trust | 6.821% | 2/10/24 | 7,451 | 8,429 |
| 3 Delta Air Lines 2009-1 Class A Pass Through Trust | 7.750% | 12/17/19 | 7,559 | 8,826 |
| 3 Delta Air Lines 2010-2 Class A Pass Through Trust | 4.950% | 5/23/19 | 2,981 | 3,223 |
| 3 Delta Air Lines 2012-1 Class A Pass Through Trust | 4.750% | 11/7/21 | 721 | 772 |
| FedEx Corp. | 2.625% | 8/1/22 | 3,050 | 2,763 |
| FedEx Corp. | 3.875% | 8/1/42 | 2,000 | 1,632 |
| 3 Hawaiian Airlines 2013-1 Class A Pass Through | ||||
| Certificates | 3.900% | 1/15/26 | 1,625 | 1,503 |
| JB Hunt Transport Services Inc. | 3.375% | 9/15/15 | 10,100 | 10,477 |
| Kansas City Southern de Mexico SA de CV | 2.350% | 5/15/20 | 1,400 | 1,302 |
| Kansas City Southern de Mexico SA de CV | 3.000% | 5/15/23 | 4,775 | 4,308 |
| 6 Kansas City Southern Railway Co. | 4.300% | 5/15/43 | 3,300 | 2,866 |
| Norfolk Southern Corp. | 5.750% | 1/15/16 | 8,200 | 8,968 |
68
| Vanguard® Total Bond Market Index Fund | ||||
| Schedule of Investments | ||||
| December 31, 2013 | ||||
| Face | Market | |||
| Maturity | Amount | Value | ||
| Coupon | Date | ($000) | ($000) | |
| Norfolk Southern Corp. | 7.700% | 5/15/17 | 5,125 | 6,109 |
| Norfolk Southern Corp. | 5.750% | 4/1/18 | 2,575 | 2,939 |
| Norfolk Southern Corp. | 5.900% | 6/15/19 | 9,350 | 10,812 |
| Norfolk Southern Corp. | 3.250% | 12/1/21 | 4,400 | 4,283 |
| Norfolk Southern Corp. | 3.000% | 4/1/22 | 70 | 66 |
| Norfolk Southern Corp. | 2.903% | 2/15/23 | 4,518 | 4,175 |
| Norfolk Southern Corp. | 5.590% | 5/17/25 | 102 | 112 |
| Norfolk Southern Corp. | 7.800% | 5/15/27 | 4,400 | 5,600 |
| Norfolk Southern Corp. | 7.250% | 2/15/31 | 4,062 | 4,975 |
| Norfolk Southern Corp. | 4.837% | 10/1/41 | 11,566 | 11,110 |
| Norfolk Southern Corp. | 7.900% | 5/15/97 | 400 | 532 |
| Norfolk Southern Corp. | 6.000% | 5/23/11 | 9,175 | 9,699 |
| Norfolk Southern Railway Co. | 9.750% | 6/15/20 | 1,559 | 2,123 |
| Ryder System Inc. | 3.150% | 3/2/15 | 5,275 | 5,411 |
| Ryder System Inc. | 7.200% | 9/1/15 | 1,130 | 1,242 |
| Ryder System Inc. | 3.600% | 3/1/16 | 3,500 | 3,655 |
| Ryder System Inc. | 5.850% | 11/1/16 | 8,425 | 9,345 |
| Ryder System Inc. | 3.500% | 6/1/17 | 1,625 | 1,701 |
| Ryder System Inc. | 2.350% | 2/26/19 | 5,900 | 5,791 |
| Southwest Airlines Co. | 5.250% | 10/1/14 | 175 | 181 |
| Southwest Airlines Co. | 5.750% | 12/15/16 | 2,955 | 3,300 |
| 3 Southwest Airlines Co. 2007-1 Pass Through Trust | 6.150% | 2/1/24 | 829 | 948 |
| 3 UAL 2009-2A Pass Through Trust | 9.750% | 7/15/18 | 777 | 893 |
| Union Pacific Corp. | 5.750% | 11/15/17 | 5 | 6 |
| Union Pacific Corp. | 5.700% | 8/15/18 | 1,000 | 1,152 |
| Union Pacific Corp. | 4.000% | 2/1/21 | 200 | 208 |
| Union Pacific Corp. | 4.163% | 7/15/22 | 30,852 | 31,797 |
| Union Pacific Corp. | 6.625% | 2/1/29 | 2,260 | 2,719 |
| Union Pacific Corp. | 4.750% | 9/15/41 | 6,325 | 6,122 |
| Union Pacific Corp. | 4.250% | 4/15/43 | 1,000 | 889 |
| 6 Union Pacific Corp. | 4.821% | 2/1/44 | 5,304 | 5,154 |
| 3 Union Pacific Railroad Co. 2007-3 Pass Through Trust | 6.176% | 1/2/31 | 1,176 | 1,341 |
| 3 United Airlines 2013-1 Class A Pass Through Trust | 4.300% | 2/15/27 | 2,675 | 2,725 |
| United Parcel Service Inc. | 3.875% | 4/1/14 | 10,175 | 10,262 |
| United Parcel Service Inc. | 1.125% | 10/1/17 | 2,500 | 2,469 |
| United Parcel Service Inc. | 5.500% | 1/15/18 | 2,395 | 2,736 |
| United Parcel Service Inc. | 5.125% | 4/1/19 | 5,175 | 5,900 |
| United Parcel Service Inc. | 3.125% | 1/15/21 | 19,106 | 19,184 |
| United Parcel Service Inc. | 2.450% | 10/1/22 | 2,990 | 2,755 |
| United Parcel Service Inc. | 6.200% | 1/15/38 | 5,000 | 6,045 |
| United Parcel Service Inc. | 4.875% | 11/15/40 | 300 | 307 |
| United Parcel Service Inc. | 3.625% | 10/1/42 | 3,768 | 3,152 |
| United Parcel Service of America Inc. | 8.375% | 4/1/20 | 10 | 13 |
| 3 US Airways 2012-1 Class A Pass Through Trust | 5.900% | 4/1/26 | 96 | 105 |
| 3 US Airways 2013-1 Class A Pass Through Trust | 3.950% | 5/15/27 | 1,725 | 1,686 |
| 3 US Airways Inc. 2012-2 Class A Pass Through Trust | 4.625% | 12/3/26 | 1,669 | 1,696 |
| 14,463,501 | ||||
| Utilities (2.6%) | ||||
| Electric (1.7%) | ||||
| AEP Texas Central Co. | 6.650% | 2/15/33 | 2,675 | 3,083 |
| Alabama Power Co. | 6.125% | 5/15/38 | 18 | 21 |
| Alabama Power Co. | 6.000% | 3/1/39 | 45 | 53 |
| Alabama Power Co. | 5.200% | 6/1/41 | 2,800 | 2,972 |
| Alabama Power Co. | 4.100% | 1/15/42 | 4,875 | 4,356 |
| Alabama Power Co. | 3.850% | 12/1/42 | 1,250 | 1,066 |
| Ameren Illinois Co. | 6.125% | 11/15/17 | 1,300 | 1,483 |
| Ameren Illinois Co. | 2.700% | 9/1/22 | 5,231 | 4,887 |
| Ameren Illinois Co. | 4.800% | 12/15/43 | 2,375 | 2,392 |
| American Electric Power Co. Inc. | 1.650% | 12/15/17 | 5,475 | 5,363 |
| American Electric Power Co. Inc. | 2.950% | 12/15/22 | 4,350 | 4,016 |
| Appalachian Power Co. | 3.400% | 5/24/15 | 5,250 | 5,417 |
| Appalachian Power Co. | 7.950% | 1/15/20 | 350 | 435 |
| Appalachian Power Co. | 4.600% | 3/30/21 | 3,875 | 4,143 |
69
| Vanguard® Total Bond Market Index Fund | ||||
| Schedule of Investments | ||||
| December 31, 2013 | ||||
| Face | Market | |||
| Maturity | Amount | Value | ||
| Coupon | Date | ($000) | ($000) | |
| Appalachian Power Co. | 5.800% | 10/1/35 | 1,475 | 1,541 |
| Appalachian Power Co. | 6.375% | 4/1/36 | 2,800 | 3,077 |
| Arizona Public Service Co. | 4.650% | 5/15/15 | 3,140 | 3,299 |
| Arizona Public Service Co. | 8.750% | 3/1/19 | 1,300 | 1,651 |
| Arizona Public Service Co. | 5.500% | 9/1/35 | 3,580 | 3,847 |
| Arizona Public Service Co. | 4.500% | 4/1/42 | 6,618 | 6,279 |
| Atlantic City Electric Co. | 7.750% | 11/15/18 | 4,225 | 5,215 |
| Baltimore Gas & Electric Co. | 5.900% | 10/1/16 | 3,525 | 3,951 |
| Baltimore Gas & Electric Co. | 3.500% | 11/15/21 | 1,700 | 1,700 |
| Baltimore Gas & Electric Co. | 3.350% | 7/1/23 | 2,400 | 2,300 |
| Baltimore Gas & Electric Co. | 6.350% | 10/1/36 | 643 | 758 |
| CenterPoint Energy Houston Electric LLC | 2.250% | 8/1/22 | 6,500 | 5,889 |
| CenterPoint Energy Houston Electric LLC | 6.950% | 3/15/33 | 300 | 383 |
| CenterPoint Energy Houston Electric LLC | 3.550% | 8/1/42 | 11,220 | 9,242 |
| CenterPoint Energy Inc. | 6.500% | 5/1/18 | 70 | 82 |
| Cleco Power LLC | 6.500% | 12/1/35 | 4,300 | 4,889 |
| Cleco Power LLC | 6.000% | 12/1/40 | 4,075 | 4,435 |
| Cleveland Electric Illuminating Co. | 7.880% | 11/1/17 | 2,742 | 3,289 |
| Cleveland Electric Illuminating Co. | 5.500% | 8/15/24 | 4,515 | 4,880 |
| CMS Energy Corp. | 6.250% | 2/1/20 | 3,476 | 3,995 |
| CMS Energy Corp. | 4.700% | 3/31/43 | 5,300 | 4,902 |
| Commonwealth Edison Co. | 5.950% | 8/15/16 | 11,630 | 13,001 |
| Commonwealth Edison Co. | 6.150% | 9/15/17 | 13,670 | 15,786 |
| Commonwealth Edison Co. | 5.800% | 3/15/18 | 2,985 | 3,439 |
| Commonwealth Edison Co. | 4.000% | 8/1/20 | 2,175 | 2,306 |
| Commonwealth Edison Co. | 3.400% | 9/1/21 | 3,000 | 3,012 |
| Commonwealth Edison Co. | 5.875% | 2/1/33 | 590 | 668 |
| Commonwealth Edison Co. | 5.900% | 3/15/36 | 3,086 | 3,503 |
| Commonwealth Edison Co. | 6.450% | 1/15/38 | 9,223 | 11,163 |
| Commonwealth Edison Co. | 4.600% | 8/15/43 | 2,750 | 2,666 |
| Connecticut Light & Power Co. | 2.500% | 1/15/23 | 5,925 | 5,396 |
| Connecticut Light & Power Co. | 6.350% | 6/1/36 | 5,100 | 6,127 |
| Consolidated Edison Co. of New York Inc. | 5.375% | 12/15/15 | 1,400 | 1,522 |
| Consolidated Edison Co. of New York Inc. | 5.500% | 9/15/16 | 5,840 | 6,502 |
| Consolidated Edison Co. of New York Inc. | 5.850% | 4/1/18 | 530 | 613 |
| Consolidated Edison Co. of New York Inc. | 7.125% | 12/1/18 | 850 | 1,039 |
| Consolidated Edison Co. of New York Inc. | 6.650% | 4/1/19 | 13,175 | 15,838 |
| Consolidated Edison Co. of New York Inc. | 5.300% | 3/1/35 | 6,100 | 6,541 |
| Consolidated Edison Co. of New York Inc. | 5.850% | 3/15/36 | 11,165 | 12,747 |
| Consolidated Edison Co. of New York Inc. | 6.200% | 6/15/36 | 3,020 | 3,553 |
| Consolidated Edison Co. of New York Inc. | 6.750% | 4/1/38 | 1,080 | 1,363 |
| Consolidated Edison Co. of New York Inc. | 5.500% | 12/1/39 | 50 | 55 |
| Consolidated Edison Co. of New York Inc. | 5.700% | 6/15/40 | 5,725 | 6,498 |
| Consolidated Edison Co. of New York Inc. | 4.200% | 3/15/42 | 18 | 16 |
| Constellation Energy Group Inc. | 4.550% | 6/15/15 | 8,636 | 9,060 |
| Constellation Energy Group Inc. | 5.150% | 12/1/20 | 4,563 | 4,854 |
| Consumers Energy Co. | 5.500% | 8/15/16 | 1,800 | 2,006 |
| Consumers Energy Co. | 6.125% | 3/15/19 | 9,550 | 11,268 |
| Consumers Energy Co. | 6.700% | 9/15/19 | 5,000 | 6,073 |
| Consumers Energy Co. | 2.850% | 5/15/22 | 8,775 | 8,371 |
| Consumers Energy Co. | 3.375% | 8/15/23 | 2,450 | 2,386 |
| Consumers Energy Co. | 3.950% | 5/15/43 | 3,425 | 3,031 |
| 6 Dayton Power & Light Co. | 1.875% | 9/15/16 | 850 | 857 |
| Delmarva Power & Light Co. | 3.500% | 11/15/23 | 1,475 | 1,440 |
| Delmarva Power & Light Co. | 4.000% | 6/1/42 | 225 | 200 |
| Dominion Resources Inc. | 5.150% | 7/15/15 | 16,818 | 17,907 |
| Dominion Resources Inc. | 2.250% | 9/1/15 | 2,980 | 3,055 |
| Dominion Resources Inc. | 1.950% | 8/15/16 | 5,450 | 5,540 |
| Dominion Resources Inc. | 6.000% | 11/30/17 | 4,625 | 5,296 |
| Dominion Resources Inc. | 6.400% | 6/15/18 | 290 | 339 |
| Dominion Resources Inc. | 8.875% | 1/15/19 | 480 | 612 |
| Dominion Resources Inc. | 4.450% | 3/15/21 | 13,275 | 14,044 |
| Dominion Resources Inc. | 6.300% | 3/15/33 | 8,275 | 9,554 |
| Dominion Resources Inc. | 5.250% | 8/1/33 | 2,195 | 2,307 |
70
| Vanguard® Total Bond Market Index Fund | ||||
| Schedule of Investments | ||||
| December 31, 2013 | ||||
| Face | Market | |||
| Maturity | Amount | Value | ||
| Coupon | Date | ($000) | ($000) | |
| Dominion Resources Inc. | 5.950% | 6/15/35 | 8,785 | 9,722 |
| Dominion Resources Inc. | 4.900% | 8/1/41 | 2,195 | 2,113 |
| Dominion Resources Inc. | 4.050% | 9/15/42 | 675 | 562 |
| 3 Dominion Resources Inc. | 7.500% | 6/30/66 | 3,775 | 4,068 |
| DTE Electric Co. | 3.450% | 10/1/20 | 1,700 | 1,741 |
| DTE Electric Co. | 3.900% | 6/1/21 | 1,575 | 1,637 |
| DTE Electric Co. | 2.650% | 6/15/22 | 5,975 | 5,594 |
| DTE Electric Co. | 3.650% | 3/15/24 | 16,775 | 16,591 |
| DTE Electric Co. | 3.950% | 6/15/42 | 7,835 | 6,959 |
| DTE Electric Co. | 4.000% | 4/1/43 | 6,375 | 5,693 |
| DTE Energy Co. | 6.375% | 4/15/33 | 4,425 | 5,045 |
| Duke Energy Carolinas LLC | 4.300% | 6/15/20 | 5,700 | 6,128 |
| Duke Energy Carolinas LLC | 6.000% | 12/1/28 | 4,670 | 5,299 |
| Duke Energy Carolinas LLC | 6.450% | 10/15/32 | 1,575 | 1,856 |
| Duke Energy Carolinas LLC | 6.100% | 6/1/37 | 10,245 | 11,675 |
| Duke Energy Carolinas LLC | 6.000% | 1/15/38 | 5,676 | 6,619 |
| Duke Energy Carolinas LLC | 6.050% | 4/15/38 | 1,240 | 1,478 |
| Duke Energy Carolinas LLC | 5.300% | 2/15/40 | 3,595 | 3,909 |
| Duke Energy Carolinas LLC | 4.250% | 12/15/41 | 5,000 | 4,701 |
| Duke Energy Carolinas LLC | 4.000% | 9/30/42 | 570 | 514 |
| Duke Energy Corp. | 3.350% | 4/1/15 | 6,775 | 6,983 |
| Duke Energy Corp. | 2.150% | 11/15/16 | 9,075 | 9,315 |
| Duke Energy Corp. | 1.625% | 8/15/17 | 7,925 | 7,894 |
| Duke Energy Corp. | 5.050% | 9/15/19 | 11,200 | 12,370 |
| Duke Energy Corp. | 3.550% | 9/15/21 | 4,100 | 4,100 |
| Duke Energy Corp. | 3.050% | 8/15/22 | 9,330 | 8,833 |
| Duke Energy Florida Inc. | 6.350% | 9/15/37 | 10,725 | 13,020 |
| Duke Energy Florida Inc. | 6.400% | 6/15/38 | 7,250 | 8,952 |
| Duke Energy Florida Inc. | 5.650% | 4/1/40 | 1,000 | 1,130 |
| Duke Energy Indiana Inc. | 6.050% | 6/15/16 | 325 | 362 |
| Duke Energy Indiana Inc. | 3.750% | 7/15/20 | 50 | 52 |
| Duke Energy Indiana Inc. | 6.120% | 10/15/35 | 1,093 | 1,182 |
| Duke Energy Indiana Inc. | 6.350% | 8/15/38 | 8,100 | 9,829 |
| Duke Energy Indiana Inc. | 6.450% | 4/1/39 | 925 | 1,138 |
| Duke Energy Indiana Inc. | 4.200% | 3/15/42 | 2,875 | 2,646 |
| Duke Energy Indiana Inc. | 4.900% | 7/15/43 | 1,450 | 1,509 |
| Duke Energy Ohio Inc. | 5.450% | 4/1/19 | 908 | 1,036 |
| Duke Energy Progress Inc. | 5.300% | 1/15/19 | 36,525 | 41,517 |
| Duke Energy Progress Inc. | 3.000% | 9/15/21 | 6,000 | 5,866 |
| Duke Energy Progress Inc. | 6.300% | 4/1/38 | 5,599 | 6,790 |
| Duke Energy Progress Inc. | 4.100% | 5/15/42 | 18 | 17 |
| Duke Energy Progress Inc. | 4.100% | 3/15/43 | 400 | 365 |
| El Paso Electric Co. | 6.000% | 5/15/35 | 1,725 | 1,783 |
| Enersis SA | 7.375% | 1/15/14 | 1,000 | 1,001 |
| Entergy Arkansas Inc. | 3.750% | 2/15/21 | 10,250 | 10,455 |
| Entergy Corp. | 4.700% | 1/15/17 | 3,125 | 3,358 |
| Entergy Gulf States Louisiana LLC | 6.000% | 5/1/18 | 3,725 | 4,256 |
| Entergy Gulf States Louisiana LLC | 5.590% | 10/1/24 | 1,387 | 1,550 |
| Entergy Louisiana LLC | 4.050% | 9/1/23 | 3,650 | 3,688 |
| Entergy Louisiana LLC | 5.400% | 11/1/24 | 1,825 | 2,025 |
| Entergy Mississippi Inc. | 3.100% | 7/1/23 | 1,645 | 1,538 |
| Entergy Texas Inc. | 7.125% | 2/1/19 | 7,575 | 8,915 |
| Exelon Corp. | 4.900% | 6/15/15 | 7,000 | 7,381 |
| Exelon Corp. | 5.625% | 6/15/35 | 1,805 | 1,783 |
| Exelon Generation Co. LLC | 6.200% | 10/1/17 | 5,255 | 5,935 |
| Exelon Generation Co. LLC | 5.200% | 10/1/19 | 20 | 22 |
| Exelon Generation Co. LLC | 4.000% | 10/1/20 | 9,875 | 9,846 |
| Exelon Generation Co. LLC | 4.250% | 6/15/22 | 12,138 | 11,654 |
| Exelon Generation Co. LLC | 6.250% | 10/1/39 | 1,193 | 1,204 |
| Exelon Generation Co. LLC | 5.750% | 10/1/41 | 225 | 215 |
| Exelon Generation Co. LLC | 5.600% | 6/15/42 | 3,276 | 3,058 |
| FirstEnergy Solutions Corp. | 6.800% | 8/15/39 | 1,803 | 1,819 |
| Florida Power & Light Co. | 5.550% | 11/1/17 | 670 | 763 |
| Florida Power & Light Co. | 2.750% | 6/1/23 | 7,625 | 7,123 |
71
| Vanguard® Total Bond Market Index Fund | ||||
| Schedule of Investments | ||||
| December 31, 2013 | ||||
| Face | Market | |||
| Maturity | Amount | Value | ||
| Coupon | Date | ($000) | ($000) | |
| Florida Power & Light Co. | 5.950% | 10/1/33 | 225 | 264 |
| Florida Power & Light Co. | 5.625% | 4/1/34 | 3,870 | 4,403 |
| Florida Power & Light Co. | 4.950% | 6/1/35 | 560 | 585 |
| Florida Power & Light Co. | 5.400% | 9/1/35 | 5,650 | 6,205 |
| Florida Power & Light Co. | 6.200% | 6/1/36 | 4,900 | 5,862 |
| Florida Power & Light Co. | 5.650% | 2/1/37 | 4,460 | 5,023 |
| Florida Power & Light Co. | 5.850% | 5/1/37 | 1,675 | 1,929 |
| Florida Power & Light Co. | 5.950% | 2/1/38 | 10,350 | 12,080 |
| Florida Power & Light Co. | 4.125% | 2/1/42 | 10,150 | 9,313 |
| Georgia Power Co. | 0.750% | 8/10/15 | 10,675 | 10,691 |
| Georgia Power Co. | 3.000% | 4/15/16 | 3,400 | 3,554 |
| Georgia Power Co. | 5.700% | 6/1/17 | 16,444 | 18,519 |
| Georgia Power Co. | 4.250% | 12/1/19 | 20 | 22 |
| Georgia Power Co. | 2.850% | 5/15/22 | 8,650 | 8,149 |
| Georgia Power Co. | 5.650% | 3/1/37 | 325 | 350 |
| Georgia Power Co. | 5.950% | 2/1/39 | 2,000 | 2,244 |
| Georgia Power Co. | 5.400% | 6/1/40 | 4,000 | 4,182 |
| Georgia Power Co. | 4.750% | 9/1/40 | 4,400 | 4,217 |
| Georgia Power Co. | 4.300% | 3/15/42 | 6,070 | 5,445 |
| Great Plains Energy Inc. | 4.850% | 6/1/21 | 1,200 | 1,262 |
| Iberdrola International BV | 6.750% | 7/15/36 | 3,675 | 4,001 |
| Indiana Michigan Power Co. | 7.000% | 3/15/19 | 625 | 742 |
| Indiana Michigan Power Co. | 3.200% | 3/15/23 | 7,325 | 6,824 |
| Indiana Michigan Power Co. | 6.050% | 3/15/37 | 7,250 | 7,864 |
| 3 Integrys Energy Group Inc. | 6.110% | 12/1/66 | 4,990 | 5,040 |
| Interstate Power & Light Co. | 6.250% | 7/15/39 | 3,175 | 3,752 |
| ITC Holdings Corp. | 4.050% | 7/1/23 | 2,925 | 2,871 |
| ITC Holdings Corp. | 5.300% | 7/1/43 | 2,875 | 2,815 |
| Jersey Central Power & Light Co. | 5.625% | 5/1/16 | 8,850 | 9,631 |
| Jersey Central Power & Light Co. | 5.650% | 6/1/17 | 4,600 | 5,088 |
| Jersey Central Power & Light Co. | 6.150% | 6/1/37 | 5,650 | 5,810 |
| 3 John Sevier Combined Cycle Generation LLC | 4.626% | 1/15/42 | 2,549 | 2,477 |
| Kansas City Power & Light Co. | 7.150% | 4/1/19 | 500 | 612 |
| Kansas City Power & Light Co. | 6.050% | 11/15/35 | 1,725 | 1,885 |
| Kansas City Power & Light Co. | 5.300% | 10/1/41 | 5,493 | 5,489 |
| 3 Kansas Gas & Electric Co. | 5.647% | 3/29/21 | 126 | 132 |
| Kentucky Utilities Co. | 1.625% | 11/1/15 | 4,850 | 4,941 |
| Kentucky Utilities Co. | 3.250% | 11/1/20 | 3,550 | 3,602 |
| Kentucky Utilities Co. | 5.125% | 11/1/40 | 1,580 | 1,664 |
| Kentucky Utilities Co. | 4.650% | 11/15/43 | 11,650 | 11,549 |
| LG&E & KU Energy LLC | 2.125% | 11/15/15 | 3,200 | 3,256 |
| LG&E & KU Energy LLC | 3.750% | 11/15/20 | 11,800 | 11,921 |
| Louisville Gas & Electric Co. | 5.125% | 11/15/40 | 2,075 | 2,181 |
| Louisville Gas & Electric Co. | 4.650% | 11/15/43 | 8,225 | 8,167 |
| Metropolitan Edison Co. | 7.700% | 1/15/19 | 5,236 | 6,320 |
| MidAmerican Energy Co. | 5.950% | 7/15/17 | 1,825 | 2,093 |
| MidAmerican Energy Co. | 5.300% | 3/15/18 | 450 | 507 |
| MidAmerican Energy Co. | 6.750% | 12/30/31 | 9,000 | 11,007 |
| MidAmerican Energy Co. | 5.750% | 11/1/35 | 1,400 | 1,564 |
| MidAmerican Energy Co. | 5.800% | 10/15/36 | 275 | 308 |
| 6 MidAmerican Energy Holdings Co. | 1.100% | 5/15/17 | 875 | 870 |
| MidAmerican Energy Holdings Co. | 5.750% | 4/1/18 | 13,125 | 14,973 |
| 6 MidAmerican Energy Holdings Co. | 2.000% | 11/15/18 | 2,200 | 2,163 |
| 6 MidAmerican Energy Holdings Co. | 3.750% | 11/15/23 | 7,250 | 7,046 |
| MidAmerican Energy Holdings Co. | 8.480% | 9/15/28 | 1,055 | 1,423 |
| MidAmerican Energy Holdings Co. | 6.125% | 4/1/36 | 20,474 | 23,232 |
| MidAmerican Energy Holdings Co. | 5.950% | 5/15/37 | 9,250 | 10,229 |
| MidAmerican Energy Holdings Co. | 6.500% | 9/15/37 | 1,255 | 1,471 |
| 6 MidAmerican Energy Holdings Co. | 5.150% | 11/15/43 | 7,050 | 7,077 |
| Mississippi Power Co. | 4.250% | 3/15/42 | 7,775 | 6,767 |
| National Rural Utilities Cooperative Finance Corp. | 1.000% | 2/2/15 | 200 | 201 |
| National Rural Utilities Cooperative Finance Corp. | 3.875% | 9/16/15 | 6,750 | 7,112 |
| National Rural Utilities Cooperative Finance Corp. | 5.450% | 4/10/17 | 500 | 558 |
| National Rural Utilities Cooperative Finance Corp. | 5.450% | 2/1/18 | 6,585 | 7,424 |
72
| Vanguard® Total Bond Market Index Fund | ||||
| Schedule of Investments | ||||
| December 31, 2013 | ||||
| Face | Market | |||
| Maturity | Amount | Value | ||
| Coupon | Date | ($000) | ($000) | |
| National Rural Utilities Cooperative Finance Corp. | 10.375% | 11/1/18 | 21,930 | 29,566 |
| National Rural Utilities Cooperative Finance Corp. | 8.000% | 3/1/32 | 2,423 | 3,257 |
| National Rural Utilities Cooperative Finance Corp. | 4.023% | 11/1/32 | 3,057 | 2,828 |
| 3 National Rural Utilities Cooperative Finance Corp. | 4.750% | 4/30/43 | 1,500 | 1,381 |
| Nevada Power Co. | 6.500% | 5/15/18 | 3,592 | 4,246 |
| Nevada Power Co. | 7.125% | 3/15/19 | 16,965 | 20,627 |
| Nevada Power Co. | 6.650% | 4/1/36 | 500 | 608 |
| Nevada Power Co. | 6.750% | 7/1/37 | 6,672 | 8,249 |
| Nevada Power Co. | 5.375% | 9/15/40 | 3,905 | 4,165 |
| Nevada Power Co. | 5.450% | 5/15/41 | 900 | 974 |
| NextEra Energy Capital Holdings Inc. | 2.600% | 9/1/15 | 2,000 | 2,053 |
| NextEra Energy Capital Holdings Inc. | 7.875% | 12/15/15 | 825 | 932 |
| NextEra Energy Capital Holdings Inc. | 6.000% | 3/1/19 | 20,650 | 23,379 |
| NextEra Energy Capital Holdings Inc. | 3.625% | 6/15/23 | 5,825 | 5,445 |
| 3 NextEra Energy Capital Holdings Inc. | 6.350% | 10/1/66 | 2,175 | 2,175 |
| 3 NextEra Energy Capital Holdings Inc. | 6.650% | 6/15/67 | 2,750 | 2,805 |
| Northern States Power Co. | 1.950% | 8/15/15 | 2,225 | 2,268 |
| Northern States Power Co. | 5.250% | 3/1/18 | 1,875 | 2,126 |
| Northern States Power Co. | 5.250% | 7/15/35 | 325 | 346 |
| Northern States Power Co. | 6.250% | 6/1/36 | 1,670 | 1,991 |
| Northern States Power Co. | 6.200% | 7/1/37 | 5,443 | 6,480 |
| Northern States Power Co. | 5.350% | 11/1/39 | 9,296 | 10,056 |
| Northern States Power Co. | 4.850% | 8/15/40 | 525 | 531 |
| Northern States Power Co. | 3.400% | 8/15/42 | 18 | 14 |
| NSTAR Electric Co. | 5.625% | 11/15/17 | 5,350 | 6,059 |
| NSTAR Electric Co. | 2.375% | 10/15/22 | 6,200 | 5,620 |
| NSTAR Electric Co. | 5.500% | 3/15/40 | 2,950 | 3,282 |
| NSTAR LLC | 4.500% | 11/15/19 | 6,535 | 7,088 |
| Oglethorpe Power Corp. | 5.950% | 11/1/39 | 1,700 | 1,848 |
| Oglethorpe Power Corp. | 5.375% | 11/1/40 | 4,800 | 4,904 |
| Oglethorpe Power Corp. | 5.250% | 9/1/50 | 18 | 17 |
| Ohio Power Co. | 6.000% | 6/1/16 | 3,275 | 3,621 |
| Ohio Power Co. | 5.375% | 10/1/21 | 1,450 | 1,615 |
| Ohio Power Co. | 6.600% | 2/15/33 | 1,500 | 1,738 |
| Ohio Power Co. | 5.850% | 10/1/35 | 5,468 | 5,872 |
| Oklahoma Gas & Electric Co. | 5.850% | 6/1/40 | 2,925 | 3,318 |
| Oklahoma Gas & Electric Co. | 3.900% | 5/1/43 | 2,000 | 1,720 |
| Oncor Electric Delivery Co. LLC | 6.375% | 1/15/15 | 7,340 | 7,748 |
| Oncor Electric Delivery Co. LLC | 6.800% | 9/1/18 | 3,325 | 3,907 |
| Oncor Electric Delivery Co. LLC | 4.100% | 6/1/22 | 1,750 | 1,764 |
| Oncor Electric Delivery Co. LLC | 7.000% | 9/1/22 | 5,336 | 6,363 |
| Oncor Electric Delivery Co. LLC | 7.000% | 5/1/32 | 2,600 | 3,175 |
| Oncor Electric Delivery Co. LLC | 7.250% | 1/15/33 | 3,680 | 4,618 |
| Oncor Electric Delivery Co. LLC | 7.500% | 9/1/38 | 1,105 | 1,433 |
| Oncor Electric Delivery Co. LLC | 5.250% | 9/30/40 | 325 | 336 |
| Oncor Electric Delivery Co. LLC | 5.300% | 6/1/42 | 425 | 441 |
| Pacific Gas & Electric Co. | 5.625% | 11/30/17 | 6,980 | 7,906 |
| Pacific Gas & Electric Co. | 3.500% | 10/1/20 | 19,650 | 20,004 |
| Pacific Gas & Electric Co. | 4.250% | 5/15/21 | 4,650 | 4,880 |
| Pacific Gas & Electric Co. | 3.250% | 6/15/23 | 9,000 | 8,521 |
| Pacific Gas & Electric Co. | 6.050% | 3/1/34 | 26,517 | 30,415 |
| Pacific Gas & Electric Co. | 5.800% | 3/1/37 | 17,770 | 19,643 |
| Pacific Gas & Electric Co. | 6.350% | 2/15/38 | 500 | 583 |
| Pacific Gas & Electric Co. | 6.250% | 3/1/39 | 3,825 | 4,436 |
| Pacific Gas & Electric Co. | 5.400% | 1/15/40 | 10 | 11 |
| Pacific Gas & Electric Co. | 4.450% | 4/15/42 | 2,469 | 2,306 |
| Pacific Gas & Electric Co. | 3.750% | 8/15/42 | 45 | 37 |
| Pacific Gas & Electric Co. | 4.600% | 6/15/43 | 9,075 | 8,634 |
| PacifiCorp | 7.700% | 11/15/31 | 1,174 | 1,558 |
| PacifiCorp | 5.250% | 6/15/35 | 100 | 106 |
| PacifiCorp | 5.750% | 4/1/37 | 150 | 172 |
| PacifiCorp | 6.250% | 10/15/37 | 8,625 | 10,367 |
| PacifiCorp | 6.000% | 1/15/39 | 2,025 | 2,356 |
| PacifiCorp | 4.100% | 2/1/42 | 4,845 | 4,384 |
73
| Vanguard® Total Bond Market Index Fund | ||||
| Schedule of Investments | ||||
| December 31, 2013 | ||||
| Face | Market | |||
| Maturity | Amount | Value | ||
| Coupon | Date | ($000) | ($000) | |
| Peco Energy Co. | 1.200% | 10/15/16 | 4,875 | 4,897 |
| Peco Energy Co. | 5.350% | 3/1/18 | 675 | 766 |
| Peco Energy Co. | 2.375% | 9/15/22 | 2,925 | 2,653 |
| Pennsylvania Electric Co. | 5.200% | 4/1/20 | 5,400 | 5,760 |
| Pennsylvania Electric Co. | 6.150% | 10/1/38 | 3,400 | 3,544 |
| Pepco Holdings Inc. | 2.700% | 10/1/15 | 150 | 154 |
| Potomac Electric Power Co. | 6.500% | 11/15/37 | 7,907 | 9,773 |
| PPL Capital Funding Inc. | 1.900% | 6/1/18 | 1,225 | 1,198 |
| PPL Capital Funding Inc. | 3.400% | 6/1/23 | 4,945 | 4,600 |
| PPL Capital Funding Inc. | 4.700% | 6/1/43 | 2,250 | 2,027 |
| PPL Electric Utilities Corp. | 3.000% | 9/15/21 | 1,075 | 1,056 |
| PPL Electric Utilities Corp. | 6.250% | 5/15/39 | 5,552 | 6,684 |
| PPL Electric Utilities Corp. | 5.200% | 7/15/41 | 3,190 | 3,387 |
| PPL Energy Supply LLC | 6.200% | 5/15/16 | 1,545 | 1,701 |
| PPL Energy Supply LLC | 6.500% | 5/1/18 | 8,025 | 8,908 |
| PPL Energy Supply LLC | 4.600% | 12/15/21 | 3,125 | 3,008 |
| Progress Energy Inc. | 4.875% | 12/1/19 | 2,475 | 2,722 |
| Progress Energy Inc. | 4.400% | 1/15/21 | 5,900 | 6,243 |
| Progress Energy Inc. | 7.750% | 3/1/31 | 1,785 | 2,292 |
| Progress Energy Inc. | 7.000% | 10/30/31 | 500 | 603 |
| Progress Energy Inc. | 6.000% | 12/1/39 | 6,720 | 7,507 |
| PSEG Power LLC | 5.500% | 12/1/15 | 14,240 | 15,429 |
| PSEG Power LLC | 2.750% | 9/15/16 | 4,400 | 4,557 |
| PSEG Power LLC | 5.125% | 4/15/20 | 1,276 | 1,390 |
| PSEG Power LLC | 4.150% | 9/15/21 | 4,269 | 4,325 |
| PSEG Power LLC | 8.625% | 4/15/31 | 350 | 475 |
| Public Service Co. of Colorado | 5.800% | 8/1/18 | 1,475 | 1,710 |
| Public Service Co. of Colorado | 5.125% | 6/1/19 | 9,725 | 10,988 |
| Public Service Co. of Colorado | 3.200% | 11/15/20 | 4,100 | 4,135 |
| Public Service Co. of Colorado | 2.250% | 9/15/22 | 3,150 | 2,850 |
| Public Service Co. of Colorado | 6.250% | 9/1/37 | 2,325 | 2,831 |
| Public Service Co. of Colorado | 4.750% | 8/15/41 | 2,925 | 2,941 |
| Public Service Co. of Colorado | 3.600% | 9/15/42 | 11,100 | 9,226 |
| Public Service Co. of New Hampshire | 3.500% | 11/1/23 | 675 | 659 |
| Public Service Co. of Oklahoma | 5.150% | 12/1/19 | 100 | 111 |
| Public Service Co. of Oklahoma | 6.625% | 11/15/37 | 4,675 | 5,407 |
| Public Service Electric & Gas Co. | 2.700% | 5/1/15 | 3,300 | 3,395 |
| Public Service Electric & Gas Co. | 2.300% | 9/15/18 | 6,200 | 6,264 |
| Public Service Electric & Gas Co. | 3.500% | 8/15/20 | 500 | 515 |
| Public Service Electric & Gas Co. | 5.700% | 12/1/36 | 3,000 | 3,416 |
| Public Service Electric & Gas Co. | 5.800% | 5/1/37 | 4,600 | 5,280 |
| Public Service Electric & Gas Co. | 5.375% | 11/1/39 | 5,772 | 6,311 |
| Public Service Electric & Gas Co. | 3.950% | 5/1/42 | 14,575 | 12,990 |
| Puget Sound Energy Inc. | 7.020% | 12/1/27 | 875 | 1,103 |
| Puget Sound Energy Inc. | 5.483% | 6/1/35 | 805 | 879 |
| Puget Sound Energy Inc. | 6.274% | 3/15/37 | 5,175 | 6,134 |
| Puget Sound Energy Inc. | 5.757% | 10/1/39 | 2,675 | 3,045 |
| Puget Sound Energy Inc. | 5.795% | 3/15/40 | 1,535 | 1,753 |
| Puget Sound Energy Inc. | 5.764% | 7/15/40 | 1,700 | 1,935 |
| Puget Sound Energy Inc. | 5.638% | 4/15/41 | 2,718 | 3,051 |
| Puget Sound Energy Inc. | 4.434% | 11/15/41 | 3,900 | 3,727 |
| San Diego Gas & Electric Co. | 5.300% | 11/15/15 | 2,100 | 2,272 |
| San Diego Gas & Electric Co. | 3.600% | 9/1/23 | 7,175 | 7,157 |
| San Diego Gas & Electric Co. | 5.350% | 5/15/35 | 1,200 | 1,309 |
| San Diego Gas & Electric Co. | 6.125% | 9/15/37 | 18 | 21 |
| San Diego Gas & Electric Co. | 6.000% | 6/1/39 | 755 | 899 |
| San Diego Gas & Electric Co. | 5.350% | 5/15/40 | 10 | 11 |
| San Diego Gas & Electric Co. | 4.500% | 8/15/40 | 2,470 | 2,431 |
| San Diego Gas & Electric Co. | 3.950% | 11/15/41 | 8,475 | 7,622 |
| San Diego Gas & Electric Co. | 4.300% | 4/1/42 | 45 | 43 |
| SCANA Corp. | 4.750% | 5/15/21 | 2,675 | 2,742 |
| SCANA Corp. | 4.125% | 2/1/22 | 1,075 | 1,042 |
| Scottish Power Ltd. | 5.375% | 3/15/15 | 4,025 | 4,224 |
| Scottish Power Ltd. | 5.810% | 3/15/25 | 900 | 948 |
74
| Vanguard® Total Bond Market Index Fund | ||||
| Schedule of Investments | ||||
| December 31, 2013 | ||||
| Face | Market | |||
| Maturity | Amount | Value | ||
| Coupon | Date | ($000) | ($000) | |
| Sierra Pacific Power Co. | 6.000% | 5/15/16 | 4,925 | 5,508 |
| Sierra Pacific Power Co. | 3.375% | 8/15/23 | 2,350 | 2,272 |
| Sierra Pacific Power Co. | 6.750% | 7/1/37 | 4,250 | 5,154 |
| South Carolina Electric & Gas Co. | 6.500% | 11/1/18 | 1,710 | 2,045 |
| South Carolina Electric & Gas Co. | 6.625% | 2/1/32 | 5,725 | 7,061 |
| South Carolina Electric & Gas Co. | 5.300% | 5/15/33 | 243 | 259 |
| South Carolina Electric & Gas Co. | 6.050% | 1/15/38 | 4,300 | 5,011 |
| South Carolina Electric & Gas Co. | 5.450% | 2/1/41 | 4,120 | 4,475 |
| South Carolina Electric & Gas Co. | 4.350% | 2/1/42 | 6,418 | 5,981 |
| South Carolina Electric & Gas Co. | 4.600% | 6/15/43 | 4,325 | 4,207 |
| Southern California Edison Co. | 4.650% | 4/1/15 | 3,600 | 3,782 |
| Southern California Edison Co. | 5.000% | 1/15/16 | 1,175 | 1,273 |
| Southern California Edison Co. | 3.875% | 6/1/21 | 26,950 | 28,267 |
| Southern California Edison Co. | 6.650% | 4/1/29 | 2,056 | 2,445 |
| Southern California Edison Co. | 6.000% | 1/15/34 | 6,035 | 7,025 |
| Southern California Edison Co. | 5.750% | 4/1/35 | 943 | 1,069 |
| Southern California Edison Co. | 5.350% | 7/15/35 | 4,400 | 4,763 |
| Southern California Edison Co. | 5.550% | 1/15/36 | 1,400 | 1,547 |
| Southern California Edison Co. | 5.625% | 2/1/36 | 6,925 | 7,713 |
| Southern California Edison Co. | 5.550% | 1/15/37 | 6,975 | 7,705 |
| Southern California Edison Co. | 5.950% | 2/1/38 | 463 | 537 |
| Southern California Edison Co. | 6.050% | 3/15/39 | 410 | 481 |
| Southern California Edison Co. | 5.500% | 3/15/40 | 18 | 20 |
| Southern California Edison Co. | 4.500% | 9/1/40 | 5,075 | 4,896 |
| Southern California Edison Co. | 3.900% | 12/1/41 | 300 | 264 |
| Southern Co. | 4.150% | 5/15/14 | 3,850 | 3,900 |
| Southern Co. | 2.375% | 9/15/15 | 2,000 | 2,047 |
| Southern Power Co. | 4.875% | 7/15/15 | 2,450 | 2,600 |
| Southern Power Co. | 5.150% | 9/15/41 | 11,090 | 10,906 |
| Southwestern Electric Power Co. | 5.550% | 1/15/17 | 400 | 440 |
| Southwestern Electric Power Co. | 5.875% | 3/1/18 | 1,167 | 1,304 |
| Southwestern Electric Power Co. | 6.450% | 1/15/19 | 3,625 | 4,161 |
| Southwestern Electric Power Co. | 3.550% | 2/15/22 | 1,850 | 1,802 |
| Southwestern Electric Power Co. | 6.200% | 3/15/40 | 2,625 | 2,861 |
| Southwestern Public Service Co. | 4.500% | 8/15/41 | 2,900 | 2,779 |
| Tampa Electric Co. | 6.100% | 5/15/18 | 275 | 319 |
| Tampa Electric Co. | 5.400% | 5/15/21 | 2,262 | 2,543 |
| Tampa Electric Co. | 2.600% | 9/15/22 | 3,025 | 2,792 |
| Tampa Electric Co. | 6.550% | 5/15/36 | 3,000 | 3,610 |
| TECO Finance Inc. | 4.000% | 3/15/16 | 2,650 | 2,814 |
| TECO Finance Inc. | 6.572% | 11/1/17 | 2,200 | 2,537 |
| TECO Finance Inc. | 5.150% | 3/15/20 | 2,475 | 2,700 |
| TransAlta Corp. | 4.750% | 1/15/15 | 1,575 | 1,632 |
| TransAlta Corp. | 6.650% | 5/15/18 | 1,325 | 1,489 |
| TransAlta Corp. | 6.500% | 3/15/40 | 650 | 624 |
| Tucson Electric Power Co. | 5.150% | 11/15/21 | 2,125 | 2,272 |
| UIL Holdings Corp. | 4.625% | 10/1/20 | 1,650 | 1,683 |
| Union Electric Co. | 6.400% | 6/15/17 | 20 | 23 |
| Union Electric Co. | 6.700% | 2/1/19 | 5,016 | 5,988 |
| Union Electric Co. | 5.300% | 8/1/37 | 3,325 | 3,546 |
| Union Electric Co. | 8.450% | 3/15/39 | 1,725 | 2,581 |
| Union Electric Co. | 3.900% | 9/15/42 | 2,225 | 1,954 |
| Virginia Electric & Power Co. | 5.400% | 1/15/16 | 1,320 | 1,439 |
| Virginia Electric & Power Co. | 5.400% | 4/30/18 | 3,170 | 3,583 |
| Virginia Electric & Power Co. | 5.000% | 6/30/19 | 3,500 | 3,933 |
| Virginia Electric & Power Co. | 2.950% | 1/15/22 | 2,975 | 2,876 |
| Virginia Electric & Power Co. | 3.450% | 9/1/22 | 250 | 249 |
| Virginia Electric & Power Co. | 6.000% | 1/15/36 | 5,575 | 6,442 |
| Virginia Electric & Power Co. | 6.000% | 5/15/37 | 2,800 | 3,237 |
| Virginia Electric & Power Co. | 6.350% | 11/30/37 | 3,450 | 4,137 |
| Virginia Electric & Power Co. | 8.875% | 11/15/38 | 28 | 43 |
| Virginia Electric & Power Co. | 4.000% | 1/15/43 | 3,653 | 3,264 |
| Virginia Electric & Power Co. | 4.650% | 8/15/43 | 6,250 | 6,167 |
| Westar Energy Inc. | 4.125% | 3/1/42 | 8,378 | 7,637 |
75
| Vanguard® Total Bond Market Index Fund | ||||
| Schedule of Investments | ||||
| December 31, 2013 | ||||
| Face | Market | |||
| Maturity | Amount | Value | ||
| Coupon | Date | ($000) | ($000) | |
| Westar Energy Inc. | 4.100% | 4/1/43 | 3,275 | 2,977 |
| Westar Energy Inc. | 4.625% | 9/1/43 | 875 | 861 |
| Western Massachusetts Electric Co. | 3.500% | 9/15/21 | 2,650 | 2,615 |
| Wisconsin Electric Power Co. | 4.250% | 12/15/19 | 4,600 | 5,037 |
| Wisconsin Electric Power Co. | 2.950% | 9/15/21 | 2,500 | 2,454 |
| Wisconsin Electric Power Co. | 5.625% | 5/15/33 | 1,025 | 1,136 |
| Wisconsin Electric Power Co. | 5.700% | 12/1/36 | 1,250 | 1,393 |
| Wisconsin Electric Power Co. | 3.650% | 12/15/42 | 418 | 348 |
| 3 Wisconsin Energy Corp. | 6.250% | 5/15/67 | 15,675 | 16,165 |
| Wisconsin Power & Light Co. | 2.250% | 11/15/22 | 3,075 | 2,749 |
| Wisconsin Power & Light Co. | 6.375% | 8/15/37 | 4,810 | 5,762 |
| Wisconsin Public Service Corp. | 3.671% | 12/1/42 | 1,625 | 1,385 |
| Xcel Energy Inc. | 0.750% | 5/9/16 | 6,250 | 6,199 |
| Xcel Energy Inc. | 5.613% | 4/1/17 | 592 | 653 |
| Xcel Energy Inc. | 4.700% | 5/15/20 | 1,000 | 1,096 |
| Xcel Energy Inc. | 6.500% | 7/1/36 | 3,065 | 3,624 |
| Natural Gas (0.9%) | ||||
| AGL Capital Corp. | 5.250% | 8/15/19 | 800 | 891 |
| AGL Capital Corp. | 3.500% | 9/15/21 | 5,845 | 5,817 |
| AGL Capital Corp. | 5.875% | 3/15/41 | 3,310 | 3,616 |
| AGL Capital Corp. | 4.400% | 6/1/43 | 3,675 | 3,319 |
| Atmos Energy Corp. | 8.500% | 3/15/19 | 1,850 | 2,362 |
| Atmos Energy Corp. | 5.500% | 6/15/41 | 10,450 | 11,268 |
| Atmos Energy Corp. | 4.150% | 1/15/43 | 9,350 | 8,371 |
| Boardwalk Pipelines LP | 5.500% | 2/1/17 | 3,725 | 4,069 |
| Boardwalk Pipelines LP | 3.375% | 2/1/23 | 5,025 | 4,493 |
| British Transco Finance Inc. | 6.625% | 6/1/18 | 2,305 | 2,705 |
| Buckeye Partners LP | 6.050% | 1/15/18 | 360 | 404 |
| Buckeye Partners LP | 2.650% | 11/15/18 | 6,000 | 5,921 |
| Buckeye Partners LP | 4.150% | 7/1/23 | 3,075 | 2,931 |
| Buckeye Partners LP | 5.850% | 11/15/43 | 5,150 | 5,054 |
| CenterPoint Energy Resources Corp. | 6.150% | 5/1/16 | 1,350 | 1,492 |
| CenterPoint Energy Resources Corp. | 4.500% | 1/15/21 | 4,226 | 4,512 |
| CenterPoint Energy Resources Corp. | 5.850% | 1/15/41 | 7,850 | 8,866 |
| DCP Midstream LLC | 8.125% | 8/16/30 | 530 | 646 |
| DCP Midstream Operating LP | 3.250% | 10/1/15 | 3,325 | 3,437 |
| DCP Midstream Operating LP | 2.500% | 12/1/17 | 2,100 | 2,113 |
| DCP Midstream Operating LP | 4.950% | 4/1/22 | 1,650 | 1,669 |
| DCP Midstream Operating LP | 3.875% | 3/15/23 | 4,150 | 3,835 |
| El Paso Natural Gas Co. LLC | 5.950% | 4/15/17 | 12,980 | 14,415 |
| El Paso Natural Gas Co. LLC | 8.625% | 1/15/22 | 6,755 | 8,505 |
| El Paso Natural Gas Co. LLC | 8.375% | 6/15/32 | 1,050 | 1,352 |
| El Paso Pipeline Partners Operating Co. LLC | 6.500% | 4/1/20 | 2,200 | 2,519 |
| El Paso Pipeline Partners Operating Co. LLC | 5.000% | 10/1/21 | 9,250 | 9,647 |
| El Paso Pipeline Partners Operating Co. LLC | 7.500% | 11/15/40 | 6,235 | 7,370 |
| El Paso Pipeline Partners Operating Co. LLC | 4.700% | 11/1/42 | 8,700 | 7,449 |
| Enbridge Energy Partners LP | 6.500% | 4/15/18 | 6,583 | 7,602 |
| Enbridge Energy Partners LP | 9.875% | 3/1/19 | 7,975 | 10,385 |
| Enbridge Energy Partners LP | 7.500% | 4/15/38 | 12,585 | 14,847 |
| Enbridge Energy Partners LP | 5.500% | 9/15/40 | 43 | 41 |
| Enbridge Inc. | 5.800% | 6/15/14 | 175 | 179 |
| Enbridge Inc. | 4.900% | 3/1/15 | 125 | 131 |
| Enbridge Inc. | 5.600% | 4/1/17 | 3,825 | 4,240 |
| Energy Transfer Partners LP | 5.950% | 2/1/15 | 8,475 | 8,930 |
| Energy Transfer Partners LP | 6.700% | 7/1/18 | 190 | 221 |
| Energy Transfer Partners LP | 9.000% | 4/15/19 | 35,063 | 44,386 |
| Energy Transfer Partners LP | 4.150% | 10/1/20 | 8,475 | 8,616 |
| Energy Transfer Partners LP | 4.650% | 6/1/21 | 2,150 | 2,207 |
| Energy Transfer Partners LP | 5.200% | 2/1/22 | 6,425 | 6,735 |
| Energy Transfer Partners LP | 3.600% | 2/1/23 | 45 | 42 |
| Energy Transfer Partners LP | 7.600% | 2/1/24 | 3,853 | 4,597 |
| Energy Transfer Partners LP | 8.250% | 11/15/29 | 10 | 12 |
| Energy Transfer Partners LP | 6.625% | 10/15/36 | 2,235 | 2,400 |
76
| Vanguard® Total Bond Market Index Fund | ||||
| Schedule of Investments | ||||
| December 31, 2013 | ||||
| Face | Market | |||
| Maturity | Amount | Value | ||
| Coupon | Date | ($000) | ($000) | |
| Energy Transfer Partners LP | 7.500% | 7/1/38 | 2,440 | 2,863 |
| Energy Transfer Partners LP | 6.050% | 6/1/41 | 2,550 | 2,593 |
| Energy Transfer Partners LP | 6.500% | 2/1/42 | 7,420 | 7,948 |
| 7 Enron Corp. | 7.625% | 9/10/04 | 1,600 | — |
| 7 Enron Corp. | 6.625% | 11/15/05 | 1,075 | — |
| 7 Enron Corp. | 7.125% | 5/15/07 | 6,846 | 1 |
| 7 Enron Corp. | 6.875% | 10/15/07 | 6,700 | 1 |
| 7 Enron Corp. | 6.750% | 8/1/09 | 5,145 | 1 |
| Enterprise Products Operating LLC | 5.600% | 10/15/14 | 1,100 | 1,143 |
| Enterprise Products Operating LLC | 5.000% | 3/1/15 | 3,185 | 3,339 |
| Enterprise Products Operating LLC | 6.300% | 9/15/17 | 13,100 | 15,164 |
| Enterprise Products Operating LLC | 6.650% | 4/15/18 | 5,450 | 6,426 |
| Enterprise Products Operating LLC | 6.500% | 1/31/19 | 6,429 | 7,617 |
| Enterprise Products Operating LLC | 5.250% | 1/31/20 | 805 | 897 |
| Enterprise Products Operating LLC | 5.200% | 9/1/20 | 160 | 178 |
| Enterprise Products Operating LLC | 4.050% | 2/15/22 | 175 | 177 |
| Enterprise Products Operating LLC | 3.350% | 3/15/23 | 8,450 | 7,999 |
| Enterprise Products Operating LLC | 6.875% | 3/1/33 | 5,393 | 6,404 |
| Enterprise Products Operating LLC | 6.650% | 10/15/34 | 5,825 | 6,764 |
| Enterprise Products Operating LLC | 5.750% | 3/1/35 | 4,700 | 4,952 |
| Enterprise Products Operating LLC | 7.550% | 4/15/38 | 2,969 | 3,721 |
| Enterprise Products Operating LLC | 6.125% | 10/15/39 | 5,260 | 5,753 |
| Enterprise Products Operating LLC | 6.450% | 9/1/40 | 743 | 846 |
| Enterprise Products Operating LLC | 5.950% | 2/1/41 | 690 | 746 |
| Enterprise Products Operating LLC | 5.700% | 2/15/42 | 8,880 | 9,284 |
| Enterprise Products Operating LLC | 4.850% | 8/15/42 | 5,648 | 5,296 |
| Enterprise Products Operating LLC | 4.450% | 2/15/43 | 6,118 | 5,388 |
| Enterprise Products Operating LLC | 4.850% | 3/15/44 | 7,050 | 6,600 |
| 3 Enterprise Products Operating LLC | 8.375% | 8/1/66 | 6,700 | 7,429 |
| Gulf South Pipeline Co. LP | 4.000% | 6/15/22 | 1,050 | 1,026 |
| 7 Internorth Inc. | 9.625% | 3/15/06 | 3,680 | — |
| KeySpan Corp. | 8.000% | 11/15/30 | 60 | 77 |
| Kinder Morgan Energy Partners LP | 3.500% | 3/1/16 | 300 | 314 |
| Kinder Morgan Energy Partners LP | 6.000% | 2/1/17 | 230 | 258 |
| Kinder Morgan Energy Partners LP | 5.950% | 2/15/18 | 22,275 | 25,335 |
| Kinder Morgan Energy Partners LP | 2.650% | 2/1/19 | 15,075 | 14,915 |
| Kinder Morgan Energy Partners LP | 6.850% | 2/15/20 | 1,045 | 1,242 |
| Kinder Morgan Energy Partners LP | 5.800% | 3/1/21 | 4,250 | 4,733 |
| Kinder Morgan Energy Partners LP | 3.950% | 9/1/22 | 250 | 243 |
| Kinder Morgan Energy Partners LP | 3.450% | 2/15/23 | 2,330 | 2,155 |
| Kinder Morgan Energy Partners LP | 3.500% | 9/1/23 | 9,063 | 8,353 |
| Kinder Morgan Energy Partners LP | 7.400% | 3/15/31 | 10 | 12 |
| Kinder Morgan Energy Partners LP | 7.300% | 8/15/33 | 2,465 | 2,896 |
| Kinder Morgan Energy Partners LP | 5.800% | 3/15/35 | 5,680 | 5,774 |
| Kinder Morgan Energy Partners LP | 6.500% | 2/1/37 | 20,690 | 22,731 |
| Kinder Morgan Energy Partners LP | 6.950% | 1/15/38 | 3,450 | 3,974 |
| Kinder Morgan Energy Partners LP | 6.500% | 9/1/39 | 5,120 | 5,628 |
| Kinder Morgan Energy Partners LP | 6.550% | 9/15/40 | 4,750 | 5,297 |
| Kinder Morgan Energy Partners LP | 5.625% | 9/1/41 | 9,350 | 9,286 |
| Kinder Morgan Energy Partners LP | 5.000% | 8/15/42 | 945 | 867 |
| Kinder Morgan Energy Partners LP | 5.000% | 3/1/43 | 9,000 | 8,187 |
| Magellan Midstream Partners LP | 6.400% | 7/15/18 | 9,000 | 10,627 |
| Magellan Midstream Partners LP | 6.550% | 7/15/19 | 9,625 | 11,362 |
| Magellan Midstream Partners LP | 4.250% | 2/1/21 | 3,920 | 4,095 |
| Magellan Midstream Partners LP | 6.400% | 5/1/37 | 2,200 | 2,507 |
| Magellan Midstream Partners LP | 4.200% | 12/1/42 | 2,100 | 1,767 |
| National Fuel Gas Co. | 6.500% | 4/15/18 | 3,000 | 3,434 |
| National Fuel Gas Co. | 4.900% | 12/1/21 | 550 | 569 |
| National Fuel Gas Co. | 3.750% | 3/1/23 | 5,525 | 5,173 |
| National Grid plc | 6.300% | 8/1/16 | 8,600 | 9,668 |
| Nisource Finance Corp. | 5.250% | 9/15/17 | 940 | 1,040 |
| Nisource Finance Corp. | 6.400% | 3/15/18 | 13,725 | 15,797 |
| Nisource Finance Corp. | 6.800% | 1/15/19 | 1,250 | 1,461 |
| Nisource Finance Corp. | 5.450% | 9/15/20 | 1,615 | 1,793 |
77
| Vanguard® Total Bond Market Index Fund | ||||
| Schedule of Investments | ||||
| December 31, 2013 | ||||
| Face | Market | |||
| Maturity | Amount | Value | ||
| Coupon | Date | ($000) | ($000) | |
| Nisource Finance Corp. | 4.450% | 12/1/21 | 3,750 | 3,817 |
| Nisource Finance Corp. | 6.125% | 3/1/22 | 1,825 | 2,029 |
| Nisource Finance Corp. | 6.250% | 12/15/40 | 8,875 | 9,628 |
| Nisource Finance Corp. | 5.950% | 6/15/41 | 48 | 50 |
| Nisource Finance Corp. | 5.800% | 2/1/42 | 4,475 | 4,637 |
| Nisource Finance Corp. | 4.800% | 2/15/44 | 1,850 | 1,669 |
| ONEOK Inc. | 5.200% | 6/15/15 | 4,010 | 4,244 |
| ONEOK Inc. | 4.250% | 2/1/22 | 1,000 | 936 |
| ONEOK Inc. | 6.000% | 6/15/35 | 5,850 | 5,492 |
| ONEOK Partners LP | 3.250% | 2/1/16 | 2,300 | 2,388 |
| ONEOK Partners LP | 6.150% | 10/1/16 | 4,540 | 5,097 |
| ONEOK Partners LP | 8.625% | 3/1/19 | 16,580 | 20,636 |
| ONEOK Partners LP | 3.375% | 10/1/22 | 100 | 94 |
| ONEOK Partners LP | 6.650% | 10/1/36 | 8,899 | 9,818 |
| ONEOK Partners LP | 6.850% | 10/15/37 | 1,575 | 1,777 |
| ONEOK Partners LP | 6.125% | 2/1/41 | 325 | 345 |
| Panhandle Eastern Pipe Line Co. LP | 6.200% | 11/1/17 | 8,050 | 9,177 |
| Panhandle Eastern Pipe Line Co. LP | 7.000% | 6/15/18 | 300 | 347 |
| Piedmont Natural Gas Co. Inc. | 4.650% | 8/1/43 | 2,150 | 2,070 |
| Plains All American Pipeline LP / PAA Finance Corp. | 6.125% | 1/15/17 | 4,440 | 5,033 |
| Plains All American Pipeline LP / PAA Finance Corp. | 6.500% | 5/1/18 | 1,695 | 1,984 |
| Plains All American Pipeline LP / PAA Finance Corp. | 8.750% | 5/1/19 | 2,475 | 3,172 |
| Plains All American Pipeline LP / PAA Finance Corp. | 5.750% | 1/15/20 | 1,410 | 1,611 |
| Plains All American Pipeline LP / PAA Finance Corp. | 5.000% | 2/1/21 | 700 | 767 |
| Plains All American Pipeline LP / PAA Finance Corp. | 3.650% | 6/1/22 | 6,900 | 6,748 |
| Plains All American Pipeline LP / PAA Finance Corp. | 2.850% | 1/31/23 | 1,970 | 1,785 |
| Plains All American Pipeline LP / PAA Finance Corp. | 6.650% | 1/15/37 | 650 | 762 |
| Plains All American Pipeline LP / PAA Finance Corp. | 5.150% | 6/1/42 | 6,425 | 6,235 |
| Plains All American Pipeline LP / PAA Finance Corp. | 4.300% | 1/31/43 | 950 | 818 |
| Questar Corp. | 2.750% | 2/1/16 | 600 | 618 |
| Sempra Energy | 2.300% | 4/1/17 | 5,925 | 6,018 |
| Sempra Energy | 6.150% | 6/15/18 | 2,200 | 2,532 |
| Sempra Energy | 9.800% | 2/15/19 | 35 | 46 |
| Sempra Energy | 2.875% | 10/1/22 | 4,175 | 3,823 |
| Sempra Energy | 4.050% | 12/1/23 | 11,475 | 11,309 |
| Sempra Energy | 6.000% | 10/15/39 | 17,550 | 19,333 |
| Southern California Gas Co. | 5.750% | 11/15/35 | 960 | 1,098 |
| Southern California Gas Co. | 3.750% | 9/15/42 | 4,770 | 4,152 |
| 6 Southern Natural Gas Co. LLC | 5.900% | 4/1/17 | 5,690 | 6,390 |
| Southern Natural Gas Co. LLC | 8.000% | 3/1/32 | 5,832 | 7,434 |
| Spectra Energy Capital LLC | 5.668% | 8/15/14 | 150 | 155 |
| Spectra Energy Capital LLC | 6.200% | 4/15/18 | 14,585 | 16,446 |
| Spectra Energy Capital LLC | 6.750% | 2/15/32 | 3,050 | 3,135 |
| Spectra Energy Partners LP | 2.950% | 9/25/18 | 875 | 887 |
| Sunoco Logistics Partners Operations LP | 3.450% | 1/15/23 | 1,650 | 1,511 |
| Sunoco Logistics Partners Operations LP | 6.850% | 2/15/40 | 750 | 830 |
| Sunoco Logistics Partners Operations LP | 6.100% | 2/15/42 | 10,440 | 10,575 |
| Sunoco Logistics Partners Operations LP | 4.950% | 1/15/43 | 5,125 | 4,567 |
| Tennessee Gas Pipeline Co. LLC | 7.000% | 10/15/28 | 120 | 141 |
| Tennessee Gas Pipeline Co. LLC | 7.625% | 4/1/37 | 1,342 | 1,698 |
| Texas Gas Transmission LLC | 4.600% | 6/1/15 | 2,875 | 3,016 |
| TransCanada PipeLines Ltd. | 0.875% | 3/2/15 | 6,350 | 6,373 |
| TransCanada PipeLines Ltd. | 3.400% | 6/1/15 | 500 | 519 |
| TransCanada PipeLines Ltd. | 0.750% | 1/15/16 | 400 | 399 |
| TransCanada PipeLines Ltd. | 6.500% | 8/15/18 | 16,550 | 19,522 |
| TransCanada PipeLines Ltd. | 7.125% | 1/15/19 | 900 | 1,091 |
| TransCanada PipeLines Ltd. | 3.800% | 10/1/20 | 7,900 | 8,161 |
| TransCanada PipeLines Ltd. | 2.500% | 8/1/22 | 14,500 | 13,212 |
| TransCanada PipeLines Ltd. | 5.600% | 3/31/34 | 3,055 | 3,212 |
| TransCanada PipeLines Ltd. | 5.850% | 3/15/36 | 13,985 | 15,184 |
| TransCanada PipeLines Ltd. | 6.200% | 10/15/37 | 8,035 | 9,119 |
| TransCanada PipeLines Ltd. | 7.250% | 8/15/38 | 2,017 | 2,553 |
| TransCanada PipeLines Ltd. | 7.625% | 1/15/39 | 354 | 471 |
| TransCanada PipeLines Ltd. | 5.000% | 10/16/43 | 5,975 | 5,856 |
78
| Vanguard® Total Bond Market Index Fund | ||||
| Schedule of Investments | ||||
| December 31, 2013 | ||||
| Face | Market | |||
| Maturity | Amount | Value | ||
| Coupon | Date | ($000) | ($000) | |
| 3 TransCanada PipeLines Ltd. | 6.350% | 5/15/67 | 17,776 | 18,265 |
| Transcontinental Gas Pipe Line Co. LLC | 5.400% | 8/15/41 | 18 | 18 |
| Western Gas Partners LP | 2.600% | 8/15/18 | 4,350 | 4,298 |
| Williams Cos. Inc. | 7.875% | 9/1/21 | 694 | 806 |
| Williams Cos. Inc. | 7.500% | 1/15/31 | 4,696 | 4,940 |
| Williams Cos. Inc. | 7.750% | 6/15/31 | 1,085 | 1,163 |
| Williams Cos. Inc. | 8.750% | 3/15/32 | 949 | 1,122 |
| Williams Partners LP | 3.800% | 2/15/15 | 2,900 | 2,996 |
| Williams Partners LP | 5.250% | 3/15/20 | 36,200 | 39,424 |
| Williams Partners LP | 4.000% | 11/15/21 | 2,600 | 2,565 |
| Williams Partners LP | 6.300% | 4/15/40 | 2,940 | 3,164 |
| Williams Partners LP | 5.800% | 11/15/43 | 1,550 | 1,578 |
| Williams Partners LP / Williams Partners Finance Corp. | 7.250% | 2/1/17 | 11,225 | 13,008 |
| Other Utility (0.0%) | ||||
| American Water Capital Corp. | 6.085% | 10/15/17 | 7,220 | 8,207 |
| American Water Capital Corp. | 3.850% | 3/1/24 | 8,050 | 7,904 |
| American Water Capital Corp. | 6.593% | 10/15/37 | 5,670 | 6,798 |
| United Utilities plc | 5.375% | 2/1/19 | 3,455 | 3,693 |
| United Utilities plc | 6.875% | 8/15/28 | 850 | 910 |
| Veolia Environnement SA | 6.000% | 6/1/18 | 5,495 | 6,214 |
| Veolia Environnement SA | 6.750% | 6/1/38 | 2,381 | 2,588 |
| 2,872,415 | ||||
| Total Corporate Bonds (Cost $25,176,178) | 25,961,234 | |||
| Sovereign Bonds (U.S. Dollar-Denominated) (5.4%) | ||||
| African Development Bank | 2.500% | 3/15/16 | 300 | 312 |
| African Development Bank | 1.250% | 9/2/16 | 6,850 | 6,932 |
| African Development Bank | 1.125% | 3/15/17 | 7,350 | 7,380 |
| African Development Bank | 0.875% | 3/15/18 | 9,150 | 8,859 |
| African Development Bank | 1.625% | 10/2/18 | 22,350 | 22,030 |
| Asian Development Bank | 4.250% | 10/20/14 | 5,875 | 6,062 |
| Asian Development Bank | 2.625% | 2/9/15 | 30,975 | 31,745 |
| Asian Development Bank | 0.500% | 8/17/15 | 17,950 | 17,984 |
| Asian Development Bank | 2.500% | 3/15/16 | 17,900 | 18,634 |
| Asian Development Bank | 5.500% | 6/27/16 | 5,225 | 5,843 |
| Asian Development Bank | 1.125% | 3/15/17 | 20,100 | 20,183 |
| Asian Development Bank | 5.250% | 6/12/17 | 600 | 685 |
| Asian Development Bank | 5.593% | 7/16/18 | 3,528 | 4,089 |
| Asian Development Bank | 1.750% | 9/11/18 | 21,325 | 21,351 |
| Asian Development Bank | 1.875% | 10/23/18 | 13,850 | 13,915 |
| Asian Development Bank | 1.750% | 3/21/19 | 3,670 | 3,630 |
| Asian Development Bank | 1.375% | 3/23/20 | 12,500 | 11,764 |
| Asian Development Bank | 5.820% | 6/16/28 | 18 | 21 |
| Banco do Brasil SA | 3.875% | 1/23/17 | 11,951 | 12,218 |
| Banco do Brasil SA | 3.875% | 10/10/22 | 2,575 | 2,240 |
| Canada | 0.875% | 2/14/17 | 34,450 | 34,435 |
| China Development Bank Corp. | 4.750% | 10/8/14 | 3,700 | 3,805 |
| China Development Bank Corp. | 5.000% | 10/15/15 | 1,450 | 1,541 |
| CNOOC Curtis Funding No 1 pty Ltd. | 4.500% | 10/3/23 | 5,000 | 4,955 |
| CNOOC Finance 2013 Ltd. | 3.000% | 5/9/23 | 6,250 | 5,579 |
| Corp. Andina de Fomento | 5.125% | 5/5/15 | 800 | 823 |
| Corp. Andina de Fomento | 3.750% | 1/15/16 | 10,725 | 11,140 |
| Corp. Andina de Fomento | 8.125% | 6/4/19 | 16,800 | 20,275 |
| Corp. Andina de Fomento | 4.375% | 6/15/22 | 20,544 | 20,522 |
| 6 Corp. Nacional del Cobre de Chile | 3.000% | 7/17/22 | 16,400 | 14,778 |
| Council Of Europe Development Bank | 2.750% | 2/10/15 | 5,675 | 5,825 |
| Council Of Europe Development Bank | 2.625% | 2/16/16 | 6,950 | 7,234 |
| Council Of Europe Development Bank | 1.500% | 2/22/17 | 12,250 | 12,410 |
| Council Of Europe Development Bank | 1.500% | 6/19/17 | 3,300 | 3,332 |
| Council Of Europe Development Bank | 1.000% | 3/7/18 | 12,500 | 12,172 |
| Council Of Europe Development Bank | 1.125% | 5/31/18 | 12,600 | 12,287 |
| 8 Development Bank of Japan Inc. | 4.250% | 6/9/15 | 11,375 | 11,983 |
| Ecopetrol SA | 4.250% | 9/18/18 | 3,065 | 3,238 |
79
| Vanguard® Total Bond Market Index Fund | ||||
| Schedule of Investments | ||||
| December 31, 2013 | ||||
| Face | Market | |||
| Maturity | Amount | Value | ||
| Coupon | Date | ($000) | ($000) | |
| Ecopetrol SA | 7.625% | 7/23/19 | 1,500 | 1,774 |
| Ecopetrol SA | 5.875% | 9/18/23 | 9,085 | 9,599 |
| European Bank for Reconstruction & Development | 2.750% | 4/20/15 | 19,450 | 20,057 |
| European Bank for Reconstruction & Development | 1.625% | 9/3/15 | 6,550 | 6,682 |
| European Bank for Reconstruction & Development | 2.500% | 3/15/16 | 20,100 | 20,928 |
| European Bank for Reconstruction & Development | 1.375% | 10/20/16 | 2,550 | 2,591 |
| European Bank for Reconstruction & Development | 1.000% | 2/16/17 | 5,050 | 5,059 |
| European Bank for Reconstruction & Development | 0.750% | 9/1/17 | 11,500 | 11,335 |
| European Bank for Reconstruction & Development | 1.000% | 6/15/18 | 5,300 | 5,159 |
| European Bank for Reconstruction & Development | 1.000% | 9/17/18 | 4,150 | 3,995 |
| European Bank for Reconstruction & Development | 1.625% | 11/15/18 | 9,300 | 9,253 |
| European Bank for Reconstruction & Development | 1.500% | 3/16/20 | 13,200 | 12,534 |
| European Investment Bank | 2.875% | 1/15/15 | 15,400 | 15,810 |
| European Investment Bank | 2.750% | 3/23/15 | 20,800 | 21,409 |
| European Investment Bank | 1.125% | 4/15/15 | 34,800 | 35,160 |
| European Investment Bank | 1.000% | 7/15/15 | 15,165 | 15,314 |
| European Investment Bank | 1.625% | 9/1/15 | 19,525 | 19,931 |
| European Investment Bank | 1.375% | 10/20/15 | 19,325 | 19,695 |
| European Investment Bank | 4.875% | 2/16/16 | 19,250 | 21,002 |
| European Investment Bank | 0.625% | 4/15/16 | 37,400 | 37,400 |
| European Investment Bank | 2.500% | 5/16/16 | 31,150 | 32,480 |
| European Investment Bank | 2.125% | 7/15/16 | 22,200 | 22,982 |
| European Investment Bank | 0.500% | 8/15/16 | 29,825 | 29,484 |
| European Investment Bank | 5.125% | 9/13/16 | 18,800 | 20,949 |
| European Investment Bank | 1.250% | 10/14/16 | 23,925 | 24,210 |
| European Investment Bank | 1.125% | 12/15/16 | 18,500 | 18,591 |
| European Investment Bank | 4.875% | 1/17/17 | 30,625 | 34,166 |
| European Investment Bank | 1.750% | 3/15/17 | 41,900 | 42,801 |
| European Investment Bank | 5.125% | 5/30/17 | 45,555 | 51,604 |
| European Investment Bank | 1.625% | 6/15/17 | 5,200 | 5,281 |
| European Investment Bank | 1.125% | 9/15/17 | 26,575 | 26,443 |
| European Investment Bank | 1.000% | 12/15/17 | 20,400 | 20,102 |
| European Investment Bank | 1.000% | 3/15/18 | 16,275 | 15,898 |
| European Investment Bank | 1.000% | 6/15/18 | 5,350 | 5,186 |
| European Investment Bank | 1.625% | 12/18/18 | 23,175 | 22,883 |
| European Investment Bank | 2.875% | 9/15/20 | 18,600 | 18,798 |
| European Investment Bank | 4.000% | 2/16/21 | 34,625 | 37,194 |
| European Investment Bank | 4.875% | 2/15/36 | 335 | 365 |
| Export Development Canada | 2.250% | 5/28/15 | 3,500 | 3,597 |
| Export Development Canada | 0.500% | 9/15/15 | 9,725 | 9,755 |
| Export Development Canada | 1.250% | 10/26/16 | 12,750 | 12,935 |
| Export Development Canada | 0.750% | 12/15/17 | 12,500 | 12,204 |
| Export Development Canada | 1.500% | 10/3/18 | 4,275 | 4,201 |
| Export-Import Bank of Korea | 5.875% | 1/14/15 | 19,125 | 20,102 |
| Export-Import Bank of Korea | 5.125% | 3/16/15 | 2,500 | 2,621 |
| Export-Import Bank of Korea | 4.125% | 9/9/15 | 4,925 | 5,166 |
| Export-Import Bank of Korea | 3.750% | 10/20/16 | 11,550 | 12,237 |
| Export-Import Bank of Korea | 4.000% | 1/11/17 | 6,450 | 6,832 |
| Export-Import Bank of Korea | 1.750% | 2/27/18 | 16,725 | 16,211 |
| Export-Import Bank of Korea | 2.875% | 9/17/18 | 8,400 | 8,435 |
| Export-Import Bank of Korea | 5.125% | 6/29/20 | 5,700 | 6,254 |
| Export-Import Bank of Korea | 4.000% | 1/29/21 | 2,800 | 2,846 |
| Export-Import Bank of Korea | 4.375% | 9/15/21 | 3,925 | 4,082 |
| Export-Import Bank of Korea | 5.000% | 4/11/22 | 4,150 | 4,494 |
| Federative Republic of Brazil | 7.875% | 3/7/15 | 8,805 | 9,439 |
| Federative Republic of Brazil | 6.000% | 1/17/17 | 33,030 | 36,581 |
| 3 Federative Republic of Brazil | 8.000% | 1/15/18 | 12,216 | 13,559 |
| Federative Republic of Brazil | 5.875% | 1/15/19 | 18,475 | 20,729 |
| Federative Republic of Brazil | 8.875% | 10/14/19 | 11,670 | 15,072 |
| Federative Republic of Brazil | 4.875% | 1/22/21 | 6,550 | 6,859 |
| Federative Republic of Brazil | 2.625% | 1/5/23 | 10,750 | 9,234 |
| Federative Republic of Brazil | 8.875% | 4/15/24 | 3,125 | 4,136 |
| Federative Republic of Brazil | 8.875% | 4/15/24 | 120 | 159 |
| Federative Republic of Brazil | 8.750% | 2/4/25 | 12,568 | 16,653 |
80
| Vanguard® Total Bond Market Index Fund | ||||
| Schedule of Investments | ||||
| December 31, 2013 | ||||
| Face | Market | |||
| Maturity | Amount | Value | ||
| Coupon | Date | ($000) | ($000) | |
| Federative Republic of Brazil | 10.125% | 5/15/27 | 10,692 | 15,717 |
| Federative Republic of Brazil | 8.250% | 1/20/34 | 16,745 | 21,224 |
| Federative Republic of Brazil | 7.125% | 1/20/37 | 17,691 | 20,176 |
| 3 Federative Republic of Brazil | 11.000% | 8/17/40 | 13,537 | 15,378 |
| Federative Republic of Brazil | 5.625% | 1/7/41 | 40,925 | 39,288 |
| FMS Wertmanagement AoeR | 0.625% | 4/18/16 | 5,650 | 5,642 |
| FMS Wertmanagement AoeR | 1.125% | 10/14/16 | 13,600 | 13,689 |
| FMS Wertmanagement AoeR | 1.000% | 11/21/17 | 8,000 | 7,860 |
| FMS Wertmanagement AoeR | 1.625% | 11/20/18 | 21,250 | 20,946 |
| Hydro-Quebec | 7.500% | 4/1/16 | 2,155 | 2,469 |
| Hydro-Quebec | 2.000% | 6/30/16 | 26,095 | 26,827 |
| Hydro-Quebec | 1.375% | 6/19/17 | 3,700 | 3,701 |
| Hydro-Quebec | 8.400% | 1/15/22 | 8,195 | 10,682 |
| Hydro-Quebec | 8.050% | 7/7/24 | 3,230 | 4,268 |
| Hydro-Quebec | 8.500% | 12/1/29 | 700 | 987 |
| Inter-American Development Bank | 2.250% | 7/15/15 | 8,950 | 9,197 |
| Inter-American Development Bank | 0.500% | 8/17/15 | 8,500 | 8,516 |
| Inter-American Development Bank | 4.250% | 9/14/15 | 7,395 | 7,866 |
| Inter-American Development Bank | 5.125% | 9/13/16 | 6,900 | 7,692 |
| Inter-American Development Bank | 1.375% | 10/18/16 | 350 | 356 |
| Inter-American Development Bank | 0.875% | 11/15/16 | 14,000 | 14,024 |
| Inter-American Development Bank | 1.125% | 3/15/17 | 20,300 | 20,410 |
| Inter-American Development Bank | 2.375% | 8/15/17 | 22,800 | 23,782 |
| Inter-American Development Bank | 0.875% | 3/15/18 | 12,200 | 11,885 |
| Inter-American Development Bank | 1.750% | 8/24/18 | 4,900 | 4,910 |
| Inter-American Development Bank | 4.250% | 9/10/18 | 2,950 | 3,285 |
| Inter-American Development Bank | 1.125% | 9/12/19 | 1,750 | 1,648 |
| Inter-American Development Bank | 3.875% | 9/17/19 | 57,490 | 62,738 |
| Inter-American Development Bank | 3.875% | 2/14/20 | 6,475 | 7,022 |
| Inter-American Development Bank | 2.125% | 11/9/20 | 9,500 | 9,180 |
| Inter-American Development Bank | 3.000% | 10/4/23 | 2,100 | 2,034 |
| Inter-American Development Bank | 7.000% | 6/15/25 | 2,950 | 3,791 |
| Inter-American Development Bank | 3.875% | 10/28/41 | 45 | 40 |
| Inter-American Development Bank | 3.200% | 8/7/42 | 5,250 | 4,115 |
| International Bank for Reconstruction & Development | 2.375% | 5/26/15 | 43,475 | 44,699 |
| International Bank for Reconstruction & Development | 2.125% | 3/15/16 | 47,425 | 49,024 |
| International Bank for Reconstruction & Development | 5.000% | 4/1/16 | 18,735 | 20,561 |
| International Bank for Reconstruction & Development | 0.500% | 4/15/16 | 35,275 | 35,057 |
| International Bank for Reconstruction & Development | 1.000% | 9/15/16 | 13,350 | 13,444 |
| International Bank for Reconstruction & Development | 0.875% | 4/17/17 | 62,375 | 62,198 |
| International Bank for Reconstruction & Development | 1.125% | 7/18/17 | 1,850 | 1,851 |
| International Bank for Reconstruction & Development | 7.625% | 1/19/23 | 3,850 | 5,181 |
| International Bank for Reconstruction & Development | 2.125% | 2/13/23 | 6,150 | 5,664 |
| International Bank for Reconstruction & Development | 8.875% | 3/1/26 | 1,050 | 1,574 |
| International Bank for Reconstruction & Development | 4.750% | 2/15/35 | 1,823 | 1,949 |
| International Finance Corp. | 2.750% | 4/20/15 | 10,375 | 10,694 |
| International Finance Corp. | 2.250% | 4/11/16 | 9,300 | 9,624 |
| International Finance Corp. | 0.500% | 5/16/16 | 2,850 | 2,837 |
| International Finance Corp. | 0.625% | 11/15/16 | 7,500 | 7,467 |
| International Finance Corp. | 1.125% | 11/23/16 | 30,400 | 30,693 |
| International Finance Corp. | 1.000% | 4/24/17 | 3,975 | 3,960 |
| International Finance Corp. | 2.125% | 11/17/17 | 16,375 | 16,843 |
| International Finance Corp. | 0.625% | 12/21/17 | 12,275 | 11,848 |
| International Finance Corp. | 1.750% | 9/4/18 | 29,150 | 29,054 |
| 8 Japan Bank for International Cooperation | 2.875% | 2/2/15 | 16,750 | 17,194 |
| 8 Japan Bank for International Cooperation | 2.500% | 1/21/16 | 6,100 | 6,322 |
| 8 Japan Bank for International Cooperation | 2.500% | 5/18/16 | 6,300 | 6,553 |
| 8 Japan Bank for International Cooperation | 2.250% | 7/13/16 | 12,125 | 12,548 |
| 8 Japan Bank for International Cooperation | 1.125% | 7/19/17 | 39,100 | 38,708 |
| 8 Japan Bank for International Cooperation | 1.750% | 7/31/18 | 13,300 | 13,184 |
| 8 Japan Bank for International Cooperation | 1.750% | 11/13/18 | 19,000 | 18,767 |
| 8 Japan Bank for International Cooperation | 3.375% | 7/31/23 | 4,600 | 4,502 |
| 8 Japan Finance Organization for Municipalities | 4.625% | 4/21/15 | 6,850 | 7,204 |
| 8 Japan Finance Organization for Municipalities | 5.000% | 5/16/17 | 4,050 | 4,518 |
81
| Vanguard® Total Bond Market Index Fund | ||||
| Schedule of Investments | ||||
| December 31, 2013 | ||||
| Face | Market | |||
| Maturity | Amount | Value | ||
| Coupon | Date | ($000) | ($000) | |
| 8 Japan Finance Organization for Municipalities | 4.000% | 1/13/21 | 9,200 | 9,809 |
| 9 KFW | 1.000% | 1/12/15 | 48,750 | 48,964 |
| 9 KFW | 2.625% | 3/3/15 | 28,730 | 29,469 |
| 9 KFW | 0.625% | 4/24/15 | 48,225 | 48,411 |
| 9 KFW | 0.500% | 9/30/15 | 19,000 | 18,971 |
| 9 KFW | 1.250% | 10/26/15 | 11,825 | 11,947 |
| 9 KFW | 2.625% | 2/16/16 | 27,900 | 29,079 |
| 9 KFW | 5.125% | 3/14/16 | 36,750 | 40,229 |
| 9 KFW | 0.500% | 4/19/16 | 17,800 | 17,669 |
| 9 KFW | 2.000% | 6/1/16 | 39,400 | 40,508 |
| 9 KFW | 1.250% | 10/5/16 | 42,675 | 43,178 |
| 9 KFW | 0.625% | 12/15/16 | 22,600 | 22,430 |
| 9 KFW | 4.875% | 1/17/17 | 780 | 867 |
| 9 KFW | 1.250% | 2/15/17 | 65,025 | 65,451 |
| 9 KFW | 0.875% | 9/5/17 | 26,650 | 26,316 |
| 9 KFW | 4.375% | 3/15/18 | 18,650 | 20,631 |
| 9 KFW | 4.500% | 7/16/18 | 14,325 | 16,012 |
| 9 KFW | 4.875% | 6/17/19 | 25,005 | 28,432 |
| 9 KFW | 4.000% | 1/27/20 | 43,650 | 47,528 |
| 9 KFW | 2.750% | 9/8/20 | 45,050 | 45,249 |
| 9 KFW | 2.750% | 10/1/20 | 18,750 | 18,883 |
| 9 KFW | 2.375% | 8/25/21 | 10,035 | 9,757 |
| 9 KFW | 2.000% | 10/4/22 | 23,500 | 21,592 |
| 9 KFW | 2.125% | 1/17/23 | 21,675 | 19,812 |
| 9 KFW | 0.000% | 4/18/36 | 14,450 | 5,656 |
| 9 KFW | 0.000% | 6/29/37 | 90 | 33 |
| Korea Development Bank | 4.375% | 8/10/15 | 6,275 | 6,599 |
| Korea Development Bank | 3.250% | 3/9/16 | 13,200 | 13,723 |
| Korea Development Bank | 4.000% | 9/9/16 | 4,250 | 4,526 |
| Korea Development Bank | 3.875% | 5/4/17 | 10,200 | 10,764 |
| Korea Development Bank | 3.500% | 8/22/17 | 5,100 | 5,316 |
| Korea Development Bank | 1.500% | 1/22/18 | 11,000 | 10,597 |
| Korea Finance Corp. | 3.250% | 9/20/16 | 11,100 | 11,582 |
| Korea Finance Corp. | 2.250% | 8/7/17 | 850 | 851 |
| Korea Finance Corp. | 4.625% | 11/16/21 | 5,975 | 6,274 |
| Landesbank Baden-Wuerttemberg | 7.625% | 2/1/23 | 1,000 | 1,189 |
| 9 Landwirtschaftliche Rentenbank | 3.125% | 7/15/15 | 12,505 | 12,994 |
| 9 Landwirtschaftliche Rentenbank | 4.875% | 11/16/15 | 9,250 | 9,970 |
| 9 Landwirtschaftliche Rentenbank | 2.500% | 2/15/16 | 2,675 | 2,780 |
| 9 Landwirtschaftliche Rentenbank | 2.125% | 7/15/16 | 11,000 | 11,331 |
| 9 Landwirtschaftliche Rentenbank | 5.000% | 11/8/16 | 2,956 | 3,281 |
| 9 Landwirtschaftliche Rentenbank | 5.125% | 2/1/17 | 9,795 | 10,923 |
| 9 Landwirtschaftliche Rentenbank | 0.875% | 9/12/17 | 11,825 | 11,617 |
| 9 Landwirtschaftliche Rentenbank | 1.000% | 4/4/18 | 6,900 | 6,730 |
| 9 Landwirtschaftliche Rentenbank | 1.875% | 9/17/18 | 12,500 | 12,488 |
| 9 Landwirtschaftliche Rentenbank | 1.375% | 10/23/19 | 10,450 | 9,940 |
| Nexen Energy ULC | 6.200% | 7/30/19 | 3,500 | 4,033 |
| Nexen Energy ULC | 7.875% | 3/15/32 | 9,965 | 12,958 |
| Nexen Energy ULC | 5.875% | 3/10/35 | 3,287 | 3,519 |
| Nexen Energy ULC | 6.400% | 5/15/37 | 9,960 | 11,267 |
| Nexen Energy ULC | 7.500% | 7/30/39 | 6,750 | 8,554 |
| Nordic Investment Bank | 2.500% | 7/15/15 | 9,200 | 9,500 |
| Nordic Investment Bank | 2.250% | 3/15/16 | 3,775 | 3,911 |
| Nordic Investment Bank | 0.500% | 4/14/16 | 8,600 | 8,578 |
| Nordic Investment Bank | 5.000% | 2/1/17 | 5,200 | 5,838 |
| Nordic Investment Bank | 1.000% | 3/7/17 | 1,650 | 1,653 |
| Nordic Investment Bank | 0.750% | 1/17/18 | 18,425 | 17,849 |
| North American Development Bank | 2.300% | 10/10/18 | 2,138 | 2,104 |
| North American Development Bank | 4.375% | 2/11/20 | 2,600 | 2,711 |
| North American Development Bank | 2.400% | 10/26/22 | 6,000 | 5,318 |
| 10 Oesterreichische Kontrollbank AG | 4.500% | 3/9/15 | 185 | 194 |
| 10 Oesterreichische Kontrollbank AG | 1.125% | 7/6/15 | 1,700 | 1,717 |
| 10 Oesterreichische Kontrollbank AG | 1.750% | 10/5/15 | 5,300 | 5,415 |
| 10 Oesterreichische Kontrollbank AG | 2.000% | 6/3/16 | 10,700 | 11,018 |
82
| Vanguard® Total Bond Market Index Fund | ||||
| Schedule of Investments | ||||
| December 31, 2013 | ||||
| Face | Market | |||
| Maturity | Amount | Value | ||
| Coupon | Date | ($000) | ($000) | |
| 10 Oesterreichische Kontrollbank AG | 0.750% | 12/15/16 | 15,700 | 15,648 |
| 10 Oesterreichische Kontrollbank AG | 5.000% | 4/25/17 | 20,045 | 22,593 |
| 10 Oesterreichische Kontrollbank AG | 1.125% | 5/29/18 | 8,200 | 7,989 |
| 3 Oriental Republic of Uruguay | 4.500% | 8/14/24 | 16,183 | 16,176 |
| 3 Oriental Republic of Uruguay | 7.625% | 3/21/36 | 6,520 | 7,840 |
| 3 Oriental Republic of Uruguay | 4.125% | 11/20/45 | 24,525 | 18,602 |
| Pemex Project Funding Master Trust | 5.750% | 3/1/18 | 44,010 | 49,046 |
| Pemex Project Funding Master Trust | 6.625% | 6/15/35 | 22,431 | 23,377 |
| Pemex Project Funding Master Trust | 6.625% | 6/15/38 | 5,975 | 6,102 |
| Petrobras Global Finance BV | 2.000% | 5/20/16 | 8,550 | 8,459 |
| Petrobras Global Finance BV | 3.000% | 1/15/19 | 2,150 | 2,014 |
| Petrobras Global Finance BV | 4.375% | 5/20/23 | 3,000 | 2,666 |
| Petrobras Global Finance BV | 5.625% | 5/20/43 | 4,975 | 4,034 |
| Petrobras International Finance Co. | 2.875% | 2/6/15 | 2,250 | 2,282 |
| Petrobras International Finance Co. | 3.875% | 1/27/16 | 24,200 | 24,855 |
| Petrobras International Finance Co. | 6.125% | 10/6/16 | 14,263 | 15,432 |
| Petrobras International Finance Co. | 3.500% | 2/6/17 | 17,400 | 17,583 |
| Petrobras International Finance Co. | 5.875% | 3/1/18 | 30,735 | 32,685 |
| Petrobras International Finance Co. | 8.375% | 12/10/18 | 10,250 | 11,986 |
| Petrobras International Finance Co. | 7.875% | 3/15/19 | 6,808 | 7,742 |
| Petrobras International Finance Co. | 5.750% | 1/20/20 | 12,222 | 12,566 |
| Petrobras International Finance Co. | 5.375% | 1/27/21 | 40,250 | 39,915 |
| Petrobras International Finance Co. | 6.875% | 1/20/40 | 13,700 | 12,918 |
| Petrobras International Finance Co. | 6.750% | 1/27/41 | 31,295 | 28,995 |
| Petroleos Mexicanos | 4.875% | 3/15/15 | 18,686 | 19,565 |
| Petroleos Mexicanos | 3.500% | 7/18/18 | 11,600 | 11,912 |
| Petroleos Mexicanos | 8.000% | 5/3/19 | 5,350 | 6,467 |
| Petroleos Mexicanos | 6.000% | 3/5/20 | 10,880 | 12,064 |
| Petroleos Mexicanos | 5.500% | 1/21/21 | 5,220 | 5,608 |
| Petroleos Mexicanos | 4.875% | 1/24/22 | 13,500 | 13,829 |
| Petroleos Mexicanos | 3.500% | 1/30/23 | 10,025 | 9,014 |
| 3 Petroleos Mexicanos | 2.290% | 2/15/24 | 2,375 | 2,336 |
| Petroleos Mexicanos | 6.500% | 6/2/41 | 15,950 | 16,531 |
| Petroleos Mexicanos | 5.500% | 6/27/44 | 28,575 | 25,884 |
| 6 Petronas Capital Ltd. | 5.250% | 8/12/19 | 1,000 | 1,096 |
| Province of British Columbia | 2.850% | 6/15/15 | 15,300 | 15,843 |
| Province of British Columbia | 2.100% | 5/18/16 | 22,000 | 22,708 |
| Province of British Columbia | 1.200% | 4/25/17 | 7,000 | 6,988 |
| Province of British Columbia | 2.650% | 9/22/21 | 1,550 | 1,506 |
| Province of British Columbia | 2.000% | 10/23/22 | 6,300 | 5,634 |
| Province of British Columbia | 6.500% | 1/15/26 | 260 | 323 |
| Province of Manitoba | 2.625% | 7/15/15 | 8,750 | 9,030 |
| Province of Manitoba | 4.900% | 12/6/16 | 13,200 | 14,735 |
| Province of Manitoba | 1.300% | 4/3/17 | 4,995 | 5,029 |
| Province of Manitoba | 1.125% | 6/1/18 | 1,000 | 976 |
| Province of Manitoba | 1.750% | 5/30/19 | 800 | 783 |
| Province of Manitoba | 2.100% | 9/6/22 | 6,000 | 5,406 |
| Province of New Brunswick | 2.750% | 6/15/18 | 14,750 | 15,324 |
| Province of Nova Scotia | 2.375% | 7/21/15 | 8,270 | 8,502 |
| Province of Nova Scotia | 5.125% | 1/26/17 | 3,500 | 3,909 |
| Province of Ontario | 4.500% | 2/3/15 | 25 | 26 |
| Province of Ontario | 2.950% | 2/5/15 | 5,130 | 5,272 |
| Province of Ontario | 0.950% | 5/26/15 | 35,525 | 35,772 |
| Province of Ontario | 2.700% | 6/16/15 | 23,375 | 24,119 |
| Province of Ontario | 1.875% | 9/15/15 | 10,300 | 10,537 |
| Province of Ontario | 4.750% | 1/19/16 | 5,375 | 5,805 |
| Province of Ontario | 5.450% | 4/27/16 | 30,325 | 33,517 |
| Province of Ontario | 2.300% | 5/10/16 | 7,450 | 7,692 |
| Province of Ontario | 1.000% | 7/22/16 | 10,975 | 10,982 |
| Province of Ontario | 1.600% | 9/21/16 | 10,700 | 10,878 |
| Province of Ontario | 1.100% | 10/25/17 | 17,250 | 17,044 |
| Province of Ontario | 3.150% | 12/15/17 | 13,000 | 13,745 |
| Province of Ontario | 1.200% | 2/14/18 | 1,450 | 1,419 |
| Province of Ontario | 3.000% | 7/16/18 | 8,475 | 8,858 |
83
| Vanguard® Total Bond Market Index Fund | ||||
| Schedule of Investments | ||||
| December 31, 2013 | ||||
| Face | Market | |||
| Maturity | Amount | Value | ||
| Coupon | Date | ($000) | ($000) | |
| Province of Ontario | 2.000% | 9/27/18 | 9,700 | 9,690 |
| Province of Ontario | 1.650% | 9/27/19 | 8,500 | 8,115 |
| Province of Ontario | 4.000% | 10/7/19 | 20,380 | 21,936 |
| Province of Ontario | 4.400% | 4/14/20 | 20,715 | 22,639 |
| Province of Ontario | 2.450% | 6/29/22 | 9,975 | 9,171 |
| Quebec | 4.600% | 5/26/15 | 8,025 | 8,489 |
| Quebec | 5.000% | 3/1/16 | 200 | 218 |
| Quebec | 5.125% | 11/14/16 | 21,210 | 23,651 |
| Quebec | 4.625% | 5/14/18 | 12,585 | 14,072 |
| Quebec | 3.500% | 7/29/20 | 16,450 | 17,033 |
| Quebec | 2.750% | 8/25/21 | 16,325 | 15,734 |
| Quebec | 2.625% | 2/13/23 | 14,775 | 13,492 |
| Quebec | 7.500% | 7/15/23 | 450 | 574 |
| Quebec | 7.125% | 2/9/24 | 2,125 | 2,656 |
| Quebec | 7.500% | 9/15/29 | 8,190 | 10,769 |
| 6 Ras Laffan Liquefied Natural Gas Co. Ltd. III | 5.500% | 9/30/14 | 350 | 360 |
| 6 Ras Laffan Liquefied Natural Gas Co. Ltd. III | 6.750% | 9/30/19 | 350 | 411 |
| Region of Lombardy Italy | 5.804% | 10/25/32 | 6,458 | 5,880 |
| Republic of Chile | 3.875% | 8/5/20 | 8,850 | 9,235 |
| Republic of Chile | 3.250% | 9/14/21 | 1,300 | 1,272 |
| Republic of Chile | 2.250% | 10/30/22 | 8,925 | 7,903 |
| Republic of Chile | 3.625% | 10/30/42 | 8,100 | 6,315 |
| Republic of Colombia | 7.375% | 1/27/17 | 18,075 | 20,922 |
| Republic of Colombia | 7.375% | 3/18/19 | 13,300 | 16,000 |
| Republic of Colombia | 11.750% | 2/25/20 | 3,350 | 4,807 |
| Republic of Colombia | 4.375% | 7/12/21 | 14,675 | 15,152 |
| 3 Republic of Colombia | 2.625% | 3/15/23 | 16,000 | 13,946 |
| Republic of Colombia | 4.000% | 2/26/24 | 5,400 | 5,224 |
| Republic of Colombia | 8.125% | 5/21/24 | 6,440 | 8,253 |
| Republic of Colombia | 7.375% | 9/18/37 | 9,872 | 12,118 |
| Republic of Colombia | 6.125% | 1/18/41 | 25,825 | 27,437 |
| Republic of Finland | 6.950% | 2/15/26 | 1,905 | 2,358 |
| Republic of Italy | 4.500% | 1/21/15 | 20,650 | 21,433 |
| Republic of Italy | 3.125% | 1/26/15 | 24,800 | 25,393 |
| Republic of Italy | 4.750% | 1/25/16 | 24,850 | 26,475 |
| Republic of Italy | 5.250% | 9/20/16 | 33,126 | 36,127 |
| Republic of Italy | 5.375% | 6/12/17 | 9,150 | 10,030 |
| Republic of Italy | 6.875% | 9/27/23 | 10,515 | 12,480 |
| Republic of Italy | 5.375% | 6/15/33 | 16,595 | 17,475 |
| Republic of Korea | 7.125% | 4/16/19 | 18,013 | 21,943 |
| Republic of Korea | 3.875% | 9/11/23 | 16,900 | 17,134 |
| Republic of Korea | 5.625% | 11/3/25 | 725 | 820 |
| Republic of Panama | 7.250% | 3/15/15 | 80 | 86 |
| Republic of Panama | 5.200% | 1/30/20 | 19,500 | 21,181 |
| Republic of Panama | 7.125% | 1/29/26 | 14,150 | 16,874 |
| Republic of Panama | 8.875% | 9/30/27 | 650 | 871 |
| Republic of Panama | 9.375% | 4/1/29 | 45 | 62 |
| 3 Republic of Panama | 6.700% | 1/26/36 | 16,120 | 18,014 |
| 3 Republic of Panama | 4.300% | 4/29/53 | 5,000 | 3,825 |
| Republic of Peru | 7.125% | 3/30/19 | 20,750 | 25,004 |
| Republic of Peru | 7.350% | 7/21/25 | 9,975 | 12,568 |
| Republic of Peru | 8.750% | 11/21/33 | 9,037 | 12,855 |
| 3 Republic of Peru | 6.550% | 3/14/37 | 12,935 | 14,875 |
| Republic of Peru | 5.625% | 11/18/50 | 17,070 | 16,716 |
| Republic of Philippines | 6.500% | 1/20/20 | 4,600 | 5,405 |
| Republic of Philippines | 4.000% | 1/15/21 | 6,675 | 6,875 |
| 3 Republic of Philippines | 7.500% | 9/25/24 | 14,050 | 17,457 |
| Republic of Philippines | 9.500% | 10/21/24 | 2,650 | 3,750 |
| Republic of Philippines | 10.625% | 3/16/25 | 13,325 | 20,321 |
| Republic of Philippines | 5.500% | 3/30/26 | 11,325 | 12,401 |
| Republic of Philippines | 9.500% | 2/2/30 | 16,350 | 24,280 |
| Republic of Philippines | 7.750% | 1/14/31 | 16,600 | 21,850 |
| Republic of Philippines | 6.375% | 1/15/32 | 4,500 | 5,231 |
| Republic of Philippines | 6.375% | 10/23/34 | 25,550 | 30,341 |
84
| Vanguard® Total Bond Market Index Fund | ||||
| Schedule of Investments | ||||
| December 31, 2013 | ||||
| Face | Market | |||
| Maturity | Amount | Value | ||
| Coupon | Date | ($000) | ($000) | |
| Republic of Philippines | 5.000% | 1/13/37 | 975 | 1,013 |
| Republic of Poland | 3.875% | 7/16/15 | 15,350 | 16,027 |
| Republic of Poland | 5.000% | 10/19/15 | 2,875 | 3,087 |
| Republic of Poland | 6.375% | 7/15/19 | 43,190 | 50,478 |
| Republic of Poland | 5.125% | 4/21/21 | 11,425 | 12,410 |
| Republic of Poland | 5.000% | 3/23/22 | 17,325 | 18,452 |
| Republic of Poland | 3.000% | 3/17/23 | 11,950 | 10,860 |
| Republic of South Africa | 6.875% | 5/27/19 | 14,875 | 16,929 |
| Republic of South Africa | 5.500% | 3/9/20 | 11,650 | 12,377 |
| Republic of South Africa | 4.665% | 1/17/24 | 17,175 | 16,467 |
| Republic of South Africa | 5.875% | 9/16/25 | 3,000 | 3,112 |
| Republic of South Africa | 6.250% | 3/8/41 | 6,900 | 7,150 |
| Republic of Turkey | 7.000% | 9/26/16 | 44,550 | 48,894 |
| Republic of Turkey | 7.500% | 7/14/17 | 22,000 | 24,651 |
| Republic of Turkey | 6.750% | 4/3/18 | 18,925 | 20,553 |
| Republic of Turkey | 7.000% | 3/11/19 | 18,650 | 20,422 |
| Republic of Turkey | 7.000% | 6/5/20 | 24,075 | 26,278 |
| Republic of Turkey | 5.625% | 3/30/21 | 2,675 | 2,686 |
| Republic of Turkey | 5.125% | 3/25/22 | 16,285 | 15,601 |
| Republic of Turkey | 6.250% | 9/26/22 | 29,000 | 29,855 |
| Republic of Turkey | 7.375% | 2/5/25 | 30,575 | 33,006 |
| Republic of Turkey | 11.875% | 1/15/30 | 9,700 | 14,472 |
| Republic of Turkey | 8.000% | 2/14/34 | 2,600 | 2,883 |
| Republic of Turkey | 6.875% | 3/17/36 | 13,100 | 12,851 |
| Republic of Turkey | 6.750% | 5/30/40 | 23,600 | 22,821 |
| Republic of Turkey | 6.000% | 1/14/41 | 14,700 | 12,907 |
| State of Israel | 5.500% | 11/9/16 | 8,100 | 9,041 |
| State of Israel | 5.125% | 3/26/19 | 18,880 | 21,297 |
| State of Israel | 4.000% | 6/30/22 | 9,100 | 9,362 |
| State of Israel | 3.150% | 6/30/23 | 13,000 | 12,319 |
| State of Israel | 4.500% | 1/30/43 | 9,250 | 8,121 |
| Statoil ASA | 3.875% | 4/15/14 | 7,250 | 7,319 |
| Statoil ASA | 1.800% | 11/23/16 | 3,550 | 3,647 |
| Statoil ASA | 3.125% | 8/17/17 | 9,325 | 9,817 |
| Statoil ASA | 1.950% | 11/8/18 | 5,400 | 5,359 |
| Statoil ASA | 5.250% | 4/15/19 | 11,948 | 13,520 |
| Statoil ASA | 2.900% | 11/8/20 | 1,650 | 1,636 |
| Statoil ASA | 3.150% | 1/23/22 | 8,450 | 8,232 |
| Statoil ASA | 2.450% | 1/17/23 | 3,650 | 3,321 |
| Statoil ASA | 7.750% | 6/15/23 | 25 | 32 |
| Statoil ASA | 2.650% | 1/15/24 | 5,825 | 5,272 |
| Statoil ASA | 3.700% | 3/1/24 | 6,925 | 6,879 |
| Statoil ASA | 7.250% | 9/23/27 | 5,375 | 6,920 |
| 6 Statoil ASA | 6.500% | 12/1/28 | 975 | 1,191 |
| Statoil ASA | 7.150% | 1/15/29 | 2,950 | 3,762 |
| Statoil ASA | 5.100% | 8/17/40 | 6,310 | 6,521 |
| Statoil ASA | 4.250% | 11/23/41 | 6,395 | 5,799 |
| Statoil ASA | 3.950% | 5/15/43 | 5,680 | 4,945 |
| Statoil ASA | 4.800% | 11/8/43 | 7,500 | 7,530 |
| Svensk Exportkredit AB | 0.625% | 9/4/15 | 15,400 | 15,317 |
| Svensk Exportkredit AB | 1.750% | 10/20/15 | 13,000 | 13,285 |
| Svensk Exportkredit AB | 0.625% | 5/31/16 | 5,000 | 4,970 |
| Svensk Exportkredit AB | 2.125% | 7/13/16 | 7,950 | 8,183 |
| Svensk Exportkredit AB | 5.125% | 3/1/17 | 1,400 | 1,566 |
| Svensk Exportkredit AB | 1.750% | 5/30/17 | 8,650 | 8,812 |
| 6 Temasek Financial I Ltd. | 5.375% | 11/23/39 | 500 | 536 |
| United Mexican States | 11.375% | 9/15/16 | 5,300 | 6,763 |
| United Mexican States | 5.625% | 1/15/17 | 35,425 | 39,494 |
| United Mexican States | 5.950% | 3/19/19 | 12,500 | 14,437 |
| United Mexican States | 3.625% | 3/15/22 | 15,450 | 15,234 |
| United Mexican States | 4.000% | 10/2/23 | 37,482 | 36,873 |
| United Mexican States | 8.300% | 8/15/31 | 22,525 | 30,492 |
| United Mexican States | 6.750% | 9/27/34 | 40,786 | 48,127 |
| United Mexican States | 6.050% | 1/11/40 | 6,391 | 6,950 |
85
| Vanguard® Total Bond Market Index Fund | ||||
| Schedule of Investments | ||||
| December 31, 2013 | ||||
| Face | Market | |||
| Maturity | Amount | Value | ||
| Coupon | Date | ($000) | ($000) | |
| United Mexican States | 4.750% | 3/8/44 | 69,042 | 62,196 |
| United Mexican States | 5.750% | 10/12/10 | 12,130 | 11,036 |
| Total Sovereign Bonds (Cost $5,820,367) | 5,838,782 | |||
| Taxable Municipal Bonds (1.0%) | ||||
| Alameda County CA Joint Powers Authority Lease | ||||
| Revenue | 7.046% | 12/1/44 | 200 | 221 |
| American Municipal Power Ohio Inc. Revenue | ||||
| (Hydroelectric Projects) | 6.449% | 2/15/44 | 50 | 53 |
| American Municipal Power Ohio Inc. Revenue (Prairie | ||||
| State Energy Campus Project) | 7.834% | 2/15/41 | 1,025 | 1,295 |
| American Municipal Power Ohio Inc. Revenue (Prairie | ||||
| State Energy Campus Project) | 6.053% | 2/15/43 | 1,000 | 1,039 |
| American Municipal Power Ohio Inc. Revenue (Prairie | ||||
| State Energy Campus Project) | 5.939% | 2/15/47 | 4,975 | 5,110 |
| American Municipal Power Ohio Inc. Revenue (Prairie | ||||
| State Energy Campus Project) | 6.270% | 2/15/50 | 1,775 | 1,891 |
| American Municipal Power Ohio Inc. Revenue (Prairie | ||||
| State Energy Campus Project) | 7.499% | 2/15/50 | 1,550 | 1,880 |
| American Municipal Power Ohio Inc. Revenue (Prairie | ||||
| State Energy Campus Project) | 8.084% | 2/15/50 | 7,725 | 10,225 |
| Bay Area Toll Authority California Toll Bridge Revenue | ||||
| (San Francisco Bay Area) | 6.793% | 4/1/30 | 2,375 | 2,787 |
| Bay Area Toll Authority California Toll Bridge Revenue | ||||
| (San Francisco Bay Area) | 6.918% | 4/1/40 | 4,075 | 4,976 |
| Bay Area Toll Authority California Toll Bridge Revenue | ||||
| (San Francisco Bay Area) | 6.263% | 4/1/49 | 6,285 | 7,538 |
| Bay Area Toll Authority California Toll Bridge Revenue | ||||
| (San Francisco Bay Area) | 7.043% | 4/1/50 | 1,000 | 1,229 |
| Bay Area Toll Authority California Toll Bridge Revenue | ||||
| (San Francisco Bay Area) | 6.907% | 10/1/50 | 7,530 | 9,124 |
| California Educational Facilities Authority Revenue | ||||
| (Stanford University) | 4.250% | 5/1/16 | 2,250 | 2,436 |
| California Educational Facilities Authority Revenue | ||||
| (Stanford University) | 4.750% | 5/1/19 | 20 | 22 |
| California GO | 5.750% | 3/1/17 | 10,750 | 12,027 |
| California GO | 6.200% | 3/1/19 | 1,400 | 1,626 |
| California GO | 6.200% | 10/1/19 | 11,175 | 13,040 |
| California GO | 5.700% | 11/1/21 | 10,000 | 11,255 |
| California GO | 7.500% | 4/1/34 | 22,750 | 28,950 |
| California GO | 7.950% | 3/1/36 | 550 | 638 |
| California GO | 7.550% | 4/1/39 | 4,630 | 6,000 |
| California GO | 7.300% | 10/1/39 | 5,210 | 6,552 |
| California GO | 7.350% | 11/1/39 | 22,025 | 28,078 |
| California GO | 7.625% | 3/1/40 | 13,375 | 17,609 |
| California GO | 7.600% | 11/1/40 | 11,325 | 14,951 |
| Central Puget Sound WA Regional Transit Authority | ||||
| Sales & Use Tax Revenue | 5.491% | 11/1/39 | 1,510 | 1,661 |
| Chicago IL Board of Education GO | 6.319% | 11/1/29 | 3,145 | 3,051 |
| Chicago IL Board of Education GO | 6.138% | 12/1/39 | 650 | 570 |
| Chicago IL GO | 7.781% | 1/1/35 | 1,860 | 2,062 |
| Chicago IL Metropolitan Water Reclamation District GO | 5.720% | 12/1/38 | 10,350 | 11,234 |
| Chicago IL O'Hare International Airport Revenue | 6.845% | 1/1/38 | 1,450 | 1,546 |
| Chicago IL O'Hare International Airport Revenue | 6.395% | 1/1/40 | 1,500 | 1,673 |
| Chicago IL Transit Authority Sales Tax Receipts | ||||
| Revenue | 6.200% | 12/1/40 | 2,850 | 3,023 |
| Chicago IL Transit Authority Transfer Tax Receipts | ||||
| Revenue | 6.899% | 12/1/40 | 6,985 | 7,830 |
| Chicago IL Wastewater Transmission Revenue | 6.900% | 1/1/40 | 1,700 | 1,895 |
| Chicago IL Water Revenue | 6.742% | 11/1/40 | 2,150 | 2,386 |
| Clark County NV Airport Revenue | 6.881% | 7/1/42 | 475 | 512 |
| Clark County NV Airport Revenue | 6.820% | 7/1/45 | 20 | 25 |
86
| Vanguard® Total Bond Market Index Fund | ||||
| Schedule of Investments | ||||
| December 31, 2013 | ||||
| Face | Market | |||
| Maturity | Amount | Value | ||
| Coupon | Date | ($000) | ($000) | |
| Commonwealth Financing Authority Pennsylvania | ||||
| Revenue | 6.218% | 6/1/39 | 6,375 | 6,928 |
| Connecticut GO | 5.090% | 10/1/30 | 7,600 | 7,498 |
| Connecticut GO | 5.850% | 3/15/32 | 6,610 | 7,406 |
| Connecticut Special Tax Revenue (Transportation | ||||
| Infrastructure) | 5.459% | 11/1/30 | 3,300 | 3,424 |
| Cook County IL GO | 6.229% | 11/15/34 | 1,950 | 1,947 |
| Curators of the University of Missouri System Facilities | ||||
| Revenue | 5.960% | 11/1/39 | 3,000 | 3,567 |
| Curators of the University of Missouri System Facilities | ||||
| Revenue | 5.792% | 11/1/41 | 3,000 | 3,480 |
| Dallas County TX Hospital District Revenue | 5.621% | 8/15/44 | 2,100 | 2,310 |
| Dallas TX Area Rapid Transit Revenue | 4.922% | 12/1/41 | 6,850 | 7,096 |
| Dallas TX Area Rapid Transit Revenue | 5.999% | 12/1/44 | 1,050 | 1,244 |
| Dallas TX Area Rapid Transit Revenue | 5.022% | 12/1/48 | 4,700 | 4,808 |
| Dallas TX Independent School District GO | 6.450% | 2/15/35 | 3,850 | 4,310 |
| Dartmouth College New Hampshire GO | 4.750% | 6/1/19 | 1,185 | 1,321 |
| Denver CO City & County School District No. 1 COP | 4.242% | 12/15/37 | 215 | 191 |
| Denver CO City & County School District No. 1 COP | 7.017% | 12/15/37 | 2,100 | 2,439 |
| Denver CO City & County School District No. 1 GO | 5.664% | 12/1/33 | 1,325 | 1,451 |
| District of Columbia Income Tax Revenue | 5.591% | 12/1/34 | 1,125 | 1,239 |
| District of Columbia Income Tax Revenue | 5.582% | 12/1/35 | 1,600 | 1,754 |
| District of Columbia Water & Sewer Authority Public | ||||
| Utility Revenue | 5.522% | 10/1/44 | 700 | 729 |
| East Baton Rouge LA Sewer Commission Revenue | 6.087% | 2/1/45 | 2,300 | 2,381 |
| East Bay CA Municipal Utility District Water System | ||||
| Revenue | 5.874% | 6/1/40 | 5,220 | 5,925 |
| Energy Northwest Washington Electric Revenue | ||||
| (Columbia Generating Station) | 2.197% | 7/1/19 | 4,000 | 3,908 |
| Florida Hurricane Catastrophe Fund Finance Corp. | ||||
| Revenue | 2.107% | 7/1/18 | 7,800 | 7,602 |
| Florida Hurricane Catastrophe Fund Finance Corp. | ||||
| Revenue | 2.995% | 7/1/20 | 10,850 | 10,268 |
| George Washington University District of Columbia GO | 3.485% | 9/15/22 | 7,450 | 7,154 |
| Georgia GO | 4.503% | 11/1/25 | 5,900 | 6,249 |
| Georgia Municipal Electric Power Authority Revenue | 6.637% | 4/1/57 | 7,575 | 7,970 |
| Georgia Municipal Electric Power Authority Revenue | 6.655% | 4/1/57 | 5,980 | 6,248 |
| Georgia Municipal Electric Power Authority Revenue | 7.055% | 4/1/57 | 3,425 | 3,466 |
| Illinois GO | 4.511% | 3/1/15 | 11,650 | 12,090 |
| Illinois GO | 5.365% | 3/1/17 | 15,950 | 17,193 |
| Illinois GO | 5.877% | 3/1/19 | 8,345 | 9,083 |
| Illinois GO | 4.950% | 6/1/23 | 13,275 | 12,874 |
| Illinois GO | 5.100% | 6/1/33 | 43,814 | 40,826 |
| Illinois GO | 6.630% | 2/1/35 | 2,855 | 2,982 |
| Illinois GO | 6.725% | 4/1/35 | 5,275 | 5,558 |
| Illinois GO | 7.350% | 7/1/35 | 650 | 724 |
| Illinois Toll Highway Authority Revenue | 6.184% | 1/1/34 | 880 | 1,011 |
| Illinois Toll Highway Authority Revenue | 5.851% | 12/1/34 | 1,650 | 1,831 |
| Indianapolis IN Local Public Improvement Revenue | 6.116% | 1/15/40 | 9,700 | 11,232 |
| JobsOhio Beverage System Statewide Liquor Profits | ||||
| Revenue | 3.985% | 1/1/29 | 6,600 | 6,025 |
| JobsOhio Beverage System Statewide Liquor Profits | ||||
| Revenue | 4.532% | 1/1/35 | 4,175 | 3,867 |
| Kansas Department of Transportation Highway | ||||
| Revenue | 4.596% | 9/1/35 | 2,000 | 1,969 |
| 11 Kansas Development Finance Authority Revenue | ||||
| (Public Employees Retirement System) | 5.501% | 5/1/34 | 4,300 | 4,421 |
| Kentucky Asset/Liability Commission General Fund | ||||
| Revenue | 3.165% | 4/1/18 | 661 | 680 |
| Las Vegas Valley Water District Nevada GO | 7.013% | 6/1/39 | 1,700 | 1,865 |
| Los Angeles CA Community College District GO | 6.600% | 8/1/42 | 4,325 | 5,355 |
| Los Angeles CA Department of Airports International | ||||
| Airport Revenue | 6.582% | 5/15/39 | 20 | 23 |
87
| Vanguard® Total Bond Market Index Fund | ||||
| Schedule of Investments | ||||
| December 31, 2013 | ||||
| Face | Market | |||
| Maturity | Amount | Value | ||
| Coupon | Date | ($000) | ($000) | |
| Los Angeles CA Department of Water & Power | ||||
| Revenue | 5.716% | 7/1/39 | 2,200 | 2,422 |
| Los Angeles CA Department of Water & Power | ||||
| Revenue | 6.008% | 7/1/39 | 6,350 | 7,111 |
| Los Angeles CA Department of Water & Power | ||||
| Revenue | 6.166% | 7/1/40 | 1,550 | 1,642 |
| Los Angeles CA Department of Water & Power | ||||
| Revenue | 6.574% | 7/1/45 | 2,700 | 3,370 |
| Los Angeles CA Department of Water & Power | ||||
| Revenue | 6.603% | 7/1/50 | 350 | 432 |
| Los Angeles CA Unified School District GO | 5.750% | 7/1/34 | 9,225 | 10,156 |
| Los Angeles CA Unified School District GO | 6.758% | 7/1/34 | 7,210 | 8,892 |
| Los Angeles County CA Metropolitan Transportation | ||||
| Authority Sales Tax Revenue | 5.735% | 6/1/39 | 5,200 | 5,595 |
| Los Angeles County CA Public Works Financing | ||||
| Authority Lease Revenue | 7.488% | 8/1/33 | 4,300 | 5,160 |
| Los Angeles County CA Public Works Financing | ||||
| Authority Lease Revenue | 7.618% | 8/1/40 | 2,250 | 2,647 |
| Maryland Transportation Authority Facilities Projects | ||||
| Revenue | 5.888% | 7/1/43 | 2,330 | 2,526 |
| Massachusetts GO | 4.200% | 12/1/21 | 5,000 | 5,265 |
| Massachusetts GO | 4.500% | 8/1/31 | 500 | 481 |
| Massachusetts GO | 5.456% | 12/1/39 | 4,600 | 5,001 |
| Massachusetts School Building Authority Dedicated | ||||
| Sales Tax Revenue | 5.715% | 8/15/39 | 2,550 | 2,856 |
| Massachusetts Transportation Fund Revenue | 5.731% | 6/1/40 | 1,000 | 1,137 |
| Massachusetts Water Pollution Abatement Trust | 5.192% | 8/1/40 | 2,825 | 2,882 |
| Metropolitan Government of Nashville & Davidson | ||||
| County TN Convention Center Authority Tourism Tax | ||||
| Revenue | 6.731% | 7/1/43 | 2,360 | 2,616 |
| Metropolitan Government of Nashville & Davidson | ||||
| County TN GO | 5.707% | 7/1/34 | 2,625 | 2,810 |
| Metropolitan Washington DC/VA Airports Authority | ||||
| Dulles Toll Road Revenue | 7.462% | 10/1/46 | 1,475 | 1,654 |
| Metropolitan Water District of Southern California | ||||
| Revenue | 6.947% | 7/1/40 | 1,670 | 1,864 |
| Mississippi GO | 5.245% | 11/1/34 | 1,375 | 1,437 |
| Missouri Highways & Transportation Commission Road | ||||
| Revenue | 5.445% | 5/1/33 | 1,650 | 1,790 |
| 12 New Jersey Economic Development Authority | ||||
| Revenue (State Pension Funding) | 7.425% | 2/15/29 | 15,150 | 18,155 |
| New Jersey Transportation Trust Fund Authority | ||||
| Transportation System Revenue | 5.754% | 12/15/28 | 12,075 | 13,026 |
| New Jersey Transportation Trust Fund Authority | ||||
| Transportation System Revenue | 6.104% | 12/15/28 | 3,555 | 3,815 |
| New Jersey Transportation Trust Fund Authority | ||||
| Transportation System Revenue | 6.561% | 12/15/40 | 585 | 686 |
| 13 New Jersey Turnpike Authority Revenue | 4.252% | 1/1/16 | 200 | 206 |
| 13 New Jersey Turnpike Authority Revenue | 4.252% | 1/1/16 | 1,095 | 1,129 |
| New Jersey Turnpike Authority Revenue | 7.414% | 1/1/40 | 14,100 | 18,788 |
| New Jersey Turnpike Authority Revenue | 7.102% | 1/1/41 | 3,750 | 4,802 |
| New York City NY GO | 6.646% | 12/1/31 | 20 | 22 |
| New York City NY GO | 6.246% | 6/1/35 | 2,150 | 2,292 |
| New York City NY GO | 5.968% | 3/1/36 | 3,200 | 3,602 |
| New York City NY GO | 5.985% | 12/1/36 | 1,650 | 1,851 |
| New York City NY GO | 5.517% | 10/1/37 | 6,800 | 7,111 |
| New York City NY GO | 6.271% | 12/1/37 | 2,000 | 2,334 |
| New York City NY GO | 5.846% | 6/1/40 | 2,100 | 2,288 |
| New York City NY Municipal Water Finance Authority | ||||
| Water & Sewer System Revenue | 5.750% | 6/15/41 | 1,435 | 1,618 |
| New York City NY Municipal Water Finance Authority | ||||
| Water & Sewer System Revenue | 5.724% | 6/15/42 | 470 | 528 |
| New York City NY Municipal Water Finance Authority | ||||
| Water & Sewer System Revenue | 5.952% | 6/15/42 | 2,900 | 3,356 |
88
| Vanguard® Total Bond Market Index Fund | ||||
| Schedule of Investments | ||||
| December 31, 2013 | ||||
| Face | Market | |||
| Maturity | Amount | Value | ||
| Coupon | Date | ($000) | ($000) | |
| New York City NY Municipal Water Finance Authority | ||||
| Water & Sewer System Revenue | 6.011% | 6/15/42 | 1,050 | 1,224 |
| New York City NY Municipal Water Finance Authority | ||||
| Water & Sewer System Revenue | 5.440% | 6/15/43 | 4,400 | 4,725 |
| New York City NY Municipal Water Finance Authority | ||||
| Water & Sewer System Revenue | 5.882% | 6/15/44 | 15,645 | 17,818 |
| New York City NY Transitional Finance Authority | ||||
| Building Aid Revenue | 6.828% | 7/15/40 | 6,300 | 7,553 |
| New York City NY Transitional Finance Authority Future | ||||
| Tax Revenue | 5.767% | 8/1/36 | 2,125 | 2,410 |
| New York City NY Transitional Finance Authority Future | ||||
| Tax Revenue | 5.508% | 8/1/37 | 8,950 | 9,812 |
| New York Metropolitan Transportation Authority | ||||
| Revenue (Dedicated Tax Fund) | 7.336% | 11/15/39 | 9,755 | 12,767 |
| New York Metropolitan Transportation Authority | ||||
| Revenue (Dedicated Tax Fund) | 6.089% | 11/15/40 | 975 | 1,114 |
| New York Metropolitan Transportation Authority | ||||
| Revenue (Transit Revenue) | 6.548% | 11/15/31 | 700 | 802 |
| New York Metropolitan Transportation Authority | ||||
| Revenue (Transit Revenue) | 5.871% | 11/15/39 | 2,200 | 2,359 |
| New York Metropolitan Transportation Authority | ||||
| Revenue (Transit Revenue) | 6.648% | 11/15/39 | 4,170 | 4,846 |
| New York State Dormitory Authority Revenue (Personal | ||||
| Income Tax) | 5.500% | 3/15/30 | 6,900 | 7,498 |
| New York State Dormitory Authority Revenue (Personal | ||||
| Income Tax) | 5.289% | 3/15/33 | 3,150 | 3,342 |
| New York State Dormitory Authority Revenue (Personal | ||||
| Income Tax) | 5.628% | 3/15/39 | 2,215 | 2,440 |
| New York State Dormitory Authority Revenue (Personal | ||||
| Income Tax) | 5.389% | 3/15/40 | 1,425 | 1,538 |
| New York State Urban Development Corp. Revenue | ||||
| (Personal Income Tax) | 5.770% | 3/15/39 | 5,875 | 6,412 |
| New York State Urban Development Corp. Revenue | ||||
| (Personal Income Tax) | 5.838% | 3/15/40 | 1,600 | 1,801 |
| New York University Hospitals Center Revenue | 4.428% | 7/1/42 | 3,500 | 2,926 |
| New York University Hospitals Center Revenue | 5.750% | 7/1/43 | 5,050 | 5,097 |
| North Texas Tollway Authority System Revenue | 6.718% | 1/1/49 | 3,070 | 3,731 |
| Ohio State University General Receipts Revenue | 4.910% | 6/1/40 | 4,410 | 4,419 |
| Ohio State University General Receipts Revenue | 4.800% | 6/1/11 | 2,675 | 2,328 |
| Ohio Water Development Authority Water Pollution | ||||
| Control Loan Fund Revenue | 4.879% | 12/1/34 | 2,550 | 2,586 |
| Orange County CA Local Transportation Authority Sales | ||||
| Tax Revenue | 6.908% | 2/15/41 | 2,090 | 2,590 |
| Oregon Department of Transportation Highway User | ||||
| Tax Revenue | 5.834% | 11/15/34 | 2,425 | 2,792 |
| Oregon GO | 5.762% | 6/1/23 | 1,950 | 2,250 |
| Oregon GO | 5.892% | 6/1/27 | 2,730 | 3,130 |
| 13 Oregon School Boards Association GO | 4.759% | 6/30/28 | 9,955 | 10,444 |
| 11 Oregon School Boards Association GO | 5.528% | 6/30/28 | 1,200 | 1,284 |
| Pennsylvania GO | 4.650% | 2/15/26 | 2,875 | 2,966 |
| Pennsylvania GO | 5.350% | 5/1/30 | 7,400 | 7,648 |
| Pennsylvania Public School Building Authority Lease | ||||
| Revenue (School District of Philadelphia) | 5.000% | 9/15/27 | 2,617 | 2,717 |
| Pennsylvania Turnpike Commission Revenue | 6.105% | 12/1/39 | 400 | 462 |
| Pennsylvania Turnpike Commission Revenue | 5.511% | 12/1/45 | 1,450 | 1,539 |
| Pennsylvania Turnpike Commission Revenue | 5.561% | 12/1/49 | 1,475 | 1,576 |
| Phoenix AZ GO | 5.269% | 7/1/34 | 5 | 5 |
| Port Authority of New York & New Jersey Revenue | 6.040% | 12/1/29 | 2,550 | 2,928 |
| Port Authority of New York & New Jersey Revenue | 5.647% | 11/1/40 | 11,575 | 12,620 |
| Port Authority of New York & New Jersey Revenue | 4.926% | 10/1/51 | 1,200 | 1,127 |
| Port Authority of New York & New Jersey Revenue | 4.458% | 10/1/62 | 21,400 | 18,144 |
| President & Fellows of Harvard College Massachusetts | ||||
| GO | 4.875% | 10/15/40 | 7,750 | 7,938 |
| Princeton University New Jersey GO | 5.700% | 3/1/39 | 3,725 | 4,257 |
89
| Vanguard® Total Bond Market Index Fund | ||||
| Schedule of Investments | ||||
| December 31, 2013 | ||||
| Face | Market | |||
| Maturity | Amount | Value | ||
| Coupon | Date | ($000) | ($000) | |
| Puerto Rico Government Development Bank Revenue | 3.670% | 5/1/14 | 4,000 | 3,792 |
| Puerto Rico Government Development Bank Revenue | 4.704% | 5/1/16 | 2,450 | 2,003 |
| Regional Transportation District of Colorado Sales Tax | ||||
| Revenue | 5.844% | 11/1/50 | 3,500 | 4,041 |
| Rutgers State University NJ Revenue | 5.665% | 5/1/40 | 1,850 | 2,034 |
| Salt River Project Arizona Agricultural Improvement & | ||||
| Power District Revenue | 4.839% | 1/1/41 | 1,900 | 1,920 |
| San Antonio TX Electric & Gas Systems Revenue | 5.985% | 2/1/39 | 4,335 | 5,158 |
| San Antonio TX Electric & Gas Systems Revenue | 5.718% | 2/1/41 | 2,725 | 3,075 |
| San Antonio TX Electric & Gas Systems Revenue | 5.808% | 2/1/41 | 4,650 | 5,273 |
| San Antonio TX Electric & Gas Systems Revenue | 4.427% | 2/1/42 | 5,500 | 5,140 |
| San Diego County CA Regional Transportation | ||||
| Commission Sales Tax Revenue | 5.911% | 4/1/48 | 975 | 1,116 |
| San Diego County CA Water Authority Revenue | 6.138% | 5/1/49 | 1,820 | 2,129 |
| San Francisco CA City & County Public Utilities | ||||
| Commission Water Revenue | 6.000% | 11/1/40 | 4,950 | 5,688 |
| Santa Clara Valley CA Transportation Authority Sales | ||||
| Tax Revenue | 5.876% | 4/1/32 | 8,900 | 9,725 |
| South Carolina Public Service Authority Revenue | 6.454% | 1/1/50 | 2,900 | 3,157 |
| Texas GO | 5.517% | 4/1/39 | 3,170 | 3,555 |
| Texas Transportation Commission Revenue | 5.028% | 4/1/26 | 2,100 | 2,259 |
| Texas Transportation Commission Revenue | 5.178% | 4/1/30 | 5,035 | 5,403 |
| Texas Transportation Commission Revenue | 4.631% | 4/1/33 | 6,450 | 6,526 |
| Texas Transportation Commission Revenue | 4.681% | 4/1/40 | 2,750 | 2,759 |
| Tufts University Massachusetts GO | 5.017% | 4/15/12 | 8,425 | 7,641 |
| University of California Regents Medical Center | ||||
| Revenue | 6.548% | 5/15/48 | 4,250 | 4,947 |
| University of California Regents Medical Center | ||||
| Revenue | 6.583% | 5/15/49 | 2,575 | 3,007 |
| University of California Revenue | 1.796% | 7/1/19 | 5,875 | 5,637 |
| University of California Revenue | 6.270% | 5/15/31 | 500 | 539 |
| University of California Revenue | 5.770% | 5/15/43 | 1,220 | 1,354 |
| University of California Revenue | 5.946% | 5/15/45 | 13,100 | 14,665 |
| University of California Revenue | 4.858% | 5/15/12 | 18,000 | 15,573 |
| University of Massachusetts Building Authority | ||||
| Revenue | 5.450% | 11/1/40 | 1,700 | 1,822 |
| University of Southern California Revenue | 5.250% | 10/1/11 | 3,900 | 4,090 |
| University of Texas System Revenue Financing System | ||||
| Revenue | 5.262% | 7/1/39 | 1,650 | 1,764 |
| University of Texas System Revenue Financing System | ||||
| Revenue | 6.276% | 8/15/41 | 1,525 | 1,663 |
| University of Texas System Revenue Financing System | ||||
| Revenue | 5.134% | 8/15/42 | 100 | 106 |
| University of Texas System Revenue Financing System | ||||
| Revenue | 4.794% | 8/15/46 | 1,310 | 1,316 |
| University of Virginia Revenue | 6.200% | 9/1/39 | 3,000 | 3,651 |
| Utah GO | 4.554% | 7/1/24 | 2,525 | 2,682 |
| Utah GO | 3.539% | 7/1/25 | 6,310 | 6,167 |
| Utah Transit Authority Sales Tax Revenue | 5.937% | 6/15/39 | 400 | 447 |
| Washington Convention Center Public Facilities District | ||||
| Revenue | 6.790% | 7/1/40 | 400 | 428 |
| Washington GO | 5.090% | 8/1/33 | 9,025 | 9,390 |
| Washington GO | 5.481% | 8/1/39 | 870 | 927 |
| Washington GO | 5.140% | 8/1/40 | 6,035 | 6,219 |
| 11 Wisconsin GO | 5.700% | 5/1/26 | 2,800 | 3,063 |
| Total Taxable Municipal Bonds (Cost $962,075) | 1,025,113 | |||
90
| Vanguard® Total Bond Market Index Fund | |||
| Schedule of Investments | |||
| December 31, 2013 | |||
| Market | |||
| Value | |||
| Coupon | Shares | ($000) | |
| Temporary Cash Investment (2.6%) | |||
| Money Market Fund (2.6%) | |||
| 14 Vanguard Market Liquidity Fund (Cost $2,788,041) | 0.125% | 2,788,040,796 | 2,788,041 |
| Total Investments (102.0%) (Cost $108,878,363) | 110,266,990 | ||
| Other Assets and Liabilities—Net (-2.0%) | (2,151,569) | ||
| Net Assets (100%) | 108,115,421 | ||
1 The issuer operates under a congressional charter; its securities are generally neither guaranteed by the U.S. Treasury nor backed by the full
faith and credit of the U.S. government.
2 The issuer was placed under federal conservatorship in September 2008; since that time, its daily operations have been managed by the Federal
Housing Finance Agency and it receives capital from the U.S. Treasury, as needed to maintain a positive net worth, in exchange for senior
preferred stock.
3 The average or expected maturity is shorter than the final maturity shown because of the possibility of interim principal payments and
prepayments or the possibility of the issue being called.
4 Includes securities purchased on a when-issued or delayed-delivery basis for which the fund has not taken delivery as of December 31, 2013.
5 Adjustable-rate security.
6 Security exempt from registration under Rule 144A of the Securities Act of 1933. Such securities may be sold in transactions exempt from
registration, normally to qualified institutional buyers. At December 31, 2013, the aggregate value of these securities was $224,298,000,
representing 0.2% of net assets.
7 Non-income-producing security--security in default.
8 Guaranteed by the Government of Japan.
9 Guaranteed by the Federal Republic of Germany.
10 Guaranteed by the Republic of Austria.
11 Scheduled principal and interest payments are guaranteed by AGM (Assured Guaranty Municipal Corporation).
12 Scheduled principal and interest payments are guaranteed by National Public Finance Guarantee Corp.
13 Scheduled principal and interest payments are guaranteed by AMBAC (Ambac Assurance Corporation).
14 Affiliated money market fund available only to Vanguard funds and certain trusts and accounts managed by Vanguard. Rate shown is the 7-day
yield.
COP—Certificate of Participation.
GO—General Obligation Bond.
REIT—Real Estate Investment Trust.
91
| © 2014 The Vanguard Group, Inc. | |
| All rights reserved. | |
| Vanguard Marketing Corporation, Distributor. | |
| SNA840_022014 |
Item 7: Disclosure of Proxy Voting Policies and Procedures for Closed-End Management Investment Companies.
Not Applicable.
Item 8: Portfolio Managers of Closed-End Management Investment Companies.
Not Applicable.
Item 9: Purchase of Equity Securities by Closed-End Management Investment Company and Affiliated
Purchasers.
Not Applicable.
Item 10: Submission of Matters to a Vote of Security Holders.
Not Applicable.
Item 11: Controls and Procedures.
(a) Disclosure Controls and Procedures. The Principal Executive and Financial Officers
concluded that the Registrant’s Disclosure Controls and Procedures are effective based on their evaluation
of the Disclosure Controls and Procedures as of a date within 90 days of the filing date of this report.
(b) Internal Control Over Financial Reporting. There were no significant changes in Registrant’s
Internal Control Over Financial Reporting or in other factors that could significantly affect this control
subsequent to the date of the evaluation, including any corrective actions with regard to significant
deficiencies and material weaknesses.
Item 12: Exhibits.
(a) Code of Ethics.
(b) Certifications.
Pursuant to the requirements of the Securities Exchange Act of 1934 and the Investment Company Act of 1940, the registrant has duly caused this report to be signed on its behalf by the undersigned, thereunto duly authorized.
| VANGUARD BOND INDEX FUNDS | |
| By: | /s/ F. WILLIAM MCNABB III* |
| F. WILLIAM MCNABB III | |
| CHIEF EXECUTIVE OFFICER | |
| Date: February 20, 2014 | |
Pursuant to the requirements of the Securities Exchange Act of 1934 and the Investment Company Act of
1940, this report has been signed below by the following persons on behalf of the registrant and in the
capacities and on the dates indicated.
| VANGUARD BOND INDEX FUNDS | |
| By: | /s/ F. WILLIAM MCNABB III* |
| F. WILLIAM MCNABB III | |
| CHIEF EXECUTIVE OFFICER | |
| Date: February 20, 2014 | |
| VANGUARD BOND INDEX FUNDS | |
| By: | /s/ THOMAS J. HIGGINS* |
| THOMAS J. HIGGINS | |
| CHIEF FINANCIAL OFFICER | |
| Date: February 20, 2014 | |
* By: /s/ Heidi Stam
Heidi Stam, pursuant to a Power of Attorney filed on March 27, 2012 see file Number 2-11444, Incorporated by Reference.