Item 1: Report to Shareholders| Maryland Short-Term Tax-Free Bond Fund | February 28, 2007 |
The views and opinions in this report were current as of February 28, 2007. They are not guarantees of performance or investment results and should not be taken as investment advice. Investment decisions reflect a variety of factors, and the managers reserve the right to change their views about individual stocks, sectors, and the markets at any time. As a result, the views expressed should not be relied upon as a forecast of the fund’s future investment intent. The report is certified under the Sarbanes-Oxley Act, which requires mutual funds and other public companies to affirm that, to the best of their knowledge, the information in their financial reports is fairly and accurately stated in all material respects.
REPORTS ON THE WEB
Sign up for our E-mail Program, and you can begin to receive updated fund reports and prospectuses online rather than through the mail. Log in to your account at troweprice.com for more information.
Fellow ShareholdersMaryland tax-free bonds produced moderate returns in the one-year period ended February 28, 2007, helped by price appreciation stemming from declining longer-term interest rates in the last six months. Despite continued concerns about inflation, the Federal Reserve kept the fed funds target rate at 5.25% since last June in anticipation that moderating economic growth would allow inflation pressures to ease. Long-term and lower-quality municipals outperformed short-term and higher-quality issues, respectively, as investors sought higher yields and returns. In this environment, the Maryland Tax-Free Funds posted solid returns that compare favorably with their benchmarks.
HIGHLIGHTS
• Long-term and lower-quality municipals outperformed short-term and higher-quality issues, respectively, as investors sought higher yields.
• The funds produced moderate returns during the past 6- and 12-month periods.
• The Fed has kept the fed funds rate at 5.25% since June 2006.
• Municipal bonds continue to be an appealing alternative for investors in higher tax brackets.
MARKET ENVIRONMENT
Economic growth moderated over the course of 2006, thanks in part to a significantly cooler housing market, softer manufacturing activity, and elevated energy costs. According to the most recent data, the economy (as measured by gross domestic product, or GDP) grew at an annualized rate of 2.2% in the fourth quarter of 2006 compared with a very robust 5.6% in the first quarter of last year.
The overall rate of inflation eased somewhat as oil and gas prices declined from their peaks last summer, but “core” inflation, which excludes food and energy prices, has remained above the comfort zone of Federal Reserve officials. Despite leaving the fed funds target rate unchanged after a two-year period of regular increases, Fed officials are vigilantly watching prices and labor costs and have left open the possibility of additional rate increases if inflation pressures do not wane as they expect.
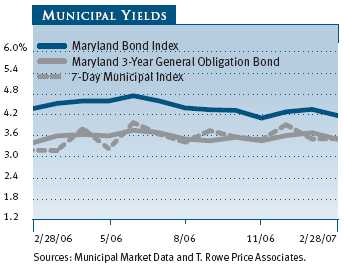
As shown in the graph, yields on Maryland three-year general obligation bonds and seven-day municipal issues ended the second half of our fiscal year about where they began and were nearly identical, reflecting the Fed’s steady stance on the fed funds target rate. Long-term rates declined over the six-month period, however, resulting in the outperformance of long-term securities and a continued flattening of the municipal yield curve. At the end of February, the difference between the yields on short-term municipal securities and the Maryland Bond Index decreased to 68 basis points—an extraordinarily and historically narrow gap (100 basis points equal 1.00%).
In the taxable bond market, the Treasury yield curve remained inverted, as short-term rates were fairly steady while intermediate- and long-term interest rates, which were already lower than short-term rates, declined in the last six months. The resulting price appreciation helped taxable securities outperform their tax-free counterparts—a reversal of the performance pattern of recent years. In the 6- and 12-month periods ended February 28, 2007, the Lehman Brothers U.S. Aggregate Index returned 3.66% and 5.54%, respectively, versus 2.89% and 4.96% for the Lehman Brothers Municipal Bond Index.
MUNICIPAL MARKET NEWS
New municipal issuance in 2006 totaled more than $383 billion, slightly less than the record $408 billion in the previous year, according to The Bond Buyer, but the second-highest issuance year ever. Fourth-quarter supply was much stronger than expected, as municipalities took advantage of falling long-term interest rates in the second half of last year, and issuance remained strong in the first two months of the new year. Nevertheless, demand for tax-free securities from traditional investors (such as mutual funds and individual investors) and from nontraditional investors (including hedge funds and foreign buyers) has been supportive, credit conditions have remained favorable, and the fiscal health of municipalities is still encouraging. If the economy cools significantly, however, the credit cycle could be approaching a near-term peak.
Long-term municipals outperformed shorter-term issues in the last six months, as they have throughout our fiscal year. High-yield munis maintained their performance advantage as investors seeking higher returns continued to embrace risk, despite the diminishing yield advantage provided by high-yield over investment-grade securities. However, the magnitude of their outperformance has been dwindling as lower-quality bond valuations reach more expensive levels.
Tobacco bonds, backed by payments from tobacco companies to the states under the Master Settlement Agreement (MSA), continued to perform well. The sector’s recent performance has been driven by predominantly favorable court rulings and credit rating agency outlooks. Housing finance revenue bonds also performed very well, as this higher-yielding sector benefited from generally low interest rate volatility for most of the period. In addition, hospital revenue bonds continued their winning streak. On the other hand, prerefunded bonds lagged as investors seeking higher yields favored higher-risk, lower-quality securities.
MARYLAND MARKET NEWS
Maryland’s economy continued to fare well compared with other states. The state’s unemployment rate was 3.8% in January 2007, much better than the national unemployment rate of 4.6%. Marylanders continued to enjoy high wages as the state ranked fourth in per capita personal income, which is 22% above the national average.
For the state’s fiscal year ended June 30, 2006, Maryland’s audited budgetary-basis general fund revenues exceeded fiscal year 2005 revenues by approximately 10%, or $1.1 billion. All major sources of revenue (personal income, corporate income, and sales and use taxes) showed healthy increases indicating the broad nature of Maryland’s participation in the economic expansion. In fiscal 2006, revenues exceeded expenditures by $422 million, which compares favorably with the $369 million surplus for fiscal 2005. As of June 30, 2006, the state’s revenue stabilization fund increased to $805 million, from $540 million one year ago, and represented a healthy 6% of general fund revenues.
Maryland’s fiscal 2007 budget allows for increased spending with record increases for kindergarten through 12th grade and higher education programs. These spending increases are cause for some concern because the growth in general fund revenues may not be sustainable in 2007. Maryland’s reserve position is strong in comparison with other states, however, and we take comfort in the state government’s long history of responsible stewardship.General obligation bonds issued by Maryland are rated Aaa by Moody’s Investors Service and AAA by Standard & Poor’s and Fitch Ratings, and all three rating agencies carry a stable outlook.
PERFORMANCE AND PORTFOLIO STRATEGIES
Maryland Tax-Free Money Fund
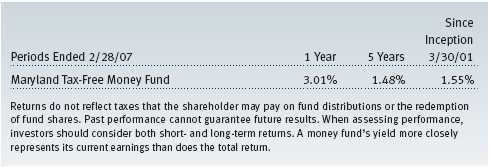
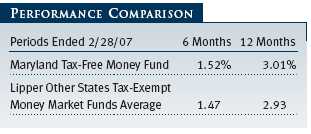
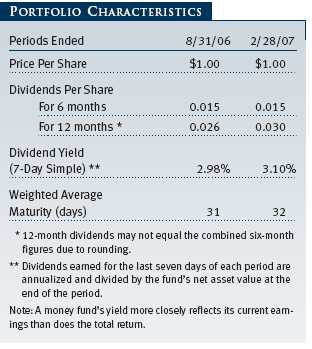
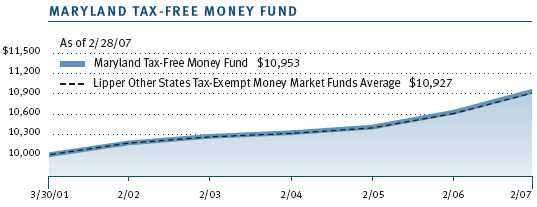
The Maryland Tax-Free Money Fund outperformed its peers during the 6- and 12-month periods ended February 28, 2007, with returns of 1.52% and 3.01%, respectively, versus the Lipper average of 1.47% and 2.93%. Municipal money fund investors benefited from a modest rise in yields during the period, even though the Federal Reserve stopped raising short-term rates last June. Since our August report, the fund’s seven-day simple yield has moved up 12 basis points (0.12%) to 3.10% from 2.98%. Over the past 12 months, the fund’s yield is up 49 basis points from 2.61%. A money fund’s yield more closely reflects its current earnings than does the total return.
Since our last report, the money market yield curves that we monitor closely have remained flat to slightly inverted, which means that short-term yields were modestly higher than longer-maturity issues. While an unchanged fed funds rate at 5.25% anchored the front end of the yield curve, changing perceptions regarding the direction and likelihood of the Federal Reserve’s next move alternately moved longer-term money market rates above and below the Fed target rate.
Over the past six months, taxable money market rates moved in a narrow band. For example, one- to three-month Libor rates averaged 5.32% to 5.35%. However, the one-year Libor fluctuated somewhat more, beginning the period yielding 5.39%, moving as high as 5.46%, and subsequently retreating to 5.23% at the end of February. The Libor yield curve inversion, along with pricing in the fed funds futures curve, suggests the market believes the Federal Reserve’s next move will be an interest rate cut. Therefore, for much of the past six months, money market investors have favored the more stable and higher yields found in the front end of the yield curve.
Unlike its taxable counterpart, the municipal money market curve has not inverted, although the curve remained remarkably flat. The yield difference between seven-day variable rate securities and one-year note rates has been between one and three basis points over the past six months. Overnight and seven-day variable rates averaged 3.58%, while one-year note yields, which started the period at 3.57%, traded as high as 3.68% and ended February at 3.65%. This development has not been lost on municipal money market investors who have pushed total industry assets to record levels.
The seeming disconnect between the one-year municipal rate and the one-year Libor rate (and indeed the rest of the municipal bond curve) is more the result of technical forces at work in the municipal money market than of a different outlook for rates. As mentioned in previous reports, continuing growth of the tender option bond market is generating large amounts of new, cheaply priced variable rate securities. This supply dynamic is pushing yields in the front end of the curve higher, while at the same time reducing demand for longer-dated maturities—especially the 6- to 12-month portion of our curve. Municipal money market rates are exhibiting less volatility, which is a plus for municipal money fund investors. In this environment, we believed the best course was to maintain a defensive weighted average portfolio maturity, which remained relatively unchanged during the period and stood at 32 days at the end of February.
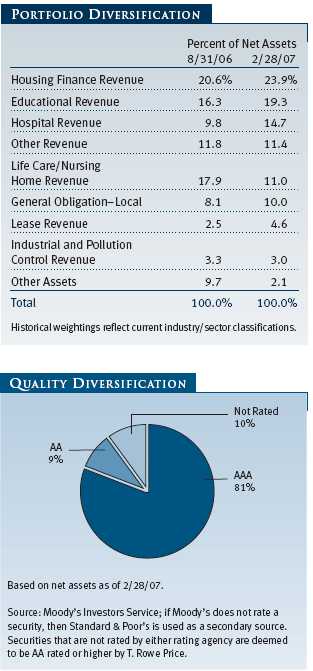
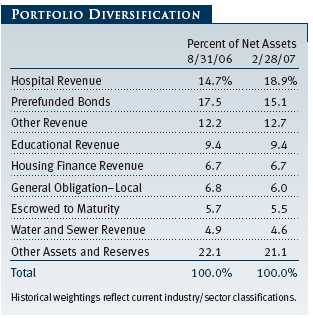
As shown in the portfolio diversification table, we made several significant shifts to the portfolio’s sector diversification over the past six months. The largest move was a reduction in life care/nursing home revenue holdings to 11.0% from 17.9% six months ago. Concurrently, we made strategic purchases in housing finance revenue, which remains our largest sector allocation, as well as in hospital revenue and educational revenue securities. These shifts reflect our ongoing effort to maintain broad diversification across our variable rate holdings, which represented almost two-thirds of the fund at the end of the reporting period. Because variable rate securities continue to grow as a percentage of the fund and we almost exclusively buy issues from the highest-quality tier, our allocation decisions are increasingly driven by our search for the highest yields rather than by our outlook for a particular sector.
Our strategy has remained generally defensive throughout the period, and, as always, the portfolio is invested entirely in high-quality (AAA and AA rated) securities. We think the Fed will remain on hold in the near term, in recognition of persistent labor force strength and given that inflation rates are somewhat above the Fed’s target level. This view, along with a flat municipal yield curve, has led us to keep our maturities relatively short and invest in the higher yields available in the front end of our curve. We intend to heavily weight our variable rate positions but expect some opportunities to develop in longer-term issues in mid-March to mid-May, when income tax-related sales typically impact our market.Maryland Short-Term Tax-Free Bond Fund
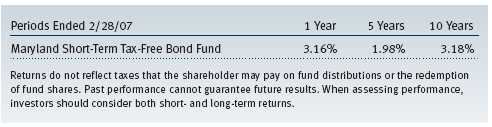
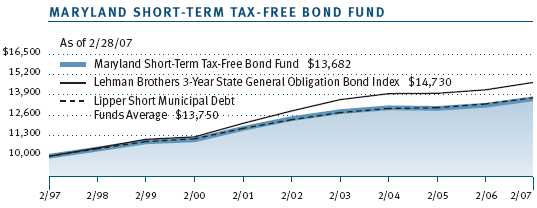
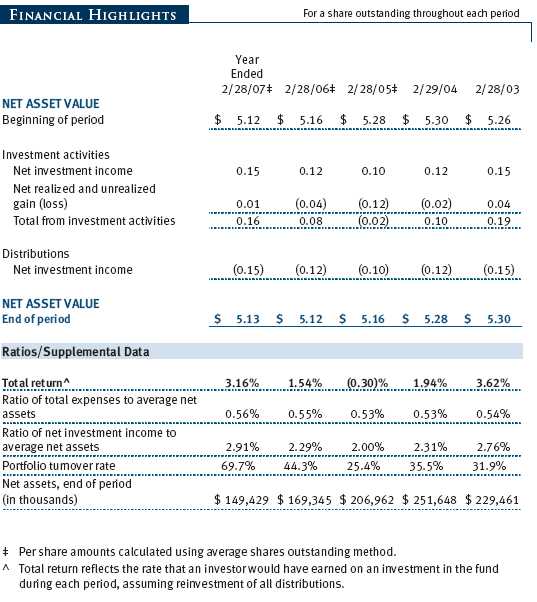
The Maryland Short-Term Tax-Free Bond Fund returned 1.54% and 3.16% for the 6- and 12-month periods ended February 28, 2007, respectively. Our results matched the return for the Lipper Short Municipal Debt Funds Average over the past six months and outperformed the benchmark for the 12-month period. We extended the duration of the portfolio in mid-2006, after the Fed put its tightening policy on hold, and we have maintained a longer duration than the Lipper benchmark ever since. (Duration is a measure of a fund’s sensitivity to changes in interest rates; please see the Glossary for a more detailed explanation.)
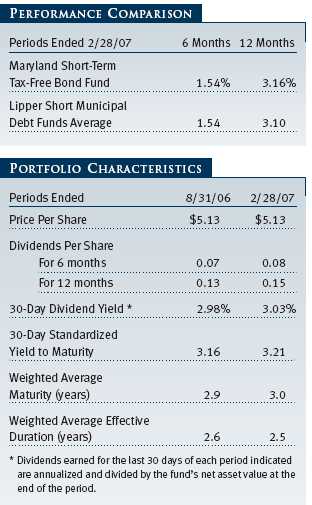
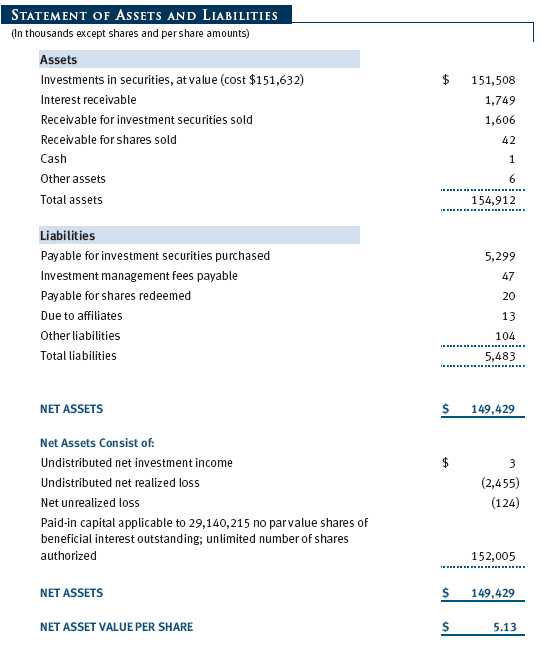
Over the past six months, the fund’s 30-day dividend yield and the 30-day standardized yield to maturity rose marginally to 3.03% and 3.21%, respectively. The rise reflects the portfolio’s slightly higher dividend payout, eight cents per share in the past six months compared with seven cents in the first half of our fiscal year, and no change in the fund’s share price, which stood at $5.13 at the end of August and February.
Over the past six months, shorter-term Treasury securities have traded in a range between 4.50% and 4.95%, and their yields have remained well below the 5.25% fed funds rate. At the extremes, these yields reflect the market’s belief that the Federal Open Market Committee (FOMC) will either leave the federal funds rate unchanged or cut it by 50 basis points over the next year (100 basis points equal one percentage point, or 1.00%). Our view has been that after raising the funds rate by 4.25% over a two-year period the FOMC was unlikely to raise it again. Indeed, if they successfully slowed the rate of growth, and subsequently inflation, the next move could well be an ease. With that backdrop, we have maintained a relatively long duration and used periods when yields were high to further extend the portfolio’s duration. Overall, we extended the fund’s weighted average maturity modestly to 3.0 years from 2.9 six months ago.
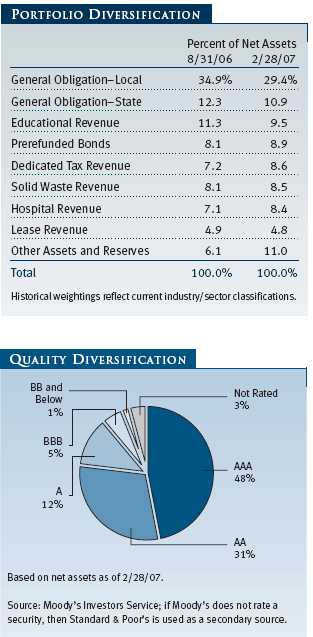
As mentioned in the Market Environment section, credit spreads remain tight, and it is difficult to significantly increase yield through sector allocations, especially in a high-credit-quality state such as Maryland. That said, we made some new investments in hospital, housing, and industrial development revenue bonds while reducing exposure to state and local general obligation bonds.
Given the narrow parameters of this portfolio—short-term Maryland tax-exempt bonds—we must position the portfolio for what we believe is most likely to happen over the next six to 12 months. While perceptions about the Fed reflected in the market may change considerably, we believe the most likely action by the FOMC is either no action or an ease; consequently, our strategy is to maintain a longer maturity position relative to our benchmark.
Maryland Tax-Free Bond Fund
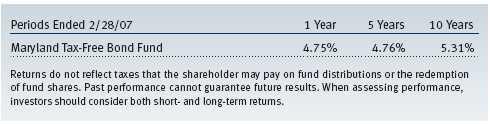
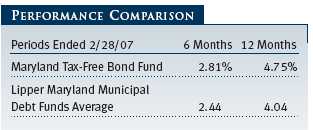
The Maryland Tax-Free Bond Fund returned 2.81% and 4.75% for the 6- and 12-month periods ended February 28, 2007, respectively, outperforming its Lipper peer group in both periods. In the last six months, returns were composed of dividends totaling $0.24 per share and $0.05 of share price appreciation. Our success versus our Lipper peer group was due to the fund’s investments in lower-quality bonds, sector allocation decisions, curve positioning, and our below-average fee structure.
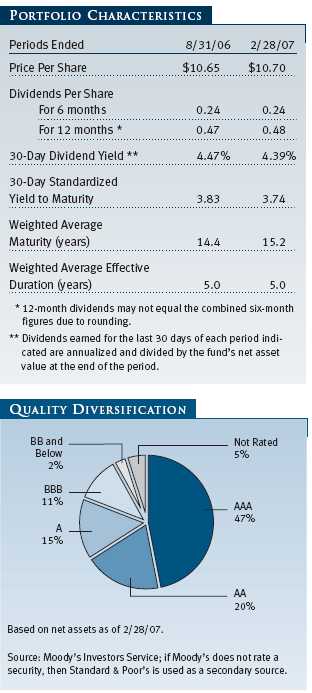
Our income payout has remained relatively constant in each of the past three six-month periods. However, because of the higher share price, the portfolio’s 30-day dividend yield dipped modestly to 3.74% at the end of the reporting period from 3.83% six months ago. Over the past six months, we extended the fund’s weighted average maturity to 15.2 years from 14.4 years but maintained duration at 5.0 years. (Duration is a measure of interest rate sensitivity; please see the Glossary for a more detailed explanation.) With yields still comparatively low from a historical perspective, low expenses are an important and sustainable advantage for the fund as they allow us to pass through more income to shareholders.
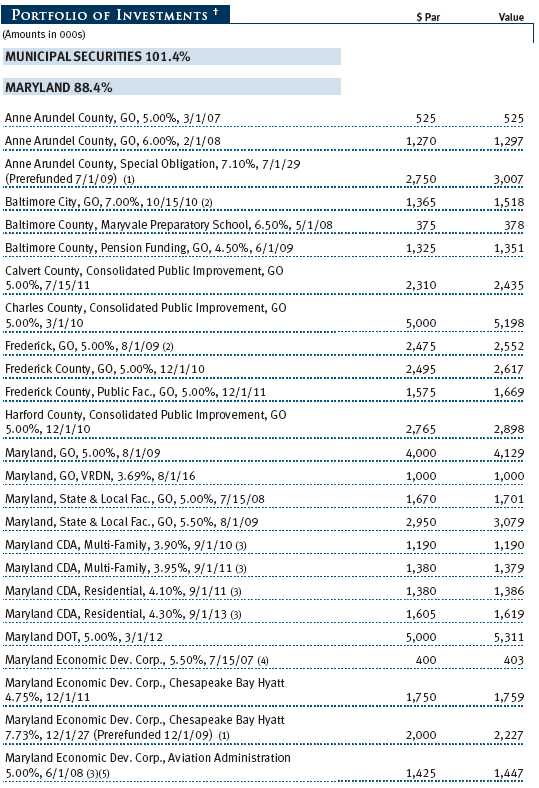
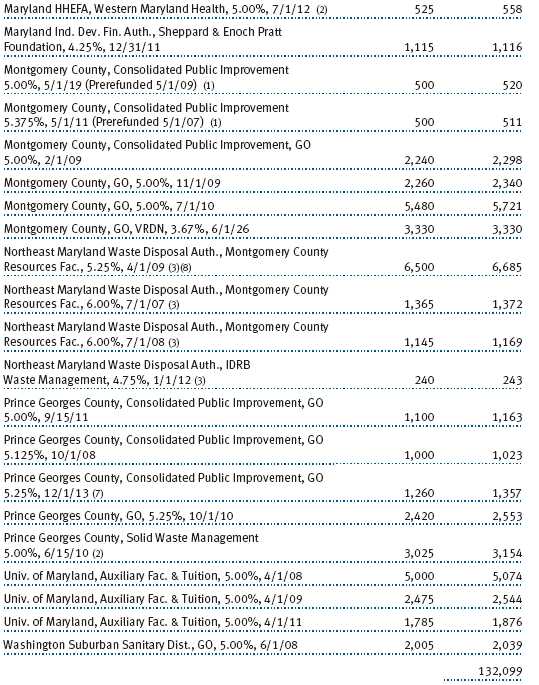
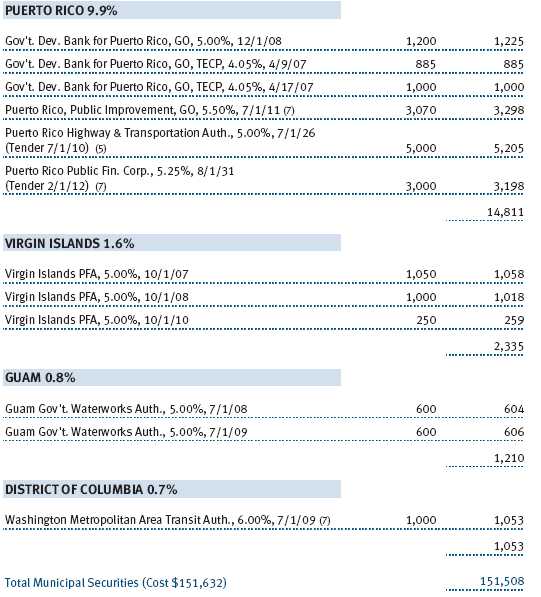
The improving economy and investors’ continuing quest for higher-yielding Maryland securities boosted returns for a number of portfolio holdings. For example, our investment in the Chesapeake Bay Hyatt in Cambridge (issued by the Maryland Economic Development Corporation) provided strong returns—we participated in their September offering. The Hyatt’s improving financial performance allowed them to refund their outstanding debt (including our holdings) and lower their interest costs at the facility. Additionally, bonds sold to fund student housing at Morgan State University also generated good performance. Overall, our positions in the lower-rated sectors of the market performed well relative to higher-quality issues. (Please see the portfolio of investments for a complete listing of holdings and the amount each represents in the portfolio.)
As has been the trend for the past year, the long end of the curve produced excellent relative returns. In particular, some education sector holdings, including Maryland Institute of Art and Loyola College were among the fund’s best contributors for the period. Most are longer-maturity holdings that provided higher tax-free income because they are not AAA rated. Nevertheless, the portfolio’s overall credit quality remained very high, and 82% of the portfolio is invested in credits rated A or higher.
Our investments in hospitals generally provide a bit of extra yield, and we continued to add to core portfolio holdings in strong local hospitals. Among others, we added to our positions in Carroll County General Hospital, University of Maryland Medical System, and Doctor’s Hospital over the last six months. These holdings contributed positively to relative returns for the period.
As the yield advantage in low-quality bonds compressed, we shifted the emphasis in our search for yield to issues rated A and higher. In general, it has become more difficult to find good value in low-quality issues in this market, and we have become particularly selective in the high-yield sector. Although many of our shorter-maturity holdings provided lower returns compared with the longer end for the period, we expect this portion of the portfolio to provide consistent returns over the long run. Additionally, these bonds help balance out the higher interest rate risk of our longer holdings.
OUTLOOK
The economy appears to be in the middle of a “soft landing”—a period of below-average growth during an economic expansion that reduces inflation pressures but does not result in a recession. Some recent economic data have been weaker than expected, and the cooling of the housing market, despite some tentative signs of stabilizing, as well as concerns about subprime mortgage lending may continue to ripple through the economy and the bond market.
At present, we anticipate renewed economic vigor will emerge by the end of 2007, little or no Fed easing this year, and bond market interest rates remaining in a fairly limited range. Although the Fed could raise rates again if cost and price pressures continue to mount, central bank officials currently believe that the 5.25% fed funds rate will allow core inflation to ease gradually while encouraging a sustainable rate of economic growth. In fact, the central bank may soon adopt the view that the risks of inflation and the risks of economic weakness are balanced.
One factor that should remain supportive of municipal bonds at current levels is the municipal yield curve’s positive slope (that is, the longest maturities still have higher yields than shorter maturities). Another factor is that demand for municipals is likely to remain steady, even though issuance in 2007 could be robust as municipalities continue to tap the credit markets to meet ongoing capital needs, including potential funding for post-employment benefits. While we are increasingly favoring high-quality securities over high-yield issues because of current valuations and the potential for increased risk aversion, we continue to identify some tactical opportunities in lower-quality credits where valuations justify the additional credit risk. As always, we will continue to rely upon our proprietary research to uncover the best credit opportunities and will selectively invest in attractive income-producing investments.
Municipal bonds have outperformed their taxable counterparts on an absolute basis over the past several years, reaching valuations one might consider rich. However, we still believe that municipal bonds may be on a long-term trend of improving valuations, which, in a broader, historical context, may still appear attractive. Thus, municipals may continue to be an appealing alternative for investors in higher tax brackets, as their after-tax yields are likely to be higher than those of comparable Treasuries or other taxable securities.
Respectfully submitted,
Joseph K. Lynagh
Chairman of the Investment Advisory Committee
Maryland Tax-Free Money Fund

Charles B. Hill
Chairman of the Investment Advisory Committee
Maryland Short-Term Tax-Free Bond Fund

Hugh D. McGuirk
Chairman of the Investment Advisory Committee
Maryland Tax-Free Bond Fund
March 23, 2007
Each committee chairman has day-to-day responsibility for managing the portfolio and works with committee members in developing and executing each fund’s investment programs.
RISKS OF FIXED-INCOME INVESTINGBonds are subject to interest rate risk (the decline in bond prices that usually accompanies a rise in interest rates) and credit risk (the chance that any fund holding could have its credit rating downgraded, or that a bond issuer will default by failing to make timely payments of interest or principal), potentially reducing the fund’s income level and share price. The Maryland Tax-Free Funds are less diversified than those investing nationally. Some income may be subject to state and local taxes and the federal alternative minimum tax.
The money fund seeks to maintain a stable net asset value and provide an appropriate place for money between investments or during uncertain market conditions. An investment in the fund is not insured or guaranteed by the FDIC or any other government agency. Although the fund seeks to preserve the value of your investment at $1.00 per share, it is possible to lose money by investing in the fund.
GLOSSARY
Appropriation-backed bonds: Long-term obligations sold under a variety of financial arrangements—primarily lease/purchase and contractual service agreements used to finance capital projects. Debt service on such obligations is appropriated by the state legislature annually, but the legislature has no legal obligation to continue to make such appropriations.
Average maturity: The weighted average of the stated maturity dates of the portfolio’s securities. In general, the longer the average maturity, the greater the fund’s sensitivity to interest rate changes. A shorter average maturity usually means less interest rate sensitivity and therefore a less volatile portfolio.
Basis point: One one-hundredth of one percentage point, or 0.01% .
Duration: A measure of a bond fund’s sensitivity to changes in interest rates, For example, a fund with a duration of five years would fall about 5% in price in response to a one-percentage-point rise in interest rates, and vice versa.
Federal funds rate: The interest rate charged on overnight loans of reserves by one financial institution to another in the United States. The Federal Reserve sets a target federal funds rate to affect the direction of interest rates.
General obligation debt: A government’s strongest pledge that obligates its full faith and credit, including, if necessary, its ability to raise taxes.
Investment grade: High-quality bonds as measured by one of the major credit rating agencies. For example, Standard & Poor’s designates the bonds in its top four categories (AAA to BBB) as investment grade.
Lehman Brothers 3-Year General Obligation Bond Index: A broadly diversified index of state-issued general obligation tax-exempt bonds with maturities between two and four years.Lehman Brothers Municipal Bond Index: A broadly diversified index of tax-exempt bonds.
Lehman Brothers U.S. Aggregate Index: A broadly diversified index of investment-grade corporate, government, and mortgage securities.
Lipper averages: The averages of available mutual fund performance returns for specified time periods in defined categories by Lipper.
Prerefunded bond: A bond that originally may have been issued as a general obligation or revenue bond but that is now secured by an escrow fund consisting entirely of direct U.S. government obligations that are sufficient for paying the bondholders.
Tender option bonds: Obligations that grant the bondholder the right to require the issuer or a specified third party acting as agent for the issuer to purchase the bonds, usually at par, at a specified time or times prior to maturity or upon the occurrence of certain events or conditions.
Yield curve: A graph depicting the relationship between yields and maturity dates for a set of similar securities. These curves are in constant flux. One of the key activities in managing any fixed-income portfolio is to study the trends reflected by yield curves.
This chart shows the value of a hypothetical $10,000 investment in the fund over the past 10 fiscal year periods or since inception (for funds lacking 10-year records). The result is compared with benchmarks, which may include a broad-based market index and a peer group average or index. Market indexes do not include expenses, which are deducted from fund returns as well as mutual fund averages and indexes.
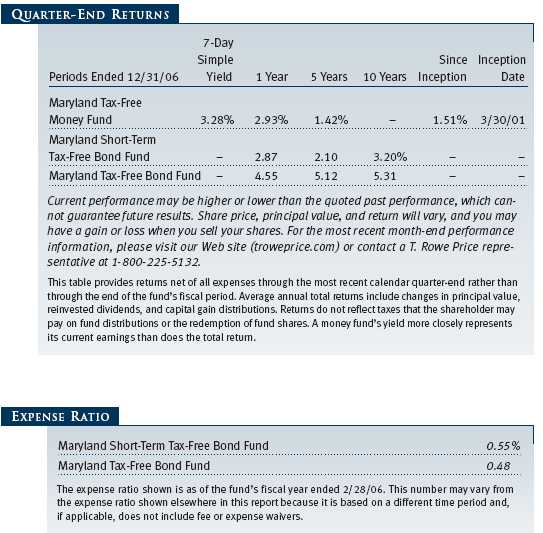
| AVERAGE ANNUAL COMPOUND TOTAL RETURN |
This table shows how the fund would have performed each year if its actual (or cumulative) returns for the periods shown had been earned at a constant rate.
This chart shows the value of a hypothetical $10,000 investment in the fund over the past 10 fiscal year periods or since inception (for funds lacking 10-year records). The result is compared with benchmarks, which may include a broad-based market index and a peer group average or index. Market indexes do not include expenses, which are deducted from fund returns as well as mutual fund averages and indexes.

| AVERAGE ANNUAL COMPOUND TOTAL RETURN |
This table shows how the fund would have performed each year if its actual (or cumulative) returns for the periods shown had been earned at a constant rate.
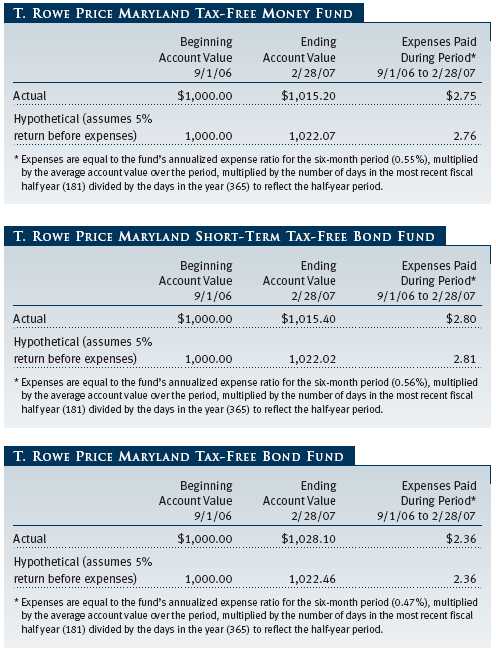
As a mutual fund shareholder, you may incur two types of costs: (1) transaction costs, such as redemption fees or sales loads, and (2) ongoing costs, including management fees, distribution and service (12b-1) fees, and other fund expenses. The following example is intended to help you understand your ongoing costs (in dollars) of investing in the fund and to compare these costs with the ongoing costs of investing in other mutual funds. The example is based on an investment of $1,000 invested at the beginning of the most recent six-month period and held for the entire period.
Actual Expenses
The first line of the following table (“Actual”) provides information about actual account values and expenses based on the fund’s actual returns. You may use the information in this line, together with your account balance, to estimate the expenses that you paid over the period. Simply divide your account value by $1,000 (for example, an $8,600 account value divided by $1,000 = 8.6), then multiply the result by the number in the first line under the heading “Expenses Paid During Period” to estimate the expenses you paid on your account during this period.
Hypothetical Example for Comparison Purposes
The information on the second line of the table (“Hypothetical”) is based on hypothetical account values and expenses derived from the fund’s actual expense ratio and an assumed 5% per year rate of return before expenses (not the fund’s actual return). You may compare the ongoing costs of investing in the fund with other funds by contrasting this 5% hypothetical example and the 5% hypothetical examples that appear in the shareholder reports of the other funds. The hypothetical account values and expenses may not be used to estimate the actual ending account balance or expenses you paid for the period.
Note: T. Rowe Price charges an annual small-account maintenance fee of $10, generally for accounts with less than $2,000 ($500 for UGMA/UTMA). The fee is waived for any investor whose T. Rowe Price mutual fund accounts total $25,000 or more, accounts employing automatic investing, and IRAs and other retirement plan accounts that utilize a prototype plan sponsored by T. Rowe Price (although a separate custodial or administrative fee may apply to such accounts). This fee is not included in the accompanying table. If you are subject to the fee, keep it in mind when you are estimating the ongoing expenses of investing in the fund and when comparing the expenses of this fund with other funds.
You should also be aware that the expenses shown in the table highlight only your ongoing costs and do not reflect any transaction costs, such as redemption fees or sales loads. Therefore, the second line of the table is useful in comparing ongoing costs only and will not help you determine the relative total costs of owning different funds. To the extent a fund charges transaction costs, however, the total cost of owning that fund is higher.
The accompanying notes are an integral part of these financial statements.

The accompanying notes are an integral part of these financial statements.
The accompanying notes are an integral part of these financial statements.

The accompanying notes are an integral part of these financial statements.
The accompanying notes are an integral part of these financial statements.
| NOTES TO FINANCIAL STATEMENTS |
NOTE 1 - SIGNIFICANT ACCOUNTING POLICIES
T. Rowe Price State Tax-Free Income Trust (the trust), is registered under the Investment Company Act of 1940 (the 1940 Act). The Maryland Short-Term Tax-Free Bond Fund (the fund), a nondiversified, open-end management investment company, is one portfolio established by the trust. The fund commenced operations on January 29, 1993. The fund seeks to provide the highest level of income exempt from federal and Maryland state and local income taxes consistent with modest fluctuation in principal value.
The accompanying financial statements were prepared in accordance with accounting principles generally accepted in the United States of America, which require the use of estimates made by fund management. Fund management believes that estimates and security valuations are appropriate; however, actual results may differ from those estimates, and the security valuations reflected in the financial statements may differ from the value the fund ultimately realizes upon sale of the securities.
Valuation The fund values its investments and computes its net asset value per share at the close of the New York Stock Exchange (NYSE), normally 4 p.m. ET, each day that the NYSE is open for business. Debt securities are generally traded in the over-the-counter market. Securities with original maturities of one year or more are valued at prices furnished by dealers who make markets in such securities or by an independent pricing service, which considers yield or price of bonds of comparable quality, coupon, maturity, and type, as well as prices quoted by dealers who make markets in such securities. Securities with original maturities of less than one year are valued at amortized cost in local currency, which approximates fair value when combined with accrued interest.
Other investments, including restricted securities, and those for which the above valuation procedures are inappropriate or are deemed not to reflect fair value are stated at fair value as determined in good faith by the T. Rowe Price Valuation Committee, established by the fund’s Board of Trustees.
Credits The fund earns credits on temporarily uninvested cash balances at the custodian that reduce the fund’s custody charges. Custody expense in the accompanying financial statements is presented before reduction for credits, which are reflected as expenses paid indirectly.
Investment Transactions, Investment Income, and Distributions Income and expenses are recorded on the accrual basis. Premiums and discounts on debt securities are amortized for financial reporting purposes. Investment transactions are accounted for on the trade date. Realized gains and losses are reported on the identified cost basis. Distributions to shareholders are recorded on the ex-dividend date. Income distributions are declared on a daily basis and paid monthly. Capital gain distributions, if any, are declared and paid by the fund, typically on an annual basis.
New Accounting Pronouncements In June 2006, the Financial Accounting Standards Board (“FASB”) issued FASB Interpretation No. 48 (“FIN 48”), Accounting for Uncertainty in Income Taxes, a clarification of FASB Statement No. 109, Accounting for Income Taxes. FIN 48 establishes financial reporting rules regarding recognition and measurement of tax positions taken or expected to be taken on a tax return. Management is evaluating the anticipated impact, if any, that FIN 48 will have on the fund upon adoption, which, pursuant to a delay granted by the U.S. Securities and Exchange Commission, is expected to be on the last business day of the fund’s semi-annual period, August 31, 2007.
In September 2006, the FASB released the Statement of Financial Accounting Standard No. 157 (“FAS 157”), Fair Value Measurements. FAS 157 clarifies the definition of fair value and establishes the framework for measuring fair value, as well as proper disclosure of this methodology in the financial statements. It will be effective for the fund’s fiscal year beginning March 1, 2008. Management is evaluating the effects of FAS 157; however, it is not expected to have a material impact on the fund’s net assets or results of operations.
NOTE 2 - INVESTMENT TRANSACTIONS
Purchases and sales of portfolio securities, other than short-term securities, aggregated $102,210,000 and $103,571,000, respectively, for the year ended February 28, 2007.
NOTE 3 - FEDERAL INCOME TAXES
No provision for federal income taxes is required since the fund intends to continue to qualify as a regulated investment company under Subchapter M of the Internal Revenue Code and distribute to shareholders all of its income and gains. Federal income tax regulations differ from generally accepted accounting principles; therefore, distributions determined in accordance with tax regulations may differ significantly in amount or character from net investment income and realized gains for financial reporting purposes. Financial reporting records are adjusted for permanent book/tax differences to reflect tax character. Financial records are not adjusted for temporary differences.
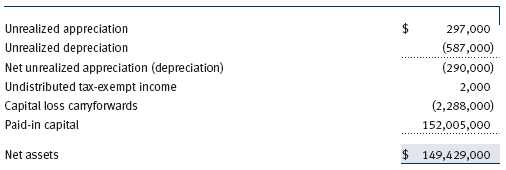
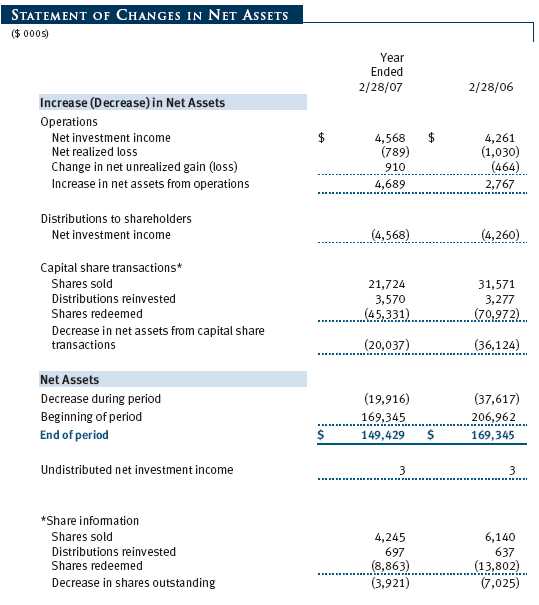
Distributions during the year ended February 28, 2007, totaled $4,568,000 and were characterized as tax-exempt income for tax purposes. At February 28, 2007, the tax-basis components of net assets were as follows:
The fund intends to retain realized gains to the extent of available capital loss carryforwards. As of February 28, 2007, the fund had $2,288,000 of capital loss carryforwards, of which $537,000 expire in fiscal 2013, $830,000 expire in fiscal 2014, and $921,000 expire in fiscal 2015.
At February 28, 2007, the cost of investments for federal income tax purposes was $151,798,000.
NOTE 4 - RELATED PARTY TRANSACTIONS
The fund is managed by T. Rowe Price Associates, Inc. (the manager or Price Associates), a wholly owned subsidiary of T. Rowe Price Group, Inc. The investment management agreement between the fund and the manager provides for an annual investment management fee, which is computed daily and paid monthly. The fee consists of an individual fund fee, equal to 0.10% of the fund’s average daily net assets, and a group fee. The group fee rate is calculated based on the combined net assets of certain mutual funds sponsored by Price Associates (the group) applied to a graduated fee schedule, with rates ranging from 0.48% for the first $1 billion of assets to 0.29% for assets in excess of $160 billion. The fund’s group fee is determined by applying the group fee rate to the fund’s average daily net assets. At February 28, 2007, the effective annual group fee rate was 0.31%.
In addition, the fund has entered into service agreements with Price Associates and a wholly owned subsidiary of Price Associates (collectively, Price). Price Associates computes the daily share price and provides certain other administrative services to the fund. T. Rowe Price Services, Inc., provides shareholder and administrative services in its capacity as the fund’s transfer and dividend disbursing agent. For the year ended February 28, 2007, expenses incurred pursuant to these service agreements were $71,000 for Price Associates and $58,000 for T. Rowe Price Services. The total amount payable at period-end pursuant to these service agreements is reflected as Due to Affiliates in the accompanying financial statements.
| REPORT OF INDEPENDENT REGISTERED PUBLIC ACCOUNTING FIRM |
To the Board of Trustees of T. Rowe Price State Tax-Free Income Trust and Shareholders of T. Rowe Price Maryland Short-Term Tax-Free Bond Fund
In our opinion, the accompanying statement of assets and liabilities, including the portfolio of investments, and the related statements of operations and of changes in net assets and the financial highlights present fairly, in all material respects, the financial position of T. Rowe Price Maryland Short-Term Tax-Free Bond Fund (one of the portfolios comprising T. Rowe Price State Tax-Free Income Trust, hereafter referred to as the “Fund”) at February 28, 2007, the results of its operations for the year then ended, the changes in its net assets for each of the two years in the period then ended and the financial highlights for each of the five years in the period then ended, in conformity with accounting principles generally accepted in the United States of America. These financial statements and financial highlights (hereafter referred to as “financial statements”) are the responsibility of the Fund’s management; our responsibility is to express an opinion on these financial statements based on our audits. We conducted our audits of these financial statements in accordance with the standards of the Public Company Accounting Oversight Board (United States). Those standards require that we plan and perform the audit to obtain reasonable assurance about whether the financial statements are free of material misstatement. An audit includes examining, on a test basis, evidence supporting the amounts and disclosures in the financial statements, assessing the accounting principles used and significant estimates made by management, and evaluating the overall financial statement presentation. We believe that our audits, which included confirmation of securities at February 28, 2007 by correspondence with the custodian, provide a reasonable basis for our opinion.
PricewaterhouseCoopers LLP
Baltimore, Maryland
April 11, 2007
| TAX INFORMATION (UNAUDITED) FOR THE TAX YEAR ENDED 2/28/07 |
We are providing this information as required by the Internal Revenue Code. The amounts shown may differ from those elsewhere in this report because of differences between tax and financial reporting requirements.
The fund’s distributions to shareholders included $4,552,000 which qualified as exempt-interest dividends.
| INFORMATION ON PROXY VOTING POLICIES, PROCEDURES, AND RECORDS |
A description of the policies and procedures used by T. Rowe Price funds and portfolios to determine how to vote proxies relating to portfolio securities is available in each fund’s Statement of Additional Information, which you may request by calling 1-800-225-5132 or by accessing the SEC’s Web site, www.sec.gov. The description of our proxy voting policies and procedures is also available on our Web site, www.troweprice.com. To access it, click on the words “Company Info” at the top of our homepage for individual investors. Then, in the window that appears, click on the “Proxy Voting Policy” navigation button in the top left corner.
Each fund’s most recent annual proxy voting record is available on our Web site and through the SEC’s Web site. To access it through our Web site, follow the directions above, then click on the words “Proxy Voting Record” at the bottom of the Proxy Voting Policy page.
| HOW TO OBTAIN QUARTERLY PORTFOLIO HOLDINGS |
The fund files a complete schedule of portfolio holdings with the Securities and Exchange Commission for the first and third quarters of each fiscal year on Form N-Q. The fund’s Form N-Q is available electronically on the SEC’s Web site (www.sec.gov); hard copies may be reviewed and copied at the SEC’s Public Reference Room, 450 Fifth St. N.W., Washington, DC 20549. For more information on the Public Reference Room, call 1-800-SEC-0330.
| ABOUT THE FUND’S TRUSTEES AND OFFICERS |
Your fund is governed by a Board of Trustees that meets regularly to review a wide variety of matters affecting the fund, including performance, investment programs, compliance matters, advisory fees and expenses, service providers, and other business affairs. The Board of Trustees elects the fund’s officers, who are listed in the final table. At least 75% of Board members are independent of T. Rowe Price Associates, Inc. (T. Rowe Price), and T. Rowe Price International, Inc. (T. Rowe Price International); “inside” or “interested” trustees are employees or officers of T. Rowe Price. The business address of each trustee and officer is 100 East Pratt Street, Baltimore, Maryland 21202. The Statement of Additional Information includes additional information about the fund trustees and is available without charge by calling a T. Rowe Price representative at 1-800-225-5132.
| Independent Trustees | |
| |
| Name | |
| (Year of Birth) | Principal Occupation(s) During Past 5 Years and Directorships of |
| Year Elected * | Other Public Companies |
| |
| Jeremiah E. Casey | Director, Allfirst Financial Inc. (previously First Maryland Bankcorp) |
| (1940) | (1983 to 2002); Director, National Life Insurance (2001 to 2005); |
| 2006 | Director, The Rouse Company, real estate developers (1990 to 2004) |
| |
| Anthony W. Deering | Chairman, Exeter Capital, LLC, a private investment firm (2004 to |
| (1945) | present); Director, Vornado Real Estate Investment Trust (3/04 to |
| 1986 | present); Director, Mercantile Bankshares (4/03 to present); Member, |
| | Advisory Board, Deutsche Bank North America (2004 to present); |
| | Director, Chairman of the Board, and Chief Executive Officer, The |
| | Rouse Company, real estate developers (1997 to 2004) |
| |
| Donald W. Dick, Jr. | Principal, EuroCapital Advisors, LLC, an acquisition and management |
| (1943) | advisory firm; Chairman, The Haven Group, a custom manufacturer of |
| 2001 | modular homes (1/04 to present) |
| |
| David K. Fagin | Chairman and President, Nye Corporation (6/88 to present); Director, |
| (1938) | Canyon Resources Corp. (5/00 to present); Director, Golden Star |
| 2001 | Resources Ltd. (5/92 to present); Director, Pacific Rim Mining |
| | Corp. (2/02 to present) |
| |
| Karen N. Horn | Director, Federal National Mortgage Association (9/06 to present); |
| (1943) | Managing Director and President, Global Private Client Services, Marsh |
| 2003 | Inc. (1999 to 2003); Managing Director and Head of International |
| | Private Banking, Bankers Trust (1996 to 1999); Director, Georgia Pacific |
| | (5/04 to 12/05), Eli Lilly and Company, and Simon Property Group |
| |
| Theo C. Rodgers | President, A&R Development Corporation (1977 to present) |
| (1941) | |
| 2005 | |
| John G. Schreiber | Owner/President, Centaur Capital Partners, Inc., a real estate invest- |
| (1946) | ment company; Partner, Blackstone Real Estate Advisors, L.P. |
| 1992 | |
| |
| * Each independent trustee oversees 118 T. Rowe Price portfolios and serves until retirement, |
| resignation, or election of a successor. |
| Inside Trustees | |
| |
| Name | |
| (Year of Birth) | |
| Year Elected * | |
| [Number of T. Rowe Price | Principal Occupation(s) During Past 5 Years and |
| Portfolios Overseen] | Directorships of Other Public Companies |
| |
| Edward C. Bernard | Director and Vice President, T. Rowe Price and T. Rowe Price Group, |
| (1956) | Inc.; Chairman of the Board, Director, and President, T. Rowe Price |
| 2006 | Investment Services, Inc.; Chairman of the Board and Director, |
| [118] | T. Rowe Price Retirement Plan Services, Inc., T. Rowe Price Services, |
| | Inc., and T. Rowe Price Savings Bank; Director, T. Rowe Price Global |
| | Asset Management Limited, T. Rowe Price Global Investment Services |
| | Limited, and T. Rowe Price International, Inc.; Chief Executive Officer, |
| | Chairman of the Board, Director, and President, T. Rowe Price Trust |
| | Company; Chairman of the Board, all funds |
| |
| Mary J. Miller, CFA | Director, T. Rowe Price Trust Company; Director and Vice President, |
| (1955) | T. Rowe Price; Vice President, T. Rowe Price Group, Inc.; President, |
| 2004 | State Tax-Free Income Trust |
| [37] | |
| |
| * Each inside trustee serves until retirement, resignation, or election of a successor. |
| Officers | |
| |
| Name (Year of Birth) | |
| Title and Fund(s) Served | Principal Occupation(s) |
| |
| Steven G. Brooks, CFA (1954) | Vice President, T. Rowe Price and T. Rowe Price |
| Vice President, State Tax-Free Income Trust | Group, Inc. |
| |
| Joseph A. Carrier, CPA (1960) | Vice President, T. Rowe Price, T. Rowe Price |
| Treasurer, State Tax-Free Income Trust | Group, Inc., T. Rowe Price Investment Services, |
| | Inc., and T. Rowe Price Trust Company |
| |
| Jonathan M. Chirunga (1966) | Vice President, T. Rowe Price |
| Vice President, State Tax-Free Income Trust | |
| |
| M. Helena Condez (1962) | Assistant Vice President, T. Rowe Price |
| Assistant Vice President, State Tax-Free | |
| Income Trust | |
| |
| G. Richard Dent (1960) | Vice President, T. Rowe Price and T. Rowe Price |
| Vice President, State Tax-Free Income Trust | Group, Inc. |
| |
| Roger L. Fiery III, CPA (1959) | Vice President, T. Rowe Price, T. Rowe Price |
| Vice President, State Tax-Free Income Trust | Group, Inc., T. Rowe Price International, Inc., |
| | and T. Rowe Price Trust Company |
| |
| John R. Gilner (1961) | Chief Compliance Officer and Vice President, |
| Chief Compliance Officer, State Tax-Free | T. Rowe Price; Vice President, T. Rowe Price |
| Income Trust | Group, Inc., and T. Rowe Price Investment |
| | Services, Inc. |
| |
| Gregory S. Golczewski (1966) | Vice President, T. Rowe Price and T. Rowe Price |
| Vice President, State Tax-Free Income Trust | Trust Company |
| |
| Charles B. Hill, CFA (1961) | Vice President, T. Rowe Price and T. Rowe Price |
| Executive Vice President, State Tax-Free | Group, Inc. |
| Income Trust | |
| |
| Henry H. Hopkins (1942) | Director and Vice President, T. Rowe Price |
| Vice President, State Tax-Free Income Trust | Investment Services, Inc., T. Rowe Price |
| | Services, Inc., and T. Rowe Price Trust |
| | Company; Vice President, T. Rowe Price, |
| | T. Rowe Price Group, Inc., T. Rowe Price |
| | International, Inc., and T. Rowe Price |
| | Retirement Plan Services, Inc. |
| |
| T. Dylan Jones (1971) | Assistant Vice President, T. Rowe Price |
| Assistant Vice President, State Tax-Free | |
| Income Trust | |
| Philip J. Kligman, CFA (1974) | Assistant Vice President, T. Rowe Price |
| Assistant Vice President, State Tax-Free | |
| Income Trust | |
| |
| Marcy M. Lash (1963) | Vice President, T. Rowe Price and T. Rowe Price |
| Vice President, State Tax-Free Income Trust | Group, Inc. |
| |
| Alan D. Levenson, Ph.D. (1958) | Vice President, T. Rowe Price and T. Rowe Price |
| Vice President, State Tax-Free Income Trust | Group, Inc. |
| |
| Patricia B. Lippert (1953) | Assistant Vice President, T. Rowe Price and |
| Secretary, State Tax-Free Income Trust | T. Rowe Price Investment Services, Inc. |
| |
| Joseph K. Lynagh, CFA (1958) | Vice President, T. Rowe Price and T. Rowe Price |
| Executive Vice President, State Tax-Free | Group, Inc. |
| Income Trust | |
| |
| Konstantine B. Mallas (1963) | Vice President, T. Rowe Price and T. Rowe Price |
| Executive Vice President, State Tax-Free | Group, Inc. |
| Income Trust | |
| |
| James M. McDonald (1949) | Vice President, T. Rowe Price, T. Rowe Price |
| Vice President, State Tax-Free Income Trust | Group, Inc., and T. Rowe Price Trust Company |
| |
| Hugh D. McGuirk, CFA (1960) | Vice President, T. Rowe Price and T. Rowe Price |
| Executive Vice President, State Tax-Free | Group, Inc. |
| Income Trust | |
| |
| Linda A. Murphy (1959) | Vice President, T. Rowe Price and T. Rowe Price |
| Vice President, State Tax-Free Income Trust | Group, Inc. |
| |
| Timothy G. Taylor, CFA (1975) | Vice President, T. Rowe Price |
| Assistant Vice President, State Tax-Free | |
| Income Trust | |
| |
| Julie L. Waples (1970) | Vice President, T. Rowe Price |
| Vice President, State Tax-Free Income Trust | |
| |
| Unless otherwise noted, officers have been employees of T. Rowe Price or T. Rowe Price International for at |
| least five years. | |
Item 2. Code of Ethics.
The registrant has adopted a code of ethics, as defined in Item 2 of Form N-CSR, applicable to its principal executive officer, principal financial officer, principal accounting officer or controller, or persons performing similar functions. A copy of this code of ethics is filed as an exhibit to this Form N-CSR. No substantive amendments were approved or waivers were granted to this code of ethics during the period covered by this report.
Item 3. Audit Committee Financial Expert.
The registrant’s Board of Directors/Trustees has determined that Mr. Donald W. Dick Jr. qualifies as an audit committee financial expert, as defined in Item 3 of Form N-CSR. Mr. Dick is considered independent for purposes of Item 3 of Form N-CSR.
Item 4. Principal Accountant Fees and Services.
(a) – (d) Aggregate fees billed to the registrant for the last two fiscal years for professional services rendered by the registrant’s principal accountant were as follows:

Audit fees include amounts related to the audit of the registrant’s annual financial statements and services normally provided by the accountant in connection with statutory and regulatory filings. Audit-related fees include amounts reasonably related to the performance of the audit of the registrant’s financial statements and specifically include the issuance of a report on internal controls and, if applicable, agreed-upon procedures related to fund acquisitions. Tax fees include amounts related to services for tax compliance, tax planning, and tax advice. The nature of these services specifically includes the review of distribution calculations and the preparation of Federal, state, and excise tax returns. Reclassification from tax fees to audit fees of fiscal 2006 amounts related to the auditing of tax disclosures within the registrant’s annual financial statements has been made in order to conform to fiscal 2007 presentation. All other fees include the registrant’s pro-rata share of amounts for agreed-upon procedures in conjunction with service contract approvals by the registrant’s Board of Directors/Trustees.
(e)(1) The registrant’s audit committee has adopted a policy whereby audit and non-audit services performed by the registrant’s principal accountant for the registrant, its investment adviser, and any entity controlling, controlled by, or under common control with the investment adviser that provides ongoing services to the registrant require pre-approval in advance at regularly scheduled audit committee meetings. If such a service is required between regularly scheduled audit committee meetings, pre-approval may be authorized by one audit committee member with ratification at the next scheduled audit committee meeting. Waiver of pre-approval for audit or non-audit services requiring fees of a de minimis amount is not permitted.
(2) No services included in (b) – (d) above were approved pursuant to paragraph (c)(7)(i)(C) of Rule 2-01 of Regulation S-X.
(f) Less than 50 percent of the hours expended on the principal accountant’s engagement to audit the registrant’s financial statements for the most recent fiscal year were attributed to work performed by persons other than the principal accountant’s full-time, permanent employees.
(g) The aggregate fees billed for the most recent fiscal year and the preceding fiscal year by the registrant’s principal accountant for non-audit services rendered to the registrant, its investment adviser, and any entity controlling, controlled by, or under common control with the investment adviser that provides ongoing services to the registrant were $1,263,000 and $883,000, respectively, and were less than the aggregate fees billed for those same periods by the registrant’s principal accountant for audit services rendered to the T. Rowe Price Funds. Preceding fiscal year amount reflects the reclassification of tax fees described in (a) – (d) above.
(h) All non-audit services rendered in (g) above were pre-approved by the registrant’s audit committee. Accordingly, these services were considered by the registrant’s audit committee in maintaining the principal accountant’s independence.
Item 5. Audit Committee of Listed Registrants.
Not applicable.
Item 6. Schedule of Investments.
Not applicable. The complete schedule of investments is included in Item 1 of this Form N-CSR.
Item 7. Disclosure of Proxy Voting Policies and Procedures for Closed-End Management Investment Companies.
Not applicable.
Item 8. Portfolio Managers of Closed-End Management Investment Companies.
Not applicable.
Item 9. Purchases of Equity Securities by Closed-End Management Investment Company and Affiliated Purchasers.
Not applicable.
Item 10. Submission of Matters to a Vote of Security Holders.
Not applicable.
Item 11. Controls and Procedures.
(a) The registrant’s principal executive officer and principal financial officer have evaluated the registrant’s disclosure controls and procedures within 90 days of this filing and have concluded that the registrant’s disclosure controls and procedures were effective, as of that date, in ensuring that information required to be disclosed by the registrant in this Form N-CSR was recorded, processed, summarized, and reported timely.
(b) The registrant’s principal executive officer and principal financial officer are aware of no change in the registrant’s internal control over financial reporting that occurred during the registrant’s second fiscal quarter covered by this report that has materially affected, or is reasonably likely to materially affect, the registrant’s internal control over financial reporting.
Item 12. Exhibits.
(a)(1) The registrant’s code of ethics pursuant to Item 2 of Form N-CSR is attached.
(2) Separate certifications by the registrant's principal executive officer and principal financial officer, pursuant to Section 302 of the Sarbanes-Oxley Act of 2002 and required by Rule 30a-2(a) under the Investment Company Act of 1940, are attached.
(3) Written solicitation to repurchase securities issued by closed-end companies: not applicable.
(b) A certification by the registrant's principal executive officer and principal financial officer, pursuant to Section 906 of the Sarbanes-Oxley Act of 2002 and required by Rule 30a-2(b) under the Investment Company Act of 1940, is attached.
| | |
SIGNATURES |
| |
| | Pursuant to the requirements of the Securities Exchange Act of 1934 and the Investment |
| Company Act of 1940, the registrant has duly caused this report to be signed on its behalf by the |
| undersigned, thereunto duly authorized. |
| |
| T. Rowe Price State Tax-Free Income Trust |
| |
| |
| By | /s/ Edward C. Bernard |
| | Edward C. Bernard |
| | Principal Executive Officer |
| |
| Date | April 16, 2007 |
| |
| |
| | Pursuant to the requirements of the Securities Exchange Act of 1934 and the Investment |
| Company Act of 1940, this report has been signed below by the following persons on behalf of |
| the registrant and in the capacities and on the dates indicated. |
| |
| |
| By | /s/ Edward C. Bernard |
| | Edward C. Bernard |
| | Principal Executive Officer |
| |
| Date | April 16, 2007 |
| |
| |
| |
| By | /s/ Joseph A. Carrier |
| | Joseph A. Carrier |
| | Principal Financial Officer |
| |
| Date | April 16, 2007 |