| UNITED STATES |
| SECURITIES AND EXCHANGE COMMISSION |
| Washington, D.C. 20549 |
| |
FORM N-CSR |
| |
CERTIFIED SHAREHOLDER REPORT OF REGISTERED |
MANAGEMENT INVESTMENT COMPANIES |
| |
| |
| |
| Investment Company Act File Number: 811-4521 |
|
| |
| T. Rowe Price State Tax-Free Income Trust |
|
| (Exact name of registrant as specified in charter) |
| |
| 100 East Pratt Street, Baltimore, MD 21202 |
|
| (Address of principal executive offices) |
| |
| David Oestreicher |
| 100 East Pratt Street, Baltimore, MD 21202 |
|
| (Name and address of agent for service) |
| |
| |
| Registrant’s telephone number, including area code: (410) 345-2000 |
| |
| |
| Date of fiscal year end: February 28 |
| |
| |
| Date of reporting period: February 28, 2009 |
Item 1: Report to Shareholders| Maryland Tax-Free Money Fund | February 28, 2009 |
The views and opinions in this report were current as of February 28, 2009. They are not guarantees of performance or investment results and should not be taken as investment advice. Investment decisions reflect a variety of factors, and the managers reserve the right to change their views about individual stocks, sectors, and the markets at any time. As a result, the views expressed should not be relied upon as a forecast of the fund’s future investment intent. The report is certified under the Sarbanes-Oxley Act, which requires mutual funds and other public companies to affirm that, to the best of their knowledge, the information in their financial reports is fairly and accurately stated in all material respects.
REPORTS ON THE WEB
Sign up for our E-mail Program, and you can begin to receive updated fund reports and prospectuses online rather than through the mail. Log in to your account at troweprice.com for more information.
Manager’s Letter
Fellow Shareholders
The economic downturn and credit crunch have affected all markets. Still, investment-grade municipal bonds produced good returns in the one-year period ended February 28, 2009. In the last six months, short- and intermediate-term securities produced moderate gains, but long-term issues generally declined. Lower-quality securities plunged in both periods, pressured by low liquidity, heightened risk aversion, periods of indiscriminate selling, and diminished demand. The T. Rowe Price Maryland Tax-Free Funds outperformed their Lipper peer group averages in both periods, largely on the strength of our rigorous, proprietary research and below-average expenses. The funds’ long-term relative performance remains favorable.
MARKET ENVIRONMENT
The U.S. economy is currently in a recession—one that began in December 2007, according to the National Bureau of Economic Research. Consumer spending, stock prices, and home values have declined; national unemployment increased to 8.1% by the end of our reporting period; and weakened financial institutions have significantly curtailed lending to preserve capital and avoid additional loan-related losses. According to current estimates, the economy shrank at an annualized rate of 6.2% in the fourth quarter of 2008, and first-quarter 2009 gross domestic product (GDP) data could be just as bad. We anticipate economic weakness will persist until at least the middle of 2009.
HIGHLIGHTS
• Longer-term Maryland municipal bonds endured a difficult six months due to investor caution, low liquidity, and other factors; short- and intermediate-term Maryland bonds generated solid gains for the six-month period; and municipal money markets offered low yields as the Fed guided official short-term rates almost to zero.
• The T. Rowe Price Maryland Tax-Free Funds remained invested predominantly in high-quality municipal securities, which generally outperformed lower-quality issues.
• Each of the funds exceeded the performance of its Lipper peer group average for the past 6- and 12-month periods.
• Although municipalities face continuing challenges, tax-exempt securities of all maturities appear to offer attractive value relative to their taxable counterparts, especially given the likelihood of tax increases in coming years.
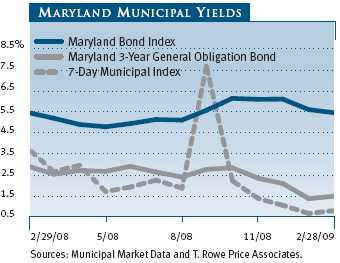
In the last six months, U.S. Treasury yields fell sharply across all maturities as the Federal Reserve reduced the fed funds target rate to an all-time low range of 0.00% to 0.25% by the end of 2008. Short- and intermediate-term municipal bond yields also declined significantly. Long-term Maryland municipal bond yields remained relatively high, however, as deleveraging and forced selling contributed to a material supply/demand imbalance that has impacted the long end of the municipal yield curve.
Although some states are struggling more than others because of significant exposure to the housing and financial market downturns, we believe municipal market weakness primarily reflects general risk aversion rather than fundamental credit concerns. Nevertheless, Maryland’s tax-free securities are still an attractive alternative to taxable bonds, particularly for investors in the highest tax brackets.
As of February 28, the 3.10% yield offered by a 10-year tax-free municipal bond rated AAA was about 103% of the 3.01% pretax yield offered by a 10-year Treasury. In comparison, high-quality 10-year municipal bonds have provided an average of about 81% of the yield offered by 10-year Treasuries since the mid-1980s. Similarly, 30-year AAA municipal bonds are also attractive, with a 4.84% yield that is about 130% of the 3.71% pretax yield offered by 30-year Treasuries.
Based on current valuations and our belief that the municipal bond market remains a high-quality market, we think investors who are seeking tax-free income and are willing to accept the potential for more near-term volatility should consider taking advantage of what still appears to be an attractive long-term buying opportunity for munis.
MUNICIPAL MARKET NEWS
New municipal supply in 2008 totaled about $390 billion, according to The Bond Buyer. Much of this supply came during the first three quarters of the year before credit markets overall seized up immediately following the collapse of Lehman Brothers in mid-September. With the national economy likely to be in a recession until at least midyear and with a significant fiscal stimulus package that will provide some direct capital spending to the states, we anticipate aggregate new borrowing in 2009 could be lower than in 2008.
Demand from retail investors for municipal securities has picked up markedly in recent months. However interest from retail alone was unable to support the market in the face of a substantial unwinding of leveraged trades involving municipal bonds, selling related to margin calls, and a diminished list of broker-dealers that were willing to provide liquidity for tax-free bonds. Given the continuing credit market stress, short- and intermediate-term and AAA rated municipal securities had greater appeal than long-term and lower-quality issues.
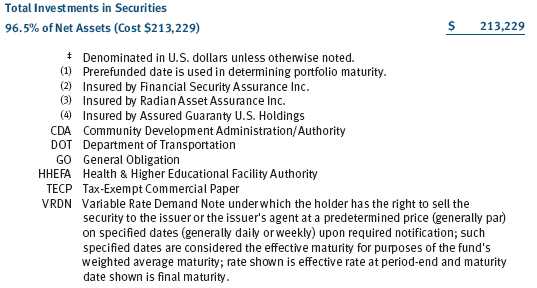
Nationally, sector performance during our fiscal year was mixed. In the last six months, prerefunded and escrowed-to-maturity bonds were the only segments that produced gains. Insured bonds and education, transportation, and housing revenue bonds were flat. In the one-year period, most high-quality sectors advanced moderately, led by prerefunded and escrowed-to-maturity bonds. Higher-yielding bonds in the industrial revenue/pollution control revenue, tobacco, and life care sectors performed extremely poorly in both periods as investors shunned lower-quality credits.
MARYLAND MARKET NEWS
Maryland’s economic profile remains strong compared with other states. Wealth levels are favorable, with Maryland’s 2007 per capita personal income (the latest available data) representing 119% of the national average and ranking fifth among all states. According to the Census Bureau, Maryland’s two-year average median household income (2006–2007) ranked second-highest in the nation, at 130% of the U.S. average. Maryland’s average unemployment rate was 6.2% at the end of January 2009 (the latest available data), well below the 7.6% national unemployment rate. The nation’s unemployment rate stood at 8.1% at the end of February.
For the fiscal year ended June 30, 2008, Maryland’s audited financial statements showed a $373 million deficit in the general fund, or approximately 2% of revenues. However, the state has ample reserves. As of June 30, 2008, its revenue stabilization account and undesignated general fund balance stood at $1.7 billion, which represents about 8% of general fund revenues.
To address a potential budget deficit for fiscal 2009, Governor O’Malley enacted several permanent revenue increases, including raising the statewide sales tax by one percentage point (to 6%), hiking the corporate income tax by one-and-one-quarter percentage points, and restructuring the personal income tax brackets. As fiscal year 2009 has unfolded, both income tax and sales tax receipts have dropped below forecasts. The governor has responded by reducing expenditures to bring the budget into balance.
Maryland’s debt load is somewhat above the national average. As of June 30, 2008, the state had about $7.4 billion of net tax-supported debt outstanding. According to Moody’s 2008 State Debt Medians, the state’s debt burden is in the upper third when measured by debt on a per capita basis and only modestly better when measured by debt relative to personal income. Nevertheless, Maryland has a long history of responsible stewardship and prudent financial management. The state’s general obligation bonds are rated Aaa, AAA, and AAA by Moody’s Investors Service, Standard & Poor’s, and Fitch Ratings, respectively, and each of the rating agencies carries a stable outlook.
PERFORMANCE AND PORTFOLIO STRATEGY REVIEW
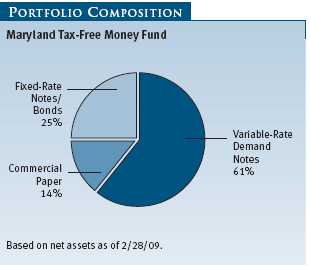
Maryland Tax-Free Money Fund
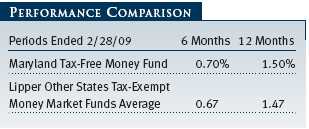
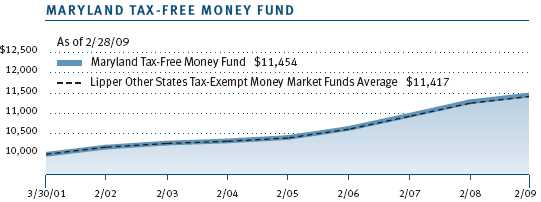
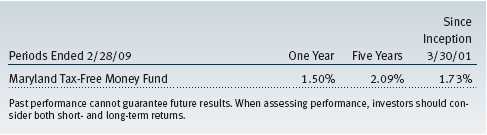
The Maryland Tax-Free Money Fund generated a 0.70% return for the six-month period and 1.50% for the 12 months ended February 28, 2009. These results compared favorably with the Lipper Other States Tax-Exempt Money Market Funds Average. The Maryland Tax-Free Money Fund continued to compare favorably with its competitors over the longer term. Lipper ranked the fund in the top half of its other states tax-exempt money market funds universe for the one-, three-, and five-year periods ended February 28, 2009. (Based on cumulative total return, Lipper ranked the Maryland Tax-Free Money Fund 14 out of 31, 12 out of 31, and 13 out of 28 funds in the other states tax-exempt money market funds universe for the one-, three-, and five-year periods ended February 28, 2009, respectively. Past performance cannot guarantee future results.)
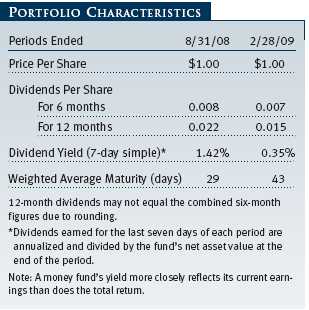
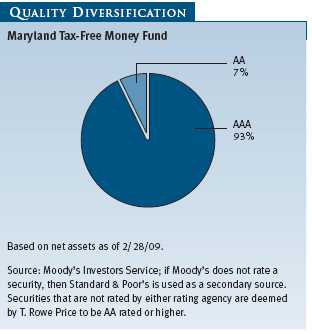
The portfolio’s seven-day simple dividend yield was 0.35% at the end of the reporting period, down 107 basis points (1.07%) from 1.42% six months ago and 2.08 basis points lower than 2.43% a year ago. As always, the fund is entirely invested in high-quality (AAA and AA) securities. A money fund’s yield more closely reflects its current earnings than does the total return.
Since our last letter to shareholders, markets have been severely tested, with the money markets at the epicenter of the turmoil where lending all but shut down in the fourth quarter. The aftershocks of this credit crunch continue to disrupt all financial markets. Investors fleeing falling markets have pushed demand for the safe haven of money funds to record levels, while high-quality investable supply has been sharply curtailed. The Lehman Brothers bankruptcy and the subsequent collapse of a non-T. Rowe Price money fund put all money funds on the defensive, creating an environment in which liquidity was of paramount concern. The deepening credit problems facing banks continue to reduce viable sources of new issue in our market. The forced mergers of Bank of America with Merrill Lynch and Wells Fargo with Wachovia further reduced potential trading counterparties. These events and plunging equity markets provided the backdrop for extreme volatility in money market rates.
Although the Federal Reserve’s move to a 0% fed funds rate has shifted all money market yields lower when compared with six months ago, the path to lower rates has been anything but smooth. Immediately following the collapse of Lehman Brothers in September, money market credit spreads widened rapidly, placing the money markets under extreme duress. For example, the three-month Libor (a taxable benchmark rate) rose 200 basis points in just three weeks. To alleviate this pressure, the Federal Reserve and Treasury buttressed the money markets with liquidity facilities and other measures to protect investors. Among the best-received initiatives was the U.S. Treasury Temporary Guarantee Program—in which your fund participated—designed to protect shareholders and boost confidence in money funds. (Additional information on the Treasury’s program can be found on page 15, before the Glossary.) Ongoing initiatives by the Federal Reserve and Treasury are slowly returning the money markets to normal, although a fully revived market remains some way off.
In many ways, the municipal money market has fared better than its taxable counterpart during these troubled times. Among other factors, the structure of municipal debt, such as variable-rate demand notes with their mandatory tender feature, has enabled municipal money funds to maintain both liquidity and stability lacking in the taxable market. Nevertheless, short-term municipal rates moved across a wide range in the past six months; the 7-Day Municipal Index, which began the period at 1.85%, moved as high as 7.67% during late September and early October and then retreated to a low of 0.64% in January before ending the reporting period at 0.78%. Rates on longer-dated maturities also spiked briefly in October but have also responded to the Fed’s aggressive rate cutting. For example, one-year municipal rates, which began the period around 1.67%, ended February yielding approximately 0.65%.
Our focus in managing your fund continues to be on stability of principal through proprietary credit research and on liquidity by maintaining a high percentage of the portfolio in high-quality variable-rate demand notes. To preserve yield in the face of falling interest rates, we have extended the portfolio’s weighted average maturity by selectively investing in higher-quality, fixed-rate issues where we have a high degree of confidence in the issuer and by increasing our exposure to high-quality commercial paper issuers.
Because of these steps, we believe it is unlikely that the fund’s yield will fall below the level of its expenses. Should this occur, however, T. Rowe Price has decided we may voluntarily waive all or a portion of its management fee for a given day in order to maintain a minimum net yield of 0.00% for all our money funds, including the Maryland Tax-Free Money Fund. You should have recently received notice of a supplement to the fund’s prospectus reflecting this change.
Looking ahead at the next six months, we expect more challenges as credit markets sort themselves out. The Federal Reserve will likely remain on hold through most, if not all, of 2009. Money market rates should remain low and could fall further as credit concerns ease. Market participants will likely continue to pay a premium for liquidity and quality. In such an unsettled environment, we take great comfort in the strength of our rigorous investment process.
Maryland Short-Term Tax-Free Bond Fund
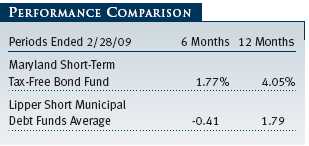
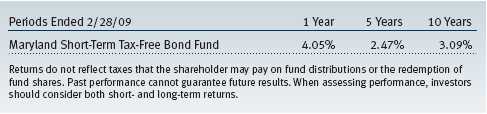
The Maryland Short-Term Tax-Free Bond Fund returned 1.77% for the six-month period and 4.05% for the year ended February 28, 2009. As shown in the table, our results exceeded the Lipper Short Municipal Debt Funds Average by wide margins. The Maryland Short-Term Tax-Free Bond Fund continued to compare favorably with its competitors over the longer term. Lipper ranked the fund in the top 19% of its short municipal debt funds universe for the three-year period and in the top 25% of its category for the one-year period ended February 28, 2009. (Based on cumulative total return, Lipper ranked the Maryland Short-Term Tax-Free Bond Fund 15 out of 61, 10 out of 54, 19 out of 51, and 11 out of 26 funds in the short municipal debt funds universe for the 1-, 3-, 5-, and 10-year periods ended February 28, 2009, respectively. Past performance cannot guarantee future results.)
Since our report at the end of August last year, the fund’s 30-day dividend yield declined substantially, largely due to the Federal Reserve’s interest rate cuts. At the end of the reporting period, the portfolio yielded 2.43%, down 42 basis points (0.42%) from 2.85% six months ago. The portfolio’s net asset value (share price) remained stable during the period, ending February at $5.23 per share. In addition to $0.07 of dividend income, the portfolio’s share price climbed $0.02 since the end of August, contributing to the fund’s total return.
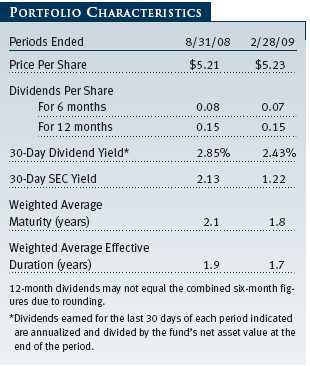
Over the last two years, yields have fallen dramatically; Maryland 3-Year General Obligation Bond yields fell from 3.5% in February 2007, to 2.9% in February 2008, to 1.50% at the end of our reporting period in February 2009. After keeping the fund’s duration above average for most of this period, we reduced it believing that further yield declines were unlikely. (Duration measures a fund’s sensitivity to interest rates; see the Glossary for a more detailed explanation.) Although short-term interest rates may stay low for an extended period, this defensive stance reduces the portfolio’s sensitivity to an unexpected uptick in municipal interest rates, which could occur in response to economic improvement or a supply/demand imbalance and might offset the very low income generated by short- and intermediate-term Maryland municipal bonds. The portfolio ended the period with a duration of 1.7 years, modestly lower than 1.9 years six months ago and 2.2 years at the end of February 2008.
Another factor contributing to performance was the fund’s exposure to short-term, high-quality bonds, which were the best-performing fixed-income assets in 2008. Maryland’s debt is very high in credit quality and is often considered the broad market benchmark for AAA bonds. Maryland’s proximity to Washington, D.C., makes it less sensitive to the more cyclical forces of the national economy. As a result, the state and many of its county general obligation bonds were some of the best-performing short-term municipal securities over the past six and 12 months.
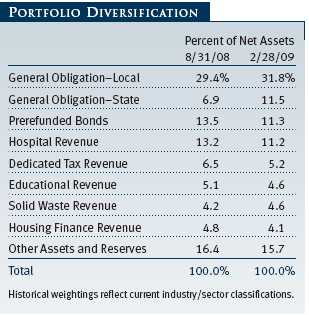
During the six-month period, we significantly increased our exposure to tax-supported state and local general obligation bonds. These holdings were the largest contributors to the fund’s total return. At the end of February, our allocation to general obligation bonds was 43.3% compared with 36.3% at the end of August. We concurrently trimmed from several other sectors, including prerefunded, hospital revenue, and dedicated tax revenue bonds. Our holdings in the life-care segment, a subset within the health care sector, were the largest detractors from total return in the past six months. Occupancy rates at assisted-living and retirement facilities have been hurt by falling home values. Fewer seniors have been able to fund a life-care change with the proceeds from their home sales.
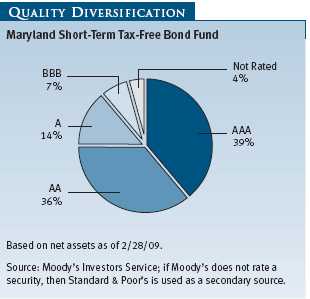
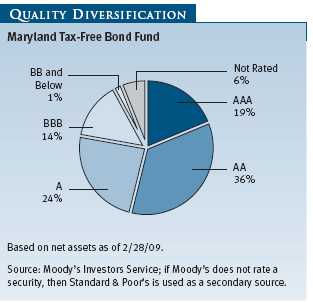
The portfolio’s credit quality, as shown in the Quality Diversification chart, remained high. We increased our holdings in AAA rated bonds to 39% from 32% six months ago. Overall, the portfolio retained its AA average credit quality rating. The portfolio is broadly diversified, and our allocation to investment-grade credits totaled 96% of net assets at the end of the reporting period. Additionally, T. Rowe Price considers the 4% allocation we hold in unrated credits to have an average credit quality of BBB+.
Looking ahead, we believe the T. Rowe Price Maryland Short-Term Tax-Free Bond Fund is an attractive investment relative to a low-yielding money market fund. We want to maintain our yield advantage, but we are unwilling to take on a lot of interest rate risk to get only a marginal amount of incremental yield. We are finding some lower-rated credits that offer extra yield, but we remain cautious on lower quality given the current economic environment.
Maryland Tax-Free Bond Fund
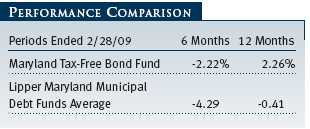
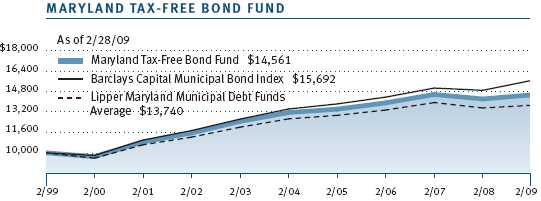
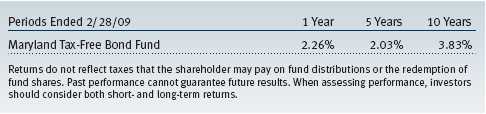
Your fund returned -2.22% and 2.26% for the 6- and 12-month periods ended February 28, 2009, respectively. Despite the volatile market environment for long-term municipal bonds, these returns easily outperformed our Lipper peer group average. Our success versus our Lipper peer group was due to the fund’s emphasis on higher-quality bonds, sector allocation decisions, yield curve positioning, and our below-average fee structure. The Maryland Tax-Free Bond Fund continued to compare favorably relative to its competitors over the longer term as well. Lipper ranked the fund in the top 23% of its Maryland municipal debt funds universe for 10 years and in the top third of its category for the one- and five-year periods ended February 28, 2009. (Based on cumulative total return, Lipper ranked the Maryland Tax-Free Bond Fund 11 out of 33, 11 out of 29, 8 out of 28, and 5 out of 21 funds in the Maryland municipal debt funds universe for the 1-, 3-, 5-, and 10-year periods ended February 28, 2009, respectively. Past performance cannot guarantee future results.)
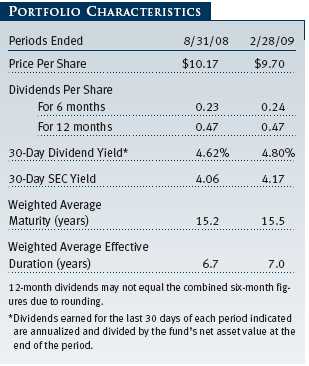
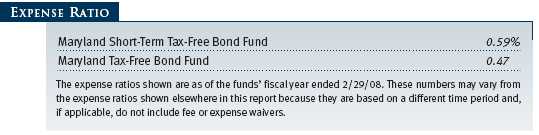
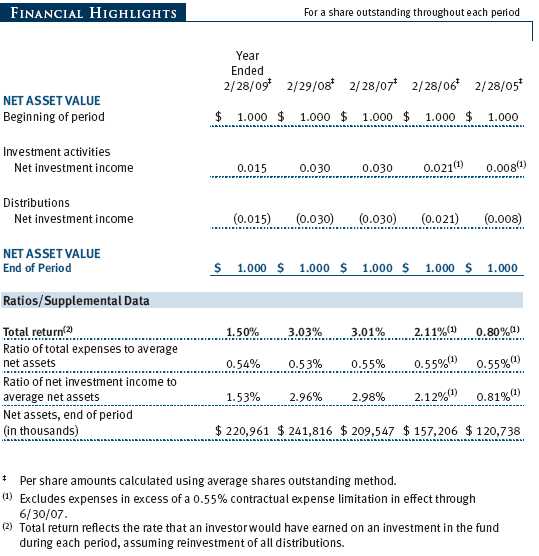
Over the last six months, dividends increased a penny to $0.24 per share from $0.23 paid in the prior six-month period. Our income payout has remained relatively constant over the last several years, totaling $0.47 per share for the past 12 months. However, because of the fund’s share price decline over the past six months, the portfolio’s 30-day dividend yield rose to 4.80% at the end of the reporting period from 4.62% six months ago. With yields still comparatively low from a historical perspective, low expenses are an important and sustainable advantage for the fund as they allow us to pass through more income to shareholders.
We targeted a neutral interest rate stance for much of the period, particularly as volatility increased, but our emphasis on longer-term bonds weighed on results. Despite the challenging environment for longer-term issues for much of 2008, this part of the portfolio has led the sharp rebound in municipals in 2009. We continue to believe the longer end of the maturity spectrum represents good value. As a consequence, the fund’s weighted average maturity and duration increased modestly.
We maintained our long-term overweight in hospital revenue bonds. While yields on these bonds were a bit more volatile and returns were weak in the past 12 months, these holdings are at the core of the portfolio’s premium-yield strategy. We continue to believe that these securities will generate excellent relative returns over time.

The best returns in the market were short and higher-quality bonds, while long and lower-quality bonds generally lagged in the six-month period. The portfolio’s strongest returns came from its prerefunded holdings. However, toward the end of the period, we took gains from this sector (trimming our exposure to 13.8% of assets from 17.5% six months ago) and redeployed the proceeds in longer-dated maturities as yields trended lower.
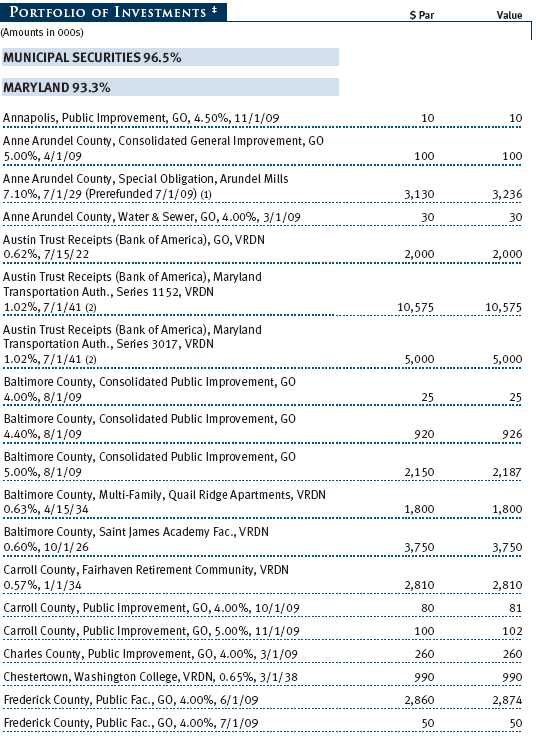
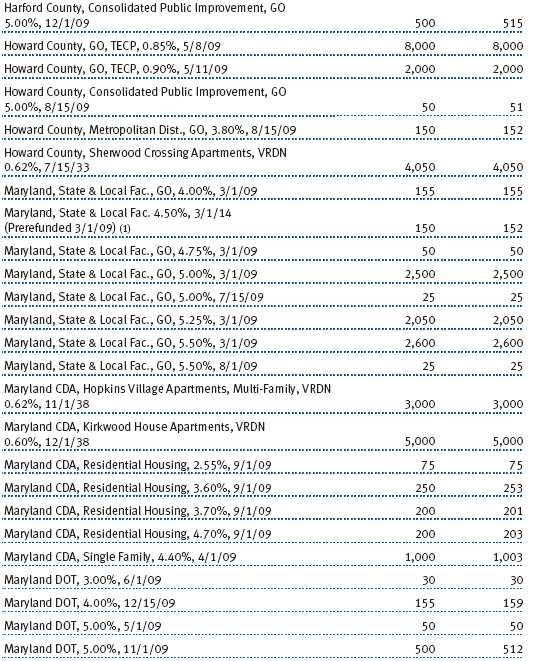
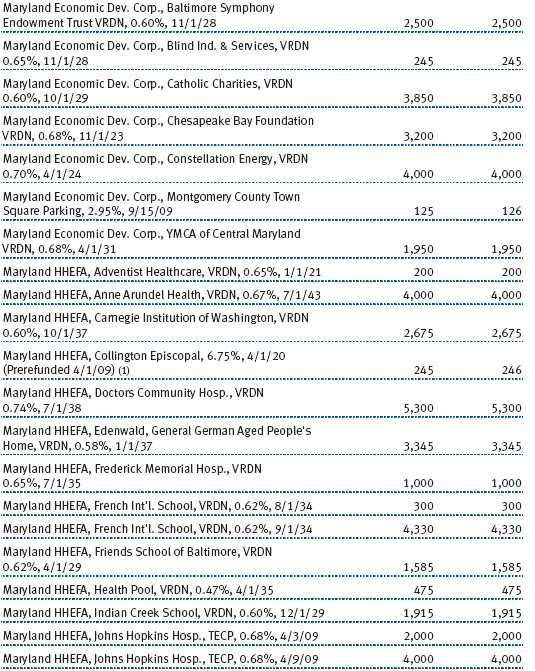
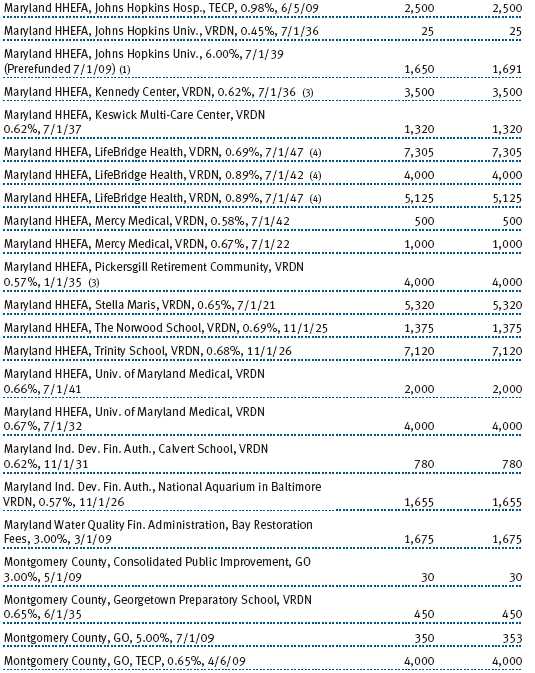
Our largest additions in the past six months were in the housing sector, which now represents 14% of the portfolio and is an important component at the core of our premium yield strategy. As yields in the sector increased to their highest level in a decade, we added a number of securities issued by the Maryland Community Development Administration, the state-run housing agency. Some of our recent additions to this sector sported yields as high as 7.25%. (Please see the portfolio of investments for a complete listing of holdings and the amount each represents in the portfolio.)
Overall, the portfolio’s quality remained very high, with an average credit quality rating of AA- at the end of the reporting period. While we would not be surprised by additional near-term volatility, we think the prospect for good relative returns in our market has improved greatly. In a market characterized by extreme risk aversion, our modest allocation to lower-quality holdings provided poor returns. The losses have made valuations in lower-tier Maryland credits quite attractive, and we may use recent weakness to increase our allocation to these higher-yielding securities. As always, an important contributor to our good relative returns is the depth and talent of our team of credit analysts.
OUTLOOK
The national recession will reduce the tax revenues collected by state and local municipalities, contributing to worries about a general decline in the overall credit quality of the municipal market. In addition, the credit environment for the municipal market is likely to remain challenging for some time. Municipal bond defaults, which historically have been rare, are likely to increase moderately over the next year. Nevertheless, many municipal issuers are making the difficult but necessary fiscal decisions—higher taxes, lower spending, or a combination of the two—as they adjust to the economic downturn.
We believe the municipal market offers good long-term value, especially considering that tax rates are likely to rise in the next few years. Investment-grade municipal bond valuations, though they have rebounded from extremely cheap levels over the last year, remain attractive. Fixed-income investors seeking relative safety have been drawn to municipal securities by their yield advantage over Treasuries and money market instruments, but investors should be prepared for additional periods of volatility stemming from occasional supply/demand imbalances.
We believe T. Rowe Price’s strong credit research capabilities have been and will continue to be an asset for our tax-free fund investors. We continue to conduct our own thorough research and assign our own independent credit ratings before making investment decisions rather than relying solely on external rating agencies or bond insurance for our investment selection. We are currently focused on buying municipal assets that have declined in price due to liquidity problems rather than fundamental credit problems. We think this will position our portfolios to generate excellent long-term relative returns that are more in line with historical norms for our asset class.
Thank you for investing with T. Rowe Price.
Respectfully submitted,

Joseph K. Lynagh
Chairman of the Investment Advisory Committee
Maryland Tax-Free Money Fund

Charles B. Hill
Chairman of the Investment Advisory Committee
Maryland Short-Term Tax-Free Bond Fund

Hugh D. McGuirk
Chairman of the Investment Advisory Committee
Maryland Tax-Free Bond Fund
March 16, 2009
Each committee chairman has day-to-day responsibility for managing each portfolio and works with committee members in developing and executing each fund’s investment programs.
T. ROWE PRICE STATE TAX-FREE INCOME TRUST
MARYLAND TAX-FREE MONEY FUND
SUPPLEMENT TO PROSPECTUS
The following information updates the prospectus for the Maryland Tax-Free Money Fund, dated July 1, 2008, and supersedes the supplement dated December 18, 2008:
The Money Fund is participating in the Temporary Guarantee Program for Money Market Funds (“Program”) established by the U.S. Treasury Department. The Program’s guarantee only covers shareholders in participating money market funds as of the close of business on September 19, 2008 (“Eligible Shareholders”), and does not protect new shareholders after that date. Subject to certain conditions and limitations, the Program guarantees that Eligible Shareholders will receive $1.00 for each money market share held. The guarantee applies if a participating money market fund’s net asset value per share falls below $0.995 and the fund decides to liquidate (“Guarantee Event”). Upon declaration of a Guarantee Event, a fund must stop accepting purchases, suspend redemptions, cease the declaration and payment of dividends, and proceed to liquidate.
The number of shares guaranteed under the Program for each Eligible Shareholder is the lesser of (1) the number of shares owned on September 19, 2008, or (2) the number of shares owned when a Guarantee Event occurs. In addition, Eligible Shareholders could lose coverage under the Program if they close their account or change their account registration. Upon any money market fund liquidation pursuant to the Program, shares not covered under the Program will receive only the fund’s net asset value per share, which may be less than $1.00. Payments under the Program are subject to an overall limit of approximately $50 billion for all money market funds participating in the Program.
The Money Fund has participated in the Program since the Program’s inception. The U.S. Treasury Department has further extended the Program through September 18, 2009, and the fund will continue participating in the Program. The Program’s guarantee still only covers Eligible Shareholders and will not protect new shareholders of the fund after the close of business on September 19, 2008. Participation in each term of the Program requires payment of a fee to the U.S. Treasury Department. The cost to participate is borne by the fund.
The participation fee paid by the fund for the initial three-month term of the Program (September 19, 2008, through December 18, 2008) was 0.01% of its net assets as of the close of business on September 19, 2008. The participation fee for the first extension of the Program (December 19, 2008, through April 30, 2009) was 0.015% of its net assets as of the close of business on September 19, 2008, and the fee for the second extension of the Program (May 1, 2009, through September 18, 2009) is 0.015% of its net assets as of the close of business on September 19, 2008.
The date of this supplement is April 13, 2009.
RISKS OF FIXED-INCOME INVESTING
Bonds are subject to interest rate risk (the decline in bond prices that usually accompanies a rise in interest rates) and credit risk (the chance that any fund holding could have its credit rating downgraded or that a bond issuer will default by failing to make timely payments of interest or principal), potentially reducing the fund’s income level and share price. The Maryland Tax-Free Funds are less diversified than those investing nationally. Some income may be subject to state and local taxes and the federal alternative minimum tax.
The money fund seeks to maintain a stable net asset value and provide an appropriate place for money between investments or during uncertain market conditions. An investment in the fund is not insured or guaranteed by the FDIC or any other government agency. Although the fund seeks to preserve the value of your investment at $1.00 per share, it is possible to lose money by investing in the fund.
GLOSSARY
30-day SEC yield: A method of calculating a fund’s yield that assumes all portfolio securities are held until maturity. The Securities and Exchange Commission (SEC) requires all bond funds to calculate this yield. Yield will vary and is not guaranteed.
Average maturity: The weighted average of the stated maturity dates of the portfolio’s securities. In general, the longer the average maturity, the greater the fund’s sensitivity to interest rate changes. A shorter average maturity usually means less interest rate sensitivity and therefore a less volatile portfolio.
Barclays Capital 3-Year State General Obligation Bond Index: A broadly diversified index of state-issued general obligation tax-exempt bonds with maturities between two and four years.
Barclays Capital Municipal Bond Index: A broadly diversified index of tax-exempt bonds.
Basis point: One one-hundredth of one percentage point, or 0.01%.
Duration: A measure of a bond fund’s sensitivity to changes in interest rates. For example, a fund with a duration of five years would fall about 5% in price in response to a one-percentage-point rise in interest rates, and vice versa.
Escrowed-to-maturity bond: A bond that has the funds necessary for repayment at maturity, or a call date, set aside in a separate or “escrow” account.
Federal funds rate: The interest rate charged on overnight loans of reserves by one financial institution to another in the United States. The Federal Reserve sets a target federal funds rate to affect the direction of interest rates.
General obligation debt: A government’s strongest pledge that obligates its full faith and credit, including, if necessary, its ability to raise taxes.
Investment grade: High-quality bonds as measured by one of the major credit rating agencies. For example, Standard & Poor’s designates the bonds in its top four categories (AAA to BBB) as investment grade.
Lipper averages: The averages of available mutual fund performance returns for specified time periods in defined categories by Lipper.
Prerefunded bonds: A bond that originally may have been issued as a general obligation or revenue bond but that is now secured by an escrow fund consisting entirely of direct U.S. government obligations that are sufficient for paying the bondholders.
Yield curve: A graph depicting the relationship between yields and maturity dates for a set of similar securities. These curves are in constant flux. One of the key activities in managing any fixed-income portfolio is to study the trends reflected by yield curves.
Performance and Expenses
This chart shows the value of a hypothetical $10,000 investment in the fund over the past 10 fiscal year periods or since inception (for funds lacking 10-year records). The result is compared with benchmarks, which may include a broad-based market index and a peer group average or index. Market indexes do not include expenses, which are deducted from fund returns as well as mutual fund averages and indexes.
| AVERAGE ANNUAL COMPOUND TOTAL RETURN |
This table shows how the fund would have performed each year if its actual (or cumulative) returns for the periods shown had been earned at a constant rate.
This chart shows the value of a hypothetical $10,000 investment in the fund over the past 10 fiscal year periods or since inception (for funds lacking 10-year records). The result is compared with benchmarks, which may include a broad-based market index and a peer group average or index. Market indexes do not include expenses, which are deducted from fund returns as well as mutual fund averages and indexes.
| AVERAGE ANNUAL COMPOUND TOTAL RETURN |
This table shows how the fund would have performed each year if its actual (or cumulative) returns for the periods shown had been earned at a constant rate.
As a mutual fund shareholder, you may incur two types of costs: (1) transaction costs, such as redemption fees or sales loads, and (2) ongoing costs, including management fees, distribution and service (12b-1) fees, and other fund expenses. The following example is intended to help you understand your ongoing costs (in dollars) of investing in the fund and to compare these costs with the ongoing costs of investing in other mutual funds. The example is based on an investment of $1,000 invested at the beginning of the most recent six-month period and held for the entire period.
Actual Expenses
The first line of the following table (“Actual”) provides information about actual account values and expenses based on the fund’s actual returns. You may use the information in this line, together with your account balance, to estimate the expenses that you paid over the period. Simply divide your account value by $1,000 (for example, an $8,600 account value divided by $1,000 = 8.6), then multiply the result by the number in the first line under the heading “Expenses Paid During Period” to estimate the expenses you paid on your account during this period.
Hypothetical Example for Comparison Purposes
The information on the second line of the table (“Hypothetical”) is based on hypothetical account values and expenses derived from the fund’s actual expense ratio and an assumed 5% per year rate of return before expenses (not the fund’s actual return). You may compare the ongoing costs of investing in the fund with other funds by contrasting this 5% hypothetical example and the 5% hypothetical examples that appear in the shareholder reports of the other funds. The hypothetical account values and expenses may not be used to estimate the actual ending account balance or expenses you paid for the period.
Note: T. Rowe Price charges an annual small-account maintenance fee of $10, generally for accounts with less than $2,000 ($500 for UGMA/UTMA). The fee is waived for any investor whose T. Rowe Price mutual fund accounts total $25,000 or more, accounts employing automatic investing, and IRAs and other retirement plan accounts that utilize a prototype plan sponsored by T. Rowe Price (although a separate custodial or administrative fee may apply to such accounts). This fee is not included in the accompanying table. If you are subject to the fee, keep it in mind when you are estimating the ongoing expenses of investing in the fund and when comparing the expenses of this fund with other funds.
You should also be aware that the expenses shown in the table highlight only your ongoing costs and do not reflect any transaction costs, such as redemption fees or sales loads. Therefore, the second line of the table is useful in comparing ongoing costs only and will not help you determine the relative total costs of owning different funds. To the extent a fund charges transaction costs, however, the total cost of owning that fund is higher.


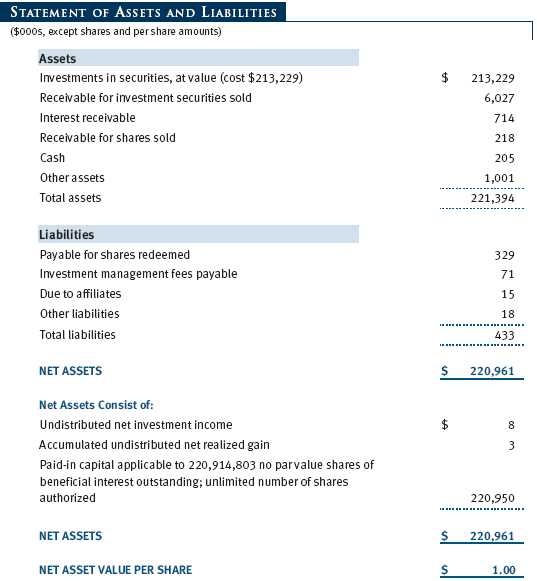
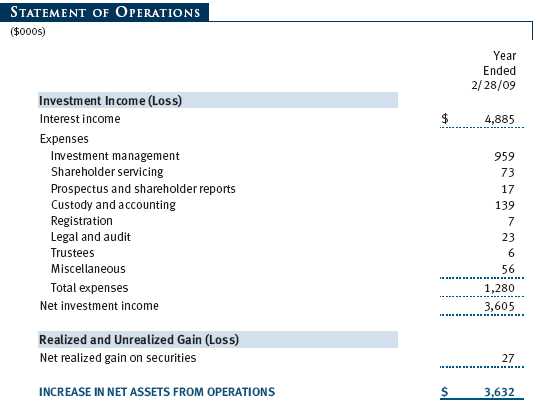
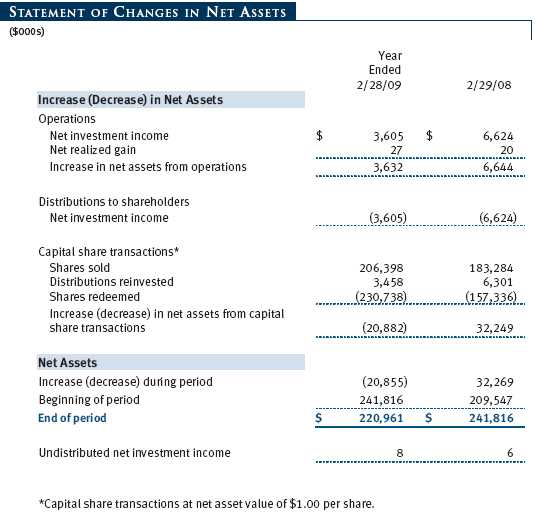
The accompanying notes are an integral part of these financial statements.


The accompanying notes are an integral part of these financial statements.
The accompanying notes are an integral part of these financial statements.
The accompanying notes are an integral part of these financial statements.
The accompanying notes are an integral part of these financial statements.
| NOTES TO FINANCIAL STATEMENTS |
T. Rowe Price State Tax-Free Income Trust (the trust), is registered under the Investment Company Act of 1940 (the 1940 Act). The Maryland Tax-Free Money Fund (the fund), a nondiversified, open-end management investment company, is one portfolio established by the trust. The fund commenced operations on March 30, 2001. The fund seeks to provide preservation of capital, liquidity, and, consistent with these objectives, the highest level of income exempt from federal and Maryland state and local income taxes.
NOTE 1 - SIGNIFICANT ACCOUNTING POLICIES
Basis of Preparation The accompanying financial statements were prepared in accordance with accounting principles generally accepted in the United States of America, which require the use of estimates made by fund management. Fund management believes that estimates and security valuations are appropriate; however, actual results may differ from those estimates, and the security valuations reflected in the financial statements may differ from the value the fund ultimately realizes upon sale of the securities.
Investment Transactions, Investment Income, and Distributions Income and expenses are recorded on the accrual basis. Premiums and discounts on debt securities are amortized for financial reporting purposes. Income tax-related interest and penalties, if incurred, would be recorded as income tax expense. Investment transactions are accounted for on the trade date. Realized gains and losses are reported on the identified cost basis. Distributions to shareholders are recorded on the ex-dividend date. Income distributions are declared on a daily basis and paid monthly.
New Accounting Pronouncements On March 1, 2008, the fund adopted Statement of Financial Accounting Standards No. 157 (FAS 157), Fair Value Measurements. FAS 157 defines fair value, establishes the framework for measuring fair value, and expands the disclosures of fair value measurements in the financial statements. Adoption of FAS 157 did not have a material impact on the fund’s net assets or results of operations.
In March 2008, the Financial Accounting Standards Board issued Statement of Financial Accounting Standards No. 161 (FAS 161), Disclosures about Derivative Instruments and Hedging Activities, which is effective for fiscal years and interim periods beginning after November 15, 2008. FAS 161 requires enhanced disclosures about derivative and hedging activities, including how such activities are accounted for and their effect on financial position, performance and cash flows. Management is currently evaluating the impact the adoption of FAS 161 will have on the fund’s financial statements and related disclosures; however, it is expected to have no material impact on the fund’s net assets or results of operations.
NOTE 2 - VALUATION
The fund values its investments and computes its net asset value per share each day that the New York Stock Exchange is open for business. In accordance with Rule 2a-7 under the 1940 Act, securities are valued at amortized cost, which approximates fair value. Securities for which amortized cost is deemed not to reflect fair value are stated at fair value as determined in good faith by the T. Rowe Price Valuation Committee, established by the fund’s Board of Trustees.
Various inputs are used to determine the value of the fund’s investments. These inputs are summarized in the three broad levels listed below:
Level 1 – quoted prices in active markets for identical securities
Level 2 – observable inputs other than Level 1 quoted prices (including, but not limited to, quoted prices for similar securities, interest rates, prepayment speeds, credit risk)
Level 3 – unobservable inputs
Observable inputs are those based on market data obtained from sources independent of the fund, and unobservable inputs reflect the fund’s own assumptions based on the best information available. The input levels are not necessarily an indication of the risk or liquidity associated with investments at that level. For example, securities held by a money market fund are generally high quality and liquid; however, they are reflected as Level 2 because the inputs used to determine fair value are not quoted prices in an active market. The fund’s investments are summarized by level, based on the inputs used to determine their values. On February 28, 2009, all of the fund’s investments were classified as Level 2.
NOTE 3 - FEDERAL INCOME TAXES
No provision for federal income taxes is required since the fund intends to continue to qualify as a regulated investment company under Subchapter M of the Internal Revenue Code and distribute to shareholders all of its income and gains. Distributions are determined in accordance with Federal income tax regulations, which differ from generally accepted accounting principles, and, therefore, may differ significantly in amount or character from net investment income and realized gains for financial reporting purposes. Financial reporting records are adjusted for permanent book/tax differences to reflect tax character but are not adjusted for temporary differences.
Reclassifications to paid-in capital relate primarily to a tax practice that treats a portion of the proceeds from each redemption of capital shares as a distribution of taxable net investment income and/or realized capital gain. For the year ended February 28, 2009, the following reclassifications, which had no impact on results of operations or net assets, were recorded to reflect tax character:
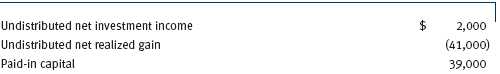
Distributions during the years ended February 28, 2009, and February 29, 2008, totaled $3,605,000 and $6,624,000, respectively, and were characterized as tax-exempt income for tax purposes. At February 28, 2009, the tax-basis cost of investments and components of net assets were as follows:

NOTE 4 - RELATED PARTY TRANSACTIONS
The fund is managed by T. Rowe Price Associates, Inc. (the manager or Price Associates), a wholly owned subsidiary of T. Rowe Price Group, Inc. The investment management agreement between the fund and the manager provides for an annual investment management fee, which is computed daily and paid monthly. The fee consists of an individual fund fee, equal to 0.10% of the fund’s average daily net assets, and a group fee. The group fee rate is calculated based on the combined net assets of certain mutual funds sponsored by Price Associates (the group) applied to a graduated fee schedule, with rates ranging from 0.48% for the first $1 billion of assets to 0.285% for assets in excess of $220 billion. The fund’s group fee is determined by applying the group fee rate to the fund’s average daily net assets. At February 28, 2009, the effective annual group fee rate was 0.31%.
In addition, the fund has entered into service agreements with Price Associates and two wholly owned subsidiaries of Price Associates (collectively, Price). Price Associates computes the daily share price and provides certain other administrative services to the fund. T. Rowe Price Services, Inc., provides shareholder and administrative services in its capacity as the fund’s transfer and dividend disbursing agent. T. Rowe Price Retirement Plan Services, Inc., provides subaccounting and recordkeeping services for certain retirement accounts invested in the fund. For the year ended February 28, 2009, expenses incurred pursuant to these service agreements were $105,000 for Price Associates and $55,000 for T. Rowe Price Services, Inc. The total amount payable at period-end pursuant to these service agreements is reflected as Due to Affiliates in the accompanying financial statements.
As of February 28, 2009, T. Rowe Price Group, Inc., and/or its wholly owned subsidiaries owned 10,883,277 shares of the fund, representing 5% of the fund’s net assets.
NOTE 5 - TREASURY’S TEMPORARY GUARANTEE PROGRAM
The fund’s Board of Trustees has approved participation in the Temporary Guarantee Program for Money Market Funds (the program), established by the U.S. Treasury Department, through September 18, 2009. Subject to certain conditions and limitations, the program guarantees that shareholders in the fund as of the close of business on September 19, 2008, will receive $1.00 for each fund share held. Shares not guaranteed under the program will be redeemed at net asset value per share. The guarantee applies only if a participating money market fund’s net asset value per share falls below $0.995 and the fund subsequently decides to liquidate.
During the year ended February 28, 2009, the fund paid $60,000, equal to 0.025% of the fund’s September 19, 2008 net asset value to participate in the program through April 30, 2009. Subsequent to year-end, the fund paid an additional $36,000, equal to 0.015% of the fund’s September 19, 2008 net asset value to extend its participation through September 18, 2009. The participation fees are borne by the fund and recognized in expenses ratably over the period of participation in the program.
| REPORT OF INDEPENDENT REGISTERED PUBLIC ACCOUNTING FIRM |
To the Board of Trustees of T. Rowe Price State Tax-Free Income Trust and
Shareholders of T. Rowe Price Maryland Tax-Free Money Fund
In our opinion, the accompanying statement of assets and liabilities, including the schedule of investments, and the related statements of operations and of changes in net assets and the financial highlights present fairly, in all material respects, the financial position of T. Rowe Price Maryland Tax-Free Money Fund (one of the portfolios comprising T. Rowe Price State Tax-Free Income Trust, hereafter referred to as the “Fund”) at February 28, 2009, the results of its operations for the year then ended, the changes in its net assets for each of the two years in the period then ended and the financial highlights for each of the five years in the period then ended, in conformity with accounting principles generally accepted in the United States of America. These financial statements and financial highlights (hereafter referred to as “financial statements”) are the responsibility of the Fund’s management; our responsibility is to express an opinion on these financial statements based on our audits. We conducted our audits of these financial statements in accordance with the standards of the Public Company Accounting Oversight Board (United States). Those standards require that we plan and perform the audit to obtain reasonable assurance about whether the financial statements are free of material misstatement. An audit includes examining, on a test basis, evidence supporting the amounts and disclosures in the financial statements, assessing the accounting principles used and significant estimates made by management, and evaluating the overall financial statement presentation. We believe that our audits, which included confirmation of securities at February 28, 2009 by correspondence with the custodian, provide a reasonable basis for our opinion.
PricewaterhouseCoopers LLP
Baltimore, Maryland
April 10, 2009
| TAX INFORMATION (UNAUDITED) FOR THE TAX YEAR ENDED 2/28/09 |
We are providing this information as required by the Internal Revenue Code. The amounts shown may differ from those elsewhere in this report because of differences between tax and financial reporting requirements.
The fund’s distributions to shareholders included:
• $11,000 from short-term capital gains
• $14,000 from long-term capital gains was subject to the 15% rate gains category.
• $3,898,000 which qualified as exempt-interest dividends.
| INFORMATION ON PROXY VOTING POLICIES, PROCEDURES, AND RECORDS |
A description of the policies and procedures used by T. Rowe Price funds and portfolios to determine how to vote proxies relating to portfolio securities is available in each fund’s Statement of Additional Information, which you may request by calling 1-800-225-5132 or by accessing the SEC’s Web site, www.sec.gov. The description of our proxy voting policies and procedures is also available on our Web site, www.troweprice.com. To access it, click on the words “Our Company” at the top of our corporate homepage. Then, when the next page appears, click on the words “Proxy Voting Policies” on the left side of the page.
Each fund’s most recent annual proxy voting record is available on our Web site and through the SEC’s Web site. To access it through our Web site, follow the directions above, then click on the words “Proxy Voting Records” on the right side of the Proxy Voting Policies page.
| HOW TO OBTAIN QUARTERLY PORTFOLIO HOLDINGS |
The fund files a complete schedule of portfolio holdings with the Securities and Exchange Commission for the first and third quarters of each fiscal year on Form N-Q. The fund’s Form N-Q is available electronically on the SEC’s Web site (www.sec.gov); hard copies may be reviewed and copied at the SEC’s Public Reference Room, 450 Fifth St. N.W., Washington, DC 20549. For more information on the Public Reference Room, call 1-800-SEC-0330.
| ABOUT THE FUND’S TRUSTEES AND OFFICERS |
Your fund is governed by a Board of Trustees (Board) that meets regularly to review a wide variety of matters affecting the fund, including performance, investment programs, compliance matters, advisory fees and expenses, service providers, and other business affairs. The Board elects the fund’s officers, who are listed in the final table. At least 75% of Board members are independent of T. Rowe Price Associates, Inc. (T. Rowe Price), and T. Rowe Price International, Inc. (T. Rowe Price International); “inside” or “interested” trustees are employees or officers of T. Rowe Price. The business address of each trustee and officer is 100 East Pratt Street, Baltimore, Maryland 21202. The Statement of Additional Information includes additional information about the trustees and is available without charge by calling a T. Rowe Price representative at 1-800-225-5132.
| Independent Trustees | |
| |
| Name | |
| (Year of Birth) | Principal Occupation(s) During Past Five Years and Directorships of |
| Year Elected* | Other Public Companies |
| |
| Jeremiah E. Casey | Director, National Life Insurance (2001 to 2005); Director, The Rouse |
| (1940) | Company, real estate developers (1990 to 2004) |
| 2006 | |
| |
| Anthony W. Deering | Chairman, Exeter Capital, LLC, a private investment firm (2004 to |
| (1945) | present); Director, Under Armour (2008 to present); Director, Vornado |
| 1986 | Real Estate Investment Trust (2004 to present); Director, Mercantile |
| | Bankshares (2002 to 2007); Member, Advisory Board, Deutsche Bank |
| | North America (2004 to present); Director, Chairman of the Board, and |
| | Chief Executive Officer, The Rouse Company, real estate developers |
| | (1997 to 2004) |
| |
| Donald W. Dick, Jr. | Principal, EuroCapital Advisors, LLC, an acquisition and management |
| (1943) | advisory firm (1995 to present) |
| 2001 | |
| |
| Karen N. Horn | Director, Eli Lilly and Company (1987 to present); Director, Simon |
| (1943) | Property Group (2004 to present); Director, Norfolk Southern (2008 |
| 2003 | to present); Director, Georgia Pacific (2004 to 2005) |
| |
| Theo C. Rodgers | President, A&R Development Corporation (1977 to present) |
| (1941) | |
| 2005 | |
| |
| John G. Schreiber | Owner/President, Centaur Capital Partners, Inc., a real estate invest- |
| (1946) | ment company (1991 to present); Partner, Blackstone Real Estate |
| 1992 | Advisors, L.P. (1992 to present) |
| |
| *Each independent trustee oversees 126 T. Rowe Price portfolios and serves until retirement, resignation, or |
| election of a successor. | |
| Inside Trustees | |
| |
| Name | |
| (Year of Birth) | |
| Year Elected* | |
| [Number of T. Rowe Price | Principal Occupation(s) During Past Five Years and Directorships of |
| Portfolios Overseen] | Other Public Companies |
| |
| Edward C. Bernard | Director and Vice President, T. Rowe Price; Vice Chairman of the Board, |
| (1956) | Director, and Vice President, T. Rowe Price Group, Inc.; Chairman of the |
| 2006 | Board, Director, and President, T. Rowe Price Investment Services, Inc.; |
| [126] | Chairman of the Board and Director, T. Rowe Price Global Investment |
| | Services Limited, T. Rowe Price Retirement Plan Services, Inc., T. Rowe |
| | Price Savings Bank, and T. Rowe Price Services, Inc.; Director, T. Rowe |
| | Price International, Inc.; Chief Executive Officer, Chairman of the Board, |
| | Director, and President, T. Rowe Price Trust Company; Chairman of the |
| | Board, all funds |
| |
| Mary J. Miller, CFA | Director, T. Rowe Price Trust Company; Director and Vice President, |
| (1955) | T. Rowe Price; Vice President, T. Rowe Price Group, Inc.; President, |
| 2004 | State Tax-Free Income Trust |
| [39] | |
| |
| *Each inside trustee serves until retirement, resignation, or election of a successor. |
| Officers | |
| |
| Name (Year of Birth) | |
| Position Held With State Tax-Free Income Trust | Principal Occupation(s) |
| |
| Jonathan M. Chirunga (1966) | Vice President, T. Rowe Price and T. Rowe Price |
| Vice President | Group, Inc. |
| |
| M. Helena Condez (1962) | Assistant Vice President, T. Rowe Price |
| Assistant Vice President | |
| |
| G. Richard Dent (1960) | Vice President, T. Rowe Price and T. Rowe Price |
| Vice President | Group, Inc. |
| |
| Charles E. Emrich (1961) | Vice President, T. Rowe Price; formerly First Vice |
| Vice President | President/Credit Analyst, Legg Mason Wood |
| | Walker, Inc. (to 2005) |
| |
| Roger L. Fiery III, CPA (1959) | Vice President, T. Rowe Price, T. Rowe Price |
| Vice President | Group, Inc., T. Rowe Price International, Inc., |
| | and T. Rowe Price Trust Company |
| |
| Kathryn A. Floyd (1982) | Vice President, T. Rowe Price; formerly student, |
| Assistant Vice President | University of Virginia, McIntire School of |
| | Commerce (to 2004) |
| |
| John R. Gilner (1961) | Chief Compliance Officer and Vice President, |
| Chief Compliance Officer | T. Rowe Price; Vice President, T. Rowe Price |
| | Group, Inc., and T. Rowe Price Investment |
| | Services, Inc. |
| |
| Gregory S. Golczewski (1966) | Vice President, T. Rowe Price and T. Rowe Price |
| Vice President | Trust Company |
| |
| Charles B. Hill, CFA (1961) | Vice President, T. Rowe Price and T. Rowe Price |
| Executive Vice President | Group, Inc. |
| |
| Gregory K. Hinkle, CPA (1958) | Vice President, T. Rowe Price, T. Rowe Price |
| Treasurer | Group, Inc., T. Rowe Price Investment Services, |
| | Inc., and T. Rowe Price Trust Company; formerly |
| | Partner, PricewaterhouseCoopers LLP (to 2007) |
| |
| Marcy M. Lash (1963) | Vice President, T. Rowe Price and T. Rowe Price |
| Vice President | Group, Inc. |
| |
| Alan D. Levenson, Ph.D. (1958) | Vice President, T. Rowe Price and T. Rowe Price |
| Vice President | Group, Inc. |
| Patricia B. Lippert (1953) | Assistant Vice President, T. Rowe Price and |
| Secretary | T. Rowe Price Investment Services, Inc. |
| |
| Joseph K. Lynagh, CFA (1958) | Vice President, T. Rowe Price and T. Rowe Price |
| Executive Vice President | Group, Inc. |
| |
| Konstantine B. Mallas (1963) | Vice President, T. Rowe Price and T. Rowe Price |
| Executive Vice President | Group, Inc. |
| |
| Hugh D. McGuirk, CFA (1960) | Vice President, T. Rowe Price and T. Rowe Price |
| Executive Vice President | Group, Inc. |
| |
| Linda A. Murphy (1959) | Vice President, T. Rowe Price and T. Rowe Price |
| Vice President | Group, Inc. |
| |
| David Oestreicher (1967) | Director and Vice President, T. Rowe Price |
| Vice President | Investment Services, Inc., T. Rowe Price Trust |
| | Company, and T. Rowe Price Services, Inc.; Vice |
| | President, T. Rowe Price, T. Rowe Price Global |
| | Investment Services Limited, T. Rowe Price |
| | Group, Inc., T. Rowe Price International, Inc., |
| | and T. Rowe Price Retirement Plan Services, Inc. |
| |
| Deborah D. Seidel (1962) | Vice President, T. Rowe Price Investment |
| Vice President | Services, Inc. |
| |
| Chen Shao (1980) | Employee, T. Rowe Price; formerly Junior |
| Assistant Vice President | Accountant, News America Corporation, and |
| | Reconciliation Associate, Cablevision Corporation |
| | (to 2005); Assistant Store Manager, Walgreen |
| | Company (to 2004) |
| |
| Timothy G. Taylor, CFA (1975) | Vice President, T. Rowe Price |
| Vice President | |
| |
| Julie L. Waples (1970) | Vice President, T. Rowe Price |
| Vice President | |
| |
| Unless otherwise noted, officers have been employees of T. Rowe Price or T. Rowe Price International |
| for at least five years. | |
Item 2. Code of Ethics.
The registrant has adopted a code of ethics, as defined in Item 2 of Form N-CSR, applicable to its principal executive officer, principal financial officer, principal accounting officer or controller, or persons performing similar functions. A copy of this code of ethics is filed as an exhibit to this Form N-CSR. No substantive amendments were approved or waivers were granted to this code of ethics during the period covered by this report.
Item 3. Audit Committee Financial Expert.
The registrant’s Board of Directors/Trustees has determined that Ms. Karen N. Horn qualifies as an audit committee financial expert, as defined in Item 3 of Form N-CSR. Ms. Horn is considered independent for purposes of Item 3 of Form N-CSR.
Item 4. Principal Accountant Fees and Services.
(a) – (d) Aggregate fees billed to the registrant for the last two fiscal years for professional services rendered by the registrant’s principal accountant were as follows:
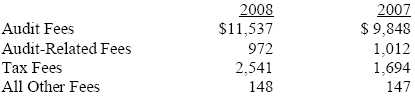
Audit fees include amounts related to the audit of the registrant’s annual financial statements and services normally provided by the accountant in connection with statutory and regulatory filings. Audit-related fees include amounts reasonably related to the performance of the audit of the registrant’s financial statements and specifically include the issuance of a report on internal controls and, if applicable, agreed-upon procedures related to fund acquisitions. Tax fees include amounts related to services for tax compliance, tax planning, and tax advice. The nature of these services specifically includes the review of distribution calculations and the preparation of Federal, state, and excise tax returns. All other fees include the registrant’s pro-rata share of amounts for agreed-upon procedures in conjunction with service contract approvals by the registrant’s Board of Directors/Trustees.
(e)(1) The registrant’s audit committee has adopted a policy whereby audit and non-audit services performed by the registrant’s principal accountant for the registrant, its investment adviser, and any entity controlling, controlled by, or under common control with the investment adviser that provides ongoing services to the registrant require pre-approval in advance at regularly scheduled audit committee meetings. If such a service is required between regularly scheduled audit committee meetings, pre-approval may be authorized by one audit committee member with ratification at the next scheduled audit committee meeting. Waiver of pre-approval for audit or non-audit services requiring fees of a de minimis amount is not permitted.
(2) No services included in (b) – (d) above were approved pursuant to paragraph (c)(7)(i)(C) of Rule 2-01 of Regulation S-X.
(f) Less than 50 percent of the hours expended on the principal accountant’s engagement to audit the registrant’s financial statements for the most recent fiscal year were attributed to work performed by persons other than the principal accountant’s full-time, permanent employees.
(g) The aggregate fees billed for the most recent fiscal year and the preceding fiscal year by the registrant’s principal accountant for non-audit services rendered to the registrant, its investment adviser, and any entity controlling, controlled by, or under common control with the investment adviser that provides ongoing services to the registrant were $1,922,000 and $1,486,000, respectively.
(h) All non-audit services rendered in (g) above were pre-approved by the registrant’s audit committee. Accordingly, these services were considered by the registrant’s audit committee in maintaining the principal accountant’s independence.
Item 5. Audit Committee of Listed Registrants.
Not applicable.
Item 6. Investments.
(a) Not applicable. The complete schedule of investments is included in Item 1 of this Form N-CSR.
(b) Not applicable.
Item 7. Disclosure of Proxy Voting Policies and Procedures for Closed-End Management Investment Companies.
Not applicable.
Item 8. Portfolio Managers of Closed-End Management Investment Companies.
Not applicable.
Item 9. Purchases of Equity Securities by Closed-End Management Investment Company and Affiliated Purchasers.
Not applicable.
Item 10. Submission of Matters to a Vote of Security Holders.
Not applicable.
Item 11. Controls and Procedures.
(a) The registrant’s principal executive officer and principal financial officer have evaluated the registrant’s disclosure controls and procedures within 90 days of this filing and have concluded that the registrant’s disclosure controls and procedures were effective, as of that date, in ensuring that information required to be disclosed by the registrant in this Form N-CSR was recorded, processed, summarized, and reported timely.
(b) The registrant’s principal executive officer and principal financial officer are aware of no change in the registrant’s internal control over financial reporting that occurred during the registrant’s second fiscal quarter covered by this report that has materially affected, or is reasonably likely to materially affect, the registrant’s internal control over financial reporting.
Item 12. Exhibits.
(a)(1) The registrant’s code of ethics pursuant to Item 2 of Form N-CSR is attached.
(2) Separate certifications by the registrant's principal executive officer and principal financial officer, pursuant to Section 302 of the Sarbanes-Oxley Act of 2002 and required by Rule 30a-2(a) under the Investment Company Act of 1940, are attached.
(3) Written solicitation to repurchase securities issued by closed-end companies: not applicable.
(b) A certification by the registrant's principal executive officer and principal financial officer, pursuant to Section 906 of the Sarbanes-Oxley Act of 2002 and required by Rule 30a-2(b) under the Investment Company Act of 1940, is attached.
| | |
SIGNATURES |
| |
| | Pursuant to the requirements of the Securities Exchange Act of 1934 and the Investment |
| Company Act of 1940, the registrant has duly caused this report to be signed on its behalf by the |
| undersigned, thereunto duly authorized. |
| |
| T. Rowe Price State Tax-Free Income Trust |
| |
| |
| |
| By | /s/ Edward C. Bernard |
| | Edward C. Bernard |
| | Principal Executive Officer |
| |
| Date | April 17, 2009 |
| |
| |
| |
| | Pursuant to the requirements of the Securities Exchange Act of 1934 and the Investment |
| Company Act of 1940, this report has been signed below by the following persons on behalf of |
| the registrant and in the capacities and on the dates indicated. |
| |
| |
| By | /s/ Edward C. Bernard |
| | Edward C. Bernard |
| | Principal Executive Officer |
| |
| Date | April 17, 2009 |
| |
| |
| |
| By | /s/ Gregory K. Hinkle |
| | Gregory K. Hinkle |
| | Principal Financial Officer |
| |
| Date | April 17, 2009 |