| UNITED STATES |
| SECURITIES AND EXCHANGE COMMISSION |
| Washington, D.C. 20549 |
| |
FORM N-CSR |
| |
CERTIFIED SHAREHOLDER REPORT OF REGISTERED |
MANAGEMENT INVESTMENT COMPANIES |
| |
| |
| |
| Investment Company Act File Number: 811-4521 |
|
| |
| T. Rowe Price State Tax-Free Income Trust |
|
| (Exact name of registrant as specified in charter) |
| |
| 100 East Pratt Street, Baltimore, MD 21202 |
|
| (Address of principal executive offices) |
| |
| David Oestreicher |
| 100 East Pratt Street, Baltimore, MD 21202 |
|
| (Name and address of agent for service) |
| |
| |
| Registrant’s telephone number, including area code: (410) 345-2000 |
| |
| |
| Date of fiscal year end: February 28 |
| |
| |
| Date of reporting period: February 28, 2009 |
Item 1: Report to Shareholders| Georgia Tax-Free Bond Fund | February 28, 2009 |
The views and opinions in this report were current as of February 28, 2009. They are not guarantees of performance or investment results and should not be taken as investment advice. Investment decisions reflect a variety of factors, and the managers reserve the right to change their views about individual stocks, sectors, and the markets at any time. As a result, the views expressed should not be relied upon as a forecast of the fund’s future investment intent. The report is certified under the Sarbanes-Oxley Act, which requires mutual funds and other public companies to affirm that, to the best of their knowledge, the information in their financial reports is fairly and accurately stated in all material respects.
REPORTS ON THE WEB
Sign up for our E-mail Program, and you can begin to receive updated fund reports and prospectuses online rather than through the mail. Log in to your account at troweprice.com for more information.
Manager’s Letter
Fellow Shareholders
The economic downturn and credit crunch have affected all markets. Still, investment-grade municipal bonds produced good returns in the one-year period ended February 28, 2009. In the last six months, short- and intermediate-term securities produced moderate gains, but long-term issues generally declined. Lower-quality securities plunged in both periods, pressured by poor liquidity, heightened risk aversion, periods of indiscriminate selling, and diminished demand. The Georgia Tax-Free Bond Fund experienced a small loss over the past six months but outperformed its Lipper peer group average for both the six and 12 months, largely on the strength of our rigorous, proprietary research; sector rotation; and opportunistic purchases of higher-quality issues in the midst of the credit market turmoil in the fall.
HIGHLIGHTS
• Longer-term municipal bonds endured a difficult six months due to investor caution, low liquidity, and other factors.
• The Georgia Tax-Free Bond Fund outperformed its Lipper benchmark over the past six and 12 months.
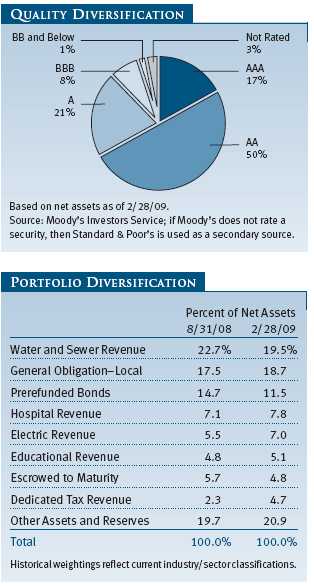
• The fund’s relative performance benefited from a smaller weighting in lower-quality issues.
• Although municipalities face continuing challenges, municipal securities appear to offer attractive value, especially given the likelihood of tax increases in the coming years.
MARKET ENVIRONMENT
The U.S. economy is currently in a recession—one that began in December 2007, according to the National Bureau of Economic Research. Consumer spending, stock prices, and home values have declined; national unemployment increased to 8.1% by the end of our reporting period; and weakened financial institutions have significantly curtailed lending to preserve capital and avoid additional loan-related losses. According to current estimates, the economy shrank at an annualized rate of 6.2% in the fourth quarter of 2008, and first-quarter 2009 gross domestic product (GDP) data could be just as bad. We anticipate economic weakness will persist until at least the middle of 2009.
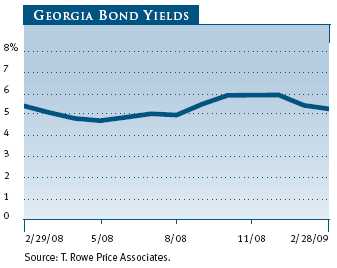
In the last six months, U.S. Treasury yields fell sharply across all maturities as the Federal Reserve reduced the fed funds target rate to an all-time low range of 0.00% to 0.25% by the end of 2008. Short- and intermediate-term municipal bond yields also declined significantly. Long-term Georgia municipal bond yields remained relatively high, however, as deleveraging and forced selling contributed to a material supply/demand imbalance that has impacted the long end of the municipal yield curve.
Although some states are struggling more than others because of significant exposure to the housing and financial market downturns, we believe municipal market weakness primarily reflects general risk aversion rather than fundamental credit concerns. Tax-free securities are still an attractive alternative to taxable bonds, particularly for investors in the highest tax brackets.
As of February 28, the 3.10% yield offered by a 10-year tax-free municipal bond rated AAA was about 103% of the 3.01% pretax yield offered by a 10-year Treasury. In comparison, high-quality 10-year municipal bonds have provided an average of about 81% of the yield offered by 10-year Treasuries since the mid-1980s. Similarly, 30-year AAA municipal bonds are also attractive, with a 4.84% yield that is about 130% of the 3.71% pretax yield offered by 30-year Treasuries.
Based on current valuations and our belief that the municipal bond market remains a high-quality market, we think investors who are seeking tax-free income and are willing to accept the potential for more near-term volatility should consider taking advantage of what still appears to be an attractive long-term buying opportunity for munis.
MUNICIPAL MARKET NEWS
New municipal supply in 2008 totaled about $390 billion, according to The Bond Buyer. Much of this supply came during the first three quarters of the year before credit markets overall seized up immediately following the collapse of Lehman Brothers in mid-September. With the national economy likely to be in a recession until at least midyear and with a significant fiscal stimulus package that will provide some direct capital spending to the states, we anticipate aggregate new borrowing in 2009 could be lower than in 2008.
Demand from retail investors for municipal securities has picked up markedly in recent months. However, interest from retail alone was unable to support the market in the face of a substantial unwinding of leveraged trades involving municipal bonds, selling related to margin calls, and a diminished list of broker-dealers willing to provide liquidity for tax-free bonds. Given the continuing credit market stress, short- and intermediate-term and AAA rated municipal securities had greater appeal than long-term and lower-quality issues.
Nationally, sector performance during our fiscal year was mixed. In the last six months, prerefunded and escrowed-to-maturity bonds were the only segments that produced gains. Insured bonds and education, transportation, and housing revenue bonds were flat. In the one-year period, most high-quality sectors advanced moderately, led by prerefunded and escrowed-to-maturity bonds. Higher-yielding bonds in the industrial revenue/pollution control revenue, tobacco, and life care sectors performed extremely poorly in both periods as investors shunned lower-quality credits.
GEORGIA MARKET NEWS
Georgia’s economy has not been immune to the national economic recession. The state’s unemployment rate increased to 7.5% by the end of 2008, slightly above the national average. The tough economic trends have continued into 2009, and in January, the state’s unemployment rate jumped to 8.6%, its highest level in over 30 years. Despite the rising unemployment problem, the state’s median household income levels remain slightly above the U.S. average and appear even more favorable when taking into account cost-of-living and quality-of-life indicators.
The tough economic times have had an impact on the state’s finances. Through the first eight months of fiscal year 2009, the state’s revenue collections were down 7.3%. Georgia’s fiscal 2008 operating revenue decreased 1.1% over its fiscal 2007 receipts, leading to a drawdown of $1.24 billion in the state’s general fund balance. Governor Sonny Perdue has continued to exhibit sound fiscal management in response to the weak collections, however, recommending that the state legislature pass his proposal to reduce the midyear fiscal 2009 budget by $1.96 billion, or 9.3%. The governor is also being conservative in his forecasting of the fiscal year 2010 budget, which includes a $595 million revenue shortfall. Georgia’s finances are benefiting as well from sound management during the last economic expansion, which allowed the state to restore its rainy day fund. The state entered fiscal 2009 with a revenue shortfall reserve of $1.49 billion, or 4.9% of its 2008 budget.
Georgia’s constitution should also guarantee that the state’s debt levels remain acceptable. The state’s maximum annual debt service is limited to 10% of total revenue receipts of the state treasury. The state has also established “debt affordability” limits, which provide that outstanding debt will not exceed 2.7% of personal income and that maximum annual debt service will not exceed 5% of the prior year’s revenues. The state’s near-term debt offerings are projected to maintain its total debt within these limits.
Responsible fiscal management and the safeguards provided by the state constitution have allowed Georgia to maintain its high credit ratings even in the face of the sharp economic slowdown. As of March 1, 2009, the state’s general obligation bonds were rated AAA by all three of the major rating agencies.
PERFORMANCE AND PORTFOLIO STRATEGY
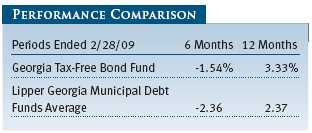
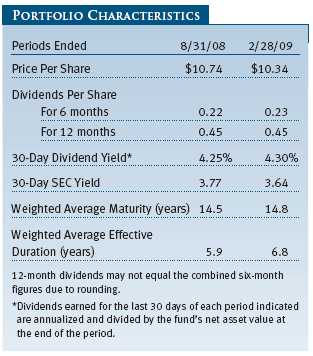
The Georgia Tax-Free Bond Fund returned -1.54% for the six-month period and 3.33% for the 12-month period ended February 28, 2009. While we surpassed the returns of our Lipper benchmark, we understand that it is never pleasant to report a loss. Several factors helped the portfolio fare better than its peers, including the fund’s emphasis on higher-quality bonds, sector allocation decisions, and our below-average fee structure. While the fund’s net asset value decreased $0.40 over the past six months, dividends paid out increased slightly from the previous reporting period.
We targeted a neutral interest rate stance for much of the period, particularly as volatility increased, but our emphasis on longer-term bonds weighed on results. Despite difficult returns for longer-term issues for much of 2008, this part of the portfolio has led the sharp rebound in municipals so far in 2009. We continue to believe the longer end of the maturity spectrum represents an attractive area of investment.
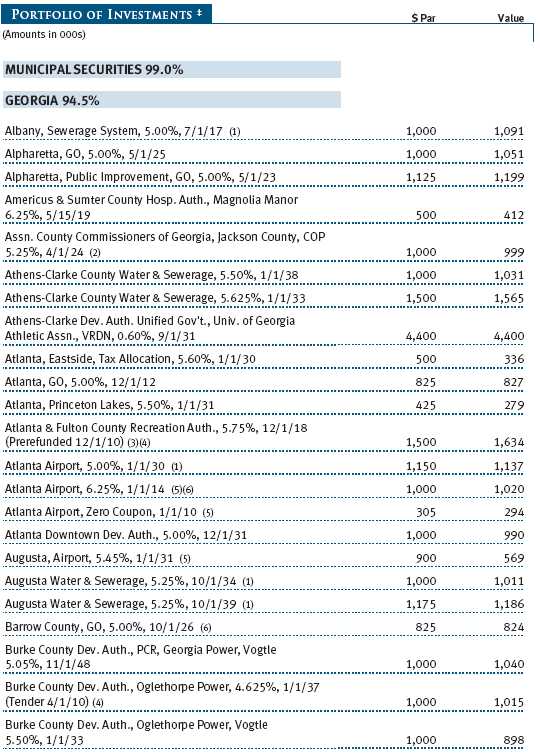
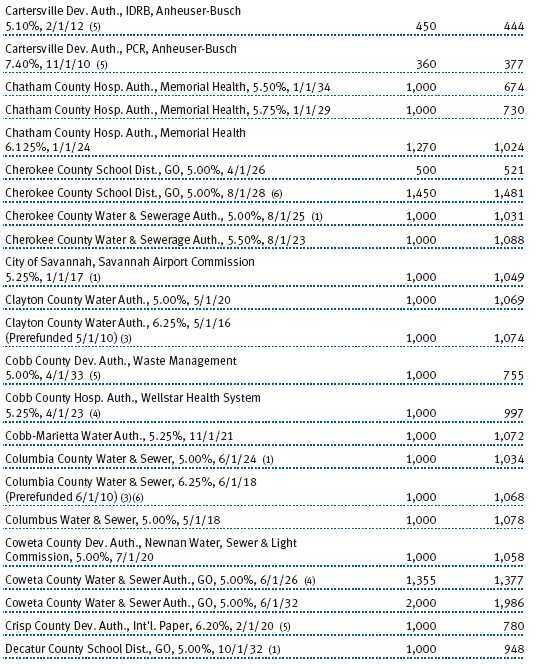
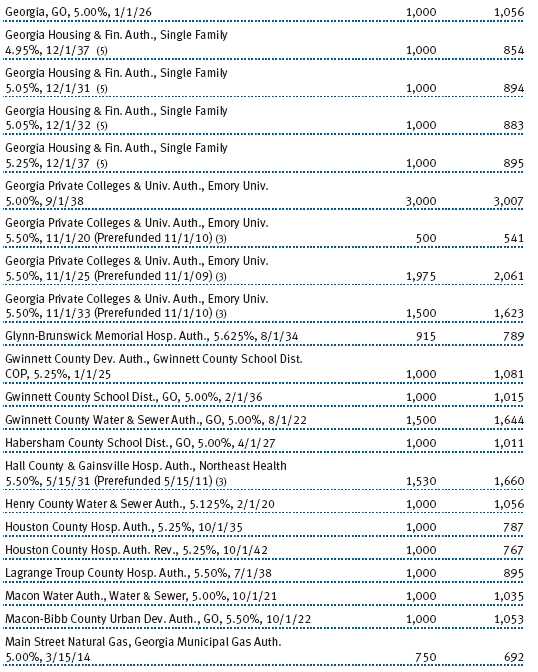
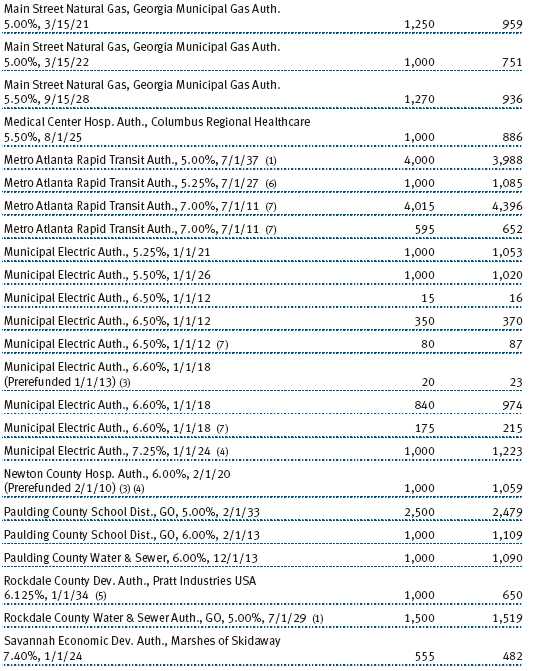
In a market characterized by extreme risk aversion, our lower-quality holdings provided poor returns. One unfortunate position that weighed on results was a Main Street Natural Gas issue backed by Lehman Brothers. This position, since eliminated, fell severely as Lehman declared bankruptcy in September, costing the portfolio roughly 0.50% of return for the fiscal year ended in February. As difficult as this loss was, our overall exposure to low-quality issues was comparatively light, which benefited our relative returns. The steep losses suffered by lower-quality issues have made valuations quite attractive, and we may use recent weakness to increase our allocation in these higher-yielding securities. (Please refer to the fund’s portfolio of investments for a complete listing of our holdings and the amount each represents in the portfolio.)
Most new positions in the portfolio over the past six months were high-quality credits. In particular, we focused on general obligation, tax-backed, and housing bonds. These sectors are generally higher in quality and our holdings in them produced some of our best returns for the period. Additionally, in order to obtain higher yields, we increased our allocation in the electric revenue sector, adding to positions in the Municipal Electric Authority of Georgia and Oglethorpe Power, both A rated utility credits.
Another factor aiding returns was our underweight position in insured bonds, which have struggled due to ratings cuts for the “monoline” insurers that back the bonds and other factors. We significantly reduced our exposure to insured bonds as this part of the market came under increasing pressure and used the proceeds to reinvest in uninsured bonds as yields increased.
OUTLOOK
The national recession will reduce the tax revenues collected by state and local municipalities, contributing to worries about a general decline in the overall credit quality of the municipal market. In addition, the credit environment for the municipal market is likely to remain challenging for some time. Municipal bond defaults, which historically have been rare, are likely to increase moderately over the next year. Nevertheless, many municipal issuers are making the difficult but necessary fiscal decisions—higher taxes, lower spending, or a combination of the two—as they adjust to the economic downturn.
We believe the municipal market offers good long-term value, especially considering that tax rates are likely to rise in the next few years. Investment-grade municipal bond valuations, though they have rebounded from extremely cheap levels over the last year, remain attractive. Fixed-income investors seeking relative safety have been drawn to municipal securities by their yield advantage over Treasuries and money market instruments, but investors should be prepared for additional periods of volatility stemming from occasional supply/demand imbalances.
We believe T. Rowe Price’s strong credit research capabilities have been and will continue to be an asset for our tax-free fund investors. We continue to conduct our own thorough research and assign our own independent credit ratings before making investment decisions rather than relying solely on external rating agencies or bond insurance for our investment selection. We are currently focused on buying municipal assets that have declined in price due to liquidity problems rather than fundamental credit problems. We think this will position our portfolios to generate excellent long-term relative returns that are more in line with historical norms for our asset class.
Respectfully submitted,

Hugh D. McGuirk
Chairman of the Investment Advisory Committee
March 17, 2009
The committee chairman has day-to-day responsibility for managing the portfolio and works with committee members in developing and executing the fund’s investment program.
RISKS OF INVESTING
As with all mutual funds, the fund’s share price can fall because of weakness in the markets, a particular industry, or specific holdings. Yield and share price will vary with interest rate changes. Investors should note that if interest rates rise significantly from current levels, the fund’s share price will decline and may even turn negative in the short term. There is also a chance that some of the fund’s holdings may have their credit rating downgraded or may default. The fund is less diversified than one investing nationally. Some income may be subject to state and local taxes and the federal alternative minimum tax.
GLOSSARY
30-day SEC yield: A method of calculating a fund’s yield that assumes all portfolio securities are held until maturity. The Securities and Exchange Commission (SEC) requires all bond funds to calculate this yield. Yield will vary and is not guaranteed.
Average maturity: The weighted average of the stated maturity dates of the portfolio’s securities. In general, the longer the average maturity, the greater the fund’s sensitivity to interest rate changes. A shorter average maturity usually means less interest rate sensitivity and therefore a less volatile portfolio.
Barclays Capital Municipal Bond Index: A broadly diversified index of tax-exempt bonds.
Basis point: One one-hundredth of one percentage point, or 0.01%.
Duration: A measure of a bond fund’s sensitivity to changes in interest rates. For example, a fund with a duration of six years would fall about 6% in price in response to a one-percentage-point rise in interest rates, and vice versa.
Escrowed-to-maturity bond: A bond that has the funds necessary for repayment at maturity, or a call date, set aside in a separate or “escrow” account.
Federal funds rate: The interest rate charged on overnight loans of reserves by one financial institution to another in the United States. The Federal Reserve sets a target federal funds rate to affect the direction of interest rates.
General obligation debt: A government’s strongest pledge that obligates its full faith and credit, including, if necessary, its ability to raise taxes.
Investment grade: High-quality bonds as measured by one of the major credit rating agencies. For example, Standard & Poor’s designates the bonds in its top four categories (AAA to BBB) as investment grade.
Lipper averages: The averages of available mutual fund performance returns for specified time periods in defined categories as tracked by Lipper Inc.
Prerefunded bond: A bond that originally may have been issued as a general obligation or revenue bond but that is now secured by an escrow fund consisting entirely of direct U.S. government obligations that are sufficient for paying the bondholders.
Yield curve: A graph depicting the relationship between yields and maturity dates for a set of similar securities. These curves are in constant flux. One of the key activities in managing any fixed-income portfolio is to study trends reflected by comparative yield curves.
Performance and Expenses
This chart shows the value of a hypothetical $10,000 investment in the fund over the past 10 fiscal year periods or since inception (for funds lacking 10-year records). The result is compared with benchmarks, which may include a broad-based market index and a peer group average or index. Market indexes do not include expenses, which are deducted from fund returns as well as mutual fund averages and indexes.

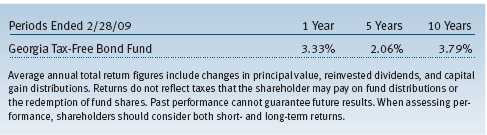
| AVERAGE ANNUAL COMPOUND TOTAL RETURN |
This table shows how the fund would have performed each year if its actual (or cumulative) returns for the periods shown had been earned at a constant rate.
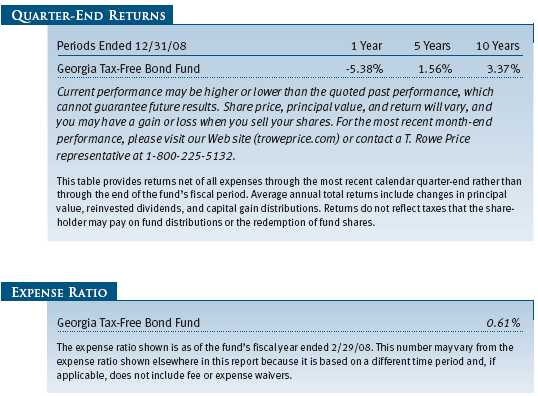
As a mutual fund shareholder, you may incur two types of costs: (1) transaction costs, such as redemption fees or sales loads, and (2) ongoing costs, including management fees, distribution and service (12b-1) fees, and other fund expenses. The following example is intended to help you understand your ongoing costs (in dollars) of investing in the fund and to compare these costs with the ongoing costs of investing in other mutual funds. The example is based on an investment of $1,000 invested at the beginning of the most recent six-month period and held for the entire period.
Actual Expenses
The first line of the following table (“Actual”) provides information about actual account values and expenses based on the fund’s actual returns. You may use the information in this line, together with your account balance, to estimate the expenses that you paid over the period. Simply divide your account value by $1,000 (for example, an $8,600 account value divided by $1,000 = 8.6), then multiply the result by the number in the first line under the heading “Expenses Paid During Period” to estimate the expenses you paid on your account during this period.
Hypothetical Example for Comparison Purposes
The information on the second line of the table (“Hypothetical”) is based on hypothetical account values and expenses derived from the fund’s actual expense ratio and an assumed 5% per year rate of return before expenses (not the fund’s actual return). You may compare the ongoing costs of investing in the fund with other funds by contrasting this 5% hypothetical example and the 5% hypothetical examples that appear in the shareholder reports of the other funds. The hypothetical account values and expenses may not be used to estimate the actual ending account balance or expenses you paid for the period.
Note: T. Rowe Price charges an annual small-account maintenance fee of $10, generally for accounts with less than $2,000 ($500 for UGMA/UTMA). The fee is waived for any investor whose T. Rowe Price mutual fund accounts total $25,000 or more, accounts employing automatic investing, and IRAs and other retirement plan accounts that utilize a prototype plan sponsored by T. Rowe Price (although a separate custodial or administrative fee may apply to such accounts). This fee is not included in the accompanying table. If you are subject to the fee, keep it in mind when you are estimating the ongoing expenses of investing in the fund and when comparing the expenses of this fund with other funds.
You should also be aware that the expenses shown in the table highlight only your ongoing costs and do not reflect any transaction costs, such as redemption fees or sales loads. Therefore, the second line of the table is useful in comparing ongoing costs only and will not help you determine the relative total costs of owning different funds. To the extent a fund charges transaction costs, however, the total cost of owning that fund is higher.

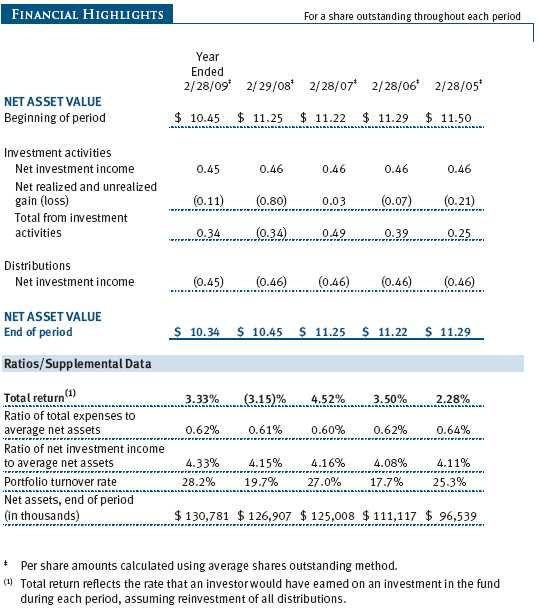
The accompanying notes are an integral part of these financial statements.


The accompanying notes are an integral part of these financial statements.

The accompanying notes are an integral part of these financial statements.
The accompanying notes are an integral part of these financial statements.

The accompanying notes are an integral part of these financial statements.
| NOTES TO FINANCIAL STATEMENTS |
T. Rowe Price State Tax-Free Income Trust (the trust), is registered under the Investment Company Act of 1940 (the 1940 Act). The Georgia Tax-Free Bond Fund (the fund), a nondiversified, open-end management investment company, is one portfolio established by the trust. The fund commenced operations on March 31, 1993. The fund seeks to provide, consistent with prudent portfolio management, the highest level of income exempt from federal and Georgia state income taxes, by investing primarily in investment-grade Georgia municipal bonds.
NOTE 1 - SIGNIFICANT ACCOUNTING POLICIES
Basis of Preparation The accompanying financial statements were prepared in accordance with accounting principles generally accepted in the United States of America, which require the use of estimates made by fund management. Fund management believes that estimates and security valuations are appropriate; however, actual results may differ from those estimates, and the security valuations reflected in the financial statements may differ from the value the fund ultimately realizes upon sale of the securities.
Investment Transactions, Investment Income, and Distributions Income and expenses are recorded on the accrual basis. Premiums and discounts on debt securities are amortized for financial reporting purposes. Income tax-related interest and penalties, if incurred, would be recorded as income tax expense. Investment transactions are accounted for on the trade date. Realized gains and losses are reported on the identified cost basis. Payments (“variation margin”) made or received to settle the daily fluctuations in the value of futures contracts are recorded as unrealized gains or losses until the contracts are closed. Distributions to shareholders are recorded on the ex-dividend date. Income distributions are declared on a daily basis and paid monthly. Capital gain distributions, if any, are declared and paid by the fund, typically on an annual basis.
Credits The fund earns credits on temporarily uninvested cash balances at the custodian that reduce the fund’s custody charges. Custody expense in the accompanying financial statements is presented before reduction for credits, which are reflected as expenses paid indirectly.
New Accounting Pronouncements On March 1, 2008, the fund adopted Statement of Financial Accounting Standards No. 157 (FAS 157), Fair Value Measurements. FAS 157 defines fair value, establishes the framework for measuring fair value, and expands the disclosures of fair value measurements in the financial statements. Adoption of FAS 157 did not have a material impact on the fund’s net assets or results of operations.
In March 2008, the Financial Accounting Standards Board issued Statement of Financial Accounting Standards No. 161 (FAS 161), Disclosures about Derivative Instruments and Hedging Activities, which is effective for fiscal years and interim periods beginning after November 15, 2008. FAS 161 requires enhanced disclosures about derivative and hedging activities, including how such activities are accounted for and their effect on financial position, performance and cash flows. Management is currently evaluating the impact the adoption of FAS 161 will have on the fund’s financial statements and related disclosures; however, it is expected to have no material impact on the fund’s net assets or results of operations.
NOTE 2 - VALUATION
The fund’s investments are reported at fair value as defined under FAS 157. The fund values its investments and computes its net asset value per share at the close of the New York Stock Exchange (NYSE), normally 4 p.m. ET, each day that the NYSE is open for business.
Valuation Methods Debt securities are generally traded in the over-the-counter (OTC) market. Securities with remaining maturities of one year or more at the time of acquisition are valued at prices furnished by dealers who make markets in such securities or by an independent pricing service, which considers the yield or price of bonds of comparable quality, coupon, maturity, and type, as well as prices quoted by dealers who make markets in such securities. Securities with remaining maturities of less than one year at the time of acquisition generally use amortized cost in local currency to approximate fair value. However, if amortized cost is deemed not to reflect fair value or the fund holds a significant amount of such securities with remaining maturities of more than 60 days, the securities are valued at prices furnished by dealers who make markets in such securities or by an independent pricing service.
Other investments, including restricted securities, and those for which the above valuation procedures are inappropriate or are deemed not to reflect fair value are stated at fair value as determined in good faith by the T. Rowe Price Valuation Committee, established by the fund’s Board of Trustees.
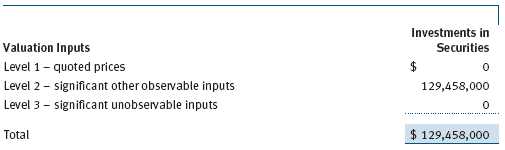
Valuation Inputs Various inputs are used to determine the value of the fund’s investments. These inputs are summarized in the three broad levels listed below:
Level 1 – quoted prices in active markets for identical securities
Level 2 – observable inputs other than Level 1 quoted prices (including, but not limited to, quoted prices for similar securities, interest rates, prepayment speeds, credit risk)
Level 3 – unobservable inputs
Observable inputs are those based on market data obtained from sources independent of the fund, and unobservable inputs reflect the fund’s own assumptions based on the best information available. The input levels are not necessarily an indication of the risk or liquidity associated with investments at that level. The following table summarizes the fund’s investments, based on the inputs used to determine their values on February 28, 2009:
NOTE 3 - INVESTMENT TRANSACTIONS
Consistent with its investment objective, the fund engages in the following practices to manage exposure to certain risks or to enhance performance. The investment objective, policies, program, and risk factors of the fund are described more fully in the fund’s prospectus and Statement of Additional Information.
Futures Contracts During the year ended February 28, 2009, the fund was a party to futures contracts, which provide for the future sale by one party and purchase by another of a specified amount of a specific financial instrument at an agreed upon price, date, time, and place. Risks arise from possible illiquidity of the futures market and from movements in security values and/or interest rates.
Other Purchases and sales of portfolio securities, other than short-term securities, aggregated $40,368,000 and $35,446,000, respectively, for the year ended February 28, 2009.
NOTE 4 - FEDERAL INCOME TAXES
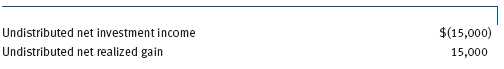
No provision for federal income taxes is required since the fund intends to continue to qualify as a regulated investment company under Subchapter M of the Internal Revenue Code and distribute to shareholders all of its income and gains. Distributions are determined in accordance with Federal income tax regulations, which differ from generally accepted accounting principles, and, therefore, may differ significantly in amount or character from net investment income and realized gains for financial reporting purposes. Financial reporting records are adjusted for permanent book/tax differences to reflect tax character but are not adjusted for temporary differences.
Reclassifications between income and gain relate primarily to differences between book/tax amortization policies. For the year ended February 28, 2009, the following reclassifications, which had no impact on results of operations or net assets, were recorded to reflect tax character:
Distributions during the years ended February 28, 2009, and February 29, 2008, totaled $5,715,000 and $5,387,000, respectively, and were characterized as tax-exempt income for tax purposes. At February 28, 2009, the tax-basis cost of investments and components of net assets were as follows:

The difference between book-basis and tax-basis net unrealized appreciation (depreciation) is attributable to the deferral of losses on certain derivative contracts for tax purposes. The fund intends to retain realized gains to the extent of available capital loss carryforwards. As of February 28, 2009, unused capital loss carryforwards expire as follows: $320,000 in fiscal 2016 and $1,554,000 in fiscal 2017. Pursuant to federal income tax regulations applicable to investment companies, recognition of capital losses on certain transactions is deferred until the subsequent tax year. Consequently, realized losses reflected in the accompanying financial statements include net capital losses realized between November 1 and the fund’s fiscal year-end that have not been recognized for tax purposes (Post-October loss deferrals).
NOTE 5 - RELATED PARTY TRANSACTIONS
The fund is managed by T. Rowe Price Associates, Inc. (the manager or Price Associates), a wholly owned subsidiary of T. Rowe Price Group, Inc. The investment management agreement between the fund and the manager provides for an annual investment management fee, which is computed daily and paid monthly. The fee consists of an individual fund fee, equal to 0.10% of the fund’s average daily net assets, and a group fee. The group fee rate is calculated based on the combined net assets of certain mutual funds sponsored by Price Associates (the group) applied to a graduated fee schedule, with rates ranging from 0.48% for the first $1 billion of assets to 0.285% for assets in excess of $220 billion. The fund’s group fee is determined by applying the group fee rate to the fund’s average daily net assets. At February 28, 2009, the effective annual group fee rate was 0.31%.
In addition, the fund has entered into service agreements with Price Associates and a wholly owned subsidiary of Price Associates (collectively, Price). Price Associates computes the daily share price and provides certain other administrative services to the fund. T. Rowe Price Services, Inc., provides shareholder and administrative services in its capacity as the fund’s transfer and dividend disbursing agent. For the year ended February 28, 2009, expenses incurred pursuant to these service agreements were $108,000 for Price Associates and $45,000 for T. Rowe Price Services, Inc. The total amount payable at period-end pursuant to these service agreements is reflected as Due to Affiliates in the accompanying financial statements.
| REPORT OF INDEPENDENT REGISTERED PUBLIC ACCOUNTING FIRM |
To the Board of Trustees of T. Rowe Price State Tax-Free Income Trust and
Shareholders of T. Rowe Price Georgia Tax-Free Bond Fund
In our opinion, the accompanying statement of assets and liabilities, including the schedule of investments, and the related statements of operations and of changes in net assets and the financial highlights present fairly, in all material respects, the financial position of T. Rowe Price Georgia Tax-Free Bond Fund (one of the portfolios comprising T. Rowe Price State Tax-Free Income Trust, hereafter referred to as the “Fund”) at February 28, 2009, the results of its operations for the year then ended, the changes in its net assets for each of the two years in the period then ended and the financial highlights for each of the five years in the period then ended, in conformity with accounting principles generally accepted in the United States of America. These financial statements and financial highlights (hereafter referred to as “financial statements”) are the responsibility of the Fund’s management; our responsibility is to express an opinion on these financial statements based on our audits. We conducted our audits of these financial statements in accordance with the standards of the Public Company Accounting Oversight Board (United States). Those standards require that we plan and perform the audit to obtain reasonable assurance about whether the financial statements are free of material misstatement. An audit includes examining, on a test basis, evidence supporting the amounts and disclosures in the financial statements, assessing the accounting principles used and significant estimates made by management, and evaluating the overall financial statement presentation. We believe that our audits, which included confirmation of securities at February 28, 2009 by correspondence with the custodian, provide a reasonable basis for our opinion.
PricewaterhouseCoopers LLP
Baltimore, Maryland
April 10, 2009
| TAX INFORMATION (UNAUDITED) FOR THE TAX YEAR ENDED 2/28/09 |
We are providing this information as required by the Internal Revenue Code. The amounts shown may differ from those elsewhere in this report because of differences between tax and financial reporting requirements.
The fund’s distributions to shareholders included $5,715,000 which qualified as exempt-interest dividends.
| INFORMATION ON PROXY VOTING POLICIES, PROCEDURES, AND RECORDS |
A description of the policies and procedures used by T. Rowe Price funds and portfolios to determine how to vote proxies relating to portfolio securities is available in each fund’s Statement of Additional Information, which you may request by calling 1-800-225-5132 or by accessing the SEC’s Web site, www.sec.gov. The description of our proxy voting policies and procedures is also available on our Web site, www.troweprice.com. To access it, click on the words “Our Company” at the top of our corporate homepage. Then, when the next page appears, click on the words “Proxy Voting Policies” on the left side of the page.
Each fund’s most recent annual proxy voting record is available on our Web site and through the SEC’s Web site. To access it through our Web site, follow the directions above, then click on the words “Proxy Voting Records” on the right side of the Proxy Voting Policies page.
| HOW TO OBTAIN QUARTERLY PORTFOLIO HOLDINGS |
The fund files a complete schedule of portfolio holdings with the Securities and Exchange Commission for the first and third quarters of each fiscal year on Form N-Q. The fund’s Form N-Q is available electronically on the SEC’s Web site (www.sec.gov); hard copies may be reviewed and copied at the SEC’s Public Reference Room, 450 Fifth St. N.W., Washington, DC 20549. For more information on the Public Reference Room, call 1-800-SEC-0330.
| ABOUT THE FUND’S TRUSTEES AND OFFICERS |
Your fund is governed by a Board of Trustees (Board) that meets regularly to review a wide variety of matters affecting the fund, including performance, investment programs, compliance matters, advisory fees and expenses, service providers, and other business affairs. The Board elects the fund’s officers, who are listed in the final table. At least 75% of Board members are independent of T. Rowe Price Associates, Inc. (T. Rowe Price), and T. Rowe Price International, Inc. (T. Rowe Price International); “inside” or “interested” trustees are employees or officers of T. Rowe Price. The business address of each trustee and officer is 100 East Pratt Street, Baltimore, Maryland 21202. The Statement of Additional Information includes additional information about the trustees and is available without charge by calling a T. Rowe Price representative at 1-800-225-5132.
| Independent Trustees | |
| |
| Name | |
| (Year of Birth) | Principal Occupation(s) During Past Five Years and Directorships of |
| Year Elected* | Other Public Companies |
| | |
| Jeremiah E. Casey | Director, National Life Insurance (2001 to 2005); Director, The Rouse |
| (1940) | Company, real estate developers (1990 to 2004) |
| 2006 | |
| | |
| Anthony W. Deering | Chairman, Exeter Capital, LLC, a private investment firm (2004 |
| (1945) | to present); Director, Under Armour (2008 to present); Director, |
| 1986 | Vornado Real Estate Investment Trust (2004 to present); Director, |
| | Mercantile Bankshares (2002 to 2007); Member, Advisory Board, |
| | Deutsche Bank North America (2004 to present); Director, Chairman |
| | of the Board, and Chief Executive Officer, The Rouse Company, real |
| | estate developers (1997 to 2004) |
| | |
| Donald W. Dick, Jr. | Principal, EuroCapital Advisors, LLC, an acquisition and management |
| (1943) | advisory firm (1995 to present) |
| 2001 | |
| | |
| Karen N. Horn | Director, Eli Lilly and Company (1987 to present); Director, Simon |
| (1943) | Property Group (2004 to present); Director, Norfolk Southern (2008 |
| 2003 | to present); Director, Georgia Pacific (2004 to 2005) |
| | |
| Theo C. Rodgers | President, A&R Development Corporation (1977 to present) |
| (1941) | |
| 2005 | |
| | |
| John G. Schreiber | Owner/President, Centaur Capital Partners, Inc., a real estate invest- |
| (1946) | ment company (1991 to present); Partner, Blackstone Real Estate |
| 1992 | Advisors, L.P. (1992 to present) |
| |
| *Each independent trustee oversees 126 T. Rowe Price portfolios and serves until retirement, resignation, |
| or election of a successor. | |
| Inside Trustees | |
| |
| Name | |
| (Year of Birth) | |
| Year Elected* | |
| [Number of T. Rowe Price | Principal Occupation(s) During Past Five Years and Directorships of |
| Portfolios Overseen] | Other Public Companies |
| | |
| Edward C. Bernard | Director and Vice President, T. Rowe Price; Vice Chairman of the Board, |
| (1956) | Director, and Vice President, T. Rowe Price Group, Inc.; Chairman of |
| 2006 | the Board, Director, and President, T. Rowe Price Investment Services, |
| [126] | Inc.; Chairman of the Board and Director, T. Rowe Price Global |
| | Investment Services Limited, T. Rowe Price Retirement Plan Services, |
| | Inc., T. Rowe Price Savings Bank, and T. Rowe Price Services, Inc.; |
| | Director, T. Rowe Price International, Inc.; Chief Executive Officer, |
| | Chairman of the Board, Director, and President, T. Rowe Price Trust |
| | Company; Chairman of the Board, all funds |
| | |
| Mary J. Miller, CFA | Director, T. Rowe Price Trust Company; Director and Vice President, |
| (1955) | T. Rowe Price; Vice President, T. Rowe Price Group, Inc.; President, |
| 2004 | State Tax-Free Income Trust |
| [39] | |
| |
| *Each inside trustee serves until retirement, resignation, or election of a successor. |
| Officers | |
| |
| Name (Year of Birth) | |
| Position Held With State Tax-Free | |
| Income Trust | Principal Occupation(s) |
| | |
| Jonathan M. Chirunga (1966) | Vice President, T. Rowe Price and T. Rowe Price |
| Vice President | Group, Inc. |
| | |
| M. Helena Condez (1962) | Assistant Vice President, T. Rowe Price |
| Assistant Vice President | |
| | |
| G. Richard Dent (1960) | Vice President, T. Rowe Price and T. Rowe Price |
| Vice President | Group, Inc. |
| | |
| Charles E. Emrich (1961) | Vice President, T. Rowe Price; formerly First Vice |
| Vice President | President/Credit Analyst, Legg Mason Wood |
| | Walker, Inc. (to 2005) |
| | |
| Roger L. Fiery III, CPA (1959) | Vice President, T. Rowe Price, T. Rowe Price |
| Vice President | Group, Inc., T. Rowe Price International, Inc., |
| | and T. Rowe Price Trust Company |
| Kathryn A. Floyd (1982) | Vice President, T. Rowe Price; formerly stu- |
| Assistant Vice President | dent, University of Virginia, McIntire School of |
| | Commerce (to 2004) |
| | |
| John R. Gilner (1961) | Chief Compliance Officer and Vice President, |
| Chief Compliance Officer | T. Rowe Price; Vice President, T. Rowe Price |
| | Group, Inc., and T. Rowe Price Investment |
| | Services, Inc. |
| | |
| Gregory S. Golczewski (1966) | Vice President, T. Rowe Price and T. Rowe Price |
| Vice President | Trust Company |
| | |
| Charles B. Hill, CFA (1961) | Vice President, T. Rowe Price and T. Rowe Price |
| Executive Vice President | Group, Inc. |
| | |
| Gregory K. Hinkle, CPA (1958) | Vice President, T. Rowe Price, T. Rowe Price |
| Treasurer | Group, Inc., T. Rowe Price Investment Services, |
| | Inc., and T. Rowe Price Trust Company; formerly |
| | Partner, PricewaterhouseCoopers LLP (to 2007) |
| | |
| Marcy M. Lash (1963) | Vice President, T. Rowe Price and T. Rowe Price |
| Vice President | Group, Inc. |
| | |
| Alan D. Levenson, Ph.D. (1958) | Vice President, T. Rowe Price and T. Rowe Price |
| Vice President | Group, Inc. |
| | |
| Patricia B. Lippert (1953) | Assistant Vice President, T. Rowe Price and |
| Secretary | T. Rowe Price Investment Services, Inc. |
| | |
| Joseph K. Lynagh, CFA (1958) | Vice President, T. Rowe Price and T. Rowe Price |
| Executive Vice President | Group, Inc. |
| | |
| Konstantine B. Mallas (1963) | Vice President, T. Rowe Price and T. Rowe Price |
| Executive Vice President | Group, Inc. |
| | |
| Hugh D. McGuirk, CFA (1960) | Vice President, T. Rowe Price and T. Rowe Price |
| Executive Vice President | Group, Inc. |
| | |
| Linda A. Murphy (1959) | Vice President, T. Rowe Price and T. Rowe Price |
| Vice President | Group, Inc. |
| David Oestreicher (1967) | Director and Vice President, T. Rowe Price |
| Vice President | Investment Services, Inc., T. Rowe Price Trust |
| | Company, and T. Rowe Price Services, Inc.; Vice |
| | President, T. Rowe Price, T. Rowe Price Global |
| | Investment Services Limited, T. Rowe Price |
| | Group, Inc., T. Rowe Price International, Inc., |
| | and T. Rowe Price Retirement Plan Services, Inc. |
| | |
| Deborah D. Seidel (1962) | Vice President, T. Rowe Price Investment |
| Vice President | Services, Inc. |
| | |
| Chen Shao (1980) | Employee, T. Rowe Price; formerly Junior |
| Assistant Vice President | Accountant, News America Corporation, |
| | and Reconciliation Associate, Cablevision |
| | Corporation (to 2005); Assistant Store Manager, |
| | Walgreen Company (to 2004) |
| | |
| Timothy G. Taylor, CFA (1975) | Vice President, T. Rowe Price |
| Vice President | |
| | |
| Julie L. Waples (1970) | Vice President, T. Rowe Price |
| Vice President | |
| |
| Unless otherwise noted, officers have been employees of T. Rowe Price or T. Rowe Price International |
| for at least five years. | |
Item 2. Code of Ethics.
The registrant has adopted a code of ethics, as defined in Item 2 of Form N-CSR, applicable to its principal executive officer, principal financial officer, principal accounting officer or controller, or persons performing similar functions. A copy of this code of ethics is filed as an exhibit to this Form N-CSR. No substantive amendments were approved or waivers were granted to this code of ethics during the period covered by this report.
Item 3. Audit Committee Financial Expert.
The registrant’s Board of Directors/Trustees has determined that Ms. Karen N. Horn qualifies as an audit committee financial expert, as defined in Item 3 of Form N-CSR. Ms. Horn is considered independent for purposes of Item 3 of Form N-CSR.
Item 4. Principal Accountant Fees and Services.
(a) – (d) Aggregate fees billed to the registrant for the last two fiscal years for professional services rendered by the registrant’s principal accountant were as follows:
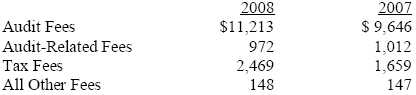
Audit fees include amounts related to the audit of the registrant’s annual financial statements and services normally provided by the accountant in connection with statutory and regulatory filings. Audit-related fees include amounts reasonably related to the performance of the audit of the registrant’s financial statements and specifically include the issuance of a report on internal controls and, if applicable, agreed-upon procedures related to fund acquisitions. Tax fees include amounts related to services for tax compliance, tax planning, and tax advice. The nature of these services specifically includes the review of distribution calculations and the preparation of Federal, state, and excise tax returns. All other fees include the registrant’s pro-rata share of amounts for agreed-upon procedures in conjunction with service contract approvals by the registrant’s Board of Directors/Trustees.
(e)(1) The registrant’s audit committee has adopted a policy whereby audit and non-audit services performed by the registrant’s principal accountant for the registrant, its investment adviser, and any entity controlling, controlled by, or under common control with the investment adviser that provides ongoing services to the registrant require pre-approval in advance at regularly scheduled audit committee meetings. If such a service is required between regularly scheduled audit committee meetings, pre-approval may be authorized by one audit committee member with ratification at the next scheduled audit committee meeting. Waiver of pre-approval for audit or non-audit services requiring fees of a de minimis amount is not permitted.
(2) No services included in (b) – (d) above were approved pursuant to paragraph (c)(7)(i)(C) of Rule 2-01 of Regulation S-X.
(f) Less than 50 percent of the hours expended on the principal accountant’s engagement to audit the registrant’s financial statements for the most recent fiscal year were attributed to work performed by persons other than the principal accountant’s full-time, permanent employees.
(g) The aggregate fees billed for the most recent fiscal year and the preceding fiscal year by the registrant’s principal accountant for non-audit services rendered to the registrant, its investment adviser, and any entity controlling, controlled by, or under common control with the investment adviser that provides ongoing services to the registrant were $1,922,000 and $1,486,000, respectively.
(h) All non-audit services rendered in (g) above were pre-approved by the registrant’s audit committee. Accordingly, these services were considered by the registrant’s audit committee in maintaining the principal accountant’s independence.
Item 5. Audit Committee of Listed Registrants.
Not applicable.
Item 6. Investments.
(a) Not applicable. The complete schedule of investments is included in Item 1 of this Form N-CSR.
(b) Not applicable.
Item 7. Disclosure of Proxy Voting Policies and Procedures for Closed-End Management Investment Companies.
Not applicable.
Item 8. Portfolio Managers of Closed-End Management Investment Companies.
Not applicable.
Item 9. Purchases of Equity Securities by Closed-End Management Investment Company and Affiliated Purchasers.
Not applicable.
Item 10. Submission of Matters to a Vote of Security Holders.
Not applicable.
Item 11. Controls and Procedures.
(a) The registrant’s principal executive officer and principal financial officer have evaluated the registrant’s disclosure controls and procedures within 90 days of this filing and have concluded that the registrant’s disclosure controls and procedures were effective, as of that date, in ensuring that information required to be disclosed by the registrant in this Form N-CSR was recorded, processed, summarized, and reported timely.
(b) The registrant’s principal executive officer and principal financial officer are aware of no change in the registrant’s internal control over financial reporting that occurred during the registrant’s second fiscal quarter covered by this report that has materially affected, or is reasonably likely to materially affect, the registrant’s internal control over financial reporting.
Item 12. Exhibits.
(a)(1) The registrant’s code of ethics pursuant to Item 2 of Form N-CSR is attached.
(2) Separate certifications by the registrant's principal executive officer and principal financial officer, pursuant to Section 302 of the Sarbanes-Oxley Act of 2002 and required by Rule 30a-2(a) under the Investment Company Act of 1940, are attached.
(3) Written solicitation to repurchase securities issued by closed-end companies: not applicable.
(b) A certification by the registrant's principal executive officer and principal financial officer, pursuant to Section 906 of the Sarbanes-Oxley Act of 2002 and required by Rule 30a-2(b) under the Investment Company Act of 1940, is attached.
| | |
SIGNATURES |
| |
| | Pursuant to the requirements of the Securities Exchange Act of 1934 and the Investment |
| Company Act of 1940, the registrant has duly caused this report to be signed on its behalf by the |
| undersigned, thereunto duly authorized. |
| |
| T. Rowe Price State Tax-Free Income Trust |
| |
| |
| |
| By | /s/ Edward C. Bernard |
| | Edward C. Bernard |
| | Principal Executive Officer |
| |
| Date | April 17, 2009 |
| |
| |
| |
| | Pursuant to the requirements of the Securities Exchange Act of 1934 and the Investment |
| Company Act of 1940, this report has been signed below by the following persons on behalf of |
| the registrant and in the capacities and on the dates indicated. |
| |
| |
| By | /s/ Edward C. Bernard |
| | Edward C. Bernard |
| | Principal Executive Officer |
| |
| Date | April 17, 2009 |
| |
| |
| |
| By | /s/ Gregory K. Hinkle |
| | Gregory K. Hinkle |
| | Principal Financial Officer |
| |
| Date | April 17, 2009 |