| UNITED STATES |
| SECURITIES AND EXCHANGE COMMISSION |
| Washington, D.C. 20549 |
| |
FORM N-CSR |
| |
CERTIFIED SHAREHOLDER REPORT OF REGISTERED |
MANAGEMENT INVESTMENT COMPANIES |
| |
| |
| |
| Investment Company Act File Number: 811-4521 |
|
| |
| T. Rowe Price State Tax-Free Income Trust |
|
| (Exact name of registrant as specified in charter) |
| |
| 100 East Pratt Street, Baltimore, MD 21202 |
|
| (Address of principal executive offices) |
| |
| David Oestreicher |
| 100 East Pratt Street, Baltimore, MD 21202 |
|
| (Name and address of agent for service) |
| |
| |
| Registrant’s telephone number, including area code: (410) 345-2000 |
| |
| |
| Date of fiscal year end: February 28 |
| |
| |
| Date of reporting period: February 28, 2010 |
Item 1: Report to Shareholders| Maryland Tax-Free Bond Fund | February 28, 2010 |
The views and opinions in this report were current as of February 28, 2010. They are not guarantees of performance or investment results and should not be taken as investment advice. Investment decisions reflect a variety of factors, and the managers reserve the right to change their views about individual stocks, sectors, and the markets at any time. As a result, the views expressed should not be relied upon as a forecast of the fund’s future investment intent. The report is certified under the Sarbanes-Oxley Act, which requires mutual funds and other public companies to affirm that, to the best of their knowledge, the information in their financial reports is fairly and accurately stated in all material respects.
REPORTS ON THE WEB
Sign up for our E-mail Program, and you can begin to receive updated fund reports and prospectuses online rather than through the mail. Log in to your account at troweprice.com for more information.
Manager’s Letter
Fellow Shareholders
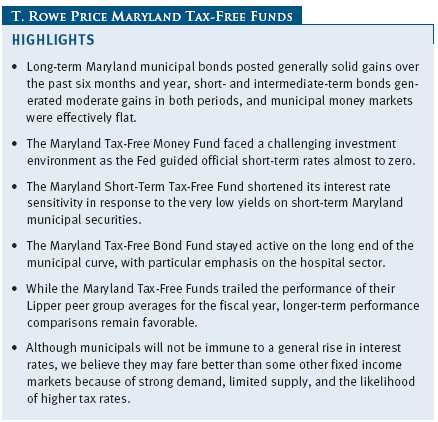
Maryland’s municipal bonds produced excellent returns in the 12-month period ended February 28, 2010, as the credit markets began working normally again. Longer-term and lower-quality securities fared much better than shorter-term and higher-quality munis. Reduced risk aversion, low money market yields, and signs of an economic recovery prompted investors to seek higher-yielding alternatives. Fears of higher future tax rates also contributed to steady investor demand for municipal securities. The T. Rowe Price Maryland Tax-Free Bond and Maryland Short-Term Tax-Free Bond Funds posted solid absolute returns in this environment. Conversely, the Maryland Tax-Free Money Fund returned very little as the Federal Reserve persisted in driving short-term interest rates to historic lows. Each fund’s longer-term relative performance remains favorable.
MARKET ENVIRONMENT
The longest and deepest U.S. recession since the Great Depression seems to be over. The economy, which shrank at an annualized rate of more than 5% in the fourth quarter of 2008 and in the first quarter of 2009, resumed expanding in the third quarter. Gross domestic product grew at a brisk 5.9% annualized rate in the last three months of 2009. Other encouraging signs include a decrease in the national unemployment rate to 9.7% at the end of our reporting period from the 10.1% peak reached in October 2009, stabilizing residential real estate markets in some cities, and the significant rebound in equities over the last 12 months. We expect economic growth to moderate in 2010 as a stimulus-aided rebound transitions into a self-sustaining recovery with improvements in job growth, the housing market, business fixed investment, and consumer spending.
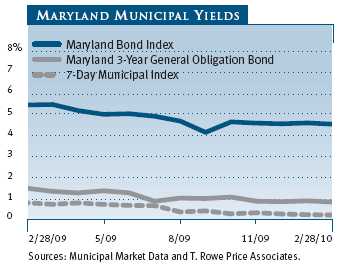
Although the economy is growing again and Treasury issuance is at record levels, Treasury yields have remained extremely low over the last 12 months. Benign inflation and economic weakness have allowed the Fed to keep the fed funds target rate in an all-time low range of 0.00% to 0.25% since the end of 2008. Short-term municipal yields gradually declined over the last year, but in the autumn of 2009 as issuance picked up and municipal valuations approached historically rich levels versus Treasuries, long-term yields bounced off historic lows.
Despite their remarkable rebound over the last year, tax-free securities remain an attractive alternative to taxable bonds, particularly for investors in the highest tax brackets. For example, as of February 28, 2010, the 4.16% yield offered by a 30-year tax-free municipal bond rated AAA was about 91% of the 4.56% pretax yield offered by a 30-year Treasury. An investor in the 28% federal tax bracket would need to invest in a taxable bond yielding about 5.78% in order to receive the same after-tax income from a 30-year AAA muni bond yielding 4.16%. (To calculate a municipal bond’s taxable-equivalent yield, divide the municipal bond’s yield by the quantity of 1.00 minus your federal tax bracket expressed as a decimal—in this case, 1.00 – 0.28, or 0.72.)
MUNICIPAL MARKET NEWS
New municipal supply in 2009 totaled about $409 billion, according to The Bond Buyer—slightly more than the $390 billion in securities issued in 2008 but lower than the record $427 billion in 2007. Tax-exempt supply in 2009 was lower than it could have been, due in part to the Build America Bonds program, which shifted about $64 billion of last year’s total municipal issuance to the taxable market and helped alleviate the supply/demand imbalance that stressed the tax-free market in 2008. With some highly indebted states unwilling to borrow at high interest rates in the credit markets and with the possible expansion of the Build America Bonds program, we expect that aggregate new tax-exempt issuance in 2010 could be somewhat lower than in 2009.
Demand from retail investors for municipal securities was very strong throughout 2009, and full-year investor cash flows into municipal bond funds totaled about 2.5 times the previous annual record level reached in 1993. In the aftermath of 2008’s financial market turbulence, investors seeking more exposure to fixed income securities have embraced munis because of their attractive after-tax yields and valuations relative to Treasuries and because of their lower-risk profile when compared with higher-yielding fixed income alternatives. Concerns about higher federal, state, and local taxes have also fueled interest in tax-free securities.
Most municipal sectors produced moderate gains in the last six months. Top performers included higher-yielding life care and industrial revenue and pollution control revenue bonds, while prerefunded and escrowed-to-maturity bonds, which are backed by U.S. Treasuries, underperformed. For the 12-month period, tobacco bonds far outpaced other sectors, but fundamentals for this sector are poor, and longer-term consumption trends do not appear to be especially positive for the bonds. Life care and industrial revenue and pollution control revenue bonds also performed well. Hospital revenue bonds also outperformed. We are generally negative on this higher-yielding sector—in part because health care reforms are likely to lead to tighter reimbursement policies—but we have uncovered several attractive investment opportunities with reasonable credit risks in Maryland.
MARYLAND MARKET NEWS
Maryland’s economic profile remains strong compared with other states. Wealth levels are favorable, with Maryland’s 2008 per capita personal income representing 121% of the national average and ranking fifth among all states. According to the Census Bureau, Maryland’s two-year average median household income (2007-2008) ranked second-highest in the nation, at 129% of the U.S. average. Maryland’s unemployment rate was 7.5% as of January 2010 (the latest available data), well below the national unemployment rate at that time.
While Maryland’s economic and demographic trends have been relatively good, its finances have not been immune to the national recession. The state acted early to address the looming recession. In late 2007, Governor O’Malley enacted several permanent revenue increases, including raising the statewide sales tax to 6% (from 5%), hiking the corporate income tax by 1.25 percentage points, and restructuring personal income tax brackets. As fiscal year 2009 unfolded, both income tax and sales tax receipts dropped below forecasts, and the governor responded by reducing expenditures to bring the budget into balance. The state has also maintained a cushion in its rainy day fund. At the end of June 2009, Maryland’s state reserve fund held $702 million, representing a solid 6% of the general fund revenues expected for fiscal 2010.
In the current fiscal year, ending June 30, 2010, Maryland faces approximately a $2 billion shortfall, which was larger than had previously been predicted. Maryland’s Board of Public Works has continued to cut expenses to address these revenue shortfalls. The state is currently working on “right-sizing” its fiscal 2011 budget and expects its reserve fund to hold $733 million as of June 30, 2011.
Maryland’s debt load is somewhat above the national average. Nevertheless, Maryland has a long history of responsible stewardship and prudent financial management. The state’s general obligation bonds are rated Aaa, AAA, and AAA by Moody’s Investors Service, Standard & Poor’s, and Fitch, respectively, and each of the rating agencies carries a stable outlook.
PERFORMANCE AND PORTFOLIO STRATEGY REVIEW
Maryland Tax-Free Money Fund
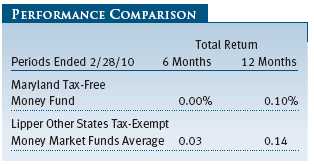
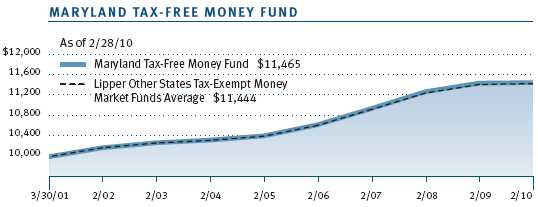
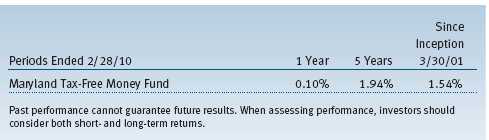
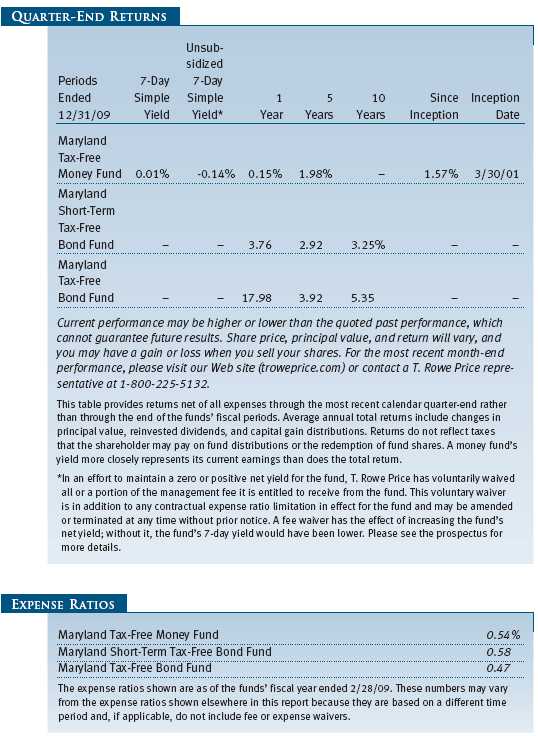
The Maryland Tax-Free Money Fund generated a 0.00% return for the six-month period and 0.10% for the 12 months ended February 28, 2010. These results modestly trailed the Lipper Other States Tax-Exempt Money Market Funds Average. The Maryland Tax-Free Money Fund continued to compare favorably with its competitors over the longer term. (Based on cumulative total return, Lipper ranked the Maryland Tax-Free Money Fund 17 out of 31, 12 out of 31, and 14 out of 30 funds in the other states tax-exempt money markets funds universe for the one-, three-, and five-year periods ended February 28, 2010, respectively. Past performance cannot guarantee future results.)
Extremely low borrowing costs will no doubt foster future economic recovery. Unfortunately, lenders—such as the Maryland Tax-Free Money Fund—have seen their interest income drop to extremely low levels. T. Rowe Price is waiving a portion of its management fee until such time as the level of income generated by the fund is sufficient to meet fund expenses. Until then, we shall continue to manage the fund for our shareholders with a focus on stability of principal and liquidity, while producing the highest level of income commensurate with those goals.
Beginning in May 2010, a series of rule changes will go into effect that will have an impact on the way taxable and tax-exempt money market funds operate. The rule changes are part of the Securities and Exchange Commission’s ongoing review of the money market fund industry. Overall, the reforms are designed to make money market funds more resilient in dealing with certain short-term market risks and to provide greater protections for investors in these funds. The rules seek to improve portfolio quality and liquidity, should result in shortening portfolio maturity, and mandate additional reporting requirements. We have been anticipating these changes for some time now and do not expect a significant impact on the operation of the T. Rowe Price Maryland Tax-Free Money Fund.
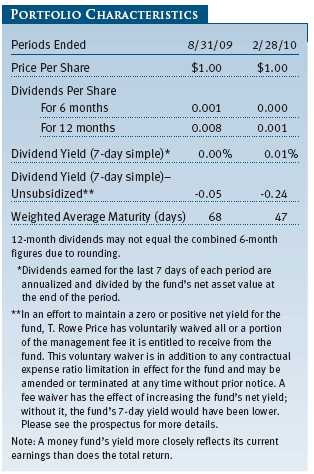
The persistence of the Federal Reserve’s zero interest rate policy has successfully driven short-term borrowing costs to extreme lows. For example, 90-day Treasury bills yield 0.11%, 90-day agency discount notes yield 0.14%, while 90-day Libor rates (an interbank lending benchmark) remain near 0.25%. Thus, it is not surprising that municipal money market rates have compressed to similar levels. At the end of our reporting period, seven-day national municipal variable rate demand notes yielded 0.19%, 90-day municipal commercial paper yielded 0.25%, and one-year municipal notes yielded 0.28%.
Despite the extreme yield environment in which we now operate, our strategy in managing your fund has not changed. While the temptation to “stretch for yield” might be understandable, we believe that taking actions to boost income—such as dipping down in credit quality or buying less-liquid, higher-yielding securities—are practices we deem inappropriate for a money fund and that the recent financial crisis has demonstrated to be fraught with risk.

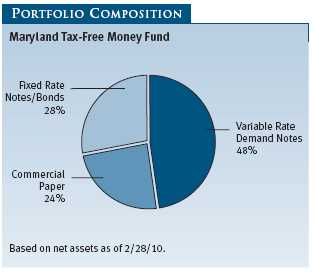
Credit quality remains a significant driver of our investment decisions. The ongoing recession has taken a significant toll on state and local governments and other municipal issuers. Maryland has weathered the slowdown better than most states. Therefore, we continue to focus on the highest-quality issuers that can demonstrate their ability to meet near-term debt obligations. Additionally, about 41% of the issues in your portfolio are backed by bank liquidity facilities or letters of credit. As a result, your portfolio’s credit quality remains very high.
In preparation for raising its target interest rates, the Federal Reserve has indicated that it believes many of the emergency measures it enacted during the financial crisis can now be allowed to lapse. Subsequent steps by the Fed will include slowly drawing down the massive liquidity it is providing to the banking system. The timing and pace of such actions by the Fed will depend heavily on the strength and sustainability of an emerging economic recovery. Until the Fed begins to act, money market rates should remain in their current range.
Maryland Short-Term Tax-Free Bond Fund
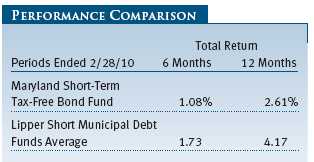
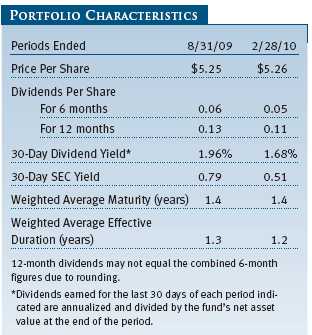
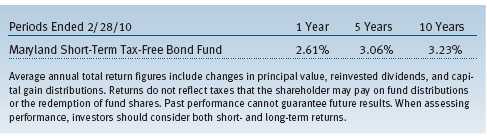
The fund returned 1.08% and 2.61% over the 6- and 12-month periods ended February 28, 2010, respectively, moderately less than the Lipper Short Municipal Debt Funds Average, which measures the performance of competing funds. The fund’s net asset value remained very stable over the past six months, rising one cent to $5.26 since the end of August. Dividends per share contributed $0.05 to the fund’s total return during the six-month period.
The Maryland Short-Term Tax-Free Bond Fund continued to compare favorably with its competitors over the longer term. (Based on cumulative total return, Lipper ranked the Maryland Short-Term Tax-Free Bond Fund 59 out of 71, 27 out of 60, 30 out of 55, and 13 out of 27 funds in the short municipal debt funds universe for the 1-, 3-, 5-, and 10-year periods ended February 28, 2010, respectively. Past performance cannot guarantee future results.)
Over the last several years, yields have fallen dramatically. Three-year Maryland general obligation bond yields fell from 3.5% in February 2007 to 1.5% in February 2009 and by almost another 50% to 0.81% at the end of the current fiscal year, February 2010. Despite this big drop in yields, investor demand stayed strong in this part of the curve, driving short-term rates to extreme lows. After keeping the fund’s duration—a measure of interest rate sensitivity—above average for most of the last three years, we reduced it over the past 12 months to 1.2 years from 1.7 years, believing that further yield declines were unlikely. Although short-term interest rates may stay low for an extended period, this defensive stance reduces the portfolio’s sensitivity to an uptick in short-term municipal interest rates.
Maryland is a very high credit quality state and demand for its debt has been extremely strong, which has driven its short-maturity bond prices to rich valuations and yields lower. (Bond yields and prices move in opposite directions.) At the end of our reporting period, a two-year Treasury note yielded about 0.90% (90 basis points) and two-year Maryland general obligations yielded 0.55% (55 basis points), just 61% of a comparable-maturity Treasury. In our view, this relationship makes this part of the curve vulnerable to rising interest rates.
Over the past six months, the Maryland Short-Term Tax-Free Bond Fund has significantly increased its cash holdings as short-term rates moved lower. The fund has largely curtailed making new investments in bonds with two- to four-year maturities except for Maryland revenue bonds that offer some excess yield. Although our average portfolio maturity and duration are longer than a money fund, both are considerably more defensive than usual. Given the current supply/demand imbalance, we don’t see a lot of value in Maryland’s short-term, high-quality bonds and believe that an uptick in interest rates would generate disappointing returns for our shareholders.
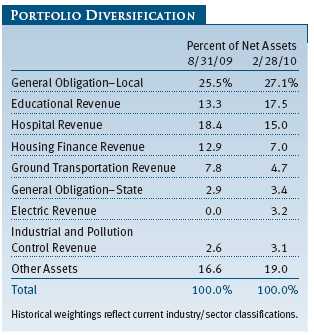
Over the past six months, cash flow into the fund has increased dramatically as investors moved assets from money funds into higher-yielding alternatives. Our largest additions were in health care and in industrial and pollution control revenue bonds. We also added to dedicated tax, housing finance, and education revenue bonds where the yield premiums offered attractive opportunities to capture additional income. Revenue sectors have outperformed due to their higher income. Our aggregate exposure to these segments rose to 38.2% at the end of February from 31.0% at the end of August 2009. At the same time, we trimmed our Maryland general obligations by a similar amount and reduced our prerefunded bonds allocation by almost 40% to 6% of the fund.

As expected, these shifts reduced our allocation to AAA rated bonds (by three percentage points) to 43% of assets, while our allocation to A and BBB rated issues widened by 3% over the past six months. Although the additional yield helped returns, our increased cash position and shorter-duration posture hurt our comparison with our Lipper peer group. It will be difficult to exceed the peer group as long as the Federal Open Market Committee keeps overnight rates near zero. However, we believe we will make up considerable ground once the Fed starts reducing its accommodative position.

Looking ahead, we believe the T. Rowe Price Maryland Short-Term Tax-Free Bond Fund is an attractive investment relative to a low-yielding money market fund. We want to maintain our yield advantage, but we are unwilling to take on significant interest rate risk to get only a marginal amount of incremental yield. Maryland is a AAA rated state with a history of fiscal responsibility, and even after the recent reductions, we have more exposure to high-quality general obligations (38.5% of assets) than many other national or single-state mutual funds.
Maryland Tax-Free Bond Fund
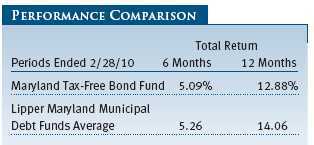
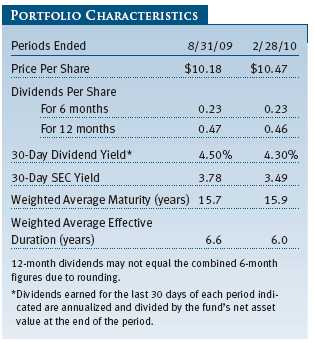
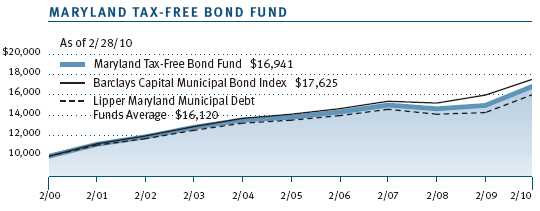
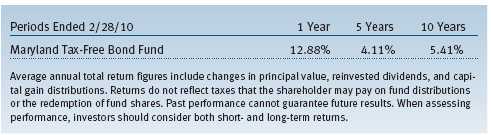
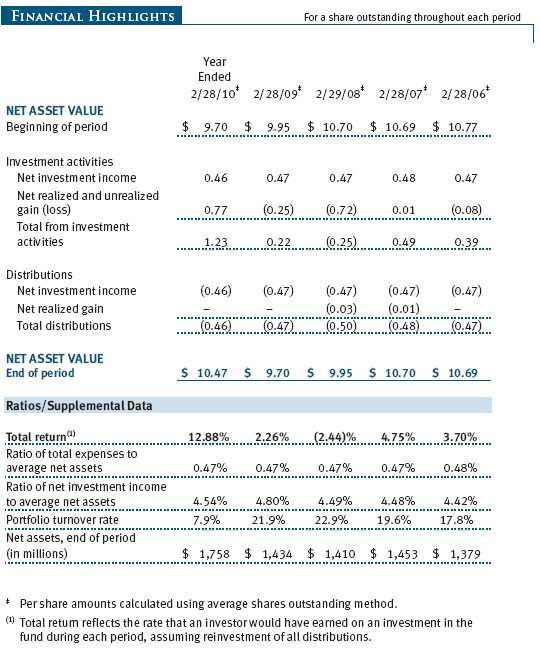
The Maryland Tax-Free Bond Fund returned 5.09% and 12.88% for the 6- and 12-month periods ended February 28, 2010, respectively. Both results modestly trailed the performance of our Lipper peer group average. The fund’s net asset value was $10.47 at the end of February, up from $10.18 six months earlier. Dividends per share contributed $0.23 to the fund’s total return over the past six months.
We are pleased to report that the fund continued to compare favorably relative to its competitors over the longer term. Lipper ranked the fund in the top quintile of its Maryland municipal debt funds universe for the 5- and 10-year periods ended February 28, 2010. (Based on cumulative total return, Lipper ranked the Maryland Tax-Free Bond Fund 14 out of 34, 7 out of 30, 4 out of 25, and 3 out of 19 funds in the Maryland municipal debt funds universe for the 1-, 3-, 5-, and 10-year periods ended February 28, 2010, respectively. Past performance cannot guarantee future results.)
During the past year, the portfolio benefited from investments made at the height of the credit crisis. In 2008, credit spreads—the extra yield investors demand for higher-risk debt—widened dramatically for municipal bonds rated AA and lower. Rather than cut back our allocation to lower-quality holdings, we continued to add to bonds rated below AAA, mostly issues rated AA and A. As spreads began to move tighter in 2009, this portion of our holdings provided excellent returns for the portfolio.
Unlike the Maryland Short-Term Tax-Free Bond Fund, which is limited by a three-year average portfolio maturity, this fund has the flexibility to purchase bonds anywhere along the municipal yield curve. The municipal yield curve was steep on a historical basis over the period, meaning that the difference in yield between long- and short-term bonds was especially large. As a result, we judged the best value along the curve to be in the long end of the market. We invested most new money in this portion of the market, which extended the portfolio’s weighted average maturity to 15.9 years. Our longer-maturity holdings produced the highest returns over the past year.
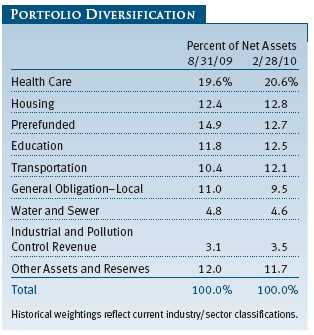
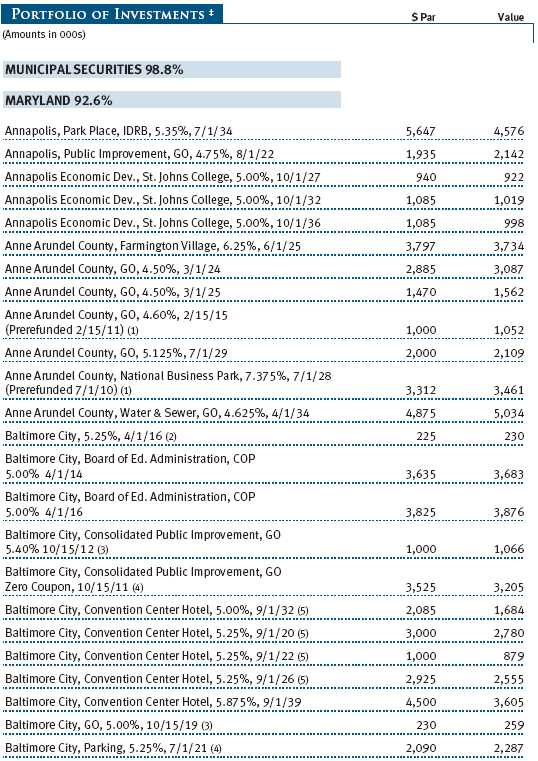
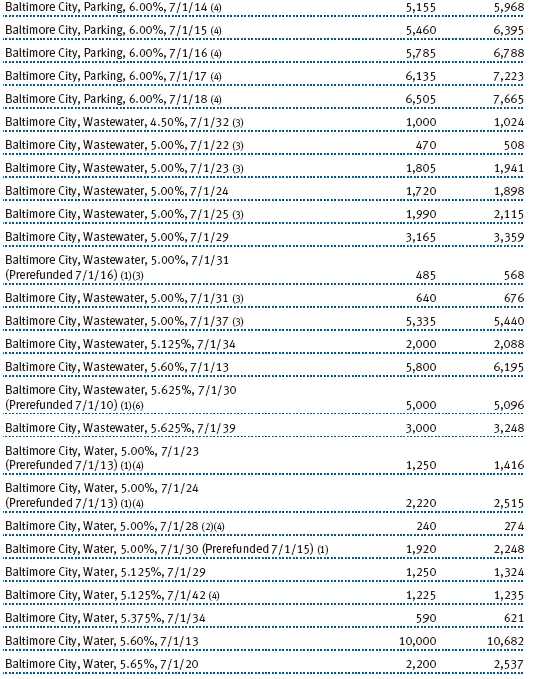
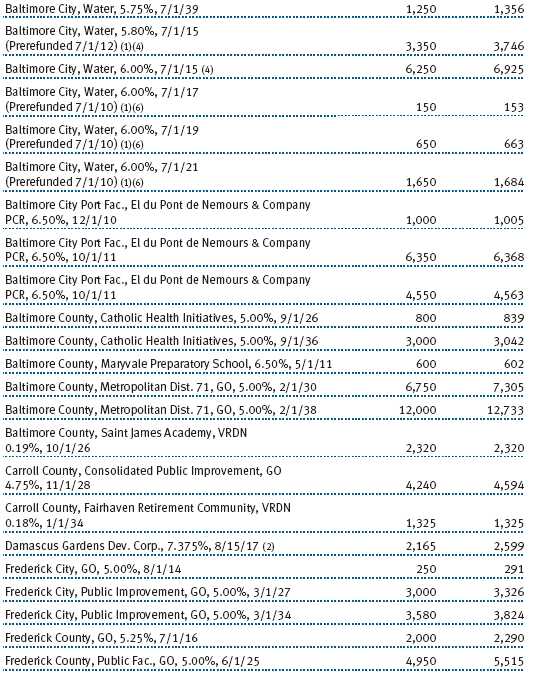
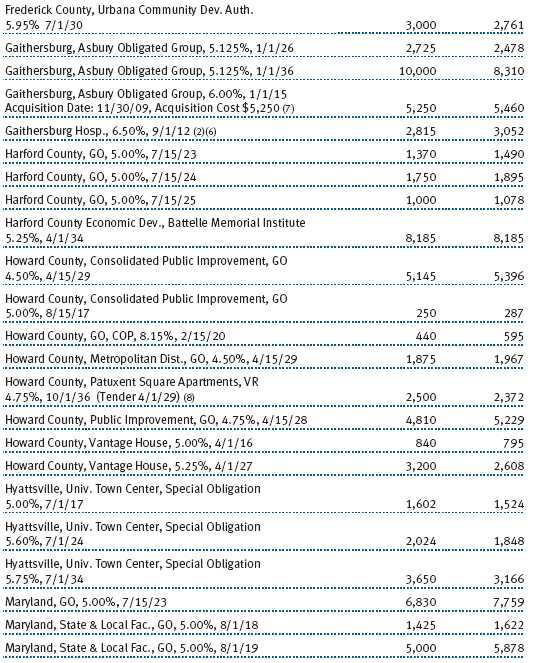
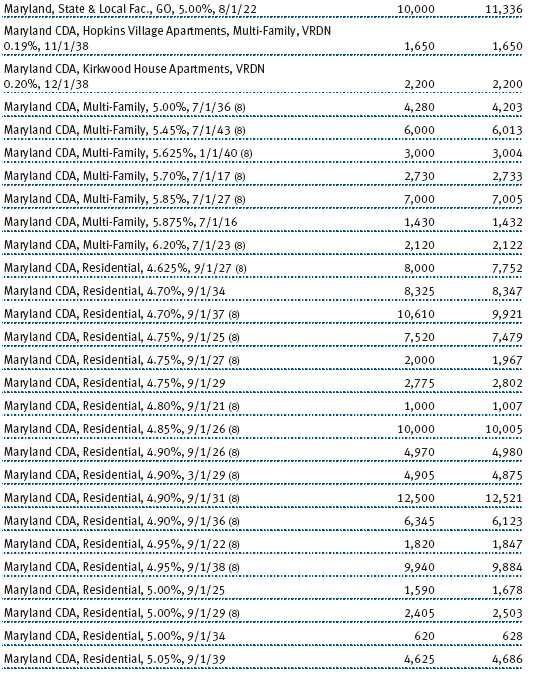
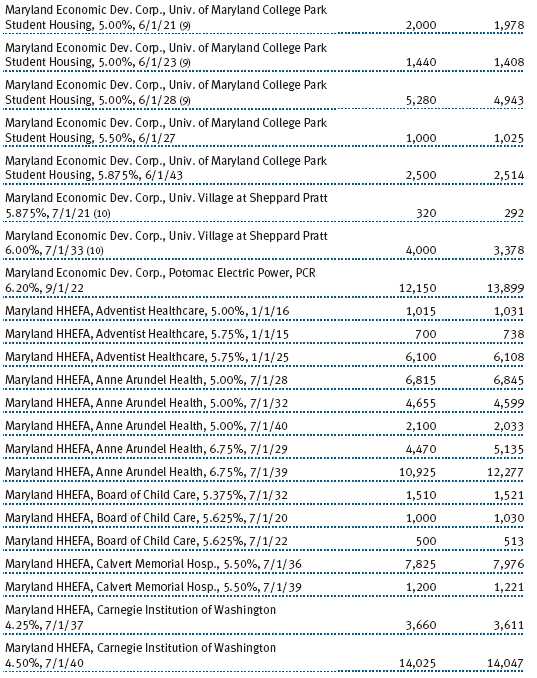
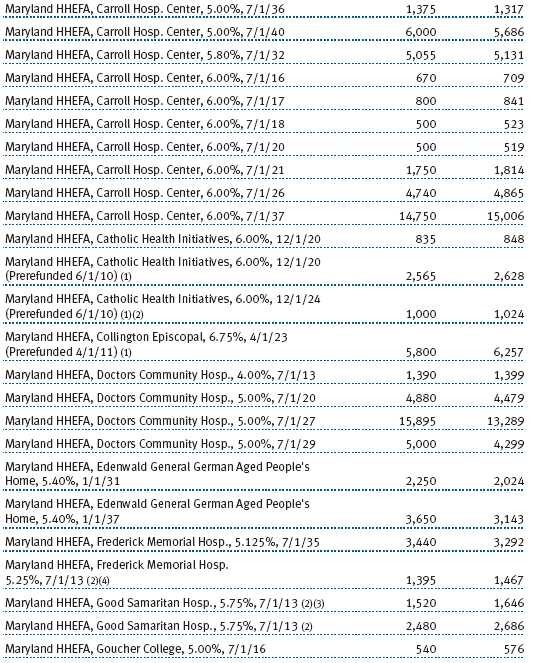
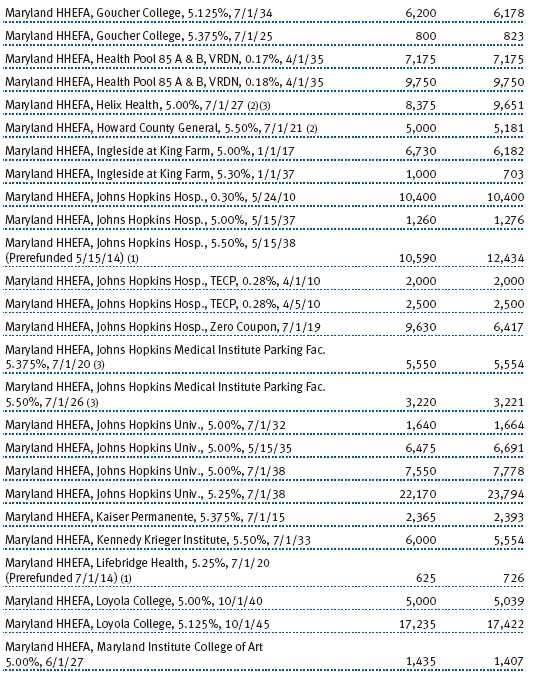
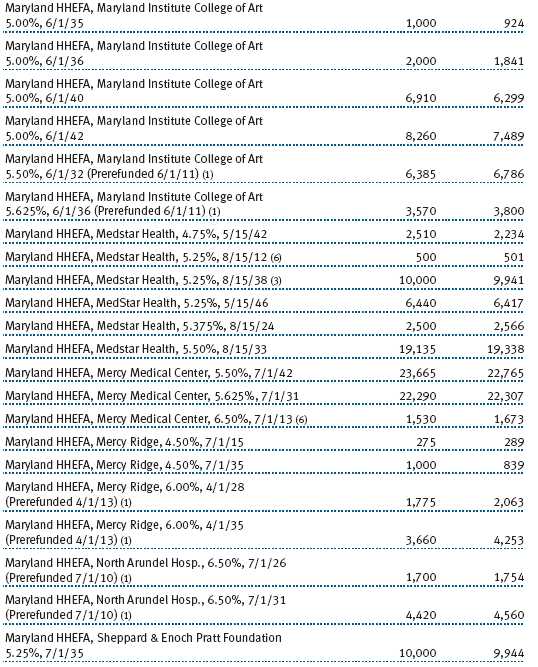
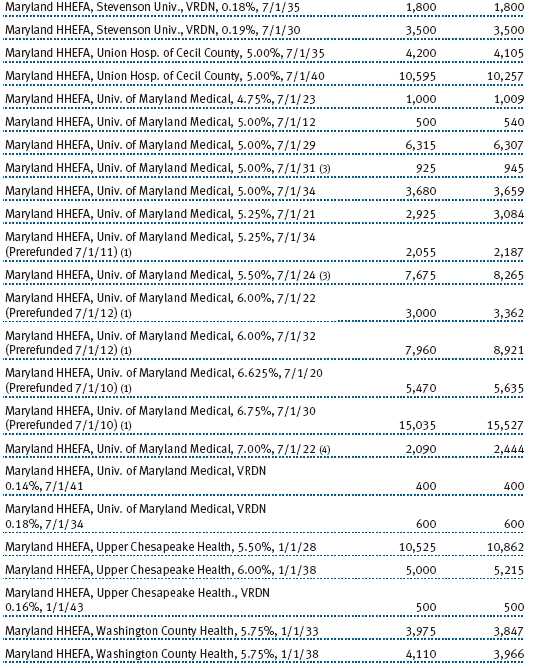
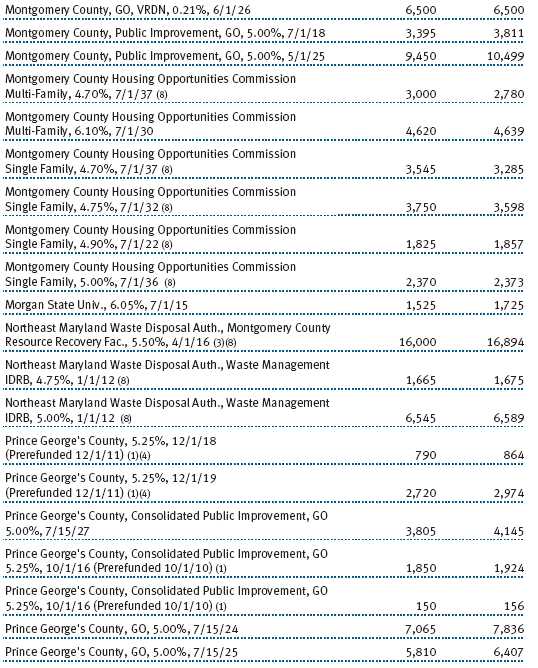
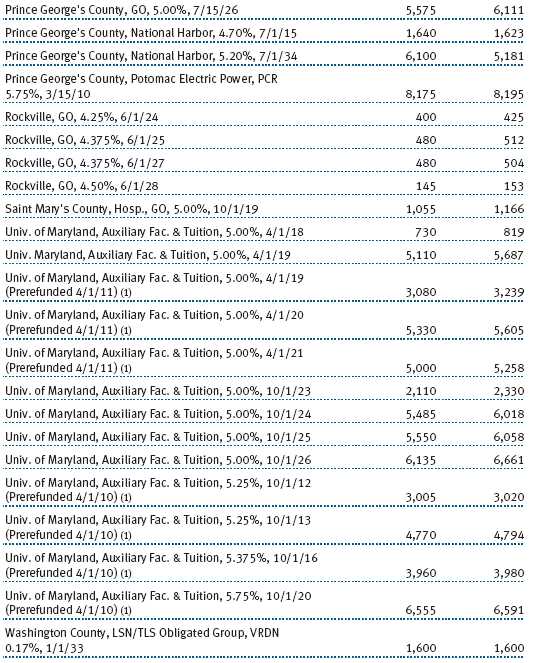
The hospital sector was a particular focus of the portfolio over the past six months. Despite the general financial pressures facing hospitals, we judged the sector to have greatly improved valuations, and we increased our allocation significantly. We feel we have added some excellent hospitals that will hold up well through the present financial strains. We made several significant purchases in this sector, including Anne Arundel Health System, Carroll County Hospital Center, and MedStar Health, all issued under Maryland Health & Higher Educational Facilities Authority. (Please refer to the fund’s portfolio of investments for a complete listing of our holdings and the amount each represents in the portfolio.)
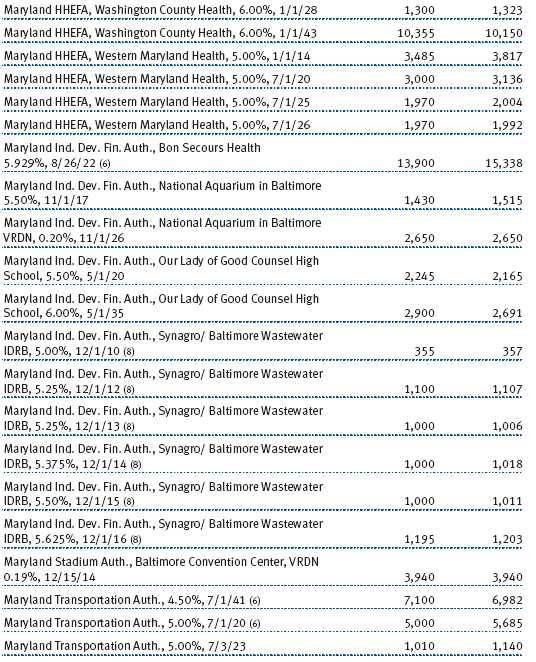
While our most significant additions were in the hospital sector, the portfolio has maintained its overall focus on revenue bonds, particularly in essential service sectors such as water and sewer and utility issues. Because essential service revenues are largely immune to the economic cycle, we consider these bonds to be a better investment than tax-backed bonds in a weak economy. Revenues from these service providers have proven to be more predictable than tax receipts. Among these, we added to bonds issued by the Maryland Economic Development Corporation for improvements to facilities at the Seagirt Marine Terminal.
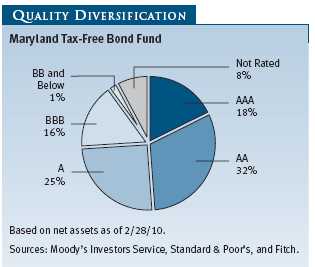
With a strong average quality of AA-, the portfolio reflects the general high quality of the Maryland municipal bond market. While we are always in search of better yield, we also subject any new purchases to a rigorous credit screening. Furthermore, with nearly 100 distinct guarantors in the fund, it offers a high level of diversification to shareholders. (Of course, diversification cannot assure a profit or protect against loss in a declining market.)
OUTLOOK
The credit environment for the municipal market could remain challenging for some time. The recession has reduced the tax revenues collected by state and local municipalities—a trend that could get worse this year. Municipal bond defaults, which have historically been rare, could increase moderately. Maintaining balanced budgets requires careful and dedicated work by state and local officials. Many issuers are trying to make the difficult but necessary fiscal decisions as they adjust to high unemployment, slow economic growth, lower tax revenues, and other tough conditions.
We believe the Maryland municipal market is still a high-quality market and that many tax-exempt securities offer good long-term value, especially considering that tax rates are likely to rise in the next few years. Longer-term and lower-rated investment-grade municipal bond valuations, though they have rebounded significantly, remain attractive and could improve further. However, we believe that most of the tightening in credit spreads is behind us. In contrast, short-term securities appear to be fully valued and could be vulnerable if short-term interest rates increase, though that does not appear likely as long as the national unemployment rate remains high.
Similarly, high-quality municipals across all maturities are expected to be very sensitive to Treasury yield fluctuations because their valuations are no longer cheap. Nevertheless, we believe three significant factors—rising tax rates, increased demand for munis, and reduced tax-exempt issuance—will help cushion the effect of rising rates on the municipal market. The higher number of bonds maturing or being “called” in 2010 will also reduce tax-exempt supply and support the municipal market.
We believe T. Rowe Price’s strong credit research capabilities have been and will remain an asset for our investors. We continue to conduct our own thorough research and assign our own independent credit ratings before making investment decisions. As always, we are on the lookout for attractively valued bonds issued by municipalities with good fundamentals. We think such investments will continue to help us generate excellent long-term results for our clients.
Thank you for investing with T. Rowe Price.
Respectfully submitted,

Joseph K. Lynagh
Chairman of the Investment Advisory Committee Maryland Tax-Free Money Fund

Charles B. Hill
Chairman of the Investment Advisory Committee Maryland Short-Term Tax-Free Bond Fund
Hugh D. McGuirk
Chairman of the Investment Advisory Committee Maryland Tax-Free Bond Fund
March 16, 2010
Each committee chairman has day-to-day responsibility for managing the portfolio and works with committee members in developing and executing each fund’s investment programs.
RISKS OF FIXED INCOME INVESTING
Bonds are subject to interest rate risk (the decline in bond prices that usually accompanies a rise in interest rates) and credit risk (the chance that any fund holding could have its credit rating downgraded or that a bond issuer will default by failing to make timely payments of interest or principal), potentially reducing the fund’s income level and share price. The Maryland Tax-Free Funds are less diversified than those investing nationally. Some income may be subject to state and local taxes and the federal alternative minimum tax.
The money fund seeks to maintain a stable net asset value and provide an appropriate place for money between investments or during uncertain market conditions. An investment in the fund is not insured or guaranteed by the FDIC or any other government agency. Although the fund seeks to preserve the value of your investment at $1.00 per share, it is possible to lose money by investing in the fund.
GLOSSARY
30-day SEC yield: A method of calculating a fund’s yield that assumes all portfolio securities are held until maturity. The Securities and Exchange Commission (SEC) requires all bond funds to calculate this yield. Yield will vary and is not guaranteed.
Average maturity: The weighted average of the stated maturity dates of the portfolio’s securities. In general, the longer the average maturity, the greater the fund’s sensitivity to interest rate changes. A shorter average maturity usually means less interest rate sensitivity and therefore a less volatile portfolio.
Barclays Capital 3-Year State General Obligation Bond Index: A broadly diversified index of state-issued general obligation tax-exempt bonds with maturities between two and four years.
Barclays Capital Municipal Bond Index: A broadly diversified index of tax-exempt bonds.
Basis point: One one-hundredth of one percentage point, or 0.01%.
Duration: A measure of a bond fund’s sensitivity to changes in interest rates. For example, a fund with a duration of five years would fall about 5% in price in response to a one-percentage-point rise in interest rates, and vice versa.
Escrowed-to-maturity bond: A bond that has the funds necessary for repayment at maturity, or a call date, set aside in a separate or “escrow” account.
Federal funds rate: The interest rate charged on overnight loans of reserves by one financial institution to another in the United States. The Federal Reserve sets a target federal funds rate to affect the direction of interest rates.
General obligation debt: A government’s strongest pledge that obligates its full faith and credit, including, if necessary, its ability to raise taxes.
Investment grade: High-quality bonds as measured by one of the major credit rating agencies. For example, Standard & Poor’s designates the bonds in its top four categories (AAA to BBB) as investment grade.
Lipper averages: The averages of available mutual fund performance returns for specified time periods in defined categories by Lipper Inc.
Prerefunded bond: A bond that originally may have been issued as a general obligation or revenue bond but that is now secured by an escrow fund consisting entirely of direct U.S. government obligations that are sufficient for paying the bondholders.
Yield curve: A graph depicting the relationship between yields and maturity dates for a set of similar securities. These curves are in constant flux. One of the key activities in managing any fixed income portfolio is to study the trends reflected by yield curves.
Performance and Expenses
This chart shows the value of a hypothetical $10,000 investment in the fund over the past 10 fiscal year periods or since inception (for funds lacking 10-year records). The result is compared with benchmarks, which may include a broad-based market index and a peer group average or index. Market indexes do not include expenses, which are deducted from fund returns as well as mutual fund averages and indexes.
| AVERAGE ANNUAL COMPOUND TOTAL RETURN |
This table shows how the fund would have performed each year if its actual (or cumulative) returns for the periods shown had been earned at a constant rate.
This chart shows the value of a hypothetical $10,000 investment in the fund over the past 10 fiscal year periods or since inception (for funds lacking 10-year records). The result is compared with benchmarks, which may include a broad-based market index and a peer group average or index. Market indexes do not include expenses, which are deducted from fund returns as well as mutual fund averages and indexes.
| AVERAGE ANNUAL COMPOUND TOTAL RETURN |
This table shows how the fund would have performed each year if its actual (or cumulative) returns for the periods shown had been earned at a constant rate.
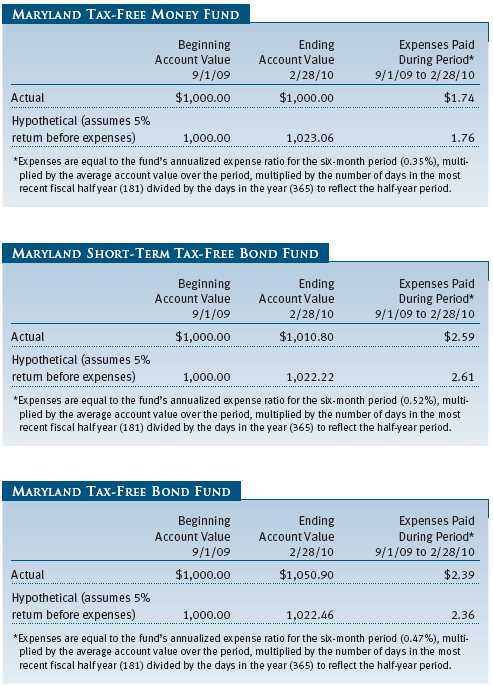
As a mutual fund shareholder, you may incur two types of costs: (1) transaction costs, such as redemption fees or sales loads, and (2) ongoing costs, including management fees, distribution and service (12b-1) fees, and other fund expenses. The following example is intended to help you understand your ongoing costs (in dollars) of investing in the fund and to compare these costs with the ongoing costs of investing in other mutual funds. The example is based on an investment of $1,000 invested at the beginning of the most recent six-month period and held for the entire period.
Actual Expenses
The first line of the following table (“Actual”) provides information about actual account values and expenses based on the fund’s actual returns. You may use the information in this line, together with your account balance, to estimate the expenses that you paid over the period. Simply divide your account value by $1,000 (for example, an $8,600 account value divided by $1,000 = 8.6), then multiply the result by the number in the first line under the heading “Expenses Paid During Period” to estimate the expenses you paid on your account during this period.
Hypothetical Example for Comparison Purposes
The information on the second line of the table (“Hypothetical”) is based on hypothetical account values and expenses derived from the fund’s actual expense ratio and an assumed 5% per year rate of return before expenses (not the fund’s actual return). You may compare the ongoing costs of investing in the fund with other funds by contrasting this 5% hypothetical example and the 5% hypothetical examples that appear in the shareholder reports of the other funds. The hypothetical account values and expenses may not be used to estimate the actual ending account balance or expenses you paid for the period.
Note: T. Rowe Price charges an annual small-account maintenance fee of $10, generally for accounts with less than $2,000 ($500 for UGMA/UTMA). The fee is waived for any investor whose T. Rowe Price mutual fund accounts total $25,000 or more, accounts employing automatic investing, and IRAs and other retirement plan accounts that utilize a prototype plan sponsored by T. Rowe Price (although a separate custodial or administrative fee may apply to such accounts). This fee is not included in the accompanying table. If you are subject to the fee, keep it in mind when you are estimating the ongoing expenses of investing in the fund and when comparing the expenses of this fund with other funds.
You should also be aware that the expenses shown in the table highlight only your ongoing costs and do not reflect any transaction costs, such as redemption fees or sales loads. Therefore, the second line of the table is useful in comparing ongoing costs only and will not help you determine the relative total costs of owning different funds. To the extent a fund charges transaction costs, however, the total cost of owning that fund is higher.
The accompanying notes are an integral part of these financial statements.


The accompanying notes are an integral part of these financial statements.

The accompanying notes are an integral part of these financial statements.
The accompanying notes are an integral part of these financial statements.
The accompanying notes are an integral part of these financial statements.
| NOTES TO FINANCIAL STATEMENTS |
T. Rowe Price State Tax-Free Income Trust (the trust), is registered under the Investment Company Act of 1940 (the 1940 Act). The Maryland Tax-Free Bond Fund (the fund), a nondiversified, open-end management investment company, is one portfolio established by the trust. The fund commenced operations on March 31, 1987. The fund seeks to provide, consistent with prudent portfolio management, the highest level of income exempt from federal and Maryland state and local income taxes by investing primarily in investment-grade Maryland municipal bonds.
NOTE 1 - SIGNIFICANT ACCOUNTING POLICIES
Basis of Preparation The accompanying financial statements were prepared in accordance with accounting principles generally accepted in the United States of America (GAAP), which require the use of estimates made by fund management. Fund management believes that estimates and security valuations are appropriate; however, actual results may differ from those estimates, and the security valuations reflected in the accompanying financial statements may differ from the value ultimately realized upon sale of the securities.
Investment Transactions, Investment Income, and Distributions Income and expenses are recorded on the accrual basis. Premiums and discounts on debt securities are amortized for financial reporting purposes. Income tax-related interest and penalties, if incurred, would be recorded as income tax expense. Investment transactions are accounted for on the trade date. Realized gains and losses are reported on the identified cost basis. Distributions to shareholders are recorded on the ex-dividend date. Income distributions are declared daily and paid monthly. Capital gain distributions, if any, are generally declared and paid by the fund, annually.
Credits The fund earns credits on temporarily uninvested cash balances held at the custodian, which reduce the fund’s custody charges. Custody expense in the accompanying financial statements is presented before reduction for credits.
New Accounting Pronouncements On March 1, 2009, the fund adopted new accounting guidance that requires enhanced disclosures about derivative and hedging activities, including how such activities are accounted for and their effect on financial position, performance, and cash flows. Adoption of this guidance had no impact on the fund’s net assets or results of operations.
In January 2010, new accounting guidance was issued that will require enhanced disclosures about fair value measurements in the financial statements; it is effective for fiscal years and interim periods beginning after December 15, 2009. Management expects that adoption of this guidance will have no impact on the fund’s net assets or results of operations.
NOTE 2 - VALUATION
The fund’s investments are reported at fair value as defined under GAAP. The fund determines the values of its assets and liabilities and computes its net asset value per share at the close of the New York Stock Exchange (NYSE), normally 4 p.m. ET, each day that the NYSE is open for business.
Valuation Methods Debt securities are generally traded in the over-the-counter (OTC) market. Securities with remaining maturities of one year or more at the time of acquisition are valued at prices furnished by dealers who make markets in such securities or by an independent pricing service, which considers the yield or price of bonds of comparable quality, coupon, maturity, and type, as well as prices quoted by dealers who make markets in such securities. Securities with remaining maturities of less than one year at the time of acquisition generally use amortized cost in local currency to approximate fair value. However, if amortized cost is deemed not to reflect fair value or the fund holds a significant amount of such securities with remaining maturities of more than 60 days, the securities are valued at prices furnished by dealers who make markets in such securities or by an independent pricing service.
Other investments, including restricted securities, and those financial instruments for which the above valuation procedures are inappropriate or are deemed not to reflect fair value are stated at fair value as determined in good faith by the T. Rowe Price Valuation Committee, established by the fund’s Board of Trustees.
Valuation Inputs Various inputs are used to determine the value of the fund’s financial instruments. These inputs are summarized in the three broad levels listed below:
Level 1 – quoted prices in active markets for identical securities
Level 2 – observable inputs other than Level 1 quoted prices (including, but not limited to, quoted prices for similar securities, interest rates, prepayment speeds, and credit risk)
Level 3 – unobservable inputs
Observable inputs are those based on market data obtained from sources independent of the fund, and unobservable inputs reflect the fund’s own assumptions based on the best information available. The input levels are not necessarily an indication of the risk or liquidity associated with financial instruments at that level. On February 28, 2010, all of the fund’s investments were classified as Level 2, based on the inputs used to determine their values.
NOTE 3 - DERIVATIVE INSTRUMENTS
During the year ended February 28, 2010, the fund invested in derivative instruments. As defined by GAAP, a derivative is a financial instrument whose value is derived from an underlying security price, foreign exchange rate, interest rate, index of prices or rates, or other variable; it requires little or no initial investment and permits or requires net settlement. The fund invests in derivatives only if the expected risks and rewards are consistent with its investment objectives, policies, and overall risk profile, as described in its prospectus and Statement of Additional Information. The fund may use derivatives for a variety of purposes, such as seeking to hedge against declines in principal value, increase yield, invest in an asset with greater efficiency and at a lower cost than is possible through direct investment, or to adjust portfolio duration and credit exposure. The risks associated with the use of derivatives are different from, and potentially much greater than, the risks associated with investing directly in the instruments on which the derivatives are based. Investments in derivatives can magnify returns positively or negatively; however, the fund at all times maintains sufficient cash reserves, liquid assets, or other SEC-permitted asset types to cover the settlement obligations under its open derivative contracts. During the year ended February 28, 2010, the fund’s exposure to derivatives, based on underlying notional amounts, was generally between 0% and 1% of net assets.
The fund values its derivatives at fair value, as described below and in Note 2, and recognizes changes in fair value currently in its results of operations. Accordingly, the fund does not follow hedge accounting, even for derivatives employed as economic hedges. As of February 28, 2010, the fund held no derivative instruments.
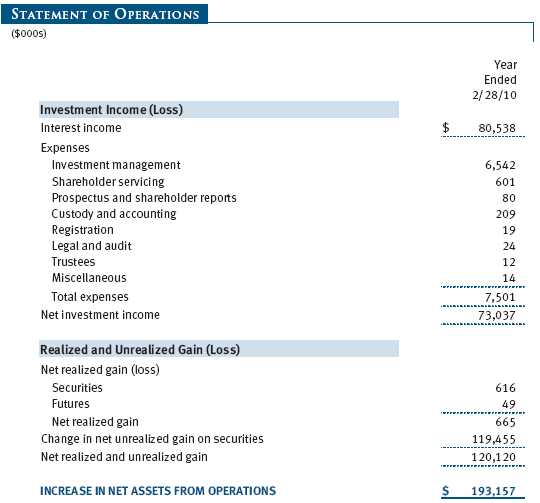
Additionally, during the year ended February 28, 2010, the fund recognized $49,000 of gain on interest rate derivatives, included in realized gain (loss) on Futures on the accompanying Statement of Operations.
Counterparty risk related to exchange-traded derivatives, including futures and options contracts, is minimal because the exchange’s clearinghouse provides protection against defaults. Additionally, for exchange-traded derivatives, each broker, in its sole discretion, may change margin requirements applicable to the fund.
Futures Contracts The fund is subject to interest rate risk in the normal course of pursuing its investment objectives and uses futures contracts to help manage such risk. The fund may enter into futures contracts to manage exposure to interest rate and yield curve movements, security prices, foreign currencies, credit quality, and mortgage prepayments; as an efficient means of adjusting exposure to all or part of a target market; to enhance income; as a cash management tool; and/or to adjust portfolio duration and credit exposure. A futures contract provides for the future sale by one party and purchase by another of a specified amount of a particular underlying financial instrument at an agreed-upon price, date, time, and place. The fund currently invests only in exchange-traded futures, which generally are standardized as to maturity date, underlying financial instrument, and other contract terms. Upon entering into a futures contract, the fund is required to deposit with the broker cash or securities in an amount equal to a certain percentage of the contract value (initial margin deposit); the margin deposit must then be maintained at the established level over the life of the contract. Subsequent payments are made or received by the fund each day to settle daily fluctuations in the value of the contract (variation margin), which reflect changes in the value of the underlying financial instrument. Variation margin is recorded as unrealized gain or loss until the contract is closed. The value of a futures contract included in net assets is the amount of unsettled variation margin; net variation margin receivable is reflected as an asset, and net variation margin payable is reflected as a liability on the accompanying Statement of Assets and Liabilities. Risks related to the use of futures contracts include possible illiquidity of the futures markets, contract prices that can be highly volatile and imperfectly correlated to movements in hedged security values and/or interest rates, and potential losses in excess of the fund’s initial investment.
NOTE 4 - OTHER INVESTMENT TRANSACTIONS
Consistent with its investment objective, the fund engages in the following practices to manage exposure to certain risks and/or to enhance performance. The investment objective, policies, program, and risk factors of the fund are described more fully in the fund’s prospectus and Statement of Additional Information.
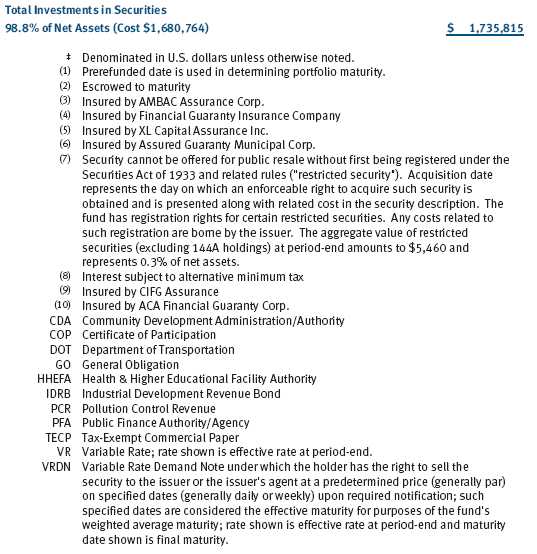
Restricted Securities The fund may invest in securities that are subject to legal or contractual restrictions on resale. Prompt sale of such securities at an acceptable price may be difficult and may involve substantial delays and additional costs.
Other Purchases and sales of portfolio securities other than short-term securities aggregated $291,618,000 and $120,854,000, respectively, for the year ended February 28, 2010.
NOTE 5 - FEDERAL INCOME TAXES
No provision for federal income taxes is required since the fund intends to continue to qualify as a regulated investment company under Subchapter M of the Internal Revenue Code and distribute to shareholders all of its income and gains. Distributions determined in accordance with federal income tax regulations may differ in amount or character from net investment income and realized gains for financial reporting purposes. Financial reporting records are adjusted for permanent book/tax differences to reflect tax character but are not adjusted for temporary differences.
The fund files U.S. federal, state, and local tax returns as required. The fund’s tax returns are subject to examination by the relevant tax authorities until expiration of the applicable statute of limitations, which is generally three years after filing of the tax return but could be longer in certain circumstances.
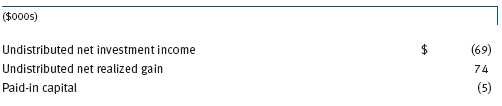
Reclassifications to paid-in capital relate primarily to undistributed income on which the fund paid tax. Reclassifications between income and gain relate primarily to the character of market discount at time of sale. Reclassifications from paid-in capital relate primarily to the tax treatment of cash received from certain regulatory settlements. For the year ended February 28, 2010, the following reclassifications were recorded to reflect tax character; there was no impact on results of operations or net assets:
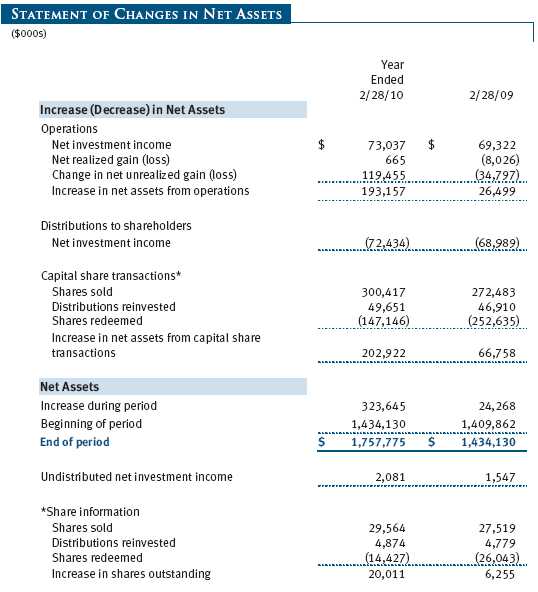
Distributions during the years ended February 28, 2010 and February 28, 2009, totaled $72,434,000 and $68,989,000, respectively, and were characterized as tax-exempt income for tax purposes. At February 28, 2010, the tax-basis cost of investments and components of net assets were as follows:
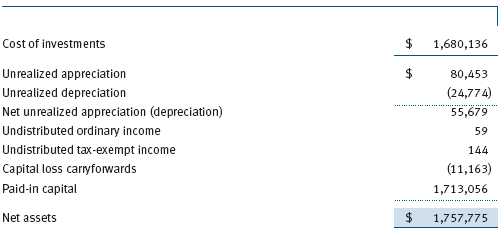
The difference between book-basis and tax-basis net unrealized appreciation (depreciation) is attributable to the realization of unrealized gains/losses on the recognition of market discount amortization for tax purposes. The fund intends to retain realized gains to the extent of available capital loss carryforwards. During the year ended February 28, 2010, the fund utilized $339,000 of capital loss carryforwards. The fund’s unused capital loss carryforwards as of February 28, 2010, expire: $1,188,000 in fiscal 2016 and $9,975,000 in fiscal 2017.
NOTE 6 - RELATED PARTY TRANSACTIONS
The fund is managed by T. Rowe Price Associates, Inc. (the manager or Price Associates), a wholly owned subsidiary of T. Rowe Price Group, Inc. The investment management agreement between the fund and the manager provides for an annual investment management fee, which is computed daily and paid monthly. The fee consists of an individual fund fee, equal to 0.10% of the fund’s average daily net assets, and a group fee. The group fee rate is calculated based on the combined net assets of certain mutual funds sponsored by Price Associates (the group) applied to a graduated fee schedule, with rates ranging from 0.48% for the first $1 billion of assets to 0.285% for assets in excess of $220 billion. The fund’s group fee is determined by applying the group fee rate to the fund’s average daily net assets. At February 28, 2010, the effective annual group fee rate was 0.30%.
In addition, the fund has entered into service agreements with Price Associates and two wholly owned subsidiaries of Price Associates (collectively, Price). Price Associates computes the daily share price and provides certain other administrative services to the fund. T. Rowe Price Services, Inc., provides shareholder and administrative services in its capacity as the fund’s transfer and dividend disbursing agent. T. Rowe Price Retirement Plan Services, Inc., provides subaccounting and recordkeeping services for certain retirement accounts invested in the fund. For the year ended February 28, 2010, expenses incurred pursuant to these service agreements were $95,000 for Price Associates; $331,000 for T. Rowe Price Services, Inc.; and less than $1,000 for T. Rowe Price Retirement Plan Services, Inc. The total amount payable at period-end pursuant to these service agreements is reflected as Due to Affiliates in the accompanying financial statements.
| REPORT OF INDEPENDENT REGISTERED PUBLIC ACCOUNTING FIRM |
To the Board of Trustees of T. Rowe Price State Tax-Free Income Trust and
Shareholders of T. Rowe Price Maryland Tax-Free Bond Fund
In our opinion, the accompanying statement of assets and liabilities, including the schedule of investments, and the related statements of operations and of changes in net assets and the financial highlights present fairly, in all material respects, the financial position of T. Rowe Price Maryland Tax-Free Bond Fund, Inc. (one of the portfolios comprising T. Rowe Price State Tax-Free Income Trust, hereafter referred to as the “Fund”) at February 28, 2010, the results of its operations for the year then ended, the changes in its net assets for each of the two years in the period then ended and the financial highlights for each of the five years in the period then ended, in conformity with accounting principles generally accepted in the United States of America. These financial statements and financial highlights (hereafter referred to as “financial statements”) are the responsibility of the Fund’s management; our responsibility is to express an opinion on these financial statements based on our audits. We conducted our audits of these financial statements in accordance with the standards of the Public Company Accounting Oversight Board (United States). Those standards require that we plan and perform the audit to obtain reasonable assurance about whether the financial statements are free of material misstatement. An audit includes examining, on a test basis, evidence supporting the amounts and disclosures in the financial statements, assessing the accounting principles used and significant estimates made by management, and evaluating the overall financial statement presentation. We believe that our audits, which included confirmation of securities at February 28, 2010 by correspondence with the custodian, provide a reasonable basis for our opinion.
PricewaterhouseCoopers LLP
Baltimore, Maryland
April 13, 2010
| TAX INFORMATION (UNAUDITED) FOR THE TAX YEAR ENDED 2/28/10 |
We are providing this information as required by the Internal Revenue Code. The amounts shown may differ from those elsewhere in this report because of differences between tax and financial reporting requirements.
The fund’s distributions to shareholders included $71,654,000 which qualified as exempt-interest dividends.
| INFORMATION ON PROXY VOTING POLICIES, PROCEDURES, AND RECORDS |
A description of the policies and procedures used by T. Rowe Price funds and portfolios to determine how to vote proxies relating to portfolio securities is available in each fund’s Statement of Additional Information, which you may request by calling 1-800-225-5132 or by accessing the SEC’s Web site, www.sec.gov. The description of our proxy voting policies and procedures is also available on our Web site, www.troweprice.com. To access it, click on the words “Our Company” at the top of our corporate homepage. Then, when the next page appears, click on the words “Proxy Voting Policies” on the left side of the page.
Each fund’s most recent annual proxy voting record is available on our Web site and through the SEC’s Web site. To access it through our Web site, follow the directions above, then click on the words “Proxy Voting Records” on the right side of the Proxy Voting Policies page.
| HOW TO OBTAIN QUARTERLY PORTFOLIO HOLDINGS |
The fund files a complete schedule of portfolio holdings with the Securities and Exchange Commission for the first and third quarters of each fiscal year on Form N-Q. The fund’s Form N-Q is available electronically on the SEC’s Web site (www.sec.gov); hard copies may be reviewed and copied at the SEC’s Public Reference Room, 450 Fifth St. N.W., Washington, DC 20549. For more information on the Public Reference Room, call 1-800-SEC-0330.
| ABOUT THE FUND’S TRUSTEES AND OFFICERS |
Your fund is governed by a Board of Trustees (Board) that meets regularly to review a wide variety of matters affecting the fund, including performance, investment programs, compliance matters, advisory fees and expenses, service providers, and other business affairs. The Board elects the fund’s officers, who are listed in the final table. At least 75% of Board members are independent of T. Rowe Price Associates, Inc. (T. Rowe Price), and T. Rowe Price International, Inc. (T. Rowe Price International); “inside” or “interested” trustees are employees or officers of T. Rowe Price. The business address of each trustee and officer is 100 East Pratt Street, Baltimore, Maryland 21202. The Statement of Additional Information includes additional information about the trustees and is available without charge by calling a T. Rowe Price representative at 1-800-225-5132.
| Independent Trustees | |
| |
| Name | |
| (Year of Birth) | Principal Occupation(s) During Past Five Years and Directorships of |
| Year Elected* | Other Public Companies |
| | |
| William R. Brody | President and Trustee, Salk Institute for Biological Studies (2009 |
| (1944) | to present); Director, Novartis, Inc. (2009 to present); Director, IBM |
| 2009 | (2007 to present); President and Trustee, Johns Hopkins University |
| | (1996 to 2009); Chairman of Executive Committee and Trustee, |
| | Johns Hopkins Health System (1996 to 2009) |
| | |
| Jeremiah E. Casey | Director, National Life Insurance (2001 to 2005); Director, The Rouse |
| (1940) | Company, real estate developers (1990 to 2004) |
| 2006 | |
| | |
| Anthony W. Deering | Chairman, Exeter Capital, LLC, a private investment firm (2004 |
| (1945) | to present); Director, Under Armour (2008 to present); Director, |
| 1986 | Vornado Real Estate Investment Trust (2004 to present); Director, |
| | Mercantile Bankshares (2002 to 2007); Member, Advisory Board, |
| | Deutsche Bank North America (2004 to present); Director, Chairman |
| | of the Board, and Chief Executive Officer, The Rouse Company, real |
| | estate developers (1997 to 2004) |
| | |
| Donald W. Dick, Jr. | Principal, EuroCapital Advisors, LLC, an acquisition and manage- |
| (1943) | ment advisory firm (1995 to present) |
| 2001 | |
| | |
| Karen N. Horn | Director, Eli Lilly and Company (1987 to present); Director, Simon |
| (1943) | Property Group (2004 to present); Director, Norfolk Southern (2008 |
| 2003 | to present); Director, Georgia Pacific (2004 to 2005) |
| | |
| Theo C. Rodgers | President, A&R Development Corporation (1977 to present) |
| (1941) | |
| 2005 | |
| John G. Schreiber | Owner/President, Centaur Capital Partners, Inc., a real estate invest- |
| (1946) | ment company (1991 to present); Partner, Blackstone Real Estate |
| 1992 | Advisors, L.P. (1992 to present) |
| | |
| Mark R. Tercek | President and Chief Executive Officer, The Nature Conservancy (2008 |
| (1957) | to present); Managing Director, The Goldman Sachs Group, Inc. |
| 2009 | (1984 to 2008) |
| |
| *Each independent trustee oversees 125 T. Rowe Price portfolios and serves until retirement, resignation, |
| or election of a successor. | |
| Inside Trustees | |
| |
| Name | |
| (Year of Birth) | |
| Year Elected* | |
| [Number of T. Rowe Price | Principal Occupation(s) During Past Five Years and Directorships of |
| Portfolios Overseen] | Other Public Companies |
| | |
| Edward C. Bernard | Director and Vice President, T. Rowe Price; Vice Chairman of the |
| (1956) | Board, Director, and Vice President, T. Rowe Price Group, Inc.; |
| 2006 | Chairman of the Board, Director, and President, T. Rowe |
| [125] | Price Investment Services, Inc.; Chairman of the Board and Director, |
| | T. Rowe Price Global Asset Management Limited, T. Rowe Price |
| | Global Investment Services Limited, T. Rowe Price Retirement |
| | Plan Services, Inc., T. Rowe Price Savings Bank, and T. Rowe Price |
| | Services, Inc.; Director, T. Rowe Price International, Inc.; Chief |
| | Executive Officer, Chairman of the Board, Director, and President, |
| | T. Rowe Price Trust Company; Chairman of the Board, all funds |
| | |
| Michael C. Gitlin | Vice President, T. Rowe Price, T. Rowe Price Group, Inc., T. Rowe |
| (1970) | Price International, Inc., and T. Rowe Price Global Investment |
| 2010 | Services Limited; formerly head of U.S. equity sales, head of Asia- |
| [39] | Pacific sales trading and cash equities, and head of international |
| | cash equities, Citigroup Global Markets (2004 to 2007) |
| |
| *Each inside trustee serves until retirement, resignation, or election of a successor. |
| Officers | |
| |
| Name (Year of Birth) | |
| Position Held With State Tax-Free Income Trust | Principal Occupation(s) |
| | |
| Jonathan M. Chirunga (1966) | Vice President, T. Rowe Price and T. Rowe Price |
| Vice President | Group, Inc. |
| | |
| M. Helena Condez (1962) | Vice President, T. Rowe Price |
| Assistant Vice President | |
| | |
| G. Richard Dent (1960) | Vice President, T. Rowe Price and T. Rowe Price |
| Vice President | Group, Inc. |
| | |
| Charles E. Emrich (1961) | Vice President, T. Rowe Price |
| Vice President | |
| | |
| Roger L. Fiery III, CPA (1959) | Vice President, T. Rowe Price, T. Rowe Price |
| Vice President | Group, Inc., T. Rowe Price International, Inc., |
| | and T. Rowe Price Trust Company |
| | |
| Kathryn A. Floyd (1982) | Vice President, T. Rowe Price |
| Vice President | |
| | |
| John R. Gilner (1961) | Chief Compliance Officer and Vice President, |
| Chief Compliance Officer | T. Rowe Price; Vice President, T. Rowe Price |
| | Group, Inc., and T. Rowe Price Investment |
| | Services, Inc. |
| | |
| Gregory S. Golczewski (1966) | Vice President, T. Rowe Price and T. Rowe Price |
| Vice President | Trust Company |
| | |
| Charles B. Hill, CFA (1961) | Vice President, T. Rowe Price and T. Rowe Price |
| Executive Vice President | Group, Inc. |
| | |
| Gregory K. Hinkle, CPA (1958) | Vice President, T. Rowe Price, T. Rowe Price |
| Treasurer | Group, Inc., and T. Rowe Price Trust Company; |
| | formerly Partner, PricewaterhouseCoopers LLP |
| | (to 2007) |
| | |
| Marcy M. Lash (1963) | Vice President, T. Rowe Price and T. Rowe Price |
| Vice President | Group, Inc. |
| | |
| Alan D. Levenson, Ph.D. (1958) | Vice President, T. Rowe Price and T. Rowe Price |
| Vice President | Group, Inc. |
| | |
| Patricia B. Lippert (1953) | Assistant Vice President, T. Rowe Price and |
| Secretary | T. Rowe Price Investment Services, Inc. |
| | |
| Joseph K. Lynagh, CFA (1958) | Vice President, T. Rowe Price, T. Rowe Price |
| Executive Vice President | Group, Inc., and T. Rowe Price Trust Company |
| | |
| Konstantine B. Mallas (1963) | Vice President, T. Rowe Price and T. Rowe Price |
| Executive Vice President | Group, Inc. |
| | |
| Hugh D. McGuirk, CFA (1960) | Vice President, T. Rowe Price and T. Rowe Price |
| President | Group, Inc. |
| | |
| Linda A. Murphy (1959) | Vice President, T. Rowe Price and T. Rowe Price |
| Vice President | Group, Inc. |
| | |
| David Oestreicher (1967) | Director and Vice President, T. Rowe Price |
| Vice President | Investment Services, Inc., T. Rowe Price Trust |
| | Company, and T. Rowe Price Services, Inc.; Vice |
| | President, T. Rowe Price, T. Rowe Price Global |
| | Asset Management Limited, T. Rowe Price |
| | Global Investment Services Limited, T. Rowe |
| | Price Group, Inc., T. Rowe Price International, |
| | Inc., and T. Rowe Price Retirement Plan |
| | Services, Inc. |
| | |
| Deborah D. Seidel (1962) | Vice President, T. Rowe Price, T. Rowe Price |
| Vice President | Investment Services, Inc., and T. Rowe Price |
| | Services, Inc. |
| | |
| Chen Shao (1980) | Employee, T. Rowe Price; formerly Junior |
| Assistant Vice President | Accountant, News America Corporation, |
| | and Reconciliation Associate, Cablevision |
| | Corporation (to 2005) |
| | |
| Timothy G. Taylor, CFA (1975) | Vice President, T. Rowe Price |
| Vice President | |
| | |
| Julie L. Waples (1970) | Vice President, T. Rowe Price |
| Vice President | |
| |
| Unless otherwise noted, officers have been employees of T. Rowe Price or T. Rowe Price International |
| for at least five years. | |
Item 2. Code of Ethics.
The registrant has adopted a code of ethics, as defined in Item 2 of Form N-CSR, applicable to its principal executive officer, principal financial officer, principal accounting officer or controller, or persons performing similar functions. A copy of this code of ethics is filed as an exhibit to this Form N-CSR. No substantive amendments were approved or waivers were granted to this code of ethics during the period covered by this report.
Item 3. Audit Committee Financial Expert.
The registrant’s Board of Directors/Trustees has determined that Mr. Anthony W. Deering qualifies as an audit committee financial expert, as defined in Item 3 of Form N-CSR. Mr. Deering is considered independent for purposes of Item 3 of Form N-CSR.
Item 4. Principal Accountant Fees and Services.
(a) – (d) Aggregate fees billed to the registrant for the last two fiscal years for professional services rendered by the registrant’s principal accountant were as follows:

Audit fees include amounts related to the audit of the registrant’s annual financial statements and services normally provided by the accountant in connection with statutory and regulatory filings. Audit-related fees include amounts reasonably related to the performance of the audit of the registrant’s financial statements and specifically include the issuance of a report on internal controls and, if applicable, agreed-upon procedures related to fund acquisitions. Tax fees include amounts related to services for tax compliance, tax planning, and tax advice. The nature of these services specifically includes the review of distribution calculations and the preparation of Federal, state, and excise tax returns. All other fees include the registrant’s pro-rata share of amounts for agreed-upon procedures in conjunction with service contract approvals by the registrant’s Board of Directors/Trustees.
(e)(1) The registrant’s audit committee has adopted a policy whereby audit and non-audit services performed by the registrant’s principal accountant for the registrant, its investment adviser, and any entity controlling, controlled by, or under common control with the investment adviser that provides ongoing services to the registrant require pre-approval in advance at regularly scheduled audit committee meetings. If such a service is required between regularly scheduled audit committee meetings, pre-approval may be authorized by one audit committee member with ratification at the next scheduled audit committee meeting. Waiver of pre-approval for audit or non-audit services requiring fees of a de minimis amount is not permitted.
(2) No services included in (b) – (d) above were approved pursuant to paragraph (c)(7)(i)(C) of Rule 2-01 of Regulation S-X.
(f) Less than 50 percent of the hours expended on the principal accountant’s engagement to audit the registrant’s financial statements for the most recent fiscal year were attributed to work performed by persons other than the principal accountant’s full-time, permanent employees.
(g) The aggregate fees billed for the most recent fiscal year and the preceding fiscal year by the registrant’s principal accountant for non-audit services rendered to the registrant, its investment adviser, and any entity controlling, controlled by, or under common control with the investment adviser that provides ongoing services to the registrant were $1,879,000 and $1,922,000, respectively.
(h) All non-audit services rendered in (g) above were pre-approved by the registrant’s audit committee. Accordingly, these services were considered by the registrant’s audit committee in maintaining the principal accountant’s independence.
Item 5. Audit Committee of Listed Registrants.
Not applicable.
Item 6. Investments.
(a) Not applicable. The complete schedule of investments is included in Item 1 of this Form N-CSR.
(b) Not applicable.
Item 7. Disclosure of Proxy Voting Policies and Procedures for Closed-End Management Investment Companies.
Not applicable.
Item 8. Portfolio Managers of Closed-End Management Investment Companies.
Not applicable.
Item 9. Purchases of Equity Securities by Closed-End Management Investment Company and Affiliated Purchasers.
Not applicable.
Item 10. Submission of Matters to a Vote of Security Holders.
Not applicable.
Item 11. Controls and Procedures.
(a) The registrant’s principal executive officer and principal financial officer have evaluated the registrant’s disclosure controls and procedures within 90 days of this filing and have concluded that the registrant’s disclosure controls and procedures were effective, as of that date, in ensuring that information required to be disclosed by the registrant in this Form N-CSR was recorded, processed, summarized, and reported timely.
(b) The registrant’s principal executive officer and principal financial officer are aware of no change in the registrant’s internal control over financial reporting that occurred during the registrant’s second fiscal quarter covered by this report that has materially affected, or is reasonably likely to materially affect, the registrant’s internal control over financial reporting.
Item 12. Exhibits.
(a)(1) The registrant’s code of ethics pursuant to Item 2 of Form N-CSR is attached.
(2) Separate certifications by the registrant's principal executive officer and principal financial officer, pursuant to Section 302 of the Sarbanes-Oxley Act of 2002 and required by Rule 30a-2(a) under the Investment Company Act of 1940, are attached.
(3) Written solicitation to repurchase securities issued by closed-end companies: not applicable.
(b) A certification by the registrant's principal executive officer and principal financial officer, pursuant to Section 906 of the Sarbanes-Oxley Act of 2002 and required by Rule 30a-2(b) under the Investment Company Act of 1940, is attached.
| | |
SIGNATURES |
| |
| | Pursuant to the requirements of the Securities Exchange Act of 1934 and the Investment |
| Company Act of 1940, the registrant has duly caused this report to be signed on its behalf by the |
| undersigned, thereunto duly authorized. |
| |
| T. Rowe Price State Tax-Free Income Trust |
| |
| |
| |
| By | /s/ Edward C. Bernard |
| | Edward C. Bernard |
| | Principal Executive Officer |
| |
| Date | April 16, 2010 |
| |
| |
| |
| | Pursuant to the requirements of the Securities Exchange Act of 1934 and the Investment |
| Company Act of 1940, this report has been signed below by the following persons on behalf of |
| the registrant and in the capacities and on the dates indicated. |
| |
| |
| By | /s/ Edward C. Bernard |
| | Edward C. Bernard |
| | Principal Executive Officer |
| |
| Date | April 16, 2010 |
| |
| |
| |
| By | /s/ Gregory K. Hinkle |
| | Gregory K. Hinkle |
| | Principal Financial Officer |
| |
| Date | April 16, 2010 |