Washington, D.C. 20549
Securities for which there is a reporting obligation pursuant to Section 15(d) of the Act:
Indicate the number of outstanding shares of each of the issuer’s classes of capital or common stock as of the close of the periods covered by the annual report:
Indicate by check mark whether the registrant by filing the information contained in this form is also thereby furnishing the information to the Commission pursuant to Rule 12g 3-2(b) under the Securities Exchange Act of 1934 (the “Exchange Act”). If “Yes” is marked, indicate the file number assigned to the registrant in connection with such rule.
Indicate by check mark whether the registrant: (1) has filed all reports required to be filed by Section 13 or 15(d) of the Exchange Act during the preceding 12 months (or for such shorter period that the registrant has been required to file such reports); and (2) has been subject to such filing requirements in the past 90 days.
This Form 40-F contains forward-looking statements within the meaning of Section 27A of the Securities Act of 1933 and Section 21E of the Securities and Exchange Act of 1934. Such statements are generally identifiable by the terminology used, such as "plan", "anticipate", "intend", "expect", "estimate", "budget" or other similar wording. Forward looking statements include but are not limited to: references to business strategy and goals; references to future capital and other expenditures; drilling plans; construction activities; refinery turnarounds; the submission of development plans; seismic activity; refining margins; oil and gas production levels and the sources of growth thereof; results of exploration activities and dates by which certain areas may be developed or may come on-stream; retail throughputs; pre-production and operating costs; reserves and resources estimates; reserves life-of-field estimates; natural gas export capacity; and environmental matters. By their very nature, these forward-looking statements require Petro-Canada to make assumptions that may not materialize or that may not be accurate. These forward-looking statements are subject to known and unknown risks and uncertainties, and other factors which may cause actual results, levels of activity and achievements to differ materially from those expressed or implied by such statements. Such factors include, but are not limited to: imprecision of reserves estimates of recoverable quantities of oil, natural gas and liquids from resource plays and other sources not currently classified as reserves; general economic, market and business conditions; industry capacity; competitive action by other companies; fluctuations in oil and gas prices; refining and marketing margins; the ability to produce and transport crude oil and natural gas to markets; the effects of weather and climate conditions; the results of exploration and development drilling and related activities; fluctuation in interest rates and foreign currency exchange rates; the ability of suppliers to meet commitments; actions by governmental authorities including increases in taxes; decisions or approvals of administrative tribunals; changes in environmental and other regulations; risks attendant with oil and gas operations, both domestic and international; international political events; expected rates of return; and other factors, many of which are beyond the control of Petro-Canada. These factors are discussed in greater detail elsewhere in this Form 40-F.
Readers are cautioned that the foregoing list of important factors affecting forward-looking statements is not exhaustive. Furthermore, the forward-looking statements contained herein are made as of the date of this Form 40-F, and Petro-Canada does not undertake any obligation to update publicly or to revise any of the included forward-looking statements, whether as a result of new information, future events or otherwise. The forward-looking statements contained in this Form 40-F are expressly qualified by this cautionary statement.
| 2 | Proved reserves replacement ratio is calculated by dividing the year-over-year net change in proved reserves, before deducting production, by the annual production over the same time period. The reserves replacement ratio is a general indicator of the Company’s reserves growth. It is only one of a number of metrics which can be used to analyse a company’s upstream business. |
Project Execution
Petro-Canada manages a number of different-sized projects to support continuing operations and future growth. Many projects are influenced by external factors beyond the Company’s control. These factors include items such as material costs, labour productivity, timely availability of skilled labour and currency fluctuations.
While Petro-Canada cannot control all project inputs, the Company is committed to continuing to improve its project management capability. Petro-Canada’s goal is to consistently and predictably deliver projects on time and on budget, and achieve defined expectations. Enhanced project management capability is expected to improve all elements of project execution, including safety and environmental performance, quality, cycle time and cost. By leveraging experience gained from major project developments, the Company has established project management “best practices.”
Non-Operated Interests
Other companies may manage the construction or operation of assets in which Petro-Canada has a significant interest. Business assets in which Petro-Canada has a major interest, but does not operate, include Hibernia (20% interest), Syncrude (12% interest), White Rose (27.5% interest) and Buzzard (29.9% interest). Major projects are managed through different forms of joint venture executive committees, resulting in Petro-Canada having some ability to influence these projects. As well, Petro-Canada has joint venture or other operating agreements which specify our expectations from third-party operators. Nevertheless, third-party operation and management of the Company’s assets could adversely affect Petro-Canada’s financial performance.
Environmental Regulations
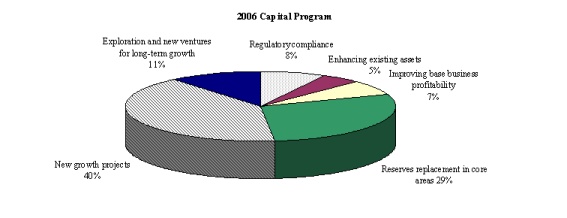
Environmental risks in the oil and gas industry are significant. This situation has arisen because related laws and regulations are becoming more stringent in Canada and in other countries where Petro-Canada operates. Due to increased regulations, Petro-Canada is investing additional capital to satisfy new product specifications and/or address environmental issues. In 2006, the Company anticipates that it will invest $265 million of its capital expenditure program toward regulatory compliance, most of which will be incurred to modify refineries to produce low-sulphur distillates. Other environmental regulations may result in future increased operating costs as a result of creating a future liability when dismantling or remediating assets.
Petro-Canada conducts Life-Cycle Value Assessments (LCVA) to integrate and balance environmental, social and economic decisions related to major projects. A key component of the LCVA process is the assessment and planning for all life-cycle stages involved in constructing, manufacturing, distributing and eventually abandoning an asset or a product. This process encourages more comprehensive exploration of alternatives. The LCVA is a useful technique; however, its predictive capability is limited by assumptions that involve the reliance on the current regulatory regime or one that can be reasonably expected.
Emission Of Greenhouse Gases
The Kyoto Protocol, ratified by the Government of Canada in December 2002 and effective as of February 16, 2005, requires signatory nations to reduce their emissions of carbon dioxide and other greenhouse gases. As a result, Petro-Canada may be required to reduce emissions of greenhouse gases from operations or to purchase emission-trading credits. While the details of implementation of the Kyoto Protocol in Canada have not been finalized, the impact on Petro-Canada could be higher capital expenditures and operating expenses. The Government of Canada may also impose higher vehicle fuel efficiency standards. The impact of this action could be to decrease the demand for gasoline and diesel fuels sold by Petro-Canada and depress the Company’s margins for refined products.
Petro-Canada is committed to reducing emissions. Additional detail will be available in the Company’s Report to the Community, which is expected to be released in the second quarter of 2006. The Report will be posted on www.petro-canada.ca. Through industry organizations, Petro-Canada continues to work with a number of regulatory groups and government associations to find a cost-effective approach which will minimize the negative financial impact of the Kyoto Protocol on the Company, while still reducing emissions. The level of influence these discussions and co-operative efforts have on the Government of Canada’s implementation plan may be quite limited.
Government Regulations
Petro-Canada’s operations are regulated by, and could be intervened upon by, a variety of governments around the world. Governments’ actions could impact the contracting of exploration and production interests, impose specific drilling obligations, and possibly expropriate or cancel contract rights. Governments may also regulate prices of commodities or refined products, or intervene through taxes, royalties and exploration rights.
Petro-Canada tries to mitigate the impact of government regulations by selecting operating environments with stable governments. To date, Petro-Canada has had a co-operative relationship with its regulators and the governments in the countries in which it operates. Most of the contact with regulators occurs through the Company’s management, regulatory affairs personnel in each business unit and a centralized corporate government relations department. Petro-Canada aims to have regular, constructive communication with regulators and governments so issues can be resolved in a mutually acceptable fashion. The Company also has a strong record of regulatory compliance within the jurisdictions where it operates. Petro-Canada operates in many different jurisdictions and derives revenue from several categories of products. This diversification makes financial performance less sensitive to the action of any single government. Nevertheless, Petro-Canada has limited ability to influence regulations which may have a material adverse effect on the Company.
Counterparties
In the normal course of business, Petro-Canada is exposed to credit risk resulting from the uncertainty of business partners’ or counterparties’ ability to fulfill their obligations. The Company has established internal credit policies and procedures that include financial assessments, exposure limits and processes to monitor and minimize the exposures against these limits. Where appropriate, Petro-Canada also uses netting and collateral arrangements to minimize risk.
OPERATIONAL RISKS
Exploring for, developing, producing, refining, transporting and marketing oil, natural gas and refined products involve significant operational hazards. These risks include well blowouts, fires, explosions, gaseous leaks, migration of harmful substances and oil spills. Any of these operational incidents could cause personal injury, environmental contamination, or damage and destruction of the Company’s assets. These incidents could also interrupt production.
Petro-Canada manages operational risks primarily through a Total Loss Management (TLM) system. TLM is an internally developed management system based on external “best practices” with standards for preventing operational incidents. Regular TLM audits test compliance with these standards.
The Company also purchases insurance to transfer the financial impact of some operational risks to high credit quality third-party insurers. Petro-Canada regularly evaluates its exposures related to operational risks and adjusts the nature of its coverage, including deductibles and limits. Although Petro-Canada maintains insurance in line with customary industry practices, the Company cannot and does not fully insure against all risks. Losses resulting from operational incidents could have a material adverse impact on the Company.
FOREIGN RISKS
Petro-Canada has significant operations in a number of countries that have varying political, economic and social systems. As a result, the Company’s operations and related assets are subject to potential risks of actions by governmental authorities, internal unrest, war, political disruption, economic and legal sanctions (such as restrictions against countries that the U.S. government may deem to sponsor terrorism), and changes in global trade policies. The Company’s operations may be restricted, disrupted or prohibited in any country in which these risks occur. Petro-Canada has production in OPEC-member countries, which is constrained by OPEC quotas.
The Company continually evaluates exposure in any one country in the context of total operations. Investment may be limited to avoid excessive exposure in any one country or region. The Company also purchases political risk insurance to partially mitigate some political risks.
MARKET RISKS
More detailed quantification of the impact of some of the following risks can be found in the earnings sensitivities table on page four of the Business Environment section in the MD&A.
Commodity Prices
In Petro-Canada’s upstream businesses, significant market risk exposure exists due to changing commodity prices of crude oil and natural gas. Commodity prices are volatile and influenced by factors such as supply and demand fundamentals, geopolitical events, OPEC decisions and weather. In 2005, the monthly average Brent crude oil price ranged between $44.23 US/bbl and $64.12 US/bbl, and the AECO-C hub index ranged between $6.16 per gigajoule (GJ) and $12.08/GJ. These commodity prices also impact the refined products margins realized by the Downstream business, another significant market risk. In 2005, the benchmark monthly average New York Harbour 3-2-1 refinery crack spread per bbl ranged from $4.86 US/bbl to $21.74 US/bbl. Petro-Canada’s ability to maintain product margins in an environment of higher feedstock costs is contingent upon the Company’s ability to flow higher costs through to customers.
Petro-Canada generally does not hedge large volumes of production. Management believes commodity prices are volatile and difficult to predict. The business is managed so that the Company can substantially withstand the impact of a lower price environment, while maintaining the opportunity to capture significant upside when the price environment is higher. However, commodity prices and margins may be hedged occasionally to capture opportunities that represent extraordinary value and to ensure the economic value of an acquisition. For example, as part of the Company’s acquisition of an interest in the Buzzard field in the U.K. sector of the North Sea, the Company entered into a series of derivative contracts related to the future sale of Brent crude oil (see Derivative Instruments below). Certain Downstream physical transactions are routinely hedged for operational needs and to facilitate sales to customers.
Foreign Exchange
As energy commodity prices are primarily priced in U.S. dollars, a large portion of Petro-Canada’s revenue stream is affected by the Canada/U.S. exchange rate. As a result, the Company’s earnings are negatively affected by a strengthening Canadian dollar. The Company is also exposed to fluctuations in other foreign currencies, such as the euro and the British pound. Generally, Petro-Canada does not hedge foreign exchange exposures, although the Company partially mitigates the U.S. dollar exposure by denominating the majority of its debt obligations in U.S. dollars. Foreign exchange exposure related to asset acquisitions or divestitures, or project capital expenditures, may be hedged on a case-by-case basis.
Interest Rates
Petro-Canada targets a blend of fixed and floating rate debt. Generally, this strategy enables the Company to take advantage of lower interest rates on floating debt, while matching overall debt maturities with the life of cash-generating assets. The Company is exposed to fluctuations in the rate of interest it pays on floating rate debt. This interest rate exposure is within the Company’s risk tolerance.
Derivative Instruments
Petro-Canada’s Market Risk and Derivative Policy prohibits the use of derivative instruments for speculative purposes. Petro-Canada instead uses derivatives primarily to hedge physical transactions for operational needs and to facilitate sales to customers. The gains and losses associated with these financial instruments essentially offset gains and losses on the physical transactions. Except as specifically authorized by the Board of Directors, the term of hedging instruments cannot exceed 18 months. Monitoring and reporting of the derivatives portfolio includes periodic testing of the fair value of all outstanding derivatives. Fair values are determined by obtaining independent third-party quotes for the value of each derivative instrument. The objectives and strategies of all hedge transactions are documented and the effectiveness of the derivative instrument in offsetting a change in the value of the hedged exposure is assessed on a regular basis.
Effective January 1, 2004, the Company elected to discontinue hedge accounting for certain hedging programs. All derivatives that do not qualify as a hedge, or are not designated as a hedge, are accounted for using the mark-to-market accounting method. These derivatives are recorded in the balance sheet as either an asset or liability, with the fair value recognized in earnings in each reporting period. As a result, the realized and unrealized values of these transactions are recognized in Investment and Other Income.
During 2004, as part of the Company’s acquisition of an interest in the Buzzard field, the Company entered into a series of derivative contracts related to the future sale of Brent crude oil. The purpose of these transactions was to ensure value-added returns to Petro-Canada on this investment, even in the event of a material decrease in oil prices. These contracts effectively lock in an average forward price of approximately $26 US/bbl on a volume of 35,840,000 barrels. This volume represents approximately 50% of the Company’s share of estimated plateau production in the 2007-2010 time frame. As at December 31, 2005, this hedge had a mark-to-market unrealized loss of $767 million after-tax, of which $562 million was recognized in the income statement in 2005.
In 2005, other derivative instruments in place for refining supply and product purchases resulted in an increase in net earnings from continuing operations of about $4 million after-tax. This result compared with a decrease in net earnings from continuing operations of about $1 million in 2004.
Upstream
Petro-Canada’s upstream operations consist of four business segments: North American Natural Gas, with current production in Western Canada and the U.S. Rockies; East Coast Oil, with three major developments offshore Newfoundland and Labrador; Oil Sands operations in northeastern Alberta; and International, where the Company is active in three core areas: Northwest Europe; North Africa/Near East; and Northern Latin America. The Company’s diverse asset base provides a balanced portfolio and a platform for long-term growth.
North American Natural Gas
Business Summary and Strategy
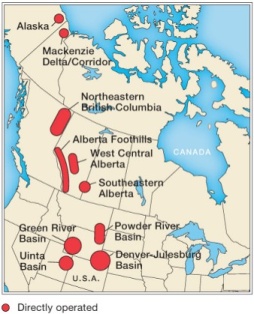
North American Natural Gas explores for and produces natural gas, crude oil and NGL in Western Canada and the U.S. Rockies. This business also markets natural gas in North America, has established resources in the Mackenzie Delta/Corridor and has landholdings in Alaska.
The North American Natural Gas strategy is to be a significant and sustainable market participant by accessing new and diverse natural gas supply sources in North America. Key features of the strategy include:
| § | transitioning further into unconventional gas plays; |
| § | optimizing core properties in Western Canada and developing coal bed methane and tight gas in the U.S. Rockies; |
| § | stepping out of traditional operating areas, with an increased focus on exploration; |
| § | developing LNG import capacity at Gros-Cacouna, Quebec; and |
| § | building the northern resource base for long-term growth. |
Western Canada and U.S. Rockies
North American Natural Gas reserve extensions, new discoveries, revisions and improved recovery added 95 billion cubic feet equivalent of natural gas, crude oil and NGL to proved reserves before royalties. Annual production before royalties totalled 244 Bcf of natural gas and 5.4 million barrels (MMbbls) of conventional crude oil and NGL. Exploration and development drilling activity in North American Natural Gas resulted in 706 gross (488 net) wells, including 680 gross (468 net) natural gas wells and two gross (two net) oil wells, for an overall success rate of 96%.
The North American realized natural gas price averaged $8.47/Mcf in 2005, up 26% from $6.72/Mcf in 2004.
Western Canada natural gas production averaged 704 million cubic feet per day of natural gas equivalent (MMcfe/d), down 8% from 764 MMcfe/d in 2004. Exploration and development drilling activity in Western Canada resulted in 373 gross successful wells, for an overall success rate of 94% in 2005. Western Canada operating and overhead costs were $1.10/Mcfe in 2005, up from $0.92/Mcfe in the previous year. The operating and overhead cost increase in Western Canada reflects insurance premium surcharges and general industry-wide cost pressures for materials, fuel and labour. The Company’s cost increases reflect industry-wide operating cost trends which have been rising approximately 15% per year.
During 2004, the North American Natural Gas business grew to include unconventional gas operations and skills. In mid-2004, its footprint was extended into the U.S. Rockies with the acquisition of Prima Energy Corporation (U.S. Rockies) for $644 million, net of acquired cash. This acquisition added production from coal bed methane in the Powder River Basin and from tight gas in the Denver-Julesburg Basin, as well as significant expertise in unconventional production. The value from the U.S. Rockies acquisition will come from developing the large inventory of probable reserves.
U.S. Rockies production averaged 52 MMcfe/d in 2005, compared to 23 MMcfe/d in 2004, which reflected the mid-year 2004 acquisition.
Exploration and development drilling activity in the U.S. Rockies resulted in more than 300 development wells in 2005, up from 148 wells in 2004. In addition, Petro-Canada obtained 407 permits for new coal bed methane wells in 2005, with 292 applications submitted for consideration. Most of the new wells are in the de-watering phase. U.S. Rockies operating and overhead costs were $1.84/Mcfe in 2005, up from $2.00/Mcfe in 2004.
In Western Canada, Petro-Canada operates 11 natural gas field processing plants with total licensed capacity of approximately 1.1 Bcf/d, of which the Company’s share is approximately 691 MMcf/d. The following table shows Petro-Canada’s working interest ownership and the capacity of operated processing plants.
PETRO-CANADA OWNERSHIP AND CAPACITY
| Petro-Canada Operated Plants | Working Interest Ownership (%) | Gross Licensed Capacity (MMcf/d) | Net Licensed Capacity (MMcf/d) |
| |
| Brazeau Sweet | 47 | 78 | 37 |
| Brazeau Sour | 30 | 107 | 32 |
Total Brazeau | | 185 | 69 |
| | | |
| Hanlan Sweet | 41 | 44 | 18 |
| Hanlan Sour | 46 | 380 | 175 |
Total Hanlan | | 424 | 193 |
| | | | |
| Wilson Creek Sweet | 52 | 12 | 7 |
| Wilson Creek Sour | 52 | 22 | 11 |
Total Wilson Creek | | 34 | 18 |
| | | | |
| Boundary Lake Sweet | 100 | 20 | 20 |
| Boundary Lake Sour | 50 | 66 | 33 |
| Parkland 1 | 44 | 18 | 8 |
| Parkland 2 | 35 | 12 | 4 |
| Wildcat Hills | 66 | 124 | 82 |
| Bearberry | 100 | 94 | 94 |
| Ferrier | 99 | 119 | 118 |
| Gilby East | 100 | 52 | 52 |
Total 2005 | | 1,148 | 691 |
Petro-Canada also has varying working interests in other natural gas processing plants and field gathering facilities operated by other oil and gas companies. The Company’s aggregate share from such interests is 173 MMcf/d of licensed capacity.
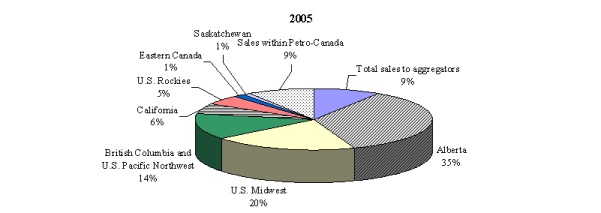
In 2005, North American Natural Gas marketed 813 MMcf/d of natural gas of which 738 MMcf/d were direct sales. Approximately 9% (75 MMcf/d) of total sales were internal to Petro-Canada, at market prices, and were used for refinery and lubricant facilities process fuel along with some plant feedstock, and steam generation at the MacKay River oil sands operation. In Western Canada, the Company markets natural gas produced by other companies in addition to Petro-Canada’s own production. In Western Canada, the Company sold 772 MMcf/d in 2005, down 9% from 844 MMcf/d in 2004 reflecting lower production. U.S. Rockies sales for 2005 were 41 MMcfe/d, compared with 19 MMcfe/d in 2004. Higher 2005 sales reflect the mid-year 2004 acquisition of the U.S. Rockies. To achieve better control over sales volumes, prices and transportation-related costs, Petro-Canada focuses on direct sales to end-users, distribution companies, wholesale marketers and natural gas spot markets. Marketing efforts include management of the gas portfolio, gas supply contracts, pipeline commitments and customer relationships.
The following table shows the market distribution of Petro-Canada’s North American Natural Gas sales.
NORTH AMERICAN NATURAL GAS SALES BY MARKET
| | 2005 | 2004 |
| | (MMcf/d) | (% of Total) | (MMcf/d) | (% of Total) |
Sales to aggregators | | | | |
| Canwest Gas Supply Inc. | 14 | 2 | 16 | 2 |
| ProGas Limited | 38 | 5 | 35 | 4 |
| Cargill Incorporated | 20 | 2 | 17 | 2 |
| Others | 3 | - | 6 | 1 |
Total sales to aggregators | 75 | 9 | 74 | 9 |
Direct sales | | | | |
| Alberta | 286 | 35 | 368 | 44 |
| U.S. Midwest | 160 | 20 | 159 | 18 |
| British Columbia and U.S. Pacific Northwest | 112 | 14 | 106 | 12 |
| California | 45 | 6 | 45 | 5 |
| U.S. Rockies | 41 | 5 | 19 | 2 |
| Eastern Canada | 12 | 1 | 12 | 1 |
| Saskatchewan | 7 | 1 | 8 | 1 |
Total before internal sales | 663 | 82 | 717 | 83 |
| Sales within Petro-Canada | 75 | 9 | 72 | 8 |
Total direct sales | 738 | 91 | 789 | 91 |
Total sales | 813 | 100 | 863 | 100 |
The Company has future commitments to sell and transport natural gas associated with normal operations. Under future fixed-price commitments entered into during the 1990s, approximately 10 MMcf/d (1.7% of estimated 2006 natural gas production in Western Canada) has been sold at an average plant gate netback price of $3.26/Mcf. In 2007, the volume of natural gas sold under these fixed-price contracts is expected to remain at 10 MMcf/d at an average plant gate netback price of $3.54/Mcf.
Royalty Regime
The royalty regimes are a significant factor in the profitability of crude oil and natural gas production. Royalties on conventional crude oil and natural gas owned by provincial governments are determined by regulation and may be amended from time to time. Royalty payments to provincial governments are generally calculated as a percentage of production and vary depending upon factors such as well production volumes, selling prices, method of recovery, location of production and date of discovery. Royalties payable on production of privately owned crude oil and natural gas are negotiated with the mineral rights owner. In 2005, Petro-Canada’s average royalty rate for North American Natural Gas was approximately 23% for conventional crude oil, NGL and natural gas.
Mackenzie Delta/Corridor, Northwest Territories
With interests in eight blocks covering approximately one million gross undeveloped acres (600,000 net acres), Petro-Canada is a significant leaseholder in the Mackenzie Delta/Corridor. During 2005, Petro-Canada acquired two exploration licences, covering 410,000 acres with work commitment bids totalling approximately $35 million. Petro-Canada’s holdings are comprised of six exploration licences and two Inuvialuit land concessions. Petro-Canada is the operator of five of the licences. The net work commitments on the licences total approximately $57.5 million and are guaranteed by performance bonds for the Company’s net share of approximately $14.4 million. Work program terms in the Inuvialuit land concessions include seismic acquisition and drilling. In 2002, a natural gas discovery at the Tuk M-18 well tested at restricted rates of up to 30 MMcf/d. Having secured what is believed to be the area’s most prospective acreage for future exploration, Petro-Canada will pace activities pending the anticipated approval and construction timeline for the Mackenzie pipeline.
Petro-Canada also holds a 100% position in 73,000 acres covering two Significant Discovery Areas (SDAs) in the Colville Hills area of the Mackenzie Corridor. The M-47 well on the Tweed Lake SDA was re-entered and tested in 2004, with restricted rates up to 10 MMcf/d.
Alaska
Petro-Canada’s initial foray into Alaska was in the Foothills area north of the Brooks Mountain Range. A field geological study has confirmed that the geology and prospectivity of this area is similar to the Alberta Foothills, where Petro-Canada has developed considerable expertise and has had significant success finding natural gas. During 2005, Petro-Canada and Anadarko Petroleum Corporation increased their joint land position to 2.5 million acres in the gas prospective North Slope region of the Brooks Range in Alaska. In January 2006, BG (Alaska) E&P Inc. joined the Foothills joint venture and each company now holds an one-third interest in the acreage. While it is unlikely the region will be serviced by a pipeline for some time, this acreage is close to a proposed pipeline route to southern markets. Also in 2004, Petro-Canada acquired a large land position (322,610 gross and net acres) in the National Petroleum Reserve-Alaska, an area with significant potential for large oil prospects.
LNG
Petro-Canada is seeking to participate in the global LNG business consistent with its strategy to add long-life producing assets to its portfolio. In July 2004, an MOU was signed with TransCanada PipeLines to develop and share (50/50) ownership of an LNG facility at Gros-Cacouna, Quebec, with a preliminary cost estimate of $660 million. The proposed facility will receive, store and re-gasify imported LNG. Petro-Canada will have throughput and marketing rights to 100% of the send-out capacity of approximately 500 MMcf of natural gas per day.
Petro-Canada continued to advance the proposed LNG import and re-gasification terminal at Gros-Cacouna, Quebec, with a joint filing of an Environmental Impact Assessment with the provincial and federal governments in the second quarter of 2005. The Company, along with its partner, TransCanada PipeLines, is aiming to secure regulatory approval by late 2006. A joint provincial and federal government hearing is scheduled for spring 2006 and pre-construction engineering is proceeding in anticipation of regulatory approvals to allow for timely construction startup. The project continues to forecast startup in late 2009.
Link to Petro-Canada’s Corporate and Strategic Priorities
The North American Natural Gas business is aligned with Petro-Canada’s strategic priorities as outlined by its progress in 2005 and goals for 2006.
| | 2005 PROGRESS | 2006 GOALS |
DELIVERING PROFITABLE GROWTH WITH A FOCUS ON OPERATED, LONG-LIFE ASSETS | § drilled 100 gross wells in Western Canada and 290 wells in the Western Canada Medicine Hat region1; § drilled 310 wells, added 37,000 net acres of land and obtained 407 permits for new coal bed methane wells in the U.S. Rockies; § filed regulatory application for the LNG facility at Gros-Cacouna; and § increased joint land position with partner in Alaska to 2.5 million acres and acquired 410,000 acres in the Mackenzie Corridor. | § create a stronger exploration focus; § expand growth of unconventional gas plays to about 25% of production; § optimize core asset concentric opportunities; and § advance exploration prospects in the Mackenzie Delta/Corridor and Alaska. |
DRIVING FOR FIRST QUARTILE2 OPERATION OF OUR ASSETS | § achieved better than 98% reliability3 at Western Canada facilities; and § conducted major turnarounds at Wildcat Hills, Wilson Creek and Gilby gas plants, with no lost-time incidents. | § achieve reliability rate approaching 99%; § conduct major turnaround of the Hanlan gas plant; and § continue to leverage costs through strategic alliances and preferred suppliers. |
CONTINUING TO WORK AT BEING A RESPONSIBLE COMPANY | § saw 44% increase in total recordable injury frequency compared to 2004. While contractor injury frequency improved, an upswing in employee injuries had a negative effect; § continued to reduce injury severity; § improved employee and contractor safety culture through initial phase of behaviour-based safety programs; § proactively remediated and reclaimed old sites; and § saw slight increase in regulatory exceedances compared to 2004. | § reduce total recordable injury frequency and regulatory exceedances; § continue safety culture improvements by rolling out the next phase of behaviour-based safety for employees and contractors; § drive for continuous improvement in contractor safety performance; § develop and implement stakeholder relations strategy; and § proactively remediate and reclaim old sites on a risked basis. |
1 Only includes wells where Petro-Canada has a working interest.
2 References to first quartile operations in this AIF do not refer to industry-wide benchmarks or externally known measures. The Company has a variety of internal metrics which define and track first quartile operational performance.
3 Throughout this AIF, we refer to reliability rates within the five business units. These reliability rates are calculated using internal methods that vary among the business units and take various factors into account. There are no existing external or industry-wide standards used in calculating reliability rates and, therefore, our resulting calculations are not necessarily comparable to other companies in the oil and gas industry.
East Coast Oil
Business Summary and Strategy
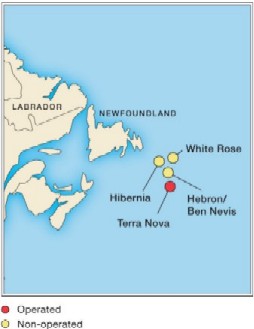
Petro-Canada is positioned in every major oil development off Canada’s East Coast. The Company is the operator and holds the largest interest in Terra Nova (34%), as well as a 20% interest in nearby Hibernia and a 27.5% interest in White Rose.
The East Coast Oil strategy is to improve reliability and sustain profitable production well into the next decade. Key features of the strategy include:
| § | delivering top quartile safety and operating performance; |
| § | sustaining profitable production through reservoir extensions and add-ons; and |
| § | pursuing high potential development projects. |
Realized crude prices remained strong while production decreased due to turnaround work to improve Terra Nova reliability in 2005. East Coast Oil realized crude prices averaged $63.15/bbl in 2005, up from $48.39/bbl in 2004. Petro-Canada’s share of East Coast Oil production averaged 75,300 b/d in 2005, down from 78,200 b/d in 2004, mainly due to the 40-day planned turnaround at Terra Nova. East Coast Oil operating and overhead costs averaged $4.52/bbl in 2005, compared with $2.89/bbl in 2004. Operating costs for East Coast Oil have remained relatively flat, excluding insurance premium surcharges and startup costs for White Rose.
Hibernia
The Hibernia oilfield lies approximately 315 kilometres southeast of St. John’s, Newfoundland and Labrador. The production system used is a fixed Gravity Base Structure (GBS), which sits on the sea floor. It has a production capacity of 230,000 b/d, storage capacity of 1.3 MMbbls, and it commenced production in November 1997.
The Hibernia oilfield, encompassing the Hibernia and Ben Nevis Avalon reservoirs, is estimated to have a remaining production life of 20 to 25 years. Assessment continues of the development potential of the Ben Nevis Avalon and southern extension of the Hibernia reservoir.
At December 31, 2005, there were 27 producing oil wells, 16 water injection wells and six gas injection wells in operation. Field production is transported by shuttle tanker either from the platform to a transshipment terminal on the Avalon Peninsula or, if tanker schedules permit, directly to market. Crude oil delivered to the transshipment facility is transferred to storage tanks and loaded onto tankers for transport to markets in Eastern Canada and the U.S. Petro-Canada has a 14% ownership interest in the transshipment facility.
Petro-Canada’s share of Hibernia’s production averaged 39,800 b/d in 2005, down slightly from 40,800 b/d in 2004. The Hibernia platform continued to operate at first quartile levels during 2005, with slightly lower production reflecting normal reservoir decline rates.
Terra Nova
The Terra Nova oilfield, which lies approximately 350 kilometres southeast of St. John’s, Newfoundland and Labrador, was discovered by Petro-Canada in 1984. Located about 35 kilometres southeast of Hibernia, it is the second oilfield to be developed offshore Newfoundland and Labrador. The production system used is a Floating Production Storage and Offloading (FPSO) vessel, which is a ship moored on location. Terra Nova was the first harsh environment development in North America to use an FPSO vessel. It has a production capacity of 180,000 b/d and a storage capacity of 960,000 bbls. Production from the Terra Nova oilfield began in January 2002. The field is estimated to have a remaining production life of approximately 14 to 16 years.
At year-end 2005, 14 producing oil wells, six water injection wells and three gas injection wells were in operation. Terra Nova uses the same system of shuttle tankers and a transshipment terminal that is currently used for Hibernia, and also transports its crude oil to markets in Eastern Canada and the U.S.
At Terra Nova, the Company’s share of production averaged 33,700 b/d in 2005, down from 37,400 b/d in 2004. During the fourth quarter of 2005, Petro-Canada successfully completed a 40-day turnaround at Terra Nova. The turnaround included regulatory inspections on equipment and modifications to improve the reliability of the gas compression and injection systems. Following the turnaround, Terra Nova was operating at a 90% facility reliability rate.
Petro-Canada continues to drive for first quartile reliability at Terra Nova, with a second phase of improvements planned to occur during an extended turnaround commencing in mid-2006. The FPSO vessel will be relocated to a dry dock to complete work required for regulatory certification and compliance; completion of reliability improvements to the gas compression system; and expansion of the accommodations to enable a larger crew to perform ongoing maintenance. Upon completion of the Terra Nova turnaround, reliability is expected to be sustained at first quartile levels.
White Rose
White Rose, the third development offshore Newfoundland and Labrador, is located about 350 kilometres southeast of St. John’s, and approximately 50 kilometres northeast of Hibernia and Terra Nova. It also uses an FPSO vessel similar to that of Terra Nova. The vessel has a design production capacity of 100,000 b/d and a storage capacity of 940,000 barrels. Production is offloaded to chartered tankers which go directly to markets in Eastern Canada and the U.S. The FPSO sailed to the field in August and, in November 2005, White Rose achieved first oil on budget and ahead of schedule. At year end, production rates averaged between 17,000 b/d to 19,000 b/d net to Petro-Canada.
Development plans for White Rose include the drilling of 19 to 21 wells, with a life-of-field estimate of 230 MMbbls (gross) of oil over a 10- to 12-year time frame. Ten wells, including three producing wells, six water injection wells and one gas injection well were drilled prior to production startup.
Offshore Oil Royalty Regime
The royalty regime for the Hibernia project has three tiers: gross royalty, net royalty and supplementary royalty. Gross royalty increased to 5% of gross field revenue on July 1, 2003. The gross royalty rate will remain at 5% until net royalty payout is reached. The gross royalty is indexed to crude oil prices under certain conditions. Upon achieving payout, including a specified return allowance, the net royalty payable becomes the greater of 30% of net revenue, or 5% of gross revenue. After a further level of payout is reached, which includes an additional return allowance, a supplementary royalty of 12.5% of net revenue also becomes payable.
The Terra Nova royalty regime has three tiers. The royalty consists of a sliding-scale basic royalty payable throughout the project’s life, with two additional tiers of net royalties which are payable upon the achievement of specified levels of profitability. The basic royalty is payable as a percentage of gross field revenue, with an initial rate of 1%, which rises to 10% depending on cumulative production levels and the occurrence of simple payout. After tier one payout has been reached, including a specified return allowance, net royalty will become the greater of the basic royalty, or 30% of net revenue. An additional net royalty equal to 12.5% of net revenue will be payable once a further level of payout, including an additional return allowance, is attained. As expected, royalty payments at Terra Nova increased in the fourth quarter of 2005 from 5% of gross revenues to a range of 27% to 29% of gross revenues.
In July 2003, the Government of Newfoundland and Labrador published regulations for the royalty regime that will apply to the development of petroleum resources in offshore areas other than Hibernia and Terra Nova. The generic offshore royalty regime consists of a sliding-scale basic royalty payable throughout a project’s life, and a two-tier net royalty payable upon the achievement of specified levels of profitability. The basic royalty is calculated as a percentage of gross field revenue commencing at 1% and rising to 7.5%, depending on cumulative production levels and the achievement of simple payout. Upon reaching tier one payout, including a return allowance, the net royalty is calculated as the greater of the basic royalty, or 20% of net revenue. An additional 10% net royalty rate is payable once a higher level of return on investment is attained. The generic royalty will apply to the White Rose development.
Other Offshore Exploration and Development
Petro-Canada’s plans to extend plateau production and expand existing developments progressed with the approval of the Far East development by the Canada-Newfoundland and Labrador Offshore Petroleum Board. The first production well in the Far East reservoir is being drilled and is expected to be on-stream in the first quarter of 2006.
In addition to existing East Coast Oil developments, Petro-Canada holds interests in a number of discoveries, including a 23.9% interest in the Hebron/Ben Nevis oilfield discoveries. Early in 2005, Chevron (as operator), Petro-Canada and the other joint venture participants signed a unitization and joint operating agreement to advance the joint evaluation of the Hebron/Ben Nevis and West Ben Nevis oilfields offshore Newfoundland and Labrador. Hebron is estimated to have total resources of approximately 580 MMbbls (gross).
Link to Petro-Canada’s Corporate and Strategic Priorities
The East Coast Oil business is aligned with Petro-Canada’s strategic priorities as outlined by its progress in 2005 and goals for 2006.
| | 2005 PROGRESS | 2006 GOALS |
DELIVERING PROFITABLE GROWTH WITH A FOCUS ON OPERATED, LONG-LIFE ASSETS | § achieved first oil production from the White Rose development; § signed joint operating agreement for Hebron; and § received regulatory approval for Far East development at Terra Nova. | § secure Hebron project provincial benefits agreement and begin front-end engineering and design; § achieve first production from the Far East development at Terra Nova; § advance in-field Hibernia growth prospects; and § delineate West White Rose prospect. |
DRIVING FOR FIRST QUARTILE OPERATION OF OUR ASSETS | § improved Terra Nova reliability to 90%; and § maintained relatively flat operating and overhead costs excluding insurance premium surcharges and startup costs for White Rose. | § conduct a 70- to 90-day turnaround scheduled at Terra Nova for regulatory compliance and first quartile reliability initiatives; and § achieve White Rose plateau production. |
CONTINUING TO WORK AT BEING A RESPONSIBLE COMPANY | § saw 6% increase in total recordable injury frequency compared to 2004; § worked with regulators to address the outcomes of the 2004 oily water discharge; § conducted Terra Nova turnaround ahead of schedule and with improved safety record; and § improved the produced water system resulting in zero regulatory exceedances for 2005. | § reduce total recordable injury frequency; § apply lessons learned from oily water discharge to prevent future incidents; § maintain zero regulatory exceedances; and § ensure major TLM focus during the significant Terra Nova turnaround and startup. |
Oil Sands
Business Summary and Strategy
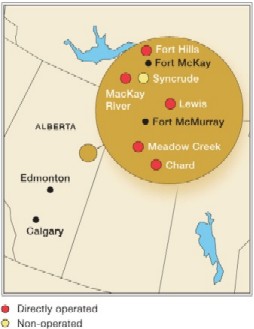
Petro-Canada’s major Oil Sands interests include a 12% ownership in the Syncrude joint venture (an oil sands mining operation and upgrading facility), 100% ownership of the MacKay River in situ bitumen development (a steam-assisted gravity drainage (SAGD) operation), a 55% ownership in and operatorship of the Fort Hills oil sands mining and upgrading project, and extensive oil sands acreage considered prospective for in situ development of bitumen resources.
The Oil Sands strategy for profitable growth includes:
§ phased and integrated development of reserves to incorporate knowledge gained;
§ disciplined capital investment to ensure long-life projects are value creating; and
§ a staged approach to development of capital-intensive Oil Sands projects to allow rigorous cost management and the opportunity to benefit from evolving technology.
Oil Sands Mining - Syncrude
Petro-Canada has a 12% interest in Syncrude, the world’s largest oil sands mining operation located approximately 40 kilometres north of Fort McMurray, Alberta. Syncrude is a joint venture formed to mine shallow deposits of oil sands from the McMurray formation in the Athabasca Oil Sands, and to extract and upgrade bitumen to produce synthetic crude oil. Syncrude is readily accessible by public roads.
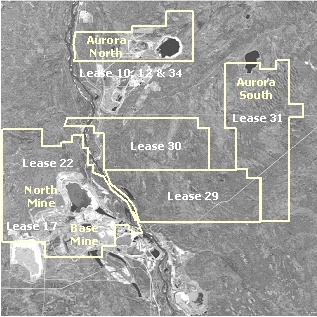
Syncrude holds eight oil sands leases (numbered 10, 12, 17, 22, 29, 30, 31 and 34) issued by the Province of Alberta, covering a total of approximately 255,000 acres. The operating licence associated with these leases expires in 2035. The licence permits Syncrude to mine oil sands and produce synthetic crude oil from approved development areas on the oil sands leases. The leases are automatically renewable as long as oil sands operations are ongoing or the leases are part of an approved development plan. All eight leases are included in a development plan approved by the Alberta Energy and Utilities Board. There were no known commercial operations on these leases prior to the startup of Syncrude operations in 1978.
Design engineering on the Syncrude project commenced in 1972. Alberta government approvals were received in 1973. Site preparation and construction continued from 1973 to 1978. Commercial operations commenced in 1978. A $1.2 billion capacity addition project was undertaken from 1984 to 1988. The first two stages of the Syncrude 21 expansion projects were completed in 1997 and 2001, respectively. The $470 million Stage I project comprised expansions of the north mine and an upgrader de-bottleneck. The $1 billion Stage II project consisted of the opening of the Aurora mine and a further upgrader de-bottleneck. Progress continues on the construction of the Stage III project, which includes a second Aurora mine and an upgrading expansion. In September 2005, the project announced a 2% increase to its total cost estimate from $8.1 billion to $8.3 billion, which was further increased to $8.4 billion in January 2006. Syncrude’s Stage III expansion is on schedule and expected to be on-stream in mid-2006 and will increase Petro-Canada’s share of production capacity to approximately 42,000 b/d. Production is expected to reach this level following a ramp up period of two to three years.
Syncrude has an estimated remaining proved and probable reserves life in excess of 50 years. Proved reserves of 30 degree synthetic crude oil from Syncrude are based on high geological certainty and the application of proven or piloted technology. Drill-hole spacing is less than 500 metres and appropriate co-owner and regulatory approvals are in place. For probable reserves, drill hole spacing is less than 1,000 metres and reserves are included in the 50-year long-range lease development plan. In 2005, approximately 153 million tons of oil sands produced 94 MMbbls of bitumen that was upgraded into 78 MMbbls of synthetic crude oil.
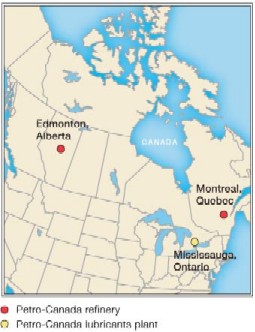
Three mines are currently in operation at Syncrude. The Base mine operations are carried out using drag lines, bucket wheel reclaimers and belt conveyors. These operations will be discontinued in 2006. The North mine and Aurora mine operations are carried out using truck, shovel and hydro-transport systems. An extraction process recovers about 90% of the crude bitumen contained in the mined sands. Refining processes upgrade the bitumen into high-quality, light (30 degree) sweet synthetic crude oil, with a process yield of approximately 85%. Syncrude’s synthetic crude oil production is processed at refineries in Edmonton, Alberta, Eastern Canada and the U.S.
Two electricity generating plants located on-site and owned by the Syncrude joint venture partners provide power for Syncrude. One plant produces a maximum of 270 megawatts (MW); the other produces 80 MW.
Syncrude’s production and operating costs were affected by turnarounds in 2005. Petro-Canada’s share of Syncrude’s production averaged 25,700 b/d in 2005, compared with 28,600 b/d in 2004. Coker and vacuum distillation unit turnarounds at Syncrude and a hydrogen plant shutdown reduced production by 2,900 b/d in 2005. Average unit operating and overhead costs increased to $31.90/bbl in 2005, up from $21.13/bbl in 2004. Higher operating costs were mainly due to lower production, higher maintenance costs, rising natural gas costs, an insurance premium surcharge and Syncrude incentive-based compensation. Syncrude realized price for synthetic crude oil averaged $70.41/bbl in 2005, up from $52.40/bbl in 2004.
Oil Sands In Situ - Bitumen
In September 2002, Petro-Canada successfully completed construction of its 100% owned, in situ bitumen production facility at MacKay River. Following the introduction of steam to the reservoir, Petro-Canada commenced bitumen production in November 2002. The extraction process at MacKay River utilizes SAGD, a technology that Petro-Canada participated in developing through its involvement in the Underground Test Facility (UTF). SAGD combines horizontal drilling with thermal steam injection. Steam is injected into the reservoir through the top well of a horizontal well pair to mobilize the bitumen, which flows to the lower producing well. This technology can economically recover more than 60% of the bitumen in place. The initial development at MacKay River includes two well pads of 12 and 13 horizontal well pairs, respectively. Well pairs are about 700 to 750 metres in length and produce 800 b/d to 1,200 b/d of bitumen. On average, wells are expected to have a six- to eight-year life. More than 90% of the water used to generate steam at MacKay River is recycled, a key feature of the environmental efficiency of the facility. The bitumen production from the project is currently being transported to the Athabasca Pipeline Terminal via a lateral insulated pipeline operated by Enbridge Pipelines (Athabasca) Inc. To enable onward shipment through major North American pipelines, the bitumen is diluted with synthetic crude oil provided under a long-term supply arrangement with Suncor Energy Marketing Inc. The MacKay River reserves are expected to sustain plateau production of 27,000 b/d to 30,000 b/d, after accounting for well maturity, turnarounds and unplanned events, for approximately 25 to 30 years.
MacKay River’s reliability improved and unit operating costs decreased in 2005. Production averaged 21,300 b/d in 2005, up from an average of 16,600 b/d in 2004. MacKay River reliability averaged 98% in 2005, up from 79% in 2004. Unit operating and overhead costs decreased by 22% in 2005, averaging $17.06/bbl, compared with $21.87/bbl in 2004. Lower unit operating costs were due to higher production which lowered per unit fixed costs, partially offset by higher natural gas costs. MacKay River realized price for bitumen averaged $18.53/bbl in 2005, compared with $18.37/bbl in 2004.
Early in 2005, Petro-Canada acquired the Dover UTF and oil sands leases adjacent to the MacKay River development. The leases provide additional SAGD development potential. Later in the year, Petro-Canada filed an application for a potential MacKay River in situ expansion project with first production by the end of the decade and peak production of an additional 40,000 b/d to follow. Petro-Canada also continued to evaluate its Lewis leases in 2005.
Fort Hills Acquisition
In early 2005, Petro-Canada strengthened its position in oil sands mining by securing the majority interest and operatorship of the Fort Hills project from UTS. Later in the year, a mining partner, Teck Cominco, joined the consortium. Petro-Canada is project operator with a 55% interest; UTS has a 30% interest; and Teck Cominco holds a 15% interest. Petro-Canada plans to market 100% of the production from Fort Hills. The Fort Hills oil sands mining and upgrading project has leases estimated to contain at least 2.8 billion bbls of bitumen resource (1.5 billion bbls net to Petro-Canada), which will be recovered over a 30- to 40-year period. The project has received regulatory approval to produce up to 190,000 b/d of bitumen from the mine.
In 2006, the Company will work on the Fort Hills mine, extraction and upgrading Design Basis Memorandum (DBM), which establishes key design parameters and a more detailed project schedule. Early in 2006, Petro-Canada announced plans to locate the Fort Hills upgrader northeast of Edmonton in Sturgeon County, in an area zoned for heavy industrial development. The upgrader is expected to use delayed coking technology to convert Fort Hills bitumen into light synthetic crude oil. Once the DBM is completed near the end of the year, a regulatory application will be filed in either late 2006 or early 2007.
Royalty Regime
During 2001, Syncrude completed the transition from a project-specific contractual royalty to the 1997 Province of Alberta Oil Sands Royalty Regulation. Effective in January 2002, the royalty payable by Syncrude to the Province of Alberta was set at the greater of 1% of gross revenue, or 25% of net revenue. The net revenue is determined by subtracting allowable operating and capital costs from gross revenue. In 2005, the royalty paid averaged $0.71/bbl. It is expected that Syncrude will reach royalty payout in early 2006, at which time the royalty rate will shift to 25% of net operating revenues from 1% of gross revenue. The total royalty payable in 2006 is expected to equate to a rate of between 3% and 10% of gross revenue, depending on crude oil prices.
The MacKay River operation is subject to the 1997 Alberta Oil Sands Royalty Regulation. Prior to royalty payout, which includes a specified return allowance, the royalty is calculated as 1% of gross revenue. After royalty payout, the royalty is based on the greater of 1% of gross revenue, or 25% of net revenue. The net revenue is determined by subtracting allowable operating and capital costs from gross revenue. In 2005, the royalty paid was $0.16/bbl.
Integrated Oil Sands Development
At the Edmonton refinery, Petro-Canada is investing to convert the facility to oil sands feedstock exclusively and to produce low-sulphur products. By mid-2008, an anticipated capital investment of $1.6 billion is expected to expand coker capacity, add new crude and vacuum units, increase sulphur plants and expand utilities. Costs based on the completion of preliminary engineering have increased from the original conceptual estimate of $1.2 billion. The increase reflects a more current assessment of refinery integration requirements and industry-wide cost pressures. Project economics remain strong as projected light/heavy crude differentials are expected to offset the increase in capital.
It is anticipated that the refinery conversion program will enable Petro-Canada to directly upgrade 26,000 b/d of bitumen and process 48,000 b/d of sour synthetic crude oil, replacing the conventional light crude feedstock refined today. The refinery conversion program supports the Company’s long-term strategy and builds on a $1.4 billion investment in gasoline and diesel desulphurization.
Link to Petro-Canada’s Corporate and Strategic Priorities
The Oil Sands business is aligned with Petro-Canada’s strategic priorities as outlined by its progress in 2005 and goals for 2006.
| | 2005 PROGRESS | 2006 GOALS |
DELIVERING PROFITABLE GROWTH WITH A FOCUS ON OPERATED, LONG-LIFE ASSETS | § secured a position in oil sands mining with Petro-Canada becoming operator and owning a 55% interest in Fort Hills; § acquired the Dover UTF and oil sands leases adjacent to MacKay River; § progressed construction of the Syncrude Stage III expansion; and § undertook an extensive drilling program at Lewis. | § advance Fort Hills and MacKay River expansion development plans; § start up Syncrude Stage III expansion; and § increase MacKay River production to between 27,000 b/d and 30,000 b/d by year end. |
DRIVING FOR FIRST QUARTILE OPERATION OF OUR ASSETS | § decreased MacKay River unit operating costs by 22%; § achieved average reliability at MacKay River of 98%, up from 79% in 2004; and § saw Syncrude non-fuel unit operating costs increase by 47%. | § decrease MacKay River non-fuel unit operating costs by 15%; § decrease Syncrude non-fuel unit operating costs by 25%; and § sustain MacKay River reliability at 2005 levels or better. |
CONTINUING TO WORK AT BEING A RESPONSIBLE COMPANY | § saw no change to total recordable injury frequency compared to 2004; § on behalf of Downstream, completed recycled waterline for reusing wastewater at the Edmonton refinery; and § established the McLelland Lake Wetland Complex Sustainability Committee to assist in the management of the patterned fen. | § maintain focus on total recordable injury frequency; and § ensure regulators, First Nations and other key stakeholders affected by major projects are properly consulted and engaged. |
International
Business Summary and Strategy
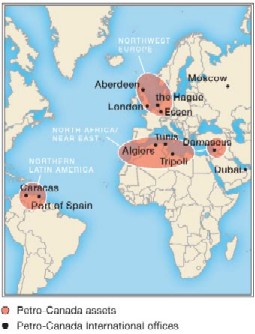
International production and exploration interests are currently focused in three regions. In Northwest Europe, production comes from the U.K. and the Netherlands sectors of the North Sea. The North Africa/Near East region provides crude oil production from interests in Libya, with exploration activity extending to Syria, Algeria, Tunisia and Morocco. In Northern Latin America, operations are focused in Trinidad and Tobago, and Venezuela.
In 2005, Petro-Canada reached an agreement to sell the Company’s mature producing assets in Syria. The sale closed on January 31, 2006. These assets and associated results are reported as discontinued operations and excluded from continuing operations.
The International strategy is to access a sizable resource base using a three-fold approach to:
| § | optimize and leverage existing assets; |
| § | seek out new, long-life opportunities; and |
| § | build a balanced exploration program. |
Strong realized commodity prices were partially offset by lower production in 2005. International production from continuing operations averaged 106,300 boe/d in 2005, compared with 117,400 boe/d in 2004. The decrease was primarily due to lower production in Northwest Europe. International crude oil and liquids realized prices from continuing operations averaged $65.90/bbl and natural gas realized prices averaged $6.97/Mcf in 2005, compared with $49.19/bbl and $5.27/Mcf, respectively, in 2004. Operating and overhead costs from continuing operations averaged $7.60/boe in 2005, up from $7.13/boe in 2004, due to lower production and higher overhead costs to support growth projects.
Northwest Europe
Production in Northwest Europe comes from the U.K. and the Netherlands sectors of the North Sea, with exploration programs extending into Denmark and Norway. Extensive industry development has taken place in the North Sea since the early 1970s. While the basin is now a mature play, moderate-size fields continue to be developed and exploited.
Petro-Canada’s Northwest Europe production averaged 44,600 boe/d in 2005, compared with 54,600 boe/d in 2004. Added production volumes from the new Pict field were more than offset by production declines in the Netherlands sector of the North Sea, an unscheduled Triton platform shutdown at the end of the year and a maintenance turnaround at the Scott platform mid-year. Northwest Europe crude oil and liquids realized prices averaged $66.13/bbl and natural gas averaged $7.35/Mcf in 2005, compared with $50.37/bbl and $5.65/Mcf, respectively, in 2004.
In the Outer Moray Firth, Petro-Canada holds a 20.6% working interest in the Scott oilfield and production platform, and a 9.4% working interest in the Telford oilfield, a subsea tie-back to the Scott platform. High-quality crude oil from Scott and Telford is transported to shore via the Forties Pipeline System. Associated gas is transported via the Scottish Area Gas Evacuation pipeline system.
In the central North Sea, the Company’s interests are centred on the Triton development area, which is comprised of the joint development of the Guillemot West and Northwest fields, the Bittern field and the Clapham field, which came on-stream at the end of 2003. The Pict field, which achieved first oil in June 2005, also produces through the Triton FPSO. The Pict field is estimated to have resources of about 13 MMbbls of oil and produced an average of 15,000 boe/d during the last half of 2005. The crude oil gathered at Triton is shipped via tanker, while gas is exported through the SEGAL system to the U.K. Petro-Canada is a 33.1% owner of the Triton FPSO.
In June 2004, the third U.K. area of focus was added in Outer Moray Firth through the acquisition of a 29.9% interest in the Buzzard oilfield. The purchase also included nearby blocks that have exploration potential. The Buzzard field is currently under development with more than 88% of the construction complete as of December 31, 2005. Progress on the field continues on schedule and on budget with first oil expected in late 2006. Peak production of 60,000 boe/d net to Petro-Canada is expected in late 2007. The field is being developed with three bridge-linked platforms supporting the wellhead facilities, the production facilities, living quarters and the utilities.
In the Netherlands sector, the major source of gas production is from Blocks L8b and L5c (Petro-Canada working interests are 25% and 30%, respectively). The produced gas is transported to shore by pipeline and sold to NV Nederlandse Gasunie under long-term delivery/offtake contracts. Petro-Canada’s oil production from the Netherlands sector is primarily from the Petro-Canada operated Hanze field (Petro-Canada working interest - 45%). Oil from the Hanze platform is exported by dedicated tanker, with the cargoes marketed on a spot basis into Northwest Europe. Petro-Canada also holds a 12% interest in the onshore Bergen gas storage facility operated by BP p.l.c. A small non-operated asset, L5b-C is expected to be on-stream in late 2006, with peak production in excess of 3,000 boe/d net to Petro-Canada.
The De Ruyter field, located in the southern North Sea approximately 60 kilometres northwest of the Hague, is expected to be on-stream in late 2006 with peak production of 10,000 boe/d net to Petro-Canada. Crude oil will be exported to shore via shuttle tanker. Gas export will be via tie-in to an existing pipeline.
Other Developments
Petro-Canada continues to focus on building a balanced exploration program. In 2005, the Company made two discoveries in the U.K. sector of the North Sea and progressed work on the Hejre discovery. Petro-Canada has a 100% working interest in the Saxon discovery in the Triton area, which is estimated to have resources of about 14 MMbbls of oil and could be on-stream sometime in 2007. A second discovery has been made in Block 13/27a, which is located northwest of the Buzzard field. Petro-Canada is determining if additional appraisal is warranted to establish commercial viability. In Denmark, work progressed on the previously discovered Hejre field, in which Petro-Canada has a 25% working interest. A successful appraisal well is being evaluated.
In the third quarter of 2005, Petro-Canada was awarded eight blocks in the U.K. Continental Shelf 23rd round of licensing. These blocks are located in the Moray Firth. Petro-Canada is the operator and currently has a 90% working interest in these blocks and a total work program of four commitment wells, plus seismic acquisition and reprocessing.
During the fourth quarter of 2005, Petro-Canada was awarded five production licences by the Norwegian Ministry of Petroleum and Energy. The licences are located in the North Sea where Petro-Canada has established knowledge and expertise. The Company is operator of two licences and non-operator for the remaining three licences. The work program on four of the licences covers reprocessing 3D seismic and a two-year drill-or-drop commitment. The work program for the remaining licence involves seismic exploration and a one-well commitment to be drilled within four years. As part of this exploration program, Petro-Canada will be opening an office in Norway.
North Africa/Near East
The core region of North Africa/Near East provides crude oil production from interests principally in Libya.
Petro-Canada’s 2005 production from continuing operations in Libya and Algeria averaged 49,800 boe/d, relatively unchanged from 50,900 boe/d in 2004. North Africa/Near East crude oil and liquids realized prices from continuing operations averaged $65.75/bbl, compared with $48.26/bbl in 2004.
In Libya, Petro-Canada is one of the country’s largest producers through its 49% interest in Veba Oil Operations (VOO), a joint venture with the National Oil Corporation of Libya (NOC). Production is high-quality, low-sulphur (sweet) crude oil.
Petro-Canada’s production through the VOO joint venture comes from three concessions that combine the operations of more than 20 fields, and one exploration and production-sharing agreement (EPSA) covering the En Naga North and En Naga West oilfields. Petro-Canada also has equity interests in the Ras Lanuf export terminal and various pipelines through which the majority of the production is exported. Petro-Canada’s production is currently sold on contract to the NOC. As Libya is a member of OPEC, Libyan production may be constrained by OPEC quotas.
In late 2005, Petro-Canada reached an agreement to sell the Company’s producing assets in Syria. Syria remains an important part of the North Africa/Near East region, with an active exploration program in Block II. In 2005, the Company procured 3D and 2D seismic surveys in Block II and plans to drill two exploration wells in 2006.
In Algeria, Petro-Canada is the operator and has a 100% working interest in the Zotti Block. The award received final government approval late in 2004 and Petro-Canada continues to process 2D seismic data acquired earlier in 2005, with a well planned for 2006.
Petro-Canada relinquished its Tinrhert Block production sharing contract (PSC) with SONATRACH, the Algerian national oil company, effective December 31, 2004. This included a 70% interest in the Tamadanet oilfield, which was producing about 600 b/d at the end of the year.
In Tunisia, Petro-Canada is operator and has a 72.5% interest in the Melitta Block, located mainly offshore in the Mediterranean Sea. In early 2006, Petro-Canada was awarded two offshore, non-operated prospecting permits.
In mid-2005, Petro-Canada signed a one-year reconnaissance licence with the Moroccan Office National Bureau for Hydrocarbons and Mines. The Company will carry out field work and studies in the Bas Draa Block (covering 59,000 square kilometres) during the reconnaissance licence period.
Northern Latin America
In Northern Latin America, Petro-Canada’s operations are focused in Trinidad and Tobago where the Company holds a 17% working interest in the North Coast Marine Area 1 (NCMA-1) offshore gas development project operated by BG Group plc (British Gas). Natural gas production is delivered by pipeline to the LNG facility operated by Atlantic LNG at Point Fortin for liquefaction and subsequent sale into U.S. markets.
In 2005, Petro-Canada’s share of Trinidad and Tobago production averaged 72 MMcf/d, unchanged from 2004. Northern Latin America realized price for natural gas averaged $6.62/Mcf, compared with $4.81/Mcf in 2004.
Petro-Canada signed PSCs with the Trinidad and Tobago Ministry of Energy and Energy Industries for offshore exploration Blocks 1a, 1b and 22 in 2005. These blocks cover 4,258 kilometres, with Block 1a containing four discoveries. Awarding of these three blocks considerably strengthens Petro-Canada’s prospects for future growth in the area. Late in 2005, work on the Trinidad and Tobago offshore exploration Block 22 was advanced with the start of a 3D seismic survey; a second seismic survey on Blocks 1a and 1b started in early 2006. The Company expects to invest more than $100 million in the first phase of exploration, which includes the 3D seismic survey and the drilling of six exploration wells.
In Western Venezuela, Petro-Canada holds a 50% working interest in the La Ceiba Block that straddles the eastern shores of Lake Maracaibo. In 2003, Petroleos de Venezuela, S.A., the national oil company of Venezuela, approved an agreement for an extended production test to evaluate the commercial viability of the La Ceiba oil discovery. A declaration of commercial viability and a field development plan were filed for the La Ceiba development in late 2005. If developed, peak production from La Ceiba is expected to be about 13,000 b/d net to Petro-Canada. This project will provide the Company with a meaningful foothold in the country, which is perceived to have significant future opportunities.
Business Development Opportunities
The Company continues to advance discussions on importing gas from Russia to North America through a joint LNG project with Gazprom. The project proposed in the St. Petersburg region is expected to export 3.5 million to 5 million tonnes per annum (or 500 MMcf/d to 700 MMcf/d) with the gas supplied from the Russian gas grid. In October 2004, an MOU was signed with Gazprom to develop a feasibility study by mid-2005. The work was completed and Petro-Canada and Gazprom are currently discussing whether to move to a commercial proposal for the project.
Link to Petro-Canada’s Corporate and Strategic Priorities
The International business is aligned with Petro-Canada’s strategic priorities as outlined by its progress in 2005 and goals for 2006.
| | 2005 PROGRESS | 2006 GOALS |
DELIVERING PROFITABLE GROWTH WITH A FOCUS ON OPERATED, LONG-LIFE ASSETS | § advanced Buzzard development on schedule and on budget; § achieved first oil at Pict in June 2005; § progressed exploration with two discoveries in the U.K. sector of the North Sea and the Hejre appraisal; and § was awarded eight blocks in the 23rd U.K. licensing round and five Norwegian production licences. | § achieve first production by year end at Buzzard in the U.K. sector of the North Sea and at De Ruyter and L5b-C in the Netherlands sector of the North Sea; § conduct 11-well drilling program with balanced risk profile; § complete seismic program in Trinidad and Tobago and refine exploration well locations; and § advance field development plans for LaCeiba in Venezuela and Saxon in the U.K. sector of the North Sea. |
DRIVING FOR FIRST QUARTILE OPERATION OF OUR ASSETS | § completed Hanze turnaround in nine days versus planned 14 days; § participated in peer benchmarking studies for North Sea producing facilities; and § secured lease on new London office building on very favourable terms. | § conduct North Sea Triton de-bottlenecking study; § ensure De Ruyter operations readiness; § increase technical and environment, health and safety co-operation in Libya; § improve reliability and uptime on the Scott platform; and § roll out International management system. |
CONTINUING TO WORK AT BEING A RESPONSIBLE COMPANY | § reduced total recordable injury frequency by 22% compared to 2004; § initiated program of Zero Harm inspections by management; § rolled out Zero Harm supervisory training for leaders; § worked with community to minimize impact of onshore well in Tunisia; § developed oil spill strategy and coastline mapping for offshore well in Tunisia; and § initiated plan to protect forest reserve during seismic operations in Syria. | § maintain focus on total recordable injury frequency; § consult with communities in Trinidad and Tobago in preparation for exploration drilling program; § reduce oil in produced water at Triton; and § introduce Employee Assistance Program for International employees. |
Discontinued Operations
In late 2005, Petro-Canada reached an agreement to sell the Company’s producing assets in Syria for EUR 484 million (Canadian equivalent of $676 million as at December 20, 2005), before adjustments. The sale closed on January 31, 2006 and a gain on disposal of approximately $140 million will be recorded in the first quarter of 2006. The sale of these mature assets aligns with Petro-Canada’s strategy to increase the proportion of long-life and operated assets within the portfolio. Syria remains an important part of the North Africa/Near East producing region. Petro-Canada has maintained an active exploration program in Block II and has continued pursuit of new opportunities. Additional information concerning Petro-Canada’s discontinued operations can be found in Note 3 to the Consolidated Financial Statements.
Upstream Production and Prices
The following table shows Petro-Canada’s average daily production of conventional crude oil, NGL, bitumen, synthetic crude oil (from mining operations) and natural gas, before and after deduction of royalties for the years indicated.
AVERAGE DAILY PRODUCTION OF CRUDE OIL, NGL,
BITUMEN, SYNTHETIC CRUDE OIL AND NATURAL GAS
| | Years Ended December 31, |
| | 2005 | 2004 | 2003 |
| | Before Royalties | After Royalties | Before Royalties | After Royalties | Before Royalties | After Royalties |
Crude oil and equivalents (thousands of barrels/day - Mbbl/d) | | | | | | |
| East Coast Oil | 75.3 | 69.6 | 78.2 | 75.1 | 86.1 | 84.0 |
Oil Sands1 | 47.0 | 46.5 | 45.2 | 44.8 | 36.1 | 35.7 |
| North American Natural Gas | 14.7 | 11.2 | 15.3 | 11.4 | 16.9 | 12.6 |
| Northwest Europe | 33.7 | 33.2 | 40.4 | 40.4 | 37.7 | 37.7 |
| North Africa/Near East | 49.8 | 44.0 | 50.9 | 43.7 | 53.4 | 43.3 |
| Total crude oil and NGL | 220.5 | 204.5 | 230.0 | 215.4 | 230.2 | 213.3 |
Natural gas production (MMcf/d) | | | | | | |
| North American Natural Gas | 668 | 512 | 695 | 530 | 693 | 521 |
| Northwest Europe | 66 | 66 | 85 | 85 | 80 | 80 |
| North Africa/Near East | - | - | - | - | - | - |
| Northern Latin America | 72 | 56 | 72 | 51 | 63 | 63 |
Total natural gas | 806 | 634 | 852 | 666 | 836 | 664 |
Total production from continuing operations2 (thousands of barrels of oil equivalent/day - Mboe/d) | 355 | 310 | 372 | 326 | 370 | 324 |
Discontinued operations | | | | | | |
Crude oil and NGL (Mbbl/d) | 65.9 | 20.3 | 75.7 | 23.7 | 89.7 | 34.6 |
Natural gas production (MMcf/d) | 25 | 4 | 21 | 3 | 32 | 6 |
Total production from discontinued operations2 (Mboe/d) | 70 | 21 | 79 | 24 | 95 | 36 |
Total production2 (Mboe/d) | 425 | 331 | 451 | 350 | 465 | 360 |
Proved oil and NGL reserves3, 4 (millions of barrels - MMbbls) | 866 | 733 | 801 | 674 | 796 | 650 |
Proved natural gas reserves (trillions of cubic feet - Tcf)4 | 2.2 | 1.7 | 2.5 | 2.0 | 2.5 | 2.0 |
1 Includes production of synthetic crude oil from Syncrude mining operation.
| 2 | Natural gas is converted to oil equivalent using six Mcf of gas to one boe. |
| 3 | Includes reserves of synthetic crude oil from Syncrude mining operation. |
| 4 | Syria proved reserves before royalties of 49 MMboe are included as at December 31, 2005. |
The following table shows Petro-Canada’s average daily production of conventional crude oil, NGL, bitumen, synthetic crude oil and natural gas, before deduction of royalties by quarter for the years indicated.
AVERAGE DAILY PRODUCTION OF CRUDE OIL, NGL,
BITUMEN, SYNTHETIC CRUDE OIL AND NATURAL GAS
BEFORE ROYALTIES BY QUARTER
| | | 2005 Three Months Ended | | 2004 Three Months Ended | |
| | | Mar. 31 | | June 30 | | Sept. 30 | | Dec. 31 | | Mar. 31 | | June 30 | | Sept. 30 | | Dec. 31 | |
Crude oil and equivalents (Mbbl/d) | | | | | | | | | | | | | | | | | | | | | | | | | |
| East Coast Oil | | | 77.9 | | | 77.8 | | | 64.7 | | | 81.1 | | | 87.5 | | | 85.4 | | | 71.5 | | | 68.4 | |
Oil Sands1 | | | 38.3 | | | 48.9 | | | 52.1 | | | 48.3 | | | 47.4 | | | 40.7 | | | 45.4 | | | 47.1 | |
| North American Natural Gas | | | 16.2 | | | 14.5 | | | 14.0 | | | 14.0 | | | 15.1 | | | 13.7 | | | 15.7 | | | 16.9 | |
| Northwest Europe | | | 34.3 | | | 26.3 | | | 38.7 | | | 35.6 | | | 46.8 | | | 43.7 | | | 36.6 | | | 34.8 | |
| North Africa/Near East | | | 48.1 | | | 49.7 | | | 50.4 | | | 50.9 | | | 51.7 | | | 50.5 | | | 51.0 | | | 50.7 | |
Total crude oil and equivalents | | | 214.8 | | | 217.2 | | | 219.9 | | | 229.9 | | | 248.5 | | | 234.0 | | | 220.2 | | | 217.9 | |
Natural gas (MMcf/d) | | | | | | | | | | | | | | | | | | | | | | | | | |
| North American Natural Gas | | | 702 | | | 654 | | | 666 | | | 649 | | | 677 | | | 691 | | | 690 | | | 720 | |
| Northwest Europe | | | 78 | | | 61 | | | 58 | | | 65 | | | 104 | | | 85 | | | 79 | | | 74 | |
| North Africa/Near East | | | - | | | - | | | - | | | - | | | - | | | - | | | - | | | - | |
| Northern Latin America | | | 75 | | | 74 | | | 72 | | | 65 | | | 67 | | | 71 | | | 74 | | | 74 | |
Total natural gas | | | 855 | | | 789 | | | 796 | | | 779 | | | 848 | | | 847 | | | 843 | | | 868 | |
Total production from continuing operations2 (Mboe/d) | | | 357 | | | 349 | | | 353 | | | 360 | | | 390 | | | 375 | | | 361 | | | 362 | |
Discontinued operations | | | | | | | | | | | | | | | | | | | | | | | | | |
Crude oil and NGL (Mbbl/d) | | | 68.9 | | | 67.1 | | | 65.2 | | | 62.4 | | | 83.4 | | | 76.6 | | | 71.8 | | | 70.8 | |
Natural gas production (MMcf/d) | | | 28 | | | 26 | | | 25 | | | 24 | | | 21 | | | 21 | | | 20 | | | 23 | |
Total production from discontinued operations2 (Mboe/d) | | | 74 | | | 71 | | | 69 | | | 66 | | | 87 | | | 80 | | | 75 | | | 75 | |
Total production (Mboe/d) | | | 431 | | | 420 | | | 422 | | | 426 | | | 477 | | | 455 | | | 436 | | | 437 | |
| 1 | Includes production of synthetic crude oil from Syncrude mining operation. |
2 Natural gas is converted to oil equivalent using six Mcf of gas to one boe.
The following table shows Petro-Canada’s average daily production of conventional crude oil, NGL, bitumen, synthetic crude oil and natural gas, after deduction of royalties by quarter for the years indicated.
AVERAGE DAILY PRODUCTION OF CRUDE OIL, NGL,
BITUMEN, SYNTHETIC CRUDE OIL AND NATURAL GAS
AFTER ROYALTIES BY QUARTER
| | | 2005 Three Months Ended | | 2004 Three Months Ended | |
| | | Mar. 31 | | June 30 | | Sept. 30 | | Dec. 31 | | Mar. 31 | | June 30 | | Sept. 30 | | Dec. 31 | |
Crude oil and equivalents (Mbbl/d) | | | | | | | | | | | | | | | | | | | | | | | | | |
| East Coast Oil | | | 74.5 | | | 73.6 | | | 60.4 | | | 70.4 | | | 85.0 | | | 82.4 | | | 68.2 | | | 65.2 | |
Oil Sands1 | | | 37.9 | | | 48.4 | | | 51.6 | | | 47.8 | | | 47.0 | | | 40.3 | | | 45.0 | | | 46.5 | |
| North American Natural Gas | | | 11.9 | | | 10.9 | | | 10.6 | | | 10.8 | | | 11.1 | | | 10.1 | | | 11.6 | | | 12.6 | |
| Northwest Europe | | | 34.3 | | | 25.2 | | | 38.0 | | | 35.2 | | | 46.8 | | | 43.7 | | | 36.6 | | | 34.8 | |
| North Africa/Near East | | | 44.6 | | | 41.7 | | | 42.8 | | | 46.8 | | | 42.0 | | | 41.7 | | | 43.9 | | | 45.5 | |
Total crude oil and equivalents | | | 203.2 | | | 199.8 | | | 203.4 | | | 211.0 | | | 231.9 | | | 218.2 | | | 205.3 | | | 204.6 | |
Natural gas (MMcf/d) | | | | | | | | | | | | | | | | | | | | | | | | | |
| North American Natural Gas | | | 534 | | | 503 | | | 527 | | | 488 | | | 508 | | | 531 | | | 522 | | | 556 | |
| Northwest Europe | | | 78 | | | 61 | | | 58 | | | 65 | | | 104 | | | 85 | | | 79 | | | 74 | |
| North Africa/Near East | | | - | | | - | | | - | | | - | | | - | | | - | | | - | | | - | |
| Northern Latin America | | | 75 | | | 49 | | | 51 | | | 53 | | | 67 | | | 40 | | | 49 | | | 45 | |
Total natural gas | | | 687 | | | 613 | | | 636 | | | 606 | | | 679 | | | 656 | | | 650 | | | 675 | |
Total production from continuing operations2 (Mboe/d) | | | 318 | | | 302 | | | 309 | | | 312 | | | 345 | | | 327 | | | 313 | | | 317 | |
Discontinued operations | | | | | | | | | | | | | | | | | | | | | | | | | |
Crude oil and NGL (Mbbl/d) | | | 22.6 | | | 20.0 | | | 19.3 | | | 19.4 | | | 28.6 | | | 24.9 | | | 21.3 | | | 22.0 | |
Natural gas production (MMcf/d) | | | 5 | | | 4 | | | 4 | | | 4 | | | 3 | | | 6 | | | 2 | | | - | |
Total production from discontinued operations2 (Mboe/d) | | | 23 | | | 21 | | | 20 | | | 20 | | | 29 | | | 26 | | | 22 | | | 22 | |
Total production2 (Mboe/d) | | | 341 | | | 323 | | | 329 | | | 332 | | | 374 | | | 353 | | | 335 | | | 339 | |
| 1 | Includes production of synthetic crude oil from Syncrude mining operation. |
| 2 | Natural gas is converted to oil equivalent using six Mcf of gas to one boe. |
Production Outlook
Upstream production from continuing operations is expected to average 365,000 boe/d to 390,000 boe/d in 2006. Petro-Canada’s production range from continuing operations is expected to be higher than in 2005, primarily due to additional production from White Rose, the De Ruyter startup, the Syncrude Stage III expansion and a new well pad at MacKay River. Factors that may impact production during 2006 include reservoir performance, drilling results, facility reliability, the ramp up of production at White Rose and the successful execution of the planned turnaround at Terra Nova.
The following table shows Petro-Canada’s 2006 production outlook for conventional crude oil, NGL, bitumen, synthetic crude oil and natural gas in crude oil equivalents before deduction of royalties.
CONSOLIDATED PRODUCTION
(Mboe/d)
| | 2005 Actual | 2006 Outlook (+/-) |
North American Natural Gas | | |
| - Natural gas | 111 | 106 |
| - Liquids | 15 | 14 |
East Coast Oil | 75 | 94 |
Oil Sands | | |
| - Syncrude | 26 | 34 |
| - MacKay River | 21 | 25 |
International | | |
- North Africa/Near East1 | 50 | 55 |
| - Northwest Europe | 45 | 43 |
| - Northern Latin America | 12 | 12 |
Total from continuing operations | 355 | 365 - 390 |
1 North Africa/Near East excludes production related to the sale of the Syrian producing assets.
The following table shows the average sale price for Petro-Canada’s conventional crude oil, NGL, bitumen, synthetic crude oil, and natural gas, produced, by country and/or region, for the years indicated.
AVERAGE PRICES FOR CRUDE OIL, NGL,
BITUMEN, SYNTHETIC CRUDE OIL AND NATURAL GAS
| | | Years Ended December 31, | |
| Average annual price received | | | 2005 | | | 2004 | | | 2003 | |
Crude oil and NGL ($/bbl) | | | | | | | | | | |
| East Coast Oil | | $ | 63.15 | | $ | 48.39 | | $ | 39.91 | |
| Oil Sands | | | 46.90 | | | 39.90 | | | 34.97 | |
| North American Natural Gas | | | 59.47 | | | 47.02 | | | 38.21 | |
| Northwest Europe | | | 66.13 | | | 50.37 | | | 41.41 | |
North Africa/Near East1 | | | 65.75 | | | 48.26 | | | 38.76 | |
Total crude oil and NGL from continuing operations | | | 60.48 | | | 46.95 | | | 38.99 | |
| Discontinued operations | | | 61.82 | | | 46.70 | | | 38.32 | |
Total crude oil and NGL | | $ | 60.79 | | $ | 46.89 | | $ | 38.80 | |
North America ($/bbl) | | | | | | | | | | |
| Average crude oil and NGL sale price | | $ | 62.55 | | $ | 48.17 | | $ | 39.63 | |
| Average bitumen sale price | | | 18.53 | | | 18.37 | | | 16.69 | |
| Average synthetic crude oil sale price | | | 70.41 | | | 52.40 | | | 42.67 | |
North America average crude oil and NGL, bitumen and synthetic crude oil price | | $ | 57.18 | | $ | 45.47 | | $ | 38.42 | |
International ($/bbl) | | | | | | | | | | |
| Northwest Europe - average crude oil and NGL sale price | | $ | 66.13 | | $ | 50.37 | | $ | 41.41 | |
North Africa/Near East - average crude oil and NGL sale price1 | | | 65.75 | | | 48.26 | | | 38.76 | |
International - average crude oil and NGL sale price from continuing operations | | $ | 65.90 | | $ | 49.19 | | $ | 39.86 | |
Natural gas ($/Mcf) | | | | | | | | | | |
| North American Natural Gas | | $ | 8.47 | | $ | 6.72 | | $ | 6.50 | |
| Northwest Europe | | | 7.35 | | | 5.65 | | | 5.42 | |
| Northern Latin America | | | 6.62 | | | 4.81 | | | 4.01 | |
Total natural gas from continuing operations | | | 8.21 | | | 6.45 | | | 6.21 | |
| Discontinued operations | | | 6.43 | | | 4.81 | | | 4.84 | |
Total natural gas | | $ | 8.16 | | $ | 6.41 | | $ | 6.16 | |
1 North Africa/Near East excludes prices realized on production related to the sale of the Syria producing assets.
The following tables on pages 34 - 37 show Petro-Canada’s average product prices, netbacks, net income and production before royalties for North American Natural Gas (natural gas equivalent), East Coast Oil (conventional crude oil), Oil Sands (synthetic crude oil and bitumen) and International regions (crude oil equivalents) for the years indicated1. Footnotes for the following tables on pages 34 - 37 can be found on page 37.
Petro-Canada monitors production costs and charges to earnings by business segment or region, rather than on a product basis. As a result, unit netbacks and net earnings for a business segment or region producing a mix of crude oil, natural gas and NGL are calculated on an oil- or gas-equivalent basis. In the North American Natural Gas business segment, most crude oil and NGL production is ancillary to the production of natural gas. In the North Africa/Near East region, natural gas and NGL production is relatively minor and linked to crude oil production. In Northwest Europe, crude oil production and associated natural gas and NGL production represent about 74% of total production on an oil-equivalent basis.
NORTH AMERICAN NATURAL GAS
($/Mcfe, unless otherwise indicated)
| | | 2005 Three Months Ended | | | | 2004 Three Months Ended | | | | | |
| | | Mar. 31 | | June 30 | | Sept. 30 | | Dec. 31 | | Total 20051 | | Mar. 31 | | June 30 | | Sept. 301 | | Dec. 311 | | Total 20041 | | Total 2003 | |
| Average price received | | $ | 6.95 | | $ | 7.56 | | $ | 8.56 | | $ | 11.72 | | $ | 8.67 | | $ | 6.50 | | $ | 7.03 | | $ | 6.81 | | $ | 7.19 | | $ | 6.89 | | $ | 6.51 | |
| Royalties | | | (1.68 | ) | | (1.75 | ) | | (1.83 | ) | | (2.89 | ) | | (2.03 | ) | | (1.63 | ) | | (1.64 | ) | | (1.68 | ) | | (1.65 | ) | | (1.65 | ) | | (1.61 | ) |
| Operating expenses | | | (0.77 | ) | | (0.91 | ) | | (0.98 | ) | | (1.14 | ) | | (0.95 | ) | | (0.65 | ) | | (0.76 | ) | | (0.84 | ) | | (0.80 | ) | | (0.76 | ) | | (0.59 | ) |
| Netback | | | 4.50 | | | 4.90 | | | 5.75 | | | 7.69 | | | 5.69 | | | 4.22 | | | 4.63 | | | 4.29 | | | 4.74 | | | 4.48 | | | 4.31 | |
Overhead expenses (G&A)2 | | | (0.16 | ) | | (0.23 | ) | | (0.21 | ) | | (0.19 | ) | | (0.20 | ) | | (0.17 | ) | | (0.16 | ) | | (0.16 | ) | | (0.26 | ) | | (0.19 | ) | | (0.15 | ) |
| Netback after overhead expenses | | | 4.34 | | | 4.67 | | | 5.54 | | | 7.50 | | | 5.49 | | | 4.05 | | | 4.47 | | | 4.13 | | | 4.48 | | | 4.29 | | | 4.16 | |
| Processing and other income | | | 0.08 | | | (0.01 | ) | | 0.01 | | | 0.18 | | | 0.07 | | | 0.04 | | | 0.02 | | | 0.06 | | | 0.11 | | | 0.06 | | | 0.02 | |
| Exploration expenses | | | (0.55 | ) | | (0.24 | ) | | (0.46 | ) | | (0.28 | ) | | (0.39 | ) | | (0.25 | ) | | (0.22 | ) | | (0.36 | ) | | (0.36 | ) | | (0.30 | ) | | (0.29 | ) |
| Depletion, depreciation and amortization | | | (1.29 | ) | | (1.32 | ) | | (1.30 | ) | | (1.31 | ) | | (1.30 | ) | | (1.04 | ) | | (1.07 | ) | | (1.14 | ) | | (1.16 | ) | | (1.10 | ) | | (0.96 | ) |
| Income and other taxes | | | (0.90 | ) | | (1.44 | ) | | (1.52 | ) | | (1.92 | ) | | (1.44 | ) | | (0.99 | ) | | (1.21 | ) | | (1.03 | ) | | (1.18 | ) | | (1.10 | ) | | (1.20 | ) |
Net earnings | | $ | 1.68 | | $ | 1.66 | | $ | 2.27 | | $ | 4.17 | | $ | 2.43 | | $ | 1.81 | | $ | 1.99 | | $ | 1.66 | | $ | 1.89 | | $ | 1.85 | | $ | 1.73 | |
Production (billion cubic feet equivalent - Bcfe) | | | 71.9 | | | 67.4 | | | 69.0 | | | 67.4 | | | 275.7 | | | 69.8 | | | 70.4 | | | 72.2 | | | 75.6 | | | 288.0 | | | 289.8 | |
EAST COAST OIL
($/bbl, unless otherwise indicated)
| | | 2005 Three Months Ended | | | | 2004 Three Months Ended | | | | | |
| | | Mar. 31 | | June 30 | | Sept. 30 | | Dec. 31 | | Total 2005 | | Mar. 31 | | June 30 | | Sept. 30 | | Dec. 31 | | Total 2004 | | Total 2003 | |
| Average price received | | $ | 55.09 | | $ | 61.41 | | $ | 73.37 | | $ | 64.23 | | $ | 63.15 | | $ | 42.73 | | $ | 47.51 | | $ | 54.43 | | $ | 50.29 | | $ | 48.39 | | $ | 39.91 | |
| Royalties | | | (2.35 | ) | | (3.33 | ) | | (4.76 | ) | | (8.44 | ) | | (4.78 | ) | | (1.19 | ) | | (1.66 | ) | | (2.56 | ) | | (2.38 | ) | | (1.89 | ) | | (0.95 | ) |
| Operating expenses | | | (3.11 | ) | | (3.85 | ) | | (5.42 | ) | | (5.21 | ) | | (4.37 | ) | | (2.54 | ) | | (2.48 | ) | | (3.29 | ) | | (2.66 | ) | | (2.72 | ) | | (2.70 | ) |
| Netback | | | 49.63 | | | 54.23 | | | 63.19 | | | 50.58 | | | 54.00 | | | 39.00 | | | 43.37 | | | 48.58 | | | 45.25 | | | 43.78 | | | 36.26 | |
Overhead expenses (G&A)2 | | | (0.09 | ) | | 0.09 | | | - | | | (0.54 | ) | | (0.15 | ) | | (0.14 | ) | | (0.16 | ) | | (0.20 | ) | | (0.18 | ) | | (0.17 | ) | | (0.18 | ) |
| Netback after overhead expenses | | | 49.54 | | | 54.32 | | | 63.19 | | | 50.04 | | | 53.85 | | | 38.86 | | | 43.21 | | | 48.38 | | | 45.07 | | | 43.61 | | | 36.08 | |
| Processing and other income | | | - | | | - | | | 0.46 | | | - | | | 0.10 | | | 5.81 | | | (0.03 | ) | | 0.24 | | | - | | | 1.66 | | | 0.78 | |
| Depletion, depreciation and amortization | | | (9.65 | ) | | (10.06 | ) | | (9.97 | ) | | (9.06 | ) | | (9.66 | ) | | (8.87 | ) | | (9.00 | ) | | (9.18 | ) | | (9.17 | ) | | (9.05 | ) | | (8.42 | ) |
| Income and other taxes | | | (11.63 | ) | | (15.34 | ) | | (17.43 | ) | | (14.65 | ) | | (14.66 | ) | | (11.35 | ) | | (10.85 | ) | | (12.75 | ) | | (11.56 | ) | | (11.58 | ) | | (8.70 | ) |
Net earnings | | $ | 28.26 | | $ | 28.92 | | $ | 36.25 | | $ | 26.33 | | $ | 29.63 | | $ | 24.45 | | $ | 23.33 | | $ | 26.69 | | $ | 24.34 | | $ | 24.64 | | $ | 19.74 | |
Production (MMbbls) | | | 7.0 | | | 7.1 | | | 6.0 | | | 7.5 | | | 27.6 | | | 8.0 | | | 7.8 | | | 6.5 | | | 6.3 | | | 28.6 | | | 31.4 | |
1 Certain 2004 and 2003 comparatives have been restated
SYNCRUDE
($/bbl, unless otherwise indicated)
| | | 2005 Three Months Ended | | | | 2004 Three Months Ended | | | | | |
| | | Mar. 31 | | June 30 | | Sept. 30 | | Dec. 31 | | Total 2005 | | Mar. 31 | | June 30 | | Sept. 30 | | Dec. 31 | | Total 2004 | | Total 2003 | |
| Average price received | | $ | 64.40 | | $ | 67.08 | | $ | 77.16 | | $ | 70.82 | | $ | 70.42 | | $ | 45.34 | | $ | 51.41 | | $ | 54.81 | | $ | 58.58 | | $ | 52.40 | | $ | 42.67 | |
| Royalties | | | (0.65 | ) | | (0.66 | ) | | (0.78 | ) | | (0.71 | ) | | (0.71 | ) | | (0.45 | ) | | (0.52 | ) | | (0.55 | ) | | (0.96 | ) | | (0.61 | ) | | (0.48 | ) |
| Operating expenses | | | (44.24 | ) | | (26.70 | ) | | (26.95 | ) | | (34.04 | ) | | (31.90 | ) | | (18.54 | ) | | (22.70 | ) | | (19.97 | ) | | (23.66 | ) | | (21.13 | ) | | (23.94 | ) |
| Netback | | | 19.51 | | | 39.72 | | | 49.43 | | | 36.07 | | | 37.81 | | | 26.35 | | | 28.19 | | | 34.29 | | | 33.96 | | | 30.66 | | | 18.25 | |
| Depletion, depreciation and amortization | | | (1.89 | ) | | (1.89 | ) | | (1.96 | ) | | (2.04 | ) | | (1.95 | ) | | (1.79 | ) | | (1.80 | ) | | (1.79 | ) | | (1.79 | ) | | (1.79 | ) | | (1.78 | ) |
| Income and other taxes | | | (5.18 | ) | | (13.64 | ) | | (15.47 | ) | | (11.45 | ) | | (12.03 | ) | | (7.35 | ) | | (8.83 | ) | | (10.57 | ) | | (10.60 | ) | | (9.31 | ) | | (5.26 | ) |
Net earnings | | $ | 12.44 | | $ | 24.19 | | $ | 32.00 | | $ | 22.58 | | $ | 23.83 | | $ | 17.21 | | $ | 17.56 | | $ | 21.93 | | $ | 21.57 | | $ | 19.56 | | $ | 11.21 | |
Production (MMbbls) | | | 1.7 | | | 2.5 | | | 2.6 | | | 2.5 | | | 9.3 | | | 2.8 | | | 2.5 | | | 2.7 | | | 2.5 | | | 10.5 | | | 9.3 | |
MACKAY RIVER
($/bbl, unless otherwise indicated)
| | | 2005 Three Months Ended | | | | 2004 Three Months Ended | | | | | |
| | | Mar. 31 | | June 30 | | Sept. 30 | | Dec. 31 | | Total 2005 | | Mar. 31 | | June 30 | | Sept. 30 | | Dec. 31 | | Total 2004 | | Total 2003 | |
| Average price received | | $ | 10.88 | | $ | 13.92 | | $ | 31.98 | | $ | 15.27 | | $ | 18.61 | | $ | 19.10 | | $ | 19.61 | | $ | 25.15 | | $ | 11.41 | | $ | 18.37 | | $ | 16.69 | |
| Royalties | | | (0.08 | ) | | (0.11 | ) | | (0.30 | ) | | (0.12 | ) | | (0.16 | ) | | (0.16 | ) | | (0.15 | ) | | (0.22 | ) | | (0.11 | ) | | (0.16 | ) | | (0.12 | ) |
| Operating expenses | | | (14.80 | ) | | (15.65 | ) | | (14.08 | ) | | (20.72 | ) | | (16.29 | ) | | (18.40 | ) | | (30.32 | ) | | (20.08 | ) | | (17.76 | ) | | (20.98 | ) | | (22.34 | ) |
| Netback | | | (4.00 | ) | | (1.84 | ) | | 17.60 | | | (5.57 | ) | | 2.16 | | | 0.54 | | | (10.86 | ) | | 4.85 | | | (6.46 | ) | | (2.77 | ) | | (5.77 | ) |
Overhead expenses (G&A)2 | | | (0.74 | ) | | (0.80 | ) | | (0.69 | ) | | (0.84 | ) | | (0.77 | ) | | (0.78 | ) | | (1.09 | ) | | (0.96 | ) | | (0.80 | ) | | (0.89 | ) | | (1.39 | ) |
| Netback after overhead expenses | | | (4.74 | ) | | (2.64 | ) | | 16.91 | | | (6.41 | ) | | 1.39 | | | (0.24 | ) | | (11.95 | ) | | 3.89 | | | (7.26 | ) | | (3.66 | ) | | (7.16 | ) |
| Processing and other income | | | (0.51 | ) | | 0.16 | | | 0.02 | | | - | | | (0.06 | ) | | - | | | - | | | - | | | (0.01 | ) | | - | | | 0.04 | |
| Exploration expenses | | | (0.44 | ) | | (0.04 | ) | | 0.03 | | | (0.07 | ) | | (0.12 | ) | | (0.04 | ) | | (0.05 | ) | | - | | | (0.02 | ) | | (0.03 | ) | | (0.11 | ) |
| Depletion, depreciation and amortization | | | (3.18 | ) | | (3.18 | ) | | (3.08 | ) | | (3.53 | ) | | (3.24 | ) | | (3.10 | ) | | (3.37 | ) | | (3.14 | ) | | (3.09 | ) | | (3.16 | ) | | (3.29 | ) |
| Income and other taxes | | | 2.63 | | | 1.22 | | | (4.37 | ) | | 2.70 | | | 0.35 | | | 1.20 | | | 4.47 | | | (0.36 | ) | | 2.78 | | | 1.94 | | | 3.24 | |
Net earnings (loss) | | $ | (6.24 | ) | $ | (4.48 | ) | $ | 9.51 | | $ | (7.31 | ) | $ | (1.68 | ) | $ | (2.18 | ) | $ | (10.90 | ) | $ | 0.39 | | $ | (7.60 | ) | $ | (4.91 | ) | $ | (7.28 | ) |
Production (MMbbls) | | | 1.7 | | | 1.9 | | | 2.2 | | | 2.0 | | | 7.8 | | | 1.5 | | | 1.2 | | | 1.6 | | | 1.8 | | | 6.1 | | | 3.9 | |
NORTHWEST EUROPE3, 4
($/boe, unless otherwise indicated)
| | | 2005 Three Months Ended | | | | 2004 Three Months Ended | | | | | |
| | | Mar. 31 | | June 30 | | Sept. 30 | | Dec. 31 | | Total 2005 | | Mar. 31 | | June 30 | | Sept. 30 | | Dec. 31 | | Total 2004 | | Total 2003 | |
Average price received5 | | $ | 53.61 | | $ | 59.11 | | $ | 65.82 | | $ | 63.82 | | $ | 60.74 | | $ | 41.00 | | $ | 44.71 | | $ | 49.99 | | $ | 50.46 | | $ | 46.08 | | $ | 38.69 | |
| Royalties | | | - | | | (2.06 | ) | | (0.96 | ) | | (0.62 | ) | | (0.85 | ) | | - | | | - | | | - | | | - | | | - | | | - | |
| Net revenue | | | 53.61 | | | 57.05 | | | 64.86 | | | 63.20 | | | 59.89 | | | 41.00 | | | 44.71 | | | 49.99 | | | 50.46 | | | 46.08 | | | 38.69 | |
| Operating expenses | | | (8.23 | ) | | (10.66 | ) | | (8.86 | ) | | (10.99 | ) | | (9.62 | ) | | (6.50 | ) | | (7.81 | ) | | (9.04 | ) | | (8.65 | ) | | (7.89 | ) | | (6.90 | ) |
| Netback | | | 45.38 | | | 46.39 | | | 56.00 | | | 52.21 | | | 50.27 | | | 34.50 | | | 36.90 | | | 40.95 | | | 41.81 | | | 38.19 | | | 31.79 | |
Overhead expenses (G&A)2 | | | (1.54 | ) | | (2.98 | ) | | (2.48 | ) | | (1.96 | ) | | (2.20 | ) | | (0.37 | ) | | (0.90 | ) | | (0.38 | ) | | (2.44 | ) | | (0.96 | ) | | (0.82 | ) |
| Netback after overhead expenses | | | 43.84 | | | 43.41 | | | 53.52 | | | 50.25 | | | 48.07 | | | 34.13 | | | 36.00 | | | 40.57 | | | 39.37 | | | 37.23 | | | 30.97 | |
| Processing and other income | | | 2.62 | | | 0.65 | | | (3.26 | ) | | 1.50 | | | 1.81 | | | 5.78 | | | (4.97 | ) | | (2.75 | ) | | 0.83 | | | (0.07 | ) | | 0.98 | |
| Exploration expenses | | | (0.75 | ) | | (2.06 | ) | | (1.15 | ) | | (1.93 | ) | | (1.43 | ) | | (0.52 | ) | | (3.79 | ) | | (1.45 | ) | | (3.55 | ) | | (2.25 | ) | | (1.17 | ) |
| Depletion, depreciation and amortization | | | (14.31 | ) | | (15.06 | ) | | (15.19 | ) | | (14.64 | ) | | (14.79 | ) | | (13.48 | ) | | (13.67 | ) | | (13.78 | ) | | (12.94 | ) | | (13.48 | ) | | (11.37 | ) |
| Income and other taxes | | | (14.17 | ) | | (11.71 | ) | | (14.62 | ) | | (14.60 | ) | | (14.50 | ) | | (10.69 | ) | | (5.57 | ) | | (8.91 | ) | | (7.85 | ) | | (8.32 | ) | | (7.90 | ) |
Net earnings | | $ | 17.23 | | $ | 15.23 | | $ | 19.30 | | $ | 20.58 | | $ | 19.16 | | $ | 15.22 | | $ | 8.00 | | $ | 13.68 | | $ | 15.86 | | $ | 13.11 | | $ | 11.51 | |
Production (MMboe) | | | 4.3 | | | 3.3 | | | 4.4 | | | 4.3 | | | 16.3 | | | 5.8 | | | 5.3 | | | 4.6 | | | 4.3 | | | 20.0 | | | 18.6 | |
NORTH AFRICA/NEAR EAST3, 6, 8
($/boe, unless otherwise indicated)
| | | 2005 Three Months Ended | | | | 2004 Three Months Ended | | | | | |
| | | Mar. 31 | | June 30 | | Sept. 30 | | Dec. 31 | | Total 2005 | | Mar. 31 | | June 30 | | Sept. 30 | | Dec. 31 | | Total 2004 | | Total 2003 | |
Average price received5 | | $ | 56.01 | | $ | 69.84 | | $ | 74.20 | | $ | 62.44 | | $ | 65.75 | | $ | 41.48 | | $ | 47.37 | | $ | 53.07 | | $ | 51.36 | | $ | 48.35 | | $ | 39.50 | |
| Royalties | | | (4.04 | ) | | (11.17 | ) | | (8.08 | ) | | (6.91 | ) | | (7.59 | ) | | (7.58 | ) | | (7.77 | ) | | (7.40 | ) | | (5.59 | ) | | (7.08 | ) | | (7.12 | ) |
| Net revenue | | | 51.97 | | | 58.67 | | | 66.12 | | | 55.53 | | | 58.16 | | | 33.90 | | | 39.60 | | | 45.67 | | | 45.77 | | | 41.27 | | | 32.38 | |
| Operating expenses | | | (5.34 | ) | | (3.35 | ) | | (5.97 | ) | | (3.39 | ) | | (4.50 | ) | | (7.62 | ) | | (5.41 | ) | | (4.28 | ) | | (4.94 | ) | | (5.56 | ) | | (4.63 | ) |
| Netback | | | 46.63 | | | 55.32 | | | 60.15 | | | 52.14 | | | 53.66 | | | 26.28 | | | 34.19 | | | 41.39 | | | 40.83 | | | 35.71 | | | 27.75 | |
Overhead expenses (G&A)2 | | | (1.17 | ) | | (0.34 | ) | | (0.66 | ) | | (0.82 | ) | | (0.75 | ) | | (1.14 | ) | | (1.24 | ) | | (1.04 | ) | | (0.71 | ) | | (1.03 | ) | | (1.14 | ) |
| Netback after overhead | | | 45.46 | | | 54.98 | | | 59.49 | | | 51.32 | | | 52.91 | | | 25.14 | | | 32.95 | | | 40.35 | | | 40.12 | | | 34.68 | | | 26.61 | |
| Processing and other income | | | 2.19 | | | 3.08 | | | 1.33 | | | 3.26 | | | 2.47 | | | 1.76 | | | (0.43 | ) | | 0.33 | | | (2.99 | ) | | (0.34 | ) | | (0.72 | ) |
| Exploration expenses | | | (0.13 | ) | | (1.42 | ) | | (0.16 | ) | | (0.41 | ) | | (0.53 | ) | | (0.48 | ) | | (2.27 | ) | | (0.67 | ) | | (0.15 | ) | | (0.89 | ) | | (0.69 | ) |
| Depletion, depreciation and amortization | | | (2.33 | ) | | (2.27 | ) | | (2.14 | ) | | (1.46 | ) | | (2.04 | ) | | (2.48 | ) | | (2.52 | ) | | (2.67 | ) | | (3.23 | ) | | (2.73 | ) | | (2.10 | ) |
| Income and other taxes | | | (39.88 | ) | | (47.19 | ) | | (52.58 | ) | | (46.26 | ) | | (46.58 | ) | | (20.54 | ) | | (26.39 | ) | | (33.97 | ) | | (25.30 | ) | | (26.58 | ) | | (23.60 | ) |
Net earnings | | $ | 5.31 | | $ | 7.18 | | $ | 5.94 | | $ | 6.45 | | $ | 6.23 | | $ | 3.40 | | $ | 1.34 | | $ | 3.37 | | $ | 8.45 | | $ | 4.14 | | $ | (0.50 | ) |
Production (MMboe) | | | 4.4 | | | 4.5 | | | 4.6 | | | 4.7 | | | 18.2 | | | 4.6 | | | 4.5 | | | 4.7 | | | 4.7 | | | 18.5 | | | 18.6 | |
NORTHERN LATIN AMERICA3, 7
($/Mcf, unless otherwise indicated)
| | | 2005 Three Months Ended | | | | 2004 Months Ended | | | | | |
| | | Mar. 31 | | June 30 | | Sept. 30 | | Dec. 31 | | Total 2005 | | Mar. 31 | | June 30 | | Sept. 30 | | Dec. 31 | | Total 2004 | | Total 2003 | |
| Average price received | | $ | 5.09 | | $ | 5.05 | | $ | 6.90 | | $ | 9.82 | | $ | 6.62 | | $ | 4.72 | | $ | 4.99 | | $ | 4.24 | | $ | 5.30 | | $ | 4.81 | | $ | 4.01 | |
| Royalties | | | - | | | (4.42 | ) | | (4.86 | ) | | (1.83 | ) | | (2.06 | ) | | - | | | (0.62 | ) | | (1.43 | ) | | (2.02 | ) | | (1.05 | ) | | - | |
| Net revenue | | | 5.09 | | | 0.63 | | | 2.04 | | | 7.99 | | | 4.56 | | | 4.72 | | | 4.37 | | | 2.81 | | | 3.28 | | | 3.76 | | | 4.01 | |
| Operating expenses | | | (0.22 | ) | | (0.14 | ) | | (0.18 | ) | | (0.15 | ) | | (0.17 | ) | | (0.13 | ) | | (0.19 | ) | | (0.07 | ) | | (0.09 | ) | | (0.12 | ) | | (0.15 | ) |
| Netback | | | 4.87 | | | 0.49 | | | 1.86 | | | 7.84 | | | 4.39 | | | 4.59 | | | 4.18 | | | 2.74 | | | 3.19 | | | 3.64 | | | 3.86 | |
Overhead expenses (G&A)2 | | | (0.11 | ) | | (0.08 | ) | | (0.08 | ) | | (0.13 | ) | | (0.10 | ) | | (0.08 | ) | | (0.12 | ) | | (0.13 | ) | | (0.19 | ) | | (0.13 | ) | | (0.07 | ) |
| Netback after overhead expenses | | | 4.76 | | | 0.41 | | | 1.78 | | | 7.71 | | | 4.29 | | | 4.51 | | | 4.06 | | | 2.61 | | | 3.00 | | | 3.51 | | | 3.79 | |
| Processing and other income | | | 0.02 | | | 0.08 | | | (0.02 | ) | | - | | | 0.02 | | | (0.04 | ) | | 0.02 | | | (0.07 | ) | | (0.07 | ) | | (0.04 | ) | | (0.55 | ) |
| Depletion, depreciation and amortization | | | (0.65 | ) | | (0.65 | ) | | (0.65 | ) | | (0.65 | ) | | (0.65 | ) | | (0.59 | ) | | (0.57 | ) | | (0.58 | ) | | (0.54 | ) | | (0.57 | ) | | (0.81 | ) |
| Income and other taxes | | | (2.48 | ) | | 1.19 | | | 0.54 | | | (4.22 | ) | | (1.89 | ) | | (1.51 | ) | | (2.60 | ) | | (1.13 | ) | | (1.28 | ) | | (1.62 | ) | | (0.68 | ) |
Net earnings | | $ | 1.65 | | $ | 1.03 | | $ | 1.65 | | $ | 2.84 | | $ | 1.77 | | $ | 2.37 | | $ | 0.91 | | $ | 0.83 | | $ | 1.11 | | $ | 1.28 | | $ | 1.75 | |
Production (Bcf) | | | 6.8 | | | 6.8 | | | 6.6 | | | 6.1 | | | 26.3 | | | 6.1 | | | 6.4 | | | 6.8 | | | 6.8 | | | 26.1 | | | 23.2 | |
DISCONTINUED OPERATIONS8
($/boe, unless otherwise indicated)
| | | 2005 Three Months Ended | | | | 2004 Three Months Ended | | | | | |
| | | Mar. 31 | | June 30 | | Sept. 30 | | Dec. 31 | | Total 2005 | | Mar. 31 | | June 30 | | Sept. 30 | | Dec. 31 | | Total 2004 | | Total 2003 | |
Average price received5 | | $ | 52.83 | | $ | 58.96 | | $ | 65.24 | | $ | 62.80 | | $ | 60.39 | | $ | 39.88 | | $ | 45.95 | | $ | 53.01 | | $ | 45.65 | | $ | 45.91 | | $ | 37.80 | |
| Royalties | | | (35.71 | ) | | (41.73 | ) | | (45.73 | ) | | (43.60 | ) | | (42.15 | ) | | (26.44 | ) | | (31.15 | ) | | (37.57 | ) | | (31.56 | ) | | (31.49 | ) | | (24.38 | ) |
| Net revenue | | | 17.12 | | | 17.23 | | | 19.51 | | | 19.20 | | | 18.24 | | | 13.44 | | | 14.80 | | | 15.44 | | | 14.09 | | | 14.42 | | | 13.42 | |
| Operating expenses | | | (3.91 | ) | | (3.08 | ) | | (4.52 | ) | | (3.96 | ) | | (3.87 | ) | | (3.34 | ) | | (4.08 | ) | | (4.17 | ) | | (4.26 | ) | | (3.94 | ) | | (3.46 | ) |
| Netback | | | 13.21 | | | 14.15 | | | 14.99 | | | 15.24 | | | 14.37 | | | 10.10 | | | 10.72 | | | 11.27 | | | 9.83 | | | 10.48 | | | 9.96 | |
Overhead expenses (G&A)2 | | | (0.21 | ) | | (0.17 | ) | | (0.12 | ) | | (0.23 | ) | | (0.19 | ) | | (0.10 | ) | | (0.15 | ) | | (0.16 | ) | | (0.16 | ) | | (0.14 | ) | | (0.13 | ) |
| Netback after overhead | | | 13.00 | | | 13.98 | | | 14.87 | | | 15.01 | | | 14.18 | | | 10.00 | | | 10.57 | | | 11.11 | | | 9.67 | | | 10.34 | | | 9.83 | |
| Processing and other income | | | 0.33 | | | 0.47 | | | (0.22 | ) | | (0.07 | ) | | 0.14 | | | 0.17 | | | 0.21 | | | (0.02 | ) | | (0.55 | ) | | (0.04 | ) | | 0.64 | |
| Depletion, depreciation and amortization | | | (6.89 | ) | | (6.63 | ) | | (6.30 | ) | | (2.66 | ) | | (5.67 | ) | | (5.13 | ) | | (5.10 | ) | | (4.96 | ) | | (4.88 | ) | | (5.02 | ) | | (3.77 | ) |
| Income and other taxes | | | (3.88 | ) | | (4.39 | ) | | (5.10 | ) | | (4.87 | ) | | (4.55 | ) | | (2.98 | ) | | (3.31 | ) | | (3.72 | ) | | (3.40 | ) | | (3.34 | ) | | (3.46 | ) |
Net earnings | | $ | 2.56 | | $ | 3.43 | | $ | 3.25 | | $ | 7.41 | | $ | 4.10 | | $ | 2.06 | | $ | 2.37 | | $ | 2.41 | | $ | 0.84 | | $ | 1.94 | | $ | 3.24 | |
Production (MMboe) | | | 6.6 | | | 6.5 | | | 6.4 | | | 6.1 | | | 25.6 | | | 7.9 | | | 7.3 | | | 6.9 | | | 6.9 | | | 29.0 | | | 34.7 | |
| 1 | North American Natural Gas includes U.S. Rockies post-acquisition date as of July 28, 2004. |
| 2 | Portion of head office expenses allocated to production. |
| 3 | Northwest Europe and North Africa/Near East include conventional crude oil, NGL and natural gas in crude oil equivalents. Northern Latin America includes only natural gas. |
| 4 | Production in Northwest Europe is subject to a conventional royalty and tax regime. No royalty is payable on reserves in the U.K. sector. Royalty is payable on onshore reserves in the Netherlands. |
| 5 | Average price for Northwest Europe and North Africa/Near East includes conventional crude oil, NGL and natural gas in crude oil equivalents. |
| 6 | Excludes assets located in Kazakhstan, which were sold in 2004. |
| 7 | Natural gas production in Trinidad and Tobago is held under a production-sharing arrangement with the government of that country. The government share is split between royalty and tax for Canadian reporting purposes. |
| 8 | North Africa/Near East excludes production related to the mature Syrian producing assets, which are shown as discontinued operations. |
Reserves
In order to harmonize its oil and gas disclosure in both Canada and the U.S., Petro-Canada applied for, and received, certain exemptions to reserves disclosure requirements as set out in National Instrument 51-101 Standards of Disclosure for Oil and Gas Activities (NI 51-101), which was adopted in 2003 by the securities regulatory authorities in Canada. These exemptions permit Petro-Canada to use its own staff of qualified reserves evaluators to prepare the Company’s reserves estimates and to use SEC and Financial Accounting Standards Board (FASB) standards when reporting reserves.
Petro-Canada strongly believes that the use of its own staff of qualified reserves evaluators who are familiar with the Company’s oil and gas assets as a result of working with them on a day-to-day basis, combined with independent third-party assessment of both its reserves processes and its reserves estimates, provides a level of confidence in its reserves data that is at least as valid as that which would be provided if the work was done solely by a third party.
Petro-Canada’s staff of qualified reserves evaluators determines the Company’s reserves data and quantities based on corporate-wide policies, procedures and practices. The Company believes these reserves policies, procedures and practices conform to the requirements of Canadian, U.S. SEC regulations and of the Association of Professional Engineers, Geologists and Geophysicists of Alberta Standard of Practice for the Evaluation of Oil and Gas Reserves for Public Disclosure.
To confirm the quality of the reserves policies, procedures and practices and the internally generated reserves estimates, Petro-Canada employs the services of independent qualified engineering evaluators and auditors. For 2005, independent petroleum reservoir engineering consultants, Sproule Associates Limited (Sproule) and Gaffney, Cline & Associates Ltd. (GCA), conducted assessments of Petro-Canada’s hydrocarbon reserves. GCA completed an independent audit of 39% of the Company’s proved crude oil, natural gas and NGL reserves outside of North America. Similarly, Sproule audited 30% of Petro-Canada’s Canadian proved conventional reserves and reviewed Syncrude. Sproule also conducted an evaluation of Petro-Canada’s proved, probable and possible reserves in the U.S. Rockies. The independent auditors’ and evaluators’ reports concluded that the Company’s year-end 2005 proved reserves estimates are reasonable.
Sproule and GCA also audited Petro-Canada’s reserves policies, procedures and practices. They concluded that Petro-Canada’s reserves booking standards meet applicable disclosure regulations, that management is complying with those standards, and that the reserves process is carried out in a manner and standard consistent with the auditors’ practices. In addition, PricewaterhouseCoopers LLP, as contract internal auditor, has tested aspects of the non-engineering management control processes used in establishing reserves.
Detailed information about Petro-Canada’s proved reserves of crude oil, NGL, natural gas, bitumen and synthetic crude oil, before and after royalties, follows this section.
Petro-Canada’s Reserves Processes
Petro-Canada has a well-established reserves management process. The key components of the process are:
Reserves Steering Committee: Chaired by the senior vice-president, North American Natural Gas, the Reserves Steering Committee meets regularly to address issues regarding the reserves evaluation and reporting processes. Senior managers representing each upstream business unit, Finance and Legal Services make up this Committee.
Reservoir Engineering Organization: One or more reservoir engineering supervisors are responsible for the functional guidance of reservoir engineering within each upstream business unit. The supervisors ensure that the appropriate standards, processes and quality assurance checks are applied to reservoir engineering activities, including reserves evaluation. The supervisors, as responsible qualified reserves evaluators, sign the annual reserves evaluations for their respective areas.
Reserves Definitions, Policies, Procedures and Practices: Petro-Canada has developed corporate-wide internal policies, procedures and practices to assist reserves evaluation personnel. These policies are designed to meet internal and external reporting requirements and are updated annually, reviewed with the reservoir engineering staff, and are maintained for reference on the reservoir engineering section of Petro-Canada’s internal Web site.
Major Property Reviews: Each year, prior to business plan development, a series of reviews is conducted with inter-disciplinary management on Petro-Canada’s major properties. These reviews are intended to ensure that there is a current, accurate and appropriately communicated understanding of these assets and their associated opportunities.
Reserves Software Tools: Petro-Canada employs a high-quality technical tool kit for reservoir engineering. This software supports the analysis of technical and economic parameters required for reserves evaluation. Ongoing training and competency assessment is used to support the effective use of the tool kit.
Independent Evaluation/Audit/Review: Independent qualified reserve evaluators are engaged to audit and/or evaluate the Company’s internal evaluation processes and to perform such tests as they deem appropriate to ensure Petro-Canada’s reserves are appropriately evaluated. The independent evaluators’ observations and recommendations are reviewed with senior management and are used to guide process improvement activities.
Reserves Review and Disclosure Process: In December of each year, the management in each business unit reviews the reserves data prepared by the reservoir engineering staff. The officer responsible for each business unit signs an assertion regarding the quality of the reserves estimates and the processes applied. Also in December, Petro-Canada’s year-end reserves and preliminary reports from the independent evaluators are reviewed by the Reserves Steering Committee and a copy of the preliminary reserves report is supplied to the external financial auditor. In January, the final reserves report is reviewed with the Executive Leadership Team and the Audit, Finance and Risk Committee of the Board of Directors (the Board).
The following tables show the Company’s estimates of Petro-Canada’s total proved conventional crude oil, NGL, natural gas, bitumen and synthetic crude oil reserves as at December 31, 2005, and average 2005 daily production by major fields.
MAJOR RESERVES AND PRODUCTION LOCATIONS, BEFORE DEDUCTION OF ROYALTIES
Crude Oilfield/Facility1, 2 | Location | Proved Reserves3, 4 at December 31, 2005 (MMbbls) | Average 2005 Daily Production (Mbbl/d) |
| Syncrude | Alberta | 342 | 26 |
| Buzzard | Offshore U.K. | 85 | - |
| Hibernia | Offshore Newfoundland and Labrador | 65 | 40 |
| Amal | Libya | 47 | 15 |
| Ghani/Zenad Farrud | Libya | 35 | 11 |
| Terra Nova | Offshore Newfoundland and Labrador | 35 | 34 |
| White Rose | Offshore Newfoundland and Labrador | 31 | 2 |
| Ghani Gir/Facha | Libya | 20 | 7 |
| Ferrier | Alberta | 18 | 3 |
| Guillemot West | Offshore U.K. | 14 | 4 |
| Other | | 148 | 133 |
Total | | 840 | 275 |
Natural Gas Field/Facility1, 2 | Location | Proved Reserves at December 31, 2005 (Bcf) | Average 2005 Daily Production3 (MMcf/d) |
| Wildcat Hills area | Alberta | 425 | 119 |
| Hanlan area | Alberta | 262 | 108 |
| NCMA-1 | Offshore Trinidad and Tobago | 238 | 72 |
| Medicine Hat | Alberta | 192 | 44 |
| Jedney/Bubbles area | British Columbia | 128 | 29 |
| Alderson | Alberta | 100 | 25 |
| Laprise area | British Columbia | 92 | 31 |
| Ricinus/Bearberry/Strachan | Alberta | 77 | 55 |
| Denver-Julesburg area | U.S. | 69 | 19 |
| Gilby/Wilson | Alberta | 54 | 24 |
| Other | | 558 | 304 |
Total | | 2,195 | 830 |
| 1 | Fields are onshore unless otherwise indicated. |
| 2 | The Company’s mature producing assets in Syria were in the process of being sold at December 31, 2005, therefore, the Syrian proved reserves of 49 MMboe before royalties are included in the tables presented. |
| 3 | The reserves and production figures shown in this table do not include NGL. Total Company proved reserves of crude oil and NGL at year-end 2005 were 866 MMbbls. |
| 4 | Syncrude reserves are synthetic crude oil reserves from oil sands mining. |
Petro-Canada believes that the crude oil, NGL, natural gas, bitumen and synthetic crude oil reserves quantities are reasonable estimates consistent with current knowledge of the characteristics and extent of the productive formations, but such estimates are subject to upward or downward revisions as additional information regarding producing fields becomes available, as technology improves and as economic conditions change. Additional proved reserves are expected to be booked during the normal course of continuing development.
The following tables show, for the years indicated, Petro-Canada’s estimates of proved reserves, before and after deduction of royalties, for each of conventional crude oil, NGL, bitumen, synthetic crude oil (from mining operations) and natural gas.
PROVED RESERVES BEFORE ROYALTIES1, 2, 3, 4, 5
(Crude oil and equivalents in MMbbls; Natural gas in Bcf)
| | | | | North American - Conventional | | | | | | | |
| | | International | | North American Natural Gas | | | | | | | | | | | |
| | | Northwest Europe6 | | North Africa/Near East 7, 8, 9, 10, 11, 17 | | Northern Latin America7, 12 | | Western Canada | | U.S. Rockies | | East Coast | | Oil Sands13 | | Total Conventional | | Syncrude Mining Operation14 | | Total | |
| | | Crude oil & NGL | | Natural gas | | Crude oil & NGL | | Natural gas | | Natural gas | | Crude oil & NGL | | Natural gas | | Crude oil & NGL | | Natural gas | | Crude oil & NGL | | Bitumen | | Crude oil, NGL & bitumen | | Synthetic crude oil | | Crude oil & equivalents | | Natural gas | |
Beginning of year 2004 | | | 65 | | | 126 | | | 261 | | | 65 | | | 324 | | | 41 | | | 2,030 | | | - | | | - | | | 71 | | | 28 | | | 466 | | | 330 | | | 796 | | | 2,545 | |
Revisions of previous estimates15 | | | 12 | | | 31 | | | 1 | | | (18 | ) | | (33 | ) | | - | | | 16 | | | - | | | (14 | ) | | 26 | | | (22 | ) | | 17 | | | 12 | | | 29 | | | (18 | ) |
| Sale of reserves in place | | | - | | | (1 | ) | | (6 | ) | | - | | | - | | | - | | | (1 | ) | | - | | | - | | | - | | | - | | | (6 | ) | | - | | | (6 | ) | | (2 | ) |
| Purchase of reserves in place | | | 86 | | | 6 | | | - | | | - | | | - | | | - | | | 7 | | | 6 | | | 109 | | | - | | | - | | | 92 | | | - | | | 92 | | | 122 | |
| Discoveries, extensions and improved recovery | | | - | | | - | | | - | | | - | | | - | | | 2 | | | 145 | | | - | | | - | | | - | | | - | | | 2 | | | - | | | 2 | | | 145 | |
| Production | | | (15 | ) | | (31 | ) | | (46 | ) | | (8 | ) | | (26 | ) | | (5 | ) | | (247 | ) | | - | | | (7 | ) | | (29 | ) | | (6 | ) | | (101 | ) | | (11 | ) | | (112 | ) | | (319 | ) |
End of year 2004 | | | 148 | | | 131 | | | 210 | | | 39 | | | 265 | | | 38 | | | 1,950 | | | 6 | | | 88 | | | 68 | | | - | | | 470 | | | 331 | | | 801 | | | 2,473 | |
Revisions of previous estimates15 | | | 2 | | | 4 | | | 29 | | | (14 | ) | | - | | | 5 | | | (36 | ) | | 2 | | | 22 | | | 68 | | | 8 | | | 114 | | | 20 | | | 134 | | | (24 | ) |
| Sale of reserves in place | | | - | | | - | | | - | | | - | | | - | | | - | | | - | | | - | | | - | | | - | | | - | | | - | | | - | | | - | | | - | |
| Purchase of reserves in place | | | 5 | | | 4 | | | - | | | - | | | - | | | - | | | - | | | - | | | - | | | - | | | - | | | 5 | | | - | | | 5 | | | 4 | |
| Discoveries, extensions and improved recovery | | | - | | | - | | | 3 | | | - | | | - | | | 4 | | | 44 | | | - | | | - | | | 23 | | | - | | | 30 | | | - | | | 30 | | | 44 | |
| Production | | | (12 | ) | | (24 | ) | | (42 | ) | | (9 | ) | | (26 | ) | | (5 | ) | | (229 | ) | | (1 | ) | | (14 | ) | | (27 | ) | | (8 | ) | | (95 | ) | | (9 | ) | | (104 | ) | | (302 | ) |
End of year 2005 | | | 143 | | | 115 | | | 200 | | | 16 | | | 239 | | | 42 | | | 1,729 | | | 7 | | | 96 | | | 132 | | | - | | | 524 | | | 342 | | | 866 | | | 2,195 | |
Proved undeveloped reserves16 | | | | | | | | | | | | | | | | | | | | | | | | | | | | | | | | | | | | | | | | | | | | | | |
Beginning of year 2004 | | | - | | | - | | | 36 | | | - | | | 190 | | | 1 | | | 82 | | | - | | | - | | | 16 | | | 17 | | | 70 | | | 165 | | | 235 | | | 272 | |
End of year 2004 | | | 101 | | | 14 | | | 21 | | | - | | | 178 | | | 1 | | | 82 | | | 2 | | | 24 | | | 19 | | | - | | | 144 | | | 189 | | | 333 | | | 298 | |
End of year 2005 | | | 95 | | | 14 | | | 22 | | | - | | | 178 | | | 1 | | | 132 | | | 3 | | | 30 | | | 43 | | | - | | | 164 | | | 209 | | | 373 | | | 354 | |
PROVED RESERVES AFTER ROYALTIES1, 2, 3, 4, 5
(Crude oil and equivalents in MMbbls; Natural gas in Bcf)
| | | | | North America - Conventional | | | | | | | |
| | | International | | North American Natural Gas | | | | | | | | | | | |
| | | Northwest Europe6 | | North Africa/Near East 7, 8, 9, 10, 11, 17 | | Northern Latin America7, 12 | | Western Canada | | U.S. Rockies | | East Coast | | Oil Sands13 | | Total Conventional | | Syncrude Mining Operation14 | | Total | |
| | | Crude oil & NGL | | Natural gas | | Crude oil & NGL | | Natural gas | | Natural gas | | Crude oil & NGL | | Natural gas | | Crude oil & NGL | | Natural gas | | Crude oil & NGL | | Bitumen | | Crude oil, NGL & bitumen | | Synthetic crude oil | | Crude oil & equivalents | | Natural gas | |
Beginning of year 2004 | | | 64 | | | 126 | | | 169 | | | 22 | | | 275 | | | 32 | | | 1,559 | | | - | | | - | | | 67 | | | 28 | | | 360 | | | 290 | | | 650 | | | 1,982 | |
Revisions of previous estimates15 | | | 13 | | | 31 | | | 3 | | | (8 | ) | | (32 | ) | | - | | | 20 | | | - | | | (11 | ) | | 21 | | | (22 | ) | | 15 | | | 7 | | | 22 | | | - | |
| Sale of reserves in place | | | - | | | (1 | ) | | (3 | ) | | - | | | - | | | - | | | (1 | ) | | - | | | - | | | - | | | - | | | (3 | ) | | - | | | (3 | ) | | (2 | ) |
| Purchase of reserves in place | | | 86 | | | 6 | | | - | | | - | | | - | | | - | | | 5 | | | 4 | | | 90 | | | - | | | - | | | 90 | | | - | | | 90 | | | 101 | |
| Discoveries, extensions and improved recovery | | | - | | | - | | | - | | | - | | | - | | | 2 | | | 113 | | | - | | | - | | | - | | | - | | | 2 | | | - | | | 2 | | | 113 | |
| Production | | | (15 | ) | | (31 | ) | | (25 | ) | | (1 | ) | | (18 | ) | | (4 | ) | | (188 | ) | | - | | | (6 | ) | | (27 | ) | | (6 | ) | | (77 | ) | | (10 | ) | | (87 | ) | | (244 | ) |
End of year 2004 | | | 148 | | | 131 | | | 144 | | | 13 | | | 225 | | | 30 | | | 1,508 | | | 4 | | | 73 | | | 61 | | | - | | | 387 | | | 287 | | | 674 | | | 1,950 | |
Revisions of previous estimates15 | | | 1 | | | 5 | | | 28 | | | (6 | ) | | (1 | ) | | 5 | | | (28 | ) | | 7 | | | 18 | | | 57 | | | 8 | | | 106 | | | 9 | | | 115 | | | (12 | ) |
| Sale of reserves in place | | | - | | | - | | | - | | | - | | | - | | | - | | | - | | | - | | | - | | | - | | | - | | | - | | | - | | | - | | | - | |
| Purchase of reserves in place | | | 5 | | | 3 | | | - | | | - | | | - | | | - | | | - | | | - | | | - | | | - | | | - | | | 5 | | | - | | | 5 | | | 3 | |
| Discoveries, extensions and improved recovery | | | - | | | - | | | 2 | | | - | | | - | | | 3 | | | 34 | | | - | | | - | | | 20 | | | - | | | 25 | | | - | | | 25 | | | 34 | |
| Production | | | (12 | ) | | (24 | ) | | (22 | ) | | (2 | ) | | (21 | ) | | (4 | ) | | (175 | ) | | (6 | ) | | (12 | ) | | (25 | ) | | (8 | ) | | (77 | ) | | (9 | ) | | (86 | ) | | (234 | ) |
End of year 2005 | | | 142 | | | 115 | | | 152 | | | 5 | | | 203 | | | 34 | | | 1,339 | | | 5 | | | 79 | | | 113 | | | - | | | 446 | | | 287 | | | 733 | | | 1,741 | |
Proved undeveloped reserves16 | | | | | | | | | | | | | | | | | | | | | | | | | | | | | | | | | | | | | | | | | | | | | | |
Beginning of year 2004 | | | - | | | - | | | 23 | | | - | | | 161 | | | 1 | | | 62 | | | - | | | - | | | 16 | | | 16 | | | 56 | | | 143 | | | 199 | | | 223 | |
End of year 2004 | | | 101 | | | 14 | | | 14 | | | - | | | 151 | | | 1 | | | 65 | | | 2 | | | 20 | | | 16 | | | - | | | 134 | | | 161 | | | 295 | | | 250 | |
End of year 2005 | | | 95 | | | 14 | | | 15 | | | - | | | 151 | | | 1 | | | 99 | | | 3 | | | 25 | | | 33 | | | - | | | 147 | | | 173 | | | 320 | | | 289 | |
1 In order to harmonize its oil and gas disclosure in both Canada and the U.S., Petro-Canada applied for, and received, certain exemptions to reserves disclosure requirements as set out in NI 51-101. These exemptions permit Petro-Canada to use its own staff of qualified reserves evaluators to prepare the Company’s reserves estimates and to use U.S. SEC and FASB standards when preparing and reporting reserves. Such reserves information may differ from reserves information prepared in accordance with Canadian disclosure standards under NI 51-101. These differences relate to the SEC requirement for disclosure only of proved reserves calculated at constant year-end prices and costs, while NI 51-101 requires disclosure of proved reserves at constant prices and costs, and proved plus probable reserves at forecast prices and costs. Also, the definition of proved reserves differs between SEC and NI 51-101 requirements. However, this difference should not be material. The Canadian Oil and Gas Evaluation Handbook (the source document for reserves definitions under NI 51-101) supports this view.
2 Petro-Canada employs the services of independent third-party evaluators/auditors to assess its reserves policies, practices and procedures and its reserves estimates.
3 Proved reserves before royalties are Petro-Canada’s working interest reserves before the deduction of Crown or other royalties. Such royalties are subject to change by legislation or regulation and can also vary depending on production rates, selling prices and timing of initial production. Reserves quantities after royalty reflect net overriding royalty interests paid and received.
4 Proved reserves are the estimated quantities of crude oil, natural gas and NGL which geological and engineering data demonstrate with reasonable certainty to be recoverable in future years from known reservoirs under existing economic and operating conditions. Proved developed reserves are those proved reserves that are expected to be recovered from existing wells or facilities. Proved undeveloped reserves are proved reserves which are not recoverable from existing wells or facilities, but which are expected to be recovered through additional development drilling or through the upgrading of existing or additional new facilities.
5 Unproved reserves are based on geological and/or engineering data similar to that used in estimates of proved reserves, but technical, contractual, economic or regulatory uncertainties precludesuch reserves being classified as proved. Unproved reserves may be further classified as probable reserves and possible reserves.
6 Reserves in Northwest Europe are subject to a conventional royalty and tax regime. No royalty is payable on reserves in the U.K. sector. Royalty is payable on onshore reserves in the Netherlands.
7 Proved reserves include quantities of crude oil and natural gas which will be produced under arrangements which involve the Company or its subsidiaries in upstream risks and rewards, but which do not transfer title of the product to those companies.
8 In Petro-Canada’s production-sharing contracts, net proved reserves have been determined using the economic interest method and include the Company’s share of future cost recovery and profit oil after foreign governments’ royalty interest, and include reserves relating to income tax payable. Under this method, reported reserves will increase as oil prices decrease (and vice versa) since the barrels necessary to achieve cost recovery change with the prevailing oil prices.
9 Reserves in Syria are held under production-sharing arrangements with the Syrian government and are calculated as per footnote 8.
10 With the exception of the En Naga field, reserves in Libya are held under a concession and are subject to a royalty and tax regime. The En Naga field is held under a production-sharing arrangement with the Libyan government, with reserves being calculated as per footnote 8.
11 The volume of oil and gas reserves before royalties reported above held under production-sharing contracts in the North Africa/Near East region at the end of 2005 was 59 MMbbls of crude oil and NGL and 15 Bcf of natural gas. At year-end 2004, the volume was 72 MMbbls of crude oil and NGL and 39 Bcf of natural gas. The after royalty reserves volumes were: year-end 2005 - 21 MMbbls of crude oil and NGL and 5 Bcf of natural gas; and year-end 2004 - 28 MMbbls of crude oil and NGL and 13 Bcf of natural gas.
12 Natural gas reserves in Trinidad and Tobago are held under a production-sharing arrangement with the applicable government and are calculated as per footnote 8. The volume of proved natural gas reserves before royalties reported above held under production-sharing contracts in Trinidad and Tobago at the end of 2005 was 239 Bcf. At year-end 2004, the volume was 265 Bcf. The after royalty reserves volumes were: year-end 2005 - 203 Bcf; and year-end 2004 - 225 Bcf.
13 Proved bitumen reserves are based on estimates of recovery from existing producer-injector well pairs. As a result of very wide light/heavy crude oil differentials and high prices for synthetic crude oil used for blending at year-end 2004 and 2005, bitumen prices were very low. Based on the SEC requirement to use year-end bitumen prices for the estimation of proved reserves, the Company transferred its remaining proved reserves of bitumen at year-end 2004 to probable reserves. With the exception of the 2005 production being classified as proved, the reserves remain as probable due to the very low year-end 2005 bitumen price.
14 Proved reserves of synthetic crude oil from the Syncrude oil sands mining operation in northeastern Alberta are separately identified from reserves of conventional crude oil. Petro-Canada views these reserves as an integral part of the Company’s business. Proved reserves of synthetic crude oil are based on high geological certainty and application of proven or piloted technology. For proved reserves, drill-hole spacing is less than 500 metres and appropriate co-owner and regulatory approvals are in place.
15 Revisions include changes in previous estimates, either upward or downward, resulting from new information (except an increase in acreage) normally obtained from drilling or production history or resulting from a change in economic factors.
16 Proved undeveloped conventional crude oil and NGL reserves represent approximately 43% of Petro-Canada’s total conventional crude oil and NGL proved reserves. The vast majority of these oil and NGL reserves are associated with large development projects currently producing or under active development, including Buzzard, White Rose, Terra Nova and Hibernia. Proved undeveloped gas reserves represent approximately 16% of total proved natural gas reserves. These reserves typically will be developed through tie-in of existing wells, drilling of additional wells or addition of compression facilities. Sixty per cent of the proved undeveloped gas reserves are associated with the currently producing NCMA-1 development in Trinidad and Tobago. Generally, the Company plans to develop proved undeveloped natural gas reserves in the next few years.
17 The Company’s mature producing assets in Syria were sold effective January 31, 2006. As at December 31, 2005, the sale had not closed. The Syrian proved reserves before royalty of 48.7 MMboe are included in the reserves totals in the above table.
Standardized Measure of Discounted Future Net Cash Flows and Changes Therein Relating to Proved Oil and Gas Reserves
The following disclosures on standardized measure of discounted cash flows and changes therein relating to proved oil and gas reserves are determined in accordance with the U.S. FASB Statement 69, Disclosures About Oil and Gas Producing Activities. The future cash flows are calculated by applying year-end prices, or prices provided by contractual arrangements, net of royalties, to year-end quantities of proved oil and gas reserves. Future production, development and asset retirement costs are based on year-end costs, and estimated future income taxes are based on legislated future income tax rates. The resulting future net cash flows are discounted at 10% per annum. The calculation does not represent a fair market value of the Company’s oil and gas reserves or of the future net cash flows. No consideration is given to the value of exploration properties or probable reserves. No consideration is given to the value of the Company’s share of the Syncrude oil sands mining operation, as it is considered a mining operation under SEC disclosure. The following benchmark commodity prices as at December 31, 2005 were used in deriving the Standardized Measure: WTI at Cushing $61.04/bbl US; dated Brent at Sullom Voe $58.21/bbl US; NYMEX gas price at the Henry Hub $11.23/million British thermal units (MMBtu) US; and Alberta price of natural gas at the AECO-C Hub Cdn$ 9.01/GJ. The following currency exchange rates were also used: Cdn$/US$ 1.1659; Cdn$/Euro 1.3725; Cdn$/British pound 2.0028.
PRESENT VALUE OF ESTIMATED FUTURE NET CASH FLOWS
(millions of dollars)
| | Western Canada1 | | U.S. Rockies | | East Coast Oil2 | |
| | | 2005 | | 2004 | | 2003 | | 2005 | | 2004 | | 2003 | | 2005 | | 2004 | | 2003 | |
| Future cash flows | | $ | 15,255 | | $ | 11,470 | | $ | 10,382 | | $ | 1,058 | | | 688 | | | - | | $ | 7,746 | | $ | 2,580 | | $ | 2,470 | |
| Future production, development and asset retirement costs | | | (2,631 | ) | | (2,344 | ) | | (2,290 | ) | | (402 | ) | | (281 | ) | | - | | | (1,314 | ) | | (786 | ) | | (523 | ) |
| Future income taxes | | | (4,121 | ) | | (2,900 | ) | | (2,517 | ) | | (245 | ) | | (110 | ) | | - | | | (1,993 | ) | | (467 | ) | | (506 | ) |
| Future net cash flows | | | 8,503 | | | 6,226 | | | 5,575 | | | 411 | | | 297 | | | - | | | 4,439 | | | 1,327 | | | 1,441 | |
| Discount of 10% for estimated timing of cash flows | | | (3,413 | ) | | (2,676 | ) | | (2,407 | ) | | (168 | ) | | (118 | ) | | - | | | (1,164 | ) | | (285 | ) | | (506 | ) |
| Discounted future net cash flows | | $ | 5,090 | | $ | 3,550 | | $ | 3,168 | | $ | 243 | | $ | 179 | | $ | - | | $ | 3,275 | | $ | 1,042 | | $ | 935 | |
| | | | | | | | | | | | | | | | | | | | | | | | | | | | | |
| | | | North Africa/Near East | Northern Latin America |
| | | | 2005 | | | 2004 | | | 2003 | | | 2005 | | | 2004 | | | 2003 | | | 2005 | | | 2004 | | | 2003 | |
| Future cash flows | | $ | 9,092 | | $ | 7,624 | | $ | 3,370 | | $ | 8,984 | | $ | 6,039 | | $ | 5,278 | | $ | 1,737 | | $ | 1,031 | | $ | 1,348 | |
| Future production, development and asset retirement costs | | | (2,844 | ) | | (3,190 | ) | | (1,341 | ) | | (800 | ) | | (981 | ) | | (954 | ) | | (248 | ) | | (151 | ) | | (147 | ) |
| Future income taxes | | | (3,227 | ) | | (1,682 | ) | | (667 | ) | | (7,092 | ) | | (4,344 | ) | | (3,719 | ) | | (813 | ) | | (479 | ) | | (647 | ) |
| Future net cash flows | | | 3,021 | | | 2,752 | | | 1,362 | | | 1,092 | | | 714 | | | 605 | | | 676 | | | 401 | | | 554 | |
| Discount of 10% for estimated timing of cash flows | | | (859 | ) | | (929 | ) | | (293 | ) | | (392 | ) | | (271 | ) | | (242 | ) | | (305 | ) | | (188 | ) | | (279 | ) |
| Discounted future net cash flows | | $ | 2,162 | | $ | 1,823 | | $ | 1,069 | | $ | 700 | | $ | 443 | | $ | 363 | | $ | 371 | | $ | 213 | | $ | 275 | |
| | | | | | | | | | | | | | | | | | | | | | | | | | | | | |
| | | Continuing Operations | Discontinued Operations | Total |
| | | | 2005 | | | 2004 | | | 2003 | | | 2005 | | | 2004 | | | 2003 | | | 2005 | | | 2004 | | | 2003 | |
| Future cash flows | | $ | 43,872 | | $ | 29,432 | | $ | 22,848 | | $ | 1,008 | | $ | 1,038 | | $ | 1,415 | | $ | 44,880 | | $ | 30,470 | | $ | 24,263 | |
| Future production, development and asset retirement costs | | | (8,239 | ) | | (7,733 | ) | | (5,255 | ) | | (336 | ) | | (453 | ) | | (482 | ) | | (8,575 | ) | | (8,186 | ) | | (5,737 | ) |
| Future income taxes | | | (17,491 | ) | | (9,982 | ) | | (8,056 | ) | | (244 | ) | | (219 | ) | | (369 | ) | | (17,735 | ) | | (10,201 | ) | | (8,425 | ) |
| Future net cash flows | | | 18,142 | | | 11,717 | | | 9,537 | | | 428 | | | 366 | | | 564 | | | 18,570 | | | 12,083 | | | 10,101 | |
| Discount of 10% for estimated timing of cash flows | | | (6,301 | ) | | (4,467 | ) | | (3,727 | ) | | (81 | ) | | (84 | ) | | (158 | ) | | (6,382 | ) | | (4,551 | ) | | (3,885 | ) |
| Discounted future net cash flows | | $ | 11,841 | | $ | 7,250 | | $ | 5,810 | | $ | 347 | | $ | 282 | | $ | 406 | | $ | 12,188 | | $ | 7,532 | | $ | 6,216 | |
| 1 | Western Canada includes the cash flows of MacKay River in 2003. There were no proved reserves at MacKay River at year-end 2004 and 2005. |
2 Additional East Coast Oil reserves quantities will be booked as proved reserves as development proceeds.
SUMMARY OF CHANGES IN PRESENT VALUE OF ESTIMATED FUTURE CASH FLOWS
(millions of dollars)
| | 2005 | | 2004 | | 2003 | |
Balance at beginning of year | | $ | 7,532 | | $ | 6,216 | | $ | 7,022 | |
Changes result from: | | | | | | | | | | |
| Sales and transfers of oil and gas produced, net of production costs | | | (5,273 | ) | | (4,348 | ) | | (4,062 | ) |
| Net changes in prices, operating costs and royalties | | | 9,013 | | | 2,482 | | | (1,608 | ) |
| Extensions, discoveries, additions and improved recoveries | | | 1,383 | | | 395 | | | 274 | |
| Changes in estimated future development costs | | | (758 | ) | | (1,235 | ) | | (767 | ) |
| Development costs incurred during the year | | | 900 | | | 966 | | | 845 | |
| Revisions of previous quantity estimates | | | 3,328 | | | 979 | | | 1,149 | |
| Accretion of discount | | | 1,374 | | | 1,117 | | | 910 | |
| Net change in income tax | | | (4,711 | ) | | (1,186 | ) | | 1,843 | |
| Purchase and sale of reserves in place | | | 246 | | | 2,017 | | | 313 | |
| Changes in timing and other | | | (846 | ) | | 129 | | | 297 | |
| Net change | | | 4,656 | | | 1,316 | | | (806 | ) |
Balance at end of year | | $ | 12,188 | | $ | 7,532 | | $ | 6,216 | |
Abandonments and Reclamation Costs
The Company’s upstream future asset retirement costs are estimated based on current costs and technology and in accordance with existing legislation and industry practice. As of December 31, 2005, the total of these future costs is estimated to be $2,748 million undiscounted or $543 million discounted at 10%. The Company’s upstream operations expect to spend approximately $41 million, $31 million and $30 million in the next three years, respectively, for future asset retirement costs. The following table summarizes Petro-Canada’s wells capable of production.
PRODUCTIVE WELLS1 AT DECEMBER 31, 2005
| | | Crude Oil Wells | | Natural Gas Wells | | Total Wells | |
| | | Gross2 | | Net3 | | Gross | | Net | | Gross | | Net | |
North America | | | | | | | | | | | | | | | | | | | |
| North American Natural Gas | | | 855 | | | 680 | | | 4,405 | | | 2,998 | | | 5,260 | | | 3,678 | |
| East Coast Oil - conventional oil and gas | | | 82 | | | 20 | | | - | | | - | | | 82 | | | 20 | |
Oil Sands - in situ bitumen recovery | | | 35 | | | 34 | | | - | | | - | | | 35 | | | 34 | |
| Total North America | | | 972 | | | 734 | | | 4,405 | | | 2,998 | | | 5,377 | | | 3,732 | |
International | | | | | | | | | | | | | | | | | | | |
| Northwest Europe - conventional oil and gas | | | 36 | | | 15 | | | 32 | | | 6 | | | 68 | | | 21 | |
| North Africa/Near East - conventional oil and gas | | | 235 | | | 108 | | | - | | | - | | | 235 | | | 108 | |
| Northern Latin America - natural gas | | | - | | | - | | | 7 | | | 1 | | | 7 | | | 1 | |
| Total International | | | 271 | | | 123 | | | 39 | | | 7 | | | 310 | | | 130 | |
Total productive wells from continuing operations | | | 1,243 | | | 857 | | | 4,444 | | | 3,005 | | | 5,687 | | | 3,862 | |
Discontinued operations | | | 327 | | | 115 | | | - | | | - | | | 327 | | | 115 | |
Total productive wells | | | 1,570 | | | 972 | | | 4,444 | | | 3,005 | | | 6,014 | | | 3,977 | |
| 1 | Wells with multiple completions are counted as one well. |
| 2 | Gross wells are wells in which Petro-Canada owns a working interest. |
| 3 | Net wells are the sums of the fractional working interests owned by Petro-Canada in gross wells, rounded to the nearest whole number. |
Oil and Natural Gas Rights
Petro-Canada’s oil and natural gas rights are summarized in the following table. Landholdings are subject to government regulation.
OIL AND GAS RIGHTS AT DECEMBER 31, 2005
| | | Developed Lands1 | | Undeveloped Lands1 | | Total | |
| | | 2005 | | 2004 | | 2005 | | 2004 | | 2005 | | 2004 | |
(millions of acres) | | Gross2 | | Net3 | | Gross2 | | Net3 | | Gross2 | | Net3 | | Gross2 | | Net3 | | Gross2 | | Net3 | | Gross2 | | Net3 | |
Canada | | | | | | | | | | | | | | | | | | | | | | | | | | | | | | | | | | | | | |
| Mainland Canada | | | 2.1 | | | 1.2 | | | 2.1 | | | 1.1 | | | 3.1 | | | 2.6 | | | 3.9 | | | 2.9 | | | 5.2 | | | 3.8 | | | 6.0 | | | 4.0 | |
| Oil Sands | | | 0.4 | | | 0.2 | | | 0.3 | | | 0.1 | | | 0.3 | | | 0.2 | | | 0.3 | | | 0.1 | | | 0.7 | | | 0.4 | | | 0.6 | | | 0.2 | |
| East Coast Oil offshore | | | 0.1 | | | - | | | 0.1 | | | - | | | 2.4 | | | 0.9 | | | 3.5 | | | 1.2 | | | 2.5 | | | 0.9 | | | 3.6 | | | 1.2 | |
Other frontier4 | | | - | | | - | | | | | | | | | 9.0 | | | 7.1 | | | 7.7 | | | 6.2 | | | 9.0 | | | 7.1 | | | 7.7 | | | 6.2 | |
Total Canada | | | 2.6 | | | 1.4 | | | 2.5 | | | 1.2 | | | 14.8 | | | 10.8 | | | 15.4 | | | 10.4 | | | 17.4 | | | 12.2 | | | 17.9 | | | 11.6 | |
United States | | | 0.1 | | | - | | | - | | | - | | | 2.4 | | | 1.4 | | | 1.2 | | | 1.1 | | | 2.5 | | | 1.4 | | | 1.2 | | | 1.1 | |
International | | | | | | | | | | | | | | | | | | | | | | | | | | | | | | | | | | | | | |
| North Africa/Near East | | | 0.4 | | | 0.2 | | | 0.4 | | | 0.2 | | | 25.8 | | | 20.0 | | | 10.0 | | | 6.7 | | | 26.2 | | | 20.2 | | | 10.4 | | | 6.9 | |
| Northwest Europe | | | 0.1 | | | - | | | 0.1 | | | - | | | 2.4 | | | 1.0 | | | 2.2 | | | 0.8 | | | 2.5 | | | 1.0 | | | 2.3 | | | 0.8 | |
| Northern Latin America | | | 0.1 | | | - | | | - | | | - | | | 1.2 | | | 1.0 | | | 0.2 | | | - | | | 1.3 | | | 1.0 | | | 0.2 | | | - | |
Total International | | | 0.6 | | | 0.2 | | | 0.5 | | | 0.2 | | | 29.4 | | | 22.0 | | | 12.4 | | | 7.5 | | | 30.0 | | | 22.2 | | | 12.9 | | | 7.7 | |
Total from continuing operations | | | 3.3 | | | 1.6 | | | 3.0 | | | 1.4 | | | 46.6 | | | 34.2 | | | 29.0 | | | 19.0 | | | 49.9 | | | 35.8 | | | 32.0 | | | 20.4 | |
Discontinued operations | | | 0.5 | | | 0.2 | | | 0.5 | | | 0.2 | | | - | | | - | | | - | | | - | | | 0.5 | | | 0.2 | | | 0.5 | | | 0.2 | |
Total | | | 3.8 | | | 1.8 | | | 3.5 | | | 1.6 | | | 46.6 | | | 34.2 | | | 29.0 | | | 19.0 | | | 50.4 | | | 36.0 | | | 32.5 | | | 20.6 | |
| 1 | Developed lands are areas capable of production, while undeveloped lands are areas with rights to explore. |
| 2 | Gross acres include the interests of others. |
| 3 | Net acres exclude the interests of others. |
| 4 | Includes lands located off the west coast of Canada where exploration is currently under moratorium. |
Work Commitments
The practice of governments requiring companies to pledge to carry out work commitments in exchange for the right to carry out exploration for and development of hydrocarbons is common, particularly in unexplored or lightly explored regions of the world. Petro-Canada has made the following commitments in regard to the lands it holds.
WORK COMMITMENTS AS AT DECEMBER 31, 2005
(millions of dollars)
| | | Petro-Canada Share of Total Work Commitments | | Petro-Canada Share of Total Work Commitments to be Incurred in 20061 |
Mainland Canada | | | | | | |
| Mackenzie Delta/Corridor region | | $ | 14.3 | | $ | - |
East Coast offshore | | | 18.1 | | | - |
International | | | | | | |
| Northern Latin America | | | 83.9 | | | 4.4 |
| Northwest Europe | | | 25.3 | | | 25.3 |
| North Africa/Near East | | | 8.1 | | | 8.1 |
Total work commitments from continuing operations | | | 149.7 | | | 37.8 |
Discontinued operations | | | 11.8 | | | 5.9 |
Total work commitments | | $ | 161.5 | | $ | 43.7 |
| 1 | Capital expenditure plans for 2006 include provisions for these work commitments. |
Land Expiries
The following table summarizes the land area by region for which Petro-Canada’s rights to explore for or develop hydrocarbons will expire in 2006.
LAND EXPIRIES IN 2006
(millions of acres)
| | Gross1 | Net2 |
North American Natural Gas | 0.9 | 0.7 |
East Coast Oil | 0.5 | 0.2 |
Oil Sands | 0.2 | 0.1 |
International | 0.5 | 0.2 |
Total expiries in 2006 | 2.1 | 1.2 |
| 1 | Gross acres include the interests of others. |
| 2 | Net acres exclude the interests of others. |
Drilling Activity
The following table shows Petro-Canada’s drilling activity during the years indicated.
EXPLORATION AND DEVELOPMENT WELLS DRILLED
| | | 2005 | | 2004 | | 2003 | |
| | | Gross1 | | Net2 | | Gross1 | | Net2 | | Gross1 | | Net2 | |
NORTH AMERICAN NATURAL GAS | | | | | | | | | | | | | | | | | | | |
Western Canada and U.S. Rockies | | | | | | | | | | | | | | | | | | | |
Exploration wells3 | | | | | | | | | | | | | | | | | | | |
| Oil | | | - | | | - | | | 2 | | | - | | | - | | | - | |
| Natural gas | | | 48 | | | 31 | | | 53 | | | 35 | | | 24 | | | 17 | |
Dry4 | | | 21 | | | 15 | | | 19 | | | 14 | | | 20 | | | 16 | |
| Subtotal | | | 69 | | | 46 | | | 74 | | | 49 | | | 44 | | | 33 | |
Development wells5 | | | | | | | | | | | | | | | | | | | |
| Oil | | | 4 | | | 2 | | | 5 | | | 2 | | | 9 | | | 2 | |
| Natural gas | | | 666 | | | 437 | | | 589 | | | 461 | | | 388 | | | 231 | |
| Dry | | | 4 | | | 3 | | | 7 | | | 5 | | | 17 | | | 14 | |
| Subtotal | | | 674 | | | 442 | | | 601 | | | 468 | | | 414 | | | 247 | |
Mackenzie Delta/Corridor and Scotian Slope | | | | | | | | | | | | | | | | | | | |
Exploration wells3 | | | | | | | | | | | | | | | | | | | |
| Suspended | | | - | | | - | | | - | | | - | | | 1 | | | 1 | |
| Subtotal | | | - | | | - | | | - | | | - | | | 1 | | | 1 | |
Total North American Natural Gas | | | 743 | | | 488 | | | 675 | | | 517 | | | 459 | | | 281 | |
EAST COAST OIL | | | | | | | | | | | | | | | | | | | |
Exploration wells3 | | | | | | | | | | | | | | | | | | | |
| Oil | | | 2 | | | 1 | | | - | | | - | | | 1 | | | - | |
Dry4 | | | - | | | - | | | - | | | - | | | 2 | | | 1 | |
| Subtotal | | | 2 | | | 1 | | | - | | | - | | | 3 | | | 1 | |
Development wells5 | | | | | | | | | | | | | | | | | | | |
| Oil | | | 13 | | | 3 | | | 17 | | | 4 | | | 11 | | | 3 | |
| Dry | | | - | | | - | | | - | | | - | | | 1 | | | - | |
| Subtotal | | | 13 | | | 3 | | | 17 | | | 4 | | | 12 | | | 3 | |
Total East Coast Oil | | | 15 | | | 4 | | | 17 | | | 4 | | | 15 | | | 4 | |
OIL SANDS | | | | | | | | | | | | | | | | | | | |
Development wells5 | | | | | | | | | | | | | | | | | | | |
| Bitumen | | | 46 | | | 46 | | | - | | | - | | | - | | | - | |
Total Oil Sands | | | 46 | | | 46 | | | - | | | - | | | - | | | - | |
1 Gross wells are wells, excluding all service wells, in which Petro-Canada owns a working interest. Gross wells include gross overriding royalty (GOR) wells.
2 Net wells are the sum of the fractional working interests owned by Petro-Canada in gross wells, rounded to the nearest whole number. Net wells exclude GOR wells.
3 Exploration wells are wells drilled to find and produce oil or natural gas in an unproved area, to find a new reservoir or to extend the known boundaries of a previously discovered reservoir.
4 A dry hole is an exploration or development well found to be incapable of producing either oil or natural gas in sufficient quantities to justify completion as an oil or natural gas well.
5 Development wells are wells drilled in an oil or natural gas reservoir to the depth of a stratigraphic horizon known to be productive.
EXPLORATION AND DEVELOPMENT WELLS DRILLED
| | | 2005 | | 2004 | | 2003 | |
| | | Gross1 | | Net2 | | Gross1 | | Net2 | | Gross1 | | Net2 | |
INTERNATIONAL - Continuing Operations | | | | | | | | | | | | | | | | | | | |
Exploration wells3 | | | | | | | | | | | | | | | | | | | |
| Oil | | | | | | | | | | | | | | | | | | | |
| Northwest Europe | | | 4 | | | 3 | | | - | | | - | | | - | | | - | |
| North Africa/Near East | | | 2 | | | 1 | | | 2 | | | 1 | | | - | | | - | |
| Natural gas | | | | | | | | | | | | | | | | | | | |
| Northwest Europe | | | - | | | - | | | - | | | - | | | 1 | | | - | |
| Northern Latin America | | | - | | | - | | | 1 | | | - | | | 1 | | | - | |
Dry4 | | | | | | | | | | | | | | | | | | | |
| Northwest Europe | | | - | | | - | | | 4 | | | 1 | | | 2 | | | 1 | |
| North Africa/Near East | | | 4 | | | 2 | | | 1 | | | 1 | | | - | | | - | |
| Subtotal | | | 10 | | | 6 | | | 8 | | | 3 | | | 4 | | | 1 | |
Development wells5 | | | | | | | | | | | | | | | | | | | |
| Oil | | | | | | | | | | | | | | | | | | | |
| Northwest Europe | | | 4 | | | 1 | | | 9 | | | 7 | | | 7 | | | 4 | |
| North Africa/Near East | | | 7 | | | 4 | | | 6 | | | 3 | | | 6 | | | 3 | |
| Natural gas | | | | | | | | | | | | | | | | | | | |
| Northwest Europe | | | 1 | | | - | | | 1 | | | - | | | 1 | | | - | |
| Northern Latin America | | | - | | | - | | | - | | | - | | | 3 | | | 1 | |
| Dry | | | | | | | | | | | | | | | | | | | |
| Northwest Europe | | | - | | | - | | | 1 | | | - | | | 4 | | | 3 | |
| Northern Latin America | | | - | | | - | | | 1 | | | - | | | 1 | | | - | |
| Subtotal | | | 12 | | | 5 | | | 18 | | | 10 | | | 22 | | | 11 | |
Total International | | | 22 | | | 11 | | | 26 | | | 13 | | | 26 | | | 12 | |
Total wells drilled from continuing operations | | | 826 | | | 549 | | | 718 | | | 534 | | | 500 | | | 297 | |
DISCONTINUED OPERATIONS | | | | | | | | | | | | | | | | | | | |
Exploration wells3 | | | | | | | | | | | | | | | | | | | |
| Oil | | | - | | | - | | | - | | | - | | | 1 | | | - | |
Development wells5 | | | | | | | | | | | | | | | | | | | |
| Oil | | | 44 | | | 15 | | | 39 | | | 13 | | | 40 | | | 14 | |
| Dry | | | 5 | | | 2 | | | 9 | | | 4 | | | 5 | | | 2 | |
Total discontinued operations | | | 49 | | | 17 | | | 48 | | | 17 | | | 46 | | | 16 | |
Total wells drilled | | | 875 | | | 566 | | | 766 | | | 551 | | | 546 | | | 313 | |
| 1 | Gross wells are wells, excluding all service wells, in which Petro-Canada owns a working interest. Gross wells include GOR wells. |
| 2 | Net wells are the sum of the fractional working interests owned by Petro-Canada in gross wells, rounded to the nearest whole number. Net wells exclude GOR wells. |
| 3 | Exploration wells are wells drilled to find and produce oil or natural gas in an unproved area, to find a new reservoir or to extend the known boundaries of a previously discovered reservoir. |
| 4 | A dry hole is an exploration or development well found to be incapable of producing either oil or natural gas in sufficient quantities to justify completion as an oil or natural gas well. |
| 5 | Development wells are wells drilled in an oil or natural gas reservoir to the depth of a stratigraphic horizon known to be productive. |
Downstream
Business Summary and Strategy
Petro-Canada is the second-largest Downstream business and the “brand of choice” in Canada. In 2005, Petro-Canada accounted for approximately 13% of the total refining capacity in Canada and about 16% of total petroleum products sold in Canada.
Downstream operations include: two refineries in Edmonton and Montreal with a total rated capacity of 40,500 cubic metres/day (m3/d) (255,000 b/d)1; a lubricants plant which is the largest producer of lubricant base stocks in Canada; a network of more than 1,300 retail service stations; Canada’s largest commercial road transport network with 212 locations; and a bulk fuel sales channel.
The strategy in the Downstream business is to increase the profitability of the base business through effective capital investment and discipline over controllable factors. In 2006, Downstream capital investment is expected to shift to growth projects as regulatory projects to produce cleaner-burning fuels are complete. The goal is superior returns and growth, including an estimated 12% return on capital employed (ROCE) based on a mid-cycle business environment. Key features of the strategy include:
| § | achieving and maintaining first quartile operating performance in all areas; |
| § | advancing Petro-Canada as the “brand of choice” for Canadian gasoline consumers; and |
| § | increasing sales of high-margin specialty lubricants. |
Refining and Supply
Petro-Canada owns and operates two refineries located in Edmonton, Alberta, and Montreal, Quebec. With a total rated capacity of approximately 40,500 m3/d at the end of 2005, these refineries represent the third-largest refining capacity in Canada, with approximately 13% of the Canadian refining industry’s total operating capacity. In April 2005, Petro-Canada completed its previously announced plans to consolidate the Eastern Canada refining operations at the Montreal refinery. This included the closure of the Oakville refining operations, which had been operating at a reduced capacity in order to increase supply flexibility during the transition period, and upgrading of the Oakville terminal facilities. Additional yield from a small expansion of Montreal’s refining capacity, completed in 2004, combined with third-party supply agreements, has replaced the 9,500 m3/d of light oil products formerly produced at the Oakville refinery. Petro-Canada’s two refineries produce a full range of refined petroleum products, including gasolines, diesel oils, heating oils, aviation fuels, heavy fuel oils, asphalts, petrochemicals and lubricant feedstock.
In 2005, programs continued at both the Edmonton and Montreal refineries to assist Petro-Canada in its goal of meeting federal regulatory requirements for lower limits for sulphur in diesel by June 1, 2006. Construction of the diesel desulphurization units are now underway at both the Montreal and Edmonton refineries, with plans to be operational at both facilities in advance of the legislated date. The following table shows the daily rated capacity of Petro-Canada’s refineries as at December 31, 2005 and the approximate average daily volumes of crude oil processed, including volumes processed by Petro-Canada for other companies for the years indicated. The overall utilization rate at the three refineries, adjusted for the closure of the partial operations of the Oakville refinery on April 11, 2005, averaged 96% in 2005.
1 Capacity reflects a small expansion of the Montreal refinery effective January 1, 2005, and closure of Oakville refinery operations, effective April 11, 2005.
RATED CAPACITY OF REFINERIES AND AVERAGE DAILY CRUDE OIL PROCESSED
(thousands of m3)
| | | Average Volumes of Crude Oil Processed/Calendar Day | | Daily Rated Capacity1 | |
| | | Years Ended December 31, | | | |
Refinery Location | | 2005 | | 2004 | | 2003 | | As at December 31, 2005 | |
| Edmonton, Alberta | | | 20.8 | | | 19.6 | | | 19.8 | | | 19.9 | |
Montreal, Quebec2 | | | 18.1 | | | 16.0 | | | 16.8 | | | 20.6 | |
Oakville, Ontario3 | | | 2.0 | | | 12.6 | | | 13.3 | | | - | |
Total | | | 40.9 | | | 48.2 | | | 49.9 | | | 40.5 | |
1 Daily rated capacity is based on calendar days and defined specifications as to types of crude oil, the products to be obtained and the refinery processes required. Variations in these factors may result in actual capacity being higher or lower than rated capacities.
2 Includes capacity expansion completed at Montreal in December 2004 and rated in 2005 at an additional 3,900 m3/d.
3 The second of two crude processing trains at the Oakville refinery was permanently closed on April 11, 2005. This was part of the previously announced consolidation of Eastern Canada refinery operations. Prior to such closure, daily rated capacity was 7,000 m3/d.
With the Eastern Canada consolidation now complete, Petro-Canada is well positioned with the supply flexibility to optimize profitability within a range of future business scenarios.
With the refining industry in need of more capacity to refine heavier crude stocks, Petro-Canada is further positioning itself to improve long-term profitability with plans to reduce feedstock costs at its refineries. In 2005, detailed engineering work was initiated to convert the Edmonton refinery to process 100% oil sands feedstock. A feasibility study was initiated to assess the addition of a coker to the Montreal refinery.
Edmonton Refinery
The Edmonton refinery is Petro-Canada’s most efficient refinery, producing a high yield of light oils. The Edmonton refinery uses synthetic crude oil for up to 40% of its crude charge. Synthetic crude oil produces a higher yield of gasoline and middle distillates than conventional crude oil. The remainder of the refinery’s crude charge is conventional light sweet and sour crude oil.
Under revised plans for upgrading and refining oil sands feedstock at the Edmonton refinery, Petro-Canada will build new crude and vacuum units, expand coker capacity and build additional sulphur capability. The new configuration, targeted for completion in 2008, will allow the refinery to directly upgrade an Athabasca blend feed of 5,500 m3/d (comprised of 4,100 m3/d of bitumen and 1,400 m3/d of diluent) and process 7,600 m3/d of sour synthetic crude oil, displacing the conventional crude that is refined today. The refinery will also continue to process sweet synthetic crude through its synthetic train. Refer to Oil Sands in the upstream section of this AIF for long-term arrangement for the supply of bitumen and sour crude oil feedstock to the Edmonton refinery on completion of the planned reconfiguration.
Montreal Refinery
The Montreal refinery, supplied with imported crude oil primarily through the Portland-Montreal pipeline, has a flexible configuration allowing it to process a variety of crude oils, including heavy grades and intermediate feedstock. The refinery produces gasolines, distillates, asphalts, petrochemicals, lubricant feedstock and solvents.
A small expansion of the Montreal refining process units and logistics handling capacity was completed as part of the Eastern Canada refining and supply consolidation project in 2004. In 2005, the Montreal refinery and logistics system used its expanded capacity to supply up to 11,500 m3/d of gasolines and distillates to southern Ontario product terminals, including the expanded Oakville terminal, via the TNPI pipeline.
Oakville Refinery
As part of the Eastern Canada refining and supply consolidation project, the Oakville refinery completed a phased shutdown of its operations during the second quarter of 2005. Oakville’s terminal facilities were expanded to handle receipt of finished light oil product from Montreal via the TNPI pipeline. In total, the expanded Oakville terminal, in combination with existing industry terminalling facilities in north Toronto, is capable of receiving TNPI’s full light oil capacity of 10,000 m3/d, replacing the light oil that was produced by the Oakville refinery operations.
Supply
Petro-Canada purchases crude oil and other refinery feedstock from Canadian and international sources under a number of different contractual arrangements. The Downstream sector is responsible for arranging domestic and foreign crude supply for the Company’s refineries. There is a well-developed infrastructure for third-party supply of both domestic and imported crudes to markets in North America. Purchases are generally through short-term, renewable contracts. Petro-Canada is not dependent on any single source of supply for conventional crude oil and does not anticipate any difficulty in obtaining an adequate supply in the foreseeable future.
Distribution
Petro-Canada operates an extensive distribution network, using pipeline, road, rail and marine transportation, to deliver refined products to retail outlets and commercial and industrial customers. The Company holds interests in two refined product pipelines and a joint venture interest in one major refined products terminal. Petro-Canada also operates 11 major refined products terminals across Canada.
Distribution efficiencies are achieved through refined product exchange, purchase, sale and short-term storage arrangements with other petroleum companies. These arrangements reduce capital and transportation costs, assist in the maintenance of supply to customers and enable Petro-Canada to participate in geographical areas without the need to invest capital in distribution facilities. Applicable agreements contain appropriate provisions for consistent product quality to be maintained for the Company’s customers.
Sales and Marketing
Petro-Canada is the second-largest marketer of petroleum products in Canada. In 2005, Petro-Canada’s petroleum product sales represented approximately 16% of total petroleum products sold in Canada. Petro-Canada markets a full range of petroleum products, including gasolines, diesel oils, heating oils, aviation fuels, heavy fuel oils, asphalts, lubricants, petrochemical feedstock and liquefied petroleum gases. Petro-Canada also generates non-petroleum revenue from convenience stores, car washes and automotive repair and maintenance services. During 2005, the Company focused on profitable growth through initiatives directed at the retail and PETRO-PASS truck stop networks.
The following table shows the approximate average daily volumes of petroleum products sold during the years indicated.
AVERAGE DAILY SALES OF PETROLEUM PRODUCTS
(thousands of m3/d)
| | | Years Ended December 31, | |
| | | 2005 | | 2004 | | 2003 | |
Gasoline1 | | | 24.4 | | | 24.7 | | | 25.8 | |
Middle distillates2 | | | 19.7 | | | 20.2 | | | 20.5 | |
Other3 | | | 8.7 | | | 11.7 | | | 10.5 | |
Total | | | 52.8 | | | 56.6 | | | 56.8 | |
| 1 | Includes motor and aviation gasolines. |
| 2 | Includes diesel oils, heating oils and aviation jet fuels. |
| 3 | Includes heavy fuel oils, asphalts, lubricants, liquefied petroleum gases, petrochemical feedstock and other petroleum and non-petroleum products. |
The following table shows the annual revenues derived from refining and marketing activities during the years indicated.
REFINING AND MARKETING REVENUES
(millions of dollars)
| | | Years Ended December 31, | |
| | | 2005 | | 2004 | | 2003 | |
Gasoline1 | | $ | 5,027 | | $ | 4,218 | | $ | 3,726 | |
Middle distillates2 | | | 4,244 | | | 3,262 | | | 2,761 | |
Other3 | | | 2,081 | | | 1,954 | | | 1,665 | |
Total | | $ | 11,352 | | $ | 9,434 | | $ | 8,152 | |
1 Includes motor and aviation gasolines.
| 2 | Includes diesel oils, heating oils and aviation jet fuels. |
| 3 | Includes heavy fuel oils, asphalts, lubricants, liquefied petroleum gases, petrochemical feedstock and other petroleum and non-petroleum products. |
Retail
As at December 31, 2005, Petro-Canada’s network of retail sites consisted of 1,323 outlets across Canada, of which 838 were Company-controlled and the balance were controlled by third parties. Independent dealers and agents operate virtually all the outlets.
The Company continued to advance Petro-Canada’s standing as the “brand of choice” through selective representation and site development, generating high site throughputs and a 16% share of the national market. In 2005, Petro-Canada led the industry in key urban market metrics and continued to improve the fundamentals of the business with more than 90% of the re-imaging program now complete. Advancement of this program has enabled the realization of industry-leading throughputs, with annual gasoline sales from re-imaged sites within Petro-Canada’s network averaging more than 6.5 million litres per site. The Company has extended this new image program to independent retailers and more than 60% of these retailers have elected to invest their capital in the new image standard.
Petro-Canada continued to leverage its position as “Canada’s Gas Station,” with the advancement of previously launched innovative product developments and new product firsts, including Citi Petro-Points MasterCard, the first general-purpose credit card in North America to offer cardholders an instant discount on gasoline, and the rollout of its Cash Point Program, the industry’s first privately owned automated bank machine network. The Company also continued to focus on expanding its non-petroleum revenue base, as evidenced by the 10% year-over-year sales growth of its convenience store business and 5% increase in same-store sales in 2005 compared to 2004.
Wholesale and Refinery Sales
Petro-Canada sells petroleum products into farm, home heating, paving, small industrial, commercial and truck markets. This category accounted for approximately 63% of total Downstream sales volumes. Petro-Canada is the leading national marketer to the commercial road transport segment in Canada with 212 PETRO-PASS sites. The Company also sells large volumes of petroleum products directly to large industrial and commercial customers and independent marketers.
The Company’s focus has been on improving its sales mix in the commercial road transport and bulk fuels channels. In 2005, Petro-Canada continued to expand and upgrade the network and increase sales volume.
Lubricants
The lubricants centre, located in Mississauga, Ontario, produces specialty lubricants and waxes that are marketed in Canada and internationally. Petro-Canada’s lubricants plant is the largest producer of lubricant base stocks in Canada, with annual base oil production capacity in excess of 700 million litres. In 2006, Petro-Canada plans to complete a de-bottlenecking of the plant with a 25% increase in capacity to support the growth of its high-margin, specialty lubricants business.
The lubricants plant utilizes a two-stage hydro-treating process, which is unique in Canada. This process enables Petro-Canada to refine gas oils produced from a wide range of crude feedstock into lubricating oil-based stocks with the highest level of purity of any base stocks in Canada. Advancing lubricant technology and environmental concerns continue to increase the demand for high-purity, hydro-treated base stocks for many lubricant applications. Petro-Canada is well positioned to meet this growing demand.
The Company’s strategy is to grow volume in high-margin sales and improve plant reliability. In 2005, Petro-Canada continued to focus on optimizing operations and maintenance procedures based on industry “best practices.” A major five-year cycle maintenance turnaround was completed at the white oils plant, which will help ensure that Petro-Canada remains well positioned for continued reliability at its Lubricants facilities. Lubricants sales in 2005 totalled 779 million litres, a decrease of approximately 7%, compared with sales volume of 833 million litres in 2004. The decrease in sales volume was primarily due to lower sales of wax and white oils. Sales of higher-margin products increased 3%, resulting in 73% of production going into higher-margin product segments. Lubricants continues to be well positioned for profitable future growth as tougher performance and environmental standards increase global demand for higher-quality base oils and finished products.
Pipelines
Petro-Canada complements its production, extracting and refining operations with ownership in several crude oil and refined product pipelines. The principal pipelines in which the Company has an interest are the Alberta Products Pipe Line Inc. pipeline, the TNPI pipeline and the Montreal Pipe Line Limited pipeline.
Link to Petro-Canada’s Corporate and Strategic Priorities
The Downstream business is aligned with Petro-Canada’s strategic priorities as outlined by its progress in 2005 and goals for 2006.
| | 2005 PROGRESS | 2006 GOALS |
DELIVERING PROFITABLE GROWTH WITH A FOCUS ON OPERATED, LONG-LIFE ASSETS | § completed Eastern Canada consolidation; § initiated detailed engineering of Edmonton refinery conversion to synthetic crude diet; and § acquired 51% interest in a paraxylene facility adjacent to the Montreal refinery. | § progress Edmonton refinery feed conversion project for completion in 2008; § conduct Montreal coker feasibility study for decision in 2007; § de-bottleneck Lubricants plant; and § continue to make refinery yield and reliability improvements. |
DRIVING FOR FIRST QUARTILE OPERATION OF OUR ASSETS | § improved the Downstream plant reliability index score by more than 16%; § achieved leading share of retail major urban market; and § increased sales of high-margin lubricants. | § continue to focus on safety, and refinery operating and maintenance procedures; § increase retail non-petroleum revenue; and § achieve 75% high-margin lubricants sales mix. |
CONTINUING TO WORK AT BEING A RESPONSIBLE COMPANY | § reduced total recordable injury frequency by 51% compared to 2004; § surpassed four million hours of work without a lost-time injury on the Edmonton Diesel Desulphurization Project; § reduced community complaints by 57% compared to 2004; § invested into producing cleaner-burning fuels; and § reduced regulatory compliance exceedances by 59% compared to 2004. | § maintain focus on total recordable injury frequency and regulatory compliance exceedances in 2006; § produce ultra-low sulphur diesel; and § meet provincial ethanol regulations. |
Research and Development
Petro-Canada owns a research facility at Sheridan Park in Mississauga, Ontario, where the Company conducts research on lubricants.
As global advancements in fuel cell technology continue to occur, the Fuelling a Cleaner Canada Association (whose members are Petro-Canada, Ballard Power Systems and Methanex Company) has focused its efforts on working with various government agencies, such as the Canadian Transportation Fuel Cell Alliance (CTFCA), to ensure appropriate funding and the optimization of independent activities directed toward the implementation of fuel cell pilot demonstrations. In addition, through the CTFCA, knowledge from other pilot projects, such as the California Fuel Cell Partnership, can be shared, thereby assisting in the advancement of Canadian demonstrations.
In 2005, Petro-Canada’s total expenditures on research and development activities were approximately $23 million.
Human Resources
As at December 31, 2005, Petro-Canada and its wholly owned subsidiaries had 4,816 employees, compared with 4,795 employees as at December 31, 2004. Of the year-end 2005 employees, 1,161 employees were employed in the upstream businesses, 168 employees were in International and 2,463 employees were in Downstream. The remaining 1,024 employees were corporate support staff. Of the upstream employees, 168 employees were in East Coast Oil, 160 employees were in Oil Sands and 833 employees were in North American Natural Gas. Fifty-four of the upstream employees, 154 of the International employees, 18 of the Downstream employees and 153 of the corporate support staff employees were employed outside of Canada. Approximately 24% of Petro-Canada’s employees were covered by collective bargaining agreements. Approximately 91% of the Company’s unionized employees were members of the Communications Energy and Paperworkers Union (CEP) that represents refinery, marketing, gas plant and offshore production workers. Three-year collective bargaining agreements with most CEP locals are currently scheduled to expire on January 31, 2007.
Social and Environmental Policies
Petro-Canada is determined to earn the support received from stakeholders, not just through excellence in meeting customers’ energy needs, but by playing an active and important role in the communities where the Company lives and operates. Petro-Canada conducts business in a highly principled manner, as guided by a Code of Business Conduct, corporate values and standards, and the values and standards of the societies that host Petro-Canada operations. Wherever the Company operates around the world, Petro-Canada aims to invest and conduct operations in a manner that is economically rewarding to all parties; recognized as being ethically, socially and environmentally responsible; welcomed by the communities in which Petro-Canada operates; and that facilitates economic, human and community development within a stable operating environment. Petro-Canada subscribes to the International Code of Ethics for Canadian Business, the United Nations Global Compact and the Universal Declaration of Human Rights.
Petro-Canada executives are accountable for the effective execution of TLM policy1 and standards. Petro-Canada conducts a major review of each business unit or area every four years to assess the implementation of the policy and standards. The executive leadership team reviews environment, health and safety performance monthly. As well, the Environment, Health and Safety Committee of the Board of Directors reviews environment, health and safety performance throughout the year.
At Petro-Canada, community investment is an integral part of the way the Company does business. Petro-Canada works with communities in key business locations to ensure the Company’s presence generates value and makes a difference for neighbours.
| 1 | Petro-Canada’s TLM framework is a systematic approach to clearly and consistently identify management systems and processes required to control risk. |
The Company invests in initiatives that provide benefits, as well as in grassroots programs and services at the local level. Petro-Canada funding is directed to areas to support education, community services, environment, and arts and culture.
CASH AND IN-KIND CONTRIBUTIONS OF NEARLY $7.2 MILLION IN 2005
(% - Contribution in North America unless otherwise stated, unaudited)
Highlights
Employees in North America, along with the Company’s Canadian retailers and wholesalers, raised more than $200,000 for the Red Cross Asian Disaster Relief effort. These contributions were matched by Petro-Canada. The International business contributed £10,000 to the London-based Disasters Emergency Committee. In 2005, Petro-Canada invested nearly $299,000 to support Canadian Olympic and Paralympic athletes and coaches through the Company’s Olympic Torch Scholarship Legacy Fund and other programs.
Employees and the Company donated more than $2.6 million to United Way campaigns across North America in 2005. Through the Volunteer Energy Program, Petro-Canada provided 421 grants of $500 each to non-profit organizations supported by employees and retirees who give their time to the community. The total amount of grants provided since the program began in 1992 was more than $1.5 million by the end of 2005.
To learn more about Petro-Canada’s corporate responsibility performance, please access the annual Report to the Community available on the Company’s Web site (www.petro-canada.ca). The 2005 Report is expected to become available in the second quarter of 2006.
Environmental Expenditures
In 2005, Petro-Canada’s environmental capital and operating expenditures totalled $856 million, compared with $651 million in 2004 and $414 million in 2003. The increase in 2005 expenditures mainly reflected preparations to meet new federal regulations for sulphur limits in diesel.
Environmental expenditures included: purchase, installation, operation and maintenance of pollution abatement equipment and facilities; replacement of underground tanks; waste management; environmental studies and research; reclamation activities; and the workforce costs of environmental staff and consultants.
The following table shows Petro-Canada’s expenditures for environmental matters during 2005.
ENVIRONMENTAL COSTS - YEAR ENDED DECEMBER 31, 2005
(millions of dollars)
| | | Capital | | Operating Expense | | Total | |
| Upstream | | $ | 71 | | $ | 95 | | $ | 166 | |
| Downstream | | | 625 | | | 65 | | | 690 | |
Total environmental costs | | $ | 696 | | $ | 160 | | $ | 856 | |
More detailed information on the Company’s policies and performance relative to the environment will be included in the annual Report to the Community, expected to become available on the Company’s Web site (www.petro-canada.ca) in the second quarter of 2006.
SELECT FINANCIAL DATA
CONSOLIDATED FINANCIAL INFORMATION
| | | Years Ended December 31, |
| (millions of dollars, except per share1 amounts) | | 2005 | 2004 | 2003 |
Statement of earnings data | | | | | | | | | | |
| Revenue | | | | | | | | | | |
| Operating | | $ | 17,585 | | $ | 14,270 | | $ | 12,392 | |
| Investment and other income | | | (806 | ) | | (312 | ) | | 16 | |
| Total revenue | | | 16,779 | | | 13,958 | | | 12,408 | |
| Earnings from continuing operations before income taxes | | | 3,402 | | | 3,090 | | | | |
| Provision for income taxes | | | 1,709 | | | 1,392 | | | 1,190 | |
| Net earnings from continuing operations | | | 1,693 | | | 1,698 | | | 1,535 | |
| Net earnings from discontinued operations | | | 98 | | | 59 | | | 115 | |
| Net earnings | | $ | 1,791 | | $ | 1,757 | | $ | 1,650 | |
| | | | | | | | | | | |
Earnings | | | | | | | | | | |
| North American Natural Gas | | $ | 660 | | $ | 500 | | $ | 459 | |
| East Coast Oil | | | 775 | | | 711 | | | 597 | |
| Oil Sands | | | 112 | | | 120 | | | (52) | |
| International | | | 453 | | | 313 | | | 182 | |
| Downstream | | | 398 | | | 310 | | | 263 | |
| Shared Services | | | (250 | ) | | (125 | ) | | (182) | |
Operating earnings from continuing operations2, 3 | | | 2,148 | | | 1,829 | | | 1,267 | |
| Foreign currency translation gain | | | 73 | | | 63 | | | 239 | |
| Unrealized loss on Buzzard derivative contracts | | | (562 | ) | | (205 | ) | | - | |
| Gain on sale of assets | | | 34 | | | 11 | | | 29 | |
| Discontinued operations | | | 98 | | | 59 | | | 115 | |
| Net earnings | | $ | 1,791 | | $ | 1,757 | | $ | 1,650 | |
| | | | | | | | | | | |
Earnings per share from continuing operations - basic | | $ | 3.27 | | $ | 3.21 | | $ | 2.90 | |
| - diluted | | | 3.22 | | | 3.17 | | | 2.87 | |
Earnings per share - basic | | | 3.45 | | | 3.32 | | | 3.11 | |
| - diluted | | | 3.41 | | | 3.28 | | | 3.08 | |
| Dividends per share | | | 0.33 | | | 0.30 | | | 0.20 | |
Cash flow from continuing operating activities before changes in non-cash working capital3 | | | 3,787 | | | 3,425 | | | 3,042 | |
Balance sheet data (at end of year) | | | | | | | | | | |
| Total assets | | | 20,655 | | | 18,136 | | | 14,774 | |
| Debt | | | 2,913 | | | 2,580 | | | 2,229 | |
Cash and cash equivalents4 | | | 789 | | | 170 | | | 635 | |
| Shareholders’ equity | | | 9,488 | | | 8,739 | | | 7,588 | |
Average capital employed4 | | $ | 11,860 | | $ | 10,533 | | $ | 9,268 | |
1 Per share amounts are quoted on a post-stock dividend basis.
2 Operating earnings, which represent net earnings excluding gains or losses on foreign currency translation, disposal of assets and the unrealized gains or losses on Buzzard derivative contracts, is used by the Company to evaluate operating performance.
3 Operating earnings and cash flow do not have any standardized meaning prescribed by Canadian GAAP and, therefore, may not be comparable with the calculation of similar measures for other companies.
4 Includes discontinued operations.
QUARTERLY INFORMATION
(millions of dollars, except per share amounts)
| | | 2005 Three Months Ended | | 2004 Three Months Ended | |
| | | Mar. 31 | | June 30 | | Sept. 30 | | Dec. 31 | | Mar. 31 | | June 30 | | Sept. 30 | | Dec. 31 | |
Total revenue from continuing operations | | $ | 3,275 | | $ | 3,945 | | $ | 4,721 | | $ | 4,838 | | $ | 3,365 | | $ | 3,455 | | $ | 3,515 | | $ | 3,623 | |
| | | | | | | | | | | | | | | | | | | | | | | | | | |
Earnings | | | | | | | | | | | | | | | | | | | | | | | | | |
| Upstream | | | | | | | | | | | | | | | | | | | | | | | | | |
| North American Natural Gas | | $ | 103 | | $ | 117 | | $ | 156 | | $ | 284 | | $ | 119 | | $ | 133 | | $ | 117 | | $ | 131 | |
| East Coast Oil | | | 169 | | | 208 | | | 218 | | | 180 | | | 186 | | | 182 | | | 190 | | | 153 | |
| Oil Sands | | | (19 | ) | | 34 | | | 82 | | | 15 | | | 34 | | | 25 | | | 51 | | | 10 | |
| International | | | 105 | | | 93 | | | 104 | | | 151 | | | 106 | | | 54 | | | 76 | | | 77 | |
| Downstream | | | 113 | | | 80 | | | 98 | | | 107 | | | 87 | | | 92 | | | 40 | | | 91 | |
| Shared Services | | | (44 | ) | | (56 | ) | | (61 | ) | | (89 | ) | | (32 | ) | | (33 | ) | | (30 | ) | | (30 | ) |
| Operating earnings from continuing operations | | | 427 | | | 476 | | | 597 | | | 648 | | | 500 | | | 453 | | | 444 | | | 432 | |
| Foreign currency translation gain (loss) | | | (4 | ) | | 8 | | | 74 | | | (5 | ) | | (13 | ) | | (21 | ) | | 54 | | | 43 | |
| Unrealized gain (loss) on Buzzard derivative contracts | | | (313 | ) | | (171 | ) | | (85 | ) | | 7 | | | - | | | (57 | ) | | (107 | ) | | (41 | ) |
| Gain on sale of assets | | | - | | | 9 | | | 7 | | | 18 | | | 9 | | | - | | | 2 | | | - | |
| Discontinued operations | | | 8 | | | 23 | | | 21 | | | 46 | | | 17 | | | 18 | | | 17 | | | 7 | |
Net earnings | | $ | 118 | | $ | 345 | | $ | 614 | | $ | 714 | | $ | 513 | | $ | 393 | | $ | 410 | | $ | 441 | |
Earnings per share from continuing operations | | | | | | | | | | | | | | | | | | | | | | | | | |
| Basic | | $ | 0.21 | | $ | 0.62 | | $ | 1.14 | | $ | 1.29 | | $ | 0.93 | | $ | 0.70 | | $ | 0.74 | | $ | 0.83 | |
| Diluted | | $ | 0.21 | | $ | 0.61 | | $ | 1.13 | | $ | 1.28 | | $ | 0.92 | | $ | 0.70 | | $ | 0.73 | | $ | 0.82 | |
Earnings per share | | | | | | | | | | | | | | | | | | | | | | | | | |
| Basic | | $ | 0.23 | | $ | 0.66 | | $ | 1.19 | | $ | 1.38 | | $ | 0.96 | | $ | 0.74 | | $ | 0.77 | | $ | 0.85 | |
| Diluted | | $ | 0.22 | | $ | 0.66 | | $ | 1.17 | | $ | 1.36 | | $ | 0.95 | | $ | 0.73 | | $ | 0.76 | | $ | 0.83 | |
Capital Expenditures on Property, Plant and Equipment and Exploration
The following table shows Petro-Canada’s capital expenditures on property, plant and equipment and exploration for the years indicated.
CAPITAL EXPENDITURES ON PROPERTY, PLANT AND EQUIPMENT AND EXPLORATION
(millions of dollars)
| | | 2005 | | 2004 | | 2003 | |
Exploration | | | | | | | | | | |
| North American Natural Gas | | $ | 173 | | $ | 157 | | $ | 143 | |
| East Coast Oil | | | 12 | | | - | | | 55 | |
| Oil Sands | | | 32 | | | 15 | | | 23 | |
| International | | | | | | | | | | |
| Northwest Europe | | | 37 | | | 48 | | | 11 | |
| North Africa/Near East | | | 29 | | | 19 | | | 12 | |
| Northern Latin America | | | 7 | | | 3 | | | 2 | |
Total exploration | | | 290 | | | 242 | | | 246 | |
Development | | | | | | | | | | |
| North American Natural Gas | | | 496 | | | 419 | | | 314 | |
| East Coast Oil | | | 302 | | | 275 | | | 289 | |
| Oil Sands | | | 432 | | | 381 | | | 420 | |
| International | | | | | | | | | | |
| Northwest Europe | | | 525 | | | 322 | | | 254 | |
| North Africa/Near East | | | 70 | | | 71 | | | 32 | |
| Northern Latin America | | | 28 | | | 22 | | | 24 | |
Total development | | | 1,853 | | | 1,490 | | | 1,333 | |
Property acquisitions | | | | | | | | | | |
| North America Natural Gas | | | 44 | | | 90 | | | 60 | |
| Oil Sands | | | 308 | | | 1 | | | - | |
| International | | | | | | | | | | |
| Northwest Europe | | | - | | | 1,222 | | | 65 | |
Total property acquisitions | | | 352 | | | 1,313 | | | 125 | |
Downstream | | | | | | | | | | |
| Refining and supply | | | 883 | | | 656 | | | 296 | |
| Sales, marketing and other | | | 108 | | | 171 | | | 117 | |
| Lubricants | | | 62 | | | 12 | | | 11 | |
Total Downstream | | | 1,053 | | | 839 | | | 424 | |
Shared Services | | | 12 | | | 9 | | | 14 | |
Total capital expenditures on property, plant and equipment and exploration from continuing operations | | | 3,560 | | | 3,893 | 1 | | 2,142 | |
Discontinued operations | | | 46 | | | 62 | | | 90 | |
Total capital expenditures on property, plant, equipment and exploration | | $ | 3,606 | | $ | 3,955 | 1 | $ | 2,232 | |
| 1 | Excludes U.S. Rockies acquisition of Prima Energy Corporation totalling $644 million, net of acquired cash. |
In 2006, it is anticipated that over 85% of the capital program for continuing operations will support delivering profitable growth and improving base business profitability. The remaining is expected to be directed toward complying with regulations and enhancing existing assets. This portion of the program was larger in 2005, primarily due to investments to produce clean-burning fuels in the Downstream business.
2006 Capital Program | | (millions of dollars) | |
| Regulatory compliance | | $ | 265 | |
| Enhancing existing assets | | | 155 | |
| Improving base business profitability | | | 240 | |
Reserves replacement in core areas1 | | | 975 | |
| New growth projects | | | 1,375 | |
| Exploration and new ventures for long-term growth | | | 375 | |
Total continuing operations | | $ | 3,385 | |
| 1 | Reserves replacement in core areas excludes capital expenditures related to the sold mature Syrian producing assets. |
Dividends
Petro-Canada regularly reviews its dividend strategy to ensure the alignment of dividend policy with shareholder expectations and financial and growth objectives. Currently, the Company’s first priority for available cash is to fund profitable growth opportunities. The second priority is to return funds to shareholders through dividends and the share buyback program. Commencing with the fourth quarter dividend paid on October 1, 2005, the Company increased the quarterly dividend 33% to $0.20/share on a pre-stock dividend basis ($0.10/share on a post-stock dividend basis). Total dividends paid in 2005 were $181 million, compared with $159 million in 2004.
DESCRIPTION OF CAPITAL STRUCTURE
General Description of Capital Structure
The Company’s authorized share capital is comprised of an unlimited number of common shares, an unlimited number of preferred shares issuable in series designated as senior preferred shares and an unlimited number of preferred shares issuable in series designated as junior preferred shares. As at December 31, 2005, there were 515,138,904 common shares issued and outstanding. To the knowledge of the Board of Directors and officers of Petro-Canada, no person beneficially owns or exercises control or direction over securities carrying 10% or more of the voting rights attached to any class of voting securities of the Company. The holders of common shares are entitled to attend all meetings of shareholders and vote at any such meeting on the basis of one vote for each common share held. As no senior preferred shares or junior preferred shares are issued and outstanding, common shareholders are entitled to receive any dividend declared by the Board of Directors on the common shares and to participate in a distribution of the Company’s assets among its shareholders for the purpose of winding up its affairs. The holders of the common shares shall be entitled to share equally, share for share, in all distributions of such assets.
Constraints
Ownership, Voting and Other Restrictions
The Petro-Canada Public Participation Act requires that the Articles of Petro-Canada include certain restrictions on the ownership and voting of voting shares of the Company. The common shares of Petro-Canada are voting shares.
No person, together with associates of that person, may subscribe for, have transferred to that person, hold, beneficially own or control otherwise than by way of security only, or vote in the aggregate, voting shares of Petro-Canada to which are attached more than 20% of the votes attached to all outstanding voting shares of Petro-Canada. Additional restrictions include provisions for suspension of voting rights, forfeiture of dividends, prohibitions against share transfer, compulsory sale of shares, redemption and suspension of other shareholder rights. The Board of Directors may at any time require holders of, or subscribers for, voting shares, and certain other persons, to furnish statutory declarations as to ownership of voting shares and certain other matters relevant to the enforcement of the restrictions. Petro-Canada is prohibited from accepting any subscription for, and issuing or registering a transfer of, any voting shares if a contravention of the individual ownership restrictions result.
Petro-Canada’s Articles, as required by the Petro-Canada Public Participation Act, also include provisions requiring Petro-Canada to: maintain its head office in Calgary, Alberta; prohibit Petro-Canada from selling, transferring or otherwise disposing of all or substantially all of its assets in one transaction, or several related transactions, to any one person or group of associated persons or to non-residents, other than by way of security only in connection with the financing of Petro-Canada; and require Petro-Canada to ensure (and to adopt, from time to time, policies describing the manner in which Petro-Canada will fulfill the requirement to ensure) that any member of the public can, in either official language of Canada (English and French), communicate with and obtain available services from Petro-Canada’s head office and any other facilities where Petro-Canada determines there is significant demand for communication with, and services from, that facility in that language.
Credit Ratings
The following table shows the ratings issued by the rating agencies noted therein as of December 31, 2005. A security rating is not a recommendation to buy, sell or hold securities and may be subject to revisions or withdrawal at any time by the rating agency.
PETRO-CANADA’S CREDIT RATINGS
| | Moody’s Investor Services Inc. | Standard & Poor’s Rating Services | Dominion Bond Rating Service |
| Outlook | Stable | Stable | Stable |
| Senior unsecured | Baa2 | BBB | A (low) |
| Short-term | - | - | R-1 (low) |
Moody’s credit ratings are on a long-term debt rating scale that ranges from Aaa to C, which represents the range from highest to lowest quality of such securities rated. According to the Moody’s rating system, debt securities rated “Baa” are considered as medium grade obligations (e.g. they are neither highly protected nor poorly secured). Interest payments and principal security appear adequate for the present but certain protective elements may be lacking or may be characteristically unreliable over any great length of time. Such bonds lack outstanding investment characteristics and, in fact, have speculative characteristics as well.
Moody’s applies numerical modifiers 1, 2 and 3 in each generic rating classification from Aa through Caa in its corporate bond rating system. The modifier 1 indicates that the issue ranks in the higher end of its generic rating category, the modifier 2 indicates a mid-range ranking and the modifier 3 indicates that the issue ranks in the lower end of its generic rating category.
S&P’s credit ratings are on a long-term debt rating scale that ranges from AAA to D, which represents the range from highest to lowest quality of such securities rated. According to the S&P rating system, an obligation rated “BBB” exhibits adequate protection parameters. However, adverse economic conditions or changing circumstances are more likely to lead to a weakened capacity of the obliger to meet its financial commitment on the obligation. The ratings from AA to CCC may be modified by the addition of a plus (+) or minus (-) sign to show relative standing within the major rating categories.
DBRS’ credit ratings are on a long-term debt rating scale that ranges from AAA to D which represents the range from highest to lowest quality of such securities rated. According to the DBRS rating system, bonds and long-term debt rated A are of satisfactory credit quality. Protection of interest and principal is still substantial, but the degree of strength is less than with AA rated entities. While a respectable rating, entities in the “A” category are considered to be more susceptible to adverse economic conditions and have greater cyclical tendencies than higher rated companies. The ratings from AA to C may be modified by the addition of a “high” or “low” grade to indicate the relative standing of a credit within a particular rating category.
DBRS’ short-term credit ratings are on a short-term debt rating scale that ranges from R1 to D which represents the range from highest to lowest quality of such securities rated. The ratings from R1 to R3 may be modified by the addition of a “high,” “mid” or “low” grade to indicate the relative standing of a credit within a particular rating category. According to the DBRS rating system, short-term debt rated R1(low) are of satisfactory credit quality. The overall strength and outlook for key liquidity, debt and profitability ratios is not normally as favourable as with higher rating categories, but these considerations are still respectable. Any qualifying negative factors that exist are considered manageable, and the entity is normally of sufficient size to have some influence in its industry.
MARKET FOR SECURITIES
Trading Price and Volume
The Company’s outstanding share capital is comprised of common shares, and each common share carries one vote. The Company’s common shares trade on the TSX under the symbol PCA and on the New York Stock Exchange (NYSE) under the symbol PCZ.
The greatest volume of trading in the Company’s shares takes place on the TSX. The following table sets out the trading range and volume traded on the TSX and the NYSE in 2005 on a monthly basis.
In July 2005, the Company effected a two-for-one stock split in the form of a stock dividend.
PETRO-CANADA SHARE TRADING ACTIVITY ON THE TORONTO STOCK EXCHANGE
AND THE NEW YORK STOCK EXCHANGE IN 20051
| | | Toronto Stock Exchange | | New York Stock Exchange | |
| | | Share Price Trading Range (dollars per share) | | | | Share Price Trading Range (U.S. dollars per share) | | | |
| | | High | | Low | | Close | | Share Volume (millions) | | High | | Low | | Close | | Share Volume (millions) | |
2005 | | | | | | | | | | | | | | | | | | | | | | | | | |
| January | | $ | 32.00 | | $ | 29.51 | | $ | 32.00 | | | 49.0 | | $ | 25.93 | | $ | 24.15 | | $ | 25.82 | | | 4.5 | |
| February | | | 34.91 | | | 31.98 | | | 34.16 | | | 39.2 | | | 28.20 | | | 25.78 | | | 27.92 | | | 5.5 | |
| March | | | 36.68 | | | 33.54 | | | 35.13 | | | 55.4 | | | 30.40 | | | 27.58 | | | 28.93 | | | 9.3 | |
| April | | | 36.23 | | | 33.65 | | | 34.93 | | | 40.9 | | | 29.84 | | | 26.90 | | | 27.74 | | | 8.8 | |
| May | | | 36.11 | | | 33.68 | | | 35.20 | | | 30.2 | | | 29.13 | | | 26.70 | | | 28.14 | | | 5.9 | |
| June | | | 41.19 | | | 35.51 | | | 39.88 | | | 51.8 | | | 33.51 | | | 28.46 | | | 32.57 | | | 8.2 | |
| July | | | 44.94 | | | 40.33 | | | 44.02 | | | 39.9 | | | 36.23 | | | 33.02 | | | 35.92 | | | 10.4 | |
| August | | | 48.09 | | | 45.41 | | | 48.00 | | | 49.3 | | | 40.35 | | | 36.65 | | | 40.35 | | | 11.0 | |
| September | | | 50.80 | | | 47.51 | | | 48.66 | | | 50.7 | | | 43.47 | | | 40.49 | | | 41.73 | | | 13.0 | |
| October | | | 50.20 | | | 40.13 | | | 41.16 | | | 60.5 | | | 43.03 | | | 33.96 | | | 34.75 | | | 11.4 | |
| November | | | 44.60 | | | 40.91 | | | 44.55 | | | 71.2 | | | 38.12 | | | 34.47 | | | 38.12 | | | 9.3 | |
| December | | $ | 47.75 | | $ | 46.00 | | $ | 46.65 | | $ | 37.9 | | $ | 40.91 | | $ | 39.24 | | $ | 40.09 | | | 8.4 | |
| 1 | Per share amounts are quoted on a post-stock dividend basis. |
Stock Performance Graph
The following graph charts performance of an investment in the Company’s common shares against each of the Standard & Poor’s (S&P)/TSX Composite Index and the S&P/TSX Energy Index, assuming an investment of $100 on December 31, 2000, and accumulation and reinvestment of all dividends paid from the date through December 31, 2005.
Year ended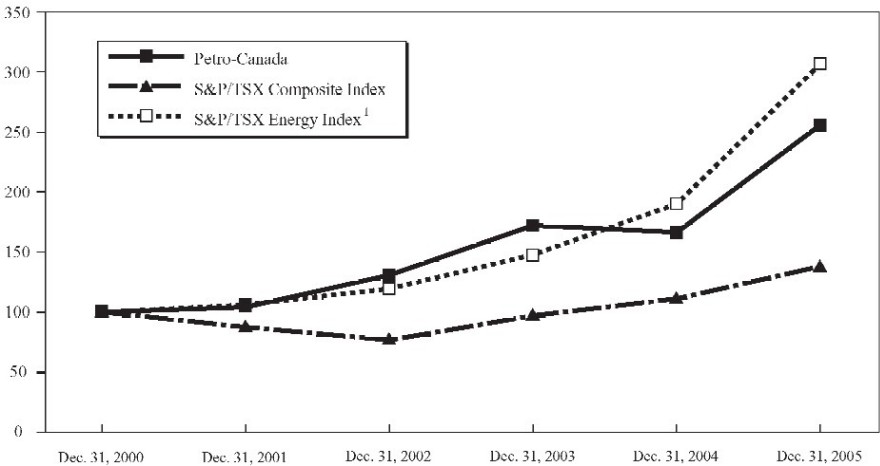
| Petro-Canada | 100.00 | 104.11 | 130.76 | 172.09 | 166.36 | 255.86 |
| S&P/TSX Composite Index | 100.00 | 87.44 | 76.62 | 97.05 | 111.13 | 138.06 |
S&P/TSX Energy Index1 | 100.00 | 106.01 | 119.48 | 147.73 | 190.10 | 306.64 |
| 1 | No dividends for S&P/TSX Energy Index. |
Prior Sales
Petro-Canada and its wholly owned subsidiary, PC Financial Partnership, filed a shelf prospectus dated November 3, 2004, which allowed the Company to issue up to $1 billion US of debt securities in the U.S. until December 2006. On May 16, 2005, Petro-Canada issued $600 million US of senior notes, representing the balance available under the shelf prospectus. The following summarizes the details of that public offering:
| Purpose of offering: | To repay existing short-term borrowing, with the balance used for working capital |
| Size of offering: | $600 million US |
| Maturity date: | May 15, 2035 |
| Form of securities: | 5.95% senior notes |
| Net proceeds of issue: | $586 million US |
| Public offering price: | 98.774% per note |
| Application of proceeds: | Repay short-term, commercial paper credit facility, with the balance used for working capital |
DIRECTORS AND OFFICERS
Directors
The following describes information concerning Directors of the Company. Details regarding share ownership, the Deferred Share Unit (DSU) Plan and compensation of Directors can be found in the Company’s Management Proxy Circular, dated March 7, 2006.
 | RON A. BRENNEMAN (Non-independent, Management) Age: 59 Calgary, Alberta, Canada Director since: 2000 Common shares: 78,7931 DSUs: 190,8872 Attendance: 9/9 Board | Ron Brenneman is the President and Chief Executive Officer of the Company. Prior to joining the Company in 2000, he held various positions within Exxon Corporation (integrated oil) and its affiliated companies. He also serves as a Director of the Bank of Nova Scotia and BCE Inc. He is a member of the Board of Directors of the Canadian Council of Chief Executives and the Canadian Unity Council. Mr. Brenneman holds a BSc. and an MSc. As a member of management, Mr. Brenneman is not a member of any Committee of the Company, but he is invited to attend all Committee meetings other than in camera sessions. |
 | ANGUS A. BRUNEAU, O.C. (Independent) Age: 70 St. John’s, Newfoundland and Labrador, Canada Director since: 1996 Common shares: 5,5271 DSUs: 10,8192 Attendance: 8/9 Board 3/3 Environment, Health and Safety Committee (Chair) 6/7 Audit, Finance and Risk Committee | Angus Bruneau is Chairman of the Board of Directors of Fortis Inc. (utilities and services corporation). He also serves as a Director of Inco Limited and SNC Lavalin Group Inc. He is an executive member of a number of not-for-profit organizations, including Sustainable Development Technology Canada, Canadian Institute for Child Health and the Canadian Foundation for Innovation. Dr. Bruneau is a P.Eng and holds a BSc., D.Eng, and a PhD. Dr. Bruneau is Chair of the Environment, Health and Safety Committee and a member of the Audit, Finance and Risk Committee. |
 | GAIL COOK-BENNETT (Independent) Age: 65 Toronto, Ontario, Canada Director since: 1991 Common shares: 4,0981 DSUs: 19,9982 Attendance: 9/9 Board 2/2 Pension Committee (Chair) 7/7 Audit, Finance and Risk Committee | Gail Cook-Bennett is Chairperson of the Canada Pension Plan Investment Board (public pension plan investment). She also serves as a Director of Emera Inc. and Manulife Financial Corporation and is a Fellow of the Institute of Corporate Directors. Dr. Cook-Bennett has earned a PhD in Economics and holds a Doctor of Laws (honoris causa) from Carleton University. Dr. Cook-Bennett is Chair of the Pension Committee and a member of the Audit, Finance and Risk Committee. |
1 The information regarding the number of common shares beneficially owned or controlled or directed has been furnished individually by the respective nominees.
2 For further details, see “Compensation of the Board of Directors” for Directors who are not employees of the Company and “Executive Compensation” for the President and Chief Executive Officer in the Company’s Management Proxy Circular, dated March 7, 2006.
 | RICHARD J. CURRIE, O.C. (Independent) Age: 68 Toronto, Ontario, Canada Director since: 2003 Common shares: 20,0001 DSUs: 3,1462 Attendance: 8/9 Board 5/6 Management Resources and Compensation Committee 1/2 Pension Committee | Dick Currie is Chairman of the Board of Bell Canada Enterprises (BCE Inc.) (telecommunications). From 1996 to 2002, he was President and Director of George Weston Limited (food processing and distribution). He serves as a Director of CAE, Inc. and Staples, Inc., is the Chancellor of the University of New Brunswick and a Fellow of the Institute of Corporate Directors. Mr. Currie holds a B.Eng and an MBA. Mr. Currie is a member of the Management Resources and Compensation Committee and the Pension Committee. |
 | CLAUDE FONTAINE, Q.C. (Independent) Age: 64 Montreal, Quebec, Canada Director since: 1987 Common shares: 15,9261 DSUs: 28,3402 Attendance: 9/9 Board 6/6 Management Resources and Compensation Committee (Chair) 1/13 Environment, Health and Safety Committee 2/23 Corporate Governance and Nominating Committee | Claude Fontaine is a Senior Partner with Ogilvy Renault LLP (barristers and solicitors). He also serves as a Director of Optimum General Inc., the Institute of Corporate Directors (Chair of the Quebec Chapter) and the Montreal Heart Institute Foundation. He is Honorary Governor of the Canadian Unity Council. Mr. Fontaine holds a BA, an LL.L., and an ICD.D. Mr. Fontaine is Chair of the Management Resources and Compensation Committee and a member of the Environment, Health and Safety Committee. |
 | PAUL HASELDONCKX (Independent) Age: 57 Essen, Germany Director since: 2002 Common shares: 3,0011 DSUs: 6,0762 Attendance: 9/9 Board 7/7 Audit, Finance and Risk Committee 3/3 Environment, Health and Safety Committee | Paul Haseldonckx is the past Chairman of the Executive Board of Veba Oil & Gas GmbH (integrated oil and gas) and its predecessor companies. He is a guest lecturer at Leiden University MBA Program on International Management. Mr. Haseldonckx holds an MSc. Mr. Haseldonckx is a member of the Audit, Finance and Risk Committee and the Environment, Health and Safety Committee. |
1 The information regarding the number of common shares beneficially owned or controlled or directed has been furnished individually by the respective nominees.
2 For further details, see “Compensation of the Board of Directors” for Directors who are not employees of the Company and “Executive Compensation” for the President and Chief Executive Officer in the Company’s Management Proxy Circular, dated March 7, 2006.
3 Mr. Fontaine ceased to be a member of the Corporate Governance and Nominating Committee effective April 26, 2005. He was appointed to the Environment, Health and Safety Committee effective April 26, 2005.
 | THOMAS E. KIERANS, O.C. (Independent) Age: 65 Toronto, Ontario, Canada Director since: 1991 Common shares: 40,9001 DSUs: 6,6592 Attendance: 7/9 Board 5/6 Management Resources and Compensation Committee 6/6 Corporate Governance and Nominating Committee | Tom Kierans is Chairman of the Canadian Journalism Foundation, prior to which he was Chairman of CSI Global Markets. He also serves as a Director of Manulife Financial Corporation, Mount Sinai Hospital and Canadian Institute for Advanced Research. Mr. Kierans is also a corporate director and sits on a number of advisory Boards of for-profit and not-for-profit organizations including Lazard (Canada), Task Force on the Modernization of Securities Legislation in Canada and the Schulich School of Business, York University. He holds a BA (Honours) and an MBA (Finance, Dean’s Honours List) and is a Fellow of the Canadian Institute of Corporate Directors. Mr. Kierans is a member of the Management Resources and Compensation Committee and the Corporate Governance and Nominating Committee. |
 | BRIAN F. MACNEILL, C.M. (Independent) Age: 66 Calgary, Alberta, Canada Director since: 1995 Common shares: 10,2001 DSUs: 37,2662 Attendance: 9/9 Board | Brian MacNeill is the Chairman of the Board of Directors of Petro-Canada. Prior to that, he was President and Chief Executive Officer of Enbridge Inc. (pipeline business). He is also Chairman and Director of Dofasco Inc. and a Director of the Toronto-Dominion Bank, West Fraser Timber Co. Ltd. and Telus Corp. He is a member of the Canadian Institute of Chartered Accountants and the Financial Executives Institute. He is also a Fellow of the Alberta and Ontario Institutes of Chartered Accountants and of the Institute of Corporate Directors and is Chair of the Board of Governors of the University of Calgary. Mr. MacNeill is a Certified Public Accountant and holds a B.Comm. Mr. MacNeill is an ex-officio member of all Committees. |
 | MAUREEN McCAW (Independent) Age: 51 Edmonton, Alberta, Canada Director since: 2004 Common shares: 4941 DSUs: 3,3142 Attendance: 8/9 Board 3/43 Corporate Governance and Nominating Committee 2/2 Pension Committee 2/23 Environment, Health and Safety Committee | Maureen McCaw is immediate past President of Leger Marketing (marketing research), formerly Criterion Research Corp., a company she founded in 1986. She is a past Chair of the Edmonton Chamber of Commerce and continues to serve as a Director. She also serves on a number of Alberta boards and advisory committees, and holds a BA. Ms. McCaw is a member of the Pension Committee and the Corporate Governance and Nominating Committee. |
 | PAUL D. MELNUK (Independent) Age: 51 St. Louis, Missouri, USA Director since: 2000 Common shares: 4,4001 DSUs: 15,9042 Attendance: 7/9 Board 7/7 Audit, Finance and Risk Committee (Chair) 3/3 Environment, Health and Safety Committee | Paul Melnuk is Chairman and Chief Executive Officer of Thermadyne Holdings Corporation (industrial products) and Managing Partner of FTL Capital Partners LLC (merchant banking). He is past President and Chief Executive Officer of Bracknell Corporation and Barrick Gold Corporation. Mr. Melnuk is a member of the Canadian Institute of Chartered Accountants and of the World Presidents' Organization, St. Louis chapter, and holds a B.Comm. Mr. Melnuk is Chair of the Audit, Finance and Risk Committee and a member of the Environment, Health and Safety Committee. |
1 The information regarding the number of common shares beneficially owned or controlled or directed has been furnished individually by the respective nominees.
2 For further details, see “Compensation of the Board of Directors” for Directors who are not employees of the Company and “Executive Compensation” for the President and Chief Executive Officer in the Company’s Management Proxy Circular, dated March 7, 2006.
3 Ms. McCaw ceased to be a member of the Environment, Health and Safety Committee effective April 26, 2005. She was appointed to the Corporate Governance and Nominating Committee effective April 26, 2005.
 | GUYLAINE SAUCIER, F.C.A., C.M. (Independent) Age: 59 Montreal, Quebec, Canada Director since: 1991 Common shares: 6,5201 DSUs: 31,5712 Attendance: 9/9 Board 6/6 Corporate Governance and Nominating Committee (Chair) 2/2 Pension Committee | Guylaine Saucier, is a Corporate Director who serves on the Boards of AXA Assurance Inc., CHC Helicopter Corp., Altran Technologies and Foundation du Musée des Beaux Arts. She is a former Chairman of the Board of Directors of the Canadian Broadcasting Corporation, a former Director of the Bank of Canada, a former Chair of the Canadian Institute of Chartered Accountants (CICA), a former Director of the International Federation of Accountants, and was Chair of the Joint Committee on Corporate Governance established by the CICA, the Toronto Stock Exchange and the Canadian Venture Exchange. She is a Fellow of the Institute of Chartered Accountants and of the Institute of Corporate Directors. Ms. Saucier is Chair of the Corporate Governance and Nominating Committee and a member of the Pension Committee. |
 | JAMES W. SIMPSON (Independent) Age: 61 Danville, California, USA Director since: 2004 Common shares: 01 DSUs: 2,9732 Attendance: 9/9 Board 7/7 Audit, Finance and Risk Committee 3/33 Management Resources and Compensation Committee 2/23 Environment, Health and Safety Committee | Jim Simpson is past President of Chevron Canada Resources (oil and gas). He is also past Chairman of the Canadian Association of Petroleum Producers and past Vice-Chairman of the Canadian Association of the World Petroleum Congresses. Mr. Simpson holds a BSc. and a MSc. Mr. Simpson is a member of the Audit, Finance and Risk Committee and the Management Resources and Compensation Committee. |
1 The information regarding the number of common shares beneficially owned or controlled or directed has been furnished individually by the respective nominees.
2 For further details, see “Compensation of the Board of Directors” for Directors who are not employees of the Company and “Executive Compensation” for the President and Chief Executive Officer in the Company’s Management Proxy Circular, dated March 7, 2006.
3 Mr. Simpson ceased to be a member of the Environment, Health and Safety Committee effective April 26, 2005. He was appointed to the Management Resources and Compensation Committee effective April 26, 2005.
The term of office for each of the Directors named above ends at the close of the next annual meeting of the shareholders of the Company, or until his or her successor is elected or appointed.
Additional Disclosure Relating to Directors
To the knowledge of Petro-Canada, no Director of Petro-Canada is, or has been in the last 10 years, a Director or Executive Officer of an issuer that, while that person was acting in that capacity:
(a) was the subject of a cease trade order or similar order, or an order that denied the issuer access to any exemptions under Canadian securities legislation, for a period of more than 30 consecutive days except that Mme. Saucier was a Director of Nortel Networks Corporation and was subject to a cease trade order issued on May 17, 2004 as a result of Nortel’s failure to file financial statements. The cease trader order was cancelled on June 21, 2005. Mme. Saucier is no longer a Director of Nortel;
(b) was subject to an event that resulted, after that person ceased to be a Director or Executive Officer of that issuer, in that issuer being the subject of a cease trade order or similar order, or an order that denied the issuer access to any exemption under Canadian securities legislation, for a period of more than 30 consecutive days; or
(c) within a year of that person ceasing to act in that capacity, became bankrupt, made a proposal under any legislation relating to bankruptcy or insolvency, or was subject to or instituted any proceedings, arrangement or compromise with creditors, or had a receiver, receiver manager or trustee appointed to hold its assets except that Telegobe Inc. filed for court protection under insolvency statutes on May 28, 2002. Messrs. Currie and Kierans were Directors of Teleglobe Inc. from December 2000 until April 2002.
The following table shows certain information concerning officers of the Company.
Name and Municipality of Residence | Served as an Officer Since | Principal Occupation1 |
| Brian F. MacNeill, Calgary, Alberta | 2000 | Chairman of the Board of the Company |
Executive Leadership Team | | |
| Ron A. Brenneman, Calgary, Alberta | 2000 | President and Chief Executive Officer of the Company |
| Peter S. Kallos, London, England | 2003 | Executive Vice-President, International |
| Boris J. Jackman, Mississauga, Ontario | 1993 | Executive Vice-President, Downstream |
| E.F.H. Roberts, Calgary, Alberta | 1989 | Executive Vice-President and Chief Financial Officer |
| Brant G. Sangster, Calgary, Alberta | 1988 | Senior Vice-President, Oil Sands |
| Kathleen E. Sendall, Calgary, Alberta | 1996 | Senior Vice-President, North American Natural Gas |
| William A. Fleming, St. John’s, Newfoundland and Labrador | 2005 | Vice-President, East Coast Oil |
Upstream | | |
| Youssef Ghoniem, Dorsten, Germany | 2002 | Senior Vice-President, Operations |
| Gordon Carrick, London, England | 2002 | Senior Vice-President, International Operations and Technology |
| Nicholas A. Maden, London, England | 2003 | Vice-President, International and Offshore Exploration |
| Graham Lyon, London, England | 2004 | Vice-President, Business Development, International |
| Donald M. Clague, Denver, Colorado | 2002 | Vice-President, U.S. Operations, North American Natural Gas |
| Francois Langlois, Calgary, Alberta | 2002 | Vice-President, Exploration, North American Natural Gas |
| John D. Miller, Calgary, Alberta | 2004 | Vice-President, Natural Gas Marketing |
| Leon Sorenson, Calgary, Alberta | 2004 | Vice-President, Canadian Operations, North American Natural Gas |
Downstream | | |
| Randall B. Koenig, Oakville, Ontario | 1996 | Vice-President, Lubricants |
| Frederick Scharf, Mississauga, Ontario | 2003 | Vice-President, Wholesale/Retail |
| Philip Churton, Burlington, Ontario | 2005 | Vice-President, Marketing |
| Daniel P. Sorochan, Mississauga, Ontario | 2003 | Vice-President, Refining and Supply |
Shared Services | | |
W. A. (Alf) Peneycad,2 Calgary, Alberta | 1986 | Vice-President, General Counsel and Chief Compliance Officer |
Andrew Stephens,2 Calgary, Alberta | 1993 | Vice-President, Human Resources |
M. A. (Greta) Raymond,2 Calgary, Alberta | 2001 | Vice-President, Environment, Health, Safety, Security and Corporate Responsibility |
| Gerhard Kinast, London, England | 2002 | Vice-President, Finance |
Neil J. Camarta2, Calgary, Alberta | 2005 | Vice-President, Corporate Planning and Communications |
| Douglas S. Fraser, Calgary, Alberta | 2002 | Treasurer |
| Hugh L. Hooker, Calgary, Alberta | 2004 | Associate General Counsel and Corporate Secretary |
| Michael Danyluk, Calgary, Alberta | 2004 | Chief Information Officer |
| Michael C. Barkwell, Calgary, Alberta | 2005 | Controller |
1 Each of the officers has been engaged in the principal occupation indicated above or in executive positions with Petro-Canada for the five preceding years except for Brian F. MacNeill who, prior to 2001, was president and chief executive officer of Enbridge Inc.; Youssef Ghoniem who, prior to 2002, was executive board member for Veba Oil & Gas GmbH; Gordon Carrick who, prior to 2002, was Terra Nova asset manager; Donald M. Clague who, prior to 2002, was manager, Exploration East Coast/Offshore, and prior thereto chief geophysicist; Douglas S. Fraser who, prior to 2002, was senior director, Downstream Accounting and Control; Francois Langlois who, prior to 2002, was manager, Southern Exploration, and prior thereto general manager, North Africa and prior thereto team leader, Foothills Exploration; Gerhard Kinast who, prior to 2002, was executive board member for Veba Oil & Gas GmbH; Peter S. Kallos who, prior to 2003, was vice-president, Corporate Planning and Communications, and prior thereto was external affairs director of Shell Exploration and Production U.K., and prior thereto was general manager of Enterprise’s U.K. Business Unit, and prior thereto was chief executive officer of Enterprise’s Italian subsidiary; Nicholas A. Maden who, prior to 2003, was exploration manager, International business unit, and prior thereto was business development manager with Veba Oil & Gas GmbH, and prior thereto held various exploration management positions with ARCO; Frederick Scharf who, prior to 2003, was general manager, Western Canada Wholesale/Retail; Daniel Sorochan who, prior to 2003, was senior director of Business Development, Refining and Supply, and prior thereto was general manager, Oakville refinery; Leon Sorenson who, prior to 2004, was manager of Production Engineering and Operations, Western Canada Productions, and prior thereto was manager of Northern Development, Western Canada Development and Operations, and prior thereto was manager of Engineering Technology; Graham Lyon who, prior to 2004, was senior director, Business Development and prior thereto was head of Business Development, Deminex UK Oil & Gas; Michael Danyluk who, prior to 2004, was senior director of Information Systems; John D. Miller who, prior to 2004, was general manager of Gas Marketing, and prior thereto was manager of Gas Marketing, and prior thereto was manager, Oil Sands Infrastructure, and prior thereto was portfolio manager, Oil Sands Business Integration, and prior thereto was portfolio manager, Natural Gas Marketing; Hugh L. Hooker who, prior to 2004, was associate general counsel; William A. Fleming who, prior to 2005, was Terra Nova asset manager, and prior thereto was manager of Engineering and Operations, Western Canada; Philip Churton who, prior to 2005, was general manager, Sales Services & Operations, Central Canada; Neil J. Camarta who, prior to 2005, was vice-president, Oil Sands for Shell Canada Limited; and Michael C. Barkwell who, prior to 2005, was assistant controller, Downstream, and prior thereto was director of Financial Reporting.
2 Associate member of the executive leadership team.
Share Ownership
As at December 31, 2005, the Directors and officers of Petro-Canada, as a group, beneficially owned or exercised control over 647,026 common shares or less than 1% of the common shares of the Company outstanding as of such date.
Corporate Governance
The Board of Directors and management of Petro-Canada are committed to adhering to superior corporate governance standards and adopts a “best practices” approach in all of its corporate governance initiatives. In accordance with the rules of the Canadian Securities Administrators and the TSX, the Board has developed sound corporate governance policies and procedures, which are monitored and reviewed on a continuous basis. Overall, the Company’s corporate governance practices do not differ significantly from the NYSE Corporate Governance Standards. Details of the Petro-Canada’s alignment with these Standards, as well as the Sarbanes Oxley Act of 2002 (SOX) and National Instrument 58-101 (NI 58-101) can be found on the Company’s Web site at www.petro-canada.ca. Details of the Company’s corporate governance practices are also available on this Web site.
Petro-Canada has received formal recognition in respect of its corporate governance practices and disclosure. In its 2005 Corporate Governance Awards (Board Games), the Globe and Mail, Report on Business ranked Petro-Canada’s corporate governance practices in the top 6% among more than 200 companies. This is a rating that has consistently improved for Petro-Canada over the past three years. In 2005, Ethical Funds included Petro-Canada in its “50 Best Corporate Citizens” publication, which involved the consideration of various factors, including Board of Directors independence and diversity. Covalence, a Geneva-based monitoring organization, recently acknowledged Petro-Canada for its strong ethical practices.
The principal role of the Corporate Governance and Nominating Committee (the Governance Committee) is to assist the Board in:
| (i) | developing and implementing principles and procedures for the overall management of corporate governance; |
| (ii) | assessing the size, competencies and skills of the existing Board and proposing qualified candidates as nominees for election to the Board and its Committees; |
| (iii) | conducting Board, Committee and individual Director evaluations; and |
| (iv) | overseeing the orientation, education and development of members of the Board. |
The Governance Committee undertook a review of the Company’s governance practices in 2005 and, in particular, considered the Corporate Governance Handbook. Following this review, the Governance Committee have approved revisions to the Board Mandate and position descriptions for the Board Chair, Chief Executive Officer, Corporate Secretary and Committee Chairs. In addition, the remaining Board Committees have approved revised versions of their respective mandates upon recommendation from the Governance Committee. In accordance with NI 58-101, a copy of the Board Mandate is published as Appendix 1 of the Management Proxy Circular.
With the approval of the Governance Committee, the Charters of each of Petro-Canada’s standing Committees and the aforementioned position descriptions are published on the Company’s Web site (www.petro-canada.ca) as part of the Corporate Governance Handbook. Additional information on the Audit, Finance and Risk Committee, including a copy of its Charter, can also be found on page 73 and Schedule “C” in this AIF.
Composition of the Board of Directors and Committees
The Articles of the Company state that the Board of Directors is to be comprised of a minimum of nine and a maximum of 13 Directors. The Governance Committee is responsible for annually reviewing the size of the Board and the competencies and skills of its members. Using a skills matrix, the Governance Committee annually reviews the size, composition, membership, Charter of the Board and each Board Committee including its own Charter, membership and performance. This review is followed by the Governance Committee’s evaluation of the effectiveness of the Board as a whole and the contributions of individual members. The results of this evaluation are reported to the Board of Directors. Based on its most recent review, the Governance Committee is satisfied that the Board has a suitable number of members and the appropriate mix of experience and skills given the size and nature of Petro-Canada’s operations.
The Board of Directors currently has five standing committees:
| § | Audit, Finance and Risk; |
| § | Corporate Governance and Nominating; |
| § | Management Resources and Compensation; |
| § | Environment Health and Safety. |
Each Committee is typically comprised of five members, each of whom are “independent” pursuant to NI 58-101, the NYSE Corporate Governance Standards and the SOX. In addition, the Audit, Finance and Risk Committee members are all independent pursuant to National Instrument 52-110 (NI 52-110), the NYSE Corporate Governance Standards and SOX, and are financially literate, with one member recognized as a “financial expert” in accordance with SOX requirements. Ron A. Brenneman, Petro-Canada’s President and Chief Executive Officer, is the only non-independent member of the Board, and, while he is not a member of any of the Committees, he is invited to attend all Committee meetings, other than the in camera sessions.
Each Committee undertakes detailed examinations of the specific aspect of the Company which falls under its purview, as outlined in its Committee Charter. Committee meetings provide a smaller, more focused forum than do meetings of the full Board of Directors and are designed to be more conducive to exhaustive and forthright discussions. The Chair of each Committee provides a report to the Board of Directors following each Committee meeting.
Director Orientation and Performance Evaluations
The Governance Committee is responsible for the orientation process for new Board members and the continuing education and development of incumbent members. Working with Petro-Canada management, one-on-one presentations are set up with each of the business unit leaders; all Board members are invited to attend seminars dealing with various topics, such as fiduciary or committee-related trends and issues, and all members are encouraged to attend facility tours. Petro-Canada also encourages its Directors to enroll in relevant continuing education programs offered by various institutions, including director colleges. Cost-sharing arrangements with Petro-Canada for these programs are available and all reasonable expenses are reimbursed.
Corporate Standards and Conduct
All Board members, employees and contractors are bound by the Company’s Code of Business Conduct (the Code), a copy of which can be found on the Company’s Web site at www.petro-canada.ca. On an annual basis, the Chief Compliance Officer reports to the Governance Committee on the Company’s Corporate Standards and Conduct, and obtains certificates from named officers verifying that each such individual adheres to the Code. Annual certifications are also provided by Petro-Canada’s senior financial officers in accordance with the Company’s Code of Ethics for Financial Officers, which can also be found on the Company’s Web site at www.petro-canada.ca. In 2005, Petro-Canada revised the Policy for the Prevention of Improper Payments (PPIP), which provides mandatory guidelines on certain activities and conduct to meet internal ethical standards and which may fall under the scope of international legislation relating to anti-bribery and corruption including, for example, U.S. Foreign Corrupt Practices Act and the OECD Anti-Bribery Convention. Throughout 2004 and 2005, the Company’s Chief Compliance Officer implemented online business integrity training for employees, as well as individual and group seminars relating to PPIP and similar legislation.
Audit Committee Disclosure
The following reviews certain information regarding the Company’s Audit, Finance and Risk Committee, as required pursuant to Multilateral Instrument 52-110.
Audit, Finance and Risk Committee
Chair: Paul D. Melnuk (Designated Financial Expert)
Members: Angus A. Bruneau, Gail Cook-Bennett, Paul Haseldonckx, James W. Simpson
2005 Committee Meetings: Seven
This Committee is composed entirely of independent Directors, each of whom is very knowledgeable in financial matters and is financially literate within the meaning of Multilateral Instrument 52-110. Details as to each committee member’s education and experience that provide the member with the necessary knowledge and understanding of accounting principles and procedures can be found above under “Directors” starting on page 66. The Committee is responsible for reviewing and providing recommendations to the Board of Directors regarding the Company’s accounting policies, reporting practices, internal controls, the Company’s annual and interim financial statements, financial information included in the Company’s disclosure documents, risk management matters, and oil and gas reserves booking and reporting. The Committee also reviews significant audit findings, material litigation and claims, and any issues between management and the auditors. The Committee maintains direct relationships with the Company’s contract internal auditor and external auditor. The Committee meets in camera with both the contract internal auditors and external auditors at least once per year. The Committee is responsible for recommending the appointment and compensation of the external auditors. The Committee has a policy in place that non-audit work may not be performed by the external auditor. The Terms of Reference of the Audit, Finance and Risk Committee are attached to this AIF as Schedule “C” and can also be found on the Company’s Web site at www.petro-canada.ca.
Audit Fees
Deloitte & Touche LLP were appointed as auditors of the Company on June 7, 2002. Deloitte & Touche LLP billed the Company for services rendered in the year ended December 31, 2005 as follows: (a) audit fees - $3,217,000 (2004 - $2,367,000), (b) audit related services for pension plan and attest services - $213,000 (2004 - $71,000), (c) tax advisory fees - nil (2004 - nil), and (d) all other fees - nil (2004 - $107,000).
The Board of Directors adheres to a practice of limiting the auditors from providing services not related to the audit. In 2004, the Company cancelled the licensing of access to industry databases provided by the auditors. All services provided by the auditors are pre-approved by the Audit, Finance and Risk Committee.
INTEREST OF MANAGEMENT AND OTHERS IN MATERIAL TRANSACTIONS |
No Director, executive officer or principal shareholder of Petro-Canada, or associate or affiliate of those persons, has any material interest, direct or indirect, in any transaction within the last three years that has materially affected or will materially affect Petro-Canada.
TRANSFER AGENTS AND REGISTRARS |
| In Canada: CIBC Mellon Trust Company 600, 333 - 7th Avenue S.W. Calgary, Alberta T2P 2Z1 Telephone: 1-800-387-0825 Website: www.cibcmellon.com | In the U.S.: Mellon Investor Services 44 Wall Street, 6th Floor New York, New York 10005 Telephone: 1-800-387-0825 Website: www.cibcmellon.com |
MATERIAL CONTRACTS
Petro-Canada has not entered into any material contracts, outside the ordinary course of business, within two years before the date of this AIF.
Deloitte & Touche LLP is the independent auditor of the Company.
Kathleen E. Sendall is a senior vice-president with the Company and has certified a report with respect to NI 51-101 oil and gas reserves disclosure. Kathleen E. Sendall does not hold more than 1% of the Company’s outstanding securities.
ADDITIONAL INFORMATION
Financial information is provided in the Company’s Consolidated Financial Statements and MD&A for its most recently completed financial year. Additional information, including Directors’ and officers’ remuneration and indebtedness of principal holders of the Company’s securities and securities authorized for issuance under equity compensation plans is contained in the Company’s Management Proxy Circular, dated March 7, 2006.
Copies of this AIF, as well as the Company’s latest Management Proxy Circular and Annual Report (which includes the Company’s Consolidated Financial Statements and MD&A) for the year ended December 31, 2005, may be obtained from the Company’s Web site at www.petro-canada.ca or by mail upon request from the corporate secretary, 150 - 6 Avenue S.W., Calgary, Alberta, T2P 3E3.
You may also access disclosure documents and any reports, statements or other information that Petro-Canada files with the Canadian provincial securities commissions or other similar regulatory authorities through the Internet on the Canadian System for Electronic Document Analysis and Retrieval, which is commonly known by the acronym SEDAR, and which may be accessed at www.sedar.com. SEDAR is the Canadian equivalent of the U.S. SEC’s Electronic Document Gathering and Retrieval System, which is commonly known by the acronym EDGAR, and which may be accessed at www.sec.gov.
SCHEDULE A
REPORT ON RESERVES DATA
BY
SENIOR OFFICER RESPONSIBLE FOR RESERVES DATA
To the Board of Directors of Petro-Canada (the Company):
1.The Company’s staff of qualified reserves evaluators have evaluated the Company’s reserves data as at December 31, 2005. The reserves data consist of the following:
| | (i) | proved oil and gas reserves quantities estimated as at December 31, 2005, using constant prices and costs; and |
| | (ii) | the Standardized Measure of Discounted Future Net Cash Flows relating to proved oil and gas reserves quantities. |
2.The reserves data are the responsibility of the Company’s management. As the member of the executive responsible for the Company’s hydrocarbon reserves data, my responsibility is to certify that the reserves data has been properly calculated in accordance with industry generally accepted procedures for the estimation of reserves data.
3.The Company’s reserves staff and management carried out their evaluations in accordance with industry generally accepted procedures for the estimation of reserves data and standards as set out in the Canadian Oil and Gas Evaluation Handbook (the COGE Handbook) prepared jointly by the Society of Petroleum Evaluation Engineers (Calgary Chapter) and the Canadian Institute of Mining, Metallurgy & Petroleum (Petroleum Society) with the necessary modifications to reflect the definition of proved reserves under the applicable U.S. Financial Accounting Standards Board policies (the FASB Standards) and the legal requirements of the U.S. Securities and Exchange Commission (SEC Requirements). The Company’s reserves staff and management are not independent of the Company within the meaning of the term “independent” under those standards.
4.The standards require that they plan and perform an evaluation to obtain reasonable assurance as to whether the reserves data are free of material misstatement. An evaluation also includes assessing whether the reserves data are developed in accordance with the evaluation practices and procedures presented in the COGE Handbook as modified to meet the requirements of the FASB Standards and SEC Requirements.
5.The following sets forth the standardized measure of future net cash flows attributed to proved oil and gas reserves quantities, estimated using constant prices and costs and calculated using a discount rate of 10%, included in the reserves data of the Company evaluated for the year ended December 31, 2005:
STANDARDIZED MEASURE OF FUTURE NET CASH FLOWS - PROVED OIL AND GAS RESERVES
(10% discount rate)
As at December 31, 2005
| Location of Reserves (by business) | | Standardized Measure (After Deducting Income Taxes) |
| | | (millions of dollars) |
| | $ | 5,333 | |
| East Coast Oil | | | 3,275 | |
| Northwest Europe | | | 2,162 | |
North Africa/Near East - continuing operations | | | 700 | |
| Northern Latin America | | | 371 | |
| Syncrude Oil Sands Mining Operation | | | 2,809 | |
| Discontinued operations | | $ | 347 | |
The Standardized Measure values above were calculated consistent with the methodology prescribed in Financial Accounting Standards Board Statement No. 69.
6.In my opinion, the reserves data evaluated by the Company’s reserves evaluation staff and management have, in all material respects, been determined in accordance with evaluation practices and procedures presented in the COGE Handbook with the necessary modifications to reflect reserves definitions and legal requirements under the applicable FASB Standards and SEC Requirements.
7.The reservoir engineering staff and management review and evaluate the reserves data on an ongoing basis and advise the executive of the Company of significant changes to the evaluations for events and circumstances occurring after the effective date of this report.
8.Reserves are estimates only and not exact quantities. In addition, the reserves data are based on judgments regarding future events; actual results will vary and the variations may be material.
/Signed/
Kathleen E. Sendall, Senior Vice-President, North American Natural Gas
Member of Executive Leadership Team Responsible for Reserves
Dated March 14, 2006
SCHEDULE B
REPORT OF MANAGEMENT AND DIRECTORS
ON RESERVES DATA AND OTHER INFORMATION
The management of Petro-Canada (the Company) is responsible for the preparation and disclosure of information with respect to the Company’s oil and gas activities in accordance with securities regulatory requirements. This information includes reserves data, which consist of the following:
| | (i) | proved oil and gas reserves quantities estimated as at December 31, 2005, using constant prices and costs; and |
| | (ii) | the Standardized Measure of Discounted Future Net Cash Flows relating to proved oil and gas reserves quantities. |
Our reserves evaluation process involves applying generally accepted practices and procedures for the estimation of reserves data as set out in the COGE Handbook and modified to reflect the definitions and standards as set out in the applicable provisions of the U.S. Financial Accounting Standards Board Statement of Financial Accounting Standards No. 69 and the relevant legal requirements of the U.S. Securities and Exchange Commission (SEC), (collectively the Reserves Data Process). Our qualified internal reserves evaluation staff and management have evaluated our reserves and the executive member responsible for reserves data certifies that the Reserves Data Process has been followed. The report of the executive member responsible for reserves data will be filed with securities regulatory authorities concurrently with this report.
The Company has designated the Audit, Finance and Risk Committee of its Board of Directors as performing the roles and responsibilities of the Reserves Committee of the Board of Directors as set out in National Instrument 51-101. The Audit, Finance and Risk Committee of the Board of Directors has:
(a) reviewed the Company’s procedures for providing information to the internal and external qualified reserves evaluators;
(b) met with the internal and external qualified reserves evaluators to determine whether any restrictions placed by management affect the ability of the internal and external qualified reserves evaluators to report without reservation; and
(c) reviewed the reserves data with reserves management and each of the qualified external reserves evaluators.
The Audit, Finance and Risk Committee of the Board of Directors has reviewed the Company’s procedures for assembling and reporting other information associated with oil and gas activities and has reviewed that information with management. The Board of Directors has, on the recommendation of the Audit, Finance and Risk Committee, approved:
(a) the content and filing with securities regulatory authorities of the reserves data and other oil and gas information;
(b) the filing of the report of the executive member responsible for reserves on the reserves data; and
(c) the content and filing of this report.
The Company has sought from, and was granted by, securities regulatory authorities an exemption from the requirement under securities legislation to involve independent qualified reserves evaluators or independent qualified reserves auditors. Notwithstanding this exemption, the Company involves independent qualified reserves evaluators or auditors as part of its corporate governance practices. In 2005, the independent evaluators/auditors evaluated, audited and/or reviewed nearly 33% of the Company’s proved reserves data by volume. Their involvement helps assure that our internal reserves data are materially correct.
In our view, the reliability of the internally generated reserves data is not materially less than would be afforded by our involving independent qualified reserves evaluators or independent qualified reserves auditors to evaluate, audit and/or review the reserves data. Our reserves data is international in nature. Our securities regulatory reporting is as an SEC registrant and, therefore, our reserves data is developed in accordance with practices and procedures set out in the Canadian Oil and Gas Evaluation Handbook and modified to meet the applicable U.S. Financial Accounting Standards Board and SEC reserves definitions, and the legal requirements of the SEC. Our procedures, records and controls relating to the accumulation of source data and preparation of reserves data by our internal reserves evaluation staff have been established, refined and documented over many years. Our internal reserves evaluation staff and management include 63 persons, with an average of more than 11 years of relevant experience in evaluating reserves, of whom 43 are qualified reserves evaluators for purposes of Canadian securities regulatory requirements. Our internal reserves evaluation management personnel includes 10 persons with an average of 22 years of relevant experience in evaluating and managing the evaluation of reserves.
Reserves data are estimates only and are not exact quantities. Because the reserves data are based on judgments regarding future events, actual results will vary and the variations may be material.
/Signed/
Ron A. Brenneman, President and Chief Executive Officer
/Signed/
Kathleen E. Sendall, Senior Vice-President, North American Natural Gas
/Signed/
Paul D. Melnuk, Director
/Signed/
Brian F. MacNeill, Director
Dated March 14, 2006
SCHEDULE C
AUDIT, FINANCE AND RISK COMMITTEE
1. | The duties and responsibilities of the Audit, Finance and Risk Committee shall include the following: |
(i)assistthe Board of Directors in the discharge of its fiduciary responsibilities relating to the Company’s accounting policies, reporting practices and internal controls, as well as to its risk management policies and practices;
(ii) maintain direct lines of communications with the Chief Financial Officer and with the contract auditor and the external auditors;
(iii) monitor the scope and costs of the activity of the contract and external auditors, and assess their performance;
(iv) formally consider the continuation of or a change in the external auditors and review all issues related to a change of external auditor, including any differences between the Company and the auditor that relate to the auditor’s opinion or a qualification thereof or an auditor comment;
| (i) | | assist the Board of Directors in the discharge of its fiduciary responsibilities relating to the Company’s accounting policies, reporting practices and internal controls, as well as to its risk management policies and practices; |
| (ii) | | maintain direct lines of communications with the Chief Financial Officer and with the contract auditor and the external auditors; |
| (iii) | | monitor the scope and costs of the activity of the contract and external auditors, and assess their performance; |
| (iv) | | formally consider the continuation of or a change in the external auditors and review all issues related to a change of external auditor, including any differences between the Company and the auditor that relate to the auditor’s opinion or a qualification thereof or an auditor comment; |
| (v) | | recommend to the Board of Directors a firm of external auditors for approval by the shareholders of the Company; review and approve the terms of their engagement; review and approve the fee, scope and timing of the audit, and be apprised of and approve in advance any audit related services and any non-audit services (which are not prohibited non-audit services) to be provided by the external auditors and the costs thereof and consider any impact of the provision of such services on the maintenance of their independence and review the Company’s hiring policies regarding employees and former employees of the present and former external auditors; |
| (vi) | | review all issues related to any proposed change in or renewal of the contract with the contract auditor; |
| (vii) | | review and recommend approval by the Board of the Company’s audited annual financial statements and Management’s Discussion and Analysis; |
| (viii) | | review before publication the Company’s unaudited quarterly financial statements, reports of quarterly earnings, and Management’s Discussion and Analysis with particular attention to the presentation of unusual or sensitive matters such as disclosure of related party transactions, significant non-recurring events, significant risks, changes in accounting principles, and estimates or reserves, and all significant variances between comparative reporting periods, and approve the publication of the Company’s unaudited quarterly financial statements and reports of quarterly earnings; |
| (ix) | | review all financial information included in annual information forms, prospectuses, other offering memoranda or other documents requiring approval by the Board of Directors; |
| (x) | | review the Statement of Management’s Responsibility for the Financial Statements as signed by senior management and included in any published document and review and approve the Statement regarding the role of the Committee as signed by the Chairman of the Committee and included in any published documents; |
| (xi) | | review the Report of Management on Oil and Gas Disclosure as signed by senior management and directors and included in any published document; |
| (xii) | | review any litigation, claim or other contingency, including tax assessments, that could have a material effect upon the financial position or operating results of the Company, monitor disclosure thereof in documents reviewed by the Committee; |
| (xiii) | | review the appropriateness and quality of the accounting policies used in the preparation of the Company’s financial statements, and consider any proposed changes to such policies; |
| (xiv) | | review with the external auditor the contents of the annual audit report and review any significant recommendations from the external auditor to strengthen the internal controls of the Company; |
| (xv) | | review the results of the external audit, any significant problems encountered in performing the audit, and the contents of any Management Letter issued by the external auditor to the Company, and management’s response thereto; |
| (xvi) | | annually review a report on the contract audit function with respect to the terms of reference, organization, staffing, independence, performance and effectiveness of the contract audit services, receive and approve the annual contract audit plan, and obtain assurances in respect of conformity with CICA and AICPA professional standards, and other regulatory bodies’ requirements, the outsourcing contract and recommendations of management and the contract auditor; |
| (xvii) | | review significant contract audit findings and recommendations, and management’s response thereto; |
| (xviii) | | oversee management’s responsibility for designing, installing and maintaining an effective control environment; approve in advance any internal control-related services performed by the external auditor; and receive regular reports on the Company’s internal control policies and procedures with particular emphasis on accounting and financial controls, and recommend changes where appropriate; |
| (xix) | | review any unresolved significant issues between management and the external auditor that could affect the financial reporting or internal controls of the Company; |
| (xx) | | annually; (a) review the Company’s internal procedures for providing reserves information to its reserves evaluators; (b) meet with internal and external reserves evaluators to determine their independence and effectiveness in preparing the reserves data of the Company; (c) review the reserves data included in the annual disclosure made by the Company; and (d) review the Company’s internal procedures for assembling and reporting other information associated with oil and gas activities and included in the annual disclosure made by the Company. |
| (xxi) | | receive reports on and review any other items deriving from the foregoing, either in respect of the Company, or a subsidiary or any other entity or relationship in which the Company has a significant interest, as requested by the Board; |
| (xxii) | | review and make recommendations to the Board concerning the following: |
| | | 1) the Company's policies regarding hedging, investments, credit and risk management; and |
| | | 2) the Company's risk identification, analysis and management procedures; |
| (xxiii) | | review, prior to each annual shareholders' meeting, the policies and practices concerning the regular examination of officers expenses and perquisites, including the use of Company assets; |
| (xxiv) | | report annually to the full Board, on the state of completion of the Audit, Finance and Risk Committee Annual Agenda Items, with appropriate recommendations; and |
| (xxv) | | report annually to the full Board on the Committee's review of the Company's reserves procedures and disclosure and recommend to the Board the approval of the reserves data and other information associated with the Company's oil and gas activities and included in the annual disclosure made by the Company. |
2. ORGANIZATION AND PROCEDURES
(i) The Committee shall meet regularly, not less than four times per year, and at such other times as may be requested by the Chair of the Committee. The Chief Executive Officer, the Chief Financial Officer, the Controller, the contract auditor, the external auditor or any member of the Committee may also request a meeting of the Committee.
(ii) The Chair of the Committee, in consultation with the Chief Financial Officer, shall set the agenda for each meeting which shall then be circulated among the Committee Members.
(iii) The Chief Executive Officer, the Chief Financial Officer and the Controller shall have direct access to the Committee and shall receive notice of and attend all meetings of the Committee, except private sessions.
(iv) The external auditor and the contract auditor shall ultimately report to the Board and the Committee and shall at any time have direct access to the Committee and shall receive notice of and be invited to attend all meetings of the Committee, except private sessions.
(v) The contract auditor, the external auditor, and one or more representatives of senior management, shall each meet separately with the Committee, in private sessions, at least once annually.
(vi) The Committee may contact directly any employee in the Company and the contract auditor as it deems necessary.
(vii) The Committee will establish procedures for:
| 1) | receipt, retention and treatment of complaints regarding accounting controls or auditing matters; and |
| 2) | confidential anonymous submission by employees of concerns regarding questionable accounting or auditing matters; and annual review of compliance under the Company’s Code of Ethics for Senior Financial Officers. |
The Committee will periodically review its own Terms of Reference, and make recommendations to the Board as required.
CONTROLS AND PROCEDURES
The company has performed an evaluation of its disclosure controls and procedures (as defined by Exchange Act rule 13a-15(e), as of December 31, 2005. Based on this evaluation, the company's Chief Executive Officer and Chief Financial Officer have concluded that the disclosure controls and procedures are effective in providing reasonable assurances that material information required to be in this annual report is made known to them by others on a timely basis.
CHANGES IN INTERNAL CONTROL OVER FINANCIAL REPORTING
The company has not made any changes in internal control over financial reporting that occurred during the period covered by this annual report that has materially affected, or is reasonably likely to materially affect, the company's internal control over financial reporting.
IDENTIFICATION OF THE AUDIT COMMITTEE
Petro-Canada has a separately-designed standing Audit, Finance and Risk Committee. The members of the Audit, Finance and Risk Committee are:
| Chair: | P. D. Melnuk |
| Members: | A. A. Bruneau |
| | G. Cook-Bennett |
| | P. Haseldonckx |
| | J. W. Simpson |
AUDIT COMMITTEE FINANCIAL EXPERT
Petro-Canada's Board of Directors has determined that Petro-Canada has an "audit committee financial expert" as defined by regulations of the U.S. Securities and Exchange Commission. The audit committee financial expert is Paul D. Melnuk, Chairman of the Audit, Finance and Risk Committee. Mr. Melnuk has been determined to be “independent”, as that term is defined by the New York Stock Exchange’s listing standards applicable to Petro-Canada.
CODE OF ETHICS
The company has adopted a code of ethics applicable to its Chief Executive Officer, Chief Financial Officer, principal accounting officer and Controller. A copy of the company's code of ethics can be found at the company's website located at www.petro-canada.ca.
PRINCIPAL ACCOUNTANT FEES AND SERVICES
Deloitte & Touche LLP billed the company for services rendered in the year ended December 31, 2005 as follows:
(a) audit fees - $3,217,000
(b) audit related fees - fees for audit of pension plans and attest services - $213,000
(c) tax fees - nil
(d) all other fees - nil
Deloitte & Touche LLP billed the company for services rendered in the year ended December 31, 2004 as follows:
(a) audit fees -$2,367,000
(b) audit related fees - audits of pension plans and attest services - $71,000;
(c) tax fees - nil
(d) all other fees - $107,000 (services related to the licensing of access to industry database)
AUDIT COMMITTEE PRE-APPROVAL POLICIES AND PROCEDURES: The Audit, Finance and Risk Committee of Petro-Canada's Board of Directors approves in advance any audit or non-audit service proposed to be provided by Deloitte & Touche LLP for Petro-Canada or its subsidiaries. The Committee has delegated to the Chairman of the Committee full authority to approve any such request, as long as the Chairman presents any such approval to the Committee at its next scheduled meeting. Since the adoption of the pre-approval requirements, no services were approved pursuant to a waiver within the meaning of Rule 2-01(c)(7)(i)(C) of Regulation S-X, other than those services related to the licensing of access to industry databases provided by Deloitte & Touche and the Company cancelled those licenses in 2004.
CONTRACTUAL OBLIGATIONS
See page 15 of the Management's Discussion and Analysis Exhibit forming part of this report
OFF-BALANCE SHEET ARRANGEMENTS
See page 15 of the Management's Discussion and Analysis Exhibit forming part of this report
UNDERTAKING AND CONSENT TO SERVICE OF PROCESS
A. Undertaking
Petro-Canada (the “Registrant”) undertakes to make available, in person or by telephone, representatives to respond to inquiries made by the staff of the Securities and Exchange Commission (“SEC”), and to furnish promptly, when requested to do so by the SEC staff, information relating to the securities in relation to which the obligation to file an annual report on Form 40-F arises or transactions in said securities.
B. Consent to Service of Process
The Registrant has previously filed a Form F-X with the SEC on March 10, 1994.
SIGNATURE
Pursuant to the requirements of the Securities Exchange Act of 1934, the registrant certifies that it meets all of the requirements for filing on Form 40-F and has duly caused this annual report to be signed on its behalf by the undersigned, thereto duly authorized.
| | PETRO-CANADA |
| | |
| Date: March 23, 2006 | /s/ Hugh L. Hooker |
| Name: | Hugh L. Hooker |
| Title: | Associate General Counsel and Corporate Secretary |
EXHIBITS
Exhibits Description
99.1 Petro-Canada Consolidated Financial Statements for the year ended December 31, 2005
99.2 Petro-Canada Management’s Discussion and Analysis
99.3 Certification of the CEO pursuant to Section 302 of the Sarbanes-Oxley Act
99.4 Certification of the CFO pursuant to Section 302 of the Sarbanes-Oxley Act
99.5 Certification of CEO pursuant to 18 U.S.C. Section 1350, as adopted pursuant to Section 906 of the Sarbanes-Oxley Act of 2002
99.6 Certification of CFO pursuant to 18 U.S.C. Section 1350, as adopted pursuant to Section 906 of the Sarbanes-Oxley Act of 2002
99.7 Consent of Deloitte & Touche LLP, Independent Registered Chartered Accountants