0707F
UNITED STATES SECURITIES AND EXCHANGE COMMISSION
Washington, D.C. 20549
FORM 40 - F
(Check One)
______ Registration statement pursuant to Section 12 of the Securities Exchange Act of 1934
or
__x___ Annual report pursuant to Section 13(a) or 15(d) of the Securities Exchange Act of 1934
For fiscal year ended: December 31, 2006
Commission File No.: 1-13922
PETRO-CANADA
(Exact name of registrant as specified in its charter)
Canada | 1311, 1321, 1382, 5541 | Not Applicable |
(Province or other jurisdiction of incorporation or organization) | (Primary standard industrial classification code number, if applicable) | (I.R.S. employer identification number, if applicable) |
| | | |
| | 150 - 6th Avenue S.W. Calgary, Alberta Canada T2P 3E3 (403) 296-8000 | |
| (Address and telephone number of registrant’s principal executive office) |
CT Corporation System
111 Eight Avenue - CT
New York, New York 10011
(212) 894-8940
(Name, address and telephone number of agent for service in the United States)
Securities registered pursuant to Section 12(b) of the Act:
Title of each class: Name of each exchange on which registered:
Common Shares New York Stock Exchange
Securities registered pursuant to Section 12(g) of the Act:
None
Securities for which there is a reporting obligation pursuant to Section 15(d) of the Act:
5% Senior Notes due 2014
9 ¼% Debentures Due 2021
7 7/8% Debentures Due 2026
7% Debentures Due 2028
4% Senior Notes Due 2013
5.35% Senior Notes Due 2033
5.95% Senior Notes Due 2035
For annual reports, indicate by check mark the information filed with this form:
__x___ Annual Information Form __x___ Audited Financial Statements
Indicate the number of outstanding shares of each of the issuer’s classes of capital or common stock as of the close of the periods covered by the annual report:
Common Shares: 497,538,385
Indicate by check mark whether the registrant by filing the information contained in this form is also thereby furnishing the information to the Commission pursuant to Rule 12g 3-2(b) under the Securities Exchange Act of 1934 (the “Exchange Act”). If “Yes” is marked, indicate the file number assigned to the registrant in connection with such rule.
Yes ______ No __x___
Indicate by check mark whether the registrant: (1) has filed all reports required to be filed by Section 13 or 15(d) of the Exchange Act during the preceding 12 months (or for such shorter period that the registrant has been required to file such reports); and (2) has been subject to such filing requirements in the past 90 days.
Yes __x___ No ______
CAUTIONARY NOTICE REGARDING FORWARD LOOKING INFORMATION
This Form 40-F contains forward-looking statements within the meaning of Section 27A of the Securities Act of 1933 and Section 21E of the Securities and Exchange Act of 1934. Such statements are generally identifiable by the terminology used, such as "plan", "anticipate", "intend", "expect", "estimate", "budget" or other similar wording. Forward looking statements include but are not limited to: references to business strategy and goals; references to future capital and other expenditures; drilling plans; construction activities; refinery turnarounds; the submission of development plans; seismic activity; refining margins; oil and gas production levels and the sources of growth thereof; results of exploration activities and dates by which certain areas may be developed or may come on-stream; retail throughputs; pre-production and operating costs; reserves and resources estimates; reserves life-of-field estimates; natural gas export capacity; and environmental matters. By their very nature, these forward-looking statements require Petro-Canada to make assumptions, that may not materialize or that may not be accurate, These forward-looking statements are subject to known and unknown risks and uncertainties and other factors which may cause actual results, levels of activity and achievements to differ materially from those expressed or implied by such statements. Such factors include, but are not limited to: imprecision of reserves estimates of recoverable quantities of oil, natural gas and liquids from resource plays and other sources not currently classified as reserves; general economic, market and business conditions; industry capacity; competitive action by other companies; fluctuations in oil and gas prices; refining and marketing margins; the ability to produce and transport crude oil and natural gas to markets; the effects of weather and climate conditions; the results of exploration and development drilling and related activities; fluctuation in interest rates and foreign currency exchange rates; the ability of suppliers to meet commitments; actions by governmental authorities including increases in taxes; decisions or approvals of administrative tribunals; changes in environmental and other regulations; risks attendant with oil and gas operations; both domestic and international; international political events; expected rates of return; and other factors, many of which are beyond the control of Petro-Canada. These factors are discussed in greater detail elsewhere in this Form 40-F.
Readers are cautioned that the foregoing list of important factors affecting forward-looking statements is not exhaustive. Furthermore, the forward-looking statements contained herein are made as of the date of this Form 40-F, and Petro-Canada does not undertake any obligation to update publicly or to revise any of the included forward-looking statements, whether as a result of new information, future events or otherwise. The forward-looking statements contained in this Form 40-F are expressly qualified by this cautionary statement.
TABLE OF CONTENTS
| Presentation of Information | 1 |
| Conversion Factors | 1 |
| Non-Generally Accepted Accounting Principles Measures | 1 |
| Legal Notice - Forward-Looking Information | 1 |
| Corporate Structure | 3 |
| Incorporation of Petro-Canada | 3 |
| Intercorporate Relationships | 3 |
| Business of Petro-Canada | 3 |
| General Development of the Business | 5 |
| Three-Year History | 5 |
| Description of the Business | 8 |
| Business Environment | 8 |
| Risk Management | 9 |
| Upstream | 14 |
| North American Natural Gas | 14 |
| East Coast Oil | 19 |
| Oil Sands | 23 |
| International | 28 |
| Upstream Production and Prices | 32 |
| Reserves | 41 |
| Downstream | 53 |
| Reasearch and Development | 59 |
| Human Resources | 59 |
| Social and Environmental Policies | 59 |
| Environmental Expenditures | 60 |
| Select Financial Data | 62 |
| Capital Expenditures on Property, Plant and Equipment and Exploration | 64 |
| Dividends | 65 |
| Capital Structure | 66 |
| General Description of Capital Structure | 66 |
| Constraints | 66 |
| Credit Ratings | 67 |
| Market for Securities | 68 |
| Trading Price and Volume | 68 |
| Prior Sales | 68 |
| Directors and Officers | 69 |
| Directors | 69 |
| Share Ownership | 76 |
| Corporate Governance | 76 |
| Audit Committee Disclosure | 80 |
| Interest of Management and Others in Material Transactions | 80 |
| Transfer Agents and Registrars | 81 |
| Material Contracts | 81 |
| Interests of Experts | 81 |
| Additional Information | 81 |
| Schedule A - Report on Reserves Data by Senior Officer Responsible for Reserves Data | 82 |
| Schedule B - Report of Management and Directors on Reserves Data and Other Information | 84 |
| Schedule C - Audit, Finance and Risk Committee | 86 |
Presentation of Information
The information contained in this Annual Information Form (AIF) is dated as at December 31, 2006, unless otherwise indicated. Throughout this AIF, the terms "Petro-Canada," the "Company," "we," "us" and "our" refer to Petro-Canada and its subsidiaries or, where the context requires, the applicable business unit within Petro-Canada (e.g. North American Natural Gas, East Coast Oil, Oil Sands, International and Downstream). Dollars are Canadian, unless otherwise stated. All oil and natural gas production and reserves volumes are stated before deduction of royalties, unless otherwise indicated.
Conversion Factors
To conform with common usage, imperial units of measurement are used in this AIF to describe exploration and production, while metric units are used for refining and marketing.
1 cubic metre (liquids) | = | 6.29 barrels |
| 1 cubic metre (natural gas) | = | 35.30 cubic feet |
| 1 litre | = | 0.22 imperial gallon |
| 1 square kilometre | = | 247.10 acres |
| 1 hectare | = | 2.47 acres |
| 1 cubic metre | = | 1,000 litres |
Non-Generally Accepted Accounting Principles Measures
Cash flow, which is expressed as cash flow from operating activities before changes in non-cash working capital, is used by the Company to analyse operating performance, leverage and liquidity. Operating earnings represent net earnings, excluding gains or losses on foreign currency translation, disposal of assets and unrealized gains or losses on the mark-to-market valuation of the derivative contracts associated with the Buzzard acquisition. Operating earnings are used by the Company to evaluate operating performance. Cash flow and operating earnings do not have a standardized meaning prescribed by Canadian generally accepted accounting principles (GAAP) and, therefore, may not be comparable with the calculation of similar measures for other companies. For reconciliation of the operating earnings and cash flow amounts to the associated GAAP measures, refer to the tables on pages 12 and 14, respectively, of Petro-Canada's Management's Discussion and Analysis (MD&A) dated February 12, 2007, as contained in the 2006 Annual Report.
Legal Notice - Forward-Looking Information
This AIF contains forward-looking information. You can usually identify this information by such words as "plan," "anticipate," "forecast," "believe," "target," "intend," "expect," "estimate," "budget" or other similar wording suggesting future outcomes or statements about an outlook. We list below examples of references to forward-looking information:
business strategies and goals outlook (including operational updates and strategic milestones) future capital, exploration and other expenditures future resource purchases and sales construction and repair activities refinery turnarounds anticipated refining margins future oil and gas production levels and the sources of their growth project development and expansion schedules and results future results of exploration activities and dates by which certain areas may be developed or may come on-stream
| retail throughputs pre-production and operating costs reserves and resources estimates royalties and taxes payable production life-of-field estimates natural gas export capacity future financing and capital activities (including purchases of Petro-Canada common shares under the Company's normal course issuer bid (NCIB) program) contingent liabilities (including potential exposure to losses related to retail licensee agreements) environmental matters future regulatory approvals
|
Such forward-looking information is subject to known and unknown risks and uncertainties. Other factors may cause actual results, levels of activity and achievements to differ materially from those expressed or implied by such information. Such factors include, but are not limited to:
industry capacity imprecise reserves estimates of recoverable quantities of oil, natural gas and liquids from resource plays and other sources not currently classified as reserves the effects of weather and climate conditions the results of exploration and development drilling and related activities the ability of suppliers to meet commitments decisions or approvals from administrative tribunals risks attendant with domestic and international oil and gas operations expected rates of return
| general economic, market and business conditions competitive action by other companies fluctuations in oil and gas prices refining and marketing margins the ability to produce and transport crude oil and natural gas to markets fluctuations in interest rates and foreign currency exchange rates actions by governmental authorities, including changes in taxes, royalty rates and resource-use strategies changes in environmental and other regulations international political events
|
Many of these and other similar factors are beyond the control of Petro-Canada. Petro-Canada discusses these factors in greater detail in filings with the Canadian provincial securities commissions and the United States (U.S.) Securities and Exchange Commission (SEC).
We caution readers that this list of important factors affecting forward-looking information is not exhaustive. Furthermore, the forward-looking information in this AIF is made as of March 22, 2007 and, except as required by applicable law, Petro-Canada does not update it publicly or revise it. This cautionary statement expressly qualifies the forward-looking information in this AIF.
Petro-Canada disclosure of reserves
Petro-Canada's qualified reserves evaluators prepare the reserves estimates the Company uses. The Canadian provincial securities commissions do not consider our reserves staff and management as independent of the Company. Petro-Canada has obtained an exemption from certain Canadian reserves disclosure requirements that allows us to make disclosure in accordance with SEC standards. This exemption allows comparisons with U.S. and other international issuers.
As a result, Petro-Canada formally discloses its reserves data and other oil and gas data using U.S. requirements and practices, and these may differ from Canadian domestic standards and practices. Note that when we use the term barrel of oil equivalent (boe) in this AIF, it may be misleading, particularly if used in isolation. A boe conversion ratio of six thousand cubic feet (Mcf) to one barrel (bbl) is based on an energy equivalency conversion method. This method primarily applies at the burner tip and does not represent a value equivalency at the wellhead.
To disclose reserves in SEC filings, oil and gas companies must prove they are economically and legally producible under existing economic and operating conditions. Proof comes from actual production or conclusive formation tests. The use of terms such as "probable," "possible," "recoverable," or "potential reserves and resources" in this AIF does not meet the SEC guidelines for SEC filings.
The table below describes the industry definitions that we currently use:
Definitions Petro-Canada uses | Reference |
| Proved oil and gas reserves (includes both proved developed and proved undeveloped) | U.S. SEC reserves definition (Accounting Rules Regulation S-X 210.4-10, FASB-69) |
| Unproved reserves, probable and possible reserves | CIM (Petroleum Society) definitions (Canadian Oil and Gas Evaluation Handbook, Vol. 1 Section 5) |
| Contingent and prospective resources | Society of Petroleum Engineers, World Petroleum Congress and American Association of Petroleum Geologist definitions (approved February 2000) |
There is no certainty that it will be economically viable or technically feasible to produce any portion of the resources. For use in this AIF, "total resources" means reserves plus resources.
SEC regulations do not define proved reserves from our oil sands mining operations as an oil and gas activity. These reserves are classified as a mining activity and are estimated in accordance with SEC Industry Guide 7. For internal management purposes, we view these reserves and their development as part of our total exploration and production operations.
Throughout this AIF, total Company reserves, total Company production, total Company reserves replacement and total Company reserves life index (RLI) are calculated using the sum of oil and gas activities, and oil sands mining activities. Before royalties, oil sands mining 2006 year-end proved reserves were 345 million barrels (MMbbls) and oil sands mining annual 2006 production was 11 MMbbls.
CORPORATE STRUCTURE
Incorporation of Petro-Canada
Petro-Canada is a corporation incorporated under the Canada Business Corporations Act. The registered and principal executive office of the Company is located at 150 - 6 Avenue S.W., Calgary, Alberta, Canada T2P 3E3. Telephone: 403-296-8000.
Intercorporate Relationships
Material operating subsidiaries owned 100%, directly or indirectly, by the Company as at December 31, 2006 were as follows:
Name | Jurisdiction of Incorporation | Purpose |
| 3908968 Canada Inc. | Canada | A Canadian subsidiary holding Petro-Canada's International interests |
| Petro-Canada U.K. Holdings Ltd. | United Kingdom (U.K.) | A subsidiary of 3908968 Canada Inc. that holds Petro-Canada's U.K. interests |
| Petro-Canada U.K. Limited | U.K. | A subsidiary of Petro-Canada U.K. Holdings Ltd. through which Petro-Canada's operations are conducted in the U.K. |
Individually, the Company's remaining subsidiaries accounted for (i) less than 10% of the Company's consolidated revenues and consolidated assets as at December 31, 2006, and (ii) less than 10% of the Company's consolidated sales and operating revenues as at December 31, 2006. In the aggregate, the remaining subsidiaries accounted for less than 20% of each of (i) and (ii) described above.
Business of Petro-Canada
The following business description should be read in conjunction with Petro-Canada's MD&A, as contained in the 2006 Annual Report, which is incorporated by reference into and forms an integral part of this AIF.
Petro-Canada is an integrated oil and gas company with a portfolio of businesses spanning both the upstream and downstream sectors of the industry. In the upstream businesses, the Company explores for, develops, produces and markets crude oil, natural gas liquids (NGL) and natural gas in Canada and internationally. The Downstream business refines crude oil and other feedstock, and markets and distributes petroleum products and related goods and services, primarily in Canada.
The table below outlines the various businesses of Petro-Canada as at December 31, 2006.
Upstream
North American Natural Gas | | East Coast Oil1 |
§ Western Canada | | § Hibernia (20% Interest) |
- Alberta Foothills | | § Terra Nova (34% Interest) |
- Southeast Alberta/ | | § White Rose (27.5% Interest) |
Southwest Saskatchewan | | § Other Significant Discoveries and Exploration Acreage |
- West Central Alberta |
- Northeast British Columbia | | |
§ U.S. Rockies | | |
§ Mackenzie Delta/Corridor | | |
§ Alaska | | |
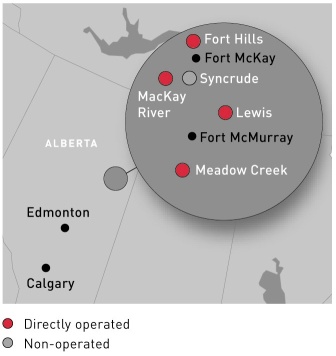
Oil Sands | | International1 |
§ Syncrude (12% Interest) | | § Northwest Europe |
§ MacKay River (100% Interest) | | - Buzzard (29.9% Interest) |
§ Fort Hills (55% Interest) | | § North Africa/Near East |
§ Other In Situ Oil Sands Leases | | § Northern Latin America |
Downstream
Refining and Supply | | Sales and Marketing | | Lubricants |
§ Montreal Refinery | | § Retail Operations | | § Mississauga Lubricants Centre |
§ Edmonton Refinery | | § Wholesale Operations | | |
§ ParaChem Chemical Plant
(51% Interest) | | | | |
1 In 2007, Petro‑Canada is consolidating its East Coast Oil and International businesses. The purpose of the consolidation is to leverage and grow the capabilities of similar operations.
GENERAL DEVELOPMENT OF THE BUSINESS
Three-Year History
The following narrative is a three-year history of notable Company events:
2006
Petro-Canada finished 2006 with solid operating earnings and cash flow. The Company achieved first production from upstream growth initiatives, record financial results in the Downstream, East Coast Oil and in Oil Sands due to a strong business environment, and advanced long-term projects to deliver the next wave of earnings and cash flow growth. Specifically, the Company:
delivered operating earnings adjusted for unusual items of approximately $2 billion and cash flow of about $3.7 billion
finished 2006 with a proved plus probable reserves replacement ratio of 175% over five years1
achieved first production from the North Sea platforms of De Ruyter and L5b‑C, as well as from the Syncrude Stage III expansion
completed lubricants plant expansion, and Downstream ultra‑low sulphur diesel refinery projects to produce cleaner burning fuels
secured drilling rigs for the 2007 and 2008 International exploration program
The Oil Sands business delivered record operating earnings of $245 million for the year, reflecting additional production from the ramp up of the Syncrude Stage III expansion and favourable bitumen pricing. At the same time, the Company added in situ oil sands resources with the purchase of additional leases adjacent to MacKay River. As part of the Fort Hills project, in December 2006, the partners filed a regulatory application to construct and operate an upgrader in Sturgeon County, about 40 kilometres northeast of Edmonton.
In 2006, East Coast Oil also delivered record operating earnings of $934 million, reflecting higher realized prices. Petro-Canada completed the extended turnaround of the Terra Nova Floating Production Storage and Offloading (FPSO) vessel, which involved regulatory inspections and reliability improvements. Development drilling in the White Rose field showed promise in 2006, with discoveries made in the west and southwest sections of the field. Additional information is being gathered and evaluated to determine the size of any additional reserves these formations may hold. The partner-operated Hibernia platform continued to have solid operations; however, regulatory decisions on the Southern Extension, originally expected in 2006, were deferred to 2007. In April 2006, Petro-Canada and its partners in the Hebron development suspended negotiations with the Government of Newfoundland and Labrador and demobilized the Hebron project team after failing to reach a development agreement. Petro-Canada continues to consider Hebron a high quality asset.
In the International business unit in early 2006, Petro‑Canada completed the sale of the Company's producing assets in Syria for net proceeds of $640 million. The sale resulted in a gain on disposal of $134 million. Later in the year, the Company completed an agreement to purchase a 90% interest in the Ash Shaer and Cherrife natural gas fields in central Syria for $54 million. Under this agreement, Petro‑Canada will act as operator and will have the option to purchase the remaining 10% interest within five years, subject only to approval by the Syrian government. The changes made in Syria in 2006 align with Petro‑Canada's strategy to increase the proportion of long‑life and operated assets within its portfolio.
In North American Natural Gas, Western Canada production continued to decline in 2006 as expected. Lower earnings in 2006 reflected lower realized prices combined with decreased Western Canada volumes and higher operating costs. These factors were partially offset by additional U.S. Rockies production. Increased operating costs in 2006 were primarily due to rising industry‑wide cost pressures. In the U.S. Rockies, water treatment permits required for wells planned in 2005 and 2006 were approved, resulting in a ramp up of coal de‑watering. The Company continues to drill in the Denver‑Julesburg Basin for natural gas from tight sands. A public hearing on the proposed liquefied natural gas (LNG) import and re‑gasification terminal at Gros‑Cacouna, Quebec was held and the Company expects to receive a regulatory decision in 2007. The Company also continued to position itself for long‑term North American supply by assessing its exploration prospects in Alaska and Mackenzie Delta/Corridor. Petro‑Canada is developing a resource position in the North in advance of proposed pipelines.
In 2006, the Downstream delivered record operating earnings of $463 million, due to the strong business environment combined with solid operations. Early in 2006, a fire occurred at the Mississauga lubricants plant, which reduced output to 50% of plant capacity for approximately two months. The lubricants plant repairs were completed in March and, in June, the facility began ramping up its 25% expansion project. In the second quarter of 2006, Petro‑Canada completed its ultra‑low sulphur diesel projects at its Edmonton and Montreal refineries, thereby providing cleaner burning fuels to consumers. The two refineries operated at a combined reliability index of 95 in 2006. During the year, construction was started to convert the Edmonton refinery to process 100% bitumen-based feedstock and work progressed to evaluate the feasibility of adding a coker to the Montreal refinery.
The Company also returned funds to shareholders during the year. On December 14, 2006, the Company declared a 30% increase in its quarterly dividend to $0.13/share commencing with the dividend payable April 1, 2007. Total cash dividends paid in 2006 were $201 million, compared with $181 million in 2005 and $159 million in 2004. In addition, Petro‑Canada renewed its NCIB program. The current program, which extends to June 21, 2007, entitles the Company to purchase up to 5% of its outstanding common shares, subject to certain conditions. During 2006, the Company repurchased and cancelled 19,778,400 shares at an average price of $51.10 per share for a total cost of just over $1 billion.
2005
In 2005, Petro‑Canada had record operating earnings adjusted for unusual items of approximately $2.4 billion and cash flow of about $4 billion. The Oil Sands business strengthened its position in mining bitumen by securing a majority interest and operatorship of the Fort Hills project from UTS Energy Corporation (UTS). Petro‑Canada is project operator with a 55% interest, UTS has a 30% interest and Teck Cominco holds a 15% interest. The Company also strengthened its East Coast Oil position in 2005 with first oil at White Rose on budget and ahead of schedule. In late 2005, Petro‑Canada reached an agreement to sell the Company's producing assets in Syria for EUR 484 million (Canadian equivalent of $676 million as at December 20, 2005), before adjustments. The sale closed on January 31, 2006. Other achievements during 2005 include the advancement of the proposed LNG import and re‑gasification terminal at Gros‑Cacouna, Quebec, by filing an Environmental Impact Statement. Also, the Company continued to position itself for long‑term North American supply by building its land position in the Mackenzie Delta/Corridor and by acquiring extensive acreage in Alaska in preparation for the proposed pipelines. In the Downstream, the Company completed the Eastern Canada refinery consolidation and acquired a 51% interest in a paraxylene facility adjacent to the Montreal refinery. In addition, Petro‑Canada increased sales at convenience stores and in its high margin lubricants. The Company also returned funds to shareholders during the year. In July 2005, the Company declared a two‑for‑one stock split in the form of a stock dividend. Commencing with the fourth quarter dividend paid on October 1, 2005, the Company increased the quarterly dividend 33% to $0.20/share on a pre‑stock dividend basis ($0.10/share on a post‑stock dividend basis). In addition, Petro‑Canada renewed the NCIB program, which was extended to June 21, 2006, entitling the Company to purchase up to 5% of its outstanding common shares, subject to certain conditions. During 2005, the Company repurchased and cancelled 8,333,400 shares (on a post‑stock dividend basis) at an average price of $41.54 per share for a total cost of approximately $346 million. During the second quarter of 2005, Petro‑Canada completed a $600 million US offering of 5.95% 30‑year senior notes. Net proceeds were used to repay existing short‑term borrowing, with the balance used for working capital purposes.
1 See Legal Notice on page 1, regarding oil and gas and oil sands mining activities.
2004
In 2004, the Company achieved then record operating earnings adjusted for unusual items of about $1.9 billion and record cash flow of approximately $3.6 billion. During 2004, North American Natural Gas acquired an interest in the U.S. Rockies with the purchase of Prima Energy Corporation for $644 million. Petro‑Canada also expanded its International position with the acquisition of a 29.9% interest in the Buzzard project and the progression of the Pict and De Ruyter developments in the North Sea. In East Coast Oil, Hibernia maintained strong production during 2004, Terra Nova reached simple royalty payout and the White Rose development advanced on schedule and on budget. Petro‑Canada continued to focus on the global LNG business and signed a Memorandum of Understanding (MOU) with TransCanada PipeLines Limited (TransCanada PipeLines) to develop and share (50/50) ownership of an LNG re‑gasification facility at Gros‑Cacouna, Quebec. Complementing the proposed LNG facility, Petro‑Canada signed an MOU with OAO «Gazprom» (Gazprom) to investigate a joint project to ship LNG from Russia to North American markets by 2009. In the Downstream, the Company successfully advanced the consolidation of its Eastern Canada refineries. This included the partial closure of the Oakville refinery, successful reversal and expansion of the Trans‑Northern Pipelines Inc. (TNPI) pipeline, expansion of the Montreal refinery and the completion of logistics tie‑ins to supply Ontario markets. The Company also returned funds to shareholders during the year by increasing its quarterly dividend to $0.15/share and commencing an NCIB to repurchase a portion of its outstanding common shares. In the fourth quarter of 2004, the Company issued $400 million US of 10‑year senior notes. The net proceeds were used to repay the U.S. Rockies acquisition credit facility. In September 2004, the Government of Canada completed the public offering of its remaining 19% interest in the Company. The government sold approximately 49 million Petro‑Canada common shares at a price of $64.50/share, resulting in total gross proceeds to the government of approximately $3.2 billion.
DESCRIPTION OF THE BUSINESS
Business Environment
The major economic factors influencing Petro‑Canada's upstream financial performance include crude oil and natural gas prices, and foreign exchange, particularly the Canadian dollar/U.S. dollar rates. Crude oil and natural gas prices are affected by a number of factors, including supply and demand balance, weather and political events. Factors influencing Downstream financial performance include the level and volatility of crude oil prices, industry refining margins, movements in crude oil price differentials, demand for refined petroleum products and the degree of market competition.
Business Environment in 2006
The year 2006 was characterized by volatile crude oil and natural gas prices. The price of North Sea Brent (Dated Brent) moved between highs in excess of $77 US/bbl, to lows of almost $55 US/bbl. Similarly, benchmark North American natural gas prices at the Henry Hub fluctuated between highs in excess of $10 US/million British thermal units (MMBtu) to lows close to $4 US/MMBtu.
On an annual average basis, the price of Dated Brent reached $65.14 US/bbl, its highest annual average value ever and almost 20% higher than the average in 2005. High oil prices in 2006 were driven by continuing demand growth from China and increased geopolitical tensions globally. Relative to last year, international light/heavy crude (Dated Brent/Mexican Maya) price differentials stabilized in 2006 around the $14 US/bbl level, while Canadian light/heavy crude (Edmonton Light/Western Canada Select) spreads narrowed noticeably.
The continuing appreciation of the Canadian dollar during 2006 reduced the positive impact of higher international prices on Canadian crude prices. The Canadian dollar averaged 88 cents US in 2006, compared with 83 cents US in 2005.
North American natural gas prices suffered a setback during 2006. Record high levels of gas in storage and lower weather‑related demand led to significantly lower prices, compared with 2005. Henry Hub prices averaged $7.26 US/MMbtu in 2006, 15% lower than in 2005. Natural gas prices in 2005 reflected the severe impact of hurricanes on U.S. Gulf of Mexico production. In 2006, the Canadian natural gas price at the AECO‑C hub fell in line with U.S. prices and averaged almost 18% below its 2005 level.
In the downstream sector, it is estimated that, in 2006, refined petroleum product sales in Canada declined by 1% on top of the 1% reduction in 2005. In spite of lower overall industry product sales and relatively unchanged international light/heavy crude price spreads, overall refining margins increased in 2006, compared with 2005. The impact of the introduction of ultra-low sulphur diesel in the U.S. and Canada effective June 2006 was to maintain heating crack spreads at strong levels. The phasing out of Methyl Tertiary Butyl Ether (MTBE) from gasoline in the U.S. and a heavy refinery turnaround season helped to improve gasoline margins relative to 2005.
Competitive Conditions
It is becoming increasingly challenging for the energy sector to find new sources of oil and gas. Petro‑Canada is well positioned to compete successfully for new opportunities that could complement existing upstream resources and increase production of oil and gas. The Company has an estimated 15.9 billion boe of total resources from which to develop new production. Approximately two‑thirds of total resources are located in Alberta's oil sands. As well, with different upstream businesses operating in Canada and internationally, the Company has the flexibility to pursue a wide range of opportunities. While the Company has wide operational scope, it remains a mid‑sized global company as measured by production levels. This means Petro‑Canada has the operational capability and balance sheet strength to invest in large projects, but smaller acquisitions can also impact the Company's production levels and financial returns.
Petro‑Canada is well positioned to compete in the petroleum product refining and marketing business in Canada. The Company accounts for 13% of the total refining capacity in Canada and has a 16% share of the petroleum products market in Canada. Its 1,312 retail service station network has the highest gasoline sales per site in Canada among the national integrated oil companies. It also has Canada's largest commercial road transport network, with 219 locations, as well as a robust bulk fuel sales channel.
The Company believes that its strong financial position, combined with a track record of executing large capital projects and depth of management experience will enable it to continue to compete successfully in the current business environment.
Risk Management
PETRO-CANADA'S RISK PROFILE
Petro‑Canada's results are impacted by risk and management's strategy for handling risks. Petro‑Canada characterizes and manages risks in four broad categories: business risks, market risks, operational risks and foreign risks. Within these categories, risks are listed in alphabetical order below. Management believes each major risk requires a unique response based on Petro‑Canada's business strategy and financial tolerance. While some risks can be effectively managed through internal controls and business processes, others are managed through insurance and hedging. The Audit, Finance and Risk Committee of the Board of Directors has responsibility to oversee risk management.1 The following describes Petro‑Canada's approach to managing major risks.
BUSINESS RISKS
Counterparties
Petro-Canada is exposed to credit risk due to the uncertainty of business partners' or counterparties' ability to fulfil their obligations. The Company has internal credit policies and procedures that include financial assessments, exposure limits and processes to monitor and minimize the exposures against these limits. Where appropriate, Petro-Canada also uses netting and collateral arrangements to minimize risk.
Environmental Regulations
Petro-Canada has always been subject to the impact of changing environmental regulations on its operations; however, the risk is considered to be increasing as related laws and regulations become more stringent in Canada and in other countries where Petro-Canada operates. Petro-Canada invests capital to satisfy new product specifications and/or address environmental issues. In 2007, the Company anticipates that it will invest $100 million of its capital expenditure program toward regulatory compliance. As well, the Company conducts Life-Cycle Value Assessments (LCVA), a system to integrate and balance environmental, social and economic decisions for major projects. This process encourages the exploration of alternatives when considering the life-cycle of an asset or product from construction through to abandonment. The LCVA is a useful technique, but it cannot predict changes in environmental regulations. As a result, changes in environmental regulations may impact Petro-Canada's business results.
The Kyoto Protocol, effective in Canada since 2005, requires signatory nations to reduce their emissions of carbon dioxide and other greenhouse gases. The details of implementation of the Protocol in Canada have not been finalized. Depending on the specifics of the regulations, Petro-Canada may be required to reduce emissions of greenhouse gases from operations, to purchase emission-trading credits or pay for other types of offsets. The impact on Petro-Canada could result in substantially higher capital expenditures and/or operating expenses. The Government of Canada may also impose higher vehicle fuel efficiency standards. The impact of this action could be to decrease the demand for gasoline and diesel fuels sold by Petro-Canada and depress industry-wide margins for refined products. Through industry organizations, Petro-Canada works with a number of regulatory groups and government associations to find an approach that will minimize the negative financial impact of the greenhouse gas emission regulations on the Company, while still reducing emissions. The level of influence these efforts have on the Government of Canada's implementation plan may be quite limited.
1 Further detail regarding the Audit, Finance and Risk Committee can be found on page 80 of the AIF and a copy of its Charter is attached as Schedule C.
Government Regulations
Petro-Canada's operations are regulated by, and could be intervened upon by, a variety of governments around the world. Governments could impact the contracting of exploration and production interests, impose specific drilling obligations, and expropriate or cancel contract rights. Governments may also regulate prices of commodities or refined products, or intervene indirectly on prices through taxes, royalties and exploration rights.
Petro-Canada tries to mitigate the potentially disruptive impact of government regulations by selecting operating environments with stable governments and by maintaining respectful relationships with governments and regulators. Contact with regulators and governments usually occurs through the Company's management and/or regulatory affairs and government relations personnel. Petro-Canada aims to have regular, constructive communication with regulators and governments so issues can be resolved in a mutually acceptable fashion. The Company also has a strong record of regulatory compliance within the jurisdictions where it operates. By virtue of Petro-Canada's integrated portfolio of businesses, the Company operates in many different jurisdictions and derives revenue from several categories of products. This diversification makes financial performance less sensitive to the action of any single government. Nevertheless, Petro-Canada has limited ability to influence regulations that may have a material adverse effect on the Company.
Licence to Operate
Petro-Canada's oil and gas production and refining operations impact communities and surrounding environments. Those impacted can become concerned over the use of scarce resources, such as land and water, the perceived or real threat to human health, the potential impact on biodiversity, and/or possible societal changes to surrounding communities. Petro-Canada must secure and maintain formal regulatory approvals and licences to conduct its operations. In addition, broader societal acceptance of the Company’s activities is necessary for resource development. An inability for Petro-Canada to secure local community support, necessary regulatory approvals and licences, and broader societal acceptance can result in projects being delayed or stopped, increasing project costs and damage to the Company's reputation. Lack of local community and stakeholder support can also lead to pressure to limit or shut down operations.
Petro-Canada manages this risk by applying a set of Principles for Responsible Investment and Operations to its businesses. These Principles provide a framework whereby Petro-Canada's operations around the world are conducted in a manner that is economically rewarding to all parties and recognized as being ethically, environmentally and socially responsible. These Principles and the Company's activities in support of them can be found on Petro-Canada's website at www.petro-canada.ca. Even though Petro-Canada is committed to following its Principles and respecting two-way dialogue with applicable stakeholders, there is no guarantee the Company will be granted the licences needed to operate projects within expected timelines or that its reputation with affected stakeholders will not be damaged.
Non-Operated Interests
Petro-Canada has a significant interest in assets where the management of construction or operation is done by other companies. Business assets in which Petro-Canada has a major interest, but does not operate, include Hibernia (20% interest), Syncrude (12% interest), White Rose (27.5% interest) and Buzzard (29.9% interest). Joint venture executive committees manage major projects, so Petro-Canada does have some ability to influence these projects. As well, Petro-Canada has joint venture or other operating agreements, which specify the Company's expectations from third-party operators. Nevertheless, third-party operation and management of the Company's assets could adversely affect Petro-Canada's financial performance.
Project Execution
Petro-Canada manages a variety of projects to support continuing operations and future growth. Petro-Canada's goal is to consistently deliver projects in alignment with expectations. Project execution risks include, but are not limited to, changes in project scope, labour availability and productivity, material and services availability and costs, design and construction errors, regulatory approvals, and project management and operational capability. To mitigate these risks, Petro-Canada applies a project delivery management system, establishes strong project management teams, breaks large projects down into manageable components, builds on experience and existing technologies, works with all stakeholders on safety and environmental expectations, and conducts post-project reviews to improve project management and operational capabilities. Petro-Canada primarily delivers projects through engineering, procurement and construction (EPC) companies. Through the establishment of strong internal project management teams, the Company establishes effective working relationships with EPC companies.
In 2006, Petro-Canada completed a number of projects, including converting refineries to produce cleaner burning fuels, expansion of the lubricants plant and bringing the Company-operated De Ruyter project in the North Sea on-stream. These projects represented $1.7 billion of investment, which was completed on time and on budget. Nevertheless, the inability of Petro-Canada to execute projects as expected is a risk to the Company. Globally, there is a focus on execution and projects are tending to be larger and more complex at the same time as the pool of experienced personnel is declining. The Company has recognized the need to provide the organizational capability to successfully execute these projects and, as such, has been building its capabilities through recruiting and internal training; however, the inability to adequately source the staffing requirements could jeopardize successful project execution.
Reserves Estimates
Estimates of economically recoverable oil and gas reserves are based upon a number of variables and assumptions. These include geoscientific interpretation, commodity prices, operating and capital costs, and historical production from properties. Petro-Canada has well-established, corporate-wide reserves booking practices that have been continuously improved for more than a decade. PricewaterhouseCoopers LLP, as contract internal auditor, has tested aspects of the non-engineering control processes Petro-Canada used in establishing reserves. As well, independent engineering firms assess a significant portion of reserves estimates every year. Over time, this means all of Petro-Canada's reserves estimates are assessed by external evaluators. The Board of Directors also reviews and approves the Company's annual reserves filings. More information on reserves booking practices can be found in the Reserves section of this AIF.
Reserves Replacement1,2
Petro-Canada's future cash flows from continuing operations are highly dependent on its ability to offset natural declines as reserves are produced. As basins mature, replacement of reserves becomes more challenging and expensive. In some geographic areas, the Company may choose to allow its reserves to decline if replacement is uneconomical, pursuing other reserves additions instead from successful exploration or acquisitions.
Petro-Canada's reserves objective is to fully replace proved reserves over a five-year period. In 2006, the Company replaced 134% of its production on a proved reserves basis, compared with 111% in 2005. The Company's five-year proved replacement ratio was 160% at year-end 2006. There is no assurance Petro-Canada will successfully replace reserves that are produced in any given year.
More detailed quantification of the impact of some of the following risks can be found in the earnings sensitivities table on page 5 of the Business Environment section in the MD&A dated February 12, 2007.
Commodity Prices
The prices of crude oil and natural gas fluctuate in response to market factors that are external to Petro-Canada. Commodity prices are volatile and influenced by factors such as supply and demand fundamentals, geopolitical events, Organization of the Petroleum Exporting Countries (OPEC) decisions and weather. For historical commodity prices, please refer to page 4 of the Business Environment section in the MD&A dated February 12, 2007. Changes in crude oil and natural gas prices affect the price that Petro-Canada receives for its upstream production. Commodity prices also impact the refined product margins realized in the Downstream business. Petro-Canada's ability to maintain product margins in an environment of higher feedstock costs is contingent upon the Company's ability to pass on higher costs to customers.
1 See Legal Notice on page 1, regarding oil and gas and oil sands mining activities.
2 Proved reserves replacement ratio is calculated by dividing the year‑over‑year net change in proved reserves, before deducting production, by the annual production over the same period. The reserves replacement ratio is a general indicator of the Company’s reserves growth. It is only one of a number of metrics that can be used to analyse a company’s upstream business.
Petro-Canada generally does not hedge large volumes of production. Management believes commodity prices are volatile and difficult to predict. The business is managed so that the Company can substantially withstand the impact of a lower price environment, while maintaining the opportunity to capture significant upside when the price environment is higher. However, commodity prices and margins may be hedged occasionally to capture opportunities that represent extraordinary value and/or to reduce commodity price risk on specific exposures. Certain Downstream physical transactions are routinely hedged for operational needs and to facilitate sales to customers.
Foreign Exchange
Because energy commodity prices are primarily in U.S. dollars, Petro-Canada's revenue stream is affected by the Canada/U.S. exchange rate. As a result, the Company's earnings are negatively affected by a strengthening Canadian dollar. The Company is also exposed to fluctuations in other foreign currencies, such as the euro and the British pound. Generally, Petro-Canada does not hedge foreign exchange exposures, although the Company partially mitigates the U.S. dollar exposure by denominating the majority of its debt obligations in U.S. dollars. Foreign exchange exposure related to asset acquisitions or divestitures, or project capital expenditures, may be hedged on a case-by-case basis.
Interest Rates
Petro-Canada targets a blend of fixed and floating rate debt. Generally, this strategy lets the Company take advantage of lower interest rates on floating debt, while matching overall debt maturities with the life of cash-generating assets. While the Company is exposed to fluctuations in the rate of interest it pays on floating rate debt, this interest rate exposure is within the Company's risk tolerance. Periodically, the Company reviews the proportion of fixed to floating rate debt issued.
Derivative Instruments
Petro-Canada has a formal policy that prohibits the use of derivative instruments for speculative purposes. All derivative instruments entered into are for the purpose of mitigating identified price risks.
Petro-Canada continually monitors outstanding derivative instruments. This includes an assessment of fair values of all derivative instruments using independent third-party quotes to determine the value of each derivative instrument. The objectives of all price risk mitigation transactions are documented, and the effectiveness of each derivative instrument in offsetting the identified price risk is periodically assessed. Petro-Canada also limits the transaction term of its derivative instruments.
The Company applied mark-to-market accounting treatment to all derivative transactions that it entered into in 2006. Realized and unrealized gains and losses resulting from changes in the fair value of derivative instruments that do not qualify for hedge accounting are recognized in "Investment and Other Income." For derivative instruments that qualify for hedge accounting, Petro-Canada may elect to apply hedge accounting treatment.
During 2004, as part of the Company's acquisition of an interest in the Buzzard field in the U.K. sector of the North Sea, the Company entered into a series of derivative contracts related to the future sale of Dated Brent crude oil. The purpose of these transactions was to ensure value-added returns to Petro-Canada on this investment, even in the event of a material decrease in oil prices. These contracts effectively lock in an average forward price of approximately $26 US/bbl on a volume of 35,840,000 bbls. This volume represents approximately 50% of the Company's share of estimated plateau production from July 1, 2007 to December 31, 2010. As at December 31, 2006, the Buzzard derivative instruments had a recognized mark-to-market unrealized loss of $1,007 million after-tax, of which $240 million was recognized in the income statement in 2006.
In 2006, other derivative instruments in place for refining supply and product purchases resulted in an increase in net earnings from continuing operations of about $1 million after-tax, compared with an increase of about $4 million in 2005.
OPERATIONAL RISKS
Exploring for, developing, producing, refining, transporting and marketing oil, natural gas and refined products involve significant operational risks. These risks include situations such as well blowouts, fires, explosions, gaseous leaks, equipment failures, migration of harmful substances and oil spills. Any of these operational incidents, including events beyond the Company's control, could cause personal injury, environmental contamination, interruption of production, and/or damage and destruction of the Company's assets.
Petro-Canada manages operational risks primarily through a Total Loss Management (TLM) system that has standards to prevent losses. Regular TLM audits test compliance with these standards. The Company also has a Zero-Harm philosophy, a belief that injuries and illnesses, on and off the job, are foreseeable and preventable.
The Company also purchases insurance to transfer the financial impact of some operational risks to third-party insurers. On an annual basis, Petro-Canada management evaluates its operational risk exposures and adjusts its insurance coverage, including deductibles and limits. While Petro-Canada maintains insurance consistent with industry practices, the Company cannot and does not fully insure against all risks. Losses resulting from operational incidents could have an adverse impact on the Company.
Interruption to production at any one of Petro-Canada's facilities could result in an adverse financial impact; however, the risk of multiple facilities experiencing production interruptions at the same time is mitigated by having multiple large producing and upgrading assets in various geographic locations throughout the world.
FOREIGN RISKS
Petro-Canada has significant operations in a number of countries that have varying political, economic and social systems. As a result, the Company's operations and related assets are subject to potential risks of actions by governmental authorities, internal unrest, war, political disruption, economic and legal sanctions (such as restrictions against countries that the U.S. government may deem to sponsor terrorism), and changes in global trade policies. The Company's operations may be restricted, disrupted or prohibited in any country in which these risks occur. Petro-Canada also has production in countries that are members of OPEC, which has resulted in, and may result in, the future for production volumes to be constrained by quotas.
The Company continually evaluates exposure in any one country in the context of total operations. Investment may be limited to avoid excessive exposure in any one country or region. The Company also purchases political risk insurance to partially mitigate certain political risks.
Upstream
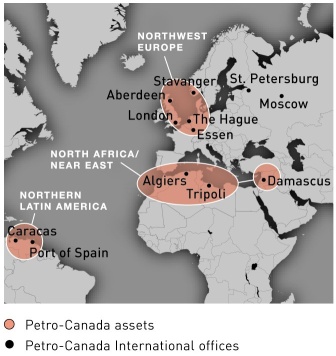
Petro-Canada's upstream operations consisted of four business segments in 2006: North American Natural Gas, with current production in Western Canada and the U.S. Rockies; East Coast Oil, with three major developments offshore Newfoundland and Labrador; Oil Sands operations in Northeast Alberta; and International, where the Company is active in three core areas: Northwest Europe, North Africa/Near East and Northern Latin America. The diverse asset base provides a balanced portfolio and a platform for long-term growth. In 2007, Petro-Canada is consolidating its East Coast Oil and International businesses. The purpose of the consolidation is to leverage and grow the capabilities of similar operations.
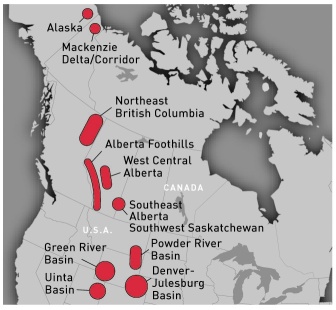
North American Natural Gas
Business Summary and Strategy
North American Natural Gas explores for and produces natural gas, and crude oil and NGL in Western Canada and the U.S. Rockies. This business also markets natural gas in North America and has established resources in the Mackenzie Delta/Corridor and Alaska.
The North American Natural Gas strategy is to be a significant market participant by accessing new and diverse natural gas supply sources in North America. Key features of the strategy include:
targeting 75% to 80% reserves replacement
transitioning further into unconventional gas plays
optimizing core properties in Western Canada and developing coal bed methane (CBM) and tight gas in the U.S. Rockies
increasing the focus on exploration
developing LNG import capacity at Gros-Cacouna, Quebec
building the northern resource base for long-term growth
Western Canada and U.S. Rockies
Annual production before royalties totalled 225 billion cubic feet (Bcf) of natural gas and 5.2 MMbbls of conventional crude oil and NGL in 2006. Exploration and development drilling activity in North American Natural Gas resulted in 676 gross (523 net) wells, including 569 gross (427 net) natural gas wells and 78 gross (71 net) oil wells, for an overall success rate of 96% in 2006.
The North American realized natural gas price averaged $6.85/Mcf in 2006, down 19% from $8.47/Mcf in 2005.
Western Canada natural gas production averaged 646 million cubic feet of equivalent/day (MMcfe/d) in 2006, down 8% from 704 MMcfe/d in 2005. Exploration and development drilling activity in Western Canada resulted in 393 successful wells (gross), for an overall success rate of 93% in 2006. Western Canada operating and overhead costs were $1.31/ thousand cubic feet of equivalent (Mcfe) in 2006, up from $1.10/Mcfe in the previous year. The operating and overhead cost increase in Western Canada reflected general industry-wide cost pressures for materials, fuel and labour, combined with lower production.
During 2004, the North American Natural Gas business grew to include unconventional natural gas operations in the U.S. Rockies. The Company acquired production from CBM in the Powder River Basin and tight gas in the Denver-Julesburg Basin, as well as significant expertise in unconventional production. Petro-Canada is focused on doubling U.S. Rockies production to 100 MMcfe/d by the end of 2007.
U.S. Rockies natural gas production averaged 55 MMcfe/d in 2006, up 6% from 52 MMcfe/d in 2005. The increase reflected natural gas breakthrough at the Wild Turkey CBM field. Exploration and development drilling activity in the U.S. Rockies during 2006 resulted in more than 280 gross wells, down from 300 wells in 2005. In addition, Petro-Canada obtained 396 permits for new CBM wells in 2006, with 363 applications submitted for consideration. Most of the new CBM wells are currently in the de-watering phase. U.S. Rockies operating and overhead costs were $2.29/Mcfe in 2006, compared with $1.84/Mcfe in 2005. This increase reflected costs associated with the increasing number of wells, along with general industry-wide cost pressures.
The Company continued the strategic shift to increased unconventional production by acquiring approximately 50,000 net exploration acres of tight gas prone land for future development, including approximately 36,000 net acres in the Uinta Basin in eastern Utah.
In Western Canada, Petro-Canada operates 10 natural gas field processing plants with total licensed capacity of approximately one billion cubic feet/day (Bcf/d), of which the Company's share is approximately 622 million cubic feet/day (MMcf/d). As part of the Company's ongoing optimization of its portfolio of assets, in early 2007, Petro-Canada completed the sale of its 31% working interest in the Brazeau plant and the majority of its 10% working interest in the West Pembina plant. The following table shows Petro-Canada's working interest ownership and the capacity of operated processing plants.
PETRO-CANADA OWNERSHIP AND CAPACITY1
| Petro-Canada Operated Plants | | Working Interest Ownership (%) | | Gross Licensed Capacity (MMcf/d) | | Net Licensed Capacity (MMcf/d) | |
| Hanlan Sweet | | | 41 | | | 44 | | | 18 | |
| Hanlan Sour | | | 46 | | | 380 | | | 175 | |
Total Hanlan | | | | | | 424 | | | 193 | |
| | | | | | | | | | | |
| Wilson Creek Sweet | | | 52 | | | 12 | | | 7 | |
| Wilson Creek Sour | | | 52 | | | 22 | | | 11 | |
Total Wilson Creek | | | | | | 34 | | | 18 | |
| | | | | | | | | | | |
| Boundary Lake Sweet | | | 100 | | | 20 | | | 20 | |
| Boundary Lake Sour | | | 50 | | | 66 | | | 33 | |
| Parkland 1 | | | 44 | | | 18 | | | 8 | |
| Parkland 2 | | | 35 | | | 12 | | | 4 | |
| Wildcat Hills | | | 66 | | | 124 | | | 82 | |
| Bearberry | | | 100 | | | 94 | | | 94 | |
| Ferrier | | | 99 | | | 119 | | | 118 | |
| Gilby East | | | 100 | | | 52 | | | 52 | |
Total 2006 | | | | | | 963 | | | 622 | |
1 Excludes the Brazeau operated plant sold in January 2007.
Petro-Canada also has varying working interests in other natural gas processing plants and field gathering facilities operated by other oil and gas companies. The Company's aggregate share from such interests is 197 MMcf/d of licensed capacity.
In 2006, North American Natural Gas marketed 716 MMcf/d of natural gas, of which 664 MMcf/d were direct sales. Approximately 11% (81 MMcf/d) of total sales were internal to Petro-Canada, at market prices, and were used at refinery and lubricant facilities as fuel and for some plant feedstock, and steam generation at the MacKay River in situ operation. In Western Canada, the Company markets natural gas produced by other companies in addition to Petro-Canada's own production. In Western Canada, the Company sold 673 MMcf/d in 2006, down 13% from 772 MMcf/d in 2005, reflecting lower production and third-party sales. U.S. Rockies sales for 2006 were 43 MMcfe/d, compared with 41 MMcfe/d in 2005. Higher 2006 sales reflect natural gas breakthrough at the Wild Turkey CBM field in the third quarter of 2006. To achieve better control over sales volumes, prices and transportation-related costs, Petro-Canada focuses on direct sales to end-users, distribution companies, wholesale marketers and natural gas spot markets. Marketing efforts include management of the gas portfolio, gas supply contracts, pipeline commitments and customer relationships.
The following table shows the market distribution of Petro-Canada's North American Natural Gas sales.
NORTH AMERICAN NATURAL GAS SALES BY MARKET
| | 2006 | 2005 |
| | (MMcf/d) | (% of Total) | (MMcf/d) | (% of Total) |
Sales to aggregators | | | | |
| ProGas Limited | 30 | 4 | 38 | 5 |
| Cargill Incorporated | 18 | 3 | 20 | 2 |
| Canwest Gas Supply Inc. | - | - | 14 | 2 |
| Others | 4 | - | 3 | - |
Total sales to aggregators | 52 | 7 | 75 | 9 |
Direct sales | | | | |
| Alberta | 228 | 32 | 286 | 35 |
| U.S. Midwest | 159 | 22 | 160 | 20 |
| British Columbia and U.S. Pacific Northwest | 84 | 12 | 112 | 14 |
| California | 43 | 6 | 45 | 6 |
| U.S. Rockies | 43 | 6 | 41 | 5 |
| Eastern Canada | 19 | 3 | 12 | 1 |
| Saskatchewan | 7 | 1 | 7 | 1 |
Total before internal sales | 583 | 82 | 663 | 82 |
| Sales within Petro-Canada | 81 | 11 | 75 | 9 |
Total direct sales | 664 | 93 | 738 | 91 |
Total sales | 716 | 100 | 813 | 100 |
The Company has future commitments to sell and transport natural gas associated with normal operations. Under future fixed-price commitments entered into during the 1990s, approximately 10 MMcf/d (2% of estimated 2007 natural gas production in Western Canada) has been sold, at an average plant gate netback price of $3.48/Mcf. In 2008, the volume of natural gas sold under these fixed-price contracts is expected to remain at 10 MMcf/d, at an average plant gate netback price of $3.62/Mcf.
Royalty Regime
The royalty regimes are a significant factor in the profitability of crude oil and natural gas production. In Western Canada, royalties on conventional crude oil and natural gas owned by provincial governments are determined by regulation and may be amended from time to time. Royalty payments to provincial governments are generally calculated as a percentage of production and vary depending upon factors such as well production volumes, selling prices, method of recovery, location of production and date of discovery. Royalties payable on production of privately owned crude oil and natural gas are negotiated with the mineral rights owner. In the U.S., production is from federal, state and freehold lands. Production from federal and state lands is subject to a fixed royalty rate plus a payment to the landowner. Freehold royalty rates are determined by negotiations with the freehold land owner. In 2006, Petro-Canada's average royalty rate for North American Natural Gas was approximately 21% for conventional crude oil, NGL and natural gas.
Mackenzie Delta/Corridor, Northwest Territories
With interests in eight exploration blocks covering approximately 1.2 million acres gross (870,000 net acres), Petro-Canada is a significant leaseholder in the Mackenzie Delta/Corridor. During 2005, Petro-Canada acquired two exploration licences covering 411,471 acres, with work commitment bids totalling approximately $35 million. Petro-Canada's holdings are comprised of six exploration licences and two Inuvialuit land concessions. Petro-Canada is the operator of five of the licences. The net work commitments on the licences total approximately $58 million and are guaranteed by performance bonds for the Company's net share of approximately $14 million. Work program terms in the Inuvialuit land concessions include seismic acquisition and drilling. In 2002, a natural gas discovery at the Tuk M-18 well tested at restricted rates of up to 30 MMcf/d. Petro-Canada also holds a 100% position in 73,000 acres covering two Significant Discovery Areas (SDAs) in the Colville Hills area of the Mackenzie Delta/Corridor. The M-47 well on the Tweed Lake SDA was re-entered and tested in 2004, with restricted rates up to 10 MMcf/d. Having secured what it believes to be the area's most prospective acreage for future exploration, Petro-Canada will pace activities pending the anticipated approval and construction timeline for the Mackenzie pipeline.
Alaska
Petro-Canada's initial foray into Alaska was in the Foothills area north of the Brooks Mountain Range. Field geological studies have confirmed that the geology and prospectivity of this area are similar to the Alberta Foothills, where Petro-Canada has developed considerable expertise and has had significant success finding natural gas. In 2005, Petro-Canada and Anadarko Petroleum Corporation formed a 50/50 Foothills joint venture through various transactions and, by January 2006, jointly held 2.5 million gross acres of leased and option lands in the Alaska Foothills. BG (Alaska) E&P Inc. became a third equal participant in the joint venture early in 2006. At state and federal lease sales in 2006, this group was a successful bidder on about 412,000 gross acres in the area (a portion of this acreage remains subject to state title verification), giving each company a net land position in the Alaska Foothills of approximately one million acres, including option acreage. While it is unlikely the region will be serviced by a pipeline for some time, this acreage is close to a proposed pipeline route to southern markets.
In 2004, Petro-Canada acquired a large position (322,610 gross and net acres) in the NW National Petroleum Reserve-Alaska (NPR-A), an area of significant potential for large oil prospects. Petro-Canada and FEX L.P. (a subsidiary of Talisman Energy Inc.) reached a pooling agreement for the joint exploration of selected leases in the NPR-A in early 2006. As a result of this agreement, Petro-Canada obtained a 30% interest in the Aklaq-2 exploration well. It was drilled in the first quarter of 2006 and found to have hydrocarbons in quantities that were not commercially economical. In the latter part of 2006, FEX and Petro-Canada acquired 48 leases, or 562,000 gross acres, at the NPR-A lease sale for $10.4 million US and subsequently pooled the majority of their NPR-A leaseholdings, covering approximately 1.2 million acres. As a result, in jointly held NPR-A acreage with FEX, Petro-Canada's net acreage position is just over 500,000 acres.
LNG
Petro-Canada is seeking to participate in the global LNG business consistent with its strategy to add long-life producing assets to its portfolio. In July 2004, an MOU was signed with TransCanada PipeLines to develop and share (50/50) ownership of an LNG facility at Gros-Cacouna, Quebec. The proposed facility will receive, store and re-gasify imported LNG. Petro-Canada will have throughput and marketing rights to 100% of the send-out capacity of approximately 500 MMcf/d of natural gas.
The partners continued to advance the proposed LNG import and re-gasification terminal at Gros-Cacouna, Quebec, with a joint filing of an Environmental Impact Assessment with the provincial and federal governments in the second quarter of 2005. A joint provincial and federal government public review and consultation process took place in 2006. The Company, along with its partner, TransCanada PipeLines, is aiming to secure regulatory approval in 2007.
Link to Petro-Canada's Corporate and Strategic Priorities
The North American Natural Gas business is aligned with Petro-Canada's strategic priorities as outlined by its progress in 2006 and goals for 2007.
| | 2006 RESULTS | 2007 GOALS |
DELIVERING PROFITABLE GROWTH WITH A FOCUS ON OPERATED,
LONG-LIFE ASSETS | drilled 393 gross wells in Western Canada, including 291 wells in the Medicine Hat region1 drilled more than 280 gross wells, added 50,000 net acres of tight gas prone land and continued to increase CBM well de-watering in the U.S. Rockies completed regulatory hearing for the LNG facility at Gros-Cacouna increased land position in Alaska to 1.5 million net acres of leased and option lands
| transition further into unconventional gas plays optimize opportunities around core assets double U.S. Rockies production to 100 MMcfe/d by year-end 2007 shift focus from developing around existing production to exploring in new areas receive regulatory decision for the LNG facility at Gros-Cacouna advance exploration prospects in the Mackenzie Delta/Corridor and Alaska
|
DRIVING FOR FIRST QUARTILE2
OPERATION OF OUR ASSETS | achieved better than 98% reliability at Western Canada facilities successfully conducted major turnaround at the Hanlan gas plant, with no air licence exceedances
| |
CONTINUING TO WORK AT BEING A RESPONSIBLE COMPANY | achieved record total recordable injury frequency (TRIF) in Western Canada, a 40% decrease compared with 2005 improved employee and contractor safety culture through behaviour-based safety programs proactively remediated and reclaimed old sites achieved record low regulatory compliance exceedances
| continue to focus on TRIF and maintain low regulatory exceedances complete the roll out of behaviour-based safety for employees and contractors drive for continuous improvement in contractor safety performance proactively remediate and reclaim old sites
|
1 Includes wells only where Petro-Canada has a working interest.
2 References to first quartile operations in this AIF do not refer to industry-wide benchmarks or externally recognized measures. The Company has a variety of internal metrics which define and track first quartile operational performance.
East Coast Oil
Business Summary and Strategy
Petro-Canada is positioned in every major oil development off Canada's East Coast. The Company holds a 20% interest in Hibernia and a 27.5% interest in White Rose, and is the operator with a 34% interest in Terra Nova.
The East Coast Oil strategy is to improve reliability and sustain profitable production well into the next decade. Key features of the strategy include:
delivering top quartile operating performance
sustaining profitable production through reservoir extensions and add-ons
pursuing high potential development projects
In 2006, realized crude oil prices remained strong, while production decreased due to the early shutdown and planned dry dock turnaround of the Terra Nova FPSO. East Coast Oil realized crude prices averaged $71.12/bbl in 2006, up from $63.15/bbl in 2005. Petro-Canada's share of east coast oil production averaged 72,700 b/d in 2006, down from 75,300 b/d in 2005. Lower Terra Nova production was partially offset by the addition of White Rose production. East Coast Oil operating and overhead costs averaged $7.71/bbl in 2006, compared with $4.52/bbl in 2005. Operating costs for East Coast Oil increased as a result of the Terra Nova turnaround, excluding insurance premium surcharges and startup costs for White Rose.
Hibernia
The Hibernia oilfield is approximately 315 kilometres southeast of St. John's, Newfoundland and Labrador. The production system used is a fixed Gravity Base Structure (GBS), which sits on the sea floor. The GBS has a production capacity of 230,000 b/d gross and storage capacity of 1.3 MMbbls gross; however, actual production levels are lower, reflecting current reservoir capability. It commenced production in November 1997. The Hibernia oilfield, encompassing the Hibernia and Ben Nevis Avalon reservoirs, is estimated to have a remaining production life of 20 to 23 years. The development potential of the Ben Nevis Avalon and Southern Extension of the Hibernia reservoir remains under assessment. In 2006, the operator submitted a development plan to the regulator for the Hibernia South Extension. In early 2007, the Government of Newfoundland and Labrador rejected the decision report of the Canada-Newfoundland and Labrador Offshore Petroleum Board (C-NLOPB) to approve the development of the Hibernia Southern Extension and asked the applicants for additional information. Petro-Canada and its partners in the Hibernia project are reviewing the decision.
At December 31, 2006, there were 28 producing oil wells, 15 water injection wells and seven gas injection wells in operation. Field production is transported by shuttle tanker either from the platform to a transshipment terminal on the Avalon Peninsula or, if tanker schedules permit, directly to market. Crude oil delivered to the transshipment facility is transferred to storage tanks and loaded onto tankers for transport to markets in Eastern Canada and the U.S. Petro-Canada has a 14% ownership interest in the transshipment facility.
Hibernia production averaged 178,500 b/d gross (35,700 b/d net) in 2006, down from 199,000 b/d gross (39,800 b/d net) in 2005. The Hibernia platform continued to operate at first quartile levels during 2006, with lower production reflecting normal reservoir decline rates. Early in 2007, Hibernia encountered a mechanical failure on one of the platform’s main power generators, thereby reducing production. While repairs are being completed, it is expected that Hibernia production will be in the range of 100,000 b/d to 110,000 b/d gross (20,000 b/d to 22,000 b/d net) for January and part of February 2007. To mitigate the impact of the main power generator repair on production, the operator advanced the planned third quarter turnaround. The planned Hibernia 30-day turnaround is expected to start in mid-February 2007.
Terra Nova
The Terra Nova oilfield, which is approximately 350 kilometres southeast of St. John's, Newfoundland and Labrador, was discovered by Petro-Canada in 1984. Located about 35 kilometres southeast of Hibernia, it is the second oilfield to be developed offshore Newfoundland and Labrador. The production system uses a FPSO vessel, which is a ship moored on location. Terra Nova was the first harsh environment development in North America to use an FPSO vessel. It has a production capacity of 180,000 b/d gross and a storage capacity of 960,000 barrels gross; however, actual production levels reflect current reservoir capability. Production from the Terra Nova oilfield began in January 2002. The field is estimated to have a remaining production life of approximately 13 to 16 years.
At year-end 2006, 15 producing oil wells, nine water injection wells and three gas injection wells were in operation. Terra Nova uses the same system of shuttle tankers and a transshipment terminal that is currently used for Hibernia, and also transports its crude oil to markets in Eastern Canada and the U.S.
At Terra Nova, production averaged 37,600 b/d gross (12,800 b/d net), down considerably from 99,100 b/d gross (33,700 b/d net) in 2005. Early in 2006, the first production well came on-stream in the Far East Block of the Terra Nova field. Terra Nova had a challenging year when its planned maintenance turnaround was advanced following the mechanical failure of the second of two main power generators. The completion of regulatory inspections and reliability improvements was expected to last up to 90 days, but was extended to complete necessary work. The reliability work included a 50% increase in onboard living quarters to support increased routine maintenance, repairs to gearboxes attached to two power generators and improvements to the gas compression system. In November, oil production from the Terra Nova field resumed. Petro-Canada's share of the total cost of the turnaround was approximately $77 million.
In December 2006, the Terra Nova FPSO encountered a mechanical issue in a swivel on the turret system that supports water injection to the reservoir. During the water injection outage, production was reduced to an average of 90,000 b/d gross (30,600 b/d net). A temporary fix was completed in late December and production returned to normal rates in excess of 100,000 b/d gross (34,000 b/d net). Full repair of the swivel requires dismantling and reassembly of the upper turret. This work is currently planned for completion during a turnaround in the summer of 2008.
White Rose
White Rose, the third development offshore Newfoundland and Labrador, is about 350 kilometres southeast of St. John's and approximately 50 kilometres northeast of Hibernia and Terra Nova. It also uses an FPSO vessel similar to Terra Nova. The vessel has a design production capacity of 100,000 b/d gross and a storage capacity of 940,000 barrels gross. Production is offloaded to chartered tankers that go directly to markets in Eastern Canada and the U.S. Production from the White Rose oilfield began in November 2005. The field is estimated to have a remaining production life of approximately 12 to 15 years.
At year-end 2006, six producing oil wells and eight water injection wells were in operation. Development plans for White Rose include the drilling of 18 to 19 wells. During 2006, the fourth, fifth and sixth production wells were completed. White Rose operated reliably in 2006, ramping up production to average 88,000 b/d gross (24,200 b/d net) compared with 6,500 b/d gross (1,800 b/d net) in 2005. The 2006 results reflected a full year of operation at White Rose.
In 2006, the West White Rose 0-28 and North Amethyst K-15 delineation wells were drilled in the west and southwest sections of the White Rose field, respectively. The White Rose 0-28 well revealed a 280-metre oil column in a multi-layered reservoir and the White Rose North Amethyst K-15 well revealed a 50- to 55-metre oil column in the Ben Nevis Avalon formation with high reservoir quality.
Offshore Oil Royalty Regime
The royalty regime for the Hibernia project has three tiers: gross royalty, net royalty and supplementary royalty. Gross royalty increased to 5% of gross field revenue on July 1, 2003. The gross royalty rate will remain at 5% until net royalty payout is reached. The gross royalty is indexed to crude oil prices under certain conditions. Upon achieving payout, including a specified return allowance, the net royalty payable becomes the greater of 30% of net revenue, or 5% of gross revenue. After a further level of payout is reached, which includes an additional return allowance, a supplementary royalty of 12.5% of net revenue also becomes payable.
The Terra Nova royalty regime has three tiers. The royalty consists of a sliding-scale basic royalty payable throughout the project's life, with two additional tiers of net royalties which are payable upon the achievement of specified levels of profitability. The basic royalty is payable as a percentage of gross field revenue, with an initial rate of 1%, which rises to 10% depending on cumulative production levels and the occurrence of simple payout. After tier one payout has been reached, including a specified return allowance, net royalty will become the greater of the basic royalty, or 30% of net revenue. An additional net royalty equal to 12.5% of net revenue will be payable once a further level of payout, including an additional return allowance, is attained. As expected, royalty payments at Terra Nova increased in the fourth quarter of 2005 from 5% of gross revenues to a range of 27% to 29% of gross revenues. The royalty regime allows for large expenditures, such as the 2006 turnaround, to be applied against revenue. Because of this, it is forecasted that Terra Nova will incur a 5% basic royalty on gross revenue for the first quarter of 2007, and will return to a 30% of net revenue royalty for the balance of 2007. Terra Nova royalty payments are expected to average between 20% and 25% of gross revenues in 2007.
In July 2003, the Government of Newfoundland and Labrador published regulations for the royalty regime that will apply to the development of petroleum resources in offshore areas other than Hibernia and Terra Nova. The generic offshore royalty regime consists of a sliding-scale basic royalty payable throughout a project's life, and a two-tier net royalty payable upon the achievement of specified levels of profitability. The basic royalty is calculated as a percentage of gross field revenue, commencing at 1% and rising to 7.5%, depending on cumulative production levels and the achievement of simple payout. Upon reaching tier one payout, including a return allowance, the net royalty is calculated as the greater of the basic royalty, or 20% of net revenue. An additional 10% net royalty rate is payable once a higher level of return on investment is attained. The generic royalty applies to the White Rose development. It is expected that White Rose will reach tier one royalty payout in the fourth quarter of 2007, at which time the royalty rate will shift to 20% of net revenue from 5% of gross revenue. The total royalty payable in 2007 is expected to equate to a rate of between 4% and 8% of gross revenue, depending on crude oil prices.
Other Offshore Exploration and Development
In addition to existing East Coast Oil developments, Petro-Canada holds interests in a number of discoveries, including a 23.9% interest in the Hebron/Ben Nevis oilfield discoveries. In 2005, Chevron (as operator), Petro-Canada and the other joint venture participants signed a unitization and joint operating agreement to advance the joint evaluation of the Hebron/Ben Nevis and West Ben Nevis oilfields offshore Newfoundland and Labrador. In April 2006, Petro-Canada and its partners in the Hebron development suspended negotiations with the Government of Newfoundland and Labrador and demobilized the Hebron project team after failing to reach a development agreement. Petro-Canada continues to consider Hebron a high quality asset. While project activities have been suspended at this time, Petro-Canada and its project partners remain optimistic that the project could proceed at a future date with the conclusion of a definitive agreement with the provincial government.
Link to Petro-Canada's Corporate and Strategic Priorities
The East Coast Oil business is aligned with Petro-Canada's strategic priorities as outlined by its progress in 2006 and goals for 2007.
| | 2006 RESULTS | 2007 GOALS |
DELIVERING PROFITABLE GROWTH WITH A FOCUS ON OPERATED,
LONG-LIFE ASSETS | ramped up White Rose production averaging 88,000 b/d gross (24,200 b/d net) completed drilling the West White Rose 0-28 and North Amethyst K-15 delineation wells at White Rose
| increase reliability at Terra Nova advance in-field Hibernia growth prospects delineate West White Rose advance development plans for South White Rose Extension, North Amethyst and West White Rose prospects
|
DRIVING FOR FIRST QUARTILE OPERATION OF OUR ASSETS | completed Terra Nova turnaround for regulatory compliance and to improve reliability saw operating and overhead costs increase, reflecting turnaround costs at Terra Nova
| conduct a 30-day turnaround scheduled at Hibernia for regulatory compliance receive regulatory approval to increase annual production from SeaRose FPSO at White Rose complete 16-day turnaround at White Rose
|
CONTINUING TO WORK AT BEING A RESPONSIBLE COMPANY | saw 28% decrease in TRIF, compared with 2005 accepted responsibility for an improper discharge of oil from Terra Nova in 2004, contributing $220,000 of the $290,000 fine to positive environmental projects improved the produced water system on Terra Nova, resulting in no regulatory compliance exceedances
| |
In 2007, Petro-Canada is consolidating its East Coast Oil and International businesses. The purpose of the consolidation is to leverage and grow the capabilities of similar operations.
Oil Sands
Business Summary and Strategy
Petro-Canada has more than 10 billion barrels of Oil Sands total resource. The Company's major Oil Sands interests include a 12% ownership in the Syncrude joint venture (an oil sands mining operation and upgrading facility), 100% ownership of the MacKay River in situ bitumen development (a steam-assisted gravity drainage (SAGD) operation), a 55% ownership in and operatorship of the proposed Fort Hills oil sands mining and upgrading project, and extensive oil sands acreage considered prospective for in situ development of bitumen resources.
The Oil Sands strategy for profitable growth includes:
The Company has chosen to participate in the full oil sands value chain due to its resource potential and strong position with bitumen upgrading capacity. Petro-Canada not only has processing capacity through Syncrude and Suncor Energy Inc. (starting in 2008), but the Company is also converting the conventional crude oil train at its Edmonton refinery to refine bitumen-based feedstock from northern Alberta, starting in 2008. This conversion, along with the existing synthetic crude train, will result in the refinery running on an exclusive diet of bitumen-based feedstock. This connection between resource and upgrading capacity should provide more economic certainty in a business where volatile light/heavy differentials affect bitumen pricing.
Oil Sands Mining - Syncrude
Petro-Canada has a 12% interest in Syncrude, the world's largest oil sands mining operation, located approximately 40 kilometres north of Fort McMurray, Alberta. Syncrude is a joint venture formed to mine shallow deposits of oil sands from the McMurray formation in the Athabasca Oil Sands, and to extract and upgrade bitumen to produce synthetic crude oil. Syncrude is readily accessible by public roads.
Syncrude holds eight oil sands leases (numbered 10, 12, 17, 22, 29, 30, 31 and 34) issued by the Province of Alberta, covering a total of approximately 255,000 acres. The operating licence associated with these leases expires in 2035. The licence permits Syncrude to mine oil sands and produce synthetic crude oil from approved development areas on the oil sands leases. The leases are automatically renewable as long as oil sands operations are ongoing or the leases are part of an approved development plan. All eight leases are included in a development plan approved by the Alberta Energy and Utilities Board. There were no known commercial operations on these leases prior to the startup of Syncrude operations in 1978.
Design engineering on the Syncrude project commenced in 1972. Alberta government approvals were received in 1973. Site preparation and construction continued from 1973 to 1978. Commercial operations commenced in 1978. A $1.2 billion capacity addition project was undertaken from 1984 to 1988. The first two stages of the Syncrude 21 expansion projects were completed in 1997 and 2001, respectively. The $470 million Stage I project comprised expansions of the north mine and an upgrader de-bottleneck. The $1 billion Stage II project consisted of the opening of the Aurora mine and a further upgrader de-bottleneck. The $8.2 billion Stage III project involved the opening of a second Aurora mine and an upgrading expansion. Following a brief run in May, Syncrude initiated bitumen feed into its new Coker 8-3 in August 2006, enabling the Stage III expansion to come online and begin ramping up production. Syncrude's Stage III expansion will increase Petro-Canada's share of production capacity to approximately 42,000 b/d. Production is expected to reach this level following a ramp up period of one to two years.
PROVED RESERVES - SYNTHETIC CRUDE OIL Working Interest Before Royalties | |
(MMbbls) | | Base Mine and North Mine1 | | Aurora2 | | Total | |
Beginning of year 2005 | | 109 | | | 222 | | | 331 | |
Revision of previous estimates | | | | | 20 | | | 20 | |
Extensions and discoveries | | - | | | | | | | |
Production, net | | (4 | ) | | (5 | ) | | (9 | ) |
End of year 2005 | | 105 | | | 237 | | | 342 | |
Revision of previous estimates | | - | | | 14 | | | 14 | |
Extensions and discoveries | | - | | | | | | | |
Production, net | | (5 | ) | | (6 | ) | | (11 | ) |
End of year 2006 | | 100 | | | 245 | | | 345 | |
2 Leases 10, 12, 31 and 34.
Syncrude has an estimated remaining proved and probable reserves life index in excess of 50 years. Proved reserves of 30 degree synthetic crude oil from Syncrude are based on high geological certainty and the application of proven technology. Drill-hole spacing is less than 500 metres, and appropriate co-owner and regulatory approvals are in place. For probable reserves, drill-hole spacing is less than 1,000 metres and reserves are included in the 50-year long-range lease development plan. In 2006, approximately 398 million tons of oil sands produced 112 MMbbls of bitumen that was upgraded into 94 MMbbls of synthetic crude oil.
Three mines, the Base mine, the North mine and the Aurora mine, are currently in operation at Syncrude. Base mine operations will be discontinued in 2007. Mine operations are carried out using truck, shovel and hydro-transport systems. An extraction process recovers about 90% of the crude bitumen contained in the mined sands. Refining processes upgrade the bitumen into high quality, light (30 degree) sweet synthetic crude oil, with a process yield of approximately 85%. Syncrude's synthetic crude oil production is processed at refineries in Edmonton, Alberta, in Eastern Canada and the U.S.
Two electricity generating plants located on site and owned by the Syncrude joint venture partners provide power for Syncrude. One plant produces a maximum of 270 megawatts (MW), the other produces 80 MW.
Syncrude's production and unit operating costs were positively affected by the startup of the Stage III expansion in 2006. Syncrude's production averaged 258,300 b/d gross (31,000 b/d net) in 2006, compared with 214,200 b/d gross (25,700 b/d net) in 2005. Average unit operating and overhead costs decreased to $30/bbl in 2006, down from $31.90/bbl in 2005. Lower unit operating costs were mainly due to higher production and lower natural gas costs, partially offset by Syncrude retention and incentive-based compensation. Syncrude realized price for synthetic crude oil averaged $72.13/bbl in 2006, up from $70.41/bbl in 2005.
SYNCRUDE MINING STATISTICS
| | | 2006 | | 2005 | | 2004 | |
Total Mined Volume1 | | | | | | | | | | |
| Millions of tons | | | 398.0 | | | 324.0 | | | 353.2 | |
| Mined volume of oil sands ratio | | | 2.3 | | | 2.1 | | | 2.1 | |
Oil Sands Processed | | | | | | | | | | |
| Millions of tons | | | 175.0 | | | 152.6 | | | 170.9 | |
Average bitumen grade (weight %) | | | 11.3 | | | 11.1 | | | 11.1 | |
Bitumen in Mined Oil Sands | | | | | | | | | | |
| Millions of tons | | | 19.6 | | | 16.9 | | | 19.0 | |
Average extraction recovery (%) | | | 90.3 | | | 89.2 | | | 87.3 | |
Bitumen Production2 | | | | | | | | | | |
| Millions of barrels | | | 111.5 | | | 94.2 | | | 103.2 | |
Average upgrading yield (%) | | | 84.9 | | | 85.3 | | | 85.5 | |
Gross Synthetic Crude Oil Shipped3 | | | | | | | | | | |
| Millions of barrels | | | 94.3 | | | 78.1 | | | 87.2 | |
Petro-Canada's Share of Marketable Crude Oil | | | | | | | | | | |
| Millions of bbls before royalties | | | 11.3 | | | 9.4 | | | 10.5 | |
| Millions of bbls after royalties | | | 10.2 | | | 9.3 | | | 10.4 | |
1 Includes pre-stripping of mine areas and reclamation volumes.
2 Bitumen production in barrels is determined by multiplying the mined bitumen volume in tons by the average extraction recovery and then applying the appropriate conversion factor.
3 In 2006, 1.35% of the produced synthetic crude oil was used internally at Syncrude with the remainder sold externally. In 2004 and 2005, the internal use was 1.30% and 1.46%, respectively.
In November 2006, Syncrude entered into a Management Services agreement with Imperial Oil Resources for the receipt of operational, technical and business services.
Fort Hills Project
In 2005, Petro-Canada strengthened its position in oil sands mining by securing the majority interest and operatorship of the Fort Hills project from UTS. Later in 2005, a mining partner, Teck Cominco, joined the consortium. Petro-Canada is project operator with a 55% interest, UTS has a 30% interest and Teck Cominco holds a 15% interest. Petro-Canada plans to market 100% of the production from Fort Hills. The Fort Hills oil sands mining and upgrading project has leases estimated to contain approximately 4 billion barrels to 5 billion barrels of bitumen resource (approximately 2.2 billion barrels to 2.8 billion barrels net to Petro-Canada), which will be recovered over a 30- to 40-year period. The project has received regulatory approval to produce up to 190,000 b/d gross (104,500 b/d net) of bitumen from the mine.
In early 2006, the Fort Hills partners acquired two additional leases adjacent to the existing Fort Hills leases to afford greater mine planning flexibility. The initial phase of mine production is expected to be in the range of 100,000 b/d to 170,000 b/d gross (55,000 b/d to 93,500 b/d net) of bitumen. The partners selected Sturgeon County, 40 kilometres northeast of Edmonton, as the location for the upgrading facility to process bitumen from the Fort Hills mine. The upgrader is expected to use delayed coking technology to convert Fort Hills bitumen into light synthetic crude oil. The initial phase of the upgrader is expected to be in the range of 85,000 b/d to 145,000 b/d gross (46,750 b/d to 79,750 b/d net). Late in 2006, Petro-Canada filed the commercial application for the Sturgeon Upgrader and expects to receive regulatory approval in 2008. First bitumen production is expected in the 2011 time frame. The Company plans to complete the design basis memorandum (DBM) and preliminary cost estimates for the project in the first half of 2007.
The Fort Hills Partnership has agreed with Alberta Energy to several development milestones for the Fort Hills oil sands project, including a production milestone requiring a mine be completed and producing 100,000 b/d gross (55,000 b/d net) of bitumen by mid-2011. In the event that the development milestones are not met, Alberta Energy may impose a performance deposit or cancel certain leases in connection with Fort Hills.
Oil Sands In Situ - Bitumen
In September 2002, Petro-Canada successfully completed construction of its 100% owned, in situ bitumen production facility at MacKay River. Following the introduction of steam to the reservoir, Petro-Canada commenced bitumen production in November 2002. The extraction process at MacKay River uses SAGD, a technology that Petro-Canada participated in developing through its involvement in the Underground Test Facility (UTF). SAGD combines horizontal drilling with thermal steam injection. Steam is injected into the reservoir through the top well of a horizontal well pair to mobilize the bitumen, which flows to the lower producing well. This technology is expected to economically recover more than 60% of the bitumen in place. The initial development at MacKay River includes two well pads of 12 and 13 horizontal well pairs, respectively. Well pairs are about 700 metres to 750 metres in length and produce 800 b/d to 1,200 b/d of bitumen. On average, wells are expected to have a six- to eight-year life. More than 90% of the water used to generate steam at MacKay River is recycled, a key feature of the environmental efficiency of the facility. The bitumen production from the project is currently being transported to the Athabasca Pipeline Terminal via a lateral insulated pipeline operated by Enbridge Pipelines (Athabasca) Inc. To enable onward shipment through major North American pipelines, the bitumen is diluted with synthetic crude oil provided under a long-term supply arrangement with Suncor Energy Marketing Inc. Work to tie in a third well pad, which includes 14 horizontal well pairs, was completed and, in January 2006, the new well pad began steaming. Production from the new well pad commenced in the second quarter of 2006 and continues to ramp up. In 2007, work to de-bottleneck water handling capacity and add production from a fourth well pad is expected to enable MacKay River to reach plateau production of 27,000 b/d to 30,000 b/d.
MacKay River's production remained flat and unit operating costs increased slightly in 2006. Production averaged 21,200 b/d in 2006, consistent with an average of 21,300 b/d in 2005, as natural declines were offset by production from the third well pad. MacKay River reliability averaged 92% in 2006, down from 98% in 2005, reflecting a gearbox failure in April. Unit operating and overhead costs increased by 5% in 2006, averaging $17.83/bbl, compared with $17.06/bbl in 2005. Higher unit operating costs were due to higher costs for goods and services, partially offset by lower natural gas costs. MacKay River realized price for bitumen averaged $28.93/bbl in 2006, compared with $18.53/bbl in 2005.
In 2005, Petro-Canada filed an application for a potential MacKay River in situ expansion project with first production by the end of the decade and peak production of an additional 40,000 b/d to follow. Petro-Canada also acquired the Dover UTF and oil sands leases adjacent to the MacKay River development in 2005. In the third quarter of 2006, the Company purchased, for $30 million, 13 additional oil sands leases, comprising a total of 31,232 hectares immediately adjacent to Petro-Canada's existing in situ development at MacKay River. The new leases provide additional SAGD development potential.
In the fourth quarter of 2006, the Company announced its intention to divest its interest in the five in situ properties of Chard, Stony Mountain, Liege, Thornbury and Ipiatik. The sale process attracted considerable attention; however, the bids received did not meet Petro-Canada's expectations; therefore, the Company will not divest its interests at this time.
Royalty Regime
During 2001, Syncrude completed the transition from a project-specific contractual royalty to the 1997 Province of Alberta Oil Sands Royalty Regulation. Effective in January 2002, the royalty payable by Syncrude to the Province of Alberta was set at the greater of 1% of gross revenue, or 25% of net revenue. The net revenue is determined by subtracting allowable operating and capital costs from gross revenue. Syncrude reached royalty payout in the second quarter of 2006 and shifted to a royalty rate of 25% of net operating revenues from 1% of gross revenues. The total royalty paid in 2006 equated to a rate of 10% of gross revenues. The total royalty payable in 2007 is expected to equate to a rate of between 10% and 15% of gross revenue, depending on crude oil prices.
The MacKay River operation is subject to the 1997 Alberta Oil Sands Royalty Regulation. Prior to royalty payout, which includes a specified return allowance, the royalty is calculated as 1% of gross revenue. After royalty payout, the royalty is based on the greater of 1% of gross revenue, or 25% of net revenue. The net revenue is determined by subtracting allowable operating and capital costs from gross revenue.
Integrated Oil Sands Development
At the Edmonton refinery, Petro-Canada is investing to convert the facility to run bitumen-based feedstock exclusively and to produce low-sulphur products. By mid-2008, an anticipated capital investment of $2 billion is expected to expand coker capacity, add new crude and vacuum units, increase sulphur plants and expand utilities. Costs based on the completion of preliminary engineering have increased from the original conceptual estimate of $1.2 billion. The increase reflects a more current assessment of refinery integration requirements and industry-wide cost pressures. Project economics remain strong as projected light/heavy crude differentials are expected to offset the increase in capital.
It is anticipated that the refinery conversion program will enable Petro-Canada to directly upgrade 26,000 b/d of bitumen and process 48,000 b/d of sour synthetic crude oil, replacing the conventional light crude feedstock refined today. The refinery conversion program supports the Company's long-term strategy and builds on a $1.4 billion investment in gasoline and diesel desulphurization.
Link to Petro-Canada's Corporate and Strategic Priorities
The Oil Sands business is aligned with Petro-Canada's strategic priorities as outlined by its progress in 2006 and goals for 2007.
| | 2006 RESULTS | 2007 GOALS |
DELIVERING PROFITABLE GROWTH WITH A FOCUS ON OPERATED,
LONG-LIFE ASSETS | selected Sturgeon County for Fort Hills upgrader location submitted commercial application for Sturgeon Upgrader acquired additional oil sands leases adjacent to MacKay River and the existing Fort Hills leases Syncrude Stage III expansion came on-stream
| complete Fort Hills DBM and initial cost estimate, and initiate front-end engineering and design (FEED) receive regulatory decision on MacKay River expansion project continue ramp up of Syncrude Stage III expansion complete MacKay River water handling capacity upgrade and tie in a fourth well pad so that production can increase in 2008
|
DRIVING FOR FIRST QUARTILE OPERATION OF OUR ASSETS | saw Syncrude non-fuel unit operating costs decrease by 5%, compared with 2005 saw MacKay River unit operating costs increase by 5%, compared with 2005, reflecting the Alberta business environment saw Syncrude enter into a Management Services agreement with Imperial Oil Resources for operational, technical and business services maintained reliability at MacKay River at 92%
| decrease MacKay River non-fuel unit operating costs by 10%, compared with 2006 decrease Syncrude non-fuel unit operating costs by 10%, compared with 2006 sustain MacKay River reliability at greater than 90%
|
CONTINUING TO WORK AT BEING A RESPONSIBLE COMPANY | | maintain focus on TLM and Zero-Harm ensure regulators, First Nations and other key stakeholders affected by major projects are properly consulted and engaged
|
International
Business Summary and Strategy
International production and exploration interests are currently focused in three regions. In Northwest Europe, production comes from the U.K. and the Netherlands sectors of the North Sea, with exploration activities extending into Denmark and Norway. The North Africa/Near East region provides crude oil production from assets in Libya, with exploration activity extending into Syria, Algeria, Tunisia and Morocco. In addition, a natural gas development is underway in Syria. In Northern Latin America, operations are focused in Trinidad and Tobago, and Venezuela.
The International strategy is to access a sizable resource base using a three-fold approach to:
International production from continuing operations averaged 103,600 barrels of oil equivalent per day (boe/d) net in 2006, compared with 106,300 boe/d net in 2005. The decrease was primarily due to lower production in Northwest Europe and Northern Latin America. International crude oil and liquids realized prices from continuing operations averaged $72.69/bbl and natural gas realized prices averaged $7.64/Mcf in 2006, compared with $65.93/bbl and $7.13/Mcf, respectively, in 2005. Operating and overhead costs from continuing operations averaged $7.61/boe in 2006, flat compared with $7.60/boe in 2005.
In 2005, Petro-Canada reached an agreement to sell the Company's mature producing assets in Syria. The sale was closed on January 31, 2006. These assets and associated results are reported as discontinued operations and excluded from continuing operations.
Northwest Europe
Production in Northwest Europe comes from the U.K. and the Netherlands sectors of the North Sea, with exploration activities extending into Denmark and Norway.
Petro-Canada's Northwest Europe production averaged 43,700 boe/d net in 2006, compared with 44,600 boe/d net in 2005. Natural declines in the U.K. and the Netherlands sectors of the North Sea were partially offset by new production from De Ruyter and L5b-C. Northwest Europe crude oil and liquids realized prices averaged $72.67/bbl and natural gas averaged $8.91/Mcf in 2006, compared with $66.13/bbl and $7.35/Mcf, respectively, in 2005.
In the central North Sea, the Company's interests are centred on the Triton development area, which is comprised of the joint development of the Guillemot West and Northwest fields, the Bittern field and the Clapham field. The Pict field, which achieved first oil in June 2005, also produces through the Triton area facilities. The Pict field produced an average of 10,460 boe/d in 2006. The 100% Petro-Canada owned and operated Saxon discovery, a Pict look-alike, advanced in 2006. The proposed development will be tied back to the Triton area infrastructure and is expected to come on-stream by the end of 2007. Saxon peak production is expected to be 7,000 boe/d. The crude oil gathered at Triton is shipped via tanker, while gas is delivered through the SEGAL system to the U.K. Petro-Canada is a 33.1% owner of the Triton FPSO.
In the Outer Moray Firth, the Company has a 29.9% interest in the Buzzard oilfield. The Buzzard field achieved first oil in January 2007. The field is expected to ramp up to peak production around the middle of 2007. The field is supported with three bridge-linked platforms supporting the wellhead facilities, the production facilities, living quarters and the utilities. Crude oil is transported via the Forties pipeline system to shore, and natural gas is transported to the St. Fergus gas terminal in Scotland via the U.K. Frigg pipeline. When the Company acquired its interest in the Buzzard field in June 2004, the purchase also included nearby blocks with exploration potential. This included Block 20/1 North where the non-operated Golden Eagle discovery was drilled in late 2006. The Company has a 25% working interest in this licence and work is ongoing to assess possible development.
Following the discovery on the Petro-Canada operated 13/27a Block (90% working interest) in 2005, the Company farmed into adjacent Blocks 13/26a and 13/26b in September 2006, obtaining a 27.5% non-operated working interest. Appraisal drilling is planned by the operator for the second half of 2007 to test the extent of the 13/27a discovery. In early 2007, Petro-Canada was awarded Block 13/24d, near Buzzard, in the U.K. 24th licensing round. The Company is operator with a 90% working interest.
Also in the Outer Moray Firth, Petro-Canada holds a 20.6% working interest in the Scott oilfield and production platform, and a 9.4% working interest in the Telford oilfield, a subsea tie-back to the Scott platform. High quality crude oil from Scott and Telford is transported to shore via the Forties pipeline system. Associated gas is transported via the Scottish Area Gas Evacuation pipeline system.
In the Netherlands sector of the North Sea, oil production comes from the Petro-Canada operated Hanze and De Ruyter platforms. The Company has a 45% working interest in Hanze and a 54.07% working interest in De Ruyter. De Ruyter came on-stream in late September, delivering 5,500 boe/d gross (2,970 boe/d net) in 2006. De Ruyter is expected to add around 18,500 boe/d gross (10,000 boe/d net) in 2007. Oil from the Hanze and De Ruyter platforms is exported by dedicated tanker, with the cargoes marketed on a spot basis into Northwest Europe. Natural gas production from Hanze is exported to shore via the Northern Offshore Gas Transport (NOGAT) pipeline, and natural gas from De Ruyter is exported via the Noord Gas Transport (NGT) pipeline system. Two offshore exploration wells near the De Ruyter field are planned in 2007.
The major source of natural gas production in the Netherlands is from the L5b-L8b non-operated gas area where Petro-Canada has around a 30% working interest. L5b-C, a non-operated asset in this area, achieved first natural gas in November 2006. The Company has a 30% working interest in L5b-C, which is expected to add 10,000 boe/d gross (3,000 boe/d net) in 2007. The produced natural gas is transported to shore by pipeline and sold to NV Nederlandse Gasunie under long-term delivery and off-take contracts. Petro-Canada also holds a 12% interest in the onshore Bergen gas storage facility operated by BP p.l.c.
In 2006, Petro-Canada opened an office in Stavanger, Norway, following the award of five production licences in the Norwegian sector of the North Sea in the 2005 Awards in Predefined Areas (APA). In 2007, the Company was awarded seven additional production licences in the 2006 APA round. Petro-Canada is operator of four of the 12 licences.
Technical and commercial studies relating to development scenarios were undertaken on the Hejre field in Denmark in 2006. A non-operated licence (20% working interest) was acquired adjacent to the Hejre field as protection acreage for the discovery in 2006. The Stork and Robin prospects were drilled and completed as dry holes. This resulted in the Company's decision to relinquish the Robin licence in January 2007. The exploration period on the Svane discovery was extended by two years in 2006 to complete technical and economic re-evaluation.
North Africa/Near East
The core region of North Africa/Near East provides crude oil production from interests principally in Libya and a natural gas development in Syria is now underway.
In 2006, Petro-Canada's production from continuing operations in this region averaged 49,400 boe/d net, relatively unchanged from 49,800 boe/d net in 2005. North Africa/Near East crude oil and liquids realized prices from continuing operations averaged $72.70/bbl in 2006, compared with $65.79/bbl in 2005.
In Libya, Petro-Canada is one of the country's larger producers through its 49% interest in Veba Oil Operations (VOO), a joint venture with the National Oil Corporation of Libya (NOC). Production is high quality, low-sulphur (sweet) crude oil.
Petro-Canada's production through the VOO joint venture comes from three concessions that combine the operations of more than 20 fields, and one exploration and production-sharing agreement (EPSA) covering the En Naga North and En Naga West oilfields. Petro-Canada also has equity interests in the Ras Lanuf export terminal and various pipelines through which the majority of the production is exported. Petro-Canada's production is currently sold on contract to the NOC. Because Libya is a member of OPEC, Libyan production has been constrained by OPEC quotas and may again be in the future.
In 2006, nine development wells were drilled in the producing fields in Libya, of which seven were completed. A further three exploration wells were drilled, with one new discovery on existing concessions. In 2007, Petro-Canada expects to participate in three exploration and appraisal wells with VOO. The Company was awarded an exploration licence in the Libyan third round EPSA IV auction. The onshore licence is located in the Sirte Basin and Petro-Canada is the operator with a 50% working interest.
Early in 2006, the Company completed the sale of its mature producing assets in Syria. In November, Petro-Canada acquired operatorship and a 90% interest in a Production-Sharing Contract (PSC) in the Ash Shaer and Cherrife natural gas fields for $54 million. Under the agreement, Petro-Canada expects to develop and produce an estimated 80 MMcf/d of natural gas, with first gas anticipated in 2010. In addition, preparations for drilling on Block II advanced with two exploration wells expected to be drilled in 2007.
In Algeria, Petro-Canada is the operator and has a 100% working interest in the Zotti Block. A well was spudded on the Block in late 2006.
In Tunisia during 2006, the Company closed its Tunis office and relinquished its 72.5% interest in the Melitta Block after completing its work commitment. In 2007, the Company intends to focus on exploration of the offshore, non-operated Cap Serrat and Bechateaur permits (33% working interest).
In Morocco, Petro-Canada extended its reconnaissance licence on the Bas Draa Block. A gravity magnetic survey will take place in the first half of 2007.
Northern Latin America
In Northern Latin America, Petro-Canada's operations are focused in Trinidad and Tobago. The Company holds a 17.3% working interest in the North Coast Marine Area 1 (NCMA-1) offshore gas development project operated by BG Group p.l.c. In 2006, subsea tie-backs to the Hibiscus platform for Phases 3a and 3b were completed and first natural gas was achieved in late 2006. Phase 3c was approved and will involve development of the Poinsettia field with a platform and pipeline tie-back to the Hibiscus platform. Production is expected to come on-stream by early 2009. Natural gas production is delivered by pipeline to the LNG facility operated by Atlantic LNG at Point Fortin for liquefaction and subsequent sale into U.S. markets.
In 2006, Petro-Canada's share of Trinidad and Tobago production averaged 63 MMcf/d net, down from 72 MMcf/d net in 2005. This was due to a reduction in overall processing capacity at the Atlantic LNG plant, following maintenance on Trains 2 and 3 and delays in commissioning Train 4. Northern Latin America realized prices for natural gas averaged $5.13/Mcf in 2006, compared with $6.62/Mcf in 2005.
Petro-Canada signed PSCs with the Trinidad and Tobago Ministry of Energy and Energy Industries for offshore exploration Blocks 1a, 1b and 22 in 2005. These blocks cover a total of 4,258 square kilometres, with Block 1a containing four discoveries. In 2006, the 3D seismic program on Blocks 1a, 1b and 22 offshore Trinidad and Tobago were completed. Drilling plans are advancing for these Blocks with the purchase of long-lead materials, evaluation of seismic data and work to obtain environmental approvals. Rigs have been secured and drilling is expected to commence in the second half of 2007.
In Western Venezuela, Petro-Canada holds a 50% working interest in the La Ceiba Block that straddles the eastern shores of Lake Maracaibo. A declaration of commercial viability and a field development plan was filed for the La Ceiba development in 2005. The field development plan is awaiting approval by the Venezuelan authorities.
Business Development Opportunities
The Company continues with discussions to import natural gas from Russia to North America through a joint LNG project with Gazprom. The liquefaction plant, proposed in the St. Petersburg region, is expected to export 3.5 million tonnes to 5 million tonnes (500 MMcf/d to 700 MMcf/d) per annum of natural gas supplied from the Russian grid. An agreement was signed with Gazprom in March 2006 to proceed with the initial engineering design of the liquefaction plant. The preliminary engineering studies will provide cost and schedule estimates, from which the Company may proceed into detailed design and engineering for the liquefaction plant.
Link to Petro-Canada's Corporate and Strategic Priorities
The International business is aligned with Petro-Canada's strategic priorities as outlined by its progress in 2006 and goals for 2007.
| | 2006 RESULTS | 2007 GOALS |
DELIVERING PROFITABLE GROWTH WITH A FOCUS ON OPERATED,
LONG-LIFE ASSETS | achieved first production at De Ruyter and L5b-C closed sale of mature Syrian producing assets acquired 90% interest and became operator of the Ash Shaer and Cherrife gas project secured drilling rigs for 2007 and 2008 exploration programs awarded Sirte licence in Libyan third round EPSA IV auction
| ramp up Buzzard and L5b-C to full production achieve first production at Saxon in the U.K. sector of the North Sea by year end participate in up to a 17-well exploration drilling program, (depending on rig arrival dates) with balanced risk profile over the next 18 months commence field appraisal and project design activities on Ash Shaer and Cherrife development establish a Libyan exploration program on the newly acquired Sirte exploration block actively pursue LNG supply opportunities
|
DRIVING FOR FIRST QUARTILE OPERATION OF OUR ASSETS | achieved more than 95% uptime on Hanze platform achieved full production capacity at De Ruyter platform ahead of schedule seconded specialists to support Libyan operations improved Scott platform reliability and uptime by 33%, compared with 2005
| |
CONTINUING TO WORK AT BEING A RESPONSIBLE COMPANY | had nine recordable injuries in 2006, compared with 14 in 2005, but TRIF rose to 0.8 in 2006, compared with 0.62 in 2005, reflecting fewer person hours worked achieved five years of continuous operations on the Hanze platform without a lost-time incident provided safety training and equipment to fishermen in Trinidad and Tobago as part of community liaison activities during seismic operations
| maintain focus on TRIF and increase leadership visibility of Zero-Harm effort reduce oil in produced water at Triton collaborate with local stakeholders in Trinidad and Tobago to minimize impact of offshore drilling
|
Discontinued Operations
On January 31, 2006, Petro-Canada completed the sale of the Company's producing assets in Syria to a joint venture of companies owned by India's Oil and Natural Gas Corporation Limited and the China National Petroleum Corporation for net proceeds of $640 million. The sale resulted in a gain on disposal of $134 million recorded in the first quarter of 2006. This sale aligned with Petro-Canada's strategy to increase the proportion of long-life and operated assets within its portfolio. Petro-Canada's activities in Syria remain part of the North Africa/Near East producing region, with an active exploration program in Block II and the addition of the Ash Shaer and Cherrife natural gas projects in Syria during 2006. Additional information concerning Petro-Canada's discontinued operations can be found in Note 4 to the Consolidated Financial Statements.
Upstream Production and Prices
The following table shows Petro-Canada's average daily production of conventional crude oil, NGL, bitumen, synthetic crude oil (from mining operations) and natural gas, before and after deduction of royalties for the years indicated.
AVERAGE DAILY PRODUCTION OF CRUDE OIL, NGL,
BITUMEN, SYNTHETIC CRUDE OIL AND NATURAL GAS
| | | Years Ended December 31, | |
| | | 2006 | | 2005 | | 2004 | |
| | | Before Royalties | | After Royalties | | Before Royalties | | After Royalties | | Before Royalties | | After Royalties | |
Crude oil and equivalents (thousands of barrels/day - Mbbl/d) | | | | | | | | | | | | | |
| East Coast Oil | | | 72.7 | | | 68.5 | | | 75.3 | | | 69.6 | | | 78.2 | | | 75.1 | |
Oil Sands1 | | | 52.2 | | | 48.8 | | | 47.0 | | | 46.5 | | | 45.2 | | | 44.8 | |
| North American Natural Gas | | | 14.2 | | | 10.8 | | | 14.7 | | | 11.2 | | | 15.3 | | | 11.4 | |
| Northwest Europe | | | 33.2 | | | 33.2 | | | 33.7 | | | 33.7 | | | 40.4 | | | 40.4 | |
| North Africa/Near East | | | 49.4 | | | 44.7 | | | 49.8 | | | 44.0 | | | 50.9 | | | 43.7 | |
Total crude oil and equivalents | | | 221.7 | | | 206.0 | | | 220.5 | | | 205.0 | | | 230.0 | | | 215.4 | |
Natural gas (MMcf/d) | | | | | | | | | | | | | | | | | | | |
| North American Natural Gas | | | 616 | | | 489 | | | 668 | | | 512 | | | 695 | | | 530 | |
| Northwest Europe | | | 63 | | | 63 | | | 66 | | | 66 | | | 85 | | | 85 | |
| Northern Latin America | | | 63 | | | 32 | | | 72 | | | 29 | | | 72 | | | 51 | |
Total natural gas | | | 742 | | | 584 | | | 806 | | | 607 | | | 852 | | | 666 | |
Total production from continuing operations2 (thousands of barrels of oil equivalent/day - Mboe/d) | | | 345 | | | 303 | | | 355 | | | 306 | | | 372 | | | 326 | |
Discontinued operations | | | | | | | | | | | | | | | | | | | |
Crude oil and NGL (Mbbl/d) | | | 5.2 | | | 1.4 | | | 65.9 | | | 20.3 | | | 75.7 | | | 23.7 | |
Natural gas (MMcf/d) | | | 2 | | | - | | | 25 | | | 4 | | | 21 | | | 3 | |
Total production from discontinued operations2 (Mboe/d) | | | 6 | | | 1 | | | 70 | | | 21 | | | 79 | | | 24 | |
Total production2 (Mboe/d) | | | 351 | | | 304 | | | 425 | | | 327 | | | 451 | | | 350 | |
Proved oil and NGL reserves3, 4
(millions of barrels - MMbbls) | | | 950 | | | 841 | | | 866 | | | 733 | | | 801 | | | 674 | |
Proved natural gas reserves
(trillions of cubic feet - Tcf)4 | | | 1.9 | | | 1.5 | | | 2.2 | | | 1.7 | | | 2.5 | | | 2.0 | |
1 Includes production of synthetic crude oil from Syncrude mining operation.
2 Natural gas is converted to oil equivalent using six Mcf of gas to one boe.
3 Includes reserves of synthetic crude oil from Syncrude mining operation.
4 The Company closed the sale of its Syrian producing assets on January 31, 2006.
The following table shows Petro-Canada's average daily production of conventional crude oil, NGL, bitumen, synthetic crude oil and natural gas, before deduction of royalties by quarter for the years indicated.
AVERAGE DAILY PRODUCTION OF CRUDE OIL, NGL,
BITUMEN, SYNTHETIC CRUDE OIL AND NATURAL GAS
BEFORE ROYALTIES BY QUARTER
| | | 2006 Three Months Ended | | 2005 Three Months Ended | |
| | | Mar. 31 | | June 30 | | Sept. 30 | | Dec. 31 | | Mar. 31 | | June 30 | | Sept. 30 | | Dec. 31 | |
Crude oil and equivalents (Mbbl/d) | | | | | | | | | | | | | | | | | |
| East Coast Oil | | | 79.4 | | | 64.1 | | | 62.3 | | | 84.7 | | | 77.9 | | | 77.8 | | | 64.7 | | | 81.1 | |
Oil Sands1 | | | 45.4 | | | 45.6 | | | 59.0 | | | 58.2 | | | 38.3 | | | 48.9 | | | 52.1 | | | 48.3 | |
| North American Natural Gas | | | 14.7 | | | 14.2 | | | 14.2 | | | 13.8 | | | 16.2 | | | 14.5 | | | 14.0 | | | 14.0 | |
| Northwest Europe | | | 34.8 | | | 31.3 | | | 26.5 | | | 40.7 | | | 34.3 | | | 26.3 | | | 38.7 | | | 35.6 | |
| North Africa/Near East | | | 50.7 | | | 49.8 | | | 49.7 | | | 47.6 | | | 48.1 | | | 49.7 | | | 50.4 | | | 50.9 | |
Total crude oil and equivalents | | | 225.0 | | | 205.0 | | | 211.7 | | | 245.0 | | | 214.8 | | | 217.2 | | | 219.9 | | | 229.9 | |
Natural gas (MMcf/d) | | | | | | | | | | | | | | | | | | | | | | | | | |
| North American Natural Gas | | | 635 | | | 605 | | | 611 | | | 615 | | | 702 | | | 654 | | | 666 | | | 649 | |
| Northwest Europe | | | 78 | | | 65 | | | 50 | | | 59 | | | 78 | | | 61 | | | 58 | | | 65 | |
| Northern Latin America | | | 66 | | | 56 | | | 64 | | | 65 | | | 75 | | | 74 | | | 72 | | | 65 | |
Total natural gas | | | 779 | | | 726 | | | 725 | | | 739 | | | 855 | | | 789 | | | 796 | | | 779 | |
Total production from continuing operations2 (Mboe/d) | | | 355 | | | 326 | | | 333 | | | 368 | | | 357 | | | 349 | | | 353 | | | 360 | |
Discontinued operations | | | | | | | | | | | | | | | | | | | | | | | | | |
Crude oil and NGL (Mbbl/d) | | | 20.6 | | | - | | | - | | | - | | | 68.9 | | | 67.1 | | | 65.2 | | | 62.4 | |
Natural gas (MMcf/d) | | | 8 | | | - | | | - | | | - | | | 28 | | | 26 | | | 25 | | | 24 | |
Total production from discontinued operations2 (Mboe/d) | | | 22 | | | - | | | - | | | - | | | 74 | | | 71 | | | 69 | | | 66 | |
Total production2 (Mboe/d) | | | 377 | | | 326 | | | 333 | | | 368 | | | 431 | | | 420 | | | 422 | | | 426 | |
1 Includes production of synthetic crude oil from Syncrude mining operation.
2 Natural gas is converted to oil equivalent using six Mcf of gas to one boe.
The following table shows Petro-Canada's average daily production of conventional crude oil, NGL, bitumen, synthetic crude oil and natural gas, after deduction of royalties by quarter for the years indicated.
AVERAGE DAILY PRODUCTION OF CRUDE OIL, NGL,
BITUMEN, SYNTHETIC CRUDE OIL AND NATURAL GAS
AFTER ROYALTIES BY QUARTER
| | | 2006 Three Months Ended | | 2005 Three Months Ended | |
| | | Mar. 31 | | June 30 | | Sept. 30 | | Dec. 31 | | Mar. 31 | | June 30 | | Sept. 30 | | Dec. 31 | |
Crude oil and equivalents (Mbbl/d) | | | | | | | | | | | | | | | | | |
| East Coast Oil | | | 71.1 | | | 59.8 | | | 60.4 | | | 82.2 | | | 74.5 | | | 73.6 | | | 60.4 | | | 70.4 | |
Oil Sands1 | | | 42.8 | | | 42.3 | | | 54.1 | | | 56.2 | | | 37.9 | | | 48.4 | | | 51.6 | | | 47.8 | |
| North American Natural Gas | | | 11.3 | | | 10.7 | | | 11.0 | | | 10.3 | | | 11.9 | | | 10.9 | | | 10.6 | | | 10.8 | |
| Northwest Europe | | | 34.8 | | | 31.3 | | | 26.5 | | | 40.7 | | | 34.3 | | | 26.3 | | | 38.7 | | | 35.6 | |
| North Africa/Near East | | | 45.7 | | | 45.2 | | | 44.9 | | | 43.0 | | | 44.6 | | | 41.7 | | | 45.0 | | | 46.8 | |
Total crude oil and equivalents | | | 205.7 | | | 189.3 | | | 196.9 | | | 232.4 | | | 203.2 | | | 200.9 | | | 206.3 | | | 211.4 | |
Natural gas (MMcf/d) | | | | | | | | | | | | | | | | | | | | | | | | | |
| North American Natural Gas | | | 487 | | | 491 | | | 509 | | | 481 | | | 534 | | | 503 | | | 527 | | | 488 | |
| Northwest Europe | | | 78 | | | 65 | | | 50 | | | 59 | | | 78 | | | 61 | | | 58 | | | 65 | |
| Northern Latin America | | | 32 | | | 28 | | | 34 | | | 32 | | | 38 | | | 27 | | | 27 | | | 25 | |
Total natural gas | | | 597 | | | 584 | | | 593 | | | 572 | | | 650 | | | 591 | | | 612 | | | 578 | |
Total production from continuing operations2 (Mboe/d) | | | 305 | | | 287 | | | 296 | | | 328 | | | 312 | | | 299 | | | 308 | | | 308 | |
Discontinued operations | | | | | | | | | | | | | | | | | | | | | | | | | |
Crude oil and NGL (Mbbl/d) | | | 5.4 | | | - | | | - | | | - | | | 22.6 | | | 20.0 | | | 19.3 | | | 19.4 | |
Natural gas (MMcf/d) | | | 1 | | | - | | | - | | | - | | | 5 | | | 4 | | | 4 | | | 4 | |
Total production from discontinued operations2 (Mboe/d) | | | 6 | | | - | | | - | | | - | | | 23 | | | 21 | | | 20 | | | 20 | |
Total production2 (Mboe/d) | | | 311 | | | 287 | | | 296 | | | 328 | | | 335 | | | 320 | | | 328 | | | 328 | |
1 Includes production of synthetic crude oil from Syncrude mining operation.
2 Natural gas is converted to oil equivalent using six Mcf of gas to one boe.
Production Outlook
Upstream production is expected to increase in 2007 with additional volumes from Buzzard, Terra Nova, the Syncrude expansion, De Ruyter and L5b-C. Offsetting these increases are lower production from North American Natural Gas and natural declines in the North Sea. Production is expected to average in the range of 390,000 boe/d net to 420,000 boe/d net in 2007, up from 2006.
Factors that may impact production during 2007 include reservoir performance, drilling results, facility reliability (particularly at Terra Nova), ramp up of production at Buzzard, De Ruyter and L5b-C, regulatory approval of increased facility throughput at White Rose and the successful execution of planned turnarounds.
The following table shows Petro-Canada's 2007 production outlook for conventional crude oil, NGL, bitumen, synthetic crude oil and natural gas in crude oil equivalents before deduction of royalties.
CONSOLIDATED PRODUCTION FROM CONTINUING OPERATIONS NET
(Mboe/d)
| | | 2006 Actual | | 2007 Outlook (+/-) | |
North American Natural Gas | | | | | |
- Natural gas | | | 103 | | | 97 | |
- Liquids | | | 14 | | | 13 | |
East Coast Oil | | | 73 | | | 87 | |
Oil Sands | | | | | | | |
- Syncrude | | | 31 | | | 34 | |
- MacKay River | | | 21 | | | 24 | |
International | | | | | | | |
- North Africa/Near East1 | | | 49 | | | 49 | |
- Northwest Europe | | | 44 | | | 85 | |
- Northern Latin America | | | 10 | | | 11 | |
Total from continuing operations | | | 345 | | | 390 - 420 | |
1 North Africa/Near East excludes production from the mature Syrian producing assets sold in 2006.
The following table shows the average sale price for Petro-Canada's conventional crude oil, NGL, bitumen, synthetic crude oil, and natural gas produced, by country and/or region, for the years indicated.
AVERAGE PRICES FOR CRUDE OIL, NGL,
BITUMEN, SYNTHETIC CRUDE OIL AND NATURAL GAS
| | | Years Ended December 31, |
| Average annual price received | | 2006 | | 2005 | | 2004 |
Crude oil and equivalents ($/bbl) | | | | | | |
| East Coast Oil | | $ | 71.12 | | $ | 63.15 | | $ | 48.39 |
| Oil Sands | | | 54.60 | | | 46.90 | | | 39.90 |
| North American Natural Gas | | | 64.87 | | | 59.47 | | | 47.02 |
| Northwest Europe | | | 72.67 | | | 66.13 | | | 50.37 |
North Africa/Near East1 | | | 72.70 | | | 65.79 | | | 48.28 |
Total crude oil and equivalents from continuing operations | | | 67.38 | | | 60.45 | | | 46.94 |
| Discontinued operations | | | 71.84 | | | 61.82 | | | 46.70 |
Total crude oil and equivalents | | $ | 67.48 | | $ | 60.77 | | $ | 46.88 |
North America ($/bbl) | | | | | | | | | |
| Average crude oil and NGL sale price | | $ | 70.10 | | $ | 62.55 | | $ | 48.17 |
| Average bitumen sale price | | | 28.93 | | | 18.53 | | | 18.37 |
| Average synthetic crude oil sale price | | | 72.13 | | | 70.41 | | | 52.40 |
North America average crude oil and NGL, bitumen and synthetic crude oil price | | $ | 64.28 | | $ | 57.18 | | $ | 45.47 |
International ($/bbl) | | | | | | | | | |
| Northwest Europe - average crude oil and NGL sale price | | $ | 72.67 | | $ | 66.13 | | $ | 50.37 |
North Africa/Near East - average crude oil and NGL sale price1 | | | 72.70 | | | 65.79 | | | 48.28 |
International - average crude oil and NGL sale price from continuing operations | | $ | 72.69 | | $ | 65.93 | | $ | 49.22 |
Natural gas ($/Mcf) | | | | | | | | | |
| North American Natural Gas | | $ | 6.85 | | $ | 8.47 | | $ | 6.72 |
| Northwest Europe | | | 8.91 | | | 7.35 | | | 5.65 |
| Northern Latin America | | | 5.13 | | | 6.62 | | | 4.81 |
Total natural gas from continuing operations | | | 6.96 | | | 8.30 | | | 6.53 |
| Discontinued operations | | | 7.94 | | | 6.43 | | | 4.81 |
Total natural gas | | $ | 6.96 | | $ | 8.24 | | $ | 6.49 |
1 North Africa/Near East excludes prices realized on production related to the mature Syrian producing assets sold in January 2006, which are shown as discontinued operations.
The following tables on pages 37 to 40 show Petro-Canada's average product prices, netbacks, net earnings and production before royalties for North American Natural Gas (natural gas equivalent), East Coast Oil (conventional crude oil), Oil Sands (synthetic crude oil and bitumen) and International regions (crude oil equivalents) for the years indicated. Footnotes for the following tables on pages 37 to 40 can be found on page 40.
Petro-Canada monitors production costs and charges to earnings by business segment or region, rather than on a product basis. As a result, unit netbacks and net earnings for a business segment or region producing a mix of crude oil, natural gas and NGL are calculated on an oil- or gas-equivalent basis. In the North American Natural Gas business segment, most crude oil and NGL production is ancillary to the production of natural gas. In the North Africa/Near East region, natural gas and NGL production is relatively minor and linked to crude oil production. In Northwest Europe, crude oil and NGL production represent about 76% of total Northwest Europe production on an oil-equivalent basis.
NORTH AMERICAN NATURAL GAS
($/Mcfe, unless otherwise indicated)
| | | 2006 Three Months Ended | | Total | | 2005 Three Months Ended | | Total | | Total | |
| | | Mar. 31 | | June 30 | | Sept. 30 | | Dec. 31 | | 2006 | | Mar. 31 | | June 30 | | Sept. 30 | | Dec. 31 | | 2005 | | 20041 | |
| Average price received | | $ | 8.93 | | $ | 6.87 | | $ | 6.63 | | $ | 6.89 | | $ | 7.34 | | $ | 6.95 | | $ | 7.56 | | $ | 8.56 | | $ | 11.72 | | $ | 8.67 | | $ | 6.89 | |
| Royalties | | | (2.08 | ) | | (1.37 | ) | | (1.19 | ) | | (1.55 | ) | | (1.55 | ) | | (1.68 | ) | | (1.75 | ) | | (1.83 | ) | | (2.89 | ) | | (2.03 | ) | | (1.65 | ) |
| Operating expenses | | | (0.97 | ) | | (1.15 | ) | | (1.21 | ) | | (1.23 | ) | | (1.14 | ) | | (0.77 | ) | | (0.91 | ) | | (0.98 | ) | | (1.14 | ) | | (0.95 | ) | | (0.76 | ) |
| Netback | | | 5.88 | | | 4.35 | | | 4.23 | | | 4.11 | | | 4.65 | | | 4.50 | | | 4.90 | | | 5.75 | | | 7.69 | | | 5.69 | | | 4.48 | |
Overhead expenses (G&A)2 | | | (0.24 | ) | | (0.28 | ) | | (0.23 | ) | | (0.25 | ) | | (0.25 | ) | | (0.16 | ) | | (0.23 | ) | | (0.21 | ) | | (0.19 | ) | | (0.20 | ) | | (0.19 | ) |
| Netback after overhead expenses | | | 5.64 | | | 4.07 | | | 4.00 | | | 3.86 | | | 4.40 | | | 4.34 | | | 4.67 | | | 5.54 | | | 7.50 | | | 5.49 | | | 4.29 | |
| Processing and other income | | | 0.03 | | | 0.09 | | | 0.06 | | | 0.06 | | | 0.06 | | | 0.08 | | | (0.01 | ) | | 0.01 | | | 0.18 | | | 0.07 | | | 0.06 | |
| Exploration expenses | | | (0.52 | ) | | (0.28 | ) | | (0.22 | ) | | (0.46 | ) | | (0.37 | ) | | (0.55 | ) | | (0.24 | ) | | (0.46 | ) | | (0.28 | ) | | (0.39 | ) | | (0.30 | ) |
| Depletion, depreciation and amortization | | | (1.50 | ) | | (1.56 | ) | | (1.56 | ) | | (1.58 | ) | | (1.55 | ) | | (1.29 | ) | | (1.32 | ) | | (1.30 | ) | | (1.31 | ) | | (1.30 | ) | | (1.10 | ) |
| Income and other taxes | | | (1.26 | ) | | (0.66 | ) | | (0.73 | ) | | (0.65 | ) | | (0.83 | ) | | (0.90 | ) | | (1.44 | ) | | (1.52 | ) | | (1.92 | ) | | (1.44 | ) | | (1.10 | ) |
Net earnings | | $ | 2.39 | | $ | 1.66 | | $ | 1.55 | | $ | 1.23 | | $ | 1.71 | | $ | 1.68 | | $ | 1.66 | | $ | 2.27 | | $ | 4.17 | | $ | 2.43 | | $ | 1.85 | |
Production, net (billion cubic feet equivalent - Bcfe) | | | 65.0 | | | 62.8 | | | 64.0 | | | 64.1 | | | 255.9 | | | 71.9 | | | 67.4 | | | 69.0 | | | 67.4 | | | 275.7 | | | 288.0 | |
EAST COAST OIL
($/bbl, unless otherwise indicated)
| | | 2006 Three Months Ended | | Total | | 2005 Three Months Ended | | Total | | Total | |
| | | Mar. 31 | | June 30 | | Sept. 30 | | Dec. 31 | | 2006 | | Mar. 31 | | June 30 | | Sept. 30 | | Dec. 31 | | 2005 | | 2004 | |
| Average price received | | $ | 69.21 | | $ | 75.85 | | $ | 74.26 | | $ | 66.32 | | $ | 71.12 | | $ | 55.08 | | $ | 61.41 | | $ | 73.37 | | $ | 64.23 | | $ | 63.15 | | $ | 48.39 | |
| Royalties | | | (7.15 | ) | | (6.79 | ) | | (2.42 | ) | | (2.02 | ) | | (4.54 | ) | | (2.35 | ) | | (3.33 | ) | | (4.76 | ) | | (8.44 | ) | | (4.78 | ) | | (1.89 | ) |
| Operating expenses | | | (5.07 | ) | | (7.49 | ) | | (13.79 | ) | | (4.32 | ) | | (7.27 | ) | | (3.11 | ) | | (3.85 | ) | | (5.42 | ) | | (5.21 | ) | | (4.37 | ) | | (2.72 | ) |
| Netback | | | 56.99 | | | 61.57 | | | 58.05 | | | 59.98 | | | 59.31 | | | 49.62 | | | 54.23 | | | 63.19 | | | 50.58 | | | 54.00 | | | 43.78 | |
Overhead expenses (G&A)2 | | | (0.26 | ) | | (0.91 | ) | | (0.42 | ) | | (0.27 | ) | | (0.44 | ) | | (0.09 | ) | | 0.09 | | | - | | | (0.54 | ) | | (0.15 | ) | | (0.17 | ) |
| Netback after overhead expenses | | | 56.73 | | | 60.66 | | | 57.63 | | | 59.71 | | | 58.87 | | | 49.53 | | | 54.32 | | | 63.19 | | | 50.04 | | | 53.85 | | | 43.61 | |
| Processing and other income | | | (0.02 | ) | | (0.37 | ) | | 3.83 | | | 1.70 | | | 1.20 | | | 0.01 | | | - | | | 0.46 | | | - | | | 0.10 | | | 1.66 | |
| Depletion, depreciation and amortization | | | (8.82 | ) | | (8.20 | ) | | (8.28 | ) | | (9.68 | ) | | (8.82 | ) | | (9.65 | ) | | (10.06 | ) | | (9.97 | ) | | (9.06 | ) | | (9.66 | ) | | (9.05 | ) |
| Income and other taxes | | | (16.49 | ) | | (11.13 | ) | | (18.13 | ) | | (17.19 | ) | | (15.87 | ) | | (11.63 | ) | | (15.34 | ) | | (17.43 | ) | | (14.65 | ) | | (14.66 | ) | | (11.58 | ) |
Net earnings | | $ | 31.40 | | $ | 41.70 | | $ | 35.05 | | $ | 34.54 | | $ | 35.38 | | $ | 28.26 | | $ | 28.92 | | $ | 36.25 | | $ | 26.33 | | $ | 29.63 | | $ | 24.64 | |
Production, net (MMbbls) | | | 7.2 | | | 5.8 | | | 5.7 | | | 7.8 | | | 26.5 | | | 7.0 | | | 7.1 | | | 6.0 | | | 7.5 | | | 27.6 | | | 28.6 | |
SYNCRUDE
($/bbl, unless otherwise indicated)
| | | 2006 Three Months Ended | | Total | | 2005 Three Months Ended | | Total | | Total | |
| | | Mar. 31 | | June 30 | | Sept. 30 | | Dec. 31 | | 2006 | | Mar. 31 | | June 30 | | Sept. 30 | | Dec. 31 | | 2005 | | 2004 | |
| Average price received | | $ | 69.29 | | $ | 78.38 | | $ | 77.91 | | $ | 63.68 | | $ | 72.13 | | $ | 64.40 | | $ | 67.08 | | $ | 77.16 | | $ | 70.82 | | $ | 70.41 | | $ | 52.40 | |
| Royalties | | | (6.72 | ) | | (8.45 | ) | | (8.48 | ) | | (4.59 | ) | | (6.98 | ) | | (0.65 | ) | | (0.66 | ) | | (0.78 | ) | | (0.71 | ) | | (0.71 | ) | | (0.61 | ) |
| Operating expenses | | | (43.87 | ) | | (32.77 | ) | | (21.85 | ) | | (26.26 | ) | | (30.00 | ) | | (44.24 | ) | | (26.70 | ) | | (26.95 | ) | | (34.04 | ) | | (31.90 | ) | | (21.13 | ) |
| Netback | | | 18.70 | | | 37.16 | | | 47.58 | | | 32.83 | | | 35.15 | | | 19.51 | | | 39.72 | | | 49.43 | | | 36.07 | | | 37.80 | | | 30.66 | |
| Processing and other income | | | - | | | - | | | 5.96 | | | - | | | 1.65 | | | - | | | - | | | - | | | - | | | - | | | - | |
| Depletion, depreciation and amortization | | | (2.70 | ) | | (2.77 | ) | | (3.79 | ) | | (5.15 | ) | | (3.74 | ) | | (1.89 | ) | | (1.89 | ) | | (1.96 | ) | | (2.04 | ) | | (1.95 | ) | | (1.79 | ) |
| Income and other taxes | | | (5.38 | ) | | 3.00 | | | (16.81 | ) | | (9.32 | ) | | (7.75 | ) | | (5.18 | ) | | (13.64 | ) | | (15.47 | ) | | (11.45 | ) | | (12.03 | ) | | (9.31 | ) |
Net earnings | | $ | 10.62 | | $ | 37.39 | | $ | 32.94 | | $ | 18.36 | | $ | 25.31 | | $ | 12.44 | | $ | 24.19 | | $ | 32.00 | | $ | 22.58 | | $ | 23.82 | | $ | 19.56 | |
Production, net (MMbbls) | | | 2.2 | | | 2.6 | | | 3.1 | | | 3.4 | | | 11.3 | | | 1.7 | | | 2.5 | | | 2.6 | | | 2.5 | | | 9.3 | | | 10.5 | |
MACKAY RIVER
($/bbl, unless otherwise indicated)
| | | 2006 Three Months Ended | | Total | | 2005 Three Months Ended | | Total | | Total | |
| | | Mar. 31 | | June 30 | | Sept. 30 | | Dec. 31 | | 2006 | | Mar. 31 | | June 30 | | Sept. 30 | | Dec. 31 | | 2005 | | 2004 | |
| Average price received | | $ | 11.24 | | $ | 39.37 | | $ | 39.13 | | $ | 25.84 | | $ | 28.93 | | $ | 10.88 | | $ | 13.92 | | $ | 31.98 | | $ | 15.27 | | $ | 18.61 | | $ | 18.37 | |
| Royalties | | | (0.09 | ) | | (0.36 | ) | | (2.07 | ) | | 0.85 | | | (0.49 | ) | | (0.08 | ) | | (0.11 | ) | | (0.30 | ) | | (0.12 | ) | | (0.16 | ) | | (0.16 | ) |
| Operating expenses | | | (18.60 | ) | | (21.24 | ) | | (14.01 | ) | | (15.42 | ) | | (16.93 | ) | | (14.80 | ) | | (15.65 | ) | | (14.08 | ) | | (20.72 | ) | | (16.29 | ) | | (20.98 | ) |
| Netback | | | (7.45 | ) | | 17.77 | | | 23.05 | | | 11.27 | | | 11.51 | | | (4.00 | ) | | (1.84 | ) | | 17.60 | | | (5.57 | ) | | 2.16 | | | (2.77 | ) |
Overhead expenses (G&A)2 | | | (0.92 | ) | | (0.94 | ) | | (0.76 | ) | | (1.01 | ) | | (0.90 | ) | | (0.74 | ) | | (0.80 | ) | | (0.69 | ) | | (0.84 | ) | | (0.77 | ) | | (0.89 | ) |
| Netback after overhead expenses | | | (8.37 | ) | | 16.83 | | | 22.29 | | | 10.26 | | | 10.61 | | | (4.74 | ) | | (2.64 | ) | | 16.91 | | | (6.41 | ) | | 1.39 | | | (3.66 | ) |
| Processing and other income | | | 0.02 | | | (0.31 | ) | | (0.03 | ) | | (0.07 | ) | | (0.05 | ) | | (0.51 | ) | | 0.16 | | | 0.02 | | | - | | | (0.06 | ) | | - | |
| Exploration expenses | | | 0.02 | | | - | | | 0.01 | | | (0.18 | ) | | (0.04 | ) | | (0.44 | ) | | (0.04 | ) | | 0.03 | | | (0.07 | ) | | (0.12 | ) | | (0.03 | ) |
| Depletion, depreciation and amortization | | | (4.16 | ) | | (3.16 | ) | | (5.22 | ) | | (5.51 | ) | | (4.63 | ) | | (3.18 | ) | | (3.18 | ) | | (3.08 | ) | | (3.53 | ) | | (3.24 | ) | | (3.16 | ) |
| Income and other taxes | | | 3.87 | | | (0.87 | ) | | (6.02 | ) | | (1.55 | ) | | (1.43 | ) | | 2.63 | | | 1.22 | | | (4.37 | ) | | 2.70 | | | 0.35 | | | 1.94 | |
Net earnings (loss) | | $ | (8.62 | ) | $ | 12.49 | | $ | 11.03 | | $ | 2.95 | | $ | 4.46 | | $ | (6.24 | ) | $ | (4.48 | ) | $ | 9.51 | | $ | (7.31 | ) | $ | (1.68 | ) | $ | (4.91 | ) |
Production, net (MMbbls) | | | 1.9 | | | 1.5 | | | 2.3 | | | 2.0 | | | 7.7 | | | 1.7 | | | 1.9 | | | 2.2 | | | 2.0 | | | 7.8 | | | 6.1 | |
NORTHWEST EUROPE3, 4
($/boe, unless otherwise indicated)
| | | 2006 Three Months Ended | | Total | | 2005 Three Months Ended | | Total | | Total | |
| | | Mar. 31 | | June 30 | | Sept. 30 | | Dec. 31 | | 2006 | | Mar. 31 | | June 30 | | Sept. 30 | | Dec. 31 | | 2005 | | 2004 | |
Average price received5 | | $ | 68.57 | | $ | 69.27 | | $ | 69.95 | | $ | 65.31 | | $ | 68.07 | | $ | 53.61 | | $ | 59.11 | | $ | 65.82 | | $ | 63.82 | | $ | 60.74 | | $ | 46.08 | |
| Royalties | | | (1.33 | ) | | (0.79 | ) | | (0.97 | ) | | (0.55 | ) | | (0.91 | ) | | - | | | (2.06 | ) | | (0.96 | ) | | (0.62 | ) | | (0.85 | ) | | - | |
| Net revenue | | | 67.24 | | | 68.48 | | | 68.98 | | | 64.76 | | | 67.16 | | | 53.61 | | | 57.05 | | | 64.86 | | | 63.20 | | | 59.89 | | | 46.08 | |
| Operating expenses | | | (8.02 | ) | | (9.46 | ) | | (11.29 | ) | | (9.87 | ) | | (9.56 | ) | | (8.23 | ) | | (10.66 | ) | | (8.86 | ) | | (10.99 | ) | | (9.62 | ) | | (7.89 | ) |
| Netback | | | 59.22 | | | 59.02 | | | 57.69 | | | 54.89 | | | 57.60 | | | 45.38 | | | 46.39 | | | 56.00 | | | 52.21 | | | 50.27 | | | 38.19 | |
Overhead expenses (G&A)2 | | | (2.34 | ) | | (2.19 | ) | | (3.44 | ) | | 0.99 | | | (1.55 | ) | | (1.54 | ) | | (2.98 | ) | | (2.48 | ) | | (1.96 | ) | | (2.20 | ) | | (0.96 | ) |
| Netback after overhead expenses | | | 56.88 | | | 56.83 | | | 54.25 | | | 55.88 | | | 56.05 | | | 43.84 | | | 43.41 | | | 53.52 | | | 50.25 | | | 48.07 | | | 37.23 | |
| Processing and other income | | | 2.07 | | | (1.14 | ) | | (0.01 | ) | | 1.44 | | | 0.70 | | | 2.62 | | | 0.65 | | | (3.26 | ) | | 1.50 | | | 1.81 | | | (0.07 | ) |
| Exploration expenses | | | (0.75 | ) | | (4.61 | ) | | 2.02 | | | (1.44 | ) | | (1.33 | ) | | (0.75 | ) | | (2.06 | ) | | (1.15 | ) | | (1.93 | ) | | (1.43 | ) | | (2.25 | ) |
| Depletion, depreciation and amortization | | | (15.64 | ) | | (16.20 | ) | | (17.13 | ) | | (23.04 | ) | | (18.22 | ) | | (14.31 | ) | | (15.06 | ) | | (15.19 | ) | | (14.64 | ) | | (14.79 | ) | | (13.48 | ) |
Income and other taxes6 | | | (75.56 | ) | | (17.59 | ) | | (19.37 | ) | | (21.30 | ) | | (34.68 | ) | | (14.17 | ) | | (11.71 | ) | | (14.62 | ) | | (14.60 | ) | | (14.50 | ) | | (8.32 | ) |
Net earnings | | $ | (33.00 | ) | $ | 17.29 | | $ | 19.76 | | $ | 11.54 | | $ | 2.52 | | $ | 17.23 | | $ | 15.23 | | $ | 19.30 | | $ | 20.58 | | $ | 19.16 | | $ | 13.11 | |
Production, net (MMboe) | | | 4.3 | | | 3.8 | | | 3.2 | | | 4.6 | | | 15.9 | | | 4.3 | | | 3.3 | | | 4.4 | | | 4.3 | | | 16.3 | | | 20.0 | |
NORTH AFRICA/NEAR EAST3, 7, 8
($/boe, unless otherwise indicated)
| | | 2006 Three Months Ended | | Total | | 2005 Three Months Ended | | Total | | Total | |
| | | Mar. 31 | | June 30 | | Sept. 30 | | Dec. 31 | | 2006 | | Mar. 31 | | June 30 | | Sept. 30 | | Dec. 31 | | 2005 | | 2004 | |
Average price received5 | | $ | 71.29 | | $ | 77.27 | | $ | 74.92 | | $ | 67.15 | | $ | 72.70 | | $ | 56.01 | | $ | 69.84 | | $ | 74.20 | | $ | 62.44 | | $ | 65.75 | | $ | 48.35 | |
| Royalties | | | (7.08 | ) | | (7.15 | ) | | (7.25 | ) | | (6.66 | ) | | (7.01 | ) | | (4.04 | ) | | (11.17 | ) | | (8.08 | ) | | (6.91 | ) | | (7.59 | ) | | (7.08 | ) |
| Net revenue | | | 64.21 | | | 70.12 | | | 67.67 | | | 60.49 | | | 65.69 | | | 51.97 | | | 58.67 | | | 66.12 | | | 55.53 | | | 58.16 | | | 41.27 | |
| Operating expenses | | | (5.40 | ) | | (3.49 | ) | | (4.73 | ) | | (6.06 | ) | | (4.91 | ) | | (5.34 | ) | | (3.35 | ) | | (5.97 | ) | | (3.39 | ) | | (4.50 | ) | | (5.56 | ) |
| Netback | | | 58.81 | | | 66.63 | | | 62.94 | | | 54.43 | | | 60.78 | | | 46.63 | | | 55.32 | | | 60.15 | | | 52.14 | | | 53.66 | | | 35.71 | |
Overhead expenses (G&A)2 | | | (0.61 | ) | | (0.63 | ) | | (0.62 | ) | | (1.38 | ) | | (0.80 | ) | | (1.17 | ) | | (0.34 | ) | | (0.66 | ) | | (0.82 | ) | | (0.75 | ) | | (1.03 | ) |
| Netback after overhead | | | 58.20 | | | 66.00 | | | 62.32 | | | 53.05 | | | 59.98 | | | 45.46 | | | 54.98 | | | 59.49 | | | 51.32 | | | 52.91 | | | 34.68 | |
| Processing and other income | | | (0.15 | ) | | (0.54 | ) | | 0.40 | | | (0.91 | ) | | (0.30 | ) | | 2.19 | | | 3.08 | | | 1.33 | | | 3.26 | | | 2.47 | | | (0.34 | ) |
| Exploration expenses | | | (0.68 | ) | | (0.48 | ) | | (0.33 | ) | | (0.38 | ) | | (0.47 | ) | | (0.13 | ) | | (1.42 | ) | | (0.16 | ) | | (0.41 | ) | | (0.53 | ) | | (0.89 | ) |
| Depletion, depreciation and amortization | | | (1.49 | ) | | (1.52 | ) | | (1.54 | ) | | (1.49 | ) | | (1.51 | ) | | (2.33 | ) | | (2.27 | ) | | (2.14 | ) | | (1.46 | ) | | (2.04 | ) | | (2.73 | ) |
| Income and other taxes | | | (52.74 | ) | | (59.97 | ) | | (54.16 | ) | | (48.53 | ) | | (53.89 | ) | | (39.88 | ) | | (47.19 | ) | | (52.58 | ) | | (46.26 | ) | | (46.58 | ) | | (26.58 | ) |
Net earnings | | $ | 3.14 | | $ | 3.49 | | $ | 6.69 | | $ | 1.74 | | $ | 3.81 | | $ | 5.31 | | $ | 7.18 | | $ | 5.94 | | $ | 6.45 | | $ | 6.23 | | $ | 4.14 | |
Production, net (MMboe) | | | 4.6 | | | 4.5 | | | 4.6 | | | 4.4 | | | 18.1 | | | 4.4 | | | 4.5 | | | 4.6 | | | 4.7 | | | 18.2 | | | 18.5 | |
NORTHERN LATIN AMERICA3, 9
($/Mcf, unless otherwise indicated)
| | | 2006 Three Months Ended | | Total | | 2005 Three Months Ended | | Total | | Total | |
| | | Mar. 31 | | June 30 | | Sept. 30 | | Dec. 31 | | 2006 | | Mar. 31 | | June 30 | | Sept. 30 | | Dec. 31 | | 2005 | | 2004 | |
| Average price received | | $ | 6.32 | | $ | 5.08 | | $ | 4.46 | | $ | 4.70 | | $ | 5.13 | | $ | 5.09 | | $ | 5.05 | | $ | 6.90 | | $ | 9.82 | | $ | 6.62 | | $ | 4.81 | |
| Royalties | | | - | | | (0.49 | ) | | (0.15 | ) | | (2.51 | ) | | (1.26 | ) | | - | | | (4.42 | ) | | (4.86 | ) | | (1.83 | ) | | (2.06 | ) | | (1.05 | ) |
| Net revenue | | | 6.32 | | | 4.59 | | | 4.31 | | | 2.19 | | | 3.87 | | | 5.09 | | | 0.63 | | | 2.04 | | | 7.99 | | | 4.56 | | | 3.76 | |
| Operating expenses | | | (0.20 | ) | | (0.16 | ) | | (0.07 | ) | | (0.28 | ) | | (0.18 | ) | | (0.22 | ) | | (0.14 | ) | | (0.18 | ) | | (0.15 | ) | | (0.17 | ) | | (0.12 | ) |
| Netback | | | 6.12 | | | 4.43 | | | 4.24 | | | 1.91 | | | 3.69 | | | 4.87 | | | 0.49 | | | 1.86 | | | 7.84 | | | 4.39 | | | 3.64 | |
Overhead expenses (G&A)2 | | | (0.07 | ) | | (0.19 | ) | | (0.12 | ) | | (0.21 | ) | | (0.15 | ) | | (0.11 | ) | | (0.08 | ) | | (0.08 | ) | | (0.13 | ) | | (0.10 | ) | | (0.13 | ) |
| Netback after overhead expenses | | | 6.05 | | | 4.24 | | | 4.12 | | | 1.70 | | | 3.54 | | | 4.76 | | | 0.41 | | | 1.78 | | | 7.71 | | | 4.29 | | | 3.51 | |
| Processing and other income | | | - | | | (0.15 | ) | | 0.10 | | | (0.07 | ) | | (0.03 | ) | | 0.02 | | | 0.08 | | | (0.02 | ) | | - | | | 0.02 | | | (0.04 | ) |
| Exploration expenses | | | (0.01 | ) | | - | | | - | | | (0.01 | ) | | (0.01 | ) | | - | | | - | | | - | | | - | | | - | | | - | |
| Depletion, depreciation and amortization | | | (0.73 | ) | | (0.73 | ) | | (0.73 | ) | | (0.73 | ) | | (0.73 | ) | | (0.65 | ) | | (0.65 | ) | | (0.65 | ) | | (0.65 | ) | | (0.65 | ) | | (0.57 | ) |
| Income and other taxes | | | (3.20 | ) | | (2.07 | ) | | (1.97 | ) | | 0.13 | | | (1.29 | ) | | (2.48 | ) | | 1.19 | | | 0.54 | | | (4.22 | ) | | (1.89 | ) | | (1.62 | ) |
Net earnings | | $ | 2.11 | | $ | 1.29 | | $ | 1.52 | | $ | 1.02 | | $ | 1.48 | | $ | 1.65 | | $ | 1.03 | | $ | 1.65 | | $ | 2.84 | | $ | 1.77 | | $ | 1.28 | |
Production, net (Bcf) | | | 5.9 | | | 5.1 | | | 5.9 | | | 6.0 | | | 22.9 | | | 6.8 | | | 6.8 | | | 6.6 | | | 6.1 | | | 26.3 | | | 26.1 | |
DISCONTINUED OPERATIONS8
($/boe, unless otherwise indicated)
| | | 2006 Three Months Ended | | Total | | 2005 Three Months Ended | | Total | | Total | |
| | | Mar. 31 | | June 30 | | Sept. 30 | | Dec. 31 | | 2006 | | Mar. 31 | | June 30 | | Sept. 30 | | Dec. 31 | | 2005 | | 2004 | |
Average price received5 | | $ | 70.36 | | | - | | | - | | | - | | $ | 70.36 | | $ | 52.83 | | $ | 58.96 | | $ | 65.24 | | $ | 62.80 | | $ | 60.39 | | $ | 45.91 | |
| Royalties | | | (52.10 | ) | | - | | | - | | | - | | | (52.10 | ) | | (35.71 | ) | | (41.73 | ) | | (45.73 | ) | | (43.60 | ) | | (42.15 | ) | | (31.49 | ) |
| Net revenue | | | 18.26 | | | - | | | - | | | - | | | 18.26 | | | 17.12 | | | 17.23 | | | 19.51 | | | 19.20 | | | 18.24 | | | 14.42 | |
| Operating expenses | | | (2.65 | ) | | - | | | - | | | - | | | (2.65 | ) | | (3.91 | ) | | (3.08 | ) | | (4.52 | ) | | (3.96 | ) | | (3.87 | ) | | (3.94 | ) |
| Netback | | | 15.61 | | | - | | | - | | | - | | | 15.61 | | | 13.21 | | | 14.15 | | | 14.99 | | | 15.24 | | | 14.37 | | | 10.48 | |
Overhead expenses (G&A)2 | | | (0.23 | ) | | - | | | - | | | - | | | (0.23 | ) | | (0.21 | ) | | (0.17 | ) | | (0.12 | ) | | (0.23 | ) | | (0.19 | ) | | (0.14 | ) |
| Netback after overhead | | | 15.38 | | | - | | | - | | | - | | | 15.38 | | | 13.00 | | | 13.98 | | | 14.87 | | | 15.01 | | | 14.18 | | | 10.34 | |
| Processing and other income | | | (1.06 | ) | | - | | | - | | | - | | | (1.06 | ) | | 0.33 | | | 0.47 | | | (0.22 | ) | | (0.07 | ) | | 0.14 | | | (0.04 | ) |
| Depletion, depreciation and amortization | | | - | | | - | | | - | | | - | | | - | | | (6.89 | ) | | (6.63 | ) | | (6.30 | ) | | (2.66 | ) | | (5.67 | ) | | (5.02 | ) |
| Income and other taxes | | | (5.11 | ) | | - | | | - | | | - | | | (5.11 | ) | | (3.88 | ) | | (4.39 | ) | | (5.10 | ) | | (4.87 | ) | | (4.55 | ) | | (3.34 | ) |
Net earnings | | $ | 9.21 | | | - | | | - | | | - | | $ | 9.21 | | $ | 2.56 | | $ | 3.43 | | $ | 3.25 | | $ | 7.41 | | $ | 4.10 | | $ | 1.94 | |
Production, net (MMboe) | | | 2.0 | | | - | | | - | | | - | | | 2.0 | | | 6.6 | | | 6.5 | | | 6.4 | | | 6.1 | | | 25.6 | | | 29.0 | |
1 North American Natural Gas includes U.S. Rockies post-acquisition date as of July 28, 2004.
2 Portion of head office expenses allocated to production.
3 Northwest Europe and North Africa/Near East include conventional crude oil, NGL and natural gas in crude oil equivalents. Northern Latin America includes only natural gas.
4 Production in Northwest Europe is subject to a conventional royalty and tax regime. No royalty is payable on production in the U.K. sector. Royalty is payable on onshore production in the Netherlands.
5 Average price for Northwest Europe and North Africa/Near East includes conventional crude oil, NGL and natural gas in crude oil equivalents.
6 In 2006, the Company recorded a $242 million charge for the U.K. supplemental corporate tax rate adjustment.
7 Excludes assets located in Kazakhstan, which were sold in 2004.
8 North Africa/Near East excludes production related to the mature Syrian producing assets sold in 2006, which are shown as discontinued operations.
9 Natural gas production in Trinidad and Tobago is held pursuant to a PSC with the government of that country. The government share is split between royalty and tax for Canadian reporting purposes.
Reserves
In order to harmonize its oil and gas disclosure in both Canada and the U.S., Petro-Canada applied for, and received, certain exemptions to reserves disclosure requirements as set out in National Instrument 51-101 Standards of Disclosure for Oil and Gas Activities (NI 51-101). This was adopted in 2003 by the securities regulatory authorities in Canada. These exemptions permit Petro-Canada to use its own staff of qualified reserves evaluators to prepare the Company's reserves estimates and to use SEC and Financial Accounting Standards Board (FASB) standards when reporting oil and gas reserves. In addition, the reserves for the Syncrude mining operation were prepared in accordance with SEC Industry Guide 7.
Petro-Canada strongly believes that the use of its own staff of qualified reserves evaluators, who are familiar with the Company's oil and gas assets as a result of working with them on a day-to-day basis, combined with independent third-party assessment of both its reserves processes and its reserves estimates, provides a level of confidence in its reserves data that is at least as valid as that which would be provided if the work was done solely by a third party.
Petro-Canada's staff of qualified reserves evaluators determines the Company's reserves data and quantities based on corporate-wide policies, procedures and practices. The Company believes these reserves policies, procedures and practices conform to the requirements of applicable Canadian and U.S. SEC regulations, and of the Association of Professional Engineers, Geologists and Geophysicists of Alberta's Standard of Practice for the Evaluation of Oil and Gas Reserves for Public Disclosure.
To confirm the quality of the reserves policies, procedures and practices and the internally generated reserves estimates, Petro-Canada employs the services of independent qualified engineering evaluators and auditors. For 2006, independent petroleum reservoir engineering consultants, Sproule Associates Limited (Sproule) and Gaffney, Cline & Associates Ltd. (GCA), conducted assessments of Petro-Canada's hydrocarbon reserves. GCA completed an independent audit of 29% of the Company's proved crude oil, natural gas and NGL reserves outside of North America. Similarly, Sproule audited 53% of Petro-Canada's North American proved oil and gas reserves. If the Syncrude oil sands mining proved reserves are included, the percentage of total North American reserves audited was 34%. The independent auditors' and evaluators' reports concluded that the Company's year-end 2006 proved reserves estimates are reasonable.
Sproule and GCA also audited Petro-Canada's reserves policies, procedures and practices. They concluded that Petro-Canada's reserves booking standards meet applicable disclosure regulations, that management is complying with those standards, and that the reserves process is carried out in a manner and standard consistent with the auditors' practices. In addition, PricewaterhouseCoopers LLP, as contract internal auditor, has tested aspects of the non-engineering management control processes used in establishing reserves.
Detailed information about Petro-Canada's proved reserves of crude oil, NGL, natural gas, bitumen and synthetic crude oil, before and after royalties, follows this section.
Petro-Canada's Reserves Processes
Petro-Canada has a well-established reserves management process. The key components of the process are:
Reserves Steering Committee: Chaired by the senior vice-president, North American Natural Gas, the Reserves Steering Committee meets regularly to address issues regarding the reserves evaluation and reporting processes. Senior managers representing each upstream business unit, finance and legal services make up this Committee.
Reservoir Engineering Organization: One or more reservoir engineering supervisors are responsible for the functional guidance of reservoir engineering within each upstream business unit. The supervisors ensure that the appropriate standards, processes and quality assurance checks are applied to reservoir engineering activities, including reserves evaluation. The supervisors, as responsible qualified reserves evaluators, sign the annual reserves evaluations for their respective areas.
Reserves Definitions, Policies, Procedures and Practices: Petro-Canada has developed corporate-wide internal policies, procedures and practices to assist reserves evaluation personnel. These policies are designed to meet internal and external reporting requirements and are updated annually, reviewed with the reservoir engineering staff, and are maintained for reference on the reservoir engineering section of Petro-Canada's internal website.
Major Property Reviews: Each year, prior to business plan development, a series of reviews are conducted with interdisciplinary management on Petro-Canada's major properties. These reviews are intended to ensure that there is a current, accurate and appropriately communicated understanding of these assets and their associated opportunities.
Reserves Software Tools: Petro-Canada employs a high quality technical tool kit for reservoir engineering. This software supports the analysis of technical and economic parameters required for reserves evaluation. Ongoing training and competency assessment is used to support the effective use of the tool kit.
Independent Evaluation/Audit/Review: Independent qualified reserves evaluators are engaged to audit and/or evaluate the Company's internal evaluation processes and to perform such tests as they deem appropriate to ensure Petro-Canada's reserves are appropriately evaluated. Each year’s annual independent evaluator assessment plan is reviewed and approved by the Audit, Finance and Risk Committee of the Board. The independent evaluators' observations and recommendations are reviewed with senior management and are used to guide process improvement activities.
Reserves Review and Disclosure Process: In December of each year, the management in each business unit reviews the reserves data prepared by the reservoir engineering staff. The officer responsible for each business unit signs an assertion regarding the quality of the reserves estimates and the processes applied. Also in December, Petro-Canada's year-end reserves and preliminary reports from the independent evaluators are reviewed by the Reserves Steering Committee and a copy of the preliminary reserves report is supplied to the external financial auditor. In January, the final reserves report is reviewed with the Executive Leadership Team and the Audit, Finance and Risk Committee of the Board.
The following tables show the Company's estimates of Petro-Canada's total proved crude oil, natural gas, bitumen and synthetic crude oil reserves as at December 31, 2006, and average 2006 daily production by major fields.
MAJOR RESERVES AND PRODUCTION LOCATIONS, BEFORE DEDUCTION OF ROYALTIES
Crude Oilfield/Facility1 | Location | Proved Reserves2, 3
at December 31, 2006
(MMbbls) | Average 2006 Daily Production
(Mbbl/d) |
Syncrude3 | Alberta | 344 | 31 |
| MacKay River | Alberta | 157 | 22 |
| Buzzard | Offshore U.K. | 104 | - |
| Hibernia | Offshore Newfoundland and Labrador | 54 | 36 |
| Amal | Libya | 42 | 16 |
| Terra Nova | Offshore Newfoundland and Labrador | 38 | 13 |
| White Rose | Offshore Newfoundland and Labrador | 32 | 24 |
| Ghani/Zenad Farrud | Libya | 30 | 11 |
| Ghani Gir/Facha | Libya | 20 | 7 |
| Ferrier | Alberta | 16 | 2 |
| Other | | 92 | 51 |
Total | | 929 | 213 |
Natural Gas Field/Facility1 | Location | Proved Reserves
at December 31, 2006 (Bcf) | Average 2006 Daily Production2
(MMcf/d) |
| Wildcat Hills area | Alberta | 326 | 114 |
| Hanlan area | Alberta | 224 | 94 |
| NCMA-1 | Offshore Trinidad and Tobago | 215 | 63 |
| Medicine Hat | Alberta | 185 | 45 |
| Jedney/Bubbles area | British Columbia | 117 | 28 |
| Alderson | Alberta | 97 | 25 |
| Laprise area | British Columbia | 83 | 27 |
| Denver-Julesburg area | U.S. | 78 | 20 |
| Ricinus/Bearberry/Strachan | Alberta | 71 | 45 |
| Powder River area | U.S. | 59 | 20 |
| Other | | 490 | 260 |
Total | | 1,945 | 741 |
1 Fields are onshore unless otherwise indicated.
2 The reserves and production figures shown in this table do not include NGL. Total Company proved reserves (include oil sands mining) of crude oil and NGL at year-end 2006 were 950 MMbbls.
3 Syncrude reserves are synthetic crude oil reserves from oil sands mining. See Legal Notice on page 1 regarding oil sands mining.
Petro-Canada believes that the crude oil, NGL, natural gas, bitumen and synthetic crude oil reserves quantities are reasonable estimates consistent with current knowledge of the characteristics and extent of the productive formations. Estimates are subject to upward or downward revisions as additional information regarding producing fields becomes available, as technology improves and as economic conditions change. Additional proved reserves are expected to be booked during the normal course of continuing development.
The following table shows, for the years indicated, Petro-Canada's estimates of proved reserves, before royalties: TABLE 1 - Oil and Gas Activities; TABLE 2 - Oil Sands Mining; TABLE 3 - Total of Oil and Gas Activities and Oil Sands Mining.
PROVED RESERVES BEFORE ROYALTIES
(Crude oil and equivalents in MMbbls; Natural gas in Bcf)
| | | TABLE 1 Oil and Gas Activities1, 2, 3, 4, 5 | | TABLE 2 Oil Sands Mining
1, 2, 3, 4, 5 | | TABLE 3 Total Oil and Gas Activities and Oil Sands Mining | |
| | | International | | North America | | | | | | | |
| | | | | | | | | | | North American Natural Gas | | | | | | | | | | | | | |
| | | Northwest Europe6 | | North Africa/Near East 7, 8, 9, 10, 11, 16 | | Northern Latin America
7, 12 | | Subtotal | | Western Canada | | U.S. Rockies | | East Coast | | Oil Sands | | Subtotal | | Total | | Syncrude Mining Operation
13 | | Total | |
| | | Crude oil & NGL | | Natural gas | | Crude oil & NGL | | Natural gas | | Natural gas | | Crude oil & NGL | | Natural gas | | Crude oil & NGL | | Natural gas | | Crude oil & NGL | | Natural gas | | Crude oil & NGL | | Bitumen | | Crude oil, NGL & bitumen | | Natural gas | | Crude oil, NGL & bitumen | | Natural gas | | Synthetic crude oil17 | | Crude oil & equivalents | |
Beginning of year 2005 | | | 148 | | | 131 | | | 210 | | | 39 | | | 265 | | | 358 | | | 435 | | | 38 | | | 1,950 | | | 6 | | | 88 | | | 68 | | | - | | | 112 | | | 2,038 | | | 470 | | | 2,473 | | | 331 | | | 801 | |
Revisions of previous estimates14 | | | 2 | | | 4 | | | 29 | | | (14 | ) | | - | | | 31 | | | (10 | ) | | 5 | | | (36 | ) | | 2 | | | 22 | | | 68 | | | 8 | | | 83 | | | (14 | ) | | 114 | | | (24 | ) | | 20 | | | 134 | |
Sale of reserves in place | | | - | | | - | | | - | | | - | | | - | | | - | | | - | | | - | | | - | | | - | | | - | | | - | | | - | | | - | | | - | | | - | | | - | | | - | | | - | |
Purchase of reserves in place | | | 5 | | | 4 | | | - | | | - | | | - | | | 5 | | | 4 | | | - | | | - | | | - | | | - | | | - | | | - | | | - | | | - | | | 5 | | | 4 | | | - | | | 5 | |
Discoveries, extension and improved recovery | | | - | | | - | | | 3 | | | - | | | - | | | 3 | | | - | | | 4 | | | 44 | | | - | | | - | | | 23 | | | - | | | 27 | | | 44 | | | 30 | | | 44 | | | - | | | 30 | |
Production net | | | (12 | ) | | (24 | ) | | (42 | ) | | (9 | ) | | (26 | ) | | (54 | ) | | (59 | ) | | (5 | ) | | (229 | ) | | (1 | ) | | (14 | ) | | (27 | ) | | (8 | ) | | (41 | ) | | (243 | ) | | (95 | ) | | (302 | ) | | (9 | ) | | (104 | ) |
End of year 2005 | | | 143 | | | 115 | | | 200 | | | 16 | | | 239 | | | 343 | | | 370 | | | 42 | | | 1,729 | | | 7 | | | 96 | | | 132 | | | - | | | 181 | | | 1,825 | | | 524 | | | 2,195 | | | 342 | | | 866 | |
Revisions of previous estimates14 | | | 13 | | | (6 | ) | | (2 | ) | | - | | | (1 | ) | | 11 | | | (7 | ) | | 1 | | | (47 | ) | | 2 | | | 64 | | | 18 | | | 165 | | | 186 | | | 17 | | | 197 | | | 10 | | | 14 | | | 211 | |
Sale of reserves in place | | | - | | | (2 | ) | | (46 | ) | | (15 | ) | | - | | | (46 | ) | | (17 | ) | | - | | | (1 | ) | | - | | | - | | | - | | | - | | | - | | | (1 | ) | | (46 | ) | | (18 | ) | | - | | | (46 | ) |
Purchase of reserves in place | | | - | | | - | | | - | | | - | | | - | | | - | | | - | | | - | | | 1 | | | - | | | - | | | - | | | - | | | - | | | 1 | | | - | | | 1 | | | - | | | - | |
Discoveries, extensions and improved recovery | | | - | | | - | | | - | | | - | | | - | | | - | | | - | | | - | | | 27 | | | - | | | - | | | - | | | - | | | - | | | 27 | | | - | | | 27 | | | - | | | - | |
Production net | | | (12 | ) | | (23 | ) | | (18 | ) | | - | | | (23 | ) | | (30 | ) | | (46 | ) | | (4 | ) | | (209 | ) | | (1 | ) | | (15 | ) | | (27 | ) | | (8 | ) | | (40 | ) | | (224 | ) | | (70 | ) | | (270 | ) | | (11 | ) | | (81 | ) |
End of year 2006 | | | 144 | | | 84 | | | 134 | | | 1 | | | 215 | | | 278 | | | 300 | | | 39 | | | 1,500 | | | 8 | | | 145 | | | 123 | | | 157 | | | 327 | | | 1,645 | | | 605 | | | 1,945 | | | 345 | | | 950 | |
Proved undeveloped reserves15 | | | | | | | | | | | | | | | | | | | | | | | | | | | | | | | | | | | | | | | | | | | | | | | | | | | | | | | | | | |
Beginning of year 2005 | | | 101 | | | 14 | | | 21 | | | - | | | 178 | | | 122 | | | 192 | | | 1 | | | 82 | | | 2 | | | 24 | | | 19 | | | - | | | 22 | | | 106 | | | 144 | | | 298 | | | 189 | | | 333 | |
End of year 2005 | | | 95 | | | 14 | | | 22 | | | - | | | 178 | | | 117 | | | 192 | | | 1 | | | 132 | | | 3 | | | 30 | | | 43 | | | - | | | 47 | | | 162 | | | 164 | | | 354 | | | 209 | | | 373 | |
End of year 2006 | | | 42 | | | 3 | | | 3 | | | - | | | 138 | | | 45 | | | 141 | | | - | | | 56 | | | 4 | | | 36 | | | 33 | | | 129 | | | 166 | | | 92 | | | 211 | | | 233 | | | 219 | | | 430 | |
The following table shows, for the years indicated, Petro-Canada's estimates of proved reserves, after royalties: TABLE 1 - Oil and Gas Activities; TABLE 2 - Oil Sands Mining; TABLE 3 - Total of Oil and Gas Activities and Oil Sands Mining.
PROVED RESERVES AFTER ROYALTIES
(Crude oil and equivalents in MMbbls; Natural gas in Bcf)
| | | TABLE 1 Oil and Gas Activities1, 2, 3, 4, 5 | | TABLE 2 Oil Sands Mining
1, 2, 3, 4, 5 | | TABLE 3 Total Oil and Gas Activities and Oil Sands Mining | |
| | | International | | North America | | | | | | | |
| | | | | | | | | | | North American Natural Gas | | | | | | | | | | | | | |
| | | Northwest Europe6 | | North Africa/Near East 7, 8, 9, 10, 11, 16 | | Northern Latin America
7, 12 | | Subtotal | | Western Canada | | U.S. Rockies | | East Coast | | Oil Sands | | Subtotal | | Total | | Syncrude Mining Operation13 | | Total | |
| | | Crude oil & NGL | | Natural gas | | Crude oil & NGL | | Natural gas | | Natural gas | | Crude oil & NGL | | Natural gas | | Crude oil & NGL | | Natural gas | | Crude oil & NGL | | Natural gas | | Crude oil & NGL | | Bitumen | | | | Natural gas | | Crude oil, NGL & bitumen | | Natural gas | | Synthetic crude oil17 | | Crude oil & equivalents | |
Beginning of year 2005 | | | 148 | | | 131 | | | 144 | | | 13 | | | 225 | | | 292 | | | 369 | | | 30 | | | 1,508 | | | 4 | | | 73 | | | 61 | | | - | | | 95 | | | 1,581 | | | 387 | | | 1,950 | | | 287 | | | 674 | |
Revisions of previous estimates14 | | | 1 | | | 5 | | | 28 | | | (6 | ) | | (1 | ) | | 29 | | | (2 | ) | | 5 | | | (28 | ) | | 7 | | | 18 | | | 57 | | | 8 | | | 77 | | | (10 | ) | | 106 | | | (12 | ) | | 9 | | | 115 | |
Sale of reserves in place | | | - | | | - | | | - | | | - | | | - | | | - | | | - | | | - | | | - | | | - | | | - | | | - | | | - | | | - | | | - | | | - | | | - | | | - | | | - | |
Purchase of reserves in place | | | 5 | | | 3 | | | - | | | - | | | - | | | 5 | | | 3 | | | - | | | - | | | - | | | - | | | - | | | - | | | - | | | - | | | 5 | | | 3 | | | - | | | 5 | |
Discoveries, extensions and improved recovery | | | - | | | - | | | 2 | | | - | | | - | | | 2 | | | - | | | 3 | | | 34 | | | - | | | - | | | 20 | | | - | | | 23 | | | 34 | | | 25 | | | 34 | | | - | | | 25 | |
Production net | | | (12 | ) | | (24 | ) | | (22 | ) | | (2 | ) | | (21 | ) | | (34 | ) | | (47 | ) | | (4 | ) | | (175 | ) | | (6 | ) | | (12 | ) | | (25 | ) | | (8 | ) | | (43 | ) | | (187 | ) | | (77 | ) | | (234 | ) | | (9 | ) | | (86 | ) |
End of year 2005 | | | 142 | | | 115 | | | 152 | | | 5 | | | 203 | | | 294 | | | 323 | | | 34 | | | 1,339 | | | 5 | | | 79 | | | 113 | | | - | | | 152 | | | 1,418 | | | 446 | | | 1,741 | | | 287 | | | 733 | |
Revisions of previous estimates14 | | | 13 | | | (6 | ) | | 28 | | | 10 | | | (2 | ) | | 41 | | | 2 | | | 1 | | | (43 | ) | | 2 | | | 55 | | | 10 | | | 159 | | | 172 | | | 12 | | | 213 | | | 14 | | | 12 | | | 225 | |
Sale of reserves in place | | | - | | | (2 | ) | | (42 | ) | | (15 | ) | | - | | | (42 | ) | | (17 | ) | | - | | | (1 | ) | | - | | | - | | | - | | | - | | | - | | | (1 | ) | | (42 | ) | | (18 | ) | | - | | | (42 | ) |
Purchase of reserves in place | | | - | | | - | | | - | | | - | | | - | | | - | | | - | | | - | | | 1 | | | - | | | - | | | - | | | - | | | - | | | 1 | | | - | | | 1 | | | - | | | - | |
Discoveries, extensions and improved recovery | | | - | | | - | | | - | | | - | | | - | | | - | | | - | | | - | | | 21 | | | - | | | - | | | - | | | - | | | - | | | 21 | | | - | | | 21 | | | - | | | - | |
Production net | | | (12 | ) | | (23 | ) | | (16 | ) | | - | | | (12 | ) | | (28 | ) | | (35 | ) | | (3 | ) | | (166 | ) | | (1 | ) | | (12 | ) | | (25 | ) | | (8 | ) | | (37 | ) | | (178 | ) | | (65 | ) | | (213 | ) | | (10 | ) | | (75 | ) |
End of year 2006 | | | 143 | | | 84 | | | 122 | | | - | | | 189 | | | 265 | | | 273 | | | 32 | | | 1,151 | | | 6 | | | 122 | | | 98 | | | 151 | | | 287 | | | 1,273 | | | 552 | | | 1,546 | | | 289 | | | 841 | |
Proved undeveloped reserves15 | | | | | | | | | | | | | | | | | | | | | | | | | | | | | | | | | | | | | | | | | | | | | | | | | | | | | | | | | | |
Beginning of year 2005 | | | 101 | | | 14 | | | 14 | | | | | | 151 | | | 115 | | | 165 | | | 1 | | | 65 | | | 2 | | | 20 | | | 16 | | | | | | 19 | | | 85 | | | 134 | | | 250 | | | 161 | | | 295 | |
End of year 2005 | | | 95 | | | 14 | | | 15 | | | | | | 151 | | | 110 | | | 165 | | | 1 | | | 99 | | | 3 | | | 25 | | | 33 | | | | | | 37 | | | 124 | | | 147 | | | 289 | | | 173 | | | 320 | |
End of year 2006 | | | 42 | | | 4 | | | 2 | | | | | | 121 | | | 44 | | | 125 | | | | | | 42 | | | 4 | | | 30 | | | 24 | | | 124 | | | 152 | | | 72 | | | 196 | | | 197 | | | 182 | | | 378 | |
| 1 | In order to harmonize its oil and gas disclosure in both Canada and the U.S., Petro-Canada applied for, and received, certain exemptions to reserves disclosure requirements as set out in NI 51-101. These exemptions permit Petro-Canada to use its own staff of qualified reserves evaluators to prepare the Company's reserves estimates and to use U.S. SEC and FASB standards when preparing and reporting reserves. Such reserves information may differ from reserves information prepared in accordance with Canadian disclosure standards under NI 51-101. These differences relate to the SEC requirement for disclosure only of proved reserves calculated at constant year-end prices and costs while NI 51-101 requires disclosure of proved reserves at constant prices and costs, and proved plus probable reserves at forecast prices and costs. Also, the definition of proved reserves differs between SEC and NI 51-101 requirements. However, this difference should not be material. The Canadian Oil and Gas Evaluation Handbook (the source document for reserves definitions under NI 51-101) supports this view. |
| 2 | Petro-Canada employs the services of independent third-party evaluators/auditors to assess its reserves policies, procedures and practices and its reserves estimates. |
| 3 | Proved reserves before royalties are Petro-Canada's working interest reserves before the deduction of Crown or other royalties. Such royalties are subject to change by legislation or regulation and can also vary depending on production rates, selling prices and timing of initial production. Reserves quantities after royalty also reflect net overriding royalty interests paid and received. |
| 4 | Proved reserves are the estimated quantities of crude oil, natural gas and NGL, which geological and engineering data demonstrate with reasonable certainty to be recoverable in future years from known reservoirs under existing economic and operating conditions. Proved developed reserves are those proved reserves that are expected to be recovered from existing wells or facilities. Proved undeveloped reserves are proved reserves which are not recoverable from existing wells or facilities, but which are expected to be recovered through additional development drilling or through the upgrading of existing or additional new facilities. |
| 5 | Unproved reserves are based on geological and/or engineering data similar to that used in estimates of proved reserves, but technical, contractual, economic or regulatory uncertainties preclude such reserves being classified as proved. Unproved reserves may be further classified as probable reserves and possible reserves. |
| 6 | Reserves in Northwest Europe are subject to a conventional royalty and tax regime. No royalty is payable on reserves in the U.K. sector. Royalty is payable on onshore reserves in the Netherlands. |
| 7 | Proved reserves include quantities of crude oil and natural gas, which will be produced under arrangements, which involve the Company or its subsidiaries in upstream risks and rewards, but which do not transfer title of the product to those companies. |
| 8 | In Petro-Canada's PSCs, after royalty proved reserves have been determined using the economic interest method and include the Company's share of future cost recovery and profit oil after foreign governments' royalty interest, and include reserves relating to income tax payable. Under this method, reported reserves will increase as oil prices decrease (and vice versa) since the bbls necessary to achieve cost recovery change with the prevailing oil prices. |
| 9 | Reserves in Syria are held under PSCs with the Syrian government and are calculated as per footnote 8. |
| 10 | With the exception of the En Naga field, reserves in Libya are held under a concession and are subject to a royalty and tax regime. The En Naga field is held under a PSC with the Libyan government, with reserves being calculated as per footnote 8. |
| 11 | The volume of oil and gas reserves before royalties reported above held under PSCs in the North Africa/Near East region at the end of 2006 was 10 MMbbls of crude oil and NGL and zero Bcf of natural gas. At year-end 2005, the volume was 59 MMbbls of crude oil and NGL and 15 Bcf of natural gas. The after royalty reserves volumes were: year-end 2006 - 7 MMbbls of crude oil and NGL and zero Bcf of natural gas, and year-end 2005 - 21 MMbbls of crude oil and NGL and 5 Bcf of natural gas. Reserves information for 2005 includes the Syrian producing assets sold in 2006. |
| 12 | Natural gas reserves in Trinidad and Tobago are held under a PSC with the applicable government and are calculated as per footnote 8. The volume of proved natural gas reserves before royalties reported above held under PSCs in Trinidad and Tobago at the end of 2006 was 215 Bcf. At year-end 2005, the volume was 239 Bcf. The after royalty reserves volumes were: year-end 2006 - 189 Bcf, and year-end 2005 - 203 Bcf. |
| 13 | U.S. SEC regulations do not define proved reserves of synthetic crude oil from oil sands mining operations as an oil and gas activity. These reserves are classified as a mining activity and are estimated in accordance with SEC Industry Guide 7. Petro-Canada views these reserves as an integral part of the Company's business. Proved reserves of synthetic crude oil are based on high geological certainty and application of proven or piloted technology. For proved reserves, drill-hole spacing is less than 500 metres and appropriate co-owner and regulatory approvals are in place. Syncrude proved oil sands mining reserves have been determined using SEC year-end prices in the economics. |
| 14 | Revisions include changes in previous estimates, either upward or downward, resulting from new information (except an increase in acreage) normally obtained from drilling or production history or resulting from a change in economic factors. |
| 15 | Proved undeveloped crude oil and NGL proved reserves in Table 1 represent approximately 35% of Petro-Canada's total crude oil and NGL proved reserves. The vast majority of these oil and NGL reserves are associated with large development projects currently producing or under active development, including Buzzard, MacKay River, White Rose, Terra Nova and Hibernia. Proved undeveloped gas reserves represent approximately 12% of total proved natural gas reserves. These reserves typically will be developed through tie-in of existing wells, drilling of additional wells or addition of compression facilities. Fifty-nine per cent of the proved undeveloped gas reserves are associated with the currently producing NCMA-1 development in Trinidad and Tobago. Generally, the Company plans to develop proved undeveloped natural gas reserves in the next few years. |
| 16 | The Company closed the sale of its Syrian producing assets on January 31, 2006. |
| 17 | For internal management purposes, we view the oil sands mining reserves as part of the Company's total exploration and production operations. |
Standardized Measure of Discounted Future Net Cash Flows and Changes Therein Relating to Proved Oil and Gas Reserves
The following disclosures on standardized measure of discounted cash flows and changes therein relating to proved oil and gas reserves are determined in accordance with the U.S. FASB Statement 69, Disclosures About Oil and Gas Producing Activities. The future cash flows are calculated by applying year-end prices, or prices provided by contractual arrangements, net of royalties, to year-end quantities of proved oil and gas reserves. Future production, development and asset retirement costs are based on year-end costs, and estimated future income taxes are based on legislated future income tax rates. The resulting future net cash flows are discounted at 10% per annum. The calculation does not represent a fair market value of the Company's oil and gas reserves or of the future net cash flows. No consideration is given to the value of exploration properties or probable reserves. No consideration is given to the value of the Company's share of the Syncrude oil sands mining operation, as it is considered a mining operation under SEC disclosure. The following benchmark commodity prices as at December 31, 2006 were used in deriving the Standardized Measure: West Texas Intermediate (WTI) at Cushing $61.05/bbl US, Dated Brent at Sullom Voe $58.93/bbl US, New York Mercantile Exchange (NYMEX) gas price at the Henry Hub $5.84/MMBtu US, and Alberta price of natural gas at the AECO-C Hub Cdn $5.68/gigajoule (GJ). The following currency exchange rates were also used: Cdn$/US$ 1.1654, Cdn$/euro 1.5377, Cdn$/British pound 2.2824.
PRESENT VALUE OF ESTIMATED FUTURE NET CASH FLOWS
(millions of Canadian dollars)
| | | Western Canada1 | U.S. Rockies | East Coast Oil2 |
| | | 2006 | | 2005 | | 2004 | | 2006 | | 2005 | | 2004 | | 2006 | | 2005 | | 2004 | |
| Future cash flows | | $ | 12,513 | | $ | 15,255 | | $ | 11,470 | | $ | 1,130 | | $ | 1,058 | | $ | 688 | | $ | 7,164 | | $ | 7,746 | | $ | 2,580 | |
| Future production, development and asset retirement costs | | | (5,593 | ) | | (2,631 | ) | | (2,344 | ) | | (525 | ) | | (402 | ) | | (281 | ) | | (1,499 | ) | | (1,314 | ) | | (786 | ) |
| Future income taxes | | | (1,764 | ) | | (4,121 | ) | | (2,900 | ) | | (187 | ) | | (245 | ) | | (110 | ) | | (1,553 | ) | | (1,993 | ) | | (467 | ) |
| Future net cash flows | | | 5,156 | | | 8,503 | | | 6,226 | | | 418 | | | 411 | | | 297 | | | 4,112 | | | 4,439 | | | 1,327 | |
| Discount of 10% for estimated timing of cash flows | | | (1,927 | ) | | (3,413 | ) | | (2,676 | ) | | (154 | ) | | (168 | ) | | (118 | ) | | (879 | ) | | (1,164 | ) | | (285 | ) |
| Discounted future net cash flows | | $ | 3,229 | | $ | 5,090 | | $ | 3,550 | | $ | 264 | | $ | 243 | | $ | 179 | | $ | 3,233 | | $ | 3,275 | | $ | 1,042 | |
| | | | | | | | | | | | | | | | | | | | | | | | | | | | | |
| | | Northwest Europe | North Africa/Near East | Northern Latin America |
| | | | 2006 | | | 2005 | | | 2004 | | | 2006 | | | 2005 | | | 2004 | | | 2006 | | | 2005 | | | 2004 | |
| Future cash flows | | $ | 8,506 | | $ | 9,092 | | $ | 7,624 | | $ | 8,011 | | $ | 8,984 | | $ | 6,039 | | $ | 838 | | $ | 1,737 | | $ | 1,031 | |
| Future production, development and asset retirement costs | | | (2,918 | ) | | (2,844 | ) | | (3,190 | ) | | (1,024 | ) | | (800 | ) | | (981 | ) | | (282 | ) | | (248 | ) | | (151 | ) |
| Future income taxes | | | (2,966 | ) | | (3,227 | ) | | (1,682 | ) | | (6,088 | ) | | (7,092 | ) | | (4,344 | ) | | (289 | ) | | (813 | ) | | (479 | ) |
| Future net cash flows | | | 2,622 | | | 3,021 | | | 2,752 | | | 899 | | | 1,092 | | | 714 | | | 267 | | | 676 | | | 401 | |
| Discount of 10% for estimated timing of cash flows | | | (532 | ) | | (859 | ) | | (929 | ) | | (309 | ) | | (392 | ) | | (271 | ) | | (119 | ) | | (305 | ) | | (188 | ) |
| Discounted future net cash flows | | $ | 2,090 | | $ | 2,162 | | $ | 1,823 | | $ | 590 | | $ | 700 | | $ | 443 | | $ | 148 | | $ | 371 | | $ | 213 | |
| | | | | | | | | | | | | | | | | | | | | | | | | | | | | |
| | | Continuing Operations | Discontinued Operations | Total |
| | | | 2006 | | | 2005 | | | 2004 | | | 2006 | | | 2005 | | | 2004 | | | 2006 | | | 2005 | | | 2004 | |
| Future cash flows | | $ | 38,162 | | $ | 43,872 | | $ | 29,432 | | $ | - | | $ | 1,008 | | $ | 1,038 | | $ | 38,162 | | $ | 44,880 | | $ | 30,470 | |
| Future production, development and asset retirement costs | | | (11,841 | ) | | (8,239 | ) | | (7,733 | ) | | - | | | (336 | ) | | (453 | ) | | (11,841 | ) | | (8,575 | ) | | (8,186 | ) |
| Future income taxes | | | (12,847 | ) | | (17,491 | ) | | (9,982 | ) | | - | | | (244 | ) | | (219 | ) | | (12,847 | ) | | (17,735 | ) | | (10,201 | ) |
| Future net cash flows | | | 13,474 | | | 18,142 | | | 11,717 | | | - | | | 428 | | | 366 | | | 13,474 | | | 18,570 | | | 12,083 | |
| Discount of 10% for estimated timing of cash flows | | | (3,920 | ) | | (6,301 | ) | | (4,467 | ) | | - | | | (81 | ) | | (84 | ) | | (3,920 | ) | | (6,382 | ) | | (4,551 | ) |
| Discounted future net cash flows | | $ | 9,554 | | $ | 11,841 | | $ | 7,250 | | $ | - | | $ | 347 | | $ | 282 | | $ | 9,554 | | $ | 12,188 | | $ | 7,532 | |
1 Western Canada includes the cash flows of MacKay River in 2006. There were no proved reserves at MacKay River at year-end 2004 and 2005.
2 Additional East Coast Oil reserves quantities will be booked as proved reserves as development proceeds.
SUMMARY OF CHANGES IN PRESENT VALUE OF ESTIMATED FUTURE CASH FLOWS
(millions of Canadian dollars)
| | | 2006 | | 2005 | | 2004 | |
Balance at beginning of year | | $ | 12,188 | | $ | 7,532 | | $ | 6,216 | |
Changes result from: | | | | | | | | | | |
| Sales and transfers of oil and gas produced, net of production costs | | | (5,480 | ) | | (5,273 | ) | | (4,348 | ) |
| Net changes in prices, operating costs and royalties | | | (2,859 | ) | | 9,013 | | | 2,482 | |
| Extensions, discoveries, additions and improved recoveries | | | 59 | | | 1,383 | | | 395 | |
| Changes in estimated future development costs | | | (597 | ) | | (758 | ) | | (1,235 | ) |
| Development costs incurred during the year | | | 900 | | | 900 | | | 966 | |
| Revisions of previous quantity estimates | | | 2,081 | | | 3,328 | | | 979 | |
| Accretion of discount | | | 2,295 | | | 1,374 | | | 1,117 | |
| Net change in income tax | | | 2,572 | | | (4,711 | ) | | (1,186 | ) |
| Purchase and sale of reserves in place | | | (367 | ) | | 246 | | | 2,017 | |
| Changes in timing and other | | | (1,238 | ) | | (846 | ) | | 129 | |
| Net change | | | (2,634 | ) | | 4,656 | | | 1,316 | |
Balance at end of year | | $ | 9,554 | | $ | 12,188 | | $ | 7,532 | |
Abandonment and Reclamation Costs
The Company's upstream future asset retirement costs are estimated based on current costs and technology, and in accordance with existing legislation and industry practice. As of December 31, 2006, the total of these future costs is estimated to be $3,418 million undiscounted, or $761 million discounted at 10%. The Company's upstream operations expect to spend approximately $36 million, $47 million and $41 million in the next three years, respectively, for future asset retirement costs. The following table summarizes Petro-Canada's wells capable of production.
PRODUCTIVE WELLS1 AT DECEMBER 31, 2006
| | | Crude Oil Wells | | Natural Gas Wells | | Total Wells | |
| | | Gross2 | | Net3 | | Gross2 | | Net3 | | Gross2 | | Net3 | |
North America | | | | | | | | | | | | | |
North American Natural Gas - conventional oil and gas | | | 926 | | | 744 | | | 5,240 | | | 3,575 | | | 6,166 | | | 4,319 | |
| East Coast Oil - conventional oil | | | 91 | | | 23 | | | - | | | - | | | 91 | | | 23 | |
Oil Sands - in situ bitumen recovery | | | 42 | | | 42 | | | - | | | - | | | 42 | | | 42 | |
| Total North America | | | 1,059 | | | 809 | | | 5,240 | | | 3,575 | | | 6,299 | | | 4,384 | |
International | | | | | | | | | | | | | | | | | | | |
| Northwest Europe - conventional oil and gas | | | 42 | | | 17 | | | 31 | | | 4 | | | 73 | | | 21 | |
| North Africa/Near East - conventional oil and gas | | | 237 | | | 109 | | | - | | | - | | | 237 | | | 109 | |
| Northern Latin America - natural gas | | | - | | | - | | | 9 | | | 2 | | | 9 | | | 2 | |
| Total International | | | 279 | | | 126 | | | 40 | | | 6 | | | 319 | | | 132 | |
Total productive wells from continuing operations | | | | | | | | | | | | | | | | | | | |
Discontinued operations | | | - | | | - | | | - | | | - | | | - | | | - | |
Total productive wells | | | 1,338 | | | 935 | | | 5,280 | | | 3,581 | | | 6,618 | | | 4,516 | |
1 Wells with multiple completions are counted as one well.
2 Gross wells are wells in which Petro-Canada owns a working interest.
3 Net wells are the sums of the fractional working interests owned by Petro-Canada in gross wells, rounded to the nearest whole number.
Oil and Natural Gas Rights
Petro-Canada's oil and natural gas rights are summarized in the following table. Landholdings are subject to government regulation.
OIL AND GAS RIGHTS AT DECEMBER 31, 2006
| | Developed Lands1 | Undeveloped Lands1 | Total |
| | 2006 | 2005 | 2006 | 2005 | 2006 | 2005 |
(millions of acres) | Gross2 | Net3 | Gross2 | Net3 | Gross2 | Net3 | Gross2 | Net3 | Gross2 | Net3 | Gross2 | Net3 |
Canada | | | | | | | | | | | | |
| Mainland Canada | 2.2 | 1.1 | 2.1 | 1.2 | 2.6 | 2.1 | 3.1 | 2.6 | 4.8 | 3.2 | 5.2 | 3.8 |
| Oil Sands | 0.4 | 0.2 | 0.4 | 0.2 | 0.4 | 0.3 | 0.3 | 0.2 | 0.8 | 0.5 | 0.7 | 0.4 |
| East Coast Oil offshore | 0.1 | - | 0.1 | - | 2.0 | 0.7 | 2.4 | 0.9 | 2.1 | 0.7 | 2.5 | 0.9 |
Other frontier4 | - | - | - | - | 8.9 | 7.1 | 9.0 | 7.1 | 8.9 | 7.1 | 9.0 | 7.1 |
Total Canada | 2.7 | 1.3 | 2.6 | 1.4 | 13.9 | 10.2 | 14.8 | 10.8 | 16.6 | 11.5 | 17.4 | 12.2 |
United States5 | 0.1 | 0.1 | 0.1 | - | 2.8 | 1.2 | 2.4 | 1.4 | 2.9 | 1.3 | 2.5 | 1.4 |
International | | | | | | | | | | | | |
| North Africa/Near East | 0.4 | 0.2 | 0.4 | 0.2 | 26.9 | 21.4 | 25.8 | 20.0 | 27.3 | 21.6 | 26.2 | 20.2 |
| Northwest Europe | 0.1 | 0.1 | 0.1 | - | 2.4 | 0.8 | 2.4 | 1.0 | 2.5 | 0.9 | 2.5 | 1.0 |
| Northern Latin America | 0.1 | - | 0.1 | - | 1.2 | 1.0 | 1.2 | 1.0 | 1.3 | 1.0 | 1.3 | 1.0 |
Total International | 0.6 | 0.3 | 0.6 | 0.2 | 30.5 | 23.2 | 29.4 | 22.0 | 31.1 | 23.5 | 30.0 | 22.2 |
Total from continuing operations | 3.4 | 1.7 | 3.3 | 1.6 | 47.2 | 34.6 | 46.6 | 34.2 | 50.6 | 36.3 | 49.9 | 35.8 |
Discontinued operations | - | - | 0.5 | 0.2 | - | - | - | - | - | - | 0.5 | 0.2 |
Total | 3.4 | 1.7 | 3.8 | 1.8 | 47.2 | 34.6 | 46.6 | 34.2 | 50.6 | 36.3 | 50.4 | 36.0 |
1 Developed lands are areas capable of production, while undeveloped lands are areas with rights to explore.
2 Gross acres include the interests of others.
3 Net acres exclude the interests of others.
4 Includes lands located off the west coast of Canada where exploration is currently subject to a moratorium.
5 Petro-Canada was successful at the 2006 Alaska State and NPR-A lease sales, acquiring approximately 974,000 gross acres and 362,000 net acres. These leases will not be issued and effective until 2007, thus they are not included in the table above. As well, U.S. figures do not include option acreage in the Alaska Foothills.
Work Commitments
The practice of governments requiring companies to pledge to carry out work commitments in exchange for the right to carry out exploration for and development of hydrocarbons is common, particularly in unexplored or lightly explored regions of the world. Petro-Canada has made the following commitments in regard to the lands it holds.
WORK COMMITMENTS AS AT DECEMBER 31, 2006
(millions of Canadian dollars)
| | | Petro-Canada Share of Total Work Commitments | | Petro-Canada Share of Total Work Commitments to be Incurred in 20071 | |
Mainland Canada | | | | | |
| Mackenzie Delta/Corridor region | | $ | 14.9 | | $ | - | |
East Coast offshore | | | 15.0 | | | 8.0 | |
International | | | | | | | |
| Northern Latin America | | | 7.7 | | | 3.2 | |
| Northwest Europe | | | 70.5 | | | 53.3 | |
| North Africa/Near East | | | 23.6 | | | 23.6 | |
Total work commitments from continuing operations | | | 131.7 | | | 88.1 | |
Discontinued operations | | | - | | | - | |
Total work commitments | | $ | 131.7 | | $ | 88.1 | |
1 Capital expenditure plan for 2007 includes provisions for these work commitments.
Land Expiries
The following table summarizes the land area by region for which Petro-Canada's rights to explore for, or develop hydrocarbons in will expire in 2007.
LAND EXPIRIES IN 2007
(millions of acres)
| | | Gross1 | | Net2 | |
North American Natural Gas | | | 0.8 | | | 0.6 | |
East Coast Oil | | | 0.5 | | | 0.2 | |
Oil Sands | | | 0.2 | | | 0.1 | |
International | | | - | | | - | |
Total expiries in 2007 | | | 1.5 | | | 0.9 | |
1 Gross acres include the interests of others.
2 Net acres exclude the interests of others.
Drilling Activity
The following table shows Petro-Canada's drilling activity during the years indicated.
EXPLORATION AND DEVELOPMENT WELLS DRILLED
| | 2006 | 2005 | 2004 |
| | Gross1 | Net2 | Gross1 | Net2 | Gross1 | Net2 |
NORTH AMERICAN NATURAL GAS | | | | | | |
Western Canada and U.S. Rockies | | | | | | |
Exploration wells3 | | | | | | |
| Oil | 3 | 3 | - | - | 2 | - |
| Natural gas | 18 | 14 | 48 | 31 | 53 | 35 |
Dry4 | 20 | 19 | 21 | 15 | 19 | 14 |
| Subtotal | 41 | 36 | 69 | 46 | 74 | 49 |
Development wells5 | | | | | | |
| Oil | 75 | 68 | 4 | 2 | 5 | 2 |
| Natural gas | 551 | 413 | 666 | 437 | 589 | 461 |
| Dry | 9 | 6 | 4 | 3 | 7 | 5 |
| Subtotal | 635 | 487 | 674 | 442 | 601 | 468 |
Total North American Natural Gas | 676 | 523 | 743 | 488 | 675 | 517 |
EAST COAST OIL | | | | | | |
Exploration wells3 | | | | | | |
| Oil | 3 | 1 | 2 | 1 | - | - |
Dry4 | - | - | - | - | - | - |
| Subtotal | 3 | 1 | 2 | 1 | - | - |
Development wells5 | | | | | | |
| Oil | 10 | 3 | 13 | 3 | 17 | 4 |
| Dry | - | - | - | - | - | - |
| Subtotal | 10 | 3 | 13 | 3 | 17 | 4 |
Total East Coast Oil | 13 | 4 | 15 | 4 | 17 | 4 |
OIL SANDS | | | | | | |
Development wells5 | | | | | | |
| Bitumen | - | - | 46 | 46 | - | - |
Total Oil Sands | - | - | 46 | 46 | - | - |
1 Gross wells are wells (excluding all service wells) in which Petro-Canada owns a working interest. This includes gross overriding royalty (GOR) wells.
2 Net wells are the sum of the fractional working interests owned by Petro-Canada in gross wells, rounded to the nearest whole number. Net wells exclude GOR wells.
3 Exploration wells are wells drilled to find and produce oil or natural gas in an unproved area, to find a new reservoir or to extend the known boundaries of a previously discovered reservoir.
4 A dry hole is an exploration or development well found to be incapable of producing either oil or natural gas in sufficient quantities to justify completion as an oil or natural gas well.
5 Development wells are wells drilled in an oil or natural gas reservoir to the depth of a stratigraphic horizon known to be productive.
EXPLORATION AND DEVELOPMENT WELLS DRILLED
| | 2006 | 2005 | 2004 |
| | Gross1 | Net2 | Gross1 | Net2 | Gross1 | Net2 |
INTERNATIONAL - Continuing Operations | | | | | | |
Exploration wells3 | | | | | | |
| Oil | | | | | | |
| Northwest Europe | - | - | 4 | 3 | - | - |
| North Africa/Near East | 1 | 1 | 2 | 1 | 2 | 1 |
| Natural gas | | | | | | |
| Northwest Europe | 1 | - | - | - | - | - |
| Northern Latin America | - | - | - | - | 1 | - |
Dry4 | | | | | | |
| Northwest Europe | 2 | - | - | - | 4 | 1 |
| North Africa/Near East | 1 | 1 | 4 | 2 | 1 | 1 |
| Subtotal | 5 | 2 | 10 | 6 | 8 | 3 |
Development wells5 | | | | | | |
| Oil | | | | | | |
| Northwest Europe | 18 | 6 | 4 | 1 | 9 | 7 |
| North Africa/Near East | 5 | 2 | 7 | 4 | 6 | 3 |
| Natural gas | | | | | | |
| Northwest Europe | - | - | 1 | - | 1 | - |
| Northern Latin America | 8 | 1 | - | - | - | - |
| Dry | | | | | | |
| Northwest Europe | 1 | - | - | - | 1 | - |
| Northern Latin America | - | - | - | - | 1 | - |
| Subtotal | 32 | 9 | 12 | 5 | 18 | 10 |
Total International | 37 | 11 | 22 | 11 | 26 | 13 |
Total wells drilled from continuing operations | 726 | 538 | 826 | 549 | 718 | 534 |
DISCONTINUED OPERATIONS | | | | | | |
Development wells5 | | | | | | |
| Oil | - | - | 44 | 15 | 39 | 13 |
| Dry | - | - | 5 | 2 | 9 | 4 |
Total discontinued operations | - | - | 49 | 17 | 48 | 17 |
Total wells drilled | 726 | 538 | 875 | 566 | 766 | 551 |
1 Gross wells are wells (excluding all service wells) in which Petro-Canada owns a working interest. This includes GOR wells.
2 Net wells are the sum of the fractional working interests owned by Petro-Canada in gross wells, rounded to the nearest whole number. Net wells exclude GOR wells.
3 Exploration wells are wells drilled to find and produce oil or natural gas in an unproved area, to find a new reservoir or to extend the known boundaries of a previously discovered reservoir.
4 A dry hole is an exploration or development well found to be incapable of producing either oil or natural gas in sufficient quantities to justify completion as an oil or natural gas well.
5 Development wells are wells drilled in an oil or natural gas reservoir to the depth of a stratigraphic horizon known to be productive.
Downstream
Business Summary and Strategy
Petro-Canada is the second largest Downstream business and the "brand of choice" in Canada. In 2006, Petro-Canada accounted for approximately 13% of the total refining capacity in Canada and about 16% of total petroleum products sold in Canada.
Downstream operations include two refineries - one in Edmonton and one in Montreal - with a total daily rated capacity of 40,500 cubic metres/day (m3/d) (255,000 b/d), a lubricants plant - the largest producer of lubricant base stocks in Canada, a network of more than 1,300 retail service stations, Canada's largest commercial road transport network of 219 locations and a robust bulk fuel sales channel.
The strategy in the Downstream business is to increase the profitability of the base business through effective capital investment and disciplined management of controllable factors. In 2007, planned Downstream capital investment will shift to growth projects as regulatory projects to produce cleaner burning fuels were completed in 2006. The Downstream business' goal is to deliver superior returns and growth, including a 12% return on capital employed (ROCE) based on a mid-cycle business environment. Key features of the strategy include:
achieving and maintaining first quartile operating performance in all areas
advancing Petro-Canada as the "brand of choice" for Canadian gasoline consumers
increasing sales of high margin specialty lubricants
Refining and Supply
Petro-Canada owns and operates two refineries, with a total daily rated capacity of approximately 40,500 m3/d at the end of 2006. This represents approximately 13% of the Canadian refining industry's total operating capacity. Petro-Canada's refineries produce a full range of refined petroleum products, including gasoline, diesel oils, heating oils, aviation fuels, heavy fuel oils, asphalts, petrochemicals and feedstock for lubricants.
Work at the Montreal and Edmonton refineries to bring new diesel desulphurization units on-stream was completed in the second quarter of 2006. Both refineries also completed major investments in 2006 to increase their capability to produce diesel fuels with better cold weather properties. The following table shows the daily rated capacity of Petro-Canada's refineries as at December 31, 2006 and the approximate average daily volumes of crude oil processed, including volumes processed by Petro-Canada for other companies for the years indicated. The overall crude utilization rate at the two refineries averaged 93% in 2006, down 3% from 2005 due to the planned shutdowns to bring the new diesel desulphurization units on-stream.
RATED CAPACITY OF REFINERIES AND AVERAGE DAILY CRUDE OIL PROCESSED
(thousands of m3/d)
| | Average Volumes of Crude Oil Processed/Calendar Day | Daily Rated Capacity1 |
| | Years Ended December 31, | |
Refinery Location | 2006 | 2005 | 2004 | As at December 31, 2006 |
| Edmonton, Alberta | 18.9 | 20.8 | 19.6 | 19.9 |
Montreal, Quebec2 | 18.9 | 18.1 | 16.0 | 20.6 |
Oakville, Ontario3 | - | 2.0 | 12.6 | - |
Total | 37.8 | 40.9 | 48.2 | 40.5 |
1 Daily rated capacity is based on calendar days and defined specifications as to types of crude oil, the products to be obtained and the refinery processes required. Variations in these factors may result in actual capacity being higher or lower than rated capacities.
2 Includes capacity expansion completed at Montreal in December 2004 and rated in 2005 at an additional 3,900 m3/d.
3 The second of the two crude processing trains at the Oakville refinery was permanently closed on April 11, 2005. This was part of the previously announced consolidation of Eastern Canada refinery operations. Prior to such closure, daily rated capacity was 7,000 m3/d.
With the major regulatory projects completed, Petro-Canada is well positioned with the supply capability to optimize profitability within a range of future business scenarios.
Looking forward, Petro-Canada intends to take advantage of the trend toward increased production of cheaper, heavier crudes. In 2006, Downstream completed detailed engineering work and started construction to convert the Edmonton refinery to process 100% bitumen-based feedstock and furthered work to evaluate the feasibility of adding a coker to the Montreal refinery.
Edmonton Refinery
The Edmonton refinery is Petro-Canada's most efficient refinery, producing a high yield of light oils. It uses synthetic crude oil for up to 40% of its crude charge. Synthetic crude oil produces a higher yield of gasoline and middle distillates than conventional crude oil. The remainder of the refinery's crude charge is conventional light sweet and sour crude oil.
At the Edmonton refinery, Petro-Canada is building new crude and vacuum units, and expanding coker capacity and sulphur removal capability to upgrade and refine bitumen-based feedstock. The new configuration, targeted for completion in 2008, will allow the refinery to directly upgrade an Athabasca blend feed of 5,500 m3/d (comprised of 4,100 m3/d of bitumen and 1,400 m3/d of diluent) and process 7,600 m3/d of sour synthetic crude oil, displacing the conventional crude that is refined today. The refinery will also continue to process sweet synthetic crude through its synthetic train. Refer to Oil Sands in the Upstream section of this AIF for long-term arrangement for the supply of bitumen and sour crude oil feedstock to the Edmonton refinery on completion of the planned reconfiguration.
Montreal Refinery
The Montreal refinery, supplied with imported crude oil primarily through the Portland-Montreal pipeline, has a flexible configuration allowing it to process a variety of crude oils, including heavy grades and intermediate feedstock. The refinery produces gasoline, distillates, asphalts, petrochemicals, solvents and feedstock for lubricants.
Petro-Canada continues its assessment of the potential addition of a 25,000 b/d coker unit, which would allow the Montreal refinery to leverage lower cost heavier crude feedstock and upgrade existing lower value asphalt and heavy fuel oil into diesel and gasoline fuel. The assessment is expected to be completed in 2007, at which time a decision will be made on whether to proceed with the project.
Oakville Refinery
As part of the Eastern Canada refining and supply consolidation project, the former Oakville refinery completed a phased shutdown of its operations during the second quarter of 2005. Oakville's terminal facilities were expanded to handle receipt of finished light oil product from Montreal via the TNPI pipeline. In total, the expanded Oakville terminal, in combination with existing industry terminal facilities in north Toronto, is capable of receiving TNPI's full light oil capacity of 10,000 m3/d, replacing the light oil that was produced by the Oakville refinery operations.
ParaChem Chemicals Plant
Petro-Canada holds a 51% working interest in ParaChem Chemicals L.P., which owns and operates a petrochemicals plant located adjacent to the Montreal refinery. The plant primarily produces up to 350,000 metric tons per year of paraxylene (PX), which is used to manufacture polyester textiles and plastic bottles. ParaChem also produces benzene, hydrogen and heavy aromatics. The 75-hectare plant site is located in Montreal's industrial district, with access to pipelines, the sea and rail shipping facilities. Its hydrocarbon storage capacity exceeds 300 million litres.
Petro-Canada currently supplies mixed xylenes and toluene to ParaChem. The integration of the Parachem plant with the Montreal refinery provides several synergies, including the ability to capture more of the petrochemicals value chain through vertical integration. In 2006, a tunnel and pipeline were completed between the Montreal refinery and the ParaChem plant, facilitating the safe and cost-effective transfer of products. Additional pipelines will be added in 2007. Parachem continues to assess various long-term growth projects that would leverage its strategic position in Quebec's petrochemical market.
Supply and Distribution
Petro-Canada purchases crude oil and other refinery feedstock from Canadian and international sources under a number of different contractual arrangements. The Downstream sector is responsible for arranging domestic and foreign crude supply for the Company's refineries. There is a well-developed infrastructure for third-party supply of both domestic and imported crudes to markets in North America. Purchases are generally through short-term, renewable contracts. Petro-Canada is not dependent on any single source of supply for conventional crude oil and does not anticipate any difficulty in obtaining an adequate supply in the foreseeable future.
Efficiencies are achieved through refined product exchange, purchase, sale and short-term storage arrangements with other petroleum companies. These arrangements reduce capital and transportation costs, assist in the maintenance of supply to customers and enable Petro-Canada to participate in geographical areas without the need to invest capital in distribution facilities. Applicable agreements contain appropriate provisions for consistent product quality to be maintained for the Company's customers.
Petro-Canada operates an extensive distribution network, using pipeline, road, rail and marine transportation, to deliver refined products to retail outlets and commercial and industrial customers. The Company holds interests in two refined product pipelines, one crude pipeline and a joint venture interest in one major refined products terminal. Petro-Canada also operates 11 major refined products terminals across Canada.
Sales and Marketing
Petro-Canada is the second largest marketer of petroleum products in Canada. In 2006, Petro-Canada's petroleum product sales represented approximately 16% of total petroleum products sold in Canada. Petro-Canada markets a full range of petroleum products, including gasoline, diesel oils, heating oils, aviation fuels, heavy fuel oils, asphalts, lubricants, petrochemical feedstock and liquefied petroleum gases. Petro-Canada also generates non-petroleum revenue from convenience stores, car washes, and automotive repair and maintenance services. During 2006, the Company focused on profitable growth through initiatives directed at the retail and PETRO-PASS truck stop networks.
AVERAGE DAILY SALES OF PETROLEUM PRODUCTS
(thousands of m3/d)
| | Years Ended December 31, |
| | 2006 | 2005 | 2004 |
Gasoline1 | 24.2 | 24.4 | 24.7 |
Middle distillates2 | 19.6 | 19.7 | 20.2 |
Other3 | 8.7 | 8.7 | 11.7 |
Total | 52.5 | 52.8 | 56.6 |
1 Includes motor and aviation gasoline.
2 Includes diesel oils, heating oils and aviation jet fuels.
3 Includes heavy fuel oils, asphalts, lubricants, liquefied petroleum gases, petrochemical feedstock and other petroleum and non-petroleum products.
The following table shows the annual revenues derived from refining and marketing activities during the years indicated.
REFINING AND MARKETING REVENUES
(millions of Canadian dollars)
| | Years Ended December 31, | |
| | 2006 | | 2005 | 2004 | |
Gasoline1 | | $ | 5,481 | | $ | 5,027 | | $ | 4,218 | |
Middle distillates2 | | | 4,537 | | | 4,244 | | | 3,262 | |
Other3 | | | 2,363 | | | 2,081 | | | 1,954 | |
Total | | $ | 12,381 | | $ | 11,352 | | $ | 9,434 | |
1 Includes motor and aviation gasoline.
2 Includes diesel oils, heating oils and aviation jet fuels.
3 Includes heavy fuel oils, asphalts, lubricants, liquefied petroleum gases, petrochemical feedstock and other petroleum and non-petroleum products.
Retail
At December 31, 2006, Petro-Canada's network of retail sites consisted of 1,312 outlets across Canada, of which 819 were Company-controlled and the balance were controlled by third parties. Independent dealers and agents operate virtually all the outlets.
The Company continued to advance Petro-Canada's standing as the "brand of choice" through selective representation and site development, generating high site throughputs and a 17% share of the national retail market. In 2006, Petro-Canada led the industry in key urban market metrics and continued to improve the fundamentals of the business with more than 90% of the re-imaging program now complete. Advancement of this program has enabled the realization of industry-leading throughputs, with annual gasoline sales from re-imaged sites within Petro-Canada's network averaging more than 7 million litres per site. The Company has extended this new image program to independent retailers and, to date, nearly 62% of these retailers have elected to invest their capital in the new image standard.
Petro-Canada continued to leverage its position as "Canada's Gas Station," with the advancement of previously launched innovative product developments and new product firsts, including Citi Petro-Points MasterCard, the first general-purpose credit card in North America to offer cardholders an instant discount on gasoline, and the rollout of its Cash Point Program, the industry's first privately owned automated bank machine network. The Company also continued to focus on expanding its non-petroleum revenue base, as evidenced by the 8% year-over-year sales growth of its convenience store business and 5% increase in same-store sales in 2006, compared with 2005.
Wholesale
Petro-Canada sells petroleum products into farm, home heating, paving, small industrial, commercial and truck markets. This category accounted for approximately 51% of total Downstream sales volumes. Petro-Canada is the leading national marketer to the commercial road transport segment in Canada with 219 PETRO-PASS sites. The Company also sells large volumes of petroleum products directly to large industrial and commercial customers and independent marketers.
The Company's focus has been on improving its sales mix in the commercial road transport and bulk fuels channels. In 2006, Petro-Canada continued to expand and upgrade the network.
Lubricants
The lubricants centre in Mississauga, Ontario produces specialty lubricants and waxes that are marketed in Canada and internationally. Petro-Canada's lubricants plant is the largest producer of lubricant base stocks in Canada, with annual base oil production capacity in excess of 900 million litres. In early 2006, a fire occurred at the Mississauga lubricants plant. The Company's investigation indicated that the fire occurred during a routine maintenance procedure in a fractionation section of the plant. The lubricants plant operated at 50% capacity following the fire. Repairs were completed and production on the unit was restored to pre-incident levels in March 2006. In June, the 25% expansion of the lubricants plant came on-stream to support the growth of its high margin, specialty lubricants business.
The lubricants plant uses a two-stage hydro-treating process, which is unique in Canada. This process enables Petro-Canada to refine gas oils produced from a wide range of crude feedstock into lubricating oil-based stocks with the highest level of purity of any base stocks in Canada. Advancing lubricant technology and growing environmental concerns continue to increase the demand for high purity, hydro-treated base stocks for many lubricant applications. Petro-Canada is well positioned to meet this growing demand.
The Company's product-driven strategy is to grow volume in high margin sales and improve plant reliability. In 2006, Petro-Canada continued to focus on optimizing operations and maintenance procedures based on industry best practices. Lubricants sales in 2006 totalled 722 million litres, a decrease of approximately 7%, compared with sales volume of 779 million litres in 2005. The decrease in sales volumes was primarily due to the fire at the plant in early 2006. Sales in high margin product segments represented 75% of total sales by year-end 2006. Lubricants continue to be well positioned for profitable future growth as tougher performance and environmental standards increase global demand for higher quality base oils and finished products like those produced at the Mississauga lubricants plant.
Pipelines
Petro-Canada complements its production, extraction and refining operations with ownership in crude oil and refined product pipelines. The principal pipelines in which the Company has an interest are Alberta Products Pipe Line Inc., TNPI and Montreal Pipe Line Limited.
Link to Petro-Canada's Corporate and Strategic Priorities
The Downstream business is aligned with Petro-Canada's strategic priorities as outlined by its progress in 2006 and goals for 2007.
| | 2006 RESULTS | 2007 GOALS |
DELIVERING PROFITABLE GROWTH WITH A FOCUS ON OPERATED,
LONG-LIFE ASSETS | | continue the Edmonton refinery conversion project to enable the planned startup in 2008 complete Montreal coker feasibility study for investment decision in 2007 continue to invest in smaller scale refinery yield and reliability improvement projects continue to integrate the Montreal refinery and the ParaChem Chemicals L.P. plant
|
DRIVING FOR FIRST QUARTILE OPERATION OF OUR ASSETS | achieved a combined reliability index of 95 at the Company's two refineries, above 90 for a second year in a row completed multi-year project to produce cleaner burning fuels at refineries maintained leading share of major retail urban market grew convenience store sales by 8% and same-store sales by 5%, compared with 2005 achieved 75% high margin lubricant sales volume mix
| continue to focus on safety and refinery reliability increase retail non-petroleum revenue grow high margin lubricants sales volume
|
CONTINUING TO WORK AT BEING A RESPONSIBLE COMPANY | reduced TRIF by 3%, compared with 2005 reduced regulatory compliance exceedances by 17%, compared with 2005
| maintain focus on TRIF and regulatory compliance exceedances meet provincial ethanol regulations continue focus on community relations, including establishment of Community Liaison Committee in Montreal continue to look for partnerships with Aboriginal communities on retail opportunities
|
Research and Development
Petro-Canada owns a research facility at Sheridan Park in Mississauga, Ontario, where the Company conducts research directed toward the development of new lubricant products and product support for the Company's customers.
The Company continues to support advancement of new bitumen recovery technologies and processes in its Oil Sands business.
In 2006, Petro-Canada's total expenditures on research and development activities were approximately $34 million.
Human Resources
As at December 31, 2006, Petro-Canada and its wholly owned subsidiaries had 5,156 employees, compared with 4,816 employees as at December 31, 2005. Of the year-end 2006 employees, 1,347 employees were employed in the North American upstream businesses, 190 employees were in International and 2,487 employees were in Downstream. The remaining 1,132 employees were corporate support staff. Of the upstream employees, 168 employees were in East Coast Oil, 295 employees were in Oil Sands and 884 employees were in North American Natural Gas. Seventy-three of the upstream employees, 171 of the International employees, 28 of the Downstream employees and 168 of the corporate support staff employees were employed outside of Canada. Approximately 23% of Petro-Canada's employees were covered by collective bargaining agreements. Approximately 91% of the Company's unionized employees were members of the Communications Energy and Paperworkers Union (CEP), which represents refinery, marketing, gas plant and offshore production workers. Three-year collective bargaining agreements with most CEP locals expired on January 31, 2007. Negotiations are currently in progress.
Social and Environmental Policies
Petro-Canada is determined to earn the support received from stakeholders, not just through excellence in meeting customers' energy needs, but, by playing an active and important role in the communities where the Company lives and operates. Petro-Canada conducts business in a highly principled manner, as guided by a Code of Business Conduct (a copy of which is available under the Company's SEDAR profile at www.sedar.com), corporate values and standards, and the values and standards of the societies that host Petro-Canada operations. Wherever the Company operates around the world, Petro-Canada aims to invest and conduct operations in a manner that is economically rewarding to all parties, is recognized as being ethically, socially and environmentally responsible, is welcomed by the communities in which Petro-Canada operates and helps facilitate economic, human and community development within a stable operating environment. Petro-Canada subscribes to the International Code of Ethics for Canadian Business, the United Nations Global Compact and the Universal Declaration of Human Rights.
Petro-Canada executives are accountable for the effective execution of TLM policy1 and standards. Petro-Canada periodically reviews each business unit or Shared Services unit based on risk to assess the implementation of the policy and standards. The Executive Leadership Team reviews environment, health and safety performance monthly. As well, the Environment, Health and Safety Committee of the Board reviews environment, health and safety performance throughout the year.
At Petro-Canada, investing in communities is an integral part of the way the Company does business. Petro-Canada works with communities in the Company's key business locations to ensure its presence generates value and makes a difference for its neighbours. The Company invests in large scale initiatives that provide significant benefits at a national level, as well as in grassroots programs and services at the local level. Following a detailed strategic review of its community partnerships program in 2006, the Company will direct its funding to education, the environment, and local community support.
1 Petro-Canada's TLM framework is a systematic approach to identify, assess and control operational risk.
CASH AND IN-KIND CONTRIBUTIONS OF MORE THAN $20 MILLION IN 2006
Highlights
In 2006, Petro-Canada invested nearly $10.7 million to support Canadian Olympic and Paralympic athletes and coaches through the Company's Olympic Torch Scholarship Legacy Fund and other programs. An additional $6.2 million was invested in local community support to strengthen the communities where employees live and work.
Employees and the Company donated more than $3 million to United Way campaigns across North America in 2006. Through its Volunteer Energy Program, Petro-Canada provided 498 grants totalling $239,7481 to non-profit organizations supported by employees and retirees who give their time to the community. The total amount of grants provided since the program began in 1992 was more than $1.8 million by the end of 2006. In addition to the grants, Petro-Canada employees and retirees contributed more than 4,300 hours of volunteer time to 112 projects for non-profit organizations through Petro-Canada's year-round Days of Caring initiatives.
To learn more about Petro-Canada's corporate responsibility performance, please access the annual Report to the Community available on the Company's website (www.petro-canada.ca). The 2006 Report is expected to become available in the second quarter of 2007.
| | | Years ended December 31, |
(millions of Canadian dollars) | | 2006 | | 2005 | | 2004 | |
Local Community Support1 | | $ | 6.2 | | $ | 3.6 | | $ | 3.1 | |
United Way2 | | | 1.2 | | | 1.0 | | | 0.8 | |
| Olympic/Paralympic | | | 10.7 | | | 0.3 | | | 0.5 | |
| International | | | - | | | - | | | 0.1 | |
| Education | | | 1.5 | | | 1.8 | | | 1.6 | |
| Environment | | | 0.6 | | | 0.6 | | | 0.6 | |
Total | | $ | 20.2 | | $ | 7.3 | | $ | 6.7 | |
1 Includes community contributions from both operating units and the community partnerships program.
2 Includes Company contributions only.
Environmental Expenditures
In 2006, Petro-Canada's environmental capital and operating expenditures totalled $501 million, compared with $856 million in 2005 and $651 million in 2004. The decrease in 2006 expenditures mainly reflected the completion of Downstream projects to meet new federal regulations for sulphur limits in diesel.
Environmental expenditures included purchase, installation, operation and maintenance of pollution abatement equipment and facilities, replacement of underground tanks, waste management, environmental studies and research, reclamation activities and the workforce costs of environmental staff and consultants.
The following table shows Petro-Canada's expenditures for environmental matters during 2006.
ENVIRONMENTAL COSTS - YEAR ENDED DECEMBER 31, 2006
(millions of Canadian dollars)
| | | Capital | | Operating
Expense | | Total | |
| Upstream | | $ | 68 | | $ | 106 | | $ | 174 | |
| Downstream | | | 298 | | | 29 | | | 327 | |
Total environmental costs | | $ | 366 | | $ | 135 | | $ | 501 | |
More detailed information on the Company's policies and performance relative to the environment will be included in the annual Report to the Community, expected to become available on the Company's website (www.petro-canada.ca) in the second quarter of 2007.
1 In previous years, the reported year-end figures represented volunteer grants only; however, in 2006, they include volunteer, teams for charity and alumni matching grants.
SELECT FINANCIAL DATA
CONSOLIDATED FINANCIAL INFORMATION
| | Years Ended December 31, | |
(millions of Canadian dollars, except per share1 amounts) | | 2006 | | 2005 | | 2004 | |
Statement of earnings data | | | | | | | |
| Revenue | | | | | | | |
| Operating | | $ | 18,911 | | $ | 17,585 | | $ | 14,270 | |
| Investment and other income (expense) | | | (242 | ) | | (806 | ) | | (312 | ) |
| Total revenue | | | 18,669 | | | 16,779 | | | 13,958 | |
| Earnings from continuing operations before income taxes | | | 3,972 | | | 3,402 | | | 3,090 | |
| Provision for income taxes | | | 2,384 | | | 1,709 | | | 1,392 | |
| Net earnings from continuing operations | | | 1,588 | | | 1,693 | | | 1,698 | |
| Net earnings from discontinued operations | | | 152 | | | 98 | | | 59 | |
| Net earnings | | $ | 1,740 | | $ | 1,791 | | $ | 1,757 | |
Earnings | | | | | | | | | | |
| North American Natural Gas | | $ | 402 | | $ | 660 | | $ | 500 | |
| East Coast Oil | | | 934 | | | 775 | | | 711 | |
| Oil Sands | | | 245 | | | 112 | | | 120 | |
| International | | | 22 | | | 453 | | | 313 | |
| Downstream | | | 463 | | | 398 | | | 310 | |
| Shared Services | | | (264 | ) | | (250 | ) | | (125 | ) |
Operating earnings from continuing operations2,3 | | | 1,802 | | | 2,148 | | | 1,829 | |
| Foreign currency translation gain | | | 1 | | | 73 | | | 63 | |
| Unrealized loss on Buzzard derivative contracts | | | (240 | ) | | (562 | ) | | (205 | ) |
| Gain on sale of assets | | | 25 | | | 34 | | | 11 | |
| Discontinued operations | | | 152 | | | 98 | | | 59 | |
| Net earnings | | $ | 1,740 | | $ | 1,791 | | $ | 1,757 | |
| Earnings per share from continuing operations - basic | | $ | 3.15 | | $ | 3.27 | | $ | 3.21 | |
| - diluted | | | 3.11 | | | 3.22 | | | 3.17 | |
| Earnings per share - basic | | | 3.45 | | | 3.45 | | | 3.32 | |
| - diluted | | | 3.41 | | | 3.41 | | | 3.28 | |
| Dividends per share | | | 0.40 | | | 0.33 | | | 0.30 | |
Cash flow from continuing operating activities before changes in non-cash working capital3 | | | 3,687 | | | 3,787 | | | 3,425 | |
Balance sheet data (at end of year) | | | | | | | | | | |
| Total assets | | | 22,646 | | | 20,655 | | | 18,136 | |
| Debt | | | 2,894 | | | 2,913 | | | 2,580 | |
Cash and cash equivalents4 | | | 499 | | | 789 | | | 170 | |
| Shareholders' equity | | | 10,441 | | | 9,488 | | | 8,739 | |
Average capital employed4 | | $ | 12,868 | | $ | 11,860 | | $ | 10,533 | |
1 Per share amounts are quoted on a post-stock dividend basis reflecting the stock dividend declared in July 2005.
2 Operating earnings, which represent net earnings excluding gains or losses on foreign currency translation, disposal of assets and the unrealized gains or losses on Buzzard derivative contracts, is used by the Company to evaluate operating performance.
3 Operating earnings and cash flow do not have any standardized meaning prescribed by Canadian GAAP and, therefore, may not be comparable to the calculation of similar measures for other companies.
4 Includes discontinued operations.
QUARTERLY INFORMATION
(millions of Canadian dollars, except per share amounts)
| | | 2006 Three Months Ended | | 2005 Three Months Ended | |
| | | | | Mar. 31 | | June 30 | | Sept. 30 | | Dec. 31 | | | | Mar. 31 | | June 30 | | Sept. 30 | | Dec. 31 | |
Total revenue from continuing operations | | | | | $ | 4,188 | | $ | 4,730 | | $ | 5,201 | | $ | 4,550 | | | | | $ | 3,275 | | $ | 3,945 | | $ | 4,721 | | $ | 4,838 | |
Earnings | | | | | | | | | | | | | | | | | | | | | | | | | | | | | | | |
| Upstream | | | | | | | | | | | | | | | | | | | | | | | | | | | | | | | |
| North American Natural Gas | | | | | $ | 139 | | $ | 97 | | $ | 75 | | $ | 91 | | | | | $ | 103 | | $ | 117 | | $ | 156 | | $ | 284 | |
| East Coast Oil | | | | | | 229 | | | 254 | | | 190 | | | 261 | | | | | | 169 | | | 208 | | | 218 | | | 180 | |
| Oil Sands | | | | | | (19 | ) | | 101 | | | 108 | | | 55 | | | | | | (19 | ) | | 34 | | | 82 | | | 15 | |
| International | | | | | | (132 | ) | | 61 | | | 60 | | | 33 | | | | | | 105 | | | 93 | | | 104 | | | 151 | |
| Downstream | | | | | | 73 | | | 136 | | | 176 | | | 78 | | | | | | 113 | | | 80 | | | 98 | | | 107 | |
| Shared Services | | | | | | (88 | ) | | (117 | ) | | (12 | ) | | (47 | ) | | | | | (44 | ) | | (56 | ) | | (61 | ) | | (89 | ) |
| Operating earnings from continuing operations | | | | | | 202 | | | 532 | | | 597 | | | 471 | | | | | | 427 | | | 476 | | | 597 | | | 648 | |
| Foreign currency translation gain (loss) | | | | | | (1 | ) | | 61 | | | (1 | ) | | (58 | ) | | | | | (4 | ) | | 8 | | | 74 | | | (5 | ) |
| Unrealized gain (loss) on Buzzard derivative contracts | | | | | | (149 | ) | | (137 | ) | | 79 | | | (33 | ) | | | | | (313 | ) | | (171 | ) | | (85 | ) | | 7 | |
| Gain on sale of assets | | | | | | 2 | | | 16 | | | 3 | | | 4 | | | | | | - | | | 9 | | | 7 | | | 18 | |
| Discontinued operations | | | | | | 152 | | | - | | | - | | | - | | | | | | 8 | | | 23 | | | 21 | | | 46 | |
Net earnings | | | | | $ | 206 | | $ | 472 | | $ | 678 | | $ | 384 | | | | | $ | 118 | | $ | 345 | | $ | 614 | | $ | 714 | |
Earnings per share from continuing operations1 | | | | | | | | | | | | | | | | | | | | | | | | | | | | | | | |
| Basic | | | | | $ | 0.11 | | $ | 0.93 | | $ | 1.36 | | $ | 0.77 | | | | | $ | 0.21 | | $ | 0.62 | | $ | 1.14 | | $ | 1.29 | |
| Diluted | | | | | $ | 0.10 | | $ | 0.92 | | $ | 1.34 | | $ | 0.76 | | | | | $ | 0.21 | | $ | 0.61 | | $ | 1.13 | | $ | 1.28 | |
Earnings per share1 | | | | | | | | | | | | | | | | | | | | | | | | | | | | | | | |
| Basic | | | | | $ | 0.40 | | $ | 0.93 | | $ | 1.36 | | $ | 0.77 | | | | | $ | 0.23 | | $ | 0.66 | | $ | 1.19 | | $ | 1.38 | |
| Diluted | | | | | $ | 0.40 | | $ | 0.92 | | $ | 1.34 | | $ | 0.76 | | | | | $ | 0.22 | | $ | 0.66 | | $ | 1.17 | | $ | 1.36 | |
1 Per share amounts are quoted on a post-stock dividend basis reflecting the stock dividend declared in July 2005.
Capital Expenditures on Property, Plant and Equipment and Exploration
The following table shows Petro-Canada's capital expenditures on property, plant and equipment and exploration for the years indicated.
CAPITAL EXPENDITURES ON PROPERTY, PLANT AND EQUIPMENT AND EXPLORATION
(millions of Canadian dollars)
| | | 2006 | | 2005 | | 2004 | |
Exploration | | | | | | | |
| North American Natural Gas | | $ | 160 | | $ | 173 | | $ | 157 | |
| East Coast Oil | | | 3 | | | 12 | | | - | |
| Oil Sands | | | 6 | | | 32 | | | 15 | |
| International | | | | | | | | | | |
| Northwest Europe | | | 37 | | | 37 | | | 48 | |
| North Africa/Near East | | | 37 | | | 29 | | | 19 | |
| Northern Latin America | | | 3 | | | 7 | | | 3 | |
Total exploration | | | 246 | | | 290 | | | 242 | |
Development | | | | | | | | | | |
| North American Natural Gas | | | 523 | | | 496 | | | 419 | |
| East Coast Oil | | | 253 | | | 302 | | | 275 | |
| Oil Sands | | | 269 | | | 432 | | | 381 | |
| International | | | | | | | | | | |
| Northwest Europe | | | 551 | | | 525 | | | 322 | |
| North Africa/Near East | | | 83 | | | 70 | | | 71 | |
| Northern Latin America | | | 49 | | | 28 | | | 22 | |
Total development | | | 1,728 | | | 1,853 | | | 1,490 | |
Property acquisitions | | | | | | | | | | |
| North American Natural Gas | | | 105 | | | 44 | | | 90 | |
| Oil Sands | | | 102 | | | 308 | | | 1 | |
| International | | | | | | | | | | |
| Northwest Europe | | | - | | | - | | | 1,222 | |
Total property acquisitions | | | 207 | | | 352 | | | 1,313 | �� |
Downstream | | | | | | | | | | |
| Refining and supply | | | 1,038 | | | 883 | | | 656 | |
| Sales, marketing and other | | | 142 | | | 108 | | | 171 | |
| Lubricants | | | 49 | | | 62 | | | 12 | |
Total Downstream | | | 1,229 | | | 1,053 | | | 839 | |
Shared Services | | | 24 | | | 12 | | | 9 | |
Total capital expenditures on property, plant and equipment and exploration from continuing operations | | | 3,434 | | | 3,560 | | | 3,893 1 | |
Discontinued operations | | | 1 | | | 46 | | | 62 | |
Total capital expenditures on property, plant and equipment and exploration | | $ | 3,435 | | $ | 3,606 | | $ | 3,9551 | |
1 Excludes U.S. Rockies acquisition of Prima Energy Corporation totalling $644 million net of acquired cash.
In 2007, spending on new growth projects is expected to increase. More than 60% of planned capital expenditures support delivering profitable new growth, and funding exploration and new ventures. This estimate is up from nearly 53% in these categories in 2006. The remaining 40% of the 2007 planned capital expenditures are directed toward replacing reserves in core areas, enhancing existing assets, improving base business profitability and complying with regulations. The regulatory compliance portion of the program was greater in 2006, primarily reflecting expenditures to produce cleaner burning fuels at Downstream refineries.
2007 Capital Outlook | | (millions of Canadian dollars) | |
| Regulatory compliance | | $ | 100 | |
| Enhancing existing assets | | | 240 | |
| Improving base business profitability | | | 160 | |
| Reserves replacement in core areas | | | 1,025 | |
| New growth projects | | | 2,020 | |
| Exploration and new ventures for long-term growth | | | 515 | |
Total continuing operations | | $ | 4,060 | |
Capital Investment by Business - 2007 Outlook | | (millions of Canadian dollars) | |
Upstream | | | |
| North American Natural Gas | | $ | 790 | |
| East Coast Oil | | | 210 | |
| Oil Sands | | | 770 | |
| International | | | 865 | |
| Subtotal | | | 2,635 | |
Downstream | | | | |
| Refining and Supply | | | 1,215 | |
| Sales and Marketing | | | 150 | |
| Lubricants | | | 25 | |
| Subtotal | | | 1,390 | |
Shared Services | | | 35 | |
Total Continuing Operations | | $ | 4,060 | |
Dividends
Petro-Canada regularly reviews its dividend strategy to ensure the alignment of dividend policy with shareholder expectations, and financial and growth objectives. Currently, the Company's first priority for available cash is to fund growth opportunities. The second priority is to return funds to shareholders through dividends and the share buyback program. Consistent with the second priority, the Company declared, on December 14, 2006, a 30% increase in the quarterly dividend to $0.13/share, commencing with the dividend payable on April 1, 2007. Total dividends paid in 2006 were $201 million, compared with $181 million in 2005 and $159 million in 2004.
CAPITAL STRUCTURE
General Description of Capital Structure
The Company's authorized share capital is comprised of an unlimited number of common shares, an unlimited number of preferred shares issuable in series designated as senior preferred shares and an unlimited number of preferred shares issuable in series designated as junior preferred shares. As at December 31, 2006, there were 497,538,385 common shares issued and outstanding. To the knowledge of the Board of Directors and officers of Petro-Canada, no person beneficially owns or exercises control or direction over securities carrying 10% or more of the voting rights attached to any class of voting securities of the Company. The holders of common shares are entitled to attend all meetings of shareholders and vote at any such meeting on the basis of one vote for each common share held. As no senior preferred shares or junior preferred shares are issued and outstanding, common shareholders are entitled to receive any dividend declared by the Board of Directors on the common shares and to participate in a distribution of the Company's assets among its shareholders for the purpose of winding up its affairs. The holders of the common shares shall be entitled to share equally, share for share, in all distributions of such assets.
Constraints
Ownership, Voting and Other Restrictions
The Petro-Canada Public Participation Act requires that the Articles of Petro-Canada include certain restrictions on the ownership and voting of voting shares of the Company. The common shares of Petro-Canada are voting shares.
No person, together with associates of that person, may subscribe for, have transferred to that person, hold, beneficially own or control otherwise than by way of security only, or vote in the aggregate, voting shares of Petro-Canada to which are attached more than 20% of the votes attached to all outstanding voting shares of Petro-Canada. Additional restrictions include provisions for suspension of voting rights, forfeiture of dividends, prohibitions against share transfer, compulsory sale of shares, and redemption and suspension of other shareholder rights. The Board of Directors may at any time require holders of, or subscribers for, voting shares, and certain other persons, to furnish statutory declarations as to ownership of voting shares and certain other matters relevant to the enforcement of the restrictions. Petro-Canada is prohibited from accepting any subscription for, and issuing or registering a transfer of, any voting shares if a contravention of the individual ownership restrictions results.
Petro-Canada's Articles, as required by the Petro-Canada Public Participation Act, also include provisions requiring Petro-Canada to maintain its head office in Calgary, Alberta; prohibit Petro-Canada from selling, transferring or otherwise disposing of all or substantially all of its assets in one transaction, or several related transactions, to any one person or group of associated persons, or to non-residents, other than by way of security only in connection with the financing of Petro-Canada; and require Petro-Canada to ensure (and to adopt, from time to time, policies describing the manner in which Petro-Canada will fulfill the requirement to ensure) that any member of the public can, in either official language of Canada (English and French), communicate with and obtain available services from Petro-Canada's head office and any other facilities where Petro-Canada determines there is significant demand for communication with, and services from, that facility in that language.
Credit Ratings
The following table shows the ratings issued by the rating agencies noted therein as of December 31, 2006. A security rating is not a recommendation to buy, sell or hold securities and may be subject to revisions or withdrawal at any time by the rating agency.
PETRO-CANADA'S CREDIT RATINGS
| | Moody's Investors Service (Moody’s) | Standard & Poor's (S&P) | Dominion Bond Rating Service (DBRS) |
| Outlook | Stable | Stable | Stable |
| Senior unsecured | Baa2 | BBB | A (low) |
| Short term | - | - | R-1 (low) |
Moody's credit ratings are on a long-term debt rating scale that ranges from Aaa to C, which represents the range from highest to lowest quality of such securities rated. According to the Moody's rating system, debt securities rated "Baa" are considered as medium grade obligations (e.g. they are neither highly protected nor poorly secured). Interest payments and principal security appear adequate for the present, but certain protective elements may be lacking or may be characteristically unreliable over any great length of time. Such bonds lack outstanding investment characteristics and, in fact, have speculative characteristics as well.
Moody's applies numerical modifiers 1, 2 and 3 in each generic rating classification from Aa through Caa in its corporate bond rating system. The modifier 1 indicates that the issue ranks in the higher end of its generic rating category, the modifier 2 indicates a mid-range ranking and the modifier 3 indicates that the issue ranks in the lower end of its generic rating category.
S&P's credit ratings are on a long-term debt rating scale that ranges from AAA to D, which represents the range from highest to lowest quality of such securities rated. According to the S&P rating system, an obligation rated "BBB" exhibits adequate protection parameters. However, adverse economic conditions or changing circumstances are more likely to lead to a weakened capacity of the obligor to meet its financial commitment on the obligation. The ratings from AA to CCC may be modified by the addition of a plus (+) or minus (-) sign to show relative standing within the major rating categories.
DBRS' credit ratings are on a long-term debt rating scale that ranges from AAA to D, which represents the range from highest to lowest quality of such securities rated. According to the DBRS rating system, bonds and long-term debt rated A are of satisfactory credit quality. Protection of interest and principal is still substantial, but the degree of strength is less than with AA rated entities. While a respectable rating, entities in the "A" category are considered to be more susceptible to adverse economic conditions and have greater cyclical tendencies than higher rated companies. The ratings from AA to C may be modified by the addition of a "high" or "low" grade to indicate the relative standing of a credit within a particular rating category.
DBRS' short-term credit ratings are on a short-term debt rating scale that ranges from R-1 to D, which represents the range from highest to lowest quality of such securities rated. The ratings from R-1 to R-3 may be modified by the addition of a "high," "mid" or "low" grade to indicate the relative standing of a credit within a particular rating category. According to the DBRS rating system, short-term debt rated R-1(low) is of satisfactory credit quality. The overall strength and outlook for key liquidity, debt and profitability ratios is not normally as favourable as with higher rating categories, but these considerations are still respectable. Any qualifying negative factors that exist are considered manageable, and the entity is normally of sufficient size to have some influence in its industry.
MARKET FOR SECURITIES
Trading Price and Volume
The Company's outstanding share capital is comprised of common shares, and each common share carries one vote. The Company's common shares trade on the Toronto Stock Exchange (TSX) under the symbol PCA and on the New York Stock Exchange (NYSE) under the symbol PCZ.
The greatest volume of trading in the Company's shares takes place on the TSX. The following table sets out the trading range and volume traded on the TSX and the NYSE in 2006 on a monthly basis.
PETRO-CANADA SHARE TRADING ACTIVITY ON THE TSX
AND THE NYSE IN 2006
| | Toronto Stock Exchange | | New York Stock Exchange |
| | Share Price Trading Range (Canadian dollars per share) | Share Volume | | Share Price Trading Range (U.S. dollars per share) | Share Volume |
| | | High | | Low | | Close | (millions) | | | High | | Low | | Close | (millions) |
2006 | | | | | | | | | | | | | | | |
| January | $ | 55.42 | $ | 48.00 | $ | 54.51 | 39.8 | | $ | 48.33 | $ | 41.20 | $ | 47.93 | 8.9 |
| February | | 58.59 | | 51.54 | | 52.06 | 55.6 | | | 51.08 | | 44.59 | | 45.76 | 14.2 |
| March | | 56.54 | | 51.65 | | 55.38 | 44.9 | | | 49.11 | | 44.60 | | 47.59 | 10.7 |
| April | | 57.80 | | 54.71 | | 55.00 | 32.5 | | | 51.11 | | 47.92 | | 49.18 | 8.0 |
| May | | 55.40 | | 46.58 | | 50.02 | 49.1 | | | 50.11 | | 41.69 | | 45.97 | 14.7 |
| June | | 52.96 | | 46.11 | | 52.96 | 42.6 | | | 47.41 | | 41.31 | | 47.41 | 15.5 |
| July | | 53.30 | | 49.76 | | 50.58 | 27.3 | | | 48.24 | | 43.73 | | 44.75 | 9.4 |
| August | | 52.20 | | 46.69 | | 47.20 | 35.7 | | | 46.53 | | 42.06 | | 42.72 | 9.3 |
| September | | 48.35 | | 42.38 | | 45.01 | 48.1 | | | 43.60 | | 37.78 | | 40.33 | 13.6 |
| October | | 48.80 | | 41.91 | | 47.88 | 41.5 | | | 43.54 | | 37.37 | | 42.59 | 13.3 |
| November | | 51.70 | | 47.24 | | 51.49 | 35.5 | | | 45.48 | | 41.67 | | 45.20 | 10.3 |
| December | $ | 51.64 | $ | 47.00 | $ | 47.75 | 31.7 | | $ | 45.18 | $ | 40.78 | $ | 41.04 | 10.6 |
Prior Sales
Petro-Canada had no debt issuances in 2006.
DIRECTORS AND OFFICERS
Directors
The following describes information concerning Directors of the Company. It should be noted that Angus A. Bruneau retires from the Board of Directors following the close of the annual general meeting (April 24, 2007). Details regarding share ownership, the Deferred Share Unit (DSU) Plan and compensation of Directors can be found in the Company's Management Proxy Circular dated March 1, 2007.
ANGUS A. BRUNEAU, O.C. Independent1 Age: 71 St. John's, Newfoundland and Labrador, Canada Director since 1996 | Angus Bruneau retired in May 2006 as Chairman of the Board of Directors of Fortis Inc. (utilities and services corporation). He also serves as a Director of Aurora Energy Resources Inc. He is an executive member of a number of not-for-profit organizations, including Sustainable Development Technology Canada and Canadian Institute for Child Health. Dr. Bruneau is a Professional Engineer and holds a Bachelor of Science, D.Eng, and a PhD. |
| Board and Committee Membership | Attendance |
| Board of Directors | 8 of 9 | 89% |
| Environment, Health and Safety Committee (Chair) | 3 of 3 | 100% |
| Audit, Finance and Risk Committee | 7 of 7 | 100% |
| Securities Held |
| Year | Common Shares2 | DSUs3 | Total of Common Shares and DSUs | Total Market Value of Common Shares and DSUs4 | Minimum Required5 |
| 2006 | 5,539 | 10,922 | 16,461 | $ 627,412 | $300,000 |
| 2005 | 5,527 | 10,819 | 16,346 | $ 786,013 |
| Options Held: None. Non-employee Directors are not eligible to participate in the Company's stock option plan. |
| Other Public Board Directorships: None |
GAIL COOK-BENNETT Independent1 Age: 66 Toronto, Ontario, Canada Director since 1991 | Gail Cook-Bennett is Chairperson of the Canada Pension Plan Investment Board (public pension plan investment). Dr. Cook-Bennett earned a Doctorate in Economics and holds a Doctor of Laws (honoris causa) from Carleton University. She is a Fellow of the Institute of Corporate Directors. |
| Board and Committee Membership | Attendance |
| Board of Directors | 9 of 9 | 100% |
| Audit, Finance and Risk Committee | 7 of 7 | 100% |
| Pension Committee (Chair) | 2 of 2 | 100% |
| Securities Held |
| Year | Common Shares2 | DSUs3 | Total of Common Shares and DSUs | Total Market Value of Common Shares and DSUs4 | Minimum Required5 |
| 2006 | 4,098 | 20,151 | 24,249 | $ 1,157,890 | $300,000 |
| 2005 | 4,098 | 19,998 | 24,096 | $ 874,303 |
| Options Held: None. Non-employee Directors are not eligible to participate in the Company's stock option plan. |
Other Public Board Directorships:6 Emera Inc. and Manulife Financial Corporation |
RICHARD J. CURRIE, O.C.8 Independent1 Age: 69 Toronto, Ontario, Canada Director since 2003 | Dick Currie is Chairman of the Board of Bell Canada Enterprises (telecommunications). From 1996 to 2002, he was President and Director of George Weston Limited (food processing) and from 1976 to 2000, President and Director of Loblaw Companies Limited (food and distribution). Mr. Currie holds a Bachelor of Engineering and a Master of Business Administration. He is the Chancellor of the University of New Brunswick and a Fellow of the Institute of Corporate Directors. |
| Board and Committee Membership | Attendance |
| Board of Directors | 7 of 9 | 78% |
| Management Resources and Compensation Committee | 3 of 4 | 75% |
| Pension Committee | 1 of 2 | 50% |
| Securities Held |
| Year | Common Shares2 | DSUs3 | Total of Common Shares and DSUs | Total Market Value of Common Shares and DSUs4 | Minimum Required5 |
| 2006 | 50,000 | 3,165 | 53,165 | $ 2,538,629 | $300,000 |
| 2005 | 20,000 | 3,146 | 23,146 | $ 1,040,467 |
| Options Held: None. Non-employee Directors are not eligible to participate in the Company's stock option plan. |
Other Public Board Directorships:6 BCE Inc. |
CLAUDE FONTAINE, Q.C. Independent1 Age: 65 Montreal, Quebec, Canada Director since 1987 | Claude Fontaine is counsel to Ogilvy Renault LLP (barristers and solicitors) and, prior to that, he was a Partner of the firm. He serves as Lead Director for Optimum General Inc. and is a Director of the Institute of Corporate Directors (Chair of the Quebec Chapter) and the Montreal Heart Institute Foundation. Mr. Fontaine holds a Bachelor of Arts, Licence in Law (LL.L), and an Institute of Corporate Directors certification. |
| Board and Committee Membership | Attendance |
| Board of Directors | 9 of 9 | 100% |
| Environment, Health and Safety Committee | 3 of 3 | 100% |
| Management Resources and Compensation Committee (Chair) | 4 of 4 | 100% |
| Securities Held |
| Year | Common Shares2 | DSUs3 | Total of Common Shares and DSUs | Total Market Value of Common Shares and DSUs4 | Minimum Required5 |
| 2006 | 15,929 | 30,221 | 46,150 | $ 2,203,663 | $300,000 |
| 2005 | 15,926 | 28,340 | 44,266 | $ 1,711,042 |
| Options Held: None. Non-employee Directors are not eligible to participate in the Company's stock option plan. |
| Other Public Board Directorships: Optimum General Inc. |
PAUL HASELDONCKX Independent1 Age: 58 Essen, Germany Director since 2002 | Paul Haseldonckx, Corporate Director, is the past Chairman of the Executive Board of Veba Oil & Gas GmbH (integrated oil and gas) and its predecessor companies. Mr. Haseldonckx holds a Master of Science. |
| Board and Committee Membership | Attendance |
| Board of Directors | 9 of 9 | 100% |
| Audit, Finance and Risk Committee | 7 of 7 | 100% |
| Environment, Health and Safety Committee | 3 of 3 | 100% |
| Securities Held |
| Year | Common Shares2 | DSUs3 | Total of Common Shares and DSUs | Total Market Value of Common Shares and DSUs4 | Minimum Required5 |
| 2006 | 6,022 | 6,119 | 12,141 | $ 579,733 | $300,000 |
| 2005 | 3,001 | 6,076 | 9,077 | $ 347,553 |
| Options Held: None. Non-employee Directors are not eligible to participate in the Company's stock option plan. |
| Other Public Board Directorships: None |
THOMAS E. KIERANS, O.C.8 Independent1 Age: 66 Toronto, Ontario, Canada Director since 1991 | Tom Kierans is Chairman of the Canadian Journalism Foundation (non-profit), prior to which he was Chairman of CSI Global Markets. Mr. Kierans holds a Bachelor of Arts (Honours) and a Master of Business Administration (Finance, Dean's Honours List), and is a Fellow of the Canadian Institute of Corporate Directors. He serves as a Director of Mount Sinai Hospital, the Canadian Institute for Advanced Research and the Social Sciences and Humanities Research Council. Mr. Kierans also sits on a number of advisory boards of for-profit and not-for-profit organizations, including Lazard (Canada) and the Schulich School of Business, York University. |
| Board and Committee Membership | Attendance |
| Board of Directors | 8 of 9 | 89% |
| Corporate Governance and Nominating Committee | 4 of 4 | 100% |
| Management Resources and Compensation Committee | 3 of 4 | 75% |
| Securities Held |
| Year | Common Shares2 | DSUs3 | Total of Common Shares and DSUs | Total Market Value of Common Shares and DSUs4 | Minimum Required5 |
| 2006 | 50,000 | 6,707 | 56,707 | $ 2,707,759 | $300,000 |
| 2005 | 40,900 | 6,659 | 47,559 | $ 2,135,456 |
| Options Held: None. Non-employee Directors are not eligible to participate in the Company's stock option plan. |
Other Public Board Directorships:6 Manulife Financial Corporation |
BRIAN F. MacNEILL, C.M. Independent1 Age: 67 Calgary, Alberta, Canada Director since 1995 | Brian MacNeill is the Chairman of the Board of Directors of Petro-Canada. Mr. MacNeill is a Certified Public Accountant and holds a Bachelor of Commerce. He is a member of the Canadian Institute of Chartered Accountants and the Financial Executives Institute. He is also a Fellow of the Alberta and Ontario Institutes of Chartered Accountants and of the Institute of Corporate Directors. He is Chair of the Board of Governors of the University of Calgary. |
| Board and Committee Membership | Attendance |
Board of Directors (Chair) As Chair of the Board, Mr. MacNeill is an ex-officio member of all Committees. | 9 of 9 | 100% |
| Securities Held |
| Year | Common Shares2 | DSUs3 | Total of Common Shares and DSUs | Total Market Value of Common Shares and DSUs4 | Minimum Required5 |
| 2006 | 10,200 | 42,573 | 52,773 | $ 2,519,911 | $300,000 |
| 2005 | 10,200 | 37,266 | 47,466 | $ 1,748,837 |
| Options Held: None. Non-employee Directors are not eligible to participate in the Company's stock option plan. |
Other Public Board Directorships: Toronto-Dominion Bank, Telus Corp. and West-Fraser Timber Co. Ltd. |
MAUREEN McCAW Independent1 Age: 52 Edmonton, Alberta, Canada Director since 2004 | Maureen McCaw is immediate past President of Leger Marketing (Alberta) (marketing research), formerly Criterion Research Corp., a company she founded in 1986. Ms. McCaw holds a Bachelor of Arts from the University of Alberta. She is a past Chair of the Edmonton Chamber of Commerce and also serves on a number of Alberta Boards and advisory committees. |
| Board and Committee Membership | Attendance |
| Board of Directors | 8 of 9 | 89% |
| Corporate Governance and Nominating Committee | 2 of 4 | 50% |
| Pension Committee | 2 of 2 | 100% |
| Securities Held |
| Year | Common Shares2 | DSUs3 | Total of Common Shares and DSUs | Total Market Value of Common Shares and DSUs4 | Minimum Required5 |
| 2006 | 1,744 | 4,757 | 6,501 | $ 310,423 | $300,000 |
| 2005 | 1,360 | 3,314 | 4,674 | $ 176,650 |
| Options Held: None. Non-employee Directors are not eligible to participate in the Company's stock option plan. |
| Other Public Board Directorships: None |
PAUL D. MELNUK Independent1 Age: 52 St. Louis, Missouri, USA Director since 2000 | Paul Melnuk is Chairman and Chief Executive Officer of Thermadyne Holdings Corporation (industrial products) and Managing Partner of FTL Capital Partners LLC (merchant banking). He is past President and Chief Executive Officer of Bracknell Corporation and Barrick Gold Corporation. Mr. Melnuk holds a Bachelor of Commerce. He is a member of the Canadian Institute of Chartered Accountants (CICA) and of the World Presidents' Organization, St. Louis chapter. |
| Board and Committee Membership | Attendance |
| Board of Directors | 9 of 9 | 100% |
| Audit, Finance and Risk Committee (Chair) | 7 of 7 | 100% |
| Environment, Health and Safety Committee | 3 of 3 | 100% |
| Securities Held |
| Year | Common Shares2 | DSUs3 | Total of Common Shares and DSUs | Total Market Value of Common Shares and DSUs4 | Minimum Required5 |
| 2006 | 4,400 | 19,624 | 24,024 | $ 1,147,146 | $300,000 |
| 2005 | 4,400 | 15,904 | 20,304 | $ 748,541 |
| Options Held: None. Non-employee Directors are not eligible to participate in the Company's stock option plan. |
| Other Public Board Directorships: Thermadyne Holdings Corporation |
GUYLAINE SAUCIER, F.C.A, C.M.7 Independent1 Age: 60 Montreal, Quebec, Canada Director since 1991 | Guylaine Saucier, Corporate Director, is a former Chair of the Board of Directors of the Canadian Broadcasting Corporation, a former Director of the Bank of Canada, a former Chair of the Canadian Institute of Chartered Accountants (CICA), a former Director of the International Federation of Accountants and former Chair of the Joint Committee on Corporate Governance established by the CICA, the Toronto Stock Exchange and the Canadian Venture Exchange. She was also the first woman to serve as President of the Quebec Chamber of Commerce. Mme Saucier obtained a Bachelor of Arts from Collège Marguerite-Bourgeois and a Bachelor of Commerce from the École des Hautes Études Commerciales, Université de Montréal. She is a Fellow of the Institute of Chartered Accountants and a member of the Order of Canada. In 2004, she received the Fellowship Award from the Institute of Corporate Directors. |
| Board and Committee Membership | Attendance |
| Board of Directors | 9 of 9 | 100% |
| Corporate Governance and Nominating Committee (Chair) | 4 of 4 | 100% |
| Pension Committee | 2 of 2 | 100% |
| Securities Held |
| Year | Common Shares2 | DSUs3 | Total of Common Shares and DSUs | Total Market Value of Common Shares and DSUs4 | Minimum Required5 |
| 2006 | 6,520 | 34,961 | 41,481 | $ 1,980,718 | $300,000 |
| 2005 | 6,520 | 31,571 | 38,091 | $ 1,382,623 |
| Options Held: None. Non-employee Directors are not eligible to participate in the Company's stock option plan. |
Other Public Board Directorships: AXA Assurance Inc., Bank of Montreal, CHC Helicopter Corp. and Groupe Areva |
JAMES W. SIMPSON Independent1 Age: 63 Danville, California, USA Director since 2004 | Jim Simpson is past President of Chevron Canada Resources (oil and gas). He serves as Lead Director for Canadian Utilities Limited and is on its Audit, Governance and, Compensation Committees. Mr. Simpson holds a Bachelor of Science and Master of Science, and graduated from the Program for Senior Executives at M.I.T's Sloan School of Business. He is also past Chairman of the Canadian Association of Petroleum Producers and past Vice-Chairman of the Canadian Association of the World Petroleum Congresses. |
| Board and Committee Membership | Attendance |
| Board of Directors | 9 of 9 | 100% |
| Audit, Finance and Risk Committee | 7 of 7 | 100% |
| Management Resources and Compensation Committee | 4 of 4 | 100% |
| Securities Held |
| Year | Common Shares2 | DSUs3 | Total of Common Shares and DSUs | Total Market Value of Common Shares and DSUs4 | Minimum Required5 |
| 2006 | 2,000 | 4,413 | 6,413 | $ 306,221 | $300,000 |
| 2005 | 0 | 2,973 | 2,973 | $ 101,558 |
| Options Held: None. Non-employee Directors are not eligible to participate in the Company's stock option plan. |
| Other Public Board Directorships: Canadian Utilities Limited |
RON A. BRENNEMAN Non-independent1, Management Age: 60 Calgary, Alberta, Canada Director since 2000 | Ron Brenneman joined Petro-Canada as President and Chief Executive Officer in January 2000. He leads the Company's Executive Leadership Team. He is responsible for the overall strategic direction of the Company and its sound management and performance. Mr. Brenneman holds a Bachelor of Science and a Master of Science. He is a member of the Board of Directors of the Canadian Council of Chief Executives. |
| Board and Committee Membership | Attendance |
Board of Directors As a member of management, Mr. Brenneman is not a member of any Committee of the Board, but he is invited to attend all Committee meetings other than in camera sessions. | 9 of 9 | 100% |
| Securities Held |
| Year | Common Shares2 | DSUs3 | Total of Common Shares and DSUs | Total Market Value of Common Shares and DSUs4 | Minimum Required5 |
| 2006 | 81,534 | 217,580 | 299,114 | $ 14,282,693 | $4,860,000 |
| 2005 | 78,793 | 190,887 | 269,680 | $ 10,196,393 |
| Options Held: 1,219,000 |
Other Public Board Directorships:6 Bank of Nova Scotia and BCE Inc. |
1 Independent: refers to the standards of independence established under Section 303A.02 of the NYSE Listed Company Manual, Section 301 and Rule 10A-3 of the Sarbanes-Oxley Act of 2002 and Section 1.2 of Canadian Securities Administrators' National Instrument 58-101.
2 Common Shares refers to the number of common shares beneficially owned, or over which control or direction is exercised by the Director, as of December 31, 2006 and December 31, 2005, respectively. For Messrs Currie, Kierans and Simpson, 2006 includes 30,000, 9,100 and 2,000 shares, respectively, purchased in January and/or February 2007.
3 DSUs refers to the number of deferred stock units held by the Director as of December 31, 2006 and December 31, 2005, respectively.
4 The Total Market Value of Common Shares is determined by multiplying the number of common shares held by the closing price of the common shares on the TSX on December 29, 2006 (the last trading day prior to December 31, 2006) of $47.75 and on December 31, 2005 of $46.65, as applicable. The Total Market Value of DSUs is based on the previous five-day average market value of Petro-Canada's common shares as of December 29, 2006 of $47.75 and December 31, 2005 of $34.16. Dividend equivalents are credited on a quarterly basis.
5 Each non-employee Director is required to hold a minimum number of Company shares or share equivalents equal in value to $300,000. Directors have five years to reach this level. Mr. Brenneman, as an employee Director, participates in the Company's Officer Share Ownership Program and is required to hold four times his annual base salary. Refer to Executive Compensation on page 16 of the Management Proxy Circular.
6 Ms. Cook-Bennett and Mr. Kierans both serve on the Board of Manulife Financial Corporation and Messrs Currie and Brenneman both serve on the Board of BCE Inc.
7 Mme Saucier was a Director of Nortel Networks Corporation until June 2005, and was subject to a cease trade order issued on May 17, 2004 as a result of Nortel's failure to file financial statements. The cease trade order was cancelled on June 21, 2005.
8 Messrs Currie and Kierans were Directors of Teleglobe Inc. from December 2000 until April 2002. Teleglobe Inc. filed for court protection under insolvency statutes on May 28, 2002.
The term of office for each of the Directors named above ends at the close of the next Annual Meeting of the shareholders of the Company, or when his or her successor is elected or appointed.
The following table shows information concerning officers of the Company.
Name and Municipality of Residence | Served as an Officer Since | Principal Occupation1 | Employment History Previous Five years |
Brian F. MacNeill, Calgary, Alberta | 2000 | Chairman of the Board of the Company | Prior to 2001, Mr. MacNeill was President and Chief Executive Officer of Enbridge Inc. |
Executive Leadership Team | | | |
Ron A. Brenneman, Calgary, Alberta | 2000 | President and Chief Executive Officer of the Company | Mr. Brenneman has held the position of President and Chief Executive Officer of the Company since 2000. |
Peter S. Kallos, London, England | 2003 | Executive Vice-President, International | Prior to 2003, Mr. Kallos was the Company's Vice-President, Corporate Planning and Communications, and prior thereto was External Affairs Director of Shell Exploration and Production U.K., and prior thereto was General Manager of Enterprise's U.K. Business Unit, and prior thereto was Chief Executive Officer of Enterprise's Italian subsidiary. |
Boris J. Jackman, Mississauga, Ontario | 1993 | Executive Vice-President, Downstream | Mr. Jackman has held the position of Executive Vice-President, Downstream since 1998. |
E.F.H. Roberts, Calgary, Alberta | 1989 | Executive Vice-President and Chief Financial Officer | Mr. Roberts has held the position of Executive Vice-President and Chief Financial Officer since 2004, and prior thereto was Senior Vice-President and Chief Financial Officer since 2000. |
Neil J. Camarta,2 Calgary, Alberta | 2005 | Senior Vice-President, Oil Sands | Prior to 2006, Mr. Camarta was the Company's Vice-President, Corporate Planning and Communications, and prior thereto was Senior Vice-President, Oil Sands for Shell Canada Limited. |
Kathleen E. Sendall, Calgary, Alberta | 1996 | Senior Vice-President, North American Natural Gas | Ms. Sendall has held the position of Senior Vice-President, North American Natural Gas since 2000. |
William A. Fleming,3 St. John's, Newfoundland and Labrador | 2005 | Vice-President, East Coast | Prior to 2005, Mr. Fleming was Terra Nova Asset Manager, and prior thereto was Manager of Engineering and Operations, Western Canada. |
Upstream | | | |
Youssef Ghoniem, Dorsten, Germany | 2002 | Senior Vice-President, Operations | Prior to 2002, Mr. Gohniem was Executive Board Member for Veba Oil & Gas GmbH. |
Gordon Carrick, London, England | 2002 | Senior Vice-President, Operations and Technology | Prior to 2002, Mr. Carrick was Terra Nova Asset Manager. |
Nicholas A. Maden, London, England | 2003 | Vice-President, International and Offshore Exploration | Prior to 2003, Mr. Maden was the Company's Exploration Manager, International business unit, and prior thereto was Business Development Manager with Veba Oil & Gas GmbH, and prior thereto held various exploration management positions with ARCO. |
Graham Lyon, London, England | 2004 | Vice-President, Business Development, International | Prior to 2004, Mr. Lyon was the Company's Senior Director, Business Development, and prior thereto was head of Business Development, Deminex UK Oil & Gas. |
Donald M. Clague, Denver, Colorado | 2002 | Vice-President, U.S. Operations, North American Natural Gas | Prior to 2002, Mr. Clague was Manager, Exploration East Coast/Offshore, and prior thereto was Chief Geophysicist. |
Francois Langlois, Calgary, Alberta | 2002 | Vice-President, Exploration, North American Natural Gas | Prior to 2002, Mr. Langlois was Manager, Southern Exploration, and prior thereto was General Manager, North Africa, and prior thereto was Team Leader, Foothills Exploration. |
John D. Miller, Calgary, Alberta | 2004 | Vice-President, Natural Gas Marketing | Prior to 2004, Mr. Miller was General Manager of Gas Marketing, and prior thereto was Manager of Gas Marketing, and prior thereto was Manager, Oil Sands Infrastructure, and prior thereto was Portfolio Manager, Oil Sands Business Integration, and prior thereto was Portfolio Manager, Natural Gas Marketing. |
Leon Sorenson, Calgary, Alberta | 2004 | Vice-President, Canadian Operations, North American Natural Gas | Prior to 2004, Mr. Sorenson was Manager of Production Engineering and Operations, Western Canada Productions, and prior thereto was Manager of Northern Development, Western Canada Development and Operations, and prior thereto was Manager of Engineering Technology. |
Name and Municipality of Residence | Served as an Officer Since | Principal Occupation1 | Employment History Previous Five years |
Susan M. MacKenzie, Calgary, Alberta | 2006 | Vice-President, In Situ Development and Operations, Oil Sands | Prior to 2006, Ms. MacKenzie was the Company's General Manager, Oil Sands In Situ, and prior thereto was Senior Director, Bitumen, and prior thereto was Project Manager, Oil Sands Bitumen. |
Colin H. Cook, Calgary, Alberta | 2006 | Vice-President, Marketing and Development, Oil Sands | Prior to 2006, Mr. Cook was the Company's General Manager, Marketing and Integration, Oil Sands, and prior thereto was General Manager, Business Integration Oil Sands. |
Hugh D. MacGregor, Calgary, Alberta | 2006 | Vice-President, Fort Hills, Oil Sands | Prior to 2006, Mr. MacGregor was the Company's Senior Director, Oil Sands Refinery Conversion Program. |
Downstream | | | |
Randall B. Koenig, Oakville, Ontario | 1996 | Vice-President, Lubricants | Mr. Koenig has held the position of Vice-President, Lubricants since 1998. |
Frederick Scharf, Mississauga, Ontario | 2003 | Vice-President, Wholesale/Retail Sales, Service and Operations | Prior to 2003, Mr. Scharf was General Manager, Western Canada Wholesale/Retail. |
Philip Churton, Burlington, Ontario | 2005 | Vice-President, Marketing | Prior to 2005, Mr. Churton was General Manager, Sales Services & Operations, Central Canada. |
Daniel P. Sorochan, Mississauga, Ontario | 2003 | Vice-President, Refining and Supply | Prior to 2003, Mr. Sorochan was Senior Director of Business Development, Refining and Supply, and prior thereto was General Manager, Oakville refinery. |
Shared Services | | | |
Scott R. Miller,4 Calgary, Alberta | 2006 | Vice-President, General Counsel | Prior to 2006, Mr. Miller was Associate General Counsel, Upstream. Mr. Miller is an Associate Member of the Executive Leadership Team. |
Andrew Stephens, Calgary, Alberta | 1993 | Vice-President, Human Resources | Mr. Stephens has held the position of Vice-President, Human Resources since 2005, and prior thereto was Vice-President, Corporate Planning and Communications, and prior thereto was Vice-President, Refining and Supply. Mr. Stephens is an Associate Member of the Executive Leadership Team. |
M. A. (Greta) Raymond, Calgary, Alberta | 2001 | Vice-President, Environment, Health, Safety and Security/Corporate Responsibility | Ms. Raymond has held the position of Vice-President, Environment, Safety and Social Responsibility since 2005, and prior thereto was also responsible for Human Resources. Ms. Raymond is an Associate Member of the Executive Leadership Team. |
Helen Wesley,5 London, England | 2006 | Vice-President, Finance IBU | Prior to 2006, Ms. Wesley was the Company's Senior Director, Corporate Communications, and prior thereto was Manager Planning, and prior to that was with Nova Chemicals as Vice-President, Purchasing and Supply. |
Wayne R. Pennington,6 Calgary, Alberta | 2006 | Treasurer | Prior to 2006, Mr. Pennington was the Company's Assistant Controller, Corporate, and prior to that was Senior Director, Financial Reporting and Accounting, and prior thereto was with EnCana Corporation as Assistant Controller, and prior to that was with PanCanadian Energy as Manager Financial Reporting and Forecasts. |
Hugh L. Hooker, Calgary, Alberta | 2004 | Chief Compliance Officer, Corporate Secretary, Associate General Counsel | In 2006, Mr. Hooker added Chief Compliance Officer to his responsibilities. Prior to 2004, Mr. Hooker was Associate General Counsel. |
Michael Danyluk, Calgary, Alberta | 2004 | Chief Information Officer | Prior to 2004, Mr. Danyluk was Senior Director of Information Systems. |
Michael C. Barkwell, Calgary, Alberta | 2005 | Controller | Prior to 2005, Mr. Barkwell was Assistant Controller, Downstream, and prior thereto was Director of Financial Reporting. |
1 Each of the officers has been engaged in the principal occupation indicated above or in executive positions with Petro-Canada for the five preceding years, except as indicated.
2 Mr. Camarta replaced Brant G. Sangster as Senior Vice-President, Oil Sands. Mr. Sangster retired from the Company in August 2006.
3 Mr. Fleming retired in February 2007.
4 Mr. Miller replaced W.A. (Alf) Peneycad as Vice-President, General Counsel. Mr. Peneycad retired from the Company in June 2006.
5 Ms. Wesley replaced Gerhard Kinast as Vice-President, Finance International. Mr. Kinast retired from the Company in February 2006.
6 Mr. Pennington replaced Douglas S. Fraser as Treasurer. Mr. Fraser left the Company in May 2006.
Share Ownership
As at December 31, 2006, the Directors and officers of Petro-Canada, as a group, beneficially owned or exercised control over 403,926 common shares, or less than 1% of the common shares of the Company outstanding as of such date.
Corporate Governance
Petro-Canada's Board of Directors (the Board) believes that superior corporate governance practices are essential to the Company's success. The Company maintains a best-practices standard in all its corporate governance initiatives and the Corporate Governance and Nominating Committee (the Governance Committee) reviews its corporate governance policies every time it meets.
Governance Committee Responsibilities
The Governance Committee is responsible for overseeing the Company's corporate governance matters and making appropriate recommendations to the Board. In particular, it helps the Board:
develop and implement corporate governance procedures
propose nominees for election to the Board
assess the size, competencies and skills of the Board
conduct Board, Committee and Director evaluations
oversee the orientation and education of Board members
2006 Governance Initiatives
This year, the Governance Committee completed a number of governance initiatives, including:
a gap analysis on Director education to benchmarch Petro-Canada's Director orientation and education programs
reviewing the Board membership matrix in connection with succession planning
an assessment of the annual Board review process
revision of the Corporate Governance Handbook
The Company's management regularly reports to the Governance Committee on governance trends, issues and developments.
Corporate Governance Practices
Petro-Canada is a Canadian integrated oil and gas company with shares listed on the TSX and the NYSE. The Company's corporate governance practices follow the rules and guidelines from both Canadian and U.S. securities regulators, including the following:
| Canadian | National Instrument 58-101 (Disclosure of Corporate Governance Practices) |
| | National Policy 58-201 (Corporate Governance Guidelines) |
| | National Instrument 52-109 (Certification of Disclosure) |
| | Multilateral Instrument 52-110 (Audit Committees) (MI 52-110) |
| | |
| U.S. | Sarbanes-Oxley Act of 2002 (SOX) |
| | NYSE Corporate Governance Standards for U.S. domestic issuers (NYSE Standards)1 |
1 Although the NYSE Standards do not apply to Petro-Canada, the Company's corporate governance practices substantially comply with these Standards.
Board Composition and Independence
Petro-Canada's Articles say that the Board must have a minimum of 9 and a maximum of 13 Directors.
Petro-Canada's Board consists of qualified members with backgrounds that help the Company to meet its performance targets. The Board has proposed 11 nominees for election to the Board. Ten are independent; Ron A. Brenneman, Petro-Canada's President and Chief Executive Officer, is the one Director who is not independent under MI 52-110, the NYSE standards and SOX. The Governance Committee annually reviews the size and effectiveness of the Board as a whole, and the skills and contributions of its members. The Company has an annual process to confirm details on Directors' current employers, other directorships, shareholdings and business relationships. This helps in deciding each Director's independence.
This year, the Governance Committee has recommended to the Board the 11 Board nominees as having the appropriate mix of experience and skill to oversee the stewardship of Petro-Canada. Please see Director Biographies in the Management Proxy Circular for more detail.
Board Roles and Responsibilities
The Board supervises the management of Petro-Canada and is responsible for its overall stewardship. In summary, the Board is responsible for:
management selection, retention, succession and remuneration
overseeing the development of the Company's business strategy and monitoring its progress
approving significant Company policies and procedures
timely and accurate reporting to shareholders and public filing of documents
approving major Company decisions and documents, including such things as audited financial statements, declaration of dividends, offering circulars and initiation of bylaw amendments
The Board meets at least six times per year and schedules in camera sessions at each meeting. In 2006, there were nine Board and in camera meetings. The Chair periodically solicits recommendations from Board members on matters that should be brought before the Board. All Directors receive a meeting agenda and background material on agenda items prior to each meeting so that they have the opportunity to review and consider the items that will be discussed. Individual Directors will notify the Board of a material interest in any matter that the Board is considering. The interested Board member is not entitled to participate in Board discussions or vote on the particular matter at the meeting.
The Board Mandate (attached to the Management Proxy Circular as Appendix A) and Terms of Reference for an individual Director contain more detail on the membership, procedures and responsibilities of the Board. These documents can be found in the Corporate Governance Handbook at www.petro-canada.ca.
Board Committees
The Board has five standing Committees:
Audit, Finance and Risk (Audit Committee)
Corporate Governance and Nominating (Governance Committee)
Environment, Health and Safety (EH&S Committee)
Management Resources and Compensation (Compensation Committee)
Pension (Pension Committee)
All members of the Committees are independent and in camera sessions are scheduled at each Committee meeting. The Governance Committee recommends to the Board the appointees of Committee Chairs. The Chairs of each Committee are responsible for the management, development and effective performance of their Committee. The Chair provides leadership to the Committee, with an aim to fulfilling the Committee's Charter and other matters delegated to it by the Board. The Committee Chairs' mandates are available in the Corporate Governance Handbook at www.petro-canada.ca.
The following summarizes the Committees' responsibilities. Each Committee's Charter contains details of its membership, procedures and responsibilities. The Charters can be found in the Corporate Governance Handbook at www.petro-canada.ca.
Audit Committee
All members of the Audit Committee are independent and financially literate. One member is recognized as a "financial expert" in accordance with SOX requirements. In camera sessions are held at each Audit Committee meeting, of which there were seven in 2006.
The Audit Committee helps the Board with (i) all matters relating to the external and contract internal auditors, (ii) reviewing and approving the audited financial statements, (iii) reviewing litigation claims, reserves data and related disclosures and (iv) overseeing accounting and risk management policies, reporting practices and internal controls.
Governance Committee
The Governance Committee helps the Board with (i) developing and complying with corporate governance policies and procedures, (ii) recommending candidates for election to the Board and its Committees, (iii) assessing the management, development and effective performance of the Board, its Committees, and their respective Mandates and Charters and (iv) orientation, education and development of Board members. In 2006, there were four Committee and in camera meetings.
EH&S Committee
All members of the EH&S Committee are independent and in camera sessions are held at each meeting. In 2006, there were three Committee and in camera meetings. The EH&S Committee helps the Board with (i) setting strategies, goals, policies and procedures in connection with environment, health and safety matters, (ii) monitoring Petro-Canada's performance in relation to these matters and (iii) complying with environment, health and safety legislation, other related regulatory provisions and public policy.
Compensation Committee
All members of the Compensation Committee are independent and in camera sessions are held at each meeting. In 2006, there were four Committee and in camera meetings. The Compensation Committee helps the Board with setting the compensation for the President and Chief Executive Officer and other senior officers, as well as overseeing the plans for (i) compensation, development and retention of employees, (ii) succession planning for senior officers and (iii) general compensation and human resource policies and issues.
Pension Committee
All members of the Pension Committee are independent and in camera sessions are held at each meeting. In 2006, there were two Committee and in camera meetings. The Pension Committee helps the Board with (i) setting strategies, goals, policies and procedures for the Company's pension plan, (ii) effectively governing the pension plan and (iii) monitoring the pension plan's financial position, and its compliance with legislative, regulatory and internal policy requirements.
Position Descriptions
Chair of the Board
The Chair of the Board is an independent Director whose position is separate from the President and Chief Executive Officer. The Chair leads the Board and is responsible for enhancing its effectiveness. The Chair also acts as an advisor to the President and Chief Executive Officer and to other officers in all matters concerning the management of Petro-Canada. The Governance Committee annually reviews the performance of the Chair of the Board.
President and Chief Executive Officer
The President and Chief Executive Officer leads Petro-Canada's Executive Leadership Team. He is responsible for the strategic direction of the Company and its sound management and performance. Each January, the Chair of the Board and the Chair of the Governance Committee canvas the Board members for their input on the President and Chief Executive Officer's performance, request input and comments from other officers as they may see fit and have a detailed discussion with the President and Chief Executive Officer. The Chair of the Board provides an evaluation report to the Management Resources and Compensation Committee, which recommends to the Board the compensation of the President and Chief Executive Officer for the upcoming year.
Detailed position descriptions for the Chair of the Board, Chief Executive Officer and Corporate Secretary are published in the Corporate Governance Handbook available at www.petro-canada.ca.
Director Evaluation and Compensation
The Governance Committee annually reviews the size, composition, charters and membership of the Board and each Board Committee, evaluating the effectiveness of the Board, its Committees and the contribution of individual Board members. The Board receives an annual report of the Governance Committee's findings. The Governance Committee also reviews Directors' compensation and recommends Director remuneration of the Board. The main objective is to have the compensation realistically reflect the responsibilities and risk involved in being a Director.
Director Orientation and Continuing Education
We give each new Director copies of:
business plan and implementation strategy
annual disclosure documents
minutes of the Board and Committee meetings for the past year
Corporate Governance Handbook
Each new Director has one-on-one sessions with each of the business unit leaders. As required, we arrange a mentor for every new Director to help them learn about the Company's operations.
Petro-Canada encourages all Directors to take advantage of continuing education programs. The Company supports Directors through a cost-sharing arrangement or by paying all reasonable expenses. Petro-Canada also provides a number of in-house education sessions, such as tours of the Company's facilities and technical paper presentations.
Ethical Business Conduct
Code of Business Conduct - All Board members, employees and contractors must follow Petro-Canada's Code of Business Conduct (the Code), which is available on the Company's website (www.petro-canada.ca). The Code provides guidance on such things as ethical business conduct generally, conflicts of interest, dealing with confidential information, insider information and the Policy for the Prevention of Improper Payments. The Board has not granted any waiver of the Code; therefore, no material change report has been filed in this regard.
Annual certificates are provided by Petro-Canada's executive officers verifying that (i) they adhere to the Code, (ii) the Code is regularly communicated and (iii) their employees adhere to the Code. Employees take electronic training on the Code's content and certify their compliance every two years. All new employees must certify that they will comply with the Code during their employment.
Senior Financial Officers - Petro-Canada's senior financial officers provide annual certifications under the Company's Code of Ethics for Financial Officers. The President and Chief Executive Officer, and Executive Vice-President and Chief Financial Officer certify the Company's quarterly and annual financial statements for filing with the Canadian and U.S. securities regulators.
Whistleblower Hotline - With the Company's whistleblower hotline, employees can report questionable accounting or auditing matters on an anonymous and confidential basis. The Chief Compliance Officer oversees the whistleblower hotline and reports complaints received through the hotline to the Chair of the Audit Committee.
Disclosure Policy - Petro-Canada has adopted a Public Disclosure Policy to govern the dissemination of information to the public and further its aim of providing clear and complete disclosure in a timely manner, while complying with all securities regulations. The procedure operating under this Policy establishes a committee that is lead by the Executive Vice-President and Chief Financial Officer, and the Vice-President and General Counsel, with representatives from all business and Shared Services units of the Company. Different types of disclosure are approved by all or part of the committee, as the circumstances warrant. The Chief Financial Officer must approve all material financial disclosures.
This report is submitted by the Corporate Governance and Nominating Committee:
Guylaine Saucier (Chair)
Thomas E. Kierans
Maureen McCaw
Brian MacNeill (ex-officio member)
Audit Committee Disclosure
The following reviews certain information regarding the Company's Audit, Finance and Risk Committee, as required pursuant to Multilateral Instrument 52-110.
Audit, Finance and Risk Committee
Chair: Paul D. Melnuk (Designated Financial Expert)
Members: Angus A. Bruneau, Gail Cook-Bennett, Paul Haseldonckx, James W. Simpson
2006 Committee Meetings: Seven
This Committee is composed entirely of independent Directors, each of whom is very knowledgeable in financial matters and is financially literate within the meaning of Multilateral Instrument 52-110. Details as to each Committee member's education and experience that provide the member with the necessary knowledge and understanding of accounting principles and procedures can be found above under Directors, starting on page 69. The Committee is responsible for reviewing and providing recommendations to the Board of Directors regarding the Company's accounting policies, reporting practices, internal controls, the Company's annual and interim financial statements, financial information included in the Company's disclosure documents, risk management matters, and oil and gas reserves booking and reporting. The Committee also reviews significant audit findings, material litigation and claims, and any issues between management and the auditors. The Committee maintains direct relationships with the Company's contract internal auditor and external auditor. The Committee meets in camera with both the contract internal auditor and external auditor at least once per year. The Committee is responsible for recommending the appointment and compensation of the external auditor. The Committee has a policy in place that non-audit work may not be performed by the external auditor. The Terms of Reference of the Audit, Finance and Risk Committee are attached to this AIF as Schedule C and can also be found on the Company's website at www.petro-canada.ca.
Audit Fees
Deloitte & Touche LLP were appointed as auditors of the Company on June 7, 2002. Deloitte & Touche LLP billed the Company for services rendered in the year ended December 31, 2006 as follows: (a) audit fees - $4,024,750 (2005 - $3,217,000), (b) audit related services for pension plan and attest services - $196,180 (2005 - $213,000), (c) tax advisory fees - nil (2005 - nil), and (d) all other fees - nil (2005 - nil).
The Board of Directors adheres to a practice of limiting the auditors from providing services not related to the audit. All services provided by the auditors are pre-approved by the Audit, Finance and Risk Committee.
INTEREST OF MANAGEMENT AND OTHERS IN MATERIAL TRANSACTIONS
No Director, executive officer or principal shareholder of Petro-Canada, or associate or affiliate of those persons, has any material interest, direct or indirect, in any transaction within the last three years that has materially affected or will materially affect Petro-Canada.
TRANSFER AGENTS AND REGISTRARS
In Canada: CIBC Mellon Trust Company 600, 333 - 7 Avenue S.W. Calgary, Alberta T2P 2Z1 Telephone: 1-800-387-0825 or 416-643-5000 outside of North America Website: www.cibcmellon.com | In the U.S.: Mellon Investor Services LLC Telephone: 1-800-387-0825 Website: www.cibcmellon.com |
MATERIAL CONTRACTS
Petro-Canada has not entered into any material contracts, outside the ordinary course of business, within two years before the date of this AIF.
INTERESTS OF EXPERTS
Deloitte & Touche LLP is the auditor of the Company and is independent in accordance with the Rules of Professional Conduct as outlined by the Institute of Chartered Accountants of Alberta. Deloitte & Touche LLP has prepared an opinion with respect to the Company's Consolidated Financial Statements as at and for the fiscal year ended December 31, 2006, as well as an opinion on management's assessment of the effectiveness of the Company's internal control over financial reporting and an opinion on the effectiveness of the Company's internal control over financial reporting. Kathleen E. Sendall is a Senior Vice-President with the Company and has certified a report with respect to NI 51-101 oil and gas reserves disclosure. Ms. Sendall does not hold more than 1% of the Company's outstanding securities.
ADDITIONAL INFORMATION
Financial information is provided in the Company's Consolidated Financial Statements and MD&A for its most recently completed financial year. Additional information, including Directors' and Officers' remuneration and indebtedness of principal holders of the Company's securities and securities authorized for issuance under equity compensation plans, is contained in the Company's Management Proxy Circular, dated March 1, 2007.
Copies of this AIF, as well as the Company's latest Management Proxy Circular and Annual Report (which includes the Company's Consolidated Financial Statements and MD&A) for the year ended December 31, 2006 may be obtained from the Company's website at www.petro-canada.ca or by mail upon request from the corporate secretary, 150 - 6 Avenue S.W., Calgary, Alberta, T2P 3E3.
You may also access disclosure documents and any reports, statements or other information that Petro-Canada files with the Canadian provincial securities commissions or other similar regulatory authorities through the Internet on the Canadian System for Electronic Document Analysis and Retrieval, which is commonly known by the acronym SEDAR, and which may be accessed at www.sedar.com. SEDAR is the Canadian equivalent of the U.S. SEC's Electronic Document Gathering and Retrieval System, which is commonly known by the acronym EDGAR, and which may be accessed at www.sec.gov.
SCHEDULE A
REPORT ON RESERVES DATA
BY
SENIOR OFFICER RESPONSIBLE FOR RESERVES DATA
To the Board of Directors of Petro-Canada (the Company):
1. The Company's staff of qualified reserves evaluators have evaluated the Company's reserves data as at December 31, 2006. The reserves data consist of the following:
(i) proved oil and gas reserves and oil sands mining quantities estimated as at December 31, 2006, using constant prices and costs; and
(ii) the Standardized Measure of Discounted Future Net Cash Flows relating to proved oil and gas reserves and oil sands mining quantities.
2. The reserves data are the responsibility of the Company's management. As the member of the executive responsible for the Company's hydrocarbon reserves data, my responsibility is to certify that the reserves data has been properly calculated in accordance with industry generally accepted procedures for the estimation of reserves data.
3. The Company's reserves staff and management carried out their evaluations in accordance with industry generally accepted procedures for the estimation of reserves data and standards as set out in the Canadian Oil and Gas Evaluation Handbook (the COGE Handbook), prepared jointly by the Society of Petroleum Evaluation Engineers (Calgary Chapter) and the Canadian Institute of Mining, Metallurgy & Petroleum (Petroleum Society), with the necessary modifications to reflect the definition of proved reserves under the applicable U.S. Financial Accounting Standards Board policies (the FASB Standards) and the legal requirements of the U.S. Securities and Exchange Commission (SEC Requirements). The Company's reserves staff and management are not independent of the Company within the meaning of the term "independent" under those standards.
4. The standards require that they plan and perform an evaluation to obtain reasonable assurance as to whether the reserves data are free of material misstatement. An evaluation also includes assessing whether the reserves data are developed in accordance with the evaluation practices and procedures presented in the COGE Handbook as modified to meet the requirements of the FASB Standards and SEC Requirements.
5. The following sets forth the standardized measure of future net cash flows attributed to proved oil and gas reserves and oil sands mining quantities, estimated using constant prices and costs and calculated using a discount rate of 10%, included in the reserves data of the Company evaluated for the year ended December 31, 2006:
STANDARDIZED MEASURE OF FUTURE NET CASH FLOWS
PROVED OIL AND GAS RESERVES AND OIL SANDS MINING
(10% discount rate)
As at December 31, 2006
| Location of Reserves (by business) | | Standardized Measure (After Deducting Income Taxes) | |
| North American Natural Gas | | $ | 3,493 | |
| East Coast Oil | | | 3,233 | |
| Northwest Europe | | | 2,090 | |
| North Africa/Near East | | | 590 | |
| Northern Latin America | | | 148 | |
| Syncrude Oil Sands Mining Operation | | $ | 3,539 | |
The Standardized Measure values above were calculated consistent with the methodology prescribed in Financial Accounting Standards Board Statement No. 69.
6. In my opinion, the reserves data evaluated by the Company's reserves evaluation staff and management has, in all material respects, been determined in accordance with evaluation practices and procedures presented in the COGE Handbook with the necessary modifications to reflect reserves definitions and legal requirements under the applicable FASB Standards and SEC Requirements.
7. The reservoir engineering staff and management review and evaluate the reserves data on an ongoing basis and advise the executive of the Company of significant changes to the evaluations for events and circumstances occurring after the effective date of this report.
8. Reserves are estimates only and not exact quantities. In addition, the reserves data are based on judgments regarding future events; actual results will vary and the variations may be material.
/Signed/ Kathleen E. Sendall Senior Vice-President, North American Natural Gas Member of Executive Leadership Team Responsible for Reserves Dated March 22, 2007 | |
SCHEDULE B
REPORT OF MANAGEMENT AND DIRECTORS
ON RESERVES DATA AND OTHER INFORMATION
The management of Petro‑Canada (the Company) is responsible for the preparation and disclosure of information with respect to the Company's oil and gas activities in accordance with securities regulatory requirements. This information includes reserves data, which consist of the following:
(i) proved oil and gas reserves and oil sands mining quantities estimated as at December 31, 2006, using constant prices and costs; and
(ii) the Standardized Measure of Discounted Future Net Cash Flows relating to proved oil and gas reserves and oil sands mining quantities.
Petro‑Canada's reserves evaluation process involves applying generally accepted practices and procedures for the estimation of reserves data as set out in the COGE Handbook and modified to reflect the definitions and standards as set out in the applicable provisions of the U.S. Financial Accounting Standards Board Statement of Financial Accounting Standards No. 69 and the relevant legal requirements of the U.S. Securities and Exchange Commission (SEC), (collectively the Reserves Data Process). Petro‑Canada's qualified internal reserves evaluation staff and management have evaluated the Company's reserves and the executive member responsible for reserves data certifies that the Reserves Data Process has been followed. The report of the executive member responsible for reserves data will be filed with securities regulatory authorities concurrently with this report.
The Company has designated the Audit, Finance and Risk Committee of its Board of Directors as performing the roles and responsibilities of the Reserves Committee of the Board of Directors as set out in National Instrument 51-101. The Audit, Finance and Risk Committee of the Board of Directors has:
(a) reviewed the Company's procedures for providing information to the internal and external qualified reserves evaluators;
(b) met with the internal and external qualified reserves evaluators to determine whether any restrictions placed by management affect the ability of the internal and external qualified reserves evaluators to report without reservation; and
(c) reviewed the reserves data with reserves management and each of the qualified external reserves evaluators.
The Audit, Finance and Risk Committee of the Board of Directors has reviewed the Company's procedures for assembling and reporting other information associated with oil and gas activities and has reviewed that information with management. The Board of Directors has, on the recommendation of the Audit, Finance and Risk Committee, approved:
(a) the content and filing with securities regulatory authorities of the reserves data and other oil and gas information;
(b) the filing of the report of the executive member responsible for reserves on the reserves data; and
(c) the content and filing of this report.
The Company has sought from, and was granted by, securities regulatory authorities an exemption from the requirement under securities legislation to involve independent qualified reserves evaluators or independent qualified reserves auditors. Notwithstanding this exemption, the Company involves independent qualified reserves evaluators or auditors as part of its corporate governance practices. In 2006, the independent evaluators/auditors, evaluated/audited approximately 45% of the Company's proved oil and gas reserves data by volume. If the Syncrude oil sands mining proved reserves are included, the percentage of total Company reserves audited was 33%. Their involvement helps assure that our internal reserves data are materially correct.
In the Company's view, the reliability of the internally generated reserves data is not materially less than would be afforded by Petro-Canada involving independent qualified reserves evaluators or independent qualified reserves auditors to evaluate, audit and/or review the reserves data. Petro-Canada's reserves data are international in nature. The Company's securities regulatory reporting is as an SEC registrant and, therefore, Petro-Canada's reserves data are developed in accordance with practices and procedures set out in the Canadian Oil and Gas Evaluation Handbook and modified to meet the applicable U.S. Financial Accounting Standards Board and SEC reserves definitions, and the legal requirements of the SEC. Petro-Canada's procedures, records and controls relating to the accumulation of source data and preparation of reserves data by the Company's internal reserves evaluation staff have been established, refined and documented over many years. Petro-Canada's internal reserves evaluation staff and management include 69 persons, with an average of more than 11 years of relevant experience in evaluating reserves, of whom 44 are qualified reserves evaluators for purposes of Canadian securities regulatory requirements. The Company's internal reserves evaluation management personnel includes 12 persons, with an average of 23 years of relevant experience in evaluating and managing the evaluation of reserves.
Reserves data are estimates only and are not exact quantities. Because the reserves data are based on judgments regarding future events, actual results will vary and the variations may be material.
/Signed/ Ron A. Brenneman President and Chief Executive Officer | |
/Signed/ Kathleen E. Sendall Senior Vice-President, North American Natural Gas | |
/Signed/ Paul D. Melnuk, Director | |
/Signed/ Brian F. MacNeill, Director Dated March 22, 2007 | |
SCHEDULE C
AUDIT, FINANCE AND RISK COMMITTEE
1. The duties and responsibilities of the Audit, Finance and Risk Committee shall include the following:
| (i) | assist the Board of Directors in the discharge of its fiduciary responsibilities relating to the Company's accounting policies, reporting practices and internal controls, as well as to its risk management policies and practices; |
| (ii) | maintain direct lines of communications with the Chief Financial Officer and with the contract auditor and the external auditors; |
| (iii) | monitor the scope and costs of the activity of the contract and external auditors, and assess their performance; |
| (iv) | formally consider the continuation of or a change in the external auditors and review all issues related to a change of external auditor, including any differences between the Company and the auditor that relate to the auditor's opinion or a qualification thereof or an auditor comment; |
(v) | recommend to the Board of Directors a firm of external auditors for approval by the shareholders of the Company; review and approve the terms of their engagement; review and approve the fee, scope and timing of the audit, and be apprised of and approve in advance any audit related services and any non-audit services (which are not prohibited non-audit services) to be provided by the external auditors and the costs thereof and consider any impact of the provision of such services on the maintenance of their independence and review the Company's hiring policies regarding employees and former employees of the present and former external auditors; |
| (vi) | review all issues related to any proposed change in or renewal of the contract with the contract auditor; |
| (vii) | review and recommend approval by the Board of the Company's audited annual financial statements and Management's Discussion and Analysis; |
(viii) | review before publication the Company's unaudited quarterly financial statements, reports of quarterly earnings, and Management's Discussion and Analysis with particular attention to the presentation of unusual or sensitive matters such as disclosure of related party transactions, significant non-recurring events, significant risks, changes in accounting principles, and estimates or reserves, and all significant variances between comparative reporting periods, and approve the publication of the Company's unaudited quarterly financial statements and reports of quarterly earnings; |
| (ix) | review all financial information included in annual information forms, prospectuses, other offering memoranda or other documents requiring approval by the Board of Directors; |
(x) | review the Statement of Management's Responsibility for the Financial Statements as signed by senior management and included in any published document, and review and approve the Statement regarding the role of the Committee as signed by the Chairman of the Committee and included in any published documents; |
| (xi) | review the Report of Management on Oil and Gas Disclosure as signed by senior management and directors and included in any published document; |
(xii) | review any litigation, claim or other contingency, including tax assessments, that could have a material effect upon the financial position or operating results of the Company, monitor disclosure thereof in documents reviewed by the Committee; |
(xiii) | review the appropriateness and quality of the accounting policies used in the preparation of the Company's financial statements, and consider any proposed changes to such policies; |
(xiv) | review with the external auditor the contents of the annual audit report and review any significant recommendations from the external auditor to strengthen the internal controls of the Company; |
(xv) | review the results of the external audit, any significant problems encountered in performing the audit, and the contents of any Management Letter issued by the external auditor to the Company, and management's response thereto; |
(xvi) | annually review a report on the contract audit function with respect to the terms of reference, organization, staffing, independence, performance and effectiveness of the contract audit services, receive and approve the annual contract audit plan, and obtain assurances in respect of conformity with CICA and AICPA professional standards, and other regulatory bodies' requirements, the outsourcing contract and recommendations of management and the contract auditor; |
| (xvii) | review significant contract audit findings and recommendations, and management's response thereto; |
(xviii) | oversee management's responsibility for designing, installing and maintaining an effective control environment; approve in advance any internal control-related services performed by the external auditor; and receive regular reports on the Company's internal control policies and procedures with particular emphasis on accounting and financial controls, and recommend changes where appropriate; |
(xix) | review any unresolved significant issues between management and the external auditor that could affect the financial reporting or internal controls of the Company; |
(xx) | annually; (a) review the Company's internal procedures for providing reserves information to its reserves evaluators; (b) meet with internal and external reserves evaluators to determine their independence and effectiveness in preparing the reserves data of the Company; (c) review the reserves data included in the annual disclosure made by the Company; and (d) review the Company's internal procedures for assembling and reporting other information associated with oil and gas activities and included in the annual disclosure made by the Company; |
(xxi) | receive reports on and review any other items deriving from the foregoing, either in respect of the Company, or a subsidiary or any other entity or relationship in which the Company has a significant interest, as requested by the Board; |
| (xxii) | review and make recommendations to the Board concerning the following: |
| 1) the Company's policies regarding hedging, investments, credit and risk management; and |
| 2) the Company's risk identification, analysis and management procedures; |
(xxiii) | review, prior to each annual shareholders' meeting, the policies and practices concerning the regular examination of officers expenses and perquisites, including the use of Company assets; |
(xxiv) | report annually to the full Board, on the state of completion of the Audit, Finance and Risk Committee Annual Agenda Items, with appropriate recommendations; and |
(xxv) | report annually to the full Board on the Committee's review of the Company's reserves procedures and disclosure and recommend to the Board the approval of the reserves data and other information associated with the Company's oil and gas activities and included in the annual disclosure made by the Company. |
2. ORGANIZATION AND PROCEDURES
(i) | The Committee shall meet regularly, not less than four times per year, and at such other times as may be requested by the Chair of the Committee. The Chief Executive Officer, the Chief Financial Officer, the Controller, the contract auditor, the external auditor or any member of the Committee may also request a meeting of the Committee. |
(ii) | The Chair of the Committee, in consultation with the Chief Financial Officer, shall set the agenda for each meeting which shall then be circulated among the Committee Members. |
(iii) | The Chief Executive Officer, the Chief Financial Officer and the Controller shall have direct access to the Committee and shall receive notice of and attend all meetings of the Committee, except private sessions. |
(iv) | The external auditor and the contract auditor shall ultimately report to the Board and the Committee and shall at any time have direct access to the Committee and shall receive notice of and be invited to attend all meetings of the Committee, except private sessions. |
(v) | The contract auditor, the external auditor, and one or more representatives of senior management, shall each meet separately with the Committee, in private sessions, at least once annually. |
| (vi) | The Committee may contact directly any employee in the Company and the contract auditor as it deems necessary. |
| (vii) | The Committee will establish procedures for: |
| 1) receipt, retention and treatment of complaints regarding accounting controls or auditing matters; and |
| 2) confidential anonymous submission by employees of concerns regarding questionable accounting or auditing matters; and annual review of compliance under the Company's Code of Ethics for Senior Financial Officers. |
The Committee will periodically review its own Terms of Reference, and make recommendations to the Board as required.
CONTROLS AND PROCEDURES
The company has performed an evaluation of its disclosure controls and procedures (as defined by Exchange Act rule 13a-15(e)), as of December 31, 2006. Based on this evaluation, the company's Chief Executive Officer and Chief Financial Officer have concluded that the disclosure controls and procedures are effective in providing reasonable assurances that material information required to be in this annual report is made known to them by others on a timely basis.
MANAGEMENT’S REPORT ON INTERNAL CONTROL OVER FINANCIAL REPORTING
[See page 1 of the Management's Discussion and Analysis Exhibit forming part of this report]
ATTESTATION REPORT OF THE REGISTERED PUBLIC ACCOUNTING FIRM
[See pages 3 and 4 of the Management's Discussion and Analysis Exhibit forming part of this report]
CHANGES IN INTERNAL CONTROL OVER FINANCIAL REPORTING
The company has not made any changes in internal control over financial reporting that occurred during the period covered by this annual report that has materially affected, or is reasonably likely to materially affect, the company's internal control over financial reporting.
IDENTIFICATION OF THE AUDIT COMMITTEE
Petro-Canada has a separately-designed standing Audit, Finance and Risk Committee. The members of the Audit, Finance and Risk Committee are:
| | Chair: | P. D. Melnuk |
| | Members: | A. A. Bruneau |
| | | G. Cook-Bennett |
| | | P. Haseldonckx |
| | | J. W. Simpson |
AUDIT COMMITTEE FINANCIAL EXPERT
Petro-Canada's Board of Directors has determined that Petro-Canada has an "audit committee financial expert" as defined by regulations of the U.S. Securities and Exchange Commission. The audit committee financial expert is Paul D. Melnuk, Chairman of the Audit, Finance and Risk Committee. Mr. Melnuk has been determined to be “independent”, as that term is defined by the New York Stock Exchange’s listing standards applicable to Petro-Canada.
CODE OF ETHICS
The company has adopted a code of ethics applicable to its Chief Executive Officer, Chief Financial Officer, principal accounting officer and Controller. A copy of the company's code of ethics and, if applicable, any future amendments or waivers of the code of ethics can be found at the company's website located at www.petro-canada.ca.
PRINCIPAL ACCOUNTANT FEES AND SERVICES
Deloitte & Touche LLP billed the company for services rendered in the year ended December 31, 2006 as follows:
(a) audit fees - $4,024,750
(b) audit related fees - fees for audit of pension plans and attest services - $196,180
(c) tax fees - nil
(d) all other fees -- nil
Deloitte & Touche LLP billed the company for services rendered in the year ended December 31, 2005 as follows:
(a) audit fees - $3,217,000
(b) audit related fees - audits of pension plans and attest services - $213,000
(c) tax fees - nil
(d) all other fees -- nil
AUDIT COMMITTEE PRE-APPROVAL POLICIES AND PROCEDURES: The Audit, Finance and Risk Committee of Petro-Canada's Board of Directors approves in advance any audit or non-audit service proposed to be provided by Deloitte & Touche LLP for Petro-Canada or its subsidiaries. The Committee has delegated to the Chairman of the Committee full authority to approve any such request, as long as the Chairman presents any such approval to the Committee at its next scheduled meeting. No services were approved pursuant to a waiver within the meaning of Rule 2-01(c) (7)(i)(C) of Regulation S-X in the years ended December 31, 2005 and December 31, 2006.
OFF-BALANCE SHEET ARRANGEMENTS
See page 17 of the Management's Discussion and Analysis Exhibit forming part of this report
CONTRACTUAL OBLIGATIONS
See page17 of the Management's Discussion and Analysis Exhibit forming part of this report
UNDERTAKING AND CONSENT TO SERVICE OF PROCESS
A. Undertaking
| | Petro-Canada (the “Registrant”) undertakes to make available, in person or by telephone, representatives to respond to inquiries made by the staff of the Securities and Exchange Commission (“SEC”), and to furnish promptly, when requested to do so by the SEC staff, information relating to the securities in relation to which the obligation to file an annual report on Form 40-F arises or transactions in said securities. |
B. Consent to Service of Process
The Registrant has previously filed a Form F-X with the SEC on March 10, 1994.
SIGNATURE
Pursuant to the requirements of the Securities Exchange Act of 1934, the registrant certifies that it meets all of the requirements for filing on Form 40-F and has duly caused this annual report to be signed on its behalf by the undersigned, thereto duly authorized.
| | PETRO-CANADA |
| | |
| Date: March 29, 2007 | /s/ Hugh L. Hooker |
| Name: | Hugh L. Hooker |
| Title: | Chief Compliance Officer, Corporate Secretary, Associate General Counsel |
EXHIBITS
Exhibits Description
99.1 Petro-Canada Consolidated Financial Statements for the year ended December 31, 2006
99.2 Petro-Canada Management’s Discussion and Analysis
99.3 Certification of the CEO pursuant to Section 302 of the Sarbanes-Oxley Act
99.4 Certification of the CFO pursuant to Section 302 of the Sarbanes-Oxley Act
| 99.5 | Certification of CEO pursuant to 18 U.S.C. Section 1350, as adopted pursuant to Section 906 of the Sarbanes-Oxley Act of 2002 |
| 99.6 | Certification of CFO pursuant to 18 U.S.C. Section 1350, as adopted pursuant to Section 906 of the Sarbanes-Oxley Act of 2002 |
99.7 Consent of Deloitte & Touche LLP, Independent Registered Chartered Accountants