Exhibit 99.1

July 30, 2009 (publié également en français)
For the six months ended June 30, 2009
MANAGEMENT’S DISCUSSION AND ANALYSIS
The Management’s Discussion and Analysis (MD&A), dated July 30, 2009, is set out in pages 1 to 24 and should be read in conjunction with the unaudited Consolidated Financial Statements of the Company for the three months ended March 31, 2009 and the three and six months ended June 30, 2009; the MD&A for the year ended December 31, 2008, the audited Consolidated Financial Statements for the year ended December 31, 2008, and the Company’s 2008 Annual Information Form (AIF), dated March 18, 2009. Amounts are in Canadian (Cdn) dollars unless otherwise specified.
LEGAL NOTICE – FORWARD-LOOKING INFORMATION
This quarterly report contains forward-looking information. You can usually identify this information by such words as "plan," "anticipate," "forecast," "believe," "target," "intend," "expect," "estimate," "budget" or other terms that suggest future outcomes or references to outlooks. Listed below are examples of references to forward-looking information:
· business strategies and goals · future investment decisions · outlook (including operational updates and strategic milestones) · future capital, exploration and other expenditures · future cash flows · future resource purchases and sales · anticipated construction and repair activities · anticipated turnarounds at refineries and other facilities · anticipated refining margins · future oil and natural gas production levels and the sources of their growth · project development, and expansion schedules and results · future exploration activities and results, and dates by which certain areas may be developed or come on-stream | · anticipated retail throughputs · anticipated pre-production and operating costs · reserves and resources estimates · future royalties and taxes payable · production life-of-field estimates · natural gas export capacity · future financing and capital activities · contingent liabilities (including potential exposure to losses related to retail licensee agreements) · the impact and cost of compliance with existing and potential environmental regulations · future regulatory approvals · expected rates of return |
Such forward-looking information is based on a number of assumptions and analysis made by the Company. These assumptions and analysis are described in greater detail throughout this quarterly report and include, without limitation, assumptions with respect to future commodity prices, the state of the economy, required capital expenditures, levels of cash flow, regulatory requirements, industry capacity, the results of exploration and development drilling, and the ability of suppliers to meet commitments.
Undue reliance should not be placed on forward-looking information. Such forward-looking information is subject to known and unknown risks and uncertainties, which may cause actual results, levels of activity and achievements to differ materially from those expressed or implied by such information. Such risks and uncertainties include, but are not limited to:
· the possibility of corporate amalgamations and reorganizations · changes in industry capacity · imprecise reserves estimates of recoverable quantities of oil, natural gas and liquids from resource plays, and other sources not currently classified as reserves · the effects of weather and climate conditions · the results of exploration and development drilling, and related activities · the ability of suppliers to meet commitments · decisions or approvals from administrative tribunals · risks associated with domestic and international oil and natural gas operations · changes in general economic, market and business conditions | · competitive action by other companies · fluctuations in oil and natural gas prices · changes in refining and marketing margins · the ability to produce and transport crude oil and natural gas to markets · fluctuations in interest rates and foreign currency exchange rates · actions by governmental authorities (including changes in taxes, royalty rates and resource-use strategies) · changes in environmental and other regulations · international political events · nature and scope of actions by stakeholders and/or the general public |
Many of these and other similar factors are beyond the control of Petro-Canada. Petro-Canada discusses these factors in greater detail in filings with the Canadian provincial securities commissions and the United States (U.S.) Securities and Exchange Commission (SEC).
Readers are cautioned that this list of important factors affecting forward-looking information is not exhaustive. Furthermore, the forward-looking information in this quarterly report is made as of July 30, 2009 and, except as required by applicable law, will not be publicly updated or revised. This cautionary statement expressly qualifies the forward-looking information in this quarterly report.
Management's Discussion and Analysis
PETRO-CANADA
Petro-Canada disclosure of reserves
Petro-Canada's qualified reserves evaluators prepare the reserves estimates the Company uses. The Canadian provincial securities commissions do not consider Petro-Canada’s reserves staff and management as independent of the Company. Petro-Canada has obtained an exemption from certain Canadian reserves disclosure requirements that allows Petro-Canada to make disclosure in accordance with SEC standards where noted in this quarterly report. This exemption allows comparisons with U.S. and other international issuers.
As a result, Petro-Canada formally discloses its proved reserves data using U.S. requirements and practices, and these may differ from Canadian domestic standards and practices. The use of the terms such as "probable," "possible," ”resources” and “life-of-field production” in this quarterly report does not meet the SEC guidelines for SEC filings. To disclose reserves in SEC filings, oil and gas companies must prove they are economically and legally producible under existing economic and operating conditions. Note that when the term barrels of oil equivalent (boe) is used in this quarterly report, it may be misleading, particularly if used in isolation. A boe conversion ratio of six thousand cubic feet (Mcf) to one barrel (bbl) is based on an energy equivalency conversion method. This method primarily applies at the burner tip and does not represent a value equivalency at the wellhead. The table below describes the industry definitions that Petro-Canada currently uses:
| Definitions Petro-Canada uses | Reference |
Proved oil and natural gas reserves (includes both proved developed and proved undeveloped) | SEC reserves definition (Accounting Rules Regulation S-X 210.4-10, U.S. Financial Accounting Standards Board Statement No. 69) SEC Guide 7 for Oil Sands Mining |
| Unproved reserves, probable and possible reserves | Canadian Securities Administrators: Canadian Oil and Gas Evaluation Handbook (COGEH), Vol. 1 Section 5 prepared by the Society of Petroleum Evaluation Engineers (SPEE) and the Canadian Institute of Mining Metallurgy and Petroleum (CIM) |
| Contingent and Prospective Resources | Petroleum Resources Management System: Society of Petroleum Engineers, SPEE, World Petroleum Congress and American Association of Petroleum Geologist definitions (approved March 2007) Canadian Securities Administrators: COGEH Vol. 1 Section 5 |
Although the Society of Petroleum Engineers resource classification has categories of 1C, 2C and 3C for Contingent Resources, and low, best and high estimates for Prospective Resources, Petro-Canada will only refer to the unrisked 2C for Contingent Resources and the partially risked best estimate for Prospective Resources when referencing resources in this quarterly report. Estimates of resources in this quarterly report include Contingent Resources that have not been adjusted for risk based on the chance of development and partially risked Prospective Resources that have been risked for chance of discovery, but have not been risked for chance of development. Such estimates are not estimates of volumes that may be recovered and actual recovery is likely to be less and may be substantially less or zero. If a discovery is made, there is no certainty that it will be developed or, if it is developed, there is no certainty as to the timing of such development.
Canadian Oil Sands represents approximately 68% of Petro-Canada’s total for Contingent and Prospective Resources. The balance of Petro-Canada’s resources is spread out across the business, most notably in the North American frontier and International areas. Also, when Petro-Canada references resources for the Company, unrisked Contingent Resources are approximately 70% of the Company’s total resources and partially risked Prospective Resources are approximately 30% of the Company’s total resources.
Cautionary statement: In the case of discovered resources or a subcategory of discovered resources other than reserves, there is no certainty that it will be commercially viable to produce any portion of the resources. In the case of undiscovered resources or a subcategory of undiscovered resources, there is no certainty that any portion of the resources will be discovered. If discovered, there is no certainty that it will be commercially viable to produce any portion of the resources.
For movement of resources to reserves categories, all projects must have an economic depletion plan and may require:
| · | additional delineation drilling and/or new technology for unrisked Contingent Resources |
| · | exploration success with respect to partially risked Prospective Resources |
| · | project sanction and regulatory approvals |
Reserves and resources information contained in this quarterly report is as at December 31, 2008.
– 2 –
Management's Discussion and Analysis
PETRO-CANADA
BUSINESS ENVIRONMENT
Market prices shown below influence average prices realized for crude oil and natural gas liquids (NGL), natural gas and petroleum products in the tables on pages 22 and 23.
UPSTREAM
Crude Oil
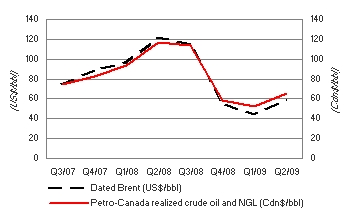 | The price of Dated Brent averaged $58.87 US/bbl in the second quarter of 2009, down 51% compared with $121.38 US/bbl in the second quarter of 2008. Further weakness in global industrial activity and trade depressed crude oil demand in the second quarter of 2009. Weaker energy prices resulted in a lower value for the Canadian dollar in the second quarter of 2009, averaging $0.86 US, 13 cents below the $0.99 US average in the second quarter of 2008. As a result, Petro-Canada’s corporate-wide realized Canadian dollar prices for crude oil and NGL decreased 44%, from $117.22/bbl in the second quarter of 2008 to $65.37/bbl in the second quarter of 2009. |
Sharp declines in Mexican heavy oil production, as well as supply cutbacks by the Organization of the Petroleum Exporting Countries (OPEC) have resulted in exceptionally narrow light/heavy differentials. In the second quarter of 2009, the spread between Dated Brent and Mexican Maya narrowed to $3.75 US/bbl, compared with $18.38 US/bbl in the second quarter of 2008. In Canada, the spread between Edmonton Light and Western Canada Select (WCS) narrowed to $6.65/bbl in the second quarter of 2009, compared with $23.20/bbl in the second quarter of 2008.
Natural Gas
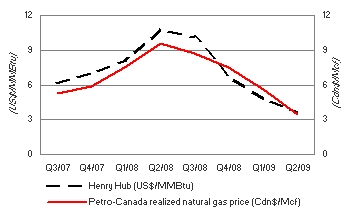 | North American natural gas prices at the Henry Hub were lower in the second quarter of 2009, compared with the second quarter of 2008, reflecting strong growth in U.S. domestic production, much weaker industrial demand and seasonally high storage levels. In the second quarter of 2009, NYMEX Henry Hub natural gas prices averaged $3.60 US/million British thermal units (MMBtu), down 67% from $10.80 US/MMBtu in the second quarter of 2008. Natural gas prices at the AECO-C hub averaged $3.81/Mcf in the second quarter of 2009, down from $9.75/Mcf in the second quarter of 2008. Petro-Canada’s realized Canadian dollar prices for its North American Natural Gas business averaged $3.29/Mcf in the second quarter of 2009, down 66% from $9.64/Mcf in the second quarter of 2008. |
– 3 –
Management's Discussion and Analysis
PETRO-CANADA
DOWNSTREAM
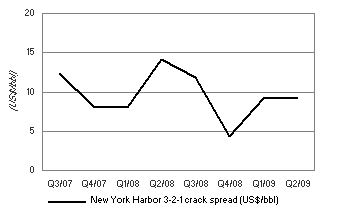 | New York Harbor 3-2-1 refinery crack spreads averaged $9.31 US/bbl in the second quarter of 2009, down 34% compared with an average of $14.09 US/bbl in the second quarter of 2008. Distillate crack spreads were much weaker, compared with the second quarter of 2008, as the recession has disproportionately affected trucking and shipping activity, which are the major sources of distillate fuel demand. Refineries have responded by reducing distillate production, which also results in lower gasoline output. Since gasoline demand has declined more moderately, inventories have remained relatively well balanced. Consequently, gasoline crack spreads in the second quarter of 2009 were stronger compared to the same period in the previous year. This provided a partial offset to the weaker distillate cracks. |
The average market prices for the periods stated were:
| Three months ended June 30, | Six months ended June 30, | ||||||||||||
| 2009 | 2008 | 2009 | 2008 | ||||||||||
Dated Brent at Sullom Voe (US$/bbl) | 58.87 | 121.38 | 51.64 | 109.14 | |||||||||
West Texas Intermediate (WTI) at Cushing (US$/bbl) | 59.62 | 123.98 | 51.35 | 110.94 | |||||||||
Dated Brent/Maya FOB price differential (US$/bbl) | 3.75 | 18.38 | 4.82 | 17.08 | |||||||||
Edmonton Light (Cdn$/bbl) | 67.32 | 126.72 | 59.48 | 112.40 | |||||||||
Edmonton Light/WCS FOB price differential (Cdn$/bbl) | 6.65 | 23.20 | 7.84 | 22.40 | |||||||||
Natural gas at Henry Hub (US$/MMBtu) | 3.60 | 10.80 | 4.23 | 9.44 | |||||||||
Natural gas at AECO (Cdn$/Mcf) | 3.81 | 9.75 | 4.84 | 8.59 | |||||||||
New York Harbor 3-2-1 crack spread (US$/bbl) | 9.31 | 14.09 | 9.23 | 11.07 | |||||||||
Exchange rate (US cents/Cdn$) | 85.7 | 99.0 | 82.9 | 99.3 | |||||||||
| Average realized prices | |||||||||||||
Crude oil and NGL ($/barrel – $/bbl) | 65.37 | 117.22 | 58.38 | 104.67 | |||||||||
Natural gas ($/thousand cubic feet – $/Mcf) | 3.44 | 9.55 | 4.56 | 8.56 | |||||||||
– 4 –
Management's Discussion and Analysis
PETRO-CANADA
The following table shows the estimated after-tax effects that changes in certain factors would have had on Petro-Canada’s 2008 net earnings had these changes occurred. Amounts are in Canadian dollars unless otherwise specified.
Factor 1, 2 | Change (+) | Annual net earnings impact | Annual net earnings impact | |||||||||
| (millions of dollars) | ($/share) 3 | |||||||||||
| Upstream | ||||||||||||
Price received for crude oil and NGL 4 | $1.00/bbl | $ | 54 | $ | 0.11 | |||||||
| Price received for natural gas | $0.25/Mcf | 30 | 0.06 | |||||||||
Exchange rate: US$/Cdn$ refers to impact on upstream earnings5 | $0.01 | (60 | ) | (0.12 | ) | |||||||
Crude oil and NGL production (barrels/day – b/d) | 1,000 b/d | 15 | 0.03 | |||||||||
Natural gas production (million cubic feet/day – MMcf/d) | 10 MMcf/d | 11 | 0.02 | |||||||||
| Downstream | ||||||||||||
| New York Harbor 3-2-1 crack spread | $1.00 US/bbl | 22 | 0.05 | |||||||||
| Chicago 3-2-1 crack spread | $1.00 US/bbl | 20 | 0.04 | |||||||||
| Seattle 3-2-1 crack spread | $1.00 US/bbl | 9 | 0.02 | |||||||||
| WTI/Dated Brent price differential | $1.00 US/bbl | 25 | 0.05 | |||||||||
| Dated Brent/Maya FOB price differential | $1.00 US/bbl | 5 | 0.01 | |||||||||
| WTI/Synthetic price differential | $1.00 US/bbl | 14 | 0.03 | |||||||||
Exchange rate: US$/Cdn$ refers to impact on Downstream cracking margins and crude price differentials 6 | $0.01 | (11 | ) | (0.02 | ) | |||||||
| Natural gas fuel cost – AECO natural gas price | $1.00 Cdn/Mcf | (10 | ) | (0.02 | ) | |||||||
| Asphalt – % of Maya crude oil price | 1 | % | 2 | – | ||||||||
| Heavy fuel oil (HFO) – % of WTI crude oil price | 1 | % | 2 | – | ||||||||
| Corporate | ||||||||||||
Exchange rate: US$/Cdn$ refers to impact of the revaluation of U.S. dollar-denominated long-term debt 7 | $0.01 | $ | 31 | $ | 0.06 | |||||||
| 1 | The impact of a change in one factor may be compounded or offset by changes in other factors. This table does not consider the impact of any inter-relationship among the factors. |
| 2 | The impact of these factors is illustrative. |
| 3 | Per share amounts are based on the number of shares outstanding as at December 31, 2008. |
| 4 | This sensitivity is based upon an equivalent change in the price of WTI and Dated Brent. |
| 5 | A strengthening Canadian dollar compared with the U.S. dollar has a negative effect on upstream net earnings. |
| 6 | A strengthening Canadian dollar compared with the U.S. dollar has a negative effect on downstream cracking margins and crude price differentials. |
| 7 | A strengthening Canadian dollar versus the U.S. dollar has a positive effect on corporate earnings with respect to the Company’s U.S. dollar-denominated debt. The impact refers to gains or losses on $2.9 billion US of the Company’s U.S. dollar-denominated long-term debt and interest costs on U.S. dollar-denominated debt. Gains or losses on $1.1 billion US of the Company’s U.S. dollar-denominated long-term debt, associated with the self-sustaining International business segment and the U.S. Rockies operations included in the North American Natural Gas business unit, are deferred and included as part of shareholders’ equity. |
– 5 –
Management's Discussion and Analysis
PETRO-CANADA
BUSINESS STRATEGY
Petro-Canada's strategy is to create shareholder value by delivering long-term, profitable growth and improving the profitability of the base business. On March 23, 2009, the Company announced plans to merge with Suncor Energy Inc. (Suncor) to create the premier Canadian energy company.
The Company continues to advance the three major growth projects previously sanctioned by the Company: the extension of the White Rose field off the East Coast of Canada; the Syria Ebla gas project; and the developments associated with the new Libya Exploration and Production Sharing Agreements (EPSAs). The other three major growth projects, MacKay River expansion, Fort Hills mining project and the Montreal coker, are not sanctioned by the Company and are on hold until the merger with Suncor is completed. After the close of the merger all capital projects for the merged company will be reviewed in the context of capital investment being directed toward projects with the strongest near-term cash flow potential, highest anticipated return on capital and lowest risk.
Petro-Canada continually works to strengthen its base business by improving the safety, reliability and efficiency of its operations and is focused on delivering upstream production in line with guidance.
| Strategic Priorities | Quarterly Update |
DELIVERING PROFITABLE GROWTH WITH A FOCUS ON OPERATED, LONG-LIFE ASSETS | · received shareholder, court and Competition Bureau approval for merger with Suncor to create Canada’s premier energy company, effective August 1, 2009 · signed a Memorandum of Understanding (MOU) with the Government of Newfoundland and Labrador and co-venturers to develop the Hibernia Southern Extension |
DRIVING FOR FIRST QUARTILE OPERATION OF OUR ASSETS | · achieved 93% facility reliability at Terra Nova · maintained reliability at 99% for Western Canada natural gas production operations · operated MacKay River at 96% reliability · delivered a combined reliability index of 92 at all three Downstream production facilities · grew convenience store sales by 6% and same-store sales by 4%, compared with the second quarter of 2008 |
MAINTAINING FINANCIAL DISCIPLINE AND FLEXIBILITY | · ended the quarter with debt levels at 22.9% of total capital and a ratio of 1.3 times debt-to-cash flow from operating activities · maintained adequate liquidity via quarter-end cash balance of $373 million and unutilized credit facility capacity of $4.7 billion |
CONTINUING TO WORK AT BEING A RESPONSIBLE COMPANY | · experienced total recordable injury frequency (TRIF) of 0.71, slightly lower than a TRIF of 0.73 in 2008 · issued the 2008 - 2009 Report to the Community, available at www.petro-canada.ca |
– 6 –
Management's Discussion and Analysis
PETRO-CANADA
ANALYSIS OF CONSOLIDATED EARNINGS
Earnings Variances
| Q2/09 VERSUS Q2/08 FACTOR ANALYSIS |
| Net Earnings |
| (millions of Canadian dollars, after-tax) |
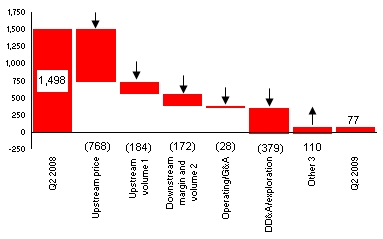 | Net earnings decreased 95% to $77 million ($0.16/share) in the second quarter of 2009, compared with $1,498 million ($3.10/share) in the second quarter of 2008. Lower upstream realized prices and volumes1, decreased Downstream margin and volumes2, higher operating, general and administrative (G&A), depreciation, depletion and amortization (DD&A) and exploration expenses were partially offset by lower other3 expenses. |
| 1 | Upstream volumes included the portion of DD&A expense associated with changes in upstream production levels. |
| 2 | Downstream margin and volume included the impact on realized margins from fluctuating crude oil feedstock costs while using a “first-in, first-out” (FIFO) inventory valuation methodology. |
| 3 | Other mainly included foreign currency translation on long-term debt and other balances ($260 million), losses on sale of assets ($94 million), upstream inventory movements ($76 million), and mark-to-market valuation of stock-based compensation ($30 million). These factors were partially offset by changes in effective tax rates ($(228) million), changes in the elimination of profits in the upstream business units for crude oil sales to Downstream, where the crude oil still resides in Downstream’s inventories ($(56) million), incremental earnings on the new Libya EPSAs relating to the first quarter of 2008, which could not be recognized until ratification in the second quarter of 2008 ($(47) million), and decreased sulphur sales ($(28) million). |
| Net Earnings by Segment |
| (millions of Canadian dollars, after-tax) |
 | The decrease in the second quarter net earnings on a segmented basis reflected net losses in North American Natural Gas and Oil Sands, as well as decreased net earnings in East Coast Canada, International and the Downstream. The results were partially offset by an increase in net earnings in Shared Services and Eliminations. |
During the second quarter of 2009, cash flow from operating activities was $465 million ($0.96 /share), down from $2,479 million ($5.12/share) in the same quarter of 2008. The decrease in cash flow from operating activities primarily reflected the decrease in net earnings in the current quarter.
– 7 –
Management's Discussion and Analysis
PETRO-CANADA
Quarterly Financial Information
| Three months ended | ||||||||||||||||||||||||||||||||
| (millions of Canadian dollars, except per share amounts) | June 30 2009 | March 31 2009 | Dec. 31 2008 | Sept. 30 2008 | June 30 2008 | March 31 2008 | Dec. 31 2007 | Sept. 30 2007 | ||||||||||||||||||||||||
| Total revenue | $ | 4,271 | $ | 3,971 | $ | 5,267 | $ | 8,286 | $ | 7,646 | $ | 6,586 | $ | 5,434 | $ | 5,497 | ||||||||||||||||
| Net earnings (loss) | $ | 77 | $ | (47 | ) | $ | (691 | ) | $ | 1,251 | $ | 1,498 | $ | 1,076 | $ | 522 | $ | 776 | ||||||||||||||
| Per share – basic | 0.16 | (0.10 | ) | (1.43 | ) | 2.58 | 3.10 | 2.22 | 1.08 | 1.59 | ||||||||||||||||||||||
| – diluted | 0.16 | (0.10 | ) | (1.43 | ) | 2.56 | 3.07 | 2.20 | 1.07 | 1.58 | ||||||||||||||||||||||
UPSTREAM
Production
Petro-Canada converts volumes of natural gas to oil equivalent at a rate of six Mcf of natural gas to one bbl of oil. Production volumes disclosed refer to net working interest before royalties, unless otherwise specified.
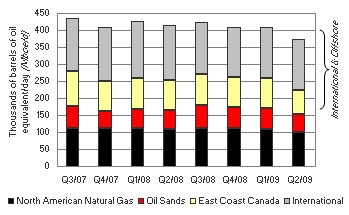 | In the second quarter of 2009, production averaged 374,000 barrels of oil equivalent/day (boe/d) net to Petro-Canada, down from 414,000 boe/d net in the same quarter of 2008. Volumes reflected decreased North American Natural Gas, East Coast Canada and International production, while Oil Sands production was relatively unchanged. |
Exploration Update
During the first half of 2009, Petro-Canada and its partners finished operations on six wells. One well was completed as a gas discovery (L6-7 in the Netherlands sector of the North Sea). This well was started in 2008 but was completed in the first quarter of 2009. In the United Kingdom (U.K.) sector of the North Sea, one well was completed as an oil discovery (Hobby), and one well was plugged and abandoned (appraisal well for the Pink discovery). The three wells drilled in Alaska (Chandler 1, Wolf Creek 4 and Gubik 4) all encountered natural gas. Drilling operations were completed for the Wolf Creek and Gubik wells, so they were plugged and abandoned. The Chandler well was suspended for possible future testing. These wells are part of a multi-season program, and the results are being evaluated for incorporation into an overall plan to determine the commerciality of natural gas development in the region.
2009 Consolidated Net Production Outlook
Upstream production is expected to be in the 355,000 boe/d to 375,000 boe/d range in 2009, in line with the 345,000 boe/d to 385,000 boe/d range provided in the production outlook on January 29, 2009.
– 8 –
Management's Discussion and Analysis
PETRO-CANADA
Factors that may impact production during the remainder of 2009 include reservoir performance, drilling results, facility reliability, changes in OPEC production quotas and successful execution of planned turnarounds.
| 2009 Outlook (+/-) | 2009 Outlook (+/-) | |||||||
| (Mboe/d net) | As at July 30, 2009 | As at January 29, 2009 | ||||||
| North American Natural Gas | ||||||||
| – Natural gas | 83 | 81 | ||||||
| – Liquids | 13 | 14 | ||||||
| Oil Sands | ||||||||
| – Syncrude | 34 | 38 | ||||||
| – MacKay River | 27 | 27 | ||||||
| International & Offshore | ||||||||
| East Coast Canada | 69 | 68 | ||||||
| International | ||||||||
| – North Sea | 87 | 85 | ||||||
| – Other International | 52 | 52 | ||||||
| Total | 355 – 375 | 345 – 385 | ||||||
North American Natural Gas
North American Natural Gas facilities continued to operate reliably in the second quarter of 2009.
| Three months ended June 30, | Six months ended June 30, | |||||||||||||||
| (millions of Canadian dollars) | 2009 | 2008 | 2009 | 2008 | ||||||||||||
| Net earnings (loss) | $ | (239 | ) | $ | 100 | $ | (241 | ) | $ | 174 | ||||||
| Cash flow from operating activities | $ | 62 | $ | 379 | $ | 121 | $ | 578 | ||||||||
North American Natural Gas recorded a net loss of $239 million in the second quarter of 2009, compared with net earnings of $100 million in the second quarter of 2008. Results reflected lower realized prices, volumes and sulphur sales, combined with higher exploration and DD&A expenses.
In the second quarter of 2009, the North American Natural Gas business unit recorded a charge of $244 million before-tax ($158 million after-tax) for impairments primarily related to the coal bed methane (CBM) assets in the U.S. Rockies due to production performance combined with lower prices. In the second quarter of 2008, the North American Natural Gas business unit recorded a net loss on sale of assets of $106 million. The main contributing factor was the sale of its Minehead assets in Western Canada for a loss on sale of $153 million before-tax ($112 million after-tax).
North American Natural Gas Production and Pricing
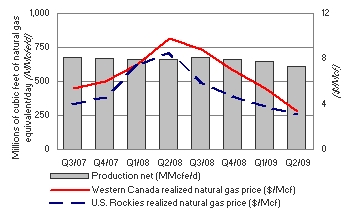 | In the second quarter of 2009, North American Natural Gas production declined by 8%, compared with the same period in 2008. Decreased production reflected reduced capital spending and natural declines. Realized natural gas prices in Western Canada and the U.S. Rockies decreased 66% and 64%, respectively, in the second quarter of 2009, compared with the same quarter of 2008, consistent with market price trends. |
– 9 –
Management's Discussion and Analysis
PETRO-CANADA
| Second quarter 2009 | Second quarter 2008 | |||||||
Production net (MMcfe/d) 1 | ||||||||
Western Canada | 515 | 556 | ||||||
U.S. Rockies | 93 | 104 | ||||||
| Total North American Natural Gas production net | 608 | 660 | ||||||
Western Canada realized natural gas price (Cdn$/Mcf) 1 | $ | 3.33 | $ | 9.82 | ||||
U.S. Rockies realized natural gas price (Cdn$/Mcf) 1 | $ | 3.05 | $ | 8.55 | ||||
| 1 | For North American Natural Gas crude oil and NGL production and average realized prices, refer to the charts on pages 21 and 22, respectively. |
Petro-Canada gas production operations in Western Canada delivered 99% reliability in the second quarter of 2009.
Oil Sands
Strong reliability and increased capability at MacKay River were offset by lower prices.
| Three months ended June 30, | Six months ended June 30, | |||||||||||||||
| (millions of Canadian dollars) | 2009 | 2008 | 2009 | 2008 | ||||||||||||
| Net earnings (loss) | $ | (188 | ) | $ | 177 | $ | (256 | ) | $ | 289 | ||||||
| Cash flow from (used in) operating activities | $ | (113 | ) | $ | 162 | $ | (88 | ) | $ | 328 | ||||||
In the second quarter of 2009, Oil Sands recorded a net loss of $188 million, compared with net earnings of $177 million in the second quarter of 2008. Results reflected lower realized prices, lower production from Syncrude and higher operating expense, partially offset by increased production from MacKay River.
In the second quarter of 2009, the Oil Sands business unit recorded expenses of $252 million before-tax ($185 million after-tax) due to the deferral of the Fort Hills project. The expenses include a $236 million before-tax ($174 million after-tax) writedown of property, plant and equipment relating specifically to the upgrading portion of the project, the result of deferring that portion of the project indefinitely, and expenses of $16 million before-tax ($11 million after-tax) to reflect costs incurred terminating certain goods and services agreements relating to the mining portion of the project.
Oil Sands Production and Pricing
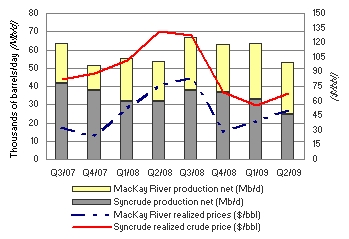 | Syncrude production decreased 22% in the second quarter of 2009, compared with the second quarter of 2008. While both periods included planned turnarounds of one of the cokers, the decreased production in the second quarter of 2009 reflected a longer turnaround than in 2008 as well as operational upsets at the upgrader. Syncrude realized prices were 48% lower in the second quarter of 2009, compared with the second quarter of 2008. MacKay River production was up 28% in the second quarter of 2009, compared with the same period of 2008, due to strong reliability and increased capability, as well as planned maintenance in the second quarter of 2008. MacKay River combined sour synthetic crude oil and bitumen realized prices averaged $50.73/bbl in the second quarter of 2009, compared with average bitumen only prices of $75.85/bbl in the second quarter of 2008. |
| Second quarter 2009 | Second quarter 2008 | |||||||
Production net (b/d) | ||||||||
Syncrude | 24,700 | 31,800 | ||||||
MacKay River 1 | 28,300 | 22,100 | ||||||
| Total Oil Sands production net | 53,000 | 53,900 | ||||||
Syncrude realized crude price ($/bbl) | $ | 68.26 | $ | 131.37 | ||||
MacKay River realized prices ($/bbl) 1 | $ | 50.73 | $ | 75.85 | ||||
| 1 | MacKay River realized prices for 2009 reflect a combination of a sour synthetic price through the Suncor processing arrangement and a bitumen price, while 2008 prices exclusively reflect a bitumen price. Reported production reflects bitumen barrels for both 2009 and 2008. |
– 10 –
Management's Discussion and Analysis
PETRO-CANADA
In the second quarter of 2009, operations at MacKay River continued to be excellent, with increased capability and reliability averaging 96%.
Major Project Update
The Fort Hills Energy Limited Partnership (FHELP) deferred the upgrading portion of the project indefinitely to reduce overall cost exposure. The mining portion of the project is on hold and work has stopped until the merger with Suncor is finalized.
The MacKay River Expansion project has been put on hold, and work has stopped, other than development drilling, until the merger with Suncor is finalized.
After the close of the merger all capital projects for the merged company will be reviewed in the context of capital investment being directed toward projects with the strongest near-term cash flow potential, highest anticipated return on capital and lowest risk.
Scheduled Turnarounds
Production at Syncrude will be impacted by a planned 15-day turnaround in the third quarter of 2009, which is significantly smaller in scope than the spring turnaround. Production at MacKay River will be impacted in the third quarter of 2009 by planned maintenance of the third-party co-generation unit.
International & Offshore
East Coast Canada
Signed MOU with the Government of Newfoundland and Labrador and co-venturers to progress the Hibernia Southern Extension satellite with production expected in late 2009 or early 2010 (Petro-Canada working interest is 20%).
| Three months ended June 30, | Six months ended June 30, | |||||||||||||||
| (millions of Canadian dollars) | 2009 | 2008 | 2009 | 2008 | ||||||||||||
Net earnings 1 | $ | 137 | $ | 385 | $ | 241 | $ | 760 | ||||||||
| Cash flow from operating activities | $ | 254 | $ | 670 | $ | 503 | $ | 1,155 | ||||||||
| 1 | East Coast Canada crude oil inventory movements increased (decreased) net earnings by $35 million before-tax ($24 million after-tax) and $(4) million before-tax ($(3) million after-tax) for the three and six months ended June 30, 2009, respectively. The same factor decreased net earnings by $57 million before-tax ($39 million after-tax) and $63 million before-tax ($43 million after-tax) for the three and six months ended June 30, 2008, respectively. |
Net earnings for East Coast Canada were $137 million in the second quarter of 2009, down from $385 million in the second quarter of 2008. Results reflected lower realized prices and production.
East Coast Canada Production and Pricing
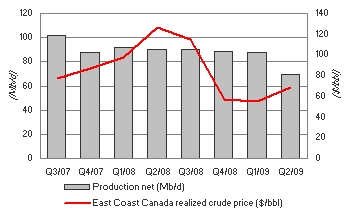 | In the second quarter of 2009, East Coast Canada production decreased 23%, compared with the same period in 2008. Hibernia production was lower due to the completion of a 25-day planned turnaround and natural declines, which were partially offset by strong reservoir performance and reliability. Terra Nova production was lower due to natural declines and the completion of a nine-day planned maintenance turnaround, while White Rose production was lower due to natural declines. During the second quarter of 2009, East Coast Canada realized crude prices decreased 46%, compared with the second quarter of 2008. |
– 11 –
Management's Discussion and Analysis
PETRO-CANADA
| Second quarter 2009 | Second quarter 2008 | |||||||
Production net (b/d) | ||||||||
Terra Nova | 29,100 | 34,900 | ||||||
Hibernia | 18,900 | 27,100 | ||||||
White Rose | 21,200 | 28,400 | ||||||
| Total East Coast Canada production net | 69,200 | 90,400 | ||||||
Average realized crude price ($/bbl) | $ | 68.14 | $ | 126.35 | ||||
The Terra Nova Floating Production Storage and Offloading (FPSO) vessel operated at 93% facility reliability in the second quarter of 2009. Performance of the Terra Nova FPSO swivel was unchanged in the second quarter of 2009. All equipment and materials are in place to repair or replace the swivel, if necessary.
White Rose Extensions Development
Development drilling has commenced and installation of subsea infrastructure is underway for the North Amethyst portion of the White Rose Extensions, with the project on schedule to deliver first oil in early 2010. The West White Rose development will be divided into two stages. Stage 1 was approved in the second quarter of 2009, and development drilling and subsea installation of this stage will take place in 2010, with first oil expected in late 2010 or early 2011. Results of Stage 1, combined with ongoing evaluation, will help define the scope of Stage 2.
Hebron
During the third quarter of 2008, the Hebron partners reached an agreement with the Government of Newfoundland and Labrador on commercial terms that will allow development activities to proceed for Hebron. The transfer of operatorship from Chevron Canada Ltd. to ExxonMobil Canada Properties (ExxonMobil) was effective in the fourth quarter of 2008. Pre-front-end engineering and design (pre-FEED) activities continued during the second quarter of 2009 and ExxonMobil opened a Hebron project office in April 2009.
Hibernia Southern Extension
In the second quarter of 2009, co-venturers in the ExxonMobil operated Hibernia South project signed a non-binding MOU with the Government of Newfoundland and Labrador establishing the key fiscal, equity and operational principles for the development of the Hibernia Southern Extension satellite (Petro-Canada’s working interest is 20%), with anticipated production starting in late 2009 or early 2010.
East Coast Canada Royalties
In the second quarter of 2009, East Coast Canada royalties averaged 31% of gross revenue, compared with 26% in the second quarter of 2008. Terra Nova production was subject to a Tier I royalty of 30% of net revenue and a Tier II royalty of an incremental 12.5% of net revenue. White Rose production was subject to a Tier I royalty of 20% of net revenue and a Tier II royalty of an incremental 10% of net revenue. In the second quarter of 2009, the royalty rate applicable to Petro-Canada’s share of Hibernia production increased from 5% of gross revenue to 30% of net revenue, based on the terms of the Hibernia Royalty Agreement and a MOU1 signed in June, 2009 between the Province of Newfoundland and Labrador and the Hibernia proponents. In addition, Petro-Canada’s share of Hibernia production was subject to a federal government net profits interest of up to 10% of net revenue.
Scheduled Turnarounds
Terra Nova successfully completed a nine-day turnaround in the second quarter of 2009 and is planning a 21-day turnaround in the third quarter of 2009 to complete planned regulatory and maintenance scope.
White Rose is planning a 28-day regulatory and maintenance turnaround in the third quarter of 2009 followed by a further period of reduced production, lasting approximately 40 days, to do subsea work associated with the tie-in of the North Amethyst project.
| 1 Exact timing of the net royalty payout is subject to final audit and assessment and could be affected by the detailed terms of formal agreements to be entered into pursuant to the MOU. |
– 12 –
Management's Discussion and Analysis
PETRO-CANADA
International
The business had a strong operational quarter, with robust operating performance at Buzzard.
| Three months ended June 30, | Six months ended June 30, | |||||||||||||||
| (millions of Canadian dollars) | 2009 | 2008 | 2009 | 2008 | ||||||||||||
Net earnings 1 | $ | 143 | $ | 672 | $ | 184 | $ | 1,008 | ||||||||
| Cash flow from operating activities | $ | 313 | $ | 1,031 | $ | 459 | $ | 1,537 | ||||||||
| 1 | International crude oil inventory movements decreased net earnings by $5 million before-tax ($1 million after-tax) and $3 million before-tax ($nil after-tax) for the three and six months ended June 30, 2009, respectively. The same factor increased (decreased) net earnings by $42 million before-tax ($(14) million after-tax) and $76 million before-tax ($11 million after-tax) for the three and six months ended June 30, 2008, respectively. |
In the second quarter of 2009, International delivered net earnings of $143 million, compared with net earnings of $672 million in the second quarter of 2008. Lower realized crude oil prices, decreased production volumes, and higher operating and DD&A expenses were partially offset by lower exploration expense and foreign exchange gains.
International Production and Pricing
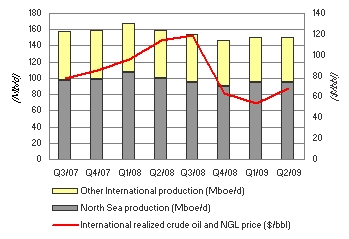 | International production decreased 6% in the second quarter of 2009, compared with the second quarter of 2008. In the second quarter of 2009, production from the U.K. and the Netherlands sectors of the North Sea decreased by 4%, reflecting natural declines in some North Sea assets. Other International production decreased by 8% in the second quarter of 2009, compared with the second quarter of 2008 due to OPEC quota constraints imposed in Libya. |
| Second quarter 2009 | Second quarter 2008 | |||||||
Production net (boe/d) | ||||||||
U.K. sector of the North Sea | 81,300 | 78,700 | ||||||
The Netherlands sector of the North Sea | 14,000 | 20,700 | ||||||
North Sea | 95,300 | 99,400 | ||||||
Other International | 55,300 | 60,100 | ||||||
| Total International production net | 150,600 | 159,500 | ||||||
Average realized crude oil and NGL prices ($/bbl) | $ | 68.49 | $ | 114.33 | ||||
Average realized natural gas price ($/Mcf) | $ | 4.21 | $ | 9.05 | ||||
International operations’ realized crude oil and NGL prices decreased 40% in the second quarter of 2009, compared with the same period in 2008. Realized prices for natural gas decreased 53% in the second quarter of 2009, compared with the same period in the prior year.
North Sea
Buzzard production averaged 203,100 boe/d gross (60,700 boe/d net) in the second quarter of 2009, up slightly compared with the same quarter of 2008. Work on engineering, procurement and construction is well underway for the fourth platform, which is being built to treat higher than expected hydrogen sulphide content in some Buzzard wells. The project is on schedule for completion in the first quarter of 2011.
In the Netherlands sector of the North Sea, the Petro-Canada operated De Ruyter and Hanze facilities continued to perform well, delivering 18,300 boe/d gross (about 9,300 boe/d net) in the second quarter of 2009.
– 13 –
Management's Discussion and Analysis
PETRO-CANADA
Other International
Production in Libya averaged 43,500 boe/d in the second quarter of 2009, down from 49,600 boe/d in the same quarter of 2008 due to OPEC quota constraints.
Trinidad and Tobago offshore gas production averaged 71 MMcf/d in the second quarter of 2009, up compared with 63 MMcf/d in the second quarter of 2008, reflecting higher demand from the Atlantic liquefied natural gas (LNG) terminal and increased field availability.
Syria Ebla Gas Project
The Syria Ebla gas project is expected to produce 80 MMcf/d of natural gas, with first gas anticipated in 2010. The project was 70% complete at the end of the second quarter of 2009. Three wells have been drilled and have been handed over to the engineering, procurement and construction contractor for tie-in. The 910 km2 Ash Shaer 3D seismic shoot was completed in the second quarter of 2009 and the seismic crew moved on to the Petro-Canada Cherrife acreage.
Libya Exploration and Production Sharing Agreements (EPSAs)
Work has now commenced on implementing the projects associated with the new EPSAs, with a focus on preparing the Amal field development program and initiating the new exploration program. Seismic operations continued in the second quarter of 2009, with four seismic crews deployed. At the end of the second quarter of 2009, the seismic program was approximately 55% complete, and one of the crews has been released. The Company expects to begin drilling Petro-Canada’s first operated exploration well in early 2010.
In early January 2009, the Libya National Oil Corporation (NOC) advised the Company that production from Petro-Canada’s Libya EPSAs will be limited to 85,000 b/d gross (42,500 b/d net) due to the quota agreed to by OPEC producers in December 2008.
Scheduled Turnarounds
A 28-day turnaround at Buzzard is planned in the third quarter of 2009 to do regulatory work and to complete tie-ins for the enhancement project. Production will be reduced for a further 14 days during the third quarter due to maintenance work on the Forties pipeline system.
DOWNSTREAM
The Downstream earnings were negatively impacted by a weaker business environment in the second quarter of 2009.
| Three months ended June 30, | Six months ended June 30, | |||||||||||||||
| (millions of Canadian dollars) | 2009 | 2008 | 2009 | 2008 | ||||||||||||
| Net earnings | $ | 121 | $ | 300 | $ | 203 | $ | 484 | ||||||||
| Cash flow from operating activities | $ | 54 | $ | 41 | $ | 352 | $ | 25 | ||||||||
The Downstream business recorded net earnings of $121 million in the second quarter of 2009, down compared with $300 million in the same quarter of 2008. The impact of fluctuating crude oil feedstock costs while using a FIFO inventory valuation methodology was lower compared with the same period last year. Also negatively impacting earnings were lower distillate cracking margins and unfavourable crude price differentials. These factors were partially offset by an increase in realized refining and sales margins and higher gasoline cracking margins.
– 14 –
Management's Discussion and Analysis
PETRO-CANADA
Downstream Net Earnings
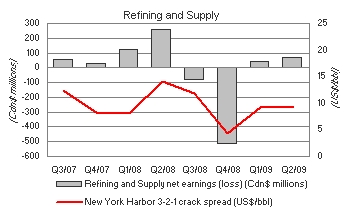 |  |
| Second quarter 2009 | Second quarter 2008 | |||||||
Refining and Supply net earnings (millions of Canadian dollars) | $ | 71 | $ | 260 | ||||
New York Harbor 3-2-1 crack spread (US$/bbl) | $ | 9.31 | $ | 14.09 | ||||
Chicago 3-2-1 crack spread (US$/bbl) | $ | 10.17 | $ | 12.91 | ||||
Seattle 3-2-1 crack spread (US$/bbl) | $ | 13.35 | $ | 16.47 | ||||
Marketing net earnings (millions of Canadian dollars) | $ | 50 | $ | 40 | ||||
The average New York Harbor 3-2-1 refinery crack spread was $9.31 US/bbl in the second quarter of 2009, down from $14.09 US/bbl in the second quarter of 2008. The average international light/heavy crude price differential was $3.75 US/bbl in the second quarter of 2009, compared with $18.38 US/bbl in the second quarter of 2008. The average domestic light/heavy crude price differential was $6.65 US/bbl in the second quarter of 2009, compared with $23.20 US/bbl in the second quarter of 2008.
In the second quarter of 2009, total sales of refined petroleum products decreased 3.6% to 4.5 billion litres, compared with the same period last year. The decrease reflected lower wholesale, Refining and Supply and lubricants sales volumes, partially offset by slightly higher retail sales volumes.
Refining and Supply contributed net earnings of $71 million in the second quarter of 2009, down significantly from net earnings of $260 million in the same quarter of 2008. Results were negatively impacted by the following four factors, listed in order of impact. First, changes in the crude price profile affecting feedstock costs while using a FIFO inventory valuation methodology were lower compared with the same period last year. Second, distillate cracking margins were lower. Third, crude price differentials were unfavourable. Fourth, depreciation, depletion and amortization was higher. These factors were partially offset by an increase in realized refining margins for asphalt and coke, lubricants, heavy fuel oil and light oil products and higher gasoline cracking margins.
Marketing contributed second quarter 2009 net earnings of $50 million, up compared with $40 million in the same quarter of 2008. Marketing results reflected higher margins and lower expenses. These factors were partially offset by the impact of feedstock costs in the Lubricants business related to changes in the crude price profile over the same period last year while using a FIFO inventory valuation methodology and lower fuel demand.
Montreal Coker
The Montreal coker project is on hold until the merger with Suncor is finalized. Activities for the remainder of 2009 are focused on completing most of the engineering, meeting procurement commitments and completing construction to a state that will benefit the refinery regardless of whether the project proceeds. After the close of the merger all capital projects for the merged company will be reviewed in the context of capital investment being directed toward projects with the strongest near-term cash flow potential, highest anticipated return on capital and lowest risk.
Downstream Turnaround Activity
In the third quarter of 2009, turnaround and maintenance activities are planned at the Montreal refinery. As with all planned Downstream turnarounds, supply arrangements are in place to meet market demand during these outages.
– 15 –
Management's Discussion and Analysis
PETRO-CANADA
CORPORATE
| Shared Services and Eliminations | Three months ended June 30, | Six months ended June 30, | ||||||||||||||
| (millions of Canadian dollars) | 2009 | 2008 | 2009 | 2008 | ||||||||||||
| Net earnings (loss) | $ | 103 | $ | (136 | ) | $ | (101 | ) | $ | (141 | ) | |||||
| Cash flow from (used in) operating activities | $ | (105 | ) | $ | 196 | $ | (410 | ) | $ | 291 | ||||||
Shared Services and Eliminations recorded net earnings of $103 million in the second quarter of 2009, compared with a net loss of $136 million for the same period in 2008. Net earnings in the second quarter of 2009 included a $273 million foreign currency translation gain on long-term debt, a $87 million charge related to the mark-to-market valuation of stock-based compensation, a charge of $16 million related to the elimination of profits in the upstream business units for crude oil sales to Downstream, where the crude oil still resides in Downstream's inventories, and other foreign currency translation losses of $10 million, mainly on cash and cash equivalents. The net loss in the second quarter of 2008 included a $117 million charge related to the mark-to-market valuation of stock-based compensation, a $13 million foreign currency translation loss on long-term debt, a recovery of $40 million related to the recovery of profits in the upstream business units for crude oil sales to Downstream, where the crude oil still resides in Downstream's inventories, and other foreign currency translation gains of $16 million, mainly on cash and cash equivalents.
Interest expense was $62 million before-tax ($43 million after-tax) during the second quarter of 2009, up from $47 million before-tax ($32 million after-tax) in the second quarter of the prior year. The Company capitalized $4 million of interest expense during the quarter, compared with $15 million in the second quarter of 2008.
Cash flow from operating activities was affected by tax deferrals resulting from the Company’s upstream partnership. These deferrals decreased cash flow from operating activities by about $118 million in the quarter, compared with an increase of about $72 million in the same period last year.
LIQUIDITY AND CAPITAL RESOURCES
Summary of Cash Flows
| Three months ended June 30, | Six months ended June 30, | |||||||||||||||
| (millions of Canadian dollars) | 2009 | 2008 | 2009 | 2008 | ||||||||||||
| Cash flow from operating activities | $ | 465 | $ | 2,479 | $ | 937 | $ | 3,914 | ||||||||
| Net cash (outflows) inflows from: | ||||||||||||||||
Investing activities | (774 | ) | (1,201 | ) | (1,823 | ) | (2,171 | ) | ||||||||
Financing activities | (90 | ) | 701 | (186 | ) | 267 | ||||||||||
| Increase (decrease) in cash and cash equivalents | (399 | ) | 1,979 | (1,072 | ) | 2,010 | ||||||||||
| Cash and cash equivalents | $ | 373 | $ | 2,241 | $ | 373 | $ | 2,241 | ||||||||
Petro-Canada’s financing strategy is designed to maintain financial strength and flexibility to support profitable growth in all business environments. Two key measures that Petro-Canada uses to measure the Company’s overall financial strength are debt-to-cash flow from operating activities and debt-to-debt plus equity. Petro-Canada’s debt-to-cash flow from operating activities ratio, a key short-term leverage measure, was 1.3 times at June 30, 2009. This was within the Company’s long-term range of no more than 2.0 times. Debt-to-debt plus equity, the long-term measure for capital structure, was 22.9% at June 30, 2009, below the Company’s long-term range of 25% to 35%.
| Financial Ratios | June 30, 2009 | December 31, 2008 | June 30, 2008 | |||||||||
Debt-to-cash flow from operating activities (times) 1 | 1.3 | 0.7 | 0.8 | |||||||||
Debt-to-debt plus equity (%) | 22.9 | 23.5 | 20.7 | |||||||||
| 1 | Calculated on a 12-month rolling basis. |
Operating Activities
The operating working capital surplus was $762 million at June 30, 2009, excluding cash and cash equivalents, the current portion of long-term debt and short-term notes payable, compared with an operating working capital deficiency of $46 million at December 31, 2008. The increase in operating working capital to a surplus position at June 30, 2009 primarily resulted from a decrease in income taxes payable, as significant Canadian tax instalments were paid during the quarter, a decrease in accounts payable and accrued liabilities due to a reduction in spending, and an increase in accounts receivable and inventories due to increases in commodity prices from the beginning of the year.
– 16 –
Management's Discussion and Analysis
PETRO-CANADA
Investing Activities
| Three months ended June 30, | Six months ended June 30, | |||||||||||||||
| (millions of Canadian dollars) | 2009 | 2008 | 2009 | 2008 | ||||||||||||
| Upstream | ||||||||||||||||
North American Natural Gas | $ | 41 | $ | 91 | $ | 136 | $ | 258 | ||||||||
Oil Sands | 105 | 225 | 244 | 403 | ||||||||||||
International & Offshore | ||||||||||||||||
East Coast Canada | 92 | 44 | 147 | 82 | ||||||||||||
International | 326 | 1,269 | 674 | 1,520 | ||||||||||||
| 564 | 1,629 | 1,201 | 2,263 | |||||||||||||
| Downstream | ||||||||||||||||
Refining and Supply | 101 | 467 | 134 | 819 | ||||||||||||
Sales and Marketing | 8 | 32 | 12 | 55 | ||||||||||||
Lubricants | 6 | 4 | 12 | 7 | ||||||||||||
| 115 | 503 | 158 | 881 | |||||||||||||
| Shared Services and Eliminations | 4 | 9 | 5 | 13 | ||||||||||||
| Total property, plant and equipment and exploration | 683 | 2,141 | 1,364 | 3,157 | ||||||||||||
| Other assets | – | – | – | – | ||||||||||||
| Total capital expenditures | $ | 683 | $ | 2,141 | $ | 1,364 | $ | 3,157 | ||||||||
Outlook – Capital Expenditures
Capital expenditures in 2009 are expected to be $3.2 billion, down $200 million from the April 28, 2009 outlook of $3.4 billion.
Financing Activities
At the end of the second quarter of 2009, the Company’s committed credit facilities and bilateral demand facilities totalled $3,803 million and $771 million, respectively, of which $341 million was used for letters of credit and overdraft coverage. The committed facilities are in place until 2013 and the syndicated portion of these facilities, which total $3,570 million, may be used to provide liquidity support to a commercial paper program. The Company does not have any plans to issue commercial paper in the near term and no commercial paper was outstanding at June 30, 2009.
At June 30, 2009, the credit ratings for the Company’s unsecured long-term debt were Baa2, developing, by Moody’s Investors Service, BBB on credit watch with positive implications by Standard & Poor’s and A (low) under review with developing implications by Dominion Bond Rating Service (DBRS). The Company’s short-term debt securities are rated R-1 (low) under review with developing implications by DBRS.
On July 28, 2009, Standard & Poor's upgraded the Company's unsecured long-term debt credit rating from BBB on credit watch with positive implications to BBB+ with stable outlook.
During the second quarter of 2009, the Company’s $500 million accounts receivable securitization program was extended, to preserve this source of liquidity, to the earlier of September 30, 2010 or the close of any merger involving Petro-Canada. As at June 30, 2009, the program was not being utilized.
The Company’s financial capacity and flexibility remain strong. This is due to the Company being able to generate cash flow, having access to existing cash balances and significant credit facility capacity, and requiring no near-term refinancing.
Returning Cash to Shareholders
Petro-Canada’s priority uses of cash are to fund the capital program and profitable growth opportunities, and to return cash to shareholders through dividends.
Petro-Canada regularly reviews its dividend strategy to ensure the alignment of dividend policy with shareholder expectations, and financial and growth objectives. Total dividends paid in the second quarter of 2009 were $97 million ($0.20/share), compared with $63 million ($0.13/share) in the same period last year.
As a result of the merger between Petro-Canada and Suncor, Petro-Canada will not be declaring further dividends. Dividends will now be granted and paid by the new amalgamated Company, subject to the approval of its new Board of Directors.
– 17 –
Management's Discussion and Analysis
PETRO-CANADA
Petro-Canada’s normal course issuer bid (NCIB) program allowing the Company to repurchase up to 5% of its outstanding common shares from June 22, 2008 to June 21, 2009 was not renewed. In the second quarter of 2009, the Company did not repurchase any of its shares, consistent with the same period last year.
Contingent Liabilities and Contractual Obligations
Contractual obligations are summarized in the Company’s 2008 annual MD&A and contingent liabilities are disclosed in Note 28 of the 2008 annual Consolidated Financial Statements. Total contractual obligations at June 30, 2009 were $38.1 billion. During the second quarter of 2009, contractual obligations increased by $2.0 billion, primarily due to increases in the pricing for product purchase commitments, partially offset by foreign exchange gains.
The Company has certain retail licensee agreements that qualify as variable interest entities, as described in Note 29 to the 2008 annual Consolidated Financial Statements. These entities were not consolidated as Petro-Canada is not the primary beneficiary, and the Company’s maximum exposure to losses from these arrangements was not expected to be material.
RISK
Petro-Canada’s risk management activities are conducted in accordance with the policies and guidelines established by the Board of Directors. On an ongoing basis, Petro-Canada monitors the risks facing the Company, identifies emerging risks and assesses the adequacy of mitigation efforts. Readers should refer to Petro-Canada’s 2008 AIF and the risk management section of the 2008 annual MD&A for a further discussion of risks relating to Petro-Canada’s business.
Merger with Suncor Energy Inc. (Suncor)
On March 23, 2009, Petro-Canada announced its intent to merge with Suncor. The merged company will be subject to certain risks, including those described in the risk sections of the Suncor and Petro-Canada AIFs, as well as risks related to the merger itself. These may include, but are not limited to, the risk that the proposed benefits of the merger will not be realized.
INTERNATIONAL FINANCIAL REPORTING STANDARDS (IFRS)
During 2008, the Canadian Accounting Standards Board confirmed that publicly accountable enterprises will be required to adopt International Financial Reporting Standards (IFRS) in place of Canadian generally accepted accounting principles (GAAP) for interim and annual reporting purposes. The required changeover date is for fiscal years beginning on or after January 1, 2011.
The Company’s IFRS conversion project began in the first quarter of 2008 with the development of a detailed IFRS project plan and team. The IFRS project continues to be on target to meet the changeover date. Note that new and revised IFRS developments will be monitored throughout the project but may result in changes to the project activities communicated in the following chart:
– 18 –
Management's Discussion and Analysis
PETRO-CANADA
IFRS Conversion Project
| Key Activity | Key Milestones | Status |
Financial Statement Preparation: Identify differences in Canadian GAAP/IFRS accounting policies. Select IFRS accounting policies. Develop IFRS financial statement format. Quantify effects of change in initial IFRS disclosure and 2010 financial statements. | Complete comprehensive analysis of the impact of IFRS differences identified in the initial scoping assessment. Senior management and steering committee approval of key IFRS accounting policy choices. Develop draft IFRS financial statement format and disclosures. | Completed comprehensive analysis of IFRS differences in the first quarter of 2009. Analysis of IFRS accounting policy choices commenced in the third quarter of 2008, including an initial evaluation of IFRS 1 transition exemptions. Analysis is ongoing throughout 2009. Prepared draft pro forma financial statements and substantially completed draft disclosure requirements. |
Training and Communication: Provide ongoing and targeted IFRS training and communication throughout the Company. Assess the effects of key IFRS related accounting policy and financial statement changes on external communications. | Deliver ongoing education and training sessions throughout the Company. Quarterly IFRS training for the Audit, Finance and Risk Committee of the Board of Directors (AFRC). Throughout the project, analyze and publish the effect of IFRS on the financial statements. | Training and communication sessions provided for senior management, Financial Reporting, Investor Relations and operating staff in 2008. Education and training sessions continue throughout the Company in 2009. Regular reporting has continued for the Company’s senior executive management and the AFRC, including detailed IFRS training and quarterly status updates. IFRS disclosure in the financial statements and MD&A will be updated throughout the project. |
Information Technology (IT) Assessment: Confirm that current systems are able to support new data requirements, revised chart of accounts and changes to mapping and functionality as a result of IFRS. | Confirm that systems can address 2010 dual reporting. Analyze impact of identified IFRS differences on systems, including modifications necessary for IFRS disclosures. | Design and implementation of approved IT dual reporting solution is proceeding as planned. Substantial progress on IT Assessment, including analysis of implications of property, plant and equipment componentization on the current systems. |
Business Assessment: Analyze and implement required changes to business processes and internal controls over financial reporting. | Ensure that changes required to current processes as a result of IFRS are appropriately identified and addressed throughout the project. Complete in-depth analysis of IFRS impact to existing control environment and key control assessments. | Continuation of Business Impact Assessment throughout 2009. |
– 19 –
Management's Discussion and Analysis
PETRO-CANADA
SHAREHOLDER INFORMATION
As at June 30, 2009, Petro-Canada’s outstanding common shares totalled 485.2 million and averaged 485.0 million during the second quarter of 2009. These figures compare with outstanding common shares of 484.4 million as at June 30, 2008 and average shares outstanding of 483.8 million for the quarter ended June 30, 2008.
Petro-Canada will hold a conference call to discuss these results with investors on Thursday, July 30, 2009 at 9:00 a.m. eastern daylight time (EDT). To participate, please call 1-800-769-8320 (toll-free in North America), 00-800-4222-8835 (toll-free internationally), or 416-695-6622 at 8:55 a.m. EDT. Media are invited to listen to the call by dialing 1-800-952-4972 (toll-free in North America) or 416-695-7848. Media are invited to ask questions at the end of the call. A live audio broadcast of the conference call will be available on Petro-Canada's website at http://www.petro-canada.ca/en/investors/845.aspx on July 30, 2009 at 9:00 a.m. EDT. Those who are unable to listen to the call live may listen to a recording of the call approximately one hour after its completion by dialing 1-800-408-3053 (toll-free in North America) or 416-695-5800 (pass code number 6821571#). Approximately one hour after the call, a recording will be available on Petro-Canada’s website.
– 20 –
Management's Discussion and Analysis
PETRO-CANADA
SELECT UPSTREAM OPERATING DATA
June 30, 2009
| Three months ended June 30, | Six months ended June 30, | |||||||||||
| 2009 | 2008 | 2009 | 2008 | |||||||||
| Before Royalties | ||||||||||||
Crude oil and NGL production net (Mb/d) | ||||||||||||
| North American Natural Gas | 13.3 | 13.0 | 13.6 | 13.0 | ||||||||
| Oil Sands | 53.0 | 53.9 | 58.4 | 54.7 | ||||||||
| International & Offshore | ||||||||||||
| East Coast Canada | 69.2 | 90.4 | 78.5 | 91.3 | ||||||||
| International | ||||||||||||
| North Sea | 87.6 | 89.4 | 86.7 | 93.4 | ||||||||
| Other International | 43.5 | 49.6 | 43.4 | 50.1 | ||||||||
| 266.6 | 296.3 | 280.6 | 302.5 | |||||||||
Natural gas production net, excluding injectants (MMcf/d) | ||||||||||||
| North American Natural Gas | 528 | 582 | 546 | 584 | ||||||||
| International | ||||||||||||
| North Sea | 46 | 60 | 51 | 59 | ||||||||
| Other International | 71 | 63 | 73 | 66 | ||||||||
| 645 | 705 | 670 | 709 | |||||||||
Total production (Mboe/d) net before royalties 1 | 374 | 414 | 392 | 421 | ||||||||
| After Royalties | ||||||||||||
Crude oil and NGL production net (Mb/d) | ||||||||||||
| North American Natural Gas | 10.2 | 10.0 | 10.3 | 9.9 | ||||||||
| Oil Sands | 49.1 | 49.1 | 56.0 | 49.8 | ||||||||
| International & Offshore | ||||||||||||
| East Coast Canada | 47.5 | 66.5 | 56.6 | 69.0 | ||||||||
| International | ||||||||||||
| North Sea | 87.6 | 89.4 | 86.7 | 93.4 | ||||||||
| Other International | 26.8 | 24.6 | 23.0 | 32.2 | ||||||||
| 221.2 | 239.6 | 232.6 | 254.3 | |||||||||
Natural gas production net, excluding injectants (MMcf/d) | ||||||||||||
| North American Natural Gas | 471 | 456 | 471 | 461 | ||||||||
| International | ||||||||||||
| North Sea | 46 | 60 | 51 | 59 | ||||||||
| Other International | 40 | 63 | 73 | 66 | ||||||||
| 557 | 579 | 595 | 586 | |||||||||
Total production (Mboe/d) net after royalties 1 | 314 | 336 | 332 | 352 | ||||||||
| 1 | Natural gas converted at six Mcf of natural gas to one bbl of oil. |
– 21 –
Management's Discussion and Analysis
PETRO-CANADA
AVERAGE UPSTREAM PRICE REALIZED
June 30, 2009
| Three months ended June 30, | Six months ended June 30, | ||||||||||||
| 2009 | 2008 | 2009 | 2008 | ||||||||||
Crude oil and NGL ($/bbl) | |||||||||||||
| North American Natural Gas | 54.23 | 112.11 | 49.27 | 100.65 | |||||||||
| Oil Sands | 58.91 | 108.61 | 52.71 | 94.39 | |||||||||
| International & Offshore | |||||||||||||
| East Coast Canada | 68.14 | 126.35 | 60.63 | 111.89 | |||||||||
| International | |||||||||||||
North Sea | 69.19 | 113.47 | 61.74 | 103.48 | |||||||||
| Other International | 61.05 | 121.06 | 56.87 | 110.08 | |||||||||
| Total crude oil and NGL | 65.37 | 117.22 | 58.38 | 104.67 | |||||||||
Natural gas ($/Mcf) | |||||||||||||
| North American Natural Gas | 3.29 | 9.64 | 4.24 | 8.57 | |||||||||
| International | |||||||||||||
| North Sea | 7.46 | 11.18 | 9.89 | 10.98 | |||||||||
| Other International | 1.59 | 5.73 | 2.82 | 5.28 | |||||||||
| Total natural gas | 3.44 | 9.55 | 4.56 | 8.56 | |||||||||
EFFECTIVE ROYALTY RATES
June 30, 2009
| Three months ended June 30, | Six months ended June 30, | ||||||||||||||
| (% of sales revenues) | 2009 | 2008 | 2009 | 2008 | |||||||||||
| North American Natural Gas | 12 | % | 22 | % | 15 | % | 21 | % | |||||||
| Oil Sands | 7 | % | 9 | % | 4 | % | 9 | % | |||||||
| International & Offshore | |||||||||||||||
| East Coast Canada | 31 | % | 26 | % | 28 | % | 24 | % | |||||||
| International | |||||||||||||||
| North Sea | – | – | – | – | |||||||||||
Other International 1 | 40 | % | 42 | % | 37 | % | 29 | % | |||||||
| Total | 16 | % | 19 | % | 15 | % | 16 | % | |||||||
| 1 | Increased royalty rates reflect a portion of the NOC’s take under the new Libya EPSAs and should be read in conjunction with the updated March 2009 Libya EPSAs Fact Sheet. |
– 22 –
Management's Discussion and Analysis
PETRO-CANADA
SELECT DOWNSTREAM OPERATING DATA
June 30, 2009
| Three months ended June 30, | Six months ended June 30, | |||||||||||
| 2009 | 2008 | 2009 | 2008 | |||||||||
Petroleum product sales (thousands of cubic metres/day – m3/d) | ||||||||||||
| Gasoline | ||||||||||||
| Eastern Canada | 13.7 | 13.4 | 13.6 | 13.1 | ||||||||
| Western Canada | 10.4 | 10.0 | 10.0 | 10.4 | ||||||||
| 24.1 | 23.4 | 23.6 | 23.5 | |||||||||
| Distillates | ||||||||||||
| Eastern Canada | 8.2 | 8.2 | 8.5 | 8.6 | ||||||||
| Western Canada | 8.3 | 9.0 | 8.8 | 9.9 | ||||||||
| 16.5 | 17.2 | 17.3 | 18.5 | |||||||||
| Other, including petrochemicals | 9.4 | 11.2 | 9.6 | 10.0 | ||||||||
| Total petroleum products sales | 50.0 | 51.8 | 50.5 | 52.0 | ||||||||
Crude oil processed by Petro-Canada (thousands of m3/d) | ||||||||||||
| Eastern Canada | 17.9 | 19.2 | 19.1 | 19.4 | ||||||||
| Western Canada | 16.6 | 19.8 | 16.0 | 20.5 | ||||||||
| Total crude oil processed by Petro-Canada | 34.5 | 39.0 | 35.1 | 39.9 | ||||||||
Average refinery utilization (%) | 85 | 96 | 87 | 99 | ||||||||
Downstream net earnings after-tax (cents/litre) | 2.7 | 6.4 | 2.2 | 5.1 | ||||||||
AVERAGE DOWNSTREAM PRICES
June 30, 2009
| Three months ended June 30, | Six months ended June 30, | ||||||||||||
| 2009 | 2008 | 2009 | 2008 | ||||||||||
Rack prices (Canadian cents/litre) | |||||||||||||
| Gasoline | |||||||||||||
| Eastern Canada | 57.31 | 88.22 | 52.03 | 79.76 | |||||||||
| Western Canada | 58.19 | 89.92 | 53.50 | 80.07 | |||||||||
| Distillates | |||||||||||||
| Eastern Canada | 53.69 | 102.61 | 54.79 | 92.51 | |||||||||
| Western Canada | 51.62 | 101.59 | 51.05 | 91.06 | |||||||||
Pump prices (Canadian cents/litre, excluding taxes) | |||||||||||||
| Gasoline | |||||||||||||
| Eastern Canada | 64.23 | 94.24 | 58.90 | 85.19 | |||||||||
| Western Canada | 67.99 | 99.81 | 63.56 | 89.96 | |||||||||
– 23 –
Management's Discussion and Analysis
PETRO-CANADA
SHARE INFORMATION
JUNE 30, 2009
| Three months ended June 30, | Six months ended June 30, | |||||||||||
| 2009 | 2008 | 2009 | 2008 | |||||||||
Weighted-average common shares outstanding (millions) | 485.0 | 483.8 | 484.9 | 483.8 | ||||||||
Weighted-average diluted common shares outstanding (millions) | 487.9 | 488.1 | 487.5 | 488.0 | ||||||||
Net earnings – basic ($/share) | 0.16 | 3.10 | 0.06 | 5.32 | ||||||||
– diluted ($/share) | 0.16 | 3.07 | 0.06 | 5.27 | ||||||||
Dividends ($/share) | 0.20 | 0.13 | 0.40 | 0.26 | ||||||||
| Toronto Stock Exchange: | ||||||||||||
Share price 1 – High | 49.90 | 60.00 | 49.90 | 60.00 | ||||||||
– Low | 34.36 | 44.69 | 24.88 | 42.77 | ||||||||
– Close at June 30 | 44.92 | 57.11 | 44.92 | 57.11 | ||||||||
Shares traded (millions) | 202.7 | 146.8 | 377.3 | 302.7 | ||||||||
| New York Stock Exchange: | ||||||||||||
Share price 2 – High | 45.64 | 61.03 | 45.64 | 61.03 | ||||||||
– Low | 27.07 | 43.70 | 19.46 | 41.95 | ||||||||
– Close at June 30 | 38.42 | 55.75 | 38.42 | 55.75 | ||||||||
Shares traded (millions) | 258.0 | 88.9 | 449.5 | 174.9 | ||||||||
| 1 | Share price is in Canadian dollars and represents the closing price. |
| 2 | Share price is in U.S. dollars and represents the closing price. |
SELECT FINANCIAL DATA
June 30, 2009
(unaudited, millions of Canadian dollars)
| Three months ended June 30, | Six months ended June 30, | |||||||||||||||
| 2009 | 2008 | 2009 | 2008 | |||||||||||||
| Net earnings | ||||||||||||||||
| Upstream | ||||||||||||||||
| North American Natural Gas | $ | (239 | ) | $ | 100 | $ | (241 | ) | $ | 174 | ||||||
| Oil Sands | (188 | ) | 177 | (256 | ) | 289 | ||||||||||
| International & Offshore | ||||||||||||||||
| East Coast Canada | 137 | 385 | 241 | 760 | ||||||||||||
| International | 143 | 672 | 184 | 1,008 | ||||||||||||
| Downstream | 121 | 300 | 203 | 484 | ||||||||||||
| Shared Services and Eliminations | 103 | (136 | ) | (101 | ) | (141 | ) | |||||||||
| Net earnings | $ | 77 | $ | 1,498 | $ | 30 | $ | 2,574 | ||||||||
| Cash flow from operating activities | $ | 465 | $ | 2,479 | $ | 937 | $ | 3,914 | ||||||||
Average capital employed 1 | ||||||||||||||||
| Upstream | $ | 10,685 | $ | 8,961 | ||||||||||||
| Downstream | 7,711 | 6,381 | ||||||||||||||
| Shared Services and Eliminations | 952 | 950 | ||||||||||||||
| Total Company | $ | 19,348 | $ | 16,292 | ||||||||||||
Return on capital employed (%) 1 | ||||||||||||||||
| Upstream | 13.4 | 36.6 | ||||||||||||||
| Downstream | (3.6 | ) | 10.5 | |||||||||||||
| Total Company | 4.1 | 24.5 | ||||||||||||||
Return on equity (%) 1 | 3.9 | 29.7 | ||||||||||||||
| Debt | $ | 4,506 | $ | 3,934 | ||||||||||||
| Cash and cash equivalents | $ | 373 | $ | 2,241 | ||||||||||||
Debt-to-cash flow from operating activities (times) 1 | 1.3 | 0.8 | ||||||||||||||
Debt-to-debt plus equity (%) | 22.9 | 20.7 | ||||||||||||||
| 1 | Calculated on a 12-month rolling basis. |
– 24 –
PETRO-CANADA
CONSOLIDATED STATEMENT OF EARNINGS (unaudited)
For the periods ended June 30
(millions of Canadian dollars, except per share amounts)
| Three months ended June 30, | Six months ended June 30, | |||||||||||||||
| 2009 | 2008 | 2009 | 2008 | |||||||||||||
| Revenue | ||||||||||||||||
| Operating | $ | 4,270 | $ | 7,766 | $ | 8,241 | $ | 14,383 | ||||||||
Investment and other income (expense) (Note 3) | 1 | (120 | ) | 1 | (151 | ) | ||||||||||
| 4,271 | 7,646 | 8,242 | 14,232 | |||||||||||||
| Expenses | ||||||||||||||||
| Crude oil and product purchases | 2,008 | 3,775 | 3,964 | 6,738 | ||||||||||||
Operating, marketing and general (Note 4) | 1,178 | 1,092 | 2,229 | 1,935 | ||||||||||||
| Exploration | 128 | 185 | 236 | 328 | ||||||||||||
Depreciation, depletion and amortization (Notes 4 and 5) | 1,016 | 472 | 1,576 | 995 | ||||||||||||
| Unrealized (gain) loss on translation of foreign currency denominated long-term debt | (282 | ) | 15 | (179 | ) | 70 | ||||||||||
| Interest | 77 | 47 | 155 | 95 | ||||||||||||
| 4,125 | 5,586 | 7,981 | 10,161 | |||||||||||||
| Earnings before income taxes | 146 | 2,060 | 261 | 4,071 | ||||||||||||
| Provision for income taxes | ||||||||||||||||
| Current | 322 | 813 | 513 | 1,657 | ||||||||||||
Future (Note 6) | (253 | ) | (251 | ) | (282 | ) | (160 | ) | ||||||||
| 69 | 562 | 231 | 1,497 | |||||||||||||
| Net earnings | $ | 77 | $ | 1,498 | $ | 30 | $ | 2,574 | ||||||||
Earnings per share (Note 7) | ||||||||||||||||
| Basic | $ | 0.16 | $ | 3.10 | $ | 0.06 | $ | 5.32 | ||||||||
| Diluted | $ | 0.16 | $ | 3.07 | $ | 0.06 | $ | 5.27 | ||||||||
CONSOLIDATED STATEMENT OF COMPREHENSIVE INCOME (unaudited)
For the periods ended June 30
(millions of Canadian dollars)
| Three months ended June 30, | Six months ended June 30, | |||||||||||||||
| 2009 | 2008 | 2009 | 2008 | |||||||||||||
| Net earnings | $ | 77 | $ | 1,498 | $ | 30 | $ | 2,574 | ||||||||
| Other comprehensive income (loss), net of tax | ||||||||||||||||
Change in foreign currency translation adjustment | (70 | ) | (49 | ) | (111 | ) | 158 | |||||||||
| Comprehensive income (loss) | $ | 7 | $ | 1,449 | $ | (81 | ) | $ | 2,732 | |||||||
| See accompanying Notes to Consolidated Financial Statements |
– 25 –
PETRO-CANADA
CONSOLIDATED STATEMENT OF CASH FLOWS (unaudited) |
For the periods ended June 30
(millions of Canadian dollars)
| Three months ended June 30, | Six months ended June 30, | |||||||||||||||
| 2009 | 2008 | 2009 | 2008 | |||||||||||||
| Operating activities | ||||||||||||||||
| Net earnings | $ | 77 | $ | 1,498 | $ | 30 | $ | 2,574 | ||||||||
| Items not affecting cash flow from operating activities: | ||||||||||||||||
Depreciation, depletion and amortization (Notes 4 and 5) | 1,016 | 472 | 1,576 | 995 | ||||||||||||
| Future income taxes | (253 | ) | (251 | ) | (282 | ) | (160 | ) | ||||||||
| Accretion of asset retirement obligations | 29 | 18 | 50 | 37 | ||||||||||||
| Unrealized (gain) loss on translation of foreign currency denominated long-term debt | (282 | ) | 15 | (179 | ) | 70 | ||||||||||
| Gain (loss) on sale of assets | (1 | ) | 134 | (2 | ) | 130 | ||||||||||
| Other | (27 | ) | (44 | ) | 34 | (33 | ) | |||||||||
| Exploration expenses | 75 | 137 | 109 | 218 | ||||||||||||
| (Increase) decrease in non-cash working capital related to operating activities | (169 | ) | 500 | (399 | ) | 83 | ||||||||||
| Cash flow from operating activities | 465 | 2,479 | 937 | 3,914 | ||||||||||||
| Investing activities | ||||||||||||||||
Expenditures on property, plant and equipment and exploration | (683 | ) | (2,141 | ) | (1,364 | ) | (3,157 | ) | ||||||||
| Proceeds from sale of assets | 2 | 33 | 5 | 45 | ||||||||||||
| (Increase) decrease in non-cash working capital related to investing activities | (93 | ) | 907 | (464 | ) | 941 | ||||||||||
| Cash flow used in investing activities | (774 | ) | (1,201 | ) | (1,823 | ) | (2,171 | ) | ||||||||
| Financing activities | ||||||||||||||||
| Decrease in short-term notes payable | - | (431 | ) | - | (109 | ) | ||||||||||
| Proceeds from issue of long-term debt | - | 1,482 | - | 1,482 | ||||||||||||
| Repayment of long-term debt | - | (300 | ) | (1 | ) | (996 | ) | |||||||||
| Proceeds from issue of common shares | 7 | 13 | 9 | 16 | ||||||||||||
| Dividends on common shares | (97 | ) | (63 | ) | (194 | ) | (126 | ) | ||||||||
| Cash flow from (used in) financing activities | (90 | ) | 701 | (186 | ) | 267 | ||||||||||
| Increase (decrease) in cash and cash equivalents | (399 | ) | 1,979 | (1,072 | ) | 2,010 | ||||||||||
| Cash and cash equivalents at beginning of period | 772 | 262 | 1,445 | 231 | ||||||||||||
| Cash and cash equivalents at end of period | $ | 373 | $ | 2,241 | $ | 373 | $ | 2,241 | ||||||||
| See accompanying Notes to Consolidated Financial Statements |
– 26 –
PETRO-CANADA
CONSOLIDATED BALANCE SHEET (unaudited)
As at June 30, 2009
(millions of Canadian dollars)
| June 30, 2009 | December 31, 2008 | |||||||
| Assets | ||||||||
| Current assets | ||||||||
| Cash and cash equivalents | $ | 373 | $ | 1,445 | ||||
| Accounts receivable | 3,057 | 2,844 | ||||||
| Inventories | 1,449 | 1,289 | ||||||
| Future income taxes | 38 | 25 | ||||||
| 4,917 | 5,603 | |||||||
Property, plant and equipment, net (Notes 4 and 5) | 23,187 | 23,485 | ||||||
| Goodwill | 814 | 852 | ||||||
| Other assets | 419 | 437 | ||||||
| $ | 29,337 | $ | 30,377 | |||||
| Liabilities and shareholders' equity | ||||||||
| Current liabilities | ||||||||
| Accounts payable and accrued liabilities | $ | 2,984 | $ | 3,186 | ||||
| Income taxes payable | 798 | 1,018 | ||||||
Current portion of long-term debt (Note 8) | 3 | 3 | ||||||
| 3,785 | 4,207 | |||||||
Long-term debt (Note 8) | 4,503 | 4,746 | ||||||
| Other liabilities | 1,248 | 1,240 | ||||||
| Asset retirement obligations | 1,604 | 1,527 | ||||||
| Future income taxes | 2,989 | 3,182 | ||||||
| Shareholders' equity | ||||||||
Common shares (Note 9) | 1,398 | 1,388 | ||||||
Contributed surplus (Note 9) | 20 | 22 | ||||||
| Retained earnings | 13,898 | 14,062 | ||||||
| Accumulated other comprehensive income (loss) | ||||||||
Foreign currency translation adjustment | (108 | ) | 3 | |||||
| 15,208 | 15,475 | |||||||
| $ | 29,337 | $ | 30,377 | |||||
CONSOLIDATED STATEMENT OF RETAINED EARNINGS (unaudited)
For the periods ended June 30
(millions of Canadian dollars)
| Three months ended June 30, | Six months ended June 30, | |||||||||||||||
| 2009 | 2008 | 2009 | 2008 | |||||||||||||
| Retained earnings at beginning of period | $ | 13,918 | $ | 12,261 | $ | 14,062 | $ | 11,248 | ||||||||
| Net earnings | 77 | 1,498 | 30 | 2,574 | ||||||||||||
| Dividends on common shares | (97 | ) | (63 | ) | (194 | ) | (126 | ) | ||||||||
| Retained earnings at end of period | $ | 13,898 | $ | 13,696 | $ | 13,898 | $ | 13,696 | ||||||||
| See accompanying Notes to Consolidated Financial Statements |
– 27 –
PETRO-CANADA
NOTES TO CONSOLIDATED FINANCIAL STATEMENTS (unaudited)
(millions of Canadian dollars)
1. SEGMENTED INFORMATION
Three months ended June 30,
| Upstream | |||||||||||||||||||||||||||||||||||||||||||||||||
| International & Offshore | |||||||||||||||||||||||||||||||||||||||||||||||||
| North American Natural Gas | Oil Sands | East Coast Canada | International | Downstream | Shared Services | Eliminations3 | Consolidated | ||||||||||||||||||||||||||||||||||||||||||
| 2009 | 2008 | 2009 | 2008 | 2009 | 2008 | 2009 | 2008 | 2009 | 2008 | 2009 | 2008 | 2009 | 2008 | 2009 | 2008 | ||||||||||||||||||||||||||||||||||
| Revenue | |||||||||||||||||||||||||||||||||||||||||||||||||
| Sales to customers | $ | 229 | $ | 581 | $ | 279 | $ | 589 | $ | 325 | $ | 820 | $ | 751 | $ | 1,295 | $ | 2,686 | $ | 4,481 | $ | - | $ | - | $ | - | $ | - | $ | 4,270 | $ | 7,766 | |||||||||||||||||
| Investment and other income (expense) | 1 | (146 | ) | 15 | (3 | ) | (9 | ) | (3 | ) | 13 | 28 | (7 | ) | (24 | ) | (12 | ) | 28 | - | - | 1 | (120 | ) | |||||||||||||||||||||||||
| Inter-segment sales | 54 | 127 | 476 | 381 | 137 | 108 | - | - | 3 | 4 | - | - | (670 | ) | (620 | ) | - | - | |||||||||||||||||||||||||||||||
| Segmented revenue | 284 | 562 | 770 | 967 | 453 | 925 | 764 | 1,323 | 2,682 | 4,461 | (12 | ) | 28 | (670 | ) | (620 | ) | 4,271 | 7,646 | ||||||||||||||||||||||||||||||
| Expenses | |||||||||||||||||||||||||||||||||||||||||||||||||
Crude oil and product purchases1 | 62 | 138 | 466 | 511 | 105 | 222 | - | - | 1,352 | 2,942 | - | - | 23 | (38 | ) | 2,008 | 3,775 | ||||||||||||||||||||||||||||||||
| Inter-segment transactions | 1 | 1 | 6 | 6 | 2 | 2 | - | - | 661 | 611 | - | - | (670 | ) | (620 | ) | - | - | |||||||||||||||||||||||||||||||
| Operating, marketing and general | 128 | 132 | 292 | 170 | 63 | 55 | 138 | 112 | 409 | 410 | 148 | 213 | - | - | 1,178 | 1,092 | |||||||||||||||||||||||||||||||||
| Exploration | 73 | 21 | 3 | - | 1 | - | 51 | 164 | - | - | - | - | - | - | 128 | 185 | |||||||||||||||||||||||||||||||||
| Depreciation, depletion and amortization | 385 | 118 | 264 | 26 | 83 | 85 | 180 | 165 | 103 | 77 | 1 | 1 | - | - | 1,016 | 472 | |||||||||||||||||||||||||||||||||
| Unrealized (gain) loss on translation of foreign currency denominated long-term debt | - | - | - | - | - | - | - | - | - | - | (282 | ) | 15 | - | - | (282 | ) | 15 | |||||||||||||||||||||||||||||||
| Interest | - | - | - | - | - | - | 15 | - | - | - | 62 | 47 | - | - | 77 | 47 | |||||||||||||||||||||||||||||||||
| 649 | 410 | 1,031 | 713 | 254 | 364 | 384 | 441 | 2,525 | 4,040 | (71 | ) | 276 | (647 | ) | (658 | ) | 4,125 | 5,586 | |||||||||||||||||||||||||||||||
| Earnings (loss) before income taxes | (365 | ) | 152 | (261 | ) | 254 | 199 | 561 | 380 | 882 | 157 | 421 | 59 | (248 | ) | (23 | ) | 38 | 146 | 2,060 | |||||||||||||||||||||||||||||
| Provision for income taxes | |||||||||||||||||||||||||||||||||||||||||||||||||
| Current | 47 | 33 | 25 | 55 | 65 | 185 | 246 | 513 | (23 | ) | 67 | (38 | ) | (38 | ) | - | (2 | ) | 322 | 813 | |||||||||||||||||||||||||||||
| Future | (173 | ) | 19 | (98 | ) | 22 | (3 | ) | (9 | ) | (9 | ) | (303 | ) | 59 | 54 | (22 | ) | (34 | ) | (7 | ) | - | (253 | ) | (251 | ) | ||||||||||||||||||||||
| (126 | ) | 52 | (73 | ) | 77 | 62 | 176 | 237 | 210 | 36 | 121 | (60 | ) | (72 | ) | (7 | ) | (2 | ) | 69 | 562 | ||||||||||||||||||||||||||||
| Net earnings (loss) | $ | (239 | ) | $ | 100 | $ | (188 | ) | $ | 177 | $ | 137 | $ | 385 | $ | 143 | $ | 672 | $ | 121 | $ | 300 | $ | 119 | $ | (176 | ) | $ | (16 | ) | $ | 40 | $ | 77 | $ | 1,498 | |||||||||||||
Expenditures on property, plant and equipment and exploration2 | $ | 41 | $ | 91 | $ | 105 | $ | 225 | $ | 92 | $ | 44 | $ | 326 | $ | 1,269 | $ | 115 | $ | 503 | $ | 4 | $ | 9 | $ | - | $ | - | $ | 683 | $ | 2,141 | |||||||||||||||||
| Cash flow from (used in) operating activities | $ | 62 | $ | 379 | $ | (113 | ) | $ | 162 | $ | 254 | $ | 670 | $ | 313 | $ | 1,031 | $ | 54 | $ | 41 | $ | (105 | ) | $ | 196 | $ | - | $ | - | $ | 465 | $ | 2,479 | |||||||||||||||
| Total assets | $ | 3,948 | $ | 4,037 | $ | 4,629 | $ | 4,235 | $ | 2,088 | $ | 2,140 | $ | 8,128 | $ | 7,555 | $ | 10,387 | $ | 10,957 | $ | 203 | $ | 1,674 | $ | (46 | ) | $ | (72 | ) | $ | 29,337 | $ | 30,526 | |||||||||||||||
| 1 | Downstream crude oil and product purchases account for substantially all of the Downstream inventories recognized as an expense during the period. |
| 2 | Consolidated expenditures include capitalized interest in the amount of $4 million for the three months ended June 30, 2009 ($15 million for the three months ended June 30, 2008). |
| 3 | Eliminations relates to sales between segments recorded at transfer prices based on current market prices, and to unrealized inter-segment profits and losses on inventories. |
– 28 –
PETRO-CANADA
NOTES TO CONSOLIDATED FINANCIAL STATEMENTS (unaudited)
(millions of Canadian dollars)
1. SEGMENTED INFORMATION continued
Six months ended June 30,
| Upstream | |||||||||||||||||||||||||||||||||||||||||||||||||
| International & Offshore | |||||||||||||||||||||||||||||||||||||||||||||||||
| North American Natural Gas | Oil Sands | East Coast Canada | International | Downstream | Shared Services | Eliminations3 | Consolidated | ||||||||||||||||||||||||||||||||||||||||||
| 2009 | 2008 | 2009 | 2008 | 2009 | 2008 | 2009 | 2008 | 2009 | 2008 | 2009 | 2008 | 2009 | 2008 | 2009 | 2008 | ||||||||||||||||||||||||||||||||||
| Revenue | |||||||||||||||||||||||||||||||||||||||||||||||||
| Sales to customers | $ | 555 | $ | 1,011 | $ | 501 | $ | 934 | $ | 640 | $ | 1,502 | $ | 1,369 | $ | 2,689 | $ | 5,176 | $ | 8,247 | $ | - | $ | - | $ | - | $ | - | $ | 8,241 | $ | 14,383 | |||||||||||||||||
| Investment and other income (expense) | - | (143 | ) | 15 | (1 | ) | (7 | ) | (2 | ) | (11 | ) | (3 | ) | 3 | (32 | ) | 1 | 30 | - | - | 1 | (151 | ) | |||||||||||||||||||||||||
| Inter-segment sales | 120 | 226 | 776 | 678 | 224 | 312 | 8 | - | 5 | 8 | - | - | (1,133 | ) | (1,224 | ) | - | - | |||||||||||||||||||||||||||||||
| Segmented revenue | 675 | 1,094 | 1,292 | 1,611 | 857 | 1,812 | 1,366 | 2,686 | 5,184 | 8,223 | 1 | 30 | (1,133 | ) | (1,224 | ) | 8,242 | 14,232 | |||||||||||||||||||||||||||||||
| Expenses | |||||||||||||||||||||||||||||||||||||||||||||||||
Crude oil and product purchases1 | 150 | 231 | 740 | 759 | 219 | 410 | - | - | 2,805 | 5,381 | - | - | 50 | (43 | ) | 3,964 | 6,738 | ||||||||||||||||||||||||||||||||
| Inter-segment transactions | 2 | 3 | 16 | 14 | 3 | 4 | - | - | 1,112 | 1,203 | - | - | (1,133 | ) | (1,224 | ) | - | - | |||||||||||||||||||||||||||||||
| Operating, marketing and general | 264 | 260 | 565 | 374 | 113 | 112 | 275 | 242 | 812 | 814 | 200 | 133 | - | - | 2,229 | 1,935 | |||||||||||||||||||||||||||||||||
| Exploration | 93 | 71 | 32 | 5 | 2 | - | 109 | 252 | - | - | - | - | - | - | 236 | 328 | |||||||||||||||||||||||||||||||||
| Depreciation, depletion and amortization | 545 | 272 | 303 | 53 | 173 | 182 | 351 | 335 | 203 | 152 | 1 | 1 | - | - | 1,576 | 995 | |||||||||||||||||||||||||||||||||
| Unrealized (gain) loss on translation of foreign currency denominated long-term debt | - | - | - | - | - | - | - | - | - | - | (179 | ) | 70 | - | - | (179 | ) | 70 | |||||||||||||||||||||||||||||||
| Interest | - | - | - | - | - | - | 15 | - | - | - | 140 | 95 | - | - | 155 | 95 | |||||||||||||||||||||||||||||||||
| 1,054 | 837 | 1,656 | 1,205 | 510 | 708 | 750 | 829 | 4,932 | 7,550 | 162 | 299 | (1,083 | ) | (1,267 | ) | 7,981 | 10,161 | ||||||||||||||||||||||||||||||||
| Earnings (loss) before income taxes | (379 | ) | 257 | (364 | ) | 406 | 347 | 1,104 | 616 | 1,857 | 252 | 673 | (161 | ) | (269 | ) | (50 | ) | 43 | 261 | 4,071 | ||||||||||||||||||||||||||||
| Provision for income taxes | |||||||||||||||||||||||||||||||||||||||||||||||||
| Current | 98 | 60 | 21 | 70 | 110 | 362 | 450 | 1,160 | (99 | ) | 90 | (67 | ) | (85 | ) | - | - | 513 | 1,657 | ||||||||||||||||||||||||||||||
| Future | (236 | ) | 23 | (129 | ) | 47 | (4 | ) | (18 | ) | (18 | ) | (311 | ) | 148 | 99 | (28 | ) | - | (15 | ) | - | (282 | ) | (160 | ) | |||||||||||||||||||||||
| (138 | ) | 83 | (108 | ) | 117 | 106 | 344 | 432 | 849 | 49 | 189 | (95 | ) | (85 | ) | (15 | ) | - | 231 | 1,497 | |||||||||||||||||||||||||||||
| Net earnings (loss) | $ | (241 | ) | $ | 174 | $ | (256 | ) | $ | 289 | $ | 241 | $ | 760 | $ | 184 | $ | 1,008 | $ | 203 | $ | 484 | $ | (66 | ) | $ | (184 | ) | $ | (35 | ) | $ | 43 | $ | 30 | $ | 2,574 | ||||||||||||
Expenditures on property, plant and equipment and exploration 2 | $ | 136 | $ | 258 | $ | 244 | $ | 403 | $ | 147 | $ | 82 | $ | 674 | $ | 1,520 | $ | 158 | $ | 881 | $ | 5 | $ | 13 | $ | - | $ | - | $ | 1,364 | $ | 3,157 | |||||||||||||||||
| Cash flow from (used in) operating activities | $ | 121 | $ | 578 | $ | (88 | ) | $ | 328 | $ | 503 | $ | 1,155 | $ | 459 | $ | 1,537 | $ | 352 | $ | 25 | $ | (410 | ) | $ | 291 | $ | - | $ | - | $ | 937 | $ | 3,914 | |||||||||||||||
| Total assets | $ | 3,948 | $ | 4,037 | $ | 4,629 | $ | 4,235 | $ | 2,088 | $ | 2,140 | $ | 8,128 | $ | 7,555 | $ | 10,387 | $ | 10,957 | $ | 203 | $ | 1,674 | $ | (46 | ) | $ | (72 | ) | $ | 29,337 | $ | 30,526 | |||||||||||||||
| 1 | Downstream crude oil and product purchases account for substantially all of the Downstream inventories recognized as an expense during the period. |
| 2 | Consolidated expenditures include capitalized interest in the amount of $15 million for the six months ended June 30, 2009 ($28 million for the six months ended June 30, 2008). |
| 3 | Eliminations relates to sales between segments recorded at transfer prices based on current market prices, and to unrealized inter-segment profits and losses on inventories. |
– 29 –
PETRO-CANADA
NOTES TO CONSOLIDATED FINANCIAL STATEMENTS (unaudited)
| (millions of Canadian dollars, unless otherwise stated) |
| 2. | BASIS OF PRESENTATION |
The note disclosure requirements for annual financial statements provide additional disclosure to that required for interim financial statements. Accordingly, these interim Consolidated Financial Statements should be read in conjunction with the December 31, 2008 audited Consolidated Financial Statements. The interim Consolidated Financial Statements are presented in accordance with Canadian generally accepted accounting principles (GAAP) and follow the accounting policies summarized in the notes to the annual Consolidated Financial Statements.
| 3. | INVESTMENT AND OTHER INCOME (EXPENSE) |
Investment and other income (expense) consists of the following amounts:
| Three months ended June 30, | Six months ended June 30, | |||||||||||||||
| 2009 | 2008 | 2009 | 2008 | |||||||||||||
| Foreign exchange gains (losses) | $ | (4 | ) | $ | 42 | $ | (10 | ) | $ | 20 | ||||||
| Gain (loss) on sale of assets | 1 | (134 | ) | 2 | (130 | ) | ||||||||||
| Loss on derivative contracts | (15 | ) | (31 | ) | (10 | ) | (44 | ) | ||||||||
| Other | 19 | 3 | 19 | 3 | ||||||||||||
| Total investment and other income (expense) | $ | 1 | $ | (120 | ) | $ | 1 | $ | (151 | ) | ||||||
| 4. | FORT HILLS PROJECT |
The upgrading portion of the Fort Hills Project has been deferred indefinitely. This has created uncertainty around the probability of realizing future benefits from costs incurred to engineer and design the upgrader, costs which had initially been capitalized as property, plant and equipment. Because of this uncertainty, GAAP requires that all such costs previously capitalized be written off. As such, the Company has recognized impairment charges of $236 million ($174 million after-tax) for the three and six months ended June 30, 2009 to reflect these writedowns.
The mining portion of the project continues to be on hold until the merger with Suncor Energy Inc. (Suncor) is finalized (Note 14). Some existing equipment supply and services agreements have been terminated or suspended. The Company has recognized expenses of $16 million ($11 million after-tax) and $82 million ($57 million after-tax) for the three and six months ended June 30, 2009, respectively, to reflect the termination or suspension of these agreements.
The impairment charges are included in depreciation, depletion and amortization and the equipment supply and the services agreement termination expenses are included in operating, marketing and general expenses, both in the Consolidated Statement of Earnings.
| 5. | ASSET WRITEDOWNS |
During the three and six months ended June 30, 2009, the Company recognized a $244 million ($158 million after-tax) impairment charge to reflect writedowns of certain natural gas production assets, primarily in the coal bed methane properties in the U.S. Rockies’ Powder River Basin, which form part of the Company’s North American Natural Gas business segment. Production declines for these assets have led management to conclude that future production will be significantly less than previously estimated. As well, developments in the North American natural gas market have caused management to downwardly revise prices in the short and medium term. The assets have been written down to management’s best estimate of fair value based on a discounted future cash flow valuation. The impairment expense is included in depreciation, depletion and amortization on the Consolidated Statement of Earnings.
– 30 –
PETRO-CANADA
NOTES TO CONSOLIDATED FINANCIAL STATEMENTS (unaudited)
| (millions of Canadian dollars, unless otherwise stated) |
| 6. | LIBYA EXPLORATION AND PRODUCTION SHARING AGREEMENTS |
On June 19, 2008, the Company signed six new Exploration and Production Sharing Agreements (EPSAs) with the Libya National Oil Corporation (NOC) to convert its existing concession agreements and old EPSA into new EPSA IV agreements. The new EPSAs were ratified as of the signing with an effective date of January 1, 2008. The new EPSAs will have an expected duration of 30 years and will enable the Company to implement jointly with the NOC the redevelopment of major fields and conduct a 100% operated exploration program in the Libyan Sirte Basin.
Net earnings for the three months ended June 30, 2008 included a $230 million future income tax recovery, which the Company recognized on ratification of the new EPSAs, and a $47 million after-tax adjustment to recognize incremental earnings on properties covered by the old agreements, based on the financial terms of the new EPSAs relating to the period January 1 to March 31, 2008, which could not be recognized until ratification on June 19, 2008.
| 7. | EARNINGS PER SHARE |
The following table provides the number of common shares used in calculating earnings per share amounts:
Three months ended June 30, | Six months ended June 30, | |||||||||||||||
| (millions) | 2009 | 2008 | 2009 | 2008 | ||||||||||||
| Weighted-average number of common shares outstanding – basic | 485.0 | 483.8 | 484.9 | 483.8 | ||||||||||||
| Effect of dilutive stock options | 2.9 | 4.3 | 2.6 | 4.2 | ||||||||||||
| Weighted-average number of common shares outstanding – diluted | 487.9 | 488.1 | 487.5 | 488.0 | ||||||||||||
| 8. | LONG-TERM DEBT |
| Maturity | June 30, 2009 | December 31, 2008 | ||||||||||
Debentures and notes 6.80% unsecured senior notes ($900 million US) | 2038 | $ | 1,034 | $ | 1,090 | |||||||
| 5.95% unsecured senior notes ($600 million US) | 2035 | 682 | 719 | |||||||||
5.35% unsecured senior notes ($300 million US) | 2033 | 302 | 320 | |||||||||
7.00% unsecured debentures ($250 million US) | 2028 | 281 | 296 | |||||||||
7.875% unsecured debentures ($275 million US) | 2026 | 315 | 332 | |||||||||
9.25% unsecured debentures ($300 million US) | 2021 | 346 | 365 | |||||||||
6.05% unsecured debentures ($600 million US) | 2018 | 692 | 729 | |||||||||
5.00% unsecured senior notes ($400 million US) 1 | 2014 | 461 | 485 | |||||||||
4.00% unsecured senior notes ($300 million US) | 2013 | 334 | 351 | |||||||||
Capital leases | 2009-2022 | 59 | 62 | |||||||||
| 4,506 | 4,749 | |||||||||||
| Current portion | (3 | ) | (3 | ) | ||||||||
| $ | 4,503 | $ | 4,746 | |||||||||
| 1 | These senior notes were issued by PC Financial Partnership, a wholly-owned finance subsidiary of Petro-Canada. Petro-Canada has fully and unconditionally guaranteed these senior notes. |
Interest on long-term debt and short-term notes payable, net of capitalized interest, was $63 million and $139 million for the three and six months ended June 30, 2009, respectively ($46 million and $92 million for the three and six months ended June 30, 2008, respectively). Interest is paid semi-annually. All debentures and notes are repayable in full upon maturity.
– 31 –
PETRO-CANADA
NOTES TO CONSOLIDATED FINANCIAL STATEMENTS (unaudited)
| (millions of Canadian dollars, unless otherwise stated) |
| 8. | LONG-TERM DEBT continued |
The Company had in place the following revolving credit facilities:
| Facility | Maturity | June 30, 2009 | December 31, 2008 | |||||||||
| Syndicated, committed | 2013 | $ | 3,570 | $ | 3,570 | |||||||
Bilateral, committed ($200 million US)1 | 2013 | 233 | - | |||||||||
| Bilateral, demand | n/a | 771 | 777 | |||||||||
| Total available credit facilities | 4,574 | 4,347 | ||||||||||
| Used for letters of credit and overdraft coverage | (341 | ) | (348 | ) | ||||||||
Total credit facilities not used2 | $ | 4,233 | $ | 3,999 | ||||||||
| 1 | Use of this facility is restricted to business activities outside of Canada. |
| 2 | Excludes $500 million capacity available under accounts receivable securitization program. |
| 9. | SHAREHOLDERS’ EQUITY |
Changes in common shares and contributed surplus were as follows:
| Shares | Amount | Contributed Surplus | ||||||||||
| Balance at December 31, 2008 | 484,597,467 | $ | 1,388 | $ | 22 | |||||||
| Issued under employee stock option and share purchase plans | 579,277 | 10 | (2 | ) | ||||||||
| Balance at June 30, 2009 | 485,176,744 | $ | 1,398 | $ | 20 | |||||||
The Company’s normal course issuer bid (NCIB) program, which allowed the Company to repurchase up to 24 million outstanding common shares during the period from June 22, 2008 to June 21, 2009, was not renewed during the three months ended June 30, 2009. During the three and six months ended June 30, 2009 and June 30, 2008, the Company did not repurchase any common shares.
| 10. | STOCK-BASED COMPENSATION |
The total stock-based compensation expense recorded was $136 million and $175 million for the three and six months ended June 30, 2009, respectively, ($189 million and $92 million for the three and six months ended June 30, 2008, respectively).
| (a) | Stock Options |
Changes in the number of outstanding stock options were as follows:
| Stock Options | ||||||||
| Number | Weighted-Average Exercise Price | |||||||
| Balance at December 31, 2008 | 22,133,902 | $ | 37 | |||||
| Granted | 2,703,900 | 25 | ||||||
| Exercised for common shares | (579,277 | ) | 15 | |||||
| Surrendered for cash payment | (348,893 | ) | 33 | |||||
| Forfeited | (354,750 | ) | 42 | |||||
| Expired | (2,000 | ) | 8 | |||||
| Balance at June 30, 2009 | 23,552,882 | $ | 36 | |||||
– 32 –
PETRO-CANADA
NOTES TO CONSOLIDATED FINANCIAL STATEMENTS (unaudited)
| (millions of Canadian dollars, unless otherwise stated) |
| 10. | STOCK-BASED COMPENSATION continued |
| (b) | Stock Appreciation Rights (SARs) |
Changes in the number of outstanding SARs were as follows:
| SARs | ||||||||
Number | Weighted-Average Exercise Price | |||||||
| Balance at December 31, 2008 | 7,207,354 | $ | 46 | |||||
| Granted | 5,450,450 | 25 | ||||||
| Exercised | (69,698 | ) | 44 | |||||
| Forfeited | (490,301 | ) | 36 | |||||
| Balance at June 30, 2009 | 12,097,805 | $ | 37 | |||||
| (c) | Performance Share Units (PSUs) |
Changes in the number of outstanding PSUs were as follows:
| PSUs | ||||
| Number | ||||
| Balance at December 31, 2008 | 828,372 | |||
| Granted | 259,467 | |||
| Redeemed | (348,980 | ) | ||
| Forfeited | (1,219 | ) | ||
| Balance at June 30, 2009 | 737,640 | |||
| (d) | Restricted Stock Units (RSUs) |
During the first quarter of 2009, the Company instituted a RSUs plan for senior management employees, whereby notional share units are awarded and settled in cash at the end of a three-year period. This award is based upon the Company’s share price at the end of the three-year period and the value of notional dividends applied during the period.
Changes in the number of outstanding RSUs were as follows:
| RSUs | ||||
| Number | ||||
| Balance at December 31, 2008 | - | |||
| Granted | 813,335 | |||
| Redeemed | - | |||
| Forfeited | (14,955 | ) | ||
| Balance at June 30, 2009 | 798,380 | |||
– 33 –
PETRO-CANADA
NOTES TO CONSOLIDATED FINANCIAL STATEMENTS (unaudited)
| (millions of Canadian dollars, unless otherwise stated) |
| 11. | EMPLOYEE FUTURE BENEFITS |
The Company maintains pension plans with defined benefit and defined contribution provisions and provides certain health care and life insurance benefits to its qualifying retirees. The expenses associated with these plans are as follows:
| Three months ended June 30, | Six months ended June 30, | |||||||||||||||
| 2009 | 2008 | 2009 | 2008 | |||||||||||||
| Pension Plans: | ||||||||||||||||
| Defined benefit plans | ||||||||||||||||
Employer current service cost | $ | 8 | $ | 10 | $ | 16 | $ | 21 | ||||||||
Interest cost | 25 | 24 | 51 | 47 | ||||||||||||
Expected return on plan assets | (22 | ) | (27 | ) | (44 | ) | (55 | ) | ||||||||
Amortization of transitional asset | (1 | ) | (2 | ) | (2 | ) | (3 | ) | ||||||||
Amortization of net actuarial losses | 18 | 12 | 36 | 24 | ||||||||||||
| 28 | 17 | 57 | 34 | |||||||||||||
| Defined contribution plans | 7 | 6 | 14 | 11 | ||||||||||||
| $ | 35 | $ | 23 | $ | 71 | $ | 45 | |||||||||
| Other post-retirement plans: | ||||||||||||||||
Employer current service cost | $ | 2 | $ | 2 | $ | 3 | $ | 3 | ||||||||
Interest cost | 3 | 4 | 7 | 7 | ||||||||||||
Amortization of transitional obligation | - | - | 1 | 1 | ||||||||||||
Amortization of net actuarial losses | - | - | - | 1 | ||||||||||||
| $ | 5 | $ | 6 | $ | 11 | $ | 12 | |||||||||
The Company expects to contribute $72 million to its pension plans in 2009.
| 12. | CAPITAL MANAGEMENT |
The Company’s capital management strategy is designed to maintain financial strength and flexibility to support profitable growth in all business environments. The Company continually monitors its capital management strategy and makes adjustments as appropriate. The Company’s capital management strategy, objectives, evaluation measures, definitions and targets have not changed significantly from the prior period.
The Company is subject to certain financial covenants associated with its various banking and debt arrangements and was in compliance with all financial covenants for the three and six months ended June 30, 2009.
| 13. | FINANCIAL RISKS AND FINANCIAL INSTRUMENTS |
The Company is exposed to a number of financial risks in the normal course of its business operations, including market risks resulting from fluctuations in commodity prices, interest rates and foreign currency exchange rates, as well as credit risks and liquidity risks. The Company monitors its exposures to these risks and employs strategies to manage the risks as it considers appropriate. The Company’s financial risk exposure and risk management strategies have not changed significantly from the prior period.
The fair values of the Company’s financial assets and financial liabilities may fluctuate in response to these risks. Excluding debentures, senior notes and capital leases, which are recorded as long-term debt, the fair values of financial instruments equals or approximates their carrying amount, due to their short maturity. The fair value of debentures, senior notes and capital leases was $4,536 million at June 30, 2009 (December 31, 2008 – $3,868 million), compared with a carrying amount of $4,506 million at June 30, 2009 (December 31, 2008 – $4,749 million). The fair values of debentures, senior notes and capital leases are based on publicly quoted market values for instruments with similar terms and risks.
– 34 –
PETRO-CANADA
NOTES TO CONSOLIDATED FINANCIAL STATEMENTS (unaudited)
| (millions of Canadian dollars, unless otherwise stated) |
| 14. | MERGER WITH SUNCOR ENERGY INC. (SUNCOR) |
On March 23, 2009, the Company announced plans to merge with Suncor. Petro-Canada and Suncor shareholders have approved the merger, as have the Court of Queen’s Bench of Alberta and the Competition Bureau. Petro-Canada and Suncor intend to make the merger effective August 1, 2009.
– 35 –