QuickLinks -- Click here to rapidly navigate through this document
SECURITIES AND EXCHANGE COMMISSION
Washington, D.C. 20549
FORM 40 - F
(Check One)
o Registration statement pursuant to Section 12 of the Securities Exchange Act of 1934
or
ý Annual report pursuant to Section 13(a) or 15(d) of the Securities Exchange Act of 1934
For fiscal year ended: December 31, 2002
Commission File No.: 1-13922
PETRO-CANADA
(Exact name of registrant as specified in its charter)
Canada | | 1311, 1321, 1382, 5541 | | Not Applicable |
(Province or other jurisdiction of incorporation or organization) | | (Primary standard industrial classification code number, if applicable) | | (I.R.S. employer identification number, if applicable) |
150 — 6th Avenue S.W.
Calgary, Alberta
Canada T2P 3E3
(403) 296-8000
(Address and telephone number of registrant’s principal executive office)
CT Corporation System
111 Eight Avenue - CT
New York, New York 10011
(212) 894-8940
(Name, address and telephone number of agent for service in the United States)
Securities registered pursuant to Section 12(b) of the Act:
Title of each class: | | Name of each exchange on which registered: |
Common Shares | | New York Stock Exchange |
Securities registered pursuant to Section 12(g) of the Act:
None
Securities for which there is a reporting obligation pursuant to Section 15(D) of the Act:
9 1/4% Debentures Due 2021
7 7/8% Debentures Due 2026
7% Debentures Due 2028
For annual reports, indicate by check mark the information filed with this form:
ý Annual Information Form ý Audited Financial Statements
Indicate the number of outstanding shares of each of the issuer’s classes of capital or common stock as of the close of the periods covered by the annual report:
Common Shares: 263,594,977
Indicate by check mark whether the registrant by filing the information contained in this form is also thereby furnishing the information to the Commission pursuant to Rule 12g 3-2(b) under the Securities Exchange Act of 1934 (the “Exchange Act”). If “Yes” is marked, indicate the file number assigned to the registrant in connection with such rule.
Yes o No ý
Indicate by check mark whether the registrant: (1) has filed all reports required to be filed by Section 13(d) or 15(d) of the Exchange Act during the preceding 12 months (or for such shorter period that the registrant has been required to file such reports); and (2) has been subject to such filing requirements in the past 90 days.
Yes ý No & #160; o
2
Annual Information Form
2002
March 6, 2003
Table of Contents
| |
| | Page
|
|---|
| Item 1 – | | Cover | | 1 |
| Item 2 – | | Corporate Structure | | 3 |
| | | Incorporation of Petro-Canada | | 3 |
| | | Intercorporate Relationships | | 4 |
| Item 3 – | | General Development of the Business | | 4 |
| | | Corporate Overview | | 4 |
| | | Significant Acquisitions and Dispositions in 2002 | | 5 |
| Item 4 – | | Description of the Business | | 6 |
| | | Business of Petro-Canada | | 6 |
| | | Upstream Canada | | 7 |
| | | • East Coast Oil | | 8 |
| | | • Oil Sands | | 10 |
| | | • North American Natural Gas | | 11 |
| | | Upstream International | | 24 |
| | | Downstream | | 32 |
| | | Research and Development | | 36 |
| | | Human Resources | | 36 |
| | | Environmental Factors | | 37 |
| | | Industry Conditions | | 37 |
| Item 5 – | | Selected Consolidated Financial Information | | 38 |
| Item 6 – | | Management's Discussion and Analysis | | 39 |
| Item 7 – | | Market for Securities | | 39 |
| Item 8 – | | Directors and Officers | | 40 |
| Item 9 – | | Additional Information | | 44 |
Conversion Factors
To conform with common usage, imperial units of measurement are used in this report to describe exploration and production while metric units are used for refining and marketing. Dollars are Canadian unless otherwise stated.
| 1 cubic metre (liquids) | | = | | 6.29 barrels |
| 1 cubic metre (natural gas) | | = | | 35.49 cubic feet |
| 1 litre | | = | | 0.22 imperial gallon |
2 Petro-Canada Annual Information Form
FORWARD-LOOKING STATEMENTS
This Annual Information Form (including Petro-Canada's Management's Discussion and Analysis – see pages 6 through 23 of the Company's 2002 Annual Report – incorporated by reference herein) contains forward-looking statements, including, but not limited to, references to: future capital and other expenditures (including the amount, nature and sources of funding thereof); oil and gas production levels and the sources of their growth; tax and royalty rates; oil and gas prices; the Canadian dollar exchange rate; interest rates; refining and marketing margins; demand for refined petroleum products; planned facilities construction and expansion; retail site throughputs; pre-production and operating costs; reserve estimates; reserves life; natural gas export capacity; plans for and results of exploration and development activities; environmental matters; drilling plans; acquisition and disposition of resource properties; and the dates by which certain areas and facilities will be developed or will come on stream. Undue reliance should not be placed on these forward-looking statements, which are based upon Petro-Canada's assumptions and are subject to known and unknown risks and uncertainties and other factors which may cause actual results, levels of activity and achievements to differ materially from those expressed or implied by such statements. Such factors include, but are not limited to: general economic, market and business conditions; industry capacity; competitive action by other companies; fluctuations in oil and gas prices; refining and marketing margins; the ability to produce and transport crude oil and natural gas to markets; the results of exploration and development drilling and related activities; fluctuation in foreign currency exchange rates and interest rates; the ability of suppliers to meet commitments; actions by governmental authorities including increases in taxes; decisions or approvals of administrative tribunals; changes in environmental and other regulations; the availability of capital markets; risks attendant with oil and gas operations; and other factors, many of which are beyond the control of Petro-Canada. Petro-Canada undertakes no obligation to update publicly or revise any forward-looking statements contained herein, and such statements are expressly qualified by this cautionary statement.
ITEM 2 – CORPORATE STRUCTURE
Incorporation of Petro-Canada
Throughout this Annual Information Form, unless the context otherwise indicates, the term "Corporation" refers to the corporate entity, Petro-Canada. The terms "Petro-Canada", the "Company", "we", "us" and "our" refer to the Corporation and its subsidiaries.
The Corporation is organized under the Canada Business Corporations Act. The registered and principal executive office of the Corporation is located at 150 - 6th Avenue S.W., Calgary, Alberta, Canada T2P 3E3. Telephone: (403) 296-8000.
The Corporation's common shares trade on The Toronto Stock Exchange under the symbol PCA and on the New York Stock Exchange under the symbol PCZ. Petro-Canada's shares are widely distributed with 81.26 per cent of the outstanding shares held by private institutional and individual investors as of December 31, 2002, and the Government of Canada owning the remaining 18.74 per cent.
3 Petro-Canada Annual Information Form
Intercorporate Relationships
Material operating subsidiaries owned 100 per cent, directly or indirectly, by Petro-Canada at December 31, 2002 were as follows:
Name
| | Jurisdiction of Incorporation
|
|---|
| 3908968 Canada Inc. | | Canada |
| | Petro-Canada UK Holdings Ltd. | | United Kingdom |
| | | Petro-Canada UK Limited | | United Kingdom |
Individually, Petro-Canada's remaining subsidiaries account for less than 10 per cent of the Company's consolidated revenues and consolidated assets and in the aggregate they account for less than 20 per cent of the Company's consolidated revenues and consolidated assets.
Additionally, Petro-Canada is the General Manager of the Petro-Canada Oil and Gas Partnership which operates our Western Canada conventional oil and gas exploration and production assets and our interest in the Syncrude joint venture.
ITEM 3 – GENERAL DEVELOPMENT OF THE BUSINESS
Corporate Overview
Prior to July 1991, the Government of Canada owned 100 per cent of the issued and outstanding common shares of the Corporation. The Corporation completed its initial public offering of common shares in July 1991. The Government of Canada's interest in the outstanding shares of the Corporation has been further reduced through a series of treasury and government secondary common share offerings. As of December 31, 2002, the Government of Canada's interest in the outstanding shares of the Corporation was 18.74 per cent. The following is a recent history of major Company events.
In 1998, Petro-Canada began development of the Terra Nova project. We sold several non-core properties in Western Canada for gross proceeds of approximately $230 million, sold ICG Propane Inc. for gross proceeds of $177 million and sold our 50 per cent interest in Petro-Canada Centre, our head office complex in Calgary, Alberta for gross proceeds of $200 million.
In 1999, to enhance opportunities for future profitable growth in Canadian natural gas and Grand Banks oil production, we acquired acreage in the Mackenzie Delta, located in the Northwest Territories, the Flemish Pass, located offshore Newfoundland, and the Scotian Slope, located offshore Nova Scotia. Construction continued on the Terra Nova project.
In 2000, to sharpen the focus on our core businesses, we sold our natural gas liquids business, non-core oil and gas properties and other assets for proceeds totalling $722 million. Our ownership interests in two Grand Banks properties, Terra Nova and White Rose, were increased through a property swap. Development of Terra Nova continued with delivery of the floating production, storage and offloading (FPSO) vessel. Construction commenced on Petro-Canada's firstin situ oil sands commercial development at MacKay River in northeastern Alberta.
In 2001, Petro-Canada commissioned the offshore facilities for the Terra Nova oil field, allowing production start-up to occur in January 2002. In Oil Sands, we participated in the launch of Phase 3 of the Syncrude expansion, advanced the construction of our MacKay River bitumen production facility and articulated a growth strategy linking staged development ofin-situ bitumen production with conversion of our Edmonton refinery. In our North American Natural Gas business we drilled the first well in the Mackenzie Delta in a decade and expanded our exploration focus with the acquisition of exploratory acreage in Alaska. Internationally, we expanded our presence in North Africa with the acquisition of an interest in
4 Petro-Canada Annual Information Form
the En Naga block in Libya's Sirte basin for $121 million. In the Downstream, improved plant reliability, a strong performance from Lubricants, and the continued growth in non-petroleum revenue produced strong results in a weaker business environment. We repurchased approximately 13 million common shares at a cost of $496 million during the term of a 12-month Normal Course Issuer Bid that expired on October 31, 2001, and we repaid $475 million of long-term debt.
In 2002, Petro-Canada acquired most of the upstream oil and gas businesses of Veba Oil & Gas GmbH for $2 234 million, establishing International as a new core business. In Canada, strong operating performance at Hibernia combined with an exceptional start-up year at Terra Nova to raise Petro-Canada's share of East Coast crude oil production to 71 900 barrels of oil per day (b/d). Development commenced at White Rose, which will be the third producing oil field on the Grand Banks. The MacKay River bitumen production facility was completed on schedule and on budget and started production in November 2002. Regulatory applications for the 80 000 b/d Meadow Creekin situ project and Edmonton refinery feed conversion advanced under government review. A natural gas discovery at the Tuk M-18 well in the Mackenzie Delta tested at restricted rates up to 30 million cubic feet per day (mmcf/d). Petro-Canada won the 2002 Convenience Store Chain of the Year Award from leading U.S. trade publication Convenience Store Decisions. We repaid $465 million of debt in 2002, followed by an additional repayment of $100 million in January 2003.
Significant Acquisitions and Dispositions in 2002
International
On May 2, 2002, Petro-Canada acquired the shares of companies holding the majority of the international upstream oil and gas businesses of Veba Oil & Gas GmbH (Veba) and on December 10, 2002, Petro-Canada acquired from Veba a 50 per cent working interest in the La Ceiba block in western Venezuela which had been subject to rights of first refusal. The total acquisition cost, consisting of a cash consideration and acquisition costs, totalled $2 234 million. Rights of first refusal were exercised by third parties with respect to assets in Norway and Egypt. A remaining right of first refusal concerning Veba's Cerro Negro heavy oil operations in Venezuela remained pending resolution at year-end. The Veba acquisition established Petro-Canada's international operations as a fifth core business with operations focused on three major hydrocarbon regions: Northwest Europe, North Africa/Near East and Northern Latin America. (Additional information regarding this acquisition can be found at Note 3 of the Notes to Consolidated Financial Statements and in Management's Discussion & Analysis, in the Financing Activities section and under International in the Upstream Review and Outlook section.)
5 Petro-Canada Annual Information Form
ITEM 4 – DESCRIPTION OF THE BUSINESS
Business of Petro-Canada
The following business description should be read in conjunction with Petro-Canada's Management's Discussion and Analysis ("MD&A") (See "Item 6 – Management's Discussion and Analysis").
Petro-Canada is an integrated oil and gas company with a portfolio of businesses spanning both the upstream and downstream of the industry. In the Upstream, Petro-Canada explores for, develops, produces and markets crude oil and natural gas. Our Downstream business refines crude oil and other feedstocks and markets and distributes petroleum products and related goods and services. For reporting purposes, Petro-Canada operates in three business segments: Upstream Canada, which includes three of the Company's core businesses, namely North American Natural Gas, Oil Sands and East Coast Oil; Upstream International; and Downstream.
The chart below outlines the various businesses of Petro-Canada as at December 31, 2002.
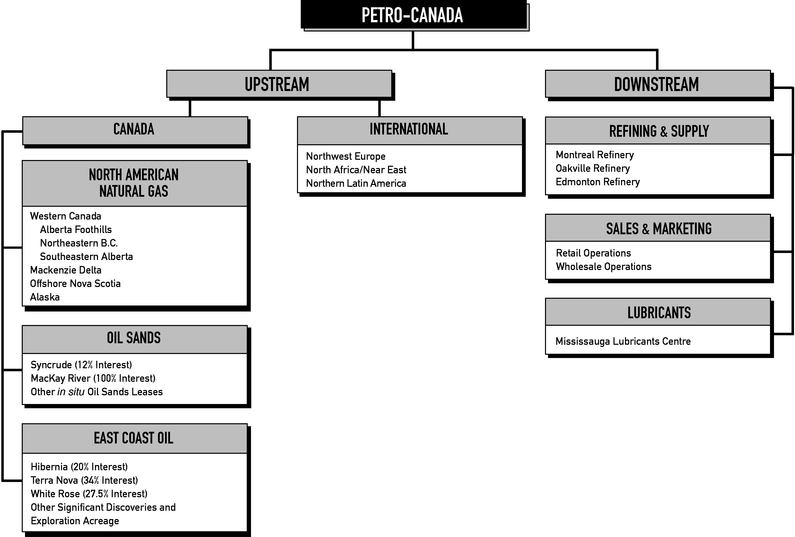
6 Petro-Canada Annual Information Form
Upstream Canada
Petro-Canada is a major participant in Canada's upstream oil and gas industry and is active in the exploration for and development of oil and natural gas reserves in Canada and exploration for natural gas in Alaska. On the Grand Banks, offshore Newfoundland, Petro-Canada has a 20 per cent interest in the Hibernia oil field, a 34 per cent share of production from the Terra Nova oil field and a 27.5 per cent interest in the White Rose oil field, which is currently under development. Our East Coast growth strategy envisions extending plateau production through field extensions at Hibernia and Terra Nova. The Company has major oil sands interests including its 12 per cent participation in the Syncrude joint venture and 100 per cent ownership of the recently completed MacKay Riverin situ development, both located in northeastern Alberta. A secondin situ development is planned at Meadow Creek (Petro-Canada working interest – 75 per cent). Application for the Meadow Creek development is under regulatory review. Start-up at Meadow Creek will be coordinated with the first phase of a planned conversion at the Edmonton refinery to allow the refinery to replace its existing feedstock with bitumen. Petro-Canada is one of the largest producers of natural gas in Western Canada and, for longer-term growth, we are pursuing exploration opportunities in such high potential areas as the Mackenzie Delta, the Scotian Slope and Alaska.
The following table shows our estimates of Petro-Canada's Canadian proved crude oil reserves (including synthetic crude oil and bitumen) before royalties and average daily production of crude oil before royalties by major fields.
CANADIAN CRUDE OIL RESERVES AND PRODUCTION BY FIELD
Fields
| | Proved Reserves Before Royalties 1 as at December 31, 2002
| | Per Cent of Total Proved Reserves
| | Average 2002 Daily Production Before Royalties 1,2
| | Per Cent of Total 2002 Daily Production
|
|---|
|
| | (millions of barrels)
| |
| | (thousands of barrels)
| |
|
|---|
| Syncrude, Alberta | | 324 | | 72 | | 27 | | 25 |
| Hibernia, Newfoundland | | 38 | | 8 | | 36 | | 34 |
| MacKay River, Alberta | | 32 | | 7 | | 1 | | 1 |
| Terra Nova, Newfoundland | | 30 | | 7 | | 36 | | 34 |
| Ferrier, Alberta | | 13 | | 3 | | 3 | | 3 |
| Other | | 12 | | 3 | | 4 | | 3 |
| | |
| |
| |
| |
|
| Total | | 449 | | 100 | | 107 | | 100 |
| | |
| |
| |
| |
|
- 1
- The reserves and production shown in this table do not include natural gas liquids (NGL).
- 2
- Production from new projects and acquisitions has been averaged over the full year. The Terra Nova field commenced production on January 20, 2002; the MacKay River field commenced production in November 2002.
7 Petro-Canada Annual Information Form
The following table shows our estimates of Petro-Canada's Canadian proved natural gas reserves before royalties and average daily production of natural gas before royalties by major fields.
CANADIAN NATURAL GAS RESERVES AND PRODUCTION BY FIELD
Fields
| | Proved Reserves Before Royalties as at December 31, 2002
| | Per Cent of Total Proved Reserves
| | Average 2002 Daily Production Before Royalties
| | Per Cent of Total 2002 Daily Production
|
|---|
|
| | (billions of cubic feet)
| |
| | (millions of cubic feet)
| |
|
|---|
| Wildcat Hills area, Alberta | | 559 | | 26 | | 157 | | 22 |
| Hanlan area, Alberta | | 273 | | 13 | | 100 | | 14 |
| Jedney/Beg/Bubbles, B.C. | | 228 | | 10 | | 40 | | 6 |
| Ricinus/Bearberry area, Alberta | | 175 | | 8 | | 98 | | 14 |
| Medicine Hat, Alberta | | 156 | | 7 | | 33 | | 4 |
| Laprise area, B.C. | | 121 | | 6 | | 39 | | 5 |
| Gilby/Wilson Creek, Alberta | | 98 | | 4 | | 31 | | 4 |
| Alderson, Alberta | | 81 | | 4 | | 23 | | 3 |
| Ferrier, Alberta | | 77 | | 3 | | 22 | | 3 |
| Clarke Lake, B.C. | | 66 | | 3 | | 35 | | 5 |
| Other | | 347 | | 16 | | 144 | | 20 |
| | |
| |
| |
| |
|
| Total | | 2 181 | | 100 | | 722 | | 100 |
| | |
| |
| |
| |
|
East Coast Oil
Petro-Canada has crude oil and natural gas interests off Canada's East Coast located principally on the Grand Banks area east of Newfoundland. To date, our focus has been directed, primarily, towards our major Grand Banks oil field developments, Hibernia, Terra Nova and White Rose. We expect that the experience, technology and infrastructure developed for these projects will form the basis for potential development of other discoveries on the Grand Banks.
Hibernia
The Hibernia oil field lies 315 kilometres east-southeast of St. John's, Newfoundland in 80 metres of water. Petro-Canada has a 20 per cent interest in the field. Petro-Canada's share of Hibernia production averaged 36 100 b/d in 2002, compared to 29 700 b/d in 2001. The Hibernia field is estimated to have a remaining production life of 18 to 20 years.
At December 31, 2002, there were 14 producing oil wells, seven water injection wells and five gas injection wells in operation in the Hibernia formation. As well, the Ben Nevis Avalon formation had three wells capable of production and two water injection wells in operation. Hibernia crude oil is transported by shuttle tanker to a transshipment terminal on the Avalon Peninsula at Whiffen Head, Newfoundland or directly to market, if tanker schedules permit. Crude oil delivered to the transshipment facility is transferred to storage tanks and loaded onto tankers for transport to market. Petro-Canada has a 14 per cent ownership interest in the transshipment facility.
The royalty regime for the Hibernia project has three tiers: gross royalty, net royalty and supplementary royalty. An initial gross royalty of one per cent of gross field revenue increased to two per cent on September 1, 1999, to three per cent on March 1, 2001 and to four per cent on June 1, 2002. The one per cent increments occur at the earlier of 18-month intervals or the attainment of specified cumulative production amounts. The gross royalty will continue to increase by increments of one per cent to a maximum of five per cent of gross field revenue. The gross royalty is indexed to crude oil prices under certain conditions. Upon achieving payout, including a specified return allowance, the net royalty payable becomes the greater of
8 Petro-Canada Annual Information Form
30 per cent of net revenue or five per cent of gross revenue. After a further level of payout is reached, which includes an additional return allowance, a supplementary royalty of 12.5 per cent of net revenue also becomes payable. Hibernia royalties averaged $0.70 per barrel in 2002.
Terra Nova
The Terra Nova oil field, which lies 350 kilometres east-southeast of St. John's, Newfoundland in 95 metres of water, was discovered by Petro-Canada in 1984. Petro-Canada is operator of the field and holds a 34 per cent working interest in the development. The Terra Nova field is estimated to have a production life of approximately 12 to 14 years.
Development of the Terra Nova field, including final commissioning of the floating production, storage and offloading (FPSO) vessel, was completed in early January 2002. Following start-up on January 20, 2002, field production was steadily ramped up to regulatory allowable levels. In December 2002, the Canada-Newfoundland Offshore Petroleum Board approved an increase in the allowable average annual production rate to 150 000 b/d. Annual production levels are affected by a number of factors including weather and sea states, sea ice and iceberg conditions, well and reservoir performance and maintenance programs. Production in 2002 averaged 105 400 b/d (35 800 b/d net to Petro-Canada). At 2002 year-end, six producing oil wells, three water injection wells and one gas injector were in operation. Terra Nova utilizes the system of shuttle tankers and transshipment terminal that is used for Hibernia.
The Terra Nova royalty regime has three tiers. The royalty consists of a sliding scale basic royalty payable throughout the project's life with two additional tiers of net royalties payable upon the achievement of specified levels of profitability. The basic royalty is payable as a per cent of gross field revenue, with an initial rate of one per cent, and rises to 10 per cent depending on cumulative production levels and the occurrence of simple payout. After tier 1 payout, including a specified return allowance, has been reached, net royalty will become the greater of the basic royalty or 30 per cent of net revenue. An additional net royalty equal to 12.5 per cent of net revenue will be payable once a further level of payout, including an additional return allowance, is attained. In 2002, Terra Nova royalties averaged $0.40 per barrel.
White Rose
In March 2002, Petro-Canada and Husky Oil Operations Limited, the operator, agreed to proceed with development of the White Rose oil field (Petro-Canada's ownership interest – 27.5 per cent). Development includes construction of an FPSO vessel with a production capacity of 100 000 barrels of oil per day and a subsea production system. Field development plans anticipate 19 to 21 wells to recover an estimated 200 to 250 million barrels of oil over a 10- to 12-year time frame. Steel cutting for the hull of the FPSO commenced in the late fall in South Korea. Engineering and fabrication of the FPSO's topsides is underway in Marystown, Newfoundland. Experience gained at Terra Nova has been incorporated into White Rose planning, which will greatly reduce project risks and uncertainties. First oil from the project is expected by year-end 2005. Peak production at an anticipated 90 000 b/d (24 700 b/d net to Petro-Canada) is expected to be sustained for a period of about four years. Two chartered tankers will ship White Rose production directly to markets. Petro-Canada's estimate of total project cost to first oil, including the cost of the first 10 wells, is $2.3 billion.
Other Offshore Exploration and Development
In addition to current East Coast developments, Petro-Canada holds interests in the Hebron/Ben Nevis oil field discoveries, where our interest is 23.9 per cent. After two years of comprehensive study, development work on the Hebron/Ben Nevis discoveries has been suspended. The potential for further advances in technology to lower development costs and improve project economics will be monitored.
Elsewhere offshore Newfoundland, Petro-Canada holds significant acreage interests in a number of unexplored or lightly explored areas, particularly in the Flemish Pass and Salar basins, where the focus is on oil discovery. In February 2003, drilling began on the first of two deep water exploration wells in the Flemish Pass region.
9 Petro-Canada Annual Information Form
Generic Offshore Newfoundland Royalty Regime
In 1996, the Government of Newfoundland and Labrador announced the main features of a royalty regime that will apply to the development of petroleum resources in offshore areas other than Hibernia and Terra Nova. The generic offshore royalty regime consists of a sliding scale basic royalty payable throughout a project's life, and a two-tier net royalty payable upon the achievement of specified levels of profitability. The basic royalty is calculated as a percentage of gross field revenue commencing at one per cent and rising to 7.5 per cent depending on cumulative production levels and the achievement of simple payout. Upon reaching tier 1 payout, including a return allowance, the net royalty is calculated as the greater of the basic royalty or 20 per cent of net revenue. An additional 10 per cent net royalty rate is payable once a higher level of return on investment is attained.
Oil Sands
Oil Sands, one of Petro-Canada's core businesses, comprises our ownership position in Syncrude, the development of our extensivein situ oil sands properties, including MacKay River, and the potential to further integrate oil sands production with processing at our Edmonton refinery.
Syncrude
Petro-Canada has a 12 per cent interest in Syncrude, the world's largest oil sands mining operation. Located north of Fort McMurray, Alberta, Syncrude is a joint venture formed to mine shallow deposits of oil sands, and to extract and upgrade bitumen to produce synthetic crude oil. Syncrude has an estimated reserve life in excess of 35 years. Three mines are currently in operation at Syncrude: the Base mine where operations are carried out using drag lines, bucket wheel reclaimers and belt conveyors; and the North mine and Aurora mine, where truck, shovel and hydro-transport systems are in use. An extraction process recovers about 91 per cent of the crude bitumen contained in the mined sands. Refining processes upgrade the bitumen into high quality, light (32 degree API) sweet synthetic crude oil.
In 1997, the Syncrude owners approved a staged growth strategy for the next decade. To date, plant expansions have increased Syncrude's annual production capacity from 200 000 b/d in 1996 to 260 000 b/d. The third stage expansion, currently underway, will increase the annual production capacity to 360 000 b/d by late 2005.
During 2001, Syncrude completed the transition from a project-specific contractual royalty to the Province of Alberta oil sands generic royalty. Effective January 2002, the royalty payable by Syncrude to the Province of Alberta has been set at the greater of one per cent of gross revenue or 25 per cent of net revenue. The net revenue is determined by subtracting allowed operating and capital costs from gross revenue. In 2002, the royalty paid was one per cent of gross revenue.
In Situ Oil Sands
In September 2002, Petro-Canada successfully completed construction of its 100 per cent owned,in situ bitumen production facility at MacKay River. Following an initial reservoir steaming process, bitumen production commenced in November. Production at MacKay River in December averaged 9 400 b/d. Production will be ramped up steadily during 2003 to approximately 30 000 b/d, a level that MacKay River reserves can sustain for 25 years. Bitumen is recoveredin situ where oil sands are too deep to be mined economically. Our bitumen extraction process utilizes steam-assisted gravity drainage (SAGD), a technology that Petro-Canada helped to develop. SAGD combines horizontal drilling with thermal steam injection. Steam is injected into the reservoir through the top well of a horizontal well pair to mobilize the bitumen, which flows to the lower producing well. This technology can economically recover over 60 per cent of the bitumen in place. The initial development phase at MacKay River includes two initial well pads of 12 and 13 horizontal well pairs. Well pairs are about 700 - 750 metres in length and are expected to produce about 1 200 barrels of bitumen per day. On average, wells are expected to have a six- to eight-year life. New well pads will be built and drilling will continue as necessary throughout the life of the field.
All the water used in the steaming process will come from underground sources, with more than 90 per cent recycled – a key feature of the environmental efficiency of the MacKay River facility. The bitumen production from the project is currently
10 Petro-Canada Annual Information Form
being transported to the Athabasca Pipeline Terminal via a lateral insulated pipeline leased from Enbridge. To enable onward shipment through major North American pipelines, the bitumen is diluted with synthetic crude oil, provided under a long-term supply arrangement with Suncor Energy Marketing Inc. Through our long experience with a SAGD pilot project at an adjacent test facility, operating technical risks at MacKay River have been minimized, resulting in high capital efficiency, lower operating costs and high reservoir confidence. Capital expenditures for the MacKay River development came in at $274 million.
TransCanada Energy Limited is currently constructing a co-generation facility that will provide MacKay River with a long-term assured supply of low-cost power and steam and reduce greenhouse gas emissions by about 50 per cent when compared to the equivalent steam and electricity produced without co-generation. The co-generation plant, which has a planned late 2003 start-up, will be owned by TransCanada Energy but operated as part of the MacKay River project.
The MacKay River operation is subject to the 1997 Alberta Oil Sands Royalty Regulation. Prior to royalty payout, which includes a specified return allowance, the royalty is calculated as one per cent of gross revenue. After royalty payout, the royalty is based on the greater of one per cent of gross revenue or 25 per cent of net revenue. The net revenue is determined by subtracting allowed operating and capital costs from gross revenue.
Late in 2001, Petro-Canada filed a commercial application with the Alberta Energy and Utilities Board and Alberta Environment for the construction of an 80 000 b/d (60 000 b/d net to Petro-Canada) production facility at Meadow Creek, the selected site for our nextin situ development. Following public consultation and regulatory approval, we will make a decision on proceeding with Meadow Creek based on economic evaluations, our experience at MacKay River, and clarification of requirements related to the Kyoto Protocol.
Our longer-term plans include linking our bitumen production with processing at our Edmonton refinery. As a first step, in 2001, Petro-Canada filed an application with regulatory bodies for approval to undertake a major refinery conversion program that would enable the Edmonton refinery to replace its existing light crude oil feedstock with bitumen, while producing low-sulphur refined products. (Additional information regarding these plans can be found under Oil Sands within the Upstream Review and Outlook section of the MD&A.)
North American Natural Gas
Western Canada
Petro-Canada's primary operating regions are Alberta and British Columbia where we are a major holder of developed and undeveloped natural gas rights. The Company also holds a number of developed and undeveloped oil rights.
In 2002, we participated in 378 gross (225 net) wells, including 347 gross (202 net) gas and 4 gross (4 net) oil wells, for an overall success rate of 93 per cent. Reserves extensions, discoveries, revisions and improved recovery added 207 billion cubic feet (bcf) of natural gas and eight million barrels of conventional crude oil and natural gas liquids to proved reserves before royalties. Petro-Canada's finding and development costs for natural gas and associated liquids averaged $1.56 per thousand cubic feet of gas equivalent (mcfe), compared with $1.52 in 2001. Our three-year average finding and development costs for natural gas and associated liquids were $1.39/mcfe. (For comparison purposes, Petro-Canada converts 6 000 cubic feet of natural gas to one barrel of oil.) Property acquisitions added 14 bcf of natural gas to reserves. Sales of producing properties with gross reserves totalling five bcf of natural gas were completed in the year. Annual production before royalties totalled 263 bcf of natural gas and seven million barrels of conventional crude oil and natural gas liquids.
The royalty regime is a significant factor in the profitability of crude oil and natural gas production. Royalties on conventional crude oil and natural gas owned by provincial governments are determined by regulation and may be amended from time to time. Royalties are generally calculated as a percentage of production and vary depending upon factors such as well production volumes, selling prices, method of recovery, location of production and date of discovery. Royalties payable on production of privately owned crude oil and natural gas are negotiated with the mineral rights owner. In 2002, Petro-Canada's average royalty rates in Western Canada were 16 per cent for conventional crude oil and 23 per cent for natural gas.
11 Petro-Canada Annual Information Form
Petro-Canada's natural gas program in Western Canada is focused on maintaining a concentrated, profitable production base. Our areas of concentration, particularly the Alberta Foothills and northeast British Columbia, are characterized by large reserves, complex geology and a high level of infrastructure ownership by Petro-Canada. A key objective is to add proved reserves at economic finding and development costs that at least replace produced volumes. With the increasing maturity of the Western Canada Sedimentary Basin, this objective is becoming more challenging.
Petro-Canada operates 12 natural gas field processing plants with total gross processing capacity of approximately 1.2 bcf of natural gas per day, of which our share is approximately 693 mmcf/d. The key plants we operate are at Hanlan, Ferrier, Wildcat Hills and Brazeau in Alberta and Boundary Lake near the Alberta/British Columbia border. We also have varying working interests in other natural gas processing plants and field gathering facilities operated by other oil and gas companies of which our share is approximately 239 mmcf/d of design capacity.
We market natural gas produced by other companies in addition to our own production. In 2002, we sold 926 mmcf/d, up three per cent from 900 mmcf/d in 2001. To achieve better control over sales volumes, prices and transportation-related costs, we focus on direct sales to end users, distribution companies, wholesale marketers and natural gas spot markets. Our marketing effort includes management of the gas portfolio, gas supply, pipeline commitments and customer relationships. The following table shows the market distribution of Petro-Canada's natural gas sales.
NATURAL GAS SALES BY MARKET
| | 2002
| | 2001
|
|---|
| | mmcf/d
| | Per Cent of Total
| | mmcf/d
| | Per Cent of Total
|
|---|
|
| Sales to Aggregators | | | | | | | | |
| Canwest Gas Supply Inc. | | 37 | | 4 | | 59 | | 7 |
| ProGas Limited | | 34 | | 4 | | 27 | | 3 |
| TransCanada Gas Services Limited | | 29 | | 3 | | 30 | | 3 |
| Other | | 6 | | 1 | | 5 | | 1 |
| | |
| |
| |
| |
|
| Total | | 106 | | 12 | | 121 | | 14 |
| | |
| |
| |
| |
|
| Direct Sales | | | | | | | | |
| Alberta | | 409 | | 44 | | 358 | | 40 |
| U.S. Midwest | | 152 | | 16 | | 167 | | 18 |
| British Columbia & U.S. Pacific Northwest | | 101 | | 11 | | 97 | | 11 |
| California | | 46 | | 5 | | 54 | | 6 |
| Eastern Canada | | 46 | | 5 | | 50 | | 5 |
| Saskatchewan | | 7 | | 1 | | 7 | | 1 |
| | |
| |
| |
| |
|
| Total before Internal Sales | | 761 | | 82 | | 733 | | 81 |
| Sales within Petro-Canada | | 59 | | 6 | | 46 | | 5 |
| | |
| |
| |
| |
|
| Total Direct Sales | | 820 | | 88 | | 779 | | 86 |
| | |
| |
| |
| |
|
| Total Sales | | 926 | | 100 | | 900 | | 100 |
| | |
| |
| |
| |
|
| Total Direct Sales Exports | | 198 | | 21 | | 260 | | 29 |
| | |
| |
| |
| |
|
Mackenzie Delta, Northwest Territories
With interests in six blocks, covering approximately one million gross undeveloped acres (0.6 million net acres), Petro-Canada is one of the largest leaseholders in the Mackenzie Delta. Petro-Canada's holdings comprise four exploration licences and two Inuvialuit land concessions. We are the operator of the four licences. Our net work commitments on the four licences total
12 Petro-Canada Annual Information Form
approximately $140 million over five years and are guaranteed by performance bonds totalling approximately $35 million. Work commitments on the Inuvialuit land concessions include seismic acquisition and drilling a total of three wells. In 2002, a natural gas discovery at the Tuk M-18 well tested at restricted rates up to 30 mmcf/d.
Alaska
Our focus in Alaska is the foothills area north of the Brooks mountain range. A field geological study has confirmed that the geology and prospectivity of the area is similar to the Alberta Foothills, where Petro-Canada has developed considerable expertise and has had significant success finding natural gas. While it is unlikely the region will be serviced by a pipeline for some time, Petro-Canada's acreage is close to a proposed pipeline route to southern markets. To comply with the State of Alaska regulations, late in 2002 Petro-Canada relinquished a portion of our acreage to reduce our holdings below the maximum allowable of 500 000 acres. As a result, our landholdings at year-end totalled 410 500 acres (gross and net).
Future Commitments
The Company has future commitments to sell and transport natural gas associated with normal operations. Under future fixed-price commitments entered into during the 1990's, approximately four per cent of our estimated 2003 natural gas production has been sold at an average plant gate netback price of $2.73 per thousand cubic feet (mcf). In 2004, the volume of natural gas sold under these fixed-price contracts will be about 40 per cent less than in 2003.
13 Petro-Canada Annual Information Form
Reserves
The following table shows, for the years indicated, our estimates of Canadian proved developed and undeveloped reserves, after and before deduction of royalties, for each of conventional crude oil and NGL, synthetic crude oil, bitumen and natural gas.
CANADIAN PROVED RESERVES
| | Western Canada
| | East Coast 1
| | Oil Sands
| | Total
| |
|---|
| | Crude Oil & NGL
| | Natural Gas 2
| | Crude Oil & NGL
| | Synthetic Crude Oi1 3
| | Bitumen 4
| | Crude Oil & Liquids
| | Natural Gas
| |
|---|
| |
| | (mmbbls)
| | (bcf)
| | (mmbbls)
| | (mmbbls)
| | (mmbbls)
| | (mmbbls)
| | (bcf)
| |
|---|
| PROVED DEVELOPED AND UNDEVELOPED RESERVES AFTER ROYALTIES 5,6 | | | | | | | | | | | | | | | |
| Beginning of year 2000 | | 93 | | 1 962 | | 32 | | 290 | | – | | 415 | | 1 962 | |
| Revisions of previous estimates 7 | | 14 | | (139 | ) | (1 | ) | (10 | ) | – | | 3 | | (139 | ) |
| Purchase/(sale) of reserves in place | | (64 | ) | (128 | ) | – | | – | | – | | (64 | ) | (128 | ) |
| Discoveries, extensions and improved recovery | | 5 | | 255 | | 14 | | – | | – | | 19 | | 255 | |
| Production | | (6 | ) | (206 | ) | (10 | ) | (7 | ) | – | | (23 | ) | (206 | ) |
| | |
| |
| |
| |
| |
| |
| |
| |
| End of year 2000 | | 42 | | 1 744 | | 35 | | 273 | | – | | 350 | | 1 744 | |
| Revisions of previous estimates | | 1 | | 70 | | 2 | | 8 | | – | | 11 | | 70 | |
| Purchase/(sale) of reserves in place | | (1 | ) | (86 | ) | – | | – | | – | | (1 | ) | (86 | ) |
| Discoveries, extensions and improved recovery | | 5 | | 203 | | 14 | | – | | 32 | | 51 | | 203 | |
| Production | | (5 | ) | (195 | ) | (11 | ) | (9 | ) | – | | (25 | ) | (195 | ) |
| | |
| |
| |
| |
| |
| |
| |
| |
| End of year 2001 | | 42 | | 1 736 | | 40 | | 272 | | 32 | | 386 | | 1 736 | |
| Revisions of previous estimates | | 2 | | (62 | ) | 46 | | 16 | | – | | 64 | | (62 | ) |
| Purchase/(sale) of reserves in place | | – | | 7 | | – | | – | | – | | – | | 7 | |
| Discoveries, extensions and improved recovery | | 4 | | 196 | | – | | – | | – | | 4 | | 196 | |
| Production | | (5 | ) | (204 | ) | (26 | ) | (10 | ) | (1 | ) | (42 | ) | (204 | ) |
| | |
| |
| |
| |
| |
| |
| |
| |
| End of year 2002 | | 43 | | 1 673 | | 60 | | 278 | | 31 | | 412 | | 1 673 | |
| | |
| |
| |
| |
| |
| |
| |
| |
| PROVED DEVELOPED RESERVES AFTER ROYALTIES 5,6 | | | | | | | | | | | | | | | |
| End of year 2000 | | 38 | | 1 555 | | 18 | | 181 | | – | | 237 | | 1 555 | |
| End of year 2001 | | 39 | | 1 560 | | 32 | | 177 | | – | | 248 | | 1 560 | |
| End of year 2002 | | 40 | | 1 516 | | 45 | | 152 | | 16 | | 253 | | 1 516 | |
| PROVED DEVELOPED AND UNDEVELOPED RESERVES BEFORE ROYALTIES 5,8 | | | | | | | | | | | | | | | |
| End of year 2000 | | 54 | | 2 331 | | 38 | | 320 | | – | | 412 | | 2 331 | |
| End of year 2001 | | 54 | | 2 228 | | 42 | | 310 | | 33 | | 439 | | 2 228 | |
| End of year 2002 | | 55 | | 2 181 | | 68 | | 324 | | 32 | | 479 | | 2 181 | |
- 1
- East Coast proved reserves, at Hibernia and Terra Nova, are based on primary recovery for drilled fault blocks and undrilled fault blocks which lie between drilled fault blocks plus incremental recovery in fault blocks showing response to water or gas injection.
- 2
- Natural gas reserves reflect marketable (not raw) quantities.
14 Petro-Canada Annual Information Form
- 3
- Proved reserves of synthetic crude oil are based on high geological certainty, with drilling hole spacing less than 500 metres and application of proven or piloted technology. Appropriate co-owner and regulatory approvals are in place.
- 4
- Proved reserves of bitumen are located at MacKay River and are based on estimates of recovery from existing producer-injector well pairs.
- 5
- Proved reserves are the estimated quantities of crude oil, natural gas and natural gas liquids which geological and engineering data demonstrate with reasonable certainty to be recoverable in future years from known reservoirs under existing economic and operating conditions. Proved developed reserves are those proved reserves that are expected to be recovered from existing wells or facilities. Proved undeveloped reserves are proved reserves which are not recoverable from existing wells or facilities, but are expected to be recovered through additional development drilling or through the upgrading of existing or additional new facilities.
- 6
- Proved developed and undeveloped reserves after royalties are Petro-Canada's working interest in reserves after the deduction of Crown or other royalties. Such royalties are subject to change by legislation or regulation and can also vary depending on production rates, selling prices and timing of initial production. No reserve quantities have been included to reflect royalty interests we have in various properties.
- 7
- Revisions include changes in previous estimates, either upward or downward, resulting from new information (except an increase in acreage) normally obtained from drilling or production history or resulting from a change in economic factors. Revisions also include movements of reserves between classes as a result of development activity, e.g., from proved undeveloped reserves to proved developed reserves as a result of the drilling and completion of a well.
- 8
- Proved developed and undeveloped reserves before royalties are Petro-Canada's working interest in reserves before the deduction of Crown or other royalties.
We believe that the reserve quantities are reasonable estimates consistent with current knowledge of the characteristics and extent of the productive formations, but such estimates are subject to upward or downward revisions as additional information regarding producing fields becomes available, as technology improves and as economic conditions change. Additional proved reserves are expected to be booked for Hibernia, Terra Nova, White Rose and MacKay River during the course of continuing development.
15 Petro-Canada Annual Information Form
Production and Prices
The following table shows Petro-Canada's average daily production of Canadian conventional crude oil, synthetic crude oil, natural gas liquids and natural gas, before and after royalties for the years indicated.
AVERAGE DAILY CANADIAN PRODUCTION
| | Years Ended December 31,
|
|---|
| | 2002
| | 2001
| | 2000
| | 1999
| | 1998
|
|---|
| | Gross 1
| | Net 2
| | Gross
| | Net
| | Gross
| | Net
| | Gross
| | Net
| | Gross
| | Net
|
|---|
|
| | (thousands of barrels)
|
|---|
| Crude Oil & NGL | | | | | | | | | | | | | | | | | | | | |
| East Coast – Crude Oil | | 71.9 | | 70.9 | | 29.7 | | 29.2 | | 28.9 | | 28.3 | | 20.0 | | 19.6 | | 13.0 | | 12.9 |
| Oil Sands – Synthetic Crude & Bitumen | | 28.6 | | 28.2 | | 26.8 | | 24.8 | | 24.3 | | 20.0 | | 26.7 | | 25.7 | | 25.2 | | 24.6 |
| Western Canada – Crude Oil & NGL | | 18.9 | | 14.2 | | 18.6 | | 13.8 | | 23.4 | | 17.6 | | 36.4 | | 28.9 | | 51.0 | | 41.7 |
| | |
| |
| |
| |
| |
| |
| |
| |
| |
| |
|
| Total Canada Crude Oil & Liquids | | 119.4 | | 113.3 | | 75.1 | | 67.8 | | 76.6 | | 65.9 | | 83.1 | | 74.2 | | 89.2 | | 79.2 |
| | |
| |
| |
| |
| |
| |
| |
| |
| |
| |
|
| Straddle Plant NGL (thousands of barrels) 3 | | – | | – | | – | | – | | 5.8 | | 5.8 | | 29.7 | | 29.7 | | 35.2 | | 35.2 |
| Natural Gas (millions of cubic feet) 4 | | 721.5 | | 557.4 | | 714.4 | | 533.4 | | 738.2 | | 563.3 | | 718.5 | | 589.9 | | 722.2 | | 600.3 |
- 1
- Gross production represents Petro-Canada's working interest before the deduction of Crown and other royalties.
- 2
- Net production is gross production less Crown and other royalties.
- 3
- These volumes, extracted from pipeline gas at the Empress straddle plant, do not represent production of the gas liquids from Petro-Canada's reserves. Production from reserves is reflected as field natural gas liquids. The volumes shown include ethane extracted at the Empress plant. The Empress straddle plant gas liquids business was sold in 2000.
- 4
- These volumes do not include natural gas produced for use in miscible flood schemes or natural gas purchased from third parties for resale.
16 Petro-Canada Annual Information Form
The following table shows Petro-Canada's average daily Canadian production of conventional crude oil, synthetic crude oil, natural gas liquids and natural gas by quarter for the years indicated.
AVERAGE DAILY GROSS CANADIAN PRODUCTION 1 BY QUARTER
| | 2002
Three Months Ended
| | 2001
Three Months Ended
|
|---|
| | Dec. 31
| | Sept. 30
| | June 30
| | Mar. 31
| | Dec. 31
| | Sept. 30
| | June 30
| | Mar. 31
|
|---|
|
| | (thousands of barrels)
|
|---|
| Crude Oil & NGL | | | | | | | | | | | | | | | | |
| East Coast – Crude Oil | | 87.5 | | 62.4 | | 78.5 | | 59.1 | | 34.9 | | 28.0 | | 28.1 | | 27.9 |
| Oil Sands – Synthetic Crude & Bitumen | | 34.4 | | 31.3 | | 21.4 | | 27.5 | | 28.1 | | 25.3 | | 25.2 | | 28.4 |
| Western Canada – Crude Oil & NGL | | 18.7 | | 19.2 | | 18.4 | | 19.4 | | 18.0 | | 18.2 | | 18.6 | | 19.8 |
| | |
| |
| |
| |
| |
| |
| |
| |
|
| Total Crude Oil & NGL | | 140.6 | | 112.9 | | 118.3 | | 106.0 | | 81.0 | | 71.5 | | 71.9 | | 76.1 |
| | |
| |
| |
| |
| |
| |
| |
| |
|
| Natural Gas (millions of cubic feet) | | 711.6 | | 707.1 | | 736.4 | | 731.3 | | 730.6 | | 701.6 | | 684.9 | | 740.9 |
- 1
- Petro-Canada's working interest production before the deduction of Crown and other royalties.
In 2002, Petro-Canada-operated properties accounted for 83 per cent of the Company's Western Canada conventional crude oil, natural gas liquids and natural gas production.
The following table shows, for the five years ended December 31, 2002, the average sale price for Petro-Canada's Canadian conventional crude oil, synthetic crude oil, natural gas liquids and natural gas produced.
AVERAGE PRICES
| | 2002
| | 2001
| | 2000
| | 1999
| | 1998
|
|---|
|
Crude Oil, Synthetic Crude Oil, Bitumen and
NGL Sale Price 1 (dollars per barrel) | | 37.95 | | 37.24 | | 41.42 | | 24.48 | | 18.00 |
| Natural Gas Sale Price 2 (dollars per thousand cubic feet) | | 4.01 | | 6.00 | | 4.75 | | 2.59 | | 1.96 |
- 1
- Average conventional crude oil, synthetic crude oil, bitumen and natural gas liquids price is after the impact of hedging activities.
- 2
- Average natural gas price in Canada is before the deduction of British Columbia gathering and processing charges and after the impact of hedging activities.
17 Petro-Canada Annual Information Form
The following tables show Petro-Canada's average product prices and netbacks for East Coast (conventional crude oil), Syncrude (synthetic crude oil) and Western Canada (natural gas equivalent) for the years indicated.
EAST COAST – CONVENTIONAL CRUDE OIL
| | Years Ended December 31,
|
|---|
| | 2002
| | 2001
| | 2000
|
|---|
|
| | (dollars per barrel)
|
|---|
| Average Price Received 1 | | 38.84 | | 36.64 | | 41.23 |
| Royalties | | 0.55 | | 0.60 | | 0.89 |
| | |
| |
| |
|
| Net Revenues | | 38.29 | | 36.04 | | 40.34 |
| Operating Expense | | 3.20 | | 2.62 | | 2.76 |
| | |
| |
| |
|
| Netback | | 35.09 | | 33.42 | | 37.58 |
| Overhead Expenses (G&A) 4 | | 0.12 | | 0.14 | | 0.14 |
| | |
| |
| |
|
| Netback after Overhead | | 34.97 | | 33.28 | | 37.44 |
| | |
| |
| |
|
SYNCRUDE – SYNTHETIC CRUDE OIL
| | Years Ended December 31,
|
|---|
| | 2002
| | 2001
| | 2000
|
|---|
|
| | (dollars per barrel)
|
|---|
| Average Price Received 1 | | 40.66 | | 39.39 | | 44.10 |
| Royalties | | 0.44 | | 2.98 | | 7.75 |
| | |
| |
| |
|
| Net Revenues | | 40.22 | | 36.41 | | 36.35 |
| Operating Expense | | 19.50 | | 19.91 | | 17.53 |
| | |
| |
| |
|
| Netback | | 20.72 | | 16.50 | | 18.82 |
| Overhead Expenses (G&A) 4 | | – | | – | | 0.06 |
| | |
| |
| |
|
| Netback after Overhead | | 20.72 | | 16.50 | | 18.76 |
| | |
| |
| |
|
18 Petro-Canada Annual Information Form
WESTERN CANADA – NATURAL GAS EQUIVALENT
| | Years Ended December 31,
|
|---|
| | 2002
| | 2001
| | 2000
|
|---|
|
| | (dollars per mcfe)
|
|---|
| Average Price Received 2 | | 4.19 | | 5.98 | | 5.04 |
| Royalties | | 0.96 | | 1.52 | | 1.20 |
| | |
| |
| |
|
| Net Revenues | | 3.23 | | 4.46 | | 3.84 |
| Operating Expense 3 | | 0.45 | | 0.48 | | 0.44 |
| | |
| |
| |
|
| Netback | | 2.78 | | 3.98 | | 3.40 |
| Overhead Expenses (G&A) 4 | | 0.12 | | 0.12 | | 0.11 |
| | |
| |
| |
|
| Netback after Overhead | | 2.66 | | 3.86 | | 3.29 |
| | |
| |
| |
|
- 1
- Average conventional crude oil and synthetic crude oil prices are after the impact of hedging activities.
- 2
- Average price includes natural gas, before the deduction of British Columbia gathering and processing charges, and conventional crude oil and field natural gas liquids in natural gas equivalent, after the impact of hedging activities.
- 3
- Includes the operating cost component of British Columbia gathering and processing fees.
- 4
- Portion of head office expenses allocated to production.
The following tables show Petro-Canada's average product prices and netbacks for East Coast (conventional crude oil), Syncrude (synthetic crude oil) and Western Canada (natural gas equivalent) by quarter for the years indicated.
EAST COAST – CONVENTIONAL CRUDE OIL
| | 2002
Three Months Ended
| | 2001
Three Months Ended
|
|---|
| | Dec. 31
| | Sept. 30
| | June 30
| | Mar. 31
| | Dec. 31
| | Sept. 30
| | June 30
| | Mar. 31
|
|---|
|
| | (dollars per barrel)
|
|---|
| Average Price Received 1 | | 42.05 | | 42.15 | | 36.63 | | 33.39 | | 29.30 | | 37.18 | | 42.15 | | 39.86 |
| Royalties | | 0.52 | | 0.98 | | 0.27 | | 0.52 | | 0.55 | | 0.47 | | 0.82 | | 0.57 |
| | |
| |
| |
| |
| |
| |
| |
| |
|
| Net Revenues | | 41.53 | | 41.17 | | 36.36 | | 32.87 | | 28.75 | | 36.71 | | 41.33 | | 39.29 |
| Operating Expense | | 2.48 | | 3.48 | | 3.58 | | 3.48 | | 2.95 | | 2.58 | | 2.28 | | 2.52 |
| | |
| |
| |
| |
| |
| |
| |
| |
|
| Netback | | 39.05 | | 37.69 | | 32.78 | | 29.39 | | 25.80 | | 34.13 | | 39.05 | | 36.77 |
| Overhead Expenses (G&A) 4 | | 0.12 | | 0.13 | | (0.20 | ) | 0.21 | | 0.07 | | 0.11 | | 0.21 | | 0.17 |
| | |
| |
| |
| |
| |
| |
| |
| |
|
| Netback after Overhead | | 38.93 | | 37.56 | | 32.98 | | 29.18 | | 25.73 | | 34.02 | | 38.84 | | 36.60 |
| | |
| |
| |
| |
| |
| |
| |
| |
|
19 Petro-Canada Annual Information Form
SYNCRUDE – SYNTHETIC CRUDE OIL
| | 2002
Three Months Ended
| | 2001
Three Months Ended
|
|---|
| | Dec. 31
| | Sept. 30
| | June 30
| | Mar. 31
| | Dec. 31
| | Sept. 30
| | June 30
| | Mar. 31
|
|---|
|
| | (dollars per barrel)
|
|---|
| Average Price Received 1 | | 43.23 | | 43.80 | | 40.44 | | 34.30 | | 31.73 | | 40.86 | | 42.36 | | 43.15 |
| Royalties | | 0.55 | | 0.45 | | 0.41 | | 0.34 | | 0.30 | | 2.30 | | 3.55 | | 5.78 |
| | |
| |
| |
| |
| |
| |
| |
| |
|
| Net Revenues | | 42.68 | | 43.35 | | 40.03 | | 33.96 | | 31.43 | | 38.56 | | 38.81 | | 37.37 |
| Operating Expense | | 20.18 | | 13.09 | | 30.03 | | 18.20 | | 19.15 | | 18.11 | | 21.86 | | 20.56 |
| | |
| |
| |
| |
| |
| |
| |
| |
|
| Netback | | 22.50 | | 30.26 | | 10.00 | | 15.76 | | 12.28 | | 20.45 | | 16.95 | | 16.81 |
| | |
| |
| |
| |
| |
| |
| |
| |
|
WESTERN CANADA – NATURAL GAS EQUIVALENT
| | 2002
Three Months Ended
| | 2001
Three Months Ended
|
|---|
| | Dec. 31
| | Sept. 30
| | June 30
| | Mar. 31
| | Dec. 31
| | Sept. 30
| | June 30
| | Mar. 31
|
|---|
|
| | (dollars per mcfe)
|
|---|
| Average Price Received 2 | | 5.43 | | 3.78 | | 4.27 | | 3.28 | | 3.30 | | 3.90 | | 6.63 | | 10.05 |
| Royalties | | 1.29 | | 0.79 | | 1.01 | | 0.75 | | 0.71 | | 0.91 | | 1.64 | | 2.80 |
| | |
| |
| |
| |
| |
| |
| |
| |
|
| Net Revenues | | 4.14 | | 2.99 | | 3.26 | | 2.53 | | 2.59 | | 2.99 | | 4.99 | | 7.25 |
| Operating Expense 3 | | 0.45 | | 0.49 | | 0.42 | | 0.44 | | 0.68 | | 0.46 | | 0.57 | | 0.45 |
| | |
| |
| |
| |
| |
| |
| |
| |
|
| Netback | | 3.69 | | 2.50 | | 2.84 | | 2.09 | | 1.91 | | 2.53 | | 4.42 | | 6.80 |
| Overhead Expenses (G&A) 4 | | 0.15 | | 0.11 | | 0.13 | | 0.09 | | 0.11 | | 0.12 | | 0.11 | | 0.12 |
| | |
| |
| |
| |
| |
| |
| |
| |
|
| Netback after Overhead | | 3.54 | | 2.39 | | 2.71 | | 2.00 | | 1.80 | | 2.41 | | 4.31 | | 6.68 |
| | |
| |
| |
| |
| |
| |
| |
| |
|
- 1
- Average conventional crude oil and synthetic crude oil prices are after the impact of hedging activities.
- 2
- Average price includes natural gas, before the deduction of British Columbia gathering and processing charges, and conventional crude oil and field natural gas liquids in natural gas equivalent, after the impact of hedging activities.
- 3
- Includes the operating cost component of British Columbia gathering and processing fees.
- 4
- Portion of head office expenses allocated to production.
20 Petro-Canada Annual Information Form
Productive Wells
The following table summarizes Petro-Canada's Canadian wells capable of production.
PRODUCTIVE WELLS 1 AT DECEMBER 31, 2002
| | Crude Oil Wells
| | Natural Gas Wells
| | Total Wells
|
|---|
| | Gross 2
| | Net 3
| | Gross
| | Net
| | Gross
| | Net
|
|---|
|
| Western Canada – conventional oil and gas | | 540 | | 326 | | 3 028 | | 2 008 | | 3 568 | | 2 334 |
| East Coast Offshore – conventional oil and gas | | 23 | | 5 | | – | | – | | 23 | | 5 |
| Oil Sands – in situ bitumen recovery | | 25 | | 25 | | – | | – | | 25 | | 25 |
| | |
| |
| |
| |
| |
| |
|
| Total Productive Wells | | 588 | | 356 | | 3 028 | | 2 008 | | 3 616 | | 2 364 |
| | |
| |
| |
| |
| |
| |
|
- 1
- Wells with multiple completions are counted as one well.
- 2
- Gross wells are wells in which Petro-Canada owns a working interest.
- 3
- Net wells are the sum of the fractional working interests owned by Petro-Canada in gross wells, rounded to the nearest whole number.
Oil and Natural Gas Rights
Petro-Canada's oil and natural gas rights in the Upstream Canada segment, totalling 20.1 million gross (12.4 million net) acres, are summarized in the following table. Landholdings are subject to government regulation.
UPSTREAM CANADA OIL AND GAS RIGHTS AT DECEMBER 31, 2002
| | Developed Lands 1
| | Undeveloped Lands 1
| | Total
|
|---|
| | 2002
| | 2001
| | 2002
| | 2001
| | 2002
| | 2001
|
|---|
| | Gross 2
| | Net 2
| | Gross
| | Net
| | Gross
| | Net
| | Gross
| | Net
| | Gross
| | Net
| | Gross
| | Net
|
|---|
|
| | (millions of acres)
|
|---|
| Canada | | | | | | | | | | | | | | | | | | | | | | | | |
| | Mainland Canada | | 2.1 | | 1.0 | | 2.0 | | 1.0 | | 4.0 | | 2.8 | | 4.1 | | 2.5 | | 6.1 | | 3.8 | | 6.1 | | 3.5 |
| | Oil Sands | | 0.3 | | – | | – | | – | | 0.7 | | 0.3 | | 0.8 | | 0.3 | | 1.0 | | 0.3 | | 0.8 | | 0.3 |
| | East Coast Offshore | | 0.1 | | – | | 0.1 | | – | | 5.0 | | 1.7 | | 6.3 | | 2.4 | | 5.1 | | 1.7 | | 6.4 | | 2.4 |
| | Other Frontier 3 | | – | | – | | – | | – | | 7.5 | | 6.2 | | 7.5 | | 6.2 | | 7.5 | | 6.2 | | 7.5 | | 6.2 |
| Alaska | | – | | – | | – | | – | | 0.4 | | 0.4 | | 0.3 | | 0.3 | | 0.4 | | 0.4 | | 0.3 | | 0.3 |
| | |
| |
| |
| |
| |
| |
| |
| |
| |
| |
| |
| |
|
| Total | | 2.5 | | 1.0 | | 2.1 | | 1.0 | | 17.6 | | 11.4 | | 19.0 | | 11.7 | | 20.1 | | 12.4 | | 21.1 | | 12.7 |
| | |
| |
| |
| |
| |
| |
| |
| |
| |
| |
| |
| |
|
- 1
- Developed lands are areas capable of production while undeveloped lands are areas with rights to explore.
- 2
- Gross acres include the interest of others while net acres exclude the interest of others.
- 3
- Exploration is not currently permitted off the West Coast of Canada.
21 Petro-Canada Annual Information Form
Drilling Activity
The following table shows Petro-Canada's drilling activity in Canada during the years indicated.
WELLS DRILLED
| | Years Ended December 31,
|
|---|
| | 2002
| | 2001
| | 2000
| | 1999
| | 1998
|
|---|
| | Gross 1,2
| | Net 2,3
| | Gross
| | Net
| | Gross
| | Net
| | Gross
| | Net
| | Gross
| | Net
|
|---|
|
| Western Canada | | | | | | | | | | | | | | | | | | | | |
| Exploration Wells 4 | | | | | | | | | | | | | | | | | | | | |
| Oil | | – | | – | | 1 | | – | | 4 | | 1 | | 3 | | 2 | | 9 | | 1 |
| Natural Gas | | 10 | | 5 | | 28 | | 21 | | 52 | | 31 | | 38 | | 23 | | 25 | | 14 |
| Dry 5 | | 17 | | 12 | | 16 | | 12 | | 10 | | 2 | | 8 | | 3 | | 9 | | 5 |
| | |
| |
| |
| |
| |
| |
| |
| |
| |
| |
|
| | | 27 | | 17 | | 45 | | 33 | | 66 | | 34 | | 49 | | 28 | | 43 | | 20 |
| | |
| |
| |
| |
| |
| |
| |
| |
| |
| |
|
| Development Wells 6 | | | | | | | | | | | | | | | | | | | | |
| Oil | | 4 | | 4 | | 12 | | 11 | | 21 | | 18 | | 30 | | 8 | | 51 | | 28 |
| Natural Gas | | 337 | | 197 | | 326 | | 208 | | 181 | | 104 | | 126 | | 72 | | 162 | | 68 |
| Dry | | 10 | | 7 | | 11 | | 4 | | 7 | | 1 | | 14 | | 2 | | 12 | | 3 |
| | |
| |
| |
| |
| |
| |
| |
| |
| |
| |
|
| | | 351 | | 208 | | 349 | | 223 | | 209 | | 123 | | 170 | | 82 | | 225 | | 99 |
| | |
| |
| |
| |
| |
| |
| |
| |
| |
| |
|
| Oil Sands | | – | | – | | 50 | | 50 | | – | | – | | – | | – | | – | | – |
| | |
| |
| |
| |
| |
| |
| |
| |
| |
| |
|
| Total Western Canada | | 378 | | 225 | | 444 | | 306 | | 275 | | 157 | | 219 | | 110 | | 268 | | 119 |
| | |
| |
| |
| |
| |
| |
| |
| |
| |
| |
|
Offshore & Frontier Canada |
|
|
|
|
|
|
|
|
|
|
|
|
|
|
|
|
|
|
|
|
| Exploration & Development Wells | | | | | | | | | | | | | | | | | | | | |
| Oil | | 13 | | 3 | | 14 | | 4 | | 9 | | 2 | | 11 | | 2 | | 7 | | 1 |
| Natural Gas | | 1 | | 1 | | – | | – | | – | | – | | – | | – | | – | | – |
| Dry | | 5 | | 2 | | – | | – | | 3 | | 1 | | 2 | | 1 | | – | | – |
| | |
| |
| |
| |
| |
| |
| |
| |
| |
| |
|
| Total Offshore & Frontier Canada | | 19 | | 6 | | 14 | | 4 | | 12 | | 3 | | 13 | | 3 | | 7 | | 1 |
| | |
| |
| |
| |
| |
| |
| |
| |
| |
| |
|
| Total Wells Drilled | | 397 | | 231 | | 458 | | 310 | | 287 | | 160 | | 232 | | 113 | | 275 | | 120 |
| | |
| |
| |
| |
| |
| |
| |
| |
| |
| |
|
- 1
- Gross wells are wells, excluding all service wells, in which Petro-Canada owns a working interest.
- 2
- Gross wells include gross overriding royalty (GOR) wells, net wells exclude GOR wells.
- 3
- Net wells are the sum of the fractional working interests owned by Petro-Canada in gross wells, rounded to the nearest whole number.
- 4
- Exploration wells are wells drilled to find and produce oil or natural gas in an unproved area, to find a new reservoir or to extend the known boundaries of a previously discovered reservoir.
- 5
- A dry hole is an exploration or development well found to be incapable of producing either oil or natural gas in sufficient quantities to justify completion as an oil or natural gas well.
- 6
- Development wells are wells drilled in an oil or natural gas reservoir to the depth of a stratigraphic horizon known to be productive.
22 Petro-Canada Annual Information Form
Capital Expenditures on Property, Plant & Equipment and Exploration
The following table shows Petro-Canada's Upstream Canada capital expenditures on property, plant and equipment and exploration for the years indicated.
UPSTREAM CANADA CAPITAL AND EXPLORATION EXPENDITURES
| | Years Ended December 31,
|
|---|
| | 2002
| | 2001
| | 2000
| | 1999
| | 1998
|
|---|
|
| | (millions of dollars)
|
|---|
| North America Natural Gas | | 529 | | 554 | | 434 | | 314 | | 431 |
| East Coast Oil | | 290 | | 273 | | 340 | | 325 | | 245 |
| Oil Sands | | 462 | | 304 | | 110 | | 107 | | 70 |
| | |
| |
| |
| |
| |
|
| Total Upstream Canada Capital and Exploration Expenditures | | 1 281 | | 1 131 | | 884 | | 746 | | 746 |
| | |
| |
| |
| |
| |
|
The following table shows Petro-Canada's Upstream Canada expenditures on exploration, development, property acquisitions and other, by quarter for the years indicated.
UPSTREAM CANADA CAPITAL AND EXPLORATION EXPENDITURES BY QUARTER
| | 2002
| | 2001
|
|---|
| | Q4
| | Q3
| | Q2
| | Q1
| | Q4
| | Q3
| | Q2
| | Q1
|
|---|
|
| | (millions of dollars)
|
|---|
| Exploration | | 53 | | 72 | | 52 | | 131 | | 74 | | 60 | | 58 | | 110 |
| Development | | 283 | | 249 | | 229 | | 189 | | 289 | | 196 | | 175 | | 160 |
| Other | | 2 | | – | | – | | 1 | | 2 | | 2 | | 3 | | 2 |
| Property acquisitions | | – | | 1 | | 19 | | – | | – | | – | | – | | – |
| | |
| |
| |
| |
| |
| |
| |
| |
|
| Total | | 338 | | 322 | | 300 | | 321 | | 365 | | 258 | | 236 | | 272 |
| | |
| |
| |
| |
| |
| |
| |
| |
|
Petro-Canada's capital expenditure budget for Upstream Canada investments in 2003 is approximately $1 500 million. Planned investments in our North American Natural Gas business total $455 million and include the drilling of at least one exploration well in the Mackenzie Delta. Spending plans for Canada's East Coast include $140 million for ongoing Hibernia and Terra Nova drilling and development programs, $170 million for development of the White Rose project, and $40 million for two exploratory wells in the Flemish Pass. Anticipated investments in oil sands include about $255 million for the Company's share of Syncrude's planned expenditures and an estimated $415 million for other oil sands opportunities, including the proposed bitumen feed conversion project at the Edmonton refinery and the development of our planned Meadow Creek bitumen project. Final decisions on whether or not to go ahead with the feed conversion at the Edmonton refinery and the Meadow Creek project will remain pending until regulatory approval is received and until the implications of the Kyoto Protocol on project economics are made clear.
23 Petro-Canada Annual Information Form
Upstream International
Following the acquisition of international oil and gas interests in 2002, Petro-Canada established international operations as a core business unit. International operations are focused on three exploration and production regions: Northwest Europe, principally the North Sea; North Africa/Near East, where our previously modest positions in Algeria, Tunisia and Libya have been significantly expanded through the addition of new exploratory and producing interests in Syria, Libya and Kazakhstan; and Northern Latin America where we have interests in a major gas producing operation in Trinidad and a prospective development in Venezuela. Integration of the new oil and gas businesses acquired from Veba was essentially completed prior to 2002 year-end. Rights of first refusal were exercised by third parties with respect to Veba's assets in Norway and Egypt and a remaining right of first refusal with respect to Veba's heavy oil assets at Cerro Negro in Venezuela was unresolved at year-end.
The following table shows our estimates of Petro-Canada's international proved crude oil reserves before royalties and average daily production of crude oil before royalties by major fields.
INTERNATIONAL CRUDE OIL RESERVES AND PRODUCTION BY FIELD
Fields
| | Proved Reserves
Before Royalties 1
as at December 31, 2002
| | Per Cent of Total
Proved Reserves
| | Average 2002
Daily Production
Before Royalties 1,2
| | Per Cent of
Total 2002
Daily Production
|
|---|
|
| | (millions of barrels)
| |
| | (thousands of barrels)
| |
|
|---|
| Ghani/Zenad Farrud, Libya | | 54 | | 16 | | 9 | | 7 |
| Amal, Libya | | 53 | | 16 | | 10 | | 8 |
| Ghani Gir/Facha, Libya | | 22 | | 6 | | 3 | | 3 |
| Guillemot West and Northwest, U.K. | | 17 | | 5 | | 10 | | 8 |
| Omar, Syria | | 17 | | 5 | | 10 | | 8 |
| Scott, U.K. | | 16 | | 5 | | 5 | | 4 |
| Other | | 162 | | 47 | | 76 | | 62 |
| | |
| |
| |
| |
|
| Total | | 341 | | 100 | | 123 | | 100 |
| | |
| |
| |
| |
|
- 1
- The reserves and production shown in this table do not include natural gas liquids.
- 2
- Production from new projects and acquisitions has been averaged over the full year. Nearly all of this production was acquired effective May 2, 2002.
24 Petro-Canada Annual Information Form
The following table shows our estimates of Petro-Canada's international proved natural gas reserves before royalties and average daily production of natural gas before royalties by major fields.
INTERNATIONAL NATURAL GAS RESERVES AND PRODUCTION BY FIELD
Fields
| | Proved Reserves
Before Royalties
as at December 31, 2002
| | Per Cent of Total
Proved Reserves
| | Average 2002
Daily Production
Before Royalties 1
| | Per Cent of
Total 2002
Daily Production
|
|---|
|
| | (billions of cubic feet)
| |
| | (millions of cubic feet)
| |
|
|---|
| NCMA-1, Trinidad 2 | | 341 | | 59 | | 13 | | 13 |
| Guillemot West & Northwest, U.K. | | 70 | | 12 | | 14 | | 14 |
| Other | | 167 | | 29 | | 76 | | 73 |
| | |
| |
| |
| |
|
| Total | | 578 | | 100 | | 103 | | 100 |
| | |
| |
| |
| |
|
- 1
- Production from new projects and acquisitions has been averaged over the full year. All of this production was acquired effective May 2, 2002.
- 2
- Natural gas production from the North Coast Marine Area-1 (NCMA-1) project in Trinidad came on stream in the third quarter of 2002.
Northwest Europe
In Northwest Europe, all of Petro-Canada's production comes from the United Kingdom and the Netherlands sectors of the North Sea. Exploration programs extend into Denmark and the Faroe Islands. Our major focus is the North Sea, where extensive development has taken place since the early 1970's. While the basin is now a mature play, moderate-size fields continue to be developed and exploited.
In the U.K. sector, Petro-Canada has interests in three operated and 14 non-operated licences. We are focused on two areas: the Outer Moray Firth and Central North Sea. In the Outer Moray Firth, we hold a 20.6 per cent working interest in the Scott oil field and production platform and a 9.4 per cent working interest in the Telford oil field, a subsea tieback to the Scott platform. High quality crude oil from Scott and Telford is exported to shore via the Forties Pipeline System; associated gas is exported via the SAGE gas pipeline system. In Central North Sea, our interests are centered on the Triton development area. This is a joint development of the Petro-Canada operated Guillemot West and Northwest fields (Petro-Canada working interest – 80 per cent) and Bittern field (Petro-Canada working interest – 4.6 per cent). The development combines subsea technology with a central FPSO vessel. The fields are tied back to the Triton FPSO (Petro-Canada working interest – 30 per cent). The tie-back of the western extension of the Guillemot Northwest field was completed in 2002. Seven oilwells and one gas producer are currently in operation at the Guillemot West and Northwest fields. The high quality crude oil is shipped via shuttle tanker, while gas is exported through the SEGAL system. The Clapham field, with peak production of about 15 000 b/d, is expected to come on-stream in 2004.
In the Netherlands sector, we have interests in three operated and 20 non-operated licences. This portfolio encompasses interests in 17 producing gas fields spread out over eight offshore and two onshore production licences. The major source of gas production is from blocks L8b and L5c (Petro-Canada working interests – 25 per cent and 30 per cent, respectively). Petro-Canada also holds a 12 per cent interest in the BP-operated onshore Bergen gas storage facility. Petro-Canada's oil production from the Netherlands sector is primarily from the Petro-Canada operated Hanze field (Petro-Canada working interest – 45 per cent). At 2002 year end, development was underway on a gas discovery on block L5b (Petro-Canada working interest – 30 per cent). Project production will be from two wells to be connected to the existing production platform on the L8-P4 field (Petro-Canada working interest – 28.3 per cent). Production is expected to be on-stream in the first quarter of 2004.
In the U.K. and Netherlands sectors of the North Sea, our strategy is infrastructure-centred with the focus on low-risk drilling prospects and undeveloped discoveries that can be brought into production rapidly. In Danish waters we hold interests in four non-operated licences. In the Faroe/West Shetlands area we have interests in two non-operated licences.
25 Petro-Canada Annual Information Form
North Africa/Near East
Combining North Africa, Syria and Kazakhstan, this core region provides a substantial portion of Petro-Canada's international production. Improved oil recovery opportunities in Libya (the Amal and Ghani/Zenad Farrud fields) and Syria (over 30 fields) exist, in addition to exploration opportunities.
In Syria, Petro-Canada's interests are consolidated under production sharing contracts with Syria Shell Petroleum Development and the Syrian Petroleum Company. The joint venture, under the name Al Furat Petroleum Company (AFPC), produces about 55 per cent of Syrian production. AFPC produces oil and gas from 36 fields with 220 wells over three concession areas. Petro-Canada's working interests range from 33 to 37 per cent. The near term goal of AFPC is to sustain gross production at the 300 000 b/d level for the next few years through improved recovery from existing fields. Oil produced by the joint venture is exported via the Scot pipeline to the Banias terminal. The natural gas production is sold into the Syrian domestic system.
In Libya, Petro-Canada is one of the country's largest producers. Our major interest in Libya is a 49 per cent participating interest in a joint venture with the National Oil Corporation of Libya (NOC). Operation of the joint venture encompasses our exploration and producing interests in eight concessions, covering 25 190 square kilometres. Petro-Canada also has equity interests in the Ras Lanuf export terminal and various pipelines. Most of the concessions are onshore in the Sirte basin. Currently, production from the joint venture is from the combined operations of more than 20 fields.
Under a separate Exploration and Production Sharing Agreement (EPSA) with NOC, Petro-Canada also holds an interest in the 2.4 million-acre En Naga block, which is also located in Sirte basin and contains the En Naga North and En Naga West oil fields, as well as exploration acreage. Development of the two fields, including construction of a related 96-kilometre pipeline to the Samah field, was nearing completion at 2002 year-end. Initial production from the project (Petro-Canada working interest – 50 per cent) is expected to come on-stream at a rate of 6 800 b/d (3 400 b/d net to Petro-Canada) in 2003. Libyan production is high quality, low sulphur (sweet) crude oil. The country is a major oil exporter, particularly to Europe. Libya is a member country in the Organization of the Petroleum Exporting Countries (OPEC). As such, production in that country may be constrained from time to time by OPEC quotas.
In Algeria, Petro-Canada and Sonatrach, the Algerian national oil company, are parties to a production sharing agreement for the exploration and development of the Tinrhert block, located over 1,000 kilometres southeast of Algiers. Petro-Canada acts as the operator of this project. We have a 70 per cent interest in the Tamadanet oil field, located on the Tinrhert block, with Sonatrach holding the remaining 30 per cent. In 2002, our total share of production before royalty and the sharing of profit oil averaged 1 600 b/d, down from 2 300 b/d in 2001 due to natural decline. An exploration well that was drilled and abandoned in 2002 completed our drilling obligations under the second phase of the production sharing contract.
In Tunisia we have an agreement with the Tunisian national oil company, ETAP, to explore jointly on the 1.8 million acre Tataouine Block in south central Tunisia. In 2000, we elected to proceed with the exploration licence phase of the agreement. Our drilling plans are pending the results of ongoing seismic evaluation.
In Kazakhstan, we have a 40 per cent working interest in the Temir production sharing contract, with modest production from temporary facilities in the Saigak oil field operated by Maersk Oil Kazakhstan. On completion of a central production facility early in 2003, we expect production from the Saigak field to increase to 12 000 b/d (4 800 b/d net to Petro-Canada).
Northern Latin America
In Northern Latin America, Petro-Canada's operations are focused on Trinidad where we hold a 17.3 per cent working interest in the North Coast Marine Area-1 gas project in partnership with the operator, British Gas. Our participation is governed by a production-sharing contract. The current program includes development of three gas fields – Hibiscus, Poinsettia and Chaconia. Commissioning of the Hibiscus production platform was completed in August. Natural gas production came on stream in the third quarter of 2002, with our share averaging 32 mmcf/d over the remaining months of the year. Project production is being delivered by pipeline to the Atlantic LNG facility at Point Fortin for liquefaction and subsequent sale into United States markets. Atlantic LNG is currently building an additional production train, which is expected to be on stream in mid 2003. As a result of this expansion we expect our share of production to increase to 60 mmcf/d.
Late in 2002, Petro-Canada completed the acquisition from Veba of a 50 per cent working interest in the La Ceiba block that straddles the eastern shores of Lake Maracaibo in western Venezuela. While a 30 per cent interest in this block formed part
26 Petro-Canada Annual Information Form
of the original Veba acquisition, the asset was excluded pending resolution of pre-emptive rights. In the interim, Veba, with Petro-Canada's consent, acquired an additional 20 per cent interest from a third party. Commercial development of hydrocarbon resources discovered on the block continues to be evaluated. A remaining right of first refusal concerning Veba's Cerro Negro heavy oil operations in Venezuela was unresolved at year-end.
Reserves
The following table shows, for the years indicated, our estimates of proved developed and undeveloped reserves, after and before deduction of royalties, for each of conventional crude oil and natural gas liquids, and natural gas in Petro-Canada's Upstream International segment.
INTERNATIONAL PROVED RESERVES
| | Northwest Europe 1
| | North Africa/ Near East 2
| | Northern Latin America 3
| | Total
| |
|---|
| | Crude Oil & NGL
| | Natural Gas 4
| | Crude Oil & NGL
| | Natural Gas
| | Crude Oil & NGL
| | Natural Gas
| | Crude Oil & NGL
| | Natural Gas
| |
|---|
| |
| | (mmbbls)
| | (bcf)
| | (mmbbls)
| | (bcf)
| | (mmbbls)
| | (bcf)
| | (mmbbls)
| | (bcf)
| |
|---|
| PROVED DEVELOPED AND UNDEVELOPED RESERVES AFTER ROYALTIES 5,6 | | | | | | | | | | | | | | | | | |
| Beginning of year 2000 | | 10 | | 9 | | 3 | | – | | – | | – | | 13 | | 9 | |
| Revisions of previous estimates 7 | | (3 | ) | – | | – | | – | | – | | – | | (3 | ) | – | |
| Purchase/(sale) of reserves in place | | (10 | ) | (8 | ) | – | | – | | – | | – | | (10 | ) | (8 | ) |
| Discoveries, extensions and improved recovery | | 6 | | – | | – | | – | | – | | – | | 6 | | – | |
| Production | | (3 | ) | (1 | ) | (1 | ) | – | | – | | – | | (4 | ) | (1 | ) |
| | |
| |
| |
| |
| |
| |
| |
| |
| |
| End of year 2000 | | – | | – | | 2 | | – | | – | | – | | 2 | | – | |
| Revisions of previous estimates | | – | | – | | – | | – | | – | | – | | – | | – | |
| Purchase/(sale) of reserves in place | | – | | – | | 6 | | – | | – | | – | | 6 | | – | |
| Discoveries, extensions and improved recovery | | – | | – | | – | | – | | – | | – | | – | | – | |
| Production | | – | | – | | (1 | ) | – | | – | | – | | (1 | ) | – | |
| | |
| |
| |
| |
| |
| |
| |
| |
| |
| End of year 2001 | | – | | – | | 7 | | – | | – | | – | | 7 | | – | |
| Revisions of previous estimates | | 3 | | 10 | | 24 | | 3 | | – | | – | | 27 | | 13 | |
| Purchase/(sale) of reserves in place | �� | 59 | | 150 | | 170 | | 19 | | – | | 292 | | 229 | | 461 | |
| Discoveries, extensions and improved recovery | | 10 | | 22 | | – | | – | | – | | – | | 10 | | 22 | |
| Production | | (10 | ) | (22 | ) | (18 | ) | (3 | ) | – | | (5 | ) | (28 | ) | (30 | ) |
| | |
| |
| |
| |
| |
| |
| |
| |
| |
| End of year 2002 | | 62 | | 160 | | 183 | | 19 | | –
| | 287 | | 245 | | 466 | |
| | |
| |
| |
| |
| |
| |
| |
| |
| |
| PROVED DEVELOPED RESERVES AFTER ROYALTIES 5,6 | | | | | | | | | | | | | | | | | |
| End of year 2000 | | – | | – | | 2 | | – | | – | | – | | 2 | | – | |
| End of year 2001 | | – | | – | | 1 | | – | | – | | – | | 1 | | – | |
| End of year 2002 | | 52 | | 138 | | 151 | | 19 | | – | | 56 | | 203 | | 213 | |
| PROVED DEVELOPED AND UNDEVELOPED RESERVES BEFORE ROYALTIES 5,8 | | | | | | | | | | | | | | | | | |
| End of year 2000 | | – | | – | | 2 | | – | | – | | – | | 2 | | – | |
| End of year 2001 | | – | | – | | 11 | | – | | – | | – | | 11 | | – | |
| End of year 2002 | | 62 | | 160 | | 289 | | 77 | | – | | 341 | | 351 | | 578 | |
- 1
- Reserves in Northwest Europe are subject to a conventional royalty and tax regime. No royalty is payable on reserves in the U.K. sector. Royalty is payable on onshore reserves in the Netherlands.
27 Petro-Canada Annual Information Form
- 2
- Reserves in Syria and Kazakhstan are held under production sharing arrangements with the governments. The State share is split between royalty and tax for Canadian reporting purposes. With the exception of the En Naga field, reserves in Libya are held under a concession and are subject to a royalty and tax regime. The En Naga field is held under a production sharing arrangement, with the government's share being split between royalty and tax for Canadian reporting purposes. Reserves in Algeria are held under a production sharing arrangement with the government. The State share is split between royalty and tax for Canadian reporting purposes.
- 3
- Natural gas reserves in Trinidad are held under a production sharing arrangement with the government. The State share is split between royalty and tax for Canadian reporting purposes.
- 4
- Natural gas reserves reflect marketable (not raw) quantities.
- 5
- Proved reserves are the estimated quantities of crude oil, natural gas and natural gas liquids which geological and engineering data demonstrate with reasonable certainty to be recoverable in future years from known reservoirs under existing economic and operating conditions. Proved developed reserves are those proved reserves that are expected to be recovered from existing wells or facilities. Proved undeveloped reserves are proved reserves which are not recoverable from existing wells or facilities, but which are expected to be recovered through additional development drilling or through the upgrading of existing or additional new facilities.
- 6
- Proved developed and undeveloped reserves after royalties are Petro-Canada's working interest in reserves after the deduction of royalties.
- 7
- Revisions include changes in previous estimates, either upward or downward, resulting from new information (except an increase in acreage) normally obtained from drilling or production history or resulting from a change in economic factors. Revisions also include movements of reserves between classes as a result of development activity, e.g., from proved undeveloped reserves to proved developed reserves as a result of the drilling and completion of a well.
- 8
- Proved developed and undeveloped reserves before royalties are Petro-Canada's working interest in reserves before the deduction of royalties.
We believe the reserve quantities are reasonable estimates consistent with current knowledge of the characteristics and extent of the productive formations, but such estimates are subject to upward or downward revisions as additional information regarding producing fields becomes available, as technology improves and as economic conditions change.
Production and Prices
The following table shows Petro-Canada's average daily international production of conventional crude oil, natural gas liquids and natural gas, before and after royalties for the years indicated.
AVERAGE INTERNATIONAL PRODUCTION1
| | Years Ended December 31,
|
|---|
| | 2002 2
| | 2001
| | 2000
| | 1999
| | 1998
|
|---|
| | Gross 3
| | Net 4
| | Gross
| | Net
| | Gross
| | Net
| | Gross
| | Net
| | Gross
| | Net
|
|---|
|
| Crude Oil & NGL (thousands of barrels) | | | | | | | | | | | | | | | | | | | | |
| North Africa/Near East | | 98.4 | | 48.1 | | 2.3 | | 1.5 | | 3.7 | | 3.0 | | 4.5 | | 3.6 | | 4.5 | | 3.6 |
| Northwest Europe 5 | | 27.1 | | 27.1 | | – | | – | | 8.9 | | 8.9 | | 7.7 | | 7.7 | | 7.4 | | 7.4 |
| | |
| |
| |
| |
| |
| |
| |
| |
| |
| |
|
| Total Crude Oil & NGL | | 125.5 | | 75.2 | | 2.3 | | 1.5 | | 12.6 | | 11.9 | | 12.2 | | 11.3 | | 11.9 | | 11.0 |
| | |
| |
| |
| |
| |
| |
| |
| |
| |
| |
|
| Natural Gas (millions of cubic feet) 6 | | | | | | | | | | | | | | | | | | | | |
| Northwest Europe | | 60.1 | | 60.1 | | – | | – | | – | | – | | – | | – | | – | | – |
| North Africa/Near East | | 29.6 | | 7.4 | | – | | – | | – | | – | | – | | – | | – | | – |
| Northern Latin America | | 13.5 | | 13.2 | | – | | – | | – | | – | | – | | – | | – | | – |
| | |
| |
| |
| |
| |
| |
| |
| |
| |
| |
|
| Total Natural Gas | | 103.2 | | 80.7 | | – | | – | | – | | – | | – | | – | | – | | – |
| | |
| |
| |
| |
| |
| |
| |
| |
| |
| |
|
- 1
- Production from new projects and acquisitions has been averaged over the full year.
- 2
- Nearly all of this production was acquired effective May 2, 2002.
- 3
- Gross production represents Petro-Canada's working interest before the deduction of royalties.
28 Petro-Canada Annual Information Form
- 4
- Net production is gross production less royalties.
- 5
- Petro-Canada sold its Norwegian interests in 2000.
- 6
- These volumes do not include natural gas produced for use in miscible flood schemes or natural gas purchased from third parties for resale.
The following table shows Petro-Canada's average daily international production of conventional crude oil, natural gas liquids and natural gas, before the deduction of royalties, by quarter for the years indicated.
AVERAGE DAILY GROSS INTERNATIONAL PRODUCTION 1 BY QUARTER
| | 2002
Three Months Ended
| | 2001
Three Months Ended
|
|---|
| | Dec. 31
| | Sept. 30
| | June 30
| | Mar. 31
| | Dec. 31
| | Sept. 30
| | June 30
| | Mar. 31
|
|---|
|
| Crude Oil & NGL (thousands of barrels) | | | | | | | | | | | | | | | | |
| North Africa/Near East | | 146.3 | | 145.8 | | 92.7 | | 1.8 | | 2.2 | | 2.4 | | 2.3 | | 2.1 |
| Northwest Europe | | 39.5 | | 43.9 | | 25.6 | | – | | – | | – | | – | | – |
| | |
| |
| |
| |
| |
| |
| |
| |
|
| Total Crude Oil & NGLs | | 185.8 | | 189.7 | | 118.3 | | 1.8 | | 2.2 | | 2.4 | | 2.3 | | 2.1 |
| | |
| |
| |
| |
| |
| |
| |
| |
|
| Natural Gas (millions of cubic feet) | | | | | | | | | | | | | | | | |
| Northwest Europe | | 88.5 | | 89.5 | | 59.5 | | – | | – | | – | | – | | – |
| North Africa/Near East | | 35.7 | | 46.1 | | 35.0 | | – | | – | | – | | – | | – |
| Northern Latin America | | 41.0 | | 18.6 | | – | | – | | – | | – | | – | | – |
| | |
| |
| |
| |
| |
| |
| |
| |
|
| Total Natural Gas | | 165.2 | | 154.2 | | 94.5 | | – | | – | | – | | – | | – |
| | |
| |
| |
| |
| |
| |
| |
| |
|
- 1
- Petro-Canada's working interest production before the deduction of royalties.
The following table shows, for the five years ended December 31, 2002, the average sale prices realized for conventional crude oil and field natural gas liquids, and natural gas production in Petro-Canada's Upstream International segment.
AVERAGE PRICES
| | 2002
| | 2001
| | 2000
| | 1999
| | 1998
|
|---|
|
| Crude Oil and Natural Gas Liquids Sale Price (dollars per barrel) | | 39.53 | | 37.62 | | 41.96 | | 24.92 | | 17.17 |
| Natural Gas Sale Price (dollars per thousand cubic feet) | | 4.52 | | – | | – | | – | | – |
29 Petro-Canada Annual Information Form
The following table shows Petro-Canada's Upstream International average netbacks for crude oil and natural gas on a barrel of oil equivalent basis in Northwest Europe and North Africa/Near East, and for natural gas in Northern Latin America for the year ended December 31, 2002.
INTERNATIONAL NETBACKS
| | Northwest Europe
| | North Africa/Near East
| | Northern Latin America
|
|---|
| | 2002
| | 2002
| | 2002
|
|---|
|
| | (dollars per boe)
| | (dollars per boe)
| | (dollars per mcf)
|
|---|
| Average Price Received | | 38.41 | | 38.73 | | 3.68 |
| Royalties | | – | | 19.79 | | 0.07 |
| | |
| |
| |
|
| Net Revenues | | 38.41 | | 18.94 | | 3.61 |
| Operating Expense | | 7.19 | | 4.18 | | 0.48 |
| | |
| |
| |
|
| Netback | | 31.22 | | 14.76 | | 3.13 |
| Overhead Expenses (G&A) | | 0.89 | | 0.22 | | 0.21 |
| | |
| |
| |
|
| Netback after Overhead | | 30.33 | | 14.54 | | 2.92 |
| | |
| |
| |
|
Productive Wells
The following table summarizes wells capable of production in Petro-Canada's Upstream International segment.
INTERNATIONAL PRODUCTIVE WELLS 1 AT DECEMBER 31, 2002
| | Crude Oil Wells
| | Natural Gas Wells
| | Total Wells
|
|---|
| | Gross 2
| | Net 3
| | Gross
| | Net
| | Gross
| | Net
|
|---|
|
| Northwest Europe | | 34 | | 10 | | 52 | | 8 | | 86 | | 18 |
| North Africa/Near East | | 451 | | 182 | | – | | – | | 451 | | 182 |
| Northern Latin America | | – | | – | | 4 | | 1 | | 4 | | 1 |
| | |
| |
| |
| |
| |
| |
|
| Total Productive Wells | | 485 | | 192 | | 56 | | 9 | | 541 | | 201 |
| | |
| |
| |
| |
| |
| |
|
- 1
- Wells with multiple completions are counted as one well.
- 2
- Gross wells are wells in which Petro-Canada owns a working interest.
- 3
- Net wells are the sum of the fractional working interests owned by Petro-Canada in gross wells, rounded to the nearest whole number.
30 Petro-Canada Annual Information Form
Oil and Natural Gas Rights
Petro-Canada's Upstream International oil and natural gas rights, totalling 12.9 million gross (7.2 million net) acres, are summarized in the following table. Landholdings are subject to government regulation.
INTERNATIONAL OIL AND GAS RIGHTS AT DECEMBER 31, 2002
| | Developed Lands 1
| | Undeveloped Lands 1
| | Total
|
|---|
| | 2002
| | 2001
| | 2002
| | 2001
| | 2002
| | 2001
|
|---|
| | Gross 2
| | Net 2
| | Gross
| | Net
| | Gross
| | Net
| | Gross
| | Net
| | Gross
| | Net
| | Gross
| | Net
|
|---|
|
| | (millions of acres)
|
|---|
| North Africa/Near East | | 0.9 | | 0.3 | | – | | – | | 9.2 | | 6.1 | | 5.7 | | 5.7 | | 10.1 | | 6.4 | | 5.7 | | 5.7 |
| Northwest Europe | | 0.1 | | 0.1 | | – | | – | | 2.5 | | 0.6 | | – | | – | | 2.6 | | 0.7 | | – | | – |
| Northern Latin America | | – | | – | | – | | – | | 0.2 | | 0.1 | | – | | – | | 0.2 | | 0.1 | | – | | – |
| | |
| |
| |
| |
| |
| |
| |
| |
| |
| |
| |
| |
|
| Total International | | 1.0 | | 0.4 | | – | | – | | 11.9 | | 6.8 | | 5.7 | | 5.7 | | 12.9 | | 7.2 | | 5.7 | | 5.7 |
| | |
| |
| |
| |
| |
| |
| |
| |
| |
| |
| |
| |
|
- 1
- Developed lands are areas capable of production while undeveloped lands are areas with rights to explore.
- 2
- Gross acres include the interest of others while net acres exclude the interest of others.
Drilling Activity
The following table shows Petro-Canada's Upstream International drilling activity during the years indicated.
EXPLORATION AND DEVELOPMENT WELLS 1 DRILLED IN UPSTREAM INTERNATIONAL
| | Years Ended December 31,
|
|---|
| | 2002
| | 2001
| | 2000
| | 1999
| | 1998
|
|---|
| | Gross 2,3
| | Net 3,4
| | Gross
| | Net
| | Gross
| | Net
| | Gross
| | Net
| | Gross
| | Net
|
|---|
|
| Northwest Europe | | | | | | | | | | | | | | | | | | | | |
| Oil | | 8 | | 5 | | – | | – | | – | | – | | – | | – | | – | | – |
| Natural Gas | | 1 | | – | | – | | – | | – | | – | | – | | – | | – | | – |
| Dry 5 | | 3 | | 1 | | – | | – | | – | | – | | – | | – | | – | | – |
| | |
| |
| |
| |
| |
| |
| |
| |
| |
| |
|
| | | 12 | | 6 | | – | | – | | – | | – | | – | | – | | – | | – |
| | |
| |
| |
| |
| |
| |
| |
| |
| |
| |
|
| North Africa/Near East | | | | | | | | | | | | | | | | | | | | |
| Oil | | 31 | | 12 | | 3 | | 1 | | 7 | | – | | 7 | | 1 | | 9 | | 3 |
| Natural Gas | | – | | – | | – | | – | | 1 | | – | | – | | – | | 1 | | 1 |
| Dry | | 6 | | 3 | | – | | – | | 3 | | 2 | | 2 | | 2 | | 2 | | 1 |
| | |
| |
| |
| |
| |
| |
| |
| |
| |
| |
|
| | | 37 | | 15 | | 3 | | 1 | | 11 | | 2 | | 9 | | 3 | | 12 | | 5 |
| | |
| |
| |
| |
| |
| |
| |
| |
| |
| |
|
| Northern Latin America | | | | | | | | | | | | | | | | | | | | |
| Natural Gas | | 4 | | 1 | | – | | – | | – | | – | | – | | – | | – | | – |
| | |
| |
| |
| |
| |
| |
| |
| |
| |
| |
|
| Total Wells Drilled | | 53 | | 22 | | 3 | | 1 | | 11 | | 2 | | 9 | | 3 | | 12 | | 5 |
| | |
| |
| |
| |
| |
| |
| |
| |
| |
| |
|
- 1
- Exploration wells are wells drilled to find and produce oil or natural gas in an unproved area, to find a new reservoir or to extend the known boundaries of a previously discovered reservoir. Development wells are wells drilled in an oil or natural gas reservoir to the depth of a stratigraphic horizon known to be productive.
- 2
- Gross wells are wells, excluding all service wells, in which Petro-Canada owns a working interest.
31 Petro-Canada Annual Information Form
- 3
- Gross wells include gross overriding royalty (GOR) wells, net wells exclude GOR wells.
- 4
- Net wells are the sum of the fractional working interests owned by Petro-Canada in gross wells, rounded to the nearest whole number.
- 5
- A dry hole is an exploration or development well found to be incapable of producing either oil or natural gas in sufficient quantities to justify completion as an oil or natural gas well.
Capital Expenditures on Property, Plant & Equipment and Exploration
The following table shows Petro-Canada's Upstream International capital expenditures on property, plant and equipment and exploration for the years indicated.
UPSTREAM INTERNATIONAL CAPITAL AND EXPLORATION EXPENDITURES
| | Years Ended December 31,
|
|---|
| | 2002
| | 2001
| | 2000
| | 1999
| | 1998
|
|---|
|
| | (millions of dollars)
|
|---|
| Northwest Europe | | 93 | | – | | 23 | | 19 | | 22 |
| North Africa/Near East | | 108 | | 153 | | 20 | | 28 | | 50 |
| Northern Latin America | | 20 | | – | | – | | – | | – |
| | |
| |
| |
| |
| |
|
| Total Capital and Exploration Expenditures | | 221 | | 153 | | 43 | | 47 | | 72 |
| | |
| |
| |
| |
| |
|
The following table shows Petro-Canada's Upstream International expenditures on exploration, development, property acquisitions and other, by quarter for the years indicated.
UPSTREAM INTERNATIONAL CAPITAL AND EXPLORATION EXPENDITURES BY QUARTER
| | 2002
| | 2001
|
|---|
| | Q4
| | Q3
| | Q2
| | Q1
| | Q4
| | Q3
| | Q2
| | Q1
|
|---|
|
| | (millions of dollars)
|
|---|
| Exploration | | 17 | | 28 | | 10 | | 6 | | 5 | | 3 | | 3 | | 5 |
| Development | | 70 | | 42 | | 38 | | 10 | | 16 | | – | | – | | – |
| Property acquisitions | | – | | – | | – | | – | | (7 | ) | 128 | | – | | – |
| | |
| |
| |
| |
| |
| |
| |
| |
|
| Total | | 87 | | 70 | | 48 | | 16 | | 14 | | 131 | | 3 | | 5 |
| | |
| |
| |
| |
| |
| |
| |
| |
|
Petro-Canada's capital expenditure budget for Upstream International for 2003 provides for estimated spending of $545 million, including $260 million to sustain existing production, $190 million for new developments, including the Clapham project in the North Sea, and $95 million on exploration opportunities.
Downstream
In the Downstream, Petro-Canada transports, refines, markets and distributes petroleum products and related goods and services. Petro-Canada is the second largest petroleum refining and marketing company in Canada.
Operating functions include Refining and Supply, Sales and Marketing and Lubricants. In addition, Integration and Planning provides support to the operating units in the areas of planning, administration, business processes and business development.
32 Petro-Canada Annual Information Form
Refining and Supply
Petro-Canada owns and operates three refineries, strategically located in Montreal, Quebec; Oakville, Ontario; and Edmonton, Alberta. With a total rated capacity of approximately 49 800 cubic metres (313 000 barrels) per day, these refineries represent the second largest refining capacity in Canada with approximately 17 per cent of the Canadian refining industry's total operating capacity. Petro-Canada's refineries produce a full range of refined petroleum products, including gasolines, diesel oils, heating oils, aviation fuels, heavy fuel oils, asphalts, petrochemicals and feedstocks for lubricants.
The following table shows the daily rated capacity of our refineries at December 31, 2002 and the approximate average daily volumes of crude oil processed, including volumes processed by Petro-Canada for other companies, for the years indicated. The overall utilization rate at our three refineries averaged 101 per cent in 2002.
RATED CAPACITY OF REFINERIES AND AVERAGE DAILY CRUDE OIL PROCESSED
| | Average Volumes of Crude Oil
Processed per Calendar Day
| | Daily Rated Capacity 1
|
|---|
| | Years Ended December 31,
| |
|
|---|
| | As at
December 31, 2002
|
|---|
Refinery Location
| | 2002
| | 2001
| | 2000
| | 1999
| | 1998
|
|---|
|
| | (thousands of cubic metres)
|
|---|
| Edmonton, Alberta | | 20.9 | | 17.8 | | 19.9 | | 19.7 | | 17.2 | | 19.9 |
| Montreal, Quebec | | 16.1 | | 16.0 | | 16.6 | | 16.4 | | 15.8 | | 16.7 |
| Oakville, Ontario | | 13.4 | | 13.9 | | 13.8 | | 12.8 | | 13.6 | | 13.2 |
| | |
| |
| |
| |
| |
| |
|
| Total | | 50.4 | | 47.7 | | 50.3 | | 48.9 | | 46.6 | | 49.8 |
| | |
| |
| |
| |
| |
| |
|
- 1
- Daily rated capacity is based on calendar days and definite specifications as to types of crude oil, the products to be obtained and the refinery processes required. Variations in these factors may result in actual capacity being higher or lower than rated capacities.
Edmonton Refinery
The Edmonton refinery is Petro-Canada's largest and most efficient refinery, producing a high yield of light oils. The Edmonton refinery can use synthetic crude oil for up to 40 per cent of its feedstock. Synthetic crude oil produces a higher yield of gasoline and middle distillates than conventional crude oil. All of the Edmonton refinery's feedstock is domestic crude oil.
Our longer-term plans include linking our expanding bitumen production in Alberta with processing at our Edmonton refinery. (Additional information on these plans is provided under Oil Sands in the Upstream Review and Outlook section of Management's Discussion and Analysis)
Montreal Refinery
The Montreal refinery, supplied with imported crude oil primarily through the Portland-Montreal pipeline, has a flexible configuration allowing it to process a variety of crude oils, including heavy grades, and intermediate feedstocks. The refinery produces gasolines, distillates, asphalts, petrochemicals, lubricant feedstocks and solvents.
Oakville Refinery
The Oakville refinery is supplied with both domestic and imported crude oil. A variety of domestic crude oil types are supplied through the Enbridge pipeline system. Since May 1999, offshore light crude oil is supplied via the Portland-Montreal pipeline, through Montreal and the Enbridge Line 9. The refinery produces a wide range of products including gasolines, distillates, asphalts and lubricant feedstocks for Petro-Canada's lubricants plant.
33 Petro-Canada Annual Information Form
Supply
Petro-Canada purchases crude oil and other refinery feedstocks from Canadian and international sources under a number of different contractual arrangements. The Downstream is responsible for arranging domestic and foreign crude supply for our refineries. There is a well-developed infrastructure for third party supply of both domestic and imported crudes to markets in North America. Purchases are generally through short-term renewable contracts. Petro-Canada is not dependent on any single source of supply for conventional crude oil and does not anticipate any difficulty in obtaining an adequate supply in the foreseeable future.
Distribution
Petro-Canada operates an extensive distribution network, utilizing pipeline, road, rail and marine transportation, to deliver refined products to retail outlets, and commercial and industrial customers. We hold interests in two refined product pipelines and operate 12 major refined product terminals across Canada.
Distribution efficiencies are achieved through refined product exchange, purchase, sale and short-term storage arrangements with other petroleum companies. These arrangements reduce capital and transportation costs, assist in the maintenance of supply to customers and enable us to participate in geographical areas without the need to invest capital in distribution facilities. Applicable agreements contain appropriate provisions for consistent product quality to be maintained for our customers.
Sales and Marketing
Petro-Canada is the second largest marketer of petroleum products in Canada. In 2002 Petro-Canada's petroleum product sales represented approximately 17 per cent of total petroleum products sold in Canada. Petro-Canada markets a full range of petroleum products including gasolines, diesel oils, heating oils, aviation fuels, heavy fuel oils, asphalts, lubricants, petrochemical feedstocks and liquefied petroleum gases. Petro-Canada also generates non-petroleum revenue from convenience stores, car washes and automotive repair and maintenance services.
The following table shows the approximate average daily volumes of petroleum products sold during the years indicated.
AVERAGE DAILY SALES OF PETROLEUM PRODUCTS
| | Years Ended December 31,
|
|---|
| | 2002
| | 2001
| | 2000
| | 1999
| | 1998
|
|---|
|
| | (thousands of cubic metres per day)
|
|---|
| Gasoline 1 | | 25.9 | | 24.6 | | 24.3 | | 22.8 | | 21.7 |
| Middle distillates 2 | | 19.3 | | 19.2 | | 20.0 | | 18.7 | | 17.1 |
| Other 3 | | 10.5 | | 10.7 | | 11.1 | | 9.7 | | 10.3 |
| | |
| |
| |
| |
| |
|
| Total | | 55.7 | | 54.5 | | 55.4 | | 51.2 | | 49.1 |
| | |
| |
| |
| |
| |
|
- 1
- Includes motor and aviation gasolines.
- 2
- Includes diesel oils, heating oils and aviation jet fuels.
- 3
- Includes heavy fuel oils, asphalts, lubricants, liquefied petroleum gases, petrochemical feedstocks and other petroleum products.
34 Petro-Canada Annual Information Form
The following table shows the annual revenues derived from refining and marketing activities during the years indicated.
REFINING AND MARKETING REVENUES
| | Years Ended December 31,
|
|---|
| | 2002
| | 2001
| | 2000
| | 1999
| | 1998
|
|---|
|
| | (millions of dollars)
|
|---|
| Gasoline 1 | | 3 439 | | 3 299 | | 3 471 | | 2 284 | | 1 818 |
| Middle distillates 2 | | 2 311 | | 2 432 | | 2 704 | | 1 594 | | 1 260 |
| Other 3 | | 1 571 | | 1 433 | | 1 613 | | 1 111 | | 990 |
| | |
| |
| |
| |
| |
|
| Total | | 7 321 | | 7 164 | | 7 788 | | 4 989 | | 4 068 |
| | |
| |
| |
| |
| |
|
- 1
- Includes motor and aviation gasolines.
- 2
- Includes diesel oils, heating oils and aviation jet fuels.
- 3
- Includes heavy fuel oils, asphalts, lubricants, liquefied petroleum feedstocks and other petroleum and non-petroleum products.
Retail
At December 31, 2002, Petro-Canada's network of retail sites consisted of 1 537 outlets across Canada, of which 903 are Company-controlled with the others operated by third parties. Independent dealers and agents operate virtually all of the outlets.
Wholesale and Refinery Sales
Petro-Canada sells petroleum products into the farm, home heating, paving, small industrial, commercial and truck markets. This category accounts for approximately 65 per cent of total Downstream sales volumes. Petro-Canada has the largest network of fueling centres to serve the trucking market in Canada, with 208 Petro-Pass sites.
We also sell large volumes of petroleum products directly to large industrial and commercial customers and independent marketers. Asphalt, a key product for Petro-Canada, allows us to leverage our heavy crude capability at our Oakville and Montreal refineries. Asphalt total sales volume in 2002 was approximately 1.6 billion litres.
Lubricants
The Lubricants Centre, located in Mississauga, Ontario, produces specialty lubricants and waxes that we market in Canada and internationally. Petro-Canada is the largest producer of lube base stocks in Canada with annual base oil production capacity in excess of 700 million litres, and the largest producer of white oils in the world.
The lubricants plant utilizes a two-stage hydro-treating process, which is unique in Canada. This process enables Petro-Canada to refine gas oils produced from a wide range of crude feedstocks into lubricating oil base stocks with the highest level of purity of any base stocks in Canada. Advancing lubricant technology and environmental concerns continue to increase the demand for high purity, hydro-treated base stocks for many lubricant applications, and Petro-Canada is well positioned to meet this growing demand.
Our strategy is focused on leveraging technological and quality advantages by growing volume in high-margin channels. Products in this high-margin category include pharmaceutical grade white oils, high viscosity index oils for use in high-end industrial applications, next-generation engine oils and transmission fluids. In 2002, high-margin sales accounted for over 60 per cent of total lubricant sales. Petro-Canada currently sells over two-thirds of its manufactured lubricants outside of Canada, and the growing global demand for these higher quality products offers significant opportunity for long-term growth.
35 Petro-Canada Annual Information Form
Pipelines
Petro-Canada complements its production, extracting and refining operations with ownership in several crude oil and refined product pipelines. The principal pipelines in which we have an interest are the Alberta Products pipeline, the Trans-Northern pipeline and the Portland-Montreal pipeline.
Capital Expenditures on Property, Plant and Equipment
The following table shows Petro-Canada's Downstream capital expenditures on property, plant and equipment for the years indicated.
DOWNSTREAM CAPITAL EXPENDITURES
| | Years Ended December 31,
|
|---|
| | 2002
| | 2001
| | 2000
| | 1999
| | 1998
|
|---|
|
| | (millions of dollars)
|
|---|
| Refining and Supply | | 210 | | 206 | | 102 | | 110 | | 125 |
| Sales, Marketing and Other | | 118 | | 156 | | 143 | | 90 | | 136 |
| Lubricants | | 16 | | 21 | | 19 | | 20 | | 15 |
| | |
| |
| |
| |
| |
|
| Total | | 344 | | 383 | | 264 | | 220 | | 276 |
| | |
| |
| |
| |
| |
|
Petro-Canada's 2003 capital expenditures budget for downstream operations amounts to approximately $500 million. The major portion of 2002 expenditures and those planned for 2003 are focused on investments to comply with federal requirements for the reduction of sulphur levels in gasoline and on the accelerated roll-out of our new-image retail sites.
Research and Development
Petro-Canada owns a research facility at Sheridan Park in Mississauga, Ontario, where we conduct research on lubricants. In 2002, Petro-Canada's expenditures on research and development activities were approximately $6 million.
As global advancements in fuel cell technology continue to occur, the Fuelling a Cleaner Canada Association (Petro-Canada, Ballard Power Systems and Methanex Corporation) has focused its efforts on working with various government agencies, such as the Canadian Transportation Fuel Cell Alliance (CTFCA), in an effort to ensure appropriate funding and the optimization of independent activities directed towards the implementation of fuel cell pilot demonstrations. In addition, through the CTFCA, knowledge from other pilot projects such as the California Fuel Cell Partnership can be shared, thereby assisting in the advancement of Canadian demonstrations.
Human Resources
At December 31, 2002, Petro-Canada and its wholly owned subsidiaries had 4 470 employees, compared with 4 178 employees at December 31, 2001. At year-end, Upstream Canada employed 1 019, Upstream International 261 and the Downstream 2 501, with the remaining 689 being corporate support staff. Approximately 25 per cent of Petro-Canada's employees are covered by collective bargaining agreements. Approximately 96 per cent of our unionized employees are members of the Communications Energy and Paperworkers Union (CEPU) that represents refinery, marketing and gas plant workers. Current three-year collective bargaining agreements with the CEPU run until February 1, 2004.
36 Petro-Canada Annual Information Form
Environmental Factors
The following table shows Petro-Canada's expenditures for environmental matters during 2002.
ENVIRONMENTAL COSTS
| | Capital
| | Expense
| | Total
|
|---|
|
| | (millions of dollars)
|
|---|
| Upstream Canada | | 45 | | 36 | | 81 |
| Upstream International | | 1 | | 17 | | 18 |
| Downstream | | 182 | | 37 | | 219 |
| | |
| |
| |
|
| Total | | 228 | | 90 | | 318 |
| | |
| |
| |
|
The expenditures included: purchase, installation, operation and maintenance of pollution abatement equipment and facilities; replacement of underground tanks; waste management; environmental studies and research; reclamation activities; and the workforce costs of environmental staff and consultants.
Industry Conditions
Oil prices are subject to international supply and demand. Political developments, especially in the Middle East, can affect world oil supply and oil prices. Natural gas prices are primarily affected by supply and demand in North America and, to a lesser extent, by prices of alternate sources of energy. Petro-Canada expects continued volatility and uncertainty in oil and natural gas prices.
Crude oil prices are generally set in U.S. dollars, while sales of refined petroleum products are primarily in Canadian dollars. Fluctuations in exchange rates between the U.S. and Canadian dollar may therefore give rise to foreign currency exposure.
The Canadian and international petroleum industry is highly competitive in all aspects, including the exploration for and development of new sources of supply, the construction and operation of pipelines and the refining, distribution and marketing of petroleum products. The Company competes in virtually every aspect of its business with other large integrated oil and gas companies. In export markets, the Company encounters active competition from other Canadian producers and foreign producers. The petroleum industry also competes with other industries in supplying energy, fuel and related products to consumers.
Exploration, production and refining require high levels of investment and have particular economic risks and opportunities. They are subject to hazards such as fire, explosion, blowouts and oil spills that can cause personal injury, damage to property, equipment and the environment and resulting interruption of operations.
The petroleum industry is also subject to regulation and intervention by governments in such matters as the award of exploration and production rights, the imposition of specific drilling obligations, environmental protection controls, control over the development and abandonment of fields (including restrictions on production) and, possibly, expropriation or cancellation of contract rights.
Risks attaching to foreign operations include, but are not limited to: international unrest and conflict; changes in laws affecting foreign ownership, fiscal regimes, exchange controls and the repatriation of funds; and foreign exchange rates.
37 Petro-Canada Annual Information Form
ITEM 5 – SELECTED CONSOLIDATED FINANCIAL INFORMATION
The following selected consolidated financial information for each of the five years in the period ended December 31, 2002 is derived from Petro-Canada's Consolidated Financial Statements. Deloitte & Touche LLP, Chartered Accountants, audited the Consolidated Financial Statements for the year ended December 31, 2002. Arthur Andersen LLP, Chartered Accountants, audited the Consolidated Financial Statements for each of the previous four years. The information set forth below should be read in conjunction with Management's Discussion and Analysis, the Consolidated Financial Statements and related notes and other financial information.
SELECTED CONSOLIDATED FINANCIAL INFORMATION
| | Years Ended December 31,
| |
|---|
| | 2002
| | 2001
| | 2000
| | 1999
| | 1998
| |
|---|
| |
| | (millions of dollars, except per share amounts)
| |
|---|
| Statement of earnings data | | | | | | | | | | | |
| Revenue | | | | | | | | | | | |
| | Operating | | 9 917 | | 8 582 | | 9 372 | | 6 095 | | 4 951 | |
| | Investment and other income | | – | | 154 | | 173 | | 73 | | 89 | |
| | |
| |
| |
| |
| |
| |
| | | Total revenue | | 9 917 | | 8 736 | | 9 545 | | 6 168 | | 5 040 | |
| | |
| |
| |
| |
| |
| |
| Earnings before income taxes | | 1 828 | | 1 329 | | 1 423 | | 547 | | 152 | |
| Provision for income taxes | | 854 | | 483 | | 564 | | 229 | | 103 | |
| | |
| |
| |
| |
| |
| |
| Net earnings | | 974 | | 846 | | 859 | | 318 | | 49 | |
| | |
| |
| |
| |
| |
| |
Earnings |
|
|
|
|
|
|
|
|
|
|
|
| Upstream | | | | | | | | | | | |
| | Canada | | 689 | | 690 | | 685 | | 249 | | 38 | |
| | International | | 225 | | (27 | ) | 19 | | (6 | ) | (9 | ) |
| Downstream | | 254 | | 300 | | 273 | | 115 | | 204 | |
| Shared Services | | (144 | ) | (51 | ) | (98 | ) | (107 | ) | (87 | ) |
| | |
| |
| |
| |
| |
| |
| Earnings from operations 1 | | 1 024 | | 912 | | 879 | | 251 | | 146 | |
| Foreign currency translation | | (52 | ) | (96 | ) | (53 | ) | 70 | | (62 | ) |
| Gain (loss) on asset sales | | 2 | | 30 | | 71 | | (3 | ) | 7 | |
| Reorganization costs | | – | | – | | (38 | ) | – | | (42 | ) |
| | |
| |
| |
| |
| |
| |
| Net earnings | | 974 | | 846 | | 859 | | 318 | | 49 | |
| | |
| |
| |
| |
| |
| |
Basic earnings per share (dollars) |
|
3.71 |
|
3.19 |
|
3.15 |
|
1.17 |
|
0.18 |
|
| Diluted earnings per share (dollars) | | 3.67 | | 3.16 | | 3.13 | | 1.17 | | 0.18 | |
| Dividends per share (dollars) | | 0.40 | | 0.40 | | 0.40 | | 0.34 | | 0.32 | |
| Cash flow 2 | | 2 276 | | 1 688 | | 1 870 | | 964 | | 830 | |
Balance sheet data (at end of year) |
|
|
|
|
|
|
|
|
|
|
|
| Total assets | | 13 439 | | 9 634 | | 10 000 | | 8 574 | | 8 186 | |
| Long-term debt, including current portion | | 3 057 | | 1 401 | | 1 774 | | 1 711 | | 1 829 | |
| Cash and short-term investments | | 234 | | 781 | | 1 415 | | 206 | | 431 | |
| Shareholders' equity | | 5 776 | | 4 877 | | 4 465 | | 3 991 | | 3 759 | |
| Average capital employed | | 7 826 | | 6 259 | | 5 883 | | 5 645 | | 5 560 | |
- 1
- In 2000 and 1998, earnings from operations are before reorganization costs.
- 2
- Cash flow from operations before changes in non-cash working capital items.
38 Petro-Canada Annual Information Form
QUARTERLY INFORMATION
| | 2002
Three Months Ended
| | 2001
Three Months Ended
| |
|---|
| | Dec. 31
| | Sept. 30
| | June 30
| | Mar. 31
| | Dec. 31
| | Sept. 30
| | June 30
| | Mar. 31
| |
|---|
| |
| Total revenue | | 3 005 | | 2 767 | | 2 437 | | 1 708 | | 1 778 | | 2 089 | | 2 307 | | 2 562 | |
Earnings |
|
|
|
|
|
|
|
|
|
|
|
|
|
|
|
|
|
| Upstream | | | | | | | | | | | | | | | | | |
| | Canada | | 248 | | 194 | | 174 | | 73 | | 53 | | 127 | | 230 | | 280 | |
| | International | | 95 | | 78 | | 58 | | (6 | ) | (1 | ) | (2 | ) | – | | (24 | ) |
| Downstream | | 78 | | 58 | | 73 | | 45 | | 48 | | 50 | | 111 | | 91 | |
| Shared Services | | (51 | ) | (41 | ) | (29 | ) | (23 | ) | (25 | ) | (8 | ) | (7 | ) | (11 | ) |
| | |
| |
| |
| |
| |
| |
| |
| |
| |
| Earnings from operations | | 370 | | 289 | | 276 | | 89 | | 75 | | 167 | | 334 | | 336 | |
| Foreign currency translation | | (16 | ) | (80 | ) | 45 | | (1 | ) | (9 | ) | (67 | ) | 65 | | (85 | ) |
| Gain (loss) on asset sales | | 2 | | – | | – | | – | | – | | (1 | ) | – | | 31 | |
| | |
| |
| |
| |
| |
| |
| |
| |
| |
| Net earnings | | 356 | | 209 | | 321 | | 88 | | 66 | | 99 | | 399 | | 282 | |
| | |
| |
| |
| |
| |
| |
| |
| |
| |
Basic earnings per share (dollars) |
|
1.35 |
|
0.79 |
|
1.22 |
|
0.34 |
|
0.25 |
|
0.38 |
|
1.50 |
|
1.05 |
|
| Diluted earnings per share (dollars) | | 1.34 | | 0.79 | | 1.21 | | 0.33 | | 0.25 | | 0.37 | | 1.48 | | 1.04 | |
ITEM 6 – MANAGEMENT'S DISCUSSION AND ANALYSIS
Petro-Canada's Management's Discussion and Analysis as contained on pages 6 through 23 in our 2002 Annual Report is incorporated by reference into and forms an integral part of this Annual Information Form.
ITEM 7 – MARKET FOR SECURITIES
The Corporation's outstanding share capital comprises common shares that are listed and posted for trading on The Toronto Stock Exchange under the symbol PCA and on the New York Stock Exchange under the symbol PCZ. Each common share carries one vote.
39 Petro-Canada Annual Information Form
ITEM 8 – DIRECTORS AND OFFICERS
Composition of the Board of Directors
The Articles of the Corporation provide that the number of directors of the Corporation shall be a minimum of nine and a maximum of 13. A quorum for meetings of the board of directors is a majority of the directors.
The by-laws of the Corporation provide that so long as the Government of Canada is the registered holder of 10 per cent or more of the outstanding voting shares:
- (a)
- a nominating committee will be appointed by the board of directors consisting of five directors, being the chairman of the board or the chief executive officer of the Corporation, and the balance being directors who are not affiliated persons;
- (b)
- the nominating committee will nominate a slate of nominees for election as directors at each annual meeting of shareholders, such nominees to consist of:
- (i)
- the chief executive officer and another senior officer of the Corporation;
- (ii)
- so long as the Government of Canada is the registered holder of 10 per cent or more of the outstanding voting shares of the Corporation, one nominee designated by the Government of Canada; and
- (iii)
- the balance being nominees selected by the nominating committee;
- (c)
- at least five of the nominees to be included in the nominating committee's slate will be individuals who, in the reasonable opinion of the nominating committee:
- (i)
- have significant business and administrative experience and who occupy or have occupied a position of senior executive authority and responsibility for a major enterprise and have a broad exposure to and understanding of the Canadian business community;
- (ii)
- are not affiliated persons; and
- (iii)
- are not current employees of the Government of Canada or current or former officers or employees of any corporation controlled by the Government of Canada;
- (d)
- the only affiliated persons who may be included in the nominating committee's slate are the officers referred to in (b)(i) above and one other affiliated person;
- (e)
- a majority of the members of any committee of the board of directors shall be directors who are neither affiliated persons nor directors designated by the Government of Canada; and
- (f)
- if at any time an executive committee of the board of directors is appointed it shall consist of five directors being the chief executive officer of the Corporation, and the balance being directors who are not affiliated persons.
The by-laws of the Corporation define an "affiliated person" as a person who is a current or former officer or employee of the Corporation or any of its affiliates or a current or former officer or employee of a corporation which was an associate of the Corporation at the time the person first became a director of the Corporation.
40 Petro-Canada Annual Information Form
Directors and Officers
The following table shows certain information concerning the directors of the Corporation.
Name and
Municipality of Residence
| | Served as a
Director Since 1
| |
Principal Occupation 2
|
|---|
|
Brian F. MacNeill 3,4,5,6,7
Calgary, Alberta | | 1995 | | Chairman of the Board of the Corporation |
Ronald A. Brenneman 5,8
Calgary, Alberta |
|
2000 |
|
Chief Executive Officer of the Corporation |
Angus A. Bruneau 5,7
St. John's, Newfoundland |
|
1996 |
|
Chairman
Fortis Inc.
(utilities and services) |
Gail Cook-Bennett 3,4,7
Toronto, Ontario |
|
1991 |
|
Chairperson
Canada Pension Plan Investment Board
(public pension plan management) |
John F. Cordeau 5,7
Calgary, Alberta |
|
1994 |
|
Partner
Bennett Jones LLP
(barristers and solicitors) |
Claude Fontaine 6
Montreal, Quebec |
|
1987 |
|
Senior Partner
Ogilvy Renault
(barristers and solicitors) |
Paul Haseldonckx 4,5
Essen, Germany |
|
2002 |
|
Corporate Director |
Thomas E. Kierans 4,6
Toronto, Ontario |
|
1991 |
|
Chairman
The Canadian Institute for Advanced Research
(research in social and natural sciences) |
Paul D. Melnuk 3,5
St. Louis, Missouri |
|
2000 |
|
Managing Partner
FTL Capital Partners LLC
(merchant bankers) |
Guylaine Saucier 3,7
Montreal, Quebec |
|
1991 |
|
Corporate Director |
William W. Siebens 4,6
Calgary, Alberta |
|
1986 |
|
President and Chief Executive Officer
Candor Investments Ltd.
(private energy and investment corporation) |
- 1
- Each of the directors served as a director of the Corporation or of Petro-Canada Limited, the Corporation's former parent, since the dates shown.
- 2
- Each of the directors has been engaged in the principal occupation indicated above for the five preceding years except for Ronald A. Brenneman who, prior to 2000, was General Manager of Corporate Planning, Exxon Corporation, and prior thereto held various positions within Exxon and its affiliated companies; Gail Cook-Bennett who, prior to 1998, was the Vice-Chair of Bennecon Ltd.; Paul Haseldonckx who, prior to 2002, was Chairman of the Executive Board of Veba Oil & Gas GmbH; Thomas E. Kierans who, prior to 2001, was Chairman and Chief Executive Officer, The Canadian Institute for Advanced Research and prior thereto was President and Chief Executive Officer of the C.D. Howe Institute; Brian F. MacNeill who, prior to 2001, was President and Chief Executive Officer
41 Petro-Canada Annual Information Form
of Enbridge Inc.; Guylaine Saucier who, prior to 2002 was Chairperson of the Joint Committee on Corporate Governance and prior thereto, was Chairperson, Canadian Broadcasting Corporation; and Paul D. Melnuk who, prior to 2002 was President and Chief Executive Officer of Bracknell Corporation and prior thereto was President and Chief Executive Officer of Barrick Gold Corporation and prior thereto, President and Chief Executive Officer of Clark USA, Inc.
- 3
- Member of the Audit, Finance and Risk Committee.
- 4
- Member of Corporate Governance and Nominating Committee.
- 5
- Member of Environment, Heath and Safety Committee.
- 6
- Member of Management Resources and Compensation Committee.
- 7
- Member of Pension Committee.
- 8
- Ronald A. Brenneman was President and Chief Executive Officer until February 1, 2002, at which time he relinquished the title of President and remained as Chief Executive Officer.
The term of office of each of the directors named above ends at the close of the next annual shareholders meeting of the Corporation, or until his or her successor is elected or appointed. The Corporation does not have an executive committee of the board of directors.
The following table shows certain information concerning officers of the Corporation.
Name and
Municipality of Residence
| | Served as an
Officer Since
| |
Principal Occupation 1
|
|---|
|
Brian F. MacNeill
Calgary, Alberta | | 2000 | | Chairman of the Board of the Corporation |
Executive Leadership Team |
Ronald A. Brenneman
Calgary, Alberta |
|
2000 |
|
Chief Executive Officer of the Corporation |
Norman F. McIntyre
London, United Kingdom |
|
1983 |
|
President |
Boris J. Jackman
Mississauga, Ontario |
|
1993 |
|
Executive Vice-President |
Ernest F. H. (Harry) Roberts
Calgary, Alberta |
|
1989 |
|
Senior Vice-President and Chief Financial Officer |
Brant G. Sangster
Calgary, Alberta |
|
1988 |
|
Senior Vice-President, Oil Sands |
Kathleen E. Sendall
Calgary, Alberta |
|
1996 |
|
Senior Vice-President, Western Canada |
Gordon J. Carrick
St. John's, Newfoundland |
|
2002 |
|
Vice-President, East Coast |
Upstream Canada |
Donald M. Clague
Calgary, Alberta |
|
2002 |
|
Vice-President, Production |
Francois Langlois
Calgary, Alberta |
|
2002 |
|
Vice-President, Exploration |
42 Petro-Canada Annual Information Form
Upstream International |
Youssef Ghoniem
Dorsten, Germany |
|
2002 |
|
Senior Vice-President, Operations |
Gerhard Kinast
London, England |
|
2002 |
|
Vice-President, Finance |
Downstream |
Randall B. Koenig
Oakville, Ontario |
|
1996 |
|
Vice-President, Lubricants |
S. Ford Ralph
Erin, Ontario |
|
1985 |
|
Vice-President, Sales |
Andrew Stephens
Mississauga, Ontario |
|
1993 |
|
Vice-President, Refining and Supply |
Shared Services |
Gary C. Bruce 2
Calgary, Alberta |
|
1991 |
|
Vice-President, Corporate Communications and Business Development |
Douglas S. Fraser
Calgary, Alberta |
|
2002 |
|
Treasurer |
W. A. (Alf) Peneycad 2
Calgary, Alberta |
|
1986 |
|
Vice-President, General Counsel and Corporate Secretary |
M. A. (Greta) Raymond 2
Calgary, Alberta |
|
2001 |
|
Vice-President, Human Resources and Environment, Health and Safety |
Christopher J. Smith
Calgary, Alberta |
|
1989 |
|
Controller |
- 1
- Each of the Officers has been engaged in the principal occupation indicated above or in executive positions with Petro-Canada for the five preceding years except for Ronald A. Brenneman who, prior to January 2000, was General Manager of Corporate Planning, Exxon Corporation, and prior thereto held various positions within Exxon and its affiliated companies; Brian F. MacNeill who, prior to 2001, was President and Chief Executive Officer of Enbridge Inc.; Donald M. Clague who, prior to 2002, was Manager, Exploration East Coast/Offshore and prior thereto Chief Geophysicist; Douglas Fraser who, prior to 2002, was Senior Director, Downstream Accounting and Control; Youssef Ghoniem who, prior to 2002, was Board Member of Veba Oil & Gas GmbH; Gerhard Kinast who, prior to 2002, was Member of the Executive Board of Veba Oil & Gas GmbH and prior thereto was Member of the Executive Board of DEMINEX GmbH; and Francois Langlois who, prior to 2002, was Manager, Southern Exploration, and prior to that General Manager, North Africa and prior thereto Team Leader, Foothills Exploration.
- 2
- Associate member of the Executive Leadership Team.
43 Petro-Canada Annual Information Form
Share Ownership
At December 31, 2002, the directors and officers of Petro-Canada, as a group, beneficially owned or exercised control over 155 356 common shares or less than one per cent of the common shares of the Corporation outstanding as of such date.
ITEM 9 – ADDITIONAL INFORMATION
Relationship with the Government of Canada
The following is a summary of certain agreements entered into by Petro-Canada with its principal shareholder, the Government of Canada, at the time of Petro-Canada's initial public offering of shares in July, 1991, and certain charter restrictions applicable to Petro-Canada.
Government of Canada Shareholding
The Government of Canada owned 18.74 per cent of the 263,594,977 common shares issued and outstanding as of December 31, 2002. The Government of Canada has stated that it will deal with its shares as an investor and not as a manager and that, in order to reflect the rights of other shareholders, it does not intend to exercise the right to vote at meetings of shareholders although it reserves the right to do so. So long as the Government of Canada holds 10 per cent or more of the outstanding voting shares it will have the right to designate one nominee for election to a board comprising between nine and 13 directors. The Government's current nominee is John F. Cordeau.
Pursuant to an agreement dated May 9, 1991 (the "Petro-Canada Privatization Agreement"), Petro-Canada and the Government of Canada have agreed that the Government will have the right to participate up to the extent of its percentage ownership in any proposed equity offerings by Petro-Canada so long as it remains the registered holder of 10 per cent or more of the outstanding common shares. So long as the Government of Canada remains the holder of 10 per cent or more of the outstanding common shares, Petro-Canada will not have the right to participate in any offering of Petro-Canada shares by the Government, unless the Government agrees.
Ownership, Voting and Other Charter Restrictions
ThePetro-Canada Public Participation Act requires that the Articles of Petro-Canada include certain restrictions on the ownership and voting of voting shares of the Corporation. The common shares of Petro-Canada are voting shares.
No person, together with associates of that person, may subscribe for, have transferred to that person, hold, beneficially own or control, otherwise than by way of security only, or vote, in the aggregate, voting shares of Petro-Canada to which are attached more than 20 per cent of the votes attached to all outstanding voting shares of Petro-Canada other than voting shares held by the Government of Canada.
As required by thePetro-Canada Public Participation Act, Petro-Canada's Articles contain provisions for the enforcement of these restrictions, including provisions for suspension of voting rights, forfeiture of dividends, prohibitions against share transfer, compulsory sale of shares, redemption and suspension of other shareholder rights. The board of directors of Petro-Canada may at any time require holders of or subscribers for voting shares and certain other persons to furnish statutory declarations as to residence, ownership of voting shares and certain other matters relevant to the enforcement of the
44 Petro-Canada Annual Information Form
restrictions. Petro-Canada is prohibited from accepting any subscription for, issuing or registering a transfer of any voting shares if a contravention of the individual or non-resident ownership restrictions result.
Petro-Canada's Articles also include provisions requiring Petro-Canada to maintain its head office in Calgary, Alberta; prohibiting Petro-Canada from selling, transferring or otherwise disposing of all or substantially all of its assets in one transaction or several related transactions, to any one person or group of associated persons or to non-residents, otherwise than by way of security only in connection with the financing of Petro-Canada; and requiring Petro-Canada to ensure (and to adopt, from time to time, policies describing the manner in which Petro-Canada will fulfil the requirement to ensure) that any member of the public can, in either official language of Canada (English and French), communicate with and obtain available services from Petro-Canada's head office and any other facilities where Petro-Canada determines there is significant demand for communications with and services from that facility in that language.
Commercial Relationships
Petro-Canada has commercial relationships with the Government of Canada and with various Canadian federal Crown corporations which cover sales of product. Such relationships have been and will continue to be on the same terms as are available to third parties.
Additional Information
Additional information, including directors' and officers' remuneration and indebtedness, the principal holders of the Corporation's securities and options to purchase securities, is contained in Petro-Canada's management proxy circular for its most recent annual meeting of shareholders. Additional financial information is contained in Petro-Canada's audited comparative consolidated financial statements for the year ended December 31, 2002.
Pursuant to National Instrument 44-101 of the Canadian Securities Administrators, Petro-Canada will provide to any person, upon request to the Corporate Secretary of the Corporation:
- (a)
- when the securities of the Corporation are in the course of a distribution pursuant to a short form prospectus or a preliminary short form prospectus has been filed in respect of a distribution of its securities,
- (i)
- one copy of the annual information form of Petro-Canada together with one copy of any document, or the pertinent pages of any document, incorporated by reference in the annual information form,
- (ii)
- one copy of the comparative consolidated financial statements of Petro-Canada for the 2002 financial year together with the accompanying report of the auditors and one copy of quarterly interim consolidated financial statements of Petro-Canada issued subsequent to the issuance of the consolidated financial statements for the 2002 financial year,
- (iii)
- one copy of Petro-Canada's management proxy circular in respect of its most recent annual meeting of shareholders,
- (iv)
- one copy of any other documents that are incorporated by reference into the preliminary short form prospectus or the short form prospectus and are not required to be provided under (i) to (iii) above; or
- (b)
- at any other time, one copy of any other documents referred to in (a) (i), (ii) and (iii) above, provided Petro-Canada may require the payment of a reasonable charge if the request is made by a person who is not a security holder of Petro-Canada.
Requests for additional information can be obtained from our Web site atwww.petro-canada.ca or from the:
45 Petro-Canada Annual Information Form
CONTROLS AND PROCEDURES
Pursuant to rules adopted by the SEC as directed by Section 302 of the Sarbanes-Oxley Act of 2002, the company has performed an evaluation of its disclosure controls and procedures (as defined by Exchange Act rule 13a-14) within 90 days of the date of the filing of this report. Based on this evaluation, the company’s Chief Executive Officer and Chief Financial Officer have concluded that these procedures are effective in ensuring that information required to be disclosed by the company is recorded, processed, summarized, and reported within the time periods specified in the SEC’s rules and forms. In addition, there have not been any significant changes in internal controls or other factors that could significantly affect internal controls subsequent to the date of the company’s most recent evaluation.
UNDERTAKING AND CONSENT TO SERVICE OF PROCESS
A. Undertaking
Petro-Canada (the “Registrant”) undertakes to make available, in person or by telephone, representatives to respond to inquiries made by the staff of the Securities and Exchange Commission (“SEC”), and to furnish promptly, when requested to do so by the SEC staff, information relating to the securities in relation to which the obligation to file an annual report on Form 40-F arises or transactions in said securities.
B. Consent to Service of Process
The Registrant has previously filed a Form F-X with the SEC on March 10, 1994.
1
SIGNATURE
Pursuant to the requirements of the Securities Exchange Act of 1934, the registrant certifies that it meets all of the requirements for filing on Form 40-F and has duly caused this annual report to be signed on its behalf by the undersigned, thereto duly authorized.
Dated: | March 26, 2003 | | PETRO-CANADA |
| | | | | |
| | | By: | | /s/ W. A. (Alf) Peneycad |
| | | | Name: | W. A. (Alf) Peneycad |
| | | | Title: | Vice-President, General Counsel |
| | | | | and Corporate Secretary |
4
CERTIFICATIONS
I, Ronald A. Brenneman, certify that:
1. I have reviewed this annual report on Form 40-F of Petro-Canada;
2. Based on my knowledge, this annual report does not contain any untrue statement of a material fact or omit to state a material fact necessary to make the statements made, in light of the circumstances under which such statements were made, not misleading with respect to the period covered by this annual report;
3. Based on my knowledge, the financial statements, and other financial information included in this annual report, fairly present in all material respects the financial condition, results of operations and cash flows of the registrant as of, and for, the periods presented in this annual report;
4. The registrant's other certifying officers and I are responsible for establishing and maintaining disclosure controls and procedures (as defined in Exchange Act Rules 13a-14 and 15d-14) for the registrant and have:
a) Designed such disclosure controls and procedures to ensure that material information relating to the issuer, including its consolidated subsidiaries, is make known to us by others within those entities, particularly during the period on which this report is being prepared;
b) Evaluated the effectiveness of the registrant's disclosure controls and procedures as of a date within 90 days prior to the filing date of this annual report ("Evaluation Date"); and
c) Presented in this annual report our conclusions about the effectiveness of the disclosure controls and procedures based on our evaluation as of the Evaluation Date;
5. The registrant's other certifying officers and I have disclosed, based on our most recent evaluation, to the registrant's auditors and the audit committee of registrant's board of directors (and persons performing the equivalent function):
a) all significant deficiencies in the design or operation of internal controls which could adversely affect the registrant's ability to record, process, summarize and report financial data and have identified for the registrant's auditors any material weaknesses in internal controls; and
b) any fraud, whether or not material, that involves management or other employees who have a significant role in the registrant's internal controls; and
6. The registrant's other certifying officers and I have indicated in this annual report whether there were significant changes in internal controls or in other factors that could significantly affect internal controls subsequent to the date of our most recent evaluation, including any corrective actions with regard to significant deficiencies and material weaknesses.
Date: March 26, 2003
/s/ Ronald A. Brenneman
Ronald A. Brenneman
Chief Executive Officer
2
CERTIFICATIONS
I, Ernest F. H. Roberts, certify that:
1. I have reviewed this annual report on Form 40-F of Petro-Canada;
2. Based on my knowledge, this annual report does not contain any untrue statement of a material fact or omit to state a material fact necessary to make the statements made, in light of the circumstances under which such statements were made, not misleading with respect to the period covered by this annual report;
3. Based on my knowledge, the financial statements, and other financial information included in this annual report, fairly present in all material respects the financial condition, results of operations and cash flows of the registrant as of, and for, the periods presented in this annual report;
4. The registrant's other certifying officers and I are responsible for establishing and maintaining disclosure controls and procedures (as defined in Exchange Act Rules 13a-14 and 15d-14) for the registrant and have:
a) Designed such disclosure controls and procedures to ensure that material information relating to the issuer, including its consolidated subsidiaries, is make known to us by others within those entities, particularly during the period on which this report is being prepared;
b) Evaluated the effectiveness of the registrant's disclosure controls and procedures as of a date within 90 days prior to the filing date of this annual report ("Evaluation Date"); and
c) Presented in this annual report our conclusions about the effectiveness of the disclosure controls and procedures based on our evaluation as of the Evaluation Date;
5. The registrant's other certifying officers and I have disclosed, based on our most recent evaluation, to the registrant's auditors and the audit committee of registrant's board of directors (and persons performing the equivalent function):
a) all significant deficiencies in the design or operation of internal controls which could adversely affect the registrant's ability to record, process, summarize and report financial data and have identified for the registrant's auditors any material weaknesses in internal controls; and
b) any fraud, whether or not material, that involves management or other employees who have a significant role in the registrant's internal controls; and
6. The registrant's other certifying officers and I have indicated in this annual report whether there were significant changes in internal controls or in other factors that could significantly affect internal controls subsequent to the date of our most recent evaluation, including any corrective actions with regard to significant deficiencies and material weaknesses.
Date: March 26, 2003
/s/ Ernest F. H. Roberts
Ernest F. H. Roberts
Senior Vice-President and
Chief Financial Officer
3
EXHIBITS
Exhibits | | Description |
| | |
1. | | Petro-Canada Consolidated Financial Statements for the year ended December 31, 2002 |
| | |
2. | | Petro-Canada Management’s Discussion and Analysis |
| | |
3. | | Certification of CEO pursuant to 18 U.S.C. Section 1350, as adopted pursuant to Section 906 of the Sarbanes-Oxley Act of 2002 |
| | |
4. | | Certification of CFO pursuant to 18 U.S.C. Section 1350, as adopted pursuant to Section 906 of the Sarbanes-Oxley Act of 2002 |
5
QuickLinks
ANNUAL INFORMATION FORMITEM 2 – CORPORATE STRUCTUREITEM 3 – GENERAL DEVELOPMENT OF THE BUSINESSITEM 4 – DESCRIPTION OF THE BUSINESSITEM 5 – SELECTED CONSOLIDATED FINANCIAL INFORMATIONITEM 6 – MANAGEMENT'S DISCUSSION AND ANALYSISITEM 7 – MARKET FOR SECURITIESITEM 8 – DIRECTORS AND OFFICERSITEM 9 – ADDITIONAL INFORMATION