QuickLinks -- Click here to rapidly navigate through this documentSECURITIES AND EXCHANGE COMMISSION
Washington, D.C. 20549
FORM 40 – F
(Check One)
o | Registration statement pursuant to Section 12 of the Securities Exchange Act of 1934 |
| |
or | |
| |
ý | Annual report pursuant to Section 13(a) or 15(d) of the Securities Exchange Act of 1934 |
| |
For fiscal year ended: | December 31, 2003 |
Commission File No.: | 1-13922 |
| | |
PETRO-CANADA
(Exact name of registrant as specified in its charter)
Canada | | 1311, 1321, 1382, 5541 | | Not Applicable |
(Province or other
jurisdiction of
incorporation or organization) | | (Primary standard industrial
classification code number,
if applicable) | | (I.R.S. employer
identification number,
if applicable) |
| | | | |
150 – 6th Avenue S.W.
Calgary, Alberta
Canada T2P 3E3
(403) 296-8000 |
(Address and telephone number of registrant’s principal executive office) |
CT Corporation System
111 Eight Avenue - CT
New York, New York 10011
(212) 894-8940
(Name, address and telephone number of agent for service in the United States)
Securities registered pursuant to Section 12(b) of the Act:
Title of each class: | | Name of each exchange on which registered: |
Common Shares | | New York Stock Exchange |
Securities registered pursuant to Section 12(g) of the Act:
None
Securities for which there is a reporting obligation pursuant to Section 15(d) of the Act:
9 1/4% Debentures Due 2021
7 7/8% Debentures Due 2026
7% Debentures Due 2028
4% Senior Notes Due 2013
5.35% Senior Notes Due 2033
For annual reports, indicate by check mark the information filed with this form:
ý Annual Information Form ý Audited Financial Statements
Indicate the number of outstanding shares of each of the issuer’s classes of capital or common stock as of the close of the periods covered by the annual report:
Common Shares: 265,586,093
Indicate by check mark whether the registrant by filing the information contained in this form is also thereby furnishing the information to the Commission pursuant to Rule 12g 3-2(b) under the Securities Exchange Act of 1934 (the “Exchange Act”). If “Yes” is marked, indicate the file number assigned to the registrant in connection with such rule.
Indicate by check mark whether the registrant: (1) has filed all reports required to be filed by Section 13(d) or 15(d) of the Exchange Act during the preceding 12 months (or for such shorter period that the registrant has been required to file such reports); and (2) has been subject to such filing requirements in the past 90 days.
CAUTIONARY NOTICE REGARDING—FORWARD LOOKING INFORMATION
This Form 40-F contains forward-looking statements. Such statements are generally identifiable by the terminology used, such as “plan”, “anticipate”, “intend”, “expect”, “estimate”, “budget” or other similar wording. Forward looking statements include but are not limited to: references to future capital and other expenditures; drilling plans; construction activities; the submission of development plans; seismic activity; refining margins; oil and gas production levels and the sources of growth thereof; results of exploration activities and dates by which certain areas may be developed or may come on-stream; retail throughputs; pre-production and operating costs; reserves estimates; reserves life; natural gas export capacity; and environmental matters. These forward-looking statements are subject to known and unknown risks and uncertainties and other factors which may cause actual results, levels of activity and achievements to differ materially from those expressed or implied by such statements. Such factors include, but are not limited to: general economic, market and business conditions; industry capacity; competitive action by other companies; fluctuations in oil and gas prices; refining and marketing margins; the ability to produce and transport crude oil and natural gas to markets; the results of exploration and development drilling and related activities; fluctuation in interest rates and foreign currency exchange rates; the ability of suppliers to meet commitments; actions by governmental authorities including increases in taxes; decisions or approvals of administrative tribunals; changes in environmental and other regulations; risks attendant with oil and gas operations; and other factors, many of which are beyond the control of Petro-Canada. These factors are discussed in greater detail elsewhere in this Form 40-F.
Readers are cautioned that the foregoing list of important factors affecting forward-looking statements is not exhaustive. Furthermore, the forward-looking statements contained herein are made as of the date of this Form 40-F, and Petro-Canada does not undertake any obligation to update publicly or to revise any of the included forward-looking statements, whether as a result of new information, future events or otherwise. The forward-looking statements contained in this Form 40-F are expressly qualified by this cautionary statement.
Annual Information Form
2003
March 4, 2004
ITEM 2 – TABLE OF CONTENTS
Table of Contents
| |
| | Page
|
|---|
| Item 1 – | | Cover | | 1 |
| Item 2 – | | Table of Contents | | 2 |
| | | Legal Notice – Forward Looking Statements/Reserves Estimates | | 3 |
| Item 3 – | | Corporate Structure | | 3 |
| | | Incorporation of Petro-Canada | | 3 |
| | | Intercorporate Relationships | | 4 |
| Item 4 – | | General Development of the Business | | 4 |
| | | Three-Year History | | 4 |
| Item 5 – | | Description of the Business | | 6 |
| | | Business of Petro-Canada | | 6 |
| | | Upstream | | 7 |
| | | • North American Gas | | 10 |
| | | • East Coast Oil | | 12 |
| | | • Oil Sands | | 14 |
| | | • International | | 15 |
| | | • Reserves | | 18 |
| | | Downstream | | 44 |
| | | Research and Development | | 48 |
| | | Human Resources | | 49 |
| | | Social and Environmental Policies | | 49 |
| | | Environmental Expenditures | | 50 |
| | | Industry Conditions | | 50 |
| | | Risk Management | | 51 |
| | | Financial Instruments | | 53 |
| Item 6 – | | Selected Consolidated Financial Information | | 54 |
| Item 7 – | | Description of Capital Structure | | 55 |
| Item 8 – | | Market for Securities | | 57 |
| Item 9 – | | Escrowed Securities | | 59 |
| Item 10 – | | Directors and Officers | | 59 |
| Item 11 – | | Promoters | | 68 |
| Item 12 – | | Legal Proceedings | | 68 |
| Item 13 – | | Interest of Management and Others in Material Transactions | | 68 |
| Item 14 – | | Transfer Agents and Registrars | | 69 |
| Item 15 – | | Material Contracts | | 69 |
| Item 16 – | | Interests of Experts | | 69 |
| Item 17 – | | Additional Information | | 69 |
Conversion Factors
To conform with common usage, imperial units of measurement are used in this report to describe exploration and production while metric units are used for refining and marketing. Dollars are Canadian unless otherwise stated.
| 1 cubic metre (liquids) | | = | | 6.29 barrels |
| 1 cubic metre (natural gas) | | = | | 35.30 cubic feet |
| 1 litre | | = | | 0.22 imperial gallon |
2 Petro-Canada Annual Information Form
LEGAL NOTICE – FORWARD LOOKING INFORMATION/RESERVES ESTIMATES
This Annual Information Form (AIF), including Petro-Canada's Management's Discussion and Analysis (MD&A) – see pages 6 through 35 of the Corporation's 2003 Annual Report – incorporated by reference herein, contains forward-looking statements. Such statements are generally identifiable by the terminology used, such as "plan", "anticipate", "intend", "expect", "estimate", "budget" or other similar wording. Forward looking statements include but are not limited to: references to future capital and other expenditures; drilling plans; construction activities; the submission of development plans; seismic activity; refining margins; oil and gas production levels and the sources of growth thereof; results of exploration activities and dates by which certain areas may be developed or may come on-stream; retail throughputs; pre-production and operating costs; reserves estimates; reserves life; natural gas export capacity; and environmental matters. These forward-looking statements are subject to known and unknown risks and uncertainties and other factors which may cause actual results, levels of activity and achievements to differ materially from those expressed or implied by such statements. Such factors include, but are not limited to: general economic, market and business conditions; industry capacity; competitive action by other companies; fluctuations in oil and gas prices; refining and marketing margins; the ability to produce and transport crude oil and natural gas to markets; the results of exploration and development drilling and related activities; fluctuation in interest rates and foreign currency exchange rates; the ability of suppliers to meet commitments; actions by governmental authorities including increases in taxes; decisions or approvals of administrative tribunals; changes in environmental and other regulations; risks attendant with oil and gas operations; and other factors, many of which are beyond the control of Petro-Canada. These factors are discussed in greater detail in filings made by Petro-Canada with the Canadian provincial securities commissions and the United States Securities and Exchange Commission (SEC).
Petro-Canada's staff of qualified reserves evaluators generate the reserves estimates used by this Corporation. Our reserves staff and management are not considered independent of the Corporation for purposes of the Canadian provincial securities commissions. The use of terms such as "probable", "possible", "recoverable" or "potential" reserves and resources does not meet the guidelines of the SEC for inclusion in documents filed with the SEC. Petro-Canada has obtained an exemption from certain Canadian reserves disclosure requirements to permit it to make disclosure in accordance with SEC standards in order to provide comparability with U.S. and other international issuers. Therefore, Petro-Canada's reserves data and other oil and gas formal disclosure is made in accordance with U.S. disclosure requirements and practices and may differ from Canadian domestic standards and practices. Where the term boe (barrel of oil equivalent) is used in this AIF it may be misleading, particularly if used in isolation. A boe conversion ratio of 6 mcf: 1 bbl is based on an energy equivalency conversion method primarily applicable at the burner tip and does not represent a value equivalency at the wellhead.
Readers are cautioned that the foregoing list of important factors affecting forward-looking statements is not exhaustive. Furthermore, the forward-looking statements contained herein are made as of the date of this AIF, and Petro-Canada does not undertake any obligation to update publicly or to revise any of the included forward-looking statements, whether as a result of new information, future events or otherwise. The forward-looking statements contained in this AIF are expressly qualified by this cautionary statement.
ITEM 3 – CORPORATE STRUCTURE
Incorporation of Petro-Canada
Throughout this Annual Information Form, unless the context otherwise indicates, the term "Corporation" refers to the corporate entity, Petro-Canada. The terms "Petro-Canada", the "Company", "we", "us" and "our" refer to the Corporation and its subsidiaries.
3 Petro-Canada Annual Information Form
The Corporation is organized under the Canada Business Corporations Act. The registered and principal executive office of the Corporation is located at 150 - 6th Avenue S.W., Calgary, Alberta, Canada T2P 3E3. Telephone: (403) 296-8000.
Intercorporate Relationships
Material operating subsidiaries owned 100 per cent, directly or indirectly, by the Corporation at December 31, 2003 were as follows:
Name
| | Jurisdiction of Incorporation
| | Purpose
|
|---|
| 3908968 Canada Inc. | | Canada | | A Canadian subsidiary holding Petro-Canada's International interests. |
Petro-Canada U.K. Holdings Ltd. |
|
United Kingdom |
|
A subsidiary of 3908968 Canada Inc. that holds
Petro-Canada's U.K. interests. |
Petro-Canada U.K. Limited |
|
United Kingdom |
|
A subsidiary of Petro-Canada U.K. Holdings Ltd. through which Petro-Canada's operations are conducted in the U.K. |
Individually, the Corporation's remaining subsidiaries account for less than 10 per cent of the Corporation's consolidated revenues and consolidated assets and in the aggregate they account for less than 20 per cent of the Corporation's consolidated revenues and consolidated assets.
ITEM 4 – GENERAL DEVELOPMENT OF THE BUSINESS
Three-Year History
The following is a recent history of major Company events:
In 2003, Petro-Canada achieved a record $1 669 million in net earnings. In Canada, development at White Rose remained on track for production start-up in early 2006. In Oil Sands, a new strategy includes a revised reconfiguration of the Edmonton refinery, a bitumen processing and refinery feedstock supply arrangement with Suncor Energy Inc., and a future focus on smaller scale bitumen projects similar to the MacKay River development. As a result, earlier plans for a large-scale bitumen plant at Meadow Creek were suspended. Internationally, Petro-Canada expanded its position in the U.K. North Sea through the exchange and acquisition of property interests. Two North Sea oil developments also came on stream. Additionally, rights to new reserves were acquired in Syria and new exploration concessions were added to our portfolio in Tunisia, Algeria and Syria. In the Downstream, the Company moved ahead with plans to consolidate our Eastern Canada refining and supply operations. This will include shutting down the Oakville refining operation by year-end 2004, expanding the existing Oakville terminalling facilities and expanding the Montreal refinery. Also in Refining and Supply, substantial progress was achieved in refinery reconfigurations to meet new lower limits of sulphur in gasoline. In Sales and Marketing, the program to convert selected Company-controlled retail sites to the new image standard approached the 80 per cent completion mark. The proceeds from a US$600 million long-term fixed rate debt offering were applied to the reduction of a short-term floating rate acquisition facility. In addition to the proceeds of the fixed rate debt offering, net debt repayments of $548 million in 2003 re-established our key financial ratios well within strategic targets.
4 Petro-Canada Annual Information Form
In 2002, Petro-Canada acquired most of the upstream oil and gas businesses of Veba Oil & Gas GmbH (Veba) for $2 234 million, establishing International as a new core business. In Canada, strong operating performance at Hibernia combined with an exceptional start-up year at Terra Nova to raise Petro-Canada's share of East Coast crude oil production to 71 900 barrels of oil per day (b/d). Development commenced at White Rose, which will be the third producing oil field on the Grand Banks. The MacKay River bitumen production facility was completed on schedule and on budget and started production in November 2002. A natural gas discovery at the Tuk M-18 well in the Mackenzie Delta tested at restricted rates up to 30 million cubic feet per day (mmcf/d). Petro-Canada won the 2002 Convenience Store Chain of the Year Award from leading U.S. trade publication Convenience Store Decisions. We repaid $465 million of debt.
In 2001, Petro-Canada commissioned the offshore facilities for the Terra Nova oil field, allowing production start-up to occur in January 2002. In Oil Sands, we participated in the launch of Phase 3 of the Syncrude expansion and advanced the construction of our MacKay River bitumen production facility. In our North American Gas business, we drilled the first well in the Mackenzie Delta in a decade and expanded our exploration focus with the acquisition of exploratory acreage in Alaska. Internationally, we expanded our presence in North Africa with the acquisition of an interest in the En Naga block in Libya's Sirte basin for $121 million. In the Downstream, improved plant reliability, a strong performance from Lubricants, and the continued growth in non-petroleum revenue produced strong results in a weak business environment. We repaid $475 million of long-term debt and over the term of a 12-month Normal Course Issuer Bid that expired on October 31, 2001 we repurchased approximately 13 million common shares at a cost of $496 million.
5 Petro-Canada Annual Information Form
ITEM 5 – DESCRIPTION OF THE BUSINESS
Business of Petro-Canada
The following business description should be read in conjunction with Petro-Canada's Management's Discussion and Analysis ("MD&A"), as contained on pages 6 through 35 of our 2003 Annual Report, which is incorporated by reference into and forms an integral part of this Annual Information Form.
Petro-Canada is an integrated oil and gas company with a portfolio of businesses spanning both the Upstream and Downstream sectors of the industry. In the Upstream, Petro-Canada explores for, develops, produces and markets crude oil and natural gas. For reporting purposes, Petro-Canada conducts its Upstream operations through four business segments, namely North American Gas, East Coast Oil, Oil Sands and International. In the Downstream, which constitutes Petro-Canada's fifth business segment, the Company refines crude oil and other feedstocks and markets and distributes petroleum products and related goods and services.
The chart below outlines the various businesses of Petro-Canada as at December 31, 2003.
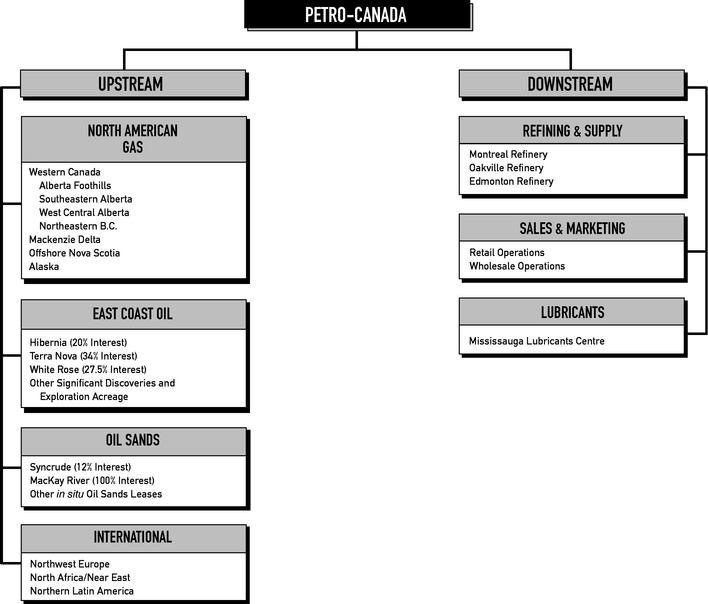
6 Petro-Canada Annual Information Form
Upstream
Petro-Canada is a major participant in Canada's upstream oil and gas industry and is active in the exploration for and development of oil and natural gas reserves in Canada and exploration for natural gas in Alaska. Our East Coast Oil business includes interests in three major oil field developments on the Grand Banks, offshore Newfoundland. These are: a 20 per cent interest in the Hibernia oil field; a 34 per cent interest in the Terra Nova oil field; and a 27.5 per cent interest in the White Rose oil field, which is currently under development. Our East Coast growth strategy envisions extending plateau production through field extensions at Hibernia and Terra Nova. In Oil Sands, the Company has a 12 per cent interest in the Syncrude joint venture and 100 per cent ownership of the MacKay River bitumen producing operation, both located in northeastern Alberta. Petro-Canada's North American Gas business is one of the largest producers of natural gas in Western Canada. For longer term in natural gas, exploration opportunities are being pursued in such high potential areas as the Mackenzie Delta/Corridor, the Scotian Slope and Alaska. In the international arena, Petro-Canada's operations are focused on three exploration and production regions: Northwest Europe, principally the U.K. and Netherlands sectors of the North Sea; North Africa/Near East, encompassing Syria, Libya, Algeria and Tunisia; and Northern Latin America, where we have interests in a major gas producing operation in Trinidad and a prospective oil field development in Venezuela.
7 Petro-Canada Annual Information Form
The following table shows our estimates of Petro-Canada's total proved conventional crude oil, natural gas liquids (NGL) and bitumen reserves as at December 31, 2003 and average 2003 daily production before royalties. Synthetic crude oil reserves and production from our share of the Syncrude oil sands mining operation are also included.
CONVENTIONAL CRUDE OIL, NATURAL GAS LIQUIDS, BITUMEN AND SYNTHETIC CRUDE OIL PROVED RESERVES AND PRODUCTION, BEFORE DEDUCTION OF ROYALTIES
| | Proved Reserves
As at December 31, 2003
| | Daily Production
Year Ended
December 31, 2003
|
|---|
|
| | (millions of barrels)
| | (thousands of barrels)
|
|---|
| North American Gas | | | | |
| | Crude Oil | | 16.9 | | 5.5 |
| | Natural Gas Liquids | | 24.6 | | 11.4 |
| | |
| |
|
| | Total North American Gas | | 41.5 | | 16.9 |
| | |
| |
|
| East Coast Oil | | | | |
| | Hibernia, Offshore Newfoundland | | 34.2 | | 40.6 |
| | Terra Nova, Offshore Newfoundland | | 36.8 | | 45.5 |
| | |
| |
|
| | Total East Coast Oil | | 71.0 | | 86.1 |
| | |
| |
|
| Oil Sands – Bitumen | | | | |
| | MacKay River, Alberta | | 28.2 | | 10.7 |
| | |
| |
|
| International | | | | |
| | Northwest Europe | | | | |
| | | Crude Oil | | 60.7 | | 35.9 |
| | | Natural Gas Liquids | | 3.6 | | 1.8 |
| | North Africa/Near East | | | | |
| | | Crude Oil | | 255.7 | | 140.1 |
| | | Natural Gas Liquids | | 5.0 | | 3.0 |
| | Northern Latin America | | | | |
| | | Crude Oil | | 0.4 | | – |
| | |
| |
|
| | Total International | | 325.4 | | 180.8 |
| | |
| |
|
| Total Conventional Crude Oil, NGL and Bitumen | | 466.1 | | 294.5 |
| Oil Sands Mining – Synthetic Crude Oil | | | | |
| | Syncrude, Alberta | | 329.8 | | 25.4 |
| | |
| |
|
| Total Crude Oil, NGL, Bitumen and Synthetic Crude Oil | | 795.9 | | 319.9 |
| | |
| |
|
8 Petro-Canada Annual Information Form
The following table shows our estimates of Petro-Canada's total proved natural gas reserves at December 31, 2003 before royalties and 2003 average daily production of natural gas before royalties by major fields.
NATURAL GAS PROVED RESERVES AND PRODUCTION, BEFORE DEDUCTION OF ROYALTIES
| | Proved Reserves
As at December 31, 2003
| | Daily Production
Year Ended
December 31, 2003
|
|---|
|
| | (billions of cubic feet)
| | (millions of cubic feet)
|
|---|
| North American Gas | | | | |
| | Wildcat Hills area, Alberta | | 524 | | 154 |
| | Hanlan area, Alberta | | 316 | | 102 |
| | Jedney, Beg and Bubbles, B.C. | | 212 | | 38 |
| | Medicine Hat, Alberta | | 163 | | 38 |
| | Ricinus/Bearberry area, Alberta | | 154 | | 85 |
| | Laprise area, B.C. | | 107 | | 34 |
| | Alderson, Alberta | | 80 | | 22 |
| | Ferrier, Alberta | | 78 | | 19 |
| | Gilby/Wilson Creek, Alberta | | 70 | | 29 |
| | Other | | 326 | | 172 |
| | |
| |
|
| | Total North American Gas | | 2 030 | | 693 |
| | |
| |
|
| International | | | | |
| | Northwest Europe | | 126 | | 80 |
| | North Africa/Near East | | 65 | | 32 |
| | Northern Latin America | | 324 | | 63 |
| | |
| |
|
| | Total International | | 515 | | 175 |
| | |
| |
|
| Total Natural Gas Reserves and Production | | 2 545 | | 868 |
| | |
| |
|
We believe that the crude oil, natural gas liquids, natural gas, bitumen and synthetic crude oil reserve quantities are reasonable estimates consistent with current knowledge of the characteristics and extent of the productive formations, but such estimates are subject to upward or downward revisions as additional information regarding producing fields becomes available, as technology improves and as economic conditions change. Additional proved reserves are expected to be booked during the normal course of continuing development.
The following table shows, as a percentage, the source of revenue from sales of crude oil, natural gas liquids (NGL), bitumen, synthetic crude oil and natural gas.
SALES DISTRIBUTION OF UPSTREAM PRODUCTION
All Upstream Products (as a percentage)
| | 2003
| | 2002
|
|---|
|
| Sales to third parties and intersegment | | 100 | | 100 |
| Sales to investees | | – | | – |
| Sales or transfers to controlling shareholders | | – | | – |
9 Petro-Canada Annual Information Form
North American Gas
Western Canada
The primary operating regions of Petro-Canada's North American Gas business are Alberta and British Columbia where we are a major holder of developed and undeveloped natural gas rights. In 2003, Petro-Canada-operated properties accounted for 84 per cent of the Company's Western Canada conventional crude oil, field natural gas liquids and natural gas production.
In 2003, exploration and development drilling activity resulted in 458 gross (280 net) wells, including 412 gross (248 net) gas and nine gross (two net) oil wells, for an overall success rate of 92 per cent. Reserves extensions, discoveries, revisions and improved recovery added 113 billion cubic feet (bcf) of natural gas and 0.6 million barrels of conventional crude oil and natural gas liquids to proved reserves before royalties. Property acquisitions added 13 bcf of natural gas to proved reserves. Sales of producing properties with reserves totalling 25 bcf of natural gas and 8 million barrels of crude oil and natural gas liquids were completed during the year. Annual production before royalties totalled 251 bcf of natural gas and 6 million barrels of conventional crude oil and natural gas liquids.
The royalty regime is a significant factor in the profitability of crude oil and natural gas production. Royalties on conventional crude oil and natural gas owned by provincial governments are determined by regulation and may be amended from time to time. Royalty payments to provincial governments are generally calculated as a percentage of production and vary depending upon factors such as well production volumes, selling prices, method of recovery, location of production and date of discovery. Royalties payable on production of privately owned crude oil and natural gas are negotiated with the mineral rights owner. In 2003, Petro-Canada's average royalty rate in Western Canada was 25 per cent for conventional crude oil, natural gas liquids and natural gas.
Petro-Canada's natural gas program in Western Canada is focused on maintaining a concentrated, profitable production base. Our areas of concentration, particularly the Alberta Foothills and northeast British Columbia, are characterized by large reserves, complex geology and a high level of infrastructure ownership by Petro-Canada. A key objective is to add proved reserves at economic finding and development costs to profitably replace produced volumes. With the increasing maturity of the Western Canada Sedimentary Basin, this objective is becoming more challenging.
Petro-Canada operates 11 natural gas field processing plants with total gross processing capacity of approximately 1.1 bcf of natural gas per day, of which our share is approximately 670 mmcf/d. The key plants we operate are at Hanlan (Petro-Canada working interests – 41 per cent in sweet gas plant and 46 per cent in sour gas plant), Ferrier (Petro-Canada working interest – 99 per cent), Wildcat Hills (Petro-Canada working interest – 66 per cent), and Brazeau (Petro-Canada working interests – 47 per cent in sweet gas plant and 30 per cent in sour gas plant) in Alberta, and Boundary Lake (Petro-Canada working interests – 100 per cent in sweet gas plant and 50 per cent in sour gas plant) near the Alberta/British Columbia border. We also have varying working interests in other natural gas processing plants and field gathering facilities operated by other oil and gas companies of which our share is approximately 240 mmcf/d of design capacity.
We market natural gas produced by other companies in addition to our own production. In 2003, we sold 850 mmcf/d, down eight per cent from 926 mmcf/d in 2002. To achieve better control over sales volumes, prices and transportation-related costs, we focus on direct sales to end users, distribution companies, wholesale marketers and natural gas spot markets. Our marketing effort includes management of the gas portfolio, gas supply, pipeline commitments and customer relationships. The following table shows the market distribution of Petro-Canada's North America natural gas sales.
10 Petro-Canada Annual Information Form
NATURAL GAS SALES BY MARKET
| | 2003
| | 2002
|
|---|
| | mmcf/d
| | Per Cent of Total
| | mmcf/d
| | Per Cent of Total
|
|---|
|
| North American Gas Business | | | | | | | | |
| Sales to Aggregators | | | | | | | | |
| Canwest Gas Supply Inc. | | 32 | | 4 | | 37 | | 4 |
| ProGas Limited | | 38 | | 5 | | 34 | | 4 |
| Cargill | | 21 | | 2 | | 29 | | 3 |
| Other | | 4 | | 1 | | 6 | | 1 |
| | |
| |
| |
| |
|
| Total Sales to Aggregators | | 95 | | 12 | | 106 | | 12 |
| | |
| |
| |
| |
|
| Direct Sales | | | | | | | | |
| Alberta | | 351 | | 41 | | 409 | | 44 |
| U.S. Midwest | | 162 | | 19 | | 152 | | 16 |
| British Columbia & U.S. Pacific Northwest | | 78 | | 9 | | 101 | | 11 |
| California | | 45 | | 5 | | 46 | | 5 |
| Eastern Canada | | 43 | | 5 | | 46 | | 5 |
| Saskatchewan | | 8 | | 1 | | 7 | | 1 |
| | |
| |
| |
| |
|
| Total before Internal Sales | | 687 | | 80 | | 761 | | 82 |
| Sales within Petro-Canada | | 68 | | 8 | | 59 | | 6 |
| | |
| |
| |
| |
|
| Total Direct Sales | | 755 | | 88 | | 820 | | 88 |
| | |
| |
| |
| |
|
| Total Sales | | 850 | | 100 | | 926 | | 100 |
| | |
| |
| |
| |
|
| Total Direct Sales Exports | | 207 | | 24 | | 198 | | 21 |
| | |
| |
| |
| |
|
The Company has future commitments to sell and transport natural gas associated with normal operations. Under future fixed-price commitments entered into during the 1990s, approximately 12 million cubic feet per day (1.9 per cent of our estimated 2004 natural gas production in Western Canada) has been sold at an average plant gate netback price of $2.56 per thousand cubic feet (mcf). In 2005, the volume of natural gas sold under these fixed-price contracts will decrease to 10.1 million cubic feet per day at a price of $3.16 per mcf.
Mackenzie Delta/Corridor, Northwest Territories
With interests in six blocks, covering approximately one million gross undeveloped acres (0.6 million net acres), Petro-Canada is one of the largest leaseholders in the Mackenzie Delta/Corridor. Petro-Canada's holdings comprise four exploration licences and two Inuvialuit land concessions. We are the operator of the four licences. Our net work commitments on the four licences total approximately $140 million over five years and are guaranteed by performance bonds totalling approximately $35 million. Work commitments on the Inuvialuit land concessions include seismic acquisition and drilling a total of three wells. In 2002, a natural gas discovery at the Tuk M-18 well tested at restricted rates up to 30 mmcf/d. This has allowed us to make a non-binding nomination of 30 mmcf/d to support the development proposal for the Mackenzie Valley pipeline. Having secured our most prospective acreage for future exploration, and pending further pipeline developments, our strategy is to defer any major activity in the Mackenzie Delta/Corridor over the 2003/2004 winter drilling season and re-evaluate our program next year as events unfold.
Alaska
Our focus in Alaska is the foothills area north of the Brooks mountain range. A field geological study has confirmed that the geology and prospectivity of this area is similar to the Alberta Foothills, where Petro-Canada has developed considerable
11 Petro-Canada Annual Information Form
expertise and has had significant success finding natural gas. Our Alaskan landholdings at year-end totalled 415 000 acres (gross and net). While it is unlikely the region will be serviced by a pipeline for some time, Petro-Canada's acreage is close to a proposed pipeline route to southern markets.
East Coast Oil
Petro-Canada has crude oil and natural gas interests off Canada's East Coast, principally on the Grand Banks area east of Newfoundland. To date, our focus has been directed, primarily, towards our major Grand Banks oil field developments, Hibernia, Terra Nova and White Rose. The Canada-Newfoundland Offshore Petroleum Board sets the allowable production rate for these projects. At December 31, 2003, the allowable average daily gross field production rate for Hibernia was 220 000 barrels of oil per day and for Terra Nova was 180 000 barrels of oil per day. Actual production levels are affected by a variety of factors including weather and sea states, sea ice and iceberg conditions, well and reservoir performance and maintenance programs. We expect that the experience, technology and infrastructure developed for existing projects will form the basis for potential development of other discoveries on the Grand Banks.
Hibernia
The Hibernia oil field lies approximately 315 kilometres east-southeast of St. John's, Newfoundland and Labrador in 80 metres of water. Petro-Canada has a 20 per cent interest in both the field and the production platform. The Hibernia field, encompassing the Hibernia and Ben Nevis Avalon reservoirs, is estimated to have a remaining production life of 18 to 20 years. Assessment of the development potential of the Ben Nevis Avalon continues. A comprehensive evaluation is underway on the results of the B-44 appraisal well, drilled late in 2002. Analysis of the reservoir will determine if additional delineation drilling is necessary before further development is started or pursued.
At December 31, 2003, there were 19 producing oil wells, nine water injection wells and five gas injection wells in operation in the Hibernia formation, and three producing wells and two water injection wells in operation in the Ben Nevis Avalon formation. Field production is transported by shuttle tanker from the platform to a transshipment terminal on the Avalon Peninsula at Whiffen Head, Newfoundland and Labrador or directly to market, if tanker schedules permit. Crude oil delivered to the transshipment facility is transferred to storage tanks and loaded onto tankers for transport to markets in Eastern Canada and the United States. Petro-Canada has a 14 per cent ownership interest in the transshipment facility.
The royalty regime for the Hibernia project has three tiers: gross royalty, net royalty and supplementary royalty. An initial gross royalty of one per cent of gross field revenue increased to two per cent on September 1, 1999, to three per cent on March 1, 2001, to four per cent on June 1, 2002 and to five per cent on July 1, 2003. The gross royalty rate will remain at five per cent until net royalty payout is reached. The gross royalty is indexed to crude oil prices under certain conditions. Upon achieving payout, including a specified return allowance, the net royalty payable becomes the greater of 30 per cent of net revenue or five per cent of gross revenue. After a further level of payout is reached, which includes an additional return allowance, a supplementary royalty of 12.5 per cent of net revenue also becomes payable. Hibernia royalties averaged $1.08 per barrel in 2003.
Terra Nova
The Terra Nova oil field, which lies approximately 350 kilometres east-southeast of St. John's, Newfoundland and Labrador in 95 metres of water, was discovered by Petro-Canada in 1984. Petro-Canada is operator of the field and holds a 34 per cent working interest in the development. The Terra Nova field is estimated to have a remaining production life of approximately 12 to 14 years.
Development of the Terra Nova field, including final commissioning of the floating production, storage and offloading vessel (FPSO), was completed in early January 2002. At 2003 year-end, eight producing oil wells, three water injection wells and two gas injection wells were in operation. Terra Nova utilizes the same system of shuttle tankers and transshipment terminal that is currently used for Hibernia and also transports its crude oil to markets in Eastern Canada and the United States.
12 Petro-Canada Annual Information Form
The Terra Nova royalty regime has three tiers. The royalty consists of a sliding scale basic royalty payable throughout the project's life with two additional tiers of net royalties payable upon the achievement of specified levels of profitability. The basic royalty is payable as a per cent of gross field revenue, with an initial rate of one per cent, and rises to 10 per cent depending on cumulative production levels and the occurrence of simple payout. After tier 1 payout, including a specified return allowance, has been reached, net royalty will become the greater of the basic royalty or 30 per cent of net revenue. An additional net royalty equal to 12.5 per cent of net revenue will be payable once a further level of payout, including an additional return allowance, is attained. In 2003, Terra Nova royalties averaged $0.84 per barrel.
White Rose
In 2002, Petro-Canada and Husky Oil Operations Limited, the operator, began development of the White Rose oil field (Petro-Canada's ownership interest – 27.5 per cent), located approximately 350 kilometres east of St. John's, Newfoundland and Labrador. Solid progress in 2003 kept the White Rose project on track for production start-up in early 2006. Key components have either been completed or remain on schedule, except construction of the topsides for the project's FPSO. Concrete steps have been taken to make up for earlier delays in topsides and engineering and procurement and still deliver first oil in early 2006. The hull of the FPSO was constructed in a South Korean shipyard and, in early 2004, following sea trials and installation of the turret, began its journey to Marystown, Newfoundland and Labrador, where installation of the topsides, hook-up and commissioning will take place. At year-end 2003, construction of the FPSO, which has a planned production capacity of 100 000 barrels of oil per day, was approximately two-thirds complete. Progress was also made during 2003 on fabrication of the subsea production systems, including risers, flowlines and umbilicals, manifolds and wellheads. Development plans for White Rose include the drilling of 19 to 21 wells to recover an estimated 200 million to 250 million barrels of oil over a 10- to 12-year time frame. Ten wells – five producing wells, four water injection wells and one gas injection well – will be drilled prior to production start-up. Field development activity in 2003 included completion of three glory holes – nine-metre-deep excavations to protect the subsea wellheads and associated production equipment against icebergs – and commencement of the development drilling program. Estimated average peak gross production of 90 000 b/d (Petro-Canada's share before royalties – 24 700 barrels per day) is believed sustainable for a period of about four years. Petro-Canada's estimate of the project's total pre-production cost, including the first 10 wells, is $2.3 billion. Late in the third quarter of 2003, encouraging results from delineation drilling in a previously undrilled fault block south of the main White Rose reservoir indicate potential for incremental oil reserves in support of the White Rose development. Two chartered tankers will ship White Rose production directly to markets in Eastern Canada and the United States.
Generic Offshore Oil Royalty Regime
In July 2003, the Government of Newfoundland and Labrador promulgated regulations for the royalty regime that will apply to the development of petroleum resources in offshore areas other than Hibernia and Terra Nova. The generic offshore royalty regime consists of a sliding scale basic royalty payable throughout a project's life, and a two-tier net royalty payable upon the achievement of specified levels of profitability. The basic royalty is calculated as a percentage of gross field revenue commencing at one per cent and rising to 7.5 per cent depending on cumulative production levels and the achievement of simple payout. Upon reaching tier 1 payout, including a return allowance, the net royalty is calculated as the greater of the basic royalty or 20 per cent of net revenue. An additional 10 per cent net royalty rate is payable once a higher level of return on investment is attained. The generic royalty will apply to the White Rose development.
Other Offshore Exploration and Development
In addition to current East Coast oil developments, Petro-Canada holds interests in a number of discoveries including the Hebron/Ben Nevis oil field discoveries, where our interest is 23.9 per cent. Elsewhere offshore Newfoundland, Petro-Canada holds significant acreage interests in a number of unexplored or lightly explored areas, particularly in the Flemish Pass and Salar basins, where the focus is on oil discovery. In 2003, two deep water exploration wells drilled in the Flemish Pass region were unsuccessful.
13 Petro-Canada Annual Information Form
Oil Sands
Petro-Canada's Oil Sands business comprises our ownership position in the Syncrude oil sands mining operation, our 100 per cent ownership of the MacKay Riverin situ bitumen producing operation and the potential for furtherin situ development of our extensive oil sands acreage.
Oil Sands In Situ – Bitumen
In September 2002, Petro-Canada successfully completed construction of its 100 per cent owned,in situ bitumen production facility at MacKay River. Following introduction of steam to the reservoir, Petro-Canada commenced bitumen production in November 2002. During 2003 the reservoir continued to respond well to steam injection but production was curtailed when the plant was shut-in in April to allow for process modifications to resolve a water treating issue. Production resumed after the shut-in at a slower rate than originally forecast. Target, design-rate production of 30 000 b/d is now anticipated in mid-2004. The MacKay River reserves are expected to sustain plateau production of 25 000 to 30 000 b/d, after accounting for turnarounds and unplanned events, for approximately 25 to 30 years. The extraction process at MacKay River utilizes Steam-Assisted Gravity Drainage (SAGD), a technology that Petro-Canada participated in developing through its involvement in the Underground Test Facility (UTF). SAGD combines horizontal drilling with thermal steam injection. Steam is injected into the reservoir through the top well of a horizontal well pair to mobilize the bitumen, which flows to the lower producing well. This technology can economically recover over 60 per cent of the bitumen in place. The initial development at MacKay River includes two well pads of 12 and 13 horizontal well pairs. Well pairs are about 700 - 750 metres in length and are expected to produce about 1 200 b/d of bitumen. On average, wells are expected to have a six- to eight-year life. New well pads will be built and drilling will continue as necessary throughout the life of the field.
More than 90 per cent of the water used at MacKay to generate steam is recycled – a key feature of the environmental efficiency of the facility. The bitumen production from the project is currently being transported to the Athabasca Pipeline Terminal via a lateral insulated pipeline leased from Enbridge Pipelines (Athabasca) Inc. To enable onward shipment through major North American pipelines, the bitumen is diluted with synthetic crude oil, provided under a long-term supply arrangement with Suncor Energy Marketing Inc.
Starting in 2004, a 165-megawatt co-generation facility completed by TransCanada Energy Ltd. late in 2003 will contribute to operating cost reduction, as well as increase steam capacity at MacKay River. By converting waste heat from an existing gas turbine, the co-generation facility is expected to improve overall energy efficiency and reduce MacKay River gas consumption by about 10 to 15 per cent. The co-generation plant is owned by TransCanada Energy.
The MacKay River operation is subject to the 1997 Alberta Oil Sands Royalty Regulation. Prior to royalty payout, which includes a specified return allowance, the royalty is calculated as one per cent of gross revenue. After royalty payout, the royalty is based on the greater of one per cent of gross revenue or 25 per cent of net revenue. The net revenue is determined by subtracting allowed operating and capital costs from gross revenue. In 2003, the royalty paid was $0.12 per barrel.
Following start-up of MacKay River in 2002, our plans anticipated creation of a large-scale, fully-integrated bitumen production and refining operation centered around our best-in-class Edmonton refinery. However, over the past year, as we completed our basic engineering for conversion of the Edmonton refinery, we began to foresee the same significant cost escalations as were taking place in all other large bitumen upgrading projects within the industry. Our disciplined project management processes prevented us from proceeding with the project at an uneconomic level but required the write-off against earnings of the engineering costs incurred to that date. After evaluating our options, we formulated a new, scaled-down plan for upgrading and refining oil sands feedstock at Edmonton. The new plan retains our longer-term objective of a fully integrated bitumen production and refining operation, while also providing the flexibility to pace the upstream portion of our strategy without having to move in lockstep with refinery projects. The plan builds on the $1.4 billion strategic investments we are already making in the refinery for long-term positioning and gasoline/diesel desulphurization. Key elements of the new plan (with new investment estimated at $1.2 billion) include building new crude and vacuum units, expanding the capacity of the existing coker and building additional sulphur and hydrogen capability. The new configuration will allow the refinery to directly upgrade approximately 26 000 b/d of bitumen and process approximately 48 000 b/d of sour synthetic crude oil.
14 Petro-Canada Annual Information Form
These lower-cost feedstocks will replace the conventional feedstock that is refined today. The refinery will also continue to process about 50 000 b/d of sweet synthetic crude.
Initially, on completion of the reconfiguration in 2008, Petro-Canada will fill out the refinery's bitumen processing capability through the purchase 26 000 b/d of bitumen from other producers. This external feedstock will be replaced in due course by supply from our nextin situ SAGD development. Another important element of the plan is an agreement with Suncor Energy Inc. that takes effect in 2008, subject to regulatory approval. Under the agreement, Suncor will process a minimum 27 000 b/d of our MacKay River bitumen production, on a fee-for-service basis, to produce an estimated 22 000 b/d of sour synthetic crude oil. This sour crude, combined with an additional 26 000 b/d of sour synthetic crude purchased from Suncor, will complete our feedstock requirements. Both the processing and sales components of the bitumen agreement will be for minimum 10-year terms.
As part of our revised oil sands strategy, earlier plans for development of Meadow Creek (owned 75 per cent by Petro-Canada) as our nextin situ bitumen production project have been suspended. We now believe that smaller plants, similar to MacKay River, are the best approach. As a result, our oil sands winter drilling evaluation program will focus on delineation of "sweet spots" at Meadow Creek and evaluation of the potential for expansion at MacKay River. Our revised plans anticipate our nextin situ project coming on-stream late in this decade.
Oil Sands Mining – Syncrude
Petro-Canada has a 12 per cent interest in Syncrude, the world's largest oil sands mining operation. Located north of Fort McMurray, Alberta, Syncrude is a joint venture formed to mine shallow deposits of oil sands, and to extract and upgrade bitumen to produce synthetic crude oil. Syncrude holds eight tar sands leases issued by the Province of Alberta, covering approximately 255 000 acres. Syncrude has an estimated remaining reserve life in excess of 35 years. Three mines are currently in operation at Syncrude: the Base mine where operations are carried out using drag lines, bucket wheel reclaimers and belt conveyors; and the North mine and Aurora mine, where truck, shovel and hydro-transport systems are in use. An extraction process recovers about 91 per cent of the crude bitumen contained in the mined sands. Refining processes upgrade the bitumen into high quality, light (32 degree API) sweet synthetic crude oil. Syncrude's synthetic crude oil production is processed at refineries in Edmonton, Eastern Canada and the United States.
In 1997, the Syncrude owners approved a staged growth strategy for the next decade. To date, plant expansions have increased Syncrude's annual gross production capacity from 200 000 b/d in 1996 to 250 000 b/d. The third stage expansion is behind schedule. More information on the schedule and costs to complete Stage 3 is expected in the first half of 2004. On completion, the Stage 3 expansion will increase the gross production capacity to approximately 350 000 b/d (Petro-Canada share – 42 000 b/d).
During 2001, Syncrude completed the transition from a project-specific contractual royalty to the 1997 Province of Alberta Oil Sands Royalty Regulation. Effective January 2002, the royalty payable by Syncrude to the Province of Alberta was set at the greater of one per cent of gross revenue or 25 per cent of net revenue. The net revenue is determined by subtracting allowed operating and capital costs from gross revenue. In 2003, the royalty paid averaged $0.48 per barrel.
International
Northwest Europe
In Northwest Europe, Petro-Canada's production comes from the United Kingdom and Netherlands sectors of the North Sea. Exploration programs extend into Denmark and the Faroe Islands. Our major focus is the North Sea, where extensive development has taken place since the early 1970s. While the basin is now a mature play, moderate-size fields continue to be developed and exploited.
In the U.K. sector, Petro-Canada has interests in six operated and 12 non-operated licences. We are focused on two areas: the Outer Moray Firth and Central North Sea. In the Outer Moray Firth, we hold a 20.6 per cent working interest in the Scott oil field and production platform and a 9.4 per cent working interest in the Telford oil field, a subsea tieback to the Scott platform. The Scott field is a significant contributor to Petro-Canada's international oil production. High quality crude oil
15 Petro-Canada Annual Information Form
from Scott and Telford is transported to shore via the Forties Pipeline System; associated gas is transported via the SAGE gas pipeline system.
In Central North Sea, our interests are centered on the Triton development area, which comprises the joint development of the Guillemot West and Northwest fields, the Bittern field (Petro-Canada working interest – 4.7 per cent) and the recently developed Clapham field (Petro-Canada – 100 per cent working interest). The Clapham development included two producing wells and two injector wells, as well as subsea facilities to tie the wells into the Triton FPSO. Production from the Clapham development, which came on stream in November 2003, reached a peak of 15 000 b/d prior to year-end. Nine oil wells and one gas production well in the Guillemot West and Northwest fields are also tied back to the Triton facility. The high quality crude oil gathered at Triton is shipped via tanker, while gas is exported through the SEGAL system to the U.K. In the third quarter of 2003, Petro-Canada enhanced its position in and around the Guillemot West and Northwest fields with the acquisition of a package of assets from Shell U.K. Limited and Esso Exploration and Production U.K. Limited. (The assets acquired from Shell were for cash plus Petro-Canada's 25 per cent interest in U.K. Block 14/28b. The assets acquired from Esso were solely for cash.) As a result of this transaction, Petro-Canada's working interest in the Guillemot West and Northwest fields increased to 90 per cent and in the Triton FPSO to 33.11 per cent. Petro-Canada also acquired interests in a number of nearby undeveloped discoveries, including a 100 per cent interest in Block 21/23b containing the Pict discovery (previously named Grebe). At 2003 year-end, design work was underway for the possible future tie-in of the Pict field to the Triton FPSO.
In the Netherlands sector, we have interests in four operated and 24 non-operated licences with oil and gas production onshore and offshore. The major source of gas production is from blocks L8b and L5c (Petro-Canada working interests – 25 per cent and 30 per cent, respectively). Petro-Canada also holds a 12 per cent interest in the BP-operated onshore Bergen gas storage facility. The produced gas is transported to shore by pipeline and sold to NV Nederlandse Gasunie under long-term delivery/offtake contracts. In October 2003, first production was achieved from development of the block L5b gas discovery (Petro-Canada working interest – 30 per cent). Production is from one well connected via a new, normally unmanned platform, to the existing production platform on the L8-P4 field (Petro-Canada working interest – 28.3 per cent). At year-end, production had reached a peak of 18 mmcf/d. Petro-Canada's oil production from the Netherlands sector is primarily from the Petro-Canada operated Hanze field (Petro-Canada working interest – 45 per cent). Oil from the Hanze platform is exported by dedicated tanker with the cargoes marketed spot into Northwest Europe.
In the U.K. and Netherlands sectors of the North Sea, our strategy is infrastructure-centred with the focus on expanding our present portfolio. In Danish waters, we hold interests in three non-operated licences. In the Faroe Islands area, we have an interest in one non-operated licence.
North Africa/Near East
This core region, which combines Syria with our North Africa interests, provides a substantial portion of Petro-Canada's international production.
In Syria, Petro-Canada's producing interests are consolidated under production sharing contracts with Syria Shell Petroleum Development and the Syrian Petroleum Company. This joint venture, under the name Al Furat Petroleum Company (AFPC), produces about 50 per cent of Syrian production. AFPC produces oil and gas from 36 fields with 220 wells in three concession areas. Petro-Canada's working interests range from 33 to 37 per cent. AFPC's near term goal is to minimize the rate of production decline and maximize recovery from these mature fields. Oil produced by the joint venture is exported via the Scot pipeline to the coastal Banias terminal. The natural gas production is sold into the Syrian domestic system.
In mid-2003, Petro-Canada, together with Syria Shell Petroleum Development B.V., finalized an agreement with the Syrian government that extends rights to deep and lateral reserves on existing acreage. The agreement supplements the three existing Production Sharing Contracts (PSC) under which the companies operate, through AFPC. The new agreement is of particular significance as production from this area will partially offset the production declines we are seeing from existing fields.
Later in 2003, Petro-Canada signed a PSC for exploration Block II with the Syrian government and the Syrian Petroleum Company. Petro-Canada holds a 100 per cent interest as operator of the PSC. The work program includes reprocessing of
16 Petro-Canada Annual Information Form
existing and acquisition of new seismic data and the drilling of two exploration wells. The block is located in northeast Syria, covers an area of 1 680 000 acres (6 800 square kilometres) and is within workable distance of existing infrastructure.
In Libya, Petro-Canada is one of the country's largest producers through its 49 per cent interest in Veba Oil Operations (VOO), a joint venture with the National Oil Corporation of Libya (NOC). Most of Libya's production is high quality, low sulphur (sweet) crude oil. The country is a major oil exporter, particularly to Europe. As Libya is a member of the Organization of the Petroleum Exporting Countries (OPEC), Libyan production is constrained by OPEC quotas. Petro-Canada's major interest in Libya is a 49 per cent participating interest in a number of concessions that are operated by VOO. Operation of the joint venture encompasses our exploration and producing interests in eight concessions, covering 6 225 000 acres (25 190 square kilometres). Most of the concessions are onshore in the Sirte basin. Currently, production from the joint venture is from the combined operations of more than 20 fields. Petro-Canada also has equity interests in the Ras Lanuf export terminal and various pipelines, through which the majority of the production is exported. Petro-Canada's production is currently sold on contract to the NOC.
Under a separate Exploration and Production Sharing Agreement (EPSA) with NOC, Petro-Canada also holds an interest in the 126 000-acre (511-square-kilometre) En Naga block, which is also located in the Sirte basin and contains the En Naga North and En Naga West oil fields. The En Naga development, including construction of a related 96-kilometre pipeline to the Samah field and connection to the onward transmission system, came on stream in February 2003. In December production volumes averaged approximately 3 600 b/d. On completion of initial development, field operation was transferred to VOO.
In Algeria, Petro-Canada andSONATRACH, the Algerian national oil company, are parties to a production sharing agreement for the exploration and development of the Tinrhert block, located over 1 000 kilometres southeast of Algiers. Petro-Canada acts as the operator of this project. We have a 70 per cent interest in the Tamadanet oil field, located on the Tinrhert block, withSONATRACH holding the remaining 30 per cent. In 2003, our total share of production before royalty and the sharing of profit oil averaged 700 b/d, down from 1 600 b/d in 2002 due to natural decline. At year-end 2003, an exploration well was being drilled at another location on the block. In the fourth quarter of 2003, Petro-Canada was successful in its bid for the Zotti Block offered in the Algerian 4th Licensing Round. Petro-Canada, with a 100 per cent working interest, will be the operator of this 691 000-acre (2 800-square-kilometre) block. The award is subject to final government approval. The work commitment includes shooting 400 kilometres of 2-D seismic and drilling one well.
During the third quarter of 2003, Petro-Canada farmed-in on the 845 000-acre (3 420-square-kilometre) Melitta Block in Tunisia and, upon formal ratification by the authorities, will become operator with a 72.5 per cent working interest. The block is located mainly offshore in the Mediterranean Sea. The farm-in agreement provides for an $18 million exploration program with at least 2 000 kilometres of seismic gathering and the drilling of two exploratory wells. We also have an agreement with the Tunisian national oil company, ETAP, to explore jointly on the 1.8-million-acre (7 300-square-kilometre) Tataouine Block in south central Tunisia. This block is currently under evaluation by Petro-Canada.
In 2003, we commenced a process to sell our 40 per cent interest in the Temir licence in Kazakhstan (including the Saigak oil field), as it was a non-core asset in a region where we have no other business interests. In the first quarter of 2003, in anticipation of the impending sale, we recorded an after-tax charge of $46 million for the impairment of the Kazakhstan asset. We closed the sale in February 2004.
Northern Latin America
In Northern Latin America, Petro-Canada's operations are focused on Trinidad where we hold a 17 per cent working interest in the North Coast Marine Area 1 (NCMA-1) gas project in partnership with British Gas, the operator. Our participation is governed by a production sharing contract. The current program includes development of three gas fields – Hibiscus, Poinsettia and Chaconia. Initial field development, including commissioning of the Hibiscus production platform, was completed in August 2002. Natural gas production came on stream in the third quarter of 2002. In 2003, a successful exploration well drilled from the Hibiscus platform was completed as a producer, providing additional gas volumes to the project. Project production is being delivered by pipeline to the liquefied natural gas facility operated by Atlantic LNG at Point Fortin for liquefaction and subsequent sale into United States markets.
17 Petro-Canada Annual Information Form
In western Venezuela, Petro-Canada holds a 50 per cent working interest in the La Ceiba block that straddles the eastern shores of Lake Maracaibo. In 2003, PDVSA, the national oil company of Venezuela, approved an agreement for an extended production test to start in 2004 to evaluate the commercial viability of the La Ceiba oil discovery. Late in 2003, discussions were terminated regarding the potential acquisition of the Cerro Negro heavy oil assets in Venezuela as pre-emptive rights held by other joint owners could not be resolved.
Reserves
At year-end 2003, proved reserves before royalties (including synthetic crude oil from oil sands mining) totalled 1 220 million barrels of oil equivalent, down five per cent from a year earlier. As part of our long-term reserves replacement strategy, we have added exploration capability and funding – especially internationally – to develop a balanced exploration program aimed at increasing our reserves base over time. In particular, we will target long-life reserves, and aim for greater Petro-Canada operatorship. Our goal is a growth portfolio that provides a balanced range of risk/reward opportunities. The new exploration acreage recently acquired in Syria, Tunisia and Algeria are early examples of initiatives in the International business. In Canada, Petro-Canada continues to pursue opportunities off the East Coast and North of 60 while in Western Canada, we plan to gradually increase our exploration program over time to improve reserves replacement.
In order to harmonize its oil and gas disclosure in both Canada and the U.S., Petro-Canada applied for, and received, certain exemptions to reserves disclosure requirements as set out in National Instrument 51-101;Standards of Disclosure for Oil and Gas Activities (NI 51-101), which was adopted in 2003 by the securities regulatory authorities in Canada. These exemptions permit Petro-Canada to use its own staff of qualified reserves evaluators to prepare the Company's reserves estimates and to use U.S. Securities and Exchange Commission (SEC) and Financial Accounting Standards Board (FASB) standards when reporting reserves. Petro-Canada strongly believes that its use of its own staff of qualified reserves evaluators who are familiar with the Company's oil and gas assets as a result of working with them on a day-to-day basis, combined with independent third party audit/evaluation of both its reserves processes and its reserves estimates, provides a level of confidence in its reserves data that is at least as good as would be provided if the work was done solely by a third party.
Petro-Canada's staff of qualified reserves evaluators determine the Company's reserves data and reserves quantities based on corporate-wide policies, procedures and practices. These reserves policies, procedures and practices conform with the requirements of Canadian as well as SEC regulations and the Association of Professional Engineers, Geologists and Geophysicists of Alberta Standard of Practice for the Evaluation of Oil and Gas Reserves for Public Disclosure. To confirm the quality of the reserves policies, procedures and practices and the internally generated reserves estimates, Petro-Canada employs the services of independent engineering evaluators/auditors. During 2003, independent petroleum reservoir engineering consultants Sproule Associates Limited (Sproule) and Gaffney, Cline & Associates Ltd. (GCA) conducted evaluations, technical audits and reviews of Petro-Canada's hydrocarbon reserves. GCA completed an independent audit of 70 per cent of the Company's proved crude oil, natural gas and natural gas liquids reserves outside of Canada. Similarly, Sproule audited Petro-Canada's proved oil and gas reserves estimates for Hibernia and Terra Nova, evaluated 54 per cent of Western Canada proved conventional oil and gas reserves and reviewed the balance of Western Canada, White Rose and Syncrude. The independent engineering evaluators'/auditors' reports concluded that the Company's year-end 2003 proved reserves estimates are reasonable.
Sproule and GCA also audited Petro-Canada's reserves policies, procedures and practices and concluded that Petro-Canada's reserve booking standards meet applicable disclosure regulations, that management is complying with those standards and the reserves process is performed in a manner and standard consistent with the auditors' practices. In addition, PricewaterhouseCoopers LLP, as contract internal auditor, tested the non-engineering management control processes used in establishing reserves.
As permitted by its exemption granted pursuant to NI 51-101, Petro-Canada's reserves data and other oil and gas disclosure in this annual information form are made in accordance with U.S. disclosure requirements and practices and may differ from Canadian domestic standards and practices as set out in NI 51-101. The proved reserves quantities disclosed herein are calculated using constant year-end prices and costs as required by the SEC and FASB standards. Canadian disclosure requirements, as set out in NI 51-101, would require disclosure of proved reserves and future net revenue calculated at constant prices as well as disclosure of proved and probable reserves and related future net revenue calculated at forecast prices and costs. The definition of proved reserves under NI 51-101 also differs from that of the SEC but the difference should not be material. Section 6.5 of the Canadian Oil and Gas Evaluation Handbook (the source document for reserves definitions under NI 51-101) supports this view.
18 Petro-Canada Annual Information Form
Petro-Canada's Reserves Processes
Petro-Canada has a well-established reserves management process. The key components of the process are:
Reserves Steering Committee: Chaired by the Senior Vice-President, North American Natural Gas, the Steering Committee meets regularly to address issues regarding the reserves evaluation and reporting processes. Senior managers representing each Upstream business unit plus Finance and Accounting make up this committee.
Reservoir Engineering Organization: One or more reservoir engineering supervisors are responsible for the functional guidance of reservoir engineering within each Upstream business unit. The supervisors ensure that the appropriate standards, processes and quality assurance checks are applied to reservoir engineering activities including reserve evaluation. The supervisors, as responsible qualified reserves evaluators, sign the annual reserve evaluations for their respective areas.
Reserves Definitions, Policies, Procedures and Practices: Petro-Canada has developed internal policies, procedures and practices to assist evaluation personnel. These are designed to meet internal and external reporting requirements. They are updated annually and reviewed with the reservoir engineering staff and are maintained for reference on the reservoir engineering Web site within Petro-Canada's intranet.
Major Property Reviews: Each year, prior to business plan development, a series of reviews is conducted with interdisciplinary management on our major properties. These reviews are intended to ensure that there is a current, accurate and appropriately communicated understanding of these assets and their associated opportunities.
Reserves Software Tools: Petro-Canada employs a high quality technical toolkit for reservoir engineering. This software supports the analyses of technical and economic parameters required for reserve evaluation. Ongoing training and competency assessment is used to support the effective use of the toolkit.
Independent Evaluation/Audit/Review: Independent qualified reserve evaluators are engaged to audit and/or evaluate our internal evaluation processes and to perform such tests as they deem appropriate to ensure Petro-Canada's reserves are appropriately evaluated. The independent evaluators' observations and recommendations are reviewed with senior management and are used to guide process improvement activities.
Reserves Review and Disclosure Process: In December each year, the business unit management in each business unit reviews the reserves data prepared by the reservoir engineering staff. Also in December, Petro-Canada's year-end reserves and preliminary reports from the independent evaluators are reviewed by the Reserves Steering Committee and a copy of the preliminary reserves report is supplied to the external financial auditor. In January, the final reserves report is reviewed with the Executive Leadership Team and the Corporate Governance and Nominating Committee of the Board, which has been assigned the roles and responsibilities of the Reserves Committee under NI 51-101.
The following tables show, for the years indicated, Petro-Canada's estimates of our proved reserves, before and after deduction of royalties, for each of conventional crude oil and field natural gas liquids, bitumen, synthetic crude oil (from mining operations) and natural gas.
19 Petro-Canada Annual Information Form
NORTH AMERICA PROVED RESERVES BEFORE DEDUCTION OF ROYALTIES 1,2,3,4,5
| |
| |
| |
| |
| | Total North America Conventional
| |
| |
|---|
| |
| |
| | East Coast 6
| |
| | Syncrude Mining Operation 7
| |
|---|
| | Western Canada
| |
| |
|---|
| | Oil Sands 8
| | Crude Oil, NGL & Bitumen
| |
| |
|---|
| | Crude Oil & NGL
| | Natural Gas
| | Crude Oil & NGL
| | Natural Gas
| | Synthetic Crude Oil
| |
|---|
| | Bitumen
| |
|---|
| |
| | (mmbbls)
| | (bcf)
| | (mmbbls)
| | (mmbbls)
| | (mmbbls)
| | (bcf)
| | (mmbbls)
| |
|---|
| Beginning of year 2002 | | 54 | | 2 228 | | 42 | | 33 | | 129 | | 2 228 | | 310 | |
| Revisions of previous estimates 16 | | 3 | | (49 | ) | 52 | | – | | 55 | | (49 | ) | 24 | |
| Sale of reserves in place | | – | | (5 | ) | – | | – | | – | | (5 | ) | – | |
| Purchase of reserves in place | | – | | 14 | | – | | – | | – | | 14 | | – | |
| Discoveries, extensions and improved recovery | | 5 | | 256 | | – | | – | | 5 | | 256 | | – | |
| Production | | (7 | ) | (263 | ) | (26 | ) | (1 | ) | (34 | ) | (263 | ) | (10 | ) |
| | |
| |
| |
| |
| |
| |
| |
| |
| End of year 2002 | | 55 | | 2 181 | | 68 | | 32 | | 155 | | 2 181 | | 324 | |
| Revisions of previous estimates 16 | | (1 | ) | 6 | | 35 | | – | | 34 | | 6 | | 15 | |
| Sale of reserves in place | | (8 | ) | (25 | ) | – | | – | | (8 | ) | (25 | ) | – | |
| Purchase of reserves in place | | – | | 13 | | – | | – | | – | | 13 | | – | |
| Discoveries, extensions and improved recovery | | 1 | | 106 | | – | | – | | 1 | | 106 | | – | |
| Production | | (6 | ) | (251 | ) | (32 | ) | (4 | ) | (42 | ) | (251 | ) | (9 | ) |
| | |
| |
| |
| |
| |
| |
| |
| |
| End of year 2003 | | 41 | | 2 030 | | 71 | | 28 | | 140 | | 2 030 | | 330 | |
| | |
| |
| |
| |
| |
| |
| |
| |
NORTH AMERICA PROVED RESERVES AFTER DEDUCTION OF ROYALTIES 1,2,3,4,5
| |
| |
| |
| |
| | Total North America Conventional
| |
| |
|---|
| |
| |
| | East Coast 6
| |
| | Syncrude Mining Operation 7
| |
|---|
| | Western Canada
| |
| |
|---|
| | Oil Sands 8
| | Crude Oil, NGL & Bitumen
| |
| |
|---|
| | Crude Oil & NGL
| | Natural Gas
| | Crude Oil & NGL
| | Natural Gas
| | Synthetic Crude Oil
| |
|---|
| | Bitumen
| |
|---|
| |
| | (mmbbls)
| | (bcf)
| | (mmbbls)
| | (mmbbls)
| | (mmbbls)
| | (bcf)
| | (mmbbls)
| |
|---|
| Beginning of year 2002 | | 42 | | 1 736 | | 40 | | 32 | | 114 | | 1 736 | | 272 | |
Revisions of previous
estimates 16 | | 2 | | (62 | ) | 46 | | – | | 48 | | (62 | ) | 16 | |
| Sale of reserves in place | | – | | (4 | ) | – | | – | | – | | (4 | ) | – | |
| Purchase of reserves in place | | – | | 11 | | – | | – | | – | | 11 | | – | |
| Discoveries, extensions and improved recovery | | 4 | | 196 | | – | | – | | 4 | | 196 | | – | |
| Production | | (5 | ) | (204 | ) | (26 | ) | (1 | ) | (32 | ) | (204 | ) | (10 | ) |
| | |
| |
| |
| |
| |
| |
| |
| |
| End of year 2002 | | 43 | | 1 673 | | 60 | | 31 | | 134 | | 1 673 | | 278 | |
Revisions of previous
estimates 16 | | – | | 4 | | 38 | | 1 | | 39 | | 4 | | 21 | |
| Sale of reserves in place | | (7 | ) | (19 | ) | – | | – | | (7 | ) | (19 | ) | – | |
| Purchase of reserves in place | | – | | 10 | | – | | – | | – | | 10 | | – | |
| Discoveries, extensions and improved recovery | | 1 | | 81 | | – | | – | | 1 | | 81 | | – | |
| Production | | (5 | ) | (190 | ) | (31 | ) | (4 | ) | (40 | ) | (190 | ) | (9 | ) |
| | |
| |
| |
| |
| |
| |
| |
| |
| End of year 2003 | | 32 | | 1 559 | | 67 | | 28 | | 127 | | 1 559 | | 290 | |
| | |
| |
| |
| |
| |
| |
| |
| |
20 Petro-Canada Annual Information Form
INTERNATIONAL PROVED RESERVES BEFORE DEDUCTION OF ROYALTIES 1,2,3,4,5
| |
| |
| | North Africa/Near East 9,11,12,13
| |
| |
| |
| |
|---|
| | Northwest Europe 10
| | Northern Latin America 9,14,15
| | Total International
| |
|---|
| | Crude Oil & NGL
| | Natural Gas
| | Crude Oil
& NGL
| | Natural Gas
| | Crude Oil
& NGL
| | Natural Gas
| |
|---|
| | Natural Gas
| |
|---|
| |
| | (mmbbls)
| | (bcf)
| | (mmbbls)
| | (bcf)
| | (bcf)
| | (mmbbls)
| | (bcf)
| |
|---|
| Beginning of year 2002 | | – | | – | | 11 | | – | | – | | 11 | | – | |
| Revisions of previous estimates 16 | | 3 | | 11 | | 45 | | 10 | | – | | 48 | | 21 | |
| Purchase of reserves in place | | 59 | | 149 | | 269 | | 78 | | 346 | | 328 | | 573 | |
| Discoveries, extensions and improved recovery | | 10 | | 22 | | – | | – | | – | | 10 | | 22 | |
| Production | | (10 | ) | (22 | ) | (36 | ) | (11 | ) | (5 | ) | (46 | ) | (38 | ) |
| | |
| |
| |
| |
| |
| |
| |
| |
| End of year 2002 | | 62 | | 160 | | 289 | | 77 | | 341 | | 351 | | 578 | |
| Revisions of previous estimates 16 | | 14 | | (8 | ) | 24 | | – | | – | | 38 | | (8 | ) |
| Sale of reserves in place | | – | | (4 | ) | – | | – | | – | | – | | (4 | ) |
| Purchase of reserves in place | | 3 | | 7 | | – | | – | | – | | 3 | | 7 | |
| Discoveries, extensions and improved recovery | | – | | – | | – | | – | | 6 | | – | | 6 | |
| Production | | (14 | ) | (29 | ) | (52 | ) | (12 | ) | (23 | ) | (66 | ) | (64 | ) |
| | |
| |
| |
| |
| |
| |
| |
| |
| End of year 2003 | | 65 | | 126 | | 261 | | 65 | | 324 | | 326 | | 515 | |
| | |
| |
| |
| |
| |
| |
| |
| |
INTERNATIONAL PROVED RESERVES AFTER DEDUCTION OF ROYALTIES 1,2,3,4,5
| |
| |
| | North Africa/Near East 9,11,12,13
| |
| |
| |
| |
|---|
| | Northwest Europe 10
| | Northern Latin America 9,14,15
| | Total International
| |
|---|
| | Crude Oil & NGL
| | Natural Gas
| | Crude Oil
& NGL
| | Natural Gas
| | Crude Oil
& NGL
| | Natural Gas
| |
|---|
| | Natural Gas
| |
|---|
| |
| | (mmbbls)
| | (bcf)
| | (mmbbls)
| | (bcf)
| | (bcf)
| | (mmbbls)
| | (bcf)
| |
|---|
| Beginning of year 2002 | | – | | – | | 7 | | – | | – | | 7 | | – | |
| Revisions of previous estimates 16 | | 3 | | 11 | | 24 | | 3 | | – | | 27 | | 14 | |
| Purchase of reserves in place | | 59 | | 149 | | 170 | | 19 | | 292 | | 229 | | 460 | |
| Discoveries, extensions and improved recovery | | 10 | | 22 | | – | | – | | – | | 10 | | 22 | |
| Production | | (10 | ) | (22 | ) | (18 | ) | (3 | ) | (5 | ) | (28 | ) | (30 | ) |
| | |
| |
| |
| |
| |
| |
| |
| |
| End of year 2002 | | 62 | | 160 | | 183 | | 19 | | 287 | | 245 | | 466 | |
| Revisions of previous estimates 16 | | 14 | | (8 | ) | 14 | | 5 | | 6 | | 28 | | 3 | |
| Sale of reserves in place | | – | | (4 | ) | – | | – | | – | | – | | (4 | ) |
| Purchase of reserves in place | | 2 | | 7 | | – | | – | | – | | 2 | | 7 | |
| Discoveries, extensions and improved recovery | | – | | – | | – | | – | | 5 | | – | | 5 | |
| Production | | (14 | ) | (29 | ) | (28 | ) | (2 | ) | (23 | ) | (42 | ) | (54 | ) |
| | |
| |
| |
| |
| |
| |
| |
| |
| End of year 2003 | | 64 | | 126 | | 169 | | 22 | | 275 | | 233 | | 423 | |
| | |
| |
| |
| |
| |
| |
| |
| |
- 1
- In order to harmonize its oil and gas disclosure in both Canada and the U.S., Petro-Canada applied for, and received, certain exemptions to reserves disclosure requirements as set out in National InstrumentNI 51-101; Standards of Disclosure for Oil and Gas
21 Petro-Canada Annual Information Form
Activities (NI 51-101). These exemptions permit Petro-Canada to use its own staff of qualified reserves evaluators to prepare the Company's reserves estimates and to use U.S. Securities and Exchange Commission (SEC) and Financial Accounting Standards Board (FASB) standards when preparing and reporting reserves. Such reserves information may differ from reserves information prepared in accordance with Canadian disclosure standards under NI 51-101. These differences relate to the SEC requirement for disclosure only of proved reserves calculated at constant year-end prices and costs while NI 51-101 requires disclosure of proved reserves at constant prices and costs and proved plus probable reserves at forecast prices and costs. Also, the definition of proved reserves differs between SEC and NI 51-101 requirements. However, this difference should not be material. The Canadian Oil and Gas Evaluation Handbook (the source document for reserves definitions under NI 51-101) supports this view.
- 2
- Petro-Canada employs the services of independent third party evaluators/auditors to assess its reserves policies, practices and procedures and its reserves estimates.
- 3
- Proved reserves before royalties are Petro-Canada's working interest reserves before the deduction of Crown or other royalties. Such royalties are subject to change by legislation or regulation and can also vary depending on production rates, selling prices and timing of initial production. No reserve quantities have been included to reflect royalty interests Petro-Canada has in various properties.
- 4
- Proved reserves are the estimated quantities of crude oil, natural gas and natural gas liquids which geological and engineering data demonstrate with reasonable certainty to be recoverable in future years from known reservoirs under existing economic and operating conditions. Proved developed reserves are those proved reserves that are expected to be recovered from existing wells or facilities. Proved undeveloped reserves are proved reserves which are not recoverable from existing wells or facilities, but which are expected to be recovered through additional development drilling or through the upgrading of existing or additional new facilities.
- 5
- Unproved reserves are based on geological and/or engineering data similar to that used in estimates of proved reserves, but technical, contractual, economic or regulatory uncertainties preclude such reserves being classified as proved. Unproved reserves may be further classified as probable reserves and possible reserves.
- 6
- Proved reserves at Hibernia and Terra Nova are based on primary recovery for drilled fault blocks plus incremental recovery in fault blocks showing response to water or gas injection. Additional reserves quantities will be booked as proved reserves as development proceeds.
- 7
- Proved reserves of synthetic crude oil from the Syncrude oil sands mining operation in northeastern Alberta are separately identified from reserves of conventional crude oil. Petro-Canada views these reserves as an integral part of the Company's business. Proved reserves of synthetic crude oil are based on high geological certainty and application of proven or piloted technology. For proved reserves, drill hole spacing is less than 500 metres and appropriate co-owner and regulatory approvals are in place.
- 8
- Proved reserves at MacKay River are based on conservative estimates of recovery from existing producer-injector well pairs.
- 9
- Proved reserves include quantities of crude oil and natural gas which will be produced under arrangements which involve the Company or its subsidiaries in upstream risks and rewards but do not transfer title of the product to those companies.
- 10
- Reserves in Northwest Europe are subject to a conventional royalty and tax regime. No royalty is payable on reserves in the U.K. sector. Royalty is payable on onshore reserves in the Netherlands.
- 11
- Reserves in Syria, Algeria and Kazakhstan are held under a production sharing arrangement with the government. The State share is split between royalty and tax for Canadian reporting purposes.
- 12
- With the exception of the En Naga field, reserves in Libya are held under a concession and are subject to a royalty and tax regime. The En Naga field is held under a production sharing arrangement, with the government's share being split between royalty and tax for Canadian reporting purposes.
- 13
- The volume of oil and gas reserves before royalties reported above held under production sharing contracts in the North Africa/Near East Region at the end of 2003 was 112 mmbbls of crude oil and NGL and 65 bcf of natural gas. At year-end 2002 the volume was 126 mmbbls of crude oil and NGL and 77 bcf of natural gas. The after royalty reserves volumes were: year-end 2003 – 44 mmbbls of crude oil and NGL and 22 bcf of natural gas; year-end 2002 – 47 mmbbls of crude oil and NGL and 19 bcf of natural gas.
- 14
- Crude oil reserves in Venezuela are subject to a conventional royalty and tax regime. Proved crude oil reserves in Venezuela at year-end 2003 were 0.4 million barrels before royalties (0.4 million barrels after royalties).
- 15
- Natural gas reserves in Trinidad are held under a production sharing arrangement with the government. The State share is split between royalty and tax for Canadian reporting purposes. The volume of proved natural gas reserves before royalties reported above held under production sharing contracts in Trinidad at the end of 2003 was 324 bcf. At year-end 2002 the volume was 341 bcf. The after royalty reserves volumes were: year-end 2003 – 275 bcf; year-end 2002 – 287 bcf.
- 16
- Revisions include changes in previous estimates, either upward or downward, resulting from new information (except an increase in acreage) normally obtained from drilling or production history or resulting from a change in economic factors.
We believe that the reserve quantities are reasonable estimates consistent with current knowledge of the characteristics and extent of the productive formations, but such estimates are subject to upward or downward revisions as additional
22 Petro-Canada Annual Information Form
information regarding producing fields becomes available, as technology improves and as economic conditions change. Additional proved reserves are expected to be booked during the normal course of continuing development.
Standardized Measure of Discounted Future Net Cash Flows and Changes Therein Relating to Proved Oil and Gas Reserves
The following disclosures on standardized measure of discounted cash flows and changes therein relating to proved oil and gas reserves are determined in accordance with the United States Financial Accounting Standards Board Statement 69 ("Disclosures About Oil and Gas Producing Activities"). The future cash flows are calculated by applying year-end prices, or prices provided by contractual arrangements, net of royalties, to year-end quantities of proved oil and gas reserves. Future production, development and site restoration costs are based on year-end costs and estimated future income taxes are based on legislated future income tax rates. The resulting future net cash flows are discounted at 10 per cent per annum. The calculation does not represent a fair market value of the Company's oil and gas reserves or of the future net cash flows. No consideration is given to the value of exploration properties or probable reserves. No consideration is given to the value of the Company's share of the Syncrude oil sands mining operation as it is considered a mining operation under SEC disclosure. The following benchmark commodity prices as at December 31, 2003 were used in deriving the Standardized Measure: West Texas Intermediate at Cushing US$32.52/barrel; Dated Brent at Sullom Voe US$30.11/barrel; NYMEX gas price at the Henry Hub US$6.189/million Btu; and Alberta price of natural gas as the AECO-C Hub Cdn$5.80/gigajoule. The following currency exchange rates were also used: $Cdn/$US 1.2924; $Cdn/euro 1.6280; $Cdn/UK pound 2.3066.
PRESENT VALUE OF ESTIMATED FUTURE NET CASH FLOWS
| | Western Canada 1
| |
|---|
| | 2003
| | 2002
| | 2001
| |
|---|
| |
| | (millions of dollars)
| |
|---|
| Future cash flows | | $ | 10 382 | | $ | 11 529 | | $ | 7 489 | |
| Future production, development and site restoration costs | | | (2 290 | ) | | (1 642 | ) | | (2 274 | ) |
| Future income taxes | | | (2 517 | ) | | (3 582 | ) | | (1 751 | ) |
| | |
| |
| |
| |
| Future net cash flows | | | 5 575 | | | 6 305 | | | 3 464 | |
| Discount of 10 per cent for estimated timing of cash flows | | | (2 407 | ) | | (2 668 | ) | | (1 368 | ) |
| | |
| |
| |
| |
| Discounted future net cash flows | | $ | 3 168 | | $ | 3 637 | | $ | 2 096 | |
| | |
| |
| |
| |
|
|
East Coast Oil 2
|
|
|---|
| | 2003
| | 2002
| | 2001
| |
|---|
| |
| | (millions of dollars)
| |
|---|
| Future cash flows | | $ | 2 470 | | $ | 2 861 | | $ | 1 203 | |
| Future production, development and site restoration costs | | | (523 | ) | | (749 | ) | | (375 | ) |
| Future income taxes | | | (506 | ) | | (653 | ) | | (77 | ) |
| | |
| |
| |
| |
| Future net cash flows | | | 1 441 | | | 1 459 | | | 751 | |
| Discount of 10 per cent for estimated timing of cash flows | | | (506 | ) | | (472 | ) | | (190 | ) |
| | |
| |
| |
| |
| Discounted future net cash flows | | $ | 935 | | $ | 987 | | $ | 561 | |
| | |
| |
| |
| |
- 1
- Western Canada includes the cash flows of MacKay River.
- 2
- Additional East Coast Oil reserves quantities will be booked as proved reserves as development proceeds.
23 Petro-Canada Annual Information Form
|
|
Northwest Europe
|
|---|
| | 2003
| | 2002
| | 2001
|
|---|
|
| | (millions of dollars)
|
|---|
| Future cash flows | | $ | 3 370 | | $ | 3 891 | | – |
| Future production, development and site restoration costs | | | (1 341 | ) | | (1 505 | ) | – |
| Future income taxes | | | (667 | ) | | (879 | ) | – |
| | |
| |
| |
|
| Future net cash flows | | | 1 362 | | | 1 507 | | – |
| Discount of 10 per cent for estimated timing of cash flows | | | (293 | ) | | (400 | ) | – |
| | |
| |
| |
|
| Discounted future net cash flows | | $ | 1 069 | | $ | 1 107 | | – |
| | |
| |
| |
|
|
|
North Africa/Near East
|
|
|---|
| | 2003
| | 2002
| | 2001
| |
|---|
| |
| | (millions of dollars)
| |
|---|
| Future cash flows | | $ | 6 693 | | $ | 8 951 | | $ | 256 | |
| Future production, development and site restoration costs | | | (1 436 | ) | | (1 866 | ) | | (90 | ) |
| Future income taxes | | | (4 088 | ) | | (5 530 | ) | | (3 | ) |
| | |
| |
| |
| |
| Future net cash flows | | | 1 169 | | | 1 555 | | | 163 | |
| Discount of 10 per cent for estimated timing of cash flows | | | (400 | ) | | (532 | ) | | (84 | ) |
| | |
| |
| |
| |
| Discounted future net cash flows | | $ | 769 | | $ | 1 023 | | $ | 79 | |
| | |
| |
| |
| |
|
|
Northern Latin America
|
|---|
| | 2003
| | 2002
| | 2001
|
|---|
|
| | (millions of dollars)
|
|---|
| Future cash flows | | $ | 1 348 | | $ | 1 244 | | – |
| Future production, development and site restoration costs | | | (147 | ) | | (161 | ) | – |
| Future income taxes | | | (647 | ) | | (552 | ) | – |
| | |
| |
| |
|
| Future net cash flows | | | 554 | | | 531 | | – |
| Discount of 10 per cent for estimated timing of cash flows | | | (279 | ) | | (263 | ) | – |
| | |
| |
| |
|
| Discounted future net cash flows | | $ | 275 | | $ | 268 | | – |
| | |
| |
| |
|
|
|
Total
|
|
|---|
| | 2003
| | 2002
| | 2001
| |
|---|
| |
| | (millions of dollars)
| |
|---|
| Future cash flows | | $ | 24 263 | | $ | 28 476 | | $ | 8 948 | |
| Future production, development and site restoration costs | | | (5 737 | ) | | (5,923 | ) | | (2 739 | ) |
| Future income taxes | | | (8 425 | ) | | (11 196 | ) | | (1 831 | ) |
| | |
| |
| |
| |
| Future net cash flows | | | 10 101 | | | 11 357 | | | 4 378 | |
| Discount of 10 per cent for estimated timing of cash flows | | | (3 885 | ) | | (4 335 | ) | | (1 642 | ) |
| | |
| |
| |
| |
| Discounted future net cash flows | | $ | 6 216 | | $ | 7 022 | | $ | 2 736 | |
| | |
| |
| |
| |
24 Petro-Canada Annual Information Form
SUMMARY OF CHANGES IN PRESENT VALUE OF ESTIMATED FUTURE NET CASH FLOWS
| | 2003
| | 2002
| | 2001
| |
|---|
| |
| | (millions of dollars)
| |
|---|
| Balance at Beginning of Year | | $ | 7 022 | | $ | 2 736 | | $ | 6 779 | |
| | |
| |
| |
| |
| Changes result from: | | | | | | | | | | |
| | Sales and transfer of oil and gas produced, net of production costs | | | (4 062 | ) | | (1 753 | ) | | (1 563 | ) |
| | Net changes in prices, operating costs and royalties | | | (1 608 | ) | | 2 807 | | | (6 744 | ) |
| | Extensions, discoveries, and improved recoveries | | | 274 | | | 500 | | | 694 | |
| | Changes in estimated future development costs | | | (767 | ) | | (674 | ) | | (506 | ) |
| | Development costs incurred during the year | | | 845 | | | 524 | | | 523 | |
| | Revisions of previous quantity estimates | | | 1 149 | | | 1 061 | | | 13 | |
| | Accretion of discount | | | 910 | | | 343 | | | 1 029 | |
| | Net changes in income tax | | | 1 843 | | | (5 435 | ) | | 2 787 | |
| | Purchase and sale of reserves in place | | | 313 | | | 6 780 | | | (160 | ) |
| | Changes in timing and other | | | 297 | | | 133 | | | (116 | ) |
| | |
| |
| |
| |
| Net change | | | (806 | ) | | 4 286 | | | (4 043 | ) |
| | |
| |
| |
| |
| Balance at End of Year | | $ | 6 216 | | $ | 7 022 | | $ | 2 736 | |
| | |
| |
| |
| |
Abandonments and Reclamation Costs
The Company's Upstream future removal and site restoration costs are estimated based on current costs and technology and in accordance with existing legislation and industry practice. As of December 31, 2003 the total of these costs is estimated to be $2 010 million undiscounted or $485 million discounted at 10 per cent. The Company's Upstream operations expect to spend approximately $21 million, $27 million and $84 million in the next three years, respectively, for future removal and site restoration costs.
25 Petro-Canada Annual Information Form
Production and Prices
The following tables show Petro-Canada's average daily production of conventional crude oil, natural gas liquids, bitumen, synthetic crude oil (from mining operations) and natural gas, before and after deduction of royalties for the years indicated.
AVERAGE DAILY PRODUCTION OF CRUDE OIL & NGL, BITUMEN AND SYNTHETIC CRUDE OIL
| | Years Ended December 31,
|
|---|
| | 2003
| | 2002 1
| | 2001
|
|---|
| | Before Royalties
| | After Royalties
| | Before Royalties
| | After Royalties
| | Before Royalties
| | After Royalties
|
|---|
|
| | (thousands of barrels)
|
|---|
| North American Gas – Crude Oil & NGL | | 16.9 | | 12.6 | | 18.9 | | 14.2 | | 18.6 | | 13.8 |
| East Coast – Crude Oil | | 86.1 | | 84.0 | | 71.9 | | 70.9 | | 29.7 | | 29.2 |
| Oil Sands – Bitumen | | 10.7 | | 10.6 | | 1.1 | | 1.0 | | – | | – |
| International – Crude Oil & NGL | | | | | | | | | | | | |
| | North Africa/Near East | | 143.1 | | 77.9 | | 98.4 | | 48.1 | | 2.3 | | 1.5 |
| | Northwest Europe | | 37.7 | | 37.7 | | 27.1 | | 27.1 | | – | | – |
| | |
| |
| |
| |
| |
| |
|
| Total Crude Oil & NGL and Bitumen | | 294.5 | | 222.8 | | 217.4 | | 161.3 | | 50.6 | | 44.5 |
| Oil Sands – Synthetic Crude Oil | | 25.4 | | 25.1 | | 27.5 | | 27.2 | | 26.8 | | 24.8 |
| | |
| |
| |
| |
| |
| |
|
| Total Crude Oil & NGL, Bitumen and Synthetic Crude Oil | | 319.9 | | 247.9 | | 244.9 | | 188.5 | | 77.4 | | 69.3 |
| | |
| |
| |
| |
| |
| |
|
- 1
- Nearly all of 2002 International production was acquired effective May 2, 2002 and averaged over the full year.
AVERAGE DAILY PRODUCTION OF NATURAL GAS1
| | Years Ended December 31,
|
|---|
| | 2003
| | 2002 2
| | 2001
|
|---|
| | Before Royalties
| | After Royalties
| | Before Royalties
| | After Royalties
| | Before Royalties
| | After Royalties
|
|---|
|
| | (millions of cubic feet)
|
|---|
| North American Gas | | 693 | | 521 | | 722 | | 557 | | 714 | | 533 |
| | |
| |
| |
| |
| |
| |
|
| International | | | | | | | | | | | | |
| | Northwest Europe | | 80 | | 80 | | 60 | | 60 | | – | | – |
| | North Africa/Near East | | 32 | | 6 | | 30 | | 8 | | – | | – |
| | Northern Latin America | | 63 | | 63 | | 13 | | 13 | | – | | – |
| | |
| |
| |
| |
| |
| |
|
| Total International | | 175 | | 149 | | 103 | | 81 | | – | | – |
| | |
| |
| |
| |
| |
| |
|
| Total Natural Gas | | 868 | | 670 | | 825 | | 638 | | 714 | | 533 |
| | |
| |
| |
| |
| |
| |
|
- 1
- These volumes do not include natural gas produced for use in miscible flood schemes or natural gas purchased from third parties for resale.
- 2
- All of 2002 International production was acquired effective May 2, 2002 and averaged over the full year.
26 Petro-Canada Annual Information Form
The following tables show Petro-Canada's average daily production of conventional crude oil, natural gas liquids, bitumen, synthetic crude oil and natural gas before deduction of royalties by quarter for the years indicated.
AVERAGE DAILY PRODUCTION OF CRUDE OIL & NGL, BITUMEN AND SYNTHETIC CRUDE OIL
BEFORE ROYALTIES BY QUARTER
| | 2003
Three Months Ended
| | 2002 1
Three Months Ended
|
|---|
| | Mar. 31
| | June 30
| | Sept. 30
| | Dec. 31
| | Mar. 31
| | June 30
| | Sept. 30
| | Dec. 31
|
|---|
|
| | (thousands of barrels)
|
|---|
| North American Gas – Crude Oil & NGL | | 18.8 | | 17.2 | | 15.8 | | 15.6 | | 19.4 | | 18.4 | | 19.2 | | 18.7 |
| East Coast – Crude Oil | | 83.4 | | 92.4 | | 81.2 | | 87.5 | | 59.1 | | 78.5 | | 62.4 | | 87.5 |
| Oil Sands – Bitumen | | 13.2 | | 5.0 | | 8.3 | | 16.3 | | – | | – | | – | | 4.5 |
| International– Crude Oil & NGL | | | | | | | | | | | | | | | | |
| | North Africa/Near East | | 140.9 | | 145.7 | | 144.4 | | 141.3 | | 1.8 | | 92.7 | | 145.8 | | 146.3 |
| | Northwest Europe | | 42.3 | | 39.9 | | 30.0 | | 38.9 | | – | | 25.6 | | 43.9 | | 39.5 |
| | |
| |
| |
| |
| |
| |
| |
| |
|
| Total Crude Oil & NGL, and Bitumen | | 298.6 | | 300.2 | | 279.7 | | 299.6 | | 80.3 | | 215.2 | | 271.3 | | 296.5 |
| Oil Sands – Synthetic Crude Oil | | 22.6 | | 25.3 | | 29.1 | | 24.5 | | 27.5 | | 21.4 | | 31.3 | | 29.9 |
| | |
| |
| |
| |
| |
| |
| |
| |
|
| Total Crude Oil & NGL, Bitumen and Synthetic Crude Oil | | 321.2 | | 325.5 | | 308.8 | | 324.1 | | 107.8 | | 236.6 | | 302.6 | | 326.4 |
| | |
| |
| |
| |
| |
| |
| |
| |
|
- 1
- Nearly all of 2002 International production was acquired May 2, 2002.
AVERAGE DAILY PRODUCTION OF NATURAL GAS BEFORE ROYALTIES BY QUARTER
| | 2003
Three Months Ended
| | 2002 1
Three Months Ended
|
|---|
| | Mar. 31
| | June 30
| | Sept. 30
| | Dec. 31
| | Mar. 31
| | June 30
| | Sept. 30
| | Dec. 31
|
|---|
|
| | (millions of cubic feet)
|
|---|
| North American Gas | | 714 | | 680 | | 683 | | 694 | | 731 | | 736 | | 707 | | 712 |
| | |
| |
| |
| |
| |
| |
| |
| |
|
| International | | | | | | | | | | | | | | | | |
| | Northwest Europe | | 96 | | 78 | | 56 | | 90 | | – | | 60 | | 89 | | 88 |
| | North Africa/Near East | | 33 | | 35 | | 33 | | 28 | | – | | 35 | | 46 | | 36 |
| | Northern Latin America | | 49 | | 62 | | 69 | | 73 | | – | | – | | 19 | | 41 |
| | |
| |
| |
| |
| |
| |
| |
| |
|
| Total International | | 178 | | 175 | | 158 | | 191 | | – | | 95 | | 154 | | 165 |
| | |
| |
| |
| |
| |
| |
| |
| |
|
| Total Natural Gas | | 892 | | 855 | | 841 | | 885 | | 731 | | 831 | | 861 | | 877 |
| | |
| |
| |
| |
| |
| |
| |
| |
|
- 1
- All of 2002 International production was acquired May 2, 2002.
27 Petro-Canada Annual Information Form
The following tables show Petro-Canada's average daily production of conventional crude oil, natural gas liquids, bitumen, synthetic crude oil and natural gas after deduction of royalties by quarter for the years indicated.
AVERAGE DAILY PRODUCTION OF CRUDE OIL & NGL, BITUMEN AND SYNTHETIC CRUDE OIL
AFTER ROYALTIES BY QUARTER
| | 2003
Three Months Ended
| | 2002 1
Three Months Ended
|
|---|
| | Mar. 31
| | June 30
| | Sept. 30
| | Dec. 31
| | Mar. 31
| | June 30
| | Sept. 30
| | Dec. 31
|
|---|
|
| | (thousands of barrels)
|
|---|
| North American Gas – Crude Oil & NGL | | 14.7 | | 12.5 | | 11.8 | | 11.2 | | 14.5 | | 14.1 | | 14.6 | | 14.0 |
| East Coast – Crude Oil | | 81.6 | | 90.7 | | 78.7 | | 85.2 | | 58.1 | | 77.9 | | 60.9 | | 86.4 |
| Oil Sands – Bitumen | | 13.1 | | 5.0 | | 8.2 | | 16.2 | | – | | – | | – | | 4.5 |
| International – Crude Oil & NGL | | | | | | | | | | | | | | | | |
| | North Africa/Near East | | 74.4 | | 76.9 | | 86.0 | | 73.9 | | 1.1 | | 45.9 | | 71.9 | | 72.3 |
| | Northwest Europe | | 42.3 | | 39.9 | | 30.0 | | 38.9 | | – | | 25.6 | | 43.9 | | 39.5 |
| | |
| |
| |
| |
| |
| |
| |
| |
|
| Total Crude Oil & NGL, and Bitumen | | 226.1 | | 225.0 | | 214.7 | | 225.4 | | 73.7 | | 163.5 | | 191.3 | | 216.7 |
| Oil Sands – Synthetic Crude Oil | | 22.4 | | 25.0 | | 28.7 | | 24.3 | | 27.3 | | 21.2 | | 31.0 | | 29.5 |
| | |
| |
| |
| |
| |
| |
| |
| |
|
| Total Crude Oil & NGL, Bitumen and Synthetic Crude Oil | | 248.5 | | 250.0 | | 243.4 | | 249.7 | | 101.0 | | 184.7 | | 222.3 | | 246.2 |
| | |
| |
| |
| |
| |
| |
| |
| |
|
- 1
- Nearly all of 2002 International production was acquired May 2, 2002.
AVERAGE DAILY PRODUCTION OF NATURAL GAS AFTER ROYALTIES BY QUARTER
| | 2003
Three Months Ended
| | 2002 1
Three Months Ended
|
|---|
| | Mar. 31
| | June 30
| | Sept. 30
| | Dec. 31
| | Mar. 31
| | June 30
| | Sept. 30
| | Dec. 31
|
|---|
|
| | (millions of cubic feet)
|
|---|
| North American Gas | | | | | | | | | | | | | | | | |
| | Western Canada | | 534 | | 499 | | 535 | | 515 | | 567 | | 558 | | 570 | | 541 |
| | |
| |
| |
| |
| |
| |
| |
| |
|
| International | | | | | | | | | | | | | | | | |
| | Northwest Europe | | 96 | | 78 | | 55 | | 90 | | – | | 60 | | 89 | | 88 |
| | North Africa/Near East | | 6 | | 9 | | 7 | | 4 | | – | | 8 | | 12 | | 10 |
| | Northern Latin America | | 49 | | 62 | | 69 | | 73 | | – | | – | | 18 | | 40 |
| | |
| |
| |
| |
| |
| |
| |
| |
|
| Total International | | 151 | | 149 | | 131 | | 167 | | – | | 68 | | 119 | | 138 |
| | |
| |
| |
| |
| |
| |
| |
| |
|
| Total Natural Gas | | 685 | | 648 | | 666 | | 682 | | 567 | | 626 | | 689 | | 679 |
| | |
| |
| |
| |
| |
| |
| |
| |
|
- 1
- All of 2002 International production was acquired May 2, 2002.
28 Petro-Canada Annual Information Form
The following table shows Petro-Canada's 2004 production outlook for conventional crude oil, natural gas liquids, bitumen, synthetic crude oil and natural gas in crude oil equivalent before deduction of royalties.
2004 PRODUCTION OUTLOOK BEFORE ROYALTIES
(as at January 29, 2004)
| | (thousands of barrels of oil equivalent per day)
|
|---|
|
| North American Gas | | |
| | Natural Gas | | 106 |
| | Crude Oil and Natural Gas Liquids (NGL) | | 13 |
| East Coast – Crude Oil | | 80 |
| Oil Sands – Bitumen | | 25 |
| International – Crude Oil, NGL and Natural Gas | | |
| | Northwest Europe – Crude Oil, NGL and Natural Gas | | 54 |
| | North Africa/Near East – Crude Oil, NGL and Natural Gas | | 133 |
| | Northern Latin America – Natural Gas | | 11 |
| | |
|
| Total Crude Oil & NGL and Bitumen | | 422 |
| Oil Sands – Synthetic Crude Oil | | 28 |
| | |
|
| Total Crude Oil & NGL, Bitumen and Synthetic Crude Oil | | 450 |
| | |
|
The following table shows the average sale price for Petro-Canada's conventional crude oil and field natural gas liquid, bitumen, synthetic crude oil, and natural gas produced, by country and/or region, for the years indicated.
AVERAGE PRICES FOR CRUDE OIL AND NGL, BITUMEN AND SYNTHETIC CRUDE OIL
| | Years Ended December 31,
|
|---|
| | 2003
| | 2002
| | 2001
|
|---|
|
| | (dollars per barrel)
|
|---|
| Canada | | | | | | | | | |
| | Average Crude Oil & NGL Sale Price | | $ | 39.63 | | $ | 37.42 | | $ | 36.04 |
| | Average Bitumen Sale Price | | | 16.69 | | | 14.61 | | | – |
| | Average Synthetic Crude Oil Sale Price | | | 42.67 | | | 40.66 | | | 39.39 |
| Canada Average Crude Oil & NGL, Bitumen & Synthetic Crude Oil Price | | | 38.42 | | | 37.95 | | | 37.24 |
| International | | | | | | | | | |
| | Northwest Europe – Average Crude Oil & NGL Sale Price | | | 41.41 | | | 41.10 | | | – |
| | North Africa/Near East– Average Crude Oil & NGL Sale Price | | | 38.49 | | | 39.08 | | | 37.62 |
| International – Average Crude Oil & NGL Sale Price | | $ | 39.10 | | $ | 39.53 | | $ | 37.62 |
29 Petro-Canada Annual Information Form
The following table shows the average sale price for Petro-Canada's natural gas produced, by country and/or region, for the years indicated.
AVERAGE PRICES FOR NATURAL GAS
| | Years Ended December 31,
|
|---|
| | 2003
| | 2002
| | 2001
|
|---|
|
| | (dollars per thousand cubic feet)
|
|---|
| Canada Average Gas Price 1 | | $ | 6.50 | | $ | 4.01 | | $ | 6.00 |
| International Average Gas Prices | | | | | | | | | |
| | Northwest Europe | | | 5.42 | | | 4.65 | | | – |
| | North Africa/Near East | | | 4.84 | | | 4.85 | | | – |
| | Northern Latin America | | $ | 4.01 | | $ | 3.68 | | | – |
- 1
- Average price is before the deduction of British Columbia gathering and processing charges.
The following tables show Petro-Canada's average product prices, netbacks and net income for Western Canada (natural gas equivalent), East Coast (conventional crude oil), Oil Sands (synthetic crude oil and bitumen) and International regions (crude oil equivalent) for the years indicated.
Petro-Canada monitors production costs and charges to earnings by business segment or region rather than on a product basis. As a result, unit netbacks and net earnings for a business segment or region producing a mix of crude oil, natural gas and NGL are calculated on an oil or gas equivalent basis. In the North American Gas business segment, most crude oil and NGL production is ancillary to the production of natural gas. In the North Africa/Near East region, natural gas and NGL production is relatively minor and linked to crude oil production. In Northwest Europe, crude oil production and associated natural gas and NGL production represents about 85 per cent of total production on an oil-equivalent basis.
WESTERN CANADA – NATURAL GAS EQUIVALENT
| | Years Ended December 31,
| |
|---|
| | 2003
| | 2002
| | 2001
| |
|---|
| |
| | (dollars per thousand cubic feet of natural gas equivalent)
| |
|---|
| Average Price Received1 | | $ | 6.51 | | $ | 4.19 | | $ | 5.98 | |
| Royalties | | | (1.61 | ) | | (0.96 | ) | | (1.52 | ) |
| | |
| |
| |
| |
| Net Revenues | | | 4.90 | | | 3.23 | | | 4.46 | |
| Operating Expense2 | | | (0.52 | ) | | (0.45 | ) | | (0.48 | ) |
| | |
| |
| |
| |
| Netback | | | 4.38 | | | 2.78 | | | 3.98 | |
| Overhead Expenses (G&A)3 | | | (0.15 | ) | | (0.12 | ) | | (0.12 | ) |
| | |
| |
| |
| |
| Netback after Overhead | | | 4.23 | | | 2.66 | | | 3.86 | |
| Processing and Other Income | | | 0.02 | | | 0.01 | | | (0.02 | ) |
| Exploration Expenses | | | (0.29 | ) | | (0.31 | ) | | (0.27 | ) |
| Depletion, Depreciation and Amortization | | | (0.96 | ) | | (0.90 | ) | | (0.83 | ) |
| Income and Other Taxes | | | (1.19 | ) | | (0.65 | ) | | (1.08 | ) |
| | |
| |
| |
| |
| Net Earnings | | $ | 1.81 | | $ | 0.81 | | $ | 1.66 | |
| | |
| |
| |
| |
30 Petro-Canada Annual Information Form
EAST COAST – CONVENTIONAL CRUDE OIL
| | Years Ended December 31,
| |
|---|
| | 2003
| | 2002
| | 2001
| |
|---|
| |
| | (dollars per barrel)
| |
|---|
| Average Price Received | | $ | 39.91 | | $ | 38.84 | | $ | 36.64 | |
| Royalties | | | (0.95 | ) | | (0.55 | ) | | (0.60 | ) |
| | |
| |
| |
| |
| Net Revenues | | | 38.96 | | | 38.29 | | | 36.04 | |
| Operating Expense | | | (2.56 | ) | | (3.20 | ) | | (2.62 | ) |
| | |
| |
| |
| |
| Netback | | | 36.40 | | | 35.09 | | | 33.42 | |
| Overhead Expenses (G&A)3 | | | (0.18 | ) | | (0.12 | ) | | (0.14 | ) |
| | |
| |
| |
| |
| Netback after Overhead | | | 36.22 | | | 34.97 | | | 33.28 | |
| Processing and Other Income | | | 0.78 | | | – | | | – | |
| Depletion, Depreciation and Amortization | | | (8.77 | ) | | (9.16 | ) | | (9.90 | ) |
| Income and Other Taxes | | | (8.63 | ) | | (7.96 | ) | | (6.66 | ) |
| | |
| |
| |
| |
| Net Earnings | | $ | 19.60 | | $ | 17.85 | | $ | 16.72 | |
| | |
| |
| |
| |
OIL SANDS MINING – SYNTHETIC CRUDE OIL
| | Years Ended December 31,
| |
|---|
| | 2003
| | 2002
| | 2001
| |
|---|
| |
| | (dollars per barrel)
| |
|---|
| Average Price Received | | $ | 42.67 | | $ | 40.66 | | $ | 39.39 | |
| Royalties | | | (0.48 | ) | | (0.44 | ) | | (2.98 | ) |
| | |
| |
| |
| |
| Net Revenues | | | 42.19 | | | 40.22 | | | 36.41 | |
| Operating Expense | | | (23.64 | ) | | (19.50 | ) | | (19.91 | ) |
| | |
| |
| |
| |
| Netback | | | 18.55 | | | 20.72 | | | 16.50 | |
| Processing and Other Income | | | – | | | – | | | 0.57 | |
| Depletion, Depreciation and Amortization | | | (1.92 | ) | | (1.89 | ) | | (1.84 | ) |
| Income and Other Taxes | | | (5.32 | ) | | (6.35 | ) | | (4.92 | ) |
| | |
| |
| |
| |
| Net Earnings | | $ | 11.31 | | $ | 12.48 | | $ | 10.31 | |
| | |
| |
| |
| |
31 Petro-Canada Annual Information Form
OIL SANDS IN SITU – BITUMEN
| | Years Ended December 31,
|
|---|
| | 2003
| | 2002
| | 2001
|
|---|
|
| | (dollars per barrel)
|
|---|
| Average Price Received | | $ | 16.69 | | – | | – |
| Royalties | | | (0.12 | ) | – | | – |
| | |
| |
| |
|
| Net Revenues | | | 16.57 | | – | | – |
| Operating Expense | | | (22.11 | ) | – | | – |
| | |
| |
| |
|
| Netback | | | (5.54 | ) | – | | – |
| Overhead Expenses (G&A)3 | | | (1.39 | ) | – | | – |
| | |
| |
| |
|
| Netback after Overhead | | | (6.93 | ) | – | | – |
| Processing and Other Income | | | 0.04 | | – | | – |
| Exploration Expenses | | | (0.11 | ) | – | | – |
| Depletion, Depreciation and Amortization | | | (3.47 | ) | – | | – |
| Income and Other Taxes | | | 3.22 | | – | | – |
| | |
| |
| |
|
| Net Loss | | $ | (7.25 | ) | – | | – |
| | |
| |
| |
|
INTERNATIONAL 4
| | Northwest Europe 5
| | North Africa/Near East
| | Northern Latin America 6
| |
|---|
| | 2003
| | 2002
| | 2003
| | 2002
| | 2003
| | 2002
| |
|---|
| |
| | (dollars per boe)
| | (dollars per boe)
| | (dollars per mcf)
| |
|---|
| Average Price Received 7 | | $ | 38.69 | | $ | 38.41 | | $ | 38.39 | | $ | 38.73 | | $ | 4.01 | | $ | 3.68 | |
| Royalties | | | – | | | – | | | (18.35 | ) | | (19.79 | ) | | – | | | (0.07 | ) |
| | |
| |
| |
| |
| |
| |
| |
| Net Revenues | | | 38.69 | | | 38.41 | | | 20.04 | | | 18.94 | | | 4.01 | | | 3.61 | |
| Operating Expense | | | (6.90 | ) | | (7.19 | ) | | (3.87 | ) | | (4.18 | ) | | (0.15 | ) | | (0.48 | ) |
| | |
| |
| |
| |
| |
| |
| |
| Netback | | | 31.79 | | | 31.22 | | | 16.17 | | | 14.76 | | | 3.86 | | | 3.13 | |
| Overhead Expenses (G&A) 3 | | | (0.82 | ) | | (0.89 | ) | | (0.48 | ) | | (0.22 | ) | | (0.07 | ) | | (0.21 | ) |
| | |
| |
| |
| |
| |
| |
| |
| Netback after Overhead | | | 30.97 | | | 30.33 | | | 15.69 | | | 14.54 | | | 3.79 | | | 2.92 | |
| Processing and Other Income | | | 0.98 | | | 0.50 | | | 0.17 | | | 0.27 | | | (0.55 | ) | | – | |
| Exploration Expenses | | | (1.17 | ) | | (0.90 | ) | | (0.24 | ) | | (0.23 | ) | | – | | | – | |
| Depletion, Depreciation and Amortization | | | (11.37 | ) | | (11.20 | ) | | (3.19 | ) | | (3.01 | ) | | (0.81 | ) | | (0.35 | ) |
| Income and Other Taxes | | | (7.90 | ) | | (5.45 | ) | | (10.49 | ) | | (8.82 | ) | | (0.68 | ) | | (0.35 | ) |
| | |
| |
| |
| |
| |
| |
| |
| Net Earnings | | $ | 11.51 | | $ | 13.28 | | $ | 1.94 | | $ | 2.75 | | $ | 1.75 | | $ | 2.22 | |
| | |
| |
| |
| |
| |
| |
| |
- 1
- Average price includes natural gas, before the deduction of British Columbia gathering and processing charges, and conventional crude oil and field natural gas liquids in natural gas equivalent. Average price also include sulphur revenues.
- 2
- Includes the operating cost component of British Columbia gathering and processing fees.
- 3
- Portion of head office expenses allocated to production.
- 4
- Northwest Europe and North Africa/Near East include conventional crude oil, NGL and natural gas in crude oil equivalent. Northern Latin America includes only natural gas.
- 5
- Reserves in Northwest Europe are subject to a conventional royalty and tax regime. No royalty is payable on reserves in the U.K. sector. Royalty is payable on onshore reserves in the Netherlands.
32 Petro-Canada Annual Information Form
- 6
- Natural gas reserves in Trinidad are held under a production sharing arrangement with the government. The State share is split between royalty and tax for Canadian reporting purposes.
- 7
- Average price for Northwest Europe and North Africa/Near East includes conventional crude oil, NGL and natural gas in crude oil equivalent.
The following tables show Petro-Canada's average product prices and netbacks for Western Canada (natural gas equivalent), East Coast (conventional crude oil), Oil Sands (synthetic crude oil and bitumen) and International regions (crude oil equivalent) by quarter for the years indicated.
WESTERN CANADA – NATURAL GAS EQUIVALENT
| | 2003
Three Months Ended
| | 2002
Three Months Ended
| |
|---|
| | Mar. 31
| | June 30
| | Sept. 30
| | Dec. 31
| | Mar. 31
| | June 30
| | Sept. 30
| | Dec. 31
| |
|---|
| |
| | (dollars per thousand cubic feet of natural gas equivalent)
| |
|---|
| Average Price Received1 | | $ | 8.10 | | $ | 6.52 | | $ | 6.03 | | $ | 5.34 | | $ | 3.28 | | $ | 4.27 | | $ | 3.78 | | $ | 5.43 | |
| Royalties | | | (2.01 | ) | | (1.72 | ) | | (1.32 | ) | | (1.38 | ) | | (0.75 | ) | | (1.01 | ) | | (0.79 | ) | | (1.29 | ) |
| | |
| |
| |
| |
| |
| |
| |
| |
| |
| Net Revenues | | | 6.09 | | | 4.80 | | | 4.71 | | | 3.96 | | | 2.53 | | | 3.26 | | | 2.99 | | | 4.14 | |
| Operating Expense2 | | | (0.47 | ) | | (0.52 | ) | | (0.55 | ) | | (0.55 | ) | | (0.44 | ) | | (0.42 | ) | | (0.49 | ) | | (0.45 | ) |
| | |
| |
| |
| |
| |
| |
| |
| |
| |
| Netback | | | 5.62 | | | 4.28 | | | 4.16 | | | 3.41 | | | 2.09 | | | 2.84 | | | 2.50 | | | 3.69 | |
| Overhead Expenses (G&A)3 | | | (0.15 | ) | | (0.15 | ) | | (0.16 | ) | | (0.14 | ) | | (0.09 | ) | | (0.13 | ) | | (0.11 | ) | | (0.15 | ) |
| | |
| |
| |
| |
| |
| |
| |
| |
| |
| Netback after Overhead | | | 5.47 | | | 4.13 | | | 4.00 | | | 3.27 | | | 2.00 | | | 2.71 | | | 2.39 | | | 3.54 | |
| Processing and Other Income | | | 0.04 | | | 0.03 | | | 0.07 | | | (0.05 | ) | | – | | | 0.02 | | | 0.04 | | | (0.02 | ) |
| Exploration Expenses | | | (0.35 | ) | | (0.17 | ) | | (0.31 | ) | | (0.32 | ) | | (0.35 | ) | | (0.23 | ) | | (0.35 | ) | | (0.31 | ) |
| Depletion, Depreciation and Amortization | | | (0.96 | ) | | (0.96 | ) | | (0.98 | ) | | (0.96 | ) | | (0.89 | ) | | (0.91 | ) | | (0.90 | ) | | (0.90 | ) |
| Income and Other Taxes | | | (1.74 | ) | | (1.13 | ) | | (1.11 | ) | | (0.76 | ) | | (0.35 | ) | | (0.73 | ) | | (0.48 | ) | | (1.04 | ) |
| | |
| |
| |
| |
| |
| |
| |
| |
| |
| Net Earnings | | $ | 2.46 | | $ | 1.90 | | $ | 1.67 | | $ | 1.18 | | $ | 0.41 | | $ | 0.86 | | $ | 0.70 | | $ | 1.27 | |
| | |
| |
| |
| |
| |
| |
| |
| |
| |
33 Petro-Canada Annual Information Form
EAST COAST – CONVENTIONAL CRUDE OIL
| | 2003
Three Months Ended
| | 2002
Three Months Ended
| |
|---|
| | Mar. 31
| | June 30
| | Sept. 30
| | Dec. 31
| | Mar. 31
| | June 30
| | Sept. 30
| | Dec. 31
| |
|---|
| |
| | (dollars per barrel)
| |
|---|
| Average Price Received | | $ | 46.84 | | $ | 35.79 | | $ | 38.93 | | $ | 38.66 | | $ | 33.39 | | $ | 36.63 | | $ | 42.15 | | $ | 42.05 | |
| Royalties | | | (0.99 | ) | | (0.67 | ) | | (1.16 | ) | | (1.03 | ) | | (0.52 | ) | | (0.27 | ) | | (0.98 | ) | | (0.52 | ) |
| | |
| |
| |
| |
| |
| |
| |
| |
| |
| Net Revenues | | | 45.85 | | | 35.12 | | | 37.77 | | | 37.63 | | | 32.87 | | | 36.36 | | | 41.17 | | | 41.53 | |
| Operating Expense | | | (2.49 | ) | | (2.36 | ) | | (2.74 | ) | | (2.69 | ) | | (3.48 | ) | | (3.58 | ) | | (3.48 | ) | | (2.48 | ) |
| | |
| |
| |
| |
| |
| |
| |
| |
| |
| Netback | | | 43.36 | | | 32.76 | | | 35.03 | | | 34.94 | | | 29.39 | | | 32.78 | | | 37.69 | | | 39.05 | |
| Overhead Expenses (G&A)3 | | | – | | | (0.25 | ) | | (0.22 | ) | | (0.24 | ) | | (0.21 | ) | | 0.20 | | | (0.13 | ) | | (0.12 | ) |
| | |
| |
| |
| |
| |
| |
| |
| |
| |
| Netback after Overhead | | | 43.36 | | | 32.51 | | | 34.81 | | | 34.70 | | | 29.18 | | | 32.98 | | | 37.56 | | | 38.93 | |
| Processing and Other Income | | | – | | | – | | | – | | | 3.05 | | | – | | | – | | | – | | | – | |
| Depletion, Depreciation and Amortization | | | (8.42 | ) | | (8.64 | ) | | (8.82 | ) | | (9.15 | ) | | (9.30 | ) | | (8.96 | ) | | (8.93 | ) | | (9.40 | ) |
| Income and Other Taxes | | | (10.86 | ) | | (4.67 | ) | | (8.83 | ) | | (10.47 | ) | | (6.12 | ) | | (7.52 | ) | | (8.87 | ) | | (8.91 | ) |
| | |
| |
| |
| |
| |
| |
| |
| |
| |
| Net Earnings | | $ | 24.08 | | $ | 19.20 | | $ | 17.16 | | $ | 18.13 | | $ | 13.76 | | $ | 16.50 | | $ | 19.76 | | $ | 20.62 | |
| | |
| |
| |
| |
| |
| |
| |
| |
| |
OIL SANDS MINING – SYNTHETIC CRUDE OIL
| | 2003
Three Months Ended
| | 2002
Three Months Ended
| |
|---|
| | Mar. 31
| | June 30
| | Sept. 30
| | Dec. 31
| | Mar. 31
| | June 30
| | Sept. 30
| | Dec. 31
| |
|---|
| |
| | (dollars per barrel)
| |
|---|
| Average Price Received | | $ | 50.79 | | $ | 41.46 | | $ | 40.80 | | $ | 38.80 | | $ | 34.30 | | $ | 40.44 | | $ | 43.80 | | $ | 43.23 | |
| Royalties | | | (0.52 | ) | | (0.42 | ) | | (0.59 | ) | | (0.39 | ) | | (0.34 | ) | | (0.41 | ) | | (0.45 | ) | | (0.55 | ) |
| | |
| |
| |
| |
| |
| |
| |
| |
| |
| Net Revenues | | | 50.27 | | | 41.04 | | | 40.21 | | | 38.41 | | | 33.96 | | | 40.03 | | | 43.35 | | | 42.68 | |
| Operating Expense | | | (26.06 | ) | | (25.80 | ) | | (17.75 | ) | | (26.25 | ) | | (18.20 | ) | | (30.03 | ) | | (13.09 | ) | | (20.18 | ) |
| | |
| |
| |
| |
| |
| |
| |
| |
| |
| Netback | | | 24.21 | | | 15.24 | | | 22.46 | | | 12.16 | | | 15.76 | | | 10.00 | | | 30.26 | | | 22.50 | |
| Depletion, Depreciation and Amortization | | | (1.92 | ) | | (1.92 | ) | | (1.92 | ) | | (1.92 | ) | | (1.88 | ) | | (1.90 | ) | | (1.89 | ) | | (1.89 | ) |
| Income and Other Taxes | | | (7.63 | ) | | 0.99 | | | (7.10 | ) | | (7.57 | ) | | (4.86 | ) | | (3.54 | ) | | (9.00 | ) | | (6.86 | ) |
| | |
| |
| |
| |
| |
| |
| |
| |
| |
| Net Earnings | | $ | 14.66 | | $ | 14.31 | | $ | 13.44 | | $ | 2.67 | | $ | 9.02 | | $ | 4.56 | | $ | 19.37 | | $ | 13.75 | |
| | |
| |
| |
| |
| |
| |
| |
| |
| |
34 Petro-Canada Annual Information Form
OIL SANDS – BITUMEN
| | 2003
Three Months Ended
| | 2002
Three Months Ended
|
|---|
| | Mar. 31
| | June 30
| | Sept. 30
| | Dec. 31
| | Mar. 31
| | June 30
| | Sept. 30
| | Dec. 31
|
|---|
|
| | (dollars per barrel)
|
|---|
| Average Price Received | | $ | 22.60 | | $ | 14.88 | | $ | 15.66 | | $ | 13.08 | | – | | – | | – | | – |
| Royalties | | | (0.18 | ) | | (0.05 | ) | | (0.08 | ) | | (0.10 | ) | – | | – | | – | | – |
| | |
| |
| |
| |
| |
| |
| |
| |
|
| Net Revenues | | | 22.42 | | | 14.83 | | | 15.58 | | | 12.98 | | – | | – | | – | | – |
| Operating Expense | | | (18.34 | ) | | (43.82 | ) | | (26.09 | ) | | (16.50 | ) | – | | – | | – | | – |
| | |
| |
| |
| |
| |
| |
| |
| |
|
| Netback | | | 4.08 | | | (28.99 | ) | | (10.51 | ) | | (3.52 | ) | – | | – | | – | | – |
| Overhead Expenses (G&A)3 | | | (0.97 | ) | | (2.71 | ) | | (2.30 | ) | | (0.85 | ) | – | | – | | – | | – |
| | |
| |
| |
| |
| |
| |
| |
| |
|
| Netback after Overhead | | | 3.11 | | | (31.70 | ) | | (12.81 | ) | | (4.37 | ) | – | | – | | – | | – |
| Processing and Other Income | | | –
| | | –
| | | 0.22 | | | –
| | – | | – | | – | | – |
| Exploration Expenses | | | (0.31 | ) | | (0.10 | ) | | (0.01 | ) | | (0.01 | ) | – | | – | | – | | – |
| Depletion, Depreciation and Amortization | | | (3.34 | ) | | (4.14 | ) | | (3.62 | ) | | (3.29 | ) | – | | – | | – | | – |
| Income and Other Taxes | | | 0.18 | | | 13.18 | | | 4.97 | | | 1.71 | | – | | – | | – | | – |
| | |
| |
| |
| |
| |
| |
| |
| |
|
| Net Loss | | $ | (0.36 | ) | $ | (22.76 | ) | $ | (11.25 | ) | $ | (5.96 | ) | – | | – | | – | | – |
| | |
| |
| |
| |
| |
| |
| |
| |
|
NORTHWEST EUROPE – CRUDE OIL & NGL AND NATURAL GAS 4
| | 2003
Three Months Ended
| | 2002
Three Months Ended
| |
|---|
| | Mar. 31
| | June 30
| | Sept. 30
| | Dec. 31
| | Mar. 31
| | June 30
| | Sept. 30
| | Dec. 31
| |
|---|
| |
| | (dollars per barrel of oil equivalent)
| |
|---|
| Average Price Received6 | | $ | 45.12 | | $ | 34.02 | | $ | 36.32 | | $ | 38.12 | | – | | $ | 34.94 | | $ | 39.37 | | $ | 39.79 | |
| Operating Expense | | | (5.12 | ) | | (5.73 | ) | | (9.26 | ) | | (8.22 | ) | – | | | (5.85 | ) | | (6.86 | ) | | (8.51 | ) |
| | |
| |
| |
| |
| |
| |
| |
| |
| |
| Netback | | | 40.00 | | | 28.29 | | | 27.06 | | | 29.90 | | – | | | 29.09 | | | 32.51 | | | 31.28 | |
| Overhead Expenses (G&A)3 | | | (0.77 | ) | | (0.62 | ) | | (1.35 | ) | | (0.67 | ) | – | | | (1.21 | ) | | (0.82 | ) | | (0.72 | ) |
| | |
| |
| |
| |
| |
| |
| |
| |
| |
| Netback after Overhead | | | 39.23 | | | 27.67 | | | 25.71 | | | 29.23 | | – | | | 27.88 | | | 31.69 | | | 30.56 | |
| Processing and Other Income | | | 1.80 | | | (0.17 | ) | | 0.43 | | | 1.61 | | – | | | – | | | – | | | 1.43 | |
| Exploration Expenses | | | (0.55 | ) | | (1.83 | ) | | (0.38 | ) | | (1.77 | ) | – | | | (0.55 | ) | | (0.43 | ) | | (1.69 | ) |
| Depletion, Depreciation and Amortization | | | (11.87 | ) | | (11.71 | ) | | (11.07 | ) | | (10.70 | ) | – | | | (12.10 | ) | | (10.14 | ) | | (11.72 | ) |
| Income and Other Taxes | | | (11.92 | ) | | (4.79 | ) | | (5.80 | ) | | (8.17 | ) | – | | | (5.65 | ) | | (10.39 | ) | | 0.28 | |
| | |
| |
| |
| |
| |
| |
| |
| |
| |
| Net Earnings | | $ | 16.69 | | $ | 9.17 | | $ | 8.89 | | $ | 10.20 | | – | | $ | 9.58 | | $ | 10.73 | | $ | 18.86 | |
| | |
| |
| |
| |
| |
| |
| |
| |
| |
35 Petro-Canada Annual Information Form
NORTH AFRICA/NEAR EAST – CRUDE OIL & NGL AND NATURAL GAS
| | 2003
Three Months Ended
| | 2002
Three Months Ended
| |
|---|
| | Mar. 31
| | June 30
| | Sept. 30
| | Dec. 31
| | Mar. 31
| | June 30
| | Sept. 30
| | Dec. 31
| |
|---|
| |
| | (dollars per barrel of oil equivalent)
| |
|---|
| Average Price Received6 | | $ | 45.08 | | $ | 34.10 | | $ | 37.64 | | $ | 36.94 | | $ | 36.16 | | $ | 35.54 | | $ | 38.92 | | $ | 40.61 | |
| Royalties | | | (21.51 | ) | | (16.18 | ) | | (17.91 | ) | | (17.92 | ) | | (21.02 | ) | | (16.26 | ) | | (21.01 | ) | | (21.10 | ) |
| | |
| |
| |
| |
| |
| |
| |
| |
| |
| Net Revenues | | | 23.57 | | | 17.92 | | | 19.73 | | | 19.02 | | | 15.14 | | | 19.28 | | | 17.91 | | | 19.51 | |
| Operating Expense | | | (4.61 | ) | | (2.98 | ) | | (4.19 | ) | | (3.72 | ) | | (5.62 | ) | | (3.35 | ) | | (4.61 | ) | | (4.20 | ) |
| | |
| |
| |
| |
| |
| |
| |
| |
| |
| Netback | | | 18.96 | | | 14.94 | | | 15.54 | | | 15.30 | | | 9.52 | | | 15.93 | | | 13.30 | | | 15.31 | |
| Overhead Expenses (G&A)3 | | | (0.40 | ) | | (0.48 | ) | | (0.51 | ) | | (0.53 | ) | | (1.06 | ) | | (0.25 | ) | | (0.26 | ) | | (0.14 | ) |
| | |
| |
| |
| |
| |
| |
| |
| |
| |
| Netback after Overhead | | | 18.56 | | | 14.46 | | | 15.03 | | | 14.77 | | | 8.46 | | | 15.68 | | | 13.04 | | | 15.17 | |
| Processing and Other Income | | | (0.44 | ) | | 0.01 | | | 2.05 | | | (1.01 | ) | | – | | | (0.05 | ) | | 0.39 | | | 0.32 | |
| Exploration Expenses | | | (0.84 | ) | | 0.09 | | | (0.16 | ) | | (0.06 | ) | | (27.96 | ) | | (0.07 | ) | | (0.02 | ) | | (0.07 | ) |
| Depletion, Depreciation and Amortization | | | (3.13 | ) | | (3.27 | ) | | (3.20 | ) | | (3.15 | ) | | (5.80 | ) | | (2.55 | ) | | (3.17 | ) | | (3.07 | ) |
| Income and Other Taxes | | | (12.11 | ) | | (10.23 | ) | | (9.58 | ) | | (10.06 | ) | | (2.28 | ) | | (8.88 | ) | | (8.07 | ) | | (9.50 | ) |
| | |
| |
| |
| |
| |
| |
| |
| |
| |
| Net Earnings (Loss) | | $ | 2.04 | | $ | 1.06 | | $ | 4.14 | | $ | 0.49 | | $ | (27.58 | ) | $ | 4.13 | | $ | 2.17 | | $ | 2.85 | |
| | |
| |
| |
| |
| |
| |
| |
| |
| |
36 Petro-Canada Annual Information Form
NORTHERN LATIN AMERICA – NATURAL GAS 5
| | 2003
Three Months Ended
| | 2002
Three Months Ended
| |
|---|
| | Mar. 31
| | June 30
| | Sept. 30
| | Dec. 31
| | Mar. 31
| | June 30
| | Sept. 30
| | Dec. 31
| |
|---|
| |
| | (dollars per thousand cubic feet)
| |
|---|
| Average Price Received | | $ | 4.93 | | $ | 4.39 | | $ | 3.85 | | $ | 3.23 | | – | | – | | $ | 2.99 | | $ | 3.89 | |
| Royalties | | | – | | | – | | | – | | | – | | – | | – | | | – | | | (0.09 | ) |
| | |
| |
| |
| |
| |
| |
| |
| |
| |
| Net Revenues | | | 4.93 | | | 4.39 | | | 3.85 | | | 3.23 | | | | | | | 2.99 | | | 3.80 | |
| Operating Expense | | | (0.16 | ) | | (0.18 | ) | | (0.29 | ) | | 0.02 | | – | | – | | | (0.76 | ) | | (0.47 | ) |
| | |
| |
| |
| |
| |
| |
| |
| |
| |
| Netback | | | 4.77 | | | 4.21 | | | 3.56 | | | 3.25 | | – | | – | | | 2.23 | | | 3.33 | |
| Overhead Expenses (G&A) 3 | | | (0.05 | ) | | (0.12 | ) | | (0.06 | ) | | (0.05 | ) | – | | – | | | (0.27 | ) | | (0.14 | ) |
| | |
| |
| |
| |
| |
| |
| |
| |
| |
| Netback after Overhead | | | 4.72 | | | 4.09 | | | 3.50 | | | 3.20 | | – | | – | | | 1.96 | | | 3.19 | |
| Processing and Other Income | | | (0.71 | ) | | (0.81 | ) | | (0.21 | ) | | (0.56 | ) | – | | – | | | – | | | – | |
| Depletion, Depreciation & Amortization | | | (0.83 | ) | | (0.82 | ) | | (0.80 | ) | | (0.80 | ) | – | | – | | | (0.50 | ) | | (0.30 | ) |
| Income and Other Taxes | | | (1.02 | ) | | (0.28 | ) | | (0.51 | ) | | (0.96 | ) | – | | – | | | (0.38 | ) | | (0.37 | ) |
| | |
| |
| |
| |
| |
| |
| |
| |
| |
| Net Earnings | | $ | 2.16 | | $ | 2.18 | | $ | 1.98 | | $ | 0.88 | | – | | – | | $ | 1.08 | | $ | 2.52 | |
| | |
| |
| |
| |
| |
| |
| |
| |
| |
- 1
- Average price includes natural gas, before the deduction of British Columbia gathering and processing charges, and conventional crude oil and field natural gas liquids in natural gas equivalent.
- 2
- Includes the operating cost component of British Columbia gathering and processing fees.
- 3
- Portion of head office expenses allocated to production.
- 4
- Reserves in Northwest Europe are subject to a conventional royalty and tax regime. No royalty is payable on reserves in the U.K. sector. Royalty is payable on onshore reserves in the Netherlands.
- 5
- Natural gas reserves in Trinidad are held under a production sharing arrangement with the government. The State share is split between royalty and tax for Canadian reporting purposes.
- 6
- Average price includes conventional crude oil, NGL and natural gas in crude oil equivalent.
37 Petro-Canada Annual Information Form
Productive Wells
The following table summarizes Petro-Canada's wells capable of production.
PRODUCTIVE WELLS 1 AT DECEMBER 31, 2003
| | Crude Oil Wells
| | Natural Gas Wells
| | Total Wells
|
|---|
| | Gross 2
| | Net 3
| | Gross
| | Net
| | Gross
| | Net
|
|---|
|
| North American Gas | | | | | | | | | | | | |
| | Western Canada – Conventional Oil & Gas | | 299 | | 212 | | 3 461 | | 2 290 | | 3 760 | | 2 502 |
| | East Coast Oil – Conventional Oil & Gas | | 30 | | 7 | | – | | – | | 30 | | 7 |
| | Oil Sands – In Situ Bitumen Recovery | | 25 | | 25 | | – | | – | | 25 | | 25 |
| | |
| |
| |
| |
| |
| |
|
| | Total Canada | | 354 | | 244 | | 3 461 | | 2 290 | | 3 815 | | 2 534 |
| | |
| |
| |
| |
| |
| |
|
| International | | | | | | | | | | | | |
| | Northwest Europe – Conventional Oil & Gas | | 39 | | 14 | | 52 | | 8 | | 91 | | 22 |
| | North Africa/Near East – Conventional Oil & Gas | | 493 | | 200 | | – | | – | | 493 | | 200 |
| | Northern Latin America – Natural Gas | | – | | – | | 7 | | 1 | | 7 | | 1 |
| | |
| |
| |
| |
| |
| |
|
| | Total International | | 532 | | 214 | | 59 | | 9 | | 591 | | 223 |
| | |
| |
| |
| |
| |
| |
|
| Total Productive Wells | | 886 | | 458 | | 3 520 | | 2 299 | | 4 406 | | 2 757 |
| | |
| |
| |
| |
| |
| |
|
- 1
- Wells with multiple completions are counted as one well.
- 2
- Gross wells are wells in which Petro-Canada owns a working interest.
- 3
- Net wells are the sum of the fractional working interests owned by Petro-Canada in gross wells, rounded to the nearest whole number.
38 Petro-Canada Annual Information Form
Oil and Natural Gas Rights
Petro-Canada's oil and natural gas rights are summarized in the following table. Landholdings are subject to government regulation.
OIL AND GAS RIGHTS AT DECEMBER 31, 2003
| | Developed Lands 1
| | Undeveloped Lands 1
| | Total
|
|---|
| | 2003
| | 2002
| | 2003
| | 2002
| | 2003
| | 2002
|
|---|
| | Gross 2
| | Net 3
| | Gross 2
| | Net 3
| | Gross 2
| | Net 3
| | Gross 2
| | Net 3
| | Gross 2
| | Net 3
| | Gross 2
| | Net 3
|
|---|
|
| | (millions of acres)
|
|---|
| Canada | | | | | | | | | | | | | | | | | | | | | | | | |
| | Mainland Canada | | 2.0 | | 1.0 | | 2.1 | | 1.0 | | 4.2 | | 3.0 | | 4.0 | | 2.8 | | 6.2 | | 4.0 | | 6.1 | | 3.8 |
| | Oil Sands | | 0.2 | | 0.1 | | 0.3 | | – | | 0.4 | | 0.2 | | 0.7 | | 0.3 | | 0.6 | | 0.3 | | 1.0 | | 0.3 |
| | East Coast Offshore | | 0.1 | | – | | 0.1 | | – | | 4.2 | | 1.5 | | 5.0 | | 1.7 | | 4.3 | | 1.5 | | 5.1 | | 1.7 |
| | Other Frontier 4 | | – | | – | | – | | – | | 7.7 | | 6.2 | | 7.5 | | 6.2 | | 7.7 | | 6.2 | | 7.5 | | 6.2 |
| | |
| |
| |
| |
| |
| |
| |
| |
| |
| |
| |
| |
|
| | Total Canada | | 2.3 | | 1.1 | | 2.5 | | 1.0 | | 16.5 | | 10.9 | | 17.2 | | 11.0 | | 18.8 | | 12.0 | | 19.7 | | 12.0 |
| | |
| |
| |
| |
| |
| |
| |
| |
| |
| |
| |
| |
|
| Alaska | | – | | – | | – | | – | | 0.4 | | 0.4 | | 0.4 | | 0.4 | | 0.4 | | 0.4 | | 0.4 | | 0.4 |
| | |
| |
| |
| |
| |
| |
| |
| |
| |
| |
| |
| |
|
| International | | | | | | | | | | | | | | | | | | | | | | | | |
| | North Africa/Near East | | 0.9 | | 0.4 | | 0.9 | | 0.3 | | 9.1 | | 6.1 | | 9.2 | | 6.1 | | 10.0 | | 6.5 | | 10.1 | | 6.4 |
| | Northwest Europe | | 0.2 | | 0.1 | | 0.1 | | 0.1 | | 2.0 | | 0.6 | | 2.5 | | 0.6 | | 2.2 | | 0.7 | | 2.6 | | 0.7 |
| | Northern Latin America | | 0.1 | | – | | – | | – | | 0.2 | | – | | 0.2 | | 0.1 | | 0.3 | | – | | 0.2 | | 0.1 |
| | |
| |
| |
| |
| |
| |
| |
| |
| |
| |
| |
| |
|
| | Total International | | 1.2 | | 0.5 | | 1.0 | | 0.4 | | 11.3 | | 6.7 | | 11.9 | | 6.8 | | 12.5 | | 7.2 | | 12.9 | | 7.2 |
| | |
| |
| |
| |
| |
| |
| |
| |
| |
| |
| |
| |
|
| Total | | 3.5 | | 1.6 | | 3.5 | | 1.4 | | 28.2 | | 18.0 | | 29.5 | | 18.2 | | 31.7 | | 19.6 | | 33.0 | | 19.6 |
| | |
| |
| |
| |
| |
| |
| |
| |
| |
| |
| |
| |
|
- 1
- Developed lands are areas capable of production while undeveloped lands are areas with rights to explore.
- 2
- Gross acres include the interest of others.
- 3
- Net acres exclude the interest of others.
- 4
- Includes lands located off the West Coast of Canada where exploration is currently under moratorium.
39 Petro-Canada Annual Information Form
Work Commitments
The practice of governments requiring companies to pledge to carry out work commitments in exchange for the right to carry out exploration for and development of hydrocarbons is a common one, particularly in unexplored or lightly explored regions of the world. Petro-Canada has made the following commitments in regards to the lands it holds.
WORK COMMITMENTS AS AT DECEMBER 31, 2003
| | Petro-Canada Share of Total Work Commitments
| | Petro-Canada Share of Total Work Commitments to be Incurred in 2004 1
|
|---|
|
| | (millions of dollars)
|
|---|
| Mainland Canada | | | | | | |
| | Mackenzie Delta/Corridor region | | $ | 19 | | $ | 6 |
| East Coast Offshore | | | 30 | | | 7 |
International |
|
|
|
|
|
|
| | North Africa/Near East | | | 14 | | | 14 |
| | Northwest Europe | | | 8 | | | 8 |
| | |
| |
|
| Total Work Commitments | | $ | 71 | | $ | 35 |
| | |
| |
|
- 1
- Capital expenditure plans for 2004 include provision for these work commitments.
Land Expiries
The following table summarizes the land area by region for which Petro-Canada's rights to explore for or develop hydrocarbons will expire in 2004.
LAND EXPIRIES IN 2004
| | Gross 1
| | Net 2
|
|---|
|
| | (millions of acres)
|
|---|
| Mainland Canada | | 1.18 | | 0.75 |
| East Coast Offshore | | 0.80 | | 0.21 |
| Oil Sands | | 0.16 | | 0.08 |
| | |
| |
|
| Total Expiries in 2004 | | 2.14 | | 1.04 |
| | |
| |
|
- 1
- Gross includes the interests of others.
- 2
- Net excludes the interests of others.
40 Petro-Canada Annual Information Form
Drilling Activity
The following table shows Petro-Canada's drilling activity during the years indicated.
WELLS DRILLED
| | 2003
| | 2002
| | 2001
|
|---|
| | Gross 1
| | Net 2
| | Gross
| | Net
| | Gross
| | Net
|
|---|
|
| NORTH AMERICAN GAS | | | | | | | | | | | | |
| Western Canada | | | | | | | | | | | | |
| Exploration wells 3 | | | | | | | | | | | | |
| | Oil | | – | | – | | – | | – | | 1 | | – |
| | Natural gas | | 24 | | 17 | | 10 | | 5 | | 28 | | 21 |
| | Dry 4 | | 20 | | 16 | | 17 | | 12 | | 16 | | 12 |
| Development wells 5 | | | | | | | | | | | | |
| | Oil | | 9 | | 2 | | 4 | | 4 | | 12 | | 11 |
| | Natural gas | | 388 | | 231 | | 337 | | 197 | | 326 | | 208 |
| | Dry | | 17 | | 14 | | 10 | | 7 | | 11 | | 4 |
| | |
| |
| |
| |
| |
| |
|
| Total Western Canada | | 458 | | 280 | | 378 | | 225 | | 394 | | 256 |
| | |
| |
| |
| |
| |
| |
|
| Mackenzie Delta/Corridor and Scotian Slope | | | | | | | | | | | | |
| Exploration wells | | | | | | | | | | | | |
| | Natural gas | | – | | – | | 1 | | 1 | | – | | – |
| | Dry | | – | | – | | 2 | | 1 | | – | | – |
| | Suspended | | 1 | | 1 | | – | | – | | – | | – |
| | |
| |
| |
| |
| |
| |
|
| Total Mackenzie Delta/Corridor and Scotian Shelf | | 1 | | 1 | | 3 | | 2 | | – | | – |
| | |
| |
| |
| |
| |
| |
|
| Total North American Gas | | 459 | | 281 | | 381 | | 227 | | 394 | | 256 |
| | |
| |
| |
| |
| |
| |
|
| EAST COAST OIL | | | | | | | | | | | | |
| Exploration wells | | | | | | | | | | | | |
| | Oil | | 1 | | – | | – | | – | | – | | – |
| | Dry | | 2 | | 1 | | 1 | | – | | – | | – |
| Development wells | | | | | | | | | | | | |
| | Oil | | 11 | | 3 | | 13 | | 3 | | 14 | | 4 |
| | Natural Gas | | – | | – | | – | | – | | – | | – |
| | Dry | | 1 | | – | | 2 | | 1 | | – | | – |
| | |
| |
| |
| |
| |
| |
|
| Total East Coast Oil | | 15 | | 4 | | 16 | | 4 | | 14 | | 4 |
| | |
| |
| |
| |
| |
| |
|
| | | | | | | | | | | | | |
41 Petro-Canada Annual Information Form
| OIL SANDS | | | | | | | | | | | | |
| Bitumen recovery wells | | – | | – | | – | | – | | 50 | | 50 |
| | |
| |
| |
| |
| |
| |
|
| INTERNATIONAL | | | | | | | | | | | | |
| Exploration wells | | | | | | | | | | | | |
| | Oil | | | | | | | | | | | | |
| | | Northwest Europe | | – | | – | | 3 | | 2 | | – | | – |
| | | North Africa/Near East | | 1 | | – | | – | | – | | – | | – |
| | Natural Gas | | | | | | | | | | | | |
| | | Northwest Europe | | 1 | | – | | 1 | | – | | – | | – |
| | | Northern Latin America | | 1 | | – | | – | | – | | – | | – |
| | Dry | | | | | | | | | | | | |
| | | Northwest Europe | | 2 | | 1 | | 3 | | 1 | | – | | – |
| | | North Africa/Near East | | – | | – | | 1 | | 1 | | – | | – |
| Development wells | | | | | | | | | | | | |
| | Oil | | | | | | | | | | | | |
| | | Northwest Europe | | 7 | | 4 | | 5 | | 3 | | – | | – |
| | | North Africa/Near East | | 46 | | 17 | | 31 | | 12 | | 3 | | 1 |
| | Natural gas | | | | | | | | | | | | |
| | | Northwest Europe | | 1 | | – | | – | | – | | – | | – |
| | | Northern Latin America | | 3 | | 1 | | 4 | | 1 | | – | | – |
| | Dry | | | | | | | | | | | | |
| | | Northwest Europe | | 4 | | 3 | | – | | – | | – | | – |
| | | North Africa/Near East | | 5 | | 2 | | 5 | | 2 | | – | | – |
| | | Northern Latin America | | 1 | | – | | – | | – | | – | | – |
| | |
| |
| |
| |
| |
| |
|
| Total International | | 72 | | 28 | | 53 | | 22 | | 3 | | 1 |
| | |
| |
| |
| |
| |
| |
|
| Total Wells Drilled | | 546 | | 313 | | 450 | | 253 | | 461 | | 311 |
| | |
| |
| |
| |
| |
| |
|
- 1
- Gross wells are wells, excluding all service wells, in which Petro-Canada owns a working interest. Gross wells include gross overriding royalty (GOR) wells.
- 2
- Net wells are the sum of the fractional working interests owned by Petro-Canada in gross wells, rounded to the nearest whole number. Net wells exclude GOR wells.
- 3
- Exploration wells are wells drilled to find and produce oil or natural gas in an unproved area, to find a new reservoir or to extend the known boundaries of a previously discovered reservoir.
- 4
- A dry hole is an exploration or development well found to be incapable of producing either oil or natural gas in sufficient quantities to justify completion as an oil or natural gas well.
- 5
- Development wells are wells drilled in an oil or natural gas reservoir to the depth of a stratigraphic horizon known to be productive.
42 Petro-Canada Annual Information Form
Capital Expenditures on Property, Plant & Equipment and Exploration
The following table shows Petro-Canada's capital expenditures on property, plant and equipment and exploration for the years indicated.
UPSTREAM CAPITAL EXPENDITURES ON PROPERTY,
PLANT & EQUIPMENT AND EXPLORATION
| | Years Ended December 31,
|
|---|
| | 2003
| | 2002
| | 2001
|
|---|
|
| | (millions of dollars)
|
|---|
| Exploration | | | | | | | | | |
| North American Gas | | $ | 213 | | $ | 259 | | $ | 258 |
| East Coast Oil | | | 47 | | | 26 | | | 16 |
| Oil Sands | | | 23 | | | 23 | | | 28 |
| International | | | | | | | | | |
| | Northwest Europe | | | 43 | | | 33 | | | – |
| | North Africa/Near East | | | 14 | | | 28 | | | 16 |
| | Northern Latin America | | | 2 | | | – | | | – |
| | |
| |
| |
|
| Total Exploration | | | 342 | | | 369 | | | 318 |
| | |
| |
| |
|
Development |
|
|
|
|
|
|
|
|
|
| North American Gas | | | 314 | | | 250 | | | 296 |
| East Coast Oil | | | 297 | | | 264 | | | 258 |
| Oil Sands | | | 425 | | | 439 | | | 275 |
| International | | | | | | | | | |
| | Northwest Europe | | | 254 | | | 60 | | | – |
| | North Africa/Near East | | | 123 | | | 80 | | | 16 |
| | Northern Latin America | | | 24 | | | 20 | | | – |
| | |
| |
| |
|
| Total Development | | | 1 437 | | | 1 113 | | | 845 |
| | |
| |
| |
|
| Property Acquisitions | | | | | | | | | |
| North America Gas | | | 33 | | | 20 | | | – |
| International | | | | | | | | | |
| | Northwest Europe | | | 65 | | | – | | | – |
| | North Africa/Near East | | | – | | | – | | | 121 |
| | |
| |
| |
|
| Total Property Acquisitions | | | 98 | | | 20 | | | 121 |
| | |
| |
| |
|
| Total Capital Expenditures on Property, Plant & Equipment and Exploration | | $ | 1 877 | | $ | 1 502 | | $ | 1 284 |
| | |
| |
| |
|
Petro-Canada's capital expenditure plans for Upstream investment in 2004 amounts to approximately $1 765 million. Planned investments in our North American Gas business total $495 million. Spending plans for Canada's East Coast include $140 million for ongoing Hibernia and Terra Nova drilling and development programs, $180 million for development of the White Rose project, and $5 million for other activities. In Oil Sands we plan to spend about $305 million for our share of Syncrude's Stage 3 expansion, sustaining capital for both Syncrude and MacKay River, delineation of future bitumen resources and other expenses. Capital expenditure plans for International provides for estimated spending of $640 million, including $400 million for new developments, including the Pict and De Ruyter discoveries in the North Sea and evaluation work at La Ceiba in Venezuela and other exploration opportunities. This new exploration will include work on Block II in Syria, the Melitta licence in Tunisia and concentric exploration associated with existing operations. The remaining $240 million of planned international expenditures is to sustain existing production.
43 Petro-Canada Annual Information Form
Downstream
In the Downstream, Petro-Canada transports, refines, markets and distributes petroleum products and related goods and services. Petro-Canada is the second largest petroleum refining and marketing company in Canada.
Operating functions include Refining and Supply, Sales and Marketing, and Lubricants. In addition, Integration and Planning provides support to the operating units in the areas of planning, administration, business processes and business development.
Refining and Supply
Petro-Canada owns and operates three refineries located in: Edmonton, Alberta; Montreal, Quebec; and Oakville, Ontario. With a total rated capacity of approximately 49 800 cubic metres per day, these refineries represent the second largest refining capacity in Canada with approximately 17 per cent of the Canadian refining industry's total operating capacity. Going forward, Petro-Canada plans to consolidate the Eastern Canada refining operations at the Montreal refinery prior to 2005. This will include the shutting down of the Oakville refining operations and a limited expansion of Montreal's refining capacity. The net result will be a decrease in total refining capacity to approximately 14 per cent of the Canadian refining industry's capacity. Petro-Canada has entered into third party supply deals that when combined with the additional yield from Montreal, will replace the 9 500 cubic metres per day of light oil products currently produced at the Oakville refinery. Petro-Canada's refineries produce a full range of refined petroleum products, including gasolines, diesel oils, heating oils, aviation fuels, heavy fuel oils, asphalts, petrochemicals and feedstocks for lubricants.
At 2003 year-end, programs were underway at both the Edmonton and Montreal refineries to enable us to meet federal regulatory requirements for lower limits for sulphur in gasoline and diesel by 2005 and 2006, respectively. The new gasoline desulphurization unit at the Montreal refinery was completed and successfully commissioned in the fourth quarter of 2003. Construction of the Edmonton gasoline desulphurization unit is ongoing and it will be operational ahead of the legislated date.
The following table shows the daily rated capacity of our refineries at December 31, 2003 and the approximate average daily volumes of crude oil processed, including volumes processed by Petro-Canada for other companies, for the years indicated. The overall utilization rate at our three refineries averaged 100 per cent in 2003.
RATED CAPACITY OF REFINERIES AND AVERAGE DAILY CRUDE OIL PROCESSED
| | Average Volumes of Crude Oil
Processed per Calendar Day
| | Daily Rated Capacity 1
|
|---|
| | Years Ended December 31,
| |
|
|---|
| | As at
December 31, 2003
|
|---|
Refinery Location
| | 2003
| | 2002
| | 2001
|
|---|
|
| | (thousands of cubic metres)
|
|---|
| Edmonton, Alberta | | 19.8 | | 20.9 | | 17.8 | | 19.9 |
| Montreal, Quebec | | 16.8 | | 16.1 | | 16.0 | | 16.7 |
| Oakville, Ontario | | 13.3 | | 13.4 | | 13.9 | | 13.2 |
| | |
| |
| |
| |
|
| Total | | 49.9 | | 50.4 | | 47.7 | | 49.8 |
| | |
| |
| |
| |
|
- 1
- Daily rated capacity is based on calendar days and definite specifications as to types of crude oil, the products to be obtained and the refinery processes required. Variations in these factors may result in actual capacity being higher or lower than rated capacities.
44 Petro-Canada Annual Information Form
Edmonton Refinery
The Edmonton refinery is Petro-Canada's largest and most efficient refinery, producing a high yield of light oils. The Edmonton refinery can use synthetic crude oil for up to 40 per cent of its feedstock. Synthetic crude oil produces a higher yield of gasoline and middle distillates than conventional crude oil. All of the Edmonton refinery's feedstock is domestic crude oil.
Under revised plans for upgrading and refining oil sands feedstock at the Edmonton refinery, we will build new crude and vacuum units, and expand the capacity of the existing coker and build additional sulphur and hydrogen capability. The new configuration, targeted for completion in 2008, will allow the refinery to directly upgrade 4 100 cubic metres per day (m3/d) of bitumen and process 7 600 m3/d of sour synthetic crude oil, in place of the conventional feedstock that is refined today. The refinery will also continue to process sweet synthetic crude through its synthetic train. (See under Oil Sands in the Upstream section of this Annual Information Form for long-term arrangement for the supply of bitumen and sour crude oil feedstocks to the Edmonton refinery on completion of the planned reconfiguration).
Montreal Refinery
The Montreal refinery, supplied with imported crude oil primarily through the Portland-Montreal pipeline, has a flexible configuration allowing it to process a variety of crude oils, including heavy grades, and intermediate feedstocks. The refinery produces gasolines, distillates, asphalts, petrochemicals, lubricant feedstocks and solvents.
A limited expansion of the refining and logistics handling capacity is being completed as part of the Eastern Canada refining and supply consolidation project. In the fourth quarter of 2004, the Montreal refinery will begin supplying up to 2 400 m3/d of finished light oil product to the expanded Oakville terminal via the Trans-Northern pipeline.
Oakville Refinery
The Oakville refinery is supplied with both domestic and imported crude oil. A variety of domestic crude oil types are supplied through the Enbridge pipeline system. Since May 1999, offshore light crude oil is supplied via the Portland-Montreal pipeline, through Montreal and the Enbridge Line 9. The refinery produces a wide range of products including gasolines, distillates, asphalts and lubricant feedstocks for Petro-Canada's lubricants plant.
As part of the Eastern Canada refining and supply consolidation project, the Oakville refinery will complete a phased shutdown of its operations during the fourth quarter of 2004. Oakville's terminal facilities are being expanded to handle receipt of finished light oil product from Montreal via the Trans-Northern pipeline. In total, the expanded Oakville terminal will receive up to 9 500 m3/d of finished light oil product to replace that which is currently produced by the Oakville refinery operations. In conjunction with the shutdown of the Oakville refinery, the asphalt operations adjacent to our Mississauga Lubricants facility will also close.
Supply
Petro-Canada purchases crude oil and other refinery feedstocks from Canadian and international sources under a number of different contractual arrangements. The Downstream sector is responsible for arranging domestic and foreign crude supply for our refineries. There is a well-developed infrastructure for third party supply of both domestic and imported crudes to markets in North America. Purchases are generally through short-term renewable contracts. Petro-Canada is not dependent on any single source of supply for conventional crude oil and does not anticipate any difficulty in obtaining an adequate supply in the foreseeable future.
Distribution
Petro-Canada operates an extensive distribution network, utilizing pipeline, road, rail and marine transportation, to deliver refined products to retail outlets, and commercial and industrial customers. We hold interests in two refined product pipelines and operate 12 major refined product terminals across Canada.
Distribution efficiencies are achieved through refined product exchange, purchase, sale and short-term storage arrangements with other petroleum companies. These arrangements reduce capital and transportation costs, assist in the
45 Petro-Canada Annual Information Form
maintenance of supply to customers and enable us to participate in geographical areas without the need to invest capital in distribution facilities. Applicable agreements contain appropriate provisions for consistent product quality to be maintained for our customers.
Sales and Marketing
Petro-Canada is the second largest marketer of petroleum products in Canada. In 2003, Petro-Canada's petroleum product sales represented approximately 17 per cent of total petroleum products sold in Canada. Petro-Canada markets a full range of petroleum products including gasolines, diesel oils, heating oils, aviation fuels, heavy fuel oils, asphalts, lubricants, petrochemical feedstocks and liquefied petroleum gases. Petro-Canada also generates non-petroleum revenue from convenience stores, car washes and automotive repair and maintenance services.
The following table shows the approximate average daily volumes of petroleum products sold during the years indicated.
AVERAGE DAILY SALES OF PETROLEUM PRODUCTS
| | Years Ended December 31,
|
|---|
| | 2003
| | 2002
| | 2001
|
|---|
|
| | (thousands of cubic metres per day)
|
|---|
| Gasoline 1 | | 25.8 | | 25.9 | | 24.6 |
| Middle distillates 2 | | 20.5 | | 19.3 | | 19.2 |
| Other 3 | | 10.5 | | 10.5 | | 10.7 |
| | |
| |
| |
|
| Total | | 56.8 | | 55.7 | | 54.5 |
| | |
| |
| |
|
- 1
- Includes motor and aviation gasolines.
- 2
- Includes diesel oils, heating oils and aviation jet fuels.
- 3
- Includes heavy fuel oils, asphalts, lubricants, liquefied petroleum gases, petrochemical feedstocks and other petroleum products.
The following table shows the annual revenues derived from refining and marketing activities during the years indicated.
REFINING AND MARKETING REVENUES
| | Years Ended December 31,
|
|---|
| | 2003
| | 2002
| | 2001
|
|---|
|
| | (millions of dollars)
|
|---|
| Gasoline 1 | | $ | 3 726 | | $ | 3 439 | | $ | 3 299 |
| Middle distillates 2 | | | 2 761 | | | 2 311 | | | 2 432 |
| Other 3 | | | 1 665 | | | 1 571 | | | 1 433 |
| | |
| |
| |
|
| Total | | $ | 8 152 | | $ | 7 321 | | $ | 7 164 |
| | |
| |
| |
|
- 1
- Includes motor and aviation gasolines.
- 2
- Includes diesel oils, heating oils and aviation jet fuels.
- 3
- Includes heavy fuel oils, asphalts, lubricants, liquefied petroleum feedstocks and other petroleum and non-petroleum products.
46 Petro-Canada Annual Information Form
Retail
At December 31, 2003, Petro-Canada's network of retail sites consisted of 1 432 outlets across Canada, of which 850 are Company-controlled with the others controlled by third parties. Independent dealers and agents operate virtually all of the outlets.
Wholesale and Refinery Sales
Petro-Canada sells petroleum products into the farm, home heating, paving, small industrial, commercial and truck markets. This category accounts for approximately 65 per cent of total Downstream sales volumes. Petro-Canada is also the leading national marketer to the commercial road transport segment in Canada with 210 Petro-Pass sites.
We also sell large volumes of petroleum products directly to large industrial and commercial customers and independent marketers. Asphalt total sales volume in 2003 was approximately 1.4 billion litres.
Lubricants
The Lubricants Centre, located in Mississauga, Ontario, produces specialty lubricants and waxes that we market in Canada and internationally. Petro-Canada is the largest producer of lube base stocks in Canada with annual base oil production capacity in excess of 700 million litres, and the largest producer of white oils in the world.
The lubricants plant utilizes a two-stage hydro-treating process, which is unique in Canada. This process enables Petro-Canada to refine gas oils produced from a wide range of crude feedstocks into lubricating oil base stocks with the highest level of purity of any base stocks in Canada. Advancing lubricant technology and environmental concerns continue to increase the demand for high purity, hydro-treated base stocks for many lubricant applications, and Petro-Canada is well positioned to meet this growing demand.
Our strategy is focused on leveraging technological and quality advantages by growing volume in high-margin channels. Products in this high-margin category include pharmaceutical grade white oils, high viscosity index oils for use in high-end industrial applications, next generation engine oils and transmission fluids. In 2003, high margin sales accounted for over 65 per cent of total lubricant sales. Our goal is to achieve over 75 per cent of total lubricant sales in the high-margin channel. Petro-Canada currently sells approximately two-thirds of its manufactured lubricants outside of Canada, and the growing global demand for these higher quality products offers significant opportunity for long-term growth.
Pipelines
Petro-Canada complements its production, extracting and refining operations with ownership in several crude oil and refined product pipelines. The principal pipelines in which we have an interest are the Alberta Products pipeline, the Trans-Northern pipeline and the Portland-Montreal pipeline.
47 Petro-Canada Annual Information Form
Capital Expenditures on Property, Plant and Equipment
The following table shows Petro-Canada's Downstream capital expenditures on property, plant and equipment for the years indicated.
DOWNSTREAM CAPITAL EXPENDITURES ON PROPERTY, PLANT AND EQUIPMENT
| | Years Ended December 31,
|
|---|
| | 2003
| | 2002
| | 2001
|
|---|
|
| | (millions of dollars)
|
|---|
| Refining and Supply | | $ | 296 | | $ | 210 | | $ | 206 |
| Sales, Marketing and Other | | | 117 | | | 118 | | | 156 |
| Lubricants | | | 11 | | | 16 | | | 21 |
| | |
| |
| |
|
| Total | | $ | 424 | | $ | 344 | | $ | 383 |
| | |
| |
| |
|
In addition to the 2003 capital expenditures included in the above table, $46 million of investments and deferred charges were made relating to acquisitions in the home heat business and business development in refining and supply.
The major portion of 2003 capital expenditures and those planned for 2004 are focused on investments to comply with federal requirements for the reduction of sulphur levels in gasoline and diesel and on the accelerated roll-out of our new-image retail sites. Montreal successfully commissioned a new gasoline desulphurization unit in the fourth quarter of 2003 to meet the 30 parts per million of sulphur in gasoline legislation that becomes effective January 1, 2005. Construction of the Edmonton gasoline desulphurization unit is ongoing and it will be operational ahead of the legislated date.
Planned Downstream capital expenditures in 2004 amount to approximately $865 million with $705 million related to Refining and Supply, $150 million for Sales and Marketing and $10 million for Lubricants. The estimated capital expenditures for Refining and Supply include about $445 million for refinery reconfiguration to meet new lower limits for sulphur in gasoline and diesel at our Edmonton and Montreal refineries; about $135 million to consolidate our Eastern Canada refinery operations at Montreal, including the conversion of our Oakville facility; and $50 million for engineering, site preparation and other costs associated with the new feedstock conversion plans for the Edmonton refinery. Sales and Marketing expenditures include $100 million for retail growth initiatives, including the continued roll-out of the new image service station program.
Research and Development
Petro-Canada owns a research facility at Sheridan Park in Mississauga, Ontario, where we conduct research on lubricants. In 2003, Petro-Canada's expenditures on research and development activities were approximately $15 million.
As global advancements in fuel cell technology continue to occur, the Fuelling a Cleaner Canada Association (Petro-Canada, Ballard Power Systems and Methanex Corporation) has focused its efforts on working with various government agencies, such as the Canadian Transportation Fuel Cell Alliance (CTFCA), in an effort to ensure appropriate funding and the optimization of independent activities directed towards the implementation of fuel cell pilot demonstrations. In addition, through the CTFCA, knowledge from other pilot projects such as the California Fuel Cell Partnership can be shared, thereby assisting in the advancement of Canadian demonstrations.
48 Petro-Canada Annual Information Form
Human Resources
At December 31, 2003, Petro-Canada and its wholly owned subsidiaries had 4 514 employees, compared with 4 470 employees at December 31, 2002. Of the year-end 2003 employees, 1 011 were employed in the Canadian Upstream, 270 in International and 2 527 in the Downstream, with the remaining 706 being Corporate support staff. Of the Canadian Upstream employees, 173 were in the East Coast Oil Business Unit, 98 in Oil Sands and 740 in North American Gas. Sixteen of the Downstream employees, as well as the 270 International employees are currently employed outside of Canada. Approximately 26 per cent of Petro-Canada's employees are covered by collective bargaining agreements. Approximately 87 per cent of our unionized employees are members of the Communications Energy and Paperworkers Union (CEPU) that represents refinery, marketing, gas plant and offshore production workers. Three-year collective bargaining agreements with the CEPU expired on January 31, 2004. Negotiations to renew these agreements are underway.
Social and Environmental Policies
Petro-Canada executives are accountable for the effective execution of our Total Loss Management policies and standards. Petro-Canada conducts a major review of each business unit or area every four years to assess the implementation of these policies and standards. Our Executive Leadership Team reviews environment, health and safety performance monthly. As well, the Environment, Health and Safety Committee of the Board of Directors reviews environment, health and safety performance throughout the year.
Petro-Canada's success as an energy company depends on the support we receive from our stakeholders. We are determined to continually earn that support, not just through excellence in meeting our customers' energy needs, but by playing an active and important role in the communities where we live and operate.
Petro-Canada's social vision statement is: We are investing our energy to develop talent, expertise and innovation through education. In 2003, Petro-Canada invested approximately $15 million in over 400 Canadian non-profit organizations in four sectors – education, the environment, health and community services, and arts and culture. This included two unique in-kind contributions: we donated a corporate aircraft and avionics shop, valued at $1.6 million, to the Southern Alberta Institute of Technology; and turned over the Petro-Canada Research Laboratory, valued at $6.9 million, to the University of Calgary. We contributed $630 000 to support Canada's Olympic team, including scholarships, the Podium Fund and the Coaching Excellence Awards. Through our Volunteer Energy Program, we provided 430 grants of $500 each to non-profit organizations supported by employees and retirees who give their time to the community. The total amount of grants, given out since 1992, surpassed the $1 million mark in 2003.
More information about Petro-Canada's environmental and social policies and performance is available on the corporate Web site at www.petro-canada.ca. The information includes our Principles for Investment and Operations, covering guidelines in the areas of business conduct, community participation, environmental protection, human rights and employee health and safety. Also available for viewing on the Web site is Petro-Canada's annual Report to the Community, which provides disclosure on a wide range of sustainable development issues.
49 Petro-Canada Annual Information Form
Environmental Expenditures
In 2003, Petro-Canada's environmental capital and operating expenditures totalled $414 million, compared with $318 million in 2002 and $135 million in 2001. The rise in expenditures in 2003 mainly reflected our preparations to meet new federal limits for sulphur in gasoline. We expect environmental costs to remain high, as we prepare to meet federal limits for sulphur in gasoline and distillate, future fuel reformulation requirements, and tighter environmental standards for oil and gas production.
The following table shows Petro-Canada's expenditures for environmental matters during 2003.
ENVIRONMENTAL COSTS – YEAR ENDED DECEMBER 31, 2003
| | Capital
| | Operating Expense
| | Total
|
|---|
|
| | (millions of dollars)
|
|---|
| Upstream | | $ | 57 | | $ | 57 | | $ | 114 |
| Downstream | | | 261 | | | 39 | | | 300 |
| | |
| |
| |
|
| Total Environmental Costs | | $ | 318 | | $ | 96 | | $ | 414 |
| | |
| |
| |
|
Environmental expenditures included: purchase, installation, operation and maintenance of pollution abatement equipment and facilities; replacement of underground tanks; waste management; environmental studies and research; reclamation activities; and the workforce costs of environmental staff and consultants.
Industry Conditions
Oil prices are subject to international supply and demand. Political developments, especially in the Middle East, can affect world oil supply and oil prices. Natural gas prices are primarily affected by supply and demand in North America and, to a lesser extent, by prices of alternate sources of energy. Petro-Canada expects continued volatility and uncertainty in oil and natural gas prices.
Crude oil prices are generally set in U.S. dollars, while sales of refined petroleum products are primarily in Canadian dollars. Fluctuations in exchange rates between the U.S. dollar and Canadian dollar may therefore give rise to foreign currency exposure.
The Canadian and international petroleum industry is highly competitive in all aspects, including the exploration for and development of new sources of supply, the construction and operation of pipelines and the refining, distribution and marketing of petroleum products. The Company competes in virtually every aspect of its business with other large integrated oil and gas companies. In export markets, the Company encounters active competition from other Canadian producers and foreign producers. The petroleum industry also competes with other industries in supplying energy, fuel and related products to consumers.
Exploration, production and refining require high levels of investment and have particular economic risks and opportunities. They are subject to hazards such as fire, explosion, blowouts and oil spills that can cause personal injury, damage to property, equipment and the environment and resulting interruption of operations.
The petroleum industry is also subject to regulation and intervention by governments in such matters as the award of exploration and production rights, the imposition of specific drilling obligations, environmental protection controls, control over the development and abandonment of fields (including restrictions on production) and, possibly, expropriation or cancellation of contract rights.
50 Petro-Canada Annual Information Form
Risks attaching to foreign operations include, but are not limited to: international unrest and conflict; changes in laws affecting foreign ownership, fiscal regimes, exchange controls and the repatriation of funds; and foreign exchange rates.
Risk Management
Petro-Canada's results are impacted by management's strategy for handling risks inherent in the underlying business, which fall into four broad categories: business risks; operational risks; political risks; and market risks.
Management believes each major risk requires a unique response within our broad business strategy and Petro-Canada's financial tolerance. While some risks can be effectively managed through internal controls and business processes, others are managed through insurance. The Audit, Finance and Risk Committee of the Board of Directors has oversight responsibility for risk management. The following describes Petro-Canada's approach to managing major risks.
Business Risks
Exploration: Petro-Canada's future cash flows are highly dependent on our ability to replace natural decline as reserves are produced. Reserves can be added through successful exploration or acquisition. However, as basins mature, replacement of reserves becomes more challenging and expensive, and we may choose to allow reserves to decline in some areas if replacement is uneconomic. Petro-Canada maintains an extensive exploration program in Canada and internationally. To support this program, we have entered into a variety of alliances with world-class suppliers. These alliances provide preferential access to equipment, labour and advanced technology at competitive prices. There is no assurance that we will successfully replace all reserves in any given year.
Reserve Estimates: Estimates of economically recoverable oil and gas reserves are based upon a number of variables and assumptions such as geoscientific interpretation, commodity prices, operating and capital costs, and production forecasts, all of which may vary considerably from actual results.
Project Execution: Petro-Canada manages a variety of small and large projects in support of continuing operations and future growth. Many project risks, such as those involving material costs, labour productivity, timely availability of skilled labour, and currency fluctuations are influenced by external factors beyond our control. Petro-Canada is enhancing its project management capability. We have built on our experience in major project development to establish effective standardized processes, backed by well-trained people, to manage projects across the organization. The goal is to consistently and predictably deliver projects on time, on budget, and achieve defined expectations, thereby improving all elements of project execution including safety and environmental performance, quality, cycle time and cost.
Third Party Operator: Other companies may manage construction or operation of assets in which Petro-Canada has an interest. The Company has limited ability to exercise influence over operations of these assets or their associated costs, which could adversely affect financial performance.
Environmental Regulations: Environmental risks inherent in the oil and gas industry are increasingly significant as related laws and regulations become more stringent in Canada and other countries where Petro-Canada operates. Increased regulations may require the Company to invest additional capital to satisfy new product specifications or address environmental issues, increase operating costs by reducing the yield of desirable products, or create a future liability for dismantling and remediating production facilities.
Petro-Canada conducts Life-Cycle Value Assessment (LCVA) to integrate and balance environmental, social and economic decisions related to major projects. A key component of the LCVA process is to include in front-end planning all life-cycle stages involved in constructing, manufacturing, distribution and eventually abandoning an asset or a product. This process encourages more comprehensive exploration for alternatives. Although LCVA is a useful technique, it relies on the current regulatory regime or one that can be reasonably expected.
51 Petro-Canada Annual Information Form
Government Regulations: The Company is subject to regulation and intervention by governments in such matters as contracting of exploration and production interests, imposition of specific drilling obligations, and possibly expropriation or cancellation of contract rights. As well, governments may regulate or intervene with respect to price, taxes, royalties and exploration. The Company has limited ability to influence these regulations and they may have a material adverse effect on the Company.
Counter-parties: In the normal course of business, Petro-Canada is exposed to credit risk resulting from the uncertainty of a counter-party's ability to fulfil an obligation in accordance with the terms and conditions of a contract. To minimize credit exposure, we have established internal credit policies and procedures that include financial assessments, exposure limits and processes to monitor the exposures against these limits. Where appropriate, we use netting and collateral arrangements to minimize risk.
Petro-Canada only transacts derivatives with counter-parties who possess a minimum long-term credit rating of A (unless otherwise approved by the Board) under a signed International Swap Dealers Association agreement. Credit limits take into account both current and potential exposure to a counter-party and limit concentration of risk.
Operational Risks
Production, refining, transporting and marketing oil and gas involve significant operational hazards. We manage operational risks primarily through our integrated Total Loss Management (TLM) system and a Corporate Insurance Program. TLM is an internally developed management system with standards for preventing operational incidents. A program of regular TLM audits tests compliance to the standards. The Corporate Insurance Program transfers some operational risks to third party insurers worldwide. Limits of insurance are based on financial quantification of a 'maximum foreseeable exposure' related to major assets. Petro-Canada optimizes the program by evaluating deductibles, limits and coverage. The Company's financial tolerance to withstand the impact of a major isolated event may be utilized to manage total premium cost. Although Petro-Canada maintains insurance in accordance with customary industry practices, we cannot fully insure against all risks. Losses resulting from operational incidents could have a material adverse impact on the Company.
Political Risks
Internationally, Petro-Canada operates in numerous countries with differing political, economic and social systems. Our operations and related assets are subject to the risks of actions by governmental authorities, insurgent groups or terrorists. Additionally, Petro-Canada operates in OPEC-member countries and production in those countries may be constrained from time to time by OPEC quotas. We evaluate our exposure in any one country in the context of the Company's total operations, may limit investment to avoid excessive exposure in any one country or region and may choose not to invest in a country based on our assessment of risk.
Market Risks
Commodity Prices: A significant market risk exposure for Petro-Canada is the commodity price of crude oil, refined products and natural gas. International commodity prices are volatile and are influenced by factors such as supply and demand fundamentals, geo-political events, OPEC decisions and weather. Refining margins are affected by North American supply and demand fundamentals and crude oil prices. These risks may be positive in a higher-price environment and negative in a lower-price environment.
Petro-Canada is generally averse to hedging large volumes of production. Management believes commodity prices go through price swings that are difficult to predict. We manage the business so that the Company can withstand the impact of a lower price environment, and is also fully exposed to capturing significant upside when the price environment is higher. However, commodity prices and margins may be hedged occasionally to capture opportunities that represent extraordinary value. Certain Downstream physical transactions are routinely hedged for operational needs and to facilitate sales to customers.
52 Petro-Canada Annual Information Form
Foreign Exchange: As energy commodity prices are primarily priced in U.S. dollars, a large portion of Petro-Canada's expense and revenue stream is affected by the U.S. dollar/Canadian dollar exchange rate. Although there is a significant natural offset to this exposure as a result of our integrated business, on a net basis Petro-Canada's earnings are negatively affected by a strengthening Canadian dollar. We do not hedge this exposure, but it is partially mitigated by issuing U.S. dollar denominated long-term debt. Foreign exchange exposure related to asset acquisitions or divestitures, or project capital expenditures may be hedged on a case-by-case basis. Petro-Canada is also exposed to fluctuations in other foreign currencies such as the euro and British pound.
Interest Rates: Petro-Canada targets a blend of fixed and floating rate debt that enables the Company to take advantage of generally lower interest rates on floating debt while generally matching overall debt maturity with the life of cash generating assets. The Company is exposed to fluctuations in the rate of interest it pays on floating rate debt. Management's perspective is that this interest rate exposure is consistent with industry practice and it is within the Company's risk tolerance.
Financial Instruments
Petro-Canada's market risk and derivative policy prohibits the use of derivative instruments for speculative purposes. Petro-Canada uses derivatives primarily to hedge physical transactions for operational needs and to facilitate sales to customers. The gains and losses associated with these financial instruments essentially offset gains and losses on the physical transactions. Except as specifically authorized by the Board of Directors, the term of hedging instruments cannot exceed 18 months. Monitoring and reporting of the derivatives portfolio includes periodic testing of the fair value of all outstanding derivatives. Fair values are determined by obtaining independent third party quotes for the value of each derivative instrument. The objectives and strategies of all hedge transactions are documented, as well as an assessment of the effectiveness of the derivative instrument in offsetting a change in the value of the hedged exposure.
In 2003, commodity, currency and interest rate hedges resulted in a net decrease in earnings of about $30 million after tax, compared with a net decrease in earnings of about $22 million in 2002. As at December 31, 2003, crude oil and natural gas contracts had been bought forward to mitigate exposure on fixed-price natural gas and refined product sales. Short-term hedge positions were also in place for refining supply and product purchases. At year end, these instruments had a fair value of $9 million. In accordance with our derivative accounting policy, this value has been deferred and will be recognized in the period in which the derivative instrument is realized.
53 Petro-Canada Annual Information Form
ITEM 6 – SELECTED CONSOLIDATED FINANCIAL INFORMATION
The following selected consolidated financial information for each of the three years in the period ended December 31, 2003 is derived from Petro-Canada's audited Consolidated Financial Statements. The information set forth below should be read in conjunction with Management's Discussion and Analysis, the Consolidated Financial Statements and related notes and other financial information.
SELECTED CONSOLIDATED FINANCIAL INFORMATION
| | Years Ended December 31,
| |
|---|
| | 2003
| | 2002
| | 2001
| |
|---|
| |
| | (millions of dollars, except per share amounts)
| |
|---|
| Statement of earnings data | | | | | | | | | | |
| Revenue | | | | | | | | | | |
| | Operating | | $ | 12 209 | | $ | 9 917 | | $ | 8 582 | |
| | Investment and other income | | | 12 | | | – | | | 154 | |
| | |
| |
| |
| |
| | | Total revenue | | $ | 12 221 | | $ | 9 917 | | $ | 8 736 | |
| | |
| |
| |
| |
| Earnings before income taxes | | $ | 2 975 | | $ | 1 828 | | $ | 1 329 | |
| Provision for income taxes | | | 1 306 | | | 854 | | | 483 | |
| | |
| |
| |
| |
| Net earnings | | $ | 1 669 | | $ | 974 | | $ | 846 | |
| | |
| |
| |
| |
| Earnings | | | | | | | | | | |
| North American Gas | | $ | 479 | | $ | 180 | | $ | 463 | |
| East Coast Oil | | | 593 | | | 430 | | | 168 | |
| Oil Sands | | | (50 | ) | | 79 | | | 59 | |
| International | | | 297 | | | 225 | | | (27 | ) |
| Downstream | | | 264 | | | 254 | | | 300 | |
| Shared Services | | | (182 | ) | | (144 | ) | | (51 | ) |
| | |
| |
| |
| |
| Earnings from operations1,3 | | | 1 401 | | | 1 024 | | | 912 | |
| Foreign currency translation | | | 239 | | | (52 | ) | | (96 | ) |
| Gain on asset sales | | | 29 | | | 2 | | | 30 | |
| | |
| |
| |
| |
| Net earnings | | $ | 1 669 | | $ | 974 | | $ | 846 | |
| | |
| |
| |
| |
| Earnings per share - basic (dollars) | | $ | 6.30 | | $ | 3.71 | | $ | 3.19 | |
| Earnings per share - diluted (dollars) | | | 6.23 | | | 3.67 | | | 3.16 | |
| Dividends per share (dollars) | | | 0.40 | | | 0.40 | | | 0.40 | |
| Cash flow2,3 | | | 3 372 | | | 2 276 | | | 1 688 | |
| Balance sheet data (at end of year) | | | | | | | | | | |
| Total assets | | | 14 590 | | | 13 439 | | | 9 634 | |
| Long-term debt, including current portion | | | 2 229 | | | 3 057 | | | 1 401 | |
| Cash and cash equivalents | | | 635 | | | 234 | | | 781 | |
| Shareholders' equity | | | 7 721 | | | 5 776 | | | 4 877 | |
| Average capital employed | | $ | 9 392 | | $ | 7 826 | | $ | 6 259 | |
- 1
- Earnings from operations, which represents net earnings excluding gains or losses on foreign currency translation and on disposal of assets, is used by the Company to evaluate operating performance.
- 2
- Cash flow, which is expressed before changes in non-cash working capital items, is used by the Company to analyze operating performance, leverage and liquidity.
- 3
- Earnings from operations and cash flow do not have any standardized meaning prescribed by Canadian generally accepted accounting principles (GAAP) and, therefore, may not be comparable with the calculation of similar measures for other companies.
54 Petro-Canada Annual Information Form
QUARTERLY INFORMATION
| | 2003
Three Months Ended
| | 2002
Three Months Ended
| |
|---|
| | Mar. 31
| | June 30
| | Sept. 30
| | Dec. 31
| | Mar. 31
| | June 30
| | Sept. 30
| | Dec. 31
| |
|---|
| |
| | (millions of dollars, except per share amounts)
| |
|---|
| Total revenue | | $ | 3 507 | | $ | 2 826 | | $ | 2 959 | | $ | 2 929 | | $ | 1 708 | | $ | 2 437 | | $ | 2 767 | | $ | 3 005 | |
| | |
| |
| |
| |
| |
| |
| |
| |
| |
Earnings |
|
|
|
|
|
|
|
|
|
|
|
|
|
|
|
|
|
|
|
|
|
|
|
|
|
| North American Gas | | | 166 | | | 144 | | | 103 | | | 66 | | | 2 | | | 57 | | | 31 | | | 90 | |
| East Coast Oil | | | 162 | | | 155 | | | 139 | | | 137 | | | 65 | | | 116 | | | 112 | | | 137 | |
| Oil Sands | | | 13 | | | 11 | | | 20 | | | (94 | ) | | 6 | | | 1 | | | 51 | | | 21 | |
| International | | | 64 | | | 70 | | | 113 | | | 50 | | | (6 | ) | | 58 | | | 78 | | | 95 | |
| Downstream | | | 130 | | | 127 | | | (27 | ) | | 34 | | | 45 | | | 73 | | | 58 | | | 78 | |
| Shared Services | | | (46 | ) | | (55 | ) | | (40 | ) | | (41 | ) | | (23 | ) | | (29 | ) | | (41 | ) | | (51 | ) |
| | |
| |
| |
| |
| |
| |
| |
| |
| |
| Earnings from operations | | | 489 | | | 452 | | | 308 | | | 152 | | | 89 | | | 276 | | | 289 | | | 370 | |
| Foreign currency translation | | | 94 | | | 98 | | | 4 | | | 43 | | | (1 | ) | | 45 | | | (80 | ) | | (16 | ) |
| Gain (loss) on asset sales | | | – | | | 35 | | | (11 | ) | | 5 | | | – | | | – | | | – | | | 2 | |
| | |
| |
| |
| |
| |
| |
| |
| |
| |
| Net earnings | | $ | 583 | | $ | 585 | | $ | 301 | | $ | 200 | | $ | 88 | | $ | 321 | | $ | 209 | | $ | 356 | |
| | |
| |
| |
| |
| |
| |
| |
| |
| |
| Earnings per share | | | | | | | | | | | | | | | | | | | | | | | | | |
| Basic (dollars) | | $ | 2.21 | | $ | 2.21 | | $ | 1.13 | | $ | 0.75 | | $ | 0.34 | | $ | 1.22 | | $ | 0.79 | | $ | 1.35 | |
| Diluted (dollars) | | $ | 2.18 | | $ | 2.18 | | $ | 1.12 | | $ | 0.75 | | $ | 0.33 | | $ | 1.21 | | $ | 0.79 | | $ | 1.34 | |
Dividends
Petro-Canada reviews its dividend strategy from time to time to ensure the alignment of dividend policy with shareholder expectations and our financial and growth objectives. Our first priority for available cash is to fund growth opportunities. The second priority is to return cash to shareholders. In 2003, when the quarterly dividend was $0.10 per share, Petro-Canada paid $106 million in dividends, compared with $105 million in 2002. The quarterly dividend payable on April 1, 2004 to shareholders of record on March 3, 2004 has been increased to $0.15 per share.
ITEM 7 – DESCRIPTION OF CAPITAL STRUCTURE
General Description of Capital Structure
The Corporation's authorized share capital is comprised of an unlimited number of Common Shares, an unlimited number of Preferred shares issuable in series designated as Senior Preferred Shares and an unlimited number of Preferred shares issuable in series designated as Junior Preferred Shares. As of December 31, 2003 there were 265,586,093 Common Shares issued and outstanding. The holders of Common Shares are entitled to attend all meetings of shareholders and vote at any such meeting on the basis of one vote for each Common Share held. As no Senior Preferred Shares or Junior Preferred Shares are issued and outstanding, Common Share holders are entitled to receive any dividend declared by the Board of Directors on the Common Shares and upon a distribution of the Corporation's assets among its shareholders for the purpose of winding-up its affairs, the holders of the Common Shares shall be entitled to share equally, share for share, in all distributions of such assets.
55 Petro-Canada Annual Information Form
Constraints
Relationship with the Government of Canada
The following is a summary of certain agreements entered into by Petro-Canada with its principal shareholder, the Government of Canada, at the time of Petro-Canada's initial public offering of shares in July 1991, and certain charter restrictions applicable to Petro-Canada.
Government of Canada Shareholding
As of December 31, 2003 the Government of Canada owned approximately 19 per cent of the 265 586 093 common shares issued and outstanding. The Government of Canada has stated that it will deal with its shares as an investor and not as a manager and that, in order to reflect the rights of other shareholders, it does not intend to exercise the right to vote at meetings of shareholders although it reserves the right to do so. So long as the Government of Canada holds 10 per cent or more of the outstanding voting shares it will have the right to designate one nominee for election to a board comprising between nine and 13 directors. The Government of Canada does regularly exercise its right to designate a nominee.
Pursuant to an agreement dated May 9, 1991 (the "Petro-Canada Privatization Agreement"), Petro-Canada and the Government of Canada have agreed that the Government will have the right to participate up to the extent of its percentage ownership in any proposed equity offerings by Petro-Canada so long as it remains the registered holder of 10 per cent or more of the outstanding common shares. So long as the Government of Canada remains the holder of 10 per cent or more of the outstanding common shares, Petro-Canada will not have the right to participate in any offering of Petro-Canada shares by the Government, unless the Government agrees.
Ownership, Voting and Other Charter Restrictions
ThePetro-Canada Public Participation Act requires that the Articles of Petro-Canada include certain restrictions on the ownership and voting of voting shares of the Corporation. The common shares of Petro-Canada are voting shares.
No person, together with associates of that person, may subscribe for, have transferred to that person, hold, beneficially own or control, otherwise than by way of security only, or vote, in the aggregate, voting shares of Petro-Canada to which are attached more than 20 per cent of the votes attached to all outstanding voting shares of Petro-Canada other than voting shares held by the Government of Canada.
As required by thePetro-Canada Public Participation Act, Petro-Canada's Articles contain provisions for the enforcement of these restrictions, including provisions for suspension of voting rights, forfeiture of dividends, prohibitions against share transfer, compulsory sale of shares, redemption and suspension of other shareholder rights. The Board of Directors of Petro-Canada may at any time require holders of or subscribers for voting shares and certain other persons to furnish statutory declarations as to ownership of voting shares and certain other matters relevant to the enforcement of the restrictions. Petro-Canada is prohibited from accepting any subscription for, issuing or registering a transfer of any voting shares if a contravention of the individual ownership restrictions result.
Petro-Canada's Articles also include provisions requiring Petro-Canada to: maintain its head office in Calgary, Alberta; prohibit Petro-Canada from selling, transferring or otherwise disposing of all or substantially all of its assets in one transaction or several related transactions, to any one person or group of associated persons or to non-residents, otherwise than by way of security only in connection with the financing of Petro-Canada; and require Petro-Canada to ensure (and to adopt, from time to time, policies describing the manner in which Petro-Canada will fulfil the requirement to ensure) that any member of the public can, in either official language of Canada (English and French), communicate with and obtain available services from Petro-Canada's head office and any other facilities where Petro-Canada determines there is significant demand for communications with and services from that facility in that language.
56 Petro-Canada Annual Information Form
Commercial Relationships
Petro-Canada has commercial relationships with the Government of Canada and with various Canadian federal Crown corporations which cover sales of product. Such relationships have been and will continue to be on the same terms as are available to third parties.
Ratings
The following table shows the ratings issued by the rating agencies noted therein as of December 31, 2003. A security rating is not a recommendation to buy, sell or hold securities and may be subject to revisions or withdrawal at any time by the rating agency.
PETRO-CANADA'S CREDIT RATINGS
| | Moody's Investors Service Inc.
| | Standard & Poor's Rating Services
| | Dominion Bond Rating Service
|
|---|
|
| Outlook | | Stable | | Stable | | Stable |
| Senior Unsecured | | Baa2 | | BBB | | A (low) |
| Short-Term | | P-2 | | A-2 | | R-1 (low) |
ITEM 8 – MARKET FOR SECURITIES
Trading Price and Volume
The Corporation's outstanding share capital comprises common shares and each common share carries one vote. The Corporation's common shares trade on The Toronto Stock Exchange under the symbol PCA and on the New York Stock Exchange under the symbol PCZ. The Corporation's shares are widely distributed with 81 per cent of the outstanding shares held by private institutional and individual investors as of December 31, 2003, and the Government of Canada owning the remaining 19 per cent.
57 Petro-Canada Annual Information Form
The greatest volume of trading in the Corporation's shares takes place on The Toronto Stock Exchange. The following table sets out the trading range and volume traded on The Toronto Stock Exchange and the New York Stock Exchange in 2003 on a monthly basis.
PETRO-CANADA SHARE TRADING ACTIVITY ON THE TORONTO STOCK EXCHANGE
AND THE NEW YORK STOCK EXCHANGE IN 2003
| | The Toronto Stock Exchange
| | New York Stock Exchange
|
|---|
| | Share Price Trading Range
| |
| | Share Price Trading Range
| |
|
|---|
| | Share Volume
| | Share Volume
|
|---|
| | High
| | Low
| | Close
| | High
| | Low
| | Close
|
|---|
|
| | (dollars per share)
| | (millions)
| | (U.S. dollars per share)
| | (millions)
|
|---|
| 2003 | | | | | | | | | | | | | | | | | | | | | | |
| January | | $ | 51.27 | | $ | 47.40 | | $ | 51.00 | | 15.9 | | $ | 33.58 | | $ | 30.68 | | $ | 33.58 | | 0.9 |
| February | | | 54.01 | | | 50.40 | | | 53.06 | | 12.6 | | | 36.22 | | | 33.09 | | | 35.87 | | 0.6 |
| March | | | 53.19 | | | 48.26 | | | 50.00 | | 19.5 | | | 36.07 | | | 32.59 | | | 34.14 | | 1.0 |
| April | | | 50.05 | | | 45.75 | | | 47.27 | | 18.4 | | | 34.27 | | | 31.56 | | | 33.00 | | 0.9 |
| May | | | 52.14 | | | 46.50 | | | 52.14 | | 12.4 | | | 38.04 | | | 32.79 | | | 38.00 | | 0.7 |
| June | | | 56.31 | | | 51.80 | | | 53.96 | | 16.3 | | | 41.74 | | | 38.01 | | | 39.95 | | 0.8 |
| July | | | 55.88 | | | 51.75 | | | 53.98 | | 10.3 | | | 40.33 | | | 37.61 | | | 38.37 | | 0.7 |
| August | | | 56.54 | | | 52.75 | | | 54.62 | | 8.7 | | | 40.69 | | | 37.56 | | | 39.40 | | 0.7 |
| September | | | 56.00 | | | 51.77 | | | 52.49 | | 10.9 | | | 40.95 | | | 38.54 | | | 38.89 | | 0.7 |
| October | | | 54.74 | | | 51.96 | | | 53.13 | | 11.3 | | | 41.39 | | | 38.81 | | | 40.29 | | 0.8 |
| November | | | 57.40 | | | 53.13 | | | 55.70 | | 10.5 | | | 44.00 | | | 40.10 | | | 42.93 | | 0.6 |
| December | | $ | 64.55 | | $ | 63.91 | | $ | 63.91 | | 13.7 | | $ | 49.75 | | $ | 42.35 | | $ | 49.32 | | 1.0 |
58 Petro-Canada Annual Information Form
ITEM 9 – ESCROWED SECURITIES
Not applicable.
ITEM 10 – DIRECTORS AND OFFICERS
Composition of the Board of Directors
The Articles of the Corporation provide that the number of Directors of the Corporation shall be a minimum of nine and a maximum of 13. A quorum for meetings of the Board of Directors is a majority of the Directors.
The Board of Directors has established five committees: Audit, Finance and Risk; Corporate Governance and Nominating; Environment, Health and Safety; Management Resources and Compensation; and Pension. The Board of Directors has not formed an Executive Committee as it deals with all transactions as a whole. Continued in this section of the Annual Information Form are the Terms of Reference for each of the Committees as well as the Mandate for the Board of Directors.
In the United States, major regulatory changes have been proposed or come into effect, arising from the Sarbanes-Oxley legislation, rules and regulations issued by the Securities Exchange Commission and the New York Stock Exchange. As well, further changes in Canada are anticipated.
The Board of Directors has monitored the various changes and where applicable amended its governance practices to align. The Board of Directors believes the Corporation's practices are consistent with and in some cases go beyond most corporate governance rules and guidelines. Set out in Schedule C is the Corporation's compliance with the proposed Multilateral Instrument 58-101 Disclosure of Corporate Governance Practices in an AIF.
Board of Directors Mandate
Chair: Brian F. MacNeill
Members: Ron Brenneman, Angus A. Bruneau, Gail Cook-Bennett, John F. Cordeau, Richard J. Currie, Claude Fontaine, Paul Hasseldonckx, Thomas E. Kierans, Paul D. Melnuk, Guylaine Saucier and William W Siebens
The Board of Directors is responsible for the supervision of the management of the Corporation's business and affairs. While the Board is called upon to manage the business, this is done through the Chief Executive Officer (CEO), who is charged with the day-to-day management of the Corporation. The Board approves the goals of the business, the objectives and policies within which it is managed, and then steps back and evaluates management performance. Reciprocally, management keeps the Board informed of the progress of the Corporation towards the achievement of its established goals and of all material deviations from the goals or objectives and policies established by the Board in a timely and candid manner.
The Board operates by delegating certain of its responsibilities and authority, including spending authorization, to management and reserving certain powers to itself. Its principal duties fall into six categories.
- 1.
- Management Selection, Retention and Succession
Subject to the Articles and By-laws of the Corporation, the Board manages its own affairs, including: planning its composition, selecting its Chairman, nominating candidates for election to the Board, appointing Committees, establishing the terms of reference and duties of Committees, and determining Board compensation. The Board has responsibility for the appointment and replacement of the CEO, for monitoring CEO performance, and for determining CEO compensation. The
59 Petro-Canada Annual Information Form
Board has responsibility for approving the appointment and remuneration of all Corporate officers, acting upon the advice of the CEO, and for ensuring that adequate provision has been made for management succession.
- 2.
- Strategy Determination
The Board has the responsibility to participate directly or through its Committees, in developing and approving the mission of the business, its objectives and goals, and the strategy for their achievement. The Board has responsibility to ensure congruence between shareholders' expectations, Corporation goals and objectives and management performance.
- 3.
- Oversight
The Board has responsibility to monitor the Corporation's progress towards its goals, and to revise and alter its direction in light of changing circumstances. The Board has responsibility to provide advice and counsel to the CEO, and to take action when performance falls short of its goals or other special circumstances warrant.
- 4.
- Policies and Procedures
The Board has responsibility to approve and monitor compliance with all significant policies and procedures by which the Corporation is operated. The Board has a particular responsibility to ensure that the Corporation operates at all times within applicable laws and regulations, and ethical and moral standards.
- 5.
- Reporting to Shareholders
The Board has responsibility for ensuring that the performance of the Corporation is adequately reported to shareholders, other security holders and regulators on a timely and regular basis. The Board has responsibility for ensuring that the audited annual financial statements are reported fairly and in accordance with generally accepted accounting standards, and for reviewing before publication, the Corporation's unaudited quarterly financial statements. The Board has responsibility for timely reporting of any developments that have a significant and material impact on the value of the Corporation.
- 6.
- General Legal Obligations
The Board and its members are charged with the management of the business and affairs of the Corporation. They must act honestly and in good faith with a view to the best interests of the Corporation, and exercise the care, diligence and skill that a reasonably prudent person would exercise in comparable circumstances.
The Board must act in accordance with the Petro-Canada Public Participation Act, the Canada Business Corporations Act, securities, environmental, and other relevant legislation, and the Corporation's Articles and By-laws. The Board is to consider as the full Board and not delegate to a Committee:
- (i)
- any submission to the shareholders of a question or matter requiring the approval of the shareholders;
- (ii)
- the filling of a vacancy among the Directors or in the office of auditor;
- (iii)
- the manner and the terms of the issuance of securities;
- (iv)
- the declaration of dividends;
- (v)
- the purchase, redemption or any other form of acquisition of shares issued by the Corporation;
- (vi)
- the payment of a commission to any person in consideration of that person purchasing or agreeing to purchase shares of the Corporation from the Corporation or from any other person, or procuring or agreeing to procure purchasers for any such shares;
- (vii)
- the approval of a management proxy circular;
- (viii)
- the approval of any take-over bid circular or Directors' circular;
- (ix)
- the approval of the annual financial statements of the Corporation; or
- (x)
- the adoption, amendment or repeal of By-laws of the Corporation.
60 Petro-Canada Annual Information Form
Terms of Reference and Membership of Board Committees
Audit, Finance and Risk Committee
Chair: Paul D. Melnuk
Members: Angus A. Bruneau, Gail Cook-Bennett, Paul Haseldonckx and Brian F. MacNeill
1. Terms of Reference
The duties and responsibilities of the Audit, Finance and Risk Committee shall include the following:
- (a)
- assist the Board of Directors in the discharge of its fiduciary responsibilities relating to the Corporation's accounting policies, reporting practices and internal controls, as well as to its risk management policies and practices;
- (b)
- maintain a direct line of communications with the Chief Financial Officer and with the contract auditor and the external auditors, and monitor the scope and costs of their audit activity, and assess their performance;
- (c)
- formally consider the continuation of or a change in the external auditors and review all issues related to a change of external auditor, including any differences between the Corporation and the auditor that relate to the auditor's opinion or a qualification thereof or an auditor comment;
- (d)
- recommend to the Board of Directors a firm of external auditors for approval by the shareholders of the Corporation; review and approve the terms of their engagement; review and approve the fee, scope and timing of the audit, and be apprised of and approve in advance any audit related services and any non-audit services (which are not prohibited non-audit services) to be provided by the external auditors and the costs thereof and consider any impact of the provision of such services on the maintenance of their independence and review the Corporation's hiring policies regarding employees and former employees of the present and former external auditors;
- (e)
- review all issues related to any proposed change in or renewal of the contract with the contract auditor;
- (f)
- review and recommend approval by the Board of the Corporation's audited annual financial statements and Management's Discussion and Analysis;
- (g)
- review before publication the Corporation's unaudited quarterly financial statements, reports of quarterly earnings, and Management's Discussion and Analysis with particular attention to the presentation of unusual or sensitive matters such as disclosure of related party transactions, significant non-recurring events, significant risks, changes in accounting principles, and estimates or reserves, and all significant variances between comparative reporting periods, and approve the publication of the Corporation's unaudited quarterly financial statements and reports of quarterly earnings;
- (h)
- review all financial information included in annual information forms, prospectuses, other offering memoranda or other documents requiring approval by the Board of Directors;
- (i)
- review the Statement of Management's Responsibility for the Financial Statements as signed by senior management and included in any published document and review and approve the Statement regarding the role of the Committee as signed by the Chairman of the Committee and included in any published documents;
- (j)
- review any litigation, claim or other contingency, including tax assessments, that could have a material effect upon the financial position or operating results of the Corporation, and ensure appropriate disclosure thereof in documents reviewed by the Committee;
- (k)
- review and ensure the appropriateness and quality of the accounting policies used in the preparation of the Corporation's financial statements, and consider any proposed changes to such policies;
- (l)
- review with the external auditor the contents of the annual audit report and review any significant recommendations from the external auditor to strengthen the internal controls of the Corporation;
61 Petro-Canada Annual Information Form
- (m)
- review the results of the external audit, any significant problems encountered in performing the audit, and the contents of any Management Letter issued by the external auditor to the Corporation, and management's response thereto;
- (n)
- annually review a report on the contract audit function with respect to the terms of reference, organization, staffing, independence, performance and effectiveness of the contract audit services, receive and approve the annual contract audit plan, and obtain assurances in respect of conformity with CICA and AICPA professional standards, and other regulatory bodies' requirements, the outsourcing contract and recommendations of management and the contract auditor;
- (o)
- review significant contract audit findings and recommendations, and management's response thereto;
- (p)
- receive a report on the Corporation's internal control policies and procedures with particular emphasis on accounting and financial controls, and recommend changes where appropriate;
- (q)
- review any unresolved significant issues between management and the external auditor that could affect the financial reporting or internal controls of the Corporation;
- (r)
- receive reports on and review any other items deriving from the foregoing, either in respect of the Corporation, or a subsidiary or any other entity or relationship in which the Corporation has a significant interest, as requested by the Board;
- (s)
- review and make recommendations to the Board concerning the following:
- (i)
- the Corporation's policies regarding hedging, investments, credit and risk management; and
- (ii)
- the Corporation's risk identification, analysis and management procedures;
- (t)
- review, prior to each annual shareholders' meeting, the policies and practices concerning the regular examination of officers' expenses and perquisites, including the use of Corporate assets; and
- (u)
- report annually to the full Board, on the state of completion of the Audit, Finance and Risk Committee Annual Agenda Items, with appropriate recommendations.
2. Organization and Procedures
- (a)
- The Committee shall meet regularly, not less than four times per year, and at such other times as may be requested by the Chair of the Committee. The Chief Executive Officer, the Chief Financial Officer, the Controller, the contract auditor, the external auditor or any member of the Committee may also request a meeting of the Committee.
- (b)
- The Chair of the Committee, in consultation with the Chief Financial Officer, shall set the agenda for each meeting which shall then be circulated among the Committee Members.
- (c)
- The Chief Executive Officer, the Chief Financial Officer and the Controller shall have direct access to the Committee and shall receive notice of and attend all meetings of the Committee, except private sessions.
- (d)
- The external auditor and the contract auditor shall ultimately report to the Board and the Committee and shall at any time have direct access to the Committee and shall receive notice of and be invited to attend all meetings of the Committee, except private sessions.
- (e)
- The contract auditor, the external auditor, and one or more representatives of senior management, shall each meet separately with the Committee, in private sessions, at least once annually.
- (f)
- The Committee may contact directly any employee in the Corporation and the contract auditor as it deems necessary.
- (g)
- The Committee will establish procedures for:
- (i)
- receipt, retention and treatment of complaints regarding accounting controls or auditing matters;
62 Petro-Canada Annual Information Form
- (ii)
- confidential anonymous submission by employees of concerns regarding accounting or auditing matters; and
- (iii)
- annual review of compliance under the Corporation's Code of Ethics for Senior Financial Officers.
- (h)
- The Committee will periodically review its own Terms of Reference to ensure they continue to be appropriate, and make recommendations to the Board as required.
Corporate Governance and Nominating Committee
Chair: Guylaine Saucier
Members: Richard J. Currie, Claude Fontaine, Thomas E. Kierans, Brian F. MacNeill and William W. Siebens
1. Terms of Reference
The Committee shall:
- (a)
- identify and select nominees for the Board of Directors, consistent with Section 5 of By-law No. 2;
- (b)
- in consultation with the Board establish criteria for Board membership and retirement therefrom;
- (c)
- make recommendations regarding the replacement of a Director in circumstances of a vacancy prior to expiration of a Director's term of office;
- (d)
- prepare and recommend to the Board a "Statement of Corporate Governance Practices" to be included in the Corporation's annual report or information circular;
- (e)
- support the Board in addressing Board Governance issues generally; and
- (f)
- review and make recommendations on the remuneration of the Directors.
2. Report
The Committee shall report to the full Board at least once each year, to permit the orderly nomination of a slate of Directors for election at the next shareholders' meeting in accordance with the By-laws.
Environment, Health and Safety Committee
Chair: Angus A. Bruneau
Members: John F. Cordeau, Paul Haseldonckx, Brian F. MacNeill and Paul D. Melnuk
1. Terms of Reference
The Environment, Health and Safety Committee shall monitor, review and make recommendations to the Board with respect to the following items in the areas of environment, health and safety:
- (a)
- the Corporation's strategy, goals, and policies;
- (b)
- the Corporation's management, reporting, audit, and education systems;
- (c)
- the performance of the Corporation in complying with its strategies and policies, in achieving its goals, and in complying with all legal requirements;
- (d)
- proposed legislative and regulatory changes and court decisions that may affect the operations of the Corporation;
- (e)
- public policy issues, trends and developments that may have a significant impact on the Corporation; and
- (f)
- any material events, incidents or issues that may arise or be brought to the attention of the Committee.
63 Petro-Canada Annual Information Form
Management Resources and Compensation Committee
Chair: Thomas E. Kierans
Members: Richard J. Currie, Claude Fontaine, Brian F. MacNeill and William W. Siebens
1. Terms of Reference
The Management Resources and Compensation Committee shall review and make recommendations to the Board concerning the following:
- (a)
- the annual salary, bonus and other benefits, direct and indirect of the Chief Executive Officer and other designated officers;
- (b)
- executive contracts;
- (c)
- the Corporation's policies in the area of management perquisites;
- (d)
- executive compensation, stock plans or other incentive plans;
- (e)
- proposed personnel changes involving officers reporting to the Chief Executive Officer and the Chair;
- (f)
- management succession plans and review process;
- (g)
- annual compensation policy and budgets for all non union employees; and
- (h)
- all mandates for the negotiation of collective bargaining agreements or other labor contracts with employees represented by unions or associations and the entering into of such agreements or contracts by the Corporation.
Pension Committee
Chair: Gail Cook-Bennett
Members: Ron A. Brenneman, John F. Cordeau, Brian F. MacNeill and Guylaine Saucier
1. Terms of Reference
The Pension Committee shall review and make recommendations to the Board concerning funding objectives and investment policy and philosophy with respect to the registered pension plans for which the Corporation is responsible (the "Plans"); and shall specifically review the investment performance of the Plans, including:
- (a)
- the establishment of general investment policy for the Plans and changes thereto from time to time;
- (b)
- the determination of appropriate investment philosophy, investment objectives, limitations and any other criteria or guidelines for the investment fund managers;
- (c)
- an annual review of the actuarial status of the Plans and Corporate contributions policy for the Plans and a presentation to the Board of Directors of an annual report on the financial position and performance of the Plans;
- (d)
- the review of any regulatory filings relating to structure, actuarial valuations, and investment policy, which may be required from time to time; and
- (e)
- approve the appointment and termination of trustees, actuaries, external auditors and performance measurement services.
64 Petro-Canada Annual Information Form
Directors and Officers
The following table shows certain information concerning the Directors of the Corporation. Detailed information regarding compensation, share ownership and education can be found in the Corporation's Management Proxy Circular dated March 4, 2004.
Name and
Municipality of Residence
| | Served as a
Director Since 1
| |
Principal Occupation 2
|
|---|
|
Brian F. MacNeill 3,4,5,6,7
Calgary, Alberta |
|
1995 |
|
Chairman of the Board of the Corporation |
Ronald A. Brenneman 7,8
Calgary, Alberta |
|
2000 |
|
President and Chief Executive Officer of the Corporation |
Angus A. Bruneau 3,5
St. John's, Newfoundland and Labrador |
|
1996 |
|
Chairman
Fortis Inc.
(utilities and services) |
Gail Cook-Bennett 3,7
Toronto, Ontario |
|
1991 |
|
Chairperson
Canada Pension Plan Investment Board
(public pension plan management) |
Richard J. Currie 4,6
Toronto, Ontario |
|
2003 |
|
Chairman
BCE Inc.
(telecommunications) |
John F. Cordeau 5,7
Calgary, Alberta |
|
1994 |
|
Partner
Bennett Jones LLP
(barristers and solicitors) |
Claude Fontaine 4,6
Montreal, Quebec |
|
1987 |
|
Senior Partner
Ogilvy Renault
(barristers and solicitors) |
Paul Haseldonckx 3,5
Essen, Germany |
|
2002 |
|
Corporate Director |
Thomas E. Kierans 4,6
Toronto, Ontario |
|
1991 |
|
Chairman
The Canadian Institute for Advanced Research
(research in social and natural sciences) |
Paul D. Melnuk 3,5
St. Louis, Missouri |
|
2000 |
|
Chairman
Thermadyne Holdings Corporation
(industrial products)
and Managing Partner
FTL Capital Partners
(merchant bankers) |
Guylaine Saucier 4,7
Montreal, Quebec |
|
1991 |
|
Corporate Director |
| | | | | |
65 Petro-Canada Annual Information Form
William W. Siebens 4,6
Calgary, Alberta |
|
1986 |
|
President and Chief Executive Officer
Candor Investments Ltd.
(private energy and investment corporation) |
- 1
- Each of the Directors served as a Director of the Corporation or of Petro-Canada Limited, the Corporation's former parent, since the dates shown.
- 2
- Each of the Directors has been engaged in the principal occupation indicated above for the five preceding years except for Ronald A. Brenneman who, prior to 2000, was General Manager of Corporate Planning, Exxon Corporation, and prior thereto held various positions within Exxon and its affiliated companies; Paul Haseldonckx who, prior to 2002, was Chairman of the Executive Board of Veba Oil & Gas GmbH; Thomas E. Kierans who, prior to 2001, was Chairman and Chief Executive Officer, The Canadian Institute for Advanced Research and prior thereto was President and Chief Executive Officer of the C.D. Howe Institute; Brian F. MacNeill who, prior to 2001, was President and Chief Executive Officer of Enbridge Inc.; Guylaine Saucier who, prior to 2001, was Chairman, Board of Directors, Canadian Broadcasting Corporation; Paul D. Melnuk who, prior to 2002 was President and Chief Executive Officer of Bracknell Corporation and prior thereto was President and Chief Executive Officer of Barrick Gold Corporation and prior thereto, President and Chief Executive Officer of Clark USA, Inc.; and Richard J. Currie who, prior to 2002 was President and Director of George Weston Limited.
- 3
- Member of the Audit, Finance and Risk Committee.
- 4
- Member of Corporate Governance and Nominating Committee.
- 5
- Member of Environment, Heath and Safety Committee.
- 6
- Member of Management Resources and Compensation Committee.
- 7
- Member of Pension Committee.
- 8
- Ronald A. Brenneman's title changed to President and Chief Executive Officer on February 15, 2004, upon the retirement of Norman F. McIntyre.
The term of office of each of the Directors named above ends at the close of the next annual shareholders meeting of the Corporation, or until his or her successor is elected or appointed.
The following table shows certain information concerning Officers of the Corporation.
Name and
Municipality of Residence
| | Served as an
Officer Since
| |
Principal Occupation 1
|
|---|
|
Brian F. MacNeill
Calgary, Alberta | | 2000 | | Chairman of the Board of the Corporation |
Executive Leadership Team |
|
|
|
|
Ron A. Brenneman
Calgary, Alberta | | 2000 | | President and Chief Executive Officer of the Corporation |
Peter S. Kallos 2
London, England | | 2003 | | Executive Vice-President, International |
Boris J. Jackman
Mississauga, Ontario | | 1993 | | Executive Vice-President, Downstream |
E. F. H. Roberts
Calgary, Alberta | | 1989 | | Senior Vice-President and Chief Financial Officer |
| | | | | |
66 Petro-Canada Annual Information Form
Brant G. Sangster
Calgary, Alberta | | 1988 | | Senior Vice-President, Oil Sands |
Kathleen E. Sendall
Calgary, Alberta | | 1996 | | Senior Vice-President, North American Natural Gas |
Gordon J. Carrick
St. John's, Newfoundland and Labrador | | 2002 | | Vice-President, East Coast |
Upstream |
|
|
|
|
Donald M. Clague
Calgary, Alberta | | 2002 | | Vice-President, Production |
Francois Langlois
Calgary, Alberta | | 2002 | | Vice-President, Exploration Continental North American Gas |
Youssef Ghoniem
Dorsten, Germany | | 2002 | | Senior Vice-President, Operations |
Gerhard Kinast
London, England | | 2002 | | Vice-President, Finance |
Nick Maden
London, England | | 2003 | | Vice-President, International and Offshore Exploration |
Downstream |
|
|
|
|
Randall B. Koenig
Oakville, Ontario | | 1996 | | Vice-President, Lubricants |
S. Ford Ralph
Erin, Ontario | | 1985 | | Vice-President, Wholesale/Retail |
Fred Scharf
Mississauga, Ontario | | 2003 | | Vice-President, Marketing |
Dan Sorochan
Mississauga, Ontario | | 2003 | | Vice-President, Refining and Supply |
Shared Services |
|
|
|
|
Andrew A. Stephens 3
Calgary, Alberta | | 1993 | | Vice-President, Corporate Planning and Communications |
Douglas S. Fraser
Calgary, Alberta | | 2002 | | Treasurer |
W. A. (Alf) Peneycad 3
Calgary, Alberta | | 1986 | | Vice-President, General Counsel, Corporate Secretary and Chief Compliance Officer |
M. A. (Greta) Raymond 3
Calgary, Alberta | | 2001 | | Vice-President, Human Resources and Environment, Health and Safety, and Chief Privacy Officer |
| | | | | |
67 Petro-Canada Annual Information Form
Christopher J. Smith
Calgary, Alberta | | 1989 | | Controller |
- 1
- Each of the Officers has been engaged in the principal occupation indicated above or in executive positions with Petro-Canada for the five preceding years except for Ronald A. Brenneman who, prior to January 2000, was General Manager of Corporate Planning, Exxon Corporation, and prior thereto held various positions within Exxon and its affiliated companies; Brian F. MacNeill who, prior to 2001, was President and Chief Executive Officer of Enbridge Inc.; Donald M. Clague who, prior to 2002, was Manager, Exploration East Coast/Offshore and prior thereto Chief Geophysicist; Douglas S. Fraser who, prior to 2002, was Senior Director, Downstream Accounting and Control; and Francois Langlois who, prior to 2002, was Manager, Southern Exploration, and prior to that General Manager, North Africa and prior thereto Team Leader, Foothills Exploration; Peter S. Kallos who, prior to 2003 was Vice-President, Corporate Planning and Communications and prior thereto was External Affairs Director of Shell Exploration and Production U.K. and prior thereto was General Manager of Enterprise's U.K. Business Unit and prior thereto was Chief Executive Officer of Enterprise's Italian subsidiary; Nick Maden who, prior to 2003 was Exploration Manager, International Business Unit and prior thereto was Business Development Manager with Veba Oil & Gas GmbH and prior thereto held various exploration management positions with ARCO; Fred Scharf, who prior to 2003 was General Manager, Western Canada Wholesale/Retail; and Dan Sorochan who, prior to 2003 was Senior Director, Business Development, Refining and Supply and prior thereto was General Manager, Oakville refinery.
- 2
- Mr. Kallos replaces Norman F. McIntyre as IBU leader. Mr. McIntyre retired from the Corporation on February 15, 2004.
- 3
- Associate member of the Executive Leadership Team.
Share Ownership
At December 31, 2003 the directors and officers of Petro-Canada, as a group, beneficially owned or exercised control over 131 625 common shares or less than one per cent of the common shares of the Corporation outstanding as of such date.
ITEM 11 – PROMOTERS
Not applicable.
ITEM 12 – LEGAL PROCEEDINGS
Petro-Canada is not named as the defendant to any proceedings that involve a liability claim of a material amount.
ITEM 13 – INTEREST OF MANAGEMENT AND OTHERS IN MATERIAL TRANSACTIONS
No director, executive officer or principal shareholder of Petro-Canada, or associate or affiliate of those persons, has any material interest, direct or indirect, in any transaction within the last three years that has materially affected or will materially affect Petro-Canada.
68 Petro-Canada Annual Information Form
ITEM 14 – TRANSFER AGENTS AND REGISTRARS
| In Canada: | | In the United States: |
| CIBC Mellon Trust Company | | Mellon Investor Services |
| 600 The Dome Tower, | | 44 Wall Street, 6th Floor |
| 333 - 7th Avenue S.W., | | New York, New York |
| Calgary, Alberta T2P 2Z1 | | 10005 |
| Tel: 1-800-387-0825 | | Tel: 1-800-387-0825 |
| Web site: www.cibcmellon.com | | Web site: www.cibcmellon.com |
ITEM 15 – MATERIAL CONTRACTS
Petro-Canada has not entered into any material contracts, outside the ordinary course of business, within two years before the date of this AIF.
ITEM 16 – INTERESTS OF EXPERTS
Deloitte & Touche LLP are the Corporation's auditors and such firm has prepared an opinion with respect to the Corporation's consolidated financial statements as at and for the fiscal year ended December 31, 2003. Kathy Sendall is a Senior Vice-President with the Corporation and has certified a report with respect to National Instrument 51-101 oil and gas reserves disclosure. Neither party holds more than one per cent of the Corporation's outstanding securities; in particular, Deloitte & Touche LLP has advised that it holds none of the Corporation's outstanding securities.
ITEM 17 – ADDITIONAL INFORMATION
Additional information relating to Petro-Canada may be found on SEDAR at www.sedar.com.
Additional information, including Directors' and Officers' remuneration and indebtedness, the principal holders of the Corporation's securities and options to purchase securities, is contained in Petro-Canada's Management Proxy Circular for its most recent annual meeting of shareholders. Additional financial information is contained in Petro-Canada's audited comparative consolidated financial statements and MD&A for the year ended December 31, 2003.
Requests for additional information can be obtained from our Web site at www.petro-canada.ca or from the:
Corporate Secretary
Petro-Canada
P.O. Box 2844
Calgary, Alberta T2P 3E3
69 Petro-Canada Annual Information Form
SCHEDULE A
REPORT ON RESERVES DATA
BY
SENIOR OFFICER RESPONSIBLE FOR RESERVES DATA
To the Board of Directors of Petro-Canada (the Corporation):
- 1.
- The Corporation's staff of qualified reserves evaluators have evaluated the Corporation's reserves data as at December 31, 2003. The reserves data consist of the following:
- (i)
- proved oil and gas reserves quantities estimated as at December 31, 2003 using constant prices and costs; and
- (ii)
- the Standardized Measure of Discounted Future Net Cash Flows relating to proved oil and gas reserves quantities.
- 2.
- The reserves data are the responsibility of the Corporation's management. As the member of the Executive responsible for the Corporation's hydrocarbon reserves data, my responsibility is to certify that the reserves data has been properly calculated in accordance with industry generally accepted procedures for the estimation of reserves data.
- 3.
- The Corporation's reserves staff and management carried out their evaluations in accordance with industry generally accepted procedures for the estimation of reserves data and standards as set out in the Canadian Oil and Gas Evaluation Handbook (the COGE Handbook) prepared jointly by the Society of Petroleum Evaluation Engineers (Calgary Chapter) and the Canadian Institute of Mining, Metallurgy & Petroleum (Petroleum Society) with the necessary modifications to reflect the definition of proved reserves under the applicable U.S. Financial Accounting Standards Board policies (the FASB Standards) and the legal requirements of the U.S. Securities and Exchange Commission(SEC Requirements). The Corporation's reserves staff and management are not independent of the Company, within the meaning of the term"independent" under those standards.
- 4.
- The standards require that they plan and perform an evaluation to obtain reasonable assurance as to whether the reserves data are free of material misstatement. An evaluation also includes assessing whether the reserves data are developed in accordance with the evaluation practices and procedures presented in the COGE Handbook as modified to meet the requirements of the FASB Standards and SEC Requirements.
- 5.
- The following sets forth the standardized measure of future net cash flows attributed to proved oil and gas reserve quantities, estimated using constant prices and costs and calculated using a discount rate of 10 percent, included in the reserves data of the Corporation evaluated for the year ended December 31, 2003:
Standardized Measure of Future Net Cash Flows – Proved Oil and Gas Reserves
(10% discount rate)
As at December 31, 2003
Location of Reserves
| | Standardized Measure
(After Deducting Income Taxes)
|
|---|
|
| | (millions of dollars)
|
|---|
| Western Canada | | 3 168 |
| East Coast | | 935 |
| Northwest Europe | | 1 069 |
| North Africa/Near East | | 769 |
| Northern Latin America | | 275 |
| Syncrude Oil Sands Mining Operation | | 1 709 |
The Standardized Measure values above were calculated consistent with the methodology prescribed in Financial Accounting Standards Board Statement No. 69.
70 Petro-Canada Annual Information Form
- 6.
- In my opinion, the reserves data evaluated by the Corporation's reserves evaluation staff and management have, in all material respects, been determined in accordance with evaluation practices and procedures presented in the COGE Handbook with the necessary modifications to reflect reserves definitions and legal requirements under the applicable FASB Standards and SEC Requirements.
- 7.
- The reservoir engineering staff and management review and evaluate the reserves data on an on-going basis and advise the executive of the Corporation of significant changes to the evaluations for events and circumstances occurring after the effective date of this report.
- 8.
- Reserves are estimates only, and not exact quantities. In addition, the reserves data are based on judgements regarding future events, actual results will vary and the variations may be material.
/Signed/
Kathleen E. Sendall, Senior Vice-President, North American Natural Gas
Member of Executive Leadership Team Responsible for Reserves
Dated March 4, 2004
71 Petro-Canada Annual Information Form
SCHEDULE B
REPORT OF MANAGEMENT AND DIRECTORS
ON RESERVES DATA AND OTHER INFORMATION
The Management of Petro-Canada (the Corporation) is responsible for the preparation and disclosure of information with respect to the Corporation's oil and gas activities in accordance with securities regulatory requirements. This information includes reserves data, which consist of the following:
- (i)
- proved oil and gas reserves quantities estimated as at December 31, 2003 using constant prices and costs; and
- (ii)
- the Standardized Measure of Discounted Future Net Cash Flows relating to proved oil and gas reserves quantities.
Our reserves evaluation process involves applying generally accepted practices and procedures for the estimation of reserves data as set out in the COGE Handbook and modified to reflect the definitions and standards as set out in the applicable provisions of the U.S. Financial Accounting Standards Board Statement of Financial Accounting Standards No. 69 and the relevant legal requirements of the U.S. Securities and Exchange Commission (SEC) (collectively the Reserves Data Process). Our qualified internal reserves evaluation staff and management have evaluated our reserves and the Executive member responsible for reserves data certifies that the Reserves Data Process has been followed. The report of the Executive member responsible for reserves data will be filed with securities regulatory authorities concurrently with this report.
The Corporation has designated the Corporate Governance and Nominating Committee of its Board of Directors as performing the roles and responsibilities of the reserves committee of the Board as set out in National Instrument 51-101. The Corporate Governance and Nominating Committee of the Board of Directors has:
- (a)
- reviewed the Corporation's procedures for providing information to the internal and external qualified reserves evaluators;
- (b)
- met with the internal and external qualified reserves evaluators to determine whether any restrictions placed by management affect the ability of the internal and external qualified reserves evaluators to report without reservation; and
- (c)
- reviewed the reserves data with reserves management and each of the qualified external reserves evaluators.
The Corporate Governance and Nominating Committee Board of Directors has reviewed the Corporation's procedures for assembling and reporting other information associated with oil and gas activities and has reviewed that information with management. The Board of Directors has, on the recommendation of the Corporate Governance and Nominating Committee, approved:
- (a)
- the content and filing with securities regulatory authorities of the reserves data and other oil and gas information;
- (b)
- the filing of the report of the Executive member responsible for reserves on the reserves data; and
- (c)
- the content and filing of this report.
The Corporation has sought from, and was granted by, securities regulatory authorities an exemption from the requirement under securities legislation to involve independent qualified reserves evaluators or independent qualified reserves auditors. Notwithstanding this exemption, the Corporation involves independent qualified reserve evaluators or auditors as part of its corporate governance practices. In 2003, the independent evaluators/auditors evaluated, audited and/or reviewed nearly 90 per cent of the Corporation's proved reserves data by volume. Their involvement helps assure that our internal reserves data are materially correct.
In our view, the reliability of the internally generated reserves data is not materially less than would be afforded by our involving independent qualified reserves evaluators or independent qualified reserves auditors to evaluate, audit and/or review the reserves data. Our reserves data is international in nature. Our securities regulatory reporting is as an SEC registrant and therefore our reserves data is developed in accordance with practices and procedures set out in the Canadian Oil and Gas Evaluation Handbook and modified to meet the applicable U.S. Financial Accounting Standards Board and SEC reserves
72 Petro-Canada Annual Information Form
definitions and the legal requirements of the SEC. Our procedures, records and controls relating to the accumulation of source data and preparation of reserves data by our internal reserves evaluation staff have been established, refined and documented over many years. Our internal reserves evaluation staff and management includes 71 persons with an average of over 10 years of relevant experience in evaluating reserves, of whom 37 are qualified reserves evaluators for purposes of Canadian securities regulatory requirements. Our internal reserves evaluation management personnel includes nine persons with an average of 19 years of relevant experience in evaluating and managing the evaluation of reserves.
Reserves data are estimates only, and are not exact quantities. Because the reserves data are based on judgements regarding future events, actual results will vary and the variations may be material.
/Signed/
Ron A. Brenneman, President and Chief Executive Officer
/Signed/
Kathleen E. Sendall, Senior Vice-President, North American Natural Gas
/Signed/
Guylaine Saucier, Director
/Signed/
Brian F. MacNeill, Director
Dated March 4, 2004
73 Petro-Canada Annual Information Form
SCHEDULE C
Set out below is Petro-Canada's analysis of its compliance with respect to the proposed new Canadian Multilateral Instrument dealing with CORPORATE GOVERNANCE DISCLOSURE, (Form 58-101F1).
PROPOSED GUIDELINES
| | DOES
PETRO-
CANADA
COMPLY?
| | DESCRIPTION OF APPROACH
|
|---|
|
| 1. | | Composition of the Board | | Yes | | | | |
| | | (a) | | Disclose whether or not the Chair of your Board of Directors is an independent director. | | | | • | | Board Chair is independent. |
| | | (b) | | Disclose whether or not a majority of Directors are independent. | | | | • | | The only Director not considered independent is Ron A. Brenneman, President and Chief Executive Officer. |
| | | (c) | | Disclose whether or not your independent Directors hold separate, regularly scheduled meetings. | | | | • | | Independent Directors regularly holdin camera meetings. |
2. |
|
Board Mandate |
|
Yes |
|
|
|
|
| | | | | Disclose text of the written mandate for your Board of Directors. | | | | • | | The Board mandate can be found in the "Composition of the Board of Directors" section of the Corporation's Annual Information Form as well as in the Corporate Governance Handbook located on the Corporation's Web site at www.petro-canada.ca. |
3. |
|
Position Descriptions |
|
Yes |
|
|
|
|
| | | (a) | | Disclose whether or not your Board has developed written position descriptions for the following roles. If not, explain how your Board assesses the performance of the individuals who occupy these roles. | | | | • | | Position descriptions can be found in the Corporate Governance Handbook located on the Corporation's Web site at www.petro-canada.ca. |
| | | | | (i) | | Chair; | | | | | | |
| | | | | (ii) | | Chair of each Board committee; and | | | | • | | The Board of Directors considers the Board Mandate and Committee Terms of Reference as the basis for role descriptions for individual Directors and committee chairs. |
| | | | | (iii) | | Director | | | | • | | The Board of Directors considers the Board Mandate and Committee Terms of Reference as the basis for role descriptions for individual Directors and committee chairs. |
| | | (b) | | Disclose whether or not your Board has developed written position description for the following role of CEO. If not, explain how your Board assesses the performance of the CEO. | | | | • | | Position descriptions can be found in the Corporate Governance Handbook located on the Corporation's Web site at www.petro-canada.ca. |
| | | | | | | | | | | | | |
74 Petro-Canada Annual Information Form
4. |
|
Orientation and Continuing Education |
|
Yes |
|
|
|
|
| | | (a) | | Briefly describe what measures, if any, your Board of Directors takes to orient new Board members regarding | | | | • | | Arrangements are made for specific briefing sessions from appropriate senior personnel to help new Directors better understand the Corporation's strategies and operations. Invitations are also given to existing Board member to join the sessions as a refresher. |
| | | | | (i) | | the role of your Board, its Directors and the committees of the Board; and | | | | • | | All new Directors are provided with the Corporate Governance Handbook, a comprehensive reference source about the Corporation, the Board and its Committees. Regularly updated version of the Handbook are also given to Directors and to Corporate officers with governance-related responsibilities. |
| | | | | (ii) | | the nature and operation of your Company's business. | | | | • | | Directors are given annual reviews for each of the Corporation's strategic business units and more detailed presentations on particular strategies. Directors are invited to participate in guided tours of the Corporation's facilities. |
| | | (b) | | Briefly describe what measures, if any, your Board of Directors takes to provide continuing education for its members. | | | | • | | Directors are encouraged to enrol in professional development courses. All expenses are reimbursed by the Corporation. |
5. |
|
Code of Business Conduct and Ethics |
|
Yes |
|
|
|
|
| | | Disclose whether or not your Board of Directors has adopted a code of business conduct and ethics for its Directors, Officers and employees. | | | | • | | A copy of the Code of Business Conduct can be found on the Corporation's Web site at
www.petro-canada.ca. |
| | | (a) | | Disclose whether or not your Board of Directors monitors compliance with its code of business conduct and ethics. | | | | • | | The Corporate Governance and Nominating Committee receives declarations from senior management confirming distribution and acceptance by employees of the Code of Business Conduct. |
| | | (b) | | If your Board of Directors has granted a waiver (including an implicit waiver) from a provision of the code of business conduct and ethics in favour of a Director or Officer, briefly describe the nature of the waiver. | | | | • | | The Board has not granted any waiver of the Code of Business Conduct. |
| | | | | | | | | | | | | |
75 Petro-Canada Annual Information Form
6. |
|
Nomination of Directors |
|
Yes |
|
|
|
|
| | | (a) | | Disclose whether or not your Board of Directors has a nominating committee. | | | | • | | For details on the Corporation's Corporate Governance and Nominating Committee please refer to the Composition of the Board of Directors section of the Annual Information Form, page 32 of the Management Proxy Circular or the Corporation's Web site at www.petro-canada.ca. |
| | | (b) | | Disclose whether or not the nominating committee is composed entirely of independent Directors | | | | • | | The Corporation's Corporate Governance and Nominating Committee is composed entirely of independent Directors. For details on the Committee please refer to the Composition of the Board of Directors section of the Annual Information Form, page 32 of the Management Proxy Circular or the
Corporation's Web site at
www.petro-canada.ca. |
| | | (c) | | Disclose the text of the nominating committee's charter. | | | | • | | The Corporation's Corporate Governance and Nominating Committee does have a charter. The Charter can be viewed in the Composition of the Board of Directors section of the Annual Information Form, or the Corporation's Web site at www.petro-canada.ca. |
| | | | | | | | | | | | | |
76 Petro-Canada Annual Information Form
7. |
|
Compensation |
|
Yes |
|
|
|
|
| | | (a) | | Disclose whether or not your Board of Directors has a compensation committee. | | | | • | | For details on the Corporation's Management Resources and Compensation Committee please refer to the Composition of the Board of Directors section of the Annual Information Form, page 33 of the Management Proxy Circular or
the Corporation's Web site at
www.petro-canada.ca. |
| | | (b) | | Disclose whether or not the compensation committee is composed entirely of independent Directors. | | | | • | | The Corporation's Management Resources and Compensation Committee is composed entirely of independent Directors. For details on the Committee please refer to the Composition of the Board of Directors section of the Annual Information Form, page 33 of the Management Proxy Circular or the Corporation's Web site at www.petro-canada.ca. |
| | | (c) | | Disclose the text of the compensation committee's charter. | | | | • | | The Corporation's Management Resources and Compensation Committee does have a charter. The Charter can be viewed in the Composition of the Board of Directors section of the Annual Information Form, or the Corporation's Web site at
www.petro-canada.ca. |
8. |
|
Regular Board Assessments |
|
Yes |
|
|
|
|
| | | Briefly describe the manner in which your Board of Directors regularly assesses its own effectiveness and performance, the effectiveness and performance of each of the committees of the Board, and the effectiveness and performance of each Board member. | | | | • | | See pages 22 and 31 of the Management Proxy Circular. |
77 Petro-Canada Annual Information Form
CONTROLS AND PROCEDURES
The company has performed an evaluation of its disclosure controls and procedures (as defined by Exchange Act rule 13a-15(e), as of December 31, 2003. Based on this evaluation, the company’s Chief Executive Officer and Chief Financial Officer have concluded that the disclosure controls and procedures are effective in providing reasonable assurances that material information required to be in this annual report is made known to them by others on a timely basis.
CHANGES IN INTERNAL CONTROL OVER FINANCIAL REPORTING
The company has not made any changes in internal control over financial reporting that occurred during the period covered by this annual report that has materially affected, or is reasonably likely to materially affect, the company’s internal control over financial reporting.
AUDIT COMMITTEE FINANCIAL EXPERT
Petro-Canada’s Board of Directors has determined that Petro-Canada has an “audit committee financial expert” as defined by regulations of the U.S. Securities and Exchange Commission. The audit committee financial expert is Paul D. Melnuk, Chairman of the Audit, Finance and Risk Committee.
CODE OF ETHICS
The company has adopted a code of ethics applicable to its Chief Executive Officer, Chief Financial Officer, principal accounting officer and Controller. A copy of the company’s code of ethics can be found at the company’s website located at www.petro-canada.ca.
2
PRINCIPAL ACCOUNTANT FEES AND SERVICES
Deloitte & Touche LLP billed the company for services rendered in the year ended December 31, 2003 as follows:
(a) | audit fees - $2,201,000; |
(b) | audit related fees - fees for audit of pension plans and attest services - $28,000; |
(c) | tax fees - nil; |
(d) | all other fees - nil. |
Deloitte & Touche LLP billed the company for services rendered in the year ended December 31, 2002 as follows:
(a) | audit fees - $2,230,000; |
(b) | audit related fees - fees for internal control reviews, acquisition due diligence, audits of pension plans and attest services - $270,000; |
(c) | tax fees - services related to customs and international trade and Canada Customs and Revenue Agency audit - $27,000; |
(d) | all other fees - primarily operational audits conducted pursuant to the contract internal audit arrangement between June 7, 2002 and August 2002 - $94,000. |
AUDIT COMMITTEE PRE-APPROVAL POLICIES AND PROCEDURES: The Audit, Finance and Risk Committee of Petro-Canada’s Board of Directors approves in advance any audit or non-audit service proposed to be provided by any accountant performing audit services for Petro-Canada or its subsidiaries. The Committee has delegated to the Chairman of the Committee full authority to approve any such request, as long as the Chairman presents any such approval to the Committee at its next scheduled meeting. Since the adoption of the pre-approval requirements, no services were approved pursuant to a waiver within the meaning of Rule 2-01(c)(7)(i)(c) of Regulation S-X.
CONTRACTUAL OBLIGATIONS
See page 21 of the Management’s Discussion and Analysis Exhibit forming part of this report
3
UNDERTAKING AND CONSENT TO SERVICE OF PROCESS
A. | Undertaking |
| |
| Petro-Canada (the “Registrant”) undertakes to make available, in person or by telephone, representatives to respond to inquiries made by the staff of the Securities and Exchange Commission (“SEC”), and to furnish promptly, when requested to do so by the SEC staff, information relating to the securities in relation to which the obligation to file an annual report on Form 40-F arises or transactions in said securities. |
| |
B. | Consent to Service of Process |
| |
| The Registrant has previously filed a Form F-X with the SEC on March 10, 1994. |
SIGNATURE
Pursuant to the requirements of the Securities Exchange Act of 1934, the registrant certifies that it meets all of the requirements for filing on Form 40-F and has duly caused this annual report to be signed on its behalf by the undersigned, thereto duly authorized.
Dated: March 25, 2004 | PETRO-CANADA |
| |
| |
| /s/ W. A. (Alf) Peneycad | |
| By: W. A. (Alf) Peneycad |
| Vice-President, General Counsel, Corporate |
| Secretary and Chief Compliance Officer |
4
EXHIBITS
Exhibits | | Description |
| | |
1. | | Petro-Canada Consolidated Financial Statements for the year ended December 31, 2003 |
| | |
2. | | Petro-Canada Management’s Discussion and Analysis |
| | |
3. | | Certification of the CEO pursuant to Section 302 of the Sarbanes-Oxley Act |
| | |
4. | | Certification of the CFO pursuant to Section 302 of the Sarbanes-Oxley Act |
| | |
5. | | Certification of CEO pursuant to 18 U.S.C. Section 1350, as adopted pursuant to Section 906 of the Sarbanes-Oxley Act of 2002 |
| | |
6. | | Certification of CFO pursuant to 18 U.S.C. Section 1350, as adopted pursuant to Section 906 of the Sarbanes-Oxley Act of 2002 |
5
QuickLinks
ANNUAL INFORMATION FORMITEM 2 – TABLE OF CONTENTSITEM 3 – CORPORATE STRUCTUREITEM 4 – GENERAL DEVELOPMENT OF THE BUSINESSITEM 5 – DESCRIPTION OF THE BUSINESSITEM 6 – SELECTED CONSOLIDATED FINANCIAL INFORMATIONITEM 7 – DESCRIPTION OF CAPITAL STRUCTUREITEM 8 – MARKET FOR SECURITIESITEM 9 – ESCROWED SECURITIESITEM 10 – DIRECTORS AND OFFICERSITEM 11 – PROMOTERSITEM 12 – LEGAL PROCEEDINGSITEM 13 – INTEREST OF MANAGEMENT AND OTHERS IN MATERIAL TRANSACTIONSITEM 14 – TRANSFER AGENTS AND REGISTRARSITEM 15 – MATERIAL CONTRACTSITEM 16 – INTERESTS OF EXPERTSITEM 17 – ADDITIONAL INFORMATION