UNITED STATES SECURITIES AND EXCHANGE COMMISSION
Washington, D.C. 20549
FORM 40 – F
(Check One)
| | Registration statement pursuant to Section 12 of the Securities Exchange Act of 1934 |
or | | |
x | | Annual report pursuant to Section 13(a) or 15(d) of the Securities Exchange Act of 1934 |
For fiscal year ended: | | December 31, 2008 |
Commission File No.: | | 1-13922 |
PETRO-CANADA
(Exact name of registrant as specified in its charter)
Canada | 1311, 1321, 1382, 5541 | Not Applicable |
(Province or other jurisdiction of incorporation or organization) | (Primary standard industrial classification code number, if applicable) | (I.R.S. employer identification number, if applicable) |
| | |
| 150 – 6th Avenue S.W. Calgary, Alberta Canada T2P 3E3 (403) 296-8000 | |
(Address and telephone number of registrant’s principal executive office) |
CT Corporation System
111 Eight Avenue - CT
New York, New York 10011
(212) 894-8940
(Name, address and telephone number of agent for service in the United States)
Securities registered pursuant to Section 12(b) of the Act: |
| | |
| Title of each class: | Name of each exchange on which registered: |
| Common Shares | New York Stock Exchange |
| | |
Securities registered pursuant to Section 12(g) of the Act: |
| None | |
| | |
Securities for which there is a reporting obligation pursuant to Section 15(d) of the Act: |
| 5% Senior Notes due 2014 | |
| 9 ¼% Debentures Due 2021 | |
| 7 7/8% Debentures Due 2026 | |
| 7% Debentures Due 2028 | |
| 4% Senior Notes Due 2013 | |
| 5.35% Senior Notes Due 2033 | |
| 5.95% Senior Notes Due 2035 | |
| 6.05% Senior Notes Due 2018 | |
| 6.80% Senior Notes Due 2038 | |
| | |
For annual reports, indicate by check mark the information filed with this form: |
| x Annual Information Form | x Audited Financial Statements |
Indicate the number of outstanding shares of each of the issuer’s classes of capital or common stock as of the close of the periods covered by the annual report:
| Common Shares: | 484,597,467 | |
Indicate by check mark whether the registrant: (1) has filed all reports required to be filed by Section 13 or 15(d) of the Exchange Act during the preceding 12 months (or for such shorter period that the registrant has been required to file such reports); and (2) has been subject to such filing requirements in the past 90 days.
CAUTIONARY NOTICE REGARDING FORWARD LOOKING INFORMATION
This Form 40-F contains forward-looking statements within the meaning of Section 27A of the Securities Act of 1933 and Section 21E of the Securities and Exchange Act of 1934. Such statements are generally identifiable by the terminology used, such as “plan”, “anticipate”, “intend”, “expect”, “estimate”, “budget” or other similar wording. Forward looking statements include but are not limited to: references to business strategy and goals; references to future capital and other expenditures; drilling plans; construction activities; refinery turnarounds; the submission of development plans; seismic activity; refining margins; oil and gas production levels and the sources of growth thereof; results of exploration activities and dates by which certain areas may be developed or may come on-stream; retail throughputs; pre-production and operating costs; reserves and resources estimates; reserves life-of-field estimates; natural gas export capacity; and environmental matters. By their very nature, these forward-looking statements require Petro-Canada to make assumptions, that may not materialize or that may not be accurate. These forward-looking statements are subject to known and unknown risks and uncertainties and other factors which may cause actual results, levels of activity and achievements to differ materially from those expressed or implied by such statements. Such factors include, but are not limited to: imprecision of reserves estimates of recoverable quantities of oil, natural gas and liquids from resource plays and other sources not currently classified as reserves; general economic, market and business conditions; industry capacity; competitive action by other companies; fluctuations in oil and gas prices; refining and marketing margins; the ability to produce and transport crude oil and natural gas to markets; the effects of weather and climate conditions; the results of exploration and development drilling and related activities; fluctuation in interest rates and foreign currency exchange rates; the ability of suppliers to meet commitments; actions by governmental authorities including increases in taxes; decisions or approvals of administrative tribunals; changes in environmental and other regulations; risks attendant with oil and gas operations; both domestic and international; international political events; expected rates of return; and other factors, many of which are beyond the control of Petro-Canada. These factors are discussed in greater detail elsewhere in this Form 40-F.
Readers are cautioned that the foregoing list of important factors affecting forward-looking statements is not exhaustive. Furthermore, the forward-looking statements contained herein are made as of the date of this Form 40-F, and Petro-Canada does not undertake any obligation to update publicly or to revise any of the included forward-looking statements, whether as a result of new information, future events or otherwise. The forward-looking statements contained in this Form 40-F are expressly qualified by this cautionary statement.

Table of Contents
Presentation of Information | 1 |
Conversion Factors | 1 |
Legal Notice – Forward-Looking Information | 1 |
Corporate Structure | 4 |
Incorporation of Petro-Canada | 4 |
Intercorporate Relationships | 4 |
Business of Petro-Canada | 5 |
General Development of the Business | 6 |
Three-Year History | 6 |
Description of the Business | 9 |
Business Environment | 9 |
Risk Management | 10 |
Upstream | 14 |
North American Natural Gas | 14 |
Oil Sands | 19 |
International & Offshore | 26 |
East Coast Canada | 26 |
International | 30 |
Upstream Production and Prices | 36 |
Reserves | 46 |
Downstream | 60 |
Human Resources | 66 |
Social and Environmental Policies | 66 |
Environmental Expenditures | 68 |
Select Financial Data | 69 |
Capital Expenditures on Property, Plant and Equipment and Exploration | 71 |
Dividends | 72 |
Capital Structure | 73 |
General Description of Capital Structure | 73 |
Constraints | 73 |
Credit Ratings | 74 |
Market for Securities | 75 |
Trading Price and Volume | 75 |
Prior Sales | 75 |
Directors and Officers | 76 |
Directors | 76 |
Share Ownership | 85 |
Audit Committee Disclosure | 85 |
Interest of Management and Others in Material Transactions | 86 |
Transfer Agents and Registrars | 86 |
Interests of Experts | 86 |
Additional Information | 86 |
Schedule A: Report on Reserves Data by Senior Officer Responsible for Reserves Data | 87 |
Schedule B: Report of Management and Directors on Reserves Data and Other Information | 89 |
Schedule C: Audit, Finance and Risk Committee | 91 |
Cover design: The Design Centre of Canada; Inside: Platinum Creative Solutions Inc.
This report was printed on paper that is acid-free and recyclable. Inks are based on linseed oil and contain no heavy metals. The printing process was alcohol-free. Volatile organic compounds associated with printing were reduced by 50% to 75% from the levels that would have been produced using traditional inks and processes.
PRESENTATION OF INFORMATION
The information contained in this Annual Information Form (AIF) is dated as at December 31, 2008, unless otherwise indicated. Throughout this AIF, the terms "Petro-Canada," the "Company," "we," "us" and "our" refer to Petro-Canada and its subsidiaries or, where the context requires, the applicable businesses within Petro-Canada (e.g. North American Natural Gas, Oil Sands, East Coast Canada, International and Downstream). Dollars are Canadian (Cdn), unless otherwise stated. All oil and natural gas production and reserves volumes are stated before deduction of royalties, unless otherwise indicated.
CONVERSION FACTORS
To conform with common usage, imperial units of measurement are used in this AIF to describe exploration and production, while metric units are used for refining and marketing.
1 cubic metre – m3 (liquids) | | = | 6.29 barrels (bbls) |
1 m3 (natural gas) | | = | 35.30 cubic feet |
1 litre | | = | 0.22 imperial gallon |
1 square kilometre | | = | 247.10 acres |
1 hectare | | = | 2.47 acres |
1 m3 | | = | 1,000 litres |
LEGAL NOTICE – FORWARD-LOOKING INFORMATION
This AIF contains forward-looking information. You can usually identify this information by such words as "plan," "anticipate," "forecast," "believe," "target," "intend," "expect," "estimate," "budget" or other terms that suggest future outcomes or references to outlooks. Forward-looking information in this AIF includes references to:
· business strategies and goals · future investment decisions · outlook (including operational updates and strategic milestones) · future capital, exploration and other expenditures · future cash flows · future resource purchases and sales · anticipated construction and repair activities · anticipated turnarounds at refineries and other facilities · anticipated refining margins · future oil and natural gas production levels and the sources of their growth · project development, and expansion schedules and results · future exploration activities and results, and dates by which certain areas may be developed or come on-stream | | · anticipated retail throughputs · anticipated pre-production and operating costs · reserves and resources estimates · future royalties and taxes payable · production life-of-field estimates · natural gas export capacity · future financing and capital activities (including purchases of Petro-Canada common shares under the Company's normal course issuer bid (NCIB) program) · contingent liabilities (including potential exposure to losses related to retail licensee agreements) · the impact and cost of compliance with existing and potential environmental regulations · future regulatory approvals · expected rates of return |

| Annual Information Form PETRO-CANADA | 1 |
Such forward-looking information is based on a number of assumptions and analysis made by the Company. These assumptions and analysis are described in greater detail throughout this AIF and include, without limitation, assumptions with respect to future commodity prices, the state of the economy, required capital expenditures, levels of cash flow, regulatory requirements, industry capacity, the results of exploration and development drilling and the ability of suppliers to meet commitments.
Undue reliance should not be placed on forward-looking information. Such forward-looking information is subject to known and unknown risks and uncertainties, which may cause actual results, levels of activity and achievements to differ materially from those expressed or implied by such information. Such risks and uncertainties include, but are not limited to:
· changes in industry capacity · imprecise reserves estimates of recoverable quantities of oil, natural gas and liquids from resource plays, and other sources not currently classified as reserves · the effects of weather and climate conditions · the results of exploration and development drilling, and related activities · the ability of suppliers to meet commitments · decisions or approvals from administrative tribunals · risks associated with domestic and international oil and natural gas operations · changes in general economic, market and business conditions | · competitive action by other companies · fluctuations in oil and natural gas prices · changes in refining and marketing margins · the ability to produce and transport crude oil and natural gas to markets · fluctuations in interest rates and foreign currency exchange rates · actions by governmental authorities (including changes in taxes, royalty rates and resource-use strategies) · changes in environmental and other regulations · international political events · nature and scope of actions by stakeholders and/or the general public |
Many of these and other similar factors are beyond the control of Petro-Canada. Petro-Canada discusses these factors in greater detail in filings with the Canadian provincial securities commissions and the United States (U.S.) Securities and Exchange Commission (SEC). See also "Risk Management – Risks Relating to Petro-Canada's Business" in this AIF for a discussion of factors that could impact Petro-Canada's operations or results.
Readers are cautioned that this list of important factors affecting forward-looking information is not exhaustive. Furthermore, the forward-looking information in this AIF is made as of March 18, 2009 and, except as required by applicable law, will not be publicly updated or revised. This cautionary statement expressly qualifies the forward-looking information in this AIF.
Petro-Canada disclosure of reserves
Petro-Canada's qualified reserves evaluators prepare the reserves estimates the Company uses. The Canadian provincial securities commissions do not consider Petro-Canada's reserves staff and management as independent of the Company. Petro-Canada has obtained an exemption from certain Canadian reserves disclosure requirements that allows Petro-Canada to make disclosure in accordance with SEC standards where noted in this AIF. This exemption allows comparisons with U.S. and other international issuers.
As a result, Petro-Canada formally discloses its proved reserves data using U.S. requirements and practices, and these may differ from Canadian domestic standards and practices. The use of the terms such as "probable," "possible," "resources" and "life-of-field production" in this AIF does not meet the SEC guidelines for SEC filings. To disclose reserves in SEC filings, oil and natural gas companies must prove they are economically and legally producible under existing economic and operating conditions. Note that when the term barrels of oil equivalent (boe) is used in this AIF, it may be misleading, particularly if used in isolation. A boe conversion ratio of six thousand cubic feet (Mcf) to one barrel (bbl) is based on an energy equivalency conversion method. This method primarily applies at the burner tip and does not represent a value equivalency at the wellhead.
2 | PETRO-CANADA Annual Information Form | 
|
The table below describes the industry definitions that Petro-Canada currently uses:
Definitions Petro-Canada uses | | Reference |
| | |
| | |
Proved oil and natural gas reserves (includes both proved developed and proved undeveloped) | | SEC reserves definition (Accounting Rules Regulation S-X 210.4-10, U.S. Financial Accounting Standards Board (FASB) Statement No. 69) SEC Guide 7 for Oil Sands Mining |
| | |
Unproved reserves, probable and possible reserves | | Canadian Securities Administrators: Canadian Oil and Gas Evaluation (COGE) Handbook, Vol. 1 Section 5 prepared by the Society of Petroleum Evaluation Engineers (SPEE) and the Canadian Institute of Mining Metallurgy and Petroleum (CIM) |
| | |
Contingent and Prospective Resources | | Petroleum Resources Management System: Society of Petroleum Engineers, SPEE, World Petroleum Congress and American Association of Petroleum Geologist definitions (approved March 2007) Canadian Securities Administrators: COGE Handbook Vol. 1 Section 5 |
| | |
Although the Society of Petroleum Engineers resource classification has categories of 1C, 2C and 3C for Contingent Resources, and low, best and high estimates for Prospective Resources, Petro-Canada will only refer to the unrisked 2C for Contingent Resources and the partially risked best estimate for Prospective Resources when referencing resources in this AIF. Estimates of resources in this AIF include contingent resources that have not been adjusted for risk based on the chance of development and partially risked prospective resources that have been risked for chance of discovery, but have not been risked for chance of development. Such estimates are not estimates of volumes that may be recovered and actual recovery is likely to be less and may be substantially less or zero. If a discovery is made, there is no certainty that it will be developed or, if it is developed, there is no certainty as to the timing of such development.
Canadian Oil Sands represents approximately 68% of Petro-Canada's total for Contingent and Prospective Resources. The balance of Petro-Canada's resources is spread out across the business, most notably in the North American frontier and International areas. Also, when Petro-Canada references resources for the Company, unrisked Contingent Resources are approximately 70% of the Company's total resources and partially risked Prospective Resources are approximately 30% of the Company's total resources.
Cautionary statement: In the case of discovered resources or a subcategory of discovered resources other than reserves, there is no certainty that it will be commercially viable to produce any portion of the resources. In the case of undiscovered resources or a subcategory of undiscovered resources, there is no certainty that any portion of the resources will be discovered. If discovered, there is no certainty that it will be commercially viable to produce any portion of the resources.
For movement of resources to reserves categories, all projects must have an economic depletion plan and may require:
· additional delineation drilling and/or new technology for unrisked Contingent Resources
· exploration success with respect to partially risked Prospective Resources
· project sanction and regulatory approvals
Reserves and resources information contained in this AIF is as at December 31, 2008.
| Annual Information Form PETRO-CANADA | 3 |
INCORPORATION OF PETRO-CANADA
Petro-Canada is a corporation continued under the Canada Business Corporations Act. The registered and principal executive office of the Company is located at 150 – 6 Avenue S.W., Calgary, Alberta, Canada T2P 3E3. Telephone: 403-296-8000.
INTERCORPORATE RELATIONSHIPS
Material operating subsidiaries owned 100%, directly or indirectly, by the Company as at December 31, 2008 were as follows:
Name | | Jurisdiction of Incorporation | | Purpose |
3908968 Canada Inc. | | Canada | | A Canadian subsidiary holding Petro-Canada's international interests |
Petro-Canada (International) Holdings BV | | Netherlands | | A subsidiary of Petro-Canada Cooperative Holding UA1 holding Petro-Canada's international interests |
Petro-Canada Germany GmbH | | Germany | | A subsidiary of Petro-Canada (International) Holdings BV that holds the majority of Petro-Canada's Libya interests |
Petro-Canada Oil (North Africa) GmbH | | Germany | | A subsidiary of Petro-Canada Germany GmbH through which the majority of Petro-Canada's Libya operations are conducted |
Petro-Canada U.K. Holdings Ltd. | | United Kingdom (U.K.) | | A subsidiary of 3908968 Canada Inc. that holds Petro-Canada's U.K. interests |
Petro-Canada U.K. Ltd. | | U.K. | | A subsidiary of Petro-Canada U.K. Holdings Ltd. through which Petro-Canada's operations are conducted in the U.K. |
1 | Petro-Canada Cooperative Holding UA is a cooperative between 3908968 Canada Inc. and 6872841 Canada Inc. with its legal jurisdiction in the Netherlands. |
| | | | | |
Individually, the Company's remaining subsidiaries accounted for (i) less than 10% of the Company's consolidated assets as at December 31, 2008, and (ii) less than 10% of the Company's consolidated sales and operating revenues as at December 31, 2008. In the aggregate, the remaining subsidiaries accounted for less than 20% of each of (i) and (ii) described above.
4 | PETRO-CANADA Annual Information Form |
|
BUSINESS OF PETRO-CANADA
The following business description should be read in conjunction with Petro-Canada's Management's Discussion and Analysis (MD&A) for the year ended December 31, 2008 in the Company's 2008 Annual Report. The MD&A is incorporated by reference into and forms an integral part of this AIF.
Petro-Canada is an integrated oil and gas company with a portfolio of businesses spanning both the upstream and downstream sectors of the industry. In the upstream businesses, the Company explores for, develops, produces and markets crude oil, natural gas liquids (NGL) and natural gas in Canada and internationally. The Downstream business unit refines crude oil and other feedstock, and markets and distributes petroleum products and related goods and services, primarily in Canada.
The table below outlines the various businesses of Petro-Canada as at December 31, 2008.
Upstream
North American Natural Gas | | Oil Sands |
| | |
| | |
· | Western Canada | | · | Syncrude (12% Interest) |
| · | Alberta Foothills | | · | MacKay River (100% Interest) |
| · | Southeast Alberta/Southwest Saskatchewan | | · | Fort Hills (60% Interest) |
| · | West Central Alberta | | · | Other In Situ Oil Sands Leases |
| · | Northeast British Columbia (B.C.) | | |
· | U.S. Rockies | | |
· | Northwest Territories (NWT)/Nunavut | | |
· | Alaska/Arctic Islands | | |
International & Offshore | | |
| | |
East Coast Canada | | International |
| | |
| | |
· | Hibernia (20% Interest) | | · | North Sea |
· | Terra Nova (34% Interest) | | | · | Buzzard (29.9% Interest) |
· | White Rose (27.5%1 Interest) | | | · | Triton Area |
· | Hebron (23.9% Interest) | | | · | Scott/Telford Area |
· | Other Significant Discovery Licences (SDLs) and Exploration Acreage | | | · | De Ruyter (54.07% Interest) |
| | | · | Hanze (45% Interest) |
| | | · | Other Exploration Acreage |
| | · | Other International |
| | | · | Libya Exploration Production Sharing Agreements (EPSAs) (50% Interest) |
| | | · | Syria Ebla Natural Gas Project (100% Interest) |
| | | · | Trinidad and Tobago North Coast Marine Area 1 (NCMA-1) (17.3% Interest) |
| | | · | Other Exploration Acreage |
Downstream
Refining and Supply | | Sales and Marketing | | Lubricants |
| | | | |
| | | | |
· | Edmonton Refinery | | · | Retail Operations | | · | Mississauga Lubricants Plant |
· | Montreal Refinery | | · | Wholesale Operations | | |
· | ParaChem Chemical Plant (51% Interest) | | | | | |
1 | Petro-Canada's working interest in the White Rose Extensions is 26.125% after the Newfoundland and Labrador Energy Corporation (NALCOR) acquired its 5% working interest effective with the signing of the final project agreements in February 2009. There is no change to the White Rose 27.5% working interest for the original field development as NALCOR is not a partner. |
| Annual Information Form PETRO-CANADA | 5 |
General Development of the Business
THREE-YEAR HISTORY
The following narrative is a three-year history of notable Company events:
2008
Petro-Canada ended a turbulent 2008 with record net earnings and cash flow from operating activities. The Company achieved record results in East Coast Canada, International and Oil Sands as a result of solid operations combined with a strong business environment for most of 2008. The Company delivered production unchanged from the prior year and at the high end of 2008 guidance. The Company also completed construction on one of its major projects and progressed the other six to deliver increased upstream production and profitable growth in the future.
Specifically the Company:
· | delivered record net earnings of $3.1 billion and record cash flow from operating activities of $6.5 billion |
· | maintained a strong liquidity position with a year-end 2008 cash balance of $1.4 billion and unutilized credit facility capacity of $4.7 billion |
· | ended 2008 with debt levels at 23.5% of total capital and a ratio of 0.7 times debt-to-cash flow from operating activities, with both measures well below the Company's long-term ranges |
· | declared a 54% increase in the quarterly dividend to $0.20/share, commencing on October 1, 2008 |
· | finished 2008 with proved reserves of 1,2861 million barrels of oil equivalent (MMboe), compared with 1,3151 MMboe at year-end 2007 |
· | signed six new EPSAs with the Libya National Oil Company (NOC), adding reserves and extending terms by an expected 30 years with improved commercial terms |
· | completed construction of the Edmonton refinery conversion project (RCP) and continued to ramp up the refinery |
In North American Natural Gas, production was strong in 2008 due to increased natural gas production in the U.S. Rockies and strong performance in Western Canada, which significantly offset natural declines. Increased net earnings of $344 million in 2008 reflected higher natural gas prices, increased U.S. Rockies production and lower exploration expenses, partially offset by decreased Western Canada production and increased operating and depreciation, depletion and amortization (DD&A) expenses. In 2008, the Company completed the sale of its Minehead assets in Western Canada. The sale of these assets is aligned with the business unit's strategy to continuously optimize the assets in its portfolio. During 2008, the Company discontinued a pilot project in northern B.C. Also in 2008, the Company completed a small acquisition of oil production and exploration land located in Colorado's Denver-Julesburg Basin. In 2008, the Company continued to position itself as a long-term North American supplier by building its northern resource base and by participating in the drilling of three exploration wells in Alaska and the NWT.
The Oil Sands business delivered record net earnings of $334 million for the year, reflecting increased production from MacKay River and higher realized prices at both Syncrude and MacKay River. These factors were partially offset by lower Syncrude production and increased operating costs at both Syncrude and MacKay River. In 2008, Petro-Canada and its partners in the Fort Hills project received regulatory approval for an amendment to the approved mine plan, which incorporates improvements identified through the mine plan optimization process. During the year, the Fort Hills Energy Limited Partnership announced that the preliminary results from the front-end engineering and design (FEED) work suggested that estimated costs for the Fort Hills project had risen considerably and that it will defer the final investment decision (FID) on the mining portion of the project until costs can be reduced and commodity prices and financial markets strengthen. The upgrader portion of the Fort Hills project was put on hold and a decision on whether to proceed with the upgrader will be made at a later date. At MacKay River, production was higher compared with the prior year as a result of increased reliability and capacity. The MacKay River expansion (MRX) project was also put on hold until commodity prices and financial markets strengthen.
1 | These reserves numbers represent the sum of oil sands mining and oil and gas activities, are presented before royalties and stated in MMboe. Reporting reserves in this manner does not conform to SEC standards and is for general supplemental information only. |
6 | PETRO-CANADA Annual Information Form |
|
The East Coast Canada business also delivered record net earnings of $1,368 million for the year, reflecting higher realized prices and strong reliability, partially offset by decreased production due to natural declines, increased royalties and higher DD&A expense. In April 2008, Petro-Canada and its partners on the White Rose Extensions1 achieved government and regulatory approval to proceed and detailed design, procurement and fabrication were underway, with necessary long-lead equipment and drilling commitments in place. The Hibernia operator submitted the Hibernia Southern Extension development plan amendment application in July 2008, which was still being reviewed. In August 2008, the Company executed formal agreements with the Government of Newfoundland and Labrador to allow development activities for the Hebron offshore oil project to proceed. Terra Nova and White Rose both reached tier two royalty payout in 2008, increasing their royalty rates. Reliability at the Petro-Canada operated Terra Nova facility remained strong in 2008.
The International business delivered record net earnings of $1,684 million in 2008, which was a significant increase over the prior year. Record net earnings were due to the absence of expenses associated with settling the Buzzard derivative contracts in 2007 as well as higher realized prices and production, partially offset by higher exploration and DD&A expenses. The Buzzard North Sea development continued to perform well, with robust operating performance in 2008. The Company signed six new EPSAs in 2008 with the Libya NOC, adding reserves and extending terms by an expected 30 years with improved commercial terms. The construction of the Syria Ebla gas facilities progressed on plan and development drilling started with two rigs operating in the field. The Ebla gas project is on schedule to deliver first gas by August 2010.
The Downstream contributed net earnings of $nil in 2008, down significantly from 2007. Net earnings were negatively impacted by a weaker business environment for gasoline cracking margins, a change in inventory accounting methodology and lower refinery yields. Refinery yields were lower predominantly at Edmonton due to planned turnaround activity to tie in and ramp up the new RCP units and unplanned operational upsets. These factors were partially offset by improved marketing margins. In the third quarter of 2008, the Company completed construction of the Edmonton RCP to process 100% oil sands-based feedstock and continued to ramp up the refinery. The Montreal coker project is on hold until financial and commodity markets strengthen, and the Company is reworking project costs to take advantage of the current market environment.
The Company returned funds to shareholders during 2008. In July 2008, the Company declared a 54% increase in the quarterly dividend to $0.20/share commencing on October 1, 2008. Total cash dividends paid in 2008 were $320 million, compared with $255 million in 2007 and $201 million in 2006. In addition, Petro-Canada renewed its NCIB program. The current program, which extends to June 21, 2009, entitles the Company to purchase up to 5% of its outstanding common shares, subject to certain conditions. The Company did not repurchase any of its common shares in 2008.
2007
In 2007, Petro-Canada had record net earnings of $2.7 billion and strong cash flow from continuing operating activities of $3.3 billion. The Company achieved 21% growth in upstream production from continuing operations, compared with 2006.
In North American Natural Gas, the Company exited 2007 with U.S. Rockies production reaching 100 million cubic feet of gas equivalent/day (MMcfe/d), achieving the goal of doubling production from 2004 acquisition levels. The Company also continued to position itself for long-term North American supply by building its land position North of 60 and by participating in the drilling of three exploration wells.
In Oil Sands, the Company finalized the agreement to earn an additional 5% working interest in the Fort Hills project, bringing Petro-Canada's total stake in the Fort Hills project to 60%. In June 2007, Petro-Canada and its partners completed and announced the design basis and preliminary cost estimate for the Fort Hills project. In addition, Petro-Canada entered into an agreement, subject to the FID, with Enbridge Inc. to develop pipeline and terminalling facilities to meet the requirements of Phase 1 and subsequent phases of the project. The Company completed the MacKay River plant capacity upgrade and began steaming the fourth well pad.
In East Coast Canada, the Hebron partners signed a non-binding Memorandum of Understanding (MOU) with the Government of Newfoundland and Labrador related to the fiscal and other terms for the future development of the Hebron/Ben Nevis offshore field. In December 2007, Petro-Canada and its partners in the North Amethyst, West White Rose and South White Rose Extension, collectively known as the White Rose Extensions1 development, signed a formal agreement with the province
1 | Petro-Canada's working interest in the White Rose Extensions is 26.125% after the NALCOR acquired its 5% working interest effective with the signing of the final project agreements in February 2009. There is no change to the White Rose 27.5% working interest for the original field development as NALCOR is not a partner. |
| Annual Information Form PETRO-CANADA | 7 |
for the development of these oilfields. The North Amethyst portion of the White Rose Extensions was sanctioned by the Board of Directors in the first quarter of 2007. Reliability at the Petro-Canada operated Terra Nova Floating Production, Storage and Offloading (FPSO) vessel increased significantly, leading to much higher production in 2007.
In International, the Company achieved first production from the Buzzard and Saxon developments in the U.K. sector of the North Sea. Late in 2007, Petro-Canada and the Libya NOC signed binding heads of agreement for a 30-year extension of the Libya concessions. In mid-2007, the Company reached a settlement with the Venezuelan Ministry for Energy and Petroleum to dispose of its 50% working interest in the La Ceiba Block and closed its office in Venezuela at the end of 2007. At the end of the year, the Company settled all outstanding Buzzard derivative contracts, resulting in a reduction in cash flow of $1,145 million after-tax.
In the Downstream, strong reliability at the Edmonton and Montreal refineries allowed Petro-Canada to maximize the benefits of unprecedented light oil refining margins. At year-end 2007, Petro-Canada had completed 61% of the construction at the Edmonton refinery to convert the refinery to process 100% oil sands-based feedstock and all the major vessels and modules had been installed. During the year, work progressed to evaluate the feasibility of adding a coker to the Montreal refinery.
The Company returned funds to shareholders during the year. The Company paid cash dividends in 2007 of $255 million and repurchased and cancelled 15,998,000 shares at an average price of $52.42 per share for a total cost of $839 million.
2006
In 2006, Petro-Canada delivered solid net earnings of $1.7 billion and cash flow from continuing operating activities of $3.6 billion.
In North American Natural Gas, water treatment permits required for wells planned in 2005 and 2006 were approved, resulting in a ramp up of coal de-watering in the U.S. Rockies. The Company also continued to position itself for long-term North American supply by assessing its exploration prospects in Alaska and Mackenzie Delta/Corridor.
In Oil Sands, the Syncrude Stage III expansion came on-stream, adding to upstream production for the year, and the Company added in situ oil sands resources with the purchase of additional leases adjacent to MacKay River. As part of the Fort Hills project, the partners filed a regulatory application to construct and operate an upgrader in Sturgeon County, about 40 kilometres northeast of Edmonton.
In East Coast Canada, the Company completed the extended turnaround of the Terra Nova FPSO and development drilling in the White Rose field showed promise, with discoveries made in the west and southwest sections of the field.
In International, the Company achieved first production from the North Sea platforms of De Ruyter and L5b-C and the Company completed the sale of its mature producing assets in Syria for net proceeds of $640 million. Later in the year, the Company completed an agreement to purchase a 90% interest in and operate the Ebla natural gas project in central Syria for $54 million.
In the Downstream, a fire occurred in early 2006 at the Mississauga lubricants plant, which reduced output to 50% of plant capacity for approximately two months. Petro-Canada completed its ultra-low sulphur diesel projects at its Edmonton and Montreal refineries, thereby providing cleaner burning fuels to consumers. During the year, construction was started to convert the Edmonton refinery to process 100% oil sands-based feedstock.
The Company returned funds to shareholders during the year. In December, the Company declared a 30% increase in its quarterly dividend to $0.13/share, commencing with the dividend payable April 1, 2007. In addition, Petro-Canada repurchased and cancelled 19,778,400 shares at an average price of $51.10 per share for a total cost of just over $1 billion.
8 | PETRO-CANADA Annual Information Form |
|
Description of the Business
BUSINESS ENVIRONMENT
The major economic factors influencing Petro-Canada's upstream financial performance include crude oil and natural gas prices and foreign exchange, particularly the Canadian dollar/U.S. dollar rates. Crude oil and natural gas prices are affected by a number of factors, including the balance of supply and demand, weather and political events. Economic factors influencing Downstream financial performance include the level and volatility of crude oil prices, industry refining margins, levels of crude oil price differentials, demand for refined petroleum products, the degree of market competition and foreign exchange, particularly the Canadian dollar/U.S. dollar rates.
Business Environment in 2008
The year 2008 was one of the most volatile on record for oil markets. The first half of the year saw significant upward momentum in oil prices as weak supply growth fell short of robust demand growth in non-Organization of Economic Co-operation and Development (OECD) countries. Economic momentum slowed dramatically in the second half of the year as the global financial crisis intensified, depressing crude oil demand growth appreciably. By the end of 2008, demand was negative. The swings in oil prices through 2008 were also accompanied by record inflows, followed by record outflows, of investment dollars from commodity market funds. The price of North Sea Brent (Dated Brent) opened the year at just under $100 US/bbl, climbed to record highs of over $140 US/bbl in early July, and then fell steadily to under $45 US/bbl by early December. Despite the declines in the latter half of the year, the annual average price of Dated Brent was the highest ever at $96.99 US/bbl, approximately one-third above the 2007 average.
In 2008, the international light/heavy crude (Dated Brent/Mexican Maya) price differential averaged $13.15 US/bbl, somewhat wider than the $12.67 US/bbl posted in 2007. Canadian light/heavy crude (Edmonton Light/Western Canada Select (WCS)) spreads narrowed in 2008 to $19.91 Cdn/bbl from $24.07 Cdn/bbl in 2007. Canadian heavy crudes continued to be sold at a greater discount to light crudes, compared with international heavy crudes. This is due to Canadian heavy crude oil production growing at a faster rate than North American investment to convert refineries to process heavy feedstock. The Canadian discount narrowed in 2008, however, as competing heavy oil imports from Mexico and Venezuela declined.
North American natural gas prices were very volatile in 2008. Natural gas prices at the Henry Hub ranged from over $13.50 US/million British thermal units (MMBtu) in July to under $6.50 US/MMBtu in November. Overall, Henry Hub prices averaged $8.95 US/MMBtu in 2008, about 30% higher than in 2007. The increase was due to higher crude oil prices, which raised the cost of distillate fuels that in turn competed with natural gas. In 2008, the Canadian natural gas price at the AECO-C hub rose 23%, somewhat less than U.S. prices, as the strength of the Canadian dollar in the first half of the year offset some of the gains in natural gas prices.
The Canadian dollar was also extremely volatile in 2008, falling from parity with the U.S. dollar in the first half of the year to under 80 cents US by December. Overall, the Canadian dollar averaged 94 cents US in 2008, compared with 93 cents US in 2007. The strength of the Canadian currency in the first half of the year reduced some of the impact of stronger international prices on Canadian crude oil and natural gas prices. Similarly, the decline in the Canadian dollar in the second half of the year offset some of the impact from the declines in international crude oil and natural gas prices.
In the downstream sector, refined petroleum products sales in Canada increased by 0.5% in 2008, compared with a gain of 3.4% in 2007. Demand growth was relatively stronger in Canada than in the U.S. in 2008, but momentum slowed steadily through the year. The New York Harbor 3-2-1 crack spread, an indicator of overall refining margins, averaged $9.58 US/bbl in 2008, compared with $14.15 US/bbl in 2007. Declines in gasoline cracking margins more than offset gains in distillate cracking margins. With the exception of relatively brief hurricane-induced spikes in September, gasoline cracking margins were pressured downward by declining U.S. consumption. Distillate margins rose markedly, averaging over $19.61 US/bbl, as strong demand for diesel fuel from non-OECD countries and commodity producers led to sharply higher product exports from the U.S.

| Annual Information Form PETRO-CANADA | 9 |
Competitive Conditions
It is increasingly challenging for the energy sector to find new sources of oil and natural gas. Petro-Canada is well positioned to successfully increase production of oil and natural gas and compete for new opportunities that could complement existing upstream resources. The Company has an estimated 14 billion boe of resources from which to develop new production, with approximately 68% of the resources located in Alberta's oil sands. With upstream business operations in Canada and internationally, the Company has the flexibility to pursue a wide range of opportunities. While the Company has significant operational scope, as measured by production levels, it remains a mid-sized global company. This means Petro-Canada has the operational capability and balance sheet strength to invest in large projects, but smaller investments can also have a meaningful impact on the Company's production levels and financial returns.
Petro-Canada is well positioned to compete in the petroleum products refining and marketing business in Canada. Petro-Canada has the second largest downstream business in Canada and is the "brand of choice." The Company conducts business in the downstream throughout Canada as an integrated business unit and participates in the refining, distribution and marketing of petroleum products. The Company also offers a wide range of ancillary non-petroleum goods and services, such as convenience retailing, automotive repair and car washes.
The Company's strong financial position, track record of successfully executing large capital projects and depth of management experience should enable it to continue to compete effectively in the current business environment.
RISK MANAGEMENT
RISKS RELATING TO PETRO-CANADA'S BUSINESS
Petro-Canada's results are impacted by several risks and management's strategies for handling these risks. Management believes each major risk requires a unique response based on Petro-Canada's business strategy and financial tolerance. Some risks can be effectively managed through internal controls, business processes, insurance and hedging. Hedging is used in limited circumstances, mainly to mitigate Downstream risks associated with refinery feedstock costs. Petro-Canada's business risks include, but are not limited to, the following items. These risks could have a material adverse effect on the Company's business, financial conditions and results of operations.
A substantial or extended decline in crude oil or natural gas prices could have a material adverse effect on Petro-Canada.
The Company's financial condition depends substantially on the market prices of crude oil and natural gas. Fluctuations in crude oil or natural gas prices could have a material adverse effect on Petro-Canada's financial condition, as well as the value and amount of the Company's reserves. Prices for crude oil and natural gas fluctuate in response to changes in the supply of and demand for crude oil and natural gas, market uncertainty and a variety of other factors beyond Petro-Canada's control. These factors include, but are not limited to, the actions of the Organization of the Petroleum Exporting Countries (OPEC), world economic conditions, government regulation, political developments, the foreign supply of oil, the price of foreign imports, the availability of alternate fuel sources and weather conditions. Canadian natural gas prices are primarily affected by North American supply and demand, weather conditions, the level of industry inventories, political events, and, to a lesser extent, the price of alternate sources of energy.
Any substantial or extended decline in the prices of crude oil or natural gas could result in a delay or cancellation of existing or future drilling, development or construction programs, curtailment in production at some properties and unused long-term transportation commitments.
The margins realized for Petro-Canada's refined products are also affected by factors such as crude oil price fluctuations due to the impact on refinery feedstock costs, third-party refined product purchases and the demand for refined petroleum products. The Company's ability to maintain product margins in an environment of higher feedstock costs depends upon its ability to pass higher costs on to customers.
10 | PETRO-CANADA Annual Information Form | 
|
Petro-Canada's operations are subject to physical damage, business interruption and casualty losses.
Petro-Canada is subject to the operating risks associated with exploring for, and producing, oil and natural gas, as well as operating midstream and downstream facilities. These risks include blowouts, explosions, fires, gaseous leaks, equipment failures, migration of harmful substances, adverse weather conditions and oil spills. These risks could cause personal injury, could result in damage or destruction to oil and natural gas wells, formations, production facilities, other property and equipment, and the environment, and could interrupt operations. In addition, Petro-Canada's operations are subject to the risks related to transporting, processing and storing of oil, natural gas and other related products, drilling of oil and natural gas wells, and operating and developing oil and natural gas properties.
Factors that affect Petro-Canada's ability to execute projects could adversely affect business results.
Petro-Canada manages a variety of projects to support operations and future growth. Significant project cost overruns could make certain projects uneconomic. The Company's ability to execute projects depends upon numerous factors, which may include, but are not limited to, changes in project scope, labour availability and productivity, staff resourcing, availability and cost of material and services, design and/or construction errors, delays in regulatory approvals, the ability of partners to deliver on project commitments and access to capital funding. As a result, Petro-Canada may not be able to execute projects on time, on budget or at all.
Fluctuations in exchange rates create foreign currency exposure.
Due to the fact that energy commodity prices are primarily in U.S. dollars, Petro-Canada's revenue stream is affected by the Cdn/US dollar exchange rate. The Company's net earnings are negatively affected by a strengthening Canadian dollar. Petro-Canada is also exposed to fluctuations in other foreign currencies, such as the euro and British pounds sterling.
Reduced liquidity in capital markets can limit the availability of capital and raise borrowing costs.
From time to time, Petro-Canada accesses the debt and/or equity markets to raise capital. The reasons may include, among other things, the need to raise financing for new operations, mergers, acquisitions and expansions. Reduced liquidity in the capital markets may restrict the Company's ability to raise the required financing and/or may significantly increase the associated cost of that capital. An inability to raise capital could jeopardize the ability of the Company to undertake a certain project and a higher cost of capital would reduce the profitability of that project.
A failure to acquire or find additional reserves would cause a decline in Petro-Canada's reserves and production levels.
The Company's future oil and natural gas reserves and production and, therefore, cash flows are highly dependent upon success in exploiting Petro-Canada's current reserves and resources base and acquiring or discovering additional reserves and resources. Without reserves additions through exploration, acquisition or development activities, Petro-Canada's reserves and production will decline over time. Exploring for, developing or acquiring reserves is capital intensive. To the extent cash flows from operations are insufficient to fund the Company's capital expenditures and external sources of capital become limited or unavailable, Petro-Canada's ability to make the necessary capital investments to maintain oil and natural gas reserves will be impaired. Costs to find and develop or acquire additional reserves also depend on success rates, which vary over time.
Petro-Canada's oil and natural gas reserves data and future net revenue estimates are subject to variability.
There are many uncertainties inherent in estimating quantities of oil and natural gas reserves, including many factors beyond the Company's control. Estimates of economically recoverable oil and natural gas reserves are based upon a number of variables and assumptions. These include geoscientific interpretation, commodity prices, operating and capital costs and historical production from properties. These estimates have some degree of uncertainty and reserves classifications are best estimates. For these reasons, estimates of the economically recoverable oil and natural gas reserves attributed to properties
| Annual Information Form PETRO-CANADA | 11 |
and classification of reserves based on recovery risk may vary substantially. Petro-Canada's actual production, revenues, taxes and development and operating expenditures related to reserves may vary materially from estimates.
Changes in governmental regulation affecting the oil and natural gas industry could have a material adverse impact on Petro-Canada.
The petroleum industry is subject to regulation and intervention by governments, including the awarding of exploration and production interests, the imposition of specific drilling obligations, environmental protection controls, regulation of the development and abandonment of fields (including restrictions on production) and, possibly, expropriation or cancellation of contract rights. As well, governments may regulate or intervene on prices, taxes, royalties and the exportation of oil and natural gas. Regulations may be changed in response to economic or political conditions. New regulations or changes to existing regulations that affect the oil and natural gas industry could reduce demand for natural gas or crude oil and increase Petro-Canada's costs.
Petro-Canada's foreign operations may expose the Company to risks, which could negatively affect results of operations.
The Company has operations in a number of countries with different political, economic and social systems. As a result, Petro-Canada's operations and related assets are subject to a number of risks, which may include, among other things, currency restrictions and exchange rate fluctuations, loss of revenue, property and equipment as a result of expropriation, nationalization, war, insurrection and geopolitical and other political risks, increases in taxes and governmental royalties, renegotiation of contracts with governmental entities and quasi-governmental agencies, changes in laws and policies governing operations of foreign-based companies, economic and legal sanctions (such as restrictions against countries that the U.S. government may deem to sponsor terrorism) and other uncertainties arising from foreign government sovereignty over Petro-Canada's international operations. If a dispute arises in Petro-Canada's foreign operations, the Company may be subject to the exclusive jurisdiction of foreign courts or may not be able to subject foreign persons to the jurisdiction of a court in the U.S. or Canada.
The Company has operations in Libya, which is a member of OPEC. Petro-Canada may operate in other OPEC-member countries in the future. Production in those countries may be constrained by OPEC quotas.
Petro-Canada's oil and natural gas production and refining operations impact communities and surrounding environments.
Those impacted by Petro-Canada's operations can become concerned over the use of resources, such as land and water, the perceived or real threat to human health, the potential impact on biodiversity, and/or possible societal changes to surrounding communities. The Company must secure and maintain formal regulatory approvals and licences in order to conduct operations. In addition, broader societal acceptance of Petro-Canada's activities is necessary for resource development. An inability for the Company to secure local community support, necessary regulatory approvals and licences, and broader societal acceptance can result in projects being delayed or stopped, resulting in higher project costs. Lack of local community and stakeholder support can lead to pressure to limit or shut down operations.
Petro-Canada is subject to environmental legislation in all jurisdictions where it operates. Changes in this legislation could negatively affect the Company's results of operations.
Petro-Canada is subject to environmental regulation under a variety of Canadian, U.S. and other foreign, federal, provincial, territorial, state and municipal laws and regulations. This is collectively referred to below as environmental legislation.
Environmental legislation imposes, among other things, restrictions, liabilities and obligations in connection with the generation, handling, use, storage, transportation, treatment and disposal of hazardous and non-hazardous substances, including natural resources and waste, and in connection with spills, releases and emissions of various substances to the environment. Environmental legislation requires that wells, facility sites and other properties associated with Petro-Canada's operations be operated, maintained, abandoned and reclaimed to the satisfaction of the applicable regulatory authorities. Certain types of operations, including exploration and development projects, and changes to certain existing projects, may require submitting and seeking the approval of environmental impact assessments (EIA) or permit applications. Complying with environmental
12 | PETRO-CANADA Annual Information Form |
|
legislation can require significant expenditures, including costs for cleanup and damages due to contaminated properties. Failure to comply with environmental legislation may result in fines and penalties. Petro-Canada is also exposed to civil and criminal liability for environmental matters, including private parties commencing actions, new theories of liability and new heads of damages. Although it is not expected that the costs of complying with environmental legislation or dealing with environmental liabilities, as they are known today, will have a material adverse effect on Petro-Canada's financial condition or results of operations, no assurance can be made that the costs of complying with future environmental legislation will not have a material effect.
Petro-Canada operates in jurisdictions that have regulated or have proposed to regulate industrial greenhouse gas (GHG) emissions. Jurisdictions that currently regulate GHG emissions include Alberta and the European Union. Jurisdictions that have proposed to regulate GHG emissions include the U.S., B.C., Quebec, Ontario and Canada. Those jurisdictions that have announced the intent to regulate GHG emissions support cap-and-trade systems and, in some cases, have also proposed implementing complementary measures, including low carbon fuel standards. To date, these jurisdictions have started or have announced plans to start consultations on the design of their regulations, as well as explore opportunities to harmonize regulations across jurisdictions within North America. Petro-Canada participates in these consultations, either directly or through industry associations. In 2007, Petro-Canada established an internal senior management team to steward these activities and, in 2008, this organization was enhanced by creating the role of Director, Climate Change. While these jurisdictions have not published details on their proposed regulations or on their compliance mechanisms, many, most notably the U.S., have identified the importance of balancing the environment, economy and energy security when developing regulations. While it is premature to predict what impact these anticipated regulations may have on Petro-Canada and the broader oil and gas sector, Petro-Canada will likely face increased capital and operating costs in order to comply with these regulations and these costs could be material. Petro-Canada is actively following policy development to ensure the Company is prepared to operate within a new framework.
Reduced asset reliability could adversely affect Petro-Canada's business.
Petro-Canada operates facilities in both the upstream and downstream sectors of the industry. A reduction in the reliability of these facilities as a result of, but not limited to, damage to equipment, plant or material loss of production capability or operational integrity, or the extension of shutdown time could contribute to reduced profitability.
Counterparties exposure.
Petro-Canada is exposed to credit risk, and operational risk associated with counterparties' abilities to fulfil their obligations to the Company.
| Annual Information Form PETRO-CANADA | 13 |
UPSTREAM
Petro-Canada's upstream operations consisted of three business units in 2008: North American Natural Gas, with production in Western Canada and the U.S. Rockies; Oil Sands, with operations in northeast Alberta; and International & Offshore. International & Offshore has two segments: East Coast Canada, with three major developments offshore Newfoundland and Labrador; and International, where the Company is active in two core areas: North Sea and Other International (Libya, Syria and Trinidad and Tobago). The diverse asset base provides a balanced portfolio and a platform for long-term growth.
North American Natural Gas
Business Summary and Strategy
North American Natural Gas explores for and produces natural gas, crude oil and NGL in Western Canada and the U.S. Rockies. This business also markets natural gas in North America and has established resources in Alaska, the NWT and the Arctic Islands. The North American Natural Gas strategy is to be a significant market participant by accessing new and diverse natural gas supply sources in North America. Key features of the strategy include: · optimizing core properties in Western Canada and in the U.S. Rockies · targeting 50% to 60% reserves replacement · increasing focus on unconventional exploration in Western Canada and the U.S. Rockies · building the northern resource base for long-term growth | | 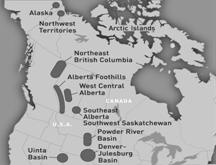
|
Western Canada and U.S. Rockies
Annual production before royalties totalled 214 billion cubic feet (Bcf) of natural gas and 4.8 million barrels (MMbbls) of conventional crude oil and NGL in 2008. Exploration and development drilling activity in North American Natural Gas resulted in 590 gross (415 net) wells, including 431 gross (280 net) natural gas wells and 148 gross (124 net) oil wells, for an overall success rate of 98% in 2008.
The realized natural gas price for North American Natural Gas averaged $8.05 /Mcf in 2008, up 28% from $6.30/Mcf in 2007.
Western Canada natural gas production averaged 562 MMcfe/d in 2008, down 5% from 590 MMcfe/d in 2007. Exploration and development drilling activity in Western Canada resulted in 292 successful wells (gross), for an overall success rate of 97% in 2008. Western Canada realized natural gas price was $8.28/Mcf in 2008, compared with $6.48/Mcf in 2007. Western Canada operating and overhead costs were $1.72/thousand cubic feet of oil equivalent (Mcfe) in 2008, up from $1.50/Mcfe in the previous year. The operating and overhead cost increase in Western Canada reflected industry-wide cost pressures for materials, fuel and labour, combined with lower production.
U.S. Rockies natural gas production averaged 103 MMcfe/d in 2008, up 23% from 84 MMcfe/d in 2007. The increase reflected the ramp up of production from the coal bed methane (CBM) fields in the Powder River Basin and increased drilling activity in the Denver-Julesburg Basin. Exploration and development drilling activity in the U.S. Rockies during 2008 resulted in 287 gross wells, up from the 150 wells in 2007. U.S. Rockies realized natural gas price was $6.63/Mcf in 2008, up 36% from $4.88/Mcf in 2007. Late in 2007, the initial expansion of the Fort Union gas gathering system was completed, helping to reduce curtailments in the Powder River Basin. The completion of the final phase of the Rockies Express pipeline expansion is expected to alleviate additional U.S. Rockies pipeline constraints when it comes on-stream in 2009. U.S. Rockies operating
14 | PETRO-CANADA Annual Information Form |
|
and overhead costs were $2.26/Mcfe in 2008, up compared with $2.21/Mcfe in 2007 due to industry-wide cost pressures for materials, fuel and labour.
In Western Canada, Petro-Canada operates 10 natural gas field processing plants, with total licensed capacity of approximately one billion cubic feet/day (Bcf/d), of which the Company's share is approximately 622 million cubic feet/day (MMcf/d). As part of the Company's ongoing optimization of its portfolio of assets, in early 2008, Petro-Canada completed the sale of its Minehead assets, resulting in a loss on sale of $112 million after-tax. The following table shows Petro-Canada's working interest ownership and the capacity of operated processing plants.
Petro-Canada Ownership and Capacity
Petro-Canada Operated Plants | | Working Interest Ownership
(%) | | Gross Licensed Capacity
(MMcf/d) | | Net Licensed Capacity
(MMcf/d) | |
Hanlan Sweet | | 41 | | 44 | | 18 | |
Hanlan Sour | | 46 | | 380 | | 175 | |
Total Hanlan | | | | 424 | | 193 | |
| | | | | | | |
Wilson Creek Sweet | | 52 | | 12 | | 7 | |
Wilson Creek Sour | | 52 | | 22 | | 11 | |
Total Wilson Creek | | | | 34 | | 18 | |
| | | | | | | |
Boundary Lake Sweet | | 100 | | 20 | | 20 | |
Boundary Lake Sour | | 50 | | 66 | | 33 | |
Parkland 1 | | 44 | | 18 | | 8 | |
Parkland 2 | | 35 | | 12 | | 4 | |
Wildcat Hills | | 66 | | 124 | | 82 | |
Bearberry | | 100 | | 94 | | 94 | |
Ferrier | | 99 | | 119 | | 118 | |
Gilby East | | 100 | | 52 | | 52 | |
Total 2008 | | | | 963 | | 622 | |
Petro-Canada also has varying working interests in other natural gas processing plants and field gathering facilities operated by other oil and natural gas companies. The Company's aggregate share from such interests is 189 MMcf/d of licensed capacity.
In 2008, North American Natural Gas marketed 695 MMcf/d of natural gas, of which 660 MMcf/d were direct sales. Approximately 13% (87 MMcf/d) of total sales were internal to Petro-Canada, at market prices, and were used at refinery and lubricant facilities as fuel and hydrogen plant feedstock, and steam generation at the MacKay River in situ operation. In Western Canada, the Company markets natural gas produced by other companies, in addition to Petro-Canada's own production. From Western Canada, the Company sold 613 MMcf/d in 2008, down 3% from 631 MMcf/d in 2007, reflecting slightly lower production. U.S. Rockies sales for 2008 were 82 MMcf/d, compared with 69 MMcf/d in 2007. Higher 2008 sales reflected improved natural gas performance in the CBM fields in the Powder River Basin and increased drilling activity in the Denver-Julesburg Basin. To achieve better control over sales volumes, prices and transportation-related costs, Petro-Canada focuses on direct sales to end-users, distribution companies, wholesale marketers and natural gas spot markets. Marketing efforts include management of the natural gas portfolio, natural gas supply contracts, pipeline commitments and customer relationships.
| Annual Information Form PETRO-CANADA | 15 |
The following table shows the market distribution of Petro-Canada's North American natural gas sales.
North American Natural Gas Sales by Market
| | 2008 | | 2007 | |
| | (MMcf/d) | | (% of Total) | | (MMcf/d) | | (% of Total) | |
Sales to aggregators | | | | | | | | | |
ProGas Limited | | 20 | | 3 | | 25 | | 4 | |
Cargill Incorporated | | 12 | | 2 | | 16 | | 2 | |
Others | | 3 | | – | | 3 | | – | |
Total sales to aggregators | | 35 | | 5 | | 44 | | 6 | |
Direct sales | | | | | | | | | |
Alberta | | 194 | | 28 | | 198 | | 29 | |
U.S. Midwest | | 167 | | 24 | | 162 | | 23 | |
B.C. and U.S. Pacific Northwest | | 85 | | 12 | | 86 | | 12 | |
U.S. Rockies | | 82 | | 11 | | 69 | | 10 | |
California | | 26 | | 4 | | 26 | | 4 | |
Eastern Canada | | 13 | | 2 | | 23 | | 3 | |
Saskatchewan | | 6 | | 1 | | 7 | | 1 | |
Total before internal sales | | 573 | | 82 | | 571 | | 82 | |
Sales within Petro-Canada | | 87 | | 13 | | 85 | | 12 | |
Total direct sales | | 660 | | 95 | | 656 | | 94 | |
Total sales | | 695 | | 100 | | 700 | | 100 | |
The Company has future commitments to sell and transport natural gas associated with normal operations. The Company has no fixed-price natural gas sales commitments for 2009 and beyond.
Royalty Regime
Royalty regimes are a significant factor in the profitability of crude oil and natural gas production. In Western Canada, royalties on conventional crude oil and natural gas owned by provincial governments are regulated and may be amended from time to time. Royalty payments to provincial governments are generally calculated as a percentage of production and vary depending upon factors such as well production volumes, depth of wells, selling prices, method of recovery, location of production and date of discovery. Royalties payable on production of privately owned crude oil and natural gas are negotiated with the mineral rights owner. In October 2007, the Alberta government published a New Alberta Royalty Framework that became effective January 1, 2009.
In the U.S., production is from federal, state and freehold lands. Production from federal and state lands is subject to a fixed royalty rate plus a payment to the surface landowner. Freehold royalty rates are determined by negotiations with the freehold mineral rights owner.
In 2008, Petro-Canada's average royalty rate for North American Natural Gas was approximately 21% for conventional crude oil, NGL and natural gas.
Northwest Territories (NWT)
With interests in five exploration blocks covering approximately 765,000 acres gross (620,000 net acres) Petro-Canada is a significant holder of petroleum and natural gas rights in the NWT. Petro-Canada's exploration holdings are comprised of two concessions granted by the Inuvialuit Land Corporation and are operated by an industry partner along with three 100% owned exploration licences. Petro-Canada's work commitments on these licences were originally secured by performance bonds, totalling approximately $14 million. Based on field work conducted to December 31, 2008, it is estimated that approximately
16 | PETRO-CANADA Annual Information Form |
|
$8 million of these performance bonds will remain outstanding once expected approvals are received. Work program obligations in the initial term of the Inuvialuit land concessions, consisting of seismic acquisition and drilling, have been satisfied. This included the drilling of the Tuk M-18 natural gas discovery well, which was tested at restricted rates of up to 30 MMcf/d. Delineation and development of this discovery is contingent on a Mackenzie Valley natural gas pipeline.
In addition to a substantial position in various oil and gas discoveries retained under SDLs in the Arctic Islands and the Beaufort Sea, Petro-Canada holds an interest in six SDLs in the mainland NWT, totalling 94,000 gross (85,000 net) acres. Included in these holdings is a 100% position in 73,000 acres covering two SDLs in the Colville Hills/Tweed Lake area. The M-47 well on the Tweed Lake SDL was re-entered and tested in 2004, with restricted flow rates of up to 10 MMcf/d. The Company is currently reviewing development options and timing for this discovery.
Alaska
Petro-Canada's initial foray into Alaska was in the Foothills area north of the Brooks Mountain Range. Geological field studies have confirmed that the geology and prospects of this area are similar to the Alberta Foothills, where Petro-Canada has developed considerable expertise and has had significant success finding and developing natural gas. In 2005, Petro-Canada and Anadarko Petroleum Corporation formed a fifty/fifty Foothills joint venture through various transactions and, by January 2006, jointly held some 2.5 million gross acres of leased and option lands in the Alaska Foothills. BG (Alaska) E&P Inc. became a third equal participant in the joint venture early in 2006, and the group acquired additional leases at state and federal lease sales later that year and again in 2008. Petro-Canada's net land position in the Alaska Foothills is now in the order of 1.1 million acres, including option acreage. In 2007, the group conducted a 276 square kilometre (106 square mile) 3D seismic survey over leaseholdings on the western edge of the Foothills near the boundary with the National Petroleum Reserve-Alaska (NPR-A). In 2008, one well was completed as a natural gas discovery, testing at rates up to 15 MMcf/d, and one well was suspended for re-entry in 2009 as planned. A three-well drilling program is planned in that area in 2009 and is currently underway. The development of discoveries in this area will depend on the establishment of pipeline infrastructure, including a possible intra-Alaska line running south to service the Fairbanks and Anchorage areas.
In 2004, Petro-Canada acquired a large position of 322,610 (gross and net) acres in the northern portion of the NPR-A, an area of significant potential for large oil prospects. Petro-Canada and FEX L.P. (FEX) (a subsidiary of Talisman Energy Inc.) reached a pooling agreement for the joint exploration of select leases in the NPR-A in early 2006 and drilled the Aklaq-2 exploration well, which encountered non-commercial hydrocarbons. In 2006, FEX and Petro-Canada acquired additional leases at the NPR-A lease sale and subsequently pooled the majority of their NPR-A leaseholdings. Further NPR-A acreage was acquired by Petro-Canada and FEX at the September 2008 lease sale. As a result, Petro-Canada's land position in NPR-A acreage held jointly with FEX is now more than 600,000 net acres. In 2007, Petro-Canada and FEX jointly conducted two drilling programs in the NPR-A: one program comprising the Amaguq-2 well (40% Petro-Canada working interest), followed by the Aklaq-6 well (30% Petro-Canada working interest) and, the other, the deeper Aklaqyaaq-1 well (20% Petro-Canada working interest). The Amaguq-2 well was abandoned, having failed to encounter reservoir quality sands in the primary target. The Aklaq-6 and Aklaqyaaq-1 wells encountered several hydrocarbon bearing zones and were suspended for future testing. Studies and planning are currently underway aimed at developing a delineation program for these discoveries.
Arctic Islands
The Company sees long-term potential for the development of Arctic Islands natural resources discovered in the 1970s and 1980s. The two largest assets Petro-Canada holds in the region are the Drake and Hecla fields on Melville Island. In 2008, a small team progressed a feasibility study to the point where uncertainty regarding regulatory approval timing was identified as a significant issue. The Company will continue to work with governments and stakeholders to streamline this process but, in the meantime, the Company has slowed Arctic Islands pre-development activities.
| Annual Information Form PETRO-CANADA | 17 |
Liquefied Natural Gas (LNG)
In July 2004, a MOU was signed with TransCanada PipeLines Limited to develop and share (fifty/fifty) ownership of a liquefied natural gas (LNG) facility at Gros-Cacouna, Quebec. The parties filed an EIA with the provincial and federal governments in the second quarter of 2005 and conducted a joint federal and provincial public review and consultation process in 2006. Regulatory approval was secured in 2007. In February 2008, Gazprom (the potential anchor supply for the proposed project) decided not to pursue a Baltic LNG project with Petro-Canada. In the first quarter of 2008, the Company recorded a charge of $24 million after-tax for the accumulated project costs relating to the proposed LNG re-gasification facility at Gros-Cacouna, Quebec, which has been postponed due to global LNG business conditions.
Link to Petro-Canada's Corporate and Strategic Priorities
The North American Natural Gas business is aligned with Petro-Canada's strategic priorities as outlined by its progress in 2008 and goals for 2009.
PRIORITY | | | 2008 GOALS | | | 2008 RESULTS | | | 2009 GOALS |
| | | | | | | | | |
Delivering Profitable
Growth with a Focus on
Operated, Long-Life
Assets | | | · continue to selectively optimize Western Canada core assets · continue U.S. Rockies CBM and tight natural gas development · target 50% to 60% reserves replacement from these core assets · focus exploration activity in Western Canada, with increasing emphasis on the U.S. · advance exploration prospects in the NWT and Alaska · initiate an Arctic LNG feasibility study | | | · implemented drilling and optimization initiatives, resulting in lower decline rates · drilled 287 gross wells in the U.S. Rockies · continued to increase exploration focus in the U.S. Rockies and B.C. shale gas · participated in three wells in Alaska and NWT, resulting in one gas discovery, one dry and abandoned and one suspended as planned · progressed Arctic LNG feasibility study, encountering uncertainty with regard to regulatory approval timing | | | · continue to optimize Western Canada and U.S. core assets · target 50% to 60% reserves replacement from core assets · focus exploration activity in Western Canada and U.S. Rockies with an emphasis on unconventional exploration · advance exploration prospects in Alaska |
| | | | | | | | | |
Driving for First Quartile Operation of Our Assets | | | · continue to focus on safety and reliability performance · continue to leverage costs through strategic alliances and preferred suppliers | | | · maintained reliability of 99% at Western Canada natural gas processing facilities · delivered value to the organization through preferred supplier relationships, while continuing to ensure competitive supply costs through selective bidding | | | · continue to focus on safety and reliability performance · continue to leverage costs through strategic alliances and preferred suppliers · renegotiate contracts to reflect economic environment |
| | | | | | | | | |
Continuing to Work at
Being a Responsible
Company | | | · continue to focus on total recordable injury frequency (TRIF) and maintain low regulatory exceedances · conduct internal stakeholder engagement training for project managers and other key business roles · strengthen approach to investigating and learning from events | | | · TRIF decreased to 1.31, compared with 1.54 in 2007 · experienced eight environmental regulatory exceedances in 2008, compared with three in 2007 · conducted training for stakeholder practitioners, project managers and key contractors · set up a formal process to identify and communicate key learnings from significant events | | | · pursue initiatives aimed at developing front-line supervisory capability in safety management · develop a water management plan for operations in areas of water scarcity and develop measures related to usage and capacity of the source · continue to improve community emergency response programs |
| | | | | | | | | |
18 | PETRO-CANADA Annual Information Form | 
|
Oil Sands
Business Summary and Strategy
Petro-Canada estimates that it has 1.21 billion bbls of total Oil Sands proved plus probable reserves and 9.52 billion bbls of total Oil Sands Contingent and Prospective Resources. The Company's major Oil Sands interests include a 12% ownership in the Syncrude joint venture (an oil sands mining operation and upgrading facility), 100% ownership of the MacKay River in situ bitumen development (a steam-assisted gravity drainage (SAGD) operation), a 60% ownership in and operatorship of the proposed Fort Hills oil sands mining project, and extensive oil sands acreage considered prospective for in situ development of bitumen resources. The Oil Sands strategy for profitable growth includes: · integrated development of resources to maximize leverage of infrastructure and to promote long-term stability of financial returns · being positioned to capture the value opportunities inherent in long-life projects · applying a phased and disciplined approach to development of capital-intensive projects to allow rigorous cost management and to create opportunities to benefit from evolving technology | 
|
The Company has chosen to participate in the full oil sands value chain due to its resource potential and strong position with bitumen upgrading capacity. Petro-Canada has processing capacity through Syncrude and Suncor Energy Inc. In 2008, the Company converted the conventional crude oil train at its Edmonton refinery to refine oil sands-based feedstock from northern Alberta. This conversion, along with the existing synthetic crude supply, resulted in the refinery being able to run on an exclusive diet of oil sands-based feedstock. This connection between resource and upgrading capacity should provide more economic certainty in a business where volatile light/heavy differentials affect bitumen pricing.
Oil Sands Mining – Syncrude
Petro-Canada has a 12% interest in Syncrude, the world's largest oil sands mining operation, located approximately 40 kilometres north of Fort McMurray, Alberta. Syncrude is a joint venture formed to mine shallow deposits of oil sands from the McMurray formation in the Athabasca Oil Sands and to extract and upgrade bitumen to produce synthetic crude oil.
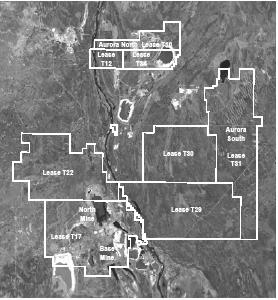
| Syncrude holds eight oil sands leases (numbered T10, T12, T17, T22, T29, T30, T31 and T34) issued by the Province of Alberta, covering a total of approximately 255,000 acres. The operating licence associated with these leases expires in 2035. The licence permits Syncrude to mine oil sands and produce synthetic crude oil from approved development areas on the oil sands leases. The leases are automatically renewable as long as oil sands operations are ongoing or the leases are part of an approved development plan. All eight leases are included in a development plan approved by the Alberta Energy and Utilities Board (now the Energy Resources Conservation Board (ERCB)).
1 These reserves numbers represent the sum of oil sands mining and oil and gas activities, including probable reserves, and are presented before royalties. Reporting reserves in this manner does not conform to SEC standards and is for general supplemental information only. 2 25% of total Oil Sands resources are risked Prospective Resources and 75% are Contingent Resources. See "Legal Notice – Petro-Canada disclosure of reserves" for additional risks to develop resources. |

| Annual Information Form PETRO-CANADA | 19 |
Commercial operations commenced at Syncrude in 1978. Capacity additions have been added over several stages, beginning in 1988 to present, and have included mine expansions, opening of the Aurora mine, upgrader additions and de-bottlenecking projects. The most recent $8.2 billion gross ($1 billion net) Stage III project involved the opening of a second Aurora mine and an upgrading expansion. Syncrude's Stage III expansion increased Petro-Canada's share of production capacity to approximately 42,000 barrels/day (b/d). Production is expected to reach this level in 2010.
Syncrude has an estimated remaining proved and probable reserves life in excess of 50 years. Proved reserves of light (32 degree) synthetic crude oil from Syncrude are based on high geological certainty and the application of proven technology. Drill-hole spacing is less than 500 metres and appropriate regulatory approvals are in place. For probable reserves, drill-hole spacing is less than 1,000 metres and reserves are included in the 50-year long-range lease development plan. In 2008, approximately 196.2 million gross tons of oil sands were processed, yielding 122.4 MMbbls of gross bitumen that were upgraded into marketable synthetic crude oil. Gross shipments of marketable synthetic crude oil were 105.8 MMbbls.
Proved Reserves – Synthetic Crude Oil
Petro-Canada's Working Interest Before and After Royalties | | | | | | | | | |
| | Base Mine and | | | | | | | | | |
| | North Mine1 | | Aurora2 | | Total | |
(MMbbls) | | Before | | After | | Before | | After | | Before | | After | |
Beginning of year 2007 | | 100 | | 83 | | 245 | | 206 | | 345 | | 289 | |
Revision of previous estimates | | (3 | ) | (2 | ) | 21 | | 13 | | 18 | | 11 | |
Extensions and discoveries | | – | | – | | – | | – | | – | | – | |
Production net | | (6 | ) | (5 | ) | (7 | ) | (6 | ) | (13 | ) | (11 | ) |
End of year 2007 | | 91 | | 76 | | 259 | | 213 | | 350 | | 289 | |
Revision of previous estimates | | 2 | | 8 | | – | | 24 | | 2 | | 32 | |
Extensions and discoveries | | 18 | | 17 | | 9 | | 9 | | 27 | | 26 | |
Production net | | (6 | ) | (5 | ) | (7 | ) | (6 | ) | (13 | ) | (11 | ) |
End of year 2008 | | 105 | | 96 | | 261 | | 240 | | 366 | | 336 | |
1 Leases T17 and T22.
2 Leases T10, T12, T31 and T34.
Two mines, the North mine and the Aurora mine, are currently in operation at Syncrude. Base mine operations were discontinued in 2007. Mine operations are carried out using truck, shovel and hydro-transport systems. An extraction process recovers about 90% of the crude bitumen contained in the mined sands. Refining processes upgrade the bitumen into high quality, light (32 degree) sweet synthetic crude oil, with a process yield of approximately 86%. Petro-Canada's share of synthetic crude oil production is processed primarily at the Petro-Canada refinery in Edmonton, with the balance periodically processed in Eastern Canada and in the U.S.
Two electricity generating plants located on site and owned by the Syncrude joint venture provide power for Syncrude. One plant produces a maximum of 270 megawatts (MW) and the other plant produces 80 MW.
Syncrude's production averaged 289,000 b/d gross (34,700 b/d net) in 2008, compared with 305,000 b/d gross (36,600 b/d net) in 2007. Syncrude production was negatively impacted by turnarounds at Cokers 8-1 and 8-2 in 2008. Average unit operating and overhead costs in 2008 increased compared with 2007. Higher unit operating costs were mainly due to lower production, higher costs associated with moving additional overburden to increase exposed minable ore inventory, higher maintenance costs and higher natural gas costs. Syncrude realized price for synthetic crude oil averaged $106.63/bbl in 2008, up from $79.20/bbl in 2007.
20 | PETRO-CANADA Annual Information Form |
|
Syncrude Mining Statistics
| | 2008 | | 2007 | | 2006 | |
Total gross mined volume1 | | | | | | | |
Millions of tons | | 492.8 | | 436.0 | | 398.0 | |
Mined volume of oil sands ratio | | 2.5 | | 2.2 | | 2.3 | |
Gross oil sands processed | | | | | | | |
Millions of tons | | 196.2 | | 200.5 | | 175.0 | |
Average bitumen grade (weight %) | | 11.1 | | 11.6 | | 11.3 | |
Gross bitumen in mined oil sands | | | | | | | |
Millions of tons | | 21.8 | | 23.2 | | 19.6 | |
Average extraction recovery (%) | | 90.3 | | 91.8 | | 90.3 | |
Gross bitumen production2 | | | | | | | |
MMbbls | | 122.4 | | 132.5 | | 111.5 | |
Average upgrading yield (%) | | 85.9 | | 84.3 | | 84.9 | |
Gross synthetic crude oil shipped3 | | | | | | | |
MMbbls | | 105.8 | | 111.3 | | 94.3 | |
Petro-Canada's share of shipped synthetic crude oil | | | | | | | |
MMbbls before royalties | | 12.7 | | 13.4 | | 11.3 | |
MMbbls after royalties | | 10.9 | | 11.4 | | 10.2 | |
1 Includes pre-stripping of mine areas and reclamation volumes.
2 Bitumen production in bbls is determined by multiplying the mined bitumen volume in tons by the average extraction recovery and then applying the appropriate conversion factor.
3 Shipped volumes vary from synthetic crude oil derived from bitumen production due to internal use and inventory management.
Fort Hills Project
In 2005, Petro-Canada strengthened its position in oil sands mining by securing the majority interest and operatorship of the Fort Hills project from UTS Energy Corporation (UTS). Later in 2005, a mining partner, Teck Cominco Ltd. (Teck), joined the consortium. In 2006, the Fort Hills partners acquired two additional leases adjacent to the existing Fort Hills leases to afford greater mine planning flexibility. In November 2007, Petro-Canada and its partners finalized an agreement for the Company to earn an additional 5% working interest in the project in return for funding $375 million of partnership expenditures. Petro-Canada is project operator with a 60% interest, and UTS and Teck each hold a 20% interest. Petro-Canada plans to initially market |
| 100% of the production from Fort Hills. The Fort Hills mining project has estimated Contingent Resources of approximately 4 billion bbls of bitumen or 3.6 billion bbls of synthetic crude oil after accounting for upgrading yields (approximately 2.4 billion bbls of bitumen or 2.2 billion bbls of synthetic crude oil based on Petro-Canada's working interest before royalties), which is expected to be recovered over approximately 40 years. The project has regulatory approval to produce up to 190,000 b/d gross (104,500 b/d net) of bitumen from the mine. An amended regulatory approval of the mine plan received in October 2008 provided for optimizations in recovery and to the tailings area. In June 2007, Petro-Canada and its partners completed and announced the design basis and approved the detailed FEED for Phase 1, which consists of the proposed Fort Hills mine and upgrader. At the completion of the FEED phase in September 2008, the estimated costs to complete the project increased by approximately 50%. The FID on the mining portion of the project is |
| Annual Information Form PETRO-CANADA | 21 |
being deferred until the extension of the Fort Hills mine lease is resolved, costs can be reduced and commodity prices and financial markets strengthen. The Fort Hills upgrader portion of the project was put on hold and a decision on whether to proceed with the upgrader will be made at a later date. Bitumen production from the first phase of the mine is expected to be about 160,000 b/d gross (96,000 b/d net). The Fort Hills Energy Limited Partnership has entered into an agreement, subject to the FID, with Enbridge Pipelines (Athabasca) Inc. to develop pipeline and terminalling facilities to meet the requirements of the Fort Hills mine Phase 1 and subsequent phases of the project.
The partners selected Sturgeon County, 40 kilometres northeast of Edmonton, as the location for a proposed upgrading facility to process bitumen from the Fort Hills mine. The upgrader will use delayed coking technology to convert Fort Hills bitumen into light synthetic crude oil. Late in 2006, Petro-Canada filed the regulatory application for the Fort Hills upgrader. Conditional ERCB regulatory approval was received in January 2009. In 2007, the Fort Hills partnership, Sturgeon County and the Alberta Capital Region Wastewater Commission (ACRWC) entered into definitive agreements, finalizing arrangements to provide treated waste water to the upgrader as its process water source.
It is anticipated that the re-scoping and revision of the FEED cost estimates for the mining portion will be completed sometime in the third quarter of 2009. Once this work is complete, the Fort Hills partnership will decide on a go forward strategy. While new orders for equipment and services were put on hold, some long-lead equipment remains on order, with plans to take delivery and put equipment into storage. Some existing equipment supply and service agreements were terminated or suspended. In the fourth quarter of 2008, costs incurred due to the deferral of the FID on the mining and upgrading portions of the Fort Hills project were $156 million after-tax. These costs reflected terminating certain goods and services agreements and DD&A charges on certain property, plant and equipment.
In two of the Oil Sands leases granted to the Fort Hills Energy Corporation by the Alberta government, there are several conditions, including a production milestone requiring that a mine be completed and producing 100,000 b/d gross (60,000 b/d net) of bitumen by mid-2011. Discussions are in progress with the Government of Alberta to amend the two Oil Sands leases. In the event that an amendment is not achieved and the Fort Hills partnership is unable to meet the existing conditions associated with the two leases, the Alberta government may impose a performance deposit or cancel the two leases if the performance deposit is not provided within the applicable time period.
Oil Sands In Situ – Bitumen
In September 2002, Petro-Canada successfully completed construction of its 100% owned in situ bitumen production facility at MacKay River. Following the introduction of steam to the reservoir, Petro-Canada commenced bitumen production in November 2002. The extraction process at MacKay River uses SAGD, a technology that Petro-Canada participated in developing through its involvement in the underground test facility. SAGD combines horizontal drilling with thermal steam injection. Steam is injected into the reservoir through the top well of a horizontal well pair to mobilize the bitumen, which flows to the lower producing well. This technology is expected to economically recover more than 60% of the bitumen in place within the development area. The initial development at MacKay River included two well pads of 12 and 13 horizontal well pairs, respectively. Original well pairs are about 700 metres to 750 metres in length and produce 800 b/d to 1,200 b/d of bitumen. On average, wells are expected to have a six- to eight-year life. More than 90% of the water used to generate steam at MacKay River is recycled, a key feature of the environmental efficiency of the facility. Work to tie in a third well pad, which included 14 horizontal well pairs, was completed in January 2006. Production from the third well pad commenced in the second quarter of 2006 and continued to ramp up during 2007. In 2007, work to de-bottleneck water handling capacity and add production from a fourth well pad was completed. Tie-in of the fourth well pad, which includes seven horizontal well pairs, was completed in late August 2007 and steaming began in September 2007. Steam to this pad was disrupted in mid-October when a steam header line was damaged. Steaming recommenced in mid-November and first production started in January 2008. MacKay River bitumen is currently being shipped under a processing agreement to Suncor, where it is processed into a sour synthetic crude and transported to the Edmonton refinery.
MacKay River's production and unit operating costs increased considerably in 2008. Production averaged 25,200 b/d in 2008, up 24% compared with 20,300 b/d in 2007. Higher production reflected increased reliability and capacity. MacKay River reliability averaged 97% in 2008, up from 87% in 2007, when operational upsets occurred. Unit operating and overhead costs increased by 18% in 2008, averaging $24.65/bbl, compared with $20.97/bbl in 2007. Higher unit operating costs were due to
22 | PETRO-CANADA Annual Information Form |
|
increased maintenance and repair costs, higher natural gas costs and a major turnaround, partially offset by increased production. MacKay River realized price for bitumen averaged $60.26/bbl in 2008, compared with $28.23/bbl in 2007.
In 2005, Petro-Canada filed an application for a potential MacKay River in situ expansion project with first production by the end of the decade and peak production of an additional 40,000 b/d to follow. In the first quarter of 2008, Petro-Canada received regulatory approval for the proposed MacKay River in situ expansion project. In December 2007, the Company announced a one-year extension for the completion of FEED for the proposed MRX project due to cost pressures, including increased royalties. Petro-Canada is pursuing cost-saving opportunities associated with using international engineering, procurement and construction (EPC) contractors on a lump-sum basis. A FID is being deferred until costs can be reduced and commodity prices and financial markets strengthen.
Royalty Regime
Currently Petro-Canada has two oil sands projects, Syncrude and MacKay River, which pay oil sands royalties to the Province of Alberta.
The Syncrude project, in 2001, completed the transition from paying project-specific contractual royalty to paying royalty under the 1997 Oil Sands Royalty Regulation. One of the key features of the transition agreement, which would expire at the end of 2015, is that Syncrude has a one-time option to convert from paying royalty based on revenues derived from the sales of synthetic crude oil to paying royalty based on revenues from the sales of bitumen.
Effective in January 2002, the royalty payable by Syncrude to the Province of Alberta was set at the greater of 1% of gross synthetic crude oil revenue, or 25% of net synthetic crude oil revenue. The net synthetic crude oil revenue is determined by subtracting allowable operating and capital costs from gross synthetic crude oil revenue. The total royalty paid in 2008 equated to a rate of 14% of the gross synthetic crude oil revenues.
In October 2007, the Alberta government published a New Alberta Royalty Framework that became effective January 1, 2009. When the government announced the New Alberta Royalty Framework, it indicated its intention to have Syncrude move to the New Alberta Royalty Framework in advance of the expiry of Syncrude's existing royalty agreement, which is the end of 2015.
In November 2008, the Alberta government and the Syncrude joint venture owners reached an agreement for the implementation of the New Alberta Royalty Framework for the Syncrude project. Under the new royalty terms, the project would continue paying the greater of 1% gross revenue, or 25% of net revenue until the end of 2015. On January 1, 2016, the royalty rates under the New Alberta Royalty Framework will apply to the Syncrude project. As part of this new agreement, Syncrude exercised its option to pay royalty based on bitumen revenues rather than on synthetic crude oil revenues. Due to this conversion to a bitumen-based royalty, the upgrader facility at the Syncrude project will no longer be considered as part of the oil sands project. The Syncrude owners have agreed to pay a total of $1.25 billion in royalties over the next 25 years, with interest to account for deductions of allowed costs related to the upgrader facility, which were previously received. The owners also agreed to pay an additional royalty of $975 million over a six-year period starting in 2010, contingent on achieving certain production levels.
The MacKay River project, which produces bitumen, has been paying royalty to the Province of Alberta under the 1997 Oil Sands Royalty Regulation. Prior to royalty payout, which includes a specified return allowance, the royalty is calculated as 1% of gross revenue. After royalty payout, the royalty is based on the greater of 1% of gross revenue or 25% of net revenue. The net revenue is determined by subtracting allowable operating and capital costs from gross revenue. The total royalty paid in 2008 equated to a rate of 1% of the gross bitumen revenues.
In 2009, MacKay River will start paying royalty under the New Alberta Royalty Framework. One of the key features of the New Alberta Royalty Framework is the linking of pre- and post-royalty payout royalty rates to the price of West Texas Intermediate (WTI) crude oil. The pre-payout royalty rate will start at 1% and increase for every dollar WTI is priced above $55 Cdn/bbl, to a maximum of 9% when WTI is $120 Cdn/bbl or higher. Royalty payout occurs when the project developer has recovered all of the investment capital in the project plus a return on the investment at a rate based on Government of Canada long-term bonds. The post-payout royalty is the greater of the pre-payout royalty or a percentage of net revenue. The percentage of net revenue starts at 25% and increases for every dollar WTI is priced above $55 Cdn/bbl, to a maximum of 40% when WTI is $120 Cdn/bbl or higher. The net revenue is determined by subtracting allowable operating and capital costs from gross revenue.
| Annual Information Form PETRO-CANADA | 23 |
Integrated Oil Sands Development
At the Edmonton refinery, Petro-Canada invested to convert the facility to run oil sands-based feedstock exclusively and to produce low-sulphur products.
The RCP enables Petro-Canada to directly upgrade 26,000 b/d of bitumen and process 48,000 b/d of sour synthetic crude oil, replacing the conventional light crude feedstock. The RCP supports the Company’s long-term strategy and builds on a $1.4 billion investment in gasoline and diesel desulphurization.
Link to Petro-Canada’s Corporate and Strategic Priorities
The Oil Sands business is aligned with Petro-Canada’s strategic priorities as outlined by its progress in 2008 and goals for 2009.
PRIORITY | | | 2008 GOALS | | | 2008 RESULTS | | | 2009 GOALS |
| | | | | | | | | |
Delivering Profitable
Growth with a Focus
on Operated, Long-Life
Assets | | | · complete Fort Hills FEED and make FID in the third quarter of 2008 · order long-lead items for Fort Hills project · continue to ramp up Syncrude Stage III expansion · receive regulatory decision on MRX project · continue to advance MRX project in preparation for the FID in the first quarter of 2009 · receive regulatory decision on the Fort Hills upgrader | | | · completed Fort Hills Phase 1 FEED · deferred making the FID for Fort Hills mine due to a more than 50% increase from initial project cost estimates and market conditions · delayed the investment decision on the Fort Hills upgrader · revisiting Fort Hills FEED and ordering of long-lead items for the Fort Hills upgrader · received regulatory approval of the Fort Hills amended mine processes and tailings locations · Syncrude production decreased due to two planned turnarounds at two cokers, and operational upsets · received regulatory approval on MRX project in the first quarter of 2008 · received fixed bids from three international engineering firms for the MRX project · deferred making the FID for MRX due to market conditions · received regulatory approval of Fort Hills upgrader in January 2009 · reached a Syncrude royalty agreement, along with its partners, with the Province of Alberta | | | · complete a new estimate for the Fort Hills mine costs by taking advantage of the current market softness · take delivery of some long-lead equipment for the Fort Hills upgrader and secure the asset for future re-activation · maintain spending discipline for 2009 capital commitments · position MRX for sanction once commodity and financial markets improve · continue to ramp up Syncrude Stage III expansion toward its design capacity |
| | | | | | | | | |
Driving for First Quartile Operation of Our Assets | | | · ramp up MacKay River production to hit 30,000 b/d and increase reliability to greater than 90% · commence shipping MacKay River bitumen to the Edmonton refinery after it has been upgraded into synthetic crude oil at Suncor · decrease Syncrude non-fuel unit operating costs by 10%, compared with 2007 | | | · achieved 97% reliability at MacKay River · achieved daily throughput average of 30,000 b/d for 30 days at MacKay River · achieved record average production of 25,200 b/d at MacKay River · commenced shipping of MacKay River bitumen to Suncor for processing and subsequent shipping to the Edmonton refinery, effective January 1, 2009 · experienced higher Syncrude non-fuel unit operating costs due to lower production and higher maintenance costs | | | · maintain MacKay River production at 27,000 b/d and reliability above 95% · optimize the integration of MacKay River bitumen and Suncor processing through to the Edmonton refinery · work through the Syncrude joint venture owners to improve reliability and lower operating and sustaining capital costs |
24 | PETRO-CANADA Annual Information Form | 
|
Link to Petro-Canada’s Corporate and Strategic Priorities (continued)
PRIORITY | | | 2008 GOALS | | | 2008 RESULTS | | | 2009 GOALS |
| | | | | | | | | |
Continuing to Work at
Being a Responsible
Company | | | · drive for continuous improvement in safety · continue relevant and transparent engagement with key stakeholders to obtain approval for the Fort Hills upgrader and mine expansion · develop capability in managing the social issues of a temporary foreign workforce · pursue research on practical solutions for tailings management | | | · TRIF decreased in 2008 to 0.67, compared with 0.75 in 2007 · experienced 20 environmental regulatory exceedances in 2008, compared with six in 2007 · received regulatory approval for the Fort Hills mine amendment without a hearing · received regulatory approval for the Fort Hills upgrader in January 2009 · implemented a risk assessment to understand and mitigate the social risks related to bringing temporary foreign workers into oil sands project camps · pursuing research and industry solutions to tailings management continues to be a priority | | | · incorporate zero liquid discharge into MRX facility design · implement performance measures aimed at lowering environmental regulatory exceedances · better understand how to manage the language and cultural aspects of the safety of foreign contract workers on Petro-Canada sites |

| Annual Information Form PETRO-CANADA | 25 |
International & Offshore
East Coast Canada
Business Summary and Strategy
Petro-Canada has a strong position in every major producing oil development off Canada’s east coast. The Company holds a 20% interest in Hibernia, a 27.5%1 interest in White Rose and a 22.7% interest in Hebron, and is the operator of Terra Nova with a 34% interest. The East Coast Canada strategy is to deliver reliable and profitable production well into the next decade, leveraging the existing infrastructure while pursuing profitable development opportunities. Key features of the strategy include: · delivering top quartile operating performance · sustaining profitable production through reservoir extensions and add-ons · pursuing high potential, near field development and exploration projects In 2008, realized crude oil prices remained strong, partially offset by decreased production. East Coast Canada realized crude prices averaged $99.13/bbl in 2008, up from $75.87/bbl in 2007. East Coast Canada production averaged 90,500 b/d in 2008, down from 98,700 b/d in 2007. Decreased production reflected natural declines in all East Coast Canada assets. Additionally, pack ice at the White Rose field in the second quarter of 2008 caused production deferments and drilling delays. East Coast Canada operating and overhead costs averaged $5.92/bbl in 2008, compared with $4.86/bbl in 2007. In 2008, unit operating costs for East Coast Canada increased as a result of decreased production and slightly higher operating costs.
| 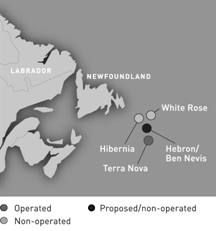
|
Hibernia
The Hibernia oilfield is approximately 315 kilometres southeast of St. John’s, Newfoundland and Labrador, and was the first field to be developed in the Jeanne d’Arc Basin offshore on the Grand Banks of Newfoundland. The production system is a fixed Gravity Base Structure (GBS), which sits on the sea floor. The GBS has a production capacity of 230,000 b/d gross and storage capacity of 1.3 MMbbls gross. Actual production levels are lower, however, reflecting current reservoir capability and natural decline. Hibernia commenced production in November 1997. The Hibernia oilfield, encompassing the Hibernia and Ben Nevis Avalon reservoirs, is estimated to have a remaining production life of 23 to 27 years. The development potential of the Ben Nevis Avalon and Southern Extension of the Hibernia reservoir remains under assessment. In 2006, the operator submitted a development plan to the regulator for the Hibernia Southern Extension. In early 2007, the Government of Newfoundland and Labrador rejected the decision report of the Canada-Newfoundland and Labrador Offshore Petroleum Board (C-NLOPB) to approve the development of the Hibernia Southern Extension and asked the applicants for additional information. In July 2008, the operator submitted the Hibernia Southern Extension development plan amendment application. The C-NLOPB is currently reviewing this updated application.
At December 31, 2008, there were 32 producing oil wells, 17 water injection wells and six gas injection wells in operation. Field production is transported by shuttle tanker either from the platform to a transshipment terminal on the Avalon Peninsula or, if tanker schedules permit, directly to market. Crude oil delivered to the transshipment facility is transferred to storage tanks and loaded onto tankers for transport to markets in Eastern Canada and the U.S. Petro-Canada has a 14% ownership interest in the transshipment facility.
1 | Petro-Canada’s working interest in the White Rose Extensions is 26.125% after the NALCOR acquired its 5% working interest effective with the signing of the final project agreements in February 2009. There is no change to the White Rose 27.5% working interest for the original field development as NALCOR is not a partner. |
26 | PETRO-CANADA Annual Information Form |
|
Hibernia production averaged 139,000 b/d gross (27,800 b/d net) in 2008, up from 134,500 b/d gross (26,900 b/d net) in 2007. Higher production in 2008 was due to the positive impact of recent well workovers, strong reliability and the addition of two new production wells, partially offset by natural declines. Hibernia had a 30-day maintenance turnaround in 2007, but no major turnaround in 2008.
Terra Nova
The Terra Nova oilfield, which is approximately 350 kilometres southeast of St. John’s, Newfoundland and Labrador, was discovered by Petro-Canada in 1984. Located about 35 kilometres southeast of Hibernia, it is the second oilfield to be developed offshore Newfoundland and Labrador. The production system uses a FPSO vessel, which is a ship moored on location. Terra Nova was the first harsh environment development in North America to use a FPSO vessel. It has a production capacity of 180,000 b/d gross and a storage capacity of 960,000 bbls gross, however, actual production levels reflect current reservoir capability. Production from the Terra Nova oilfield began in January 2002. The field is estimated to have a remaining production life of approximately 13 to 20 years.
In December 2006, the Terra Nova FPSO encountered a mechanical issue in a swivel connection on the turret system that supports water injection to the reservoir. A repair was completed in late December 2006 and Terra Nova has been producing at normal rates in excess of 100,000 b/d gross (34,000 b/d net) since. Performance of the water injection swivel was satisfactory throughout 2008. Contingency plans have been developed and parts have been sourced for the modification or replacement of the swivel in the event performance deteriorates.
At year-end 2008, 15 producing oil wells, nine water injection wells and three gas injection wells were in operation. Terra Nova uses the same system of shuttle tankers and transshipment terminal that are used for Hibernia, and also transports its crude oil to markets in Eastern Canada and the U.S.
At Terra Nova, production averaged 102,700 b/d gross (34,900 b/d net) in 2008, down from 116,200 b/d gross (39,500 b/d net) in 2007, due to natural reservoir decline. Terra Nova had a strong year, with facility reliability averaging 90% for 2008.
White Rose
White Rose, the third development offshore Newfoundland and Labrador, is about 350 kilometres southeast of St. John’s and approximately 50 kilometres northeast of Hibernia and Terra Nova. It uses a FPSO vessel similar to Terra Nova. The vessel had an initial design production capacity of 100,000 b/d gross and a storage capacity of 940,000 bbls gross. Production is offloaded to chartered tankers that go directly to markets in Eastern Canada and the U.S. Production from the White Rose oilfield began in November 2005. The field is estimated to have a remaining production life of approximately 15 to 18 years.
At year-end 2008, eight producing oil wells and 10 water injection wells were in operation. Effective June 1, 2007, White Rose was granted regulatory approval to increase the daily oil production rate on the SeaRose FPSO to 140,000 b/d gross (38,500 b/d net) and to increase the annual oil production rate to 50 MMbbls. White Rose production averaged 101,100 b/d gross (27,800 b/d net) in 2008, compared with 117,500 b/d gross (32,300 b/d net) in 2007. Decreased White Rose production in 2008 was due to the impact of pack ice in the field in the second quarter of 2008 that shut in production and delayed development drilling.
In September 2007, the Government of Newfoundland and Labrador approved the C-NLOPB recommendation to permit development of the South White Rose Extension. Subsequently, the White Rose partners reached an agreement in principle with the province on fiscal and other terms for the White Rose Extensions development, incorporating the South White Rose Extension, North Amethyst and West White Rose satellite fields. In December 2007, Petro-Canada and its partners signed a formal agreement with the Province of Newfoundland and Labrador for the development of these oilfields. North Amethyst will be developed initially, with first oil targeted for late 2009. The development of the West White Rose satellite is expected to follow. FEED for the North Amethyst portion of the project is complete and detailed design, procurement and fabrication are underway, with necessary long-lead equipment and drilling commitments in place. The partners achieved regulatory and government approval in April 2008.
| Annual Information Form PETRO-CANADA | 27 |
Offshore Oil Royalty Regime
The royalty regime for the Hibernia project has three tiers: gross royalty, net royalty and supplementary royalty. Gross royalty increased to 5% of gross field revenue on July 1, 2003. The gross royalty rate will remain at 5% until net royalty payout is reached. The gross royalty is indexed to crude oil prices under certain conditions. Upon achieving payout, including a specified return allowance, the net royalty payable becomes the greater of 30% of net revenue, or 5% of gross revenue. After a further level of payout is reached, which includes an additional return allowance, a supplementary royalty of 12.5% of net revenue also becomes payable. At this time, Hibernia continues to be subject to basic royalties of 5% of gross revenue. However, provincial government royalty rates are expected to increase from 5% of gross revenue to 30% of net revenue in the near future. In addition, Hibernia production will be subject to a federal government net profits interest of up to 10% of net revenue commencing in the first quarter of 2009.
The Terra Nova royalty regime has three tiers. The royalty consists of a sliding-scale basic royalty payable throughout the project’s life, with two additional tiers of incremental net royalties, which are payable upon the achievement of specified levels of profitability. The basic royalty is payable as a percentage of gross field revenue, with an initial rate of 1%, which rises to 10% depending on cumulative production levels and the occurrence of simple payout. After tier one payout has been reached, including a specified return allowance, tier one net royalty will become the greater of the basic royalty, or 30% of net revenue. An additional tier two net royalty equal to 12.5% of net revenue will be payable once a further level of payout, including an additional return allowance, is attained. In the second quarter of 2008, Terra Nova reached tier two royalty payout and the royalty rate shifted to 42.5% of net revenue from 30% of net revenue. Terra Nova average royalty payments are expected to be between 30% and 35% of gross revenues in 2009, depending on crude oil prices.
In July 2003, the Government of Newfoundland and Labrador published regulations for the royalty regime that will apply to the development of petroleum resources in offshore areas other than at Hibernia and Terra Nova. The generic offshore royalty regime consists of a sliding-scale basic royalty payable throughout a project’s life, and a two-tier incremental net royalty payable upon the achievement of specified levels of profitability. The basic royalty is calculated as a percentage of gross field revenue, commencing at 1% and rising to 7.5%, depending on cumulative production levels and the achievement of simple payout. Upon reaching tier one payout, including a return allowance, the tier one net royalty is calculated as the greater of the basic royalty, or 20% of net revenue. An additional 10% tier two net royalty rate is payable once a higher level of return on investment is attained. In the first quarter of 2008, White Rose reached tier two royalty payout and the royalty rate shifted to 30% of net revenue from 20% of net revenue. The total royalty payable in 2009 is expected to equate to a rate of between 20% and 25% of gross revenue, depending on crude oil prices.
Other Offshore Exploration and Development
In addition to existing East Coast Canada developments, Petro-Canada holds interests in a number of discoveries, including a 22.7% interest in the Hebron/Ben Nevis oilfield discoveries. In 2005, Chevron Canada Resources (as operator), Petro-Canada and the other joint venture participants signed a unitization and joint operating agreement to advance the joint evaluation of the Hebron/Ben Nevis and West Ben Nevis oilfields offshore Newfoundland and Labrador. In August 2007, the Hebron partners signed a non-binding MOU with the Government of Newfoundland and Labrador related to the fiscal and other terms for the future development of the Hebron/Ben Nevis offshore oilfield. In August 2008, the Hebron partners reached a formal agreement with the Government of Newfoundland and Labrador on commercial terms that will allow development activities to proceed for Hebron. The partners also agreed to transfer operatorship from Chevron Canada Ltd. to ExxonMobil. First production from Hebron is expected in 2016 or 2017.
In 2008, Petro-Canada, in conjunction with partners, secured two high prospectivity licences in the Jeanne d’Arc Basin. In 2009, Petro-Canada is planning to drill an operated exploration well on the Ballicatters prospect, which is located adjacent to one of these licences immediately northeast of the Hibernia field.
28 | PETRO-CANADA Annual Information Form |
|
Link to Petro-Canada’s Corporate and Strategic Priorities
The East Coast Canada business is aligned with Petro-Canada’s strategic priorities as outlined by its progress in 2008 and goals for 2009.
PRIORITY | | | 2008 GOALS | | | 2008 RESULTS | | | 2009 GOALS |
| | | | | | | | | |
Delivering Profitable Growth with a Focus on Operated, Long-Life Assets | | | · advance White Rose Extensions development toward regulatory approval and FID in 2008, with first oil targeted for late 2009 · commence development drilling for the White Rose Extensions project · achieve binding formal agreements and re-establish the Hebron project team, with the goal of submitting the project for regulatory approval in the 2010 time frame · advance the Hibernia Southern Extension growth project | | | · achieved internal and regulatory approval for North Amethyst portion of the White Rose Extensions in 2008; on track for first oil in late 2009 · drilled a pilot well in North Amethyst for the White Rose Extensions project · signed binding formal agreements for Hebron · filed a development plan amendment application for the Hibernia Southern Extension project | | | · drill two development wells in the main Terra Nova field · drill exploration well in Ballicatters prospect · achieve formal agreement for Hibernia Southern Extension development · advance the target Hebron first oil date · achieve first oil at North Amethyst and finalize development concept for West White Rose |
| | | | | | | | | |
Driving for First Quartile Operation of Our Assets | | | · achieve and maintain greater than 90% reliability at Terra Nova · finalize Terra Nova swivel repair plans · complete 16-day turnarounds at Terra Nova and partner-operated White Rose | | | · achieved 90% reliability at Terra Nova · put in place all swivel contingency plans and materials if repair/ replacement is required · completed Terra Nova and White Rose turnarounds on time | | | · maintain greater than 90% reliability at Terra Nova and close process safety gaps · complete 28-day turnarounds at Terra Nova and White Rose, and 21-day turnaround at Hibernia · identify and implement opportunities to reduce administrative and operating costs across the business |
| | | | | | | | | |
Continuing to Work at Being a Responsible Company | | | · continue to reduce injuries and illnesses through implementation of Exposure Based Safety program and first aid reduction initiatives · enhance focus on process safety management · continue to implement loss containment improvement plan · continue to enhance produced water management · integrate stakeholder management process and tools and streamline with regulatory processes and requirements | | | · TRIF increased to 2.5, compared with 0.5 in 2007 · achieved lower combined first aids, medical aids and restricted work cases in 2008, compared with 2007 · scored 93% on Total Loss Management (TLM) process safety audit · recorded one environmental regulatory exceedance, compared with zero in 2007 · improved produced water quality · trained more than 60 employees on stakeholder information management system · successfully completed an on-water oil spill countermeasure exercise · successfully completed Terra Nova operations authorization | | | · develop action plan to address injury frequency · develop gap closure plan and stewardship to address process safety and TLM self-assessment gap · implement continuous improvement initiatives relating to oil spill response · develop and implement GHG emissions reduction strategy and continue initiatives to improve flare management and produced water quality · support research and development initiatives that have personal safety, environmental and community benefits |

| Annual Information Form PETRO-CANADA | 29 |
International
For reporting purposes, Petro-Canada consolidated its International activities into two core areas: the North Sea (the U.K., the Netherlands and Norway sectors) and Other International areas (Libya, Syria and offshore Trinidad and Tobago).
Business Summary and Strategy
International is concentrating on countries and regions where material positions may be built, with a particular focus on increasing the proportion of long-life assets in the portfolio. These regions include the North Sea, Libya, Syria and Trinidad and Tobago. | | 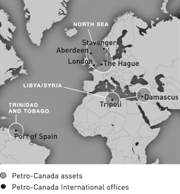
|
| |
Petro-Canada’s International strategy capitalizes on the strengths of a mid-sized exploration and production company, which is big enough to execute large scale projects and agile enough to develop smaller projects that can still create significant value, such as the Company’s concentric developments around the Triton hub in the North Sea. Key features of the International strategy are: | |
· expanding and exploiting the existing portfolio · targeting new growth opportunities · executing a substantial and balanced exploration program | |
International production averaged 157,200 barrels of oil equivalent/day (boe/d) net in 2008, compared with 150,500 boe/d net in 2007. The increase was primarily due to additional North Sea production. International crude oil and NGL realized prices averaged $98.25/bbl and natural gas realized prices averaged $10.15/Mcf in 2008, compared with $75.90/bbl and $6.46/Mcf, respectively, in 2007. Operating and overhead costs averaged $7.33/boe in 2008, down 20% compared with $9.12/boe in 2007, due to lower operating expenses related to new EPSAs in Libya.
In 2005, Petro-Canada reached an agreement to sell the Company’s mature producing assets in Syria. The sale was closed on January 31, 2006. These assets and associated results are reported as discontinued operations and excluded from continuing operations. Sale proceeds were used to buy back shares under the NCIB program.
North Sea
In the North Sea, the Company is growing its business around core production areas in the U.K. and the Netherlands sectors, with exploration activities extending into Norway.
Petro-Canada’s North Sea production averaged 97,700 boe/d net in 2008, compared with 91,100 boe/d net in 2007. Additional production from Buzzard and Saxon and a full year of production from De Ruyter and L5b-C were partially offset by natural declines and problems with two producing wells in the Triton area. North Sea crude oil and NGL realized prices averaged $97.76/bbl and natural gas averaged $12.15/Mcf in 2008, compared with $75.12/bbl and $7.94/Mcf, respectively, in 2007.
The Company’s U.K. position is built around three core production hubs: Triton, Buzzard and Scott/Telford. The Triton development area exemplifies Petro-Canada’s approach to concentric development in the North Sea, where the Company has gained world class operating capability in subsea development. Triton comprises the Guillemot West and Northwest fields, the Bittern field, the Pict field, the Clapham field and the Saxon field. Although this group of fields is relatively modest in size, it contributes significantly to cash flow and net earnings. The crude oil gathered at Triton is shipped via tanker, while natural gas is delivered through the SEGAL system to the U.K. Petro-Canada is a 33.1% owner of the Triton FPSO.
The second core hub in the U.K. North Sea is the Buzzard oilfield, located in the Outer Moray Firth. Buzzard achieved first oil in January 2007 and the Company has a 29.9% interest in the field. The field ramped up to peak production in the middle of 2007. Buzzard is supported by three bridge-linked platforms supporting wellhead facilities, production facilities, living quarters and utilities. Crude oil is transported via the Forties pipeline system to shore and natural gas is transported to the St. Fergus
30 | PETRO-CANADA Annual Information Form | 
|
gas terminal in Scotland via the Frigg pipeline in the U.K. Petro-Canada and its partners in the Buzzard field evaluated solutions to address the moderate, but higher than expected levels of hydrogen sulphide (H2S) in some of the producing wells. A decision on the appropriate solution was made in 2008 and a new H2S stripping facilities platform is being constructed to manage the export quality of the oil production.
In keeping with Petro-Canada’s concentric development approach, the Company’s acquisition of its interest in the Buzzard field in June 2004 included a number of nearby blocks with exploration potential. This included Block 20/1 North, where the non-operated Golden Eagle discovery was drilled in late 2006. The well was drilled to a depth of approximately 2,286 metres and encountered 37 metres of net oil pay. The well tested at more than 4,000 b/d of light crude oil. The well was sidetracked to appraise the accumulation. Exploration success continued in 2008 with the non-operated Pink discovery, also located in Block 20/1 North. Together with its joint venture partners, the Company is evaluating more exploration opportunities in the immediate area, with a view to optimizing the development plan for the discovered resources. Petro-Canada holds a 25% working interest in the Golden Eagle discovery and a 33% interest in the Pink discovery.
Following the 2005 discovery on the Petro-Canada operated 13/27a Block (90% working interest), the Company farmed into adjacent Blocks 13/26a and 13/26b in September 2006, obtaining a 27.5% non-operated working interest. An appraisal well was drilled during 2007 on Block 13/26a, which encountered hydrocarbons but did not confirm the commerciality of the original discovery. Plans are to dilute Petro-Canada’s 92.5% working interest by farming out to further appraise the accumulation.
In November 2008, Petro-Canada, as operator, bid for Blocks 13/27e, 14/25b and 15/21 (split), and 30/11c in the U.K. 25th licensing round. It is anticipated these blocks will be awarded in 2009.
The Company’s third core production hub in the U.K. North Sea, Scott/Telford, is also located in the Outer Moray Firth and consists of a 20.6% working interest in the Scott oilfield and production platform, and a 9.4% working interest in the Telford oilfield, with a subsea tie-back to the Scott platform. High quality crude oil from Scott/Telford is transported to shore via the Forties pipeline system. Associated natural gas is transported via the Scottish Area Gas Evacuation pipeline system.
In the Netherlands sector of the North Sea, oil production comes from the Petro-Canada operated Hanze and De Ruyter platforms. The Company has a 45% working interest in Hanze and a 54.07% working interest in De Ruyter. De Ruyter came on-stream in late September 2006. Oil from the Hanze and De Ruyter platforms is exported by a dedicated tanker, with the cargoes marketed on a spot basis into Northwest Europe. Natural gas production from Hanze is exported to shore via the Northern Offshore Gas Transport (NOGAT) pipeline, and natural gas from De Ruyter is exported via the Noord Gas Transport (NGT) pipeline system.
In 2007, the Company drilled two successful exploration wells, van Nes and van Brakel, in which Petro-Canada is operator with a 50% and 60% working interest, respectively. In 2008, the Company, as operator with a 50% working interest, drilled the successful exploration van Ghent well. All three wells are in the vicinity of the De Ruyter development. Van Nes was drilled to a depth of 2,048 metres and encountered 38 metres of net gas pay, while the van Brakel well was drilled to a depth of 1,598 metres and encountered 24 metres of net gas pay. The van Ghent well was drilled to a depth of 1,852 metres and encountered 49 metres of net gas and 12 metres of net oil pay. Both van Nes and van Brakel have been suspended as natural gas discoveries and van Ghent has been suspended as an oil and gas discovery. The Company is assessing its development options.
The major source of natural gas production in the Netherlands is from the L5b-L8b non-operated natural gas area, where Petro-Canada has a working interest of approximately 30%. L5b-C, a non-operated asset in this area, achieved first natural gas in November 2006. The Company has a 30% working interest in L5b-C. The produced natural gas is transported to shore by pipeline and sold to NV Nederlandse Gasunie under long-term delivery and off-take contracts. Petro-Canada also holds a 12% interest in the onshore Bergen gas storage facility operated by TAQA.
In 2006, Petro-Canada opened an office in Stavanger, Norway, following the award of five production licences in the Norwegian sector of the North Sea in the 2005 Awards in Predefined Areas (APA). In 2007, the Company was awarded nine additional production licences in the 2006 APA round. In 2008, the Company was awarded four additional production licences. At the end of 2008, Petro-Canada held 17 production licences, including relinquishment, of which five are operated.
| Annual Information Form PETRO-CANADA | 31 |
In the third quarter of 2008, the Company completed a sales and purchase agreement with Bayerngas Norge AS for the sale of all the Company’s interests in Denmark for net proceeds of $140 million, resulting in an $82 million after-tax gain on the sale of these assets. The sale of all of Petro-Canada’s interests in Denmark is consistent with the International & Offshore business unit strategy to optimize the portfolio by reducing participation in countries where the Company cannot foresee developing a material position.
Other International
Crude oil production comes from interests principally in Libya, with natural gas production from assets offshore Trinidad and Tobago. A natural gas development is also underway in Syria.
Libya
In June 2008, Petro-Canada signed six new EPSAs with the Libya NOC to replace existing concession agreements and one EPSA. The new EPSAs were ratified as of the signing, with an effective date of January 1, 2008. Following ratification of the new agreements, a payment of $500 million US, representing 50% of the signature bonus, was made to the Libya NOC in July 2008, with the remaining $500 million to be paid between 2009 and 2013. The commercial terms of the new agreements, including the signing bonus, match those announced when the heads of agreement were completed in December 2007. The new EPSAs will run for 30 years and enable the Company and the NOC to jointly design and implement the redevelopment of the existing fields in the Sirte Basin. Petro-Canada and the NOC will each pay one-half of development expenditures that are expected to total up to $7 billion US gross over the term of the licences and to double existing production to 100,000 boe/d net. Under the new agreements, the Company is the exploration operator and has committed to fully fund an exploration program at an estimated cost of $460 million US over a five-year period. Petro-Canada has started to acquire 3D seismic over the new EPSA acreage and expects to start exploration drilling in 2009.
In 2008, Petro-Canada’s production in Libya averaged 48,800 boe/d net, up 2% from 47,700 boe/d net in 2007. Libyan crude oil and NGL realized prices averaged $101.97/bbl in 2008, compared with $77.26/bbl in 2007. Petro-Canada’s production is currently sold on contract to the NOC. In early January 2009, the NOC advised the Company that production from Petro-Canada’s Libya EPSAs will be limited to 85,000 b/d gross (42,500 b/d net) due to the quota agreed to by OPEC producers in December 2008.
In 2008, 12 development wells were completed in the producing fields in Libya, consisting of 11 production wells and one injection well. A further five development wells were drilling at year end. Additionally, one appraisal well was drilled.
Petro-Canada is the operator, with a 50% working interest, of Block 137 in the Sirte Basin. In 2008, the Company completed 2D and 3D seismic acquisition and is evaluating the data in preparation for drilling an exploration well, possibly in 2009.
Syria
Early in 2006, the Company completed the sale of its mature producing assets in Syria. In November 2006, Petro-Canada acquired operatorship and a 90% interest in a Production Sharing Contract (PSC) in the Ebla gas project for $54 million. Under the agreement, Petro-Canada expects to spend approximately $1 billion to develop and produce an estimated 80 MMcf/d of natural gas from the Ash Shaer and Cherrife natural gas fields, with first gas anticipated in 2010. The development includes take or pay contracts for the gas, the price of which is tied to Mediterranean heavy fuel oil prices. In December 2007, the Company exercised its option to purchase the remaining 10% interest in the Ebla gas PSC. In 2008, the Company completed FEED and awarded the EPC contract for the production facilities and commenced construction. A 2D and 3D appraisal and development seismic program was started in August 2008 and two drilling rigs were mobilized to commence development drilling. Overall, the Ebla gas project was 50% complete at year end and is on schedule to meet the contractual commitment of first gas by mid-2010. On Block II, the Company completed the evaluation of the Al Dahramat well and moved into the second exploration period for the licence.
32 | PETRO-CANADA Annual Information Form |
|
Trinidad and Tobago
The Company holds a 17.3% working interest in the NCMA-1 offshore natural gas development project operated by BG Group p.l.c. In 2006, subsea tie-backs to the Hibiscus platform for Phases 3a and 3b were completed and first natural gas was achieved in late 2006. Phase 3c was approved and will involve development of the Poinsettia field, with a platform and pipeline tie-back to the Hibiscus platform. Production is expected to come on-stream by early 2009. Petro-Canada participated in a well to appraise the Poinsettia discovery, which was spudded late in 2007. Natural gas production is delivered by pipeline to the LNG facility operated by Atlantic LNG at Point Fortin for liquefaction and subsequent sale into U.S. markets.
In 2008, Petro-Canada’s share of Trinidad and Tobago offshore production averaged 64 MMcf/d net, down from 71 MMcf/d net in 2007. Decreased production reflected additional maintenance at the Atlantic LNG plant, rebalancing of mutual aid production among producers to the Atlantic LNG plant and several brief shutdowns of NCMA to prepare for the start up of the new Poinsettia field. Trinidad and Tobago realized prices for natural gas averaged $7.15/Mcf in 2008, compared with $4.34/Mcf in 2007.
Petro-Canada signed PSCs with the Trinidad and Tobago Ministry of Energy and Energy Industries for offshore exploration Blocks 1a, 1b and 22 in 2005. These blocks cover a total of 4,258 square kilometres. In 2006, the 3D seismic program on Blocks 1a, 1b and 22 offshore Trinidad and Tobago were completed. In 2007, Petro-Canada completed and received approval of its EIAs for the drilling programs on Blocks 1a, 1b and 22 in advance of the arrival of the contracted drilling rigs. In the third quarter of 2007, the Company drilled and completed the successful Zandolie West exploration well on Block 1a. The Anole well on Block 1b was abandoned as a dry hole. Two further wells were drilled on Block 1a in 2008. Zandolie East was completed as a gas discovery, while Tegu was a dry hole. On Block 22 offshore Trinidad and Tobago, Petro-Canada, as operator with a 90% working interest in the block, drilled the Cassra-1 well in 2007 in 430 metres of water and reached a depth of 1,712 metres below sea level. The well encountered the reservoir objective and established a gas water contact. The well was completed as a discovery and was followed in 2008 by the successful appraisal well Cassra-2. Two further wells were drilled on Block 22 during 2008; Bene was a dry hole and Sancoche was a gas discovery. The Company is now considering development options for all of its discoveries in Trinidad and Tobago.
Other
In Tunisia during 2006, the Company closed its Tunis office and relinquished its 72.5% interest in the Melitta Block after completing its work commitment. In 2007, the Company focused on exploration of the offshore, non-operated Cap Serrat and Bechateur permits (33% working interest).
In July 2008, Petro-Canada converted its existing reconnaissance licence in southern Morocco to an exploration permit. Petro-Canada’s partners in the exploration licence include German company RWE and the Moroccan National Office of Hydrocarbons.
Business Development Opportunities
In 2007, the Company continued its discussions to import natural gas from Russia to North America through a joint LNG project with Gazprom. An agreement was signed with Gazprom in March 2006 to proceed with the initial engineering design of the liquefaction plant. In February 2008, Petro-Canada was informed that Gazprom had decided not to pursue this project and instead wanted to focus on other projects.
| Annual Information Form PETRO-CANADA | 33 |
Link to Petro-Canada’s Corporate and Strategic Priorities
The International business is aligned with Petro-Canada’s strategic priorities as outlined by its progress in 2008 and goals for 2009.
PRIORITY | 2008 GOALS | 2008 RESULTS | 2009 GOALS |
| | | |
Delivering Profitable Growth with a Focus on Operated, Long-Life Assets | · evaluate 2007 exploration results and deliver 2008 exploration program · develop a transition plan for the Libya Concession Development project · develop a detailed exploration program in Libya · award EPC contract for Syria Ebla gas project and finalize commercial agreements · spud first well for the Syria Ebla gas project · evaluate opportunities to commercialize Trinidad and Tobago gas discoveries, subject to exploration results | · drilled 13 exploration wells, with nine wells suspended as discoveries, four wells abandoned as dry holes and one well still drilling at year end · signed six new EPSAs with the Libya NOC, adding reserves and extending terms by an expected 30 years with improved commercial terms · commenced 3D seismic program in Libya · completed 50% of Syria Ebla gas project · commenced seismic and development drilling on the Syria Ebla gas project · participated in four gas discoveries in Trinidad and Tobago and began study of commercialization options | · continue appraisal and development planning for the U.K. and the Netherlands exploration discoveries · drill up to three exploration wells in the U.K. and Norway depending on rig availability · continue Libya exploration 3D seismic program and start exploration drilling program · prepare and submit redevelopment plans for the Libya Amal field and pursue early production gains across the new contract areas · complete the Syria Ebla seismic program and continue development drilling and construction of the Syria Ebla gas plant with a first gas target of mid-2010 · develop appraisal and commercialization strategies for the Trinidad and Tobago discoveries |
| | | |
Driving for First Quartile Operation of Our Assets | · maintain excellent production efficiency at the Petro-Canada operated De Ruyter and Hanze platforms · deliver plateau level production at Buzzard while the enhancement program is implemented | · delivered 97% reliability at both the De Ruyter and Hanze facilities · Buzzard achieved average production of 205,000 boe/d gross (61,300 boe/d net), in line with plateau production expectations | · maintain greater than 90% reliability at Hanze and De Ruyter and drill a Hanze Pliocene development well · develop and implement Triton de-bottlenecking and reliability improvement plans · identify and implement opportunities to reduce administrative and operating costs across the business |
| | | |
Continuing to Work at Being a Responsible Company | · continue to work with contractors to reduce injuries and illnesses · continue to improve TLM systems and processes in Libya · complete the EIA for the Ebla gas project in Syria · continue to develop stakeholder management processes to maintain positive outcomes with key stakeholders | · TRIF was 0.62, a decrease of 56% compared with 1.42 in 2007 · held Zero-Harm conference for major contractors in the Netherlands and Syria · experienced one environmental regulatory exceedance, compared with zero in 2007 · established fully capable Environment Safety and Social Responsibility (ES&SR) organizations in Libya and Syria · completed the EIA for the Syria Ebla gas project · addressed local stakeholder concerns in Trinidad and Tobago (impact on fishing activities) and in Syria (feeding grounds of Northern Bald Ibis) | · focus on contractor management to improve safety performance, with particular emphasis in Syria and Libya on land transport safety · monitor water consumption required to support Syria and Libya activities and identify opportunities to reduce water use · continue stakeholder engagement training in Syria and Libya and support implementation of processes and tools |
34 | PETRO-CANADA Annual Information Form |
|
Discontinued Operations
On January 31, 2006, Petro-Canada completed the sale of the Company’s producing assets in Syria to a joint venture of companies owned by India’s Oil and Natural Gas Corporation Limited and the China National Petroleum Corporation for net proceeds of $640 million. The sale resulted in a gain on disposal of $134 million recorded in the first quarter of 2006. This sale aligned with Petro-Canada’s strategy to increase the proportion of long-life and operated assets within its portfolio. Petro-Canada’s activities in Syria remain part of the Other International producing region, with an active exploration program in Block II and the addition of the Ebla gas project in Syria during 2006. Additional information concerning Petro-Canada’s discontinued operations can be found in Note 5 to the Consolidated Financial Statements.
| Annual Information Form PETRO-CANADA | 35 |
UPSTREAM PRODUCTION AND PRICES
The following table shows Petro-Canada’s average daily production of conventional crude oil, NGL, bitumen, synthetic crude oil (from mining operations) and natural gas, before and after deduction of royalties for the years indicated.
Average Daily Production of Crude Oil, NGL, Bitumen, Synthetic Crude Oil and Natural Gas
Reserves information in this table does not conform to SEC standards and is supplemental general information.1
| Years Ended December 31, |
| | 2008 | | 2007 | | 2006 |
| Before
Royalties | After
Royalties | Before
Royalties | After
Royalties | Before
Royalties | After
Royalties |
Crude oil and equivalents
(thousands of barrels/day – Mbbls/d) | | | | | | |
North American Natural Gas | 13.1 | 9.9 | 12.5 | 9.5 | 14.2 | 10.8 |
Oil Sands2 | 59.9 | 54.7 | 56.9 | 51.2 | 52.2 | 48.8 |
International & Offshore | | | | | | |
East Coast Canada | 90.5 | 68.6 | 98.7 | 84.4 | 72.7 | 68.5 |
International | | | | | | |
North Sea | 88.4 | 88.4 | 81.3 | 81.3 | 33.2 | 33.2 |
Other International | 48.8 | 31.0 | 47.7 | 43.4 | 49.4 | 44.7 |
Total crude oil and equivalents | 300.7 | 252.6 | 297.1 | 269.8 | 221.7 | 206.0 |
Natural gas (MMcf/d) | | | | | | |
North American Natural Gas | 586 | 466 | 599 | 471 | 616 | 489 |
International | | | | | | |
North Sea | 56 | 56 | 58 | 58 | 63 | 63 |
Other International | 64 | 63 | 71 | 65 | 63 | 32 |
Total natural gas | 706 | 585 | 728 | 594 | 742 | 584 |
Total production from continuing operations3 (thousands of barrels of oil equivalent/day – Mboe/d) | 418 | 350 | 418 | 369 | 345 | 303 |
Discontinued operations 4 | | | | | | |
Crude oil and NGL (Mbbls/d) | – | – | – | – | 5.2 | 1.4 |
Natural gas (MMcf/d) | – | – | – | – | 2 | – |
Total production from discontinued operations3,4 (Mboe/d) | – | – | – | – | 6 | 1 |
Total production3 (Mboe/d) | 418 | 350 | 418 | 369 | 351 | 304 |
Proved oil and NGL reserves1,4
(MMbbls) | 1,037 | 888 | 1,022 | 886 | 950 | 841 |
Proved natural gas reserves
(trillions of cubic feet – tcf)4 | 1.5 | 1.2 | 1.8 | 1.4 | 1.9 | 1.5 |
1 Reporting working interest reserves before royalties and combining oil and gas with oil sands mining activities does not conform to SEC standards and is for general supplemental information only.
2 Includes production of synthetic crude oil from Syncrude mining operation.
3 Natural gas is converted to oil equivalent using six Mcf of gas to one boe.
4 The Company closed the sale of its Syrian producing assets on January 31, 2006.
36 | PETRO-CANADA Annual Information Form | 
|
The following table shows Petro-Canada’s average daily production of conventional crude oil, NGL, bitumen, synthetic crude oil and natural gas, before deduction of royalties by quarter for the years indicated.
Average Daily Production of Crude Oil, NGL, Bitumen, Synthetic Crude Oil and Natural Gas Before Royalties by Quarter
| 2008
Three Months Ended | | 2007 Three Months Ended |
| Mar. 31 | June 30 | Sept. 30 | Dec. 31 | | Mar. 31 | June 30 | Sept. 30 | Dec. 31 |
Crude oil and equivalents (Mbbls/d) | | | | | | | | | |
North American Natural Gas | 13.1 | 13.0 | 13.0 | 13.7 | | 12.4 | 12.6 | 12.6 | 12.5 |
Oil Sands1 | 55.5 | 53.9 | 66.9 | 63.1 | | 59.7 | 52.4 | 63.8 | 51.7 |
International & Offshore | | | | | | | | | |
East Coast Canada | 92.1 | 90.4 | 90.6 | 88.7 | | 97.3 | 108.4 | 102.1 | 87.4 |
International | | | | | | | | | |
North Sea | 97.4 | 89.4 | 85.7 | 81.2 | | 64.5 | 84.7 | 87.5 | 88.4 |
Other International | 49.8 | 49.6 | 49.6 | 45.4 | | 46.5 | 46.2 | 49.1 | 49.0 |
Total crude oil and equivalents | 307.9 | 296.3 | 305.8 | 292.1 | | 280.4 | 304.3 | 315.1 | 289.0 |
Natural gas (MMcf/d) | | | | | | | | | |
North American Natural Gas | 586 | 582 | 596 | 579 | | 605 | 599 | 599 | 594 |
International | | | | | | | | | |
North Sea | 58 | 60 | 54 | 54 | | 68 | 49 | 59 | 59 |
Other International | 68 | 63 | 59 | 66 | | 75 | 73 | 65 | 72 |
Total natural gas | 712 | 705 | 709 | 699 | | 748 | 721 | 723 | 725 |
Total production2 (Mboe/d) | 427 | 414 | 424 | 409 | | 405 | 425 | 436 | 410 |
1 Includes production of synthetic crude oil from Syncrude mining operation.
2 Natural gas is converted to oil equivalent using six Mcf of gas to one boe.

| Annual Information Form PETRO-CANADA | 37 |
The following table shows Petro-Canada’s average daily production of conventional crude oil, NGL, bitumen, synthetic crude oil and natural gas, after deduction of royalties by quarter for the years indicated.
Average Daily Production of Crude Oil, NGL, Bitumen, Synthetic Crude Oil and Natural Gas After Royalties by Quarter
| 2008 Three Months Ended | | 2007 Three Months Ended |
| Mar. 31 | June 30 | Sept. 30 | Dec. 31 | | Mar. 31 | June 30 | Sept. 30 | Dec. 31 |
Crude oil and equivalents (Mbbls/d) | | | | | | | | | |
North American Natural Gas | 10.0 | 10.0 | 10.0 | 9.9 | | 9.5 | 10.0 | 10.1 | 9.5 |
Oil Sands1 | 50.6 | 49.1 | 60.2 | 59.9 | | 55.2 | 47.6 | 57.1 | 45.3 |
International & Offshore | | | | | | | | | |
East Coast Canada | 72.1 | 66.5 | 67.7 | 69.4 | | 87.2 | 95.1 | 83.7 | 72.8 |
International | | | | | | | | | |
North Sea | 97.4 | 89.4 | 85.7 | 81.2 | | 64.5 | 84.7 | 87.5 | 88.4 |
Other International | 45.8 | 24.6 | 28.3 | 30.6 | | 41.3 | 41.8 | 44.9 | 45.2 |
Total crude oil and equivalents | 275.9 | 239.6 | 251.9 | 251.0 | | 257.7 | 279.2 | 283.3 | 261.2 |
Natural gas (MMcf/d) | | | | | | | | | |
North American Natural Gas | 466 | 456 | 466 | 479 | | 477 | 470 | 476 | 462 |
International | | | | | | | | | |
North Sea | 58 | 60 | 54 | 54 | | 68 | 49 | 59 | 59 |
Other International | 68 | 63 | 59 | 54 | | 75 | 53 | 43 | 56 |
Total natural gas | 592 | 579 | 579 | 587 | | 620 | 572 | 578 | 577 |
Total production2 (Mboe/d) | 375 | 336 | 348 | 349 | | 361 | 375 | 380 | 357 |
1 Includes production of synthetic crude oil from Syncrude mining operation.
2 Natural gas is converted to oil equivalent using six Mcf of gas to one boe.
38 | PETRO-CANADA Annual Information Form |
|
Production Outlook
In 2008, production of crude oil, NGL and natural gas averaged 418,000 boe/d net, which was at the high end of the 2008 guidance range of 400,000 boe/d to 420,000 boe/d. Upstream production is expected to decrease in 2009 due to large facility turnarounds in East Coast Canada and International, natural declines in East Coast Canada and Western Canada, cutbacks to 2009 planned capital expenditures that affect near-term production and OPEC quota restraints in Libya. Offsetting these decreases is the expectation of higher Oil Sands production. Production is expected to average in the range of 345,000 boe/d to 385,000 boe/d in 2009. The production guidance range was expanded to reflect market uncertainty in the current environment and the potential impact on near-term production if low commodity prices persist or worsen and further reductions to capital expenditures are needed.
Factors that may impact production during 2009 include reservoir performance, drilling results, facility reliability, changes in OPEC production quotas and the successful execution of planned turnarounds.1
The following table shows Petro-Canada’s 2009 production outlook for conventional crude oil, NGL, bitumen, synthetic crude oil and natural gas in crude oil equivalents before deduction of royalties.
Consolidated Production Net
(Mboe/d)
| 2008 Actual | 2009 Outlook (+/–) As at January 29, 2009 |
North American Natural Gas | | |
– Natural gas | 98 | 81 |
– Liquids | 13 | 14 |
Oil Sands | | |
– Syncrude | 35 | 38 |
– MacKay River | 25 | 27 |
International & Offshore | | |
East Coast Canada | 90 | 68 |
International | | |
– North Sea | 98 | 85 |
– Other International | 59 | 52 |
| 418 | 345 – 385 |
1 See the Legal Notice on page 1 for a more complete discussion of the factors that may impact production during 2009.
| Annual Information Form PETRO-CANADA | 39 |
The following table shows the average sale price for Petro-Canada’s conventional crude oil, NGL, bitumen, synthetic crude oil and natural gas produced, by country and/or region, for the years indicated.
Average Prices for Crude Oil, NGL, Bitumen, Synthetic Crude Oil and Natural Gas
| Years Ended December 31, |
Average annual price received | | 2008 | | 2007 | | 2006 |
Crude oil and equivalents ($/barrel - $/bbl) | | | | | | |
North American Natural Gas | $ | 90.37 | $ | 67.37 | $ | 64.87 |
Oil Sands | | 87.10 | | 61.02 | | 54.60 |
International & Offshore | | | | | | |
East Coast Canada | | 99.13 | | 75.87 | | 71.12 |
International | | | | | | |
North Sea | | 97.76 | | 75.12 | | 72.67 |
Other International1 | | 101.97 | | 77.26 | | 72.70 |
Total crude oil and equivalents from continuing operations | | 95.63 | | 72.66 | | 67.38 |
Discontinued operations | | – | | – | | 71.84 |
Total crude oil and equivalents | $ | 95.63 | $ | 72.66 | $ | 67.48 |
North America ($/bbl) | | | | | | |
Average crude oil and NGL sale price | $ | 98.02 | $ | 74.91 | $ | 70.10 |
Average bitumen sale price | | 60.26 | | 28.23 | | 28.93 |
Average synthetic crude oil sale price | | 106.63 | | 79.20 | | 72.13 |
North America average crude oil and NGL, bitumen and synthetic crude oil price | $ | 94.03 | $ | 70.22 | $ | 64.28 |
International ($/bbl) | | | | | | |
North Sea – average crude oil and NGL sale price | $ | 97.76 | $ | 75.12 | $ | 72.67 |
Other International – average crude oil and NGL sale price1 | | 101.97 | | 77.26 | | 72.70 |
International – average crude oil and NGL sale price from continuing operations | $ | 98.25 | $ | 75.90 | $ | 72.69 |
Natural gas ($/thousand cubic feet - $/Mcf) | | | | | | |
North American Natural Gas | $ | 8.05 | $ | 6.30 | $ | 6.85 |
International | | | | | | |
North Sea | | 12.15 | | 7.94 | | 8.91 |
Other International | | 7.15 | | 4.34 | | 5.13 |
Total natural gas from continuing operations | | 8.34 | | 6.32 | | 6.96 |
Discontinued operations | | – | | – | | 7.94 |
Total natural gas | $ | 8.34 | $ | 6.32 | $ | 6.96 |
1 Other International excludes prices realized on production related to the mature Syrian producing assets sold in January 2006, which are shown as discontinued operations.
40 | PETRO-CANADA Annual Information Form |
|
The following tables on pages 41 to 45 show Petro-Canada’s average product prices, netbacks, net earnings and production before royalties for North American Natural Gas (natural gas equivalent), Oil Sands (synthetic crude oil and bitumen), East Coast Canada (conventional crude oil), and International regions (crude oil equivalents) for the years indicated. Footnotes for the following tables on pages 41 to 45 can be found on page 45.
Petro-Canada monitors production costs and charges to earnings by business segment or region, rather than on a product basis. As a result, unit netbacks and net earnings for a business segment or region producing a mix of crude oil, natural gas and NGL are calculated on an oil- or gas-equivalent basis. In the North American Natural Gas business segment, most crude oil and NGL production is ancillary to the production of natural gas. In the North Sea, crude oil and NGL production represent about 91% of total North Sea production on an oil-equivalent basis. In the Other International region, crude oil and NGL production represent about 82% of total Other International production on an oil-equivalent basis.
North American Natural Gas1
($/thousand cubic feet equivalent – $/Mcfe, unless otherwise indicated)
| | 2008 Three Months Ended | | | Total | | | 2007 Three Months Ended | | | Total | | Total | |
| | Mar. 31 | | June 30 | | Sept. 30 | | Dec. 31 | | | 2008 | | | Mar. 31 | | June 30 | | Sept. 30 | | Dec. 31 | | | 2007 | | 2006 | |
Average price received | | $ 8.53 | | $ 11.50 | | $ 9.90 | | $ 7.07 | | | $ 9.24 | | | $ 7.64 | | $ 7.30 | | $ 5.95 | | $ 6.64 | | | $ 6.88 | | $ 7.34 | |
Royalties | | (1.79 | ) | (2.46 | ) | (2.25 | ) | (1.28 | ) | | (1.95 | ) | | (1.68 | ) | (1.62 | ) | (1.26 | ) | (1.48 | ) | | (1.51 | ) | (1.55 | ) |
Operating expenses | | (1.39 | ) | (1.45 | ) | (1.43 | ) | (1.68 | ) | | (1.49 | ) | | (1.32 | ) | (1.18 | ) | (1.34 | ) | (1.32 | ) | | (1.29 | ) | (1.14 | ) |
Netback | | 5.35 | | 7.59 | | 6.22 | | 4.11 | | | 5.80 | | | 4.64 | | 4.50 | | 3.35 | | 3.84 | | | 4.08 | | 4.65 | |
Overhead expenses (general and administrative – G&A)2 | | (0.30 | ) | (0.29 | ) | (0.28 | ) | (0.37 | ) | | (0.31 | ) | | (0.30 | ) | (0.32 | ) | (0.25 | ) | (0.29 | ) | | (0.29 | ) | (0.25 | ) |
Netback after overhead expenses | | 5.05 | | 7.30 | | 5.94 | | 3.74 | | | 5.49 | | | 4.34 | | 4.18 | | 3.10 | | 3.55 | | | 3.79 | | 4.40 | |
Processing and other income | | 0.06 | | 0.07 | | 0.09 | | 0.12 | | | 0.08 | | | 0.04 | | 0.08 | | 0.06 | | 0.02 | | | 0.05 | | 0.06 | |
Exploration expenses | | (0.37 | ) | (0.21 | ) | (0.51 | ) | (0.86 | ) | | (0.49 | ) | | (0.54 | ) | (0.26 | ) | (0.31 | ) | (1.01 | ) | | (0.53 | ) | (0.37 | ) |
DD&A3 | | (2.50 | ) | (1.93 | ) | (1.98 | ) | (2.89 | ) | | (2.32 | ) | | (1.76 | ) | (1.74 | ) | (1.72 | ) | (4.22 | ) | | (2.36 | ) | (1.55 | ) |
Income and other taxes4 | | (0.72 | ) | (0.97 | ) | (1.13 | ) | (0.03 | ) | | (0.71 | ) | | (0.67 | ) | (0.67 | ) | (0.40 | ) | 0.82 | | | (0.23 | ) | (0.83 | ) |
Net earnings | | $ 1.52 | | $ 4.26 | | $ 2.41 | | $ 0.08 | | | $ 2.05 | | | $ 1.41 | | $ 1.59 | | $ 0.73 | | $ (0.84 | ) | | $ 0.72 | | $ 1.71 | |
Production, net
(billion cubic feet equivalent – Bcfe) | | 60.5 | | 60.1 | | 62.0 | | 60.9 | | | 243.5 | | | 61.1 | | 61.5 | | 62.0 | | 61.5 | | | 246.1 | | 255.9 | |

| Annual Information Form PETRO-CANADA | 41 |
Oil Sands – Syncrude
($/bbl, unless otherwise indicated)
| | 2008 Three Months Ended | | | Total | | | 2007 Three Months Ended | | | Total | | Total | |
| | Mar. 31 | | June 30 | | Sept. 30 | | Dec. 31 | | | 2008 | | | Mar. 31 | | June 30 | | Sept. 30 | | Dec. 31 | | | 2007 | | 2006 | |
Average price received | | $ 101.27 | | $ 131.37 | | $ 127.24 | | $ 69.07 | | | $ 106.63 | | | $ 68.79 | | $ 76.71 | | $ 81.77 | | $ 88.01 | | | $ 79.20 | | $ 72.13 | |
Royalties | | (14.74 | ) | (20.04 | ) | (21.59 | ) | (5.74 | ) | | (15.41 | ) | | (8.26 | ) | (11.15 | ) | (12.65 | ) | (14.87 | ) | | (11.86 | ) | (6.98 | ) |
Operating expenses | | (39.03 | ) | (42.30 | ) | (34.40 | ) | (36.38 | ) | | (37.79 | ) | | (26.68 | ) | (33.44 | ) | (20.92 | ) | (28.49 | ) | | (26.94 | ) | (30.00 | ) |
Netback | | 47.50 | | 69.03 | | 71.25 | | 26.95 | | | 53.43 | | | 33.85 | | 32.12 | | 48.20 | | 44.65 | | | 40.40 | | 35.15 | |
Processing and other income | | – | | – | | – | | – | | | – | | | – | | – | | – | | – | | | – | | 1.65 | |
DD&A | | (4.95 | ) | (4.95 | ) | (4.95 | ) | (4.95 | ) | | (4.95 | ) | | (5.11 | ) | (5.13 | ) | (5.12 | ) | (5.12 | ) | | (5.12 | ) | (3.74 | ) |
Income and other taxes4 | | (12.41 | ) | (18.71 | ) | (20.80 | ) | (6.85 | ) | | (14.66 | ) | | (9.33 | ) | (6.23 | ) | (13.83 | ) | 5.91 | | | (6.02 | ) | (7.75 | ) |
Net earnings | | $ 30.14 | | $ 45.37 | | $ 45.50 | | $ 15.15 | | | $ 33.82 | | | $ 19.41 | | $ 20.76 | | $ 29.25 | | $ 45.44 | | | $ 29.26 | | $ 25.31 | |
Production, net
(MMbbls) | | 2.9 | | 2.9 | | 3.5 | | 3.4 | | | 12.7 | | | 3.2 | | 2.9 | | 3.8 | | 3.5 | | | 13.4 | | 11.3 | |
Oil Sands – MacKay River
($/bbl, unless otherwise indicated)
| | 2008 Three Months Ended | | | Total | | | 2007 Three Months Ended | | | Total | | Total | |
| | Mar. 31 | | June 30 | | Sept. 30 | | Dec. 31 | | | 2008 | | | Mar. 31 | | June 30 | | Sept. 30 | | Dec. 31 | | | 2007 | | 2006 | |
Average price received | | $ 52.43 | | $ 75.85 | | $ 83.51 | | $ 28.41 | | | $ 60.26 | | | $ 29.08 | | $ 25.58 | | $ 32.48 | | $ 24.13 | | | $ 28.23 | | $ 28.93 | |
Royalties | | (0.50 | ) | (0.01 | ) | (0.85 | ) | (0.26 | ) | | (0.43 | ) | | (0.27 | ) | (0.23 | ) | (0.28 | ) | (0.15 | ) | | (0.24 | ) | (0.49 | ) |
Operating expenses | | (23.01 | ) | (29.71 | ) | (22.16 | ) | (20.82 | ) | | (23.66 | ) | | (15.08 | ) | (21.56 | ) | (17.28 | ) | (28.49 | ) | | (19.71 | ) | (16.93 | ) |
Netback | | 28.92 | | 46.13 | | 60.50 | | 7.33 | | | 36.17 | | | 13.73 | | 3.79 | | 14.92 | | (4.51 | ) | | 8.28 | | 11.51 | |
Overhead expenses
(G&A)2 | | (1.01 | ) | (1.16 | ) | (0.88 | ) | (0.97 | ) | | (0.99 | ) | | (1.06 | ) | (1.36 | ) | (1.26 | ) | (1.45 | ) | | (1.26 | ) | (0.90 | ) |
Netback after overhead expenses | | 27.91 | | 44.97 | | 59.62 | | 6.36 | | | 35.18 | | | 12.67 | | 2.43 | | 13.66 | | (5.96 | ) | | 7.02 | | 10.61 | |
Processing and other income | | (0.17 | ) | 0.83 | | 0.43 | | 2.48 | | | 0.91 | | | – | | 0.11 | | (0.83 | ) | (0.54 | ) | | (0.29 | ) | (0.05 | ) |
Exploration expenses | | (1.54 | ) | (0.04 | ) | (0.13 | ) | (0.08 | ) | | (0.42 | ) | | (1.38 | ) | (0.20 | ) | 0.02 | | (0.32 | ) | | (0.51 | ) | (0.04 | ) |
DD&A | | (3.44 | ) | (3.23 | ) | (3.09 | ) | (3.42 | ) | | (3.29 | ) | | (4.30 | ) | (4.51 | ) | (4.82 | ) | (3.73 | ) | | (4.39 | ) | (4.63 | ) |
Income and other taxes4 | | (6.63 | ) | (13.15 | ) | (17.47 | ) | (0.52 | ) | | (9.59 | ) | | (2.51 | ) | 0.17 | | (2.93 | ) | (0.21 | ) | | (1.53 | ) | (1.43 | ) |
Net earnings (loss) | | $ 16.13 | | $ 29.38 | | $ 39.36 | | $ 4.82 | | | $ 22.79 | | | $ 4.48 | | $ (2.00 | ) | $ 5.10 | | $ (10.76 | ) | | $ 0.30 | | $ 4.46 | |
Production, net
(MMbbls) | | 2.1 | | 2.0 | | 2.7 | | 2.4 | | | 9.2 | | | 2.2 | | 1.9 | | 2.0 | | 1.3 | | | 7.4 | | 7.7 | |
42 | PETRO-CANADA Annual Information Form | 
|
International & Offshore
East Coast Canada
($/bbl, unless otherwise indicated)
| | 2008 Three Months Ended | | | Total | | | 2007 Three Months Ended | | | Total | | Total | |
| | Mar. 31 | | June 30 | | Sept. 30 | | Dec. 31 | | | 2008 | | | Mar. 31 | | June 30 | | Sept. 30 | | Dec. 31 | | | 2007 | | 2006 | |
Average price received | | $ 97.70 | | $ 126.35 | | $ 114.76 | | $ 57.19 | | | $ 99.13 | | | $ 65.76 | | $ 75.29 | | $ 76.83 | | $ 86.45 | | | $ 75.87 | | $ 71.12 | |
Royalties | | (20.88 | ) | (32.65 | ) | (29.04 | ) | (12.50 | ) | | (23.79 | ) | | (6.75 | ) | (9.28 | ) | (13.78 | ) | (14.34 | ) | | (10.97 | ) | (4.54 | ) |
Operating expenses | | (4.76 | ) | (5.46 | ) | (5.44 | ) | (6.30 | ) | | (5.49 | ) | | (5.14 | ) | (4.67 | ) | (5.40 | ) | (3.27 | ) | | (4.66 | ) | (7.27 | ) |
Netback | | 72.06 | | 88.24 | | 80.28 | | 38.39 | | | 69.85 | | | 53.87 | | 61.34 | | 57.65 | | 68.84 | | | 60.24 | | 59.31 | |
Overhead expenses
(G&A)2 | | (0.32 | ) | (0.47 | ) | (0.37 | ) | (0.58 | ) | | (0.43 | ) | | (0.13 | ) | (0.21 | ) | (0.20 | ) | (0.27 | ) | | (0.20 | ) | (0.44 | ) |
Netback after overhead expenses | | 71.74 | | 87.77 | | 79.91 | | 37.81 | | | 69.42 | | | 53.74 | | 61.13 | | 57.45 | | 68.57 | | | 60.04 | | 58.87 | |
Processing and other income | | 4.98 | | 0.05 | | 0.03 | | 0.07 | | | 1.30 | | | 0.03 | | 0.99 | | (0.03 | ) | 3.80 | | | 1.12 | | 1.20 | |
Exploration expenses | | 0.01 | | – | | 0.03 | | – | | | 0.01 | | | (0.38 | ) | – | | – | | 0.01 | | | (0.09 | ) | – | |
DD&A | | (11.31 | ) | (11.96 | ) | (11.68 | ) | (11.88 | ) | | (11.70 | ) | | (11.49 | ) | (11.07 | ) | (11.51 | ) | (11.31 | ) | | (11.34 | ) | (8.82 | ) |
Income and other taxes4 | | (20.43 | ) | (23.74 | ) | (21.60 | ) | (8.33 | ) | | (18.57 | ) | | (14.20 | ) | (16.63 | ) | (15.51 | ) | (14.83 | ) | | (15.35 | ) | (15.87 | ) |
Net earnings | | $ 44.99 | | $ 52.12 | | $ 46.69 | | $ 17.67 | | | $ 40.46 | | | $ 27.70 | | $ 34.42 | | $ 30.40 | | $ 46.24 | | | $ 34.38 | | $ 35.38 | |
Production, net
(MMbbls) | | 8.4 | | 8.2 | | 8.3 | | 8.2 | | | 33.1 | | | 8.7 | | 9.9 | | 9.4 | | 8.1 | | | 36.1 | | 26.5 | |
North Sea5, 6
($/barrel of oil equivalent – $/boe, unless otherwise indicated)
| | 2008 Three Months Ended | | | Total | | | 2007 Three Months Ended | | | Total | | Total | |
| | Mar. 31 | | June 30 | | Sept. 30 | | Dec. 31 | | | 2008 | | | Mar. 31 | | June 30 | | Sept. 30 | | Dec. 31 | | | 2007 | | 2006 | |
Average price received7 | | $ 91.65 | | $ 108.79 | | $ 113.57 | | $ 66.01 | | | $ 95.38 | | | $ 64.34 | | $ 68.12 | | $ 73.56 | | $ 80.54 | | | $ 72.18 | | $ 67.16 | |
Operating expenses | | (7.01 | ) | (8.79 | ) | (8.55 | ) | (10.92 | ) | | (8.74 | ) | | (14.92 | ) | (7.48 | ) | (7.41 | ) | (7.64 | ) | | (9.03 | ) | (9.56 | ) |
Netback | | 84.64 | | 100.00 | | 105.02 | | 55.09 | | | 86.64 | | | 49.42 | | 60.64 | | 66.15 | | 72.90 | | | 63.15 | | 57.60 | |
Overhead expenses
(G&A)2 | | (1.13 | ) | (1.30 | ) | (0.63 | ) | (2.07 | ) | | (1.27 | ) | | (2.77 | ) | (1.22 | ) | (1.60 | ) | (0.80 | ) | | (1.53 | ) | (1.55 | ) |
Netback after overhead expenses | | 83.51 | | 98.70 | | 104.39 | | 53.02 | | | 85.37 | | | 46.65 | | 59.42 | | 64.55 | | 72.10 | | | 61.62 | | 56.05 | |
Processing and other income | | 0.71 | | (0.21 | ) | 3.70 | | 7.64 | | | 2.81 | | | 2.70 | | (0.32 | ) | (0.16 | ) | 0.80 | | | 0.65 | | 0.70 | |
Exploration expenses | | (1.99 | ) | (2.72 | ) | 0.51 | | (0.01 | ) | | (1.11 | ) | | (0.77 | ) | (3.38 | ) | 0.32 | | (2.75 | ) | | (1.68 | ) | (1.33 | ) |
Derivative contracts associated with Buzzard acquisition | | – | | – | | – | | – | | | – | | | – | | – | | (14.71 | ) | (17.67 | ) | | (8.75 | ) | – | |
DD&A | | (15.51 | ) | (15.50 | ) | (16.50 | ) | (14.91 | ) | | (15.61 | ) | | (20.66 | ) | (18.86 | ) | (18.71 | ) | (17.17 | ) | | (18.73 | ) | (18.22 | ) |
Income and other taxes8 | | (32.75 | ) | (39.53 | ) | (46.42 | ) | (24.41 | ) | | (35.86 | ) | | (13.75 | ) | (18.39 | ) | (18.26 | ) | (19.99 | ) | | (17.84 | ) | (34.68 | ) |
Net earnings | | $ 33.97 | | $ 40.74 | | $ 45.68 | | $ 21.33 | | | $ 35.60 | | | $ 14.17 | | $ 18.47 | | $ 13.03 | | $ 15.32 | | | $ 15.27 | | $ 2.52 | |
Production, net
(MMboe) | | 9.7 | | 9.1 | | 8.7 | | 8.3 | | | 35.8 | | | 6.8 | | 8.4 | | 8.9 | | 9.0 | | | 33.1 | | 15.9 | |
| Annual Information Form PETRO-CANADA | 43 |
North Africa/Near East5, 9, 11
($/boe, unless otherwise indicated)
| | 2008 Three Months Ended | | | Total | | | 2007 Three Months Ended | | | Total | | Total | |
| | Mar. 31 | | June 30 | | Sept. 30 | | Dec. 31 | | | 2008 | | | Mar. 31 | | June 30 | | Sept. 30 | | Dec. 31 | | | 2007 | | 2006 | |
Average price received7 | | $ 99.13 | | $ 121.06 | | $ 126.47 | | $ 63.73 | | | $ 102.00 | | | $ 66.68 | | $ 75.31 | | $ 77.59 | | $ 88.53 | | | $ 77.26 | | $ 72.70 | |
Royalties | | (7.94 | ) | (69.56 | ) | (54.26 | ) | (20.53 | ) | | (37.33 | ) | | (7.55 | ) | (7.22 | ) | (6.71 | ) | (6.92 | ) | | (7.05 | ) | (7.01 | ) |
Operating expenses12 | | (9.20 | ) | 4.36 | | (2.46 | ) | (1.69 | ) | | (2.26 | ) | | (9.19 | ) | (6.50 | ) | (7.27 | ) | (7.08 | ) | | (7.50 | ) | (4.91 | ) |
Netback | | 81.99 | | 55.86 | | 69.75 | | 41.51 | | | 62.41 | | | 49.94 | | 61.59 | | 63.61 | | 74.53 | | | 62.71 | | 60.78 | |
Overhead expenses
(G&A)2 | | (1.56 | ) | (1.88 | ) | (3.07 | ) | 3.06 | | | (0.94 | ) | | (0.51 | ) | (0.68 | ) | (0.64 | ) | (1.27 | ) | | (0.78 | ) | (0.80 | ) |
Netback after overhead | | 80.43 | | 53.98 | | 66.68 | | 44.57 | | | 61.47 | | | 49.43 | | 60.91 | | 62.97 | | 73.26 | | | 61.93 | | 59.98 | |
Processing and other income | | (1.67 | ) | (8.71 | ) | (10.45 | ) | (5.49 | ) | | (3.44 | ) | | 0.57 | | 0.36 | | (1.26 | ) | (0.06 | ) | | (0.12 | ) | (0.30 | ) |
Exploration expenses | | (1.87 | ) | (10.70 | ) | 0.52 | | (7.52 | ) | | (4.80 | ) | | (4.56 | ) | (0.53 | ) | 0.42 | | (1.44 | ) | | (1.49 | ) | (0.47 | ) |
DD&A | | (2.94 | ) | (3.33 | ) | (6.00 | ) | (7.32 | ) | | (5.33 | ) | | (2.47 | ) | (2.27 | ) | (2.15 | ) | (2.12 | ) | | (2.25 | ) | (1.51 | ) |
Income and other taxes | | (69.89 | ) | (7.95 | ) | (44.82 | ) | (28.03 | ) | | (37.51 | ) | | (38.89 | ) | (52.37 | ) | (55.34 | ) | (64.84 | ) | | (53.13 | ) | (53.89 | ) |
Net earnings (loss) | | $ 4.06 | | $ 23.29 | | $ 5.93 | | $ (3.79 | ) | | $ 10.39 | | | $ 4.08 | | $ 6.10 | | $ 4.64 | | $ 4.80 | | | $ 4.94 | | $ 3.81 | |
Production, net
(MMboe) | | 4.5 | | 4.5 | | 4.6 | | 4.2 | | | 17.9 | | | 4.2 | | 4.2 | | 4.5 | | 4.5 | | | 17.4 | | 18.1 | |
Northern Latin America5, 10
($/Mcf, unless otherwise indicated)
| | 2008 Three Months Ended | | | Total | | | 2007 Three Months Ended | | | Total | | Total | |
| | Mar. 31 | | June 30 | | Sept. 30 | | Dec. 31 | | | 2008 | | | Mar. 31 | | June 30 | | Sept. 30 | | Dec. 31 | | | 2007 | | 2006 | |
Average price received | | $ 4.95 | | $ 5.73 | | $ 7.85 | | $ 11.95 | | | $ 7.15 | | | $ 4.89 | | $ 4.59 | | $ 4.19 | | $ 3.65 | | | $ 4.34 | | $ 5.13 | |
Royalties | | – | | – | | (2.20 | ) | (2.37 | ) | | (0.20 | ) | | – | | (1.39 | ) | (1.38 | ) | (0.82 | ) | | (0.38 | ) | (1.26 | ) |
Operating expenses | | (0.17 | ) | (0.22 | ) | (0.25 | ) | (0.23 | ) | | (0.22 | ) | | (0.05 | ) | (0.17 | ) | (0.15 | ) | (0.12 | ) | | (0.12 | ) | (0.18 | ) |
Netback | | 4.78 | | 5.51 | | 5.40 | | 9.35 | | | 6.73 | | | 4.84 | | 3.03 | | 2.66 | | 2.71 | | | 3.84 | | 3.69 | |
Overhead expenses
(G&A)2 | | (0.06 | ) | (0.10 | ) | (0.07 | ) | (0.09 | ) | | (0.08 | ) | | (0.07 | ) | (0.11 | ) | (0.12 | ) | (0.19 | ) | | (0.13 | ) | (0.15 | ) |
Netback after overhead expenses | | 4.72 | | 5.41 | | 5.33 | | 9.26 | | | 6.65 | | | 4.77 | | 2.92 | | 2.54 | | 2.52 | | | 3.71 | | 3.54 | |
Processing and other income | | 0.26 | | (0.30 | ) | (0.34 | ) | (0.24 | ) | | (0.14 | ) | | (0.16 | ) | 0.02 | | (0.03 | ) | 0.17 | | | – | | (0.03 | ) |
Exploration expenses | | – | | – | | – | | (0.81 | ) | | (0.21 | ) | | (0.01 | ) | (0.01 | ) | – | | (0.01 | ) | | (0.01 | ) | (0.01 | ) |
DD&A | | (1.24 | ) | (1.24 | ) | (1.24 | ) | (1.24 | ) | | (1.24 | ) | | (0.88 | ) | (0.88 | ) | (0.88 | ) | (0.88 | ) | | (0.88 | ) | (0.73 | ) |
Income and other taxes | | (1.13 | ) | (2.24 | ) | (2.05 | ) | (3.97 | ) | | (2.80 | ) | | (1.49 | ) | (1.30 | ) | (0.66 | ) | (0.59 | ) | | (1.53 | ) | (1.29 | ) |
Net earnings | | $ 2.61 | | $ 1.63 | | $ 1.70 | | $ 3.00 | | | $ 2.26 | | | $ 2.23 | | $ 0.75 | | $ 0.97 | | $ 1.21 | | | $ 1.29 | | $ 1.48 | |
Production, net (Bcf) | | 6.2 | | 5.8 | | 5.5 | | 6.1 | | | 23.6 | | | 6.8 | | 6.6 | | 6.0 | | 6.7 | | | 26.1 | | 22.9 | |
44 | PETRO-CANADA Annual Information Form |
|
Discontinued Operations11
($/boe, unless otherwise indicated)
| | 2008 Three Months Ended | | | Total | | | 2007 Three Months Ended | | | Total | | Total | |
| | Mar. 31 | | June 30 | | Sept. 30 | | Dec. 31 | | | 2008 | | | Mar. 31 | | June 30 | | Sept. 30 | | Dec. 31 | | | 2007 | | 2006 | |
Average price received7 | | – | | – | | – | | – | | | – | | | – | | – | | – | | – | | | – | | $ 70.36 | |
Royalties | | – | | – | | – | | – | | | – | | | – | | – | | – | | – | | | – | | (52.10 | ) |
Operating expenses | | – | | – | | – | | – | | | – | | | – | | – | | – | | – | | | – | | (2.65 | ) |
Netback | | – | | – | | – | | – | | | – | | | – | | – | | – | | – | | | – | | 15.61 | |
Overhead expenses
(G&A)2 | | – | | – | | – | | – | | | – | | | – | | – | | – | | – | | | – | | (0.23 | ) |
Netback after overhead | | – | | – | | – | | – | | | – | | | – | | – | | – | | – | | | – | | 15.38 | |
Processing and other income | | – | | – | | – | | – | | | – | | | – | | – | | – | | – | | | – | | (1.06 | ) |
DD&A | | – | | – | | – | | – | | | – | | | – | | – | | – | | – | | | – | | – | |
Income and other taxes | | – | | – | | – | | – | | | – | | | – | | – | | – | | – | | | – | | (5.11 | ) |
Net earnings | | – | | – | | – | | – | | | – | | | – | | – | | – | | – | | | – | | $ 9.21 | |
Production, net
(MMboe) | | – | | – | | – | | – | | | – | | | – | | – | | – | | – | | | – | | 2.0 | |
1 | North American Natural Gas includes conventional crude oil, NGL and natural gas in natural gas equivalents. |
2 | Portion of head office expenses allocated to production. |
3 | In the fourth quarter of 2007, the North American Natural Gas business unit recorded a charge of $97 million after-tax for the impairment of CBM assets in the U.S. Rockies due to probable reserves reductions combined with lower prices. |
4 | Income and other taxes in the fourth quarter of 2007 included a tax rate adjustment reflecting the reduction in Canadian federal income tax rates. |
5 | North Sea and North Africa/Near East include conventional crude oil, NGL and natural gas in crude oil equivalents. Northern Latin America includes only natural gas. |
6 | Production in the North Sea is subject to a conventional royalty and tax regime. No royalty is payable on production in the U.K. sector. |
7 | Average price for North Sea and North Africa/Near East includes conventional crude oil, NGL and natural gas in crude oil equivalents. |
8 | In 2007, the Company recorded a $36 million recovery (2006 – $242 million charge) for the U.K. supplemental corporate tax rate adjustment. |
9 | On June 19, 2008, the Company signed six new EPSAs with the Libya NOC to replace existing concession agreements and one EPSA. The new EPSAs were ratified as of the signing with an effective date of January 1, 2008. Net earnings for the three months ended June 30, 2008 included a $47 million after-tax adjustment to recognize incremental earnings on the EPSAs relating to the period from January 1 to March 31, 2008, which could not be ratified until June 19, 2008. The government share is split between royalty and tax for Canadian reporting purposes. |
10 | Natural gas production offshore Trinidad and Tobago is held pursuant to a PSC with the government of that country. The government share is split between royalty and tax for Canadian reporting purposes. |
11 | North Africa/Near East excludes production related to the mature Syrian producing assets sold in 2006, which are shown as discontinued operations. |
12 | The Company is not obligated to pay operating expenses for the Libya NOC’s share of production under the EPSAs. |

| Annual Information Form PETRO-CANADA | 45 |
RESERVES
In order to harmonize its oil and gas disclosure in both Canada and the U.S., Petro-Canada applied for, and received, certain exemptions to reserves disclosure requirements as set out in National Instrument 51-101 Standards of Disclosure for Oil and Gas Activities (NI 51-101). These exemptions permit Petro-Canada to use its own staff of qualified reserves evaluators to prepare the Company’s reserves estimates and to use SEC and FASB standards when reporting oil and gas reserves. In addition, the reserves for the Syncrude mining operation were prepared in accordance with SEC Industry Guide 7.
Petro-Canada strongly believes that the use of its own staff of qualified reserves evaluators, who are familiar with the Company’s oil and natural gas assets as a result of working with them on a day-to-day basis, combined with independent third-party assessment of both its reserves processes and its reserves estimates, provides a level of confidence in its reserves data that is at least as valid as that which would be provided if the work was done solely by a third party.
Petro-Canada’s staff of qualified reserves evaluators determines the Company’s reserves data and quantities based on corporate-wide policies, procedures and practices. The Company believes these reserves policies, procedures and practices conform to the requirements of applicable Canadian and SEC regulations, and of the Association of Professional Engineers, Geologists and Geophysicists of Alberta’s Standard of Practice for the Evaluation of Oil and Gas Reserves for Public Disclosure.
To confirm the quality of the reserves policies, procedures and practices and the internally generated reserves estimates, Petro-Canada employs the services of independent qualified engineering evaluators and auditors. For 2008, independent petroleum reservoir engineering consultants, Sproule Associates Limited (Sproule) and RPS Energy (RPS), conducted assessments of Petro-Canada’s hydrocarbon reserves. RPS completed an independent audit of 60% of the Company’s proved crude oil, natural gas and NGL reserves outside of North America. Similarly, Sproule audited 49% of Petro-Canada’s North American proved oil and natural gas reserves, not including Oil Sands. Also in 2008, 100% of Oil Sands bitumen proved reserves were audited and 100% of Oil Sands mining proved reserves were reviewed by independent reserves evaluators. The independent auditors’ and evaluators’ reports concluded that the Company’s year-end 2008 proved reserves estimates are reasonable.
Sproule and RPS also audited Petro-Canada’s reserves policies, procedures and practices. They concluded that Petro-Canada’s reserves booking standards meet applicable disclosure regulations, that management is complying with those standards and that the reserves process is carried out in a manner and standard consistent with the auditors’ practices. In addition, PricewaterhouseCoopers LLP, as contract internal auditor, has tested aspects of the non-engineering management control processes used in establishing reserves.
Detailed information about Petro-Canada’s proved reserves of crude oil, NGL, natural gas, bitumen and synthetic crude oil, before and after royalties, follows this section.
Petro-Canada’s Reserves Processes
Petro-Canada has a well-established reserves management process. The key components of the process are:
Reserves Steering Committee: Chaired by the senior vice-president, North American Natural Gas, the Reserves Steering Committee meets regularly to address issues regarding the reserves evaluation and reporting processes. Senior managers representing each upstream business unit, finance and legal services make up this Committee.
Reservoir Engineering Organization: One or more reservoir engineering supervisors are responsible for the functional guidance of reservoir engineering within each upstream business unit. The supervisors ensure that the appropriate standards, processes and quality assurance checks are applied to reservoir engineering activities, including reserves evaluation. The supervisors, as responsible qualified reserves evaluators, sign the annual reserves evaluations for their respective areas.
46 | PETRO-CANADA Annual Information Form | 
|
Reserves Definitions, Policies, Procedures and Practices: Petro-Canada has developed corporate-wide internal policies, procedures and practices to assist reserves evaluation personnel. These policies are designed to meet internal and external reporting requirements, are updated annually, are reviewed with the reservoir engineering staff and are maintained for reference on the reservoir engineering section of Petro-Canada’s internal website.
Major Property Reviews: Each year, prior to business plan development, a series of reviews are conducted with interdisciplinary management on Petro-Canada’s major properties. These reviews are intended to ensure that there is a current, accurate and appropriately communicated understanding of these assets and their associated opportunities.
Reserves Software Tools: Petro-Canada employs a high quality, technical tool kit for reservoir engineering. This software supports the analysis of technical and economic parameters required for reserves evaluation. Ongoing training and competency assessment support the effective use of the tool kit.
Independent Evaluation/Audit/Review: Independent qualified reserves evaluators are engaged to audit and/or evaluate the Company’s internal evaluation processes and to perform such tests as they deem appropriate to ensure Petro-Canada’s reserves are appropriately evaluated. Each year’s annual independent evaluator assessment plan is reviewed and approved by the Audit, Finance and Risk Committee of the Board of Directors (Board). The independent evaluators’ observations and recommendations are reviewed with senior management and are used to guide process improvement activities.
Reserves Review and Disclosure Process: In December of each year, the management in each business unit reviews the reserves data prepared by the reservoir engineering staff. The officer responsible for each business unit signs an assertion regarding the quality of the reserves estimates and the processes applied. Also in December, Petro-Canada’s year-end reserves and preliminary reports from the independent evaluators are reviewed by the Reserves Steering Committee and a copy of the preliminary reserves report is supplied to the external financial auditor. In January, the final reserves report is reviewed with the Audit, Finance and Risk Committee of the Board.
| Annual Information Form PETRO-CANADA | 47 |
The following tables show the Company’s estimates of Petro-Canada’s total proved crude oil, natural gas, bitumen and synthetic crude oil reserves as at December 31, 2008 and average 2008 daily production by major fields. These reserves numbers represent the sum of oil sands mining and oil and gas activities and are presented before royalties. Reserves shown in this format do not conform to SEC standards and are for general supplemental information only.
Major Reserves and Production Locations, Before Deduction of Royalties
Crude Oil field/Facility1 | | Location | | Proved Reserves2,3 at
December 31, 2008
(MMbbls) | | Average 2008
Daily Production2
(Mbbls/d) | |
Syncrude3 | | Alberta | | 366 | | 35 | |
MacKay River | | Alberta | | 258 | | 25 | |
Buzzard | | Offshore U.K. | | 132 | | 59 | |
Amal | | Libya | | 42 | | 15 | |
Hibernia | | Offshore Newfoundland and Labrador | | 41 | | 28 | |
Terra Nova | | Offshore Newfoundland and Labrador | | 23 | | 35 | |
Ghani Gir/Facha | | Libya | | 23 | | 9 | |
White Rose | | Offshore Newfoundland and Labrador | | 17 | | 27 | |
Ghani/Zenad Farrud | | Libya | | 17 | | 9 | |
Denver-Julesburg area | | U.S. | | 14 | | 3 | |
Other | | | | 90 | | 48 | |
Total | | | | 1,023 | | 293 | |
Natural Gas Field/Facility1 | | Location | | Proved Reserves at
December 31, 2008
(Bcf) | | Average 2008
Daily Production
(MMcf/d) | |
Wildcat Hills area | | Alberta | | 204 | | 87 | |
Hanlan area | | Alberta | | 185 | | 80 | |
NCMA-1 | | Offshore Trinidad and Tobago | | 157 | | 64 | |
Medicine Hat | | Alberta | | 135 | | 44 | |
Denver-Julesburg area | | U.S. | | 84 | | 24 | |
Jedney/Bubbles area | | British Columbia | | 79 | | 26 | |
Alderson | | Alberta | | 76 | | 26 | |
Laprise area | | British Columbia | | 62 | | 23 | |
Powder River area | | U.S. | | 59 | | 55 | |
Coleman | | Alberta | | 47 | | 17 | |
Other | | | | 406 | | 260 | |
Total | | | | 1,494 | | 706 | |
1 | Fields are onshore unless otherwise indicated. |
2 | The reserves and production figures shown in this table do not include NGL. Total Company proved reserves (including oil sands mining) of crude oil and NGL at year-end 2008 were 1,037 MMbbls. |
3 | Syncrude reserves are synthetic crude oil reserves from oil sands mining. See Legal Notice on page 1 regarding oil sands mining. |
Petro-Canada believes that the crude oil, NGL, natural gas, bitumen and synthetic crude oil reserves quantities are reasonable estimates consistent with current knowledge of the characteristics and extent of the productive formations. Estimates are subject to upward or downward revisions as additional information regarding producing fields becomes available, as technology improves and as economic conditions change. Additional proved reserves are expected to be booked during the normal course of continuing development.
48 | PETRO-CANADA Annual Information Form |
|
The table below shows, for the years indicated, Petro-Canada’s estimates of proved reserves, before royalties, for Oil and Gas activities. The reporting of working interest reserves before royalties does not conform to SEC standards and is for general supplemental information.
Proved Developed and Undeveloped Reserves Before Royalties
(Crude oil and equivalents in MMbbls; Natural gas in Bcf)
| | | | | | | | | | | | | | | | | | | | | | | | | | | | | | | | | | | | | | | | | | | | | | | | | | | |
| | Oil and Gas Activities1,2,3,4,5 | |
| | | | | | International | | | | | | | | North America | | | | | | | | |
| | | | | | | Other International | | | | | | | | North American Natural Gas | | | | | | | | | | | | | | | | | | | |
| | North Sea6 | | | North Africa/Near
East7,8,9,10 | | | Northern
Latin
America7,11 | | | Subtotal | | | Western Canada | | | U.S. Rockies | | | East
Coast | | | Oil
Sands | | | Subtotal | | | Total | |
| | Crude
oil &
NGL | | | Natural
gas | | | Crude
oil &
NGL | | | Natural
gas | | | Natural
gas | | | Crude
oil &
NGL | | | Natural
gas | | | Crude
oil &
NGL | | | Natural
gas | | | Crude
oil &
NGL | | | Natural
gas | | | Crude
oil &
NGL | | | Bitumen | | | Crude oil,
NGL &
bitumen | | | Natural
gas | | | Crude
oil,
NGL &
bitumen | | | Natural
gas | |
Beginning of year 2007 | | 144 | | 84 | | 134 | | 1 | | 215 | | 278 | | 300 | | 39 | | 1,500 | | 8 | | 145 | | 123 | | 157 | | 327 | | 1,645 | | 605 | | 1,945 | |
Revisions of previous estimates13 | | 7 | | 16 | | (9) | | (1) | | – | | (2) | | 15 | | (1) | | (90) | | 1 | | 10 | | 7 | | 72 | | 79 | | (80) | | 77 | | (65) | |
Sale of reserves in place | | – | | – | | – | | – | | – | | – | | – | | (1) | | (11) | | – | | – | | – | | – | | (1) | | (11) | | (1) | | (11) | |
Purchase of reserves in place | | – | | – | | – | | – | | – | | – | | – | | – | | 1 | | – | | – | | – | | – | | – | | 1 | | – | | 1 | |
Discoveries, extensions and improved recovery | | 19 | | 12 | | 3 | | – | | – | | 22 | | 12 | | 1 | | 102 | | 3 | | 41 | | 6 | | 55 | | 65 | | 143 | | 87 | | 155 | |
Production net | | (30) | | (21) | | (17) | | – | | (26) | | (47) | | (47) | | (4) | | (194) | | (1) | | (25) | | (36) | | (8) | | (49) | | (219) | | (96) | | (266) | |
End of year 2007 | | 140 | | 91 | | 111 | | – | | 189 | | 251 | | 280 | | 34 | | 1,308 | | 11 | | 171 | | 100 | | 276 | | 421 | | 1,479 | | 672 | | 1,759 | |
Revisions of previous estimates13 | | (4) | | (30) | | (31) | | – | | (8) | | (35) | | (38) | | (3) | | (39) | | (4) | | (28) | | 14 | | (9) | | (2) | | (67) | | (37) | | (105) | |
Sale of reserves in place | | – | | – | | – | | – | | – | | – | | – | | – | | (1) | | – | | – | | – | | – | | – | | (1) | | – | | (1) | |
| | | | | | | | | | | | | | | | | | | | | | | | | | | | | | | | | | | |
Purchase of reserves in place | | – | | – | | 65 | | – | | – | | 65 | | – | | – | | – | | 5 | | 9 | | – | | – | | 5 | | 9 | | 70 | | 9 | |
Discoveries, extensions and improved recovery | | 59 | | 10 | | – | | – | | 12 | | 59 | | 22 | | 1 | | 42 | | 3 | | 26 | | – | | – | | 4 | | 68 | | 63 | | 90 | |
Production net | | (32) | | (20) | | (18) | | – | | (24) | | (50) | | (44) | | (4) | | (184) | | (1) | | (30) | | (33) | | (9) | | (47) | | (214) | | (97) | | (258) | |
End of year 2008 | | 163 | | 51 | | 127 | | – | | 169 | | 290 | | 220 | | 28 | | 1,126 | | 14 | | 148 | | 81 | | 258 | | 381 | | 1,274 | | 671 | | 1,494 | |
Proved undeveloped reserves | | | | | | | | | | | | | | | | | | | | | | | | | | | | | | | | | | | |
| | | | | | | | | | | | | | | | | | | | | | | | | | | | | | | | | | | |
Beginning of year 2007 | | 42 | | 3 | | 3 | | – | | 138 | | 45 | | 141 | | – | | 56 | | 4 | | 36 | | 33 | | 129 | | 166 | | 92 | | 211 | | 233 | |
End of year 2007 | | 20 | | 2 | | 2 | | – | | 138 | | 22 | | 140 | | 1 | | 69 | | 6 | | 46 | | 29 | | 230 | | 266 | | 115 | | 288 | | 255 | |
End of year 2008 | | 68 | | 9 | | 1 | | – | | 131 | | 69 | | 140 | | – | | 45 | | 7 | | 39 | | 26 | | 207 | | 240 | | 84 | | 309 | | 224 | |
See footnotes on page 53.

| Annual Information Form PETRO-CANADA 49 |
The table below shows, for the years indicated, Petro-Canada’s estimates of proved reserves, after royalties for Oil and Gas activities in accordance with SEC standards for oil and gas activities.
Proved Developed and Undeveloped Reserves After Royalties
(Crude oil and equivalents in MMbbls; Natural gas in Bcf)
| | | | | | | | | | | | | | | | | | | | | | | | | | | | | | | | | | | | | | | | | | | | | | | | | | | |
| | Oil and Gas Activities1,2,3,4,5 | |
| | | | | | International | | | | | | | | | North America | | | | | | | | |
| | | | | | | Other International | | | | | | | | North American Natural Gas | | | | | | | | | | | | | | | | | | | |
| | North Sea6 | | | North Africa/Near
East7,8,9,10 | | | Northern
Latin
America7,11 | | | Subtotal | | | Western Canada | | | U.S. Rockies | | | East
Coast | | | Oil
Sands | | | Subtotal | | | Total | |
| | Crude
oil &
NGL | | | Natural
gas | | | Crude
oil &
NGL | | | Natural
gas | | | Natural
gas | | | Crude
oil &
NGL | | | Natural
gas | | | Crude
oil &
NGL | | | Natural
gas | | | Crude
oil &
NGL | | | Natural
gas | | | Crude
oil &
NGL | | | Bitumen | | | Crude oil,
NGL &
bitumen | | | Natural
gas | | | Crude
oil, NGL
&
bitumen | | | Natural
gas | |
Beginning of year 2007 | | 143 | | 84 | | 122 | | – | | 189 | | 265 | | 273 | | 32 | | 1,151 | | 6 | | 122 | | 98 | | 151 | | 287 | | 1,273 | | 552 | | 1,546 | |
Revisions of previous estimates13 | | 7 | | 16 | | (7) | | – | | – | | – | | 16 | | (1) | | (70) | | 1 | | 8 | | 2 | | 55 | | 57 | | (62) | | 57 | | (46) | |
Sale of reserves in place | | – | | – | | – | | – | | – | | – | | – | | (1) | | (8) | | – | | – | | – | | – | | (1) | | (8) | | (1) | | (8) | |
| | | | | | | | | | | | | | | | | | | | | | | | | | | | | | | | | | | |
Purchase of reserves in place | | – | | – | | – | | – | | – | | – | | – | | – | | 1 | | – | | – | | – | | – | | – | | 1 | | – | | 1 | |
Discoveries, extensions and improved recovery | | 20 | | 12 | | 2 | | – | | – | | 22 | | 12 | | – | | 77 | | 3 | | 34 | | 4 | | 48 | | 55 | | 111 | | 77 | | 123 | |
Production net | | (30) | | (21) | | (16) | | – | | (24) | | (46) | | (45) | | (3) | | (151) | | (1) | | (21) | | (31) | | (7) | | (42) | | (172) | | (88) | | (217) | |
End of year 2007 | | 140 | | 91 | | 101 | | – | | 165 | | 241 | | 256 | | 27 | | 1,000 | | 9 | | 143 | | 73 | | 247 | | 356 | | 1,143 | | 597 | | 1,399 | |
Revisions of previous estimates13 | | (4) | | (30) | | (74) | | – | | 3 | | (78) | | (27) | | (1) | | (2) | | (2) | | (22) | | 17 | | 18 | | 32 | | (24) | | (46) | | (51) | |
Sale of reserves in place | | – | | – | | – | | – | | – | | – | | – | | – | | (1) | | – | | – | | – | | – | | – | | (1) | | – | | (1) | |
| | | | | | | | | | | | | | | | | | | | | | | | | | | | | | | | | | | |
Purchase of reserves in place | | – | | – | | 17 | | – | | – | | 17 | | – | | – | | – | | 4 | | 8 | | – | | – | | 4 | | 8 | | 21 | | 8 | |
Discoveries, extensions and improved recovery | | 59 | | 10 | | – | | – | | 11 | | 59 | | 21 | | – | | 33 | | 2 | | 20 | | – | | – | | 2 | | 53 | | 61 | | 74 | |
Production net | | (32) | | (20) | | (11) | | – | | (23) | | (43) | | (43) | | (3) | | (146) | | (1) | | (25) | | (25) | | (9) | | (38) | | (171) | | (81) | | (214) | |
End of year 2008 | | 163 | | 51 | | 33 | | – | | 156 | | 196 | | 207 | | 23 | | 884 | | 12 | | 124 | | 65 | | 256 | | 356 | | 1,008 | | 552 | | 1,215 | |
Proved undeveloped reserves | | | | | | | | | | | | | | | | | | | | | | | | | | | | | | | | | | | |
| | | | | | | | | | | | | | | | | | | | | | | | | | | | | | | | | | | |
Beginning of year 2007 | | 42 | | 4 | | 2 | | – | | 121 | | 44 | | 125 | | – | | 42 | | 4 | | 30 | | 24 | | 124 | | 152 | | 72 | | 196 | | 197 | |
End of year 2007 | | 20 | | 2 | | 2 | | – | | 121 | | 22 | | 123 | | – | | 52 | | 5 | | 38 | | 20 | | 201 | | 226 | | 90 | | 248 | | 213 | |
End of year 2008 | | 68 | | 9 | | – | | – | | 120 | | 68 | | 129 | | – | | 34 | | 6 | | 32 | | 22 | | 204 | | 232 | | 66 | | 300 | | 195 | |
See footnotes on page 53.
50 PETRO-CANADA Annual Information Form | 
|
The table below shows, for the years indicated, Petro-Canada’s estimates of proved reserves for Oil Sands mining activities in accordance with SEC Industry Guide 7.
Proved Developed and Undeveloped Reserves
(Synthetic crude oil in MMbbls)
| | Syncrude Mining Operation1,2,3,4,5,12,15 | |
| | Before Royalties | | After Royalties | |
Beginning of year 2007 | | 345 | | 289 | |
Revisions of previous estimates13 | | 18 | | 11 | |
Sale of reserves in place | | – | | – | |
Purchase of reserves in place | | – | | – | |
Discoveries, extensions and improved recovery | | – | | – | |
Production net | | (13 | ) | (11 | ) |
End of year 2007 | | 350 | | 289 | |
Revisions of previous estimates13 | | 2 | | 32 | |
Sale of reserves in place | | – | | – | |
Purchase of reserves in place | | – | | – | |
Discoveries, extensions and improved recovery | | 27 | | 26 | |
Production net | | (13 | ) | (11 | ) |
End of year 2008 | | 366 | | 336 | |
Proved undeveloped reserves | | | | | |
| | | | | |
Beginning of year 2007 | | 219 | | 182 | |
End of year 2007 | | 238 | | 197 | |
End of year 2008 | | 251 | | 231 | |
See footnotes on page 53.

| Annual Information Form PETRO-CANADA 51 |
The table below shows, for the years indicated, Petro-Canada’s estimates of proved reserves for Oil and Gas activities and Oil Sands mining activities. The reporting of working interest reserves before royalties, MMboe and combining oil and gas and oil sands mining activities together does not conform to SEC standards and is for general supplemental information.
Proved Developed and Undeveloped Reserves
| | Oil and Gas Activities and Oil Sands Mining | |
| | Natural Gas
(Bcf) | | Crude Oil & NGLs
(MMbbls) | | Crude Oil, Natural Gas
& NGLs
(MMboe) | |
| | Before
Royalties | | After
Royalties | | Before
Royalties | | After
Royalties | | Before
Royalties | | After
Royalties | |
Beginning of year 2007 | | 1,945 | | 1,546 | | 950 | | 841 | | 1,274 | | 1,099 | |
Revisions of previous estimates13 | | (65 | ) | (46 | ) | 95 | | 68 | | 84 | | 60 | |
Sale of reserves in place | | (11 | ) | (8 | ) | (1 | ) | (1 | ) | (3 | ) | (2 | ) |
Purchase of reserves in place | | 1 | | 1 | | – | | – | | – | | – | |
Discoveries, extensions and improved recovery | | 155 | | 123 | | 87 | | 77 | | 113 | | 97 | |
Production net | | (266 | ) | (217 | ) | (109 | ) | (99 | ) | (153 | ) | (135 | ) |
End of year 2007 | | 1,759 | | 1,399 | | 1,022 | | 886 | | 1,315 | | 1,119 | |
Revisions of previous estimates13 | | (105 | ) | (51 | ) | (35 | ) | (14 | ) | (53 | ) | (22 | ) |
Sale of reserves in place | | (1 | ) | (1 | ) | – | | – | | – | | – | |
Purchase of reserves in place | | 9 | | 8 | | 70 | | 21 | | 72 | | 22 | |
Discoveries, extensions and improved recovery | | 90 | | 74 | | 90 | | 87 | | 105 | | 99 | |
Production net | | (258 | ) | (214 | ) | (110 | ) | (92 | ) | (153 | ) | (128 | ) |
End of year 2008 | | 1,494 | | 1,215 | | 1,037 | | 888 | | 1,286 | | 1,090 | |
Proved undeveloped reserves14 | | | | | | | | | | | | | |
| | | | | | | | | | | | | |
Beginning of year 2007 | | 233 | | 197 | | 430 | | 378 | | 469 | | 411 | |
End of year 2007 | | 255 | | 213 | | 526 | | 445 | | 569 | | 481 | |
End of year 2008 | | 224 | | 195 | | 560 | | 531 | | 597 | | 564 | |
See footnotes on page 53.
52 PETRO-CANADA Annual Information Form | 
|
1 In order to harmonize its oil and gas disclosure in both Canada and the U.S., Petro-Canada applied for, and received, certain exemptions to reserves disclosure requirements as set out in NI 51-101. These exemptions permit Petro-Canada to use its own staff of qualified reserves evaluators to prepare the Company’s reserves estimates and to use SEC and FASB standards when preparing and reporting reserves. Such reserves information may differ from reserves information prepared in accordance with Canadian disclosure standards under NI 51-101. These differences relate to the SEC requirement for disclosure only of proved reserves calculated at constant year-end prices and costs, while NI 51-101 requires disclosure of proved plus probable reserves at forecast prices and costs. Also, the definition of proved reserves differs between SEC and NI 51-101 requirements. However, this difference should not be material. The COGE Handbook (the source document for reserves definitions under NI 51-101) supports this view.
2 Petro-Canada employs the services of independent third-party evaluators/auditors to assess its reserves policies, procedures and practices and its reserves estimates.
3 Proved reserves before royalties are Petro-Canada’s working interest reserves before the deduction of Crown or other royalties. Such royalties are subject to change by legislation or regulation and can also vary depending on production rates, selling prices and timing of initial production. Reserves quantities after royalty also reflect net overriding royalty interests paid and received.
4 Proved reserves are the estimated quantities of crude oil, natural gas and NGL, which geological and engineering data demonstrate with reasonable certainty to be recoverable in future years from known reservoirs under existing economic and operating conditions. Proved developed reserves are those proved reserves that are expected to be recovered from existing wells or facilities. Proved undeveloped reserves are proved reserves, which are not recoverable from existing wells or facilities, but which are expected to be recovered through additional development drilling or through the upgrading of existing or additional new facilities.
5 Unproved reserves are based on geological and/or engineering data similar to that used in estimates of proved reserves, but technical, contractual, economic or regulatory uncertainties preclude such reserves being classified as proved. Unproved reserves may be further classified as probable reserves and possible reserves.
6 Reserves in the North Sea are subject to a conventional royalty and tax regime. No royalty is payable on reserves in the U.K. sector. Royalty is payable on onshore reserves in the Netherlands.
7 Proved reserves include quantities of crude oil and natural gas, which will be produced under arrangements, which involve the Company or its subsidiaries in upstream risks and rewards, but which do not transfer title of the product to those companies.
8 In Petro-Canada’s production sharing contracts (PSCs), after royalty proved reserves have been determined using the economic interest method and include the Company’s share of future cost recovery and Profit Oil after foreign governments’ royalty interests, and include reserves relating to income tax payable. Under this method, reported reserves will increase as oil prices decrease (and vice versa), since the bbls necessary to achieve cost recovery change with the prevailing oil prices. Twelve per cent of Petro-Canada’s total proved reserves before royalty and 5% after royalty are held under PSCs.
9 Reserves in North Africa/Near East are calculated as per footnote 8.
10 The volume of proved oil and gas reserves before royalties reported above held under PSCs in the North Africa/Near East region at the end of 2008 was 127 MMbbls of crude oil and NGL and zero Bcf of natural gas. At year-end 2007, the volume held under PSCs was 8 MMbbls of crude oil and NGL and zero Bcf of natural gas. The after royalty reserves volume at year-end 2008 held under PSCs was 33 MMbbls of crude oil and NGL and zero Bcf of natural gas, compared with year-end 2007, which was 7 MMbbls of crude oil and NGL and zero Bcf of natural gas.
11 Natural gas reserves offshore Trinidad and Tobago are held under a PSC with the applicable government and are calculated as per footnote 8. The volume of proved natural gas reserves before royalties reported above held under PSCs offshore Trinidad and Tobago at the end of 2008 was 169 Bcf. At year-end 2007, the volume was 189 Bcf. The after royalty reserves volume at year-end 2008 was 156 Bcf and at year-end 2007 was 165 Bcf.
12 SEC regulations do not define proved reserves of synthetic crude oil from oil sands mining operations as an oil and gas activity. These reserves are classified as a mining activity and are estimated in accordance with SEC Industry Guide 7. Petro-Canada views these reserves as an integral part of the Company’s business. Proved reserves of synthetic crude oil are based on high geological certainty and application of proven or piloted technology. Syncrude proved oil sands mining reserves have been determined using SEC year-end prices in the economics.
13 Revisions include changes in previous estimates, either upward or downward, resulting from new information (except an increase in acreage) normally obtained from drilling or production history or resulting from a change in economic factors.
14 Proved undeveloped crude oil and NGL reserves represent approximately 54% of Petro-Canada’s total crude oil and NGL proved reserves. The vast majority of these oil and NGL reserves are associated with large development projects currently producing or under active development, including Buzzard, MacKay River, Syncrude, Terra Nova and Hibernia. Proved undeveloped gas reserves represent approximately 15% of total proved natural gas reserves. These reserves typically will be developed through tie-in of existing wells, drilling of additional wells or addition of compression facilities. Fifty-eight per cent of the proved undeveloped gas reserves are associated with the currently producing NCMA-1 development offshore Trinidad and Tobago. Generally, the Company plans to develop proved undeveloped natural gas reserves in the next few years.
15 For internal management purposes, Petro-Canada views the oil sands mining reserves as part of the Company’s total exploration and production operations.
| Annual Information Form PETRO-CANADA 53 |
Standardized Measure of Discounted Future Net Cash Flows and Changes Therein Relating to Proved Oil and Gas Reserves
The following disclosures on Standardized Measure of discounted cash flows and changes therein relating to proved oil and natural gas reserves are determined in accordance with the U.S. FASB Statement 69, Disclosures About Oil and Gas Producing Activities. The future cash flows are calculated by applying year-end prices, or prices provided by contractual arrangements, net of royalties, to year-end quantities of proved oil and natural gas reserves. Future production, development and asset retirement costs are based on year-end costs and estimated future income taxes are based on legislated future income tax rates. The resulting future net cash flows are discounted at 10% per annum. The calculation does not represent a fair market value of the Company’s oil and natural gas reserves or of the future net cash flows. No consideration is given to the value of exploration properties or probable reserves. No consideration is given to the value of the Company’s share of the Syncrude oil sands mining operation, as it is considered a mining operation under SEC disclosure. The following benchmark commodity prices as at December 31, 2008 were used in deriving the Standardized Measure: WTI at Cushing $44.60/bbl US, Dated Brent at Sullom Voe $36.55/bbl US, New York Mercantile Exchange (NYMEX) gas price at the Henry Hub $5.62/MMBtu US and Alberta price of natural gas at the AECO-C Hub Cdn $6.04/gigajoule (GJ). The following currency exchange rates were also used: Cdn$/US$ 1.2246, Cdn$/euro 1.6998, Cdn$/British pound 1.78.
Present Value of Estimated Future Net Cash Flows
(millions of Canadian dollars)
| | Western Canada1,2 | | U.S. Rockies | | East Coast Canada3 | |
| | 2008 | | 2007 | | 2006 | | 2008 | | 2007 | | 2006 | | 2008 | | 2007 | | 2006 | |
Future cash flows | | $ | 13,413 | | $ | 20,422 | | $ | 12,513 | | $ | 992 | | $ | 1,899 | | $ | 1,130 | | $ | 3,115 | | $ | 7,387 | | $ | 7,164 | |
Future production, development and asset retirement costs | | (9,769 | ) | (9,205 | ) | (5,593 | ) | (426 | ) | (486 | ) | (525 | ) | (1,686 | ) | (1,685 | ) | (1,499 | ) |
Future income taxes | | (605 | ) | (2,682 | ) | (1,764 | ) | (68 | ) | (382 | ) | (187 | ) | (245 | ) | (1,457 | ) | (1,553 | ) |
Future net cash flows | | 3,039 | | 8,535 | | 5,156 | | 498 | | 1,031 | | 418 | | 1,184 | | 4,245 | | 4,112 | |
Discount of 10% for estimated timing of cash flows | | (1,102 | ) | (4,159 | ) | (1,927 | ) | (169 | ) | (446 | ) | (154 | ) | (152 | ) | (1,003 | ) | (879 | ) |
Discounted future net cash flows | | $ | 1,937 | | $ | 4,376 | | $ | 3,229 | | $ | 329 | | $ | 585 | | $ | 264 | | $ | 1,032 | | $ | 3,242 | | $ | 3,233 | |
| | | | | | | | | | | | | | | | | | | |
| | North Sea | | North Africa/Near East | | Northern Latin America | |
| | 2008 | | 2007 | | 2006 | | 2008 | | 2007 | | 2006 | | 2008 | | 2007 | | 2006 | |
Future cash flows | | $ | 7,468 | | $ | 13,220 | | $ | 8,506 | | $ | 1,585 | | $ | 9,491 | | $ | 8,011 | | $ | 661 | | $ | 819 | | $ | 838 | |
Future production, development and asset retirement costs | | (2,720 | ) | (3,172 | ) | (2,918 | ) | (941 | ) | (1,015 | ) | (1,024 | ) | (239 | ) | (205 | ) | (282 | ) |
Future income taxes | | (2,658 | ) | (5,303 | ) | (2,966 | ) | (412 | ) | (7,457 | ) | (6,088 | ) | (190 | ) | (321 | ) | (289 | ) |
Future net cash flows | | 2,090 | | 4,745 | | 2,622 | | 232 | | 1,019 | | 899 | | 232 | | 293 | | 267 | |
Discount of 10% for estimated timing of cash flows | | (548 | ) | (963 | ) | (532 | ) | (80 | ) | (322 | ) | (309 | ) | (69 | ) | (111 | ) | (119 | ) |
Discounted future net cash flows | | $ | 1,542 | | $ | 3,782 | | $ | 2,090 | | $ | 152 | | $ | 697 | | $ | 590 | | $ | 163 | | $ | 182 | | $ | 148 | |
| | | | | | | | | | | | | | | | | | | |
| | | | Total | | | | | | | | | | | | | | | |
| | 2008 | | 2007 | | 2006 | | | | | | | | | | | | | |
Future cash flows | | $ | 27,234 | | $ | 53,238 | | $ | 38,162 | | | | | | | | | | | | | |
Future production, development and asset retirement costs | | (15,781 | ) | (15,768 | ) | (11,841 | ) | | | | | | | | | | | | |
Future income taxes | | (4,178 | ) | (17,602 | ) | (12,847 | ) | | | | | | | | | | | | |
Future net cash flows | | 7,275 | | 19,868 | | 13,474 | | | | | | | | | | | | | |
Discount of 10% for estimated timing of cash flows | | (2,120 | ) | (7,004 | ) | (3,920 | ) | | | | | | | | | | | | |
Discounted future net cash flows | | $ | 5,155 | | $ | 12,864 | | $ | 9,554 | | | | | | | | | | | | | |
| | | | | | | | | | | | | | | | | | | | | | | | | | | | |
| | | | | | | | | | | | | | | | | | | | | | | | | | | | | | | | | | | | | | | | | | | | | | | | | | | |
1 Western Canada includes the cash flows of MacKay River in 2006, 2007 and 2008.
2 Cash flow for Western Canada has been restated for 2007.
3 Additional East Coast Canada reserves quantities will be booked as proved reserves as development proceeds.
54 PETRO-CANADA Annual Information Form |
|
Summary of Changes in Present Value of Estimated Future Cash Flows
(millions of Canadian dollars)
| | 2008 | | 20071 | | 2006 | |
Balance at beginning of year | | $ | 12,864 | | $ | 9,554 | | $ | 12,188 | |
Changes result from: | | | | | | | |
Sales and transfers of oil and gas produced, net of production costs | | (10,360 | ) | (7,147 | ) | (5,480 | ) |
Net changes in prices, operating costs and royalties | | (7,441 | ) | 9,406 | | (2,859 | ) |
Extensions, discoveries, additions and improved recoveries | | 1,657 | | 2,376 | | 59 | |
Changes in estimated future development costs | | (1,108 | ) | (1,198 | ) | (597 | ) |
Development costs incurred during the year | | 764 | | 698 | | 900 | |
Revisions of previous quantity estimates | | (58 | ) | 1,157 | | 2,081 | |
Accretion of discount | | 2,480 | | 2,042 | | 2,295 | |
Net change in income tax | | 8,881 | | (2,868 | ) | 2,572 | |
Purchase and sale of reserves in place | | 88 | | 642 | | (367 | ) |
Changes in timing and other | | (2,612 | ) | (1,798 | ) | (1,238 | ) |
Net change | | (7,709 | ) | 3,310 | | (2,634 | ) |
Balance at end of year | | $ | 5,155 | | $ | 12,864 | | $ | 9,554 | |
1 Cash flow for Western Canada has been restated for 2007.
Abandonment and Reclamation Costs
The Company’s upstream future asset retirement costs are estimated based on current costs and technology and in accordance with existing legislation and industry practice. As of December 31, 2008, the total of these future costs was estimated to be $5,336 million undiscounted, or $911 million discounted at 10%. The Company’s upstream operations expect to spend approximately $33 million, $31 million and $38 million in the next three years, respectively, for future asset retirement costs. The following table summarizes Petro-Canada’s wells that are capable of production.
Productive Wells1 at December 31, 2008
| | Crude Oil Wells | | Natural Gas Wells | | Total Wells | |
| | Gross2 | | Net3 | | Gross2 | | Net3 | | Gross2 | | Net3 | |
North America | | | | | | | | | | | | | |
North American Natural Gas – conventional oil and natural gas | | 1,341 | | 1,113 | | 5,993 | | 4,166 | | 7,334 | | 5,279 | |
Oil Sands – in situ bitumen recovery | | 49 | | 49 | | – | | – | | 49 | | 49 | |
East Coast Canada – conventional oil | | 100 | | 25 | | – | | – | | 100 | | 25 | |
Total North America | | 1,490 | | 1,187 | | 5,993 | | 4,166 | | 7,483 | | 5,353 | |
International | | | | | | | | | | | | | |
North Sea – conventional oil and natural gas | | 58 | | 24 | | 32 | | 5 | | 90 | | 29 | |
Other International | | | | | | | | | | | | | |
North Africa/Near East – conventional oil and natural gas | | 233 | | 111 | | – | | – | | 233 | | 111 | |
Northern Latin America – natural gas | | – | | – | | 11 | | 2 | | 11 | | 2 | |
Total International | | 291 | | 135 | | 43 | | 7 | | 334 | | 142 | |
Total productive wells | | 1,781 | | 1,322 | | 6,036 | | 4,173 | | 7,817 | | 5,495 | |
1 Wells with multiple completions are counted as one well.
2 Gross wells include the interests of others.
3 Net wells exclude the interests of others.

| Annual Information Form PETRO-CANADA | 55 |
Oil and Natural Gas Rights
Petro-Canada’s oil and natural gas rights are summarized in the following table. Landholdings are subject to government regulation.
Oil and Natural Gas Rights at December 31, 2008
| | Developed Lands1 | | Undeveloped Lands1 | | Total | |
| | 2008 | | 2007 | | 2008 | | 2007 | | 2008 | | 2007 | |
(millions of acres) | | Gross2 | | Net3 | | Gross2 | | Net3 | | Gross2 | | Net3 | | Gross2 | | Net3 | | Gross2 | | Net3 | | Gross2 | | Net3 | |
Canada | | | | | | | | | | | | | | | | | | | | | | | | | |
Mainland Canada | | 2.3 | | 1.2 | | 2.2 | | 1.2 | | 2.1 | | 1.8 | | 2.6 | | 2.2 | | 4.4 | | 3.0 | | 4.8 | | 3.4 | |
Oil Sands | | 0.4 | | 0.2 | | 0.4 | | 0.2 | | 0.4 | | 0.3 | | 0.4 | | 0.3 | | 0.8 | | 0.5 | | 0.8 | | 0.5 | |
East Coast Canada offshore | | 0.1 | | – | | 0.1 | | – | | 1.3 | | 0.5 | | 1.1 | | 0.3 | | 1.4 | | 0.5 | | 1.2 | | 0.3 | |
Other frontier4 | | – | | – | | – | | – | | 8.5 | | 7.0 | | 8.6 | | 7.0 | | 8.5 | | 7.0 | | 8.6 | | 7.0 | |
Total Canada | | 2.8 | | 1.4 | | 2.7 | | 1.4 | | 12.3 | | 9.6 | | 12.7 | | 9.8 | | 15.1 | | 11.0 | | 15.4 | | 11.2 | |
U.S.5 | | 0.1 | | 0.1 | | 0.1 | | 0.1 | | 4.5 | | 1.8 | | 0.4 | | 0.3 | | 4.6 | | 1.9 | | 0.5 | | 0.4 | |
International | | | | | | | | | | | | | | | | | | | | | | | | | |
North Sea | | 0.1 | | 0.1 | | 0.1 | | – | | 2.9 | | 1.0 | | 3.0 | | 1.0 | | 3.0 | | 1.1 | | 3.1 | | 1.0 | |
Other International | | | | | | | | | | | | | | | | | | | | | | | | | |
North Africa/Near East | | 0.4 | | 0.2 | | 0.4 | | 0.2 | | 13.8 | | 7.5 | | 27.7 | | 21.4 | | 14.2 | | 7.7 | | 28.1 | | 21.6 | |
Northern Latin America | | 0.1 | | – | | 0.1 | | – | | 0.9 | | 0.8 | | 1.0 | | 0.9 | | 1.0 | | 0.8 | | 1.1 | | 0.9 | |
Total International | | 0.6 | | 0.3 | | 0.6 | | 0.2 | | 17.6 | | 9.3 | | 31.7 | | 23.3 | | 18.2 | | 9.6 | | 32.3 | | 23.5 | |
Total | | 3.5 | | 1.8 | | 3.4 | | 1.7 | | 34.4 | | 20.7 | | 44.8 | | 33.4 | | 37.9 | | 22.5 | | 48.2 | | 35.1 | |
1 Developed lands are areas capable of production, while undeveloped lands are areas with rights to explore.
2 Gross acres include the interests of others.
3 Net acres exclude the interests of others.
4 Includes lands located off the west coast of Canada where exploration is currently subject to a moratorium (approximately 5.8 million acres of land gross and net).
5 U.S. figures do not include option acreage in the Alaska Foothills.
56 | PETRO-CANADA Annual Information Form | 
|
Work Commitments
The practice of governments requiring companies to pledge to carry out work commitments in exchange for the right to carry out exploration for and development of hydrocarbons is common, particularly in unexplored or lightly explored regions of the world. Petro-Canada has made the following commitments in regard to the lands it holds.
Work Commitments as at December 31, 2008
(millions of Canadian dollars)
| | Petro-Canada Share of Total
Work Commitments | | Petro-Canada Share of Total
Work Commitments to be
Incurred in 20091 | |
Mainland Canada | | | | | |
NWT region | | $ | 14.2 | | 8.0 | |
International & Offshore | | | | | |
East Coast Canada | | 18.0 | | – | |
North Sea | | 43.3 | | 43.3 | |
Other International | | | | | |
North Africa/Near East | | 692.4 | | 322.7 | |
Northern Latin America | | – | | – | |
Total work commitments | | $ | 767.9 | | 374.0 | |
1 Capital expenditure plan for 2009 includes provisions for these work commitments.
Land Expiries
The following table summarizes the land area by region for which Petro-Canada’s rights to explore for or develop hydrocarbons will expire in 2009.
Land Expiries in 2009
(millions of acres)
| | Gross1 | | Net2 | |
North American Natural Gas | | 0.5 | | 0.4 | |
Oil Sands | | 0.2 | | 0.1 | |
International & Offshore | | | | | |
East Coast Canada | | – | | – | |
International | | – | | – | |
Total expiries in 2009 | | 0.7 | | 0.5 | |
1 Gross acres include the interests of others.
2 Net acres exclude the interests of others.
| Annual Information Form PETRO-CANADA | 57 |
Drilling Activity
The following table shows Petro-Canada’s drilling activity during the years indicated.
Exploration and Development Wells Drilled
| | 2008 | | 2007 | | 2006 | |
| | Gross1 | | Net2 | | Gross1 | | Net2 | | Gross1 | | Net2 | |
NORTH AMERICAN NATURAL GAS | | | | | | | | | | | | | |
Western Canada and U.S. Rockies | | | | | | | | | | | | | |
Exploration wells3 | | | | | | | | | | | | | |
Oil | | – | | – | | 2 | | 1 | | 3 | | 3 | |
Natural gas | | 6 | | 5 | | 5 | | 4 | | 18 | | 14 | |
Dry4 | | 4 | | 4 | | 17 | | 11 | | 20 | | 19 | |
Subtotal | | 10 | | 9 | | 24 | | 16 | | 41 | | 36 | |
Development wells5 | | | | | | | | | | | | | |
Oil | | 148 | | 124 | | 131 | | 117 | | 75 | | 68 | |
Natural gas | | 425 | | 275 | | 405 | | 293 | | 551 | | 413 | |
Dry | | 7 | | 7 | | 20 | | 16 | | 9 | | 6 | |
Subtotal | | 580 | | 406 | | 556 | | 426 | | 635 | | 487 | |
Total North American Natural Gas | | 590 | | 415 | | 580 | | 442 | | 676 | | 523 | |
OIL SANDS | | | | | | | | | | | | | |
Development wells5 | | | | | | | | | | | | | |
Bitumen | | 31 | | 31 | | 19 | | 19 | | – | | – | |
Total Oil Sands | | 31 | | 31 | | 19 | | 19 | | – | | – | |
International & Offshore | | | | | | | | | | | | | |
EAST COAST CANADA | | | | | | | | | | | | | |
Exploration wells3 | | | | | | | | | | | | | |
Oil | | 3 | | 1 | | 2 | | 1 | | 3 | | 1 | |
Dry4 | | – | | – | | – | | – | | – | | – | |
Subtotal | | 3 | | 1 | | 2 | | 1 | | 3 | | 1 | |
Development wells5 | | | | | | | | | | | | | |
Oil | | 5 | | 1 | | 7 | | 1 | | 10 | | 3 | |
Dry | | – | | – | | – | | – | | – | | – | |
Subtotal | | 5 | | 1 | | 7 | | 1 | | 10 | | 3 | |
Total East Coast Canada | | 8 | | 2 | | 9 | | 2 | | 13 | | 4 | |
See footnotes on page 59.
58 | PETRO-CANADA Annual Information Form |
|
Exploration and Development Wells Drilled
| | 2008 | | 2007 | | 2006 | |
| | Gross1 | | Net2 | | Gross1 | | Net2 | | Gross1 | | Net2 | |
International & Offshore –(continued) | | | | | | | | | | | | | |
INTERNATIONAL – Continuing Operations | | | | | | | | | | | | | |
Exploration wells3 | | | | | | | | | | | | | |
Oil | | | | | | | | | | | | | |
North Sea | | 3 | | 1 | | 3 | | 1 | | – | | – | |
North Africa/Near East | | 1 | | 1 | | 2 | | 1 | | 1 | | 1 | |
Natural gas | | | | | | | | | | | | | |
North Sea | | 2 | | 1 | | 2 | | 1 | | 1 | | – | |
Northern Latin America | | 4 | | 3 | | 1 | | 1 | | – | | – | |
Dry4 | | | | | | | | | | | | | |
North Sea | | 2 | | 1 | | 1 | | 1 | | 2 | | – | |
North Africa/Near East | | – | | – | | 1 | | 1 | | 1 | | 1 | |
Northern Latin America | | 2 | | 1 | | 1 | | 1 | | – | | – | |
Subtotal | | 14 | | 8 | | 11 | | 7 | | 5 | | 2 | |
Development wells5 | | | | | | | | | | | | | |
Oil | | | | | | | | | | | | | |
North Sea | | 3 | | 1 | | 11 | | 5 | | 18 | | 6 | |
North Africa/Near East | | 11 | | 6 | | 4 | | 2 | | 5 | | 2 | |
Natural gas | | | | | | | | | | | | | |
North Sea | | 1 | | – | | – | | – | | – | | – | |
North Africa/Near East | | 3 | | 3 | | – | | – | | – | | – | |
Northern Latin America | | 1 | | – | | – | | – | | 8 | | 1 | |
Dry | | | | | | | | | | | | | |
North Sea | | – | | – | | – | | – | | 1 | | – | |
Subtotal | | 19 | | 10 | | 15 | | 7 | | 32 | | 9 | |
Total International | | 33 | | 18 | | 26 | | 14 | | 37 | | 11 | |
Total wells drilled | | 662 | | 466 | | 634 | | 477 | | 726 | | 538 | |
1 Gross wells (excluding all service wells) include the interests of others. This includes gross overriding royalty (GOR) wells.
2 Net wells exclude the interests of others. Net wells exclude GOR wells.
3 Exploration wells are wells drilled to find and produce oil or natural gas in an unproved area, to find a new reservoir or to extend the known boundaries of a previously discovered reservoir.
4 A dry hole is an exploration or development well found to be incapable of producing either oil or natural gas in sufficient quantities to justify completion as an oil or natural gas well.
5 Development wells are wells drilled in an oil or natural gas reservoir to the depth of a stratigraphic horizon known to be productive.
| Annual Information Form PETRO-CANADA | 59 |
DOWNSTREAM
Business Summary and Strategy
Petro-Canada has the second largest downstream business and is the "brand of choice" in Canada. In 2008, Petro-Canada accounted for approximately 13% of the total refining capacity in Canada and about 15% of total petroleum products sold in Canada. | 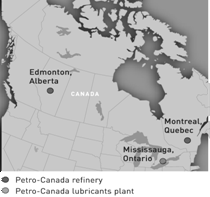
|
|
Downstream operations include two refineries - one in Edmonton and one in Montreal - with a total daily rated capacity of 40,500 cubic metre/day (m3/d) (255,000 b/d), a lubricants plant that is the largest producer of lubricant base stocks in Canada, a network of 1,323 retail service stations, Canada's largest national commercial road transport network of 233 locations and a robust bulk fuel sales channel. |
|
The strategy in the Downstream business is to increase the profitability of the base business through effective capital investment and disciplined management of controllable factors. The Downstream business goal is to deliver superior returns and growth, including a 12% return on capital employed (ROCE) based on a mid-cycle business environment. Key features of the strategy include: |
· achieving and maintaining first quartile operating performance in all areas
· managing and reducing costs, with a specific focus on reducing feedstock costs
· growing revenue
Refining and Supply
Petro-Canada owns and operates two refineries, with a total daily rated capacity of approximately 40,500 m3/d at the end of 2008. This represented approximately 13% of the Canadian refining industry's total refining capacity in 2008. Petro-Canada's refineries produce a full range of refined petroleum products, including gasoline, diesel oils, heating oils, aviation fuels, heavy fuel oil, asphalts, petrochemicals and feedstock for lubricants.
The following table shows the daily rated capacity of Petro-Canada's refineries as at December 31, 2008 and the approximate average daily volumes of crude oil processed, including volumes processed by Petro-Canada for other companies for the years indicated. The overall crude utilization rate at the two refineries averaged 89% in 2008, down 10% from 2007, due largely to the planned shutdowns in 2008 needed to bring the Edmonton RCP on-stream and subsequent ramp up and, in part, due to unplanned outages at the Edmonton refinery in the third quarter.
60 | PETRO-CANADA Annual Information Form | 
|
Rated Capacity of Refineries and Average Daily Crude Oil Processed
(thousands of m3/d)
| | Average Volumes of
Crude Oil Processed/Calendar Day | | Daily Rated Capacity1 | |
| | Years Ended December 31, | | | |
Refinery Location | | 2008 | | 2007 | | 2006 | | As at December 31, 2008 | |
Edmonton, Alberta | | 16.3 | | 20.4 | | 18.9 | | 19.9 | |
Montreal, Quebec | | 19.7 | | 19.7 | | 18.9 | | 20.6 | |
Total | | 36.0 | | 40.1 | | 37.8 | | 40.5 | |
1 | Daily rated capacity is based on calendar days and defined specifications as to types of crude oil, the products to be obtained and the refinery processes required. Variations in these factors may result in actual capacity being higher or lower than rated capacities. |
In 2008, construction of the Edmonton RCP to process 100% oil sands-based feedstock was completed and operations utilizing the new feedstocks began ramping up. At the Montreal refinery, engineering and evaluation of a potential 4,000 m3/d (25,000 b/d) coker was progressed.
Petro-Canada is well positioned with the supply capability to optimize profitability within a range of future business scenarios.
Edmonton Refinery
The Edmonton refinery is Petro-Canada's most efficient refinery, producing a high yield of light oils. Following completion of the RCP in third quarter 2008, the refinery now runs entirely on oil sands-based feedstocks. The conventional crude unit at Edmonton was replaced with new crude and vacuum units, and expanded coker capacity and sulphur removal capability to upgrade and refine oil sands-based feedstock. The new configuration allows the refinery to directly upgrade an Athabasca blend feed of 5,500 m3/d (comprised of 4,100 m3/d of bitumen and 1,400 m3/d of diluent) and process 7,600 m3/d of sour synthetic crude oil, replacing the more expensive conventional light crude feedstock previously refined. The refinery continues to process sweet synthetic crude through its synthetic train. Refer to the Oil Sands content in the Upstream section of this AIF for bitumen and sour crude oil feedstock supply arrangements.
Montreal Refinery
The Montreal refinery, supplied with imported crude oil primarily through the Portland-Montreal pipeline, has a flexible configuration that allows processing of a variety of crude oils, including heavy grades and intermediate feedstock. The refinery produces gasoline, distillates, asphalts, heavy fuel oil, petrochemicals, solvents and feedstock for lubricants.
Petro-Canada continues its assessment of the potential addition of a 4,000 m3/d (25,000 b/d) coker unit, which would allow the Montreal refinery to leverage lower cost heavier crude feedstock and shift production of lower value asphalt and heavy fuel oil to higher value diesel and gasoline fuel. However, the project is on hold until commodity prices and financial markets strengthen, and the Company is reworking the project costs to take advantage of the current market environment.
ParaChem Chemicals Plant
Petro-Canada holds a 51% working interest in ParaChem Chemicals L.P. (ParaChem), which owns and operates a petrochemicals plant located adjacent to the Montreal refinery. The plant primarily produces up to 350,000 metric tons/year of paraxylene (PX), which is used to manufacture polyester textiles and plastic bottles. ParaChem also produces benzene, hydrogen and heavy aromatics. The 75-hectare plant site is located in Montreal's industrial district, with access to pipelines, shipping lanes and rail shipping facilities. Its hydrocarbon storage capacity exceeds 300 million litres.

| Annual Information Form PETRO-CANADA | 61 |
Petro-Canada currently supplies mixed xylenes and toluene to ParaChem. The integration of the ParaChem plant with the Montreal refinery provides several synergies, including the ability to capture more of the petrochemicals value chain through vertical integration.
Supply and Distribution
Petro-Canada purchases crude oil and other refinery feedstock from Canadian and international sources under a number of different contractual arrangements. The Downstream business is responsible for arranging domestic and foreign crude supply for the Company's refineries, as well as marketing Petro-Canada's upstream crude oil production. Upstream crude oil production is generally marketed through short-term, renewable contracts. There is a well-developed infrastructure for third-party supply of both domestic and imported crudes to markets in North America. Purchases are generally through short-term, renewable contracts. Petro-Canada is not dependent on any single source of supply for conventional crude oil and does not anticipate any difficulty in obtaining an adequate supply in the foreseeable future.
Efficiencies are achieved through refined product exchange, purchase, sale and short-term storage arrangements with other petroleum companies. These arrangements reduce capital and transportation costs, assist in the maintenance of supply to customers and enable Petro-Canada to participate in geographical areas without the need to invest capital in distribution facilities. Applicable agreements contain appropriate provisions for consistent product quality to be maintained for the Company's customers.
Petro-Canada operates an extensive distribution network, using pipeline, road, rail and marine transportation to deliver refined products to retail outlets and commercial and industrial customers. The Company holds interests in two refined product pipelines, one crude pipeline and a joint venture interest in one major refined products terminal. Petro-Canada also owns and operates 11 major refined products terminals across Canada.
Sales and Marketing
In 2008, Petro-Canada was the second largest marketer of petroleum products in Canada. Petro-Canada's petroleum products sales represented approximately 15% of total petroleum products sold in Canada during 2008. Petro-Canada markets a full range of petroleum products, including gasoline, diesel oils, heating oils, aviation fuels, heavy fuel oil, asphalts, lubricants, petrochemical feedstock and liquefied petroleum gases. Petro-Canada also generates non-petroleum revenue from convenience stores, car washes and automotive repair and maintenance services. During 2008, the Company continued to focus on profitable growth through initiatives directed at the retail and PETRO-PASS truck stop networks.
62 | PETRO-CANADA Annual Information Form |
|
Average Daily Sales of Petroleum Products
(thousands of m3/d)
| | Years Ended December 31, | |
| | 2008 | | 2007 | | 2006 | |
Gasoline1 | | | | | | | |
Eastern Canada | | 13.4 | | 13.8 | | 13.5 | |
Western Canada | | 10.0 | | 10.3 | | 10.7 | |
Subtotal | | 23.4 | | 24.1 | | 24.2 | |
Middle distillates2 | | | | | | | |
Eastern Canada | | 8.9 | | 8.8 | | 8.7 | |
Western Canada | | 10.0 | | 11.1 | | 10.9 | |
Subtotal | | 18.9 | | 19.9 | | 19.6 | |
Other3 | | 10.1 | | 9.3 | | 8.7 | |
Total | | 52.4 | | 53.3 | | 52.5 | |
1 | Includes motor and aviation gasoline. |
| |
2 | Includes diesel oils, heating oils and aviation jet fuels. |
| |
3 | Includes heavy fuel oil, asphalts, lubricants, liquefied petroleum gases, petrochemical feedstock and other petroleum and non-petroleum products. |
The following table shows the annual revenues derived from refining and marketing activities during the years indicated.
Refining and Marketing Revenues
(millions of Canadian dollars)
| | Years Ended December 31, | |
| | 2008 | | 2007 | | 2006 | |
Gasoline1 | | $ | 6,786 | | $ | 5,883 | | $ | 5,481 | |
Middle distillates2 | | 6,117 | | 4,864 | | 4,537 | |
Other3 | | 3,392 | | 2,606 | | 2,363 | |
Total | | $ | 16,295 | | $ | 13,353 | | $ | 12,381 | |
1 | Includes motor and aviation gasoline. |
| |
2 | Includes diesel oils, heating oils and aviation jet fuels. |
| |
3 | Includes heavy fuel oil, asphalts, lubricants, liquefied petroleum gases, petrochemical feedstock and other petroleum and non-petroleum products. |
Retail
At December 31, 2008, Petro-Canada's network of retail sites consisted of 1,323 outlets across Canada, of which 808 outlets were Company-controlled and the balance of the outlets were controlled by third parties. Independent dealers and agents operate all the outlets.
The Company continued to advance Petro-Canada's standing as the "brand of choice" through focusing on selective representation and site development, generating high site throughputs and achieving a 16% share of the national retail market. In 2008, Petro-Canada led the industry in key urban market metrics and continued to improve the fundamentals of the business. Within the Company's network, annual sales averaged 6.1 million litres per site. The Company also added locations nationally to its independent retail network in 2008. In addition, the Company advanced the development of its new integrated highway facilities, which is a combined retail and PETRO-PASS offering.
Petro-Canada continued to expand its non-petroleum revenue base. This included advancing previously launched product offerings and implementing new products, such as the Fuel Savings Reward Card and car wash Seasons Passes. The business continued to expand the Neighbours fresh food offering and industry-leading Glide Autowash offering. Based on the
| Annual Information Form PETRO-CANADA | 63 |
success of these developments, the Company plans to broaden the availability of these offerings over the coming years. Despite a challenging business environment in 2008, year-over-year convenience store sales grew by 1%, and same-store sales declined by 1% compared with 2007.
Wholesale
Petro-Canada sells petroleum products into farm, home heating, paving, small industrial, commercial and truck markets. This category accounted for approximately 61% of total Downstream sales volumes in 2008, down slightly from 62% in 2007. Petro-Canada is the leading national marketer to the commercial road transport segment in Canada with 233 PETRO-PASS sites. The Company also sells large volumes of petroleum products directly to large industrial and commercial customers and independent marketers.
The Company's focus has been on improving its sales mix in the high value channels of commercial road transport and bulk fuels channels. In 2008, Petro-Canada continued to expand and upgrade the network in key growth markets.
Lubricants
The lubricants plant in Mississauga, Ontario produces specialty lubricants and waxes that are marketed in Canada and internationally. Petro-Canada's lubricants plant is the largest producer of lubricant base stocks in Canada, the sixth largest in North America and the twelfth largest in the world, with annual base oil production capacity in excess of 900 million litres. In June 2006, the lubricants plant was expanded by 25% to support the growth of its high value, specialty lubricants business.
The lubricants plant uses a two-stage hydro-treating process, which is unique in Canada. This process enables Petro-Canada to refine gas oils produced from a wide range of crude feedstock into lubricating oil-based stocks that are among the highest level of purity of any base stocks in the world. Advancing lubricant technology and growing environmental concerns continue to increase the demand for high purity, hydro-treated base stocks for many lubricant applications. Petro-Canada is well positioned to meet this growing demand. In 2008, Lubricants advanced product development and commercialization of its new eco-friendly lawn care product lines, receiving U.S. National Environmental Protection Agency approval for sales into the U.S. market. Product launch plans are currently underway. Also in 2008, Lubricants obtained a business licence to participate in direct sales into the China market.
The Company's product-driven strategy is to improve plant safety and reliability and grow volume in high value segments. In 2008, Petro-Canada continued to focus on optimizing operations and maintenance procedures based on industry best practices. Lubricants sales in 2008 totalled 850 million litres, an increase of approximately 9%, compared with sales volumes of 778 million litres in 2007. The increase in sales volumes was due to higher process fluid, white oil, base oil, and commercial and industrial product sales, partially offset by a decline in wax and automotive product sales. Sales in high value product segments represented 75% of total sales by year-end 2008.
Pipelines
Petro-Canada complements its production, extraction and refining operations with ownership in crude oil and refined product pipelines. The principal pipelines in which the Company has an interest are Alberta Products Pipe Line Inc., Trans-Northern Pipelines Inc. and Montreal Pipe Line Limited.
64 | PETRO-CANADA Annual Information Form |
|
Link to Petro-Canada’s Corporate and Strategic Priorities
The Downstream business is aligned with Petro-Canada’s strategic priorities as outlined by its progress in 2008 and goals for 2009.
PRIORITY | | | 2008 GOALS | | | 2008 RESULTS | | | 2009 GOALS |
| | | | | | | | | |
| | | | | | | | | |
Delivering Profitable Growth with a Focus on Operated, Long-Life Assets | | | · advance Montreal coker, with FID expected in the second quarter of 2008 · complete Edmonton RCP for startup in the fourth quarter of 2008 · continue to invest in smaller scale refinery yield and reliability improvement projects · selectively invest in retail and wholesale assets | | | · completed FEED for proposed 25,000 b/d Montreal coker; FID for project was delayed due to market conditions · completed construction of the Edmonton RCP and started up in the fourth quarter · invested $41 million in smaller scale refinery yield and reliability improvement projects · made selective investments in retail and wholesale assets | | | · review costs for Montreal coker project and position it for sanction when commodity and financial markets improve · realize value of the Edmonton RCP investment · prudently manage refinery capital expenditure spending consistent with economic conditions · selectively invest in retail and wholesale assets |
| | | | | | | | | |
| | | | | | | | | |
Driving for First Quartile Operation of Our Assets | | | · continue to focus on safety and refinery reliability, with increased focus on process safety · reduce feedstock costs · increase retail non-petroleum revenue · grow high value lubricants sales volumes | | | · achieved a combined reliability index of 84 at the Company's two refineries · began processing lower cost oil sands-based feedstock at completed Edmonton RCP · grew convenience store sales by 1%, while same-store sales declined by 1% compared with 2007 · increased high value lubricants sales volumes by 13% | | | · continue to focus on personal and process safety, refinery reliability and environmental responsibility · reduce feedstock costs · increase retail non-petroleum revenue · grow high value lubricants sales volumes |
| | | | | | | | | |
| | | | | | | | | |
Continuing to Work at Being a Responsible Company | | | · maintain focus on TRIF and regulatory compliance exceedances · assess highest risk retail sites for safety and security enhancements · assess water use at retail and wholesale facilities and review current management activities in high risk areas | | | · TRIF decreased to 0.60, compared with 0.64 in 2007 · recorded 13 environmental regulatory exceedances, compared with 12 in 2007 · completed safety and security assessments at retail sites and implemented upgrades based on priority profile · assessed water quality risks and identified highest risk retail and wholesale facilities and developed water quality management plans based on corporate water principles | | | · execute drinking water management plans for high risk wholesale and retail facilities and develop criteria to audit success · employ Life-Cycle Value Assessment (LCVA) to help inform decisions regarding waste management and minimization at refineries · maintain focus on energy efficiency and GHG mitigation opportunities and establish a baseline for new Edmonton refinery configuration · maintain focus on TRIF and integrate new measures related to process safety activities |
| | | | | | | | | |
| | | | | | | | | |

| Annual Information Form PETRO-CANADA | 65 |
HUMAN RESOURCES
As at December 31, 2008, Petro-Canada and its wholly owned subsidiaries had 6,088 employees, compared with 5,603 employees as at December 31, 2007. Of the year-end 2008 employees, 896 employees were employed in the North American Natural Gas business unit, 661 employees were employed in the Oil Sands business unit, 519 employees were employed in the International & Offshore business unit and 2,522 employees were employed in Downstream. The remaining 1,490 employees were corporate support staff. Seven hundred and twelve employees were employed outside of Canada, of which 274 were corporate support staff employees and 35 were Downstream employees.
Approximately 20% of Petro-Canada's employees were covered by collective bargaining agreements in 2008. Approximately 90% of the Company's unionized employees were members of the Communications Energy and Paperworkers Union (CEP) in 2008, which represents refinery, marketing, gas plant and offshore production workers. Three-year collective bargaining agreements with most CEP locals will expire on January 31, 2010. A collective agreement at our Montreal refinery was reached in December 2008, following a 13-month Company-initiated work stoppage. Negotiations between the Company and the union representing employees on the Terra Nova FPSO commenced well in advance of the contract expiry and a tentative agreement was reached in early 2009.
SOCIAL AND ENVIRONMENTAL POLICIES
Petro-Canada is determined to earn the support received from stakeholders, not just through excellence in meeting customers' energy needs, but by also playing an active and important role in the communities where the Company lives and operates. Petro-Canada conducts business in a highly principled manner, as guided by a Code of Business Conduct (a copy of which is available under the Company's SEDAR profile at www.sedar.com), corporate values and standards, and the values and standards of the societies that host Petro-Canada operations. Wherever the Company operates around the world, Petro-Canada aims to invest and conduct operations in a manner that is economically rewarding to all parties, is recognized as being ethically, socially and environmentally responsible, is welcomed by the communities in which Petro-Canada operates, and helps facilitate economic, human and community development within a stable operating environment. Petro-Canada subscribes to the International Code of Ethics for Canadian Business, the United Nations Global Compact and the Universal Declaration of Human Rights.
Petro-Canada executives are accountable for the effective execution of TLM policy1 and standards. Petro-Canada periodically reviews each business unit or Shared Services unit based on risk to assess the implementation of the policy and standards. The Executive Leadership Team reviews environment, health and safety performance monthly. As well, the Environment, Health and Safety Committee of the Board reviews environment, health and safety performance throughout the year.
At Petro-Canada, investing in communities is an integral part of the way the Company does business. Petro-Canada works with communities in the Company's key business locations to ensure its presence generates value and makes a difference for its neighbours. The Company invests in large scale initiatives that provide significant benefits at a national level, as well as in grassroots programs and services at the local level. Following a detailed strategic review of its community partnerships program, a new strategy was launched in 2007 with a focus on education, the environment and local community support.
1 Petro-Canada's TLM framework is a systematic approach to identify, assess and control operational risk.
66 | PETRO-CANADA Annual Information Form | 
|
CASH AND IN-KIND CONTRIBUTIONS OF NEARLY $14 MILLION IN 2008
Highlights
In 2008, Petro-Canada invested nearly $8 million to strengthen key communities where the Company has operations, and where employees live and work. In support of the Company's largest partnership – the Olympics and Paralympics – Petro-Canada invested nearly $6 million to support Canadian athletes and coaches at the grassroots level.
Education is a key area of investment to develop skills and competencies Petro-Canada uses today and will need in the future. Since its creation in 2006, the Petro-Canada Emerging Leaders Awards program has been established at six post-secondary institutes for a total long-term commitment of more than $4 million.
To ensure the strength of its community partnerships, the Company is actively involved in the London Benchmarking Group, which provides a framework and tools to measure the input and impact of community investment.
Petro-Canada employees are consistently involved in providing leadership and assistance within their communities. Employees and the Company donated nearly $3.5 million to United Way campaigns across North America in 2008. In addition, the Petro-Cares program provided 814 grants totalling $305,901 to non-profit organizations supported by employees and retirees who give their time to the community. These volunteer grants, created in 1992, have now surpassed $2.4 million globally. In Canada, through the Company's year-round Petro-Cares days, employees and retirees contributed more than 3,300 hours of volunteer time to 104 projects for non-profit organizations.
In 2008, Petro-Canada reaffirmed its commitment to the pursuit of the Olympic ideals by presenting the Petro-Canada sports leadership conference in Halifax, by providing Canadian Olympians and Paralympians the opportunity to take their inspirational messages to schools, and by developing the popular iwilldreambig.ca website to profile developing Canadian athletes.
To learn more about Petro-Canada's community involvement, please access the annual Report to the Community available on the Company's website (www.petro-canada.ca). The 2008 report will be published mid-2009.
| | Years ended December 31, | |
(millions of Canadian dollars) | | 2008 | | 2007 | | 2006 | |
Local community support1 | | $ | 3.2 | | $ | 5.0 | | $ | 6.2 | |
Olympic/Paralympic | | 5.9 | | 5.0 | | 10.7 | |
Education | | 2.5 | | 2.4 | | 1.5 | |
United Way2 | | 1.5 | | 1.3 | | 1.2 | |
Environment | | 0.6 | | 1.2 | | 0.6 | |
Total | | $ | 13.7 | | $ | 14.9 | | $ | 20.2 | |
1 Cash contributions to communities from Petro-Canada's community partnerships program (including the Petro-Cares program), business operating units plus in-kind donations.
2 Company cash contributions and campaign costs only (excludes employee donations).
| Annual Information Form PETRO-CANADA | 67 |
ENVIRONMENTAL EXPENDITURES
In 2008, Petro-Canada's environmental capital and operating expenditures totalled $412 million, compared with $280 million in 2007 and $501 million in 2006. The increase in 2008 expenditures mainly reflected the completion of Downstream projects to meet federal regulations for sulphur limits in diesel.
Environmental expenditures included purchase, installation, operation and maintenance of pollution abatement equipment and facilities, replacement of underground tanks, waste management, environmental studies and research, reclamation activities and the workforce costs of environmental staff and consultants.
The following table shows Petro-Canada's expenditures for environmental matters during 2008.
Environmental Costs – Year Ended December 31, 2008
(millions of Canadian dollars)
| | Capital | | Operating
Expense | | Total | |
Upstream | | $ | 67 | | 143 | | 210 | |
Downstream | | 150 | | 52 | | 202 | |
Total environmental costs | | $ | 217 | | 195 | | 412 | |
More detailed information on the Company's policies and performance relative to the environment will be included in the annual Report to the Community, which will be published on the Company's website (www.petro-canada.ca) mid-2009.
Petro-Canada will likely face increased capital and operating costs in the future in order to comply with proposed environmental regulations. See "Risk Management – Risks Relating to Petro-Canada's Business."
68 | PETRO-CANADA Annual Information Form |
|
Consolidated Financial Information
| | Years Ended December 31, | |
(millions of Canadian dollars, except per share amounts) | | | 2008 | | 2007 | | 2006 | |
Statement of earnings data | | | | | | | |
Revenue | | | | | | | |
Operating | | $ | 27,585 | | $ | 21,710 | | $ | 18,911 | |
Investment and other income (expense) | | 200 | | (460 | ) | (242 | ) |
Total revenue | | 27,785 | | 21,250 | | 18,669 | |
Earnings from continuing operations before income taxes | | 5,753 | | 4,907 | | 3,972 | |
Provision for income taxes | | 2,619 | | 2,174 | | 2,384 | |
Net earnings from continuing operations | | 3,134 | | 2,733 | | 1,588 | |
Net earnings from discontinued operations | | – | | – | | 152 | |
Net earnings | | $ | 3,134 | | $ | 2,733 | | $ | 1,740 | |
Net earnings | | | | | | | |
Upstream | | | | | | | |
North American Natural Gas | | $ | 344 | | $ | 191 | | $ | 405 | |
Oil Sands | | 334 | | 316 | | 245 | |
International & Offshore | | | | | | | |
East Coast Canada | | 1,368 | | 1,229 | | 934 | |
International | | 1,684 | | 374 | | (206 | ) |
Downstream | | – | | 629 | | 473 | |
Shared Services and Eliminations | | (596 | ) | (6 | ) | (263 | ) |
Discontinued operations | | – | | – | | 152 | |
Net earnings | | $ | 3,134 | | $ | 2,733 | | $ | 1,740 | |
Earnings per share from continuing operations | – basic | | $ | 6.47 | | $ | 5.59 | | $ | 3.15 | |
| – diluted | | 6.43 | | 5.53 | | 3.11 | |
Earnings per share | – basic | | 6.47 | | 5.59 | | 3.45 | |
| – diluted | | 6.43 | | 5.53 | | 3.41 | |
Dividends per share | | 0.66 | | 0.52 | | 0.40 | |
Cash flow from continuing operating activities | | 6,522 | | 3,339 | | 3,608 | |
Balance sheet data (at end of year) | | | | | | | |
Total assets | | 30,377 | | 23,852 | | 22,646 | |
Debt | | 4,749 | | 3,450 | | 2,894 | |
Cash and cash equivalents1 | | 1,445 | | 231 | | 499 | |
Shareholders' equity | | 15,475 | | 11,870 | | 10,441 | |
Average capital employed1 | | $ | 17,772 | | $ | 14,328 | | $ | 12,868 | |
| | | | | | | | | | | | |
1 Includes discontinued operations associated with the mature Syrian assets sold in 2006.
| Annual Information Form PETRO-CANADA | 69 |
Quarterly Information
(millions of Canadian dollars, except per share amounts)
| | 2008
Three Months Ended | | 2007
Three Months Ended | |
| | Mar. 31 | | June 30 | | Sept. 30 | | Dec. 31 | | Mar. 31 | | June 30 | | Sept. 30 | | Dec. 31 | |
Total revenue | | $ | 6,586 | | $ | 7,646 | | $ | 8,286 | | $ | 5,267 | | $ | 4,841 | | $ | 5,478 | | $ | 5,497 | | $ | 5,434 | |
Net earnings | | | | | | | | | | | | | | | | | |
Upstream | | | | | | | | | | | | | | | | | |
North American Natural Gas | | $ | 74 | | $ | 100 | | $ | 165 | | $ | 5 | | $ | 112 | | $ | 81 | | $ | 55 | | $ | (57 | ) |
Oil Sands | | 112 | | 177 | | 209 | | (164 | ) | 43 | | 34 | | 110 | | 129 | |
International & Offshore | | | | | | | | | | | | | | | | | |
East Coast Canada | | 375 | | 385 | | 397 | | 211 | | 256 | | 334 | | 293 | | 346 | |
International | | 336 | | 672 | | 483 | | 193 | | 9 | | 195 | | 200 | | (30 | ) |
Downstream | | 184 | | 300 | | (27 | ) | (457 | ) | 184 | | 259 | | 105 | | 81 | |
Shared Services and Eliminations | | (5 | ) | (136 | ) | 24 | | (479 | ) | (14 | ) | (58 | ) | 13 | | 53 | |
Net earnings | | $ | 1,076 | | $ | 1,498 | | $ | 1,251 | | $ | (691 | ) | $ | 590 | | $ | 845 | | $ | 776 | | $ | 522 | |
Earnings per share | | | | | | | | | | | | | | | | | |
Basic | | $ | 2.22 | | $ | 3.10 | | $ | 2.58 | | $ | (1.43 | ) | $ | 1.19 | | $ | 1.71 | | $ | 1.59 | | $ | 1.08 | |
Diluted | | $ | 2.20 | | $ | 3.07 | | $ | 2.56 | | $ | (1.43 | ) | $ | 1.18 | | $ | 1.70 | | $ | 1.58 | | $ | 1.07 | |
70 | PETRO-CANADA Annual Information Form | 
|
CAPITAL EXPENDITURES ON PROPERTY, PLANT AND EQUIPMENT AND EXPLORATION
The following table shows Petro-Canada's capital expenditures on property, plant and equipment and exploration for the years indicated.
Capital Expenditures on Property, Plant and Equipment and Exploration
(millions of Canadian dollars)
| | 2008 | | 2007 | | 2006 | |
Exploration | | | | | | | |
North American Natural Gas | | $ | 232 | | $ | 144 | | $ | 160 | |
Oil Sands | | – | | 20 | | 6 | |
International & Offshore | | | | | | | |
East Coast Canada | | 7 | | (2 | ) | 3 | |
International | | | | | | | |
North Sea | | 60 | | 71 | | 37 | |
Other International | | 279 | | 220 | | 40 | |
Total exploration | | 578 | | 453 | | 246 | |
Development | | | | | | | |
North American Natural Gas | | 445 | | 514 | | 523 | |
Oil Sands | | 1,060 | | 408 | | 269 | |
International & Offshore | | | | | | | |
East Coast Canada | | 269 | | 161 | | 253 | |
International | | | | | | | |
North Sea | | 221 | | 324 | | 551 | |
Other International | | 599 | | 147 | | 132 | |
Total development | | 2,594 | | 1,554 | | 1,728 | |
Property acquisitions | | | | | | | |
North American Natural Gas | | 346 | | 208 | | 105 | |
Oil Sands | | 3 | | 351 | | 102 | |
International | | | | | | | |
Other International | | 956 | | – | | – | |
Total property acquisitions | | 1,305 | | 559 | | 207 | |
Downstream | | | | | | | |
Refining and supply | | 1,651 | | 1,214 | | 1,038 | |
Sales, marketing and other | | 156 | | 155 | | 142 | |
Lubricants | | 27 | | 27 | | 49 | |
Total Downstream | | 1,834 | | 1,396 | | 1,229 | |
Shared Services | | 33 | | 26 | | 24 | |
Total capital expenditures on property, plant and equipment and exploration from continuing operations | | 6,344 | | 3,988 | | 3,434 | |
Discontinued operations | | – | | – | | 1 | |
Total capital expenditures on property, plant and equipment and exploration | | $ | 6,344 | | $ | 3,988 | | $ | 3,435 | |

| Annual Information Form PETRO-CANADA | 71 |
For 2009, the Company expects to cover its capital program with cash flow, cash and, if necessary, from available credit facilities. On December 11, 2008, the Company released an outlook for 2009 planned capital expenditures totalling $3,960 million. Subsequent to the release of this guidance, as a result of persistently low commodity prices, the Company plans to further reduce 2009 planned capital expenditures to more properly balance the levels being invested on capital expenditures and the draws on the liquidity resources comprised of cash flow, cash and available credit facilities. In 2009, spending on new growth projects is expected to decrease, while spending on replacing reserves in core areas is expected to increase. Approximately 54% of planned capital expenditures support delivering profitable new growth and funding exploration and new ventures. This is down by $2.5 billion, compared with the same categories in 2008. Approximately 34% of planned capital expenditures will be directed toward replacing reserves in core areas, an increase of $170 million compared with 2008. The remaining 12% of 2009 planned capital expenditures is directed toward enhancing existing assets, improving base business profitability and complying with new regulations.
2009 Capital Outlook | | (millions of Canadian dollars) | |
Comply with new regulations | | $ | 130 | |
Enhance existing assets | | 300 | |
Improve base business profitability | | 60 | |
Replace reserves in core areas | | 1,340 | |
Advance new growth projects | | 1,935 | |
Fund exploration and new ventures for long-term growth | | 195 | |
Total | | $ | 3,960 | |
Capital Investment by Business – 2009 Outlook | | (millions of Canadian dollars) | |
Upstream | | | |
North American Natural Gas | | $ | 580 | |
Oil Sands | | 985 | |
International & Offshore | | | |
East Coast Canada | | 530 | |
International | | 1,270 | |
Subtotal | | 3,365 | |
Downstream | | | |
Refining and Supply | | 460 | |
Sales and Marketing | | 70 | |
Lubricants | | 30 | |
Subtotal | | 560 | |
Shared Services | | 35 | |
Total | | $ | 3,960 | |
DIVIDENDS
Petro-Canada's priority uses of cash are to fund the capital program and profitable growth opportunities, and to return cash to shareholders through dividends and a share buyback program.
Petro-Canada regularly reviews its dividend strategy to ensure the alignment of dividend policy with shareholder expectations, and financial and growth objectives. Consistent with this objective, on July 23, 2008, the Company declared a 54% increase in its quarterly dividend to $0.20/share, commencing with the dividend payable on October 1, 2008. Total dividends paid in 2008 were $320 million ($0.66/share), compared with $255 million ($0.52/share) in 2007 and $201 million ($0.40/share) in 2006.
72 | PETRO-CANADA Annual Information Form |
|
GENERAL DESCRIPTION OF CAPITAL STRUCTURE
The Company's authorized share capital is comprised of an unlimited number of common shares, an unlimited number of preferred shares issuable in series designated as senior preferred shares and an unlimited number of preferred shares issuable in series designated as junior preferred shares. As at December 31, 2008, there were 484,597,467 common shares issued and outstanding. To the knowledge of the Board and executive officers of Petro-Canada, no person beneficially owns or exercises control or direction over securities carrying 10% or more of the voting rights attached to any class of voting securities of the Company. The investment firm of Alliance Bernstein L.P. exercises control or direction over 51,029,472 common shares of the Company as at November 10, 2008, representing approximately 10.5% of the total issued and outstanding common shares of the Company as at December 31, 2008. The holders of common shares are entitled to attend all meetings of shareholders and vote at any such meeting on the basis of one vote for each common share held. As no senior preferred shares or junior preferred shares are issued and outstanding, common shareholders are entitled to receive any dividend declared by the Board on the common shares and to participate in a distribution of the Company's assets among its shareholders for the purpose of winding up its affairs. The holders of the common shares shall be entitled to share equally, share for share, in all distributions of such assets.
CONSTRAINTS
Ownership, Voting and Other Restrictions
The Petro-Canada Public Participation Act requires that the Articles of Petro-Canada include certain restrictions on the ownership and voting of voting shares of the Company. The common shares of Petro-Canada are voting shares.
No person, together with associates of that person, may subscribe for, have transferred to that person, hold, beneficially own or control otherwise than by way of security only, or vote in the aggregate, voting shares of Petro-Canada to which are attached more than 20% of the votes attached to all outstanding voting shares of Petro-Canada. Additional restrictions include provisions for suspension of voting rights, forfeiture of dividends, prohibitions against share transfer, compulsory sale of shares, and redemption and suspension of other shareholder rights. The Board may at any time require holders of, or subscribers for, voting shares, and certain other persons, to furnish statutory declarations as to ownership of voting shares and certain other matters relevant to the enforcement of the restrictions. Petro-Canada is prohibited from accepting any subscription for, and issuing or registering a transfer of, any voting shares if a contravention of the individual ownership restrictions results.
Petro-Canada's Articles, as required by the Petro-Canada Public Participation Act, also include provisions requiring Petro-Canada to maintain its head office in Calgary, Alberta; prohibiting Petro-Canada from selling, transferring or otherwise disposing of all or substantially all of its assets in one transaction, or several related transactions, to any one person or group of associated persons, or to non-residents, other than by way of security only in connection with the financing of Petro-Canada; and requiring Petro-Canada to ensure (and to adopt, from time to time, policies describing the manner in which Petro-Canada will fulfil the requirement to ensure) that any member of the public can, in either official language of Canada (English and French), communicate with and obtain available services from Petro-Canada's head office and any other facilities where Petro-Canada determines there is significant demand for communication with, and services from, that facility in that language.

| Annual Information Form PETRO-CANADA | 73 |
CREDIT RATINGS
The following table shows the ratings issued by the rating agencies noted therein as of December 31, 2008. A security rating is not a recommendation to buy, sell or hold securities and may be subject to revisions or withdrawal at any time by the rating agency.
Petro-Canada's Credit Ratings
| | Moody's Investors
Service (Moody's) | | Standard & Poor's
(S&P) | | Dominion Bond
Rating Service
(DBRS) | |
Outlook | | Stable | | Stable | | Negative | |
Senior unsecured | | Baa2 | | BBB | | A (low) | |
Short term | | – | | – | | R-1 (low) | |
Moody's credit ratings are on a long-term debt rating scale that ranges from Aaa to C, which represents the range from highest to lowest quality of such securities rated. According to Moody's rating system, obligations rated "Baa" are subject to moderate credit risk. They are considered medium-grade and, as such, may possess certain speculative characteristics.
Moody's applies numerical modifiers 1, 2 and 3 in each generic rating classification from Aa through Caa in its corporate bond rating system. The modifier 1 indicates that the issue ranks in the higher end of its generic rating category; the modifier 2 indicates a mid-range ranking and the modifier 3 indicates that the issue ranks in the lower end of its generic rating category.
S&P's credit ratings are on a long-term debt rating scale that ranges from AAA to D, which represents the range from highest to lowest quality of such securities rated. According to the S&P rating system, an obligor rated BBB has adequate capacity to meet its financial commitments. However, adverse economic conditions or changing circumstances are more likely to lead to a weakened capacity of the obligor to meet its financial commitments on the obligation. The ratings from AA to CCC may be modified by the addition of a plus (+) or minus (–) sign to show relative standing within the major rating categories.
DBRS' credit ratings are on a long-term debt rating scale that ranges from AAA to D, which represents the range from highest to lowest quality of such securities rated. According to the DBRS rating system, bonds and long-term debt rated A are of satisfactory credit quality. Protection of interest and principal is still substantial, but the degree of strength is less than with AA rated entities. While a respectable rating, entities in the A category are considered to be more susceptible to adverse economic conditions and have greater cyclical tendencies than higher rated companies. The ratings from AA to C may be modified by the addition of a "high" or "low" grade to indicate the relative standing of a credit within a particular rating category.
DBRS' short-term credit ratings are on a short-term debt rating scale that ranges from R-1 to D, which represents the range from highest to lowest quality of such securities rated. The ratings from R-1 to R-2 may be modified by the addition of a "high," "mid" or "low" grade to indicate the relative standing of a credit within a particular rating category. According to the DBRS rating system, short-term debt rated R-1 (low) is of satisfactory credit quality. The overall strength and outlook for key liquidity, debt and profitability ratios is not normally as favourable as with higher rating categories, but these considerations are still respectable. Any qualifying negative factors that exist are considered manageable, and the entity is normally of sufficient size to have some influence in its industry.
DBRS uses "rating trends" for its ratings in the corporate sector. Rating trends provide guidance in respect of DBRS's opinion regarding the outlook for the rating in question, with rating trends falling into one of three categories: "Positive," "Stable" or "Negative." The rating trend indicates the direction in which DBRS considers the rating is headed should present tendencies continue or, in some cases, unless challenges are addressed. In general, the DBRS view is based primarily on an evaluation of the issuing entity or guarantor itself, but may also include consideration of the outlook for the industry or industries in which the issuing entity operates. A Positive or Negative Trend is not an indication that a rating change is imminent. Rather, a Positive or Negative Trend represents an indication that there is a greater likelihood that the rating could change in the future than would be the case if a Stable Trend was assigned to the security.
74 | PETRO-CANADA Annual Information Form | 
|
TRADING PRICE AND VOLUME
The Company's outstanding share capital is comprised of common shares, and each common share carries one vote. The Company's common shares trade on the Toronto Stock Exchange (TSX) under the symbol PCA and on the New York Stock Exchange (NYSE) under the symbol PCZ.
The greatest volume of trading in the Company's shares takes place on the TSX. The following table sets out the trading range and volume traded on the TSX and the NYSE in 2008 on a monthly basis.
Petro-Canada Share Trading Activity on the TSX and the NYSE in 2008
| | Toronto Stock Exchange | | New York Stock Exchange | |
| | Share Price Trading Range
(Canadian dollars per share) | | Share
Volume | | Share Price Trading Range
(U.S. dollars per share) | | Share
Volume | |
| | High | | Low | | Close | | (millions) | | High | | Low | | Close | | (millions) | |
2008 | | | | | | | | | | | | | | | | | |
January | | $ | 55.35 | | 45.63 | | 45.63 | | 52.7 | | $ | | 55.99 | | 45.52 | | 45.60 | | 25.2 | |
February | | | 49.41 | | 43.12 | | 47.11 | | 50.6 | | | 50.27 | | 42.77 | | 48.04 | | 28.8 | |
March | | | 47.11 | | 42.77 | | 44.72 | | 52.6 | | | 47.79 | | 41.95 | | 43.41 | | 32.0 | |
April | | | 52.00 | | 44.69 | | 50.46 | | 45.2 | | | 51.77 | | 43.70 | | 50.12 | | 24.6 | |
May | | | 60.00 | | 50.27 | | 57.33 | | 52.9 | | | 61.03 | | 49.43 | | 57.72 | | 32.4 | |
June | | | 59.05 | | 54.15 | | 57.11 | | 48.7 | | | 58.24 | | 53.40 | | 55.75 | | 31.9 | |
July | | | 55.75 | | 46.04 | | 47.26 | | 47.2 | | | 56.90 | | 45.44 | | 46.23 | | 37.9 | |
August | | | 48.42 | | 45.13 | | 46.95 | | 43.9 | | | 47.10 | | 42.53 | | 44.14 | | 36.1 | |
September | | | 43.92 | | 33.70 | | 35.40 | | 75.4 | | | 41.25 | | 32.35 | | 33.35 | | 61.4 | |
October | | | 35.23 | | 23.70 | | 30.14 | | 77.8 | | | 33.18 | | 19.08 | | 24.96 | | 92.6 | |
November | | | 33.73 | | 20.83 | | 33.73 | | 54.7 | | | 25.30 | | 16.43 | | 25.05 | | 56.2 | |
December | | $ | 29.25 | | 25.28 | | 26.72 | | 47.1 | | $ | | 24.46 | | 19.92 | | 21.89 | | 52.3 | |
PRIOR SALES
On May 15, 2008, the Company issued $600 million US of 10-year notes, bearing interest at the rate of 6.05% per year, and $900 million US of 30-year notes, bearing interest at the rate of 6.80% per year, under its previously filed base shelf prospectus. The base shelf prospectus provides for the offering of up to $4 billion US of debt securities in Canada or the U.S. over the course of a 25-month period from March 31, 2008.
| Annual Information Form PETRO-CANADA | 75 |
DIRECTORS
The following describes the Directors of the Company. Details on compensation and share ownership guidelines for the Directors can be found in the Company’s Management Proxy Circular dated March 5, 2009.

HANS BRENNINKMEYER9 Independent1 Age: 63 Toronto, Ontario, Canada Director since July 2008 | | Hans Brenninkmeyer has been the Chairman of Porticus N.A. (a charitable foundation) since 2005. Prior to that he was Chairman and President of American Retail Group and the former Chief Executive Officer of Comark Canada. Mr. Brenninkmeyer sits on the Board of Governors of The New School University in New York City. He holds a Master of Business Administration from New York University. |
| |
| |
| Board and Committee Membership | Attendance |
| Board of Directors | 4 of 4 | 100% |
| Audit, Finance and Risk Committee | 3 of 3 | 100% |
| Pension Committee | 1 of 1 | 100% |
| |
| |
| Securities Held |
| |
| | | Deferred | | | |
| | | Share | | | |
| | Common | Units | Total of Common | Total Market Value of | Minimum |
| Year | Shares2 | (DSUs)3 | Shares and DSUs | Common Shares and DSUs4 | Required5 |
| | | | | (Cdn $) | (Cdn $) |
| 2008 | – | 2,033 | 2,033 | $61,250 | $420,000 |
| | | | | | |
| | | | | | |
| Options Held: None. Non-employee Directors are not eligible to participate in the Company’s stock option plan. |
| | | | | | |
| Other Public Board Directorships: None |
| | | | | | | | | |

GAIL COOK-BENNETT, C.M. Independent1,6
Age: 68
Toronto, Ontario, Canada Director since 1991 | | Gail Cook-Bennett was appointed Chair of the Board of Manulife Financial during 2008. Prior to that she had been the Chairperson of the Canada Pension Plan Investment Board (public pension plan investment) since 1998. Ms. Cook-Bennett has earned a PhD in Economics from the University of Michigan and holds a Doctor of Laws (honoris causa) from Carleton University. She is a Fellow of the Institute of Corporate Directors. |
| | | |
| Board and Committee Membership | Attendance |
| Board of Directors | 8 of 8 | 100% |
| Audit, Finance and Risk Committee | 6 of 7 | 86% |
| Pension Committee (Chair) | 2 of 2 | 100% |
| |
| Securities Held |
| |
| Year | Common Shares2 | DSUs3 | Total of Common
Shares and DSUs | Total Market Value of
Common Shares and DSUs4 | Minimum
Required5 |
| | | | | (Cdn $) | (Cdn $) |
| 2008 | 4,098 | 20,575 | 24,673 | $ 712,020 | $420,000 |
| | | | | |
| 2007 | 4,098 | 20,361 | 24,459 | $1,284,524 |
| |
| |
| Options Held: None. Non-employee Directors are not eligible to participate in the Company’s stock option plan. |
| | | | | | |
| Other Public Board Directorships: Emera Inc. and Manulife Financial Corporation |
| | | | | | | | | | |
76 | PETRO-CANADA Annual Information Form | 
|

CLAUDE FONTAINE, Q.C. Independent1
Age: 67
Montréal, Quebec, Canada Director since 1987 | | Claude Fontaine, Corporate Director, is a former partner of Ogilvy Renault LLP (barristers and solicitors). He serves as a Director or on the advisory board of a number of for-profit and not-for-profit organizations, including AAER inc. and the Montreal Heart Institute Foundation. Mr. Fontaine holds a Bachelor of Arts (BA), a Licence in Law (LL.L) and an Institute of Corporate Directors certification (ICD.D). |
| | |
| | |
| Board and Committee Membership | Attendance |
| Board of Directors | 7 of 8 | 88% |
| Environment, Health and Safety Committee | 3 of 3 | 100% |
| Management Resources and Compensation Committee (Chair) | 6 of 7 | 86% |
| |
| |
| Securities Held |
| |
| Year | Common
Shares2 | DSUs3 | Total of Common
Shares and DSUs | Total Market Value of
Common Shares and DSUs4 | Minimum
Required5 |
| | | | | (Cdn $) | (Cdn $) |
| 2008 | 20,585 | 30,864 | 51,449 | $1,530,283 | $420,000 |
| | | | | |
| 2007 | 16,598 | 30,535 | 47,133 | $2,482,961 |
| |
| |
| Options Held: None. Non-employee Directors are not eligible to participate in the Company’s stock option plan. |
| | | | | | |
| Other Public Board Directorships: AAER inc. |
| | | | | | | | | |

PAUL HASELDONCKX Independent1
Age: 60
Essen, Germany Director since 2002 | | Paul Haseldonckx, Corporate Director, is the past Chairman of the Executive Board of Veba Oil & Gas GmbH (global upstream) and its predecessor companies. He has also been a Member of the Management Board of Veba Oel AG, Germany’s largest downstream company, including Aral. Mr. Haseldonckx represented Veba’s interests at the Board of the Cerro Negro joint venture, an in situ oil sands development including an upgrader, during the construction and early production phase. Mr. Haseldonckx holds a Master of Science. |
| | |
| | |
| Board and Committee Membership | Attendance |
| Board of Directors | 8 of 8 | 100% |
| Audit, Finance and Risk Committee | 7 of 7 | 100% |
| Environment, Health and Safety Committee (Chair) | 3 of 3 | 100% |
| |
| |
| Securities Held |
| |
| Year | Common
Shares2 | DSUs3 | Total of Common
Shares and DSUs | Total Market Value of
Common Shares and DSUs4 | Minimum
Required5 |
| | | | | (Cdn $) | (Cdn $) |
| 2008 | 8,089 | 6,249 | 14,338 | $548,060 | $420,000 |
| | | | | |
| 2007 | 8,047 | 6,186 | 14,233 | $752,464 |
| |
| |
| Options Held: None. Non-employee Directors are not eligible to participate in the Company’s stock option plan. |
| | | | | | |
| Other Public Board Directorships: None |
| | | | | | | | | |

| Annual Information Form PETRO-CANADA | 77 |

THOMAS E. KIERANS, O.C.7 Independent1,6 Age: 68 Toronto, Ontario, Canada Director since 1991 | | Tom Kierans is Chair of Council and Vice-President of the Social Sciences and Humanities Research Council and a Senior Fellow of Massey College in the University of Toronto. Before that he was Chair of the Canadian Journalism Foundation and Chair of CSI Global Markets. Mr. Kierans holds a Bachelor of Arts (Honours) and a Master of Business Administration (Finance, Dean’s Honours List), and is a Fellow of the Canadian Institute of Corporate Directors. He serves as a Director of Manulife Financial Corporation, Mount Sinai Hospital and the Canadian Institute for Advanced Research. Mr. Kierans also sits on a number of advisory boards of for-profit and not-for-profit organizations, including the Schulich School of Business, York University. |
| | |
| | |
| Board and Committee Membership | Attendance |
| Board of Directors | 7 of 8 | 88% |
| Corporate Governance and Nominating Committee | 3 of 4 | 75% |
| Management Resources and Compensation Committee | 7 of 7 | 100% |
| |
| |
| Securities Held |
| |
| Year | Common
Shares2 | DSUs3 | Total of Common
Shares and DSUs | Total Market Value of
Common Shares and DSUs4 | Minimum
Required5 |
| | | | | (Cdn $) | (Cdn $) |
| 2008 | 50,000 | 6,855 | 56,855 | $1,554,354 | $420,000 |
| | | | | |
| 2007 | 50,000 | 6,780 | 56,780 | $3,017,569 |
| |
| |
| Options Held: None. Non-employee Directors are not eligible to participate in the Company’s stock option plan. |
| | | | | | |
| Other Public Board Directorships: Manulife Financial Corporation |
| | | | | | | | | |

BRIAN F. MACNEILL, C.M. Independent1 Age: 69 Calgary, Alberta, Canada Director since 1995 | | Brian MacNeill is the Chairman of the Board of Directors of Petro-Canada. Prior to that he was President and CEO of Enbridge Inc. Mr. MacNeill is a Chartered Accountant and a Certified Public Accountant and holds a Bachelor of Commerce. He is a member of the Canadian Institute of Chartered Accountants and the Financial Executives Institute. He is also a Fellow of the Alberta Institute of Chartered Accountants and of the Institute of Corporate Directors. |
| | |
| | |
| Board and Committee Membership | Attendance |
| Board of Directors | 8 of 8 | 100% |
| | | |
| As Chair of the Board, Mr. MacNeill is an ex-officio member of all Committees. | | |
| |
| |
| Securities Held |
| |
| Year | Common
Shares2 | DSUs3 | Total of Common
Shares and DSUs | Total Market Value of
Common Shares and DSUs4 | Minimum
Required5 |
| | | | | (Cdn $) | (Cdn $) |
| 2008 | 10,200 | 55,659 | 65,839 | $2,214,487 | $1,095,000 |
| | | | | |
| 2007 | 10,200 | 47,798 | 57,998 | $3,046,331 |
| |
| |
| Options Held: None. Non-employee Directors are not eligible to participate in the Company’s stock option plan. |
| | | | | | |
| Other Public Board Directorships: Toronto-Dominion Bank, Telus Corp. and West-Fraser Timber Co. Ltd. |
| | | | | | | | | |
78 | PETRO-CANADA Annual Information Form |
|

MAUREEN MCCAW Independent1 Age: 54 Edmonton, Alberta, Canada Director since 2004 | | Maureen McCaw is Senior Vice-President (Edmonton) of Leger Marketing (marketing research), formerly Criterion Research Corp., a company she founded in 1986. Ms. McCaw holds a Bachelor of Arts from the University of Alberta and an Institute of Corporate Directors certification (ICD.D). She is a past Chair of the Edmonton Chamber of Commerce and also serves on a number of Alberta boards and advisory committees. |
| | |
| | |
| Board and Committee Membership | Attendance |
| Board of Directors | 8 of 8 | 100% |
| Corporate Governance and Nominating Committee | 4 of 4 | 100% |
| Pension Committee | 2 of 2 | 100% |
| |
| |
| Securities Held |
| |
| Year | Common
Shares2 | DSUs3 | Total of Common
Shares and DSUs | Total Market Value of
Common Shares and DSUs4 | Minimum
Required5 |
| | | | | (Cdn $) | (Cdn $) |
| 2008 | 2,610 | 9,410 | 12,020 | $495,291 | $420,000 |
| | | | | |
| 2007 | 2,414 | 5,824 | 8,238 | $433,548 |
| |
| |
| Options Held: None. Non-employee Directors are not eligible to participate in the Company’s stock option plan. |
| | | | | | |
| Other Public Board Directorships: None |
| | | | | | | | | |

PAUL D. MELNUK Independent1 Age: 54 Winter Garden, Florida, U.S. Director since 2000 | | Paul Melnuk is Chairman and Chief Executive Officer of Thermadyne Holdings Corporation (industrial products) and Managing Partner of FTL Capital Partners LLC (merchant banking). He is past President and Chief Executive Officer of Bracknell Corporation and Barrick Gold Corporation and Clark USA Inc (an oil refining and marketing company). Mr. Melnuk holds a Bachelor of Commerce. He is a member of the Canadian Institute of Chartered Accountants and of the World Presidents’ Organization, St. Louis chapter. |
| | |
| | |
| Board and Committee Membership | Attendance |
| Board of Directors | 8 of 8 | 100% |
| Audit, Finance and Risk Committee (Chair) | 7 of 7 | 100% |
| Environment, Health and Safety Committee | 3 of 3 | 100% |
| |
| |
| Securities Held |
| |
| Year | Common
Shares2 | DSUs3 | Total of Common
Shares and DSUs | Total Market Value of
Common Shares and DSUs4 | Minimum
Required5 |
| | | | | (Cdn $) | (Cdn $) |
| 2008 | 4,400 | 29,436 | 33,836 | $1,228,580 | $420,000 |
| | | | | |
| 2007 | 4,400 | 23,320 | 27,720 | $1,455,568 |
| |
| |
| Options Held: None. Non-employee Directors are not eligible to participate in the Company’s stock option plan. |
| | | | | | |
| Other Public Board Directorships: Thermadyne Holdings Corporation |
| | | | | | | | | |
| Annual Information Form PETRO-CANADA | 79 |

GUYLAINE SAUCIER, F.C.A., C.M.8 Independent1 Age: 62 Montréal, Quebec, Canada Director since 1991 | | Guylaine Saucier, Corporate Director, is a former Chair of the Board of Directors of the Canadian Broadcasting Corporation, a former Director of the Bank of Canada, a former Chair of the Canadian Institute of Chartered Accountants, a former Director of the International Federation of Accountants and former Chair of the Joint Committee on Corporate Governance established by the Canadian Institute of Chartered Accountants, the Toronto Stock Exchange and the Canadian Venture Exchange. She was also the first woman to serve as President of the Quebec Chamber of Commerce. Mme. Saucier obtained a Bachelor of Arts from Collège Marguerite-Bourgeois and a Bachelor of Commerce from the École des Hautes Études Commerciales, Université de Montréal. She is a Fellow of “Ordre des compatables agréés du Québec” and a Member of the Order of Canada. In 2004, she received the Fellowship Award from the Institute of Corporate Directors. |
| | |
| | |
| Board and Committee Membership | Attendance |
| Board of Directors | 7 of 8 | 88% |
| Corporate Governance and Nominating Committee (Chair) | 4 of 4 | 100% |
| Management Resources and Compensation Committee10 | 3 of 3 | 100% |
| Pension Committee | 2 of 2 | 100% |
| |
| |
| Securities Held |
| |
| Year | Common
Shares2 | DSUs3 | Total of Common
Shares and DSUs | Total Market Value of
Common Shares and DSUs4 | Minimum
Required5 |
| | | | | (Cdn $) | (Cdn $) |
| 2008 | 4,520 | 37,205 | 41,725 | $1,323,937 | $420,000 |
| | | | | |
| 2007 | 4,520 | 36,804 | 43,324 | $2,168,115 |
| |
| |
| Options Held: None. Non-employee Directors are not eligible to participate in the Company’s stock option plan. |
| | | | | | |
| Other Public Board Directorship: AXA Assurance Inc., Bank of Montreal, Groupe Danone and Groupe Areva |
| | | | | | | | | |

JAMES W. SIMPSON Independent1 Age: 64 Danville, California, U.S. Director since 2004 | | Jim Simpson is past President of Chevron Canada Resources (oil and gas). He serves as Lead Director for Canadian Utilities Limited and is on its Corporate Governance, Nomination, Compensation and Succession Committee and Risk Review Committee, as well as being the Chairman for the Audit Committee. Mr. Simpson holds a Bachelor of Science and Master of Science, and graduated from the Program for Senior Executives at M.I.T.’s Sloan School of Business. He is also past Chairman of the Canadian Association of Petroleum Producers and past Vice-Chairman of the Canadian Association of the World Petroleum Congresses. |
| | |
| | |
| Board and Committee Membership | Attendance |
| Board of Directors | 8 of 8 | 100% |
| Audit, Finance and Risk Committee | 7 of 7 | 100% |
| Management Resources and Compensation Committee | 7 of 7 | 100% |
| |
| |
| Securities Held |
| |
| Year | Common
Shares2 | DSUs3 | Total of Common
Shares and DSUs | Total Market Value of
Common Shares and DSUs4 | Minimum
Required5 |
| | | | | (Cdn $) | (Cdn $) |
| 2008 | 3,700 | 8,693 | 12,393 | $469,735 | $420,000 |
| | | | | |
| 2007 | 3,700 | 5,814 | 7,814 | $606,244 |
| |
| |
| Options Held: None. Non-employee Directors are not eligible to participate in the Company’s stock option plan. |
| | | | | | |
| Other Public Board Directorships: Canadian Utilities Limited |
| | | | | | | | | |
80 | PETRO-CANADA Annual Information Form |
|

DANIEL L. VALOT Independent1 Age: 64 Boulogne-Billancourt, France Director since 2007 | | Daniel Valot, Corporate Director, is the past Chairman and Chief Executive Officer of Technip S.A. (oil and gas engineering and construction). Prior to that, Mr. Valot held a number of leadership roles in exploration and production, refining, and North American operations with Total. A former student of the National School of Administration, Mr. Valot served as a civil servant in various positions. He holds a degree from the Paris Institute of Political Science and of the National School of Administration (ENA). |
| | |
| | |
| Board and Committee Membership | Attendance |
| Board of Directors | 8 of 8 | 100% |
| Audit, Finance and Risk Committee | 7 of 7 | 100% |
| Environment, Health and Safety Committee | 3 of 3 | 100% |
| |
| |
| Securities Held |
| |
| Year | Common
Shares2 | DSUs3 | Total of Common
Shares and DSUs | Total Market Value of
Common Shares and DSUs4 | Minimum
Required5 |
| | | | | (Cdn $) | (Cdn $) |
| 2008 | 1,375 | 5,695 | 7,070 | $265,836 | $420,000 |
| | | | | |
| 2007 | 1,375 | 640 | 2,015 | $106,736 |
| |
| |
| Options Held: None. Non-employee Directors are not eligible to participate in the Company’s stock option plan. |
| | | | | | |
| Other Public Board Directorships: CGGVeritas and SCOR |
| | | | | | | | | |

RON A. BRENNEMAN Non-independent1, Management Age: 62 Calgary, Alberta, Canada Director since 2000 | | Ron Brenneman is the President and Chief Executive Officer of the Company. Prior to joining the Company in 2000, he held various positions within Exxon Corporation and its affiliated companies. He leads the Company’s Executive Leadership Team (ELT). He is responsible for the overall strategic direction of the Company and its sound management and performance. Mr. Brenneman holds a Bachelor of Science and a Master of Science. He is a member of the Board of Directors of the Canadian Council of Chief Executives. |
| | |
| | |
| Board and Committee Membership | Attendance |
| Board of Directors | 8 of 8 | 100% |
| | | |
| As a member of management, Mr. Brenneman is not a member of any Committee of the Board, but he is invited to attend all Committee meetings other than in camera sessions. |
| |
| |
| Securities Held |
| |
| Year | Common
Shares2 | DSUs3 | Total of Common
Shares and DSUs | Total Market Value of
Common Shares and DSUs4 | Minimum
Required5 |
| | | | | (Cdn $) | (Cdn $) |
| 2008 | 88,547 | 221,215 | 309,762 | $ 9,563,988 | $5,250,000 |
| | | | | |
| 2007 | 84,457 | 219,823 | 304,280 | $16,009,466 |
| |
| |
| Options Held: 1,319,800 |
| | | | | | |
| Other Public Board Directorships: Bank of Nova Scotia and BCE Inc. |
| | | | | | | | | |
1 | Independent: refers to the standards of independence established under Section 303A.02 of the NYSE Listed Company Manual, Section 301 and Rule 10A-3 of the Sarbanes-Oxley Act of 2002 and Section 1.2 of Canadian Securities Administrators’ National Instrument 58-101. |
| |
2 | Common Shares refers to the number of common shares beneficially owned, controlled or directed, directly or indirectly, by the Director, as of December 31, 2008. |
| |
3 | DSUs refers to the number of Deferred Stock Units held by the Director as of December 31, 2008. |
| |
4 | The Total Market Value of Common Shares and DSUs for 2008 is based on the greater of purchase price, grant price or market value for the shares/units held by that Director. The Total Market Value of Common Shares for 2007 is determined by multiplying the number of common shares held by the closing price of the common shares on the TSX on December 31, 2007 of $53.25. The Total Market Value of DSUs is |
| Annual Information Form PETRO-CANADA | 81 |
| based on the previous five-day average market value of Petro-Canada’s common shares as of December 31, 2007 of $52.37. Dividend equivalents are used to purchase additional DSUs and are credited on a quarterly basis. |
| |
5 | Each non-employee Director is required to hold a minimum number of Company shares or share equivalents equal in value to three times the annual retainer ($420,000 for non-employee Directors and $1,095,000 for the Chair). Non-employee Directors have until December 31, 2011 or five years (if later) from being appointed a Director to achieve the required share ownership guidelines. Mr. Brenneman, as an employee Director, participates in the Company’s Officer Share Ownership Program and is required to hold four times his annual base salary. Refer to Compensation Discussion and Analysis beginning on page 21 of the Company’s Management Proxy Circular dated March 5, 2009. |
| |
6 | Ms. Cook-Bennett and Mr. Kierans both serve on the Board (but not on any of the same committees) of Manulife Financial. |
| |
7 | Mr. Kierans was a Director of Teleglobe Inc. from December 2000 until April 2002. Teleglobe Inc. filed for court protection under insolvency statutes on May 28, 2002. |
| |
8 | Mme. Saucier was a Director of Nortel Networks Corporation until June 2005, and was subject to a cease trade order issued on May 17, 2004 as a result of Nortel’s failure to file financial statements. The cease trade order was cancelled on June 21, 2005. |
| |
9 | Mr. Brenninkmeyer was appointed to the Board of Directors in July 2008. |
| |
10 | MMe. Saucier joined the Management Resources and Compensation Committee in September 2008. |
The term of office for each of the Directors named above ends at the close of the next Annual Meeting of the shareholders of the Company, or when his or her successor is elected or appointed.
The following table provides the five-year employment history of each of the officers of the Company.
Name and
Municipality of Residence | | Served
as an
Officer
Since | | Principal Occupation1 | | Employment History Previous Five Years |
| | | | | | |
| | | | | | |
Brian F. MacNeill,
Calgary, Alberta | | 2000 | | Chairman of the Board of the Company | | |
| | | | | | |
| | | | | | |
Executive Leadership Team | | | | | | |
| | | | | | |
| | | | | | |
Ron A. Brenneman,
Calgary, Alberta | | 2000 | | President and Chief Executive Officer of the Company | | |
| | | | | | |
Peter S. Kallos,
London, England | | 2003 | | Executive Vice-President, International & Offshore | | Prior to 2003, Mr. Kallos was the Company’s Vice-President, Corporate Planning and Communications, and prior thereto was External Affairs Director of Shell Exploration and Production U.K., and prior thereto was General Manager of Enterprise’s U.K. Business Unit, and prior thereto was Chief Executive Officer of Enterprise’s Italian subsidiary. |
| | | | | | |
Boris J. Jackman,
Mississauga, Ontario | | 1993 | | Executive Vice-President, Downstream | | |
| | | | | | |
E.F.H. Roberts,
Calgary, Alberta | | 1989 | | Executive Vice-President and Chief Financial Officer | | Mr. Roberts has held the position of Executive Vice-President and Chief Financial Officer since 2004, and prior thereto was Senior Vice-President and Chief Financial Officer since 2000. |
| | | | | | |
Neil J. Camarta,
Calgary, Alberta | | 2005 | | Senior Vice-President, Oil Sands | | Prior to 2006, Mr. Camarta was the Company’s Vice-President, Corporate Planning and Communications, and prior thereto was Senior Vice-President, Oil Sands for Shell Canada Limited. |
| | | | | | |
Kathleen E. Sendall,
Calgary, Alberta | | 1996 | | Senior Vice-President, North American Natural Gas | | |
| | | | | | |
Andrew Stephens,
Calgary, Alberta | | 1993 | | Senior Vice-President, Corporate Relations | | Mr. Stephens was appointed Senior Vice-President, Corporate Relations in 2007. Prior thereto Mr. Stephens held the position of Vice-President, Human Resources since 2005, and prior thereto was Vice-President, Corporate Planning and Communications, and prior thereto was Vice-President, Refining and Supply. |
| | | | | | |
82 | PETRO-CANADA Annual Information Form |
|
Name and
Municipality of Residence | | Served
as an
Officer
Since | | Principal Occupation1 | | Employment History Previous Five Years |
| | | | | | |
Upstream | | | | | | |
| | | | | | |
Alan Brown
St. John’s, Newfoundland
and Labrador | | 2008 | | Vice-President, East Coast | | Prior to 2008, Mr. Brown was Regional Manager, East Coast, and prior
thereto held a number of managerial and technical positions with
ExxonMobil. |
| | | | | | |
Gordon Carrick,
London, England | | 2002 | | Senior Vice-President, Development and Production | | Until the end of 2008, Mr. Carrick was Senior Vice-President, Operations
and Technology. |
| | | | | | |
Nicholas A. Maden,
London, England | | 2003 | | Vice-President, International &
Offshore Exploration | | Prior to 2003, Mr. Maden was the Company’s Exploration Manager,
International business unit, and prior thereto was Business Development
Manager with Veba Oil & Gas GmbH, and prior thereto held various
exploration management positions with ARCO. |
| | | | | | |
Donald M. Clague,
Calgary, Alberta | | 2002 | | Vice-President, In Situ
Development and Operations | | Mr. Clague had been the Vice-President, Operations U.S. since 2002, prior
to then he had been the Manager, Exploration East Coast/Offshore, and
prior thereto was Chief Geophysicist. |
| | | | | | |
Francois Langlois,
Calgary, Alberta | | 2002 | | Vice-President, Western
Canada Production and North
American Exploration | | |
| | | | | | |
John D. Miller,
Calgary, Alberta | | 2004 | | Vice-President, Natural Gas
Marketing, Acquisition &
Disposition and Midstream | | Prior to 2004, Mr. Miller was General Manager of Gas Marketing, and prior
thereto was Manager of Gas Marketing, and prior thereto was Manager, Oil
Sands Infrastructure, and prior thereto was Portfolio Manager, Oil Sands
Business Integration, and prior thereto was Portfolio Manager, Natural Gas
Marketing. |
| | | | | | |
Leon Sorenson,
London, England | | 2004 | | Vice-President, Technology | | Mr. Sorenson had been the Vice-President Arctic Island Project since 2007.
Prior thereto Mr. Sorenson was Vice-President Canadian Operations, North
American Natural Gas since 2004, and prior thereto Mr. Sorenson was Manager of Production Engineering and Operations, Western Canada
Productions, and prior thereto was Manager of Northern Development,
Western Canada Development and Operations, and prior thereto was
Manager of Engineering Technology. |
| | | | | | |
Edward L. McLaughlin,
Denver, Colorado | | 2007 | | Vice-President, Operations – U.S. Rockies | | Prior to his appointment, Mr. McLaughlin was Vice-President, Land for
Petro-Canada Resources (USA) Inc., and prior thereto had been
Vice-President, Land and Business Development for Prima Energy
Corporation, and prior thereto had been Vice-President, Land and
Business Development with Ensign Oil and Gas Corporation. |
| | | | | | |
Colin H. Cook,
Calgary, Alberta | | 2006 | | Vice-President, Marketing and
Development, Oil Sands | | Prior to 2006, Mr. Cook was General Manager, Marketing and Integration,
Oil Sands, and prior thereto was General Manager, Business Integration,
Oil Sands. |

| Annual Information Form PETRO-CANADA | 83 |
Name and
Municipality of Residence | | Served
as an
Officer
Since | | Principal Occupation1 | | Employment History Previous Five Years |
| | | | | | |
Downstream | | | | | | |
| | | | | | |
Randall B. Koenig,
Oakville, Ontario | | 1996 | | Vice-President, Lubricants | | |
| | | | | | |
Frederick Scharf,
Mississauga, Ontario | | 2003 | | Vice-President,
Wholesale/Retail Sales,
Service and Operations | | Prior to 2003, Mr. Scharf was General Manager, Western Canada Wholesale/Retail. |
| | | | | | |
Philip Churton,
Burlington, Ontario | | 2005 | | Vice-President, Marketing | | Prior to 2005, Mr. Churton was General Manager, Sales Services and Operations, Central Canada. |
| | | | | | |
Daniel P. Sorochan,
Mississauga, Ontario | | 2003 | | Vice-President, Refining and Supply | | Prior to 2003, Mr. Sorochan was Senior Director of Business Development, Refining and Supply, and prior thereto was General Manager, Oakville refinery. |
| | | | | | |
Shared Services | | | | | | |
| | | | | | |
Scott R. Miller,
Calgary, Alberta | | 2006 | | Vice-President, General Counsel | | Prior to 2006, Mr. Miller was Associate General Counsel, Upstream. Mr. Miller is an Associate Member of the Executive Leadership Team. |
| | | | | | |
Susan M. MacKenzie,
Calgary, Alberta | | 2006 | | Vice-President, Human Resources | | Ms. MacKenzie, prior to her appointment, held the position of Vice-President, In Situ Development and Operations, Oil Sands since 2006, and prior thereto was Senior Director, Bitumen, and prior thereto was Project Manager, Oil Sands Bitumen. |
| | | | | | |
M. A. (Greta) Raymond,
Calgary, Alberta | | 2001 | | Vice-President, Environment, Safety and Social Responsibility | | Ms. Raymond has held the position of Vice-President, Environment, Safety and Social Responsibility since 2005, and prior thereto was also responsible for Human Resources. Ms. Raymond is an Associate Member of the Executive Leadership Team. |
| | | | | | |
Helen Wesley,
London, England | | 2006 | | Vice-President, Finance International & Offshore | | Prior to 2006, Ms. Wesley was the Company’s Senior Director, Corporate Communications, and prior thereto was Manager, Planning, and prior to that was with Nova Chemicals as Vice-President, Purchasing and Supply. |
| | | | | | |
Wayne R. Pennington,
Calgary, Alberta | | 2006 | | Treasurer | | Prior to 2006, Mr. Pennington was the Company’s Assistant Controller, Corporate, and prior thereto was Senior Director, Financial Reporting and Accounting, and prior thereto was with EnCana Corporation as Assistant Controller, and prior thereto was with PanCanadian Energy as Manager, Financial Reporting and Forecasts. |
| | | | | | |
Hugh L. Hooker,
Calgary, Alberta | | 2004 | | Chief Compliance Officer, Corporate Secretary, Associate General Counsel | | In 2006, Mr. Hooker added Chief Compliance Officer to his responsibilities. Prior to 2004, Mr. Hooker was Associate General Counsel. |
| | | | | | |
Michael Danyluk,
Calgary, Alberta | | 2004 | | Vice-President and Chief Information Officer | | Prior to 2004, Mr. Danyluk was Senior Director of Information Systems. |
| | | | | | |
Michael C. Barkwell,
Calgary, Alberta | | 2005 | | Vice-President and Controller | | Prior to 2005, Mr. Barkwell was Assistant Controller, Downstream, and prior thereto was Director of Financial Reporting. |
| | | | | | |
Leonard Chow-Wah | | 2008 | | Vice-President, Tax | | Prior to his appointment, Mr. Chow-Wah had been the Senior Director, Tax since 2000. |
| | | | | | |
1 | | Each of the officers has been engaged in the principal occupation indicated above or in executive positions with Petro-Canada for the five preceding years, except as indicated. |
84 | PETRO-CANADA Annual Information Form | 
|
SHARE OWNERSHIP
As at December 31, 2008, the Directors and officers of Petro-Canada, as a group, beneficially owned or exercised control or direction over 396,754 common shares, or less than 1% of the common shares, of the Company outstanding as of such date.
AUDIT COMMITTEE DISCLOSURE
The following reviews certain information regarding the Company’s Audit, Finance and Risk Committee, as required pursuant to National Instrument 52-110.
Audit, Finance and Risk Committee
Chair: Paul D. Melnuk (Designated Financial Expert)
Members: Gail Cook-Bennett, Paul Haseldonckx, James W. Simpson, Daniel Valot, Hans Brenninkmeyer, and Brian MacNeill (ex officio)
2008 Committee Meetings: seven
This Committee is composed entirely of independent Directors, each of whom is very knowledgeable in financial matters and is financially literate within the meaning of National Instrument 52-110. Details as to each Committee member’s education and experience that provide the member with the necessary knowledge and understanding of accounting principles and procedures can be found above under Directors, starting on page 76. The Committee is responsible for reviewing and providing recommendations to the Board regarding the Company’s accounting policies, reporting practices, internal controls, the Company’s annual and interim financial statements, financial information included in the Company’s disclosure documents, risk management matters, and oil and gas reserves booking and reporting. The Committee also reviews significant audit findings, material litigation and claims, and any issues between management and the auditors. The Committee maintains direct relationships with the Company’s contract internal auditor and external auditor. The Committee meets in camera with both the contract internal auditor and external auditor at least once per year. The Committee is responsible for recommending the appointment and compensation of the external auditor. The Committee has a policy in place that non-audit work may not be performed by the external auditor. All services performed by the external auditor are approved by the Committee. The Terms of Reference of the Audit, Finance and Risk Committee are attached to this AIF as Schedule C and can also be found on the Company’s website at www.petro-canada.ca.
Audit Fees
Deloitte & Touche LLP were appointed as external auditors of the Company on June 7, 2002. Deloitte & Touche LLP billed the Company for services rendered in the year ended December 31, 2008 as follows: (a) Audit Fees – $4,310,000 (2007 – $5,548,000), (b) Audit Related Fees – audit related services for pension plan and attest services – $633,000 (2007 – $705,000), (c) Tax Fees – nil (2007 – nil), and (d) All Other Fees – nil (2007 – nil).
The Board adheres to a practice of limiting the external auditors from providing services not related to the audit. All services provided by the external auditors are pre-approved by the Audit, Finance and Risk Committee.
| Annual Information Form PETRO-CANADA | 85 |
Interest of Management and Others in Material Transactions |
No Director, executive officer or principal shareholder of Petro-Canada, or associate or affiliate of those persons, has any material interest, direct or indirect, in any transaction within the last three years that has materially affected or will materially affect Petro-Canada.
Transfer Agents and Registrars
In Canada:
CIBC Mellon Trust Company
600, 333 – 7 Avenue S.W.
Calgary, Alberta T2P 2Z1
Telephone: 1-800-387-0825 or
416-643-5500 outside of North America
Website: www.cibcmellon.com | | In the U.S.:
The Bank of New York Mellon
Telephone: 1-800-387-0825
Website: www.cibcmellon.com |
Deloitte & Touche LLP is the auditor of the Company and is independent in accordance with the Rules of Professional Conduct as outlined by the Institute of Chartered Accountants of Alberta. Kathleen E. Sendall is a Senior Vice-President with the Company and has certified a report with respect to NI 51-101 oil and gas reserves disclosure. Ms. Sendall does not hold more than 1% of the Company’s outstanding securities.
Financial information is provided in the Company’s Consolidated Financial Statements and MD&A for its most recently completed financial year. Additional information, including Directors’ and Officers’ remuneration and indebtedness of principal holders of the Company’s securities and securities authorized for issuance under equity compensation plans, is contained in the Company’s Management Proxy Circular, dated March 5, 2009.
Copies of this AIF, as well as the Company’s latest Management Proxy Circular and Annual Report (which includes the Company’s Consolidated Financial Statements and MD&A) for the year ended December 31, 2008 may be obtained from the Company’s website at www.petro-canada.ca or by mail upon request from the Corporate Secretary, 150 – 6 Avenue S.W., Calgary, Alberta, T2P 3E3.
You may also access disclosure documents and any reports, statements or other information that Petro-Canada files with the Canadian provincial securities commissions or other similar regulatory authorities through the Internet on the Canadian System for Electronic Document Analysis and Retrieval, which is commonly known by the acronym SEDAR, and which may be accessed at www.sedar.com. SEDAR is the Canadian equivalent of the SEC’s Electronic Data Gathering, Analysis and Retrieval System, which is commonly known by the acronym EDGAR, and which may be accessed at www.sec.gov.
86 | PETRO-CANADA Annual Information Form |
|
Schedule A
Report on Reserves Data by Senior Officer Responsible for Reserves Data
To the Board of Directors of Petro-Canada (the Company):
1. The Company’s staff of qualified reserves evaluators has evaluated the Company’s reserves data as at December 31, 2008. The reserves data consist of the following:
(i) proved oil and gas reserves and oil sands mining quantities estimated as at December 31, 2008, using constant prices and costs; and
(ii) the Standardized Measure of Discounted Future Net Cash Flows relating to proved oil and gas reserves and oil sands mining quantities.
2. The reserves data are the responsibility of the Company’s management. As the member of the executive responsible for the Company’s hydrocarbon reserves data, my responsibility is to certify that the reserves data has been properly calculated in accordance with industry generally accepted procedures for the estimation of reserves data.
3. The Company’s reserves staff and management carried out their evaluations in accordance with industry generally accepted procedures for the estimation of reserves data and standards as set out in the Canadian Oil and Gas Evaluation Handbook (the COGE Handbook), prepared jointly by the Society of Petroleum Evaluation Engineers (Calgary Chapter) and the Canadian Institute of Mining, Metallurgy & Petroleum (Petroleum Society), with the necessary modifications to reflect the definition of proved reserves under the applicable U.S. Financial Accounting Standards Board policies (the FASB Standards) and the legal requirements of the U.S. Securities and Exchange Commission (SEC Requirements). The Company’s reserves staff and management are not independent of the Company within the meaning of the term “independent” under those standards.
4. The standards require that they plan and perform an evaluation to obtain reasonable assurance as to whether the reserves data are free of material misstatement. An evaluation also includes assessing whether the reserves data are developed in accordance with the evaluation practices and procedures presented in the COGE Handbook as modified to meet the requirements of the FASB Standards and SEC Requirements.
5. The following sets forth the Standardized Measure of future net cash flows attributed to proved oil and gas reserves and oil sands mining quantities, estimated using constant prices and costs and calculated using a discount rate of 10%, included in the reserves data of the Company evaluated for the year ended December 31, 2008:
Standardized Measure of Future Net Cash Flows Proved Oil and Gas Reserves and Oil Sands Mining
(10% discount rate)
As at December 31, 2008
Location of Reserves (by business) After Deducting Income Taxes | | Oil and Gas
Standardized
Measure | | | Oil Sands Mining
Standardized
Measure |
Western Canada1 | $ | 1,937 | | $ | – |
U.S. Rockies | | 329 | | | – |
East Coast Canada | | 1,032 | | | – |
North Sea | | 1,542 | | | – |
Other International | | | | | |
North Africa/Near East | | 152 | | | – |
Northern Latin America | | 163 | | | – |
Syncrude Oil Sands Mining Operation | $ | — | | $ | 1,263 |
1 Western Canada includes the cash flows of MacKay River.
The Standardized Measure values above were calculated consistent with the methodology prescribed in Financial Accounting Standards Board Statement No. 69 for Oil and Gas activities, and SEC Industry Guide 7 for Oil Sands Mining.

| Annual Information Form PETRO-CANADA | 87 |
6. In my opinion, the reserves data evaluated by the Company’s reserves evaluation staff and management has, in all material respects, been determined in accordance with evaluation practices and procedures presented in the COGE Handbook with the necessary modifications to reflect reserves definitions and legal requirements under the applicable FASB Standards and SEC Requirements.
7. The reservoir engineering staff and management review and evaluate the reserves data on an ongoing basis and advise the executive of the Company of significant changes to the evaluations for events and circumstances occurring after the effective date of this report.
8. Reserves are estimates only and not exact quantities. In addition, the reserves data are based on judgments regarding future events; actual results will vary and the variations may be material. However, any variations should be consistent with the fact that reserves are categorized according to the probability of their recovery.
/Signed/ Kathleen E. Sendall
Senior Vice-President, North American Natural Gas
Member of Executive Leadership Team Responsible for Reserves
Dated March 18, 2009 |
88 | PETRO-CANADA Annual Information Form | 
|
Schedule B
Report of Management and Directors on Reserves Data and Other Information
The management of Petro-Canada (the Company) is responsible for the preparation and disclosure of information with respect to the Company’s oil and gas activities in accordance with securities regulatory requirements. This information includes reserves data, which consist of the following:
(i) proved oil and gas reserves and oil sands mining quantities estimated as at December 31, 2008, using constant prices and costs; and
(ii) the Standardized Measure of Discounted Future Net Cash Flows relating to proved oil and gas reserves and oil sands mining quantities.
Petro-Canada’s reserves evaluation process involves applying generally accepted practices and procedures for the estimation of reserves data as set out in the COGE Handbook and modified to reflect the definitions and standards as set out in the applicable provisions of the U.S. Financial Accounting Standards Board Statement of Financial Accounting Standards No. 69 and the relevant legal requirements of the U.S. Securities and Exchange Commission (SEC), (collectively the Reserves Data Process). Petro-Canada’s qualified internal reserves evaluation staff and management have evaluated the Company’s reserves and the executive member responsible for reserves data certifies that the Reserves Data Process has been followed. The report of the executive member responsible for reserves data will be filed with securities regulatory authorities concurrently with this report.
The Company has designated the Audit, Finance and Risk Committee of its Board of Directors as performing the roles and responsibilities of the Reserves Committee of the Board of Directors as set out in National Instrument 51-101. The Audit, Finance and Risk Committee of the Board of Directors has:
(a) reviewed the Company’s procedures for providing information to the internal and external qualified reserves evaluators;
(b) met with the internal and external qualified reserves evaluators to determine whether any restrictions placed by management affect the ability of the internal and external qualified reserves evaluators to report without reservation; and
(c) reviewed the reserves data with reserves management and each of the qualified external reserves evaluators.
The Audit, Finance and Risk Committee of the Board of Directors has reviewed the Company’s procedures for assembling and reporting other information associated with oil and gas activities and has reviewed that information with management. The Board of Directors has, on the recommendation of the Audit, Finance and Risk Committee, approved:
(a) the content and filing with securities regulatory authorities of the reserves data and other oil and gas information;
(b) the filing of the report of the executive member responsible for reserves on the reserves data; and
(c) the content and filing of this report.
The Company has sought from, and was granted by, securities regulatory authorities an exemption from the requirement under securities legislation to involve independent qualified reserves evaluators or independent qualified reserves auditors. Notwithstanding this exemption, the Company involves independent qualified reserves evaluators or auditors as part of its corporate governance practices. In 2008, the independent evaluators/auditors assessed approximately 77% of the Company’s proved oil and gas reserves data by volume. If Oil Sands proved reserves are excluded, the percentage of total Company reserves audited was 55%. Their involvement helps assure that our internal reserves data are materially correct.
In the Company’s view, the reliability of the internally generated reserves data is not materially less than would be afforded by Petro-Canada involving independent qualified reserves evaluators or independent qualified reserves auditors to evaluate, audit and/or review the reserves data. Petro-Canada’s reserves data are international in nature. The Company’s securities regulatory reporting is as an SEC registrant and, therefore, Petro-Canada’s reserves data are developed in accordance with practices and procedures set out in the COGE Handbook and modified to meet the applicable U.S. Financial Accounting Standards Board and SEC reserves definitions, and the legal requirements of the SEC. Petro-Canada’s procedures, records and controls relating to the accumulation of source data and preparation of reserves data by the Company’s internal reserves evaluation staff have been established, refined and documented over many years. Petro-Canada’s internal reserves evaluation staff and
| Annual Information Form PETRO-CANADA | 89 |
management include 74 persons, with an average of more than 11 years of relevant experience in evaluating reserves, of whom 50 are qualified reserves evaluators for purposes of Canadian securities regulatory requirements. The Company’s internal reserves evaluation management personnel includes 12 persons, with an average of 22 years of relevant experience in evaluating and managing the evaluation of reserves.
Reserves data are estimates only and are not exact quantities. Because the reserves data are based on judgments regarding future events, actual results will vary and the variations may be material. However, any variations should be consistent with the fact that reserves are categorized according to the probability of their recovery.
/Signed/ Ron A. Brenneman President and Chief Executive Officer | |
| |
| |
/Signed/ Kathleen E. Sendall Senior Vice-President, North American Natural Gas | |
| |
| |
/Signed/ Paul D. Melnuk Director | |
| |
| |
/Signed/ Brian F. MacNeill Director Dated March 18, 2009 | |
90 | PETRO-CANADA Annual Information Form |
|
Schedule C
Audit, Finance and Risk Committee
1. | | The duties and responsibilities of the Audit, Finance and Risk Committee (the Committee) shall include the following: |
| | | | |
| | (i) | | assist the Board of Directors in the discharge of its fiduciary responsibilities relating to the Company’s accounting policies, reporting practices and internal controls, as well as to its risk management policies and practices; |
| | | | |
| | (ii) | | maintain direct lines of communications with the Chief Financial Officer and with the contract auditor and the external auditors; |
| | | | |
| | (iii) | | monitor the scope and costs of the activity of the contract and external auditors, and assess their performance; |
| | | | |
| | (iv) | | formally consider the continuation of or a change in the external auditors and review all issues related to a change of external auditor, including any differences between the Company and the auditor that relate to the auditor’s opinion or a qualification thereof or an auditor comment; |
| | | | |
| | (v) | | recommend to the Board of Directors a firm of external auditors for approval by the shareholders of the Company; review and approve the terms of their engagement; review and approve the fee, scope and timing of the audit, and be apprised of and approve in advance any audit related services and any non-audit services (which are not prohibited non-audit services) to be provided by the external auditors and the costs thereof and consider any impact of the provision of such services on the maintenance of their independence and review the Company’s hiring policies regarding employees and former employees of the present and former external auditors; |
| | | | |
| | (vi) | | review all issues related to any proposed change in or renewal of the contract with the contract auditor; |
| | | | |
| | (vii) | | review and recommend approval by the Board of the Company’s audited annual financial statements and Management’s Discussion and Analysis; |
| | | | |
| | (viii) | | review before publication the Company’s unaudited quarterly financial statements, reports of quarterly earnings, and Management’s Discussion and Analysis with particular attention to the presentation of unusual or sensitive matters such as disclosure of related party transactions, significant non-recurring events, significant risks, changes in accounting principles, and estimates or reserves, and all significant variances between comparative reporting periods, and approve the publication of the Company’s unaudited quarterly financial statements and reports of quarterly earnings; |
| | | | |
| | (ix) | | review all financial information included in annual information forms, prospectuses, other offering memoranda or other documents requiring approval by the Board of Directors; |
| | | | |
| | (x) | | review the Statement of Management’s Responsibility for the Financial Statements as signed by senior management and included in any published document, and review and approve the Statement regarding the role of the Committee as signed by the Chairman of the Committee and included in any published documents; |
| | | | |
| | (xi) | | review the Report of Management on Oil and Gas Disclosure as signed by senior management and directors and included in any published document; |
| | | | |
| | (xii) | | review any litigation, claim or other contingency, including tax assessments, that could have a material effect upon the financial position or operating results of the Company, monitor disclosure thereof in documents reviewed by the Committee; |
| | | | |
| | (xiii) | | review the appropriateness and quality of the accounting policies used in the preparation of the Company’s financial statements, and consider any proposed changes to such policies; |
| | | | |
| | (xiv) | | review with the external auditor the contents of the annual audit report and review any significant recommendations from the external auditor to strengthen the internal controls of the Company; |
| | | | |
| | (xv) | | review the results of the external audit, any significant problems encountered in performing the audit, and the contents of any Management Letter issued by the external auditor to the Company, and management’s response thereto; |
| | | | |
| | (xvi) | | annually review a report on the contract audit function with respect to the terms of reference, organization, staffing, independence, performance and effectiveness of the contract audit services, receive and approve the |
| Annual Information Form PETRO-CANADA | 91 |
| | | | annual contract audit plan, and obtain assurances in respect of conformity with CICA and AICPA professional standards, and other regulatory bodies’ requirements, the outsourcing contract and recommendations of management and the contract auditor; |
| | | | |
| | (xvii) | | review significant contract audit findings and recommendations, and management’s response thereto; |
| | | | |
| | (xviii) | | oversee management’s responsibility for designing, installing and maintaining an effective control environment; approve in advance any internal control-related services performed by the external auditor; and receive regular reports on the Company’s internal control policies and procedures with particular emphasis on accounting and financial controls, and recommend changes where appropriate; |
| | | | |
| | (xix) | | review any unresolved significant issues between management and the external auditor that could affect the financial reporting or internal controls of the Company; |
| | | | |
| | (xx) | | annually (a) review the Company’s internal procedures for providing reserves information to its reserves evaluators; (b) meet with internal and external reserves evaluators to determine their independence and effectiveness in preparing the reserves data of the Company; (c) review the reserves data included in the annual disclosure made by the Company; and (d) review the Company’s internal procedures for assembling and reporting other information associated with oil and gas activities and included in the annual disclosure made by the Company; |
| | | | |
| | (xxi) | | receive reports on and review any other items deriving from the foregoing, either in respect of the Company, or a subsidiary or any other entity or relationship in which the Company has a significant interest, as requested by the Board; |
| | | | |
| | (xxii) | | review and make recommendations to the Board concerning the following: |
| | | | |
| | | | 1) | | the Company’s policies regarding hedging, investments, credit and risk management; and |
| | | | | | |
| | | | 2) | | the Company’s risk identification, analysis and management procedures; |
| | | | |
| | (xxiii) | | review, prior to each annual shareholders’ meeting, the policies and practices concerning the regular examination of officers’ expenses and perquisites, including the use of Company assets; |
| | | | |
| | (xxiv) | | report annually to the full Board, on the state of completion of the Audit, Finance and Risk Committee Annual Agenda Items, with appropriate recommendations; and |
| | | | |
| | (xxv) | | report annually to the full Board on the Committee’s review of the Company’s reserves procedures and disclosure and recommend to the Board the approval of the reserves data and other information associated with the Company’s oil and gas activities and included in the annual disclosure made by the Company. |
| | | | |
2. | | Organization and Procedures |
| | | | |
| | (i) | | The Committee shall meet regularly, not less than four times per year, and at such other times as may be requested by the Chair of the Committee. The Chief Executive Officer, the Chief Financial Officer, the Controller, the contract auditor, the external auditor or any member of the Committee may also request a meeting of the Committee. |
| | | | |
| | (ii) | | The Chair of the Committee, in consultation with the Chief Financial Officer, shall set the agenda for each meeting which shall then be circulated among the Committee Members. |
| | | | |
| | (iii) | | The Chief Executive Officer, the Chief Financial Officer and the Controller shall have direct access to the Committee and shall receive notice of and attend all meetings of the Committee, except private sessions. |
| | | | |
| | (iv) | | The external auditor and the contract auditor shall ultimately report to the Board and the Committee and shall at any time have direct access to the Committee and shall receive notice of and be invited to attend all meetings of the Committee, except private sessions. |
| | | | |
| | (v) | | The contract auditor, the external auditor, and one or more representatives of senior management, shall each meet separately with the Committee, in private sessions, at least once annually. |
| | | | |
| | (vi) | | The Committee may contact directly any employee in the Company and the contract auditor as it deems necessary. |
92 | PETRO-CANADA Annual Information Form |
|
| | (vii) | | The Committee will establish procedures for: |
| | | | |
| | | | 1) | | receipt, retention and treatment of complaints regarding accounting controls or auditing matters; and |
| | | | | | |
| | | | 2) | | confidential anonymous submission by employees of concerns regarding questionable accounting or auditing matters; and annual review of compliance under the Company’s Code of Ethics for Senior Financial Officers. |
The Committee will periodically review its own Terms of Reference, and make recommendations to the Board as required.
| Annual Information Form PETRO-CANADA | 93 |
|
|
|
|
|
|
|
|
GENERAL INQUIRIES |
|
Petro-Canada |
P.O. Box 2844, Calgary, Alberta, Canada T2P 3E3 |
Telephone: 403-296-8000 Fax: 403-296-3030 |
|
To learn more about Petro-Canada, |
Please visit our website at www.petro-canada.ca |
|
|
|
|
|
|
|
|
|
|
|
|
|
|
|
|
|
|
|
|
|
|
|
|
|
|
|
|
|
|
|
|

|
|
|
Publié également en français |
www.petro-canada.ca |
|
|
CONTROLS AND PROCEDURES
The company has performed an evaluation of its disclosure controls and procedures (as defined by Exchange Act rule 13a-15(e)), as of December 31, 2008. Based on this evaluation, the Company’s Chief Executive Officer and Chief Financial Officer have concluded that the disclosure controls and procedures are effective within the meaning of the rule.
MANAGEMENT’S REPORT ON INTERNAL CONTROL OVER FINANCIAL REPORTING
[See page 1 of the Financial Statements Exhibit forming part of this report]
ATTESTATION REPORT OF THE REGISTERED PUBLIC ACCOUNTING FIRM
[See pages 3 and 4 of the Financial Statements Exhibit forming part of this report]
CHANGES IN INTERNAL CONTROL OVER FINANCIAL REPORTING
The company has not made any changes in internal control over financial reporting that occurred during the period covered by this annual report that has materially affected, or is reasonably likely to materially affect, the company’s internal control over financial reporting.
IDENTIFICATION OF THE AUDIT COMMITTEE
Petro-Canada has a separately-designed standing Audit, Finance and Risk Committee. The members of the Audit, Finance and Risk Committee are:
| Chair: | P. D. Melnuk |
| Members: | G. Cook-Bennett |
| | H. Brenninkmeyer P. Haseldonckx |
| | J. W. Simpson |
| | D. Valot |
| | B. F. MacNeill (ex officio) |
| | |
AUDIT COMMITTEE FINANCIAL EXPERT
Petro-Canada’s Board of Directors has determined that Petro-Canada has an “audit committee financial expert” as defined by regulations of the U.S. Securities and Exchange Commission. The audit committee financial expert is
Paul D. Melnuk, Chairman of the Audit, Finance and Risk Committee. Mr. Melnuk has been determined to be “independent”, as that term is defined by the New York Stock Exchange’s listing standards applicable to Petro-Canada.
CODE OF ETHICS
The company has adopted a code of ethics applicable to its Chief Executive Officer, Chief Financial Officer, principal accounting officer and Controller. A copy of the company’s code of ethics and, if applicable, any future amendments or waivers of the code of ethics can be found at the company’s website located at www.petro-canada.ca.
PRINCIPAL ACCOUNTANT FEES AND SERVICES
Deloitte & Touche LLP billed the company for services rendered in the year ended December 31, 2008 as follows:
(a) audit fees - $4,310,000
(b) audit related fees - fees for audit of pension plans and attest services $633,000
(c) tax fees – nil
(d) all other fees — nil
Deloitte & Touche LLP billed the company for services rendered in the year ended December 31, 2007 as follows:
(a) audit fees - $5,548,000
(b) audit related fees - audits of pension plans and attest services - $705,000
(c) tax fees – nil
(d) all other fees — nil
AUDIT COMMITTEE PRE-APPROVAL POLICIES AND PROCEDURES: The Audit, Finance and Risk Committee of Petro-Canada’s Board of Directors approves in advance any audit or non-audit service proposed to be provided by Deloitte & Touche LLP for Petro-Canada or its subsidiaries. The Committee has delegated to the Chairman of the Committee full authority to approve any such request, as long as the Chairman presents any such approval to the Committee at its next scheduled meeting. No services were approved pursuant to a waiver within the meaning of Rule 2-01(c) (7)(i)(C) of Regulation S-X in the years ended December 31, 2006 and December 31, 2007.
OFF-BALANCE SHEET ARRANGEMENTS
See page 26 of the Management’s Discussion and Analysis Exhibit forming part of this report
CONTRACTUAL OBLIGATIONS
See page 27 of the Management’s Discussion and Analysis Exhibit forming part of this report
UNDERTAKING AND CONSENT TO SERVICE OF PROCESS
A. Undertaking
Petro-Canada (the “Registrant”) undertakes to make available, in person or by telephone, representatives to respond to inquiries made by the staff of the Securities and Exchange Commission (“SEC”), and to furnish promptly, when requested to do so by the SEC staff, information relating to the securities in relation to which the obligation to file an annual report on Form 40-F arises or transactions in said securities.
B. Consent to Service of Process
The Registrant has previously filed a Form F-X with the SEC on March 10, 1994.
SIGNATURE
Pursuant to the requirements of the Securities Exchange Act of 1934, the registrant certifies that it meets all of the requirements for filing on Form 40-F and has duly caused this annual report to be signed on its behalf by the undersigned, thereto duly authorized.
| | PETRO-CANADA |
| | |
| | |
Date: March 18, 2009 | | /s/ Hugh L. Hooker |
Name: | | Hugh L. Hooker |
Title: | | Chief Compliance Officer, Corporate Secretary, Associate General Counsel |
EXHIBITS
| | |
99.1 | | Petro-Canada Consolidated Financial Statements for the year ended December 31, 2008 |
99.2 | | Petro-Canada Management’s Discussion and Analysis |
99.3 | | Certification of the CEO pursuant to Section 302 of the Sarbanes-Oxley Act |
99.4 | | Certification of the CFO pursuant to Section 302 of the Sarbanes-Oxley Act |
99.5 | | Certification of CEO pursuant to 18 U.S.C. Section 1350, as adopted pursuant to Section 906 of the Sarbanes-Oxley Act of 2002 |
99.6 | | Certification of CFO pursuant to 18 U.S.C. Section 1350, as adopted pursuant to Section 906 of the Sarbanes-Oxley Act of 2002 |
99.7 | | Consent of Deloitte & Touche LLP, Independent Registered Chartered Accountants |