
Investor Presentation
Fourth Quarter 2008

Forward-Looking Statements
and Non-GAAP Financial Information
The forward-looking statements, as defined in the applicable federal securities laws, being made today are subject to risks
and uncertainties. TSFG’s actual results may differ materially from those set forth in such forward-looking statements.
These statements include, but are not limited to, factors that may affect TSFG’s return goals, loan growth, loan sales,
customer funding growth, expense control, income tax rate, expected financial results for acquisitions, noninterest income,
adequacy of capital and future capital levels, factors that will affect credit quality and the net interest margin, effectiveness
of hedging strategies, risks and effects of changes in interest rates, effects of future economic conditions, and market
performance. Reference is made to TSFG’s reports filed with the Securities and Exchange Commission for a discussion of
factors that may cause such differences to occur. TSFG undertakes no obligation to release revisions to these forward-
looking statements or reflect events or circumstances after today’s presentation.
This presentation contains certain non-GAAP measures that exclude the impact of certain nonoperating items. TSFG
management uses these non-GAAP, or operating measures, in its analysis of TSFG’s performance. TSFG believes
presentations of financial measures excluding the impact of certain items provide useful supplemental information and
better reflect its core operating activities. Management uses operating measures, in particular, to analyze on a consistent
basis and over a longer period of time, the performance of which it considers to be its core operations.
Operating measures adjust GAAP information to exclude the effects of nonoperating items, such as gains or losses on
certain asset sales, early extinguishment of debt, employment contract buyouts, impairment charges, and other
nonoperating expenses. The limitations associated with utilizing operating measures are the risk that persons might
disagree as to the appropriateness of items comprising these measures and different companies might calculate these
measures differently. Management compensates for these limitations by providing detailed reconciliations between GAAP
and operating measures. These disclosures should not be considered an alternative to GAAP results. A reconciliation of
GAAP results and non-GAAP measures is provided in the Quarterly Financial Data Supplement on our web site,
www.thesouthgroup.com, in the Investor Relations section under Quarterly Earnings.
Total assets $13.7
Loans held for investment $10.3
Customer funding* $8.0
Tangible shareholders’ equity $1.0
Shareholders' equity $1.5
Tangible equity** to tangible
assets 7.94%
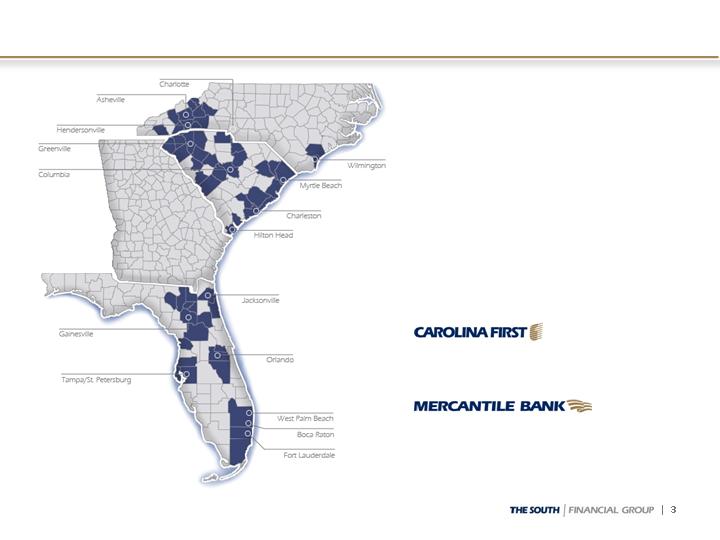
Branch offices:
NC 27
SC 82
FL 71
TSFG AT A GLANCE
$ in billions, as of 9/30/08
Company Overview
* Customer funding includes total deposits less brokered deposits plus customer sweeps.
** Includes $249 million of mandatorily convertible preferred stock issued in May 2008
*** Mercantile Bank is a division of Carolina First Bank.
***

Super-Community Bank Model
Community banking is the core strength of TSFG
Focused on customer relationships with local decision-making
Accessible and responsive
Involved in our communities
Target middle-market and small businesses and retail customers
Built through multi-product relationships
Located in attractive Southeastern markets with long-term growth
potential
Led by local Market Presidents in 13 markets
Average of 23 years banking experience
Local market and customer knowledge
Local authority to make customer decisions
PROJECTED HOUSEHOLD GROWTH (2008-2013)
Growth estimates deposit weighted by county as of 6/30/08
SOURCE: SNL Financial
Footprint: Long-term Growth Potential
6.3
Trustmark
6.4
Regions
6.5
Operating Peer Median
6.5
U.S. Median
7.0
Whitney
6.7
BOK Financial
10.5
Colonial BancGroup
10.5
SunTrust Banks
11.3
Zions Bancorporation
11.8
Cullen/Frost
8.3
BB&T
10.2
The South Financial Group
%
14.2
United Community Banks
5.5
8.8
Household Growth
(%)
Synovus
Company Name
First Horizon
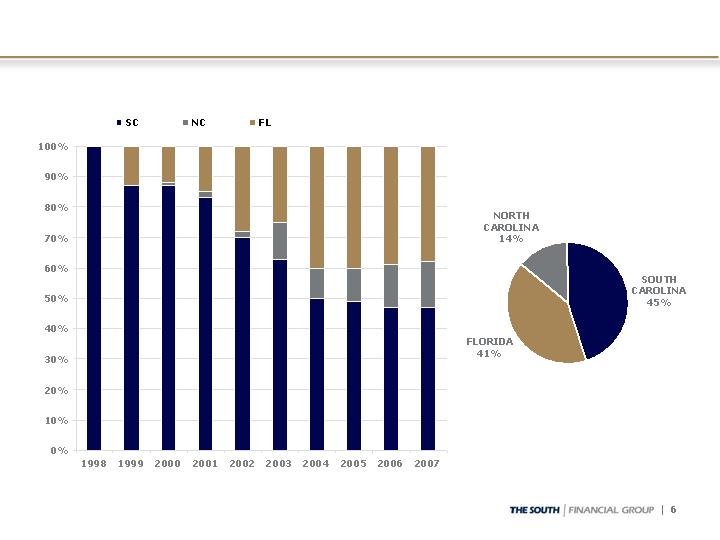
DEPOSITS BY STATE*
*Percent of total deposits by state as of December 31; reflects customer deposits after 12/31/04
As of September 30, 2008
Footprint: Geographic Diversification

Proactive and Realistic Approach to Cycle
$250 million Capital Raise in May 2008
Attracted sophisticated large investors
Reduced quarterly common cash dividend to $0.01 per share;
preserves $52 million annually in retained capital
Strengthened overall Liquidity Position
$4.7 billion unused capacity at 9/30/08
In May 2008, suspended indirect automobile lending in Florida
Parent company has over $125 million in cash to cover expected
cash flow needs, debt service and existing dividends through 2011
with no support from banking subsidiary
New Risk Management team
Lynn Harton (former Chief Credit Officer of Regions/Union
Planters) hired in 2/07; now Interim President & CEO
Significant number of senior leadership level hires from same
team
Large bank experience in turnaround situations

Proactive and Realistic Approach (continued)
Resulted in Early Identification of real estate credit issues
New management processes reflected in risk grades identified
growing level of problems
Disclosed rising levels of nonaccruals in 1Q08, ahead of
Southeastern Peers
Increased loan loss reserve in 1Q08 to one of the highest levels in
the Southeast; continued in 2Q08 and 3Q08
Began loan sales (2Q08) earlier than peers
Recognized by analysts as having a realistic and aggressive
posture in managing credit risk
Continue Transition of CEO
Search well underway by Board
Lynn Harton named Interim President & CEO November 14, 2008
$347 million of TARP Capital
Received preliminary approval November 14, 2008

Control operating noninterest expenses, excluding
environmental costs
Early stages of efficiency project with focus on both
expense management and revenue opportunities
Expense Control
Increase through growth in deposits and wealth
management revenues
Noninterest Income
Continue to manage tangible equity ratio
Maintain strong regulatory capital ratios
Capital Management
Aggressively identify and resolve stressed portfolios
Improve longer-term performance relative to peers
Credit Quality
Focus on liquidity in near-term with longer-term
view of improving NIM
Lower funding costs longer-term by improving
volume, mix, and cost of deposits
Funding
Focus on relationship-based lending to small and
family-owned businesses in market
Deemphasize noncore portfolios: indirect, lot loans,
residential construction, shared national credits
Loan Growth
OBJECTIVES
EXECUTION POINTS
Strategic Objectives
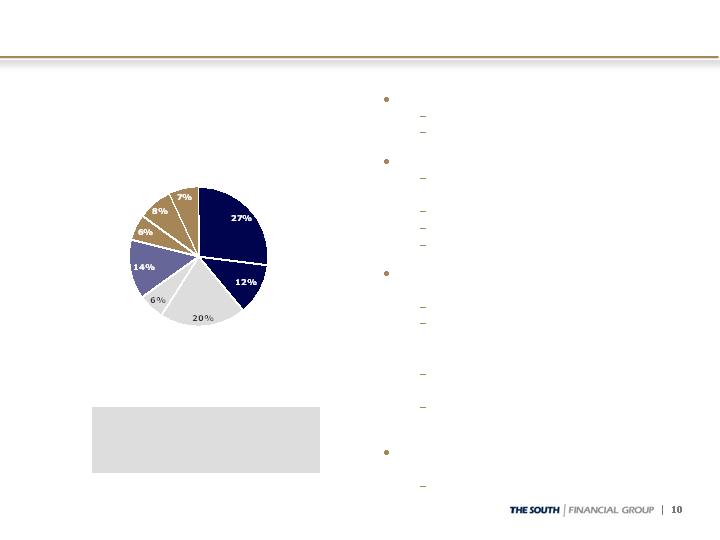
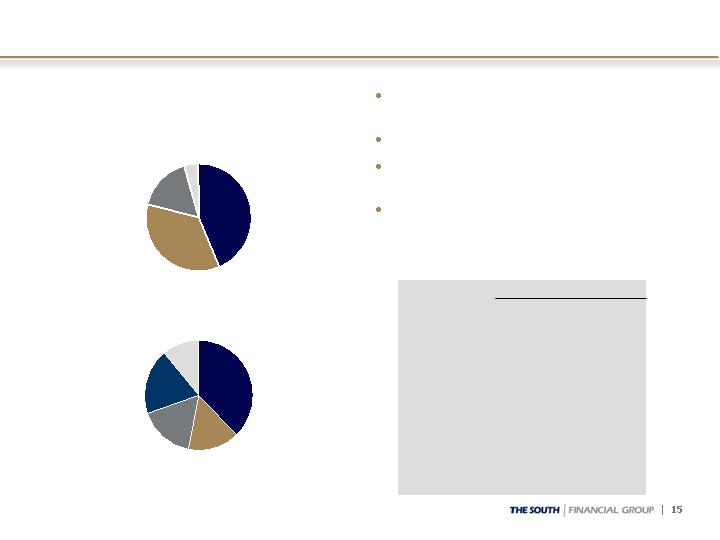
Diversified Loan Portfolio
Loan Mix
As of September 30, 2008
($ in millions)
Total Loans Held for
Investment $10,300
C&I
Commercial
Development
Mortgage*
Diversified portfolio
By product and customer
By geography
In-footprint focus
Customers we know; markets
we understand
No broker mortgage/HE loans
Minimal subprime exposure
Suspended Florida indirect
Disciplined approval and portfolio
management processes
Local credit officers
Executive credit committee
approval for largest
relationships
Special assets department for
high risk loans
Centralized consumer
approval and collections
Specialized credit support for our
largest businesses
CRE; Corporate Banking/SNC
Owner-
Occupied
Indirect -
Sales Finance
Income
Property
Residential
Construction
Home Equity
* Mortgage includes Consumer Lot Loans and Other (Direct Retail and Unsecured Lines).
Credit Quality Results – 3Q08
Residential construction and housing-related loans primary stress
NCOs $75.4 million, or 2.87% of average loans annualized
$28.1 million related to loan sales and loans transferred to held for sale
$17.6 million from the recognition of previously-established specific reserves on
impaired loans as charge-offs (including $5.5 million related to loans sold or held
for sale)
Provision of $84.6 million, a $20.8 million increase from 2Q08
Exceeds NCOs by $9.2 million
Built reserve to 1.97% (from 1.85% at 6/30/08)
Coverage of NPLs held for investment relatively unchanged at 0.84 times
NPAs increased to 2.83% of loans and foreclosed property
Ratio is 2.62%, excluding NPLs held for sale of $22.6 million
NPLs held for investment increased to $240.1 million, up from $220.2 million at
6/30/08
3Q08 loan sales ($ in millions):
Compared to 2Q08 loan sales of $40 million with NCOs of $16.1 million
$39.4
23.3
$16.1
Sales
Price
$71.7
45.8
$25.9
Legal
Balance
$22.6
22.6
$ --
Nonaccrual
Loans HFS
$28.1
$4.2
Total
20.6
1.9
Pending sale
$7.5
$2.3
Loans sold
3Q08
NCOs
Pre-Q3
NCOs
Loan and Credit Quality Stress is Housing-Related
0.84%
$47.0
2.09%
$219
$10,476
Total, 6/30/08
1.16%
$147.4
$75.4
2.30%
$238
100%
$10,300
Total Loans HFI
4.64%
11.9
6.9
5.92%
36
6%
610
Mortgage**
1.69%
9.1
3.4
0.10%
1
6%
680
Indirect – sales
finance
0.71%
3.6
2.6
0.68%
5
8%
784
Home equity
2.16%
0.94%
9.03%
1.87%
1.05%
0.58%
0.97%
NAL %
of O/S
Balance
1.1
78.1
12.5
4.9
1.7
$24.5
YTD Net
Charge-
offs
$25.0
0.0
44.6
2.5
1.9
0.8
$12.7
QTD Net
Charge-
offs
1.14%
1.84%
1.76%
0.27%
1.15%
0.79%
0.44%
30-day
past due
%
22
20%
2,084
Completed
income property
11
6%
601
Commercial
development
$10,276
100
1,410
1,207
$ 2,824
Outstanding
Balance
1%
14%
12%
27%
% of O/S
Balance
1
Other**
7
Owner-occupied
CRE
$28
C&I
127
Residential
construction
$222
Nonaccrual
Loans HFI*
Total, 3/31/08
As of September 30, 2008, $ in millions
HFI = Held for Investment; 30-day past due % of outstanding balance excludes nonaccrual loans.
* Nonaccrual loans exclude nonaccrual loans held for sale of $22.6 million.
** Mortgage includes Consumer Lot Loans. Other includes Direct Retail and Unsecured Lines.
See page 9 of the Quarterly Financial Data Supplement for Commercial Real Estate loans by product type and by
geography. Commercial Development includes Commercial A&D and Commercial Construction. Residential
Construction includes Residential A&D, Residential Construction, Residential Condo, and Undeveloped Land.
Residential Construction
2.40%
$20.9
13.18%
$96
47%
$729
Total FL, 6/30/08
1.33%
$22.3
8.47%
$131
$1,550
Overall Total, 6/30/08
0.45%
$3.5
$2.5
2.14%
$10
34%
$485
Total SC, 9/30/08
0.29%
$0.8
2.93%
$15
32%
$499
Total SC, 6/30/08
0.52%
$0.6
6.43%
$21
21%
$322
Total NC, 6/30/08
1.87%
$70.2
$39.4
15.47%
$96
44%
$619
Total FL, 9/30/08
2.41%
$9.8
12.80%
$103
50%
$806
Total FL, 3/31/08
1.76%
$78.1
$44.6
9.03%
$127
100%
$1,410
Overall Total,
9/30/08
1.58%
$11.2
8.23%
$134
$1,628
Overall Total, 3/31/08
3.63%
$4.4
$2.7
6.93%
$21
22%
$306
Total NC, 9/30/08
27.18%
12.36%
19.70%
10.63%
NAL %
of O/S
Balance
21.7
3.5
27.7
$17.3
YTD Net
Charge-
offs
11.2
1.1
16.2
$10.9
QTD Net
Charge-
offs
0.00%
3.12%
1.12%
2.43%
30-day
past due
%
39
14%
196
FL residential A&D
11
6%
90
FL residential
construction
65
$268
Outstanding
Balance
5%
19%
% of
Resid.
Constr.
17
FL residential
condo
$29
FL undeveloped
land
Residential Construction:
Nonaccrual
Loans
HFI*
As of September 30, 2008, $ in millions
30-day past due % of outstanding balance excludes nonaccrual loans.
* Nonaccrual loans exclude nonaccrual loans held for sale of $20 million.
Performing Differently
By Geography
Commercial Nonaccruals – Net Balance
$195
127
11
22
7
$28
9/30/08
Nonaccrual
Loan
Balance
$165
108
10
20
6
$21
Net Balance
Less
Specific
Reserve
67%
$30
$53
$248
Total Commercial
67%
76%
76%
67%
56%
Net Balance
as % of
Unpaid
Principal
2
4
26
Completed income
property
1
2
13
Commercial
development
163
8
$38
Unpaid
Principal (1)
36
1
$10
Cumulative
Net Charge-
offs (2)
19
Residential
construction
1
Owner-occupied
CRE
$7
C&I
9/30/08
Specific
Reserve (3)
$ in millions
-
=
-
=
(1) Outstanding balance at default
(2) Typically charge-down at nonaccrual to approximately 80% of most recent appraised value
(3) Additional specific reserves are established as necessary based on estimated holding period and current market and economic conditions;
recognized as charge-offs when realized. However, these amounts do not include the qualitative components within the overall allowance for
credit loans.
Home Equity Lines/Loans
SC, $343
43.6%
FL, $276
35.3%
NC, $131
16.7%
As of September 30, 2008, $ in millions
Originated by TSFG sales force in-
market; no broker loans
Strong FICO scores
Conservative LTV position and usage
amounts
Not pushed as a growth product
Home Equity Portfolio = HE Line and HE Loan portfolios
Geography based on customer address
Other, $34
4.4%
Summary Statistics
NA
NA
55%
WAvg Util %
70%
55%
45%
730
730
$784
Total
67%
71%
Orig WAvg
LTV %
20%
67%
2nd Lien %
80%
33%
1st Lien %
693
740
Jul 08 FICO
699
737
Orig FICO
$190
$594
Balance $
Loans
Lines
2008, $87
11.1%
2007, $152
19.3%
2006, $129
16.5%
2004 or before
$296
37.7%
2005, $120
15.4%
By Vintage
Total Home Equity Portfolio, $784
By Geography
Mortgage Banking Portfolio
Remains a small portion of
entire portfolio
$610 million
6% of total loans HFI
NAL increase of $7.7 million
from Q2 to Q3
Increases from higher risk
portions of the portfolio (Lot
Loans and Construction Perm)
Balances continue to decline
in both Lot Loans and
Construction Perm products
As of September 30, 2008, $ in millions
Construction Perm:
$113.8
$113.3
$95.7
$78.8
Balance
0.38%
2.91%
5.86%
1.70%
30-89 DPD
0.00%
0.00%
0.00%
0.00%
90+ DPD
2.62%
4.11%
9.85%
15.98%
NAL %
$3.0
$4.7
$9.4
$12.6
NAL $
Lot Loans:
$311.4
$291.4
$266.2
$249.1
Balance
2.92%
5.34%
2.09%
3.84%
30-89 DPD
0.78%
1.03%
2.00%
2.34%
90+ DPD
1.92%
2.89%
4.07%
6.12%
NAL %
$6.0
$8.4
$10.8
$15.2
NAL $
SIVA* Alt-A:
$3.9
1.56%
1.87%
6.22%
$251.8
1Q08
$2.7
1.06%
1.17%
7.52%
$254.9
4Q07
$8.1
$8.3
NAL $
3.04%
2.94%
NAL %
0.69%
2.21%
90+ DPD
0.90%
1.89%
30-89 DPD
$267.9
$282.3
Balance
2Q08
3Q08
Mortgage Portfolio = Mortgage, Consumer Lot Loans, and Construction Perm products (excludes HE Loan)
* SIVA = Stated Income Verified Assets
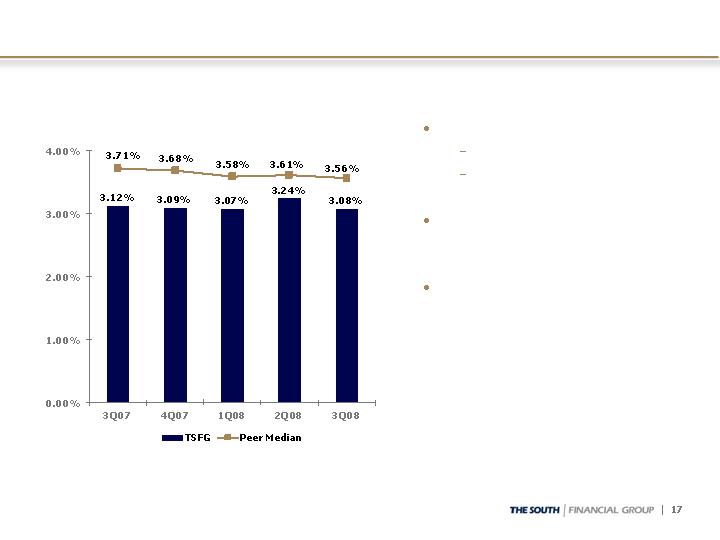
Net Interest Margin
Net Interest Margin (FTE)
Decrease 3Q08 vs. 2Q08
Funding mix: –10 bp
Increase in nonaccrual
interest reversals: -3 bp
Better positioned with less
volatility; interest rate risk
reduced
Near-term margin pressures
persist; levels and/or pricing
of customer funding, levels
of NPAs and NCOs, maturing
interest rate swaps, short-
term movements in LIBOR,
and recent cuts in the
Federal Funds target rate
-5
+3
-10
-3
-5
Peer
-16
+17
-2
-3
0
TSFG
Basis Point Change:
Customer Funding
25.3%
372
1,468
1,840
Time deposits < $100,000
(16.5)%
(357)
2,163
1,806
Money market
(0.8)%
(61)
7,496
7,435
Customer deposits
2.8%
15
537
552
Customer sweep accounts
Customer deposits:
(0.6)%
3.0%
(0.7)%
(3.2)%
(7.6)%
LQ %
Change
(36)
1,127
1,091
Interest-bearing
(1)
151
150
Savings accounts
45
1,480
1,525
Time deposits $100,000 or
more
$(46)
$8,033
$7,987
Total customer funding
$(84)
$ Change
$1,107
6/30/08
Balance
$1,023
9/30/08
Balance
Noninterest-bearing
$ in millions
Customer funding reflects total deposits excluding brokered deposits plus customer
sweeps.
Wholesale Borrowings
29%
2%
19%
2%
--
2%
3%
1%
Actual
% of Total Assets
By Maturity
$4,713
40%
$3,984
$1,771
$959
$767
$487
Total wholesale
borrowings
--
25%
2,574
998
954
622
--
Brokered CDs
--
20%
19
--
5
14
--
Commercial paper
633
20%
298
298
--
--
--
FHLB advances
275
200
--
$ --
> 1 year
20%
20%
20%
20%
Policy
limit
275
226
480
$112
Total
--
453
3,627
$ --
Unused
capacity
--
26
--
Repurchase
agreements
--
375
$ 112
Over-
night
--
105
$ --
2 days
to 3
mos.
--
Other*
--
Fed Reserve and
T,T&L
$ --
Fed funds
purchased
4 to 12
mos.
As of September 30, 2008, $ in millions
* No parent company ($207 million) or bank ($68 million) exposure to capital markets
rollover risk for trust preferred securities and related obligations until 2033 for parent
company and 2012 for bank-level
Capital Position
10.49%
13.84%
12.11%
12.30%
15.68%
14.18%
10.57%
9/30/08
Pro
Forma
with
TARP*
7.77%
10.69%
8.91%
8.16%
10.88%
9.33%
6.72%
Pre-
Capital
Raise
3/31/08
Actual
9/30 Pro Forma in Excess
of Well Capitalized Min.
$1,127
$683
$1,086
$1,500
$1,012
$1,458
$929
Pre-tax $
assuming 35%
tax rate **
5%
10%
6%
5%
10%
6%
TSFG
target
>6%
Well
Capitalized
Minimum
8.54%
11.59%
9.86%
9.70%
12.68%
11.18%
7.94%
9/30/08
Actual
$444
Total risk-based
$732
Leverage
CAROLINA FIRST
BANK
$706
Tier 1 risk-based
$658
Total risk-based
$975
Leverage
$947
Tier 1 risk-based
$604
Tangible equity to
tangible assets
THE SOUTH
FINANCIAL
GROUP
After-tax
$
$ in millions
* Assumes $347 million of capital with 75% initially contributed to Carolina First Bank
** For illustrative purposes only
FDIC insurance
Loan collection and monitoring
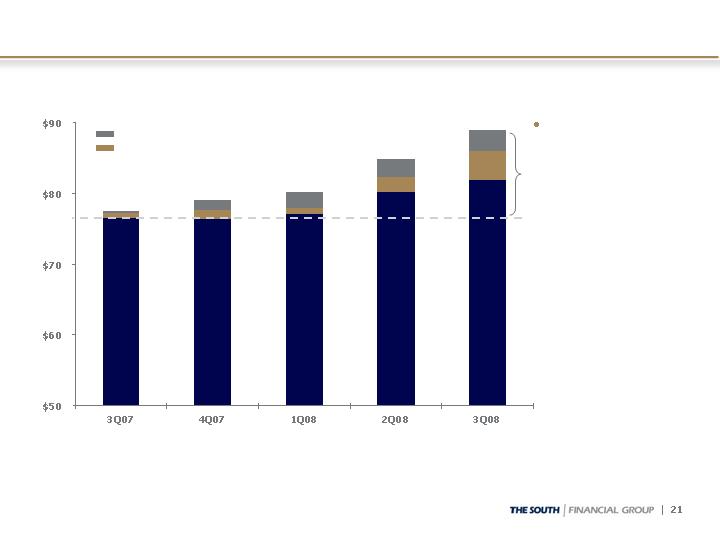
Noninterest Expenses
Operating Noninterest Expenses
TSFG operating noninterest expenses exclude nonoperating items, such as goodwill impairment, loss on early extinguishment of debt, Visa-related
litigation, and employment contract buyouts/severance. GAAP noninterest expenses totaled $78.7 for 3Q07, $80.5 for 4Q07, $268.2 for 1Q08, $87.6 for
2Q08, and $93.4 for 3Q08. For non-operating items, see reconciliations of GAAP to non-GAAP measures provided on page 15 of the Quarterly Financial
Data Supplement for 3Q08 included in the Appendix and on TSFG’s web site, www.thesouthgroup.com, in the Investor Relations section.
$77.4
$79.1
$80.1
$84.7
$88.9
More than
half of the
$11.5 million
year-over-
year increase
is from loan
collection
and FDIC
insurance
expense
$ in millions
2.56%
2.46%
2.33%
2.25%
2.19%
TSFG
As % of Average Assets (annualized):
Efficiency Improvement Project
Three fundamental objectives:
Increase revenue
Improve our customers’ experience
Manage expenses
Emphasis on improving the customer experience by improving
workflows, policies, and procedures
Specific examples include back office branch operations,
lending process redesign, centralized procurement function
Outstanding commitment across the organization
Management support at the highest level
Started with 40 business leaders throughout company
Engage employees in on-going idea generation
Timing
Initial launch 4Q08 based on Phase I Analysis
1Q09 complete opportunity sizing
12-18 months to realize benefits
Operating Noninterest Income
For Qtr Ending September 30, 2008, $ in millions
Noninterest Income
See page 3 of the Quarterly Financial Data Supplement for additional information on categories of noninterest income. Total nonterest income for
3Q08 totaled $27.9 and included a $(0.7) net loss on securities, which is excluded from operating noninterest income shown above.
Together, customer fee and wealth management income comprise over 70% of total
Customer fee income
Deposit related
Treasury Services
Wealth management income
Private bankers as portal to leverage and expand customer base
Licensed branch employees
n/m
n/m
(3%)
(0.8)
Loss on OREO
(4)%
(6)%
23%
6.5
Other
% Change 3Q08 vs.
3Q08
(3)%
(6)%
100%
$ 28.6
Total
5%
(53)%
3%
0.9
Mortgage banking
(3)%
2%
25%
7.2
Wealth management
9%
(2)%
7%
2.0
-- Debit card income
9%
3%
8%
2.2
-- Treasury services
2%
3%
52%
$14.8
Customer fee income
3Q07
2Q08
% of Total
$

Positioned to Emerge Stronger
Operate as Super-Community Bank
Leverage strategic footprint and its long-term growth
potential
Deep and experienced management team
Risk management talent and processes
Maintain strong balance sheet throughout credit environment
Capital strength
Liquidity management
Higher loan loss reserves
Relationship lending with focus on deposit balances
Appendix – List of Operating Peers
Associated (ASBC)
BOK Financial (BOKF)
Colonial (CNB)
Commerce (CBSH)
Cullen/Frost (CFR)
Fulton (FULT)
Synovus (SNV)
Trustmark (TRMK)
United Community (UCBI)
Valley National (VLY)
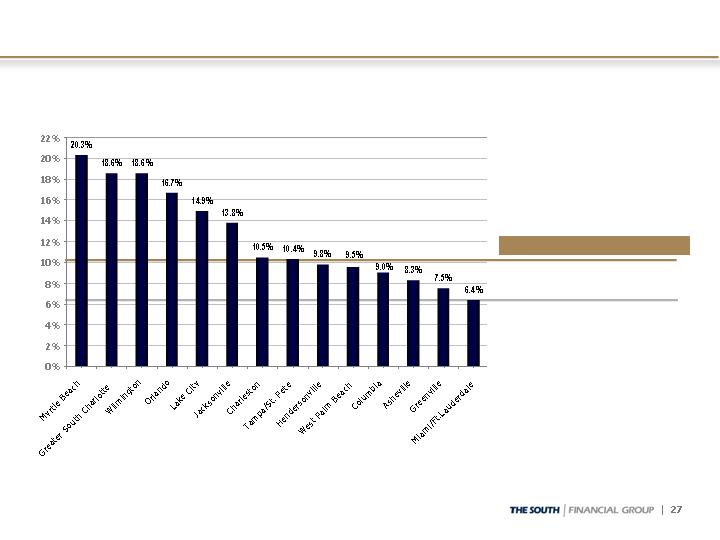
U.S. Median 6.5%
TSFG Weighted Average* 10.2%
*Deposit weighted by county based on
TSFG deposits in each market
SOURCE: SNL Financial
PROJECTED HOUSEHOLD GROWTH (2008-2013)
NOTE: The regions highlighted are complete MSAs except for Greater South Charlotte, which is York County, SC (Rock Hill), Hendersonville, NC, which is
Henderson County, and West Palm Beach, which is Palm Beach County.
TSFG’s Footprint: Household Growth
Loan and Credit Quality Composition, 6/30/08
0.84%
$71.9
$47.0
2.09%
$219
100%
$10,476
Total Loans HFI
3.21%
5.0
3.8
4.51%
28
6%
629
Mortgage*
1.46%
5.7
3.3
0.07%
1
7%
729
Indirect – sales
finance
0.74%
0.9
0.8
0.60%
5
7%
781
Home equity
2.16%
0.20%
8.47%
0.57%
0.84%
0.43%
0.98%
NAL %
of O/S
Balance
1.0
33.6
10.0
2.9
0.9
$11.8
YTD Net
Charge-
offs
$25.0
1.0
22.3
8.7
2.6
0.4
$4.4
QTD Net
Charge-
offs
1.14%
1.95%
1.33%
0.86%
0.21%
0.43%
0.50%
30-day
past due
%
17
19%
2,037
Completed
income property
3
6%
575
Commercial
development
$10,276
100
1,550
1,184
$ 2,891
Outstanding
Balance
1%
15%
11%
28%
% of O/S
Balance
0
Other*
5
Owner-occupied
CRE
$28
C&I
131
Residential
construction
$222
Nonaccrual
Loans
Total, 3/31/08
As of June 30, 2008, $ in millions
HFI = Held for Investment; 30-day past due % of outstanding balance excludes nonaccrual loans
* Mortgage includes Consumer Lot Loans. Other includes Direct Retail and Unsecured Lines.
Commercial Development includes Commercial A&D and Commercial Construction. Residential Construction
includes Residential A&D, Residential Construction, Residential Condo, and Undeveloped Land.

Residential Construction by Geography, 6/30/08
0.29%
$1.0
$0.8
2.93%
$15
32%
$499
Total SC
0.14%
$0.2
2.67%
$14
31%
$506
Total SC, 3/31/08
1.77%
$1.2
5.48%
$17
19%
$316
Total NC, 3/31/08
2.40%
$30.8
$20.9
13.18%
$96
47%
$729
Total FL
2.41%
$9.8
12.80%
$103
50%
$806
Total FL, 3/31/08
1.33%
$33.6
$22.3
8.47%
$131
100%
$1,550
Overall Total
1.58%
$11.2
8.23%
$134
$1,628
Overall Total, 3/31/08
0.52%
$1.7
$0.6
6.43%
$21
21%
$322
Total NC
33.19%
5.79%
16.90%
6.88%
NAL %
of O/S
Balance
10.6
2.3
11.5
$6.3
YTD Net
Charge-
offs
7.7
2.3
6.5
$4.4
QTD Net
Charge-
offs
4.91%
8.47%
0.40%
1.33%
30-day
past due
%
44
17%
259
FL residential A&D
6
7%
103
FL residential
construction
80
$287
Outstanding
Balance
5%
18%
% of
Resid.
Constr.
27
FL residential
condo
$20
FL undeveloped
land
Residential Construction:
Nonaccrual
Loans
As of June 30, 2008, $ in millions
30-day past due % of outstanding balance excludes nonaccrual loans.

Current as of 12/1/08
