Investor Presentation
First Quarter 2009

Forward-Looking Statements
and Non-GAAP Financial Information
The forward-looking statements, as defined in the applicable federal securities laws, being made today are subject to risks
and uncertainties. TSFG’s actual results may differ materially from those set forth in such forward-looking statements.
These statements include, but are not limited to, factors that may affect TSFG’s return goals, loan growth, loan sales,
customer funding growth, expense control, income tax rate, expected financial results for acquisitions, noninterest income,
adequacy of capital and future capital levels, factors that will affect credit quality and the net interest margin, effectiveness
of hedging strategies, risks and effects of changes in interest rates, effects of general economic and financial market
conditions, and market performance. Reference is made to TSFG’s reports filed with the Securities and Exchange
Commission for a discussion of factors that may cause such differences to occur. TSFG undertakes no obligation to release
revisions to these forward-looking statements or reflect events or circumstances after today’s presentation.
This presentation contains certain non-GAAP measures that exclude the impact of certain nonoperating items. TSFG
management uses these non-GAAP, or operating measures, in its analysis of TSFG’s performance. TSFG believes
presentations of financial measures excluding the impact of certain items provide useful supplemental information and
better reflect its core operating activities. Management uses operating measures, in particular, to analyze on a consistent
basis and over a longer period of time, the performance of which it considers to be its core operations.
Operating measures adjust GAAP information to exclude the effects of nonoperating items, such as gains or losses on
certain asset sales, early extinguishment of debt, employment contract buyouts, impairment charges, and other
nonoperating expenses. The limitations associated with utilizing operating measures are the risk that persons might
disagree as to the appropriateness of items comprising these measures and different companies might calculate these
measures differently. Management compensates for these limitations by providing detailed reconciliations between GAAP
and operating measures. These disclosures should not be considered an alternative to GAAP results. A reconciliation of
GAAP results and non-GAAP measures is provided in the Quarterly Financial Data Supplement on our web site,
www.thesouthgroup.com, in the Investor Relations section under Quarterly Earnings.
Total assets $13.6
Loans held for investment $10.2
Customer funding* $8.0
Tangible shareholders’ equity $1.4
Tangible equity to tangible
assets
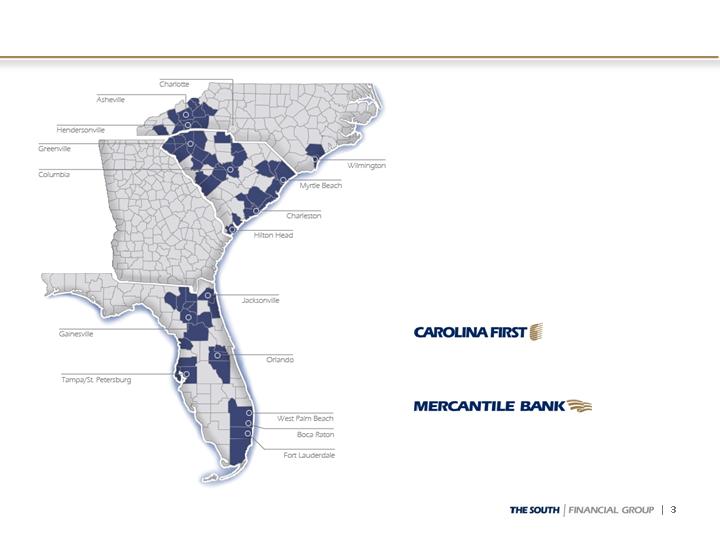
Branch offices:
NC 27
SC 82
FL 71
TSFG AT A GLANCE
$ in billions, as of 12/31/08
Company Overview
* Customer funding includes total deposits less brokered deposits plus customer sweeps.
** Mercantile Bank is a division of Carolina First Bank.
10.29%

Goal: Relationship Bank of Choice
Building core banking relationships
Focused on customer relationships with local decision-making
Accessible and responsive
Involved in our communities
Target small businesses, middle market, and retail customers
Built through multi-product relationships
Located in attractive Southeastern markets with long-term growth
potential
Led by local Market Presidents in 12 markets
Average of 24 years banking experience
Local market and customer knowledge
Local authority to make customer decisions
PROJECTED HOUSEHOLD GROWTH (2008-2013)
Growth estimates deposit weighted by county as of 6/30/08
SOURCE: SNL Financial
Footprint: Long-term Growth Potential
6.3
Trustmark
6.4
Regions
6.5
Operating Peer Median
6.5
U.S. Median
7.0
Whitney
6.7
BOK Financial
10.5
Colonial BancGroup
10.5
SunTrust Banks
11.1
Zions Bancorporation
11.8
Cullen/Frost
8.3
BB&T
10.2
The South Financial Group
%
14.2
United Community Banks
5.5
8.8
Household Growth
(%)
Synovus
Company Name
First Horizon

DEPOSITS BY STATE*
*Percent of total deposits by state as of December 31; reflects customer deposits after 12/31/04
As of December 31, 2008
Footprint: Geographic Diversification

Proactive and Realistic Approach to Cycle
$250 million Capital Raise in May 2008
Attracted sophisticated large investors
Reduced quarterly common cash dividend to $0.01 per share;
preserves $52 million annually in retained capital
Strengthened overall Liquidity Position
$4.4 billion unused secured capacity at 12/31/08
In May 2008, suspended indirect automobile lending in Florida
Parent company has $210 million in cash at 12/31/08 to cover
expected cash flow needs, debt service and existing dividends
through 2012 with no support from banking subsidiary
New Risk Management team
Lynn Harton (former Chief Credit Officer of Regions/Union
Planters) hired in June 2007; now President & CEO
Significant number of senior leadership level hires from same
team
Large bank experience in turnaround situations

Proactive and Realistic Approach (continued)
Resulted in Early Identification of real estate credit issues
New management processes reflected in risk grades identified
growing level of problems
Disclosed rising levels of nonaccruals in 1Q08, ahead of
Southeastern Peers
Increased loan loss reserve in 1Q08 to one of the highest levels in
the Southeast; built to 2.45% at 12/31/08
Began loan sales (2Q08) earlier than peers
Recognized by analysts as having a realistic and aggressive
posture in managing credit risk
$347 million of U.S. Treasury CPP Capital in December 2008
Lynn Harton named President & CEO in February 2009
Served as Interim since 11/13/08

New Leadership - Initial Actions
Organizational leadership changes
New Florida leadership
Executive Mgmt structure modified to clarify responsibilities/ownership
Director of Commercial Banking Strategy created to drive support and
strategy for largest business line
All line bankers now reporting to the State Bank Presidents instead of
operating in “silo” lines of business
Intense focus on communication to clarify ONE Bank strategy
Clarify target customers and methods of delivering value
Changed incentive plans to support relationship bank strategy
Created internal segmentation of “core/non-core” product segments to
measure success of each piece of the business
Quick moves to begin streamlining cost structure
December 2008 staff reductions
No 2008 bonus or 2009 merit increases for Executive Mgmt Team
Corporate campus evaluation
Initiated Phase 1 of Project NOW
8 workstreams, each with a full-time employee “owner” supported by
outside project management experts
Anticipated annual pre-tax operating benefits of $18-$20 million
Citizens/Southern Bank
1988
45
President, North and South Carolina
Scott M. Frierson
Colonial/Chase Manhattan
Mortgage/HomeSide Lending
2006
50
EVP, Chief Operations and
Technology Officer
Tanya A. Butts
AmSouth/Wells Fargo
2005
49
EVP, Director Commercial Strategy
Christopher S. Gompper
BB&T/Regions
2007
44
EVP, Chief Credit Officer
Robert A. Edwards
PwC/Union Planters/National
Commerce
2007
43
Sr. EVP, Chief Financial Officer
James R. Gordon
National Commerce/Trustmark
2006
45
Sr. EVP, Director Retail Strategy
Christopher T. Holmes
Wyche, Burgess, Freeman &
Parham
2002
46
EVP, Chief Legal and Risk Officer
William P. Crawford, Jr.
Barnett Bank/NationsBank
2002
58
EVP, Chief Human Resources Officer
Mary A. Jeffrey
Regions/Terrabank/Southeast
Bank
2007
43
President, Florida
J. Ernesto “Ernie” Diaz
BB&T/Union Planters/Regions
2007
47
President and CEO
H. Lynn Harton
First Horizon
2005
54
EVP, General Auditor
Keith D. Williamson
Prior Experience
Year
Joined
TSFG
Age
Position
Name
Executive Management Team
NOTE: Shading indicates new role or added responsibilities effective in 4Q08.
Control operating noninterest expenses, excluding
environmental costs
Launched Phase 1 of efficiency project with focus on
both expense management and revenue
opportunities
Expense Control
Increase through growth in deposits and wealth
management revenues
Noninterest Income
Continue to manage tangible equity ratio
Maintain strong regulatory capital ratios
Capital Management
Aggressively identify and resolve stressed portfolios
Improve longer-term performance relative to peers
Credit Quality
Focus on liquidity in near-term with longer-term
view of improving NIM
Lower funding costs longer-term by improving
volume, mix, and cost of deposits
Funding
Focus on relationship-based lending to small and
family-owned businesses in market
Deemphasize noncore portfolios: indirect, lot loans,
residential construction, shared national credits
Loan Growth
OBJECTIVES
EXECUTION POINTS
Strategic Objectives

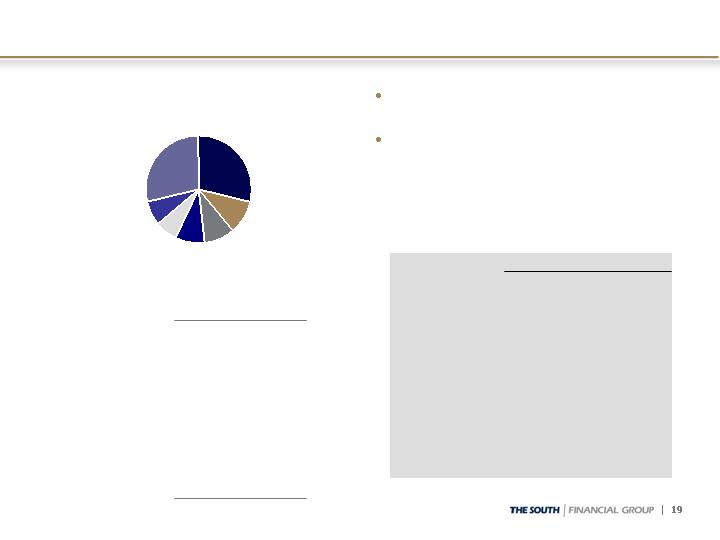
Diversified Loan Portfolio
Loan Mix
As of December 31, 2008
($ in millions)
Total Loans Held for
Investment $10,192
C&I
Commercial
Development
Mortgage*
Diversified portfolio
By product and customer
By geography
In-footprint focus
Customers we know; markets
we understand
No broker mortgage/HE loans
Minimal subprime exposure
Suspended Florida indirect
Disciplined approval and portfolio
management processes
Local credit officers
Executive credit committee
approval for largest
relationships
Special assets department for
high risk loans
Centralized consumer
approval and collections
Specialized credit support for our
largest businesses
CRE; Corporate Banking/SNC
Owner-
Occupied
Indirect -
Sales Finance
Income
Property
Residential
Construction
Home Equity
* Mortgage includes Consumer Lot Loans and Other (Direct Retail and Unsecured Lines).

Credit Quality Results
Residential construction and housing-related loans continue to be primary
stress across entire footprint
Reduced residential construction portfolio by $365 million, or 22%, since
3/31/08
Recession showing signs of impacting C&I and consumer loan categories
NCOs $76.1 million, or 2.93% of average loans annualized (YTD 2.16%)
Provision of $122.9 million, a $38.3 million increase from 3Q08
Exceeds NCOs by $46.9 million; reserve build of $121.2 million in 2008
Built reserve to 2.45% (from 1.97% at 9/30/08 and 1.26% at
12/31/07)
NPAs increased to 4.10% of loans and foreclosed property
NPLs held for investment increased to $355.6 million, up from $240.1
million at 9/30/08
Commercial NALs carried at 67% after deducting specific reserves
Inflows reflect migration of existing watch loans (NAL inflows: $195
million for 4Q08, $104 million for 3Q08, $74 million for 2Q08, and $175
million for 1Q08)
Gaining control of assets through foreclosure process
Limited loan sale activity in 4Q08 due to less liquidity for buyers and
continuing uncertainty regarding market outlook
Loan and Credit Quality Composition
1.16%
$75.4
2.30%
$238
$10,300
9/30/08
0.84%
$47.0
2.09%
$219
$10,476
6/30/08
2.22%
$223.4
$76.1
3.42%
$349
100%
$10,192
Total Loans HFI
9.46%
24.1
12.1
10.17%
59
6%
580
Mortgage**
2.21%
14.1
5.0
0.11%
1
6%
636
Indirect – sales
finance
1.42%
6.1
2.4
1.01%
8
8%
813
Home equity
2.16%
0.26%
11.24%
4.85%
2.67%
1.17%
1.32%
NAL % of
O/S
Balance
1.0
102.6
15.1
15.2
3.5
$42.1
YTD Net
Charge-
offs
$25.0
0.0
24.5
2.6
10.3
1.8
$17.6
QTD Net
Charge-
offs
1.14%
3.04%
4.93%
1.45%
1.32%
1.19%
1.01%
30-day
past due
%
59
22%
2,203
Completed
income property
29
6%
608
Commercial
development
$10,276
95
1,263
1,271
$ 2,723
Outstanding
Balance
1%
12%
12%
27%
% of
O/S
Balance
--
Other**
15
Owner-occupied
CRE
$36
C&I
142
Residential
construction
$222
Nonaccrual
Loans
HFI*
3/31/08
As of December 31, 2008, $ in millions
HFI = Held for Investment; 30-day past due % of outstanding balance excludes nonaccrual loans. See page 9 of the Quarterly Financial Data Supplement
for Commercial Real Estate loans by product type and by geography. Commercial Development includes Commercial A&D and Commercial Construction.
Residential Construction includes Residential A&D, Residential Construction, Residential Condo, and Undeveloped Land.
* Nonaccrual loans exclude nonaccrual loans held for sale of $16.5 million.
** Mortgage includes Consumer Lot Loans. Other includes Direct Retail and Unsecured Lines.
Credit Quality Trends - Commercial
1.76%
$44.6
9.03%
$127
$1,410
3Q08
1.33%
$22.3
8.47%
$131
$1,550
2Q08
0.27%
$2.5
1.87%
$11
$601
3Q08
0.86%
$8.7
0.57%
$3
$575
2Q08
1.15%
$1.9
1.05%
$22
$2,084
3Q08
0.21%
$2.6
0.84%
$17
$2,037
2Q08
0.79%
$0.8
0.58%
$7
$1,207
3Q08
0.43%
$0.4
0.43%
$5
$1,184
2Q08
0.44%
$12.7
0.97%
$28
$2,824
3Q08
0.50%
$4.4
0.98%
$28
$2,891
2Q08
4Q08
4Q08
4Q08
4Q08
4Q08
11.24%
4.85%
2.67%
1.17%
1.32%
NAL % of
O/S Balance
$24.5
$2.6
$10.3
$1.8
$17.6
QTD Net
Charge-offs
4.93%
1.45%
1.32%
1.19%
1.01%
30-day past
due %
$59
$2,203
Completed income
$29
$608
Commercial
development
$1,263
$1,271
$ 2,723
Outstanding
Balance
$15
Owner-occupied CRE
$36
C&I
$142
Residential
construction
Nonaccrual
Loans HFI
$ in millions
HFI = Held for Investment; 30-day past due % of outstanding balance excludes nonaccrual loans.

Credit Quality Trends - Consumer
3.04%
$0.0
0.26%
$ --
$95
4Q08
Other**
1.84%
$0.0
0.94%
$1
$100
3Q08
4.64%
$6.9
5.92%
$36
$610
3Q08
3.21%
$3.8
4.51%
$28
$629
2Q08
0.71%
$2.6
0.68%
$5
$784
3Q08
0.74%
$0.8
0.60%
$5
$781
2Q08
1.69%
$3.4
0.10%
$1
$680
3Q08
1.46%
$3.3
0.07%
$1
$729
2Q08
2Q08
4Q08
4Q08
4Q08
9.46%
$12.1
10.17%
$59
$580
Mortgage**
2.21%
$5.0
0.11%
$1
$636
Indirect–sales finance
1.42%
$2.4
1.01%
$8
$813
Home equity
0.20%
NAL % of
O/S Balance
$1.0
QTD Net
Charge-offs
1.95%
30-day past
due %
$100
Outstanding
Balance
$ --
Nonaccrual
Loans HFI
$ in millions
HFI = Held for Investment; 30-day past due % of outstanding balance excludes nonaccrual loans.
** Mortgage includes Consumer Lot Loans. Other includes Direct Retail and Unsecured Lines.
Residential Construction by Geography
1.76%
$44.6
9.03%
$127
$1,410
9/30/08
1.33%
$22.3
8.47%
$131
$1,550
6/30/08
5.35%
$5.5
$2.0
4.85%
$22
35%
$439
Total SC, 12/31/08
0.45%
$2.5
2.14%
$10
34%
$485
9/30/08
3.63%
$2.7
6.93%
$21
22%
$306
9/30/08
6.13%
$88.8
$18.6
16.94%
$90
42%
$534
Total FL, 12/31/08
1.87%
$39.4
15.47%
$96
44%
$619
9/30/08
4.93%
$102.6
$24.5
11.24%
$142
100%
$1,263
Overall Total,
12/31/08
1.58%
$11.2
8.23%
$134
$1,628
3/31/08
2.10%
$8.3
$3.9
10.45%
$30
23%
$290
Total NC,12/31/08
17.61%
16.16%
11.21%
20.20%
NAL %
of O/S
Balance
28.0
5.5
35.6
$19.7
YTD Net
Charge-
offs
6.2
2.1
7.9
$2.4
QTD Net
Charge-
offs
0.00%
1.46%
1.29%
11.88%
30-day
past due
%
16
11%
145
FL residential A&D
9
5%
59
FL residential
construction
78
$252
Outstanding
Balance
6%
20%
% of
Resid.
Constr.
14
FL residential
condo
$51
FL undeveloped
land
Residential Construction:
Nonaccrual
Loans HFI
As of December 31, 2008, $ in millions
30-day past due % of outstanding balance excludes nonaccrual loans.
See page 9 of the Quarterly Financial Data Supplement for detail for NC and SC.
Commercial Nonaccruals – Net Balance
$281
142
29
59
15
$36
12/31/08
Nonaccrual
Loan
Balance
$237
122
22
54
11
$28
Net
Balance
Less
Specific
Reserve
67%
$44
$71
$352
Total
Commercial
69%
57%
76%
65%
57%
Net
Balance
as % of
Unpaid
Principal
5
12
71
Completed
income property
8
9
38
Commercial
development
177
17
$49
Unpaid
Principal
(1)
35
2
$13
Cumulative
Net Charge-
offs (2)
19
Residential
construction
4
Owner-occupied
CRE
$8
C&I
12/31/08
Specific
Reserve(3)
$ in millions
-
=
-
=
(1) Outstanding balance at default
(2) Typically charge-down at nonaccrual to approximately 80% of most recent appraised value
(3) Additional specific reserves are established as necessary based on estimated disposal costs, estimated holding period and current market
and economic conditions; recognized as charge-offs when realized. However, these amounts do not include the qualitative components within
the overall allowance for credit loans.
Consistent
with
9/30/08
Indirect – Sales Finance
As of December 31, 2008, $ in millions
In 5/08, ceased production in
Florida
Effective 1/09, offered only
through full relationship
dealerships in NC and SC
Toyota
29%
Summary Statistics
66%
70%
61%
New %
34%
30%
39%
Used %
$699
$464
$235
12/07 Balance
59%
41%
695
722
$636
Total
66%
48%
Foreign %
34%
52%
Domestic %
686
710
Jan 09 FICO
716
729
Orig FICO
$381
$255
12/08 Balance
FL
NC/SC
30-day Past Dues, By Auto Make (Top 10)
Total, $636 million or 6% of loans
By Auto Make
2.35%
18
Chrysler
2.55%
18
Hyundai
2.16%
$530
Top 10
0.98%
19
Jeep
2.20%
25
Nissan
2.78%
42
Dodge
2.10%
47
Ford
1.77%
56
Kia
2.94%
60
Chevrolet
2.09%
62
Honda
1.99%
$183
Toyota
30-day %
O/S$
Honda
10%
Ford
7%
Other
29%
Chevrolet
9%
Dodge
7%
Kia
9%
Home Equity Lines/Loans
SC, $354
43%
FL, $283
35%
NC, $135
17%
As of December 31, 2008, $ in millions
Originated by TSFG sales force
in-market; no broker loans
Strong FICO scores
Conservative LTV position and
usage amounts
Not pushed as a growth product
Home Equity Portfolio = HE Line and HE Loan portfolios
Geography based on customer address
Other, $41
5%
Summary Statistics
NA
NA
70%
WAvg Util %
69%
56%
44%
718
727
$812
Total
66%
70%
Orig WAvg
LTV %
19%
67%
2ndLien %
81%
33%
1stLien %
701
724
Jan 09 FICO
711
730
Orig FICO
$185
$627
Balance $
Loans
Lines
2008, $112
14%
2007, $155
19%
2006, $131
16%
2004 or before
$294, 36%
2005, $121
15%
By Vintage
Total, $813 million or 8% of loans
By Geography
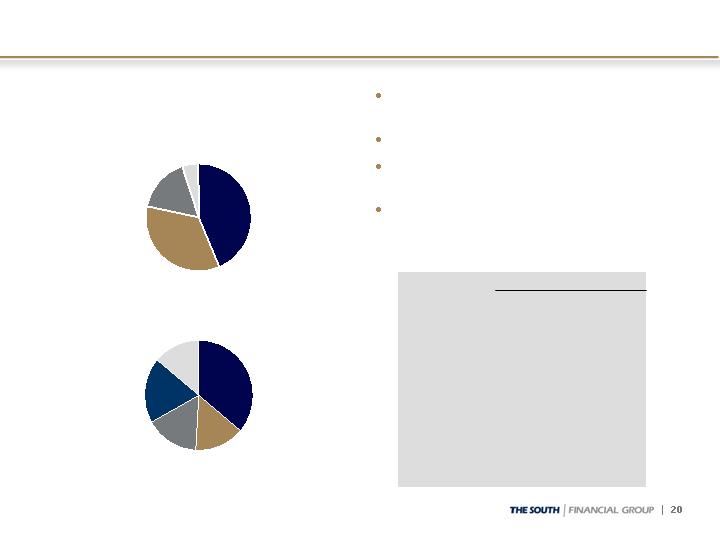
Mortgage Banking Portfolio
Remains a small portion of
entire portfolio
$580 million
6% of total loans HFI
NAL increase of $23 million
from Q3 to Q4
Increases from higher risk
portions of the portfolio
(Lot Loans and
Construction Perm)
Reduced balances in Lot
Loans and Construction
Perm products by $136
million in 2008
Consumer restructured
loans of $3.6 million
(included in NPLs) from
working with borrowers to
do loan modifications
As of December 31, 2008, $ in millions
$12.6
15.98%
0.00%
1.70%
$78.8
$15.2
6.12%
2.34%
3.84%
$249.1
$8.3
2.94%
2.21%
1.89%
$282.3
3Q08
$4.7
4.11%
0.00%
2.91%
$113.3
$8.4
2.89%
1.03%
5.34%
$291.4
$3.9
1.56%
1.87%
6.22%
$251.8
1Q08
Construction Perm:
$95.7
$64.0
Balance
5.86%
5.22%
30-89 DPD
0.00%
0.00%
90+ DPD
9.85%
20.02%
NAL %
$9.4
$12.8
NAL $
Lot Loans:
$266.2
$225.5
Balance
2.09%
6.34%
30-89 DPD
2.00%
1.84%
90+ DPD
4.07%
13.20%
NAL %
$10.8
$29.9
NAL $
SIVA* Alt-A:
$8.1
$16.3
NAL $
3.04%
5.59%
NAL %
0.69%
3.41%
90+ DPD
0.90%
7.90%
30-89 DPD
$267.9
$290.7
Balance
2Q08
4Q08
Mortgage Portfolio = Mortgage, Consumer Lot Loans, and Construction Perm products (excludes HE Loan)
* SIVA = Stated Income Verified Assets
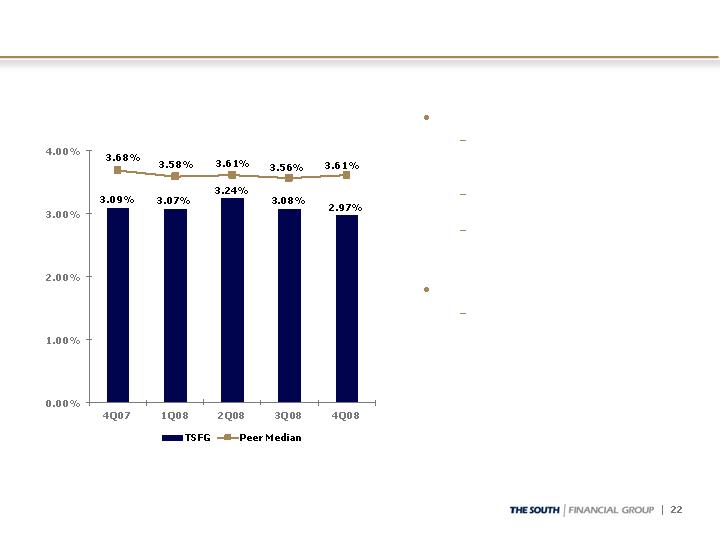
Net Interest Margin
Net Interest Margin (FTE)
Decrease 4Q08 vs. 3Q08
Increase in nonaccrual
interest reversals:
-4 bp
Maturing prime-based
swaps: -4 bp
Balance sheet mix:
-3 bp
1Q09 Headwind
Limitations for passing-
through the recent
sharp Federal funds
rate cuts given the low
absolute level of
interest rates on non-
maturity deposits and
impact from credit
issues
+5
-5
+3
-10
-3
Peer
-11
-16
+17
-2
-3
TSFG
Basis Point Change:

Customer Funding
1.3%
24
1,840
1,864
Time deposits < $100,000
(1.6)%
28
1,806
1,834
Money market
0.8%
62
7,435
7,497
Customer deposits
(10.7)%
(59)
552
493
Customer sweep accounts
Customer deposits:
-- %
(2.4)%
26.7%
(1.1)%
1.8%
LQ %
Change
(12)
1,091
1,079
Interest-bearing
40
150
190
Savings accounts
(36)
1,525
1,489
Time deposits $100,000 or
more
$3
$7,987
$7,990
Total customer funding
$18
$ Change
$1,023
9/30/08
Balance
$1,041
12/31/08
Balance
Noninterest-bearing
$ in millions
Customer funding reflects total deposits excluding brokered deposits plus customer
sweeps. Customer deposits reflect seasonal increase in public funds.
Wholesale Borrowings
By Maturity
$4,385
$3,750
$1,396
$2,354
Total wholesale
borrowings
--
1,909
719
1,190
Brokered CDs
--
13
--
13
Commercial paper
864
233
203
30
FHLB advances
274
200
--
$ --
> 1
year
274
200
1,054
$67
Total
--
851
2,670
$ --
Unused
Secured
capacity
--
Repurchase
agreements
--
1,054
$ 67
1 year
or less
Other*
Fed Reserve and
T,T&L
Fed funds
purchased
As of December 31, 2008, $ in millions
* No bank ($68 million) exposure to capital markets rollover risk for debt obligations
until 2012
$4.7 billion
at 9/30/08
Strong parent company
liquidity position
Parent company cash of
$210 million at
12/31/08
No debt maturities until
2033
Expected annual
dividends of $43 million
(preferred and common)
Cash sufficient to satisfy
all fixed obligations over
the next 4 years
Parent Company Liquidity

Capital Position
Capital Purchase Program (U.S. Treasury Investment)
Received $347 million on December 5, 2008
Issued warrant to purchase 10.1 million shares at $5.15 per share
($19.6 million allocated value)
Effective dividend yield of 6.3%
Utilized $260 million for capital injection into Carolina First Bank
Kept $87 at parent company for liquidity
Temporary use of proceeds to enhance liquidity (increase cash reserves
and pay-down wholesale borrowings) pending opportunity to lend
Tangible common equity to tangible assets of 6.05%
Down 56 bp from 12/31/07 while absorbing $344.6 million of credit
losses in 2008
Does not include Mandatorily Convertible Preferred Stock (MCPS) of
$238.7 million, or 179 basis points reflecting conversion
Believe MCPS should be viewed as key component of common equity
since automatically converts on May 1, 2011; conversion is assumed
when looking at common tangible book value per share
Approximately $60 million has already converted to date, including
$48.7 million subsequent to year-end (which includes conversion
involving issuance of 2.5 million common shares as inducement to
convert)

Capital Position
7.84%
7.94%
Tangible common equity to tangible
assets
$9.40
$9.42
Common tangible book value per
share
Assuming conversion of Mandatorily Convertible Preferred:***
8.54%
11.55%
9.82%
9.70%
12.68%
11.18%
6.06%
9/30/08
Actual
$604
$304
$573
$839
$512
$808
Capital in Excess of
Well Capitalized
Minimum
After-tax $
5%
10%
6%
5%
10%
6%
Well
Capitalized
Minimum
9.49%
12.59%
10.88%
11.22%
14.35%
12.86%
6.05%
12/31/08
Actual*
Total risk-based
Leverage
CAROLINA FIRST BANK
Tier 1 risk-based
Total risk-based
Leverage
Tier 1 risk-based
Tangible common equity to
tangible assets
THE SOUTH FINANCIAL GROUP
$ in millions
* Estimated
** For illustrative purposes only
*** Assumes full conversion of $239 million of Mandatorily Convertible Preferred at $6.50 per common share fixed conversion ratio (automatically
converts into common stock on May 1, 2011) and excludes CPP Preferred

Noninterest Expenses
3.1
0.1
1.5
4.5
4.6
Loan and foreclosed asset*
1.9
0.4
1.5
3.0
3.4
FDIC insurance*
1.6
0.3
(3.6)
(2.3)
(2.0)
FAS 91 Salary Deferral (included in Salaries)*
237.6
237.6
--
--
237.6
Goodwill impairment
1.0
0.2
3.8
4.6
4.8
Professional fees
2.0
0.6
15.4
16.8
17.4
Occupancy and FF&E
$ Change
$341.8
2.8
9.6
91.8
15.7
$45.9
4Q08
1.5
2.9
1.3
(0.1)
Other
$261.1
$247.6
$80.7
$94.2
Total noninterest expenses
9.6
12.4
0.9
$3.5
4Q08 vs.
4Q07
1.8
14.8
13.9
Other
2.1
79.4
89.7
Operating noninterest expenses
5.0
--
4.6
Employment contracts
$(1.0)
4Q08 vs.
3Q08
$42.4
4Q07
$46.9
3Q08
Salaries and employee benefits
$ in millions
Note: Other includes (gain) loss on early extinguishment of debt ($1.7 million for 4Q08, $(125,000) for 3Q08, and $499,000 for 4Q07), loss on
derivative collateral ($1.1 million for 4Q08), and Visa-related litigation ($881,000 for 4Q07).
*Approximately half of the $12.4 million year-over-year increase relates to the current
environment – higher loan and foreclosed asset and FDIC insurance expense and lower
loan origination salary deferrals. For 2009, expect higher FDIC insurance, loan and
foreclosed asset expense, and non-operating charges related to the corporate campus
under construction (evaluation of alternatives underway).

Noninterest Income
(0.2)
0.2
1.3
0.9
1.1
Mortgage banking income
$ Change
$1.0
2.3
(1.3)
0.3
(0.1)
1.0
(0.2)
(0.9)
$(1.6)
4Q08 vs.
3Q08
(0.1)
0.8
0.9
0.7
Merchant processing income, net
$29.7
1.6
28.1
3.2
(0.3)
3.9
6.3
$13.2
4Q08
Non-operating items:
(0.3)
--
(0.2)
Gain/(loss) on certain derivative
activities
0.8
3.1
2.9
Bank-owned life insurance**
2.9
(1.3)
(0.7)
Gain/(loss) on securities
$0.7
$29.0
$28.7
Total noninterest income
(1.2)
7.5
7.2
Wealth management income*
0.4
2.8
2.9
Other
(2.2)
30.3
29.4
Operating noninterest income
$(1.6)
4Q08 vs.
4Q07
$14.8
4Q07
$14.8
3Q08
Customer fee income*
$ in millions
*Together, approximately 70% of operating noninterest income. Reflect impacts from
economic downturn, such as fewer customer transactions and lower asset valuations.
**4Q08 includes $1.3 million for death proceeds partially offset by $645,000 in related
compensation expense (included in operating noninterest expenses).

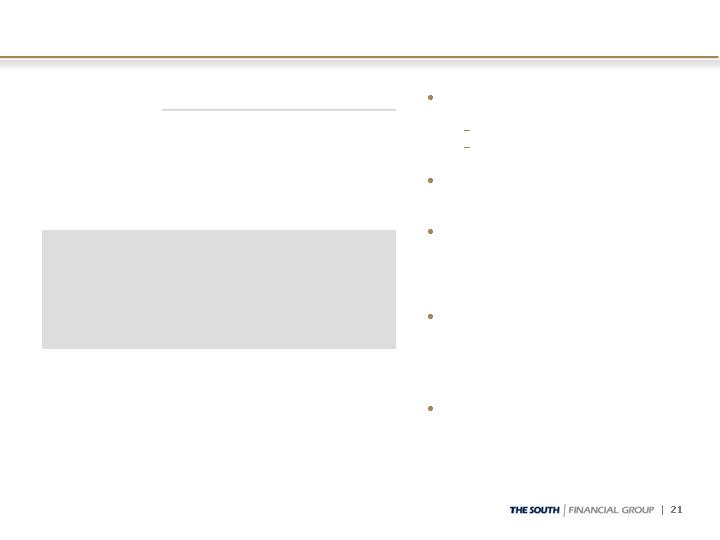
Expectations for 2009
Operating environment and results will remain challenging for all of 2009
Credit losses for first half of 2009 similar to last half of 2008; provisioning
depends on continuing economic developments
Continued headwinds from loan collection costs and FDIC insurance
Potential one-time charges arising from ultimate corporate campus decision
and continuing evaluation of small level of other investments for
impairment
Continue to evaluate the realizability of the net deferred tax asset
throughout 2009 for both book and regulatory purposes
Near-term pressure on margin in first half of year, followed by expansion of
margin as pricing initiatives on both the loan and deposit side begin to show
results
Positive impact from Project NOW and other expense initiatives
Potential for FDIC deposit transactions if market overlap promotes
efficiency and product set improves customer funding measures
Focus on cross sell; customer satisfaction; other measures that support our
strategic positioning

Positioned to Emerge Stronger
Mission to be best relationship bank in each of our markets
Leverage strategic footprint and its long-term growth
potential
Deep and experienced management team
Risk management talent and processes
Maintain strong balance sheet throughout credit environment
Capital position
Liquidity management
Higher loan loss reserves
Relationship lending with focus on deposit balances

Appendix – List of Operating Peers
Associated (ASBC)
BOK Financial (BOKF)
Colonial (CNB)
Commerce (CBSH)
Cullen/Frost (CFR)
Fulton (FULT)
Synovus (SNV)
Trustmark (TRMK)
United Community (UCBI)
Valley National (VLY)
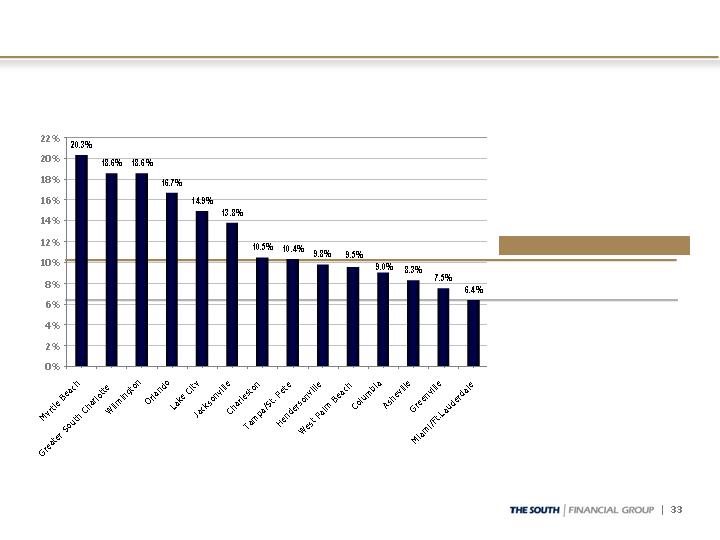
U.S. Median 6.5%
TSFG Weighted Average* 10.2%
*Deposit weighted by county based on
TSFG deposits in each market
SOURCE: SNL Financial
PROJECTED HOUSEHOLD GROWTH (2008-2013)
NOTE: The regions highlighted are complete MSAs except for Greater South Charlotte, which is York County, SC (Rock Hill), Hendersonville, NC, which is
Henderson County, and West Palm Beach, which is Palm Beach County.
TSFG’s Footprint: Household Growth

Current as of 2/19/09