Exhibit 99.1

Annual Meeting of Shareholders
May 5, 2009

Forward-Looking Statements
and Non-GAAP Financial Information
The forward-looking statements, as defined in the applicable federal securities laws, being made today are subject to
risks and uncertainties. TSFG’s actual results may differ materially from those set forth in such forward-looking
statements. These statements include, but are not limited to, factors that may affect TSFG’s return goals, loan growth,
loan sales, customer funding growth, expense control, income tax rate, expected financial results for acquisitions,
noninterest income, adequacy of capital and future capital levels, factors that will affect credit quality and the net
interest margin, effectiveness of hedging strategies, risks and effects of changes in interest rates, effects of general
economic and financial market conditions, and market performance. Reference is made to TSFG’s reports filed with the
Securities and Exchange Commission for a discussion of factors that may cause such differences to occur. TSFG
undertakes no obligation to release revisions to these forward-looking statements or reflect events or circumstances
after today’s presentation.
This presentation contains certain non-GAAP measures, such as results excluding the impact of certain nonoperating
items and separation of the loan portfolio into core and non-core loans (based on TSFG’s ability to build/expand
banking relationships). TSFG management uses these non-GAAP, or operating measures, in its analysis of TSFG’s
performance. TSFG believes presentations of financial measures excluding the impact of certain items provide useful
supplemental information and better reflect its core operating activities. Management uses operating measures, in
particular, to analyze on a consistent basis and over a longer period of time, the performance of which it considers to be
its core operations. Operating measures adjust GAAP information to exclude the effects of nonoperating items, such as
gains or losses on certain asset sales, early extinguishment of debt, employment contract buyouts, impairment charges,
and other nonoperating expenses.
The limitations associated with utilizing operating measures are the risk that persons might disagree as to the
appropriateness of items comprising these measures and different companies might calculate these measures
differently. Management compensates for these limitations by providing detailed reconciliations between GAAP and
operating measures. These disclosures should not be considered an alternative to GAAP results. A reconciliation of GAAP
results and non-GAAP measures is provided in the Quarterly Financial Data Supplement on our web site,
www.thesouthgroup.com, in the Investor Relations section under Quarterly Earnings.

Change is needed
History of 4th Quartile Financial Performance
Financial performance reputation of the Company
is less than stellar

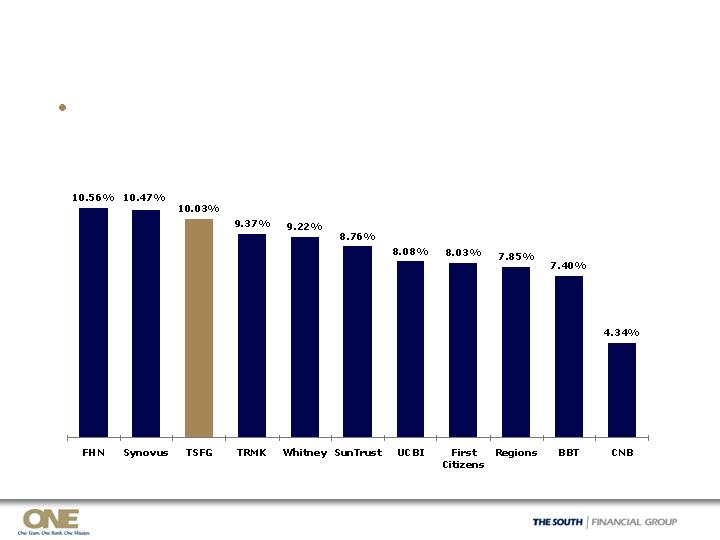
Pre-Cycle ROA vs. Southeast Peers
SOURCE: GAAP ROA per SNL Financial; Southeast peers include BBT, CNB, FCNCA, FHN, RF, SNV, STI, TRMK, UCBI, and WTNY
Entered credit cycle with below-peer financial performance
1.16%
0.73%
5-Yr Avg. ROA
(2003-2007)
1.24%
1.13%
Southeast Peer
Median
0.74%
0.59%
TSFG
10-Yr Avg. ROA
(1998-2007)
3-Yr Avg. ROA
(2005-2007)
Pre-Cycle Return on Average Assets
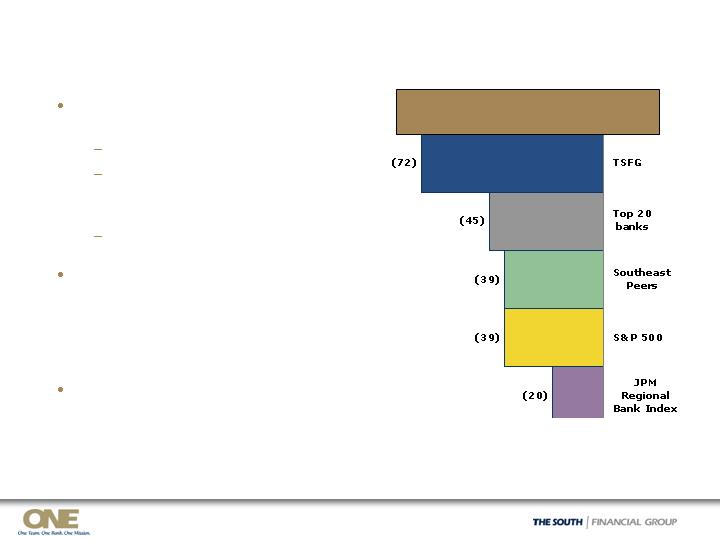
2008 Financial Performance
For non-operating items, see reconciliations of GAAP to non-GAAP measures provided on page 17 of the Quarterly Financial Data Supplement
available on TSFG’s web site, www.thesouthgroup.com, in the Investor Relations section.
SOURCE: SNL Financial; Southeast peers include BBT, CNB, FCNCA, FHN, RF, SNV, STI, TRMK, TSFG, UCBI, and WTNY; JPMorgan Regional
Bank Index includes top 40 banks by market cap excluding JPM, WFC, and BAC
Stock Price Change
% Decline in 2008
2008 loss available to common
shareholders:
$569 million reported (GAAP)
Non-cash goodwill impairment
of $426 million for FL banking
segment
$134 million operating loss
Increased allowance for credit
losses to 2.45% at Y/E 2008 (from
1.26% at Y/E 2007) and 2008 net
charge-offs of $223 million (vs.
$53 million a year ago)
Strengthened capital base and
maintained overall liquidity
position

Challenging Environment
All financial institutions affected, but TSFG has had
higher than peer losses
Mix (portfolio and geography)
Underwriting
Must be prepared – the Credit Contraction/Credit Crunch
will deepen and prolong the recession
Regulatory environment will become more intense
Have the beginnings of a clear separation of winners and
losers

Winners will be rewarded
Fewer Competitors
Re-intermediation (for a time)
Margin Improvements
Core Business continues to be viable
In the business of building financial wealth and
security
The “hope and dream” of every individual

TSFG can be positioned well
Solidify strong brand and community support in SC and
then re-create in Florida and NC
Community focused; flexible; “do business” bias
Improved controls; adequate now to control/grow the
business
Simple core operating systems
Strategically, enough size (and in the right location) to
become one of the consolidators of smaller
Southeastern banks looking for an exit strategy
Focused on the “right” footprint; management team
capable of integrating problem institutions

Action Plan to realize the opportunities
Build/choose leadership that can make the vision come
true
Preserve and generate capital and liquidity
Continue focus on credit management and execution
Reduce costs and execute on Revenue and Efficiency
Project (Project NOW)
Set clear performance targets
Build consensus around vision/strategy
Visit each market to have face to face communication of
new vision, possibilities, and strategies
Organizational Changes
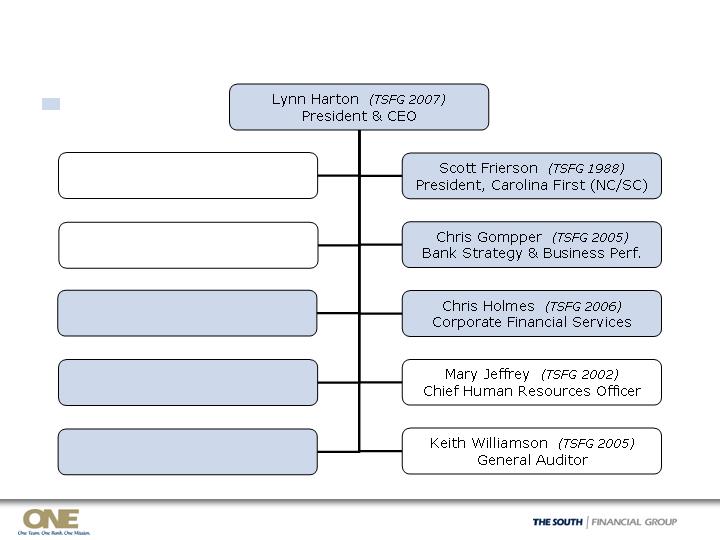
Our Executive Management Team
James Gordon (TSFG 2007)
Chief Financial Officer
Tanya Butts (TSFG 2006)
Operations & Technology
William Crawford (TSFG 2002)
Chief Legal & Risk Officer
Ernie Diaz (TSFG 2007)
President, Mercantile (FL)
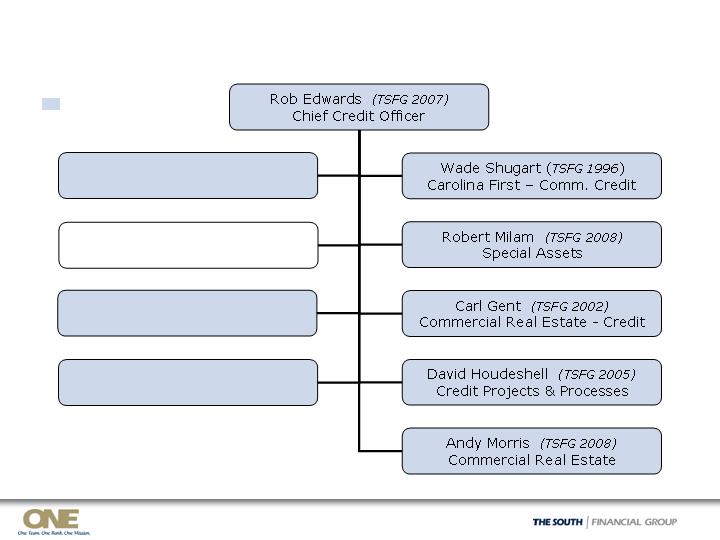
Rob Edwards (TSFG 2007)
Chief Credit Officer
New TSFG role in
last 12 months
Eliminated line of business “silos”
All relationship management teams report to and are
integrated by Bank Presidents
Incentive plans changed to foster cooperation “all win
or lose together”
Line of Business support (strategies, product
development, performance management, etc.) created
and consolidated under one leader
One Team. One Bank. One Mission.

Capital and Liquidity
Capital Base – Proactive Steps Taken
$347 million preferred from U.S. Treasury’s
Capital Purchase Program
12/08:
Actively managing balance sheet growth
Exited indirect lending in FL and non-
relationship dealers in NC/FL
Grow core loans
Reduced non-core ($230 million in 1Q09)
Ongoing:
$250 million of mandatorily convertible
preferred stock
To date, $60 million converted to
common
Reduced quarterly cash dividend to $0.01
5/08:
Total Capital Position vs. Southeast Peers
Higher is better
Tangible Equity as % Tangible Assets
As of 3/31/09
SOURCE: SNL Financial; First Citizens as of 12/31/08 since 3/31/09 information is not available
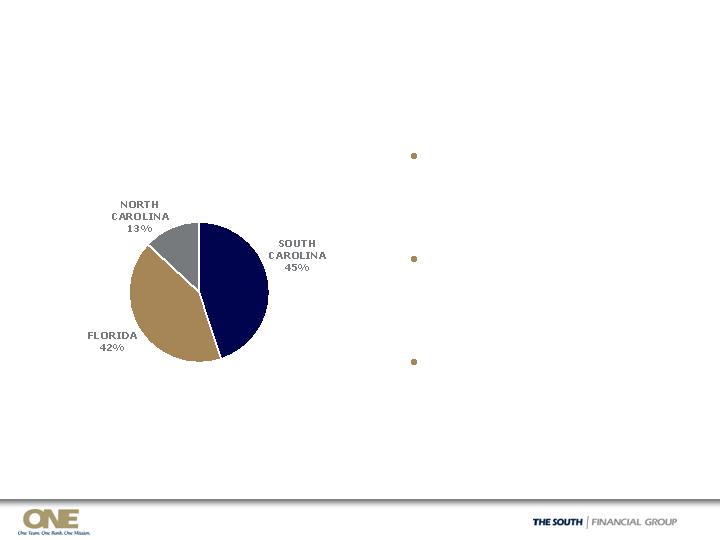
*Customer deposits are total deposits less brokered deposits. Core deposits are total deposits less certificates of deposit.
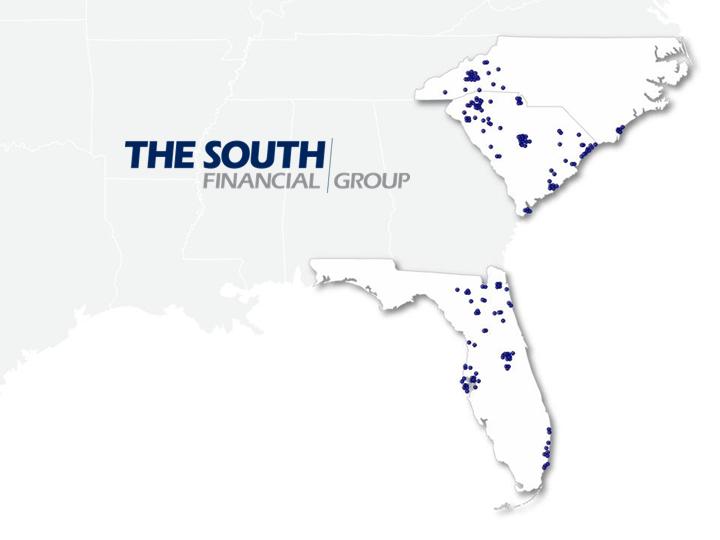
Customer Deposits
By State*
As of March 31, 2009
Geographic Diversification and Liquidity
Liquidity Position:
Unused secured
borrowing capacity of
$3.9 billion at 3/31/09
2.8% linked-quarter
growth in core
deposits in 1Q09
Strong parent
company liquidity

Credit Execution

“All about Credit”
Gross Nonaccrual Loan Inflows
$ in millions
Net Charge-Offs
$ in millions
* Nonperforming assets as a % of loans and foreclosed property
Nonperforming Asset Ratio*
Allowance for Credit Losses
as % of Loans HFI
Credit Actions
Early Identification of real estate credit issues
Disclosed rising levels of nonaccruals in 1Q08, ahead of SE Peers
Built loan loss reserves to one of highest levels for SE peers
Began proactive loan sales in 2Q08
Recognized cumulative NCOs during cycle (1Q08 to 1Q09) of
$332 million
No significant investment security credit issues
Risk Management
New Chief Credit Officer, Lynn Harton, in Jan 2007 (now CEO,
bringing credit/risk background)
Strengthened overall leadership in credit with large bank
turnaround experience
Over 50% change in key credit risk managers
Named Robert Edwards as Chief Credit Officer and William
Crawford as Chief Risk Officer in Dec 2008
Our Credit Team
Jay Richards (TSFG 2008)
Mercantile – Comm. Credit
Chuck Valerio (TSFG 1999)
Retail Credit
Mark Mullins (TSFG 2007)
Risk Reporting & Analytics
Holly Russell (TSFG 2008)
Mortgage Credit
New TSFG role
since mid-2007
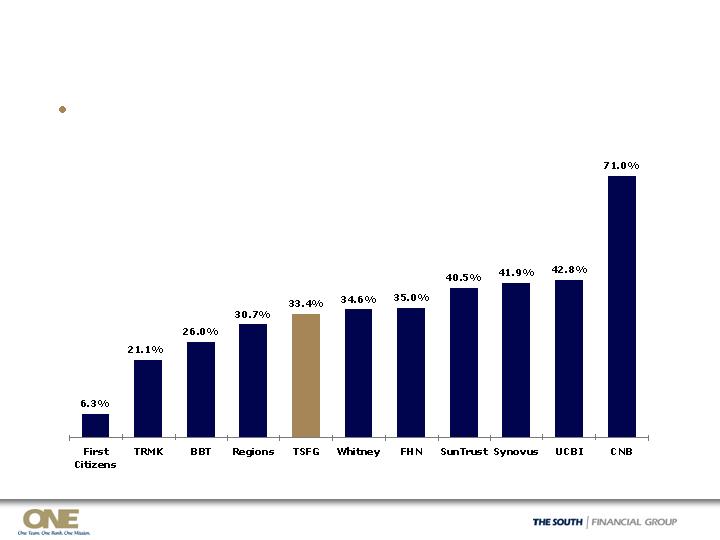
“Texas Ratio” vs. Southeast Peers
Lower is better
NPAs plus 90+ Days Past Due as % of GAAP
Tangible Equity plus Loan Loss Reserve
As of 3/31/09
SOURCE: SNL Financial; First Citizens as of 12/31/08 since 3/31/09 information is not available

Cost Reductions

Proactive & Realistic Approach to Cycle
Headwinds
Immediate Expense Reductions
FDIC insurance; special
assessment
Loan and foreclosed asset
expense
Non-operating charges related
to Corporate Campus under
construction
Actions taken:
Total Employees down 3%
linked-quarter
No Executive Management
Bonuses for 2008 performance
No Employee merit increases
during 2009
401k match cut 50%
New travel and other expense
policies
Credit-related costs* and FDIC insurance
Noninterest Expense Control
* Credit–related costs include loan and foreclosed asset expense, loss on nonperforming loans held for sale, and gain/loss on sale of OREO.
For non-operating items, see reconciliations of GAAP to non-GAAP measures provided on page 15 of the Quarterly Financial Data Supplement
available on TSFG’s web site, www.thesouthgroup.com, in the Investor Relations section.
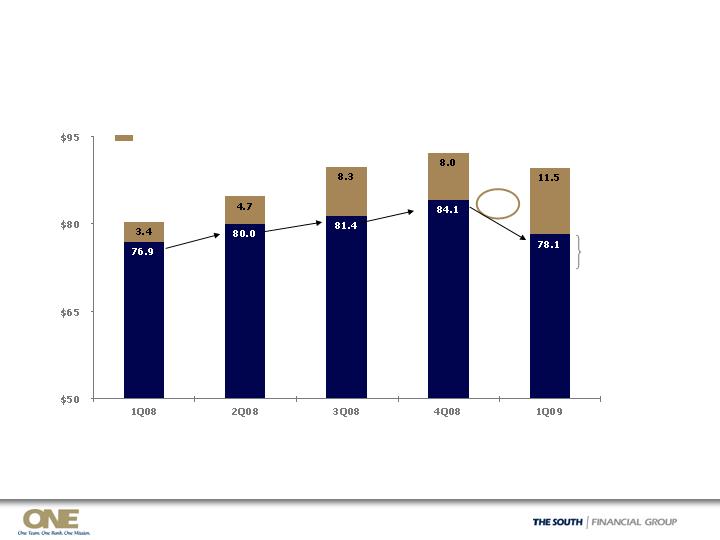
$80.3
$84.7
$89.7
$92.1
$ in millions
+$3.1
+$2.7
Operating Noninterest Expenses
- $6.0
$89.6
+$1.4
Includes
$1.3 for
Project
NOW
costs
2,430
2,505
2,535
2,572
2,485
# Employees (FTEs):
Project NOW
Anticipated annual pre-tax operating benefits of $18 to $20 million
(revenue improvements of $12 to $13 million and expense savings of
$5 to $7 million)
Approximately $10 to $11 million on track for realization in
second half of 2009
1Q09 noninterest expenses included associated costs of $1.3 million
#6 Consolidate Retail Products
#7 Collect Commercial Loan Fees & Pricing
#8 Streamline Commercial Processes
#5 Rationalize Information Technology Applications
#4 Centralize Procurement Function
#3 Optimize Sales & Service Center Operations
#2 Enhance Retail Deposit Fees
#1 Simplify Branch Processes
8 Initial Workstreams (Phase 1)

Set Clear Performance Measures
Performance Measures
Achieve Pre-Tax, Pre-Provision Operating Income Budget
Reduce 2009 operating noninterest expenses
(excl. OREO/LHS write-downs)
Deliver Project NOW targets for 2009
Improve efficiency and expense
management
Maintain NPA% relative to SE peer median
Maintain NCO% relative to SE peer median
Improve credit quality
Increase core deposits/total customer funding
Lower core loan to customer funding ratio
Achieve deposit growth and
funding mix targets
Achieve core loan growth per budget
Reduce non-core loan portfolio per budget
Achieve loan portfolio mix and
growth targets
Improve overall core loan yields/fees from 1/09
Reduce overall customer funding costs from 1/09
Increase pricing spreads on loans
and deposits
Performance Target
Corporate Goals
Achieve annual growth in core noninterest income
(excl. BOLI/Derivatives)
Grow noninterest income and
deepen relationship cross-sell

Vision, Strategy, Communication, Branding

Vision/Strategy – Our Mission
To be the relationship bank of choice
in the markets we serve,
distinguished by knowledgeable and
trusted professionals working
together to make a difference for
our customers, shareholders, team
members and communities

Vision/Strategy – Our Segments
Commercial Banking
Local C&I and select real estate and corporate
relationships (those with a meaningful opportunity for
deposits and noninterest income services)
Private Banking
Emerging and high net worth persons associated with
the businesses we bank (owners and executives), and
professional service firms
Retail Banking
Local consumer and small businesses that value
service delivery over price and product features

Vision/Strategy – Our Value Proposition
We know our customers, and we care about their
success
We operate with integrity and deliver “plain talk” and
personal attention
We are big enough to serve our customers, while
providing personalized service
Decisions are made by local people that our clients know
and trust
We offer a competitive product mix at a fair price
We are accessible, highly responsive and exceed
expectations

Communication and Market Visits
Clear communication – must be a priority in times of
opportunity and rebuilding
Improved Internal Communications
ONE Messages to all team members
Vision/Strategy Workshops
TSFG Board tour of Florida markets
Market visits
Customer Road Shows in 7 Markets since February
Observations from Market/Branch On-Site Visits
Marketing/Branding Campaign
Our mission – to be the best relationship bank in each
of our markets – as the foundation
Carolina First and Mercantile Bank start from different
positions
Tailor marketing/branding accordingly
High potential for growth
Established history
Expensive media markets
“Affordable” media
Limited branch network
Strong branch network
Low market share
Strong market share
Low awareness
High awareness
Weak to no brand investment
Strong branding investment
Mercantile Bank
Carolina First
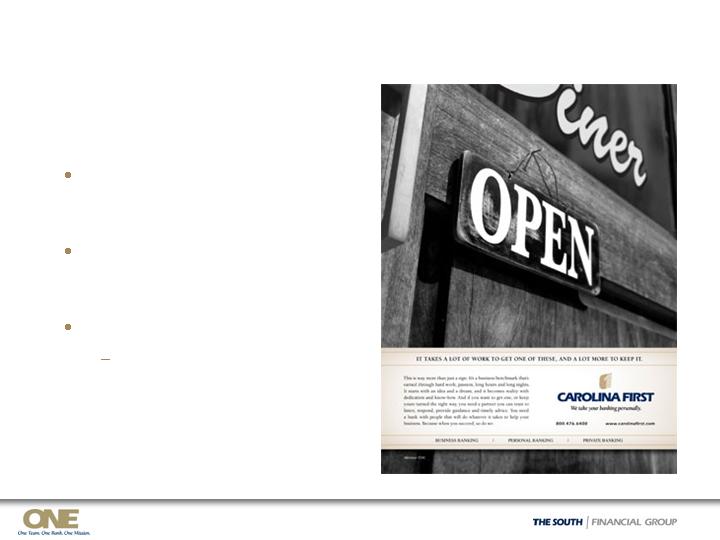
Carolina First
In keeping with our mission
and the methods we use to
deliver
Builds on existing brand
strength and past branding
investments
Campaign features “icons”
Positions us as partner/
trusted advisor
“We take your
banking personally.”
Mercantile Bank
Lack strong brand identity;
need more assertive
message
Simple, straightforward call
to action
Campaign features
“numbers” and “people”
Put faces and names on
local market leaders,
making them
recognizable, real, and
accessible
“Let’s do business.”

PROJECTED HOUSEHOLD GROWTH (2008-2013)
Growth estimates deposit weighted by county as of 6/30/08
SOURCE: SNL Financial
Footprint: Long-term Growth Potential
Company Name
Household Growth
(%)
United Community Banks
14.2
%
Cullen/Frost
11.8
Zions Bancorporation
11.1
SunTrust Banks
10.5
Colonial BancGroup
10.5
The South Financial Group
10.2
Synovus
8.8
BB&T
8.3
Whitney
7.0
BOK Financial
6.7
U.S. Median
6.5
Operating Peer Median
6.5
Regions
6.4
Trustmark
6.3
First Horizon
5.5
Questions